Embed Size (px)
Citation preview
Economic Development Impacts of Bus Rapid Transit Initial Findings – Rail~Volution 2015
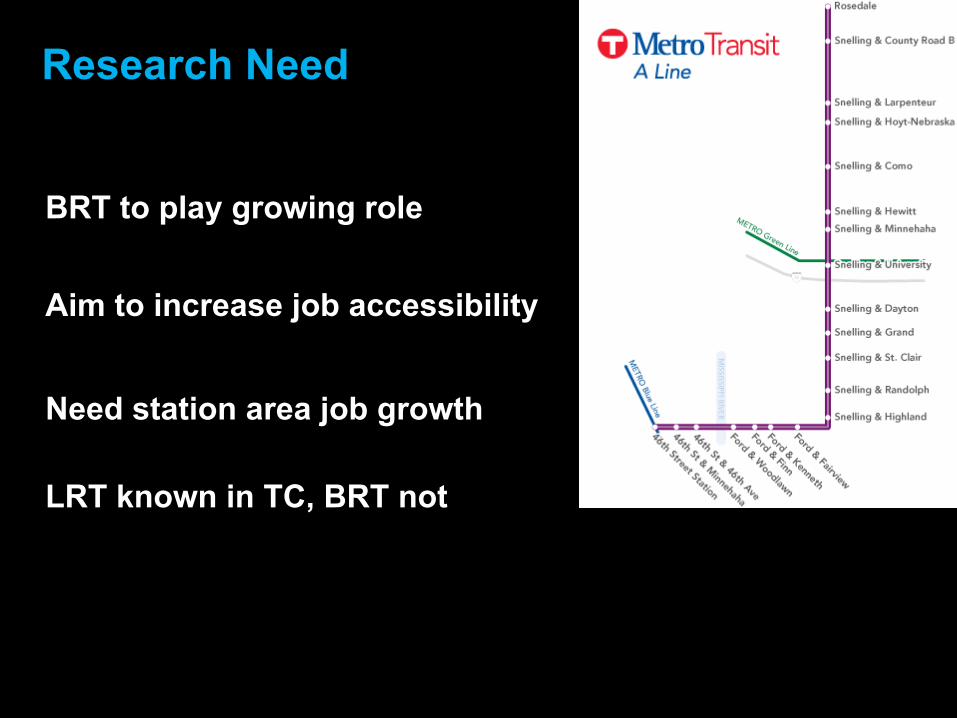
Research Need
BRT to play growing role
Aim to increase job accessibility
Need station area job growth
LRT known in TC, BRT not
Research Question
What determines job growth prospects in BRT station areas?
How and in what circumstances do those prospects differ from LRT?

Study Regions & Modes
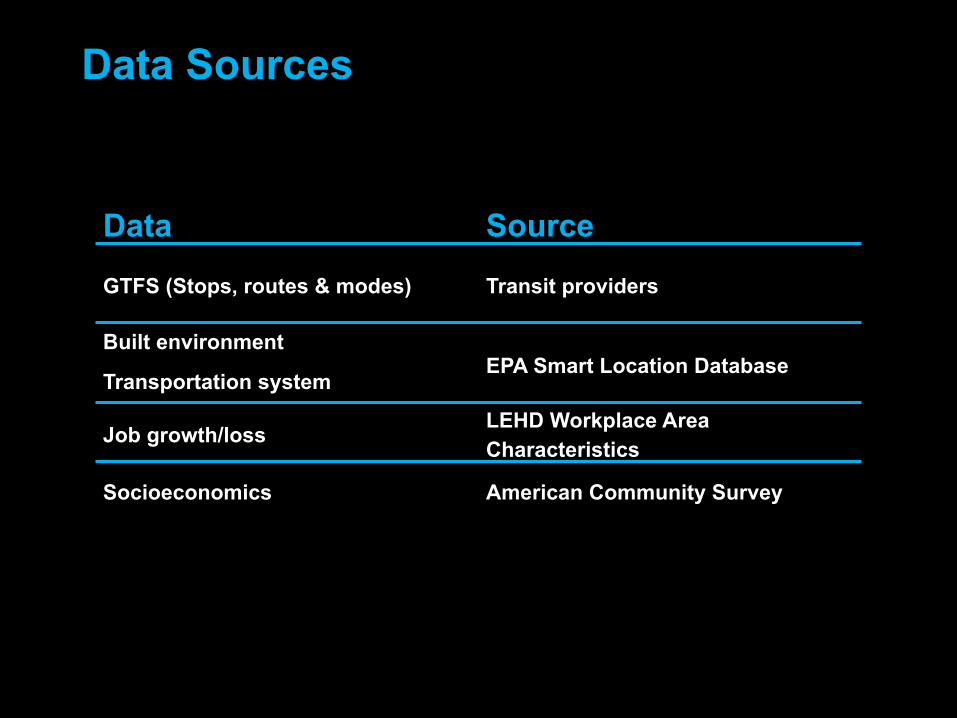
Data Sources
Data Source
GTFS (Stops, routes & modes) Transit providers
Built environment EPA Smart Location Database
Transportation system
Job growth/loss LEHD Workplace Area Characteristics
Socioeconomics American Community Survey
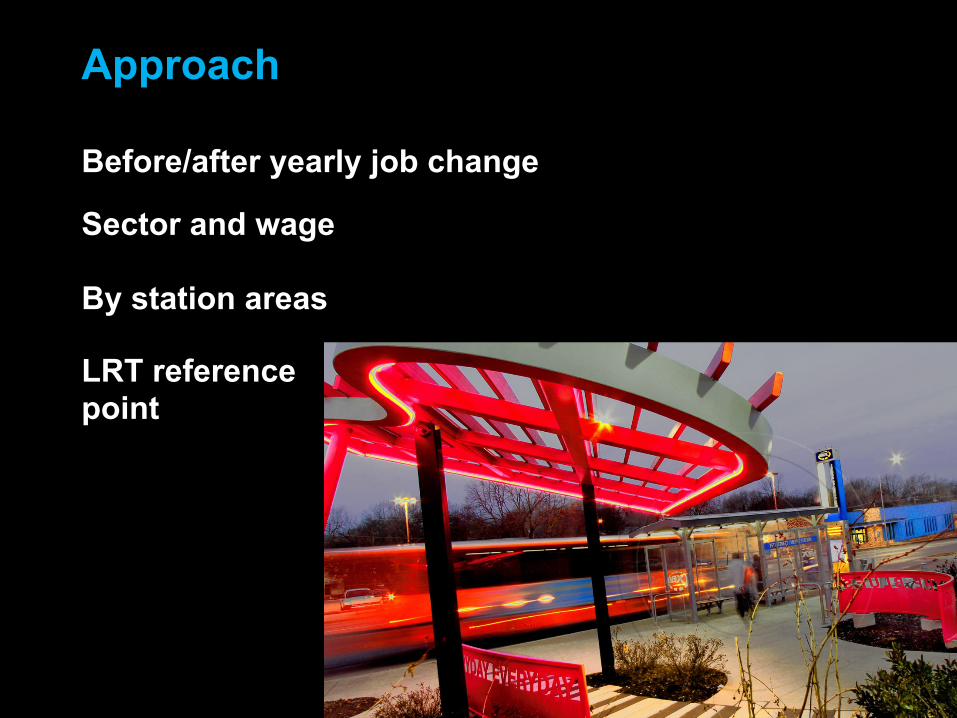
Approach
Before/after yearly job change
Sector and wage
By station areas
LRT reference point
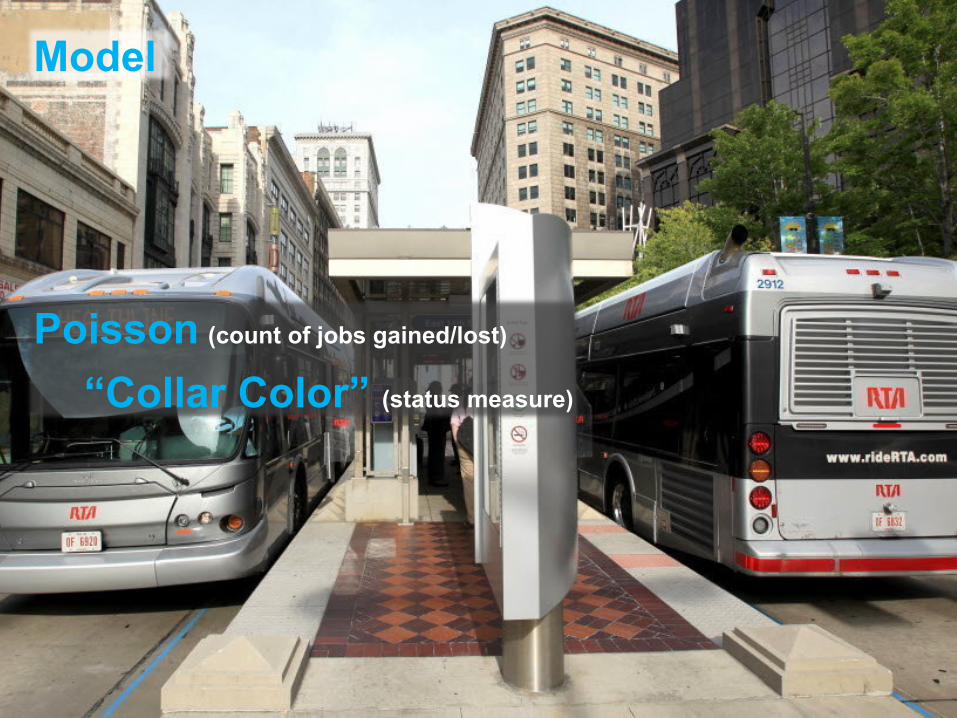
Poisson (count of jobs gained/lost)
“Collar Color” (status measure)
Model
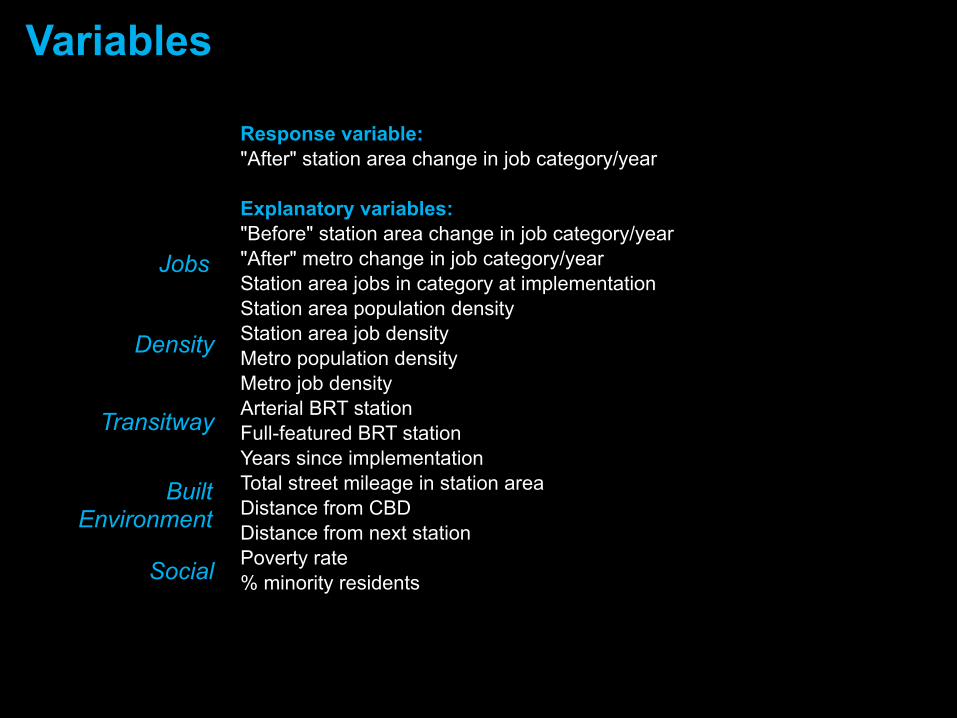
Variables
Response variable: "After" station area change in job category/year Explanatory variables: "Before" station area change in job category/year "After" metro change in job category/year Station area jobs in category at implementation Station area population density Station area job density Metro population density Metro job density Arterial BRT station Full-featured BRT station Years since implementation Total street mileage in station area Distance from CBD Distance from next station Poverty rate % minority residents
Jobs
Density
Transitway
Built Environment
Social
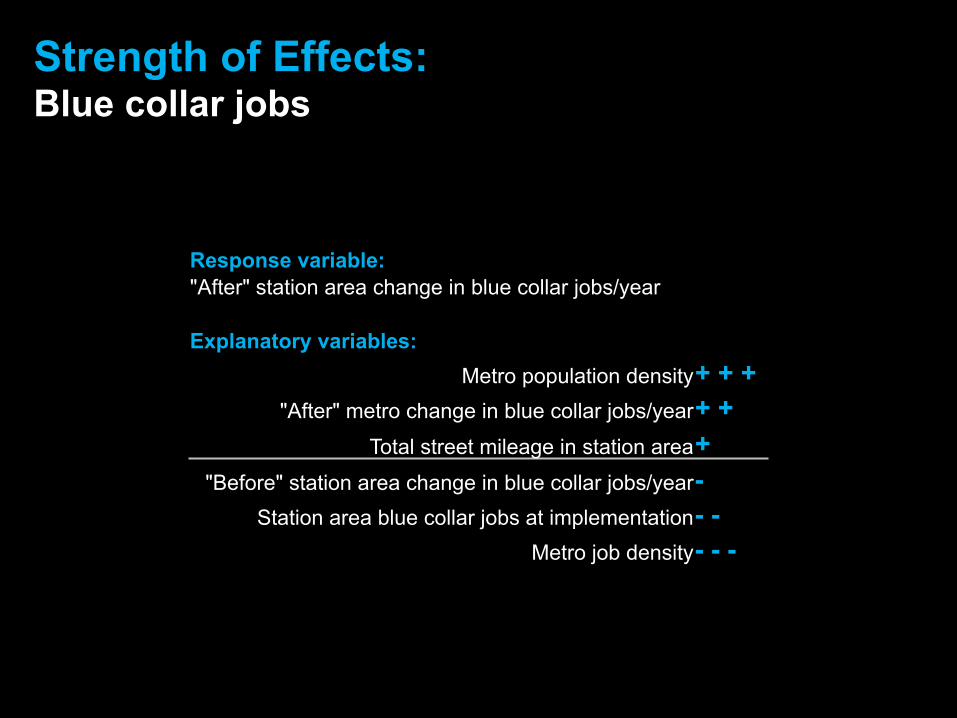
Strength of Effects: Blue collar jobs
Response variable: "After" station area change in blue collar jobs/year Explanatory variables:
Metro population density + + + "After" metro change in blue collar jobs/year + +
Total street mileage in station area + "Before" station area change in blue collar jobs/year -
Station area blue collar jobs at implementation - - Metro job density - - -
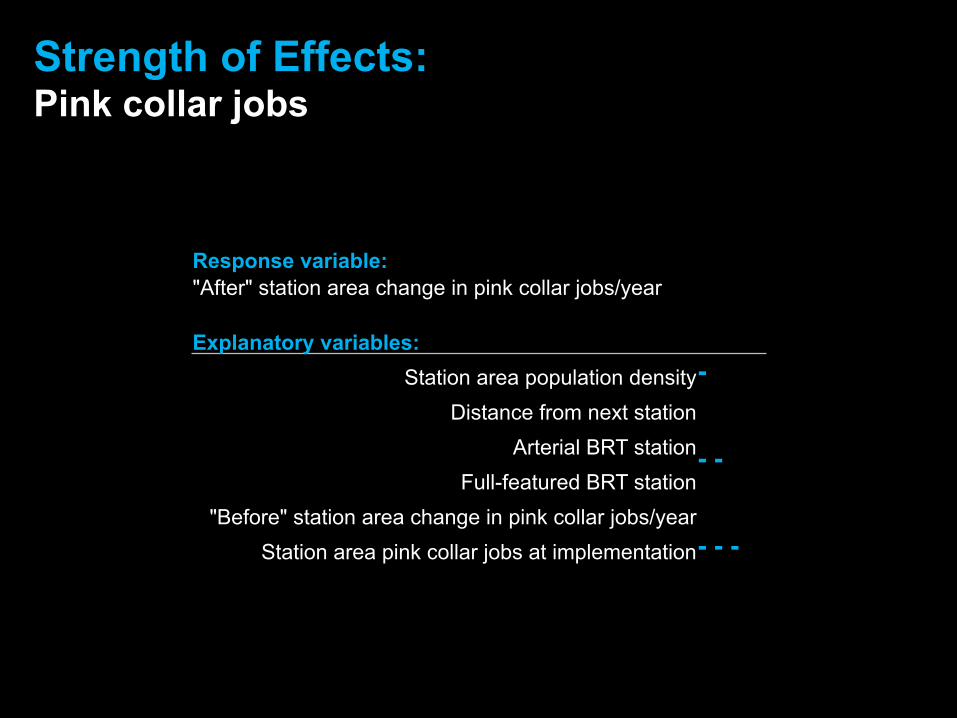
Strength of Effects: Pink collar jobs
Response variable: "After" station area change in pink collar jobs/year Explanatory variables:
Station area population density - Distance from next station
Arterial BRT station - - Full-featured BRT station
"Before" station area change in pink collar jobs/year Station area pink collar jobs at implementation - - -
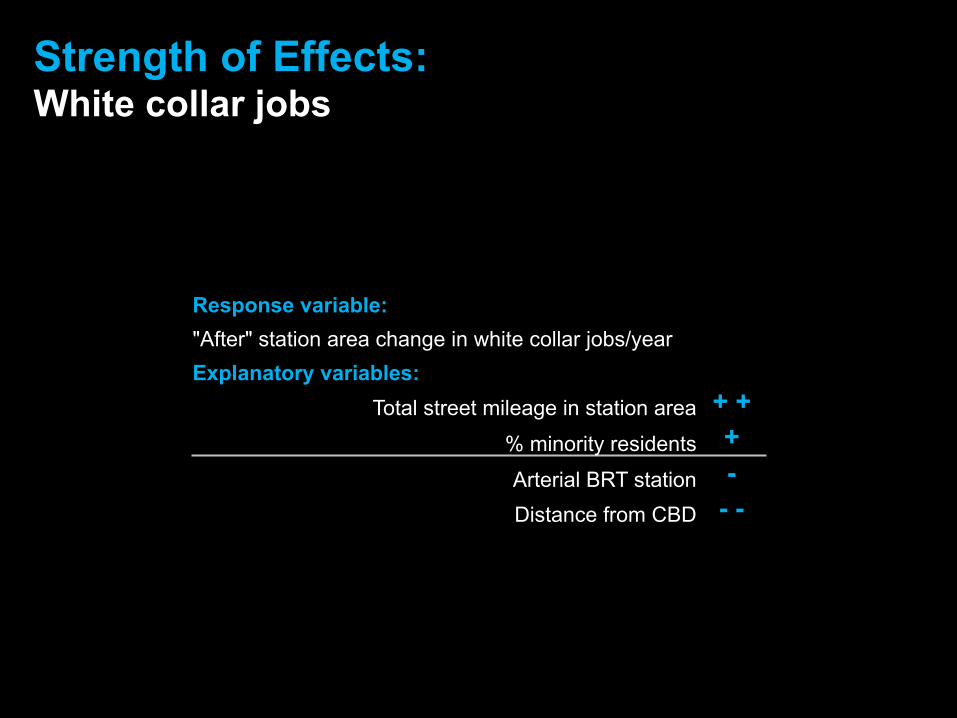
Strength of Effects: White collar jobs
Response variable: "After" station area change in white collar jobs/year Explanatory variables:
Total street mileage in station area + + % minority residents + Arterial BRT station - Distance from CBD - -
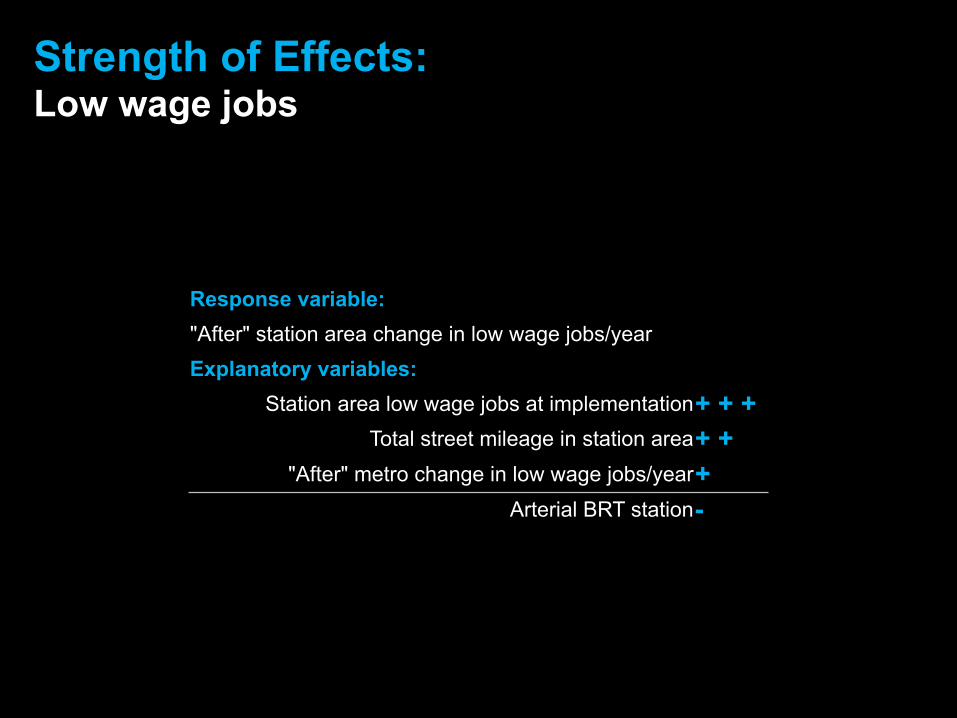
Strength of Effects: Low wage jobs
Response variable: "After" station area change in low wage jobs/year Explanatory variables:
Station area low wage jobs at implementation + + + Total street mileage in station area + +
"After" metro change in low wage jobs/year + Arterial BRT station -
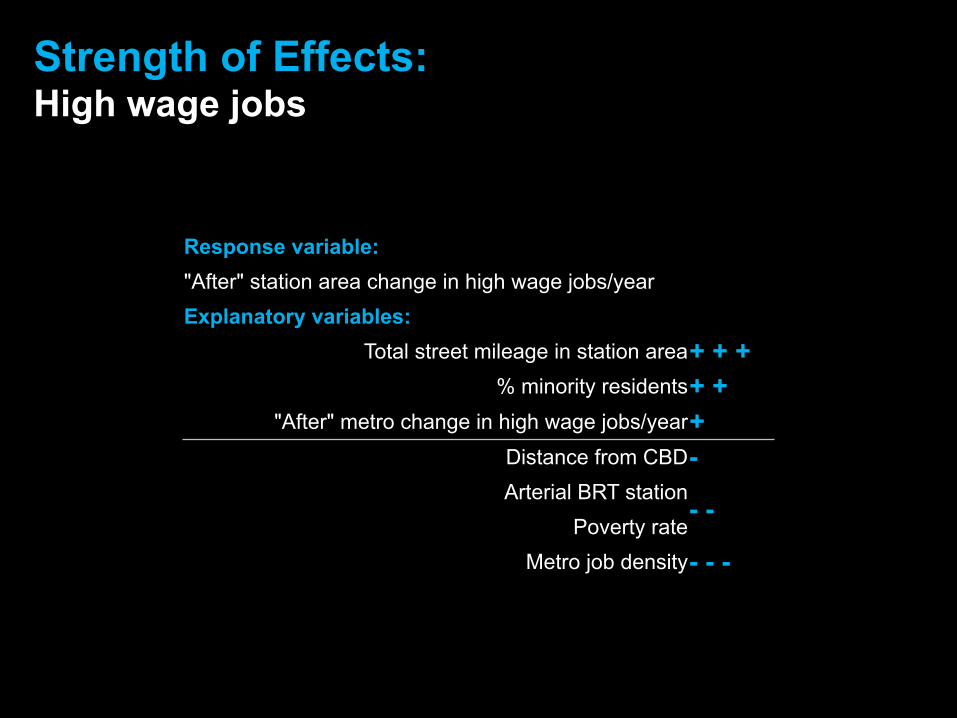
Strength of Effects: High wage jobs
Response variable: "After" station area change in high wage jobs/year Explanatory variables:
Total street mileage in station area + + + % minority residents + +
"After" metro change in high wage jobs/year + Distance from CBD - Arterial BRT station
- - Poverty rate
Metro job density - - -
Conclusions
Mix of regional & local determinants
Fixed infrastructure matters.
BRT needs pro-active job growth promotion efforts.
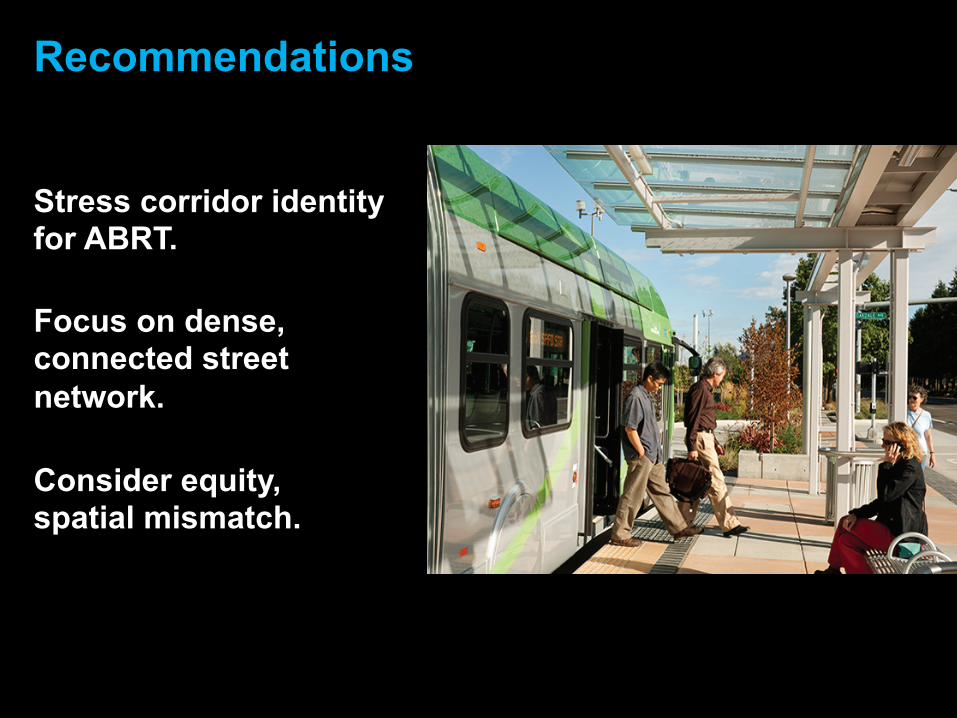
Recommendations
Stress corridor identity for ABRT.
Focus on dense, connected street network.
Consider equity, spatial mismatch.
Contacts: Andrew Guthrie (612) 625-4534 [email protected] Yingling Fan (612) 626-2930 [email protected]
Thank you!


![[A4] XIAOMEI_Guangzhou BRT and New BRT in China - Ed](https://img.pdfslide.net/doc/110x75/577ce47b1a28abf1038e73a0/a4-xiaomeiguangzhou-brt-and-new-brt-in-china-ed.jpg)