Embed Size (px)
Citation preview

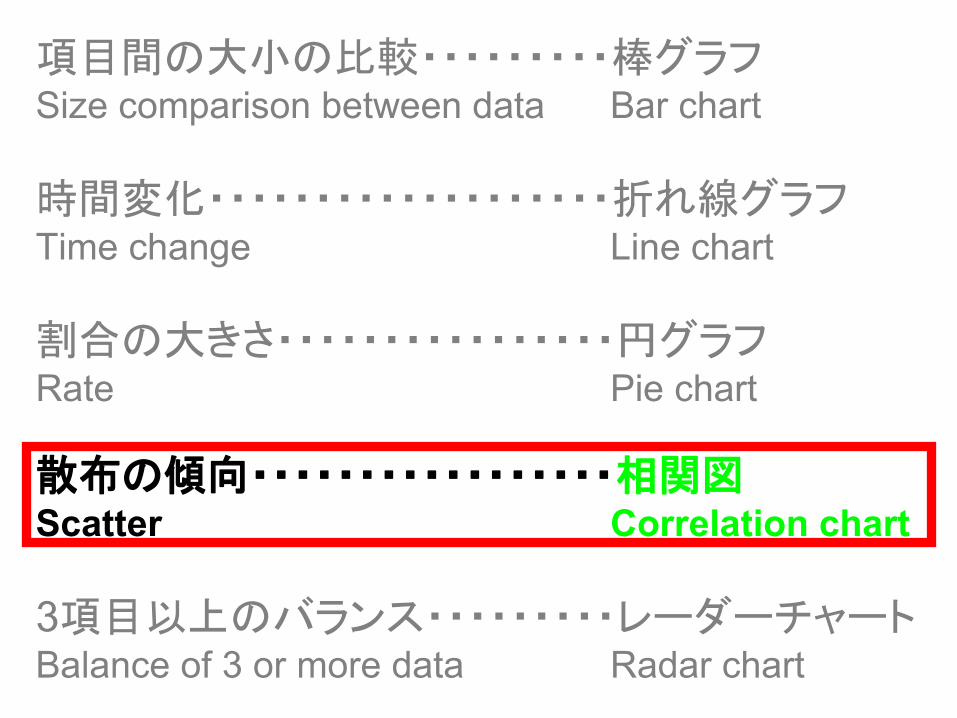
グラフの作成法How To Make a Chart
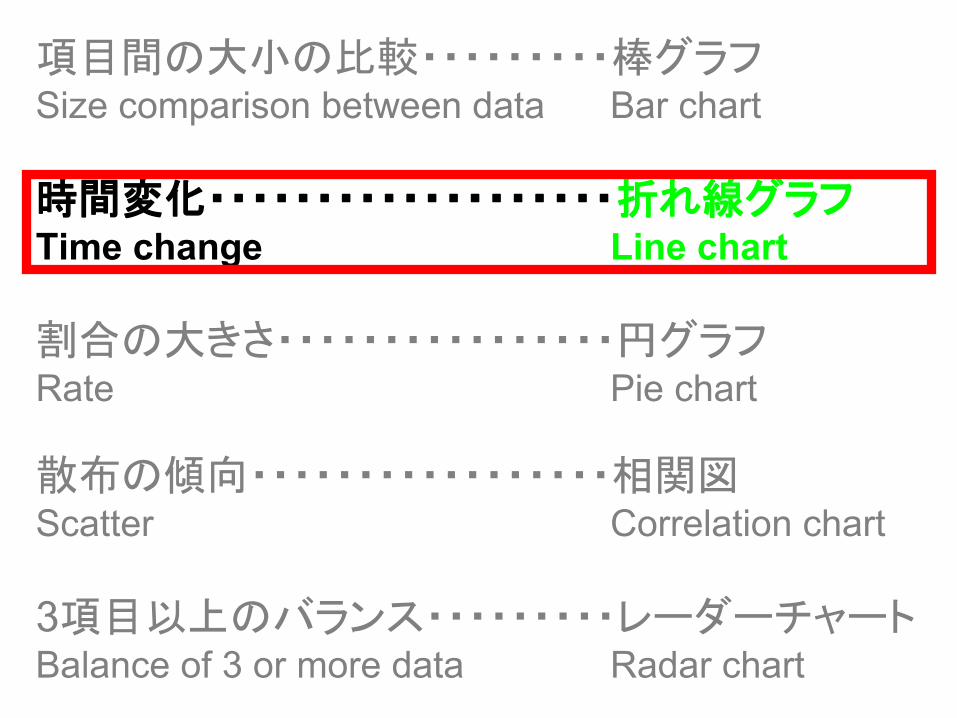
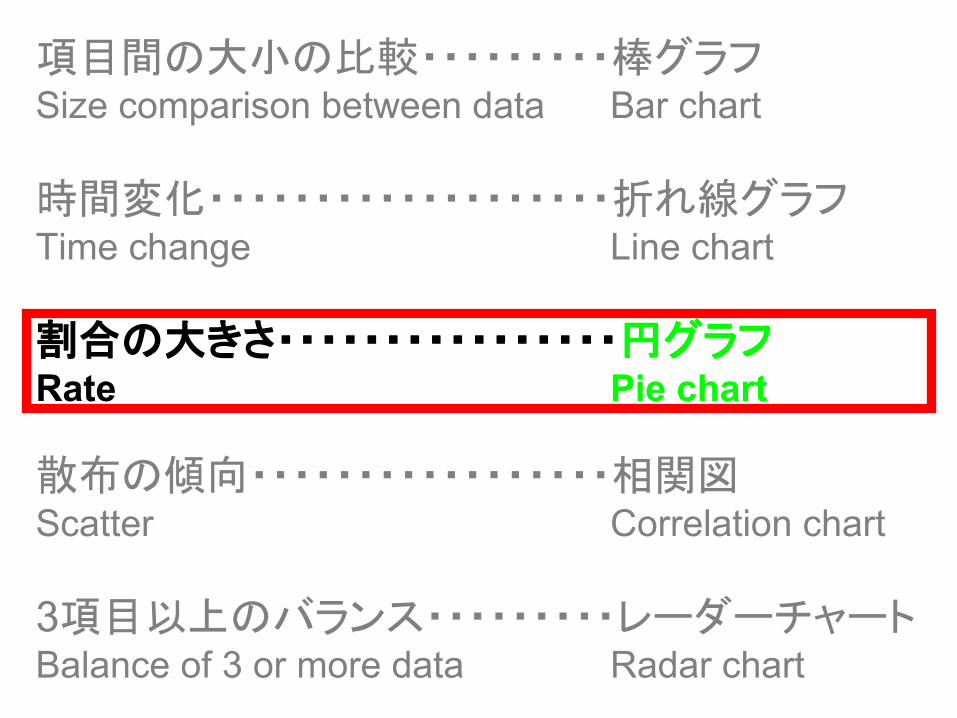
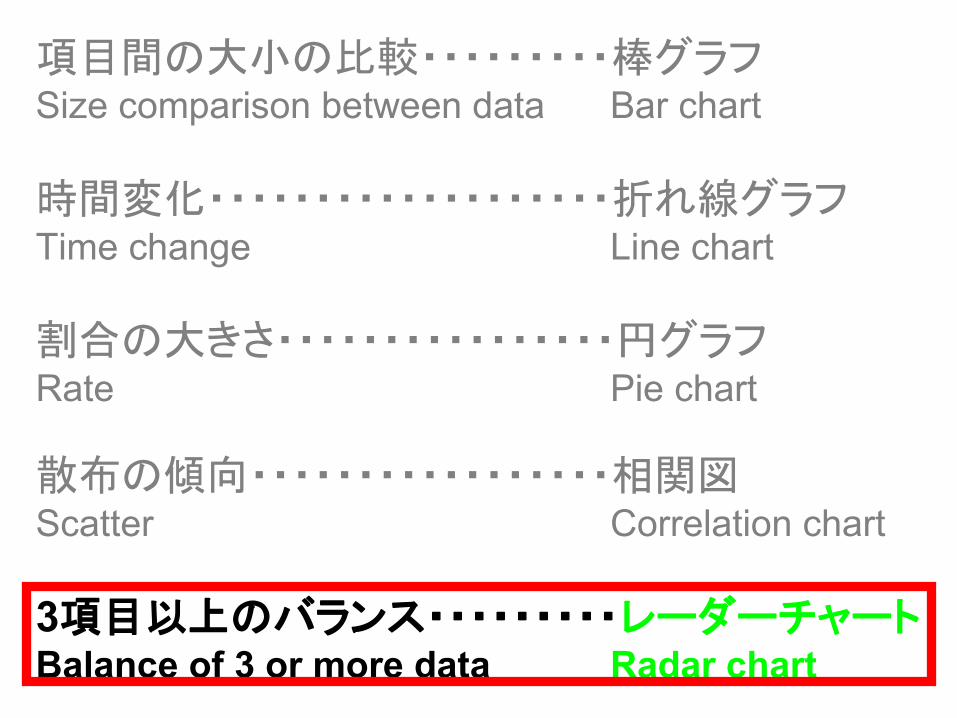
項目間の大小の比較・・・・・・・・・棒グラフSize comparison between data Bar chart
時間変化・・・・・・・・・・・・・・・・・・・折れ線グラフTime change Line chart
割合の大きさ・・・・・・・・・・・・・・・・円グラフRate Pie chart
散布の傾向・・・・・・・・・・・・・・・・・相関図Scatter Correlation chart
3項目以上のバランス・・・・・・・・・レーダーチャートBalance of 3 or more data Radar chart
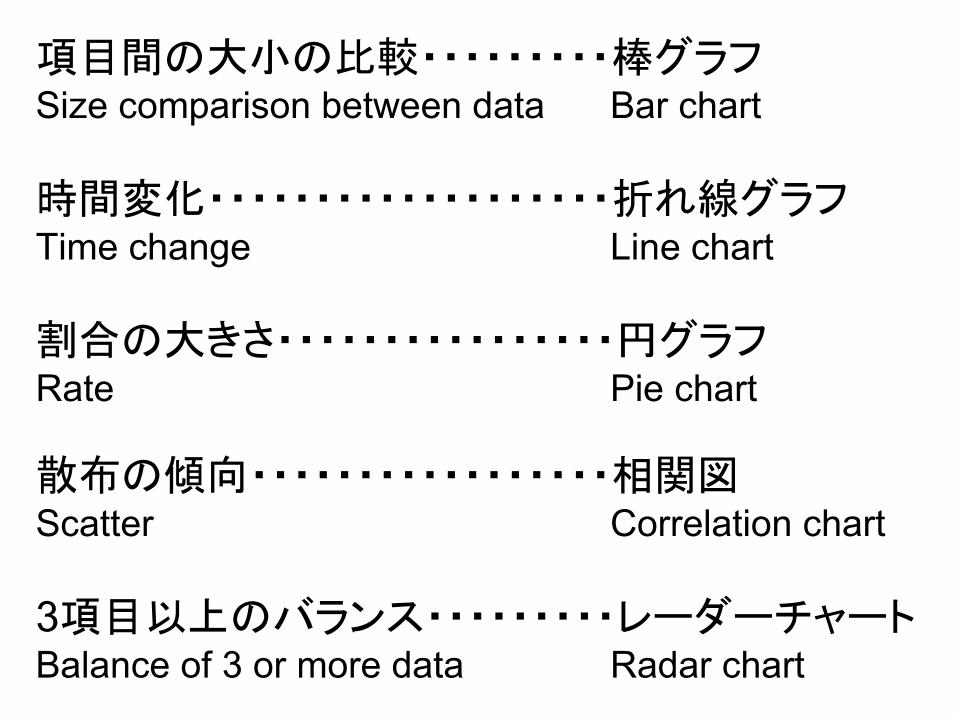
項目間の大小の比較・・・・・・・・・棒グラフSize comparison between data Bar chart
時間変化・・・・・・・・・・・・・・・・・・・折れ線グラフTime change Line chart
割合の大きさ・・・・・・・・・・・・・・・・円グラフRate Pie chart
散布の傾向・・・・・・・・・・・・・・・・・相関図Scatter Correlation chart
3項目以上のバランス・・・・・・・・・レーダーチャートBalance of 3 or more data Radar chart
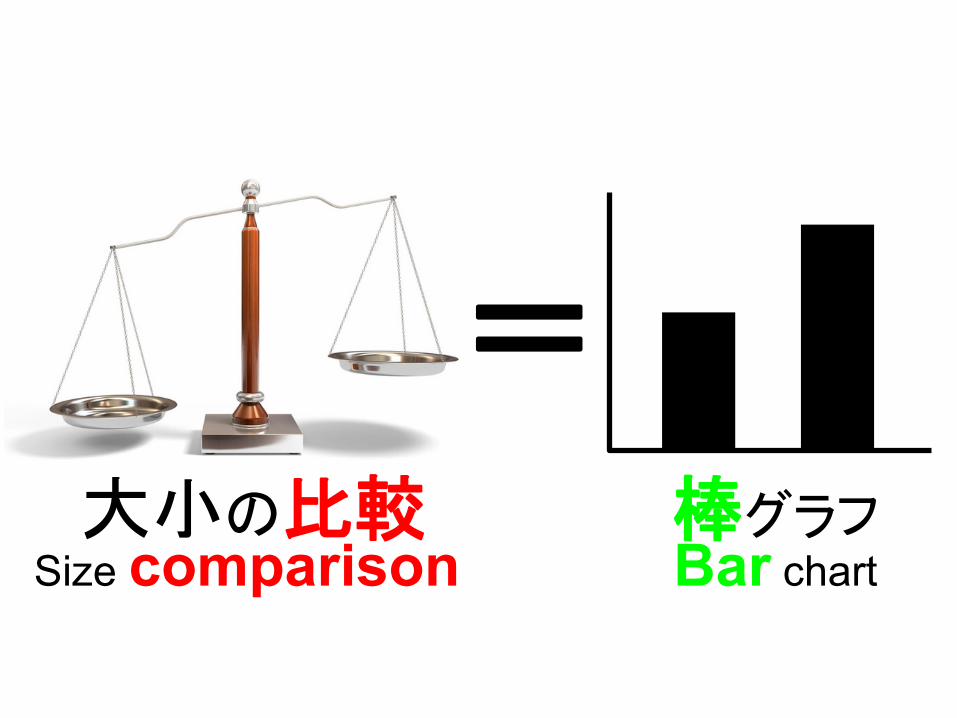
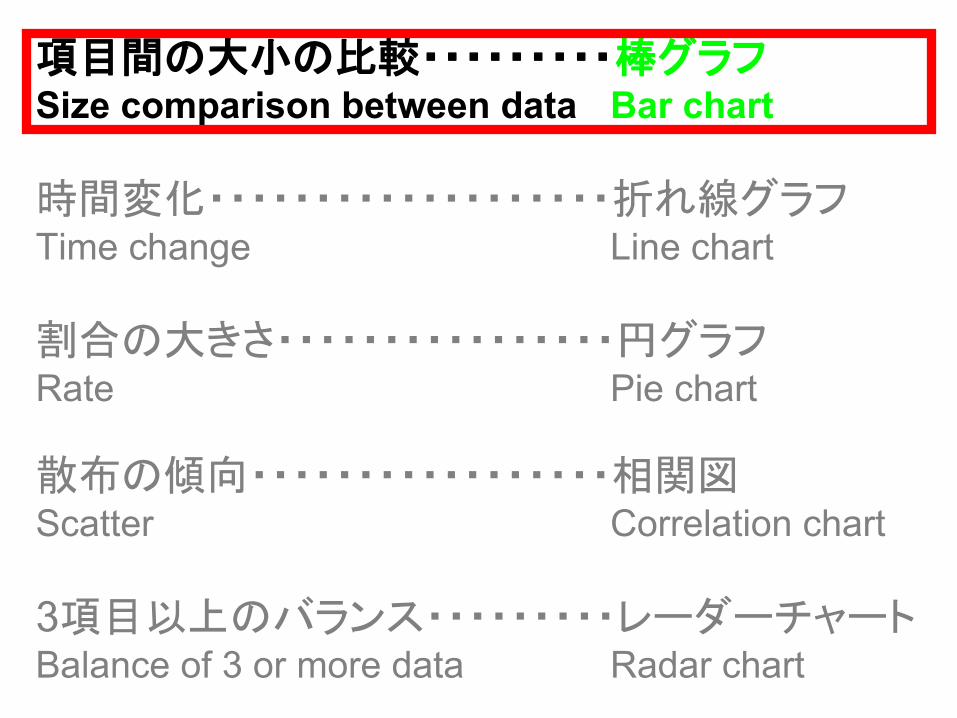
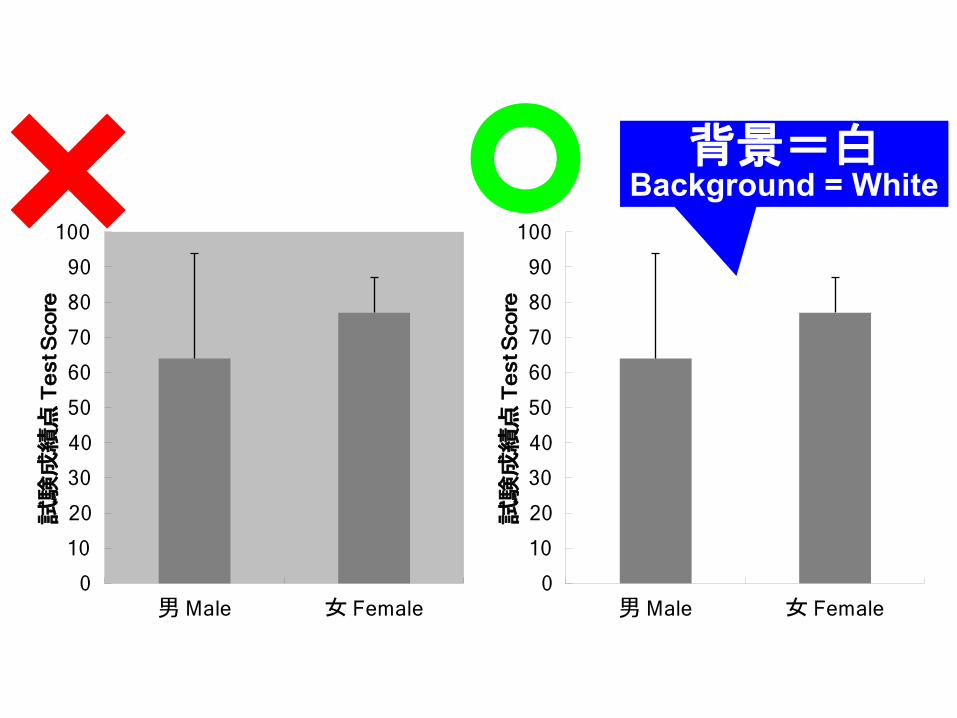
棒グラフBar chart
大小の比較Size comparison
=
0
10
20
30
40
50
60
70
80
90
100
男Male 女 Female
試験成績点
Te
st S
core
0
10
20
30
40
50
60
70
80
90
100
男Male 女 Female
試験成績点
Te
st S
core
背景=白Background = White
0
10
20
30
40
50
60
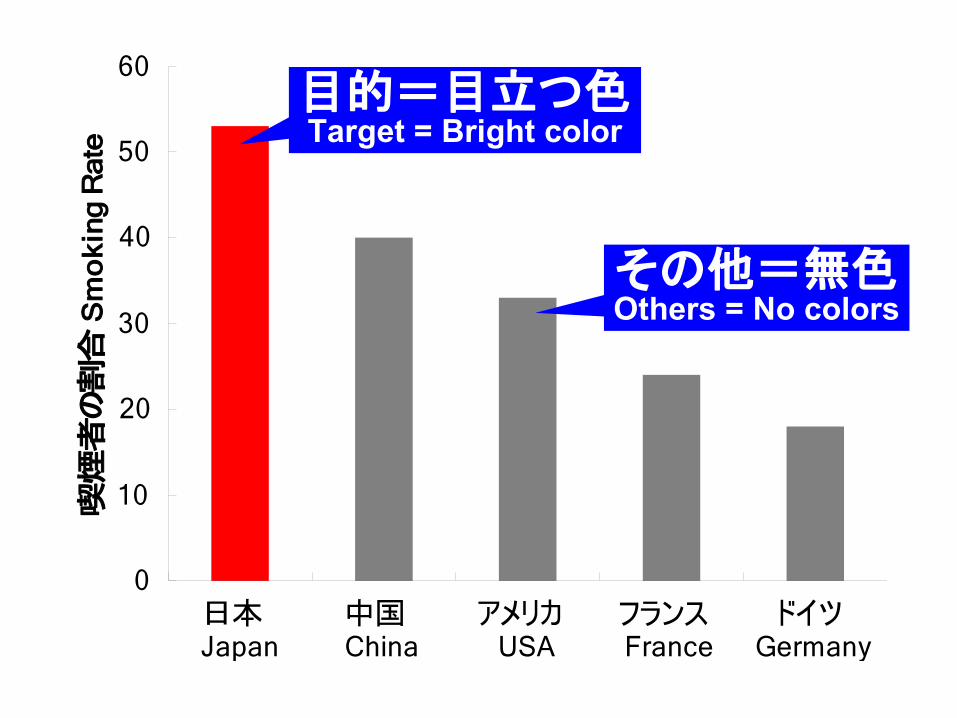
日本Japan
中国China
アメリカUSA
フランスFrance
ドイツGermany
喫煙者の割合
Sm
ok
ing
Ra
te目的=目立つ色Target = Bright color
その他=無色Others = No colors
項目間の大小の比較・・・・・・・・・棒グラフSize comparison between data Bar chart
時間変化・・・・・・・・・・・・・・・・・・・折れ線グラフTime change Line chart
割合の大きさ・・・・・・・・・・・・・・・・円グラフRate Pie chart
散布の傾向・・・・・・・・・・・・・・・・・相関図Scatter Correlation chart
3項目以上のバランス・・・・・・・・・レーダーチャートBalance of 3 or more data Radar chart
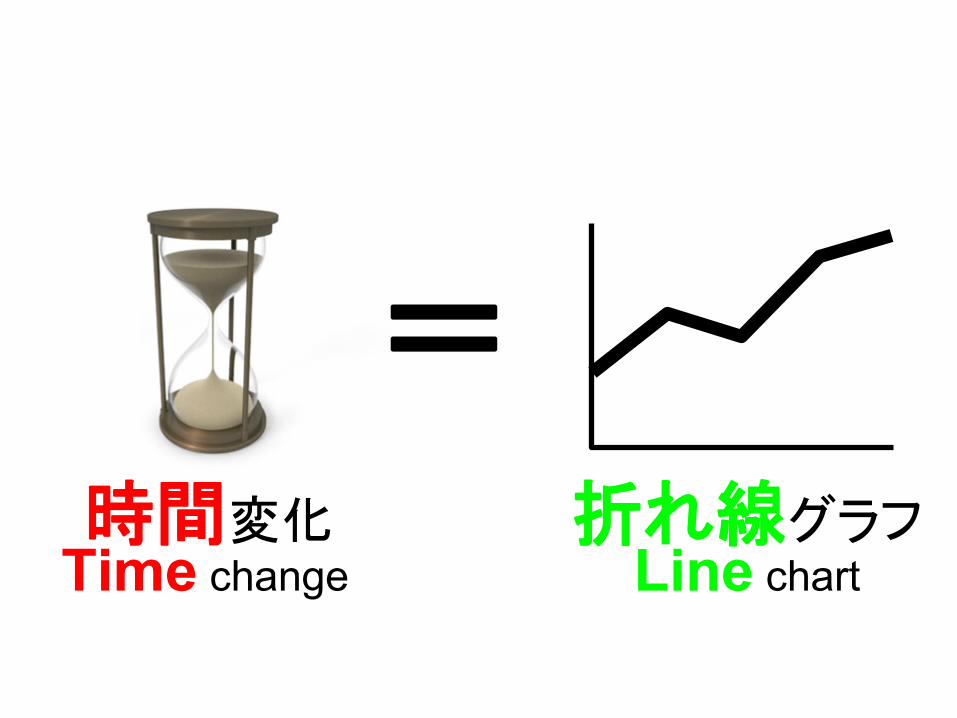
折れ線グラフLine chart
時間変化Time change
=
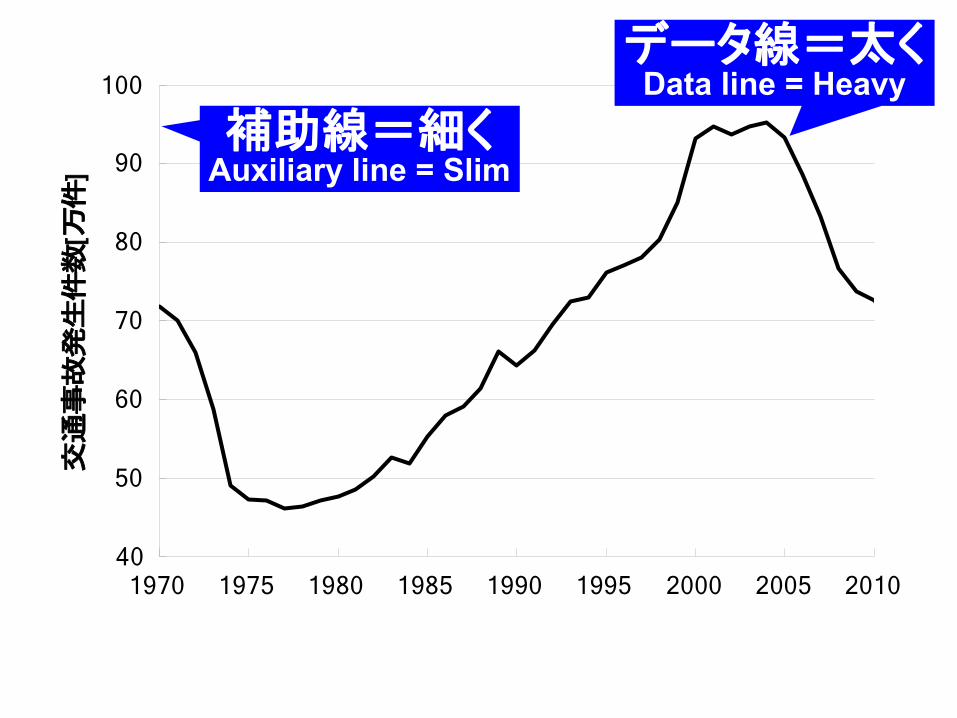
40
50
60
70
80
90
100
1970 1975 1980 1985 1990 1995 2000 2005 2010
交通事故発生件数
[万件
]データ線=太く
Data line = Heavy
補助線=細くAuxiliary line = Slim
40
50
60
70
80
90
100
19
66
19
69
19
72
19
75
19
78
19
81
19
84
19
87
19
90
19
93
19
96
19
99
20
02
20
05
20
08
20
11
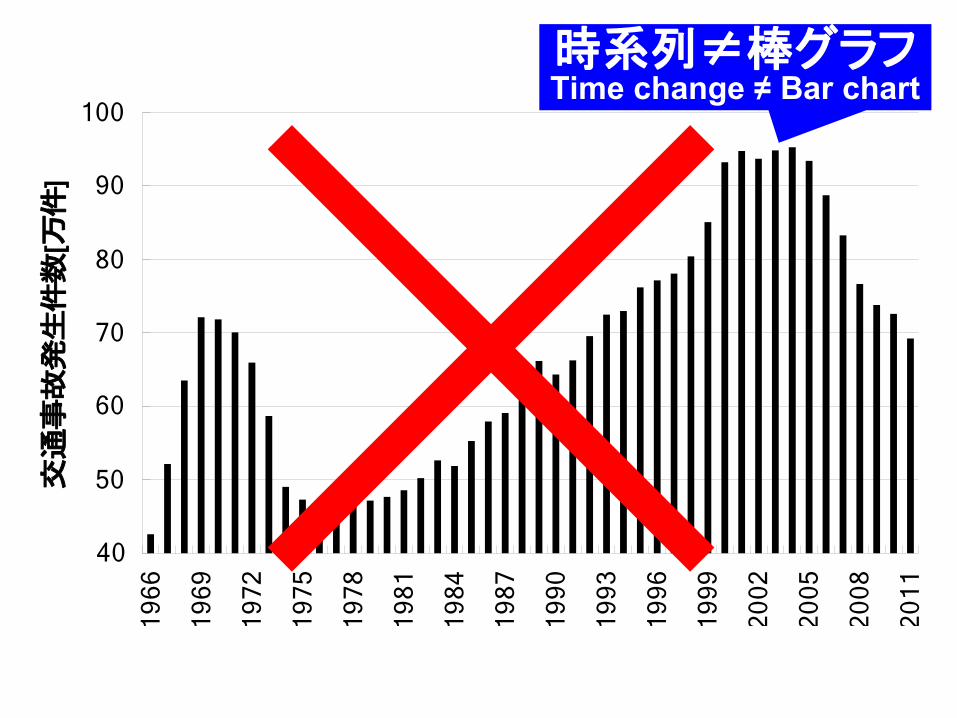
交通事故発生件数
[万件
]時系列≠棒グラフTime change ≠ Bar chart
項目間の大小の比較・・・・・・・・・棒グラフSize comparison between data Bar chart
時間変化・・・・・・・・・・・・・・・・・・・折れ線グラフTime change Line chart
割合の大きさ・・・・・・・・・・・・・・・・円グラフRate Pie chart
散布の傾向・・・・・・・・・・・・・・・・・相関図Scatter Correlation chart
3項目以上のバランス・・・・・・・・・レーダーチャートBalance of 3 or more data Radar chart
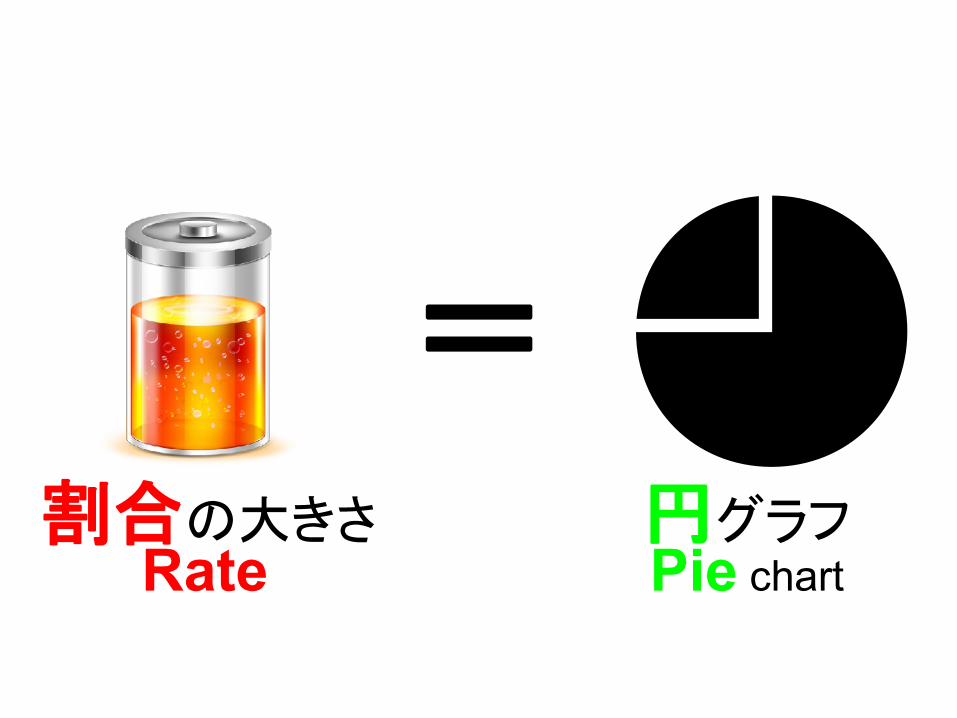
円グラフPie chart
割合の大きさRate
=
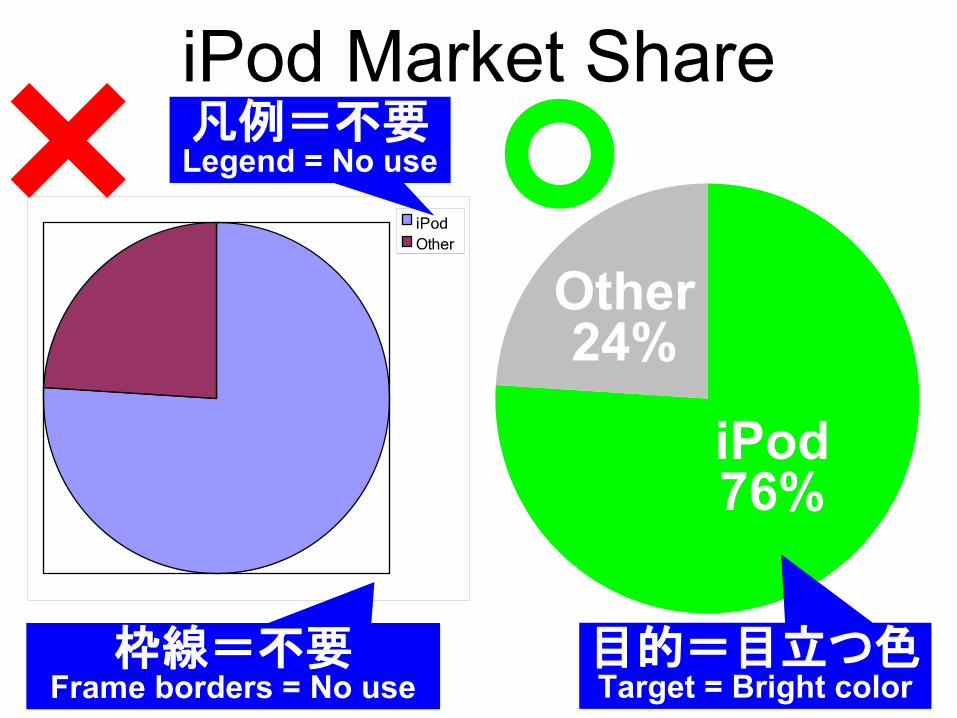
iPod Market Share
iPodOther
iPod76%
Other24%
目的=目立つ色Target = Bright color
凡例=不要Legend = No use
枠線=不要Frame borders = No use
項目間の大小の比較・・・・・・・・・棒グラフSize comparison between data Bar chart
時間変化・・・・・・・・・・・・・・・・・・・折れ線グラフTime change Line chart
割合の大きさ・・・・・・・・・・・・・・・・円グラフRate Pie chart
散布の傾向・・・・・・・・・・・・・・・・・相関図Scatter Correlation chart
3項目以上のバランス・・・・・・・・・レーダーチャートBalance of 3 or more data Radar chart
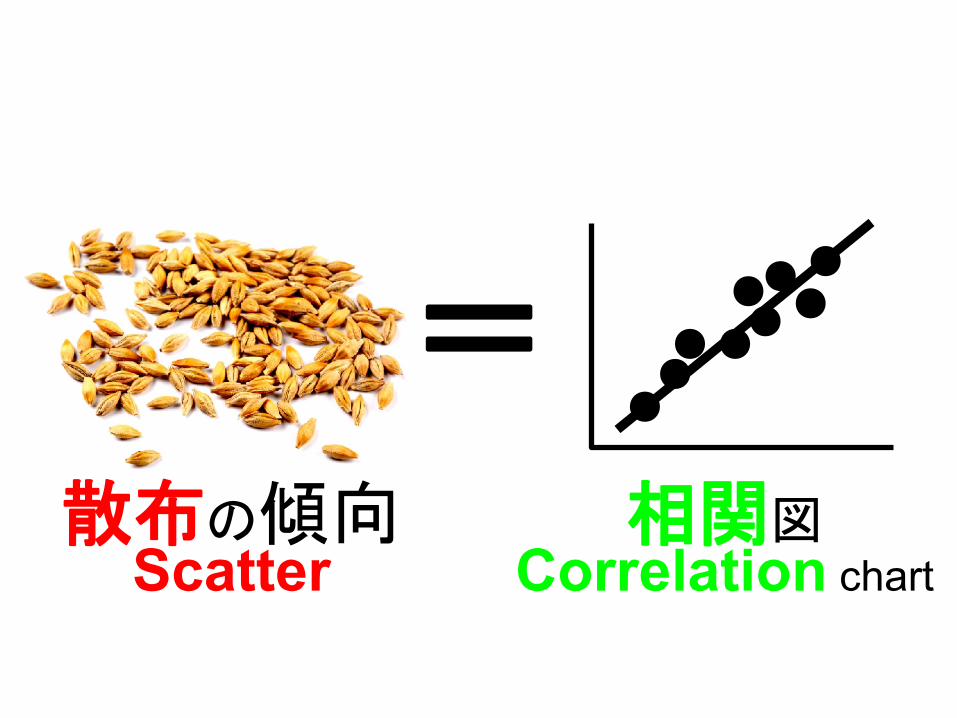
相関図Correlation chart
=散布の傾向
Scatter
0
10
20
30
40
50
60
70
80
90
100
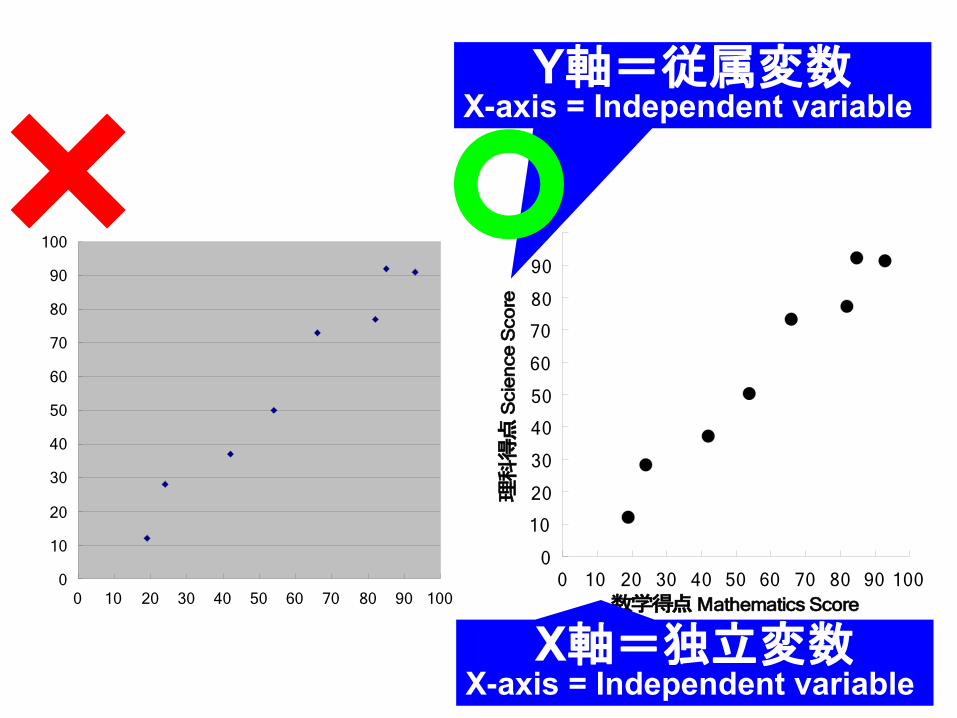
0 10 20 30 40 50 60 70 80 90 100数学得点Mathematics Score
理科得点
Sci
en
ce S
core
0
10
20
30
40
50
60
70
80
90
100
0 10 20 30 40 50 60 70 80 90 100
Y軸=従属変数X-axis = Independent variable
X軸=独立変数X-axis = Independent variable
項目間の大小の比較・・・・・・・・・棒グラフSize comparison between data Bar chart
時間変化・・・・・・・・・・・・・・・・・・・折れ線グラフTime change Line chart
割合の大きさ・・・・・・・・・・・・・・・・円グラフRate Pie chart
散布の傾向・・・・・・・・・・・・・・・・・相関図Scatter Correlation chart
3項目以上のバランス・・・・・・・・・レーダーチャートBalance of 3 or more data Radar chart
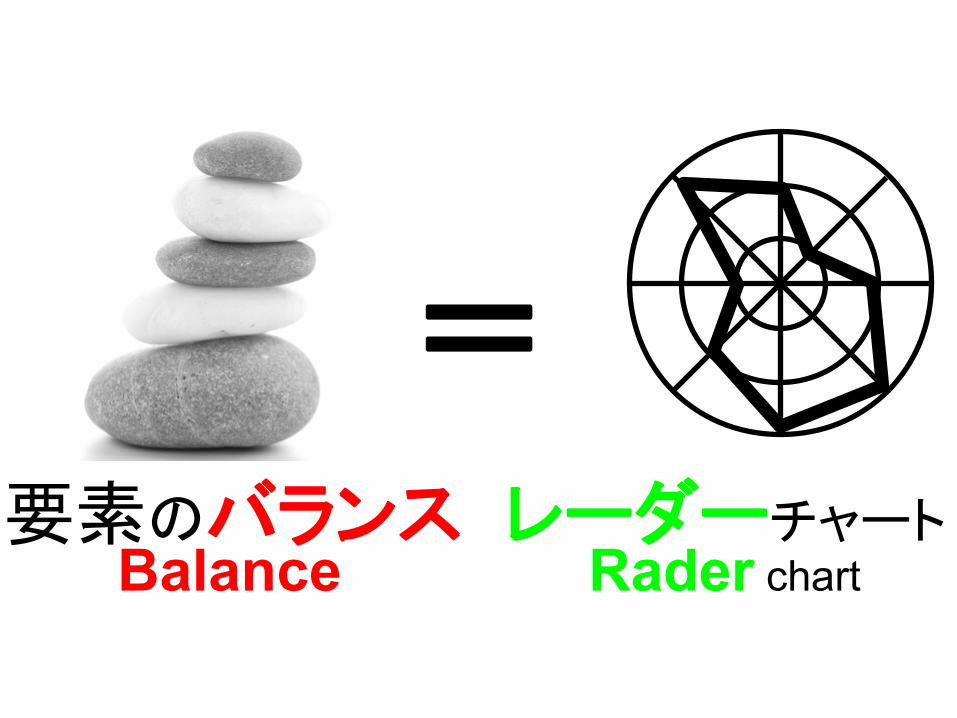
レーダーチャートRader chart
=要素のバランス
Balance
0
20
40
60
80
100
国語Japanese
数学Mathematics
理科Science
社会Social studies
英語English
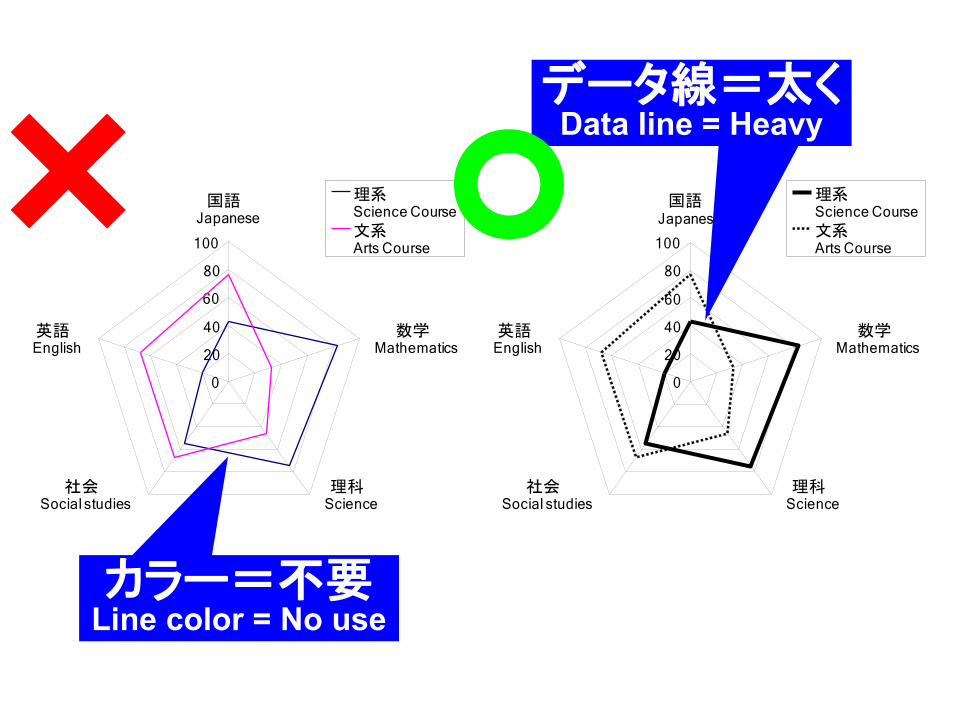
理系Science Course文系Arts Course
0
20
40
60
80
100
国語Japanese
数学Mathematics
理科Science
社会Social studies
英語English
理系Science Course文系Arts Course
データ線=太くData line = Heavy
カラー=不要Line color = No use
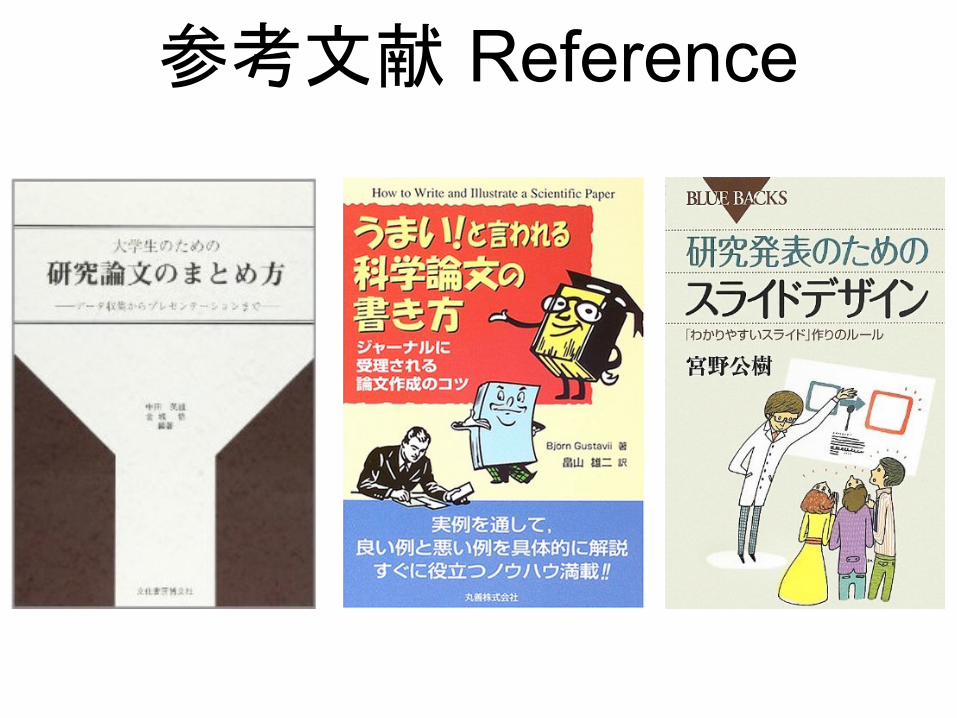
参考文献 Reference