Embed Size (px)
Citation preview
- APRIL 2022
GOA COLLEGE OF ARCHITECTURE,GOA.

TEAM NIVAS 2.0 | HOMEGROUND
Table of Contents
1. Executive Summary ............................................................................................................................................................ 1
2. Team Introduction...............................................................................................................................................................2
3. Project Background............................................................................................................................................................5
4. Performance Specifications.................................................................................................................................................7
5. Goals....................................................................................................................................................................................8
6. Design Documentation........................................................................................................................................................9

TEAM NIVAS 2.0 | HOMEGROUND
List of Figures
Figure 1.1…………………………………………………………………………………………………………………10
Figure 1.2…………………………………………………………………………………………………………………10
Figure 1.3…………………………………………………………………………………………………………………10
Figure 1.4…………………………………………………………………………………………………………………11
Figure 1.5…………………………………………………………………………………………………………………11
Figure 1.6…………………………………………………………………………………………………………………11
Figure 1.7…………………………………………………………………………………………………………………11
Figure 1.8…………………………………………………………………………………………………………………11
Figure 1.9…………………………………………………………………………………………………………………12
Figure 1.10………………………………………………………………………………………………………………..13
Figure 1.11…………………………………………………………………………………………………………….….13
Figure 1.12………………………………………………………………………………………………………………..14
Figure 2.1…………………………………………………………………………………………………………………14
Figure 2.2………………………………………………………………………………………………………………….14
Figure 2.3………………………………………………………………………………………………………………….15
Figure 2.4………………………………………………………………………………………………………………….15
Figure 2.5………………………………………………………………………………………………………………….15
Figure 2.6………………………………………………………………………………………………………………….16
Figure 2.7…………………………………………………………………………………………………………………16
Figure 2.8…………………………………………………………………………………………………………………16
Figure 2.9…………………………………………………………………………………………………………………16
Figure 2.10.….…………………………………………………………………………………………………………….16
Figure 2.11.….……………………………………………………………………………………………………………16
Figure 2.12.….…………………………………………………………………………………………………………….17
Figure 2.13.….……………………………………………………………………………………………………………17
Figure 2.14.….……………………………………………………………………………………………………………17
Figure 2.15.….……………………………………………………………………………………………………………17
Figure 2.16.….……………………………………………………………………………………………………………17
Figure 2.17.….……………………………………………………………………………………………………………18
Figure 2.18.….……………………………………………………………………………………………………………18

TEAM NIVAS 2.0 | HOMEGROUND
Figure 2.19.….…………………………………………………………………………………………………………….19
Figure 3.1…………………………………………………………………………………………………………………19
Figure 3.2…………………………………………………………………………………………………………………19
Figure 3.3…………………………………………………………………………………………………………………19
Figure 3.4…………………………………………………………………………………………………………………19
Figure 3.5…………………………………………………………………………………………………………………21
Figure 3.6……………………………………………………………………………………………………………….…21
Figure 4.1………………………………………………………………………………………………………………….22
Figure 4.2…………………………………………………………………………………………………………….……22
Figure 4.3……………………………………………………………………………………………………………….…22
Figure 4.4………………………………………………………………………………………………………………….23
Figure 4.5………………………………………………………………………………………………………………….25
Figure 4.6…………………………………………………………………………………………………………………25
Figure 4.7…………………………………………………………………………………………………………………26
Figure 4.8…………………………………………………………………………………………………………………26
Figure 4.9…………………………………………………………………………………………………………………26
Figure 5.1…………………………………………………………………………………………………………………27
Figure 5.2…………………………………………………………………………………………………………………27
Figure 5.3…………………………………………………………………………………………………………………28
Figure 5.4…………………………………………………………………………………………………………………28
Figure 5.5…………………………………………………………………………………………………………………28
Figure 5.6…………………………………………………………………………………………………………………29
Figure 5.7…………………………………………………………………………………………………………………29
Figure 5.8…………………………………………………………………………………………………………………29
Figure 5.9…………………………………………………………………………………………………………………29
Figure 5.10…………………………………………………..……………………………………………………………29
Figure 5.11…………………………………………..……………………………………………………………………29
Figure 6.1…………………………………………………………………………………………………………………30
Figure 6.2…………………………………………………………………………………………………………………30
Figure 6.3…………………………………………………………………………………………………………………31
Figure 6.4…………………………………………………………………………………………………………………32
TEAM NIVAS 2.0 | HOMEGROUND
Figure 6.5…………………………………………………………………………………………………………………32
Figure 6.6…………………………………………………………………………………………………………………32
Figure 6.7…………………………………………………………………………………………………………………32
Figure 7.1…………………………………………………………………………………………………………………33
Figure 7.2…………………………………………………………………………………………………………………33
Figure 7.3…………………………………………………………………………………………………………………33
Figure 7.4…………………………………………………………………………………………………………………34
Figure 7.5…………………………………………………………………………………………………………………34
Figure 7.6…………………………………………………………………………………………………………………34
Figure 8.1…………………………………………………………………………………………………………………36
Figure 8.2…………………………………………………………………………………………………………………36
Figure 9.1…………………………………………………………………………………………………………………37
Figure 9.2…………………………………………………………………………………………………………………38
Figure 10.1……..…………………………………………………………………………………………………………39

TEAM NIVAS 2.0 | HOMEGROUND
List of Tables
Table 3.1………………………………………………………………………………………………….………………19
Table 3.2………………………………………………………………………………………………….………………19
Table 3.3………………………………………………………………………………………………….………………19
Table 3.4……………………………………………………………………………………………….…………………19
Table 4.1………………………………………………………………………………………………….………………22
Table 4.2………………………………………………………………………………………………….………………23
Table 4.3………………………………………………………………………………………………….………………23
Table 6.1………………………………………………………………………………………………….………………30
Table 6.2………………………………………………………………………………………………….………………31
Table 6.3………………………………………………………………………………………………….………………31
Table 6.4……………………………………………………………………………………………….…………………32
Table 8.1………………………………………………………………………………………………….………………35
Table 8.2………………………………………………………………………………………………….………………35
Table 9.1………………………………………………………………………………………………….………………37
Table 9.2………………………………………………………………………………………………….………………38
1
TEAM NIVAS 2.0 | HOMEGROUNDHOMEGROUND HOMEGROUND
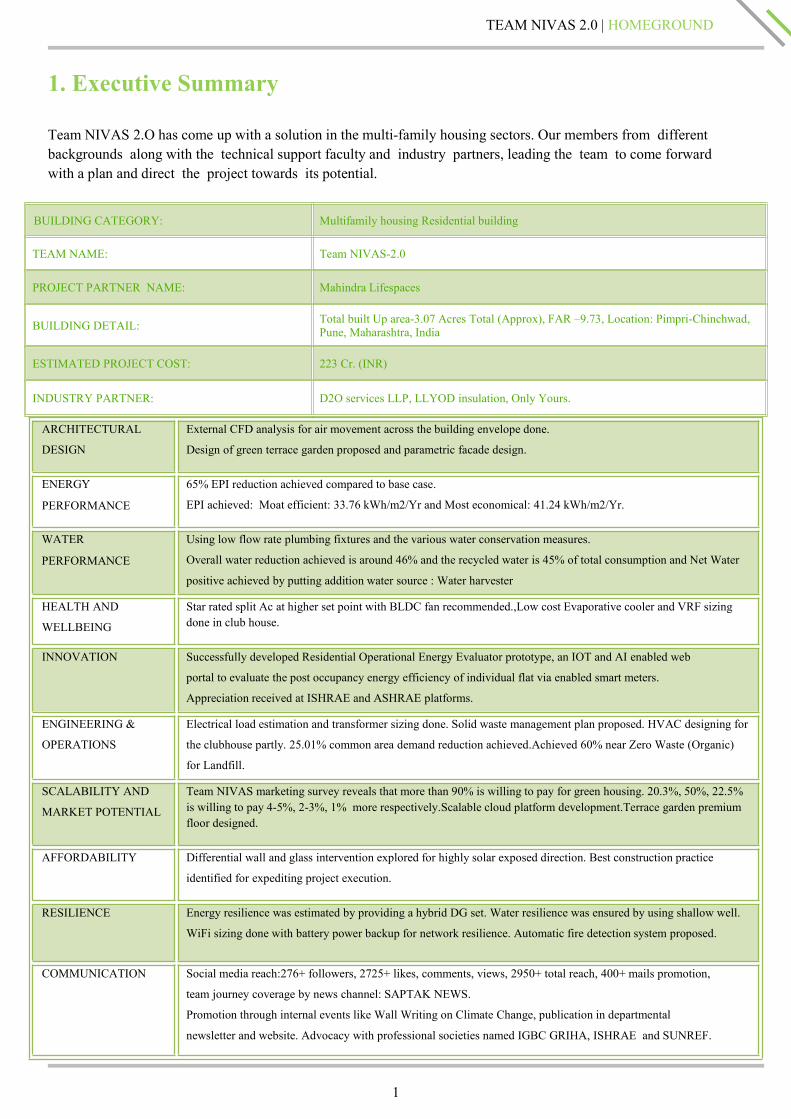
1. Executive Summary
Team NIVAS 2.O has come up with a solution in the multi-family housing sectors. Our members from differentbackgrounds along with the technical support faculty and industry partners, leading the team to come forwardwith a plan and direct the project towards its potential.
BUILDING CATEGORY: Multifamily housing Residential building
TEAM NAME: Team NIVAS-2.0
PROJECT PARTNER NAME: Mahindra Lifespaces
BUILDING DETAIL: Total built Up area-3.07 Acres Total (Approx), FAR –9.73, Location: Pimpri-Chinchwad,Pune, Maharashtra, India
ESTIMATED PROJECT COST: 223 Cr. (INR)
INDUSTRY PARTNER: D2O services LLP, LLYOD insulation, Only Yours.
ARCHITECTURAL
DESIGN
External CFD analysis for air movement across the building envelope done.
Design of green terrace garden proposed and parametric facade design.
ENERGY
PERFORMANCE
65% EPI reduction achieved compared to base case.
EPI achieved: Moat efficient: 33.76 kWh/m2/Yr and Most economical: 41.24 kWh/m2/Yr.
WATER
PERFORMANCE
Using low flow rate plumbing fixtures and the various water conservation measures.
Overall water reduction achieved is around 46% and the recycled water is 45% of total consumption and Net Water
positive achieved by putting addition water source : Water harvester
HEALTH AND
WELLBEING
Star rated split Ac at higher set point with BLDC fan recommended.,Low cost Evaporative cooler and VRF sizingdone in club house.
INNOVATION Successfully developed Residential Operational Energy Evaluator prototype, an IOT and AI enabled web
portal to evaluate the post occupancy energy efficiency of individual flat via enabled smart meters.
Appreciation received at ISHRAE and ASHRAE platforms.
ENGINEERING &
OPERATIONS
Electrical load estimation and transformer sizing done. Solid waste management plan proposed. HVAC designing for
the clubhouse partly. 25.01% common area demand reduction achieved.Achieved 60% near Zero Waste (Organic)
for Landfill.
SCALABILITY AND
MARKET POTENTIAL
Team NIVAS marketing survey reveals that more than 90% is willing to pay for green housing. 20.3%, 50%, 22.5%is willing to pay 4-5%, 2-3%, 1% more respectively.Scalable cloud platform development.Terrace garden premiumfloor designed.
AFFORDABILITY Differential wall and glass intervention explored for highly solar exposed direction. Best construction practice
identified for expediting project execution.
RESILIENCE Energy resilience was estimated by providing a hybrid DG set. Water resilience was ensured by using shallow well.
WiFi sizing done with battery power backup for network resilience. Automatic fire detection system proposed.
COMMUNICATION Social media reach:276+ followers, 2725+ likes, comments, views, 2950+ total reach, 400+ mails promotion,
team journey coverage by news channel: SAPTAK NEWS.
Promotion through internal events like Wall Writing on Climate Change, publication in departmental
newsletter and website. Advocacy with professional societies named IGBC GRIHA, ISHRAE and SUNREF.
2
TEAM NIVAS 2.0 | HOMEGROUNDHOMEGROUND HOMEGROUND
2. Team Introduction
Team name: TEAM NIVAS 2.0
Lead institution: Institute of Engineering & Management, Kolkata
Partner member institute(s): Ashoka School of Planning and Architecture,Hyderabad Jawaharlal NehruTechnological University,National Institute of Technology (NIT), Raipur ,Goa college of Architecture.
Division: Multi-family Housing.Team NIVAS 2.0 is a multidisciplinary team of 15 dynamic members who have been involved in various real- lifeprojects, architectural projects, internships on building performance and are even winners of various building designand HVAC competitions conducted by ISHRAE. In the last year our Team NIVAS had participated in SolarDecathlon India 2020-2021 for the first time and made it to top 6 under the Multi-Family Housing domain. Also, themajority of the team members are a part of ISHRAE-IEM Model Student Chapter. The focused team of 15 membershave already segmented themselves to work in the allocated domains to serve the best to the project.
Team members:
Associate team members:
Acknowledgements:We would also like to extend our regards to Professor. Ayan Kumar Panja, Mr.Debdut Bosu, Mr.Avinish Kumar, MrNikunj Verma, Mrs Riya Kasliwal , Shubhra Pal, Sushant Shandilya, Gaurav Kumar, Suhail Haider, SubhankarSabaru, Subhankar Das, G. Sanjana.Josyula, Lakshmi Pratysha, Pratwusha Sahoo for their support.
Approach: Team Nivas 2.0 is having team members from diverse domains. Keeping Sustainability as ourfundamental objective our approach is based on two main considerations, Environmental and Economical. We willanalyze the site and climatic condition for our project location. Moving to the design stage, first we will sort thepotential strategies and will set the goals to achieve. Adaptive comfort with visual comfort and thermal comfort willbe taken into consideration following NBC and Green Homes guidelines. Following the parametric design approach,we will study the base case scenario for conventional building envelopes and understanding the project requirementwe will incorporate insulation and shading materials with mixed- mode ventilation to find the most efficient design.For the operational period, we will estimate solar generation capacity to cut down the energy demand and reduceoverall maintenance cost and water consumption to make this project an affordable net-zero project. We will try to

3
TEAM NIVAS 2.0 | HOMEGROUNDHOMEGROUND HOMEGROUND
integrate SMART HOME Technology to monitor real-time building performance. Finally, we will explore someinnovative strategies to improve the overall building performance.
Institution details:Institute of Engineering & Management (IEM), Kolkata is the first and the oldest privateengineering college in the West Bengal state. The IEM group is an acclaimed educational group amongst the industry-centred academic training organizations of today with two Universities at Jaipur and Kolkata. IEM has been ranked‘A’ Category by NAAC.
Faculty lead:
Prof. Gunjan Kumar, Alumnus of ISM (IIT), Dhanbad, Assistant Professor, Department ofMechanical Engineering, IEM Kolkata. Research scholar Jadavpur University. National StudentActivities Vice Chair ISHRAE & BOG Member – ASHRAE East India. He was awardedthe best faculty advisor for SDI 2020-2021. 16+ years experience.
Prof.Pinaki Mukherjee, Technical Assistant, Department of Mechanical Engineering, IEM Kolkata. Hehas an industrial experience of over 8.5 years with companies like TractorsIndia Limited, Besco Limited,
Jaypee Hydraulics and Texaco Limited.
Prof.Debashish Ghosh, faculty of Electrical engineering in IEM who holds a M.Tech in Illuminationtechnology and design from Jadavpur University along with an experience of 9years.
Prof. Amartya Mukhejee, the HOD of CSE(AIML),CSBS in IEM with 14 years ofexperience in the field has written numerous books and research articles.
Prof. Anju Manikoth from Ashoka School of Planning and Architecture is an Architect/ AssociateProfessor. She is in this field of teaching for1.5 years.
Industry partners:
Design2Occupancy Services LLP (D2O) is a leading consulting organization providing a wide range of services ingreen building certification facilitation, energy and daylight simulation, CFD analysis, etc. Mr.Anuj Gupta from D2Oservice LLP guided the team .
Lloyd Insulations specialize in the supply, contracting and manufacturing of insulation, fireproofing and many more.Mr.A.S. Chowdhury, AGM, Technical and Marketing of Lloyd Insulations guided the team as an instructor andmentor for Insulation and U – Value Simulation.
Only Yours is a unit of Technine Ventures dealing with various fields of technology. Mr Arijit Neogi helped andguided the team especially in the Innovation segment.
Team, Faculty, Alumni, Project/Industry Partner Meeting Details
MEETINGSEGMENT
NO. OFMEETINGS AGENDA
Full Team50 (Every
week) Team – wide segment progress updates, Coordination with other segments for inputs
Energy 11 Design Builder model development, Energy simulation, Solar System sizing
Water 10 Water demand, Rainwater harvesting, Suggestion Review
Resilience 6 Identification of work scope, Estimation of DG sets for power resilience
Affordability 7 Affordable materials and insulation, Affordability of innovation, Fixture price andcost estimation analysis
Innovation 8 Brainstorming, Tech stack allocation, Research
4
TEAM NIVAS 2.0 | HOMEGROUNDHOMEGROUND HOMEGROUND
Health &Wellbeing 10 Thermal comfort hour analysis, HVAC system sizing, Heat load calculation
Engineering &Operations 9 Electrical load estimation, Transformer sizing, Waste generation calculation
ArchitecturalDesign 12 Site analysis, Building area calculation, External CFD
Scalability &Market Potential
6 Research on modern construction practice, Survey creation
Communication 7 Audience identification, Communication schedule development, News articledevelopment, Awareness handout, Internal event launch
*Platforms used for communication were Google Meet, In – person meeting, Google Drive, WhatsApp and Miro.
Project and Industry Partner and Mentor MeetingsPROJECT/INDUSTRYPARTNER/MENTOR
NO. OFMEETINGS AGENDA
Mahindra LifeSpaces DevelopersLimited (Project Partner) 7 Project understanding and suggestions, Design development
discussion, Cost input, Simulation input parameter reviewDesign2Occupancy Services LLP
(D2O) (Industry Partner) 8 Architecture, Solar, Energy discussed, Solid waste procedure andreport writing feedback received
Lloyd Insulation (Industry Partner) 4 Necessity and choice of insulation, Effect on U – Value, U – ValueSimulation Review
Only Yours 3 Guidance to Innovation, Scalability
Mr.Debdut Bosu, Mr.Avinish Kumar 18 Guidance to Scalability, Communication, Affordabilitysegments,cost estimation
**Platforms used for communication were Google Meet and email.
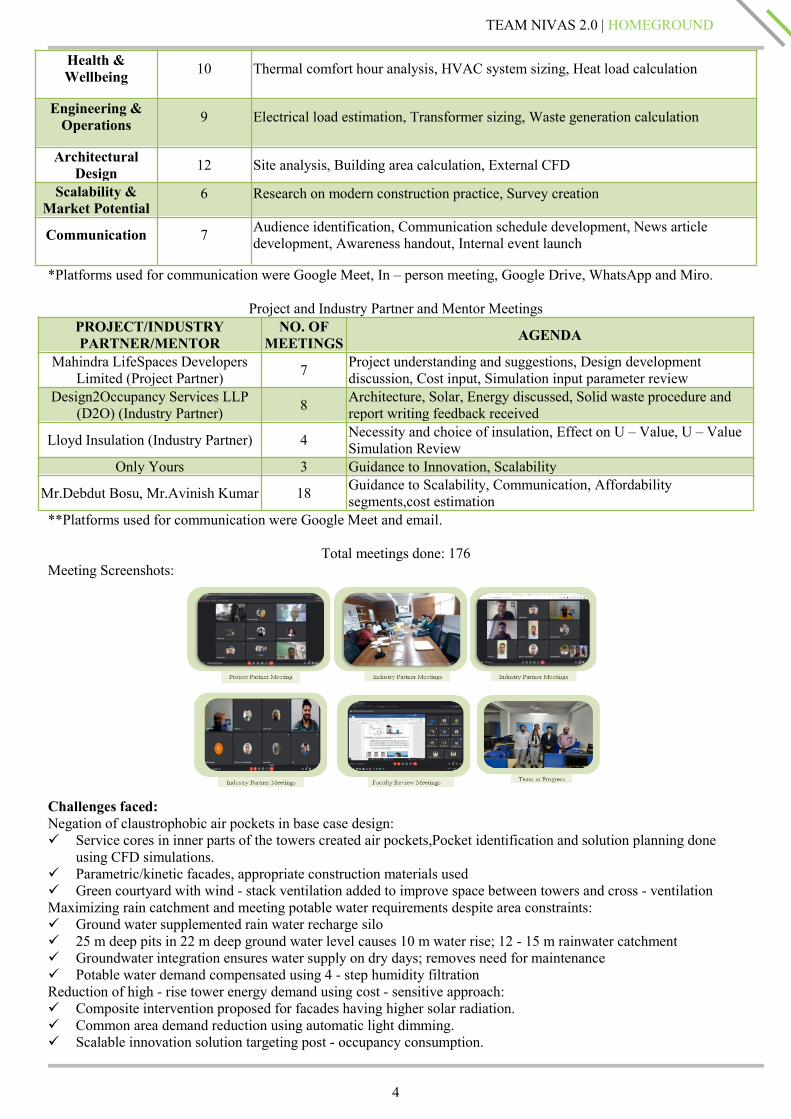
Total meetings done: 176Meeting Screenshots:
Challenges faced:Negation of claustrophobic air pockets in base case design: Service cores in inner parts of the towers created air pockets,Pocket identification and solution planning done
using CFD simulations. Parametric/kinetic facades, appropriate construction materials used Green courtyard with wind - stack ventilation added to improve space between towers and cross - ventilationMaximizing rain catchment and meeting potable water requirements despite area constraints: Ground water supplemented rain water recharge silo 25 m deep pits in 22 m deep ground water level causes 10 m water rise; 12 - 15 m rainwater catchment Groundwater integration ensures water supply on dry days; removes need for maintenance Potable water demand compensated using 4 - step humidity filtrationReduction of high - rise tower energy demand using cost - sensitive approach: Composite intervention proposed for facades having higher solar radiation. Common area demand reduction using automatic light dimming. Scalable innovation solution targeting post - occupancy consumption.

5
TEAM NIVAS 2.0 | HOMEGROUNDHOMEGROUND HOMEGROUND
3. Project Background
Project Name: Home Ground, Project partner: Mahindra Lifespaces Developers Limited
Dr. Sunita Purushottam- Head of Sustainability and Project Partner POC.
Email: [email protected]
Mr. Abhishek Palit – Sustainability Manager and Project partner coordinator with Team Nivas 2.0.
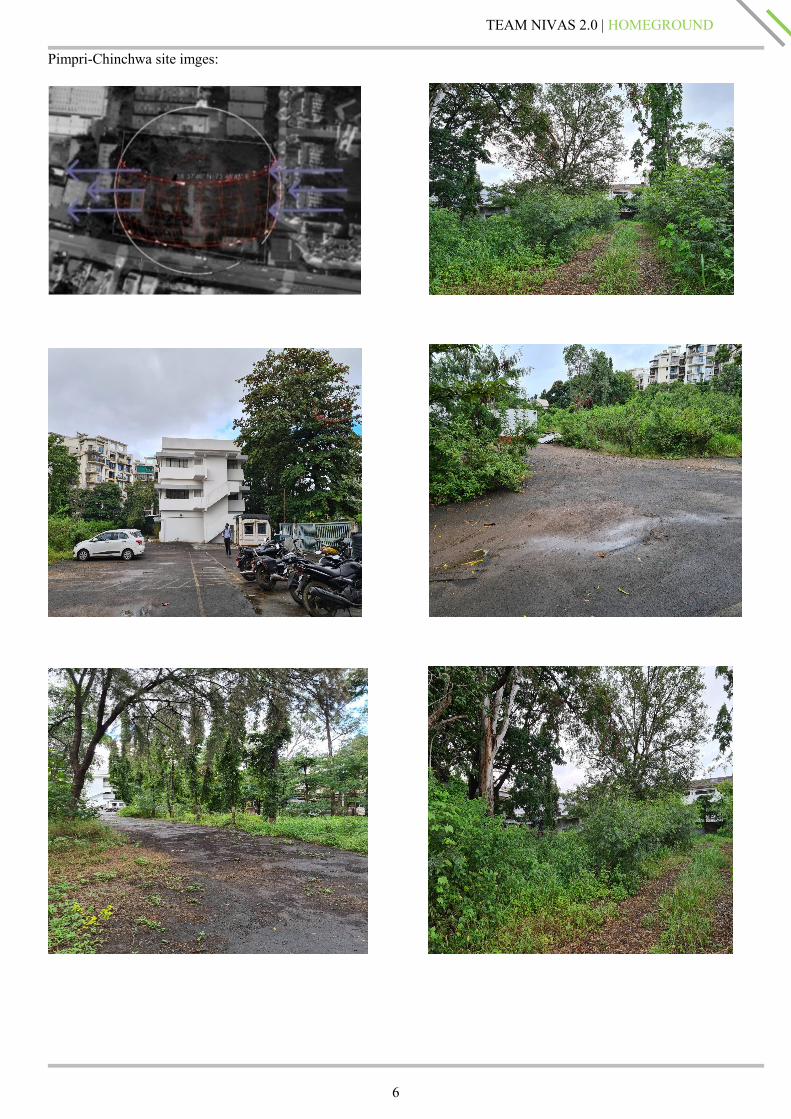
Description of the Project Partner: Mahindra Lifespaces Ltd. is one of the most reputed residential property developersin India. They have projects across the country and provide thoughtfully designed living spaces. They espouseresponsible, green design and development, and are driven by our mission of Sustainable Urbanization. Some of theNotable Achievements of Mahindra Lifespaces Ltd. Include-17.47 million sq. ft. of completed residential projects, 7.9million sq. ft. of ongoing and forthcoming residential projects, over 5000 acres of ongoing and forthcoming integratedcities and industrial clusters in three cities, Projects in Mumbai Metropolitan Region, Pune, Nagpur, Ahmedabad,Delhi NCR, Jaipur,Hyderabad, Chennai & Bengaluru. About, Pimpri-Chinchwad, Pune: Pune, situated in west-centralMaharashtra, India, is also known as the “Queen of the Deccan”. It is the seventh most populous city in India and thesecond-largest city in the state with an estimated population of 7.4 million as of 2020. It has been ranked as "the mostlivable city in India" several times. Pune lies on the western margin of the Deccan Plateau, at an altitude of 560 m(1,840 ft) above sea level. It is on the leeward– side of the Sahyadri mountain range, which forms a barrier from theArabian Sea. Our project site, located in the Pimpri-Chinchwadarea, falls on eastern side of the Western Ghats calledSahyadri ranges. The site is situated near major urban and industrial groups of Pune and Pimpri Chinchwad. Thetopographical elevation ranges between 589m to 586m. Northern portion has been observed to be little elevatedcompared to the southern portion of the study area.
Brief description of the Project: Mahindra Lifespaces (MLDL) intends to develop an area of 3.07 Acres, located inPimpri-Chinchwad Haveli Tahsil of the north-western part of Pune district. The study area comes under the SOItopographic sheet number 47F/13 on the 1: 50,000 scale and is located between 180 30’N to 190 05’N. Latitude 73032’E to 740 15’E longitudes.
Climate Zone: Warm and humid zone as per ECBC-2017, Status of the project: Still in concept and design, Hours ofoperation: 24hours.
Profile of occupants: As building configuration is of mixed type (2BHK-3BHK) so the intended target audience arethe migrants working for various industries like IT, Electronics, Education, Pharma, etc.
Total Site Area (in m2) = 12423.85 sq.m, Permissible Built-up Area (in m2) = 67000 sq.m, Proposed Built- up area (inm2) = 16.4 acres, 66368.45 sq.m, Ground Coverage Area (in m2) = 1.15 acres, 4653.885 sq.m, 37.40%
Total Built Up Area:
Total plot area= 3.07 Acres Total Appx. Built Up area that need to be constructed = 16.44 Acres Project site area=1.15 Acres, FAR= 9.73, Total no. of Tower to be construed = 4, Total number of Units = 484 nos., Target EPI:45kWh/sqm., However, we will try to reduce it by 20-25%, Estimate of on-site renewable energy generation potential:35-45 MWh annually.
Specific Target for the Project: IGBC Green Homes, Climate Responsive Design, Reduction in cost after post
maintenance of operation.
Timeline: The project is in concept and Design stage and approximately it would take 46 months.
Construction Budget: The preliminary construction cost is approximately around 223 Crores INR
6
TEAM NIVAS 2.0 | HOMEGROUNDHOMEGROUND HOMEGROUND
Pimpri-Chinchwa site imges:
7
TEAM NIVAS 2.0 | HOMEGROUNDHOMEGROUND HOMEGROUND
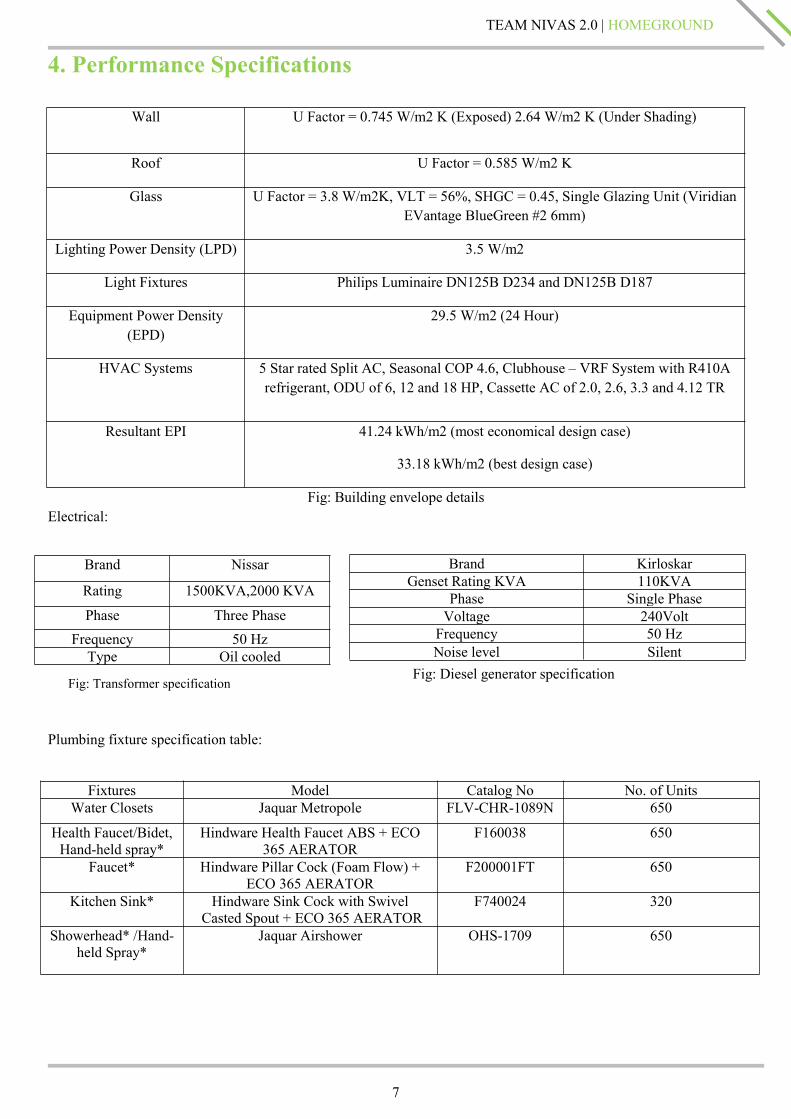
4. Performance Specifications
Wall U Factor = 0.745 W/m2 K (Exposed) 2.64 W/m2 K (Under Shading)
Roof U Factor = 0.585 W/m2 K
Glass U Factor = 3.8 W/m2K, VLT = 56%, SHGC = 0.45, Single Glazing Unit (ViridianEVantage BlueGreen #2 6mm)
Lighting Power Density (LPD) 3.5 W/m2
Light Fixtures Philips Luminaire DN125B D234 and DN125B D187
Equipment Power Density(EPD)
29.5 W/m2 (24 Hour)
HVAC Systems 5 Star rated Split AC, Seasonal COP 4.6, Clubhouse – VRF System with R410Arefrigerant, ODU of 6, 12 and 18 HP, Cassette AC of 2.0, 2.6, 3.3 and 4.12 TR
Resultant EPI 41.24 kWh/m2 (most economical design case)
33.18 kWh/m2 (best design case)
Fig: Building envelope detailsElectrical:
Plumbing fixture specification table:
Brand KirloskarGenset Rating KVA 110KVA
Phase Single PhaseVoltage 240Volt
Frequency 50 HzNoise level Silent
Brand Nissar
Rating 1500KVA,2000 KVA
Phase Three PhaseFrequency 50 Hz
Type Oil cooled
Fixtures Model Catalog No No. of UnitsWater Closets Jaquar Metropole FLV-CHR-1089N 650
Health Faucet/Bidet,Hand-held spray*
Hindware Health Faucet ABS + ECO365 AERATOR
F160038 650
Faucet* Hindware Pillar Cock (Foam Flow) +ECO 365 AERATOR
F200001FT 650
Kitchen Sink* Hindware Sink Cock with SwivelCasted Spout + ECO 365 AERATOR
F740024 320
Showerhead* /Hand-held Spray*
Jaquar Airshower OHS-1709 650
Fig. Transformer specification Fig: Diesel generator specificationFig: Transformer specification
8
TEAM NIVAS 2.0 | HOMEGROUNDHOMEGROUND HOMEGROUND
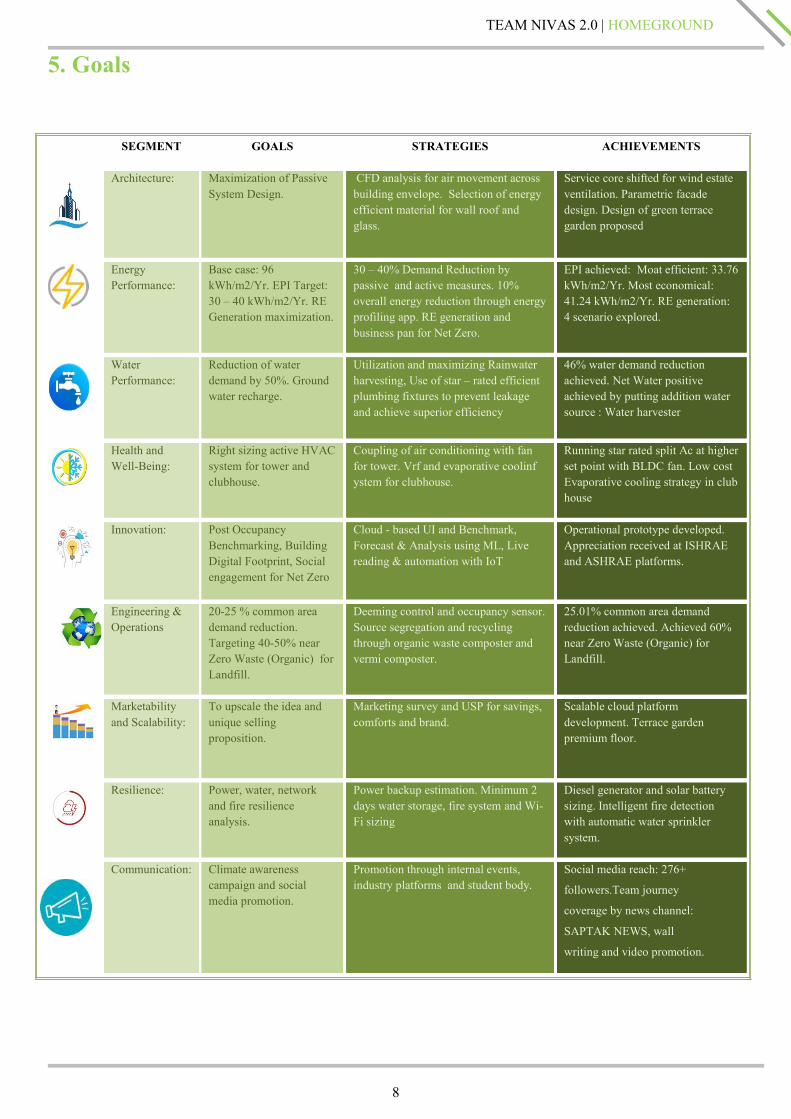
5. Goals
SEGMENT GOALS STRATEGIES ACHIEVEMENTS
Architecture: Maximization of PassiveSystem Design.
CFD analysis for air movement acrossbuilding envelope. Selection of energyefficient material for wall roof andglass.
Service core shifted for wind estateventilation. Parametric facadedesign. Design of green terracegarden proposed
EnergyPerformance:
Base case: 96kWh/m2/Yr. EPI Target:30 – 40 kWh/m2/Yr. REGeneration maximization.
30 – 40% Demand Reduction bypassive and active measures. 10%overall energy reduction through energyprofiling app. RE generation andbusiness pan for Net Zero.
EPI achieved: Moat efficient: 33.76kWh/m2/Yr. Most economical:41.24 kWh/m2/Yr. RE generation:4 scenario explored.
WaterPerformance:
Reduction of waterdemand by 50%. Groundwater recharge.
Utilization and maximizing Rainwaterharvesting, Use of star – rated efficientplumbing fixtures to prevent leakageand achieve superior efficiency
46% water demand reductionachieved. Net Water positiveachieved by putting addition watersource : Water harvester
Health andWell-Being:
Right sizing active HVACsystem for tower andclubhouse.
Coupling of air conditioning with fanfor tower. Vrf and evaporative coolinfystem for clubhouse.
Running star rated split Ac at higherset point with BLDC fan. Low costEvaporative cooling strategy in clubhouse
Innovation: Post OccupancyBenchmarking, BuildingDigital Footprint, Socialengagement for Net Zero
Cloud - based UI and Benchmark,Forecast & Analysis using ML, Livereading & automation with IoT
Operational prototype developed.Appreciation received at ISHRAEand ASHRAE platforms.
Engineering &Operations
20-25 % common areademand reduction.Targeting 40-50% nearZero Waste (Organic) forLandfill.
Deeming control and occupancy sensor.Source segregation and recyclingthrough organic waste composter andvermi composter.
25.01% common area demandreduction achieved. Achieved 60%near Zero Waste (Organic) forLandfill.
Marketabilityand Scalability:
To upscale the idea andunique sellingproposition.
Marketing survey and USP for savings,comforts and brand.
Scalable cloud platformdevelopment. Terrace gardenpremium floor.
Resilience: Power, water, networkand fire resilienceanalysis.
Power backup estimation. Minimum 2days water storage, fire system and Wi-Fi sizing
Diesel generator and solar batterysizing. Intelligent fire detectionwith automatic water sprinklersystem.
Communication: Climate awarenesscampaign and socialmedia promotion.
Promotion through internal events,industry platforms and student body.
Social media reach: 276+
followers.Team journey
coverage by news channel:
SAPTAK NEWS, wall
writing and video promotion.
9
TEAM NIVAS 2.0 | HOMEGROUNDHOMEGROUND HOMEGROUND
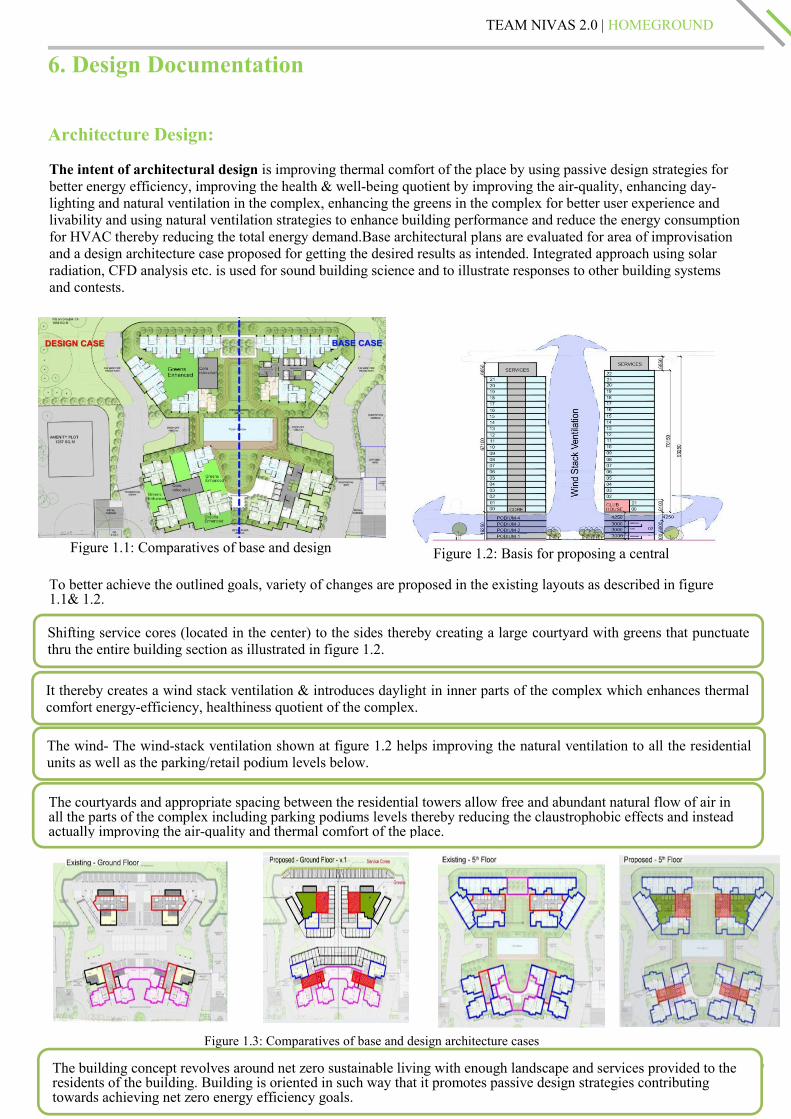
Figure 1.2: Basis for proposing a centralFigure 1.1: Comparatives of base and design
6. Design Documentation
Architecture Design:
The intent of architectural design is improving thermal comfort of the place by using passive design strategies forbetter energy efficiency, improving the health & well-being quotient by improving the air-quality, enhancing day-lighting and natural ventilation in the complex, enhancing the greens in the complex for better user experience andlivability and using natural ventilation strategies to enhance building performance and reduce the energy consumptionfor HVAC thereby reducing the total energy demand.Base architectural plans are evaluated for area of improvisationand a design architecture case proposed for getting the desired results as intended. Integrated approach using solarradiation, CFD analysis etc. is used for sound building science and to illustrate responses to other building systemsand contests.
To better achieve the outlined goals, variety of changes are proposed in the existing layouts as described in figure1.1& 1.2.
Shifting service cores (located in the center) to the sides thereby creating a large courtyard with greens that punctuatethru the entire building section as illustrated in figure 1.2.
It thereby creates a wind stack ventilation & introduces daylight in inner parts of the complex which enhances thermalcomfort energy-efficiency, healthiness quotient of the complex.
The wind- The wind-stack ventilation shown at figure 1.2 helps improving the natural ventilation to all the residentialunits as well as the parking/retail podium levels below.
The courtyards and appropriate spacing between the residential towers allow free and abundant natural flow of air inall the parts of the complex including parking podiums levels thereby reducing the claustrophobic effects and insteadactually improving the air-quality and thermal comfort of the place.
Figure 1.3: Comparatives of base and design architecture cases
The building concept revolves around net zero sustainable living with enough landscape and services provided to theresidents of the building. Building is oriented in such way that it promotes passive design strategies contributingtowards achieving net zero energy efficiency goals.
10
TEAM NIVAS 2.0 | HOMEGROUNDHOMEGROUND HOMEGROUND
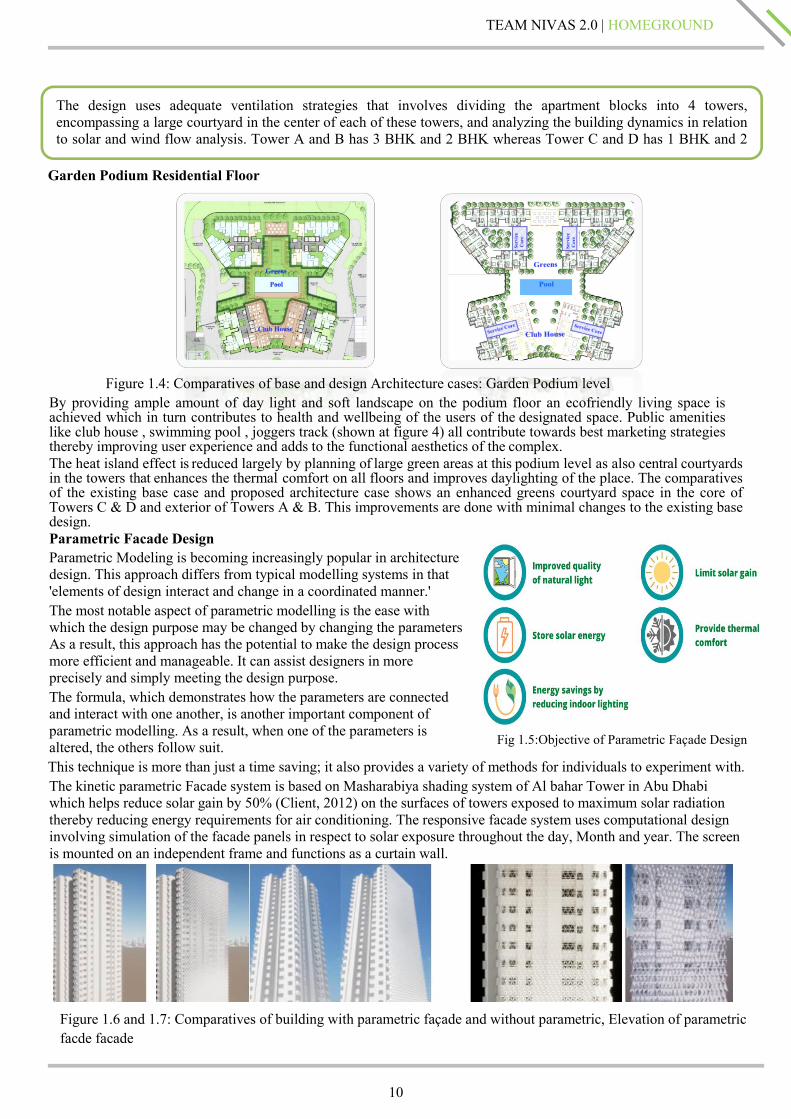
Figure 1.4: Comparatives of base and design Architecture cases: Garden Podium level
Garden Podium Residential Floor
By providing ample amount of day light and soft landscape on the podium floor an ecofriendly living space isachieved which in turn contributes to health and wellbeing of the users of the designated space. Public amenitieslike club house , swimming pool , joggers track (shown at figure 4) all contribute towards best marketing strategiesthereby improving user experience and adds to the functional aesthetics of the complex.The heat island effect is reduced largely by planning of large green areas at this podium level as also central courtyardsin the towers that enhances the thermal comfort on all floors and improves daylighting of the place. The comparativesof the existing base case and proposed architecture case shows an enhanced greens courtyard space in the core ofTowers C & D and exterior of Towers A & B. This improvements are done with minimal changes to the existing basedesign.Parametric Facade DesignParametric Modeling is becoming increasingly popular in architecturedesign. This approach differs from typical modelling systems in that'elements of design interact and change in a coordinated manner.'The most notable aspect of parametric modelling is the ease withwhich the design purpose may be changed by changing the parameters.As a result, this approach has the potential to make the design processmore efficient and manageable. It can assist designers in moreprecisely and simply meeting the design purpose.The formula, which demonstrates how the parameters are connectedand interact with one another, is another important component ofparametric modelling. As a result, when one of the parameters isaltered, the others follow suit.This technique is more than just a time saving; it also provides a variety of methods for individuals to experiment with.The kinetic parametric Facade system is based on Masharabiya shading system of Al bahar Tower in Abu Dhabiwhich helps reduce solar gain by 50% (Client, 2012) on the surfaces of towers exposed to maximum solar radiationthereby reducing energy requirements for air conditioning. The responsive facade system uses computational designinvolving simulation of the facade panels in respect to solar exposure throughout the day, Month and year. The screenis mounted on an independent frame and functions as a curtain wall.
The design uses adequate ventilation strategies that involves dividing the apartment blocks into 4 towers,encompassing a large courtyard in the center of each of these towers, and analyzing the building dynamics in relationto solar and wind flow analysis. Tower A and B has 3 BHK and 2 BHK whereas Tower C and D has 1 BHK and 2BHK
Fig 1.5:Objective of Parametric Façade Design
Figure 1.6 and 1.7: Comparatives of building with parametric façade and without parametric, Elevation of parametricfacde facade
11
TEAM NIVAS 2.0 | HOMEGROUNDHOMEGROUND HOMEGROUND
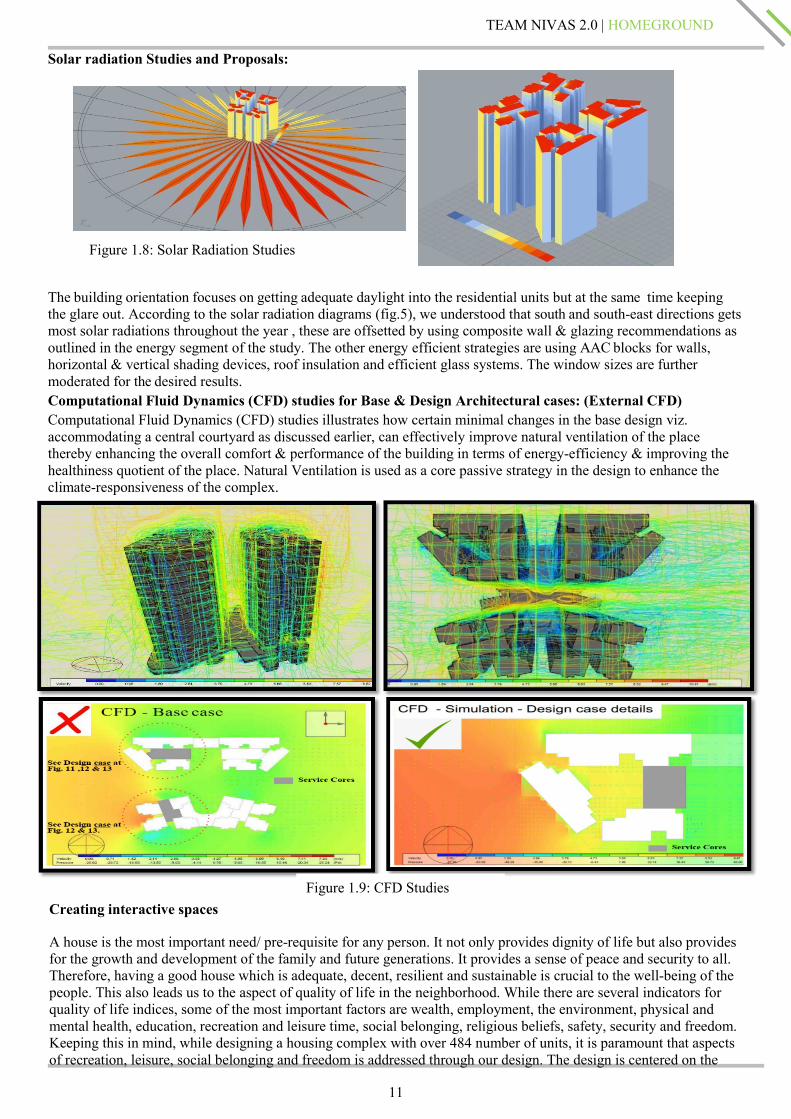
Solar radiation Studies and Proposals:
The building orientation focuses on getting adequate daylight into the residential units but at the same time keepingthe glare out. According to the solar radiation diagrams (fig.5), we understood that south and south-east directions getsmost solar radiations throughout the year , these are offsetted by using composite wall & glazing recommendations asoutlined in the energy segment of the study. The other energy efficient strategies are using AAC blocks for walls,horizontal & vertical shading devices, roof insulation and efficient glass systems. The window sizes are furthermoderated for the desired results.Computational Fluid Dynamics (CFD) studies for Base & Design Architectural cases: (External CFD)Computational Fluid Dynamics (CFD) studies illustrates how certain minimal changes in the base design viz.accommodating a central courtyard as discussed earlier, can effectively improve natural ventilation of the placethereby enhancing the overall comfort & performance of the building in terms of energy-efficiency & improving thehealthiness quotient of the place. Natural Ventilation is used as a core passive strategy in the design to enhance theclimate-responsiveness of the complex.
Creating interactive spaces
A house is the most important need/ pre-requisite for any person. It not only provides dignity of life but also providesfor the growth and development of the family and future generations. It provides a sense of peace and security to all.Therefore, having a good house which is adequate, decent, resilient and sustainable is crucial to the well-being of thepeople. This also leads us to the aspect of quality of life in the neighborhood. While there are several indicators forquality of life indices, some of the most important factors are wealth, employment, the environment, physical andmental health, education, recreation and leisure time, social belonging, religious beliefs, safety, security and freedom.Keeping this in mind, while designing a housing complex with over 484 number of units, it is paramount that aspectsof recreation, leisure, social belonging and freedom is addressed through our design. The design is centered on the
Figure 1.8: Solar Radiation Studies
Figure 1.9: CFD Studies
12
TEAM NIVAS 2.0 | HOMEGROUNDHOMEGROUND HOMEGROUND
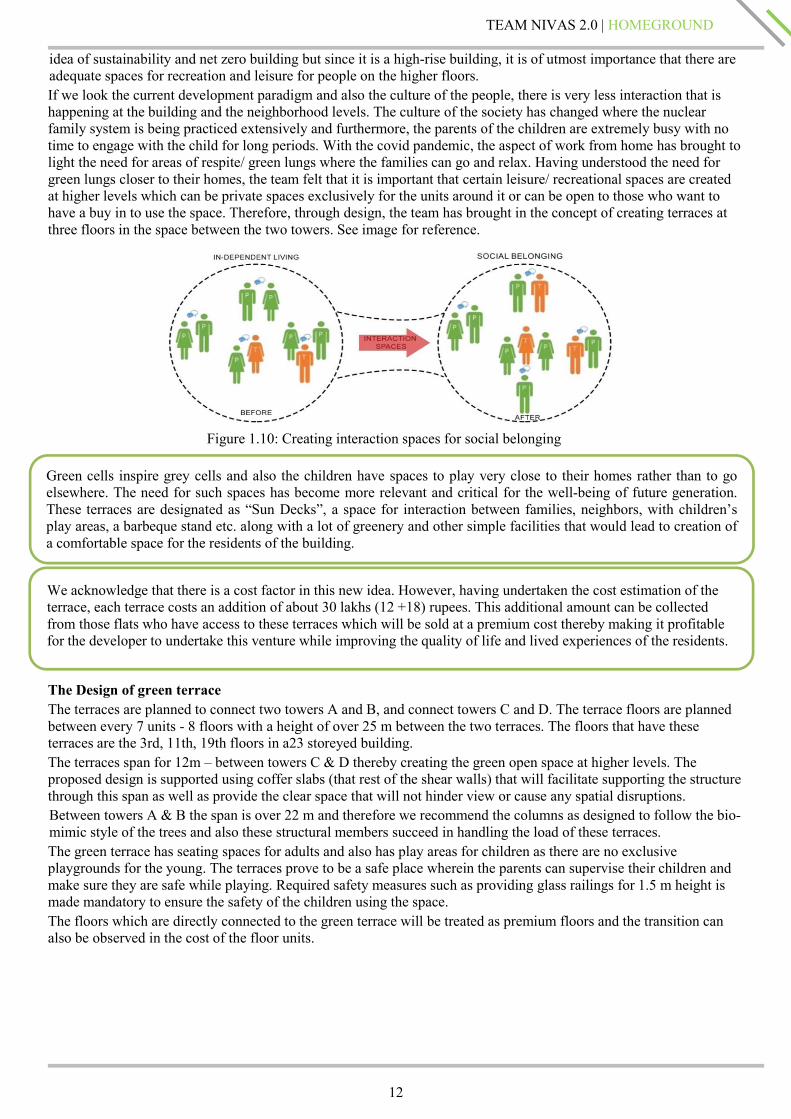
idea of sustainability and net zero building but since it is a high-rise building, it is of utmost importance that there areadequate spaces for recreation and leisure for people on the higher floors.If we look the current development paradigm and also the culture of the people, there is very less interaction that ishappening at the building and the neighborhood levels. The culture of the society has changed where the nuclearfamily system is being practiced extensively and furthermore, the parents of the children are extremely busy with notime to engage with the child for long periods. With the covid pandemic, the aspect of work from home has brought tolight the need for areas of respite/ green lungs where the families can go and relax. Having understood the need forgreen lungs closer to their homes, the team felt that it is important that certain leisure/ recreational spaces are createdat higher levels which can be private spaces exclusively for the units around it or can be open to those who want tohave a buy in to use the space. Therefore, through design, the team has brought in the concept of creating terraces atthree floors in the space between the two towers. See image for reference.
The Design of green terraceThe terraces are planned to connect two towers A and B, and connect towers C and D. The terrace floors are plannedbetween every 7 units - 8 floors with a height of over 25 m between the two terraces. The floors that have theseterraces are the 3rd, 11th, 19th floors in a23 storeyed building.The terraces span for 12m – between towers C & D thereby creating the green open space at higher levels. Theproposed design is supported using coffer slabs (that rest of the shear walls) that will facilitate supporting the structurethrough this span as well as provide the clear space that will not hinder view or cause any spatial disruptions.Between towers A & B the span is over 22 m and therefore we recommend the columns as designed to follow the bio-mimic style of the trees and also these structural members succeed in handling the load of these terraces.The green terrace has seating spaces for adults and also has play areas for children as there are no exclusiveplaygrounds for the young. The terraces prove to be a safe place wherein the parents can supervise their children andmake sure they are safe while playing. Required safety measures such as providing glass railings for 1.5 m height ismade mandatory to ensure the safety of the children using the space.The floors which are directly connected to the green terrace will be treated as premium floors and the transition canalso be observed in the cost of the floor units.
Figure 1.10: Creating interaction spaces for social belonging
Green cells inspire grey cells and also the children have spaces to play very close to their homes rather than to goelsewhere. The need for such spaces has become more relevant and critical for the well-being of future generation.These terraces are designated as “Sun Decks”, a space for interaction between families, neighbors, with children’splay areas, a barbeque stand etc. along with a lot of greenery and other simple facilities that would lead to creation ofa comfortable space for the residents of the building.
We acknowledge that there is a cost factor in this new idea. However, having undertaken the cost estimation of theterrace, each terrace costs an addition of about 30 lakhs (12 +18) rupees. This additional amount can be collectedfrom those flats who have access to these terraces which will be sold at a premium cost thereby making it profitablefor the developer to undertake this venture while improving the quality of life and lived experiences of the residents.
13
TEAM NIVAS 2.0 | HOMEGROUNDHOMEGROUND HOMEGROUND
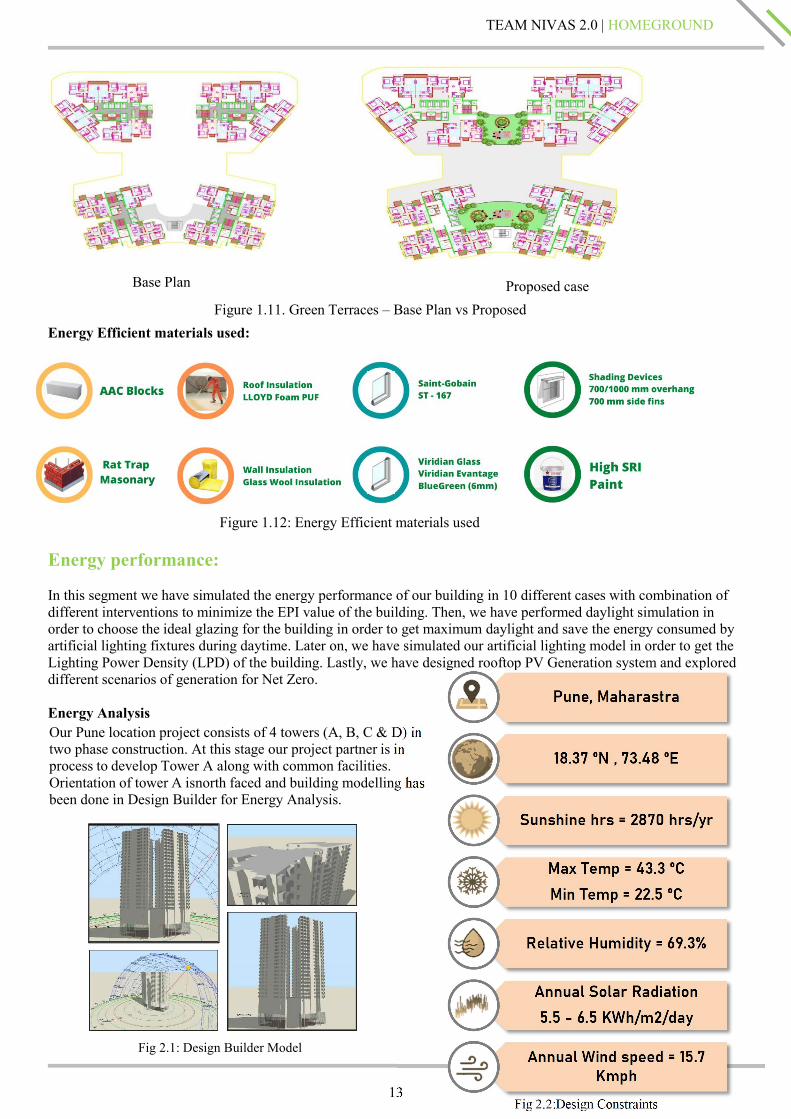
Energy Efficient materials used:
Energy performance:
In this segment we have simulated the energy performance of our building in 10 different cases with combination ofdifferent interventions to minimize the EPI value of the building. Then, we have performed daylight simulation inorder to choose the ideal glazing for the building in order to get maximum daylight and save the energy consumed byartificial lighting fixtures during daytime. Later on, we have simulated our artificial lighting model in order to get theLighting Power Density (LPD) of the building. Lastly, we have designed rooftop PV Generation system and exploreddifferent scenarios of generation for Net Zero.
Energy AnalysisOur Pune location project consists of 4 towers (A, B, C & D) intwo phase construction. At this stage our project partner is inprocess to develop Tower A along with common facilities.Orientation of tower A isnorth faced and building modelling hasbeen done in Design Builder for Energy Analysis.
Base Plan Proposed caseFigure 1.11. Green Terraces – Base Plan vs Proposed
Figure 1.12: Energy Efficient materials used
Fig 2.1: Design Builder Model
14
TEAM NIVAS 2.0 | HOMEGROUNDHOMEGROUND HOMEGROUND
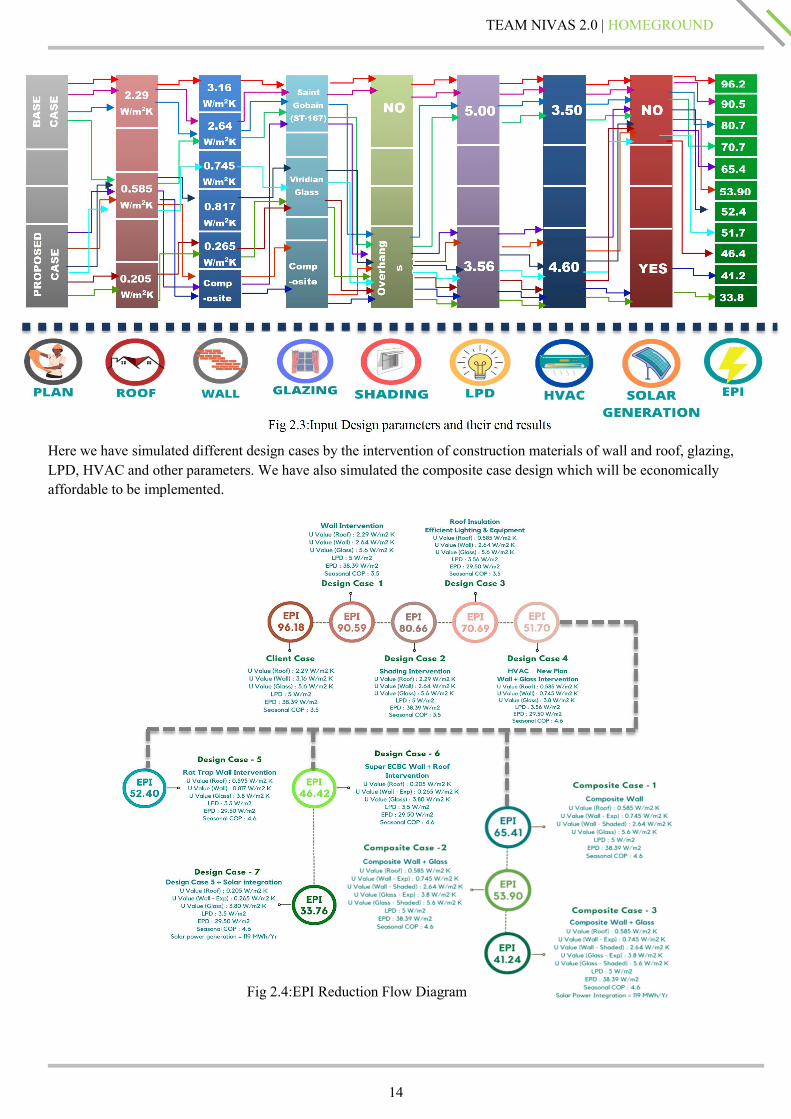
Here we have simulated different design cases by the intervention of construction materials of wall and roof, glazing,LPD, HVAC and other parameters. We have also simulated the composite case design which will be economicallyaffordable to be implemented.
Fig 2.4:EPI Reduction Flow Diagram
15
TEAM NIVAS 2.0 | HOMEGROUNDHOMEGROUND HOMEGROUND
21st Sept, Overcast sky, 9am 21st Sept, Overcast sky, 2pm
21st Sept, Overcast sky, 9am [Design 21st Sept, Overcast sky, 2pm
Fig 2.10: Simulation Results
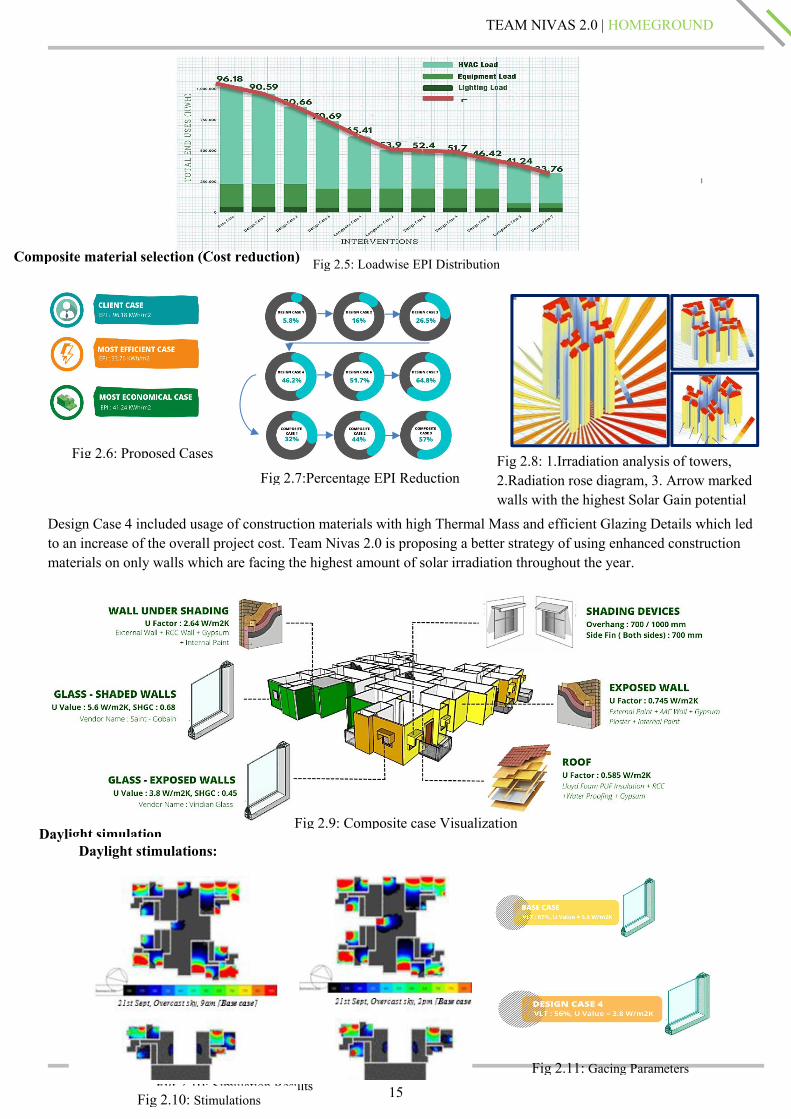
Fig 2.5: Loadwise EPI Distribution
Fig 2.6: Proposed Cases
Fig 2.7:Percentage EPI Reduction
Composite material selection (Cost reduction)
Fig 2.9: Composite case Visualization
Fig 2.8: 1.Irradiation analysis of towers,2.Radiation rose diagram, 3. Arrow markedwalls with the highest Solar Gain potential
Design Case 4 included usage of construction materials with high Thermal Mass and efficient Glazing Details which ledto an increase of the overall project cost. Team Nivas 2.0 is proposing a better strategy of using enhanced constructionmaterials on only walls which are facing the highest amount of solar irradiation throughout the year.
Daylight simulation
Fig 2.11: Gacing Parameters
Daylight stimulations:
Fig 2.10: Stimulations
16
TEAM NIVAS 2.0 | HOMEGROUNDHOMEGROUND HOMEGROUND
‘
Fig 2.11: Glazing Parameters
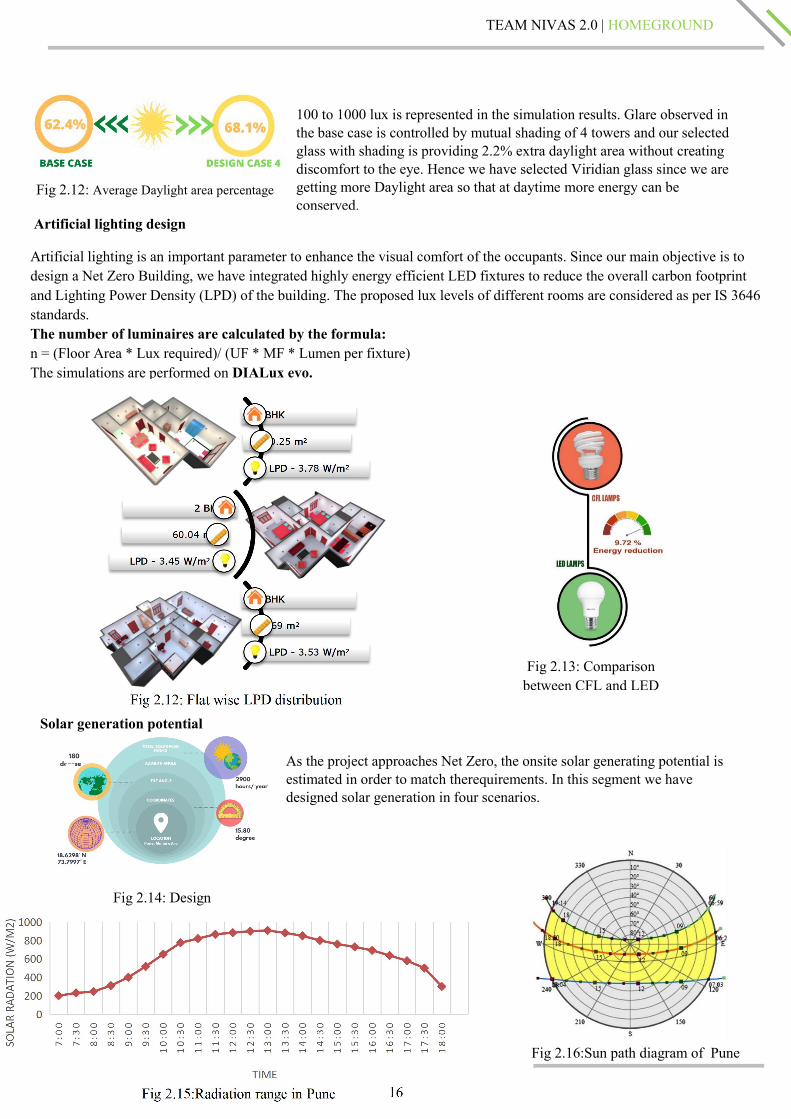
100 to 1000 lux is represented in the simulation results. Glare observed inthe base case is controlled by mutual shading of 4 towers and our selectedglass with shading is providing 2.2% extra daylight area without creatingdiscomfort to the eye. Hence we have selected Viridian glass since we aregetting more Daylight area so that at daytime more energy can beconserved.
As the project approaches Net Zero, the onsite solar generating potential isestimated in order to match therequirements. In this segment we havedesigned solar generation in four scenarios.
Fig 2.12: Average Daylight area percentage
Fig 2.14: Design
Artificial lighting design
Artificial lighting is an important parameter to enhance the visual comfort of the occupants. Since our main objective is todesign a Net Zero Building, we have integrated highly energy efficient LED fixtures to reduce the overall carbon footprintand Lighting Power Density (LPD) of the building. The proposed lux levels of different rooms are considered as per IS 3646standards.The number of luminaires are calculated by the formula:n = (Floor Area * Lux required)/ (UF * MF * Lumen per fixture)The simulations are performed on DIALux evo.
Fig 2.13: Comparisonbetween CFL and LED
Solar generation potential
Fig 2.16:Sun path diagram of Pune
17
TEAM NIVAS 2.0 | HOMEGROUNDHOMEGROUND HOMEGROUND
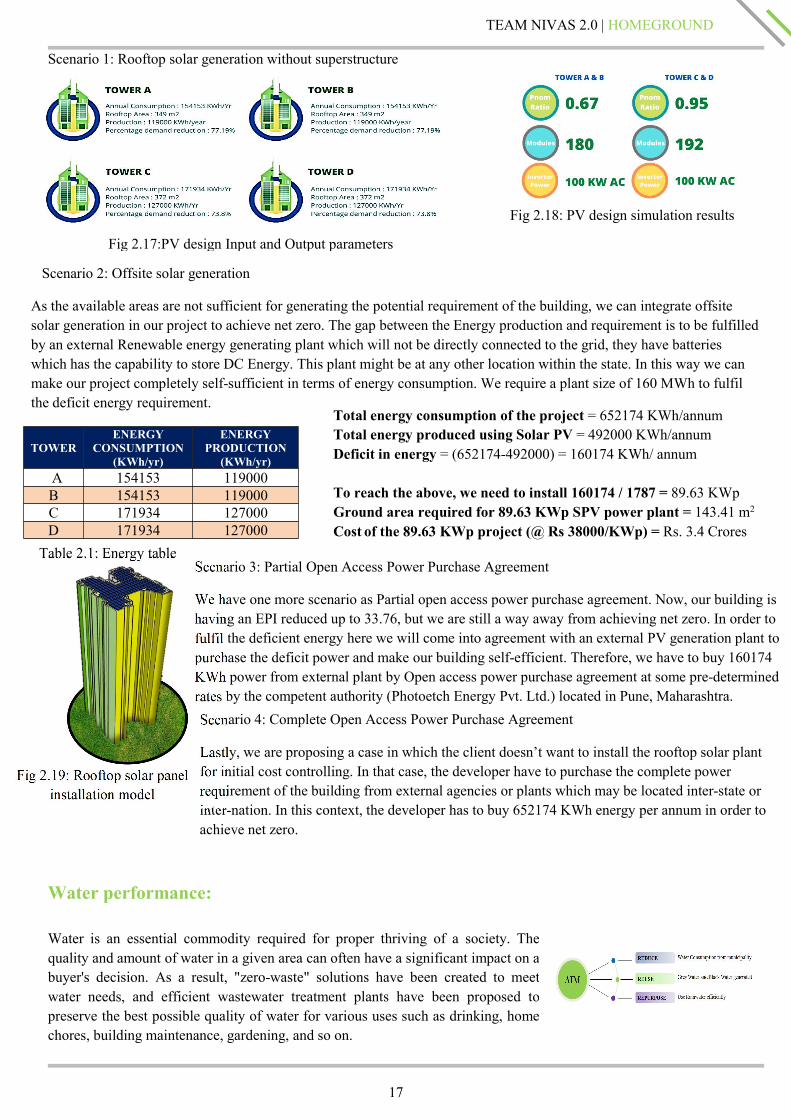
Scenario 1: Rooftop solar generation without superstructure
Water performance:
Water is an essential commodity required for proper thriving of a society. Thequality and amount of water in a given area can often have a significant impact on abuyer's decision. As a result, "zero-waste" solutions have been created to meetwater needs, and efficient wastewater treatment plants have been proposed topreserve the best possible quality of water for various uses such as drinking, homechores, building maintenance, gardening, and so on.
Fig 2.18: PV design simulation results
Scenario 4: Complete Open Access Power Purchase Agreement
Lastly, we are proposing a case in which the client doesn’t want to install the rooftop solar plantfor initial cost controlling. In that case, the developer have to purchase the complete powerrequirement of the building from external agencies or plants which may be located inter-state orinter-nation. In this context, the developer has to buy 652174 KWh energy per annum in order toachieve net zero.
Fig 2.17:PV design Input and Output parameters
Scenario 2: Offsite solar generation
As the available areas are not sufficient for generating the potential requirement of the building, we can integrate offsitesolar generation in our project to achieve net zero. The gap between the Energy production and requirement is to be fulfilledby an external Renewable energy generating plant which will not be directly connected to the grid, they have batterieswhich has the capability to store DC Energy. This plant might be at any other location within the state. In this way we canmake our project completely self-sufficient in terms of energy consumption. We require a plant size of 160 MWh to fulfilthe deficit energy requirement.
TOWERENERGY
CONSUMPTION(KWh/yr)
ENERGYPRODUCTION
(KWh/yr)A 154153 119000B 154153 119000C 171934 127000D 171934 127000
Total energy consumption of the project = 652174 KWh/annumTotal energy produced using Solar PV = 492000 KWh/annumDeficit in energy = (652174-492000) = 160174 KWh/ annum
To reach the above, we need to install 160174 / 1787 = 89.63 KWpGround area required for 89.63 KWp SPV power plant = 143.41 m2
Cost of the 89.63 KWp project (@ Rs 38000/KWp) = Rs. 3.4 Crores
Scenario 3: Partial Open Access Power Purchase Agreement
We have one more scenario as Partial open access power purchase agreement. Now, our building ishaving an EPI reduced up to 33.76, but we are still a way away from achieving net zero. In order tofulfil the deficient energy here we will come into agreement with an external PV generation plant topurchase the deficit power and make our building self-efficient. Therefore, we have to buy 160174KWh power from external plant by Open access power purchase agreement at some pre-determinedrates by the competent authority (Photoetch Energy Pvt. Ltd.) located in Pune, Maharashtra.
Table 2.1: Energy table
18
TEAM NIVAS 2.0 | HOMEGROUNDHOMEGROUND HOMEGROUND
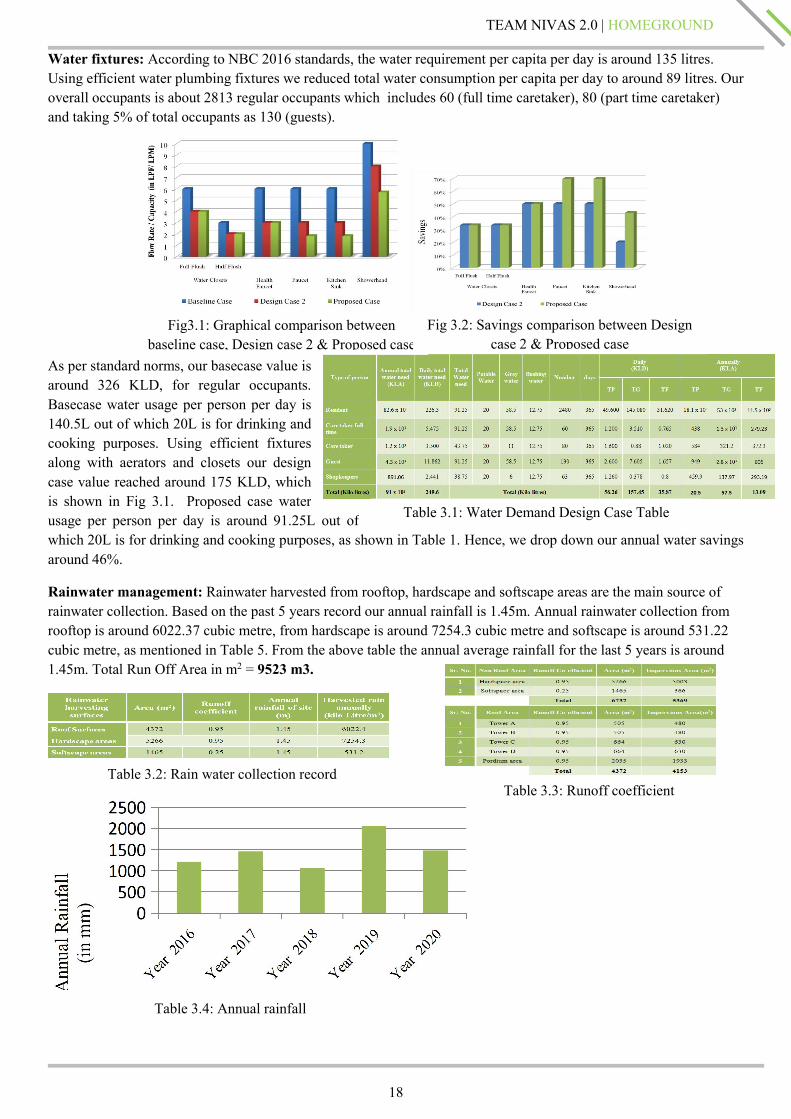
Water fixtures: According to NBC 2016 standards, the water requirement per capita per day is around 135 litres.Using efficient water plumbing fixtures we reduced total water consumption per capita per day to around 89 litres. Ouroverall occupants is about 2813 regular occupants which includes 60 (full time caretaker), 80 (part time caretaker)and taking 5% of total occupants as 130 (guests).
As per standard norms, our basecase value isaround 326 KLD, for regular occupants.Basecase water usage per person per day is140.5L out of which 20L is for drinking andcooking purposes. Using efficient fixturesalong with aerators and closets our designcase value reached around 175 KLD, whichis shown in Fig 3.1. Proposed case waterusage per person per day is around 91.25L out ofwhich 20L is for drinking and cooking purposes, as shown in Table 1. Hence, we drop down our annual water savingsaround 46%.
Rainwater management: Rainwater harvested from rooftop, hardscape and softscape areas are the main source ofrainwater collection. Based on the past 5 years record our annual rainfall is 1.45m. Annual rainwater collection fromrooftop is around 6022.37 cubic metre, from hardscape is around 7254.3 cubic metre and softscape is around 531.22cubic metre, as mentioned in Table 5. From the above table the annual average rainfall for the last 5 years is around1.45m. Total Run Off Area in m2 = 9523 m3.
Fig3.1: Graphical comparison betweenbaseline case, Design case 2 & Proposed case
Fig 3.2: Savings comparison between Designcase 2 & Proposed case
Table 3.1: Water Demand Design Case Table
Table 3.2: Rain water collection recordTable 3.3: Runoff coefficient
Table 3.4: Annual rainfall
19
TEAM NIVAS 2.0 | HOMEGROUNDHOMEGROUND HOMEGROUND
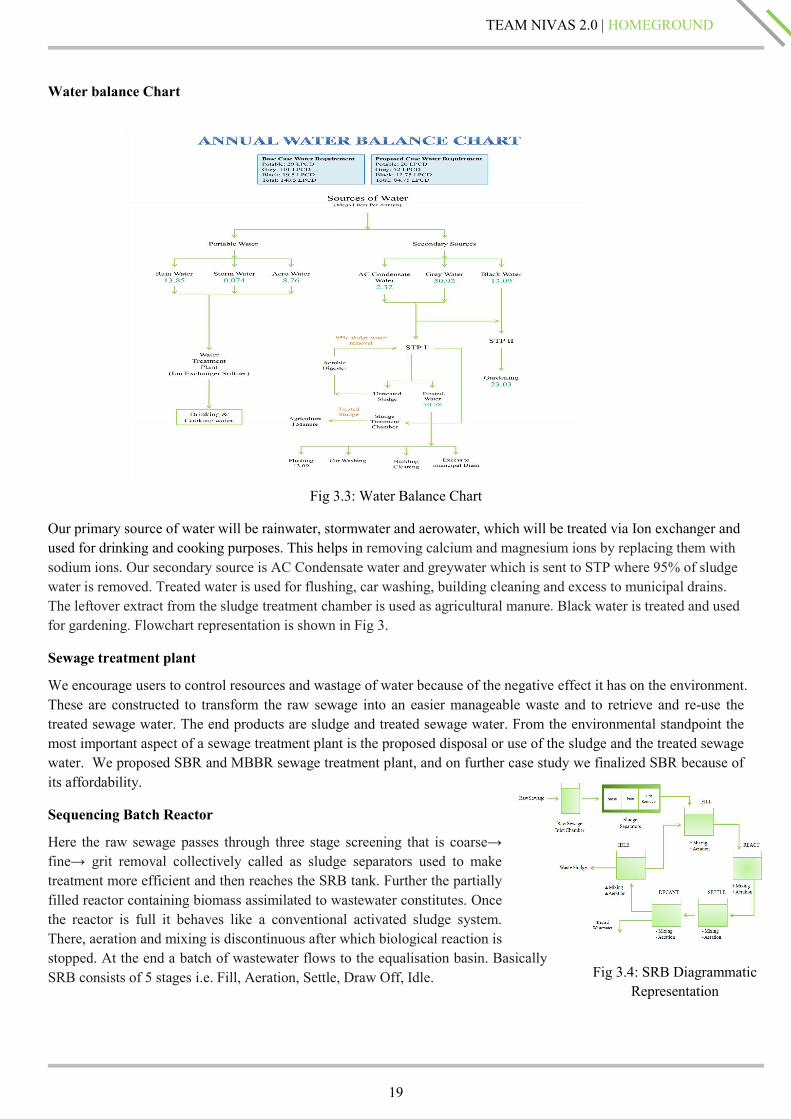
Water balance Chart
Fig 3.3: Water Balance Chart
Our primary source of water will be rainwater, stormwater and aerowater, which will be treated via Ion exchanger andused for drinking and cooking purposes. This helps in removing calcium and magnesium ions by replacing them withsodium ions. Our secondary source is AC Condensate water and greywater which is sent to STP where 95% of sludgewater is removed. Treated water is used for flushing, car washing, building cleaning and excess to municipal drains.The leftover extract from the sludge treatment chamber is used as agricultural manure. Black water is treated and usedfor gardening. Flowchart representation is shown in Fig 3.
Sewage treatment plant
We encourage users to control resources and wastage of water because of the negative effect it has on the environment.These are constructed to transform the raw sewage into an easier manageable waste and to retrieve and re-use thetreated sewage water. The end products are sludge and treated sewage water. From the environmental standpoint themost important aspect of a sewage treatment plant is the proposed disposal or use of the sludge and the treated sewagewater. We proposed SBR and MBBR sewage treatment plant, and on further case study we finalized SBR because ofits affordability.
Sequencing Batch Reactor
Here the raw sewage passes through three stage screening that is coarse→fine→ grit removal collectively called as sludge separators used to maketreatment more efficient and then reaches the SRB tank. Further the partiallyfilled reactor containing biomass assimilated to wastewater constitutes. Oncethe reactor is full it behaves like a conventional activated sludge system.There, aeration and mixing is discontinuous after which biological reaction isstopped. At the end a batch of wastewater flows to the equalisation basin. BasicallySRB consists of 5 stages i.e. Fill, Aeration, Settle, Draw Off, Idle. Fig 3.4: SRB Diagrammatic
Representation
20
TEAM NIVAS 2.0 | HOMEGROUNDHOMEGROUND HOMEGROUND
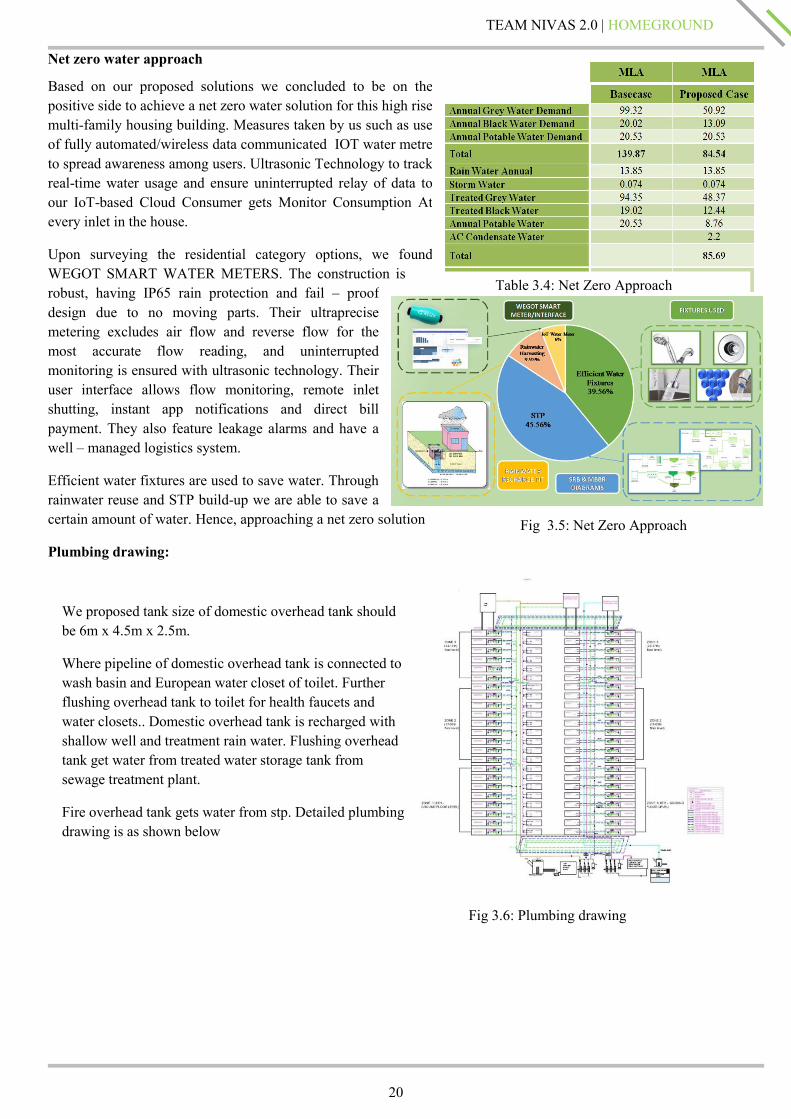
Net zero water approach
Based on our proposed solutions we concluded to be on thepositive side to achieve a net zero water solution for this high risemulti-family housing building. Measures taken by us such as useof fully automated/wireless data communicated IOT water metreto spread awareness among users. Ultrasonic Technology to trackreal-time water usage and ensure uninterrupted relay of data toour IoT-based Cloud Consumer gets Monitor Consumption Atevery inlet in the house.
Upon surveying the residential category options, we foundWEGOT SMART WATER METERS. The construction isrobust, having IP65 rain protection and fail – proofdesign due to no moving parts. Their ultraprecisemetering excludes air flow and reverse flow for themost accurate flow reading, and uninterruptedmonitoring is ensured with ultrasonic technology. Theiruser interface allows flow monitoring, remote inletshutting, instant app notifications and direct billpayment. They also feature leakage alarms and have awell – managed logistics system.
Efficient water fixtures are used to save water. Throughrainwater reuse and STP build-up we are able to save acertain amount of water. Hence, approaching a net zero solution.
Plumbing drawing:
Table 3.4: Net Zero Approach
Fig 3.6: Plumbing drawing
Fig 3.5: Net Zero Approach
We proposed tank size of domestic overhead tank shouldbe 6m x 4.5m x 2.5m.
Where pipeline of domestic overhead tank is connected towash basin and European water closet of toilet. Furtherflushing overhead tank to toilet for health faucets andwater closets.. Domestic overhead tank is recharged withshallow well and treatment rain water. Flushing overheadtank get water from treated water storage tank fromsewage treatment plant.
Fire overhead tank gets water from stp. Detailed plumbingdrawing is as shown below
21
TEAM NIVAS 2.0 | HOMEGROUNDHOMEGROUND HOMEGROUND
Health &Wellbeing:
Every aspect of our life influences our state of Health & wellbeing. It’s a complex combination of a person’s physical,mental, emotional & social health factors.
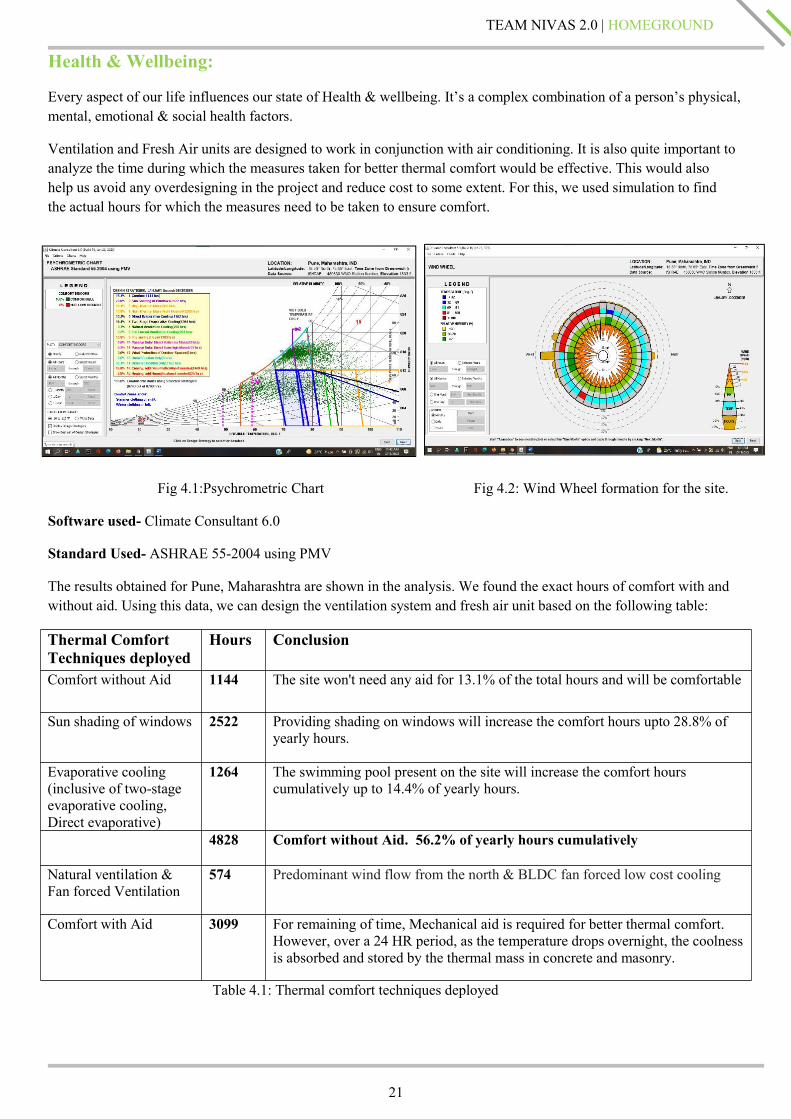
Ventilation and Fresh Air units are designed to work in conjunction with air conditioning. It is also quite important toanalyze the time during which the measures taken for better thermal comfort would be effective. This would alsohelp us avoid any overdesigning in the project and reduce cost to some extent. For this, we used simulation to findthe actual hours for which the measures need to be taken to ensure comfort.
Fig 4.1:Psychrometric Chart Fig 4.2: Wind Wheel formation for the site.
Software used- Climate Consultant 6.0
Standard Used- ASHRAE 55-2004 using PMV
The results obtained for Pune, Maharashtra are shown in the analysis. We found the exact hours of comfort with andwithout aid. Using this data, we can design the ventilation system and fresh air unit based on the following table:
Thermal ComfortTechniques deployed
Hours Conclusion
Comfort without Aid 1144 The site won't need any aid for 13.1% of the total hours and will be comfortable
Sun shading of windows 2522 Providing shading on windows will increase the comfort hours upto 28.8% ofyearly hours.
Evaporative cooling(inclusive of two-stageevaporative cooling,Direct evaporative)
1264 The swimming pool present on the site will increase the comfort hourscumulatively up to 14.4% of yearly hours.
4828 Comfort without Aid. 56.2% of yearly hours cumulatively
Natural ventilation &Fan forced Ventilation
574 Predominant wind flow from the north & BLDC fan forced low cost cooling
Comfort with Aid 3099 For remaining of time, Mechanical aid is required for better thermal comfort.However, over a 24 HR period, as the temperature drops overnight, the coolnessis absorbed and stored by the thermal mass in concrete and masonry.
Table 4.1: Thermal comfort techniques deployed
22
TEAM NIVAS 2.0 | HOMEGROUNDHOMEGROUND HOMEGROUND
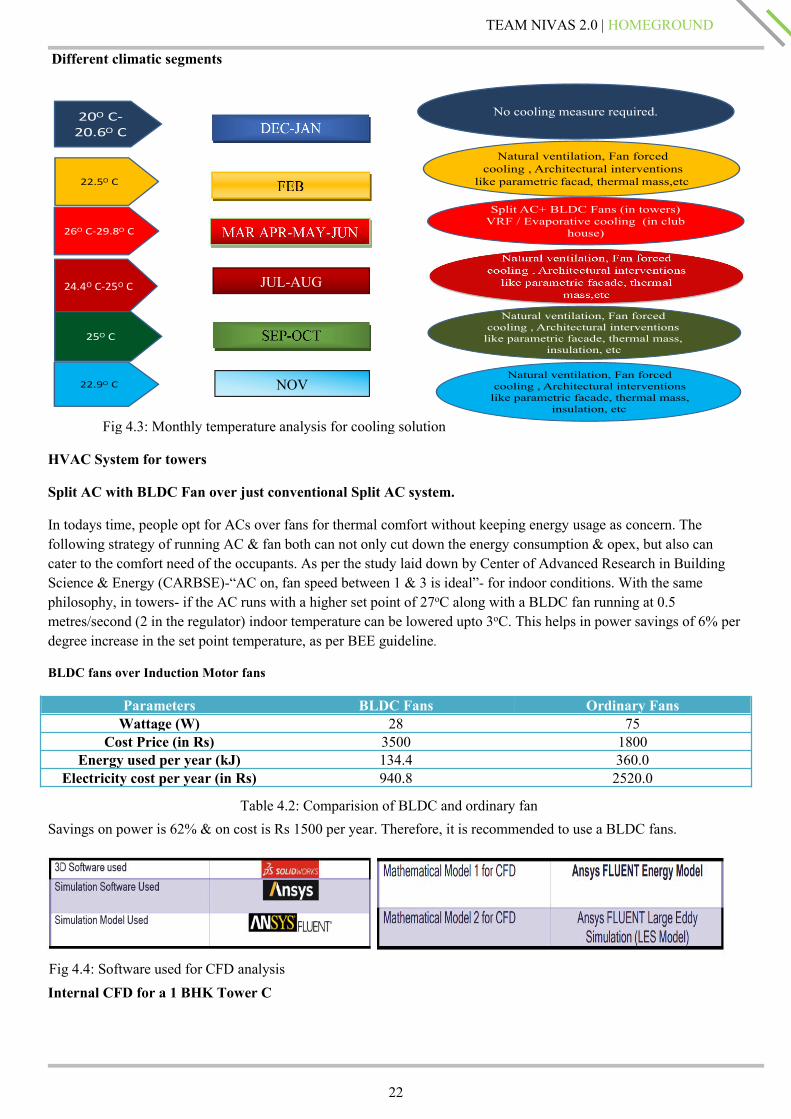
Different climatic segments
HVAC System for towers
Split AC with BLDC Fan over just conventional Split AC system.
In todays time, people opt for ACs over fans for thermal comfort without keeping energy usage as concern. Thefollowing strategy of running AC & fan both can not only cut down the energy consumption & opex, but also cancater to the comfort need of the occupants. As per the study laid down by Center of Advanced Research in BuildingScience & Energy (CARBSE)-“AC on, fan speed between 1 & 3 is ideal”- for indoor conditions. With the samephilosophy, in towers- if the AC runs with a higher set point of 27oC along with a BLDC fan running at 0.5metres/second (2 in the regulator) indoor temperature can be lowered upto 3oC. This helps in power savings of 6% perdegree increase in the set point temperature, as per BEE guideline.
BLDC fans over Induction Motor fans
Parameters BLDC Fans Ordinary FansWattage (W) 28 75
Cost Price (in Rs) 3500 1800Energy used per year (kJ) 134.4 360.0
Electricity cost per year (in Rs) 940.8 2520.0
Savings on power is 62% & on cost is Rs 1500 per year. Therefore, it is recommended to use a BLDC fans.
Internal CFD for a 1 BHK Tower C
22.5O C
20O C-20.6O C
26O C-29.8O C
24.4O C-25O C
25O C
22.9O C
No cooling measure required.
Natural ventilation, Fan forced cooling , Architectural interventions
like parametric facad, thermal mass,etc
Split AC+ BLDC Fans (in towers)VRF / Evaporative cooling (in club
house)
Natural ventilation, Fan forced cooling , Architectural interventions
like parametric facade, thermal mass, insulation, etc
Natural ventilation, Fan forced cooling , Architectural interventions like parametric facade, thermal mass,
insulation, etc
JUL-AUG
NOV
Fig 4.3: Monthly temperature analysis for cooling solution
Table 4.2: Comparision of BLDC and ordinary fan
Fig 4.4: Software used for CFD analysis
23
TEAM NIVAS 2.0 | HOMEGROUNDHOMEGROUND HOMEGROUND
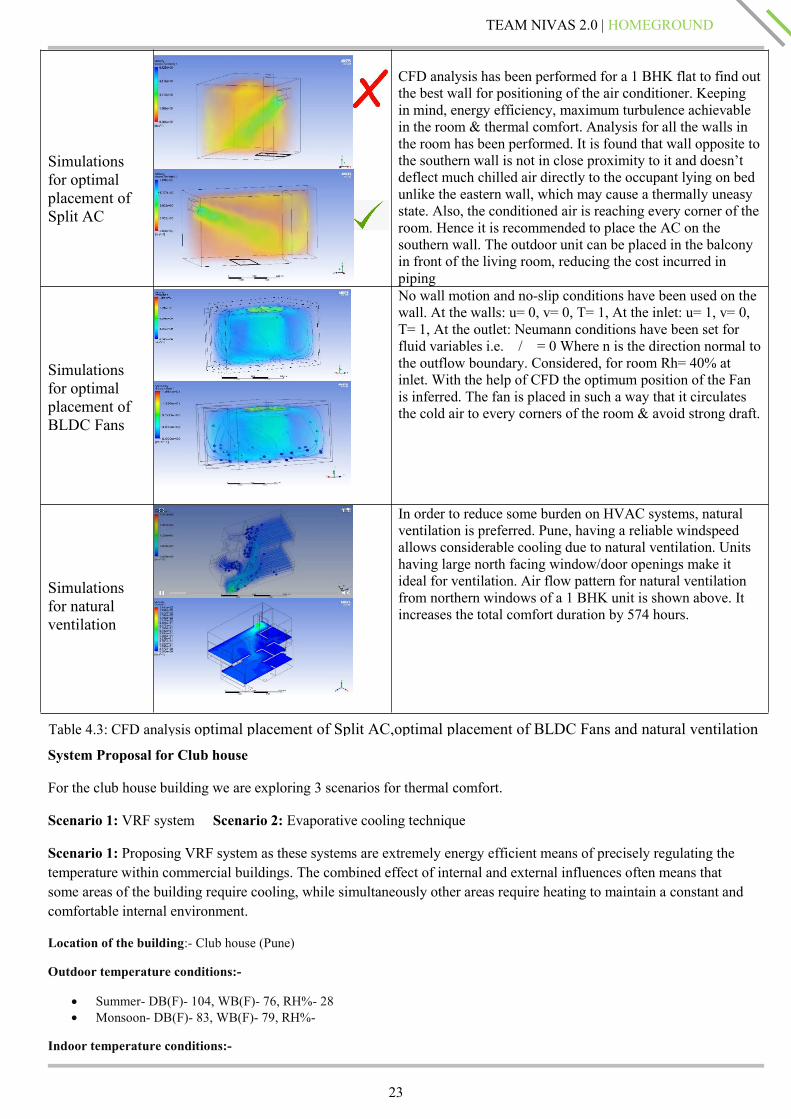
Simulationsfor optimalplacement ofSplit AC
CFD analysis has been performed for a 1 BHK flat to find outthe best wall for positioning of the air conditioner. Keepingin mind, energy efficiency, maximum turbulence achievablein the room & thermal comfort. Analysis for all the walls inthe room has been performed. It is found that wall opposite tothe southern wall is not in close proximity to it and doesn’tdeflect much chilled air directly to the occupant lying on bedunlike the eastern wall, which may cause a thermally uneasystate. Also, the conditioned air is reaching every corner of theroom. Hence it is recommended to place the AC on thesouthern wall. The outdoor unit can be placed in the balconyin front of the living room, reducing the cost incurred inpiping
Simulationsfor optimalplacement ofBLDC Fans
No wall motion and no-slip conditions have been used on thewall. At the walls: u= 0, v= 0, T= 1, At the inlet: u= 1, v= 0,T= 1, At the outlet: Neumann conditions have been set forfluid variables i.e. / = 0 Where n is the direction normal tothe outflow boundary. Considered, for room Rh= 40% atinlet. With the help of CFD the optimum position of the Fanis inferred. The fan is placed in such a way that it circulatesthe cold air to every corners of the room & avoid strong draft.
Simulationsfor naturalventilation
In order to reduce some burden on HVAC systems, naturalventilation is preferred. Pune, having a reliable windspeedallows considerable cooling due to natural ventilation. Unitshaving large north facing window/door openings make itideal for ventilation. Air flow pattern for natural ventilationfrom northern windows of a 1 BHK unit is shown above. Itincreases the total comfort duration by 574 hours.
System Proposal for Club house
For the club house building we are exploring 3 scenarios for thermal comfort.
Scenario 1: VRF system Scenario 2: Evaporative cooling technique
Scenario 1: Proposing VRF system as these systems are extremely energy efficient means of precisely regulating thetemperature within commercial buildings. The combined effect of internal and external influences often means thatsome areas of the building require cooling, while simultaneously other areas require heating to maintain a constant andcomfortable internal environment.
Location of the building:- Club house (Pune)
Outdoor temperature conditions:-
Summer- DB(F)- 104, WB(F)- 76, RH%- 28 Monsoon- DB(F)- 83, WB(F)- 79, RH%-
Indoor temperature conditions:-
Table 4.3: CFD analysis optimal placement of Split AC,optimal placement of BLDC Fans and natural ventilation
24
TEAM NIVAS 2.0 | HOMEGROUNDHOMEGROUND HOMEGROUND
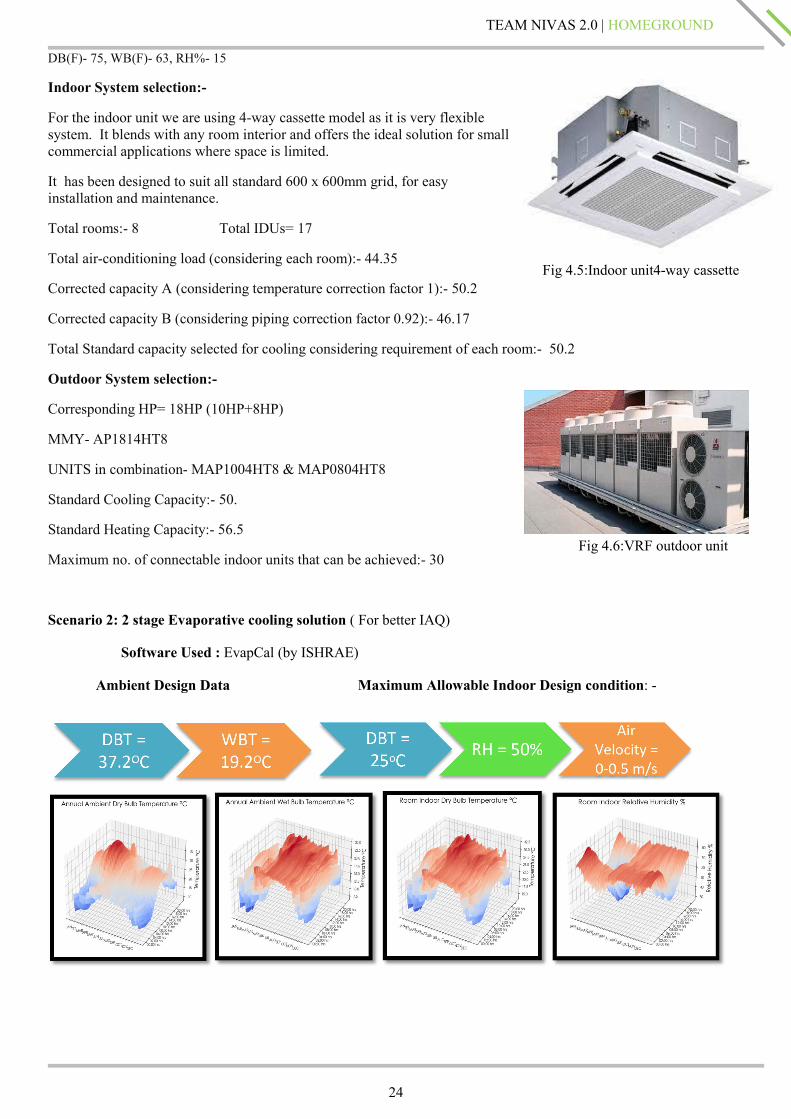
Fig 4.5:Indoor unit4-way cassette
Fig 4.6:VRF outdoor unit
DB(F)- 75, WB(F)- 63, RH%- 15
Indoor System selection:-
For the indoor unit we are using 4-way cassette model as it is very flexiblesystem. It blends with any room interior and offers the ideal solution for smallcommercial applications where space is limited.
It has been designed to suit all standard 600 x 600mm grid, for easyinstallation and maintenance.
Total rooms:- 8 Total IDUs= 17
Total air-conditioning load (considering each room):- 44.35
Corrected capacity A (considering temperature correction factor 1):- 50.2
Corrected capacity B (considering piping correction factor 0.92):- 46.17
Total Standard capacity selected for cooling considering requirement of each room:- 50.2
Outdoor System selection:-
Corresponding HP= 18HP (10HP+8HP)
MMY- AP1814HT8
UNITS in combination- MAP1004HT8 & MAP0804HT8
Standard Cooling Capacity:- 50.
Standard Heating Capacity:- 56.5
Maximum no. of connectable indoor units that can be achieved:- 30
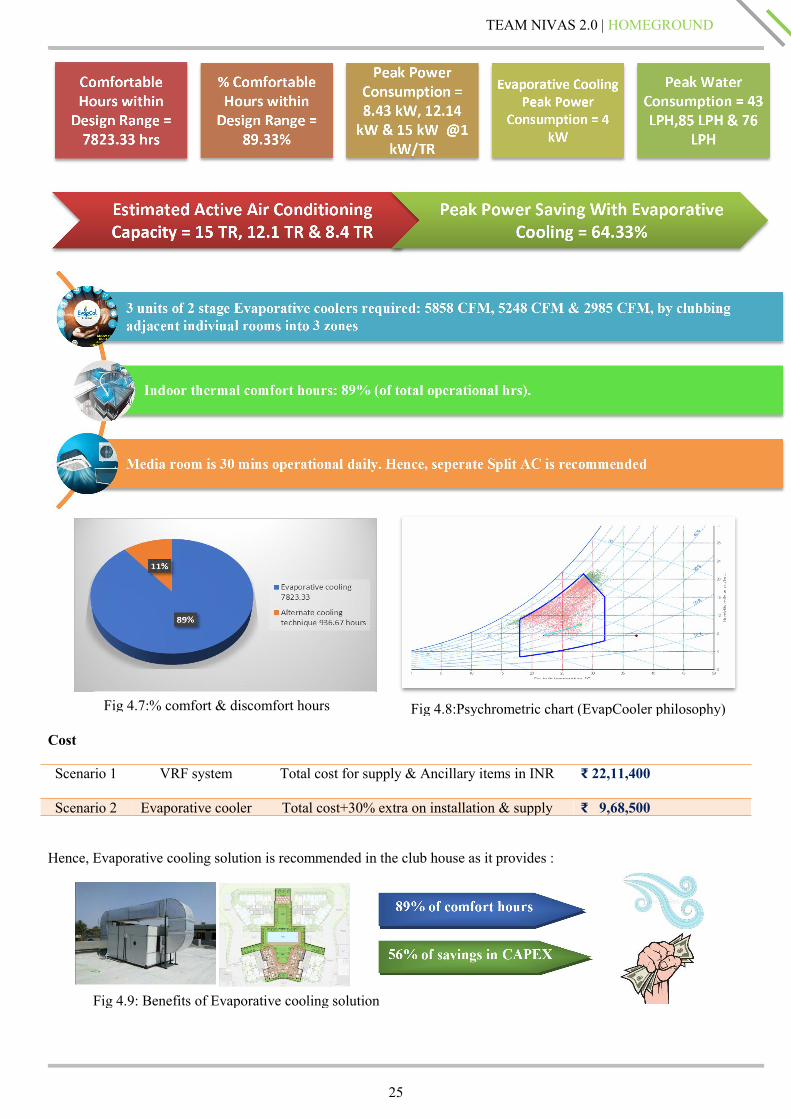
Scenario 2: 2 stage Evaporative cooling solution ( For better IAQ)
Software Used : EvapCal (by ISHRAE)
Ambient Design Data Maximum Allowable Indoor Design condition: -
25
TEAM NIVAS 2.0 | HOMEGROUNDHOMEGROUND HOMEGROUND
Cost
Scenario 1 VRF system Total cost for supply & Ancillary items in INR ₹ 22,11,400
Scenario 2 Evaporative cooler Total cost+30% extra on installation & supply ₹ 9,68,500
Hence, Evaporative cooling solution is recommended in the club house as it provides :
Fig 4.7:% comfort & discomfort hours Fig 4.8:Psychrometric chart (EvapCooler philosophy)
Fig 4.9: Benefits of Evaporative cooling solution
26
TEAM NIVAS 2.0 | HOMEGROUNDHOMEGROUND HOMEGROUND
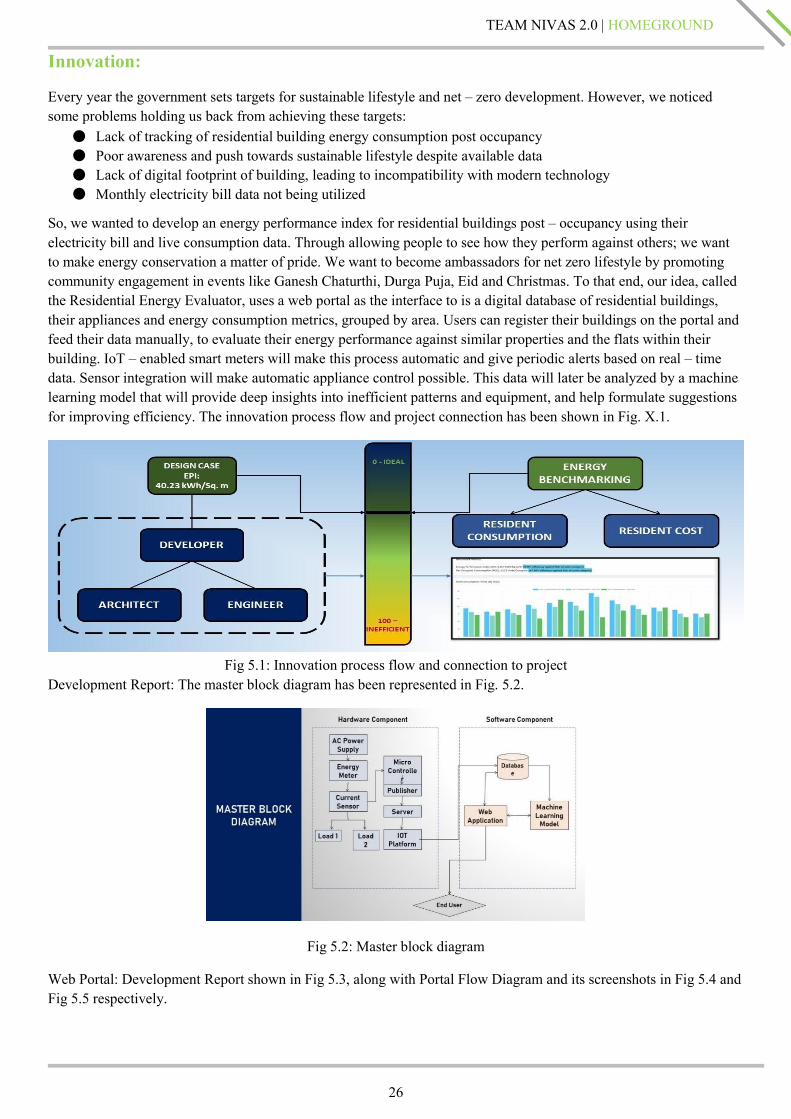
Innovation:
Every year the government sets targets for sustainable lifestyle and net – zero development. However, we noticedsome problems holding us back from achieving these targets:
● Lack of tracking of residential building energy consumption post occupancy● Poor awareness and push towards sustainable lifestyle despite available data● Lack of digital footprint of building, leading to incompatibility with modern technology● Monthly electricity bill data not being utilized
So, we wanted to develop an energy performance index for residential buildings post – occupancy using theirelectricity bill and live consumption data. Through allowing people to see how they perform against others; we wantto make energy conservation a matter of pride. We want to become ambassadors for net zero lifestyle by promotingcommunity engagement in events like Ganesh Chaturthi, Durga Puja, Eid and Christmas. To that end, our idea, calledthe Residential Energy Evaluator, uses a web portal as the interface to is a digital database of residential buildings,their appliances and energy consumption metrics, grouped by area. Users can register their buildings on the portal andfeed their data manually, to evaluate their energy performance against similar properties and the flats within theirbuilding. IoT – enabled smart meters will make this process automatic and give periodic alerts based on real – timedata. Sensor integration will make automatic appliance control possible. This data will later be analyzed by a machinelearning model that will provide deep insights into inefficient patterns and equipment, and help formulate suggestionsfor improving efficiency. The innovation process flow and project connection has been shown in Fig. X.1.
Fig 5.1: Innovation process flow and connection to projectDevelopment Report: The master block diagram has been represented in Fig. 5.2.
Fig 5.2: Master block diagram
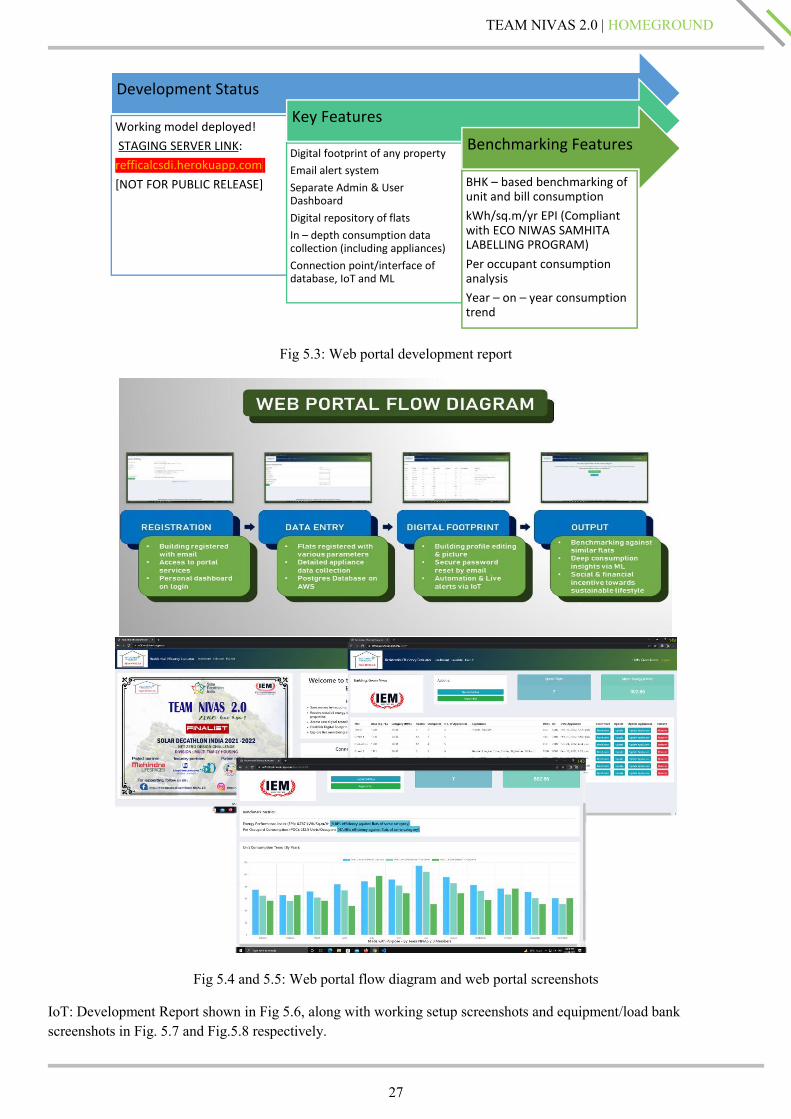
Web Portal: Development Report shown in Fig 5.3, along with Portal Flow Diagram and its screenshots in Fig 5.4 andFig 5.5 respectively.
27
TEAM NIVAS 2.0 | HOMEGROUNDHOMEGROUND HOMEGROUND
Development Status
Working model deployed!STAGING SERVER LINK:
refficalcsdi.herokuapp.com[NOT FOR PUBLIC RELEASE]
Key Features
Digital footprint of any propertyEmail alert systemSeparate Admin & UserDashboardDigital repository of flatsIn – depth consumption datacollection (including appliances)Connection point/interface ofdatabase, IoT and ML
Benchmarking Features
BHK – based benchmarking ofunit and bill consumptionkWh/sq.m/yr EPI (Compliantwith ECO NIWAS SAMHITALABELLING PROGRAM)Per occupant consumptionanalysisYear – on – year consumptiontrend
Fig 5.3: Web portal development report
Fig 5.4 and 5.5: Web portal flow diagram and web portal screenshots
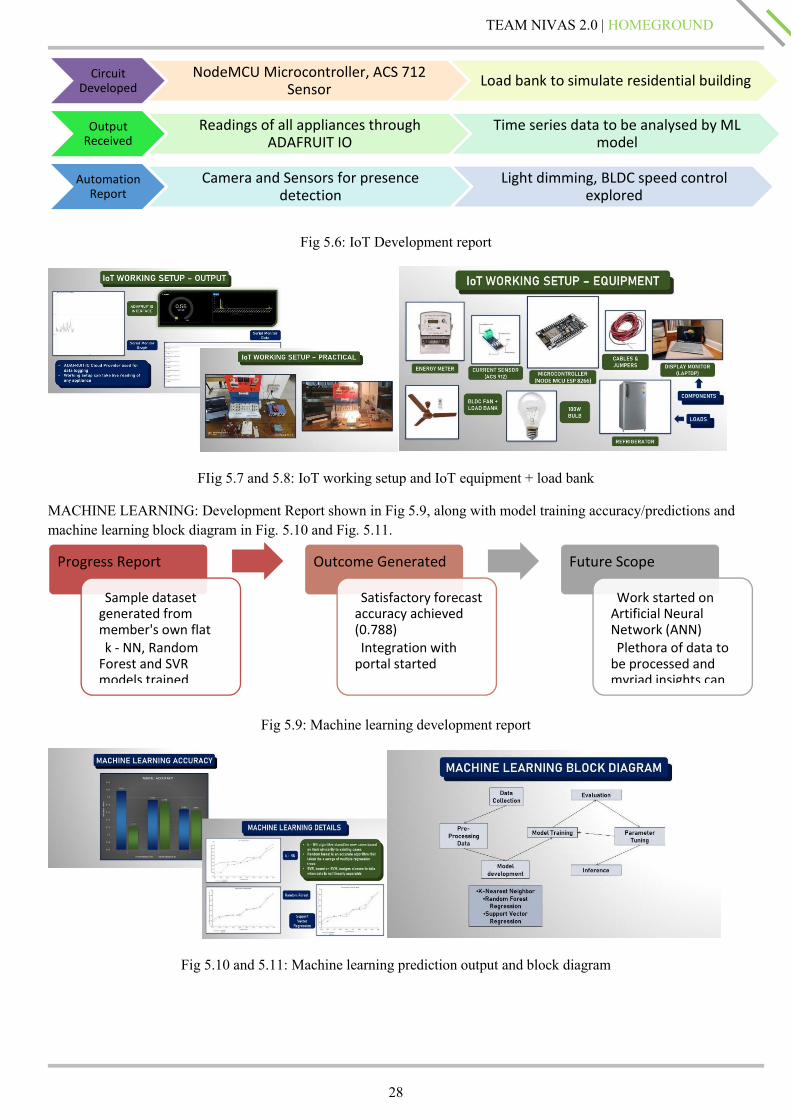
IoT: Development Report shown in Fig 5.6, along with working setup screenshots and equipment/load bankscreenshots in Fig. 5.7 and Fig.5.8 respectively.
28
TEAM NIVAS 2.0 | HOMEGROUNDHOMEGROUND HOMEGROUND
CircuitDeveloped
NodeMCU Microcontroller, ACS 712Sensor Load bank to simulate residential building
OutputReceived
Readings of all appliances throughADAFRUIT IO
Time series data to be analysed by MLmodel
AutomationReport
Camera and Sensors for presencedetection
Light dimming, BLDC speed controlexplored
Fig 5.6: IoT Development report
FIig 5.7 and 5.8: IoT working setup and IoT equipment + load bank
MACHINE LEARNING: Development Report shown in Fig 5.9, along with model training accuracy/predictions andmachine learning block diagram in Fig. 5.10 and Fig. 5.11.
Progress Report
Sample datasetgenerated frommember's own flatk - NN, Random
Forest and SVRmodels trained
Outcome Generated
Satisfactory forecastaccuracy achieved(0.788)Integration with
portal started
Future Scope
Work started onArtificial NeuralNetwork (ANN)Plethora of data to
be processed andmyriad insights can
Fig 5.9: Machine learning development report
Fig 5.10 and 5.11: Machine learning prediction output and block diagram
29
TEAM NIVAS 2.0 | HOMEGROUNDHOMEGROUND HOMEGROUND
Engineering design and operations:
In this segment, we estimated electrical grid connectivity, chose a transformer, and produced a power distributiondiagram. In addition, we demonstrated waste management.
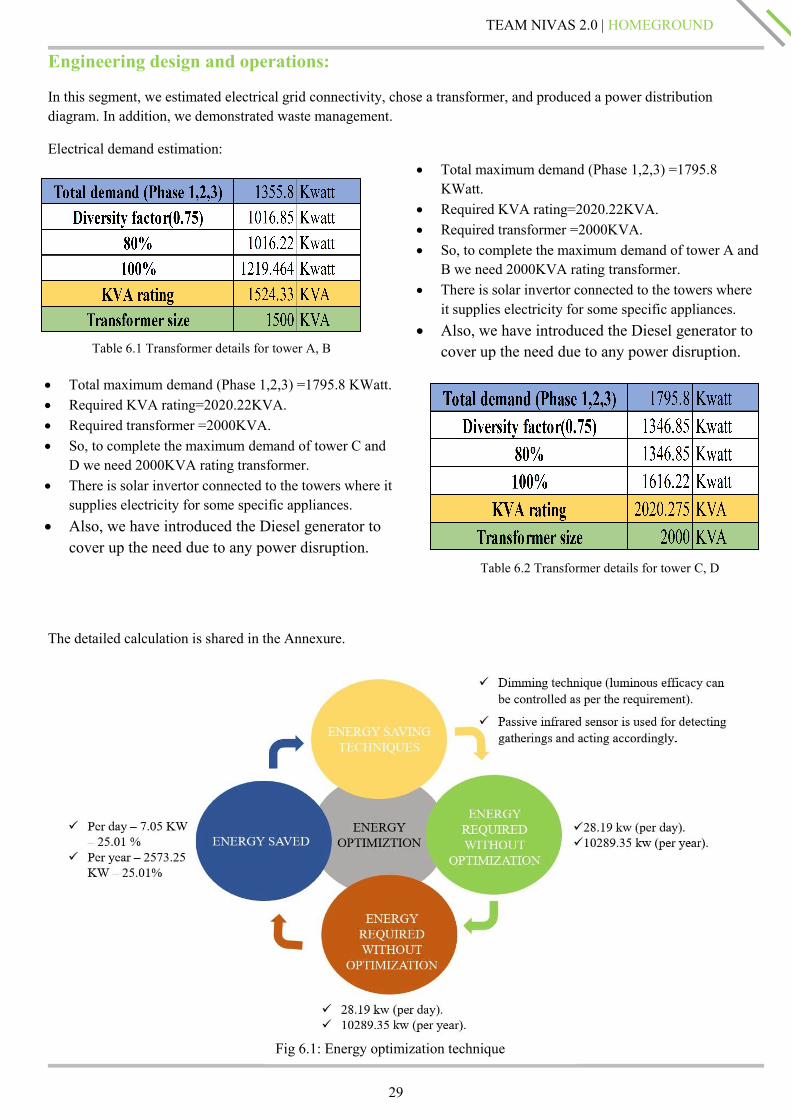
Electrical demand estimation:
The detailed calculation is shared in the Annexure.
Fig 6.1: Energy optimization technique
Total maximum demand (Phase 1,2,3) =1795.8KWatt.
Required KVA rating=2020.22KVA. Required transformer =2000KVA. So, to complete the maximum demand of tower A and
B we need 2000KVA rating transformer. There is solar invertor connected to the towers where
it supplies electricity for some specific appliances. Also, we have introduced the Diesel generator to
cover up the need due to any power disruption.Table 6.1 Transformer details for tower A, B
Total maximum demand (Phase 1,2,3) =1795.8 KWatt. Required KVA rating=2020.22KVA. Required transformer =2000KVA. So, to complete the maximum demand of tower C and
D we need 2000KVA rating transformer. There is solar invertor connected to the towers where it
supplies electricity for some specific appliances. Also, we have introduced the Diesel generator to
cover up the need due to any power disruption.Table 6.2 Transformer details for tower C, D
30
TEAM NIVAS 2.0 | HOMEGROUNDHOMEGROUND HOMEGROUND
The Detailed power distribution SLD, Calculations and equipment ratings are given in the appendix-1.
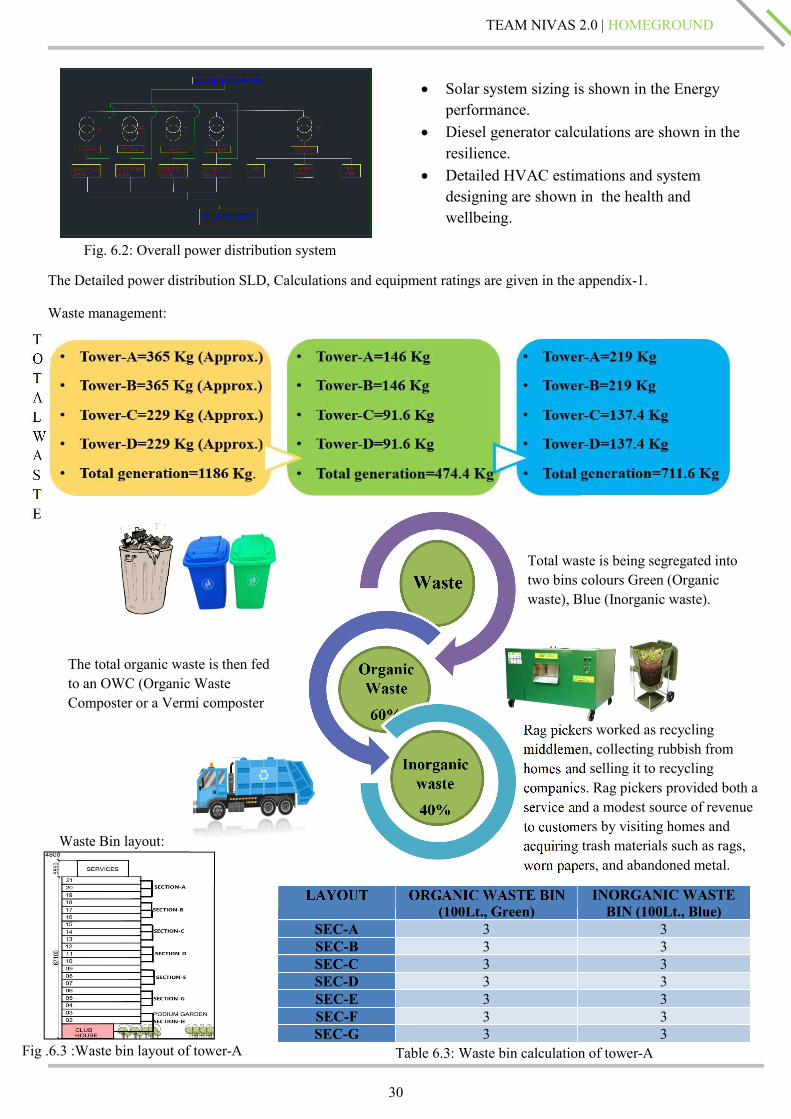
Waste management:
WASTE BIN
LAYOUT ORGANICWASTE BIN(100Lt., Green)
INORGANICWASTEBIN (100Lt., Blue)
SEC-A 3 3SEC-B 3 3SEC-C 3 3SEC-D 3 3SEC-E 3 3SEC-F 3 3SEC-G 3 3
Waste Bin layout:
Rag pickers worked as recyclingmiddlemen, collecting rubbish fromhomes and selling it to recyclingcompanies. Rag pickers provided both aservice and a modest source of revenueto customers by visiting homes andacquiring trash materials such as rags,worn papers, and abandoned metal.
Fig .6.3 :Waste bin layout of tower-A
Fig. 6.2: Overall power distribution system
Solar system sizing is shown in the Energyperformance.
Diesel generator calculations are shown in theresilience.
Detailed HVAC estimations and systemdesigning are shown in the health andwellbeing.
Total waste is being segregated intotwo bins colours Green (Organicwaste), Blue (Inorganic waste).
The total organic waste is then fedto an OWC (Organic WasteComposter or a Vermi composter
Table 6.3: Waste bin calculation of tower-A
31
TEAM NIVAS 2.0 | HOMEGROUNDHOMEGROUND HOMEGROUND
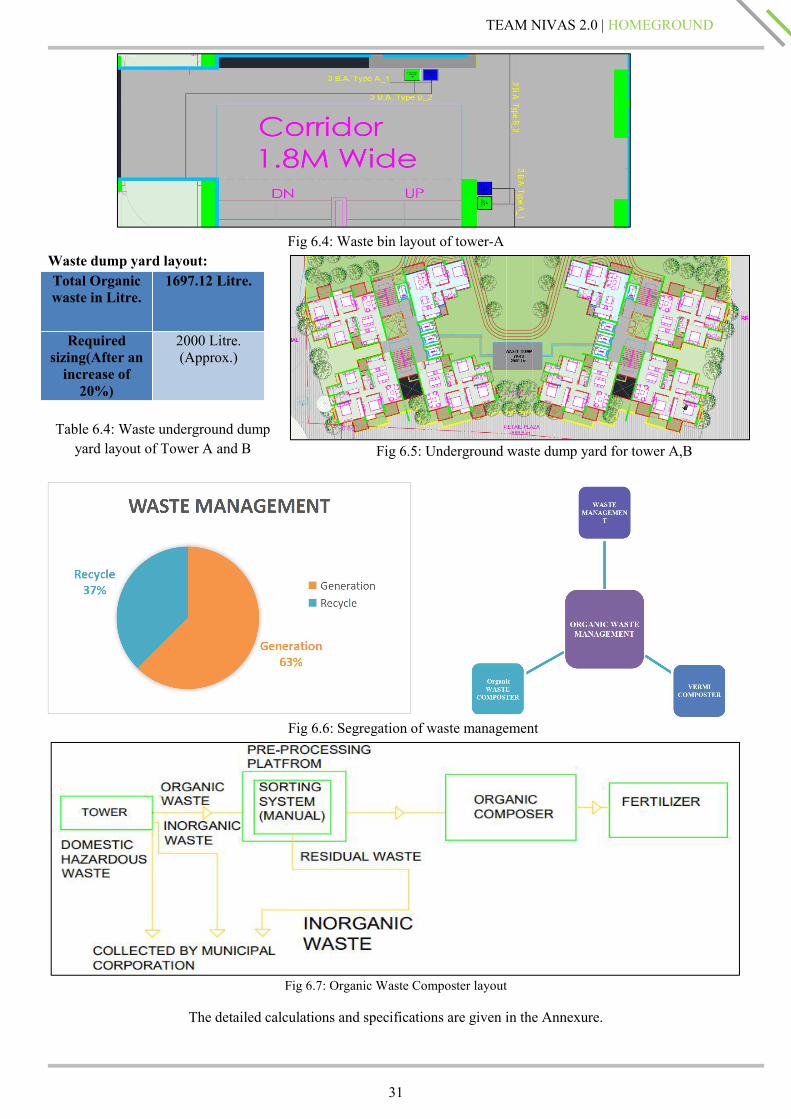
Fig 6.4: Waste bin layout of tower-AWaste dump yard layout:Total Organicwaste in Litre.
1697.12 Litre.
Requiredsizing(After anincrease of20%)
2000 Litre.(Approx.)
Table 6.4: Waste underground dumpyard layout of Tower A and B
Fig 6.7: Organic Waste Composter layout
The detailed calculations and specifications are given in the Annexure.
Fig 6.5: Underground waste dump yard for tower A,B
Fig 6.6: Segregation of waste management
32
TEAM NIVAS 2.0 | HOMEGROUNDHOMEGROUND HOMEGROUND
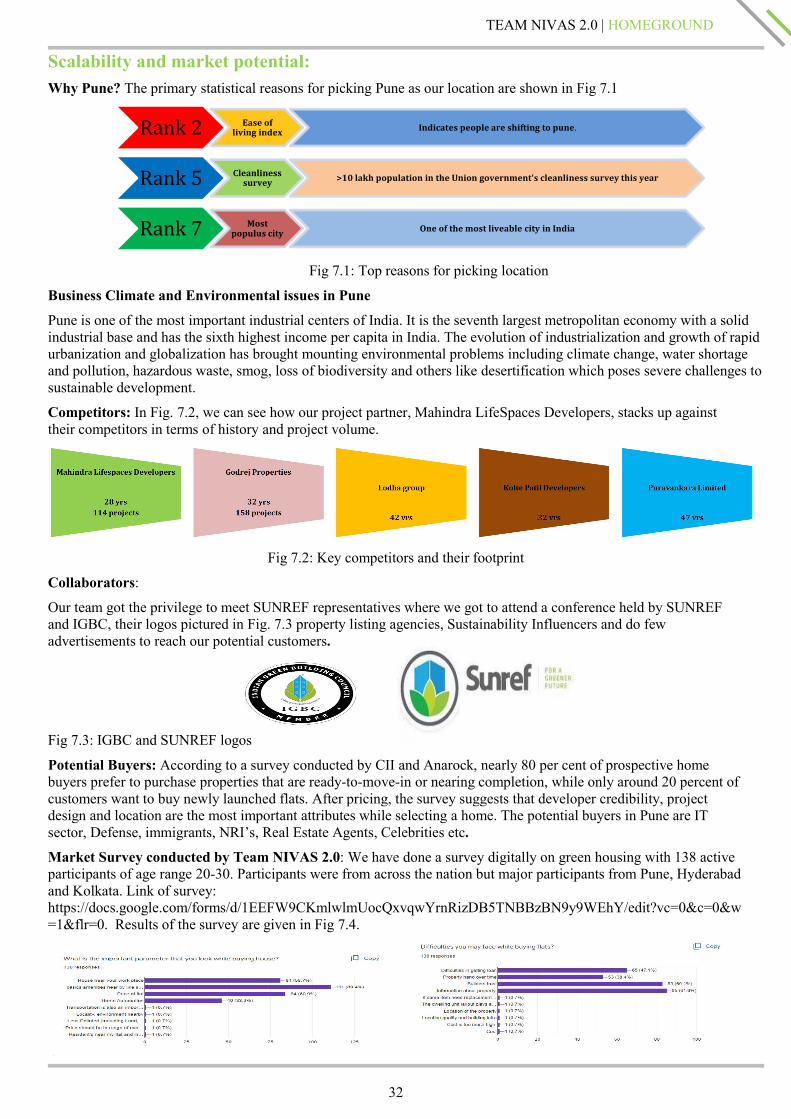
Scalability and market potential:Why Pune? The primary statistical reasons for picking Pune as our location are shown in Fig 7.1
Rank 2 Ease ofliving index Indicates people are shifting to pune.
Rank 5 Cleanlinesssurvey >10 lakh population in the Union government's cleanliness survey this year
Rank 7 Mostpopulus city One of the most liveable city in India
Fig 7.1: Top reasons for picking location
Business Climate and Environmental issues in Pune
Pune is one of the most important industrial centers of India. It is the seventh largest metropolitan economy with a solidindustrial base and has the sixth highest income per capita in India. The evolution of industrialization and growth of rapidurbanization and globalization has brought mounting environmental problems including climate change, water shortageand pollution, hazardous waste, smog, loss of biodiversity and others like desertification which poses severe challenges tosustainable development.
Competitors: In Fig. 7.2, we can see how our project partner, Mahindra LifeSpaces Developers, stacks up againsttheir competitors in terms of history and project volume.
Fig 7.2: Key competitors and their footprint
Collaborators:
Our team got the privilege to meet SUNREF representatives where we got to attend a conference held by SUNREFand IGBC, their logos pictured in Fig. 7.3 property listing agencies, Sustainability Influencers and do fewadvertisements to reach our potential customers.
Fig 7.3: IGBC and SUNREF logos
Potential Buyers: According to a survey conducted by CII and Anarock, nearly 80 per cent of prospective homebuyers prefer to purchase properties that are ready-to-move-in or nearing completion, while only around 20 percent ofcustomers want to buy newly launched flats. After pricing, the survey suggests that developer credibility, projectdesign and location are the most important attributes while selecting a home. The potential buyers in Pune are ITsector, Defense, immigrants, NRI’s, Real Estate Agents, Celebrities etc.
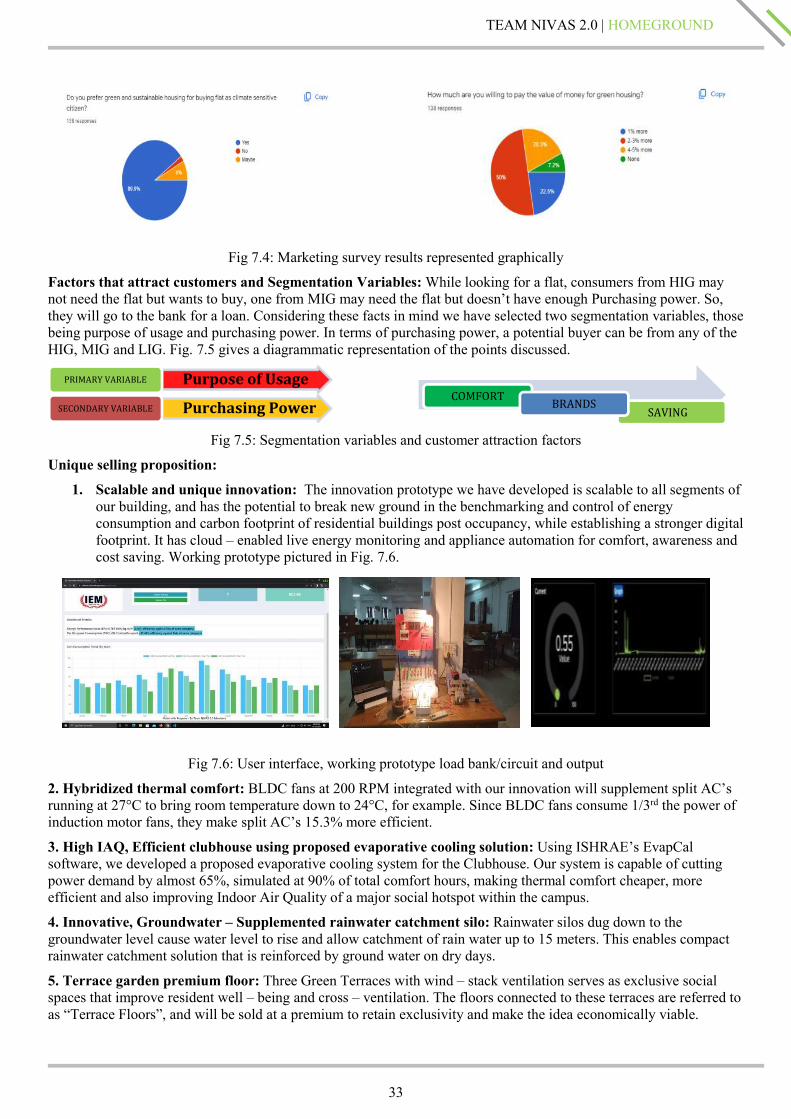
Market Survey conducted by Team NIVAS 2.0: We have done a survey digitally on green housing with 138 activeparticipants of age range 20-30. Participants were from across the nation but major participants from Pune, Hyderabadand Kolkata. Link of survey:https://docs.google.com/forms/d/1EEFW9CKmlwlmUocQxvqwYrnRizDB5TNBBzBN9y9WEhY/edit?vc=0&c=0&w=1&flr=0. Results of the survey are given in Fig 7.4.
33
TEAM NIVAS 2.0 | HOMEGROUNDHOMEGROUND HOMEGROUND
Fig 7.4: Marketing survey results represented graphically
Factors that attract customers and Segmentation Variables: While looking for a flat, consumers from HIG maynot need the flat but wants to buy, one from MIG may need the flat but doesn’t have enough Purchasing power. So,they will go to the bank for a loan. Considering these facts in mind we have selected two segmentation variables, thosebeing purpose of usage and purchasing power. In terms of purchasing power, a potential buyer can be from any of theHIG, MIG and LIG. Fig. 7.5 gives a diagrammatic representation of the points discussed.
Purpose of UsagePRIMARY VARIABLE
Purchasing PowerSECONDARY VARIABLE
Fig 7.5: Segmentation variables and customer attraction factors
Unique selling proposition:
1. Scalable and unique innovation: The innovation prototype we have developed is scalable to all segments ofour building, and has the potential to break new ground in the benchmarking and control of energyconsumption and carbon footprint of residential buildings post occupancy, while establishing a stronger digitalfootprint. It has cloud – enabled live energy monitoring and appliance automation for comfort, awareness andcost saving. Working prototype pictured in Fig. 7.6.
Fig 7.6: User interface, working prototype load bank/circuit and output
2. Hybridized thermal comfort: BLDC fans at 200 RPM integrated with our innovation will supplement split AC’srunning at 27°C to bring room temperature down to 24°C, for example. Since BLDC fans consume 1/3rd the power ofinduction motor fans, they make split AC’s 15.3% more efficient.
3. High IAQ, Efficient clubhouse using proposed evaporative cooling solution: Using ISHRAE’s EvapCalsoftware, we developed a proposed evaporative cooling system for the Clubhouse. Our system is capable of cuttingpower demand by almost 65%, simulated at 90% of total comfort hours, making thermal comfort cheaper, moreefficient and also improving Indoor Air Quality of a major social hotspot within the campus.
4. Innovative, Groundwater – Supplemented rainwater catchment silo: Rainwater silos dug down to thegroundwater level cause water level to rise and allow catchment of rain water up to 15 meters. This enables compactrainwater catchment solution that is reinforced by ground water on dry days.
5. Terrace garden premium floor: Three Green Terraces with wind – stack ventilation serves as exclusive socialspaces that improve resident well – being and cross – ventilation. The floors connected to these terraces are referred toas “Terrace Floors”, and will be sold at a premium to retain exclusivity and make the idea economically viable.
SAVINGCOMFORT BRANDS
34
TEAM NIVAS 2.0 | HOMEGROUNDHOMEGROUND HOMEGROUND
Affordability:
Various cost effective construction techniques have been adapted in the design case in order to achieve theaffordability goals for the target market. Further, alternative building materials have been explored to arrive at the bestcost solution while taking into consideration the energy efficiency and eco sensitivity of the building materials alongwith the affordable cooling and water savings strategies. These resulted in reduced construction timeline and increasedlabour productivity.
Energy savings by affordable means:
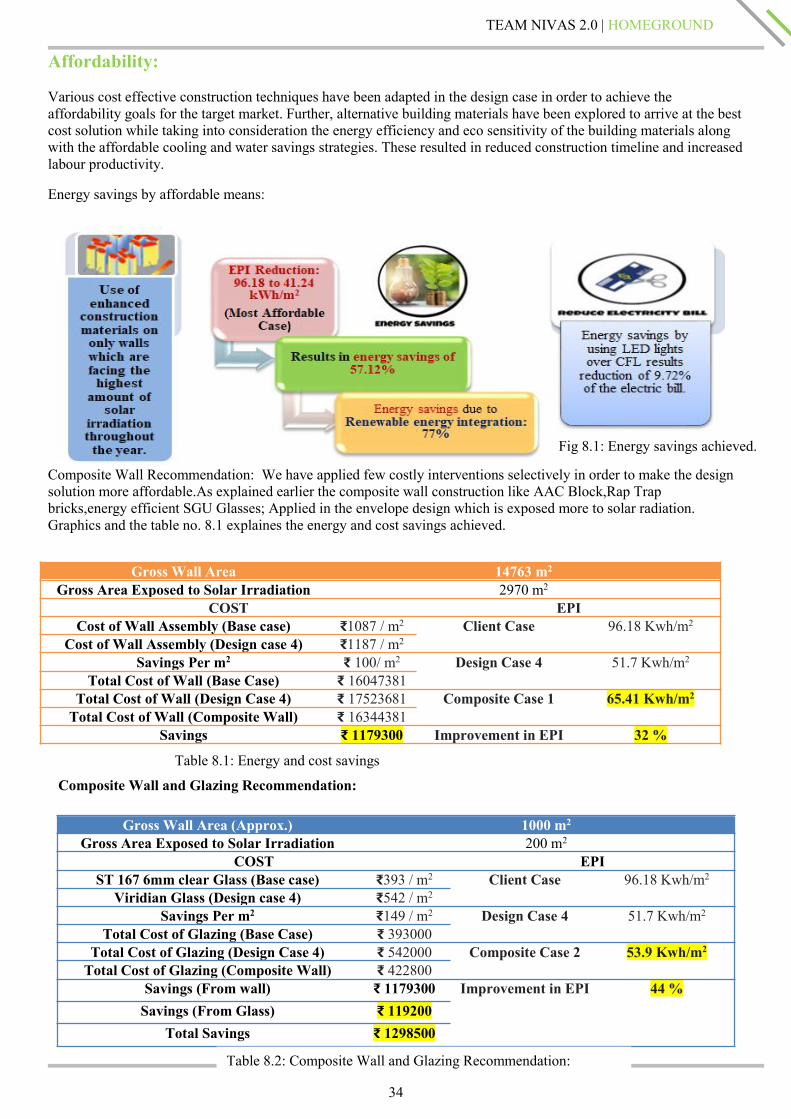
Composite Wall Recommendation: We have applied few costly interventions selectively in order to make the designsolution more affordable.As explained earlier the composite wall construction like AAC Block,Rap Trapbricks,energy efficient SGU Glasses; Applied in the envelope design which is exposed more to solar radiation.Graphics and the table no. 8.1 explaines the energy and cost savings achieved.
Gross Wall Area 14763 m2
Gross Area Exposed to Solar Irradiation 2970 m2
COST EPICost of Wall Assembly (Base case) ₹1087 / m2 Client Case 96.18 Kwh/m2
Cost of Wall Assembly (Design case 4) ₹1187 / m2
Savings Per m2 ₹ 100/ m2 Design Case 4 51.7 Kwh/m2
Total Cost of Wall (Base Case) ₹ 16047381Total Cost of Wall (Design Case 4) ₹ 17523681 Composite Case 1 65.41 Kwh/m2
Total Cost of Wall (Composite Wall) ₹ 16344381Savings ₹ 1179300 Improvement in EPI 32 %
Gross Wall Area (Approx.) 1000 m2
Gross Area Exposed to Solar Irradiation 200 m2
COST EPIST 167 6mm clear Glass (Base case) ₹393 / m2 Client Case 96.18 Kwh/m2
Viridian Glass (Design case 4) ₹542 / m2
Savings Per m2 ₹149 / m2 Design Case 4 51.7 Kwh/m2
Total Cost of Glazing (Base Case) ₹ 393000Total Cost of Glazing (Design Case 4) ₹ 542000 Composite Case 2 53.9 Kwh/m2
Total Cost of Glazing (Composite Wall) ₹ 422800Savings (From wall) ₹ 1179300 Improvement in EPI 44 %Savings (From Glass) ₹ 119200
Total Savings ₹ 1298500
Composite Wall and Glazing Recommendation:
Table 8.1: Energy and cost savingsachieved.
Table 8.2: Composite Wall and Glazing Recommendation:
Fig 8.1: Energy savings achieved.
35
TEAM NIVAS 2.0 | HOMEGROUNDHOMEGROUND HOMEGROUND
-
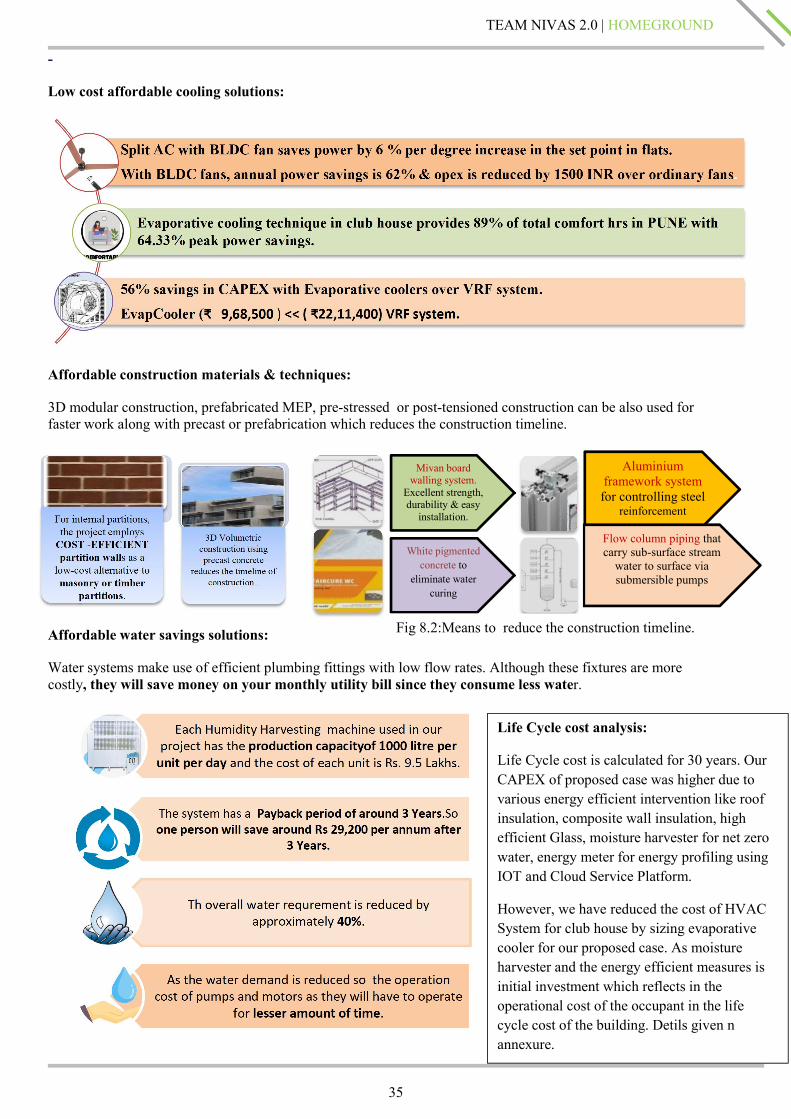
Low cost affordable cooling solutions:
Affordable construction materials & techniques:
3D modular construction, prefabricated MEP, pre-stressed or post-tensioned construction can be also used forfaster work along with precast or prefabrication which reduces the construction timeline.
Affordable water savings solutions:
Water systems make use of efficient plumbing fittings with low flow rates. Although these fixtures are morecostly, they will save money on your monthly utility bill since they consume less water.
White pigmentedconcrete to
eliminate watercuring
Mivan boardwalling system.
Excellent strength,durability & easy
installation.
Aluminiumframework systemfor controlling steel
reinforcement
Flow column piping thatcarry sub-surface stream
water to surface viasubmersible pumps
Fig 8.2:Means to reduce the construction timeline.
Life Cycle cost analysis:
Life Cycle cost is calculated for 30 years. OurCAPEX of proposed case was higher due tovarious energy efficient intervention like roofinsulation, composite wall insulation, highefficient Glass, moisture harvester for net zerowater, energy meter for energy profiling usingIOT and Cloud Service Platform.
However, we have reduced the cost of HVACSystem for club house by sizing evaporativecooler for our proposed case. As moistureharvester and the energy efficient measures isinitial investment which reflects in theoperational cost of the occupant in the lifecycle cost of the building. Detils given nannexure.
36
TEAM NIVAS 2.0 | HOMEGROUNDHOMEGROUND HOMEGROUND
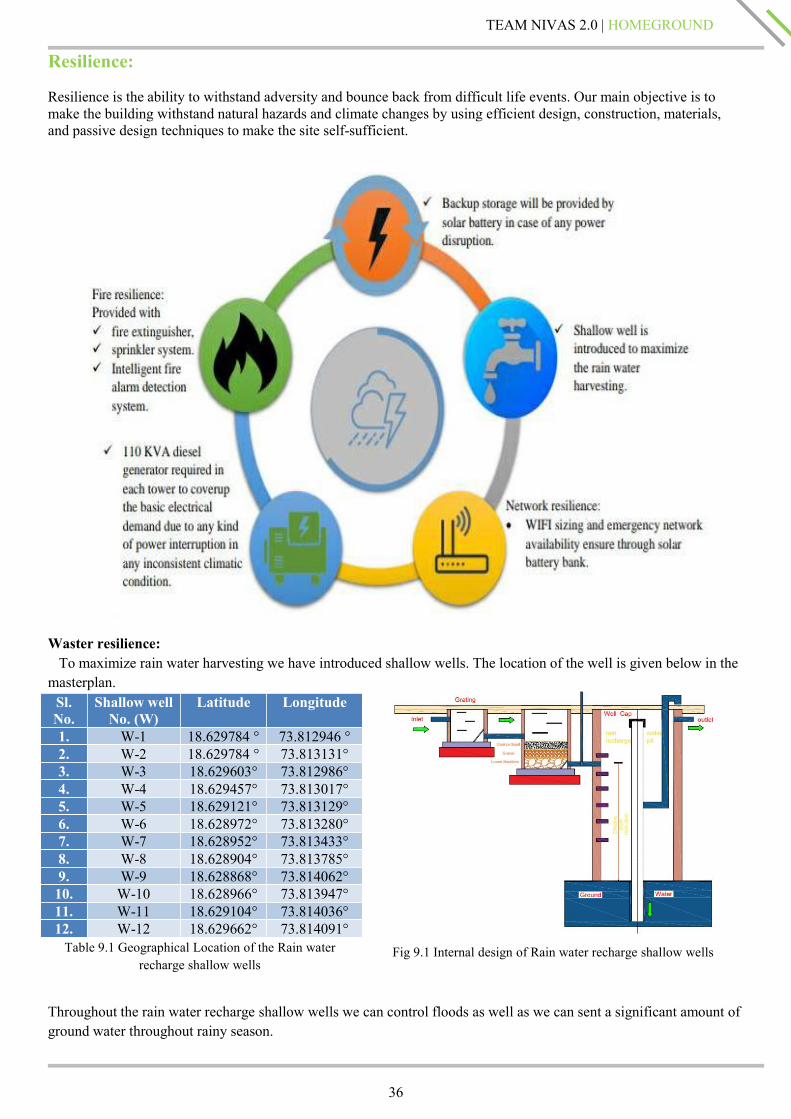
Resilience:
Resilience is the ability to withstand adversity and bounce back from difficult life events. Our main objective is tomake the building withstand natural hazards and climate changes by using efficient design, construction, materials,and passive design techniques to make the site self-sufficient.
Waster resilience:To maximize rain water harvesting we have introduced shallow wells. The location of the well is given below in the
masterplan.Sl.No.
Shallow wellNo. (W)
Latitude Longitude
1. W-1 18.629784 ° 73.812946 °2. W-2 18.629784 ° 73.813131°3. W-3 18.629603° 73.812986°4. W-4 18.629457° 73.813017°5. W-5 18.629121° 73.813129°6. W-6 18.628972° 73.813280°7. W-7 18.628952° 73.813433°8. W-8 18.628904° 73.813785°9. W-9 18.628868° 73.814062°10. W-10 18.628966° 73.813947°11. W-11 18.629104° 73.814036°12. W-12 18.629662° 73.814091°
Throughout the rain water recharge shallow wells we can control floods as well as we can sent a significant amount ofground water throughout rainy season.
Table 9.1 Geographical Location of the Rain waterrecharge shallow wells
Fig 9.1 Internal design of Rain water recharge shallow wells
37
TEAM NIVAS 2.0 | HOMEGROUNDHOMEGROUND HOMEGROUND
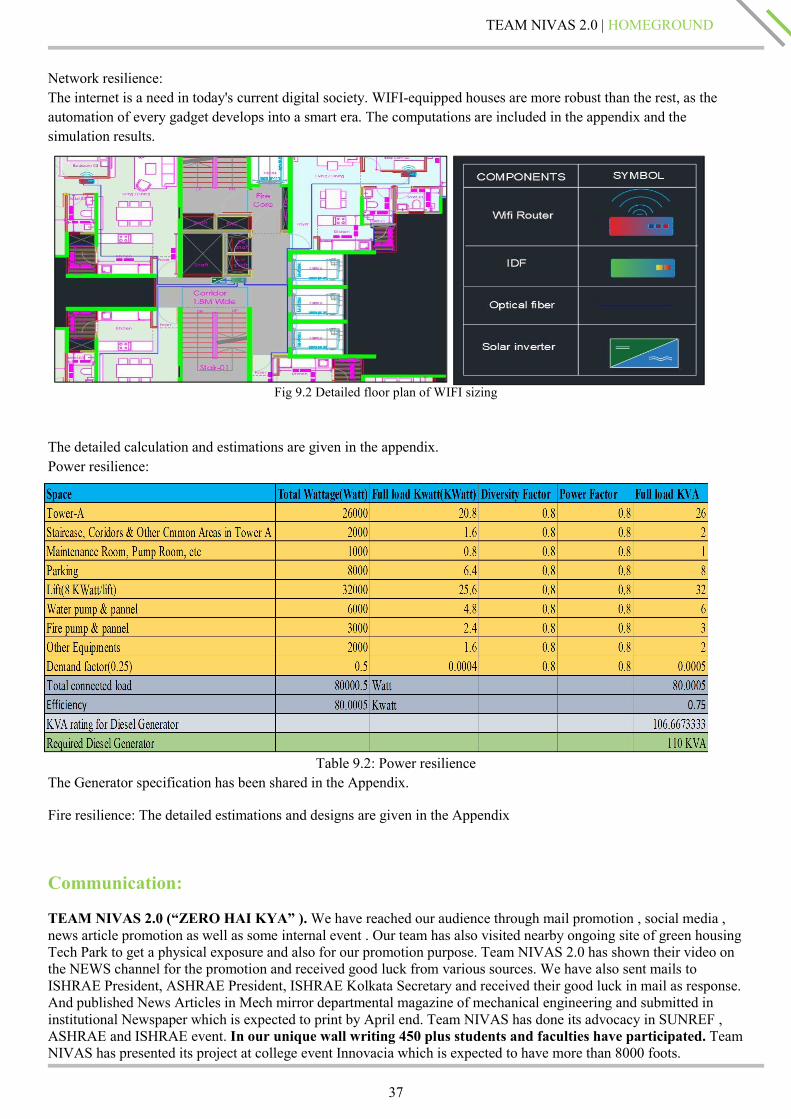
Network resilience:The internet is a need in today's current digital society. WIFI-equipped houses are more robust than the rest, as theautomation of every gadget develops into a smart era. The computations are included in the appendix and thesimulation results.
The detailed calculation and estimations are given in the appendix.Power resilience:
Table 9.2: Power resilienceThe Generator specification has been shared in the Appendix.
Fire resilience: The detailed estimations and designs are given in the Appendix
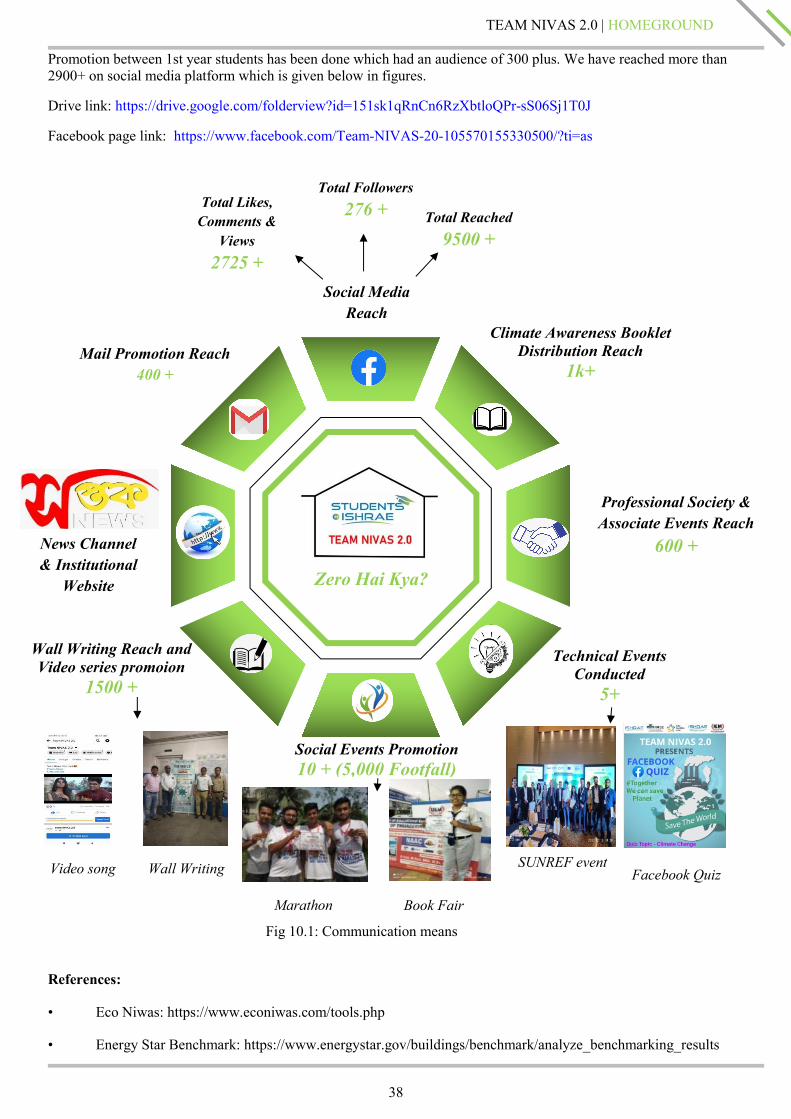
Communication:
TEAM NIVAS 2.0 (“ZERO HAI KYA” ). We have reached our audience through mail promotion , social media ,news article promotion as well as some internal event . Our team has also visited nearby ongoing site of green housingTech Park to get a physical exposure and also for our promotion purpose. Team NIVAS 2.0 has shown their video onthe NEWS channel for the promotion and received good luck from various sources. We have also sent mails toISHRAE President, ASHRAE President, ISHRAE Kolkata Secretary and received their good luck in mail as response.And published News Articles in Mech mirror departmental magazine of mechanical engineering and submitted ininstitutional Newspaper which is expected to print by April end. Team NIVAS has done its advocacy in SUNREF ,ASHRAE and ISHRAE event. In our unique wall writing 450 plus students and faculties have participated. TeamNIVAS has presented its project at college event Innovacia which is expected to have more than 8000 foots.
Fig 9.2 Detailed floor plan of WIFI sizing
38
TEAM NIVAS 2.0 | HOMEGROUNDHOMEGROUND HOMEGROUND
Promotion between 1st year students has been done which had an audience of 300 plus. We have reached more than2900+ on social media platform which is given below in figures.
Drive link: https://drive.google.com/folderview?id=151sk1qRnCn6RzXbtloQPr-sS06Sj1T0J
Facebook page link: https://www.facebook.com/Team-NIVAS-20-105570155330500/?ti=as
References:
• Eco Niwas: https://www.econiwas.com/tools.php
• Energy Star Benchmark: https://www.energystar.gov/buildings/benchmark/analyze_benchmarking_results
Social MediaReach
Technical EventsConducted
5+
Climate Awareness BookletDistribution Reach
1k+
Professional Society &Associate Events Reach
600 +
Wall Writing Reach andVideo series promoion
1500 +
Social Events Promotion10 + (5,000 Footfall)
News Channel& Institutional
Website
Mail Promotion Reach400 +
Zero Hai Kya?
Total Followers276 +Total Likes,
Comments &Views2725 +
Total Reached9500 +
Video song Wall Writing
Marathon Book Fair
SUNREF eventFacebook Quiz
Fig 10.1: Communication means
39
TEAM NIVAS 2.0 | HOMEGROUNDHOMEGROUND HOMEGROUND
• Django (Portal Backend): https://www.djangoproject.com/
• ADAFRUIT IO (IoT): https://io.adafruit.com/
• Google Colab (ML): https://colab.research.google.com/
https://www.thehindu.com/news/cities/mumbai/Fixing-Mumbai-Electricity-from-waste/article60527006.ece
• https://www.indiamart.com/proddetail/solar-power-purchase-agreement-service-10944075973.html
Codes and standards
IS 3646 CODE OF PRACTICE FOR INTERIOR ILLUMINATIONNBC 2016, VOL I AND VOL 2 NATIONAL BUILDING CODE OF INDIAIGBC GREEN HOMES INDIAN GREEN BUILDING COUNCILECBC 2017 ENERGY CONSERVATION BUILDING CODEUPC 2008 Uniform Plumbing CodeBEE Bureau of Energy EfficiencyASHRAE American Society of Heating Refrigeration and Air – Conditioning EngineersISHRAE Indian Society of Heating Refrigeration and Air – Conditioning EngineersBIS Bureau of Indian Standards


![da Vinci Decathlon - Years 9, 10 and 11 Practice Tasks [4.9MB]](https://img.pdfslide.net/doc/110x75/6337c12840a96001d4011672/da-vinci-decathlon-years-9-10-and-11-practice-tasks-49mb.jpg)