Embed Size (px)
Citation preview
For Private Circulation Only. FOR IMPORTANT INFORMATION ABOUT KOTAK SECURITIES’ RATING SYSTEM AND OTHER DISCLOSURES. REFER TO THE END OF THIS MATERIAL.
Contents
Special Reports
Strategy
Strategy: There is no getting away from costs
Good cost management in times of crisis
Various sectors used different levers to manage costs; some linked to lower
volumes
Bulk of cost savings will go away as and when situation normalizes across
sectors
Nature of products/services and markets material for retention of cost
savings (if any)
Theme Report
Metals & Mining: Beverage cans: a structural and sustainable growth story
Beverage packaging - aluminum eating into plastic dominance
Can sheet demand enjoys structural drivers with the war on plastic just
warming up
Deficit market to keep margins high; scrap benefits to stay higher for longer
Novelis has structural growth drivers and high ESG score, time to change
the commodity lens
Daily Alerts
Sector alerts
Consumer Staples: Month in review - Nov 2020
Pricing: Steep increase in tea, edible oil and soaps and reduction in
detergents
RM prices - Inflationary trends in palm oil, PFAD and monomers (paints); tea
prices ease slightly
Economy alerts
Economy: Trade deficit widens further
Exports lose further momentum after a second wave of infections
Normalization in import activity takes a pause in November
Expect FY2021E BOP to be comfortably in surplus; USD-INR to trade in the
72-75 range
INDIA DAILY December 3, 2020 India 2-Dec 1-day 1-mo 3-mo
Sensex 44,618 (0.1) 10.8 14.4
Nifty 13,114 0.0 11.0 13.8
Global/Regional indices
Dow Jones 29,884 0.2 8.7 5.6
Nasdaq Composite 12,349 (0.0) 10.7 7.8
FTSE 6,463 1.2 11.7 10.5
Nikkei 26,777 (0.1) 14.9 14.1
Hang Seng 26,623 0.3 6.8 6.5
KOSPI 2,683 0.3 14.5 12.0
Value traded – India
Cash (NSE+BSE) 721 730 251
Derivatives (NSE) 29,051 15,196 20,23
1
Deri. open interest 4,615 3,512 3,869
Forex/money market
Change, basis points
2-Dec 1-day 1-mo 3-mo
Rs/US$ 73.7 1 (76) 27
10yr govt bond, % 6.2 1 (1) (14)
Net investment (US$ mn)
1-Dec MTD CYTD
FIIs 481 - 6,546
MFs (249) - 727
Top movers
Change, %
Best performers 2-Dec 1-day 1-mo 3-mo
TTMT/A IN Equity 79 0.6 42.1 42.4
IIB IN Equity 897 0.2 38.8 42.0
APHS IN Equity 2,412 (2.1) 14.2 41.9
BJFIN IN Equity 8,802 0.6 53.3 38.5
TATA IN Equity 604 3.2 48.5 37.9
Worst performers
BHEL IN Equity 34 (0.7) 20.9 (15.5)
UPLL IN Equity 442 2.1 6.0 (15.3)
BHARTI IN Equity 485 1.1 6.7 (9.9)
RIL IN Equity 1,958 0.2 5.8 (7.3)
EDEL IN Equity 74 1.1 47.1 (7.2)
[email protected]: +91 22 6218 6427
For Private Circulation Only. FOR IMPORTANT INFORMATION ABOUT KOTAK SECURITIES’ RATING SYSTEM AND OTHER DISCLOSURES, REFER TO THE END OF THIS MATERIAL.
Good cost management in times of crisis
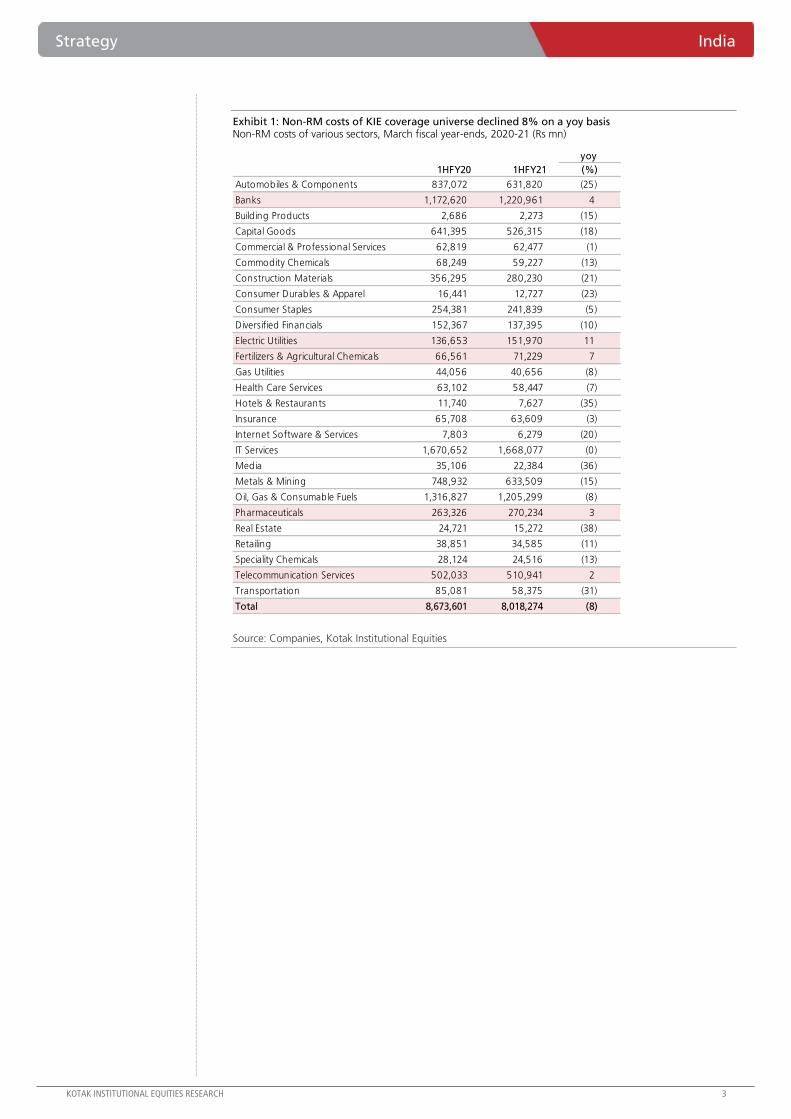
Non-RM costs of KIE coverage universe declined 7.6% on a yoy basis (see Exhibit 1) with many
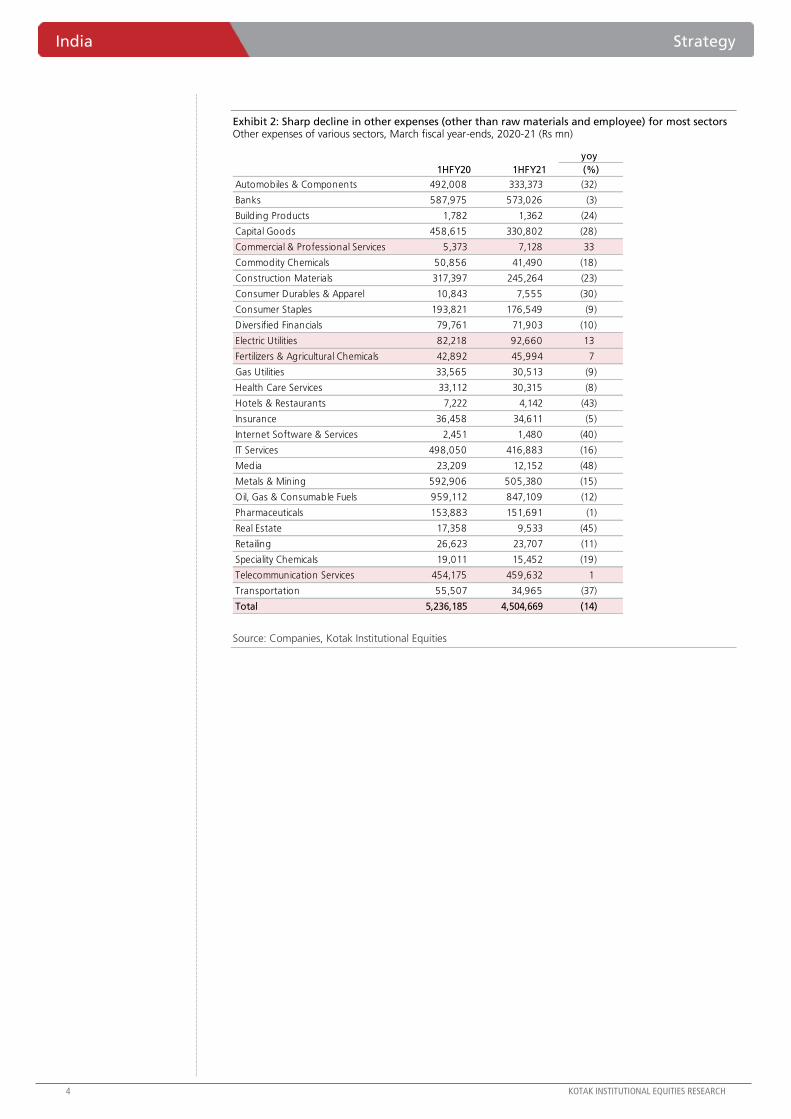
sectors reporting a double-digit decline. The decline was entirely led by non-employee costs as
overall employee costs increased modestly despite sharp decline in employee costs in several
stressed sectors (see Exhibits 2-3). We would note that part of the non-RM and non-employee
costs are variable in nature (for example, freight and power & fuel costs in the case of
construction materials companies). Thus, we would be careful about reading too much or
extrapolating the cost reductions seen in 1HFY21.
Various sectors used different levers to manage costs; some linked to lower volumes
A few sectors saw sharp decline in 1HFY21 costs. Capital goods saw lower manufacturing costs
(see Exhibit 4) but this reflects lower volumes too, construction materials saw lower freight as
well as fuel costs linked to lower volumes and per unit costs (see Exhibits 5-7), consumer staples
cut their A&P expenses (see Exhibit 8), IT services companies saved large amounts in travel
expenses (see Exhibit 9) while metal and mining companies also saw lower freight and
production costs (see Exhibit 10) on lower volumes.
Bulk of cost savings will go away as and when situation normalizes across sectors
In our view, the large ‘cuts’ seen in 1HFY21 may not sustain over FY2022-23 as operations
normalize across sectors. In some cases (capital goods, construction materials, metals & mining),
higher volumes would automatically result in higher non-RM costs. In others, employee costs
will increase sharply as companies restore employee levels to pre-Covid levels; this is true for
hotels & restaurants, real estate and retailing sectors, which saw job losses and wage cuts. Even
in the consumer staples sector, we would expect A&P expenses to increase unless companies
want to risk underinvesting in their brands; this seems unlikely.
Nature of products/services and markets material for retention of cost savings (if any)
The extent of benefit to companies in the form of higher profitability (from cost ‘savings’) will
depend on the nature of their products and markets even assuming they can retain a portion of
the cost savings. Based on a simple 2X2 matrix of product (nature of product: commodity, non-
commodity) and market (structure of market: low, high competition), we would expect (1) any
cost savings to be passed on to consumers in B2C businesses with high competition and in B2B
businesses in general (commodities, IT services sector where clients have deep knowledge of
vendor costs) and (2) some cost savings to be retained in B2C businesses with low competition
due to strong business moats (staples, alcohol, tobacco) or in B2C businesses with low
competition due to artificial factors (unregulated monopolies, cartelization).
Strategy Market
There is no getting away from costs. We believe the bulk of cost ‘savings’ seen in
1HFY21 will likely disappear over the next few quarters. 1HFY21 employee costs for
companies under our coverage increased 2% yoy despite sharp job and salary cuts in a
few stressed sectors; these jobs will return as and when capacity utilizations improve.
Also, we doubt even consumer companies can get away with lower A&P expenses as
continued investment in brands is important for long-term volume growth.
INDIA
DECEMBER 02, 2020
NEW RELEASE
BSE-30: 44,618
QUICK NUMBERS
1HFY21 non-RM
costs of KIE
coverage universe
declined 8% yoy
1HFY21 employee
costs of KIE
coverage universe
increased 2% yoy
1HFY21 other costs
of KIE coverage
universe declined
14% yoy
Sanjeev Prasad
Anindya Bhowmik
Sunita Baldawa
[email protected]: +91 22 6218 6427
Strategy India
KOTAK INSTITUTIONAL EQUITIES RESEARCH 3
Exhibit 1: Non-RM costs of KIE coverage universe declined 8% on a yoy basis Non-RM costs of various sectors, March fiscal year-ends, 2020-21 (Rs mn)
Source: Companies, Kotak Institutional Equities
1HFY20 1HFY21
Automobiles & Components 837,072 631,820 (25)
Banks 1,172,620 1,220,961 4
Building Products 2,686 2,273 (15)
Capital Goods 641,395 526,315 (18)
Commercial & Professional Services 62,819 62,477 (1)
Commodity Chemicals 68,249 59,227 (13)
Construction Materials 356,295 280,230 (21)
Consumer Durables & Apparel 16,441 12,727 (23)
Consumer Staples 254,381 241,839 (5)
Diversified Financials 152,367 137,395 (10)
Electric Utilities 136,653 151,970 11
Fertilizers & Agricultural Chemicals 66,561 71,229 7
Gas Utilities 44,056 40,656 (8)
Health Care Services 63,102 58,447 (7)
Hotels & Restaurants 11,740 7,627 (35)
Insurance 65,708 63,609 (3)
Internet Software & Services 7,803 6,279 (20)
IT Services 1,670,652 1,668,077 (0)
Media 35,106 22,384 (36)
Metals & Mining 748,932 633,509 (15)
Oil, Gas & Consumable Fuels 1,316,827 1,205,299 (8)
Pharmaceuticals 263,326 270,234 3
Real Estate 24,721 15,272 (38)
Retailing 38,851 34,585 (11)
Speciality Chemicals 28,124 24,516 (13)
Telecommunication Services 502,033 510,941 2
Transportation 85,081 58,375 (31)
Total 8,673,601 8,018,274 (8)
yoy
(%)
India Strategy
4 KOTAK INSTITUTIONAL EQUITIES RESEARCH
Exhibit 2: Sharp decline in other expenses (other than raw materials and employee) for most sectors Other expenses of various sectors, March fiscal year-ends, 2020-21 (Rs mn)
Source: Companies, Kotak Institutional Equities
1HFY20 1HFY21
Automobiles & Components 492,008 333,373 (32)
Banks 587,975 573,026 (3)
Building Products 1,782 1,362 (24)
Capital Goods 458,615 330,802 (28)
Commercial & Professional Services 5,373 7,128 33
Commodity Chemicals 50,856 41,490 (18)
Construction Materials 317,397 245,264 (23)
Consumer Durables & Apparel 10,843 7,555 (30)
Consumer Staples 193,821 176,549 (9)
Diversified Financials 79,761 71,903 (10)
Electric Utilities 82,218 92,660 13
Fertilizers & Agricultural Chemicals 42,892 45,994 7
Gas Utilities 33,565 30,513 (9)
Health Care Services 33,112 30,315 (8)
Hotels & Restaurants 7,222 4,142 (43)
Insurance 36,458 34,611 (5)
Internet Software & Services 2,451 1,480 (40)
IT Services 498,050 416,883 (16)
Media 23,209 12,152 (48)
Metals & Mining 592,906 505,380 (15)
Oil, Gas & Consumable Fuels 959,112 847,109 (12)
Pharmaceuticals 153,883 151,691 (1)
Real Estate 17,358 9,533 (45)
Retailing 26,623 23,707 (11)
Speciality Chemicals 19,011 15,452 (19)
Telecommunication Services 454,175 459,632 1
Transportation 55,507 34,965 (37)
Total 5,236,185 4,504,669 (14)
yoy
(%)
Strategy India
KOTAK INSTITUTIONAL EQUITIES RESEARCH 5
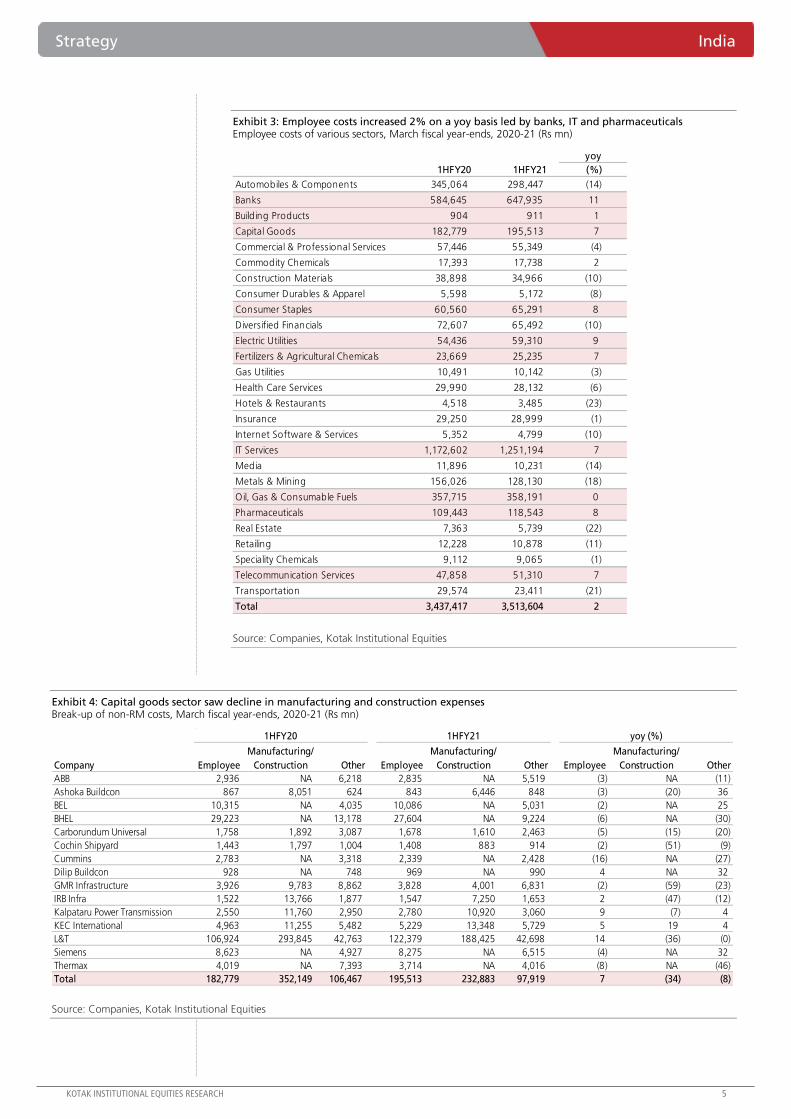
Exhibit 3: Employee costs increased 2% on a yoy basis led by banks, IT and pharmaceuticals Employee costs of various sectors, March fiscal year-ends, 2020-21 (Rs mn)
Source: Companies, Kotak Institutional Equities
Exhibit 4: Capital goods sector saw decline in manufacturing and construction expenses Break-up of non-RM costs, March fiscal year-ends, 2020-21 (Rs mn)
Source: Companies, Kotak Institutional Equities
1HFY20 1HFY21
Automobiles & Components 345,064 298,447 (14)
Banks 584,645 647,935 11
Building Products 904 911 1
Capital Goods 182,779 195,513 7
Commercial & Professional Services 57,446 55,349 (4)
Commodity Chemicals 17,393 17,738 2
Construction Materials 38,898 34,966 (10)
Consumer Durables & Apparel 5,598 5,172 (8)
Consumer Staples 60,560 65,291 8
Diversified Financials 72,607 65,492 (10)
Electric Utilities 54,436 59,310 9
Fertilizers & Agricultural Chemicals 23,669 25,235 7
Gas Utilities 10,491 10,142 (3)
Health Care Services 29,990 28,132 (6)
Hotels & Restaurants 4,518 3,485 (23)
Insurance 29,250 28,999 (1)
Internet Software & Services 5,352 4,799 (10)
IT Services 1,172,602 1,251,194 7
Media 11,896 10,231 (14)
Metals & Mining 156,026 128,130 (18)
Oil, Gas & Consumable Fuels 357,715 358,191 0
Pharmaceuticals 109,443 118,543 8
Real Estate 7,363 5,739 (22)
Retailing 12,228 10,878 (11)
Speciality Chemicals 9,112 9,065 (1)
Telecommunication Services 47,858 51,310 7
Transportation 29,574 23,411 (21)
Total 3,437,417 3,513,604 2
yoy
(%)
Manufacturing/ Manufacturing/ Manufacturing/
Company Employee Construction Other Employee Construction Other Employee Construction Other
ABB 2,936 NA 6,218 2,835 NA 5,519 (3) NA (11)
Ashoka Buildcon 867 8,051 624 843 6,446 848 (3) (20) 36
BEL 10,315 NA 4,035 10,086 NA 5,031 (2) NA 25
BHEL 29,223 NA 13,178 27,604 NA 9,224 (6) NA (30)
Carborundum Universal 1,758 1,892 3,087 1,678 1,610 2,463 (5) (15) (20)
Cochin Shipyard 1,443 1,797 1,004 1,408 883 914 (2) (51) (9)
Cummins 2,783 NA 3,318 2,339 NA 2,428 (16) NA (27)
Dilip Buildcon 928 NA 748 969 NA 990 4 NA 32
GMR Infrastructure 3,926 9,783 8,862 3,828 4,001 6,831 (2) (59) (23)
IRB Infra 1,522 13,766 1,877 1,547 7,250 1,653 2 (47) (12)
Kalpataru Power Transmission 2,550 11,760 2,950 2,780 10,920 3,060 9 (7) 4
KEC International 4,963 11,255 5,482 5,229 13,348 5,729 5 19 4
L&T 106,924 293,845 42,763 122,379 188,425 42,698 14 (36) (0)
Siemens 8,623 NA 4,927 8,275 NA 6,515 (4) NA 32
Thermax 4,019 NA 7,393 3,714 NA 4,016 (8) NA (46)
Total 182,779 352,149 106,467 195,513 232,883 97,919 7 (34) (8)
1HFY20 1HFY21 yoy (%)
India Strategy
6 KOTAK INSTITUTIONAL EQUITIES RESEARCH
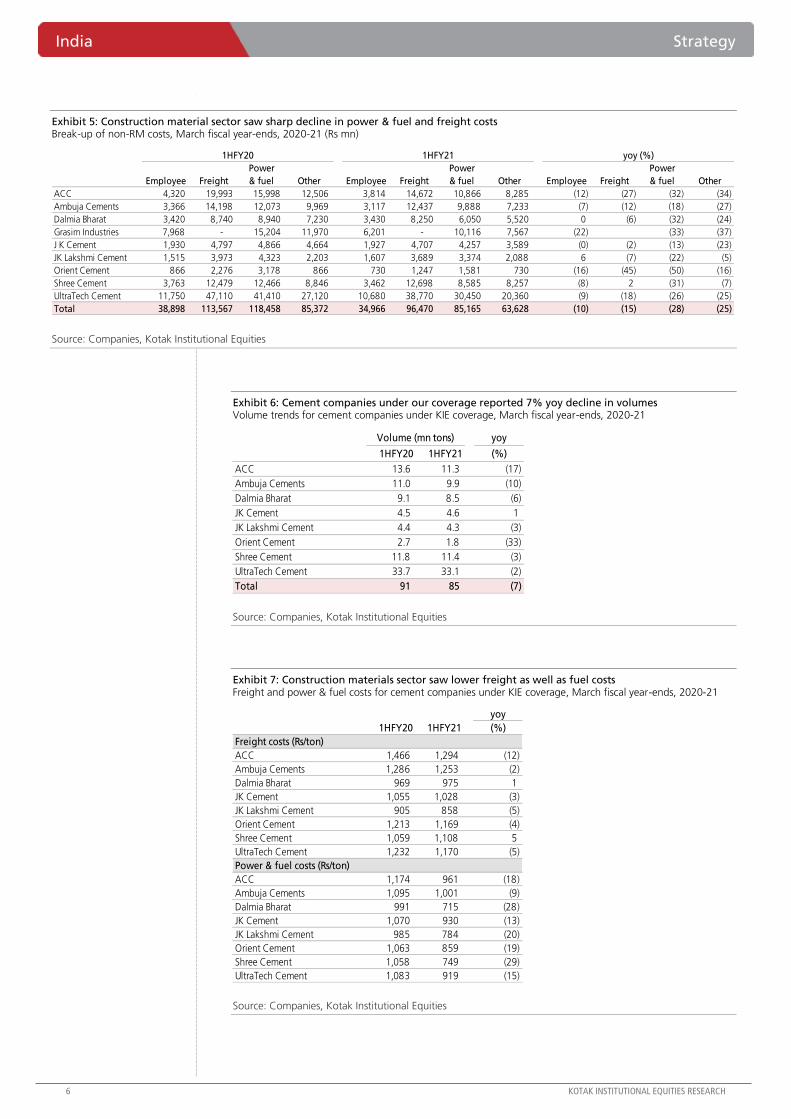
Exhibit 5: Construction material sector saw sharp decline in power & fuel and freight costs Break-up of non-RM costs, March fiscal year-ends, 2020-21 (Rs mn)
Source: Companies, Kotak Institutional Equities
Exhibit 6: Cement companies under our coverage reported 7% yoy decline in volumes Volume trends for cement companies under KIE coverage, March fiscal year-ends, 2020-21
Source: Companies, Kotak Institutional Equities
Exhibit 7: Construction materials sector saw lower freight as well as fuel costs Freight and power & fuel costs for cement companies under KIE coverage, March fiscal year-ends, 2020-21
Source: Companies, Kotak Institutional Equities
Power Power Power
Employee Freight & fuel Other Employee Freight & fuel Other Employee Freight & fuel Other
ACC 4,320 19,993 15,998 12,506 3,814 14,672 10,866 8,285 (12) (27) (32) (34)
Ambuja Cements 3,366 14,198 12,073 9,969 3,117 12,437 9,888 7,233 (7) (12) (18) (27)
Dalmia Bharat 3,420 8,740 8,940 7,230 3,430 8,250 6,050 5,520 0 (6) (32) (24)
Grasim Industries 7,968 - 15,204 11,970 6,201 - 10,116 7,567 (22) (33) (37)
J K Cement 1,930 4,797 4,866 4,664 1,927 4,707 4,257 3,589 (0) (2) (13) (23)
JK Lakshmi Cement 1,515 3,973 4,323 2,203 1,607 3,689 3,374 2,088 6 (7) (22) (5)
Orient Cement 866 2,276 3,178 866 730 1,247 1,581 730 (16) (45) (50) (16)
Shree Cement 3,763 12,479 12,466 8,846 3,462 12,698 8,585 8,257 (8) 2 (31) (7)
UltraTech Cement 11,750 47,110 41,410 27,120 10,680 38,770 30,450 20,360 (9) (18) (26) (25)
Total 38,898 113,567 118,458 85,372 34,966 96,470 85,165 63,628 (10) (15) (28) (25)
1HFY20 1HFY21 yoy (%)
yoy
1HFY20 1HFY21 (%)
ACC 13.6 11.3 (17)
Ambuja Cements 11.0 9.9 (10)
Dalmia Bharat 9.1 8.5 (6)
JK Cement 4.5 4.6 1
JK Lakshmi Cement 4.4 4.3 (3)
Orient Cement 2.7 1.8 (33)
Shree Cement 11.8 11.4 (3)
UltraTech Cement 33.7 33.1 (2)
Total 91 85 (7)
Volume (mn tons)
yoy
1HFY20 1HFY21 (%)
Freight costs (Rs/ton)
ACC 1,466 1,294 (12)
Ambuja Cements 1,286 1,253 (2)
Dalmia Bharat 969 975 1
JK Cement 1,055 1,028 (3)
JK Lakshmi Cement 905 858 (5)
Orient Cement 1,213 1,169 (4)
Shree Cement 1,059 1,108 5
UltraTech Cement 1,232 1,170 (5)
Power & fuel costs (Rs/ton)
ACC 1,174 961 (18)
Ambuja Cements 1,095 1,001 (9)
Dalmia Bharat 991 715 (28)
JK Cement 1,070 930 (13)
JK Lakshmi Cement 985 784 (20)
Orient Cement 1,063 859 (19)
Shree Cement 1,058 749 (29)
UltraTech Cement 1,083 919 (15)
Strategy India
KOTAK INSTITUTIONAL EQUITIES RESEARCH 7
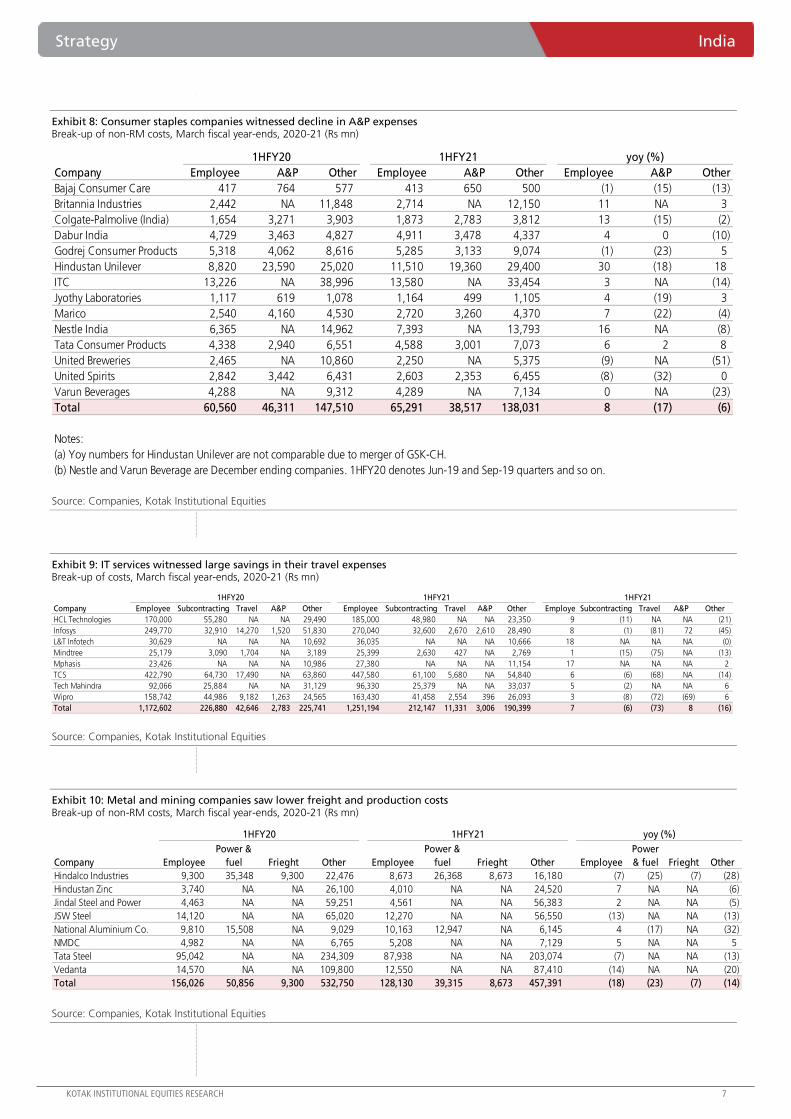
Exhibit 8: Consumer staples companies witnessed decline in A&P expenses Break-up of non-RM costs, March fiscal year-ends, 2020-21 (Rs mn)
Source: Companies, Kotak Institutional Equities
Exhibit 9: IT services witnessed large savings in their travel expenses Break-up of costs, March fiscal year-ends, 2020-21 (Rs mn)
Source: Companies, Kotak Institutional Equities
Exhibit 10: Metal and mining companies saw lower freight and production costs Break-up of non-RM costs, March fiscal year-ends, 2020-21 (Rs mn)
Source: Companies, Kotak Institutional Equities
Company Employee A&P Other Employee A&P Other Employee A&P Other
Bajaj Consumer Care 417 764 577 413 650 500 (1) (15) (13)
Britannia Industries 2,442 NA 11,848 2,714 NA 12,150 11 NA 3
Colgate-Palmolive (India) 1,654 3,271 3,903 1,873 2,783 3,812 13 (15) (2)
Dabur India 4,729 3,463 4,827 4,911 3,478 4,337 4 0 (10)
Godrej Consumer Products 5,318 4,062 8,616 5,285 3,133 9,074 (1) (23) 5
Hindustan Unilever 8,820 23,590 25,020 11,510 19,360 29,400 30 (18) 18
ITC 13,226 NA 38,996 13,580 NA 33,454 3 NA (14)
Jyothy Laboratories 1,117 619 1,078 1,164 499 1,105 4 (19) 3
Marico 2,540 4,160 4,530 2,720 3,260 4,370 7 (22) (4)
Nestle India 6,365 NA 14,962 7,393 NA 13,793 16 NA (8)
Tata Consumer Products 4,338 2,940 6,551 4,588 3,001 7,073 6 2 8
United Breweries 2,465 NA 10,860 2,250 NA 5,375 (9) NA (51)
United Spirits 2,842 3,442 6,431 2,603 2,353 6,455 (8) (32) 0
Varun Beverages 4,288 NA 9,312 4,289 NA 7,134 0 NA (23)
Total 60,560 46,311 147,510 65,291 38,517 138,031 8 (17) (6)
Notes:
(a) Yoy numbers for Hindustan Unilever are not comparable due to merger of GSK-CH.
(b) Nestle and Varun Beverage are December ending companies. 1HFY20 denotes Jun-19 and Sep-19 quarters and so on.
1HFY20 1HFY21 yoy (%)
Company Employee Subcontracting Travel A&P Other Employee Subcontracting Travel A&P Other Employe Subcontracting Travel A&P Other
HCL Technologies 170,000 55,280 NA NA 29,490 185,000 48,980 NA NA 23,350 9 (11) NA NA (21)
Infosys 249,770 32,910 14,270 1,520 51,830 270,040 32,600 2,670 2,610 28,490 8 (1) (81) 72 (45)
L&T Infotech 30,629 NA NA NA 10,692 36,035 NA NA NA 10,666 18 NA NA NA (0)
Mindtree 25,179 3,090 1,704 NA 3,189 25,399 2,630 427 NA 2,769 1 (15) (75) NA (13)
Mphasis 23,426 NA NA NA 10,986 27,380 NA NA NA 11,154 17 NA NA NA 2
TCS 422,790 64,730 17,490 NA 63,860 447,580 61,100 5,680 NA 54,840 6 (6) (68) NA (14)
Tech Mahindra 92,066 25,884 NA NA 31,129 96,330 25,379 NA NA 33,037 5 (2) NA NA 6
Wipro 158,742 44,986 9,182 1,263 24,565 163,430 41,458 2,554 396 26,093 3 (8) (72) (69) 6
Total 1,172,602 226,880 42,646 2,783 225,741 1,251,194 212,147 11,331 3,006 190,399 7 (6) (73) 8 (16)
1HFY20 1HFY21 1HFY21
Company Employee
Power &
fuel Frieght Other Employee
Power &
fuel Frieght Other Employee
Power
& fuel Frieght Other
Hindalco Industries 9,300 35,348 9,300 22,476 8,673 26,368 8,673 16,180 (7) (25) (7) (28)
Hindustan Zinc 3,740 NA NA 26,100 4,010 NA NA 24,520 7 NA NA (6)
Jindal Steel and Power 4,463 NA NA 59,251 4,561 NA NA 56,383 2 NA NA (5)
JSW Steel 14,120 NA NA 65,020 12,270 NA NA 56,550 (13) NA NA (13)
National Aluminium Co. 9,810 15,508 NA 9,029 10,163 12,947 NA 6,145 4 (17) NA (32)
NMDC 4,982 NA NA 6,765 5,208 NA NA 7,129 5 NA NA 5
Tata Steel 95,042 NA NA 234,309 87,938 NA NA 203,074 (7) NA NA (13)
Vedanta 14,570 NA NA 109,800 12,550 NA NA 87,410 (14) NA NA (20)
Total 156,026 50,856 9,300 532,750 128,130 39,315 8,673 457,391 (18) (23) (7) (14)
1HFY20 1HFY21 yoy (%)
Company Report
For Private Circulation Only. In the US, this document may only be distributed to QIBs (qualified institutional buyers) as defined under rule 144A of the Securities Act of 1933. This document is not for public distribution
and has been furnished to you solely for your information and may not be reproduced or redistributed to any other person. The manner of circulation and distribution of this document may be restricted by law or regulation in certain countries, including the United States. Persons into whose possession this document may come are required to inform themselves of, and to observe, such restrictions.
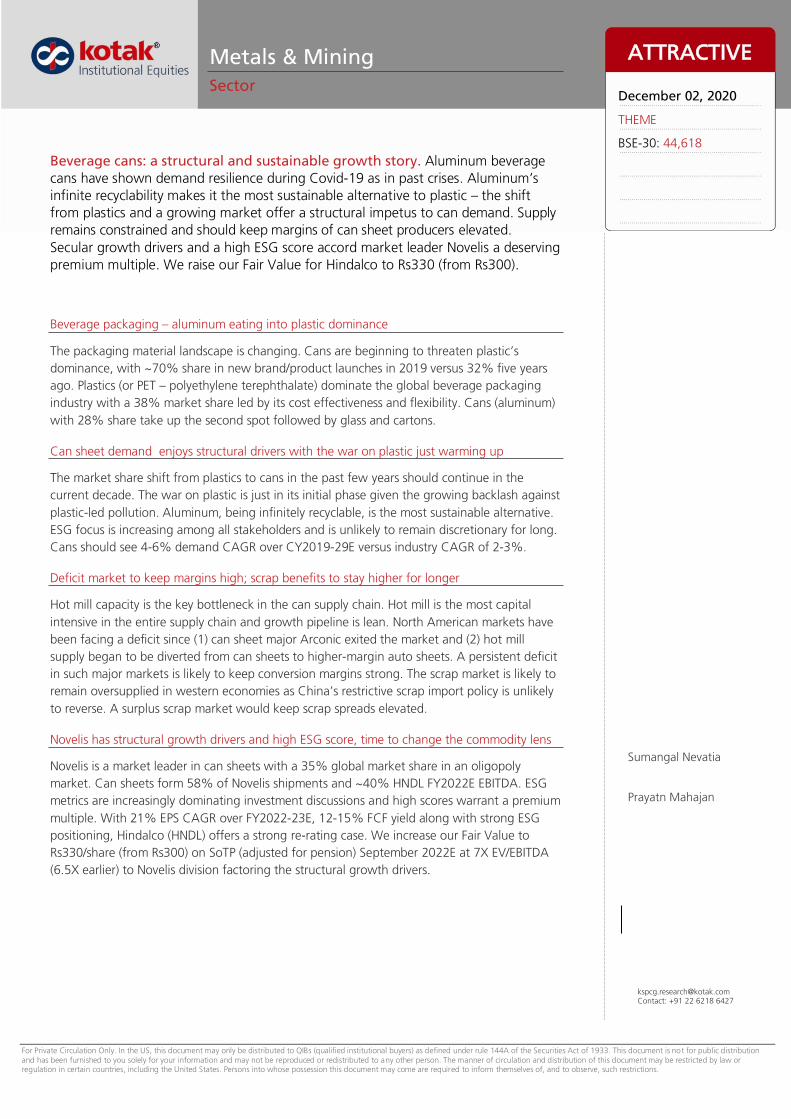
Metals & Mining
Sector
Beverage cans: a structural and sustainable growth story. Aluminum beverage
cans have shown demand resilience during Covid-19 as in past crises. Aluminum’s
infinite recyclability makes it the most sustainable alternative to plastic – the shift
from plastics and a growing market offer a structural impetus to can demand. Supply
remains constrained and should keep margins of can sheet producers elevated.
Secular growth drivers and a high ESG score accord market leader Novelis a deserving
premium multiple. We raise our Fair Value for Hindalco to Rs330 (from Rs300).
Beverage packaging – aluminum eating into plastic dominance
The packaging material landscape is changing. Cans are beginning to threaten plastic’s
dominance, with ~70% share in new brand/product launches in 2019 versus 32% five years
ago. Plastics (or PET – polyethylene terephthalate) dominate the global beverage packaging
industry with a 38% market share led by its cost effectiveness and flexibility. Cans (aluminum)
with 28% share take up the second spot followed by glass and cartons.
Can sheet demand enjoys structural drivers with the war on plastic just warming up
The market share shift from plastics to cans in the past few years should continue in the
current decade. The war on plastic is just in its initial phase given the growing backlash against
plastic-led pollution. Aluminum, being infinitely recyclable, is the most sustainable alternative.
ESG focus is increasing among all stakeholders and is unlikely to remain discretionary for long.
Cans should see 4-6% demand CAGR over CY2019-29E versus industry CAGR of 2-3%.
Deficit market to keep margins high; scrap benefits to stay higher for longer
Hot mill capacity is the key bottleneck in the can supply chain. Hot mill is the most capital
intensive in the entire supply chain and growth pipeline is lean. North American markets have
been facing a deficit since (1) can sheet major Arconic exited the market and (2) hot mill
supply began to be diverted from can sheets to higher-margin auto sheets. A persistent deficit
in such major markets is likely to keep conversion margins strong. The scrap market is likely to
remain oversupplied in western economies as China’s restrictive scrap import policy is unlikely
to reverse. A surplus scrap market would keep scrap spreads elevated.
Novelis has structural growth drivers and high ESG score, time to change the commodity lens
Novelis is a market leader in can sheets with a 35% global market share in an oligopoly
market. Can sheets form 58% of Novelis shipments and ~40% HNDL FY2022E EBITDA. ESG
metrics are increasingly dominating investment discussions and high scores warrant a premium
multiple. With 21% EPS CAGR over FY2022-23E, 12-15% FCF yield along with strong ESG
positioning, Hindalco (HNDL) offers a strong re-rating case. We increase our Fair Value to
Rs330/share (from Rs300) on SoTP (adjusted for pension) September 2022E at 7X EV/EBITDA
(6.5X earlier) to Novelis division factoring the structural growth drivers.
ATTRACTIVE
December 02, 2020
THEME
BSE-30: 44,618
Sumangal Nevatia
Prayatn Mahajan
[email protected]: +91 22 6218 6427
KOTAK INSTITUTIONAL EQUITIES RESEARCH 3
Sector Metals & Mining
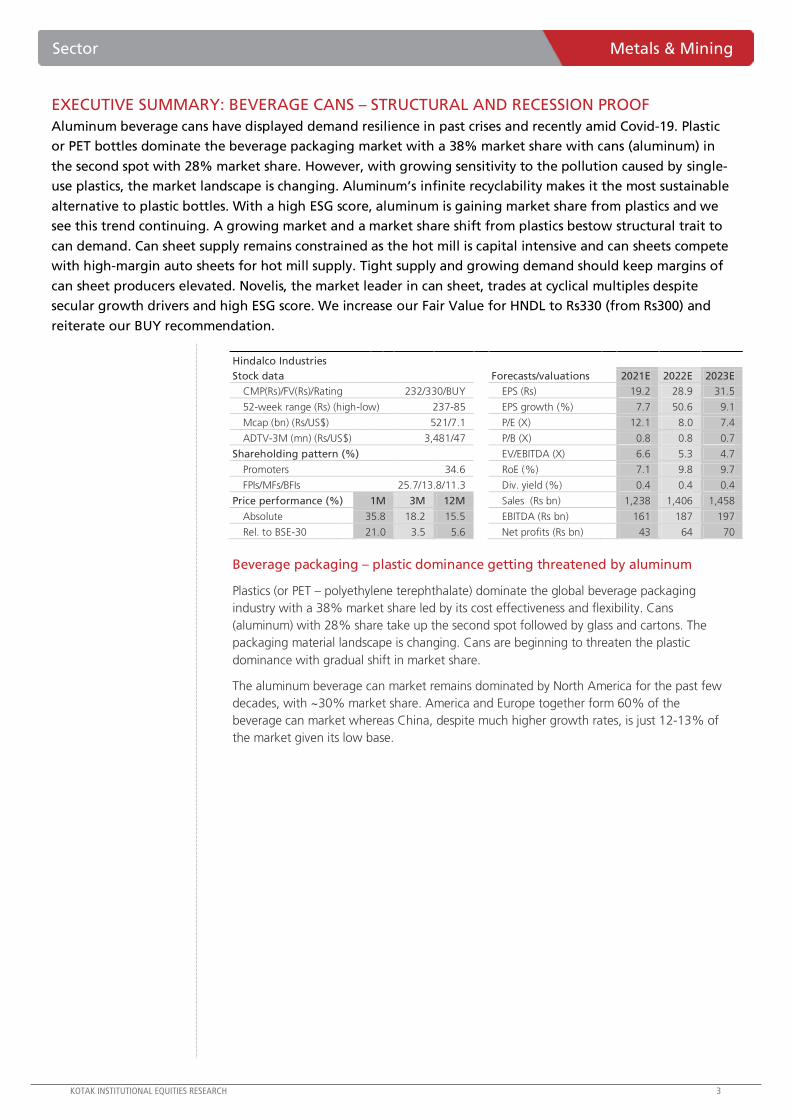
EXECUTIVE SUMMARY: BEVERAGE CANS – STRUCTURAL AND RECESSION PROOF
Aluminum beverage cans have displayed demand resilience in past crises and recently amid Covid-19. Plastic
or PET bottles dominate the beverage packaging market with a 38% market share with cans (aluminum) in
the second spot with 28% market share. However, with growing sensitivity to the pollution caused by single-
use plastics, the market landscape is changing. Aluminum’s infinite recyclability makes it the most sustainable
alternative to plastic bottles. With a high ESG score, aluminum is gaining market share from plastics and we
see this trend continuing. A growing market and a market share shift from plastics bestow structural trait to
can demand. Can sheet supply remains constrained as the hot mill is capital intensive and can sheets compete
with high-margin auto sheets for hot mill supply. Tight supply and growing demand should keep margins of
can sheet producers elevated. Novelis, the market leader in can sheet, trades at cyclical multiples despite
secular growth drivers and high ESG score. We increase our Fair Value for HNDL to Rs330 (from Rs300) and
reiterate our BUY recommendation.
Hindalco Industries
Stock data
Forecasts/valuations
2021E 2022E 2023E
CMP(Rs)/FV(Rs)/Rating 232/330/BUY
EPS (Rs) 19.2 28.9 31.5
52-week range (Rs) (high-low) 237-85
EPS growth (%) 7.7 50.6 9.1
Mcap (bn) (Rs/US$) 521/7.1
P/E (X) 12.1 8.0 7.4
ADTV-3M (mn) (Rs/US$) 3,481/47
P/B (X) 0.8 0.8 0.7
Shareholding pattern (%)
EV/EBITDA (X) 6.6 5.3 4.7
Promoters 34.6
RoE (%) 7.1 9.8 9.7
FPIs/MFs/BFIs 25.7/13.8/11.3
Div. yield (%) 0.4 0.4 0.4
Price performance (%) 1M 3M 12M
Sales (Rs bn) 1,238 1,406 1,458
Absolute 35.8 18.2 15.5
EBITDA (Rs bn) 161 187 197
Rel. to BSE-30 21.0 3.5 5.6
Net profits (Rs bn) 43 64 70
Beverage packaging – plastic dominance getting threatened by aluminum
Plastics (or PET – polyethylene terephthalate) dominate the global beverage packaging
industry with a 38% market share led by its cost effectiveness and flexibility. Cans
(aluminum) with 28% share take up the second spot followed by glass and cartons. The
packaging material landscape is changing. Cans are beginning to threaten the plastic
dominance with gradual shift in market share.
The aluminum beverage can market remains dominated by North America for the past few
decades, with ~30% market share. America and Europe together form 60% of the
beverage can market whereas China, despite much higher growth rates, is just 12-13% of
the market given its low base.
4 KOTAK INSTITUTIONAL EQUITIES RESEARCH
Metals & Mining Sector
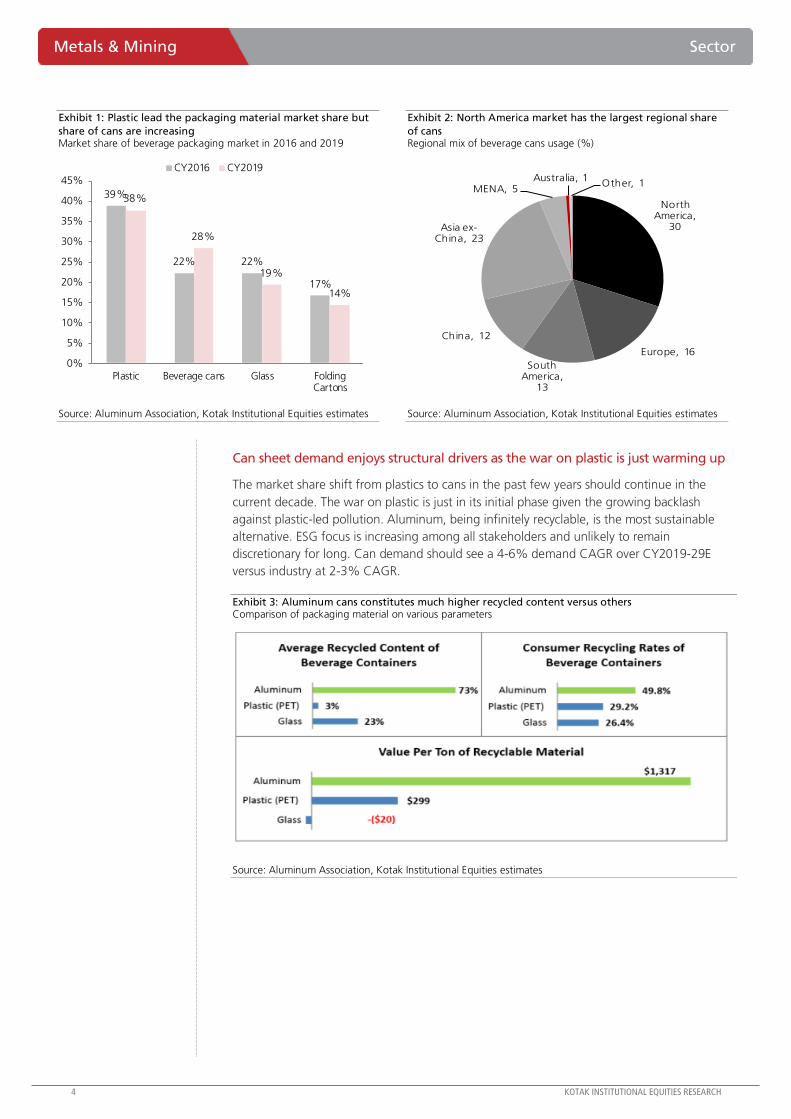
Exhibit 1: Plastic lead the packaging material market share but
share of cans are increasing Market share of beverage packaging market in 2016 and 2019
39%
22% 22%
17%
38%
28%
19%
14%
0%
5%
10%
15%
20%
25%
30%
35%
40%
45%
Plastic Beverage cans Glass FoldingCartons
CY2016 CY2019
Source: Aluminum Association, Kotak Institutional Equities estimates
Exhibit 2: North America market has the largest regional share
of cans Regional mix of beverage cans usage (%)
North America,
30
Europe, 16
South America,
13
China, 12
Asia ex-China, 23
MENA, 5 Australia, 1
Other, 1
Source: Aluminum Association, Kotak Institutional Equities estimates
Can sheet demand enjoys structural drivers as the war on plastic is just warming up
The market share shift from plastics to cans in the past few years should continue in the
current decade. The war on plastic is just in its initial phase given the growing backlash
against plastic-led pollution. Aluminum, being infinitely recyclable, is the most sustainable
alternative. ESG focus is increasing among all stakeholders and unlikely to remain
discretionary for long. Can demand should see a 4-6% demand CAGR over CY2019-29E
versus industry at 2-3% CAGR.
Exhibit 3: Aluminum cans constitutes much higher recycled content versus others Comparison of packaging material on various parameters
Source: Aluminum Association, Kotak Institutional Equities estimates
KOTAK INSTITUTIONAL EQUITIES RESEARCH 5
Sector Metals & Mining
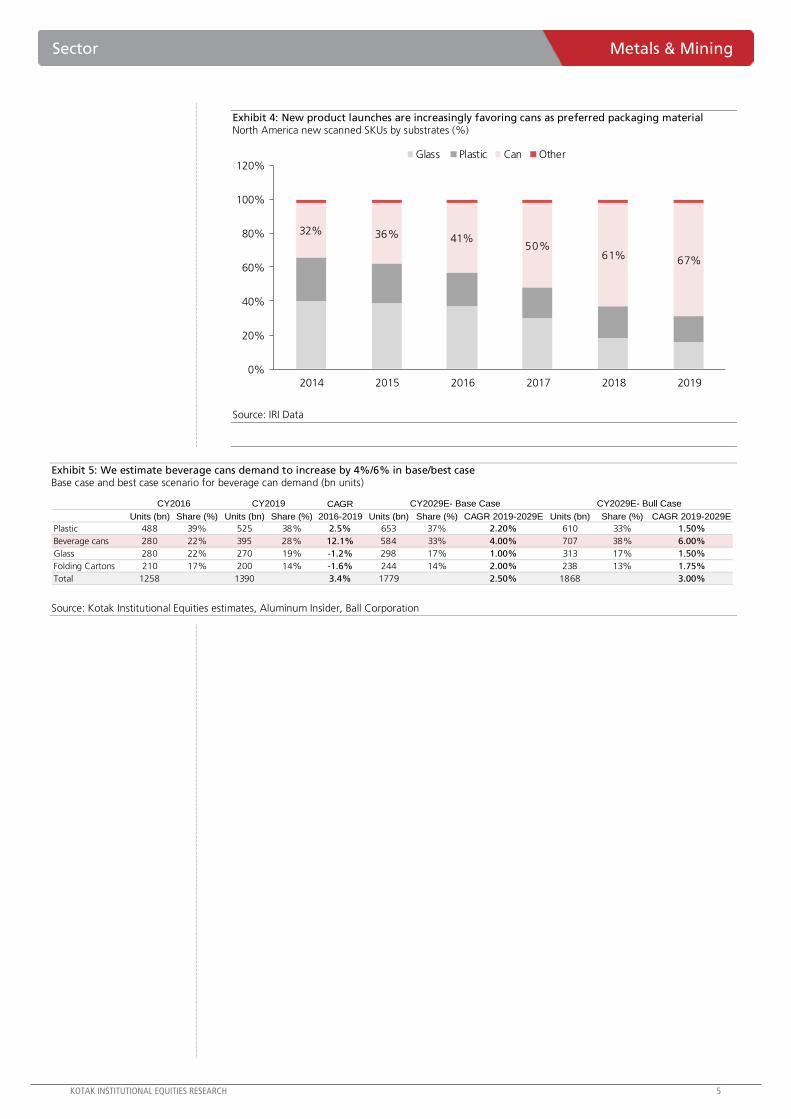
Exhibit 4: New product launches are increasingly favoring cans as preferred packaging material North America new scanned SKUs by substrates (%)
32% 36% 41%50%
61% 67%
0%
20%
40%
60%
80%
100%
120%
2014 2015 2016 2017 2018 2019
Glass Plastic Can Other
Source: IRI Data
Exhibit 5: We estimate beverage cans demand to increase by 4%/6% in base/best case Base case and best case scenario for beverage can demand (bn units)
CAGR
Units (bn) Share (%) Units (bn) Share (%) 2016-2019 Units (bn) Share (%) CAGR 2019-2029E Units (bn) Share (%) CAGR 2019-2029E
Plastic 488 39% 525 38% 2.5% 653 37% 2.20% 610 33% 1.50%
Beverage cans 280 22% 395 28% 12.1% 584 33% 4.00% 707 38% 6.00%
Glass 280 22% 270 19% -1.2% 298 17% 1.00% 313 17% 1.50%
Folding Cartons 210 17% 200 14% -1.6% 244 14% 2.00% 238 13% 1.75%
Total 1258 1390 3.4% 1779 2.50% 1868 3.00%
CY2029E- Base Case CY2029E- Bull CaseCY2019CY2016
Source: Kotak Institutional Equities estimates, Aluminum Insider, Ball Corporation
6 KOTAK INSTITUTIONAL EQUITIES RESEARCH
Metals & Mining Sector
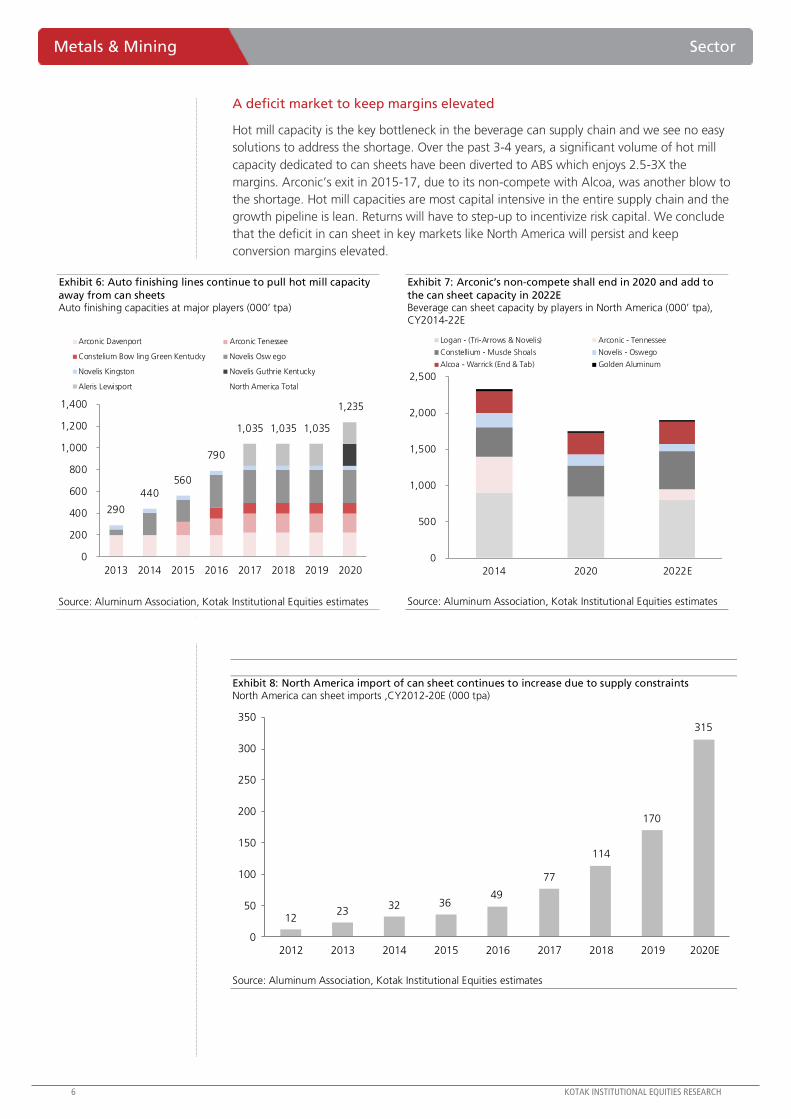
A deficit market to keep margins elevated
Hot mill capacity is the key bottleneck in the beverage can supply chain and we see no easy
solutions to address the shortage. Over the past 3-4 years, a significant volume of hot mill
capacity dedicated to can sheets have been diverted to ABS which enjoys 2.5-3X the
margins. Arconic’s exit in 2015-17, due to its non-compete with Alcoa, was another blow to
the shortage. Hot mill capacities are most capital intensive in the entire supply chain and the
growth pipeline is lean. Returns will have to step-up to incentivize risk capital. We conclude
that the deficit in can sheet in key markets like North America will persist and keep
conversion margins elevated.
Exhibit 6: Auto finishing lines continue to pull hot mill capacity
away from can sheets Auto finishing capacities at major players (000’ tpa)
290
440
560
790
1,035 1,035 1,035
1,235
0
200
400
600
800
1,000
1,200
1,400
2013 2014 2015 2016 2017 2018 2019 2020
Arconic Davenport Arconic Tenessee
Constelium Bow ling Green Kentucky Novelis Osw ego
Novelis Kingston Novelis Guthrie Kentucky
Aleris Lewisport North America Total
Source: Aluminum Association, Kotak Institutional Equities estimates
Exhibit 7: Arconic’s non-compete shall end in 2020 and add to
the can sheet capacity in 2022E Beverage can sheet capacity by players in North America (000’ tpa), CY2014-22E
0
500
1,000
1,500
2,000
2,500
2014 2020 2022E
Logan - (Tri-Arrows & Novelis) Arconic - Tennessee
Constellium - Muscle Shoals Novelis - Oswego
Alcoa - Warrick (End & Tab) Golden Aluminum
Source: Aluminum Association, Kotak Institutional Equities estimates
Exhibit 8: North America import of can sheet continues to increase due to supply constraints North America can sheet imports ,CY2012-20E (000 tpa)
1223
32 3649
77
114
170
315
0
50
100
150
200
250
300
350
2012 2013 2014 2015 2016 2017 2018 2019 2020E
Source: Aluminum Association, Kotak Institutional Equities estimates
KOTAK INSTITUTIONAL EQUITIES RESEARCH 7
Sector Metals & Mining
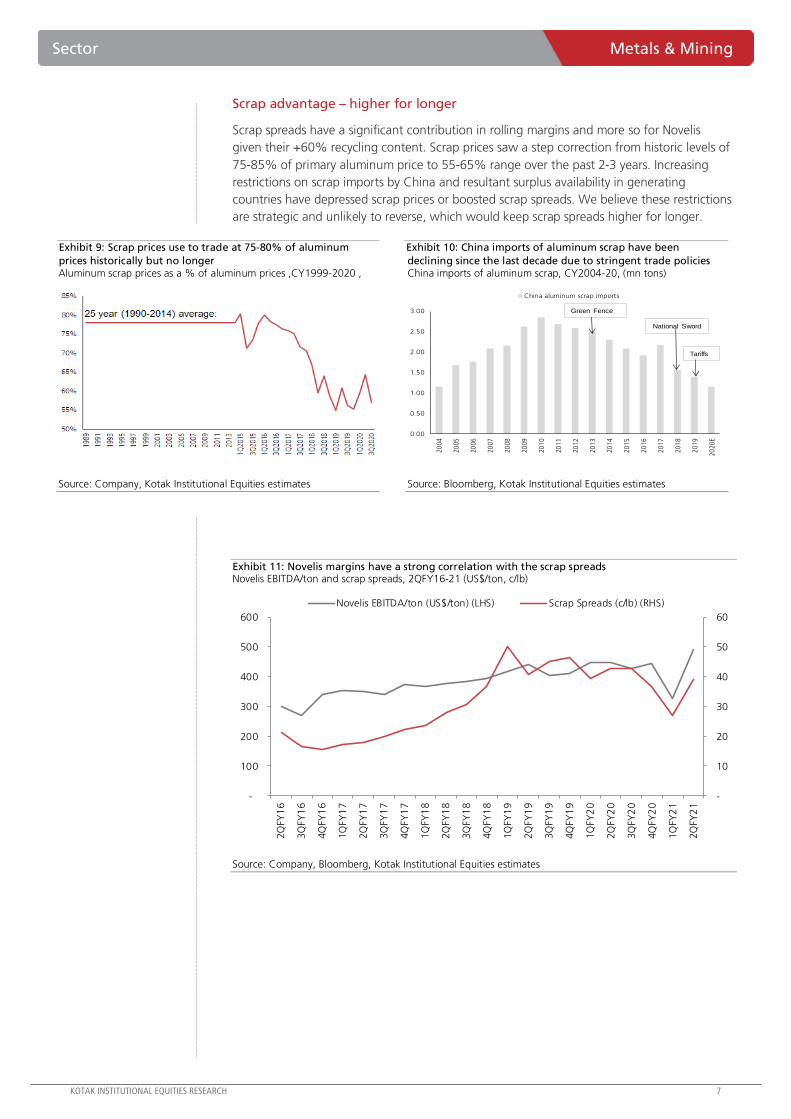
Scrap advantage – higher for longer
Scrap spreads have a significant contribution in rolling margins and more so for Novelis
given their +60% recycling content. Scrap prices saw a step correction from historic levels of
75-85% of primary aluminum price to 55-65% range over the past 2-3 years. Increasing
restrictions on scrap imports by China and resultant surplus availability in generating
countries have depressed scrap prices or boosted scrap spreads. We believe these restrictions
are strategic and unlikely to reverse, which would keep scrap spreads higher for longer.
Exhibit 9: Scrap prices use to trade at 75-80% of aluminum
prices historically but no longer Aluminum scrap prices as a % of aluminum prices ,CY1999-2020 ,
Source: Company, Kotak Institutional Equities estimates
Exhibit 10: China imports of aluminum scrap have been
declining since the last decade due to stringent trade policies China imports of aluminum scrap, CY2004-20, (mn tons)
Source: Bloomberg, Kotak Institutional Equities estimates
Exhibit 11: Novelis margins have a strong correlation with the scrap spreads Novelis EBITDA/ton and scrap spreads, 2QFY16-21 (US$/ton, c/lb)
-
10
20
30
40
50
60
-
100
200
300
400
500
600
2Q
FY1
6
3Q
FY1
6
4Q
FY1
6
1Q
FY1
7
2Q
FY1
7
3Q
FY1
7
4Q
FY1
7
1Q
FY1
8
2Q
FY1
8
3Q
FY1
8
4Q
FY1
8
1Q
FY1
9
2Q
FY1
9
3Q
FY1
9
4Q
FY1
9
1Q
FY2
0
2Q
FY2
0
3Q
FY2
0
4Q
FY2
0
1Q
FY2
1
2Q
FY2
1
Novelis EBITDA/ton (US$/ton) (LHS) Scrap Spreads (c/lb) (RHS)
Source: Company, Bloomberg, Kotak Institutional Equities estimates
0.00
0.50
1.00
1.50
2.00
2.50
3.00
20
04
20
05
20
06
20
07
20
08
20
09
20
10
20
11
20
12
20
13
20
14
20
15
20
16
20
17
20
18
20
19
20
20
E
China aluminum scrap imports
Green Fence
National Sword
Tariffs
8 KOTAK INSTITUTIONAL EQUITIES RESEARCH
Metals & Mining Sector
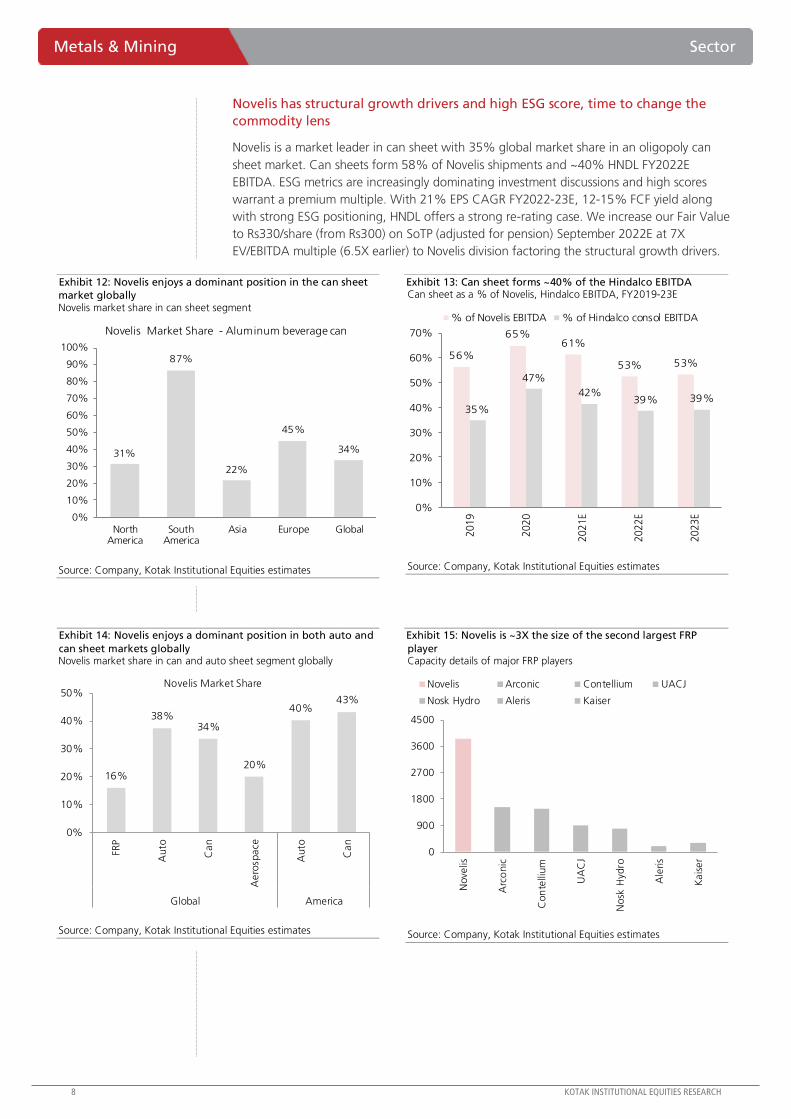
Novelis has structural growth drivers and high ESG score, time to change the
commodity lens
Novelis is a market leader in can sheet with 35% global market share in an oligopoly can
sheet market. Can sheets form 58% of Novelis shipments and ~40% HNDL FY2022E
EBITDA. ESG metrics are increasingly dominating investment discussions and high scores
warrant a premium multiple. With 21% EPS CAGR FY2022-23E, 12-15% FCF yield along
with strong ESG positioning, HNDL offers a strong re-rating case. We increase our Fair Value
to Rs330/share (from Rs300) on SoTP (adjusted for pension) September 2022E at 7X
EV/EBITDA multiple (6.5X earlier) to Novelis division factoring the structural growth drivers.
Exhibit 12: Novelis enjoys a dominant position in the can sheet
market globally Novelis market share in can sheet segment
31%
87%
22%
45%
34%
NorthAmerica
SouthAmerica
Asia Europe Global0%
10%
20%
30%
40%
50%
60%
70%
80%
90%
100%
Novelis Market Share - Aluminum beverage can
Source: Company, Kotak Institutional Equities estimates
Exhibit 13: Can sheet forms ~40% of the Hindalco EBITDA Can sheet as a % of Novelis, Hindalco EBITDA, FY2019-23E
56%
65%61%
53% 53%
35%
47%
42%39% 39%
0%
10%
20%
30%
40%
50%
60%
70%
2019
2020
2021E
2022E
2023E
% of Novelis EBITDA % of Hindalco consol EBITDA
Source: Company, Kotak Institutional Equities estimates
Exhibit 14: Novelis enjoys a dominant position in both auto and
can sheet markets globally Novelis market share in can and auto sheet segment globally
16%
38%34%
20%
40%43%
0%
10%
20%
30%
40%
50%
FRP
Auto
Can
Aero
space
Auto
Can
Global America
Novelis Market Share
Source: Company, Kotak Institutional Equities estimates
Exhibit 15: Novelis is ~3X the size of the second largest FRP
player Capacity details of major FRP players
0
900
1800
2700
3600
4500
Nove
lis
Arc
onic
Con
telli
um
UA
CJ
Nosk
Hyd
ro
Ale
ris
Kais
er
Novelis Arconic Contellium UACJ
Nosk Hydro Aleris Kaiser
Source: Company, Kotak Institutional Equities estimates
KOTAK INSTITUTIONAL EQUITIES RESEARCH 9
Sector Metals & Mining
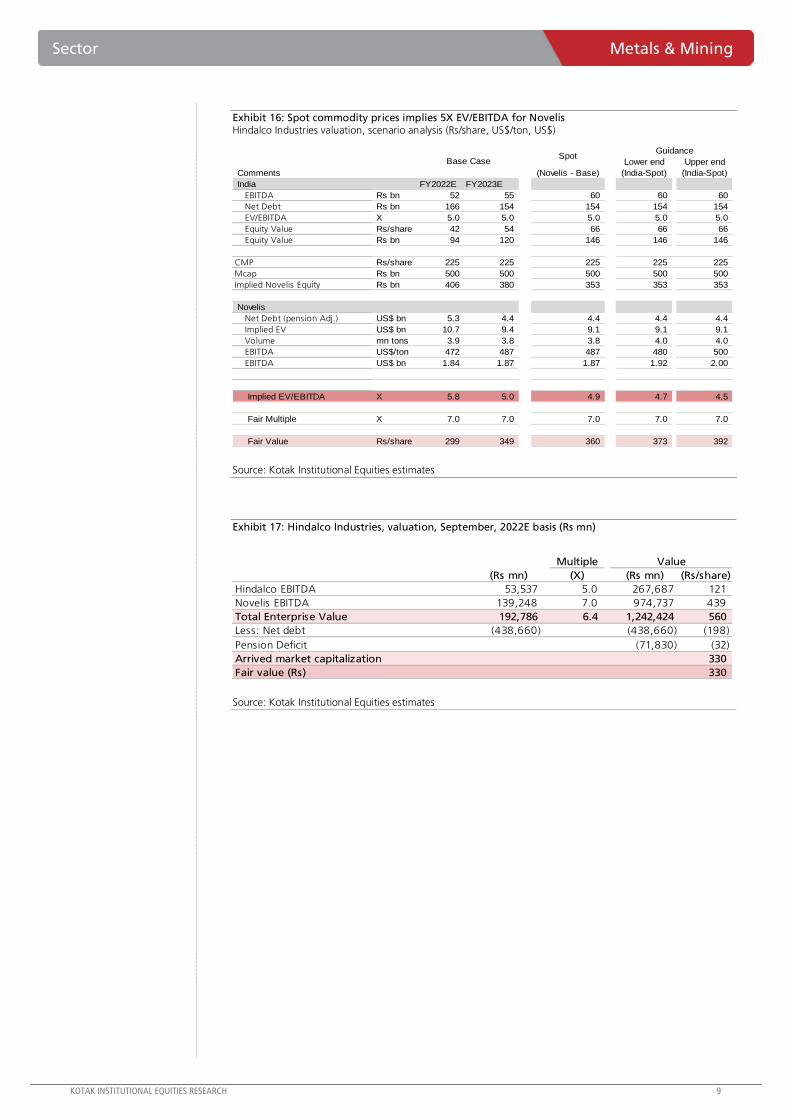
Exhibit 16: Spot commodity prices implies 5X EV/EBITDA for Novelis Hindalco Industries valuation, scenario analysis (Rs/share, US$/ton, US$)
Lower end Upper end
Comments (Novelis - Base) (India-Spot) (India-Spot)
India FY2022E FY2023E
EBITDA Rs bn 52 55 60 60 60
Net Debt Rs bn 166 154 154 154 154
EV/EBITDA X 5.0 5.0 5.0 5.0 5.0
Equity Value Rs/share 42 54 66 66 66
Equity Value Rs bn 94 120 146 146 146
CMP Rs/share 225 225 225 225 225
Mcap Rs bn 500 500 500 500 500
Implied Novelis Equity Rs bn 406 380 353 353 353
Novelis
Net Debt (pension Adj.) US$ bn 5.3 4.4 4.4 4.4 4.4
Implied EV US$ bn 10.7 9.4 9.1 9.1 9.1
Volume mn tons 3.9 3.8 3.8 4.0 4.0
EBITDA US$/ton 472 487 487 480 500
EBITDA US$ bn 1.84 1.87 1.87 1.92 2.00
Implied EV/EBITDA X 5.8 5.0 4.9 4.7 4.5
Fair Multiple X 7.0 7.0 7.0 7.0 7.0
Fair Value Rs/share 299 349 360 373 392
GuidanceSpot
Base Case
Source: Kotak Institutional Equities estimates
Exhibit 17: Hindalco Industries, valuation, September, 2022E basis (Rs mn)
Multiple
(Rs mn) (X) (Rs mn) (Rs/share)
Hindalco EBITDA 53,537 5.0 267,687 121
Novelis EBITDA 139,248 7.0 974,737 439
Total Enterprise Value 192,786 6.4 1,242,424 560
Less: Net debt (438,660) (438,660) (198)
Pension Deficit (71,830) (32)
Arrived market capitalization 330
Fair value (Rs) 330
Value
Source: Kotak Institutional Equities estimates
10 KOTAK INSTITUTIONAL EQUITIES RESEARCH
Metals & Mining Sector
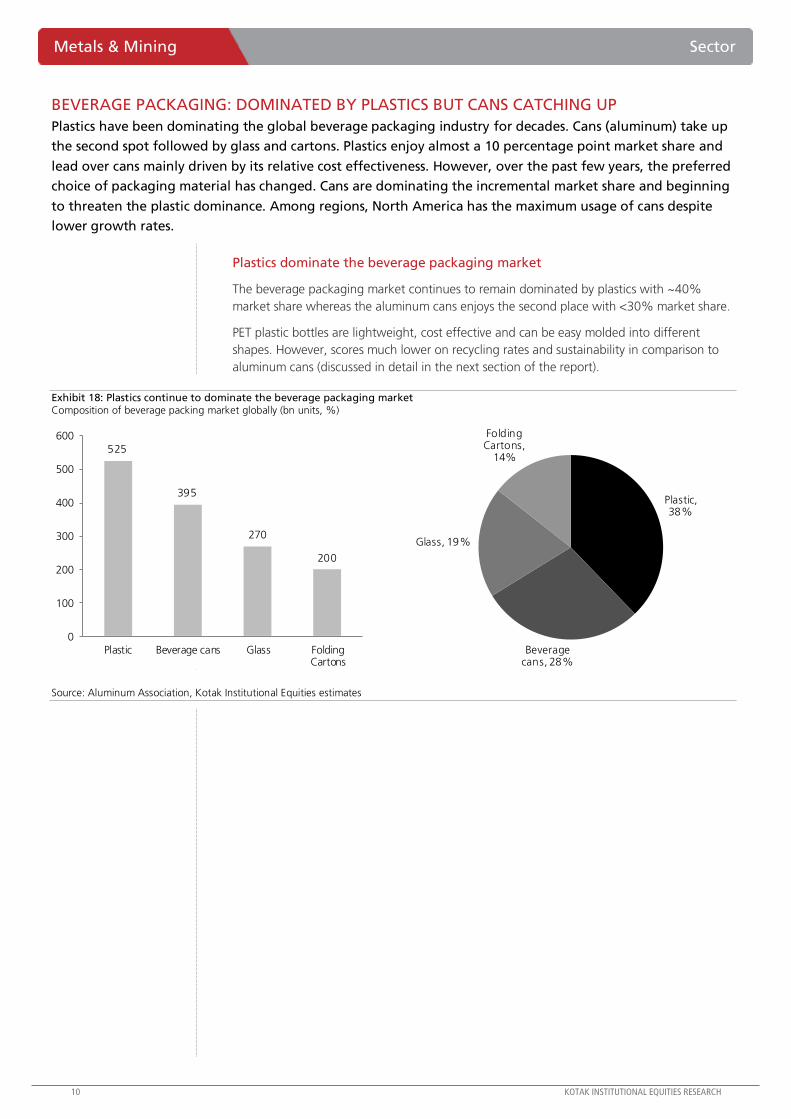
BEVERAGE PACKAGING: DOMINATED BY PLASTICS BUT CANS CATCHING UP
Plastics have been dominating the global beverage packaging industry for decades. Cans (aluminum) take up
the second spot followed by glass and cartons. Plastics enjoy almost a 10 percentage point market share and
lead over cans mainly driven by its relative cost effectiveness. However, over the past few years, the preferred
choice of packaging material has changed. Cans are dominating the incremental market share and beginning
to threaten the plastic dominance. Among regions, North America has the maximum usage of cans despite
lower growth rates.
Plastics dominate the beverage packaging market
The beverage packaging market continues to remain dominated by plastics with ~40%
market share whereas the aluminum cans enjoys the second place with <30% market share.
PET plastic bottles are lightweight, cost effective and can be easy molded into different
shapes. However, scores much lower on recycling rates and sustainability in comparison to
aluminum cans (discussed in detail in the next section of the report).
Exhibit 18: Plastics continue to dominate the beverage packaging market Composition of beverage packing market globally (bn units, %)
525
395
270
200
0
100
200
300
400
500
600
Plastic Beverage cans Glass FoldingCartons
Plastic, 38%
Beverage cans, 28%
Glass, 19%
Folding Cartons,
14%
Source: Aluminum Association, Kotak Institutional Equities estimates
KOTAK INSTITUTIONAL EQUITIES RESEARCH 11
Sector Metals & Mining
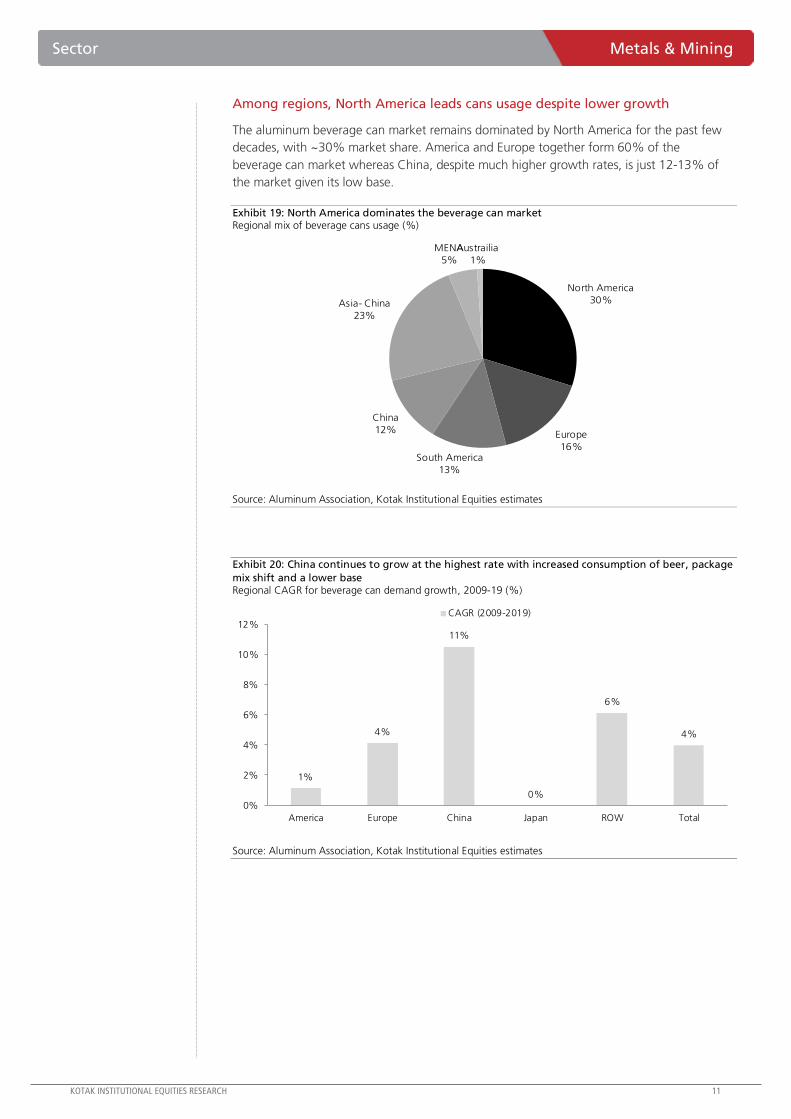
Among regions, North America leads cans usage despite lower growth
The aluminum beverage can market remains dominated by North America for the past few
decades, with ~30% market share. America and Europe together form 60% of the
beverage can market whereas China, despite much higher growth rates, is just 12-13% of
the market given its low base.
Exhibit 19: North America dominates the beverage can market Regional mix of beverage cans usage (%)
North America
30%
Europe
16%South America
13%
China
12%
Asia- China
23%
MENA
5%
Austrailia
1%
Source: Aluminum Association, Kotak Institutional Equities estimates
Exhibit 20: China continues to grow at the highest rate with increased consumption of beer, package
mix shift and a lower base Regional CAGR for beverage can demand growth, 2009-19 (%)
1%
4%
11%
0%
6%
4%
0%
2%
4%
6%
8%
10%
12%
America Europe China Japan ROW Total
CAGR (2009-2019)
Source: Aluminum Association, Kotak Institutional Equities estimates
12 KOTAK INSTITUTIONAL EQUITIES RESEARCH
Metals & Mining Sector
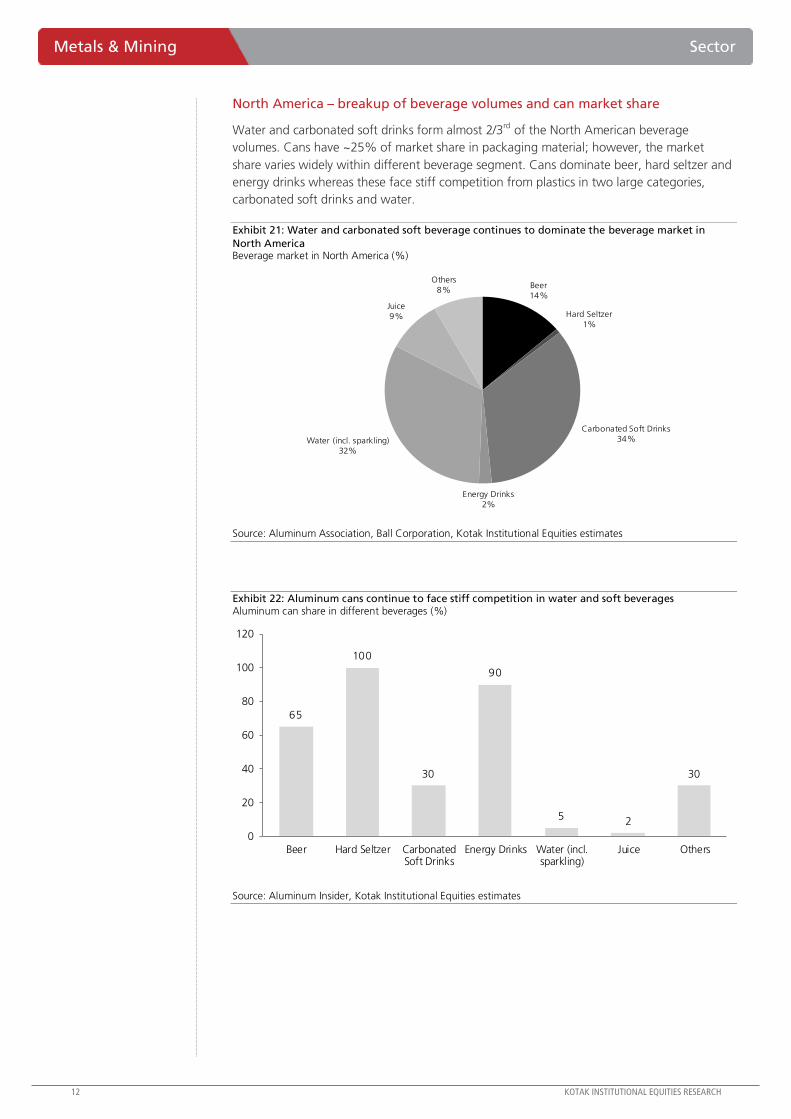
North America – breakup of beverage volumes and can market share
Water and carbonated soft drinks form almost 2/3rd of the North American beverage
volumes. Cans have ~25% of market share in packaging material; however, the market
share varies widely within different beverage segment. Cans dominate beer, hard seltzer and
energy drinks whereas these face stiff competition from plastics in two large categories,
carbonated soft drinks and water.
Exhibit 21: Water and carbonated soft beverage continues to dominate the beverage market in
North America Beverage market in North America (%)
Beer
14%
Hard Seltzer
1%
Carbonated Soft Drinks
34%
Energy Drinks
2%
Water (incl. sparkling)
32%
Juice
9%
Others
8%
Source: Aluminum Association, Ball Corporation, Kotak Institutional Equities estimates
Exhibit 22: Aluminum cans continue to face stiff competition in water and soft beverages Aluminum can share in different beverages (%)
65
100
30
90
5 2
30
Beer Hard Seltzer CarbonatedSoft Drinks
Energy Drinks Water (incl.sparkling)
Juice Others0
20
40
60
80
100
120
Source: Aluminum Insider, Kotak Institutional Equities estimates
KOTAK INSTITUTIONAL EQUITIES RESEARCH 13
Sector Metals & Mining
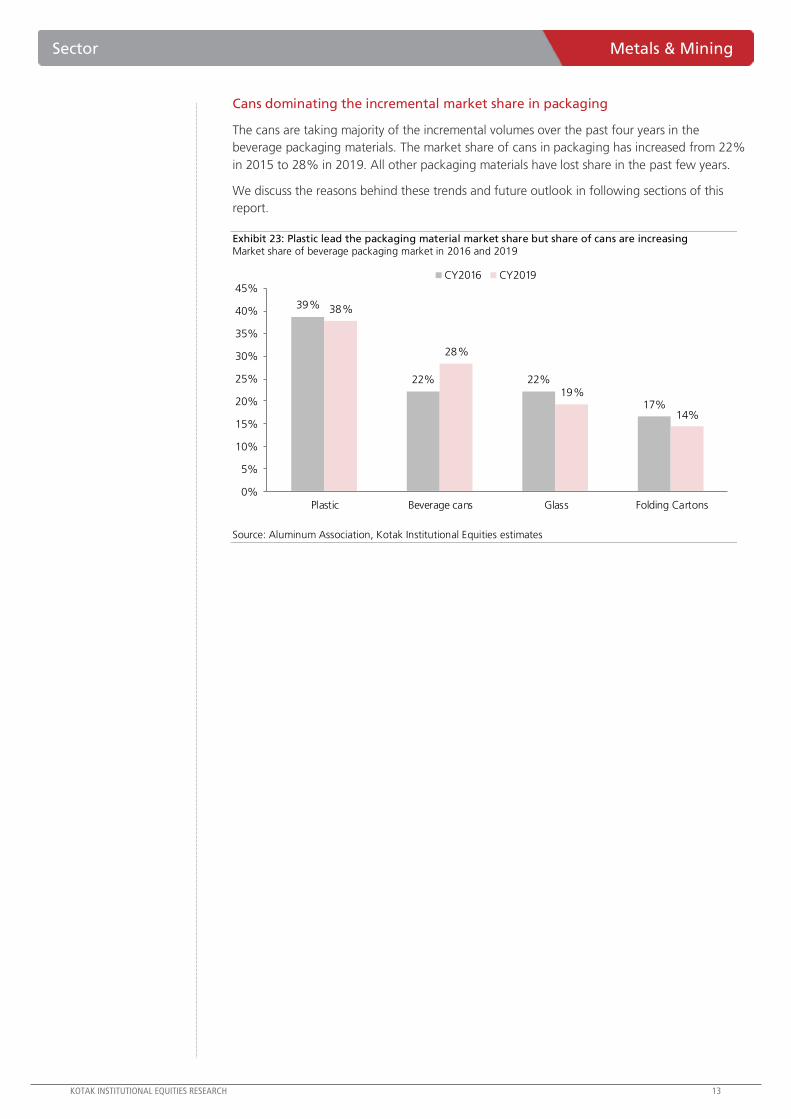
Cans dominating the incremental market share in packaging
The cans are taking majority of the incremental volumes over the past four years in the
beverage packaging materials. The market share of cans in packaging has increased from 22%
in 2015 to 28% in 2019. All other packaging materials have lost share in the past few years.
We discuss the reasons behind these trends and future outlook in following sections of this
report.
Exhibit 23: Plastic lead the packaging material market share but share of cans are increasing Market share of beverage packaging market in 2016 and 2019
39%
22% 22%
17%
38%
28%
19%
14%
0%
5%
10%
15%
20%
25%
30%
35%
40%
45%
Plastic Beverage cans Glass Folding Cartons
CY2016 CY2019
Source: Aluminum Association, Kotak Institutional Equities estimates
14 KOTAK INSTITUTIONAL EQUITIES RESEARCH
Metals & Mining Sector
THE CAN ADVANTAGE AND GROWING GLOBAL PARTICIPATION
Aluminum cans are by far the most suitable beverage container. It scores significantly above its substitutes –
glass and plastic on convenience and sustainability. Aluminum cans protect the flavors of beverages, chills
quickly and most importantly, it is infinitely recyclable thus more sustainable. With growing backlash against
polluting plastics, aluminum can offers the most sustainable alternative. Almost 75% of aluminum ever
produced is still in use and it offers a truly circular supply chain with a 60-day turnaround.
Aluminum cans – multiple benefits
The aluminum cans sheets are extensively used in beverage packaging. Aluminum cans are
the most sustainable beverage package and are infinitely recyclable. They chill quickly,
provide a superior metal canvas to print on and, perhaps most importantly, protect the
flavor and integrity of beverages. It is lightweight, has a high recycling rate with easy
fabrication process as it can be molded in innovative shapes and sizes.
Key advantages of beverage can are below:
The most sustainable beverage container. As the most valuable package in the bin,
aluminum cans are, by far, the most recycled beverage container. The average can
contain 70% recycled metal.
Shipping efficiency: the weight advantage. Aluminum cans are lightweight and easily
stacked. This provides storage and shipping efficiencies and limits overall transportation
carbon emissions through logistics and supply chain.
True closed loop recycling. Aluminum cans are recycled over and over again in a true
‘closed loop‘ recycling process. Glass and plastic are typically ‘down-cycled‘ into products
like carpet fiber or landfill liner.
Maintains product quality. Nearly 500 craft beer brewers use aluminum to can more
than 1,700 different beers. Protection from light and oxygen are two key benefits of
aluminum packaging, which help preserve the product life.
Enhanced marketing. Aluminum provides a much superior metal canvas to print on,
which allows more efficient marketing from the producer.
The virtuous cycle
Aluminum can scrap is a vital input for the industry and allows can manufacturers to make
beverage containers in the most environment friendly and economical way possible.
Recycling aluminum saves more than 90% of the energy needed to produce new, or primary,
aluminum.
In addition, aluminum’s recycling profile and the high value of the material means that,
unlike competing packages like glass and plastic bottles, the aluminum used beverage
container (UBC) is most often recycled directly back into itself. This process occurs repeatedly
without degradation in product quality. This closed-loop process drives a virtuous cycle of
high recycling rates, a large percentage of recycled content in the average aluminum can
and an economically sustainable process that effectively subsidizes municipal recycling
programs nationwide.
KOTAK INSTITUTIONAL EQUITIES RESEARCH 15
Sector Metals & Mining
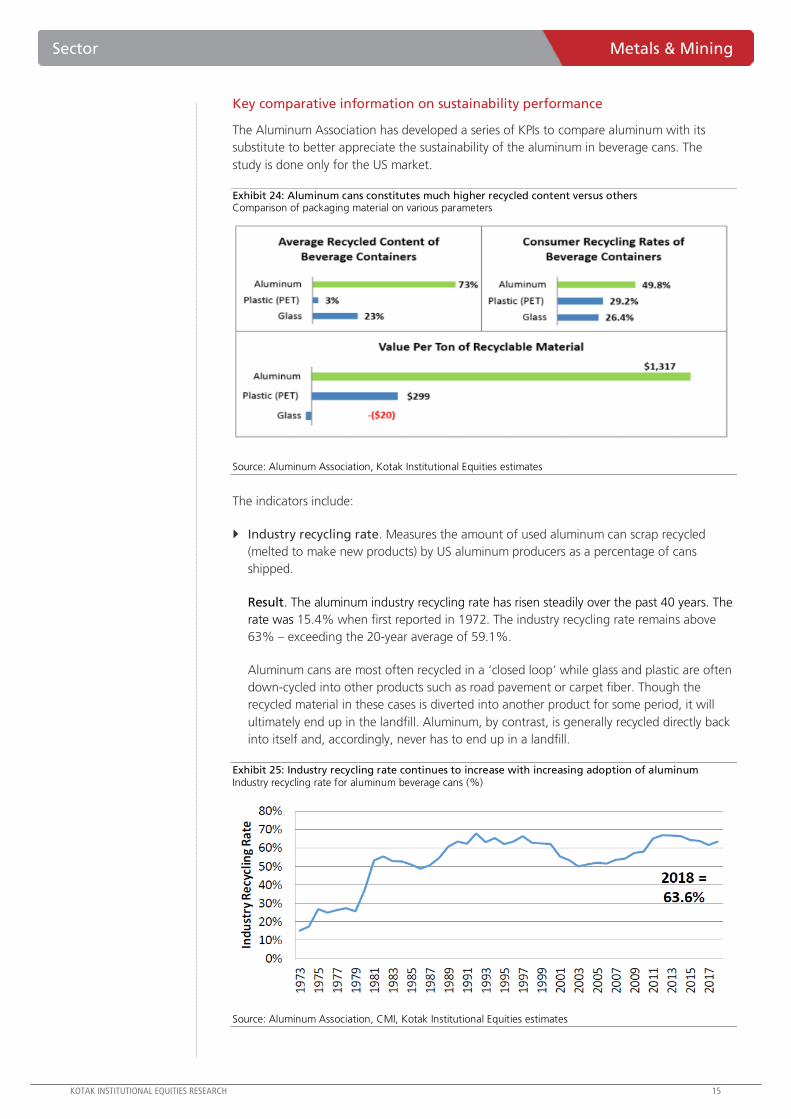
Key comparative information on sustainability performance
The Aluminum Association has developed a series of KPIs to compare aluminum with its
substitute to better appreciate the sustainability of the aluminum in beverage cans. The
study is done only for the US market.
Exhibit 24: Aluminum cans constitutes much higher recycled content versus others Comparison of packaging material on various parameters
Source: Aluminum Association, Kotak Institutional Equities estimates
The indicators include:
Industry recycling rate. Measures the amount of used aluminum can scrap recycled
(melted to make new products) by US aluminum producers as a percentage of cans
shipped.
Result. The aluminum industry recycling rate has risen steadily over the past 40 years. The
rate was 15.4% when first reported in 1972. The industry recycling rate remains above
63% – exceeding the 20-year average of 59.1%.
Aluminum cans are most often recycled in a ‘closed loop‘ while glass and plastic are often
down-cycled into other products such as road pavement or carpet fiber. Though the
recycled material in these cases is diverted into another product for some period, it will
ultimately end up in the landfill. Aluminum, by contrast, is generally recycled directly back
into itself and, accordingly, never has to end up in a landfill.
Exhibit 25: Industry recycling rate continues to increase with increasing adoption of aluminum Industry recycling rate for aluminum beverage cans (%)
Source: Aluminum Association, CMI, Kotak Institutional Equities estimates
16 KOTAK INSTITUTIONAL EQUITIES RESEARCH
Metals & Mining Sector
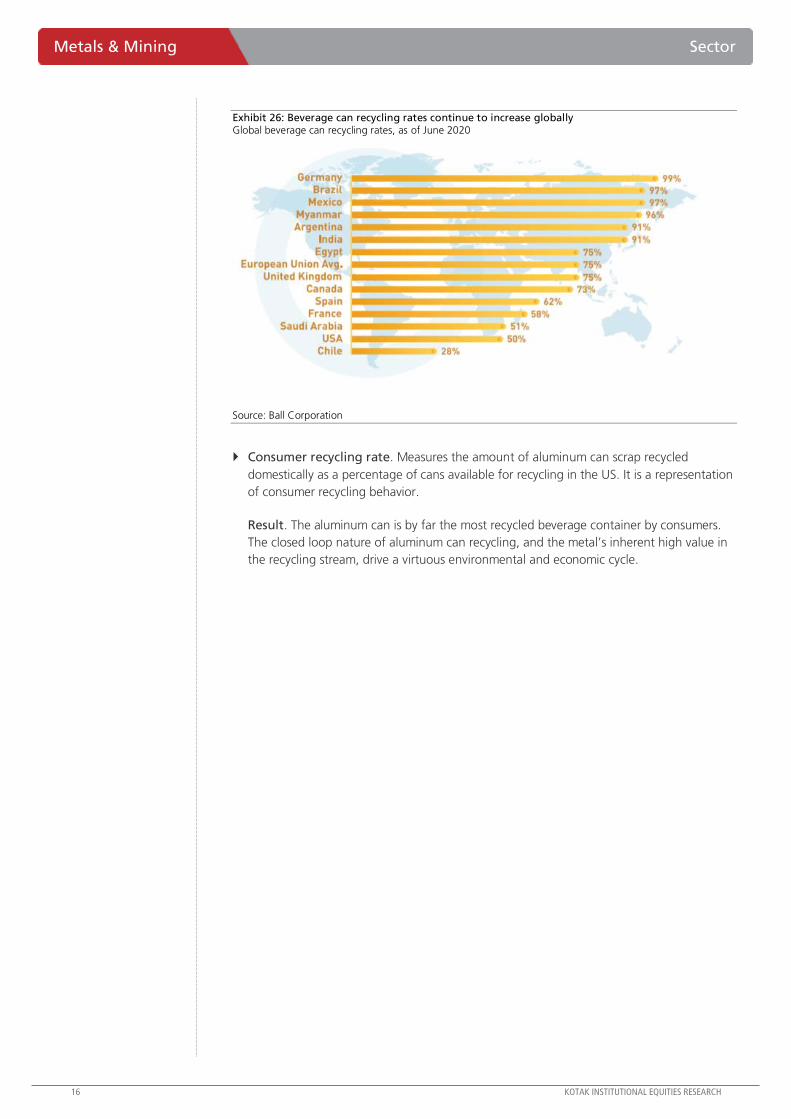
Exhibit 26: Beverage can recycling rates continue to increase globally Global beverage can recycling rates, as of June 2020
Source: Ball Corporation
Consumer recycling rate. Measures the amount of aluminum can scrap recycled
domestically as a percentage of cans available for recycling in the US. It is a representation
of consumer recycling behavior.
Result. The aluminum can is by far the most recycled beverage container by consumers.
The closed loop nature of aluminum can recycling, and the metal’s inherent high value in
the recycling stream, drive a virtuous environmental and economic cycle.
KOTAK INSTITUTIONAL EQUITIES RESEARCH 17
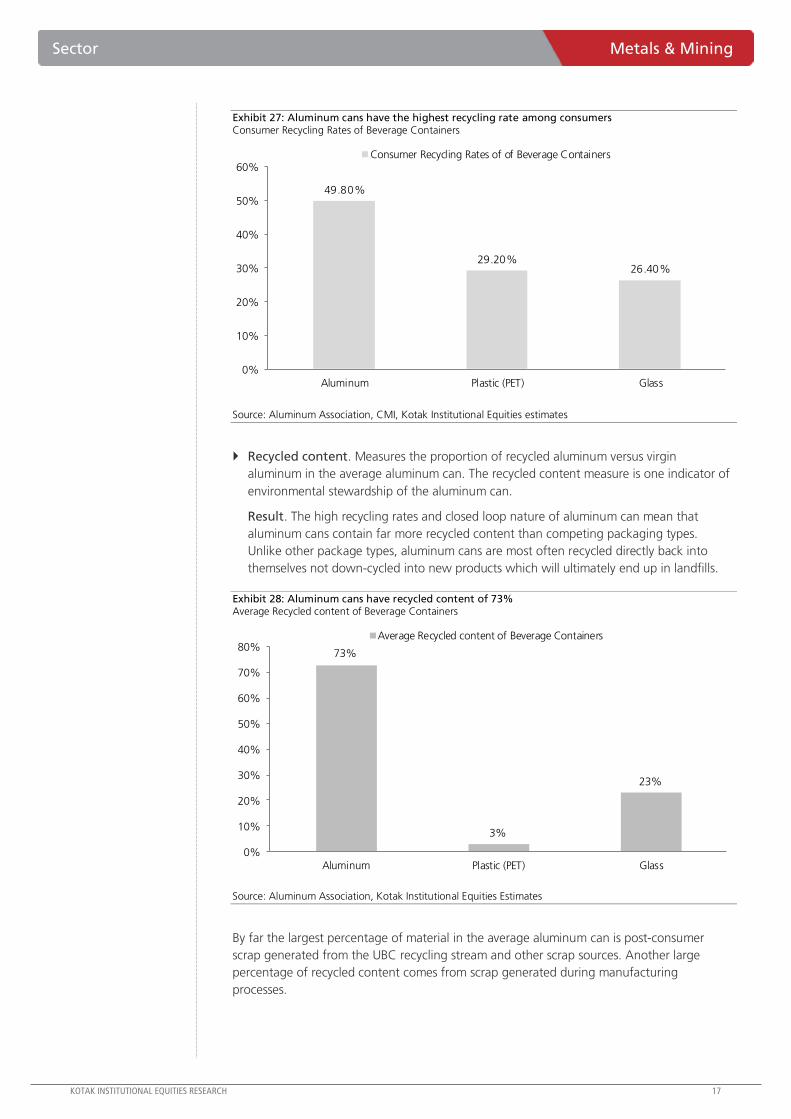
Sector Metals & Mining
Exhibit 27: Aluminum cans have the highest recycling rate among consumers Consumer Recycling Rates of Beverage Containers
49.80%
29.20%26.40%
0%
10%
20%
30%
40%
50%
60%
Aluminum Plastic (PET) Glass
Consumer Recycling Rates of of Beverage Containers
Source: Aluminum Association, CMI, Kotak Institutional Equities estimates
Recycled content. Measures the proportion of recycled aluminum versus virgin
aluminum in the average aluminum can. The recycled content measure is one indicator of
environmental stewardship of the aluminum can.
Result. The high recycling rates and closed loop nature of aluminum can mean that
aluminum cans contain far more recycled content than competing packaging types.
Unlike other package types, aluminum cans are most often recycled directly back into
themselves not down-cycled into new products which will ultimately end up in landfills.
Exhibit 28: Aluminum cans have recycled content of 73% Average Recycled content of Beverage Containers
73%
3%
23%
0%
10%
20%
30%
40%
50%
60%
70%
80%
Aluminum Plastic (PET) Glass
Average Recycled content of Beverage Containers
Source: Aluminum Association, Kotak Institutional Equities Estimates
By far the largest percentage of material in the average aluminum can is post-consumer
scrap generated from the UBC recycling stream and other scrap sources. Another large
percentage of recycled content comes from scrap generated during manufacturing
processes.
18 KOTAK INSTITUTIONAL EQUITIES RESEARCH
Metals & Mining Sector
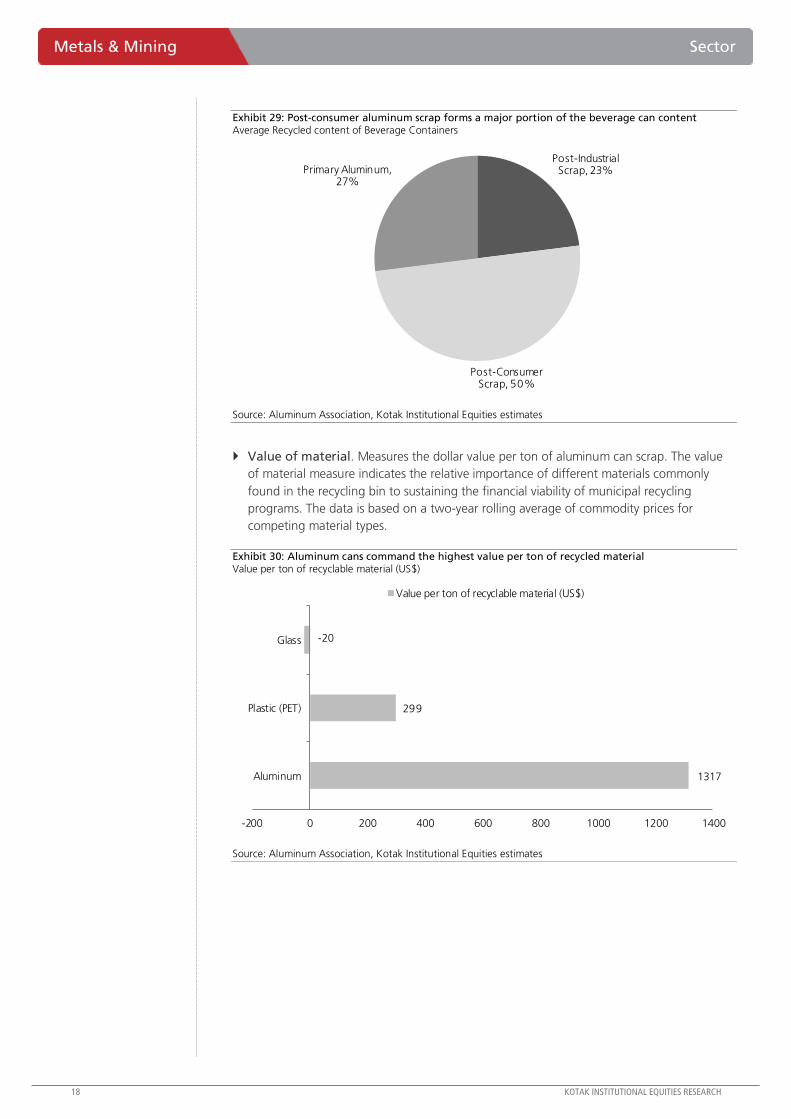
Exhibit 29: Post-consumer aluminum scrap forms a major portion of the beverage can content Average Recycled content of Beverage Containers
Post-Industrial Scrap, 23%
Post-Consumer Scrap, 50%
Primary Aluminum, 27%
Source: Aluminum Association, Kotak Institutional Equities estimates
Value of material. Measures the dollar value per ton of aluminum can scrap. The value
of material measure indicates the relative importance of different materials commonly
found in the recycling bin to sustaining the financial viability of municipal recycling
programs. The data is based on a two-year rolling average of commodity prices for
competing material types.
Exhibit 30: Aluminum cans command the highest value per ton of recycled material Value per ton of recyclable material (US$)
1317
299
-20
-200 0 200 400 600 800 1000 1200 1400
Aluminum
Plastic (PET)
Glass
Value per ton of recyclable material (US$)
Source: Aluminum Association, Kotak Institutional Equities estimates
KOTAK INSTITUTIONAL EQUITIES RESEARCH 19
Sector Metals & Mining
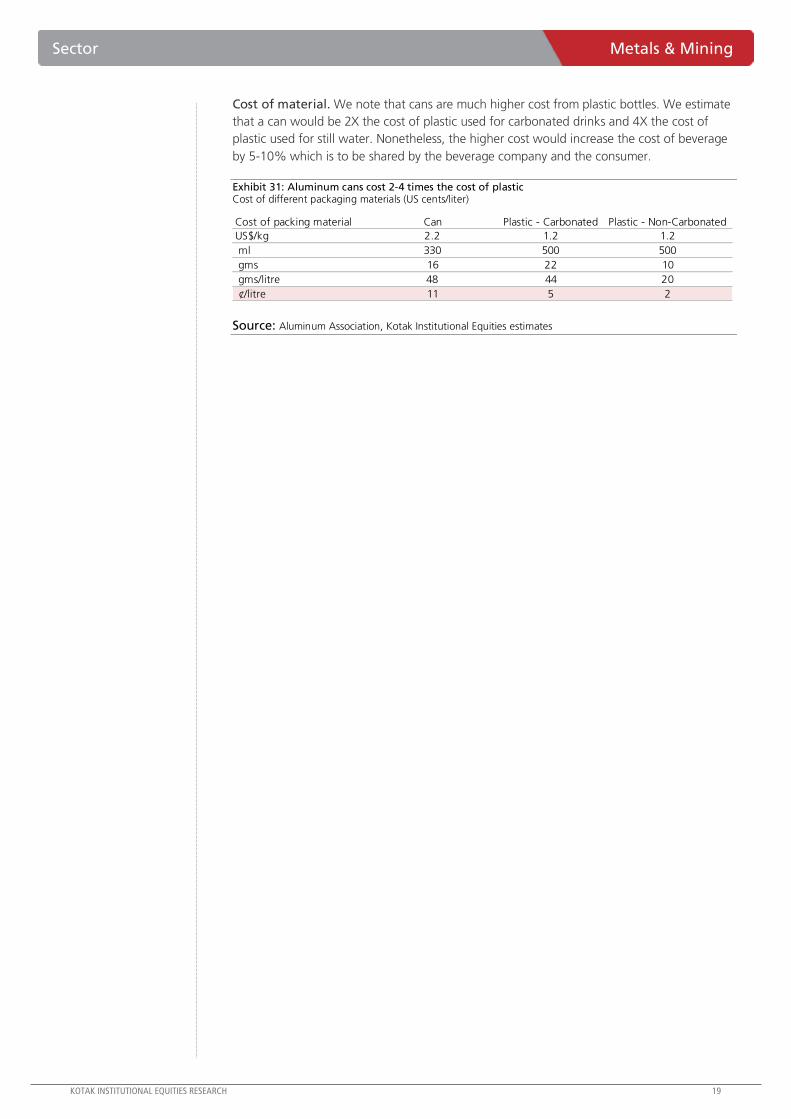
Cost of material. We note that cans are much higher cost from plastic bottles. We estimate
that a can would be 2X the cost of plastic used for carbonated drinks and 4X the cost of
plastic used for still water. Nonetheless, the higher cost would increase the cost of beverage
by 5-10% which is to be shared by the beverage company and the consumer.
Exhibit 31: Aluminum cans cost 2-4 times the cost of plastic Cost of different packaging materials (US cents/liter)
Cost of packing material Can Plastic - Carbonated Plastic - Non-Carbonated
US$/kg 2.2 1.2 1.2
ml 330 500 500
gms 16 22 10
gms/litre 48 44 20
¢/litre 11 5 2
Source: Aluminum Association, Kotak Institutional Equities estimates
20 KOTAK INSTITUTIONAL EQUITIES RESEARCH
Metals & Mining Sector
Plastic – bleak future
In recent years, a groundswell of negative publicity and consumer backlash has emerged
against disposable plastic products, particularly bottles. Images of bottles overflowing
landfills and adversely impacting ecosystems have soured consumers and drawn the ire of
environmental organizations and activists worldwide. As a result, many are calling for
increased government and industry intervention to address the growing problem.
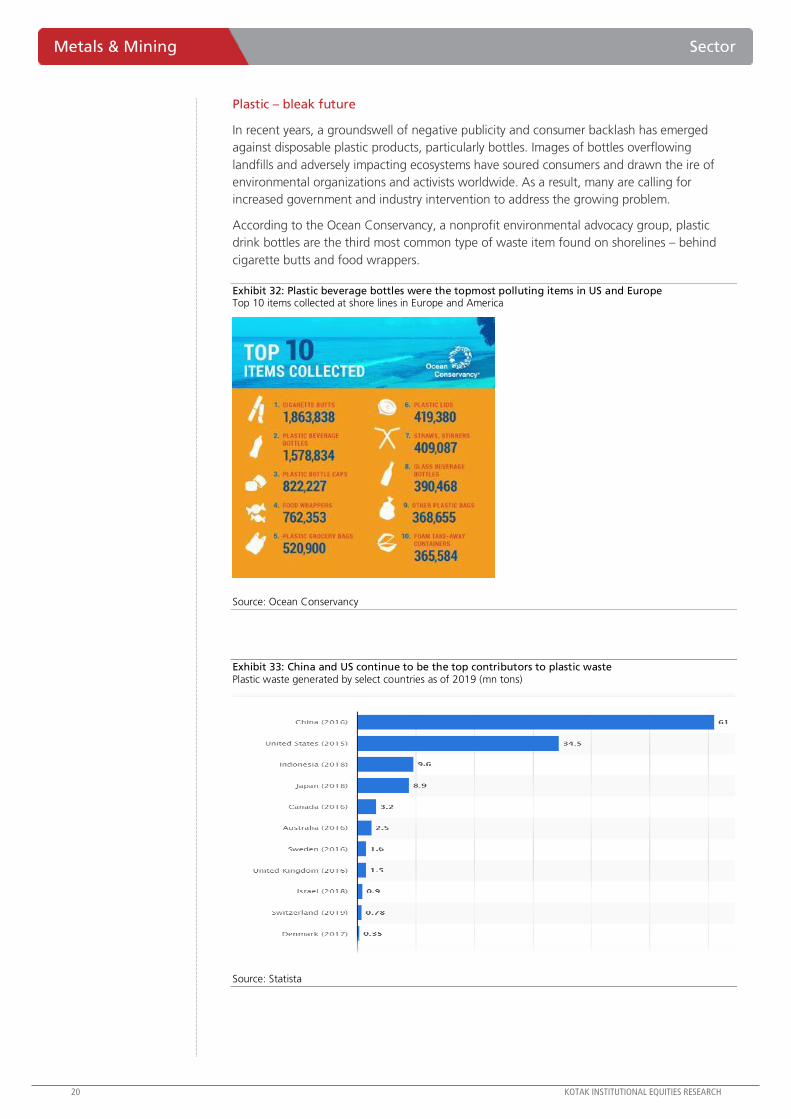
According to the Ocean Conservancy, a nonprofit environmental advocacy group, plastic
drink bottles are the third most common type of waste item found on shorelines – behind
cigarette butts and food wrappers.
Exhibit 32: Plastic beverage bottles were the topmost polluting items in US and Europe Top 10 items collected at shore lines in Europe and America
Source: Ocean Conservancy
Exhibit 33: China and US continue to be the top contributors to plastic waste Plastic waste generated by select countries as of 2019 (mn tons)
Source: Statista
KOTAK INSTITUTIONAL EQUITIES RESEARCH 21
Sector Metals & Mining
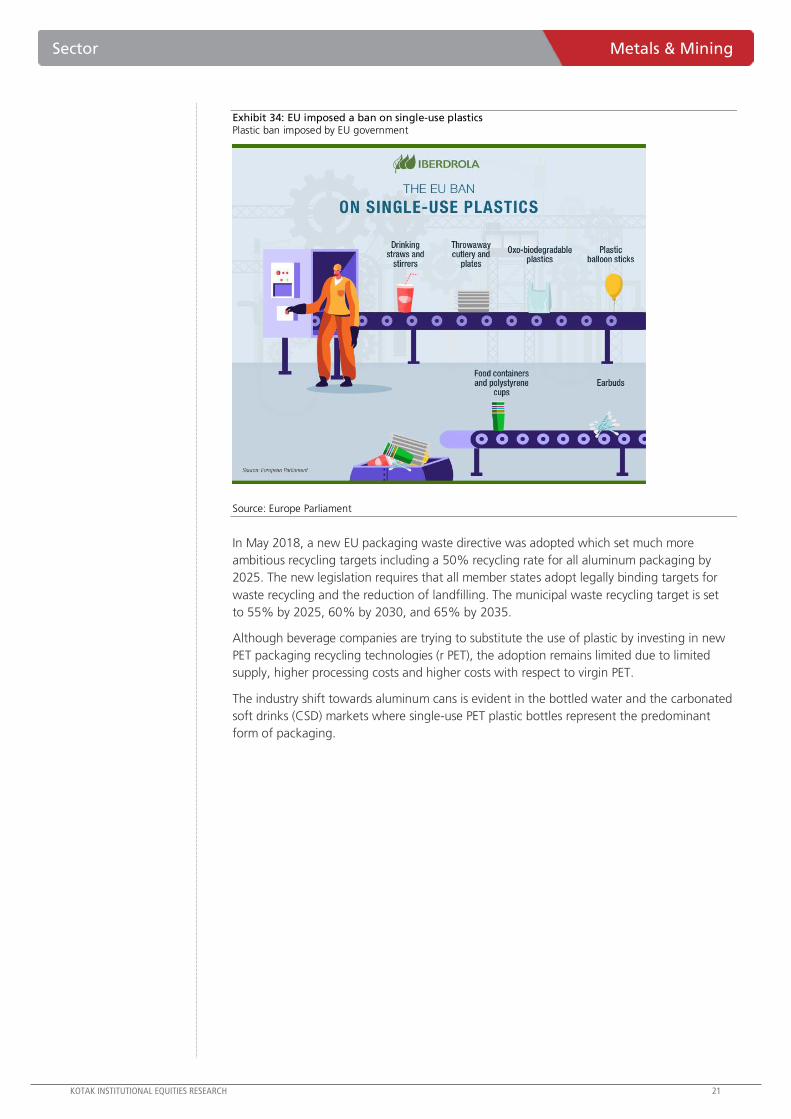
Exhibit 34: EU imposed a ban on single-use plastics Plastic ban imposed by EU government
Source: Europe Parliament
In May 2018, a new EU packaging waste directive was adopted which set much more
ambitious recycling targets including a 50% recycling rate for all aluminum packaging by
2025. The new legislation requires that all member states adopt legally binding targets for
waste recycling and the reduction of landfilling. The municipal waste recycling target is set
to 55% by 2025, 60% by 2030, and 65% by 2035.
Although beverage companies are trying to substitute the use of plastic by investing in new
PET packaging recycling technologies (r PET), the adoption remains limited due to limited
supply, higher processing costs and higher costs with respect to virgin PET.
The industry shift towards aluminum cans is evident in the bottled water and the carbonated
soft drinks (CSD) markets where single-use PET plastic bottles represent the predominant
form of packaging.
22 KOTAK INSTITUTIONAL EQUITIES RESEARCH
Metals & Mining Sector
CAN DEMAND: SET TO GROW STRUCTURALLY
We believe the market share shift from plastics to cans would continue in the current decade. ESG focus is
increasing among all stakeholders – corporates, consumers, investors and governments; and Covid-19 has only
helped. Sustainability is taking greater mind share and we believe it would gradually transit from
‘discretionary’ in nature towards ‘license to operate’ over coming years. With a 2-3% growth in beverage
packaging industry, aluminum cans should see a 4%/6% demand CAGR in our base/best case over CY2019-29E.
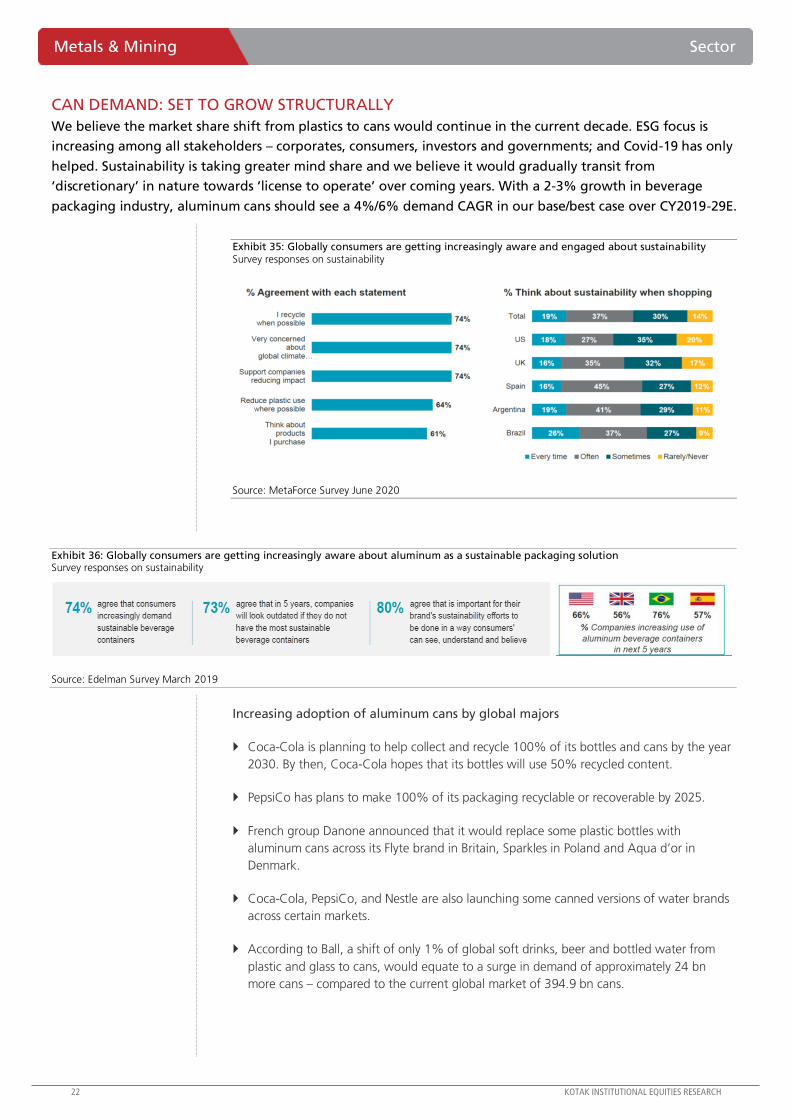
Exhibit 35: Globally consumers are getting increasingly aware and engaged about sustainability Survey responses on sustainability
Source: MetaForce Survey June 2020
Exhibit 36: Globally consumers are getting increasingly aware about aluminum as a sustainable packaging solution Survey responses on sustainability
Source: Edelman Survey March 2019
Increasing adoption of aluminum cans by global majors
Coca-Cola is planning to help collect and recycle 100% of its bottles and cans by the year
2030. By then, Coca-Cola hopes that its bottles will use 50% recycled content.
PepsiCo has plans to make 100% of its packaging recyclable or recoverable by 2025.
French group Danone announced that it would replace some plastic bottles with
aluminum cans across its Flyte brand in Britain, Sparkles in Poland and Aqua d’or in
Denmark.
Coca-Cola, PepsiCo, and Nestle are also launching some canned versions of water brands
across certain markets.
According to Ball, a shift of only 1% of global soft drinks, beer and bottled water from
plastic and glass to cans, would equate to a surge in demand of approximately 24 bn
more cans – compared to the current global market of 394.9 bn cans.
KOTAK INSTITUTIONAL EQUITIES RESEARCH 23
Sector Metals & Mining
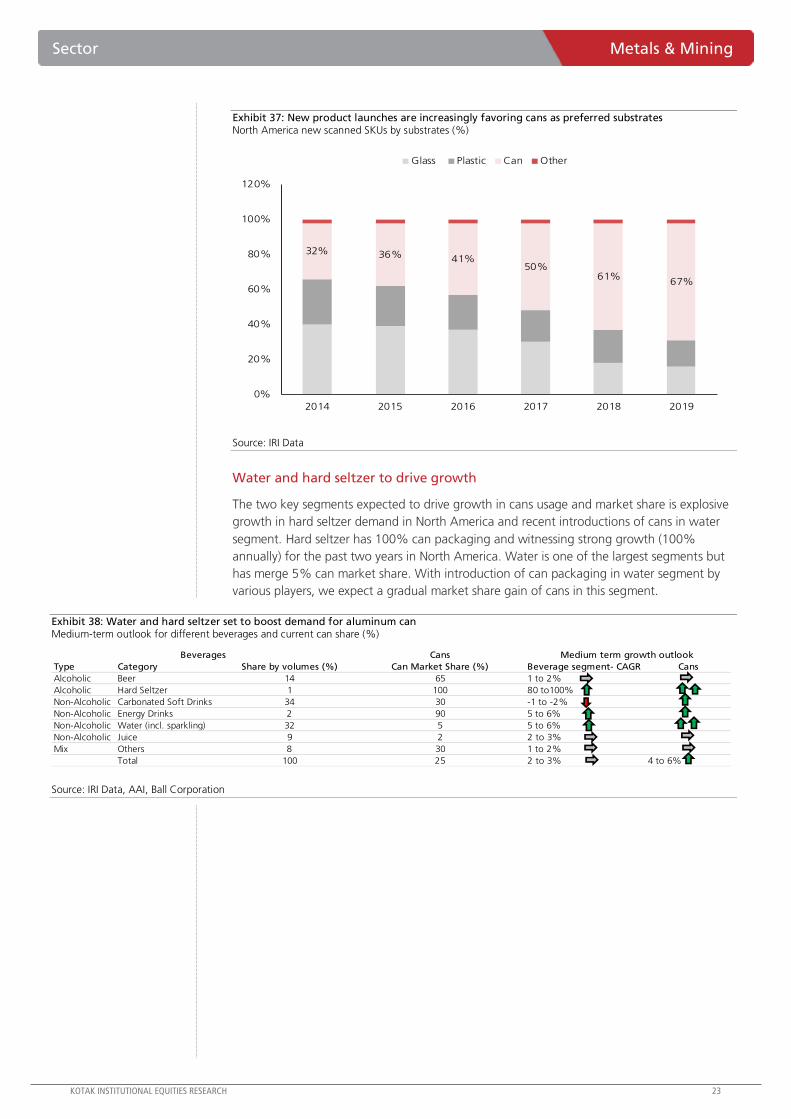
Exhibit 37: New product launches are increasingly favoring cans as preferred substrates North America new scanned SKUs by substrates (%)
32% 36% 41%50%
61%67%
0%
20%
40%
60%
80%
100%
120%
2014 2015 2016 2017 2018 2019
Glass Plastic Can Other
Source: IRI Data
Water and hard seltzer to drive growth
The two key segments expected to drive growth in cans usage and market share is explosive
growth in hard seltzer demand in North America and recent introductions of cans in water
segment. Hard seltzer has 100% can packaging and witnessing strong growth (100%
annually) for the past two years in North America. Water is one of the largest segments but
has merge 5% can market share. With introduction of can packaging in water segment by
various players, we expect a gradual market share gain of cans in this segment.
Exhibit 38: Water and hard seltzer set to boost demand for aluminum can Medium-term outlook for different beverages and current can share (%)
Cans
Type Category Share by volumes (%) Can Market Share (%) Beverage segment- CAGR Cans
Alcoholic Beer 14 65 1 to 2%
Alcoholic Hard Seltzer 1 100 80 to100%
Non-Alcoholic Carbonated Soft Drinks 34 30 -1 to -2%
Non-Alcoholic Energy Drinks 2 90 5 to 6%
Non-Alcoholic Water (incl. sparkling) 32 5 5 to 6%
Non-Alcoholic Juice 9 2 2 to 3%
Mix Others 8 30 1 to 2%
Total 100 25 2 to 3% 4 to 6%
Medium term growth outlook Beverages
Source: IRI Data, AAI, Ball Corporation
24 KOTAK INSTITUTIONAL EQUITIES RESEARCH
Metals & Mining Sector
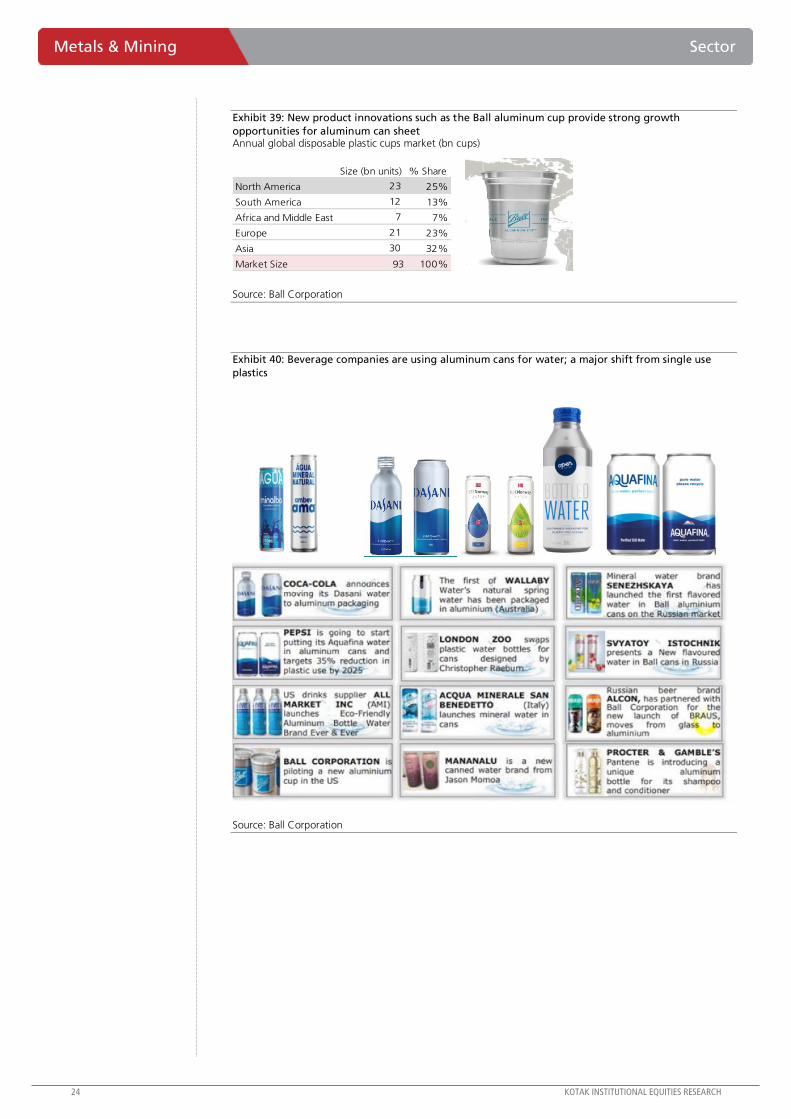
Exhibit 39: New product innovations such as the Ball aluminum cup provide strong growth
opportunities for aluminum can sheet Annual global disposable plastic cups market (bn cups)
Size (bn units) % Share
North America 23 25%
South America 12 13%
Africa and Middle East 7 7%
Europe 21 23%
Asia 30 32%
Market Size 93 100%
Source: Ball Corporation
Exhibit 40: Beverage companies are using aluminum cans for water; a major shift from single use
plastics
Source: Ball Corporation
KOTAK INSTITUTIONAL EQUITIES RESEARCH 25
Sector Metals & Mining
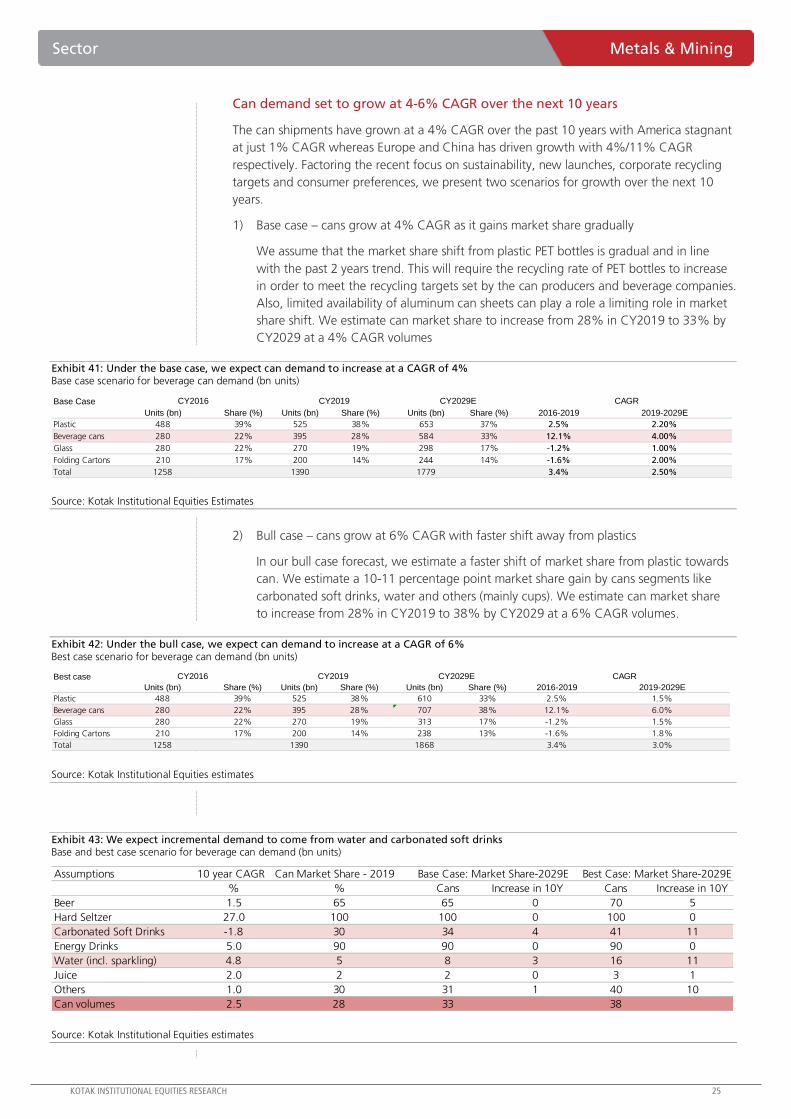
Can demand set to grow at 4-6% CAGR over the next 10 years
The can shipments have grown at a 4% CAGR over the past 10 years with America stagnant
at just 1% CAGR whereas Europe and China has driven growth with 4%/11% CAGR
respectively. Factoring the recent focus on sustainability, new launches, corporate recycling
targets and consumer preferences, we present two scenarios for growth over the next 10
years.
1) Base case – cans grow at 4% CAGR as it gains market share gradually
We assume that the market share shift from plastic PET bottles is gradual and in line
with the past 2 years trend. This will require the recycling rate of PET bottles to increase
in order to meet the recycling targets set by the can producers and beverage companies.
Also, limited availability of aluminum can sheets can play a role a limiting role in market
share shift. We estimate can market share to increase from 28% in CY2019 to 33% by
CY2029 at a 4% CAGR volumes
Exhibit 41: Under the base case, we expect can demand to increase at a CAGR of 4% Base case scenario for beverage can demand (bn units)
Base Case
Units (bn) Share (%) Units (bn) Share (%) Units (bn) Share (%) 2016-2019 2019-2029E
Plastic 488 39% 525 38% 653 37% 2.5% 2.20%
Beverage cans 280 22% 395 28% 584 33% 12.1% 4.00%
Glass 280 22% 270 19% 298 17% -1.2% 1.00%
Folding Cartons 210 17% 200 14% 244 14% -1.6% 2.00%
Total 1258 1390 1779 3.4% 2.50%
CAGRCY2016 CY2019 CY2029E
Source: Kotak Institutional Equities Estimates
2) Bull case – cans grow at 6% CAGR with faster shift away from plastics
In our bull case forecast, we estimate a faster shift of market share from plastic towards
can. We estimate a 10-11 percentage point market share gain by cans segments like
carbonated soft drinks, water and others (mainly cups). We estimate can market share
to increase from 28% in CY2019 to 38% by CY2029 at a 6% CAGR volumes.
Exhibit 42: Under the bull case, we expect can demand to increase at a CAGR of 6% Best case scenario for beverage can demand (bn units)
Best case
Units (bn) Share (%) Units (bn) Share (%) Units (bn) Share (%) 2016-2019 2019-2029E
Plastic 488 39% 525 38% 610 33% 2.5% 1.5%
Beverage cans 280 22% 395 28% 707 38% 12.1% 6.0%
Glass 280 22% 270 19% 313 17% -1.2% 1.5%
Folding Cartons 210 17% 200 14% 238 13% -1.6% 1.8%
Total 1258 1390 1868 3.4% 3.0%
CAGRCY2016 CY2019 CY2029E
Source: Kotak Institutional Equities estimates
Exhibit 43: We expect incremental demand to come from water and carbonated soft drinks Base and best case scenario for beverage can demand (bn units)
Assumptions 10 year CAGR Can Market Share - 2019
% % Cans Increase in 10Y Cans Increase in 10Y
Beer 1.5 65 65 0 70 5
Hard Seltzer 27.0 100 100 0 100 0
Carbonated Soft Drinks -1.8 30 34 4 41 11
Energy Drinks 5.0 90 90 0 90 0
Water (incl. sparkling) 4.8 5 8 3 16 11
Juice 2.0 2 2 0 3 1
Others 1.0 30 31 1 40 10
Can volumes 2.5 28 33 38
Base Case: Market Share-2029E Best Case: Market Share-2029E
Source: Kotak Institutional Equities estimates
26 KOTAK INSTITUTIONAL EQUITIES RESEARCH
Metals & Mining Sector
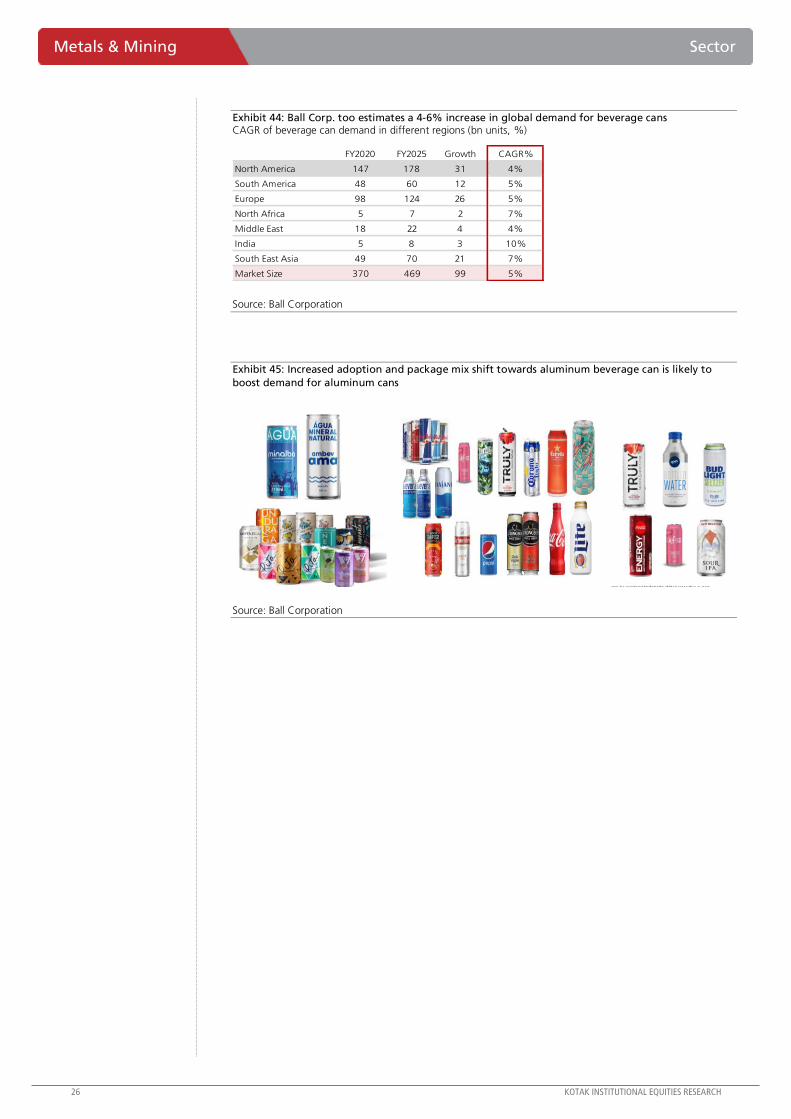
Exhibit 44: Ball Corp. too estimates a 4-6% increase in global demand for beverage cans CAGR of beverage can demand in different regions (bn units, %)
FY2020 FY2025 Growth CAGR%
North America 147 178 31 4%
South America 48 60 12 5%
Europe 98 124 26 5%
North Africa 5 7 2 7%
Middle East 18 22 4 4%
India 5 8 3 10%
South East Asia 49 70 21 7%
Market Size 370 469 99 5%
Source: Ball Corporation
Exhibit 45: Increased adoption and package mix shift towards aluminum beverage can is likely to
boost demand for aluminum cans
Source: Ball Corporation
KOTAK INSTITUTIONAL EQUITIES RESEARCH 27
Sector Metals & Mining
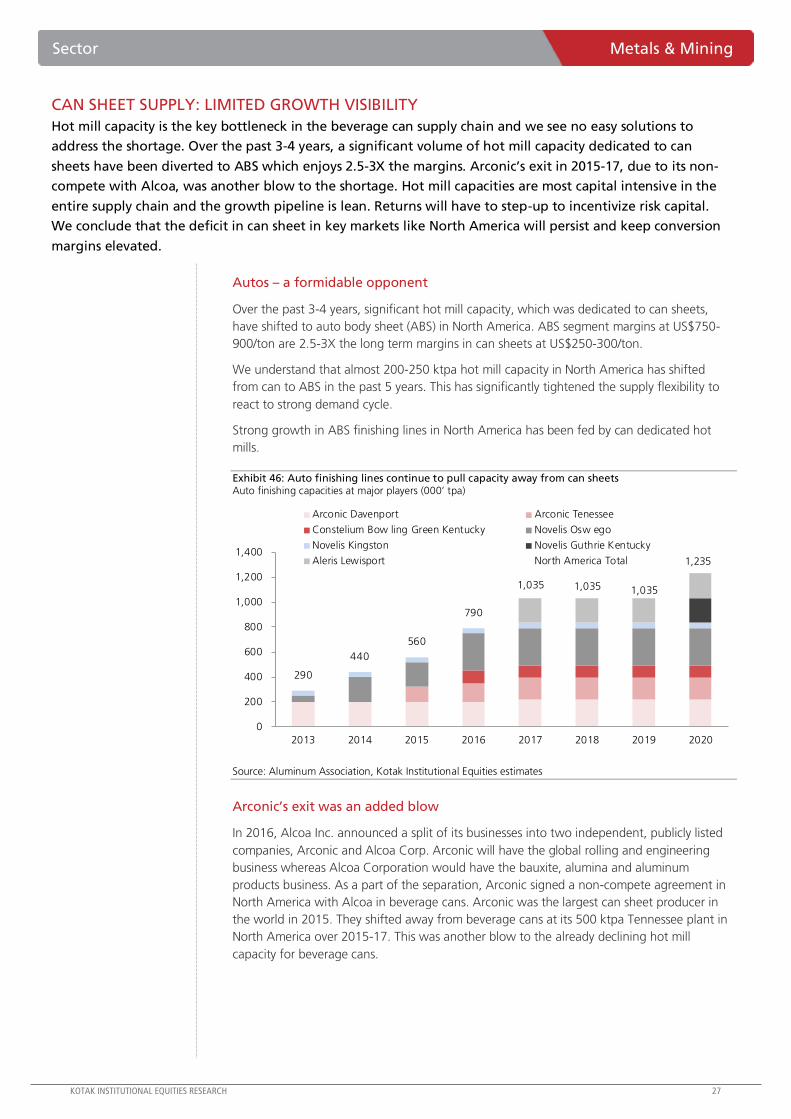
CAN SHEET SUPPLY: LIMITED GROWTH VISIBILITY
Hot mill capacity is the key bottleneck in the beverage can supply chain and we see no easy solutions to
address the shortage. Over the past 3-4 years, a significant volume of hot mill capacity dedicated to can
sheets have been diverted to ABS which enjoys 2.5-3X the margins. Arconic’s exit in 2015-17, due to its non-
compete with Alcoa, was another blow to the shortage. Hot mill capacities are most capital intensive in the
entire supply chain and the growth pipeline is lean. Returns will have to step-up to incentivize risk capital.
We conclude that the deficit in can sheet in key markets like North America will persist and keep conversion
margins elevated.
Autos – a formidable opponent
Over the past 3-4 years, significant hot mill capacity, which was dedicated to can sheets,
have shifted to auto body sheet (ABS) in North America. ABS segment margins at US$750-
900/ton are 2.5-3X the long term margins in can sheets at US$250-300/ton.
We understand that almost 200-250 ktpa hot mill capacity in North America has shifted
from can to ABS in the past 5 years. This has significantly tightened the supply flexibility to
react to strong demand cycle.
Strong growth in ABS finishing lines in North America has been fed by can dedicated hot
mills.
Exhibit 46: Auto finishing lines continue to pull capacity away from can sheets Auto finishing capacities at major players (000’ tpa)
290
440
560
790
1,035 1,035 1,035
1,235
0
200
400
600
800
1,000
1,200
1,400
2013 2014 2015 2016 2017 2018 2019 2020
Arconic Davenport Arconic Tenessee
Constelium Bow ling Green Kentucky Novelis Osw ego
Novelis Kingston Novelis Guthrie Kentucky
Aleris Lewisport North America Total
Source: Aluminum Association, Kotak Institutional Equities estimates
Arconic’s exit was an added blow
In 2016, Alcoa Inc. announced a split of its businesses into two independent, publicly listed
companies, Arconic and Alcoa Corp. Arconic will have the global rolling and engineering
business whereas Alcoa Corporation would have the bauxite, alumina and aluminum
products business. As a part of the separation, Arconic signed a non-compete agreement in
North America with Alcoa in beverage cans. Arconic was the largest can sheet producer in
the world in 2015. They shifted away from beverage cans at its 500 ktpa Tennessee plant in
North America over 2015-17. This was another blow to the already declining hot mill
capacity for beverage cans.
28 KOTAK INSTITUTIONAL EQUITIES RESEARCH
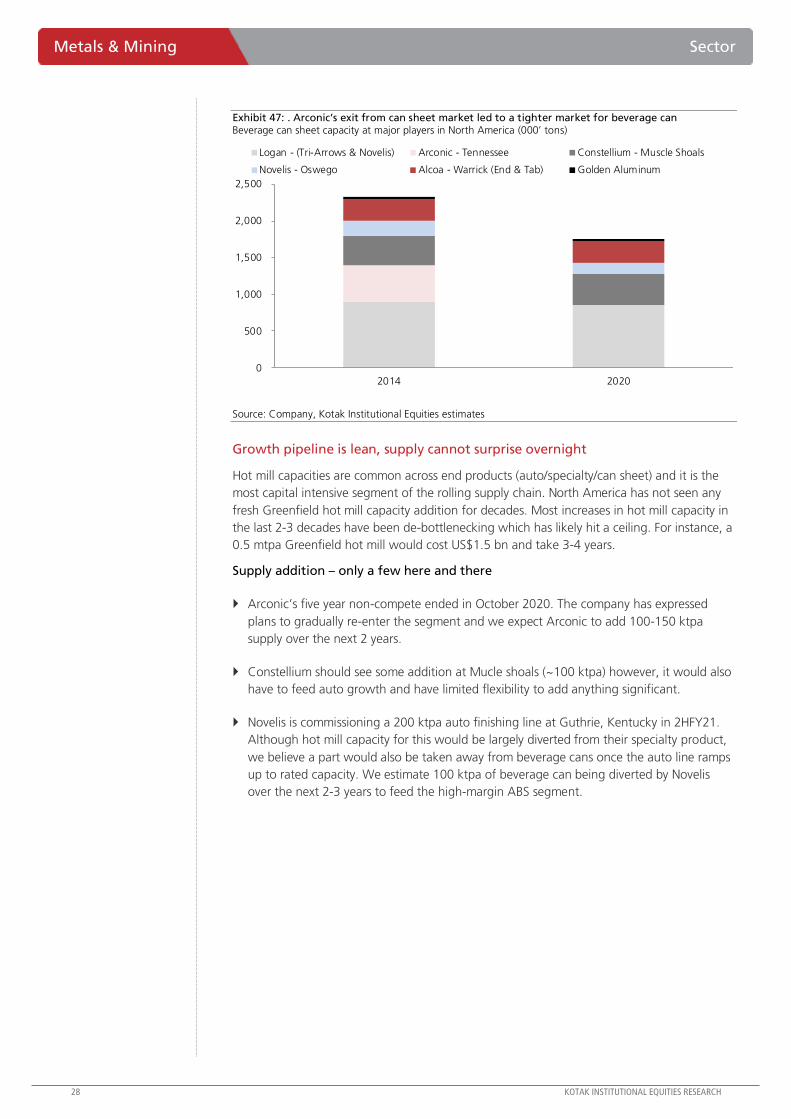
Metals & Mining Sector
Exhibit 47: . Arconic’s exit from can sheet market led to a tighter market for beverage can Beverage can sheet capacity at major players in North America (000’ tons)
0
500
1,000
1,500
2,000
2,500
2014 2020
Logan - (Tri-Arrows & Novelis) Arconic - Tennessee Constellium - Muscle Shoals
Novelis - Oswego Alcoa - Warrick (End & Tab) Golden Aluminum
Source: Company, Kotak Institutional Equities estimates
Growth pipeline is lean, supply cannot surprise overnight
Hot mill capacities are common across end products (auto/specialty/can sheet) and it is the
most capital intensive segment of the rolling supply chain. North America has not seen any
fresh Greenfield hot mill capacity addition for decades. Most increases in hot mill capacity in
the last 2-3 decades have been de-bottlenecking which has likely hit a ceiling. For instance, a
0.5 mtpa Greenfield hot mill would cost US$1.5 bn and take 3-4 years.
Supply addition – only a few here and there
Arconic’s five year non-compete ended in October 2020. The company has expressed
plans to gradually re-enter the segment and we expect Arconic to add 100-150 ktpa
supply over the next 2 years.
Constellium should see some addition at Mucle shoals (~100 ktpa) however, it would also
have to feed auto growth and have limited flexibility to add anything significant.
Novelis is commissioning a 200 ktpa auto finishing line at Guthrie, Kentucky in 2HFY21.
Although hot mill capacity for this would be largely diverted from their specialty product,
we believe a part would also be taken away from beverage cans once the auto line ramps
up to rated capacity. We estimate 100 ktpa of beverage can being diverted by Novelis
over the next 2-3 years to feed the high-margin ABS segment.
KOTAK INSTITUTIONAL EQUITIES RESEARCH 29
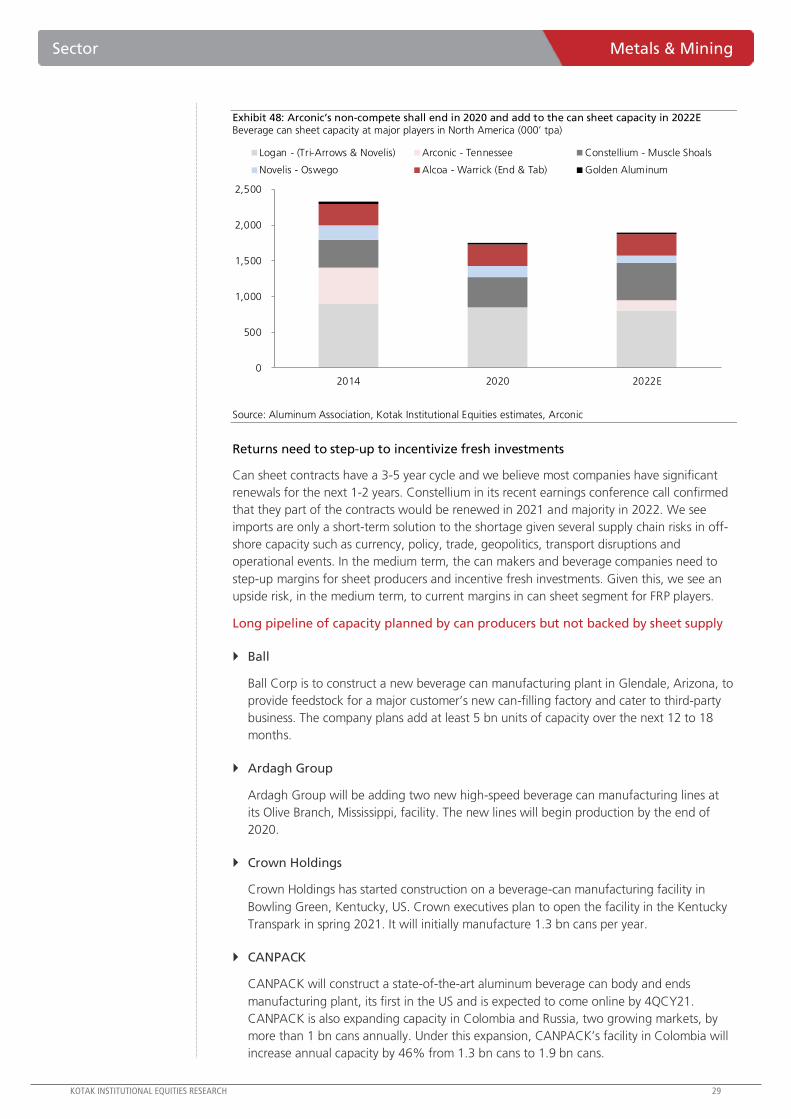
Sector Metals & Mining
Exhibit 48: Arconic’s non-compete shall end in 2020 and add to the can sheet capacity in 2022E Beverage can sheet capacity at major players in North America (000’ tpa)
0
500
1,000
1,500
2,000
2,500
2014 2020 2022E
Logan - (Tri-Arrows & Novelis) Arconic - Tennessee Constellium - Muscle Shoals
Novelis - Oswego Alcoa - Warrick (End & Tab) Golden Aluminum
Source: Aluminum Association, Kotak Institutional Equities estimates, Arconic
Returns need to step-up to incentivize fresh investments
Can sheet contracts have a 3-5 year cycle and we believe most companies have significant
renewals for the next 1-2 years. Constellium in its recent earnings conference call confirmed
that they part of the contracts would be renewed in 2021 and majority in 2022. We see
imports are only a short-term solution to the shortage given several supply chain risks in off-
shore capacity such as currency, policy, trade, geopolitics, transport disruptions and
operational events. In the medium term, the can makers and beverage companies need to
step-up margins for sheet producers and incentive fresh investments. Given this, we see an
upside risk, in the medium term, to current margins in can sheet segment for FRP players.
Long pipeline of capacity planned by can producers but not backed by sheet supply
Ball
Ball Corp is to construct a new beverage can manufacturing plant in Glendale, Arizona, to
provide feedstock for a major customer’s new can-filling factory and cater to third-party
business. The company plans add at least 5 bn units of capacity over the next 12 to 18
months.
Ardagh Group
Ardagh Group will be adding two new high-speed beverage can manufacturing lines at
its Olive Branch, Mississippi, facility. The new lines will begin production by the end of
2020.
Crown Holdings
Crown Holdings has started construction on a beverage-can manufacturing facility in
Bowling Green, Kentucky, US. Crown executives plan to open the facility in the Kentucky
Transpark in spring 2021. It will initially manufacture 1.3 bn cans per year.
CANPACK
CANPACK will construct a state-of-the-art aluminum beverage can body and ends
manufacturing plant, its first in the US and is expected to come online by 4QCY21.
CANPACK is also expanding capacity in Colombia and Russia, two growing markets, by
more than 1 bn cans annually. Under this expansion, CANPACK’s facility in Colombia will
increase annual capacity by 46% from 1.3 bn cans to 1.9 bn cans.
30 KOTAK INSTITUTIONAL EQUITIES RESEARCH
Metals & Mining Sector
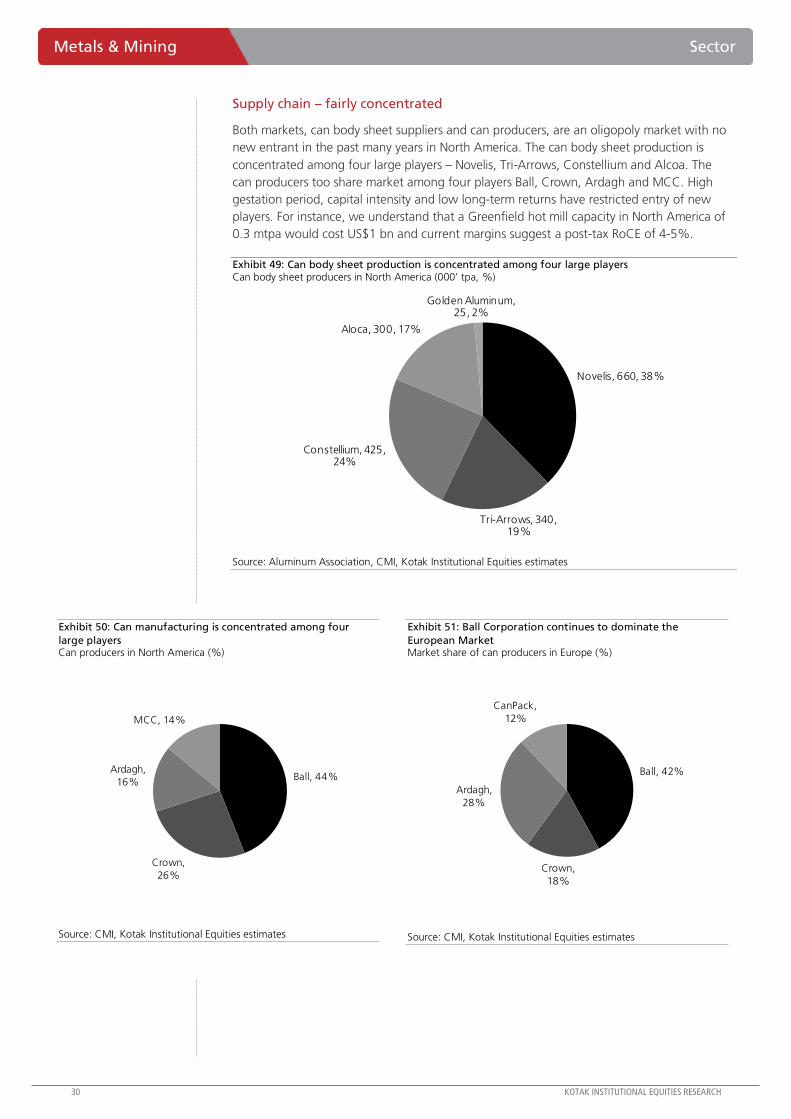
Supply chain – fairly concentrated
Both markets, can body sheet suppliers and can producers, are an oligopoly market with no
new entrant in the past many years in North America. The can body sheet production is
concentrated among four large players – Novelis, Tri-Arrows, Constellium and Alcoa. The
can producers too share market among four players Ball, Crown, Ardagh and MCC. High
gestation period, capital intensity and low long-term returns have restricted entry of new
players. For instance, we understand that a Greenfield hot mill capacity in North America of
0.3 mtpa would cost US$1 bn and current margins suggest a post-tax RoCE of 4-5%.
Exhibit 49: Can body sheet production is concentrated among four large players Can body sheet producers in North America (000’ tpa, %)
Novelis, 660, 38%
Tri-Arrows, 340, 19%
Constellium, 425, 24%
Aloca, 300, 17%
Golden Aluminum, 25, 2%
Source: Aluminum Association, CMI, Kotak Institutional Equities estimates
Exhibit 50: Can manufacturing is concentrated among four
large players Can producers in North America (%)
Ball, 44%
Crown,
26%
Ardagh,
16%
MCC, 14%
Source: CMI, Kotak Institutional Equities estimates
Exhibit 51: Ball Corporation continues to dominate the
European Market Market share of can producers in Europe (%)
Ball, 42%
Crown,
18%
Ardagh,
28%
CanPack,
12%
Source: CMI, Kotak Institutional Equities estimates
KOTAK INSTITUTIONAL EQUITIES RESEARCH 31
Sector Metals & Mining
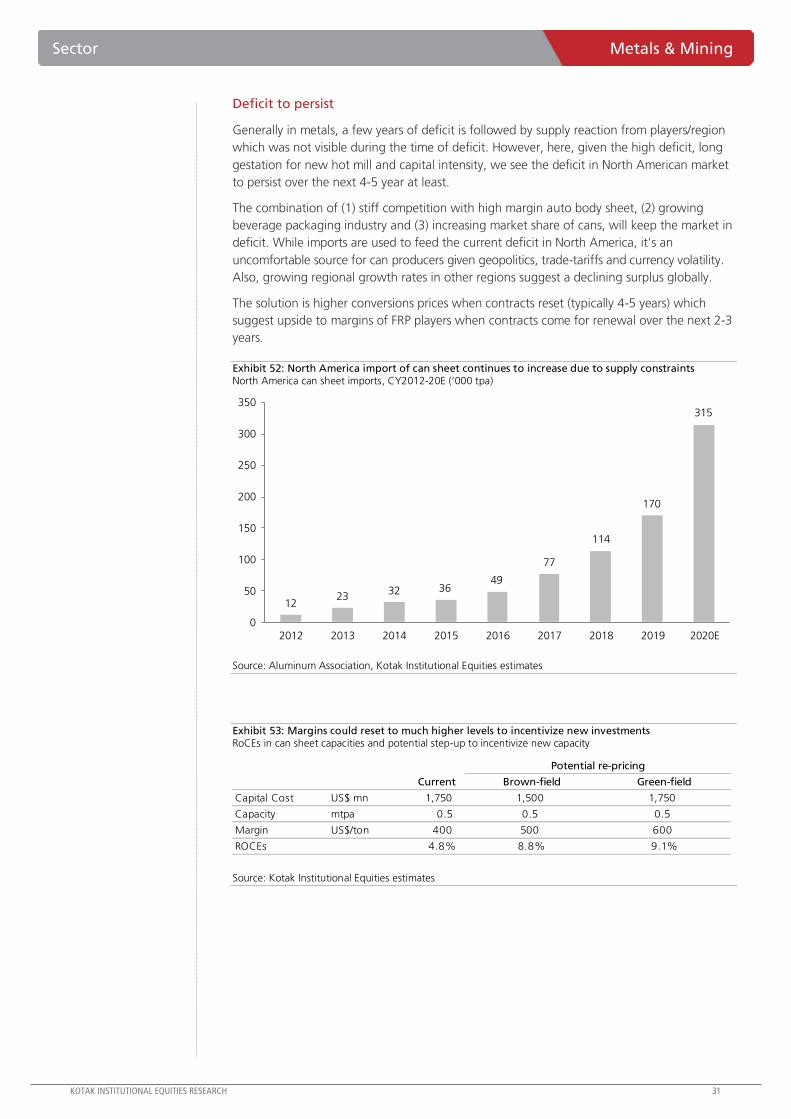
Deficit to persist
Generally in metals, a few years of deficit is followed by supply reaction from players/region
which was not visible during the time of deficit. However, here, given the high deficit, long
gestation for new hot mill and capital intensity, we see the deficit in North American market
to persist over the next 4-5 year at least.
The combination of (1) stiff competition with high margin auto body sheet, (2) growing
beverage packaging industry and (3) increasing market share of cans, will keep the market in
deficit. While imports are used to feed the current deficit in North America, it’s an
uncomfortable source for can producers given geopolitics, trade-tariffs and currency volatility.
Also, growing regional growth rates in other regions suggest a declining surplus globally.
The solution is higher conversions prices when contracts reset (typically 4-5 years) which
suggest upside to margins of FRP players when contracts come for renewal over the next 2-3
years.
Exhibit 52: North America import of can sheet continues to increase due to supply constraints North America can sheet imports, CY2012-20E (‘000 tpa)
1223
32 3649
77
114
170
315
0
50
100
150
200
250
300
350
2012 2013 2014 2015 2016 2017 2018 2019 2020E
Source: Aluminum Association, Kotak Institutional Equities estimates
Exhibit 53: Margins could reset to much higher levels to incentivize new investments RoCEs in can sheet capacities and potential step-up to incentivize new capacity
Current Brown-field Green-field
Capital Cost US$ mn 1,750 1,500 1,750
Capacity mtpa 0.5 0.5 0.5
Margin US$/ton 400 500 600
ROCEs 4.8% 8.8% 9.1%
Potential re-pricing
Source: Kotak Institutional Equities estimates
32 KOTAK INSTITUTIONAL EQUITIES RESEARCH
Metals & Mining Sector
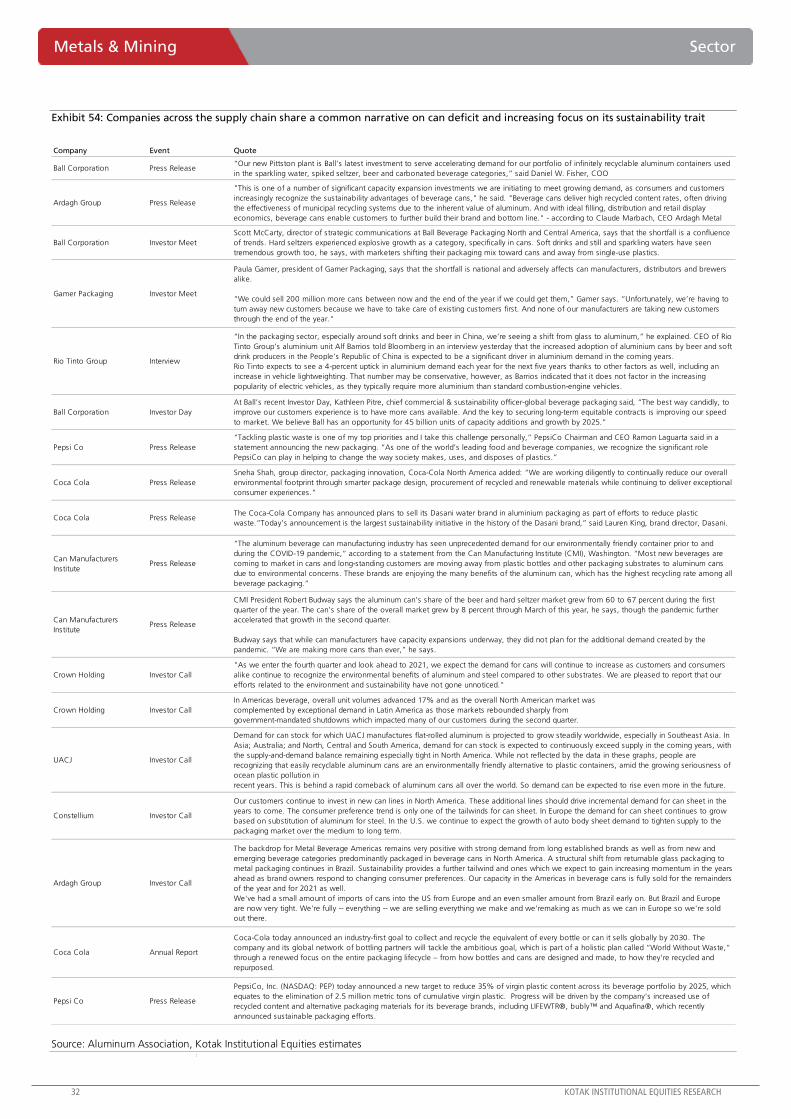
Exhibit 54: Companies across the supply chain share a common narrative on can deficit and increasing focus on its sustainability trait
Company Event Quote
Ball Corporation Press Release“Our new Pittston plant is Ball’s latest investment to serve accelerating demand for our portfolio of infinitely recyclable aluminum containers used
in the sparkling water, spiked seltzer, beer and carbonated beverage categories,” said Daniel W. Fisher, COO
Ardagh Group Press Release
"This is one of a number of significant capacity expansion investments we are initiating to meet growing demand, as consumers and customers
increasingly recognize the sustainability advantages of beverage cans," he said. "Beverage cans deliver high recycled content rates, often driving
the effectiveness of municipal recycling systems due to the inherent value of aluminum. And with ideal filling, distribution and retail display
economics, beverage cans enable customers to further build their brand and bottom line." - according to Claude Marbach, CEO Ardagh Metal
Ball Corporation Investor Meet
Scott McCarty, director of strategic communications at Ball Beverage Packaging North and Central America, says that the shortfall is a confluence
of trends. Hard seltzers experienced explosive growth as a category, specifically in cans. Soft drinks and still and sparkling waters have seen
tremendous growth too, he says, with marketers shifting their packaging mix toward cans and away from single-use plastics.
Gamer Packaging Investor Meet
Paula Gamer, president of Gamer Packaging, says that the shortfall is national and adversely affects can manufacturers, distributors and brewers
alike.
“We could sell 200 million more cans between now and the end of the year if we could get them,” Gamer says. “Unfortunately, we’re having to
turn away new customers because we have to take care of existing customers first. And none of our manufacturers are taking new customers
through the end of the year."
Rio Tinto Group Interview
“In the packaging sector, especially around soft drinks and beer in China, we’re seeing a shift from glass to aluminum,” he explained. CEO of Rio
Tinto Group’s aluminium unit Alf Barrios told Bloomberg in an interview yesterday that the increased adoption of aluminium cans by beer and soft
drink producers in the People’s Republic of China is expected to be a significant driver in aluminium demand in the coming years.
Rio Tinto expects to see a 4-percent uptick in aluminium demand each year for the next five years thanks to other factors as well, including an
increase in vehicle lightweighting. That number may be conservative, however, as Barrios indicated that it does not factor in the increasing
popularity of electric vehicles, as they typically require more aluminium than standard combustion-engine vehicles.
Ball Corporation Investor Day
At Ball’s recent Investor Day, Kathleen Pitre, chief commercial & sustainability officer-global beverage packaging said, “The best way candidly, to
improve our customers experience is to have more cans available. And the key to securing long-term equitable contracts is improving our speed
to market. We believe Ball has an opportunity for 45 billion units of capacity additions and growth by 2025.”
Pepsi Co Press Release
“Tackling plastic waste is one of my top priorities and I take this challenge personally,” PepsiCo Chairman and CEO Ramon Laguarta said in a
statement announcing the new packaging. “As one of the world’s leading food and beverage companies, we recognize the significant role
PepsiCo can play in helping to change the way society makes, uses, and disposes of plastics.”
Coca Cola Press Release
Sneha Shah, group director, packaging innovation, Coca-Cola North America added: “We are working diligently to continually reduce our overall
environmental footprint through smarter package design, procurement of recycled and renewable materials while continuing to deliver exceptional
consumer experiences.”
Coca Cola Press ReleaseThe Coca-Cola Company has announced plans to sell its Dasani water brand in aluminium packaging as part of efforts to reduce plastic
waste.“Today’s announcement is the largest sustainability initiative in the history of the Dasani brand,” said Lauren King, brand director, Dasani.
Can Manufacturers
InstitutePress Release
“The aluminum beverage can manufacturing industry has seen unprecedented demand for our environmentally friendly container prior to and
during the COVID-19 pandemic,” according to a statement from the Can Manufacturing Institute (CMI), Washington. “Most new beverages are
coming to market in cans and long-standing customers are moving away from plastic bottles and other packaging substrates to aluminum cans
due to environmental concerns. These brands are enjoying the many benefits of the aluminum can, which has the highest recycling rate among all
beverage packaging.”
Can Manufacturers
InstitutePress Release
CMI President Robert Budway says the aluminum can’s share of the beer and hard seltzer market grew from 60 to 67 percent during the first
quarter of the year. The can’s share of the overall market grew by 8 percent through March of this year, he says, though the pandemic further
accelerated that growth in the second quarter.
Budway says that while can manufacturers have capacity expansions underway, they did not plan for the additional demand created by the
pandemic. “We are making more cans than ever,” he says.
Crown Holding Investor Call
"As we enter the fourth quarter and look ahead to 2021, we expect the demand for cans will continue to increase as customers and consumers
alike continue to recognize the environmental benefits of aluminum and steel compared to other substrates. We are pleased to report that our
efforts related to the environment and sustainability have not gone unnoticed."
Crown Holding Investor Call
In Americas beverage, overall unit volumes advanced 17% and as the overall North American market was
complemented by exceptional demand in Latin America as those markets rebounded sharply from
government-mandated shutdowns which impacted many of our customers during the second quarter.
UACJ Investor Call
Demand for can stock for which UACJ manufactures flat-rolled aluminum is projected to grow steadily worldwide, especially in Southeast Asia. In
Asia; Australia; and North, Central and South America, demand for can stock is expected to continuously exceed supply in the coming years, with
the supply-and-demand balance remaining especially tight in North America. While not reflected by the data in these graphs, people are
recognizing that easily recyclable aluminum cans are an environmentally friendly alternative to plastic containers, amid the growing seriousness of
ocean plastic pollution in
recent years. This is behind a rapid comeback of aluminum cans all over the world. So demand can be expected to rise even more in the future.
Constellium Investor Call
Our customers continue to invest in new can lines in North America. These additional lines should drive incremental demand for can sheet in the
years to come. The consumer preference trend is only one of the tailwinds for can sheet. In Europe the demand for can sheet continues to grow
based on substitution of aluminum for steel. In the U.S. we continue to expect the growth of auto body sheet demand to tighten supply to the
packaging market over the medium to long term.
Ardagh Group Investor Call
The backdrop for Metal Beverage Americas remains very positive with strong demand from long established brands as well as from new and
emerging beverage categories predominantly packaged in beverage cans in North America. A structural shift from returnable glass packaging to
metal packaging continues in Brazil. Sustainability provides a further tailwind and ones which we expect to gain increasing momentum in the years
ahead as brand owners respond to changing consumer preferences. Our capacity in the Americas in beverage cans is fully sold for the remainders
of the year and for 2021 as well.
We've had a small amount of imports of cans into the US from Europe and an even smaller amount from Brazil early on. But Brazil and Europe
are now very tight. We're fully -- everything -- we are selling everything we make and we'remaking as much as we can in Europe so we're sold
out there.
Coca Cola Annual Report
Coca-Cola today announced an industry-first goal to collect and recycle the equivalent of every bottle or can it sells globally by 2030. The
company and its global network of bottling partners will tackle the ambitious goal, which is part of a holistic plan called “World Without Waste,”
through a renewed focus on the entire packaging lifecycle – from how bottles and cans are designed and made, to how they’re recycled and
repurposed.
Pepsi Co Press Release
PepsiCo, Inc. (NASDAQ: PEP) today announced a new target to reduce 35% of virgin plastic content across its beverage portfolio by 2025, which
equates to the elimination of 2.5 million metric tons of cumulative virgin plastic. Progress will be driven by the company's increased use of
recycled content and alternative packaging materials for its beverage brands, including LIFEWTR®, bubly™ and Aquafina®, which recently
announced sustainable packaging efforts.
Source: Aluminum Association, Kotak Institutional Equities estimates
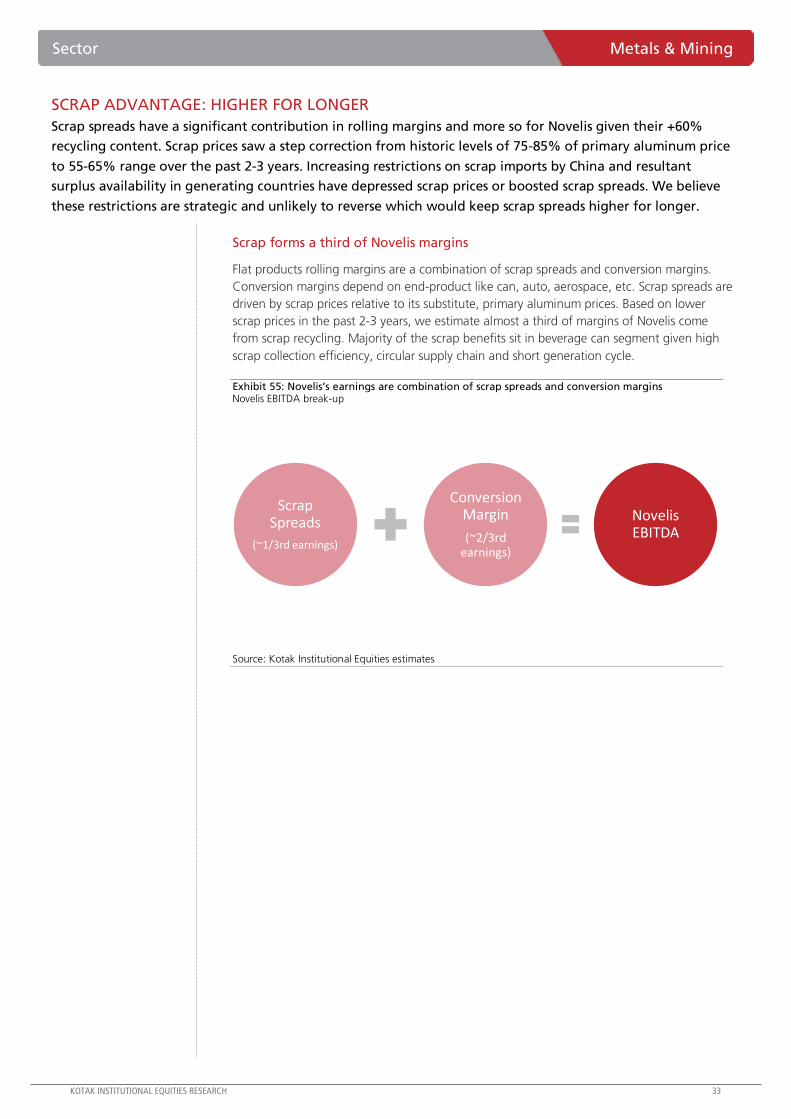
KOTAK INSTITUTIONAL EQUITIES RESEARCH 33
Sector Metals & Mining
SCRAP ADVANTAGE: HIGHER FOR LONGER
Scrap spreads have a significant contribution in rolling margins and more so for Novelis given their +60%
recycling content. Scrap prices saw a step correction from historic levels of 75-85% of primary aluminum price
to 55-65% range over the past 2-3 years. Increasing restrictions on scrap imports by China and resultant
surplus availability in generating countries have depressed scrap prices or boosted scrap spreads. We believe
these restrictions are strategic and unlikely to reverse which would keep scrap spreads higher for longer.
Scrap forms a third of Novelis margins
Flat products rolling margins are a combination of scrap spreads and conversion margins.
Conversion margins depend on end-product like can, auto, aerospace, etc. Scrap spreads are
driven by scrap prices relative to its substitute, primary aluminum prices. Based on lower
scrap prices in the past 2-3 years, we estimate almost a third of margins of Novelis come
from scrap recycling. Majority of the scrap benefits sit in beverage can segment given high
scrap collection efficiency, circular supply chain and short generation cycle.
Exhibit 55: Novelis’s earnings are combination of scrap spreads and conversion margins Novelis EBITDA break-up
Source: Kotak Institutional Equities estimates
Scrap Spreads
(~1/3rd earnings)
Conversion Margin
(~2/3rd earnings)
Novelis EBITDA
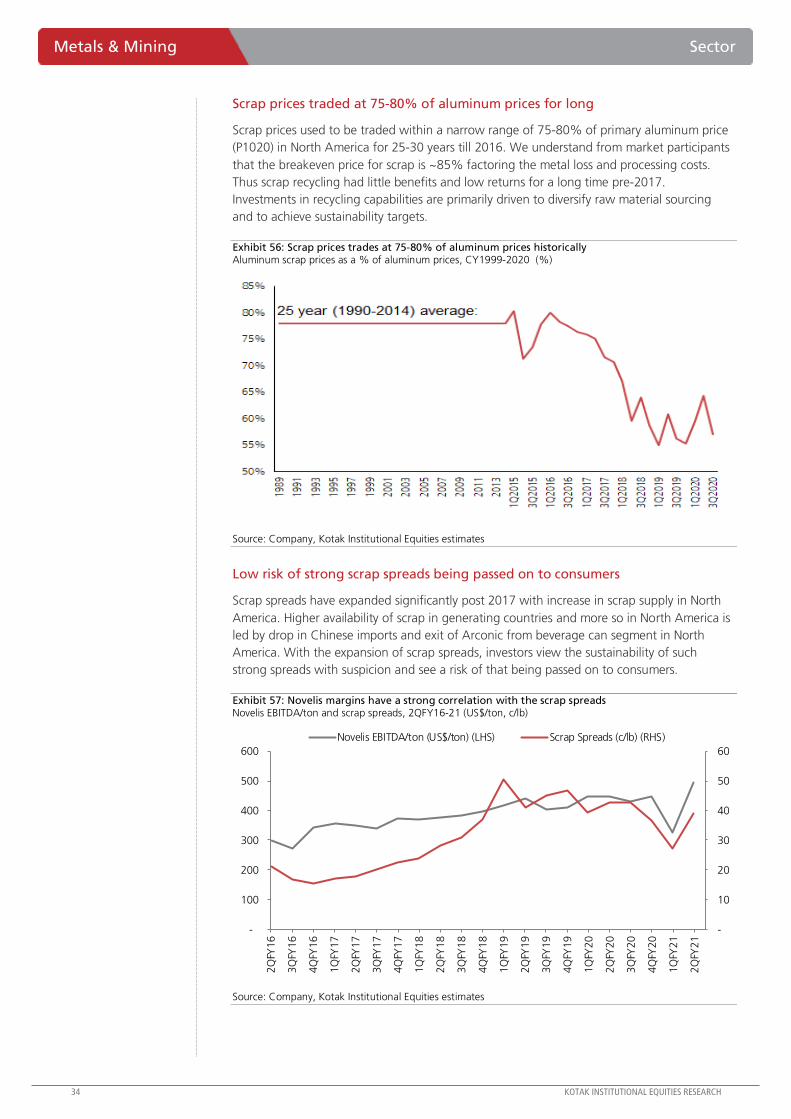
34 KOTAK INSTITUTIONAL EQUITIES RESEARCH
Metals & Mining Sector
Scrap prices traded at 75-80% of aluminum prices for long
Scrap prices used to be traded within a narrow range of 75-80% of primary aluminum price
(P1020) in North America for 25-30 years till 2016. We understand from market participants
that the breakeven price for scrap is ~85% factoring the metal loss and processing costs.
Thus scrap recycling had little benefits and low returns for a long time pre-2017.
Investments in recycling capabilities are primarily driven to diversify raw material sourcing
and to achieve sustainability targets.
Exhibit 56: Scrap prices trades at 75-80% of aluminum prices historically Aluminum scrap prices as a % of aluminum prices, CY1999-2020 (%)
Source: Company, Kotak Institutional Equities estimates
Low risk of strong scrap spreads being passed on to consumers
Scrap spreads have expanded significantly post 2017 with increase in scrap supply in North
America. Higher availability of scrap in generating countries and more so in North America is
led by drop in Chinese imports and exit of Arconic from beverage can segment in North
America. With the expansion of scrap spreads, investors view the sustainability of such
strong spreads with suspicion and see a risk of that being passed on to consumers.
Exhibit 57: Novelis margins have a strong correlation with the scrap spreads Novelis EBITDA/ton and scrap spreads, 2QFY16-21 (US$/ton, c/lb)
-
10
20
30
40
50
60
-
100
200
300
400
500
600
2Q
FY16
3Q
FY16
4Q
FY16
1Q
FY17
2Q
FY17
3Q
FY17
4Q
FY17
1Q
FY18
2Q
FY18
3Q
FY18
4Q
FY18
1Q
FY19
2Q
FY19
3Q
FY19
4Q
FY19
1Q
FY20
2Q
FY20
3Q
FY20
4Q
FY20
1Q
FY21
2Q
FY21
Novelis EBITDA/ton (US$/ton) (LHS) Scrap Spreads (c/lb) (RHS)
Source: Company, Kotak Institutional Equities estimates
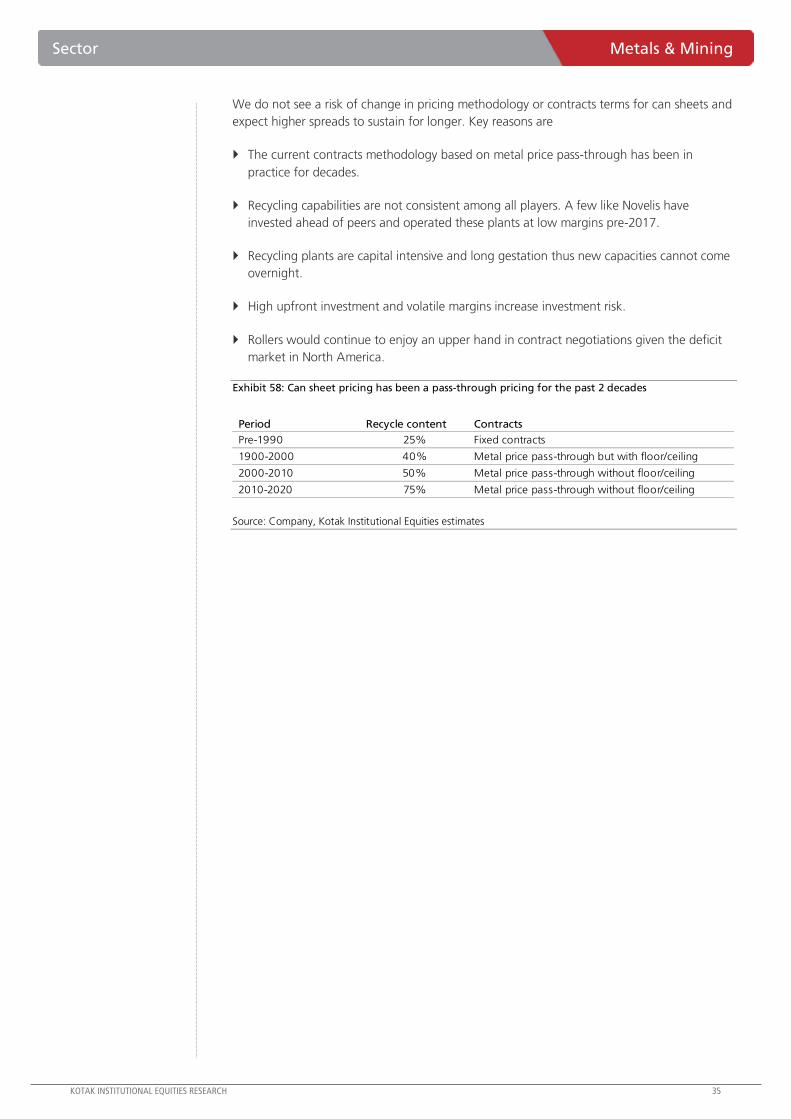
KOTAK INSTITUTIONAL EQUITIES RESEARCH 35
Sector Metals & Mining
We do not see a risk of change in pricing methodology or contracts terms for can sheets and
expect higher spreads to sustain for longer. Key reasons are
The current contracts methodology based on metal price pass-through has been in
practice for decades.
Recycling capabilities are not consistent among all players. A few like Novelis have
invested ahead of peers and operated these plants at low margins pre-2017.
Recycling plants are capital intensive and long gestation thus new capacities cannot come
overnight.
High upfront investment and volatile margins increase investment risk.
Rollers would continue to enjoy an upper hand in contract negotiations given the deficit
market in North America.
Exhibit 58: Can sheet pricing has been a pass-through pricing for the past 2 decades
Period Recycle content Contracts
Pre-1990 25% Fixed contracts
1900-2000 40% Metal price pass-through but with floor/ceiling
2000-2010 50% Metal price pass-through without floor/ceiling
2010-2020 75% Metal price pass-through without floor/ceiling
Source: Company, Kotak Institutional Equities estimates
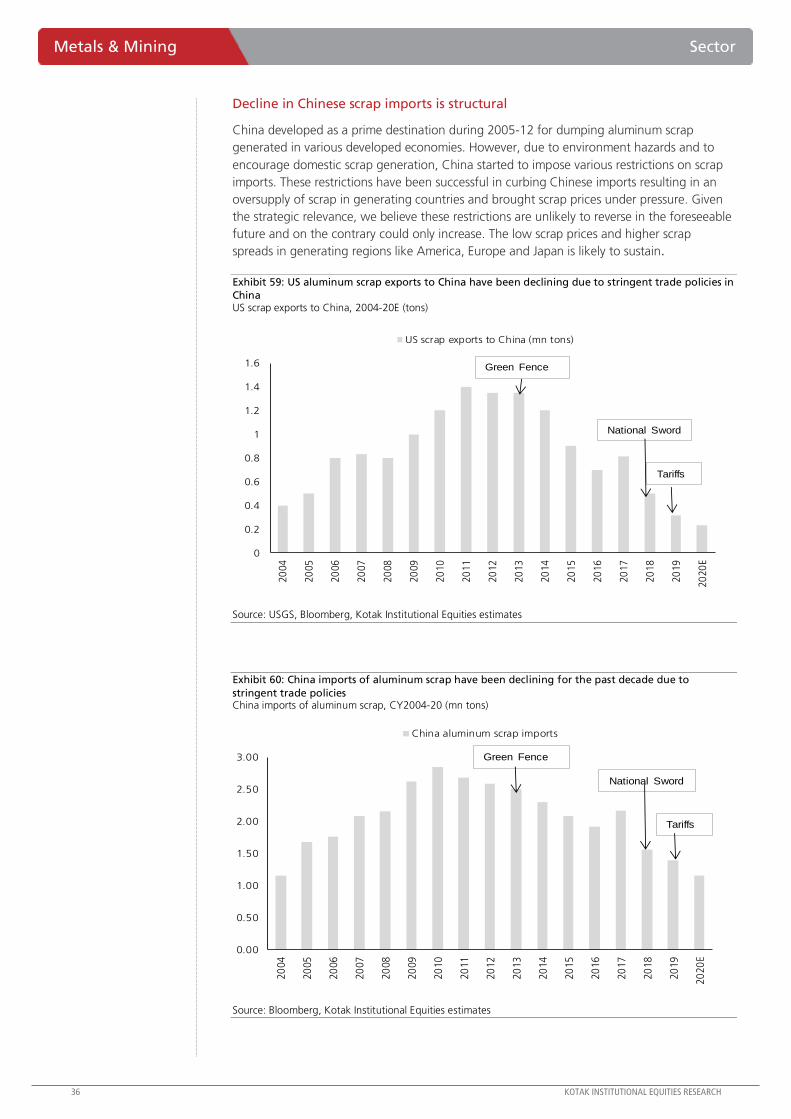
36 KOTAK INSTITUTIONAL EQUITIES RESEARCH
Metals & Mining Sector
Decline in Chinese scrap imports is structural
China developed as a prime destination during 2005-12 for dumping aluminum scrap
generated in various developed economies. However, due to environment hazards and to
encourage domestic scrap generation, China started to impose various restrictions on scrap
imports. These restrictions have been successful in curbing Chinese imports resulting in an
oversupply of scrap in generating countries and brought scrap prices under pressure. Given
the strategic relevance, we believe these restrictions are unlikely to reverse in the foreseeable
future and on the contrary could only increase. The low scrap prices and higher scrap
spreads in generating regions like America, Europe and Japan is likely to sustain.
Exhibit 59: US aluminum scrap exports to China have been declining due to stringent trade policies in
China US scrap exports to China, 2004-20E (tons)
Source: USGS, Bloomberg, Kotak Institutional Equities estimates
Exhibit 60: China imports of aluminum scrap have been declining for the past decade due to
stringent trade policies China imports of aluminum scrap, CY2004-20 (mn tons)
Source: Bloomberg, Kotak Institutional Equities estimates
0
0.2
0.4
0.6
0.8
1
1.2
1.4
1.6
20
04
20
05
20
06
20
07
20
08
20
09
20
10
20
11
20
12
20
13
20
14
20
15
20
16
20
17
20
18
20
19
20
20
E
US scrap exports to China (mn tons)
Green Fence
National Sword
Tariffs
0.00
0.50
1.00
1.50
2.00
2.50
3.00
20
04
20
05
20
06
20
07
20
08
20
09
20
10
20
11
20
12
20
13
20
14
20
15
20
16
20
17
20
18
20
19
20
20
E
China aluminum scrap imports
Green Fence
National Sword
Tariffs
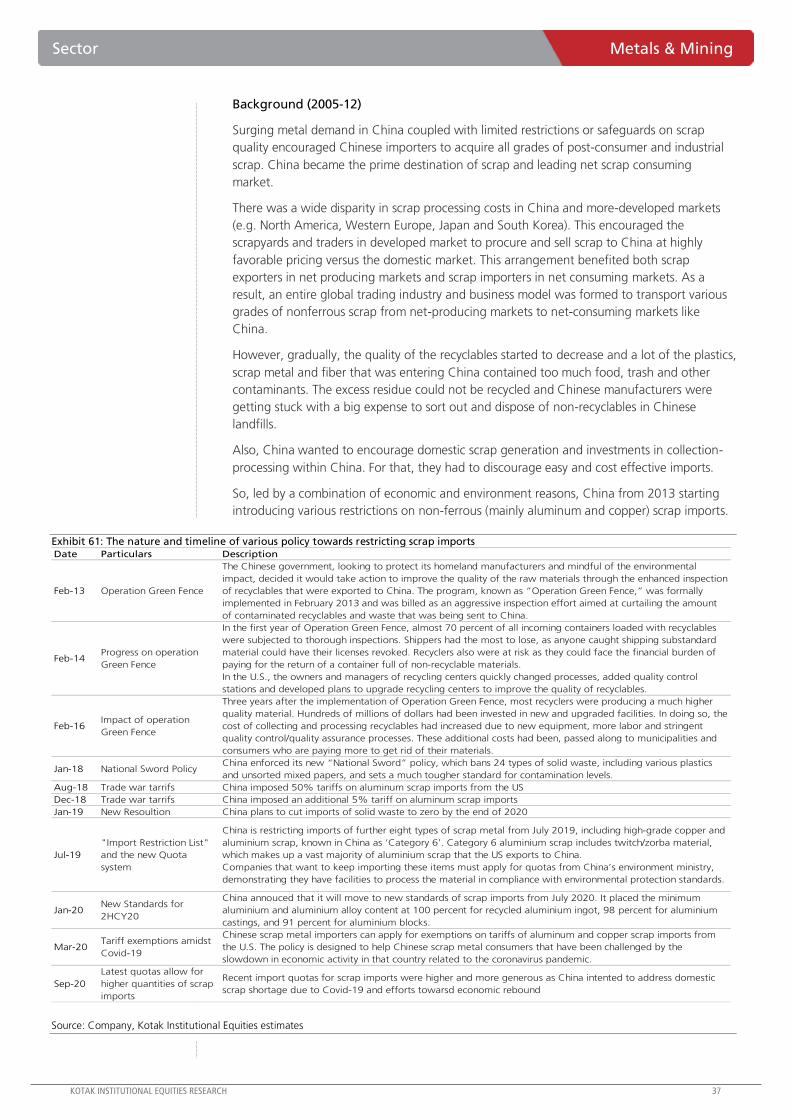
KOTAK INSTITUTIONAL EQUITIES RESEARCH 37
Sector Metals & Mining
Background (2005-12)
Surging metal demand in China coupled with limited restrictions or safeguards on scrap
quality encouraged Chinese importers to acquire all grades of post-consumer and industrial
scrap. China became the prime destination of scrap and leading net scrap consuming
market.
There was a wide disparity in scrap processing costs in China and more-developed markets
(e.g. North America, Western Europe, Japan and South Korea). This encouraged the
scrapyards and traders in developed market to procure and sell scrap to China at highly
favorable pricing versus the domestic market. This arrangement benefited both scrap
exporters in net producing markets and scrap importers in net consuming markets. As a
result, an entire global trading industry and business model was formed to transport various
grades of nonferrous scrap from net-producing markets to net-consuming markets like
China.
However, gradually, the quality of the recyclables started to decrease and a lot of the plastics,
scrap metal and fiber that was entering China contained too much food, trash and other
contaminants. The excess residue could not be recycled and Chinese manufacturers were
getting stuck with a big expense to sort out and dispose of non-recyclables in Chinese
landfills.
Also, China wanted to encourage domestic scrap generation and investments in collection-
processing within China. For that, they had to discourage easy and cost effective imports.
So, led by a combination of economic and environment reasons, China from 2013 starting
introducing various restrictions on non-ferrous (mainly aluminum and copper) scrap imports.
Exhibit 61: The nature and timeline of various policy towards restricting scrap imports Date Particulars Description
Feb-13 Operation Green Fence
The Chinese government, looking to protect its homeland manufacturers and mindful of the environmental
impact, decided it would take action to improve the quality of the raw materials through the enhanced inspection
of recyclables that were exported to China. The program, known as “Operation Green Fence,” was formally
implemented in February 2013 and was billed as an aggressive inspection effort aimed at curtailing the amount
of contaminated recyclables and waste that was being sent to China.
Feb-14Progress on operation
Green Fence
In the first year of Operation Green Fence, almost 70 percent of all incoming containers loaded with recyclables
were subjected to thorough inspections. Shippers had the most to lose, as anyone caught shipping substandard
material could have their licenses revoked. Recyclers also were at risk as they could face the financial burden of
paying for the return of a container full of non-recyclable materials.
In the U.S., the owners and managers of recycling centers quickly changed processes, added quality control
stations and developed plans to upgrade recycling centers to improve the quality of recyclables.
Feb-16Impact of operation
Green Fence
Three years after the implementation of Operation Green Fence, most recyclers were producing a much higher
quality material. Hundreds of millions of dollars had been invested in new and upgraded facilities. In doing so, the
cost of collecting and processing recyclables had increased due to new equipment, more labor and stringent
quality control/quality assurance processes. These additional costs had been, passed along to municipalities and
consumers who are paying more to get rid of their materials.
Jan-18 National Sword PolicyChina enforced its new “National Sword” policy, which bans 24 types of solid waste, including various plastics
and unsorted mixed papers, and sets a much tougher standard for contamination levels.
Aug-18 Trade war tarrifs China imposed 50% tariffs on aluminum scrap imports from the US
Dec-18 Trade war tarrifs China imposed an additional 5% tariff on aluminum scrap imports
Jan-19 New Resoultion China plans to cut imports of solid waste to zero by the end of 2020
Jul-19
"Import Restriction List"
and the new Quota
system
China is restricting imports of further eight types of scrap metal from July 2019, including high-grade copper and
aluminium scrap, known in China as ‘Category 6’. Category 6 aluminium scrap includes twitch/zorba material,
which makes up a vast majority of aluminium scrap that the US exports to China.
Companies that want to keep importing these items must apply for quotas from China’s environment ministry,
demonstrating they have facilities to process the material in compliance with environmental protection standards.
Jan-20New Standards for
2HCY20
China annouced that it will move to new standards of scrap imports from July 2020. It placed the minimum
aluminium and aluminium alloy content at 100 percent for recycled aluminium ingot, 98 percent for aluminium
castings, and 91 percent for aluminium blocks.
Mar-20Tariff exemptions amidst
Covid-19
Chinese scrap metal importers can apply for exemptions on tariffs of aluminum and copper scrap imports from
the U.S. The policy is designed to help Chinese scrap metal consumers that have been challenged by the
slowdown in economic activity in that country related to the coronavirus pandemic.
Sep-20
Latest quotas allow for
higher quantities of scrap
imports
Recent import quotas for scrap imports were higher and more generous as China intented to address domestic
scrap shortage due to Covid-19 and efforts towarsd economic rebound
Source: Company, Kotak Institutional Equities estimates
38 KOTAK INSTITUTIONAL EQUITIES RESEARCH
Metals & Mining Sector
New scrap imports policy
China has introduced new standards for its imports of aluminum scrap effective from July 1, 2020. The new standards are set to replace the current quota policy in place since July 2019.
Under the new rules, three categories of scrap and secondary aluminum products have been identified, and will be allowed to be imported into China.
Aluminum castings scrap with an aluminum content of over 98%.
Secondary ingot with 100% aluminum and aluminum alloy content.
Aluminum shredded scrap with a minimum metal content of 99.1% and an aluminum
and aluminum alloy content of at least 91%.
However, Chinese customs have not yet released key information regarding the specific HS
codes for scrap shipments under the new policy. Once the new codes are issued, scrap that
meets the specifications will be categorized as raw material and will be free of import
restrictions. Until then, the current quota system will prevail.
These new measures are further step towards its environmental campaign and plan to
reduce imports of solid waste to zero by the end of 2020.
News reports are also speculating that all scrap with coating or painting will be banned as it
could result in air pollution, which includes UBC. Historically China is not a big importer of
direct UBC, nonetheless, a ban would add to UBC’s price pressure.
Impact of various scrap import restrictions
Decline in imports
China remained the largest import market for scrap, however, import volumes for
aluminum scrap have been on a declining trend since 2011 led by
Various restrictive policies.
The requirement for secondary feedstock like scrap began to fall as China’s smelting
and refining capabilities grew.
Rising wages gradually made the Chinese market an increasingly unattractive export
market. Rising wages in China versus developed countries increased commercial
processing costs.
New investments in China
In June 2020, Scholz Recycling and Weiqiao have announced to partner in developing
a recycling plant in Shandong, China. Scholz Recycling GmbH and Shandong Weiqiao
Pioneering Group have signed an MoU to develop a 0.2 mtpa recycling plant in Huimin,
Shandong province China. The plant will produce secondary aluminum and process
50,000 end of life vehicles annually in an integrated recycling complex.
Scholz, a large European metal recycler was acquired by Chinese company Chiho
Environmental Group in 2016. The acquisition was seen as a way of building
intellectual property, in anticipation of rapid growth in scrap supply in China.
The MoU is a strong signal that Chinese policies towards scrap imports are achieving its
objective to make Chinese companies focus on recycling.
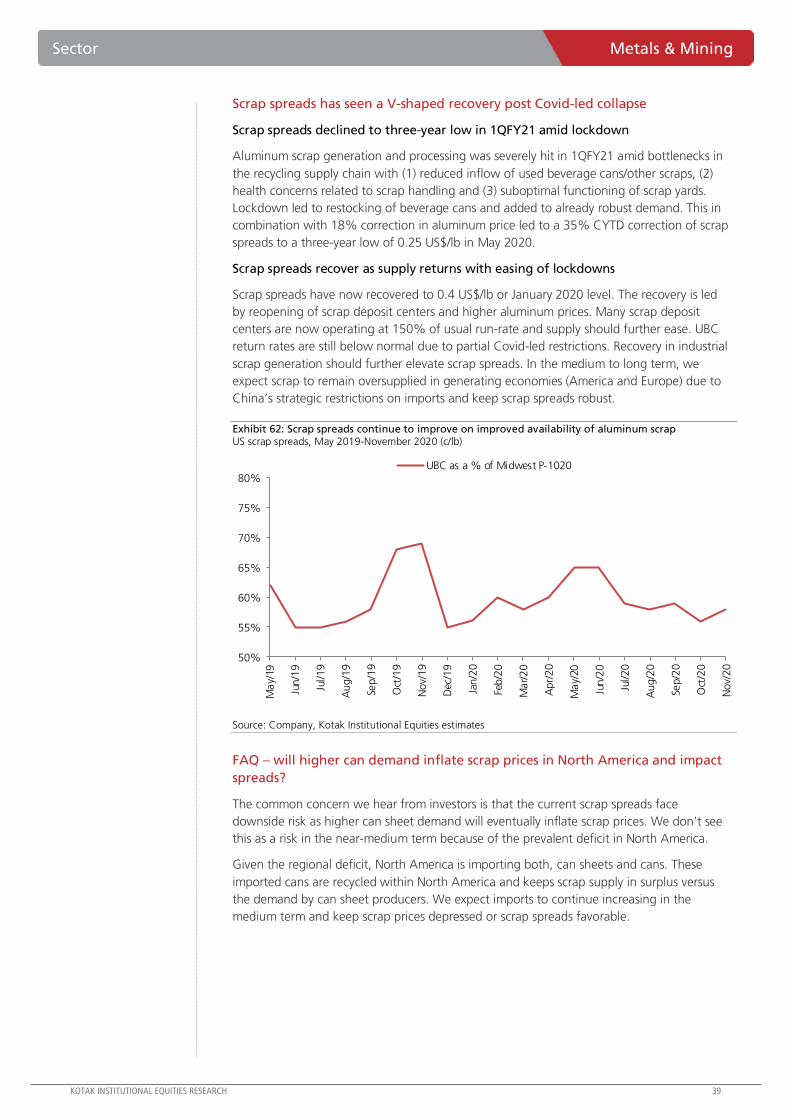
KOTAK INSTITUTIONAL EQUITIES RESEARCH 39
Sector Metals & Mining
Scrap spreads has seen a V-shaped recovery post Covid-led collapse
Scrap spreads declined to three-year low in 1QFY21 amid lockdown
Aluminum scrap generation and processing was severely hit in 1QFY21 amid bottlenecks in
the recycling supply chain with (1) reduced inflow of used beverage cans/other scraps, (2)
health concerns related to scrap handling and (3) suboptimal functioning of scrap yards.
Lockdown led to restocking of beverage cans and added to already robust demand. This in
combination with 18% correction in aluminum price led to a 35% CYTD correction of scrap
spreads to a three-year low of 0.25 US$/lb in May 2020.
Scrap spreads recover as supply returns with easing of lockdowns
Scrap spreads have now recovered to 0.4 US$/lb or January 2020 level. The recovery is led
by reopening of scrap deposit centers and higher aluminum prices. Many scrap deposit
centers are now operating at 150% of usual run-rate and supply should further ease. UBC
return rates are still below normal due to partial Covid-led restrictions. Recovery in industrial
scrap generation should further elevate scrap spreads. In the medium to long term, we
expect scrap to remain oversupplied in generating economies (America and Europe) due to
China’s strategic restrictions on imports and keep scrap spreads robust.
Exhibit 62: Scrap spreads continue to improve on improved availability of aluminum scrap US scrap spreads, May 2019-November 2020 (c/lb)
50%
55%
60%
65%
70%
75%
80%
May/
19
Jun/1
9
Jul/19
Aug/1
9
Sep/1
9
Oct
/19
Nov/
19
Dec
/19
Jan/2
0
Feb/2
0
Mar/20
Apr/
20
May/
20
Jun/2
0
Jul/20
Aug/2
0
Sep/2
0
Oct
/20
Nov/
20
UBC as a % of Midwest P-1020
Source: Company, Kotak Institutional Equities estimates
FAQ – will higher can demand inflate scrap prices in North America and impact
spreads?
The common concern we hear from investors is that the current scrap spreads face
downside risk as higher can sheet demand will eventually inflate scrap prices. We don’t see
this as a risk in the near-medium term because of the prevalent deficit in North America.
Given the regional deficit, North America is importing both, can sheets and cans. These
imported cans are recycled within North America and keeps scrap supply in surplus versus
the demand by can sheet producers. We expect imports to continue increasing in the
medium term and keep scrap prices depressed or scrap spreads favorable.
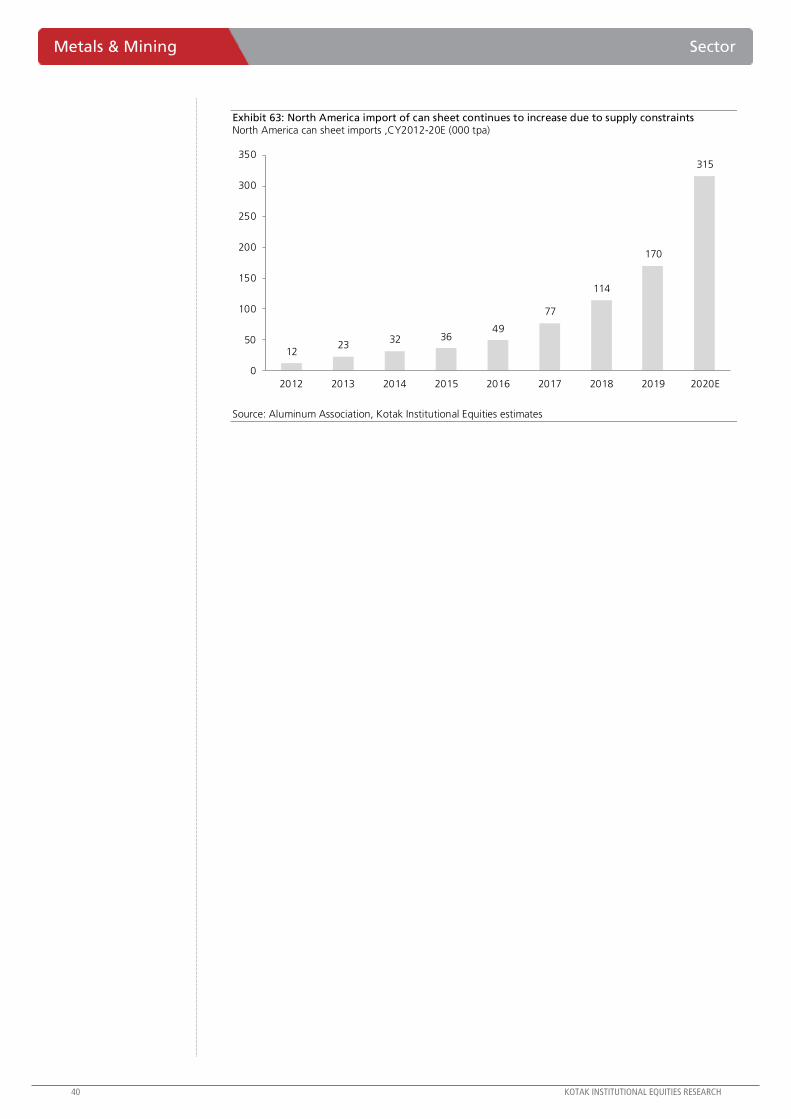
40 KOTAK INSTITUTIONAL EQUITIES RESEARCH
Metals & Mining Sector
Exhibit 63: North America import of can sheet continues to increase due to supply constraints North America can sheet imports ,CY2012-20E (000 tpa)
1223
32 3649
77
114
170
315
0
50
100
150
200
250
300
350
2012 2013 2014 2015 2016 2017 2018 2019 2020E
Source: Aluminum Association, Kotak Institutional Equities estimates
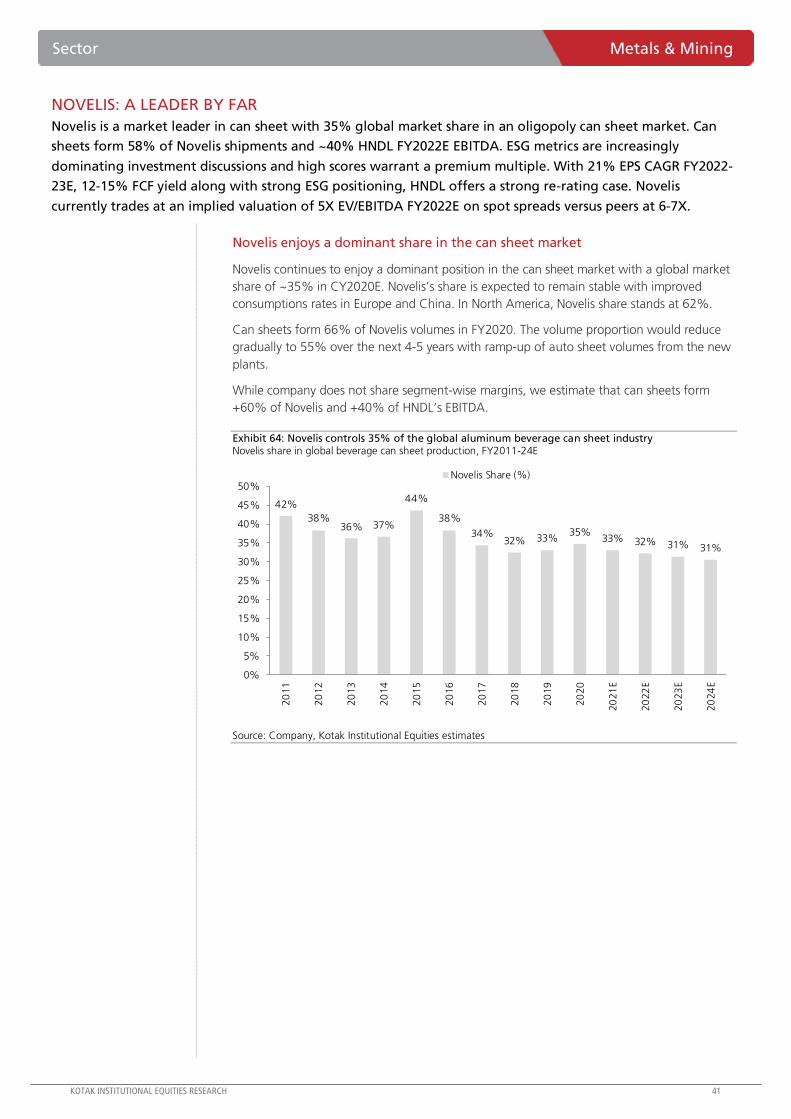
KOTAK INSTITUTIONAL EQUITIES RESEARCH 41
Sector Metals & Mining
NOVELIS: A LEADER BY FAR
Novelis is a market leader in can sheet with 35% global market share in an oligopoly can sheet market. Can
sheets form 58% of Novelis shipments and ~40% HNDL FY2022E EBITDA. ESG metrics are increasingly
dominating investment discussions and high scores warrant a premium multiple. With 21% EPS CAGR FY2022-
23E, 12-15% FCF yield along with strong ESG positioning, HNDL offers a strong re-rating case. Novelis
currently trades at an implied valuation of 5X EV/EBITDA FY2022E on spot spreads versus peers at 6-7X.
Novelis enjoys a dominant share in the can sheet market
Novelis continues to enjoy a dominant position in the can sheet market with a global market
share of ~35% in CY2020E. Novelis’s share is expected to remain stable with improved
consumptions rates in Europe and China. In North America, Novelis share stands at 62%.
Can sheets form 66% of Novelis volumes in FY2020. The volume proportion would reduce
gradually to 55% over the next 4-5 years with ramp-up of auto sheet volumes from the new
plants.
While company does not share segment-wise margins, we estimate that can sheets form
+60% of Novelis and +40% of HNDL’s EBITDA.
Exhibit 64: Novelis controls 35% of the global aluminum beverage can sheet industry Novelis share in global beverage can sheet production, FY2011-24E
42%
38%36% 37%
44%
38%
34%32% 33%
35%33% 32% 31% 31%
0%
5%
10%
15%
20%
25%
30%
35%
40%
45%
50%
20
11
20
12
20
13
20
14
20
15
20
16
20
17
20
18
20
19
20
20
20
21
E
20
22
E
20
23
E
20
24
E
Novelis Share (%)
Source: Company, Kotak Institutional Equities estimates
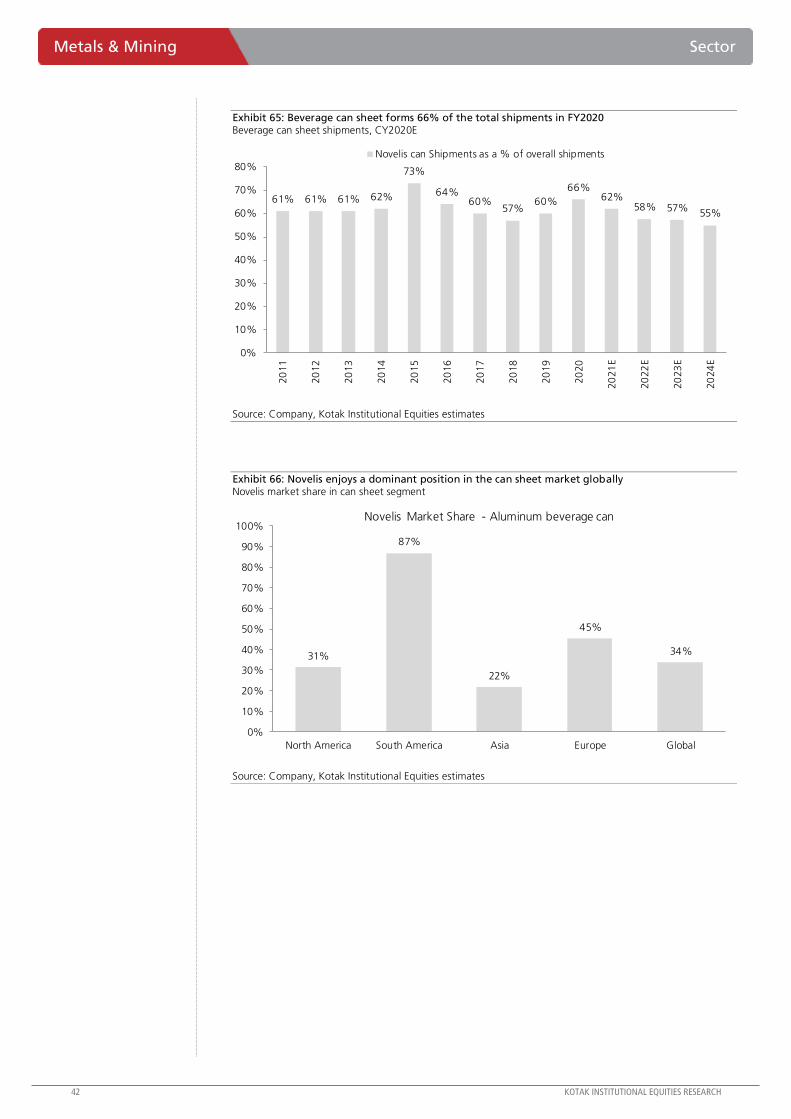
42 KOTAK INSTITUTIONAL EQUITIES RESEARCH
Metals & Mining Sector
Exhibit 65: Beverage can sheet forms 66% of the total shipments in FY2020 Beverage can sheet shipments, CY2020E
61% 61% 61% 62%
73%
64%60%
57%60%
66%62%
58% 57%55%
0%
10%
20%
30%
40%
50%
60%
70%
80%
20
11
20
12
20
13
20
14
20
15
20
16
20
17
20
18
20
19
20
20
20
21
E
20
22
E
20
23
E
20
24
E
Novelis can Shipments as a % of overall shipments
Source: Company, Kotak Institutional Equities estimates
Exhibit 66: Novelis enjoys a dominant position in the can sheet market globally Novelis market share in can sheet segment
31%
87%
22%
45%
34%
North America South America Asia Europe Global
0%
10%
20%
30%
40%
50%
60%
70%
80%
90%
100%Novelis Market Share - Aluminum beverage can
Source: Company, Kotak Institutional Equities estimates
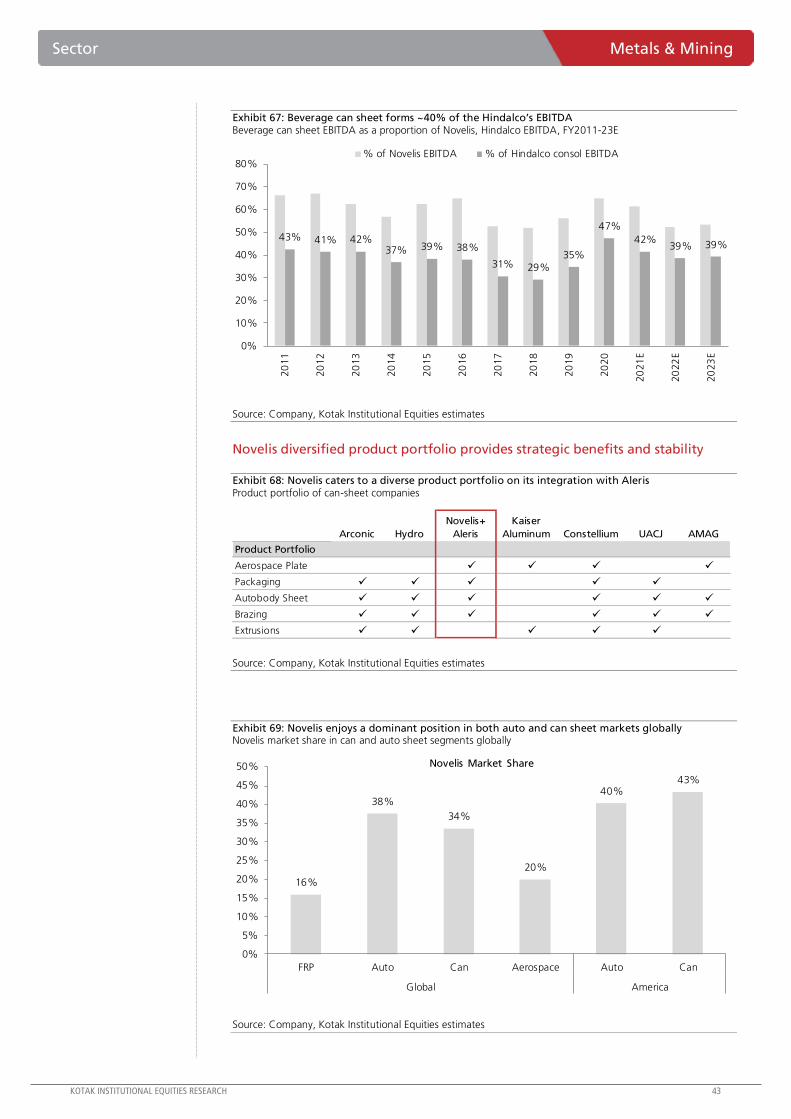
KOTAK INSTITUTIONAL EQUITIES RESEARCH 43
Sector Metals & Mining
Exhibit 67: Beverage can sheet forms ~40% of the Hindalco’s EBITDA Beverage can sheet EBITDA as a proportion of Novelis, Hindalco EBITDA, FY2011-23E
43% 41% 42%37% 39% 38%
31% 29%
35%
47%
42%39% 39%
0%
10%
20%
30%
40%
50%
60%
70%
80%
20
11
20
12
20
13
20
14
20
15
20
16
20
17
20
18
20
19
20
20
20
21
E
20
22
E
20
23
E
% of Novelis EBITDA % of Hindalco consol EBITDA
Source: Company, Kotak Institutional Equities estimates
Novelis diversified product portfolio provides strategic benefits and stability
Exhibit 68: Novelis caters to a diverse product portfolio on its integration with Aleris Product portfolio of can-sheet companies
Arconic Hydro
Novelis+
Aleris
Kaiser
Aluminum Constellium UACJ AMAG
Product Portfolio
Aerospace Plate
Packaging
Autobody Sheet
Brazing
Extrusions
Source: Company, Kotak Institutional Equities estimates
Exhibit 69: Novelis enjoys a dominant position in both auto and can sheet markets globally Novelis market share in can and auto sheet segments globally
16%
38%
34%
20%
40%43%
0%
5%
10%
15%
20%
25%
30%
35%
40%
45%
50%
FRP Auto Can Aerospace Auto Can
Global America
Novelis Market Share
Source: Company, Kotak Institutional Equities estimates
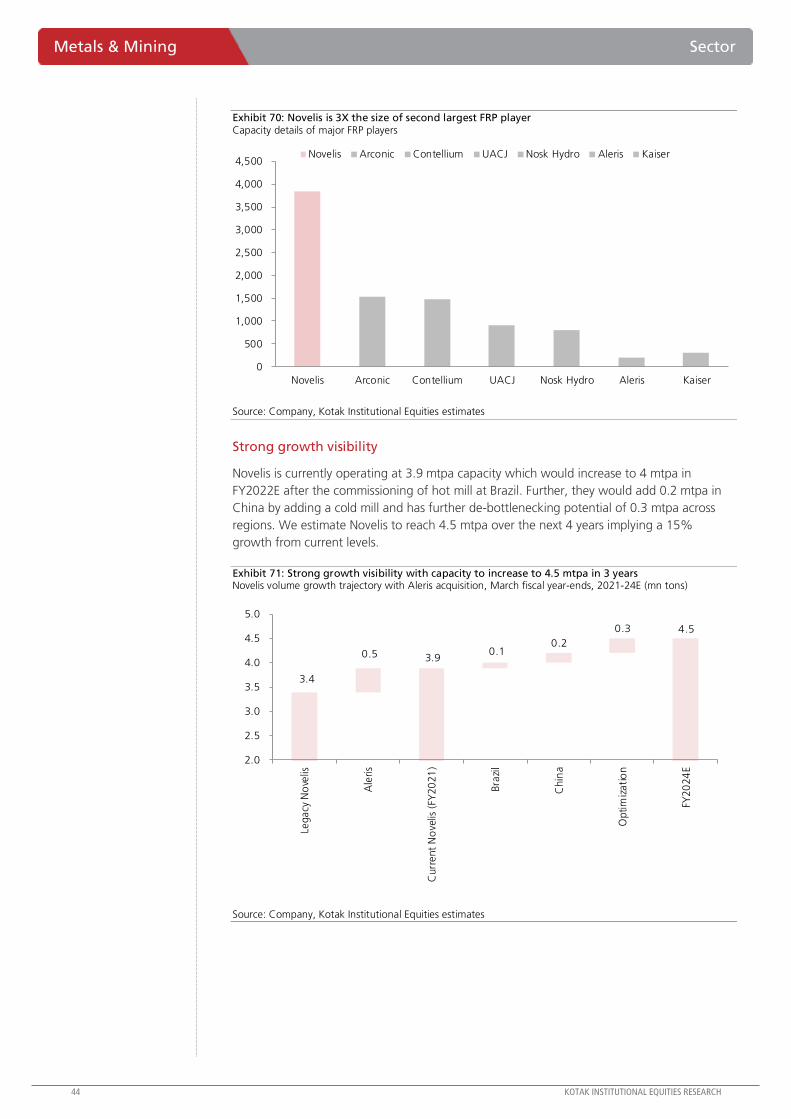
44 KOTAK INSTITUTIONAL EQUITIES RESEARCH
Metals & Mining Sector
Exhibit 70: Novelis is 3X the size of second largest FRP player Capacity details of major FRP players
0
500
1,000
1,500
2,000
2,500
3,000
3,500
4,000
4,500
Novelis Arconic Contellium UACJ Nosk Hydro Aleris Kaiser
Novelis Arconic Contellium UACJ Nosk Hydro Aleris Kaiser
Source: Company, Kotak Institutional Equities estimates
Strong growth visibility
Novelis is currently operating at 3.9 mtpa capacity which would increase to 4 mtpa in
FY2022E after the commissioning of hot mill at Brazil. Further, they would add 0.2 mtpa in
China by adding a cold mill and has further de-bottlenecking potential of 0.3 mtpa across
regions. We estimate Novelis to reach 4.5 mtpa over the next 4 years implying a 15%
growth from current levels.
Exhibit 71: Strong growth visibility with capacity to increase to 4.5 mtpa in 3 years Novelis volume growth trajectory with Aleris acquisition, March fiscal year-ends, 2021-24E (mn tons)
Source: Company, Kotak Institutional Equities estimates
3.4
0.5 3.9 0.1
0.2
0.3 4.5
2.0
2.5
3.0
3.5
4.0
4.5
5.0
Legacy
No
velis
Ale
ris
Curr
ent
No
velis
(FY
20
21
)
Bra
zil
Chin
a
Optim
izatio
n
FY20
24
E
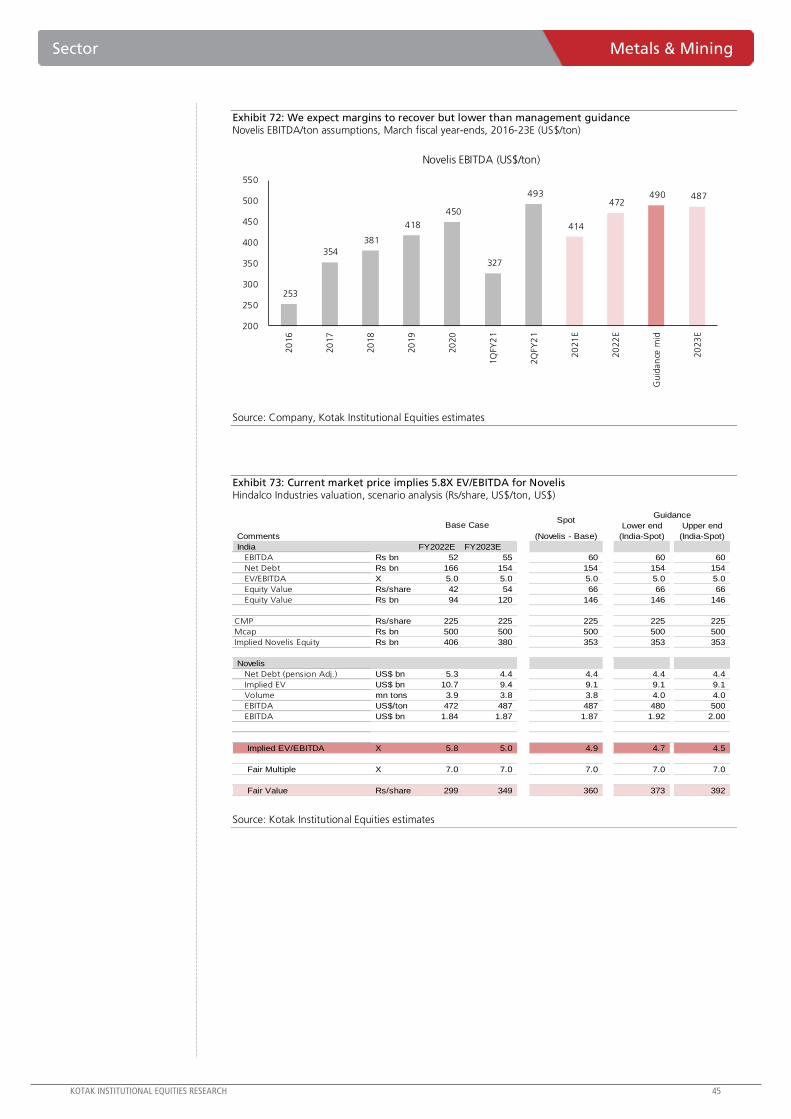
KOTAK INSTITUTIONAL EQUITIES RESEARCH 45
Sector Metals & Mining
Exhibit 72: We expect margins to recover but lower than management guidance Novelis EBITDA/ton assumptions, March fiscal year-ends, 2016-23E (US$/ton)
Source: Company, Kotak Institutional Equities estimates
Exhibit 73: Current market price implies 5.8X EV/EBITDA for Novelis Hindalco Industries valuation, scenario analysis (Rs/share, US$/ton, US$)
Source: Kotak Institutional Equities estimates
253
354
381
418
450
327
493
414
472 490 487
200
250
300
350
400
450
500
550
20
16
20
17
20
18
20
19
20
20
1Q
FY2
1
2Q
FY2
1
20
21
E
20
22
E
Guid
an
ce m
id
20
23
E
Novelis EBITDA (US$/ton)
Lower end Upper end
Comments (Novelis - Base) (India-Spot) (India-Spot)
India FY2022E FY2023E
EBITDA Rs bn 52 55 60 60 60
Net Debt Rs bn 166 154 154 154 154
EV/EBITDA X 5.0 5.0 5.0 5.0 5.0
Equity Value Rs/share 42 54 66 66 66
Equity Value Rs bn 94 120 146 146 146
CMP Rs/share 225 225 225 225 225
Mcap Rs bn 500 500 500 500 500
Implied Novelis Equity Rs bn 406 380 353 353 353
Novelis
Net Debt (pension Adj.) US$ bn 5.3 4.4 4.4 4.4 4.4
Implied EV US$ bn 10.7 9.4 9.1 9.1 9.1
Volume mn tons 3.9 3.8 3.8 4.0 4.0
EBITDA US$/ton 472 487 487 480 500
EBITDA US$ bn 1.84 1.87 1.87 1.92 2.00
Implied EV/EBITDA X 5.8 5.0 4.9 4.7 4.5
Fair Multiple X 7.0 7.0 7.0 7.0 7.0
Fair Value Rs/share 299 349 360 373 392
GuidanceSpot
Base Case
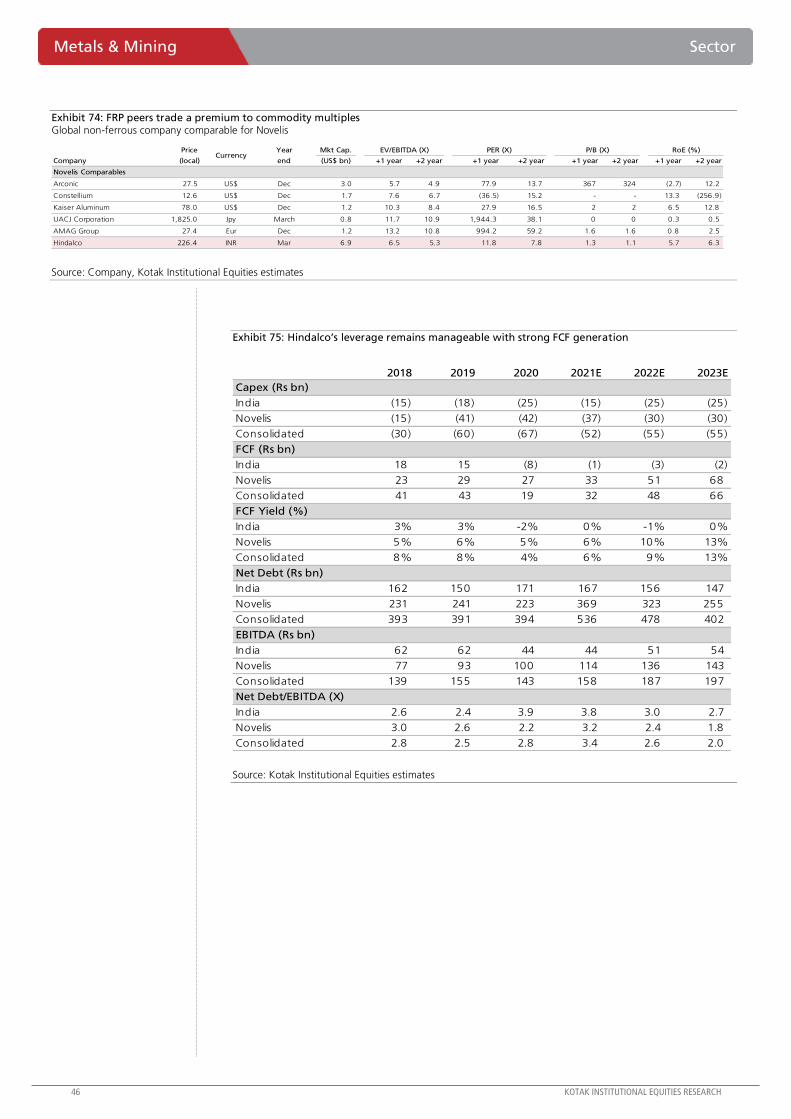
46 KOTAK INSTITUTIONAL EQUITIES RESEARCH
Metals & Mining Sector
Exhibit 74: FRP peers trade a premium to commodity multiples Global non-ferrous company comparable for Novelis
Price Year Mkt Cap.
Company (local) end (US$ bn) +1 year +2 year +1 year +2 year +1 year +2 year +1 year +2 year
Novelis Comparables
Arconic 27.5 US$ Dec 3.0 5.7 4.9 77.9 13.7 367 324 (2.7) 12.2
Constellium 12.6 US$ Dec 1.7 7.6 6.7 (36.5) 15.2 - - 13.3 (256.9)
Kaiser Aluminum 78.0 US$ Dec 1.2 10.3 8.4 27.9 16.5 2 2 6.5 12.8
UACJ Corporation 1,825.0 Jpy March 0.8 11.7 10.9 1,944.3 38.1 0 0 0.3 0.5
AMAG Group 27.4 Eur Dec 1.2 13.2 10.8 994.2 59.2 1.6 1.6 0.8 2.5
Hindalco 226.4 INR Mar 6.9 6.5 5.3 11.8 7.8 1.3 1.1 5.7 6.3
EV/EBITDA (X) PER (X) P/B (X) RoE (%)Currency
Source: Company, Kotak Institutional Equities estimates
Exhibit 75: Hindalco’s leverage remains manageable with strong FCF generation
2018 2019 2020 2021E 2022E 2023E
Capex (Rs bn)
India (15) (18) (25) (15) (25) (25)
Novelis (15) (41) (42) (37) (30) (30)
Consolidated (30) (60) (67) (52) (55) (55)
FCF (Rs bn)
India 18 15 (8) (1) (3) (2)
Novelis 23 29 27 33 51 68
Consolidated 41 43 19 32 48 66
FCF Yield (%)
India 3% 3% -2% 0% -1% 0%
Novelis 5% 6% 5% 6% 10% 13%
Consolidated 8% 8% 4% 6% 9% 13%
Net Debt (Rs bn)
India 162 150 171 167 156 147
Novelis 231 241 223 369 323 255
Consolidated 393 391 394 536 478 402
EBITDA (Rs bn)
India 62 62 44 44 51 54
Novelis 77 93 100 114 136 143
Consolidated 139 155 143 158 187 197
Net Debt/EBITDA (X)
India 2.6 2.4 3.9 3.8 3.0 2.7
Novelis 3.0 2.6 2.2 3.2 2.4 1.8
Consolidated 2.8 2.5 2.8 3.4 2.6 2.0
Source: Kotak Institutional Equities estimates
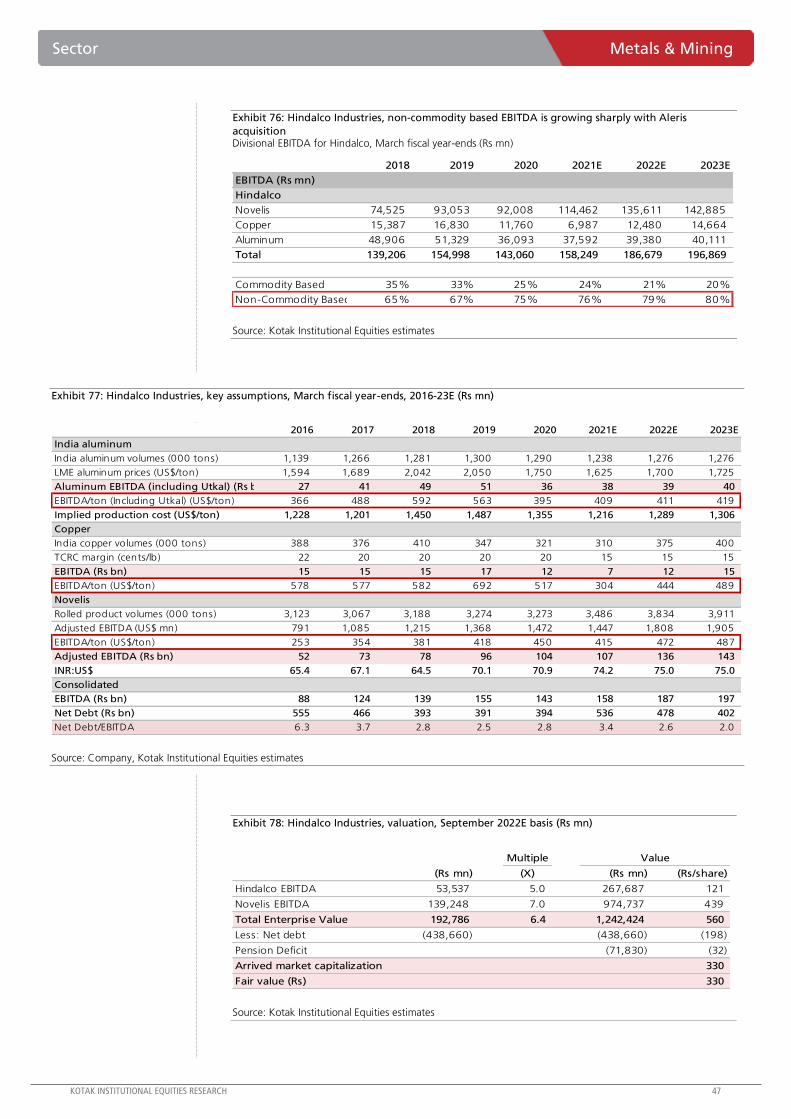
KOTAK INSTITUTIONAL EQUITIES RESEARCH 47
Sector Metals & Mining
Exhibit 76: Hindalco Industries, non-commodity based EBITDA is growing sharply with Aleris
acquisition Divisional EBITDA for Hindalco, March fiscal year-ends (Rs mn)
Source: Kotak Institutional Equities estimates
Exhibit 77: Hindalco Industries, key assumptions, March fiscal year-ends, 2016-23E (Rs mn)
2016 2017 2018 2019 2020 2021E 2022E 2023E
India aluminum
India aluminum volumes (000 tons) 1,139 1,266 1,281 1,300 1,290 1,238 1,276 1,276
LME aluminum prices (US$/ton) 1,594 1,689 2,042 2,050 1,750 1,625 1,700 1,725
Aluminum EBITDA (including Utkal) (Rs bn) 27 41 49 51 36 38 39 40
EBITDA/ton (Including Utkal) (US$/ton) 366 488 592 563 395 409 411 419
Implied production cost (US$/ton) 1,228 1,201 1,450 1,487 1,355 1,216 1,289 1,306
Copper
India copper volumes (000 tons) 388 376 410 347 321 310 375 400
TCRC margin (cents/lb) 22 20 20 20 20 15 15 15
EBITDA (Rs bn) 15 15 15 17 12 7 12 15
EBITDA/ton (US$/ton) 578 577 582 692 517 304 444 489
Novelis
Rolled product volumes (000 tons) 3,123 3,067 3,188 3,274 3,273 3,486 3,834 3,911
Adjusted EBITDA (US$ mn) 791 1,085 1,215 1,368 1,472 1,447 1,808 1,905
EBITDA/ton (US$/ton) 253 354 381 418 450 415 472 487
Adjusted EBITDA (Rs bn) 52 73 78 96 104 107 136 143
INR:US$ 65.4 67.1 64.5 70.1 70.9 74.2 75.0 75.0
Consolidated
EBITDA (Rs bn) 88 124 139 155 143 158 187 197
Net Debt (Rs bn) 555 466 393 391 394 536 478 402
Net Debt/EBITDA 6.3 3.7 2.8 2.5 2.8 3.4 2.6 2.0
Source: Company, Kotak Institutional Equities estimates
Exhibit 78: Hindalco Industries, valuation, September 2022E basis (Rs mn)
Multiple
(Rs mn) (X) (Rs mn) (Rs/share)
Hindalco EBITDA 53,537 5.0 267,687 121
Novelis EBITDA 139,248 7.0 974,737 439
Total Enterprise Value 192,786 6.4 1,242,424 560
Less: Net debt (438,660) (438,660) (198)
Pension Deficit (71,830) (32)
Arrived market capitalization 330
Fair value (Rs) 330
Value
Source: Kotak Institutional Equities estimates
2018 2019 2020 2021E 2022E 2023E
EBITDA (Rs mn)
Hindalco
Novelis 74,525 93,053 92,008 114,462 135,611 142,885
Copper 15,387 16,830 11,760 6,987 12,480 14,664
Aluminum 48,906 51,329 36,093 37,592 39,380 40,111
Total 139,206 154,998 143,060 158,249 186,679 196,869
Commodity Based 35% 33% 25% 24% 21% 20%
Non-Commodity Based 65% 67% 75% 76% 79% 80%
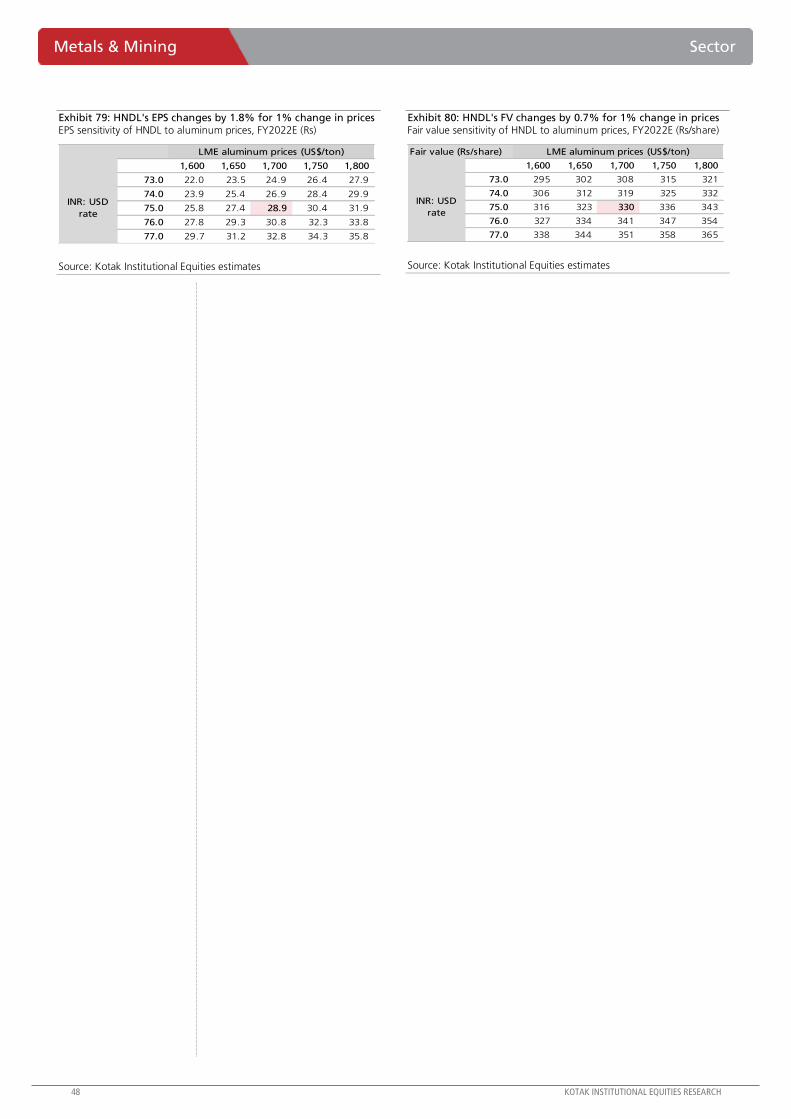
48 KOTAK INSTITUTIONAL EQUITIES RESEARCH
Metals & Mining Sector
Exhibit 79: HNDL's EPS changes by 1.8% for 1% change in prices EPS sensitivity of HNDL to aluminum prices, FY2022E (Rs)
1,600 1,650 1,700 1,750 1,800
73.0 22.0 23.5 24.9 26.4 27.9
74.0 23.9 25.4 26.9 28.4 29.9
75.0 25.8 27.4 28.9 30.4 31.9
76.0 27.8 29.3 30.8 32.3 33.8
77.0 29.7 31.2 32.8 34.3 35.8
LME aluminum prices (US$/ton)
INR: USD
rate
Source: Kotak Institutional Equities estimates
Exhibit 80: HNDL's FV changes by 0.7% for 1% change in prices Fair value sensitivity of HNDL to aluminum prices, FY2022E (Rs/share)
Fair value (Rs/share)
1,600 1,650 1,700 1,750 1,800
73.0 295 302 308 315 321
74.0 306 312 319 325 332
75.0 316 323 330 336 343
76.0 327 334 341 347 354
77.0 338 344 351 358 365
LME aluminum prices (US$/ton)
INR: USD
rate
Source: Kotak Institutional Equities estimates
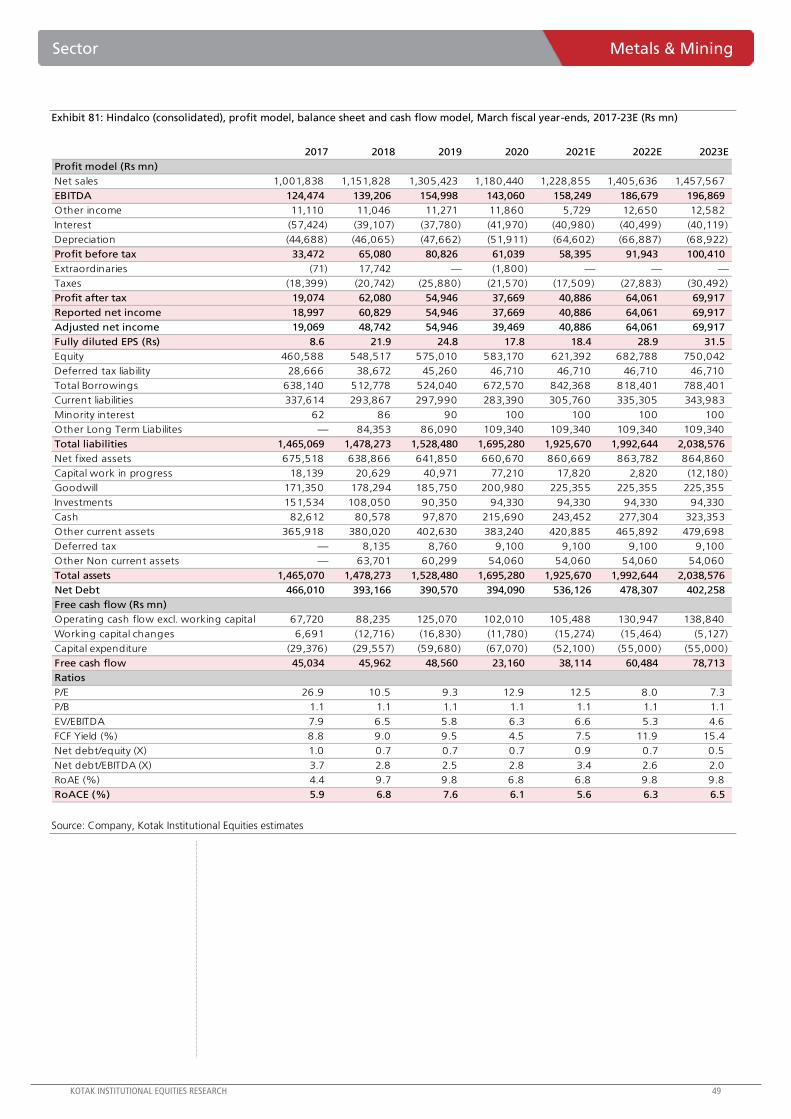
KOTAK INSTITUTIONAL EQUITIES RESEARCH 49
Sector Metals & Mining
Exhibit 81: Hindalco (consolidated), profit model, balance sheet and cash flow model, March fiscal year-ends, 2017-23E (Rs mn)
2017 2018 2019 2020 2021E 2022E 2023E
Profit model (Rs mn)
Net sales 1,001,838 1,151,828 1,305,423 1,180,440 1,228,855 1,405,636 1,457,567
EBITDA 124,474 139,206 154,998 143,060 158,249 186,679 196,869
Other income 11,110 11,046 11,271 11,860 5,729 12,650 12,582
Interest (57,424) (39,107) (37,780) (41,970) (40,980) (40,499) (40,119)
Depreciation (44,688) (46,065) (47,662) (51,911) (64,602) (66,887) (68,922)
Profit before tax 33,472 65,080 80,826 61,039 58,395 91,943 100,410
Extraordinaries (71) 17,742 — (1,800) — — —
Taxes (18,399) (20,742) (25,880) (21,570) (17,509) (27,883) (30,492)
Profit after tax 19,074 62,080 54,946 37,669 40,886 64,061 69,917
Reported net income 18,997 60,829 54,946 37,669 40,886 64,061 69,917
Adjusted net income 19,069 48,742 54,946 39,469 40,886 64,061 69,917
Fully diluted EPS (Rs) 8.6 21.9 24.8 17.8 18.4 28.9 31.5
Equity 460,588 548,517 575,010 583,170 621,392 682,788 750,042
Deferred tax liability 28,666 38,672 45,260 46,710 46,710 46,710 46,710
Total Borrowings 638,140 512,778 524,040 672,570 842,368 818,401 788,401
Current liabilities 337,614 293,867 297,990 283,390 305,760 335,305 343,983
Minority interest 62 86 90 100 100 100 100
Other Long Term Liabilites — 84,353 86,090 109,340 109,340 109,340 109,340
Total liabilities 1,465,069 1,478,273 1,528,480 1,695,280 1,925,670 1,992,644 2,038,576
Net fixed assets 675,518 638,866 641,850 660,670 860,669 863,782 864,860
Capital work in progress 18,139 20,629 40,971 77,210 17,820 2,820 (12,180)
Goodwill 171,350 178,294 185,750 200,980 225,355 225,355 225,355
Investments 151,534 108,050 90,350 94,330 94,330 94,330 94,330
Cash 82,612 80,578 97,870 215,690 243,452 277,304 323,353
Other current assets 365,918 380,020 402,630 383,240 420,885 465,892 479,698
Deferred tax — 8,135 8,760 9,100 9,100 9,100 9,100
Other Non current assets — 63,701 60,299 54,060 54,060 54,060 54,060
Total assets 1,465,070 1,478,273 1,528,480 1,695,280 1,925,670 1,992,644 2,038,576
Net Debt 466,010 393,166 390,570 394,090 536,126 478,307 402,258
Free cash flow (Rs mn)
Operating cash flow excl. working capital 67,720 88,235 125,070 102,010 105,488 130,947 138,840
Working capital changes 6,691 (12,716) (16,830) (11,780) (15,274) (15,464) (5,127)
Capital expenditure (29,376) (29,557) (59,680) (67,070) (52,100) (55,000) (55,000)
Free cash flow 45,034 45,962 48,560 23,160 38,114 60,484 78,713
Ratios
P/E 26.9 10.5 9.3 12.9 12.5 8.0 7.3
P/B 1.1 1.1 1.1 1.1 1.1 1.1 1.1
EV/EBITDA 7.9 6.5 5.8 6.3 6.6 5.3 4.6
FCF Yield (%) 8.8 9.0 9.5 4.5 7.5 11.9 15.4
Net debt/equity (X) 1.0 0.7 0.7 0.7 0.9 0.7 0.5
Net debt/EBITDA (X) 3.7 2.8 2.5 2.8 3.4 2.6 2.0
RoAE (%) 4.4 9.7 9.8 6.8 6.8 9.8 9.8
RoACE (%) 5.9 6.8 7.6 6.1 5.6 6.3 6.5
Source: Company, Kotak Institutional Equities estimates
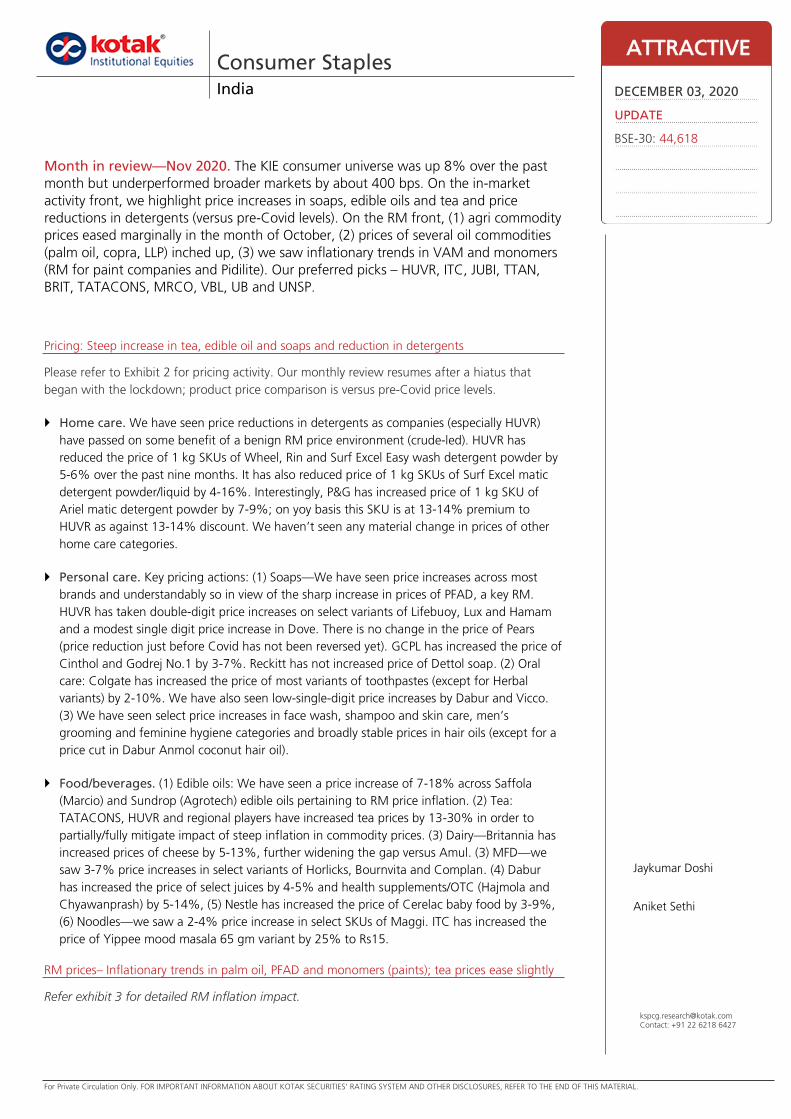
For Private Circulation Only. FOR IMPORTANT INFORMATION ABOUT KOTAK SECURITIES’ RATING SYSTEM AND OTHER DISCLOSURES, REFER TO THE END OF THIS MATERIAL.
Pricing: Steep increase in tea, edible oil and soaps and reduction in detergents
Please refer to Exhibit 2 for pricing activity. Our monthly review resumes after a hiatus that
began with the lockdown; product price comparison is versus pre-Covid price levels.
Home care. We have seen price reductions in detergents as companies (especially HUVR)
have passed on some benefit of a benign RM price environment (crude-led). HUVR has
reduced the price of 1 kg SKUs of Wheel, Rin and Surf Excel Easy wash detergent powder by
5-6% over the past nine months. It has also reduced price of 1 kg SKUs of Surf Excel matic
detergent powder/liquid by 4-16%. Interestingly, P&G has increased price of 1 kg SKU of
Ariel matic detergent powder by 7-9%; on yoy basis this SKU is at 13-14% premium to
HUVR as against 13-14% discount. We haven’t seen any material change in prices of other
home care categories.
Personal care. Key pricing actions: (1) Soaps—We have seen price increases across most
brands and understandably so in view of the sharp increase in prices of PFAD, a key RM.
HUVR has taken double-digit price increases on select variants of Lifebuoy, Lux and Hamam
and a modest single digit price increase in Dove. There is no change in the price of Pears
(price reduction just before Covid has not been reversed yet). GCPL has increased the price of
Cinthol and Godrej No.1 by 3-7%. Reckitt has not increased price of Dettol soap. (2) Oral
care: Colgate has increased the price of most variants of toothpastes (except for Herbal
variants) by 2-10%. We have also seen low-single-digit price increases by Dabur and Vicco.
(3) We have seen select price increases in face wash, shampoo and skin care, men’s
grooming and feminine hygiene categories and broadly stable prices in hair oils (except for a
price cut in Dabur Anmol coconut hair oil).
Food/beverages. (1) Edible oils: We have seen a price increase of 7-18% across Saffola
(Marcio) and Sundrop (Agrotech) edible oils pertaining to RM price inflation. (2) Tea:
TATACONS, HUVR and regional players have increased tea prices by 13-30% in order to
partially/fully mitigate impact of steep inflation in commodity prices. (3) Dairy—Britannia has
increased prices of cheese by 5-13%, further widening the gap versus Amul. (3) MFD—we
saw 3-7% price increases in select variants of Horlicks, Bournvita and Complan. (4) Dabur
has increased the price of select juices by 4-5% and health supplements/OTC (Hajmola and
Chyawanprash) by 5-14%, (5) Nestle has increased the price of Cerelac baby food by 3-9%,
(6) Noodles—we saw a 2-4% price increase in select SKUs of Maggi. ITC has increased the
price of Yippee mood masala 65 gm variant by 25% to Rs15.
RM prices– Inflationary trends in palm oil, PFAD and monomers (paints); tea prices ease slightly
Refer exhibit 3 for detailed RM inflation impact.
Consumer Staples India
Month in review—Nov 2020. The KIE consumer universe was up 8% over the past
month but underperformed broader markets by about 400 bps. On the in-market
activity front, we highlight price increases in soaps, edible oils and tea and price
reductions in detergents (versus pre-Covid levels). On the RM front, (1) agri commodity
prices eased marginally in the month of October, (2) prices of several oil commodities
(palm oil, copra, LLP) inched up, (3) we saw inflationary trends in VAM and monomers
(RM for paint companies and Pidilite). Our preferred picks – HUVR, ITC, JUBI, TTAN,
BRIT, TATACONS, MRCO, VBL, UB and UNSP.
ATTRACTIVE
DECEMBER 03, 2020
UPDATE
BSE-30: 44,618
Jaykumar Doshi
Aniket Sethi
[email protected]: +91 22 6218 6427
Consumer Staples India
KOTAK INSTITUTIONAL EQUITIES RESEARCH 57
Agri-inputs. Select agri commodities showed deflationary trends in October. Domestic
tea prices saw some respite (down 18% mom) but are still up 70% in the past six
months. The tea market continues to be in deficit as production has declined and
demand has sustained at a healthy level. Coffee prices were also down 5-9% mom in the
month as demand in key international markets, including Europe, has been impacted.
Milk prices were down 8% mom after rising steadily post the sharp fall seen in April.
Sugar and wheat prices were broadly stable for the month (down 1% mom) while barley
was up 2% mom. Maize saw sharp inflationary pressure (up 12% mom).
Oil commodities basket. Crude prices were down 2% mom for the month. Despite the
increase in the past six months, crude is still down 32% yoy. Most of the agri-oils saw a
moderate inflationary trend for the month. Palm oil and PFAD prices continued to rise (up
3% mom each) and are now up 43-55% on a yoy basis. Copra and coconut oil saw 2-
5% mom rise while groundnut oil was up 3% mom. LLP was up 8% mom. Rice bran oil
was down 1% mom but is up 27% yoy.
Other commodities. Sharp inflationary pressure was seen for select commodities. VAM
prices were up 4-5% mom in October and Styrene monomer (RM for decorative paints
emulsions) prices were up 7% mom (we gather that prices have increased further in
November due to supply shortage/disruption). Caustic soda and soda ash prices were up
4-8% mom. Gold traded flat for the month.
Who benefits? (1) Easing tea prices should provide some relief to HUVR and TATACONS
even as further easing is needed. (2) Lower milk prices should help NEST, JUBI and BRIT.
Who gets impacted? (1) Higher prices for monomers and VAM are negative for paint
companies and PIDI. (2) PFAD inflation is likely to hurt HUVR, GCPL and JYL. (3) Higher
caustic soda prices are negative for HUL, GCPL and JYL. (4) Inflation in Copra, LLP, Rice
Bran would weigh on edible oil and hair oil categories.
Sector (KIE consumer universe) underperformed broader market
Our overall consumer coverage universe underperformed the broader markets over the past
month, up 8% while broader market was up 12%.
Key stocks that outperformed were VBL (up 30% mom), TTAN (up 19% mom), ITC (up 18%
mom), JUBI (up 17% mom), PAG (up 17% mom), and UBBL (up 15% mom). Key under-
performers were DABUR (down 1% mom), HUVR (up 3% mom), CLGT (up 1% mom) and
PIDI (up 3% mom).
On a 12-month basis, the sector is underperforming the broader markets, posting a 7%
absolute gain (11% ex-ITC) versus a 9% gain for the broader market. Our preferred picks
are HUVR, ITC, JUBI, TTAN, BRIT, TATACONS, MRCO, VBL, UB and UNSP.
India Consumer Staples
58 KOTAK INSTITUTIONAL EQUITIES RESEARCH
New launches/re-launches
CSE: Honey sold by major brands in India adulterated with sugar syrup. According
to the Centre for Science and Environment (CSE), 10 out of 13 Indian honey brands failed
Nuclear Magnetic Resonance (NMR) tests (purity test) conducted at a laboratory in
Germany and the honey of these ten brands was found to be adulterated with sugar
syrup. Among major brands, Dabur, Patanjali and Emami honey failed these tests whereas
Marico’s Saffola honey cleared the test. Dabur and Emami have disputed these claims.
Unilever to introduce mouthwash formulation in India. Unilever has confirmed that
preliminary lab test results show that mouthwash formulation containing CPC Technology
reduces 99.9 per cent of SARS-CoV-2, the virus that causes COVID-19, after 30 seconds
of rinsing. HUL is working on bringing this technology to India in December 2020 and will
launch it under Pepsodent Germicheck Mouth Rinse Liquid.
Emami forays into home care. Emami has entered into the home hygiene and home
care space. It has launched a new brand, Emasol with products such as disinfectant floor
cleaner, toilet cleaner, bathroom cleaner, dishwash gel and sanitizer. Emami has also
roped in cricketer Shikhar Dhawan as its brand ambassador.
GSK launches global oral care brand Polident in India. GSK has entered the
specialised denture category in India with the launch of its global brand Polident in India.
The company has said that dental expert and dentists will play a key role in establishing
the category in India.
HUL unveils its new homecare brand. HUL has launched its homecare brand, Nature
Protect, which includes a range of innovative hygiene products infused with neem extract
and plant-based actives. The product range includes surface cleaners, detergent, wipes
and sprays. The Nature Protect range is available at outlets in Kerala, Tamil Nadu, Andhra
Pradesh, Telangana, and Karnataka as well as on leading ecommerce platforms such as
Amazon across India.
Kellogg’s launches upma. Kellogg’s India has just launched ready-to-eat-in-3-minutes
‘Upma’ in two flavours: Nutty Rava and Veggie Masala Burst. The product is available
across e-commerce platforms and offline stores for Rs20/pack.
Lactalis launches Lactel brand in India. Lactalis’ French milk brand Lactel, has launched
its UHT toned milk 1 liter packet into India. The milk which will retail for Rs70 is fortified
with Vitamins A and D.
Marico enters chyawanprash segment. Marico has extended its edible oil brand
Saffola into the chyawanprash category. The company has launched chyawanprash to
capitalize on increased awareness and need for immunity boosting products. The product
is priced at Rs190 for half kg.
Berger launches a multi-surface protector. Berger has launched a multi-surface
protector named ‘BreatheEasy Safe 24’ in association with IIT Guwahati. The product
protects surfaces from germs, bacteria and viruses for 24 hours and prevents its spread.
Sunfeast launches ‘Noodles in a Bowl’. Sunfeast YiPPee has launched noodles in a
bowl under the Quick Mealz range. The product is available pan-India, across large
format stores, modern trade and e-commerce. Both Veggie Delight and Chicken Delight
will be available in a 70 gms SKU at the price point of Rs45 and Rs50, respectively.
Consumer Staples India
KOTAK INSTITUTIONAL EQUITIES RESEARCH 59
ITC launches Sunfeast Caker to expand its presence in the cakes category. ITC’s
Sunfeast has now expanded its footprint in the cakes category with the launch of a new
sub-brand, Sunfeast Caker. The brand, according to the company, will have a portfolio of
innovative products that will provide premium experiences to consumers at affordable
prices. The offering includes 28 gm SKU of Trinity and 29 gm SKU of Swiss Roll which will
be available at Rs10 while the layer cakes will be available at two price points of Rs5 and
Rs10, respectively.
Hamdard enters Honey segment. Hamdard has entered the honey segment and plans
to setup a facility in Haryana for this. They are also looking to invest Rs100-150 mn in
branding and marketing of the same.
Other newsflow
FMCG industry sees signs of recovery in Sept quarter: Nielsen. According to market
insight firm Nielsen, the FMCG industry has displayed signs of recovery in 3QCY20 with a
growth of 1.6% yoy. This was following a 19% yoy decline in 2QCY20. As per Nielsen,
the growth seen in the FMCG sector reflected positivity witnessed in the overall
macroeconomic scenario amid opening up of the economy and easing of lockdown
restrictions.
ANS Commerce onboards Bikanervala onto its platform. E-commerce enabler ANS
Commerce has onboarded traditional Indian food brand Bikanervala onto its platform,
which it said was aimed at expanding the brand’s portfolio and offering services under a
single umbrella. With this, Bikanervala will gain unrestricted access to ANS Commerce’s
tech-powered e-commerce solution with pre-integrated payment gateways, omni-
channel delivery and real-time inventory sync.
P&G to invest Rs4 bn to build local vendor partnerships. P&G India will invest Rs4 bn
to partner local manufacturers and suppliers in line with the government's vision of a self-
reliant India. The company said that this is part of its ‘vGROW’ program that focuses on
identifying and collaborating with start-ups, small businesses, individuals or large
organizations that can offer innovative solutions.
Amway to invest Rs1.5 bn on digital transformation. Amway has announced an
investment of Rs1.5 bn for digitally transforming its business, which it said was aimed at
stepping up manufacturing automation, home delivery and strengthening its digital
capabilities.
Starbucks fined for not passing on GST cut benefits. The National Anti-Profiteering
Authority has fined Starbucks Rs10.4 mn plus 18% interest for not passing on the benefit
of a reduction in the GST rate from 18% to 5% to consumers between November 2017
and June 2018. Starbucks was also directed to reduce the prices of its products.
Mondelez registers growth in September quarter in India. Mondelēz International
has highlighted its recovery to high-single-digit growth in India in the September quarter,
led by high demand for chocolates/biscuits and increased availability upon easing
restrictions.
Liquor sales decline 29% in 1HFY21. Liquor apex body CIABC in their half-yearly sales
review said that ban on sale of liquor during the months of complete lockdown followed
by imposition of corona cess in May by some states has resulted in the sale of hard sprits
declining 29% yoy in 1HFY21. They also said that the situation has been worse in states
like Andhra Pradesh, Chattisgargh, West Bengal and Rajasthan where sales have seen a
steep decline.
India Consumer Staples
60 KOTAK INSTITUTIONAL EQUITIES RESEARCH
Pernod Ricard grew 6% yoy in India during FY2020. Pernod Ricard reported 6% yoy
growth in its India revenues in FY2020, following 27% growth in FY2019. However,
profit grew 24% as the company focused more on premium brands.
Andhra Pradesh government slashes liquor prices. The Andhra Pradesh government
has cut down the price of IMFL in the medium and premium categories by at least 25-
30% (in end-October), citing instances of 'smuggling' from outside the state. The rate
cut, which the government termed a rationalization, was aimed at curbing inter-border
smuggling of liquor from neighboring states that has become rampant in recent days.
JSW Paints plans 500 colourvista senses retail stores. JSW Paints plans to open 500
colourvista senses retail stores across the country in two to three years. JSW Paints
colourvista senses store is conceptualized to have a home-like look and feel.
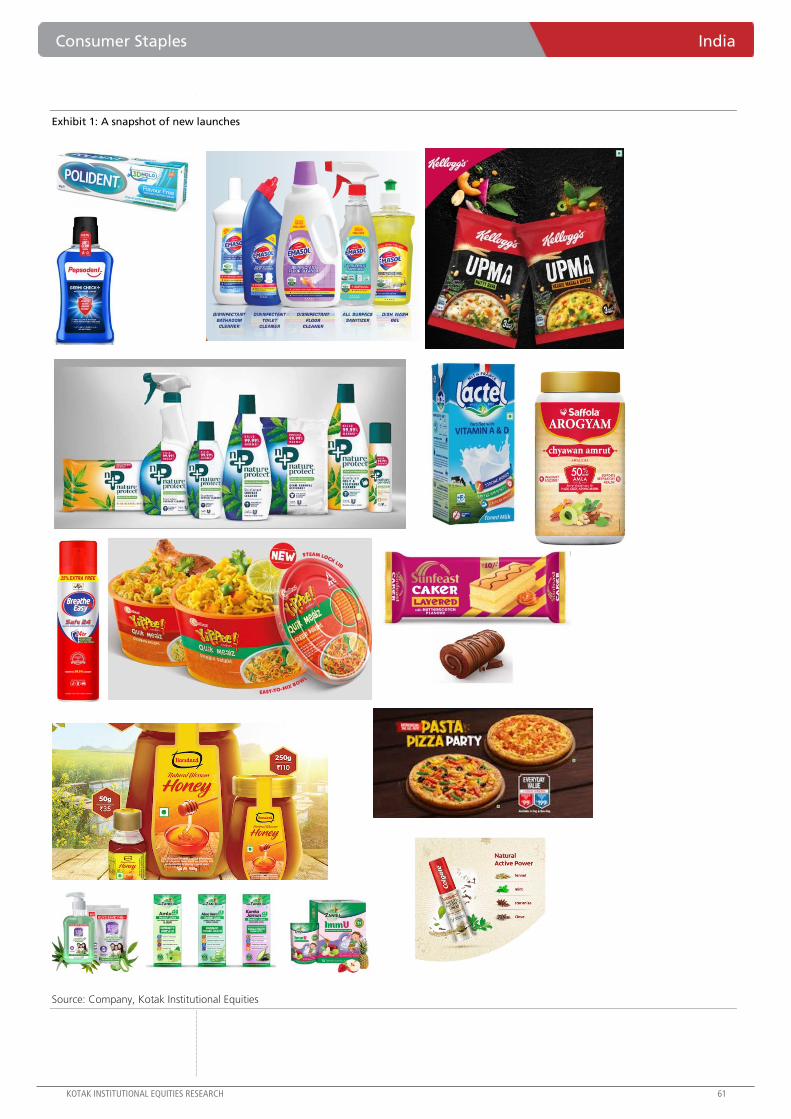
Consumer Staples India
KOTAK INSTITUTIONAL EQUITIES RESEARCH 61
Exhibit 1: A snapshot of new launches
Source: Company, Kotak Institutional Equities
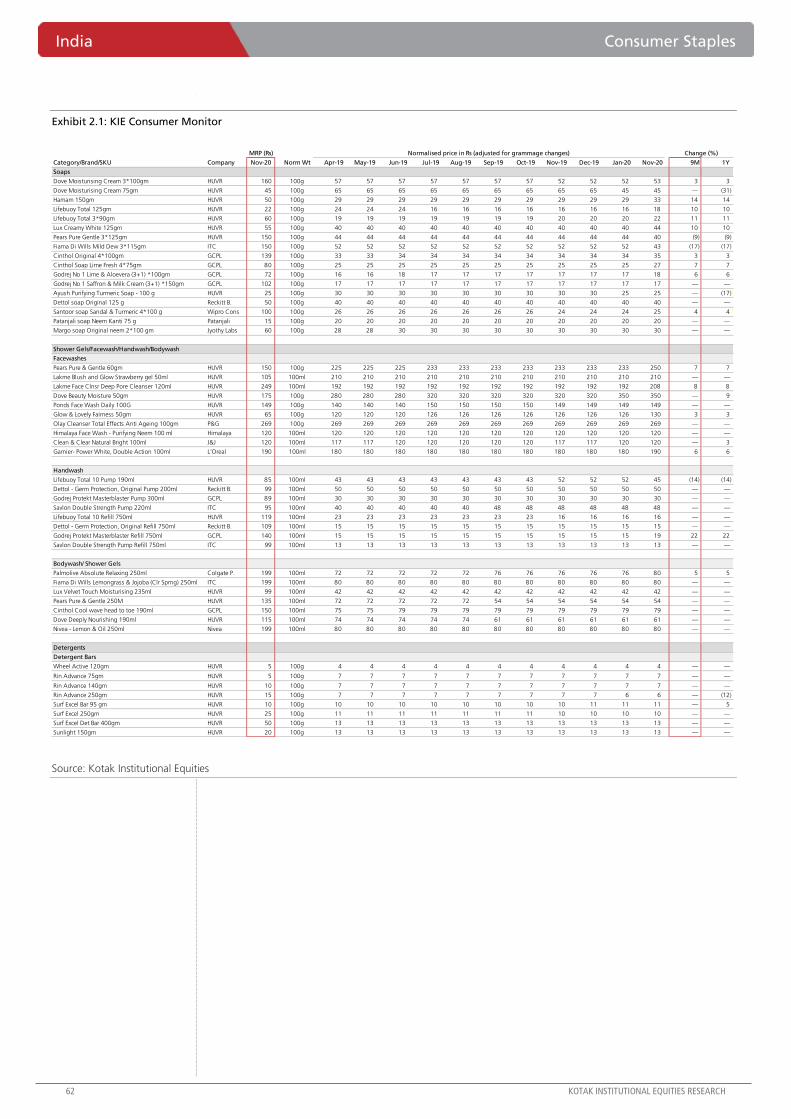
India Consumer Staples
62 KOTAK INSTITUTIONAL EQUITIES RESEARCH
Exhibit 2.1: KIE Consumer Monitor
Source: Kotak Institutional Equities
MRP (Rs)
Category/Brand/SKU Company Nov-20 Norm Wt Apr-19 May-19 Jun-19 Jul-19 Aug-19 Sep-19 Oct-19 Nov-19 Dec-19 Jan-20 Nov-20 9M 1Y
Soaps
Dove Moisturising Cream 3*100gm HUVR 160 100g 57 57 57 57 57 57 57 52 52 52 53 3 3
Dove Moisturising Cream 75gm HUVR 45 100g 65 65 65 65 65 65 65 65 65 45 45 — (31)
Hamam 150gm HUVR 50 100g 29 29 29 29 29 29 29 29 29 29 33 14 14
Lifebuoy Total 125gm HUVR 22 100g 24 24 24 16 16 16 16 16 16 16 18 10 10
Lifebuoy Total 3*90gm HUVR 60 100g 19 19 19 19 19 19 19 20 20 20 22 11 11
Lux Creamy White 125gm HUVR 55 100g 40 40 40 40 40 40 40 40 40 40 44 10 10
Pears Pure Gentle 3*125gm HUVR 150 100g 44 44 44 44 44 44 44 44 44 44 40 (9) (9)
Fiama Di Wills Mild Dew 3*115gm ITC 150 100g 52 52 52 52 52 52 52 52 52 52 43 (17) (17)
Cinthol Original 4*100gm GCPL 139 100g 33 33 34 34 34 34 34 34 34 34 35 3 3
Cinthol Soap Lime Fresh 4*75gm GCPL 80 100g 25 25 25 25 25 25 25 25 25 25 27 7 7
Godrej No 1 Lime & Aloevera (3+1) *100gm GCPL 72 100g 16 16 18 17 17 17 17 17 17 17 18 6 6
Godrej No 1 Saffron & Milk Cream (3+1) *150gm GCPL 102 100g 17 17 17 17 17 17 17 17 17 17 17 — —
Ayush Purifying Turmeric Soap - 100 g HUVR 25 100g 30 30 30 30 30 30 30 30 30 25 25 — (17)
Dettol soap Original 125 g Reckitt B. 50 100g 40 40 40 40 40 40 40 40 40 40 40 — —
Santoor soap Sandal & Turmeric 4*100 g Wipro Cons 100 100g 26 26 26 26 26 26 26 24 24 24 25 4 4
Patanjali soap Neem Kanti 75 g Patanjali 15 100g 20 20 20 20 20 20 20 20 20 20 20 — —
Margo soap Original neem 2*100 gm Jyothy Labs 60 100g 28 28 30 30 30 30 30 30 30 30 30 — —
Shower Gels/Facewash/Handwash/Bodywash
Facewashes
Pears Pure & Gentle 60gm HUVR 150 100g 225 225 225 233 233 233 233 233 233 233 250 7 7
Lakme Blush and Glow Strawberry gel 50ml HUVR 105 100ml 210 210 210 210 210 210 210 210 210 210 210 — —
Lakme Face Clnsr Deep Pore Cleanser 120ml HUVR 249 100ml 192 192 192 192 192 192 192 192 192 192 208 8 8
Dove Beauty Moisture 50gm HUVR 175 100g 280 280 280 320 320 320 320 320 320 350 350 — 9
Ponds Face Wash Daily 100G HUVR 149 100g 140 140 140 150 150 150 150 149 149 149 149 — —
Glow & Lovely Fairness 50gm HUVR 65 100g 120 120 120 126 126 126 126 126 126 126 130 3 3
Olay Cleanser Total Effects Anti Ageing 100gm P&G 269 100g 269 269 269 269 269 269 269 269 269 269 269 — —
Himalaya Face Wash - Purifying Neem 100 ml Himalaya 120 100ml 120 120 120 120 120 120 120 120 120 120 120 — —
Clean & Clear Natural Bright 100ml J&J 120 100ml 117 117 120 120 120 120 120 117 117 120 120 — 3
Garnier- Power White, Double Action 100ml L'Oreal 190 100ml 180 180 180 180 180 180 180 180 180 180 190 6 6
Handwash
Lifebuoy Total 10 Pump 190ml HUVR 85 100ml 43 43 43 43 43 43 43 52 52 52 45 (14) (14)
Dettol - Germ Protection, Original Pump 200ml Reckitt B. 99 100ml 50 50 50 50 50 50 50 50 50 50 50 — —
Godrej Protekt Masterblaster Pump 300ml GCPL 89 100ml 30 30 30 30 30 30 30 30 30 30 30 — —
Savlon Double Strength Pump 220ml ITC 95 100ml 40 40 40 40 40 48 48 48 48 48 48 — —
Lifebuoy Total 10 Refill 750ml HUVR 119 100ml 23 23 23 23 23 23 23 16 16 16 16 — —
Dettol - Germ Protection, Original Refill 750ml Reckitt B. 109 100ml 15 15 15 15 15 15 15 15 15 15 15 — —
Godrej Protekt Masterblaster Refill 750ml GCPL 140 100ml 15 15 15 15 15 15 15 15 15 15 19 22 22
Savlon Double Strength Pump Refill 750ml ITC 99 100ml 13 13 13 13 13 13 13 13 13 13 13 — —
Bodywash/ Shower Gels
Palmolive Absolute Relaxing 250ml Colgate P. 199 100ml 72 72 72 72 72 76 76 76 76 76 80 5 5
Fiama Di Wills Lemongrass & Jojoba (Clr Sprng) 250ml ITC 199 100ml 80 80 80 80 80 80 80 80 80 80 80 — —
Lux Velvet Touch Moisturising 235ml HUVR 99 100ml 42 42 42 42 42 42 42 42 42 42 42 — —
Pears Pure & Gentle 250M HUVR 135 100ml 72 72 72 72 72 54 54 54 54 54 54 — —
Cinthol Cool wave head to toe 190ml GCPL 150 100ml 75 75 79 79 79 79 79 79 79 79 79 — —
Dove Deeply Nourishing 190ml HUVR 115 100ml 74 74 74 74 74 61 61 61 61 61 61 — —
Nivea - Lemon & Oil 250ml Nivea 199 100ml 80 80 80 80 80 80 80 80 80 80 80 — —
Detergents
Detergent Bars
Wheel Active 120gm HUVR 5 100g 4 4 4 4 4 4 4 4 4 4 4 — —
Rin Advance 75gm HUVR 5 100g 7 7 7 7 7 7 7 7 7 7 7 — —
Rin Advance 140gm HUVR 10 100g 7 7 7 7 7 7 7 7 7 7 7 — —
Rin Advance 250gm HUVR 15 100g 7 7 7 7 7 7 7 7 7 6 6 — (12)
Surf Excel Bar 95 gm HUVR 10 100g 10 10 10 10 10 10 10 10 11 11 11 — 5
Surf Excel 250gm HUVR 25 100g 11 11 11 11 11 11 11 10 10 10 10 — —
Surf Excel Det Bar 400gm HUVR 50 100g 13 13 13 13 13 13 13 13 13 13 13 — —
Sunlight 150gm HUVR 20 100g 13 13 13 13 13 13 13 13 13 13 13 — —
Change (%)Normalised price in Rs (adjusted for grammage changes)
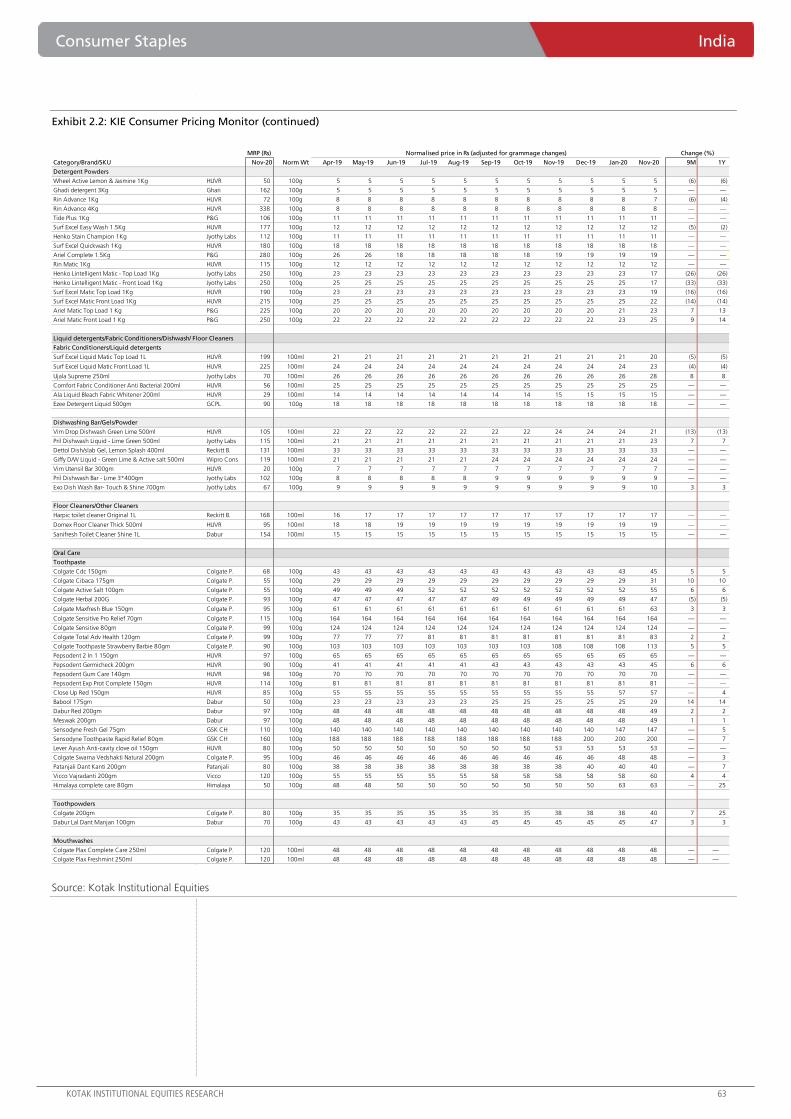
Consumer Staples India
KOTAK INSTITUTIONAL EQUITIES RESEARCH 63
Exhibit 2.2: KIE Consumer Pricing Monitor (continued)
Source: Kotak Institutional Equities
MRP (Rs)
Category/Brand/SKU Nov-20 Norm Wt Apr-19 May-19 Jun-19 Jul-19 Aug-19 Sep-19 Oct-19 Nov-19 Dec-19 Jan-20 Nov-20 9M 1Y
Detergent Powders
Wheel Active Lemon & Jasmine 1Kg HUVR 50 100g 5 5 5 5 5 5 5 5 5 5 5 (6) (6)
Ghadi detergent 3Kg Ghari 162 100g 5 5 5 5 5 5 5 5 5 5 5 — —
Rin Advance 1Kg HUVR 72 100g 8 8 8 8 8 8 8 8 8 8 7 (6) (4)
Rin Advance 4Kg HUVR 338 100g 8 8 8 8 8 8 8 8 8 8 8 — —
Tide Plus 1Kg P&G 106 100g 11 11 11 11 11 11 11 11 11 11 11 — —
Surf Excel Easy Wash 1.5Kg HUVR 177 100g 12 12 12 12 12 12 12 12 12 12 12 (5) (2)
Henko Stain Champion 1Kg Jyothy Labs 112 100g 11 11 11 11 11 11 11 11 11 11 11 — —
Surf Excel Quickwash 1Kg HUVR 180 100g 18 18 18 18 18 18 18 18 18 18 18 — —
Ariel Complete 1.5Kg P&G 280 100g 26 26 18 18 18 18 18 19 19 19 19 — —
Rin Matic 1Kg HUVR 115 100g 12 12 12 12 12 12 12 12 12 12 12 — —
Henko Lintelligent Matic - Top Load 1Kg Jyothy Labs 250 100g 23 23 23 23 23 23 23 23 23 23 17 (26) (26)
Henko Lintelligent Matic - Front Load 1Kg Jyothy Labs 250 100g 25 25 25 25 25 25 25 25 25 25 17 (33) (33)
Surf Excel Matic Top Load 1Kg HUVR 190 100g 23 23 23 23 23 23 23 23 23 23 19 (16) (16)
Surf Excel Matic Front Load 1Kg HUVR 215 100g 25 25 25 25 25 25 25 25 25 25 22 (14) (14)
Ariel Matic Top Load 1 Kg P&G 225 100g 20 20 20 20 20 20 20 20 20 21 23 7 13
Ariel Matic Front Load 1 Kg P&G 250 100g 22 22 22 22 22 22 22 22 22 23 25 9 14
Liquid detergents/Fabric Conditioners/Dishwash/ Floor Cleaners
Fabric Conditioners/Liquid detergents
Surf Excel Liquid Matic Top Load 1L HUVR 199 100ml 21 21 21 21 21 21 21 21 21 21 20 (5) (5)
Surf Excel Liquid Matic Front Load 1L HUVR 225 100ml 24 24 24 24 24 24 24 24 24 24 23 (4) (4)
Ujala Supreme 250ml Jyothy Labs 70 100ml 26 26 26 26 26 26 26 26 26 26 28 8 8
Comfort Fabric Conditioner Anti Bacterial 200ml HUVR 56 100ml 25 25 25 25 25 25 25 25 25 25 25 — —
Ala Liquid Bleach Fabric Whitener 200ml HUVR 29 100ml 14 14 14 14 14 14 14 15 15 15 15 — —
Ezee Detergent Liquid 500gm GCPL 90 100g 18 18 18 18 18 18 18 18 18 18 18 — —
Dishwashing Bar/Gels/Powder
Vim Drop Dishwash Green Lime 500ml HUVR 105 100ml 22 22 22 22 22 22 22 24 24 24 21 (13) (13)
Pril Dishwash Liquid - Lime Green 500ml Jyothy Labs 115 100ml 21 21 21 21 21 21 21 21 21 21 23 7 7
Dettol Dish/slab Gel, Lemon Splash 400ml Reckitt B. 131 100ml 33 33 33 33 33 33 33 33 33 33 33 — —
Giffy D/W Liquid - Green Lime & Active salt 500ml Wipro Cons 119 100ml 21 21 21 21 21 24 24 24 24 24 24 — —
Vim Utensil Bar 300gm HUVR 20 100g 7 7 7 7 7 7 7 7 7 7 7 — —
Pril Dishwash Bar - Lime 3*400gm Jyothy Labs 102 100g 8 8 8 8 8 9 9 9 9 9 9 — —
Exo Dish Wash Bar- Touch & Shine 700gm Jyothy Labs 67 100g 9 9 9 9 9 9 9 9 9 9 10 3 3
Floor Cleaners/Other Cleaners
Harpic toilet cleaner Original 1L Reckitt B. 168 100ml 16 17 17 17 17 17 17 17 17 17 17 — —
Domex Floor Cleaner Thick 500ml HUVR 95 100ml 18 18 19 19 19 19 19 19 19 19 19 — —
Sanifresh Toilet Cleaner Shine 1L Dabur 154 100ml 15 15 15 15 15 15 15 15 15 15 15 — —
Oral Care
Toothpaste
Colgate Cdc 150gm Colgate P. 68 100g 43 43 43 43 43 43 43 43 43 43 45 5 5
Colgate Cibaca 175gm Colgate P. 55 100g 29 29 29 29 29 29 29 29 29 29 31 10 10
Colgate Active Salt 100gm Colgate P. 55 100g 49 49 49 52 52 52 52 52 52 52 55 6 6
Colgate Herbal 200G Colgate P. 93 100g 47 47 47 47 47 49 49 49 49 49 47 (5) (5)
Colgate Maxfresh Blue 150gm Colgate P. 95 100g 61 61 61 61 61 61 61 61 61 61 63 3 3
Colgate Sensitive Pro Relief 70gm Colgate P. 115 100g 164 164 164 164 164 164 164 164 164 164 164 — —
Colgate Sensitive 80gm Colgate P. 99 100g 124 124 124 124 124 124 124 124 124 124 124 — —
Colgate Total Adv Health 120gm Colgate P. 99 100g 77 77 77 81 81 81 81 81 81 81 83 2 2
Colgate Toothpaste Strawberry Barbie 80gm Colgate P. 90 100g 103 103 103 103 103 103 103 108 108 108 113 5 5
Pepsodent 2 In 1 150gm HUVR 97 100g 65 65 65 65 65 65 65 65 65 65 65 — —
Pepsodent Germicheck 200gm HUVR 90 100g 41 41 41 41 41 43 43 43 43 43 45 6 6
Pepsodent Gum Care 140gm HUVR 98 100g 70 70 70 70 70 70 70 70 70 70 70 — —
Pepsodent Exp Prot Complete 150gm HUVR 114 100g 81 81 81 81 81 81 81 81 81 81 81 — —
Close Up Red 150gm HUVR 85 100g 55 55 55 55 55 55 55 55 55 57 57 — 4
Babool 175gm Dabur 50 100g 23 23 23 23 23 25 25 25 25 25 29 14 14
Dabur Red 200gm Dabur 97 100g 48 48 48 48 48 48 48 48 48 48 49 2 2
Meswak 200gm Dabur 97 100g 48 48 48 48 48 48 48 48 48 48 49 1 1
Sensodyne Fresh Gel 75gm GSK CH 110 100g 140 140 140 140 140 140 140 140 140 147 147 — 5
Sensodyne Toothpaste Rapid Relief 80gm GSK CH 160 100g 188 188 188 188 188 188 188 188 200 200 200 — 7
Lever Ayush Anti-cavity clove oil 150gm HUVR 80 100g 50 50 50 50 50 50 50 53 53 53 53 — —
Colgate Swarna Vedshakti Natural 200gm Colgate P. 95 100g 46 46 46 46 46 46 46 46 46 48 48 — 3
Patanjali Dant Kanti 200gm Patanjali 80 100g 38 38 38 38 38 38 38 38 40 40 40 — 7
Vicco Vajradanti 200gm Vicco 120 100g 55 55 55 55 55 58 58 58 58 58 60 4 4
Himalaya complete care 80gm Himalaya 50 100g 48 48 50 50 50 50 50 50 50 63 63 — 25
Toothpowders
Colgate 200gm Colgate P. 80 100g 35 35 35 35 35 35 35 38 38 38 40 7 25
Dabur Lal Dant Manjan 100gm Dabur 70 100g 43 43 43 43 43 45 45 45 45 45 47 3 3
Mouthwashes
Colgate Plax Complete Care 250ml Colgate P. 120 100ml 48 48 48 48 48 48 48 48 48 48 48 — —
Colgate Plax Freshmint 250ml Colgate P. 120 100ml 48 48 48 48 48 48 48 48 48 48 48 — —
Change (%)Normalised price in Rs (adjusted for grammage changes)
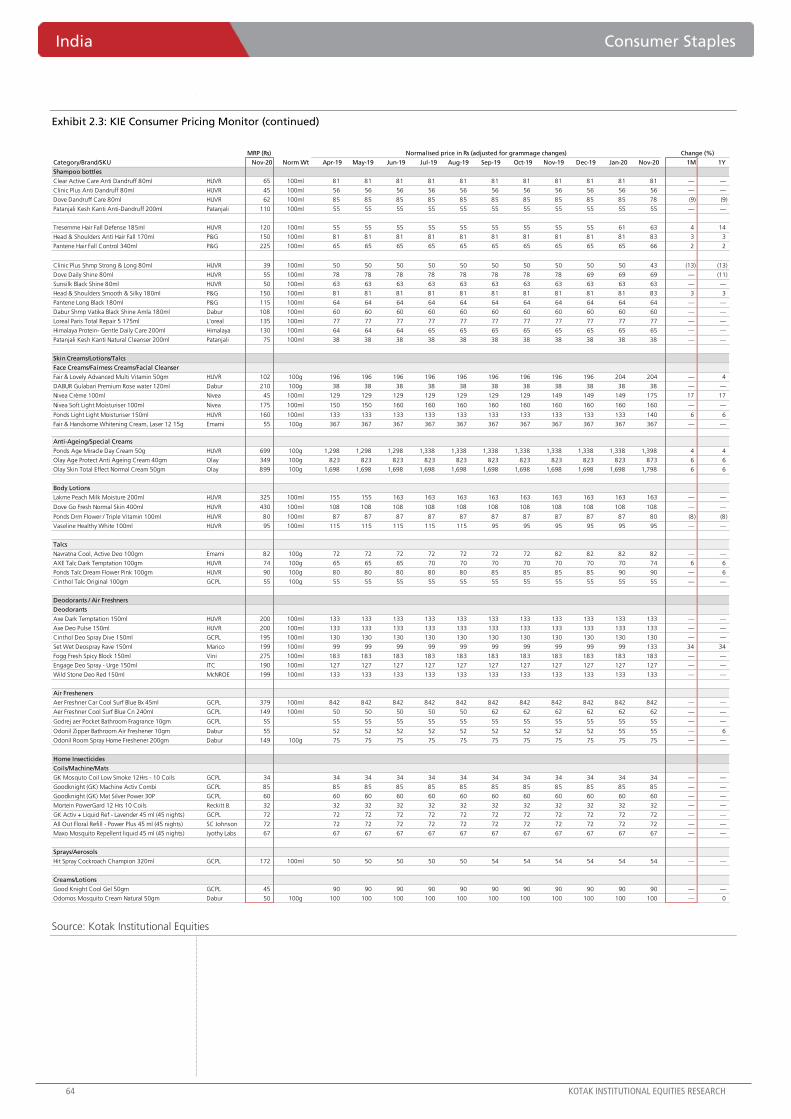
India Consumer Staples
64 KOTAK INSTITUTIONAL EQUITIES RESEARCH
Exhibit 2.3: KIE Consumer Pricing Monitor (continued)
Source: Kotak Institutional Equities
MRP (Rs)
Category/Brand/SKU Nov-20 Norm Wt Apr-19 May-19 Jun-19 Jul-19 Aug-19 Sep-19 Oct-19 Nov-19 Dec-19 Jan-20 Nov-20 1M 1Y
Shampoo bottles
Clear Active Care Anti Dandruff 80ml HUVR 65 100ml 81 81 81 81 81 81 81 81 81 81 81 — —
Clinic Plus Anti Dandruff 80ml HUVR 45 100ml 56 56 56 56 56 56 56 56 56 56 56 — —
Dove Dandruff Care 80ml HUVR 62 100ml 85 85 85 85 85 85 85 85 85 85 78 (9) (9)
Patanjali Kesh Kanti Anti-Dandruff 200ml Patanjali 110 100ml 55 55 55 55 55 55 55 55 55 55 55 — —
Tresemme Hair Fall Defense 185ml HUVR 120 100ml 55 55 55 55 55 55 55 55 55 61 63 4 14
Head & Shoulders Anti Hair Fall 170ml P&G 150 100ml 81 81 81 81 81 81 81 81 81 81 83 3 3
Pantene Hair Fall Control 340ml P&G 225 100ml 65 65 65 65 65 65 65 65 65 65 66 2 2
Clinic Plus Shmp Strong & Long 80ml HUVR 39 100ml 50 50 50 50 50 50 50 50 50 50 43 (13) (13)
Dove Daily Shine 80ml HUVR 55 100ml 78 78 78 78 78 78 78 78 69 69 69 — (11)
Sunsilk Black Shine 80ml HUVR 50 100ml 63 63 63 63 63 63 63 63 63 63 63 — —
Head & Shoulders Smooth & Silky 180ml P&G 150 100ml 81 81 81 81 81 81 81 81 81 81 83 3 3
Pantene Long Black 180ml P&G 115 100ml 64 64 64 64 64 64 64 64 64 64 64 — —
Dabur Shmp Vatika Black Shine Amla 180ml Dabur 108 100ml 60 60 60 60 60 60 60 60 60 60 60 — —
Loreal Paris Total Repair 5 175ml L'oreal 135 100ml 77 77 77 77 77 77 77 77 77 77 77 — —
Himalaya Protein- Gentle Daily Care 200ml Himalaya 130 100ml 64 64 64 65 65 65 65 65 65 65 65 — —
Patanjali Kesh Kanti Natural Cleanser 200ml Patanjali 75 100ml 38 38 38 38 38 38 38 38 38 38 38 — —
Skin Creams/Lotions/Talcs
Face Creams/Fairness Creams/Facial Cleanser
Fair & Lovely Advanced Multi Vitamin 50gm HUVR 102 100g 196 196 196 196 196 196 196 196 196 204 204 — 4
DABUR Gulabari Premium Rose water 120ml Dabur 210 100g 38 38 38 38 38 38 38 38 38 38 38 — —
Nivea Crème 100ml Nivea 45 100ml 129 129 129 129 129 129 129 149 149 149 175 17 17
Nivea Soft Light Moisturiser 100ml Nivea 175 100ml 150 150 160 160 160 160 160 160 160 160 160 — —
Ponds Light Light Moisturiser 150ml HUVR 160 100ml 133 133 133 133 133 133 133 133 133 133 140 6 6
Fair & Handsome Whitening Cream, Laser 12 15g Emami 55 100g 367 367 367 367 367 367 367 367 367 367 367 — —
Anti-Ageing/Special Creams
Ponds Age Miracle Day Cream 50g HUVR 699 100g 1,298 1,298 1,298 1,338 1,338 1,338 1,338 1,338 1,338 1,338 1,398 4 4
Olay Age Protect Anti Ageing Cream 40gm Olay 349 100g 823 823 823 823 823 823 823 823 823 823 873 6 6
Olay Skin Total Effect Normal Cream 50gm Olay 899 100g 1,698 1,698 1,698 1,698 1,698 1,698 1,698 1,698 1,698 1,698 1,798 6 6
Body Lotions
Lakme Peach Milk Moisture 200ml HUVR 325 100ml 155 155 163 163 163 163 163 163 163 163 163 — —
Dove Go Fresh Normal Skin 400ml HUVR 430 100ml 108 108 108 108 108 108 108 108 108 108 108 — —
Ponds Drm Flower / Triple Vitamin 100ml HUVR 80 100ml 87 87 87 87 87 87 87 87 87 87 80 (8) (8)
Vaseline Healthy White 100ml HUVR 95 100ml 115 115 115 115 115 95 95 95 95 95 95 — —
Talcs
Navratna Cool, Active Deo 100gm Emami 82 100g 72 72 72 72 72 72 72 82 82 82 82 — —
AXE Talc Dark Temptation 100gm HUVR 74 100g 65 65 65 70 70 70 70 70 70 70 74 6 6
Ponds Talc Dream Flower Pink 100gm HUVR 90 100g 80 80 80 80 80 85 85 85 85 90 90 — 6
Cinthol Talc Original 100gm GCPL 55 100g 55 55 55 55 55 55 55 55 55 55 55 — —
Deodorants / Air Freshners
Deodorants
Axe Dark Temptation 150ml HUVR 200 100ml 133 133 133 133 133 133 133 133 133 133 133 — —
Axe Deo Pulse 150ml HUVR 200 100ml 133 133 133 133 133 133 133 133 133 133 133 — —
Cinthol Deo Spray Dive 150ml GCPL 195 100ml 130 130 130 130 130 130 130 130 130 130 130 — —
Set Wet Deospray Rave 150ml Marico 199 100ml 99 99 99 99 99 99 99 99 99 99 133 34 34
Fogg Fresh Spicy Block 150ml Vini 275 100ml 183 183 183 183 183 183 183 183 183 183 183 — —
Engage Deo Spray - Urge 150ml ITC 190 100ml 127 127 127 127 127 127 127 127 127 127 127 — —
Wild Stone Deo Red 150ml McNROE 199 100ml 133 133 133 133 133 133 133 133 133 133 133 — —
Air Fresheners
Aer Freshner Car Cool Surf Blue Bx 45ml GCPL 379 100ml 842 842 842 842 842 842 842 842 842 842 842 — —
Aer Freshner Cool Surf Blue Cn 240ml GCPL 149 100ml 50 50 50 50 50 62 62 62 62 62 62 — —
Godrej aer Pocket Bathroom Fragrance 10gm GCPL 55 55 55 55 55 55 55 55 55 55 55 55 — —
Odonil Zipper Bathroom Air Freshener 10gm Dabur 55 52 52 52 52 52 52 52 52 52 55 55 — 6
Odonil Room Spray Home Freshener 200gm Dabur 149 100g 75 75 75 75 75 75 75 75 75 75 75 — —
Home Insecticides
Coils/Machine/Mats
GK Mosquto Coil Low Smoke 12Hrs - 10 Coils GCPL 34 34 34 34 34 34 34 34 34 34 34 34 — —
Goodknight (GK) Machine Activ Combi GCPL 85 85 85 85 85 85 85 85 85 85 85 85 — —
Goodknight (GK) Mat Silver Power 30P GCPL 60 60 60 60 60 60 60 60 60 60 60 60 — —
Mortein PowerGard 12 Hrs 10 Coils Reckitt B. 32 32 32 32 32 32 32 32 32 32 32 32 — —
GK Activ + Liquid Ref - Lavender 45 ml (45 nights) GCPL 72 72 72 72 72 72 72 72 72 72 72 72 — —
All Out Floral Refill - Power Plus 45 ml (45 nights) SC Johnson 72 72 72 72 72 72 72 72 72 72 72 72 — —
Maxo Mosquito Repellent liquid 45 ml (45 nights) Jyothy Labs 67 67 67 67 67 67 67 67 67 67 67 67 — —
Sprays/Aerosols
Hit Spray Cockroach Champion 320ml GCPL 172 100ml 50 50 50 50 50 54 54 54 54 54 54 — —
Creams/Lotions
Good Knight Cool Gel 50gm GCPL 45 90 90 90 90 90 90 90 90 90 90 90 — —
Odomos Mosquito Cream Natural 50gm Dabur 50 100g 100 100 100 100 100 100 100 100 100 100 100 — 0
Change (%)Normalised price in Rs (adjusted for grammage changes)
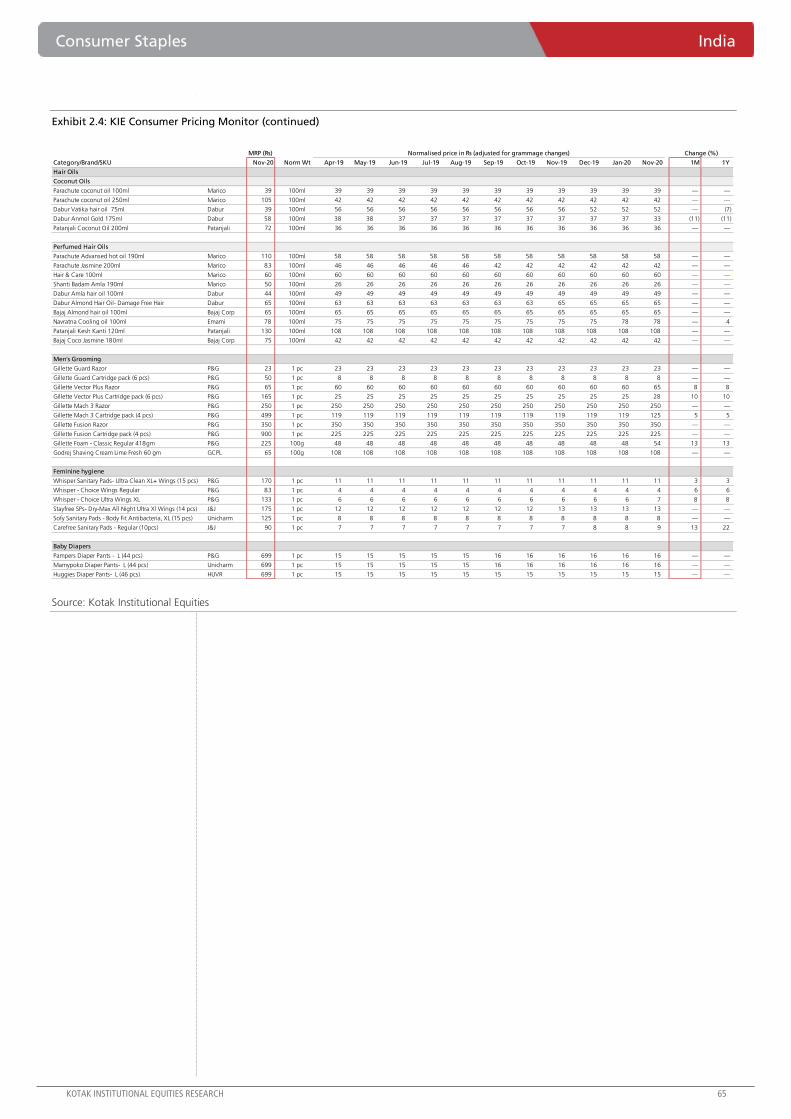
Consumer Staples India
KOTAK INSTITUTIONAL EQUITIES RESEARCH 65
Exhibit 2.4: KIE Consumer Pricing Monitor (continued)
Source: Kotak Institutional Equities
MRP (Rs)
Category/Brand/SKU Nov-20 Norm Wt Apr-19 May-19 Jun-19 Jul-19 Aug-19 Sep-19 Oct-19 Nov-19 Dec-19 Jan-20 Nov-20 1M 1Y
Hair Oils
Coconut Oils
Parachute coconut oil 100ml Marico 39 100ml 39 39 39 39 39 39 39 39 39 39 39 — —
Parachute coconut oil 250ml Marico 105 100ml 42 42 42 42 42 42 42 42 42 42 42 — —
Dabur Vatika hair oil 75ml Dabur 39 100ml 56 56 56 56 56 56 56 56 52 52 52 — (7)
Dabur Anmol Gold 175ml Dabur 58 100ml 38 38 37 37 37 37 37 37 37 37 33 (11) (11)
Patanjali Coconut Oil 200ml Patanjali 72 100ml 36 36 36 36 36 36 36 36 36 36 36 — —
Perfumed Hair Oils
Parachute Advansed hot oil 190ml Marico 110 100ml 58 58 58 58 58 58 58 58 58 58 58 — —
Parachute Jasmine 200ml Marico 83 100ml 46 46 46 46 46 42 42 42 42 42 42 — —
Hair & Care 100ml Marico 60 100ml 60 60 60 60 60 60 60 60 60 60 60 — —
Shanti Badam Amla 190ml Marico 50 100ml 26 26 26 26 26 26 26 26 26 26 26 — —
Dabur Amla hair oil 100ml Dabur 44 100ml 49 49 49 49 49 49 49 49 49 49 49 — —
Dabur Almond Hair Oil- Damage Free Hair Dabur 65 100ml 63 63 63 63 63 63 63 65 65 65 65 — —
Bajaj Almond hair oil 100ml Bajaj Corp 65 100ml 65 65 65 65 65 65 65 65 65 65 65 — —
Navratna Cooling oil 100ml Emami 78 100ml 75 75 75 75 75 75 75 75 75 78 78 — 4
Patanjali Kesh Kanti 120ml Patanjali 130 100ml 108 108 108 108 108 108 108 108 108 108 108 — —
Bajaj Coco Jasmine 180ml Bajaj Corp 75 100ml 42 42 42 42 42 42 42 42 42 42 42 — —
Men's Grooming
Gillette Guard Razor P&G 23 1 pc 23 23 23 23 23 23 23 23 23 23 23 — —
Gillette Guard Cartridge pack (6 pcs) P&G 50 1 pc 8 8 8 8 8 8 8 8 8 8 8 — —
Gillette Vector Plus Razor P&G 65 1 pc 60 60 60 60 60 60 60 60 60 60 65 8 8
Gillette Vector Plus Cartridge pack (6 pcs) P&G 165 1 pc 25 25 25 25 25 25 25 25 25 25 28 10 10
Gillette Mach 3 Razor P&G 250 1 pc 250 250 250 250 250 250 250 250 250 250 250 — —
Gillette Mach 3 Cartridge pack (4 pcs) P&G 499 1 pc 119 119 119 119 119 119 119 119 119 119 125 5 5
Gillette Fusion Razor P&G 350 1 pc 350 350 350 350 350 350 350 350 350 350 350 — —
Gillette Fusion Cartridge pack (4 pcs) P&G 900 1 pc 225 225 225 225 225 225 225 225 225 225 225 — —
Gillette Foam - Classic Regular 418gm P&G 225 100g 48 48 48 48 48 48 48 48 48 48 54 13 13
Godrej Shaving Cream Lime Fresh 60 gm GCPL 65 100g 108 108 108 108 108 108 108 108 108 108 108 — —
Feminine hygiene
Whisper Sanitary Pads- Ultra Clean XL+ Wings (15 pcs) P&G 170 1 pc 11 11 11 11 11 11 11 11 11 11 11 3 3
Whisper - Choice Wings Regular P&G 83 1 pc 4 4 4 4 4 4 4 4 4 4 4 6 6
Whisper - Choice Ultra Wings XL P&G 133 1 pc 6 6 6 6 6 6 6 6 6 6 7 8 8
Stayfree SPs- Dry-Max All Night Ultra Xl Wings (14 pcs) J&J 175 1 pc 12 12 12 12 12 12 12 13 13 13 13 — —
Sofy Sanitary Pads - Body Fit Antibacteria, XL (15 pcs) Unicharm 125 1 pc 8 8 8 8 8 8 8 8 8 8 8 — —
Carefree Sanitary Pads - Regular (10pcs) J&J 90 1 pc 7 7 7 7 7 7 7 7 8 8 9 13 22
Baby Diapers
Pampers Diaper Pants - L (44 pcs) P&G 699 1 pc 15 15 15 15 15 16 16 16 16 16 16 — —
Mamypoko Diaper Pants- L (44 pcs) Unicharm 699 1 pc 15 15 15 15 15 16 16 16 16 16 16 — —
Huggies Diaper Pants- L (46 pcs) HUVR 699 1 pc 15 15 15 15 15 15 15 15 15 15 15 — —
Change (%)Normalised price in Rs (adjusted for grammage changes)
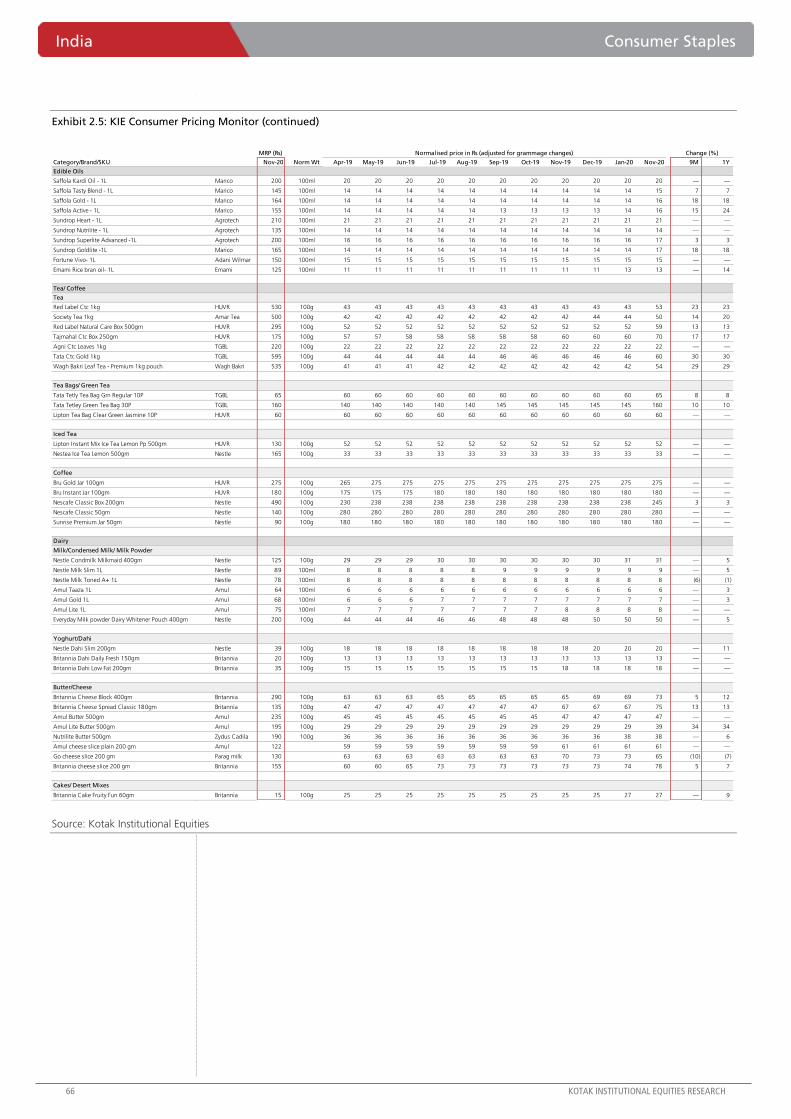
India Consumer Staples
66 KOTAK INSTITUTIONAL EQUITIES RESEARCH
Exhibit 2.5: KIE Consumer Pricing Monitor (continued)
Source: Kotak Institutional Equities
MRP (Rs)
Category/Brand/SKU Nov-20 Norm Wt Apr-19 May-19 Jun-19 Jul-19 Aug-19 Sep-19 Oct-19 Nov-19 Dec-19 Jan-20 Nov-20 9M 1Y
Edible Oils
Saffola Kardi Oil - 1L Marico 200 100ml 20 20 20 20 20 20 20 20 20 20 20 — —
Saffola Tasty Blend - 1L Marico 145 100ml 14 14 14 14 14 14 14 14 14 14 15 7 7
Saffola Gold - 1L Marico 164 100ml 14 14 14 14 14 14 14 14 14 14 16 18 18
Saffola Active - 1L Marico 155 100ml 14 14 14 14 14 13 13 13 13 14 16 15 24
Sundrop Heart - 1L Agrotech 210 100ml 21 21 21 21 21 21 21 21 21 21 21 — —
Sundrop Nutrilite - 1L Agrotech 135 100ml 14 14 14 14 14 14 14 14 14 14 14 — —
Sundrop Superlite Advanced -1L Agrotech 200 100ml 16 16 16 16 16 16 16 16 16 16 17 3 3
Sundrop Goldlite -1L Marico 165 100ml 14 14 14 14 14 14 14 14 14 14 17 18 18
Fortune Vivo- 1L Adani Wilmar 150 100ml 15 15 15 15 15 15 15 15 15 15 15 — —
Emami Rice bran oil- 1L Emami 125 100ml 11 11 11 11 11 11 11 11 11 13 13 — 14
Tea/ Coffee
Tea
Red Label Ctc 1kg HUVR 530 100g 43 43 43 43 43 43 43 43 43 43 53 23 23
Society Tea 1kg Amar Tea 500 100g 42 42 42 42 42 42 42 42 44 44 50 14 20
Red Label Natural Care Box 500gm HUVR 295 100g 52 52 52 52 52 52 52 52 52 52 59 13 13
Tajmahal Ctc Box 250gm HUVR 175 100g 57 57 58 58 58 58 58 60 60 60 70 17 17
Agni Ctc Leaves 1kg TGBL 220 100g 22 22 22 22 22 22 22 22 22 22 22 — —
Tata Ctc Gold 1kg TGBL 595 100g 44 44 44 44 44 46 46 46 46 46 60 30 30
Wagh Bakri Leaf Tea - Premium 1kg pouch Wagh Bakri 535 100g 41 41 41 42 42 42 42 42 42 42 54 29 29
Tea Bags/ Green Tea
Tata Tetly Tea Bag Grn Regular 10P TGBL 65 60 60 60 60 60 60 60 60 60 60 65 8 8
Tata Tetley Green Tea Bag 30P TGBL 160 140 140 140 140 140 145 145 145 145 145 160 10 10
Lipton Tea Bag Clear Green Jasmine 10P HUVR 60 60 60 60 60 60 60 60 60 60 60 60 — —
Iced Tea
Lipton Instant Mix Ice Tea Lemon Pp 500gm HUVR 130 100g 52 52 52 52 52 52 52 52 52 52 52 — —
Nestea Ice Tea Lemon 500gm Nestle 165 100g 33 33 33 33 33 33 33 33 33 33 33 — —
Coffee
Bru Gold Jar 100gm HUVR 275 100g 265 275 275 275 275 275 275 275 275 275 275 — —
Bru Instant Jar 100gm HUVR 180 100g 175 175 175 180 180 180 180 180 180 180 180 — —
Nescafe Classic Box 200gm Nestle 490 100g 230 238 238 238 238 238 238 238 238 238 245 3 3
Nescafe Classic 50gm Nestle 140 100g 280 280 280 280 280 280 280 280 280 280 280 — —
Sunrise Premium Jar 50gm Nestle 90 100g 180 180 180 180 180 180 180 180 180 180 180 — —
Dairy
Milk/Condensed Milk/ Milk Powder
Nestle Condmilk Milkmaid 400gm Nestle 125 100g 29 29 29 30 30 30 30 30 30 31 31 — 5
Nestle Milk Slim 1L Nestle 89 100ml 8 8 8 8 8 9 9 9 9 9 9 — 5
Nestle Milk Toned A+ 1L Nestle 78 100ml 8 8 8 8 8 8 8 8 8 8 8 (6) (1)
Amul Taaza 1L Amul 64 100ml 6 6 6 6 6 6 6 6 6 6 6 — 3
Amul Gold 1L Amul 68 100ml 6 6 6 7 7 7 7 7 7 7 7 — 3
Amul Lite 1L Amul 75 100ml 7 7 7 7 7 7 7 8 8 8 8 — —
Everyday Milk powder Dairy Whitener Pouch 400gm Nestle 200 100g 44 44 44 46 46 48 48 48 50 50 50 — 5
Yoghurt/Dahi
Nestle Dahi Slim 200gm Nestle 39 100g 18 18 18 18 18 18 18 18 20 20 20 — 11
Britannia Dahi Daily Fresh 150gm Britannia 20 100g 13 13 13 13 13 13 13 13 13 13 13 — —
Britannia Dahi Low Fat 200gm Britannia 35 100g 15 15 15 15 15 15 15 18 18 18 18 — —
Butter/Cheese
Britannia Cheese Block 400gm Britannia 290 100g 63 63 63 65 65 65 65 65 69 69 73 5 12
Britannia Cheese Spread Classic 180gm Britannia 135 100g 47 47 47 47 47 47 47 67 67 67 75 13 13
Amul Butter 500gm Amul 235 100g 45 45 45 45 45 45 45 47 47 47 47 — —
Amul Lite Butter 500gm Amul 195 100g 29 29 29 29 29 29 29 29 29 29 39 34 34
Nutrilite Butter 500gm Zydus Cadila 190 100g 36 36 36 36 36 36 36 36 36 38 38 — 6
Amul cheese slice plain 200 gm Amul 122 59 59 59 59 59 59 59 61 61 61 61 — —
Go cheese slice 200 gm Parag milk 130 63 63 63 63 63 63 63 70 73 73 65 (10) (7)
Britannia cheese slice 200 gm Britannia 155 60 60 65 73 73 73 73 73 73 74 78 5 7
Cakes/ Desert Mixes
Britannia Cake Fruity Fun 60gm Britannia 15 100g 25 25 25 25 25 25 25 25 25 27 27 — 9
Change (%)Normalised price in Rs (adjusted for grammage changes)
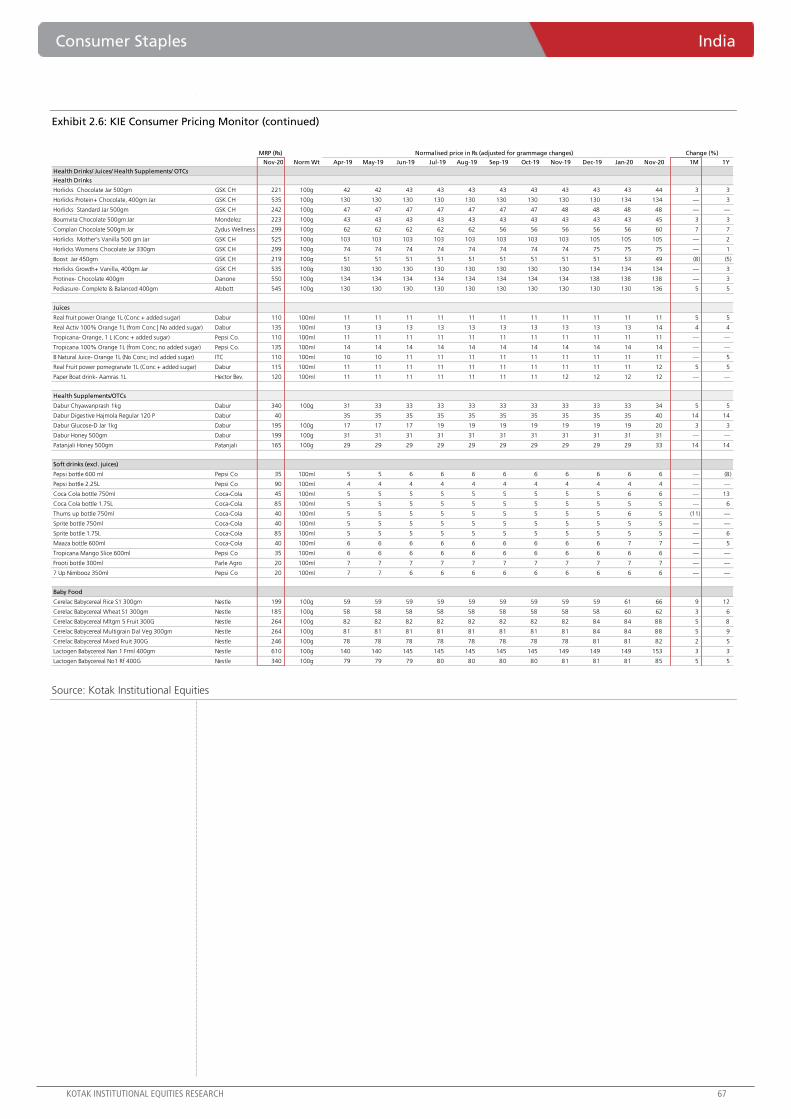
Consumer Staples India
KOTAK INSTITUTIONAL EQUITIES RESEARCH 67
Exhibit 2.6: KIE Consumer Pricing Monitor (continued)
Source: Kotak Institutional Equities
MRP (Rs)
Nov-20 Norm Wt Apr-19 May-19 Jun-19 Jul-19 Aug-19 Sep-19 Oct-19 Nov-19 Dec-19 Jan-20 Nov-20 1M 1Y
Health Drinks/ Juices/ Health Supplements/ OTCs
Health Drinks
Horlicks Chocolate Jar 500gm GSK CH 221 100g 42 42 43 43 43 43 43 43 43 43 44 3 3
Horlicks Protein+ Chocolate, 400gm Jar GSK CH 535 100g 130 130 130 130 130 130 130 130 130 134 134 — 3
Horlicks Standard Jar 500gm GSK CH 242 100g 47 47 47 47 47 47 47 48 48 48 48 — —
Bournvita Chocolate 500gm Jar Mondelez 223 100g 43 43 43 43 43 43 43 43 43 43 45 3 3
Complan Chocolate 500gm Jar Zydus Wellness 299 100g 62 62 62 62 62 56 56 56 56 56 60 7 7
Horlicks Mother's Vanilla 500 gm Jar GSK CH 525 100g 103 103 103 103 103 103 103 103 105 105 105 — 2
Horlicks Womens Chocolate Jar 330gm GSK CH 299 100g 74 74 74 74 74 74 74 74 75 75 75 — 1
Boost Jar 450gm GSK CH 219 100g 51 51 51 51 51 51 51 51 51 53 49 (8) (5)
Horlicks Growth+ Vanilla, 400gm Jar GSK CH 535 100g 130 130 130 130 130 130 130 130 134 134 134 — 3
Protinex- Chocolate 400gm Danone 550 100g 134 134 134 134 134 134 134 134 138 138 138 — 3
Pediasure- Complete & Balanced 400gm Abbott 545 100g 130 130 130 130 130 130 130 130 130 130 136 5 5
Juices
Real fruit power Orange 1L (Conc + added sugar) Dabur 110 100ml 11 11 11 11 11 11 11 11 11 11 11 5 5
Real Activ 100% Orange 1L (from Conc | No added sugar) Dabur 135 100ml 13 13 13 13 13 13 13 13 13 13 14 4 4
Tropicana- Orange, 1 L (Conc + added sugar) Pepsi Co. 110 100ml 11 11 11 11 11 11 11 11 11 11 11 — —
Tropicana 100% Orange 1L (from Conc; no added sugar) Pepsi Co. 135 100ml 14 14 14 14 14 14 14 14 14 14 14 — —
B Natural Juice- Orange 1L (No Conc; incl added sugar) ITC 110 100ml 10 10 11 11 11 11 11 11 11 11 11 — 5
Real Fruit power pomegranate 1L (Conc + added sugar) Dabur 115 100ml 11 11 11 11 11 11 11 11 11 11 12 5 5
Paper Boat drink- Aamras 1L Hector Bev. 120 100ml 11 11 11 11 11 11 11 12 12 12 12 — —
Health Supplements/OTCs
Dabur Chyawanprash 1kg Dabur 340 100g 31 33 33 33 33 33 33 33 33 33 34 5 5
Dabur Digestive Hajmola Regular 120 P Dabur 40 35 35 35 35 35 35 35 35 35 35 40 14 14
Dabur Glucose-D Jar 1kg Dabur 195 100g 17 17 17 19 19 19 19 19 19 19 20 3 3
Dabur Honey 500gm Dabur 199 100g 31 31 31 31 31 31 31 31 31 31 31 — —
Patanjali Honey 500gm Patanjali 165 100g 29 29 29 29 29 29 29 29 29 29 33 14 14
Soft drinks (excl. juices)
Pepsi bottle 600 ml Pepsi Co 35 100ml 5 5 6 6 6 6 6 6 6 6 6 — (8)
Pepsi bottle 2.25L Pepsi Co 90 100ml 4 4 4 4 4 4 4 4 4 4 4 — —
Coca Cola bottle 750ml Coca-Cola 45 100ml 5 5 5 5 5 5 5 5 5 6 6 — 13
Coca Cola bottle 1.75L Coca-Cola 85 100ml 5 5 5 5 5 5 5 5 5 5 5 — 6
Thums up bottle 750ml Coca-Cola 40 100ml 5 5 5 5 5 5 5 5 5 6 5 (11) —
Sprite bottle 750ml Coca-Cola 40 100ml 5 5 5 5 5 5 5 5 5 5 5 — —
Sprite bottle 1.75L Coca-Cola 85 100ml 5 5 5 5 5 5 5 5 5 5 5 — 6
Maaza bottle 600ml Coca-Cola 40 100ml 6 6 6 6 6 6 6 6 6 7 7 — 5
Tropicana Mango Slice 600ml Pepsi Co 35 100ml 6 6 6 6 6 6 6 6 6 6 6 — —
Frooti bottle 300ml Parle Agro 20 100ml 7 7 7 7 7 7 7 7 7 7 7 — —
7 Up Nimbooz 350ml Pepsi Co 20 100ml 7 7 6 6 6 6 6 6 6 6 6 — —
Baby Food
Cerelac Babycereal Rice S1 300gm Nestle 199 100g 59 59 59 59 59 59 59 59 59 61 66 9 12
Cerelac Babycereal Wheat S1 300gm Nestle 185 100g 58 58 58 58 58 58 58 58 58 60 62 3 6
Cerelac Babycereal Mltgrn 5 Fruit 300G Nestle 264 100g 82 82 82 82 82 82 82 82 84 84 88 5 8
Cerelac Babycereal Multigrain Dal Veg 300gm Nestle 264 100g 81 81 81 81 81 81 81 81 84 84 88 5 9
Cerelac Babycereal Mixed Fruit 300G Nestle 246 100g 78 78 78 78 78 78 78 78 81 81 82 2 5
Lactogen Babycereal Nan 1 Frml 400gm Nestle 610 100g 140 140 145 145 145 145 145 149 149 149 153 3 3
Lactogen Babycereal No1 Rf 400G Nestle 340 100g 79 79 79 80 80 80 80 81 81 81 85 5 5
Change (%)Normalised price in Rs (adjusted for grammage changes)
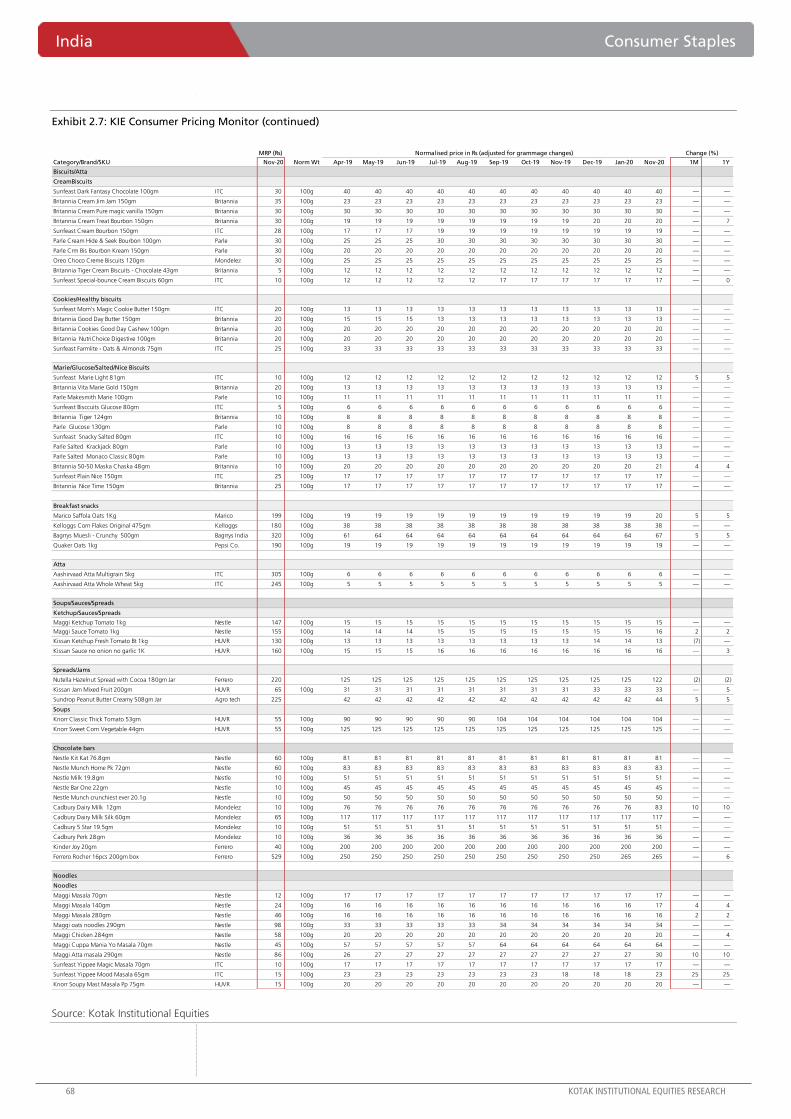
India Consumer Staples
68 KOTAK INSTITUTIONAL EQUITIES RESEARCH
Exhibit 2.7: KIE Consumer Pricing Monitor (continued)
Source: Kotak Institutional Equities
MRP (Rs)
Category/Brand/SKU Nov-20 Norm Wt Apr-19 May-19 Jun-19 Jul-19 Aug-19 Sep-19 Oct-19 Nov-19 Dec-19 Jan-20 Nov-20 1M 1Y
Biscuits/Atta
CreamBiscuits
Sunfeast Dark Fantasy Chocolate 100gm ITC 30 100g 40 40 40 40 40 40 40 40 40 40 40 — —
Britannia Cream Jim Jam 150gm Britannia 35 100g 23 23 23 23 23 23 23 23 23 23 23 — —
Britannia Cream Pure magic vanilla 150gm Britannia 30 100g 30 30 30 30 30 30 30 30 30 30 30 — —
Britannia Cream Treat Bourbon 150gm Britannia 30 100g 19 19 19 19 19 19 19 19 20 20 20 — 7
Sunfeast Cream Bourbon 150gm ITC 28 100g 17 17 17 19 19 19 19 19 19 19 19 — —
Parle Cream Hide & Seek Bourbon 100gm Parle 30 100g 25 25 25 30 30 30 30 30 30 30 30 — —
Parle Crm Bis Bourbon Kream 150gm Parle 30 100g 20 20 20 20 20 20 20 20 20 20 20 — —
Oreo Choco Creme Biscuits 120gm Mondelez 30 100g 25 25 25 25 25 25 25 25 25 25 25 — —
Britannia Tiger Cream Biscuits - Chocolate 43gm Britannia 5 100g 12 12 12 12 12 12 12 12 12 12 12 — —
Sunfeast Special-bounce Cream Biscuits 60gm ITC 10 100g 12 12 12 12 12 17 17 17 17 17 17 — 0
Cookies/Healthy biscuits
Sunfeast Mom's Magic Cookie Butter 150gm ITC 20 100g 13 13 13 13 13 13 13 13 13 13 13 — —
Britannia Good Day Butter 150gm Britannia 20 100g 15 15 15 13 13 13 13 13 13 13 13 — —
Britannia Cookies Good Day Cashew 100gm Britannia 20 100g 20 20 20 20 20 20 20 20 20 20 20 — —
Britannia NutriChoice Digestive 100gm Britannia 20 100g 20 20 20 20 20 20 20 20 20 20 20 — —
Sunfeast Farmlite - Oats & Almonds 75gm ITC 25 100g 33 33 33 33 33 33 33 33 33 33 33 — —
Marie/Glucose/Salted/Nice Biscuits
Sunfeast Marie Light 81gm ITC 10 100g 12 12 12 12 12 12 12 12 12 12 12 5 5
Britannia Vita Marie Gold 150gm Britannia 20 100g 13 13 13 13 13 13 13 13 13 13 13 — —
Parle Makesmith Marie 100gm Parle 10 100g 11 11 11 11 11 11 11 11 11 11 11 — —
Sunfeast Bisccuits Glucose 80gm ITC 5 100g 6 6 6 6 6 6 6 6 6 6 6 — —
Britannia Tiger 124gm Britannia 10 100g 8 8 8 8 8 8 8 8 8 8 8 — —
Parle Glucose 130gm Parle 10 100g 8 8 8 8 8 8 8 8 8 8 8 — —
Sunfeast Snacky Salted 80gm ITC 10 100g 16 16 16 16 16 16 16 16 16 16 16 — —
Parle Salted Krackjack 80gm Parle 10 100g 13 13 13 13 13 13 13 13 13 13 13 — —
Parle Salted Monaco Classic 80gm Parle 10 100g 13 13 13 13 13 13 13 13 13 13 13 — —
Britannia 50-50 Maska Chaska 48gm Britannia 10 100g 20 20 20 20 20 20 20 20 20 20 21 4 4
Sunfeast Plain Nice 150gm ITC 25 100g 17 17 17 17 17 17 17 17 17 17 17 — —
Britannia Nice Time 150gm Britannia 25 100g 17 17 17 17 17 17 17 17 17 17 17 — —
Breakfast snacks
Marico Saffola Oats 1Kg Marico 199 100g 19 19 19 19 19 19 19 19 19 19 20 5 5
Kelloggs Corn Flakes Original 475gm Kelloggs 180 100g 38 38 38 38 38 38 38 38 38 38 38 — —
Bagrrys Muesli - Crunchy 500gm Bagrrys India 320 100g 61 64 64 64 64 64 64 64 64 64 67 5 5
Quaker Oats 1kg Pepsi Co. 190 100g 19 19 19 19 19 19 19 19 19 19 19 — —
Atta
Aashirvaad Atta Multigrain 5kg ITC 305 100g 6 6 6 6 6 6 6 6 6 6 6 — —
Aashirvaad Atta Whole Wheat 5kg ITC 245 100g 5 5 5 5 5 5 5 5 5 5 5 — —
Soups/Sauces/Spreads
Ketchup/Sauces/Spreads
Maggi Ketchup Tomato 1kg Nestle 147 100g 15 15 15 15 15 15 15 15 15 15 15 — —
Maggi Sauce Tomato 1kg Nestle 155 100g 14 14 14 15 15 15 15 15 15 15 16 2 2
Kissan Ketchup Fresh Tomato Bt 1kg HUVR 130 100g 13 13 13 13 13 13 13 13 14 14 13 (7) —
Kissan Sauce no onion no garlic 1K HUVR 160 100g 15 15 15 16 16 16 16 16 16 16 16 — 3
Spreads/Jams
Nutella Hazelnut Spread with Cocoa 180gm Jar Ferrero 220 125 125 125 125 125 125 125 125 125 125 122 (2) (2)
Kissan Jam Mixed Fruit 200gm HUVR 65 100g 31 31 31 31 31 31 31 31 33 33 33 — 5
Sundrop Peanut Butter Creamy 508gm Jar Agro tech 225 42 42 42 42 42 42 42 42 42 42 44 5 5
Soups
Knorr Classic Thick Tomato 53gm HUVR 55 100g 90 90 90 90 90 104 104 104 104 104 104 — —
Knorr Sweet Corn Vegetable 44gm HUVR 55 100g 125 125 125 125 125 125 125 125 125 125 125 — —
Chocolate bars
Nestle Kit Kat 76.8gm Nestle 60 100g 81 81 81 81 81 81 81 81 81 81 81 — —
Nestle Munch Home Pk 72gm Nestle 60 100g 83 83 83 83 83 83 83 83 83 83 83 — —
Nestle Milk 19.8gm Nestle 10 100g 51 51 51 51 51 51 51 51 51 51 51 — —
Nestle Bar One 22gm Nestle 10 100g 45 45 45 45 45 45 45 45 45 45 45 — —
Nestle Munch crunchiest ever 20.1g Nestle 10 100g 50 50 50 50 50 50 50 50 50 50 50 — —
Cadbury Dairy Milk 12gm Mondelez 10 100g 76 76 76 76 76 76 76 76 76 76 83 10 10
Cadbury Dairy Milk Silk 60gm Mondelez 65 100g 117 117 117 117 117 117 117 117 117 117 117 — —
Cadbury 5 Star 19.5gm Mondelez 10 100g 51 51 51 51 51 51 51 51 51 51 51 — —
Cadbury Perk 28gm Mondelez 10 100g 36 36 36 36 36 36 36 36 36 36 36 — —
Kinder Joy 20gm Ferrero 40 100g 200 200 200 200 200 200 200 200 200 200 200 — —
Ferrero Rocher 16pcs 200gm box Ferrero 529 100g 250 250 250 250 250 250 250 250 250 265 265 — 6
Noodles
Noodles
Maggi Masala 70gm Nestle 12 100g 17 17 17 17 17 17 17 17 17 17 17 — —
Maggi Masala 140gm Nestle 24 100g 16 16 16 16 16 16 16 16 16 16 17 4 4
Maggi Masala 280gm Nestle 46 100g 16 16 16 16 16 16 16 16 16 16 16 2 2
Maggi oats noodles 290gm Nestle 98 100g 33 33 33 33 33 34 34 34 34 34 34 — —
Maggi Chicken 284gm Nestle 58 100g 20 20 20 20 20 20 20 20 20 20 20 — 4
Maggi Cuppa Mania Yo Masala 70gm Nestle 45 100g 57 57 57 57 57 64 64 64 64 64 64 — —
Maggi Atta masala 290gm Nestle 86 100g 26 27 27 27 27 27 27 27 27 27 30 10 10
Sunfeast Yippee Magic Masala 70gm ITC 10 100g 17 17 17 17 17 17 17 17 17 17 17 — —
Sunfeast Yippee Mood Masala 65gm ITC 15 100g 23 23 23 23 23 23 23 18 18 18 23 25 25
Knorr Soupy Mast Masala Pp 75gm HUVR 15 100g 20 20 20 20 20 20 20 20 20 20 20 — —
Change (%)Normalised price in Rs (adjusted for grammage changes)
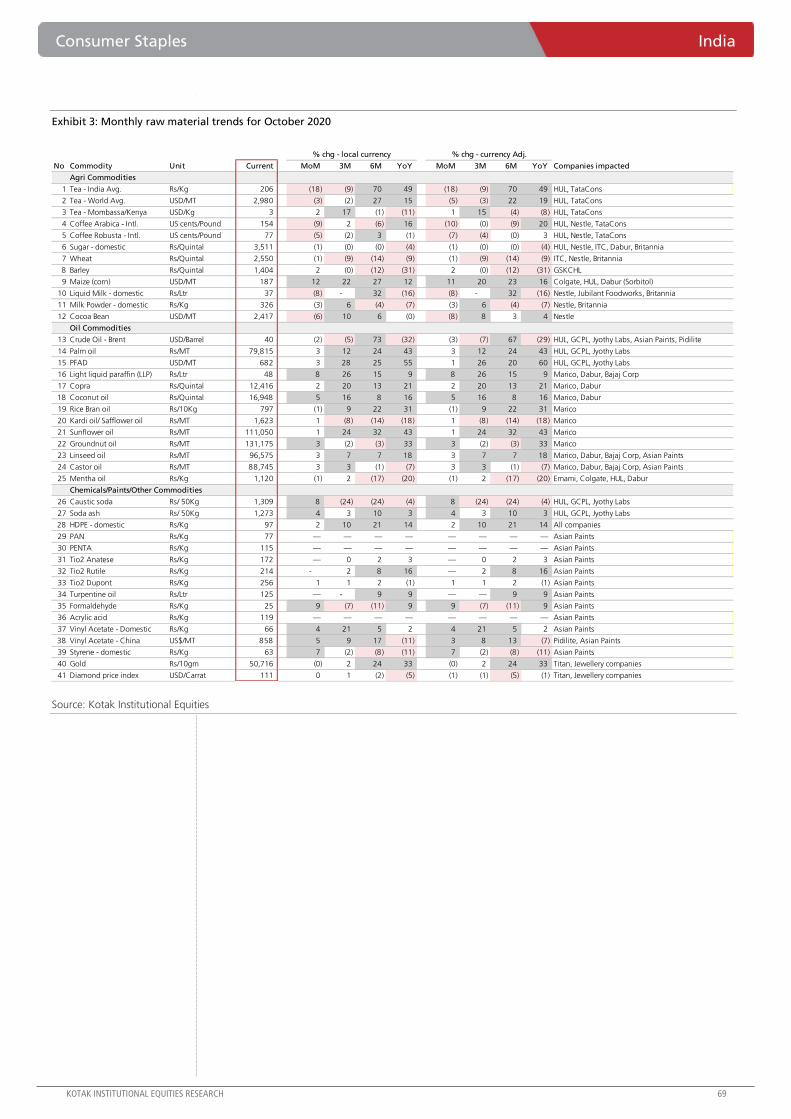
Consumer Staples India
KOTAK INSTITUTIONAL EQUITIES RESEARCH 69
Exhibit 3: Monthly raw material trends for October 2020
Source: Kotak Institutional Equities
No Commodity Unit Current MoM 3M 6M YoY MoM 3M 6M YoY Companies impacted
Agri Commodities
1 Tea - India Avg. Rs/Kg 206 (18) (9) 70 49 (18) (9) 70 49 HUL, TataCons
2 Tea - World Avg. USD/MT 2,980 (3) (2) 27 15 (5) (3) 22 19 HUL, TataCons
3 Tea - Mombassa/Kenya USD/Kg 3 2 17 (1) (11) 1 15 (4) (8) HUL, TataCons
4 Coffee Arabica - Intl. US cents/Pound 154 (9) 2 (6) 16 (10) (0) (9) 20 HUL, Nestle, TataCons
5 Coffee Robusta - Intl. US cents/Pound 77 (5) (2) 3 (1) (7) (4) (0) 3 HUL, Nestle, TataCons
6 Sugar - domestic Rs/Quintal 3,511 (1) (0) (0) (4) (1) (0) (0) (4) HUL, Nestle, ITC, Dabur, Britannia
7 Wheat Rs/Quintal 2,550 (1) (9) (14) (9) (1) (9) (14) (9) ITC, Nestle, Britannia
8 Barley Rs/Quintal 1,404 2 (0) (12) (31) 2 (0) (12) (31) GSKCHL
9 Maize (corn) USD/MT 187 12 22 27 12 11 20 23 16 Colgate, HUL, Dabur (Sorbitol)
10 Liquid Milk - domestic Rs/Ltr 37 (8) - 32 (16) (8) - 32 (16) Nestle, Jubilant Foodworks, Britannia
11 Milk Powder - domestic Rs/Kg 326 (3) 6 (4) (7) (3) 6 (4) (7) Nestle, Britannia
12 Cocoa Bean USD/MT 2,417 (6) 10 6 (0) (8) 8 3 4 Nestle
Oil Commodities
13 Crude Oil - Brent USD/Barrel 40 (2) (5) 73 (32) (3) (7) 67 (29) HUL, GCPL, Jyothy Labs, Asian Paints, Pidilite
14 Palm oil Rs/MT 79,815 3 12 24 43 3 12 24 43 HUL, GCPL, Jyothy Labs
15 PFAD USD/MT 682 3 28 25 55 1 26 20 60 HUL, GCPL, Jyothy Labs
16 Light liquid paraffin (LLP) Rs/Ltr 48 8 26 15 9 8 26 15 9 Marico, Dabur, Bajaj Corp
17 Copra Rs/Quintal 12,416 2 20 13 21 2 20 13 21 Marico, Dabur
18 Coconut oil Rs/Quintal 16,948 5 16 8 16 5 16 8 16 Marico, Dabur
19 Rice Bran oil Rs/10Kg 797 (1) 9 22 31 (1) 9 22 31 Marico
20 Kardi oil/ Safflower oil Rs/MT 1,623 1 (8) (14) (18) 1 (8) (14) (18) Marico
21 Sunflower oil Rs/MT 111,050 1 24 32 43 1 24 32 43 Marico
22 Groundnut oil Rs/MT 131,175 3 (2) (3) 33 3 (2) (3) 33 Marico
23 Linseed oil Rs/MT 96,575 3 7 7 18 3 7 7 18 Marico, Dabur, Bajaj Corp, Asian Paints
24 Castor oil Rs/MT 88,745 3 3 (1) (7) 3 3 (1) (7) Marico, Dabur, Bajaj Corp, Asian Paints
25 Mentha oil Rs/Kg 1,120 (1) 2 (17) (20) (1) 2 (17) (20) Emami, Colgate, HUL, Dabur
Chemicals/Paints/Other Commodities
26 Caustic soda Rs/ 50Kg 1,309 8 (24) (24) (4) 8 (24) (24) (4) HUL, GCPL, Jyothy Labs
27 Soda ash Rs/ 50Kg 1,273 4 3 10 3 4 3 10 3 HUL, GCPL, Jyothy Labs
28 HDPE - domestic Rs/Kg 97 2 10 21 14 2 10 21 14 All companies
29 PAN Rs/Kg 77 — — — — — — — — Asian Paints
30 PENTA Rs/Kg 115 — — — — — — — — Asian Paints
31 Tio2 Anatese Rs/Kg 172 — 0 2 3 — 0 2 3 Asian Paints
32 Tio2 Rutile Rs/Kg 214 - 2 8 16 — 2 8 16 Asian Paints
33 Tio2 Dupont Rs/Kg 256 1 1 2 (1) 1 1 2 (1) Asian Paints
34 Turpentine oil Rs/Ltr 125 — - 9 9 — — 9 9 Asian Paints
35 Formaldehyde Rs/Kg 25 9 (7) (11) 9 9 (7) (11) 9 Asian Paints
36 Acrylic acid Rs/Kg 119 — — — — — — — — Asian Paints
37 Vinyl Acetate - Domestic Rs/Kg 66 4 21 5 2 4 21 5 2 Asian Paints
38 Vinyl Acetate - China US$/MT 858 5 9 17 (11) 3 8 13 (7) Pidilite, Asian Paints
39 Styrene - domestic Rs/Kg 63 7 (2) (8) (11) 7 (2) (8) (11) Asian Paints
40 Gold Rs/10gm 50,716 (0) 2 24 33 (0) 2 24 33 Titan, Jewellery companies
41 Diamond price index USD/Carrat 111 0 1 (2) (5) (1) (1) (5) (1) Titan, Jewellery companies
% chg - local currency % chg - currency Adj.
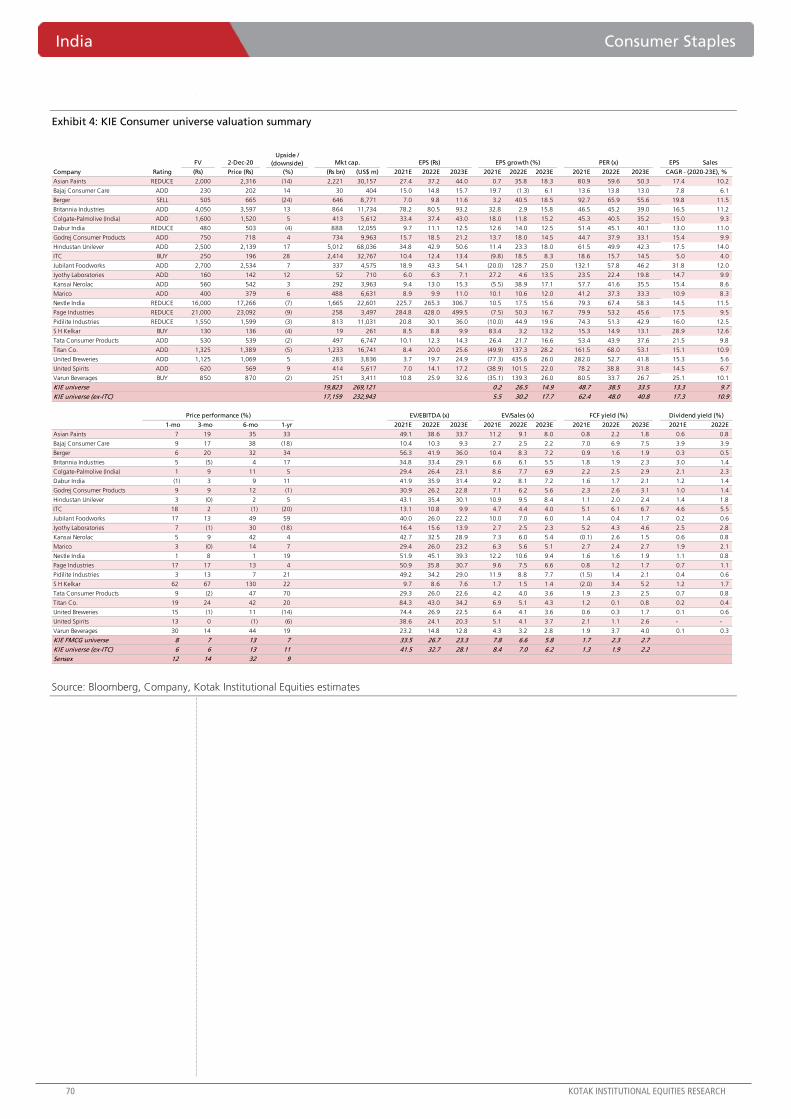
India Consumer Staples
70 KOTAK INSTITUTIONAL EQUITIES RESEARCH
Exhibit 4: KIE Consumer universe valuation summary
Source: Bloomberg, Company, Kotak Institutional Equities estimates
FV 2-Dec-20 EPS Sales
Company Rating (Rs) Price (Rs) (Rs bn) (US$ m) 2021E 2022E 2023E 2021E 2022E 2023E 2021E 2022E 2023E
Asian Paints REDUCE 2,000 2,316 (14) 2,221 30,157 27.4 37.2 44.0 0.7 35.8 18.3 80.9 59.6 50.3 17.4 10.2
Bajaj Consumer Care ADD 230 202 14 30 404 15.0 14.8 15.7 19.7 (1.3) 6.1 13.6 13.8 13.0 7.8 6.1
Berger SELL 505 665 (24) 646 8,771 7.0 9.8 11.6 3.2 40.5 18.5 92.7 65.9 55.6 19.8 11.5
Britannia Industries ADD 4,050 3,597 13 864 11,734 78.2 80.5 93.2 32.8 2.9 15.8 46.5 45.2 39.0 16.5 11.2
Colgate-Palmolive (India) ADD 1,600 1,520 5 413 5,612 33.4 37.4 43.0 18.0 11.8 15.2 45.3 40.5 35.2 15.0 9.3
Dabur India REDUCE 480 503 (4) 888 12,055 9.7 11.1 12.5 12.6 14.0 12.5 51.4 45.1 40.1 13.0 11.0
Godrej Consumer Products ADD 750 718 4 734 9,963 15.7 18.5 21.2 13.7 18.0 14.5 44.7 37.9 33.1 15.4 9.9
Hindustan Unilever ADD 2,500 2,139 17 5,012 68,036 34.8 42.9 50.6 11.4 23.3 18.0 61.5 49.9 42.3 17.5 14.0
ITC BUY 250 196 28 2,414 32,767 10.4 12.4 13.4 (9.8) 18.5 8.3 18.6 15.7 14.5 5.0 4.0
Jubilant Foodworks ADD 2,700 2,534 7 337 4,575 18.9 43.3 54.1 (20.0) 128.7 25.0 132.1 57.8 46.2 31.8 12.0
Jyothy Laboratories ADD 160 142 12 52 710 6.0 6.3 7.1 27.2 4.6 13.5 23.5 22.4 19.8 14.7 9.9
Kansai Nerolac ADD 560 542 3 292 3,963 9.4 13.0 15.3 (5.5) 38.9 17.1 57.7 41.6 35.5 15.4 8.6
Marico ADD 400 379 6 488 6,631 8.9 9.9 11.0 10.1 10.6 12.0 41.2 37.3 33.3 10.9 8.3
Nestle India REDUCE 16,000 17,266 (7) 1,665 22,601 225.7 265.3 306.7 10.5 17.5 15.6 79.3 67.4 58.3 14.5 11.5
Page Industries REDUCE 21,000 23,092 (9) 258 3,497 284.8 428.0 499.5 (7.5) 50.3 16.7 79.9 53.2 45.6 17.5 9.5
Pidilite Industries REDUCE 1,550 1,599 (3) 813 11,031 20.8 30.1 36.0 (10.0) 44.9 19.6 74.3 51.3 42.9 16.0 12.5
S H Kelkar BUY 130 136 (4) 19 261 8.5 8.8 9.9 83.4 3.2 13.2 15.3 14.9 13.1 28.9 12.6
Tata Consumer Products ADD 530 539 (2) 497 6,747 10.1 12.3 14.3 26.4 21.7 16.6 53.4 43.9 37.6 21.5 9.8
Titan Co. ADD 1,325 1,389 (5) 1,233 16,741 8.4 20.0 25.6 (49.9) 137.3 28.2 161.5 68.0 53.1 15.1 10.9
United Breweries ADD 1,125 1,069 5 283 3,836 3.7 19.7 24.9 (77.3) 435.6 26.0 282.0 52.7 41.8 15.3 5.6
United Spirits ADD 620 569 9 414 5,617 7.0 14.1 17.2 (38.9) 101.5 22.0 78.2 38.8 31.8 14.5 6.7
Varun Beverages BUY 850 870 (2) 251 3,411 10.8 25.9 32.6 (35.1) 139.3 26.0 80.5 33.7 26.7 25.1 10.1
KIE universe 19,823 269,121 0.2 26.5 14.9 48.7 38.5 33.5 13.3 9.7
KIE universe (ex-ITC) 17,159 232,943 5.5 30.2 17.7 62.4 48.0 40.8 17.3 10.9
1-mo 3-mo 6-mo 1-yr 2021E 2022E 2023E 2021E 2022E 2023E 2021E 2022E 2023E 2021E 2022E
Asian Paints 7 19 35 33 49.1 38.6 33.7 11.2 9.1 8.0 0.8 2.2 1.8 0.6 0.8
Bajaj Consumer Care 9 17 38 (18) 10.4 10.3 9.3 2.7 2.5 2.2 7.0 6.9 7.5 3.9 3.9
Berger 6 20 32 34 56.3 41.9 36.0 10.4 8.3 7.2 0.9 1.6 1.9 0.3 0.5
Britannia Industries 5 (5) 4 17 34.8 33.4 29.1 6.6 6.1 5.5 1.8 1.9 2.3 3.0 1.4
Colgate-Palmolive (India) 1 9 11 5 29.4 26.4 23.1 8.6 7.7 6.9 2.2 2.5 2.9 2.1 2.3
Dabur India (1) 3 9 11 41.9 35.9 31.4 9.2 8.1 7.2 1.6 1.7 2.1 1.2 1.4
Godrej Consumer Products 9 9 12 (1) 30.9 26.2 22.8 7.1 6.2 5.6 2.3 2.6 3.1 1.0 1.4
Hindustan Unilever 3 (0) 2 5 43.1 35.4 30.1 10.9 9.5 8.4 1.1 2.0 2.4 1.4 1.8
ITC 18 2 (1) (20) 13.1 10.8 9.9 4.7 4.4 4.0 5.1 6.1 6.7 4.6 5.5
Jubilant Foodworks 17 13 49 59 40.0 26.0 22.2 10.0 7.0 6.0 1.4 0.4 1.7 0.2 0.6
Jyothy Laboratories 7 (1) 30 (18) 16.4 15.6 13.9 2.7 2.5 2.3 5.2 4.3 4.6 2.5 2.8
Kansai Nerolac 5 9 42 4 42.7 32.5 28.9 7.3 6.0 5.4 (0.1) 2.6 1.5 0.6 0.8
Marico 3 (0) 14 7 29.4 26.0 23.2 6.3 5.6 5.1 2.7 2.4 2.7 1.9 2.1
Nestle India 1 8 1 19 51.9 45.1 39.3 12.2 10.6 9.4 1.6 1.6 1.9 1.1 0.8
Page Industries 17 17 13 4 50.9 35.8 30.7 9.6 7.5 6.6 0.8 1.2 1.7 0.7 1.1
Pidilite Industries 3 13 7 21 49.2 34.2 29.0 11.9 8.8 7.7 (1.5) 1.4 2.1 0.4 0.6
S H Kelkar 62 67 130 22 9.7 8.6 7.6 1.7 1.5 1.4 (2.0) 3.4 5.2 1.2 1.7
Tata Consumer Products 9 (2) 47 70 29.3 26.0 22.6 4.2 4.0 3.6 1.9 2.3 2.5 0.7 0.8
Titan Co. 19 24 42 20 84.3 43.0 34.2 6.9 5.1 4.3 1.2 0.1 0.8 0.2 0.4
United Breweries 15 (1) 11 (14) 74.4 26.9 22.5 6.4 4.1 3.6 0.6 0.3 1.7 0.1 0.6
United Spirits 13 0 (1) (6) 38.6 24.1 20.3 5.1 4.1 3.7 2.1 1.1 2.6 - -
Varun Beverages 30 14 44 19 23.2 14.8 12.8 4.3 3.2 2.8 1.9 3.7 4.0 0.1 0.3
KIE FMCG universe 8 7 13 7 33.5 26.7 23.3 7.8 6.6 5.8 1.7 2.3 2.7
KIE universe (ex-ITC) 6 6 13 11 41.5 32.7 28.1 8.4 7.0 6.2 1.3 1.9 2.2
Sensex 12 14 32 9
FCF yield (%)
EPS growth (%)
EV/EBITDA (x) EV/Sales (x)
CAGR - (2020-23E), %
Dividend yield (%)
EPS (Rs) PER (x)Mkt cap.
Price performance (%)
Upside /
(downside)
(%)
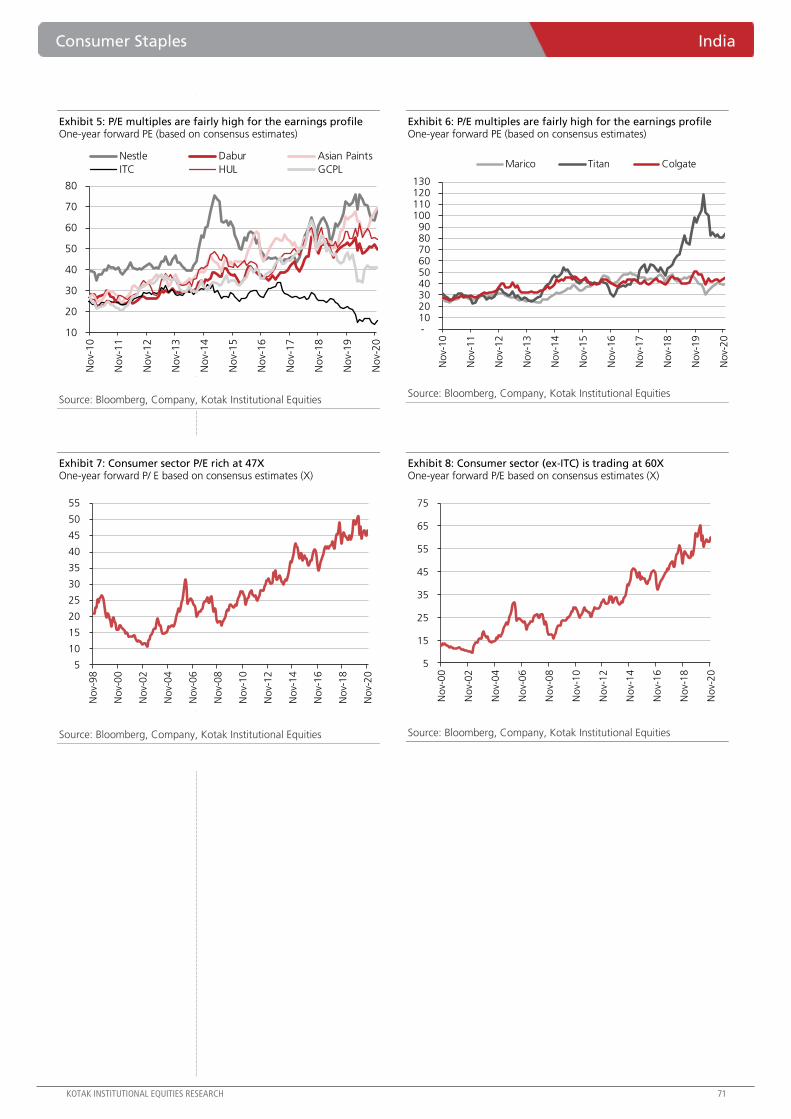
Consumer Staples India
KOTAK INSTITUTIONAL EQUITIES RESEARCH 71
Exhibit 5: P/E multiples are fairly high for the earnings profile One-year forward PE (based on consensus estimates)
Source: Bloomberg, Company, Kotak Institutional Equities
Exhibit 6: P/E multiples are fairly high for the earnings profile One-year forward PE (based on consensus estimates)
Source: Bloomberg, Company, Kotak Institutional Equities
Exhibit 7: Consumer sector P/E rich at 47X One-year forward P/ E based on consensus estimates (X)
Source: Bloomberg, Company, Kotak Institutional Equities
Exhibit 8: Consumer sector (ex-ITC) is trading at 60X One-year forward P/E based on consensus estimates (X)
Source: Bloomberg, Company, Kotak Institutional Equities
10
20
30
40
50
60
70
80
No
v-1
0
No
v-1
1
No
v-1
2
No
v-1
3
No
v-1
4
No
v-1
5
No
v-1
6
No
v-1
7
No
v-1
8
No
v-1
9
No
v-2
0
Nestle Dabur Asian Paints
ITC HUL GCPL
- 10 20 30 40 50 60 70 80 90
100 110 120 130
No
v-1
0
No
v-1
1
No
v-1
2
No
v-1
3
No
v-1
4
No
v-1
5
No
v-1
6
No
v-1
7
No
v-1
8
No
v-1
9
No
v-2
0
Marico Titan Colgate
5
10
15
20
25
30
35
40
45
50
55
No
v-9
8
No
v-0
0
No
v-0
2
No
v-0
4
No
v-0
6
No
v-0
8
No
v-1
0
No
v-1
2
No
v-1
4
No
v-1
6
No
v-1
8
No
v-2
0
5
15
25
35
45
55
65
75
No
v-0
0
No
v-0
2
No
v-0
4
No
v-0
6
No
v-0
8
No
v-1
0
No
v-1
2
No
v-1
4
No
v-1
6
No
v-1
8
No
v-2
0
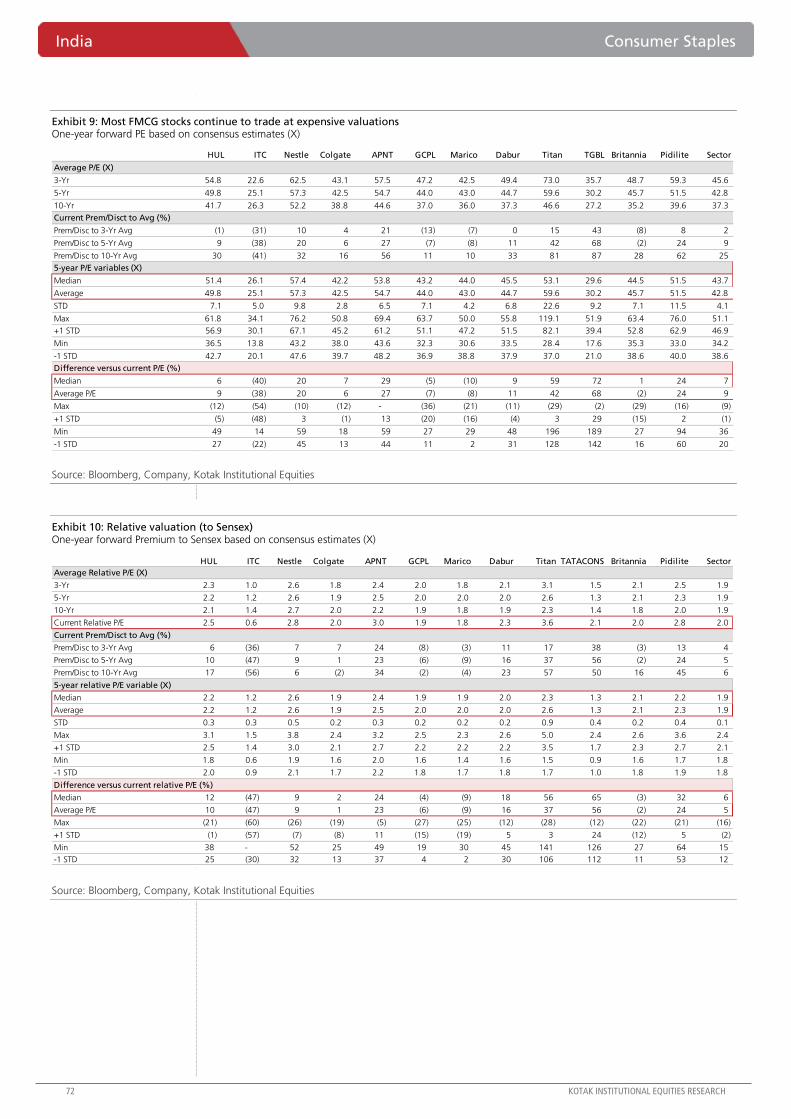
India Consumer Staples
72 KOTAK INSTITUTIONAL EQUITIES RESEARCH
Exhibit 9: Most FMCG stocks continue to trade at expensive valuations One-year forward PE based on consensus estimates (X)
Source: Bloomberg, Company, Kotak Institutional Equities
Exhibit 10: Relative valuation (to Sensex) One-year forward Premium to Sensex based on consensus estimates (X)
Source: Bloomberg, Company, Kotak Institutional Equities
HUL ITC Nestle Colgate APNT GCPL Marico Dabur Titan TGBL Britannia Pidilite Sector
Average P/E (X)
3-Yr 54.8 22.6 62.5 43.1 57.5 47.2 42.5 49.4 73.0 35.7 48.7 59.3 45.6
5-Yr 49.8 25.1 57.3 42.5 54.7 44.0 43.0 44.7 59.6 30.2 45.7 51.5 42.8
10-Yr 41.7 26.3 52.2 38.8 44.6 37.0 36.0 37.3 46.6 27.2 35.2 39.6 37.3
Current Prem/Disct to Avg (%)
Prem/Disc to 3-Yr Avg (1) (31) 10 4 21 (13) (7) 0 15 43 (8) 8 2
Prem/Disc to 5-Yr Avg 9 (38) 20 6 27 (7) (8) 11 42 68 (2) 24 9
Prem/Disc to 10-Yr Avg 30 (41) 32 16 56 11 10 33 81 87 28 62 25
5-year P/E variables (X)
Median 51.4 26.1 57.4 42.2 53.8 43.2 44.0 45.5 53.1 29.6 44.5 51.5 43.7
Average 49.8 25.1 57.3 42.5 54.7 44.0 43.0 44.7 59.6 30.2 45.7 51.5 42.8
STD 7.1 5.0 9.8 2.8 6.5 7.1 4.2 6.8 22.6 9.2 7.1 11.5 4.1
Max 61.8 34.1 76.2 50.8 69.4 63.7 50.0 55.8 119.1 51.9 63.4 76.0 51.1
+1 STD 56.9 30.1 67.1 45.2 61.2 51.1 47.2 51.5 82.1 39.4 52.8 62.9 46.9
Min 36.5 13.8 43.2 38.0 43.6 32.3 30.6 33.5 28.4 17.6 35.3 33.0 34.2
-1 STD 42.7 20.1 47.6 39.7 48.2 36.9 38.8 37.9 37.0 21.0 38.6 40.0 38.6
Difference versus current P/E (%)
Median 6 (40) 20 7 29 (5) (10) 9 59 72 1 24 7
Average P/E 9 (38) 20 6 27 (7) (8) 11 42 68 (2) 24 9
Max (12) (54) (10) (12) - (36) (21) (11) (29) (2) (29) (16) (9)
+1 STD (5) (48) 3 (1) 13 (20) (16) (4) 3 29 (15) 2 (1)
Min 49 14 59 18 59 27 29 48 196 189 27 94 36
-1 STD 27 (22) 45 13 44 11 2 31 128 142 16 60 20
HUL ITC Nestle Colgate APNT GCPL Marico Dabur Titan TATACONS Britannia Pidilite Sector
Average Relative P/E (X)
3-Yr 2.3 1.0 2.6 1.8 2.4 2.0 1.8 2.1 3.1 1.5 2.1 2.5 1.9
5-Yr 2.2 1.2 2.6 1.9 2.5 2.0 2.0 2.0 2.6 1.3 2.1 2.3 1.9
10-Yr 2.1 1.4 2.7 2.0 2.2 1.9 1.8 1.9 2.3 1.4 1.8 2.0 1.9
Current Relative P/E 2.5 0.6 2.8 2.0 3.0 1.9 1.8 2.3 3.6 2.1 2.0 2.8 2.0
Current Prem/Disct to Avg (%)
Prem/Disc to 3-Yr Avg 6 (36) 7 7 24 (8) (3) 11 17 38 (3) 13 4
Prem/Disc to 5-Yr Avg 10 (47) 9 1 23 (6) (9) 16 37 56 (2) 24 5
Prem/Disc to 10-Yr Avg 17 (56) 6 (2) 34 (2) (4) 23 57 50 16 45 6
5-year relative P/E variable (X)
Median 2.2 1.2 2.6 1.9 2.4 1.9 1.9 2.0 2.3 1.3 2.1 2.2 1.9
Average 2.2 1.2 2.6 1.9 2.5 2.0 2.0 2.0 2.6 1.3 2.1 2.3 1.9
STD 0.3 0.3 0.5 0.2 0.3 0.2 0.2 0.2 0.9 0.4 0.2 0.4 0.1
Max 3.1 1.5 3.8 2.4 3.2 2.5 2.3 2.6 5.0 2.4 2.6 3.6 2.4
+1 STD 2.5 1.4 3.0 2.1 2.7 2.2 2.2 2.2 3.5 1.7 2.3 2.7 2.1
Min 1.8 0.6 1.9 1.6 2.0 1.6 1.4 1.6 1.5 0.9 1.6 1.7 1.8
-1 STD 2.0 0.9 2.1 1.7 2.2 1.8 1.7 1.8 1.7 1.0 1.8 1.9 1.8
Difference versus current relative P/E (%)
Median 12 (47) 9 2 24 (4) (9) 18 56 65 (3) 32 6
Average P/E 10 (47) 9 1 23 (6) (9) 16 37 56 (2) 24 5
Max (21) (60) (26) (19) (5) (27) (25) (12) (28) (12) (22) (21) (16)
+1 STD (1) (57) (7) (8) 11 (15) (19) 5 3 24 (12) 5 (2)
Min 38 - 52 25 49 19 30 45 141 126 27 64 15
-1 STD 25 (30) 32 13 37 4 2 30 106 112 11 53 12
For Private Circulation Only.
Exports lose further momentum after a second wave of infections
Preliminary estimates suggest that exports fell 9.1% in November ((-)5.9%mom) to US$23.4 bn
as against (-)5.1% last month (Exhibits 1-2). The loss of momentum in exports is indicative of
weaker activity in regions, which are seeing a second wave of infections and are tightening
restrictions. Oil exports fell 61% to US$1.5 bn, while non-oil exports were almost flat (Exhibit
3). Non-oil non-gems and jewelry exports fell 0.6% ((-)5%mom), as against a rise of 6.4% in
October. Industry-led exports were weak on the back of 8% fall each in exports of engineering
goods and of organic and inorganic chemicals (Exhibit 4). Exports of drugs and pharmaceuticals
continued to grow at a robust pace of 11%. Meanwhile, consumption-related exports were
supported by 13% growth in exports of agriculture and allied products, 4% growth in exports
of gems and jewelry and 1.5% growth in exports of textiles.
Normalization in import activity takes a pause in November
November imports fell 13.3% ((-)11.5% in October) to US$33.4 bn, and by 0.7% on a
sequential basis. Non-oil imports fell 1.2% (sequential fall of 1.8%), while oil imports fell
43.4% to US$6.3 bn. Non-oil non-gold imports fell 1.7% ((-)4.1% mom) to US$24.1 bn.
Consumption-related imports fared well supported by a 12% growth in imports of electronics
and 3% in imports of gold, an indication of festive demand (Exhibit 5). Agri-imports also
expanded by 37%. Industrial-led imports remain weak led by a 17% fall in imports of capital
goods and a 5% fall in imports of base metals, ores and minerals. Overall, the November trade
deficit stood at US$10 bn (US$8.7 bn in October). For 8MFY21, trade deficit stands at US$42.8
bn (US$113.4 bn in 8MFY20).
Expect FY2021E BOP to be comfortably in surplus; USD-INR to trade in the 72-75 range
Export activity in the rest of FY2021 is at risk of losing momentum owing to a second wave of
infections. Imports may also stabilize at around the current levels as the impact of festive and
pent-up demand abates, and as certain regions re-impose restrictions to curb the spread of the
virus. Factoring in our revised GDP estimates, we maintain our estimate of current account
surplus of 1.1% of GDP. Meanwhile, the capital account is likely to remain well supported by
foreign investment. We continue to expect BOP surplus of US$94.4 bn in FY2021E (Exhibit 6).
Despite strong capital flows on the back of a favorable electoral outcome in the US along with
positive vaccine-related developments, INR has broadly been stable owing to RBI’s active
intervention. Unsterilized intervention however results in liquidity infusion, which may be
difficult to continue with since (1) headline CPI inflation remains comfortably above the RBI’s
upper limit of 6%, and (2) short-term market rates have fallen well below the reverse repo rate.
With the global policy stance likely to remain accommodative in the near term, the RBI may
have to reduce spot intervention and let the INR appreciate gradually (witnessed recently).
Along with sound domestic external vulnerability metrics, we therefore continue to see USD-INR
in the range of 72-75 through the rest of FY2021. Risks to this range could emanate from
geopolitical tensions pertaining to India and possibility of a second wave of infections in India.
Economy External Sector
Trade deficit widens further. Overall imports remained largely unchanged since last
month, while exports lost further momentum leading to a wider trade deficit in
November. Both domestic and global economic activity remain at risk from a second
wave of infections. After factoring in our revised GDP estimates, we continue to expect
FY2021E current account to register a surplus of 1.1% of GDP along with a BOP surplus
of US$94.4 bn. We retain our USD-INR range of 72-75 for the rest of FY2021.
INDIA
DECEMBER 03, 2020
UPDATE
BSE-30: 44,618
QUICK NUMBERS
November trade
deficit at US$10 bn
Export growth at
(-)9.1%, import
growth at (-)13.3%
Expect FY2021E BOP
surplus at US$94.4
bn
Expect USD-INR in
the range of 72-75
Suvodeep Rakshit
Upasna Bhardwaj
Avijit Puri
[email protected]: +91 22 6218 6427
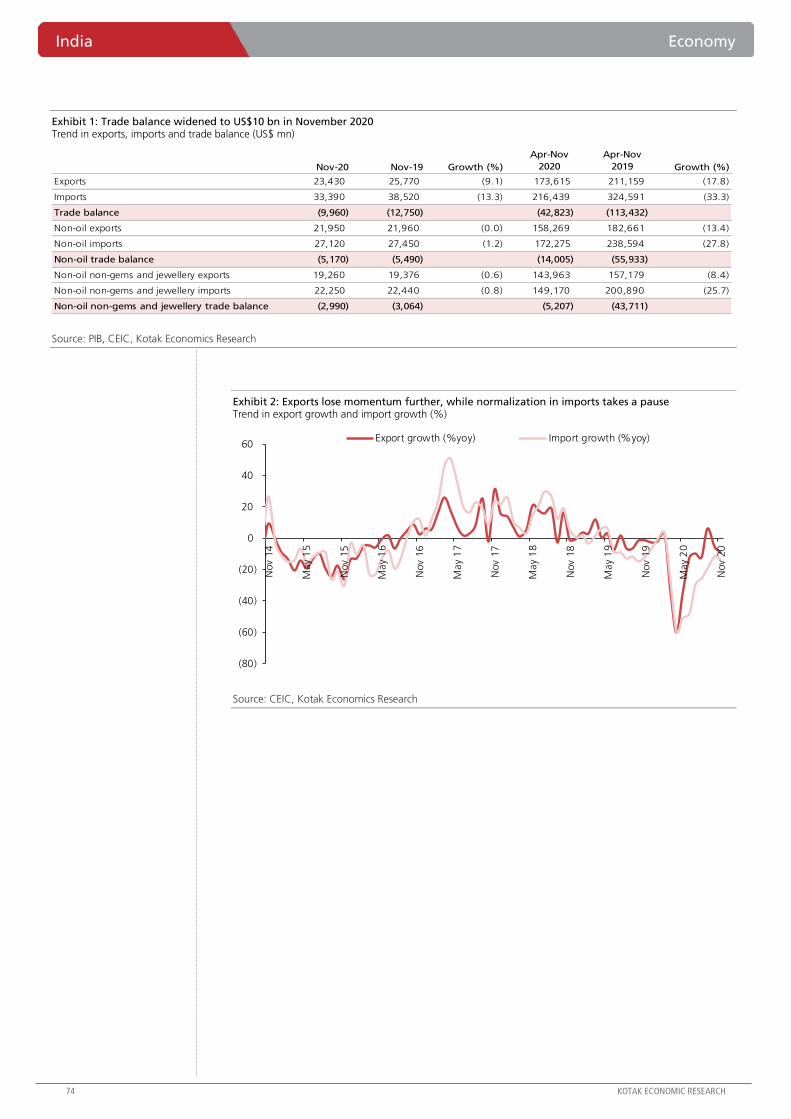
India Economy
74 KOTAK ECONOMIC RESEARCH
Exhibit 1: Trade balance widened to US$10 bn in November 2020 Trend in exports, imports and trade balance (US$ mn)
Source: PIB, CEIC, Kotak Economics Research
Exhibit 2: Exports lose momentum further, while normalization in imports takes a pause Trend in export growth and import growth (%)
Source: CEIC, Kotak Economics Research
Nov-20 Nov-19 Growth (%)
Apr-Nov
2020
Apr-Nov
2019 Growth (%)
Exports 23,430 25,770 (9.1) 173,615 211,159 (17.8)
Imports 33,390 38,520 (13.3) 216,439 324,591 (33.3)
Trade balance (9,960) (12,750) (42,823) (113,432)
Non-oil exports 21,950 21,960 (0.0) 158,269 182,661 (13.4)
Non-oil imports 27,120 27,450 (1.2) 172,275 238,594 (27.8)
Non-oil trade balance (5,170) (5,490) (14,005) (55,933)
Non-oil non-gems and jewellery exports 19,260 19,376 (0.6) 143,963 157,179 (8.4)
Non-oil non-gems and jewellery imports 22,250 22,440 (0.8) 149,170 200,890 (25.7)
Non-oil non-gems and jewellery trade balance (2,990) (3,064) (5,207) (43,711)
(80)
(60)
(40)
(20)
0
20
40
60
Nov
14
May
15
Nov
15
May
16
Nov
16
May
17
Nov
17
May
18
Nov
18
May
19
Nov
19
May
20
Nov
20
Export growth (%yoy) Import growth (%yoy)
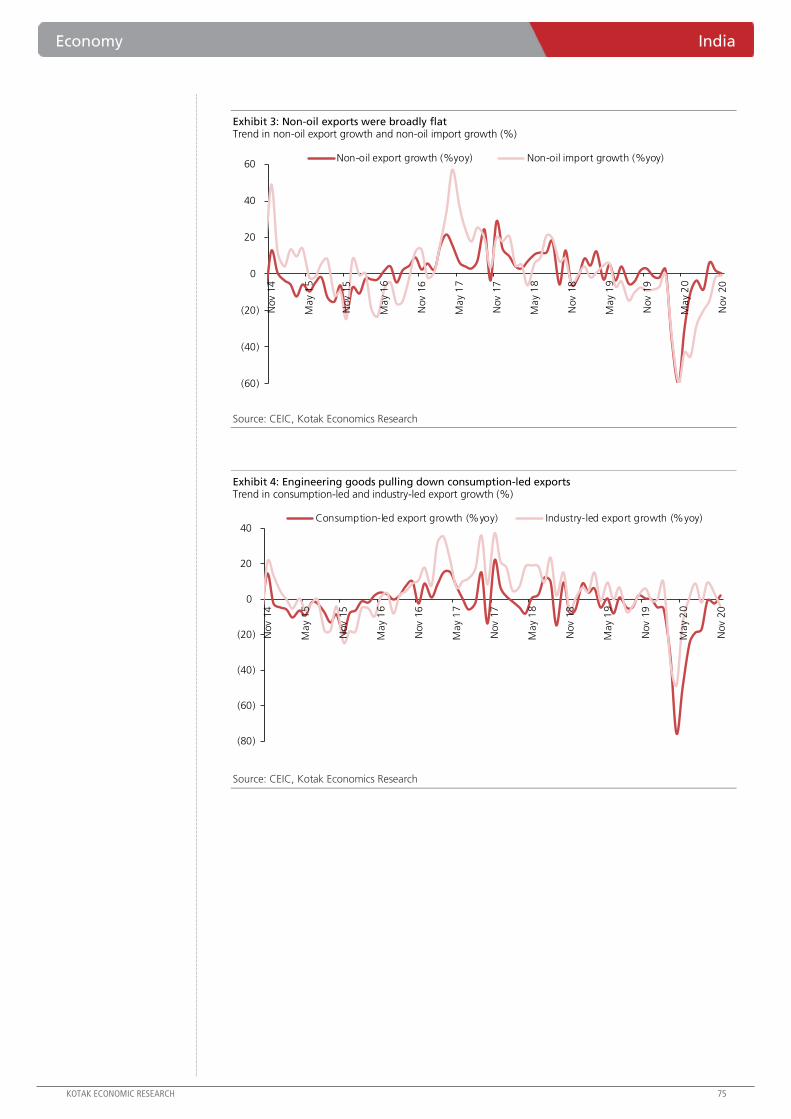
Economy India
KOTAK ECONOMIC RESEARCH 75
Exhibit 3: Non-oil exports were broadly flat Trend in non-oil export growth and non-oil import growth (%)
Source: CEIC, Kotak Economics Research
Exhibit 4: Engineering goods pulling down consumption-led exports Trend in consumption-led and industry-led export growth (%)
Source: CEIC, Kotak Economics Research
(60)
(40)
(20)
0
20
40
60
Nov
14
May
15
Nov
15
May
16
Nov
16
May
17
Nov
17
May
18
Nov
18
May
19
Nov
19
May
20
Nov
20
Non-oil export growth (%yoy) Non-oil import growth (%yoy)
(80)
(60)
(40)
(20)
0
20
40
Nov
14
May
15
Nov
15
May
16
Nov
16
May
17
Nov
17
May
18
Nov
18
May
19
Nov
19
May
20
Nov
20
Consumption-led export growth (%yoy) Industry-led export growth (%yoy)
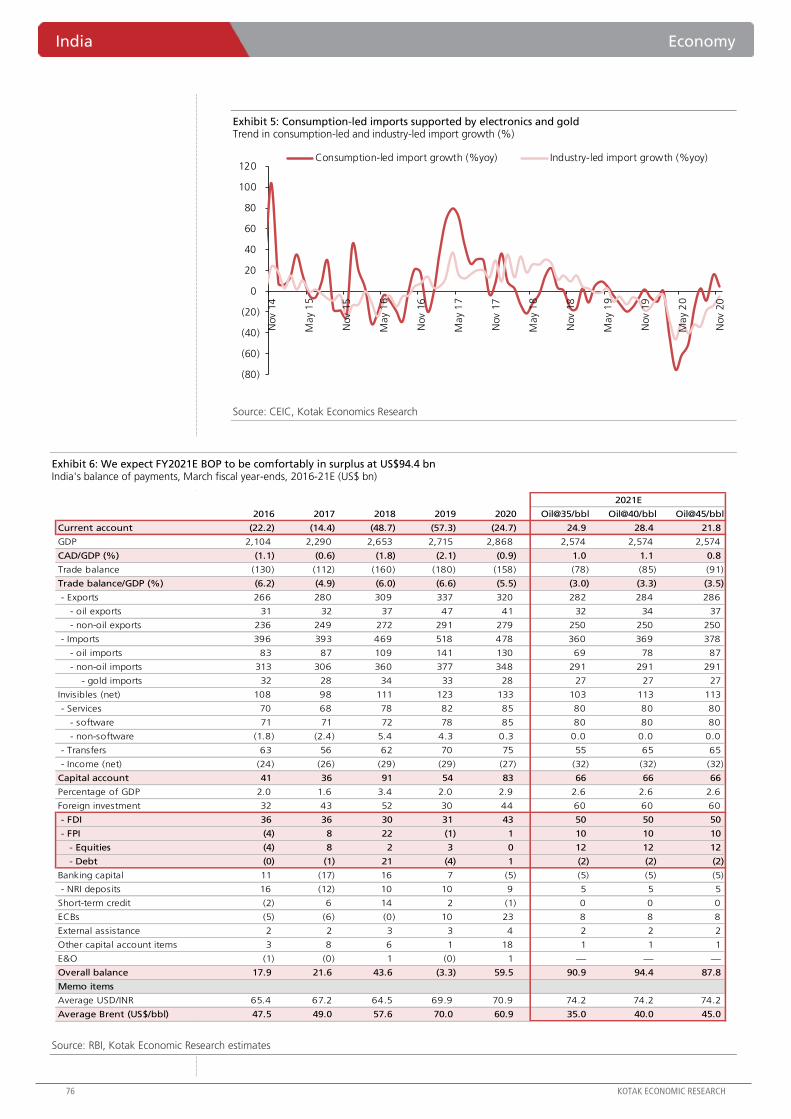
India Economy
76 KOTAK ECONOMIC RESEARCH
Exhibit 5: Consumption-led imports supported by electronics and gold Trend in consumption-led and industry-led import growth (%)
Source: CEIC, Kotak Economics Research
Exhibit 6: We expect FY2021E BOP to be comfortably in surplus at US$94.4 bn India's balance of payments, March fiscal year-ends, 2016-21E (US$ bn)
Source: RBI, Kotak Economic Research estimates
(80)
(60)
(40)
(20)
0
20
40
60
80
100
120
Nov
14
May
15
Nov
15
May
16
Nov
16
May
17
Nov
17
May
18
Nov
18
May
19
Nov
19
May
20
Nov
20
Consumption-led import growth (%yoy) Industry-led import growth (%yoy)
2016 2017 2018 2019 2020 Oil@35/bbl Oil@40/bbl Oil@45/bbl
Current account (22.2) (14.4) (48.7) (57.3) (24.7) 24.9 28.4 21.8
GDP 2,104 2,290 2,653 2,715 2,868 2,574 2,574 2,574
CAD/GDP (%) (1.1) (0.6) (1.8) (2.1) (0.9) 1.0 1.1 0.8
Trade balance (130) (112) (160) (180) (158) (78) (85) (91)
Trade balance/GDP (%) (6.2) (4.9) (6.0) (6.6) (5.5) (3.0) (3.3) (3.5)
- Exports 266 280 309 337 320 282 284 286
- oil exports 31 32 37 47 41 32 34 37
- non-oil exports 236 249 272 291 279 250 250 250
- Imports 396 393 469 518 478 360 369 378
- oil imports 83 87 109 141 130 69 78 87
- non-oil imports 313 306 360 377 348 291 291 291
- gold imports 32 28 34 33 28 27 27 27
Invisibles (net) 108 98 111 123 133 103 113 113
- Services 70 68 78 82 85 80 80 80
- software 71 71 72 78 85 80 80 80
- non-software (1.8) (2.4) 5.4 4.3 0.3 0.0 0.0 0.0
- Transfers 63 56 62 70 75 55 65 65
- Income (net) (24) (26) (29) (29) (27) (32) (32) (32)
Capital account 41 36 91 54 83 66 66 66
Percentage of GDP 2.0 1.6 3.4 2.0 2.9 2.6 2.6 2.6
Foreign investment 32 43 52 30 44 60 60 60
- FDI 36 36 30 31 43 50 50 50
- FPI (4) 8 22 (1) 1 10 10 10
- Equities (4) 8 2 3 0 12 12 12
- Debt (0) (1) 21 (4) 1 (2) (2) (2)
Banking capital 11 (17) 16 7 (5) (5) (5) (5)
- NRI deposits 16 (12) 10 10 9 5 5 5
Short-term credit (2) 6 14 2 (1) 0 0 0
ECBs (5) (6) (0) 10 23 8 8 8
External assistance 2 2 3 3 4 2 2 2
Other capital account items 3 8 6 1 18 1 1 1
E&O (1) (0) 1 (0) 1 — — —
Overall balance 17.9 21.6 43.6 (3.3) 59.5 90.9 94.4 87.8
Memo items
Average USD/INR 65.4 67.2 64.5 69.9 70.9 74.2 74.2 74.2
Average Brent (US$/bbl) 47.5 49.0 57.6 70.0 60.9 35.0 40.0 45.0
2021E
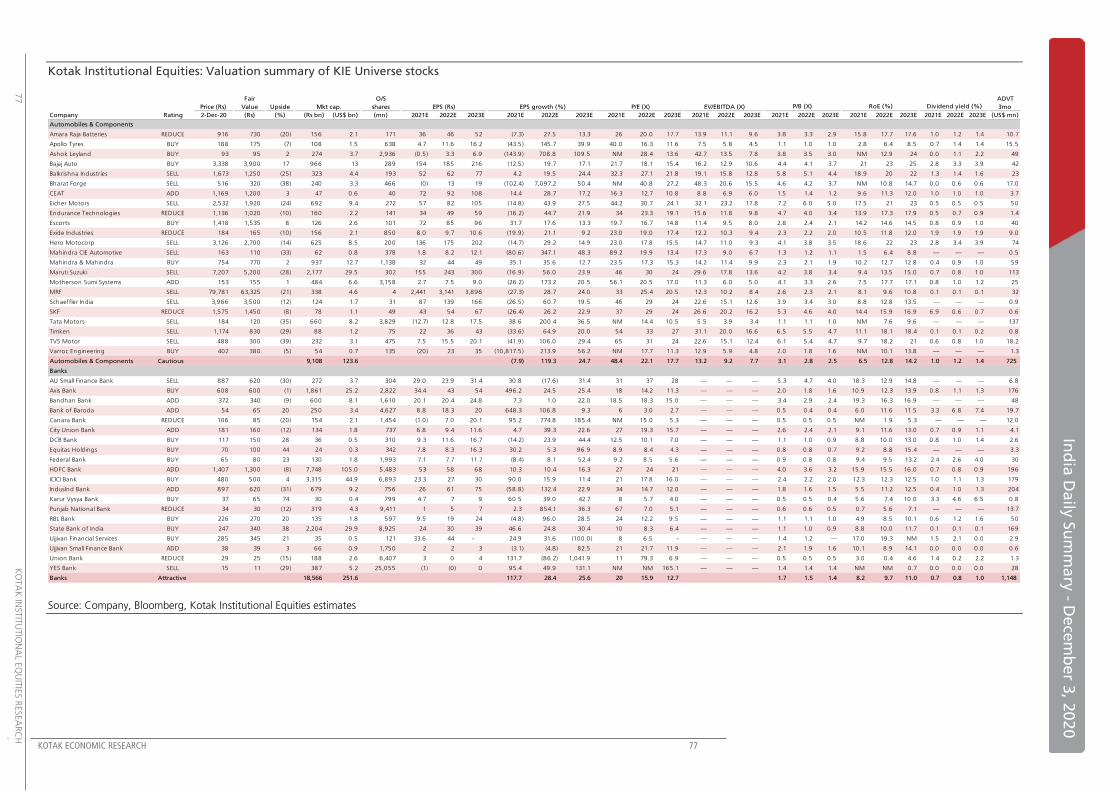
KOTAK ECONOMIC RESEARCH 77
In
dia
Da
ily S
um
ma
ry - D
ece
mb
er 3
, 20
20
77
K
OTA
K IN
STIT
UTIO
NA
L EQ
UIT
IES R
ESEA
RC
H
Kotak Institutional Equities: Valuation summary of KIE Universe stocks
Source: Company, Bloomberg, Kotak Institutional Equities estimates
Fair O/S ADVT
Price (Rs) Value Upside Mkt cap. shares EPS (Rs) EPS growth (%) P/E (X) EV/EBITDA (X) 3mo
Company Rating 2-Dec-20 (Rs) (%) (Rs bn) (US$ bn) (mn) 2021E 2022E 2023E 2021E 2022E 2023E 2021E 2022E 2023E 2021E 2022E 2023E 2021E 2022E 2023E 2021E 2022E 2023E 2021E 2022E 2023E (US$ mn)
Automobiles & Components
Amara Raja Batteries REDUCE 916 730 (20) 156 2.1 171 36 46 52 (7.3) 27.5 13.3 26 20.0 17.7 13.9 11.1 9.6 3.8 3.3 2.9 15.8 17.7 17.6 1.0 1.2 1.4 10.7
Apollo Tyres BUY 188 175 (7) 108 1.5 638 4.7 11.6 16.2 (43.5) 145.7 39.9 40.0 16.3 11.6 7.5 5.8 4.5 1.1 1.0 1.0 2.8 6.4 8.5 0.7 1.4 1.4 15.5
Ashok Leyland BUY 93 95 2 274 3.7 2,936 (0.5) 3.3 6.9 (143.9) 708.8 109.5 NM 28.4 13.6 42.7 13.5 7.8 3.8 3.5 3.0 NM 12.9 24 0.0 1.1 2.2 49
Bajaj Auto BUY 3,338 3,900 17 966 13 289 154 185 216 (12.5) 19.7 17.1 21.7 18.1 15.4 16.2 12.9 10.6 4.4 4.1 3.7 21 23 25 2.8 3.3 3.9 42
Balkrishna Industries SELL 1,673 1,250 (25) 323 4.4 193 52 62 77 4.2 19.5 24.4 32.3 27.1 21.8 19.1 15.8 12.8 5.8 5.1 4.4 18.9 20 22 1.3 1.4 1.6 23
Bharat Forge SELL 516 320 (38) 240 3.3 466 (0) 13 19 (102.4) 7,097.2 50.4 NM 40.8 27.2 48.3 20.6 15.5 4.6 4.2 3.7 NM 10.8 14.7 0.0 0.6 0.6 17.0
CEAT ADD 1,169 1,200 3 47 0.6 40 72 92 108 14.4 28.7 17.2 16.3 12.7 10.8 8.8 6.9 6.0 1.5 1.4 1.2 9.6 11.3 12.0 1.0 1.0 1.0 3.7
Eicher Motors SELL 2,532 1,920 (24) 692 9.4 272 57 82 105 (14.8) 43.9 27.5 44.2 30.7 24.1 32.1 23.2 17.8 7.2 6.0 5.0 17.5 21 23 0.5 0.5 0.5 50
Endurance Technologies REDUCE 1,136 1,020 (10) 160 2.2 141 34 49 59 (16.2) 44.7 21.9 34 23.3 19.1 15.6 11.8 9.8 4.7 4.0 3.4 13.9 17.3 17.9 0.5 0.7 0.9 1.4
Escorts BUY 1,418 1,535 8 126 2.6 101 72 85 96 31.7 17.6 13.3 19.7 16.7 14.8 11.4 9.5 8.0 2.8 2.4 2.1 14.2 14.6 14.5 0.8 0.9 1.0 40
Exide Industries REDUCE 184 165 (10) 156 2.1 850 8.0 9.7 10.6 (19.9) 21.1 9.2 23.0 19.0 17.4 12.2 10.3 9.4 2.3 2.2 2.0 10.5 11.8 12.0 1.9 1.9 1.9 9.0
Hero Motocorp SELL 3,126 2,700 (14) 625 8.5 200 136 175 202 (14.7) 29.2 14.9 23.0 17.8 15.5 14.7 11.0 9.3 4.1 3.8 3.5 18.6 22 23 2.8 3.4 3.9 74
Mahindra CIE Automotive SELL 163 110 (33) 62 0.8 378 1.8 8.2 12.1 (80.6) 347.1 48.3 89.2 19.9 13.4 17.3 9.0 6.7 1.3 1.2 1.1 1.5 6.4 8.8 — — — 0.5
Mahindra & Mahindra BUY 754 770 2 937 12.7 1,138 32 44 49 35.1 35.6 12.7 23.5 17.3 15.3 14.2 11.4 9.9 2.3 2.1 1.9 10.2 12.7 12.8 0.4 0.9 1.0 59
Maruti Suzuki SELL 7,207 5,200 (28) 2,177 29.5 302 155 243 300 (16.9) 56.0 23.9 46 30 24 29.6 17.8 13.6 4.2 3.8 3.4 9.4 13.5 15.0 0.7 0.8 1.0 113
Motherson Sumi Systems ADD 153 155 1 484 6.6 3,158 2.7 7.5 9.0 (26.2) 173.2 20.5 56.1 20.5 17.0 11.3 6.0 5.0 4.1 3.3 2.6 7.5 17.7 17.1 0.8 1.0 1.2 25
MRF SELL 79,781 63,325 (21) 338 4.6 4 2,441 3,141 3,896 (27.3) 28.7 24.0 33 25.4 20.5 12.3 10.2 8.4 2.6 2.3 2.1 8.1 9.6 10.8 0.1 0.1 0.1 32
Schaeffler India SELL 3,966 3,500 (12) 124 1.7 31 87 139 166 (26.5) 60.7 19.5 46 29 24 22.6 15.1 12.6 3.9 3.4 3.0 8.8 12.8 13.5 — — — 0.9
SKF REDUCE 1,575 1,450 (8) 78 1.1 49 43 54 67 (26.4) 26.2 22.9 37 29 24 26.6 20.2 16.2 5.3 4.6 4.0 14.4 15.9 16.9 6.9 0.6 0.7 0.6
Tata Motors SELL 184 120 (35) 660 8.2 3,829 (12.7) 12.8 17.5 38.6 200.4 36.5 NM 14.4 10.5 5.5 3.9 3.4 1.1 1.1 1.0 NM 7.6 9.6 — — — 137
Timken SELL 1,174 830 (29) 88 1.2 75 22 36 43 (33.6) 64.9 20.0 54 33 27 31.1 20.0 16.6 6.5 5.5 4.7 11.1 18.1 18.4 0.1 0.1 0.2 0.8
TVS Motor SELL 488 300 (39) 232 3.1 475 7.5 15.5 20.1 (41.9) 106.0 29.4 65 31 24 22.6 15.1 12.4 6.1 5.4 4.7 9.7 18.2 21 0.6 0.8 1.0 18.2
Varroc Engineering BUY 402 380 (5) 54 0.7 135 (20) 23 35 (10,817.5) 213.9 56.2 NM 17.7 11.3 12.9 5.9 4.8 2.0 1.8 1.6 NM 10.1 13.8 — — — 1.3
Automobiles & Components Cautious 9,108 123.6 (7.9) 119.3 24.7 48.4 22.1 17.7 13.2 9.2 7.7 3.1 2.8 2.5 6.5 12.8 14.2 1.0 1.2 1.4 725
Banks
AU Small Finance Bank SELL 887 620 (30) 272 3.7 304 29.0 23.9 31.4 30.8 (17.6) 31.4 31 37 28 — — — 5.3 4.7 4.0 18.3 12.9 14.8 — — — 6.8
Axis Bank BUY 608 600 (1) 1,861 25.2 2,822 34.4 43 54 496.2 24.5 25.4 18 14.2 11.3 — — — 2.0 1.8 1.6 10.9 12.3 13.9 0.8 1.1 1.3 176
Bandhan Bank ADD 372 340 (9) 600 8.1 1,610 20.1 20.4 24.8 7.3 1.0 22.0 18.5 18.3 15.0 — — — 3.4 2.9 2.4 19.3 16.3 16.9 — — — 48
Bank of Baroda ADD 54 65 20 250 3.4 4,627 8.8 18.3 20 648.3 106.8 9.3 6 3.0 2.7 — — — 0.5 0.4 0.4 6.0 11.6 11.5 3.3 6.8 7.4 19.7
Canara Bank REDUCE 106 85 (20) 154 2.1 1,454 (1.0) 7.0 20.1 95.2 774.8 185.4 NM 15.0 5.3 — — — 0.5 0.5 0.5 NM 1.9 5.3 — — — 12.0
City Union Bank ADD 181 160 (12) 134 1.8 737 6.8 9.4 11.6 4.7 39.3 22.6 27 19.3 15.7 — — — 2.6 2.4 2.1 9.1 11.6 13.0 0.7 0.9 1.1 4.1
DCB Bank BUY 117 150 28 36 0.5 310 9.3 11.6 16.7 (14.2) 23.9 44.4 12.5 10.1 7.0 — — — 1.1 1.0 0.9 8.8 10.0 13.0 0.8 1.0 1.4 2.6
Equitas Holdings BUY 70 100 44 24 0.3 342 7.8 8.3 16.3 30.2 5.3 96.9 8.9 8.4 4.3 — — — 0.8 0.8 0.7 9.2 8.8 15.4 — — — 3.3
Federal Bank BUY 65 80 23 130 1.8 1,993 7.1 7.7 11.7 (8.4) 8.1 52.4 9.2 8.5 5.6 — — — 0.9 0.8 0.8 9.4 9.5 13.2 2.4 2.6 4.0 30
HDFC Bank ADD 1,407 1,300 (8) 7,748 105.0 5,483 53 58 68 10.3 10.4 16.3 27 24 21 — — — 4.0 3.6 3.2 15.9 15.5 16.0 0.7 0.8 0.9 196
ICICI Bank BUY 480 500 4 3,315 44.9 6,893 23.3 27 30 90.0 15.9 11.4 21 17.8 16.0 — — — 2.4 2.2 2.0 12.3 12.3 12.5 1.0 1.1 1.3 179
IndusInd Bank ADD 897 620 (31) 679 9.2 756 26 61 75 (58.8) 132.4 22.9 34 14.7 12.0 — — — 1.8 1.6 1.5 5.5 11.2 12.5 0.4 1.0 1.3 204
Karur Vysya Bank BUY 37 65 74 30 0.4 799 4.7 7 9 60.5 39.0 42.7 8 5.7 4.0 — — — 0.5 0.5 0.4 5.6 7.4 10.0 3.3 4.6 6.5 0.8
Punjab National Bank REDUCE 34 30 (12) 319 4.3 9,411 1 5 7 2.3 854.1 36.3 67 7.0 5.1 — — — 0.6 0.6 0.5 0.7 5.6 7.1 — — — 13.7
RBL Bank BUY 226 270 20 135 1.8 597 9.5 19 24 (4.8) 96.0 28.5 24 12.2 9.5 — — — 1.1 1.1 1.0 4.9 8.5 10.1 0.6 1.2 1.6 50
State Bank of India BUY 247 340 38 2,204 29.9 8,925 24 30 39 46.6 24.8 30.4 10 8.3 6.4 — — — 1.1 1.0 0.9 8.8 10.0 11.7 0.1 0.1 0.1 169
Ujjivan Financial Services BUY 285 345 21 35 0.5 121 33.6 44 - 24.9 31.6 (100.0) 8 6.5 - — — — 1.4 1.2 — 17.0 19.3 NM 1.5 2.1 0.0 2.9
Ujjivan Small Finance Bank ADD 38 39 3 66 0.9 1,750 2 2 3 (3.1) (4.8) 82.5 21 21.7 11.9 — — — 2.1 1.9 1.6 10.1 8.9 14.1 0.0 0.0 0.0 0.6
Union Bank REDUCE 29 25 (15) 188 2.6 6,407 3 0 4 131.7 (86.2) 1,041.9 11 79.3 6.9 — — — 0.5 0.5 0.5 3.0 0.4 4.6 1.4 0.2 2.2 1.3
YES Bank SELL 15 11 (29) 387 5.2 25,055 (1) (0) 0 95.4 49.9 131.1 NM NM 165.1 — — — 1.4 1.4 1.4 NM NM 0.7 0.0 0.0 0.0 28
Banks Attractive 18,566 251.6 117.7 28.4 25.6 20 15.9 12.7 1.7 1.5 1.4 8.2 9.7 11.0 0.7 0.8 1.0 1,148
P/B (X) RoE (%) Dividend yield (%)
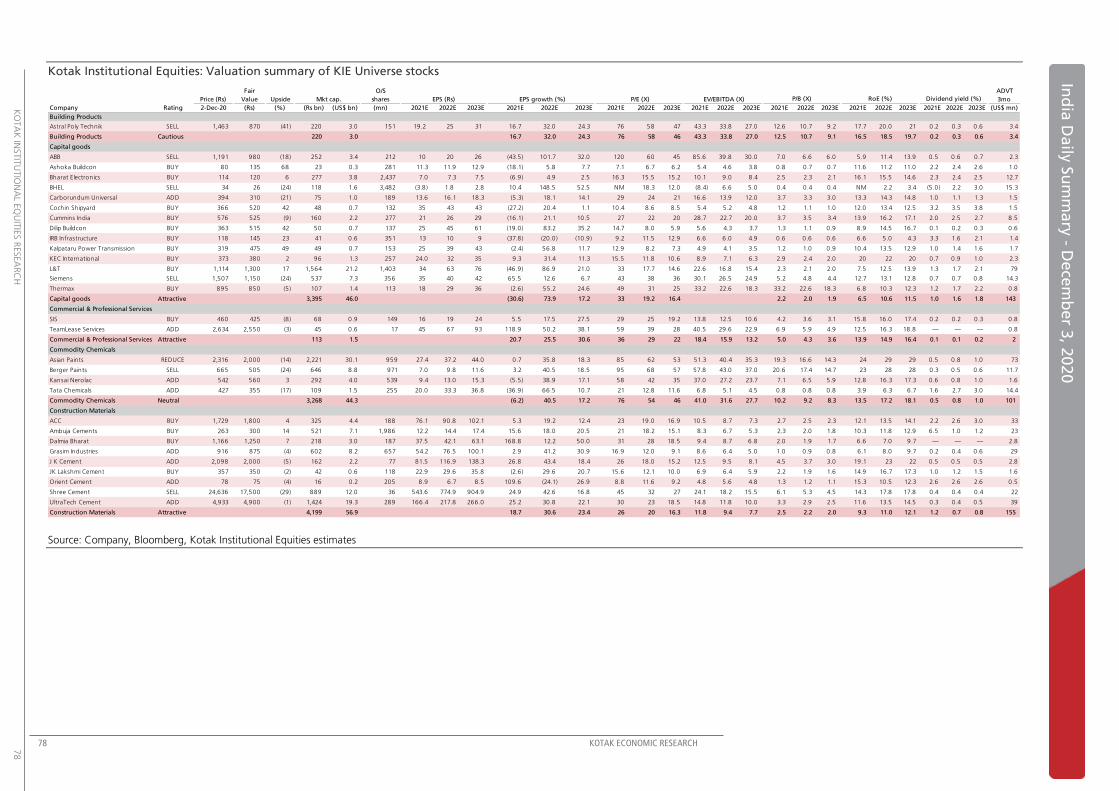
78 KOTAK ECONOMIC RESEARCH
K
OTA
K IN
STIT
UTIO
NA
L EQ
UIT
IES R
ESEA
RC
H
78
Ind
ia D
aily
Su
mm
ary
- Dece
mb
er 3
, 20
20
Kotak Institutional Equities: Valuation summary of KIE Universe stocks
Source: Company, Bloomberg, Kotak Institutional Equities estimates
Fair O/S ADVT
Price (Rs) Value Upside Mkt cap. shares EPS (Rs) EPS growth (%) P/E (X) EV/EBITDA (X) 3mo
Company Rating 2-Dec-20 (Rs) (%) (Rs bn) (US$ bn) (mn) 2021E 2022E 2023E 2021E 2022E 2023E 2021E 2022E 2023E 2021E 2022E 2023E 2021E 2022E 2023E 2021E 2022E 2023E 2021E 2022E 2023E (US$ mn)
Building Products
Astral Poly Technik SELL 1,463 870 (41) 220 3.0 151 19.2 25 31 16.7 32.0 24.3 76 58 47 43.3 33.8 27.0 12.6 10.7 9.2 17.7 20.0 21 0.2 0.3 0.6 3.4
Building Products Cautious 220 3.0 16.7 32.0 24.3 76 58 46 43.3 33.8 27.0 12.5 10.7 9.1 16.5 18.5 19.7 0.2 0.3 0.6 3.4
Capital goods
ABB SELL 1,191 980 (18) 252 3.4 212 10 20 26 (43.5) 101.7 32.0 120 60 45 85.6 39.8 30.0 7.0 6.6 6.0 5.9 11.4 13.9 0.5 0.6 0.7 2.3
Ashoka Buildcon BUY 80 135 68 23 0.3 281 11.3 11.9 12.9 (18.1) 5.8 7.7 7.1 6.7 6.2 5.4 4.6 3.8 0.8 0.7 0.7 11.6 11.2 11.0 2.2 2.4 2.6 1.0
Bharat Electronics BUY 114 120 6 277 3.8 2,437 7.0 7.3 7.5 (6.9) 4.9 2.5 16.3 15.5 15.2 10.1 9.0 8.4 2.5 2.3 2.1 16.1 15.5 14.6 2.3 2.4 2.5 12.7
BHEL SELL 34 26 (24) 118 1.6 3,482 (3.8) 1.8 2.8 10.4 148.5 52.5 NM 18.3 12.0 (8.4) 6.6 5.0 0.4 0.4 0.4 NM 2.2 3.4 (5.0) 2.2 3.0 15.3
Carborundum Universal ADD 394 310 (21) 75 1.0 189 13.6 16.1 18.3 (5.3) 18.1 14.1 29 24 21 16.6 13.9 12.0 3.7 3.3 3.0 13.3 14.3 14.8 1.0 1.1 1.3 1.5
Cochin Shipyard BUY 366 520 42 48 0.7 132 35 43 43 (27.2) 20.4 1.1 10.4 8.6 8.5 5.4 5.2 4.8 1.2 1.1 1.0 12.0 13.4 12.5 3.2 3.5 3.8 1.5
Cummins India BUY 576 525 (9) 160 2.2 277 21 26 29 (16.1) 21.1 10.5 27 22 20 28.7 22.7 20.0 3.7 3.5 3.4 13.9 16.2 17.1 2.0 2.5 2.7 8.5
Dilip Buildcon BUY 363 515 42 50 0.7 137 25 45 61 (19.0) 83.2 35.2 14.7 8.0 5.9 5.6 4.3 3.7 1.3 1.1 0.9 8.9 14.5 16.7 0.1 0.2 0.3 0.6
IRB Infrastructure BUY 118 145 23 41 0.6 351 13 10 9 (37.8) (20.0) (10.9) 9.2 11.5 12.9 6.6 6.0 4.9 0.6 0.6 0.6 6.6 5.0 4.3 3.3 1.6 2.1 1.4
Kalpataru Power Transmission BUY 319 475 49 49 0.7 153 25 39 43 (2.4) 56.8 11.7 12.9 8.2 7.3 4.9 4.1 3.5 1.2 1.0 0.9 10.4 13.5 12.9 1.0 1.4 1.6 1.7
KEC International BUY 373 380 2 96 1.3 257 24.0 32 35 9.3 31.4 11.3 15.5 11.8 10.6 8.9 7.1 6.3 2.9 2.4 2.0 20 22 20 0.7 0.9 1.0 2.3
L&T BUY 1,114 1,300 17 1,564 21.2 1,403 34 63 76 (46.9) 86.9 21.0 33 17.7 14.6 22.6 16.8 15.4 2.3 2.1 2.0 7.5 12.5 13.9 1.3 1.7 2.1 79
Siemens SELL 1,507 1,150 (24) 537 7.3 356 35 40 42 65.5 12.6 6.7 43 38 36 30.1 26.5 24.9 5.2 4.8 4.4 12.7 13.1 12.8 0.7 0.7 0.8 14.3
Thermax BUY 895 850 (5) 107 1.4 113 18 29 36 (2.6) 55.2 24.6 49 31 25 33.2 22.6 18.3 33.2 22.6 18.3 6.8 10.3 12.3 1.2 1.7 2.2 0.8
Capital goods Attractive 3,395 46.0 (30.6) 73.9 17.2 33 19.2 16.4 2.2 2.0 1.9 6.5 10.6 11.5 1.0 1.6 1.8 143
Commercial & Professional Services
SIS BUY 460 425 (8) 68 0.9 149 16 19 24 5.5 17.5 27.5 29 25 19.2 13.8 12.5 10.6 4.2 3.6 3.1 15.8 16.0 17.4 0.2 0.2 0.3 0.8
TeamLease Services ADD 2,634 2,550 (3) 45 0.6 17 45 67 93 118.9 50.2 38.1 59 39 28 40.5 29.6 22.9 6.9 5.9 4.9 12.5 16.3 18.8 — — — 0.8
Commercial & Professional Services Attractive 113 1.5 20.7 25.5 30.6 36 29 22 18.4 15.9 13.2 5.0 4.3 3.6 13.9 14.9 16.4 0.1 0.1 0.2 2
Commodity Chemicals
Asian Paints REDUCE 2,316 2,000 (14) 2,221 30.1 959 27.4 37.2 44.0 0.7 35.8 18.3 85 62 53 51.3 40.4 35.3 19.3 16.6 14.3 24 29 29 0.5 0.8 1.0 73
Berger Paints SELL 665 505 (24) 646 8.8 971 7.0 9.8 11.6 3.2 40.5 18.5 95 68 57 57.8 43.0 37.0 20.6 17.4 14.7 23 28 28 0.3 0.5 0.6 11.7
Kansai Nerolac ADD 542 560 3 292 4.0 539 9.4 13.0 15.3 (5.5) 38.9 17.1 58 42 35 37.0 27.2 23.7 7.1 6.5 5.9 12.8 16.3 17.3 0.6 0.8 1.0 1.6
Tata Chemicals ADD 427 355 (17) 109 1.5 255 20.0 33.3 36.8 (36.9) 66.5 10.7 21 12.8 11.6 6.8 5.1 4.5 0.8 0.8 0.8 3.9 6.3 6.7 1.6 2.7 3.0 14.4
Commodity Chemicals Neutral 3,268 44.3 (6.2) 40.5 17.2 76 54 46 41.0 31.6 27.7 10.2 9.2 8.3 13.5 17.2 18.1 0.5 0.8 1.0 101
Construction Materials
ACC BUY 1,729 1,800 4 325 4.4 188 76.1 90.8 102.1 5.3 19.2 12.4 23 19.0 16.9 10.5 8.7 7.3 2.7 2.5 2.3 12.1 13.5 14.1 2.2 2.6 3.0 33
Ambuja Cements BUY 263 300 14 521 7.1 1,986 12.2 14.4 17.4 15.6 18.0 20.5 21 18.2 15.1 8.3 6.7 5.3 2.3 2.0 1.8 10.3 11.8 12.9 6.5 1.0 1.2 23
Dalmia Bharat BUY 1,166 1,250 7 218 3.0 187 37.5 42.1 63.1 168.8 12.2 50.0 31 28 18.5 9.4 8.7 6.8 2.0 1.9 1.7 6.6 7.0 9.7 — — — 2.8
Grasim Industries ADD 916 875 (4) 602 8.2 657 54.2 76.5 100.1 2.9 41.2 30.9 16.9 12.0 9.1 8.6 6.4 5.0 1.0 0.9 0.8 6.1 8.0 9.7 0.2 0.4 0.6 29
J K Cement ADD 2,098 2,000 (5) 162 2.2 77 81.5 116.9 138.3 26.8 43.4 18.4 26 18.0 15.2 12.5 9.5 8.1 4.5 3.7 3.0 19.1 23 22 0.5 0.5 0.5 2.8
JK Lakshmi Cement BUY 357 350 (2) 42 0.6 118 22.9 29.6 35.8 (2.6) 29.6 20.7 15.6 12.1 10.0 6.9 6.4 5.9 2.2 1.9 1.6 14.9 16.7 17.3 1.0 1.2 1.5 1.6
Orient Cement ADD 78 75 (4) 16 0.2 205 8.9 6.7 8.5 109.6 (24.1) 26.9 8.8 11.6 9.2 4.8 5.6 4.8 1.3 1.2 1.1 15.3 10.5 12.3 2.6 2.6 2.6 0.5
Shree Cement SELL 24,636 17,500 (29) 889 12.0 36 543.6 774.9 904.9 24.9 42.6 16.8 45 32 27 24.1 18.2 15.5 6.1 5.3 4.5 14.3 17.8 17.8 0.4 0.4 0.4 22
UltraTech Cement ADD 4,933 4,900 (1) 1,424 19.3 289 166.4 217.8 266.0 25.2 30.8 22.1 30 23 18.5 14.8 11.8 10.0 3.3 2.9 2.5 11.6 13.5 14.5 0.3 0.4 0.5 39
Construction Materials Attractive 4,199 56.9 18.7 30.6 23.4 26 20 16.3 11.8 9.4 7.7 2.5 2.2 2.0 9.3 11.0 12.1 1.2 0.7 0.8 155
P/B (X) RoE (%) Dividend yield (%)
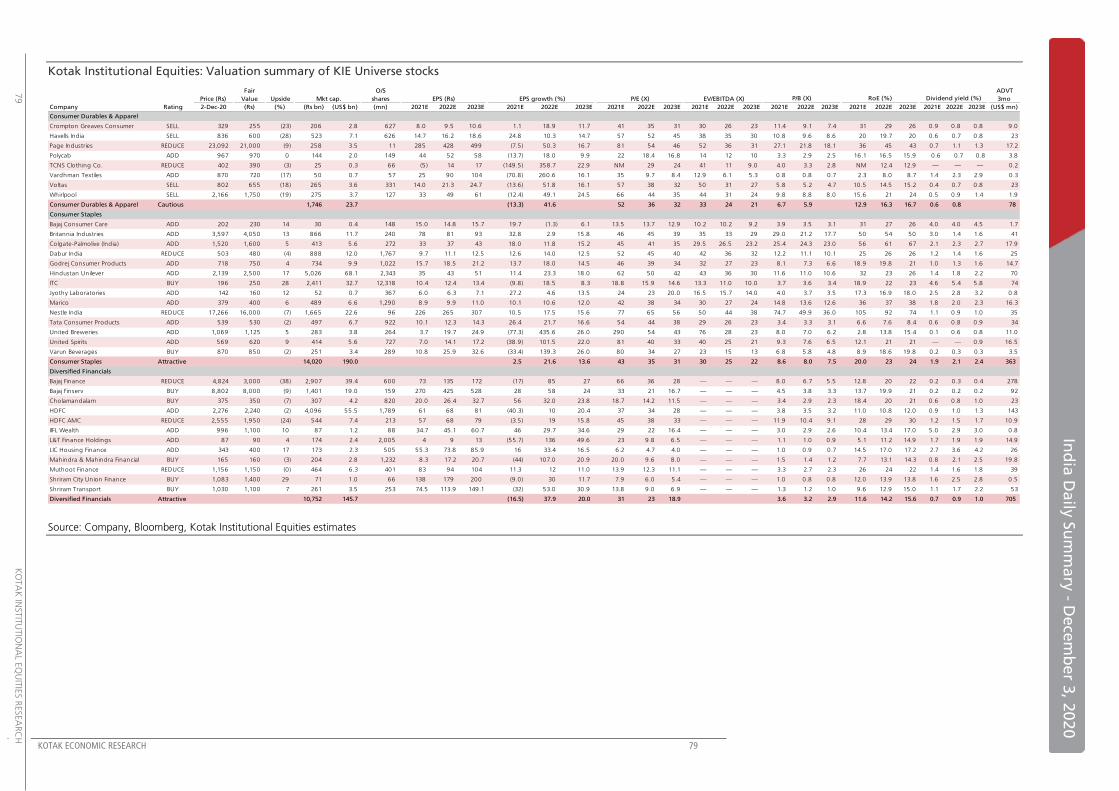
KOTAK ECONOMIC RESEARCH 79
In
dia
Da
ily S
um
ma
ry - D
ece
mb
er 3
, 20
20
79
K
OTA
K IN
STIT
UTIO
NA
L EQ
UIT
IES R
ESEA
RC
H
Kotak Institutional Equities: Valuation summary of KIE Universe stocks
Source: Company, Bloomberg, Kotak Institutional Equities estimates
Fair O/S ADVT
Price (Rs) Value Upside Mkt cap. shares EPS (Rs) EPS growth (%) P/E (X) EV/EBITDA (X) 3mo
Company Rating 2-Dec-20 (Rs) (%) (Rs bn) (US$ bn) (mn) 2021E 2022E 2023E 2021E 2022E 2023E 2021E 2022E 2023E 2021E 2022E 2023E 2021E 2022E 2023E 2021E 2022E 2023E 2021E 2022E 2023E (US$ mn)
Consumer Durables & Apparel
Crompton Greaves Consumer SELL 329 255 (23) 206 2.8 627 8.0 9.5 10.6 1.1 18.9 11.7 41 35 31 30 26 23 11.4 9.1 7.4 31 29 26 0.9 0.8 0.8 9.0
Havells India SELL 836 600 (28) 523 7.1 626 14.7 16.2 18.6 24.8 10.3 14.7 57 52 45 38 35 30 10.8 9.6 8.6 20 19.7 20 0.6 0.7 0.8 23
Page Industries REDUCE 23,092 21,000 (9) 258 3.5 11 285 428 499 (7.5) 50.3 16.7 81 54 46 52 36 31 27.1 21.8 18.1 36 45 43 0.7 1.1 1.3 17.2
Polycab ADD 967 970 0 144 2.0 149 44 52 58 (13.7) 18.0 9.9 22 18.4 16.8 14 12 10 3.3 2.9 2.5 16.1 16.5 15.9 0.6 0.7 0.8 3.8
TCNS Clothing Co. REDUCE 402 390 (3) 25 0.3 66 (5) 14 17 (149.5) 358.7 22.9 NM 29 24 41 11 9.0 4.0 3.3 2.8 NM 12.4 12.9 — — — 0.2
Vardhman Textiles ADD 870 720 (17) 50 0.7 57 25 90 104 (70.8) 260.6 16.1 35 9.7 8.4 12.9 6.1 5.3 0.8 0.8 0.7 2.3 8.0 8.7 1.4 2.3 2.9 0.3
Voltas SELL 802 655 (18) 265 3.6 331 14.0 21.3 24.7 (13.6) 51.8 16.1 57 38 32 50 31 27 5.8 5.2 4.7 10.5 14.5 15.2 0.4 0.7 0.8 23
Whirlpool SELL 2,166 1,750 (19) 275 3.7 127 33 49 61 (12.4) 49.1 24.5 66 44 35 44 31 24 9.8 8.8 8.0 15.6 21 24 0.5 0.9 1.4 1.9
Consumer Durables & Apparel Cautious 1,746 23.7 (13.3) 41.6 52 36 32 33 24 21 6.7 5.9 12.9 16.3 16.7 0.6 0.8 78
Consumer Staples
Bajaj Consumer Care ADD 202 230 14 30 0.4 148 15.0 14.8 15.7 19.7 (1.3) 6.1 13.5 13.7 12.9 10.2 10.2 9.2 3.9 3.5 3.1 31 27 26 4.0 4.0 4.5 1.7
Britannia Industries ADD 3,597 4,050 13 866 11.7 240 78 81 93 32.8 2.9 15.8 46 45 39 35 33 29 29.0 21.2 17.7 50 54 50 3.0 1.4 1.6 41
Colgate-Palmolive (India) ADD 1,520 1,600 5 413 5.6 272 33 37 43 18.0 11.8 15.2 45 41 35 29.5 26.5 23.2 25.4 24.3 23.0 56 61 67 2.1 2.3 2.7 17.9
Dabur India REDUCE 503 480 (4) 888 12.0 1,767 9.7 11.1 12.5 12.6 14.0 12.5 52 45 40 42 36 32 12.2 11.1 10.1 25 26 26 1.2 1.4 1.6 25
Godrej Consumer Products ADD 718 750 4 734 9.9 1,022 15.7 18.5 21.2 13.7 18.0 14.5 46 39 34 32 27 23 8.1 7.3 6.6 18.9 19.8 21 1.0 1.3 1.6 14.7
Hindustan Unilever ADD 2,139 2,500 17 5,026 68.1 2,343 35 43 51 11.4 23.3 18.0 62 50 42 43 36 30 11.6 11.0 10.6 32 23 26 1.4 1.8 2.2 70
ITC BUY 196 250 28 2,411 32.7 12,318 10.4 12.4 13.4 (9.8) 18.5 8.3 18.8 15.9 14.6 13.3 11.0 10.0 3.7 3.6 3.4 18.9 22 23 4.6 5.4 5.8 74
Jyothy Laboratories ADD 142 160 12 52 0.7 367 6.0 6.3 7.1 27.2 4.6 13.5 24 23 20.0 16.5 15.7 14.0 4.0 3.7 3.5 17.3 16.9 18.0 2.5 2.8 3.2 0.8
Marico ADD 379 400 6 489 6.6 1,290 8.9 9.9 11.0 10.1 10.6 12.0 42 38 34 30 27 24 14.8 13.6 12.6 36 37 38 1.8 2.0 2.3 16.3
Nestle India REDUCE 17,266 16,000 (7) 1,665 22.6 96 226 265 307 10.5 17.5 15.6 77 65 56 50 44 38 74.7 49.9 36.0 105 92 74 1.1 0.9 1.0 35
Tata Consumer Products ADD 539 530 (2) 497 6.7 922 10.1 12.3 14.3 26.4 21.7 16.6 54 44 38 29 26 23 3.4 3.3 3.1 6.6 7.6 8.4 0.6 0.8 0.9 34
United Breweries ADD 1,069 1,125 5 283 3.8 264 3.7 19.7 24.9 (77.3) 435.6 26.0 290 54 43 76 28 23 8.0 7.0 6.2 2.8 13.8 15.4 0.1 0.6 0.8 11.0
United Spirits ADD 569 620 9 414 5.6 727 7.0 14.1 17.2 (38.9) 101.5 22.0 81 40 33 40 25 21 9.3 7.6 6.5 12.1 21 21 — — 0.9 16.5
Varun Beverages BUY 870 850 (2) 251 3.4 289 10.8 25.9 32.6 (33.4) 139.3 26.0 80 34 27 23 15 13 6.8 5.8 4.8 8.9 18.6 19.8 0.2 0.3 0.3 3.5
Consumer Staples Attractive 14,020 190.0 2.5 21.6 13.6 43 35 31 30 25 22 8.6 8.0 7.5 20.0 23 24 1.9 2.1 2.4 363
Diversified Financials
Bajaj Finance REDUCE 4,824 3,000 (38) 2,907 39.4 600 73 135 172 (17) 85 27 66 36 28 — — — 8.0 6.7 5.5 12.8 20 22 0.2 0.3 0.4 278
Bajaj Finserv BUY 8,802 8,000 (9) 1,401 19.0 159 270 425 528 28 58 24 33 21 16.7 — — — 4.5 3.8 3.3 13.7 19.9 21 0.2 0.2 0.2 92
Cholamandalam BUY 375 350 (7) 307 4.2 820 20.0 26.4 32.7 56 32.0 23.8 18.7 14.2 11.5 — — — 3.4 2.9 2.3 18.4 20 21 0.6 0.8 1.0 23
HDFC ADD 2,276 2,240 (2) 4,096 55.5 1,789 61 68 81 (40.3) 10 20.4 37 34 28 — — — 3.8 3.5 3.2 11.0 10.8 12.0 0.9 1.0 1.3 143
HDFC AMC REDUCE 2,555 1,950 (24) 544 7.4 213 57 68 79 (3.5) 19 15.8 45 38 33 — — — 11.9 10.4 9.1 28 29 30 1.2 1.5 1.7 10.9
IIFL Wealth ADD 996 1,100 10 87 1.2 88 34.7 45.1 60.7 46 29.7 34.6 29 22 16.4 — — — 3.0 2.9 2.6 10.4 13.4 17.0 5.0 2.9 3.0 0.8
L&T Finance Holdings ADD 87 90 4 174 2.4 2,005 4 9 13 (55.7) 136 49.6 23 9.8 6.5 — — — 1.1 1.0 0.9 5.1 11.2 14.9 1.7 1.9 1.9 14.9
LIC Housing Finance ADD 343 400 17 173 2.3 505 55.3 73.8 85.9 16 33.4 16.5 6.2 4.7 4.0 — — — 1.0 0.9 0.7 14.5 17.0 17.2 2.7 3.6 4.2 26
Mahindra & Mahindra Financial BUY 165 160 (3) 204 2.8 1,232 8.3 17.2 20.7 (44) 107.0 20.9 20.0 9.6 8.0 — — — 1.5 1.4 1.2 7.7 13.1 14.3 0.8 2.1 2.5 19.8
Muthoot Finance REDUCE 1,156 1,150 (0) 464 6.3 401 83 94 104 11.3 12 11.0 13.9 12.3 11.1 — — — 3.3 2.7 2.3 26 24 22 1.4 1.6 1.8 39
Shriram City Union Finance BUY 1,083 1,400 29 71 1.0 66 138 179 200 (9.0) 30 11.7 7.9 6.0 5.4 — — — 1.0 0.8 0.8 12.0 13.9 13.8 1.6 2.5 2.8 0.5
Shriram Transport BUY 1,030 1,100 7 261 3.5 253 74.5 113.9 149.1 (32) 53.0 30.9 13.8 9.0 6.9 — — — 1.3 1.2 1.0 9.6 12.9 15.0 1.1 1.7 2.2 53
Diversified Financials Attractive 10,752 145.7 (16.5) 37.9 20.0 31 23 18.9 3.6 3.2 2.9 11.6 14.2 15.6 0.7 0.9 1.0 705
P/B (X) RoE (%) Dividend yield (%)
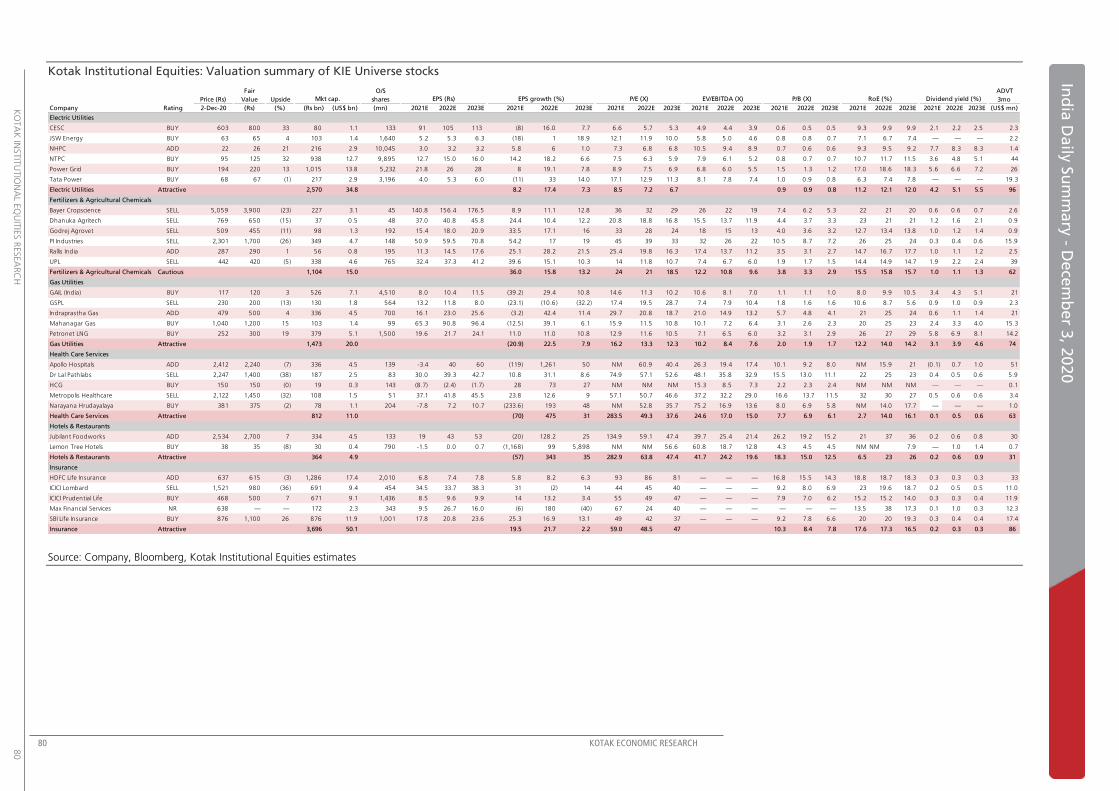
80 KOTAK ECONOMIC RESEARCH
K
OTA
K IN
STIT
UTIO
NA
L EQ
UIT
IES R
ESEA
RC
H
80
Ind
ia D
aily
Su
mm
ary
- Dece
mb
er 3
, 20
20
Kotak Institutional Equities: Valuation summary of KIE Universe stocks
Source: Company, Bloomberg, Kotak Institutional Equities estimates
Fair O/S ADVT
Price (Rs) Value Upside shares 3mo
Company Rating 2-Dec-20 (Rs) (%) (Rs bn) (US$ bn) (mn) 2021E 2022E 2023E 2021E 2022E 2023E 2021E 2022E 2023E 2021E 2022E 2023E 2021E 2022E 2023E 2021E 2022E 2023E 2021E 2022E 2023E (US$ mn)
Electric Utilities
CESC BUY 603 800 33 80 1.1 133 91 105 113 (8) 16.0 7.7 6.6 5.7 5.3 4.9 4.4 3.9 0.6 0.5 0.5 9.3 9.9 9.9 2.1 2.2 2.5 2.3
JSW Energy BUY 63 65 4 103 1.4 1,640 5.2 5.3 6.3 (18) 1 18.9 12.1 11.9 10.0 5.8 5.0 4.6 0.8 0.8 0.7 7.1 6.7 7.4 — — — 2.2
NHPC ADD 22 26 21 216 2.9 10,045 3.0 3.2 3.2 5.8 6 1.0 7.3 6.8 6.8 10.5 9.4 8.9 0.7 0.6 0.6 9.3 9.5 9.2 7.7 8.3 8.3 1.4
NTPC BUY 95 125 32 938 12.7 9,895 12.7 15.0 16.0 14.2 18.2 6.6 7.5 6.3 5.9 7.9 6.1 5.2 0.8 0.7 0.7 10.7 11.7 11.5 3.6 4.8 5.1 44
Power Grid BUY 194 220 13 1,015 13.8 5,232 21.8 26 28 8 19.1 7.8 8.9 7.5 6.9 6.8 6.0 5.5 1.5 1.3 1.2 17.0 18.6 18.3 5.6 6.6 7.2 26
Tata Power BUY 68 67 (1) 217 2.9 3,196 4.0 5.3 6.0 (11) 33 14.0 17.1 12.9 11.3 8.1 7.8 7.4 1.0 0.9 0.8 6.3 7.4 7.8 — — — 19.3
Electric Utilities Attractive 2,570 34.8 8.2 17.4 7.3 8.5 7.2 6.7 0.9 0.9 0.8 11.2 12.1 12.0 4.2 5.1 5.5 96
Fertilizers & Agricultural Chemicals
Bayer Cropscience SELL 5,059 3,900 (23) 227 3.1 45 140.8 156.4 176.5 8.9 11.1 12.8 36 32 29 26 22 19 7.4 6.2 5.3 22 21 20 0.6 0.6 0.7 2.6
Dhanuka Agritech SELL 769 650 (15) 37 0.5 48 37.0 40.8 45.8 24.4 10.4 12.2 20.8 18.8 16.8 15.5 13.7 11.9 4.4 3.7 3.3 23 21 21 1.2 1.6 2.1 0.9
Godrej Agrovet SELL 509 455 (11) 98 1.3 192 15.4 18.0 20.9 33.5 17.1 16 33 28 24 18 15 13 4.0 3.6 3.2 12.7 13.4 13.8 1.0 1.2 1.4 0.9
PI Industries SELL 2,301 1,700 (26) 349 4.7 148 50.9 59.5 70.8 54.2 17 19 45 39 33 32 26 22 10.5 8.7 7.2 26 25 24 0.3 0.4 0.6 15.9
Rallis India ADD 287 290 1 56 0.8 195 11.3 14.5 17.6 25.1 28.2 21.5 25.4 19.8 16.3 17.4 13.7 11.2 3.5 3.1 2.7 14.7 16.7 17.7 1.0 1.1 1.2 2.5
UPL SELL 442 420 (5) 338 4.6 765 32.4 37.3 41.2 39.6 15.1 10.3 14 11.8 10.7 7.4 6.7 6.0 1.9 1.7 1.5 14.4 14.9 14.7 1.9 2.2 2.4 39
Fertilizers & Agricultural Chemicals Cautious 1,104 15.0 36.0 15.8 13.2 24 21 18.5 12.2 10.8 9.6 3.8 3.3 2.9 15.5 15.8 15.7 1.0 1.1 1.3 62
Gas Utilities
GAIL (India) BUY 117 120 3 526 7.1 4,510 8.0 10.4 11.5 (39.2) 29.4 10.8 14.6 11.3 10.2 10.6 8.1 7.0 1.1 1.1 1.0 8.0 9.9 10.5 3.4 4.3 5.1 21
GSPL SELL 230 200 (13) 130 1.8 564 13.2 11.8 8.0 (23.1) (10.6) (32.2) 17.4 19.5 28.7 7.4 7.9 10.4 1.8 1.6 1.6 10.6 8.7 5.6 0.9 1.0 0.9 2.3
Indraprastha Gas ADD 479 500 4 336 4.5 700 16.1 23.0 25.6 (3.2) 42.4 11.4 29.7 20.8 18.7 21.0 14.9 13.2 5.7 4.8 4.1 21 25 24 0.6 1.1 1.4 21
Mahanagar Gas BUY 1,040 1,200 15 103 1.4 99 65.3 90.8 96.4 (12.5) 39.1 6.1 15.9 11.5 10.8 10.1 7.2 6.4 3.1 2.6 2.3 20 25 23 2.4 3.3 4.0 15.3
Petronet LNG BUY 252 300 19 379 5.1 1,500 19.6 21.7 24.1 11.0 11.0 10.8 12.9 11.6 10.5 7.1 6.5 6.0 3.2 3.1 2.9 26 27 29 5.8 6.9 8.1 14.2
Gas Utilities Attractive 1,473 20.0 (20.9) 22.5 7.9 16.2 13.3 12.3 10.2 8.4 7.6 2.0 1.9 1.7 12.2 14.0 14.2 3.1 3.9 4.6 74
Health Care Services
Apollo Hospitals ADD 2,412 2,240 (7) 336 4.5 139 -3.4 40 60 (119) 1,261 50 NM 60.9 40.4 26.3 19.4 17.4 10.1 9.2 8.0 NM 15.9 21 (0.1) 0.7 1.0 51
Dr Lal Pathlabs SELL 2,247 1,400 (38) 187 2.5 83 30.0 39.3 42.7 10.8 31.1 8.6 74.9 57.1 52.6 48.1 35.8 32.9 15.5 13.0 11.1 22 25 23 0.4 0.5 0.6 5.9
HCG BUY 150 150 (0) 19 0.3 143 (8.7) (2.4) (1.7) 28 73 27 NM NM NM 15.3 8.5 7.3 2.2 2.3 2.4 NM NM NM — — — 0.1
Metropolis Healthcare SELL 2,122 1,450 (32) 108 1.5 51 37.1 41.8 45.5 23.8 12.6 9 57.1 50.7 46.6 37.2 32.2 29.0 16.6 13.7 11.5 32 30 27 0.5 0.6 0.6 3.4
Narayana Hrudayalaya BUY 381 375 (2) 78 1.1 204 -7.8 7.2 10.7 (233.6) 193 48 NM 52.8 35.7 75.2 16.9 13.6 8.0 6.9 5.8 NM 14.0 17.7 — — — 1.0
Health Care Services Attractive 812 11.0 (70) 475 31 283.5 49.3 37.6 24.6 17.0 15.0 7.7 6.9 6.1 2.7 14.0 16.1 0.1 0.5 0.6 63
Hotels & Restaurants
Jubilant Foodworks ADD 2,534 2,700 7 334 4.5 133 19 43 53 (20) 128.2 25 134.9 59.1 47.4 39.7 25.4 21.4 26.2 19.2 15.2 21 37 36 0.2 0.6 0.8 30
Lemon Tree Hotels BUY 38 35 (8) 30 0.4 790 -1.5 0.0 0.7 (1,168) 99 5,898 NM NM 56.6 60.8 18.7 12.8 4.3 4.5 4.5 NM NM 7.9 — 1.0 1.4 0.7
Hotels & Restaurants Attractive 364 4.9 (57) 343 35 282.9 63.8 47.4 41.7 24.2 19.6 18.3 15.0 12.5 6.5 23 26 0.2 0.6 0.9 31
Insurance
HDFC Life Insurance ADD 637 615 (3) 1,286 17.4 2,010 6.8 7.4 7.8 5.8 8.2 6.3 93 86 81 — — — 16.8 15.5 14.3 18.8 18.7 18.3 0.3 0.3 0.3 33
ICICI Lombard SELL 1,521 980 (36) 691 9.4 454 34.5 33.7 38.3 31 (2) 14 44 45 40 — — — 9.2 8.0 6.9 23 19.6 18.7 0.2 0.5 0.5 11.0
ICICI Prudential Life BUY 468 500 7 671 9.1 1,436 8.5 9.6 9.9 14 13.2 3.4 55 49 47 — — — 7.9 7.0 6.2 15.2 15.2 14.0 0.3 0.3 0.4 11.9
Max Financial Services NR 638 — — 172 2.3 343 9.5 26.7 16.0 (6) 180 (40) 67 24 40 — — — — — — 13.5 38 17.3 0.1 1.0 0.3 12.3
SBI Life Insurance BUY 876 1,100 26 876 11.9 1,001 17.8 20.8 23.6 25.3 16.9 13.1 49 42 37 — — — 9.2 7.8 6.6 20 20 19.3 0.3 0.4 0.4 17.4
Insurance Attractive 3,696 50.1 19.5 21.7 2.2 59.0 48.5 47 10.3 8.4 7.8 17.6 17.3 16.5 0.2 0.3 0.3 86
Mkt cap. EPS (Rs) EPS growth (%) P/E (X) EV/EBITDA (X) P/B (X) RoE (%) Dividend yield (%)
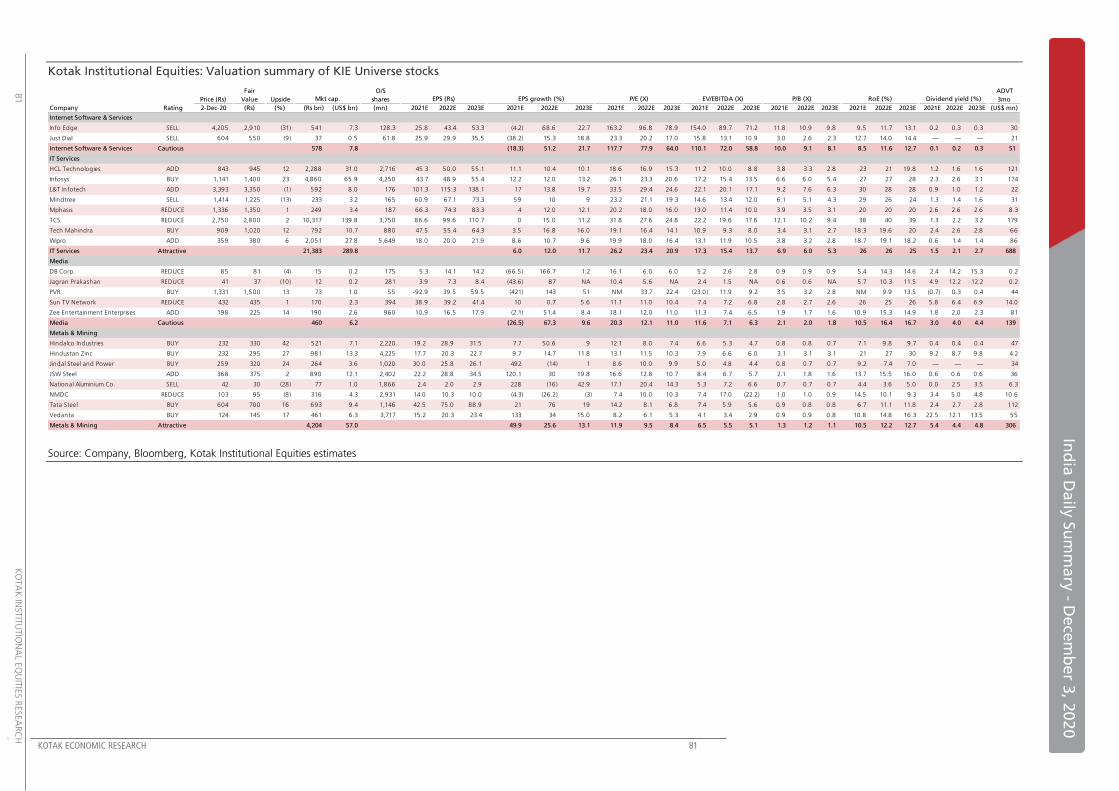
KOTAK ECONOMIC RESEARCH 81
In
dia
Da
ily S
um
ma
ry - D
ece
mb
er 3
, 20
20
81
K
OTA
K IN
STIT
UTIO
NA
L EQ
UIT
IES R
ESEA
RC
H
Kotak Institutional Equities: Valuation summary of KIE Universe stocks
Source: Company, Bloomberg, Kotak Institutional Equities estimates
Fair O/S ADVT
Price (Rs) Value Upside shares 3mo
Company Rating 2-Dec-20 (Rs) (%) (Rs bn) (US$ bn) (mn) 2021E 2022E 2023E 2021E 2022E 2023E 2021E 2022E 2023E 2021E 2022E 2023E 2021E 2022E 2023E 2021E 2022E 2023E 2021E 2022E 2023E (US$ mn)
Internet Software & Services
Info Edge SELL 4,205 2,910 (31) 541 7.3 128.3 25.8 43.4 53.3 (4.2) 68.6 22.7 163.2 96.8 78.9 154.0 89.7 71.2 11.8 10.9 9.8 9.5 11.7 13.1 0.2 0.3 0.3 30
Just Dial SELL 604 550 (9) 37 0.5 61.8 25.9 29.9 35.5 (38.2) 15.3 18.8 23.3 20.2 17.0 15.8 13.1 10.9 3.0 2.6 2.3 12.7 14.0 14.4 — — — 21
Internet Software & Services Cautious 578 7.8 (18.3) 51.2 21.7 117.7 77.9 64.0 110.1 72.0 58.8 10.0 9.1 8.1 8.5 11.6 12.7 0.1 0.2 0.3 51
IT Services
HCL Technologies ADD 843 945 12 2,288 31.0 2,716 45.3 50.0 55.1 11.1 10.4 10.1 18.6 16.9 15.3 11.2 10.0 8.8 3.8 3.3 2.8 23 21 19.8 1.2 1.6 1.6 121
Infosys BUY 1,141 1,400 23 4,860 65.9 4,250 43.7 48.9 55.4 12.2 12.0 13.2 26.1 23.3 20.6 17.2 15.4 13.5 6.6 6.0 5.4 27 27 28 2.3 2.6 3.1 174
L&T Infotech ADD 3,393 3,350 (1) 592 8.0 176 101.3 115.3 138.1 17 13.8 19.7 33.5 29.4 24.6 22.1 20.1 17.1 9.2 7.6 6.3 30 28 28 0.9 1.0 1.2 22
Mindtree SELL 1,414 1,225 (13) 233 3.2 165 60.9 67.1 73.3 59 10 9 23.2 21.1 19.3 14.6 13.4 12.0 6.1 5.1 4.3 29 26 24 1.3 1.4 1.6 31
Mphasis REDUCE 1,336 1,350 1 249 3.4 187 66.3 74.3 83.3 4 12.0 12.1 20.2 18.0 16.0 13.0 11.4 10.0 3.9 3.5 3.1 20 20 20 2.6 2.6 2.6 8.3
TCS REDUCE 2,750 2,800 2 10,317 139.8 3,750 86.6 99.6 110.7 0 15.0 11.2 31.8 27.6 24.8 22.2 19.6 17.6 12.1 10.2 9.4 38 40 39 1.3 2.2 3.2 179
Tech Mahindra BUY 909 1,020 12 792 10.7 880 47.5 55.4 64.3 3.5 16.8 16.0 19.1 16.4 14.1 10.9 9.3 8.0 3.4 3.1 2.7 18.3 19.6 20 2.4 2.6 2.8 66
Wipro ADD 359 380 6 2,051 27.8 5,649 18.0 20.0 21.9 8.6 10.7 9.6 19.9 18.0 16.4 13.1 11.9 10.5 3.8 3.2 2.8 18.7 19.1 18.2 0.6 1.4 1.4 86
IT Services Attractive 21,383 289.8 6.0 12.0 11.7 26.2 23.4 20.9 17.3 15.4 13.7 6.9 6.0 5.3 26 26 25 1.5 2.1 2.7 688
Media
DB Corp. REDUCE 85 81 (4) 15 0.2 175 5.3 14.1 14.2 (66.5) 166.7 1.2 16.1 6.0 6.0 5.2 2.6 2.8 0.9 0.9 0.9 5.4 14.3 14.6 2.4 14.2 15.3 0.2
Jagran Prakashan REDUCE 41 37 (10) 12 0.2 281 3.9 7.3 8.4 (43.6) 87 NA 10.4 5.6 NA 2.4 1.5 NA 0.6 0.6 NA 5.7 10.3 11.5 4.9 12.2 12.2 0.2
PVR BUY 1,331 1,500 13 73 1.0 55 -92.9 39.5 59.5 (421) 143 51 NM 33.7 22.4 (23.0) 11.9 9.2 3.5 3.2 2.8 NM 9.9 13.5 (0.7) 0.3 0.4 44
Sun TV Network REDUCE 432 435 1 170 2.3 394 38.9 39.2 41.4 10 0.7 5.6 11.1 11.0 10.4 7.4 7.2 6.8 2.8 2.7 2.6 26 25 26 5.8 6.4 6.9 14.0
Zee Entertainment Enterprises ADD 198 225 14 190 2.6 960 10.9 16.5 17.9 (2.1) 51.4 8.4 18.1 12.0 11.0 11.3 7.4 6.5 1.9 1.7 1.6 10.9 15.3 14.9 1.8 2.0 2.3 81
Media Cautious 460 6.2 (26.5) 67.3 9.6 20.3 12.1 11.0 11.6 7.1 6.3 2.1 2.0 1.8 10.5 16.4 16.7 3.0 4.0 4.4 139
Metals & Mining
Hindalco Industries BUY 232 330 42 521 7.1 2,220 19.2 28.9 31.5 7.7 50.6 9 12.1 8.0 7.4 6.6 5.3 4.7 0.8 0.8 0.7 7.1 9.8 9.7 0.4 0.4 0.4 47
Hindustan Zinc BUY 232 295 27 981 13.3 4,225 17.7 20.3 22.7 9.7 14.7 11.8 13.1 11.5 10.3 7.9 6.6 6.0 3.1 3.1 3.1 21 27 30 9.2 8.7 9.8 4.2
Jindal Steel and Power BUY 259 320 24 264 3.6 1,020 30.0 25.8 26.1 492 (14) 1 8.6 10.0 9.9 5.0 4.8 4.4 0.8 0.7 0.7 9.2 7.4 7.0 — — — 34
JSW Steel ADD 368 375 2 890 12.1 2,402 22.2 28.8 34.5 120.1 30 19.8 16.6 12.8 10.7 8.4 6.7 5.7 2.1 1.8 1.6 13.7 15.5 16.0 0.6 0.6 0.6 36
National Aluminium Co. SELL 42 30 (28) 77 1.0 1,866 2.4 2.0 2.9 228 (16) 42.9 17.1 20.4 14.3 5.3 7.2 6.6 0.7 0.7 0.7 4.4 3.6 5.0 0.0 2.5 3.5 6.3
NMDC REDUCE 103 95 (8) 316 4.3 2,931 14.0 10.3 10.0 (4.3) (26.2) (3) 7.4 10.0 10.3 7.4 17.0 (22.2) 1.0 1.0 0.9 14.5 10.1 9.3 3.4 5.0 4.8 10.6
Tata Steel BUY 604 700 16 693 9.4 1,146 42.5 75.0 88.9 21 76 19 14.2 8.1 6.8 7.4 5.9 5.6 0.9 0.8 0.8 6.7 11.1 11.8 2.4 2.7 2.8 112
Vedanta BUY 124 145 17 461 6.3 3,717 15.2 20.3 23.4 133 34 15.0 8.2 6.1 5.3 4.1 3.4 2.9 0.9 0.9 0.8 10.8 14.8 16.3 22.5 12.1 13.5 55
Metals & Mining Attractive 4,204 57.0 49.9 25.6 13.1 11.9 9.5 8.4 6.5 5.5 5.1 1.3 1.2 1.1 10.5 12.2 12.7 5.4 4.4 4.8 306
Mkt cap. EPS (Rs) EPS growth (%) P/E (X) EV/EBITDA (X) P/B (X) RoE (%) Dividend yield (%)
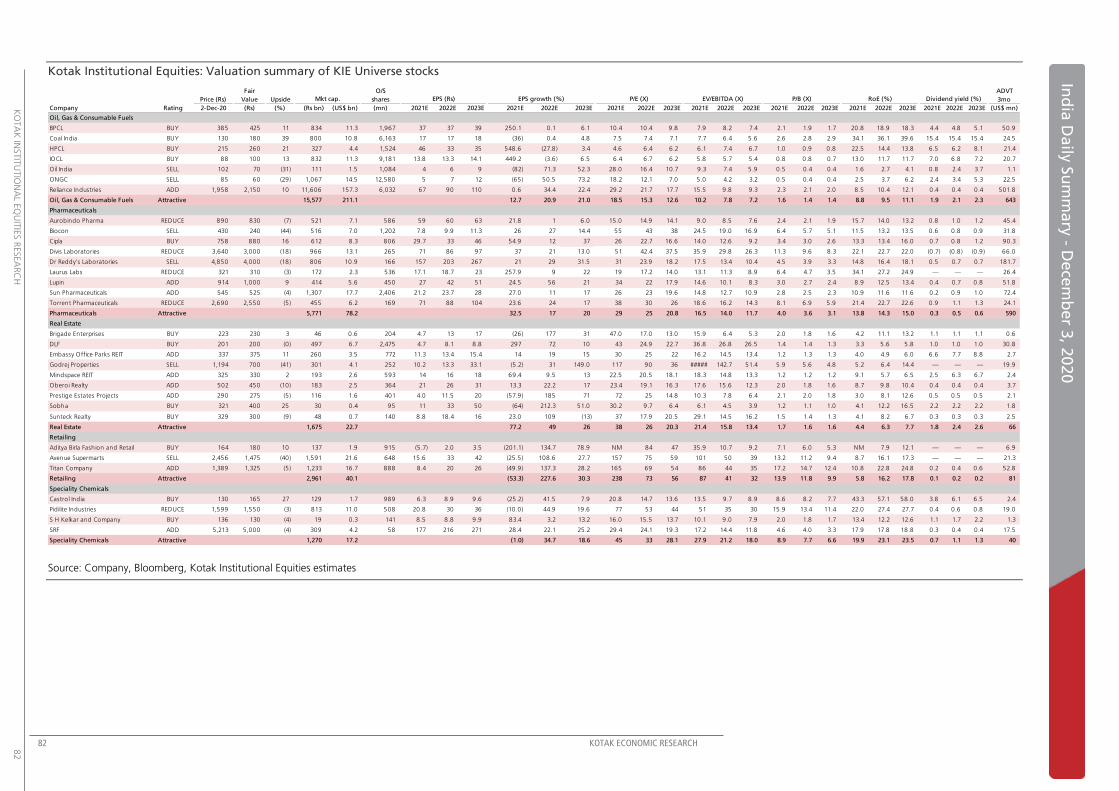
82 KOTAK ECONOMIC RESEARCH
K
OTA
K IN
STIT
UTIO
NA
L EQ
UIT
IES R
ESEA
RC
H
82
Ind
ia D
aily
Su
mm
ary
- Dece
mb
er 3
, 20
20
Kotak Institutional Equities: Valuation summary of KIE Universe stocks
Source: Company, Bloomberg, Kotak Institutional Equities estimates
Fair O/S ADVT
Price (Rs) Value Upside shares 3mo
Company Rating 2-Dec-20 (Rs) (%) (Rs bn) (US$ bn) (mn) 2021E 2022E 2023E 2021E 2022E 2023E 2021E 2022E 2023E 2021E 2022E 2023E 2021E 2022E 2023E 2021E 2022E 2023E 2021E 2022E 2023E (US$ mn)
Oil, Gas & Consumable Fuels
BPCL BUY 385 425 11 834 11.3 1,967 37 37 39 250.1 0.1 6.1 10.4 10.4 9.8 7.9 8.2 7.4 2.1 1.9 1.7 20.8 18.9 18.3 4.4 4.8 5.1 50.9
Coal India BUY 130 180 39 800 10.8 6,163 17 17 18 (36) 0.4 4.8 7.5 7.4 7.1 7.7 6.4 5.6 2.6 2.8 2.9 34.1 36.1 39.6 15.4 15.4 15.4 24.5
HPCL BUY 215 260 21 327 4.4 1,524 46 33 35 548.6 (27.8) 3.4 4.6 6.4 6.2 6.1 7.4 6.7 1.0 0.9 0.8 22.5 14.4 13.8 6.5 6.2 8.1 21.4
IOCL BUY 88 100 13 832 11.3 9,181 13.8 13.3 14.1 449.2 (3.6) 6.5 6.4 6.7 6.2 5.8 5.7 5.4 0.8 0.8 0.7 13.0 11.7 11.7 7.0 6.8 7.2 20.7
Oil India SELL 102 70 (31) 111 1.5 1,084 4 6 9 (82) 71.3 52.3 28.0 16.4 10.7 9.3 7.4 5.9 0.5 0.4 0.4 1.6 2.7 4.1 0.8 2.4 3.7 1.1
ONGC SELL 85 60 (29) 1,067 14.5 12,580 5 7 12 (65) 50.5 73.2 18.2 12.1 7.0 5.0 4.2 3.2 0.5 0.4 0.4 2.5 3.7 6.2 2.4 3.4 5.3 22.5
Reliance Industries ADD 1,958 2,150 10 11,606 157.3 6,032 67 90 110 0.6 34.4 22.4 29.2 21.7 17.7 15.5 9.8 9.3 2.3 2.1 2.0 8.5 10.4 12.1 0.4 0.4 0.4 501.8
Oil, Gas & Consumable Fuels Attractive 15,577 211.1 12.7 20.9 21.0 18.5 15.3 12.6 10.2 7.8 7.2 1.6 1.4 1.4 8.8 9.5 11.1 1.9 2.1 2.3 643
Pharmaceuticals
Aurobindo Pharma REDUCE 890 830 (7) 521 7.1 586 59 60 63 21.8 1 6.0 15.0 14.9 14.1 9.0 8.5 7.6 2.4 2.1 1.9 15.7 14.0 13.2 0.8 1.0 1.2 45.4
Biocon SELL 430 240 (44) 516 7.0 1,202 7.8 9.9 11.3 26 27 14.4 55 43 38 24.5 19.0 16.9 6.4 5.7 5.1 11.5 13.2 13.5 0.6 0.8 0.9 31.8
Cipla BUY 758 880 16 612 8.3 806 29.7 33 46 54.9 12 37 26 22.7 16.6 14.0 12.6 9.2 3.4 3.0 2.6 13.3 13.4 16.0 0.7 0.8 1.2 90.3
Divis Laboratories REDUCE 3,640 3,000 (18) 966 13.1 265 71 86 97 37 21 13.0 51 42.4 37.5 35.9 29.8 26.3 11.3 9.6 8.3 22.1 22.7 22.0 (0.7) (0.8) (0.9) 66.0
Dr Reddy's Laboratories SELL 4,850 4,000 (18) 806 10.9 166 157 203 267 21 29 31.5 31 23.9 18.2 17.5 13.4 10.4 4.5 3.9 3.3 14.8 16.4 18.1 0.5 0.7 0.7 181.7
Laurus Labs REDUCE 321 310 (3) 172 2.3 536 17.1 18.7 23 257.9 9 22 19 17.2 14.0 13.1 11.3 8.9 6.4 4.7 3.5 34.1 27.2 24.9 — — — 26.4
Lupin ADD 914 1,000 9 414 5.6 450 27 42 51 24.5 56 21 34 22 17.9 14.6 10.1 8.3 3.0 2.7 2.4 8.9 12.5 13.4 0.4 0.7 0.8 51.8
Sun Pharmaceuticals ADD 545 525 (4) 1,307 17.7 2,406 21.2 23.7 28 27.0 11 17 26 23 19.6 14.8 12.7 10.9 2.8 2.5 2.3 10.9 11.6 11.6 0.2 0.9 1.0 72.4
Torrent Pharmaceuticals REDUCE 2,690 2,550 (5) 455 6.2 169 71 88 104 23.6 24 17 38 30 26 18.6 16.2 14.3 8.1 6.9 5.9 21.4 22.7 22.6 0.9 1.1 1.3 24.1
Pharmaceuticals Attractive 5,771 78.2 32.5 17 20 29 25 20.8 16.5 14.0 11.7 4.0 3.6 3.1 13.8 14.3 15.0 0.3 0.5 0.6 590
Real Estate
Brigade Enterprises BUY 223 230 3 46 0.6 204 4.7 13 17 (26) 177 31 47.0 17.0 13.0 15.9 6.4 5.3 2.0 1.8 1.6 4.2 11.1 13.2 1.1 1.1 1.1 0.6
DLF BUY 201 200 (0) 497 6.7 2,475 4.7 8.1 8.8 297 72 10 43 24.9 22.7 36.8 26.8 26.5 1.4 1.4 1.3 3.3 5.6 5.8 1.0 1.0 1.0 30.8
Embassy Office Parks REIT ADD 337 375 11 260 3.5 772 11.3 13.4 15.4 14 19 15 30 25 22 16.2 14.5 13.4 1.2 1.3 1.3 4.0 4.9 6.0 6.6 7.7 8.8 2.7
Godrej Properties SELL 1,194 700 (41) 301 4.1 252 10.2 13.3 33.1 (5.2) 31 149.0 117 90 36 ##### 142.7 51.4 5.9 5.6 4.8 5.2 6.4 14.4 — — — 19.9
Mindspace REIT ADD 325 330 2 193 2.6 593 14 16 18 69.4 9.5 13 22.5 20.5 18.1 18.3 14.8 13.3 1.2 1.2 1.2 9.1 5.7 6.5 2.5 6.3 6.7 2.4
Oberoi Realty ADD 502 450 (10) 183 2.5 364 21 26 31 13.3 22.2 17 23.4 19.1 16.3 17.6 15.6 12.3 2.0 1.8 1.6 8.7 9.8 10.4 0.4 0.4 0.4 3.7
Prestige Estates Projects ADD 290 275 (5) 116 1.6 401 4.0 11.5 20 (57.9) 185 71 72 25 14.8 10.3 7.8 6.4 2.1 2.0 1.8 3.0 8.1 12.6 0.5 0.5 0.5 2.1
Sobha BUY 321 400 25 30 0.4 95 11 33 50 (64) 212.3 51.0 30.2 9.7 6.4 6.1 4.5 3.9 1.2 1.1 1.0 4.1 12.2 16.5 2.2 2.2 2.2 1.8
Sunteck Realty BUY 329 300 (9) 48 0.7 140 8.8 18.4 16 23.0 109 (13) 37 17.9 20.5 29.1 14.5 16.2 1.5 1.4 1.3 4.1 8.2 6.7 0.3 0.3 0.3 2.5
Real Estate Attractive 1,675 22.7 77.2 49 26 38 26 20.3 21.4 15.8 13.4 1.7 1.6 1.6 4.4 6.3 7.7 1.8 2.4 2.6 66
Retailing
Aditya Birla Fashion and Retail BUY 164 180 10 137 1.9 915 (5.7) 2.0 3.5 (201.1) 134.7 78.9 NM 84 47 35.9 10.7 9.2 7.1 6.0 5.3 NM 7.9 12.1 — — — 6.9
Avenue Supermarts SELL 2,456 1,475 (40) 1,591 21.6 648 15.6 33 42 (25.5) 108.6 27.7 157 75 59 101 50 39 13.2 11.2 9.4 8.7 16.1 17.3 — — — 21.3
Titan Company ADD 1,389 1,325 (5) 1,233 16.7 888 8.4 20 26 (49.9) 137.3 28.2 165 69 54 86 44 35 17.2 14.7 12.4 10.8 22.8 24.8 0.2 0.4 0.6 52.8
Retailing Attractive 2,961 40.1 (53.3) 227.6 30.3 238 73 56 87 41 32 13.9 11.8 9.9 5.8 16.2 17.8 0.1 0.2 0.2 81
Speciality Chemicals
Castrol India BUY 130 165 27 129 1.7 989 6.3 8.9 9.6 (25.2) 41.5 7.9 20.8 14.7 13.6 13.5 9.7 8.9 8.6 8.2 7.7 43.3 57.1 58.0 3.8 6.1 6.5 2.4
Pidilite Industries REDUCE 1,599 1,550 (3) 813 11.0 508 20.8 30 36 (10.0) 44.9 19.6 77 53 44 51 35 30 15.9 13.4 11.4 22.0 27.4 27.7 0.4 0.6 0.8 19.0
S H Kelkar and Company BUY 136 130 (4) 19 0.3 141 8.5 8.8 9.9 83.4 3.2 13.2 16.0 15.5 13.7 10.1 9.0 7.9 2.0 1.8 1.7 13.4 12.2 12.6 1.1 1.7 2.2 1.3
SRF ADD 5,213 5,000 (4) 309 4.2 58 177 216 271 28.4 22.1 25.2 29.4 24.1 19.3 17.2 14.4 11.8 4.6 4.0 3.3 17.9 17.8 18.8 0.3 0.4 0.4 17.5
Speciality Chemicals Attractive 1,270 17.2 (1.0) 34.7 18.6 45 33 28.1 27.9 21.2 18.0 8.9 7.7 6.6 19.9 23.1 23.5 0.7 1.1 1.3 40
Mkt cap. EPS (Rs) EPS growth (%) P/E (X) EV/EBITDA (X) P/B (X) RoE (%) Dividend yield (%)
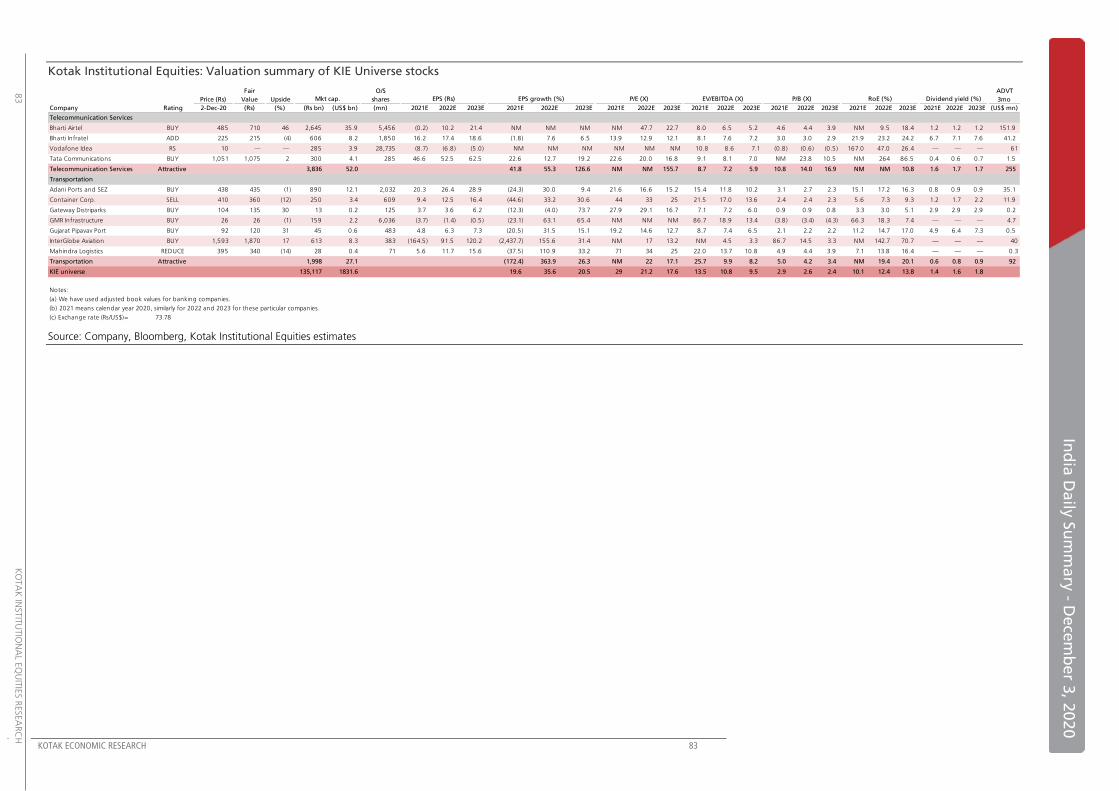
KOTAK ECONOMIC RESEARCH 83
In
dia
Da
ily S
um
ma
ry - D
ece
mb
er 3
, 20
20
83
K
OTA
K IN
STIT
UTIO
NA
L EQ
UIT
IES R
ESEA
RC
H
Kotak Institutional Equities: Valuation summary of KIE Universe stocks
Source: Company, Bloomberg, Kotak Institutional Equities estimates
Fair O/S ADVT
Price (Rs) Value Upside shares 3mo
Company Rating 2-Dec-20 (Rs) (%) (Rs bn) (US$ bn) (mn) 2021E 2022E 2023E 2021E 2022E 2023E 2021E 2022E 2023E 2021E 2022E 2023E 2021E 2022E 2023E 2021E 2022E 2023E 2021E 2022E 2023E (US$ mn)
Telecommunication Services
Bharti Airtel BUY 485 710 46 2,645 35.9 5,456 (0.2) 10.2 21.4 NM NM NM NM 47.7 22.7 8.0 6.5 5.2 4.6 4.4 3.9 NM 9.5 18.4 1.2 1.2 1.2 151.9
Bharti Infratel ADD 225 215 (4) 606 8.2 1,850 16.2 17.4 18.6 (1.8) 7.6 6.5 13.9 12.9 12.1 8.1 7.6 7.2 3.0 3.0 2.9 21.9 23.2 24.2 6.7 7.1 7.6 41.2
Vodafone Idea RS 10 — — 285 3.9 28,735 (8.7) (6.8) (5.0) NM NM NM NM NM NM 10.8 8.6 7.1 (0.8) (0.6) (0.5) 167.0 47.0 26.4 — — — 61
Tata Communications BUY 1,051 1,075 2 300 4.1 285 46.6 52.5 62.5 22.6 12.7 19.2 22.6 20.0 16.8 9.1 8.1 7.0 NM 23.8 10.5 NM 264 86.5 0.4 0.6 0.7 1.5
Telecommunication Services Attractive 3,836 52.0 41.8 55.3 126.6 NM NM 155.7 8.7 7.2 5.9 10.8 14.0 16.9 NM NM 10.8 1.6 1.7 1.7 255
Transportation
Adani Ports and SEZ BUY 438 435 (1) 890 12.1 2,032 20.3 26.4 28.9 (24.3) 30.0 9.4 21.6 16.6 15.2 15.4 11.8 10.2 3.1 2.7 2.3 15.1 17.2 16.3 0.8 0.9 0.9 35.1
Container Corp. SELL 410 360 (12) 250 3.4 609 9.4 12.5 16.4 (44.6) 33.2 30.6 44 33 25 21.5 17.0 13.6 2.4 2.4 2.3 5.6 7.3 9.3 1.2 1.7 2.2 11.9
Gateway Distriparks BUY 104 135 30 13 0.2 125 3.7 3.6 6.2 (12.3) (4.0) 73.7 27.9 29.1 16.7 7.1 7.2 6.0 0.9 0.9 0.8 3.3 3.0 5.1 2.9 2.9 2.9 0.2
GMR Infrastructure BUY 26 26 (1) 159 2.2 6,036 (3.7) (1.4) (0.5) (23.1) 63.1 65.4 NM NM NM 86.7 18.9 13.4 (3.8) (3.4) (4.3) 66.3 18.3 7.4 — — — 4.7
Gujarat Pipavav Port BUY 92 120 31 45 0.6 483 4.8 6.3 7.3 (20.5) 31.5 15.1 19.2 14.6 12.7 8.7 7.4 6.5 2.1 2.2 2.2 11.2 14.7 17.0 4.9 6.4 7.3 0.5
InterGlobe Aviation BUY 1,593 1,870 17 613 8.3 383 (164.5) 91.5 120.2 (2,437.7) 155.6 31.4 NM 17 13.2 NM 4.5 3.3 86.7 14.5 3.3 NM 142.7 70.7 — — — 40
Mahindra Logistics REDUCE 395 340 (14) 28 0.4 71 5.6 11.7 15.6 (37.5) 110.9 33.2 71 34 25 22.0 13.7 10.8 4.9 4.4 3.9 7.1 13.8 16.4 — — — 0.3
Transportation Attractive 1,998 27.1 (172.4) 363.9 26.3 NM 22 17.1 25.7 9.9 8.2 5.0 4.2 3.4 NM 19.4 20.1 0.6 0.8 0.9 92
KIE universe 135,117 1831.6 19.6 35.6 20.5 29 21.2 17.6 13.5 10.8 9.5 2.9 2.6 2.4 10.1 12.4 13.8 1.4 1.6 1.8
Notes:
(a) We have used adjusted book values for banking companies.
(b) 2021 means calendar year 2020, similarly for 2022 and 2023 for these particular companies.
(c) Exchange rate (Rs/US$)= 73.78
Mkt cap. EPS (Rs) EPS growth (%) P/E (X) EV/EBITDA (X) P/B (X) RoE (%) Dividend yield (%)
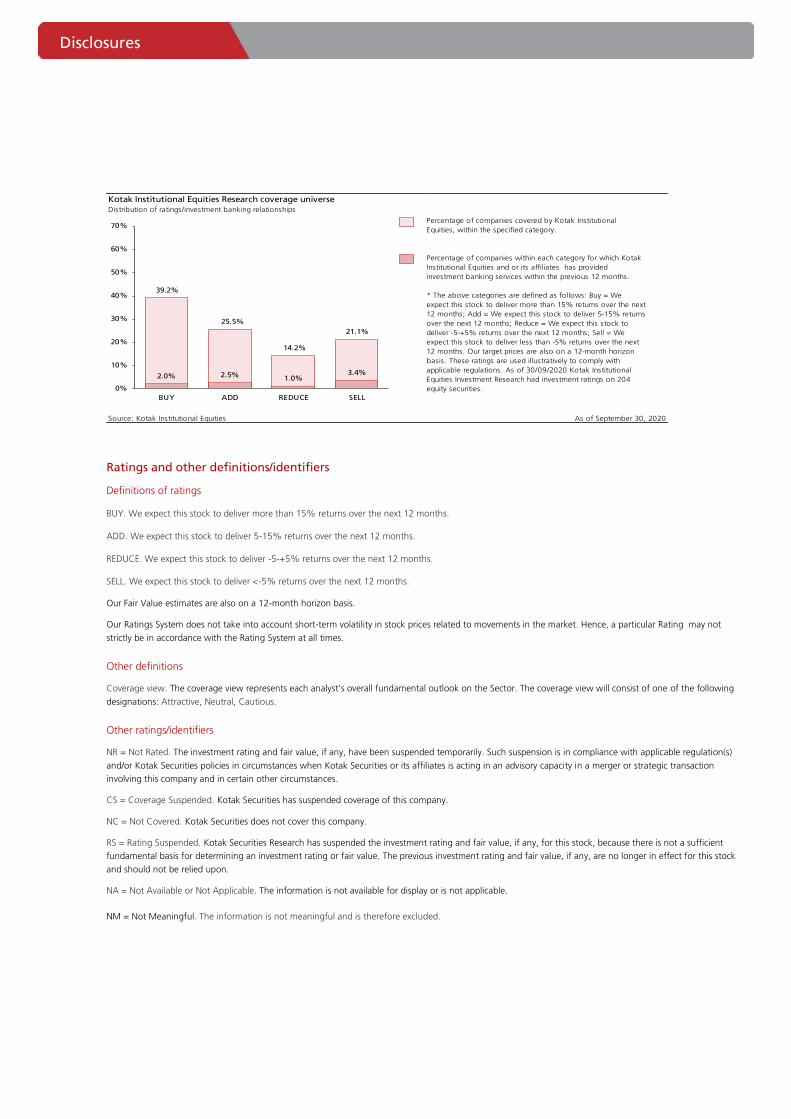
Disclo
sure
s
Disclosures
Ratings and other definitions/identifiers
Definitions of ratings
BUY. We expect this stock to deliver more than 15% returns over the next 12 months.
ADD. We expect this stock to deliver 5-15% returns over the next 12 months.
REDUCE. We expect this stock to deliver -5-+5% returns over the next 12 months.
SELL. We expect this stock to deliver <-5% returns over the next 12 months.
Our Fair Value estimates are also on a 12-month horizon basis.
Our Ratings System does not take into account short-term volatility in stock prices related to movements in the market. Hence, a particular Rating may not
strictly be in accordance with the Rating System at all times.
Other definitions
Coverage view. The coverage view represents each analyst’s overall fundamental outlook on the Sector. The coverage view will consist of one of the following
designations: Attractive, Neutral, Cautious.
Other ratings/identifiers
NR = Not Rated. The investment rating and fair value, if any, have been suspended temporarily. Such suspension is in compliance with applicable regulation(s)
and/or Kotak Securities policies in circumstances when Kotak Securities or its affiliates is acting in an advisory capacity in a merger or strategic transaction
involving this company and in certain other circumstances.
CS = Coverage Suspended. Kotak Securities has suspended coverage of this company.
NC = Not Covered. Kotak Securities does not cover this company.
RS = Rating Suspended. Kotak Securities Research has suspended the investment rating and fair value, if any, for this stock, because there is not a sufficient
fundamental basis for determining an investment rating or fair value. The previous investment rating and fair value, if any, are no longer in effect for this stock
and should not be relied upon.
NA = Not Available or Not Applicable. The information is not available for display or is not applicable.
NM = Not Meaningful. The information is not meaningful and is therefore excluded.
Kotak Institutional Equities Research coverage universeDistribution of ratings/investment banking relationships
Source: Kotak Institutional Equities As of September 30, 2020
Percentage of companies covered by Kotak Institutional
Equities, within the specified category.
* The above categories are defined as follows: Buy = We
expect this stock to deliver more than 15% returns over the next
12 months; Add = We expect this stock to deliver 5-15% returns
over the next 12 months; Reduce = We expect this stock to
deliver -5-+5% returns over the next 12 months; Sell = We
expect this stock to deliver less than -5% returns over the next
12 months. Our target prices are also on a 12-month horizon
basis. These ratings are used illustratively to comply with
applicable regulations. As of 30/09/2020 Kotak Institutional
Equities Investment Research had investment ratings on 204
equity securities.
Percentage of companies within each category for which Kotak
Institutional Equities and or its affiliates has provided
investment banking services within the previous 12 months.
39.2%
25.5%
14.2%
21.1%
2.0% 2.5% 1.0%3.4%
0%
10%
20%
30%
40%
50%
60%
70%
BUY ADD REDUCE SELL
Corporate Office Overseas Affiliates
Kotak Securities Ltd.
27 BKC, Plot No. C-27, “G Block”
Bandra Kurla Complex, Bandra (E)
Mumbai 400 051, India
Tel: +91-22-43360000
Kotak Mahindra (UK) Ltd
8th Floor, Portsoken House
155-157 Minories
London EC3N 1LS
Tel: +44-20-7977-6900
Kotak Mahindra Inc
369 Lexington Avenue
28th Floor, New York
NY 10017, USA
Tel:+1 212 600 8856
Copyright 2020 Kotak Institutional Equities (Kotak Securities Limited). All rights reserved. 1. Note that the research analysts contributing to this report may not be registered/qualified as research analysts with FINRA; and
2. Such research analysts may not be associated persons of Kotak Mahindra Inc and therefore, may not be subject to NASD Rule 2711 restrictions on communications with a subject company, public appearances and trading securities held by a research analyst account.
3. Any U.S. recipients of the research who wish to effect transactions in any security covered by the report should do so with or through Kotak Mahindra Inc and (ii) any transactions in the securities covered by the research by U.S. recipients must be effected only through Kotak Mahindra Inc at [email protected].
This report is distributed in Singapore by Kotak Mahindra (UK) Limited (Singapore Branch) to institutional investors, accredited investors or expert investors only as defined under the Securities and Futures Act. Recipients of this analysis / report are to contact Kotak Mahindra (UK) Limited (Singapore Branch) (16 Raffles Quay, #35-02/03, Hong Leong Building, Singapore 048581) in respect of any matters arising from, or in connection with, this analysis / report. Kotak Mahindra (UK) Limited (Singapore Branch) is regulated by the Monetary Authority of Singapore. Kotak Securities Limited and its affiliates are a full-service, integrated investment banking, investment management, brokerage and financing group. We along with our affiliates are leading underwriter of securities and participants in virtually all securities trading markets in India. We and our affiliates have investment banking and other business relationships with a significant percentage of the companies covered by our Investment Research Department. Our research professionals provide important input into our investment banking and other business selection processes. Investors should assume that Kotak Securities Limited and/or its affiliates are seeking or will seek investment banking or other business from the company or companies that are the subject of this material and that the research professionals who were involved in preparing this material may participate in the solicitation of such business. Our research professionals are paid in part based on the profitability of Kotak Securities Limited, which include earnings from investment banking and other business. Kotak Securities Limited generally prohibits its analysts, persons reporting to analysts, and members of their households from maintaining a financial interest in the securities or derivatives of any companies that the analysts cover. Additionally, Kotak Securities Limited generally prohibits its analysts and persons reporting to analysts from serving as an officer, director, or advisory board member of any companies that the analysts cover. Our salespeople, traders, and other professionals may provide oral or written market commentary or trading strategies to our clients that reflect opinions that are contrary to the opinions expressed herein, and our proprietary trading and investing businesses may make investment decisions that are inconsistent with the recommendations expressed herein. In reviewing these materials, you should be aware that any or all of the foregoing, among other things, may give rise to real or potential conflicts of interest. Additionally, other important information regarding our relationships with the company or companies that are the subject of this material is provided herein. This material should not be construed as an offer to sell or the solicitation of an offer to buy any security in any jurisdiction where such an offer or solicitation would be illegal. We are not soliciting any action based on this material. It is for the general information of clients of Kotak Securities Limited. It does not constitute a personal recommendation or take into account the particular investment objectives, financial situations, or needs of individual clients. Before acting on any advice or recommendation in this material, clients should consider whether it is suitable for their particular circumstances and, if necessary, seek professional advice. The price and value of the investments referred to in this material and the income from them may go down as well as up, and investors may realize losses on any investments. Past performance is not a guide for future performance, future returns are not guaranteed and a loss of original capital may occur. Kotak Securities Limited does not provide tax advise to its clients, and all investors are strongly advised to consult with their tax advisers regarding any potential investment. Certain transactions -including those involving futures, options, and other derivatives as well as non-investment-grade securities - give rise to substantial risk and are not suitable for all investors. The material is based on information that we consider reliable, but we do not represent that it is accurate or complete, and it should not be relied on as such. Opinions expressed are our current opinions as of the date appearing on this material only. We endeavor to update on a reasonable basis the information discussed in this material, but regulatory, compliance, or other reasons may prevent us from doing so. We and our affiliates, officers, directors, and employees, including persons involved in the preparation or issuance of this material, may from time to time have "long" or "short" positions in, act as principal in, and buy or sell the securities or derivatives thereof of companies mentioned herein. Kotak Securities Limited and its non US affiliates may, to the extent permissible under applicable laws, have acted on or used this research to the extent that it relates to non US issuers, prior to or immediately following its publication. Foreign currency denominated securities are subject to fluctuations in exchange rates that could have an adverse effect on the value or price of or income derived from the investment. In addition, investors in securities such as ADRs, the value of which are influenced by foreign currencies affectively assume currency risk. In addition options involve risks and are not suitable for all investors. Please ensure that you have read and understood the current derivatives risk disclosure document before entering into any derivative transactions. Kotak Securities Limited established in 1994, is a subsidiary of Kotak Mahindra Bank Limited. Kotak Securities is one of India's largest brokerage and distribution house. Kotak Securities Limited is a corporate trading and clearing member of Bombay Stock Exchange Limited (BSE), National Stock Exchange of India Limited (NSE), Metropolitan Stock Exchange of India Limited (MSE), National Commodity and Derivatives Exchange (NCDEX) and Multi Commodity Exchange(MCX). Our businesses include stock broking, services rendered in connection with distribution of primary market issues and financial products like mutual funds and fixed deposits, depository services and Portfolio Management. Kotak Securities Limited is also a depository participant with National Securities Depository Limited (NSDL) and Central Depository Services (India) Limited (CDSL). Kotak Securities Limited is also registered with Insurance Regulatory and Development Authority as Corporate Agent for Kotak Mahindra Old Mutual Life Insurance Limited and is also a Mutual Fund Advisor registered with Association of Mutual Funds in India (AMFI). Kotak Securities Limited is registered as a Research Analyst under SEBI (Research Analyst) Regulations, 2014. We hereby declare that our activities were neither suspended nor we have defaulted with any stock exchange authority with whom we are registered in last five years. However SEBI, Exchanges and Depositories have conducted the routine inspection and based on their observations have issued advise letters or levied minor penalty on KSL for certain operational deviations. We have not been debarred from doing business by any Stock Exchange / SEBI or any other authorities; nor has our certificate of registration been cancelled by SEBI at any point of time. We offer our research services to primarily institutional investors and their employees, directors, fund managers, advisors who are registered with us Details of Associates are available on website i.e. www.kotak.com Research Analyst has served as an officer, director or employee of subject company(ies): No We or our associates may have received compensation from the subject company(ies) in the past 12 months. We or our associates have managed or co-managed public offering of securities for the subject company(ies) in the past 12 months. YES. Visit our website for more details We or our associates may have received compensation for investment banking or merchant banking or brokerage services from the subject company(ies) in the past 12 months. We or our associates may have received any compensation for products or services other than investment banking or merchant banking or brokerage services from the subject company(ies) in the past 12 months. We or our associates may have received compensation or other benefits from the subject company(ies) or third party in connection with the research report. Our associates may have financial interest in the subject company(ies). Research Analyst or his/her relative's financial interest in the subject company(ies): No Kotak Securities Limited has financial interest in the subject company(ies) at the end of the month immediately preceding the date of publication of Research Report: YES Nature of Financial interest: Holding equity shares or derivatives of the subject company. Our associates may have actual/beneficial ownership of 1% or more securities of the subject company(ies) at the end of the month immediately preceding the date of publication of Research Report. Research Analyst or his/her relatives has actual/beneficial ownership of 1% or more securities of the subject company(ies) at the end of the month immediately preceding the date of publication of Research Report: No Kotak Securities Limited has actual/beneficial ownership of 1% or more securities of the subject company(ies) at the end of the month immediately preceding the date of publication of Research Report: No Subject company(ies) may have been client during twelve months preceding the date of distribution of the research report. A graph of daily closing prices of securities is available at https://www.moneycontrol.com/india/stockpricequote/ and http://economictimes.indiatimes.com/markets/stocks/stock-quotes. (Choose a company from the list on the browser and select the"three years" icon in the price chart).
Kotak Securities Limited. Registered Office: 27 BKC, C 27, G Block, Bandra Kurla Complex, Bandra (E), Mumbai 400051. CIN: U99999MH1994PLC134051, Telephone No.: +22 43360000, Fax No.: +22 67132430. Website: www.kotak.com / www.kotaksecurities.com. Correspondence Address: Infinity IT Park, Bldg. No 21, Opp. Film City Road, A K Vaidya Marg, Malad (East), Mumbai 400097. Telephone No: 42856825. SEBI Registration No. INZ000200137(Member of NSE, BSE, MSE, MCX & NCDEX). Member Id: NSE-08081; BSE-673; MSE-1024; MCX-56285; NCDEX-1262. AMFI ARN 0164, PMS INP000000258 and Research Analyst INH000000586. NSDL/CDSL: IN-DP-NSDL-23-97. Compliance Officer Details: Mr. Manoj Agarwal. Call: 022 - 4285 8484, or Email: [email protected]. Investments in securities market are subject to market risks, read all the related documents carefully before investing. In case you require any clarification or have any concern, kindly write to us at below email ids: Level 1: For Trading related queries, contact our customer service at ‘[email protected]’ and for demat account related queries contact us at [email protected] or call us on: Toll free numbers 18002099191 / 1860 266 9191 Level 2: If you do not receive a satisfactory response at Level 1 within 3 working days, you may write to us at [email protected] or call us on 022-42858445 and if you feel you are still unheard, write to our customer service HOD at [email protected] or call us on 022-42858208. Level 3: If you still have not received a satisfactory response at Level 2 within 3 working days, you may contact our Compliance Officer (Name: Mr. Manoj Agarwal) at [email protected] or call on 91- (022) 4285 8484. Level 4 : If you have not received a satisfactory response at Level 3 within 7 working days, you may also approach Managing Director / CEO (Mr. Jaideep Hansraj) at [email protected] or call on 91-(022) 4285 8301. First Cut notes published on this site are for information purposes only. They represent early notations and responses by analysts to recent events. Data in the notes may not have been verified by us and investors should not act upon any data or views in these notes. Most First Cut notes, but not necessarily all, will be followed by final research reports on the subject. There could be variance between the First cut note and the final research note on any subject, in which case the contents of the final research note would prevail. We accept no liability for the contents of the First Cut Notes.


![[Kotak] India Daily, September 26, 2017](https://img.pdfslide.net/doc/110x75/63327c9bb0a33e5201069701/kotak-india-daily-september-26-2017.jpg)


![[Kotak] India Daily, October 28, 2016 - Kotak Securities](https://img.pdfslide.net/doc/110x75/6329071ecedd78c2b50e5976/kotak-india-daily-october-28-2016-kotak-securities.jpg)


![[Kotak] India Daily, November 29, 2017 - Kotak Securities](https://img.pdfslide.net/doc/110x75/633a3425260edeb87a0d95fd/kotak-india-daily-november-29-2017-kotak-securities.jpg)


![[Kotak] India Daily, February 06, 2017](https://img.pdfslide.net/doc/110x75/631c3f337051d371800f6356/kotak-india-daily-february-06-2017.jpg)


