Embed Size (px)
Citation preview
*30001547920696*11111111111111111
https://etd.uwc.ac.za/
/
THESIS: "THE COMMUNITY OF BLUE DOWNS INTHE OOSTENBERG MUNICIPALITY".
BY: JACOBUS J.P. HARMSE
DATE: mLY, 2000
SUPERVISOR: PROF. C. MPHAISHA
A RESEARCE REPORT PREPARED IN PARTIALFULFILMENT OF THE REQUIREMENT FOR THEDEGREE OF MAGISTER PUBLICAEADMINISTRA TIONIS
FACULTY OF ECONOMIC AND MANAGEMENTSCIENCES: SCHOOL OF GOVERNMENT
https://etd.uwc.ac.za/
~s '-\-'")..\~;LlBAAAv
UNIVERII1V OF THI: ""t:SrERN CAPE
Ul\as:.s. VAN 'WEI- KMPI.NB818UOTEEK
https://etd.uwc.ac.za/
I
TABLE OF CONTENTS
Page No
DEDICATION IV
DECLARA TION v
ACKNOWLEDGEMENTS VI
ABSTRACT OF THE RESEARCH vii - viii
GLOSSARY OF TERMS IX
ABSTRACT x
CHAPTER ONE 1
IntroductionProblem StatementObjectives of the StudyResearch MethodologyQuantitive SurveyLimitationsOrganisation of the Study
1456789
CHAPTER TWO 10
BLUE DOWNSIntroductionHistory of Local Government Development in South AfricaLocal Government and the IDPOostenberg Municipal AreaSocio-Economic ProfileThe Area Blue DownsEconomic Growth NodesThe Blue Downs Spatial FrameworkGeneralised ComponentsMarket Driven DevelopmentThe Role of the Local AuthorityFactors which determine DevelopmentIndustrial DevelopmentOostenberg Agri-VillageUrban ManagementSummary
1010111416171820212226272829313232
https://etd.uwc.ac.za/
11
CHAPTER THREE 34
NEEDS-ASSESSMENT 34
SPANDAU 34
Introduction 34Main Findings 34Housing 39Decision Making 43Socio-Economic Information 44Expressed Needs 47Community Involvement 52Community Perceptions 54
NOOIENSFONTEIN
Introduction 57Main Findings 57Housing 62Decision Making 67Socio-Economic Information 68Expressed Needs 71Community Involvement 76Community Perceptions 78
CHAPTER FOUR 81
Economic OpportunitiesIntroductionSmall, Medium and Micro EnterprisesHi - Tech FarmingLocationOwnershipOrganisational StructureCompetitive AdvantageVisionMission StatementStrategiesTraining Plans, Performance AppraisalsInfrastructure Requirements and HousingSummaryWestbank Cooking and Training CentreOrganisation and RationaleWestbank Training Vision
8181828383848586878888919192949496
https://etd.uwc.ac.za/
111
Westbank. Training Mission StatementCareer PathBulb Project "Gold Cup"Westbank Training VisionDevelopment Framework for the West Bank! Vlei AreaSummary
9799101102105107
CHAPTER FIVE 108
OverviewRecommendationConclusionBibliography
108113114117
LIST OF APPENDICES
APPENDIX AAPPENDIXBAPPENDIXC
Questionnaire: Oostenberg SurveyPhoto's: Processes regarding WorksessionsLayout of Maps
https://etd.uwc.ac.za/
iv
DEDICATION
This research thesis is dedicated to the staff of the Directorate: Community Services andFacilities and the community of Blue Downs, especially those people living in Spandauand the Nooiensfontein area, for the support, commitment, dedication, guidance andinspiration to produce the outcome of this work. It was both a learning and enrichingexperience to reach the result of this research. Without their assistance and support, Inever would have been able to complete this assignment.
https://etd.uwc.ac.za/
v
DECLARA TION
I declare that:
The study, outcomes and proposals contained in this thesis is my own work and that allthe sources that I have used and quoted have been indicated and acknowledged by meansof references.
https://etd.uwc.ac.za/
VI
ACKNOWLEDGEMENTS
To my lecturer, Professor Chisepo J J Mphaisha, for his support, continuousencouragement and constructive guidance and patience, who guided me in achieving theoutcome of this research paper.
To the community of Blue Downs, who provided the valuable information freely, eventhough some informationwas of a sensitive nature.
To the staff of the Directorate: Community Services and Facilities, as well as EconomicDevelopment and Planning and Provincial Administration: Western Cape for their inputand hard work to collate the information, process and fine-tune it to ensure that theinformation collected conformed to the criteria envisaged for the research.
Last but not least to my son and also my typist who had the daunting task of assisting meto finalise the research byway of technical support.
https://etd.uwc.ac.za/
vii
ABSTRACT OF THE RESEARCH
INTRODUCTION
This research contains the findings of a needs-assessment, one-on-one interviews withcommunities, i.e. workshops etc, as well as unstructured interviews with staff of theMunicipality of Oostenberg and by doing a literature review with regards to developmentand poverty and health manuals and journals in its quest to make the OostenbergMunicipality a thriving and prosperous town where people will love to work and stay.
The purpose of the study is to identify the needs of the people in specifically the BlueDowns area and to look at ways to address and implement the findings of the research.The research can also be regarded as a blue print, which could be adapted to the needs ofthe communities in other areas within the Oostenberg Municipal area.
The executive summary, methodology, findings and recommendations are conveyed inreport format. The research should not be viewed as an end-result but rather as a startingpoint to prepare Oostenberg for the new millenium, and to tackle problems head on. Thesuccess of the research is solely based on the commitment of all role-players includingthe decision-makers and to implement the recommendations.
STRUCTURE OF THE REPORT
Chapter 1 sets out the scope of and the approach of the work, and draws together thethemes and key fmdings of the research.
Chapter 2 deals with a case study of Blue Downs and set the stage for job creation asdetermined in Chapter 4 of this study, which could be implemented to address theoutcomes of the survey and workshops held with the community.
Chapter 3 sets out the framework for analysing the data captured from the needs-assessments, which was executed and provides descriptions of the key features andoutcomes of the surveys.
The ultimate objective of this research is to look at ways to improve the quality of life ofthe communities of Oostenberg, especially in the Blue Downs area. The research alsopaves the way for other research projects within the Municipal area or can be used oradapted for communities to address their own needs.
Nonetheless, in a research of this nature, issues pertaining to communities are of vitalimportance. Where I have made comments and/or recommendations, it is important thatthese be reviewed for implementation.
https://etd.uwc.ac.za/
viii
The Oostenberg Municipality is one of the seven local authorities within the CapeMetropolitan Area and is in this context a big local authority. It was thus not appropriateto consider all areas in the region, thus limiting the research to the Blue Downs area.
https://etd.uwc.ac.za/
ix
GLOSSARY OF TERMS
• CMA The CMA refers to the Cape Metropolitan Area
• CMC Cape Metropolitan Council
• ITA Informal Traders Association
• ITF Informal Traders Forum
• PTI Public Transport Interchange
• SMME Small Medium Micro Enter Prize
• IDP Integrated Development Planning
• RDP Reconstruction and Development Programme
• CBDS Community Based Development Structures
• NGO Non-Governmental Organisation
• CCTV Close Circuit Television
• SAFIC South African Farming Investment Corporation
• UK United Kingdom
• SLAG Settlement and Land Acquisition Grant
• CMIP Consolidated Municipal Infrastructure Programme
• SPG Settlement Planning Grant
• GNP Gross National Product
• NPOS Non-Public Organisation Structures
https://etd.uwc.ac.za/
x
ABSTRACT
This research study focuses on the community of Blue Downs and their associated
problems. The study furthermore provides some insight on the history of Local
Government, the past policies of the Government of the day with specific reference to
separation of communities, which was based on racial segregation.
In this context the distribution of wealth, resources and income was uneven and separate
development of population groups was a deliberate policy of the previous government.
Townships such as Mitchells Plain, Atlantis and Blue Downs came into being as a result
of these policies, while no employment opportunities existed. This and other social
factors all lead to hardship and poverty.
It is commonly accepted and consensus exists that the continuing high levels of poverty
are the single biggest threat to sustainable economic growth and democratic
consolidation. It is thus important to understand and appreciate why Local Government
can playa critical meaningful role in addressing these challenges.
The purpose of the study is to identify the needs of the people in specifically the Blue
Downs area and to look at ways to address and implement the findings of the research.
The research can also be regarded as a blue print, which could be adapted to the needs of
the communities in other areas within the Oostenberg Municipal area.
https://etd.uwc.ac.za/
xi
The methodology adopted to achieve the objectives of this research comprises a literature
review of relevant legislation, existing documentation on the Oostenberg Municipal
socio-economic indicators and a literature review on any existing literature on Blue
Downs. Public meetings were held during the months of June, July and September 2000.
Whilst a quantitative approach in the form of open-ended questions was also undertaken.
The research study is divided into the following 5 chapters:
Chapter 1 sets out the scope of and the approach of the work, and draws together the
themes and key fmdings of the research.
Chapter 2 deals with a case study of Blue Downs, the historical perspective with relation
to Local Government and the community and set the stage for job creation as determined
in Chapter 4 of this study, which could be implemented to address the outcomes of the
survey and workshops held with the community.
Chapter 3 sets out the framework for analysing the data captured from the needs-
assessments, which was executed and provides descriptions of the key features and
outcomes of the surveys. The ultimate objective of this research is to look at ways to
improve the quality of life of the communities of Oostenberg, especially in the Blue
Downs area. The research also paves the way for other research projects within the
Municipal area or can be used or adapted for communities to address their own needs.
https://etd.uwc.ac.za/
xii
Nonetheless, in a research of this nature, issues pertaining to communities are of vital
importance. Where I have made comments and/or recommendations, it is important that
these be reviewed for implementation.
Chapter 4 looks at the existing and new economic opportunities that are available in the
Blue Downs Area.
Chapter 5 describes the fmdings of the research and recommendations. The research
highlights the unemployment situation in the Blue Downs area. It is thus imperative that
the local community, together with the Local authority becomes the driving force in order
to ensure that the recommendations and implementation gets underway. The research
study could be used as a tool for the upliftment of the local community by the community
through a joint partnership with the business sector and local authority.
https://etd.uwc.ac.za/
CHAPTER ONE
INTRODUcnON
The development discourse in the South African context was always characterised by the
past government "apartheid" policies. These policies were not only racially structured,
but also racially planned and implemented. People were either forcefully removed from
their land or denied access of any from of tenure. In the case of Blue Downs, this
township came about as a result of specific those "apartheid" policies where people was
relocated in such a manner that they are not in close proximity to white areas as they
never had a choice of where they could live. As this was the government's policy of the
past, this on the other hand led to misery and poverty. During 1994 with the first
democratic elections the South African Constitution came into being and which mandated
Local Government to promote social and economic development.
. The objective of economic development in a specific area is to reduce poverty and human
misery, by increasing the availability of basic needs, jobs, education and freeing people ~
from a paternal life style. It is in this instance that the research of Blue downs
undertaken.
"
The research focus on the community of Blue Downs, their needs, and explore possible
solutions to their problems with particular emphasis on the creation of employment
opportunities and thereby alleviating poverty. The research looked at the socio-economic
profile of the community in the study area and analyse the policies of the past, which
https://etd.uwc.ac.za/
2
contributed to the current problems of the Blue Downs community. Poverty in this
instance is not simply the lack of income, but it also encompass a lack of access to
income, jobs and infrastructure. According to Dudley, (1999:8) the symptoms of
unemployment manifest in the lack of income, malnutrition, dependericy on welfare,
escalation in crime and a lack of self-esteem. Thus it is clear that this research will look at
job creation and the beneficiary community and it would look at the options available and
the key tasks required to address the problems and to exploit opportunities relating to job
creation. Ultimately, the research paper tries to identify and bring resources together by
determining the people's needs that should collectively be addressed in an integrated
manner and to ensure that the objectives are achieved in order that a difference could be
made in the lives of the most marginalized communities living in Blue Downs. The]
research will be used to inform decisions relating to the overall problem in the area.
The research focus on the community of Blue Downs, their needs, and explore possible
solutions to their problems with particular emphasis on the creation of employment
opportunities and thereby alleviating poverty. The research looked at the socio-economic 1
profile of the community in the study area and analysed the policies of the past, which )
contributed to the current problems of the community of Blue Downs community. As a
result of these policies, the area was riddled with poverty. Poverty in this instance is not ~
simply the lack of income, but it also encompass a lack of access to income, jobs and
infrastructure. According to Dudley, (1999:8) the symptoms of unemployment manifest)
in the lack of income, malnutrition, dependency on welfare, escalation in crime and a 7lack of self-esteem. Thus it is clear that this research will look at job creation and the
.,
https://etd.uwc.ac.za/
3
beneficiary community and it would look at the options available and the key tasks (
required to address the problems and to exploit opportunities relating to job creation. II
Ultimately, the research paper tries to identify and bring resources together by f
determining the people's needs that should collectively be addressed in an integrated I ~(
manner and to ensure that the objectives are achieved in order that a difference could be
made in the lives of the most marginalized communities living in Blue Downs. The j
research will be used to inform decisions relating to the overall problem in the area
The research will also look at the present system of local government and with specific
reference to the Oostenberg Municipality, its role and its Constitutional obligations.
The study highlights certain intervention studies that could be followed to assist in
increasing an environment and infrastucture condusive to investment which could
eradicate poverty.
The South African Constitution (1996) mandates local government to promote social and
economic development and to work with local communities to find sustainable ways to
work together and to improve the quality of life of its residents (White Paper on Local IGovernment, 1998: 17). Another very important section of the Constitution as listed in J
Chapter 7 of the Constitution that has come to the forefront, and has become the main (
focus of developmental local government in the post - apartheid era, is the Integrated
Developmental Planning (IDP) process. According to the Department of Constitutional J
Development (1998: 45), the "lOP process is an integrated approach to development ((
planning with all sectors and functions working together in pursuit of a common vision".
"
https://etd.uwc.ac.za/
4
It can be argued that for the IDP to be successful municipalities must establish Iparticipatory processes, which are constructive and effective, is a requirement for
democratic and developmental local government.
PROBLEM STATEMENT
The research examines the problem of unemployment in the area and highlights certain I
employment opportunities that may alleviate poverty. The research study also looked at r(
the socio-economic profile of the community living in Blue Downs, its history in terms of II
past policy directives and tries to address the problems associated with poverty. It is
argued that a person's well being is often measured in terms of income. The income ofa
house-holder determines the capability to satisfy basic needs such as proper housing,
food, health services and educational facilities. This poses a major problem for the area
as not many of its residents are formally employed. It is acknowledged that employment
is critical to achieve sustainable livelihoods and thereby reducing poverty and inequality.
It is also a fact that unemployment is a significant contributor to poverty and the
unemployment rates in general, are the highest amongst African women and the youth.
However, the high rate of unemployment in the area can mainly be attributed as a result
of the closure oflarge industries in or near to the area or that no sustainable employment
opportunities are available within a reasonable travelling distance.
.,
https://etd.uwc.ac.za/
5
OBJECTIVES OF THE STUDY
The aim of the study is to look at the socio-economic profile of the community of Blue
Downs. It seeks to address the high unemployment rate of the community and provides
solutions to those problems.
The concerns of the research are centered around the problems associated with,
unemployment in the Blue Downs area The local authority on the other hand is
confronted by these challenges as it is compelled in terms ofits Constitutional obligations
and developmental role to facilitate and provide assistance to the needs of the
unemployed through safety nets, community-based local government infrastructure, I
)public works programmes and provide support for micro-enterprise entrepreneurs.
The aim of this research, is thus focus on a case study of the Blue Downs area, to
understand its history in terms of development, to understand the dynamics of
unemployment and the reasons for its persistence. Irrorder to understand the problem, the
researcher prepared a questionnaire and undertook a needs assessment in two areas
namely Spandau and Nooiensfontein. The questionnaire were thereafter analysed and
assessed.
.,
The research also highlighted the present business opportunities that exist and new
opportunities that may be available. It thus provides an audit of existing and new
economic activities that are currently taking place inBlue Downs. It is believed that any
economic development strategy should be build on existing activity in the area It also
https://etd.uwc.ac.za/
6
highlights the opportunities that exist in the area and to formulate and implement a
strategy to explore those opportunities to it's fullest.
Ultimately, the "Loop" in this process should be closed with continuous monitoring and
evaluation of the strategies upon their implementation in order to refine and fine-tune {ftthem and to ensure that they remain relevant and sensitive to all changes that may occur
in the demand for employment opportunities and the various impacting factors.
RESEARCH METHODOLOGY
The following steps have been taken for the research study.
Literature Review
In undertaking this research, the author has taken into account that a number of related
studies most probably have been undertaken in the area, especially in the area of housing
and the Nooiensfontein wetlands. These documentation have been perused and
scrutinized to ensure that no overlapping occurs and that the information provided could
be used as a benchmark for further studies.
The study also looked at a available literature of existing legislation such as the
Constitution of the Republic of South Africa (Act 108 of 1996), a review on any existing
documentation on the Oostenberg Municipality's socio-economic indicators, as .well as
any other existing literature on the Blue Downs, and surrounding areas.
.,
https://etd.uwc.ac.za/
7
QUANTITATIVE SURVEY
Separate surveys were conducted in the compilation of this report. For Nooiensfontein
120 households were interviewed, totaling 494 residents, whilst for Spandau 52
households, totaling 238 people were interviewed. These interviews were held face-to-
face. Notwithstanding the above, 68 people attended the West Bank environmental
workshop, whilst 220 persons attended workshops on job creation and sport in general
over a two month period.
Residents were interviewed on the basis of a quota sample. This involved selecting the
numbers to be interviewed proportional to the population in Nooiensfontein and Blue
Downs. A quota was then set for Spandau. Blue Downs based on the 1996 census data.
Given the sample size, the method of selection, the sample's geographical dispersion and
its demographic composition, it can be accepted that it is reliable in representing the
views of the specific population.
The questionnaire was developed in consultation with communities and took into account
the need for indicators that can be tracked over time to feed into the wider study. The
draft questionnaire was piloted with 20 residents to ensure that it "worked" in the field
and minor changes were made to question wording as a result of this.
.,
https://etd.uwc.ac.za/
LIMITATIONS
The scope of the research was limited to the Blue Downs area and this report should not
be construed as for the whole of Oostenberg.
The time period for this research was April to September 2000.
I am aware that the information contained and provided by communities may neither be )
comprehensive nor accurate in all areas. Nonetheless it has been used to establish high-t
level benchmarks and/or broad indicators of performance.
Inmost cases, the data sought and provided, was the bare minimum considered necessary
to effectively and efficiently manage and compile the research. The fact that this was not
always readily available in an accurate and complete form, and that measures of
workload/activity and performance are not generally used on a regular basis, is a key ,
finding in itself.
One should also acknowledged that the indicators and comparisons in general, and those
used in this research in particular, have their limitations and do not take account of all the
factors involved. Nonetheless, in the absence of more extensive and detailed information,
the work is relatively comprehensive.
",
https://etd.uwc.ac.za/

9
ORGANISATION OF THE STUDY
Chapter One: Is the Introduction that leads up to the research study.
Chapter Two: Describes the study area in the fonn of a case study and it focuses on the
history of Blue Downs, the problems of the past and the opportunities that are presently
available to explore the results.
Chapter Three: This chapter document the results derived from the questionnaire for the
needs assessment that was undertaken for Spandau and Nooiensfontein. This chapter
presents some perspective on the socio economic profile of the local community.
Chapter Four: Examines and reviews the economic opportunities that exist in the study
areas as a short and long term solution to address the problem and recommends an
appropriate approach to revitalize the economy.
Chapter Five: Provides an overview and conclusion of the research report of pertinent
issues of what was said and done in the research and provide recommendations for the
problem.
.,
https://etd.uwc.ac.za/
9
ORGANISATION OF THE STUDY
Chapter One: Is the Introduction that leads up to the research study.
Chapter Two: Describes the study area in the form of a case study and it focuses on the
history of Blue Downs, the problems of the past and the opportunities that are presently
available to explore the results.
Chapter Three: This chapter document the results derived from the questionnaire for the
needs assessment that was undertaken for Spandau and Nooiensfontein. This chapter
presents some perspective on the socio economic profile of the local community.
Chapter Four: Examines and reviews the economic opportunities that exist in the study
areas as a short and long term solution to address the problem and recommends an
appropriate approach to revitalize the economy.
Chapter Five: Provides an overview and conclusion of the research report of pertinent
issues of what was said and done in the research and provide recommendations for the
problem.
"
https://etd.uwc.ac.za/
10
CHAPTER TWO:BLUE DOWNS
INTRODUcnON
In this chapter the focus will be on the study area namely Blue Downs. The area in
essence is a product and creation of the past "Apartheid" policies. It came into being
together with areas such as Mitchell's Plain and Atlantis. These areas were purely created
to relocate the so-called coloured community. The townships was established in such a
manner to ensure that it is a considerable distance from the main and more particularly
national roads that could create a buffer zone between whites and non-whites. There were
no employment opportunities in the immediate vicinity resulting that the community had
to commute a considerable distance to the industrial areas in search for employment. The
area thus became a dormitory town with communities only sleeping in the area Most of
the residents meager salaries were spent on transport and survival issues. During the early
1980's with the closure ofa number of factories and high interest rates, the community
suffered real hardship as most of them become unemployed. All of this then contributed
to the problem of poverty.
It is against this background that the research is undertaken. The research starts with a
case study of Blue Downs, its people and it will examine the problems and opportunities
available to the residents living in the area. In dealing with the problems associated with
the crisis of unemployment within and across the Oostenberg municipal area, we need to
look at the history of government especially local government in order to determine the
context in which the issue has been formulated and came about. It is also true that the.,
https://etd.uwc.ac.za/
11
system of Apartheid ensured that poverty and underdevelopment existed side by side with J~commercial infrastructures. The distribution of resources and income was uneven and
separate development of population groups was deliberate policy of the previous
government. In the South African context it is also argued that towns and cities exist or
have come into existence as a result of people migrating to such towns and cities, either
in search of employment or economic opportunities or because of some other motive(s).
In the context of such migration, specific opportunities and/or challenges emerged to
which urban managers / decision-makers must respond in order to ensure the future
viability of such towns and cities. Therefore, to come up with a framework that will
address the above problems, one needs to look at the epistemology of the problem.
The chapter commences with a historical background of the policies of the past local
government and the IDP, a brief description of the Oostenberg municipal area of which
Blue Downs is a suburb and explains the current situation of Blue Downs with particular
emphasis on the development patterns over the last 15 years.
mSTORY OF LOCAL GOVERNMENT DEVELOPMENT IN SOUTH AFRICA
During the 1950's Local Government was governed by racial regulations through the
Group Areas Act (Swilling, 1996: 170). This Act allowed the government to divide the
cities into four racial segments reserved exclusively for Whites, Africans, Coloured,
Indians and the disempowerment of the large majority of the black constituency of the
country. The Groups Area Act, which is considered to be the key piece of apartheid
legislation, authorised residential segregation and compulsory removal of black people to
these "own group" areas (White Paper on Local Government, 1998: 1).-,
https://etd.uwc.ac.za/
12
According to the (White Paper on Local Government, 1998: 17) the "own management"
structures during the apartheid era "was in part to compensate for restricted rights and in
part to bolster the political and economic privileges of racial exclusion". The
government's idea was not to give residents a form of political expression but to shift the
responsibility for townships from White Local Authorities to non-legitimate Black Local
Authorities in order to minimise protest in the townships (Ismail, 1997: 51).
According to Williams (2000: 167-183), he argues that the changes to the Socio-Spatial
Land Use Planning could be directly attributed to the changes in South Africa,
particularly as a result of the first democratic government in 1994. He therefore argues
that the future of South Africa is inextricably linked with the future of its cities and
therefore he is of opinion that the South African cities reflect the state of the nation and
welfare of its people. The legacy of the Apartheid Policies of the then government was
based on separate developments and in this context planning and development
frameworks were racially planned and implemented.
Williams furthermore argues that the policies of the past were explicitly based on racially
motivated, planning frameworks and has been systematically enforced by the
administrators to the benefit of the minority white race group at the cost of the majority
"black designated group".
Ferreira, VanWyk and Odendaal (1994:2) describes urbanisation as "a universal process
of change" whereby urban settlements arise in the course of time because of the
https://etd.uwc.ac.za/
13
transformation in the character and lifestyle of a society as it changes from predominantly
rural to a predominantly urban one."
According to Gillis, Perkens, Roemer and Snodgrass (1996:200), urbanisation is a well-
known concomitant of development, as a result of which, low-income countries have a
great majority of people living in rural areas, while most people in middle and high-class
income countries live in towns and cities. (Ferreira et al, 1995:44) expresses the view that
the concept ''urbanisation'' includes two contexts, namely, that relating to demographic
and social-cultural issues. The demographic context relates to a process of a changed
concentration in population because of non-fanning activities, and which includes:
• a shift from rural to urban migration
• an increase in the number of urban points of concentration, and
• an increase in the size of individual concentration.
The foregoing demographic context accordingly refers to rural - urban migration and an
increase in size of the established urban population, as well as inter-urban migration or
the flow of people from cities to towns to other cities and towns.
The socio-cultural context of urbanisation is also dynamic, but relates to a change of
lifestyle from rural to an urban lifestyle with an associated change in values, attitudes and
behaviour. Urbanisation accordingly increases individual freedom and mobility and
weakens the bond between the individual and society. In an urban environment, people of
different backgrounds, cultures, race and views on life are grouped together in an
https://etd.uwc.ac.za/
economic association, which grouping gives rise to the establishment of new sub-cultures
and the promotion of acculturation or cultural change (Ferreira et al, 1994: 14).
However, urbanisation is a worldwide phenomenon that could bring about various
problems and difficulties that test and stretch the initiative and financial resources of
local authorities to the utmost According to Ferreira (1994:7) people have lived
relatively peacefully for many years in rural environment and in a more or less static
society. (Gillis et al, 1996:486) express the view that since the Industrial Revolution,
urbanisation and industrialisation have moved in tandem and that such trend towards
urbanisation with industrial development is still evident today in cross-country
comparisons.
However, in the South Africa context, people of colour never had a choice of where they
would prefer to live. There were forced removals, unsettling displacement and dividing of
families. This on the other hand led to misery and poverty. It was only after the
abolishment of influx control when movement of communities was allowed, and in this 1instance movement was only allowed amongst blacks as they were separated from If?whites. As this was the government's policy of the past, this also led to unemployment
and poverty.
LOCAL GOVERNMENT AND THE lPIt is generally known that the structure of local government during the apartheid era in 1South Africa was highly fragmented and unresponsive to the needs and demands of r
.,
https://etd.uwc.ac.za/
15
society at large. Decision-making by the authorities was centralised, hence most policies
were introduced to control and direct citizens actions.
With the 1994 democratic elections and the acceptance of the Constitution of South
Africa, Act 108 of 1996 and various other pieces oflegislation it paved the way for a new
system oflocal government. A system that would be more responsive, developmental and
accountable to citizen needs.
Section 153 of the Constitution (1996) explains the developmental duties of local
government: requiring each municipality to structure and manage its administration and
its budgeting and planning process to give priority to the basic needs of the community.
The White Paper further defines the concepts of developmental local government by
identifying four interrelated aspects maximising economic growth and social
development, integrating and coordinating the development activities of other role
players, democratising development by facilitating and encouraging participation by
citizens and by learning the encouraging local solutions to local problems (Ministry of
Provincial Affairs and Constitutional Development, 1998).
The IDP is the tool by which development is expressed through a process of community
participation. It is supposed to play a central role in integrating different planning
strategies of the municipality thus simplifying the planning process. It is envisaged that
the IDP will transform the municipality to fulfill its new developmental role.
In addition to providing many of the traditional municipal services, municipalities must
now lead, manage and plan for development (lOP, User Friendly Guide, 1998: 3). The.,
https://etd.uwc.ac.za/
16
purpose of development should be focused on improving the standard of living and
quality ofall sectors of the community. To establish agreement on development goals
the participation of stakeholders in the process is essential.
THE OOSTENBERG MUNICIPAL AREA
During the transformation process in 1996 a number of small local authorities were
amalgamated and 7 local authorities were established. Oostenberg municipality is one of
the seven after the amalgamation ofKuilsriver, Brackenfell, Meltonrose, Scottsdene and
Kraaifontein Municipalities.
Oostenberg is located on the north-eastern :fringe of the metropole, ± 30 km from the
Cape Town CBD. It forms an area of ± 135 km2 extending ± 27 km oom its northern to
its southern edge and 5 - 7 km east-west. Oostenberg has four (4) main districts, namely
Kraaifontein, Brackenfell, Kuilsrivier and Blue Downs, that includes areas such as
Nooiensfontein, Spandau, Eersterivier, Blackheath, Rustdal and Melton Rose. In terms
of the hierarchy of towns, these areas are of a lower order than that of the neighbouring
Bellville CBD and the Tyger Valley corridor, which in tum is of a lower order than the
Cape Town CBD. The significance of this fact is that Oostenberg is a sub-component of
a larger metro.
Oostenberg has excellent road, rail and air accessibility to the Southern African
hinterland and beyond. In the north it straddles the key Gauteng bound rail and road
(Nl) routes and in the south it stretches across the other key national road route (N2)
leading to Natal, Southern and Eastern Cape via the Garden Route. Its western border is"
https://etd.uwc.ac.za/
17
the strategic R300 road that provides quick access to Cape Town Metropole and
International Airport and provides an important link between the Nl and N2 National
Roads.
Utilising the information obtained from the Central Statistical Services, it was estimated
that the total population in Oostenberg was approximately 240 000 in 1996. Taking
cognisance of the population figures for Oostenberg in 1991, it was determined that the
population growth rate in the area is appreximately 2.0 % per annum. This growth is not
high and it can be assumed that it is mainly due to natural growth. By applying this
growth rate to the 1996 population figures, the estimated total Oostenberg population in
the year 2000 should be 260 000.
According to the census (1996) data, it was determined that 82.5 %of households consist
of less than six persons, while approximately 16.4 % of the households have between 6
and 9 members. Approximately 1.1 % of all households in Oostenberg consist of
households with ten and more members. It was determined that the average household
size is 4.2 persons per household. By applying the average household size of 4.2 persons
per household to the total population, the number of households could be determined.
The number of households in the Oostenberg municipal area increased from 57 148
households in 1996 to 61 966 households in the year 2000. This amounts to an increase
of 4 819 households bétween the period 1996 and 2000.
SOCIO ECONOMIC PROFILE
.,
https://etd.uwc.ac.za/
18
Utilising the information from the census, the socio-economic profile of the Oostenberg
area is summarised as follows:
• The Oostenberg population consists of128 007 (492 %) males and 131 991 (50.8 %)
females.
• Approximately 9.9 % of the population in Oostenberg obtained Grade 10, while 6.5
% obtained matric and/or higher qualifications.
• Unemployment was 19.1 % in 1996. During the period 1980-1991, unemployment
increased at 20 % per annum, but declined to a growth rate of approximately 4 %
during the period 1991 to 1996. If this growth rate is applied to the 1996
unemployment figure, it is estimated that unemployment in the year 2000 is
approximately 12.7 % (15463 people) of the total labour force.
THE AREA BLUE DOWNS
The area known as Blue Downs is part of the broader Oostenberg Municipality and is
situated on the Cape Flats between Cape Town International Airport in the west, and the
main railway line to Stellenbosh/ Somerset West in the east, and between the R300 and
Belhar in the north and the N2 Freeway in the south.
The population is estimated at 130 000 people in Blue Downs. The area is Close to
informal squatter communities and large tracts of undeveloped bush. The majority of the
predominately working-class residents in Blue Downs, purchased their properties on a
plot and-plan basis from property developers with 20-30 year mortgage bonds.
.,
https://etd.uwc.ac.za/
19
Typical families in the area are young married couples with children of early high school
age and younger. Both parents usually work while day-care mothers or grandparents
accommodate children. VeI)' little employment is available locally and residents
generally commute to Cape Town and its immediate suburbs, or to Bellville and its
surrounding areas.
The development of the Blue Downs area has been characterised with an industrial
development in the north which is known as Blackheath and as fur as the remainder of the
area is concerned, fragmented with residential development namely Gaylee, Kleinvlei,
Eersterivier, Stratford, Rustdal, Penhill, Spandau, Nooiensfontein and Westbank.
During the planning stage in 1985 it was envisaged that approximately 250 000 residents
will eventually settle in the area, comprising :fromsurrounding suburbs in and around the
Cape Metropolitan Area During those days the development authority was the
Development Board, House of Representatives.
Originally the area developed at an enormous tempo with the assistance of private
property developers until 1988 when everything came to a halt
Reasons for this phenomenon being the high interest rates resulting that a number of
residents lost their properties and also that nobody became interested in Blue Downs.
As a result of these problems the banks became hesitant to invest further in Blue Downs
resulting that the development in the area came to a standstill.
-.
https://etd.uwc.ac.za/
20
At that stage of the interest rate crisis approximately 80 % of the erven in Blue Downs
have been developed and most of the erven have homes built on them, etc. Blue Downs
in essence was thus already a big town or suburb. Also of importance, at that time, was
the development of the Blue Downs area, which was, to a great extent, characterised by
fragmentation, as a number of erven relating to the development was allocated to
potential developers in parcels. As a result of the withdrawal of the banks, no significant
development was forthcoming.
ECONOMIC GROWTH NODES
A large number of the social and economic activities of the residents take place within
the Oostenberg, Cape Town and Tygerberg municipal areas. Shopping activities
generally take place in Eersterivier, Kuilsrivier and Bellville, whilst recreational and
entertainment activities mainly take place at home or at facilities located within Blue
Downs. Although some residents may shop in areas such as Nl City, Tyger Valley and
Somerset Mall.
Retail and office opportunities have recorded high growth rates as a result of new
residential developments and it is anticipated to bring additional growth to the established
Kuilsrivier retail strip, Eersterivier and Blue Downs CBD's.
As a result of the growth recorded on metropolitan level, local industrial properties have
experienced new demand. Blackheath and Brackenfell industrial areas are increasingly
focusing on small and medium industrial operations, catering for many new
.,
https://etd.uwc.ac.za/
21
manufacturing and exporting firms. Growth in the economic base of Oostenberg is also
evident from the number of buildings completed.
THE BLUE DOWNS SPATIAL FRAMEWORK
The Blue Downs area consists of the entire area ofOostenberg south of the Stellenbosch
Arterial and involves the combination of approximately eight structure plans. As already
explained, a number of problems have been identified in this area, one of which relates to
residential development Residential development in this area is very dispersed,
characterised by fragmented and isolated developments. This lead to other problems such
as a lack of decent facilities.
Another problem identified in this area is the state of the middle-income housing market.
People falling in this income bracket receive little or no subsidy. Consequently housing
development caters mainly for the low-income segment of the population and not the
middle income segment.
Furthermore it is very clear from the pattern of the vacant land that fragmentation of
residential neighbourlJ.oods is a serious problem in the Blue Downs area The reasons for
the fragmentation have already been discussed. Another problem in the area is the fact
that most of the vacant land is zoned as agricultural land. Most of this vacant land is
owned by the Housing Board, and therefore this does not pose real problems when
acquiring land for development purposes.
"
https://etd.uwc.ac.za/
22
GENERALISED COMPONENTS
The Greater Blue Downs area consists of a number of components of which each playa
specific role in a sub-regional context. These components are as follows:
Blackheath industrial area in the north: an extensive industrial area with large tracks of
unserviced land that offers affordable industrial land, together with the Wimbledon
industrial area, which still has a large amount of developable land available;
The area also include areas such as Vergenoegd industrial area in the south: This large
(250 ha) potential industrial area situated beside the National Accelerator Centre offers
excellent work opportunities alongside Blue Downs and Khayelitsha, that can reduce the
traveling distances of the residents who can least afford travelling costs, which can also
relieve the pressure placed on metropolitan road/traffic systems.
The eastern residential areas: This more established and less fragmented residential area
forms a middle class suburb of the south-eastem edgelborder of the Cape Metropole. The
three stations in the area ensure that residents arrive at work, although travelling time to
Cape Town City Centre is reasonably long.
.,
The NooiensfonteinlRotterdam residential area: The development between the
WimbledonlEersterivier route and the Kuilsrivier is fragmented and there is a serious
shortage of a significant urban influence.
https://etd.uwc.ac.za/
23
Mfuleni: Although Mfuleni was incorporated into the Tygerberg substructure, by the
Demarcation Board in 1995, it functionally blends in more naturally with Blue Downs.
To a large extent it is separated from the rest ofTygerberg by the Kuils River flood level
and, together with the R300 and N2 worsens the spatial isolation of Mfuleni.
Consequently Mfuleni must be taken into consideration in any planning processes.
Wesbank: Wesbank is a low-income residential area, consisting of 5 500 erven, where
the first houses were built in January 1999 and development is rapidly nearing its final
phase. Westbank fulfills a metropolitan role by providing low-cost housing.
Also of importance inWesbank is the Nooiensfontein Vlei area, which was identified as
an area that required further investigation in the recent Kuilsrivier Metropolitan Open
Space System Study (March 1999). InMay 1999, the Nooiensfontein Vlei Management
Study was commissioned by the Cape Metropolitan Council's Spatial Planning,
Environmental Management and Catchment Management Departments, the result of
which is keenly awaited on.
Nooiensfontein Vlei forms part of the Kuils River and is located between the
Stellenbosch Arterial Road and Hindle Road and includes the river and vlei, as well as
the detention pond and dune areas within Westbank and the flood plain area on both sides
of the river.
https://etd.uwc.ac.za/
24
The entire land holding along the western bank of the river is owned by the Oostenberg
Municipality. On the eastern side of the area, the land is owned either by the Provincial
Administration, Western Cape or the private sector. The land in government ownership
represents an important opportunity in terms offacilitating the establishment oflow land
value activities such as urban agriculture, which represents an important aspect of an
overall balanced urban environment.
Due to the present Wesbank development, there is little landscaping, schools, community
facilities and other facilities, which are normally associated with an established
community. However, the efforts to retain existing trees, particularly along the
riverbanks, do help to some extent to alleviate a monotonous environment. This
monotony is exacerbated by the lack of commercial and industrial facilities at this stage.
The area along the riverbanks provides relief from the urban development. It consists of
a broad expanse of open space and reeds in the wetland. There are a number of birds and
other forms of wild life that add to the potential "conservation" value of the area which
could be established in a positive tourist attraction route.
To the east of the river, the main topographical feature (except in the north where it has
not been destroyed by urban development) is a longitudinal dune barrier that separates
the river corridor from the higher land to the east.
"
https://etd.uwc.ac.za/
25
These developments consist ofisolated "leap frog" townships whose built fabric consists
of medium sized residential dwellings on a one-house-one-plot configuration.
The longitudinal dune forms a natural demarcation between changes in levels and will
form a "barrier" between changes in land use. For instance, the dunes could form a
barrier between future urban development, (which should be more intense than that
which has been developed to date), and the open space/urban agriculture. Urban
agricultural plots could occur between the longitudinal dunes and the river within the
1:50 year flood line and set back at least 25 m from the river. Dwellings associated with
urban agriculture could be located outside of the 1:50 year flood line, at the base of the
longitudinal dunes, with the remainder of the farms within the 1:50 year flood line. This
on the other side could potentially create SMME employment opportunities to the
residents ofWesbank.
The eastern side of the river comprises an extensive flood plain with the remains of
farmhouses located along a longitudinal dune. This dune forms an important transition
line between the land set aside for urban development to the east abutting Nooiensfontein
Road and the flood plain area along the riverbanks. Towards the north east the proposed
extension to the Camelot residential area encroaches into the flood plain. There are also
two approved, but undeveloped townships jutting into the flood plain. It is a principle of
river corridor planning that the natural 1:50 year flood line should form the minimum(
development setback line.
.,
https://etd.uwc.ac.za/
26
The only school in the entire area is Silversands Primary School. This school's enrolment
has doubled over the past year from 700 to 1500 pupils. This was due to the development
of housing in Wesbank without the concurrent development of school facilities, The
pressure to increase the enrolment at Silversands is continually growing, as the only other
alternative school for Wesbank. children is Delft.
The Wesbank. Township consists of informal residential zoning, together with associated
commercial, school and public open space facilities, There are large areas of public open
space demarcated along much of the river corridor. Most of the remainder of the area,
including the area to the south of Hindle road, the Kuilsrivier corridor itself and large
tracts ofland to the east of the river are zoned as agricultural land.
~TD~NDEVELOPMENTAs has already been mentioned, a large percentage of the Greater Blue Downs area, as it
is seen today, was developed in the short period of time between 1985 and 1989. The
development still taking place is mainly through housing subsidies. The point being that
vel)' little residential development has taken place in this area since 1989.
Except for the interest rate crisis, already discussed, abolition of the Group Areas Act
also inhibited further development in the area, as people could consequently purchase
houses or land in any area of their choice.
The biggest problem concerning Blue Downs is the fact that there is an income group that
finds it vel)' difficult to find suitable housing. This is the group that roughly earns-,
( https://etd.uwc.ac.za/
27
between Rl 500 and R4 500 per month, which falls within the market of houses between
R25 000 and R75 000. These people are dependent on private loans to supplement the
government subsidy. This type of development is less attractive to developers than
housing subsidies in the lowest category because the process of obtaining loans is
difficult and apparently banks are very careful/weary of granting loans to persons that full
within this category.
Probably the most successful attempt of addressing this problem is through employee
housing schemes, although this practice is limited to employees of larger firms. The
Transnet scheme at Melton Rose station is a good example of employer involvement in
the delivery of housing for its workers.
The big problem that is now being experienced in the area is that there are still a number
of "in fill" developments that must take place and that, as long as the market driven
developments are not taking place, the pressure/demand for low-income housing is
increasing.
THE ROLE OF THE LOCAL AUTHORITY
According to Ivan Turok the role of Local Authorities is to develop partnerships and
perform a wide range of functions depending on local circumstances.
The role of Local Authorities is to provide a framework for nodes where economic
forces, without harmful consequences for the area, can function. Such framework can be
applied for the following reasons:-,
https://etd.uwc.ac.za/
28
• the consideration of applications of development;
• the positioning of community facilities; and
• extending and promoting of the nodes with the most potential.
Concentration and the establishment of strong/powerful nodes that offer a larger variety
of services and of which the community can be proud must be the basic goal/aim.
Lastly it must be borne in mind that nodes and linear development (activity routes)
complement each other. In order to gain a clearer overview both features must be viewed
in coherence with one another, with the understanding of the necessary differences. An
important theme is that functions with an order with a large general "client base" must be
placed as higher order nodes as often as possible and not beside streets with a lower order
activity.
FACTORS WlDCH DETERMINE DEVELOPMENT
It must be realised that the development of nodes cannot always be predicted with
certainty. There are especially 4 factors that influence the actual development:
• the availability of initial infrastructure and facilities through investment; especially
with regards to transport infrastructure which determines accessibility;
• development of surrounding neighbourhoods; i.e., intensity of electricity purchased in
a given circumference around the central district; :;JJ• consumer preferences and perceptions; and
• entrepreneurs preferences and perceptions.
.,
https://etd.uwc.ac.za/
29
The latter two mentioned above can only be determined through comprehensive
questionnaires. Perceptions regarding socio-economic aspects, for example, safety and
class also probably playa determining role.
As explained above the business areas are located strategically on the vel)' important
nodes as fully discussed above. These areas, however, playa vel)' important role in the
daily lives of the residents in the area, be it to purchase goods or employment
opportunities.
INDUSTRIAL DEVELOPMENT
Another important reason why the Blue Downs development came to an abrupt standstill
can be attributed to the past government's apartheid policies and the sanctions imposed
on South Africa Numerous factories had to close down when big businesses withdrew
from South Africa Major industrialists such as Leyland closed down their factories in
Blue Downs resulting in high unemployment, which contributed to poverty. Another
important aspect was also an access road from the Stellenbosch arterial road to the Blue
Downs CBD was not sufficient and a number of companies invested in areas such as
Tygerberg and Cape Town.
However, recently a number of economists were looking at the Blue Downs CBD and
industrial parks with renewed interest. This is mainly due to the following:
• The Blackheath industrial area can still expand with the development of the
Wimbledon strip, which is approximately 70 ha in size. At present Blackheath has
"
https://etd.uwc.ac.za/
30
developed approximately 75 %, which leaves approximately 55 ha ofindustrialland.
In total Blackheath offers approximately 135 ha of industrial land.
• A portion of 12 ha ofBlackheath beside the Stellenbosch bypass road, between the
Strand road and the railway track (opposite Saxenburg Park).
• The Vergenoegd industrial area, which is approximately 240 ha in the south.
As already mentioned, the area known as Vergenoegd comprises ofa very large industrial
area with a potential of 240 ha, which can offer excellent work opportunities to the
residents of the Blue Downs and Khayelitsha areas. This would also shorten the distances
that residents would have to commute, especially for those who cannot really afford the
high travelling costs and it would also relieve the pressure placed on metropolitan traffic
systems.
The Saxenburg Park development of which the first phase was completed in 1998 and
which offers 60 ha oflight commercial industrial land. This well-designed, functional and
attractive development is perfectly located and combines an environment with solid
commercial sense that is pleasing to the eye. This development is right in the leading
growth point of the Western Cape. This industrial park is on the wine route of
Stellenbosch and the air routes of Cape Town International Airport. It borders the fully
established industrial areas and is ideally located near the CBD's of Cape Town,
Somerset West and Stellenbosch.
.,
https://etd.uwc.ac.za/
31
Saxenburg Park is different in this context that it is situated on the Stellenbosch/Cape
Town/Somerset West nodes and is very accessible. The Oostenberg Municipality and
especially Blue Downs are very fortunate in having this dynamic progressive industry in
its area. It is expected that this development would, to some extent, alleviate the
unemployment situation in the area
OOSTENBERG AGRI - VILLAGE
Adjacent to the Saxenburg Industrial Park a new agri-village concept will soon be
developed. This development will be located east of the RI02 arterial route between
Somerset West and Kuilsrivier. A railway line also runs parallel to this thoroughfare
while Blackheath, Kleinvlei and Eersterivier local areas are located west of these
transport routes. Agricultural land, of high quality with attractive vineyards, completes
the eastern boundary, The properties are all registered in the name of the Provincial
Housing Development Board and the land has also been identified as suitable for a land
reform project The land is zoned for agriculture and its size is sufficient to accommodate 1~a small fann development. The main idea is to create high density/intensity farming J~methods.
In the case of Blue Downs Area, approximately 650 new emerging fanners will jointly
hold 30 % of the shares in the company called Safic (Pty) Ltd (South African Farming
Investment Corporation) with its headquarters in London. Itwill be the first Hydroponic
Station in South Afiica with enormous spin-offs for the local residents who will be
employed as fanners/shareholders and opportunities in refrigerated trucking, exporting
and housing development will emerge from this development..,
https://etd.uwc.ac.za/
32
URBAN MANAGEMENT
In Lieu of the resource constraints faced by local authorities in providing high levels of
service, it is essential that every effort is taken to lessen the burden of service provision.
In this regard the area should be divided into management zones with a school cluster as
the basis for management. This will create the opportunity for schools to take a central
role in the urban management of their particular sector. This does not mean that the
burden of urban management should fallon school children, but rather that the school
facilities themselves can serve as centres from which various urban activities, including
community clean ups, neighbourhood watches and communal gardens etc., can be
organised. However a learned community of the environment in general is an asset to any
organisation.
SUMMARY
The research study of the Blue Downs area is typical of the urbanisation process, namely
the transformation of a society from a rural to a predominantly urban culture, is of great
significance to any society. The abolition ofinflux control on 30 June 1986 brought about
huge urban challenges as some of the major urban areas struggled, and indeed are still
struggling to accommodate the millions of predominantly black people migrating from
rural to urban areas. According to Todes, A (April 1999) movement patterns are most
static or continuous. She argues that the waves of migration occur at a particular time,
which subsides but may later emerge or new patterns occur.
https://etd.uwc.ac.za/
33
Although Blue Downs is unique, in that it was not a question of migration, the area is
characterised by the phenomenon of unemployment and poverty, which could be,
attributed to the apartheid policies of separate developments for South Africa's diverse
population, sanctions and high interest rates during the 1986 period and banks losing
interest in the area Notwithstanding the negative connotations of the past policies, a
number of positive possibilities exist in the area, which can bring about spin-offs for the
area. These however, need to be explored to the fullest if a meaning-full difference is to
be made to the area and to address the issue of poverty.
Apartheid-styled development planning has fundamentally damaged the spatial, social
and economic environments, in which people live, work, raise families and seek
fulfillment for their aspirations. As a result, Local Government, as the sphere of
government closest to the residents bas a critical role to play in rebuilding local ( ~
communities and environments as the basis fur a democratic, integrated, prosperous and (rtruly non-racial society. New ideas need to emerge and effective and efficient leadership
of councillors is of great importance. Local Government should encourage partnershiPs)
and empower communities to be sustainable in projects that support small, medium and 7micro enterprises.
It is within this context that policy-makers and urban managers have to develo~ viable lurban policies to address and indeed attempt to overcome these challenges.
"
https://etd.uwc.ac.za/
34
CHAPTER THREENeeds Assesment ofSpandau & Nooiensfontein
SPANDAU
INTRODUCfION
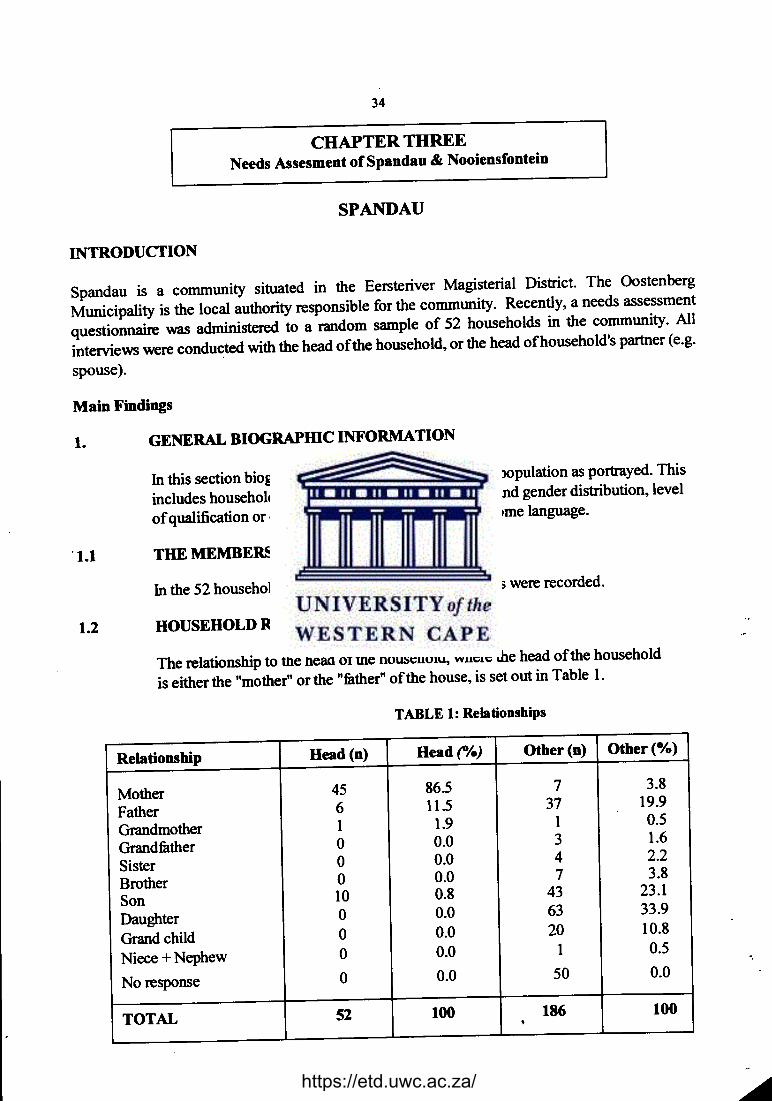
Spandau is a community situated in the Eersteriver Magisterial District. The OostenbergMunicipality is the local authority responsible for the community. Recently, a needs assessmentquestionnaire was administered to a random sample of 52 households in the community. Allinterviews were conducted with the head of the household, or the head ofhousehold's partner (e.g.
spouse).
Main Findings
1. GENERAL BIOGRAPIDC INFORMATION
In this section biographical data relating to the sample population as portrayed. Thisincludes household composition, household size, age and gender distribution, levelof qualification or education, household income and home language.
·1.1 TIlE MEMBERS OF TIlE HOUSEHOLD
In the 52 households interviewed a total of238 persons were recorded.
1.2 HOUSEHOLD RELATIONSHIPS
The relationship to the head of the household, where the head of the householdis either the "mother" or the "father" of the house, is set out in Table 1.
TABLE1:Relationships
Relationship Head(n) Headf»/o) Other(n) Other (%)
Mother 45 86.5 7 3.8
Father 6 11.5 37 19.9
Grandmother I 1.9 1 0.5
Grandfather 0 0.0 3 1.6
Sister 0 0.0 4 2.2
Brother 0 0.0 7 3.8
Son 10 0.8 43 23.1
Daughter 0 0.0 63 33.9
Grandchild 0 0.0 20 10.8
Niece + Nephew 0 0.0 1 0.5
No response 0 0.0 50 0.0
TOTAL 52 100 186 100•
https://etd.uwc.ac.za/
35
In respect of the relationship to the head of the household, most persons in the dwelling are theimmediate family. Households have a predominately nuclear family structure: mother, father, sonsand daughters. Grand children constitute 10% of the households population.
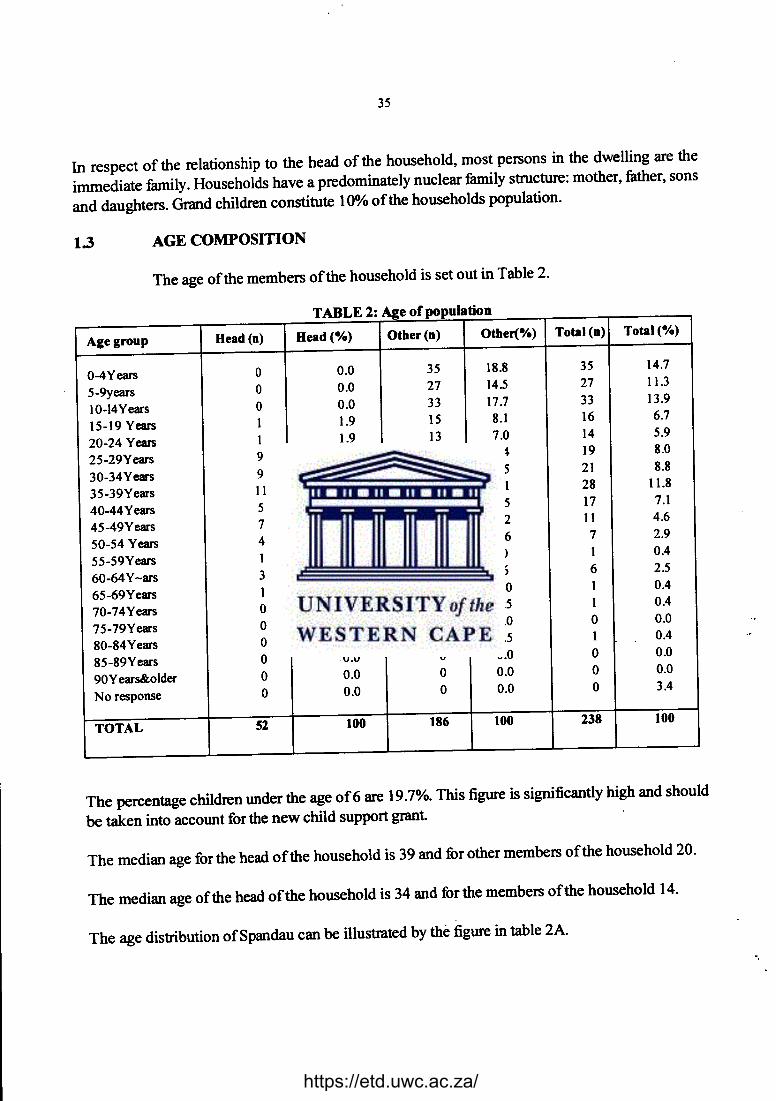
13 AGECO~OSnnONThe age of the members of the household is set out in Table 2.
Age group Head (0) Head (-Jo) Otber(o) Otber(%) Total (n) Total (%)
0-4Years 0 0.0 35 18.8 35 14.7
5-9years 0 0.0 27 14.5 27 11.3
10-14Years 0 0.0 33 17.7 33 13.9
15-19 Years 1 1.9 15 8.1 16 6.7
20-24 Years 1 1.9 13 7.0 14 5.9
25-29Years 9 173 10 5.4 19 8.0
30-34Years 9 17.3 12 6.5 21 8.8
35-39Years 11 21.2 17 9.1 28 11.8
40-44Years 5 9.6 12 6.5 17 7.1
45-49Years 7 13.5 4 2.2 11 4.6
50-54 Years 4 7.7 3 1.6 7 2.9
55-59Years 1 1.9 0 0 1 0.4
60-64Y-ars 3 5.8 3 16 6 2.5
65-69Years 1 1.9 0 0.0 1 0.4
70-74Years 0 0.0 1 0.5 1 0.4
75-79Years 0 0.0 0 0.0 0 0.0
80-84Years 0 0.0 1 0.5 1 0.4
85-89Years 0 0.0 0 0.0 0 0.0
90Years&older 0 0.0 0 0.0 0 0.0
No response 0 0.0 0 0.0 0 3.4
TOTAL 52 100 186 100 238 100
TABLE 2: Age of population
The percentage children under the age of 6 are 19.7%. This figure is significantly high and shouldbe taken into account for the new child support grant
The median age for the head of the household is 39 and for other members of the household 20.
The median age of the head of the household is 34 and for the members of the household 14.
The age distribution ofSpandau can be illustrated by the figure in table 2A.
https://etd.uwc.ac.za/
36
From Table 2 it can be seen that Spandau is a relatively young community. The community is stillexperiencing rapid population growth. More than a third of the population (39.9010) are youngerthan 15 years. It is estimated that the growth in population will place a heavy strain on health,education and social service delivery. Employment also has to be provided for the growingnumbers of people.
1.4 GENDER
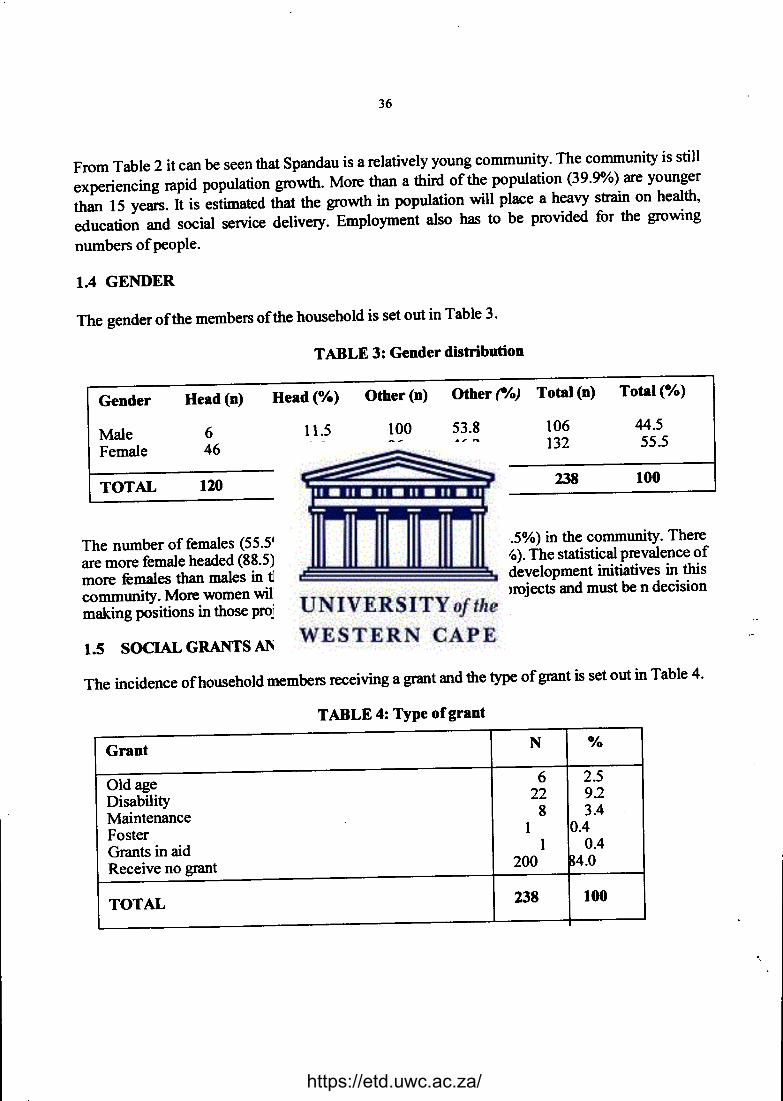
The gender of the members of the household is set out in Table 3.
TABLE 3: Gender distribution
Gender Head(n) Head (0/0) Other(n) Other rIo) Total (n) Total (0/0)
Male 6 11.5 100 53.8 106 44.5
Female 46 88.5 86 462 132 55.5
TOTAL 120 100 186 100 238 100
The number of females (55.5%) exceeds the number of males (44.5%) in the community. Thereare more female headed (88.5) than male headed households (11.5%). The statistical prevalence ofmore females than males in this community has implications for development initiatives in thiscommunity. More women will have to be involved in developing projects and must be n decisionmaking positions in those projects.
1.5 SOCIAL GRANTS ANDPENSIONS
The incidence of household members receiving a grant and the type of grant is set out in Table 4.
TABLE 4: Type of grant
Grant N °10
Old age 6 2.5Disability 22 92Maintenance 8 3.4
Foster 1 0.4Grants in aid 1 0.4Receive no grant 200 ~4.0
TOTAL 238 100
"
https://etd.uwc.ac.za/
37
About 15.9% of the household members ofSpandau are recipients of social welfare grants and/orpensions. Of these recipients, 3.4% are state maintenance grant beneficiaries. These individualsand their children will be hard hit by the current phasing out of the state maintenance grant,especially if one takes into account the situation of high unemployment (88.5% see Table 19) andlow income level. There are 48.5% households with an income ofR500 per month or less (seeTable 23). In the light of this and bearing in mind the large number of children under the age of6years (19.7%), it is suggested that the community urgently investigate its members' eligribity forthe new child support grant through its nearest Social Services district office.
There is not a high dependency on social security benefits in the community; only 5.4% of thepopulation are recipients.
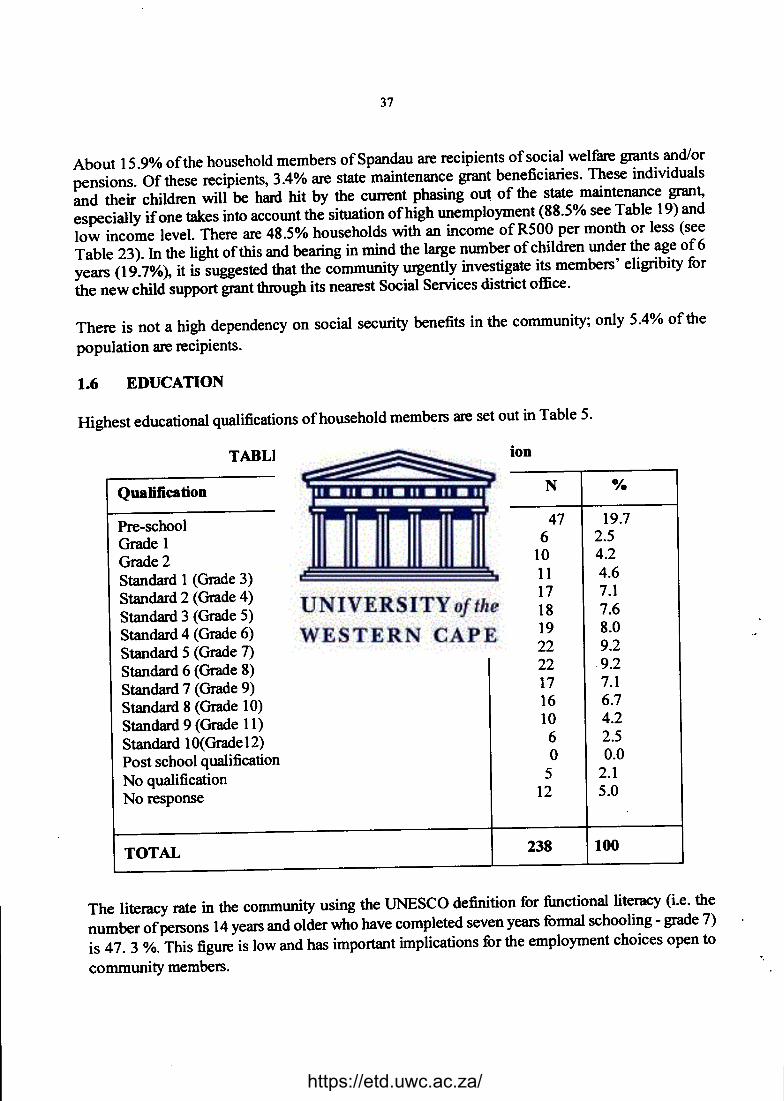
1.6 EDUCATION
Highest educational qualifications of household members are set out in Table 5.
TABLE 5 : Highest educational qualification
Qualification N 0/0
Pre-school 47 19.7
Grade 1 6 2.5
Grade 2 10 4.2
Standard 1 (Grade 3) 11 4.6
Standard 2 (Grade 4) 17 7.1
Standard 3 (Grade 5) 18 7.6Standard 4 (Grade 6) 19 8.0
Standard 5 (Grade 7) 22 9.2
Standard 6 (Grade 8) 22 9.2
Standard 7 (Grade 9) 17 7.1Standard 8 (Grade 10) 16 6.7
Standard 9 (Grade 11) 10 4.2
Standard 10(GradeI2) 6 2.5Post school qualification 0 0.0
No qualification 5 2.1
No response 12 5.0
TOTAL 238 100
The literacy rate in the community using the UNESCO definition for functional literacy (i.e. thenumber of persons 14 years and older who have completed seven years formal schooling - grade 7)is 47. 3 %. This figure is low and has important implications for the employment choices open tocommunity members. .,
https://etd.uwc.ac.za/
38
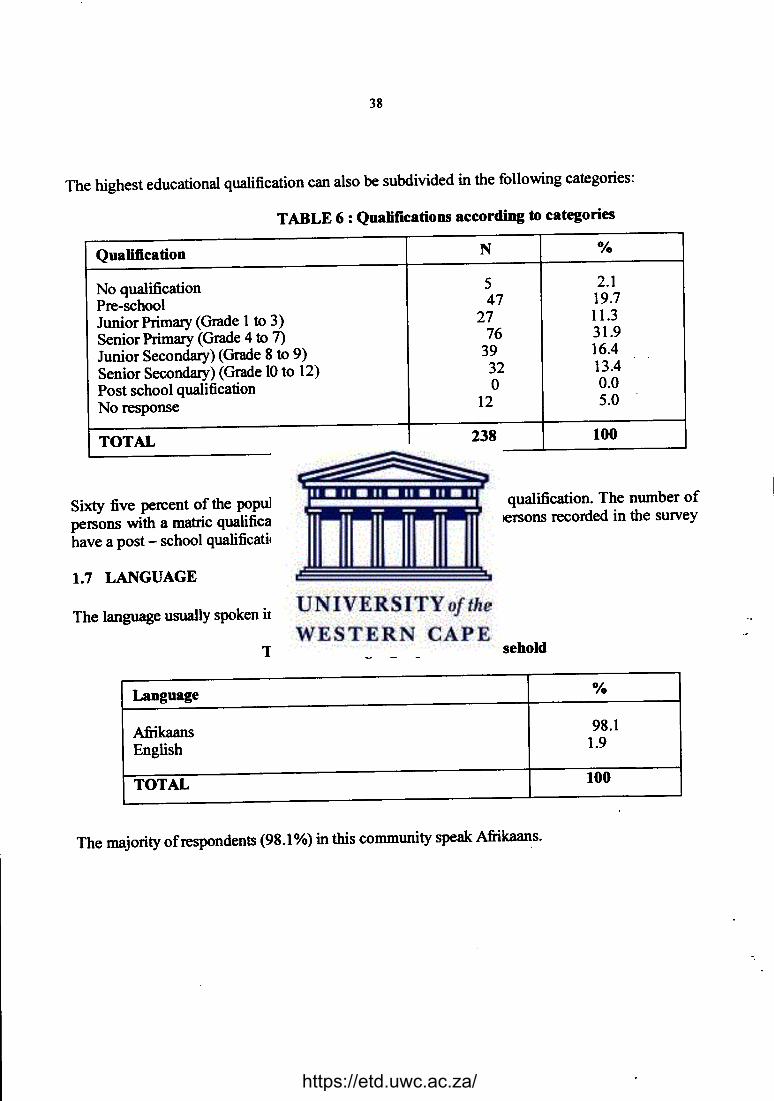
The highest educational qualification can also be subdivided in the following categories:
TABLE 6 : Qualifications according to categories
Qualification N 0/0
No qualification 5 2.1Pre-school 47 19.7Junior Primary (Grade 1 to 3) 27 11.3Senior Primary (Grade 4 to 7) 76 31.9Junior Secondary) (Grade 8 to 9) 39 16.4Senior Secondary) (Grade 10to 12) 32 13.4Post school qualification 0 0.0No response 12 5.0
TOTAL 238 100
Sixty five percent of the population have only a primary or lower qualification. The number ofpersons with a matric qualification is 2.5%, while not one of the persons recorded in the surveyhave a post - school qualification.
1.7 LANGUAGE
The language usually spoken in the household, is set out in Table 7.
TABLE 7: Language spoken in household
Language%
Afrikaans 98.1English 1.9
TOTAL 100
The majority of respondents (98.1 %) in this community speak Afrikaans.
.,
https://etd.uwc.ac.za/
39
2. HOUSING
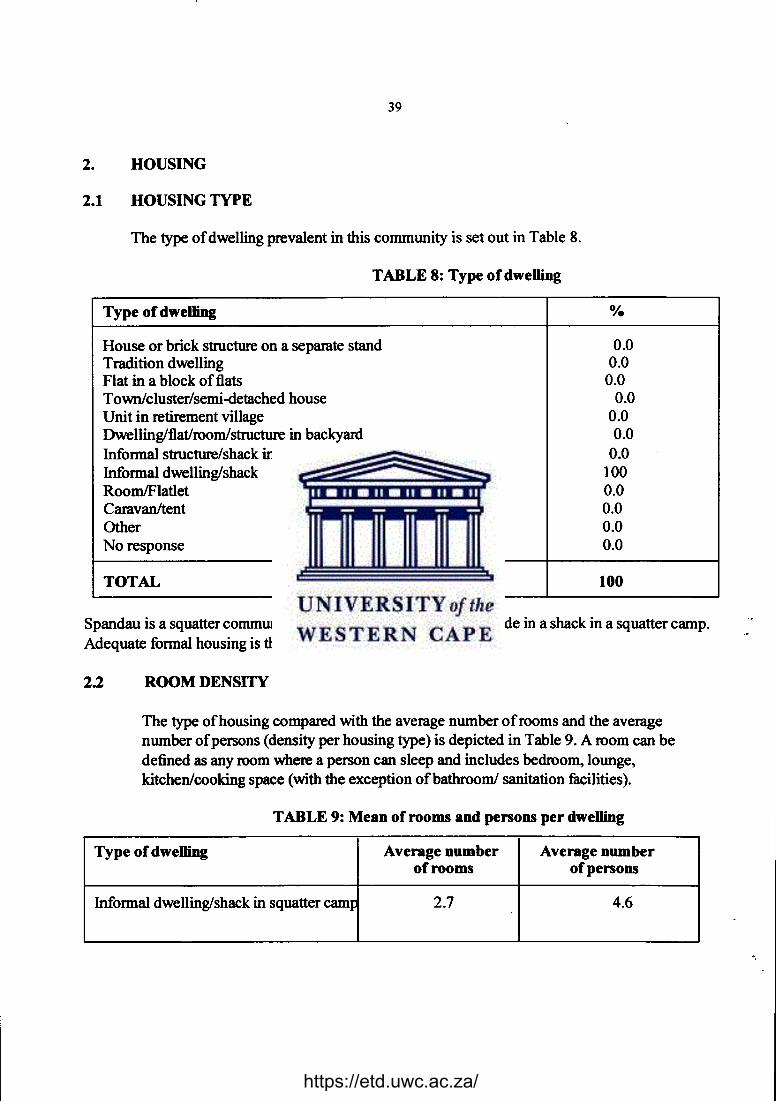
2.1 HOUSING TYPE
The type of dwelling prevalent in this community is set out in Table 8.
TABLE 8: Type of dwelling
Type of dwelling %
House or brick structure on a separate stand 0.0Tradition dwelling 0.0Flat in a block of flats 0.0Town/cluster/semi-detached house 0.0Unit in retirement village 0.0Dwelling/flatlroomlstructure in backyard 0.0Informal structure/shack in back yard 0.0Informal dwelling/shack 100RoomIFlatlet 0.0Caravan/tent 0.0Other 0.0No response 0.0
TOTAL 100
Spandau is a squatter community. All the respondents (100%) reside in a shack in a squatter camp.Adequate formal housing is thus a priority for this community.
2.2 ROOM DENSITY
The type of housing compared with the average number of rooms and the averagenumber of persons (density per housing type) is depicted in Table 9. A room can bedefined as any room where a person can sleep and includes bedroom, lounge,kitchen/cooking space (with the exception ofbathrooml sanitation facilities).
.,
TABLE 9: Mean of rooms and persons per dwelling
Type of dwelling Average number Average numberof rooms of persons
Informal dwelling/shack in squatter camp 2.7 4.6
https://etd.uwc.ac.za/
40
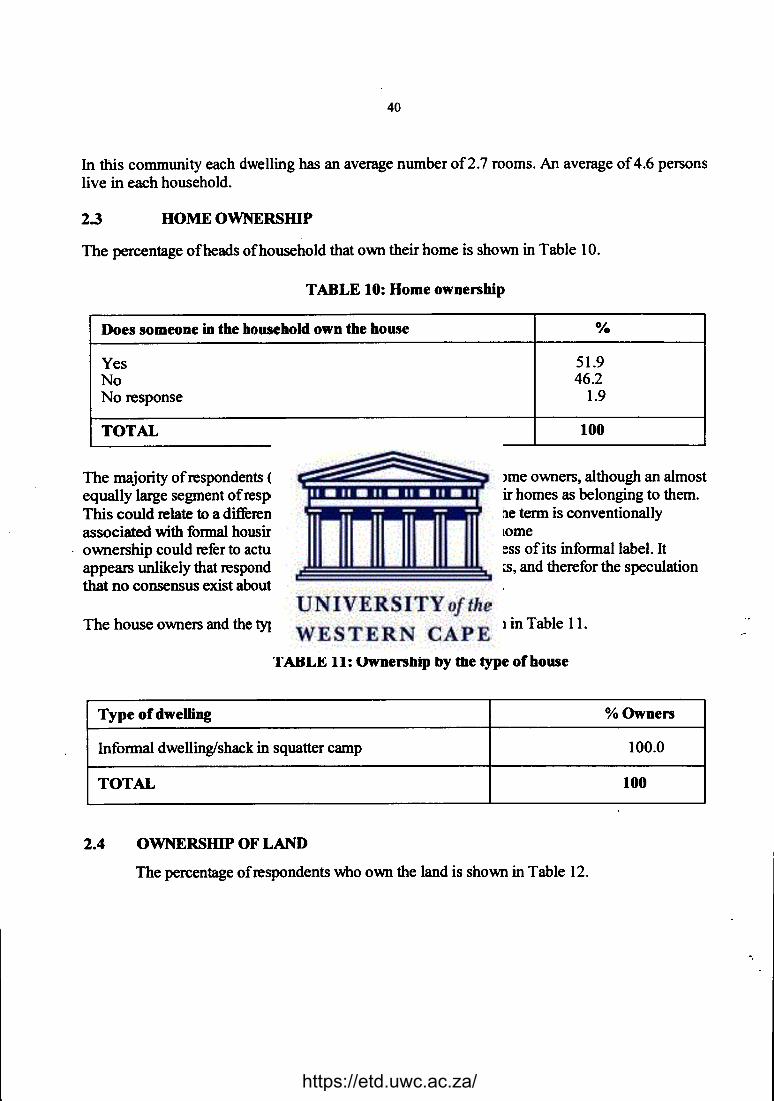
In this community each dwelling has an average number of2.7 rooms. An average of 4.6 personslive in each household.
2.3 HOME OWNERSIDP
The percentage of heads of household that own their home is shown in Table 10.
TABLE 10: Home ownership
Does someone in the household own the house 0/0
Yes 51.9No 46.2No response 1.9
TOTAL 100
The majority of respondents (51.9%) indicated that they are the home owners, although an almostequally large segment of respondents (462%) do not perceive their homes as belonging to them.This could relate to a difference in defining "home ownership." The term is conventionallyassociated with formal housing. To some respondents however, homeownership could refer to actual ownership of the structure regardless of its informal label. Itappears unlikely that respondents would be sub-letting their shacks, and therefor the speculationthat no consensus exist about the definition seems more probable.
The house owners and the type of dwellings they own can be seen in Table Il.
TABLE 11: Ownership by the type of house
Type of dwelling %Owners
Informal dwelling/shack in squatter camp 100.0
TOTAL 100
2.4 OWNERSmP OF LAND
.,
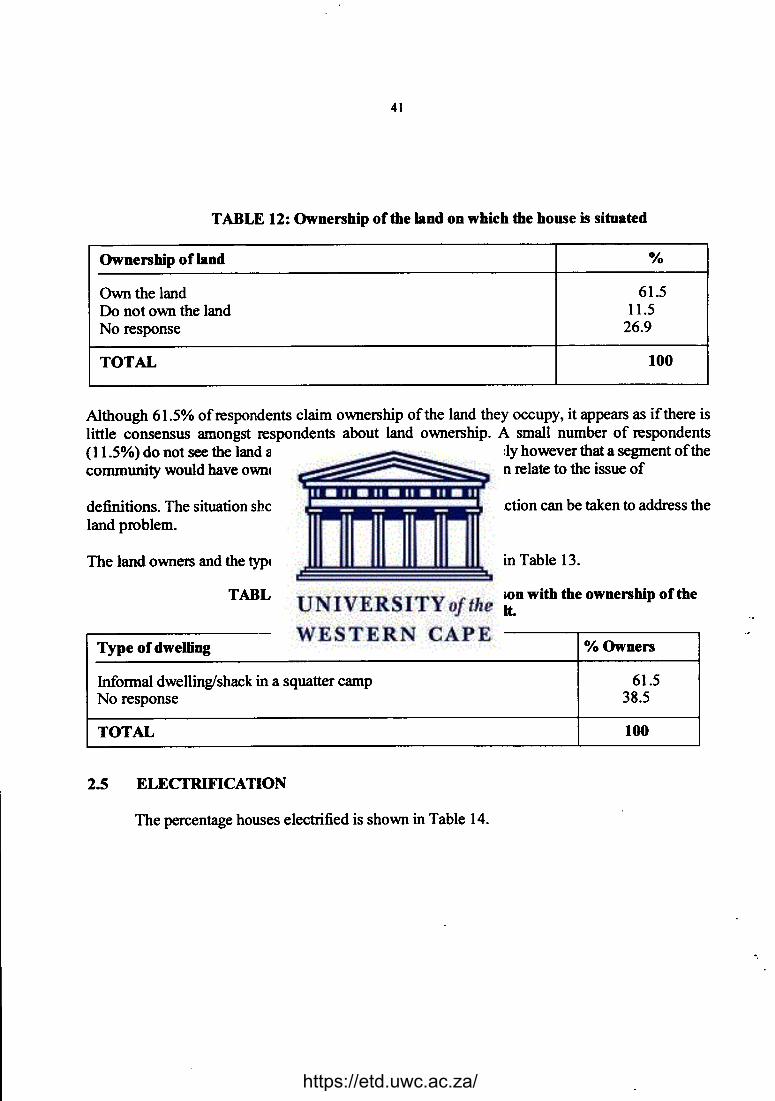
The percentage of respondents who own the land is shown in Table 12.
https://etd.uwc.ac.za/
41
TABLE 12: Ownership of the land on which the house is situated
Ownership of land 0/0
Own the land 61.5Do not own the land 11.5No response 26.9
TOTAL 100
Although 61.5% of respondents claim ownership of the land they occupy, it appears as if there islittle consensus amongst respondents about land ownership. A small number of respondents(11.5%) do not see the land as belonging to them. It seems unlikely however that a segment of thecommunity would have ownership and other not. This could again relate to the issue of
definitions. The situation should be clarified, so that appropriate action can be taken to address theland problem.
The land owners and the type of dwellings they own can be seen in Table 13.
TABLE 13: Type of dwelling in comparison with the ownership of theland on which the house is built.
Type of dwelling %Owners
Informal dwelling/shack in a squatter camp 61.5No response 38.5
TOTAL 100
2.5 ELECTRIFICATION
The percentage houses electrified is shown in Table 14.
"
https://etd.uwc.ac.za/
42
TABLE 14: Electrification ofthe house
House is electrified %
Yes 3.9No 96.1
TOTAL 100
The vast majority of households in Spandau (96.1 %) do not have access to electricity forhousehould use.
The type of houses that are electrified are shown in Table 15.
TABLE 15 T f d iii tbat l Ie "tied. ypeo we ng lSe ctri.Type of dwelling % Electrified
Informal dwelling/shack in squatter camp 100
TOTAL 100
Specifics of which aspects of the house is electrified is shown in Table 16.
TABLE 16: Type of electrification
Type of electrification %
No electricity 96.2No response 3.9
TOTAL 100
Respondents did not provide answers to the type of electrification that they are supplied with. Itcan be assumed that the electricity that they use is from another source
2.6 ENERGY SOURCES
The details of the type of energy that the household uses for cooking, heat and light,is set out in Table 17.
https://etd.uwc.ac.za/
43
TABLE 17: Energy source for household use
Energy source Cooking Heating Lighting0/0 % %
Electricity from other source 3.9 0.0 0.0Gas 73.1 0.0 0.0Paraffin 17.3 11.5 17.3Wood 3.9 69.2 0.0Coal 1.9 0.0 0.0Candles 0.0 0.0 82.7No response 0.0 19.2 0.0
TOTAL 100 100 100
A wide variety of energy sources are utilized in this community. The majority of households usegas (73.1%) for cooking, candles for light (82.7%) and wood for heat (69.2%). Paraffin is alsoused for cooking (17.3%), heat(l1.5%) and light (17.3%). The impact of the extentto which woodis used on the environment should be monitored and the provision of alternative energy sourcesshould be investigated.
3. DECISION MAKING
3.1 HOUSEHOLD PARTICIPATION IN DECISION MAKING
Participation in decision making in the household regarding specific issues are set out in Table 18below.
TABLE 18: Decisions
Decision 1: Money (saving. borrowing. spending) %
Jointly (partners) 42.3
Father 9.6
Mother 48.1
Decision 2: Children (discipline, schooling) %
Jointly (partners) 42.3Father 7.7Mother 50.0
TOTAL 100
.,
https://etd.uwc.ac.za/
44
D«ision 3: Major purchases (appliances, furniture) %
Jointly (partners) 44.2
Father 11.5
Mother ·44.2
Decision 4: The rules of the house) 0/0
Jointly (partners) 32.7Father 19.2Mother 46.2No Response 1.9
TOTAL 100
In all cases of decision making in the household, the majority of decisions are made by the motheralone (around 40-50%), or to a lesser extent jointly by both partners (around 32-44%). Maternaldominance in household decision making could be attributed to the fact that most of thehouseholds in Spandau are headed by women. There is no provision for the children to participatein decision making.
4. SOCIO-ECONOMIC INFORMATION
4.1 EMPLOYMENT OF HEAD OF HOUSEHOLD
The type of employment of the household head is set out in Table 19.
Employment %
Own family's business 5.8Work for an employer on permanent base 66.7Seasonal or temporary worker 5.8Don't work at aU 21.7
TOTAL 100 .,
TABLE 19:Employment of the household head
https://etd.uwc.ac.za/
45
The majority of head of households (66.7%) are permanent employees, while a minority (5.8%)are temporary/seasonal workers. 21.7% of the respondents report that they are unemployed.
4.2 EMPLOYMENT OF PARTNER
Employment status of partner/spouse is set out in Table 20.
TABLE 20: Employment status of the partner/spouse
Employment status %
Partner employed 25.0Partner unemployed 65.4No response 9.6
TOTAL 100
Although unemployment amongst partners (65.4%) is less severe than that of head of households,it is still very high.
4.3 OCCUPATION
The type of work that the household head and his/her partner do is set out in Table 21.
TABLE 21: Type of work
Type of work Respondent Partner% %
Unemployed/housewife/pensioner 86.5 71.2Farm labourers/Seasonal workers 1.9 0.0Semi-skilled (security work/factorylhand man) 1.9 0.0Domestic workers 5.8 1.09Artisansffradesman (painters/cabinet making) 0.0 23.1Sales (shop assistant/sales/reps) 1.9 0.0Services (Sangoma/fire brigade/traffic) 0.0 1.9Unclassified 1.9 1.9
TOTAL 100 100
-,
https://etd.uwc.ac.za/
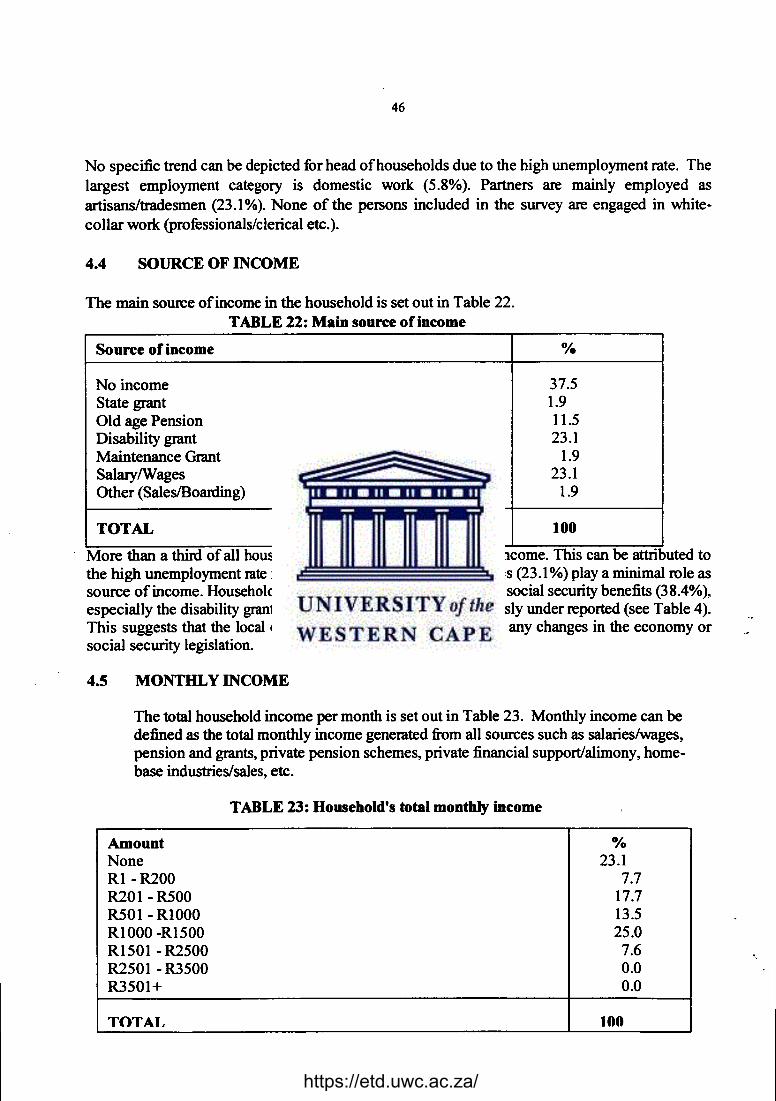
46
No specific trend can be depicted for head of households due to the high unemployment rate. Thelargest employment category is domestic work (5.8%). Partners are mainly employed asartisans/tradesmen (23.1%). None of the persons included in the survey are engaged in white-collar work (professionals/clerical etc.).
4.4 SOURCEOF INCOME
The main source of income in the household is set out in Table 22.TABLE 22: Main source of income
Source of income 0/0
No income 37.5State grant 1.9Old age Pension 11.5Disability grant 23.1Maintenance Grant 1.9SalarylWages 23.1Other (SalesIBoarding) 1.9
TOTAL 100.More than a third of all households (37.5%) have no source of income. This can be attributed to
the high unemployment rate in the community. Salaries andwages (23.1%) playa minimal role assource of income. Households are to a large extent dependent on social security benefits (38.4%),especially the disability grant although this situation was previously under reported (see Table 4).This suggests that the local economy is extremely vulnerable to any changes in the economy orsocial security legislation.
4.5 MONTHLYINCOME
The total household income per month is set out in Table 23. Monthly income can bedefined as the total monthly income generated from all sources such as salaries/wages,pension and grants, private pension schemes, private financial support/alimony, home-base industries/sales, etc.
TABLE 23: Household's total monthly income
Amount %None 23.1Rl -R200 7.7R20l-R500 17.7R50l-RlOOO 13.5RlOOO -R1500 25.0R150l - R2500 7.6R250l - R3500 0.0R350l+ 0.0
TOTAl. 100
"
https://etd.uwc.ac.za/
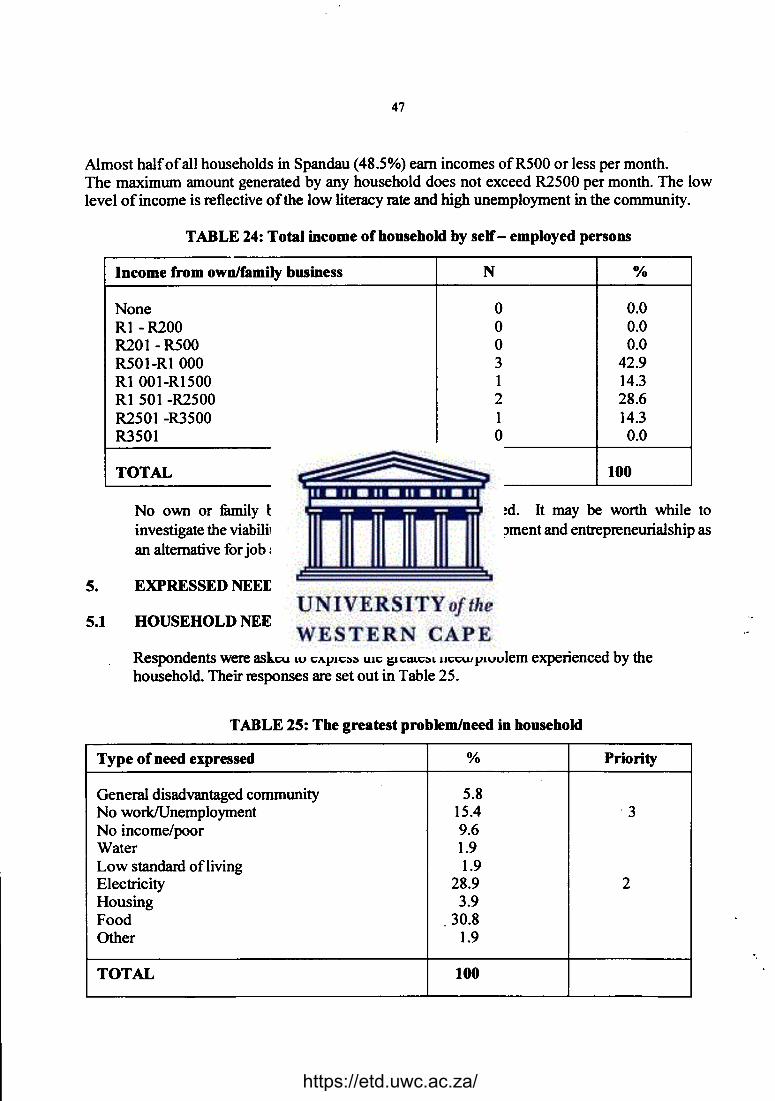
47
Almost halfofall households in Spandau (48.5%) earn incomes ofR500 or less per month.The maximum amount generated by any household does not exceed R2500 per month. The lowlevel of income is reflective of the low literacy rate and high unemployment in the community.
TABLE 24: Total income of household by self-employed persons
Income from own/family business N %
None 0 0.0Rl-R200 0 0.0R20l-R500 0 0.0R50l-RlOOO 3 42.9Rl 001-R1500 1 14.3Rl 501 -R2500 2 28.6R250l -R3500 1 14.3R350l 0 0.0
TOTAL 7 100
No own or family business undertakings were recorded. It may be worth while toinvestigate the viability of initiating small business development and entrepreneurial ship asan alternative for job and income generation.
5. EXPRESSED NEEDS
5.1 HOUSEHOLD NEEDS
Respondents were asked to express the greatest need/problem experienced by thehousehold. Their responses are set out in Table 25.
TABLE 25: The greatest problem/need in household
Type of need expressed % Priority
General disadvantaged community 5.8No worklUnemployment 15.4 '3No income/poor 9.6Water 1.9Low standard ofliving 1.9Electricity 28.9 2Housing 3.9Food 30.8Other 1.9
TOTAL 100-,
https://etd.uwc.ac.za/
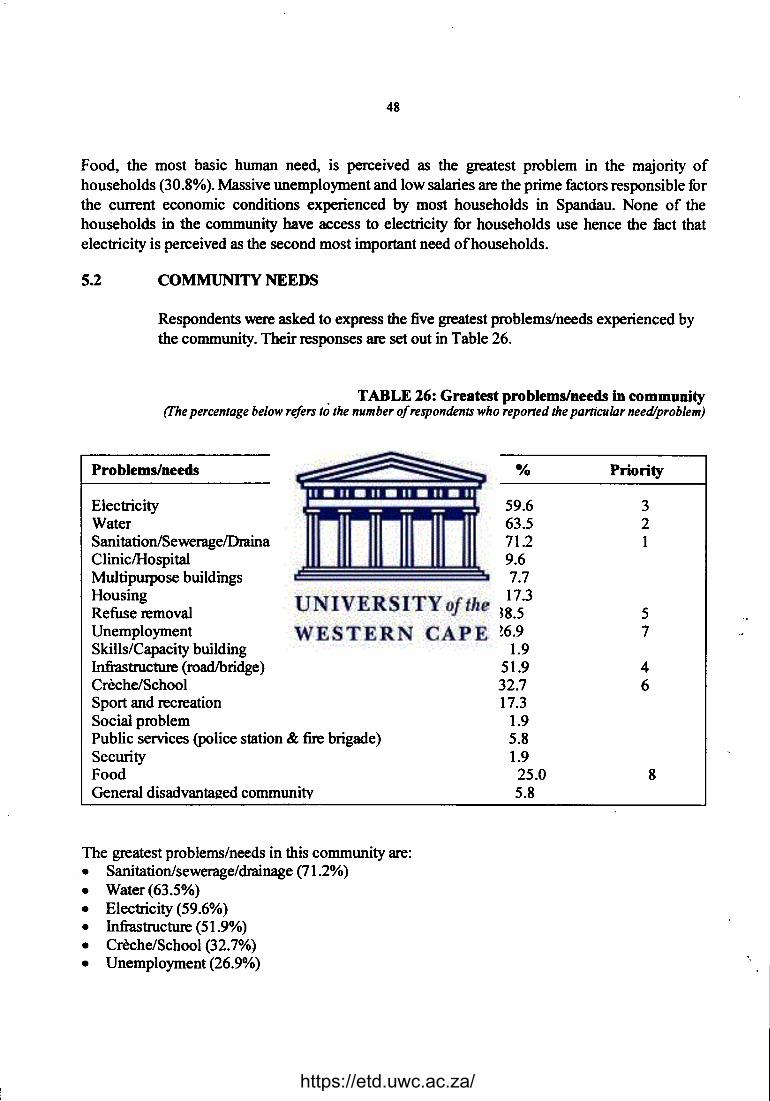
48
Food, the most basic human need, is perceived as the greatest problem in the majority ofhouseholds (30.8%). Massive unemployment and low salaries are the prime factors responsible forthe current economic conditions experienced by most households in Spandau. None of thehouseholds in the community have access to electricity for households use hence the filet thatelectricity is perceived as the second most important need ofhouseholds.
5.2 COMMUNITY NEEDS
Respondents were asked to express the five greatest problems/needs experienced bythe community. Their responses are set out in Table 26.
. TABLE 26: Greatest problems/needs in community(The percentage below refers to the number of respondents who reported the particular need/problem)
Problems/needs % Priority
Electricity 59.6 3Water 63.5 2Sanitation/SeweragelDrainage 712 1ClinicIHospitaI 9.6Multipurpose buildings 7.7Housing 17.3Refuse removal 38.5 5Unemployment 26.9 7Skills/Capacity building 1.9Infrastructure (road/bridge) 51.9 4Creche/School 32.7 6Sport and recreation 17.3Social problem 1.9Public services (police station & fire brigade) 5.8Security 1.9Food 25.0 8General disadvantaged community 5.8
The greatest problems/needs in this community are:• Sanitation/sewerage/drainage (71.2%)• Water (63.5%)• Electricity (59.6%)• Infrastructure (51.9%)• Creche/School (32.7%)• Unemployment (26.9%)
.,
https://etd.uwc.ac.za/
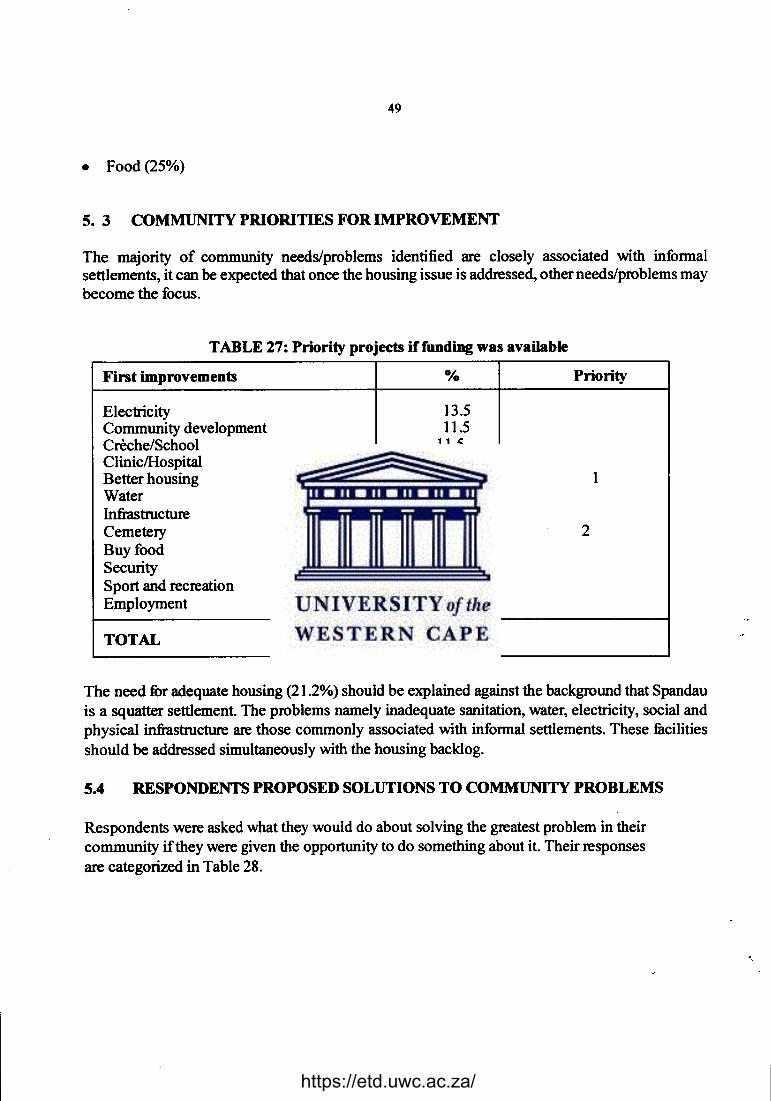
49
• Food (25%)
5. 3 COMMUNITY PRIORITIES FOR IMPROVEMENT
The majority of community needs/problems identified are closely associated with informalsettlements, it can be expected that once the housing issue is addressed, other needs/problems maybecome the focus.
TABLE 27: Priority projects iffundiDg was available
First improvements % Priority
Electricity 13.5Community development 11.5Creche/School 11.5ClinicIHospital 1.9Better housing 21.2 1Water 1.9Infiastructure 9.6Cemetery 17.3 2Buy food 1.9Security 3.9Sport and recreation 1.9Employment 3.9
TOTAL 100
The need for adequate housing (21.2%) should be explained against the background that Spandauis a squatter settlement. The problems namely inadequate sanitation, water, electricity, social andphysical infrastructure are those commonly associated with informal settlements. These facilitiesshould be addressed simultaneously with the housing backlog.
5.4 RESPONDENTS PROPOSED SOLUTIONS TO COMMUNITY PROBLEMS
Respondents were asked what they would do about solving the greatest problem in theircommunity ifthey were given the opportunity to do something about it. Their responsesare categorized in Table 28.
.,
https://etd.uwc.ac.za/
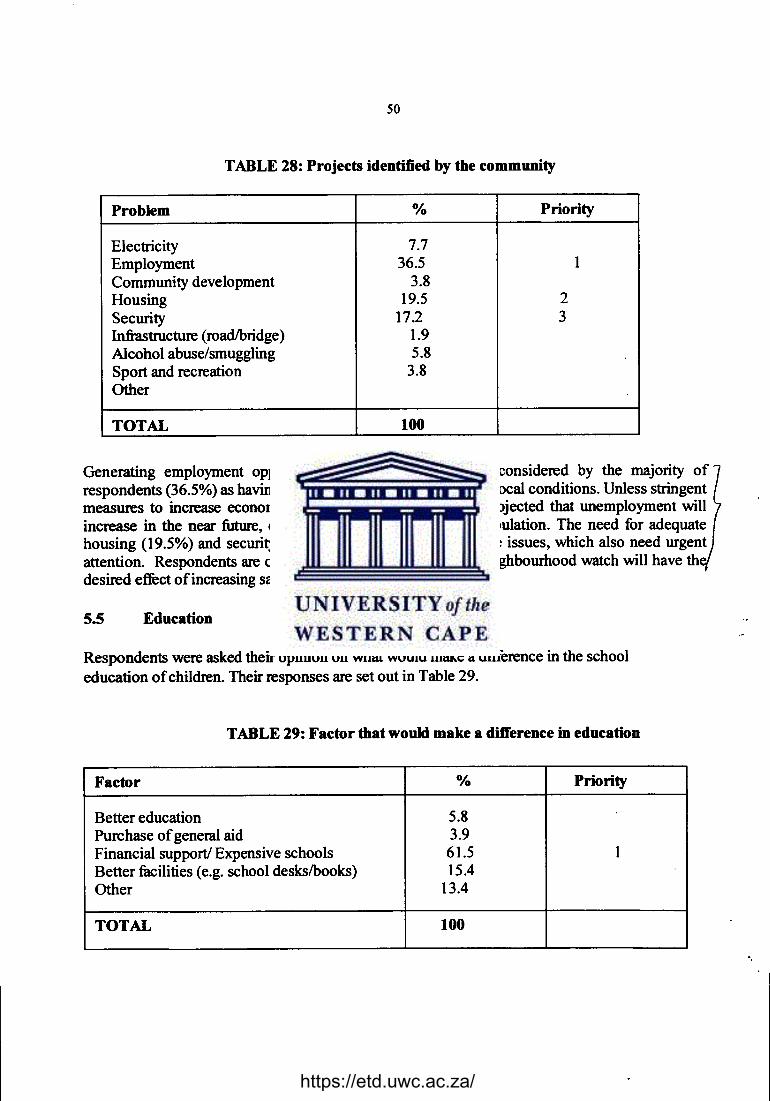
50
TABLE 28: Projects identified by the ~ommunity
Problem % Priority
Electricity 7.7Employment 36.5 1Community development 3.8Housing 19.5 2Security 172 3Infrastructure (road/bridge) 1.9Alcohol abuse/smuggling 5.8Sport and recreation 3.8Other
TOTAL 100
Generating employment opportunities in the community is considered by the majority ofrespondents (36.5%) as having the greatest potential to improve local conditions. Unless stringentmeasures to increase economic growth are introduced, it is projected that unemployment willincrease in the near future, considering the large youngful population. The need for adequatehousing (19.5%) and security in the neighbourhood (17.2%) are issues, which also need urgentattention. Respondents are of the opinion that introducing a neighbourhood watch will have thdesired effect of increasing safety in the community.
5.5 Edu~ation
Respondents were asked their opinion on what would make a difference in the schooleducation of children. Their responses are set out in Table 29.
TABLE 29: Factor that would make a difJeren~e in edueatioa
Factor % Priority
Better education 5.8Purchase of general aid 3.9Financial support! Expensive schools 61.5 1Better facilities (e.g. school desks/books) 15.4Other 13.4
TOTAL 100.,
https://etd.uwc.ac.za/
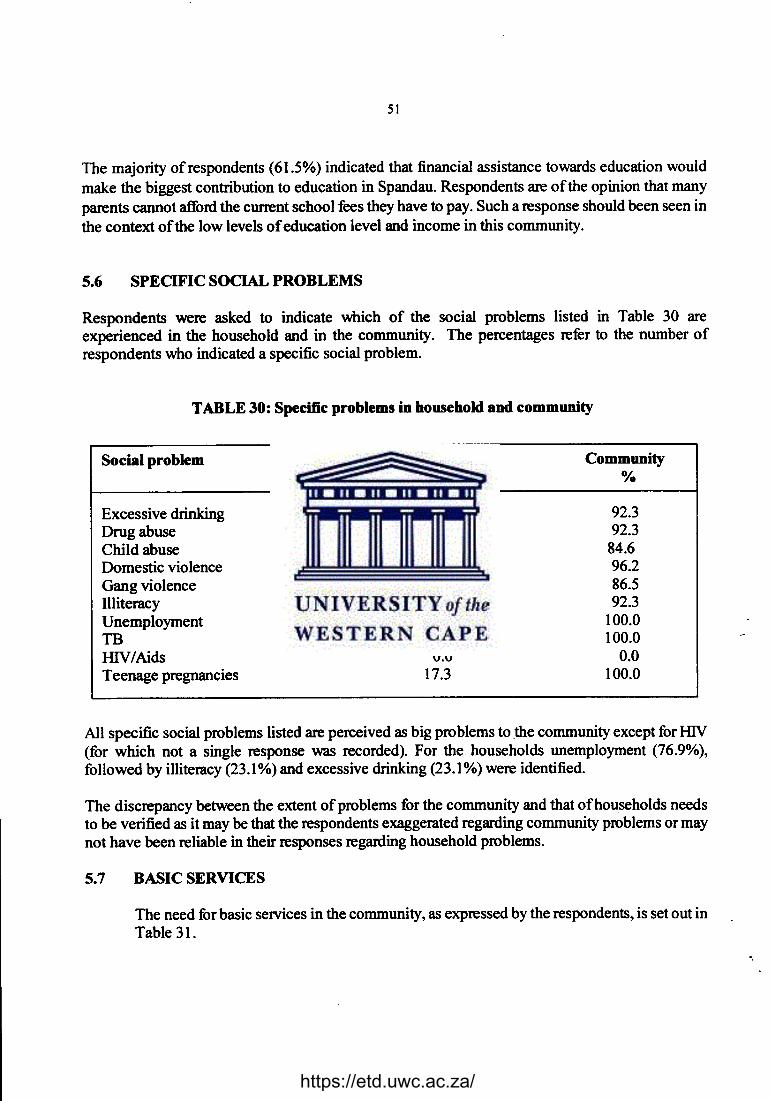
51
The majority of respondents (61.5%) indicated that financial assistance towards education wouldmake the biggest contribution to education in Spandau. Respondents are of the opinion that manyparents cannot afford the current school fees they have to pay. Such a response should been seen inthe context of the low levels of education level and income in this community.
5.6 SPECIFIC SOCIAL PROBLEMS
Respondents were asked to indicate which of the social problems listed in Table 30 areexperienced in the household and in the community. The percentages refer to the number ofrespondents who indicated a specific social problem.
TABLE 30: Specific problems in household and community
Social problem Household Community% %
Excessive drinking 23.1 92.3Drug abuse 7.7 92.3Child abuse 0.0 84.6Domestic violence 11.5 96.2Gang violence 0.0 86.5Illiteracy 23.1 92.3Unemployment 76.9 100.0TB 13.5 100.0IDV/Aids 0.0 0.0Teenage pregnancies 17.3 100.0
All specific social problems listed are perceived as big problems to the community except formv(for which not a single response was recorded). For the households unemployment (76.9%),followed by illiteracy (23.1%) and excessive drinking (23.1%) were identified.
The discrepancy between the extent of problems for the community and that of'households needsto be verified as it may be that the respondents exaggerated regarding community problems or maynot have been reliable in their responses regarding household problems.
5.7 BASIC SERVICES
The need for basic services in the community, as expressed by the respondents, is set out inTable 31.
.,
https://etd.uwc.ac.za/
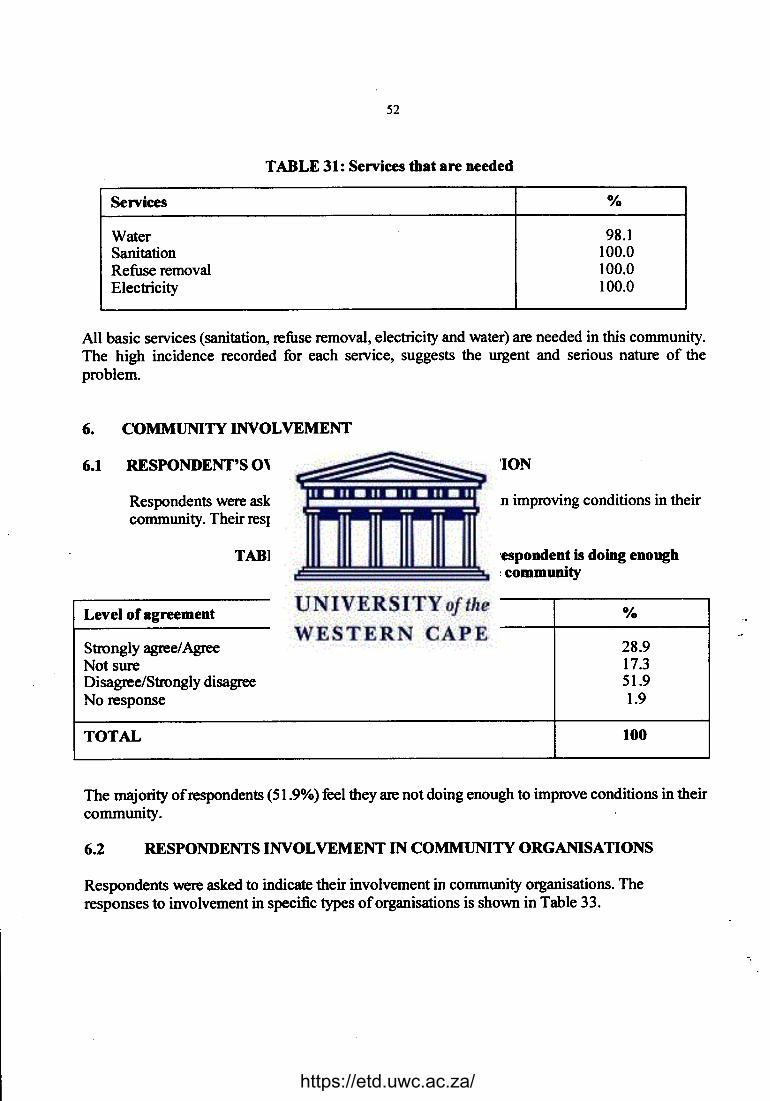
52
TABLE 31: Services that are needed
Services %
Water 98.1Sanitation 100.0Refuse removal 100.0Electricity 100.0
All basic services (sanitation, refuse removal, electricity and water) are needed in this community.The high incidence recorded for each service, suggests the urgent and serious nature of theproblem.
6. COMMUNITY INVOLVEMENT
6.1 RESPONDENT'S OWN COMMUNITY PARTICIPATION
Respondents were asked to report their own participation in improving conditions in theircommunity. Their responses are set out inTable 32.
TABLE 31: Opinion as to whether the respondent is doing enoughto improve conditions ~ the community
Level of agreement %
Strongly agree/Agree 28.9Not sure 17.3Disagree/Strongly disagree 51.9No response 1.9
TOTAL 100
The majority of respondents (51.9%) feel they are not doing enough to improve conditions in theircommunity.
6.1 RESPONDENTS INVOLVEMENT IN COMMUNITY ORGANISATIONS
Respondents were asked to indicate their involvement in community organisations. Theresponses to involvement in specific types of organisations is shown in Table 33.
https://etd.uwc.ac.za/
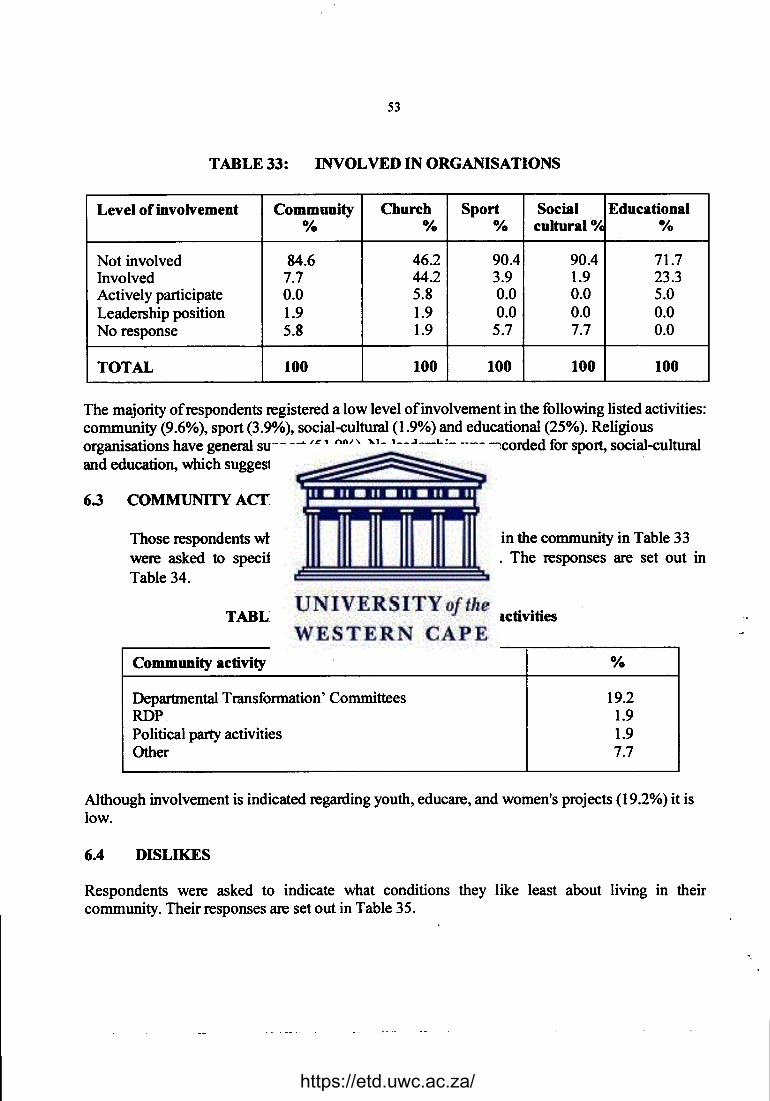
53
TABLE 33: INVOLVED IN ORGANISATIONS
Level of involvement Community Church Sport Social Educational% % % cultural o/c %
Not involved 84.6 46.2 90.4 90.4 71.7Involved 7.7 44.2 3.9 1.9 23.3Actively participate 0.0 5.8 0.0 0.0 5.0Leadership position 1.9 1.9 0.0 0.0 0.0No response 5.8 1.9 5.7 7.7 0.0
TOTAL 100 100 100 100 100
The majority of respondents registered a low level of involvement in the following listed activities:community (9.6%), sport (3.9%), social-cultural (1.9%) and educational (25%). Religiousorganisations have general support (51.9%). No leadership was recorded for sport, social-culturaland education, which suggests a need for capacity building.
6.3 COMMUNITY ACTIVITIES
Those respondents who indicated that they were involved in the community in Table 33were asked to specify the nature of their involvement The responses are set out inTable 34.
TABLE 34: Involvement in community activities
Community activity %
Departmental Transformation' Committees 19.2RDP 1.9Political party activities 1.9Other 7.7
Although involvement is indicated regarding youth, educare, and women's projects (19.2%) it is~~ ,
6.4 DISLIKES
Respondents were asked to indicate what conditions they like least about living in theircommunity. Their responses are set out in Table 35.
.,
https://etd.uwc.ac.za/
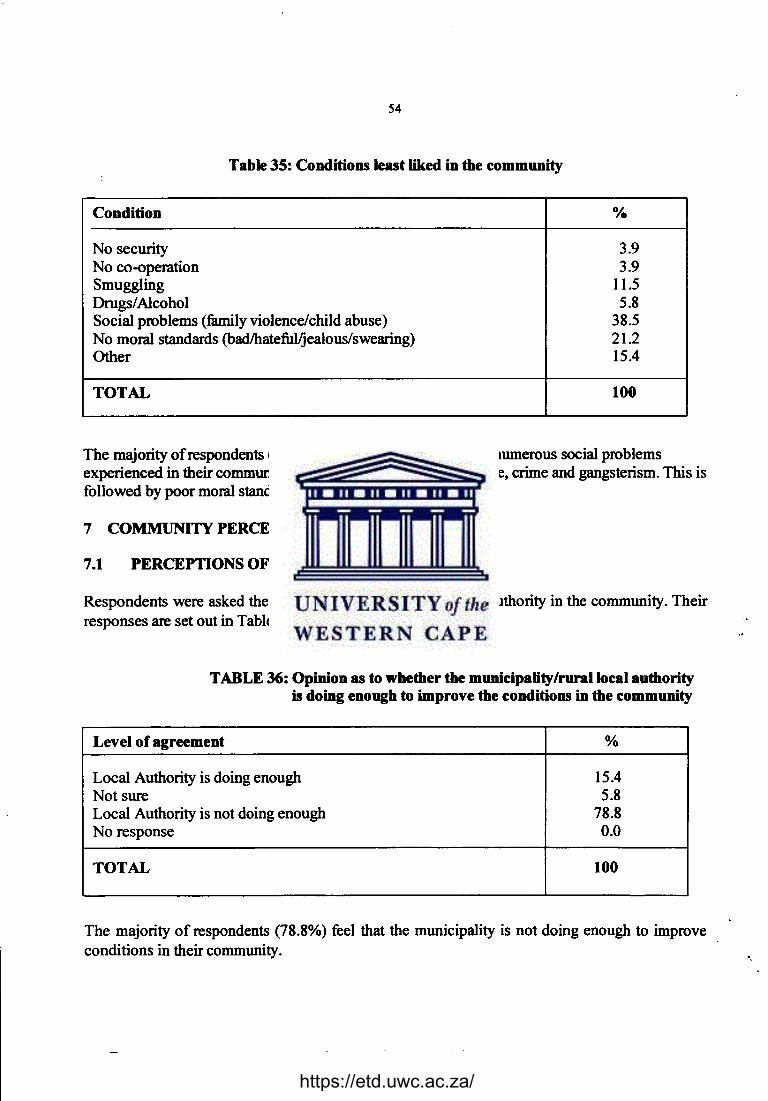
54
Table 35: Conditions least liked in the community
Condition %
No security 3.9No co-operation 3.9Smuggling 11.5Drugs/Alcohol 5.8Social problems (family violence/child abuse) 38.5No moral standards (bad/hateful/jealouslswearing) 21.2Other 15.4
TOTAL 100
The majority of respondents (38.5%) dislike the presence of the numerous social problemsexperienced in their community such as smuggling, alcohol abuse, crime and gangsterism. This isfollowed by poor moral standards (21.2%).
7 COMMUNITY PERCEPTIONS
7.1 PERCEPTIONS OF LOCAL GOVERNMENT
Respondents were asked their opinion on the role of the local authority in the community. Theirresponses are set out in Table 36.
TABLE 36: Opinion as to whether the municipality/rurallocal authorityis doing enough to improve the conditions in the community
Level of agreement %
Local Authority is doing enough 15.4Not sure 5.8Local Authority is not doing enough 78.8No response 0.0
TOTAL 100
The majority of respondents (78.8%) feel that the municipality is not doing enough to improveconditions in their community. .,
https://etd.uwc.ac.za/
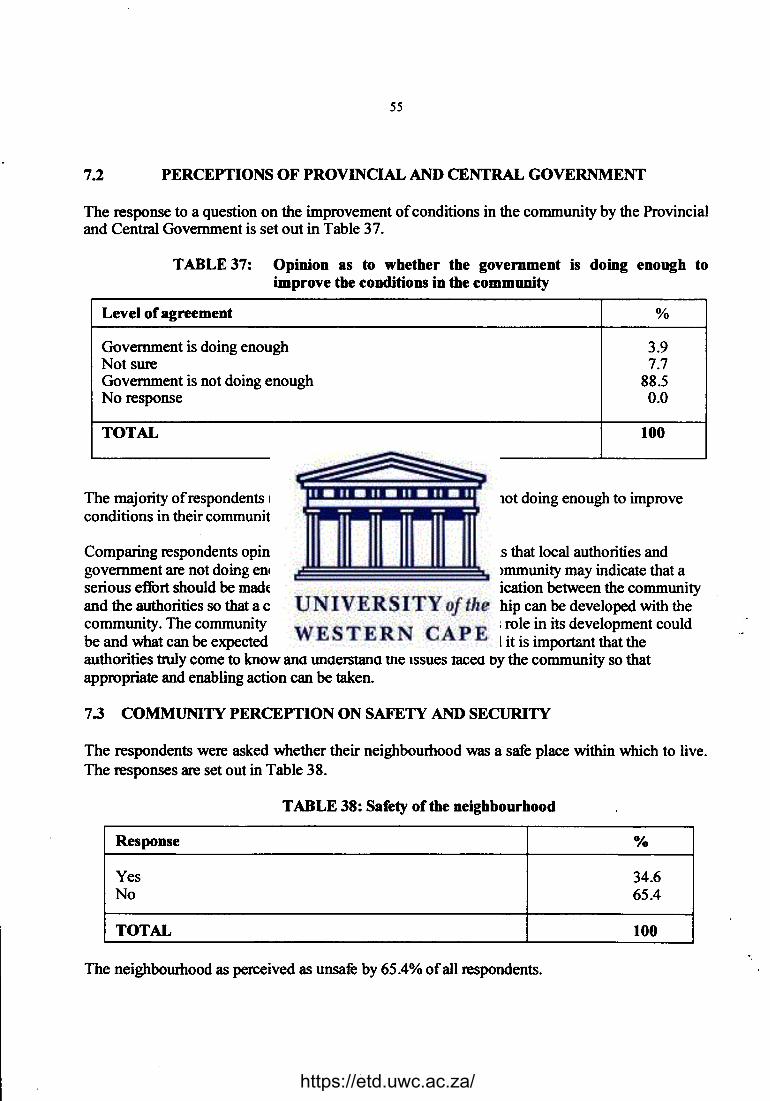
55
7.2 PERCEPTIONS OF PROVINCIAL AND CENTRAL GOVERNMENT
The response to a question on the improvement of conditions in the community by the Provincialand Central Government is set out in Table 37.
TABLE 37: Opinion as to whether the government is doing enough toimprove the conditions in the community
Level of agreement %
Government is doing enough 3.9Not sure 7.7Government is not doing enough 88.5No response 0.0TOTAL 100
The majority of respondents (88.4%) feel that the government is not doing enough to improveconditions in their community.
Comparing respondents opinion under Table 32 with the opinions that local authorities andgovernment are not doing enough to improve conditions in the community may indicate that aserious effort should be made to establish good! healthy communication between the communityand the authorities so that a collaborative and supportive partnership can be developed with thecommunity. The community needs to Clearly understand what its role in its development couldbe and what can be expected of the authorities. On the other hand it is important that theauthorities truly come to know and understand the issues faced by the community so thatappropriate and enabling action can be taken.
7.3 COMMUNITY PERCEPTION ON SAFETY AND SECURITY
The respondents were asked whether their neighbourhood was a safe place within which to live.The responses are set out in Table 38.
TABLE 38: Safety of the neighbourhood
Response 0/0
Yes 34.6No 65.4
TOTAL 100"
The neighbourhood as perceived as unsafe by 65.4% of all respondents.
https://etd.uwc.ac.za/
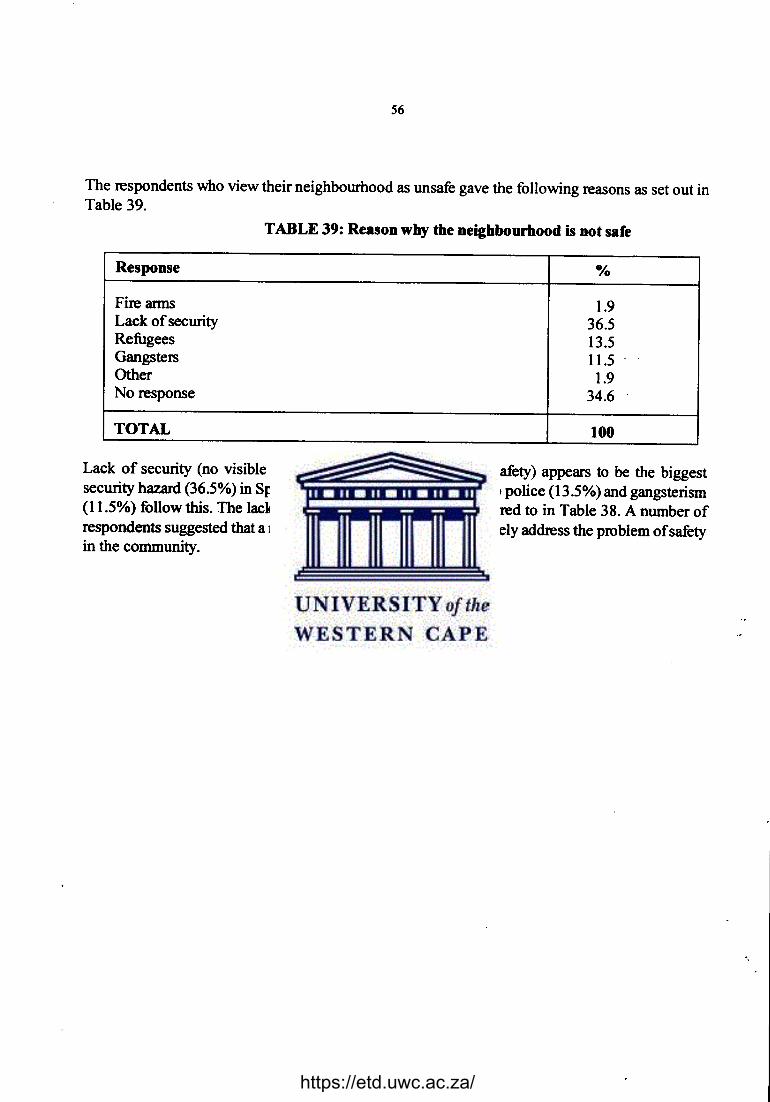
56
The respondents who view their neighbourhood as unsafe gave the following reasons as set out inTable 39.
TABLE 39: Reason why the neighbourhood is not safe
Response %
Fire arms 1.9Lack of security 36.5Refugees 13.5Gangsters 11.5Other 1.9No response 34.6
TOTAL 100
Lack of security (no visible policing, crime, fear for personal safety) appears to be the biggestsecurity hazard (36.5%) in Spandau. Concerns about resistance to police (13.5%) and gangsterism(11.5%) follow this. The lack of security in Spandau is also referred to in Table 38. A number ofrespondents suggested that a neighbourhood watch could effectively address the problem of safetyin the community.
https://etd.uwc.ac.za/
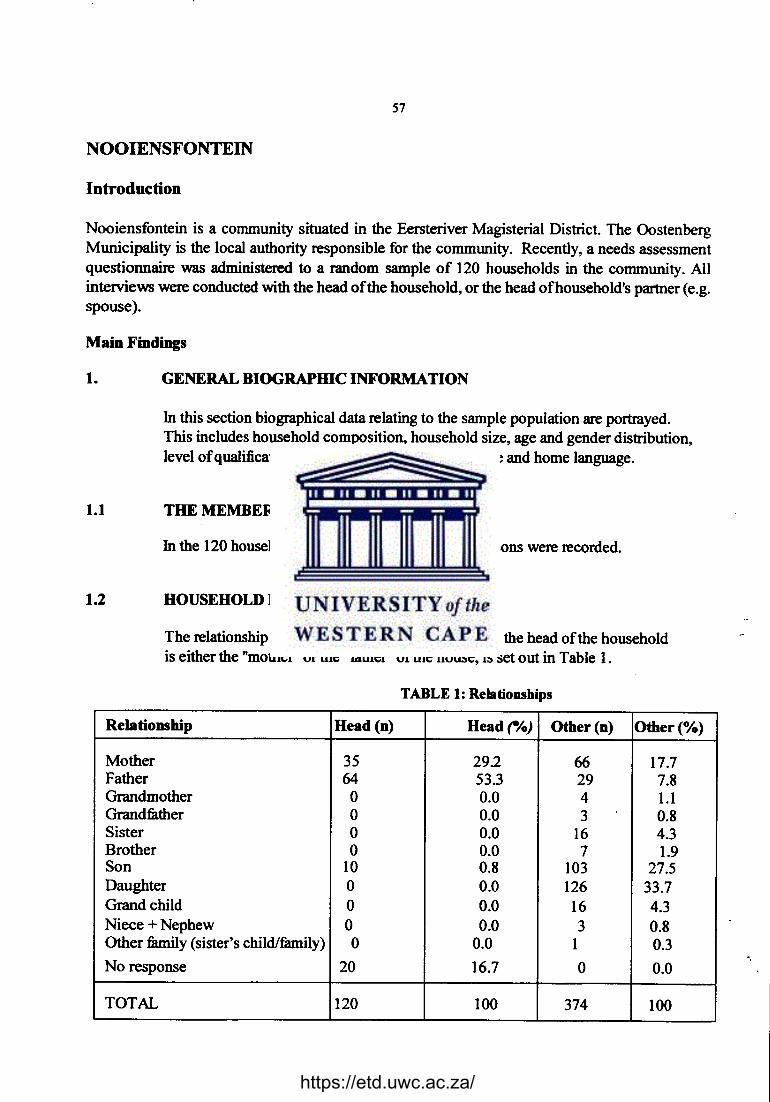
57
NOOIENSFONTEIN
Introduction
Nooiensfontein is a community situated in the Eersteriver Magisterial District. The OostenbergMunicipality is the local authority responsible for the community. Recently, a needs assessmentquestionnaire was administered to a random sample of 120 households in the community. Allinterviews were conducted with the head of the household, or the head of house hold's partner (e.g.spouse).
Main Findings
1. GENERAL BIOGRAPIDC INFORMATION
In this section biographical data relating to the sample population are portrayed.This includes household composition, household size, age and gender distribution,level of qualification or education, household income and home language.
1.1 THE MEMBERS OF THE HOUSEHOLD
In the 120 households interviewed a total of 494 persons were recorded.
1.2 HOUSEHOLD RELATIONSIDPS
The relationship to the head of the household, where the head of the householdis either the "mother" or the "father" of the house, is set out in Table 1.
TABLE 1: Relationships
Relationship Head (n) Head rio) Other(n) Other(%)
Mother 35 292 66 17.7Father 64 53.3 29 7.8Grandmother 0 0.0 4 1.1Grandfather 0 0.0 3 0.8Sister 0 0.0 16 4.3Brother 0 0.0 7 1.9Son 10 0.8 103 27.5Daughter 0 0.0 126 33.7Grand child 0 0.0 16 4.3Niece + Nephew 0 0.0 3 0.8Other family (sister's child/family) 0 0.0 1 0.3No response 20 16.7 0 0.0
TOTAL 120 100 374 100
https://etd.uwc.ac.za/
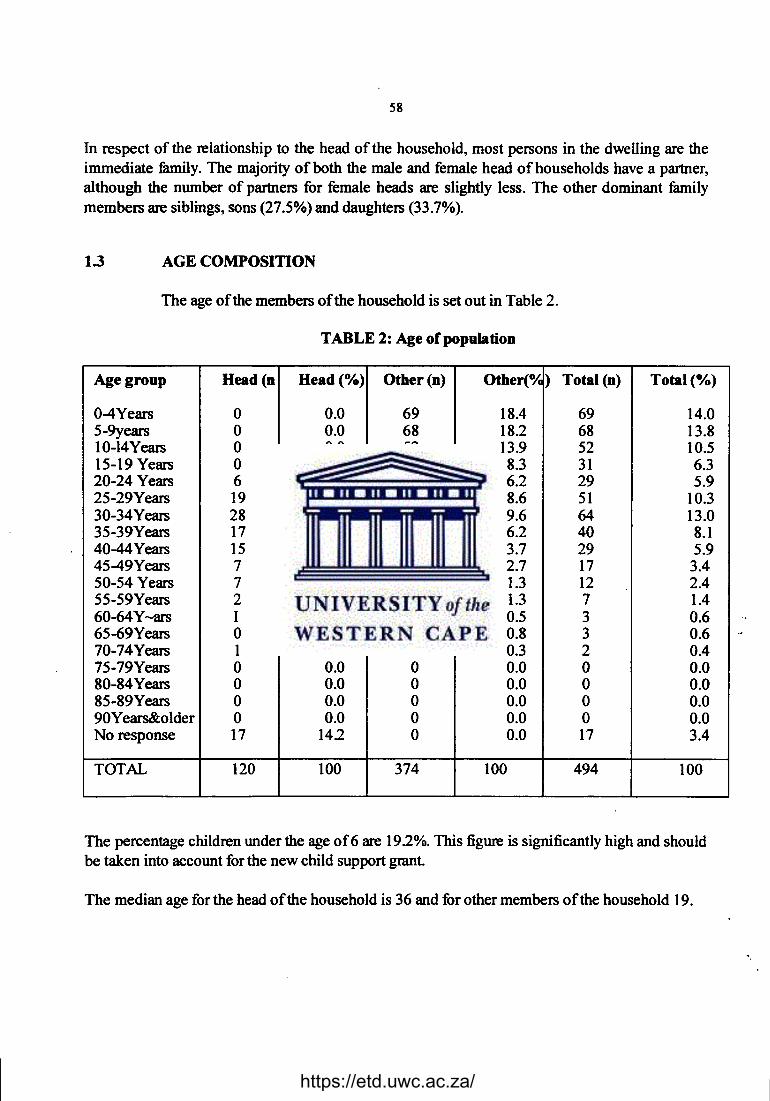
58
In respect of the relationship to the head of the household, most persons in the dwelling are theimmediate family, The majority of both the male and female head of households have a partner,although the number of partners for female heads are slightly less. The other dominant familymembers are siblings, sons (27.5%) and daughters (33.7%).
13 AGECO~OSnnON
The age of the members of the household is set out in Table 2.
TABLE 2: Age of population
Age group Head (n Head(%) Other(n) Other(o/c ) Total (n) Total(%)
0-4Years 0 0.0 69 18.4 69 14.05-9years 0 0.0 68 18.2 68 13.810-14Years 0 0.0 52 13.9 52 10.515-19 Years 0 0.0 31 8.3 31 6.320-24 Years 6 5.0 23 6.2 29 5.925-29Years 19 15.8 32 8.6 51 10.330-34Years 28 23.3 36 9.6 64 13.035-39Years 17 142 23 6.2 40 8.140-44Years 15 12.5 14 3.7 29 5.945-49Years 7 5.8 10 2.7 17 3.450-54 Years 7 5.8 5 1.3 12 2.455-59Years 2 1.7 5 1.3 7 1.460-64Y-ars I 0.8 2 0.5 3 0.665-69Years 0 0.0 3 0.8 3 0.670-74Years 1 0.8 I 0.3 2 0.475-79Years 0 0.0 0 0.0 0 0.080-84Years 0 0.0 0 0.0 0 0.085-89Years 0 0.0 0 0.0 0 0.090Years&0lder 0 0.0 0 0.0 0 0.0No response 17 142 0 0.0 17 3.4
TOTAL 120 100 374 100 494 100
The percentage children under the age of 6 are 19.2%. This figure is significantly high and shouldbe taken into account for the new child support grant.
The median age for the head of the household is 36 and for other members of the household 19.
"
https://etd.uwc.ac.za/
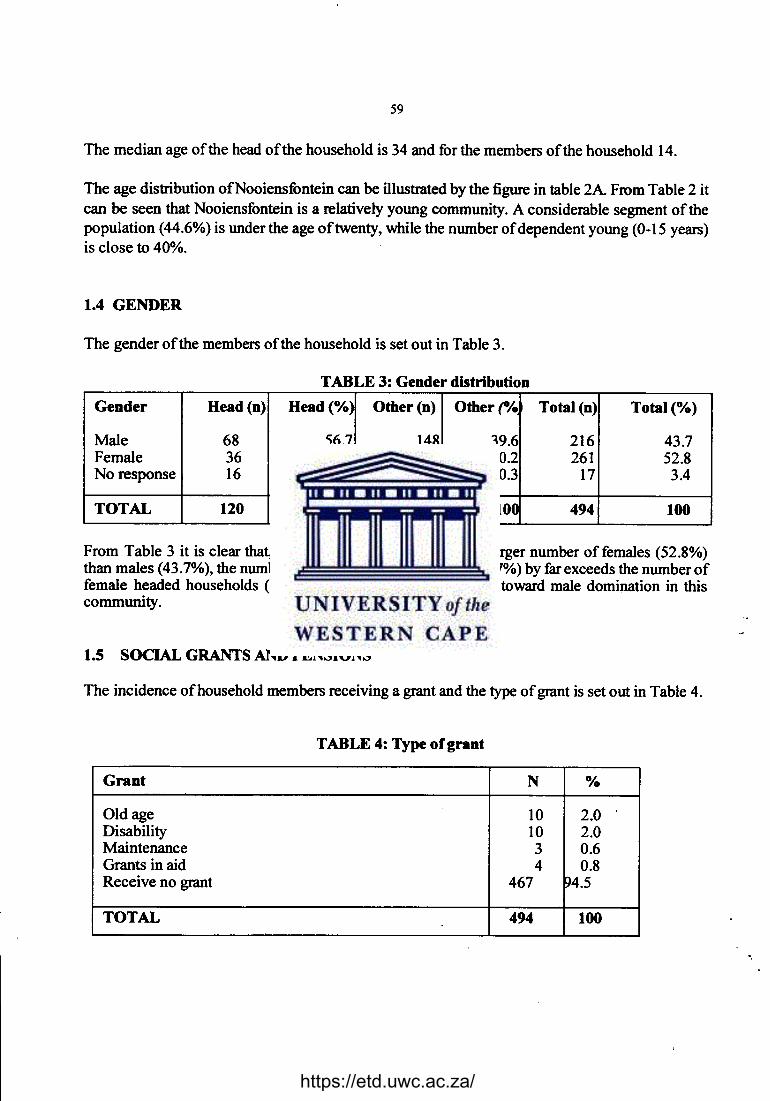
59
The median age of the head of the household is 34 and for the members of the household 14.
The age distribution ofNooiensfontein can be illustrated by the figure in table 2A From Table 2 itcan be seen that Nooiensfontein is a relatively young community. A considerable segment of thepopulation (44.6%) is under the age of twenty, while the number of dependent young (0-15 years)is close to 40%.
1.4 GENDER
The gender of the members of the household is set out in Table 3.
TABLE 3: Gender distributionGender Head(n) Head(%) Other(n) Other rio Total (n) Total (%)
Male 68 56.7 148 39.6 216 43.7Female 36 30.0 225 60.2 261 52.8No response 16 13.3 1 0.3 17 3.4
TOTAL 120 100 374 10~ 494 100
From Table 3 it is clear that, although there is a substantially larger number of females (52.8%)than males (43.7%), the number of male headed households (56.7%) by far exceeds the number offemale headed households (30%). This suggests is a tendency toward male domination in thiscommunity.
1.5 SOCIAL GRANTS AND PENSIONS
The incidence of household members receiving a grant and the type of grant is set out in Table 4.
TABLE 4: Type of grant
Grant N %
Old age 10 2.0Disability 10 2.0Maintenance 3 0.6Grants in aid 4 0.8Receive no grant 467 94.5
TOTAL 494 100.,
https://etd.uwc.ac.za/
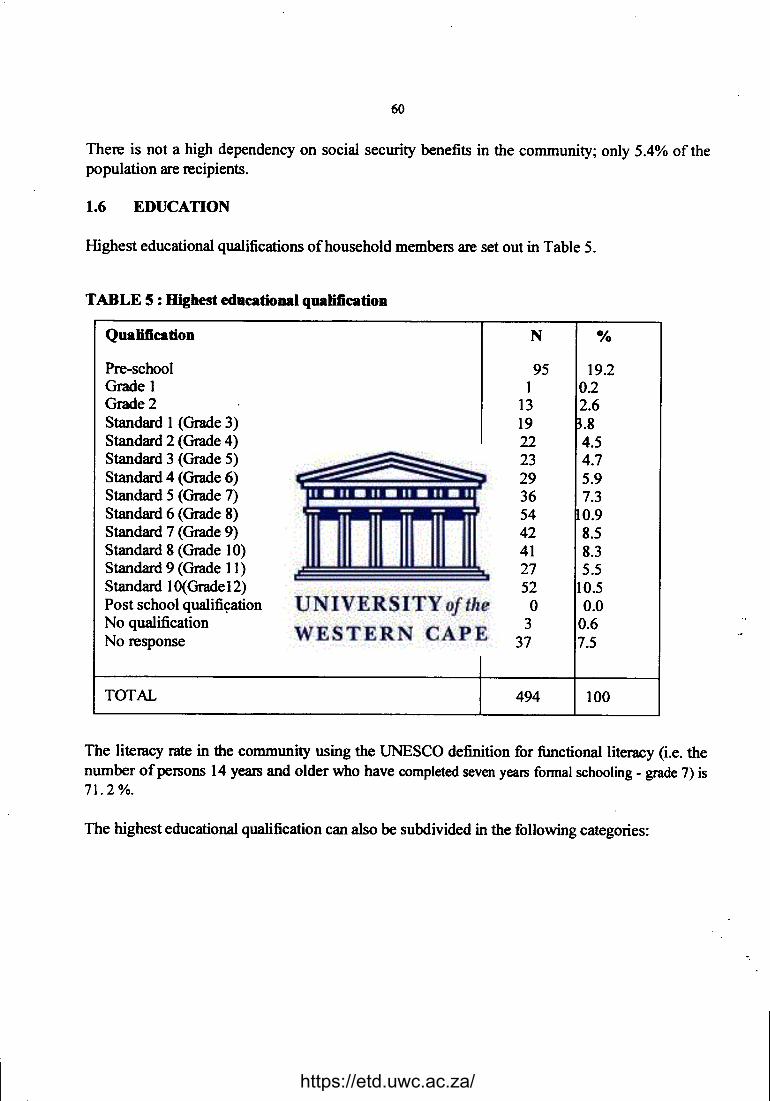
60
There is not a high dependency on social security benefits in the community; only 5.4% of thepopulation are recipients.
1.6 EDUCATION
Highest educational qualifications of household members are set out in Table 5.
TABLE 5 : Highest educational qualification
Qualification N 0/0
Pre-school 95 19.2Grade 1 1 0.2Grade2 13 2.6Standard 1 (Grade 3) 19 ~.8Standard 2 (Grade 4) 22 4.5Standard 3 (Grade 5) 23 4.7Standard 4 (Grade 6) 29 5.9Standard 5 (Grade 7) 36 7.3Standard 6 (Grade 8) 54 0.9Standard 7 (Grade 9) 42 8.5Standard 8 (Grade 10) 41 8.3Standard 9 (Grade 11) 27 5.5Standard 10(GradeI2) 52 10.5Postschoolqualifi~ation 0 0.0No qualification 3 0.6No response 37 7.5
TOTAL 494 100
The literacy rate in the community using the UNESCO definition for functional literacy (i.e. thenumber of persons 14 years and older who have completed seven years formal schooling - grade 7) is71. 2 %.
The highest educational qualification can also be subdivided in the following categories:
"
https://etd.uwc.ac.za/
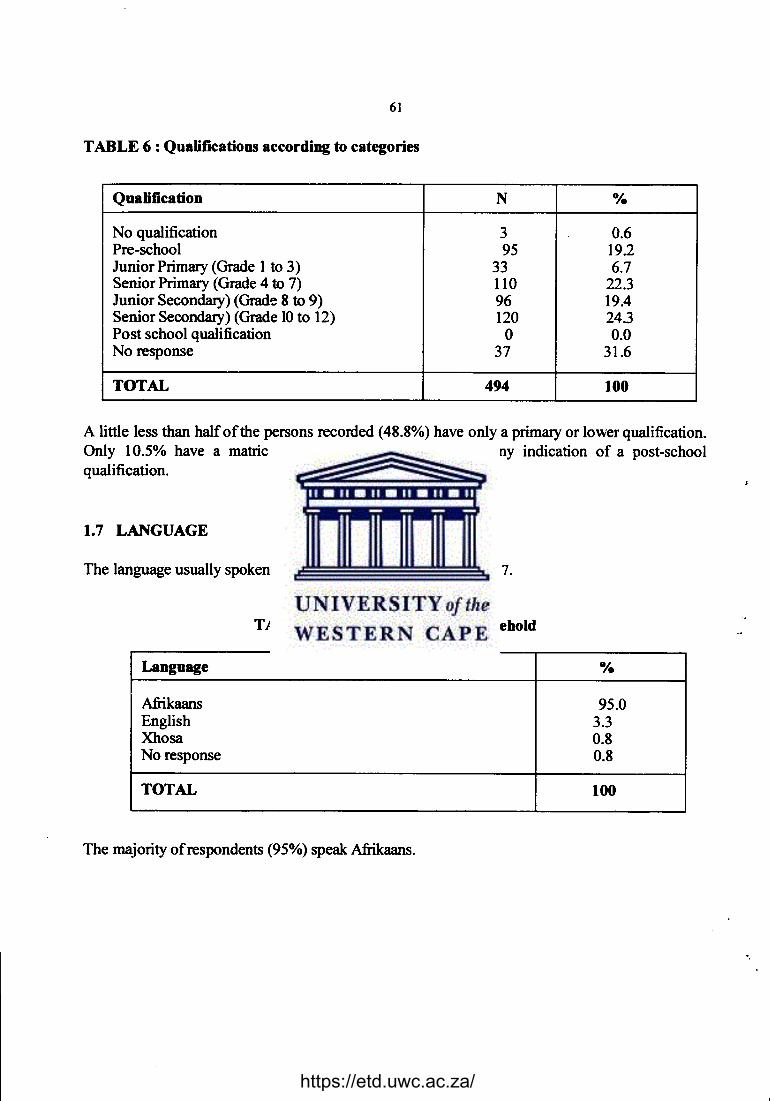
61
TABLE 6 : QuaHfications according to categories
QuaHfication N %
No qualification 3 0.6Pre-school 95 192Junior Primary (Grade 1 to 3) 33 6.7Senior Primary (Grade 4 to 7) 110 22.3Junior Secondary) (Grade 8 to 9) 96 19.4Senior Secondary) (Grade 10to 12) 120 24.3Post school qualification 0 0.0No response 37 31.6
TOTAL 494 100
A little less than half of the persons recorded (48.8%) have only a primary or lower qualification.Only 10.5% have a matrlc qualification, while none gave any indication of a post-schoolqualification.
1.7 LANGUAGE
The language usually spoken in the household, is set out inTable 7.
TABLE 7: Language spoken in household
Language %
Afrikaans 95.0English 3.3Xhosa 0.8No response 0.8
TOTAL 100
The majority of respondents (95%) speak Afrikaans.
"
https://etd.uwc.ac.za/
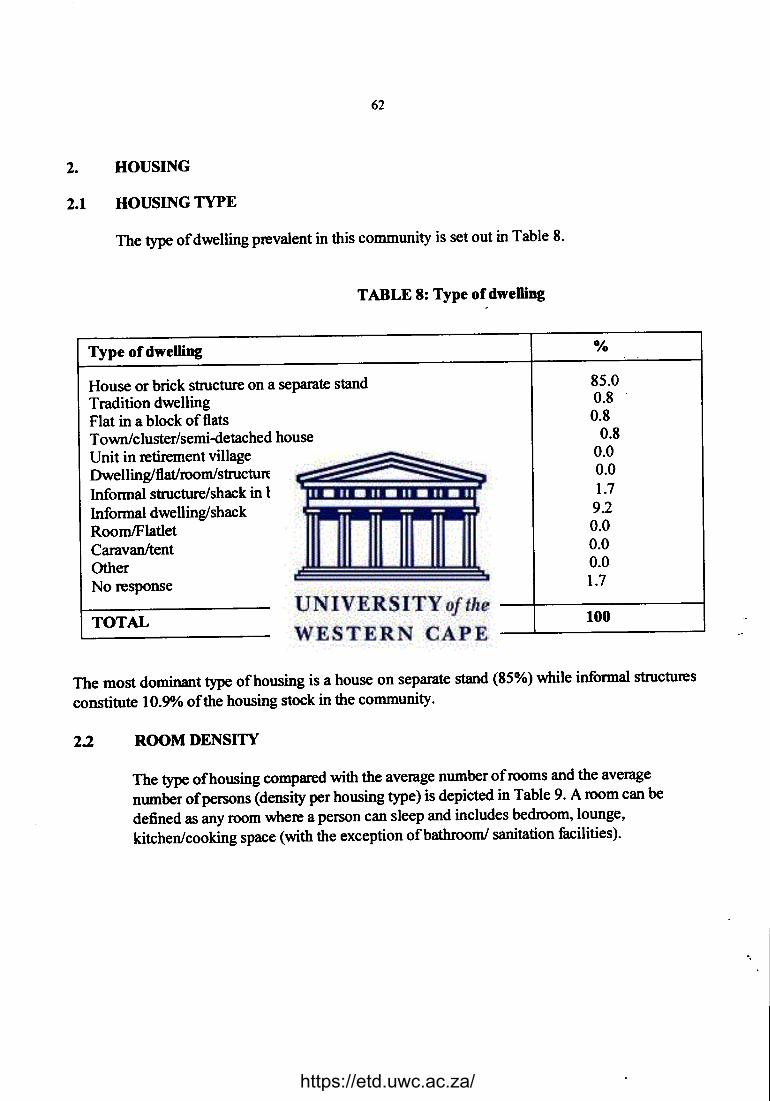
62
2. HOUSING
2.1 HOUSINGTYPE
The type of dwelling prevalent in this community is set out in Table 8.
TABLE 8: Type of dwelling
Type of dwelling 0/0
House or brick structure on a separate stand 85.0Tradition dwelling 0.8Flat in a block of flats 0.8Townlcluster/semi-detached house 0.8Unit in retirement village 0.0Dwelling/fiat/roomlstructure in backyard 0.0Informal structure/shack in back yard 1.7Informal dwelling/shack 92RoomIFlatlet 0.0Caravanltent 0.0Other 0.0No response 1.7
TOTAL 100
The most dominant type of housing is a house on separate stand (85%) while informal structuresconstitute 10.9010of the housing stock in the community.
2.2 ROOM DENSITY
The type of housing compared with the average number of rooms and the averagenumber of persons (density per housing type) is depicted inTable 9. A room can bedefined as any room where a person can sleep and includes bedroom, lounge,kitchen/cooking space (with the exception ofbathrooml sanitation facilities).
"
https://etd.uwc.ac.za/
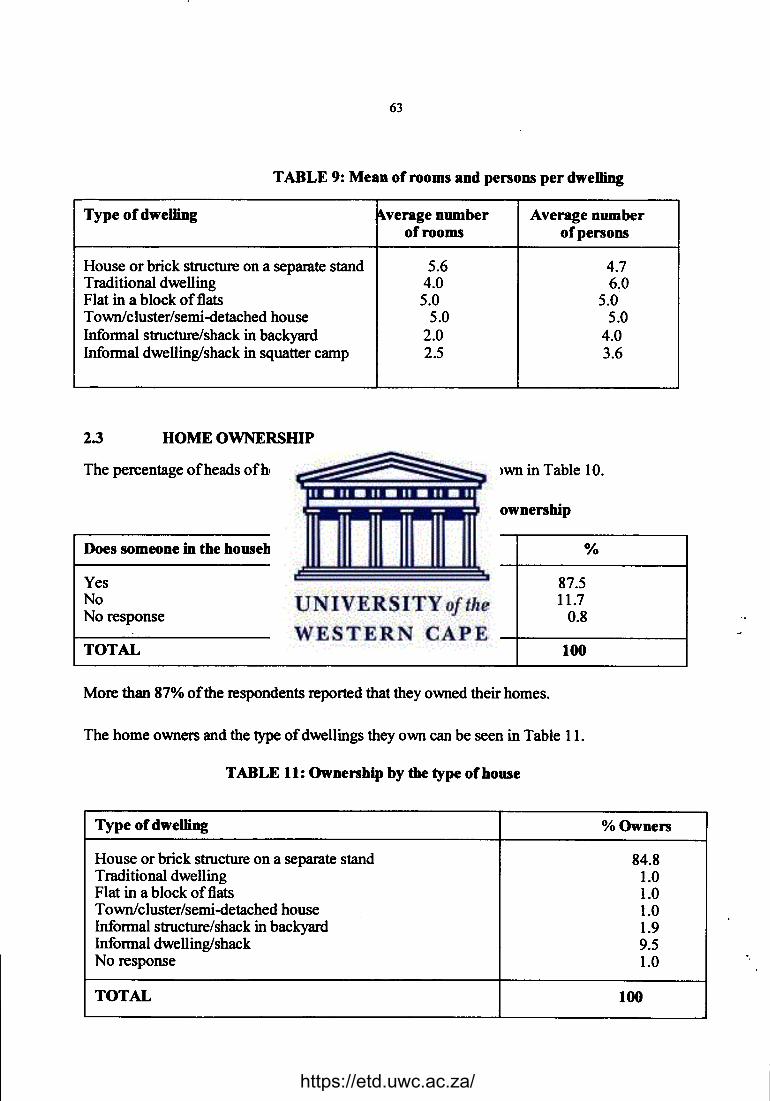
63
TABLE 9: Mean of rooms and persons per dwelling
Type of dwelling ~verage number Average numberof rooms of persons
House or brick structure on a separate stand 5.6 4.7Traditional dwelling 4.0 6.0Flat in a block of flats 5.0 5.0Townlcluster/semi-detached house 5.0 5.0Informal structure/shack in backyard 2.0 4.0Informal dwelling/shack in squatter camp 2.5 3.6
2.3 HOME OWNERSHIP
The percentage of heads of household who own their home is shown in Table 10.
TABLE 10: Home ownership
Does someone in the household own the house %
Yes 87.5No 11.7No response 0.8
TOTAL 100
More than 87% of the respondents reported that they owned their homes.
The home owners and the type of dwellings they own can be seen in Table 11.
TABLE 11: Ownership by the type of house
Type of dwelling %Owners
House or brick structure on a separate stand 84.8Traditional dwelling 1.0Flat in a block of flats 1.0Townlcluster/semi-detached house 1.0Informal structure/shack in backyard 1.9Informal dwelling/shack 9.5No response 1.0
TOTAL 100
.,
https://etd.uwc.ac.za/
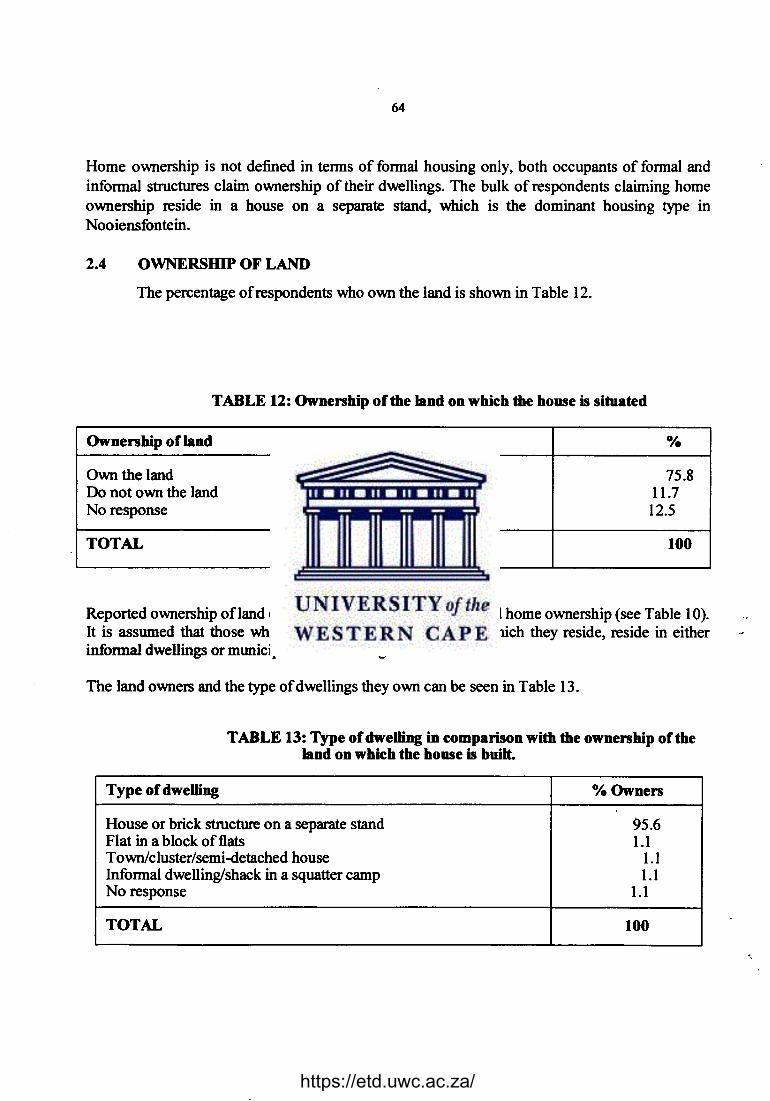
64
Home ownership is not defined in terms of formal housing only, both occupants of formal andinformal structures claim ownership of their dwellings. The bulk of respondents claiming homeownership reside in a house on a separate stand, which is the dominant housing type inNooiensfontein.
2.4 OWNERSHIP OF LAND
The percentage of respondents who own the land is shown in Table 12.
TABLE 12: Ownersbip of the land on wbicb the bouse is situated
Ownership of land %
Own the land 75.8Do not own the land 11.7No response 12.5
TOTAL 100
Reported ownership ofland (75.8%) is slightly less than reported home ownership (see Table 10).It is assumed that those who claim not to own the land on which they reside, reside in eitherinformal dwellings or municipal rental housing shack.
The land owners and the type of dwellings they own can be seen in Table 13.
TABLE 13: Type ofdweUing in comparison witb the ownership oftbeland on wbicb tbe bouse is built.
Type of dwelling %Owners
House or brick structure on a separate stand 95.6Flat in a block of flats 1.1Townlclusterlsemi-detached house 1.1Informal dwelling/shack in a squatter camp 1.1No response 1.1
TOTAL 100.,
https://etd.uwc.ac.za/
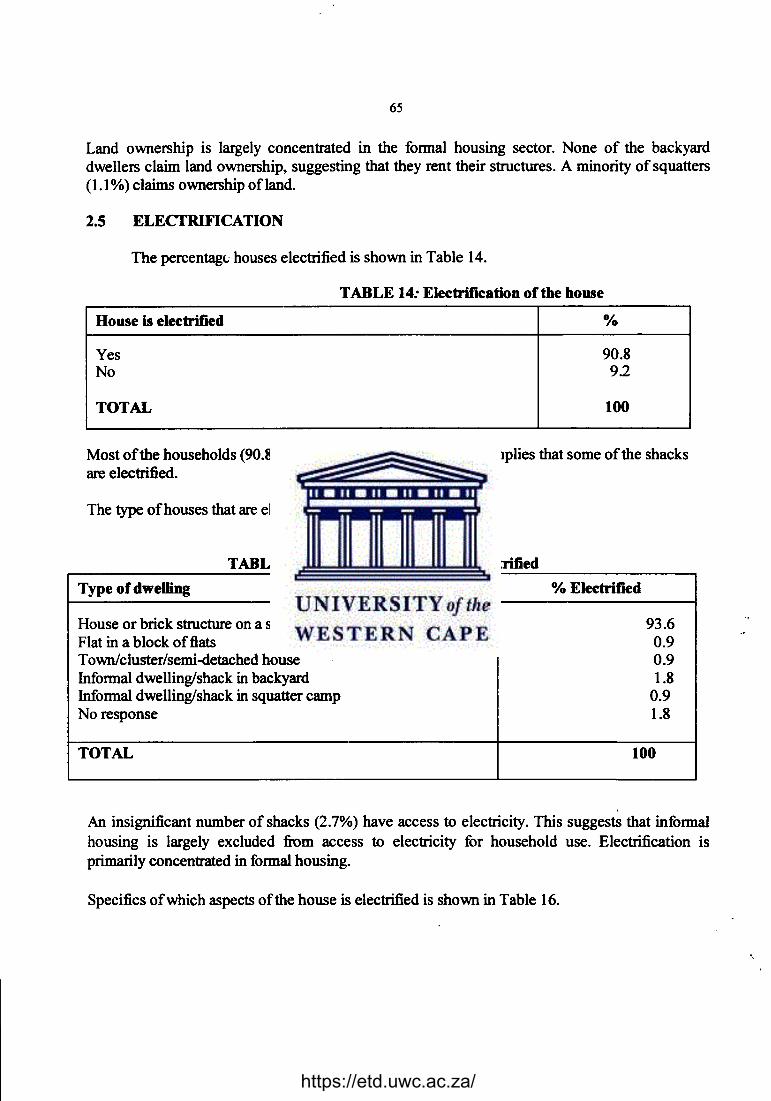
65
Land ownership is largely concentrated in the formal housing sector. None of the backyarddwellers claim land ownership, suggesting that they rent their structures. A minority of squatters(1.1%) claims ownership ofland.
2.5 ELECfRlFICATION
The percentage houses electrified is shown in Table 14.
TABLE 14: Electrification of the house
House is electrified %
Yes 90.8No 9.2
TOTAL 100
Most of the households (90.8%) have access to electricity, this implies that some of the shacksare electrified.
The type of houses that are electrified are shown in Table 15.
TABLE 15: Type ofdweUing that is electrified
Type of dwelling % Electrified
House or brick structure on a separate stand 93.6Flat in a block oftlats 0.9Town/cluster/semi-detached house 0.9Informal dwelling/shack in backyard 1.8Informal dwelling/shack in squatter camp 0.9No response 1.8
TOTAL 100
An insignificant number of shacks (2.7%) have access to electricity. This suggests that informalhousing is largely excluded from access to electricity for household use. Electrification isprimarily concentrated in formal housing.
Specifics of which aspects of the house is electrified is shown in Table 16.
.,
https://etd.uwc.ac.za/
66
TABLE 16: Type of electrification
Type of electrification 0/0
Complete electrification (lights, plugs, geyser) 88.3Lights, plugs only 0.8Lights only 1.7No electricity 9.2
TOTAL 100
The great majority of the households (88.3%) have access to complete electrification (lights, plugsand hot water cylinder), while some have access to only lights (1.7%) and to lights and plugs(0.8%).
2.6 ENERGYSOURCES
The details of the type of energy that the household uses for cooking, heat and light,is set out inTable 17.
TABLE 17:Energy source for household use
Energy source Cooking Heating Lighting% 0/0 0/0
Electricity from ESKOM 90.8 80.0 90.8Wood 92 10.0 0.0Candles 0.0 0.0 9.2No response 0.0 10.0 0.0
TOTAL 100 100 100
Electricity supplied by ESKOM is the primary source of energy for all spheres of domestic use:cooking (90.8%), heat (80%) and light (90.8%). Wood is exploited to a limited extent for bothcooking (9.2%) and heating (10%). A minority of households (9.2%) use candles as a source oflight.
.,
https://etd.uwc.ac.za/
67
3. DECISION MAKING
3.1 HOUSEHOLD PARTICIPATION IN DECISION MAKING
Households were asked about who takes decisions on a number of issues. The issues andparticipation in decision making in the household on these issues are set out in Table 18 below.
TABLE 18: Decisions
Decision 1: Money (saving. borrowing. spending) %
Jointly (partners) 74.2Children (parentis and children) 1.7Father 6.7Mother 16.7No Response 0.8
TOTAL 100
Decision 2: Children (discipline, schooling) %
Jointly (partners) 74.2Children (parentis and children) 2.5Father 4.2Mother 15.0No Response 4.2
TOTAL 100
Decision 3: Major purchases (appliances, furniture) 0/0
Jointly (partners) 75.0Children (parentis and children) 0.8Father 5.8Mother 17.5No Response 0.8
TOTAL 100.,
https://etd.uwc.ac.za/
68
Decision 4: The rules of the house) %
Jointly (partners) 68.3Children (parentis and children) 0.8Father 12.5Mother 16.7No Response 1.7
TOTAL 100
In all cases of decision making in the household, the majority of decisions are made jointly (68-75%), or to a limited extent by the mother alone (15-16%). Children by large do not participatingindomestic decision-making. .
4. SOCIO-ECONOMIC INFORMATION
4.1 EMPLOYMENT OF HEAD OF HOUSEHOLD
The type of employment of the household head is setout in Table 19.
TABLE 19: Employment of the household head
Employment %
Own family's business 5.8Work for an employer on permanent base 66.7Seasonal or temporary worker 5.8Don't wolk at all 21.7
TOTAL 100
The majority of head of households (66.7%) are permanent employees, while a minority (5.8%)are temporary/seasonal workers. 21.7% of the respondents report that they are unemployed.
4.2 EMPLOYMENT OF PARTNER
Employment status of partner/spouse is set out in Table 20.
https://etd.uwc.ac.za/
69
TABLE 20: Employment status of the partner/spouse
Employment status %
Partner employed 53.3Partner unemployed 33.3No response 13.3
TOTAL 100
The unemployment figure for partners (33.3%) is higher than that recorded for head of households.The employment figure (53.3%) does however make no distinction between permanent, temporaryand self-employment The no responses of 13.3% can be assumed to refer to the economicallyunproductive such as housewives, pensioners etc.
4.3 OCCUPATION
The type of work that the household head and hislher partner do is set out in Table 21.
TABLE 21: Type of work
Type of work Respondent Partner% %
Unemployedlhousewife/pensioner 22.5 47.5Professional (teacher/doctor/nurse) 5.0 8.3Farm labourers/Seasonal workers 3.3 0.0Semi-skilled (security work/factory/hand man) 21.7 10.8Transportation/drivers/taxi's 5.0 3.3Domestic workers 5.0 3.3Home industry (candle/bamboo making) 0.0 2.5Artisans/fradesman (painters/cabinet making) 11.7 0.8Labourers/Construction workers 5.8 0.8Clerical occupation (typist/Secretary) 9.2 8.3Sales (shop assistant/sales/reps) 0.0 6.7Services (Sangoma/fire brigade/traffic) 5.0 0.0Unclassified 5.8 7.5
TOTAL 100 100.,
https://etd.uwc.ac.za/
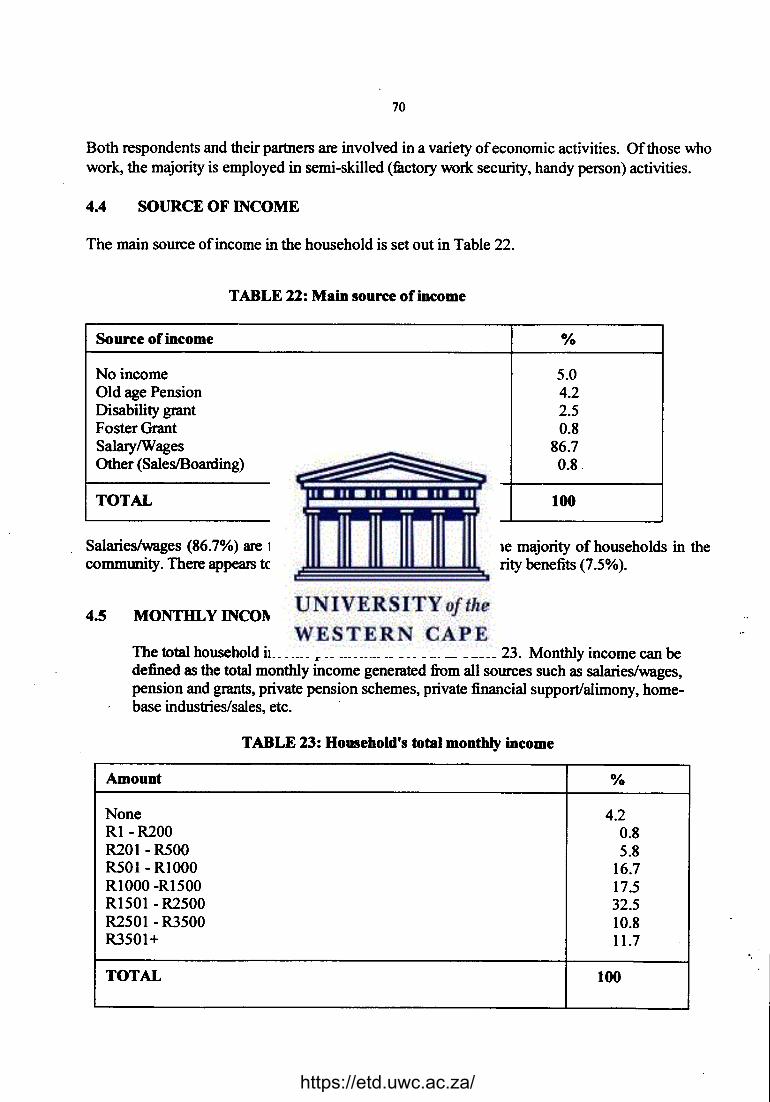
70
Both respondents and their partners are involved in a variety of economic activities. Of those whowork, the majority is employed in semi-skilled (factory work security, handy person) activities.
4.4 SOURCEOF INCOME
The main source of income in the household is set out in Table 22.
TABLE 22: Main source of income
Source of income %
No income 5.0Old age Pension 4.2Disability grant 2.5Foster Grant 0.8SalarylWages 86.7Other (SalesIBoarding) 0.8
TOTAL 100
Salaries/wages (86.7%) are the primary source of income for the majority of households in thecommunity. There appears to be little dependence on social security benefits (7.5%).
4.5 MONTHLY INCOME
The total household income per month is set out in Table 23. Monthly income can bedefined as the total monthly income generated from all sources such as salaries/wages,pension and grants, private pension schemes, private financial support/alimony, home-base industries/sales, etc. .
TABLE 23: Household's total monthly income
Amount %
None 4.2R1-R200 0.8R201-R500 5.8R501-RI000 16.7R1000 -R1500 17.5R1501 - R2500 32.5R2501-R3500 10.8R3501+ 11.7
TOTAL 100.,
https://etd.uwc.ac.za/
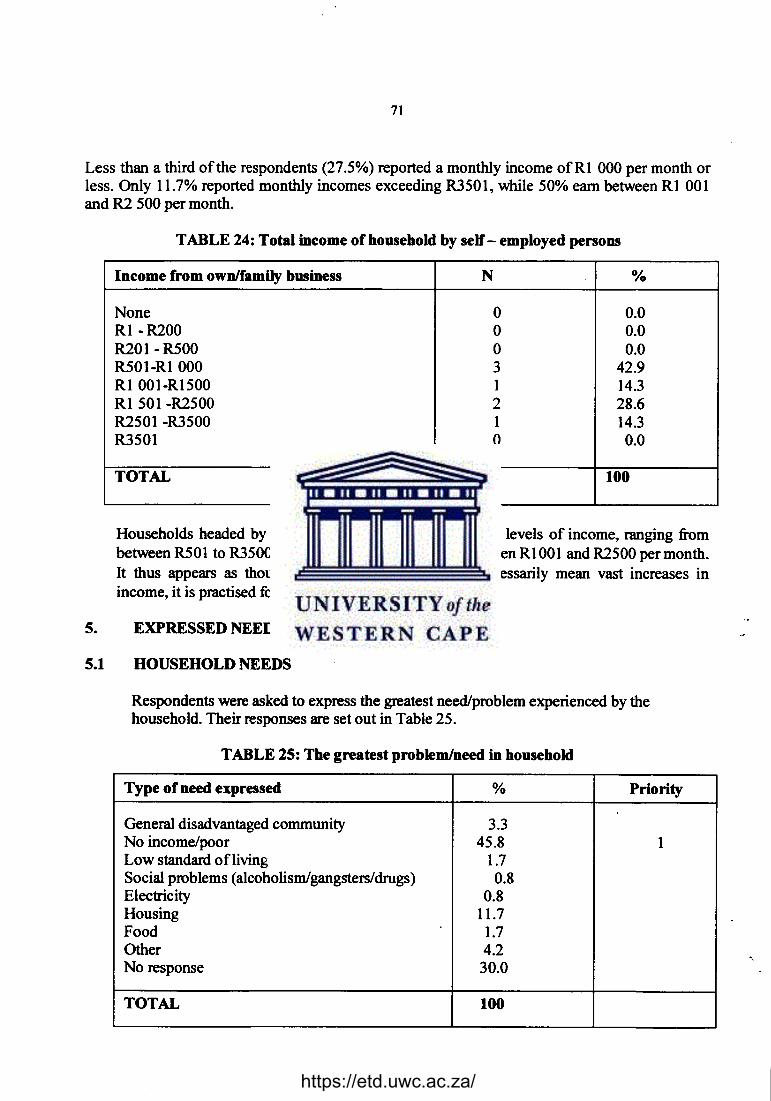
71
Less than a third of the respondents (27.5%) reported a monthly income ofRI 000 per month orless. Only 11.7% reported monthly incomes exceeding R3501, while 50% earn between RIOOland R2 500 per month.
TABLE 24: Total income of household by self - employed persons
Income from own/family business N 0/0
None 0 0.0Rl -R200 0 0.0R20I-R500 0 0.0R501-RIOOO 3 42.9Rl 001-R1500 1 14.3Rl 501 -R2500 2 28.6R2501 -R3500 1 14.3R3501 0 0.0
TOTAL 7 100
Households headed by self-employed persons have varied levels of income, ranging frombetween R501 to R3500 per month, while 42.9% earn between RIOOl and R2500 per month.It thus appears as though self-employment does not necessarily mean vast increases inincome, it is practised for subsistence purposes.
5. EXPRESSEDNEEDS
5.1 HOUSEHOLDNEEDS
Respondents were asked to express the greatest need/problem experienced by thehousehold. Their responses are set out in Table 25.
TABLE 25: The greatest problem/need in household
Type of need expressed % Priority
General disadvantaged community 3.3No income/poor 45.8 1Low standard ofliving 1.7Social problems (alcoholism/gangsters/drugs) 0.8Electricity 0.8Housing 11.7Food 1.7Other 4.2No response 30.0
TOTAL 100
.,
https://etd.uwc.ac.za/
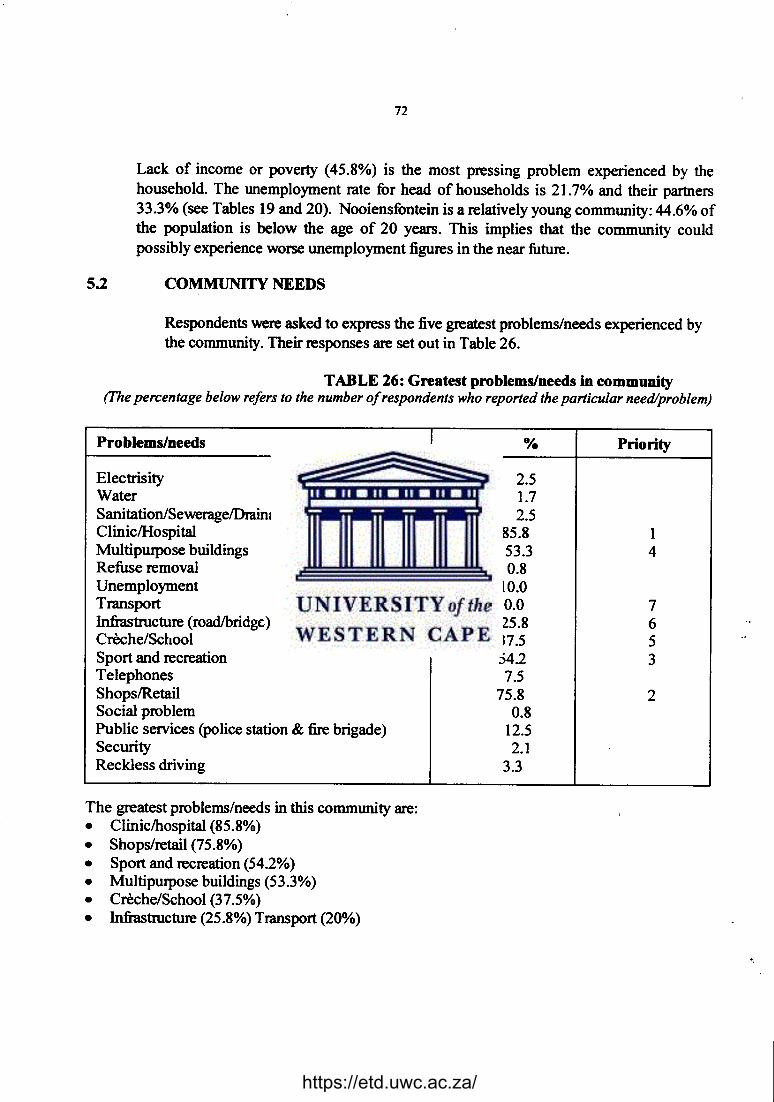
72
Lack of income or poverty (45.8%) is the most pressing problem experienced by thehousehold. The unemployment rate for head of households is 21.7% and their partners33.3% (see Tables 19 and 20). Nooiensfontein is a relatively young community: 44.6% ofthe population is below the age of 20 years. This implies that the community couldpossibly experience worse unemployment figures in the near future.
5.2 COMMUNITY NEEDS
Respondents were asked to express the five greatest problems/needs experienced bythe community. Their responses are set out in Table 26.
TABLE 26: Greatest problems/needs in community(The percentage below refers to the number of respondents who reported the particular need/problem)
Problems/needs 8/0 Priority
Electrisity 2.5Water 1.7SanitationlSeweragelDrainage 2.5ClinicIHospital 85.8 1Multipwpose buildings 53.3 4Refuse removal 0.8Unemployment 10.0Transport 20.0 7Infiastructure (road/bridge) 25.8 6Creche/School 37.5 5Sport and recreation 542 3Telephones 7.5ShopslRetail 75.8 2Social problem 0.8Public services (police station & fire brigade) 12.5Security 2.1Reckless driving 3.3
The greatest problems/needs in this community are:• ClinicIhospital (85.8%)• Shops/retail (75.8%)• Sport and recreation (54.2%)• Multipurpose buildings (53.3%)• Creche/School (37.5%)• Infiastructure (25.8%) Transport (20%)
.,
https://etd.uwc.ac.za/
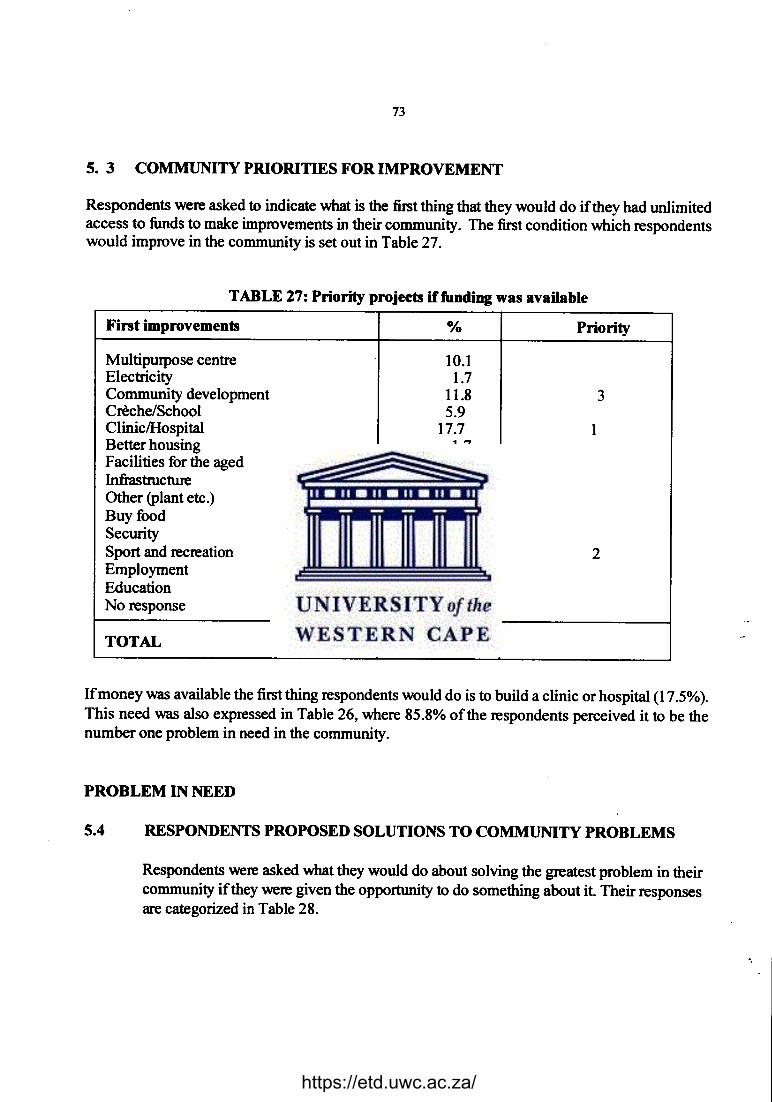
73
5. 3 COMMUNITY PRIORITIES FOR IMPROVEMENT
Respondents were asked to indicate what is the first thing that they would do if they had unlimitedaccess to funds to make improvements in their community. The first condition which respondentswould improve in the community is set out in Table 27.
TABLE 27: Priority projects if funding was available
First improvements % Priority
Multipwpose centre 10.1Electricity 1.7Community development 11.8 3Creche/School 5.9ClinicIHospital 17.7 1Better housing 1.7Facilities for the aged 7.6Infrastructure 4.2Other (plant etc.) 6.7Buy food 2.5Security 0.8Sport and recreation 16.8 2Employment 2.5Education 0.8No response 9.2TOTAL 100
Ifmoney was available the first thing respondents would do is to build a clinic or hospital (17.5%).This need was also expressed in Table 26, where 85.8% of the respondents perceived it to be thenumber one problem in need in the community.
PROBLEM IN NEED
5.4 RESPONDENTS PROPOSED SOLUTIONS TO COMMUNITY PROBLEMS
.,
Respondents were asked what they would do about solving the greatest problem in theircommunity if they were given the opportunity to do something about it Their responsesare categorized in Table 28.
https://etd.uwc.ac.za/
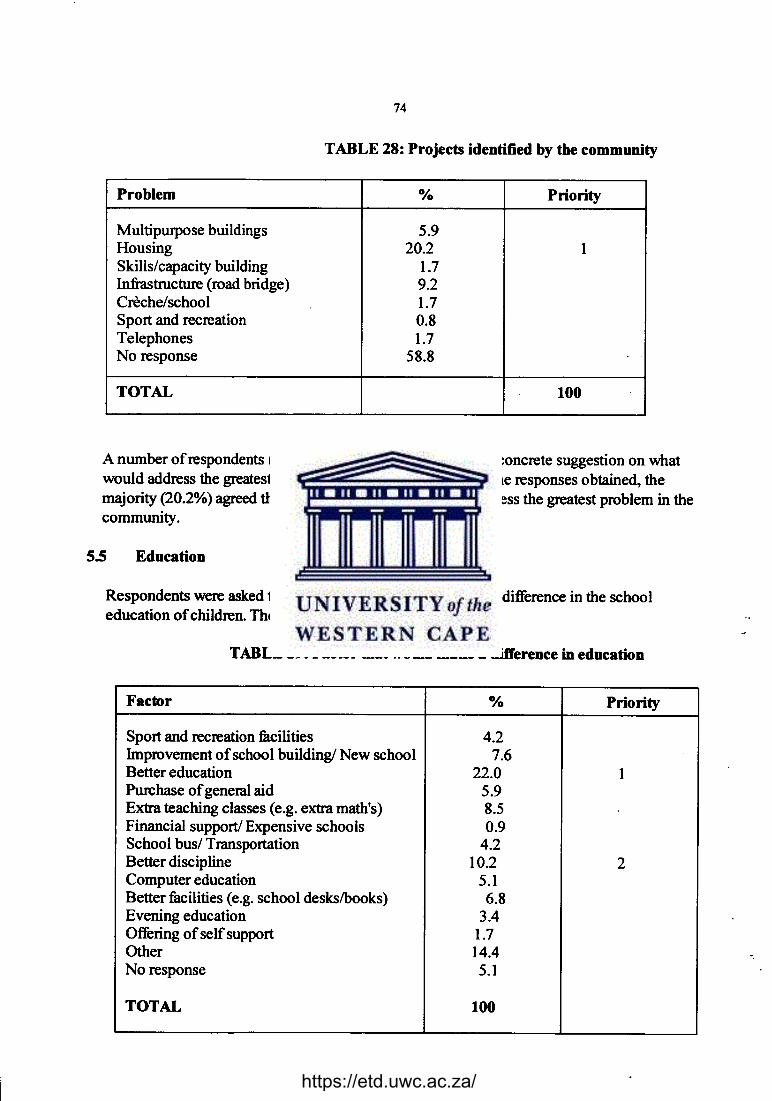
74
TABLE 28: Projects identified by the community
Problem % Priority
Multipurpose buildings 5.9Housing 20.2 1Skills/capacity building 1.7Infrastructure (road bridge) 9.2Creche/school 1.7Sport and recreation 0.8Telephones 1.7No response 58.8
TOTAL 100
A number of respondents (58.8%) failed to come up with any concrete suggestion on whatwould address the greatest problem in the community. From the responses obtained, themajority (20.2%) agreed that housing had the potential to address the greatest problem in thecommunity.
5.5 Education
Respondents were asked their opinion on what would make a difference in the schooleducation of children. Their responses are set out in Table 29.
TABLE 29: Factor that would make a difference in education
Factor % Priority
Sport and recreation facilities 4.2Improvement of school building! New school 7.6Better education 22.0 1Purchase of general aid 5.9Extra teaching classes (e.g. extra math's) 8.5Financial support! Expensive schools 0.9School bus/ Transportation 4.2Better discipline 10.2 2Computer education 5.1Better facilities (e.g. school deskslbooks) 6.8Evening education 3.4Offering of self support 1.7Other 14.4No response 5.1
TOTAL 100
.,
https://etd.uwc.ac.za/
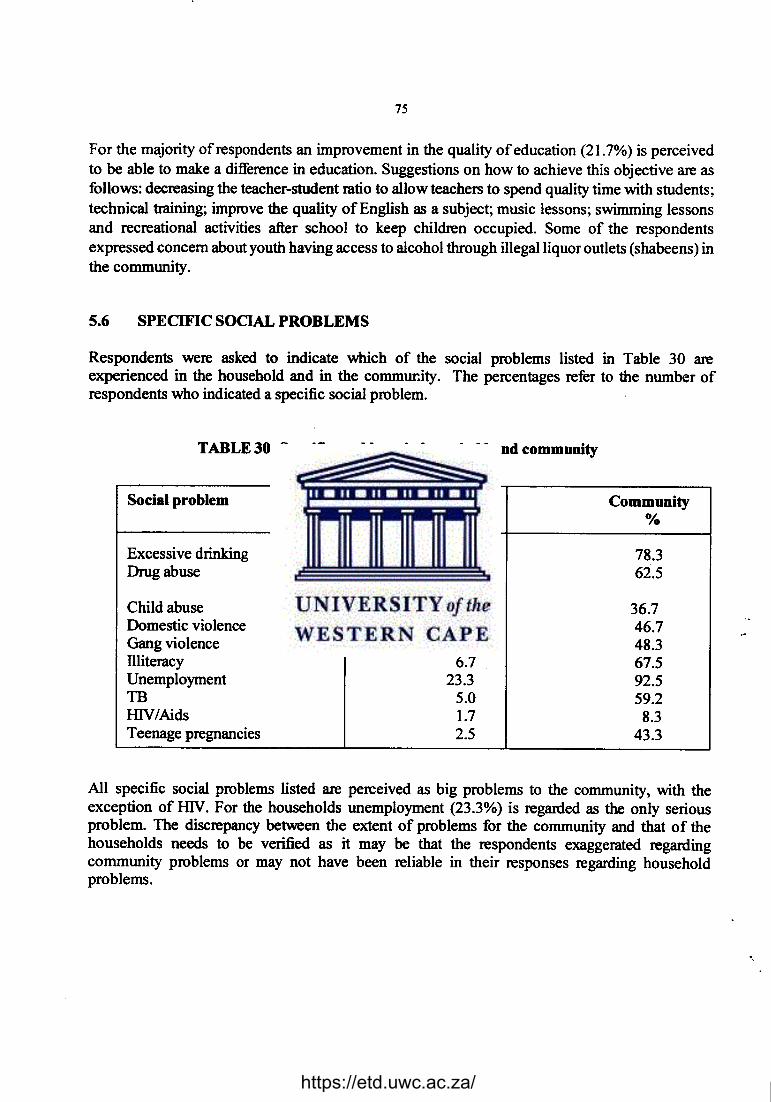
75
For the majority of respondents an improvement in the quality of education (21.7%) is perceivedto be able to make a difference in education. Suggestions on how to achieve this objective are asfollows: decreasing the teacher-student ratio to allow teachers to spend quality time with students;technical training; improve the quality of English as a subject; music lessons; swimming lessonsand recreational activities after school to keep children occupied. Some of the respondentsexpressed concern about youth having access to alcohol through illegal liquor outlets (shabeens) inthe community.
5.6 SPECIFIC SOCIAL PROBLEMS
Respondents were asked to indicate which of the social problems listed in Table 30 areexperienced in the household and in the community, The percentages refer to the number ofrespondents who indicated a specific social problem.
TABLE 30: Specific problems in household and community
Social problem Household Community% %
Excessive drinking 7.5 78.3Drug abuse 6.7 62.5
Child abuse 0.0 36.7Domestic violence 2.5 46.7Gang violence 0.8 48.3llliteracy 6.7 67.5Unemployment 23.3 92.5TB 5.0 59.2IDV/Aids 1.7 8.3Teenage pregnancies 2.5 43.3
All specific social problems listed are perceived as big problems to the community, with theexception of IDV. For the households unemployment (23.3%) is regarded as the only seriousproblem. The discrepancy between the extent of problems for the community and that of thehouseholds needs to be verified as it may be that the respondents exaggerated regardingcommunity problems or may not have been reliable in their responses regarding householdproblems.
"
https://etd.uwc.ac.za/
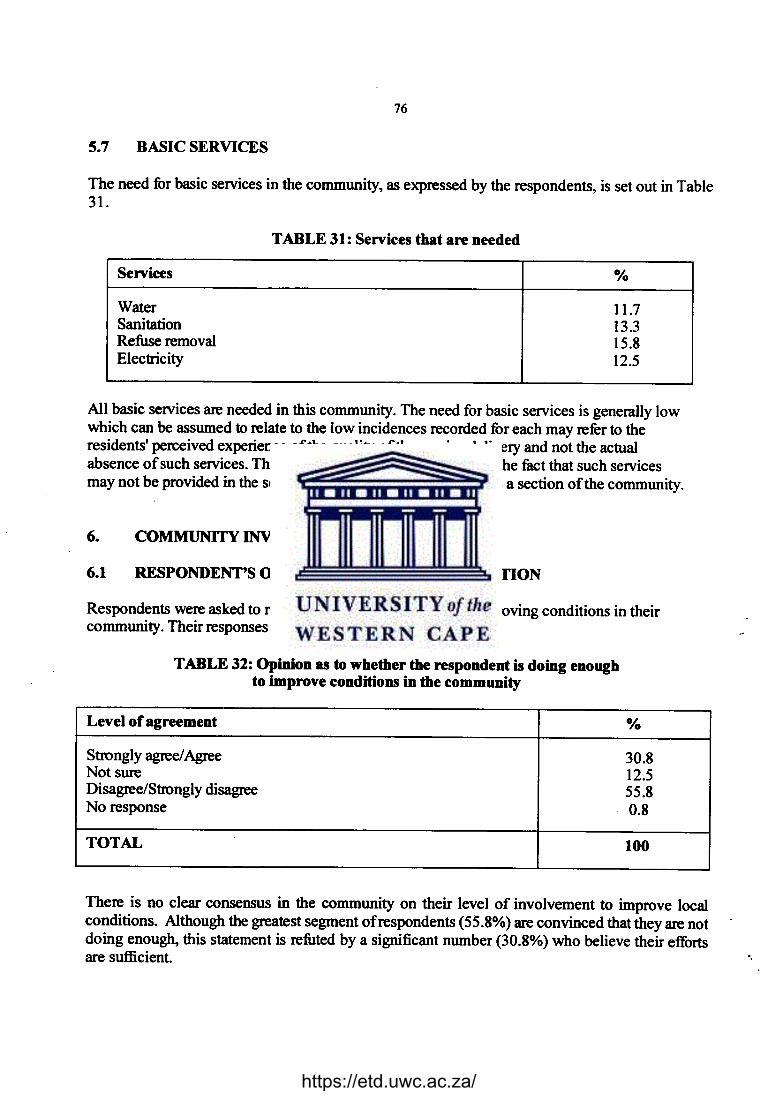
76
5.7 BASIC SERVICES
The need for basic services in the community, as expressed by the respondents, is set out in Table31.
TABLE 31: Services that are needed
Services %
Water 11.7Sanitation 13.3Refuse removal 15.8Electricity 12.5
All basic services are needed in this community. The need for basic services is generally lowwhich can be assumed to relate to the low incidences recorded for each may refer to theresidents' perceived experience of the quality of the service delivery and not the actualabsence of such services. These low incidence may also refer to the fact that such servicesmay not be provided in the squatter settlement, which constitutes a section of the community.
6. COMMUNITY INVOLVEMENT
6.1 RESPONDENT'S OWN COMMUNITY PARTICIPATION
Respondents were asked to report their own participation in improving conditions in theircommunity. Their responses are set out in Table 32.
TABLE 32: Opinion as to whether the respondent is doing enoughto improve conditions in the community
Level of agreement %
Strongly agree/Agree 30.8Not sure 12.5Disagree/Strongly disagree 55.8No response ' 0.8
TOTAL 100
There is no clear consensus in the community on their level of involvement to improve localconditions. Although the greatest segment of respondents (55.8%) are convinced that they are notdoing enough, this statement is refuted by a significant number (30.8%) who believe their effortsare sufficient. .,
https://etd.uwc.ac.za/
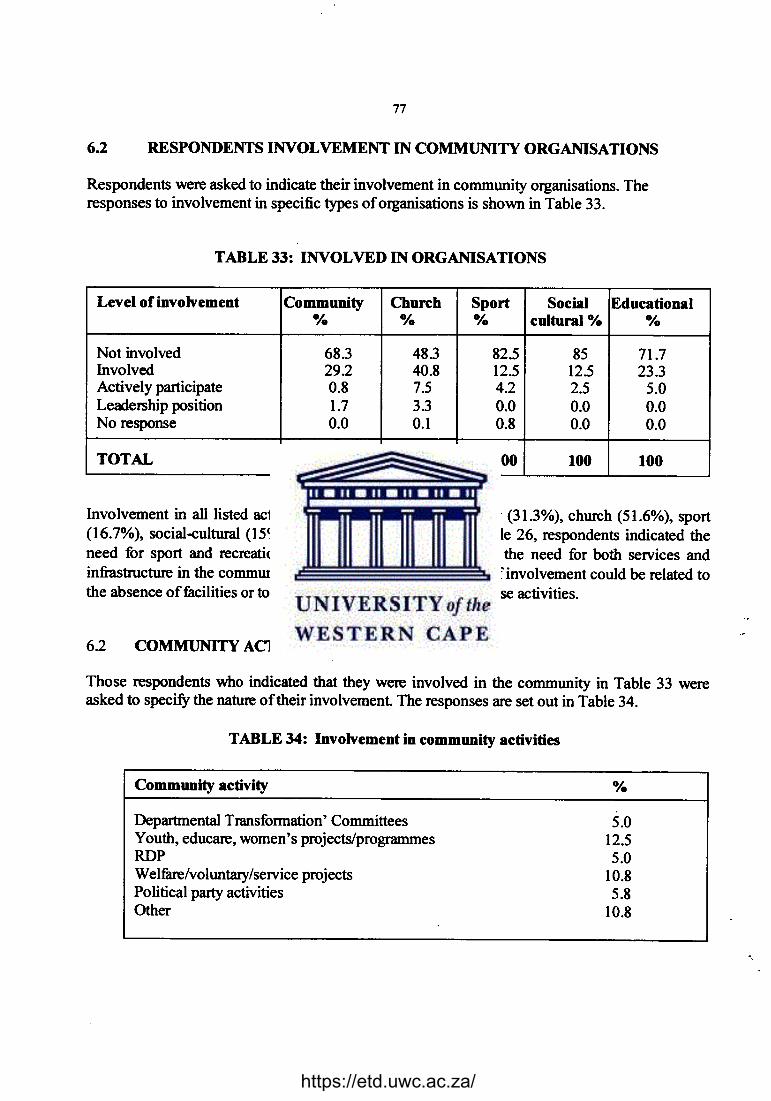
77
6.2 RESPONDENTS INVOLVEMENT IN COMMUNITY ORGANISATIONS
Respondents were asked to indicate their involvement in community organisations. Theresponses to involvement in specific types of organisations is shown in Table 33.
TABLE 33: INVOLVED IN ORGANISATIONS
Level of involvement Community Church Sport Social Educational% % % cultural % 0/0
Not involved 68.3 483 82.5 85 71.7Involved 29.2 40.8 12.5 12.5 23.3Actively participate 0.8 7.5 4.2 2.5 5.0Leadership position 1.7 3.3 0.0 0.0 0.0No response 0.0 0.1 0.8 0.0 0.0
TOTAL 100 100 100 100 100
Involvement in all listed activities is generally low: community (31.3%), church (51.6%), sport(16.7%), social-cultural (15%) and education (28.3%). In Table 26, respondents indicated theneed for sport and recreation in the community. Considering the need for both services andinfiastructure in the community (see Table 26), the poor level ofinvolvement could be related tothe absence of facilities or to the opportunity to participate in these activities.
6.2 COMMUNITY ACTlVlTIF.S
Those respondents who indicated that they were involved in the community in Table 33 wereasked to specify the nature of their involvement The responses are set out in Table 34.
TABLE 34: Involvement in community activities
Community activity %
Departmental Transformation' CommitteesYouth, educare, women's projects/programmesRDPWelfare/voluntary/service projectsPolitical party activitiesOther
5.012.55.010.85.810.8
.,
https://etd.uwc.ac.za/
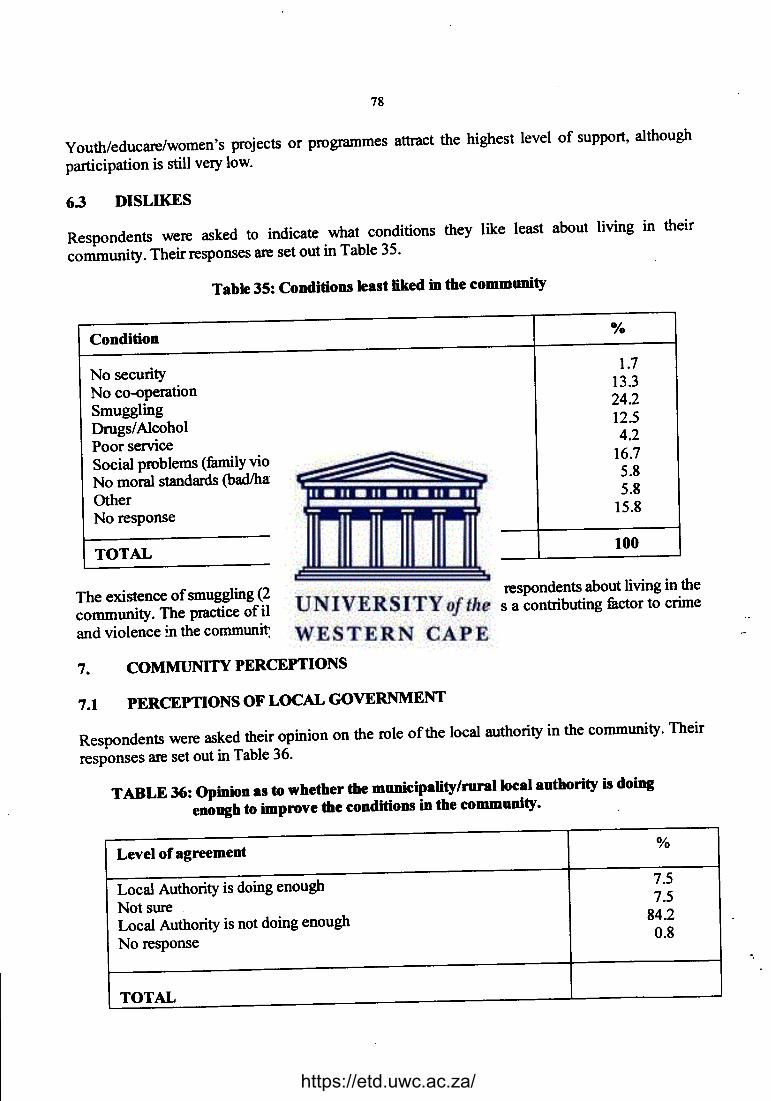
78
Youthleducare/women's projects or programmes attract the highest level of support, althoughparticipation is still very low.
6.3 DISLIKES
Respondents were asked to indicate what conditions they like least about living in theircommunity. Their responses are set out in Table 35.
Table 35: Conditions least liked in the community
Conditionoio
No security1.7
No co-operation13.3
Smuggling24.2
Drugs/Alcohol12.5
Poor service4.2
Social problems (family violence/child abuse) 16.7
No moral standards (bad/hatefulljealouslswearing) 5.8
Other5.8
No response15.8
TOTAL100
The existence of smuggling (24.2%) is the condition least liked by respondents about living in thecommunity. The practice of illegally selling alcohol is regarded as a contributing factor to crimeand violence in the community.
7. COMMUNITY PERCEPTIONS
7.1 PERCEPTIONS OF LOCAL GOVERNMENT
Respondents were asked their opinion on the role of the local authority in the community. Theirresponses are set out inTable 36.
TABLE 36: Opinion as to whether the municipatity/rurallocal authority is doingenough to improve the conditions in the community.
Level of agreement %
Local Authority is doing enough 7.5
Not sure7.5
Local Authority is not doing enough 84.2
No response0.8
TOTAL
.,
https://etd.uwc.ac.za/
79
Respondents appear to be highly critical of the local authority. The majority (84.2%) is of theopinion that the local authority is not doing enough to improve local conditions.
7.2 PERCEPTIONS OF PROVINCIAL AND CENTRAL GOVERNMENT
The response to a question on the improvement of conditions in the community by the Provincialand Central Government is set out in Table 37.
TABLE 37: Opinion as to whether the government is doing enough to improve theconditions in the community
Level of agreement %
Government is doing 1.7
Not sure8.3
Government is not doing enough 89.2
No response 0.8
TOTAL 100
The government appears to have even less support than the local authority as recorded in theprevious table. The bulk of respondents (89.2%) are critical of the government's attempts toimprove local conditions.
Comparing the respondents opinion under Table 32 with the opinions that local authorities andgovernment are not doing enough to improve conditions in the community, may indicate that aserious effort should be made to establish good, healthy communication between the communityand the authorities so that a collaborative and supportive partnership can be developed with thecommunity. The community needs to clearly understand what its role in its development could beand what can be expected of the authorities. On the other hand it is important that the authoritiestruly come to know and understand the issues faced by the community so that appropriate andenabling action can be taken.
7.3 COMMUNITY PERCEPTION ON SAFETY AND SECURITY
The respondents were asked whether their neighbourhood was a safe place within which to live.The responses are set out in Table 38.
https://etd.uwc.ac.za/
80
TABLE 38: Safety of the neighbourhood
Response0/0
Yes63.3
No35.0
No response1.7
TOTAL100
The majority of respondents (63.3%) view the neighbourhood as still being safe despite thecommon occurrence of smuggling in the community which they associated with increased crimeand violence (see Table 35).
The respondents who view their neighbourhood as unsafe gave the following reasons as set out in
Table 39.
TABLE 39: Reason why the neighbourhood is not safe
Response0/0
Fire arms0.8
Lack of security 11.7
Refugees5.0
Gangsters 11.7
Other4.2
No response 65.8
TOTAL 100
The no response rate of 65.8% refer to those who are satisfied with the level of security (seeprevious table) as well as respondents who failed to cite reasons for feeling that the neighbourhoodwas unsafe. Respondents offer a variety of reasons why they view their neighbourhoods unsafe.Crime violence alcohol abuse gang-related activities are some of their primacy concerns.
.,
https://etd.uwc.ac.za/
81
CHAPTER4
ECONOMIC OPPORTUNITIES
INTRODUCI10N
The previous chapter dealt with the community needs assessment for the areas known as Spandau
and Nooiensfontein. These areas, especially Spandau showed a vel)' high unemployment rate,
which is bound to increase to the growing and large young population under the age of 15 years,
who have to enter the labour market within a few years. In Spandau, only 1.9% of all heads of
households have secured permanent employment, while none of them are responsible for
generating their own income. A person's wellbeing is often measured in terms of income. The,--
income of a household determines the capability to satisfy basic needs such as proper housing,
food, health services and educational facilities. Quality employment is critical to achieve
sustainable livelihoods and thereby reducing poverty and inequality. To address this problem and
simultaneously increase employment, is through the introduction oflabour-intensive technologies
and creation of smal!, medium and micro enterprises. Much of the employment here involves
informal home-based micro enterprises generating low incomes. Those in the informal sector tend
to remain in poverty while still being in employment, as these enterprises are mainly for survival
issues. Therefore, the current policies that is aimed at this industry need to be better structured and
targeted, in particular at the most vulnerable enterprises. In this instance access to strong internal
and global markets need to be provided to ensure that they could compete effectively and
.,
contribute in a significant way to the economy.
https://etd.uwc.ac.za/
82
In view of the above, this chapter intends to explore possible employment opportunities in the
study area which will address the needs of the communities and simultaneously contribute to
poverty alleviation.
The focus in this section will be on job creation and in this instance we shall look at the current
problems and solutions that could create a great stimulus to the community.
SMALL, MEDIUM AND MICRO ENTERPRISES
Small businesses have a major role to play in the South African economy in terms of employment
creation, income generation and output growth. These industries (SMME's) account for
approximately 60% of all employment in the economy and 40% of output. SMME's are often
regarded as the vehicle by which the lowest income people in society gain access to economic
opportunities. Therefore it is imperative that significant investment is made in SMME's in order
to create both short and long term capacity for labour absorption and output growth, as well as to
improve income generation and redistribution. These objectives are :firmly recognized by the
government, in terms of the Reconstruction and Development Programme (RDP) and the Growth
Employment and Redistribution Strategy (Gear).(Gouden, S.M.)(1997)
We are all aware of the major disparities in South Africa in the extent of business ownership and
participation in the provision of goods, service and works, when we compare the previously
disadvantaged race groups with the formerly advantaged race groups as a result of the apartheid
legacy. Similar disparities are also found in terms of gender. However, it is believed that the
projects listed hereunder will to an extent alleviate the poverty problems in Blue Downs and
contribute in a positive manner to job creation. "
https://etd.uwc.ac.za/
83
HI - TECH FARMING
The current community living in Spandau is historically from the neighbouring farms, but due to
financial difficulties to make ends meet, they have located to the area now known as Spandau and
thus became unemployed. From the survey conducted it is very clear that a high rate of
unemployment amongst head of households (88.5%) existed. It was also realised that unless
drastic measures are taken, this figure is bound to increase due to the growing and large young
population under the age of 15 years who have to enter in the labour market within the next few
years as only 1.9% of all households has secured permanent employment Taking into account
in society. In view of the above it became clear that notwithstanding the difficulties experienced
that the majority of head of households are women, it has special implications for development
initiatives in the area as women are by nature of their gender one of the most disadvantaged groups
in securing employment opportunities for the Spandau communities, there exists a number of
opportunities which needs to be explored. One of these is in the field of agriculture. As South
Africa prepares itself to move into a new era a key area of development will be to address the
expectations of land and agriculture ownership of significant number of its inhabitants and in this
context, Blue Downs which is a suburb of the Oostenberg Municipality. This need was recognized
by the Spandau community, as well as a group of private individuals and organizations and the
Oostenberg Municipality. After several workshops and meetings it was agreed that a close
corporation be established and this led to the formation of the Agri - Village Development Team.
LOCATION
In realising this dream it was agreed upon that the Oostenberg Agri - Village Development Team
will negotiate to obtain an in - principle approval from the Oostenberg Municipality for the
developments of certain portions for small farmer settlement These include:.,
https://etd.uwc.ac.za/
84
• portions 5,25,26,31,32,35,36 and 42 offarm 468 Pen Hill; and
• portions 3 and 8 offarm 410 Pen Hill.
These properties are located east of the RI02 arterial route Somerset West and Kuils River. A
railway line also runs parallel to this thoroughfare. Blackheath, Kleinvlei and Eerste River local
areas are located west of these transport routes.
The Welmoed regional cemetery can be found adjacent to the southern boundary of the proposed
development. The Blackheath water treatment works and sludge ponds are situated north of the
indicated property. Agricultural land of high quality, with attractive vineyards, completes the
eastern boundary. The location plan is attached as an Annexure.
OWNERSHIP
These properties are all registered in the name of the Provincial Housing Development Board.
During the 1994/ 1995 the Town Planners of the provincial Administration developed business
plans for all undeveloped properties of the Housing Board: Western Cape. The land is zoned for
agricultural and its size is sufficient to accommodate a small farmer development. Main services
are available to support the creation of group wealth by utilizing high density/ intensity properties
prohibiting the section 15(2Xa) of the Housing Act, (Act 107 of 1997). The Municipality will in
tum deal with the land in terms of its powers under the Municipal Ordinance (Ord. 20 of 1974)
which will include making the land available through a Land Availability Agreement, which will,
inter alia, make provision for the payment on individual transfer of residential units.
"
https://etd.uwc.ac.za/
85
The land is perfectly situated for an emerging farmer project with efficient access for rail and road
transportation to the airport, markets and the like. For purposes of this business plan a purchase
price ofR2.25 million for the land has been assumed.
ORGANISATIONAL STRUCfURE
The Agri - Village Development Team will register and fonn part of the South African Farming
Investment Company who is a specialist in the field of agriculture. They have the expertise and
will empower and train the people of Spandau in new farming techniques. SAFIC is an
international company who is in partnership with its mother company in London.
The Southern African Fanning Investment Corporation (Pty) Ltd or SAFIC (Pty) Ltd proposes the
installation and operation of large hygroponics farming stations within the Southern African
environment. Each so-called "hygro station" will trade as a company and be known as, for
example, SAFIC - Oostenberg. In the international arena the various stations will join forces to act
as a united business group focussed on the production, processing, packing and marketing of
hygroponically grown fruit and vegetables for export markets.
Strategic joint ventures will ensure that each SAFIC station has access to the technological and
marketing prowess and expertise earned through proven track records in both vegetable marketing
and hydroponics technology. This will ensure that revolving purchase orders are already in place
for large quantities of produce and that technology can be transferred to the growers effectively.
Mainly investors will own the Holding Company, SAFIC of London.
This company will also have certain direct responsibilities such as controlling the offshore .,
https://etd.uwc.ac.za/
86
marketing of produce via African Marketing Suppliers of London and co-ordinating the SAFIC
Group's macro operations. Each SAFIC "hygro Station" will operate as an independent company
answerable to its shareholders, but operating in concert with its affiliates with regards to the
offshore supply of produce.
In the case of Blue Downs, approximately 650 new emerging farmers will jointly hold 30% of the
shares but will be subject to a 5-year 'handcuff period to confirm the bonafides ofthé participant.
However, during this period the normal benefits of shareholding shall accrue to the riew farmers.
Other shareholders are likely to be SAFIC of London. It is important to note that share holding of
each SAFIC hygro station by SAFIC of London will be dependent on the SAFIC investor's criteria
and the local investor's equity or other input The objective remains to ensure that the new
emerging farmers have a collective 30% share in their respective SAFIC hygro stations.
Shareholding by management and other support employees will only be considered when the
company decides to list on the Stock Exchange.
COMPETITIVE ADVANTAGE
SAFIC will be the first company to introduce hydroponics technology of this scale into Southern
Africa. The uniqueness of the utilised systems will allow the production of high quality produce
that will be targeted at the unmistakable growth in demand for hygroponically produced
vegetables in the world's major markets. These markets have the resources to afford the high price
premiums involved. Europe will be the initial target market as the company already has a
relatively small order by world market standards.
This is, however, a large order in terms offoreign currency generation for Southern Africa It has "
https://etd.uwc.ac.za/
87
generally been accepted that one needs to take the present situation in perspective. Presently, the
South African horticultural, fruit and vegetable marketing structures are too fragmented to
represent formidable force on world markets. Independent producers will also be enlisted as
suppliers. The company's advantage will be their price competitiveness.
The lack of consistent procuetion quality standards, economies of scale and relevant product
quality further aggravate this situation. This project will attempt to address all these dimensions
of competitiveness, not only by virtue of new technology but also by actively unifying national
marketing efforts and promotion of competitive activity across the whole spectrum of products.
These products will range from fresh vegetables to beny fluit. The intention is to focus firstly on
products that we are comfurtable with and then to expand and research additional produce so as to
improve the viability of the organisation. This is an international project with the intention to
grow to a level placing it at least on equal footing with the sugar, wine and citrus industries.
VISION
The beneficiary community will come from the areas known as Spandau and Nooiensfontein
residents. Theses residents are to some extent au faix with farm type of work as they previously
resided on farms prior to be relocated to Spandau and Nooiensfontein.
The focus will thus be placed on the creation of jobs and thereby eliminate poverty. It will also
empower previously disadvantaged fanners without moving away from sound viable business
structures whilst exploiting new opportunities for harnessing Southern Africa's comparative
advantages in agricultural production through high quality, state - of the - art fiuit and vegetable
production and exporting marketing. "
https://etd.uwc.ac.za/
88
MISSION STATEMENT
• To become market leaders in agricultural exporting within 5 years.
• To create job opportunities to the most marginalised communities.
• Train the beneficiary community in skills related to marketing and sales - business.
• To develop our industry to meet superior standards of the international markets.
• To ensure a high return on shareholder investment.
• To create an environment in which employees gain equity empowerment through recognition
of participation, loyalty and superior performance.
• To contribute towards the general welfare and development of the communities in which we
operate.
• To implement ongoing training and skills tmnsfer.
• To become fully fledge partners which will enable the beneficiary community big returns on
their 'sweat investment' .
• To conduct ongoing regional research and development of hydroponics planting materials and
methods, specific to the Southern African context.
• To empower community and teach them new skills in high technologic manufacturing
products.
STRATEGIES
It is believed that the solution to many development problems for the developing world resides in
technology selection an application, the major criterion being cost - effectiveness. Indeed,
Africa's salvation lies in the creative adoption of high technologies mixed with simplistic
applications. .,
https://etd.uwc.ac.za/
89
Many technologies have come about due to the much harsher conditions experienced by our
northern hemispheric markets thus giving us an advantage considering our milder climatic
conditions.
~• Sales targets over the plan period: The success of this joint venture will ensure the following:
Increase the number of distribution channels
Break into the USA and far eastern markets
Extend hydroponics technology to outreach communal and small-scale farmers.
• High return on shareholder equity
Close monitoring and supervision of grower activity
Keep transport logistic costs down by locating the packing and processing factory as close to
growers and freight routes as possible
Quality is free. We will enforce high international quality standards
Select distributors according to how close they are to the end user
Cost control culture.
Most of all, to create job opportunities and a stable income for the disadvantaged communities.
• Maintaining high employee productivity
Maintain a cost control culture
Implement a performance - based incentive scheme
Institute profit sharing at all levels through share allocation and dividend payouts.
To significantly extend hydroponics infrastructure within the South African region so as to
empower disen:franchised communities .,
https://etd.uwc.ac.za/
90
Reduce grower capital and logistical costs by grouping growers under one project
Assist with training and capital funding for housing.
• Selling Methods
Employ customer service officer in 2002.
Institute direct mail campaigns in 8th month of year 1
Set up an internet home page and advertise on bulletin boards
- Exhibit at trade exhibition
Rationalise distribution network
• Service & Delivery
It is acknowledged that this joint venture will create a wealth of opportunities, which will pave the
way for training and expand job opportunities in the following fields.
Refrigerated trucks
Aircraft leasing
Customer collection
Passenger airlines
Shipping lines
• Employment & Personnel Plans
One can assume that a number of employment opportunities will be realized in the long term.
Manual labour in the factory will be phased in depending on the level of plant activity required.
All labour will be drawn from within the hygro station family pool although casual labour from
outside will also be drawn from. However there will only be minimal seasonal variations in"
https://etd.uwc.ac.za/
91
manpower deployment since the supplier base will be using a technology that does not depend on
climatic changes.
Whilst all personnel working for the station will fall under the Labour Relations Act of 1995, they
are also shareholders in the above company and hence the company shall run on a shareholder
basis. The risk oflabour unrest will thus be limited or even be nullified. The company shall adopt
a representative committee to oversee disciplinary and other issues.
TRAINING PLANS, PERFORMANCE APPRAISALS
Since this is a "greenfields" project for which there is no South Afiican precedent, it will be
necessary to train key personnel on the requirements of this project. Attachments to Afiican
Marketing Suppliers (Pty) Ltd and Hygro (Pty) Ltd, both of London (UK), are envisaged for this
purpose. This may occur at the same time that growers receive their training in the operation of
hygroponics tunnels. Performance evaluations that reward superior performance will form part of
the overall human resources policy framework.
INFRASTRUCfURE REQUIREMENTS AND HOUSING
The present water supply system is operating at capacity and as a result the local authority, in
collaboration with the Cape Metropolitan Council, has commissioned an independent study to
determine the water requirements of the greater area surrounding the proposed development, The
project costing has allowed for a reservoir to supply water to tunnels in addition to the requirement
of approximately 650 residential erven. It is worth noting that a significant portion of this supply
.,
to the respective tunnels will be re - circulated thus limiting the water consumption. The building
of the water reservoir will also create much - needed jobs to those people in the building industry,
https://etd.uwc.ac.za/
92
Present utilisation, at capacity, of the adjacent sewer network has necessitated additional
expenditure for an extended line to an approved connection point. On the other hand, storm water
disposal poses no major difficulties.
As most of the communities living in Spandau do not have adequate shelter, it is important to note
that the development is divided into two parts, viz. for housing and farming respectively. The
internal infrastructure including the construction of houses will be funded by the Settlement and
Land Acquisition Grant (SLAG - Department of Land Affairs) while the bulk services
infiastructure will be funded by the Consolidated Municipal Infrastructure Programme (CMIP).
Indirect costs will be funded separately by means of the Settlement Planning Grant (SPG) within
stated boundaries. These grants or subsidies are free to the beneficiaries.
This is essential to note that a project of this magnitude will not only address the unemployment lJ;but also the housing needs of the community in the Blue Downs areas such as Spandau and the JGreater Nooiensfontein.
SUMMARY
The above is a very exciting project and although it is appreciated that not everyone will benefit t
from this project, the opportunities that exists holds enormous benefits for the area The objective rof any development in a specific area is to reduce poverty and human misery, by increasing the {
availability of basic needs, jobs, education and freeing people from a paternal life style. '\ ~\.
However, as a result of its magnitude, thorough planning is crucial to the project A flexible
management approach, whilst being guided and controlled formally by a strategic planning
process, will have to be adopted. Existing produce orders as mentioned elsewhere in the research ."
report have presented a challenge that must be faced.
https://etd.uwc.ac.za/
93
One hundred and eighty (180) tunnels are to be installed within the first 6 months of the
implementation schedule being initiated. The programme for settlement of families (680) in the
residential portion of the development will be determined by the contractor responsible for civil
services and housing and will slightly lag the tunnel installation programme.
It is acknowledged that this project has the potential, not only to eradicate and eliminate poverty
and unemployment issues, but it also bas the ability to transform the area by making Blue Downs a ?prosperous and thriving suburb - valued by wealth creators, residents and visitors for its quality of
life.
https://etd.uwc.ac.za/
94
WESTBANK COOKING AND TRAINING CENTRE
Westbank which forms part of Blue Downs is a new development within the Nooiensfontein
area, and in serious need for development and upliftment. Unemployment, shortage of
housing, shortage of skills and a lack of career opportunities all contribute to a township that
need a coherent development intervention that will address some of the needs within the
community.
The Westbank cooking and catering training centre, the development of the same area for the
mass produce of disease :free quality plant material as well as other related employment
opportunities could successfully be implemented in this area.
The population is estimated at 25 000 people. The area is close to informal squatter
communities and large tracts of undeveloped bush. However, some of the most marginalised
and poorest community members live in low-cost housing units of approximately 24 - 28
square meter dwellings in Westbank.
As a result of the above, a work strategy was developed for the area which could create
employment opportunities for the community. The project which was earmarked as an
The project is earmarked to address the following: .,
intervention strategy is the Westbank cooking and training centre. A centre which will educate 7and develop skills to enable people to enter formal employment in the food and catering sector. If!:.
THE ORGANISATION AND ITS RATIONALE
https://etd.uwc.ac.za/
95
• The evident face of poverty, which is a consequence of unemployment ID deprived
communities, of which Westbank is one.
• The high level of unemployment among the undereducated youth and adults who can still
make a meaningful contribution at the workplace, but do not have a specific skill to
provide.
• The gap that exists between formal education and the needs of the country at human
resource leveL
The pulse of poverty continues to beat in South Africa. As a small percentage of the
population enjoy economic stability and success, 53% of South Africans still face the realities
of unemployment, inadequate health care, poor housing, limited job opportunities and
inaccessibility to basic resources (utilities), (figures from October 1995 RDP survey).
The inception of the centre as envisaged, is in response to the comprehensive needs assessment
carried out with the unemployed in Blue Downs, especially the Nooiensfontein needs
assessment. The needs that were identified included the need for trained workers in the areas
of cooking and catering, business skills and entrepreneurship. After extensive consultation
with locally based organisations and members of the community, a creation of this kind of
body in Blue Downs became an imperative.
It is envisaged that the Westbank centre will provide entry level training in technical career
orientated skills in cooking and catering. This training is coupled with business skills training,
to equip those ,:"ho prefer to explore business ventures upon completion of the course. The 7 .,.target beneficiaries comprise mainly of the youth, unemployed men and women to help them ) ~
https://etd.uwc.ac.za/
96
join or rejoin the labour market, but now with a specific trade. It is furthermore envisaged thatJ
the centre will not only open its doors to the communities from the Westbank area, but it will
also open its doors to surrounding communities, such as Delft, Bellhar, Eerste River, Umfuleni,
Kalkfontein, Khayelitsha, Spandau, Happy Valley, Mitchellsplain, Wallacedene and
Bloekombos.
While the centre understands the economic conditions of its applicants, a minimal fee will be Icharged and it is expected from trainees to pay in flexible terms that suit their limited means. \
)These fees will go towards transport requirements to venues of in-service training and I
ingredients used in practical lessons. However, this payment increases the level ofl
commitment in the trainees' development. Upon graduation, through the placement wing of
the "After Care" programme, graduates resume work in hotels, restaurants and the big kitchens
in the peninsula As part of "After Care", the centre seeks feed back from employers on how
the graduates as the immediate product of the centre fare in the work environment. This,
information helps to uplift the training standards and thus meeting the exact needs of the
employers in the industry. The "After Care" programme also assists in counselling in
nurturing those who choose to take the small business route after training.
THE WESTBANK TRAINING VISION
It is envisged that the West Bank Training Centre will enter into a partnership or twineing with
the successful Eziko Training School in Langa and eventually become one' of the most
.,
successful training projects for the unemployed and semi-skilled workers in the Western Cape
in uplifting previously disadvantaged communities and thus restoring lives, self purpose and
pride of many who were once destitute.
https://etd.uwc.ac.za/
97
THE WEST BANK TRAINING MISSION STATEMENT
To grow and develop unemployed people with life and technical career-orientated skills in the
cooking and catering field, and to empower them to negotiate for a living wage and attempt to
secure employment for them, which will promote quality service delivery to everybody.
Tbe West Bank Training Centre wisbes to promote and enbance community partnersbip,wbicb wiD:
• Serve the needs and interest of the community
• Empower people~
• Deliver sustained quality service
• Focus on the development of human potential
• Display integrity at all times
Programme Objectives:
• Targeting and training of the youth and the unemployed
• The creation of entrepreneurship awareness
• Provision of business skills to the community
• Bridging the gap between the disadvantaged communities through skills advancement.
• Explore and involve the hospitality industry in direct involvement with the community.
• Encouragement of tourism and tourism opportunities to the community.
• The creation of business opportunities through the involvement of people in their own
development.
Strategic Objectives
• To empower the most marginalized communities..,
• Create job opportunities.
https://etd.uwc.ac.za/
98
• Develop the area.
• Contribute towards Gross National Product (GNP).
Programmes
It is envisaged that the project will be linked to two training components that will run in
modular form over seven weeks:
Training in basic cooking and catering, which will consist of:
• Theory modules
• Food theory and practice
• In-service training
Business Training
Various marketing tools will be used, such as the local print and electronic media, such as The
Argus and Cape Times, community papers and trade magazines such as the Hotel and Caterer.
It is also important to negotiate with radio stations, such as KFM, Cape Talk Radio Goodhope,
and P4 for time slots.
It is believed that the project will qualify as a training centre in terms of the national
qualifications framework. This will allow students to continue with national qualification
skills training. National qualifications are assessed in the workplace as part of the on-the-job-
training. The West Bank Centre will as an entry-level training institution be tailoring its
programme in such a manner to create bridging opportunities for students wishing to study
further. Students can access Technikons, Hotel Schools, Technical Colleges and Culinary
Schools..,
https://etd.uwc.ac.za/
99
Career Path
Through the placement programme, graduates enter at entry level in the following career paths:
(a) Restaurant/Hotel Model
• Scullery (Kitchen Cleaner / Pot Wash)
• Commis Chef / Salad Chef / Junior Cook
• Chef de Parties (section chef)
• Senior Chef de Parties
• Sous Chef
• Head Chef (management)
(b) Industrial Caterers
• Assistant food servers
• Scullery
• Cook (junior / senior)
• Supervisor
• Management
The West Bank Training Centre will be marketed as a catering enterprise.
(c) Sustainability
In South Africa, thousands ofNGO's, NPO's, CBO's seek funding from the same sources. In
the mean time, corporate bodies are moving away from donation funding, therefore
organisations can no longer enjoy the "social responsibility" budget. This means that
organisations must seek creative and holistic solutions that can sustain themselves beyond
donor funding. Dependency on donors even to the National Government to address
unemployment and poverty is unrealistic. The government has a role to play but the public.,
https://etd.uwc.ac.za/
100
and organisations alike must realise that South Africa is not a welfare state and the government 1~cannot address poverty and unemployment alone.
Experience around the world seems to demonstrate that when the poor are empowered and
become active participants in their own development, the outcome is not only new ideas and
strategies but increased effectiveness as well.
The planned utilisation of the facilities are:
• To start a restaurant and a catering operation aimed at the tourist market.
• To expand the current training scope and ofIer an integrated functional and vocationalvenue that will give students direct access to the hospitality industry in a conducivelearning environment.
• To provide hands-on experience for students who have completed the entry-level trainingto facilitate advanced practice and boost their aptitude for cooking.
• The dining space will be converted to a conference or meeting venue upon request.
• To generate income to meet some of the running expenses.
• To provide a tourist friendly environment especially for the visitors who want to see the ~
Western Cape communities and how people in these communities are reclaiming
because more people will identify other sites of local interest and bring the community
responsibility for their lives. For the local communities the centre will act as a catalyst,
closer to tourism.
-,
https://etd.uwc.ac.za/
101
DULD PROJECf "Gold Cup"
As in the case with the hygro agricultmal project, the "Gold Cup" bulb project has
the potential to develup into a fully fledge industry with enormous spin-offs for the
flower export market. Coupled with this project is the development of the dune
areas and thereby creating awareness towards the environment.
The Cape Floral Kingdom, the smallest of the 7 floral kingdoms in the world, is
regarded as the richest and most diverse. It contains 8 500 of South Africa's 24 000
p1ant species, and is the original home of the Freesia and the Gladiolus, the Gerbera
and the Geraniwn. This quantity is unparalleled anywhere else in the world. The
Westbank area is not only known for the "anun lilly" but is also home for almost 10
000 plant species. According to a recent study of plants in the area it was
established that the sof texture in the West Bank is ideal for the cultivation of the
Ornothogallum hybrid or commonly known as the ''Gold Cup" plant. If the "Gold
Cup" bulb could be cultivated in Westbank it will provide full-time employment for
approximately 100 people while others could be trained in technical career
orientated skills in the growing of bulbs. This training is coupled with business
skills training, to equip those who prefer to explore business ventmes upon
completion of the course. The target beneficiaries comprise mainly of the youth,
unemployed men and women to help them join or rejoin the labour market, but now
with a specific trade. It is furthermore envisaged that the project will not only
address the communities from the Westbank area, but it will also open its doors to
"
https://etd.uwc.ac.za/
102
surrounding communities. While the project is totally dependent on the economic
conditions of its applicants, training will be free to the beneficiaries.
The Westbank Training Vision
It is envisaged that the West Bank Training Centre will enter into a partnership
with Cape Bulb and Seed and eventually become one of the most successful training
projects for the tmemployed and semi-skilled workers in the Western Cape, in
uplifting previously disadvantaged communities and thus restoring lives, self
purpose and pride of many who once were destitute.
The following is envisaged to mass-produce disease-free quality plant materialising
in-vitro plant tissue culture teclmiques. To grow and develop unemployed people
with life and technical career-orientated skills in the horticultural field, and to
empower them to negotiate for a living wage and attempt to secure employment for
them, which will promote quality service delivery to everybody.
The West Bank Bulb and Seed ''Gold Cup" Project wishes to promote and enhance
community partnership, which will:
• Be the catalyst for other ruraVurban upliftment projects based on further on-
growing
of the plant material that is produced by the facility
• Serve the needs and interest of the community
• Empower people
• Deliver sustained quality service.,
https://etd.uwc.ac.za/
103
• Focus on the development of human potential
• Display integrity at all times.
• To develop a laboratory for disease-free quality plant material that will create
employment opportunities and could alleviate poverty.
Programme Objectives:
• Targeting and training of the youth and the unemployed
• The creation of entrepreneurship awareness
• Provision of business skills to the community
• Bridging the gap between the disadvantaged communities through skill
advancement.
• Explore and involve the hospitality industry m direct involvement with the
community.
• Encouragement oftourlsm and tourism opportunities to the community.
• The creation of business opportunities through the involvement of people in
their own development.
Strategic Objectives
• To reach profitahility within a two year period
• To empower the most marginalised communities
• Job creation
• Development
• Contribution to Gross National Product (GNP)
.,
https://etd.uwc.ac.za/
104
• To provide employment for approximately 100 people with a further
development of communities in flower selling, growing of bulbs, etc.
Method of Recl1litment and Selection Procedures
Various marketing tools will be used, such as the local print and electronic media,
internal, etc., community papers and trade magazines and radio stations.
V.Test Bank. has an abundance of plan; and bird life in the area, with its dune banks.
This
too will be a bonus for tourists who wouJd like to walk the trails in the dunes and to
explore the plant life.
-,
https://etd.uwc.ac.za/
105
DEVELOPMENT FRAMEWORK FOR THE WESTBANKI VLEI AREA
The Nooiensfontein Vlei is one of the few remaining wetlands on the Cape Flats.
However, the nature of the vlei has changed froma seasonally wet area to a nutrient rich,
permanently wet system. A number of specialist studies were undertaken in order to
assess the ecological value of the study area and tt:' provide guidance with respect to
management options. The vlei is perceived as a valuable educational resource for the
community and the children, and should be used by schools as a living laboratory so that
they can view, touch and experience the plants and living organisms. Unemploymeni:is a
problem in Westbank and thus it is important that opportunities for job and income
generating activities be created in order to employ local people. Income generating
activities which could be mtroduced include: breeding of birds, trout hatchery, owning
boats, planting of vegetable gardens and the harvesting of indigenous species such as
arum lilies, Cyperus texilus and waterblommetjies. This could also make the area
attractive enough to attract tourists to stop en-route to Stellenbosch or elsewhere. The
lack of recreational facilities within the Westbank could also lead to employment
opportunities.
These projects inter-aliaare the following:
• Walking trails: The banks of the river should be bounded by a series of walking trails.
These could consist of gravelf'laterite" pathways that give the residents access to
jogging/running, walking and cycling trails along the river banks connected into the
adjacent urban areas. This could lead to job creation and self-employment
.,
https://etd.uwc.ac.za/
106
• Crossing points: In order to provide circular walks and runs that are attractive to
users, two new crossing points are proposed. In the north, there is a causeway
originally constructed by the farmers to get from one side of the river to the other.
This causeway should be examined to ensure that there is sufficient freeboard during
higher flows, and then bridged with appropriate pedestrian bridges in order to provide
a crossing point In the south, a pedestrian bridge spanning the narrow river channel
along the Silversands road alignment should be provided. There is some urgency
attached to the soutthem crossing point as there are already a large number of
children in Wesibank who cross the river in various places to attend school at
Silversands Primary School. Once again this could be a community driven project
which could generate some employment to the residents.
• Picnic areas at various strategic locations (determined either by proximity to large
numbers of people or by already existing natural features that could be incorporated at
little cost) could be provided with the right mind shift this could also create
employment opportunities and encourage visitors and tourists to the area The spin-
om could be enormous in monetary terms.
• Urban Park: The complex of dunes, stormwater detention ponds and re-vegetated
areas already partially developed on the south western banks of the river abutting
Westbank should be consolidated and further developed as an important community
asset which could attract visitors and tourists to the area and thus create employment
opportunities.
"
https://etd.uwc.ac.za/
107
• School and communal gardens: At strategic locations, ideally abutting the existing
school sites or in close proximity to schools or communal facilities, opportunities for
school and communal gardens could be developed. Ifnecessary, irrigation could be
provided to those areas from the Kuils River. This obviously will be an asset for
future generations.
SUMMARY
As mentioned above there exist a number of opportunities in the area which are windows
of opportunities for 1<>C21residence in Blue Downs. However, they need the support of
all role players to be successful. Blue Downs; as in the case with other towns are
experiencing problems associated with poverty as a result of unemployment, decreasing
food security and economic decline. As Blue Downs is on the urban edge, it is most
likely to attract rural migrants and become centres of crisis that are unable to meet
pressures created by rapid population growth and increasing demands for food. This is
often compelled with the lack of basic skills, knowledge, capacity and resources, which
must be addressed.
The whole notion of self-reliance through SMME's and people meeting their own needs,
and thus generating their own employment and income are to an extent advantageous in
any situation which provides a framework to harness talent, skills and human resource. It
is also an effective way to address gender and environmental issues and concerns.
.,
https://etd.uwc.ac.za/
108
CHAPTERS
OVERVIEW
This research paper provides an overview of the problem in Blue Downs and provides
data on the views of Blue Downs residents and possible solutions to address the issue of
poverty through job creation. The data also provides information on the main strategic
themes, which should help the community and the Municipality to target their work
programme and to plan a repeat of the survey within two to three years' time, and to
provide evidence of change over time.
What the research does is to bring to the attention of the role-players, i.e. communities
and authorities, that a plan of action needs to be implemented to address the concerns of
the community. This can be done by probing at the problem and making
recommendations on how to become a prosperous and thriving town, where everybody
would want to live, work and enjoy the prosperity of the town.
As only a sample was interviewed and not the entire population of the Blue Downs
residents, one cannot be sure that the results obtained would be the same if the entire
population had been interviewed, Nevertheless, given the spread, size and selection
sample, it is possible to calculate the likely level of accuracy of the sample we have
obtained. The measure most commonly used is the 95% confidence internal, which
defines the margins of error we would expect in nineteen out of every twenty samples
selected at random.
.,
https://etd.uwc.ac.za/
109
The swvey provides the researcher with feedback from a representative sample of
residents in the Nooiensfontein area and in the Spandau area and emerging from the
above it was acknowledged that:
Blue Downs town centre is used by most residents during the day, but only by just over a
third of residents in the evenings. Most residents use the town centre for shopping and
travel in by car or public transport.
The most popular improvements suggested to the town centre were "more and better
public toilets", ''improved public transport", and "improved cleanliness". Younger
people prefer "more pubs and clubs", "restaurants", "sports facilities" and "child
minding/changing facilities".
Most residents shop in the Blue Downs town centre and markets at least occasionally.
Prices, quality of goods, general atmosphere and the service from traders are all thought
to be good. People who do not use the markets generally are of the opinion that it is
because supermarkets and other shops in other areas are more convenient.
Not many residents are worried about crime, though some groups are particularly worried
about house burglary. Experience of crime is much less, though some residents actually
experienced some form of crime.
Not many residents have taken part in community activities in the last 6 months, though
-,
https://etd.uwc.ac.za/
IlO
some have shown an interest in being more involved, particularly in the younger age
groups. Most of the residents are happy with where they live, though some are not, and
for most of these it is because their home is too small.
The condition of streets, pavements and dog-fouling are considered to be a problem in the
Blue Downs area. Certain residents are not interested in the environment, but agree that
awareness should be encouraged.
The area is characterised with a very high unemployment rate. Unemployed people felt}
that the main problem they had was that there were no suitable jobs available within a
reasonable travelling distance.
From the above it is clear that only limited progress has been made in the development of
the area. Although the Blue Downs CBD has been developed in the 1980's, nothing has
been done to revitalise the area. Since the Blue Downs Sport Complex and the
magisterial courts have been constructed, new interest in the CBD. The development of
Saxenberg Park, the Safic Hygro development project and the new interest in the
Blackheath industrial park are all positive factors for the economic upheaval of the Blue
Downs area. However, the following are important factors that one must be content with:
• A large percentage of the local population is poor, illiterate and they do not have
access to employment opportunities.
• The area is characterised by a housing backlog and limited funds are available to
continue with existing and future housing delivery programmes.
https://etd.uwc.ac.za/
111
• As a result of natural growth and expected in-migration into low-income areas, it is
assumed that low-in-come-areas will increase at a higher rate than in the middle and
high-income areas. This would necessitate a housing strategy that would concentrate
especially on housing delivery in the low-income-areas.
• Limited economic growth is expected that would not generate adequate employment
opportunities to ensure that all the residents of Blue Downs earn adequate income.
The expected growth could further attract new households into the area, contributing
to the existing socio-economic, economic and housing problems. Opportunities to
create employment opportunities for the local population would need to be identified
or created.
It is thus important that every opportunity be explored to bring some of these projects
to life alongside the Integrated Development Programme (IDP). This exercise would
be continually extended to include additional measures of social and environmental
progress. This will reflect other initiatives in the Oostenberg Municipal area and
could be used to encourage some leverage of additional effort.
The study therefore provides an opportunity to begin to measure not only against
specific objectives of the programme, but also for tracking the broader quality oflife
in a geographical area which will continue to need the partnership's attention if
regeneration in Oostenberg (in this context, Blue Downs) is to be sustainable.
"
https://etd.uwc.ac.za/
112
The research paper is designed to firmly entrench the Oostenberg's commitment to
the process of Reconstruction and Development in South Africa, and to ensure that a
difference is made in the lives of the most marginalised disadvantaged communities
in the municipal area. In this instance a number of role-players, such as Non-
Governmental Organisations (NGO's), Community Based Development Structures
(CBD's) and ROP Forums worked together in this regard.
The research also looked at job creation and the beneficiary community and the role
they will play, but more over the key task areas to be informed by the outcome of this
research paper will be the following:
(i) Promoting integrated social developing planning
By bringing people, structure, strategies and programmes together in a coordinated
and structured way to harness all resources in a coherent and purposeful manner which
will be sustainable in future. The research paper tries to identify and bring the
resources together by determining the people's needs that should collectively be
addressed in an integrated manner.
(ii) Building the Capacity orPeopleWe acknowledged that people have aspirations that need to be addressed. In an 'effort to
eradicate poverty and underdevelopment of our people, we need to strengthen
individuals, forums and community based structures through capacity empowerment
programmes.
"
https://etd.uwc.ac.za/
113
Recommendation
The research study points to the need for a structure to co-ordinate an overall strategy or
programme for the area. The local authority must also be committed and sincere in its
developmental role and ensures that resources, financial and otherwise are released to
ensure that developmental projects can be initiated and implemented as well as fundraise
for LED activities.
The various initiatives in the area relies on matters of mutual interest, such as training and \
small business support in areas such as agricultural and eco-tourism projects. However, j~these projects need to be co-ordinated in an effective manner otherwise little success will
be achieved.
In response to the employment crisis in the area, the need to retrain people who had lost 7jobs in the past is ? challenge for the community and local authority. It is however ~. ~ .-
important that development programmes be initiated which could offer skills training to fPprospective small business entrepreneurs and training in business development.
Support to farming especially in the hi-tech agri-village and cultivation ofbulps should
be provided to ensure that spin-offs could be realised, which in tum could contribute to
the regions economy. Incentives should be offerea which could include free industrial
sites and grounds to entrepreneurs who have the ability to start businesses in the area
"
https://etd.uwc.ac.za/
114
should be encouraged. This will enable local people to be empowered end employed
from within the area
Conclusion
The outcome of this research paper clearly spells out a need for intervention strategies
that could promote aspects of the economy, including the structural features, particularly
those that create employment opportunities and poverty eradication. It is thus clear that
the effective implementation of local economic development strategies as highlighted in
the research must be complemented by the availability of some form of fiscal resources,
private sector investment and capital formation, technological innovations as well as the
existence of appropriate social and institutional settings. The challenges of creating a
developmental and competitive system with effective and efficient services will require
far more of the systems of governance than that which are currently the case. Therefore
employment opportunities, tax incentives and other options need to be put in place to
address the employment problems.
It will require high levels of civic leadership to address the development challenges
facing Blue Downs. It will also require high quality decision-making within and from the
organization (internal governance). It will require higher levels of inter-governmental
working, both within the area and in terms of establishing and fostering continental and &global links and partnerships. Obviously apartheid-styled development planning
fundamentally damaged the spatial, social and economic environments in which people
live, work, raise families and seek to fulfill their aspirations. As a result, local
-,
https://etd.uwc.ac.za/
115
government, as the sphere of government closest to the residents, has a critical role to
play in rebuilding local communities and environments as the basis for a democratic,
integrated, prosperous and truly non-racial society, surrounded with wealth creations.
As already mentioned the research paper highlights the problems associated with poverty
and urbanisation. The legacy of apartheid especially the abolition of influx control on 30
June 1986 brought about huge urban challenges as some of the major urban areas
struggled and indeed are still struggling to accommodate the millions of people migrating
from rural areas in search of employment.
Although Blue Downs was a direct result of the apartheid policies of separate
developments for South Africa, most of its problems are also as a result of no
employment opportunities in the area. However the research paper also provides a
number of avenues to explore to eradicate and reduce poverty. It is therefore important
that strategies be developed that could address the issues of reducing poverty but it
should also have to address issues of low self-esteem, lack of access to services such as
transportation, childcare, inadequate housing and household services, and discrimination.
The local authority should also encourage and foster partnerships with the community
and to encourage community economic development.
Community economic development in this context focuses on combining employment,
training, human resources and enterprise development to enhance access to and the
creation of jobs, careers and self-sufficiency for disadvantaged communities. In other
.,
https://etd.uwc.ac.za/
116
words, this strategy aims to create new job opportunities by opening small businesses. It
is thus important that the recommendations in this report be investigated with a view to
implement it.
"
https://etd.uwc.ac.za/
117
BmLIOGRAPHY
• Allison, B., O'Sullivan, T., Owen, A, Rice, J., Rothwell, A and Saunders, C. (1996)De Montfore University, Research Skills for Students. Published by Kogan Page Ltd.London
• ANC, 1994. The Reconstruction and Development Program. Umanyano PublicationsJohannesburg
• Anonymous, 1998. An Integrated Development Framework for the CapeMetropolitan Area Draft 1.
• Anonymous, 1996. Metropolitan Special Development Framework (April).• Bernstein, A Focus on the cities - towards a new national agenda. Social Dynamics
15 (1):65-71.• Burkley, S. (1993). People First. A guide to self-reliant, participatory rural'
development. Zed Books, New Jersey.• BKS Consulting Engineers. Report on high-tech farming.• Chambers, R. (1997). Whose Reality Counts: Putting the first last. Intermediate
Technology Publications, London.• Cohan, L. and Manion, L. (1996). Research Method in Education, Fourth Edition.
Published by Croom Helm Ltd. London.• CMC. Going Global, Working Local: An economic development framework and
Local Government Strategy for the CMA. June 1999.• Fellows, R. and Liil, A (1997), Research Methods for Construction. Published by
Blackwell Science Ltd. Oxford. U.K.• Ferreira, G.M., Van Wy~ W.J. Odendaal, M. 1994. Public Administration
(Honours). Only Study Guide for Human (Government and Urbanisation) Pretoria:University of South Africa.
• Gillis, M., Perkhuis D. H., Roemer, M. and Snodgrass, D.R. 1996. Economics ofDevelopment (Fourth Edition) New York: W.W. Norton and Company.
• Government Printers, Cape Town; S A Constitution (Act 108 of 1996).• Government Printers, Cape Town; Transitional Act, Second Amendment Act of 1996
(Act 97 of 1996).• Jourdon and Gordham: Spatial Development Initiatives (development corridors)
1996.• Korton,D.C.(1990). Getting to the 21 st Century. Voluntary action and the global
agenda Kumarian Press, Connecticut.• Korton, D.C. and Klaus (ed) (1998) in Theron 1998). People-centred Development:
Contributions towards theory and planning frameworks. Kumarian Press,Connecticut
• Kotze, D.A and Kotze.P.(1997) Understanding Communities: A holistic approach. InKotze D.A Development administration and management: A holistic approach. J.L.VanSchaik Publishers, Pretoria.
• Oliver, S. 1990. Urbanisation the Future, Metropolitan Digest, 9(7): 4.• National Cencus Statistic (1991)• Robertson,A.F.(1984). People and State. Anthropology of planned development.
University Press, Cambridge. "
https://etd.uwc.ac.za/
118
• R.S.A. Local Government Transition Act: (1993) Government Gazette 15468.• R.S.A. Local Government Transition Act: (1998) Government Printer Pretoria.• Teitelbaum, H. (1989) ARCO: How to write a Thesis, Third Edition. Published by
Macmillan, New York.• The Minist.ty for Provincial Affairs and Constitutional Development (1998). The
White Paper on Local Government.• Thomas, W.F. Small Business Promotion at Provincial, Metro-, District and Local
Authority Levels, 1998.• Todes, Alison "An Overview of urbanisation Issue in the 1990's" Research Paper,
April 1999.• Turok et al. Inclusive Cities: Building Local Capacityfor Development, 1998.• The World Bank (1975). The assault on World poverty. Problems of rural
development, education and health. John Hopkins University Press, London.• Theron, F. (1998) Development Management Orientation Document:
Contexualisation Development Theory and Strategy. School of Public ManagementUniversity of Stellenbosch.
INTERVIEWS
• Van Der Merwe E: Directorate Community Services and Facilities Oostenberg.• Simons Y: Member of United Action Against TB: Tuberculoses Advocate Team.• Community leader: Wallacedene, Bloekombos and Scottsdene.• Nooiensfontein community (survey) one-on-one interviews.• Spandau community (survey) one-on-one interviews.• Staff. Provincial Administration Western Cape.• South African Police Services (Blue Downs).• Workshops with role-players in the Blue Downs area
.,
https://etd.uwc.ac.za/
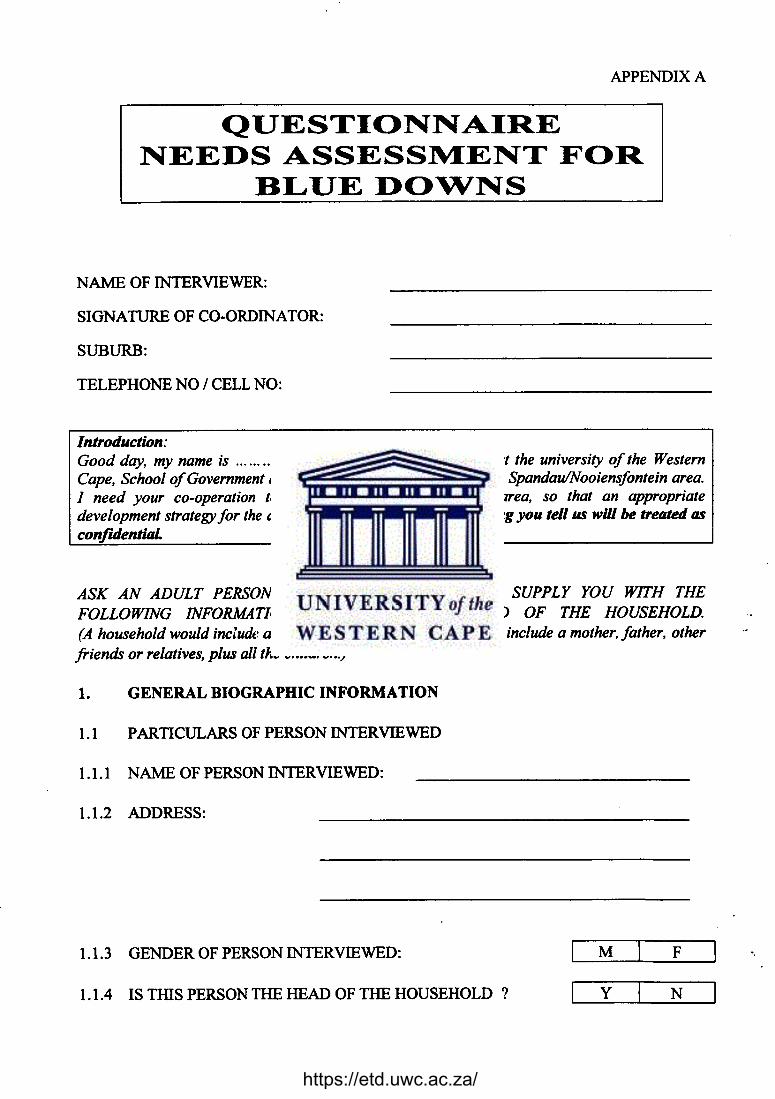
APPENDIX A
QUESTIONNAIRENEEDS ASSESSlMENT FOR
BLUE DO,",NS
NAME OF INTERVIEWER:
SIGNATURE OF CO-ORDINATOR:
SUBURB:
TELEPHONE NO I CELL NO:
Introduction:Good day, my name is a student at the university of the WesternCape, School of Government and I am conducting a survey of the SpandauINooiensfontein area.I need your co-operation to determine the needs in your area, so that an appropriatedevelopment strategyfor the area could be developed. Everything you tell us will be treated asconfuJentÏIIL
INTERVIEWERASK AN ADULT PERSON LIVING ON THE STAND TO SUPPLY YOU WITH THEFOLLOWING INFORMATION, PREFERABLY THE HEAD OF THE HOUSEHOLD.(A household would include all persons who eat together. It may include a mother, father, otherfriends or relatives, plus all the children.)
1. GENERAL BIOGRAPHIC INFORMATION
1.1 PARTICULARS OF PERSON INTERVIEWED
1.1.1 NAME OF PERSON INTERVIEWED:
1.1.2 ADDRESS:
1.1.3 GENDER OF PERSON INTERVIEWED: M F
1.1.4 IS rms PERSON THE HEAD OF THE HOUSEHOLD ? y N
https://etd.uwc.ac.za/
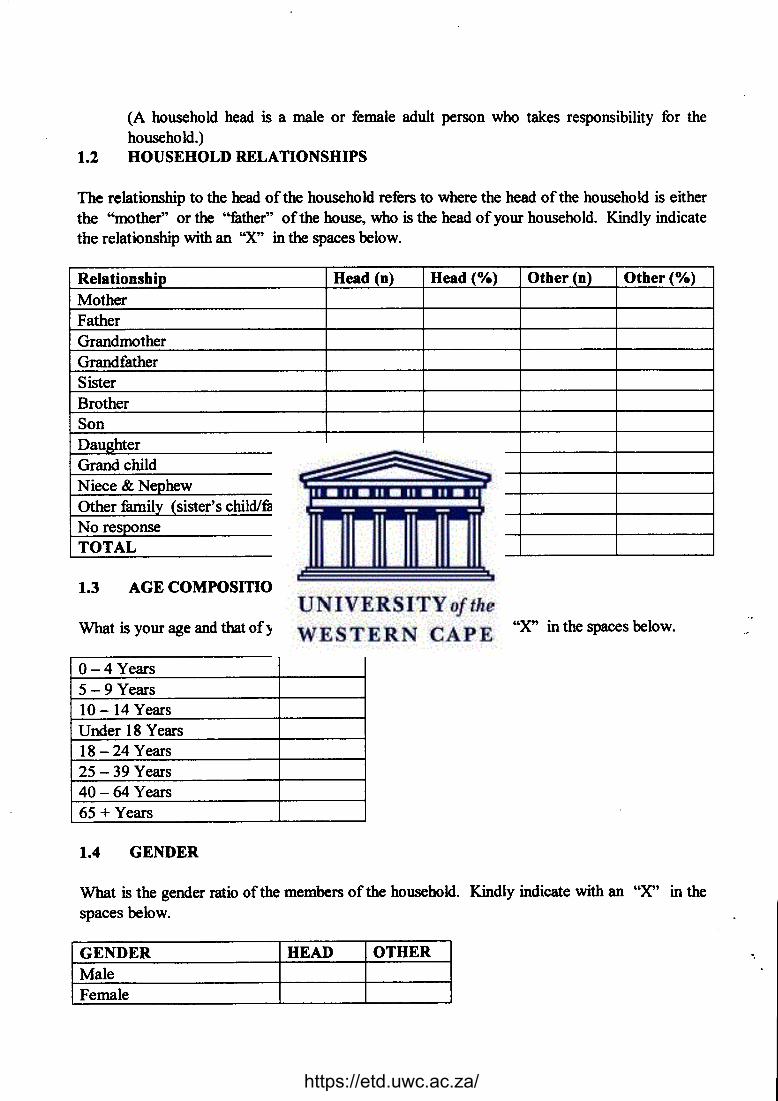
(A household head is a male or female adult person who takes responsibility for thehousehold.)
1.2 HOUSEHOLD RELATIONSHIPS
The relationship to the head of the household refers to where the head of the household is eitherthe "mother" or the "father" of the house, who is the head of your household. Kindly indicatethe relationship with an "X" in the spaces below.
Relationship Head (n) Head (%) Other (n) Other(%)MotherFatherGrandmotherGrandfatherSisterBrotherSonDaughterGrand childNiece & NephewOther family (sister's child/family)No responseTOTAL
1.3 AGE COMPOSITION
What is your age and that of your family. Kindly indicate with an "X" in the spaces below.
0-4 Years5 - 9 Years10 -14 YearsUnder 18 Years18 - 24 Years25 - 39 Years40 - 64 Years65 + Years
1.4 GENDER
What is the gender ratio of the members of the household. Kindly indicate with an "X" in thespaces below.
IGENDERMaleFemale
https://etd.uwc.ac.za/
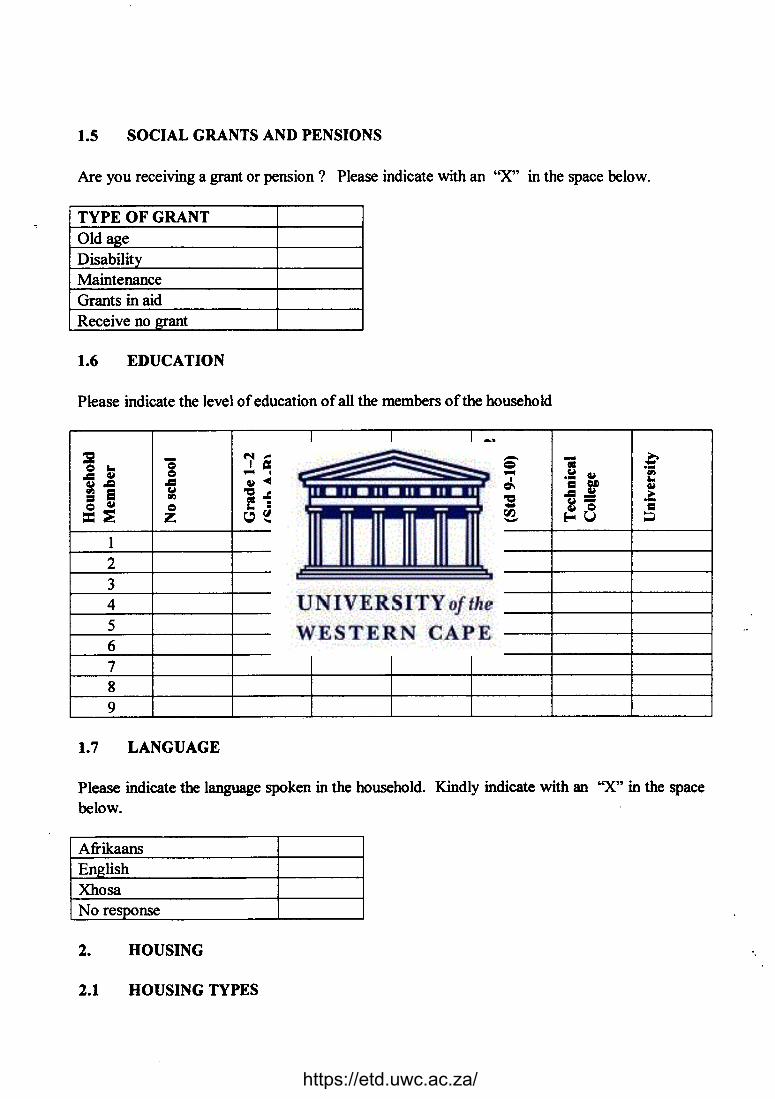
1.5 SOCIAL GRANTS AND PENSIONS
Are you receiving a grant or pension? Please indicate with an ''X'' in the space below.
TYPE OF GRANTOld ageDisabilityMaintenanceGrants in aidReceive no grant
1.6 EDUCATION
Please indicate the level of education of all the members of the household
N
-= '1= r- = - c- - I - -- = ~In' 1_ -= ale ... .•.1:1 ~ e
- IOCoc - - ~ ~ G'J
.1:1 ~< ~ I ~ I ~ I.• ...~.Q m ifG'J EI ~ ".Q -=- -=~ -=0'1 ~
= G'J f'S f'S f~ .1:1- ~f = ~ - .-= ~ = ~ = m=~ Z ~~ ~~ ~~ ~~ E--U ~
123456789
1.7 LANGUAGE
Please indicate the language spoken in the household. Kindly indicate with an ''X'' in the spacebelow.
AfrikaansEnglishXhosaNo response
2. HOUSING .,
2.1 HOUSING TYPES
https://etd.uwc.ac.za/
Please indicate for each household with an ''X'' in the space below.
(a) The type of building or structure they live in on the stand / plot.(b) The main material used for the building or structure that they live in on the site.
HOUSEHOLD(a) Type of building 1 2 3 4
Main buildingGarageOutbuildingShackOther (specify)
HOUSEHOLD(b) Material 1 2 3 4
BricksWoodCorrugated ironPlasticAsbestosOther (specify)
2.2 ROOM DENSITY
Please indicate for each household with an "X" in the spaces below.
Type of dwelling Average number of Average number ofrooms persons
House or brick structure on a separate standTraditional dwellingFlat in a block of flatsTownlcluster/semi-detached houseInformal structure/shack in backyardInformal dwelling/shack in squatter camp
2.3 HOME OWNERSHIP
Does someone in the household own the home. Please indicate with an "X" in the space below.
YesNoNo response
https://etd.uwc.ac.za/
I TOTALTYPE OF HOUSE
What is the ownership by the type of home. Please indicate with an "X" in the space below.
Type of dwellingHouse or brick structure on a separate standTraditional dwellingFlat in a block of flatsTown/cluster/semi-detached houseInformal structure/shack in backyardInformal dwelling/shack in SQuatter campNo responseTOTAL
2.4 OWNERSHIP OF LAND
Do you own the land on which the house is situated (indicate with an "X")
TOTAL
Ownership of land
Own the landDo not own the landNo response
Indicate with an "X" the type of dwelling in comparison with the ownership of the land onwhich the house is built
Type of dwelling
House or brick structure on a separate standFlat in a block of flatsTown/cluster/semi-detached houseInformal dwelling/shack in a SQuatter campNo responseTOTAL
2.5 ELECTRIFICATION
Is the home electrified (indicate with an "X")
I ;;:~ is electrifled
https://etd.uwc.ac.za/
I TOTALIndicate witb an "X" tbe type of bouses tbat are electrified
Type of dwelling Electrified
House or brick structure on a separate standFlat ina block of flatsTown/cluster/semi-detached houseInformal dwelling/shack in backyardInformal dwelling/shack in SQuattercampNo responseTOTAL
Indicate witb an "X" tbe type of electrification
Type of electrification
Complete electrification(lights, PIUiZS, geyser)Lights, plugs onlyLights onlyNo electricityTOTAL
2.6 ENERGY SOURCES
Indicate witb an "X" tbe energy source for housebold use
Energy source Cooking Heating Lighting
Electricity from ESKOMWoodCandlesNo responseTOTAL
3. DECISION MAKING
3.1 HOUSEHOLD PARTICIPATION IN DECISION MAKING
Indicate witb an "X" tbe person/s tbat makes decisions in the bousebolds on the following:
(a)(b)(c)(d)
MoneyChildrenMajor purchasesRules of the home .,
https://etd.uwc.ac.za/
Decision 1: Money (saving. borrowing. spending)
Jointly (partners)Children (parentis and children)FatherMotherNo ResponseTOTAL
Decision 2: Children (discipline, schooling)
Jointly (partners)Children (parentis and children)FatherMotherNo ResponseTOTAL
Decision 3: Major purchases (appliances, furniture)
Jointly (partners)Children (parentis and children)FatherMotherNo ResponseTOTAL
Decision 4: The rules of the house
Jointly (partners)Children (parentis and children)FatherMotherNo ResponseTOTAL
4. SOCIO-ECONOMIC INFORMATION
4.1 EMPLOYMENT OF HEAD OF HOUSEHOLD
Indicate with an "X" the employment status of the household head
Employment
Own / family's businessWork for an employer on permanent baseSeasonal or te y workerDon't work at all
"
https://etd.uwc.ac.za/
I TOTAL4.2 EMPLOYMENT OF PARTNER
Wbat is tbe employment status of tbe partner/spouse of tbe bousebold. Indicate witb an"X"Employment status
Partner employedPartner unemployedNo responseTOTAL
4.3 OCCUPATION
Indicate witb an "X" tbe sector and type of work tbat tbe bousebold bead and bis/berpartner do.
Type of work Respondent Partner
Unemployed/housewife/pensionerProfessional (teacher/doctor/nurse)Farm labourers/Seasonal workersSemi-skilled (security work/factory/hand man)Transportation/drivers/taxi'sDomestic workersHome industry (candlelbamboo making)ArtisanslTradesman (painters/cabinet making)Labourers/Construction workersClerical occupation (typist/Secretary)Sales (shop assistant/sales/reps)Services (Sangoma/fire brigade/traffic)UnclassifiedTOTAL
4.4 SOURCE OF INCOME
Indicate with an "X" the main source of income in the household
Source of income
No incomeOld age PensionDisability grantFoster GrantSalary/WagesOther (Sales/Boarding)
"
https://etd.uwc.ac.za/
I TOTAL4.5 MONTHLY INCOME
Monthly income can be defmed as the total monthly income generated from all sources such assalaries/wages, pension and grants, private pension schemes, private financial support/alimony,home-base industries/sales, etc.
Indicate with an "X" the household's total monthly income
Amount
NoneRl - R200R201 - R500R501 - RIOOORIOOO-R1500Rl501 - R2500R2501 - R3500R3501+TOTAL
Indicate with an "X" the income of household by self-employed persons
Income from own/family business
NoneRl - R200R201 - R500R501-RIOOORl 001-R1500 -Rl 501 -R2500R2501 -R3500R3501TOTAL
5. EXPRESSED NEEDS
5.1 HOUSEHOLD NEEDS
Indicate with an "X" the greatest problem / need in household
Type of need expressed 0/0 Priority
General disadvantaged communityNo income/poorLow standard of livingSocial problems (alcoholism/gangsters/drugs)
https://etd.uwc.ac.za/
Type of need expressed % Priority
ElectricityHousingFoodOtherNo responseTOTAL
5.2 COMMUNITY NEEDS
Indicate with an "X" the greatest problem / needs in the community
Problems/needs
ElectricityWaterSanitationiSeweragelDrainageCliniclHo spitalMultipurpose buildingsRefuse removalUnemploymentTransportInfrastructure (roadlbridge)Creche/SchoolSport and recreationTelephonesShopslRetailSocial problemPublic services (police station & fire brigade)SecurityReckless driving
5. 3 COMMUNITY PRIORITIES FOR IMPROVEMENT
Indicate with an "X" your community's priority projects if funding was available
First improvements
Multipurpose centreElectricityCommunity developmentCreche/SchoolClinic/HospitalBetter housingFacilities for the ~edInfrastructure
"
https://etd.uwc.ac.za/
First improvements
Other (plant etc.)Buy foodSecuritySport and recreationEmploymentEducationNo respo_nseTOTAL
5.4 RESPONDENTS PROPOSED SOLUTIONS TO COMMUNITY PROBLEMS
Indicate with an "X" the greatest problem (project) in your community
Problem
Multipurpose buildingsHousingSkills/capacity buildingInfrastructure (road bridge)Creche/schoolSport and recreationTelephonesNo responseTOTAL
5.5 Education
Indicate with an "X" the factor that would make a difference in educationFactor
Sport and recreation facilitiesImprovement of school building/New schoolBetter educationPurchase of general aidExtra teaching classes (e.g. extra math's)Financial support! Expensive schoolsSchool bus! TransportationBetter disciplineComputer educationBetter facilities (e.g. school desks/books)Evening educationOffering of self supportOtherNo response
"
https://etd.uwc.ac.za/
I TOTAL5.6 SPECIFIC SOCIAL PROBLEMS
Indicate with an "X" your community's specific social problems in household
Social problem
Excessive drinkingDrug abuseChild abuseDomestic violenceGang violenceIlliteracyUnemploymentTBmV/AidsTeenage pregnancies
5.7 BASIC SERVICES
Indicate with an "X" the services that are needed in your community
Sanitation
.Serviees
Water
Refuse removalElectricity
6. COMMUNITY INVOLVEMENT
6.1 RESPONDENT'S OWN COMMUNITY PARTICIPATION
Indicate with an "X" whether you as a member of the community is doing enough
Level of agreement
Strongly agree/AgreeNot sureDisagree/Strongly disagreeNo response
TOTAL
"
https://etd.uwc.ac.za/
6.2 RESPONDENTS INVOLVEMENT IN COMMUNITY ORGANISATIONS
Indicate with an "X" your involvement in community organisations
Level of involvement
Not involvedInvolvedActively participateLeadership positionNo response
TOTAL
6.3 COMMUNITY ACTIVITIES
Indicate with an "X" the nature of your involvement in community activities.
Community activity
Departmental Transformation' CommitteesYouth, educare, women's projects/programmesRDPWelfare/voluntary/service projectsPolitical party activitiesOther
6.4 DISLIKES
Indicate with an "X" the conditions least liked in your community
Condition
No securityNo co-operationSmugglingDrugs/AlcoholPoor serviceSocial problems (family violence/child abuse)No moral standards (badihateful/jealouslswearing)OtherNo responseTOTAL
"
https://etd.uwc.ac.za/
7. COMMUNITY PERCEPTIONS
7.1 PERCEPTIONS OF LOCAL GOVERNMENT
Indicate with an "X" your opinion as to whether the municipality/rurallocal authority isdoing enough to improve the conditions in your community
Level of agreement
Local Authority is doing enoughNot sureLocal Authority is not doing enoughNo response
TOTAL
7.2 PERCEPTIONS OF PROVINCIAL AND CENTRAL GOVERNMENT
Indicate with an "X" whether the government is doing enough to improve the conditionsin your community
Level of agreement
Government is doingNot sureGovernment is not doing enoughNo responseTOTAL
7.3 COMMUNITY PERCEPTION ON SAFETY AND SECURITY
Indicate with an "X" whether you regard your neighbourhood as being safe
Response
YesNoNo responseTOTAL
Indicate with an "X" the reason why you perceive your neighbourhood as being unsafe
IResponse "
Fire arms~ack of security
https://etd.uwc.ac.za/
Response
RefugeesGangstersOtherNo responseTOTAL
"
https://etd.uwc.ac.za/
APPENDIXB
https://etd.uwc.ac.za/
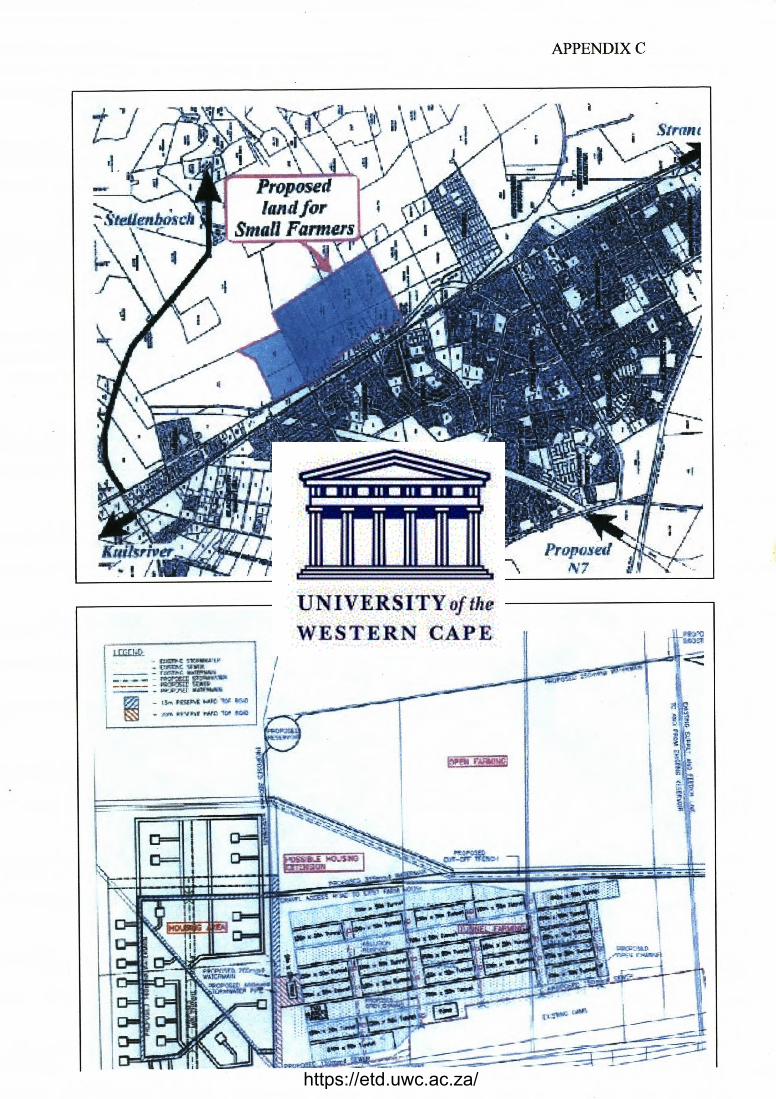
APPENDIXC
https://etd.uwc.ac.za/


