Embed Size (px)
Citation preview
2
BRING NEW AVENUES INGLOBAL TRADE
BRING NEW AVENUES INGLOBAL TRADE
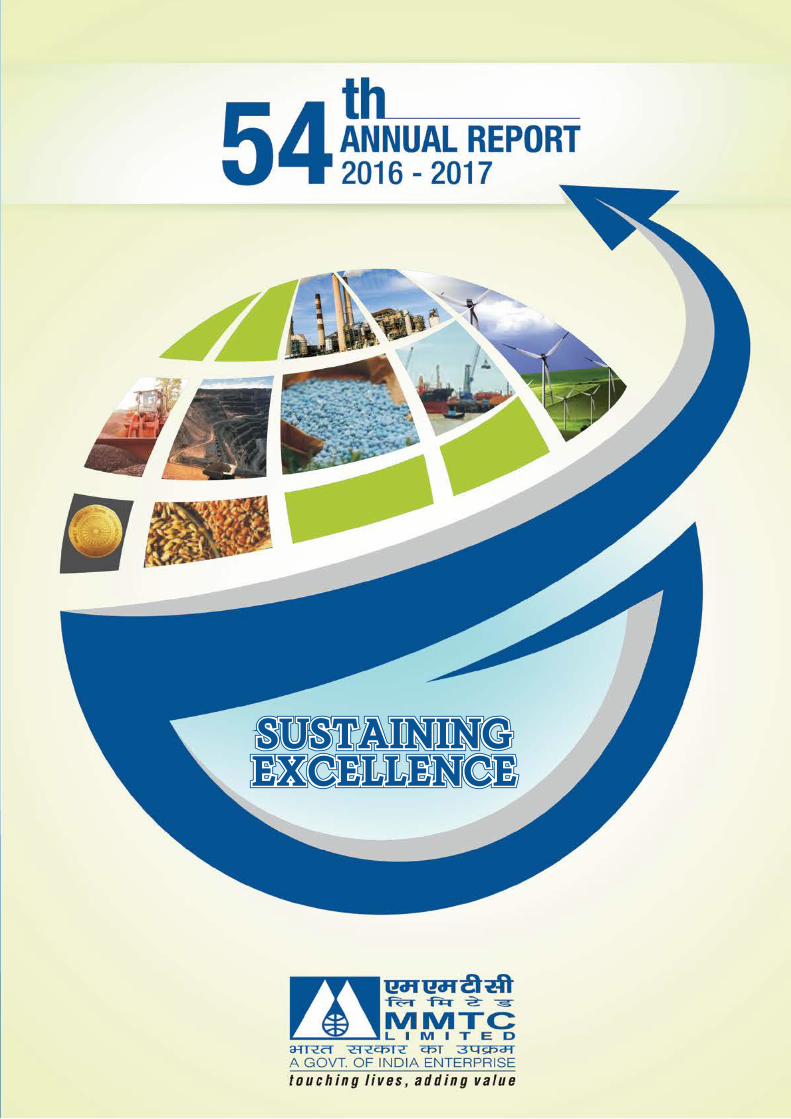
54 th2016 - 2017ANNUAL REPORT
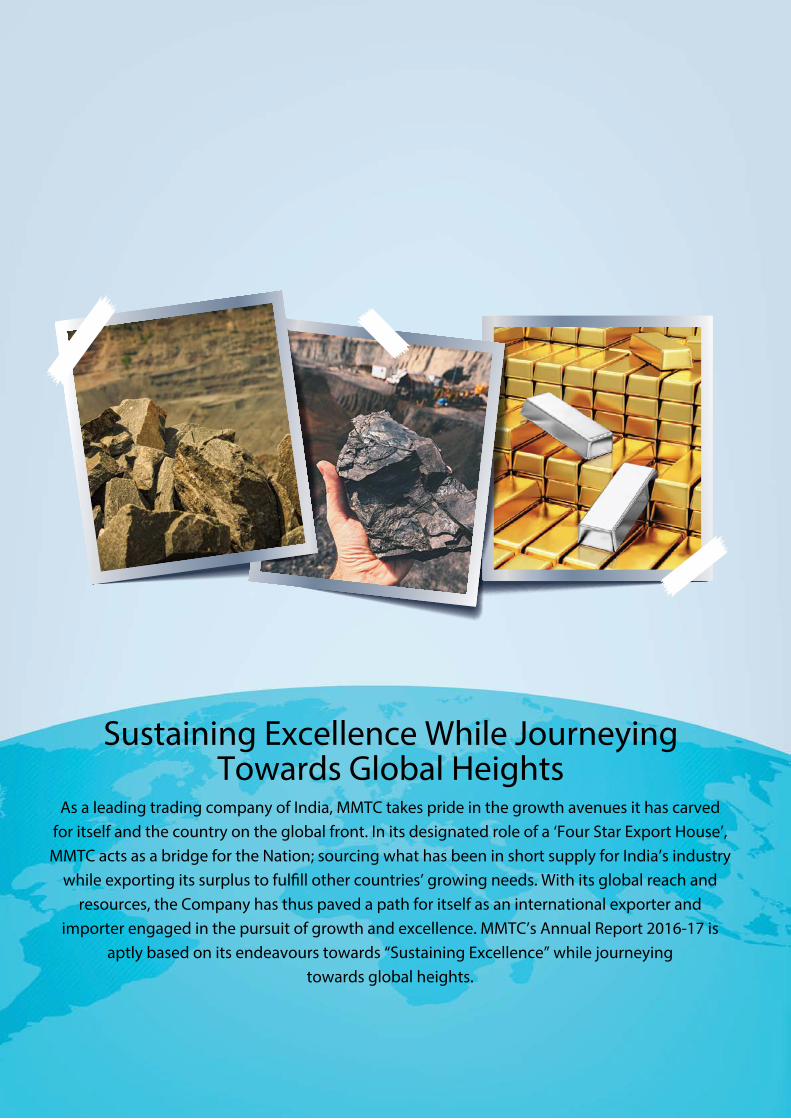
Sustaining Excellence While JourneyingTowards Global Heights
As a leading trading company of India, MMTC takes pride in the growth avenues it has carved for itself and the country on the global front. In its designated role of a ‘Four Star Export House’,
MMTC acts as a bridge for the Nation; sourcing what has been in short supply for India’s industry while exporting its surplus to ful�ll other countries’ growing needs. With its global reach and
resources, the Company has thus paved a path for itself as an international exporter and importer engaged in the pursuit of growth and excellence. MMTC’s Annual Report 2016-17 is
aptly based on its endeavours towards “Sustaining Excellence” while journeyingtowards global heights.
BRING NEW AVENUES INGLOBAL TRADE
BRING NEW AVENUES INGLOBAL TRADE
54 th2016 - 2017ANNUAL REPORT
Sustaining Excellence While JourneyingTowards Global Heights
As a leading trading company of India, MMTC takes pride in the growth avenues it has carved for itself and the country on the global front. In its designated role of a ‘Four Star Export House’,
MMTC acts as a bridge for the Nation; sourcing what has been in short supply for India’s industry while exporting its surplus to ful�ll other countries’ growing needs. With its global reach and
resources, the Company has thus paved a path for itself as an international exporter and importer engaged in the pursuit of growth and excellence. MMTC’s Annual Report 2016-17 is
aptly based on its endeavours towards “Sustaining Excellence” while journeyingtowards global heights.
12
BRING NEW AVENUES INGLOBAL TRADE
BRING NEW AVENUES INGLOBAL TRADE
54 th2016 - 2017ANNUAL REPORT
Sustaining Excellence While JourneyingTowards Global Heights
As a leading trading company of India, MMTC takes pride in the growth avenues it has carved for itself and the country on the global front. In its designated role of a ‘Four Star Export House’, MMTC acts as a bridge for the Nation; sourcing what has been in short supply for India’s industry
while exporting its surplus to ful�ll other countries’ growing needs. With its global reach and resources, the Company has thus paved a path for itself as an international exporter and
importer engaged in the pursuit of growth and excellence. MMTC’s Annual Report 2016-17 is aptly based on its endeavours towards “Sustaining Excellence” while journeying
towards global heights.
CONTENTSCorporates Mission 2Corporate Objective/ Major Achievments 3Performance at Glance 4Chairman’s Statement 5Board of Directors 8Director’s Report 10Management Discussion and Analysis Report 21Report on CSR Activities 27Report on corporate Governance 31MMTC Business Responsibility Report 41Auditor’s Report 56Statutory Auditor’s Report and Management Reply thereon 65Comments of C & A G of India 69Decade at a Glance 73Financial Statement of MMTC Limited 97Transnational PTE Ltd. Singapore 163Consolidated Financial Statements 183MMTC Auditors 263MMTC Bankers 264MMTC Offices 265
2
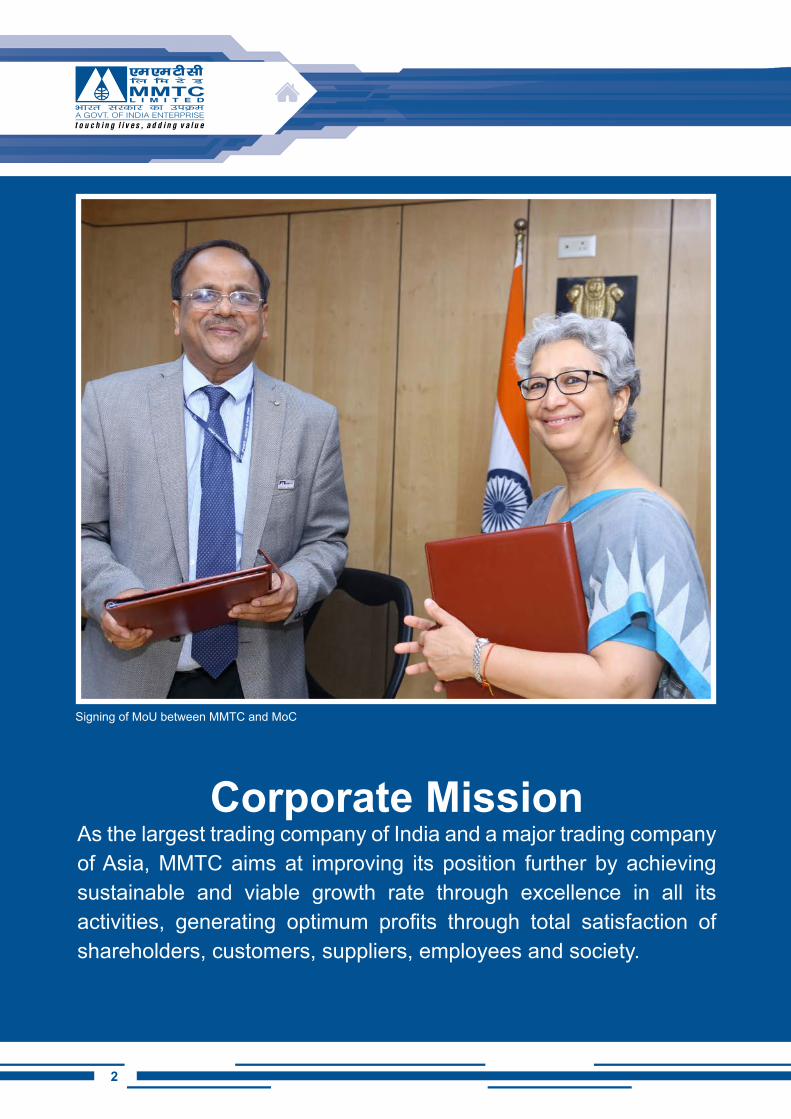
Corporate MissionAs the largest trading company of India and a major trading company of Asia, MMTC aims at improving its position further by achieving sustainable and viable growth rate through excellence in all its activities, generating optimum profits through total satisfaction of shareholders, customers, suppliers, employees and society.
Signing of MoU between MMTC and MoC
32
Corporate Objectives ± To be a leading International Trading House in India operating
in the competitive global trading environment, with focus on “bulk” as core competency and to improve returns on capital employed.
± To retain the position of single largest trader in the country for product lines like minerals, metals and precious metals.
± To render high quality of service to all categories of customers with professionalism and efficiency.
± To provide support services to the medium and small scale sectors.
± To streamline system within the company for settlement of commercial disputes.
± To promote development of trade-related infrastructure.
Major Achievements • Tied up with 7 banks to sell India Gold Coin, India’s first Sovereign
Gold Coin through its 400 branches to make easy availability of the coins across India.
• Phase 1 of Kandla FTWZ (Free Trade Warehousing Zone) has been made operational during the year 2016-17, a Joint Venture project between MMTC and IL&FS Ltd.
• Signing of mining lease agreement with Govt. of Odisha for allocation of captive mines for NINL.
• Renewed 3 years LTA (Long Term Agreement ) with Japanese and Korean Steel Mills for exports of high grade iron ore.
4
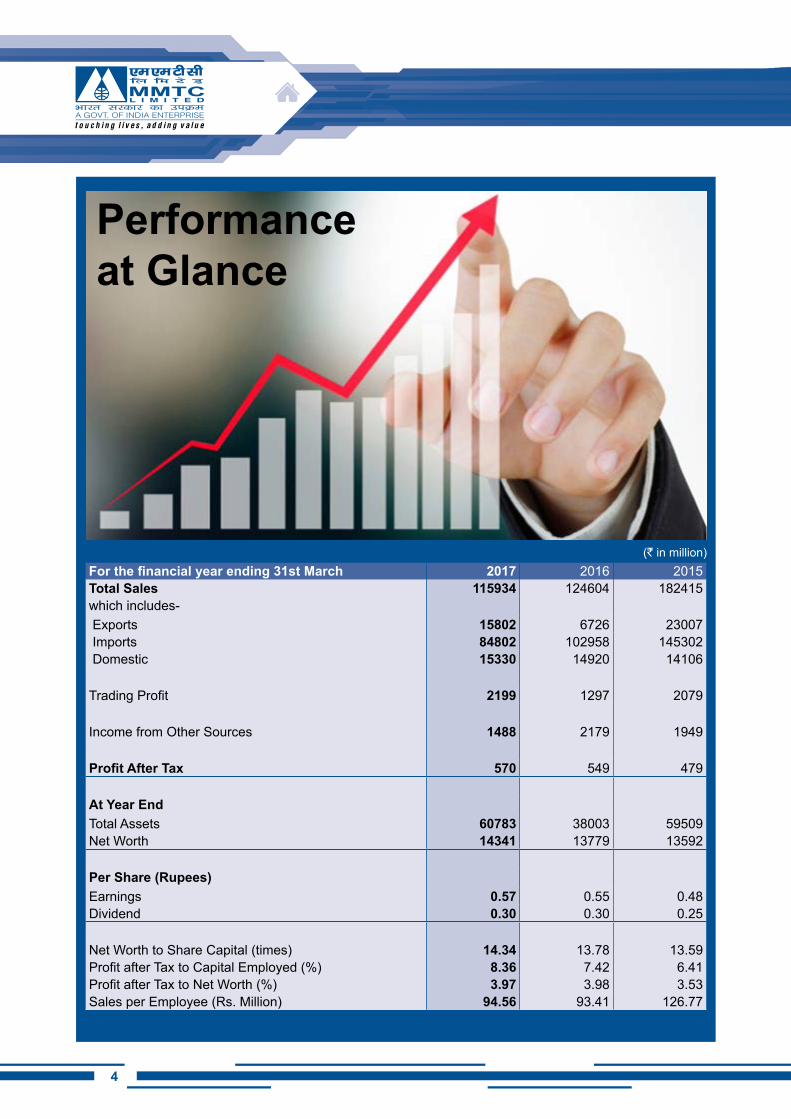
Performance at Glance
(` in million)For the financial year ending 31st March 2017 2016 2015Total Sales 115934 124604 182415which includes- Exports 15802 6726 23007 Imports 84802 102958 145302 Domestic 15330 14920 14106
Trading Profit 2199 1297 2079
Income from Other Sources 1488 2179 1949
Profit After Tax 570 549 479
At Year EndTotal Assets 60783 38003 59509Net Worth 14341 13779 13592
Per Share (Rupees)Earnings 0.57 0.55 0.48Dividend 0.30 0.30 0.25
Net Worth to Share Capital (times) 14.34 13.78 13.59Profit after Tax to Capital Employed (%) 8.36 7.42 6.41Profit after Tax to Net Worth (%) 3.97 3.98 3.53Sales per Employee (Rs. Million) 94.56 93.41 126.77
54
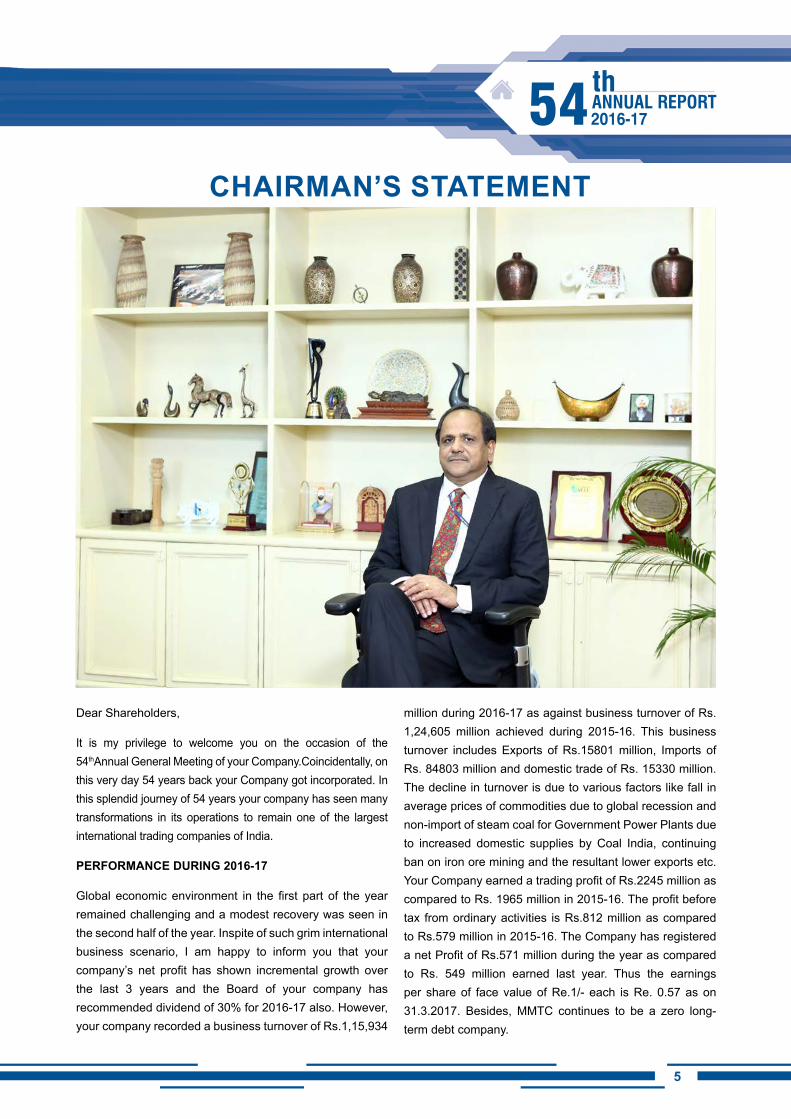
ChAiRMAN’S STATEMENT
Dear Shareholders,
It is my privilege to welcome you on the occasion of the 54thAnnual General Meeting of your Company.Coincidentally, on this very day 54 years back your Company got incorporated. In this splendid journey of 54 years your company has seen many transformations in its operations to remain one of the largest international trading companies of India.
PERFORMANCE DURiNG 2016-17
Global economic environment in the first part of the year remained challenging and a modest recovery was seen in the second half of the year. Inspite of such grim international business scenario, I am happy to inform you that your company’s net profit has shown incremental growth over the last 3 years and the Board of your company has recommended dividend of 30% for 2016-17 also. However, your company recorded a business turnover of Rs.1,15,934
million during 2016-17 as against business turnover of Rs. 1,24,605 million achieved during 2015-16. This business turnover includes Exports of Rs.15801 million, Imports of Rs. 84803 million and domestic trade of Rs. 15330 million. The decline in turnover is due to various factors like fall in average prices of commodities due to global recession and non-import of steam coal for Government Power Plants due to increased domestic supplies by Coal India, continuing ban on iron ore mining and the resultant lower exports etc. Your Company earned a trading profit of Rs.2245 million as compared to Rs. 1965 million in 2015-16. The profit before tax from ordinary activities is Rs.812 million as compared to Rs.579 million in 2015-16. The Company has registered a net Profit of Rs.571 million during the year as compared to Rs. 549 million earned last year. Thus the earnings per share of face value of Re.1/- each is Re. 0.57 as on 31.3.2017. Besides, MMTC continues to be a zero long-term debt company.
6
Your company imported Pulses on Government account in the crisis period faced by the country which has helped to stabilize prices for consumers. Your company has opened an office in Guwahati to cater to the trading needs of North East Region of the country. Your company has tied up with 7 banks to sell India Gold Coins through about 400 branches to make easy availability of the coins across India. The phase – 1 of Kandla FTWZ has been made operational during the year, a JV project between MMTC and ILFS Ltd. Your company has renewed 3 years Long Term Agreement with Japanese and Korean Steel Mills for export of High Grade Iron Ore.
During the year, your company has received many accolades for its business performance in different sectors which included the CAPEXIL’s most coveted Award for total minerals exports consecutively for 24th time in a row and Star Performer Award for 2014-15 in “Basic Iron & Steel (Large Enterprise)” by EEPC, etc.
SUBSiDiARY COMPANY
During the financial year 2016-17, MTPL achieved sales turnover of USD 113 million as against US$108million during last fiscal. The Subsidiary Company has shown profit during the financial year 2016-17 in comparison to the marginal loss incurred in 2015-16. The net worth of MTPL stood at US$ 15.40 million as on 31st March 2017.
MMTC’S PROMOTED PROJECT - Neelachal Ispat Nigam Ltd. (NINL)
During the year 2016-17, NINL achieved a turnover of Rs.12687 million, EBITDA of Rs.14 million and incurred net loss of Rs.3567 million. This was primarily due to recession in the economy and steel sector in particular. After lot of persuasion and efforts, finally NINL could sign Iron Ore Mining Lease on captive basis with Govt. of Odisha for 874 hectare having 92 million tonne of mineable reserves in the State of Odisha. Mines are expected to commission iron ore production by June, 2018. NINL has also signed MOU with NALCO for setting up of Coal Tar Pitch Plant. With the stabilization of steel making facility and starting of iron ore mining by June, 2018, NINL’s production and financial performance is expected to improve substantially.
Projects/ Joint Ventures
• The joint venture for medallion manufacturing unit,
MMTC-PAMP India Pvt. Ltd. achieved a turnover of Rs. 243902 million and profit after tax of Rs. 149 million during 2016-17. MMTC has received a dividend of 20% i.e. Rs. 35 Million for its investment in MMTC-PAMP India Pvt. Ltd for the FY 2016-17.
• Your Company achieved a turnover of Rs. 77 million and a profit of Rs.69 million from its 15 MW capacity Wind Mill project with 25 Wind Energy Generators commissioned in March, 2007
• Your Company has received an interim dividend of Rs. 5/- & final dividend of Rs. 23/- per equity share against its shareholding of 38,961 equity shares of Rs. 2/- each, in BSE Limited, The total dividend received during the year was Rs. 1.09 millions.
• The shareholding of your Company in Indian Commodity Exchange Limited (ICEX) was reduced to 9.55% subsequent to right issues in which your Company did not participate. The JV company has recently launched the World’s First Diamond Derivatives Exchange which was formally inaugurated on 28th August 2017 at the hands of the Chairman, GJEPC at Mumbai. ICEX has also received in principle approval for Brent Crude and WTI Crude for trading.
• Your Company has decided to exit from JV Project M/s. SICAL Iron Ore Terminals Limited (SIOTL) as it could not commence commercial operations due to non-availability of iron ore for exports from Bellary-Hospet Sector in Karnataka State & facility owned by SIOTL has been authorized to handle Coal and coal does not have synergy with MMTC’s existing line of business. The exit process is in progress.
CORPORATE GOVERNANCE
Corporate governance is about maximizing shareholder value legally, ethically and on a sustainable basis. At MMTC, the goal of corporate governance is to ensure fairness for every stakeholder – our customers, investors, vendor-partners, the community, and the governments of the countries in which we operate. We believe that sound corporate governance is critical in enhancing and retaining investor trust. It is a reflection of our culture, our policies, our relationship with stakeholders and our commitment to values. Accordingly, we always seek to ensure that our performance is driven by integrity. All efforts have been
76
made to ensure that all statutory Corporate Governance requirements have been complied in letter and spirit.
hUMAN RESOURCE
Human Resource is the backbone of any organization, as a matter of fact Human Resource is the best resource an organization can have and which can make-up for all other resources which are in short supply. In your company, the focus is on building an enabling culture and enhanced competency of employees at all levels and ensure a flow of motivated people with required skill sets. The focus is also on continuous skill development and promoting core values which would inspire the employees to achieve excellence in all endeavors and maximize stakeholder’s value. The Company’s manpower stood at 1225 as on 31st March 2017 inclusive of five whole time Board level Directors which has since been reduced to 1183 as on 1st September 2017.
CORPORATE SOCiAL RESPONSiBiLiTY
The underlining theme of our CSR philosophy is to create equity in society with our actions. Caring, Sharing and Growing is at the core of MMTC’s CSR philosophy. Our goal is to ensure that our economic growth is socially and environmentally sustainable. CSR initiatives are focused to enable the citizen to enjoy the benefits of science led innovations. Our socio-economic interventions are focused towards underprivileged communities. During the year 2016-17, a sum of Rs. 81.41 lakhs was allocated for undertaking the CSR activities which was spent towards activities mainly related to the Swachh Bharat Abhiyan, Clean Ganga Mission, Skill India Mission, Promotion of healthcare and Yoga and Promotion of sports/ para-sports. Besides this, MMTC supported distribution of artificial limbs and assistive devices to the differently abled people.
FUTURE PROSPECTS
With the implementation of GST a paradigm shift is expected in the way of doing business in India. A greater consolidation will be seen in the markets and the role of organized sector will be enhanced. This will be particularly good for Gold and Metals business of your Company. Further reduction in multiple taxes levied for doing business in India will enhance the investor’s confidence and an explosive growth is expected from FY 2018-19.Your Company is also gearing up to grab all the good opportunities that may arise during the growth journey of the Country and is assured of a better future.
Your company has prepared a road map for doubling the turnover in next five years by strengthening of existing areas of business/diversifying into new areas of retail sales of precious metals items, minerals, coal, etc and also business development through e-commerce/e-auction.
ACKNOWLEDGEMENTS
I take this opportunity, to express my thanks to all the shareholders for their continued trust in the Board of Directors and the Management of the Company. On behalf of the Company, I would also like to thank all our Vendors, Customers and Business Associates who have extended their support in the development and growth of your Company. Before I conclude, I wish to thank all other stakeholders namely; Government specially Department of Commerce, Railways, Ports, public and private sector banks etc. for their co-operation and support in successfully managing the organization.
Ved PrakashChairman and Managing Director
26th September 2017

8
BOARD OF DiRECTORS
GOVERNMENT NOMiNEE DiRECTORS
FUNCTiONAL DiRECTORS
VED PRAKAShChairman and Managing Director
DR. iNDER JiT SiNGhAdditional Secretary
Department of Commerce, MoC & I
P. K. JAiNDirector (Marketing)
J.K. DADOOAdditional Secretary & Financial Advisor
Department of Commerce, MoC& I
AShWANi SONDhiDirector (Marketing)
T. K. SENGUPTADirector (Personnel)
98
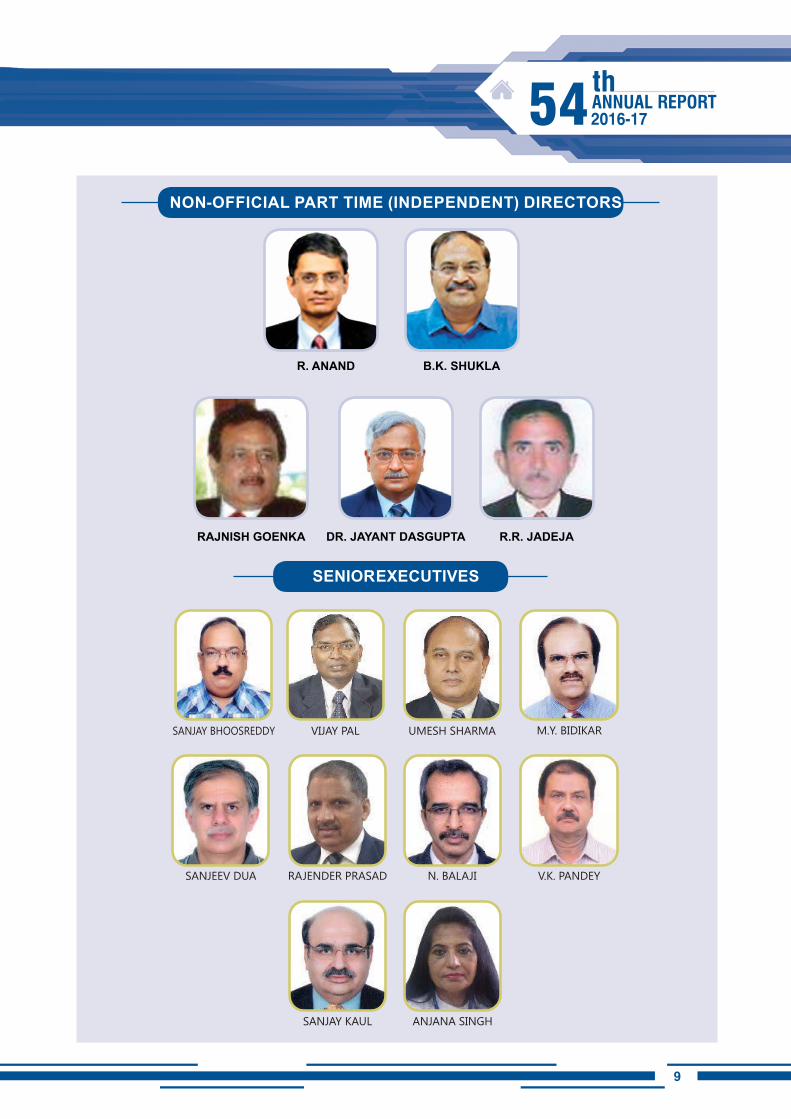
SANJAY BHOOSREDDY
SANJEEV DUA
VIJAY PAL UMESH SHARMA M.Y. BIDIKAR
RAJENDER PRASAD N. BALAJI V.K. PANDEY
SANJAY KAUL ANJANA SINGH
NON-OFFiCiAL PART TiME (iNDEPENDENT) DiRECTORS
SENiOR ExECUTiVES
R. ANAND
RAJNiSh GOENKA DR. JAYANT DASGUPTA R.R. JADEJA
B.K. ShUKLA
10
The MembersMMTC Limited, New Delhi.
Ladies & Gentlemen,
On behalf of Board of Directors, I have the pleasure of presenting the 54th Annual Report on your company’s performance for the financial year ended 31st March 2017 along with audited statements of accounts and Statutory Auditor’s Report.
OPERATiONAL RESULTS
Your company, one of the leading trading companies in India, recorded a turnover of `115934.28 millions during 2016-17 as against the turnover of `124606.41 million registered during last fiscal. This business turnover includes Exports of `15801.4 million, Imports of `84802.6 million and domestic trade of `15330.3 million. The Company has reported a net profit of `570.59 million in the current fiscal compared to Rs.548.93 million earned last year.
The highlights of the Company’s performance during 2016-17 are as below: -
(` in Million) 2016-17 2015-16Sales of products 115,680.01 124,344.04Sales of services 254.27 262.37Other Trade Earning 1,149.30 1,083.19
2016-17 2015-16Total Revenue from Operations 117,083.58 125,689.59
Cost of Sales 114,839.06 123,724.47Gross Profit from Operations 2,244.52 1,965.12
Add: Dividend and other Income 145.71 278.37
Less: Establishment & Administrative Overheads, etc.
2,477.12 2,549.60
Less: Debts/Claims Written off 6.61 0.97
Less: Provisions for Doubtful Debts/ Claims/Advances/Investments
4.80 2.80
Profit Before Interest, Depreciation and Amortization Expenses and Taxes
(98.30) (309.89)
Add: Interest Earned (Net) (Interest earned minus Finance Cost)
64.66 293.33
Profit Before Depreciation and Amortization Expenses and Taxes
(33.64) (16.55)
Less: Depreciation and Amortization Expenses
66.78 57.97
Less: Exceptional Items (912.74) (653.67)Profit Before Taxes 812.32 579.14
DiRECTORS’ REPORT
1110
2016-17 2015-16Less: Provision for Current Taxes
274.53 44.20
Less: Provision for Deferred Taxes (32.80) (14.00)
Profit After Taxes 570.59 548.93 Add: Balance brought forward from the previous year
6,979.76 6,824.29
Items of other comprehensive income recognized directly in retain earnings Remeasurements of post employment benefit obligation net of tax
0.09 (8.54)
Unamortized premium on forward contract - 7.36
Transfer from Corporate Social Responsibility - 0.07
Dividend & Dividend Tax (361.07) (300.89)Appropriations: General Reserve - (100.00)Other Adjustments - 8.54Leaving a Balance to be carried forward 7,189.37 6,979.76
The performance of different business groups of your Company
is highlighted in the Management Discussion and Analysis
Report, which is annexed and forms part of this Report.
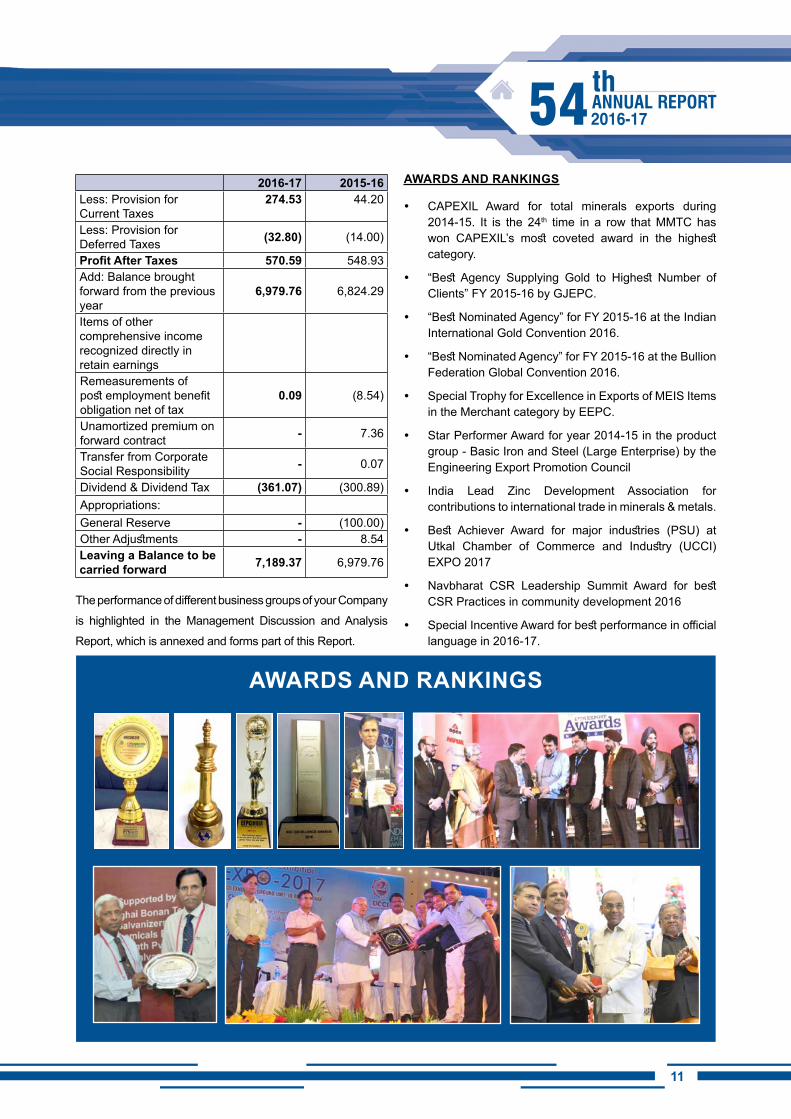
AWARDS AND RANKiNGS
y CAPEXIL Award for total minerals exports during 2014-15. It is the 24th time in a row that MMTC has won CAPEXIL’s most coveted award in the highest category.
y “Best Agency Supplying Gold to Highest Number of Clients” FY 2015-16 by GJEPC.
y “Best Nominated Agency” for FY 2015-16 at the Indian International Gold Convention 2016.
y “Best Nominated Agency” for FY 2015-16 at the Bullion Federation Global Convention 2016.
y Special Trophy for Excellence in Exports of MEIS Items in the Merchant category by EEPC.
y Star Performer Award for year 2014-15 in the product group - Basic Iron and Steel (Large Enterprise) by the Engineering Export Promotion Council
y India Lead Zinc Development Association for contributions to international trade in minerals & metals.
y Best Achiever Award for major industries (PSU) at Utkal Chamber of Commerce and Industry (UCCI) EXPO 2017
y Navbharat CSR Leadership Summit Award for best CSR Practices in community development 2016
y Special Incentive Award for best performance in official language in 2016-17.
AWARDS AND RANKiNGS
12
EQUiTY ShARE CAPiTAL & DiViDEND
The Board of Directors recommends declaration of dividend @ 30% on the equity capital of ̀ 1,000 million of the Company for the year 2016-17 out of profits of the Company.
RESERVES
A sum of `13149.58 million was available in the reserves and surplus of your Company as on 1st April, 2016. Your Directors have proposed that Dividend at the rate of 30% be paid out of profits of the Company. Accordingly, an amount of `13359.15 million was available in “Reserves and Surplus” of your Company as on 31st March, 2017.
FOREiGN ExChANGE EARNiNGS AND OUTGO
The Foreign Exchange earnings and outgo of your Company during 2016-17 has been as under:-
EARNiNGS OUTGO` In Million ` In Million
Exports 15,473.32 Imports 100,786.97Others 1.02 Others 111.16Total 15,474.34 Total 100,898.13
SUBSiDiARY COMPANY
The wholly owned subsidiary of your Company - MMTC Transnational Pte. Ltd. Singapore (MTPL) incorporated in October 1994 with the objective to take advantage of liberalization/globalization of trade and commerce to tap South East Asian market for trading in commodities has been engaged in commodity trading and has established itself as a credible and reputable trading outfit in Singapore. During the financial year 2016-17 MTPL achieved sales turnover of USD 113.17 million as against US$108.28 million during last fiscal. The Net Profit earned by MTPL during the financial year 2016-17 amounted to US$ 0.04 million. The net worth of MTPL stood at US$ 15.40 million as on 31st March 2017.
Pursuant to the provisions of Section 129 of the Companies Act, 2013, the audited financial statements of MTPL together with Directors’ Report & Auditor’s Report are attached herewith.
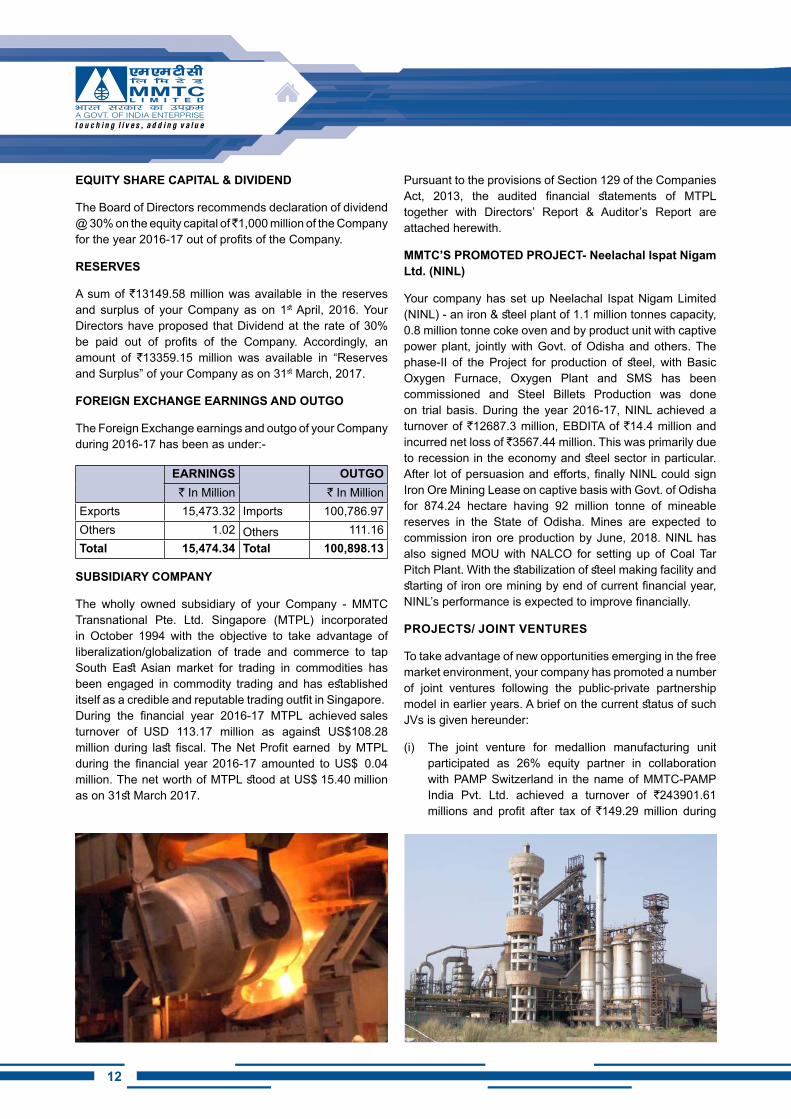
MMTC’S PROMOTED PROJECT- Neelachal Ispat Nigam Ltd. (NINL)
Your company has set up Neelachal Ispat Nigam Limited (NINL) - an iron & steel plant of 1.1 million tonnes capacity, 0.8 million tonne coke oven and by product unit with captive power plant, jointly with Govt. of Odisha and others. The phase-II of the Project for production of steel, with Basic Oxygen Furnace, Oxygen Plant and SMS has been commissioned and Steel Billets Production was done on trial basis. During the year 2016-17, NINL achieved a turnover of `12687.3 million, EBDITA of `14.4 million and incurred net loss of `3567.44 million. This was primarily due to recession in the economy and steel sector in particular. After lot of persuasion and efforts, finally NINL could sign Iron Ore Mining Lease on captive basis with Govt. of Odisha for 874.24 hectare having 92 million tonne of mineable reserves in the State of Odisha. Mines are expected to commission iron ore production by June, 2018. NINL has also signed MOU with NALCO for setting up of Coal Tar Pitch Plant. With the stabilization of steel making facility and starting of iron ore mining by end of current financial year, NINL’s performance is expected to improve financially.
PROJECTS/ JOiNT VENTURES
To take advantage of new opportunities emerging in the free market environment, your company has promoted a number of joint ventures following the public-private partnership model in earlier years. A brief on the current status of such JVs is given hereunder:
(i) The joint venture for medallion manufacturing unit participated as 26% equity partner in collaboration with PAMP Switzerland in the name of MMTC-PAMP India Pvt. Ltd. achieved a turnover of `243901.61 millions and profit after tax of `149.29 million during
1312
2016-17. MMTC has received a dividend of 20% for its investment in MMTC-PAMP India Pvt. Ltd. for FY 2016-17. MMTC-PAMP became India’s first LBMA accredited refiner for Gold and silver. During 2016-17 MMTC has sold Gold Bars produced by MPIPL in the domestic market achieving a turnover of `7922.2 million.
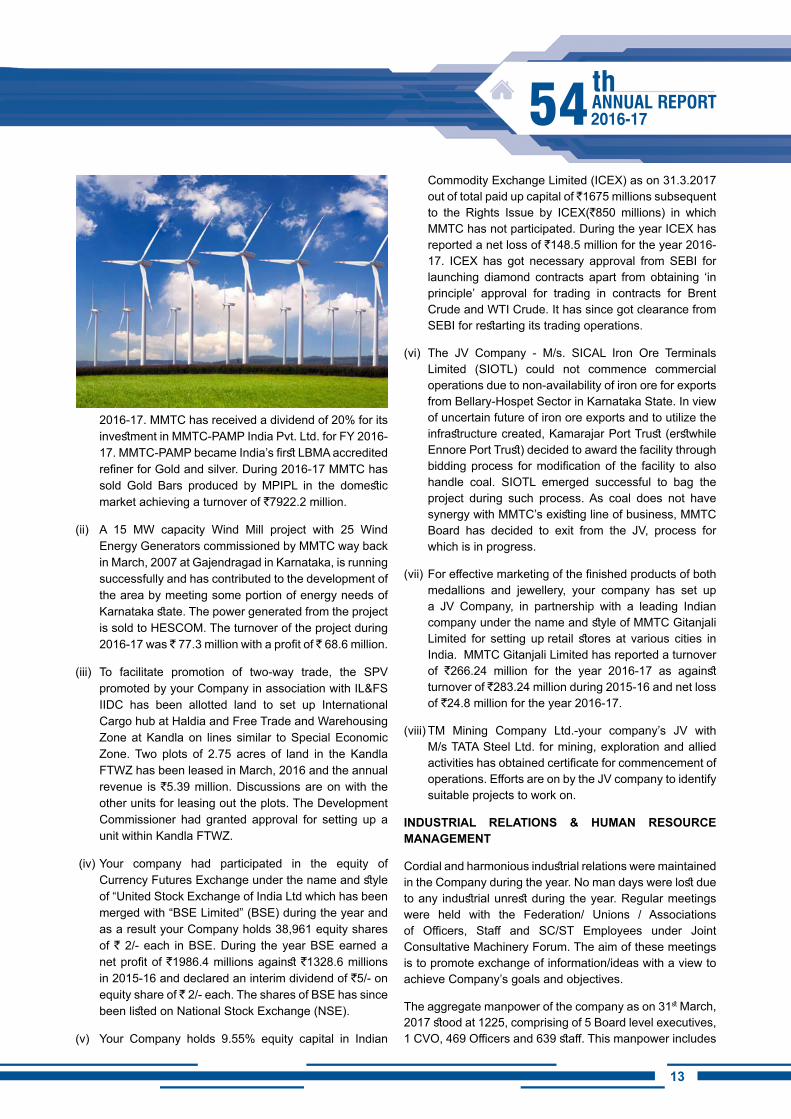
(ii) A 15 MW capacity Wind Mill project with 25 Wind Energy Generators commissioned by MMTC way back in March, 2007 at Gajendragad in Karnataka, is running successfully and has contributed to the development of the area by meeting some portion of energy needs of Karnataka state. The power generated from the project is sold to HESCOM. The turnover of the project during 2016-17 was ̀ 77.3 million with a profit of ̀ 68.6 million.
(iii) To facilitate promotion of two-way trade, the SPV promoted by your Company in association with IL&FS IIDC has been allotted land to set up International Cargo hub at Haldia and Free Trade and Warehousing Zone at Kandla on lines similar to Special Economic Zone. Two plots of 2.75 acres of land in the Kandla FTWZ has been leased in March, 2016 and the annual revenue is `5.39 million. Discussions are on with the other units for leasing out the plots. The Development Commissioner had granted approval for setting up a unit within Kandla FTWZ.
(iv) Your company had participated in the equity of Currency Futures Exchange under the name and style of “United Stock Exchange of India Ltd which has been merged with “BSE Limited” (BSE) during the year and as a result your Company holds 38,961 equity shares of ` 2/- each in BSE. During the year BSE earned a net profit of `1986.4 millions against `1328.6 millions in 2015-16 and declared an interim dividend of `5/- on equity share of ̀ 2/- each. The shares of BSE has since been listed on National Stock Exchange (NSE).
(v) Your Company holds 9.55% equity capital in Indian
Commodity Exchange Limited (ICEX) as on 31.3.2017 out of total paid up capital of ̀ 1675 millions subsequent to the Rights Issue by ICEX(`850 millions) in which MMTC has not participated. During the year ICEX has reported a net loss of `148.5 million for the year 2016-17. ICEX has got necessary approval from SEBI for launching diamond contracts apart from obtaining ‘in principle’ approval for trading in contracts for Brent Crude and WTI Crude. It has since got clearance from SEBI for restarting its trading operations.
(vi) The JV Company - M/s. SICAL Iron Ore Terminals Limited (SIOTL) could not commence commercial operations due to non-availability of iron ore for exports from Bellary-Hospet Sector in Karnataka State. In view of uncertain future of iron ore exports and to utilize the infrastructure created, Kamarajar Port Trust (erstwhile Ennore Port Trust) decided to award the facility through bidding process for modification of the facility to also handle coal. SIOTL emerged successful to bag the project during such process. As coal does not have synergy with MMTC’s existing line of business, MMTC Board has decided to exit from the JV, process for which is in progress.
(vii) For effective marketing of the finished products of both medallions and jewellery, your company has set up a JV Company, in partnership with a leading Indian company under the name and style of MMTC Gitanjali Limited for setting up retail stores at various cities in India. MMTC Gitanjali Limited has reported a turnover of `266.24 million for the year 2016-17 as against turnover of `283.24 million during 2015-16 and net loss of `24.8 million for the year 2016-17.
(viii) TM Mining Company Ltd.-your company’s JV with M/s TATA Steel Ltd. for mining, exploration and allied activities has obtained certificate for commencement of operations. Efforts are on by the JV company to identify suitable projects to work on.
iNDUSTRiAL RELATiONS & hUMAN RESOURCE MANAGEMENT
Cordial and harmonious industrial relations were maintained in the Company during the year. No man days were lost due to any industrial unrest during the year. Regular meetings were held with the Federation/ Unions / Associations of Officers, Staff and SC/ST Employees under Joint Consultative Machinery Forum. The aim of these meetings is to promote exchange of information/ideas with a view to achieve Company’s goals and objectives.
The aggregate manpower of the company as on 31st March, 2017 stood at 1225, comprising of 5 Board level executives, 1 CVO, 469 Officers and 639 staff. This manpower includes
14
6 officers, 105 staff / workers of erstwhile Mica Trading Company Ltd., which had been merged with your company pursuant to the orders of BIFR. The composite representation of the total manpower is - women employees representing 21.06% (258 employees) of the total manpower; SC, ST, OBC & persons with disabilities (PWD) to the extent of 20.89% (256 employees), 9.14% (112 employees), 9.39% (115 employees) and 1.96% (24 employees) respectively. During the year 08 officers were inducted through open advertisement.
RESERVATiON POLiCY
Policy for reservations for SCs, STs, OBCs and PWD in services was followed fully as per the government guidelines
in recruitment and promotion.
TRAiNiNG AND DEVELOPMENT
For further enhancing / upgrading the skills of employees in the constantly changing business scenario, 556 employees were imparted training during the year in different spheres of company’s activities. This was done through programmes organized in association with in-house faculty as well as external resource persons from renowned institutions/organizations. The employees deputed for training had adequate representation of SC, ST and women employees (SC- 71, ST- 33 and women -162). In terms of man days, such training works out to 745 training man days during the year 2016-17.
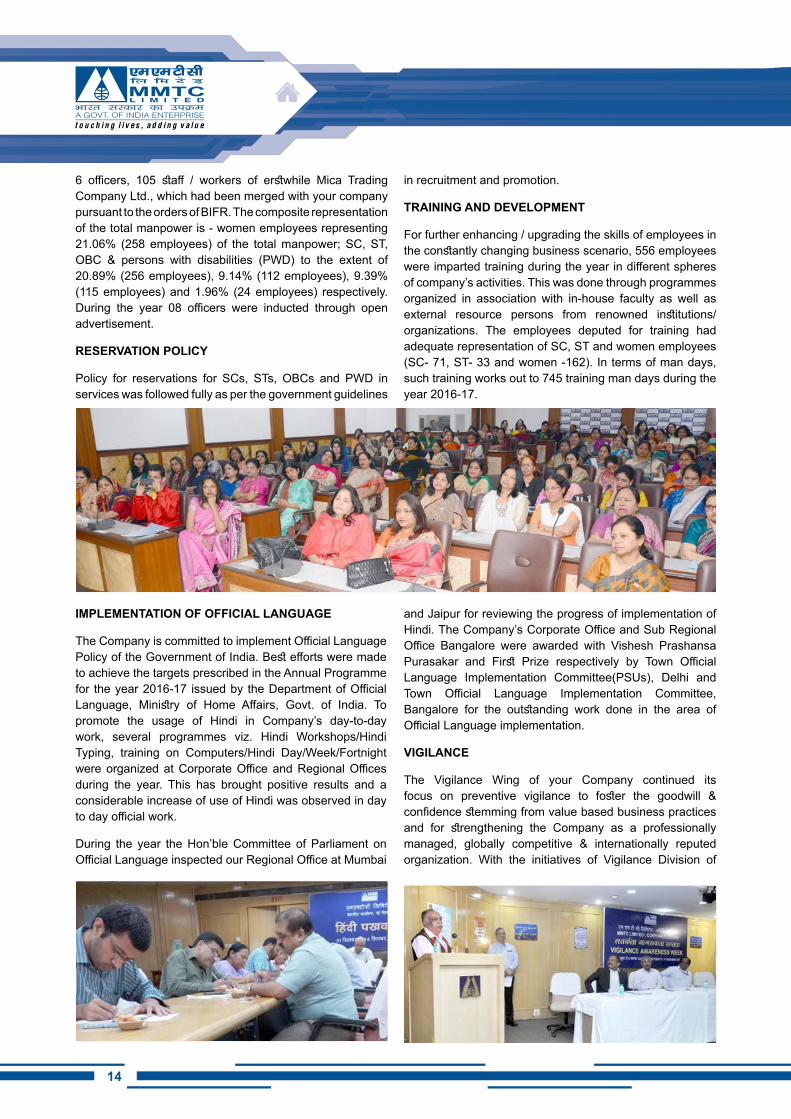
iMPLEMENTATiON OF OFFiCiAL LANGUAGE
The Company is committed to implement Official Language Policy of the Government of India. Best efforts were made to achieve the targets prescribed in the Annual Programme for the year 2016-17 issued by the Department of Official Language, Ministry of Home Affairs, Govt. of India. To promote the usage of Hindi in Company’s day-to-day work, several programmes viz. Hindi Workshops/Hindi Typing, training on Computers/Hindi Day/Week/Fortnight were organized at Corporate Office and Regional Offices during the year. This has brought positive results and a considerable increase of use of Hindi was observed in day to day official work.
During the year the Hon’ble Committee of Parliament on Official Language inspected our Regional Office at Mumbai
and Jaipur for reviewing the progress of implementation of Hindi. The Company’s Corporate Office and Sub Regional Office Bangalore were awarded with Vishesh Prashansa Purasakar and First Prize respectively by Town Official Language Implementation Committee(PSUs), Delhi and Town Official Language Implementation Committee, Bangalore for the outstanding work done in the area of Official Language implementation.
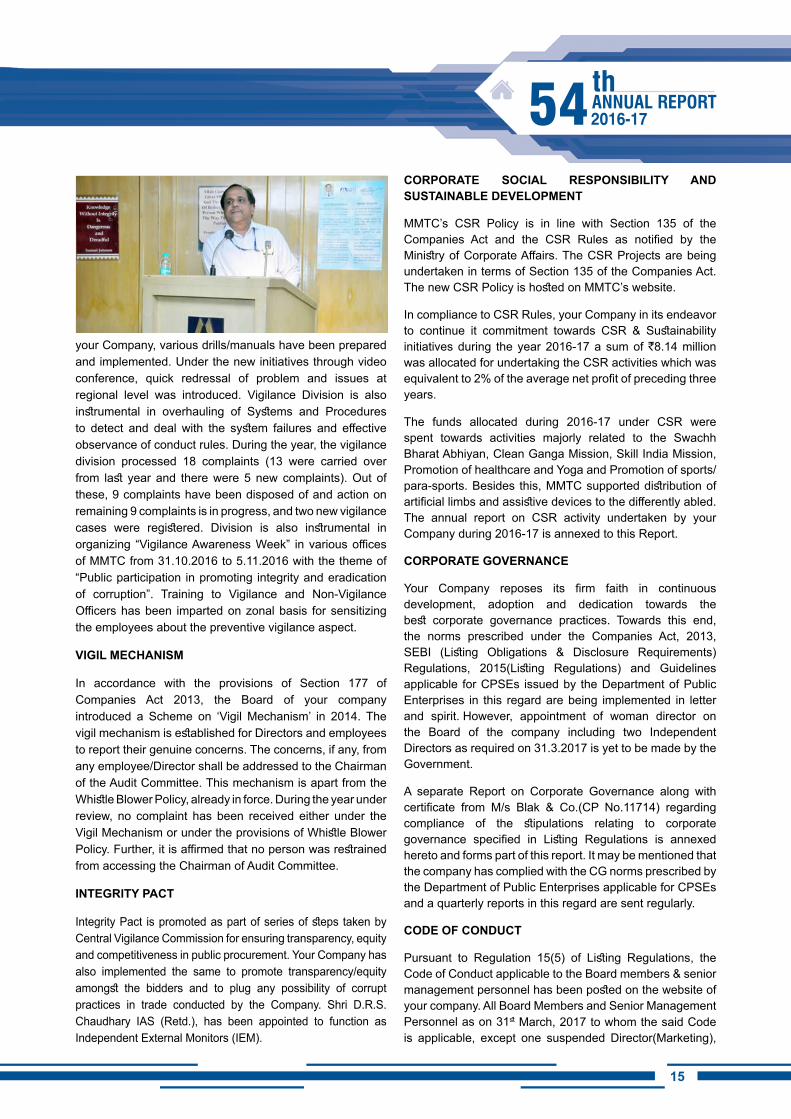
ViGiLANCE
The Vigilance Wing of your Company continued its focus on preventive vigilance to foster the goodwill & confidence stemming from value based business practices and for strengthening the Company as a professionally managed, globally competitive & internationally reputed organization. With the initiatives of Vigilance Division of
1514
your Company, various drills/manuals have been prepared and implemented. Under the new initiatives through video conference, quick redressal of problem and issues at regional level was introduced. Vigilance Division is also instrumental in overhauling of Systems and Procedures to detect and deal with the system failures and effective observance of conduct rules. During the year, the vigilance division processed 18 complaints (13 were carried over from last year and there were 5 new complaints). Out of these, 9 complaints have been disposed of and action on remaining 9 complaints is in progress, and two new vigilance cases were registered. Division is also instrumental in organizing “Vigilance Awareness Week” in various offices of MMTC from 31.10.2016 to 5.11.2016 with the theme of “Public participation in promoting integrity and eradication of corruption”. Training to Vigilance and Non-Vigilance Officers has been imparted on zonal basis for sensitizing the employees about the preventive vigilance aspect.
ViGiL MEChANiSM
In accordance with the provisions of Section 177 of Companies Act 2013, the Board of your company introduced a Scheme on ‘Vigil Mechanism’ in 2014. The vigil mechanism is established for Directors and employees to report their genuine concerns. The concerns, if any, from any employee/Director shall be addressed to the Chairman of the Audit Committee. This mechanism is apart from the Whistle Blower Policy, already in force. During the year under review, no complaint has been received either under the Vigil Mechanism or under the provisions of Whistle Blower Policy. Further, it is affirmed that no person was restrained from accessing the Chairman of Audit Committee.
iNTEGRiTY PACT
Integrity Pact is promoted as part of series of steps taken by Central Vigilance Commission for ensuring transparency, equity and competitiveness in public procurement. Your Company has also implemented the same to promote transparency/equity amongst the bidders and to plug any possibility of corrupt practices in trade conducted by the Company. Shri D.R.S. Chaudhary IAS (Retd.), has been appointed to function as Independent External Monitors (IEM).
CORPORATE SOCiAL RESPONSiBiLiTY AND SUSTAiNABLE DEVELOPMENT
MMTC’s CSR Policy is in line with Section 135 of the Companies Act and the CSR Rules as notified by the Ministry of Corporate Affairs. The CSR Projects are being undertaken in terms of Section 135 of the Companies Act. The new CSR Policy is hosted on MMTC’s website.
In compliance to CSR Rules, your Company in its endeavor to continue it commitment towards CSR & Sustainability initiatives during the year 2016-17 a sum of `8.14 million was allocated for undertaking the CSR activities which was equivalent to 2% of the average net profit of preceding three years.
The funds allocated during 2016-17 under CSR were spent towards activities majorly related to the Swachh Bharat Abhiyan, Clean Ganga Mission, Skill India Mission, Promotion of healthcare and Yoga and Promotion of sports/para-sports. Besides this, MMTC supported distribution of artificial limbs and assistive devices to the differently abled. The annual report on CSR activity undertaken by your Company during 2016-17 is annexed to this Report.
CORPORATE GOVERNANCE
Your Company reposes its firm faith in continuous development, adoption and dedication towards the best corporate governance practices. Towards this end, the norms prescribed under the Companies Act, 2013, SEBI (Listing Obligations & Disclosure Requirements) Regulations, 2015(Listing Regulations) and Guidelines applicable for CPSEs issued by the Department of Public Enterprises in this regard are being implemented in letter and spirit. However, appointment of woman director on the Board of the company including two Independent Directors as required on 31.3.2017 is yet to be made by the Government.
A separate Report on Corporate Governance along with certificate from M/s Blak & Co.(CP No.11714) regarding compliance of the stipulations relating to corporate governance specified in Listing Regulations is annexed hereto and forms part of this report. It may be mentioned that the company has complied with the CG norms prescribed by the Department of Public Enterprises applicable for CPSEs and a quarterly reports in this regard are sent regularly.
CODE OF CONDUCT
Pursuant to Regulation 15(5) of Listing Regulations, the Code of Conduct applicable to the Board members & senior management personnel has been posted on the website of your company. All Board Members and Senior Management Personnel as on 31st March, 2017 to whom the said Code is applicable, except one suspended Director(Marketing),
16
have affirmed compliance of the same for the period ended 31st March, 2017. Based on the affirmation received from Board Members and Senior Management Personnel, declaration regarding compliance of Code of Conduct made by the Chairman & Managing Director is given below:
Declaration as required under SEBI (Listing Obligations and Disclosure Requirements) Regulations, 2015 and DPE’s Guidelines on Corporate Governance
“All the members of the Board and Senior Management Personnel except one Director(Marketing) have affirmed compliance of the ‘Code of Business Conduct & Ethics for Board Members and Senior Management Personnel’ of the company for the financial year ended on March 31, 2017.”
Sd/-VED PRAKASh
Chairman & Managing DirectorDiN.: 02988628
1716
BUSiNESS RESPONSiBiLiTY REPORT
In accordance with the provisions of regulation 34(2) of SEBI (Listing Obligations and Disclosure Requirements) Regulations, 2015, your Company has prepared the Business Responsibility Report for inclusion in the Annual Report for the year 2016-17. The framework and principles suggested by SEBI to assess compliance with environment, social and governance norms pertaining to Corporate Social Responsibility and Sustainable Development activities of the Company. The Business Responsibility Report of your Company is annexed herewith and forms part of the Annual Report.
PPP for MSEs
In pursuance of Public Procurement Policy (PPP) for Micro and Small Enterprises (MSEs), in its endeavor, MMTC have been making efforts to procure goods and services from MSEs equivalent to 20% of the value of its annual requirement. Out of 20%, 4% of items are to be procured from the entrepreneurs belonging to the category of SCs and STs.
During 2016-17, MMTC in respect of its administrative requirements, procured goods and services (which mainly include office equipments, stationery items, office maintenance, house keeping & security services etc.) has procured 58.26% (Rs.46.8 millions) from annual procurement of `81.8 millions and `5.1 millions from MSEs owned by SC/ST entrepreneurs which is 31.19% against a sub-target of 4% out of 20% MSE target of annual procurement, earmarked for procuring from MSEs owned by SC/ST entrepreneurs.
During 2017-18, MMTC, in respect of administrative requirements, intends to procure goods and services amounting to `80 millions (+/-10%) (approx.) In compliance of Public Procurement Policy for Micro & Small Enterprises.
PUBLiC DEPOSiT SChEME
As on 1st April 2017, there were no outstanding public deposits and the company did not invite/ accept any public deposit during the year ended 31st March, 2017.
ANNUAL RETURN
The extracts of Annual Return pursuant to provisions of Section 92 read with Rule 12 of the Companies (Management and Administration) Rules, 2014 is furnished in prescribed form-MGT-9 and the same is annexed herewith.
STATUTORY AUDiTOR’S REPORT
The report of Statutory Auditors for the year 2016-17 along with Management’s reply to the observations of the Statutory Auditors is annexed herewith.
COMMENTS OF COMPTROLLER & AUDiTOR GENERAL OF iNDiA
The Comptroller & Auditor General of India (C&AG) has given “Nil” comments under section 143 (6) (b) of the Companies Act, 2013 on the accounts of the Company for the year ended 31.03.2017. The communication dated 25.07.2017 of C&AG of India in this regard is annexed herewith.
SECRETARiAL AUDiT
Pursuant to provisions of Section 204 of the Companies Act, 2013 read with Rule 9 of the Companies (Appointment and Remuneration of Managerial Personnel) Rules 2014, your Company engaged the services of M/s. Blak & Co., Practicing Company Secretaries, New Delhi to conduct the Secretarial Audit of the Company for the financial year ended March 31, 2017. The Secretarial Audit Report (in Form MR-3) along with Management’s Reply on the observations of the Secretarial Auditor is annexed herewith.
PARTiCULARS OF LOANS, GUARANTEES OR iNVESTMENTS UNDER SECTiON 186 OF ThE COMPANiES ACT, 2013
Details of investments, loans and guarantees covered under the provisions of Section 186 of the Companies Act, 2013 are given in Note 8,10,13 and 36 respectively of the Notes forming part of the financial statements. The company has extended working capital credit facilities limit of `14050 millions during the financial year 2016-17 (reduced to `13450 millions as on 31.3.2017) to meet the day to day operational activities of the JV company – M/s Neelachal Ispat Nigam Limited in accordance with provisions of Section 186 of Companies Act 2013 duly approved by the Board out of which the total outstanding as on 31.3.2017 is ` 13274.8 millions.
RELATED PARTY TRANSACTiONS
All transactions entered by the Company with Related Parties were in the Ordinary Course of Business and not at Arm’s Length basis. The Audit Committee granted omnibus approval for the transactions undertaken during 2016-17. The approval of the Board and Shareholders at the AGM for such Related Party Transactions were taken. Suitable disclosures as required under Ind AS-24 have been made in Note 44 of Notes to the financial statements. Details of the
18
transaction are provided in Form AOC-2 which is annexed herewith.
The Policy on Related Party Transactions as approved by the Board of Directors has been uploaded on the Company’s website at the following link: http://mmtclimited.com/files/.pdf/95_party_policy.pdf
RiSK MANAGEMENT POLiCY
The Board of Directors approved the Risk Management Policy after the same has been duly recommended by the Audit Committee of Directors to take care of various risks associated with the business undertaken by your company. The details of Risk Management as practiced by the Company is provided as part of Management Discussion and Analysis Report which is annexed herewith.
CONSERVATiON OF ENERGY
During the year 2016-17, there was no production activity in (Mica group) of your company. Hence, the provisions of Rule 8(3) of Companies (Accounts) Rules, 2014, are not applicable.
PARTiCULARS OF EMPLOYEES
Pursuant to provisions of Rule 5(2) of The Companies (Appointment and Remuneration of Managerial Personnel) Rules, as amended from time to time, it is stated that there were no employees who were in receipt of remuneration exceeding `60 lakhs per annum or ` 5.00 lakhs per month during the year 2016-17.
DiRECTORS’ RESPONSiBiLiTY STATEMENT
Pursuant to the provisions of Section 134(5) of the Companies Act, 2013, your Directors state that:
a) in the preparation of the annual accounts, the applicable accounting standards had been followed along with proper explanation relating to material departures;
b) the Directors had selected such accounting policies and applied them consistently and made judgments and estimates that are reasonable and prudent so as to give a true and fair view of the state of affairs of the Company at the end of the financial year and of the profit and loss of the Company for the year ended 31.3.2017;
c) the Directors have taken a proper and sufficient care for the maintenance of adequate accounting records in accordance with the provisions of this Act for safeguarding the assets of the Company and for preventing and detecting fraud and other irregularities;
d) the Directors had prepared the annual accounts on a going concern basis.
e) the directors of your company had laid down internal financial controls to be followed by the company and that such internal financial controls are adequate and were operating effectively; and
f) the Directors had devised proper systems to ensure compliance with the provisions of all applicable laws and that such systems were adequate and operating effectively.
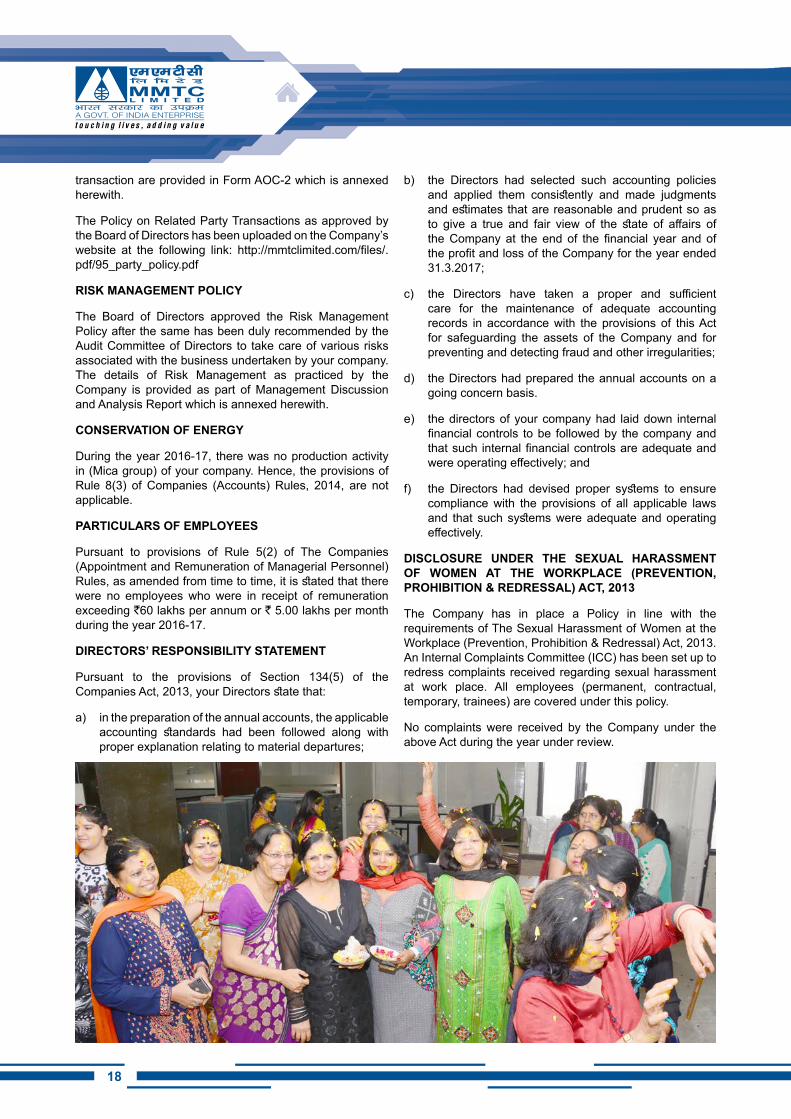
DiSCLOSURE UNDER ThE SExUAL hARASSMENT OF WOMEN AT ThE WORKPLACE (PREVENTiON, PROhiBiTiON & REDRESSAL) ACT, 2013
The Company has in place a Policy in line with the requirements of The Sexual Harassment of Women at the Workplace (Prevention, Prohibition & Redressal) Act, 2013. An Internal Complaints Committee (ICC) has been set up to redress complaints received regarding sexual harassment at work place. All employees (permanent, contractual, temporary, trainees) are covered under this policy.
No complaints were received by the Company under the above Act during the year under review.
1918
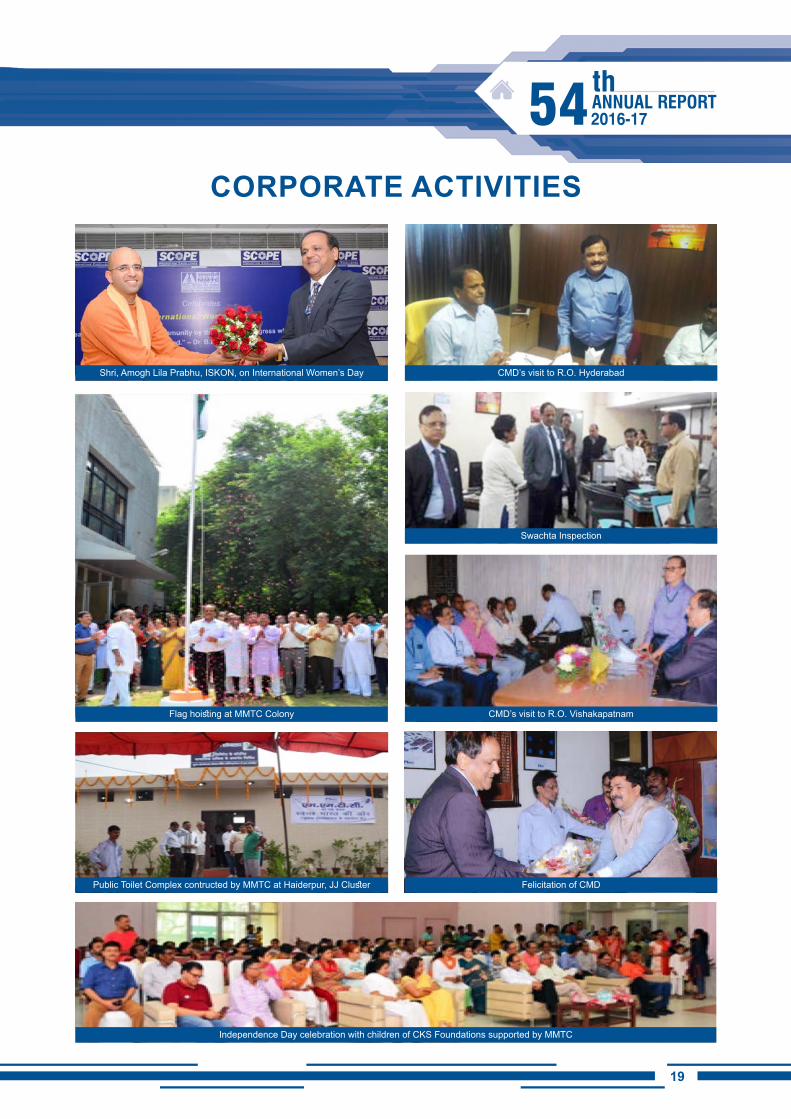
CORPORATE ACTiViTiES
Shri, Amogh Lila Prabhu, ISKON, on International Women’s Day CMD’s visit to R.O. Hyderabad
Swachta Inspection
CMD’s visit to R.O. Vishakapatnam
Felicitation of CMDPublic Toilet Complex contructed by MMTC at Haiderpur, JJ Cluster
Flag hoisting at MMTC Colony
Independence Day celebration with children of CKS Foundations supported by MMTC
20
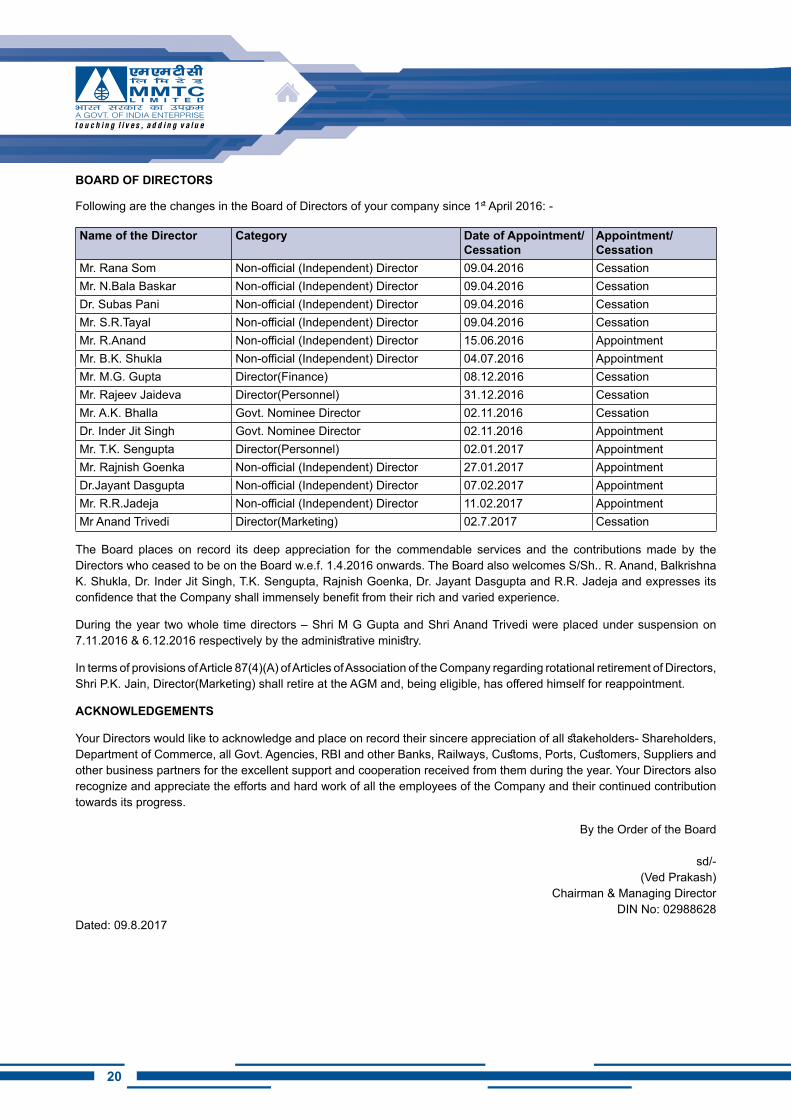
BOARD OF DiRECTORS
Following are the changes in the Board of Directors of your company since 1st April 2016: -
Name of the Director Category Date of Appointment/Cessation
Appointment/Cessation
Mr. Rana Som Non-official (Independent) Director 09.04.2016 CessationMr. N.Bala Baskar Non-official (Independent) Director 09.04.2016 CessationDr. Subas Pani Non-official (Independent) Director 09.04.2016 CessationMr. S.R.Tayal Non-official (Independent) Director 09.04.2016 CessationMr. R.Anand Non-official (Independent) Director 15.06.2016 AppointmentMr. B.K. Shukla Non-official (Independent) Director 04.07.2016 AppointmentMr. M.G. Gupta Director(Finance) 08.12.2016 CessationMr. Rajeev Jaideva Director(Personnel) 31.12.2016 CessationMr. A.K. Bhalla Govt. Nominee Director 02.11.2016 CessationDr. Inder Jit Singh Govt. Nominee Director 02.11.2016 AppointmentMr. T.K. Sengupta Director(Personnel) 02.01.2017 AppointmentMr. Rajnish Goenka Non-official (Independent) Director 27.01.2017 AppointmentDr.Jayant Dasgupta Non-official (Independent) Director 07.02.2017 AppointmentMr. R.R.Jadeja Non-official (Independent) Director 11.02.2017 AppointmentMr Anand Trivedi Director(Marketing) 02.7.2017 Cessation
The Board places on record its deep appreciation for the commendable services and the contributions made by the Directors who ceased to be on the Board w.e.f. 1.4.2016 onwards. The Board also welcomes S/Sh.. R. Anand, Balkrishna K. Shukla, Dr. Inder Jit Singh, T.K. Sengupta, Rajnish Goenka, Dr. Jayant Dasgupta and R.R. Jadeja and expresses its confidence that the Company shall immensely benefit from their rich and varied experience.
During the year two whole time directors – Shri M G Gupta and Shri Anand Trivedi were placed under suspension on 7.11.2016 & 6.12.2016 respectively by the administrative ministry.
In terms of provisions of Article 87(4)(A) of Articles of Association of the Company regarding rotational retirement of Directors, Shri P.K. Jain, Director(Marketing) shall retire at the AGM and, being eligible, has offered himself for reappointment.
ACKNOWLEDGEMENTS
Your Directors would like to acknowledge and place on record their sincere appreciation of all stakeholders- Shareholders, Department of Commerce, all Govt. Agencies, RBI and other Banks, Railways, Customs, Ports, Customers, Suppliers and other business partners for the excellent support and cooperation received from them during the year. Your Directors also recognize and appreciate the efforts and hard work of all the employees of the Company and their continued contribution towards its progress.
By the Order of the Board
sd/-(Ved Prakash)
Chairman & Managing DirectorDIN No: 02988628
Dated: 09.8.2017
2120
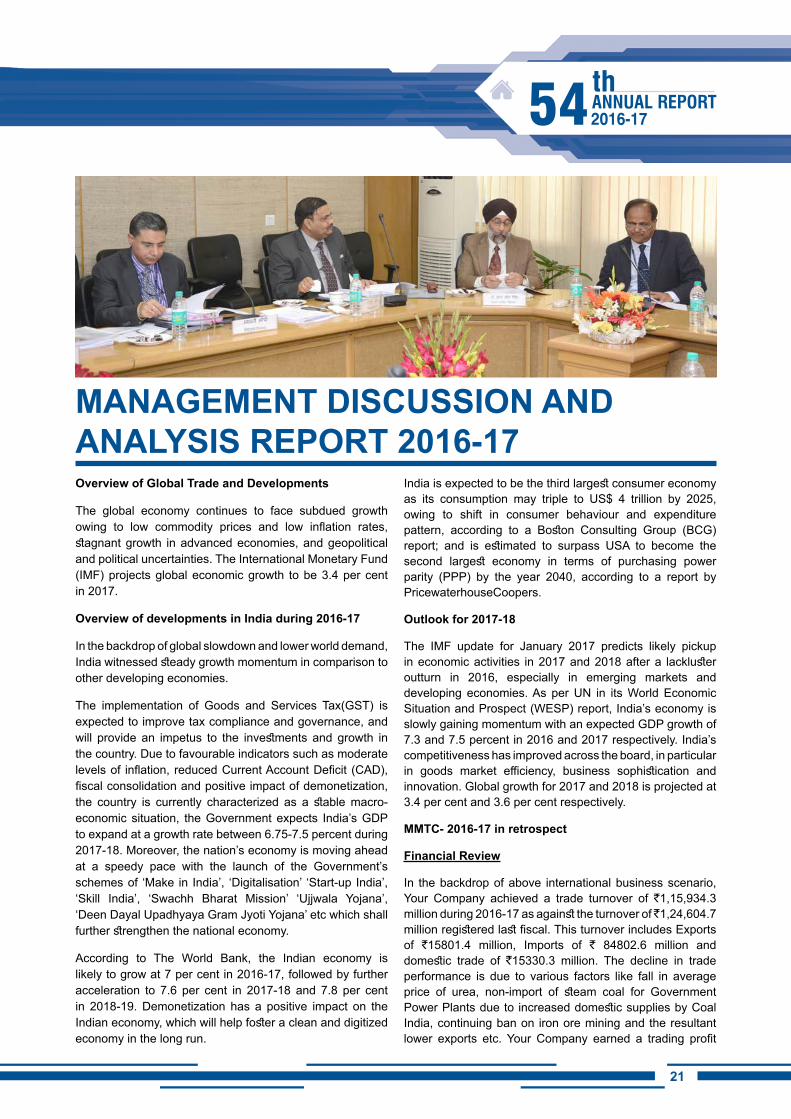
Overview of Global Trade and Developments
The global economy continues to face subdued growth owing to low commodity prices and low inflation rates, stagnant growth in advanced economies, and geopolitical and political uncertainties. The International Monetary Fund (IMF) projects global economic growth to be 3.4 per cent in 2017.
Overview of developments in India during 2016-17
In the backdrop of global slowdown and lower world demand, India witnessed steady growth momentum in comparison to other developing economies.
The implementation of Goods and Services Tax(GST) is expected to improve tax compliance and governance, and will provide an impetus to the investments and growth in the country. Due to favourable indicators such as moderate levels of inflation, reduced Current Account Deficit (CAD), fiscal consolidation and positive impact of demonetization, the country is currently characterized as a stable macro-economic situation, the Government expects India’s GDP to expand at a growth rate between 6.75-7.5 percent during 2017-18. Moreover, the nation’s economy is moving ahead at a speedy pace with the launch of the Government’s schemes of ‘Make in India’, ‘Digitalisation’ ‘Start-up India’, ‘Skill India’, ‘Swachh Bharat Mission’ ‘Ujjwala Yojana’, ‘Deen Dayal Upadhyaya Gram Jyoti Yojana’ etc which shall further strengthen the national economy.
According to The World Bank, the Indian economy is likely to grow at 7 per cent in 2016-17, followed by further acceleration to 7.6 per cent in 2017-18 and 7.8 per cent in 2018-19. Demonetization has a positive impact on the Indian economy, which will help foster a clean and digitized economy in the long run.
India is expected to be the third largest consumer economy as its consumption may triple to US$ 4 trillion by 2025, owing to shift in consumer behaviour and expenditure pattern, according to a Boston Consulting Group (BCG) report; and is estimated to surpass USA to become the second largest economy in terms of purchasing power parity (PPP) by the year 2040, according to a report by PricewaterhouseCoopers.
Outlook for 2017-18
The IMF update for January 2017 predicts likely pickup in economic activities in 2017 and 2018 after a lackluster outturn in 2016, especially in emerging markets and developing economies. As per UN in its World Economic Situation and Prospect (WESP) report, India’s economy is slowly gaining momentum with an expected GDP growth of 7.3 and 7.5 percent in 2016 and 2017 respectively. India’s competitiveness has improved across the board, in particular in goods market efficiency, business sophistication and innovation. Global growth for 2017 and 2018 is projected at 3.4 per cent and 3.6 per cent respectively.
MMTC- 2016-17 in retrospect
Financial Review
In the backdrop of above international business scenario, Your Company achieved a trade turnover of `1,15,934.3 million during 2016-17 as against the turnover of ̀ 1,24,604.7 million registered last fiscal. This turnover includes Exports of `15801.4 million, Imports of ` 84802.6 million and domestic trade of `15330.3 million. The decline in trade performance is due to various factors like fall in average price of urea, non-import of steam coal for Government Power Plants due to increased domestic supplies by Coal India, continuing ban on iron ore mining and the resultant lower exports etc. Your Company earned a trading profit
MANAGEMENT DiSCUSSiON AND ANALYSiS REPORT 2016-17
22
of Rs.2244.5 million as compared to `1965.1 million in 2015-16. The profit before tax from ordinary activities is `812.3 million as compared to `579.1 million in 2015-16. The Company has registered a net Profit of `570.6 million during the year as compared to `548.9 million earned last year. Thus the earnings per share of face value of `1/- each is ` 0.57 as on 31.3.2017. Besides, MMTC continues to be a zero long-term debt company.
Source and Utilization of Funds
The source of funds of the company as on 31st March, 2017 comprises of shareholders fund amounting to `14340.77 million including equity share capital of `1000 million and non-current and current liabilities of `1876.96 million and ` 44565.17 million respectively. These funds have been deployed inter alia towards non-current assets amounting to `9920.79 million and current assets of `50862.11 million as on 31st March, 2017.
Internal Control Procedures
In MMTC, day-to-day affairs are managed at various managerial levels in accordance with a well-defined “Delegation of Powers”. Major issues are deliberated to arrive at conscious decisions by the respective Committees of Directors constituted by the Board of Directors as detailed in the report on Corporate Governance annexed herewith.
MMTC has well-settled Internal Audit System & Procedures which is commensurate with its diverse functions. The company has an Internal Audit Division, to coordinate with external auditing firms in conducting internal audit all through the year. Number of initiatives started during the last fiscal for strengthening the internal controls through concurrent audit of bullion transactions, special audit for bullion transactions for earlier years, etc. continued during the year also. Towards this, a well defined Internal Audit Manual, Corporate Risk Management Policy and
Business-cum-Internal Control Manual for various trades of MMTC approved by the Board of Directors have been put in place to take care of internal control mechanisms, risk assessment on the business proposals and systematic SOP for undertaking various trades.
The Audit Committee of Directors meets the Company’s Statutory Auditors and Internal Auditors regularly to ascertain their concerns and observations on financial reports. The directions of the Audit Committee are strictly implemented by the Management.
Subsidiary Company
The wholly owned subsidiary of your Company - MMTC Transnational Pte. Ltd. Singapore (MTPL) incorporated in October 1994 with the objective to take advantage of liberalization/globalization of trade and commerce to tap South East Asian market for trading in commodities has been engaged in commodity trading and has established itself as a credible and reputable trading outfit in Singapore. During the financial year 2016-17 MTPL achieved sales turnover of USD 113.17 million as against US$108.52 million during last fiscal. The Net Profit earned by MTPL during the financial year 2016-17 amounted to US$ 0.04 million as against loss of US$0.28 million incurred in 2015-16. The net worth of MTPL stood at US$ 15.39 million as on 31st March 2017.
MTPL enjoyed prestigious “Global Trader Programme” (GTP) status awarded to it by International Enterprise, Singapore, an arm of the Govt. of Singapore from the year 2000 to 2013.
Business Group wise Review for 2016-17
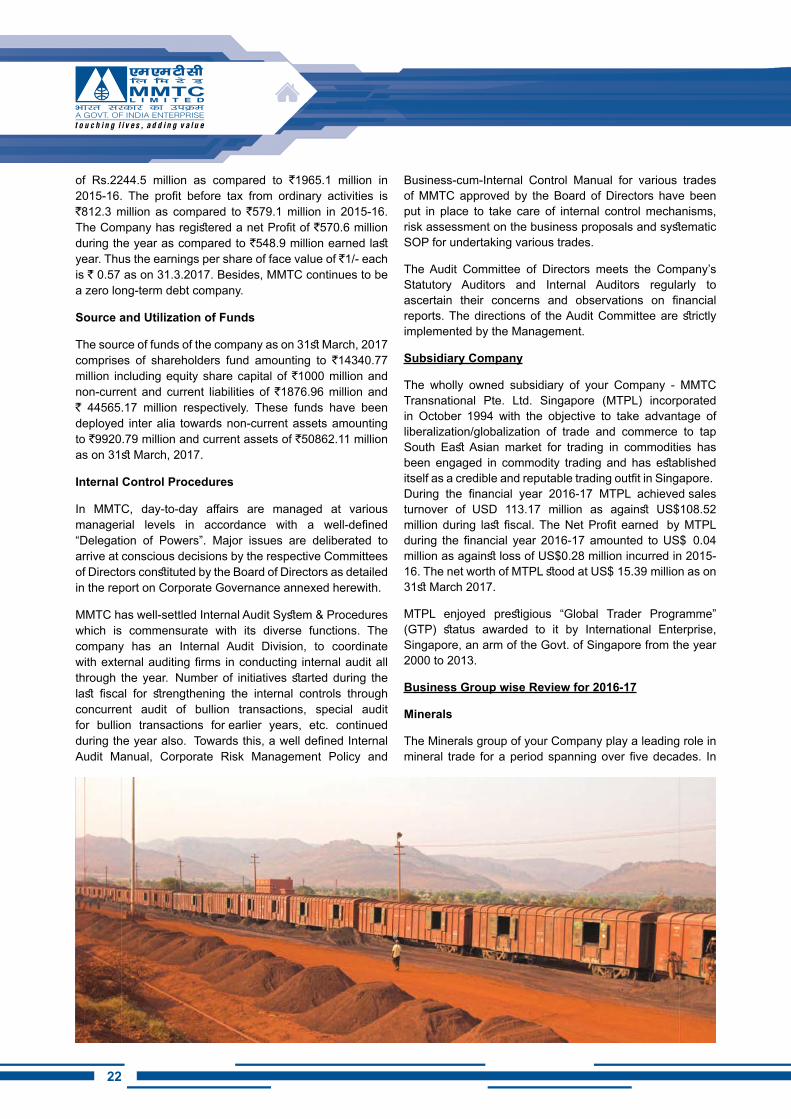
Minerals
The Minerals group of your Company play a leading role in mineral trade for a period spanning over five decades. In
2322
the last decade, MMTC could withstand the stiff competition in the global market by consolidating the mineral portfolio, dynamic and prudent strategies to insulate against the market vagaries, expanding extensively its infrastructure facilities and by attaching utmost care and importance to its trade commitments as also the quality of service and products.
The group has been consistently striving to enhance its competitiveness in the area of value addition. MMTC has provided further fillip to value addition of minerals. MMTC’s co-promoted 1.1. million tpa Neelachal Ispat Nigam Ltd. (NINL) consumes annually over 2.2 million tons of various types of minerals on annual basis arranged mainly by MMTC.
During 2016-17 the Minerals Group of your Company achieved a turnover of `12873 million, which includes exports of Iron Ore valuing `9228.60 million, Chrome Ore, Chrome Concentrate approx. `3499.40 million. As per current EXIM Policy iron ore (Fe content 64% & above), Chrome Ore & Concentrate and Manganese ore are allowed for export through MMTC. The group has also achieved a turnover of `145.65 million by domestic trading of Minerals & Ore which comprises of limestone valued at `54.50 million and other minerals valued at `91.15 million.
Continuation of restrictions on Iron ore mining and its ban on movement for exports from Bellary-Hospet Sector, regulation of exports from Eastern Sector, uncompetitive FOB sale prices of Indian origin ore vis-à-vis other international suppliers i.e. Australia and Brazil (on account of export duty), subdued iron ore demand/prices in the international/spot market, high iron ore inventory with Chinese steel mills, general slowdown of Chinese economy, relative prices increase in domestic demand of ore, etc. continued to have impact on the iron ore exports during 2016-17. Despite this and the stiff competition, MMTC continued to maintain its position as a prominent exporter of minerals during the year under review. MMTC has established itself as a reliable supplier of iron ore to Japanese & South Korean markets over many decades and this portfolio will continue to bring steady business for your Company. Reimposition of 30% ad valorem export duty on chrome ore/Chrome Concentrate from 26.05.2016 has resulted in limited export of Chrome ore/Chrome Concentrate from India. Moreover, increase in steel production/consumption in India would result in further demand of iron ore, Chrome ore and Manganese ore from domestic industry and may affect the availability of these products for export in future. Export of more ferro-chrome may adversely affect availability of chrome ore and also concentrates for export.
Precious Metals, Gems & Jewellery
The Gems and Jewellery sector plays a significant role in the Indian economy, contributing around 6% to 7% of the country’s GDP. It is one of the fastest growing sectors and
is extremely export oriented and labour intensive.
Your Company enjoys the position of one of the market leaders in the Indian bullion trade, having flexibility to operate from various centers spread all over the country offering novel product services, besides maintaining enduring relationship.
Despite high volatility in prices of bullion as well as Indian Rupee - US Dollar exchange rates, Precious Metals Group of your Company contributed a gross turnover of `60391.40 million contributing to approx. 50 percent of the total turnover achieved by the company. The turnover of this group includes import of gold and silver worth `48743.60 million, domestic trade of `11,646.10 million and export of gold medallions worth `1.50 million. Your Company’s share stands at 2% for Gold and 10% for silver in the country’s bullion trade for 2016-17. MMTC is one of the nominated agencies for import of Bullion for supply to exporters as well as domestic traders/jewelers which is the basic raw material for Gems & Jewellery Industry of India. Being a nominated Body, MMTC plays a vital role in association with Govt. of India in Policy formulation to support Gems & Jewellery exports from India and development of Jewellery sector on Pan-India basis. Government has always been supportive since inception way back in 1980s when the Jhandewalan jewellery Complex was approved by the Ministry of Commerce and MMTC being nominated as Agency for supply of gold to DTA w.e.f. September 1992.
Govt. of India also launched Gold Monetization Scheme in 2015 for which MMTC has been assigned two important projects for implementation, namely, sale of Indian Gold Coins and e-Auction of medium and long term gold deposits of Govt. of India, promoting the circulation of domestic gold into the economy thereby reducing the Bullion imports saving valuable foreign exchange.
The Precious Metals Group of your Company marketed the Indian Gold Coins(IGC) unveiled by the Hon’ble Prime Minister of India in 5 gm, 10 gms and bars of 20 gms minted at India Govt. Mint Mumbai and Kolkata. Total turnover of IGC sales achieved during 2016-17 is `1291 million. Your Company tied up with banks to sell Indian Gold Coin. Efforts are on to further expand distribution network for sale of Indian Gold Coin.
24
The flagship event of MMTC Limited “Festival of Gold” was held. The turnover achieved during the Festival of Gold (FOG) “Akshay Tritiya and DIWALI”, 2016 was `68 million and `210 million respectively.
Your company has been supplying Gold/Silver Medallions to various Corporates apart from effecting showroom sales. During the year your company also refined Gold/Silver offerings and supplied medallions / bars to Shri Mata Vaishno Devi and Mata Mansa Devi Shrine Boards. Further, we have also fabricated and supplied Silver Commemorative Medallions, the replica of Sikh Sovereign Coin on the occasion of 300th Year of martyrdom of Baba Banda Singh Bahadur and also on the occasion of 350th Birth Anniversary of Shri Guru Gobind Singhji.
The Company’s joint venture MMTC-PAMP India Pvt. Ltd. achieved a turnover of `243901.61 million and a profit (after tax) of `149.29 million. During the fiscal MMTC has sold 2.87 MTs of Gold Bars produced by MPIPL in the domestic market achieving a turnover of `7922.2 million. Another Joint Venture for retail trade in jewellery i.e. MMTC Gitanjali Limited has reported a turnover of `266.24 million for the year 2016-17 as against turnover of `283.24 million during 2015-16.
With increasing competition among the gold traders, there is a continuous decrease in the profit margin being experienced in the trade. The Goods & Service Tax(GST) will hopefully change the shape of the industry.
Demand for Gold is expected to remain firm for this year on account of strong demand owing to traditional importance of the metal in India which is very difficult to alter. By the end of 2016, silver was the second-best asset in the precious-metals space, up 16.5% since the start of the year and only behind palladium. Outlook for silver in 2017 is an upward trend in prices due to expectations on solid fundamentals, as mine supply is likely to contract while industrial and jewellery demand is like to increase.
The Precious Metals Group of your Company shall be making efforts to bring back big customers in various metro and non-metro cities through constant customer engagement. On account of jewellers’ strike in the first half of the year, the DTA Gold operations were strengthened. MMTC set up a unit in SEZ at SEEPZ Mumbai and is making efforts to set up a unit in the SEZ at Sitapura Jaipur which would further boost DTA operations. Although India’s silver imports declined as compared to last year, MMTC’s market share increased to 10% as compared to 8% last year. Strategies for the current year include maximizing DTA operations, simplified procedures for importing bullion through FTWZ, enrolment of new foreign suppliers to have better supplier base to be more competitive and have adequate quantity to supply, conduct successful rollout of the e-auction of bullion bars under the GMS scheme, etc. The group shall be exploring new avenues of business like the Dore import
business for which government departments are being pursued vigorously, auctioning of gold/silver confiscated by customs and that available with prominent temple trusts.
Metals and Industrial Raw Materials
During 2016-17 the metals group of your Company has achieved a turnover of `6928.10 million which includes export of Pig Iron worth `2415.80 million, import of Non Ferrous Metals like Zinc, Nickel, Cobalt and Tin worth `2733.40 million, import of Industrial Raw Material viz. Antimony metal worth `42.80 million and Domestic Trade in Steel products like pig iron, slag, billets etc worth `1736.10 million. The Pig Iron is produced by MMTC’s joint venture with Govt. of Odisha, M/s. Neelachal Ispat Nigam Limited.
MMTC’s strength lies in that its supplier base comprised of reputable international suppliers of all base and minor metals and linkages with major PSUs, Railways and Ordnance Factories to ensure steady stream of business. However, non-standardized and custom specified material are not available with empanelled suppliers. Procurement of imported NFM takes a minimum of 3-4 weeks’ time which becomes a bottleneck for serving the industry locally.
The opportunities in NFM trade are expansion in minor metals and Ferro Alloys markets, sale of unpriced base Non Ferrous Metals or ex-Bond, SEZ or ex-FTWZ basis and expansion of supply base for import of NFM. The threats include increase in domestic production of secondary and recycled metals from indigenous and imported scrap and increase in domestic manufacture of base metals like Copper, Aluminium, Lead and Zinc creating an alternative supply source.
Possibility of sale of Non Ferrous Metals through FTWZ will be explored by the NFM Group of your company. The possibility of tying up for long-term/annual supplies with producers and major overseas traders may also be explored to enable MMTC to offer better commercial terms and competitive edge over other traders in the market.
In the Steel segment during 2016-17, the group has sold Non-Alloy Pig Iron with value of approx. Rs.2415.8 million in international market apart from sale in the domestic market. The group will be eyeing import financing opportunities-mapping with our product portfolio and business model &
2524
Policies, HMS & Shredded scrap import through Kandla, Mundra & Chennai Port. It has empanelled around 10 foreign suppliers for supply of HMS & Shredded Scraps. The group shall be exploring possibility of export of Pig Iron & Billets to Bangladeshi/Nepali markets.
Agro Products
The Agro group of your Company achieved a turnover of `2089.60 million during FY 2016-17 which include import of pulses worth `1057.60 million, and domestic trade of pulses worth `1032 million. The group has imported pulses on Government Account to contain the price fluctuation in the open market.
MMTC has been in agri trade business for almost two and half decades, beginning with the then sunrise segment of Soyabean processing for export of soya DOC and sale of Crude Soya Oil in the domestic market. Opportunities for export/import of grains like Rice, Wheat and Sugar also were available either on Government account or on commercial basis. Under the Price Stabilization, MMTC has played a pioneering role for import of pulses. For building buffer stock of pulses, MMTC has been designated as one of the agencies for import of pulses by Government of India. As per directions of Govt. of India, during FY 2016-17, MMTC has imported approx 3.4888 lakh MT of various pulses like toor, urad, masur and chana for the buffer stock programme. These pulses are being stored at various port godowns and are being released to State Government Agencies and open market as per the advice of Department of Consumer Affairs, Govt. of India.
Depending upon the domestic production, opportunities either for export or for import emerges. Very high volatility in some of the agro commodities is on the basis of price trend in international commodity market, and currency rate fluctuations pose a threat to agri business apart from natural vagaries like draught/monsoon etc.
Globally, there has been slow down in all commodities markets right from crude oil, steel, agri commodities, edible oils, etc. Slow down of economic growth in China, EU and other countries have adversely affected the commodities markets. The group is no exception to this development.
Outlook for 2017-18 for agri commodities except pulses are
not very encouraging considering the fact that international market for agri commodities are yet to recover and major commodities like wheat, rice, edible oil, etc are also yet to recover from the bearish sentiments. Initiatives have been taken and efforts are going on to export Indian Rice to Indonesia and Egypt on Govt. to Govt. arrangements. MMTC is the Government nodal agency for import of pulses under the price stabilization scheme.
Fertilizers and Chemicals
MMTC Limited is one of the major importers of fertilizers in India. It is engaged in the import of finished, intermediate and raw fertilizers. MMTC handles about 3 to 4 million tonnes of fertilizers. It continues to remain a trusted and reliable supplier of fertilizers to many institutional customers in India. This has been possible owing to a reputation of trust and reliability assiduously built by the company over four decades.
MMTC has built a niche for itself and has been extending the benefit of its four decades of experience in buying, selling and excellent net-working, which has been continuously adding value in the supply chain. As a result, MMTC remains the single unique window for buying and selling of all fertilizer products globally.
The Fertilizer group of your Company imports urea on behalf of Department of Fertilizers, Ministry of Chemicals and Fertilizers. During FY 2016-17, the Fertilizer and Chemicals group of your Company has contributed a turnover of `26734.10 million during the financial year 2016-17. It included import on behalf of Government of India of about 1.63 million tonnes of urea valued at about `23913 million, and import of non-canalized fertilizer like Phosphoric acid, Powdered Mono Ammonium Phosphate(PMAP), Sulphur, MOP and Urea worth `2608.30 million, domestic trade of fertilizers worth `1.80 million. Around 10000 MT of Urea was exported to Nepal valuing `211 million. Urea is one of the major fertilizers to meet nitrogen nutrient requirement of the soil.
Powdered Mono Ammonium Phosphate (PMAP) is a new product added to the product range of the Group, which contributed a turnover of `241.70 million during the period under review.
Fertilizer industry in India has been passing through tough phase in recent years. The year under review was a difficult
26
period for the fertilizer industry in general in India due to the rainfall turned marginally below the normal which directly impacts the quantum of chemical fertilizers used in agriculture. Further, disparity in the import price of various fertilizers caused the demand destruction which ultimately affects the business of MMTC.
As regards import of Urea on Government account, the total imports of India have come down which also impacted the overall business volumes of MMTC. Urea imports have come down as domestic production has increased which substantially bridged the gap between production and consumption.
The outlook for 2017-18 for India will depend on the monsoon and the Government policy. The global economy continues to face challenges. With food inflation being felt by countries across the globe including India, the focus especially for the developing nations would be on increasing productivity in agriculture. However, the global supply position of all the major fertilizers is expected to remain comfortable with new addition in capacities mainly in Urea, DAP and MOP.
Efforts are continuously being made to increase the volume of business in the existing product line and aggressively exploring new fertilizer products for trading. The action plan for achieving targets for 2017-18 includes import of MOP by retaining the existing customers and adding new customers, import of required quantities of Urea by Department of Fertilizers in 2017-18 and focus on Phosphates raw materials intermediates and finished fertilizers.
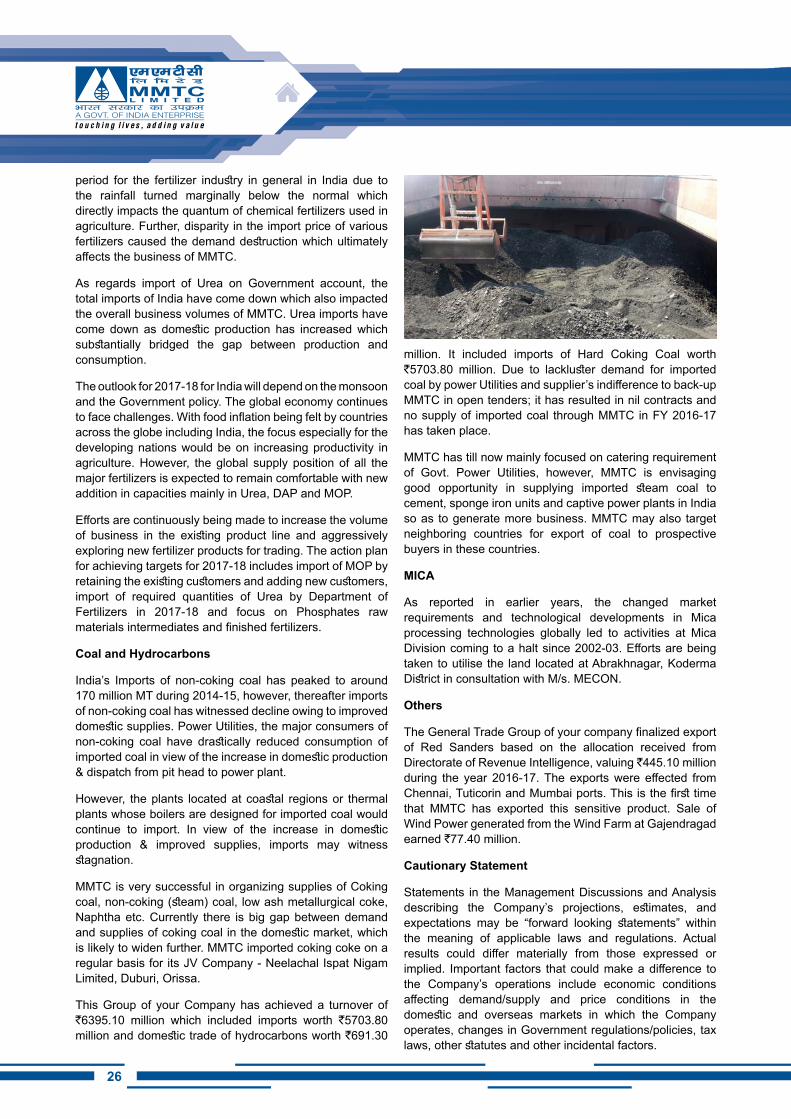
Coal and Hydrocarbons
India’s Imports of non-coking coal has peaked to around 170 million MT during 2014-15, however, thereafter imports of non-coking coal has witnessed decline owing to improved domestic supplies. Power Utilities, the major consumers of non-coking coal have drastically reduced consumption of imported coal in view of the increase in domestic production & dispatch from pit head to power plant.
However, the plants located at coastal regions or thermal plants whose boilers are designed for imported coal would continue to import. In view of the increase in domestic production & improved supplies, imports may witness stagnation.
MMTC is very successful in organizing supplies of Coking coal, non-coking (steam) coal, low ash metallurgical coke, Naphtha etc. Currently there is big gap between demand and supplies of coking coal in the domestic market, which is likely to widen further. MMTC imported coking coke on a regular basis for its JV Company - Neelachal Ispat Nigam Limited, Duburi, Orissa.
This Group of your Company has achieved a turnover of `6395.10 million which included imports worth `5703.80 million and domestic trade of hydrocarbons worth `691.30
million. It included imports of Hard Coking Coal worth `5703.80 million. Due to lackluster demand for imported coal by power Utilities and supplier’s indifference to back-up MMTC in open tenders; it has resulted in nil contracts and no supply of imported coal through MMTC in FY 2016-17 has taken place.
MMTC has till now mainly focused on catering requirement of Govt. Power Utilities, however, MMTC is envisaging good opportunity in supplying imported steam coal to cement, sponge iron units and captive power plants in India so as to generate more business. MMTC may also target neighboring countries for export of coal to prospective buyers in these countries.
MiCA
As reported in earlier years, the changed market requirements and technological developments in Mica processing technologies globally led to activities at Mica Division coming to a halt since 2002-03. Efforts are being taken to utilise the land located at Abrakhnagar, Koderma District in consultation with M/s. MECON.
Others
The General Trade Group of your company finalized export of Red Sanders based on the allocation received from Directorate of Revenue Intelligence, valuing `445.10 million during the year 2016-17. The exports were effected from Chennai, Tuticorin and Mumbai ports. This is the first time that MMTC has exported this sensitive product. Sale of Wind Power generated from the Wind Farm at Gajendragad earned `77.40 million.
Cautionary Statement
Statements in the Management Discussions and Analysis describing the Company’s projections, estimates, and expectations may be “forward looking statements” within the meaning of applicable laws and regulations. Actual results could differ materially from those expressed or implied. Important factors that could make a difference to the Company’s operations include economic conditions affecting demand/supply and price conditions in the domestic and overseas markets in which the Company operates, changes in Government regulations/policies, tax laws, other statutes and other incidental factors.
2726
1. A brief outline of the company’s CSR policy, including overview of projects or programs proposed to be undertaken and a reference to the web-link to the CSR policy and projects or programs.
MMTC has consistently played the role of a good corporate citizen and has shown its deep commitment towards Corporate Social Responsibility practices by conducting its business in an economically, socially and environmentally sustainable manner. Even in the absence of an official mandate regarding CSR activities, MMTC adopted CSR as a policy initiative long ago in Sept. 2006, effective from 2007-08, and allocated 1% of retainable profit of previous year for undertaking CSR activities. Special emphasis were given on education, health care, promotion of art & culture and undertaking community related activities, besides providing relief in times of natural calamities.
In 2010, The Department of Public Enterprises (DPE) issued detailed guidelines on CSR for adoption by CPSEs. MMTC adopted these guidelines and realigned its CSR policy accordingly. These were followed by DPE guidelines of November 2011 and April 2013 which were again duly adopted by MMTC.
MMTC’s CSR policy is now in line with Section 135 of the Companies Act and the CSR Rules as notified by the Ministry of Corporate Affairs. The CSR projects are being undertaken in terms of Section 135 of the Companies Act. The New CSR Policy is hosted on MMTC’s website.
During the year 2016-17, a sum of Rs. 81.41 lakhs was allocated for undertaking the CSR activities which was equivalent to 2% of the average net profit of preceeding three years.
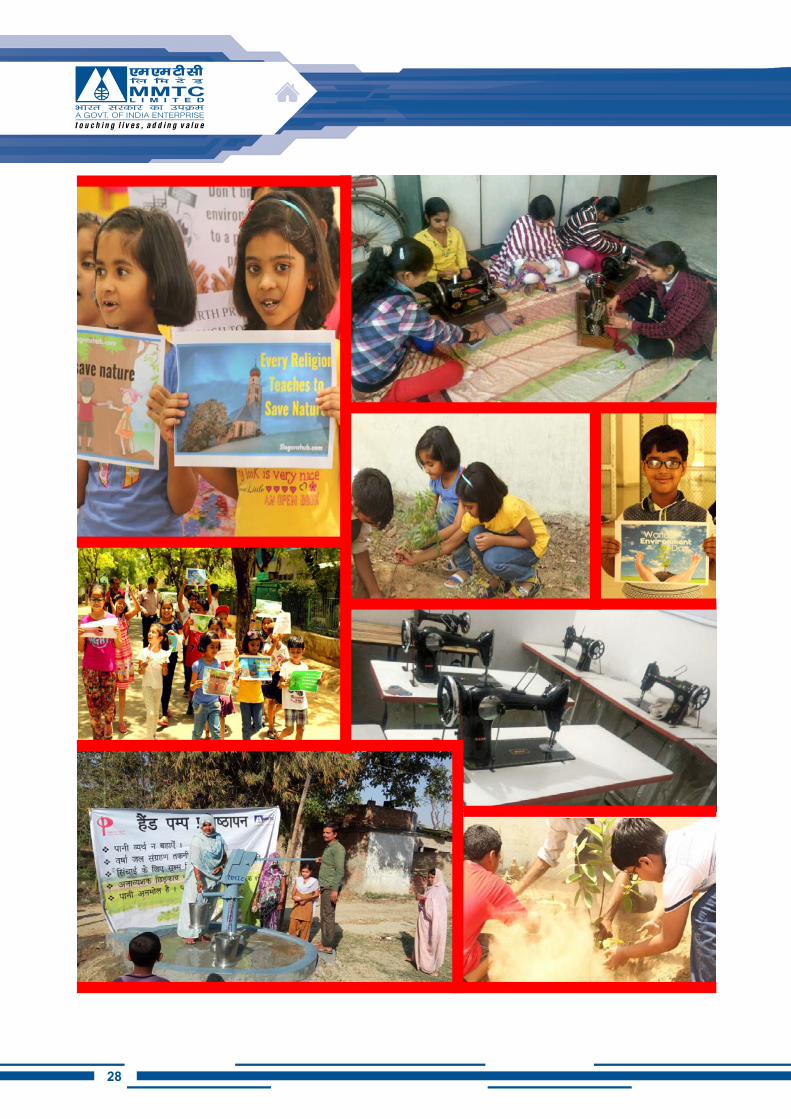
The funds allocated during 2016-17 under CSR were spent towards activities majorly related to the Swachh Bharat Abhiyan, Clean Ganga Mission, Skill India Mission, Promotion of healthcare and Yoga and Promotion of sports/ para-sports. Besides this, MMTC supported distribution of artificial limbs and assistive devices to the differently abled.
2. The Composition of the CSR Committee
The Committee of Directors on CSR during 2016-17 comprised of the following members:
• Shri R. Anand, Independent Director as Chairman• Shri Ved Prakash, CMD as Member• Shri Rajeev Jaideva, Director (Personnel) as
Member- up to 31.12.2016
• Shri M.G. Gupta, Director (Finance)-up to 08.12.2016
3. Average net profit of the company for last three financial years
For the purpose of ascertaining the CSR Budget “average net profit” was calculated in accordance with the provisions of section 198 of the Companies Act, 2013.
The net profits for the preceding three financial years 2013-14, 2014-15 and 2015-16 were Rs. 14.46 crores, Rs. 59.87 crores and Rs. 47.79 crores respectively.
Thus the average net profit of the preceding three years worked out to Rs. 40.706 crores.
4. Prescribed CSR Expenditure (two per cent. of the amount as in item 3 above)
2% of the average net profit of the Company in the preceding 3 years was Rs. 81.41 lakhs.
5. Details of CSR spent during the financial year.
(a) Total amount to be spent for the financial year; Rs. 81.41 lakhs was spent during 2016-17
(b) Amount unspent, if any; Nil
(c) Manner in which the amount spent during the financial year is detailed below.
Provided at Annexure-I
6. In case the company has failed to spend the two per cent of the average net profit of the last three financial years or any part thereof, the company shall provide the reasons for not spending the amount in its Board report.
NA
It is certified that the Implementation and Monitoring of CSR Policy, is in compliance with the CSR objectives and Policy of the Company.
sd/-(Ved Prakash)CMD, MMTC sd/- (R Anand)Chairman of the CSR Committeefor the year 2016-17
ThE ANNUAL REPORT ON CSR ACTiViTiES – 2016-17
28
2928
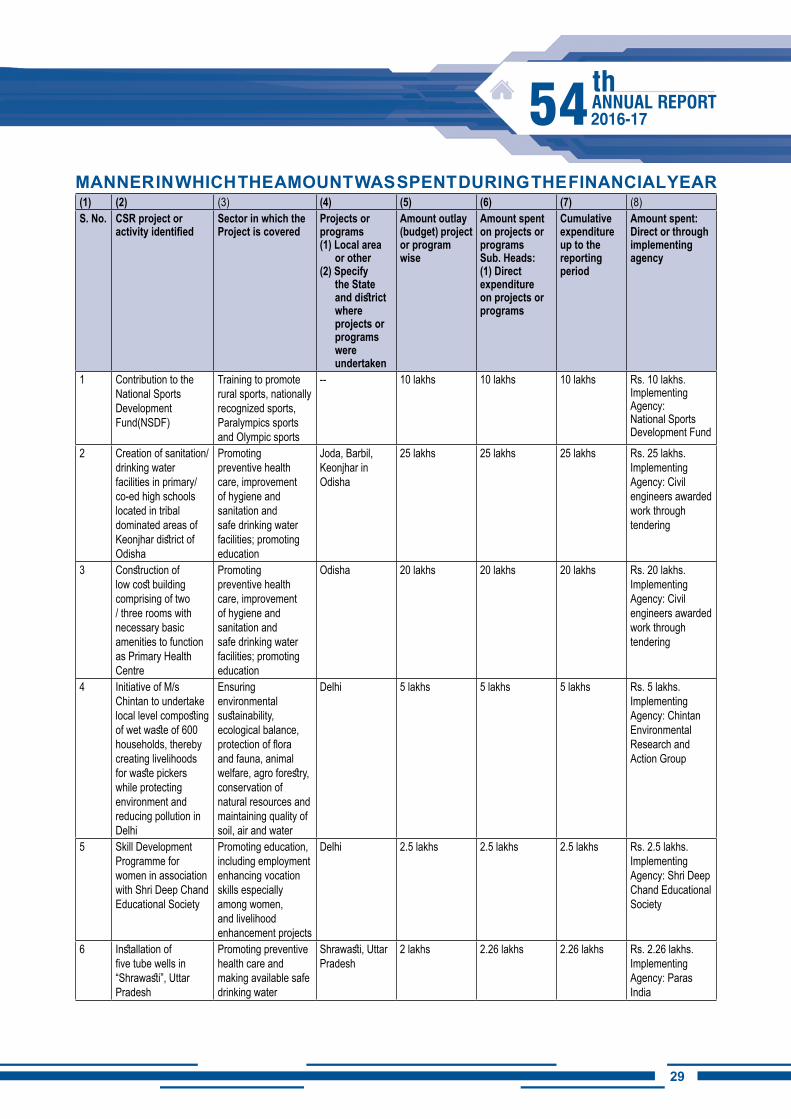
MANNER iN WhiCh ThE AMOUNT WAS SPENT DURiNG ThE FiNANCiAL YEAR(1) (2) (3) (4) (5) (6) (7) (8)S. No. CSR project or
activity identifiedSector in which the Project is covered
Projects or programs(1) Local area
or other(2) Specify
the State and district where projects or programs were undertaken
Amount outlay (budget) project or program wise
Amount spent on projects or programsSub. Heads:(1) Direct expenditure on projects or programs
Cumulative expenditure up to the reporting period
Amount spent: Direct or through implementing agency
1 Contribution to the National Sports Development Fund(NSDF)
Training to promote rural sports, nationally recognized sports, Paralympics sports and Olympic sports
-- 10 lakhs 10 lakhs 10 lakhs Rs. 10 lakhs.Implementing Agency: National Sports Development Fund
2 Creation of sanitation/ drinking water facilities in primary/co-ed high schools located in tribal dominated areas of Keonjhar district of Odisha
Promoting preventive health care, improvement of hygiene and sanitation and safe drinking water facilities; promoting education
Joda, Barbil, Keonjhar in Odisha
25 lakhs 25 lakhs 25 lakhs Rs. 25 lakhs.Implementing Agency: Civil engineers awarded work through tendering
3 Construction of low cost building comprising of two / three rooms with necessary basic amenities to function as Primary Health Centre
Promoting preventive health care, improvement of hygiene and sanitation and safe drinking water facilities; promoting education
Odisha 20 lakhs 20 lakhs 20 lakhs Rs. 20 lakhs.Implementing Agency: Civil engineers awarded work through tendering
4 Initiative of M/s Chintan to undertake local level composting of wet waste of 600 households, thereby creating livelihoods for waste pickers while protecting environment and reducing pollution in Delhi
Ensuring environmental sustainability, ecological balance, protection of flora and fauna, animal welfare, agro forestry, conservation of natural resources and maintaining quality of soil, air and water
Delhi 5 lakhs 5 lakhs 5 lakhs Rs. 5 lakhs.Implementing Agency: Chintan Environmental Research and Action Group
5 Skill Development Programme for women in association with Shri Deep Chand Educational Society
Promoting education, including employment enhancing vocation skills especially among women, and livelihood enhancement projects
Delhi 2.5 lakhs 2.5 lakhs 2.5 lakhs Rs. 2.5 lakhs.Implementing Agency: Shri Deep Chand Educational Society
6 Installation of five tube wells in “Shrawasti”, Uttar Pradesh
Promoting preventive health care and making available safe drinking water
Shrawasti, Uttar Pradesh
2 lakhs 2.26 lakhs 2.26 lakhs Rs. 2.26 lakhs.Implementing Agency: Paras India
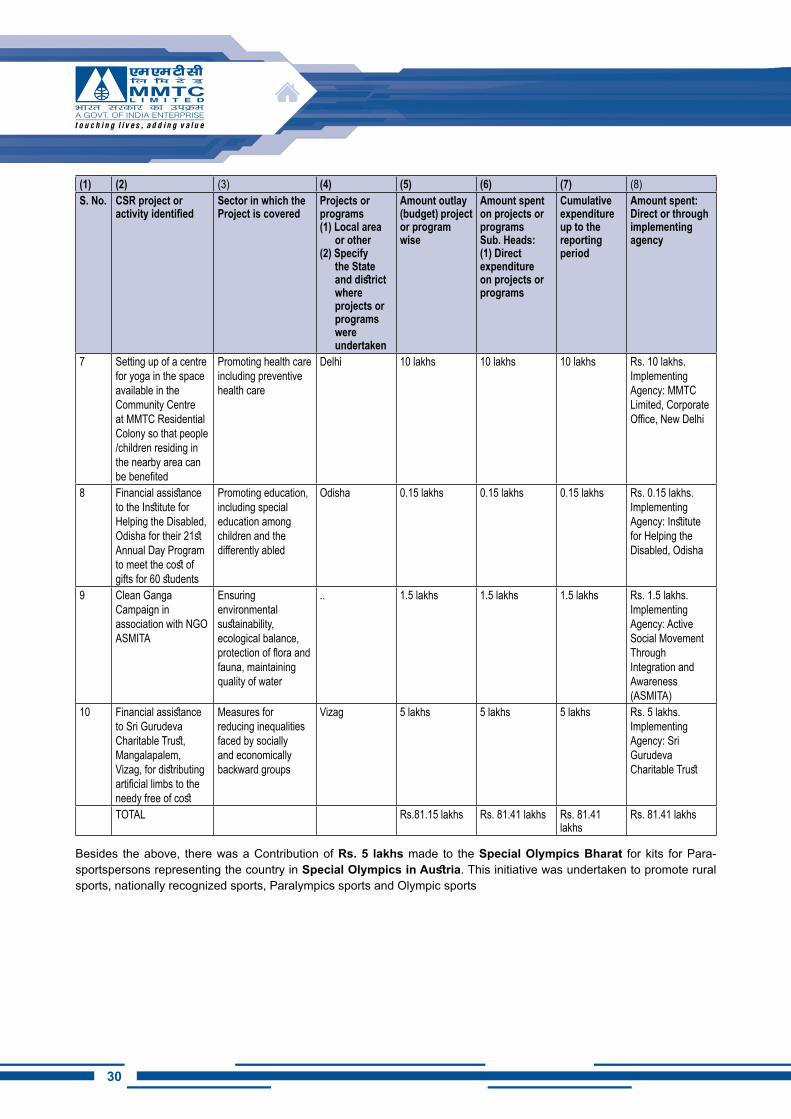
30
(1) (2) (3) (4) (5) (6) (7) (8)S. No. CSR project or
activity identifiedSector in which the Project is covered
Projects or programs(1) Local area
or other(2) Specify
the State and district where projects or programs were undertaken
Amount outlay (budget) project or program wise
Amount spent on projects or programsSub. Heads:(1) Direct expenditure on projects or programs
Cumulative expenditure up to the reporting period
Amount spent: Direct or through implementing agency
7 Setting up of a centre for yoga in the space available in the Community Centre at MMTC Residential Colony so that people /children residing in the nearby area can be benefited
Promoting health care including preventive health care
Delhi 10 lakhs 10 lakhs 10 lakhs Rs. 10 lakhs.Implementing Agency: MMTC Limited, Corporate Office, New Delhi
8 Financial assistance to the Institute for Helping the Disabled, Odisha for their 21st Annual Day Program to meet the cost of gifts for 60 students
Promoting education, including special education among children and the differently abled
Odisha 0.15 lakhs 0.15 lakhs 0.15 lakhs Rs. 0.15 lakhs.Implementing Agency: Institute for Helping the Disabled, Odisha
9 Clean Ganga Campaign in association with NGO ASMITA
Ensuring environmental sustainability, ecological balance, protection of flora and fauna, maintaining quality of water
.. 1.5 lakhs 1.5 lakhs 1.5 lakhs Rs. 1.5 lakhs.Implementing Agency: Active Social Movement Through Integration and Awareness (ASMITA)
10 Financial assistance to Sri Gurudeva Charitable Trust, Mangalapalem, Vizag, for distributing artificial limbs to the needy free of cost
Measures for reducing inequalities faced by socially and economically backward groups
Vizag 5 lakhs 5 lakhs 5 lakhs Rs. 5 lakhs.Implementing Agency: Sri Gurudeva Charitable Trust
TOTAL Rs.81.15 lakhs Rs. 81.41 lakhs Rs. 81.41 lakhs
Rs. 81.41 lakhs
Besides the above, there was a Contribution of Rs. 5 lakhs made to the Special Olympics Bharat for kits for Para-sportspersons representing the country in Special Olympics in Austria. This initiative was undertaken to promote rural sports, nationally recognized sports, Paralympics sports and Olympic sports
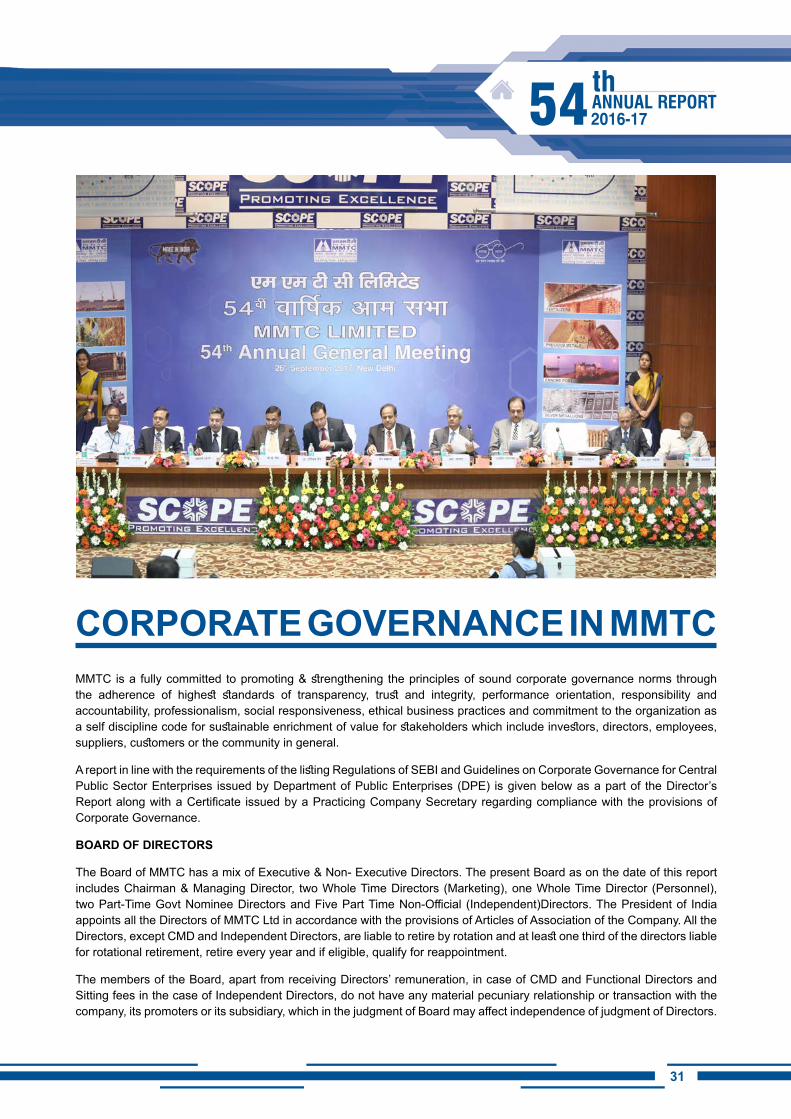
3130
MMTC is a fully committed to promoting & strengthening the principles of sound corporate governance norms through the adherence of highest standards of transparency, trust and integrity, performance orientation, responsibility and accountability, professionalism, social responsiveness, ethical business practices and commitment to the organization as a self discipline code for sustainable enrichment of value for stakeholders which include investors, directors, employees, suppliers, customers or the community in general.
A report in line with the requirements of the listing Regulations of SEBI and Guidelines on Corporate Governance for Central Public Sector Enterprises issued by Department of Public Enterprises (DPE) is given below as a part of the Director’s Report along with a Certificate issued by a Practicing Company Secretary regarding compliance with the provisions of Corporate Governance.
BOARD OF DiRECTORS
The Board of MMTC has a mix of Executive & Non- Executive Directors. The present Board as on the date of this report includes Chairman & Managing Director, two Whole Time Directors (Marketing), one Whole Time Director (Personnel), two Part-Time Govt Nominee Directors and Five Part Time Non-Official (Independent)Directors. The President of India appoints all the Directors of MMTC Ltd in accordance with the provisions of Articles of Association of the Company. All the Directors, except CMD and Independent Directors, are liable to retire by rotation and at least one third of the directors liable for rotational retirement, retire every year and if eligible, qualify for reappointment.
The members of the Board, apart from receiving Directors’ remuneration, in case of CMD and Functional Directors and Sitting fees in the case of Independent Directors, do not have any material pecuniary relationship or transaction with the company, its promoters or its subsidiary, which in the judgment of Board may affect independence of judgment of Directors.
CORPORATE GOVERNANCE iN MMTC
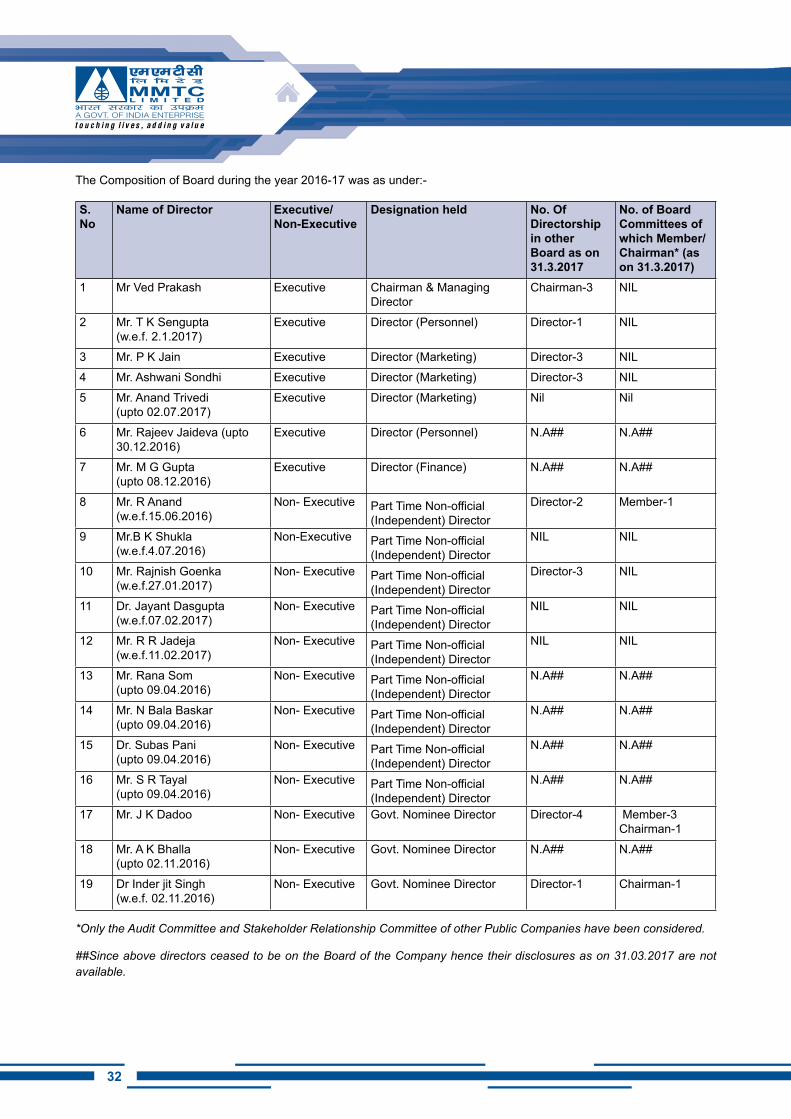
32
The Composition of Board during the year 2016-17 was as under:-
S. No
Name of Director Executive/ Non-Executive
Designation held No. Of Directorship in other Board as on 31.3.2017
No. of Board Committees of which Member/ Chairman* (as on 31.3.2017)
1 Mr Ved Prakash Executive Chairman & Managing Director
Chairman-3 NIL
2 Mr. T K Sengupta(w.e.f. 2.1.2017)
Executive Director (Personnel) Director-1 NIL
3 Mr. P K Jain Executive Director (Marketing) Director-3 NIL4 Mr. Ashwani Sondhi Executive Director (Marketing) Director-3 NIL5 Mr. Anand Trivedi
(upto 02.07.2017)Executive Director (Marketing) Nil Nil
6 Mr. Rajeev Jaideva (upto 30.12.2016)
Executive Director (Personnel) N.A## N.A##
7 Mr. M G Gupta(upto 08.12.2016)
Executive Director (Finance) N.A## N.A##
8 Mr. R Anand (w.e.f.15.06.2016)
Non- Executive Part Time Non-official (Independent) Director
Director-2 Member-1
9 Mr.B K Shukla (w.e.f.4.07.2016)
Non-Executive Part Time Non-official (Independent) Director
NIL NIL
10 Mr. Rajnish Goenka (w.e.f.27.01.2017)
Non- Executive Part Time Non-official (Independent) Director
Director-3 NIL
11 Dr. Jayant Dasgupta (w.e.f.07.02.2017)
Non- Executive Part Time Non-official (Independent) Director
NIL NIL
12 Mr. R R Jadeja (w.e.f.11.02.2017)
Non- Executive Part Time Non-official (Independent) Director
NIL NIL
13 Mr. Rana Som(upto 09.04.2016)
Non- Executive Part Time Non-official (Independent) Director
N.A## N.A##
14 Mr. N Bala Baskar(upto 09.04.2016)
Non- Executive Part Time Non-official (Independent) Director
N.A## N.A##
15 Dr. Subas Pani(upto 09.04.2016)
Non- Executive Part Time Non-official (Independent) Director
N.A## N.A##
16 Mr. S R Tayal (upto 09.04.2016)
Non- Executive Part Time Non-official (Independent) Director
N.A## N.A##
17 Mr. J K Dadoo Non- Executive Govt. Nominee Director Director-4 Member-3Chairman-1
18 Mr. A K Bhalla(upto 02.11.2016)
Non- Executive Govt. Nominee Director N.A## N.A##
19 Dr Inder jit Singh(w.e.f. 02.11.2016)
Non- Executive Govt. Nominee Director Director-1 Chairman-1
*Only the Audit Committee and Stakeholder Relationship Committee of other Public Companies have been considered.
##Since above directors ceased to be on the Board of the Company hence their disclosures as on 31.03.2017 are not available.
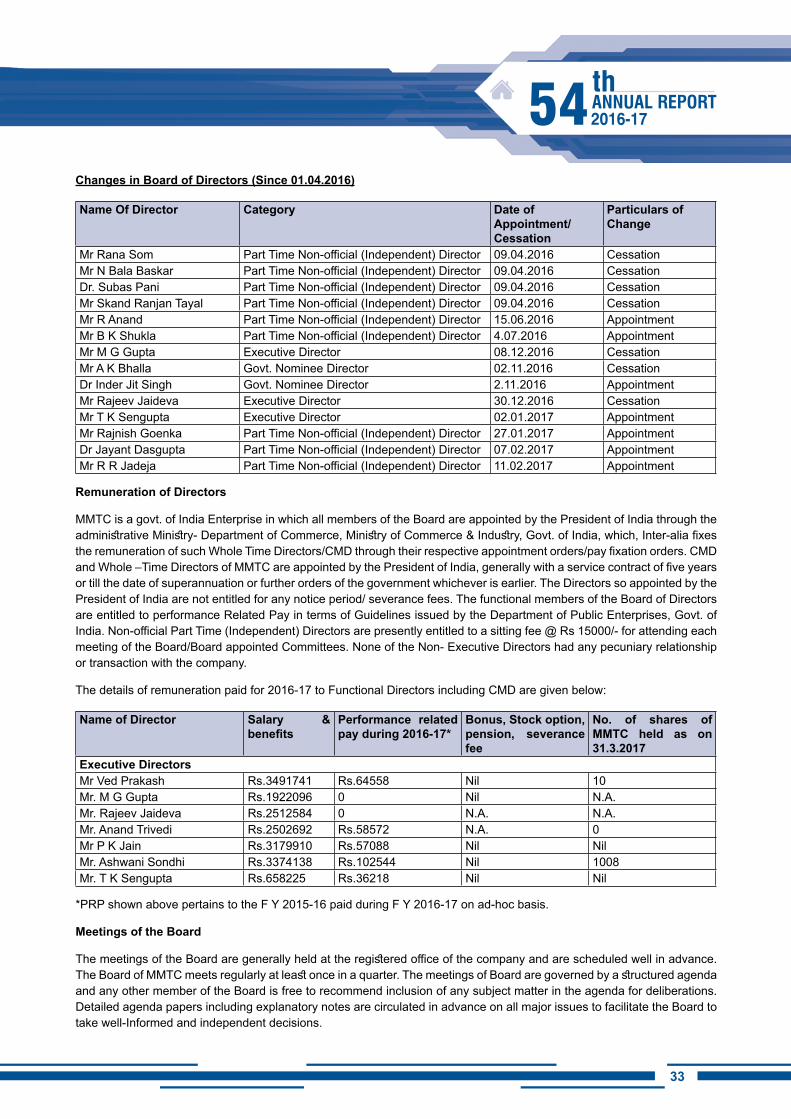
3332
Changes in Board of Directors (Since 01.04.2016)
Name Of Director Category Date of Appointment/ Cessation
Particulars of Change
Mr Rana Som Part Time Non-official (Independent) Director 09.04.2016 CessationMr N Bala Baskar Part Time Non-official (Independent) Director 09.04.2016 CessationDr. Subas Pani Part Time Non-official (Independent) Director 09.04.2016 CessationMr Skand Ranjan Tayal Part Time Non-official (Independent) Director 09.04.2016 CessationMr R Anand Part Time Non-official (Independent) Director 15.06.2016 AppointmentMr B K Shukla Part Time Non-official (Independent) Director 4.07.2016 AppointmentMr M G Gupta Executive Director 08.12.2016 CessationMr A K Bhalla Govt. Nominee Director 02.11.2016 CessationDr Inder Jit Singh Govt. Nominee Director 2.11.2016 AppointmentMr Rajeev Jaideva Executive Director 30.12.2016 CessationMr T K Sengupta Executive Director 02.01.2017 AppointmentMr Rajnish Goenka Part Time Non-official (Independent) Director 27.01.2017 AppointmentDr Jayant Dasgupta Part Time Non-official (Independent) Director 07.02.2017 AppointmentMr R R Jadeja Part Time Non-official (Independent) Director 11.02.2017 Appointment
Remuneration of Directors
MMTC is a govt. of India Enterprise in which all members of the Board are appointed by the President of India through the administrative Ministry- Department of Commerce, Ministry of Commerce & Industry, Govt. of India, which, Inter-alia fixes the remuneration of such Whole Time Directors/CMD through their respective appointment orders/pay fixation orders. CMD and Whole –Time Directors of MMTC are appointed by the President of India, generally with a service contract of five years or till the date of superannuation or further orders of the government whichever is earlier. The Directors so appointed by the President of India are not entitled for any notice period/ severance fees. The functional members of the Board of Directors are entitled to performance Related Pay in terms of Guidelines issued by the Department of Public Enterprises, Govt. of India. Non-official Part Time (Independent) Directors are presently entitled to a sitting fee @ Rs 15000/- for attending each meeting of the Board/Board appointed Committees. None of the Non- Executive Directors had any pecuniary relationship or transaction with the company.
The details of remuneration paid for 2016-17 to Functional Directors including CMD are given below:
Name of Director Salary & benefits
Performance related pay during 2016-17*
Bonus, Stock option, pension, severance fee
No. of shares of MMTC held as on 31.3.2017
Executive DirectorsMr Ved Prakash Rs.3491741 Rs.64558 Nil 10Mr. M G Gupta Rs.1922096 0 Nil N.A.Mr. Rajeev Jaideva Rs.2512584 0 N.A. N.A.Mr. Anand Trivedi Rs.2502692 Rs.58572 N.A. 0Mr P K Jain Rs.3179910 Rs.57088 Nil NilMr. Ashwani Sondhi Rs.3374138 Rs.102544 Nil 1008Mr. T K Sengupta Rs.658225 Rs.36218 Nil Nil
*PRP shown above pertains to the F Y 2015-16 paid during F Y 2016-17 on ad-hoc basis.
Meetings of the Board
The meetings of the Board are generally held at the registered office of the company and are scheduled well in advance. The Board of MMTC meets regularly at least once in a quarter. The meetings of Board are governed by a structured agenda and any other member of the Board is free to recommend inclusion of any subject matter in the agenda for deliberations. Detailed agenda papers including explanatory notes are circulated in advance on all major issues to facilitate the Board to take well-Informed and independent decisions.
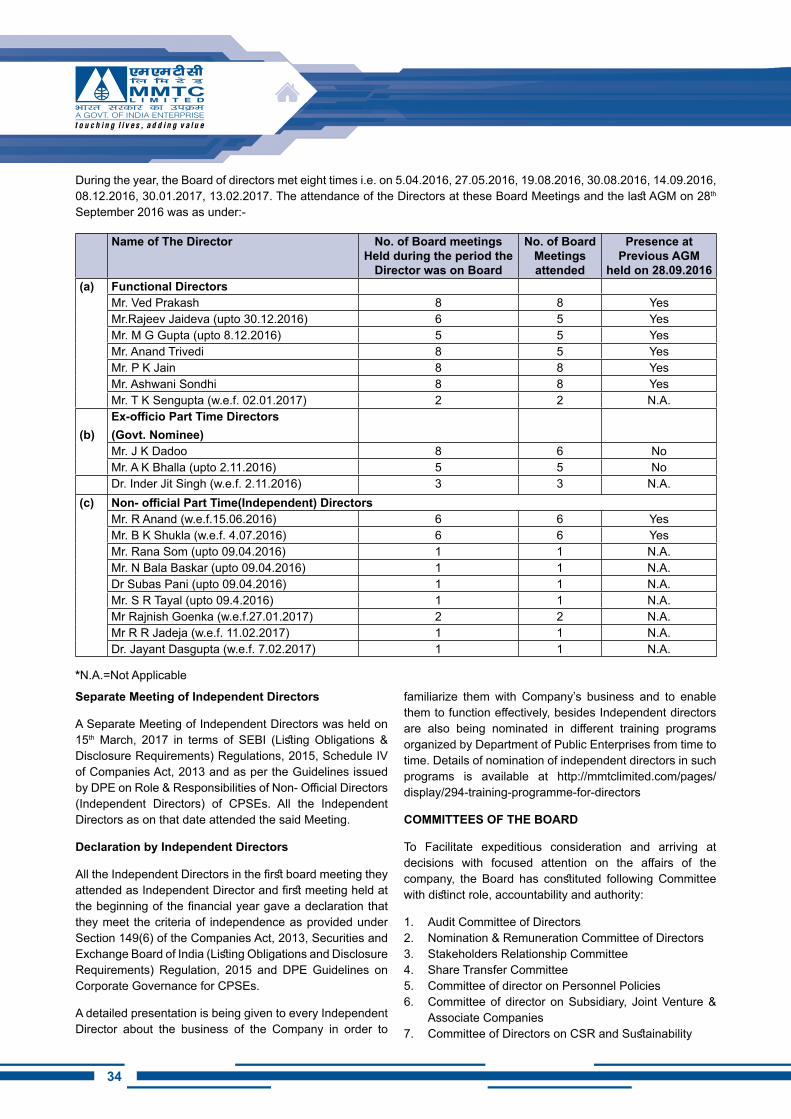
34
During the year, the Board of directors met eight times i.e. on 5.04.2016, 27.05.2016, 19.08.2016, 30.08.2016, 14.09.2016, 08.12.2016, 30.01.2017, 13.02.2017. The attendance of the Directors at these Board Meetings and the last AGM on 28th September 2016 was as under:-
Name of The Director No. of Board meetings Held during the period the
Director was on Board
No. of Board Meetings attended
Presence at Previous AGM
held on 28.09.2016(a) Functional Directors
Mr. Ved Prakash 8 8 YesMr.Rajeev Jaideva (upto 30.12.2016) 6 5 YesMr. M G Gupta (upto 8.12.2016) 5 5 YesMr. Anand Trivedi 8 5 YesMr. P K Jain 8 8 YesMr. Ashwani Sondhi 8 8 YesMr. T K Sengupta (w.e.f. 02.01.2017) 2 2 N.A.
(b)Ex-officio Part Time Directors (Govt. Nominee)Mr. J K Dadoo 8 6 NoMr. A K Bhalla (upto 2.11.2016) 5 5 NoDr. Inder Jit Singh (w.e.f. 2.11.2016) 3 3 N.A.
(c) Non- official Part Time(Independent) DirectorsMr. R Anand (w.e.f.15.06.2016) 6 6 YesMr. B K Shukla (w.e.f. 4.07.2016) 6 6 YesMr. Rana Som (upto 09.04.2016) 1 1 N.A.Mr. N Bala Baskar (upto 09.04.2016) 1 1 N.A.Dr Subas Pani (upto 09.04.2016) 1 1 N.A.Mr. S R Tayal (upto 09.4.2016) 1 1 N.A.Mr Rajnish Goenka (w.e.f.27.01.2017) 2 2 N.A.Mr R R Jadeja (w.e.f. 11.02.2017) 1 1 N.A.Dr. Jayant Dasgupta (w.e.f. 7.02.2017) 1 1 N.A.
*N.A.=Not Applicable
Separate Meeting of Independent Directors
A Separate Meeting of Independent Directors was held on 15th March, 2017 in terms of SEBI (Listing Obligations & Disclosure Requirements) Regulations, 2015, Schedule IV of Companies Act, 2013 and as per the Guidelines issued by DPE on Role & Responsibilities of Non- Official Directors (Independent Directors) of CPSEs. All the Independent Directors as on that date attended the said Meeting.
Declaration by Independent Directors
All the Independent Directors in the first board meeting they attended as Independent Director and first meeting held at the beginning of the financial year gave a declaration that they meet the criteria of independence as provided under Section 149(6) of the Companies Act, 2013, Securities and Exchange Board of India (Listing Obligations and Disclosure Requirements) Regulation, 2015 and DPE Guidelines on Corporate Governance for CPSEs.
A detailed presentation is being given to every Independent Director about the business of the Company in order to
familiarize them with Company’s business and to enable them to function effectively, besides Independent directors are also being nominated in different training programs organized by Department of Public Enterprises from time to time. Details of nomination of independent directors in such programs is available at http://mmtclimited.com/pages/display/294-training-programme-for-directors
COMMiTTEES OF ThE BOARD
To Facilitate expeditious consideration and arriving at decisions with focused attention on the affairs of the company, the Board has constituted following Committee with distinct role, accountability and authority:
1. Audit Committee of Directors 2. Nomination & Remuneration Committee of Directors 3. Stakeholders Relationship Committee4. Share Transfer Committee5. Committee of director on Personnel Policies6. Committee of director on Subsidiary, Joint Venture &
Associate Companies7. Committee of Directors on CSR and Sustainability
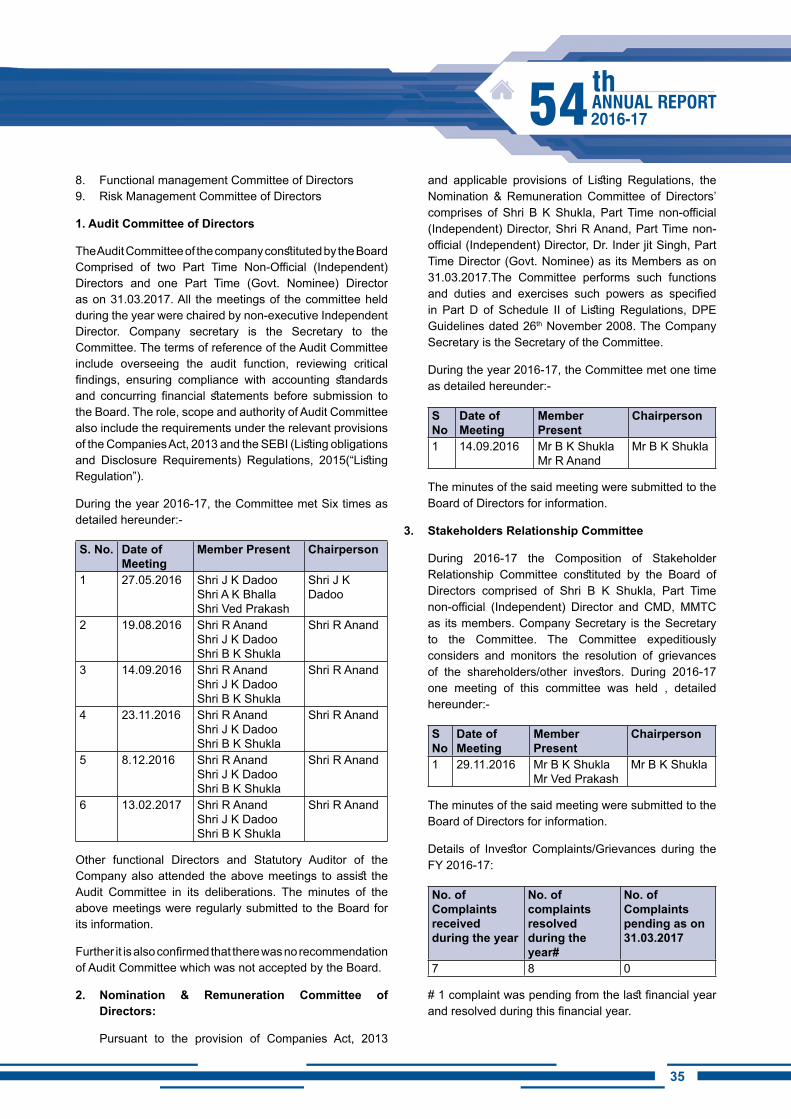
3534
8. Functional management Committee of Directors 9. Risk Management Committee of Directors
1. Audit Committee of Directors
The Audit Committee of the company constituted by the Board Comprised of two Part Time Non-Official (Independent) Directors and one Part Time (Govt. Nominee) Director as on 31.03.2017. All the meetings of the committee held during the year were chaired by non-executive Independent Director. Company secretary is the Secretary to the Committee. The terms of reference of the Audit Committee include overseeing the audit function, reviewing critical findings, ensuring compliance with accounting standards and concurring financial statements before submission to the Board. The role, scope and authority of Audit Committee also include the requirements under the relevant provisions of the Companies Act, 2013 and the SEBI (Listing obligations and Disclosure Requirements) Regulations, 2015(“Listing Regulation”).
During the year 2016-17, the Committee met Six times as detailed hereunder:-
S. No. Date of Meeting
Member Present Chairperson
1 27.05.2016 Shri J K Dadoo Shri A K Bhalla Shri Ved Prakash
Shri J K Dadoo
2 19.08.2016 Shri R Anand Shri J K Dadoo Shri B K Shukla
Shri R Anand
3 14.09.2016 Shri R Anand Shri J K Dadoo Shri B K Shukla
Shri R Anand
4 23.11.2016 Shri R Anand Shri J K Dadoo Shri B K Shukla
Shri R Anand
5 8.12.2016 Shri R Anand Shri J K Dadoo Shri B K Shukla
Shri R Anand
6 13.02.2017 Shri R Anand Shri J K Dadoo Shri B K Shukla
Shri R Anand
Other functional Directors and Statutory Auditor of the Company also attended the above meetings to assist the Audit Committee in its deliberations. The minutes of the above meetings were regularly submitted to the Board for its information.
Further it is also confirmed that there was no recommendation of Audit Committee which was not accepted by the Board.
2. Nomination & Remuneration Committee of Directors:
Pursuant to the provision of Companies Act, 2013
and applicable provisions of Listing Regulations, the Nomination & Remuneration Committee of Directors’ comprises of Shri B K Shukla, Part Time non-official (Independent) Director, Shri R Anand, Part Time non-official (Independent) Director, Dr. Inder jit Singh, Part Time Director (Govt. Nominee) as its Members as on 31.03.2017.The Committee performs such functions and duties and exercises such powers as specified in Part D of Schedule II of Listing Regulations, DPE Guidelines dated 26th November 2008. The Company Secretary is the Secretary of the Committee.
During the year 2016-17, the Committee met one time as detailed hereunder:-
S No
Date of Meeting
Member Present
Chairperson
1 14.09.2016 Mr B K Shukla Mr R Anand
Mr B K Shukla
The minutes of the said meeting were submitted to the Board of Directors for information.
3. Stakeholders Relationship Committee
During 2016-17 the Composition of Stakeholder Relationship Committee constituted by the Board of Directors comprised of Shri B K Shukla, Part Time non-official (Independent) Director and CMD, MMTC as its members. Company Secretary is the Secretary to the Committee. The Committee expeditiously considers and monitors the resolution of grievances of the shareholders/other investors. During 2016-17 one meeting of this committee was held , detailed hereunder:-
S No
Date of Meeting
Member Present
Chairperson
1 29.11.2016 Mr B K ShuklaMr Ved Prakash
Mr B K Shukla
The minutes of the said meeting were submitted to the Board of Directors for information.
Details of Investor Complaints/Grievances during the FY 2016-17:
No. of Complaints received during the year
No. of complaints resolvedduring the year#
No. of Complaints pending as on 31.03.2017
7 8 0
# 1 complaint was pending from the last financial year and resolved during this financial year.
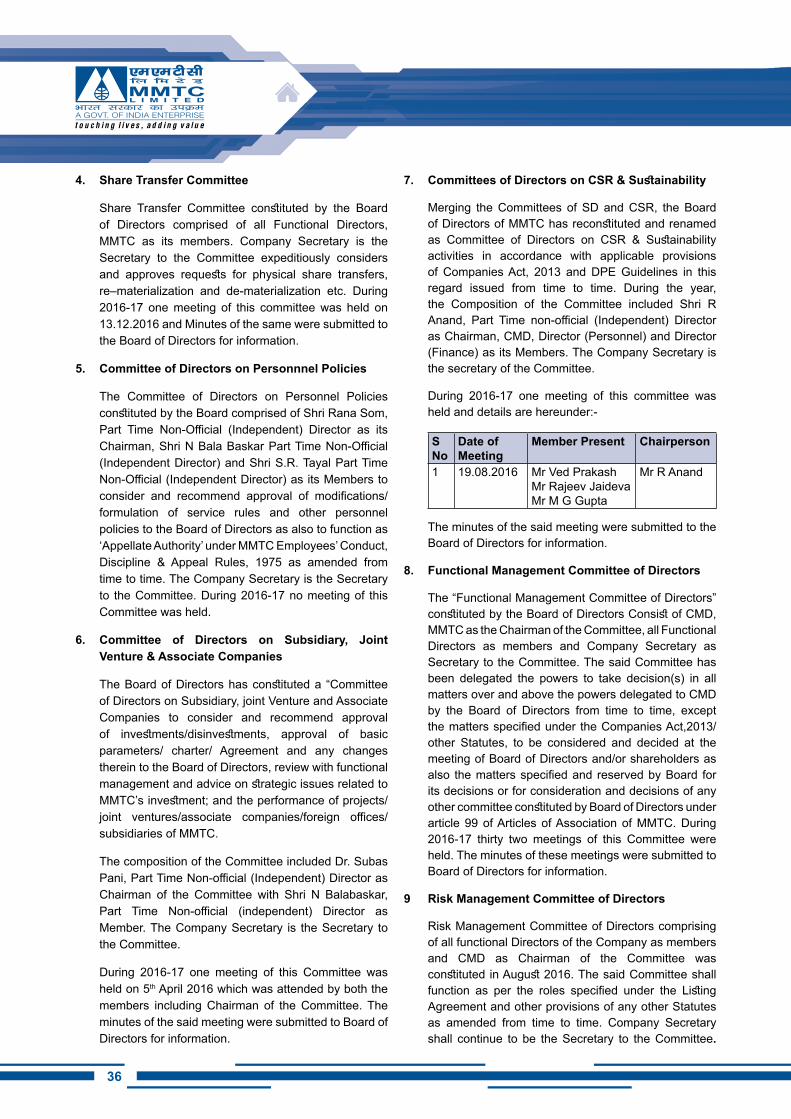
36
4. Share Transfer Committee
Share Transfer Committee constituted by the Board of Directors comprised of all Functional Directors, MMTC as its members. Company Secretary is the Secretary to the Committee expeditiously considers and approves requests for physical share transfers, re–materialization and de-materialization etc. During 2016-17 one meeting of this committee was held on 13.12.2016 and Minutes of the same were submitted to the Board of Directors for information.
5. Committee of Directors on Personnnel Policies
The Committee of Directors on Personnel Policies constituted by the Board comprised of Shri Rana Som, Part Time Non-Official (Independent) Director as its Chairman, Shri N Bala Baskar Part Time Non-Official (Independent Director) and Shri S.R. Tayal Part Time Non-Official (Independent Director) as its Members to consider and recommend approval of modifications/formulation of service rules and other personnel policies to the Board of Directors as also to function as ‘Appellate Authority’ under MMTC Employees’ Conduct, Discipline & Appeal Rules, 1975 as amended from time to time. The Company Secretary is the Secretary to the Committee. During 2016-17 no meeting of this Committee was held.
6. Committee of Directors on Subsidiary, Joint Venture & Associate Companies
The Board of Directors has constituted a “Committee of Directors on Subsidiary, joint Venture and Associate Companies to consider and recommend approval of investments/disinvestments, approval of basic parameters/ charter/ Agreement and any changes therein to the Board of Directors, review with functional management and advice on strategic issues related to MMTC’s investment; and the performance of projects/ joint ventures/associate companies/foreign offices/subsidiaries of MMTC.
The composition of the Committee included Dr. Subas Pani, Part Time Non-official (Independent) Director as Chairman of the Committee with Shri N Balabaskar, Part Time Non-official (independent) Director as Member. The Company Secretary is the Secretary to the Committee.
During 2016-17 one meeting of this Committee was held on 5th April 2016 which was attended by both the members including Chairman of the Committee. The minutes of the said meeting were submitted to Board of Directors for information.
7. Committees of Directors on CSR & Sustainability
Merging the Committees of SD and CSR, the Board of Directors of MMTC has reconstituted and renamed as Committee of Directors on CSR & Sustainability activities in accordance with applicable provisions of Companies Act, 2013 and DPE Guidelines in this regard issued from time to time. During the year, the Composition of the Committee included Shri R Anand, Part Time non-official (Independent) Director as Chairman, CMD, Director (Personnel) and Director (Finance) as its Members. The Company Secretary is the secretary of the Committee.
During 2016-17 one meeting of this committee was held and details are hereunder:-
S No
Date of Meeting
Member Present Chairperson
1 19.08.2016 Mr Ved PrakashMr Rajeev JaidevaMr M G Gupta
Mr R Anand
The minutes of the said meeting were submitted to the Board of Directors for information.
8. Functional Management Committee of Directors
The “Functional Management Committee of Directors” constituted by the Board of Directors Consist of CMD, MMTC as the Chairman of the Committee, all Functional Directors as members and Company Secretary as Secretary to the Committee. The said Committee has been delegated the powers to take decision(s) in all matters over and above the powers delegated to CMD by the Board of Directors from time to time, except the matters specified under the Companies Act,2013/other Statutes, to be considered and decided at the meeting of Board of Directors and/or shareholders as also the matters specified and reserved by Board for its decisions or for consideration and decisions of any other committee constituted by Board of Directors under article 99 of Articles of Association of MMTC. During 2016-17 thirty two meetings of this Committee were held. The minutes of these meetings were submitted to Board of Directors for information.
9 Risk Management Committee of Directors
Risk Management Committee of Directors comprising of all functional Directors of the Company as members and CMD as Chairman of the Committee was constituted in August 2016. The said Committee shall function as per the roles specified under the Listing Agreement and other provisions of any other Statutes as amended from time to time. Company Secretary shall continue to be the Secretary to the Committee.
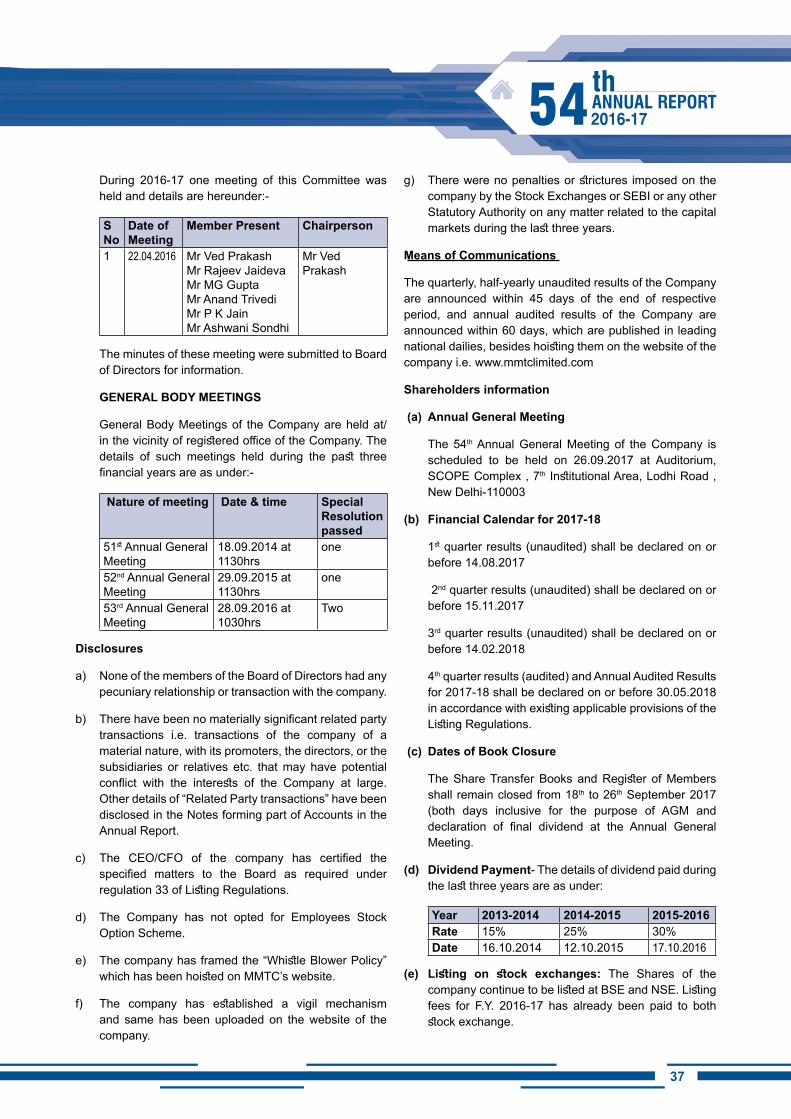
3736
During 2016-17 one meeting of this Committee was held and details are hereunder:-
S No
Date of Meeting
Member Present Chairperson
1 22.04.2016 Mr Ved PrakashMr Rajeev JaidevaMr MG GuptaMr Anand TrivediMr P K JainMr Ashwani Sondhi
Mr Ved Prakash
The minutes of these meeting were submitted to Board of Directors for information.
GENERAL BODY MEETiNGS
General Body Meetings of the Company are held at/in the vicinity of registered office of the Company. The details of such meetings held during the past three financial years are as under:-
Nature of meeting Date & time Special Resolution passed
51st Annual General Meeting
18.09.2014 at 1130hrs
one
52nd Annual General Meeting
29.09.2015 at 1130hrs
one
53rd Annual General Meeting
28.09.2016 at 1030hrs
Two
Disclosures
a) None of the members of the Board of Directors had any pecuniary relationship or transaction with the company.
b) There have been no materially significant related party transactions i.e. transactions of the company of a material nature, with its promoters, the directors, or the subsidiaries or relatives etc. that may have potential conflict with the interests of the Company at large. Other details of “Related Party transactions” have been disclosed in the Notes forming part of Accounts in the Annual Report.
c) The CEO/CFO of the company has certified the specified matters to the Board as required under regulation 33 of Listing Regulations.
d) The Company has not opted for Employees Stock Option Scheme.
e) The company has framed the “Whistle Blower Policy” which has been hoisted on MMTC’s website.
f) The company has established a vigil mechanism and same has been uploaded on the website of the company.
g) There were no penalties or strictures imposed on the company by the Stock Exchanges or SEBI or any other Statutory Authority on any matter related to the capital markets during the last three years.
Means of Communications
The quarterly, half-yearly unaudited results of the Company are announced within 45 days of the end of respective period, and annual audited results of the Company are announced within 60 days, which are published in leading national dailies, besides hoisting them on the website of the company i.e. www.mmtclimited.com
Shareholders information
(a) Annual General Meeting
The 54th Annual General Meeting of the Company is scheduled to be held on 26.09.2017 at Auditorium, SCOPE Complex , 7th Institutional Area, Lodhi Road , New Delhi-110003
(b) Financial Calendar for 2017-18
1st quarter results (unaudited) shall be declared on or before 14.08.2017
2nd quarter results (unaudited) shall be declared on or before 15.11.2017
3rd quarter results (unaudited) shall be declared on or before 14.02.2018
4th quarter results (audited) and Annual Audited Results for 2017-18 shall be declared on or before 30.05.2018 in accordance with existing applicable provisions of the Listing Regulations.
(c) Dates of Book Closure
The Share Transfer Books and Register of Members shall remain closed from 18th to 26th September 2017 (both days inclusive for the purpose of AGM and declaration of final dividend at the Annual General Meeting.
(d) Dividend Payment- The details of dividend paid during the last three years are as under:
Year 2013-2014 2014-2015 2015-2016Rate 15% 25% 30%Date 16.10.2014 12.10.2015 17.10.2016
(e) Listing on stock exchanges: The Shares of the company continue to be listed at BSE and NSE. Listing fees for F.Y. 2016-17 has already been paid to both stock exchange.
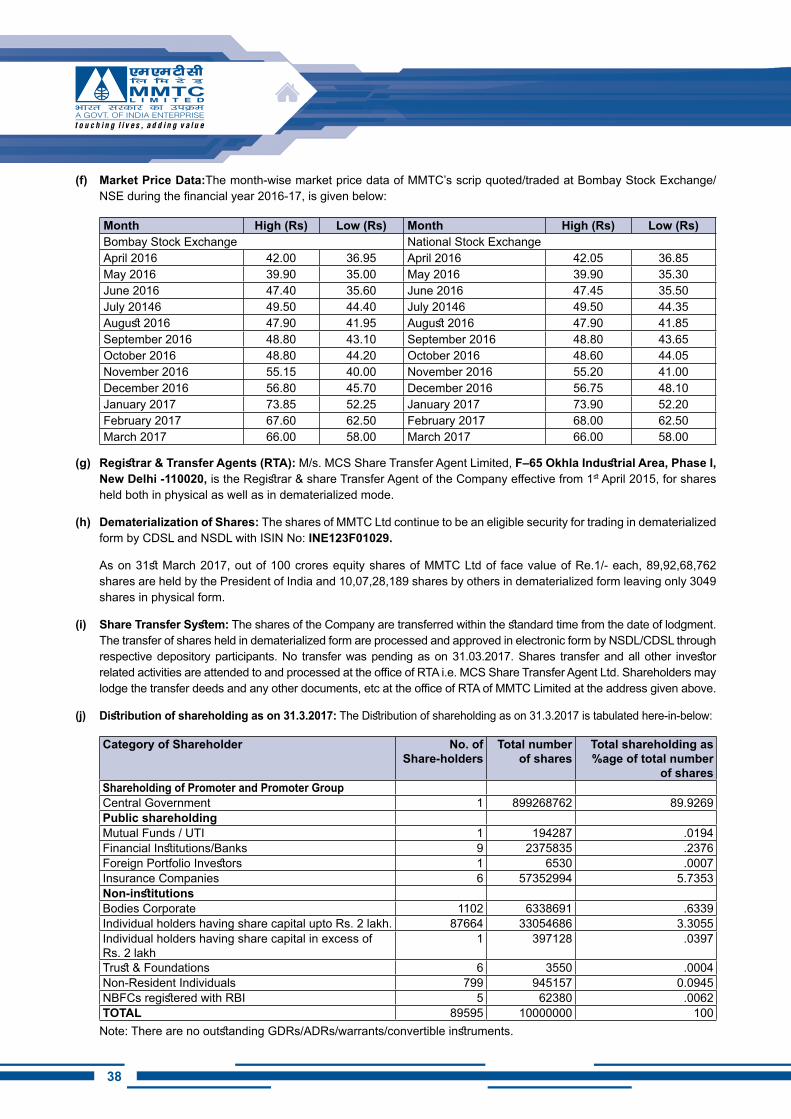
38
(f) Market Price Data:The month-wise market price data of MMTC’s scrip quoted/traded at Bombay Stock Exchange/NSE during the financial year 2016-17, is given below:
Month High (Rs) Low (Rs) Month High (Rs) Low (Rs)Bombay Stock Exchange National Stock ExchangeApril 2016 42.00 36.95 April 2016 42.05 36.85May 2016 39.90 35.00 May 2016 39.90 35.30June 2016 47.40 35.60 June 2016 47.45 35.50July 20146 49.50 44.40 July 20146 49.50 44.35August 2016 47.90 41.95 August 2016 47.90 41.85September 2016 48.80 43.10 September 2016 48.80 43.65October 2016 48.80 44.20 October 2016 48.60 44.05November 2016 55.15 40.00 November 2016 55.20 41.00December 2016 56.80 45.70 December 2016 56.75 48.10January 2017 73.85 52.25 January 2017 73.90 52.20February 2017 67.60 62.50 February 2017 68.00 62.50March 2017 66.00 58.00 March 2017 66.00 58.00
(g) Registrar & Transfer Agents (RTA): M/s. MCS Share Transfer Agent Limited, F–65 Okhla Industrial Area, Phase I, New Delhi -110020, is the Registrar & share Transfer Agent of the Company effective from 1st April 2015, for shares held both in physical as well as in dematerialized mode.
(h) Dematerialization of Shares: The shares of MMTC Ltd continue to be an eligible security for trading in dematerialized form by CDSL and NSDL with ISIN No: iNE123F01029.
As on 31st March 2017, out of 100 crores equity shares of MMTC Ltd of face value of Re.1/- each, 89,92,68,762 shares are held by the President of India and 10,07,28,189 shares by others in dematerialized form leaving only 3049 shares in physical form.
(i) Share Transfer System: The shares of the Company are transferred within the standard time from the date of lodgment. The transfer of shares held in dematerialized form are processed and approved in electronic form by NSDL/CDSL through respective depository participants. No transfer was pending as on 31.03.2017. Shares transfer and all other investor related activities are attended to and processed at the office of RTA i.e. MCS Share Transfer Agent Ltd. Shareholders may lodge the transfer deeds and any other documents, etc at the office of RTA of MMTC Limited at the address given above.
(j) Distribution of shareholding as on 31.3.2017: The Distribution of shareholding as on 31.3.2017 is tabulated here-in-below:
Category of Shareholder No. of Share-holders
Total number of shares
Total shareholding as %age of total number
of sharesShareholding of Promoter and Promoter Group Central Government 1 899268762 89.9269Public shareholdingMutual Funds / UTI 1 194287 .0194Financial Institutions/Banks 9 2375835 .2376Foreign Portfolio Investors 1 6530 .0007Insurance Companies 6 57352994 5.7353Non-institutionsBodies Corporate 1102 6338691 .6339Individual holders having share capital upto Rs. 2 lakh. 87664 33054686 3.3055Individual holders having share capital in excess of Rs. 2 lakh
1 397128 .0397
Trust & Foundations 6 3550 .0004Non-Resident Individuals 799 945157 0.0945NBFCs registered with RBI 5 62380 .0062TOTAL 89595 10000000 100
Note: There are no outstanding GDRs/ADRs/warrants/convertible instruments.
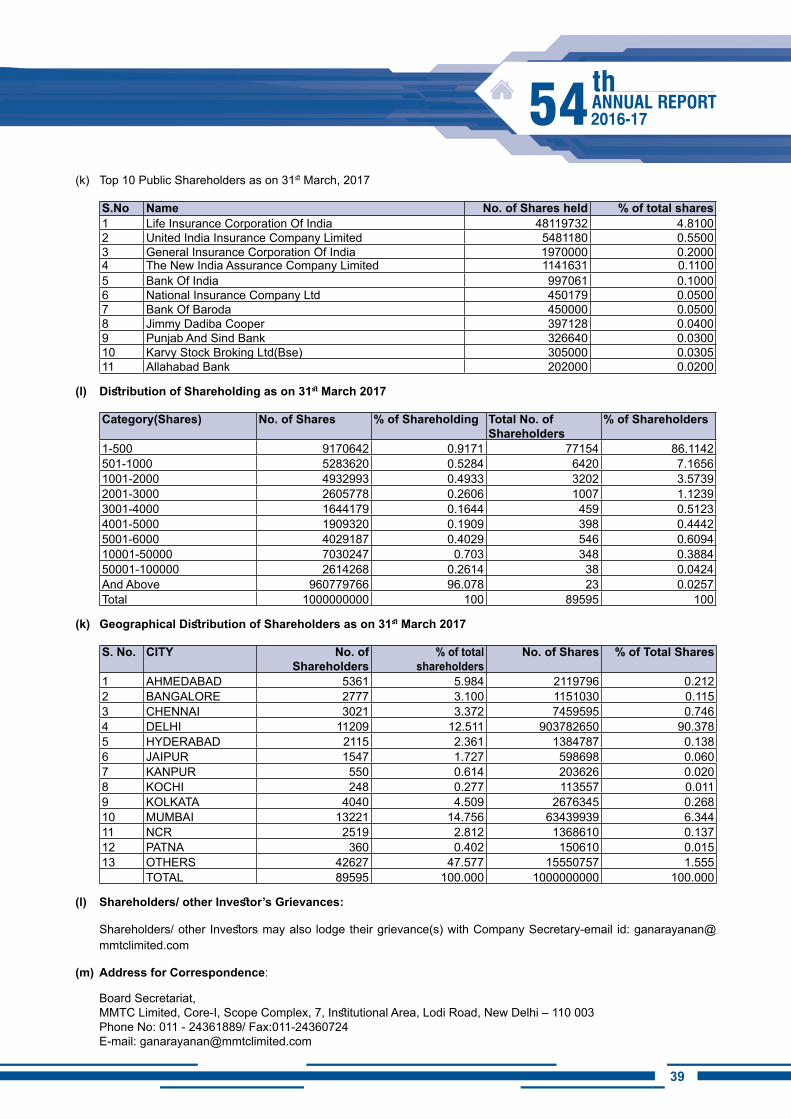
3938
(k) Top 10 Public Shareholders as on 31st March, 2017
S.No Name No. of Shares held % of total shares1 Life Insurance Corporation Of India 48119732 4.8100 2 United India Insurance Company Limited 5481180 0.5500 3 General Insurance Corporation Of India 1970000 0.2000 4 The New India Assurance Company Limited 1141631 0.1100 5 Bank Of India 997061 0.1000 6 National Insurance Company Ltd 450179 0.0500 7 Bank Of Baroda 450000 0.0500 8 Jimmy Dadiba Cooper 397128 0.0400 9 Punjab And Sind Bank 326640 0.0300 10 Karvy Stock Broking Ltd(Bse) 305000 0.0305 11 Allahabad Bank 202000 0.0200
(l) Distribution of Shareholding as on 31st March 2017
Category(Shares) No. of Shares % of Shareholding Total No. of Shareholders
% of Shareholders
1-500 9170642 0.9171 77154 86.1142501-1000 5283620 0.5284 6420 7.16561001-2000 4932993 0.4933 3202 3.57392001-3000 2605778 0.2606 1007 1.12393001-4000 1644179 0.1644 459 0.51234001-5000 1909320 0.1909 398 0.44425001-6000 4029187 0.4029 546 0.609410001-50000 7030247 0.703 348 0.388450001-100000 2614268 0.2614 38 0.0424And Above 960779766 96.078 23 0.0257Total 1000000000 100 89595 100
(k) Geographical Distribution of Shareholders as on 31st March 2017
S. No. CiTY No. of Shareholders
% of total shareholders
No. of Shares % of Total Shares
1 AHMEDABAD 5361 5.984 2119796 0.2122 BANGALORE 2777 3.100 1151030 0.1153 CHENNAI 3021 3.372 7459595 0.7464 DELHI 11209 12.511 903782650 90.3785 HYDERABAD 2115 2.361 1384787 0.1386 JAIPUR 1547 1.727 598698 0.0607 KANPUR 550 0.614 203626 0.0208 KOCHI 248 0.277 113557 0.0119 KOLKATA 4040 4.509 2676345 0.26810 MUMBAI 13221 14.756 63439939 6.34411 NCR 2519 2.812 1368610 0.13712 PATNA 360 0.402 150610 0.01513 OTHERS 42627 47.577 15550757 1.555 TOTAL 89595 100.000 1000000000 100.000
(l) Shareholders/ other Investor’s Grievances:
Shareholders/ other Investors may also lodge their grievance(s) with Company Secretary-email id: [email protected]
(m) Address for Correspondence:
Board Secretariat, MMTC Limited, Core-I, Scope Complex, 7, Institutional Area, Lodi Road, New Delhi – 110 003Phone No: 011 - 24361889/ Fax:011-24360724E-mail: [email protected]
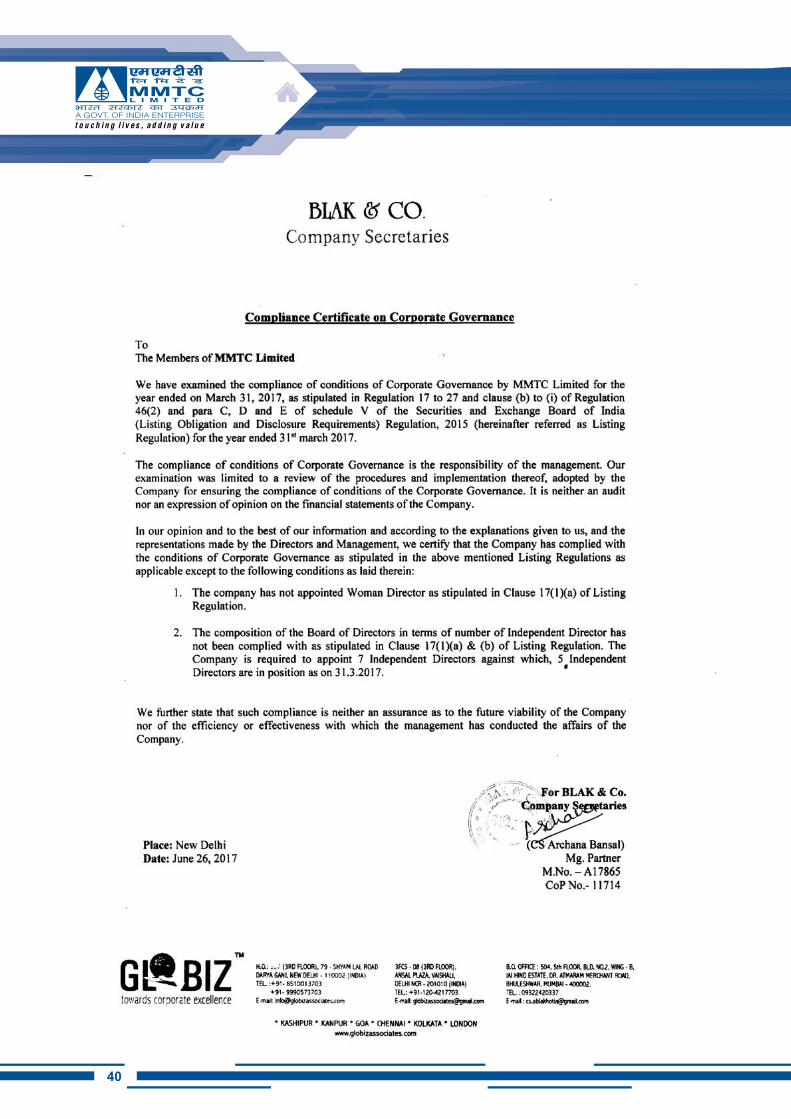
40
4140
About Us
MMTC is a leading international trading Central Public Sector Undertaking under the administrative control of Ministry of Commerce & Industry, Govt. of India. The registered office of the Company is situated at Core-1, SCOPE Complex, 7, Institutional Area, Lodi Road, New Delhi – 110 003, India. The Company has 09 Regional Offices in major cities and ports of India and a wholly owned subsidiary – MMTC Transnational Pvt. Ltd (MTPL), Singapore.
The principal activities of the Company are export of Minerals and import of Precious metals, Non-Ferrous Metals, Fertilizers, Agro Products, Coal and Hydrocarbon etc. MMTC also deals in Engineering products and Drugs & Pharmaceuticals.
The Company’s trade activities span across various countries in Asia, Europe, Africa and Middle East.
It is the first Public Sector Enterprise to be accorded the status of “FIVE STAR EXPORT HOUSE” by Government of India for long standing contribution to exports.
MMTC has promoted various joint ventures like Neelanchal Ispat Nigam Ltd., MMTC PAMP India Pvt Ltd, MMTC Gitanjali Ltd, TM Mining Company Ltd., SICAL Iron Ore Terminal Ltd., Free Trade Warehousing Pvt. Ltd. and Indian Commodity Exchange Ltd etc. following the public-private partnership route to take advantage of new opportunities emerging in the free market environment.
Corporate Mission
As the largest trading company of India and a major trading company of Asia, MMTC aims at improving its position further by achieving sustainable and viable growth rate through excellence in all its activities, generating optimum profits through total satisfaction of shareholders, customers, suppliers, employees and society.
Corporate Objectives
z To be a leading International Trading House in India operating in the competitive global trading environment, with focus on “bulk” as core competency and to improve returns on capital employed.
z To retain the position of single largest trader in the country for product lines like minerals, metals and precious metals.
z To promote development of trade-related infrastructure.
z To provide support services to the medium and small
scale sectors.
z To render high quality of service to all categories of customers with professionalism and efficiency.
z To streamline system within the Company for settlement of commercial disputes.
z To upgrade employees’ skills for achieving higher productivity.
Business Responsibility Report – FY 2016-17
As per the Clause 55 of the Listing Agreement of the Securities Exchange Board of India [SEBI] introduced in 2012, the top hundred listed companies in terms of market capitalisation have been mandated to issue annual Business Responsibility Report [BRR]. This year, MMTC is not in the top hundred list, yet we continue to publish our annual BRR.
SECTiON A: GENERAL iNFORMATiON ABOUT ThE COMPANY
1. Corporate Identity Number (CIN) of the CompanyL51909DL1963GOi004033
2. Name of the CompanyMMTC LiMiTED
3. Registered addressCore-1, Scope Complex, 7 Institutional Area, Lodhi Road, New Delhi -110003
4. Websitewww.mmtclimited.com
5. E-mail [email protected]
6. Financial Year reported2016-17
7. Sector(s) that the Company is engaged in (industrial activity code-wise)Trading
8. List three key products/services that the Company manufactures/provides (as in balance sheet)(i) Gold(ii) Urea(iii) Silver
9. Total number of locations where business activity is undertaken by the Company
i. Number of International Locations (Provide details of major 5)
BUSiNESS RESPONSiBiLiTY REPORT FY 2016-17
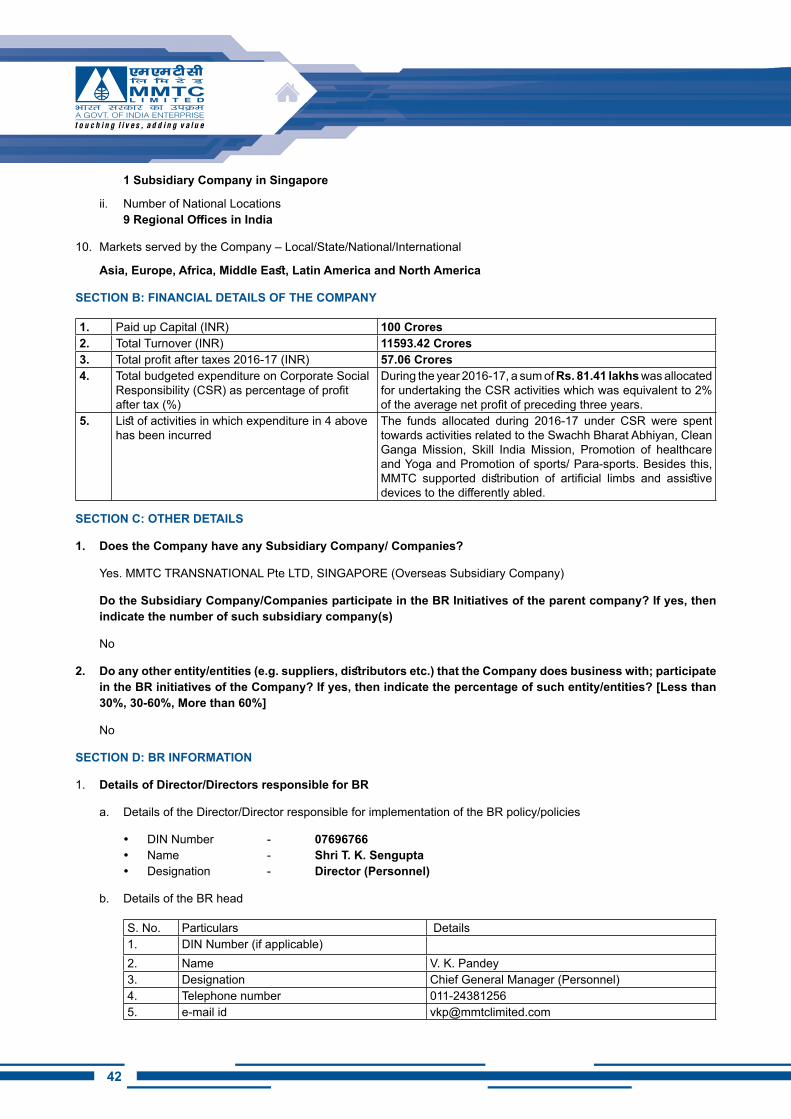
42
1 Subsidiary Company in Singapore
ii. Number of National Locations9 Regional Offices in India
10. Markets served by the Company – Local/State/National/International
Asia, Europe, Africa, Middle East, Latin America and North America
SECTiON B: FiNANCiAL DETAiLS OF ThE COMPANY
1. Paid up Capital (INR) 100 Crores2. Total Turnover (INR) 11593.42 Crores3. Total profit after taxes 2016-17 (INR) 57.06 Crores4. Total budgeted expenditure on Corporate Social
Responsibility (CSR) as percentage of profit after tax (%)
During the year 2016-17, a sum of Rs. 81.41 lakhs was allocated for undertaking the CSR activities which was equivalent to 2% of the average net profit of preceding three years.
5. List of activities in which expenditure in 4 above has been incurred
The funds allocated during 2016-17 under CSR were spent towards activities related to the Swachh Bharat Abhiyan, Clean Ganga Mission, Skill India Mission, Promotion of healthcare and Yoga and Promotion of sports/ Para-sports. Besides this, MMTC supported distribution of artificial limbs and assistive devices to the differently abled.
SECTiON C: OThER DETAiLS
1. Does the Company have any Subsidiary Company/ Companies?
Yes. MMTC TRANSNATIONAL Pte LTD, SINGAPORE (Overseas Subsidiary Company)
Do the Subsidiary Company/Companies participate in the BR Initiatives of the parent company? If yes, then indicate the number of such subsidiary company(s)
No
2. Do any other entity/entities (e.g. suppliers, distributors etc.) that the Company does business with; participate in the BR initiatives of the Company? If yes, then indicate the percentage of such entity/entities? [Less than 30%, 30-60%, More than 60%]
No
SECTiON D: BR iNFORMATiON
1. Details of Director/Directors responsible for BR
a. Details of the Director/Director responsible for implementation of the BR policy/policies
y DIN Number - 07696766 y Name - Shri T. K. Sengupta y Designation - Director (Personnel)
b. Details of the BR head
S. No. Particulars Details1. DIN Number (if applicable) 2. Name V. K. Pandey3. Designation Chief General Manager (Personnel)4. Telephone number 011-243812565. e-mail id [email protected]
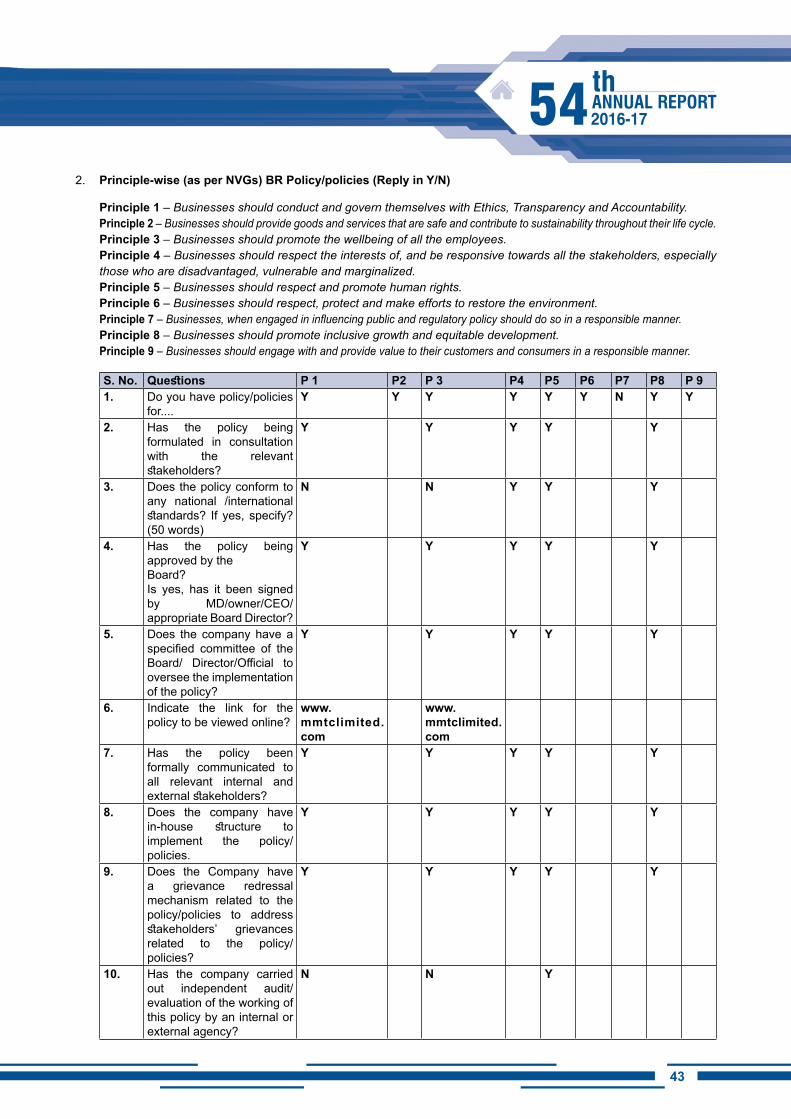
4342
2. Principle-wise (as per NVGs) BR Policy/policies (Reply in Y/N)
Principle 1 – Businesses should conduct and govern themselves with Ethics, Transparency and Accountability.Principle 2 – Businesses should provide goods and services that are safe and contribute to sustainability throughout their life cycle.Principle 3 – Businesses should promote the wellbeing of all the employees.Principle 4 – Businesses should respect the interests of, and be responsive towards all the stakeholders, especially those who are disadvantaged, vulnerable and marginalized.Principle 5 – Businesses should respect and promote human rights.Principle 6 – Businesses should respect, protect and make efforts to restore the environment.Principle 7 – Businesses, when engaged in influencing public and regulatory policy should do so in a responsible manner.Principle 8 – Businesses should promote inclusive growth and equitable development. Principle 9 – Businesses should engage with and provide value to their customers and consumers in a responsible manner.
S. No. Questions P 1 P2 P 3 P4 P5 P6 P7 P8 P 91. Do you have policy/policies
for.... Y Y Y Y Y Y N Y Y
2. Has the policy being formulated in consultation with the relevant stakeholders?
Y Y Y Y Y
3. Does the policy conform to any national /international standards? If yes, specify? (50 words)
N N Y Y Y
4. Has the policy being approved by the Board? Is yes, has it been signed by MD/owner/CEO/appropriate Board Director?
Y Y Y Y Y
5. Does the company have a specified committee of the Board/ Director/Official to oversee the implementation of the policy?
Y Y Y Y Y
6. Indicate the link for the policy to be viewed online?
www.mmtclimited.com
www.mmtclimited.com
7. Has the policy been formally communicated to all relevant internal and external stakeholders?
Y Y Y Y Y
8. Does the company have in-house structure to implement the policy/policies.
Y Y Y Y Y
9. Does the Company have a grievance redressal mechanism related to the policy/policies to address stakeholders’ grievances related to the policy/policies?
Y Y Y Y Y
10. Has the company carried out independent audit/evaluation of the working of this policy by an internal or external agency?
N N Y
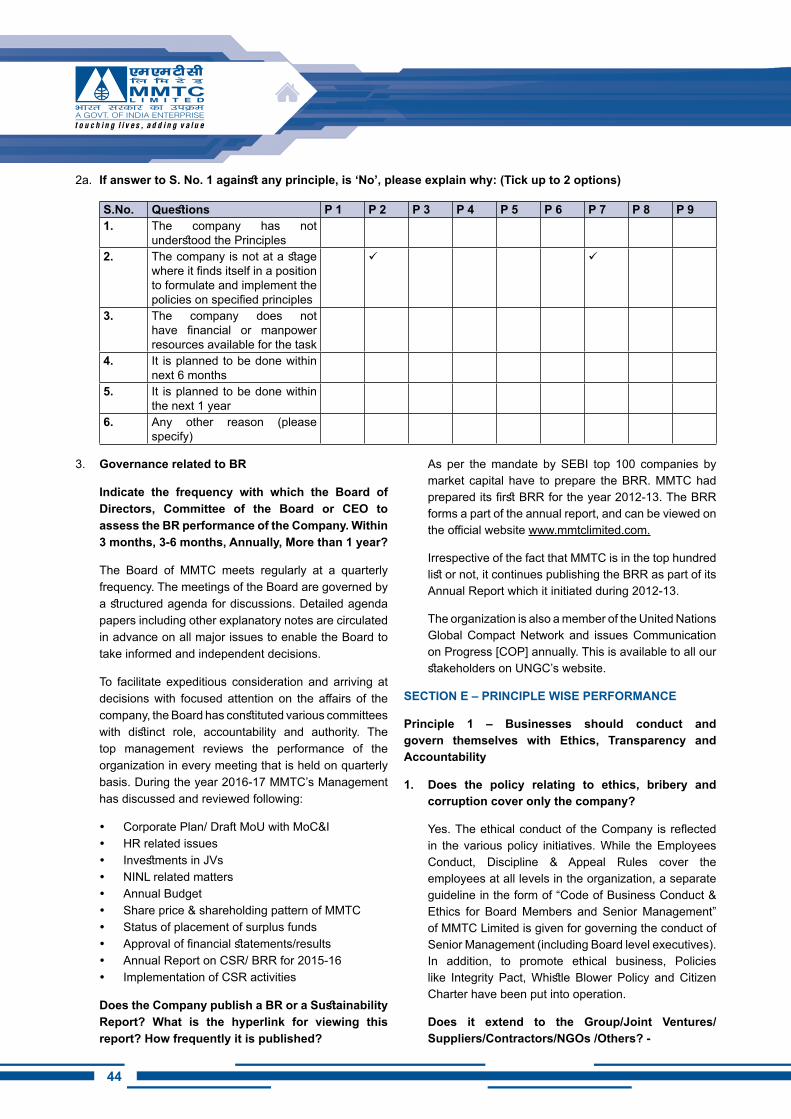
44
3. Governance related to BR
Indicate the frequency with which the Board of Directors, Committee of the Board or CEO to assess the BR performance of the Company. Within 3 months, 3-6 months, Annually, More than 1 year?
The Board of MMTC meets regularly at a quarterly frequency. The meetings of the Board are governed by a structured agenda for discussions. Detailed agenda papers including other explanatory notes are circulated in advance on all major issues to enable the Board to take informed and independent decisions.
To facilitate expeditious consideration and arriving at decisions with focused attention on the affairs of the company, the Board has constituted various committees with distinct role, accountability and authority. The top management reviews the performance of the organization in every meeting that is held on quarterly basis. During the year 2016-17 MMTC’s Management has discussed and reviewed following:
y Corporate Plan/ Draft MoU with MoC&I y HR related issues y Investments in JVs y NINL related matters y Annual Budget y Share price & shareholding pattern of MMTC y Status of placement of surplus funds y Approval of financial statements/results y Annual Report on CSR/ BRR for 2015-16 y Implementation of CSR activities
Does the Company publish a BR or a Sustainability Report? What is the hyperlink for viewing this report? How frequently it is published?
As per the mandate by SEBI top 100 companies by market capital have to prepare the BRR. MMTC had prepared its first BRR for the year 2012-13. The BRR forms a part of the annual report, and can be viewed on the official website www.mmtclimited.com.
Irrespective of the fact that MMTC is in the top hundred list or not, it continues publishing the BRR as part of its Annual Report which it initiated during 2012-13.
The organization is also a member of the United Nations Global Compact Network and issues Communication on Progress [COP] annually. This is available to all our stakeholders on UNGC’s website.
SECTiON E – PRiNCiPLE WiSE PERFORMANCE
Principle 1 – Businesses should conduct and govern themselves with Ethics, Transparency and Accountability
1. Does the policy relating to ethics, bribery and corruption cover only the company?
Yes. The ethical conduct of the Company is reflected in the various policy initiatives. While the Employees Conduct, Discipline & Appeal Rules cover the employees at all levels in the organization, a separate guideline in the form of “Code of Business Conduct & Ethics for Board Members and Senior Management” of MMTC Limited is given for governing the conduct of Senior Management (including Board level executives). In addition, to promote ethical business, Policies like Integrity Pact, Whistle Blower Policy and Citizen Charter have been put into operation.
Does it extend to the Group/Joint Ventures/ Suppliers/Contractors/NGOs /Others? -
2a. If answer to S. No. 1 against any principle, is ‘No’, please explain why: (Tick up to 2 options)
S.No. Questions P 1 P 2 P 3 P 4 P 5 P 6 P 7 P 8 P 9 1. The company has not
understood the Principles 2. The company is not at a stage
where it finds itself in a position to formulate and implement the policies on specified principles
3. The company does not have financial or manpower resources available for the task
4. It is planned to be done within next 6 months
5. It is planned to be done within the next 1 year
6. Any other reason (please specify)
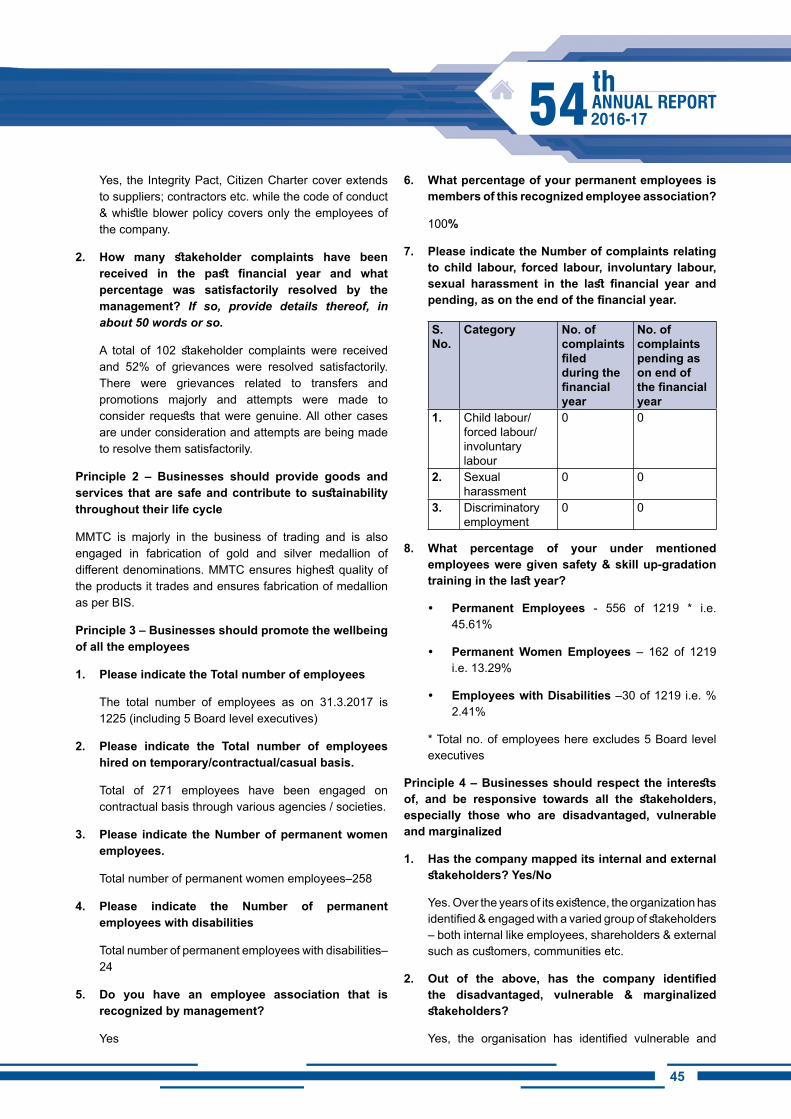
4544
Yes, the Integrity Pact, Citizen Charter cover extends to suppliers; contractors etc. while the code of conduct & whistle blower policy covers only the employees of the company.
2. How many stakeholder complaints have been received in the past financial year and what percentage was satisfactorily resolved by the management? If so, provide details thereof, in about 50 words or so.
A total of 102 stakeholder complaints were received and 52% of grievances were resolved satisfactorily. There were grievances related to transfers and promotions majorly and attempts were made to consider requests that were genuine. All other cases are under consideration and attempts are being made to resolve them satisfactorily.
Principle 2 – Businesses should provide goods and services that are safe and contribute to sustainability throughout their life cycle
MMTC is majorly in the business of trading and is also engaged in fabrication of gold and silver medallion of different denominations. MMTC ensures highest quality of the products it trades and ensures fabrication of medallion as per BIS.
Principle 3 – Businesses should promote the wellbeing of all the employees
1. Please indicate the Total number of employees
The total number of employees as on 31.3.2017 is 1225 (including 5 Board level executives)
2. Please indicate the Total number of employees hired on temporary/contractual/casual basis.
Total of 271 employees have been engaged on contractual basis through various agencies / societies.
3. Please indicate the Number of permanent women employees.
Total number of permanent women employees–258
4. Please indicate the Number of permanent employees with disabilities
Total number of permanent employees with disabilities– 24
5. Do you have an employee association that is recognized by management?
Yes
6. What percentage of your permanent employees is members of this recognized employee association?
100%
7. Please indicate the Number of complaints relating to child labour, forced labour, involuntary labour, sexual harassment in the last financial year and pending, as on the end of the financial year.
S. No.
Category No. of complaints filed during the financial year
No. of complaints pending as on end of the financial year
1. Child labour/forced labour/involuntary labour
0 0
2. Sexual harassment
0 0
3. Discriminatory employment
0 0
8. What percentage of your under mentioned employees were given safety & skill up-gradation training in the last year?
y Permanent Employees - 556 of 1219 * i.e. 45.61%
y Permanent Women Employees – 162 of 1219 i.e. 13.29%
y Employees with Disabilities –30 of 1219 i.e. % 2.41%
* Total no. of employees here excludes 5 Board level executives
Principle 4 – Businesses should respect the interests of, and be responsive towards all the stakeholders, especially those who are disadvantaged, vulnerable and marginalized
1. Has the company mapped its internal and external stakeholders? Yes/No
Yes. Over the years of its existence, the organization has identified & engaged with a varied group of stakeholders – both internal like employees, shareholders & external such as customers, communities etc.
2. Out of the above, has the company identified the disadvantaged, vulnerable & marginalized stakeholders?
Yes, the organisation has identified vulnerable and
46
marginalised stakeholders in the communities and has engaged with them through its CSR activities.
3. Are there any special initiatives taken by the company to engage with the disadvantaged, vulnerable and marginalized stakeholders. If so, provide details thereof, in about 50 words or so.
Yes. MMTC follows the presidential directives and guidelines issued by Government of India regarding reservation in services for SC/ ST/ OBC/ PWD (Persons with Disabilities)/ Ex servicemen to promote inclusive growth. Grievance/ Complaint Registers are also maintained at Division/ Region for registering grievances. Efforts are made to promptly dispose off representations / grievances received from SC/ ST employees. Employees belonging to PWD have been assigned jobs which they can perform efficiently keeping in view their disability. A permanent ramp has been erected at the main entrance gate of Corporate Office for easy mobility of a PWD employee who uses wheel chair.
Office buildings have auditory signals announcing the floor destination. Some of them have floor requisition buttons in Braille Symbols.
In addition, CSR activities are planned to maximize benefits to the disadvantaged, vulnerable and marginalized stakeholders. Engagement with these stakeholders is done through local Government bodies and NGOs working in the area.
Principle 5 – Businesses should respect and promote human rights
1. Does the policy of the company on human rights cover only the company or extend to the Group/Joint Ventures/Suppliers/Contractors/NGOs/Others?
The Company does not have any specific policy on Human Rights for the time being.
However, being a Government of India Company, MMTC owes allegiance to the Constitution of India, which resolves to secure to all its citizens justice, liberty, equality and fraternity and which also encompasses the fundamental human rights as envisioned in the Universal Declaration of Human Rights. MMTC stands committed to support and respect the protection of internationally proclaimed human rights at its work places and ensure that its employees enjoy the fundamental human rights. MMTC has 3 tier grievance redressal systems called “Sahayata” for resolving employees‟ grievances. MMTC has in its management system provisions for health, safety, housing and education. Comprehensively covering all these
aspects, MMTC has appropriate systems in place.
2. How many stakeholder complaints have been received in the past financial year and what percent was satisfactorily resolved by the management?
No such complaint was received in the financial year.
Principle 6 – Businesses should respect, protect and make efforts to restore the environment
Manufacturing is not the main line of commercial activities of MMTC. This principle is therefore, not applicable.
1. Does the policy related to Principle 6 cover only the company or extends to the Group/Joint Ventures/Suppliers/Contractors/NGOs/others.
The organization does not have a written policy on environment. However, being the member of the UN Global Compact, the company functions in an environmentally responsible fashion.
2. Does the company have strategies/ initiatives to address global environmental issues such as climate change, global warming, etc? Y/N. If yes, please give hyperlink for webpage etc.
Even though manufacturing is not the main line of commercial activities of MMTC, it is committed towards environmental upkeep through afforestation in the mining areas, development of tribal areas and in and around operation areas. Also, The Organisation regularly reports on its various initiatives through the Communication on Progress [COP] for the UN Global Compact.
3. Does the company identify and assess potential environmental risks? Y/N
While the organization is not directly involved in manufacturing, it functions in an environmentally responsible fashion. MMTC adheres to the guidelines issued by Department of Public Enterprise, Govt. of India, as per which projects related to environmental aspects are identified & implemented.
4. Does the company have any project related to Clean Development Mechanism? If so, provide details thereof, in about 50 words or so. Also, if yes, whether any environmental compliance report is filed?
No
5. Has the company undertaken any other initiatives on – clean technology, energy efficiency, renewable energy, etc. Y/N. If yes, please give hyperlink for
4746
web page etc.
MMTC uses energy efficient star rated electrical equipments for energy conservation across the Organization.
MMTC has also installed a 50KWP Solar Power plant on the rooftop of its Delhi regional Office at Jhandewalan and at MMTC Residential Colony, New Delhi.
6. Are the Emissions/Wastes generated by the company within the permissible limits given by CPCB/SPCB for the financial year being reported?
Not Applicable
7. Number of show cause/ legal notices received from CPCB/SPCB which is pending (i.e. not resolved to satisfaction) as on end of Financial Year.
Not Applicable
Principle 7 – Businesses, when engaged in influencing public and regulatory policy should do so in a responsible manner.
1. Is your company a member of any trade and chamber or association? If Yes, Name only those major ones that your business deals with
a. CII
b. FIEO
c. FICCI
d. ASSOCHAM
2. Have you advocated/lobbied through above associations for the advancement or improvement of public good? Yes/No; if yes specify the broad areas (drop box: Governance and Administration, Economic Reforms, inclusive Development Policies, Energy security, Water, Food Security, Sustainable Business Principles, Others).
The Organization has not advocated/lobbied through above Associations on any matters relating to public good.
Principle 8 – Businesses should promote inclusive growth and equitable development
1. Does the company have specified programmes/initiatives/projects in pursuit of the policy related to Principle 8? If yes details thereof.
Although the organization is not involved in manufacturing products and therefore doesn’t create
any direct negative impact on the environment & society where it operates, still it has a CSR policy. MMTC also adopted Section 135 of the Companies Act, 2013, the CSR Rules of Ministry of Corporate Affairs and the CSR Guidelines issued by Department of Public Enterprises, Government of India. MMTC has structured process of spending a portion of its earnings in CSR activities that are directed towards the betterment of the society. The funds allocated during 2016-17 under CSR were spent towards activities majorly related to the Swachh Bharat Abhiyan, Clean Ganga Mission, Skill India Mission, Promotion of healthcare and Yoga and Promotion of sports/ Para-sports. Besides this, MMTC supported distribution of artificial limbs and assistive devices to the differently abled
2. Are the programmes/projects undertaken through in-house team/own foundation/external NGO/government structures/any other organization?
MMTC has a Board Level Committee on CSR & Sustainability consisting of Independent Directors and Functional Directors with the Co. Secy. as Member Secretary. The CSR division thoroughly evaluates various CSR proposals received which are then forwarded to the CSR Committee. The proposals so considered by the CSR Committee are forwarded to the Board, for final approval. The status of its implementation of projects so approved by the Board is put up for information on a quarterly basis.
Depending upon the geographical area in which the project will be undertaken, the concerned Regional/Sub-regional office is directed to monitor and implement the project either directly or in association with a private /public partner. For each project a nodal officer is duly appointed whose task is to monitor timely completion of the project and update the corporate office with respect to the status of completion of the project. Upon completion the projects are evaluated by an independent agency.
3. Have you done any impact assessment of your initiative?
The Impact Assessment is undertaken by an independent agency in order to assess the “social impact” of the CSR activities undertaken by MMTC.
4. What is your company’s direct contribution to community development projects- Amount in INR and the details of the projects undertaken?
MMTC made an allocation of Rs. 81.41 lakhs for undertaking CSR activities during 2016-17.
The funds allocated during 2016-17 under CSR
48
were spent towards activities majorly related to the Swachh Bharat Abhiyan, Clean Ganga Mission, Skill India Mission, Promotion of healthcare and Yoga and Promotion of sports/ Para-sports. Besides this, MMTC supported distribution of artificial limbs and assistive devices to the differently abled
5. Have you taken steps to ensure that this community development initiative is successfully adopted by the community? Please explain in 50 words, or so.
MMTC’s CSR initiatives seek to strengthen community based organizations by engaging with the marginalized especially women, youth, and children in activities that would improve their quality of life. The projects implemented by MMTC are first identified through the need assessment survey carried out by a professional agency and we ensure the participation of local community in identifying their needs, developing plans to address them, engaging them in implementation and also seek their feedback for further planning.
Principle 9 – Businesses should engage with and provide value to their customers and consumers in a responsible manner
1. What percentage of customer complaints/consumer cases are pending as on the end of financial year.
There were no complaints of such nature in the reporting period.
2. Does the company display product information on the product label, over and above what is mandated as per local laws? Yes/No/N.A. /Remarks(additional information)
The company retails silver and gold medallions and silverware under the brand name SANCHI. The packaging of these items contains relevant product information. Further these items are bar coded.
3. Is there any case filed by any stakeholder against the company regarding unfair trade practices, irresponsible advertising and/or anti-competitive behaviour during the last five years and pending at end of financial year. If so, provide details thereof, in about 50 words or so.
Two cases are pending for redressal before District Consumer Disputes Redressal Forum at Kolkata and New Delhi respectively.
4. Did your company carry out any consumer survey/ consumer satisfaction trends?
Yes. Many Regional Offices organize regular Customers’ Meet for Feedback and response. During Festival of Gold (May 2016 and October 2016), customer feedback was also taken. Such Feedback has helped organization in conducting future events in more satisfactory manner.
4948
Form No. MGT-9ExTRACT OF ANNUAL RETURN
As on the financial year ended on March 31, 2017[Pursuant to section 92(3) of the Companies Act, 2013 and rule 12(1) of the Companies (Management and
Administration) Rules, 2014]
i. REGiSTRATiON AND OThER DETAiLS:
1) Corporate Identification Number L51909DL1963GOI0040332) Registration Date September 26, 19633) Name of the Company MMTC Limited4) Category/ Sub-Category of the Company Government Company5) Address of Registered Office and Contact Details Core-1, SCOPE Complex, 7 Institutional Area,
Lodi Road, New Delhi-110003Phone No.-01124362200Email- [email protected]
6) Whether Listed or Unlisted Listed7) Name, address and Contact details of Registrar and Transfer Agent, if any
MCS Share Transfer Agent Limited,F-65, Okhla Industrial Area,Phase-1, New Delhi-110020Ph:- 011-4140 6149Fax:- 011-4170 9881Email :- [email protected]
ii. PRiNCiPAL BUSiNESS ACTiViTiES OF ThE COMPANY
All the business activities contributing 10 % or more of the total turnover of the company shall be stated:-
Sl. No. Name and Description ofmain products / services
NIC Code of theProduct/ service
% to total turnover of the company
1. Gold 3831,3835 41.482. Urea 3012 20.85
iii. PARTiCULARS OF hOLDiNG, SUBSiDiARY AND ASSOCiATE COMPANiES –
S. No
NAME ANDADDRESS OFTHE COMPANY
CIN/GLN HOLDING/SUBSIDIARY/ASSOCIATE
% of sharesHeld
Applicable Section
1. MMTC Transnational Pte Ltd, Singapore
199407265M WHOLLY OWNED ASSOCIATE COMPANY
100.00 2 (87)
2. NeelachalIspat Nigam Ltd. U27109OR1982GOI001050 ASSOCIATE 49.78 2(6)3. Free Trade Warehousing Pvt.
Ltd.U63023DL2005PTC134299 ASSOCIATE 26.00 2(6)
4. MMTC Pamp India Pvt. Ltd. U27310HR2008PTC042218 ASSOCIATE 26.00 2(6)5. Sical Iron Ore Terminal Ltd. U13100TN2006PLC061022 ASSOCIATE 26.00 2(6)6. MMTC Gitanjali Ltd. U74999MH2008PLC187891 ASSOCIATE 26.00 2(6)7. TM Mining Company Ltd. U13100WB2010PLC156401 ASSOCIATE 26.00 2(6)8. Indian Commodity Exchange Ltd. U67120DL2008PLC182140 ASSOCIATE 16.00 2(6)
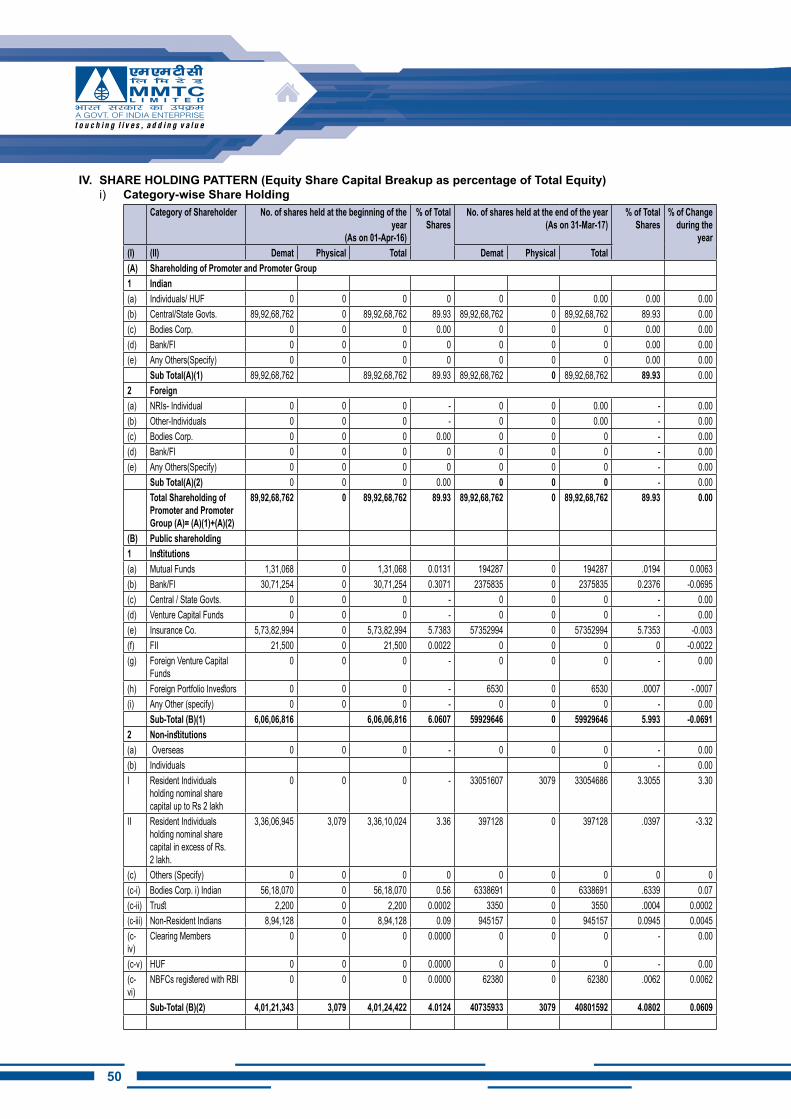
50
IV. SHARE HOLDING PATTERN (Equity Share Capital Breakup as percentage of Total Equity)i) Category-wise Share Holding
Category of Shareholder No. of shares held at the beginning of the year
(As on 01-Apr-16)
% of Total Shares
No. of shares held at the end of the year (As on 31-Mar-17)
% of Total Shares
% of Change during the
year(i) (ii) Demat Physical Total Demat Physical Total(A) Shareholding of Promoter and Promoter Group1 Indian(a) Individuals/ HUF 0 0 0 0 0 0 0.00 0.00 0.00(b) Central/State Govts. 89,92,68,762 0 89,92,68,762 89.93 89,92,68,762 0 89,92,68,762 89.93 0.00(c) Bodies Corp. 0 0 0 0.00 0 0 0 0.00 0.00(d) Bank/FI 0 0 0 0 0 0 0 0.00 0.00(e) Any Others(Specify) 0 0 0 0 0 0 0 0.00 0.00
Sub Total(A)(1) 89,92,68,762 89,92,68,762 89.93 89,92,68,762 0 89,92,68,762 89.93 0.002 Foreign(a) NRIs- Individual 0 0 0 - 0 0 0.00 - 0.00(b) Other-Individuals 0 0 0 - 0 0 0.00 - 0.00(c) Bodies Corp. 0 0 0 0.00 0 0 0 - 0.00(d) Bank/FI 0 0 0 0 0 0 0 - 0.00(e) Any Others(Specify) 0 0 0 0 0 0 0 - 0.00
Sub Total(A)(2) 0 0 0 0.00 0 0 0 - 0.00Total Shareholding of Promoter and Promoter Group (A)= (A)(1)+(A)(2)
89,92,68,762 0 89,92,68,762 89.93 89,92,68,762 0 89,92,68,762 89.93 0.00
(B) Public shareholding1 Institutions(a) Mutual Funds 1,31,068 0 1,31,068 0.0131 194287 0 194287 .0194 0.0063(b) Bank/FI 30,71,254 0 30,71,254 0.3071 2375835 0 2375835 0.2376 -0.0695(c) Central / State Govts. 0 0 0 - 0 0 0 - 0.00(d) Venture Capital Funds 0 0 0 - 0 0 0 - 0.00(e) Insurance Co. 5,73,82,994 0 5,73,82,994 5.7383 57352994 0 57352994 5.7353 -0.003(f) FII 21,500 0 21,500 0.0022 0 0 0 0 -0.0022(g) Foreign Venture Capital
Funds0 0 0 - 0 0 0 - 0.00
(h) Foreign Portfolio Investors 0 0 0 - 6530 0 6530 .0007 -.0007(i) Any Other (specify) 0 0 0 - 0 0 0 - 0.00
Sub-Total (B)(1) 6,06,06,816 6,06,06,816 6.0607 59929646 0 59929646 5.993 -0.06912 Non-institutions(a) Overseas 0 0 0 - 0 0 0 - 0.00(b) Individuals 0 - 0.00I Resident Individuals
holding nominal share capital up to Rs 2 lakh
0 0 0 - 33051607 3079 33054686 3.3055 3.30
II Resident Individuals holding nominal share capital in excess of Rs. 2 lakh.
3,36,06,945 3,079 3,36,10,024 3.36 397128 0 397128 .0397 -3.32
(c) Others (Specify) 0 0 0 0 0 0 0 0 0(c-i) Bodies Corp. i) Indian 56,18,070 0 56,18,070 0.56 6338691 0 6338691 .6339 0.07(c-ii) Trust 2,200 0 2,200 0.0002 3350 0 3550 .0004 0.0002(c-iii) Non-Resident Indians 8,94,128 0 8,94,128 0.09 945157 0 945157 0.0945 0.0045(c-iv)
Clearing Members 0 0 0 0.0000 0 0 0 - 0.00
(c-v) HUF 0 0 0 0.0000 0 0 0 - 0.00(c-vi)
NBFCs registered with RBI 0 0 0 0.0000 62380 0 62380 .0062 0.0062
Sub-Total (B)(2) 4,01,21,343 3,079 4,01,24,422 4.0124 40735933 3079 40801592 4.0802 0.0609
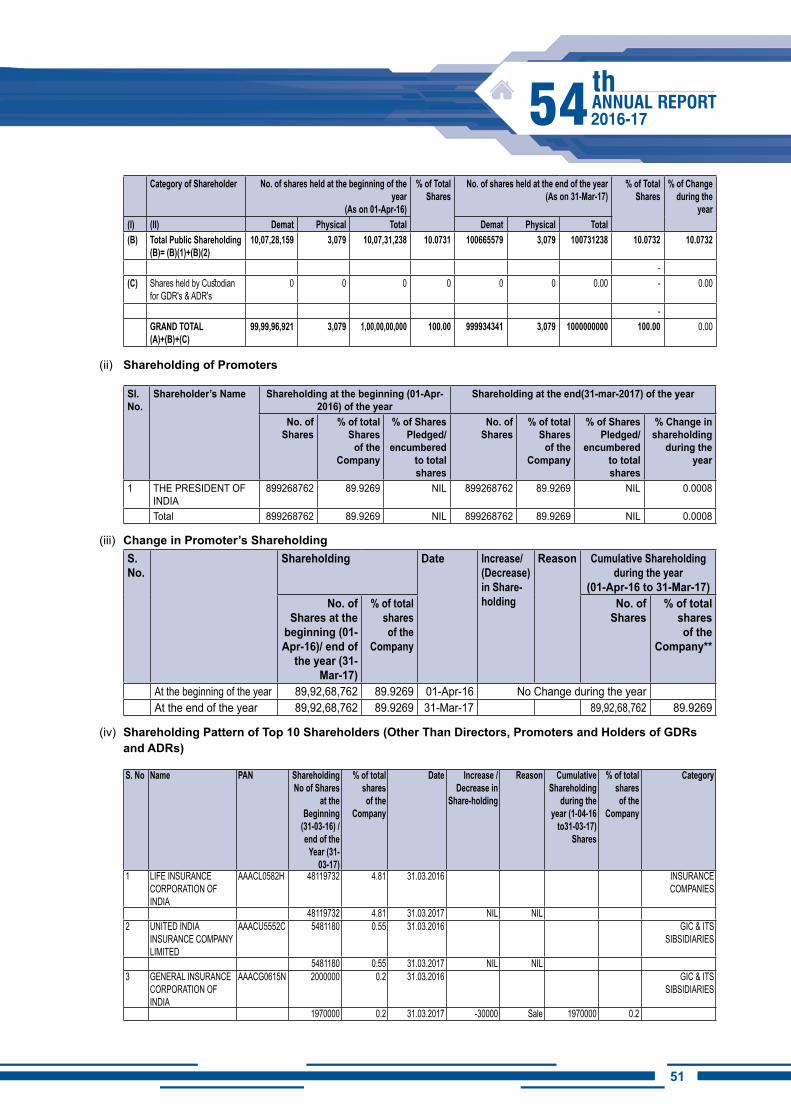
5150
Category of Shareholder No. of shares held at the beginning of the year
(As on 01-Apr-16)
% of Total Shares
No. of shares held at the end of the year (As on 31-Mar-17)
% of Total Shares
% of Change during the
year(i) (ii) Demat Physical Total Demat Physical Total(B) Total Public Shareholding
(B)= (B)(1)+(B)(2)10,07,28,159 3,079 10,07,31,238 10.0731 100665579 3,079 100731238 10.0732 10.0732
-(C) Shares held by Custodian
for GDR's & ADR's0 0 0 0 0 0 0.00 - 0.00
-GRAND TOTAL (A)+(B)+(C)
99,99,96,921 3,079 1,00,00,00,000 100.00 999934341 3,079 1000000000 100.00 0.00
(ii) Shareholding of Promoters
Sl. No.
Shareholder’s Name Shareholding at the beginning (01-Apr-2016) of the year
Shareholding at the end(31-mar-2017) of the year
No. of Shares
% of total Shares
of the Company
% of Shares Pledged/
encumbered to total shares
No. of Shares
% of total Shares
of the Company
% of Shares Pledged/
encumbered to total shares
% Change in shareholding
during the year
1 THE PRESIDENT OF INDIA
899268762 89.9269 NIL 899268762 89.9269 NIL 0.0008
Total 899268762 89.9269 NIL 899268762 89.9269 NIL 0.0008
(iii) Change in Promoter’s ShareholdingS. No.
Shareholding Date increase/(Decrease) in Share-holding
Reason Cumulative Shareholding during the year
(01-Apr-16 to 31-Mar-17)No. of
Shares at the beginning (01-Apr-16)/ end of
the year (31-Mar-17)
% of total shares of the
Company
No. of Shares
% of total shares of the
Company**
At the beginning of the year 89,92,68,762 89.9269 01-Apr-16 No Change during the yearAt the end of the year 89,92,68,762 89.9269 31-Mar-17 89,92,68,762 89.9269
(iv) Shareholding Pattern of Top 10 Shareholders (Other Than Directors, Promoters and Holders of GDRs and ADRs)
S. No Name PAN ShareholdingNo of Shares
at the Beginning
(31-03-16) /end of the
Year (31-03-17)
% of total shares of the
Company
Date increase / Decrease in
Share-holding
Reason Cumulative Shareholding
during the year (1-04-16
to31-03-17)Shares
% of total shares of the
Company
Category
1 LIFE INSURANCE CORPORATION OF INDIA
AAACL0582H 48119732 4.81 31.03.2016 INSURANCE COMPANIES
48119732 4.81 31.03.2017 NIL NIL2 UNITED INDIA
INSURANCE COMPANY LIMITED
AAACU5552C 5481180 0.55 31.03.2016 GIC & ITS SIBSIDIARIES
5481180 0.55 31.03.2017 NIL NIL3 GENERAL INSURANCE
CORPORATION OF INDIA
AAACG0615N 2000000 0.2 31.03.2016 GIC & ITS SIBSIDIARIES
1970000 0.2 31.03.2017 -30000 Sale 1970000 0.2
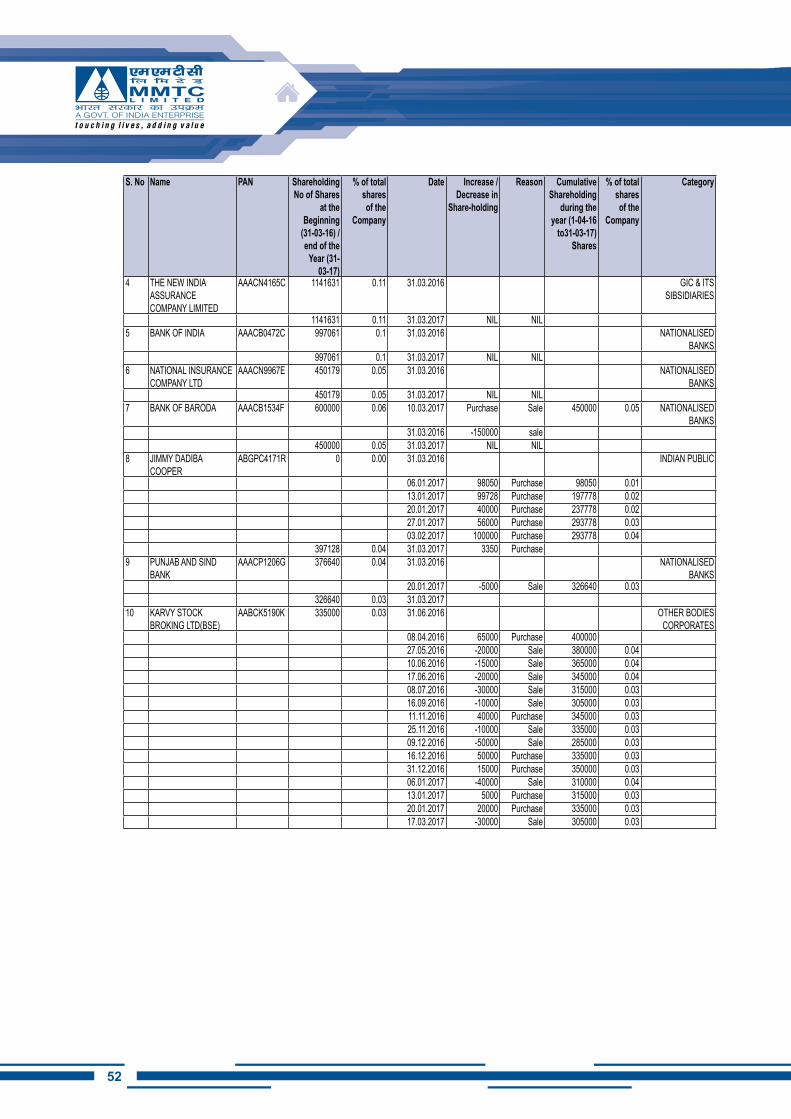
52
S. No Name PAN ShareholdingNo of Shares
at the Beginning
(31-03-16) /end of the
Year (31-03-17)
% of total shares of the
Company
Date increase / Decrease in
Share-holding
Reason Cumulative Shareholding
during the year (1-04-16
to31-03-17)Shares
% of total shares of the
Company
Category
4 THE NEW INDIA ASSURANCE COMPANY LIMITED
AAACN4165C 1141631 0.11 31.03.2016 GIC & ITS SIBSIDIARIES
1141631 0.11 31.03.2017 NIL NIL5 BANK OF INDIA AAACB0472C 997061 0.1 31.03.2016 NATIONALISED
BANKS997061 0.1 31.03.2017 NIL NIL
6 NATIONAL INSURANCE COMPANY LTD
AAACN9967E 450179 0.05 31.03.2016 NATIONALISED BANKS
450179 0.05 31.03.2017 NIL NIL7 BANK OF BARODA AAACB1534F 600000 0.06 10.03.2017 Purchase Sale 450000 0.05 NATIONALISED
BANKS31.03.2016 -150000 sale
450000 0.05 31.03.2017 NIL NIL8 JIMMY DADIBA
COOPERABGPC4171R 0 0.00 31.03.2016 INDIAN PUBLIC
06.01.2017 98050 Purchase 98050 0.0113.01.2017 99728 Purchase 197778 0.0220.01.2017 40000 Purchase 237778 0.0227.01.2017 56000 Purchase 293778 0.0303.02.2017 100000 Purchase 293778 0.04
397128 0.04 31.03.2017 3350 Purchase9 PUNJAB AND SIND
BANKAAACP1206G 376640 0.04 31.03.2016 NATIONALISED
BANKS20.01.2017 -5000 Sale 326640 0.03
326640 0.03 31.03.201710 KARVY STOCK
BROKING LTD(BSE)AABCK5190K 335000 0.03 31.06.2016 OTHER BODIES
CORPORATES08.04.2016 65000 Purchase 40000027.05.2016 -20000 Sale 380000 0.0410.06.2016 -15000 Sale 365000 0.0417.06.2016 -20000 Sale 345000 0.0408.07.2016 -30000 Sale 315000 0.0316.09.2016 -10000 Sale 305000 0.0311.11.2016 40000 Purchase 345000 0.0325.11.2016 -10000 Sale 335000 0.0309.12.2016 -50000 Sale 285000 0.0316.12.2016 50000 Purchase 335000 0.0331.12.2016 15000 Purchase 350000 0.0306.01.2017 -40000 Sale 310000 0.0413.01.2017 5000 Purchase 315000 0.0320.01.2017 20000 Purchase 335000 0.0317.03.2017 -30000 Sale 305000 0.03
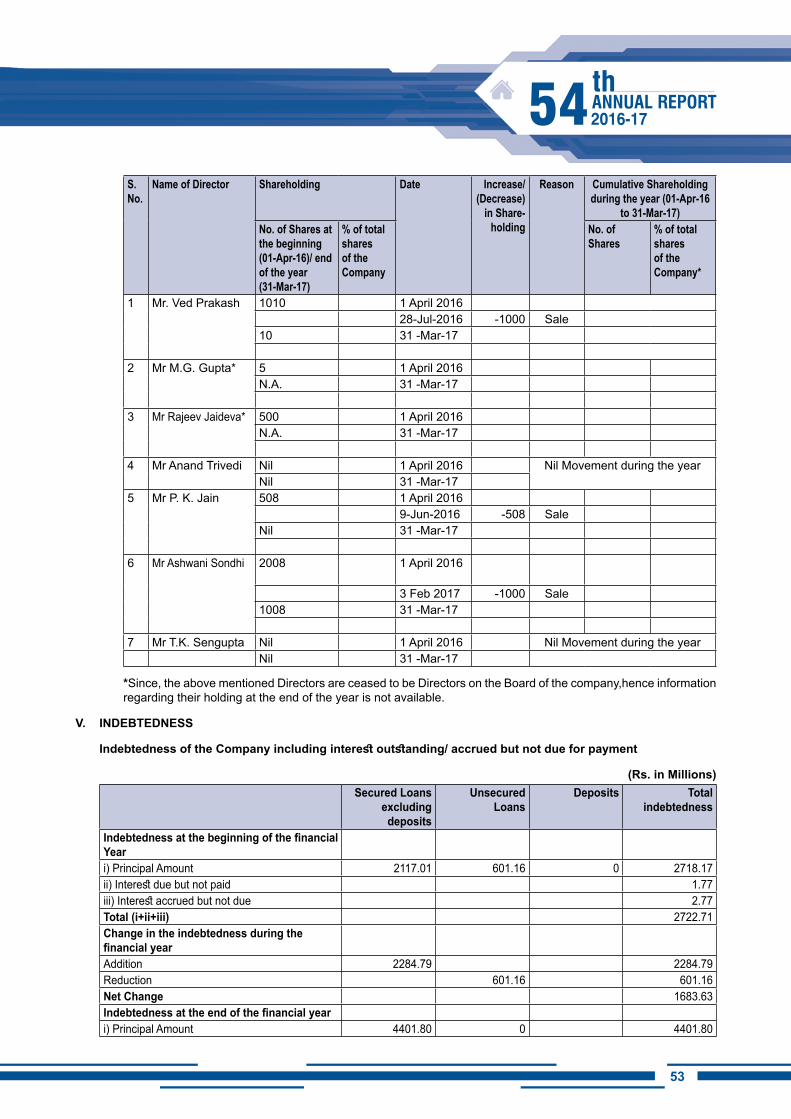
5352
S. No.
Name of Director Shareholding Date increase/(Decrease)
in Share-holding
Reason Cumulative Shareholding during the year (01-Apr-16
to 31-Mar-17)No. of Shares at the beginning (01-Apr-16)/ end of the year (31-Mar-17)
% of total shares of the Company
No. of Shares
% of total shares of the Company*
1 Mr. Ved Prakash 1010 1 April 201628-Jul-2016 -1000 Sale
10 31 -Mar-17
2 Mr M.G. Gupta* 5 1 April 2016N.A. 31 -Mar-17
3 Mr Rajeev Jaideva* 500 1 April 2016N.A. 31 -Mar-17
4 Mr Anand Trivedi Nil 1 April 2016 Nil Movement during the yearNil 31 -Mar-17
5 Mr P. K. Jain 508 1 April 20169-Jun-2016 -508 Sale
Nil 31 -Mar-17
6 Mr Ashwani Sondhi 2008 1 April 2016
3 Feb 2017 -1000 Sale1008 31 -Mar-17
7 Mr T.K. Sengupta Nil 1 April 2016 Nil Movement during the yearNil 31 -Mar-17
*Since, the above mentioned Directors are ceased to be Directors on the Board of the company,hence information regarding their holding at the end of the year is not available.
V. iNDEBTEDNESS
Indebtedness of the Company including interest outstanding/ accrued but not due for payment
(Rs. in Millions) Secured Loans
excluding deposits
Unsecured Loans
Deposits Total indebtedness
Indebtedness at the beginning of the financial Year
i) Principal Amount 2117.01 601.16 0 2718.17ii) Interest due but not paid 1.77iii) Interest accrued but not due 2.77Total (i+ii+iii) 2722.71Change in the indebtedness during the financial year Addition 2284.79 2284.79Reduction 601.16 601.16Net Change 1683.63Indebtedness at the end of the financial yeari) Principal Amount 4401.80 0 4401.80
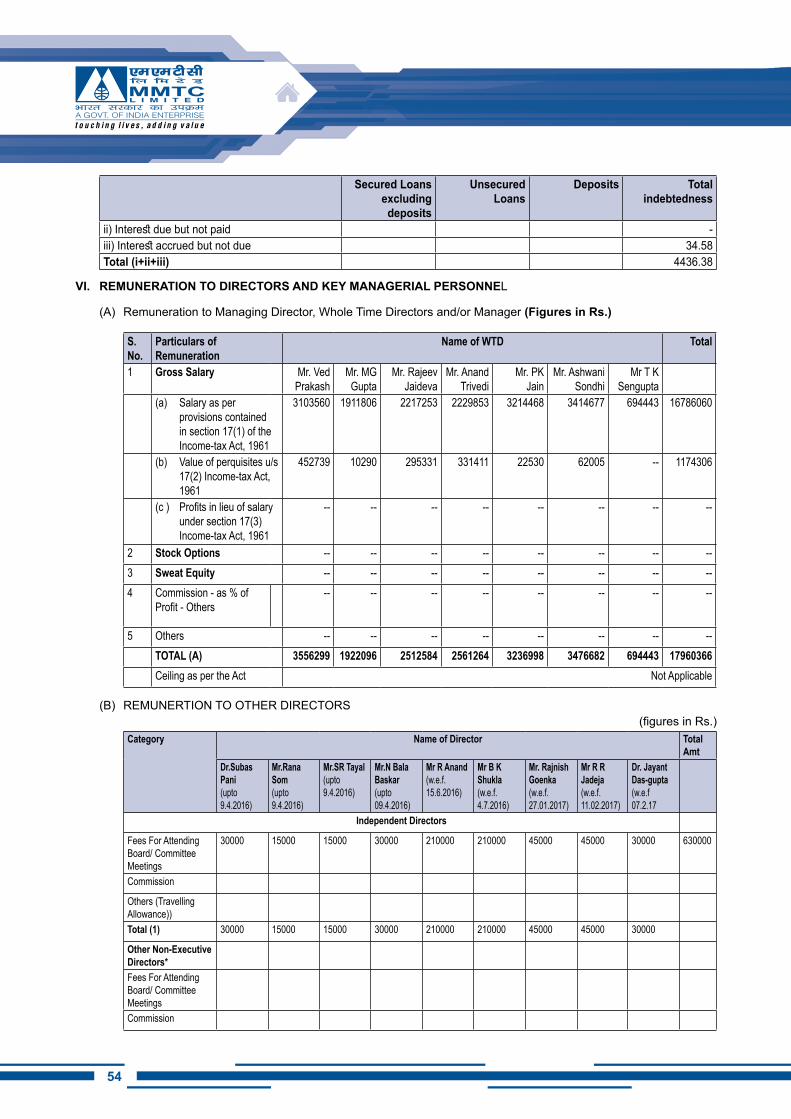
54
Secured Loans excluding deposits
Unsecured Loans
Deposits Total indebtedness
ii) Interest due but not paid -iii) Interest accrued but not due 34.58Total (i+ii+iii) 4436.38
Vi. REMUNERATiON TO DiRECTORS AND KEY MANAGERiAL PERSONNEL
(A) Remuneration to Managing Director, Whole Time Directors and/or Manager (Figures in Rs.)
S. No.
Particulars of Remuneration
Name of WTD Total
1 Gross Salary Mr. Ved Prakash
Mr. MG Gupta
Mr. Rajeev Jaideva
Mr. Anand Trivedi
Mr. PK Jain
Mr. Ashwani Sondhi
Mr T K Sengupta
(a) Salary as per provisions contained in section 17(1) of the Income-tax Act, 1961
3103560 1911806 2217253 2229853 3214468 3414677 694443 16786060
(b) Value of perquisites u/s 17(2) Income-tax Act, 1961
452739 10290 295331 331411 22530 62005 -- 1174306
(c ) Profits in lieu of salary under section 17(3) Income-tax Act, 1961
-- -- -- -- -- -- -- --
2 Stock Options -- -- -- -- -- -- -- --3 Sweat Equity -- -- -- -- -- -- -- --4 Commission - as % of
Profit - Others-- -- -- -- -- -- -- --
5 Others -- -- -- -- -- -- -- --TOTAL (A) 3556299 1922096 2512584 2561264 3236998 3476682 694443 17960366Ceiling as per the Act Not Applicable
(B) REMUNERTION TO OTHER DIRECTORS (figures in Rs.)
Category
Name of Director Total Amt
Dr.Subas Pani(upto 9.4.2016)
Mr.Rana Som(upto 9.4.2016)
Mr.SR Tayal(upto 9.4.2016)
Mr.N Bala Baskar(upto 09.4.2016)
Mr R Anand(w.e.f. 15.6.2016)
Mr B K Shukla(w.e.f. 4.7.2016)
Mr. Rajnish Goenka(w.e.f.27.01.2017)
Mr R RJadeja(w.e.f. 11.02.2017)
Dr. Jayant Das-gupta(w.e.f 07.2.17
Independent Directors
Fees For Attending Board/ Committee Meetings
30000 15000 15000 30000 210000 210000 45000 45000 30000 630000
Commission
Others (Travelling Allowance))Total (1) 30000 15000 15000 30000 210000 210000 45000 45000 30000
Other Non-Executive Directors*Fees For Attending Board/ Committee MeetingsCommission
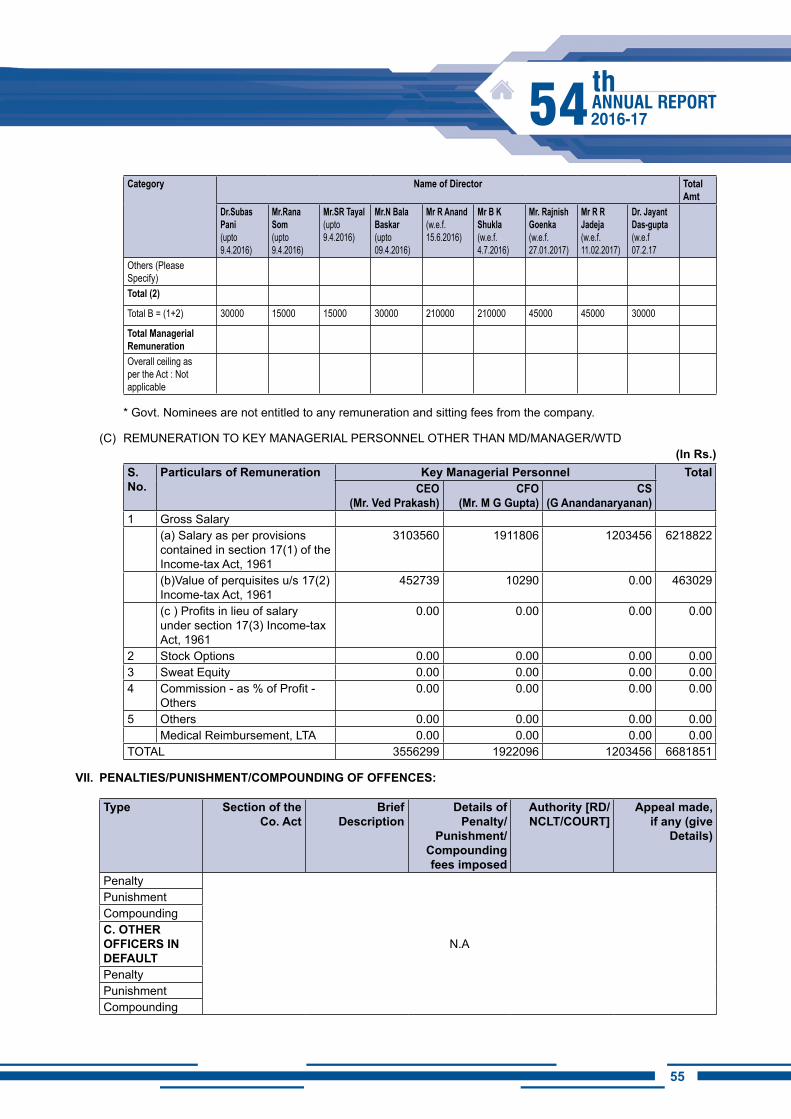
5554
Category
Name of Director Total Amt
Dr.Subas Pani(upto 9.4.2016)
Mr.Rana Som(upto 9.4.2016)
Mr.SR Tayal(upto 9.4.2016)
Mr.N Bala Baskar(upto 09.4.2016)
Mr R Anand(w.e.f. 15.6.2016)
Mr B K Shukla(w.e.f. 4.7.2016)
Mr. Rajnish Goenka(w.e.f.27.01.2017)
Mr R RJadeja(w.e.f. 11.02.2017)
Dr. Jayant Das-gupta(w.e.f 07.2.17
Others (Please Specify)Total (2)
Total B = (1+2) 30000 15000 15000 30000 210000 210000 45000 45000 30000
Total Managerial RemunerationOverall ceiling as per the Act : Not applicable
* Govt. Nominees are not entitled to any remuneration and sitting fees from the company.
(C) REMUNERATION TO KEY MANAGERIAL PERSONNEL OTHER THAN MD/MANAGER/WTD(in Rs.)
S. No.
Particulars of Remuneration Key Managerial Personnel TotalCEO
(Mr. Ved Prakash)CFO
(Mr. M G Gupta)CS
(G Anandanaryanan)1 Gross Salary
(a) Salary as per provisions contained in section 17(1) of the Income-tax Act, 1961
3103560 1911806 1203456 6218822
(b)Value of perquisites u/s 17(2) Income-tax Act, 1961
452739 10290 0.00 463029
(c ) Profits in lieu of salary under section 17(3) Income-tax Act, 1961
0.00 0.00 0.00 0.00
2 Stock Options 0.00 0.00 0.00 0.003 Sweat Equity 0.00 0.00 0.00 0.004 Commission - as % of Profit -
Others0.00 0.00 0.00 0.00
5 Others 0.00 0.00 0.00 0.00Medical Reimbursement, LTA 0.00 0.00 0.00 0.00
TOTAL 3556299 1922096 1203456 6681851
Vii. PENALTiES/PUNiShMENT/COMPOUNDiNG OF OFFENCES:
Type Section of the Co. Act
Brief Description
Details of Penalty/
Punishment/Compounding fees imposed
Authority [RD/NCLT/COURT]
Appeal made, if any (give
Details)
Penalty
N.A
PunishmentCompoundingC. OThER OFFiCERS iN DEFAULTPenaltyPunishmentCompounding
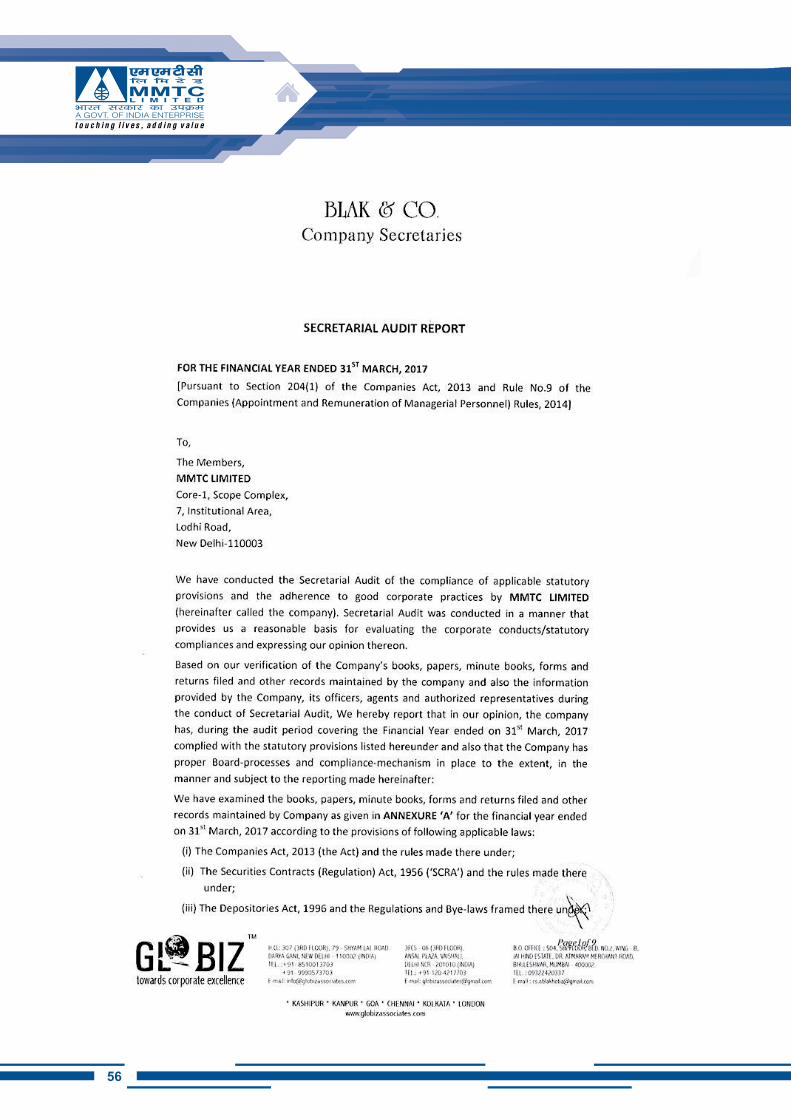
56
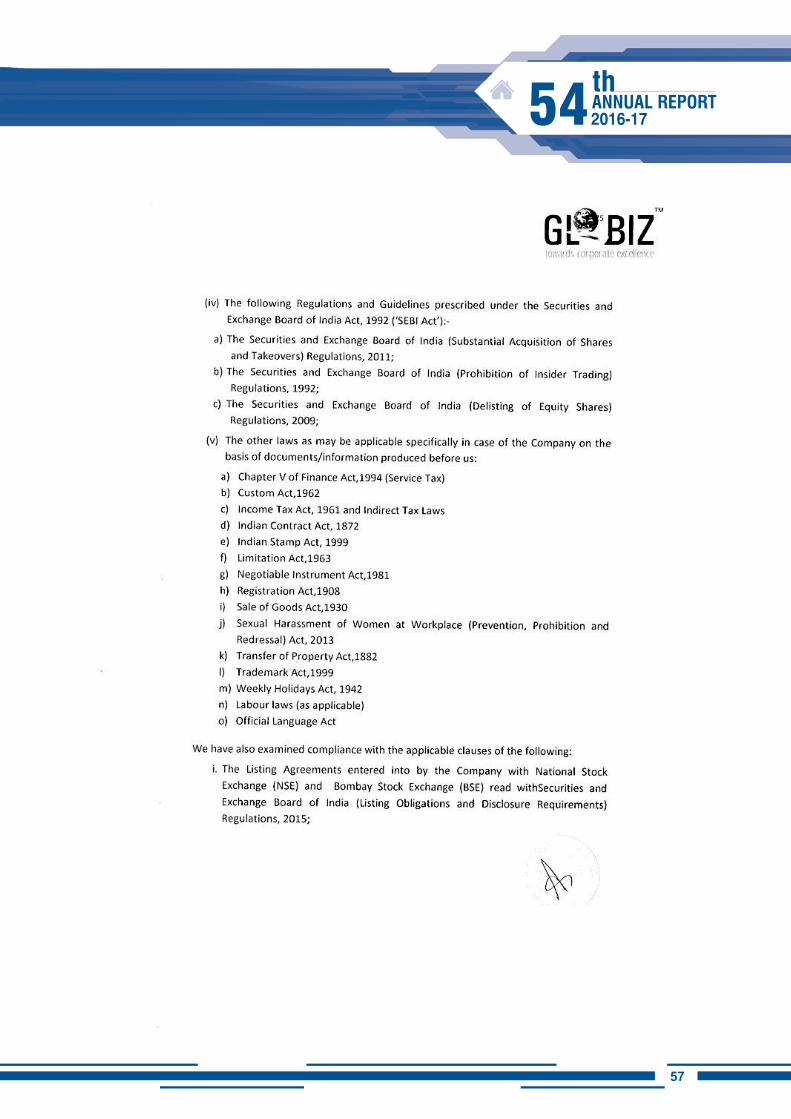
5756
75
58
76
5958
77
60
78
6160
79
62
80
6362
81
64
82
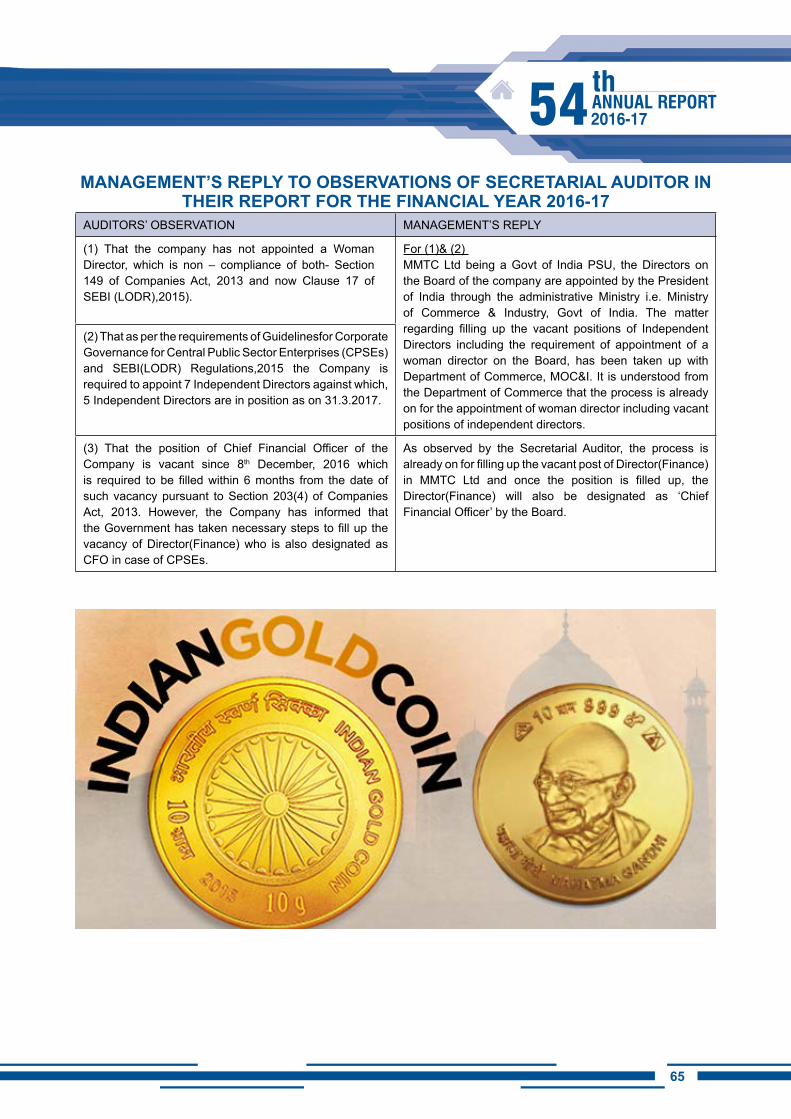
6564
MANAGEMENT’S REPLY TO OBSERVATiONS OF SECRETARiAL AUDiTOR iN ThEiR REPORT FOR ThE FiNANCiAL YEAR 2016-17
AUDITORS’ OBSERVATION MANAGEMENT’S REPLY
(1) That the company has not appointed a Woman Director, which is non – compliance of both- Section 149 of Companies Act, 2013 and now Clause 17 of SEBI (LODR),2015).
For (1)& (2) MMTC Ltd being a Govt of India PSU, the Directors on the Board of the company are appointed by the President of India through the administrative Ministry i.e. Ministry of Commerce & Industry, Govt of India. The matter regarding filling up the vacant positions of Independent Directors including the requirement of appointment of a woman director on the Board, has been taken up with Department of Commerce, MOC&I. It is understood from the Department of Commerce that the process is already on for the appointment of woman director including vacant positions of independent directors.
(2) That as per the requirements of Guidelinesfor Corporate Governance for Central Public Sector Enterprises (CPSEs) and SEBI(LODR) Regulations,2015 the Company is required to appoint 7 Independent Directors against which, 5 Independent Directors are in position as on 31.3.2017.
(3) That the position of Chief Financial Officer of the Company is vacant since 8th December, 2016 which is required to be filled within 6 months from the date of such vacancy pursuant to Section 203(4) of Companies Act, 2013. However, the Company has informed that the Government has taken necessary steps to fill up the vacancy of Director(Finance) who is also designated as CFO in case of CPSEs.
As observed by the Secretarial Auditor, the process is already on for filling up the vacant post of Director(Finance) in MMTC Ltd and once the position is filled up, the Director(Finance) will also be designated as ‘Chief Financial Officer’ by the Board.
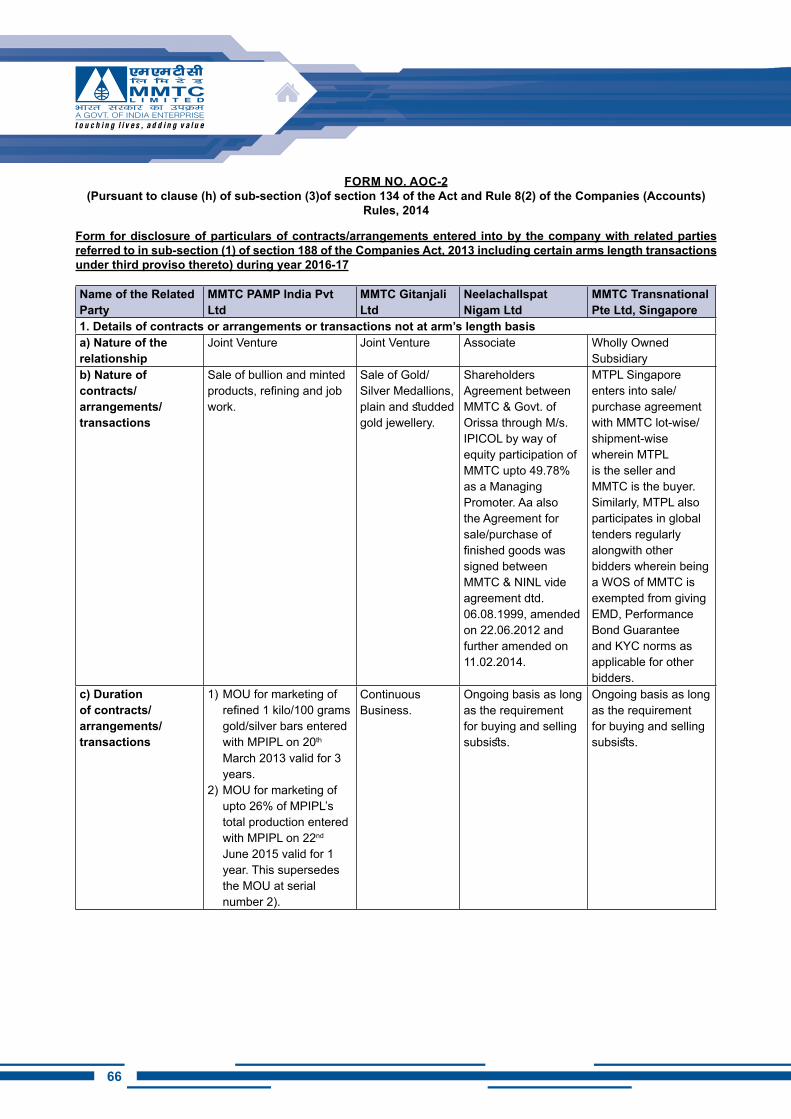
66
FORM NO. AOC-2(Pursuant to clause (h) of sub-section (3)of section 134 of the Act and Rule 8(2) of the Companies (Accounts)
Rules, 2014
Form for disclosure of particulars of contracts/arrangements entered into by the company with related parties referred to in sub-section (1) of section 188 of the Companies Act, 2013 including certain arms length transactions under third proviso thereto) during year 2016-17
Name of the Related Party
MMTC PAMP India Pvt Ltd
MMTC Gitanjali Ltd
Neelachalispat Nigam Ltd
MMTC Transnational Pte Ltd, Singapore
1. Details of contracts or arrangements or transactions not at arm’s length basisa) Nature of the relationship
Joint Venture Joint Venture Associate Wholly Owned Subsidiary
b) Nature of contracts/arrangements/transactions
Sale of bullion and minted products, refining and job work.
Sale of Gold/Silver Medallions, plain and studded gold jewellery.
Shareholders Agreement between MMTC & Govt. of Orissa through M/s. IPICOL by way of equity participation of MMTC upto 49.78% as a Managing Promoter. Aa also the Agreement for sale/purchase of finished goods was signed between MMTC & NINL vide agreement dtd. 06.08.1999, amended on 22.06.2012 and further amended on 11.02.2014.
MTPL Singapore enters into sale/purchase agreement with MMTC lot-wise/shipment-wise wherein MTPL is the seller and MMTC is the buyer. Similarly, MTPL also participates in global tenders regularly alongwith other bidders wherein being a WOS of MMTC is exempted from giving EMD, Performance Bond Guarantee and KYC norms as applicable for other bidders.
c) Duration of contracts/arrangements/transactions
1) MOU for marketing of refined 1 kilo/100 grams gold/silver bars entered with MPIPL on 20th
March 2013 valid for 3 years.
2) MOU for marketing of upto 26% of MPIPL’s total production entered with MPIPL on 22nd June 2015 valid for 1 year. This supersedes the MOU at serial number 2).
Continuous Business.
Ongoing basis as long as the requirement for buying and selling subsists.
Ongoing basis as long as the requirement for buying and selling subsists.
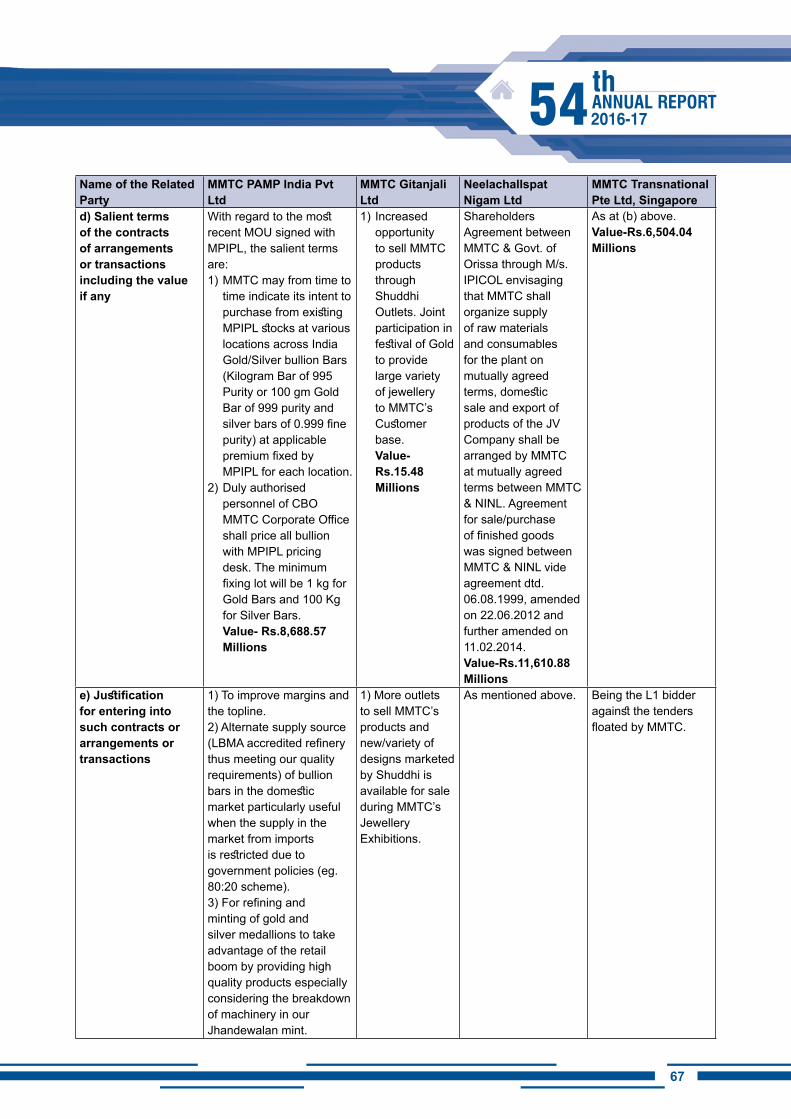
6766
Name of the Related Party
MMTC PAMP India Pvt Ltd
MMTC Gitanjali Ltd
Neelachalispat Nigam Ltd
MMTC Transnational Pte Ltd, Singapore
d) Salient terms of the contracts of arrangements or transactions including the value if any
With regard to the most recent MOU signed with MPIPL, the salient terms are:1) MMTC may from time to
time indicate its intent to purchase from existing MPIPL stocks at various locations across India Gold/Silver bullion Bars (Kilogram Bar of 995 Purity or 100 gm Gold Bar of 999 purity and silver bars of 0.999 fine purity) at applicable premium fixed by MPIPL for each location.
2) Duly authorised personnel of CBO MMTC Corporate Office shall price all bullion with MPIPL pricing desk. The minimum fixing lot will be 1 kg for Gold Bars and 100 Kg for Silver Bars.
Value- Rs.8,688.57 Millions
1) Increased opportunity to sell MMTC products through Shuddhi Outlets. Joint participation in festival of Gold to provide large variety of jewellery to MMTC’s Customer base.
Value- Rs.15.48 Millions
Shareholders Agreement between MMTC & Govt. of Orissa through M/s. IPICOL envisaging that MMTC shall organize supply of raw materials and consumables for the plant on mutually agreed terms, domestic sale and export of products of the JV Company shall be arranged by MMTC at mutually agreed terms between MMTC & NINL. Agreement for sale/purchase of finished goods was signed between MMTC & NINL vide agreement dtd. 06.08.1999, amended on 22.06.2012 and further amended on 11.02.2014.Value-Rs.11,610.88 Millions
As at (b) above.Value-Rs.6,504.04 Millions
e) Justification for entering into such contracts or arrangements or transactions
1) To improve margins and the topline.2) Alternate supply source (LBMA accredited refinery thus meeting our quality requirements) of bullion bars in the domestic market particularly useful when the supply in the market from imports is restricted due to government policies (eg. 80:20 scheme).3) For refining and minting of gold and silver medallions to take advantage of the retail boom by providing high quality products especially considering the breakdown of machinery in our Jhandewalan mint.
1) More outlets to sell MMTC’s products and new/variety of designs marketed by Shuddhi is available for sale during MMTC’s Jewellery Exhibitions.
As mentioned above. Being the L1 bidder against the tenders floated by MMTC.
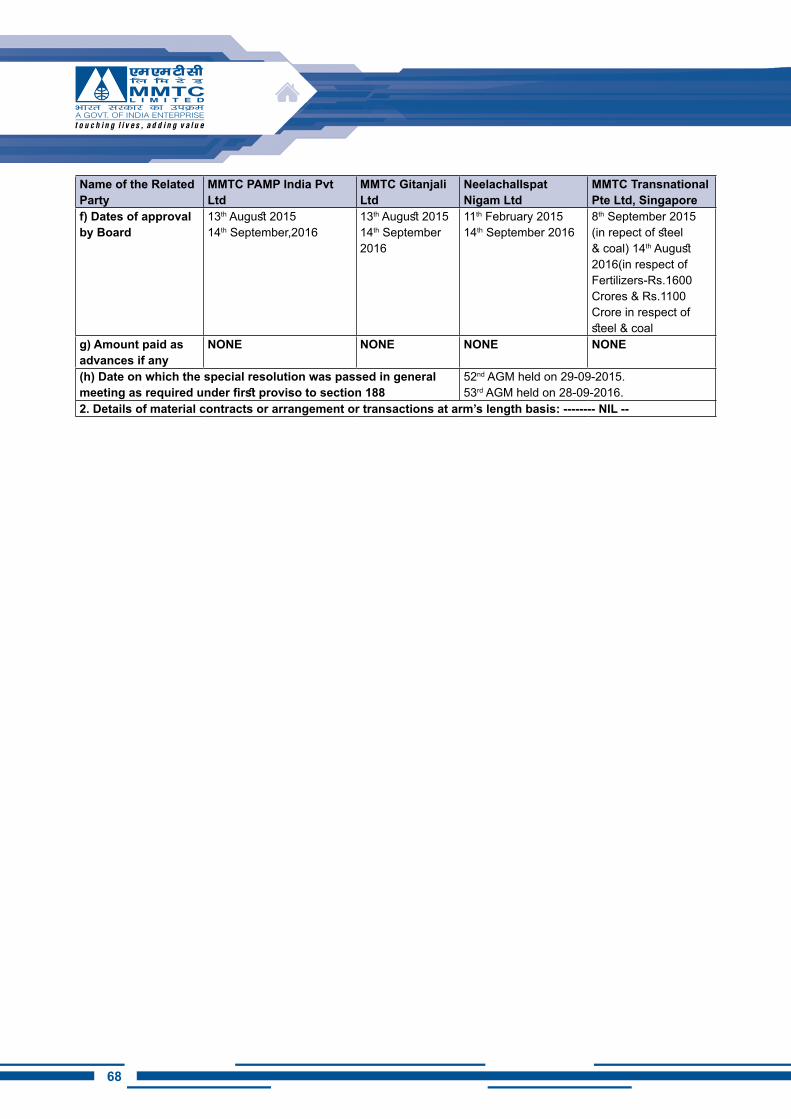
68
Name of the Related Party
MMTC PAMP India Pvt Ltd
MMTC Gitanjali Ltd
Neelachalispat Nigam Ltd
MMTC Transnational Pte Ltd, Singapore
f) Dates of approval by Board
13th August 201514th September,2016
13th August 201514th September 2016
11th February 201514th September 2016
8th September 2015 (in repect of steel & coal) 14th August 2016(in respect of Fertilizers-Rs.1600 Crores & Rs.1100 Crore in respect of steel & coal
g) Amount paid as advances if any
NONE NONE NONE NONE
(h) Date on which the special resolution was passed in general meeting as required under first proviso to section 188
52nd AGM held on 29-09-2015.53rd AGM held on 28-09-2016.
2. Details of material contracts or arrangement or transactions at arm’s length basis: -------- NIL --
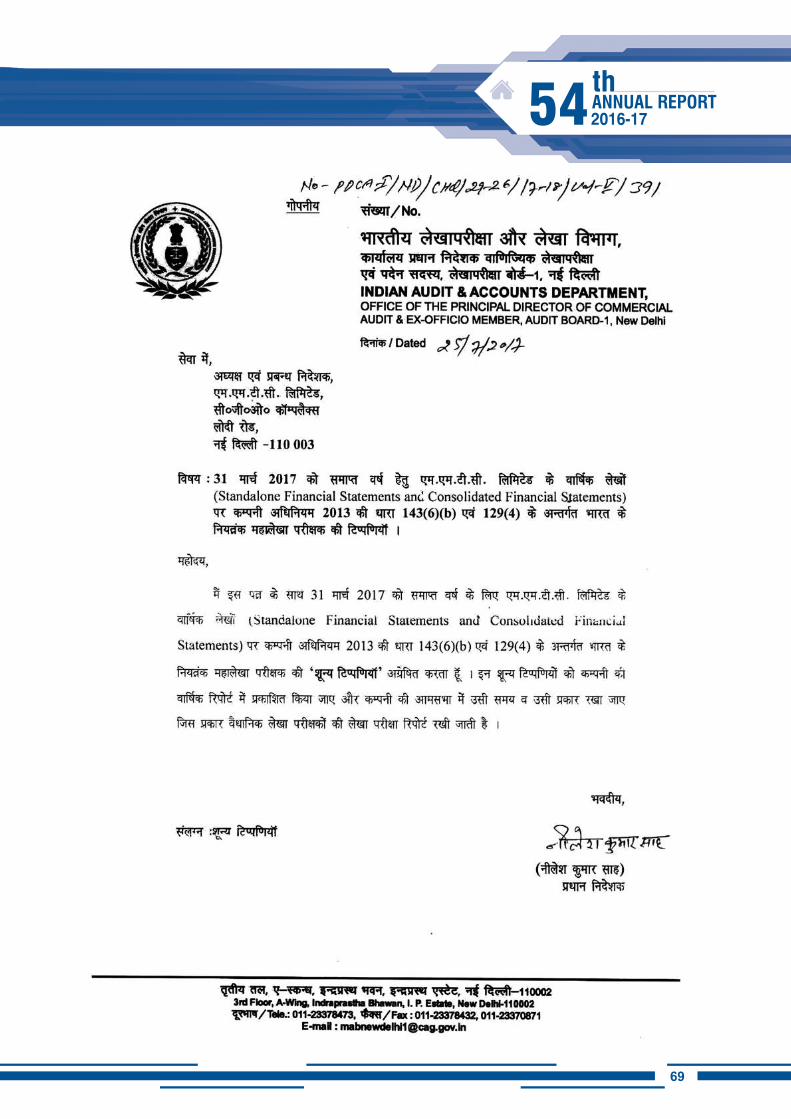
6968
70
7170
72
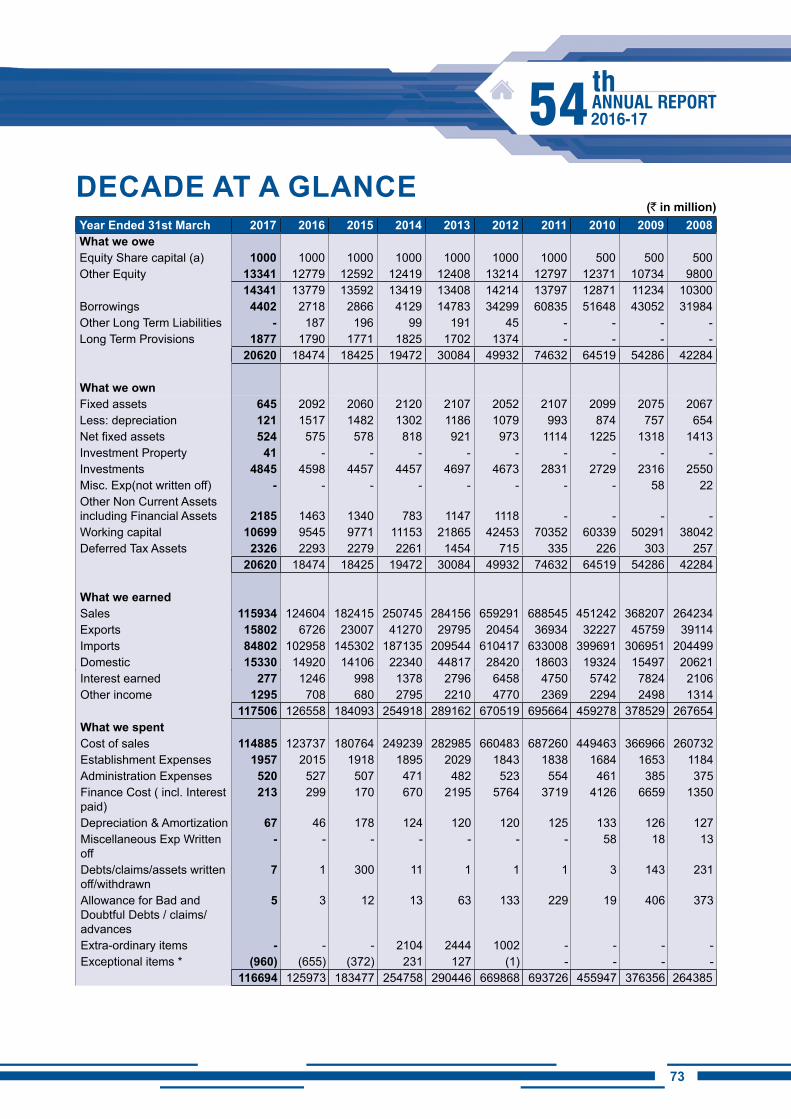
7372
DECADE AT A GLANCE(` in million)
Year Ended 31st March 2017 2016 2015 2014 2013 2012 2011 2010 2009 2008What we oweEquity Share capital (a) 1000 1000 1000 1000 1000 1000 1000 500 500 500Other Equity 13341 12779 12592 12419 12408 13214 12797 12371 10734 9800
14341 13779 13592 13419 13408 14214 13797 12871 11234 10300Borrowings 4402 2718 2866 4129 14783 34299 60835 51648 43052 31984Other Long Term Liabilities - 187 196 99 191 45 - - - - Long Term Provisions 1877 1790 1771 1825 1702 1374 - - - -
20620 18474 18425 19472 30084 49932 74632 64519 54286 42284
What we ownFixed assets 645 2092 2060 2120 2107 2052 2107 2099 2075 2067Less: depreciation 121 1517 1482 1302 1186 1079 993 874 757 654Net fixed assets 524 575 578 818 921 973 1114 1225 1318 1413Investment Property 41 - - - - - - - - - Investments 4845 4598 4457 4457 4697 4673 2831 2729 2316 2550Misc. Exp(not written off) - - - - - - - - 58 22Other Non Current Assets including Financial Assets 2185 1463 1340 783 1147 1118 - - - - Working capital 10699 9545 9771 11153 21865 42453 70352 60339 50291 38042Deferred Tax Assets 2326 2293 2279 2261 1454 715 335 226 303 257
20620 18474 18425 19472 30084 49932 74632 64519 54286 42284
What we earnedSales 115934 124604 182415 250745 284156 659291 688545 451242 368207 264234Exports 15802 6726 23007 41270 29795 20454 36934 32227 45759 39114Imports 84802 102958 145302 187135 209544 610417 633008 399691 306951 204499Domestic 15330 14920 14106 22340 44817 28420 18603 19324 15497 20621Interest earned 277 1246 998 1378 2796 6458 4750 5742 7824 2106Other income 1295 708 680 2795 2210 4770 2369 2294 2498 1314
117506 126558 184093 254918 289162 670519 695664 459278 378529 267654What we spentCost of sales 114885 123737 180764 249239 282985 660483 687260 449463 366966 260732Establishment Expenses 1957 2015 1918 1895 2029 1843 1838 1684 1653 1184Administration Expenses 520 527 507 471 482 523 554 461 385 375Finance Cost ( incl. Interest paid)
213 299 170 670 2195 5764 3719 4126 6659 1350
Depreciation & Amortization 67 46 178 124 120 120 125 133 126 127Miscellaneous Exp Written off
- - - - - - - 58 18 13
Debts/claims/assets written off/withdrawn
7 1 300 11 1 1 1 3 143 231
Allowance for Bad and Doubtful Debts / claims/ advances
5 3 12 13 63 133 229 19 406 373
Extra-ordinary items - - - 2104 2444 1002 - - - - Exceptional items * (960) (655) (372) 231 127 (1) - - - -
116694 125973 183477 254758 290446 669868 693726 455947 376356 264385
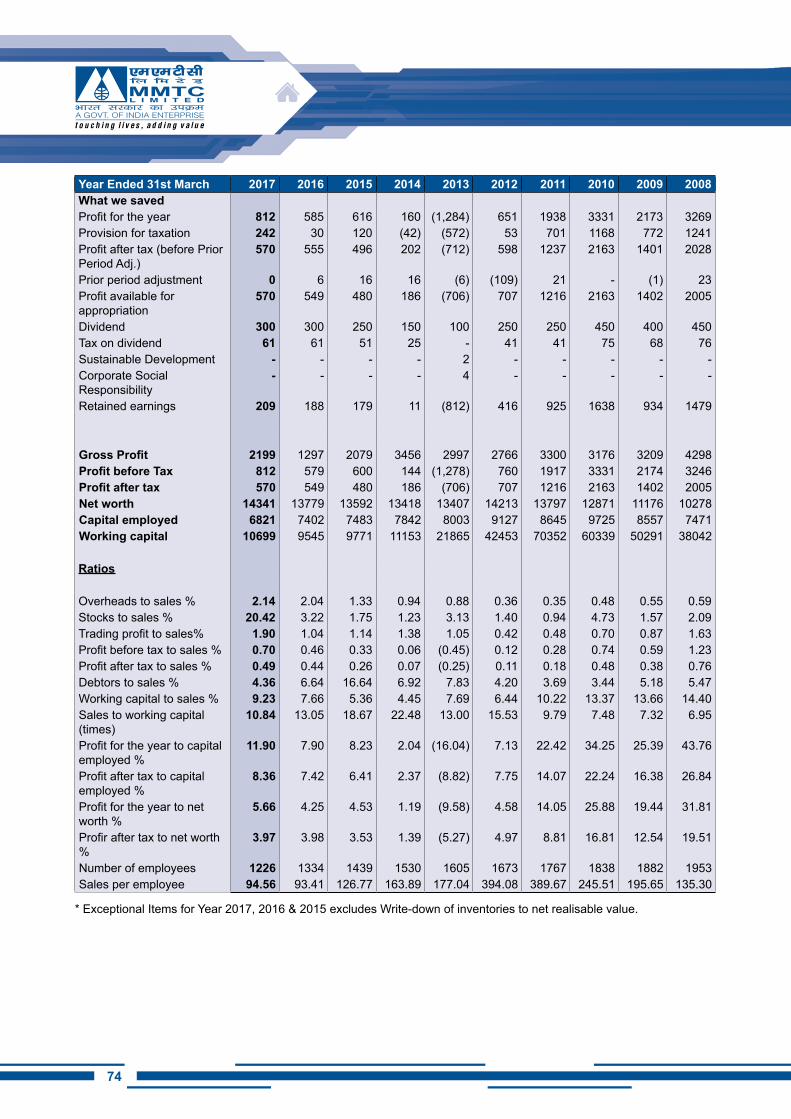
74
Year Ended 31st March 2017 2016 2015 2014 2013 2012 2011 2010 2009 2008What we savedProfit for the year 812 585 616 160 (1,284) 651 1938 3331 2173 3269Provision for taxation 242 30 120 (42) (572) 53 701 1168 772 1241Profit after tax (before Prior Period Adj.)
570 555 496 202 (712) 598 1237 2163 1401 2028
Prior period adjustment 0 6 16 16 (6) (109) 21 - (1) 23Profit available for appropriation
570 549 480 186 (706) 707 1216 2163 1402 2005
Dividend 300 300 250 150 100 250 250 450 400 450Tax on dividend 61 61 51 25 - 41 41 75 68 76Sustainable Development - - - - 2 - - - - - Corporate Social Responsibility
- - - - 4 - - - - -
Retained earnings 209 188 179 11 (812) 416 925 1638 934 1479
Gross Profit 2199 1297 2079 3456 2997 2766 3300 3176 3209 4298Profit before Tax 812 579 600 144 (1,278) 760 1917 3331 2174 3246Profit after tax 570 549 480 186 (706) 707 1216 2163 1402 2005Net worth 14341 13779 13592 13418 13407 14213 13797 12871 11176 10278Capital employed 6821 7402 7483 7842 8003 9127 8645 9725 8557 7471Working capital 10699 9545 9771 11153 21865 42453 70352 60339 50291 38042
Ratios
Overheads to sales % 2.14 2.04 1.33 0.94 0.88 0.36 0.35 0.48 0.55 0.59Stocks to sales % 20.42 3.22 1.75 1.23 3.13 1.40 0.94 4.73 1.57 2.09Trading profit to sales% 1.90 1.04 1.14 1.38 1.05 0.42 0.48 0.70 0.87 1.63Profit before tax to sales % 0.70 0.46 0.33 0.06 (0.45) 0.12 0.28 0.74 0.59 1.23Profit after tax to sales % 0.49 0.44 0.26 0.07 (0.25) 0.11 0.18 0.48 0.38 0.76Debtors to sales % 4.36 6.64 16.64 6.92 7.83 4.20 3.69 3.44 5.18 5.47Working capital to sales % 9.23 7.66 5.36 4.45 7.69 6.44 10.22 13.37 13.66 14.40Sales to working capital (times)
10.84 13.05 18.67 22.48 13.00 15.53 9.79 7.48 7.32 6.95
Profit for the year to capital employed %
11.90 7.90 8.23 2.04 (16.04) 7.13 22.42 34.25 25.39 43.76
Profit after tax to capital employed %
8.36 7.42 6.41 2.37 (8.82) 7.75 14.07 22.24 16.38 26.84
Profit for the year to net worth %
5.66 4.25 4.53 1.19 (9.58) 4.58 14.05 25.88 19.44 31.81
Profir after tax to net worth %
3.97 3.98 3.53 1.39 (5.27) 4.97 8.81 16.81 12.54 19.51
Number of employees 1226 1334 1439 1530 1605 1673 1767 1838 1882 1953Sales per employee 94.56 93.41 126.77 163.89 177.04 394.08 389.67 245.51 195.65 135.30
* Exceptional Items for Year 2017, 2016 & 2015 excludes Write-down of inventories to net realisable value.
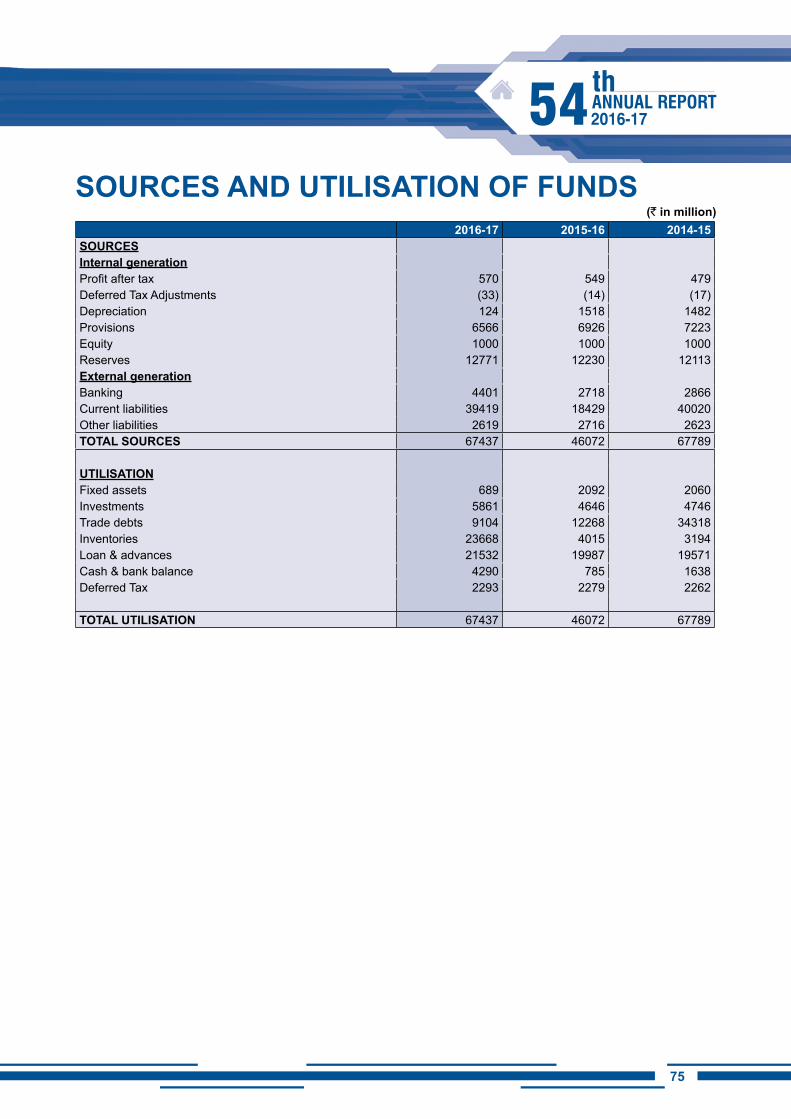
7574
SOURCES AND UTiLiSATiON OF FUNDS(` in million)
2016-17 2015-16 2014-15SOURCESInternal generationProfit after tax 570 549 479Deferred Tax Adjustments (33) (14) (17)Depreciation 124 1518 1482Provisions 6566 6926 7223Equity 1000 1000 1000Reserves 12771 12230 12113External generationBanking 4401 2718 2866Current liabilities 39419 18429 40020Other liabilities 2619 2716 2623TOTAL SOURCES 67437 46072 67789
UTiLiSATiONFixed assets 689 2092 2060Investments 5861 4646 4746Trade debts 9104 12268 34318Inventories 23668 4015 3194Loan & advances 21532 19987 19571Cash & bank balance 4290 785 1638Deferred Tax 2293 2279 2262
TOTAL UTiLiSATiON 67437 46072 67789
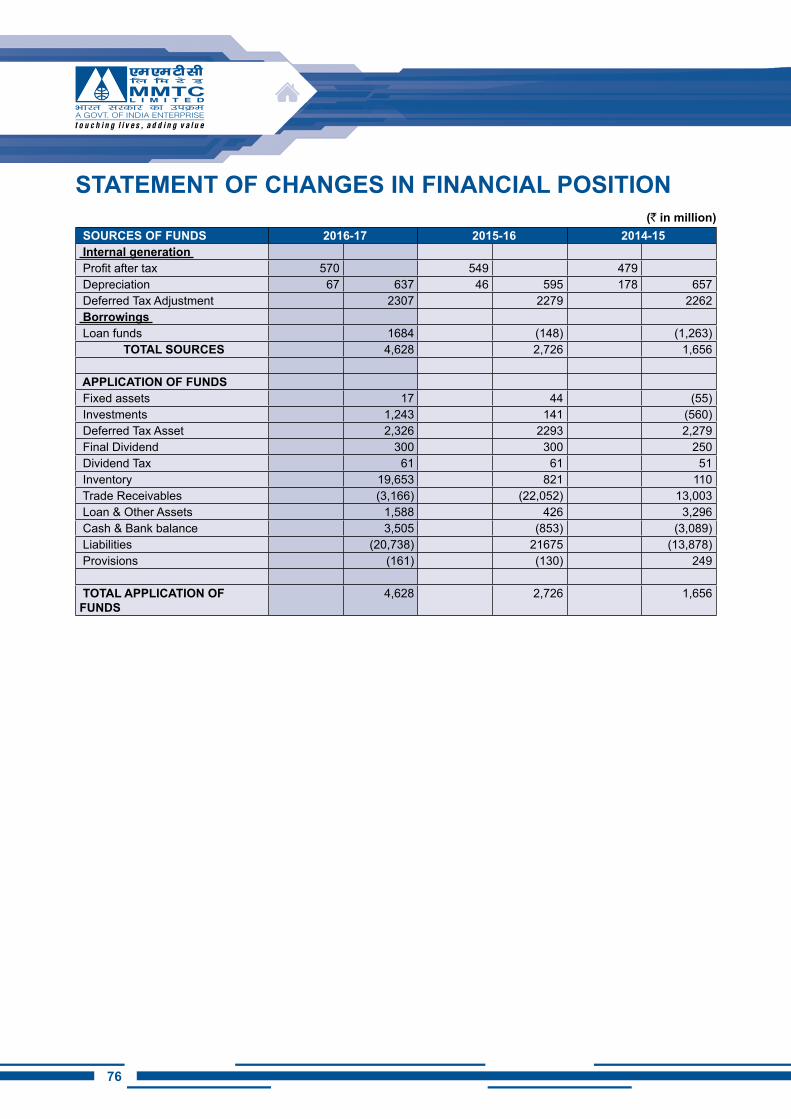
76
STATEMENT OF ChANGES iN FiNANCiAL POSiTiON(` in million)
SOURCES OF FUNDS 2016-17 2015-16 2014-15 Internal generation Profit after tax 570 549 479 Depreciation 67 637 46 595 178 657 Deferred Tax Adjustment 2307 2279 2262 Borrowings Loan funds 1684 (148) (1,263)
TOTAL SOURCES 4,628 2,726 1,656
APPLiCATiON OF FUNDS Fixed assets 17 44 (55) Investments 1,243 141 (560) Deferred Tax Asset 2,326 2293 2,279 Final Dividend 300 300 250 Dividend Tax 61 61 51 Inventory 19,653 821 110 Trade Receivables (3,166) (22,052) 13,003 Loan & Other Assets 1,588 426 3,296 Cash & Bank balance 3,505 (853) (3,089) Liabilities (20,738) 21675 (13,878) Provisions (161) (130) 249
TOTAL APPLiCATiON OF FUNDS
4,628 2,726 1,656
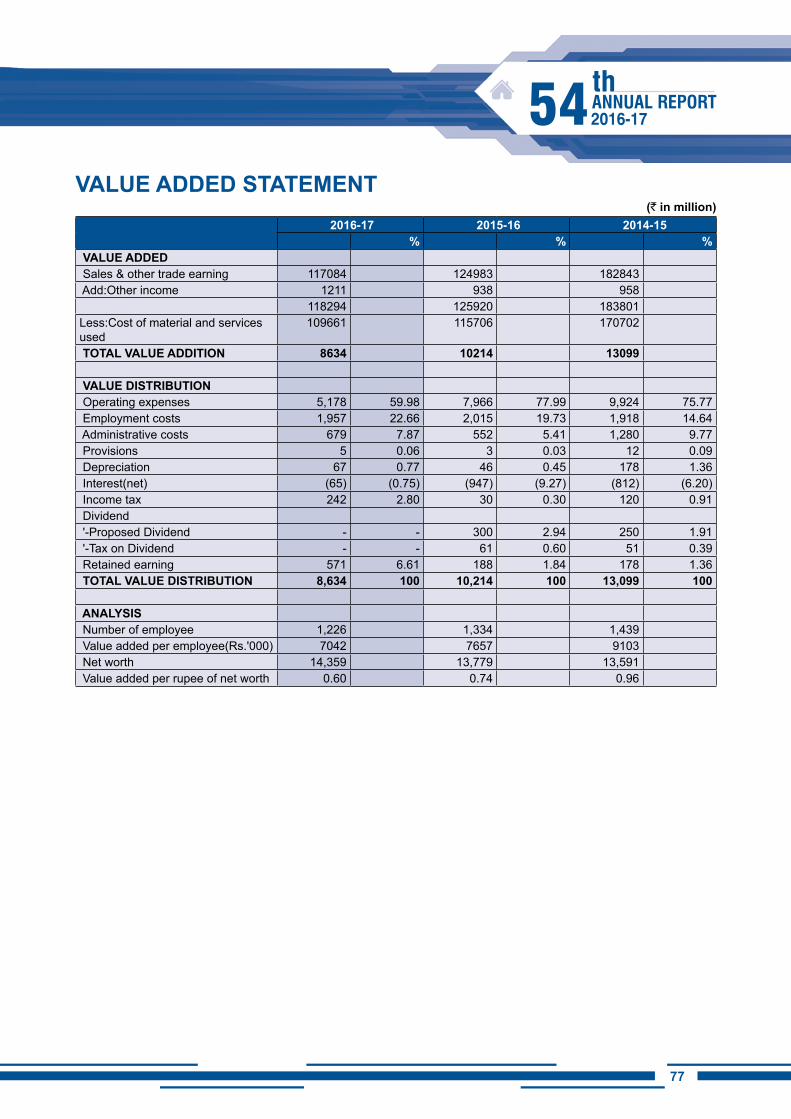
7776
VALUE ADDED STATEMENT(` in million)
2016-17 2015-16 2014-15 % % %
VALUE ADDED Sales & other trade earning 117084 124983 182843 Add:Other income 1211 938 958
118294 125920 183801 Less:Cost of material and services used
109661 115706 170702
TOTAL VALUE ADDiTiON 8634 10214 13099
VALUE DiSTRiBUTiON Operating expenses 5,178 59.98 7,966 77.99 9,924 75.77 Employment costs 1,957 22.66 2,015 19.73 1,918 14.64 Administrative costs 679 7.87 552 5.41 1,280 9.77 Provisions 5 0.06 3 0.03 12 0.09 Depreciation 67 0.77 46 0.45 178 1.36 Interest(net) (65) (0.75) (947) (9.27) (812) (6.20) Income tax 242 2.80 30 0.30 120 0.91 Dividend '-Proposed Dividend - - 300 2.94 250 1.91 '-Tax on Dividend - - 61 0.60 51 0.39 Retained earning 571 6.61 188 1.84 178 1.36 TOTAL VALUE DiSTRiBUTiON 8,634 100 10,214 100 13,099 100
ANALYSiS Number of employee 1,226 1,334 1,439 Value added per employee(Rs.'000) 7042 7657 9103 Net worth 14,359 13,779 13,591 Value added per rupee of net worth 0.60 0.74 0.96
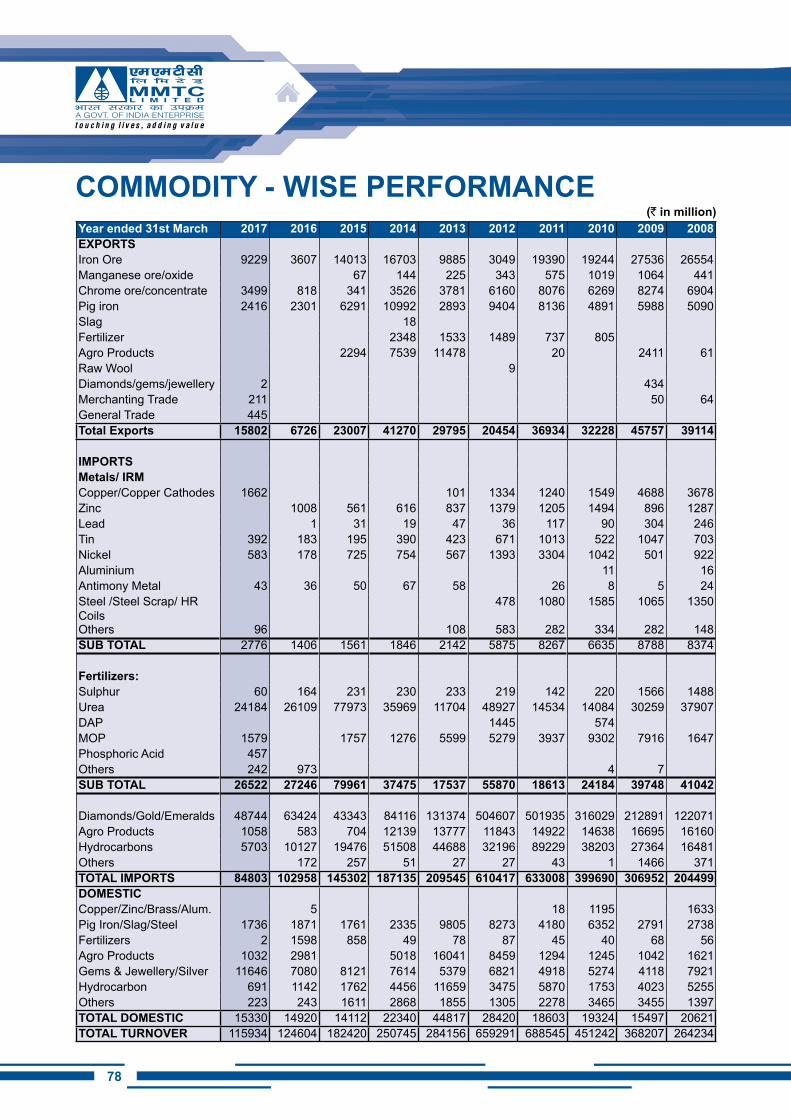
78
COMMODiTY - WiSE PERFORMANCE(` in million)
Year ended 31st March 2017 2016 2015 2014 2013 2012 2011 2010 2009 2008ExPORTSIron Ore 9229 3607 14013 16703 9885 3049 19390 19244 27536 26554Manganese ore/oxide 67 144 225 343 575 1019 1064 441Chrome ore/concentrate 3499 818 341 3526 3781 6160 8076 6269 8274 6904Pig iron 2416 2301 6291 10992 2893 9404 8136 4891 5988 5090Slag 18Fertilizer 2348 1533 1489 737 805Agro Products 2294 7539 11478 20 2411 61Raw Wool 9Diamonds/gems/jewellery 2 434Merchanting Trade 211 50 64General Trade 445Total Exports 15802 6726 23007 41270 29795 20454 36934 32228 45757 39114
iMPORTSMetals/ iRMCopper/Copper Cathodes 1662 101 1334 1240 1549 4688 3678Zinc 1008 561 616 837 1379 1205 1494 896 1287Lead 1 31 19 47 36 117 90 304 246Tin 392 183 195 390 423 671 1013 522 1047 703Nickel 583 178 725 754 567 1393 3304 1042 501 922Aluminium 11 16Antimony Metal 43 36 50 67 58 26 8 5 24Steel /Steel Scrap/ HR Coils
478 1080 1585 1065 1350
Others 96 108 583 282 334 282 148SUB TOTAL 2776 1406 1561 1846 2142 5875 8267 6635 8788 8374
Fertilizers:Sulphur 60 164 231 230 233 219 142 220 1566 1488Urea 24184 26109 77973 35969 11704 48927 14534 14084 30259 37907DAP 1445 574MOP 1579 1757 1276 5599 5279 3937 9302 7916 1647Phosphoric Acid 457Others 242 973 4 7SUB TOTAL 26522 27246 79961 37475 17537 55870 18613 24184 39748 41042
Diamonds/Gold/Emeralds 48744 63424 43343 84116 131374 504607 501935 316029 212891 122071Agro Products 1058 583 704 12139 13777 11843 14922 14638 16695 16160Hydrocarbons 5703 10127 19476 51508 44688 32196 89229 38203 27364 16481Others 172 257 51 27 27 43 1 1466 371TOTAL iMPORTS 84803 102958 145302 187135 209545 610417 633008 399690 306952 204499DOMESTiCCopper/Zinc/Brass/Alum. 5 18 1195 1633Pig Iron/Slag/Steel 1736 1871 1761 2335 9805 8273 4180 6352 2791 2738Fertilizers 2 1598 858 49 78 87 45 40 68 56Agro Products 1032 2981 5018 16041 8459 1294 1245 1042 1621Gems & Jewellery/Silver 11646 7080 8121 7614 5379 6821 4918 5274 4118 7921Hydrocarbon 691 1142 1762 4456 11659 3475 5870 1753 4023 5255Others 223 243 1611 2868 1855 1305 2278 3465 3455 1397TOTAL DOMESTiC 15330 14920 14112 22340 44817 28420 18603 19324 15497 20621TOTAL TURNOVER 115934 124604 182420 250745 284156 659291 688545 451242 368207 264234
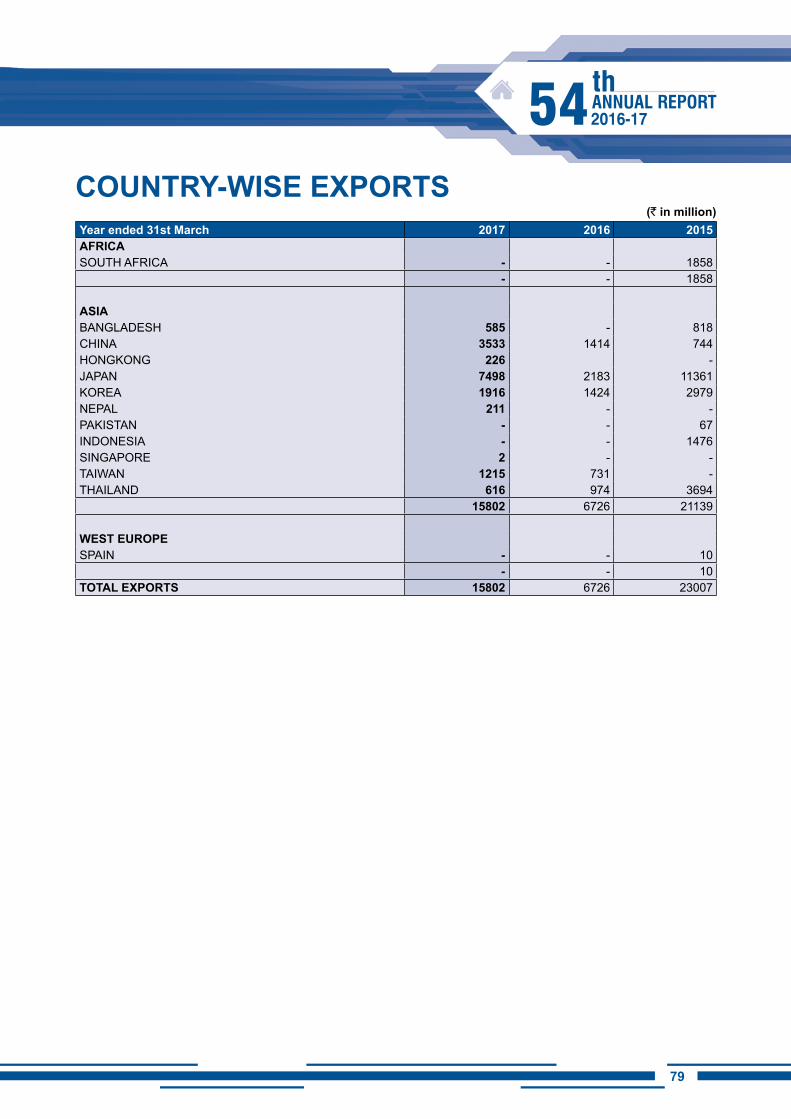
7978
COUNTRY-WiSE ExPORTS(` in million)
Year ended 31st March 2017 2016 2015AFRiCASOUTH AFRICA - - 1858
- - 1858
ASiABANGLADESH 585 - 818CHINA 3533 1414 744HONGKONG 226 -JAPAN 7498 2183 11361KOREA 1916 1424 2979NEPAL 211 - -PAKISTAN - - 67INDONESIA - - 1476SINGAPORE 2 - -TAIWAN 1215 731 -THAILAND 616 974 3694
15802 6726 21139
WEST EUROPESPAIN - - 10
- - 10TOTAL ExPORTS 15802 6726 23007
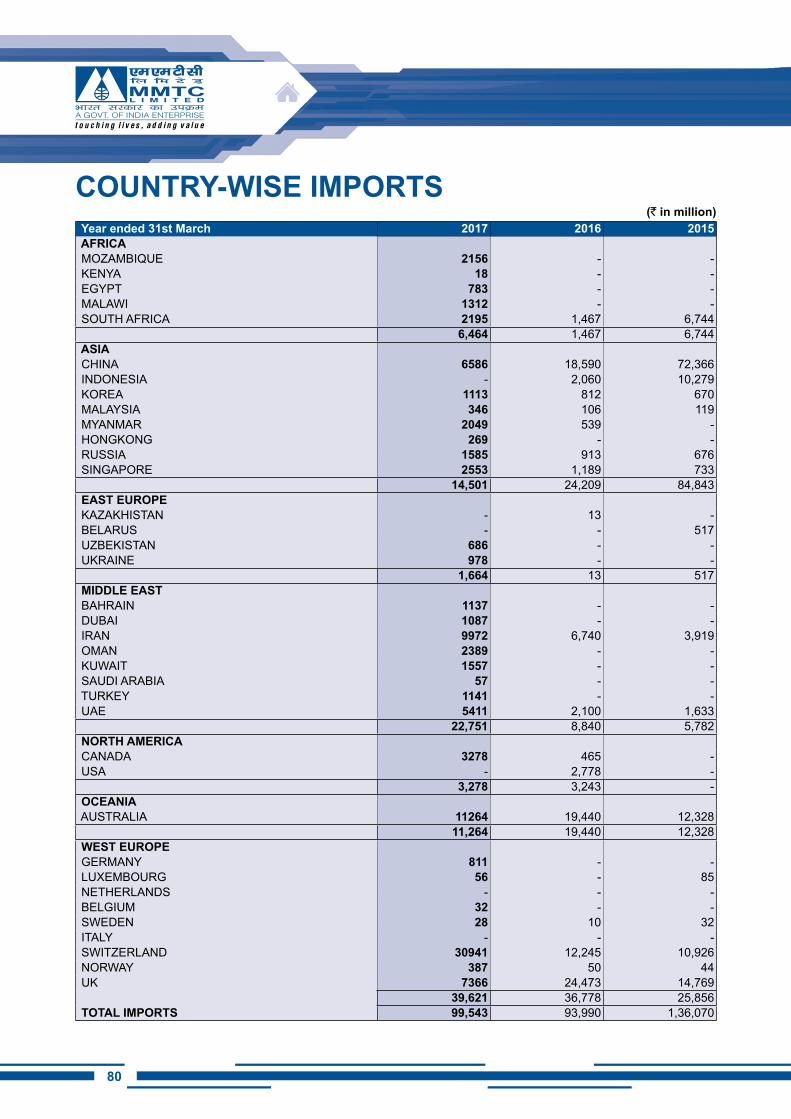
80
COUNTRY-WiSE iMPORTS(` in million)
Year ended 31st March 2017 2016 2015 AFRiCA MOZAMBIQUE 2156 - - KENYA 18 - - EGYPT 783 - - MALAWI 1312 - - SOUTH AFRICA 2195 1,467 6,744
6,464 1,467 6,744 ASiA CHINA 6586 18,590 72,366 INDONESIA - 2,060 10,279 KOREA 1113 812 670 MALAYSIA 346 106 119 MYANMAR 2049 539 - HONGKONG 269 - - RUSSIA 1585 913 676 SINGAPORE 2553 1,189 733
14,501 24,209 84,843 EAST EUROPE KAZAKHISTAN - 13 - BELARUS - - 517 UZBEKISTAN 686 - - UKRAINE 978 - -
1,664 13 517 MiDDLE EAST BAHRAIN 1137 - - DUBAI 1087 - - IRAN 9972 6,740 3,919 OMAN 2389 - - KUWAIT 1557 - - SAUDI ARABIA 57 - - TURKEY 1141 - - UAE 5411 2,100 1,633
22,751 8,840 5,782 NORTh AMERiCA CANADA 3278 465 - USA - 2,778 -
3,278 3,243 - OCEANiA AUSTRALIA 11264 19,440 12,328
11,264 19,440 12,328 WEST EUROPE GERMANY 811 - - LUXEMBOURG 56 - 85 NETHERLANDS - - - BELGIUM 32 - - SWEDEN 28 10 32 ITALY - - - SWITZERLAND 30941 12,245 10,926 NORWAY 387 50 44 UK 7366 24,473 14,769
39,621 36,778 25,856 TOTAL iMPORTS 99,543 93,990 1,36,070
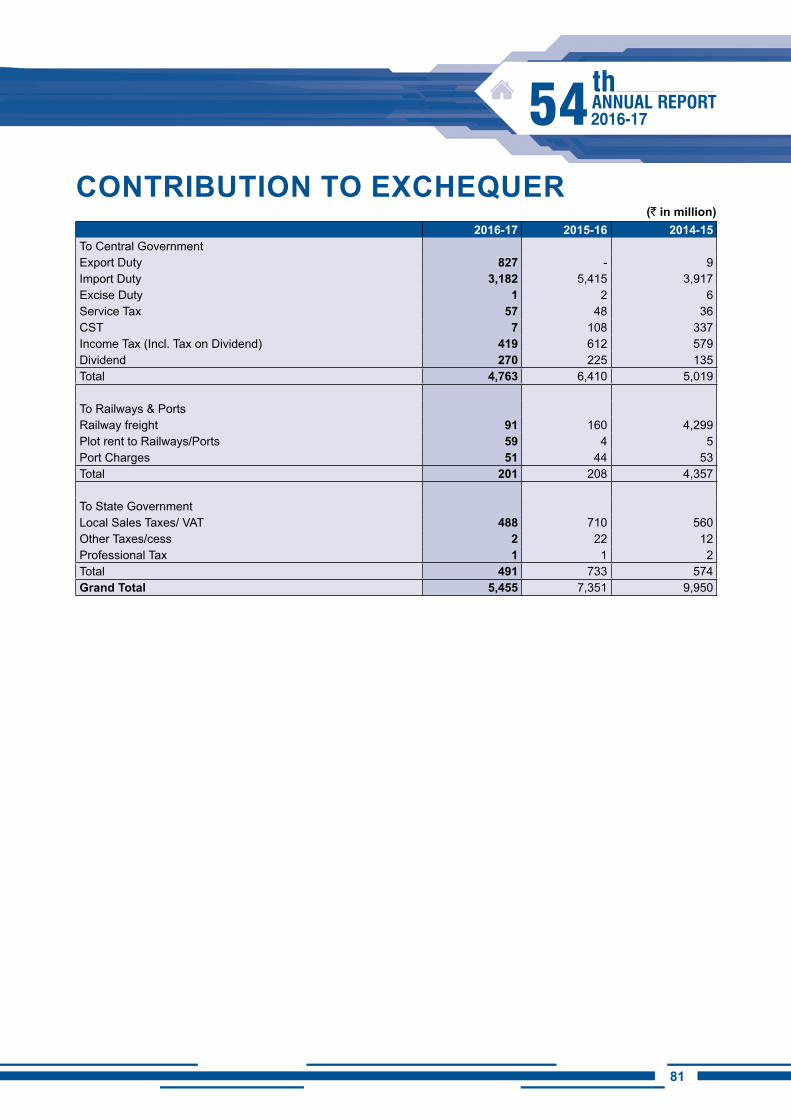
8180
CONTRiBUTiON TO ExChEQUER(` in million)
2016-17 2015-16 2014-15 To Central GovernmentExport Duty 827 - 9 Import Duty 3,182 5,415 3,917 Excise Duty 1 2 6 Service Tax 57 48 36 CST 7 108 337 Income Tax (Incl. Tax on Dividend) 419 612 579 Dividend 270 225 135 Total 4,763 6,410 5,019
To Railways & PortsRailway freight 91 160 4,299 Plot rent to Railways/Ports 59 4 5 Port Charges 51 44 53 Total 201 208 4,357
To State GovernmentLocal Sales Taxes/ VAT 488 710 560 Other Taxes/cess 2 22 12 Professional Tax 1 1 2 Total 491 733 574 Grand Total 5,455 7,351 9,950
82
TO ThE MEMBERS OF MMTC LTD.
Report on the Standalone Ind AS Financial Statements
1. We have audited the accompanying Standalone Ind AS financial statements of MMTC Limited (“the Company”), which comprises the Balance Sheet as at 31st March, 2017, the statement of Profit and Loss (including other comprehensive income), the statement of Cash Flows and statement of changes in Equity for the year then ended and a summary of significant accounting policies and other explanatory information.
Management’s Responsibility for the Standalone Ind AS Financial Statements
2. The Company’s Board of Directors is responsible for the matters stated in Section 134(5) of the Companies Act, 2013 (“the Act”) with respect to the preparation of these standalone Ind AS financial statements to give a true and fair view of the financial position, financial performance (including other comprehensive income), cash flows and changes in equity of the Company in accordance with the accounting principles generally accepted in India, including the Indian Accounting Standards specified in the Companies (Indian Accounting Standards) Rules, 2015 (as amended) under Section 133 of the Act. This responsibility also includes maintenance of adequate accounting records in accordance with the provisions of the Act for safeguarding of the assets of the Company and for preventing and detecting frauds and other irregularities; selection and application of appropriate accounting policies; making judgments and estimates that are reasonable and prudent; and design, implementation and maintenance of adequate internal financial controls, that were operating effectively for ensuring the accuracy and completeness of the accounting records, relevant to the preparation and presentation of the standalone Ind AS financial statements that give a true and fair view and are free from material misstatement, whether due to fraud or error.
Auditors’ Responsibility
3. Our responsibility is to express an opinion on these standalone Ind AS financial statements based on our audit.
We have taken into account the provisions of the Act, the accounting and auditing standards and matters which are required to be included in the audit report under the provisions of the Act and the Rules made
thereunder.
We conducted our audit in accordance with the Standards on Auditing specified under Section 143(10) of the Act and other applicable authoritative pronouncements issued by The Institute of Chartered Accountants of India. Those Standards and pronouncements require that we comply with ethical requirements and plan and perform the audit to obtain reasonable assurance about whether the standalone Ind AS financial statements are free from material misstatement.
An audit involves performing procedures to obtain audit evidence about the amounts and the disclosures in the standalone Ind AS financial statements. The procedures selected depend on the auditors’ judgment, including the assessment of the risks of material misstatement of the standalone Ind AS financial statements, whether due to fraud or error. In making those risk assessments, the auditor considers internal financial control relevant to the Company’s preparation of the standalone Ind AS financial statements that give a true and fair view, in order to design audit procedures that are appropriate in the circumstances. An audit also includes evaluating the appropriateness of the accounting policies used and the reasonableness of the accounting estimates made by the Company’s Directors, as well as evaluating the overall presentation of the standalone Ind AS financial statements.
We believe that the audit evidence we have obtained is sufficient and appropriate to provide a basis for our audit opinion on the standalone Ind AS financial statements.
Opinion
In our opinion and to the best of our information and according to the explanation provided to us, the aforesaid Ind AS financial statements give the information required by the Act in the manner so required and give a true and fair view in conformity with the accounting principles generally accepted in India including Ind AS of the financial position of the Company as at 31stMarch, 2017 and its financial performance including other comprehensive income, its cash flows and the changes in the equity for the year ended on that date
Emphasis of Matter
a. We draw attention to Note No. 36(ix) to the standalone Ind AS financial statements in respect
iNDEPENDENT AUDiTORS’ REPORT
8382
of non-provision of liability, if any arises, in case of non- extension of time/waiver/write off of GR-1 forms.
b. We draw attention to Note No. 49 to the standalone Ind AS financial statements in respect of balances under Sundry Creditors/Sundry Debtors/Claims Recoverable/Loans & advances/Other Liabilities which, in many cases have not been confirmed and any adjustments due to consequent reconciliation, if any, required is not ascertainable.
c. We draw attention to Note No.36 (v), (vi) and 38 (c) to the standalone Ind AS financial statements in respect of fund based and non-fund based exposure of the Company in M/s Neelachal Ispat Nigam Ltd. (NINL) – a Joint Venture Company.
Our opinion is not modified in respect of this matter.
Other Matters
A. The comparative financial information of the Company for the year ended March 31, 2016 and the transition date opening balance sheet as at April 1, 2015 included in these standalone Ind AS financial statements, are based on the previously issued statutory financial statements for the years ended March 31, 2016 and March 31, 2015 prepared in accordance with the Companies (Accounting Standards) Rules, 2006 (as amended). Financial statement for the financial year ended 31st March 2016 were audited by us and expressed an unmodified opinion vide report dated 27th May 2016, whereas financial statement for the year ended 31st March 2015 which were audited by the predecessor auditor and expressed an unmodified opinion vide report dated 21st May 2015. The adjustments to those financial statements for the differences in accounting principles adopted by the Company on transition to the Ind AS have been audited by us.
B. We did not audit the Ind AS financial statements/ financial information of 8 regional offices included in the standalone financial statements of the company whose Ind AS financial statements/financial information reflect total assets of INR 45,597.62 million as at March 31, 2017 and total revenue of INR 78,702.83 million for the year ended on that date, as considered in the standalone Ind AS financial statements. The Ind AS financial statements/financial information of these branches have been audited by the branch auditors whose reports have been furnished to us and our opinion in so far as it relates to the amount and disclosure
included in respect of these branches, is based solely on the report of such branch auditors.
Report on Other Legal and Regulatory Requirements
4. As required by the Companies (Auditor’s Report) Order, 2016 (“the Order”) issued by the Central Government of India in terms of sub-section (11) of section 143 of the Act, we give in the “Annexure-1” a statement on the matters specified in the paragraph 3 and 4 of the Order, to the extent applicable.
5. As required by Section 143 (3) of the Act, we report that:
a) We have sought and obtained all the information and explanations, which to the best of our knowledge and belief were necessary for the purposes of our audit;
b) In our opinion, proper books of account as required by law have been kept by the Company so far as appears from our examination of those books;
c) The reports on the accounts of the branch offices of the Company audited under section 143 (8) of the Act by the Branch auditors have been sent to us and have been properly dealt with by us in preparing the report;
d) The Balance Sheet, the Statement of Profit and Loss, the Statement of Cash Flows and Statement of Changes in Equity, referred to in this report are in agreement with the books of accounts;
e) In our opinion, the aforesaid standalone Ind AS financial statements comply with the Accounting Standards specified under Section 133 of the Act, read with relevant rules issued thereunder;
f) On the basis of written representations received from the directors as on 31st March 2017, taken on record by the Board of Directors, none of the directors is disqualified as on 31st March 2017 from being appointed as a director in terms of Section 164(2) of the Companies Act, 2013;
g) With respect to the other matters to be included in the Auditor’s Report in accordance with Rule 11 of the Companies (Audit and Auditors) Rules, 2014, in our opinion and to the best of our information and according to the explanations given to us
i. There are pending litigations including matters relating to sales tax, custom duty and excise duty which are disclosed as contingent liability - refer to Note 36 and 38 to the standalone
84
Ind AS financial statements, the impact of the same is unascertainable as the matters are sub-judice.
ii. The Company has made provision, as required under the applicable law or accounting standards, for material foreseeable losses, if any, on long term contracts including derivative contracts.
iii. There has been no delay in transferring amounts required to be transferred to the Investors Education and Protection Fund by the Company.
iv. With respect to the adequacy of internal financial controls over financial reporting of the company and operating effectiveness of such controls, refer to our separate Report in “Annexure-2”.
v. The company has provided requisite disclosure in note no. 52 to these standalone
Ind AS financial statements as to holding of Specified Bank Notes on 8th November 2016 and 30th December 2016 as well as dealing in specified notes during the period 8th November 2016 to 30th December 2016. The disclosures are in accordance with the books of accounts maintained by the company and as produced before us by the management.
6. As required by C&AG of India through sub-directions, issued under Section 143 (5) of the Company’s Act, we give our report in the attached “Annexure-3”
For O.P. Tulsyan & CompanyChartered Accountants
FRN: 500028N
Place: New Delhi Rakesh AgarwalDate: 29.05.2017 Partner
M No.: 081808
8584
Annexure-1 To the Independent Auditors’ Report on the Standalone Ind AS Financial Statements of MMTC LTD.(Referred to in Paragraph 1 under the “Other Legal & Regulatory Requirement”)We further report that:
1. In Respect of Its Fixed Assets
i. The Company has maintained proper records in respect of its fixed assets showing full particulars including quantitative details and situation of fixed asset.
ii. Based on the physical verification reports produced before us, in our opinion, the said assets have been physically verified by the management at reasonable intervals.
iii. Title Deeds of immovable property are held in the name of the company except in the case mentioned below:
Region/Office Asset Description Gross Value Area RemarksCorporate Office Land for Residential
Colony at New Delhi13.16 Lakhs 32.33
AcresLease Agreement is in Joint Name of MMTC and State Trading Corporation
Bhubaneshwar Office
Residential Building, Roads, Culverts and Electrical Installations
49.01 Lakhs 2 Acres Lease Deed Expired in 2011
2. in Respect of Its Inventory
i. As explained to us, the inventories have been physically verified during the year by the management.
ii. In our opinion and according to the information and explanation given to us, no material discrepancies were noticed during the course of physical verification.
iii. In our opinion and according to the information and explanation given to us, the procedure of physical verification of inventories followed by the management needs to be further strengthened in relation to the size of the MMTC Limited and the nature of its business.
3. Loans given to parties covered under section 189
The company has granted unsecured loan to one of its joint venture company, M/s Neelachal Ispat Nigam Limited.
i. In our opinion and according to the information and explanation given to us, terms and conditions on which loan has been granted is not pre-judicial to the interest of the company.
ii. According to the information and explanation given to us repayment schedule has been agreed with the company.
iii. According to the information and explanation given to us, there is no amount overdue.
4. Compliance of Provision of Section 185 and 186 of the Companies Act, 2013 in respect of loans, guarantees and securities
According to the information and explanations given to us, and as per the records verified by us, the company has complied the provisions of Section 185 and 186.
5. Acceptance of Deposits
According to the information and explanations given to us, the company has not accepted deposits as per the directive issued by the Reserve Bank of India and the provision of Section 73 to 76 or any other relevant provision of the Act and the rules framed there under.
6. Maintenance of Cost Records
As explained to us, maintenance of cost records has not been prescribed by the Central Government for the company under Section 148(1) of the Act.
7. Undisputed & Disputed Statutory Dues
(a) According to the information and explanations given to us and as per the records verified by us, the Company has been regular in depositing undisputed statutory dues including Income Tax, Provident Fund dues, Professional Tax, Value Added Tax and Service Tax with the appropriate authorities.
86
(b) There were no undisputed amount payable in respect of Income Tax, Provident Fund dues, Professional Tax, Value Added Tax and Service Tax and other statutory dues in arrear as at 31st March 2017 for more than six months from the date they became payable.
(c) In case if dues of Income Tax or sales tax or service tax or duty of custom or duty of excise or value tax or cess have not been deposited on account of any dispute are attachedas Annexure A:
8. Loans from Banks/Financial institutions/Government/Debentures
According to the information and explanations given to us and as per the records verified by us, the company has not defaulted in repayment of loans or borrowings to a financial institution, bank, Government or dues to debenture holders.
9. Proceeds of Public Issue (including debt instruments)/Term Loans
According to the information and explanations given to us and as per the records verified by us, the Company has not raised any money during the year through initial/further public offer (including debt instruments). Term loans raised by the company during the year have been utilized for the purpose for which they were obtained.
10. Frauds on or by the Company
According to the information and explanations given to us and as per the records verified by us, carried out in accordance with the generally accepted auditing practices in India, we have neither come across any instance of fraud on or by the company or its officers, noticed or reported during the year, nor have we been informed of such case by the management.
11. Managerial Remuneration
According to the information and explanations given to us and as per the records verified by us, managerial remuneration has been paid/provided for by the company during the year under review is within the purview of Section 197, read with Schedule V to the Act.
12. Nidhi Companies
The Company is not a Nidhi Company during the year under review and hence, the criteria as stipulated under Nidhi Rules 2014 are not applicable to the company.
13. Related Party Transactions
As per the information and explanations given during the course of our verification, in our opinion, all transactions with the related parties made by the company were in compliance with section 177 and 188 of the Act, to the extent applicable to the company during the year, the relevant details in respect of which have been appropriately disclosed in the Ind AS financial statements.
14. Preferential issue
During the year, the company has not made any preferential allotment or private placement of equity shares or convertible debentures and hence the requirements of Section 42 of the Act are not applicable.
15. Non-Cash Transactions with Director’s etc.
As per the informations and explanations provided to us, during the year, the Company has not entered into any non-cash transactions with directors or persons connected with the directors within the purview of section 192 of the Act are not applicable.
16. Provision of 45-IA of the Reserve Bank of India Act,1934
According to the information and explanations given to us and as per the records verified by us, during the year, the Company is not required to be registered under Section 45-IA of the Reserve Bank of India Act 1934.
For O.P. Tulsyan & CompanyChartered Accountants
FRN: 500028N
Place: New Delhi Rakesh AgarwalDate: 29.05.2017 Partner
M No.: 081808
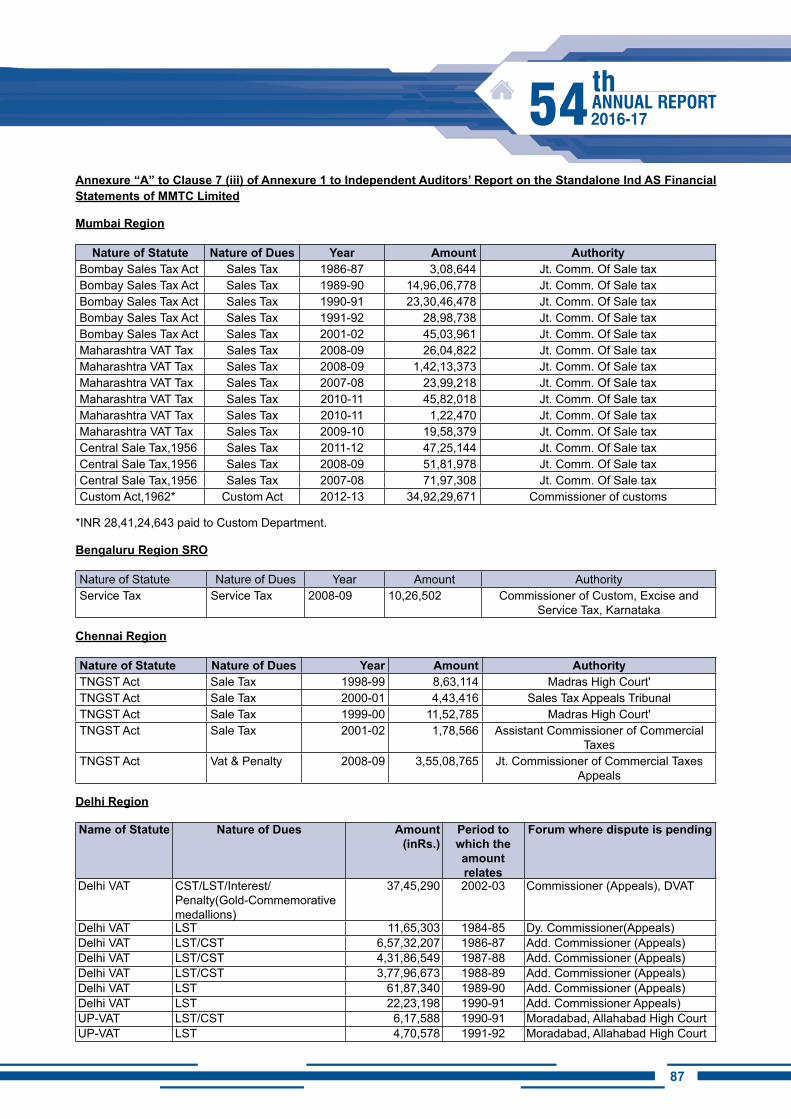
8786
Annexure “A” to Clause 7 (iii) of Annexure 1 to Independent Auditors’ Report on the Standalone Ind AS Financial Statements of MMTC Limited
Mumbai Region
Nature of Statute Nature of Dues Year Amount AuthorityBombay Sales Tax Act Sales Tax 1986-87 3,08,644 Jt. Comm. Of Sale taxBombay Sales Tax Act Sales Tax 1989-90 14,96,06,778 Jt. Comm. Of Sale taxBombay Sales Tax Act Sales Tax 1990-91 23,30,46,478 Jt. Comm. Of Sale taxBombay Sales Tax Act Sales Tax 1991-92 28,98,738 Jt. Comm. Of Sale taxBombay Sales Tax Act Sales Tax 2001-02 45,03,961 Jt. Comm. Of Sale taxMaharashtra VAT Tax Sales Tax 2008-09 26,04,822 Jt. Comm. Of Sale taxMaharashtra VAT Tax Sales Tax 2008-09 1,42,13,373 Jt. Comm. Of Sale taxMaharashtra VAT Tax Sales Tax 2007-08 23,99,218 Jt. Comm. Of Sale taxMaharashtra VAT Tax Sales Tax 2010-11 45,82,018 Jt. Comm. Of Sale taxMaharashtra VAT Tax Sales Tax 2010-11 1,22,470 Jt. Comm. Of Sale taxMaharashtra VAT Tax Sales Tax 2009-10 19,58,379 Jt. Comm. Of Sale taxCentral Sale Tax,1956 Sales Tax 2011-12 47,25,144 Jt. Comm. Of Sale taxCentral Sale Tax,1956 Sales Tax 2008-09 51,81,978 Jt. Comm. Of Sale taxCentral Sale Tax,1956 Sales Tax 2007-08 71,97,308 Jt. Comm. Of Sale taxCustom Act,1962* Custom Act 2012-13 34,92,29,671 Commissioner of customs
*INR 28,41,24,643 paid to Custom Department.
Bengaluru Region SRO
Nature of Statute Nature of Dues Year Amount AuthorityService Tax Service Tax 2008-09 10,26,502 Commissioner of Custom, Excise and
Service Tax, Karnataka
Chennai Region
Nature of Statute Nature of Dues Year Amount AuthorityTNGST Act Sale Tax 1998-99 8,63,114 Madras High Court'TNGST Act Sale Tax 2000-01 4,43,416 Sales Tax Appeals TribunalTNGST Act Sale Tax 1999-00 11,52,785 Madras High Court'TNGST Act Sale Tax 2001-02 1,78,566 Assistant Commissioner of Commercial
TaxesTNGST Act Vat & Penalty 2008-09 3,55,08,765 Jt. Commissioner of Commercial Taxes
Appeals
Delhi Region
Name of Statute Nature of Dues Amount(inRs.)
Period to which the amount relates
Forum where dispute is pending
Delhi VAT CST/LST/Interest/Penalty(Gold-Commemorative medallions)
37,45,290 2002-03 Commissioner (Appeals), DVAT
Delhi VAT LST 11,65,303 1984-85 Dy. Commissioner(Appeals)Delhi VAT LST/CST 6,57,32,207 1986-87 Add. Commissioner (Appeals)Delhi VAT LST/CST 4,31,86,549 1987-88 Add. Commissioner (Appeals)Delhi VAT LST/CST 3,77,96,673 1988-89 Add. Commissioner (Appeals)Delhi VAT LST 61,87,340 1989-90 Add. Commissioner (Appeals)Delhi VAT LST 22,23,198 1990-91 Add. Commissioner Appeals)UP-VAT LST/CST 6,17,588 1990-91 Moradabad, Allahabad High CourtUP-VAT LST 4,70,578 1991-92 Moradabad, Allahabad High Court
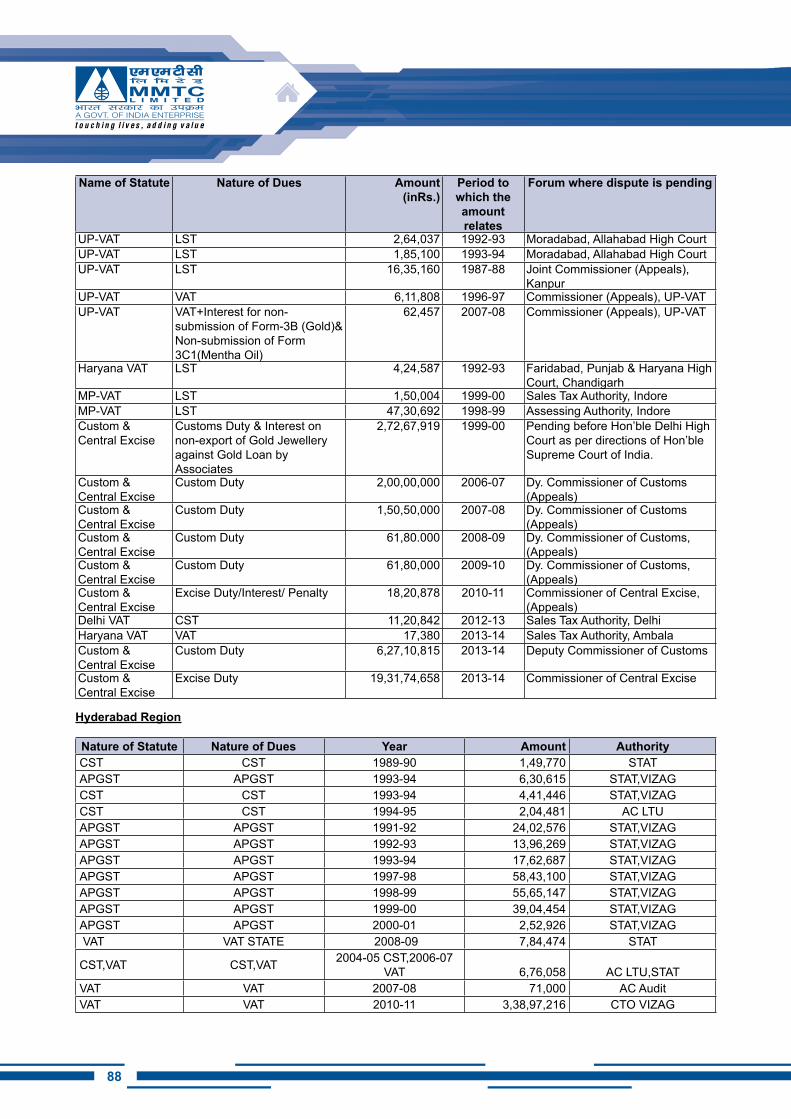
88
Name of Statute Nature of Dues Amount(inRs.)
Period to which the amount relates
Forum where dispute is pending
UP-VAT LST 2,64,037 1992-93 Moradabad, Allahabad High CourtUP-VAT LST 1,85,100 1993-94 Moradabad, Allahabad High CourtUP-VAT LST 16,35,160 1987-88 Joint Commissioner (Appeals),
KanpurUP-VAT VAT 6,11,808 1996-97 Commissioner (Appeals), UP-VATUP-VAT VAT+Interest for non-
submission of Form-3B (Gold)& Non-submission of Form 3C1(Mentha Oil)
62,457 2007-08 Commissioner (Appeals), UP-VAT
Haryana VAT LST 4,24,587 1992-93 Faridabad, Punjab & Haryana High Court, Chandigarh
MP-VAT LST 1,50,004 1999-00 Sales Tax Authority, IndoreMP-VAT LST 47,30,692 1998-99 Assessing Authority, IndoreCustom & Central Excise
Customs Duty & Interest on non-export of Gold Jewellery against Gold Loan by Associates
2,72,67,919 1999-00 Pending before Hon’ble Delhi High Court as per directions of Hon’ble Supreme Court of India.
Custom & Central Excise
Custom Duty 2,00,00,000 2006-07 Dy. Commissioner of Customs (Appeals)
Custom & Central Excise
Custom Duty 1,50,50,000 2007-08 Dy. Commissioner of Customs (Appeals)
Custom & Central Excise
Custom Duty 61,80.000 2008-09 Dy. Commissioner of Customs, (Appeals)
Custom & Central Excise
Custom Duty 61,80,000 2009-10 Dy. Commissioner of Customs, (Appeals)
Custom & Central Excise
Excise Duty/Interest/ Penalty 18,20,878 2010-11 Commissioner of Central Excise, (Appeals)
Delhi VAT CST 11,20,842 2012-13 Sales Tax Authority, DelhiHaryana VAT VAT 17,380 2013-14 Sales Tax Authority, AmbalaCustom & Central Excise
Custom Duty 6,27,10,815 2013-14 Deputy Commissioner of Customs
Custom & Central Excise
Excise Duty 19,31,74,658 2013-14 Commissioner of Central Excise
Hyderabad Region
Nature of Statute Nature of Dues Year Amount AuthorityCST CST 1989-90 1,49,770 STATAPGST APGST 1993-94 6,30,615 STAT,VIZAGCST CST 1993-94 4,41,446 STAT,VIZAGCST CST 1994-95 2,04,481 AC LTUAPGST APGST 1991-92 24,02,576 STAT,VIZAGAPGST APGST 1992-93 13,96,269 STAT,VIZAGAPGST APGST 1993-94 17,62,687 STAT,VIZAGAPGST APGST 1997-98 58,43,100 STAT,VIZAGAPGST APGST 1998-99 55,65,147 STAT,VIZAGAPGST APGST 1999-00 39,04,454 STAT,VIZAGAPGST APGST 2000-01 2,52,926 STAT,VIZAG VAT VAT STATE 2008-09 7,84,474 STAT
CST,VAT CST,VAT 2004-05 CST,2006-07 VAT 6,76,058 AC LTU,STAT
VAT VAT 2007-08 71,000 AC AuditVAT VAT 2010-11 3,38,97,216 CTO VIZAG
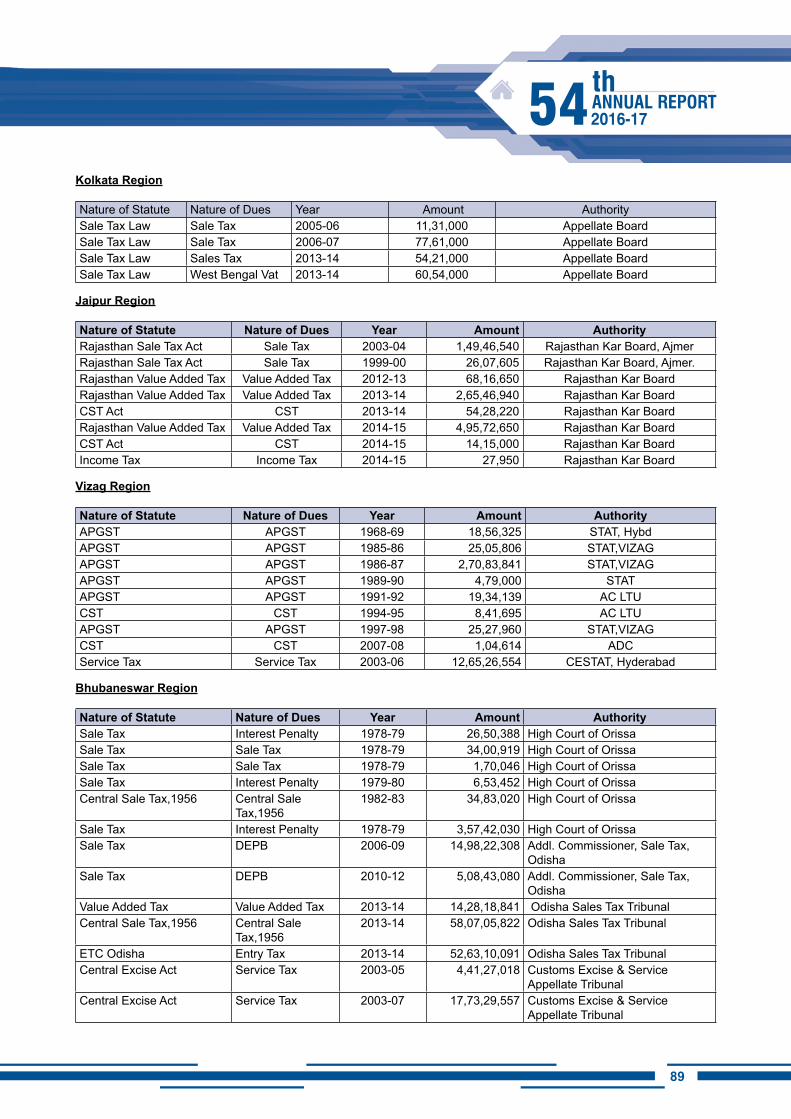
8988
Kolkata Region
Nature of Statute Nature of Dues Year Amount AuthoritySale Tax Law Sale Tax 2005-06 11,31,000 Appellate BoardSale Tax Law Sale Tax 2006-07 77,61,000 Appellate BoardSale Tax Law Sales Tax 2013-14 54,21,000 Appellate BoardSale Tax Law West Bengal Vat 2013-14 60,54,000 Appellate Board
Jaipur Region
Nature of Statute Nature of Dues Year Amount AuthorityRajasthan Sale Tax Act Sale Tax 2003-04 1,49,46,540 Rajasthan Kar Board, AjmerRajasthan Sale Tax Act Sale Tax 1999-00 26,07,605 Rajasthan Kar Board, Ajmer.Rajasthan Value Added Tax Value Added Tax 2012-13 68,16,650 Rajasthan Kar BoardRajasthan Value Added Tax Value Added Tax 2013-14 2,65,46,940 Rajasthan Kar BoardCST Act CST 2013-14 54,28,220 Rajasthan Kar BoardRajasthan Value Added Tax Value Added Tax 2014-15 4,95,72,650 Rajasthan Kar BoardCST Act CST 2014-15 14,15,000 Rajasthan Kar BoardIncome Tax Income Tax 2014-15 27,950 Rajasthan Kar Board
Vizag Region
Nature of Statute Nature of Dues Year Amount AuthorityAPGST APGST 1968-69 18,56,325 STAT, HybdAPGST APGST 1985-86 25,05,806 STAT,VIZAGAPGST APGST 1986-87 2,70,83,841 STAT,VIZAGAPGST APGST 1989-90 4,79,000 STATAPGST APGST 1991-92 19,34,139 AC LTUCST CST 1994-95 8,41,695 AC LTUAPGST APGST 1997-98 25,27,960 STAT,VIZAGCST CST 2007-08 1,04,614 ADCService Tax Service Tax 2003-06 12,65,26,554 CESTAT, Hyderabad
Bhubaneswar Region
Nature of Statute Nature of Dues Year Amount AuthoritySale Tax Interest Penalty 1978-79 26,50,388 High Court of OrissaSale Tax Sale Tax 1978-79 34,00,919 High Court of OrissaSale Tax Sale Tax 1978-79 1,70,046 High Court of OrissaSale Tax Interest Penalty 1979-80 6,53,452 High Court of OrissaCentral Sale Tax,1956 Central Sale
Tax,19561982-83 34,83,020 High Court of Orissa
Sale Tax Interest Penalty 1978-79 3,57,42,030 High Court of OrissaSale Tax DEPB 2006-09 14,98,22,308 Addl. Commissioner, Sale Tax,
OdishaSale Tax DEPB 2010-12 5,08,43,080 Addl. Commissioner, Sale Tax,
OdishaValue Added Tax Value Added Tax 2013-14 14,28,18,841 Odisha Sales Tax TribunalCentral Sale Tax,1956 Central Sale
Tax,19562013-14 58,07,05,822 Odisha Sales Tax Tribunal
ETC Odisha Entry Tax 2013-14 52,63,10,091 Odisha Sales Tax TribunalCentral Excise Act Service Tax 2003-05 4,41,27,018 Customs Excise & Service
Appellate TribunalCentral Excise Act Service Tax 2003-07 17,73,29,557 Customs Excise & Service
Appellate Tribunal
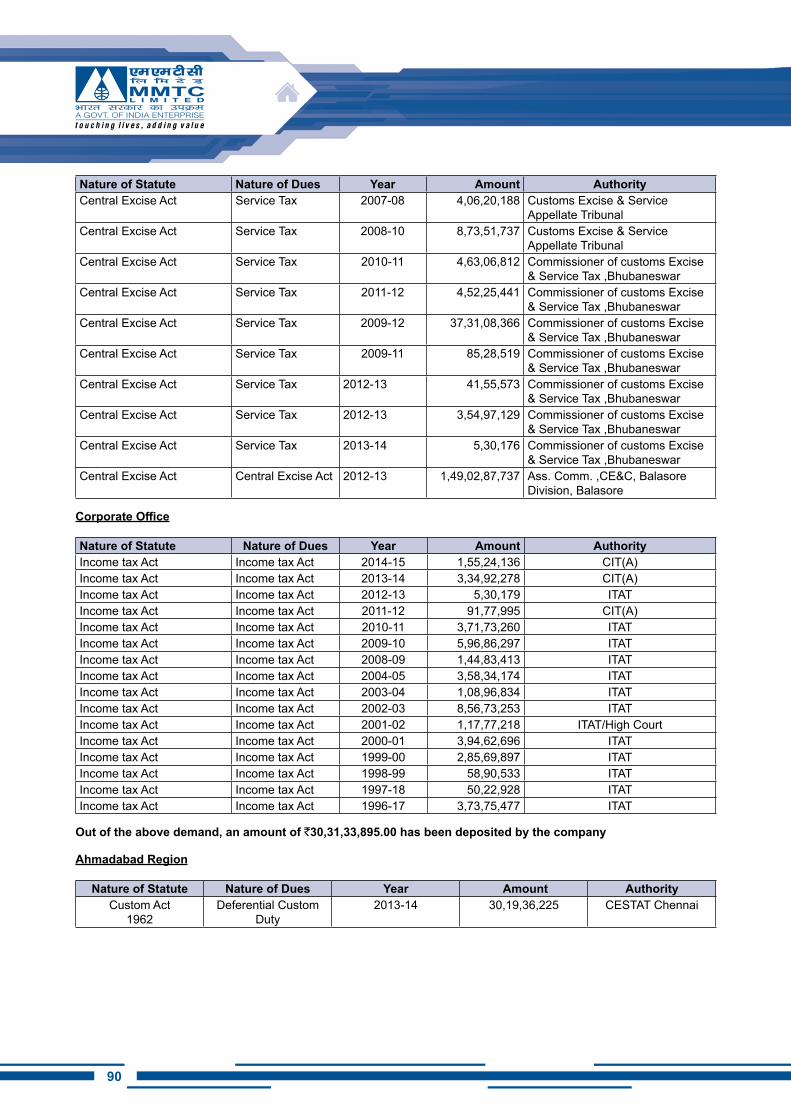
90
Nature of Statute Nature of Dues Year Amount AuthorityCentral Excise Act Service Tax 2007-08 4,06,20,188 Customs Excise & Service
Appellate TribunalCentral Excise Act Service Tax 2008-10 8,73,51,737 Customs Excise & Service
Appellate TribunalCentral Excise Act Service Tax 2010-11 4,63,06,812 Commissioner of customs Excise
& Service Tax ,BhubaneswarCentral Excise Act Service Tax 2011-12 4,52,25,441 Commissioner of customs Excise
& Service Tax ,BhubaneswarCentral Excise Act Service Tax 2009-12 37,31,08,366 Commissioner of customs Excise
& Service Tax ,BhubaneswarCentral Excise Act Service Tax 2009-11 85,28,519 Commissioner of customs Excise
& Service Tax ,BhubaneswarCentral Excise Act Service Tax 2012-13 41,55,573 Commissioner of customs Excise
& Service Tax ,BhubaneswarCentral Excise Act Service Tax 2012-13 3,54,97,129 Commissioner of customs Excise
& Service Tax ,BhubaneswarCentral Excise Act Service Tax 2013-14 5,30,176 Commissioner of customs Excise
& Service Tax ,BhubaneswarCentral Excise Act Central Excise Act 2012-13 1,49,02,87,737 Ass. Comm. ,CE&C, Balasore
Division, Balasore
Corporate Office
Nature of Statute Nature of Dues Year Amount AuthorityIncome tax Act Income tax Act 2014-15 1,55,24,136 CIT(A)Income tax Act Income tax Act 2013-14 3,34,92,278 CIT(A)Income tax Act Income tax Act 2012-13 5,30,179 ITATIncome tax Act Income tax Act 2011-12 91,77,995 CIT(A)Income tax Act Income tax Act 2010-11 3,71,73,260 ITATIncome tax Act Income tax Act 2009-10 5,96,86,297 ITATIncome tax Act Income tax Act 2008-09 1,44,83,413 ITATIncome tax Act Income tax Act 2004-05 3,58,34,174 ITATIncome tax Act Income tax Act 2003-04 1,08,96,834 ITATIncome tax Act Income tax Act 2002-03 8,56,73,253 ITATIncome tax Act Income tax Act 2001-02 1,17,77,218 ITAT/High CourtIncome tax Act Income tax Act 2000-01 3,94,62,696 ITATIncome tax Act Income tax Act 1999-00 2,85,69,897 ITATIncome tax Act Income tax Act 1998-99 58,90,533 ITATIncome tax Act Income tax Act 1997-18 50,22,928 ITATIncome tax Act Income tax Act 1996-17 3,73,75,477 ITAT
Out of the above demand, an amount of `30,31,33,895.00 has been deposited by the company
Ahmadabad Region
Nature of Statute Nature of Dues Year Amount AuthorityCustom Act
1962Deferential Custom
Duty 2013-14 30,19,36,225 CESTAT Chennai
9190
Annexure-2 To the Independent Auditors’ Report of even date on the Ind AS standalone financial statements of MMTC Ltd.
Report on the Internal Financial Controls over financial reporting under Section 143(3)(i) of the Companies Act, 2013 (“the Act”)
We have audited the internal financial controls over financial reporting of MMTC Ltd. (“the Company”) as of March 31, 2017, in conjunction with our audit of the standalone Ind AS financial statements of the Company for the year ended on that date.
Management’s Responsibility for Internal Financial Controls:
The Company’s management is responsible for establishing and maintaining internal financial controls based on the internal control over financial reporting criteria established by the company considering the essential components of internal control stated in the Guidance Note on Audit of Internal Financial Controls over financial reporting issued by the Institute of Chartered Accountants of India (the ICAI). These responsibilities include the design, implementation and maintenance of adequate internal financial controls that were operating effectively for ensuring the orderly and efficient conduct of its business, including adherence to Company’s policies, the safeguarding of its assets, the prevention and detection of frauds and errors, the accuracy and completeness of the accounting records, and the timely preparation of reliable financial information, as required under the Companies Act, 2013.
Auditor’s Responsibility:
Our responsibility is to express an opinion on the Company’s internal financial controls over financial reporting based on our audit. We conducted our audit in accordance with the Guidance Note on Audit of Internal financial controls over financial reporting and the Standards on Auditing, issued by the ICAI deemed to be prescribed under section 143(10) of the Companies Act, 2013, to the extent applicable to an audit of internal financial controls. Those standards and the Guidance Note that we comply with ethical requirements and plan and perform the audit to obtain reasonable assurance about whether adequate internal financial controls over financial reporting was established and maintained and if such controls operated effectively in all material respects.
Our audit involves performing procedures to obtain audit evidence about the adequacy of the internal financial controls system over financial reporting and their operating effectiveness. Our audit of internal financial controls over financial reporting included obtaining an understanding of internal financial controls over financial reporting, assessing the risk that a material weakness exist, and testing and evaluating the design and operating effectiveness of the internal control based on the assessed risk . The procedures selected depend on the auditor’s judgment, including the assessment of risks of material misstatements of the Ind AS financial statements, whether due to fraud or error.
We believe that the audit evidence we have obtained is sufficient and appropriate to provide a basis of our audit opinion on the Company’s internal financial controls system over financial reporting.
Meaning of Internal Financial Controls over Financial Reporting:
A company’s internal financial control over financial reporting is a process designed to provide reasonable assurance regarding the reliability of financial reporting and the preparation of Ind AS financial statements for external purposes in accordance with generally accepted accounting principles. A company’s internal financial control over financial reporting includes those policies and procedures that:
1. Pertain to the maintenance of records that, in reasonable detail, accurately and fairly reflect the transactions and dispositions of the assets of the company;
2. Provide reasonable assurance that transactions are recorded as necessary to permit preparation of Ind AS financial statements in accordance with generally accepted principles, and that receipts and expenditures of the company are being made only in accordance with authorizations of management and directors of the company; and
3. Provide reasonable assurance regarding prevention or timely detection of unauthorized acquisition, use, or disposition of the company’s assets that could have a material effect on the Ind AS financial statements.
92
Inherent Limitations of Internal Financial Controls over Financial Reporting:
Because of the inherent limitations of internal financial controls over financial reporting, including the possibility of collusion or improper management override of controls, material misstatements due to error or fraud may occur and not be detected. Also, projections of any evaluation of the internal financial controls over financial reporting to future periods are subject to the risk that the internal financial control over financial reporting may become inadequate because of changes in conditions, or that the degree of compliance with the policies or procedures may deteriorate.
Opinion:
In our opinion, subject to a few areas in which improvement, as discussed and agreed with the management, is required, the Company has, in all material respects, an adequate internal financial controls system over financial reporting and such internal financial controls over financial reporting were operating effectively as at March 31st 2017, based on the internal control over financial reporting criteria established by the company considering the essential components of internal control stated in the Guidance Note on Audit of Internal Financial Controls Over Financial Reporting issued by the Institute of Chartered Accountants of India.
For O.P. Tulsyan & CompanyChartered Accountants
FRN: 500028N
Place: New Delhi Rakesh AgarwalDate: 29.05.2017 Partner
M No.: 081808
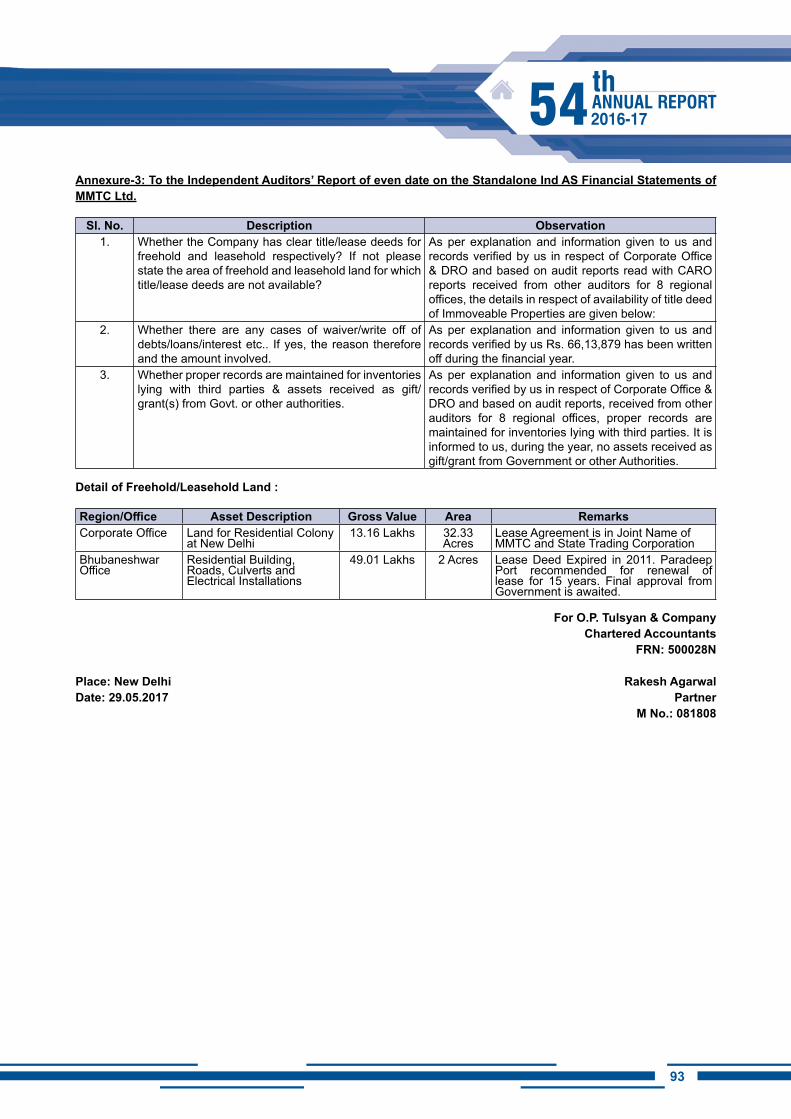
9392
Annexure-3: To the Independent Auditors’ Report of even date on the Standalone Ind AS Financial Statements of MMTC Ltd.
Sl. No. Description Observation1. Whether the Company has clear title/lease deeds for
freehold and leasehold respectively? If not please state the area of freehold and leasehold land for which title/lease deeds are not available?
As per explanation and information given to us and records verified by us in respect of Corporate Office & DRO and based on audit reports read with CARO reports received from other auditors for 8 regional offices, the details in respect of availability of title deed of Immoveable Properties are given below:
2. Whether there are any cases of waiver/write off of debts/loans/interest etc.. If yes, the reason therefore and the amount involved.
As per explanation and information given to us and records verified by us Rs. 66,13,879 has been written off during the financial year.
3. Whether proper records are maintained for inventories lying with third parties & assets received as gift/grant(s) from Govt. or other authorities.
As per explanation and information given to us and records verified by us in respect of Corporate Office & DRO and based on audit reports, received from other auditors for 8 regional offices, proper records are maintained for inventories lying with third parties. It is informed to us, during the year, no assets received as gift/grant from Government or other Authorities.
Detail of Freehold/Leasehold Land :
Region/Office Asset Description Gross Value Area RemarksCorporate Office Land for Residential Colony
at New Delhi13.16 Lakhs 32.33
AcresLease Agreement is in Joint Name of MMTC and State Trading Corporation
Bhubaneshwar Office
Residential Building, Roads, Culverts and Electrical Installations
49.01 Lakhs 2 Acres Lease Deed Expired in 2011. Paradeep Port recommended for renewal of lease for 15 years. Final approval from Government is awaited.
For O.P. Tulsyan & CompanyChartered Accountants
FRN: 500028N
Place: New Delhi Rakesh AgarwalDate: 29.05.2017 Partner
M No.: 081808
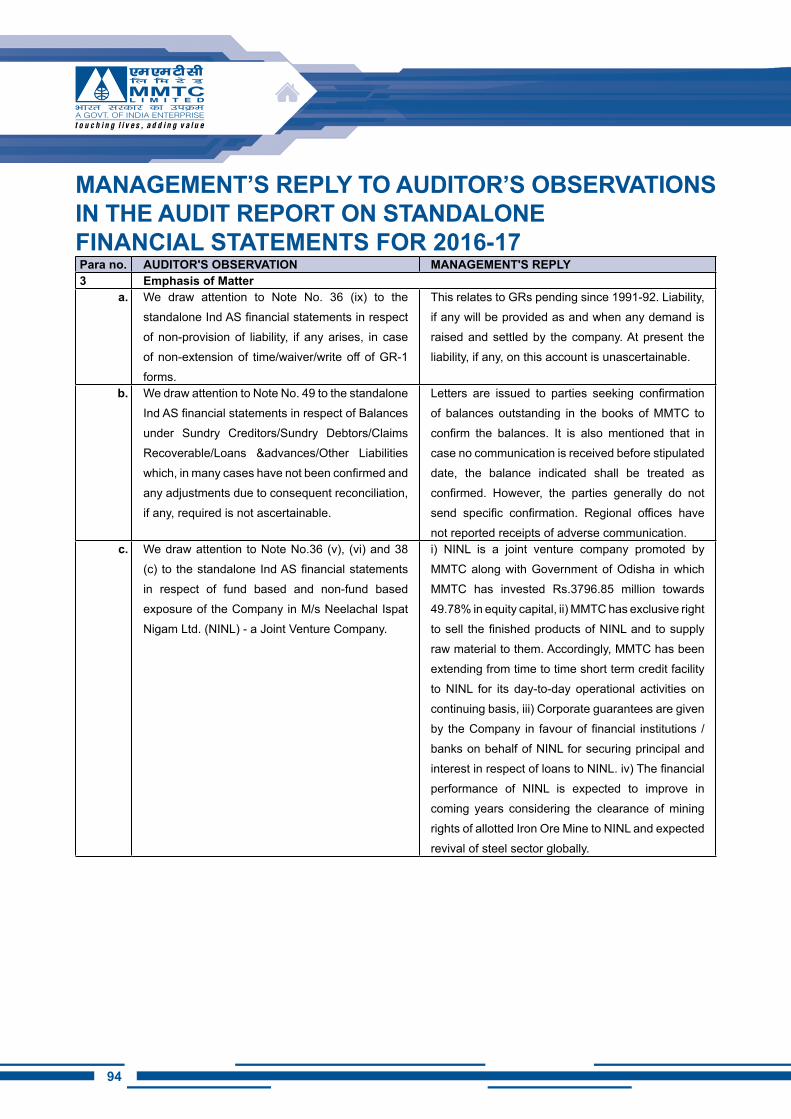
94
MANAGEMENT’S REPLY TO AUDiTOR’S OBSERVATiONS iN ThE AUDiT REPORT ON STANDALONEFiNANCiAL STATEMENTS FOR 2016-17Para no. AUDiTOR'S OBSERVATiON MANAGEMENT'S REPLY3 Emphasis of Matter
a. We draw attention to Note No. 36 (ix) to the standalone Ind AS financial statements in respect of non-provision of liability, if any arises, in case of non-extension of time/waiver/write off of GR-1 forms.
This relates to GRs pending since 1991-92. Liability, if any will be provided as and when any demand is raised and settled by the company. At present the liability, if any, on this account is unascertainable.
b. We draw attention to Note No. 49 to the standalone Ind AS financial statements in respect of Balances under Sundry Creditors/Sundry Debtors/Claims Recoverable/Loans &advances/Other Liabilities which, in many cases have not been confirmed and any adjustments due to consequent reconciliation, if any, required is not ascertainable.
Letters are issued to parties seeking confirmation of balances outstanding in the books of MMTC to confirm the balances. It is also mentioned that in case no communication is received before stipulated date, the balance indicated shall be treated as confirmed. However, the parties generally do not send specific confirmation. Regional offices have not reported receipts of adverse communication.
c. We draw attention to Note No.36 (v), (vi) and 38 (c) to the standalone Ind AS financial statements in respect of fund based and non-fund based exposure of the Company in M/s Neelachal Ispat Nigam Ltd. (NINL) - a Joint Venture Company.
i) NINL is a joint venture company promoted by MMTC along with Government of Odisha in which MMTC has invested Rs.3796.85 million towards 49.78% in equity capital, ii) MMTC has exclusive right to sell the finished products of NINL and to supply raw material to them. Accordingly, MMTC has been extending from time to time short term credit facility to NINL for its day-to-day operational activities on continuing basis, iii) Corporate guarantees are given by the Company in favour of financial institutions / banks on behalf of NINL for securing principal and interest in respect of loans to NINL. iv) The financial performance of NINL is expected to improve in coming years considering the clearance of mining rights of allotted Iron Ore Mine to NINL and expected revival of steel sector globally.
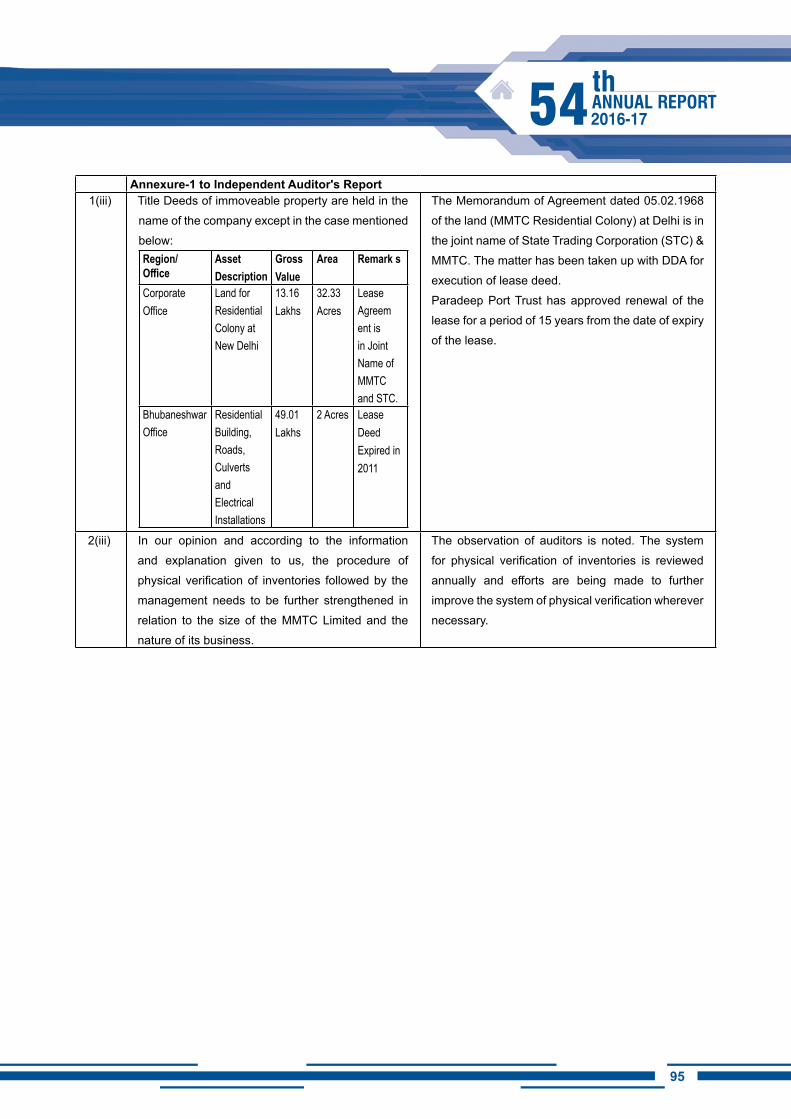
9594
Annexure-1 to Independent Auditor's Report1(iii) Title Deeds of immoveable property are held in the
name of the company except in the case mentioned below:Region/ Office
Asset Description
Gross Value
Area Remark s
Corporate Office
Land for Residential Colony at New Delhi
13.16 Lakhs
32.33 Acres
Lease Agreem ent is in Joint Name of MMTC and STC.
Bhubaneshwar Office
Residential Building, Roads, Culverts and Electrical Installations
49.01 Lakhs
2 Acres Lease Deed Expired in 2011
The Memorandum of Agreement dated 05.02.1968 of the land (MMTC Residential Colony) at Delhi is in the joint name of State Trading Corporation (STC) & MMTC. The matter has been taken up with DDA for execution of lease deed.Paradeep Port Trust has approved renewal of the lease for a period of 15 years from the date of expiry of the lease.
2(iii) In our opinion and according to the information and explanation given to us, the procedure of physical verification of inventories followed by the management needs to be further strengthened in relation to the size of the MMTC Limited and the nature of its business.
The observation of auditors is noted. The system for physical verification of inventories is reviewed annually and efforts are being made to further improve the system of physical verification wherever necessary.

96
Our Responsibility…
CORPORATE OFFICE: MMTC LIMITED, CORE -1, "SCOPE COMPLEX", 7 INSTITUTIONAL AREA, LODHI ROAD, NEW DELHI - 110003
…Extends Beyond Trading
9796
Financial StatementsFor the �nancial year ended 31st March, 2017
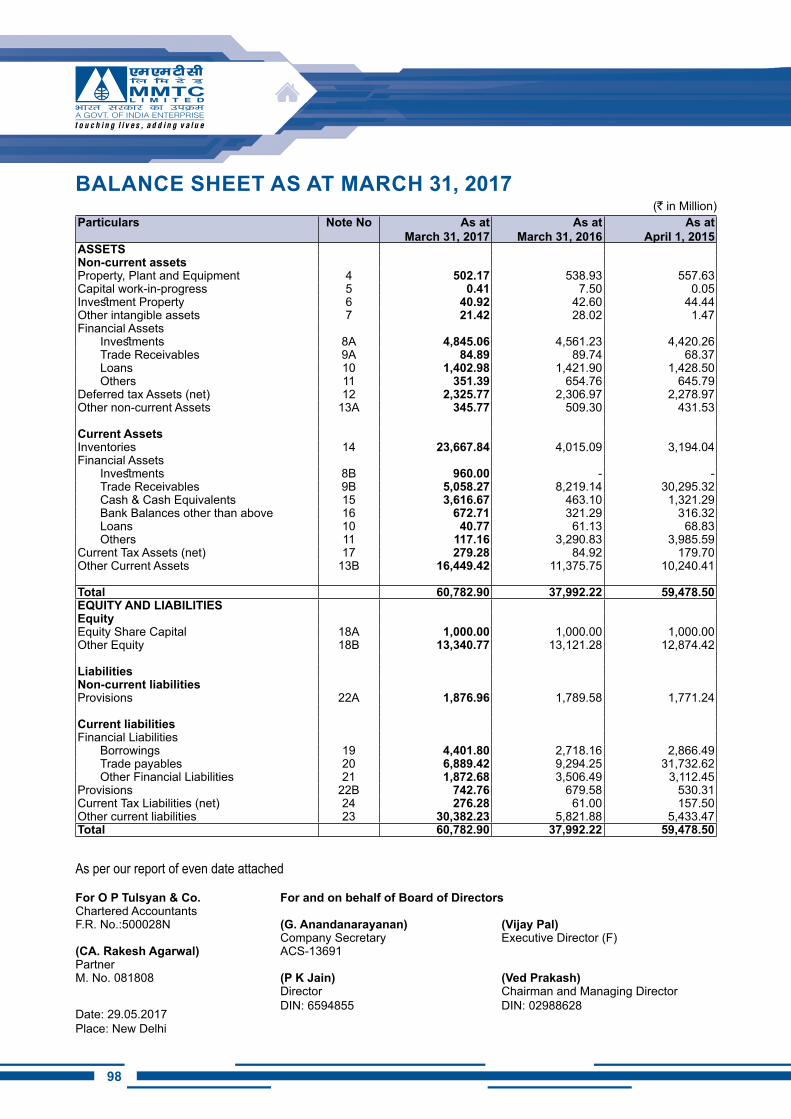
98
BALANCE ShEET AS AT MARCh 31, 2017(` in Million)
Particulars Note No As at March 31, 2017
As at March 31, 2016
As at April 1, 2015
ASSETSNon-current assetsProperty, Plant and Equipment 4 502.17 538.93 557.63 Capital work-in-progress 5 0.41 7.50 0.05 Investment Property 6 40.92 42.60 44.44 Other intangible assets 7 21.42 28.02 1.47 Financial Assets
Investments 8A 4,845.06 4,561.23 4,420.26 Trade Receivables 9A 84.89 89.74 68.37 Loans 10 1,402.98 1,421.90 1,428.50 Others 11 351.39 654.76 645.79
Deferred tax Assets (net) 12 2,325.77 2,306.97 2,278.97 Other non-current Assets 13A 345.77 509.30 431.53
Current AssetsInventories 14 23,667.84 4,015.09 3,194.04 Financial Assets
Investments 8B 960.00 - - Trade Receivables 9B 5,058.27 8,219.14 30,295.32 Cash & Cash Equivalents 15 3,616.67 463.10 1,321.29 Bank Balances other than above 16 672.71 321.29 316.32 Loans 10 40.77 61.13 68.83 Others 11 117.16 3,290.83 3,985.59
Current Tax Assets (net) 17 279.28 84.92 179.70 Other Current Assets 13B 16,449.42 11,375.75 10,240.41
Total 60,782.90 37,992.22 59,478.50 EQUiTY AND LiABiLiTiESEquityEquity Share Capital 18A 1,000.00 1,000.00 1,000.00 Other Equity 18B 13,340.77 13,121.28 12,874.42
LiabilitiesNon-current liabilitiesProvisions 22A 1,876.96 1,789.58 1,771.24
Current liabilitiesFinancial Liabilities
Borrowings 19 4,401.80 2,718.16 2,866.49 Trade payables 20 6,889.42 9,294.25 31,732.62 Other Financial Liabilities 21 1,872.68 3,506.49 3,112.45
Provisions 22B 742.76 679.58 530.31 Current Tax Liabilities (net) 24 276.28 61.00 157.50 Other current liabilities 23 30,382.23 5,821.88 5,433.47 Total 60,782.90 37,992.22 59,478.50
As per our report of even date attached
For O P Tulsyan & Co. For and on behalf of Board of DirectorsChartered Accountants F.R. No.:500028N (G. Anandanarayanan) (Vijay Pal)
Company Secretary Executive Director (F) (CA. Rakesh Agarwal) ACS-13691PartnerM. No. 081808 (P K Jain) (Ved Prakash)
DirectorDIN: 6594855
Chairman and Managing DirectorDIN: 02988628
Date: 29.05.2017Place: New Delhi
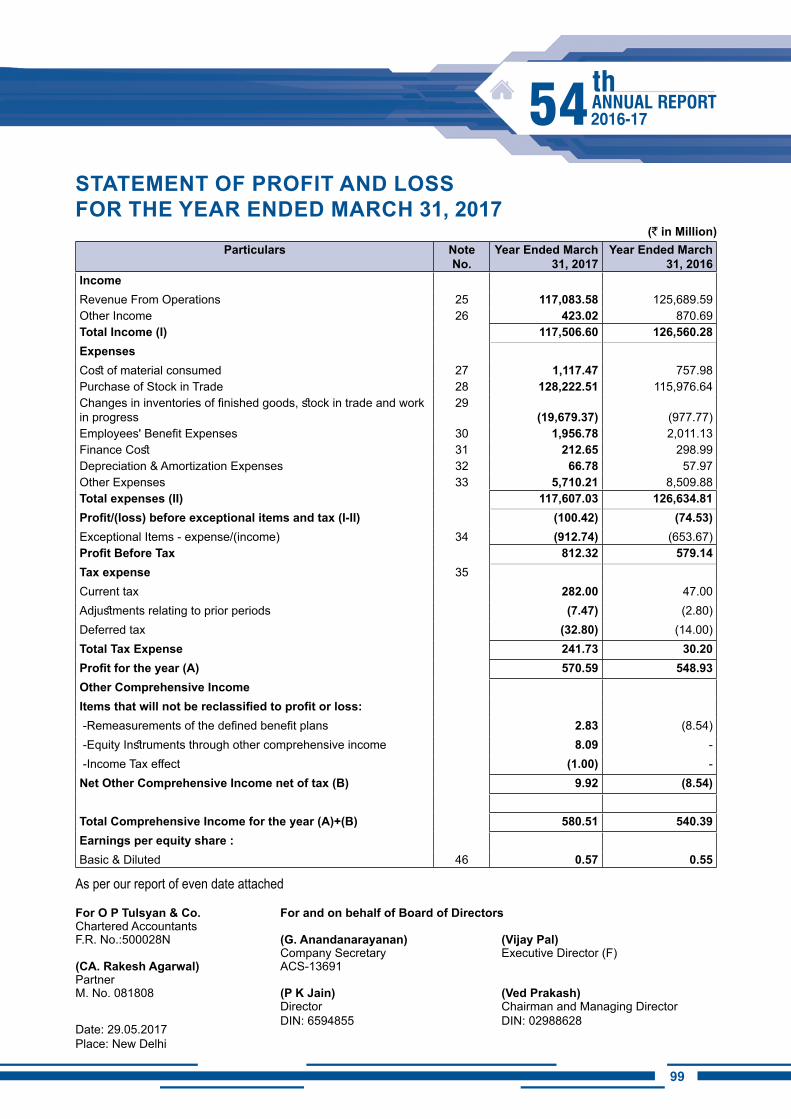
9998
As per our report of even date attached
For O P Tulsyan & Co. For and on behalf of Board of DirectorsChartered Accountants F.R. No.:500028N (G. Anandanarayanan) (Vijay Pal)
Company Secretary Executive Director (F) (CA. Rakesh Agarwal) ACS-13691PartnerM. No. 081808 (P K Jain) (Ved Prakash)
DirectorDIN: 6594855
Chairman and Managing DirectorDIN: 02988628
Date: 29.05.2017Place: New Delhi
STATEMENT OF PROFiT AND LOSS FOR ThE YEAR ENDED MARCh 31, 2017
(` in Million)Particulars Note
No.Year Ended March
31, 2017Year Ended March
31, 2016incomeRevenue From Operations 25 117,083.58 125,689.59 Other Income 26 423.02 870.69 Total income (i) 117,506.60 126,560.28 ExpensesCost of material consumed 27 1,117.47 757.98 Purchase of Stock in Trade 28 128,222.51 115,976.64 Changes in inventories of finished goods, stock in trade and work in progress
29 (19,679.37) (977.77)
Employees' Benefit Expenses 30 1,956.78 2,011.13 Finance Cost 31 212.65 298.99 Depreciation & Amortization Expenses 32 66.78 57.97 Other Expenses 33 5,710.21 8,509.88 Total expenses (II) 117,607.03 126,634.81 Profit/(loss) before exceptional items and tax (I-II) (100.42) (74.53)Exceptional Items - expense/(income) 34 (912.74) (653.67)Profit Before Tax 812.32 579.14 Tax expense 35Current tax 282.00 47.00 Adjustments relating to prior periods (7.47) (2.80)Deferred tax (32.80) (14.00)Total Tax Expense 241.73 30.20 Profit for the year (A) 570.59 548.93 Other Comprehensive incomeItems that will not be reclassified to profit or loss: -Remeasurements of the defined benefit plans 2.83 (8.54) -Equity Instruments through other comprehensive income 8.09 - -Income Tax effect (1.00) - Net Other Comprehensive Income net of tax (B) 9.92 (8.54)
Total Comprehensive Income for the year (A)+(B) 580.51 540.39 Earnings per equity share :Basic & Diluted 46 0.57 0.55
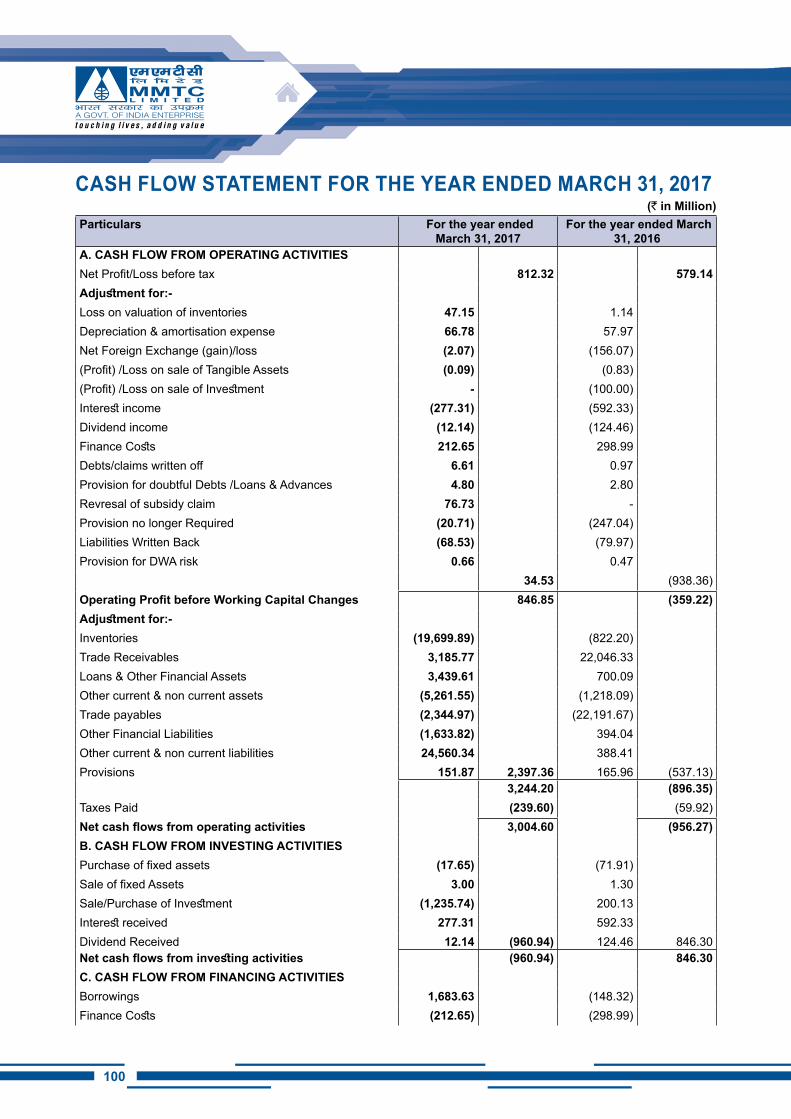
100
CASh FLOW STATEMENT FOR ThE YEAR ENDED MARCh 31, 2017 (` in Million)
Particulars For the year ended March 31, 2017
For the year ended March 31, 2016
A. CASh FLOW FROM OPERATiNG ACTiViTiESNet Profit/Loss before tax 812.32 579.14 Adjustment for:-Loss on valuation of inventories 47.15 1.14 Depreciation & amortisation expense 66.78 57.97 Net Foreign Exchange (gain)/loss (2.07) (156.07)(Profit) /Loss on sale of Tangible Assets (0.09) (0.83)(Profit) /Loss on sale of Investment - (100.00)Interest income (277.31) (592.33)Dividend income (12.14) (124.46)Finance Costs 212.65 298.99 Debts/claims written off 6.61 0.97 Provision for doubtful Debts /Loans & Advances 4.80 2.80 Revresal of subsidy claim 76.73 - Provision no longer Required (20.71) (247.04)Liabilities Written Back (68.53) (79.97)Provision for DWA risk 0.66 0.47
34.53 (938.36)Operating Profit before Working Capital Changes 846.85 (359.22)Adjustment for:-Inventories (19,699.89) (822.20)Trade Receivables 3,185.77 22,046.33 Loans & Other Financial Assets 3,439.61 700.09 Other current & non current assets (5,261.55) (1,218.09)Trade payables (2,344.97) (22,191.67)Other Financial Liabilities (1,633.82) 394.04 Other current & non current liabilities 24,560.34 388.41 Provisions 151.87 2,397.36 165.96 (537.13)
3,244.20 (896.35)Taxes Paid (239.60) (59.92)Net cash flows from operating activities 3,004.60 (956.27)B. CASh FLOW FROM iNVESTiNG ACTiViTiESPurchase of fixed assets (17.65) (71.91)Sale of fixed Assets 3.00 1.30 Sale/Purchase of Investment (1,235.74) 200.13 Interest received 277.31 592.33 Dividend Received 12.14 (960.94) 124.46 846.30 Net cash flows from investing activities (960.94) 846.30 C. CASh FLOW FROM FiNANCiNG ACTiViTiESBorrowings 1,683.63 (148.32)Finance Costs (212.65) (298.99)
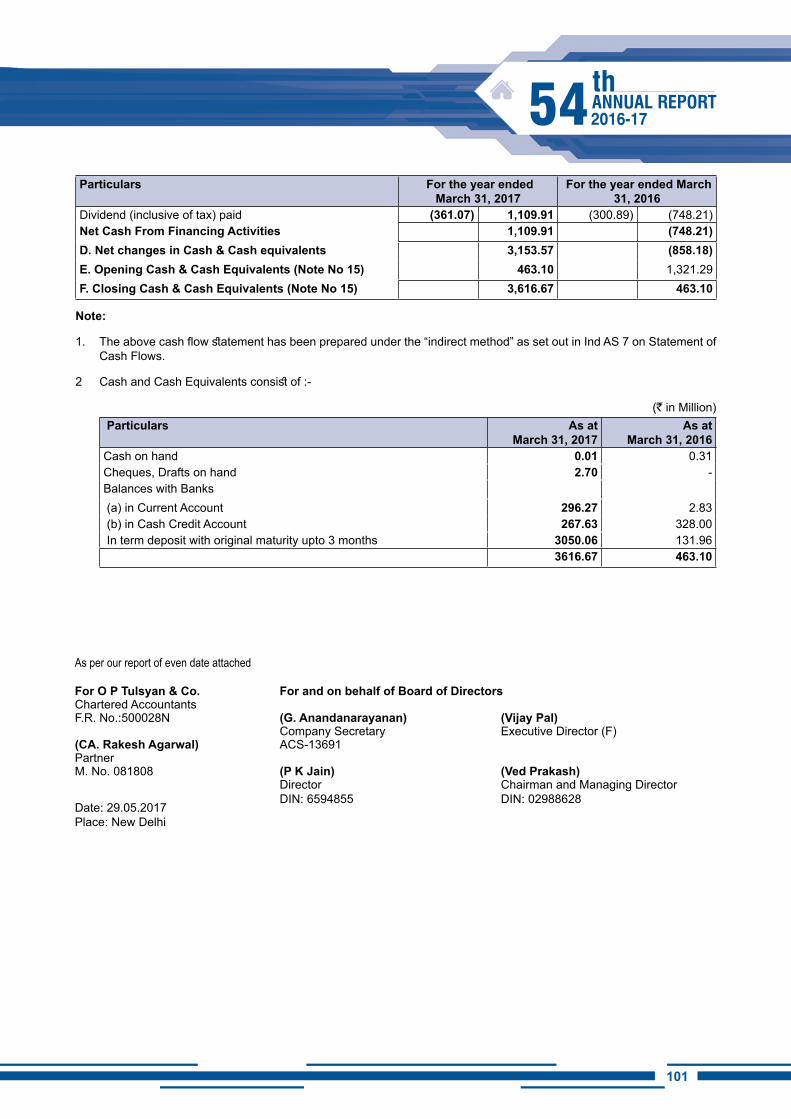
101100
Particulars For the year ended March 31, 2017
For the year ended March 31, 2016
Dividend (inclusive of tax) paid (361.07) 1,109.91 (300.89) (748.21)Net Cash From Financing Activities 1,109.91 (748.21)D. Net changes in Cash & Cash equivalents 3,153.57 (858.18)E. Opening Cash & Cash Equivalents (Note No 15) 463.10 1,321.29 F. Closing Cash & Cash Equivalents (Note No 15) 3,616.67 463.10
Note:
1. The above cash flow statement has been prepared under the “indirect method” as set out in Ind AS 7 on Statement of Cash Flows.
2 Cash and Cash Equivalents consist of :-
(` in Million) Particulars As at
March 31, 2017 As at
March 31, 2016 Cash on hand 0.01 0.31Cheques, Drafts on hand 2.70 - Balances with Banks (a) in Current Account 296.27 2.83 (b) in Cash Credit Account 267.63 328.00 In term deposit with original maturity upto 3 months 3050.06 131.96
3616.67 463.10
As per our report of even date attached
For O P Tulsyan & Co. For and on behalf of Board of DirectorsChartered Accountants F.R. No.:500028N (G. Anandanarayanan) (Vijay Pal)
Company Secretary Executive Director (F) (CA. Rakesh Agarwal) ACS-13691PartnerM. No. 081808 (P K Jain) (Ved Prakash)
DirectorDIN: 6594855
Chairman and Managing DirectorDIN: 02988628
Date: 29.05.2017Place: New Delhi
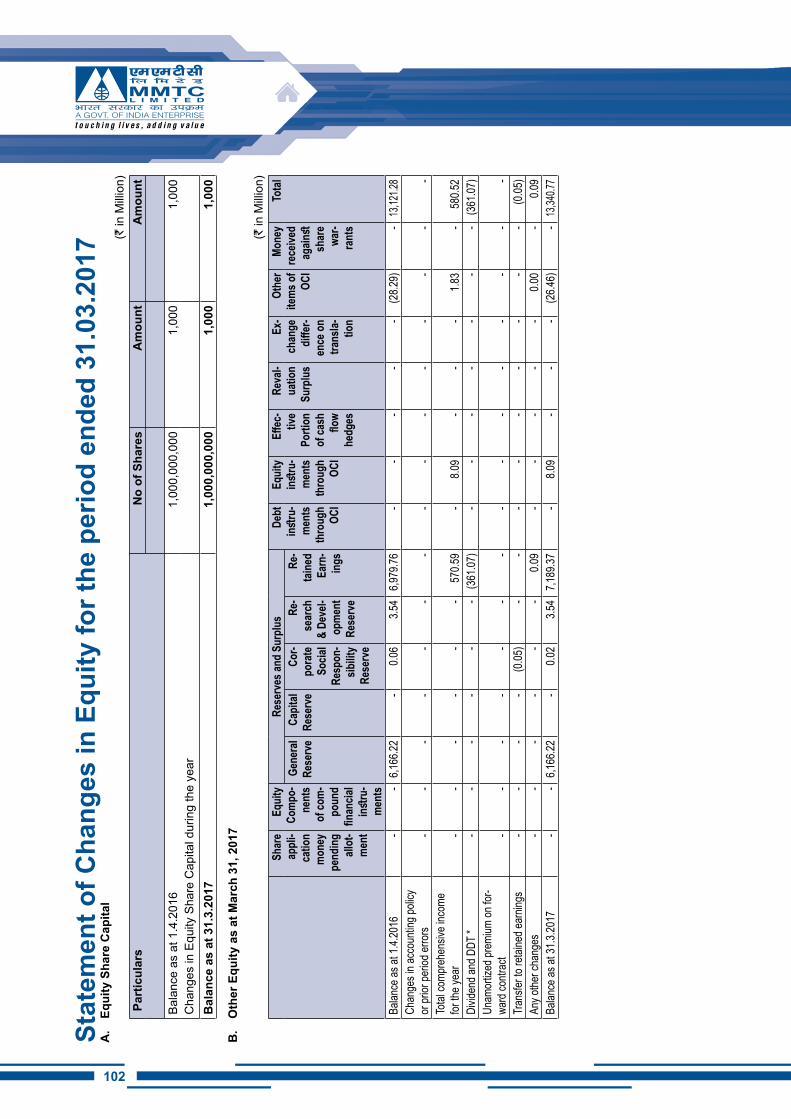
102
Stat
emen
t of C
hang
es in
Equ
ity fo
r the
per
iod
ende
d 31
.03.
2017
A.
Equi
ty S
hare
Cap
ital
(` in
Milli
on)
Par
ticul
ars
No
of S
hare
s A
mou
nt
Am
ount
Bala
nce
as a
t 1.4
.201
6 1
,000
,000
,000
1
,000
1
,000
C
hang
es in
Equ
ity S
hare
Cap
ital d
urin
g th
e ye
arB
alan
ce a
s at
31.
3.20
17 1
,000
,000
,000
1
,000
1
,000
B.
Oth
er E
quity
as
at M
arch
31,
201
7
(` in
Milli
on)
Shar
e ap
pli-
catio
n mo
ney
pend
ing
allot
-me
nt
Equit
y Co
mpo-
nent
s of
com -
poun
d fin
ancia
l inst
ru-
ment
s
Rese
rves
and S
urplu
s De
bt
instru
-me
nts
thro
ugh
OCi
Equit
y inst
ru-
ment
s th
roug
h OC
i
Effec
-tiv
e Po
rtion
of
cash
flo
w he
dges
Reva
l-ua
tion
Surp
lus
Ex-
chan
ge
differ
-en
ce on
tra
nsla- tio
n
Othe
r ite
ms of
OC
i
Mone
y re
ceive
d ag
ainst
shar
e wa
r-ra
nts
Total
Gene
ral
Rese
rve
Capit
al Re
serv
eCo
r-po
rate
Socia
l Re
spon
-sib
ility
Rese
rve
Re-
sear
ch
& De
vel-
opme
nt
Rese
rve
Re-
taine
d Ea
rn-
ings
Balan
ce as
at 1.
4.201
6-
-6,1
66.22
-0.0
63.5
46,9
79.76
--
--
-(2
8.29)
-13
,121.2
8Ch
ange
s in a
ccou
nting
polic
y or
prior
perio
d erro
rs-
--
--
--
--
--
--
--
Total
comp
rehe
nsive
inco
me
for th
e yea
r-
--
--
-57
0.59
-8.0
9-
--
1.83
-58
0.52
Divid
end a
nd D
DT *
--
--
--
(361
.07)
--
--
--
-(3
61.07
)Un
amor
tized
prem
ium on
for-
ward
contr
act
--
--
--
--
--
--
--
-Tr
ansfe
r to r
etaine
d ear
nings
--
--
(0.05
)-
--
--
--
--
(0.05
)An
y othe
r cha
nges
--
--
--
0.09
--
--
-0.0
0-
0.09
Balan
ce as
at 31
.3.20
17-
-6,1
66.22
-0.0
23.5
47,1
89.37
-8.0
9-
--
(26.4
6)-
13,34
0.77
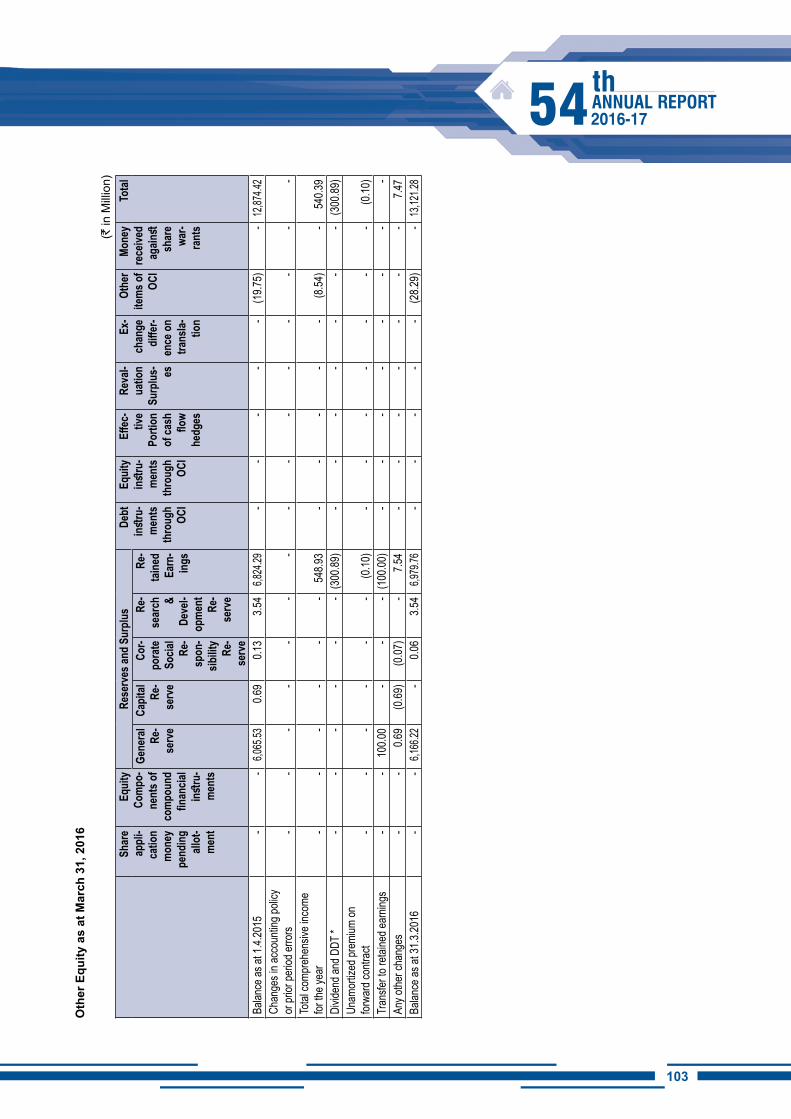
103102
Oth
er E
quity
as
at M
arch
31,
201
6
(` in
Milli
on)
Shar
e ap
pli-
catio
n mo
ney
pend
ing
allot
-me
nt
Equit
y Co
mpo-
nent
s of
comp
ound
fin
ancia
l inst
ru-
ment
s
Rese
rves
and S
urplu
s De
bt
instru
-me
nts
thro
ugh
OCi
Equit
y inst
ru-
ment
s th
roug
h OC
i
Effec
-tiv
e Po
rtion
of
cash
flo
w he
dges
Reva
l-ua
tion
Surp
lus- es
Ex-
chan
ge
differ
-en
ce on
tra
nsla- tio
n
Othe
r ite
ms of
OC
i
Mone
y re
ceive
d ag
ainst
shar
e wa
r-ra
nts
Total
Gene
ral
Re-
serv
e
Capit
al Re-
serv
e
Cor-
pora
te So
cial
Re-
spon
-sib
ility
Re-
serv
e
Re-
sear
ch &
Deve
l -op
ment
Re
-se
rve
Re-
taine
d Ea
rn-
ings
Balan
ce as
at 1.
4.201
5-
-6,0
65.53
0.69
0.13
3.54
6,824
.29-
--
--
(19.7
5)-
12,87
4.42
Chan
ges i
n acc
ounti
ng po
licy
or pr
ior pe
riod e
rrors
--
--
--
--
--
--
--
-To
tal co
mpre
hens
ive in
come
for
the y
ear
--
--
--
548.9
3-
--
--
(8.54
)-
540.3
9Di
viden
d and
DDT
*-
--
--
-(3
00.89
)-
--
--
--
(300
.89)
Unam
ortiz
ed pr
emium
on
forwa
rd co
ntrac
t-
--
--
-(0
.10)
--
--
--
-(0
.10)
Tran
sfer t
o reta
ined e
arnin
gs-
-10
0.00
--
-(1
00.00
)-
--
--
--
-An
y othe
r cha
nges
--
0.69
(0.69
)(0
.07)
-7.5
4-
--
--
--
7.47
Balan
ce as
at 31
.3.20
16-
-6,1
66.22
-0.0
63.5
46,9
79.76
--
--
-(2
8.29)
-13
,121.2
8
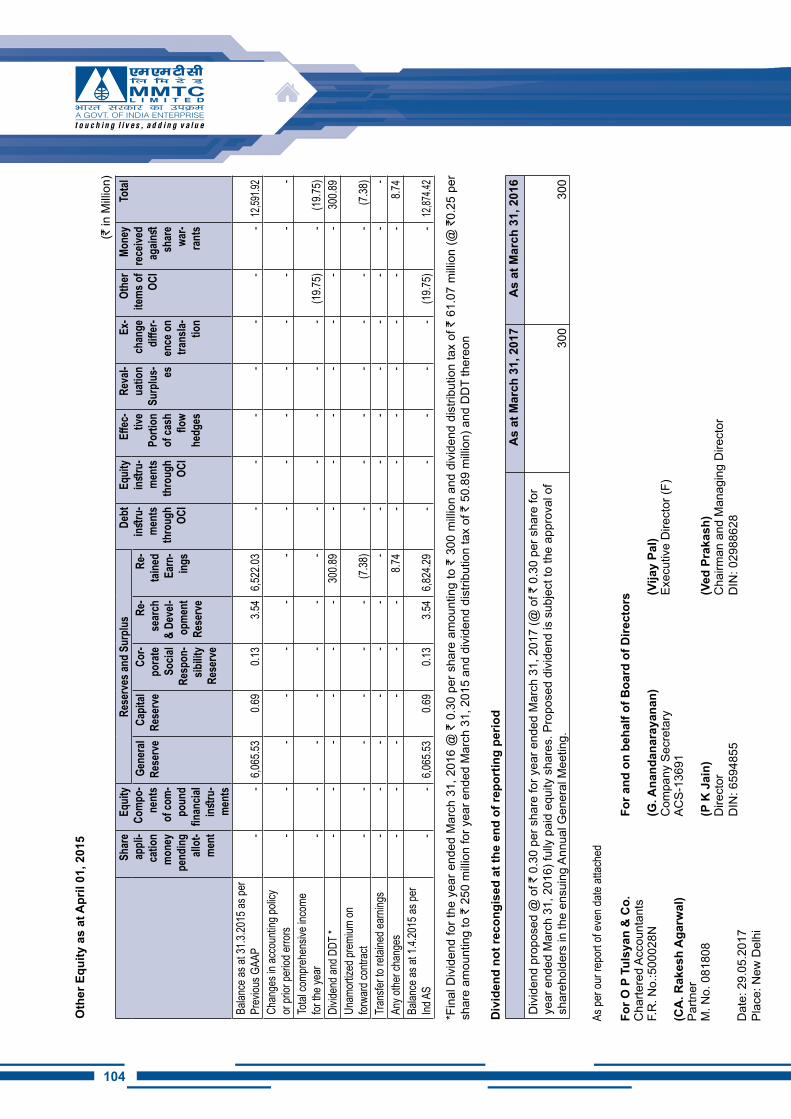
104
Oth
er E
quity
as
at A
pril
01, 2
015
(` in
Milli
on)
Shar
e ap
pli-
catio
n mo
ney
pend
ing
allot
-me
nt
Equit
y Co
mpo-
nent
s of
com-
poun
d fin
ancia
l inst
ru-
ment
s
Rese
rves
and S
urplu
s De
bt
instru
-me
nts
thro
ugh
OCi
Equit
y inst
ru-
ment
s th
roug
h OC
i
Effec
-tiv
e Po
rtion
of
cash
flo
w he
dges
Reva
l-ua
tion
Surp
lus- es
Ex-
chan
ge
differ
-en
ce on
tra
nsla- tio
n
Othe
r ite
ms of
OC
i
Mone
y re
ceive
d ag
ainst
shar
e wa
r-ra
nts
Total
Gene
ral
Rese
rve
Capit
al Re
serv
eCo
r-po
rate
Socia
l Re
spon
-sib
ility
Rese
rve
Re-
sear
ch
& De
vel-
opme
nt
Rese
rve
Re-
taine
d Ea
rn-
ings
Balan
ce as
at 31
.3.20
15 as
per
Prev
ious G
AAP
--
6,065
.530.6
90.1
33.5
46,5
22.03
--
--
--
-12
,591.9
2Ch
ange
s in a
ccou
nting
polic
y or
prior
perio
d erro
rs-
--
--
--
--
--
--
--
Total
comp
rehe
nsive
inco
me
for th
e yea
r-
--
--
--
--
--
-(1
9.75)
-(1
9.75)
Divid
end a
nd D
DT *
--
--
--
300.8
9-
--
--
--
300.8
9Un
amor
tized
prem
ium on
for
ward
contr
act
--
--
--
(7.38
)-
--
--
--
(7.38
)Tr
ansfe
r to r
etaine
d ear
nings
--
--
--
--
--
--
--
-An
y othe
r cha
nges
--
--
--
8.74
--
--
--
-8.7
4Ba
lance
as at
1.4.2
015 a
s per
Ind
AS
--
6,065
.530.6
90.1
33.5
46,8
24.29
--
--
-(1
9.75)
-12
,874.4
2
*Fin
al D
ivid
end
for t
he y
ear e
nded
Mar
ch 3
1, 2
016
@ `
0.3
0 pe
r sha
re a
mou
ntin
g to
` 3
00 m
illion
and
div
iden
d di
strib
utio
n ta
x of
` 6
1.07
milli
on (@
`0.
25 p
er
shar
e am
ount
ing
to `
250
milli
on fo
r yea
r end
ed M
arch
31,
201
5 an
d di
vide
nd d
istri
butio
n ta
x of
` 5
0.89
milli
on) a
nd D
DT
ther
eon
Div
iden
d no
t rec
ongi
sed
at th
e en
d of
repo
rtin
g pe
riod
As
at M
arch
31,
201
7 A
s at
Mar
ch 3
1, 2
016
Div
iden
d pr
opos
ed @
of `
0.3
0 pe
r sha
re fo
r yea
r end
ed M
arch
31,
201
7 (@
of `
0.3
0 pe
r sha
re fo
r ye
ar e
nded
Mar
ch 3
1, 2
016)
fully
pai
d eq
uity
sha
res.
Pro
pose
d di
vide
nd is
sub
ject
to th
e ap
prov
al o
f sh
areh
olde
rs in
the
ensu
ing
Annu
al G
ener
al M
eetin
g.30
030
0
As p
er o
ur re
port
of e
ven
date
atta
ched
For O
P T
ulsy
an &
Co.
For a
nd o
n be
half
of B
oard
of D
irect
ors
Cha
rtere
d Ac
coun
tant
s F.
R. N
o.:5
0002
8N(G
. Ana
ndan
aray
anan
) (V
ijay
Pal)
Com
pany
Sec
reta
ry
Exec
utiv
e D
irect
or (F
) (C
A. R
akes
h A
garw
al)
ACS-
1369
1Pa
rtner
M. N
o. 0
8180
8(P
K J
ain)
(V
ed P
raka
sh)
Dire
ctor
DIN
: 659
4855
Cha
irman
and
Man
agin
g D
irect
orD
IN: 0
2988
628
Dat
e: 2
9.05
.201
7Pl
ace:
New
Del
hi
105104
1. General information
Established in 1963 and domiciled in India, the Company is a Mini-Ratna public sector undertaking under the administrative control of Ministry of Commerce & Industry, Government of India. The registered office of the Company is situated at Core-1, Scope Complex, 7, Institutional Area, Lodi Road, New Delhi-110003, India. The company has 9 Regional Offices at various places in India and a wholly owned subsidiary MMTC Transnational Pte Ltd, at Singapore.
The principal activities of the Company are export of Minerals and import of Precious Metals, Non-ferrous metals, Fertilizers, Agro Products, coal and hydrocarbon etc.
The company’s trade activities span across various countries in Asia, Europe, Africa, Middle East, Latin America and North America.
2. First time adoption of Indian Accounting Standards (Ind-AS)
All companies (listed or unlisted) having net worth of ` 5,000 Million or more are required to adopt Ind AS. Accordingly, the company has adopted Ind-AS, in accordance with Notification dated February 16, 2015 issued by Ministry of Corporate Affairs, Government of India, with effect from April 01, 2016 with a transition date on April 01, 2015. The details of transition from previous GAAP to Ind-AS is given at Note 54.
3. Significant Accounting Policies
3.1 Statement of Compliance and basis of preparation of Financial Statements
The financial statements have been prepared in accordance with Indian Accounting Standards (Ind-AS) as notified by Ministry of Corporate Affairs, Government of India vide Notification dated February 16, 2015. Accounting policies have been applied consistently to all periods presented in these financial statements. The Financial Statements are prepared under historical cost convention from the books of accounts maintained under accrual basis except for certain financial instruments which are measured at fair value and in accordance with the Indian Accounting Standards prescribed under the Companies Act, 2013
3.2 Functional & presentation currency
All amounts included in the financial statements
are reported in millions of Indian rupees (Rupees in millions) except number of equity shares and per share data and when otherwise indicated.
3.3 Use of estimates and judgment
The preparation of financial statements requires judgements, estimates and assumptions to be made that affect the reported amount of assets and liabilities, disclosure of contingent liabilities on the date of financial statements and the reported amount of revenues and expenses during the reporting period. Difference between the actual results and estimates are recognised in the period in which the results are known/materialised
3.4 Functional and presentation currency
These financial statements are presented in Indian rupees, the national currency of India, which is the functional currency of the Company.
3.5 Revenue Recognition
i) Trading Income
Revenue from the sale of goods is measured at the fair value of the consideration received or receivable, net of returns and allowances, trade discount and volume rebates. Revenue is recognized when the significant risks and rewards of ownership have been transferred to the buyer, it is probable that economic benefits associated with the transaction will flow to the entity, the associated costs incurred or to be incurred in respect of the transaction can be measured reliably and there is no continuing management involvement with the goods. The point of transfer of risks and rewards depends upon the terms of the contract of sale with individual customers.
Purchases and Sales
a. In case of certain commodities import of which is canalized through the company, imported on ‘Government Account’ against authorization letter issued by Government of India, Purchase/ Sale is booked in the name of the Company
b. Products are also traded through the commodity exchanges. Purchase/ Sale is booked in respect of trade done through different commodity exchanges and is backed by physical delivery of goods.
Notes to the Financial Statements for the year ended March 31, 2017
106
c. Gold/Silver kept under deposit: As per the arrangements with the Suppliers of Gold/Silver, the metal is kept by the supplier with the company on unfixed price basis for subsequent withdrawal on loan or outright purchase basis.
(i) Purchases include gold/silver withdrawn from consignment deposit of the supplier on outright purchase basis for sale to exporters, as per the scheme of Exim Policy being operated by the Company as a nominated agency.
(ii) Purchase of Gold during the year for domestic sale is accounted for on withdrawal from the Gold/Silver consignment deposit of the supplier and fixation of price with the suppliers. The stock held by the company at year end as Gold/ Silver under Deposit is accounted for under current assets as ‘stock towards unbilled purchases’ and under current liability as amount payable towards unbilled purchases’ at the bullion price prevailing as at the close of the year. However, customs duty paid in respect of balance in deposits is accounted for as prepaid expenses.
(iii) Gold/silver withdrawn on loan basis from the Gold/Silver under deposit, are booked as loan given to customers and grouped under financial assets. The corresponding liability towards the stocks received from foreign suppliers is grouped under Sundry Creditors. Loan/Sundry Creditors are adjusted when purchase and sales are booked.
d. In the case of replenishment basis, gold/silver booked by exporter by paying margin money, purchase is booked after “fixing” the price with the foreign suppliers. However, sale is booked when quantity is actually delivered after completion of export.
e. High Sea Sales
Sale during the course of import by transfer of documents of title i.e. high seas sale is booked upon transfer of documents of title to the goods in favour
of buyer before the goods cross the custom frontiers of India.
ii) Other Operating Revenue
The income relating to the core activities of the company which are not included in revenue from sales / services for e.g. dispatch earned, subsidy, claims against losses on trade transactions, interest on credit sales and trade related advances (other than on overdue) etc., which are derived based on the terms of related trade agreements with business associates or schemes on related trade, are accounted for under ‘Other Operating Revenue’.
iii) Claims
Claims are recognized in the Statement of Profit & Loss (Net of any payable) on accrual basis including receivables from Govt. towards subsidy, cash incentives, reimbursement of losses etc, when it is not unreasonable to expect ultimate collection. Claims recognized but subsequently becoming doubtful are provided for through Statement of Profit and Loss. Insurance claims are accounted upon being accepted by the insurance company
iv) Service Income
When the outcome of a transaction involving the rendering of services can be estimated reliably, revenue associated with the transaction shall be recognized by reference to the stage of completion (Percentage of Completion Method) of the transaction at the end of the reporting period. The outcome of a transaction can be estimated reliably when all the following conditions are satisfied:-
a) The amount of revenue can be measured reliably;
b) It is probable that the economic benefits associated with the transaction will flow to the company;
c) The stage of completion of the transaction can be measured reliably;
d) Costs incurred for the transaction and to complete the transaction can be measured reliably.
v) Dividend and interest income
Dividend income from investments is recognized when the Company’s right
107106
to receive payment is established and it is probable that the economic benefits associated with the transactions will flow to the Company and the amount of income can be measured reliably.
Interest income is recognised on a time proportion basis taking into account the amount outstanding and the effective interest rate, which is the rate that exactly discounts estimated future cash receipts through the expected life of the financial asset to the gross carrying amount of a financial asset.
vi) Revenue Recognition on Actual Realization
Revenue is recognized on accrual basis except in the following items which are accounted for on actual realization since realisability of such items is uncertain, in accordance with the provisions of Ind AS-18 :-
a) Duty credit / exemption under various promotional schemes of EXIM policy in force, Tax credit, refund of custom duty on account of survey shortage, and refund of income-tax/service tax / sales-tax /VAT and interest thereon etc.
b) Decrees pending for execution/contested dues and interest thereon, if any:
c) Interest on overdue recoverable where realisability is uncertain.
d) Liquidated damages on suppliers/underwriters.
3.6 Property, Plant and Equipments
All Property, Plant and Equipments (PPE) are stated at carrying value in accordance with previous GAAP, which is used as deemed cost on the date of transition to Ind AS using the exemption granted under Ind AS 101.
The cost of an item of property, plant and equipment is recognized as an asset if, and only if it is probable that future economic benefits associated with the item will flow to the company and the cost of the item can be measured reliably. The cost of an item of PPE is the cash price equivalent at the recognition date. The cost of an item of PPE comprises:
i) Purchase price, including import duties and non-refundable purchase taxes, after deducting trade discounts and rebates.
ii) Costs directly attributable to bringing the PPE
to the location and condition necessary for it to be capable of operating in the manner intended by management.
iii) The initial estimate of the costs of dismantling and removing the item and restoring the site on which it is located, the obligation for which the company incurs either when the PPE is acquired or as a consequence of having used the PPE during a particular period for purposes other than to produce inventories during that period.
The company has chosen the cost model of recognition and this model is applied to an entire class of PPE. After recognition as an asset, an item of PPE is carried at its cost less any accumulated depreciation and any accumulated impairment losses.
3.7 Intangible Assets
All Intangible Assets are stated at carrying value in accordance with previous GAAP, which is used as deemed cost on the date of transition to Ind AS using the exemption granted under Ind AS 101
Identifiable intangible assets are recognized when the company controls the asset; it is probable that future economic benefits expected with the respective assets will flow to the company for more than one economic period; and the cost of the asset can be measured reliably. At initial recognition, intangible assets are recognized at cost. Intangible assets are amortized on straight line basis over estimated useful lives from the date on which they are available for use. Softwares are amortized over its useful life subject to a maximum period of 5 years or over the license period as applicable.
3.8 Non-Current Assets Held for Sale
The company classifies a non-current asset (or disposal group of assets) as held for sale if its carrying amount will be recovered principally through a sale transaction rather than through continuing use. The non-current asset (or disposal group) classified as held for sale is measured at the lower of its carrying amount and the fair value less costs to sell.
3.9 Depreciation
Depreciation is provided on straight line method as per the useful lives approved by the Board of Directors, which are equal to those provided under schedule II of the Companies Act, 2013. The useful life of an asset is reviewed at each financial year-
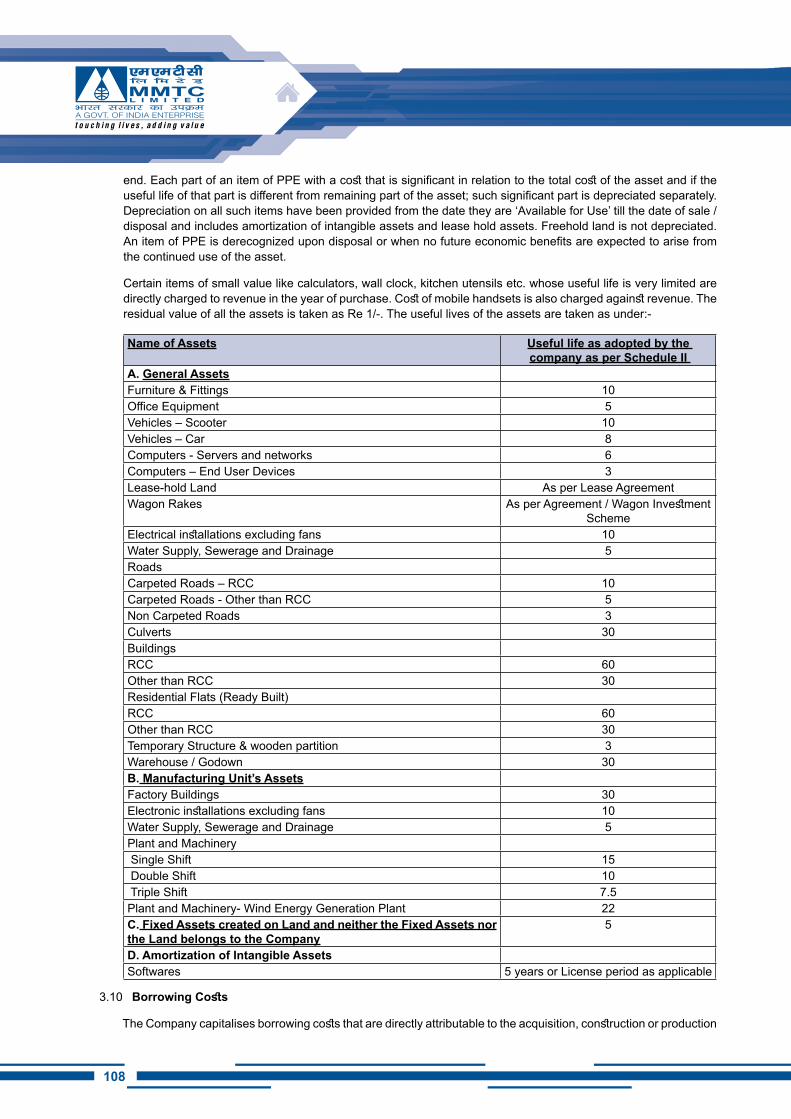
108
end. Each part of an item of PPE with a cost that is significant in relation to the total cost of the asset and if the useful life of that part is different from remaining part of the asset; such significant part is depreciated separately. Depreciation on all such items have been provided from the date they are ‘Available for Use’ till the date of sale / disposal and includes amortization of intangible assets and lease hold assets. Freehold land is not depreciated. An item of PPE is derecognized upon disposal or when no future economic benefits are expected to arise from the continued use of the asset.
Certain items of small value like calculators, wall clock, kitchen utensils etc. whose useful life is very limited are directly charged to revenue in the year of purchase. Cost of mobile handsets is also charged against revenue. The residual value of all the assets is taken as Re 1/-. The useful lives of the assets are taken as under:-
Name of Assets Useful life as adopted by the company as per Schedule ii
A. General Assets Furniture & Fittings 10Office Equipment 5Vehicles – Scooter 10Vehicles – Car 8Computers - Servers and networks 6Computers – End User Devices 3Lease-hold Land As per Lease AgreementWagon Rakes As per Agreement / Wagon Investment
SchemeElectrical installations excluding fans 10Water Supply, Sewerage and Drainage 5Roads Carpeted Roads – RCC 10Carpeted Roads - Other than RCC 5Non Carpeted Roads 3Culverts 30Buildings RCC 60Other than RCC 30Residential Flats (Ready Built) RCC 60Other than RCC 30Temporary Structure & wooden partition 3Warehouse / Godown 30B. Manufacturing Unit’s Assets Factory Buildings 30Electronic installations excluding fans 10Water Supply, Sewerage and Drainage 5Plant and Machinery Single Shift 15 Double Shift 10 Triple Shift 7.5Plant and Machinery- Wind Energy Generation Plant 22C. Fixed Assets created on Land and neither the Fixed Assets nor the Land belongs to the Company
5
D. Amortization of Intangible Assets Softwares 5 years or License period as applicable
3.10 Borrowing Costs
The Company capitalises borrowing costs that are directly attributable to the acquisition, construction or production
109108
of qualifying asset as a part of the cost of the asset.
The Company recognises other borrowing costs as an expense in the period in which it incurs them.
A qualifying asset is an asset that necessarily takes a substantial period of time to get ready for its intended use or sale.
3.11 Foreign currency translation
Transactions in currencies other than the functional currency are recognized at the rates of exchange prevailing at the dates of the transactions.
At the end of each reporting period, monetary items denominated in foreign currencies are retranslated at the rates prevailing at that date. Non-monetary items carried at fair value that are denominated in foreign currencies are re-translated at the rates prevailing at the date when the fair value was determined. Non-monetary items that are measured in terms of historical cost in a foreign currency are not retranslated.
Foreign currency monetary items (except overdue recoverable where reliasibility is uncertain) are converted using the closing rate as defined in the Ind AS-21. Non-monetary items are reported using the exchange rate at the date of the transaction. The exchange difference gain/loss is recognized in the Statement of Profit and Loss.
Liability in foreign currency relating to acquisition of fixed assets is converted using the closing rate. The difference in exchange is recognized in the Statement of Profit and Loss.
3.12 Inventory
Inventories are stated at the lower of cost and net realisable value. Net realisable value represents the estimated selling price for inventories less all estimated costs of completion and costs necessary to make the sale. The method of determination of cost and valuation is as under:
a) Exports:
(i) Cost of export stocks is arrived at after including direct expenses incurred up to the point at which the stocks are lying. Similarly the realisable value is derived by deducting from the market price the expenses to be incurred from that point to the stage where they are sold.
(ii) In respect of mineral ores the realisable value of ores is worked out at the minimum of the Fe/Mn contents of the
grade of the ore as per export contract and is compared with the weighted average cost at weighted average Fe/Mn contents/weighted average moisture contents of the ore. The embedded stocks of Iron ore are excluded from inventory and hence not valued.
b) Imports:
(i) The cost of imported stocks is arrived at by working out the yearly regional weighted average cost except for Non-ferrous Metals where weighted average cost of remaining stock after including all expenses incurred up to the point at which they are lying is considered. However, where stocks are specifically identifiable, actual cost of the material including all expenses incurred up to the point at which they are lying is considered.
(ii) Gold/Silver purchased from foreign suppliers against booking by exporters under replenishment option and not delivered at the year-end are shown as stocks of company and valued at cost.
c) Domestic:
(i) The cost of gold/silver medallions and silver articles is arrived at by working out the yearly location-wise weighted average cost of material and cost of opening stock. Costs include manufacturing/fabrication charges, wastages and other direct cost.
(ii) In case of cut & polished stones and jewellery (finished/semi-finished) where stocks are specifically identifiable, actual cost of the material including all expenses incurred up to the point at which they are lying is considered. Costs include wastage and other direct manufacturing costs.
d) Packing material
Packing material is valued at lower of the cost or net realisable value.
e) Stocks with fabricators
Stocks with fabricators are taken as the stocks of the company, till adjustments.
3.13 Provisions
Provisions are recognized when the company has a present obligation (legal or constructive) as a
110
result of a past event, it is probable that an outflow of economic benefits will be required to settle the obligation and a reliable estimate can be made for the amount of the obligation.
3.14 Contingent Liabilities / Assets
Contingent Liabilities
Contingent liabilities are not recognized but disclosed in Notes to the Accounts when the company has possible obligation due to past events and existence of the obligation depends upon occurrence or non-occurrence of future events not wholly within the control of the company.
Contingent liabilities are assessed continuously to determine whether outflow of economic resources have become probable. If the outflow becomes probable then relative provision is recognized in the financial statements.
Where an entity is jointly and severally liable for an obligation, the part of the obligation that is expected to be met by other parties is treated as a contingent liability. The entity recognises a provision for the part of the obligation for which an outflow of resources embodying economic benefits is probable, except in the extremely rare circumstances where no reliable estimate can be made
Contingent Liabilities are disclosed in the General Notes forming part of the accounts
Contingent Assets
Contingent Assets are not recognised in the financial statements. Such contingent assets are assessed continuously and are disclosed in Notes when the inflow of economic benefits becomes probable. If it’s virtually certain that inflow of economic benefits will arise then such assets and the relative income will be recognised in the financial statements.
3.15 Leases
Assets held under lease, in which a significant portion of the risks and rewards of ownership are transferred to lessee are classified as finance leases. Other leases are classified as operating leases. The company normally enters into operating leases which are accounted for as under:-
(i) Rental income from operating leases is recognized on a straight-line basis over the term of the relevant lease.
(ii) Where the company is a lessee, operating lease payments are recognized as an expense on a straight-line basis over the lease term. Initial direct costs incurred in negotiating and arranging an operating lease are added to the carrying amount of the leased asset and recognized on a straight-line basis over the lease term.
3.16 Employee benefits
i. Provision for gratuity, leave encashment/availment and long service benefits i.e. service award, compassionate gratuity, employees’ family benefit scheme and special benefit to MICA division employees is made on the basis of actuarial valuation using the projected unit credit method. Re-measurement, comprising actuarial gains and losses, the effect of the changes to the asset ceiling (if applicable) and the return on plan assets (excluding interest), is reflected immediately in the statement of financial position with a charge or credit recognized in other comprehensive income in the period in which they occur. Re-measurement recognized in other comprehensive income is reflected immediately in retained earnings and will not be reclassified to Statement of Profit or Loss.
ii. Provision for post-retirement medical benefit is made on defined contribution basis.
iii. Provident fund contribution is made to Provident Fund Trust on accrual basis.
iv. Payment of Ex-gratia and Notice pay on Voluntary Retirement are charged to revenue in the year incurred.
v. Superannuation plan, a defined contribution scheme is administered by Life Insurance Corporation of India (LIC). The Company makes contributions based on a specified percentage of each eligible employee’s salary.
Short-term employee benefit obligations
Short-term employee benefit obligations are measured on an undiscounted basis and are recorded as expense as the related service is provided. A liability is recognized for the amount expected to be paid under PLI / PRP Scheme, if the Company has a present legal or constructive obligation to pay this amount as a result of past service provided by the employee and the obligation can be estimated reliably.
111110
3.17 Taxation
Income tax expense represents the sum of the tax currently payable and deferred tax.
Current tax
The tax currently payable is based on taxable profit for the year. Taxable profit differs from ‘profit before tax’ as reported in the statement of profit or loss and other comprehensive income/statement of profit or loss because of items of income or expense that are taxable or deductible in other years and items that are never taxable or deductible. The Company’s current tax is calculated using tax rates that have been enacted or substantively enacted by the end of the reporting period.
Deferred tax
Deferred tax is recognized on temporary differences between the carrying amounts of assets and liabilities in the financial statements and the corresponding tax bases used in the computation of taxable profit. Deferred tax liabilities are generally recognized for all taxable temporary differences. Deferred tax assets are generally recognized for all deductible temporary differences to the extent that it is probable that taxable profits will be available against which those deductible temporary differences can be utilized. Such deferred tax assets and liabilities are not recognized if the temporary difference arises from the initial recognition (other than in a business combination) of assets and liabilities in a transaction that affects neither the taxable profit nor the accounting profit. In addition, deferred tax liabilities are not recognized if the temporary difference arises from the initial recognition of goodwill.
Deferred tax liabilities are recognized for taxable temporary differences associated with investments in subsidiaries and associates, and interests in joint ventures, except where the company is able to control the reversal of the temporary difference and it is probable that the temporary difference will not reverse in the foreseeable future. Deferred tax assets arising from deductible temporary differences associated with such investments and interests are only recognized to the extent that it is probable that there will be sufficient taxable profits against which to utilize the benefits of the temporary differences and they are expected to reverse in the foreseeable future.
The carrying amount of deferred tax assets is reviewed at the end of each reporting period and
reduced to the extent that it is no longer probable that sufficient taxable profits will be available to allow all or part of the asset to be recovered.
Deferred tax liabilities and assets are measured at the tax rates that are expected to apply in the period in which the liability is settled or the asset realised, based on tax rates (and tax laws) that have been enacted or substantively enacted by the end of the reporting period.
Current and deferred tax for the year
Current and deferred tax are recognized in profit or loss, except when they relate to items that are recognized in other comprehensive income or directly in equity, in which case, the current and deferred tax are also recognized in other comprehensive income or directly in equity respectively. Where current tax or deferred tax arises from the initial accounting for a business combination, the tax effect is included in the accounting for the business combination.
3.18 Investment Property
Investment properties are properties held to earn rentals and/or for capital appreciation (including property under construction for such purposes). Investment properties are measured initially at cost, including transaction costs. All of the Company’s property interests held under operating leases to earn rentals or for capital appreciation purposes are accounted for as investment properties.
After initial recognition, the company measures investment property at cost.
An investment property is derecognized upon disposal or when the investment property is permanently withdrawn from use and no future economic benefits are expected from the disposal. Any gain or loss arising on de recognition of the property (calculated as the difference between the net disposal proceeds and the carrying amount of the asset) is included in profit or loss in the period in which the property is derecognized.
Investment properties to be depreciated in accordance to the class of asset that it belongs and the life of the asset shall be as conceived for the same class of asset at the Company.
3.19 impairment
If the recoverable amount of an asset (or cash-generating unit) is estimated to be less than its carrying amount, the carrying amount of the asset (or cash-generating unit) is reduced to
112
its recoverable amount. An impairment loss is recognized immediately in profit or loss, unless the relevant asset is carried at a revalue amount, in which case the impairment loss is treated as a revaluation decrease.
Recoverable amount is the higher of fair value less costs of disposal and value in use. In assessing value in use, the estimated future cash flows are discounted to their present value using a pre-tax discount rate that reflects current market assessments of the time value of money and the risks specific to the asset for which the estimates of future cash flows have not been adjusted.
When an impairment loss subsequently reverses, the carrying amount of the asset (or a cash-generating unit) is increased to the revised estimate of its recoverable amount, but so that the increased carrying amount does not exceed the carrying amount that would have been determined had no impairment loss been recognized for the asset (or cash-generating unit) in prior years. A reversal of an impairment loss is recognized immediately in profit or loss, unless the relevant asset is carried at a revalued amount, in which case the reversal of the impairment loss is treated as a revaluation increase.
At the end of each reporting period, the company reviews the carrying amounts of its tangible, intangible assets to determine whether there is any indication that those assets have suffered an impairment loss. If any such indication exists, the recoverable amount of the asset is estimated in order to determine the extent of the impairment loss (if any). When it is not possible to estimate the recoverable amount of an individual asset, The Company estimates the recoverable amount of the cash-generating unit to which the asset belongs. When a reasonable and consistent basis of allocation can be identified,
Intangible assets with indefinite useful lives and intangible assets not yet available for use are tested for impairment at least annually, and whenever there is an indication that the asset may be impaired.
Impairment of financial assets
Financial assets, other than those at Fair Value through Profit and Loss (FVTPL), are assessed for indicators of impairment at the end of each reporting period. Financial assets are considered to be impaired when there is objective evidence that, as a result of one or more events that occurred after the initial recognition of the financial asset,
the estimated future cash flows of the investment have been affected. For Available for Sale (AFS) equity investments, a significant or prolonged decline in the fair value of the security below its cost is considered to be objective evidence of impairment.
For all other financial assets, objective evidence of impairment could include:
• Significant financial difficulty of the issuer or counterparty;
• Breach of contract, such as a default or delinquency in interest or principal payments;
• It becoming probable that the borrower will enter bankruptcy or financial re-organisation; or the disappearance of an active market for that financial asset because of financial difficulties.
For certain categories of financial assets, such as trade receivables, assets are assessed for impairment on individual basis. Objective evidence of impairment for a portfolio of receivables could include company’s past experience of collecting payments, an increase in the number of delayed payments in the portfolio past the average credit period of zero days, as well as observable changes in national or local economic conditions that correlate with default on receivables.
For financial assets that are carried at cost, the amount of impairment loss is measured as the difference between the asset’s carrying amount and the present value of the estimated future cash flows discounted at the current market rate of return for a similar financial asset. Such impairment loss will not be reversed in subsequent periods
The carrying amount of the financial asset is reduced by the impairment loss directly for all financial assets with the exception of trade receivables; such impairment loss is reduced through the use of an allowance account for respective financial asset. When a trade receivable is considered uncollectible, it is written off against the allowance account. Subsequent recoveries of amounts previously written off are credited against the allowance account. Changes in the carrying amount of the allowance account are recognized in profit or loss.
For financial assets measured at amortised cost, if, in a subsequent period, the amount of the impairment loss decreases and the decrease can be related objectively to an event occurring after the impairment was recognized, the previously
113112
recognized impairment loss is reversed through profit or loss to the extent that the carrying amount of the investment at the date the impairment is reversed does not exceed what the amortised cost would have been had the impairment not been recognized.
De-recognition of financial assets
The Company de-recognises a financial asset when the contractual rights to the cash flows from the asset expire, or when it transfers the financial asset and substantially all the risks and rewards of ownership of the asset to another party. If the Company neither transfers nor retains substantially all the risks and rewards of ownership and continues to control the transferred asset, The Company recognises its retained interest in the asset and an associated liability for amounts it may have to pay. If the Company retains substantially all the risks and rewards of ownership of a transferred financial asset, the Company continues to recognise the financial asset and also recognises a collateralised borrowing for the proceeds received.
On de-recognition of a financial asset in its entirety, the difference between the asset’s carrying amount and the sum of the consideration received and receivable and the cumulative gain or loss that had been recognized in other comprehensive income and accumulated in equity is recognized in profit or loss.
3.20 Earnings per share
A basic earnings per equity is computed by dividing the net profit attributable to the equity holders of the company by the weighted average number of equity shares outstanding during the period. Diluted earnings per equity share is computed by dividing the net profit attributable to the equity holders of the company by the weighted average number of equity shares considered for deriving basic earnings per equity share and also the weighted average number of equity shares that could have been issued upon conversion of all dilutive potential equity shares. The dilutive potential equity shares are adjusted for the proceeds receivable had the equity shares been actually issued at fair value (i.e. the average market value of the outstanding equity shares). Dilutive potential equity shares are deemed converted as of the beginning of the period, unless issued at a later date. Dilutive potential equity shares are determined independently for each period presented.
The number of equity shares and potentially dilutive
equity shares are adjusted retrospectively for all periods presented for any shares splits and bonus shares issues including for changes effected prior to the approval of the financial statements by the Board of Directors.
3.21 Discontinued operations
A discontinued operation is a component of the Company’s business that represents a separate line of business that has been disposed off or is held for sale, or is a subsidiary acquired exclusively with a view to resale. Classification as a discontinued operation occurs upon the earlier of disposal or when the operation meets the criteria to be classified as held for sale.
3.22 Financial instruments
i) Non-derivative financial instruments
Non-derivative financial instruments consist of:
• financial assets, which include cash and cash equivalents, trade receivables, unbilled revenues, finance lease receivables, employee and other advances, investments in equity and debt securities and eligible current and non-current assets;
• Financial liabilities, which include long and short-term loans and borrowings, bank overdrafts, trade payables, eligible current and non-current liabilities.
Non derivative financial instruments are recognized initially at fair value including any directly attributable transaction costs. Financial assets are derecognized when substantial risks and rewards of ownership of the financial asset have been transferred. In cases where substantial risks and rewards of ownership of the financial assets are neither transferred nor retained, financial assets are derecognized only when the Company has not retained control over the financial asset.
Subsequent to initial recognition, non-derivative financial instruments are measured as described below:
a) Cash and cash equivalents
For the purposes of the cash flow statement, cash and cash
114
equivalents include cash in hand, at banks and demand deposits with banks, net of outstanding bank overdrafts that are repayable on demand and are considered part of the Company’s cash management system. In the statement of financial position, bank overdrafts are presented under borrowings within current liabilities.
b) Investments in liquid mutual funds, equity securities (other than Subsidiaries, Joint Venture and Associates) are valued at their fair value. These investments are measured at fair value and changes therein, other than impairment losses, are recognized in other comprehensive income and presented within equity, net of taxes. The impairment losses, if any, are reclassified from equity into statement of income. When an available for sale financial asset is derecognized, the related cumulative gain or loss recognised in equity is transferred to the statement of income.
c) Loans and receivables
Loans and receivables are non-derivative financial assets with fixed or determinable payments that are not quoted in an active market. They are presented as current assets, except for those maturing later than 12 months after the reporting date which are presented as non-current assets. Loans and receivables are initially recognized at fair value plus directly attributable transaction costs and subsequently measured at amortized cost using the effective interest method, less any impairment losses. Loans and receivables comprise trade receivables, unbilled revenues and other assets.
The company estimates the un-collectability of accounts receivable by analysing historical payment patterns, customer concentrations, customer credit-worthiness and current economic trends. If the financial condition of a customer deteriorates, additional allowances
may be required.
d) Trade and other payables
Trade and other payables are initially recognized at fair value, and subsequently carried at amortized cost using the effective interest method. For these financial instruments, the carrying amounts approximate fair value due to the short term maturity of these instruments.
e) Investments in Subsidiary, Associates and Joint Venture
The company accounts investment in subsidiary, joint ventures and associates at cost.
An entity controlled by the company is considered as a subsidiary of the company.
Investments in subsidiary company outside India are translated at the rate of exchange prevailing on the date of acquisition.
Investments where the company has significant influence are classified as associates. Significant influence is the power to participate in the financial and operating policy decisions of the investee but is not control or joint control over those policies.
A joint arrangement whereby the parties that have joint control of the arrangement have rights to the net assets of the joint arrangement is classified as a joint venture. Joint control is the contractually agreed sharing of control of an arrangement, which exists only when decisions about the relevant activities require unanimous consent of the parties sharing control.
ii) Derivative financial instruments
The Company is exposed to foreign currency fluctuations on foreign currency assets, liabilities, net investment in foreign operations and forecasted cash flows denominated in foreign currency.
115114
The Company limits the effect of foreign exchange rate fluctuations by following established risk management policies including the use of derivatives. The Company enters into derivative financial instruments where the counterparty is primarily a bank.
Derivatives are recognized and measured at fair value. Attributable transaction costs are recognized in statement of income as cost.
Subsequent to initial recognition, derivative financial instruments are measured as described below:
a) Cash flow hedges
Changes in the fair value of the derivative hedging instrument designated as a cash flow hedge are recognized in other comprehensive income and held in cash flow hedging reserve, net of taxes, a component of equity, to the extent that the hedge is effective. To the extent that the hedge is ineffective, changes in fair value are recognized in the statement of income and reported within foreign exchange gains/ (losses), net within results from operating activities. If the hedging instrument no longer meets the criteria for hedge accounting, then hedge accounting is discontinued prospectively. The cumulative gain or loss previously recognized in the cash flow hedging reserve is transferred to the statement of income upon the occurrence of the related forecasted transaction. If the forecasted transaction is no longer expected to occur, such cumulative balance is immediately recognized in the statement of income.
b) Others
Changes in fair value of foreign currency derivative instruments neither designated as cash flow hedges nor hedges of net investment in foreign operations are recognized in the statement of income and reported within foreign exchange gains/ (losses), net within results from operating activities.
Changes in fair value and gains/ (losses) on settlement of foreign currency derivative instruments relating to borrowings, which have not been designated as hedges are recorded in finance expense.
3.23 Segment Information
The Chairman cum Managing Director (CMD) of the Company has been identified as the Chief Operating Decision Maker (CODM) as defined by Ind AS-108, “Operating Segments.” The CMD of the Company evaluates the segments based on their revenue growth and operating income.
The Company has identified its Operating Segments as Minerals, Precious Metals, Metals, Agro Products, Coal & Hydrocarbon, Fertilizer and General Trade/others.
The Assets and liabilities used in the Company’s business that are not identified to any of the operating segments are shown as unallocable assets/liabilities. Management believes that it is currently not practicable to provide segment disclosures relating to total assets and liabilities since a meaningful segregation of the available data is onerous.
3.24 Prior Period Errors
Errors of material amount relating to prior period(s) are disclosed by a note with nature of prior period errors, amount of correction of each such prior period presented retrospectively, to the extent practicable along with change in basic and diluted earnings per share. However, where retrospective restatement is not practicable for a particular period then the circumstances that lead to the existence of that condition and the description of how and from where the error is corrected are disclosed in Notes to Accounts. Taking into account the nature of activities of the company, prior period errors are considered material if the items of income / expenditure collectively (net) exceed 0.5% of sales turnover of the company.
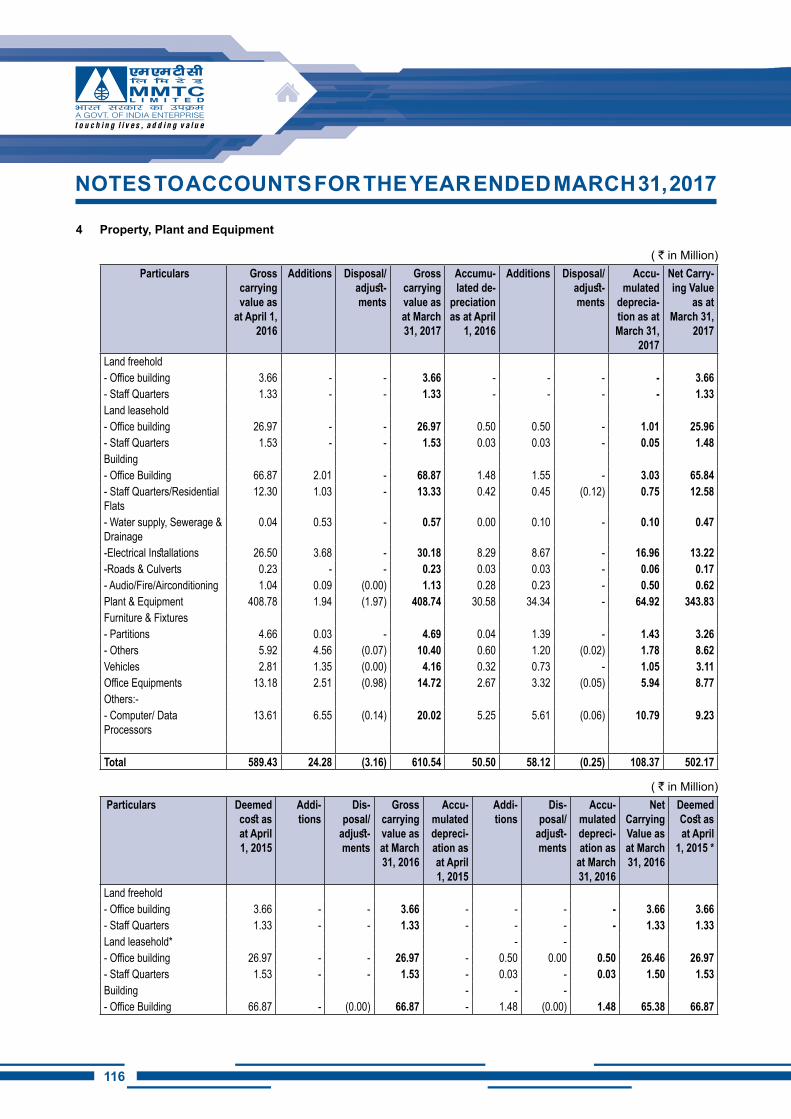
116
4 Property, Plant and Equipment
( ` in Million) Particulars Gross
carrying value as
at April 1, 2016
Additions Disposal/adjust-ments
Gross carrying value as at March 31, 2017
Accumu-lated de-
preciation as at April
1, 2016
Additions Disposal/adjust-ments
Accu-mulated
deprecia-tion as at March 31,
2017
Net Carry-ing Value
as at March 31,
2017
Land freehold- Office building 3.66 - - 3.66 - - - - 3.66 - Staff Quarters 1.33 - - 1.33 - - - - 1.33 Land leasehold- Office building 26.97 - - 26.97 0.50 0.50 - 1.01 25.96 - Staff Quarters 1.53 - - 1.53 0.03 0.03 - 0.05 1.48 Building - Office Building 66.87 2.01 - 68.87 1.48 1.55 - 3.03 65.84 - Staff Quarters/Residential Flats
12.30 1.03 - 13.33 0.42 0.45 (0.12) 0.75 12.58
- Water supply, Sewerage & Drainage
0.04 0.53 - 0.57 0.00 0.10 - 0.10 0.47
-Electrical Installations 26.50 3.68 - 30.18 8.29 8.67 - 16.96 13.22 -Roads & Culverts 0.23 - - 0.23 0.03 0.03 - 0.06 0.17 - Audio/Fire/Airconditioning 1.04 0.09 (0.00) 1.13 0.28 0.23 - 0.50 0.62 Plant & Equipment 408.78 1.94 (1.97) 408.74 30.58 34.34 - 64.92 343.83 Furniture & Fixtures- Partitions 4.66 0.03 - 4.69 0.04 1.39 - 1.43 3.26 - Others 5.92 4.56 (0.07) 10.40 0.60 1.20 (0.02) 1.78 8.62 Vehicles 2.81 1.35 (0.00) 4.16 0.32 0.73 - 1.05 3.11 Office Equipments 13.18 2.51 (0.98) 14.72 2.67 3.32 (0.05) 5.94 8.77 Others:-- Computer/ Data Processors
13.61 6.55 (0.14) 20.02 5.25 5.61 (0.06) 10.79 9.23
Total 589.43 24.28 (3.16) 610.54 50.50 58.12 (0.25) 108.37 502.17
( ` in Million) Particulars Deemed
cost as at April 1, 2015
Addi-tions
Dis-posal/
adjust-ments
Gross carrying value as at March 31, 2016
Accu-mulated depreci-ation as at April 1, 2015
Addi-tions
Dis-posal/
adjust-ments
Accu-mulated depreci-ation as
at March 31, 2016
Net Carrying Value as at March 31, 2016
Deemed Cost as at April
1, 2015 *
Land freehold- Office building 3.66 - - 3.66 - - - - 3.66 3.66 - Staff Quarters 1.33 - - 1.33 - - - - 1.33 1.33 Land leasehold* - - - Office building 26.97 - - 26.97 - 0.50 0.00 0.50 26.46 26.97 - Staff Quarters 1.53 - - 1.53 - 0.03 - 0.03 1.50 1.53 Building - - - - Office Building 66.87 - (0.00) 66.87 - 1.48 (0.00) 1.48 65.38 66.87
NOTES TO ACCOUNTS FOR ThE YEAR ENDED MARCh 31, 2017
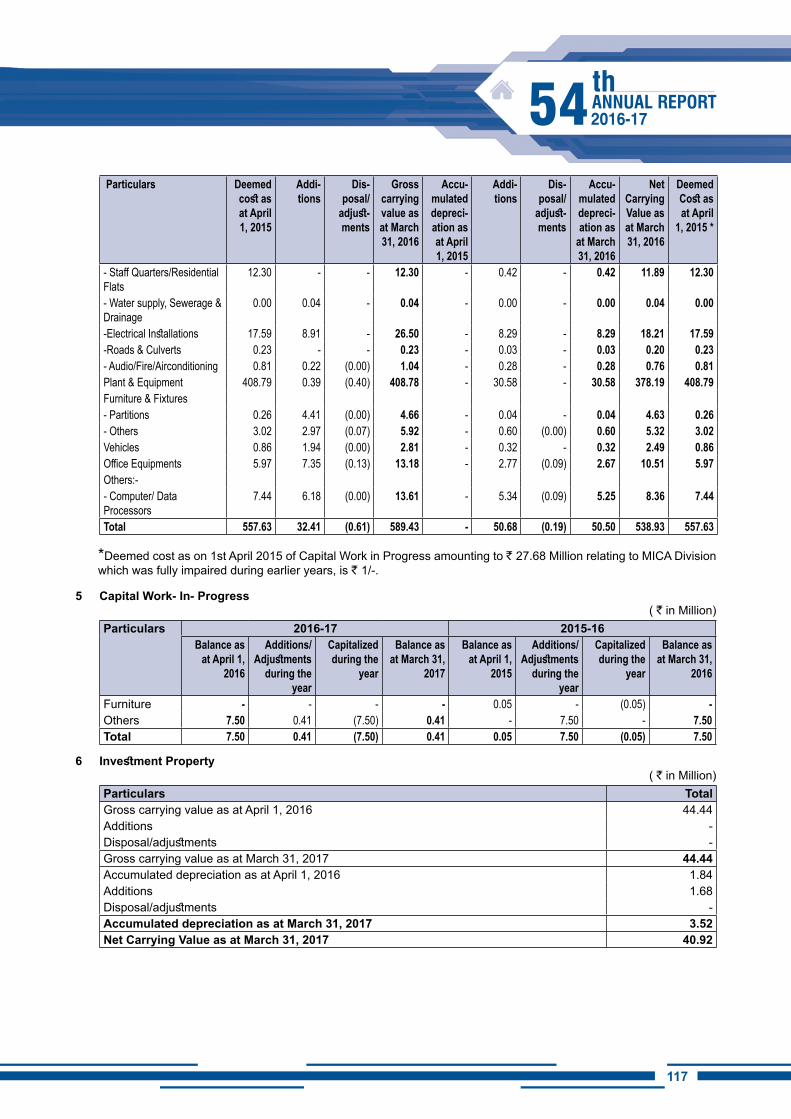
117116
Particulars Deemed cost as at April 1, 2015
Addi-tions
Dis-posal/
adjust-ments
Gross carrying value as at March 31, 2016
Accu-mulated depreci-ation as at April 1, 2015
Addi-tions
Dis-posal/
adjust-ments
Accu-mulated depreci-ation as
at March 31, 2016
Net Carrying Value as at March 31, 2016
Deemed Cost as at April
1, 2015 *
- Staff Quarters/Residential Flats
12.30 - - 12.30 - 0.42 - 0.42 11.89 12.30
- Water supply, Sewerage & Drainage
0.00 0.04 - 0.04 - 0.00 - 0.00 0.04 0.00
-Electrical Installations 17.59 8.91 - 26.50 - 8.29 - 8.29 18.21 17.59 -Roads & Culverts 0.23 - - 0.23 - 0.03 - 0.03 0.20 0.23 - Audio/Fire/Airconditioning 0.81 0.22 (0.00) 1.04 - 0.28 - 0.28 0.76 0.81 Plant & Equipment 408.79 0.39 (0.40) 408.78 - 30.58 - 30.58 378.19 408.79 Furniture & Fixtures- Partitions 0.26 4.41 (0.00) 4.66 - 0.04 - 0.04 4.63 0.26 - Others 3.02 2.97 (0.07) 5.92 - 0.60 (0.00) 0.60 5.32 3.02 Vehicles 0.86 1.94 (0.00) 2.81 - 0.32 - 0.32 2.49 0.86 Office Equipments 5.97 7.35 (0.13) 13.18 - 2.77 (0.09) 2.67 10.51 5.97 Others:-- Computer/ Data Processors
7.44 6.18 (0.00) 13.61 - 5.34 (0.09) 5.25 8.36 7.44
Total 557.63 32.41 (0.61) 589.43 - 50.68 (0.19) 50.50 538.93 557.63
*Deemed cost as on 1st April 2015 of Capital Work in Progress amounting to ` 27.68 Million relating to MICA Division which was fully impaired during earlier years, is ` 1/-.
5 Capital Work- In- Progress( ` in Million)
Particulars 2016-17 2015-16Balance as
at April 1, 2016
Additions/Adjustments
during the year
Capitalized during the
year
Balance as at March 31,
2017
Balance as at April 1,
2015
Additions/Adjustments
during the year
Capitalized during the
year
Balance as at March 31,
2016
Furniture - - - - 0.05 - (0.05) - Others 7.50 0.41 (7.50) 0.41 - 7.50 - 7.50 Total 7.50 0.41 (7.50) 0.41 0.05 7.50 (0.05) 7.50
6 Investment Property( ` in Million)
Particulars Total Gross carrying value as at April 1, 2016 44.44 Additions - Disposal/adjustments - Gross carrying value as at March 31, 2017 44.44 Accumulated depreciation as at April 1, 2016 1.84 Additions 1.68 Disposal/adjustments - Accumulated depreciation as at March 31, 2017 3.52 Net Carrying Value as at March 31, 2017 40.92
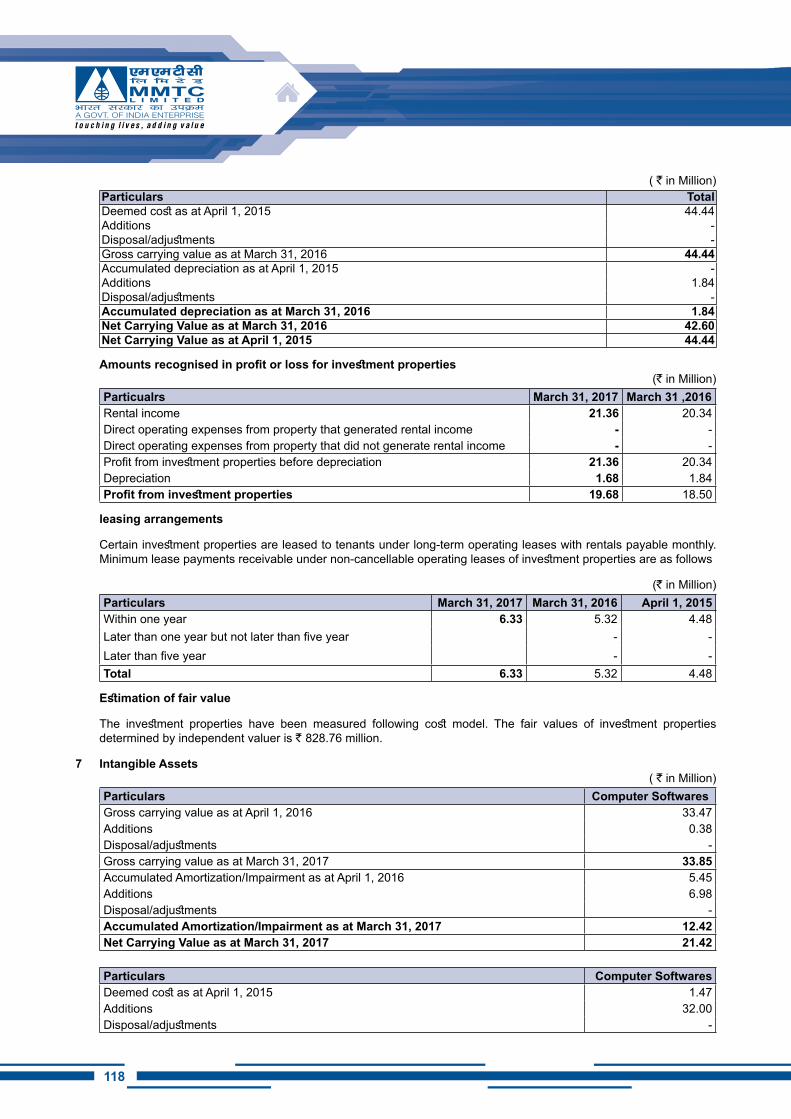
118
( ` in Million)Particulars Total Deemed cost as at April 1, 2015 44.44 Additions - Disposal/adjustments - Gross carrying value as at March 31, 2016 44.44 Accumulated depreciation as at April 1, 2015 - Additions 1.84 Disposal/adjustments - Accumulated depreciation as at March 31, 2016 1.84 Net Carrying Value as at March 31, 2016 42.60 Net Carrying Value as at April 1, 2015 44.44
Amounts recognised in profit or loss for investment properties(` in Million)
Particualrs March 31, 2017 March 31 ,2016Rental income 21.36 20.34Direct operating expenses from property that generated rental income - - Direct operating expenses from property that did not generate rental income - - Profit from investment properties before depreciation 21.36 20.34Depreciation 1.68 1.84Profit from investment properties 19.68 18.50
leasing arrangements
Certain investment properties are leased to tenants under long-term operating leases with rentals payable monthly. Minimum lease payments receivable under non-cancellable operating leases of investment properties are as follows
(` in Million)Particulars March 31, 2017 March 31, 2016 April 1, 2015Within one year 6.33 5.32 4.48Later than one year but not later than five year - - Later than five year - - Total 6.33 5.32 4.48
Estimation of fair value
The investment properties have been measured following cost model. The fair values of investment properties determined by independent valuer is ` 828.76 million.
7 Intangible Assets( ` in Million)
Particulars Computer SoftwaresGross carrying value as at April 1, 2016 33.47 Additions 0.38 Disposal/adjustments - Gross carrying value as at March 31, 2017 33.85 Accumulated Amortization/Impairment as at April 1, 2016 5.45 Additions 6.98 Disposal/adjustments - Accumulated Amortization/Impairment as at March 31, 2017 12.42 Net Carrying Value as at March 31, 2017 21.42
Particulars Computer Softwares Deemed cost as at April 1, 2015 1.47 Additions 32.00 Disposal/adjustments -
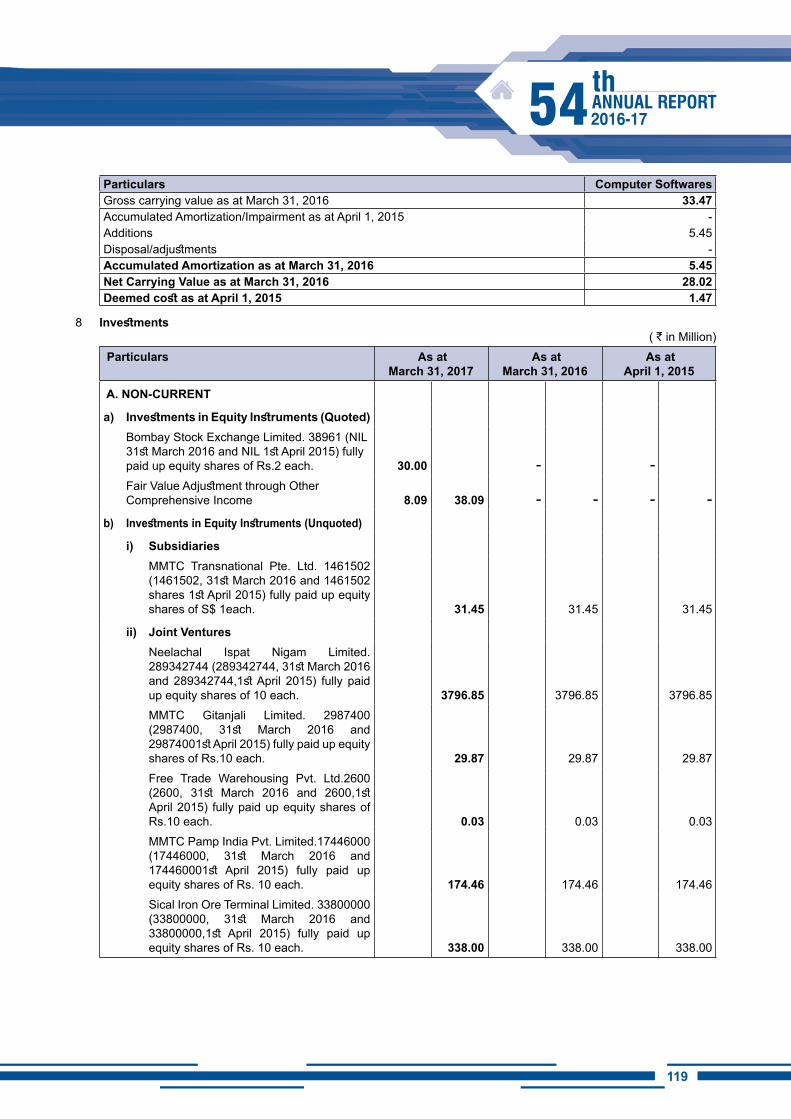
119118
Particulars Computer Softwares Gross carrying value as at March 31, 2016 33.47 Accumulated Amortization/Impairment as at April 1, 2015 - Additions 5.45 Disposal/adjustments - Accumulated Amortization as at March 31, 2016 5.45 Net Carrying Value as at March 31, 2016 28.02 Deemed cost as at April 1, 2015 1.47
8 Investments ( ` in Million)
Particulars As at March 31, 2017
As at March 31, 2016
As at April 1, 2015
A. NON-CURRENT
a) Investments in Equity Instruments (Quoted) Bombay Stock Exchange Limited. 38961 (NIL
31st March 2016 and NIL 1st April 2015) fully paid up equity shares of Rs.2 each. 30.00 - -
Fair Value Adjustment through Other Comprehensive Income 8.09 38.09 - - - -
b) Investments in Equity Instruments (Unquoted)
i) Subsidiaries MMTC Transnational Pte. Ltd. 1461502
(1461502, 31st March 2016 and 1461502 shares 1st April 2015) fully paid up equity shares of S$ 1each. 31.45 31.45 31.45
ii) Joint Ventures Neelachal Ispat Nigam Limited.
289342744 (289342744, 31st March 2016 and 289342744,1st April 2015) fully paid up equity shares of 10 each. 3796.85 3796.85 3796.85
MMTC Gitanjali Limited. 2987400 (2987400, 31st March 2016 and 29874001st April 2015) fully paid up equity shares of Rs.10 each. 29.87 29.87 29.87
Free Trade Warehousing Pvt. Ltd.2600 (2600, 31st March 2016 and 2600,1st April 2015) fully paid up equity shares of Rs.10 each. 0.03 0.03 0.03
MMTC Pamp India Pvt. Limited.17446000 (17446000, 31st March 2016 and 174460001st April 2015) fully paid up equity shares of Rs. 10 each. 174.46 174.46 174.46
Sical Iron Ore Terminal Limited. 33800000 (33800000, 31st March 2016 and 33800000,1st April 2015) fully paid up equity shares of Rs. 10 each. 338.00 338.00 338.00
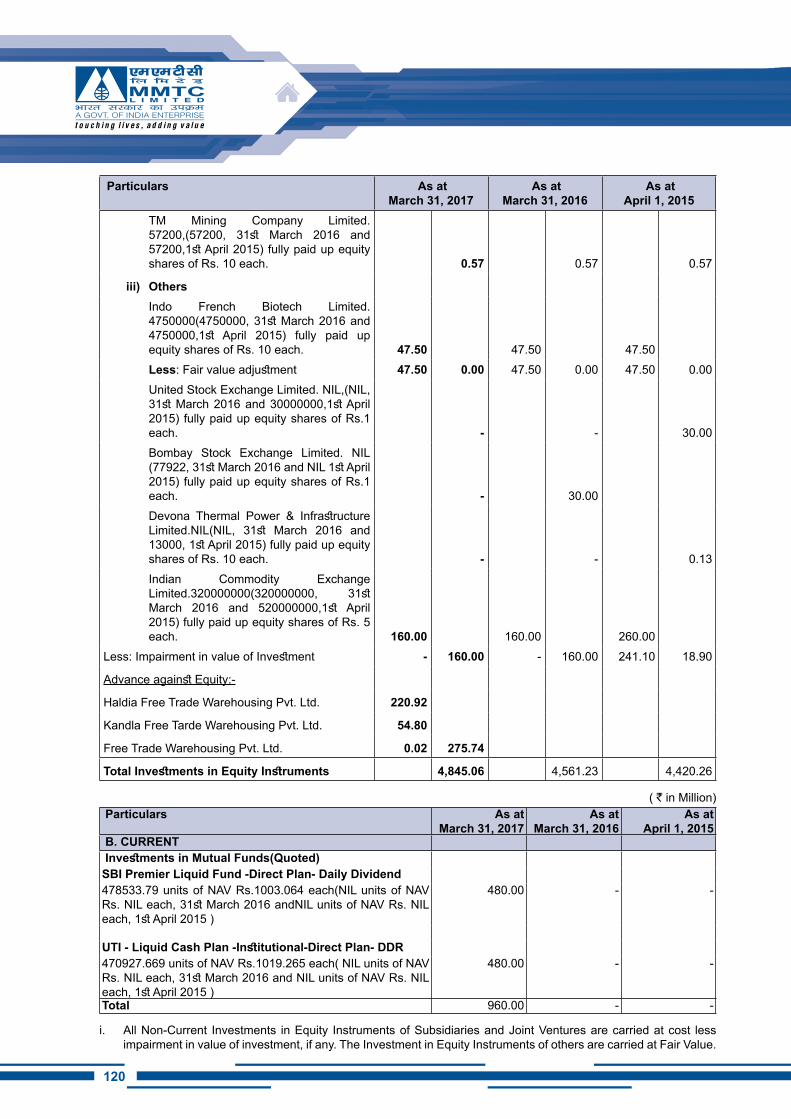
120
Particulars As at March 31, 2017
As at March 31, 2016
As at April 1, 2015
TM Mining Company Limited. 57200,(57200, 31st March 2016 and 57200,1st April 2015) fully paid up equity shares of Rs. 10 each. 0.57 0.57 0.57
iii) OthersIndo French Biotech Limited. 4750000(4750000, 31st March 2016 and 4750000,1st April 2015) fully paid up equity shares of Rs. 10 each. 47.50 47.50 47.50Less: Fair value adjustment 47.50 0.00 47.50 0.00 47.50 0.00United Stock Exchange Limited. NIL,(NIL, 31st March 2016 and 30000000,1st April 2015) fully paid up equity shares of Rs.1 each. - - 30.00Bombay Stock Exchange Limited. NIL (77922, 31st March 2016 and NIL 1st April 2015) fully paid up equity shares of Rs.1 each. - 30.00Devona Thermal Power & Infrastructure Limited.NIL(NIL, 31st March 2016 and 13000, 1st April 2015) fully paid up equity shares of Rs. 10 each. - - 0.13Indian Commodity Exchange Limited.320000000(320000000, 31st March 2016 and 520000000,1st April 2015) fully paid up equity shares of Rs. 5 each. 160.00 160.00 260.00
Less: Impairment in value of Investment - 160.00 - 160.00 241.10 18.90
Advance against Equity:-
Haldia Free Trade Warehousing Pvt. Ltd. 220.92
Kandla Free Tarde Warehousing Pvt. Ltd. 54.80
Free Trade Warehousing Pvt. Ltd. 0.02 275.74
Total Investments in Equity Instruments 4,845.06 4,561.23 4,420.26
( ` in Million) Particulars As at
March 31, 2017 As at
March 31, 2016 As at
April 1, 2015 B. CURRENT Investments in Mutual Funds(Quoted)SBI Premier Liquid Fund -Direct Plan- Daily Dividend478533.79 units of NAV Rs.1003.064 each(NIL units of NAV Rs. NIL each, 31st March 2016 andNIL units of NAV Rs. NIL each, 1st April 2015 )
480.00 - -
UTI - Liquid Cash Plan -Institutional-Direct Plan- DDR470927.669 units of NAV Rs.1019.265 each( NIL units of NAV Rs. NIL each, 31st March 2016 and NIL units of NAV Rs. NIL each, 1st April 2015 )
480.00 - -
Total 960.00 - -
i. All Non-Current Investments in Equity Instruments of Subsidiaries and Joint Ventures are carried at cost less impairment in value of investment, if any. The Investment in Equity Instruments of others are carried at Fair Value.
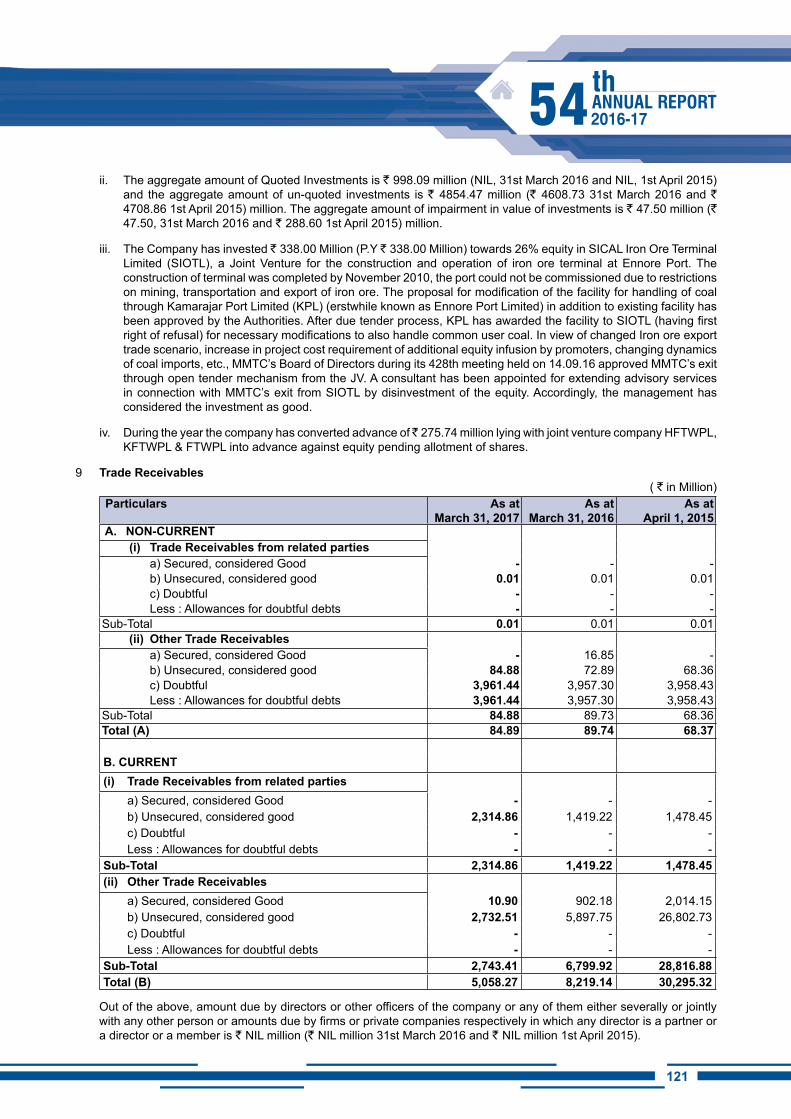
121120
ii. The aggregate amount of Quoted Investments is ` 998.09 million (NIL, 31st March 2016 and NIL, 1st April 2015) and the aggregate amount of un-quoted investments is ` 4854.47 million (` 4608.73 31st March 2016 and ` 4708.86 1st April 2015) million. The aggregate amount of impairment in value of investments is ` 47.50 million (` 47.50, 31st March 2016 and ` 288.60 1st April 2015) million.
iii. The Company has invested ` 338.00 Million (P.Y ` 338.00 Million) towards 26% equity in SICAL Iron Ore Terminal Limited (SIOTL), a Joint Venture for the construction and operation of iron ore terminal at Ennore Port. The construction of terminal was completed by November 2010, the port could not be commissioned due to restrictions on mining, transportation and export of iron ore. The proposal for modification of the facility for handling of coal through Kamarajar Port Limited (KPL) (erstwhile known as Ennore Port Limited) in addition to existing facility has been approved by the Authorities. After due tender process, KPL has awarded the facility to SIOTL (having first right of refusal) for necessary modifications to also handle common user coal. In view of changed Iron ore export trade scenario, increase in project cost requirement of additional equity infusion by promoters, changing dynamics of coal imports, etc., MMTC’s Board of Directors during its 428th meeting held on 14.09.16 approved MMTC’s exit through open tender mechanism from the JV. A consultant has been appointed for extending advisory services in connection with MMTC’s exit from SIOTL by disinvestment of the equity. Accordingly, the management has considered the investment as good.
iv. During the year the company has converted advance of ̀ 275.74 million lying with joint venture company HFTWPL, KFTWPL & FTWPL into advance against equity pending allotment of shares.
9 Trade Receivables( ` in Million)
Particulars As at March 31, 2017
As at March 31, 2016
As at April 1, 2015
A. NON-CURRENT (i) Trade Receivables from related parties
a) Secured, considered Good - - - b) Unsecured, considered good 0.01 0.01 0.01 c) Doubtful - - - Less : Allowances for doubtful debts - - -
Sub-Total 0.01 0.01 0.01 (ii) Other Trade Receivables
a) Secured, considered Good - 16.85 - b) Unsecured, considered good 84.88 72.89 68.36 c) Doubtful 3,961.44 3,957.30 3,958.43 Less : Allowances for doubtful debts 3,961.44 3,957.30 3,958.43
Sub-Total 84.88 89.73 68.36 Total (A) 84.89 89.74 68.37
B. CURRENT(i) Trade Receivables from related parties
a) Secured, considered Good - - - b) Unsecured, considered good 2,314.86 1,419.22 1,478.45 c) Doubtful - - - Less : Allowances for doubtful debts - - -
Sub-Total 2,314.86 1,419.22 1,478.45 (ii) Other Trade Receivables
a) Secured, considered Good 10.90 902.18 2,014.15 b) Unsecured, considered good 2,732.51 5,897.75 26,802.73 c) Doubtful - - - Less : Allowances for doubtful debts - - -
Sub-Total 2,743.41 6,799.92 28,816.88 Total (B) 5,058.27 8,219.14 30,295.32
Out of the above, amount due by directors or other officers of the company or any of them either severally or jointly with any other person or amounts due by firms or private companies respectively in which any director is a partner or a director or a member is ` NIL million (` NIL million 31st March 2016 and ` NIL million 1st April 2015).
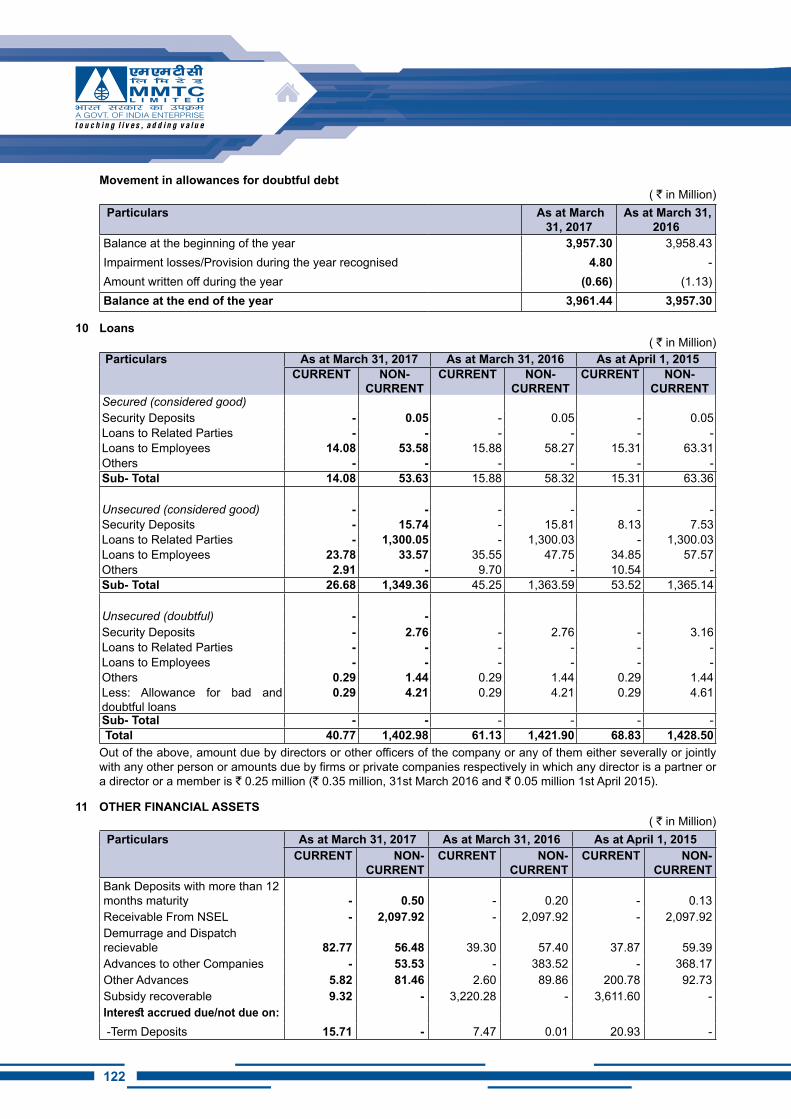
122
Movement in allowances for doubtful debt( ` in Million)
Particulars As at March 31, 2017
As at March 31, 2016
Balance at the beginning of the year 3,957.30 3,958.43 Impairment losses/Provision during the year recognised 4.80 - Amount written off during the year (0.66) (1.13)Balance at the end of the year 3,961.44 3,957.30
10 Loans( ` in Million)
Particulars As at March 31, 2017 As at March 31, 2016 As at April 1, 2015 CURRENT NON-
CURRENTCURRENT NON-
CURRENTCURRENT NON-
CURRENTSecured (considered good)Security Deposits - 0.05 - 0.05 - 0.05 Loans to Related Parties - - - - - - Loans to Employees 14.08 53.58 15.88 58.27 15.31 63.31 Others - - - - - - Sub- Total 14.08 53.63 15.88 58.32 15.31 63.36
Unsecured (considered good) - - - - - - Security Deposits - 15.74 - 15.81 8.13 7.53 Loans to Related Parties - 1,300.05 - 1,300.03 - 1,300.03 Loans to Employees 23.78 33.57 35.55 47.75 34.85 57.57 Others 2.91 - 9.70 - 10.54 - Sub- Total 26.68 1,349.36 45.25 1,363.59 53.52 1,365.14
Unsecured (doubtful) - - Security Deposits - 2.76 - 2.76 - 3.16 Loans to Related Parties - - - - - - Loans to Employees - - - - - - Others 0.29 1.44 0.29 1.44 0.29 1.44 Less: Allowance for bad and doubtful loans
0.29 4.21 0.29 4.21 0.29 4.61
Sub- Total - - - - - - Total 40.77 1,402.98 61.13 1,421.90 68.83 1,428.50 Out of the above, amount due by directors or other officers of the company or any of them either severally or jointly with any other person or amounts due by firms or private companies respectively in which any director is a partner or a director or a member is ` 0.25 million (` 0.35 million, 31st March 2016 and ` 0.05 million 1st April 2015).
11 OThER FiNANCiAL ASSETS( ` in Million)
Particulars As at March 31, 2017 As at March 31, 2016 As at April 1, 2015 CURRENT NON-
CURRENTCURRENT NON-
CURRENTCURRENT NON-
CURRENTBank Deposits with more than 12 months maturity - 0.50 - 0.20 - 0.13 Receivable From NSEL - 2,097.92 - 2,097.92 - 2,097.92 Demurrage and Dispatch recievable 82.77 56.48 39.30 57.40 37.87 59.39 Advances to other Companies - 53.53 - 383.52 - 368.17 Other Advances 5.82 81.46 2.60 89.86 200.78 92.73 Subsidy recoverable 9.32 - 3,220.28 - 3,611.60 - Interest accrued due/not due on: -Term Deposits 15.71 - 7.47 0.01 20.93 -
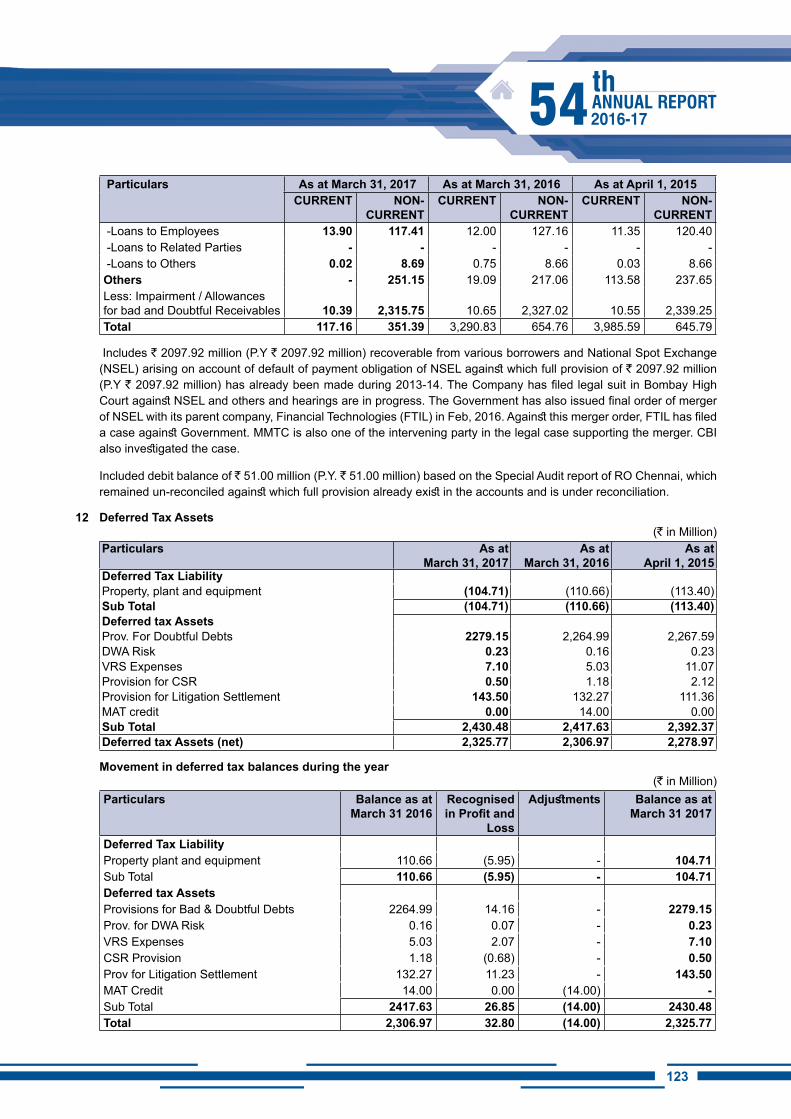
123122
Particulars As at March 31, 2017 As at March 31, 2016 As at April 1, 2015 CURRENT NON-
CURRENTCURRENT NON-
CURRENTCURRENT NON-
CURRENT -Loans to Employees 13.90 117.41 12.00 127.16 11.35 120.40 -Loans to Related Parties - - - - - - -Loans to Others 0.02 8.69 0.75 8.66 0.03 8.66 Others - 251.15 19.09 217.06 113.58 237.65 Less: Impairment / Allowances for bad and Doubtful Receivables 10.39 2,315.75 10.65 2,327.02 10.55 2,339.25 Total 117.16 351.39 3,290.83 654.76 3,985.59 645.79
Includes ` 2097.92 million (P.Y ` 2097.92 million) recoverable from various borrowers and National Spot Exchange (NSEL) arising on account of default of payment obligation of NSEL against which full provision of ` 2097.92 million (P.Y ` 2097.92 million) has already been made during 2013-14. The Company has filed legal suit in Bombay High Court against NSEL and others and hearings are in progress. The Government has also issued final order of merger of NSEL with its parent company, Financial Technologies (FTIL) in Feb, 2016. Against this merger order, FTIL has filed a case against Government. MMTC is also one of the intervening party in the legal case supporting the merger. CBI also investigated the case.
Included debit balance of ` 51.00 million (P.Y. ` 51.00 million) based on the Special Audit report of RO Chennai, which remained un-reconciled against which full provision already exist in the accounts and is under reconciliation.
12 Deferred Tax Assets (` in Million)
Particulars As at March 31, 2017
As at March 31, 2016
As at April 1, 2015
Deferred Tax LiabilityProperty, plant and equipment (104.71) (110.66) (113.40)Sub Total (104.71) (110.66) (113.40)Deferred tax AssetsProv. For Doubtful Debts 2279.15 2,264.99 2,267.59 DWA Risk 0.23 0.16 0.23 VRS Expenses 7.10 5.03 11.07 Provision for CSR 0.50 1.18 2.12Provision for Litigation Settlement 143.50 132.27 111.36MAT credit 0.00 14.00 0.00Sub Total 2,430.48 2,417.63 2,392.37 Deferred tax Assets (net) 2,325.77 2,306.97 2,278.97
Movement in deferred tax balances during the year(` in Million)
Particulars Balance as at March 31 2016
Recognised in Profit and
Loss
Adjustments Balance as at March 31 2017
Deferred Tax LiabilityProperty plant and equipment 110.66 (5.95) - 104.71Sub Total 110.66 (5.95) - 104.71Deferred tax AssetsProvisions for Bad & Doubtful Debts 2264.99 14.16 - 2279.15Prov. for DWA Risk 0.16 0.07 - 0.23VRS Expenses 5.03 2.07 - 7.10CSR Provision 1.18 (0.68) - 0.50Prov for Litigation Settlement 132.27 11.23 - 143.50MAT Credit 14.00 0.00 (14.00) - Sub Total 2417.63 26.85 (14.00) 2430.48Total 2,306.97 32.80 (14.00) 2,325.77
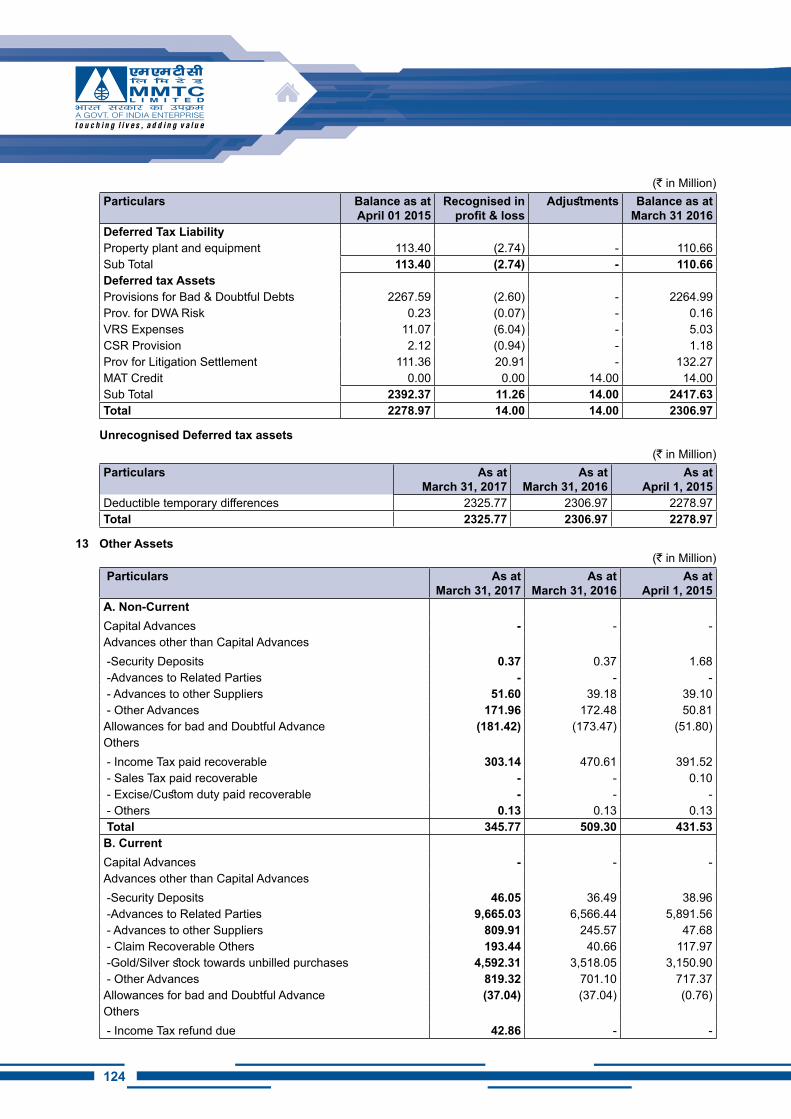
124
(` in Million) Particulars Balance as at
April 01 2015Recognised in
profit & lossAdjustments Balance as at
March 31 2016Deferred Tax LiabilityProperty plant and equipment 113.40 (2.74) - 110.66Sub Total 113.40 (2.74) - 110.66Deferred tax AssetsProvisions for Bad & Doubtful Debts 2267.59 (2.60) - 2264.99Prov. for DWA Risk 0.23 (0.07) - 0.16VRS Expenses 11.07 (6.04) - 5.03CSR Provision 2.12 (0.94) - 1.18Prov for Litigation Settlement 111.36 20.91 - 132.27MAT Credit 0.00 0.00 14.00 14.00Sub Total 2392.37 11.26 14.00 2417.63Total 2278.97 14.00 14.00 2306.97
Unrecognised Deferred tax assets(` in Million)
Particulars As at March 31, 2017
As at March 31, 2016
As at April 1, 2015
Deductible temporary differences 2325.77 2306.97 2278.97Total 2325.77 2306.97 2278.97
13 Other Assets(` in Million)
Particulars As at March 31, 2017
As at March 31, 2016
As at April 1, 2015
A. Non-CurrentCapital Advances - - - Advances other than Capital Advances -Security Deposits 0.37 0.37 1.68 -Advances to Related Parties - - - - Advances to other Suppliers 51.60 39.18 39.10 - Other Advances 171.96 172.48 50.81 Allowances for bad and Doubtful Advance (181.42) (173.47) (51.80)Others - Income Tax paid recoverable 303.14 470.61 391.52 - Sales Tax paid recoverable - - 0.10 - Excise/Custom duty paid recoverable - - - - Others 0.13 0.13 0.13 Total 345.77 509.30 431.53 B. CurrentCapital Advances - - - Advances other than Capital Advances -Security Deposits 46.05 36.49 38.96 -Advances to Related Parties 9,665.03 6,566.44 5,891.56 - Advances to other Suppliers 809.91 245.57 47.68 - Claim Recoverable Others 193.44 40.66 117.97 -Gold/Silver stock towards unbilled purchases 4,592.31 3,518.05 3,150.90 - Other Advances 819.32 701.10 717.37 Allowances for bad and Doubtful Advance (37.04) (37.04) (0.76)Others - Income Tax refund due 42.86 - -
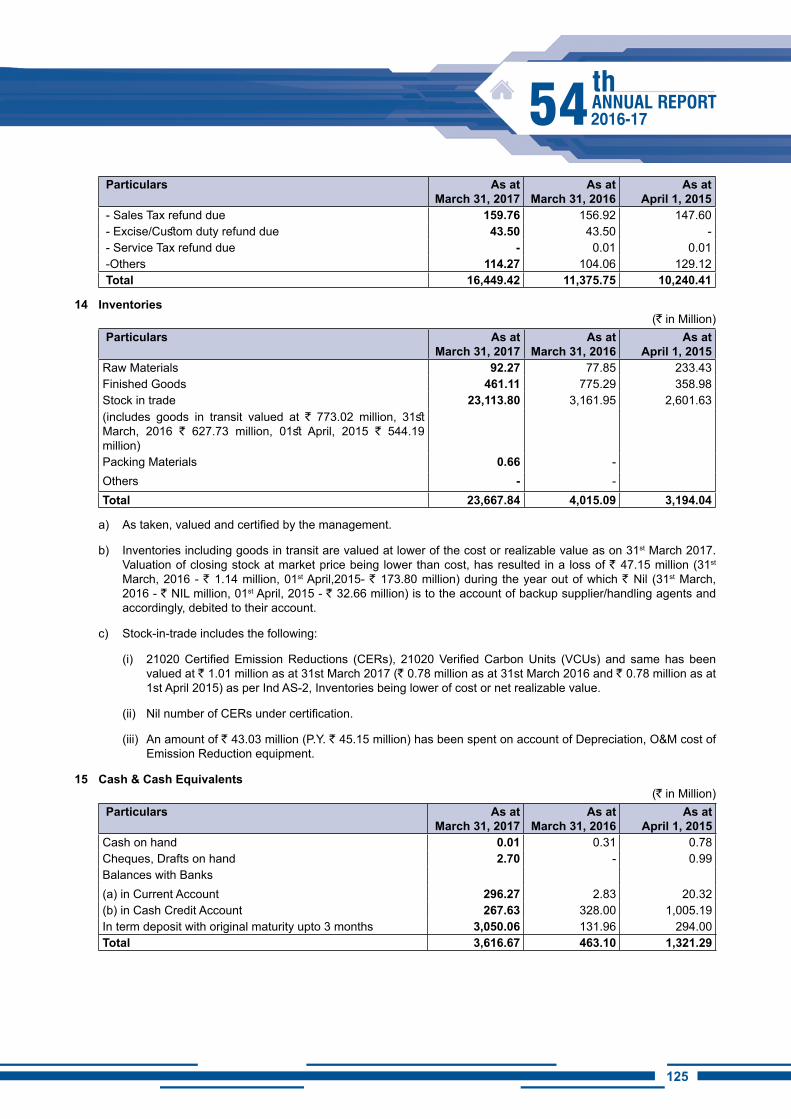
125124
Particulars As at March 31, 2017
As at March 31, 2016
As at April 1, 2015
- Sales Tax refund due 159.76 156.92 147.60 - Excise/Custom duty refund due 43.50 43.50 - - Service Tax refund due - 0.01 0.01 -Others 114.27 104.06 129.12 Total 16,449.42 11,375.75 10,240.41
14 inventories(` in Million)
Particulars As at March 31, 2017
As at March 31, 2016
As at April 1, 2015
Raw Materials 92.27 77.85 233.43 Finished Goods 461.11 775.29 358.98 Stock in trade 23,113.80 3,161.95 2,601.63 (includes goods in transit valued at ` 773.02 million, 31st March, 2016 ` 627.73 million, 01st April, 2015 ` 544.19 million)Packing Materials 0.66 - Others - - Total 23,667.84 4,015.09 3,194.04
a) As taken, valued and certified by the management.
b) Inventories including goods in transit are valued at lower of the cost or realizable value as on 31st March 2017. Valuation of closing stock at market price being lower than cost, has resulted in a loss of ` 47.15 million (31st
March, 2016 - ` 1.14 million, 01st April,2015- ` 173.80 million) during the year out of which ` Nil (31st March, 2016 - ` NIL million, 01st April, 2015 - ` 32.66 million) is to the account of backup supplier/handling agents and accordingly, debited to their account.
c) Stock-in-trade includes the following:
(i) 21020 Certified Emission Reductions (CERs), 21020 Verified Carbon Units (VCUs) and same has been valued at ` 1.01 million as at 31st March 2017 (` 0.78 million as at 31st March 2016 and ` 0.78 million as at 1st April 2015) as per Ind AS-2, Inventories being lower of cost or net realizable value.
(ii) Nil number of CERs under certification.
(iii) An amount of ` 43.03 million (P.Y. ` 45.15 million) has been spent on account of Depreciation, O&M cost of Emission Reduction equipment.
15 Cash & Cash Equivalents(` in Million)
Particulars As at March 31, 2017
As at March 31, 2016
As at April 1, 2015
Cash on hand 0.01 0.31 0.78 Cheques, Drafts on hand 2.70 - 0.99 Balances with Banks(a) in Current Account 296.27 2.83 20.32 (b) in Cash Credit Account 267.63 328.00 1,005.19 In term deposit with original maturity upto 3 months 3,050.06 131.96 294.00 Total 3,616.67 463.10 1,321.29
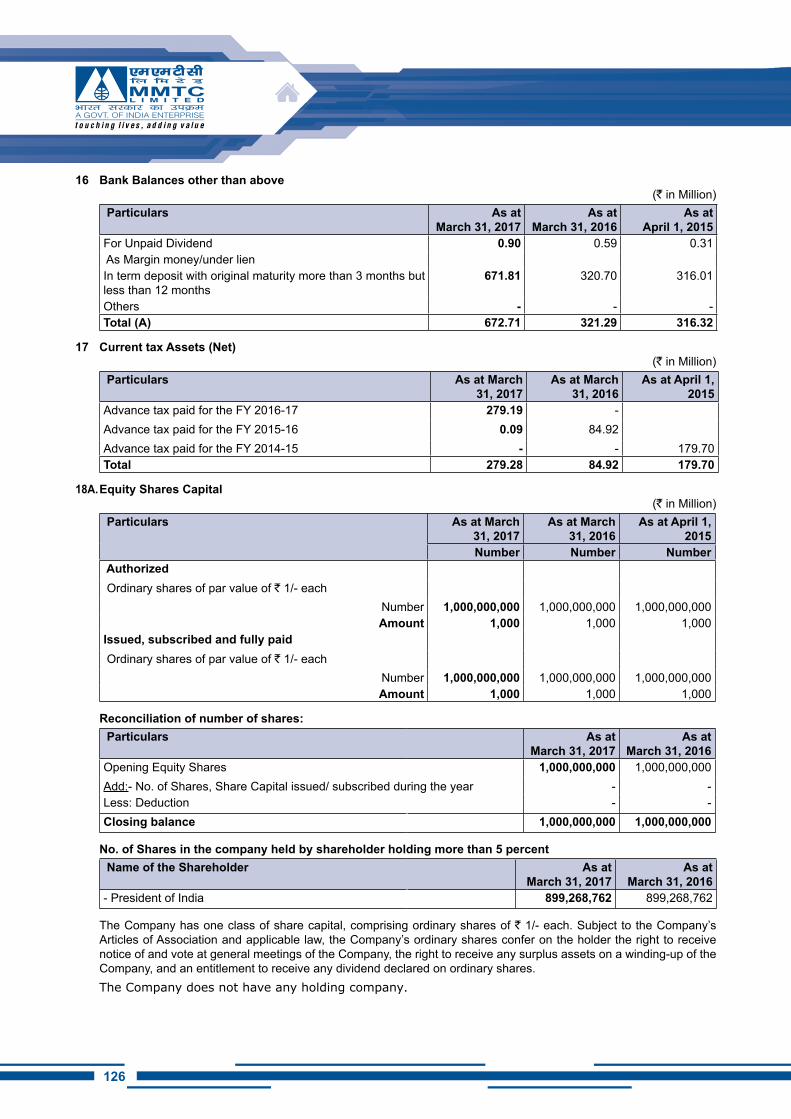
126
16 Bank Balances other than above(` in Million)
Particulars As at March 31, 2017
As at March 31, 2016
As at April 1, 2015
For Unpaid Dividend 0.90 0.59 0.31 As Margin money/under lienIn term deposit with original maturity more than 3 months but less than 12 months
671.81 320.70 316.01
Others - - - Total (A) 672.71 321.29 316.32
17 Current tax Assets (Net)(` in Million)
Particulars As at March 31, 2017
As at March 31, 2016
As at April 1, 2015
Advance tax paid for the FY 2016-17 279.19 - Advance tax paid for the FY 2015-16 0.09 84.92 Advance tax paid for the FY 2014-15 - - 179.70 Total 279.28 84.92 179.70
18A. Equity Shares Capital(` in Million)
Particulars As at March 31, 2017
As at March 31, 2016
As at April 1, 2015
Number Number Number Authorized Ordinary shares of par value of ` 1/- each
Number 1,000,000,000 1,000,000,000 1,000,000,000 Amount 1,000 1,000 1,000
Issued, subscribed and fully paid Ordinary shares of par value of ` 1/- each
Number 1,000,000,000 1,000,000,000 1,000,000,000 Amount 1,000 1,000 1,000
Reconciliation of number of shares: Particulars As at
March 31, 2017 As at
March 31, 2016 Opening Equity Shares 1,000,000,000 1,000,000,000 Add:- No. of Shares, Share Capital issued/ subscribed during the year - - Less: Deduction - - Closing balance 1,000,000,000 1,000,000,000
No. of Shares in the company held by shareholder holding more than 5 percent Name of the Shareholder As at
March 31, 2017 As at
March 31, 2016 - President of India 899,268,762 899,268,762
The Company has one class of share capital, comprising ordinary shares of ` 1/- each. Subject to the Company’s Articles of Association and applicable law, the Company’s ordinary shares confer on the holder the right to receive notice of and vote at general meetings of the Company, the right to receive any surplus assets on a winding-up of the Company, and an entitlement to receive any dividend declared on ordinary shares.The Company does not have any holding company.
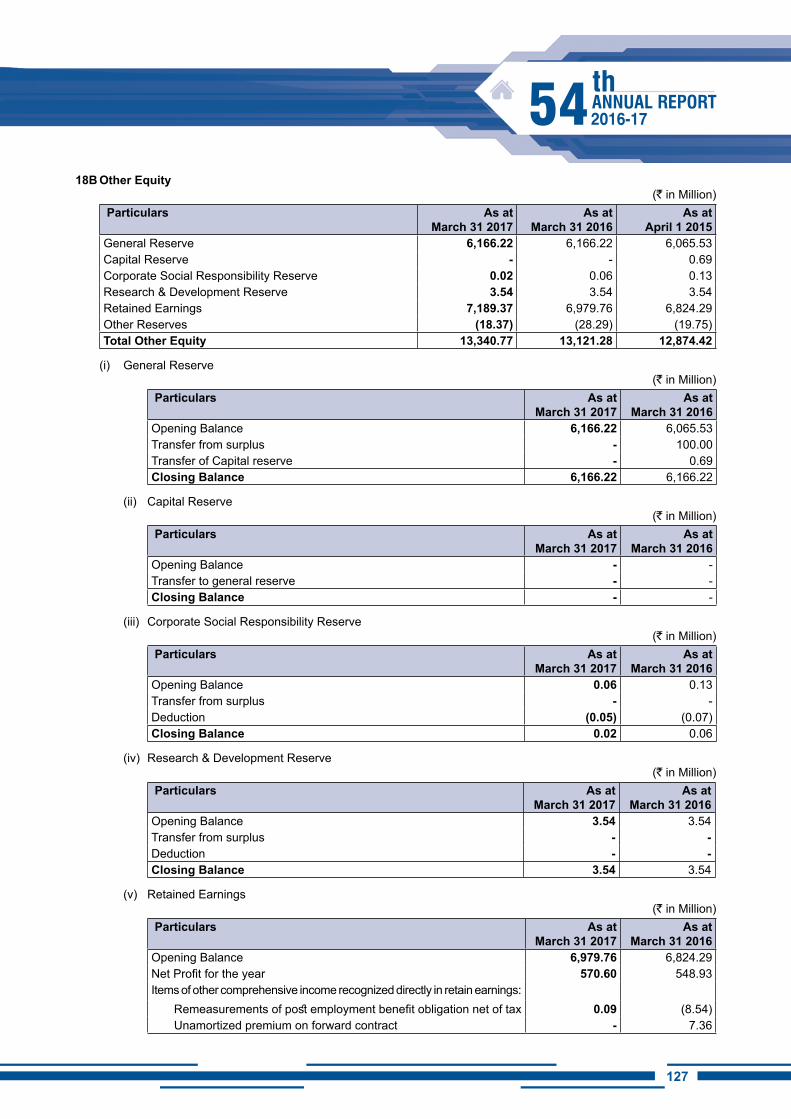
127126
18B Other Equity(` in Million)
Particulars As at March 31 2017
As at March 31 2016
As at April 1 2015
General Reserve 6,166.22 6,166.22 6,065.53 Capital Reserve - - 0.69 Corporate Social Responsibility Reserve 0.02 0.06 0.13 Research & Development Reserve 3.54 3.54 3.54 Retained Earnings 7,189.37 6,979.76 6,824.29 Other Reserves (18.37) (28.29) (19.75)Total Other Equity 13,340.77 13,121.28 12,874.42
(i) General Reserve(` in Million)
Particulars As at March 31 2017
As at March 31 2016
Opening Balance 6,166.22 6,065.53 Transfer from surplus - 100.00 Transfer of Capital reserve - 0.69 Closing Balance 6,166.22 6,166.22
(ii) Capital Reserve(` in Million)
Particulars As at March 31 2017
As at March 31 2016
Opening Balance - - Transfer to general reserve - - Closing Balance - -
(iii) Corporate Social Responsibility Reserve(` in Million)
Particulars As at March 31 2017
As at March 31 2016
Opening Balance 0.06 0.13 Transfer from surplus - - Deduction (0.05) (0.07)Closing Balance 0.02 0.06
(iv) Research & Development Reserve(` in Million)
Particulars As at March 31 2017
As at March 31 2016
Opening Balance 3.54 3.54 Transfer from surplus - - Deduction - - Closing Balance 3.54 3.54
(v) Retained Earnings (` in Million)
Particulars As at March 31 2017
As at March 31 2016
Opening Balance 6,979.76 6,824.29 Net Profit for the year 570.60 548.93 Items of other comprehensive income recognized directly in retain earnings:
Remeasurements of post employment benefit obligation net of tax 0.09 (8.54)Unamortized premium on forward contract - 7.36
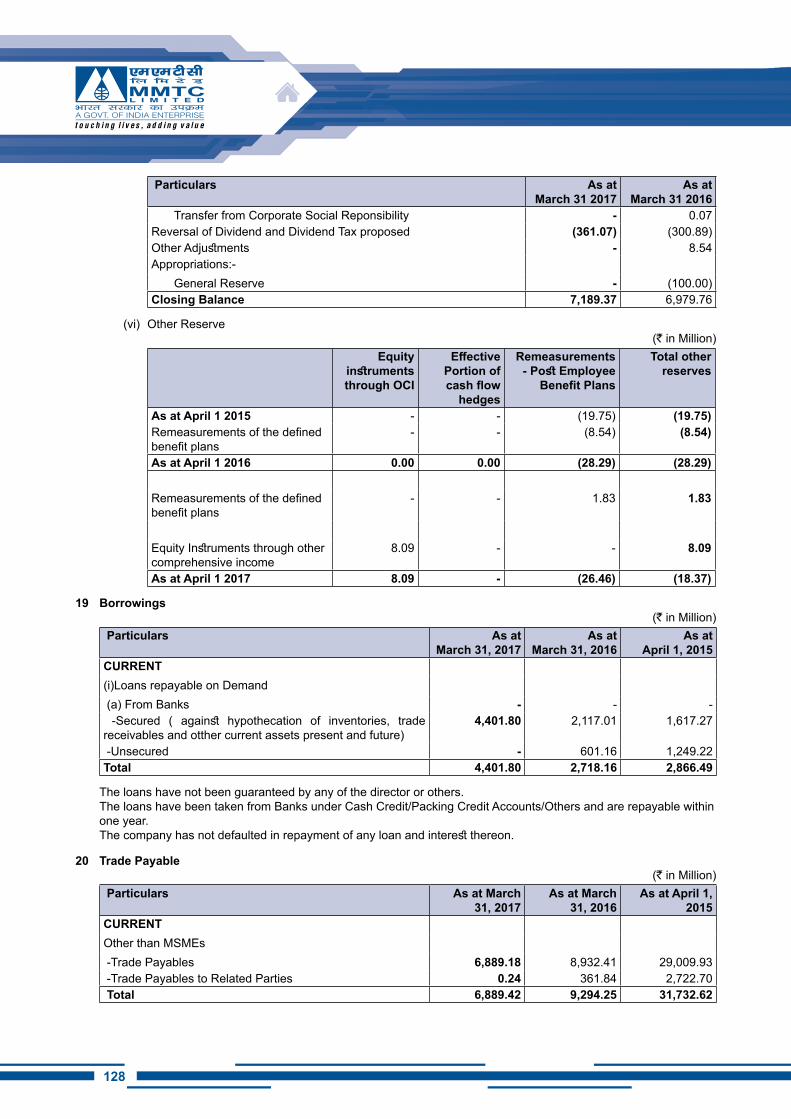
128
Particulars As at March 31 2017
As at March 31 2016
Transfer from Corporate Social Reponsibility - 0.07 Reversal of Dividend and Dividend Tax proposed (361.07) (300.89)Other Adjustments - 8.54 Appropriations:-
General Reserve - (100.00)Closing Balance 7,189.37 6,979.76
(vi) Other Reserve(` in Million)
Equity instruments through OCI
Effective Portion of cash flow
hedges
Remeasurements - Post Employee
Benefit Plans
Total other reserves
As at April 1 2015 - - (19.75) (19.75)Remeasurements of the defined benefit plans
- - (8.54) (8.54)
As at April 1 2016 0.00 0.00 (28.29) (28.29)
Remeasurements of the defined benefit plans
- - 1.83 1.83
Equity Instruments through other comprehensive income
8.09 - - 8.09
As at April 1 2017 8.09 - (26.46) (18.37)
19 Borrowings(` in Million)
Particulars As at March 31, 2017
As at March 31, 2016
As at April 1, 2015
CURRENT(i)Loans repayable on Demand (a) From Banks - - - -Secured ( against hypothecation of inventories, trade receivables and otther current assets present and future)
4,401.80 2,117.01 1,617.27
-Unsecured - 601.16 1,249.22 Total 4,401.80 2,718.16 2,866.49
The loans have not been guaranteed by any of the director or others.The loans have been taken from Banks under Cash Credit/Packing Credit Accounts/Others and are repayable within one year.The company has not defaulted in repayment of any loan and interest thereon.
20 Trade Payable(` in Million)
Particulars As at March 31, 2017
As at March 31, 2016
As at April 1, 2015
CURRENTOther than MSMEs -Trade Payables 6,889.18 8,932.41 29,009.93 -Trade Payables to Related Parties 0.24 361.84 2,722.70 Total 6,889.42 9,294.25 31,732.62
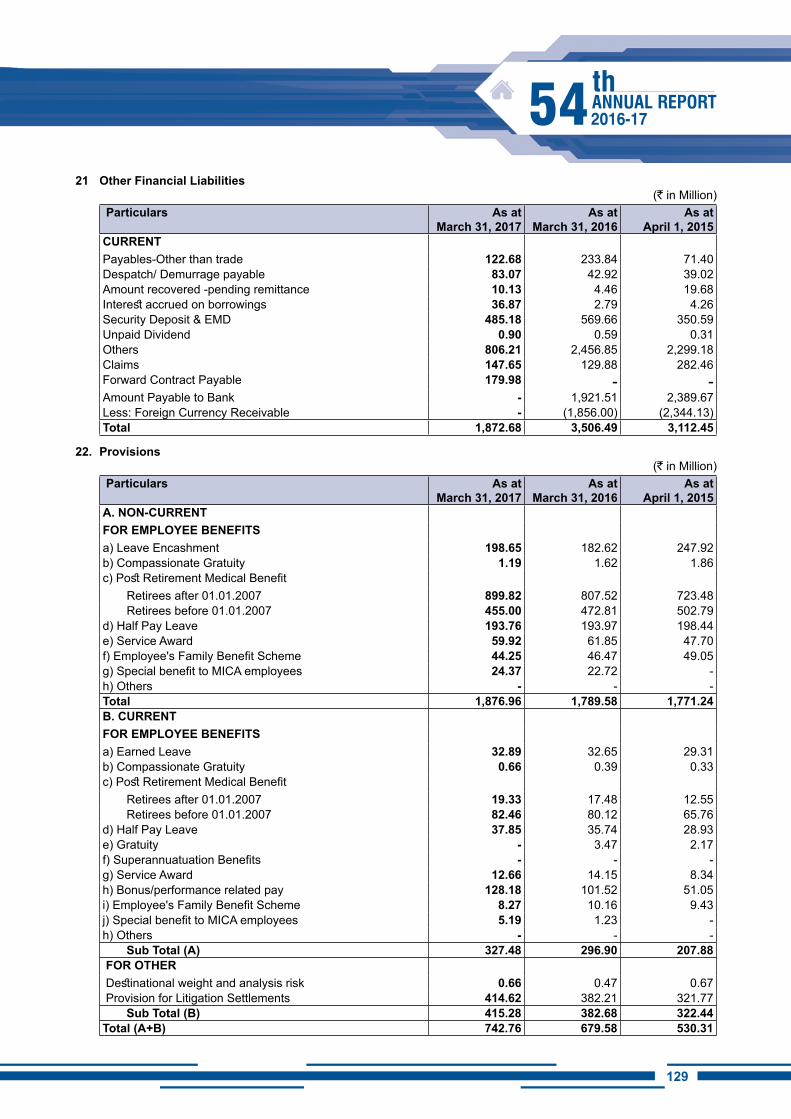
129128
21 Other Financial Liabilities(` in Million)
Particulars As at March 31, 2017
As at March 31, 2016
As at April 1, 2015
CURRENTPayables-Other than trade 122.68 233.84 71.40 Despatch/ Demurrage payable 83.07 42.92 39.02 Amount recovered -pending remittance 10.13 4.46 19.68 Interest accrued on borrowings 36.87 2.79 4.26 Security Deposit & EMD 485.18 569.66 350.59 Unpaid Dividend 0.90 0.59 0.31 Others 806.21 2,456.85 2,299.18 Claims 147.65 129.88 282.46 Forward Contract Payable 179.98 - -Amount Payable to Bank - 1,921.51 2,389.67 Less: Foreign Currency Receivable - (1,856.00) (2,344.13)Total 1,872.68 3,506.49 3,112.45
22. Provisions(` in Million)
Particulars As at March 31, 2017
As at March 31, 2016
As at April 1, 2015
A. NON-CURRENTFOR EMPLOYEE BENEFiTS a) Leave Encashment 198.65 182.62 247.92 b) Compassionate Gratuity 1.19 1.62 1.86 c) Post Retirement Medical Benefit
Retirees after 01.01.2007 899.82 807.52 723.48 Retirees before 01.01.2007 455.00 472.81 502.79
d) Half Pay Leave 193.76 193.97 198.44 e) Service Award 59.92 61.85 47.70 f) Employee's Family Benefit Scheme 44.25 46.47 49.05 g) Special benefit to MICA employees 24.37 22.72 - h) Others - - - Total 1,876.96 1,789.58 1,771.24 B. CURRENT FOR EMPLOYEE BENEFiTS a) Earned Leave 32.89 32.65 29.31 b) Compassionate Gratuity 0.66 0.39 0.33 c) Post Retirement Medical Benefit
Retirees after 01.01.2007 19.33 17.48 12.55 Retirees before 01.01.2007 82.46 80.12 65.76
d) Half Pay Leave 37.85 35.74 28.93 e) Gratuity - 3.47 2.17 f) Superannuatuation Benefits - - - g) Service Award 12.66 14.15 8.34 h) Bonus/performance related pay 128.18 101.52 51.05 i) Employee's Family Benefit Scheme 8.27 10.16 9.43 j) Special benefit to MICA employees 5.19 1.23 - h) Others - - -
Sub Total (A) 327.48 296.90 207.88 FOR OThER Destinational weight and analysis risk 0.66 0.47 0.67 Provision for Litigation Settlements 414.62 382.21 321.77
Sub Total (B) 415.28 382.68 322.44 Total (A+B) 742.76 679.58 530.31
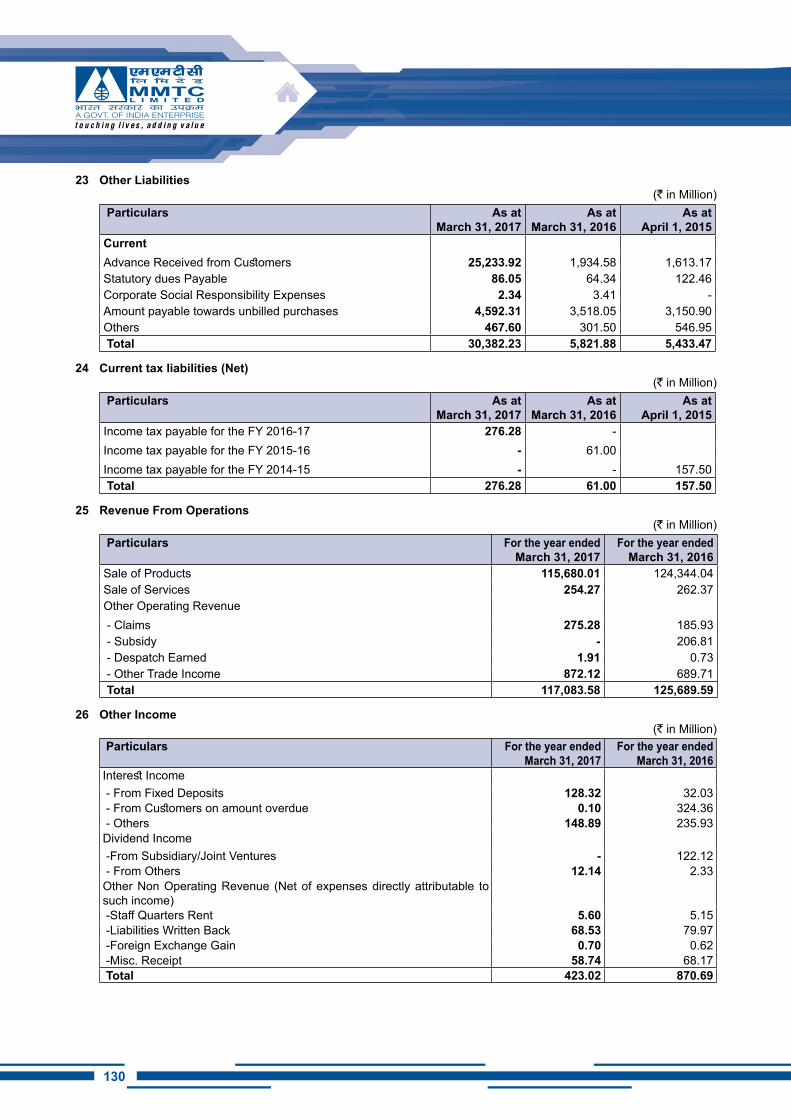
130
23 Other Liabilities(` in Million)
Particulars As at March 31, 2017
As at March 31, 2016
As at April 1, 2015
CurrentAdvance Received from Customers 25,233.92 1,934.58 1,613.17 Statutory dues Payable 86.05 64.34 122.46 Corporate Social Responsibility Expenses 2.34 3.41 - Amount payable towards unbilled purchases 4,592.31 3,518.05 3,150.90 Others 467.60 301.50 546.95 Total 30,382.23 5,821.88 5,433.47
24 Current tax liabilities (Net)(` in Million)
Particulars As at March 31, 2017
As at March 31, 2016
As at April 1, 2015
Income tax payable for the FY 2016-17 276.28 - Income tax payable for the FY 2015-16 - 61.00 Income tax payable for the FY 2014-15 - - 157.50 Total 276.28 61.00 157.50
25 Revenue From Operations(` in Million)
Particulars For the year ended March 31, 2017
For the year ended March 31, 2016
Sale of Products 115,680.01 124,344.04 Sale of Services 254.27 262.37 Other Operating Revenue - Claims 275.28 185.93 - Subsidy - 206.81 - Despatch Earned 1.91 0.73 - Other Trade Income 872.12 689.71 Total 117,083.58 125,689.59
26 Other income(` in Million)
Particulars For the year ended March 31, 2017
For the year ended March 31, 2016
Interest Income - From Fixed Deposits 128.32 32.03 - From Customers on amount overdue 0.10 324.36 - Others 148.89 235.93 Dividend Income -From Subsidiary/Joint Ventures - 122.12 - From Others 12.14 2.33 Other Non Operating Revenue (Net of expenses directly attributable to such income) -Staff Quarters Rent 5.60 5.15 -Liabilities Written Back 68.53 79.97 -Foreign Exchange Gain 0.70 0.62 -Misc. Receipt 58.74 68.17 Total 423.02 870.69
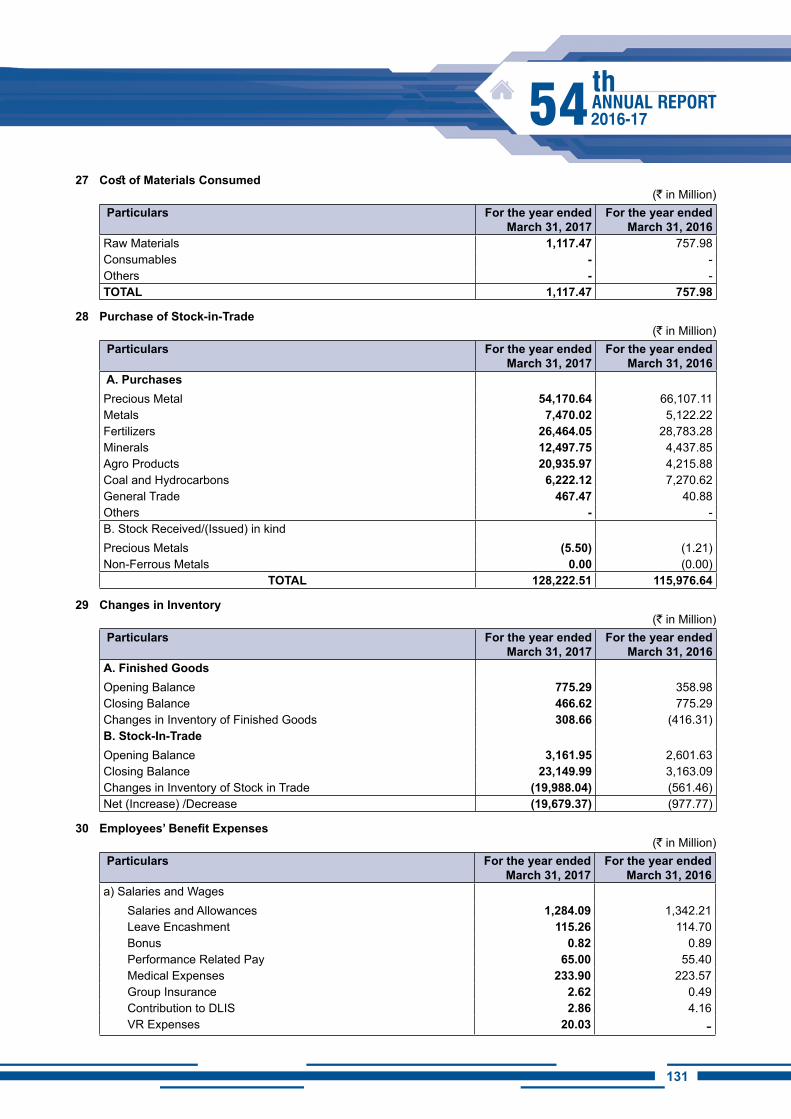
131130
27 Cost of Materials Consumed(` in Million)
Particulars For the year ended March 31, 2017
For the year ended March 31, 2016
Raw Materials 1,117.47 757.98 Consumables - - Others - - TOTAL 1,117.47 757.98
28 Purchase of Stock-in-Trade(` in Million)
Particulars For the year ended March 31, 2017
For the year ended March 31, 2016
A. Purchases Precious Metal 54,170.64 66,107.11 Metals 7,470.02 5,122.22 Fertilizers 26,464.05 28,783.28 Minerals 12,497.75 4,437.85 Agro Products 20,935.97 4,215.88 Coal and Hydrocarbons 6,222.12 7,270.62 General Trade 467.47 40.88 Others - - B. Stock Received/(Issued) in kindPrecious Metals (5.50) (1.21)Non-Ferrous Metals 0.00 (0.00)
TOTAL 128,222.51 115,976.64
29 Changes in Inventory(` in Million)
Particulars For the year ended March 31, 2017
For the year ended March 31, 2016
A. Finished GoodsOpening Balance 775.29 358.98 Closing Balance 466.62 775.29 Changes in Inventory of Finished Goods 308.66 (416.31)B. Stock-In-TradeOpening Balance 3,161.95 2,601.63 Closing Balance 23,149.99 3,163.09 Changes in Inventory of Stock in Trade (19,988.04) (561.46)Net (Increase) /Decrease (19,679.37) (977.77)
30 Employees’ Benefit Expenses(` in Million)
Particulars For the year ended March 31, 2017
For the year ended March 31, 2016
a) Salaries and WagesSalaries and Allowances 1,284.09 1,342.21 Leave Encashment 115.26 114.70 Bonus 0.82 0.89 Performance Related Pay 65.00 55.40 Medical Expenses 233.90 223.57 Group Insurance 2.62 0.49 Contribution to DLIS 2.86 4.16 VR Expenses 20.03 -
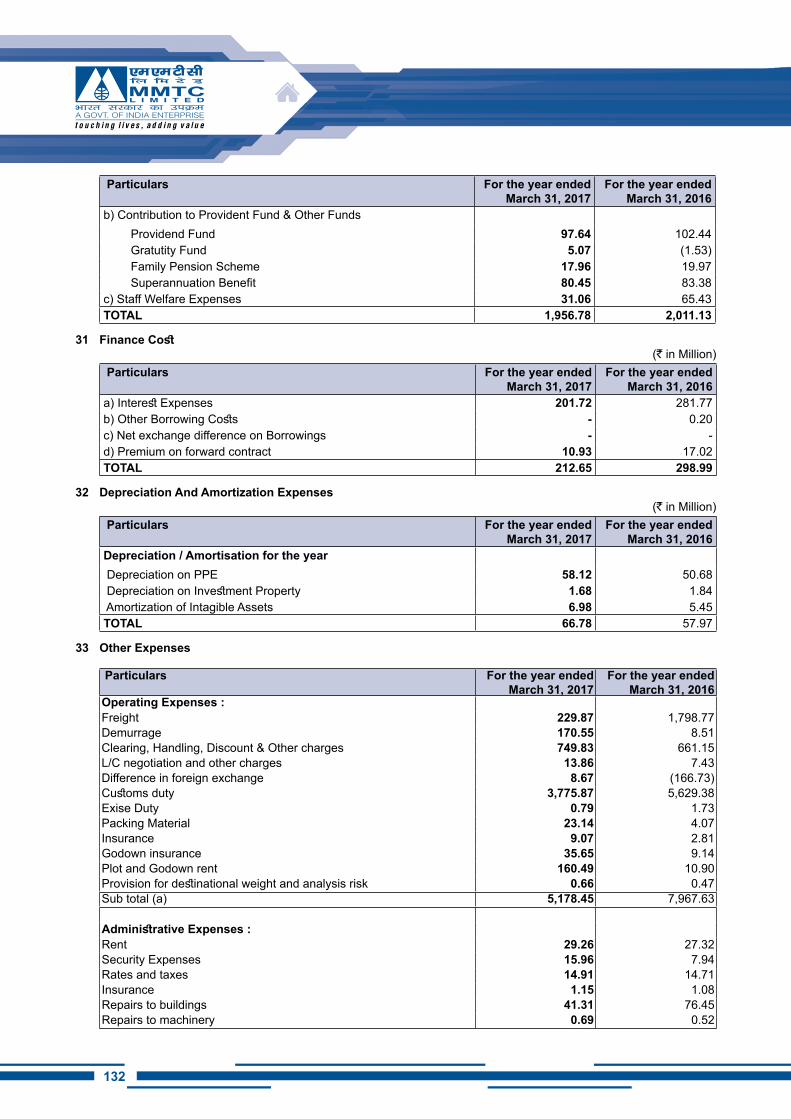
132
Particulars For the year ended March 31, 2017
For the year ended March 31, 2016
b) Contribution to Provident Fund & Other Funds Providend Fund 97.64 102.44 Gratutity Fund 5.07 (1.53) Family Pension Scheme 17.96 19.97 Superannuation Benefit 80.45 83.38
c) Staff Welfare Expenses 31.06 65.43 TOTAL 1,956.78 2,011.13
31 Finance Cost(` in Million)
Particulars For the year ended March 31, 2017
For the year ended March 31, 2016
a) Interest Expenses 201.72 281.77 b) Other Borrowing Costs - 0.20 c) Net exchange difference on Borrowings - - d) Premium on forward contract 10.93 17.02 TOTAL 212.65 298.99
32 Depreciation And Amortization Expenses(` in Million)
Particulars For the year ended March 31, 2017
For the year ended March 31, 2016
Depreciation / Amortisation for the year Depreciation on PPE 58.12 50.68 Depreciation on Investment Property 1.68 1.84 Amortization of Intagible Assets 6.98 5.45 TOTAL 66.78 57.97
33 Other Expenses
Particulars For the year ended March 31, 2017
For the year ended March 31, 2016
Operating Expenses :Freight 229.87 1,798.77 Demurrage 170.55 8.51 Clearing, Handling, Discount & Other charges 749.83 661.15 L/C negotiation and other charges 13.86 7.43 Difference in foreign exchange 8.67 (166.73)Customs duty 3,775.87 5,629.38 Exise Duty 0.79 1.73 Packing Material 23.14 4.07 Insurance 9.07 2.81 Godown insurance 35.65 9.14 Plot and Godown rent 160.49 10.90 Provision for destinational weight and analysis risk 0.66 0.47 Sub total (a) 5,178.45 7,967.63
Administrative Expenses :Rent 29.26 27.32 Security Expenses 15.96 7.94 Rates and taxes 14.91 14.71 Insurance 1.15 1.08 Repairs to buildings 41.31 76.45 Repairs to machinery 0.69 0.52
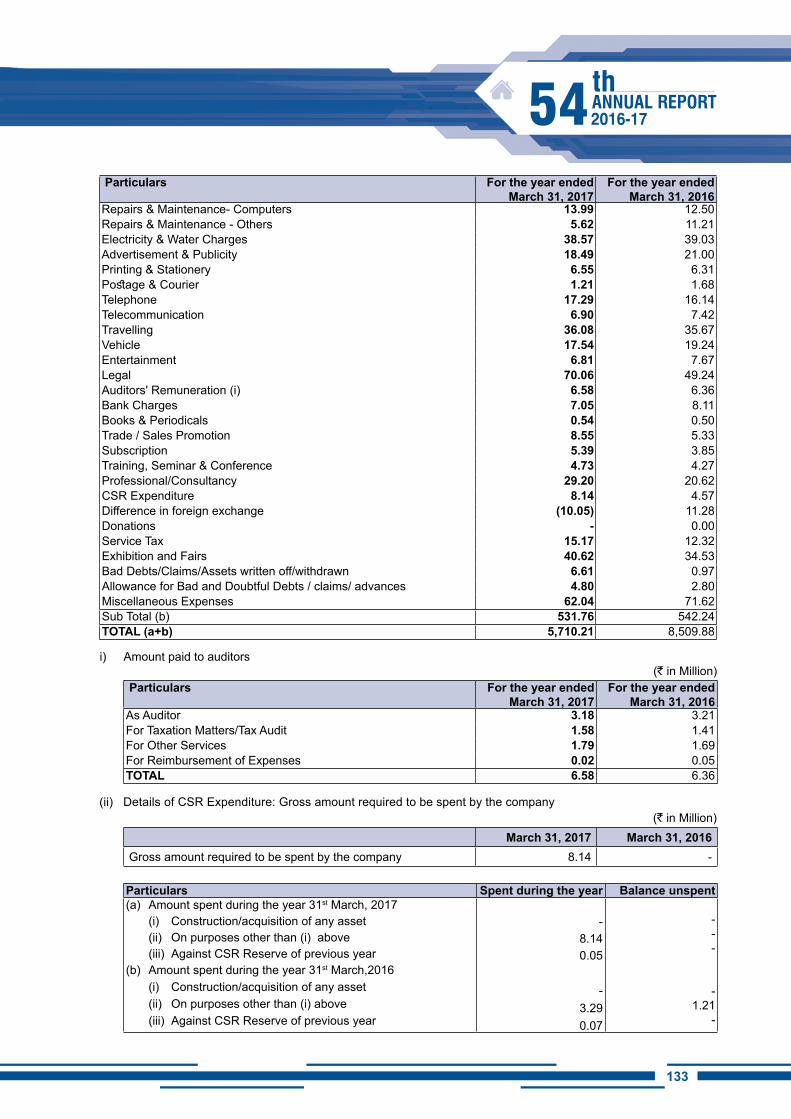
133132
Particulars For the year ended March 31, 2017
For the year ended March 31, 2016
Repairs & Maintenance- Computers 13.99 12.50 Repairs & Maintenance - Others 5.62 11.21 Electricity & Water Charges 38.57 39.03 Advertisement & Publicity 18.49 21.00 Printing & Stationery 6.55 6.31 Postage & Courier 1.21 1.68 Telephone 17.29 16.14 Telecommunication 6.90 7.42 Travelling 36.08 35.67 Vehicle 17.54 19.24 Entertainment 6.81 7.67 Legal 70.06 49.24 Auditors' Remuneration (i) 6.58 6.36 Bank Charges 7.05 8.11 Books & Periodicals 0.54 0.50 Trade / Sales Promotion 8.55 5.33 Subscription 5.39 3.85 Training, Seminar & Conference 4.73 4.27 Professional/Consultancy 29.20 20.62 CSR Expenditure 8.14 4.57 Difference in foreign exchange (10.05) 11.28 Donations - 0.00 Service Tax 15.17 12.32 Exhibition and Fairs 40.62 34.53 Bad Debts/Claims/Assets written off/withdrawn 6.61 0.97 Allowance for Bad and Doubtful Debts / claims/ advances 4.80 2.80 Miscellaneous Expenses 62.04 71.62 Sub Total (b) 531.76 542.24 TOTAL (a+b) 5,710.21 8,509.88
i) Amount paid to auditors(` in Million)
Particulars For the year ended March 31, 2017
For the year ended March 31, 2016
As Auditor 3.18 3.21 For Taxation Matters/Tax Audit 1.58 1.41 For Other Services 1.79 1.69 For Reimbursement of Expenses 0.02 0.05 TOTAL 6.58 6.36
(ii) Details of CSR Expenditure: Gross amount required to be spent by the company(` in Million)
March 31, 2017 March 31, 2016Gross amount required to be spent by the company 8.14 -
Particulars Spent during the year Balance unspent(a) Amount spent during the year 31st March, 2017
(i) Construction/acquisition of any asset (ii) On purposes other than (i) above (iii) Against CSR Reserve of previous year
(b) Amount spent during the year 31st March,2016(i) Construction/acquisition of any asset (ii) On purposes other than (i) above (iii) Against CSR Reserve of previous year
-8.14 0.05
-3.29 0.07
---
-1.21
-
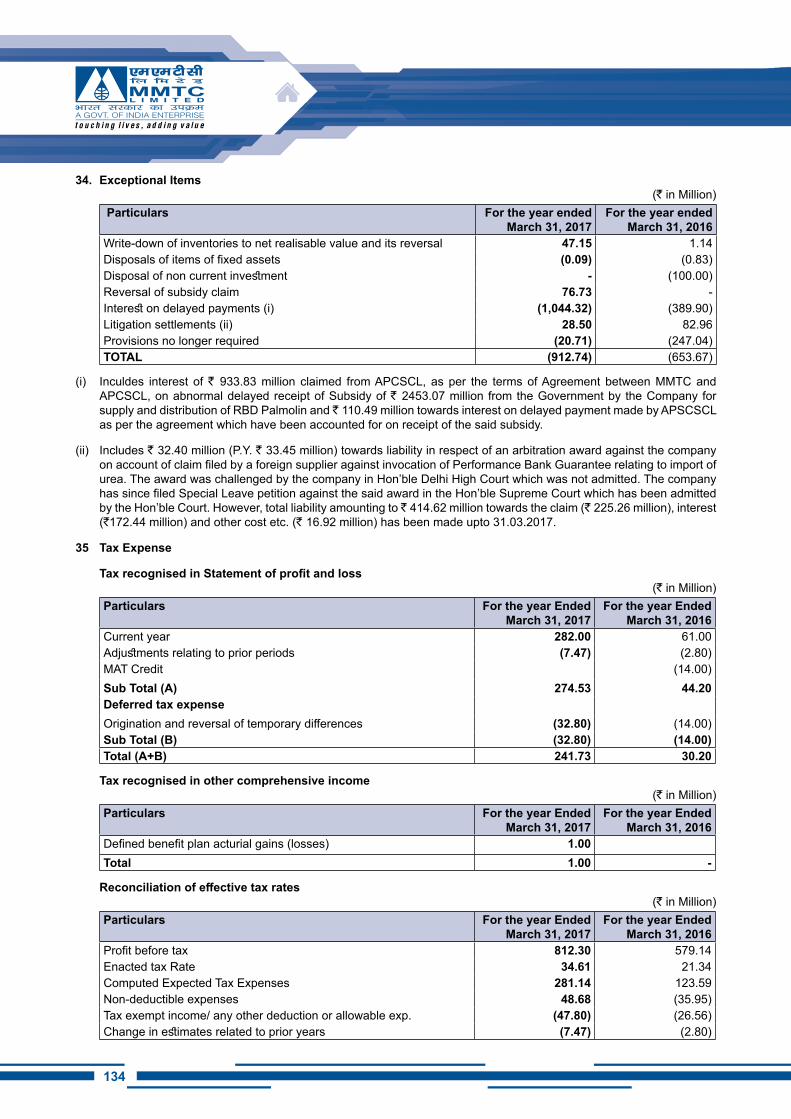
134
34. Exceptional Items(` in Million)
Particulars For the year ended March 31, 2017
For the year ended March 31, 2016
Write-down of inventories to net realisable value and its reversal 47.15 1.14 Disposals of items of fixed assets (0.09) (0.83)Disposal of non current investment - (100.00)Reversal of subsidy claim 76.73 - Interest on delayed payments (i) (1,044.32) (389.90)Litigation settlements (ii) 28.50 82.96 Provisions no longer required (20.71) (247.04)TOTAL (912.74) (653.67)
(i) Inculdes interest of ` 933.83 million claimed from APCSCL, as per the terms of Agreement between MMTC and APCSCL, on abnormal delayed receipt of Subsidy of ` 2453.07 million from the Government by the Company for supply and distribution of RBD Palmolin and ̀ 110.49 million towards interest on delayed payment made by APSCSCL as per the agreement which have been accounted for on receipt of the said subsidy.
(ii) Includes ` 32.40 million (P.Y. ` 33.45 million) towards liability in respect of an arbitration award against the company on account of claim filed by a foreign supplier against invocation of Performance Bank Guarantee relating to import of urea. The award was challenged by the company in Hon’ble Delhi High Court which was not admitted. The company has since filed Special Leave petition against the said award in the Hon’ble Supreme Court which has been admitted by the Hon’ble Court. However, total liability amounting to ̀ 414.62 million towards the claim (` 225.26 million), interest (`172.44 million) and other cost etc. (` 16.92 million) has been made upto 31.03.2017.
35 Tax Expense
Tax recognised in Statement of profit and loss(` in Million)
Particulars For the year Ended March 31, 2017
For the year Ended March 31, 2016
Current year 282.00 61.00Adjustments relating to prior periods (7.47) (2.80)MAT Credit (14.00)Sub Total (A) 274.53 44.20 Deferred tax expenseOrigination and reversal of temporary differences (32.80) (14.00)Sub Total (B) (32.80) (14.00)Total (A+B) 241.73 30.20
Tax recognised in other comprehensive income(` in Million)
Particulars For the year Ended March 31, 2017
For the year Ended March 31, 2016
Defined benefit plan acturial gains (losses) 1.00 Total 1.00 -
Reconciliation of effective tax rates(` in Million)
Particulars For the year Ended March 31, 2017
For the year Ended March 31, 2016
Profit before tax 812.30 579.14Enacted tax Rate 34.61 21.34Computed Expected Tax Expenses 281.14 123.59Non-deductible expenses 48.68 (35.95)Tax exempt income/ any other deduction or allowable exp. (47.80) (26.56)Change in estimates related to prior years (7.47) (2.80)
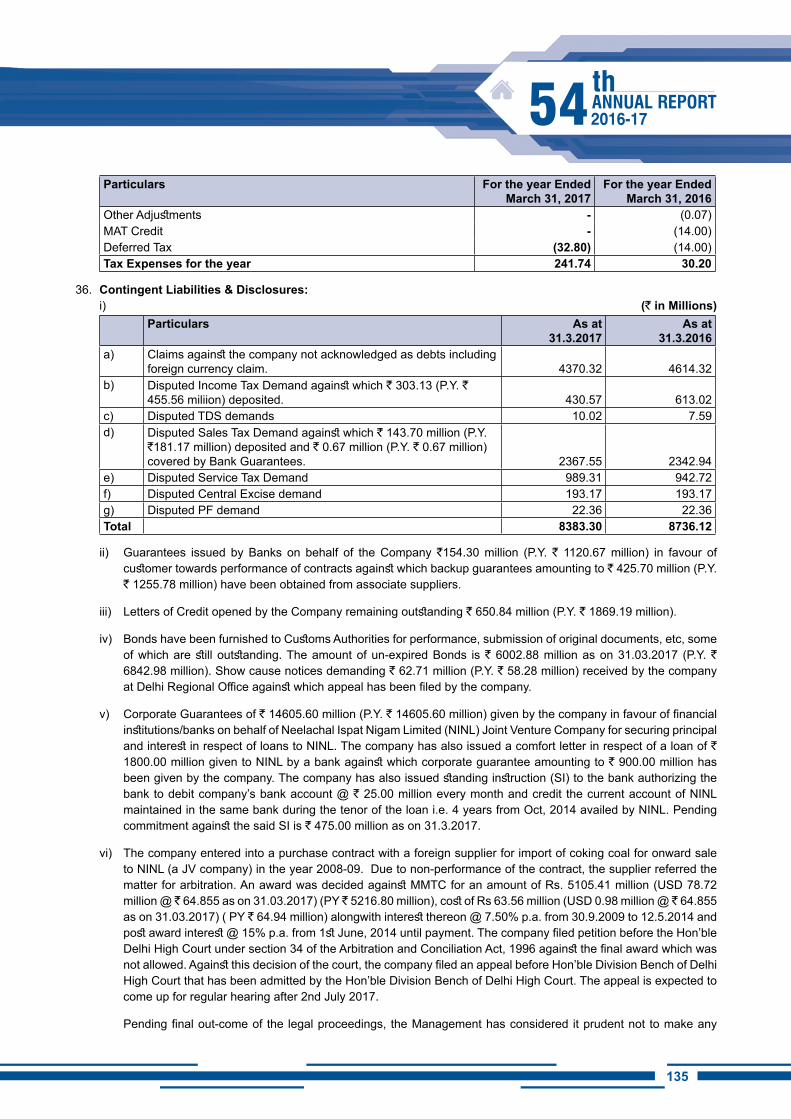
135134
Particulars For the year Ended March 31, 2017
For the year Ended March 31, 2016
Other Adjustments - (0.07)MAT Credit - (14.00)Deferred Tax (32.80) (14.00)Tax Expenses for the year 241.74 30.20
36. Contingent Liabilities & Disclosures: i) (` in Millions)
Particulars As at 31.3.2017
As at 31.3.2016
a) Claims against the company not acknowledged as debts including foreign currency claim. 4370.32 4614.32
b) Disputed Income Tax Demand against which ` 303.13 (P.Y. ` 455.56 miliion) deposited. 430.57 613.02
c) Disputed TDS demands 10.02 7.59d) Disputed Sales Tax Demand against which ` 143.70 million (P.Y.
`181.17 million) deposited and ` 0.67 million (P.Y. ` 0.67 million) covered by Bank Guarantees. 2367.55 2342.94
e) Disputed Service Tax Demand 989.31 942.72f) Disputed Central Excise demand 193.17 193.17g) Disputed PF demand 22.36 22.36Total 8383.30 8736.12
ii) Guarantees issued by Banks on behalf of the Company `154.30 million (P.Y. ` 1120.67 million) in favour of customer towards performance of contracts against which backup guarantees amounting to ` 425.70 million (P.Y. ` 1255.78 million) have been obtained from associate suppliers.
iii) Letters of Credit opened by the Company remaining outstanding ` 650.84 million (P.Y. ` 1869.19 million).
iv) Bonds have been furnished to Customs Authorities for performance, submission of original documents, etc, some of which are still outstanding. The amount of un-expired Bonds is ` 6002.88 million as on 31.03.2017 (P.Y. ` 6842.98 million). Show cause notices demanding ` 62.71 million (P.Y. ` 58.28 million) received by the company at Delhi Regional Office against which appeal has been filed by the company.
v) Corporate Guarantees of ` 14605.60 million (P.Y. ` 14605.60 million) given by the company in favour of financial institutions/banks on behalf of Neelachal Ispat Nigam Limited (NINL) Joint Venture Company for securing principal and interest in respect of loans to NINL. The company has also issued a comfort letter in respect of a loan of ` 1800.00 million given to NINL by a bank against which corporate guarantee amounting to ` 900.00 million has been given by the company. The company has also issued standing instruction (SI) to the bank authorizing the bank to debit company’s bank account @ ` 25.00 million every month and credit the current account of NINL maintained in the same bank during the tenor of the loan i.e. 4 years from Oct, 2014 availed by NINL. Pending commitment against the said SI is ` 475.00 million as on 31.3.2017.
vi) The company entered into a purchase contract with a foreign supplier for import of coking coal for onward sale to NINL (a JV company) in the year 2008-09. Due to non-performance of the contract, the supplier referred the matter for arbitration. An award was decided against MMTC for an amount of Rs. 5105.41 million (USD 78.72 million @ ̀ 64.855 as on 31.03.2017) (PY ̀ 5216.80 million), cost of Rs 63.56 million (USD 0.98 million @ ̀ 64.855 as on 31.03.2017) ( PY ` 64.94 million) alongwith interest thereon @ 7.50% p.a. from 30.9.2009 to 12.5.2014 and post award interest @ 15% p.a. from 1st June, 2014 until payment. The company filed petition before the Hon’ble Delhi High Court under section 34 of the Arbitration and Conciliation Act, 1996 against the final award which was not allowed. Against this decision of the court, the company filed an appeal before Hon’ble Division Bench of Delhi High Court that has been admitted by the Hon’ble Division Bench of Delhi High Court. The appeal is expected to come up for regular hearing after 2nd July 2017.
Pending final out-come of the legal proceedings, the Management has considered it prudent not to make any
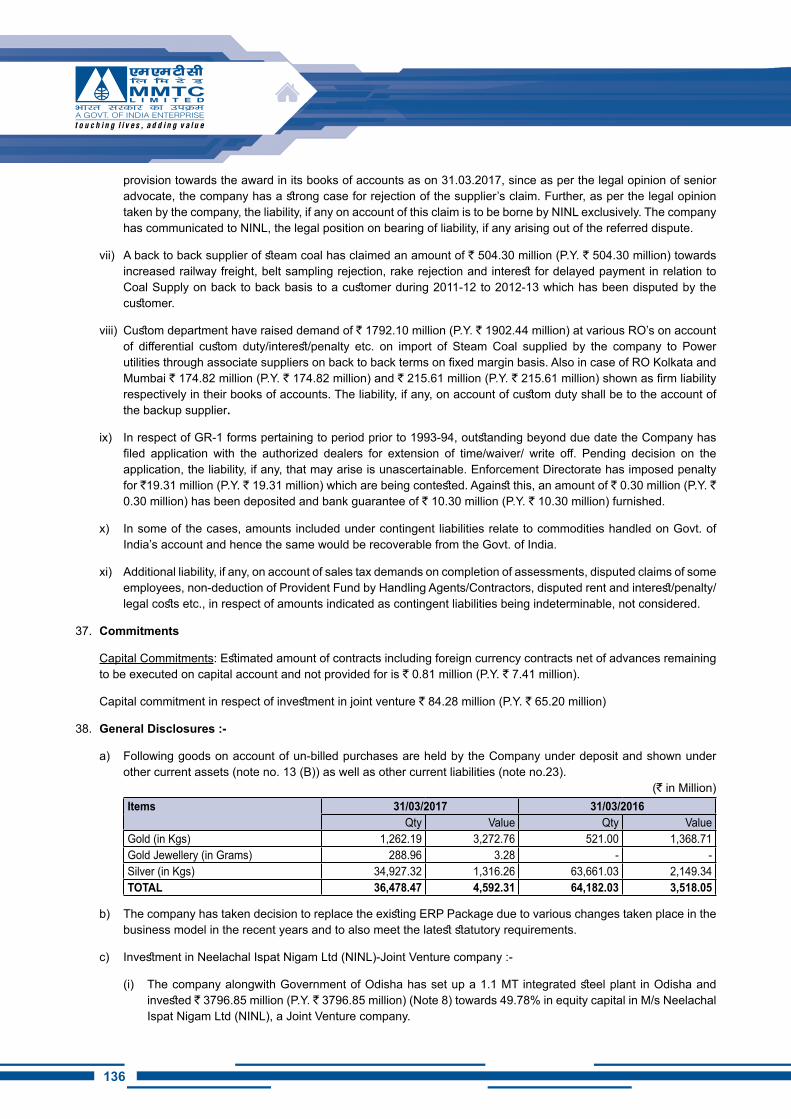
136
provision towards the award in its books of accounts as on 31.03.2017, since as per the legal opinion of senior advocate, the company has a strong case for rejection of the supplier’s claim. Further, as per the legal opinion taken by the company, the liability, if any on account of this claim is to be borne by NINL exclusively. The company has communicated to NINL, the legal position on bearing of liability, if any arising out of the referred dispute.
vii) A back to back supplier of steam coal has claimed an amount of ` 504.30 million (P.Y. ` 504.30 million) towards increased railway freight, belt sampling rejection, rake rejection and interest for delayed payment in relation to Coal Supply on back to back basis to a customer during 2011-12 to 2012-13 which has been disputed by the customer.
viii) Custom department have raised demand of ` 1792.10 million (P.Y. ` 1902.44 million) at various RO’s on account of differential custom duty/interest/penalty etc. on import of Steam Coal supplied by the company to Power utilities through associate suppliers on back to back terms on fixed margin basis. Also in case of RO Kolkata and Mumbai ` 174.82 million (P.Y. ` 174.82 million) and ` 215.61 million (P.Y. ` 215.61 million) shown as firm liability respectively in their books of accounts. The liability, if any, on account of custom duty shall be to the account of the backup supplier.
ix) In respect of GR-1 forms pertaining to period prior to 1993-94, outstanding beyond due date the Company has filed application with the authorized dealers for extension of time/waiver/ write off. Pending decision on the application, the liability, if any, that may arise is unascertainable. Enforcement Directorate has imposed penalty for `19.31 million (P.Y. ` 19.31 million) which are being contested. Against this, an amount of ` 0.30 million (P.Y. ` 0.30 million) has been deposited and bank guarantee of ` 10.30 million (P.Y. ` 10.30 million) furnished.
x) In some of the cases, amounts included under contingent liabilities relate to commodities handled on Govt. of India’s account and hence the same would be recoverable from the Govt. of India.
xi) Additional liability, if any, on account of sales tax demands on completion of assessments, disputed claims of some employees, non-deduction of Provident Fund by Handling Agents/Contractors, disputed rent and interest/penalty/legal costs etc., in respect of amounts indicated as contingent liabilities being indeterminable, not considered.
37. Commitments
Capital Commitments: Estimated amount of contracts including foreign currency contracts net of advances remaining to be executed on capital account and not provided for is ` 0.81 million (P.Y. ` 7.41 million).
Capital commitment in respect of investment in joint venture ` 84.28 million (P.Y. ` 65.20 million)
38. General Disclosures :-
a) Following goods on account of un-billed purchases are held by the Company under deposit and shown under other current assets (note no. 13 (B)) as well as other current liabilities (note no.23).
(` in Million)items 31/03/2017 31/03/2016
Qty Value Qty ValueGold (in Kgs) 1,262.19 3,272.76 521.00 1,368.71 Gold Jewellery (in Grams) 288.96 3.28 - - Silver (in Kgs) 34,927.32 1,316.26 63,661.03 2,149.34 TOTAL 36,478.47 4,592.31 64,182.03 3,518.05
b) The company has taken decision to replace the existing ERP Package due to various changes taken place in the business model in the recent years and to also meet the latest statutory requirements.
c) Investment in Neelachal Ispat Nigam Ltd (NINL)-Joint Venture company :-
(i) The company alongwith Government of Odisha has set up a 1.1 MT integrated steel plant in Odisha and invested ` 3796.85 million (P.Y. ` 3796.85 million) (Note 8) towards 49.78% in equity capital in M/s Neelachal Ispat Nigam Ltd (NINL), a Joint Venture company.
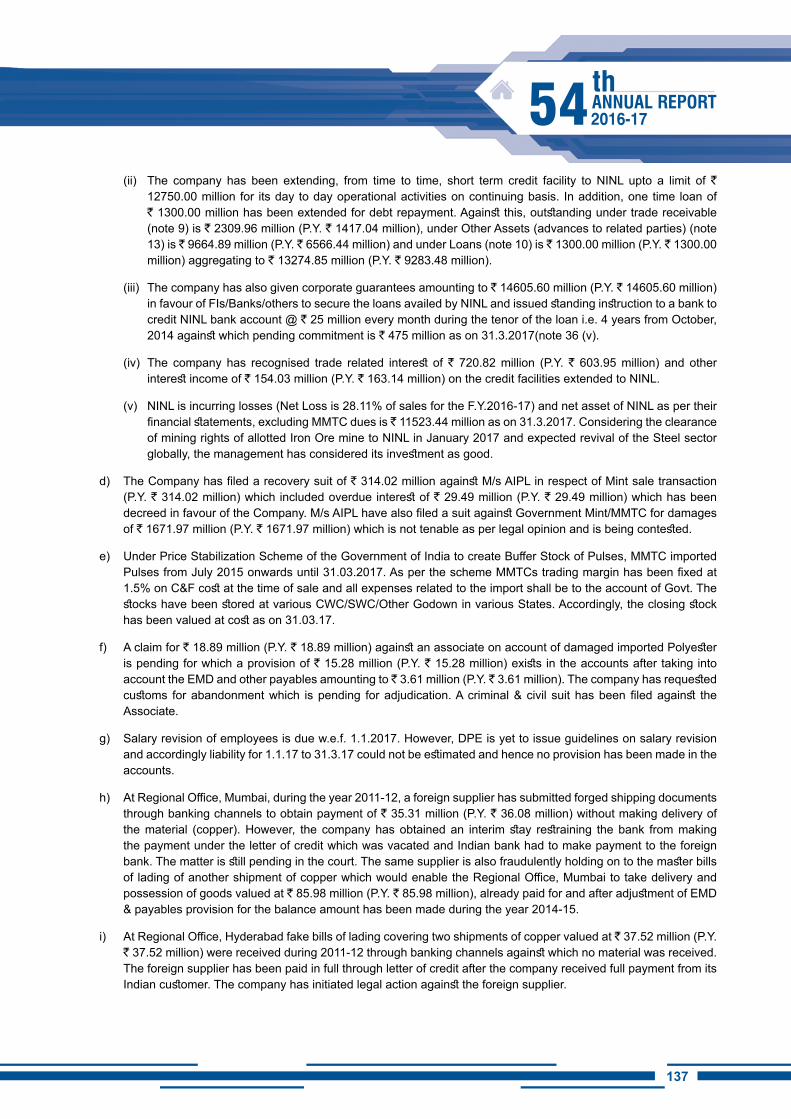
137136
(ii) The company has been extending, from time to time, short term credit facility to NINL upto a limit of ` 12750.00 million for its day to day operational activities on continuing basis. In addition, one time loan of ` 1300.00 million has been extended for debt repayment. Against this, outstanding under trade receivable (note 9) is ` 2309.96 million (P.Y. ` 1417.04 million), under Other Assets (advances to related parties) (note 13) is ` 9664.89 million (P.Y. ` 6566.44 million) and under Loans (note 10) is ` 1300.00 million (P.Y. ` 1300.00 million) aggregating to ` 13274.85 million (P.Y. ` 9283.48 million).
(iii) The company has also given corporate guarantees amounting to ` 14605.60 million (P.Y. ` 14605.60 million) in favour of FIs/Banks/others to secure the loans availed by NINL and issued standing instruction to a bank to credit NINL bank account @ ` 25 million every month during the tenor of the loan i.e. 4 years from October, 2014 against which pending commitment is ` 475 million as on 31.3.2017(note 36 (v).
(iv) The company has recognised trade related interest of ` 720.82 million (P.Y. ` 603.95 million) and other interest income of ` 154.03 million (P.Y. ` 163.14 million) on the credit facilities extended to NINL.
(v) NINL is incurring losses (Net Loss is 28.11% of sales for the F.Y.2016-17) and net asset of NINL as per their financial statements, excluding MMTC dues is ̀ 11523.44 million as on 31.3.2017. Considering the clearance of mining rights of allotted Iron Ore mine to NINL in January 2017 and expected revival of the Steel sector globally, the management has considered its investment as good.
d) The Company has filed a recovery suit of ` 314.02 million against M/s AIPL in respect of Mint sale transaction (P.Y. ` 314.02 million) which included overdue interest of ` 29.49 million (P.Y. ` 29.49 million) which has been decreed in favour of the Company. M/s AIPL have also filed a suit against Government Mint/MMTC for damages of ` 1671.97 million (P.Y. ` 1671.97 million) which is not tenable as per legal opinion and is being contested.
e) Under Price Stabilization Scheme of the Government of India to create Buffer Stock of Pulses, MMTC imported Pulses from July 2015 onwards until 31.03.2017. As per the scheme MMTCs trading margin has been fixed at 1.5% on C&F cost at the time of sale and all expenses related to the import shall be to the account of Govt. The stocks have been stored at various CWC/SWC/Other Godown in various States. Accordingly, the closing stock has been valued at cost as on 31.03.17.
f) A claim for ` 18.89 million (P.Y. ` 18.89 million) against an associate on account of damaged imported Polyester is pending for which a provision of ` 15.28 million (P.Y. ` 15.28 million) exists in the accounts after taking into account the EMD and other payables amounting to ̀ 3.61 million (P.Y. ̀ 3.61 million). The company has requested customs for abandonment which is pending for adjudication. A criminal & civil suit has been filed against the Associate.
g) Salary revision of employees is due w.e.f. 1.1.2017. However, DPE is yet to issue guidelines on salary revision and accordingly liability for 1.1.17 to 31.3.17 could not be estimated and hence no provision has been made in the accounts.
h) At Regional Office, Mumbai, during the year 2011-12, a foreign supplier has submitted forged shipping documents through banking channels to obtain payment of ` 35.31 million (P.Y. ` 36.08 million) without making delivery of the material (copper). However, the company has obtained an interim stay restraining the bank from making the payment under the letter of credit which was vacated and Indian bank had to make payment to the foreign bank. The matter is still pending in the court. The same supplier is also fraudulently holding on to the master bills of lading of another shipment of copper which would enable the Regional Office, Mumbai to take delivery and possession of goods valued at ` 85.98 million (P.Y. ` 85.98 million), already paid for and after adjustment of EMD & payables provision for the balance amount has been made during the year 2014-15.
i) At Regional Office, Hyderabad fake bills of lading covering two shipments of copper valued at ` 37.52 million (P.Y. ` 37.52 million) were received during 2011-12 through banking channels against which no material was received. The foreign supplier has been paid in full through letter of credit after the company received full payment from its Indian customer. The company has initiated legal action against the foreign supplier.
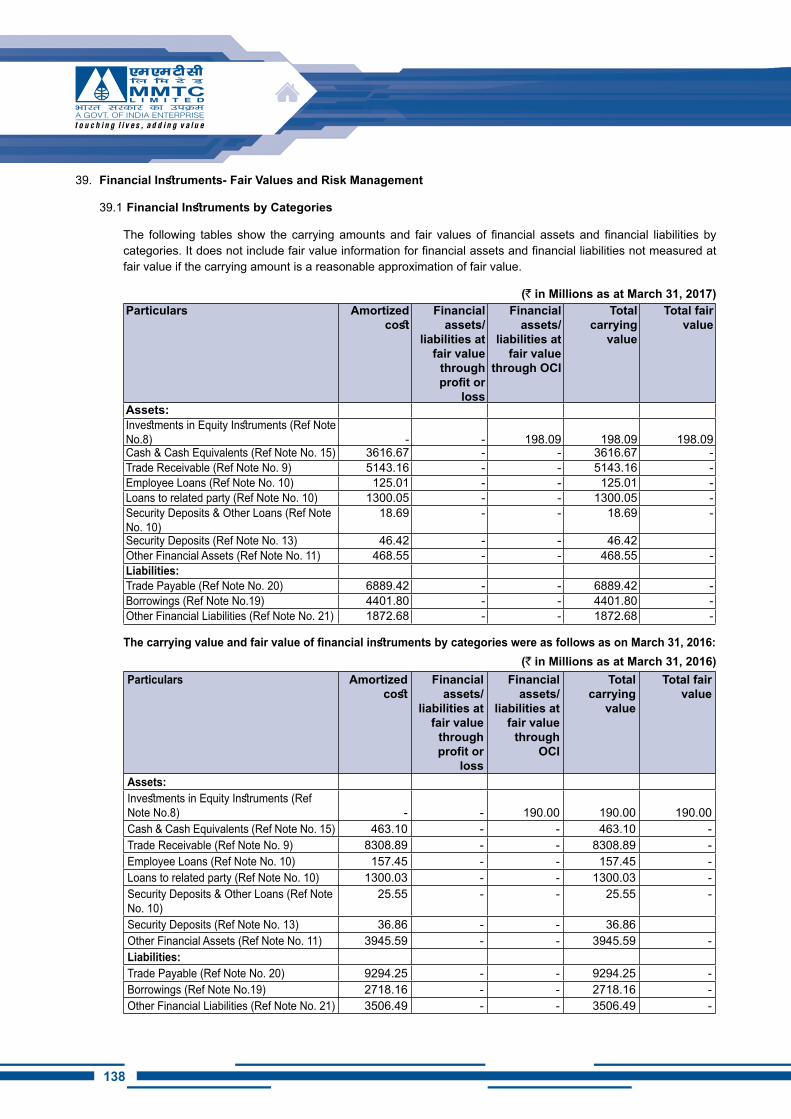
138
39. Financial Instruments- Fair Values and Risk Management
39.1 Financial Instruments by Categories
The following tables show the carrying amounts and fair values of financial assets and financial liabilities by categories. It does not include fair value information for financial assets and financial liabilities not measured at fair value if the carrying amount is a reasonable approximation of fair value.
(` in Millions as at March 31, 2017)Particulars Amortized
costFinancial
assets/ liabilities at
fair value through profit or
loss
Financial assets/
liabilities at fair value
through OCI
Total carrying
value
Total fair value
Assets:Investments in Equity Instruments (Ref Note No.8) - - 198.09 198.09 198.09Cash & Cash Equivalents (Ref Note No. 15) 3616.67 - - 3616.67 -Trade Receivable (Ref Note No. 9) 5143.16 - - 5143.16 -Employee Loans (Ref Note No. 10) 125.01 - - 125.01 -Loans to related party (Ref Note No. 10) 1300.05 - - 1300.05 -Security Deposits & Other Loans (Ref Note No. 10)
18.69 - - 18.69 -
Security Deposits (Ref Note No. 13) 46.42 - - 46.42Other Financial Assets (Ref Note No. 11) 468.55 - - 468.55 -Liabilities:Trade Payable (Ref Note No. 20) 6889.42 - - 6889.42 -Borrowings (Ref Note No.19) 4401.80 - - 4401.80 -Other Financial Liabilities (Ref Note No. 21) 1872.68 - - 1872.68 -
The carrying value and fair value of financial instruments by categories were as follows as on March 31, 2016:(` in Millions as at March 31, 2016)
Particulars Amortized cost
Financial assets/
liabilities at fair value
through profit or
loss
Financial assets/
liabilities at fair value
through OCi
Total carrying
value
Total fair value
Assets:Investments in Equity Instruments (Ref Note No.8) - - 190.00 190.00 190.00Cash & Cash Equivalents (Ref Note No. 15) 463.10 - - 463.10 -Trade Receivable (Ref Note No. 9) 8308.89 - - 8308.89 -Employee Loans (Ref Note No. 10) 157.45 - - 157.45 -Loans to related party (Ref Note No. 10) 1300.03 - - 1300.03 -Security Deposits & Other Loans (Ref Note No. 10)
25.55 - - 25.55 -
Security Deposits (Ref Note No. 13) 36.86 - - 36.86Other Financial Assets (Ref Note No. 11) 3945.59 - - 3945.59 -Liabilities:Trade Payable (Ref Note No. 20) 9294.25 - - 9294.25 -Borrowings (Ref Note No.19) 2718.16 - - 2718.16 -Other Financial Liabilities (Ref Note No. 21) 3506.49 - - 3506.49 -
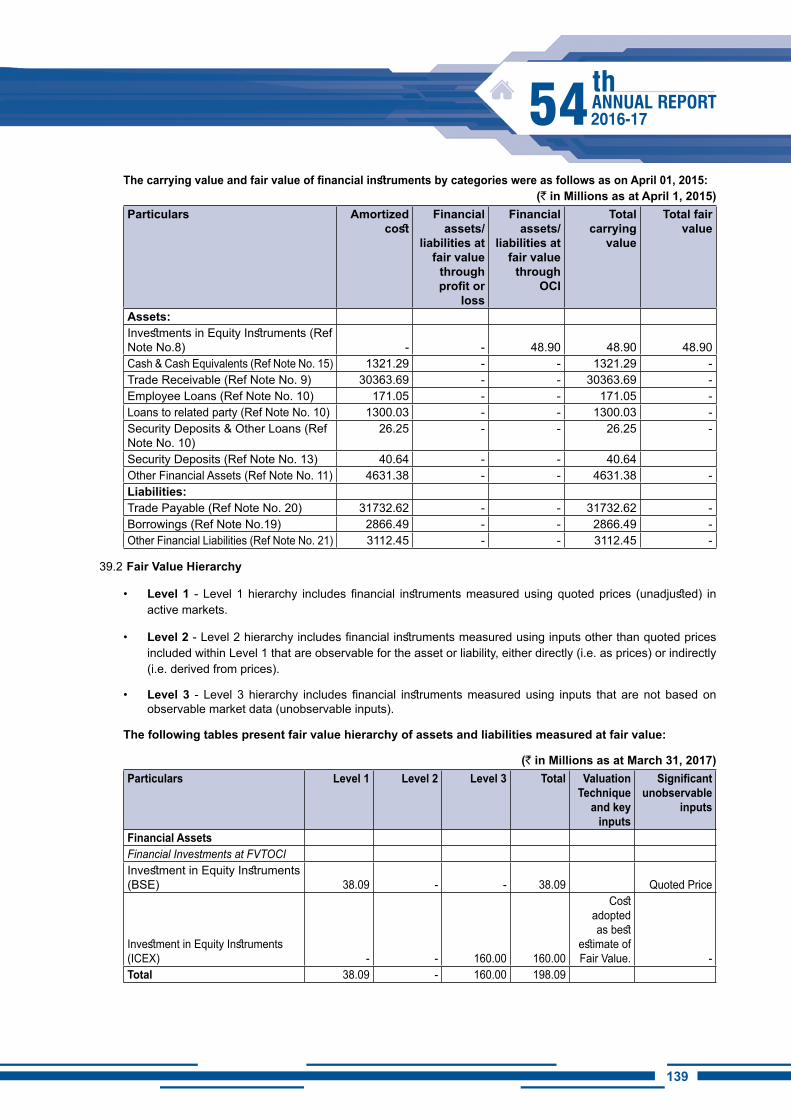
139138
The carrying value and fair value of financial instruments by categories were as follows as on April 01, 2015:(` in Millions as at April 1, 2015)
Particulars Amortized cost
Financial assets/
liabilities at fair value
through profit or
loss
Financial assets/
liabilities at fair value
through OCi
Total carrying
value
Total fair value
Assets:Investments in Equity Instruments (Ref Note No.8) - - 48.90 48.90 48.90 Cash & Cash Equivalents (Ref Note No. 15) 1321.29 - - 1321.29 - Trade Receivable (Ref Note No. 9) 30363.69 - - 30363.69 - Employee Loans (Ref Note No. 10) 171.05 - - 171.05 - Loans to related party (Ref Note No. 10) 1300.03 - - 1300.03 - Security Deposits & Other Loans (Ref Note No. 10)
26.25 - - 26.25 -
Security Deposits (Ref Note No. 13) 40.64 - - 40.64Other Financial Assets (Ref Note No. 11) 4631.38 - - 4631.38 - Liabilities:Trade Payable (Ref Note No. 20) 31732.62 - - 31732.62 - Borrowings (Ref Note No.19) 2866.49 - - 2866.49 - Other Financial Liabilities (Ref Note No. 21) 3112.45 - - 3112.45 -
39.2 Fair Value Hierarchy
• Level 1 - Level 1 hierarchy includes financial instruments measured using quoted prices (unadjusted) in active markets.
• Level 2 - Level 2 hierarchy includes financial instruments measured using inputs other than quoted prices included within Level 1 that are observable for the asset or liability, either directly (i.e. as prices) or indirectly (i.e. derived from prices).
• Level 3 - Level 3 hierarchy includes financial instruments measured using inputs that are not based on observable market data (unobservable inputs).
The following tables present fair value hierarchy of assets and liabilities measured at fair value:
(` in Millions as at March 31, 2017)Particulars Level 1 Level 2 Level 3 Total Valuation
Technique and key
inputs
Significant unobservable
inputs
Financial AssetsFinancial Investments at FVTOCIInvestment in Equity Instruments (BSE) 38.09 - - 38.09 Quoted Price
Investment in Equity Instruments (ICEX) - - 160.00 160.00
Cost adopted as best
estimate of Fair Value. -
Total 38.09 - 160.00 198.09
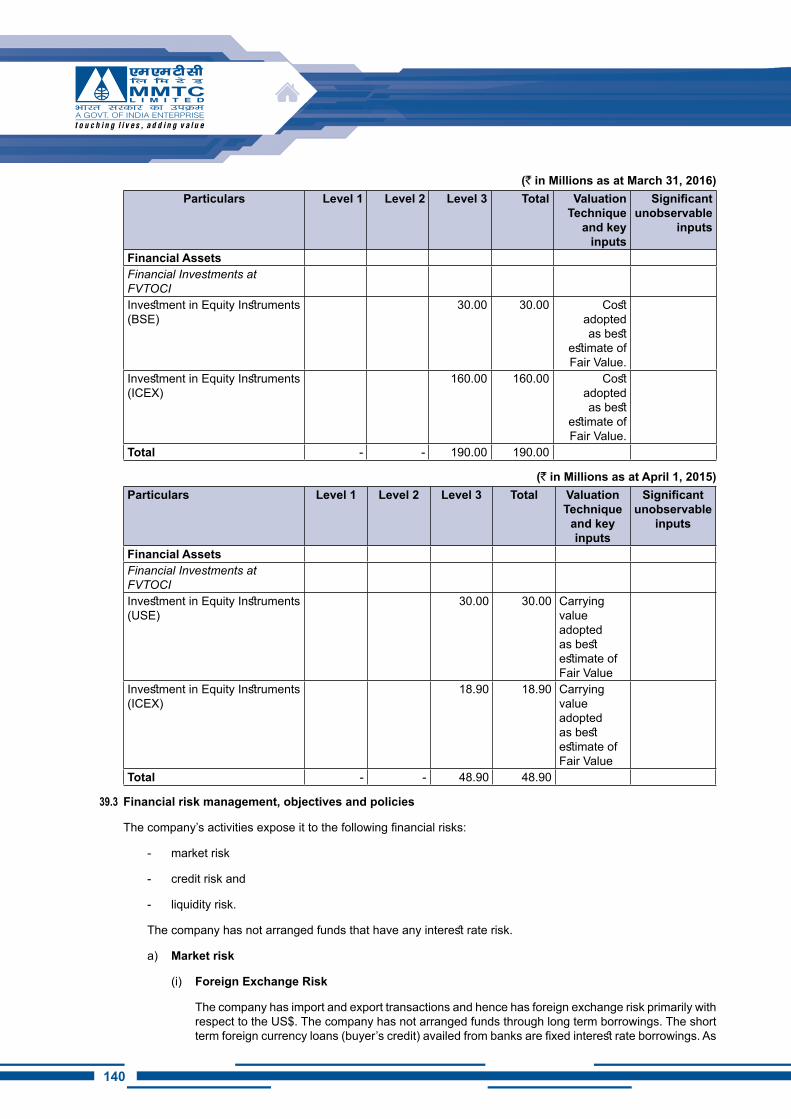
140
(` in Millions as at March 31, 2016)Particulars Level 1 Level 2 Level 3 Total Valuation
Technique and key
inputs
Significant unobservable
inputs
Financial AssetsFinancial Investments at FVTOCIInvestment in Equity Instruments (BSE)
30.00 30.00 Cost adopted as best
estimate of Fair Value.
Investment in Equity Instruments (ICEX)
160.00 160.00 Cost adopted as best
estimate of Fair Value.
Total - - 190.00 190.00
(` in Millions as at April 1, 2015)Particulars Level 1 Level 2 Level 3 Total Valuation
Technique and key inputs
Significant unobservable
inputs
Financial AssetsFinancial Investments at FVTOCIInvestment in Equity Instruments (USE)
30.00 30.00 Carrying value adopted as best estimate of Fair Value
Investment in Equity Instruments (ICEX)
18.90 18.90 Carrying value adopted as best estimate of Fair Value
Total - - 48.90 48.90
39.3 Financial risk management, objectives and policies
The company’s activities expose it to the following financial risks:
- market risk
- credit risk and
- liquidity risk.
The company has not arranged funds that have any interest rate risk.
a) Market risk
(i) Foreign Exchange Risk
The company has import and export transactions and hence has foreign exchange risk primarily with respect to the US$. The company has not arranged funds through long term borrowings. The short term foreign currency loans (buyer’s credit) availed from banks are fixed interest rate borrowings. As
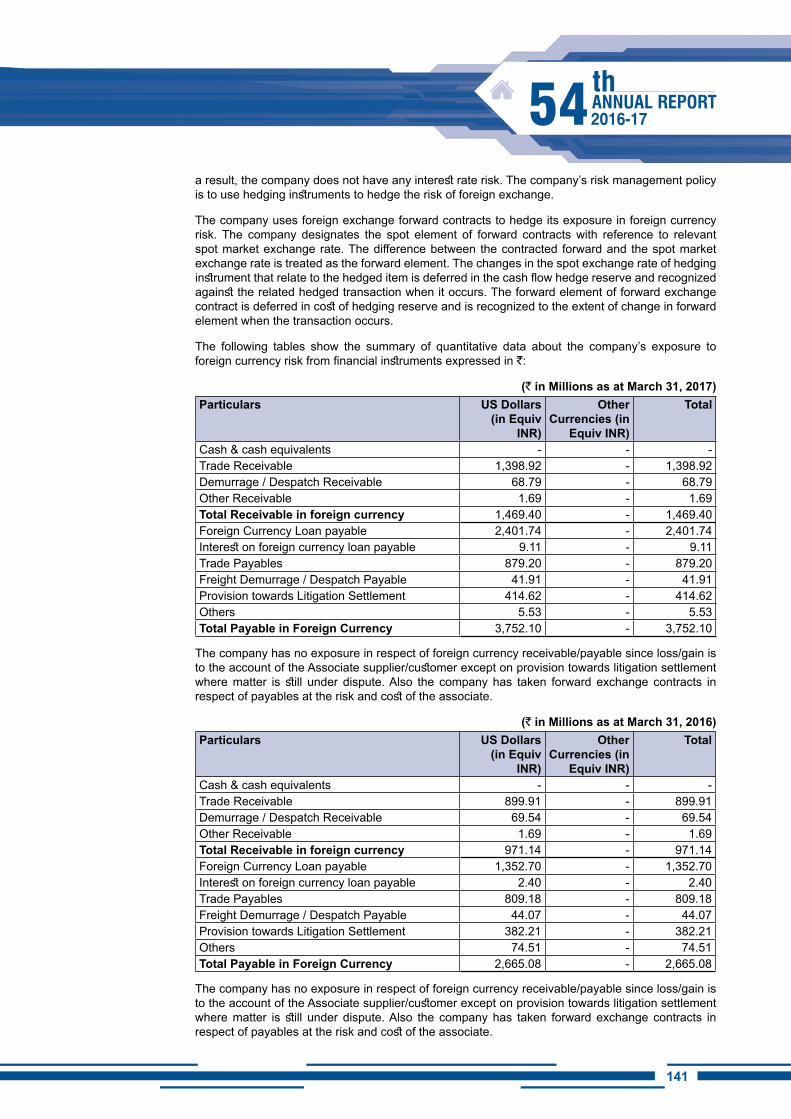
141140
a result, the company does not have any interest rate risk. The company’s risk management policy is to use hedging instruments to hedge the risk of foreign exchange.
The company uses foreign exchange forward contracts to hedge its exposure in foreign currency risk. The company designates the spot element of forward contracts with reference to relevant spot market exchange rate. The difference between the contracted forward and the spot market exchange rate is treated as the forward element. The changes in the spot exchange rate of hedging instrument that relate to the hedged item is deferred in the cash flow hedge reserve and recognized against the related hedged transaction when it occurs. The forward element of forward exchange contract is deferred in cost of hedging reserve and is recognized to the extent of change in forward element when the transaction occurs.
The following tables show the summary of quantitative data about the company’s exposure to foreign currency risk from financial instruments expressed in `:
(` in Millions as at March 31, 2017)Particulars US Dollars
(in Equiv iNR)
Other Currencies (in
Equiv iNR)
Total
Cash & cash equivalents - - - Trade Receivable 1,398.92 - 1,398.92 Demurrage / Despatch Receivable 68.79 - 68.79 Other Receivable 1.69 - 1.69 Total Receivable in foreign currency 1,469.40 - 1,469.40 Foreign Currency Loan payable 2,401.74 - 2,401.74 Interest on foreign currency loan payable 9.11 - 9.11 Trade Payables 879.20 - 879.20 Freight Demurrage / Despatch Payable 41.91 - 41.91 Provision towards Litigation Settlement 414.62 - 414.62 Others 5.53 - 5.53 Total Payable in Foreign Currency 3,752.10 - 3,752.10
The company has no exposure in respect of foreign currency receivable/payable since loss/gain is to the account of the Associate supplier/customer except on provision towards litigation settlement where matter is still under dispute. Also the company has taken forward exchange contracts in respect of payables at the risk and cost of the associate.
(` in Millions as at March 31, 2016)Particulars US Dollars
(in Equiv iNR)
Other Currencies (in
Equiv iNR)
Total
Cash & cash equivalents - - - Trade Receivable 899.91 - 899.91 Demurrage / Despatch Receivable 69.54 - 69.54 Other Receivable 1.69 - 1.69 Total Receivable in foreign currency 971.14 - 971.14 Foreign Currency Loan payable 1,352.70 - 1,352.70 Interest on foreign currency loan payable 2.40 - 2.40 Trade Payables 809.18 - 809.18 Freight Demurrage / Despatch Payable 44.07 - 44.07 Provision towards Litigation Settlement 382.21 - 382.21 Others 74.51 - 74.51 Total Payable in Foreign Currency 2,665.08 - 2,665.08
The company has no exposure in respect of foreign currency receivable/payable since loss/gain is to the account of the Associate supplier/customer except on provision towards litigation settlement where matter is still under dispute. Also the company has taken forward exchange contracts in respect of payables at the risk and cost of the associate.
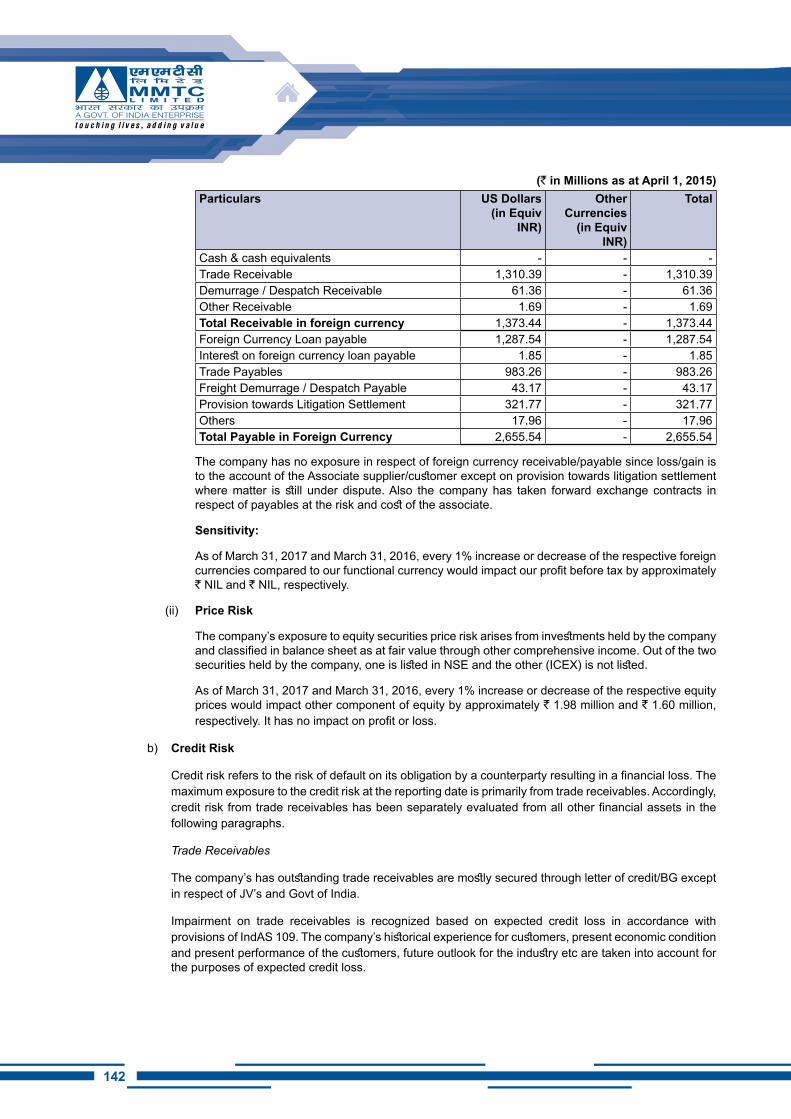
142
(` in Millions as at April 1, 2015)Particulars US Dollars
(in Equiv iNR)
Other Currencies
(in Equiv iNR)
Total
Cash & cash equivalents - - -Trade Receivable 1,310.39 - 1,310.39Demurrage / Despatch Receivable 61.36 - 61.36Other Receivable 1.69 - 1.69Total Receivable in foreign currency 1,373.44 - 1,373.44Foreign Currency Loan payable 1,287.54 - 1,287.54Interest on foreign currency loan payable 1.85 - 1.85Trade Payables 983.26 - 983.26Freight Demurrage / Despatch Payable 43.17 - 43.17Provision towards Litigation Settlement 321.77 - 321.77Others 17.96 - 17.96Total Payable in Foreign Currency 2,655.54 - 2,655.54
The company has no exposure in respect of foreign currency receivable/payable since loss/gain is to the account of the Associate supplier/customer except on provision towards litigation settlement where matter is still under dispute. Also the company has taken forward exchange contracts in respect of payables at the risk and cost of the associate.
Sensitivity:
As of March 31, 2017 and March 31, 2016, every 1% increase or decrease of the respective foreign currencies compared to our functional currency would impact our profit before tax by approximately ` NIL and ` NIL, respectively.
(ii) Price Risk
The company’s exposure to equity securities price risk arises from investments held by the company and classified in balance sheet as at fair value through other comprehensive income. Out of the two securities held by the company, one is listed in NSE and the other (ICEX) is not listed.
As of March 31, 2017 and March 31, 2016, every 1% increase or decrease of the respective equity prices would impact other component of equity by approximately ` 1.98 million and ` 1.60 million, respectively. It has no impact on profit or loss.
b) Credit Risk
Credit risk refers to the risk of default on its obligation by a counterparty resulting in a financial loss. The maximum exposure to the credit risk at the reporting date is primarily from trade receivables. Accordingly, credit risk from trade receivables has been separately evaluated from all other financial assets in the following paragraphs.
Trade Receivables
The company’s has outstanding trade receivables are mostly secured through letter of credit/BG except in respect of JV’s and Govt of India.
Impairment on trade receivables is recognized based on expected credit loss in accordance with provisions of IndAS 109. The company’s historical experience for customers, present economic condition and present performance of the customers, future outlook for the industry etc are taken into account for the purposes of expected credit loss.
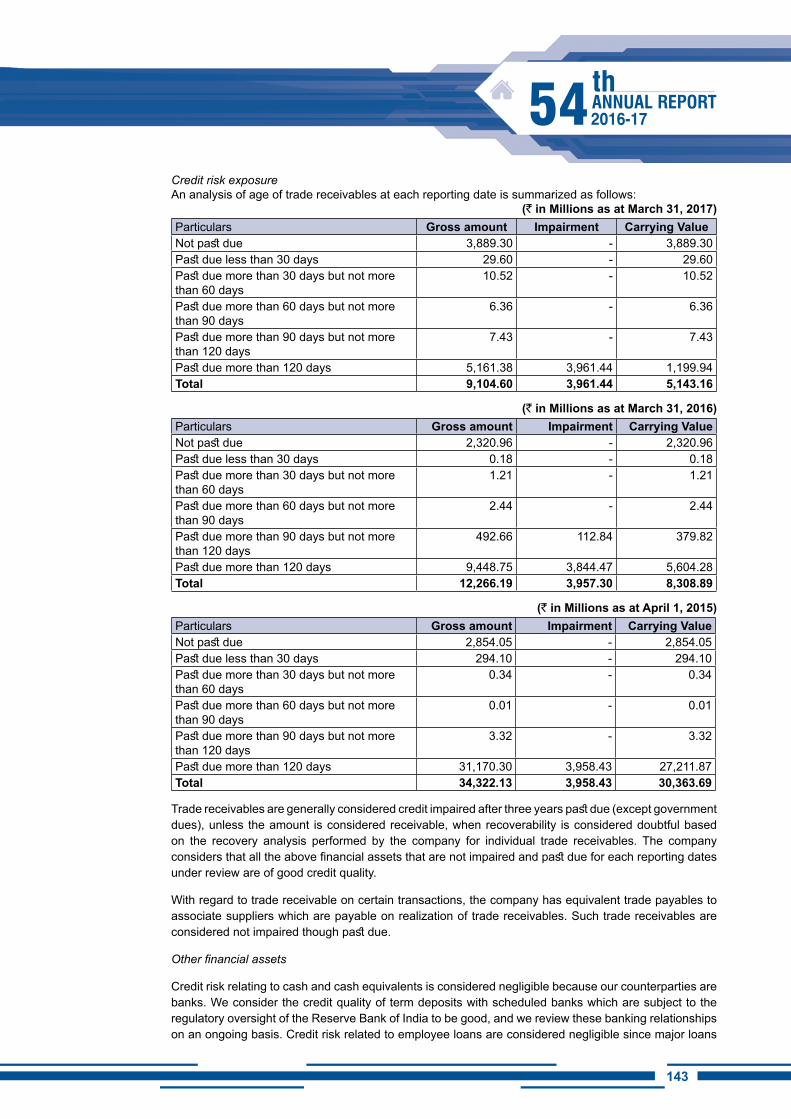
143142
Credit risk exposureAn analysis of age of trade receivables at each reporting date is summarized as follows:
(` in Millions as at March 31, 2017)Particulars Gross amount impairment Carrying ValueNot past due 3,889.30 - 3,889.30 Past due less than 30 days 29.60 - 29.60 Past due more than 30 days but not more than 60 days
10.52 - 10.52
Past due more than 60 days but not more than 90 days
6.36 - 6.36
Past due more than 90 days but not more than 120 days
7.43 - 7.43
Past due more than 120 days 5,161.38 3,961.44 1,199.94 Total 9,104.60 3,961.44 5,143.16
(` in Millions as at March 31, 2016)Particulars Gross amount impairment Carrying ValueNot past due 2,320.96 - 2,320.96 Past due less than 30 days 0.18 - 0.18 Past due more than 30 days but not more than 60 days
1.21 - 1.21
Past due more than 60 days but not more than 90 days
2.44 - 2.44
Past due more than 90 days but not more than 120 days
492.66 112.84 379.82
Past due more than 120 days 9,448.75 3,844.47 5,604.28 Total 12,266.19 3,957.30 8,308.89
(` in Millions as at April 1, 2015)Particulars Gross amount impairment Carrying ValueNot past due 2,854.05 - 2,854.05 Past due less than 30 days 294.10 - 294.10 Past due more than 30 days but not more than 60 days
0.34 - 0.34
Past due more than 60 days but not more than 90 days
0.01 - 0.01
Past due more than 90 days but not more than 120 days
3.32 - 3.32
Past due more than 120 days 31,170.30 3,958.43 27,211.87 Total 34,322.13 3,958.43 30,363.69
Trade receivables are generally considered credit impaired after three years past due (except government dues), unless the amount is considered receivable, when recoverability is considered doubtful based on the recovery analysis performed by the company for individual trade receivables. The company considers that all the above financial assets that are not impaired and past due for each reporting dates under review are of good credit quality.
With regard to trade receivable on certain transactions, the company has equivalent trade payables to associate suppliers which are payable on realization of trade receivables. Such trade receivables are considered not impaired though past due.
Other financial assets
Credit risk relating to cash and cash equivalents is considered negligible because our counterparties are banks. We consider the credit quality of term deposits with scheduled banks which are subject to the regulatory oversight of the Reserve Bank of India to be good, and we review these banking relationships on an ongoing basis. Credit risk related to employee loans are considered negligible since major loans
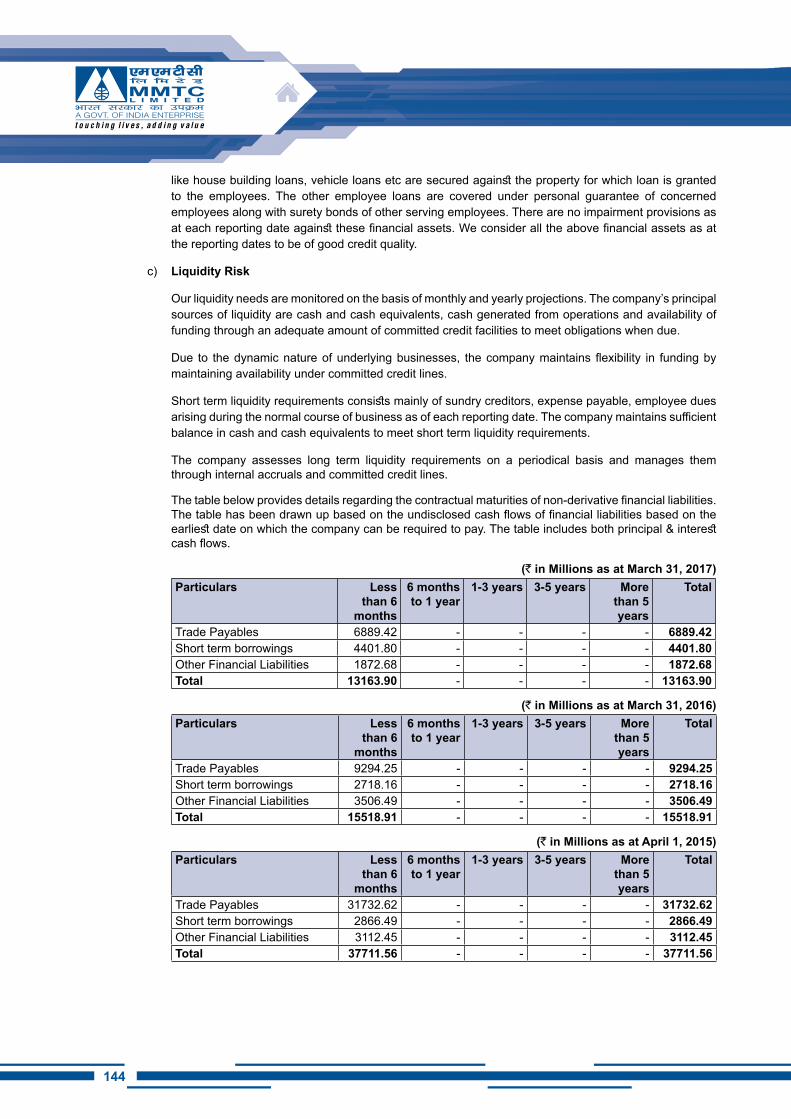
144
like house building loans, vehicle loans etc are secured against the property for which loan is granted to the employees. The other employee loans are covered under personal guarantee of concerned employees along with surety bonds of other serving employees. There are no impairment provisions as at each reporting date against these financial assets. We consider all the above financial assets as at the reporting dates to be of good credit quality.
c) Liquidity Risk
Our liquidity needs are monitored on the basis of monthly and yearly projections. The company’s principal sources of liquidity are cash and cash equivalents, cash generated from operations and availability of funding through an adequate amount of committed credit facilities to meet obligations when due.
Due to the dynamic nature of underlying businesses, the company maintains flexibility in funding by maintaining availability under committed credit lines.
Short term liquidity requirements consists mainly of sundry creditors, expense payable, employee dues arising during the normal course of business as of each reporting date. The company maintains sufficient balance in cash and cash equivalents to meet short term liquidity requirements.
The company assesses long term liquidity requirements on a periodical basis and manages them through internal accruals and committed credit lines.
The table below provides details regarding the contractual maturities of non-derivative financial liabilities. The table has been drawn up based on the undisclosed cash flows of financial liabilities based on the earliest date on which the company can be required to pay. The table includes both principal & interest cash flows.
(` in Millions as at March 31, 2017)Particulars Less
than 6 months
6 months to 1 year
1-3 years 3-5 years More than 5 years
Total
Trade Payables 6889.42 - - - - 6889.42Short term borrowings 4401.80 - - - - 4401.80Other Financial Liabilities 1872.68 - - - - 1872.68Total 13163.90 - - - - 13163.90
(` in Millions as at March 31, 2016)Particulars Less
than 6 months
6 months to 1 year
1-3 years 3-5 years More than 5 years
Total
Trade Payables 9294.25 - - - - 9294.25Short term borrowings 2718.16 - - - - 2718.16Other Financial Liabilities 3506.49 - - - - 3506.49Total 15518.91 - - - - 15518.91
(` in Millions as at April 1, 2015)Particulars Less
than 6 months
6 months to 1 year
1-3 years 3-5 years More than 5 years
Total
Trade Payables 31732.62 - - - - 31732.62Short term borrowings 2866.49 - - - - 2866.49Other Financial Liabilities 3112.45 - - - - 3112.45Total 37711.56 - - - - 37711.56
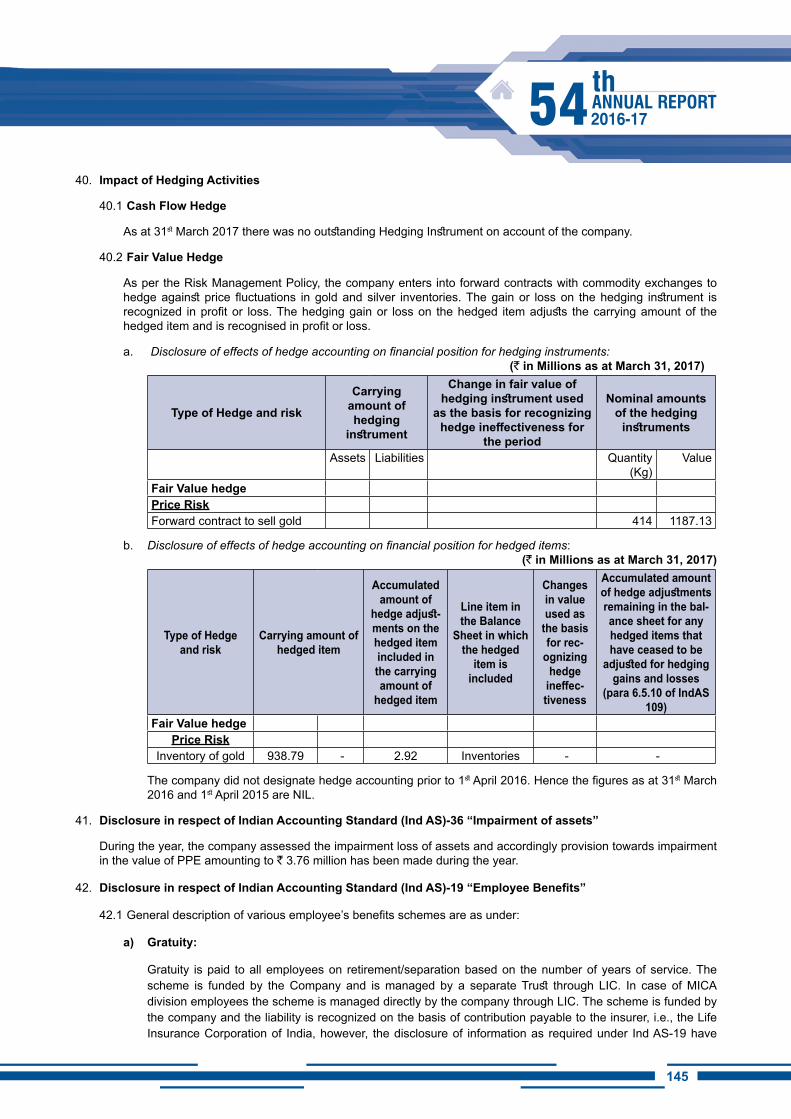
145144
40. Impact of Hedging Activities
40.1 Cash Flow Hedge
As at 31st March 2017 there was no outstanding Hedging Instrument on account of the company.
40.2 Fair Value Hedge
As per the Risk Management Policy, the company enters into forward contracts with commodity exchanges to hedge against price fluctuations in gold and silver inventories. The gain or loss on the hedging instrument is recognized in profit or loss. The hedging gain or loss on the hedged item adjusts the carrying amount of the hedged item and is recognised in profit or loss.
a. Disclosure of effects of hedge accounting on financial position for hedging instruments: (` in Millions as at March 31, 2017)
Type of Hedge and risk
Carrying amount of hedging
instrument
Change in fair value of hedging instrument used
as the basis for recognizing hedge ineffectiveness for
the period
Nominal amounts of the hedging
instruments
Assets Liabilities Quantity (Kg)
Value
Fair Value hedgePrice RiskForward contract to sell gold 414 1187.13
b. Disclosure of effects of hedge accounting on financial position for hedged items:(` in Millions as at March 31, 2017)
Type of Hedge and risk
Carrying amount of hedged item
Accumulated amount of
hedge adjust-ments on the hedged item included in the carrying amount of
hedged item
Line item in the Balance
Sheet in which the hedged
item is included
Changes in value used as
the basis for rec-
ognizing hedge
ineffec-tiveness
Accumulated amount of hedge adjustments remaining in the bal-ance sheet for any hedged items that have ceased to be
adjusted for hedging gains and losses
(para 6.5.10 of IndAS 109)
Fair Value hedgePrice Risk
Inventory of gold 938.79 - 2.92 Inventories - -
The company did not designate hedge accounting prior to 1st April 2016. Hence the figures as at 31st March 2016 and 1st April 2015 are NIL.
41. Disclosure in respect of Indian Accounting Standard (Ind AS)-36 “Impairment of assets”
During the year, the company assessed the impairment loss of assets and accordingly provision towards impairment in the value of PPE amounting to ` 3.76 million has been made during the year.
42. Disclosure in respect of indian Accounting Standard (Ind AS)-19 “Employee Benefits”
42.1 General description of various employee’s benefits schemes are as under:
a) Gratuity:
Gratuity is paid to all employees on retirement/separation based on the number of years of service. The scheme is funded by the Company and is managed by a separate Trust through LIC. In case of MICA division employees the scheme is managed directly by the company through LIC. The scheme is funded by the company and the liability is recognized on the basis of contribution payable to the insurer, i.e., the Life Insurance Corporation of India, however, the disclosure of information as required under Ind AS-19 have
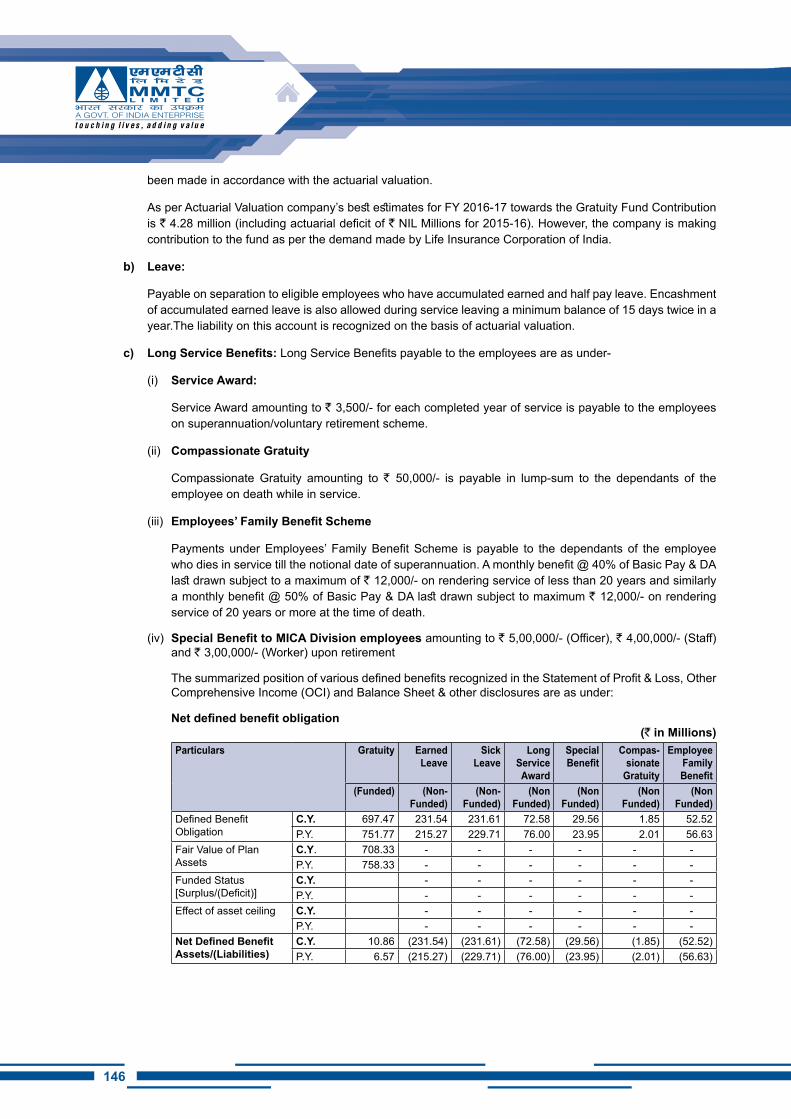
146
been made in accordance with the actuarial valuation.
As per Actuarial Valuation company’s best estimates for FY 2016-17 towards the Gratuity Fund Contribution is ` 4.28 million (including actuarial deficit of ` NIL Millions for 2015-16). However, the company is making contribution to the fund as per the demand made by Life Insurance Corporation of India.
b) Leave:
Payable on separation to eligible employees who have accumulated earned and half pay leave. Encashment of accumulated earned leave is also allowed during service leaving a minimum balance of 15 days twice in a year.The liability on this account is recognized on the basis of actuarial valuation.
c) Long Service Benefits: Long Service Benefits payable to the employees are as under-
(i) Service Award:
Service Award amounting to ` 3,500/- for each completed year of service is payable to the employees on superannuation/voluntary retirement scheme.
(ii) Compassionate Gratuity
Compassionate Gratuity amounting to ` 50,000/- is payable in lump-sum to the dependants of the employee on death while in service.
(iii) Employees’ Family Benefit Scheme
Payments under Employees’ Family Benefit Scheme is payable to the dependants of the employee who dies in service till the notional date of superannuation. A monthly benefit @ 40% of Basic Pay & DA last drawn subject to a maximum of ` 12,000/- on rendering service of less than 20 years and similarly a monthly benefit @ 50% of Basic Pay & DA last drawn subject to maximum ` 12,000/- on rendering service of 20 years or more at the time of death.
(iv) Special Benefit to MICA Division employees amounting to ` 5,00,000/- (Officer), ` 4,00,000/- (Staff) and ` 3,00,000/- (Worker) upon retirement
The summarized position of various defined benefits recognized in the Statement of Profit & Loss, Other Comprehensive Income (OCI) and Balance Sheet & other disclosures are as under:
Net defined benefit obligation(` in Millions)
Particulars Gratuity Earned Leave
Sick Leave
Long Service Award
Special Benefit
Compas-sionate
Gratuity
Employee Family Benefit
(Funded) (Non-Funded)
(Non-Funded)
(Non Funded)
(Non Funded)
(Non Funded)
(Non Funded)
Defined Benefit Obligation
C.Y. 697.47 231.54 231.61 72.58 29.56 1.85 52.52 P.Y. 751.77 215.27 229.71 76.00 23.95 2.01 56.63
Fair Value of Plan Assets
C.Y. 708.33 - - - - - - P.Y. 758.33 - - - - - -
Funded Status [Surplus/(Deficit)]
C.Y. - - - - - - P.Y. - - - - - -
Effect of asset ceiling C.Y. - - - - - - P.Y. - - - - - -
Net Defined Benefit Assets/(Liabilities)
C.Y. 10.86 (231.54) (231.61) (72.58) (29.56) (1.85) (52.52)P.Y. 6.57 (215.27) (229.71) (76.00) (23.95) (2.01) (56.63)
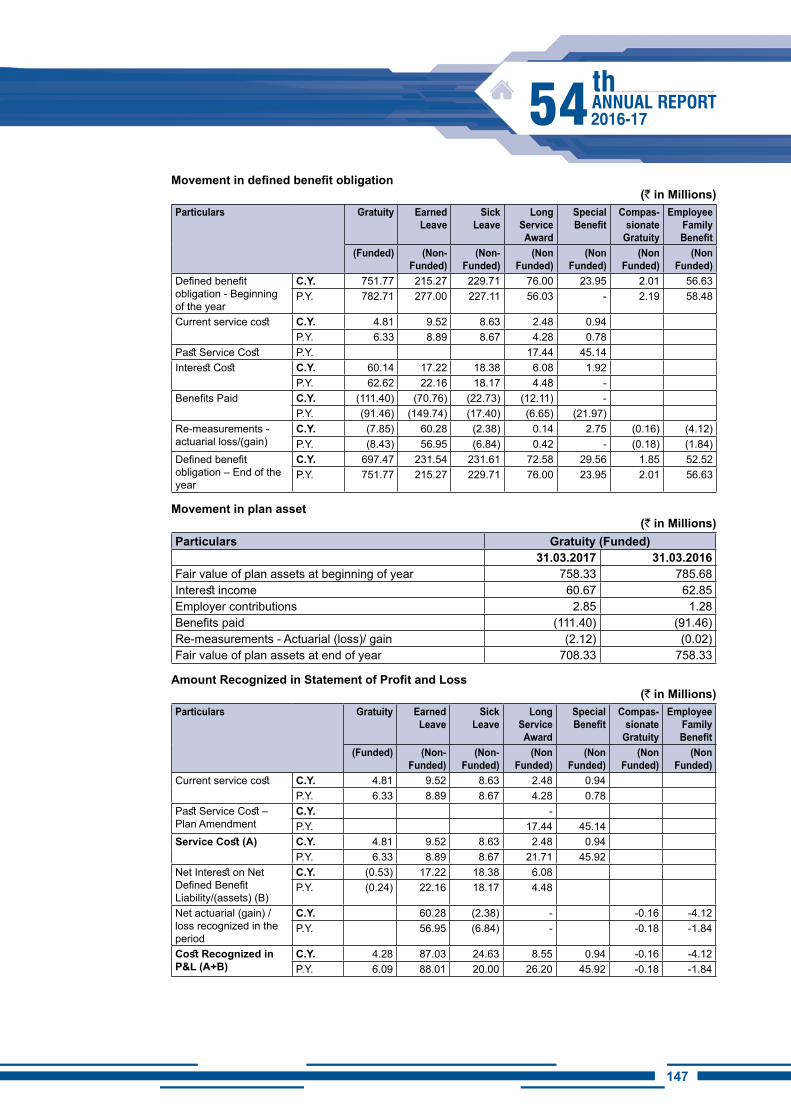
147146
Movement in defined benefit obligation(` in Millions)
Particulars Gratuity Earned Leave
Sick Leave
Long Service Award
Special Benefit
Compas-sionate
Gratuity
Employee Family Benefit
(Funded) (Non-Funded)
(Non-Funded)
(Non Funded)
(Non Funded)
(Non Funded)
(Non Funded)
Defined benefit obligation - Beginning of the year
C.Y. 751.77 215.27 229.71 76.00 23.95 2.01 56.63P.Y. 782.71 277.00 227.11 56.03 - 2.19 58.48
Current service cost C.Y. 4.81 9.52 8.63 2.48 0.94P.Y. 6.33 8.89 8.67 4.28 0.78
Past Service Cost P.Y. 17.44 45.14Interest Cost C.Y. 60.14 17.22 18.38 6.08 1.92
P.Y. 62.62 22.16 18.17 4.48 - Benefits Paid C.Y. (111.40) (70.76) (22.73) (12.11) -
P.Y. (91.46) (149.74) (17.40) (6.65) (21.97)Re-measurements - actuarial loss/(gain)
C.Y. (7.85) 60.28 (2.38) 0.14 2.75 (0.16) (4.12)P.Y. (8.43) 56.95 (6.84) 0.42 - (0.18) (1.84)
Defined benefit obligation – End of the year
C.Y. 697.47 231.54 231.61 72.58 29.56 1.85 52.52P.Y. 751.77 215.27 229.71 76.00 23.95 2.01 56.63
Movement in plan asset (` in Millions)
Particulars Gratuity (Funded)31.03.2017 31.03.2016
Fair value of plan assets at beginning of year 758.33 785.68Interest income 60.67 62.85Employer contributions 2.85 1.28Benefits paid (111.40) (91.46)Re-measurements - Actuarial (loss)/ gain (2.12) (0.02)Fair value of plan assets at end of year 708.33 758.33
Amount Recognized in Statement of Profit and Loss(` in Millions)
Particulars Gratuity Earned Leave
Sick Leave
Long Service Award
Special Benefit
Compas-sionate
Gratuity
Employee Family Benefit
(Funded) (Non-Funded)
(Non-Funded)
(Non Funded)
(Non Funded)
(Non Funded)
(Non Funded)
Current service cost C.Y. 4.81 9.52 8.63 2.48 0.94P.Y. 6.33 8.89 8.67 4.28 0.78
Past Service Cost – Plan Amendment
C.Y. - P.Y. 17.44 45.14
Service Cost (A) C.Y. 4.81 9.52 8.63 2.48 0.94P.Y. 6.33 8.89 8.67 21.71 45.92
Net Interest on Net Defined Benefit Liability/(assets) (B)
C.Y. (0.53) 17.22 18.38 6.08P.Y. (0.24) 22.16 18.17 4.48
Net actuarial (gain) / loss recognized in the period
C.Y. 60.28 (2.38) - -0.16 -4.12P.Y. 56.95 (6.84) - -0.18 -1.84
Cost Recognized in P&L (A+B)
C.Y. 4.28 87.03 24.63 8.55 0.94 -0.16 -4.12P.Y. 6.09 88.01 20.00 26.20 45.92 -0.18 -1.84
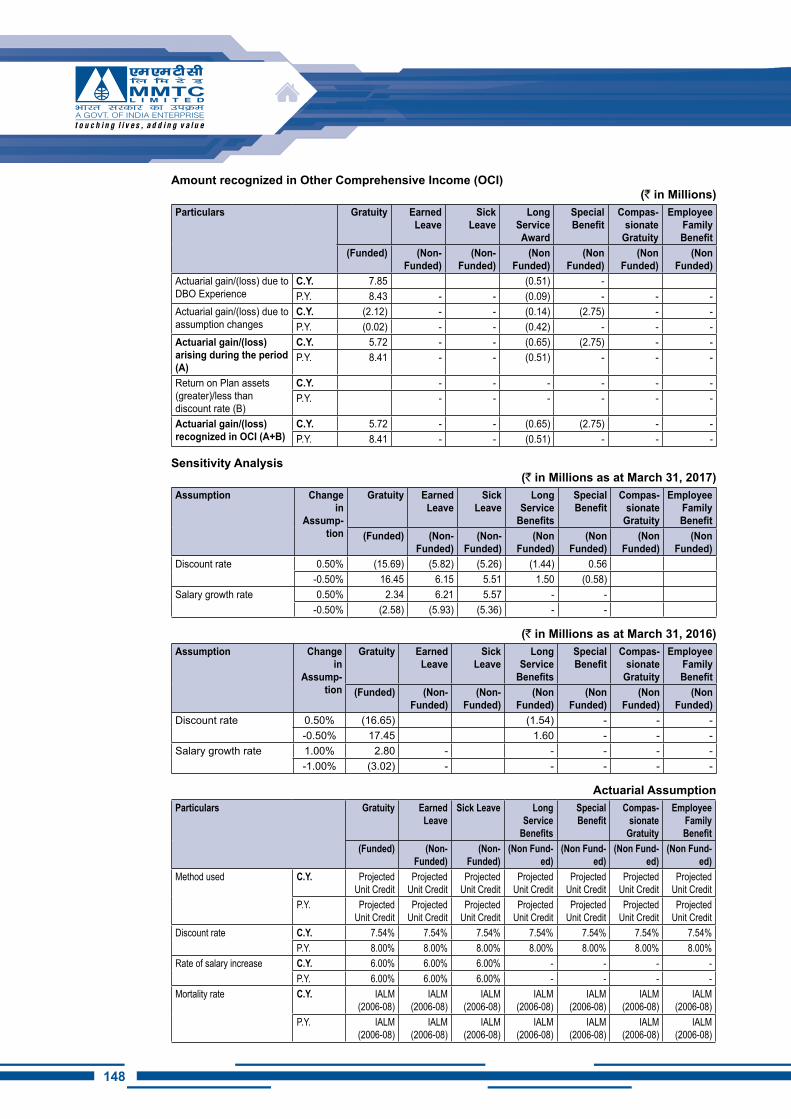
148
Amount recognized in Other Comprehensive Income (OCI) (` in Millions)
Particulars Gratuity Earned Leave
Sick Leave
Long Service Award
Special Benefit
Compas-sionate
Gratuity
Employee Family Benefit
(Funded) (Non-Funded)
(Non-Funded)
(Non Funded)
(Non Funded)
(Non Funded)
(Non Funded)
Actuarial gain/(loss) due to DBO Experience
C.Y. 7.85 (0.51) - P.Y. 8.43 - - (0.09) - - -
Actuarial gain/(loss) due to assumption changes
C.Y. (2.12) - - (0.14) (2.75) - - P.Y. (0.02) - - (0.42) - - -
Actuarial gain/(loss) arising during the period (A)
C.Y. 5.72 - - (0.65) (2.75) - - P.Y. 8.41 - - (0.51) - - -
Return on Plan assets (greater)/less than discount rate (B)
C.Y. - - - - - - P.Y. - - - - - -
Actuarial gain/(loss) recognized in OCI (A+B)
C.Y. 5.72 - - (0.65) (2.75) - - P.Y. 8.41 - - (0.51) - - -
Sensitivity Analysis(` in Millions as at March 31, 2017)
Assumption Change in
Assump-tion
Gratuity Earned Leave
Sick Leave
Long Service
Benefits
Special Benefit
Compas-sionate
Gratuity
Employee Family Benefit
(Funded) (Non-Funded)
(Non-Funded)
(Non Funded)
(Non Funded)
(Non Funded)
(Non Funded)
Discount rate 0.50% (15.69) (5.82) (5.26) (1.44) 0.56 -0.50% 16.45 6.15 5.51 1.50 (0.58)
Salary growth rate 0.50% 2.34 6.21 5.57 - --0.50% (2.58) (5.93) (5.36) - -
(` in Millions as at March 31, 2016)Assumption Change
in Assump-
tion
Gratuity Earned Leave
Sick Leave
Long Service
Benefits
Special Benefit
Compas-sionate
Gratuity
Employee Family Benefit
(Funded) (Non-Funded)
(Non-Funded)
(Non Funded)
(Non Funded)
(Non Funded)
(Non Funded)
Discount rate 0.50% (16.65) (1.54) - - - -0.50% 17.45 1.60 - - -
Salary growth rate 1.00% 2.80 - - - - - -1.00% (3.02) - - - - -
Actuarial Assumption Particulars Gratuity Earned
LeaveSick Leave Long
Service Benefits
Special Benefit
Compas-sionate
Gratuity
Employee Family Benefit
(Funded) (Non- Funded)
(Non- Funded)
(Non Fund-ed)
(Non Fund-ed)
(Non Fund-ed)
(Non Fund-ed)
Method used C.Y. Projected Unit Credit
Projected Unit Credit
Projected Unit Credit
Projected Unit Credit
Projected Unit Credit
Projected Unit Credit
Projected Unit Credit
P.Y. Projected Unit Credit
Projected Unit Credit
Projected Unit Credit
Projected Unit Credit
Projected Unit Credit
Projected Unit Credit
Projected Unit Credit
Discount rate C.Y. 7.54% 7.54% 7.54% 7.54% 7.54% 7.54% 7.54%P.Y. 8.00% 8.00% 8.00% 8.00% 8.00% 8.00% 8.00%
Rate of salary increase C.Y. 6.00% 6.00% 6.00% - - - - P.Y. 6.00% 6.00% 6.00% - - - -
Mortality rate C.Y. IALM (2006-08)
IALM (2006-08)
IALM (2006-08)
IALM (2006-08)
IALM (2006-08)
IALM (2006-08)
IALM (2006-08)
P.Y. IALM (2006-08)
IALM (2006-08)
IALM (2006-08)
IALM (2006-08)
IALM (2006-08)
IALM (2006-08)
IALM (2006-08)
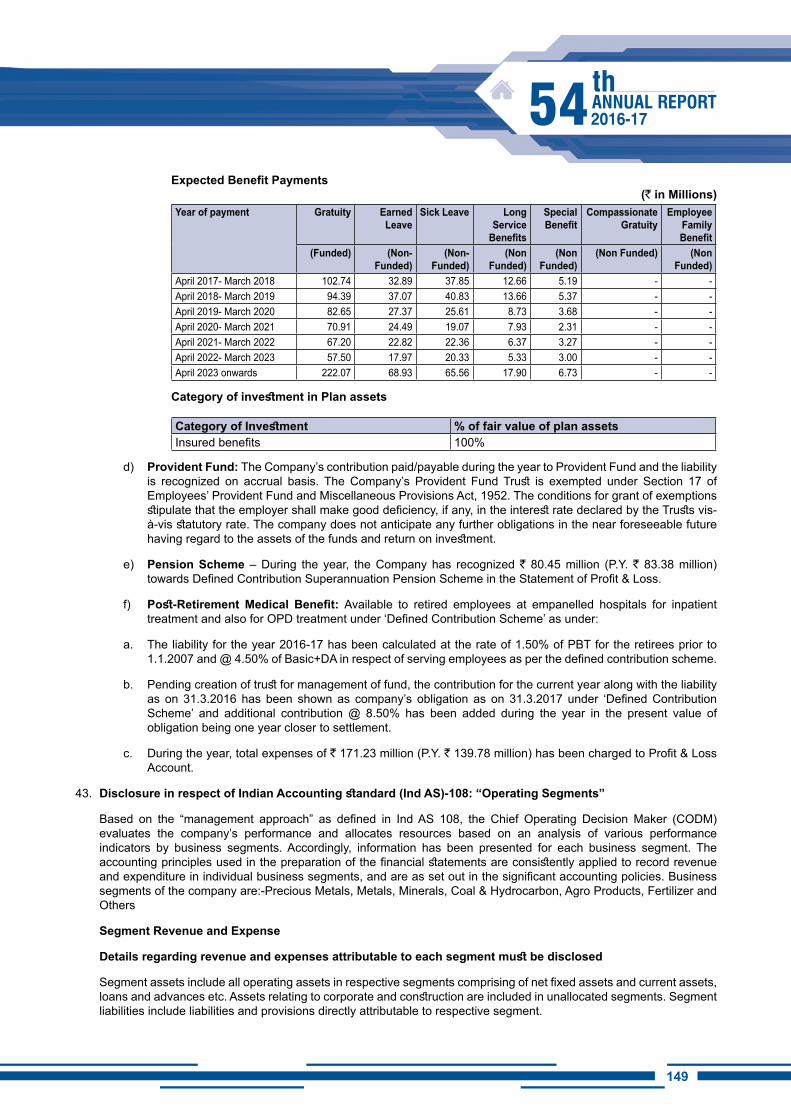
149148
Expected Benefit Payments (` in Millions)
Year of payment Gratuity Earned Leave
Sick Leave Long Service
Benefits
Special Benefit
Compassionate Gratuity
Employee Family Benefit
(Funded) (Non-Funded)
(Non-Funded)
(Non Funded)
(Non Funded)
(Non Funded) (Non Funded)
April 2017- March 2018 102.74 32.89 37.85 12.66 5.19 - - April 2018- March 2019 94.39 37.07 40.83 13.66 5.37 - - April 2019- March 2020 82.65 27.37 25.61 8.73 3.68 - - April 2020- March 2021 70.91 24.49 19.07 7.93 2.31 - - April 2021- March 2022 67.20 22.82 22.36 6.37 3.27 - - April 2022- March 2023 57.50 17.97 20.33 5.33 3.00 - - April 2023 onwards 222.07 68.93 65.56 17.90 6.73 - -
Category of investment in Plan assets
Category of Investment % of fair value of plan assetsInsured benefits 100%
d) Provident Fund: The Company’s contribution paid/payable during the year to Provident Fund and the liability is recognized on accrual basis. The Company’s Provident Fund Trust is exempted under Section 17 of Employees’ Provident Fund and Miscellaneous Provisions Act, 1952. The conditions for grant of exemptions stipulate that the employer shall make good deficiency, if any, in the interest rate declared by the Trusts vis-à-vis statutory rate. The company does not anticipate any further obligations in the near foreseeable future having regard to the assets of the funds and return on investment.
e) Pension Scheme – During the year, the Company has recognized ` 80.45 million (P.Y. ` 83.38 million) towards Defined Contribution Superannuation Pension Scheme in the Statement of Profit & Loss.
f) Post-Retirement Medical Benefit: Available to retired employees at empanelled hospitals for inpatient treatment and also for OPD treatment under ‘Defined Contribution Scheme’ as under:
a. The liability for the year 2016-17 has been calculated at the rate of 1.50% of PBT for the retirees prior to 1.1.2007 and @ 4.50% of Basic+DA in respect of serving employees as per the defined contribution scheme.
b. Pending creation of trust for management of fund, the contribution for the current year along with the liability as on 31.3.2016 has been shown as company’s obligation as on 31.3.2017 under ‘Defined Contribution Scheme’ and additional contribution @ 8.50% has been added during the year in the present value of obligation being one year closer to settlement.
c. During the year, total expenses of ` 171.23 million (P.Y. ` 139.78 million) has been charged to Profit & Loss Account.
43. Disclosure in respect of Indian Accounting standard (Ind AS)-108: “Operating Segments”
Based on the “management approach” as defined in Ind AS 108, the Chief Operating Decision Maker (CODM) evaluates the company’s performance and allocates resources based on an analysis of various performance indicators by business segments. Accordingly, information has been presented for each business segment. The accounting principles used in the preparation of the financial statements are consistently applied to record revenue and expenditure in individual business segments, and are as set out in the significant accounting policies. Business segments of the company are:-Precious Metals, Metals, Minerals, Coal & Hydrocarbon, Agro Products, Fertilizer and Others
Segment Revenue and Expense
Details regarding revenue and expenses attributable to each segment must be disclosed
Segment assets include all operating assets in respective segments comprising of net fixed assets and current assets, loans and advances etc. Assets relating to corporate and construction are included in unallocated segments. Segment liabilities include liabilities and provisions directly attributable to respective segment.
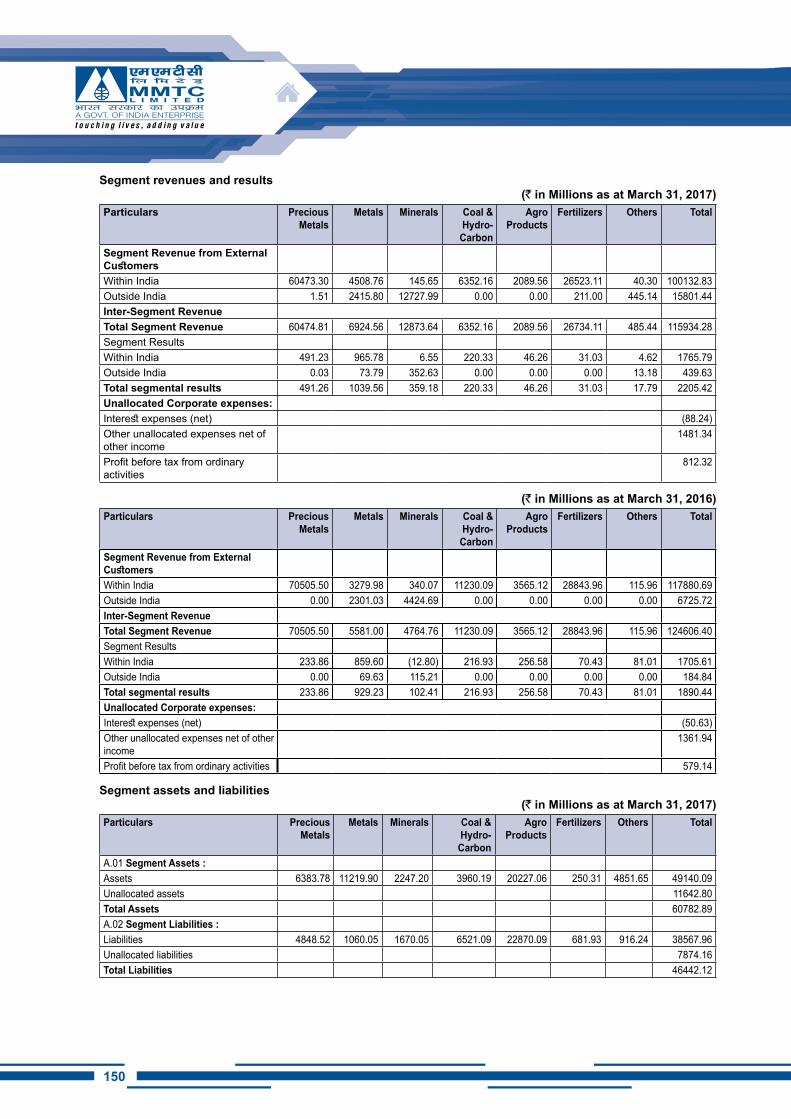
150
Segment revenues and results (` in Millions as at March 31, 2017)
Particulars Precious Metals
Metals Minerals Coal & Hydro-Carbon
Agro Products
Fertilizers Others Total
Segment Revenue from External CustomersWithin India 60473.30 4508.76 145.65 6352.16 2089.56 26523.11 40.30 100132.83Outside India 1.51 2415.80 12727.99 0.00 0.00 211.00 445.14 15801.44Inter-Segment RevenueTotal Segment Revenue 60474.81 6924.56 12873.64 6352.16 2089.56 26734.11 485.44 115934.28Segment ResultsWithin India 491.23 965.78 6.55 220.33 46.26 31.03 4.62 1765.79Outside India 0.03 73.79 352.63 0.00 0.00 0.00 13.18 439.63Total segmental results 491.26 1039.56 359.18 220.33 46.26 31.03 17.79 2205.42Unallocated Corporate expenses:Interest expenses (net) (88.24)Other unallocated expenses net of other income
1481.34
Profit before tax from ordinary activities
812.32
(` in Millions as at March 31, 2016)Particulars Precious
MetalsMetals Minerals Coal &
Hydro-Carbon
Agro Products
Fertilizers Others Total
Segment Revenue from External CustomersWithin India 70505.50 3279.98 340.07 11230.09 3565.12 28843.96 115.96 117880.69Outside India 0.00 2301.03 4424.69 0.00 0.00 0.00 0.00 6725.72Inter-Segment RevenueTotal Segment Revenue 70505.50 5581.00 4764.76 11230.09 3565.12 28843.96 115.96 124606.40Segment ResultsWithin India 233.86 859.60 (12.80) 216.93 256.58 70.43 81.01 1705.61Outside India 0.00 69.63 115.21 0.00 0.00 0.00 0.00 184.84Total segmental results 233.86 929.23 102.41 216.93 256.58 70.43 81.01 1890.44Unallocated Corporate expenses:Interest expenses (net) (50.63)Other unallocated expenses net of other income
1361.94
Profit before tax from ordinary activities 579.14
Segment assets and liabilities(` in Millions as at March 31, 2017)
Particulars Precious Metals
Metals Minerals Coal & Hydro-Carbon
Agro Products
Fertilizers Others Total
A.01 Segment Assets :Assets 6383.78 11219.90 2247.20 3960.19 20227.06 250.31 4851.65 49140.09Unallocated assets 11642.80Total Assets 60782.89A.02 Segment Liabilities :Liabilities 4848.52 1060.05 1670.05 6521.09 22870.09 681.93 916.24 38567.96Unallocated liabilities 7874.16Total Liabilities 46442.12
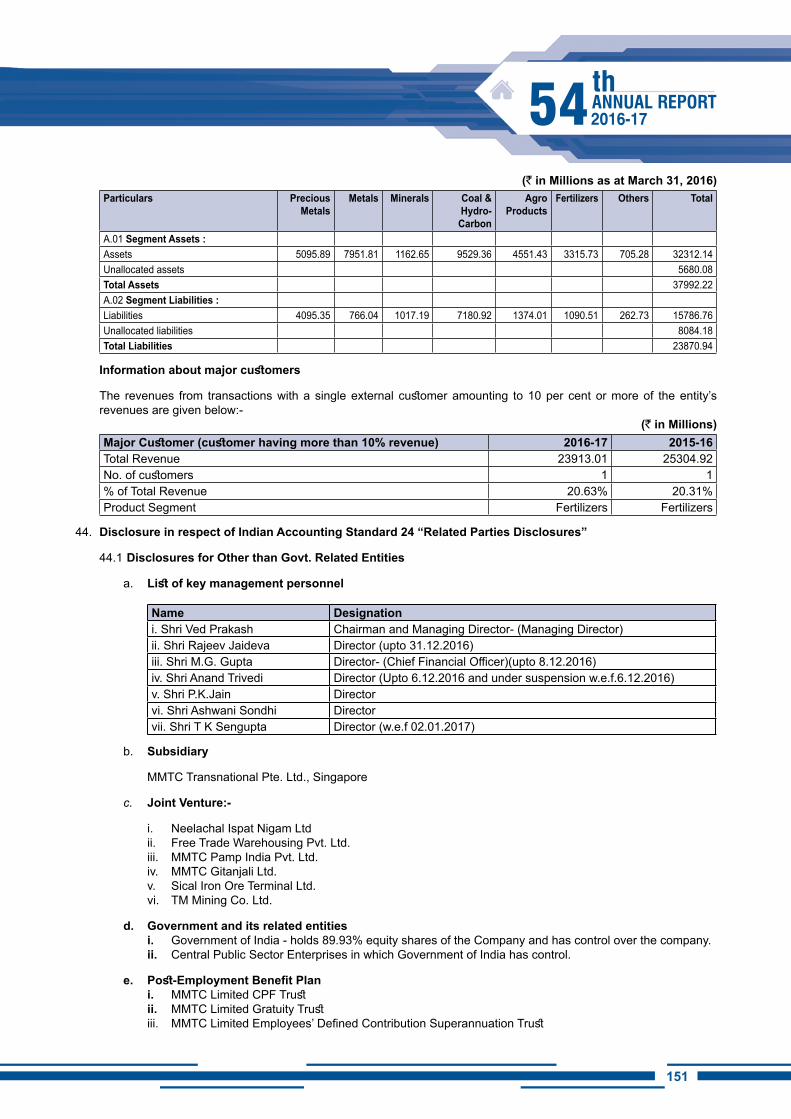
151150
(` in Millions as at March 31, 2016)Particulars Precious
MetalsMetals Minerals Coal &
Hydro-Carbon
Agro Products
Fertilizers Others Total
A.01 Segment Assets :Assets 5095.89 7951.81 1162.65 9529.36 4551.43 3315.73 705.28 32312.14Unallocated assets 5680.08Total Assets 37992.22A.02 Segment Liabilities :Liabilities 4095.35 766.04 1017.19 7180.92 1374.01 1090.51 262.73 15786.76Unallocated liabilities 8084.18Total Liabilities 23870.94
Information about major customers
The revenues from transactions with a single external customer amounting to 10 per cent or more of the entity’s revenues are given below:-
(` in Millions)Major Customer (customer having more than 10% revenue) 2016-17 2015-16Total Revenue 23913.01 25304.92No. of customers 1 1% of Total Revenue 20.63% 20.31%Product Segment Fertilizers Fertilizers
44. Disclosure in respect of Indian Accounting Standard 24 “Related Parties Disclosures”
44.1 Disclosures for Other than Govt. Related Entities
a. List of key management personnel
Name Designationi. Shri Ved Prakash Chairman and Managing Director- (Managing Director)ii. Shri Rajeev Jaideva Director (upto 31.12.2016)iii. Shri M.G. Gupta Director- (Chief Financial Officer)(upto 8.12.2016)iv. Shri Anand Trivedi Director (Upto 6.12.2016 and under suspension w.e.f.6.12.2016)v. Shri P.K.Jain Directorvi. Shri Ashwani Sondhi Directorvii. Shri T K Sengupta Director (w.e.f 02.01.2017)
b. Subsidiary
MMTC Transnational Pte. Ltd., Singapore
c. Joint Venture:-
i. Neelachal Ispat Nigam Ltdii. Free Trade Warehousing Pvt. Ltd.iii. MMTC Pamp India Pvt. Ltd.iv. MMTC Gitanjali Ltd.v. Sical Iron Ore Terminal Ltd.vi. TM Mining Co. Ltd.
d. Government and its related entitiesi. Government of India - holds 89.93% equity shares of the Company and has control over the company.ii. Central Public Sector Enterprises in which Government of India has control.
e. Post-Employment Benefit Plani. MMTC Limited CPF Trust ii. MMTC Limited Gratuity Trustiii. MMTC Limited Employees’ Defined Contribution Superannuation Trust
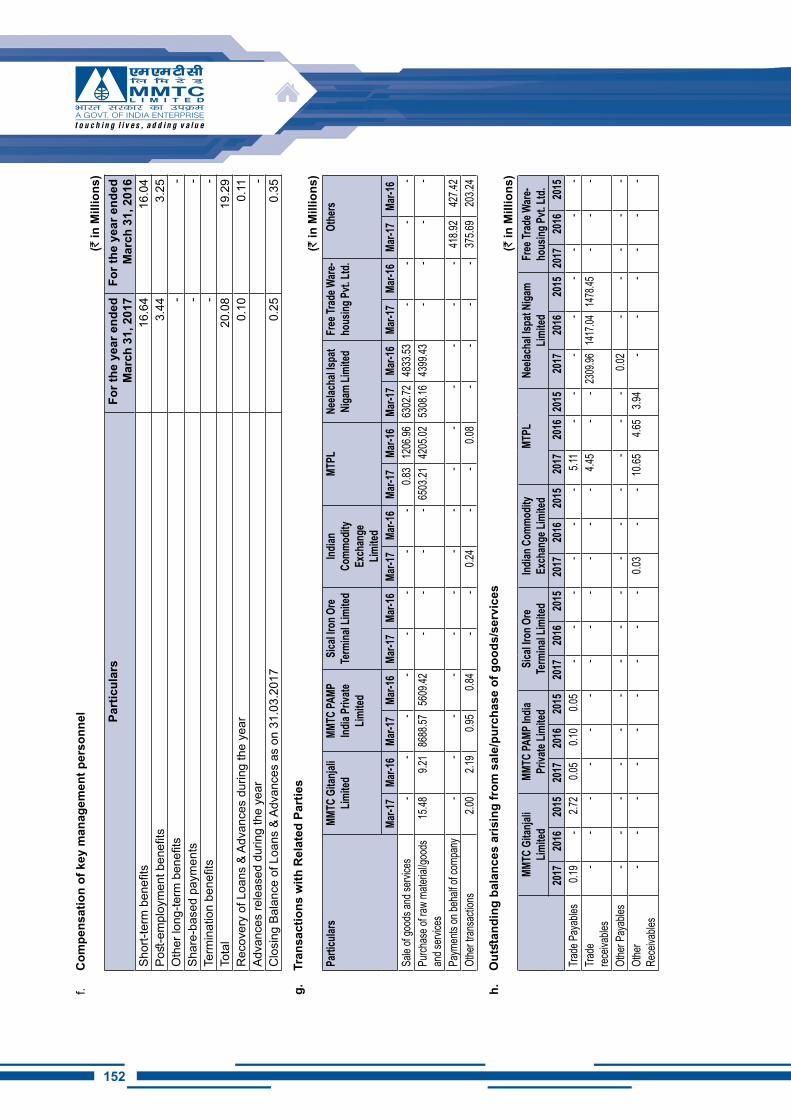
152
f. C
ompe
nsat
ion
of k
ey m
anag
emen
t per
sonn
el
(`
in M
illio
ns)
Part
icul
ars
For t
he y
ear e
nded
M
arch
31,
201
7Fo
r the
yea
r end
ed
Mar
ch 3
1, 2
016
Shor
t-ter
m b
enefi
ts16
.64
16.0
4Po
st-e
mpl
oym
ent b
enefi
ts3.
443.
25O
ther
long
-term
ben
efits
--
Shar
e-ba
sed
paym
ents
--
Term
inat
ion
bene
fits
--
Tota
l20
.08
19.2
9R
ecov
ery
of L
oans
& A
dvan
ces
durin
g th
e ye
ar
0.10
0.11
Adva
nces
rele
ased
dur
ing
the
year
-C
losi
ng B
alan
ce o
f Loa
ns &
Adv
ance
s as
on
31.0
3.20
170.
250.
35
g.
Tran
sact
ions
with
Rel
ated
Par
ties
(` in
Mill
ions
)Pa
rticu
lars
MMTC
Gita
njali
Limite
dMM
TC PA
MP
India
Priva
te Lim
ited
Sical
iron O
re Te
rmina
l Lim
ited
Indian
Co
mmod
ity
Exch
ange
Lim
ited
MTPL
Neela
chal
ispat
Niga
m Lim
ited
Free
Trad
e Ware
-ho
using
Pvt. L
td.Ot
hers
Mar-1
7Ma
r-16
Mar-1
7Ma
r-16
Mar-1
7Ma
r-16
Mar-1
7Ma
r-16
Mar-1
7Ma
r-16
Mar-1
7Ma
r-16
Mar-1
7Ma
r-16
Mar-1
7Ma
r-16
Sale
of go
ods a
nd se
rvice
s -
- -
- -
- -
- 0.8
312
06.96
6302
.7248
33.53
- -
--
Purch
ase o
f raw
mater
ial/go
ods
and s
ervice
s 15
.489.2
186
88.57
5609
.42 -
- -
- 65
03.21
4205
.0253
08.16
4399
.43 -
- -
-
Paym
ents
on be
half o
f com
pany
- -
- -
- -
- -
- -
- -
- -
418.9
2 42
7.42
Othe
r tran
sacti
ons
2.00
2.19
0.95
0.84
- -
0.24
- -
0.08
- -
- -
375.6
9 20
3.24
h.
Out
stan
ding
bal
ance
s ar
isin
g fr
om s
ale/
purc
hase
of g
oods
/ser
vice
s(`
in M
illio
ns)
MMTC
Gita
njali
Limite
dMM
TC PA
MP In
dia
Priva
te Lim
ited
Sical
iron O
re Te
rmina
l Lim
ited
Indian
Com
modit
y Ex
chan
ge Li
mited
MTPL
Neela
chal
Ispat
Niga
m Lim
ited
Free
Trad
e Ware
-ho
using
Pvt. L
td.20
1720
1620
1520
1720
1620
1520
1720
1620
1520
1720
1620
1520
1720
1620
1520
1720
1620
1520
1720
1620
15Tra
de P
ayab
les
0.19
-
2.72
0.
05
0.10
0.
05
- -
- -
- -
5.11
-
- -
- -
- -
- Tra
de
receiv
ables
-
- -
- -
- -
- -
- -
- 4.
45
- -
2309
.96 1
417.0
4 14
78.45
-
- -
Othe
r Pay
ables
- -
- -
- -
- -
- -
- -
- -
- 0.
02
- -
- -
- Ot
her
Rece
ivable
s -
- -
- -
- -
- -
0.03
-
- 10
.65
4.65
3.9
4 -
- -
- -
-
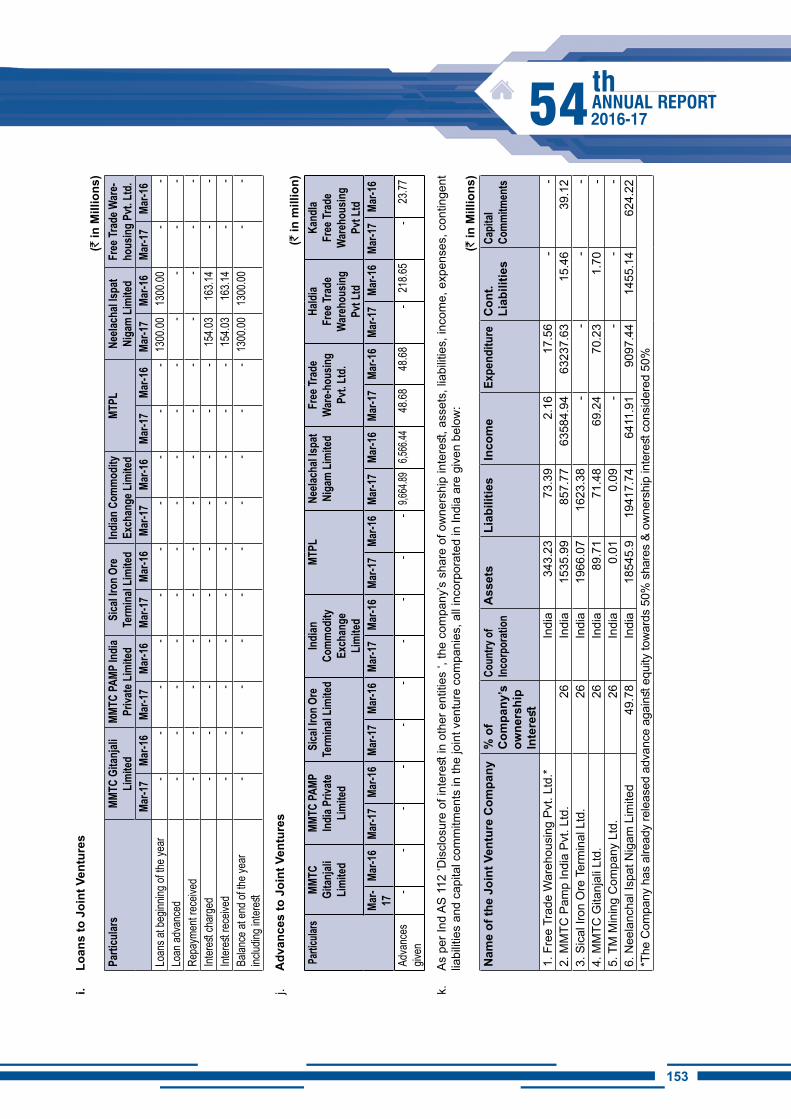
153152
i. Lo
ans
to J
oint
Ven
ture
s(`
in M
illio
ns)
Parti
cular
sMM
TC G
itanja
li Lim
ited
MMTC
PAMP
India
Pr
ivate
Limite
dSi
cal ir
on O
re
Term
inal L
imite
dInd
ian C
ommo
dity
Exch
ange
Limi
tedMT
PLNe
elach
al isp
at Ni
gam
Limite
dFr
ee Tr
ade W
are-
hous
ing P
vt. Lt
d.Ma
r-17
Mar-1
6Ma
r-17
Mar-1
6Ma
r-17
Mar-1
6Ma
r-17
Mar-1
6Ma
r-17
Mar-1
6Ma
r-17
Mar-1
6Ma
r-17
Mar-1
6Lo
ans a
t beg
inning
of th
e yea
r -
- -
- -
- -
- -
- 13
00.00
1300
.00 -
- Lo
an ad
vanc
ed -
- -
- -
- -
- -
- -
- -
- Re
paym
ent r
eceiv
ed -
- -
- -
- -
- -
- -
- -
- Int
erest
char
ged
- -
- -
- -
- -
- -
154.0
316
3.14
- -
Inter
est re
ceive
d -
- -
- -
- -
- -
- 15
4.03
163.1
4 -
- Ba
lance
at en
d of th
e yea
r inc
luding
inter
est -
- -
- -
- -
- -
- 13
00.00
1300
.00 -
-
j. A
dvan
ces
to J
oint
Ven
ture
s(`
in m
illio
n)Pa
rticula
rsMM
TC
Gitan
jali
Limite
d
MMTC
PAMP
Ind
ia Pr
ivate
Limite
d
Sica
l iron
Ore
Te
rmina
l Lim
ited
Indian
Co
mmod
ity
Exch
ange
Lim
ited
MTPL
Neela
chal
ispat
Niga
m Lim
ited
Free
Trad
e W
are-h
ousin
g Pv
t. Ltd
.
Haldi
a Fr
ee Tr
ade
War
ehou
sing
Pvt L
td
Kand
la Fr
ee Tr
ade
War
ehou
sing
Pvt L
tdMa
r- 17Ma
r-16
Mar-1
7Ma
r-16
Mar-1
7Ma
r-16
Mar-1
7Ma
r-16
Mar-1
7Ma
r-16
Mar-1
7Ma
r-16
Mar-1
7Ma
r-16
Mar-1
7Ma
r-16
Mar-1
7Ma
r-16
Adva
nces
giv
en -
- -
- -
- -
- -
- 9,6
64.89
6,5
66.44
48
.68
48.68
-
218.6
5 -
23.77
k.
As p
er In
d AS
112
‘Dis
clos
ure
of in
tere
st in
oth
er e
ntiti
es ‘,
the
com
pany
’s s
hare
of o
wne
rshi
p in
tere
st, a
sset
s, li
abilit
ies,
inco
me,
exp
ense
s, c
ontin
gent
lia
bilit
ies
and
capi
tal c
omm
itmen
ts in
the
join
t ven
ture
com
pani
es, a
ll in
corp
orat
ed in
Indi
a ar
e gi
ven
belo
w:
(` in
Mill
ions
)N
ame
of th
e Jo
int V
entu
re C
ompa
ny%
of
Com
pany
’s
owne
rshi
p In
tere
st
Coun
try of
inc
orpo
ratio
nA
sset
sLi
abili
ties
inco
me
Expe
nditu
reC
ont.
Liab
ilitie
sCa
pital
Comm
itmen
ts
1. F
ree
Trad
e W
areh
ousi
ng P
vt. L
td.*
Indi
a34
3.23
73.3
92.
1617
.56
--
2. M
MTC
Pam
p In
dia
Pvt.
Ltd.
26In
dia
1535
.99
857.
7763
584.
9463
237.
6315
.46
39.1
23.
Sic
al Ir
on O
re T
erm
inal
Ltd
.26
Indi
a19
66.0
716
23.3
8 -
- -
-4.
MM
TC G
itanj
ali L
td.
26In
dia
89.7
171
.48
69.2
470
.23
1.70
-5.
TM
Min
ing
Com
pany
Ltd
.26
Indi
a0.
010.
09 -
- -
-6.
Nee
lanc
hal I
spat
Nig
am L
imite
d49
.78
Indi
a18
545.
919
417.
7464
11.9
190
97.4
414
55.1
462
4.22
*The
Com
pany
has
alre
ady
rele
ased
adv
ance
aga
inst
equ
ity to
war
ds 5
0% s
hare
s &
owne
rshi
p in
tere
st c
onsi
dere
d 50
%
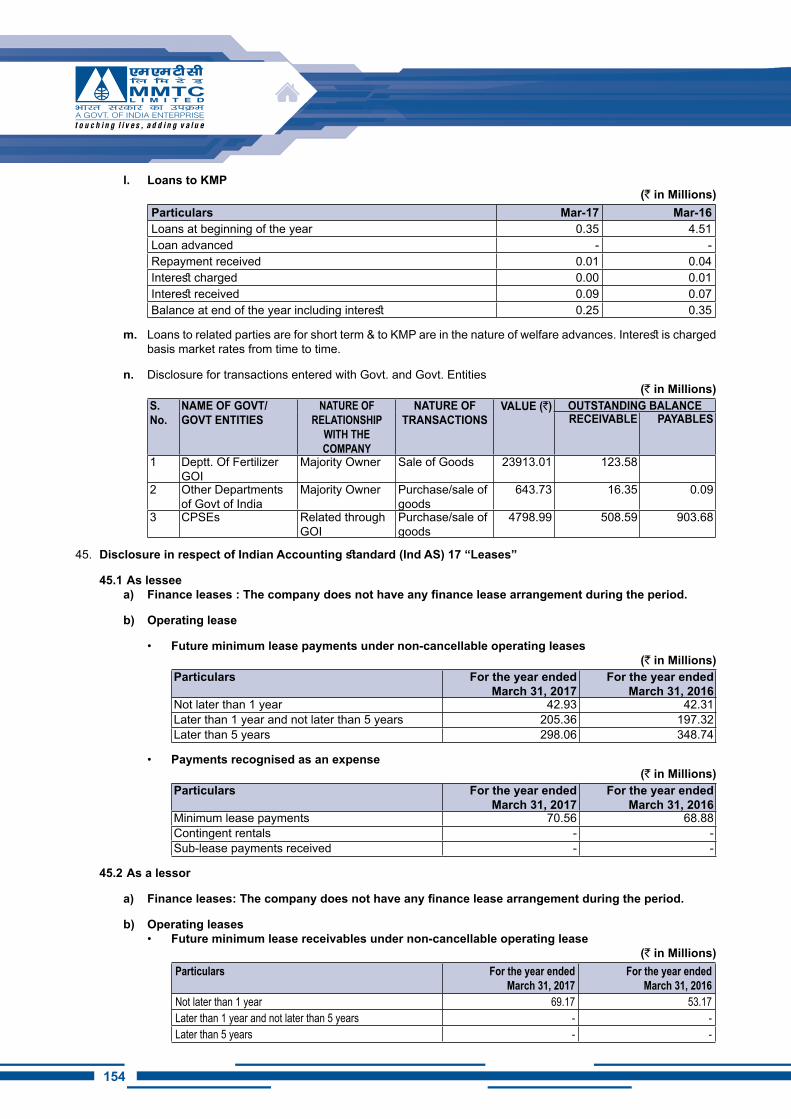
154
l. Loans to KMP (` in Millions)
Particulars Mar-17 Mar-16Loans at beginning of the year 0.35 4.51Loan advanced - - Repayment received 0.01 0.04Interest charged 0.00 0.01Interest received 0.09 0.07Balance at end of the year including interest 0.25 0.35
m. Loans to related parties are for short term & to KMP are in the nature of welfare advances. Interest is charged basis market rates from time to time.
n. Disclosure for transactions entered with Govt. and Govt. Entities(` in Millions)
S. No.
NAME OF GOVT/GOVT ENTiTiES
NATURE OF RELATiONShiP
WiTh ThE COMPANY
NATURE OF TRANSACTiONS
VALUE (`) OUTSTANDiNG BALANCE RECEiVABLE PAYABLES
1 Deptt. Of Fertilizer GOI
Majority Owner Sale of Goods 23913.01 123.58
2 Other Departments of Govt of India
Majority Owner Purchase/sale of goods
643.73 16.35 0.09
3 CPSEs Related through GOI
Purchase/sale of goods
4798.99 508.59 903.68
45. Disclosure in respect of Indian Accounting standard (Ind AS) 17 “Leases”
45.1 As lesseea) Finance leases : The company does not have any finance lease arrangement during the period.
b) Operating lease
• Future minimum lease payments under non-cancellable operating leases(` in Millions)
Particulars For the year ended March 31, 2017
For the year ended March 31, 2016
Not later than 1 year 42.93 42.31Later than 1 year and not later than 5 years 205.36 197.32Later than 5 years 298.06 348.74
• Payments recognised as an expense(` in Millions)
Particulars For the year ended March 31, 2017
For the year ended March 31, 2016
Minimum lease payments 70.56 68.88Contingent rentals - -Sub-lease payments received - -
45.2 As a lessor
a) Finance leases: The company does not have any finance lease arrangement during the period.
b) Operating leases • Future minimum lease receivables under non-cancellable operating lease
(` in Millions)Particulars For the year ended
March 31, 2017For the year ended
March 31, 2016Not later than 1 year 69.17 53.17Later than 1 year and not later than 5 years - -Later than 5 years - -
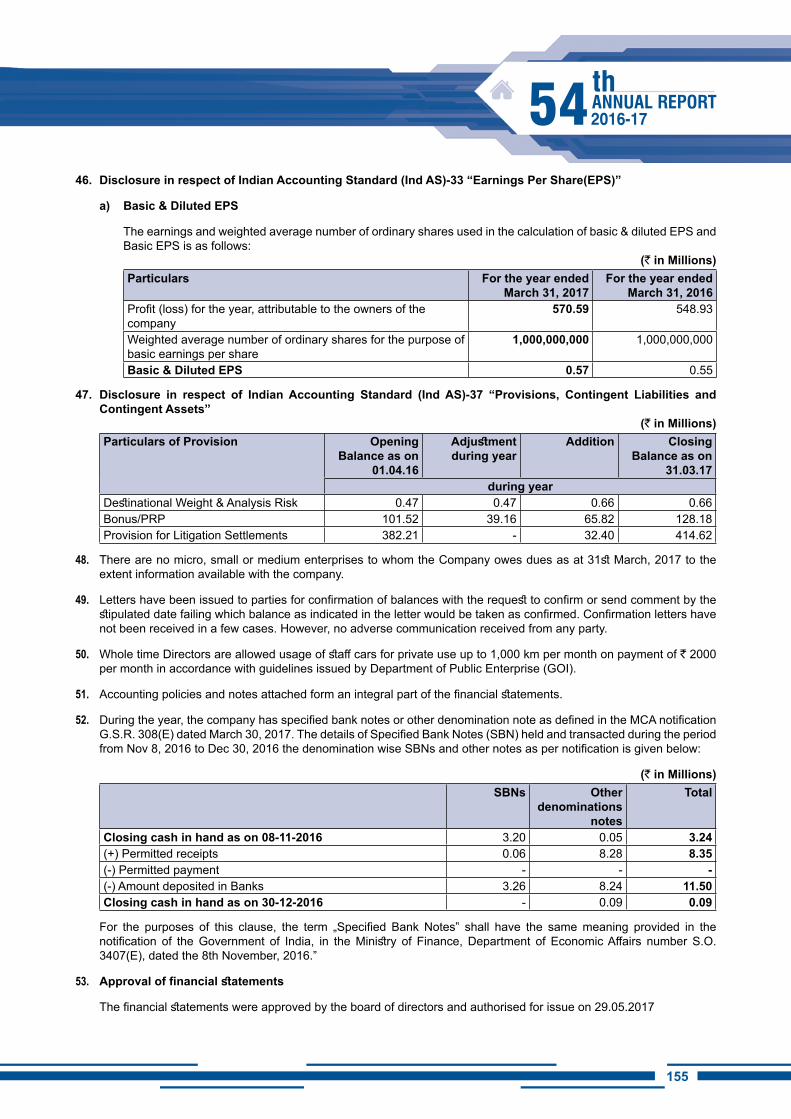
155154
46. Disclosure in respect of Indian Accounting Standard (Ind AS)-33 “Earnings Per Share(EPS)”
a) Basic & Diluted EPS
The earnings and weighted average number of ordinary shares used in the calculation of basic & diluted EPS and Basic EPS is as follows:
(` in Millions)Particulars For the year ended
March 31, 2017For the year ended
March 31, 2016Profit (loss) for the year, attributable to the owners of the company
570.59 548.93
Weighted average number of ordinary shares for the purpose of basic earnings per share
1,000,000,000 1,000,000,000
Basic & Diluted EPS 0.57 0.55
47. Disclosure in respect of Indian Accounting Standard (Ind AS)-37 “Provisions, Contingent Liabilities and Contingent Assets”
(` in Millions)Particulars of Provision Opening
Balance as on 01.04.16
Adjustment during year
Addition Closing Balance as on
31.03.17during year
Destinational Weight & Analysis Risk 0.47 0.47 0.66 0.66Bonus/PRP 101.52 39.16 65.82 128.18 Provision for Litigation Settlements 382.21 - 32.40 414.62
48. There are no micro, small or medium enterprises to whom the Company owes dues as at 31st March, 2017 to the extent information available with the company.
49. Letters have been issued to parties for confirmation of balances with the request to confirm or send comment by the stipulated date failing which balance as indicated in the letter would be taken as confirmed. Confirmation letters have not been received in a few cases. However, no adverse communication received from any party.
50. Whole time Directors are allowed usage of staff cars for private use up to 1,000 km per month on payment of ` 2000 per month in accordance with guidelines issued by Department of Public Enterprise (GOI).
51. Accounting policies and notes attached form an integral part of the financial statements.
52. During the year, the company has specified bank notes or other denomination note as defined in the MCA notification G.S.R. 308(E) dated March 30, 2017. The details of Specified Bank Notes (SBN) held and transacted during the period from Nov 8, 2016 to Dec 30, 2016 the denomination wise SBNs and other notes as per notification is given below:
(` in Millions)SBNs Other
denominations notes
Total
Closing cash in hand as on 08-11-2016 3.20 0.05 3.24(+) Permitted receipts 0.06 8.28 8.35(-) Permitted payment - - - (-) Amount deposited in Banks 3.26 8.24 11.50Closing cash in hand as on 30-12-2016 - 0.09 0.09
For the purposes of this clause, the term „Specified Bank Notes‟ shall have the same meaning provided in the notification of the Government of India, in the Ministry of Finance, Department of Economic Affairs number S.O. 3407(E), dated the 8th November, 2016.”
53. Approval of financial statements
The financial statements were approved by the board of directors and authorised for issue on 29.05.2017
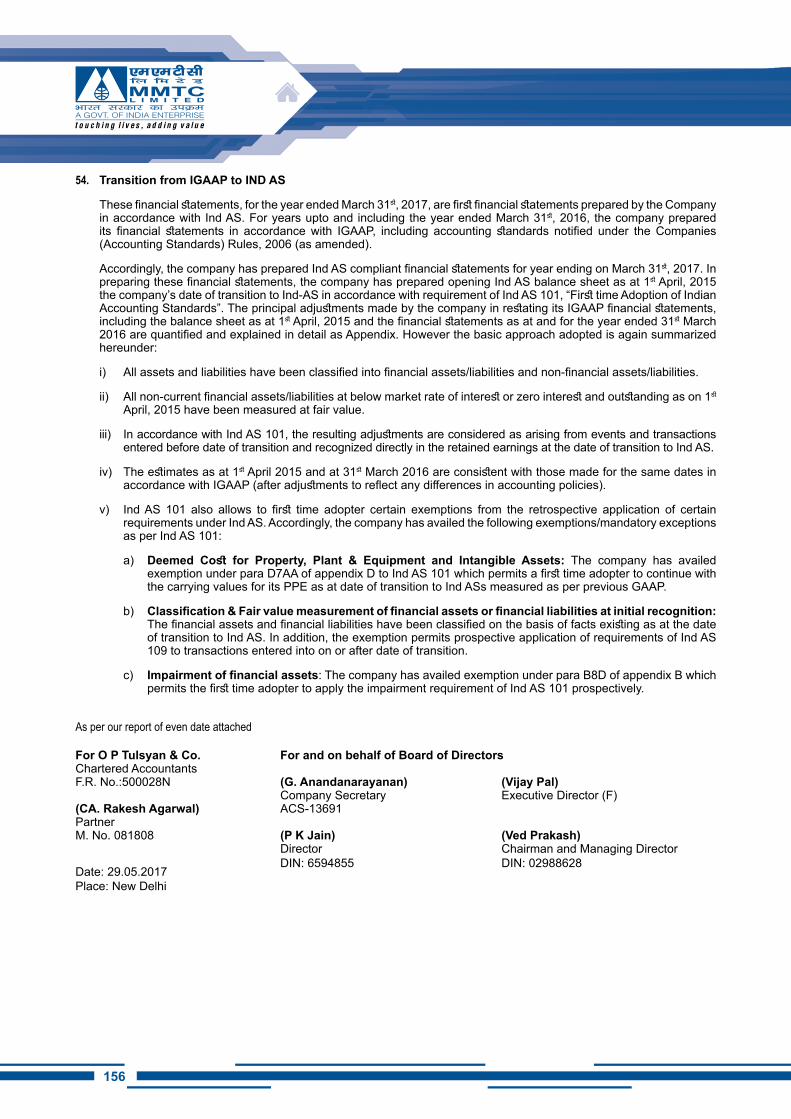
156
54. Transition from iGAAP to iND AS
These financial statements, for the year ended March 31st, 2017, are first financial statements prepared by the Company in accordance with Ind AS. For years upto and including the year ended March 31st, 2016, the company prepared its financial statements in accordance with IGAAP, including accounting standards notified under the Companies (Accounting Standards) Rules, 2006 (as amended).
Accordingly, the company has prepared Ind AS compliant financial statements for year ending on March 31st, 2017. In preparing these financial statements, the company has prepared opening Ind AS balance sheet as at 1st April, 2015 the company’s date of transition to Ind-AS in accordance with requirement of Ind AS 101, “First time Adoption of Indian Accounting Standards”. The principal adjustments made by the company in restating its IGAAP financial statements, including the balance sheet as at 1st April, 2015 and the financial statements as at and for the year ended 31st March 2016 are quantified and explained in detail as Appendix. However the basic approach adopted is again summarized hereunder:
i) All assets and liabilities have been classified into financial assets/liabilities and non-financial assets/liabilities.
ii) All non-current financial assets/liabilities at below market rate of interest or zero interest and outstanding as on 1st April, 2015 have been measured at fair value.
iii) In accordance with Ind AS 101, the resulting adjustments are considered as arising from events and transactions entered before date of transition and recognized directly in the retained earnings at the date of transition to Ind AS.
iv) The estimates as at 1st April 2015 and at 31st March 2016 are consistent with those made for the same dates in accordance with IGAAP (after adjustments to reflect any differences in accounting policies).
v) Ind AS 101 also allows to first time adopter certain exemptions from the retrospective application of certain requirements under Ind AS. Accordingly, the company has availed the following exemptions/mandatory exceptions as per Ind AS 101:
a) Deemed Cost for Property, Plant & Equipment and Intangible Assets: The company has availed exemption under para D7AA of appendix D to Ind AS 101 which permits a first time adopter to continue with the carrying values for its PPE as at date of transition to Ind ASs measured as per previous GAAP.
b) Classification & Fair value measurement of financial assets or financial liabilities at initial recognition: The financial assets and financial liabilities have been classified on the basis of facts existing as at the date of transition to Ind AS. In addition, the exemption permits prospective application of requirements of Ind AS 109 to transactions entered into on or after date of transition.
c) Impairment of financial assets: The company has availed exemption under para B8D of appendix B which permits the first time adopter to apply the impairment requirement of Ind AS 101 prospectively.
As per our report of even date attached
For O P Tulsyan & Co. For and on behalf of Board of DirectorsChartered Accountants F.R. No.:500028N (G. Anandanarayanan) (Vijay Pal)
Company Secretary Executive Director (F) (CA. Rakesh Agarwal) ACS-13691PartnerM. No. 081808 (P K Jain) (Ved Prakash)
DirectorDIN: 6594855
Chairman and Managing DirectorDIN: 02988628
Date: 29.05.2017Place: New Delhi
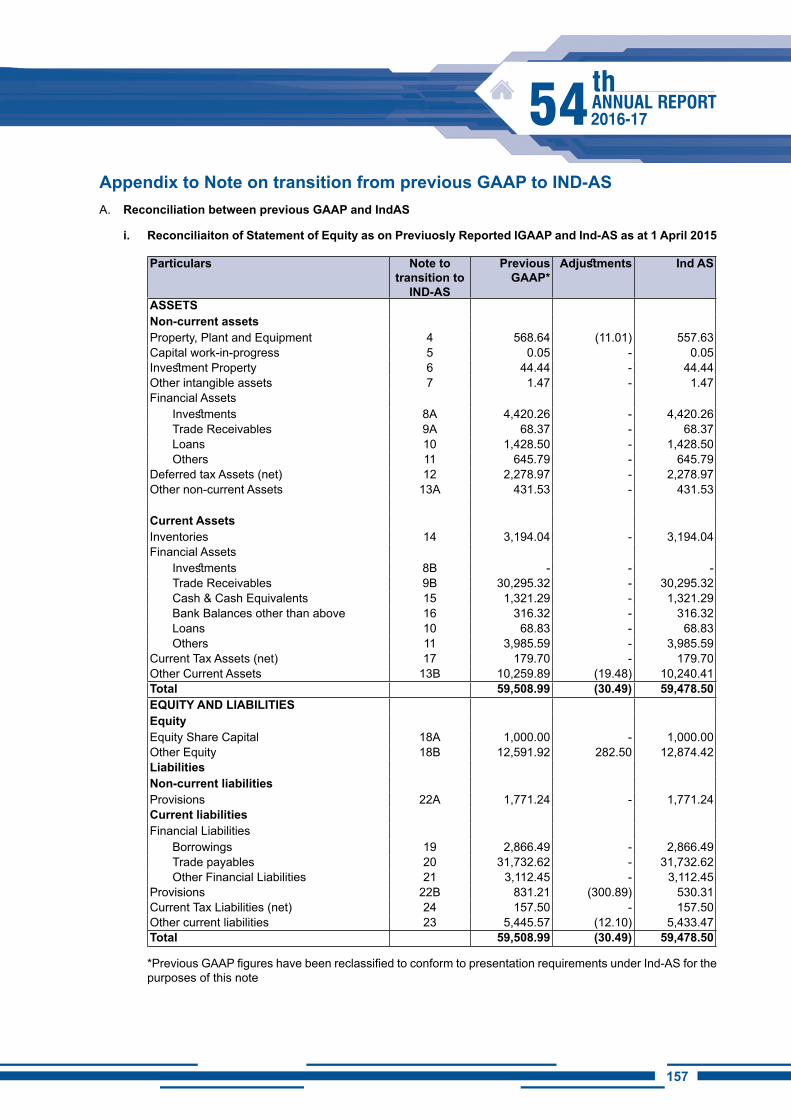
157156
Appendix to Note on transition from previous GAAP to iND-ASA. Reconciliation between previous GAAP and IndAS
i. Reconciliaiton of Statement of Equity as on Previuosly Reported IGAAP and Ind-AS as at 1 April 2015
Particulars Note to transition to
iND-AS
Previous GAAP*
Adjustments Ind AS
ASSETSNon-current assetsProperty, Plant and Equipment 4 568.64 (11.01) 557.63 Capital work-in-progress 5 0.05 - 0.05 Investment Property 6 44.44 - 44.44 Other intangible assets 7 1.47 - 1.47 Financial Assets
Investments 8A 4,420.26 - 4,420.26 Trade Receivables 9A 68.37 - 68.37 Loans 10 1,428.50 - 1,428.50 Others 11 645.79 - 645.79
Deferred tax Assets (net) 12 2,278.97 - 2,278.97 Other non-current Assets 13A 431.53 - 431.53
Current AssetsInventories 14 3,194.04 - 3,194.04 Financial Assets
Investments 8B - - - Trade Receivables 9B 30,295.32 - 30,295.32 Cash & Cash Equivalents 15 1,321.29 - 1,321.29 Bank Balances other than above 16 316.32 - 316.32 Loans 10 68.83 - 68.83 Others 11 3,985.59 - 3,985.59
Current Tax Assets (net) 17 179.70 - 179.70 Other Current Assets 13B 10,259.89 (19.48) 10,240.41 Total 59,508.99 (30.49) 59,478.50 EQUiTY AND LiABiLiTiESEquityEquity Share Capital 18A 1,000.00 - 1,000.00 Other Equity 18B 12,591.92 282.50 12,874.42 LiabilitiesNon-current liabilitiesProvisions 22A 1,771.24 - 1,771.24 Current liabilitiesFinancial Liabilities
Borrowings 19 2,866.49 - 2,866.49 Trade payables 20 31,732.62 - 31,732.62 Other Financial Liabilities 21 3,112.45 - 3,112.45
Provisions 22B 831.21 (300.89) 530.31 Current Tax Liabilities (net) 24 157.50 - 157.50 Other current liabilities 23 5,445.57 (12.10) 5,433.47 Total 59,508.99 (30.49) 59,478.50
*Previous GAAP figures have been reclassified to conform to presentation requirements under Ind-AS for the purposes of this note
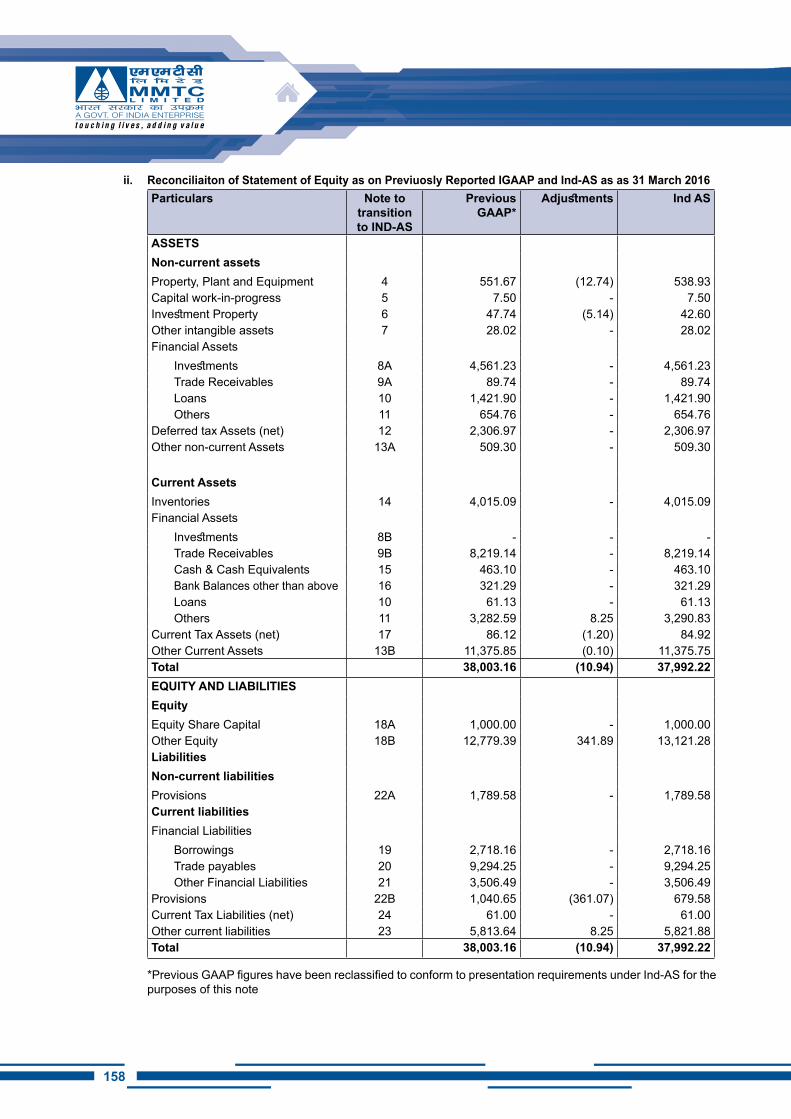
158
ii. Reconciliaiton of Statement of Equity as on Previuosly Reported IGAAP and Ind-AS as as 31 March 2016Particulars Note to
transition to iND-AS
Previous GAAP*
Adjustments Ind AS
ASSETSNon-current assetsProperty, Plant and Equipment 4 551.67 (12.74) 538.93 Capital work-in-progress 5 7.50 - 7.50 Investment Property 6 47.74 (5.14) 42.60 Other intangible assets 7 28.02 - 28.02 Financial Assets
Investments 8A 4,561.23 - 4,561.23 Trade Receivables 9A 89.74 - 89.74 Loans 10 1,421.90 - 1,421.90 Others 11 654.76 - 654.76
Deferred tax Assets (net) 12 2,306.97 - 2,306.97 Other non-current Assets 13A 509.30 - 509.30
Current AssetsInventories 14 4,015.09 - 4,015.09 Financial Assets
Investments 8B - - - Trade Receivables 9B 8,219.14 - 8,219.14 Cash & Cash Equivalents 15 463.10 - 463.10 Bank Balances other than above 16 321.29 - 321.29 Loans 10 61.13 - 61.13 Others 11 3,282.59 8.25 3,290.83
Current Tax Assets (net) 17 86.12 (1.20) 84.92 Other Current Assets 13B 11,375.85 (0.10) 11,375.75 Total 38,003.16 (10.94) 37,992.22 EQUiTY AND LiABiLiTiESEquityEquity Share Capital 18A 1,000.00 - 1,000.00 Other Equity 18B 12,779.39 341.89 13,121.28 LiabilitiesNon-current liabilitiesProvisions 22A 1,789.58 - 1,789.58 Current liabilitiesFinancial Liabilities
Borrowings 19 2,718.16 - 2,718.16 Trade payables 20 9,294.25 - 9,294.25 Other Financial Liabilities 21 3,506.49 - 3,506.49
Provisions 22B 1,040.65 (361.07) 679.58 Current Tax Liabilities (net) 24 61.00 - 61.00 Other current liabilities 23 5,813.64 8.25 5,821.88 Total 38,003.16 (10.94) 37,992.22
*Previous GAAP figures have been reclassified to conform to presentation requirements under Ind-AS for the purposes of this note
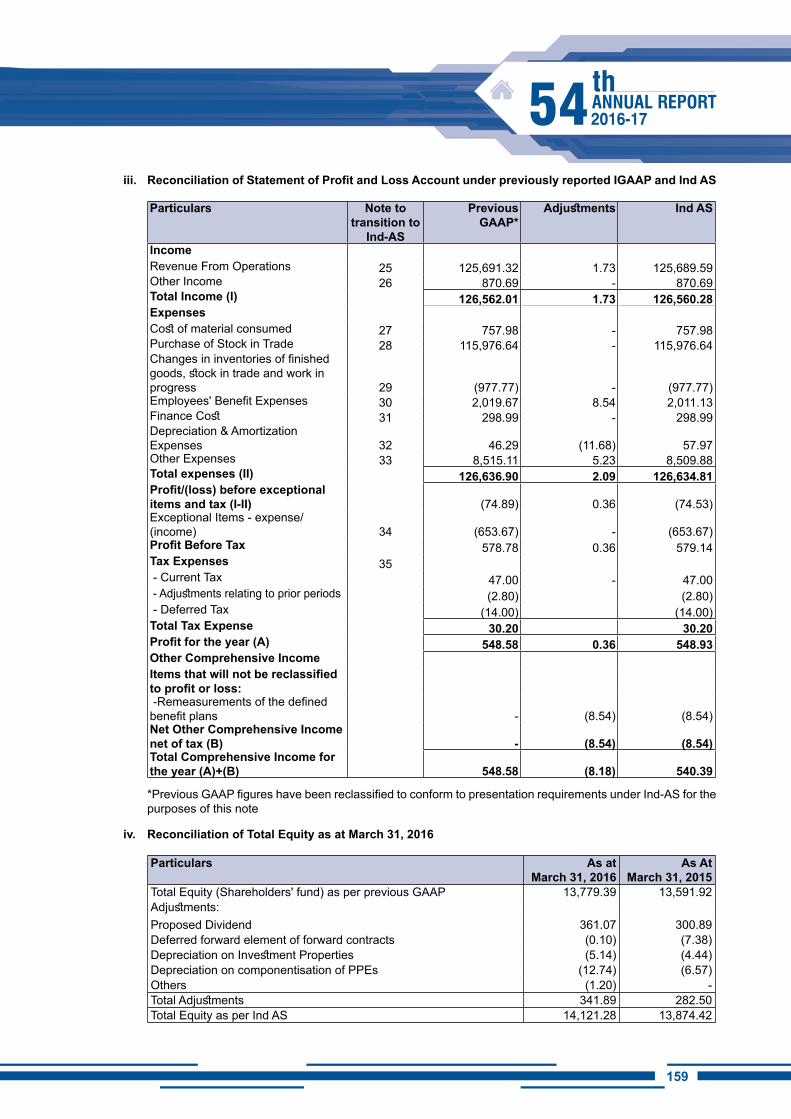
159158
iii. Reconciliation of Statement of Profit and Loss Account under previously reported IGAAP and Ind AS
Particulars Note to transition to
Ind-AS
Previous GAAP*
Adjustments Ind AS
incomeRevenue From Operations 25 125,691.32 1.73 125,689.59 Other Income 26 870.69 - 870.69 Total income (i) 126,562.01 1.73 126,560.28 ExpensesCost of material consumed 27 757.98 - 757.98 Purchase of Stock in Trade 28 115,976.64 - 115,976.64 Changes in inventories of finished goods, stock in trade and work in progress 29 (977.77) - (977.77)Employees' Benefit Expenses 30 2,019.67 8.54 2,011.13 Finance Cost 31 298.99 - 298.99 Depreciation & Amortization Expenses 32 46.29 (11.68) 57.97 Other Expenses 33 8,515.11 5.23 8,509.88 Total expenses (II) 126,636.90 2.09 126,634.81 Profit/(loss) before exceptional items and tax (I-II) (74.89) 0.36 (74.53)Exceptional Items - expense/(income) 34 (653.67) - (653.67)Profit Before Tax 578.78 0.36 579.14 Tax Expenses 35 - Current Tax 47.00 - 47.00 - Adjustments relating to prior periods (2.80) (2.80) - Deferred Tax (14.00) (14.00)Total Tax Expense 30.20 30.20 Profit for the year (A) 548.58 0.36 548.93 Other Comprehensive incomeItems that will not be reclassified to profit or loss: -Remeasurements of the defined benefit plans - (8.54) (8.54)Net Other Comprehensive income net of tax (B) - (8.54) (8.54)Total Comprehensive income for the year (A)+(B) 548.58 (8.18) 540.39
*Previous GAAP figures have been reclassified to conform to presentation requirements under Ind-AS for the purposes of this note
iv. Reconciliation of Total Equity as at March 31, 2016
Particulars As at March 31, 2016
As At March 31, 2015
Total Equity (Shareholders' fund) as per previous GAAP 13,779.39 13,591.92 Adjustments:Proposed Dividend 361.07 300.89 Deferred forward element of forward contracts (0.10) (7.38)Depreciation on Investment Properties (5.14) (4.44)Depreciation on componentisation of PPEs (12.74) (6.57)Others (1.20) - Total Adjustments 341.89 282.50 Total Equity as per Ind AS 14,121.28 13,874.42
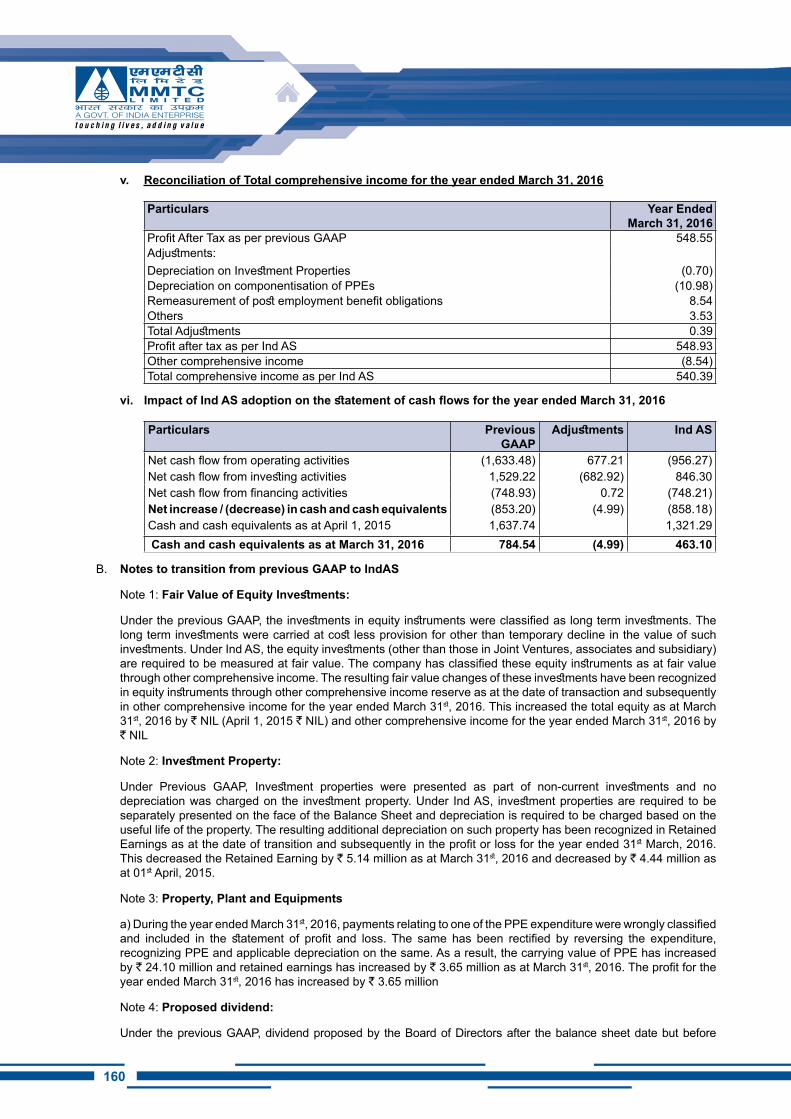
160
v. Reconciliation of Total comprehensive income for the year ended March 31, 2016
Particulars Year Ended March 31, 2016
Profit After Tax as per previous GAAP 548.55 Adjustments:Depreciation on Investment Properties (0.70)Depreciation on componentisation of PPEs (10.98)Remeasurement of post employment benefit obligations 8.54 Others 3.53 Total Adjustments 0.39 Profit after tax as per Ind AS 548.93 Other comprehensive income (8.54)Total comprehensive income as per Ind AS 540.39
vi. Impact of Ind AS adoption on the statement of cash flows for the year ended March 31, 2016
Particulars Previous GAAP
Adjustments Ind AS
Net cash flow from operating activities (1,633.48) 677.21 (956.27)Net cash flow from investing activities 1,529.22 (682.92) 846.30 Net cash flow from financing activities (748.93) 0.72 (748.21)Net increase / (decrease) in cash and cash equivalents (853.20) (4.99) (858.18)Cash and cash equivalents as at April 1, 2015 1,637.74 1,321.29 Cash and cash equivalents as at March 31, 2016 784.54 (4.99) 463.10
B. Notes to transition from previous GAAP to IndAS
Note 1: Fair Value of Equity Investments:
Under the previous GAAP, the investments in equity instruments were classified as long term investments. The long term investments were carried at cost less provision for other than temporary decline in the value of such investments. Under Ind AS, the equity investments (other than those in Joint Ventures, associates and subsidiary) are required to be measured at fair value. The company has classified these equity instruments as at fair value through other comprehensive income. The resulting fair value changes of these investments have been recognized in equity instruments through other comprehensive income reserve as at the date of transaction and subsequently in other comprehensive income for the year ended March 31st, 2016. This increased the total equity as at March 31st, 2016 by ` NIL (April 1, 2015 ` NIL) and other comprehensive income for the year ended March 31st, 2016 by ` NIL
Note 2: Investment Property:
Under Previous GAAP, Investment properties were presented as part of non-current investments and no depreciation was charged on the investment property. Under Ind AS, investment properties are required to be separately presented on the face of the Balance Sheet and depreciation is required to be charged based on the useful life of the property. The resulting additional depreciation on such property has been recognized in Retained Earnings as at the date of transition and subsequently in the profit or loss for the year ended 31st March, 2016. This decreased the Retained Earning by ` 5.14 million as at March 31st, 2016 and decreased by ` 4.44 million as at 01st April, 2015.
Note 3: Property, Plant and Equipments
a) During the year ended March 31st, 2016, payments relating to one of the PPE expenditure were wrongly classified and included in the statement of profit and loss. The same has been rectified by reversing the expenditure, recognizing PPE and applicable depreciation on the same. As a result, the carrying value of PPE has increased by ` 24.10 million and retained earnings has increased by ` 3.65 million as at March 31st, 2016. The profit for the year ended March 31st, 2016 has increased by ` 3.65 million
Note 4: Proposed dividend:
Under the previous GAAP, dividend proposed by the Board of Directors after the balance sheet date but before
161160
the approval of the financial statements was considered as adjusting events. Accordingly, provision for proposed dividend was recognized as a liability under provisions. Under Ind AS such dividends are recognized when the same is approved by the share holders in the general meeting. Accordingly, the liability for proposed of ` 361.09 million as at March 31st, 2016 (April 1st, 2015 ` 300.89 million) included under provisions has been reversed with corresponding adjustments to retained earnings. Consequently, the total equity increased by an equivalent amount.
Note 5: Excise Duty:
Under the previous GAAP, revenue from sale of products was presented exclusive of excise duty. Under IndAS, revenue from sale of goods is presented inclusive of excise duty. The excise duty paid is included under other expenses of the statement of profit and loss. This change has resulted in an increase in total revenue and there expenses for the year ended March 31st, 2016 by ` 1.73 million. There is no impact on the total equity and profit.
Note 6: Remeasurements of Post-Employment Benefit Obligations:
Under Ind AS, re-measurements i.e. actuarial gains or losses are recognized in other comprehensive income instead of profit or loss. Under the previous GAAP these re-measurements were forming part of the profit or loss for the year. As a result of this change the profit for the year ended March 31, 2016 increased by ` 8.54 million there is no impact on the total equity as at March 31st, 2016.
Note 7: Retained Earnings:
Retained earnings as at April 1st, 2015 and as at March 31, 2016 has been adjusted consequent to the above Ind AS transition adjustments.
Note 8: Other Comprehensive income:
Under Ind AS, all items of income and expense recognized in a period should be included in the profit or loss of the period, unless a standard requires or permits otherwise. Items of income or expense that are not recognized under profit or loss but are shown in the statement of profit and loss as other comprehensive income include re-measurements of defined benefit plans, effective portion of gains and losses on cash flow hedging instruments and fair value gains or losses on equity instruments through other comprehensive income. The concept of other comprehensive income did not exist under previous GAAP.
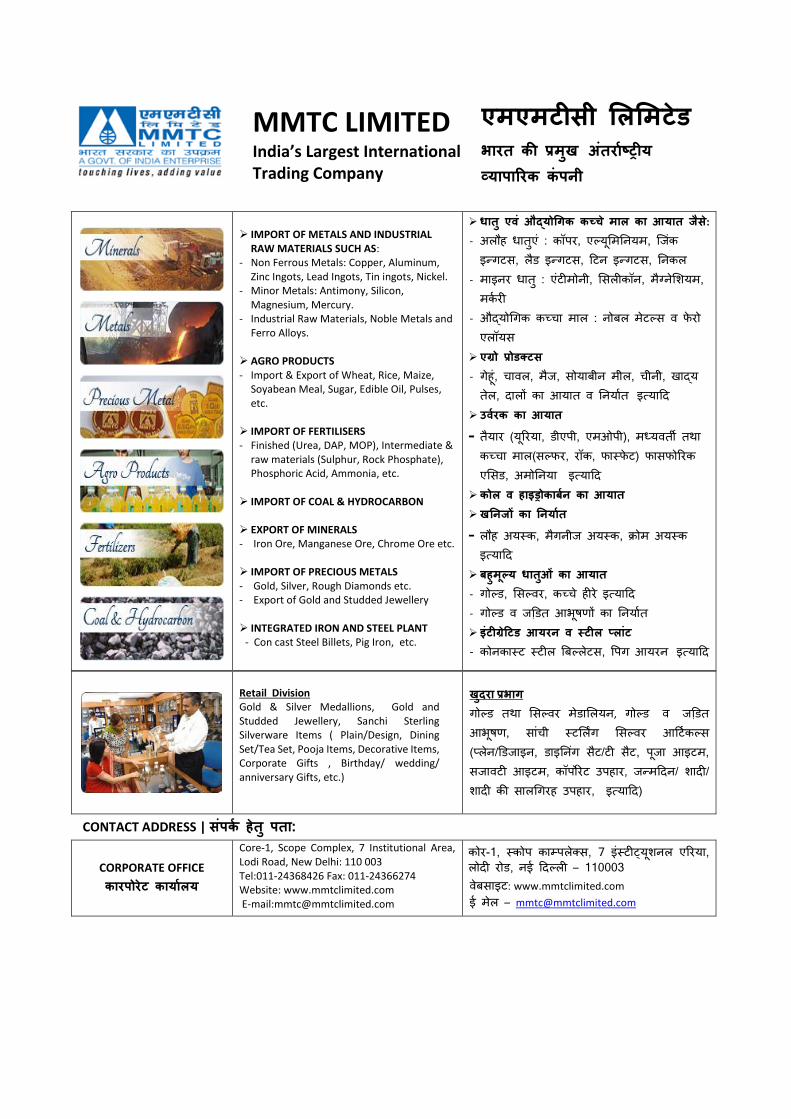
162
MMTC LIMITED India’s Largest International Trading Company
एमएमटीसी लिलमटेड भारत की प्रमुख अतंरााष्ट रीय व् यापाराकरक कंपार ी
Retail Division Gold & Silver Medallions, Gold and Studded Jewellery, Sanchi Sterling Silverware Items ( Plain/Design, Dining Set/Tea Set, Pooja Items, Decorative Items, Corporate Gifts , Birthday/ wedding/ anniversary Gifts, etc.)
खुदरा प्रभाग
गोल्ड तथा सिल्वर मेडासियन, गोल्ड् व् डि़ तडत्आभूषण, िाांची् स््टसिगग् सिल्वर् आ्टकलल्ि (प््िेनिि़डडा न, डा ननांग्िैटिटी्िैट, पूडा्आ टम, िडावटी्आ टम, लॉपोरेट्उपहार, डन्म्िनि्शािीि्शािी्ली्िािगगरह्उपहार, त््या्ि)
CONTACT ADDRESS | सपंारका हेत ुपारता:
CORPORATE OFFICE कारपारोरेट कायाािय
Core-1, Scope Complex, 7 Institutional Area, Lodi Road, New Delhi: 110 003 Tel:011-24368426 Fax: 011-24366274 Website: www.mmtclimited.com E-mail:[email protected]
लोर-1,्स््लोप्ला्पिे््ि,्7् ांस््टीट्यूयूशनि्ियरया,्िोिी्रोड,्नई््िल्िी्–्110003् वेबिा ट: www.mmtclimited.com ई्मेि्–्[email protected]
IMPORT OF METALS AND INDUSTRIAL RAW MATERIALS SUCH AS:
- Non Ferrous Metals: Copper, Aluminum, Zinc Ingots, Lead Ingots, Tin ingots, Nickel.
- Minor Metals: Antimony, Silicon, Magnesium, Mercury.
- Industrial Raw Materials, Noble Metals and Ferro Alloys.
AGRO PRODUCTS - Import & Export of Wheat, Rice, Maize,
Soyabean Meal, Sugar, Edible Oil, Pulses, etc.
IMPORT OF FERTILISERS - Finished (Urea, DAP, MOP), Intermediate &
raw materials (Sulphur, Rock Phosphate), Phosphoric Acid, Ammonia, etc.
IMPORT OF COAL & HYDROCARBON
EXPORT OF MINERALS - Iron Ore, Manganese Ore, Chrome Ore etc.
IMPORT OF PRECIOUS METALS - Gold, Silver, Rough Diamonds etc. - Export of Gold and Studded Jewellery
INTEGRATED IRON AND STEEL PLANT
- Con cast Steel Billets, Pig Iron, etc.
धातु एव ंऔद्योगगक कच् च ेमाि का ायात स स:े - अिौह्धातुिां्:्लॉपर,्िल्यूसमननयम,्ंडांल् न्गटि,्िैड् न्गटि,््टन् न्गटि,्ननलि
- मा नर्धातु्:्िांटीमोनी,्सििीलॉन,्मैग््नेसशयम,्मलक री्
- औद्योगगल्लच््चा्माि्:्नोबि्मेटल्ि्व्ेेरो्ििॉयि्
एग्रो प्रोडक् टस्
- गेहूां,्चावि,्मैड,्िोयाबीन्मीि,्चीनी,्खाद्य्तेि,्िािों्ला्आयात्व्ननयाकत ् त््या्ि
उवारक का ायात
- तैयार्(यूयरया,्डीिपी,्िमओपी),्मध््यवतती ्तथा्लच््चा्माि(िल्े र,्रॉल,्ेास््ेे ट)्ेािेोयरल्िसिड,्अमोननया्् त््या्ि
कोि व हाइड्रोकार्ा का ायात
खन सों का न याात
- िौह्अयस््ल,्मैगनीड्अयस््ल,््ोम्अयस््ल् त््या्ि्
र्हुमूल् य धातुं ं का ायात - गोल्ड,्सिल्वर,्लच््चे्हीरे् त््या्ि्
- गोल्ड्व्डि़ तडत्आभूषणों्ला्ननयाकत्
इंटीगे्रटटड ायर व स् टीि िांट
- लोनलास््ट्स््टीि्लबलिेटि,्गपग्आयरन ् त््या्ि
163162
BRING NEW AVENUES INGLOBAL TRADE
BRING NEW AVENUES INGLOBAL TRADE
54 th2016 - 2017ANNUAL REPORT
Financial StatementsFor the financial year ended 31st March, 2017
MMTC TRANSNATIONAL PTE LTD(Incorporated in Singapore. Registration Number: 199407265M)
164
The Directors present their statement to the member together with the audited financial statements for the financial year ended 31 March 2017.
In the opinion of the Directors,
(a) the financial statements as set out on pages 6 to 27 are as drawn up so as to give a true and fair view of the financial position of the Company at 31 March 2017 and the financial performance, changes in equity and cash flows of the Company for the financial year covered by the financial statements; and
(b) at the date of this statement, there are reasonable grounds to believe that the Company will be able to pay its debts as and when they fall due.
Directors
The Directors in office at the date of this statement are as follows:
Ved PrakashTapas Kumar Sengupta (appointed on 2 January 2017)Praveen Kumar JainAshwani SondhiRajender PrasadDeepak Kumar Dua
Arrangements to enable Directors to acquire shares and debentures
Neither at the end of nor at any time during the financial year was the Company a party to any arrangement whose
object was to enable the Directors of the Company to acquire benefits by means of the acquisition of shares in, or debentures of, the Company or any other body corporate.
Directors’ interests in shares or debentures
According to the register of Directors’ shareholdings, none of the Directors holding office at the end of the financial year had any interest in the shares or debentures of the Company or its related corporations.
Share options
There were no options granted during the financial year to subscribe for unissued shares of the Company.
No shares were issued during the financial year by virtue of the exercise of options to take up unissued shares of the Company.
There were no unissued shares of the Company under option at the end of the financial year.
Independent auditor
The independent auditor, PricewaterhouseCoopers LLP, have expressed their willingness to accept re-appointment.
On behalf of the Directors
Rajender PrasadDirector
Deepak Kumar Dua Director
27 April, 2017
Directors’ statementfor the financial year enDeD 31st march, 2017
165164
Report on the Audit of the Financial Statements
Our opinion
In our opinion, the accompanying financial statements of MMTC Transnational Pte Ltd (“the Company”) are properly drawn up in accordance with the provisions of the Companies Act, Chapter 50 (“the Act”) and Financial Reporting Standards in Singapore (“FRSs”) so as to give a true and fair view of the financial position of the Company as at 31 March 2017 and of the financial performance, changes in equity and cash flows of the Company for the year ended on that date.
What we have audited
The financial statements of the Company comprise:
y the balance sheet as at 31 March 2017;
y the statement of comprehensive income for the year then ended;
y the statement of changes in equity for the year then ended;
y the statement of cash flows for the year then ended; and
y the notes to the financial statements, including a summary of significant accounting policies.
Basis for Opinion
We conducted our audit in accordance with Singapore Standards on Auditing (“SSAs”). Our responsibilities under those standards are further described in the Auditor’s Responsibilities for the Audit of the Financial Statements section of our report.
We believe that the audit evidence we have obtained is sufficient and appropriate to provide a basis for our opinion.
Independence
We are independent of the Company in accordance with the Accounting and Corporate Regulatory Authority Code of Professional Conduct and Ethics for Public Accountants and Accounting Entities (“ACRA Code”) together with the ethical requirements that are relevant to our audit of the financial statements in Singapore, and we have fulfilled our other ethical responsibilities in accordance with these requirements and the ACRA Code.
Other information
Management is responsible for the other information. The other information comprises the Directors’ Statement but does not include the financial statements and our auditor’s report thereon.
Our opinion on the financial statements does not cover the other information and we do not and will not express any form of assurance conclusion thereon.
In connection with our audit of the financial statements, our responsibility is to read the other information and, in doing so, consider whether the other information is materially inconsistent with the financial statements or our knowledge obtained in the audit, or otherwise appears to be materially misstated. If, based on the work we have performed on the other information, we conclude that there is a material misstatement of this other information, we are required to report that fact. We have nothing to report in this regard.
Responsibilities of Management and Directors for the Financial Statements
Management is responsible for the preparation of financial statements that give a true and fair view in accordance with the provisions of the Act and FRSs, and for devising and maintaining a system of internal accounting controls sufficient to provide a reasonable assurance that assets are safeguarded against loss from unauthorised use or disposition; and transactions are properly authorised and that they are recorded as necessary to permit the preparation of true and fair financial statements and to maintain accountability of assets.
In preparing the financial statements, management is responsible for assessing the Company’s ability to continue as a going concern, disclosing, as applicable, matters related to going concern and using the going concern basis of accounting unless management either intends to liquidate the Company or to cease operations, or has no realistic alternative but to do so.
The directors’ responsibilities include overseeing the Company’s financial reporting process.
Auditor’s Responsibilities for the Audit of the Financial Statements
Our objectives are to obtain reasonable assurance about whether the financial statements as a whole are free from material misstatement, whether due to fraud or error, and to issue an auditor’s report that includes our opinion. Reasonable assurance is a high level of assurance, but is not a guarantee that an audit conducted in accordance with SSAs will always detect a material misstatement when it
iNDEPENDENT AUDiTOR’S REPORT TO ThE ShAREhOLDER OF MMTC TRANSNATiONAL PTE LTD
166
exists. Misstatements can arise from fraud or error and are considered material if, individually or in the aggregate, they could reasonably be expected to influence the economic decisions of users taken on the basis of these financial statements.
As part of an audit in accordance with SSAs, we exercise professional judgement and maintain professional scepticism throughout the audit. We also:
• Identify and assess the risks of material misstatement of the financial statements, whether due to fraud or error, design and perform audit procedures responsive to those risks, and obtain audit evidence that is sufficient and appropriate to provide a basis for our opinion. The risk of not detecting a material misstatement resulting from fraud is higher than for one resulting from error, as fraud may involve collusion, forgery, intentional omissions, misrepresentations, or the override of internal control.
y Obtain an understanding of internal control relevant to the audit in order to design audit procedures that are appropriate in the circumstances, but not for the purpose of expressing an opinion on the effectiveness of the Company’s internal control.
y Evaluate the appropriateness of accounting policies used and the reasonableness of accounting estimates and related disclosures made by management.
y Conclude on the appropriateness of management’s use of the going concern basis of accounting and, based on the audit evidence obtained, whether a material
uncertainty exists related to events or conditions that may cast significant doubt on the Company’s ability to continue as a going concern. If we conclude that a material uncertainty exists, we are required to draw attention in our auditor’s report to the related disclosures in the financial statements or, if such disclosures are inadequate, to modify our opinion. Our conclusions are based on the audit evidence obtained up to the date of our auditor’s report. However, future events or conditions may cause the Company to cease to continue as a going concern.
y Evaluate the overall presentation, structure and content of the financial statements, including the disclosures, and whether the financial statements represent the underlying transactions and events in a manner that achieves fair presentation.
We communicate with the directors regarding, among other matters, the planned scope and timing of the audit and significant audit findings, including any significant deficiencies in internal control that we identify during our audit.
Report on Other Legal and Regulatory Requirements
In our opinion, the accounting and other records required by the Act to be kept by the Company have been properly kept in accordance with the provisions of the Act.
Price water house Coopers LLPPublic Accountants and Chartered Accountants, Singapore, 27 April, 2017
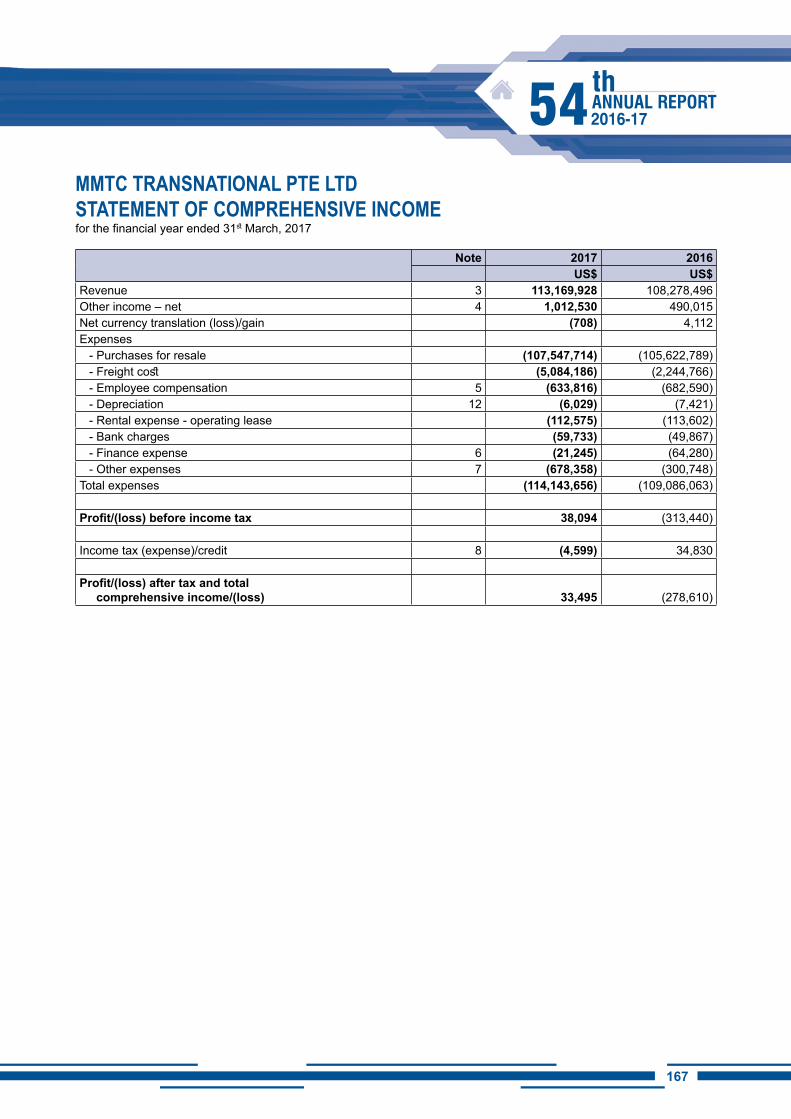
167166
mmtc transnational Pte ltDstatement of comPrehensive income for the financial year ended 31st March, 2017
Note 2017 2016US$ US$
Revenue 3 113,169,928 108,278,496Other income – net 4 1,012,530 490,015Net currency translation (loss)/gain (708) 4,112Expenses
- Purchases for resale (107,547,714) (105,622,789)- Freight cost (5,084,186) (2,244,766)- Employee compensation 5 (633,816) (682,590)- Depreciation 12 (6,029) (7,421)- Rental expense - operating lease (112,575) (113,602)- Bank charges (59,733) (49,867)- Finance expense 6 (21,245) (64,280)- Other expenses 7 (678,358) (300,748)
Total expenses (114,143,656) (109,086,063)
Profit/(loss) before income tax 38,094 (313,440)
Income tax (expense)/credit 8 (4,599) 34,830
Profit/(loss) after tax and total comprehensive income/(loss) 33,495 (278,610)
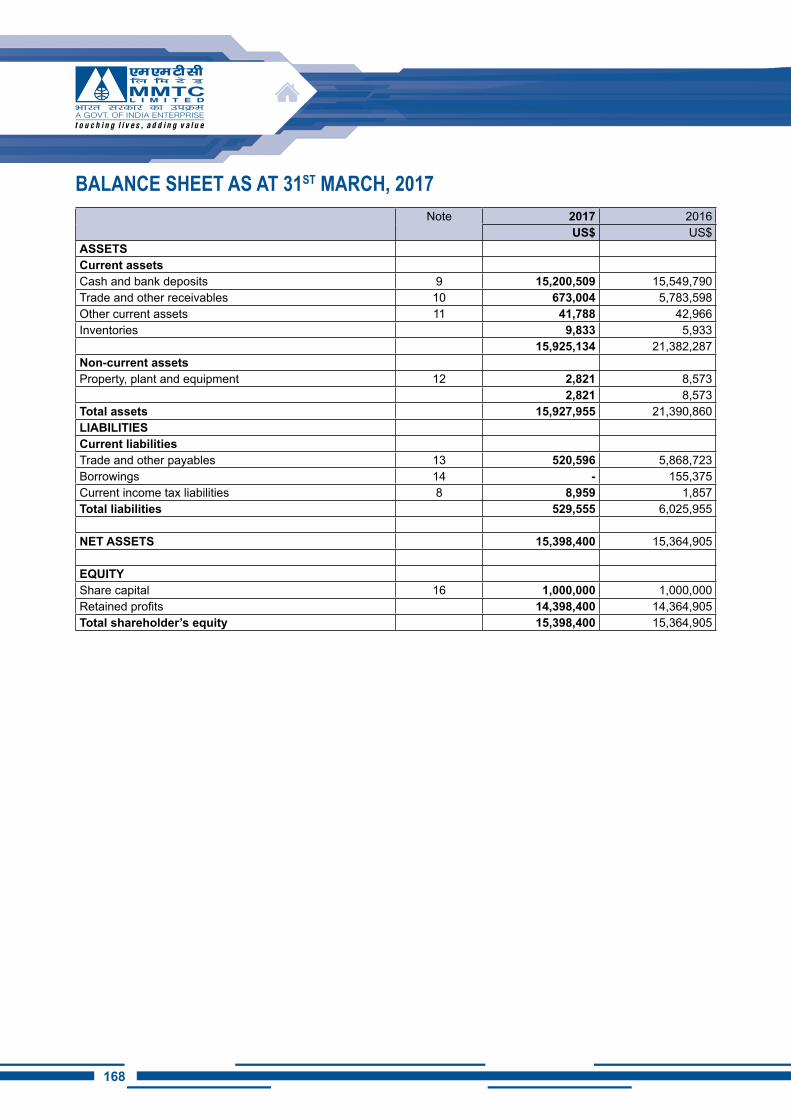
168
Balance sheet as at 31st march, 2017Note 2017 2016
US$ US$ASSETSCurrent assetsCash and bank deposits 9 15,200,509 15,549,790Trade and other receivables 10 673,004 5,783,598Other current assets 11 41,788 42,966Inventories 9,833 5,933
15,925,134 21,382,287Non-current assetsProperty, plant and equipment 12 2,821 8,573
2,821 8,573Total assets 15,927,955 21,390,860LiABiLiTiESCurrent liabilitiesTrade and other payables 13 520,596 5,868,723Borrowings 14 - 155,375Current income tax liabilities 8 8,959 1,857Total liabilities 529,555 6,025,955
NET ASSETS 15,398,400 15,364,905
EQUiTYShare capital 16 1,000,000 1,000,000Retained profits 14,398,400 14,364,905Total shareholder’s equity 15,398,400 15,364,905
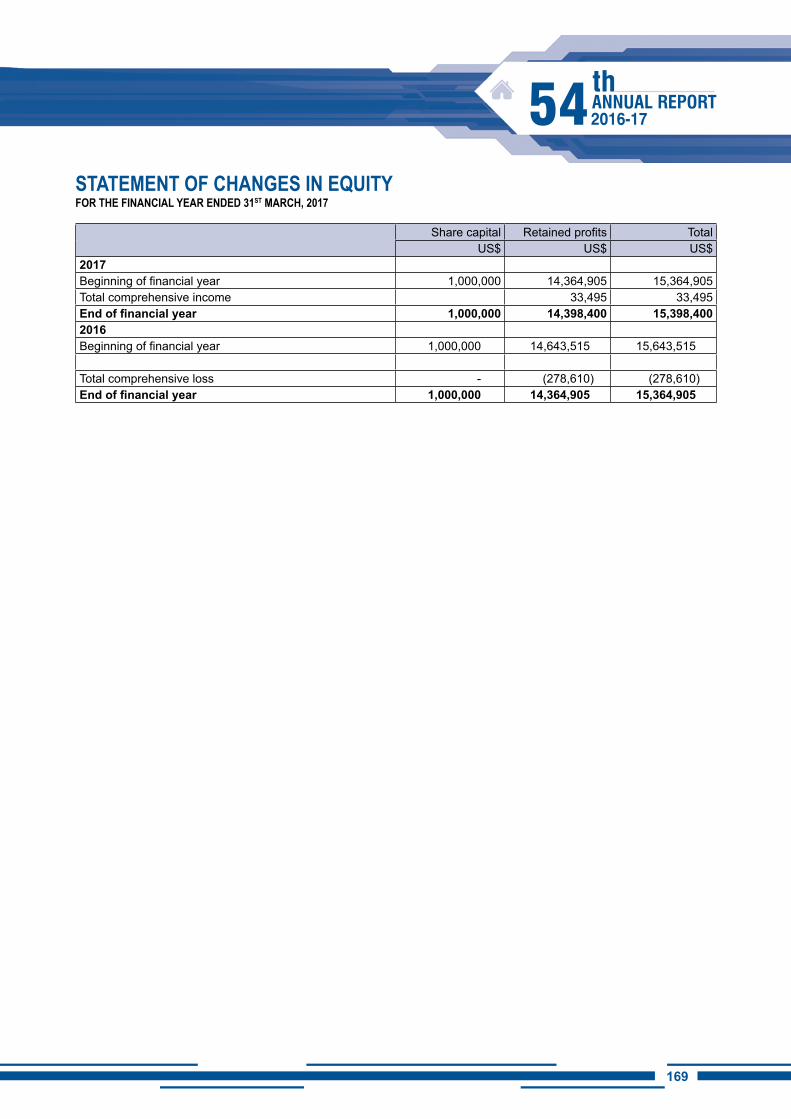
169168
statement of changes in equity for the financial year enDeD 31st march, 2017
Share capital Retained profits TotalUS$ US$ US$
2017Beginning of financial year 1,000,000 14,364,905 15,364,905Total comprehensive income 33,495 33,495End of financial year 1,000,000 14,398,400 15,398,4002016Beginning of financial year 1,000,000 14,643,515 15,643,515
Total comprehensive loss - (278,610) (278,610)End of financial year 1,000,000 14,364,905 15,364,905
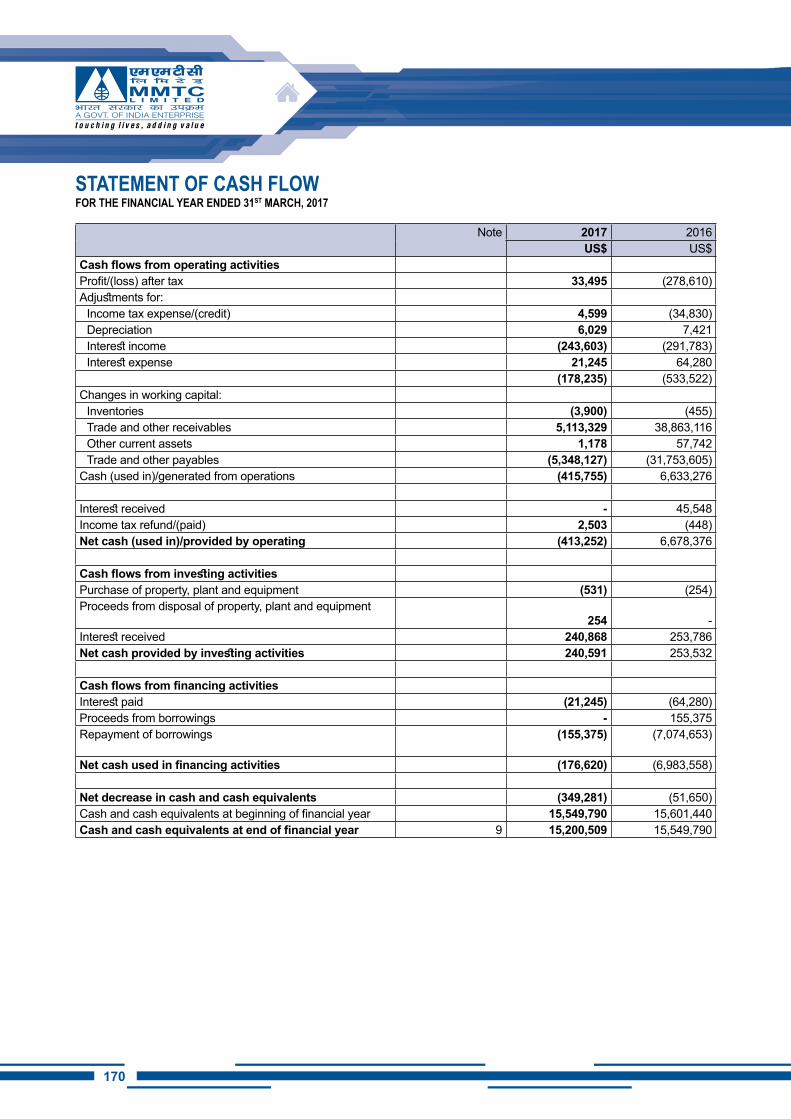
170
statement of cash flow for the financial year enDeD 31st march, 2017
Note 2017 2016US$ US$
Cash flows from operating activitiesProfit/(loss) after tax 33,495 (278,610)Adjustments for:
Income tax expense/(credit) 4,599 (34,830)Depreciation 6,029 7,421Interest income (243,603) (291,783)Interest expense 21,245 64,280
(178,235) (533,522)Changes in working capital:
Inventories (3,900) (455)Trade and other receivables 5,113,329 38,863,116Other current assets 1,178 57,742Trade and other payables (5,348,127) (31,753,605)
Cash (used in)/generated from operations (415,755) 6,633,276
Interest received - 45,548Income tax refund/(paid) 2,503 (448)Net cash (used in)/provided by operating (413,252) 6,678,376
Cash flows from investing activitiesPurchase of property, plant and equipment (531) (254)Proceeds from disposal of property, plant and equipment
254 -Interest received 240,868 253,786Net cash provided by investing activities 240,591 253,532
Cash flows from financing activitiesInterest paid (21,245) (64,280)Proceeds from borrowings - 155,375Repayment of borrowings (155,375) (7,074,653)
Net cash used in financing activities (176,620) (6,983,558)
Net decrease in cash and cash equivalents (349,281) (51,650)Cash and cash equivalents at beginning of financial year 15,549,790 15,601,440Cash and cash equivalents at end of financial year 9 15,200,509 15,549,790
171170
These notes form an integral part of and should be read in conjunction with the accompanying financial statements.
1. General information
The Company is incorporated and domiciled in Singapore. The address of its registered office is 3 Raffles Place, #08-01, Bharat Building, Singapore 048617.
The principal activities of the Company are trading in minerals, metals, fertilizers, agricultural products, coal, gold and hydrocarbon products, jewellery and other commodities.
2. Significant accounting policies
2.1 Basis of preparation
The financial statements have been prepared in accordance with Singapore Financial Reporting Standards (“FRS”) under the historical cost convention, except as disclosed in the accounting policies below.
The preparation of financial statements in conformity with FRS requires management to exercise its judgement in the process of applying the Company’s accounting policies. It also requires the use of certain critical accounting estimates and assumptions. The management has assessed that there are no estimates or judgements used that have a significant risk of causing a material adjustment to the carrying amounts of assets and liabilities within the next financial year.
Interpretations and amendments to published standards effective in 2016
On 1 April 2016, the Company adopted the new or amended FRS and interpretation to FRS (“INT FRS”) that are mandatory for application from that date. Changes to the Company’s accounting policies have been made as required, in accordance with the relevant transitional provisions in the respective FRS and INT FRS.
The adoption of these new or amended FRS and INT FRS did not result in substantial changes to the Company’s accounting policies and had no material effect on the amounts reported for the current or prior financial years.
2.2 Revenue recognition
Revenue comprises the fair value of the consideration received or receivable for the sale of goods in the ordinary course of the Company’s activities. Revenue is presented, net of goods and services tax, rebates
and discounts.
Revenue is recognised as follows:
(a) Sale of goods
Revenue from the sale of goods is recognised when products have been delivered in accordance with the shipment terms.
(b) Freight income
Freight income is recognised rateably over the terms of the agreement. All freight income and freight costs are recognised as the freight services are rendered (percentage of completion). The percentage of completion is determined using the discharge-to-discharge method. According to this method, freight income and related costs are recognised in the income statement according to the charter parties from the vessel’s departure date to the delivery of the cargo (discharge). For voyages in progress at the end of an accounting period that will conclude in a subsequent accounting period, freight income and related costs are recognised according to the percentage of the estimated duration of the voyage concluded at the reporting date.
(c) Interest income
Interest income is recognised using the effective interest method.
(d) Demurrage income
Demurrage income is recognised if the claim is considered probable.
2.3 Currency translation
These financial statements are presented in United States Dollar, which is the functional currency of the Company.
Transactions denominated in a currency other than United States Dollar (“foreign currency”) are translated into United States Dollar using the exchange rates prevailing at the dates of the transactions. Currency exchange differences resulting from the settlement of such transactions and from the translation of monetary assets and liabilities denominated in foreign currencies at the closing rates at the balance sheet date are recognised in profit or loss.
mmtc transnational Pte. ltD. notes to the financial statementsfor the financial year ended 31st march, 2017
172
2.4 Bank balances
Trade and other receivables
Deposits
Bank balances, trade and other receivables and deposits are initially recognised at fair value and subsequently carried at amortised cost using the effective interest method, less any accumulated impairment losses.
Financial assets are derecognised when the rights to receive cash flows from the financial assets have expired or have been transferred and the Company has transferred substantially all risks and rewards of ownership. On disposal of a financial asset, the difference between the carrying amount and the sale proceeds is recognised in profit or loss. Any amount previously recognised in other comprehensive income relating to that asset is reclassified to profit or loss.
Trade receivables that are factored out to banks and other financial institutions with recourse to the Company are not derecognised until the recourse period has expired and the risks and rewards of the receivables have been fully transferred. The corresponding cash received from the financial institutions is recorded as borrowings.
The Company assesses at each balance sheet date whether there is objective evidence that these financial assets are impaired and recognises an allowance for impairment when such evidence exists. Significant financial difficulties of the debtor, probability that the debtor will enter bankruptcy and default or significant delay in payments are objective evidence that these financial assets are impaired.
The carrying amount of these assets is reduced through the use of an impairment allowance account which is calculated as the difference between the carrying amount and the present value of estimated future cash flows, discounted at the original effective interest rate.
These assets are presented as current assets, except for those maturing later than 12 months after the balance sheet date which are presented as non-current assets.
2.5 Income taxes
Current income tax is recognised at the amount expected to be paid to or recovered from the tax authorities, using the tax rates and tax laws that have been enacted or substantively enacted by the balance sheet date.
Deferred income tax is recognised for all temporary differences arising between the tax bases of assets and liabilities and their carrying amounts in the financial statements except when the deferred income tax arises from the initial recognition of an asset or liability in a transaction that is not a business combination and affects neither accounting nor taxable profit or loss at the time of transaction.
Current and deferred income taxes are recognised as income or expenses in profit or loss, except to the extent that the tax arises from a business combination or a transaction which is recognised directly in equity. Deferred tax arising from a business combination is adjusted against goodwill on acquisition.
2.6 Inventories
Inventories, comprise goods held for resale, are carried at the lower of cost and net realisable value. Cost is determined on a specific identification method. Net realisable value is the estimated selling price in the ordinary course of business less applicable variable selling expenses.
2.7 Property, plant and equipment
Property, plant and equipment are recognised at cost less accumulated depreciation and accumulated impairment losses.
Subsequent expenditure relating to property, plant and equipment that has already been recognised is added to the carrying amount of the asset only when it is probable that future economic benefits associated with the item will flow to the Company and cost of the item can be measured reliably.
Depreciation on property, plant and equipment is calculated using the straight-line method to allocate depreciable amounts over their expected useful lives of 3 years.
The residual values, estimated useful lives and depreciation method of property, plant and equipment are reviewed, and adjusted as appropriate, at each balance sheet date. The effects of any revision are recognised in profit or loss when the changes arise.
On disposal of an item of property, plant and equipment, the difference between the net disposal proceeds and its carrying amount is taken to profit or loss.
2.8 Impairment of non-financial assets
Property, plant and equipment and investments in subsidiary are tested for impairment whenever there is
173172
any objective evidence or indication that these assets may be impaired.
For the purpose of impairment testing, the recoverable amount (i.e. the higher of the fair value less cost to sell and the value-in-use) is determined on an individual asset basis unless the asset does not generate cash inflows that are largely independent of those from other assets. If this is the case, the recoverable amount is determined for the CGU to which the asset belongs.
If the recoverable amount of the asset is estimated to be less than its carrying amount, the carrying amount of the asset is reduced to its recoverable amount. The difference between the carrying amount and recoverable amount is recognised as an impairment loss in profit or loss.
An impairment loss for an asset is reversed if, and only if, there has been a change in the estimates used to determine the asset’s recoverable amount since the last impairment loss was recognised. The carrying amount of the asset is increased to its revised recoverable amount, provided that this amount does not exceed the carrying amount that would have been determined (net of accumulated depreciation) had no impairment loss been recognised for the asset in prior years. A reversal of impairment loss for an asset is recognised in profit or loss.
2.9 Trade and other payables
Trade and other payables represent liabilities for goods and services provided to the Company prior to the end of financial year which are unpaid. They are classified as current liabilities if payment is due within one year or less (or in the normal operating cycle of the business if longer). Otherwise, they are presented as non-current liabilities.
Trade and other payables are initially recognised at fair value, and subsequently measured at amortised cost, using the effective interest method.
2.10 Operating lease payments
Leases where substantially all risks and rewards incidental to ownership are retained by the lessors are classified as operating leases. Payments made under operating leases (net of any incentives received from the lessors) are recognised in profit or loss on a straight-line basis over the period of the lease. Payments made under operating leases (net of any incentives received from the lessor) are recognised in profit or loss on a straight-line basis over the period of the lease.
2.11 Employee compensation
(a) Defined contribution plans
Defined contribution plans are post-employment benefit plans under which the Company pays fixed contributions into separate entities such as the Central Provident Fund on a mandatory, contractual or voluntary basis. The Company has no further payment obligations once the contributions have been paid.
The Company’s contributions to defined contribution plans are recognised as employee compensation expense when the contributions are due.
(b) Employee leave entitlement
Employee entitlements to annual leave are recognised when they accrue to employees. A provision is made for the estimated liability for annual leave as a result of services rendered by employees up to the balance sheet date.
2.12 Cash and cash equivalents
Cash and cash equivalents include cash on hand, deposits with financial institutions and bank overdrafts. Bank overdrafts are shown within borrowings in current liabilities on the balance sheet.
2.13 Borrowing costs
Borrowing costs are recognised in profit or loss using the effective interest method.
2.14 Fair value estimation of financial assets and liabilities
The fair values of current financial assets and liabilities carried at amortised cost approximate their carrying amounts.
2.15 Borrowings
Borrowings are presented as current liabilities unless the Company has an unconditional right to defer settlement for at least 12 months after the balance sheet date, in which case they are presented as non-current liabilities.
Borrowings are initially recognised at their fair values (net of transaction costs) and subsequently carried at amortised cost. Any difference between the proceeds (net of transaction costs) and the redemption value is recognised in profit or loss over the period of the borrowings using the effective interest method.
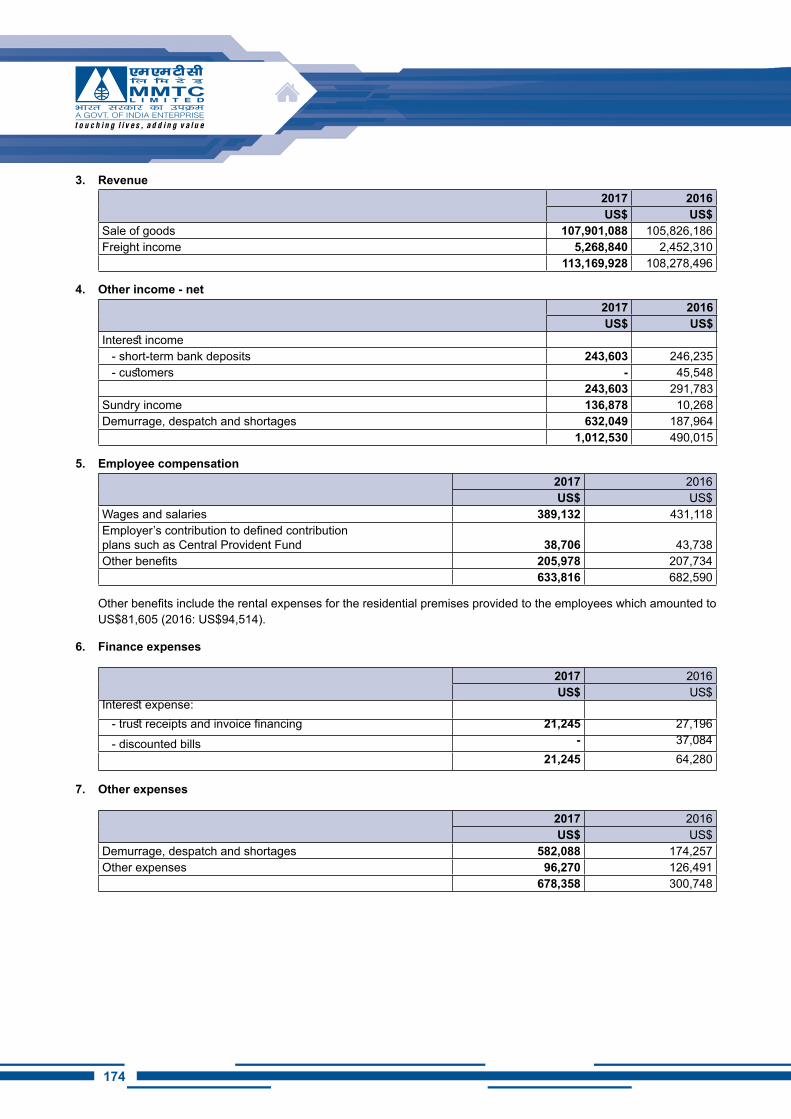
174
3. Revenue2017 2016US$ US$
Sale of goods 107,901,088 105,826,186Freight income 5,268,840 2,452,310
113,169,928 108,278,496
4. Other income - net2017 2016US$ US$
Interest income- short-term bank deposits 243,603 246,235- customers - 45,548
243,603 291,783Sundry income 136,878 10,268Demurrage, despatch and shortages 632,049 187,964
1,012,530 490,015
5. Employee compensation2017 2016US$ US$
Wages and salaries 389,132 431,118Employer’s contribution to defined contribution plans such as Central Provident Fund 38,706 43,738Other benefits 205,978 207,734
633,816 682,590
Other benefits include the rental expenses for the residential premises provided to the employees which amounted to US$81,605 (2016: US$94,514).
6. Finance expenses
2017 2016US$ US$
Interest expense:- trust receipts and invoice financing 21,245 27,196- discounted bills - 37,084
21,245 64,280
7. Other expenses
2017 2016US$ US$
Demurrage, despatch and shortages 582,088 174,257Other expenses 96,270 126,491
678,358 300,748
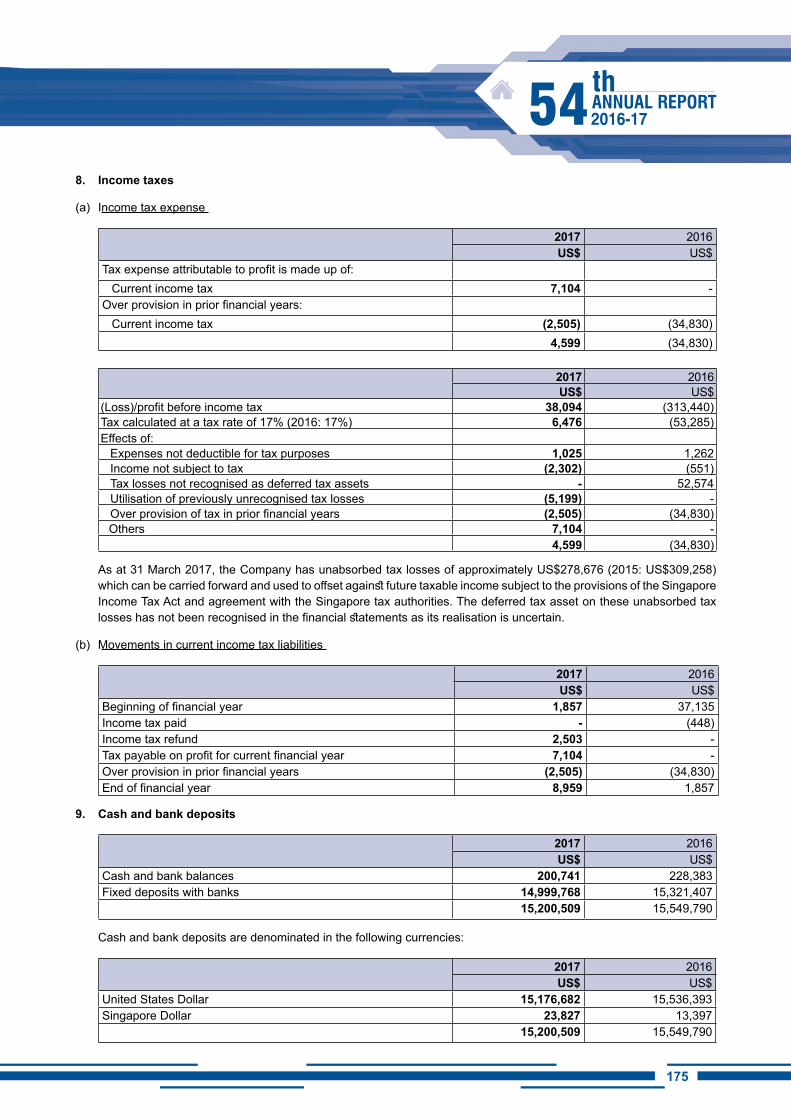
175174
8. Income taxes
(a) Income tax expense
2017 2016US$ US$
Tax expense attributable to profit is made up of:Current income tax 7,104 -
Over provision in prior financial years:Current income tax (2,505) (34,830)
4,599 (34,830)
2017 2016US$ US$
(Loss)/profit before income tax 38,094 (313,440)Tax calculated at a tax rate of 17% (2016: 17%) 6,476 (53,285)Effects of:
Expenses not deductible for tax purposes 1,025 1,262Income not subject to tax (2,302) (551)Tax losses not recognised as deferred tax assets - 52,574Utilisation of previously unrecognised tax losses (5,199) -Over provision of tax in prior financial years (2,505) (34,830)Others 7,104 -
4,599 (34,830)
As at 31 March 2017, the Company has unabsorbed tax losses of approximately US$278,676 (2015: US$309,258) which can be carried forward and used to offset against future taxable income subject to the provisions of the Singapore Income Tax Act and agreement with the Singapore tax authorities. The deferred tax asset on these unabsorbed tax losses has not been recognised in the financial statements as its realisation is uncertain.
(b) Movements in current income tax liabilities
2017 2016US$ US$
Beginning of financial year 1,857 37,135Income tax paid - (448)Income tax refund 2,503 -Tax payable on profit for current financial year 7,104 -Over provision in prior financial years (2,505) (34,830)End of financial year 8,959 1,857
9. Cash and bank deposits
2017 2016US$ US$
Cash and bank balances 200,741 228,383Fixed deposits with banks 14,999,768 15,321,407
15,200,509 15,549,790
Cash and bank deposits are denominated in the following currencies:
2017 2016US$ US$
United States Dollar 15,176,682 15,536,393Singapore Dollar 23,827 13,397
15,200,509 15,549,790
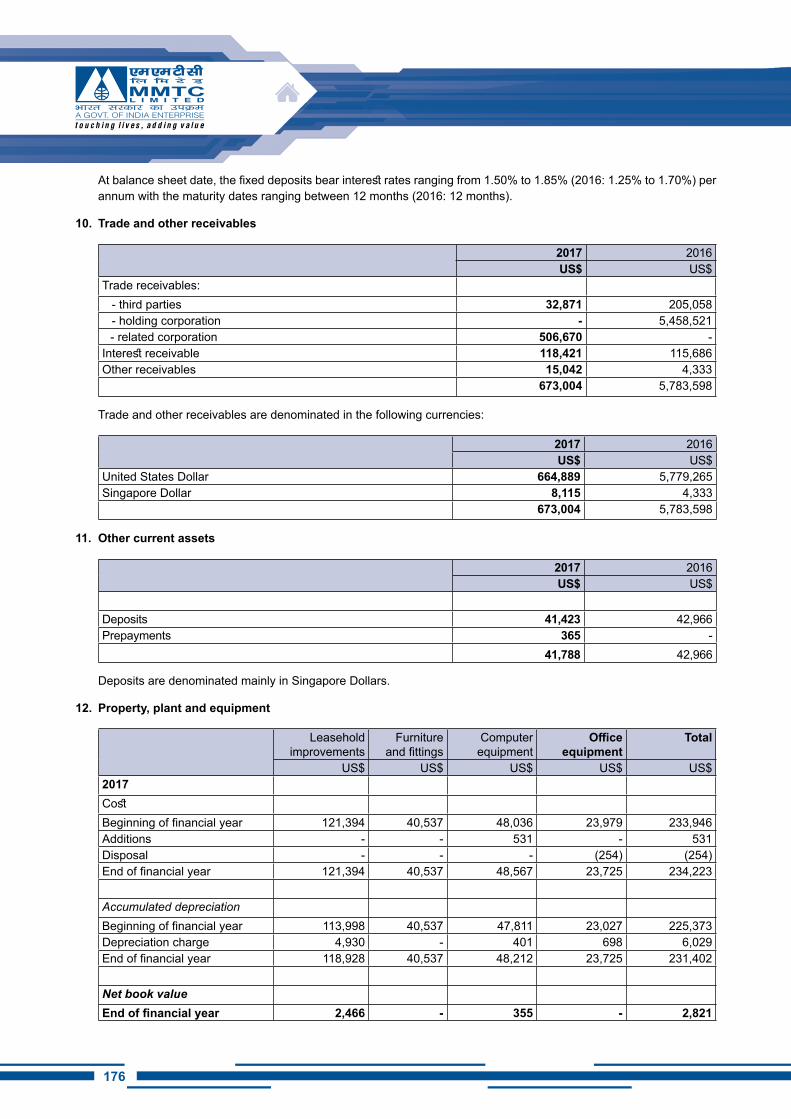
176
At balance sheet date, the fixed deposits bear interest rates ranging from 1.50% to 1.85% (2016: 1.25% to 1.70%) per annum with the maturity dates ranging between 12 months (2016: 12 months).
10. Trade and other receivables
2017 2016US$ US$
Trade receivables:- third parties 32,871 205,058- holding corporation - 5,458,521- related corporation 506,670 -
Interest receivable 118,421 115,686Other receivables 15,042 4,333
673,004 5,783,598
Trade and other receivables are denominated in the following currencies:
2017 2016US$ US$
United States Dollar 664,889 5,779,265Singapore Dollar 8,115 4,333
673,004 5,783,598
11. Other current assets
2017 2016US$ US$
Deposits 41,423 42,966Prepayments 365 -
41,788 42,966
Deposits are denominated mainly in Singapore Dollars.
12. Property, plant and equipment
Leaseholdimprovements
Furnitureand fittings
Computerequipment
Officeequipment
Total
US$ US$ US$ US$ US$2017CostBeginning of financial year 121,394 40,537 48,036 23,979 233,946Additions - - 531 - 531Disposal - - - (254) (254)End of financial year 121,394 40,537 48,567 23,725 234,223
Accumulated depreciationBeginning of financial year 113,998 40,537 47,811 23,027 225,373Depreciation charge 4,930 - 401 698 6,029End of financial year 118,928 40,537 48,212 23,725 231,402
Net book valueEnd of financial year 2,466 - 355 - 2,821
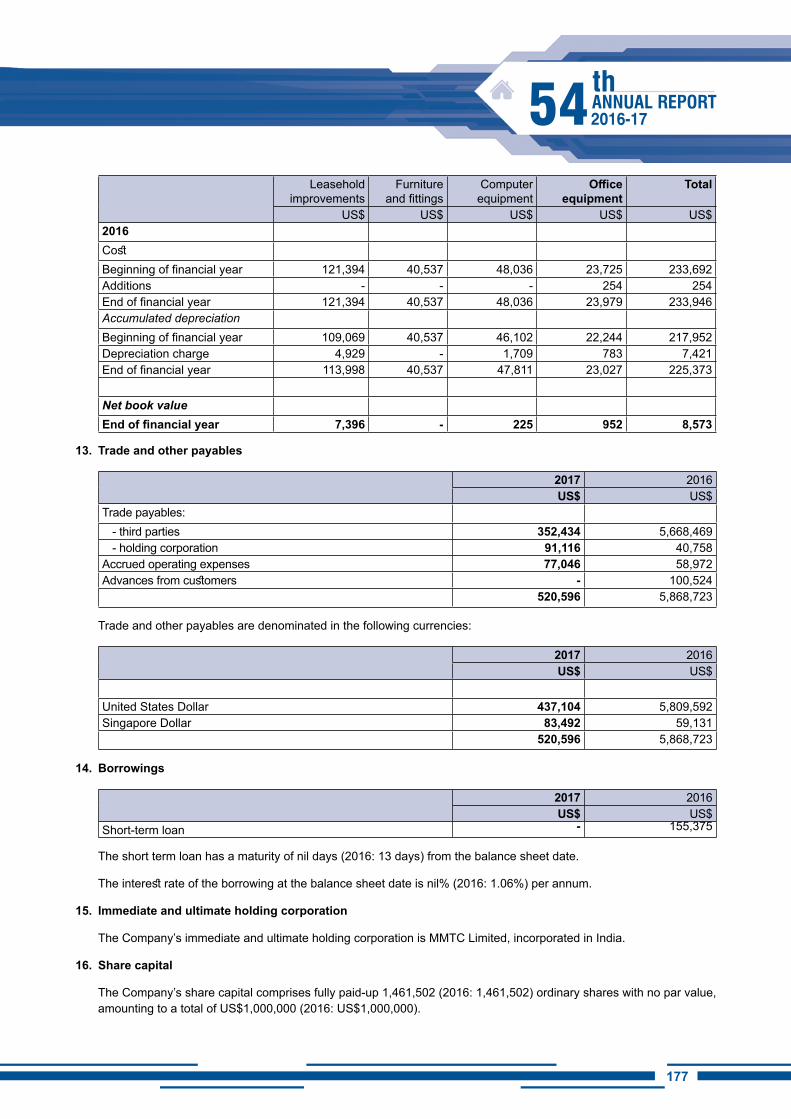
177176
Leaseholdimprovements
Furnitureand fittings
Computerequipment
Officeequipment
Total
US$ US$ US$ US$ US$2016CostBeginning of financial year 121,394 40,537 48,036 23,725 233,692Additions - - - 254 254End of financial year 121,394 40,537 48,036 23,979 233,946Accumulated depreciationBeginning of financial year 109,069 40,537 46,102 22,244 217,952Depreciation charge 4,929 - 1,709 783 7,421End of financial year 113,998 40,537 47,811 23,027 225,373
Net book valueEnd of financial year 7,396 - 225 952 8,573
13. Trade and other payables
2017 2016US$ US$
Trade payables:- third parties 352,434 5,668,469- holding corporation 91,116 40,758
Accrued operating expenses 77,046 58,972Advances from customers - 100,524
520,596 5,868,723
Trade and other payables are denominated in the following currencies:
2017 2016US$ US$
United States Dollar 437,104 5,809,592Singapore Dollar 83,492 59,131
520,596 5,868,723
14. Borrowings
2017 2016US$ US$
Short-term loan - 155,375
The short term loan has a maturity of nil days (2016: 13 days) from the balance sheet date.
The interest rate of the borrowing at the balance sheet date is nil% (2016: 1.06%) per annum.
15. Immediate and ultimate holding corporation
The Company’s immediate and ultimate holding corporation is MMTC Limited, incorporated in India.
16. Share capital
The Company’s share capital comprises fully paid-up 1,461,502 (2016: 1,461,502) ordinary shares with no par value, amounting to a total of US$1,000,000 (2016: US$1,000,000).
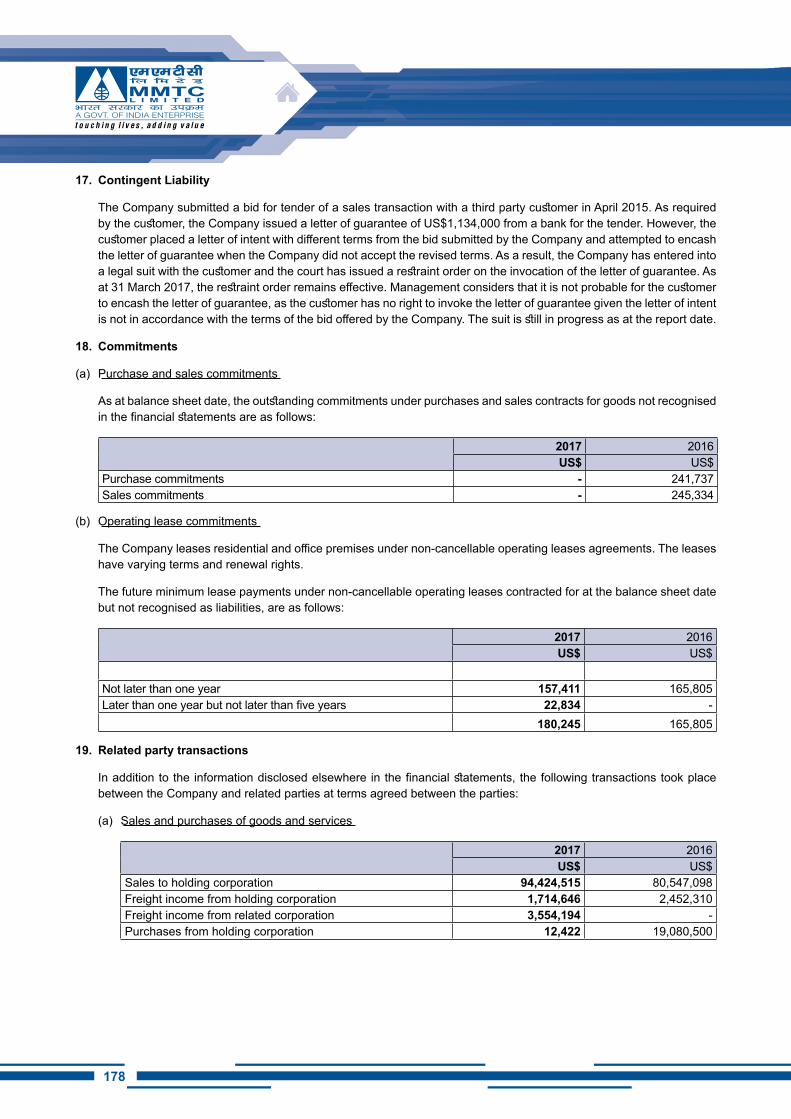
178
17. Contingent Liability
The Company submitted a bid for tender of a sales transaction with a third party customer in April 2015. As required by the customer, the Company issued a letter of guarantee of US$1,134,000 from a bank for the tender. However, the customer placed a letter of intent with different terms from the bid submitted by the Company and attempted to encash the letter of guarantee when the Company did not accept the revised terms. As a result, the Company has entered into a legal suit with the customer and the court has issued a restraint order on the invocation of the letter of guarantee. As at 31 March 2017, the restraint order remains effective. Management considers that it is not probable for the customer to encash the letter of guarantee, as the customer has no right to invoke the letter of guarantee given the letter of intent is not in accordance with the terms of the bid offered by the Company. The suit is still in progress as at the report date.
18. Commitments
(a) Purchase and sales commitments
As at balance sheet date, the outstanding commitments under purchases and sales contracts for goods not recognised in the financial statements are as follows:
2017 2016US$ US$
Purchase commitments - 241,737Sales commitments - 245,334
(b) Operating lease commitments
The Company leases residential and office premises under non-cancellable operating leases agreements. The leases have varying terms and renewal rights.
The future minimum lease payments under non-cancellable operating leases contracted for at the balance sheet date but not recognised as liabilities, are as follows:
2017 2016US$ US$
Not later than one year 157,411 165,805Later than one year but not later than five years 22,834 -
180,245 165,805
19. Related party transactions
In addition to the information disclosed elsewhere in the financial statements, the following transactions took place between the Company and related parties at terms agreed between the parties:
(a) Sales and purchases of goods and services
2017 2016US$ US$
Sales to holding corporation 94,424,515 80,547,098Freight income from holding corporation 1,714,646 2,452,310Freight income from related corporation 3,554,194 -Purchases from holding corporation 12,422 19,080,500
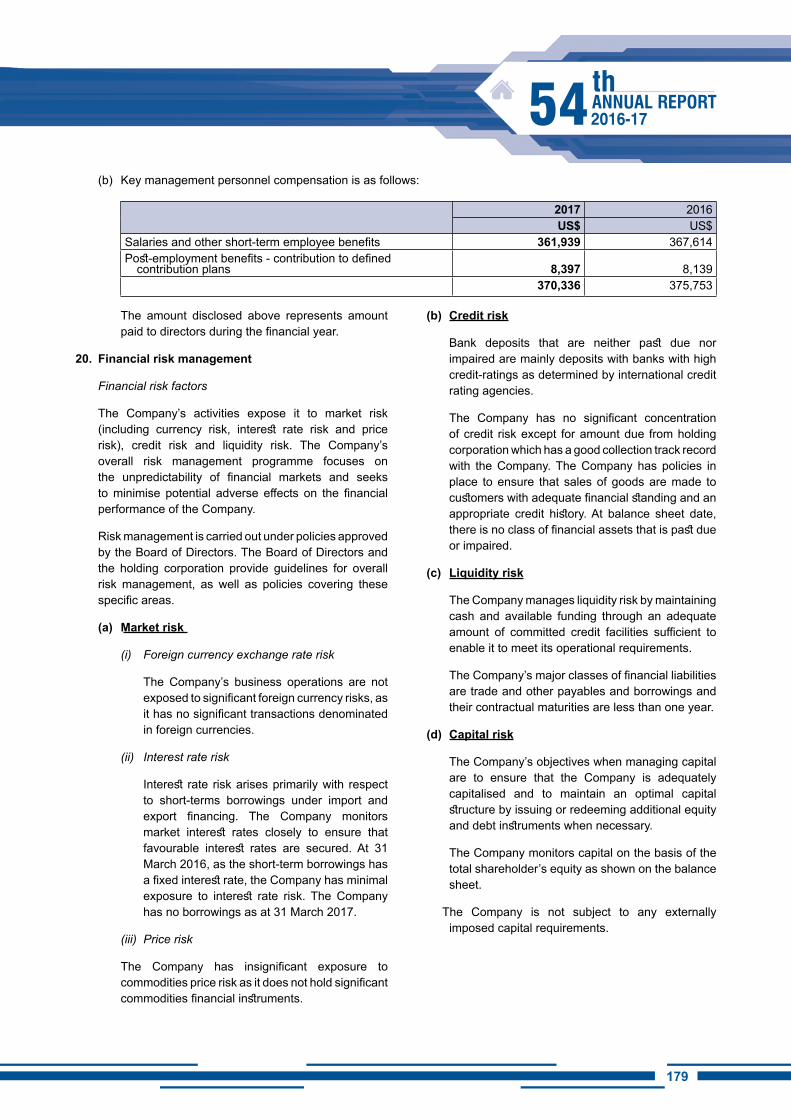
179178
(b) Key management personnel compensation is as follows:
2017 2016US$ US$
Salaries and other short-term employee benefits 361,939 367,614Post-employment benefits - contribution to defined
contribution plans 8,397 8,139370,336 375,753
The amount disclosed above represents amount paid to directors during the financial year.
20. Financial risk management
Financial risk factors
The Company’s activities expose it to market risk (including currency risk, interest rate risk and price risk), credit risk and liquidity risk. The Company’s overall risk management programme focuses on the unpredictability of financial markets and seeks to minimise potential adverse effects on the financial performance of the Company.
Risk management is carried out under policies approved by the Board of Directors. The Board of Directors and the holding corporation provide guidelines for overall risk management, as well as policies covering these specific areas.
(a) Market risk
(i) Foreign currency exchange rate risk
The Company’s business operations are not exposed to significant foreign currency risks, as it has no significant transactions denominated in foreign currencies.
(ii) Interest rate risk
Interest rate risk arises primarily with respect to short-terms borrowings under import and export financing. The Company monitors market interest rates closely to ensure that favourable interest rates are secured. At 31 March 2016, as the short-term borrowings has a fixed interest rate, the Company has minimal exposure to interest rate risk. The Company has no borrowings as at 31 March 2017.
(iii) Price risk
The Company has insignificant exposure to commodities price risk as it does not hold significant commodities financial instruments.
(b) Credit risk
Bank deposits that are neither past due nor impaired are mainly deposits with banks with high credit-ratings as determined by international credit rating agencies.
The Company has no significant concentration of credit risk except for amount due from holding corporation which has a good collection track record with the Company. The Company has policies in place to ensure that sales of goods are made to customers with adequate financial standing and an appropriate credit history. At balance sheet date, there is no class of financial assets that is past due or impaired.
(c) Liquidity risk
The Company manages liquidity risk by maintaining cash and available funding through an adequate amount of committed credit facilities sufficient to enable it to meet its operational requirements.
The Company’s major classes of financial liabilities are trade and other payables and borrowings and their contractual maturities are less than one year.
(d) Capital risk
The Company’s objectives when managing capital are to ensure that the Company is adequately capitalised and to maintain an optimal capital structure by issuing or redeeming additional equity and debt instruments when necessary.
The Company monitors capital on the basis of the total shareholder’s equity as shown on the balance sheet.
The Company is not subject to any externally imposed capital requirements.
180
(e) Financial instruments by category
The aggregate carrying amounts of loans and receivables and financial liabilities at amortized cost are as follows:
2017 2016$ $
Loans and receivables 15,914,936 21,376,354Financial liabilities at
amortised cost 520,596 5,923,574
21. New or revised accounting Standards and interpretations
Below are the mandatory standards, amendments and interpretations to existing standards that have been published, and are relevant for the Company’s accounting periods beginning on or after 1 April 2017 and which the Company has not early adopted:
• FRS 115 Revenue from contracts with customers (effective for annual periods beginning on or after 1 January 2018)
This is the converged standard on revenue recognition. It replaces FRS 11 Construction contracts, FRS 18 Revenue, and related interpretations. Revenue is recognised when a customer obtains control of a good or service. A customer obtains control when it has the ability to direct the use of and obtain the benefits from the good or service. The core principle of FRS 115 is that an entity recognises revenue to depict the transfer of promised goods or services to customers in an amount that reflects the consideration to which the entity expects to be entitled in exchange for those goods or services. An entity recognises revenue in accordance with that core principle by applying the following steps:
• Step 1: Identify the contract(s) with a customer
• Step 2: Identify the performance obligations in the contract
• Step 3: Determine the transaction price
• Step 4: Allocate the transaction price to the performance obligations in the contract
• Step 5: Recognise revenue when (or as) the entity satisfies a performance obligation
FRS 115 also includes a cohesive set of disclosure requirements that will result in an entity providing users of financial statements with comprehensive information about the nature, amount, timing and uncertainty
of revenue and cash flows arising from the entity’s contracts with customers.
Management is currently assessing the effects of applying FRS115 on the Company’s financial statements and plans to adopt the standard on the required effective date.
• FRS 109 Financial instruments (effective for annual periods beginning on or after 1 January 2018)
The complete version of FRS 109 replaces most of the guidance in FRS 39. FRS 109 retains the mixed measurement model and establishes three primary measurement categories for financial assets: amortised cost, fair value through Other Comprehensive Income (OCI) and fair value through Profit or Loss. The basis of classification depends on the entity’s business model and the contractual cash flow characteristics of the financial asset. Investments in equity instruments are required to be measured at fair value through profit or loss with the irrevocable option at inception to present changes in fair value in OCI. There were no changes to classification and measurement of financial liabilities except for the recognition in own credit risk in OCI, for liabilities designated at fair value through profit or loss.
FRS 109 relaxes the requirements for hedge effectiveness by replacing the bright line hedge effectiveness tests. It requires an economic relationship between the hedged item and hedging instrument and for the ‘hedged ratio’ to be the same as the one management actually use for risk management purposes.
There is now a new expected credit losses model that replaces the incurred loss impairment model used in FRS 39. It applies to financial assets classified at amortised cost, debt instruments measured at fair value through OCI, contract assets under FRS 115 Revenue from contracts with customers, lease receivables, loan commitments and certain financial guarantee contracts.
The new standard also introduces expanded disclosure requirements and changes in presentation.
Management is currently assessing the effects of applying FRS109 on the Company’s financial statements and plans to adopt the standard on the required effective date.
• FRS 116 Leases (effective for annual periods beginning on or after 1 January 2019)
181180
FRS 116 will result in almost all leases being recognised on the balance sheet, as the distinction between operating and finance leases is removed. Under the new standard, an asset (the right to use the leased item) and a financial liability to pay rentals are recognised. The only exceptions are short-term and low-value leases. The accounting for lessors will not change significantly.
The standard will affect primarily the accounting for the Company’s operating leases. As at the reporting date, the Company has non-cancellable operating lease commitments of US$180,245 (Note 18). However, the Company has yet to determine to what extent these commitments will result in the recognition of an asset and a liability for future payments and how this will affect the Company’s profit and classification of cash flows.
Some of the commitments may be covered by the exception for short-term and low-value leases and some commitments may relate to arrangements that will not qualify as leases under FRS 116.
Management is currently assessing the effects of applying FRS116 on the Company’s financial statements and plans to adopt the standard on the required effective date.
22. Authorisation of financial statements
These financial statements were authorised for issue in accordance with a resolution of the Board of Directors of MMTC Transnational Pte Ltd on27 April 2017

182
183182
ConsolidatedFinancial Statements
For the �nancial year ended 31st March, 2017
184
TO ThE MEMBERS OF MMTC LTD.
Report on the Consolidated Ind AS Financial Statements
1. We have audited the accompanying Consolidated Ind AS financial statements of MMTC Limited (herein after referred to as “The Holding Company”) its subsidiaries and (the Holding Company and its subsidiaries together referred to as “the Group”) and jointly controlled entities, which comprise the Consolidated Balance Sheet as at 31st March, 2017, the Consolidated Statement of Profit and Loss (including other comprehensive income), the Consolidated Statement of Cash Flows and Consolidated Statement of Changes in Equity for the year then ended and a summary of significant accounting policies and other explanatory information.
Management’s Responsibility for the Consolidated Ind AS Financial Statements
2. The Holding Company’s Board of Directors is responsible for the matters stated in Section 134(5) of the Companies Act, 2013 (“the Act”) with respect to the preparation of these Consolidated Ind AS financial statements to give a true and fair view of the Consolidated financial position, Consolidated financial performance (including other comprehensive income), Consolidated cash flows and Consolidated Changes in Equity of the Company in accordance with the accounting principles generally accepted in India, including the Indian Accounting Standards specified in the Companies (Indian Accounting Standards) Rules, 2015 (as amended) under Section 133 of the Act. This responsibility also includes maintenance of adequate accounting records in accordance with the provisions of the Act for safeguarding of the assets of the Company and for preventing and detecting frauds and other irregularities; selection and application of appropriate accounting policies; making judgments and estimates that are reasonable and prudent; and design, implementation and maintenance of adequate internal financial controls, that were operating effectively for ensuring the accuracy and completeness of the accounting records, relevant to the preparation and presentation of the Consolidated Ind AS financial statements that give a true and fair view and are free from material misstatement, whether due to fraud or error which have been used for the purpose of preparation of the Consolidated Ind AS financial statements by the Directors of the Holding Company, as aforesaid.
Auditors’ Responsibility
3. Our responsibility is to express an opinion on these Consolidated Ind AS financial statements based on our audit.
While conducting the audit, we have taken into account the provisions of the Act, the accounting and auditing standards and matters which are required to be included in the audit report under the provisions of the Act and the Rules made thereunder.
We conducted our audit in accordance with the Standards on Auditing specified under Section 143(10) of the Act and other applicable authoritative pronouncements issued by the Institute of Chartered Accountants of India. Those Standards and pronouncements require that we comply with ethical requirements and plan and perform the audit to obtain reasonable assurance about whether the Consolidated Ind AS financial statements are free from material misstatement.
An audit involves performing procedures to obtain audit evidence about the amounts and the disclosures in the Consolidated Ind AS financial statements. The procedures selected depend on the auditors’ judgment, including the assessment of the risks of material misstatement of the Consolidated Ind AS financial statements, whether due to fraud or error. In making those risk assessments, the auditor considers internal financial control relevant to the Holding Company’s preparation of the Consolidated Ind AS financial statements that give a true and fair view, in order to design audit procedures that are appropriate in the circumstances. An audit also includes evaluating the appropriateness of the accounting policies used and the reasonableness of the accounting estimates made by the Holding Company’s Board of Directors, as well as evaluating the overall presentation of the Consolidated Ind AS financial statements.
We believe that the audit evidence we have obtained is sufficient and appropriate to provide a basis for our audit opinion on the Consolidated Ind AS financial statements.
Opinion
In our opinion and to the best of our information and according to the explanation provided to us, the aforesaid Consolidated Ind AS financial statements give the information required by the Act in the manner so required and give a true and fair view in conformity with the accounting principles generally accepted in India including Ind AS, of the Consolidated financial position of the Holding Company as at 31stMarch,
iNDEPENDENT AUDiTORS’ REPORT
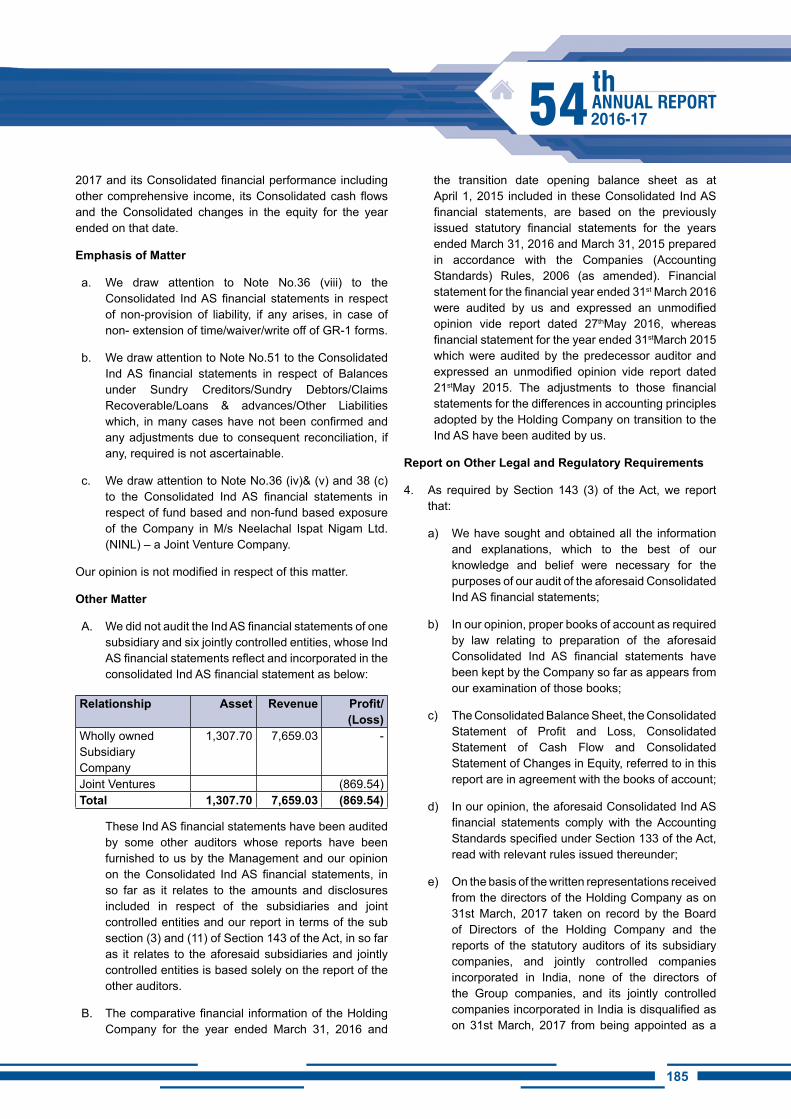
185184
2017 and its Consolidated financial performance including other comprehensive income, its Consolidated cash flows and the Consolidated changes in the equity for the year ended on that date.
Emphasis of Matter
a. We draw attention to Note No.36 (viii) to the Consolidated Ind AS financial statements in respect of non-provision of liability, if any arises, in case of non- extension of time/waiver/write off of GR-1 forms.
b. We draw attention to Note No.51 to the Consolidated Ind AS financial statements in respect of Balances under Sundry Creditors/Sundry Debtors/Claims Recoverable/Loans & advances/Other Liabilities which, in many cases have not been confirmed and any adjustments due to consequent reconciliation, if any, required is not ascertainable.
c. We draw attention to Note No.36 (iv)& (v) and 38 (c)to the Consolidated Ind AS financial statements in respect of fund based and non-fund based exposure of the Company in M/s Neelachal Ispat Nigam Ltd. (NINL) – a Joint Venture Company.
Our opinion is not modified in respect of this matter.
Other Matter
A. We did not audit the Ind AS financial statements of one subsidiary and six jointly controlled entities, whose Ind AS financial statements reflect and incorporated in the consolidated Ind AS financial statement as below:
Relationship Asset Revenue Profit/(Loss)
Wholly owned Subsidiary Company
1,307.70 7,659.03 -
Joint Ventures (869.54)Total 1,307.70 7,659.03 (869.54)
These Ind AS financial statements have been audited by some other auditors whose reports have been furnished to us by the Management and our opinion on the Consolidated Ind AS financial statements, in so far as it relates to the amounts and disclosures included in respect of the subsidiaries and joint controlled entities and our report in terms of the sub section (3) and (11) of Section 143 of the Act, in so far as it relates to the aforesaid subsidiaries and jointly controlled entities is based solely on the report of the other auditors.
B. The comparative financial information of the Holding Company for the year ended March 31, 2016 and
the transition date opening balance sheet as at April 1, 2015 included in these Consolidated Ind AS financial statements, are based on the previously issued statutory financial statements for the years ended March 31, 2016 and March 31, 2015 prepared in accordance with the Companies (Accounting Standards) Rules, 2006 (as amended). Financial statement for the financial year ended 31st March 2016 were audited by us and expressed an unmodified opinion vide report dated 27thMay 2016, whereas financial statement for the year ended 31stMarch 2015 which were audited by the predecessor auditor and expressed an unmodified opinion vide report dated 21stMay 2015. The adjustments to those financial statements for the differences in accounting principles adopted by the Holding Company on transition to the Ind AS have been audited by us.
Report on Other Legal and Regulatory Requirements
4. As required by Section 143 (3) of the Act, we report that:
a) We have sought and obtained all the information and explanations, which to the best of our knowledge and belief were necessary for the purposes of our audit of the aforesaid Consolidated Ind AS financial statements;
b) In our opinion, proper books of account as required by law relating to preparation of the aforesaid Consolidated Ind AS financial statements have been kept by the Company so far as appears from our examination of those books;
c) The Consolidated Balance Sheet, the Consolidated Statement of Profit and Loss, Consolidated Statement of Cash Flow and Consolidated Statement of Changes in Equity, referred to in this report are in agreement with the books of account;
d) In our opinion, the aforesaid Consolidated Ind AS financial statements comply with the Accounting Standards specified under Section 133 of the Act, read with relevant rules issued thereunder;
e) On the basis of the written representations received from the directors of the Holding Company as on 31st March, 2017 taken on record by the Board of Directors of the Holding Company and the reports of the statutory auditors of its subsidiary companies, and jointly controlled companies incorporated in India, none of the directors of the Group companies, and its jointly controlled companies incorporated in India is disqualified as on 31st March, 2017 from being appointed as a
186
director in terms of Section 164 (2) of the Act.
f) With respect to the adequacy of internal financial controls over financial reporting of the Company and operating effectiveness of such controls, refer to our separate report in “Annexure-1”
g) With respect to the other matters to be included in the Auditor’s Report in accordance with Rule 11 of the Companies (Audit and Auditors) Rules, 2014, in our opinion and to the best of our information and according to the explanations given to us
i. There are pending litigations including matters relating to sales tax, custom duty and excise duty which are disclosed as contingent liability - refer to Note No. 36 to the Consolidated Ind AS financial statements, the impact of the same is unascertainable as the matters are sub-judice.
ii. Company has made provision, as required under the applicable law or accounting standards, for material foreseeable losses, if any, on long term contracts including derivative contracts.
iii. There has been no delay in transferring amounts required to be transferred to the
investors Education and Protection Fund by the Holding Company, its subsidiary and jointly controlled companies incorporated in India.
iv. The company has provided requisite disclosure in note no. 54 to these Consolidated Ind AS financial statements as to holding of Specified Bank Notes on 8th November 2016 and 30th December 2016 as well as dealing in specified notes during the period 8th November 2016 to 30th December 2016. The disclosures are in accordance with the books of accounts maintained Holding Company and jointly controlled companies incorporated in India and as produced before us by the management of the Holding company.
For O.P. Tulsyan & Co.Chartered Accountants
FRN: 500028N
Place: New Delhi Rakesh AgarwalDate:29.05.2017 Partner
M No.: 081808
187186
Annexure-1 To the Independent Auditor’s Report of even date on the Consolidated Ind AS Financial Statements of MMTC Ltd.
Report on the Internal Financial Controls under Section 143(3) (i) of the Companies Act, 2013 (“the Act”)
We have audited the internal financial controls over financial reporting of MMTC Ltd. (“the Company”) as of March 31, 2017, in conjunction with our audit of the Consolidated Ind AS financial statements of the Company for the year ended on that date
Management’s Responsibility for Internal Financial Controls:
The respective Board of Directors of the of the Holding company, its subsidiary companies, its associate companies and jointly controlled companies, which are companies incorporated in India, are responsible for establishing and maintaining internal financial controls based on “the internal control over financial reporting criteria established by the Company considering the essential components of internal control stated in the Guidance Note on Audit of Internal Financial Controls Over Financial Reporting issued by the Institute of Chartered Accountants of India (ICAI)”.These responsibilities include the design, implementation and maintenance of adequate internal financial controls that were operating effectively for ensuring the orderly and efficient conduct of its business, including adherence to the respective company’s policies, the safeguarding of its assets, the prevention and detection of frauds and errors, the accuracy and completeness of the accounting records, and the timely preparation of reliable financial information, as required under the Companies Act, 2013
Auditor’s Responsibility:
Our responsibility is to express an opinion on the Company’s internal financial controls over financial reporting based on our audit. We conducted our audit in accordance with the Guidance Note on Audit of Internal financial controls over financial reporting and the Standards on Auditing, issued by the ICAI deemed to be prescribed under section 143(10) of the Companies Act, 2013, to the extent applicable to an audit of internal financial controls, both applicable to an audit of Internal Financial Controls and, both issued by the ICAI. Those standards and the Guidance Note that we comply with ethical requirements and plan and perform the audit to obtain reasonable assurance about whether adequate internal financial controls over financial reporting was established and maintained and if such controls operated effectively in all material respects.
Our audit involves performing procedures to obtain audit evidence about the adequacy of the internal financial
controls system over financial reporting and their operating effectiveness. Our audit of internal financial controls over financial reporting included obtaining an understanding of internal financial controls over financial reporting, assessing the risk that a material weakness exist, and testing and evaluating the design and operating effectiveness of the internal control based on the assessed risk . The procedures selected depend on the auditor’s judgment, including the assessment of risks of material misstatements of the Ind AS financial statements, whether due to fraud or error.
We believe that the audit evidence we have obtained and the audit evidence obtained by the other auditors in terms of their reports referred to in the Other Matters paragraph below, is sufficient and appropriate to provide a basis for our audit opinion on the Company’s internal financial controls system over financial reporting.
Meaning of Internal Financial Controls over Financial Reporting:
A company’s internal financial control over financial reporting is a process designed to provide reasonable assurance regarding the reliability of financial reporting and the preparation of Ind AS Financial Statements for external purposes in accordance with generally accepted accounting principles. A company’s internal financial control over financial reporting includes those policies and procedures that
(1) Pertain to the maintenance of records that, in reasonable detail, accurately and fairly reflect the transactions and dispositions of the assets of the company;
(2) Provide reasonable assurance that transactions are recorded as necessary to permit preparation of Ind AS financial statements in accordance with generally accepted principles, and that receipts and expenditures of the company are being made only in accordance with authorizations of management and directors of the company; and
(3) Provide reasonable assurance regarding prevention or timely detection of unauthorized acquisition, use, or disposition of the company’s assets that could have a material effect on the Ind AS financial statements.
inherent Limitations of internal Financial Controls over Financial Reporting:
Because of the inherent limitations of internal financial controls over financial reporting, including the possibility of collusion or improper management override of controls, material misstatements due to error or fraud may occur and not be detected. Also, projections of any evaluation of the internal financial controls over financial reporting to future periods are subject to the risk that the internal financial
188
control over financial reporting may become inadequate because of changes in conditions, or that the degree of compliance with the policies or procedures may deteriorate.
Opinion:
In our opinion, the Holding Company and jointly controlled companies, which are companies incorporated in India, have, in all material respects, an adequate internal financial controls system over financial reporting and such internal financial controls over financial reporting were operating effectively as at March 31, 2017, based on “the internal control over financial reporting criteria established by the Company considering the essential components of internal control stated in the Guidance Note on Audit of Internal Financial Controls Over Financial Reporting issued by the Institute of Chartered Accountants of India”.
Other Matters
Our aforesaid reports under Section 143(3)(i) of the Act on the adequacy and operating effectiveness of the internal financial controls over financial reporting in so far as it relates to six jointly controlled companies, which are companies incorporated in India, is based on the corresponding reports of the auditors of such companies incorporated in India.
For O.P. Tulsyan & Co.Chartered Accountants
FRN: 500028N
Place: New Delhi Rakesh AgarwalDate:29.05.2017 Partner
M No.: 081808
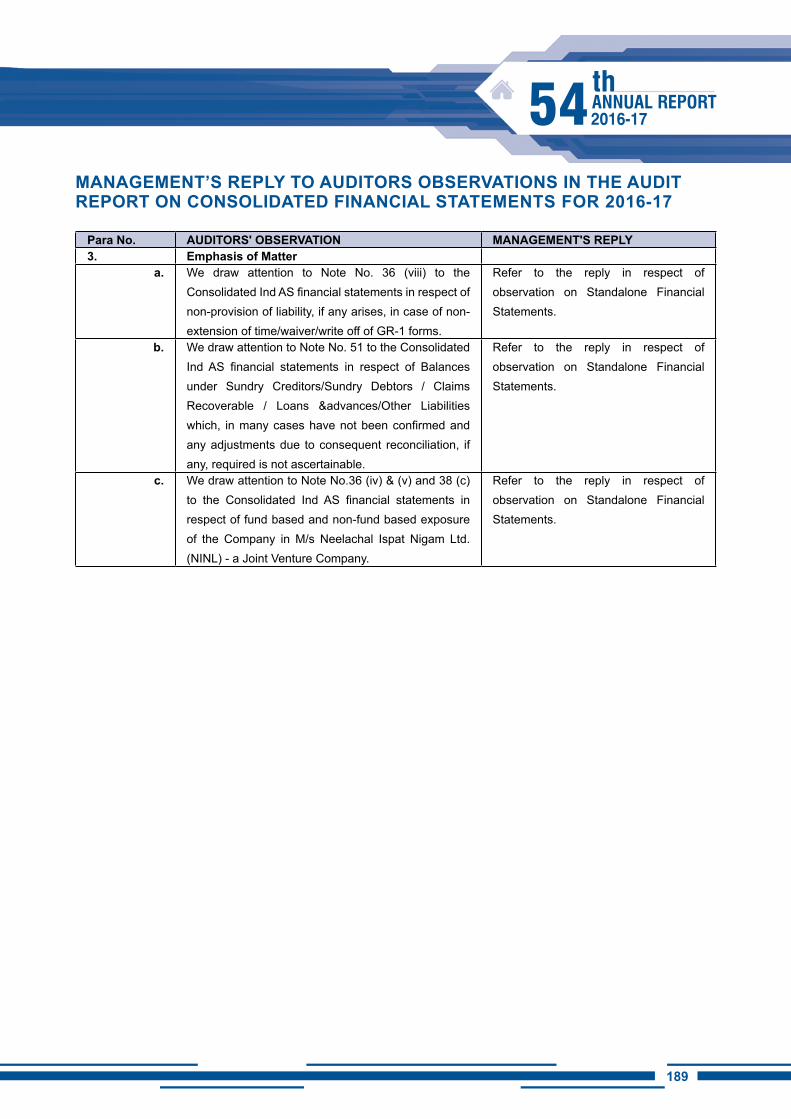
189188
MANAGEMENT’S REPLY TO AUDiTORS OBSERVATiONS iN ThE AUDiT REPORT ON CONSOLiDATED FiNANCiAL STATEMENTS FOR 2016-17
Para No. AUDiTORS' OBSERVATiON MANAGEMENT'S REPLY3. Emphasis of Matter
a. We draw attention to Note No. 36 (viii) to the Consolidated Ind AS financial statements in respect of non-provision of liability, if any arises, in case of non- extension of time/waiver/write off of GR-1 forms.
Refer to the reply in respect of observation on Standalone Financial Statements.
b. We draw attention to Note No. 51 to the Consolidated Ind AS financial statements in respect of Balances under Sundry Creditors/Sundry Debtors / Claims Recoverable / Loans &advances/Other Liabilities which, in many cases have not been confirmed and any adjustments due to consequent reconciliation, if any, required is not ascertainable.
Refer to the reply in respect of observation on Standalone Financial Statements.
c. We draw attention to Note No.36 (iv) & (v) and 38 (c) to the Consolidated Ind AS financial statements in respect of fund based and non-fund based exposure of the Company in M/s Neelachal Ispat Nigam Ltd. (NINL) - a Joint Venture Company.
Refer to the reply in respect of observation on Standalone Financial Statements.
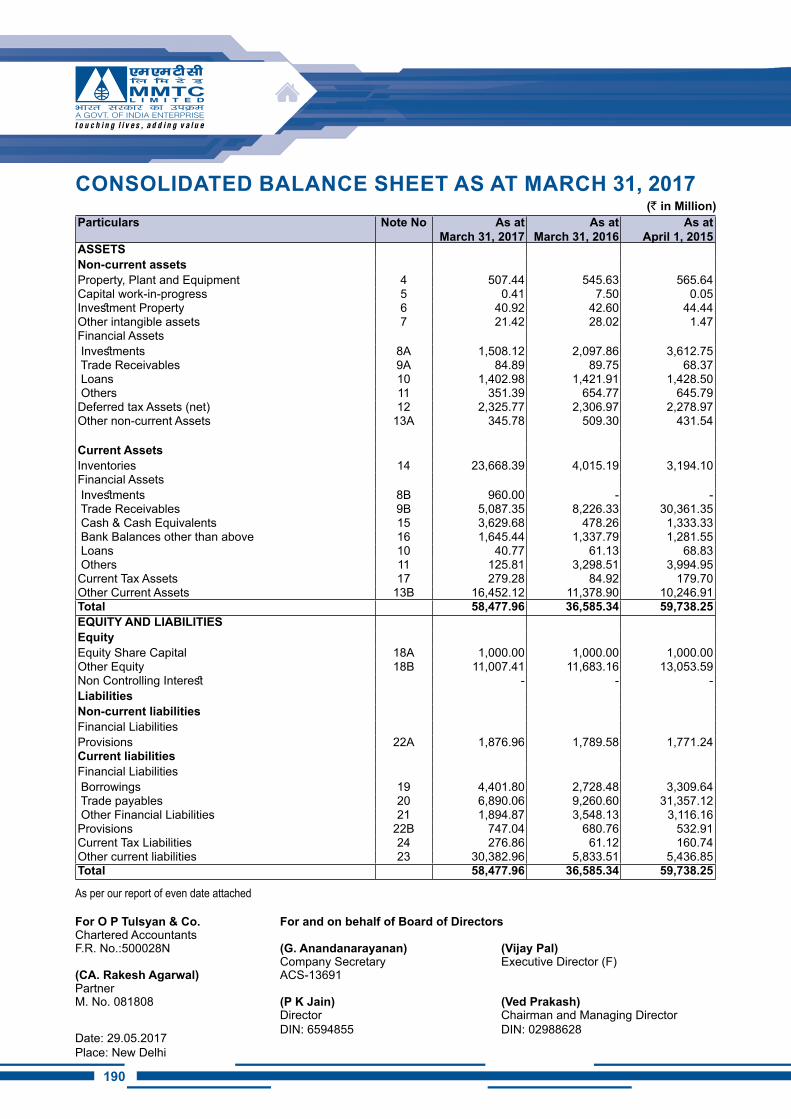
190
CONSOLiDATED BALANCE ShEET AS AT MARCh 31, 2017(` in Million)
Particulars Note No As at March 31, 2017
As at March 31, 2016
As at April 1, 2015
ASSETSNon-current assetsProperty, Plant and Equipment 4 507.44 545.63 565.64 Capital work-in-progress 5 0.41 7.50 0.05 Investment Property 6 40.92 42.60 44.44 Other intangible assets 7 21.42 28.02 1.47 Financial Assets Investments 8A 1,508.12 2,097.86 3,612.75 Trade Receivables 9A 84.89 89.75 68.37 Loans 10 1,402.98 1,421.91 1,428.50 Others 11 351.39 654.77 645.79 Deferred tax Assets (net) 12 2,325.77 2,306.97 2,278.97 Other non-current Assets 13A 345.78 509.30 431.54
Current AssetsInventories 14 23,668.39 4,015.19 3,194.10 Financial Assets Investments 8B 960.00 - - Trade Receivables 9B 5,087.35 8,226.33 30,361.35 Cash & Cash Equivalents 15 3,629.68 478.26 1,333.33 Bank Balances other than above 16 1,645.44 1,337.79 1,281.55 Loans 10 40.77 61.13 68.83 Others 11 125.81 3,298.51 3,994.95 Current Tax Assets 17 279.28 84.92 179.70 Other Current Assets 13B 16,452.12 11,378.90 10,246.91 Total 58,477.96 36,585.34 59,738.25 EQUiTY AND LiABiLiTiESEquityEquity Share Capital 18A 1,000.00 1,000.00 1,000.00 Other Equity 18B 11,007.41 11,683.16 13,053.59 Non Controlling Interest - - - LiabilitiesNon-current liabilitiesFinancial LiabilitiesProvisions 22A 1,876.96 1,789.58 1,771.24 Current liabilitiesFinancial Liabilities Borrowings 19 4,401.80 2,728.48 3,309.64 Trade payables 20 6,890.06 9,260.60 31,357.12 Other Financial Liabilities 21 1,894.87 3,548.13 3,116.16 Provisions 22B 747.04 680.76 532.91 Current Tax Liabilities 24 276.86 61.12 160.74 Other current liabilities 23 30,382.96 5,833.51 5,436.85 Total 58,477.96 36,585.34 59,738.25
As per our report of even date attached
For O P Tulsyan & Co. For and on behalf of Board of DirectorsChartered Accountants F.R. No.:500028N (G. Anandanarayanan) (Vijay Pal)
Company Secretary Executive Director (F) (CA. Rakesh Agarwal) ACS-13691PartnerM. No. 081808 (P K Jain) (Ved Prakash)
DirectorDIN: 6594855
Chairman and Managing DirectorDIN: 02988628
Date: 29.05.2017Place: New Delhi
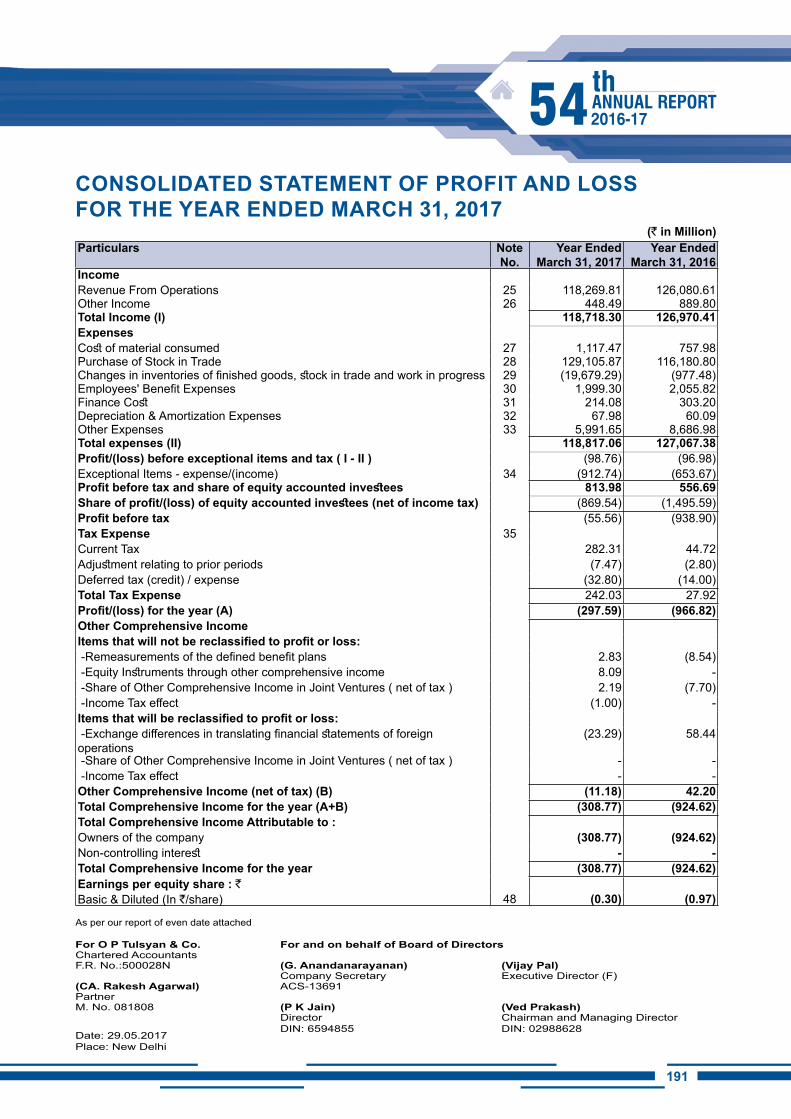
191190
CONSOLiDATED STATEMENT OF PROFiT AND LOSS FOR ThE YEAR ENDED MARCh 31, 2017
(` in Million)Particulars Note
No.Year Ended
March 31, 2017Year Ended
March 31, 2016incomeRevenue From Operations 25 118,269.81 126,080.61 Other Income 26 448.49 889.80 Total income (i) 118,718.30 126,970.41 ExpensesCost of material consumed 27 1,117.47 757.98 Purchase of Stock in Trade 28 129,105.87 116,180.80 Changes in inventories of finished goods, stock in trade and work in progress 29 (19,679.29) (977.48)Employees' Benefit Expenses 30 1,999.30 2,055.82 Finance Cost 31 214.08 303.20 Depreciation & Amortization Expenses 32 67.98 60.09 Other Expenses 33 5,991.65 8,686.98 Total expenses (II) 118,817.06 127,067.38 Profit/(loss) before exceptional items and tax ( I - II ) (98.76) (96.98)Exceptional Items - expense/(income) 34 (912.74) (653.67)Profit before tax and share of equity accounted investees 813.98 556.69 Share of profit/(loss) of equity accounted investees (net of income tax) (869.54) (1,495.59)Profit before tax (55.56) (938.90)Tax Expense 35Current Tax 282.31 44.72 Adjustment relating to prior periods (7.47) (2.80)Deferred tax (credit) / expense (32.80) (14.00)Total Tax Expense 242.03 27.92 Profit/(loss) for the year (A) (297.59) (966.82)Other Comprehensive incomeItems that will not be reclassified to profit or loss: -Remeasurements of the defined benefit plans 2.83 (8.54) -Equity Instruments through other comprehensive income 8.09 - -Share of Other Comprehensive Income in Joint Ventures ( net of tax ) 2.19 (7.70) -Income Tax effect (1.00) - Items that will be reclassified to profit or loss: -Exchange differences in translating financial statements of foreign operations
(23.29) 58.44
-Share of Other Comprehensive Income in Joint Ventures ( net of tax ) - - -Income Tax effect - - Other Comprehensive Income (net of tax) (B) (11.18) 42.20 Total Comprehensive Income for the year (A+B) (308.77) (924.62)Total Comprehensive income Attributable to :Owners of the company (308.77) (924.62)Non-controlling interest - - Total Comprehensive Income for the year (308.77) (924.62)Earnings per equity share : `Basic & Diluted (In `/share) 48 (0.30) (0.97)
As per our report of even date attached
For O P Tulsyan & Co. For and on behalf of Board of DirectorsChartered Accountants F.R. No.:500028N (G. Anandanarayanan) (Vijay Pal)
Company Secretary Executive Director (F) (CA. Rakesh Agarwal) ACS-13691PartnerM. No. 081808 (P K Jain) (Ved Prakash)
DirectorDIN: 6594855
Chairman and Managing DirectorDIN: 02988628
Date: 29.05.2017Place: New Delhi
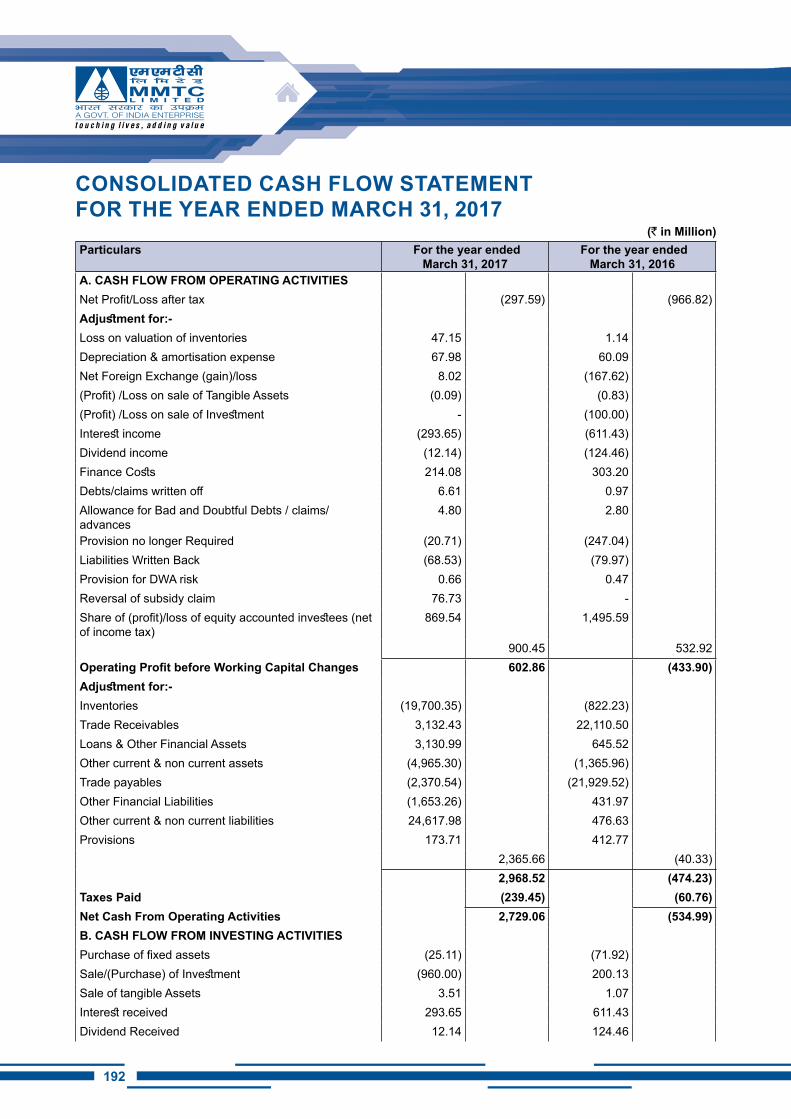
192
CONSOLiDATED CASh FLOW STATEMENT FOR ThE YEAR ENDED MARCh 31, 2017
(` in Million)Particulars For the year ended
March 31, 2017 For the year ended
March 31, 2016 A. CASh FLOW FROM OPERATiNG ACTiViTiESNet Profit/Loss after tax (297.59) (966.82)Adjustment for:-Loss on valuation of inventories 47.15 1.14 Depreciation & amortisation expense 67.98 60.09 Net Foreign Exchange (gain)/loss 8.02 (167.62)(Profit) /Loss on sale of Tangible Assets (0.09) (0.83)(Profit) /Loss on sale of Investment - (100.00)Interest income (293.65) (611.43)Dividend income (12.14) (124.46)Finance Costs 214.08 303.20 Debts/claims written off 6.61 0.97 Allowance for Bad and Doubtful Debts / claims/ advances
4.80 2.80
Provision no longer Required (20.71) (247.04)Liabilities Written Back (68.53) (79.97)Provision for DWA risk 0.66 0.47 Reversal of subsidy claim 76.73 - Share of (profit)/loss of equity accounted investees (net of income tax)
869.54 1,495.59
900.45 532.92 Operating Profit before Working Capital Changes 602.86 (433.90)Adjustment for:-Inventories (19,700.35) (822.23)Trade Receivables 3,132.43 22,110.50 Loans & Other Financial Assets 3,130.99 645.52 Other current & non current assets (4,965.30) (1,365.96)Trade payables (2,370.54) (21,929.52)Other Financial Liabilities (1,653.26) 431.97 Other current & non current liabilities 24,617.98 476.63 Provisions 173.71 412.77
2,365.66 (40.33) 2,968.52 (474.23)
Taxes Paid (239.45) (60.76)Net Cash From Operating Activities 2,729.06 (534.99)B. CASh FLOW FROM iNVESTiNG ACTiViTiESPurchase of fixed assets (25.11) (71.92)Sale/(Purchase) of Investment (960.00) 200.13 Sale of tangible Assets 3.51 1.07 Interest received 293.65 611.43 Dividend Received 12.14 124.46
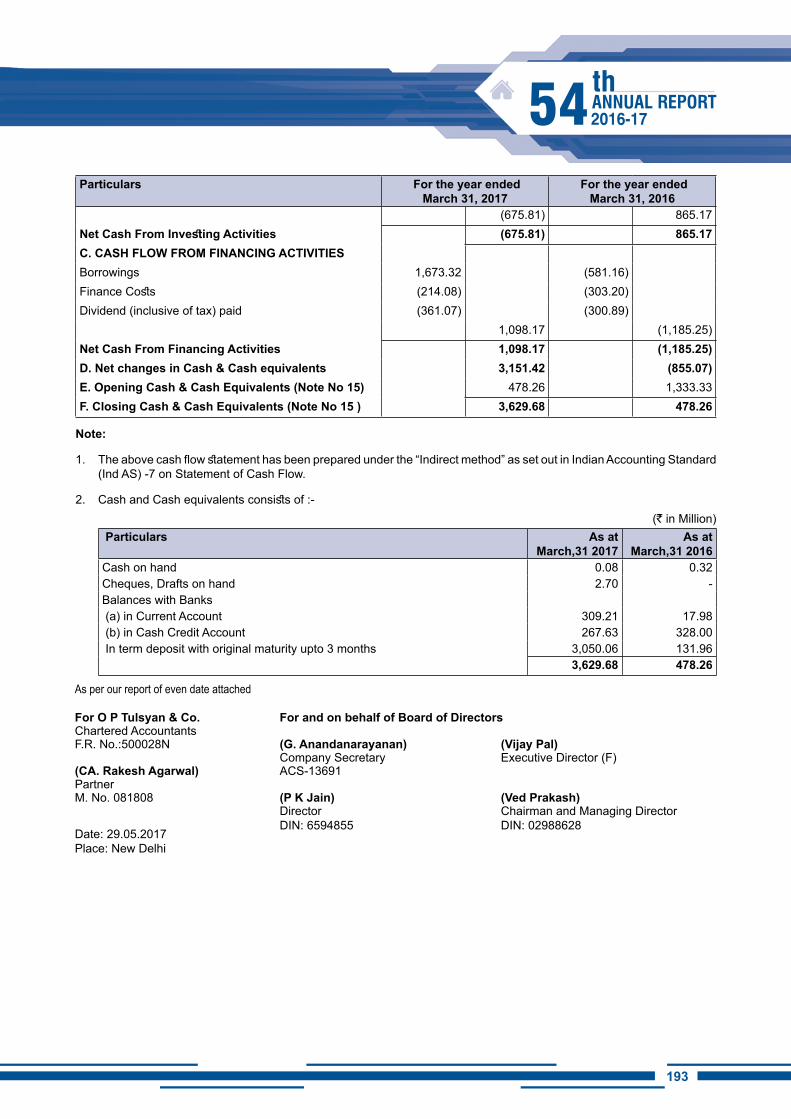
193192
Particulars For the year ended March 31, 2017
For the year ended March 31, 2016
(675.81) 865.17 Net Cash From Investing Activities (675.81) 865.17 C. CASh FLOW FROM FiNANCiNG ACTiViTiESBorrowings 1,673.32 (581.16)Finance Costs (214.08) (303.20)Dividend (inclusive of tax) paid (361.07) (300.89)
1,098.17 (1,185.25)Net Cash From Financing Activities 1,098.17 (1,185.25)D. Net changes in Cash & Cash equivalents 3,151.42 (855.07)E. Opening Cash & Cash Equivalents (Note No 15) 478.26 1,333.33 F. Closing Cash & Cash Equivalents (Note No 15 ) 3,629.68 478.26
Note:
1. The above cash flow statement has been prepared under the “Indirect method” as set out in Indian Accounting Standard (Ind AS) -7 on Statement of Cash Flow.
2. Cash and Cash equivalents consists of :-(` in Million)
Particulars As at March,31 2017
As at March,31 2016
Cash on hand 0.08 0.32 Cheques, Drafts on hand 2.70 - Balances with Banks (a) in Current Account 309.21 17.98 (b) in Cash Credit Account 267.63 328.00 In term deposit with original maturity upto 3 months 3,050.06 131.96
3,629.68 478.26
As per our report of even date attached
For O P Tulsyan & Co. For and on behalf of Board of DirectorsChartered Accountants F.R. No.:500028N (G. Anandanarayanan) (Vijay Pal)
Company Secretary Executive Director (F) (CA. Rakesh Agarwal) ACS-13691PartnerM. No. 081808 (P K Jain) (Ved Prakash)
DirectorDIN: 6594855
Chairman and Managing DirectorDIN: 02988628
Date: 29.05.2017Place: New Delhi
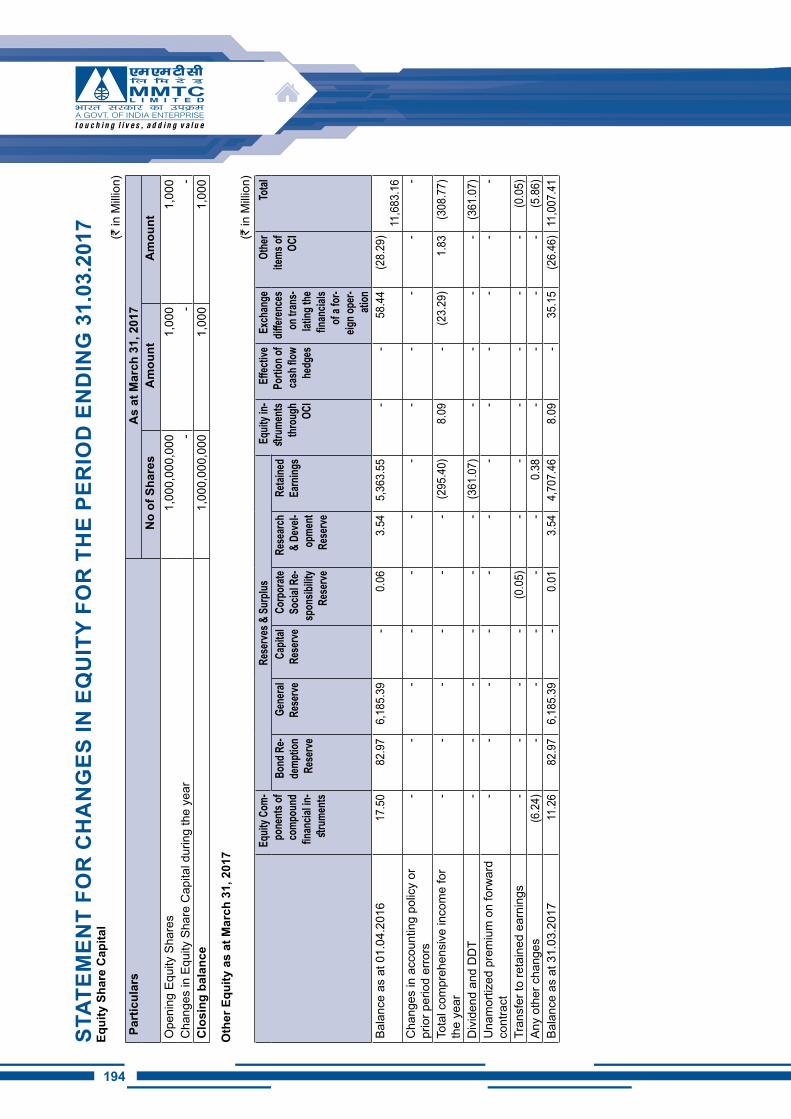
194
STAT
EMEN
T FO
R C
hA
NG
ES iN
EQ
UiT
Y FO
R T
hE
PER
iOD
EN
DiN
G 3
1.03
.201
7Eq
uity
Sha
re C
apita
l(`
in M
illion
) P
artic
ular
s A
s at
Mar
ch 3
1, 2
017
No
of S
hare
s A
mou
nt
Am
ount
O
peni
ng E
quity
Sha
res
1,0
00,0
00,0
00
1,0
00
1,0
00
Cha
nges
in E
quity
Sha
re C
apita
l dur
ing
the
year
- -
- C
losi
ng b
alan
ce 1
,000
,000
,000
1
,000
1
,000
Oth
er E
quity
as
at M
arch
31,
201
7(`
in M
illion
)Eq
uity C
om-
pone
nts of
co
mpou
nd
finan
cial in
-str
umen
ts
Rese
rves &
Surp
lusEq
uity i
n-str
umen
ts thr
ough
OC
i
Effec
tive
Porti
on of
ca
sh flo
w he
dges
Exch
ange
diff
erenc
es
on tr
ans-
lating
the
finan
cials
of a f
or-
eign o
per-
ation
Othe
r ite
ms of
OC
i
Total
Bond
Re-
demp
tion
Rese
rve
Gene
ral
Rese
rveCa
pital
Rese
rveCo
rpor
ate
Socia
l Re-
spon
sibilit
y Re
serve
Rese
arch
& De
vel-
opme
nt Re
serve
Retai
ned
Earn
ings
Bala
nce
as a
t 01.
04.2
016
17.
50
82.
97
6,1
85.3
9 -
0.0
6 3
.54
5,3
63.5
5 -
- 5
8.44
(2
8.29
)
11,6
83.1
6 C
hang
es in
acc
ount
ing
polic
y or
pr
ior p
erio
d er
rors
- -
- -
- -
- -
- -
- -
Tota
l com
preh
ensi
ve in
com
e fo
r th
e ye
ar -
- -
- -
- (2
95.4
0) 8
.09
- (2
3.29
) 1
.83
(308
.77)
Div
iden
d an
d D
DT
- -
- -
- -
(361
.07)
- -
- -
(361
.07)
Una
mor
tized
pre
miu
m o
n fo
rwar
d co
ntra
ct -
- -
- -
- -
- -
- -
-
Tran
sfer
to re
tain
ed e
arni
ngs
- -
- -
(0.0
5) -
- -
- -
- (0
.05)
Any
othe
r cha
nges
(6.2
4) -
- -
- -
0.3
8 -
- -
- (5
.86)
Bala
nce
as a
t 31.
03.2
017
11.
26
82.
97
6,1
85.3
9 -
0.0
1 3
.54
4,70
7.46
8
.09
- 3
5.15
(2
6.46
)11
,007
.41
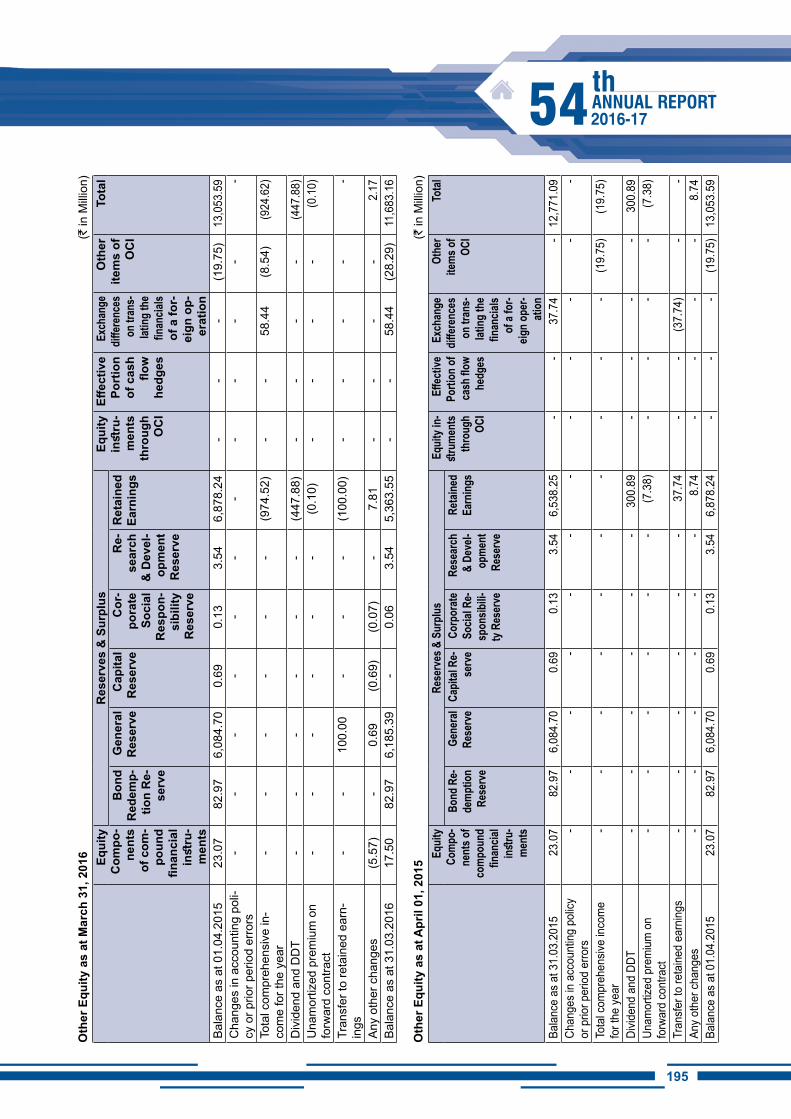
195194
Oth
er E
quity
as
at M
arch
31,
201
6 (`
in M
illion
)Eq
uity
C
ompo
-ne
nts
of c
om-
poun
d fin
anci
al
inst
ru-
men
ts
Res
erve
s &
Sur
plus
Equi
ty
inst
ru-
men
ts
thro
ugh
OC
i
Effec
tive
Port
ion
of c
ash
flow
he
dges
Exch
ange
diff
eren
ces
on tr
ans-
lating
the
finan
cials
of a
for-
eign
op-
erat
ion
Oth
er
item
s of
O
Ci
Tota
lB
ond
Red
emp-
tion
Re-
serv
e
Gen
eral
R
eser
veC
apita
l R
eser
veC
or-
pora
te
Soci
al
Res
pon-
sibi
lity
Res
erve
Re-
sear
ch
& D
evel
-op
men
t R
eser
ve
Ret
aine
d Ea
rnin
gs
Bala
nce
as a
t 01.
04.2
015
23.
07
82.
97
6,0
84.7
0 0
.69
0.1
3 3
.54
6,8
78.2
4 -
- -
(19.
75)
13,
053.
59
Cha
nges
in a
ccou
ntin
g po
li-cy
or p
rior p
erio
d er
rors
- -
- -
- -
- -
- -
- -
Tota
l com
preh
ensi
ve in
-co
me
for t
he y
ear
- -
- -
- -
(974
.52)
- -
58.
44
(8.5
4) (9
24.6
2)
Div
iden
d an
d D
DT
- -
- -
- -
(447
.88)
- -
- -
(447
.88)
Una
mor
tized
pre
miu
m o
n fo
rwar
d co
ntra
ct -
- -
- -
- (0
.10)
- -
- -
(0.1
0)
Tran
sfer
to re
tain
ed e
arn-
ings
- -
100
.00
- -
- (1
00.0
0) -
- -
- -
Any
othe
r cha
nges
(5.5
7) -
0.6
9 (0
.69)
(0.0
7) -
7.8
1 -
- -
- 2
.17
Bala
nce
as a
t 31.
03.2
016
17.
50
82.
97
6,1
85.3
9 -
0.0
6 3
.54
5,3
63.5
5 -
- 5
8.44
(2
8.29
) 1
1,68
3.16
Oth
er E
quity
as
at A
pril
01, 2
015
(` in
Milli
on)
Equit
y Co
mpo-
nent
s of
comp
ound
fin
ancia
l inst
ru-
ment
s
Rese
rves
& S
urplu
sEq
uity i
n-str
umen
ts th
roug
h OC
i
Effec
tive
Porti
on of
ca
sh flo
w he
dges
Exch
ange
diff
eren
ces
on tr
ans -
lating
the
finan
cials
of a
for -
eign o
per-
ation
Othe
r ite
ms of
OC
i
Total
Bond
Re-
demp
tion
Rese
rve
Gene
ral
Rese
rve
Capit
al Re
-se
rve
Corp
orate
So
cial R
e-sp
onsib
ili-ty
Rese
rve
Rese
arch
&
Deve
l-op
ment
Re
serv
e
Retai
ned
Earn
ings
Bala
nce
as a
t 31.
03.2
015
23.
07
82.
97
6,0
84.7
0 0
.69
0.1
3 3
.54
6,5
38.2
5 -
- 3
7.74
-
12,
771.
09
Chan
ges
in a
ccou
ntin
g po
licy
or p
rior p
erio
d er
rors
- -
- -
- -
- -
- -
- -
Tota
l com
preh
ensiv
e in
com
e fo
r the
yea
r -
- -
- -
- -
- -
- (1
9.75
) (1
9.75
)
Divid
end
and
DDT
- -
- -
- -
300
.89
- -
- -
300
.89
Unam
ortiz
ed p
rem
ium
on
forw
ard
cont
ract
- -
- -
- -
(7.3
8) -
- -
- (7
.38)
Tran
sfer
to re
tain
ed e
arni
ngs
- -
- -
- -
37.
74
- -
(37.
74)
- -
Any
othe
r cha
nges
- -
- -
- -
8.7
4 -
- -
- 8
.74
Bala
nce
as a
t 01.
04.2
015
23.
07
82.
97
6,0
84.7
0 0
.69
0.1
3 3
.54
6,8
78.2
4 -
- -
(19.
75)
13,
053.
59
196
Div
iden
d no
t rec
ongi
sed
at th
e en
d of
repo
rtin
g pe
riod
As
at M
arch
31, 2
017
As
at M
arch
31, 2
016
Div
iden
d pr
opos
ed @
of `
0.3
0 pe
r sha
re fo
r yea
r end
ed M
arch
31,
201
7 (@
of `
0.3
0 pe
r sha
re fo
r yea
r end
ed
Mar
ch 3
1, 2
016)
fully
pai
d eq
uity
sha
res.
Pro
pose
d di
vide
dn is
sub
ject
to th
e ap
prov
al o
f sha
reho
lder
s in
the
ensu
ing
Annu
al G
ener
al M
eetin
g.
300
300
As p
er o
ur re
port
of e
ven
date
atta
ched
For O
P T
ulsy
an &
Co.
For a
nd o
n be
half
of B
oard
of D
irect
ors
Cha
rtere
d Ac
coun
tant
s F.
R. N
o.:5
0002
8N(G
. Ana
ndan
aray
anan
) (V
ijay
Pal)
Com
pany
Sec
reta
ry
Exec
utiv
e D
irect
or (F
) (C
A. R
akes
h A
garw
al)
ACS-
1369
1Pa
rtner
M. N
o. 0
8180
8(P
K J
ain)
(V
ed P
raka
sh)
Dire
ctor
DIN
: 659
4855
Cha
irman
and
Man
agin
g D
irect
orD
IN: 0
2988
628
Dat
e: 2
9.05
.201
7Pl
ace:
New
Del
hi
197196
1. General information
Established in 1963 and domiciled in India, the Company is a Mini-Ratna public sector undertaking under the administrative control of Ministry of Commerce & Industry, Government of India. The registered office of the Company is situated at Core-1, Scope Complex, 7, Institutional Area, Lodi Road, New Delhi-110003, India. The company has 9 Regional Offices at various places in India and a wholly owned subsidiary MMTC Transnational Pte Ltd, at Singapore.
The principal activities of the Company are export of Minerals and import of Precious Metals, Non-ferrous metals, Fertilizers, Agro Products, coal and hydrocarbon etc.
The company’s trade activities span across various countries in Asia, Europe, Africa, Middle East, Latin America and North America.
2. First time adoption of Indian Accounting Standards (Ind-AS)
All companies (listed or unlisted) having net worth of ` 5,000 Million or more are required to adopt Ind AS. Accordingly, the company has adopted Ind-AS, in accordance with Notification dated February 16, 2015 issued by Ministry of Corporate Affairs, Government of India, with effect from April 01, 2016 with a transition date on April 01, 2015. The details of transition from previous GAAP to Ind-AS is given at Note 57.
3. Significant Accounting Policies
3.1 a) Statement of Compliance and basis of preparation of Financial Statements
The financial statements have been prepared in accordance with Indian Accounting Standards (Ind-AS) as notified by Ministry of Corporate Affairs, Government of India vide Notification dated February 16, 2015. Accounting policies have been applied consistently to all periods presented in these financial statements. The Financial Statements are prepared under historical cost convention from the books of accounts maintained under accrual basis except for certain financial instruments which are measured at fair value and in accordance with the Indian Accounting Standards prescribed under the Companies Act, 2013
b) Basis of Consolidation
MMTC Limited together with its subsidiaries is hereinafter referred to as ‘the Group’. The Company consolidates entities which it owns or controls as per the provisions of Ind AS-110. The consolidated financial statements comprise the financial statements of the Company and its subsidiaries as disclosed in Note 43. The financial statements of the Group companies are consolidated on a line-by-line basis and intra-group balances and transactions, including unrealized gain / loss from such transactions, are eliminated upon consolidation. These financial statements are prepared by applying uniform accounting policies in use at the Group. Non-controlling interests which represent part of the net profit or loss and net assets of subsidiaries that are not, directly or indirectly, owned or controlled by the group , are excluded.
Associates are entities over which the Group has significant influence but not control. Joint Ventures are entities in which the group has joint control and has rights to the net assets of the entity. Investments in associates and joint ventures are accounted for using the equity method of accounting as per the provisions of Ind AS-28. The investment is initially recognized at cost, and the carrying amount is increased or decreased to recognize the investor’s share of the profit or loss of the investee after the acquisition date.
3.2 Functional & presentation currency
All amounts included in the financial statements are reported in millions of Indian rupees (Rupees in millions) except number of equity shares and per share data and when otherwise indicated.
3.3 Use of estimates and judgment
The preparation of financial statements requires judgements, estimates and assumptions to be made that affect the reported amount of assets and liabilities, disclosure of contingent liabilities on the date of financial statements and the reported amount of revenues and expenses during the reporting period. Difference between the actual results and estimates are recognised in the period in which the results are known/materialised
NOTES TO CONSOLiDATED FiNANCiAL STATEMENTS FOR ThE YEAR ENDED MARCh 31, 2017
198
3.4 Functional and presentation currency
These financial statements are presented in Indian rupees, the national currency of India, which is the functional currency of the Company.
3.5 Revenue Recognition
i) Trading Income
Revenue from the sale of goods is measured at the fair value of the consideration received or receivable, net of returns and allowances, trade discount and volume rebates. Revenue is recognized when the significant risks and rewards of ownership have been transferred to the buyer, it is probable that economic benefits associated with the transaction will flow to the entity, the associated costs incurred or to be incurred in respect of the transaction can be measured reliably and there is no continuing management involvement with the goods. The point of transfer of risks and rewards depends upon the terms of the contract of sale with individual customers.
Purchases and Sales
a. In case of certain commodities import of which is canalized through the company, imported on ‘Government Account’ against authorization letter issued by Government of India, Purchase/ Sale is booked in the name of the Company
b. Products are also traded through the commodity exchanges. Purchase/ Sale is booked in respect of trade done through different commodity exchanges and is backed by physical delivery of goods.
c. Gold/Silver kept under deposit: As per the arrangements with the Suppliers of Gold/Silver, the metal is kept by the supplier with the company on unfixed price basis for subsequent withdrawal on loan or outright purchase basis.
(i) Purchases include gold/silver withdrawn from consignment deposit of the supplier on outright purchase basis for sale to exporters, as per the scheme of Exim Policy being operated by the Company as a nominated agency.
(ii) Purchase of Gold during the year for domestic sale is accounted for on withdrawal from the Gold/Silver consignment deposit of the supplier and fixation of price with the suppliers. The stock held by the company at year end as Gold/ Silver under Deposit is accounted for under current assets as ‘stock towards unbilled purchases’ and under current liability as
amount payable towards unbilled purchases’ at the bullion price prevailing as at the close of the year. However, customs duty paid in respect of balance in deposits is accounted for as prepaid expenses.
(iii) Gold/silver withdrawn on loan basis from the Gold/Silver under deposit, are booked as loan given to customers and grouped under financial assets. The corresponding liability towards the stocks received from foreign suppliers is grouped under Sundry Creditors. Loan/Sundry Creditors are adjusted when purchase and sales are booked.
d. In the case of replenishment basis, gold/silver booked by exporter by paying margin money, purchase is booked after “fixing” the price with the foreign suppliers. However, sale is booked when quantity is actually delivered after completion of export.
e. High Sea Sales
Sale during the course of import by transfer of documents of title i.e. high seas sale is booked upon transfer of documents of title to the goods in favour of buyer before the goods cross the custom frontiers of India.
ii) Other Operating Revenue
The income relating to the core activities of the company which are not included in revenue from sales / services for e.g. dispatch earned, subsidy, claims against losses on trade transactions, interest on credit sales and trade related advances (other than on overdue) etc., which are derived based on the terms of related trade agreements with business associates or schemes on related trade, are accounted for under ‘Other Operating Revenue’.
iii) Claims
Claims are recognized in the Statement of Profit & Loss (Net of any payable) on accrual basis including receivables from Govt. towards subsidy, cash incentives, reimbursement of losses etc, when it is not unreasonable to expect ultimate collection. Claims recognized but subsequently becoming doubtful are provided for through Statement of Profit and Loss. Insurance claims are accounted upon being accepted by the insurance company
iv) Service Income
When the outcome of a transaction involving the
199198
rendering of services can be estimated reliably, revenue associated with the transaction shall be recognized by reference to the stage of completion (Percentage of Completion Method) of the transaction at the end of the reporting period. The outcome of a transaction can be estimated reliably when all the following conditions are satisfied:-
a) The amount of revenue can be measured reliably;
b) It is probable that the economic benefits associated with the transaction will flow to the company ;
c) The stage of completion of the transaction can be measured reliably;
d) Costs incurred for the transaction and to complete the transaction can be measured reliably.
v) Dividend and interest income
Dividend income from investments is recognized when the Company’s right to receive payment is established and it is probable that the economic benefits associated with the transactions will flow to the Company and the amount of income can be measured reliably.
Interest income is recognised on a time proportion basis taking into account the amount outstanding and the effective interest rate, which is the rate that exactly discounts estimated future cash receipts through the expected life of the financial asset to the gross carrying amount of a financial asset.
vi) Revenue Recognition on Actual Realization
Revenue is recognized on accrual basis except in the following items which are accounted for on actual realization since realisability of such items is uncertain, in accordance with the provisions of Ind AS-18 :-
a) Duty credit / exemption under various promotional schemes of EXIM policy in force, Tax credit, refund of custom duty on account of survey shortage, and refund of income-tax/service tax / sales-tax /VAT and interest thereon etc.
b) Decrees pending for execution/contested dues and interest thereon, if any:
c) Interest on overdue recoverable where realisability is uncertain.
d) Liquidated damages on suppliers/underwriters.
3.6 Property, Plant and Equipments
All Property, Plant and Equipments (PPE) are stated at carrying value in accordance with previous GAAP, which
is used as deemed cost on the date of transition to Ind AS using the exemption granted under Ind AS 101.
The cost of an item of property, plant and equipment is recognized as an asset if, and only if it is probable that future economic benefits associated with the item will flow to the company and the cost of the item can be measured reliably. The cost of an item of PPE is the cash price equivalent at the recognition date. The cost of an item of PPE comprises:
i) Purchase price, including import duties and non-refundable purchase taxes, after deducting trade discounts and rebates.
ii) Costs directly attributable to bringing the PPE to the location and condition necessary for it to be capable of operating in the manner intended by management.
iii) The initial estimate of the costs of dismantling and removing the item and restoring the site on which it is located, the obligation for which the company incurs either when the PPE is acquired or as a consequence of having used the PPE during a particular period for purposes other than to produce inventories during that period.
The company has chosen the cost model of recognition and this model is applied to an entire class of PPE. After recognition as an asset, an item of PPE is carried at its cost less any accumulated depreciation and any accumulated impairment losses.
3.7 Intangible Assets
All Intangible Assets are stated at carrying value in accordance with previous GAAP, which is used as deemed cost on the date of transition to Ind AS using the exemption granted under Ind AS 101
Identifiable intangible assets are recognized when the company controls the asset; it is probable that future economic benefits expected with the respective assets will flow to the company for more than one economic period; and the cost of the asset can be measured reliably. At initial recognition, intangible assets are recognized at cost. Intangible assets are amortized on straight line basis over estimated useful lives from the date on which they are available for use. Softwares are amortized over its useful life subject to a maximum period of 5 years or over the license period as applicable.
3.8 Non-Current Assets Held for Sale
The company classifies a non-current asset (or disposal group of assets) as held for sale if its carrying amount
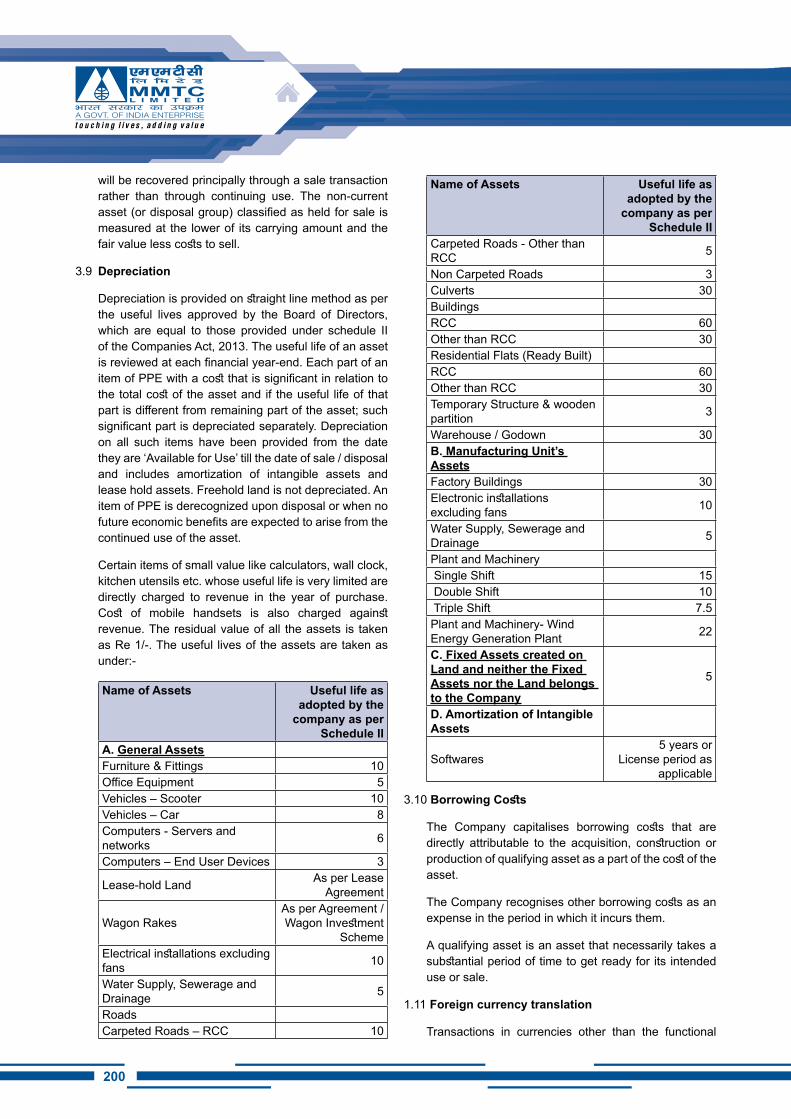
200
will be recovered principally through a sale transaction rather than through continuing use. The non-current asset (or disposal group) classified as held for sale is measured at the lower of its carrying amount and the fair value less costs to sell.
3.9 Depreciation
Depreciation is provided on straight line method as per the useful lives approved by the Board of Directors, which are equal to those provided under schedule II of the Companies Act, 2013. The useful life of an asset is reviewed at each financial year-end. Each part of an item of PPE with a cost that is significant in relation to the total cost of the asset and if the useful life of that part is different from remaining part of the asset; such significant part is depreciated separately. Depreciation on all such items have been provided from the date they are ‘Available for Use’ till the date of sale / disposal and includes amortization of intangible assets and lease hold assets. Freehold land is not depreciated. An item of PPE is derecognized upon disposal or when no future economic benefits are expected to arise from the continued use of the asset.
Certain items of small value like calculators, wall clock, kitchen utensils etc. whose useful life is very limited are directly charged to revenue in the year of purchase. Cost of mobile handsets is also charged against revenue. The residual value of all the assets is taken as Re 1/-. The useful lives of the assets are taken as under:-
Name of Assets Useful life as adopted by the
company as per Schedule ii
A. General Assets Furniture & Fittings 10Office Equipment 5Vehicles – Scooter 10Vehicles – Car 8Computers - Servers and networks 6
Computers – End User Devices 3
Lease-hold Land As per Lease Agreement
Wagon RakesAs per Agreement / Wagon Investment
SchemeElectrical installations excluding fans 10
Water Supply, Sewerage and Drainage 5
Roads Carpeted Roads – RCC 10
Name of Assets Useful life as adopted by the
company as per Schedule ii
Carpeted Roads - Other than RCC 5
Non Carpeted Roads 3Culverts 30Buildings RCC 60Other than RCC 30Residential Flats (Ready Built) RCC 60Other than RCC 30Temporary Structure & wooden partition 3
Warehouse / Godown 30B. Manufacturing Unit’s Assets
Factory Buildings 30Electronic installations excluding fans 10
Water Supply, Sewerage and Drainage 5
Plant and Machinery Single Shift 15 Double Shift 10 Triple Shift 7.5Plant and Machinery- Wind Energy Generation Plant 22
C. Fixed Assets created on Land and neither the Fixed Assets nor the Land belongs to the Company
5
D. Amortization of Intangible Assets
Softwares5 years or
License period as applicable
3.10 Borrowing Costs
The Company capitalises borrowing costs that are directly attributable to the acquisition, construction or production of qualifying asset as a part of the cost of the asset.
The Company recognises other borrowing costs as an expense in the period in which it incurs them.
A qualifying asset is an asset that necessarily takes a substantial period of time to get ready for its intended use or sale.
1.11 Foreign currency translation
Transactions in currencies other than the functional
201200
currency are recognized at the rates of exchange prevailing at the dates of the transactions.
At the end of each reporting period, monetary items denominated in foreign currencies are retranslated at the rates prevailing at that date. Non-monetary items carried at fair value that are denominated in foreign currencies are re-translated at the rates prevailing at the date when the fair value was determined. Non-monetary items that are measured in terms of historical cost in a foreign currency are not retranslated.
Foreign currency monetary items (except overdue recoverable where reliasibility is uncertain) are converted using the closing rate as defined in the Ind AS-21. Non-monetary items are reported using the exchange rate at the date of the transaction. The exchange difference gain/loss is recognized in the Statement of Profit and Loss.
Liability in foreign currency relating to acquisition of fixed assets is converted using the closing rate. The difference in exchange is recognized in the Statement of Profit and Loss.
3.12 Inventory
Inventories are stated at the lower of cost and net realisable value. Net realisable value represents the estimated selling price for inventories less all estimated costs of completion and costs necessary to make the sale. The method of determination of cost and valuation is as under:
a) Exports:
(i) Cost of export stocks is arrived at after including direct expenses incurred up to the point at which the stocks are lying. Similarly the realisable value is derived by deducting from the market price the expenses to be incurred from that point to the stage where they are sold.
(ii) In respect of mineral ores the realisable value of ores is worked out at the minimum of the Fe/Mn contents of the grade of the ore as per export contract and is compared with the weighted average cost at weighted average Fe/Mn contents/weighted average moisture contents of the ore. The embedded stocks of Iron ore are excluded from inventory and hence not valued.
b) Imports:
(i) The cost of imported stocks is arrived at by
working out the yearly regional weighted average cost except for Non-ferrous Metals where weighted average cost of remaining stock after including all expenses incurred up to the point at which they are lying is considered. However, where stocks are specifically identifiable, actual cost of the material including all expenses incurred up to the point at which they are lying is considered.
(ii) Gold/Silver purchased from foreign suppliers against booking by exporters under replenishment option and not delivered at the year-end are shown as stocks of company and valued at cost.
c) Domestic:
(i) The cost of gold/silver medallions and silver articles is arrived at by working out the yearly location-wise weighted average cost of material and cost of opening stock. Costs include manufacturing/fabrication charges, wastages and other direct cost.
(ii) In case of cut & polished stones and jewellery (finished/semi-finished) where stocks are specifically identifiable, actual cost of the material including all expenses incurred up to the point at which they are lying is considered. Costs include wastage and other direct manufacturing costs.
d) Packing material
Packing material is valued at lower of the cost or net realisable value.
e) Stocks with fabricators
Stocks with fabricators are taken as the stocks of the company, till adjustments.
3.13 Provisions
Provisions are recognized when the company has a present obligation (legal or constructive) as a result of a past event, it is probable that an outflow of economic benefits will be required to settle the obligation and a reliable estimate can be made of the amount of the obligation.
3.14 Contingent Liabilities / Assets
Contingent Liabilities
Contingent liabilities are not recognized but disclosed in Notes to the Accounts when the company has
202
possible obligation due to past events and existence of the obligation depends upon occurrence or non-occurrence of future events not wholly within the control of the company.
Contingent liabilities are assessed continuously to determine whether outflow of economic resources have become probable. If the outflow becomes probable then relative provision is recognized in the financial statements.
Where an entity is jointly and severally liable for an obligation, the part of the obligation that is expected to be met by other parties is treated as a contingent liability. The entity recognises a provision for the part of the obligation for which an outflow of resources embodying economic benefits is probable, except in the extremely rare circumstances where no reliable estimate can be made
Contingent Liabilities are disclosed in the General Notes forming part of the accounts
Contingent Assets
Contingent Assets are not recognised in the financial statements. Such contingent assets are assessed continuously and are disclosed in Notes when the inflow of economic benefits becomes probable. If it’s virtually certain that inflow of economic benefits will arise then such assets and the relative income will be recognised in the financial statements.
3.15 Leases
Assets held under lease, in which a significant portion of the risks and rewards of ownership are transferred to lessee are classified as finance leases. Other leases are classified as operating leases. The company normally enters into operating leases which are accounted for as under:-
(i) Rental income from operating leases is recognized on a straight-line basis over the term of the relevant lease.
(ii) Where the company is a lessee, operating lease payments are recognized as an expense on a straight-line basis over the lease term. Initial direct costs incurred in negotiating and arranging an operating lease are added to the carrying amount of the leased asset and recognized on a straight-line basis over the lease term.
3.16 Employee benefits
i. Provision for gratuity, leave encashment/availment
and long service benefits i.e. service award, compassionate gratuity, employees’ family benefit scheme and special benefit to MICA division employees is made on the basis of actuarial valuation using the projected unit credit method. Re-measurement, comprising actuarial gains and losses, the effect of the changes to the asset ceiling (if applicable) and the return on plan assets (excluding interest), is reflected immediately in the statement of financial position with a charge or credit recognized in other comprehensive income in the period in which they occur. Re-measurement recognized in other comprehensive income is reflected immediately in retained earnings and will not be reclassified to Statement of Profit or Loss.
ii. Provision for post-retirement medical benefit is made on defined contribution basis.
iii. Provident fund contribution is made to Provident Fund Trust on accrual basis.
iv. Payment of Ex-gratia and Notice pay on Voluntary Retirement are charged to revenue in the year incurred.
v. Superannuation plan, a defined contribution scheme is administered by Life Insurance Corporation of India (LIC). The Company makes contributions based on a specified percentage of each eligible employee’s salary.
Short-term employee benefit obligations
Short-term employee benefit obligations are measured on an undiscounted basis and are recorded as expense as the related service is provided. A liability is recognized for the amount expected to be paid under PLI / PRP Scheme, if the Company has a present legal or constructive obligation to pay this amount as a result of past service provided by the employee and the obligation can be estimated reliably.
3.17 Taxation
Income tax expense represents the sum of the tax currently payable and deferred tax.
Current tax
The tax currently payable is based on taxable profit for the year. Taxable profit differs from ‘profit before tax’ as reported in the statement of profit or loss and other comprehensive income/statement of profit or loss because of items of income or expense that are taxable or deductible in other years and items that are never taxable or deductible. The Company’s current tax
203202
is calculated using tax rates that have been enacted or substantively enacted by the end of the reporting period.
Deferred tax
Deferred tax is recognized on temporary differences between the carrying amounts of assets and liabilities in the financial statements and the corresponding tax bases used in the computation of taxable profit. Deferred tax liabilities are generally recognized for all taxable temporary differences. Deferred tax assets are generally recognized for all deductible temporary differences to the extent that it is probable that taxable profits will be available against which those deductible temporary differences can be utilized. Such deferred tax assets and liabilities are not recognized if the temporary difference arises from the initial recognition (other than in a business combination) of assets and liabilities in a transaction that affects neither the taxable profit nor the accounting profit. In addition, deferred tax liabilities are not recognized if the temporary difference arises from the initial recognition of goodwill.
Deferred tax liabilities are recognized for taxable temporary differences associated with investments in subsidiaries and associates, and interests in joint ventures, except where the company is able to control the reversal of the temporary difference and it is probable that the temporary difference will not reverse in the foreseeable future. Deferred tax assets arising from deductible temporary differences associated with such investments and interests are only recognized to the extent that it is probable that there will be sufficient taxable profits against which to utilize the benefits of the temporary differences and they are expected to reverse in the foreseeable future.
The carrying amount of deferred tax assets is reviewed at the end of each reporting period and reduced to the extent that it is no longer probable that sufficient taxable profits will be available to allow all or part of the asset to be recovered.
Deferred tax liabilities and assets are measured at the tax rates that are expected to apply in the period in which the liability is settled or the asset realised, based on tax rates (and tax laws) that have been enacted or substantively enacted by the end of the reporting period.
Current and deferred tax for the year
Current and deferred tax are recognized in profit or loss, except when they relate to items that are recognized in other comprehensive income or directly in equity,
in which case, the current and deferred tax are also recognized in other comprehensive income or directly in equity respectively. Where current tax or deferred tax arises from the initial accounting for a business combination, the tax effect is included in the accounting for the business combination.
3.18 Investment Property
Investment properties are properties held to earn rentals and/or for capital appreciation (including property under construction for such purposes). Investment properties are measured initially at cost, including transaction costs. All of the Company’s property interests held under operating leases to earn rentals or for capital appreciation purposes are accounted for as investment properties.
After initial recognition, the company measures investment property at cost.
An investment property is derecognized upon disposal or when the investment property is permanently withdrawn from use and no future economic benefits are expected from the disposal. Any gain or loss arising on de recognition of the property (calculated as the difference between the net disposal proceeds and the carrying amount of the asset) is included in profit or loss in the period in which the property is derecognized.
Investment properties to be depreciated in accordance to the class of asset that it belongs and the life of the asset shall be as conceived for the same class of asset at the Company.
3.19 impairment
If the recoverable amount of an asset (or cash-generating unit) is estimated to be less than its carrying amount, the carrying amount of the asset (or cash-generating unit) is reduced to its recoverable amount. An impairment loss is recognized immediately in profit or loss, unless the relevant asset is carried at a revalue amount, in which case the impairment loss is treated as a revaluation decrease.
Recoverable amount is the higher of fair value less costs of disposal and value in use. In assessing value in use, the estimated future cash flows are discounted to their present value using a pre-tax discount rate that reflects current market assessments of the time value of money and the risks specific to the asset for which the estimates of future cash flows have not been adjusted.
When an impairment loss subsequently reverses, the carrying amount of the asset (or a cash-generating unit)
204
is increased to the revised estimate of its recoverable amount, but so that the increased carrying amount does not exceed the carrying amount that would have been determined had no impairment loss been recognized for the asset (or cash-generating unit) in prior years. A reversal of an impairment loss is recognized immediately in profit or loss, unless the relevant asset is carried at a revalued amount, in which case the reversal of the impairment loss is treated as a revaluation increase.
At the end of each reporting period, the company reviews the carrying amounts of its tangible, intangible assets to determine whether there is any indication that those assets have suffered an impairment loss. If any such indication exists, the recoverable amount of the asset is estimated in order to determine the extent of the impairment loss (if any). When it is not possible to estimate the recoverable amount of an individual asset, The Company estimates the recoverable amount of the cash-generating unit to which the asset belongs. When a reasonable and consistent basis of allocation can be identified,
Intangible assets with indefinite useful lives and intangible assets not yet available for use are tested for impairment at least annually, and whenever there is an indication that the asset may be impaired.
Impairment of financial assets
Financial assets, other than those at Fair Value through Profit and Loss (FVTPL), are assessed for indicators of impairment at the end of each reporting period. Financial assets are considered to be impaired when there is objective evidence that, as a result of one or more events that occurred after the initial recognition of the financial asset, the estimated future cash flows of the investment have been affected. For Available for Sale (AFS) equity investments, a significant or prolonged decline in the fair value of the security below its cost is considered to be objective evidence of impairment.
For all other financial assets, objective evidence of impairment could include:
• Significant financial difficulty of the issuer or counterparty;
• Breach of contract, such as a default or delinquency in interest or principal payments;
• It becoming probable that the borrower will enter bankruptcy or financial re-organisation; or the disappearance of an active market for that financial asset because of financial difficulties.
For certain categories of financial assets, such as
trade receivables, assets are assessed for impairment on individual basis. Objective evidence of impairment for a portfolio of receivables could include company’s past experience of collecting payments, an increase in the number of delayed payments in the portfolio past the average credit period of zero days, as well as observable changes in national or local economic conditions that correlate with default on receivables.
For financial assets that are carried at cost, the amount of impairment loss is measured as the difference between the asset’s carrying amount and the present value of the estimated future cash flows discounted at the current market rate of return for a similar financial asset. Such impairment loss will not be reversed in subsequent periods
The carrying amount of the financial asset is reduced by the impairment loss directly for all financial assets with the exception of trade receivables; such impairment loss is reduced through the use of an allowance account for respective financial asset. When a trade receivable is considered uncollectible, it is written off against the allowance account. Subsequent recoveries of amounts previously written off are credited against the allowance account. Changes in the carrying amount of the allowance account are recognized in profit or loss.
For financial assets measured at amortised cost, if, in a subsequent period, the amount of the impairment loss decreases and the decrease can be related objectively to an event occurring after the impairment was recognized, the previously recognized impairment loss is reversed through profit or loss to the extent that the carrying amount of the investment at the date the impairment is reversed does not exceed what the amortised cost would have been had the impairment not been recognized.
De-recognition of financial assets
The Company de-recognises a financial asset when the contractual rights to the cash flows from the asset expire, or when it transfers the financial asset and substantially all the risks and rewards of ownership of the asset to another party. If the Company neither transfers nor retains substantially all the risks and rewards of ownership and continues to control the transferred asset, The Company recognises its retained interest in the asset and an associated liability for amounts it may have to pay. If the Company retains substantially all the risks and rewards of ownership of a transferred financial asset, the Company continues to recognise the financial asset and also recognises a collateralised borrowing for the proceeds received.
205204
On de-recognition of a financial asset in its entirety, the difference between the asset’s carrying amount and the sum of the consideration received and receivable and the cumulative gain or loss that had been recognized in other comprehensive income and accumulated in equity is recognized in profit or loss.
3.20 Earnings per share
A basic earnings per equity is computed by dividing the net profit attributable to the equity holders of the company by the weighted average number of equity shares outstanding during the period. Diluted earnings per equity share is computed by dividing the net profit attributable to the equity holders of the company by the weighted average number of equity shares considered for deriving basic earnings per equity share and also the weighted average number of equity shares that could have been issued upon conversion of all dilutive potential equity shares. The dilutive potential equity shares are adjusted for the proceeds receivable had the equity shares been actually issued at fair value (i.e. the average market value of the outstanding equity shares). Dilutive potential equity shares are deemed converted as of the beginning of the period, unless issued at a later date. Dilutive potential equity shares are determined independently for each period presented.
The number of equity shares and potentially dilutive equity shares are adjusted retrospectively for all periods presented for any shares splits and bonus shares issues including for changes effected prior to the approval of the financial statements by the Board of Directors.
3.21 Discontinued operations
A discontinued operation is a component of the Company’s business that represents a separate line of business that has been disposed off or is held for sale, or is a subsidiary acquired exclusively with a view to resale. Classification as a discontinued operation occurs upon the earlier of disposal or when the operation meets the criteria to be classified as held for sale.
3.22 Financial instruments
i) Non-derivative financial instruments
Non-derivative financial instruments consist of:
• financial assets, which include cash and cash equivalents, trade receivables, unbilled revenues, finance lease receivables, employee and other advances, investments in equity and
debt securities and eligible current and non-current assets;
• Financial liabilities, which include long and short-term loans and borrowings, bank overdrafts, trade payables, eligible current and non-current liabilities.
Non derivative financial instruments are recognized initially at fair value including any directly attributable transaction costs. Financial assets are derecognized when substantial risks and rewards of ownership of the financial asset have been transferred. In cases where substantial risks and rewards of ownership of the financial assets are neither transferred nor retained, financial assets are derecognized only when the Company has not retained control over the financial asset.
Subsequent to initial recognition, non-derivative financial instruments are measured as described below:
a) Cash and cash equivalents
For the purposes of the cash flow statement, cash and cash equivalents include cash in hand, at banks and demand deposits with banks, net of outstanding bank overdrafts that are repayable on demand and are considered part of the Company’s cash management system. In the statement of financial position, bank overdrafts are presented under borrowings within current liabilities.
b) Investments in liquid mutual funds, equity securities (other than Subsidiaries, Joint Venture and Associates) are valued at their fair value. These investments are measured at fair value and changes therein, other than impairment losses, are recognized in other comprehensive income and presented within equity, net of taxes. The impairment losses, if any, are reclassified from equity into statement of income. When an available for sale financial asset is derecognized, the related cumulative gain or loss recognised in equity is transferred to the statement of income.
c) Loans and receivables
Loans and receivables are non-derivative financial assets with fixed or determinable
206
payments that are not quoted in an active market. They are presented as current assets, except for those maturing later than 12 months after the reporting date which are presented as non-current assets. Loans and receivables are initially recognized at fair value plus directly attributable transaction costs and subsequently measured at amortized cost using the effective interest method, less any impairment losses. Loans and receivables comprise trade receivables, unbilled revenues and other assets.
The company estimates the un-collectability of accounts receivable by analysing historical payment patterns, customer concentrations, customer credit-worthiness and current economic trends. If the financial condition of a customer deteriorates, additional allowances may be required.
d) Trade and other payables
Trade and other payables are initially recognized at fair value, and subsequently carried at amortized cost using the effective interest method. For these financial instruments, the carrying amounts approximate fair value due to the short term maturity of these instruments.
e) Investments in Subsidiary, Associates and Joint Venture
The company accounts investment in subsidiary, joint ventures and associates at cost
An entity controlled by the company is considered as a subsidiary of the company.
Investments in subsidiary company outside India are translated at the rate of exchange prevailing on the date of acquisition.
Investments where the company has significant influence are classified as associates. Significant influence is the power to participate in the financial and operating policy decisions of the investee but is not control or joint control over those policies.
A joint arrangement whereby the parties that have joint control of the arrangement have rights to the net assets of the joint arrangement is classified as a joint venture. Joint control is the contractually agreed sharing of control of an arrangement, which exists only when decisions about the relevant activities require unanimous consent of the parties sharing control.
ii) Derivative financial instruments
The Company is exposed to foreign currency fluctuations on foreign currency assets, liabilities, net investment in foreign operations and forecasted cash flows denominated in foreign currency.
The Company limits the effect of foreign exchange rate fluctuations by following established risk management policies including the use of derivatives. The Company enters into derivative financial instruments where the counterparty is primarily a bank.
Derivatives are recognized and measured at fair value. Attributable transaction costs are recognized in statement of income as cost.
Subsequent to initial recognition, derivative financial instruments are measured as described below:
a) Cash flow hedges
Changes in the fair value of the derivative hedging instrument designated as a cash flow hedge are recognized in other comprehensive income and held in cash flow hedging reserve, net of taxes, a component of equity, to the extent that the hedge is effective. To the extent that the hedge is ineffective, changes in fair value are recognized in the statement of income and reported within foreign exchange gains/ (losses), net within results from operating activities. If the hedging instrument no longer meets the criteria for hedge accounting, then hedge accounting is discontinued prospectively. The cumulative gain or loss previously recognized in the cash flow hedging reserve is transferred to the statement of income upon the occurrence of the related forecasted transaction. If the forecasted transaction is no longer expected to occur, such cumulative balance is immediately recognized in the statement of income.
207206
b) Others
Changes in fair value of foreign currency derivative instruments neither designated as cash flow hedges nor hedges of net investment in foreign operations are recognized in the statement of income and reported within foreign exchange gains/ (losses), net within results from operating activities.
Changes in fair value and gains/ (losses) on settlement of foreign currency derivative instruments relating to borrowings, which have not been designated as hedges are recorded in finance expense.
3.23 Segment Information
The Chairman cum Managing Director (CMD) of the Company has been identified as the Chief Operating Decision Maker (CODM) as defined by Ind AS-108, “Operating Segments.” The CMD of the Company evaluates the segments based on their revenue growth and operating income.
The Company has identified its Operating Segments as Minerals, Precious Metals, Metals, Agro Products, Coal
& Hydrocarbon, Fertilizer and Others.
The Assets and liabilities used in the Company’s business that are not identified to any of the operating segments are shown as unallocable assets/liabilities. Management believes that it is currently not practicable to provide segment disclosures relating to total assets and liabilities since a meaningful segregation of the available data is onerous.
3.24 Prior Period Errors
Errors of material amount relating to prior period(s) are disclosed by a note with nature of prior period errors, amount of correction of each such prior period presented retrospectively, to the extent practicable along with change in basic and diluted earnings per share. However, where retrospective restatement is not practicable for a particular period then the circumstances that lead to the existence of that condition and the description of how and from where the error is corrected are disclosed in Notes to Accounts. Taking into account the nature of activities of the company, prior period errors are considered material if the items of income / expenditure collectively (net) exceed 0.5% of sales turnover of the company.
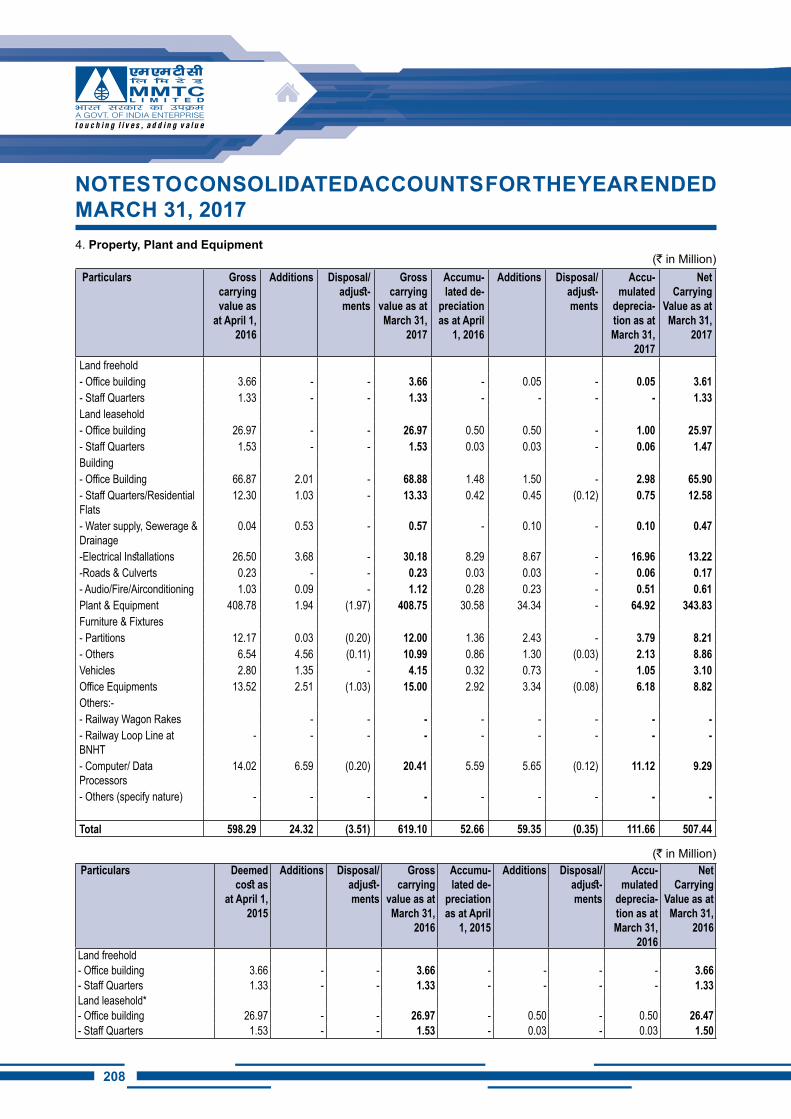
208
4. Property, Plant and Equipment(` in Million)
Particulars Gross carrying value as
at April 1, 2016
Additions Disposal/adjust-ments
Gross carrying
value as at March 31,
2017
Accumu-lated de-
preciation as at April
1, 2016
Additions Disposal/adjust-ments
Accu-mulated
deprecia-tion as at March 31,
2017
Net Carrying
Value as at March 31,
2017
Land freehold- Office building 3.66 - - 3.66 - 0.05 - 0.05 3.61 - Staff Quarters 1.33 - - 1.33 - - - - 1.33 Land leasehold- Office building 26.97 - - 26.97 0.50 0.50 - 1.00 25.97 - Staff Quarters 1.53 - - 1.53 0.03 0.03 - 0.06 1.47 Building - Office Building 66.87 2.01 - 68.88 1.48 1.50 - 2.98 65.90 - Staff Quarters/Residential Flats
12.30 1.03 - 13.33 0.42 0.45 (0.12) 0.75 12.58
- Water supply, Sewerage & Drainage
0.04 0.53 - 0.57 - 0.10 - 0.10 0.47
-Electrical Installations 26.50 3.68 - 30.18 8.29 8.67 - 16.96 13.22 -Roads & Culverts 0.23 - - 0.23 0.03 0.03 - 0.06 0.17 - Audio/Fire/Airconditioning 1.03 0.09 - 1.12 0.28 0.23 - 0.51 0.61 Plant & Equipment 408.78 1.94 (1.97) 408.75 30.58 34.34 - 64.92 343.83 Furniture & Fixtures- Partitions 12.17 0.03 (0.20) 12.00 1.36 2.43 - 3.79 8.21 - Others 6.54 4.56 (0.11) 10.99 0.86 1.30 (0.03) 2.13 8.86 Vehicles 2.80 1.35 - 4.15 0.32 0.73 - 1.05 3.10 Office Equipments 13.52 2.51 (1.03) 15.00 2.92 3.34 (0.08) 6.18 8.82 Others:-- Railway Wagon Rakes - - - - - - - - - Railway Loop Line at BNHT
- - - - - - - - -
- Computer/ Data Processors
14.02 6.59 (0.20) 20.41 5.59 5.65 (0.12) 11.12 9.29
- Others (specify nature) - - - - - - - - -
Total 598.29 24.32 (3.51) 619.10 52.66 59.35 (0.35) 111.66 507.44
(` in Million) Particulars Deemed
cost as at April 1,
2015
Additions Disposal/adjust-ments
Gross carrying
value as at March 31,
2016
Accumu-lated de-
preciation as at April
1, 2015
Additions Disposal/adjust-ments
Accu-mulated
deprecia-tion as at March 31,
2016
Net Carrying
Value as at March 31,
2016
Land freehold- Office building 3.66 - - 3.66 - - - - 3.66 - Staff Quarters 1.33 - - 1.33 - - - - 1.33 Land leasehold*- Office building 26.97 - - 26.97 - 0.50 - 0.50 26.47 - Staff Quarters 1.53 - - 1.53 - 0.03 - 0.03 1.50
NOTES TO CONSOLiDATED ACCOUNTS FOR ThE YEAR ENDED MARCh 31, 2017
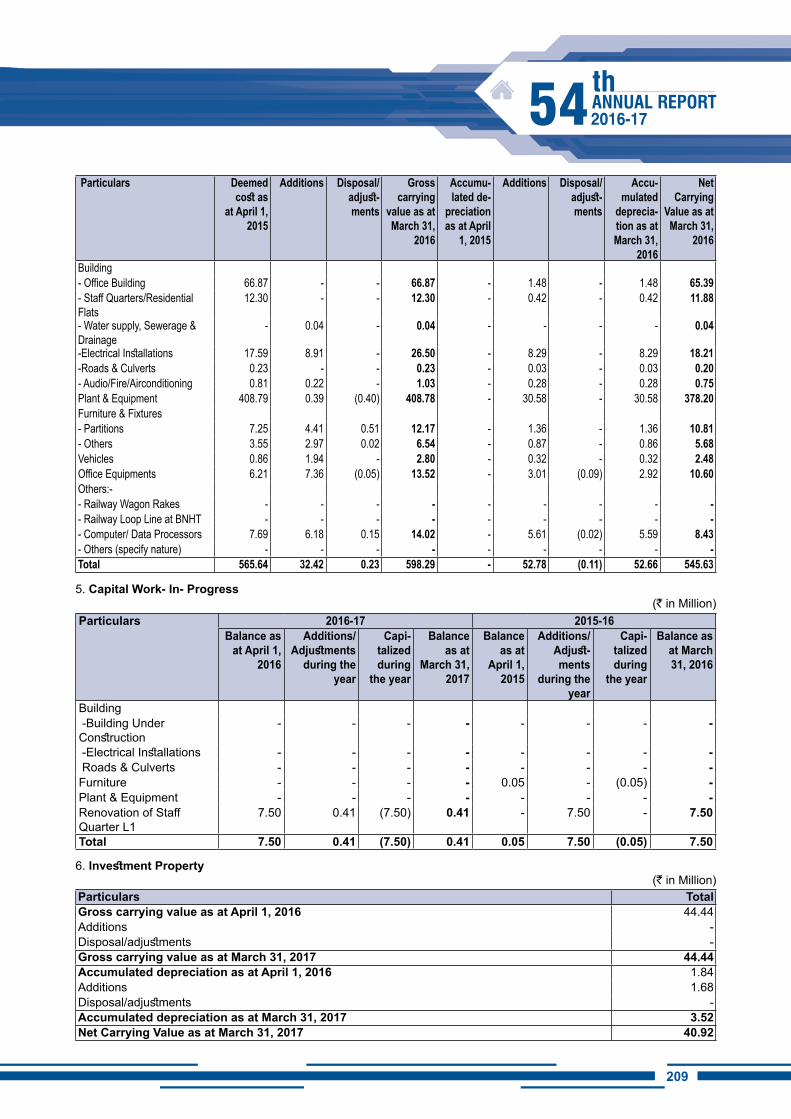
209208
Particulars Deemed cost as
at April 1, 2015
Additions Disposal/adjust-ments
Gross carrying
value as at March 31,
2016
Accumu-lated de-
preciation as at April
1, 2015
Additions Disposal/adjust-ments
Accu-mulated
deprecia-tion as at March 31,
2016
Net Carrying
Value as at March 31,
2016
Building - Office Building 66.87 - - 66.87 - 1.48 - 1.48 65.39 - Staff Quarters/Residential Flats
12.30 - - 12.30 - 0.42 - 0.42 11.88
- Water supply, Sewerage & Drainage
- 0.04 - 0.04 - - - - 0.04
-Electrical Installations 17.59 8.91 - 26.50 - 8.29 - 8.29 18.21 -Roads & Culverts 0.23 - - 0.23 - 0.03 - 0.03 0.20 - Audio/Fire/Airconditioning 0.81 0.22 - 1.03 - 0.28 - 0.28 0.75 Plant & Equipment 408.79 0.39 (0.40) 408.78 - 30.58 - 30.58 378.20 Furniture & Fixtures- Partitions 7.25 4.41 0.51 12.17 - 1.36 - 1.36 10.81 - Others 3.55 2.97 0.02 6.54 - 0.87 - 0.86 5.68 Vehicles 0.86 1.94 - 2.80 - 0.32 - 0.32 2.48 Office Equipments 6.21 7.36 (0.05) 13.52 - 3.01 (0.09) 2.92 10.60 Others:-- Railway Wagon Rakes - - - - - - - - - - Railway Loop Line at BNHT - - - - - - - - - - Computer/ Data Processors 7.69 6.18 0.15 14.02 - 5.61 (0.02) 5.59 8.43 - Others (specify nature) - - - - - - - - - Total 565.64 32.42 0.23 598.29 - 52.78 (0.11) 52.66 545.63
5. Capital Work- In- Progress(` in Million)
Particulars 2016-17 2015-16Balance as
at April 1, 2016
Additions/Adjustments
during the year
Capi-talized during
the year
Balance as at
March 31, 2017
Balance as at
April 1, 2015
Additions/Adjust-ments
during the year
Capi-talized during
the year
Balance as at March 31, 2016
Building -Building Under Construction
- - - - - - - -
-Electrical Installations - - - - - - - - Roads & Culverts - - - - - - - - Furniture - - - - 0.05 - (0.05) - Plant & Equipment - - - - - - - - Renovation of Staff Quarter L1
7.50 0.41 (7.50) 0.41 - 7.50 - 7.50
Total 7.50 0.41 (7.50) 0.41 0.05 7.50 (0.05) 7.50
6. Investment Property(` in Million)
Particulars Total Gross carrying value as at April 1, 2016 44.44 Additions - Disposal/adjustments - Gross carrying value as at March 31, 2017 44.44 Accumulated depreciation as at April 1, 2016 1.84 Additions 1.68 Disposal/adjustments - Accumulated depreciation as at March 31, 2017 3.52 Net Carrying Value as at March 31, 2017 40.92
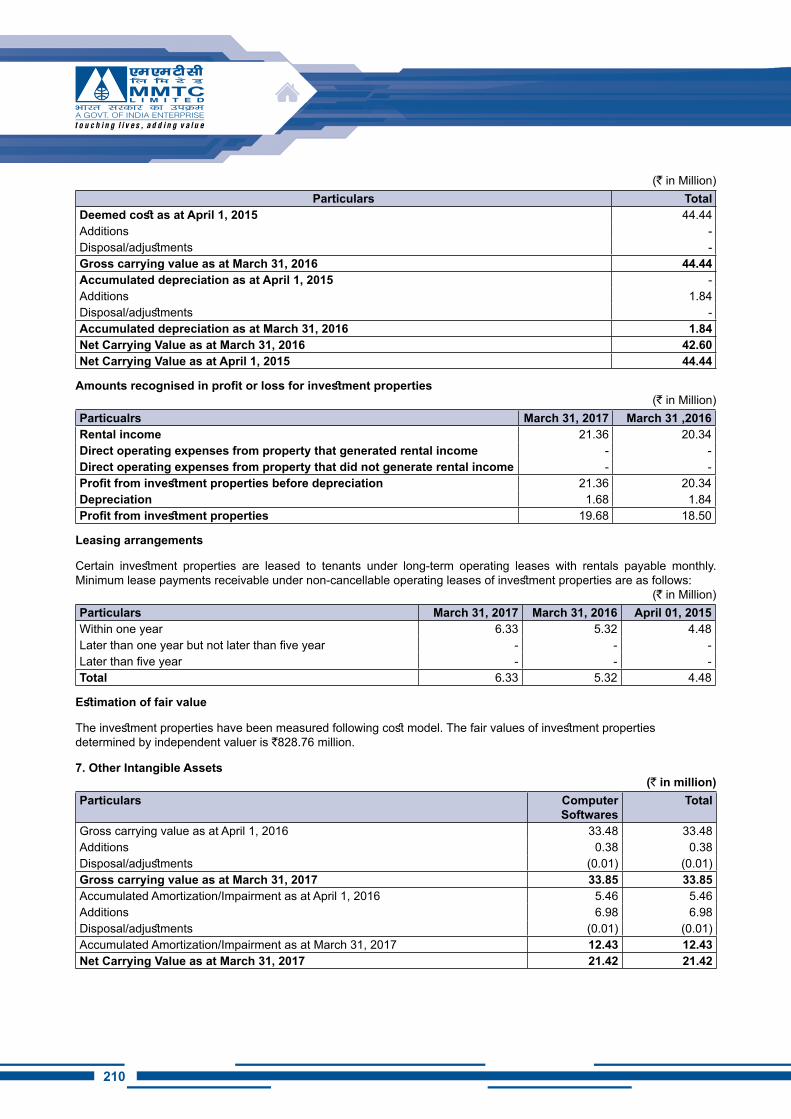
210
(` in Million)Particulars Total
Deemed cost as at April 1, 2015 44.44 Additions - Disposal/adjustments - Gross carrying value as at March 31, 2016 44.44 Accumulated depreciation as at April 1, 2015 - Additions 1.84 Disposal/adjustments - Accumulated depreciation as at March 31, 2016 1.84 Net Carrying Value as at March 31, 2016 42.60 Net Carrying Value as at April 1, 2015 44.44
Amounts recognised in profit or loss for investment properties(` in Million)
Particualrs March 31, 2017 March 31 ,2016Rental income 21.36 20.34 Direct operating expenses from property that generated rental income - - Direct operating expenses from property that did not generate rental income - - Profit from investment properties before depreciation 21.36 20.34 Depreciation 1.68 1.84 Profit from investment properties 19.68 18.50
Leasing arrangements
Certain investment properties are leased to tenants under long-term operating leases with rentals payable monthly. Minimum lease payments receivable under non-cancellable operating leases of investment properties are as follows:
(` in Million)Particulars March 31, 2017 March 31, 2016 April 01, 2015Within one year 6.33 5.32 4.48Later than one year but not later than five year - - - Later than five year - - - Total 6.33 5.32 4.48
Estimation of fair value
The investment properties have been measured following cost model. The fair values of investment properties determined by independent valuer is `828.76 million.
7. Other Intangible Assets (` in million)
Particulars Computer Softwares
Total
Gross carrying value as at April 1, 2016 33.48 33.48 Additions 0.38 0.38 Disposal/adjustments (0.01) (0.01)Gross carrying value as at March 31, 2017 33.85 33.85 Accumulated Amortization/Impairment as at April 1, 2016 5.46 5.46 Additions 6.98 6.98 Disposal/adjustments (0.01) (0.01)Accumulated Amortization/Impairment as at March 31, 2017 12.43 12.43 Net Carrying Value as at March 31, 2017 21.42 21.42
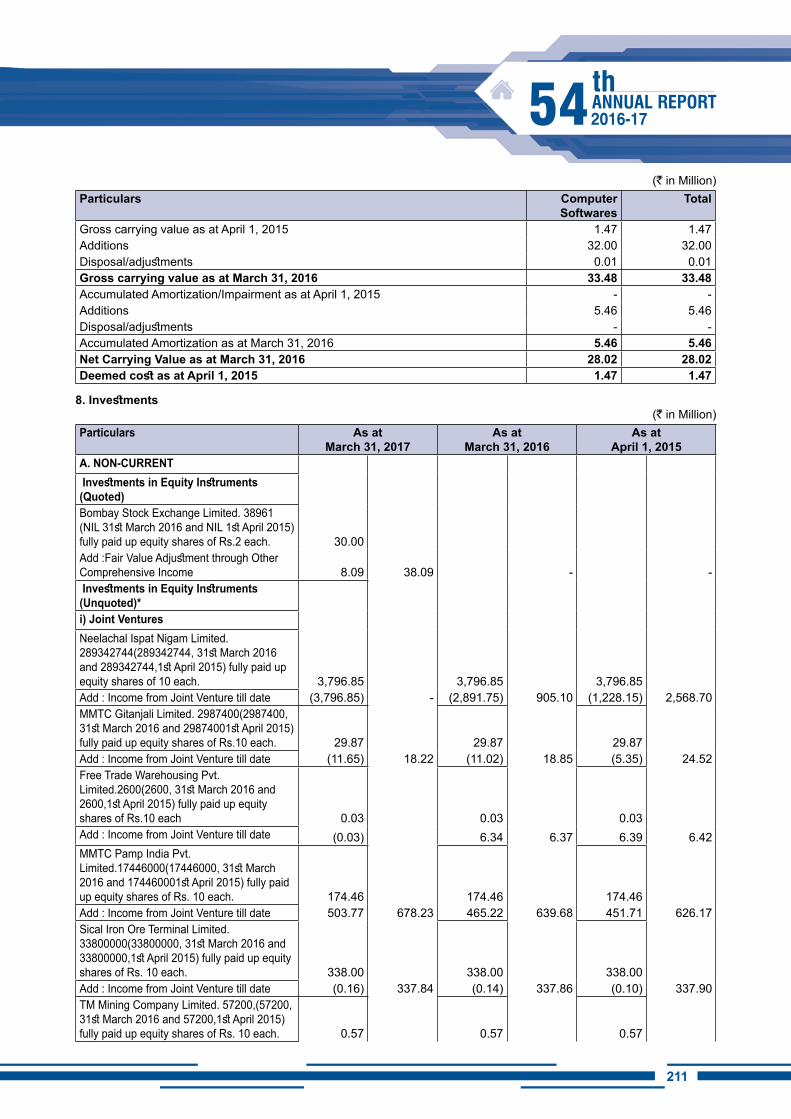
211210
(` in Million)Particulars Computer
Softwares Total
Gross carrying value as at April 1, 2015 1.47 1.47 Additions 32.00 32.00 Disposal/adjustments 0.01 0.01 Gross carrying value as at March 31, 2016 33.48 33.48 Accumulated Amortization/Impairment as at April 1, 2015 - - Additions 5.46 5.46 Disposal/adjustments - - Accumulated Amortization as at March 31, 2016 5.46 5.46 Net Carrying Value as at March 31, 2016 28.02 28.02 Deemed cost as at April 1, 2015 1.47 1.47
8. Investments(` in Million)
Particulars As at March 31, 2017
As at March 31, 2016
As at April 1, 2015
A. NON-CURRENT Investments in Equity Instruments (Quoted)Bombay Stock Exchange Limited. 38961 (NIL 31st March 2016 and NIL 1st April 2015) fully paid up equity shares of Rs.2 each. 30.00 Add :Fair Value Adjustment through Other Comprehensive Income 8.09 38.09 - - Investments in Equity Instruments (Unquoted)*i) Joint Ventures Neelachal Ispat Nigam Limited. 289342744(289342744, 31st March 2016 and 289342744,1st April 2015) fully paid up equity shares of 10 each. 3,796.85 3,796.85 3,796.85 Add : Income from Joint Venture till date (3,796.85) - (2,891.75) 905.10 (1,228.15) 2,568.70 MMTC Gitanjali Limited. 2987400(2987400, 31st March 2016 and 29874001st April 2015) fully paid up equity shares of Rs.10 each. 29.87 29.87 29.87 Add : Income from Joint Venture till date (11.65) 18.22 (11.02) 18.85 (5.35) 24.52 Free Trade Warehousing Pvt. Limited.2600(2600, 31st March 2016 and 2600,1st April 2015) fully paid up equity shares of Rs.10 each 0.03 0.03 0.03 Add : Income from Joint Venture till date (0.03) 6.34 6.37 6.39 6.42 MMTC Pamp India Pvt. Limited.17446000(17446000, 31st March 2016 and 174460001st April 2015) fully paid up equity shares of Rs. 10 each. 174.46 174.46 174.46 Add : Income from Joint Venture till date 503.77 678.23 465.22 639.68 451.71 626.17 Sical Iron Ore Terminal Limited. 33800000(33800000, 31st March 2016 and 33800000,1st April 2015) fully paid up equity shares of Rs. 10 each. 338.00 338.00 338.00 Add : Income from Joint Venture till date (0.16) 337.84 (0.14) 337.86 (0.10) 337.90 TM Mining Company Limited. 57200,(57200, 31st March 2016 and 57200,1st April 2015) fully paid up equity shares of Rs. 10 each. 0.57 0.57 0.57
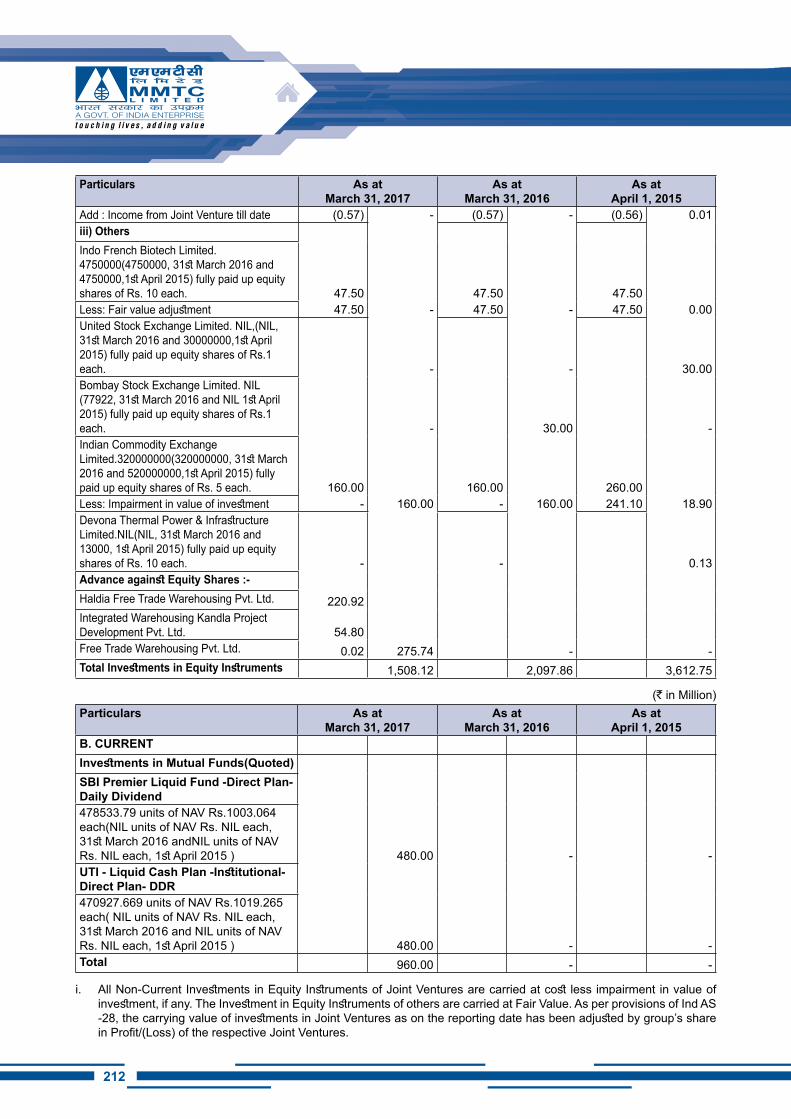
212
Particulars As at March 31, 2017
As at March 31, 2016
As at April 1, 2015
Add : Income from Joint Venture till date (0.57) - (0.57) - (0.56) 0.01 iii) OthersIndo French Biotech Limited. 4750000(4750000, 31st March 2016 and 4750000,1st April 2015) fully paid up equity shares of Rs. 10 each. 47.50 47.50 47.50 Less: Fair value adjustment 47.50 - 47.50 - 47.50 0.00 United Stock Exchange Limited. NIL,(NIL, 31st March 2016 and 30000000,1st April 2015) fully paid up equity shares of Rs.1 each. - - 30.00 Bombay Stock Exchange Limited. NIL (77922, 31st March 2016 and NIL 1st April 2015) fully paid up equity shares of Rs.1 each. - 30.00 - Indian Commodity Exchange Limited.320000000(320000000, 31st March 2016 and 520000000,1st April 2015) fully paid up equity shares of Rs. 5 each. 160.00 160.00 260.00 Less: Impairment in value of investment - 160.00 - 160.00 241.10 18.90 Devona Thermal Power & Infrastructure Limited.NIL(NIL, 31st March 2016 and 13000, 1st April 2015) fully paid up equity shares of Rs. 10 each. - - 0.13 Advance against Equity Shares :-Haldia Free Trade Warehousing Pvt. Ltd. 220.92 Integrated Warehousing Kandla Project Development Pvt. Ltd. 54.80 Free Trade Warehousing Pvt. Ltd. 0.02 275.74 - - Total Investments in Equity Instruments 1,508.12 2,097.86 3,612.75
(` in Million)Particulars As at
March 31, 2017As at
March 31, 2016As at
April 1, 2015B. CURRENTInvestments in Mutual Funds(Quoted)SBI Premier Liquid Fund -Direct Plan- Daily Dividend478533.79 units of NAV Rs.1003.064 each(NIL units of NAV Rs. NIL each, 31st March 2016 andNIL units of NAV Rs. NIL each, 1st April 2015 ) 480.00 - - UTI - Liquid Cash Plan -Institutional-Direct Plan- DDR470927.669 units of NAV Rs.1019.265 each( NIL units of NAV Rs. NIL each, 31st March 2016 and NIL units of NAV Rs. NIL each, 1st April 2015 ) 480.00 - - Total 960.00 - -
i. All Non-Current Investments in Equity Instruments of Joint Ventures are carried at cost less impairment in value of investment, if any. The Investment in Equity Instruments of others are carried at Fair Value. As per provisions of Ind AS -28, the carrying value of investments in Joint Ventures as on the reporting date has been adjusted by group’s share in Profit/(Loss) of the respective Joint Ventures.
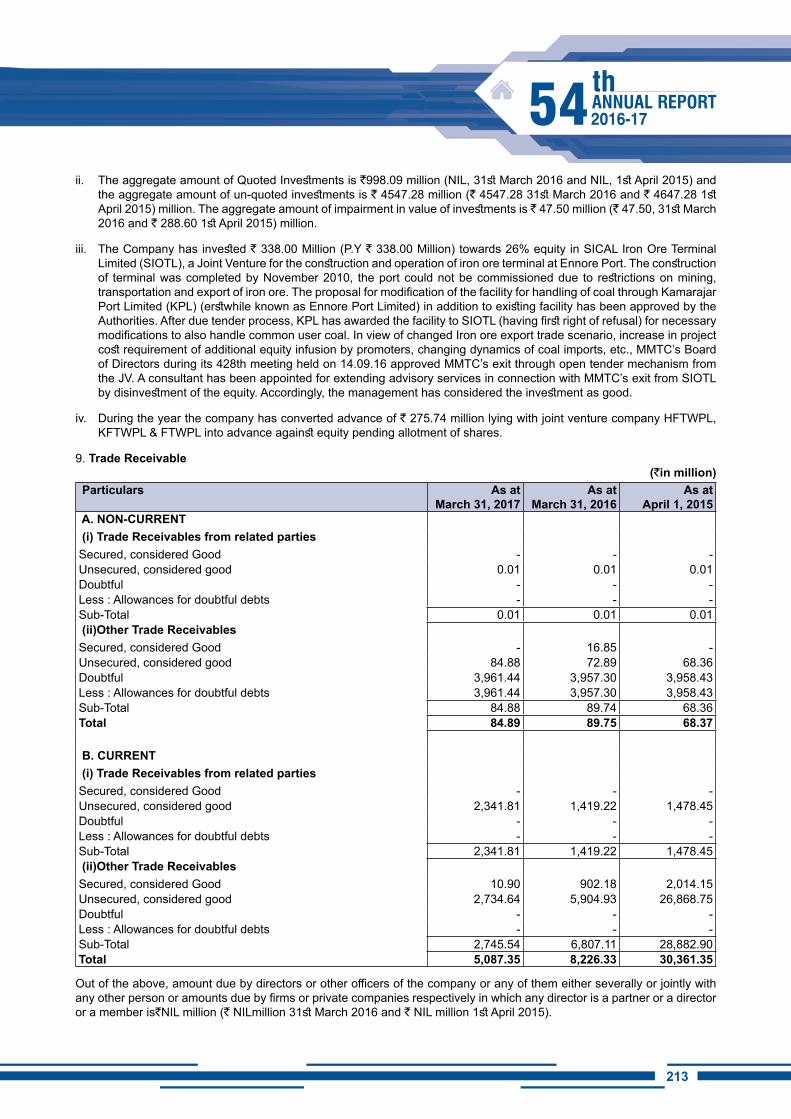
213212
ii. The aggregate amount of Quoted Investments is `998.09 million (NIL, 31st March 2016 and NIL, 1st April 2015) and the aggregate amount of un-quoted investments is ` 4547.28 million (` 4547.28 31st March 2016 and ` 4647.28 1st April 2015) million. The aggregate amount of impairment in value of investments is ` 47.50 million (` 47.50, 31st March 2016 and ` 288.60 1st April 2015) million.
iii. The Company has invested ` 338.00 Million (P.Y ` 338.00 Million) towards 26% equity in SICAL Iron Ore Terminal Limited (SIOTL), a Joint Venture for the construction and operation of iron ore terminal at Ennore Port. The construction of terminal was completed by November 2010, the port could not be commissioned due to restrictions on mining, transportation and export of iron ore. The proposal for modification of the facility for handling of coal through Kamarajar Port Limited (KPL) (erstwhile known as Ennore Port Limited) in addition to existing facility has been approved by the Authorities. After due tender process, KPL has awarded the facility to SIOTL (having first right of refusal) for necessary modifications to also handle common user coal. In view of changed Iron ore export trade scenario, increase in project cost requirement of additional equity infusion by promoters, changing dynamics of coal imports, etc., MMTC’s Board of Directors during its 428th meeting held on 14.09.16 approved MMTC’s exit through open tender mechanism from the JV. A consultant has been appointed for extending advisory services in connection with MMTC’s exit from SIOTL by disinvestment of the equity. Accordingly, the management has considered the investment as good.
iv. During the year the company has converted advance of ` 275.74 million lying with joint venture company HFTWPL, KFTWPL & FTWPL into advance against equity pending allotment of shares.
9. Trade Receivable(`in million)
Particulars As at March 31, 2017
As at March 31, 2016
As at April 1, 2015
A. NON-CURRENT (i) Trade Receivables from related parties Secured, considered Good - - - Unsecured, considered good 0.01 0.01 0.01 Doubtful - - - Less : Allowances for doubtful debts - - - Sub-Total 0.01 0.01 0.01 (ii)Other Trade Receivables Secured, considered Good - 16.85 - Unsecured, considered good 84.88 72.89 68.36 Doubtful 3,961.44 3,957.30 3,958.43 Less : Allowances for doubtful debts 3,961.44 3,957.30 3,958.43 Sub-Total 84.88 89.74 68.36 Total 84.89 89.75 68.37
B. CURRENT (i) Trade Receivables from related parties Secured, considered Good - - - Unsecured, considered good 2,341.81 1,419.22 1,478.45 Doubtful - - - Less : Allowances for doubtful debts - - - Sub-Total 2,341.81 1,419.22 1,478.45 (ii)Other Trade Receivables Secured, considered Good 10.90 902.18 2,014.15 Unsecured, considered good 2,734.64 5,904.93 26,868.75 Doubtful - - - Less : Allowances for doubtful debts - - - Sub-Total 2,745.54 6,807.11 28,882.90 Total 5,087.35 8,226.33 30,361.35
Out of the above, amount due by directors or other officers of the company or any of them either severally or jointly with any other person or amounts due by firms or private companies respectively in which any director is a partner or a director or a member is`NIL million (` NILmillion 31st March 2016 and ` NIL million 1st April 2015).
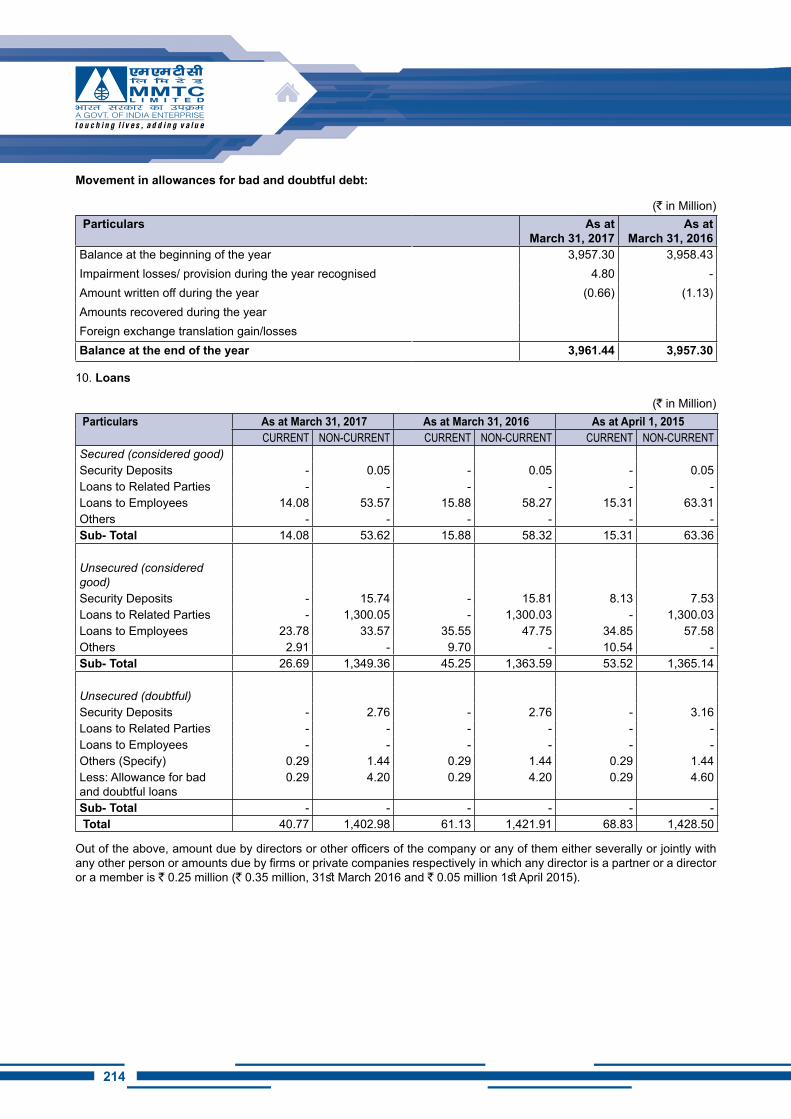
214
Movement in allowances for bad and doubtful debt:
(` in Million) Particulars As at
March 31, 2017 As at
March 31, 2016 Balance at the beginning of the year 3,957.30 3,958.43 Impairment losses/ provision during the year recognised 4.80 - Amount written off during the year (0.66) (1.13)Amounts recovered during the yearForeign exchange translation gain/lossesBalance at the end of the year 3,961.44 3,957.30
10. Loans
(` in Million) Particulars As at March 31, 2017 As at March 31, 2016 As at April 1, 2015
CURRENT NON-CURRENT CURRENT NON-CURRENT CURRENT NON-CURRENTSecured (considered good)Security Deposits - 0.05 - 0.05 - 0.05 Loans to Related Parties - - - - - - Loans to Employees 14.08 53.57 15.88 58.27 15.31 63.31 Others - - - - - - Sub- Total 14.08 53.62 15.88 58.32 15.31 63.36
Unsecured (considered good)Security Deposits - 15.74 - 15.81 8.13 7.53 Loans to Related Parties - 1,300.05 - 1,300.03 - 1,300.03 Loans to Employees 23.78 33.57 35.55 47.75 34.85 57.58 Others 2.91 - 9.70 - 10.54 - Sub- Total 26.69 1,349.36 45.25 1,363.59 53.52 1,365.14
Unsecured (doubtful)Security Deposits - 2.76 - 2.76 - 3.16 Loans to Related Parties - - - - - - Loans to Employees - - - - - - Others (Specify) 0.29 1.44 0.29 1.44 0.29 1.44 Less: Allowance for bad and doubtful loans
0.29 4.20 0.29 4.20 0.29 4.60
Sub- Total - - - - - - Total 40.77 1,402.98 61.13 1,421.91 68.83 1,428.50
Out of the above, amount due by directors or other officers of the company or any of them either severally or jointly with any other person or amounts due by firms or private companies respectively in which any director is a partner or a director or a member is ` 0.25 million (` 0.35 million, 31st March 2016 and ` 0.05 million 1st April 2015).
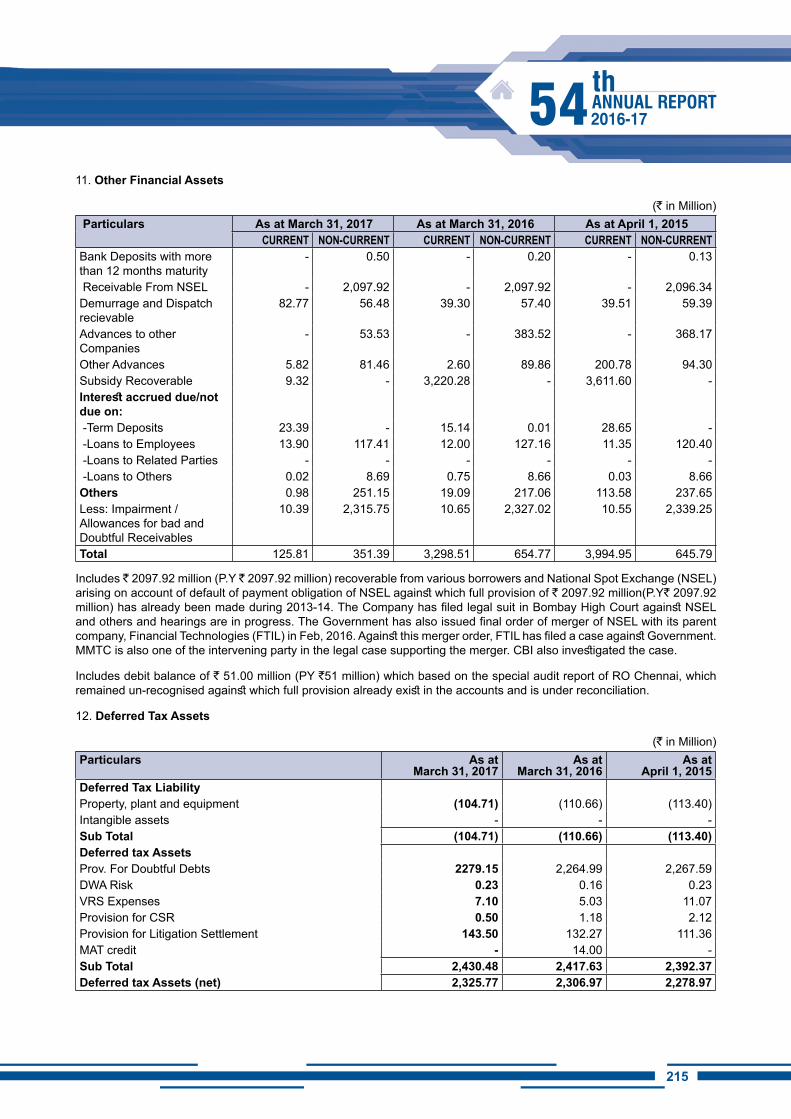
215214
11. Other Financial Assets
(` in Million) Particulars As at March 31, 2017 As at March 31, 2016 As at April 1, 2015
CURRENT NON-CURRENT CURRENT NON-CURRENT CURRENT NON-CURRENTBank Deposits with more than 12 months maturity
- 0.50 - 0.20 - 0.13
Receivable From NSEL - 2,097.92 - 2,097.92 - 2,096.34 Demurrage and Dispatch recievable
82.77 56.48 39.30 57.40 39.51 59.39
Advances to other Companies
- 53.53 - 383.52 - 368.17
Other Advances 5.82 81.46 2.60 89.86 200.78 94.30 Subsidy Recoverable 9.32 - 3,220.28 - 3,611.60 - Interest accrued due/not due on: -Term Deposits 23.39 - 15.14 0.01 28.65 - -Loans to Employees 13.90 117.41 12.00 127.16 11.35 120.40 -Loans to Related Parties - - - - - - -Loans to Others 0.02 8.69 0.75 8.66 0.03 8.66 Others 0.98 251.15 19.09 217.06 113.58 237.65 Less: Impairment / Allowances for bad and Doubtful Receivables
10.39 2,315.75 10.65 2,327.02 10.55 2,339.25
Total 125.81 351.39 3,298.51 654.77 3,994.95 645.79
Includes ` 2097.92 million (P.Y ̀ 2097.92 million) recoverable from various borrowers and National Spot Exchange (NSEL) arising on account of default of payment obligation of NSEL against which full provision of ` 2097.92 million(P.Y` 2097.92 million) has already been made during 2013-14. The Company has filed legal suit in Bombay High Court against NSEL and others and hearings are in progress. The Government has also issued final order of merger of NSEL with its parent company, Financial Technologies (FTIL) in Feb, 2016. Against this merger order, FTIL has filed a case against Government. MMTC is also one of the intervening party in the legal case supporting the merger. CBI also investigated the case.
Includes debit balance of ` 51.00 million (PY `51 million) which based on the special audit report of RO Chennai, which remained un-recognised against which full provision already exist in the accounts and is under reconciliation.
12. Deferred Tax Assets
(` in Million)Particulars As at
March 31, 2017As at
March 31, 2016As at
April 1, 2015Deferred Tax LiabilityProperty, plant and equipment (104.71) (110.66) (113.40)Intangible assets - - -Sub Total (104.71) (110.66) (113.40)Deferred tax AssetsProv. For Doubtful Debts 2279.15 2,264.99 2,267.59DWA Risk 0.23 0.16 0.23VRS Expenses 7.10 5.03 11.07Provision for CSR 0.50 1.18 2.12Provision for Litigation Settlement 143.50 132.27 111.36MAT credit - 14.00 -Sub Total 2,430.48 2,417.63 2,392.37Deferred tax Assets (net) 2,325.77 2,306.97 2,278.97
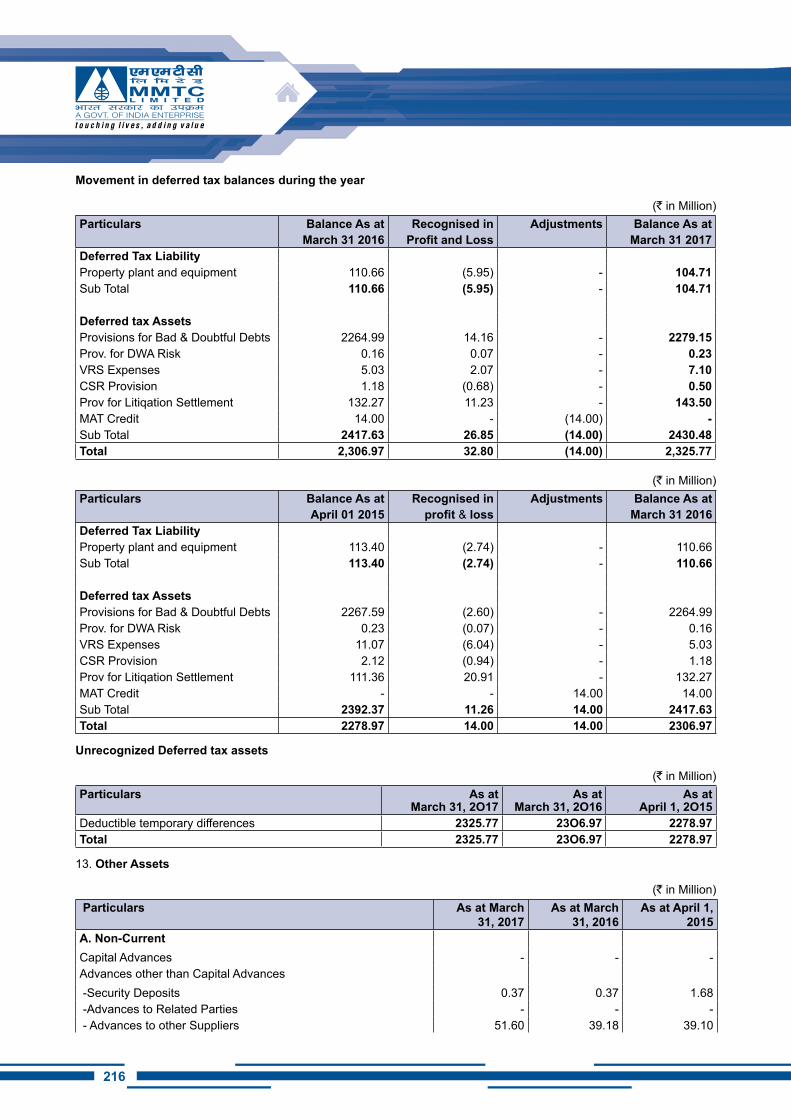
216
Movement in deferred tax balances during the year
(` in Million)Particulars Balance As at
March 31 2016Recognised in
Profit and LossAdjustments Balance As at
March 31 2017Deferred Tax LiabilityProperty plant and equipment 110.66 (5.95) - 104.71Sub Total 110.66 (5.95) - 104.71
Deferred tax AssetsProvisions for Bad & Doubtful Debts 2264.99 14.16 - 2279.15Prov. for DWA Risk 0.16 0.07 - 0.23VRS Expenses 5.03 2.07 - 7.10CSR Provision 1.18 (0.68) - 0.50Prov for Litiqation Settlement 132.27 11.23 - 143.50MAT Credit 14.00 - (14.00) -Sub Total 2417.63 26.85 (14.00) 2430.48Total 2,306.97 32.80 (14.00) 2,325.77
(` in Million)Particulars Balance As at
April 01 2015Recognised in
profit & lossAdjustments Balance As at
March 31 2016Deferred Tax LiabilityProperty plant and equipment 113.40 (2.74) - 110.66Sub Total 113.40 (2.74) - 110.66
Deferred tax AssetsProvisions for Bad & Doubtful Debts 2267.59 (2.60) - 2264.99Prov. for DWA Risk 0.23 (0.07) - 0.16VRS Expenses 11.07 (6.04) - 5.03CSR Provision 2.12 (0.94) - 1.18Prov for Litiqation Settlement 111.36 20.91 - 132.27MAT Credit - - 14.00 14.00Sub Total 2392.37 11.26 14.00 2417.63Total 2278.97 14.00 14.00 2306.97
Unrecognized Deferred tax assets
(` in Million)Particulars As at
March 31, 2O17As at
March 31, 2O16As at
April 1, 2O15Deductible temporary differences 2325.77 23O6.97 2278.97Total 2325.77 23O6.97 2278.97
13. Other Assets
(` in Million) Particulars As at March
31, 2017 As at March
31, 2016 As at April 1,
2015 A. Non-CurrentCapital Advances - - - Advances other than Capital Advances -Security Deposits 0.37 0.37 1.68 -Advances to Related Parties - - - - Advances to other Suppliers 51.60 39.18 39.10
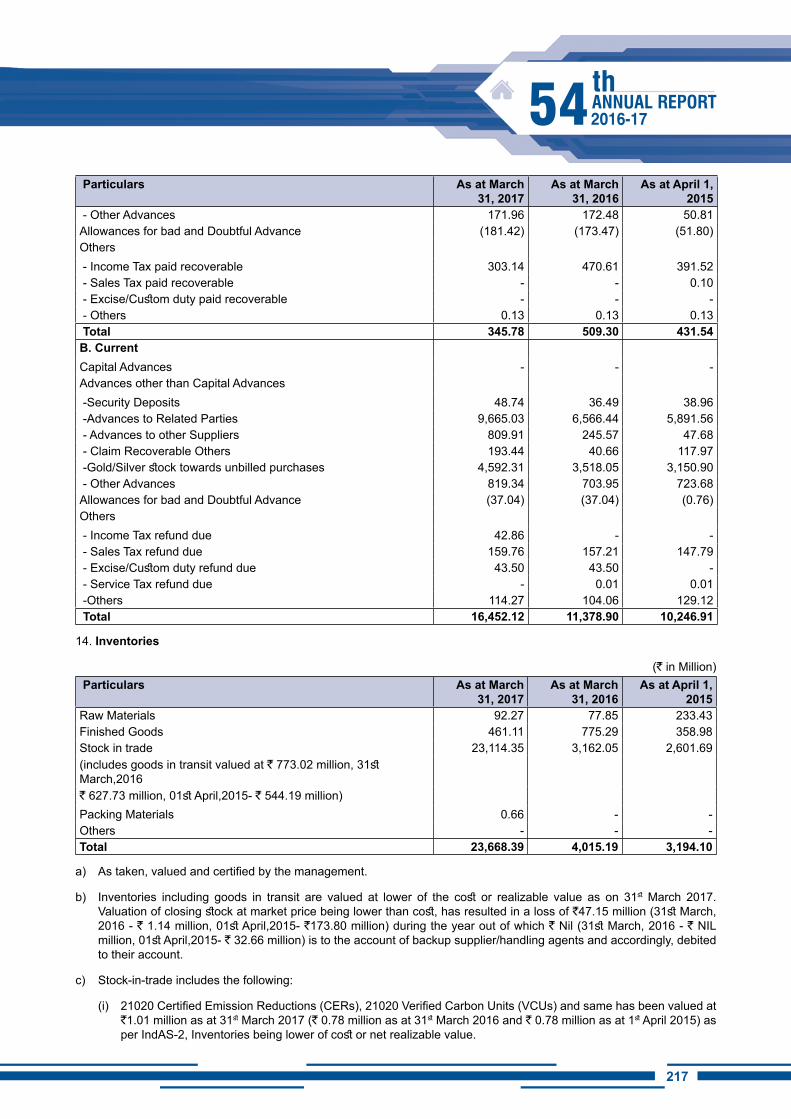
217216
Particulars As at March 31, 2017
As at March 31, 2016
As at April 1, 2015
- Other Advances 171.96 172.48 50.81Allowances for bad and Doubtful Advance (181.42) (173.47) (51.80)Others - Income Tax paid recoverable 303.14 470.61 391.52 - Sales Tax paid recoverable - - 0.10 - Excise/Custom duty paid recoverable - - - - Others 0.13 0.13 0.13 Total 345.78 509.30 431.54 B. CurrentCapital Advances - - - Advances other than Capital Advances -Security Deposits 48.74 36.49 38.96 -Advances to Related Parties 9,665.03 6,566.44 5,891.56 - Advances to other Suppliers 809.91 245.57 47.68 - Claim Recoverable Others 193.44 40.66 117.97 -Gold/Silver stock towards unbilled purchases 4,592.31 3,518.05 3,150.90 - Other Advances 819.34 703.95 723.68 Allowances for bad and Doubtful Advance (37.04) (37.04) (0.76)Others - Income Tax refund due 42.86 - - - Sales Tax refund due 159.76 157.21 147.79 - Excise/Custom duty refund due 43.50 43.50 - - Service Tax refund due - 0.01 0.01 -Others 114.27 104.06 129.12 Total 16,452.12 11,378.90 10,246.91
14. inventories
(` in Million) Particulars As at March
31, 2017 As at March
31, 2016 As at April 1,
2015 Raw Materials 92.27 77.85 233.43 Finished Goods 461.11 775.29 358.98 Stock in trade 23,114.35 3,162.05 2,601.69 (includes goods in transit valued at ` 773.02 million, 31st March,2016` 627.73 million, 01st April,2015- ` 544.19 million) Packing Materials 0.66 - - Others - - - Total 23,668.39 4,015.19 3,194.10
a) As taken, valued and certified by the management.
b) Inventories including goods in transit are valued at lower of the cost or realizable value as on 31st March 2017. Valuation of closing stock at market price being lower than cost, has resulted in a loss of `47.15 million (31st March, 2016 - ` 1.14 million, 01st April,2015- `173.80 million) during the year out of which ` Nil (31st March, 2016 - ` NIL million, 01st April,2015- ` 32.66 million) is to the account of backup supplier/handling agents and accordingly, debited to their account.
c) Stock-in-trade includes the following:
(i) 21020 Certified Emission Reductions (CERs), 21020 Verified Carbon Units (VCUs) and same has been valued at `1.01 million as at 31st March 2017 (` 0.78 million as at 31st March 2016 and ` 0.78 million as at 1st April 2015) as per IndAS-2, Inventories being lower of cost or net realizable value.
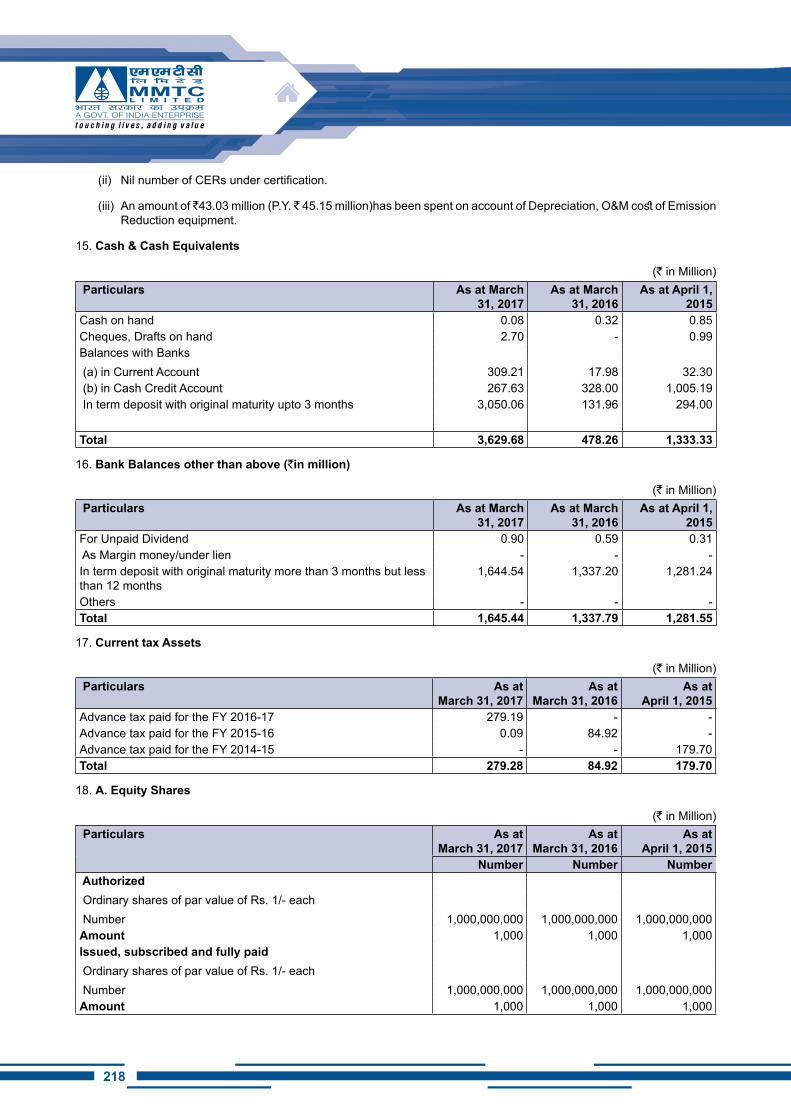
218
(ii) Nil number of CERs under certification.
(iii) An amount of ̀ 43.03 million (P.Y. ̀ 45.15 million)has been spent on account of Depreciation, O&M cost of Emission Reduction equipment.
15. Cash & Cash Equivalents
(` in Million) Particulars As at March
31, 2017 As at March
31, 2016 As at April 1,
2015 Cash on hand 0.08 0.32 0.85 Cheques, Drafts on hand 2.70 - 0.99 Balances with Banks (a) in Current Account 309.21 17.98 32.30 (b) in Cash Credit Account 267.63 328.00 1,005.19 In term deposit with original maturity upto 3 months 3,050.06 131.96 294.00
Total 3,629.68 478.26 1,333.33
16. Bank Balances other than above (`in million)
(` in Million) Particulars As at March
31, 2017 As at March
31, 2016 As at April 1,
2015 For Unpaid Dividend 0.90 0.59 0.31 As Margin money/under lien - - - In term deposit with original maturity more than 3 months but less than 12 months
1,644.54 1,337.20 1,281.24
Others - - - Total 1,645.44 1,337.79 1,281.55
17. Current tax Assets
(` in Million) Particulars As at
March 31, 2017 As at
March 31, 2016 As at
April 1, 2015 Advance tax paid for the FY 2016-17 279.19 - - Advance tax paid for the FY 2015-16 0.09 84.92 - Advance tax paid for the FY 2014-15 - - 179.70 Total 279.28 84.92 179.70
18. A. Equity Shares
(` in Million) Particulars As at
March 31, 2017 As at
March 31, 2016 As at
April 1, 2015 Number Number Number
Authorized Ordinary shares of par value of Rs. 1/- each Number 1,000,000,000 1,000,000,000 1,000,000,000 Amount 1,000 1,000 1,000 Issued, subscribed and fully paid Ordinary shares of par value of Rs. 1/- each Number 1,000,000,000 1,000,000,000 1,000,000,000 Amount 1,000 1,000 1,000
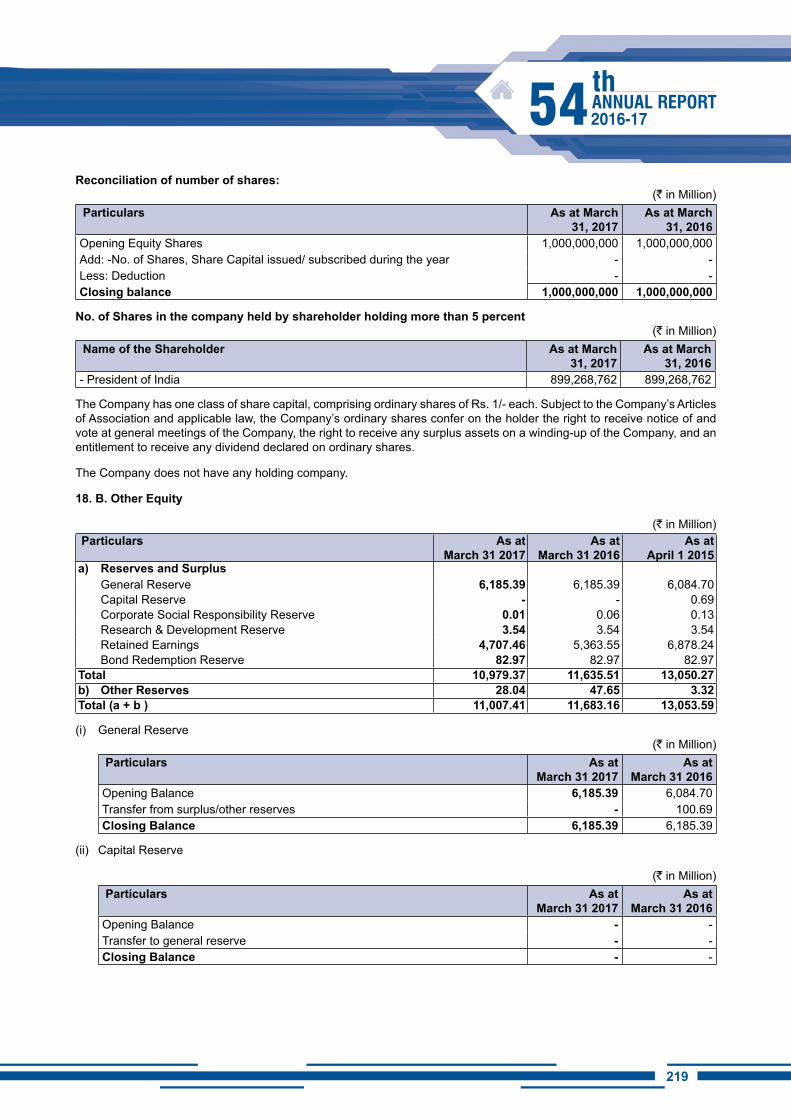
219218
Reconciliation of number of shares:(` in Million)
Particulars As at March 31, 2017
As at March 31, 2016
Opening Equity Shares 1,000,000,000 1,000,000,000 Add: -No. of Shares, Share Capital issued/ subscribed during the year - - Less: Deduction - - Closing balance 1,000,000,000 1,000,000,000
No. of Shares in the company held by shareholder holding more than 5 percent(` in Million)
Name of the Shareholder As at March 31, 2017
As at March 31, 2016
- President of India 899,268,762 899,268,762
The Company has one class of share capital, comprising ordinary shares of Rs. 1/- each. Subject to the Company’s Articles of Association and applicable law, the Company’s ordinary shares confer on the holder the right to receive notice of and vote at general meetings of the Company, the right to receive any surplus assets on a winding-up of the Company, and an entitlement to receive any dividend declared on ordinary shares.
The Company does not have any holding company.
18. B. Other Equity
(` in Million) Particulars As at
March 31 2017 As at
March 31 2016 As at
April 1 2015 a) Reserves and Surplus
General Reserve 6,185.39 6,185.39 6,084.70 Capital Reserve - - 0.69 Corporate Social Responsibility Reserve 0.01 0.06 0.13 Research & Development Reserve 3.54 3.54 3.54 Retained Earnings 4,707.46 5,363.55 6,878.24 Bond Redemption Reserve 82.97 82.97 82.97
Total 10,979.37 11,635.51 13,050.27 b) Other Reserves 28.04 47.65 3.32 Total (a + b ) 11,007.41 11,683.16 13,053.59
(i) General Reserve(` in Million)
Particulars As at March 31 2017
As at March 31 2016
Opening Balance 6,185.39 6,084.70 Transfer from surplus/other reserves - 100.69 Closing Balance 6,185.39 6,185.39
(ii) Capital Reserve
(` in Million) Particulars As at
March 31 2017 As at
March 31 2016 Opening Balance - - Transfer to general reserve - - Closing Balance - -
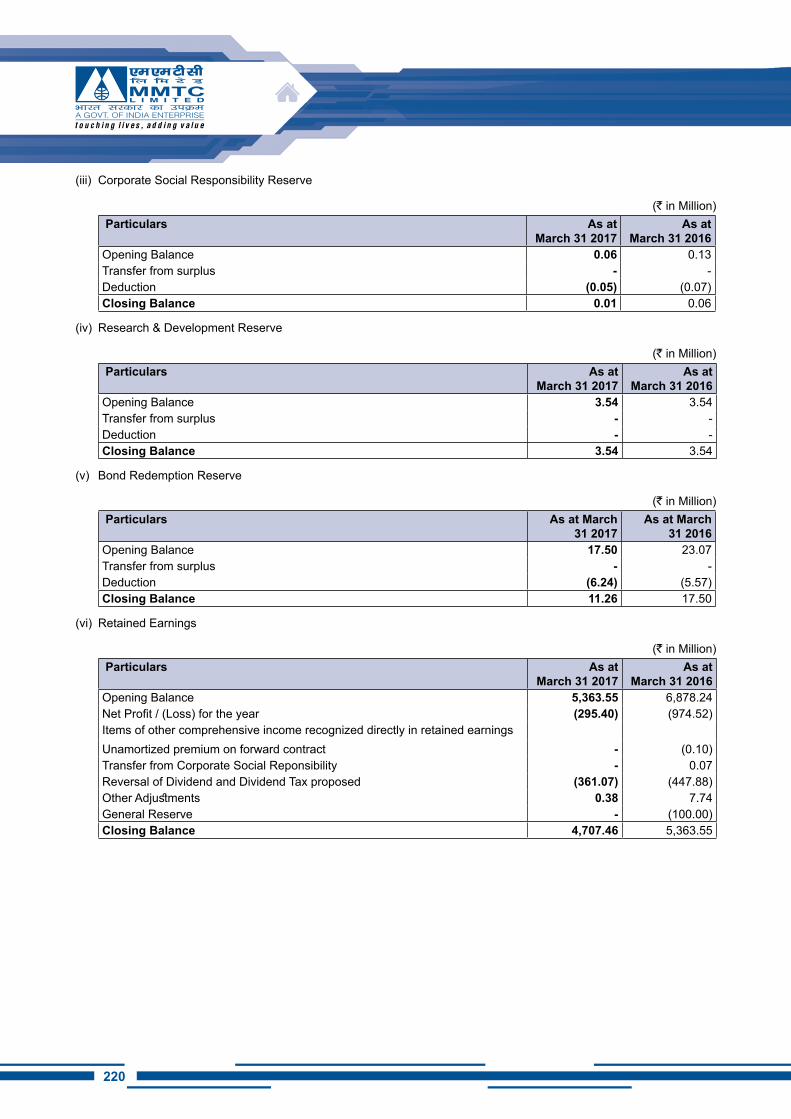
220
(iii) Corporate Social Responsibility Reserve
(` in Million) Particulars As at
March 31 2017 As at
March 31 2016 Opening Balance 0.06 0.13 Transfer from surplus - - Deduction (0.05) (0.07)Closing Balance 0.01 0.06
(iv) Research & Development Reserve
(` in Million) Particulars As at
March 31 2017 As at
March 31 2016 Opening Balance 3.54 3.54 Transfer from surplus - - Deduction - - Closing Balance 3.54 3.54
(v) Bond Redemption Reserve
(` in Million) Particulars As at March
31 2017 As at March
31 2016 Opening Balance 17.50 23.07 Transfer from surplus - - Deduction (6.24) (5.57)Closing Balance 11.26 17.50
(vi) Retained Earnings
(` in Million) Particulars As at
March 31 2017 As at
March 31 2016 Opening Balance 5,363.55 6,878.24 Net Profit / (Loss) for the year (295.40) (974.52)Items of other comprehensive income recognized directly in retained earningsUnamortized premium on forward contract - (0.10)Transfer from Corporate Social Reponsibility - 0.07 Reversal of Dividend and Dividend Tax proposed (361.07) (447.88)Other Adjustments 0.38 7.74 General Reserve - (100.00)Closing Balance 4,707.46 5,363.55
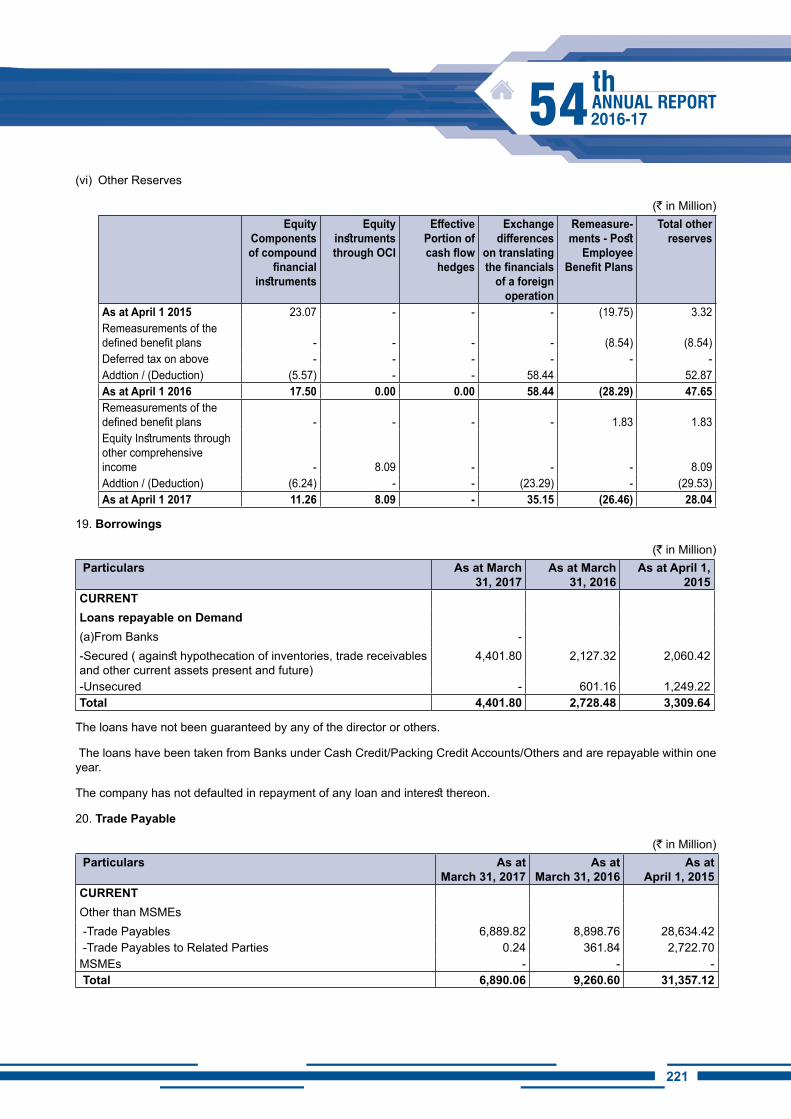
221220
(vi) Other Reserves
(` in Million)Equity
Components of compound
financial instruments
Equity instruments through OCI
Effective Portion of cash flow
hedges
Exchange differences
on translating the financials
of a foreign operation
Remeasure-ments - Post
Employee Benefit Plans
Total other reserves
As at April 1 2015 23.07 - - - (19.75) 3.32 Remeasurements of the defined benefit plans - - - - (8.54) (8.54)Deferred tax on above - - - - - - Addtion / (Deduction) (5.57) - - 58.44 52.87 As at April 1 2016 17.50 0.00 0.00 58.44 (28.29) 47.65 Remeasurements of the defined benefit plans - - - - 1.83 1.83 Equity Instruments through other comprehensive income - 8.09 - - - 8.09 Addtion / (Deduction) (6.24) - - (23.29) - (29.53)As at April 1 2017 11.26 8.09 - 35.15 (26.46) 28.04
19. Borrowings
(` in Million) Particulars As at March
31, 2017 As at March
31, 2016 As at April 1,
2015 CURRENTLoans repayable on Demand(a)From Banks - -Secured ( against hypothecation of inventories, trade receivables and other current assets present and future)
4,401.80 2,127.32 2,060.42
-Unsecured - 601.16 1,249.22 Total 4,401.80 2,728.48 3,309.64
The loans have not been guaranteed by any of the director or others.
The loans have been taken from Banks under Cash Credit/Packing Credit Accounts/Others and are repayable within one year.
The company has not defaulted in repayment of any loan and interest thereon.
20. Trade Payable
(` in Million) Particulars As at
March 31, 2017 As at
March 31, 2016 As at
April 1, 2015 CURRENTOther than MSMEs -Trade Payables 6,889.82 8,898.76 28,634.42 -Trade Payables to Related Parties 0.24 361.84 2,722.70 MSMEs - - - Total 6,890.06 9,260.60 31,357.12
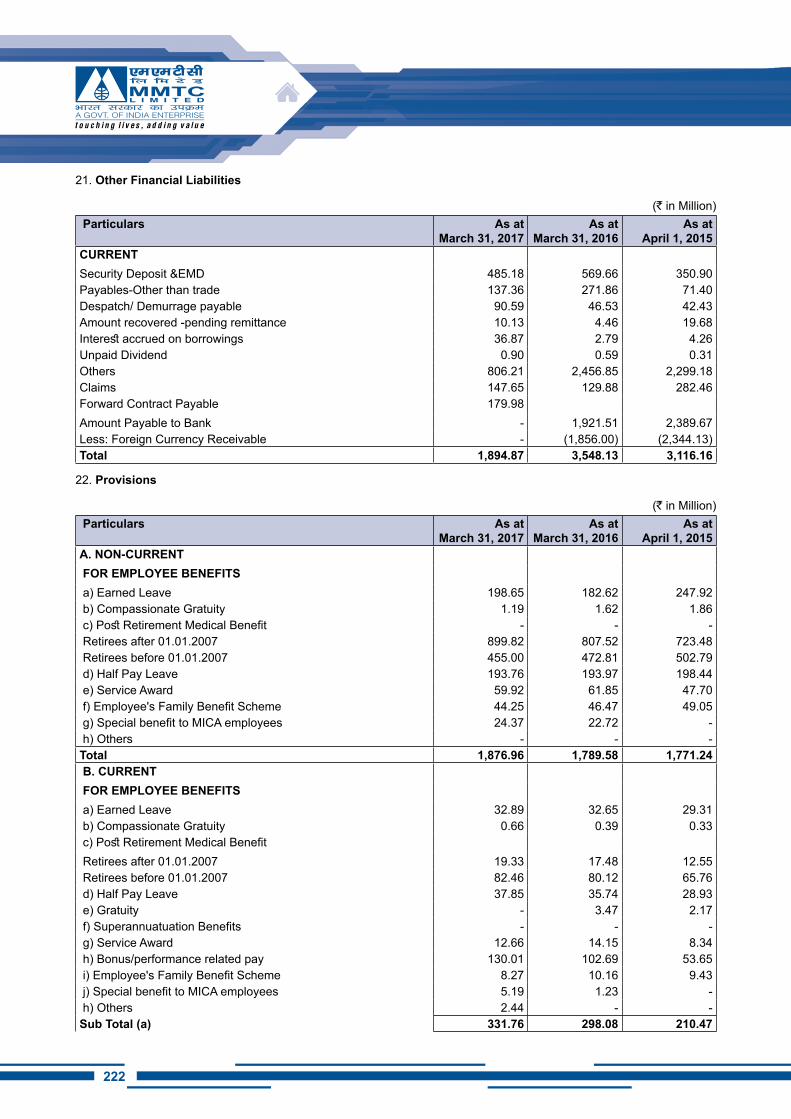
222
21. Other Financial Liabilities
(` in Million) Particulars As at
March 31, 2017 As at
March 31, 2016 As at
April 1, 2015 CURRENTSecurity Deposit &EMD 485.18 569.66 350.90 Payables-Other than trade 137.36 271.86 71.40 Despatch/ Demurrage payable 90.59 46.53 42.43 Amount recovered -pending remittance 10.13 4.46 19.68 Interest accrued on borrowings 36.87 2.79 4.26 Unpaid Dividend 0.90 0.59 0.31 Others 806.21 2,456.85 2,299.18 Claims 147.65 129.88 282.46 Forward Contract Payable 179.98 Amount Payable to Bank - 1,921.51 2,389.67 Less: Foreign Currency Receivable - (1,856.00) (2,344.13)Total 1,894.87 3,548.13 3,116.16
22. Provisions
(` in Million) Particulars As at
March 31, 2017 As at
March 31, 2016 As at
April 1, 2015 A. NON-CURRENT FOR EMPLOYEE BENEFiTS a) Earned Leave 198.65 182.62 247.92 b) Compassionate Gratuity 1.19 1.62 1.86 c) Post Retirement Medical Benefit - - - Retirees after 01.01.2007 899.82 807.52 723.48 Retirees before 01.01.2007 455.00 472.81 502.79 d) Half Pay Leave 193.76 193.97 198.44 e) Service Award 59.92 61.85 47.70 f) Employee's Family Benefit Scheme 44.25 46.47 49.05 g) Special benefit to MICA employees 24.37 22.72 - h) Others - - - Total 1,876.96 1,789.58 1,771.24 B. CURRENT FOR EMPLOYEE BENEFiTS a) Earned Leave 32.89 32.65 29.31 b) Compassionate Gratuity 0.66 0.39 0.33 c) Post Retirement Medical Benefit Retirees after 01.01.2007 19.33 17.48 12.55 Retirees before 01.01.2007 82.46 80.12 65.76 d) Half Pay Leave 37.85 35.74 28.93 e) Gratuity - 3.47 2.17 f) Superannuatuation Benefits - - - g) Service Award 12.66 14.15 8.34 h) Bonus/performance related pay 130.01 102.69 53.65 i) Employee's Family Benefit Scheme 8.27 10.16 9.43 j) Special benefit to MICA employees 5.19 1.23 - h) Others 2.44 - - Sub Total (a) 331.76 298.08 210.47
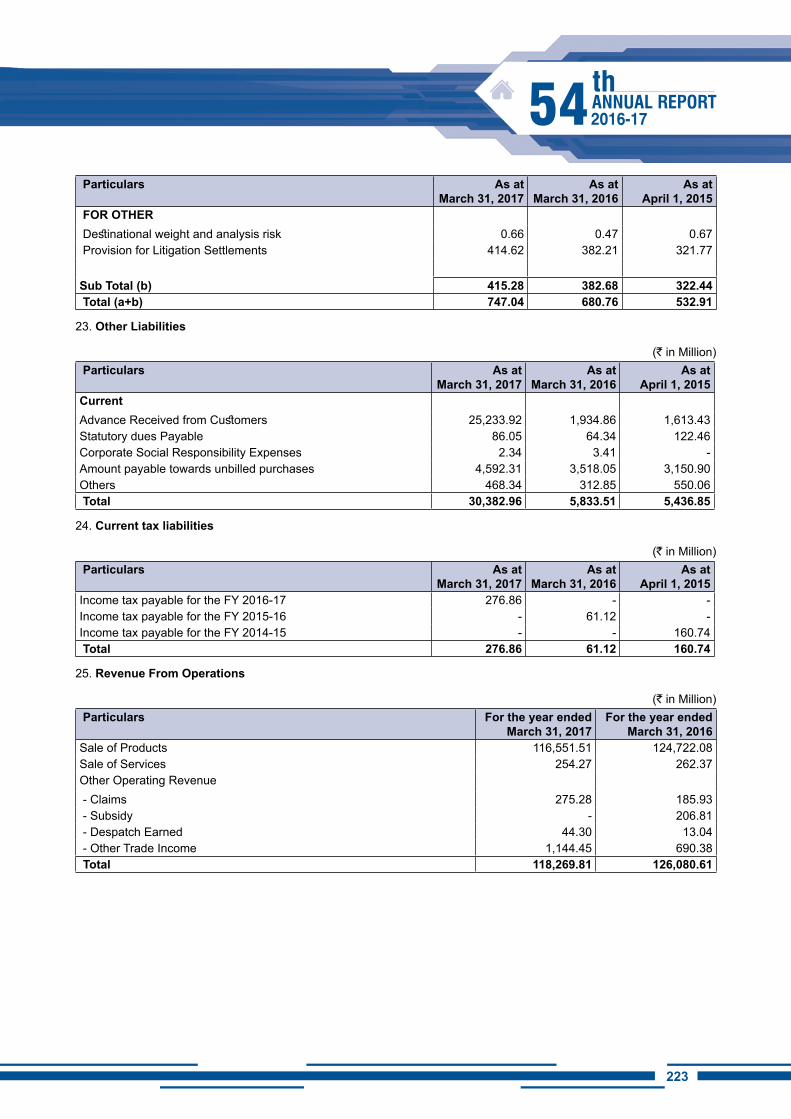
223222
Particulars As at March 31, 2017
As at March 31, 2016
As at April 1, 2015
FOR OThER Destinational weight and analysis risk 0.66 0.47 0.67 Provision for Litigation Settlements 414.62 382.21 321.77
Sub Total (b) 415.28 382.68 322.44 Total (a+b) 747.04 680.76 532.91
23. Other Liabilities
(` in Million) Particulars As at
March 31, 2017As at
March 31, 2016As at
April 1, 2015CurrentAdvance Received from Customers 25,233.92 1,934.86 1,613.43 Statutory dues Payable 86.05 64.34 122.46 Corporate Social Responsibility Expenses 2.34 3.41 - Amount payable towards unbilled purchases 4,592.31 3,518.05 3,150.90 Others 468.34 312.85 550.06 Total 30,382.96 5,833.51 5,436.85
24. Current tax liabilities
(` in Million) Particulars As at
March 31, 2017As at
March 31, 2016As at
April 1, 2015Income tax payable for the FY 2016-17 276.86 - - Income tax payable for the FY 2015-16 - 61.12 - Income tax payable for the FY 2014-15 - - 160.74 Total 276.86 61.12 160.74
25. Revenue From Operations
(` in Million) Particulars For the year ended
March 31, 2017 For the year ended
March 31, 2016 Sale of Products 116,551.51 124,722.08 Sale of Services 254.27 262.37 Other Operating Revenue - Claims 275.28 185.93 - Subsidy - 206.81 - Despatch Earned 44.30 13.04 - Other Trade Income 1,144.45 690.38 Total 118,269.81 126,080.61
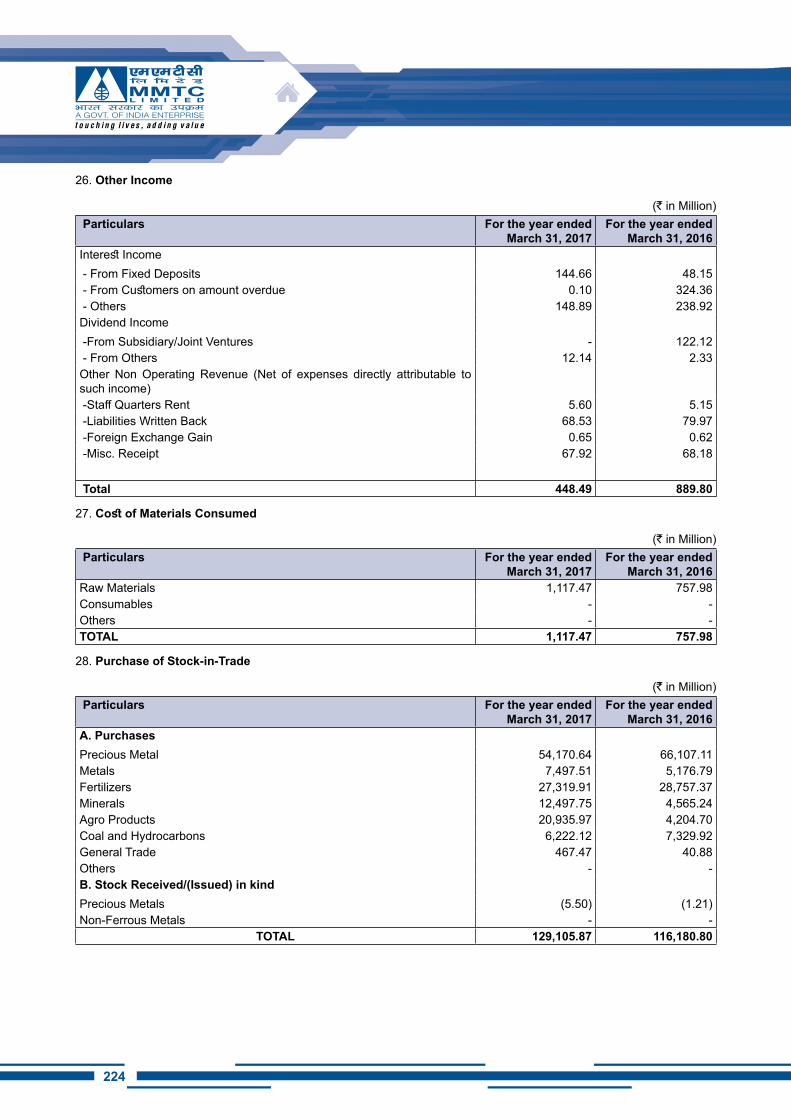
224
26. Other income
(` in Million) Particulars For the year ended
March 31, 2017 For the year ended
March 31, 2016 Interest Income - From Fixed Deposits 144.66 48.15 - From Customers on amount overdue 0.10 324.36 - Others 148.89 238.92 Dividend Income -From Subsidiary/Joint Ventures - 122.12 - From Others 12.14 2.33 Other Non Operating Revenue (Net of expenses directly attributable to such income) -Staff Quarters Rent 5.60 5.15 -Liabilities Written Back 68.53 79.97 -Foreign Exchange Gain 0.65 0.62 -Misc. Receipt 67.92 68.18
Total 448.49 889.80
27. Cost of Materials Consumed
(` in Million) Particulars For the year ended
March 31, 2017 For the year ended
March 31, 2016 Raw Materials 1,117.47 757.98 Consumables - - Others - - TOTAL 1,117.47 757.98
28. Purchase of Stock-in-Trade
(` in Million) Particulars For the year ended
March 31, 2017 For the year ended
March 31, 2016 A. PurchasesPrecious Metal 54,170.64 66,107.11 Metals 7,497.51 5,176.79 Fertilizers 27,319.91 28,757.37 Minerals 12,497.75 4,565.24 Agro Products 20,935.97 4,204.70 Coal and Hydrocarbons 6,222.12 7,329.92 General Trade 467.47 40.88 Others - - B. Stock Received/(Issued) in kindPrecious Metals (5.50) (1.21)Non-Ferrous Metals - -
TOTAL 129,105.87 116,180.80
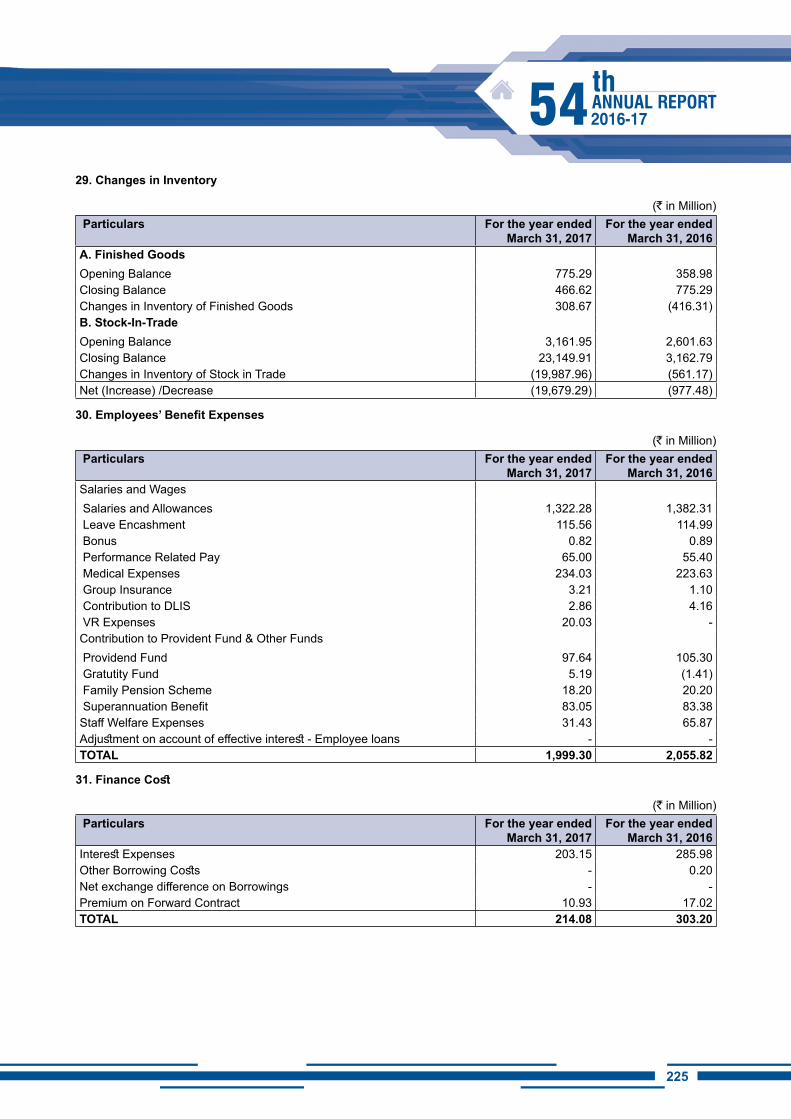
225224
29. Changes in Inventory
(` in Million) Particulars For the year ended
March 31, 2017 For the year ended
March 31, 2016 A. Finished GoodsOpening Balance 775.29 358.98 Closing Balance 466.62 775.29 Changes in Inventory of Finished Goods 308.67 (416.31)B. Stock-In-TradeOpening Balance 3,161.95 2,601.63 Closing Balance 23,149.91 3,162.79 Changes in Inventory of Stock in Trade (19,987.96) (561.17)Net (Increase) /Decrease (19,679.29) (977.48)
30. Employees’ Benefit Expenses
(` in Million) Particulars For the year ended
March 31, 2017 For the year ended
March 31, 2016 Salaries and Wages Salaries and Allowances 1,322.28 1,382.31 Leave Encashment 115.56 114.99 Bonus 0.82 0.89 Performance Related Pay 65.00 55.40 Medical Expenses 234.03 223.63 Group Insurance 3.21 1.10 Contribution to DLIS 2.86 4.16 VR Expenses 20.03 - Contribution to Provident Fund & Other Funds Providend Fund 97.64 105.30 Gratutity Fund 5.19 (1.41) Family Pension Scheme 18.20 20.20 Superannuation Benefit 83.05 83.38 Staff Welfare Expenses 31.43 65.87 Adjustment on account of effective interest - Employee loans - - TOTAL 1,999.30 2,055.82
31. Finance Cost
(` in Million) Particulars For the year ended
March 31, 2017 For the year ended
March 31, 2016 Interest Expenses 203.15 285.98 Other Borrowing Costs - 0.20 Net exchange difference on Borrowings - - Premium on Forward Contract 10.93 17.02 TOTAL 214.08 303.20
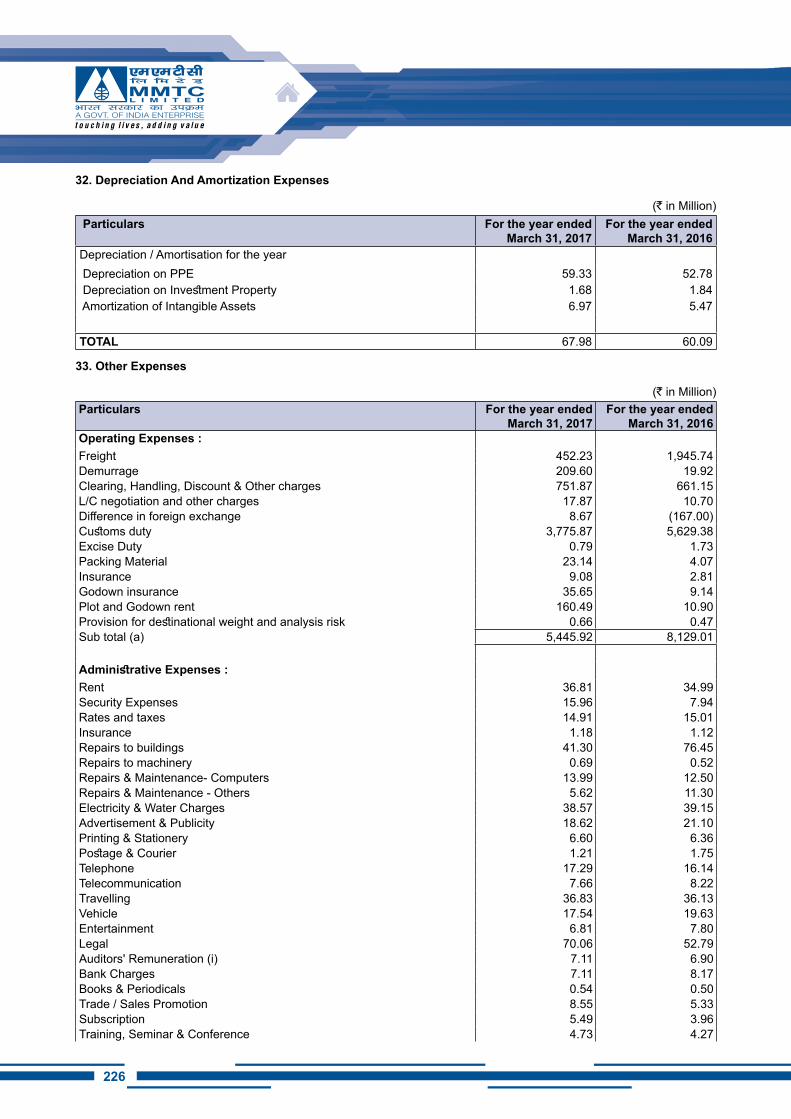
226
32. Depreciation And Amortization Expenses
(` in Million) Particulars For the year ended
March 31, 2017 For the year ended
March 31, 2016 Depreciation / Amortisation for the year Depreciation on PPE 59.33 52.78 Depreciation on Investment Property 1.68 1.84 Amortization of Intangible Assets 6.97 5.47
TOTAL 67.98 60.09
33. Other Expenses
(` in Million)Particulars For the year ended
March 31, 2017 For the year ended
March 31, 2016 Operating Expenses :Freight 452.23 1,945.74 Demurrage 209.60 19.92 Clearing, Handling, Discount & Other charges 751.87 661.15 L/C negotiation and other charges 17.87 10.70 Difference in foreign exchange 8.67 (167.00)Customs duty 3,775.87 5,629.38 Excise Duty 0.79 1.73 Packing Material 23.14 4.07 Insurance 9.08 2.81 Godown insurance 35.65 9.14 Plot and Godown rent 160.49 10.90 Provision for destinational weight and analysis risk 0.66 0.47 Sub total (a) 5,445.92 8,129.01
Administrative Expenses :Rent 36.81 34.99 Security Expenses 15.96 7.94 Rates and taxes 14.91 15.01 Insurance 1.18 1.12 Repairs to buildings 41.30 76.45 Repairs to machinery 0.69 0.52 Repairs & Maintenance- Computers 13.99 12.50 Repairs & Maintenance - Others 5.62 11.30 Electricity & Water Charges 38.57 39.15 Advertisement & Publicity 18.62 21.10 Printing & Stationery 6.60 6.36 Postage & Courier 1.21 1.75 Telephone 17.29 16.14 Telecommunication 7.66 8.22 Travelling 36.83 36.13 Vehicle 17.54 19.63 Entertainment 6.81 7.80 Legal 70.06 52.79 Auditors' Remuneration (i) 7.11 6.90 Bank Charges 7.11 8.17 Books & Periodicals 0.54 0.50 Trade / Sales Promotion 8.55 5.33 Subscription 5.49 3.96 Training, Seminar & Conference 4.73 4.27
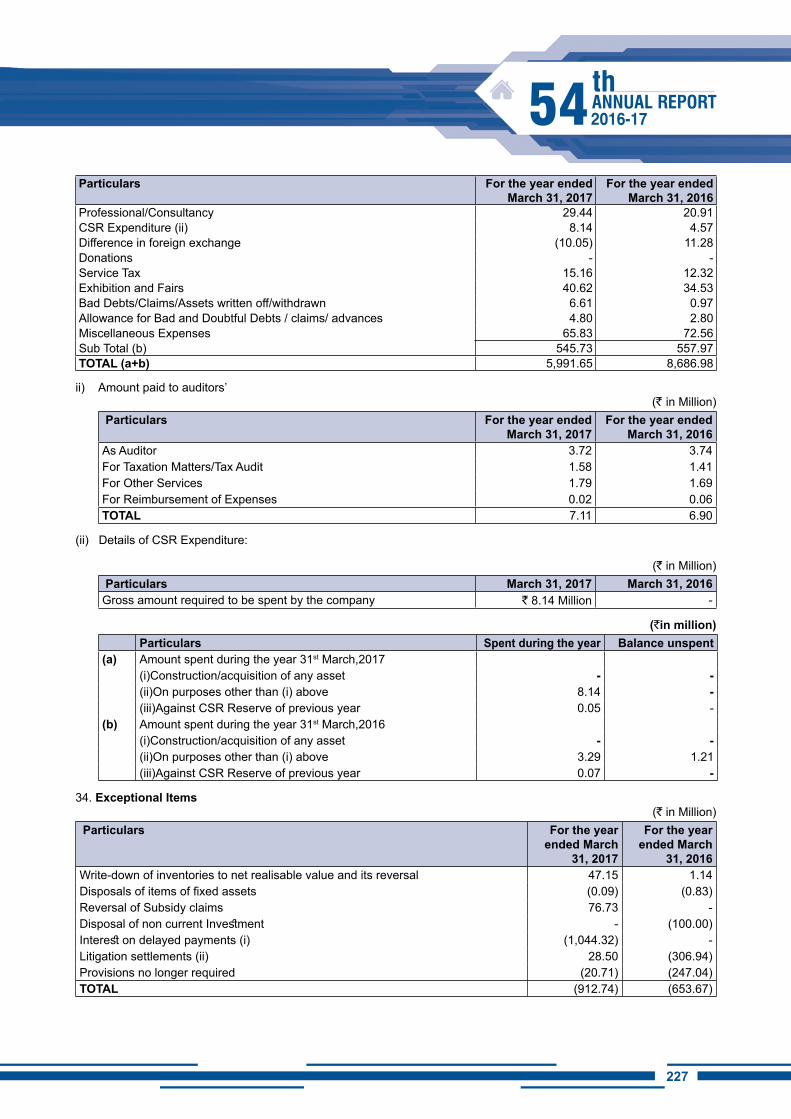
227226
Particulars For the year ended March 31, 2017
For the year ended March 31, 2016
Professional/Consultancy 29.44 20.91 CSR Expenditure (ii) 8.14 4.57 Difference in foreign exchange (10.05) 11.28 Donations - - Service Tax 15.16 12.32 Exhibition and Fairs 40.62 34.53 Bad Debts/Claims/Assets written off/withdrawn 6.61 0.97 Allowance for Bad and Doubtful Debts / claims/ advances 4.80 2.80 Miscellaneous Expenses 65.83 72.56 Sub Total (b) 545.73 557.97 TOTAL (a+b) 5,991.65 8,686.98
ii) Amount paid to auditors’ (` in Million)
Particulars For the year ended March 31, 2017
For the year ended March 31, 2016
As Auditor 3.72 3.74 For Taxation Matters/Tax Audit 1.58 1.41 For Other Services 1.79 1.69 For Reimbursement of Expenses 0.02 0.06 TOTAL 7.11 6.90
(ii) Details of CSR Expenditure:
(` in Million) Particulars March 31, 2017 March 31, 2016 Gross amount required to be spent by the company ` 8.14 Million -
(`in million)Particulars Spent during the year Balance unspent
(a) Amount spent during the year 31st March,2017(i)Construction/acquisition of any asset - -(ii)On purposes other than (i) above 8.14 -(iii)Against CSR Reserve of previous year 0.05 -
(b) Amount spent during the year 31st March,2016(i)Construction/acquisition of any asset - -(ii)On purposes other than (i) above 3.29 1.21(iii)Against CSR Reserve of previous year 0.07 -
34. Exceptional Items(` in Million)
Particulars For the year ended March
31, 2017
For the year ended March
31, 2016 Write-down of inventories to net realisable value and its reversal 47.15 1.14 Disposals of items of fixed assets (0.09) (0.83)Reversal of Subsidy claims 76.73 - Disposal of non current Investment - (100.00)Interest on delayed payments (i) (1,044.32) - Litigation settlements (ii) 28.50 (306.94)Provisions no longer required (20.71) (247.04)TOTAL (912.74) (653.67)
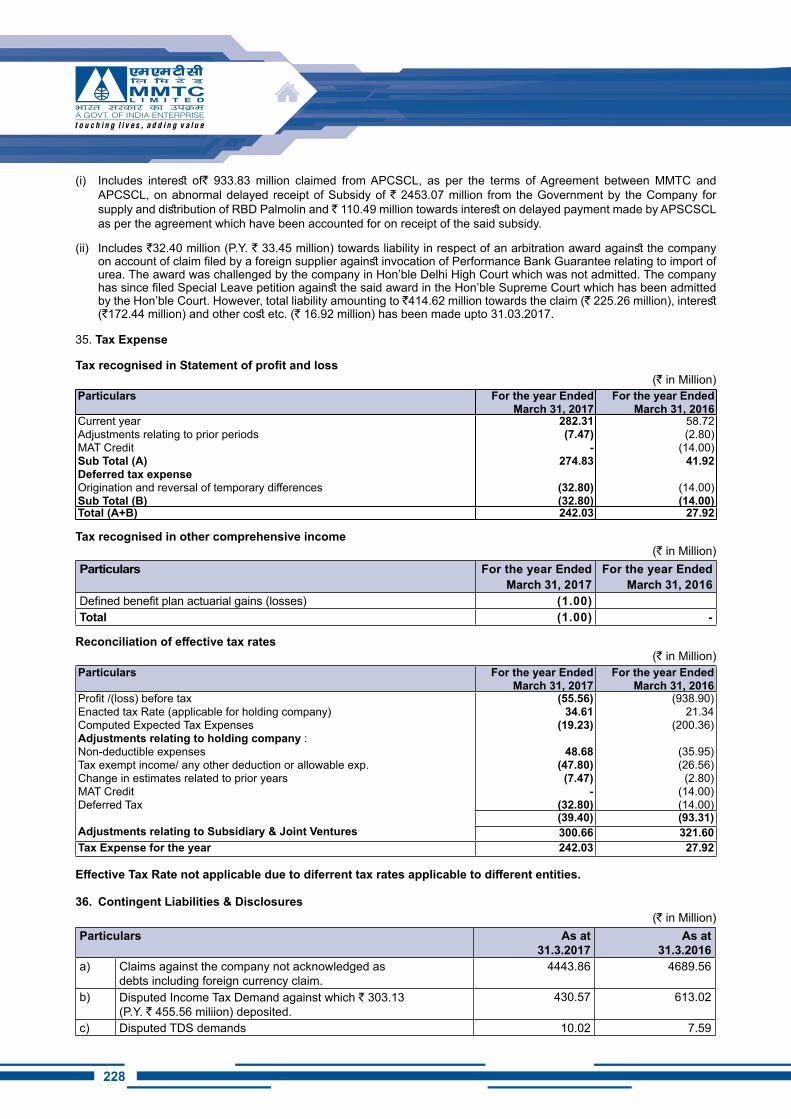
228
(i) Includes interest of` 933.83 million claimed from APCSCL, as per the terms of Agreement between MMTC and APCSCL, on abnormal delayed receipt of Subsidy of ` 2453.07 million from the Government by the Company for supply and distribution of RBD Palmolin and ` 110.49 million towards interest on delayed payment made by APSCSCL as per the agreement which have been accounted for on receipt of the said subsidy.
(ii) Includes `32.40 million (P.Y. ` 33.45 million) towards liability in respect of an arbitration award against the company on account of claim filed by a foreign supplier against invocation of Performance Bank Guarantee relating to import of urea. The award was challenged by the company in Hon’ble Delhi High Court which was not admitted. The company has since filed Special Leave petition against the said award in the Hon’ble Supreme Court which has been admitted by the Hon’ble Court. However, total liability amounting to `414.62 million towards the claim (` 225.26 million), interest (`172.44 million) and other cost etc. (` 16.92 million) has been made upto 31.03.2017.
35. Tax Expense
Tax recognised in Statement of profit and loss(` in Million)
Particulars For the year Ended March 31, 2017
For the year Ended March 31, 2016
Current year Adjustments relating to prior periods MAT Credit Sub Total (A) Deferred tax expense Origination and reversal of temporary differences Sub Total (B)
282.31 (7.47)
-274.83
(32.80) (32.80)
58.72 (2.80)
(14.00) 41.92
(14.00) (14.00)
Total (A+B) 242.03 27.92
Tax recognised in other comprehensive income(` in Million)
Particulars For the year Ended March 31, 2017
For the year Ended March 31, 2016
Defined benefit plan actuarial gains (losses) (1.00)Total (1.00) -
Reconciliation of effective tax rates(` in Million)
Particulars For the year Ended March 31, 2017
For the year Ended March 31, 2016
Profit /(loss) before tax Enacted tax Rate (applicable for holding company) Computed Expected Tax Expenses Adjustments relating to holding company :Non-deductible expenses Tax exempt income/ any other deduction or allowable exp. Change in estimates related to prior years MAT Credit Deferred Tax
Adjustments relating to Subsidiary & Joint Ventures
(55.56) 34.61
(19.23)
48.68 (47.80)
(7.47)-
(32.80)
(938.90) 21.34
(200.36)
(35.95) (26.56) (2.80)
(14.00) (14.00)
(39.40) (93.31)300.66 321.60
Tax Expense for the year 242.03 27.92
Effective Tax Rate not applicable due to diferrent tax rates applicable to different entities.
36. Contingent Liabilities & Disclosures (` in Million)
Particulars As at 31.3.2017
As at 31.3.2016
a) Claims against the company not acknowledged asdebts including foreign currency claim.
4443.86 4689.56
b) Disputed Income Tax Demand against which ` 303.13(P.Y. ` 455.56 miliion) deposited.
430.57 613.02
c) Disputed TDS demands 10.02 7.59
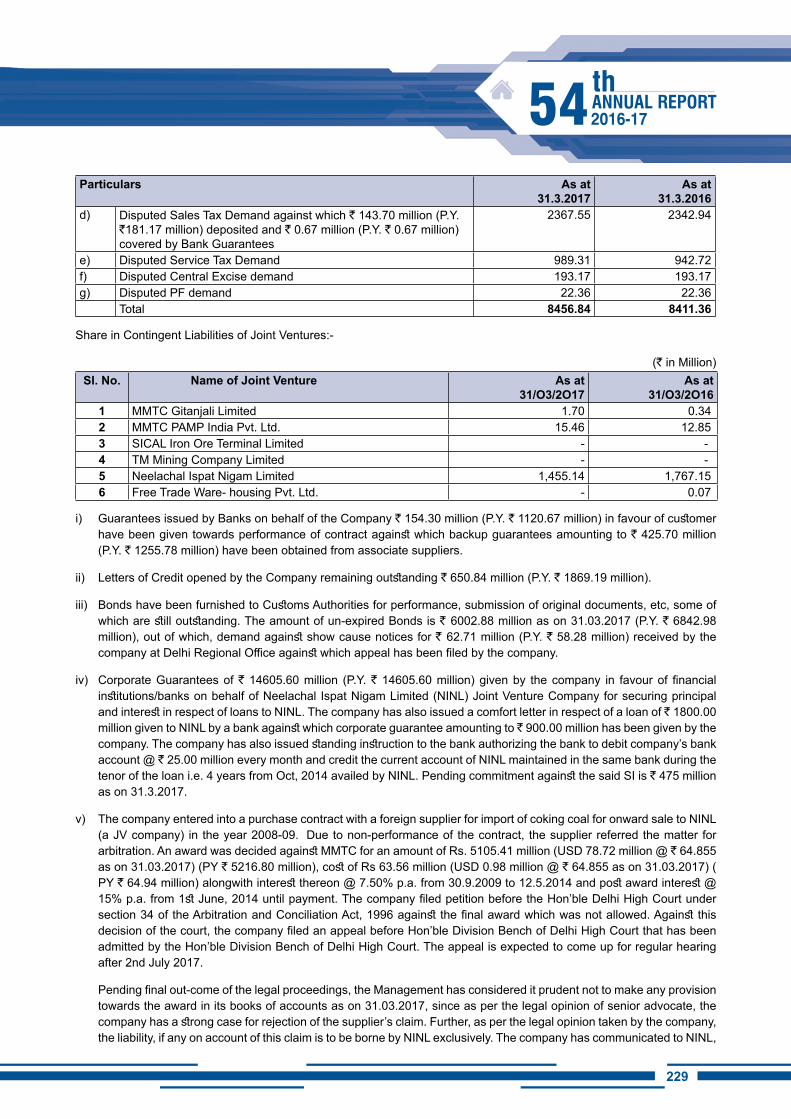
229228
Particulars As at 31.3.2017
As at 31.3.2016
d) Disputed Sales Tax Demand against which ` 143.70 million (P.Y. `181.17 million) deposited and ` 0.67 million (P.Y. ` 0.67 million) covered by Bank Guarantees
2367.55 2342.94
e) Disputed Service Tax Demand 989.31 942.72f) Disputed Central Excise demand 193.17 193.17g) Disputed PF demand 22.36 22.36
Total 8456.84 8411.36
Share in Contingent Liabilities of Joint Ventures:-
(` in Million)Si. No. Name of Joint Venture As at
31/O3/2O17As at
31/O3/2O161 MMTC Gitanjali Limited 1.70 0.342 MMTC PAMP India Pvt. Ltd. 15.46 12.853 SICAL Iron Ore Terminal Limited - -4 TM Mining Company Limited - -5 Neelachal Ispat Nigam Limited 1,455.14 1,767.156 Free Trade Ware- housing Pvt. Ltd. - 0.07
i) Guarantees issued by Banks on behalf of the Company ` 154.30 million (P.Y. ` 1120.67 million) in favour of customer have been given towards performance of contract against which backup guarantees amounting to ` 425.70 million (P.Y. ` 1255.78 million) have been obtained from associate suppliers.
ii) Letters of Credit opened by the Company remaining outstanding ` 650.84 million (P.Y. ` 1869.19 million).
iii) Bonds have been furnished to Customs Authorities for performance, submission of original documents, etc, some of which are still outstanding. The amount of un-expired Bonds is ` 6002.88 million as on 31.03.2017 (P.Y. ` 6842.98 million), out of which, demand against show cause notices for ` 62.71 million (P.Y. ` 58.28 million) received by the company at Delhi Regional Office against which appeal has been filed by the company.
iv) Corporate Guarantees of ` 14605.60 million (P.Y. ` 14605.60 million) given by the company in favour of financial institutions/banks on behalf of Neelachal Ispat Nigam Limited (NINL) Joint Venture Company for securing principal and interest in respect of loans to NINL. The company has also issued a comfort letter in respect of a loan of ` 1800.00 million given to NINL by a bank against which corporate guarantee amounting to ̀ 900.00 million has been given by the company. The company has also issued standing instruction to the bank authorizing the bank to debit company’s bank account @ ` 25.00 million every month and credit the current account of NINL maintained in the same bank during the tenor of the loan i.e. 4 years from Oct, 2014 availed by NINL. Pending commitment against the said SI is ` 475 million as on 31.3.2017.
v) The company entered into a purchase contract with a foreign supplier for import of coking coal for onward sale to NINL (a JV company) in the year 2008-09. Due to non-performance of the contract, the supplier referred the matter for arbitration. An award was decided against MMTC for an amount of Rs. 5105.41 million (USD 78.72 million @ ` 64.855 as on 31.03.2017) (PY ` 5216.80 million), cost of Rs 63.56 million (USD 0.98 million @ ` 64.855 as on 31.03.2017) ( PY ` 64.94 million) alongwith interest thereon @ 7.50% p.a. from 30.9.2009 to 12.5.2014 and post award interest @ 15% p.a. from 1st June, 2014 until payment. The company filed petition before the Hon’ble Delhi High Court under section 34 of the Arbitration and Conciliation Act, 1996 against the final award which was not allowed. Against this decision of the court, the company filed an appeal before Hon’ble Division Bench of Delhi High Court that has been admitted by the Hon’ble Division Bench of Delhi High Court. The appeal is expected to come up for regular hearing after 2nd July 2017.
Pending final out-come of the legal proceedings, the Management has considered it prudent not to make any provision towards the award in its books of accounts as on 31.03.2017, since as per the legal opinion of senior advocate, the company has a strong case for rejection of the supplier’s claim. Further, as per the legal opinion taken by the company, the liability, if any on account of this claim is to be borne by NINL exclusively. The company has communicated to NINL,
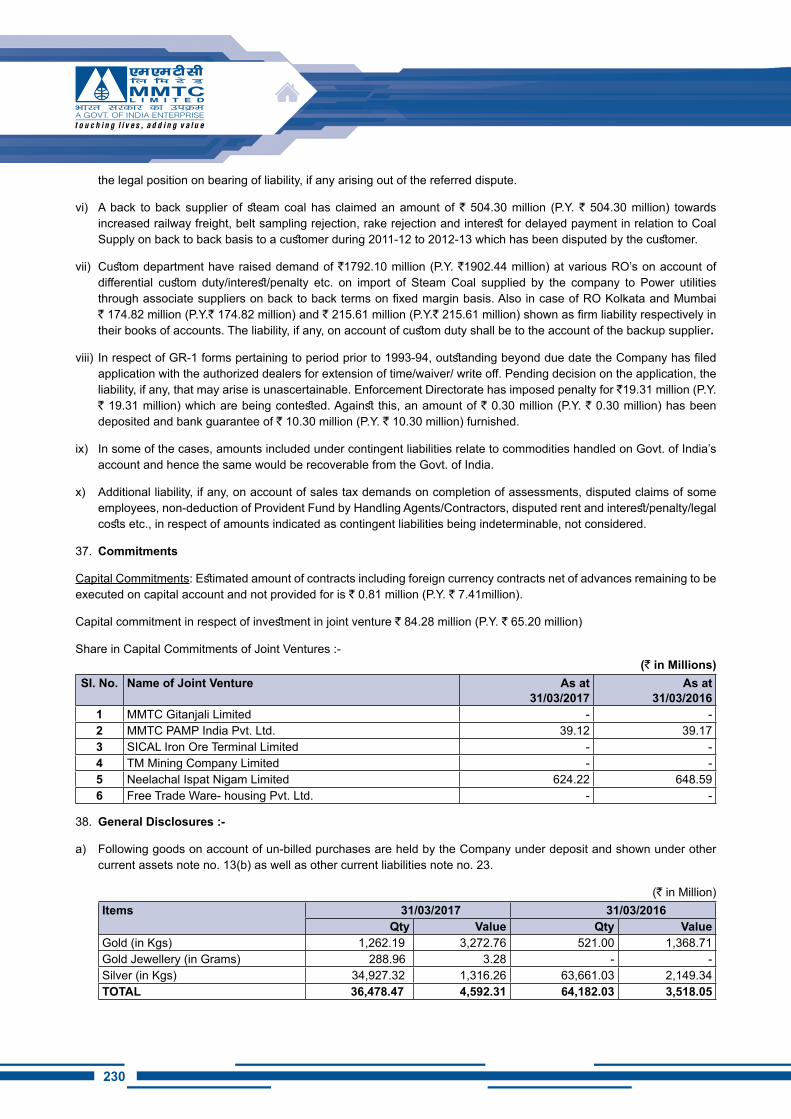
230
the legal position on bearing of liability, if any arising out of the referred dispute.
vi) A back to back supplier of steam coal has claimed an amount of ` 504.30 million (P.Y. ` 504.30 million) towards increased railway freight, belt sampling rejection, rake rejection and interest for delayed payment in relation to Coal Supply on back to back basis to a customer during 2011-12 to 2012-13 which has been disputed by the customer.
vii) Custom department have raised demand of `1792.10 million (P.Y. `1902.44 million) at various RO’s on account of differential custom duty/interest/penalty etc. on import of Steam Coal supplied by the company to Power utilities through associate suppliers on back to back terms on fixed margin basis. Also in case of RO Kolkata and Mumbai ` 174.82 million (P.Y.` 174.82 million) and ` 215.61 million (P.Y.` 215.61 million) shown as firm liability respectively in their books of accounts. The liability, if any, on account of custom duty shall be to the account of the backup supplier.
viii) In respect of GR-1 forms pertaining to period prior to 1993-94, outstanding beyond due date the Company has filed application with the authorized dealers for extension of time/waiver/ write off. Pending decision on the application, the liability, if any, that may arise is unascertainable. Enforcement Directorate has imposed penalty for `19.31 million (P.Y. ` 19.31 million) which are being contested. Against this, an amount of ` 0.30 million (P.Y. ` 0.30 million) has been deposited and bank guarantee of ` 10.30 million (P.Y. ` 10.30 million) furnished.
ix) In some of the cases, amounts included under contingent liabilities relate to commodities handled on Govt. of India’s account and hence the same would be recoverable from the Govt. of India.
x) Additional liability, if any, on account of sales tax demands on completion of assessments, disputed claims of some employees, non-deduction of Provident Fund by Handling Agents/Contractors, disputed rent and interest/penalty/legal costs etc., in respect of amounts indicated as contingent liabilities being indeterminable, not considered.
37. Commitments
Capital Commitments: Estimated amount of contracts including foreign currency contracts net of advances remaining to be executed on capital account and not provided for is ` 0.81 million (P.Y. ` 7.41million).
Capital commitment in respect of investment in joint venture ` 84.28 million (P.Y. ` 65.20 million)
Share in Capital Commitments of Joint Ventures :-(` in Millions)
Si. No. Name of Joint Venture As at 31/03/2017
As at 31/03/2016
1 MMTC Gitanjali Limited - -2 MMTC PAMP India Pvt. Ltd. 39.12 39.173 SICAL Iron Ore Terminal Limited - -4 TM Mining Company Limited - -5 Neelachal Ispat Nigam Limited 624.22 648.596 Free Trade Ware- housing Pvt. Ltd. - -
38. General Disclosures :-
a) Following goods on account of un-billed purchases are held by the Company under deposit and shown under other current assets note no. 13(b) as well as other current liabilities note no. 23.
(` in Million)items 31/03/2017 31/03/2016
Qty Value Qty ValueGold (in Kgs) 1,262.19 3,272.76 521.00 1,368.71Gold Jewellery (in Grams) 288.96 3.28 - -Silver (in Kgs) 34,927.32 1,316.26 63,661.03 2,149.34TOTAL 36,478.47 4,592.31 64,182.03 3,518.05
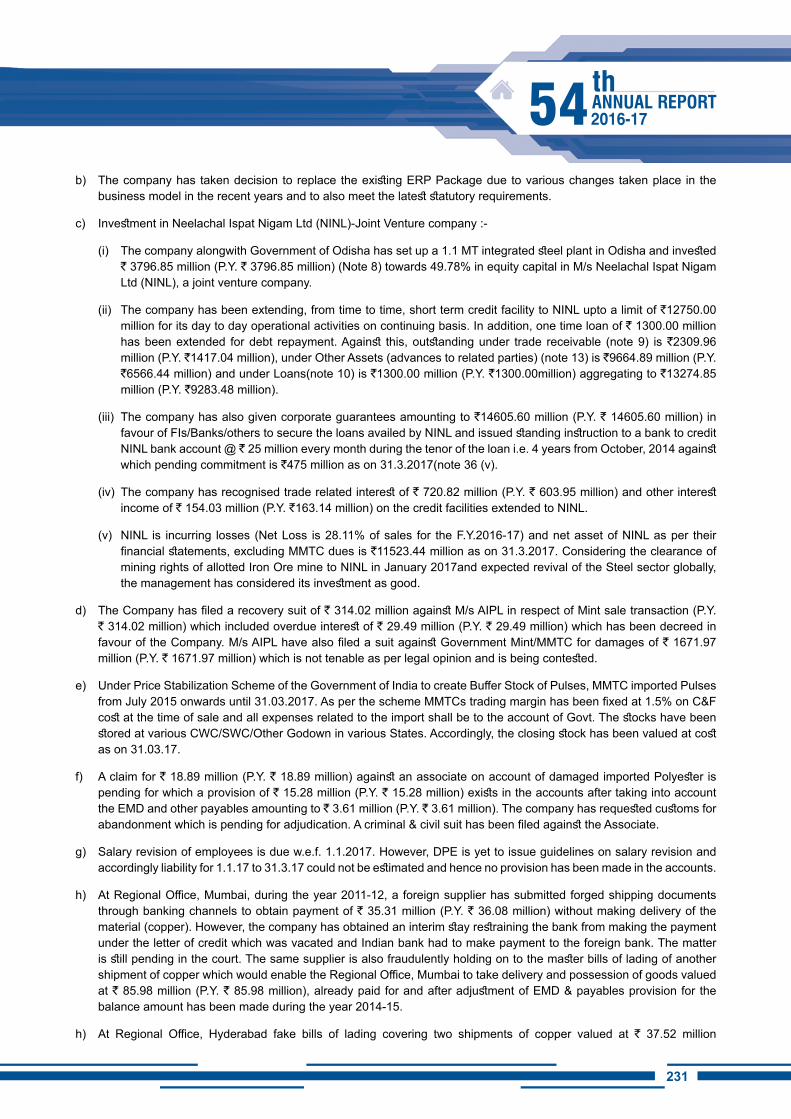
231230
b) The company has taken decision to replace the existing ERP Package due to various changes taken place in the business model in the recent years and to also meet the latest statutory requirements.
c) Investment in Neelachal Ispat Nigam Ltd (NINL)-Joint Venture company :-
(i) The company alongwith Government of Odisha has set up a 1.1 MT integrated steel plant in Odisha and invested ` 3796.85 million (P.Y. ` 3796.85 million) (Note 8) towards 49.78% in equity capital in M/s Neelachal Ispat Nigam Ltd (NINL), a joint venture company.
(ii) The company has been extending, from time to time, short term credit facility to NINL upto a limit of `12750.00 million for its day to day operational activities on continuing basis. In addition, one time loan of ` 1300.00 million has been extended for debt repayment. Against this, outstanding under trade receivable (note 9) is `2309.96 million (P.Y. `1417.04 million), under Other Assets (advances to related parties) (note 13) is `9664.89 million (P.Y. `6566.44 million) and under Loans(note 10) is `1300.00 million (P.Y. `1300.00million) aggregating to `13274.85 million (P.Y. `9283.48 million).
(iii) The company has also given corporate guarantees amounting to `14605.60 million (P.Y. ` 14605.60 million) in favour of FIs/Banks/others to secure the loans availed by NINL and issued standing instruction to a bank to credit NINL bank account @ ` 25 million every month during the tenor of the loan i.e. 4 years from October, 2014 against which pending commitment is `475 million as on 31.3.2017(note 36 (v).
(iv) The company has recognised trade related interest of ` 720.82 million (P.Y. ` 603.95 million) and other interest income of ` 154.03 million (P.Y. `163.14 million) on the credit facilities extended to NINL.
(v) NINL is incurring losses (Net Loss is 28.11% of sales for the F.Y.2016-17) and net asset of NINL as per their financial statements, excluding MMTC dues is `11523.44 million as on 31.3.2017. Considering the clearance of mining rights of allotted Iron Ore mine to NINL in January 2017and expected revival of the Steel sector globally, the management has considered its investment as good.
d) The Company has filed a recovery suit of ` 314.02 million against M/s AIPL in respect of Mint sale transaction (P.Y. ` 314.02 million) which included overdue interest of ` 29.49 million (P.Y. ` 29.49 million) which has been decreed in favour of the Company. M/s AIPL have also filed a suit against Government Mint/MMTC for damages of ` 1671.97 million (P.Y. ` 1671.97 million) which is not tenable as per legal opinion and is being contested.
e) Under Price Stabilization Scheme of the Government of India to create Buffer Stock of Pulses, MMTC imported Pulses from July 2015 onwards until 31.03.2017. As per the scheme MMTCs trading margin has been fixed at 1.5% on C&F cost at the time of sale and all expenses related to the import shall be to the account of Govt. The stocks have been stored at various CWC/SWC/Other Godown in various States. Accordingly, the closing stock has been valued at cost as on 31.03.17.
f) A claim for ` 18.89 million (P.Y. ` 18.89 million) against an associate on account of damaged imported Polyester is pending for which a provision of ` 15.28 million (P.Y. ` 15.28 million) exists in the accounts after taking into account the EMD and other payables amounting to ` 3.61 million (P.Y. ` 3.61 million). The company has requested customs for abandonment which is pending for adjudication. A criminal & civil suit has been filed against the Associate.
g) Salary revision of employees is due w.e.f. 1.1.2017. However, DPE is yet to issue guidelines on salary revision and accordingly liability for 1.1.17 to 31.3.17 could not be estimated and hence no provision has been made in the accounts.
h) At Regional Office, Mumbai, during the year 2011-12, a foreign supplier has submitted forged shipping documents through banking channels to obtain payment of ` 35.31 million (P.Y. ` 36.08 million) without making delivery of the material (copper). However, the company has obtained an interim stay restraining the bank from making the payment under the letter of credit which was vacated and Indian bank had to make payment to the foreign bank. The matter is still pending in the court. The same supplier is also fraudulently holding on to the master bills of lading of another shipment of copper which would enable the Regional Office, Mumbai to take delivery and possession of goods valued at ` 85.98 million (P.Y. ` 85.98 million), already paid for and after adjustment of EMD & payables provision for the balance amount has been made during the year 2014-15.
h) At Regional Office, Hyderabad fake bills of lading covering two shipments of copper valued at ` 37.52 million
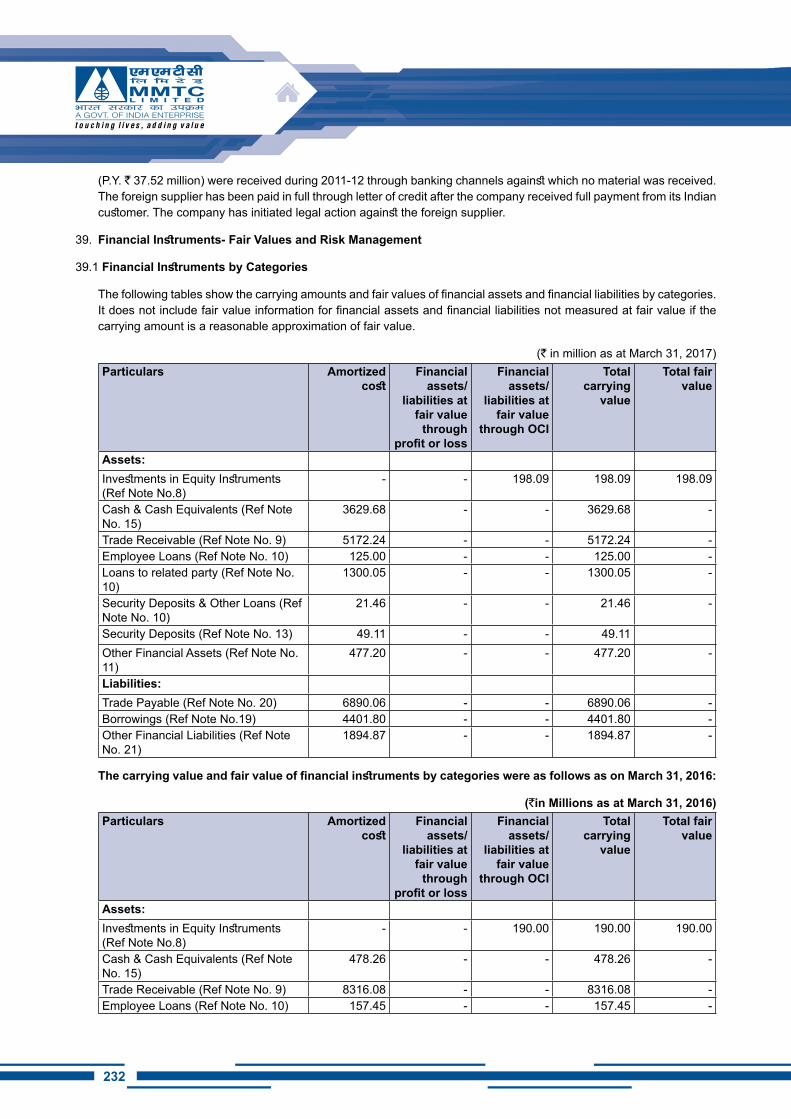
232
(P.Y. ` 37.52 million) were received during 2011-12 through banking channels against which no material was received. The foreign supplier has been paid in full through letter of credit after the company received full payment from its Indian customer. The company has initiated legal action against the foreign supplier.
39. Financial Instruments- Fair Values and Risk Management
39.1 Financial Instruments by Categories
The following tables show the carrying amounts and fair values of financial assets and financial liabilities by categories. It does not include fair value information for financial assets and financial liabilities not measured at fair value if the carrying amount is a reasonable approximation of fair value.
(` in million as at March 31, 2017)Particulars Amortized
costFinancial
assets/ liabilities at
fair value through
profit or loss
Financial assets/
liabilities at fair value
through OCI
Total carrying
value
Total fair value
Assets:Investments in Equity Instruments (Ref Note No.8)
- - 198.09 198.09 198.09
Cash & Cash Equivalents (Ref Note No. 15)
3629.68 - - 3629.68 -
Trade Receivable (Ref Note No. 9) 5172.24 - - 5172.24 - Employee Loans (Ref Note No. 10) 125.00 - - 125.00 - Loans to related party (Ref Note No. 10)
1300.05 - - 1300.05 -
Security Deposits & Other Loans (Ref Note No. 10)
21.46 - - 21.46 -
Security Deposits (Ref Note No. 13) 49.11 - - 49.11Other Financial Assets (Ref Note No. 11)
477.20 - - 477.20 -
Liabilities:Trade Payable (Ref Note No. 20) 6890.06 - - 6890.06 - Borrowings (Ref Note No.19) 4401.80 - - 4401.80 - Other Financial Liabilities (Ref Note No. 21)
1894.87 - - 1894.87 -
The carrying value and fair value of financial instruments by categories were as follows as on March 31, 2016:
(`in Millions as at March 31, 2016)Particulars Amortized
costFinancial
assets/ liabilities at
fair value through
profit or loss
Financial assets/
liabilities at fair value
through OCI
Total carrying
value
Total fair value
Assets:Investments in Equity Instruments (Ref Note No.8)
- - 190.00 190.00 190.00
Cash & Cash Equivalents (Ref Note No. 15)
478.26 - - 478.26 -
Trade Receivable (Ref Note No. 9) 8316.08 - - 8316.08 - Employee Loans (Ref Note No. 10) 157.45 - - 157.45 -
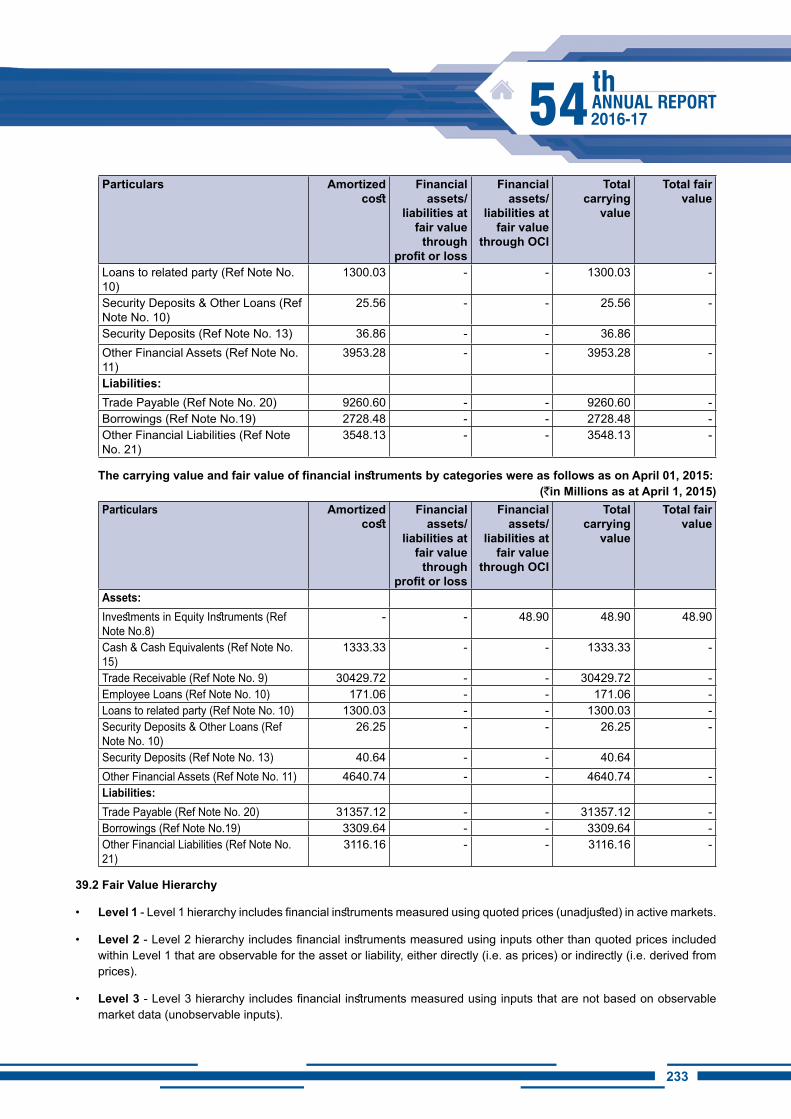
233232
Particulars Amortized cost
Financial assets/
liabilities at fair value
through profit or loss
Financial assets/
liabilities at fair value
through OCI
Total carrying
value
Total fair value
Loans to related party (Ref Note No. 10)
1300.03 - - 1300.03 -
Security Deposits & Other Loans (Ref Note No. 10)
25.56 - - 25.56 -
Security Deposits (Ref Note No. 13) 36.86 - - 36.86Other Financial Assets (Ref Note No. 11)
3953.28 - - 3953.28 -
Liabilities:Trade Payable (Ref Note No. 20) 9260.60 - - 9260.60 - Borrowings (Ref Note No.19) 2728.48 - - 2728.48 - Other Financial Liabilities (Ref Note No. 21)
3548.13 - - 3548.13 -
The carrying value and fair value of financial instruments by categories were as follows as on April 01, 2015:(`in Millions as at April 1, 2015)
Particulars Amortized cost
Financial assets/
liabilities at fair value
through profit or loss
Financial assets/
liabilities at fair value
through OCI
Total carrying
value
Total fair value
Assets:Investments in Equity Instruments (Ref Note No.8)
- - 48.90 48.90 48.90
Cash & Cash Equivalents (Ref Note No. 15)
1333.33 - - 1333.33 -
Trade Receivable (Ref Note No. 9) 30429.72 - - 30429.72 - Employee Loans (Ref Note No. 10) 171.06 - - 171.06 - Loans to related party (Ref Note No. 10) 1300.03 - - 1300.03 - Security Deposits & Other Loans (Ref Note No. 10)
26.25 - - 26.25 -
Security Deposits (Ref Note No. 13) 40.64 - - 40.64Other Financial Assets (Ref Note No. 11) 4640.74 - - 4640.74 - Liabilities:Trade Payable (Ref Note No. 20) 31357.12 - - 31357.12 - Borrowings (Ref Note No.19) 3309.64 - - 3309.64 - Other Financial Liabilities (Ref Note No. 21)
3116.16 - - 3116.16 -
39.2 Fair Value Hierarchy
• Level 1 - Level 1 hierarchy includes financial instruments measured using quoted prices (unadjusted) in active markets.
• Level 2 - Level 2 hierarchy includes financial instruments measured using inputs other than quoted prices included within Level 1 that are observable for the asset or liability, either directly (i.e. as prices) or indirectly (i.e. derived from prices).
• Level 3 - Level 3 hierarchy includes financial instruments measured using inputs that are not based on observable market data (unobservable inputs).
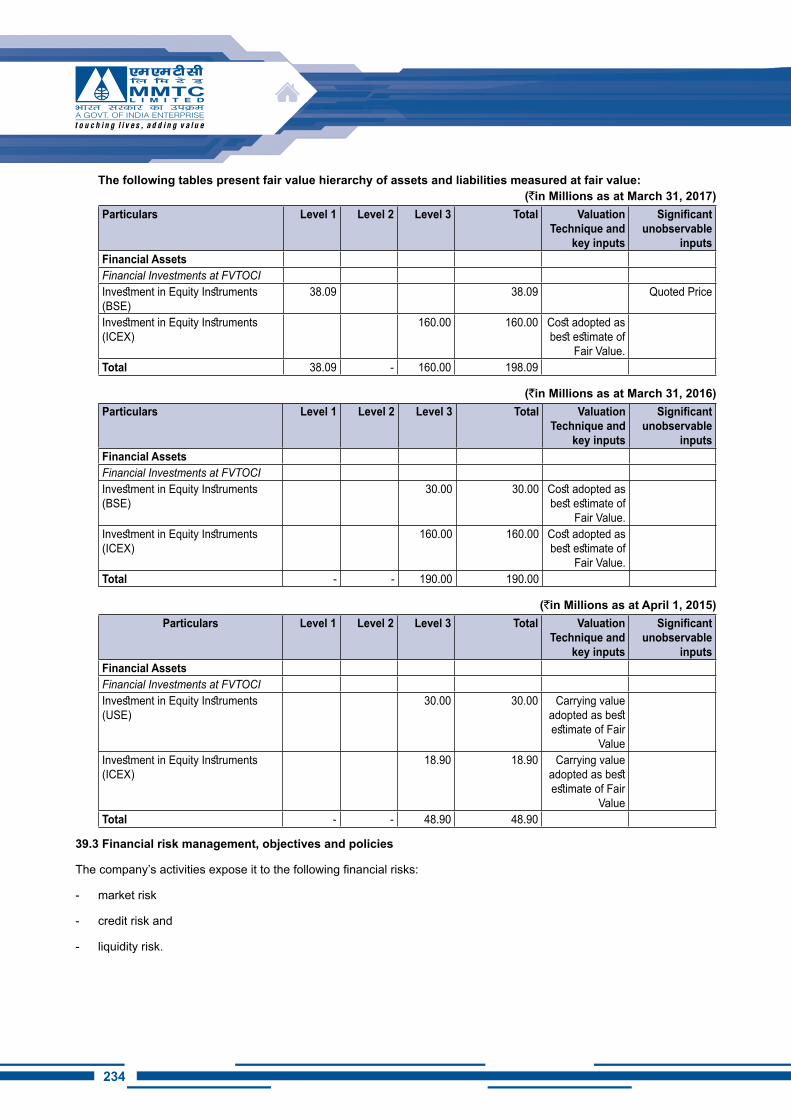
234
The following tables present fair value hierarchy of assets and liabilities measured at fair value: (`in Millions as at March 31, 2017)
Particulars Level 1 Level 2 Level 3 Total Valuation Technique and
key inputs
Significant unobservable
inputsFinancial AssetsFinancial Investments at FVTOCIInvestment in Equity Instruments (BSE)
38.09 38.09 Quoted Price
Investment in Equity Instruments (ICEX)
160.00 160.00 Cost adopted as best estimate of
Fair Value.Total 38.09 - 160.00 198.09
(`in Millions as at March 31, 2016)Particulars Level 1 Level 2 Level 3 Total Valuation
Technique and key inputs
Significant unobservable
inputsFinancial AssetsFinancial Investments at FVTOCIInvestment in Equity Instruments (BSE)
30.00 30.00 Cost adopted as best estimate of
Fair Value.Investment in Equity Instruments (ICEX)
160.00 160.00 Cost adopted as best estimate of
Fair Value.Total - - 190.00 190.00
(`in Millions as at April 1, 2015)Particulars Level 1 Level 2 Level 3 Total Valuation
Technique and key inputs
Significant unobservable
inputsFinancial AssetsFinancial Investments at FVTOCIInvestment in Equity Instruments (USE)
30.00 30.00 Carrying value adopted as best estimate of Fair
ValueInvestment in Equity Instruments (ICEX)
18.90 18.90 Carrying value adopted as best estimate of Fair
ValueTotal - - 48.90 48.90
39.3 Financial risk management, objectives and policies
The company’s activities expose it to the following financial risks:
- market risk
- credit risk and
- liquidity risk.
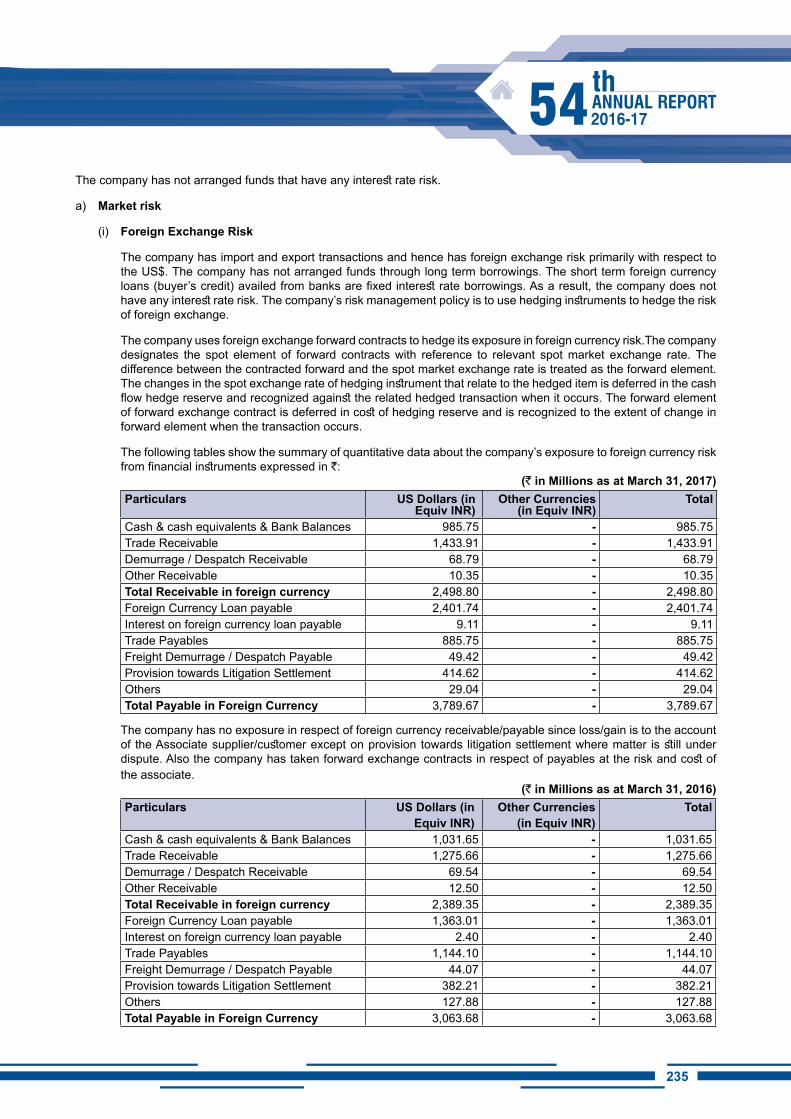
235234
The company has not arranged funds that have any interest rate risk.
a) Market risk
(i) Foreign Exchange Risk
The company has import and export transactions and hence has foreign exchange risk primarily with respect to the US$. The company has not arranged funds through long term borrowings. The short term foreign currency loans (buyer’s credit) availed from banks are fixed interest rate borrowings. As a result, the company does not have any interest rate risk. The company’s risk management policy is to use hedging instruments to hedge the risk of foreign exchange.
The company uses foreign exchange forward contracts to hedge its exposure in foreign currency risk.The company designates the spot element of forward contracts with reference to relevant spot market exchange rate. The difference between the contracted forward and the spot market exchange rate is treated as the forward element. The changes in the spot exchange rate of hedging instrument that relate to the hedged item is deferred in the cash flow hedge reserve and recognized against the related hedged transaction when it occurs. The forward element of forward exchange contract is deferred in cost of hedging reserve and is recognized to the extent of change in forward element when the transaction occurs.
The following tables show the summary of quantitative data about the company’s exposure to foreign currency risk from financial instruments expressed in `:
(` in Millions as at March 31, 2017)Particulars US Dollars (in
Equiv iNR)Other Currencies
(in Equiv iNR)Total
Cash & cash equivalents & Bank Balances 985.75 - 985.75Trade Receivable 1,433.91 - 1,433.91Demurrage / Despatch Receivable 68.79 - 68.79Other Receivable 10.35 - 10.35Total Receivable in foreign currency 2,498.80 - 2,498.80Foreign Currency Loan payable 2,401.74 - 2,401.74Interest on foreign currency loan payable 9.11 - 9.11Trade Payables 885.75 - 885.75Freight Demurrage / Despatch Payable 49.42 - 49.42Provision towards Litigation Settlement 414.62 - 414.62Others 29.04 - 29.04Total Payable in Foreign Currency 3,789.67 - 3,789.67
The company has no exposure in respect of foreign currency receivable/payable since loss/gain is to the account of the Associate supplier/customer except on provision towards litigation settlement where matter is still under dispute. Also the company has taken forward exchange contracts in respect of payables at the risk and cost of the associate.
(` in Millions as at March 31, 2016)Particulars US Dollars (in
Equiv iNR)Other Currencies
(in Equiv iNR)Total
Cash & cash equivalents & Bank Balances 1,031.65 - 1,031.65Trade Receivable 1,275.66 - 1,275.66Demurrage / Despatch Receivable 69.54 - 69.54Other Receivable 12.50 - 12.50Total Receivable in foreign currency 2,389.35 - 2,389.35Foreign Currency Loan payable 1,363.01 - 1,363.01Interest on foreign currency loan payable 2.40 - 2.40Trade Payables 1,144.10 - 1,144.10Freight Demurrage / Despatch Payable 44.07 - 44.07Provision towards Litigation Settlement 382.21 - 382.21Others 127.88 - 127.88Total Payable in Foreign Currency 3,063.68 - 3,063.68
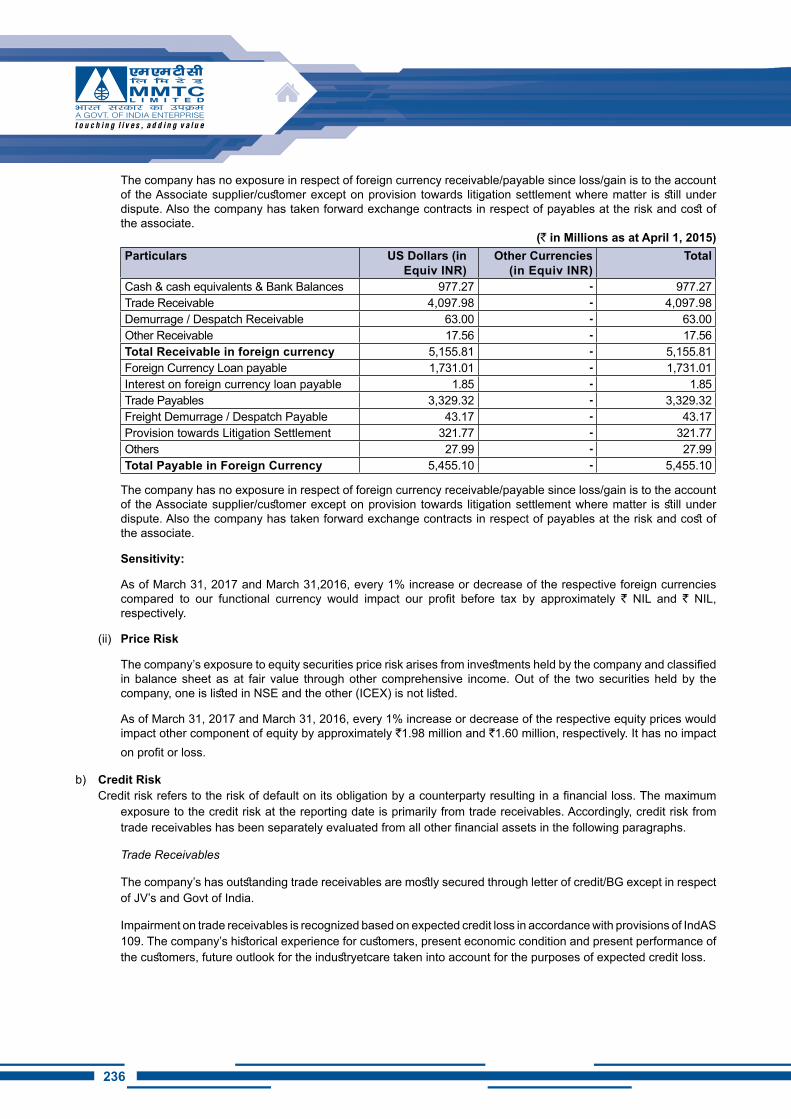
236
The company has no exposure in respect of foreign currency receivable/payable since loss/gain is to the account of the Associate supplier/customer except on provision towards litigation settlement where matter is still under dispute. Also the company has taken forward exchange contracts in respect of payables at the risk and cost of the associate.
(` in Millions as at April 1, 2015)Particulars US Dollars (in
Equiv iNR)Other Currencies
(in Equiv iNR)Total
Cash & cash equivalents & Bank Balances 977.27 - 977.27Trade Receivable 4,097.98 - 4,097.98Demurrage / Despatch Receivable 63.00 - 63.00Other Receivable 17.56 - 17.56Total Receivable in foreign currency 5,155.81 - 5,155.81Foreign Currency Loan payable 1,731.01 - 1,731.01Interest on foreign currency loan payable 1.85 - 1.85Trade Payables 3,329.32 - 3,329.32Freight Demurrage / Despatch Payable 43.17 - 43.17Provision towards Litigation Settlement 321.77 - 321.77Others 27.99 - 27.99Total Payable in Foreign Currency 5,455.10 - 5,455.10
The company has no exposure in respect of foreign currency receivable/payable since loss/gain is to the account of the Associate supplier/customer except on provision towards litigation settlement where matter is still under dispute. Also the company has taken forward exchange contracts in respect of payables at the risk and cost of the associate.
Sensitivity:
As of March 31, 2017 and March 31,2016, every 1% increase or decrease of the respective foreign currencies compared to our functional currency would impact our profit before tax by approximately ` NIL and ` NIL, respectively.
(ii) Price Risk
The company’s exposure to equity securities price risk arises from investments held by the company and classified in balance sheet as at fair value through other comprehensive income. Out of the two securities held by the company, one is listed in NSE and the other (ICEX) is not listed.
As of March 31, 2017 and March 31, 2016, every 1% increase or decrease of the respective equity prices would impact other component of equity by approximately `1.98 million and `1.60 million, respectively. It has no impact on profit or loss.
b) Credit RiskCredit risk refers to the risk of default on its obligation by a counterparty resulting in a financial loss. The maximum
exposure to the credit risk at the reporting date is primarily from trade receivables. Accordingly, credit risk from trade receivables has been separately evaluated from all other financial assets in the following paragraphs.
Trade Receivables
The company’s has outstanding trade receivables are mostly secured through letter of credit/BG except in respect of JV’s and Govt of India.
Impairment on trade receivables is recognized based on expected credit loss in accordance with provisions of IndAS 109. The company’s historical experience for customers, present economic condition and present performance of the customers, future outlook for the industryetcare taken into account for the purposes of expected credit loss.
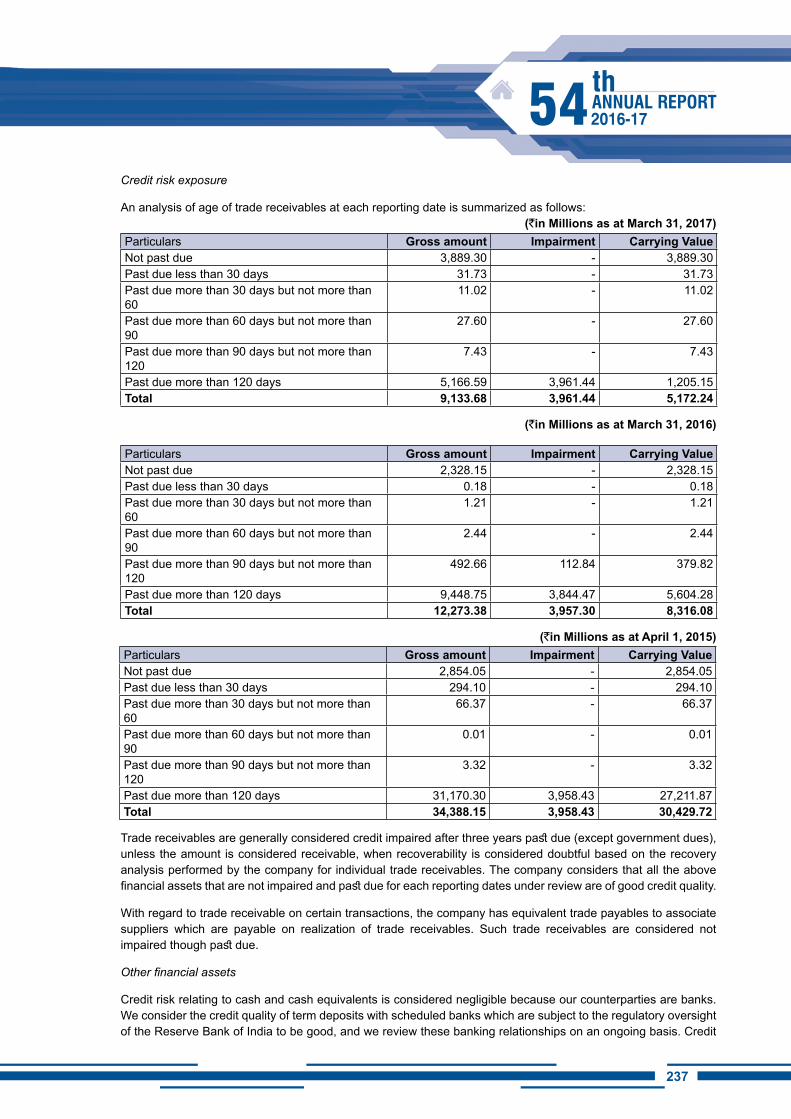
237236
Credit risk exposure
An analysis of age of trade receivables at each reporting date is summarized as follows:(`in Millions as at March 31, 2017)
Particulars Gross amount impairment Carrying ValueNot past due 3,889.30 - 3,889.30Past due less than 30 days 31.73 - 31.73Past due more than 30 days but not more than 60
11.02 - 11.02
Past due more than 60 days but not more than 90
27.60 - 27.60
Past due more than 90 days but not more than 120
7.43 - 7.43
Past due more than 120 days 5,166.59 3,961.44 1,205.15Total 9,133.68 3,961.44 5,172.24
(`in Millions as at March 31, 2016)
Particulars Gross amount impairment Carrying ValueNot past due 2,328.15 - 2,328.15Past due less than 30 days 0.18 - 0.18Past due more than 30 days but not more than 60
1.21 - 1.21
Past due more than 60 days but not more than 90
2.44 - 2.44
Past due more than 90 days but not more than 120
492.66 112.84 379.82
Past due more than 120 days 9,448.75 3,844.47 5,604.28Total 12,273.38 3,957.30 8,316.08
(`in Millions as at April 1, 2015)Particulars Gross amount impairment Carrying ValueNot past due 2,854.05 - 2,854.05Past due less than 30 days 294.10 - 294.10Past due more than 30 days but not more than 60
66.37 - 66.37
Past due more than 60 days but not more than 90
0.01 - 0.01
Past due more than 90 days but not more than 120
3.32 - 3.32
Past due more than 120 days 31,170.30 3,958.43 27,211.87Total 34,388.15 3,958.43 30,429.72
Trade receivables are generally considered credit impaired after three years past due (except government dues), unless the amount is considered receivable, when recoverability is considered doubtful based on the recovery analysis performed by the company for individual trade receivables. The company considers that all the above financial assets that are not impaired and past due for each reporting dates under review are of good credit quality.
With regard to trade receivable on certain transactions, the company has equivalent trade payables to associate suppliers which are payable on realization of trade receivables. Such trade receivables are considered not impaired though past due.
Other financial assets
Credit risk relating to cash and cash equivalents is considered negligible because our counterparties are banks. We consider the credit quality of term deposits with scheduled banks which are subject to the regulatory oversight of the Reserve Bank of India to be good, and we review these banking relationships on an ongoing basis. Credit
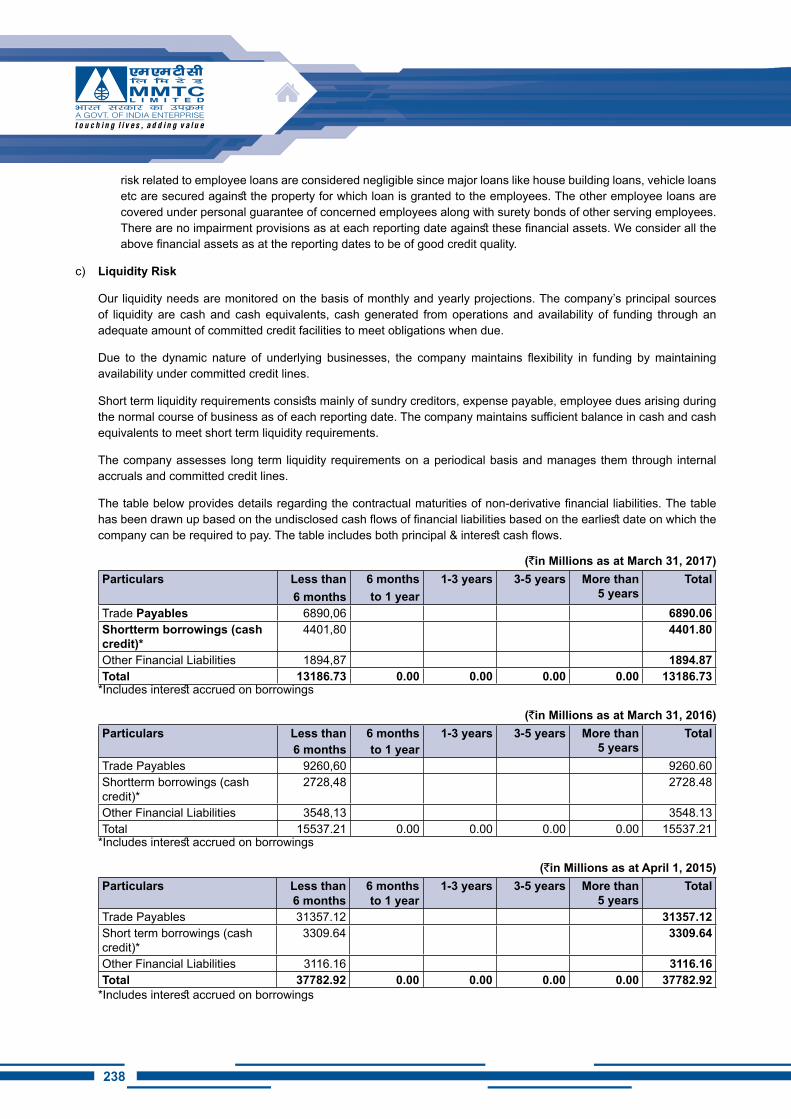
238
risk related to employee loans are considered negligible since major loans like house building loans, vehicle loans etc are secured against the property for which loan is granted to the employees. The other employee loans are covered under personal guarantee of concerned employees along with surety bonds of other serving employees. There are no impairment provisions as at each reporting date against these financial assets. We consider all the above financial assets as at the reporting dates to be of good credit quality.
c) Liquidity Risk
Our liquidity needs are monitored on the basis of monthly and yearly projections. The company’s principal sources of liquidity are cash and cash equivalents, cash generated from operations and availability of funding through an adequate amount of committed credit facilities to meet obligations when due.
Due to the dynamic nature of underlying businesses, the company maintains flexibility in funding by maintaining availability under committed credit lines.
Short term liquidity requirements consists mainly of sundry creditors, expense payable, employee dues arising during the normal course of business as of each reporting date. The company maintains sufficient balance in cash and cash equivalents to meet short term liquidity requirements.
The company assesses long term liquidity requirements on a periodical basis and manages them through internal accruals and committed credit lines.
The table below provides details regarding the contractual maturities of non-derivative financial liabilities. The table has been drawn up based on the undisclosed cash flows of financial liabilities based on the earliest date on which the company can be required to pay. The table includes both principal & interest cash flows.
(`in Millions as at March 31, 2017)Particulars Less than
6 months6 months to 1 year
1-3 years 3-5 years More than 5 years
Total
Trade Payables 6890,06 6890.06Shortterm borrowings (cash credit)*
4401,80 4401.80
Other Financial Liabilities 1894,87 1894.87Total 13186.73 0.00 0.00 0.00 0.00 13186.73
*Includes interest accrued on borrowings
(`in Millions as at March 31, 2016)Particulars Less than
6 months6 months to 1 year
1-3 years 3-5 years More than 5 years
Total
Trade Payables 9260,60 9260.60Shortterm borrowings (cash credit)*
2728,48 2728.48
Other Financial Liabilities 3548,13 3548.13Total 15537.21 0.00 0.00 0.00 0.00 15537.21
*Includes interest accrued on borrowings
(`in Millions as at April 1, 2015)Particulars Less than
6 months6 months to 1 year
1-3 years 3-5 years More than 5 years
Total
Trade Payables 31357.12 31357.12Short term borrowings (cash credit)*
3309.64 3309.64
Other Financial Liabilities 3116.16 3116.16Total 37782.92 0.00 0.00 0.00 0.00 37782.92
*Includes interest accrued on borrowings
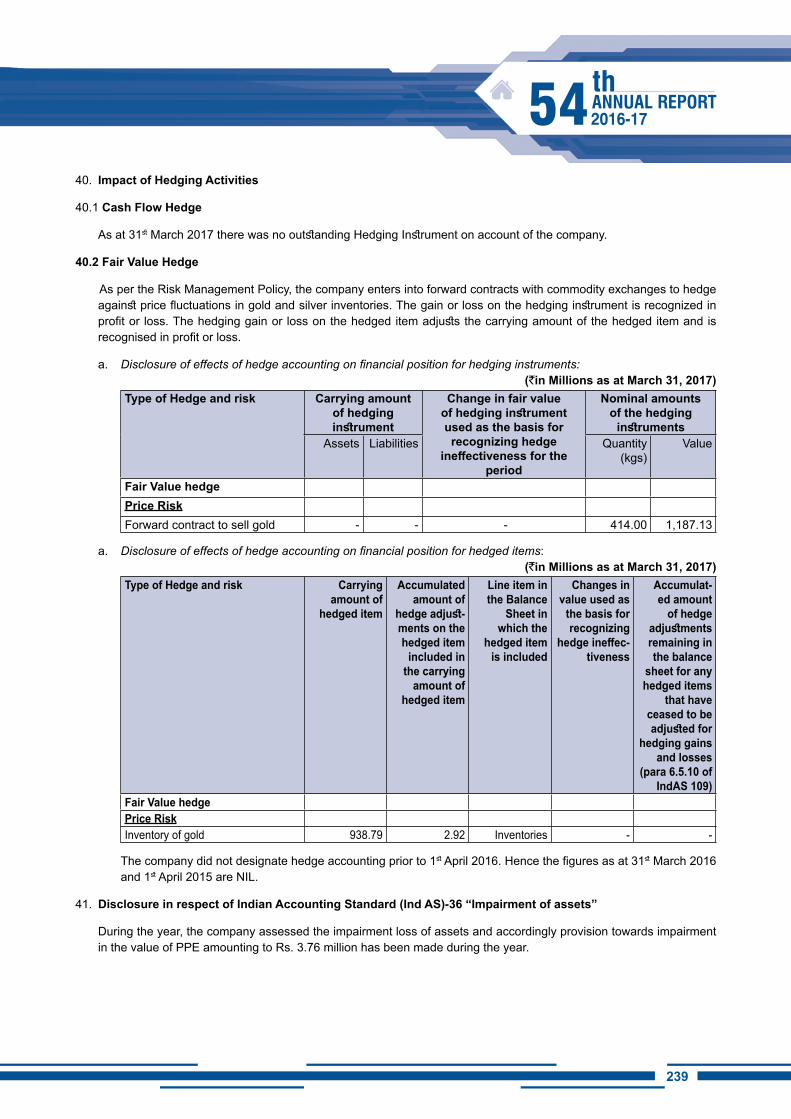
239238
40. Impact of Hedging Activities
40.1 Cash Flow Hedge
As at 31st March 2017 there was no outstanding Hedging Instrument on account of the company.
40.2 Fair Value Hedge
As per the Risk Management Policy, the company enters into forward contracts with commodity exchanges to hedge against price fluctuations in gold and silver inventories. The gain or loss on the hedging instrument is recognized in profit or loss. The hedging gain or loss on the hedged item adjusts the carrying amount of the hedged item and is recognised in profit or loss.
a. Disclosure of effects of hedge accounting on financial position for hedging instruments: (`in Millions as at March 31, 2017)
Type of Hedge and risk Carrying amount of hedging instrument
Change in fair value of hedging instrument used as the basis for
recognizing hedge ineffectiveness for the
period
Nominal amounts of the hedging
instrumentsAssets Liabilities Quantity
(kgs)Value
Fair Value hedgePrice RiskForward contract to sell gold - - - 414.00 1,187.13
a. Disclosure of effects of hedge accounting on financial position for hedged items:(`in Millions as at March 31, 2017)
Type of Hedge and risk Carrying amount of
hedged item
Accumulated amount of
hedge adjust-ments on the hedged item
included in the carrying
amount of hedged item
Line item in the Balance
Sheet in which the
hedged item is included
Changes in value used as
the basis for recognizing
hedge ineffec-tiveness
Accumulat-ed amount
of hedge adjustments remaining in the balance
sheet for any hedged items
that have ceased to be adjusted for
hedging gains and losses
(para 6.5.10 of IndAS 109)
Fair Value hedgePrice RiskInventory of gold 938.79 2.92 Inventories - -
The company did not designate hedge accounting prior to 1st April 2016. Hence the figures as at 31st March 2016 and 1st April 2015 are NIL.
41. Disclosure in respect of Indian Accounting Standard (Ind AS)-36 “Impairment of assets”
During the year, the company assessed the impairment loss of assets and accordingly provision towards impairment in the value of PPE amounting to Rs. 3.76 million has been made during the year.
240
42. Disclosure in respect of Indian Accounting Standard (Ind AS)-19 “Employee Benefits”
42.1 General description of various employee’s benefits schemes are as under:
a) Gratuity:
Gratuity is paid to all employees on retirement/separation based on the number of years of service. The scheme is funded by the Company and is managed by a separate Trust through LIC. In case of MICA division employees the scheme is managed directly by the company through LIC. The scheme is funded by the company and the liability is recognized on the basis of contribution payable to the insurer, i.e., the Life Insurance Corporation of India, however, the disclosure of information as required under Ind AS-19 have been made in accordance with the actuarial valuation.
As per Actuarial Valuation company’s best estimates for FY 2016-17 towards the Gratuity Fund Contribution is ` 4.28 million (including actuarial deficit of ` NIL Millions for 2015-16). However, the company is making contribution to the fund as per the demand made by Life Insurance Corporation of India.
b) Leave:
Payable on separation to eligible employees who have accumulated earned and half pay leave. Encashment of accumulated earned leave is also allowed during service leaving a minimum balance of 15 days twice in a year.The liability on this account is recognized on the basis of actuarial valuation.
c) Long Service Benefits: Long Service Benefits payable to the employees are as under-
(i) Service Award:
Service Award amounting to 3,500/- for each completed year of service is payable to the employees on superannuation/voluntary retirement scheme.
(ii) Compassionate Gratuity
Compassionate Gratuity amounting to 50,000/- is payable in lump-sum to the dependants of the employee on death while in service.
(iii) Employees’ Family Benefit Scheme
Payments under Employees’ Family Benefit Scheme is payable to the dependants of the employee who dies in service till the notional date of superannuation. A monthly benefit @ 40% of Basic Pay & DA last drawn subject to a maximum of 12,000/- on rendering service of less than 20 years and similarly a monthly benefit @ 50% of Basic Pay & DA last drawn subject to maximum 12,000/- on rendering service of 20 years or more at the time of death.
(iv) Special Benefit to MICA Division employees amounting to 5,00,000/- (Officer), 4,00,000/- (Staff) and 3,00,000/- (Worker) upon retirement
The summarized position of various defined benefits recognized in the Statement of Profit & Loss, Other Comprehensive Income (OCI) and Balance Sheet & other disclosures are as under:
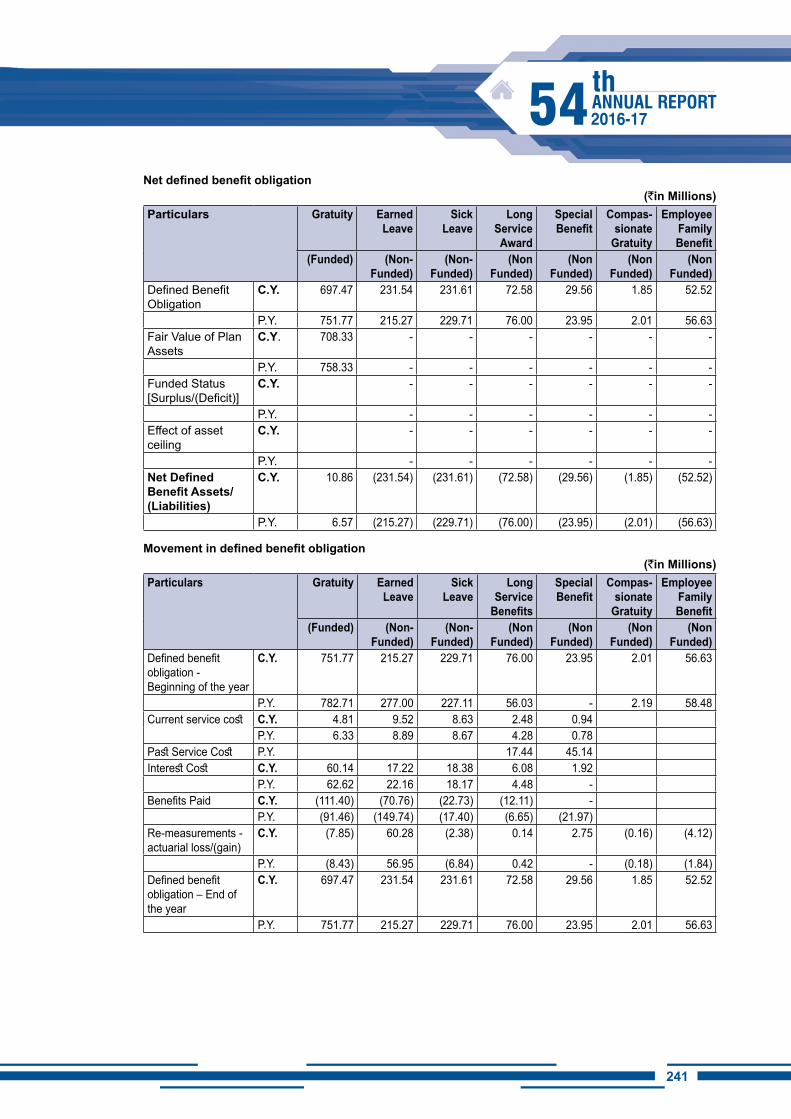
241240
Net defined benefit obligation(`in Millions)
Particulars Gratuity Earned Leave
Sick Leave
Long Service Award
Special Benefit
Compas-sionate
Gratuity
Employee Family Benefit
(Funded) (Non-Funded)
(Non-Funded)
(Non Funded)
(Non Funded)
(Non Funded)
(Non Funded)
Defined Benefit Obligation
C.Y. 697.47 231.54 231.61 72.58 29.56 1.85 52.52
P.Y. 751.77 215.27 229.71 76.00 23.95 2.01 56.63 Fair Value of Plan Assets
C.Y. 708.33 - - - - - -
P.Y. 758.33 - - - - - - Funded Status [Surplus/(Deficit)]
C.Y. - - - - - -
P.Y. - - - - - - Effect of asset ceiling
C.Y. - - - - - -
P.Y. - - - - - - Net Defined Benefit Assets/(Liabilities)
C.Y. 10.86 (231.54) (231.61) (72.58) (29.56) (1.85) (52.52)
P.Y. 6.57 (215.27) (229.71) (76.00) (23.95) (2.01) (56.63)
Movement in defined benefit obligation(`in Millions)
Particulars Gratuity Earned Leave
Sick Leave
Long Service
Benefits
Special Benefit
Compas-sionate
Gratuity
Employee Family Benefit
(Funded) (Non-Funded)
(Non-Funded)
(Non Funded)
(Non Funded)
(Non Funded)
(Non Funded)
Defined benefit obligation - Beginning of the year
C.Y. 751.77 215.27 229.71 76.00 23.95 2.01 56.63
P.Y. 782.71 277.00 227.11 56.03 - 2.19 58.48Current service cost C.Y. 4.81 9.52 8.63 2.48 0.94
P.Y. 6.33 8.89 8.67 4.28 0.78Past Service Cost P.Y. 17.44 45.14Interest Cost C.Y. 60.14 17.22 18.38 6.08 1.92
P.Y. 62.62 22.16 18.17 4.48 - Benefits Paid C.Y. (111.40) (70.76) (22.73) (12.11) -
P.Y. (91.46) (149.74) (17.40) (6.65) (21.97)Re-measurements - actuarial loss/(gain)
C.Y. (7.85) 60.28 (2.38) 0.14 2.75 (0.16) (4.12)
P.Y. (8.43) 56.95 (6.84) 0.42 - (0.18) (1.84)Defined benefit obligation – End of the year
C.Y. 697.47 231.54 231.61 72.58 29.56 1.85 52.52
P.Y. 751.77 215.27 229.71 76.00 23.95 2.01 56.63
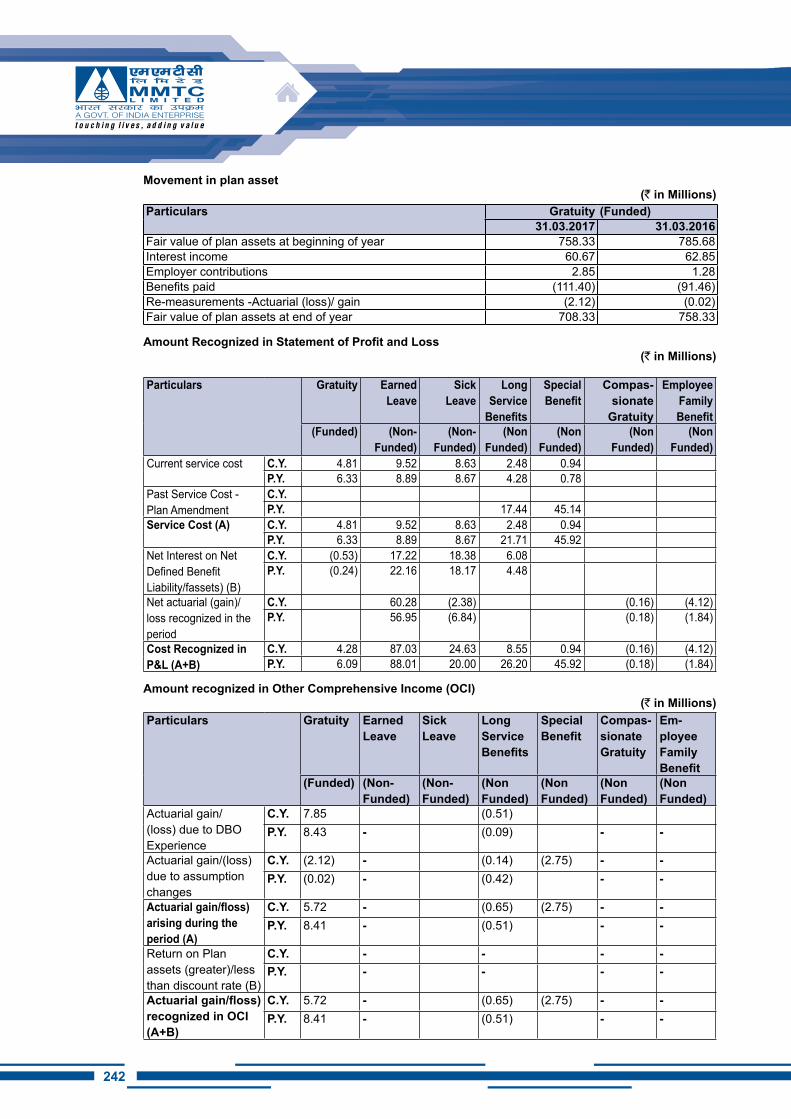
242
Movement in plan asset (` in Millions)
Particulars Gratuity (Funded)31.03.2017 31.03.2016
Fair value of plan assets at beginning of year 758.33 785.68Interest income 60.67 62.85Employer contributions 2.85 1.28Benefits paid (111.40) (91.46)Re-measurements -Actuarial (loss)/ gain (2.12) (0.02)Fair value of plan assets at end of year 708.33 758.33
Amount Recognized in Statement of Profit and Loss(` in Millions)
Particulars Gratuity Earned Leave
Sick Leave
Long Service
Benefits
Special Benefit
Compas-sionate
Gratuity
Employee Family Benefit
(Funded) (Non-Funded)
(Non-Funded)
(Non Funded)
(Non Funded)
(Non Funded)
(Non Funded)
Current service cost C.Y. 4.81 9.52 8.63 2.48 0.94P.Y. 6.33 8.89 8.67 4.28 0.78
Past Service Cost - Plan Amendment
C.Y.P.Y. 17.44 45.14
Service Cost (A) C.Y. 4.81 9.52 8.63 2.48 0.94P.Y. 6.33 8.89 8.67 21.71 45.92
Net Interest on Net Defined Benefit Liability/fassets) (B)
C.Y. (0.53) 17.22 18.38 6.08P.Y. (0.24) 22.16 18.17 4.48
Net actuarial (gain)/ loss recognized in the period
C.Y. 60.28 (2.38) (0.16) (4.12)P.Y. 56.95 (6.84) (0.18) (1.84)
Cost Recognized in P&L (A+B)
C.Y. 4.28 87.03 24.63 8.55 0.94 (0.16) (4.12)P.Y. 6.09 88.01 20.00 26.20 45.92 (0.18) (1.84)
Amount recognized in Other Comprehensive Income (OCI) (` in Millions)
Particulars Gratuity Earned Leave
Sick Leave
Long Service Benefits
Special Benefit
Compas-sionate Gratuity
Em-ployee Family Benefit
(Funded) (Non-Funded)
(Non-Funded)
(Non Funded)
(Non Funded)
(Non Funded)
(Non Funded)
Actuarial gain/(loss) due to DBO Experience
C.Y. 7.85 (0.51)P.Y. 8.43 - (0.09) - -
Actuarial gain/(loss) due to assumption changes
C.Y. (2.12) - (0.14) (2.75) - -P.Y. (0.02) - (0.42) - -
Actuarial gain/floss) arising during the period (A)
C.Y. 5.72 - (0.65) (2.75) - -P.Y. 8.41 - (0.51) - -
Return on Plan assets (greater)/less than discount rate (B)
C.Y. - - - -P.Y. - - - -
Actuarial gain/floss) recognized in OCI (A+B)
C.Y. 5.72 - (0.65) (2.75) - -P.Y. 8.41 - (0.51) - -
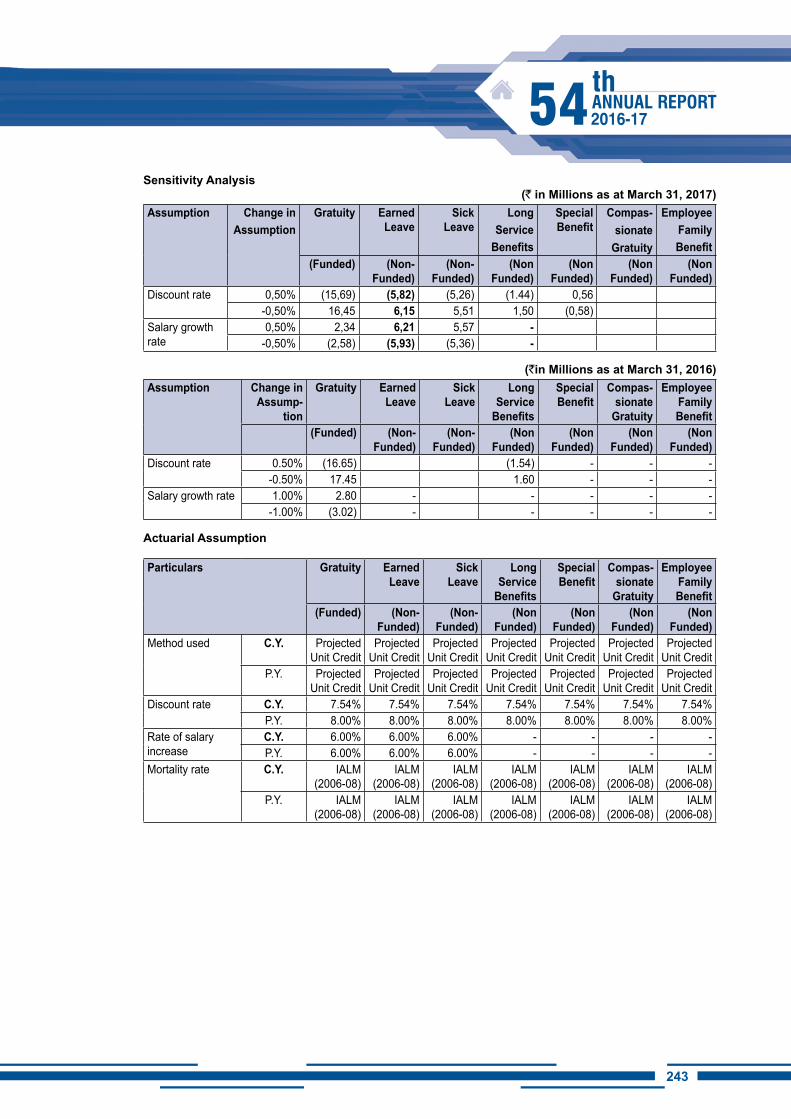
243242
Sensitivity Analysis(` in Millions as at March 31, 2017)
Assumption Change in Assumption
Gratuity Earned Leave
Sick Leave
Long Service
Benefits
Special Benefit
Compas-sionate
Gratuity
Employee Family Benefit
(Funded) (Non-Funded)
(Non-Funded)
(Non Funded)
(Non Funded)
(Non Funded)
(Non Funded)
Discount rate 0,50% (15,69) (5,82) (5,26) (1.44) 0,56-0,50% 16,45 6,15 5,51 1,50 (0,58)
Salary growth rate
0,50% 2,34 6,21 5,57 --0,50% (2,58) (5,93) (5,36) -
(`in Millions as at March 31, 2016)Assumption Change in
Assump-tion
Gratuity Earned Leave
Sick Leave
Long Service
Benefits
Special Benefit
Compas-sionate
Gratuity
Employee Family Benefit
(Funded) (Non-Funded)
(Non-Funded)
(Non Funded)
(Non Funded)
(Non Funded)
(Non Funded)
Discount rate 0.50% (16.65) (1.54) - - - -0.50% 17.45 1.60 - - -
Salary growth rate 1.00% 2.80 - - - - - -1.00% (3.02) - - - - -
Actuarial Assumption
Particulars Gratuity Earned Leave
Sick Leave
Long Service
Benefits
Special Benefit
Compas-sionate
Gratuity
Employee Family Benefit
(Funded) (Non-Funded)
(Non-Funded)
(Non Funded)
(Non Funded)
(Non Funded)
(Non Funded)
Method used C.Y. Projected Unit Credit
Projected Unit Credit
Projected Unit Credit
Projected Unit Credit
Projected Unit Credit
Projected Unit Credit
Projected Unit Credit
P.Y. Projected Unit Credit
Projected Unit Credit
Projected Unit Credit
Projected Unit Credit
Projected Unit Credit
Projected Unit Credit
Projected Unit Credit
Discount rate C.Y. 7.54% 7.54% 7.54% 7.54% 7.54% 7.54% 7.54%P.Y. 8.00% 8.00% 8.00% 8.00% 8.00% 8.00% 8.00%
Rate of salary increase
C.Y. 6.00% 6.00% 6.00% - - - - P.Y. 6.00% 6.00% 6.00% - - - -
Mortality rate C.Y. IALM (2006-08)
IALM (2006-08)
IALM (2006-08)
IALM (2006-08)
IALM (2006-08)
IALM (2006-08)
IALM (2006-08)
P.Y. IALM (2006-08)
IALM (2006-08)
IALM (2006-08)
IALM (2006-08)
IALM (2006-08)
IALM (2006-08)
IALM (2006-08)
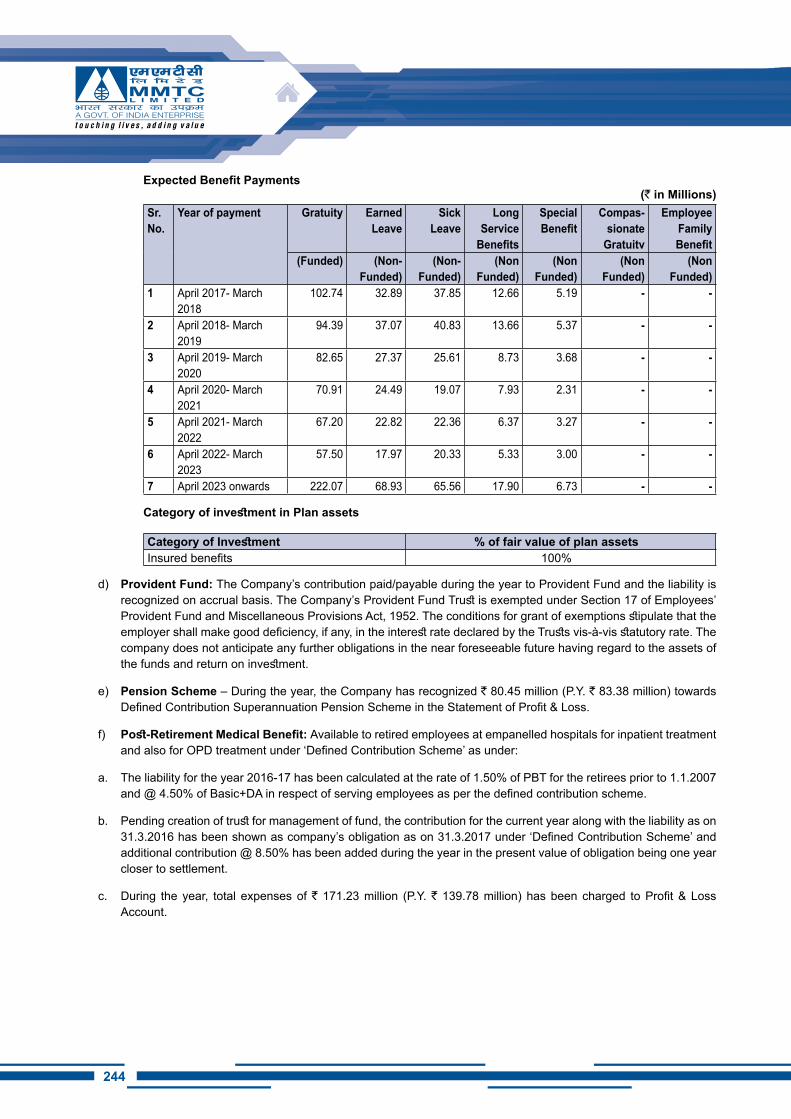
244
Expected Benefit Payments(` in Millions)
Sr. No.
Year of payment Gratuity Earned Leave
Sick Leave
Long Service
Benefits
Special Benefit
Compas-sionate
Gratuitv
Employee Family Benefit
(Funded) (Non-Funded)
(Non-Funded)
(Non Funded)
(Non Funded)
(Non Funded)
(Non Funded)
1 April 2017- March 2018
102.74 32.89 37.85 12.66 5.19 - -
2 April 2018- March 2019
94.39 37.07 40.83 13.66 5.37 - -
3 April 2019- March 2020
82.65 27.37 25.61 8.73 3.68 - -
4 April 2020- March 2021
70.91 24.49 19.07 7.93 2.31 - -
5 April 2021- March 2022
67.20 22.82 22.36 6.37 3.27 - -
6 April 2022- March 2023
57.50 17.97 20.33 5.33 3.00 - -
7 April 2023 onwards 222.07 68.93 65.56 17.90 6.73 - -
Category of investment in Plan assets
Category of Investment % of fair value of plan assetsInsured benefits 100%
d) Provident Fund: The Company’s contribution paid/payable during the year to Provident Fund and the liability is recognized on accrual basis. The Company’s Provident Fund Trust is exempted under Section 17 of Employees’ Provident Fund and Miscellaneous Provisions Act, 1952. The conditions for grant of exemptions stipulate that the employer shall make good deficiency, if any, in the interest rate declared by the Trusts vis-à-vis statutory rate. The company does not anticipate any further obligations in the near foreseeable future having regard to the assets of the funds and return on investment.
e) Pension Scheme – During the year, the Company has recognized ` 80.45 million (P.Y. ` 83.38 million) towards Defined Contribution Superannuation Pension Scheme in the Statement of Profit & Loss.
f) Post-Retirement Medical Benefit: Available to retired employees at empanelled hospitals for inpatient treatment and also for OPD treatment under ‘Defined Contribution Scheme’ as under:
a. The liability for the year 2016-17 has been calculated at the rate of 1.50% of PBT for the retirees prior to 1.1.2007 and @ 4.50% of Basic+DA in respect of serving employees as per the defined contribution scheme.
b. Pending creation of trust for management of fund, the contribution for the current year along with the liability as on 31.3.2016 has been shown as company’s obligation as on 31.3.2017 under ‘Defined Contribution Scheme’ and additional contribution @ 8.50% has been added during the year in the present value of obligation being one year closer to settlement.
c. During the year, total expenses of ` 171.23 million (P.Y. ` 139.78 million) has been charged to Profit & Loss Account.
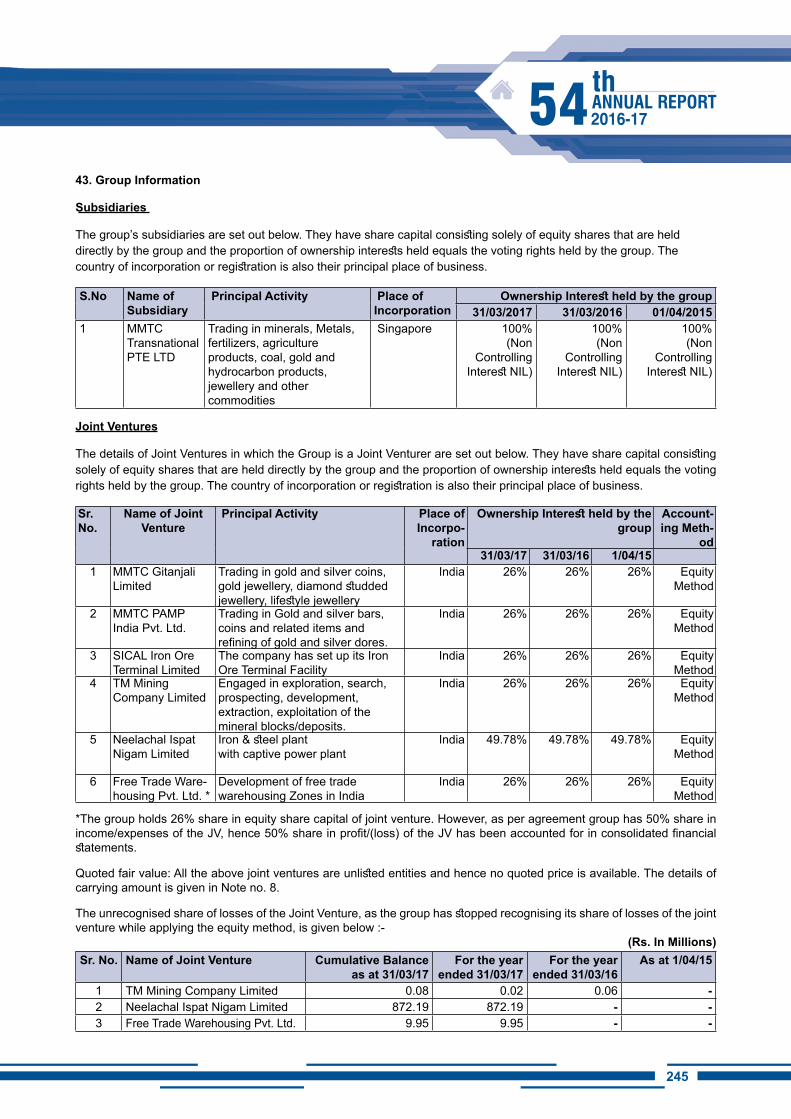
245244
43. Group information
Subsidiaries
The group’s subsidiaries are set out below. They have share capital consisting solely of equity shares that are held directly by the group and the proportion of ownership interests held equals the voting rights held by the group. The country of incorporation or registration is also their principal place of business.
S.No Name of Subsidiary
Principal Activity Place of incorporation
Ownership Interest held by the group 31/03/2017 31/03/2016 01/04/2015
1 MMTC Transnational PTE LTD
Trading in minerals, Metals, fertilizers, agriculture products, coal, gold and hydrocarbon products, jewellery and other commodities
Singapore 100%(Non
Controlling Interest NIL)
100%(Non
Controlling Interest NIL)
100%(Non
Controlling Interest NIL)
Joint Ventures
The details of Joint Ventures in which the Group is a Joint Venturer are set out below. They have share capital consisting solely of equity shares that are held directly by the group and the proportion of ownership interests held equals the voting rights held by the group. The country of incorporation or registration is also their principal place of business.
Sr. No.
Name of Joint Venture
Principal Activity Place of incorpo-
ration
Ownership Interest held by the group
Account-ing Meth-
od31/03/17 31/03/16 1/04/15
1 MMTC Gitanjali Limited
Trading in gold and silver coins, gold jewellery, diamond studded jewellery, lifestyle jewellery
India 26% 26% 26% Equity Method
2 MMTC PAMP India Pvt. Ltd.
Trading in Gold and silver bars, coins and related items and refining of gold and silver dores.
India 26% 26% 26% Equity Method
3 SICAL Iron Ore Terminal Limited
The company has set up its Iron Ore Terminal Facility
India 26% 26% 26% Equity Method
4 TM Mining Company Limited
Engaged in exploration, search, prospecting, development, extraction, exploitation of the mineral blocks/deposits.
India 26% 26% 26% Equity Method
5 Neelachal Ispat Nigam Limited
Iron & steel plant with captive power plant
India 49.78% 49.78% 49.78% Equity Method
6 Free Trade Ware- housing Pvt. Ltd. *
Development of free trade warehousing Zones in India
India 26% 26% 26% Equity Method
*The group holds 26% share in equity share capital of joint venture. However, as per agreement group has 50% share in income/expenses of the JV, hence 50% share in profit/(loss) of the JV has been accounted for in consolidated financial statements.
Quoted fair value: All the above joint ventures are unlisted entities and hence no quoted price is available. The details of carrying amount is given in Note no. 8.
The unrecognised share of losses of the Joint Venture, as the group has stopped recognising its share of losses of the joint venture while applying the equity method, is given below :-
(Rs. in Millions)Sr. No. Name of Joint Venture Cumulative Balance
as at 31/03/17For the year
ended 31/03/17For the year
ended 31/03/16As at 1/04/15
1 TM Mining Company Limited 0.08 0.02 0.06 - 2 Neelachal Ispat Nigam Limited 872.19 872.19 - - 3 Free Trade Warehousing Pvt. Ltd. 9.95 9.95 - -
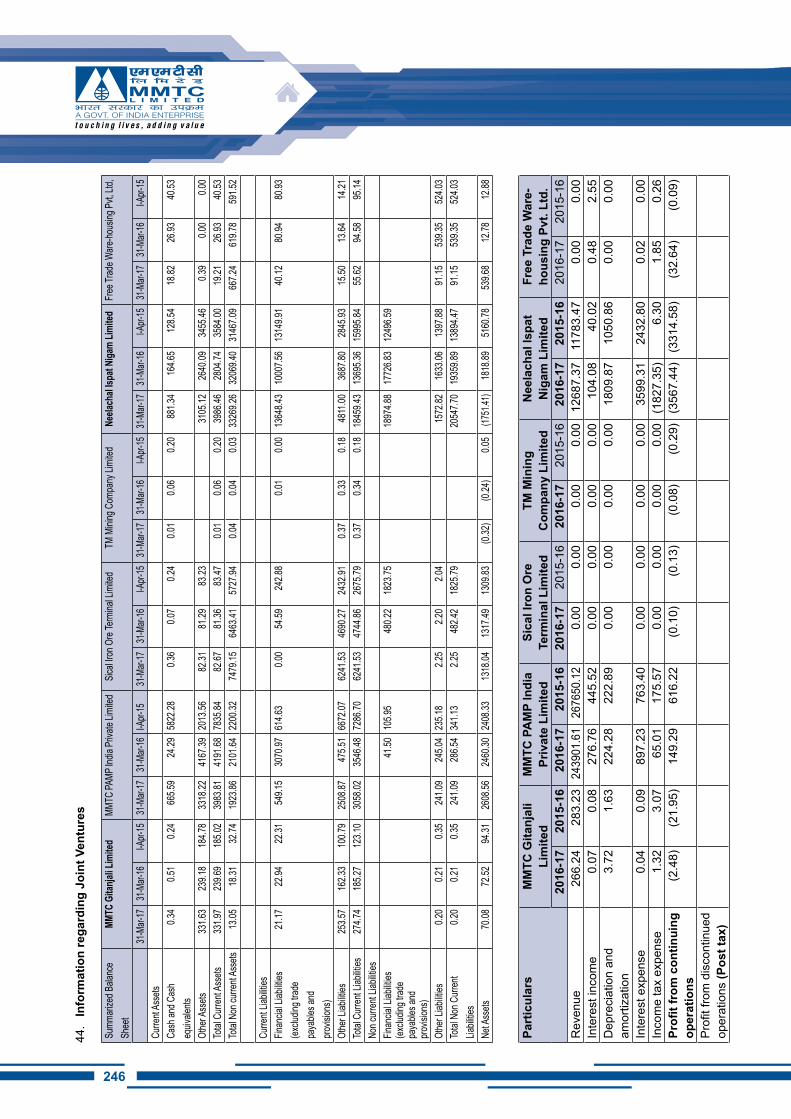
246
44.
Info
rmat
ion
rega
rdin
g Jo
int V
entu
res
Summ
arize
d Bala
nce
Shee
tMM
TC G
itanja
li Lim
ited
MMTC
PAMP
India
Priva
te Lim
ited
Sical
Iron O
re Te
rmina
l Lim
ited
TM M
ining
Com
pany
Limi
tedNe
elach
al Isp
at Ni
gam
Limite
dFr
ee Tr
ade W
are-ho
using
Pvt,
Ltd,
31-M
ar-17
31-M
ar-16
l-Apr-
1531
-Mar-
1731
-Mar-
16l-A
pr-15
31-M
ar-17
31-M
ar-16
l-Apr-
1531
-Mar-
1731
-Mar-
16l-A
pr-15
31-M
ar-17
31-M
ar-16
l-Apr-
1531
-Mar-
1731
-Mar-
16l-A
pr-15
Curre
nt As
sets
Cash
and C
ash
equiv
alents
0.34
0.51
0.24
665.5
924
.2958
22.28
0.36
0.07
0.24
0.01
0.06
0.20
881.3
416
4.65
128.5
418
.8226
.9340
.53
Othe
r Ass
ets33
1.63
239.1
818
4.78
3318
.2241
67.39
2013
.5682
.3181
.2983
.2331
05.12
2640
.0934
55.46
0.39
0.00
0.00
Total
Curr
ent A
ssets
331.9
723
9.69
185.0
239
83.81
4191
.6878
35.84
82.67
81.36
83.47
0.01
0.06
0.20
3986
.4628
04.74
3584
.0019
.2126
.9340
.53To
tal N
on cu
rrent
Asse
ts13
.0518
.3132
.7419
23.86
2101
.6422
00.32
7479
.1564
63.41
5727
.940.0
40.0
40.0
333
269.2
632
069.4
031
467.0
966
7.24
619.7
859
1.52
Curre
nt Lia
bilitie
sFin
ancia
l Liab
ilities
(ex
cludin
g trad
e pa
yable
s and
pro
vision
s)
21.17
22.94
22.31
549.1
530
70.97
614.6
30.0
054
.5924
2.88
0.01
0.00
1364
8.43
1000
7.56
1314
9.91
40.12
80.94
80.93
Othe
r Liab
ilities
253.5
716
2.33
100.7
925
08.87
475.5
166
72.07
6241
.5346
90.27
2432
.910.3
70.3
30.1
848
11.00
3687
.8028
45.93
15.50
13.64
14.21
Total
Curr
ent L
iabilit
ies27
4.74
185.2
712
3.10
3058
.0235
46.48
7286
.7062
41.53
4744
.8626
75.79
0.37
0.34
0.18
1845
9.43
1369
5.36
1599
5.84
55.62
94.58
95.14
Non c
urren
t Liab
ilities
Finan
cial L
iabilit
ies
(exclu
ding t
rade
paya
bles a
nd
provis
ions)
41.50
105.9
548
0.22
1823
.7518
974.8
817
726.8
312
496.5
9
Othe
r Liab
ilities
0.20
0.21
0.35
241.0
924
5.04
235.1
82.2
52.2
02.0
415
72.82
1633
.0613
97.88
91.15
539.3
552
4.03
Total
Non
Curr
ent
Liabil
ities
0.20
0.21
0.35
241.0
928
6.54
341.1
32.2
548
2.42
1825
.7920
547.7
019
359.8
913
894.4
791
.1553
9.35
524.0
3
Net A
ssets
70.08
72.52
94.31
2608
.5624
60.30
2408
.3313
18.04
1317
.4913
09.83
(0.32
)(0.
24)
0.05
(1751
.41)
1818
.8951
60.78
539.6
812
.7812
.88
Part
icul
ars
MM
TC G
itanj
ali
Lim
ited
MM
TC P
AM
P In
dia
Priv
ate
Lim
ited
Sica
l iro
n O
re
Term
inal
Lim
ited
TM M
inin
g C
ompa
ny L
imite
dN
eela
chal
ispa
t N
igam
Lim
ited
Free
Tra
de W
are-
hous
ing
Pvt.
Ltd.
2016
-17
2015
-16
2016
-17
2015
-16
2016
-17
2015
-16
2016
-17
2015
-16
2016
-17
2015
-16
2016
-17
2015
-16
Rev
enue
266.
2428
3.23
2439
01.6
126
7650
.12
0.00
0.00
0.00
0.00
1268
7.37
1178
3.47
0.00
0.00
Inte
rest
inco
me
0.07
0.08
276.
7644
5.52
0.00
0.00
0.00
0.00
104.
0840
.02
0.48
2.55
Dep
reci
atio
n an
d am
ortiz
atio
n3.
721.
6322
4.28
222.
890.
000.
000.
000.
0018
09.8
710
50.8
60.
000.
00
Inte
rest
exp
ense
0.04
0.09
897.
2376
3.40
0.00
0.00
0.00
0.00
3599
.31
2432
.80
0.02
0.00
Inco
me
tax
expe
nse
1.32
3.07
65.0
117
5.57
0.00
0.00
0.00
0.00
(182
7.35
)6.
301.
850.
26Pr
ofit f
rom
con
tinui
ng
oper
atio
ns(2
.48)
(21.
95)
149.
2961
6.22
(0.1
0)(0
.13)
(0.0
8)(0
.29)
(356
7.44
)(3
314.
58)
(32.
64)
(0.0
9)
Profi
t fro
m d
isco
ntin
ued
oper
atio
ns (P
ost t
ax)
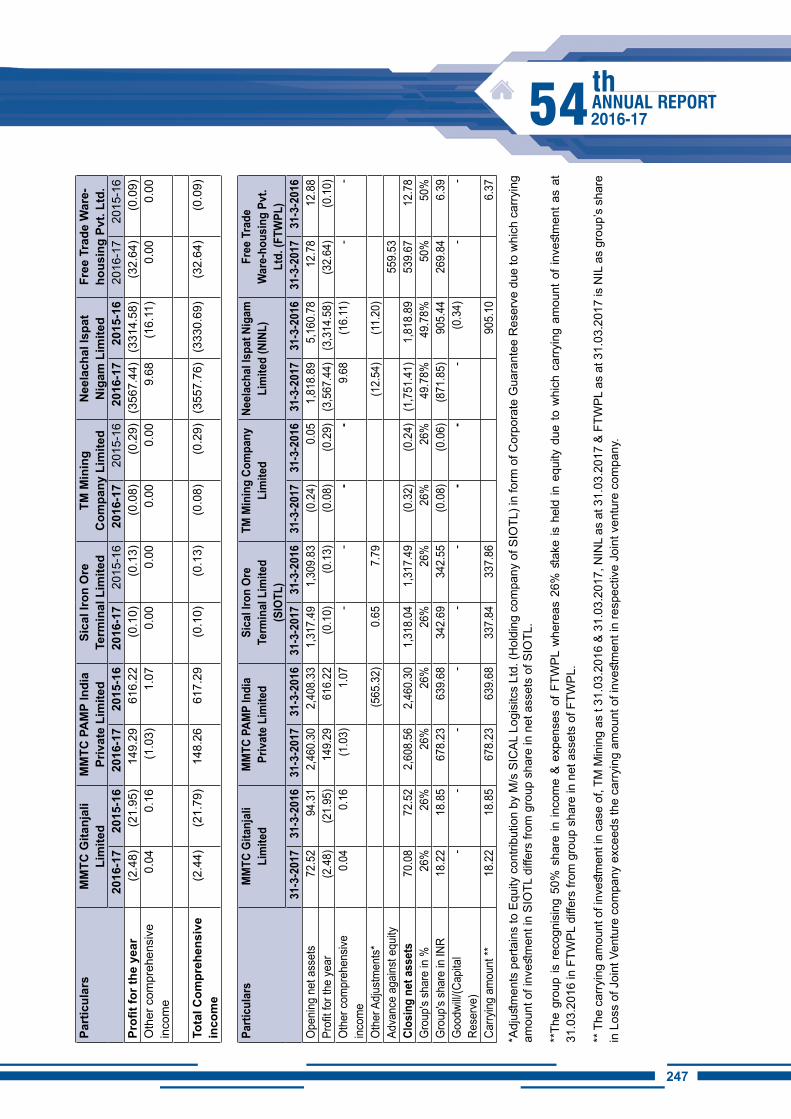
247246
Part
icul
ars
MM
TC G
itanj
ali
Lim
ited
MM
TC P
AM
P In
dia
Priv
ate
Lim
ited
Sica
l iro
n O
re
Term
inal
Lim
ited
TM M
inin
g C
ompa
ny L
imite
dN
eela
chal
ispa
t N
igam
Lim
ited
Free
Tra
de W
are-
hous
ing
Pvt.
Ltd.
2016
-17
2015
-16
2016
-17
2015
-16
2016
-17
2015
-16
2016
-17
2015
-16
2016
-17
2015
-16
2016
-17
2015
-16
Profi
t for
the
year
(2.4
8)(2
1.95
)14
9.29
616.
22(0
.10)
(0.1
3)(0
.08)
(0.2
9)(3
567.
44)
(331
4.58
)(3
2.64
)(0
.09)
Oth
er c
ompr
ehen
sive
in
com
e0.
040.
16(1
.03)
1.07
0.00
0.00
0.00
0.00
9.68
(16.
11)
0.00
0.00
Tota
l Com
preh
ensi
ve
inco
me
(2.4
4)(2
1.79
)14
8.26
617.
29(0
.10)
(0.1
3)(0
.08)
(0.2
9)(3
557.
76)
(333
0.69
)(3
2.64
)(0
.09)
Parti
cula
rsM
MTC
Gita
njal
i Li
mite
dM
MTC
PAM
P In
dia
Priv
ate
Lim
ited
Sica
l iro
n Or
e Te
rmin
al L
imite
d (S
iOTL
)
TM M
inin
g Co
mpa
ny
Lim
ited
Neel
acha
l Isp
at N
igam
Li
mite
d (N
INL)
Free
Tra
de
War
e-ho
usin
g Pv
t. Lt
d. (F
TWPL
)31
-3-2
017
31-3
-201
631
-3-2
017
31-3
-201
631
-3-2
017
31-3
-201
631
-3-2
017
31-3
-201
631
-3-2
017
31-3
-201
631
-3-2
017
31-3
-201
6O
peni
ng n
et a
sset
s72
.52
94.3
12,
460.
302,
408.
331,
317.
491,
309.
83(0
.24)
0.05
1,81
8.89
5,16
0.78
12.7
812
.88
Profi
t for
the
year
(2.4
8)(2
1.95
)14
9.29
616.
22(0
.10)
(0.1
3)(0
.08)
(0.2
9)(3
,567
.44)
(3,3
14.5
8)(3
2.64
)(0
.10)
Oth
er c
ompr
ehen
sive
inco
me
0.04
0.16
(1.0
3)1.
07-
--
-9.
68(1
6.11
)-
-
Oth
er A
djus
tmen
ts*
(565
.32)
0.65
7.79
(12.
54)
(11.
20)
Adva
nce
agai
nst e
quity
559.
53Cl
osin
g ne
t ass
ets
70.0
872
.52
2,60
8.56
2,46
0.30
1,31
8.04
1,31
7.49
(0.3
2)(0
.24)
(1,7
51.4
1)1,
818.
8953
9.67
12.7
8G
roup
's sh
are
in %
26%
26%
26%
26%
26%
26%
26%
26%
49.7
8%49
.78%
50%
50%
Gro
up's
shar
e in
INR
18.2
218
.85
678.
2363
9.68
342.
6934
2.55
(0.0
8)(0
.06)
(871
.85)
905.
4426
9.84
6.39
Goo
dwill/
(Cap
ital
Rese
rve)
--
--
--
--
-(0
.34)
--
Carry
ing
amou
nt **
18.2
218
.85
678.
2363
9.68
337.
8433
7.86
905.
106.
37
*Adj
ustm
ents
per
tain
s to
Equ
ity c
ontri
butio
n by
M/s
SIC
AL L
ogis
itcs
Ltd.
(Hol
ding
com
pany
of S
IOTL
) in
form
of C
orpo
rate
Gua
rant
ee R
eser
ve d
ue to
whi
ch c
arry
ing
amou
nt o
f inv
estm
ent i
n SI
OTL
diff
ers
from
gro
up s
hare
in n
et a
sset
s of
SIO
TL.
**Th
e gr
oup
is r
ecog
nisi
ng 5
0% s
hare
in in
com
e &
expe
nses
of F
TWPL
whe
reas
26%
stak
e is
hel
d in
equ
ity d
ue to
whi
ch c
arry
ing
amou
nt o
f inv
estm
ent a
s at
31
.03.
2016
in F
TWPL
diff
ers
from
gro
up s
hare
in n
et a
sset
s of
FTW
PL.
** T
he c
arry
ing
amou
nt o
f inv
estm
ent i
n ca
se o
f, TM
Min
ing
as t
31.0
3.20
16 &
31.
03.2
017,
NIN
L as
at 3
1.03
.201
7 &
FTW
PL a
s at
31.
03.2
017
is N
IL a
s gr
oup’
s sh
are
in L
oss
of J
oint
Ven
ture
com
pany
exc
eeds
the
carry
ing
amou
nt o
f inv
estm
ent i
n re
spec
tive
Join
t ven
ture
com
pany
.
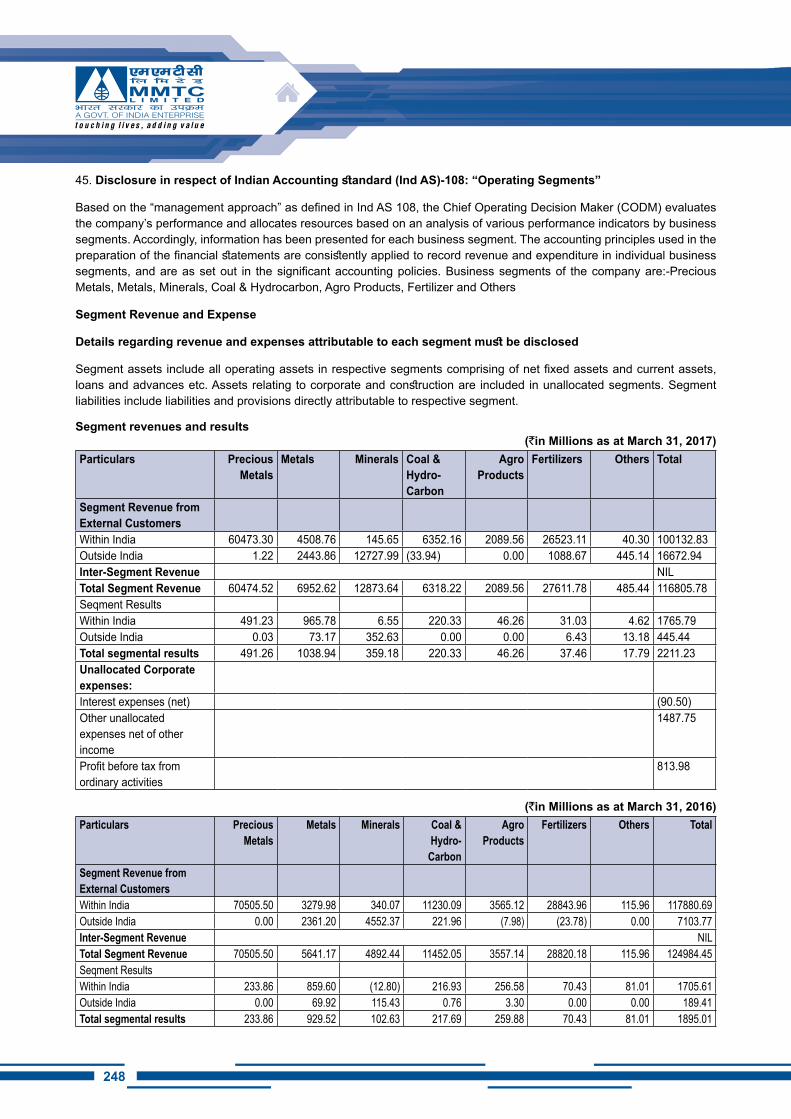
248
45. Disclosure in respect of Indian Accounting standard (Ind AS)-108: “Operating Segments”
Based on the “management approach” as defined in Ind AS 108, the Chief Operating Decision Maker (CODM) evaluates the company’s performance and allocates resources based on an analysis of various performance indicators by business segments. Accordingly, information has been presented for each business segment. The accounting principles used in the preparation of the financial statements are consistently applied to record revenue and expenditure in individual business segments, and are as set out in the significant accounting policies. Business segments of the company are:-Precious Metals, Metals, Minerals, Coal & Hydrocarbon, Agro Products, Fertilizer and Others
Segment Revenue and Expense
Details regarding revenue and expenses attributable to each segment must be disclosed
Segment assets include all operating assets in respective segments comprising of net fixed assets and current assets, loans and advances etc. Assets relating to corporate and construction are included in unallocated segments. Segment liabilities include liabilities and provisions directly attributable to respective segment.
Segment revenues and results (`in Millions as at March 31, 2017)
Particulars Precious Metals
Metals Minerals Coal & Hydro-Carbon
Agro Products
Fertilizers Others Total
Segment Revenue from External CustomersWithin India 60473.30 4508.76 145.65 6352.16 2089.56 26523.11 40.30 100132.83Outside India 1.22 2443.86 12727.99 (33.94) 0.00 1088.67 445.14 16672.94Inter-Segment Revenue NILTotal Segment Revenue 60474.52 6952.62 12873.64 6318.22 2089.56 27611.78 485.44 116805.78Seqment ResultsWithin India 491.23 965.78 6.55 220.33 46.26 31.03 4.62 1765.79Outside India 0.03 73.17 352.63 0.00 0.00 6.43 13.18 445.44Total segmental results 491.26 1038.94 359.18 220.33 46.26 37.46 17.79 2211.23Unallocated Corporate expenses:Interest expenses (net) (90.50)Other unallocated expenses net of other income
1487.75
Profit before tax from ordinary activities
813.98
(`in Millions as at March 31, 2016)Particulars Precious
MetalsMetals Minerals Coal &
Hydro-Carbon
Agro Products
Fertilizers Others Total
Segment Revenue from External CustomersWithin India 70505.50 3279.98 340.07 11230.09 3565.12 28843.96 115.96 117880.69Outside India 0.00 2361.20 4552.37 221.96 (7.98) (23.78) 0.00 7103.77Inter-Segment Revenue NILTotal Segment Revenue 70505.50 5641.17 4892.44 11452.05 3557.14 28820.18 115.96 124984.45Seqment ResultsWithin India 233.86 859.60 (12.80) 216.93 256.58 70.43 81.01 1705.61Outside India 0.00 69.92 115.43 0.76 3.30 0.00 0.00 189.41Total segmental results 233.86 929.52 102.63 217.69 259.88 70.43 81.01 1895.01
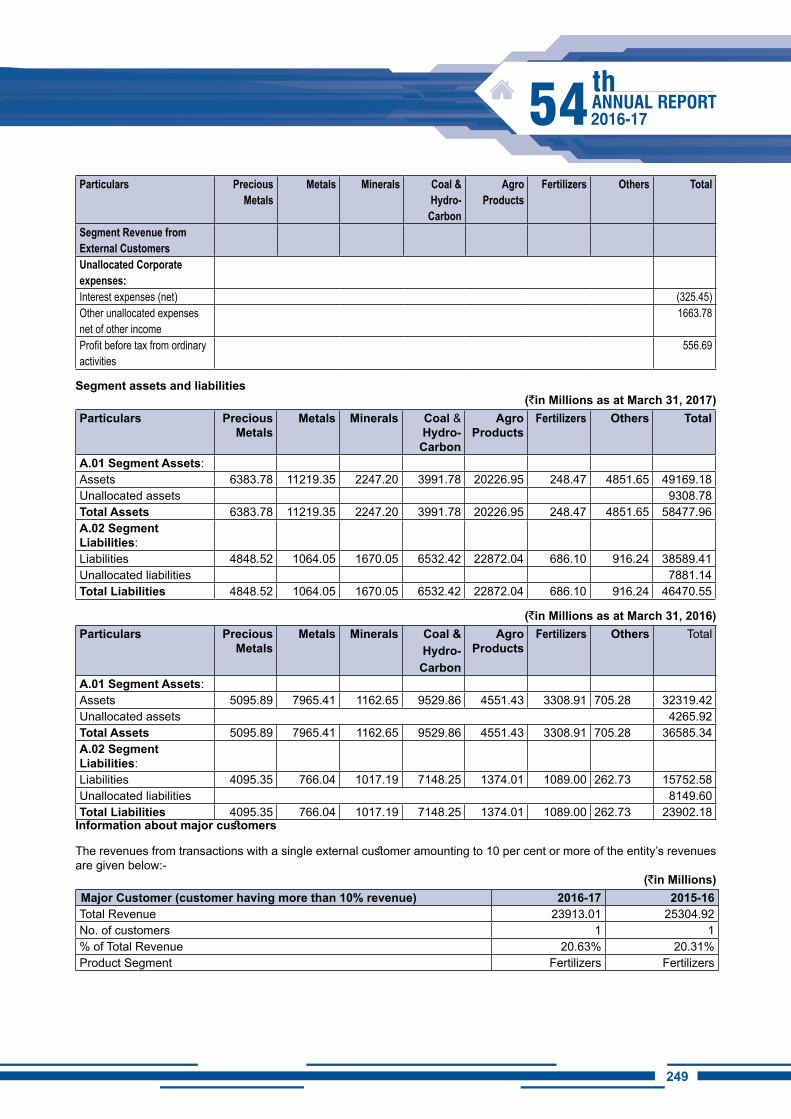
249248
Particulars Precious Metals
Metals Minerals Coal & Hydro-Carbon
Agro Products
Fertilizers Others Total
Segment Revenue from External CustomersUnallocated Corporate expenses:Interest expenses (net) (325.45)Other unallocated expenses net of other income
1663.78
Profit before tax from ordinary activities
556.69
Segment assets and liabilities (`in Millions as at March 31, 2017)
Particulars Precious Metals
Metals Minerals Coal & Hydro-
Carbon
Agro Products
Fertilizers Others Total
A.01 Segment Assets:Assets 6383.78 11219.35 2247.20 3991.78 20226.95 248.47 4851.65 49169.18Unallocated assets 9308.78Total Assets 6383.78 11219.35 2247.20 3991.78 20226.95 248.47 4851.65 58477.96A.02 Segment Liabilities:Liabilities 4848.52 1064.05 1670.05 6532.42 22872.04 686.10 916.24 38589.41Unallocated liabilities 7881.14Total Liabilities 4848.52 1064.05 1670.05 6532.42 22872.04 686.10 916.24 46470.55
(`in Millions as at March 31, 2016)Particulars Precious
MetalsMetals Minerals Coal &
Hydro-Carbon
Agro Products
Fertilizers Others Total
A.01 Segment Assets:Assets 5095.89 7965.41 1162.65 9529.86 4551.43 3308.91 705.28 32319.42Unallocated assets 4265.92Total Assets 5095.89 7965.41 1162.65 9529.86 4551.43 3308.91 705.28 36585.34A.02 Segment Liabilities:Liabilities 4095.35 766.04 1017.19 7148.25 1374.01 1089.00 262.73 15752.58Unallocated liabilities 8149.60Total Liabilities 4095.35 766.04 1017.19 7148.25 1374.01 1089.00 262.73 23902.18
Information about major customers
The revenues from transactions with a single external customer amounting to 10 per cent or more of the entity’s revenues are given below:-
(`in Millions)Major Customer (customer having more than 10% revenue) 2016-17 2015-16Total Revenue 23913.01 25304.92No. of customers 1 1% of Total Revenue 20.63% 20.31%Product Segment Fertilizers Fertilizers
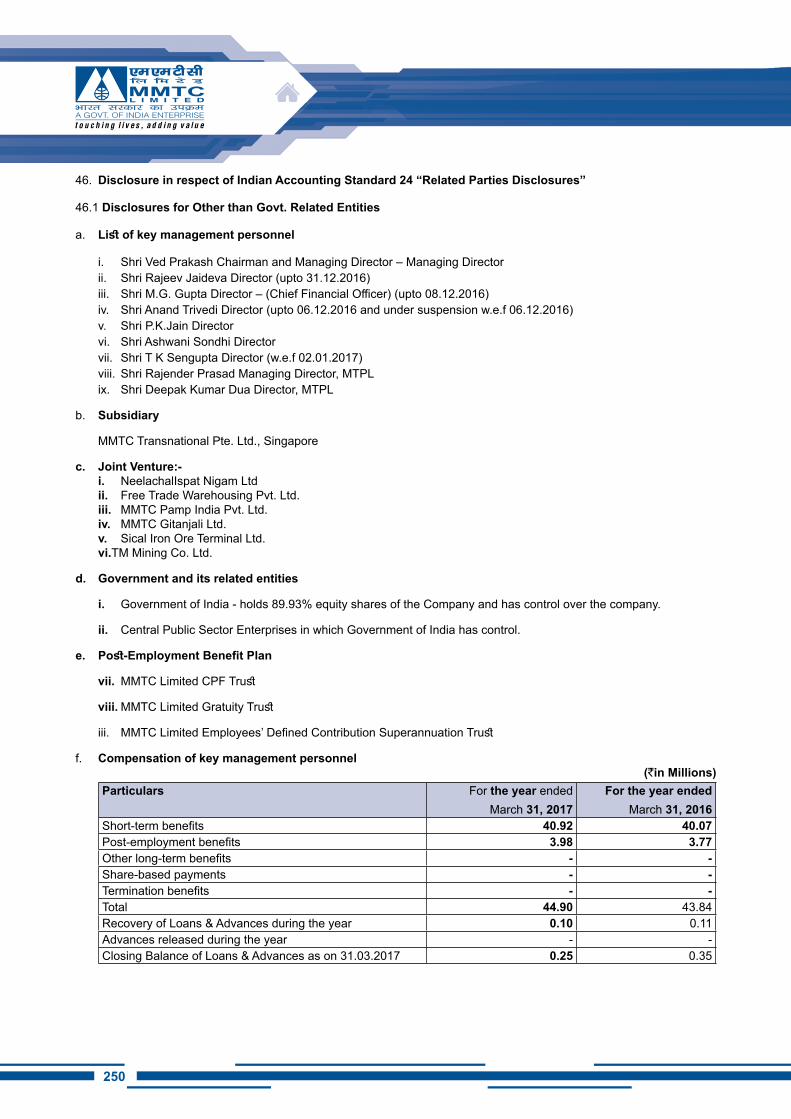
250
46. Disclosure in respect of Indian Accounting Standard 24 “Related Parties Disclosures”
46.1 Disclosures for Other than Govt. Related Entities
a. List of key management personnel
i. Shri Ved Prakash Chairman and Managing Director – Managing Directorii. Shri Rajeev Jaideva Director (upto 31.12.2016)iii. Shri M.G. Gupta Director – (Chief Financial Officer) (upto 08.12.2016)iv. Shri Anand Trivedi Director (upto 06.12.2016 and under suspension w.e.f 06.12.2016)v. Shri P.K.Jain Directorvi. Shri Ashwani Sondhi Directorvii. Shri T K Sengupta Director (w.e.f 02.01.2017)viii. Shri Rajender Prasad Managing Director, MTPL ix. Shri Deepak Kumar Dua Director, MTPL
b. Subsidiary
MMTC Transnational Pte. Ltd., Singapore
c. Joint Venture:-i. NeelachalIspat Nigam Ltdii. Free Trade Warehousing Pvt. Ltd.iii. MMTC Pamp India Pvt. Ltd.iv. MMTC Gitanjali Ltd.v. Sical Iron Ore Terminal Ltd.
vi. TM Mining Co. Ltd.
d. Government and its related entities
i. Government of India - holds 89.93% equity shares of the Company and has control over the company.
ii. Central Public Sector Enterprises in which Government of India has control.
e. Post-Employment Benefit Plan
vii. MMTC Limited CPF Trust
viii. MMTC Limited Gratuity Trust
iii. MMTC Limited Employees’ Defined Contribution Superannuation Trust
f. Compensation of key management personnel (`in Millions)
Particulars For the year ended March 31, 2017
For the year ended March 31, 2016
Short-term benefits 40.92 40.07Post-employment benefits 3.98 3.77Other long-term benefits - -Share-based payments - -Termination benefits - -Total 44.90 43.84Recovery of Loans & Advances during the year 0.10 0.11Advances released during the year - -Closing Balance of Loans & Advances as on 31.03.2017 0.25 0.35
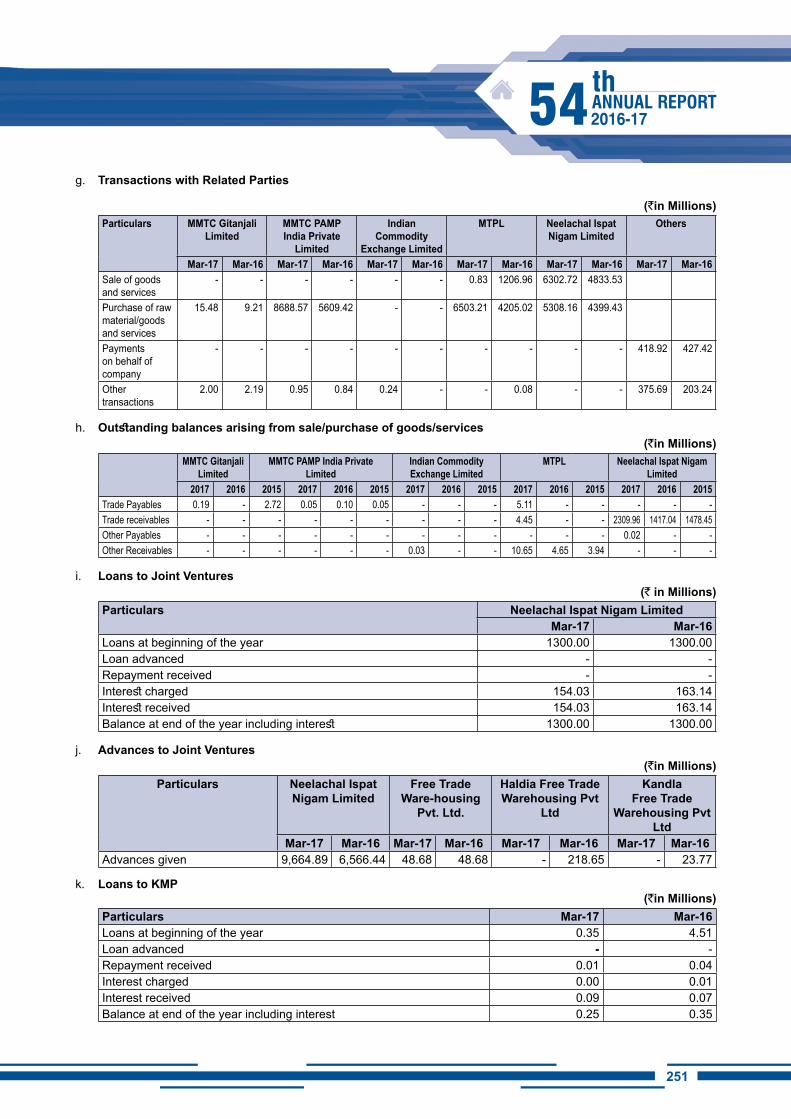
251250
g. Transactions with Related Parties
(`in Millions)Particulars MMTC Gitanjali
LimitedMMTC PAMP India Private
Limited
Indian Commodity
Exchange Limited
MTPL Neelachal ispat Nigam Limited
Others
Mar-17 Mar-16 Mar-17 Mar-16 Mar-17 Mar-16 Mar-17 Mar-16 Mar-17 Mar-16 Mar-17 Mar-16Sale of goods and services
- - - - - - 0.83 1206.96 6302.72 4833.53
Purchase of raw material/goods and services
15.48 9.21 8688.57 5609.42 - - 6503.21 4205.02 5308.16 4399.43
Payments on behalf of company
- - - - - - - - - - 418.92 427.42
Other transactions
2.00 2.19 0.95 0.84 0.24 - - 0.08 - - 375.69 203.24
h. Outstanding balances arising from sale/purchase of goods/services(`in Millions)
MMTC Gitanjali Limited
MMTC PAMP India Private Limited
Indian Commodity Exchange Limited
MTPL Neelachal Ispat Nigam Limited
2017 2016 2015 2017 2016 2015 2017 2016 2015 2017 2016 2015 2017 2016 2015Trade Payables 0.19 - 2.72 0.05 0.10 0.05 - - - 5.11 - - - - - Trade receivables - - - - - - - - - 4.45 - - 2309.96 1417.04 1478.45 Other Payables - - - - - - - - - - - - 0.02 - - Other Receivables - - - - - - 0.03 - - 10.65 4.65 3.94 - - -
i. Loans to Joint Ventures(` in Millions)
Particulars Neelachal Ispat Nigam LimitedMar-17 Mar-16
Loans at beginning of the year 1300.00 1300.00Loan advanced - - Repayment received - - Interest charged 154.03 163.14Interest received 154.03 163.14Balance at end of the year including interest 1300.00 1300.00
j. Advances to Joint Ventures (`in Millions)
Particulars Neelachal ispat Nigam Limited
Free Trade Ware-housing
Pvt. Ltd.
Haldia Free Trade Warehousing Pvt
Ltd
Kandla Free Trade
Warehousing Pvt Ltd
Mar-17 Mar-16 Mar-17 Mar-16 Mar-17 Mar-16 Mar-17 Mar-16Advances given 9,664.89 6,566.44 48.68 48.68 - 218.65 - 23.77
k. Loans to KMP (`in Millions)
Particulars Mar-17 Mar-16Loans at beginning of the year 0.35 4.51Loan advanced - -Repayment received 0.01 0.04Interest charged 0.00 0.01Interest received 0.09 0.07Balance at end of the year including interest 0.25 0.35
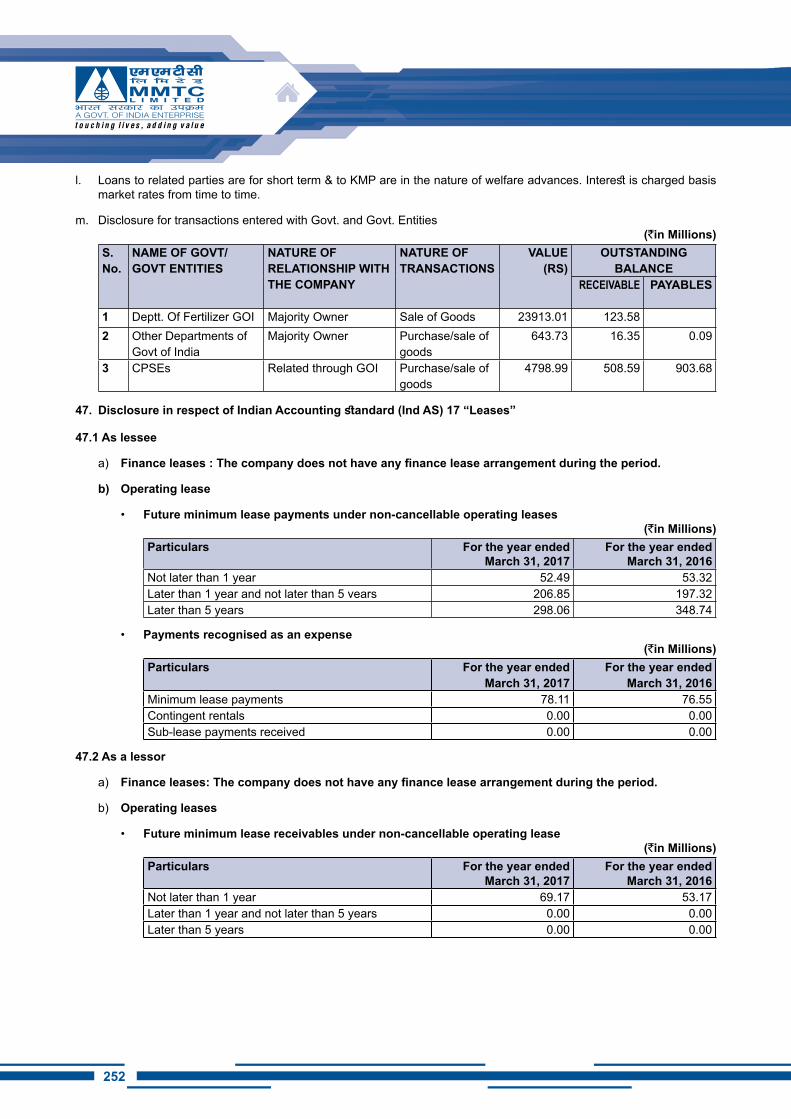
252
l. Loans to related parties are for short term & to KMP are in the nature of welfare advances. Interest is charged basis market rates from time to time.
m. Disclosure for transactions entered with Govt. and Govt. Entities(`in Millions)
S. No.
NAME OF GOVT/GOVT ENTiTiES
NATURE OF RELATiONShiP WiTh ThE COMPANY
NATURE OF TRANSACTiONS
VALUE (RS)
OUTSTANDiNG BALANCE
RECEiVABLE PAYABLES
1 Deptt. Of Fertilizer GOI Majority Owner Sale of Goods 23913.01 123.582 Other Departments of
Govt of IndiaMajority Owner Purchase/sale of
goods643.73 16.35 0.09
3 CPSEs Related through GOI Purchase/sale of goods
4798.99 508.59 903.68
47. Disclosure in respect of Indian Accounting standard (Ind AS) 17 “Leases”
47.1 As lessee
a) Finance leases : The company does not have any finance lease arrangement during the period.
b) Operating lease
• Future minimum lease payments under non-cancellable operating leases(`in Millions)
Particulars For the year ended March 31, 2017
For the year ended March 31, 2016
Not later than 1 year 52.49 53.32Later than 1 year and not later than 5 vears 206.85 197.32Later than 5 years 298.06 348.74
• Payments recognised as an expense(`in Millions)
Particulars For the year ended March 31, 2017
For the year ended March 31, 2016
Minimum lease payments 78.11 76.55Contingent rentals 0.00 0.00Sub-lease payments received 0.00 0.00
47.2 As a lessor
a) Finance leases: The company does not have any finance lease arrangement during the period.
b) Operating leases
• Future minimum lease receivables under non-cancellable operating lease(`in Millions)
Particulars For the year ended March 31, 2017
For the year ended March 31, 2016
Not later than 1 year 69.17 53.17Later than 1 year and not later than 5 years 0.00 0.00Later than 5 years 0.00 0.00
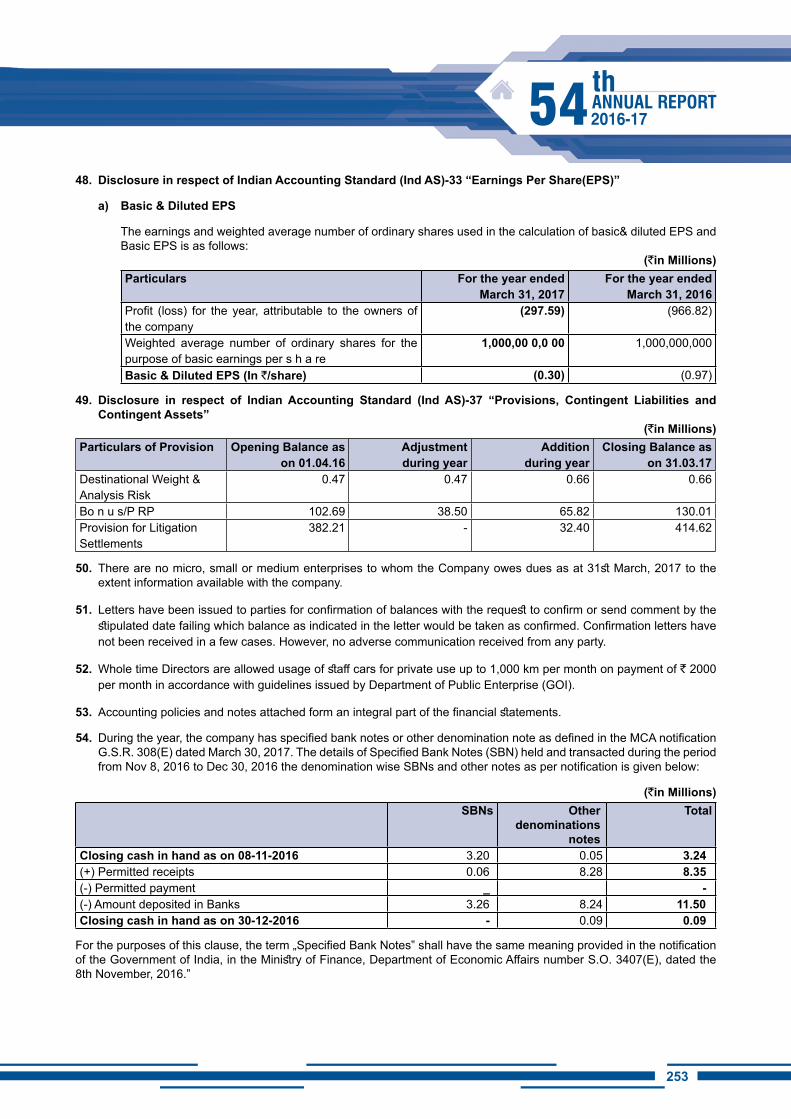
253252
48. Disclosure in respect of Indian Accounting Standard (Ind AS)-33 “Earnings Per Share(EPS)”
a) Basic & Diluted EPS
The earnings and weighted average number of ordinary shares used in the calculation of basic& diluted EPS and Basic EPS is as follows:
(`in Millions)Particulars For the year ended
March 31, 2017For the year ended
March 31, 2016Profit (loss) for the year, attributable to the owners of the company
(297.59) (966.82)
Weighted average number of ordinary shares for the purpose of basic earnings per s h a re
1,000,00 0,0 00 1,000,000,000
Basic & Diluted EPS (In `/share) (0.30) (0.97)
49. Disclosure in respect of Indian Accounting Standard (Ind AS)-37 “Provisions, Contingent Liabilities and Contingent Assets”
(`in Millions)Particulars of Provision Opening Balance as
on 01.04.16Adjustment during year
Addition during year
Closing Balance as on 31.03.17
Destinational Weight & Analysis Risk
0.47 0.47 0.66 0.66
Bo n u s/P RP 102.69 38.50 65.82 130.01Provision for Litigation Settlements
382.21 - 32.40 414.62
50. There are no micro, small or medium enterprises to whom the Company owes dues as at 31st March, 2017 to the extent information available with the company.
51. Letters have been issued to parties for confirmation of balances with the request to confirm or send comment by the stipulated date failing which balance as indicated in the letter would be taken as confirmed. Confirmation letters have not been received in a few cases. However, no adverse communication received from any party.
52. Whole time Directors are allowed usage of staff cars for private use up to 1,000 km per month on payment of ` 2000 per month in accordance with guidelines issued by Department of Public Enterprise (GOI).
53. Accounting policies and notes attached form an integral part of the financial statements.
54. During the year, the company has specified bank notes or other denomination note as defined in the MCA notification G.S.R. 308(E) dated March 30, 2017. The details of Specified Bank Notes (SBN) held and transacted during the period from Nov 8, 2016 to Dec 30, 2016 the denomination wise SBNs and other notes as per notification is given below:
(`in Millions) SBNs Other
denominations notes
Total
Closing cash in hand as on 08-11-2016 3.20 0.05 3.24(+) Permitted receipts 0.06 8.28 8.35(-) Permitted payment _ -(-) Amount deposited in Banks 3.26 8.24 11.50Closing cash in hand as on 30-12-2016 - 0.09 0.09
For the purposes of this clause, the term „Specified Bank Notes‟ shall have the same meaning provided in the notification of the Government of India, in the Ministry of Finance, Department of Economic Affairs number S.O. 3407(E), dated the 8th November, 2016.”
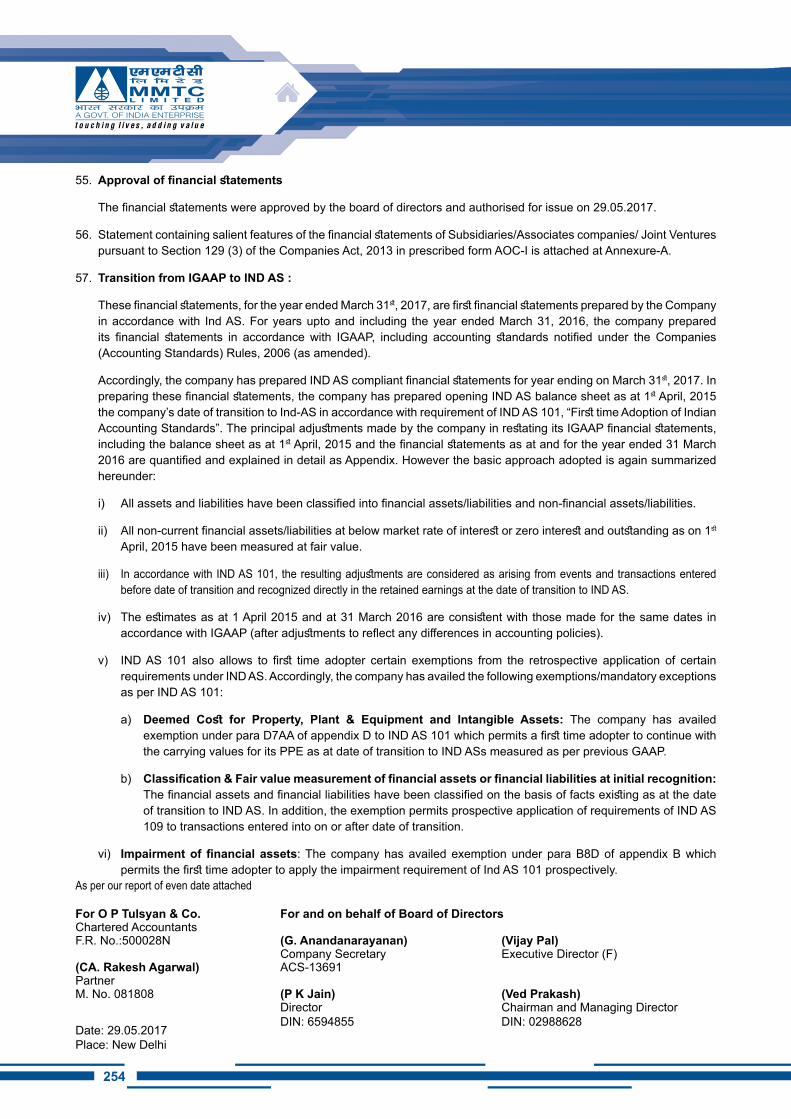
254
55. Approval of financial statements
The financial statements were approved by the board of directors and authorised for issue on 29.05.2017.
56. Statement containing salient features of the financial statements of Subsidiaries/Associates companies/ Joint Ventures pursuant to Section 129 (3) of the Companies Act, 2013 in prescribed form AOC-I is attached at Annexure-A.
57. Transition from iGAAP to iND AS :
These financial statements, for the year ended March 31st, 2017, are first financial statements prepared by the Company in accordance with Ind AS. For years upto and including the year ended March 31, 2016, the company prepared its financial statements in accordance with IGAAP, including accounting standards notified under the Companies (Accounting Standards) Rules, 2006 (as amended).
Accordingly, the company has prepared IND AS compliant financial statements for year ending on March 31st, 2017. In preparing these financial statements, the company has prepared opening IND AS balance sheet as at 1st April, 2015 the company’s date of transition to Ind-AS in accordance with requirement of IND AS 101, “First time Adoption of Indian Accounting Standards”. The principal adjustments made by the company in restating its IGAAP financial statements, including the balance sheet as at 1st April, 2015 and the financial statements as at and for the year ended 31 March 2016 are quantified and explained in detail as Appendix. However the basic approach adopted is again summarized hereunder:
i) All assets and liabilities have been classified into financial assets/liabilities and non-financial assets/liabilities.
ii) All non-current financial assets/liabilities at below market rate of interest or zero interest and outstanding as on 1st April, 2015 have been measured at fair value.
iii) In accordance with IND AS 101, the resulting adjustments are considered as arising from events and transactions entered before date of transition and recognized directly in the retained earnings at the date of transition to IND AS.
iv) The estimates as at 1 April 2015 and at 31 March 2016 are consistent with those made for the same dates in accordance with IGAAP (after adjustments to reflect any differences in accounting policies).
v) IND AS 101 also allows to first time adopter certain exemptions from the retrospective application of certain requirements under IND AS. Accordingly, the company has availed the following exemptions/mandatory exceptions as per IND AS 101:
a) Deemed Cost for Property, Plant & Equipment and Intangible Assets: The company has availed exemption under para D7AA of appendix D to IND AS 101 which permits a first time adopter to continue with the carrying values for its PPE as at date of transition to IND ASs measured as per previous GAAP.
b) Classification & Fair value measurement of financial assets or financial liabilities at initial recognition: The financial assets and financial liabilities have been classified on the basis of facts existing as at the date of transition to IND AS. In addition, the exemption permits prospective application of requirements of IND AS 109 to transactions entered into on or after date of transition.
vi) Impairment of financial assets: The company has availed exemption under para B8D of appendix B which permits the first time adopter to apply the impairment requirement of Ind AS 101 prospectively.
As per our report of even date attached
For O P Tulsyan & Co. For and on behalf of Board of DirectorsChartered Accountants F.R. No.:500028N (G. Anandanarayanan) (Vijay Pal)
Company Secretary Executive Director (F) (CA. Rakesh Agarwal) ACS-13691PartnerM. No. 081808 (P K Jain) (Ved Prakash)
DirectorDIN: 6594855
Chairman and Managing DirectorDIN: 02988628
Date: 29.05.2017Place: New Delhi
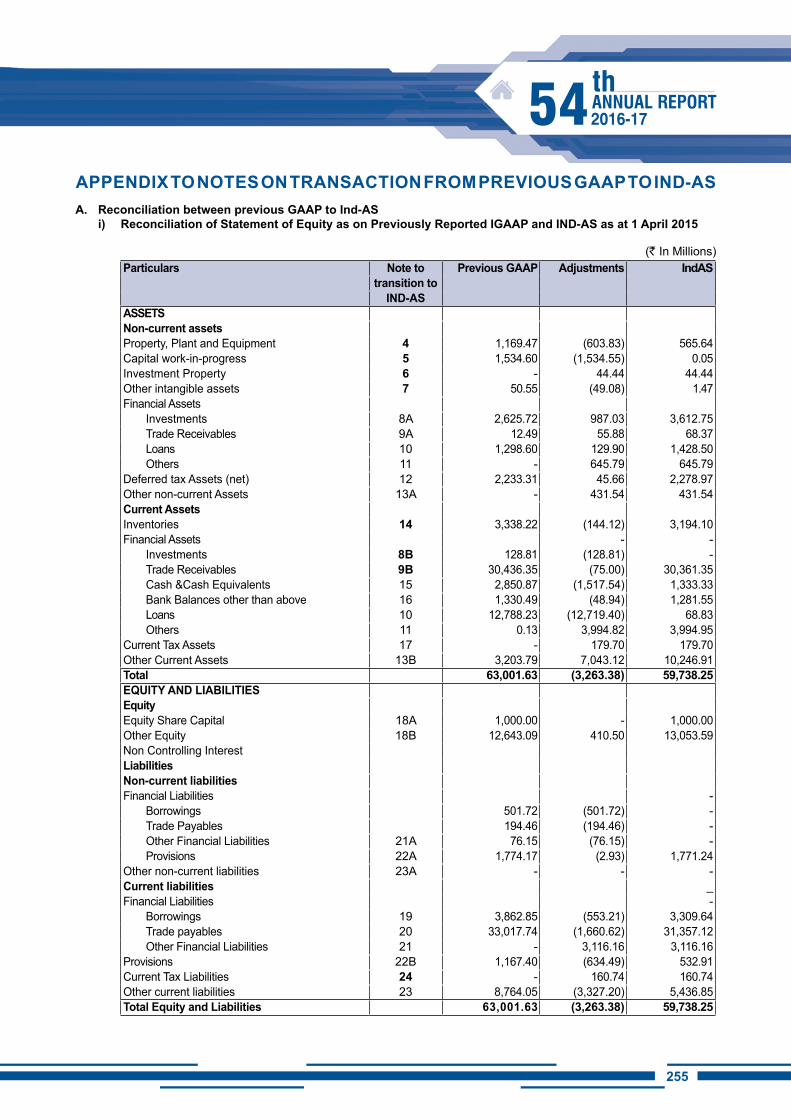
255254
APPENDix TO NOTES ON TRANSACTiON FROM PREViOUS GAAP TO iND-AS A. Reconciliation between previous GAAP to Ind-AS
i) Reconciliation of Statement of Equity as on Previously Reported IGAAP and IND-AS as at 1 April 2015
(` In Millions)Particulars Note to Previous GAAP Adjustments IndAS
transition toiND-AS
ASSETSNon-current assetsProperty, Plant and Equipment 4 1,169.47 (603.83) 565.64Capital work-in-progress 5 1,534.60 (1,534.55) 0.05Investment Property 6 - 44.44 44.44Other intangible assets 7 50.55 (49.08) 1.47Financial Assets
Investments 8A 2,625.72 987.03 3,612.75Trade Receivables 9A 12.49 55.88 68.37Loans 10 1,298.60 129.90 1,428.50Others 11 - 645.79 645.79
Deferred tax Assets (net) 12 2,233.31 45.66 2,278.97Other non-current Assets 13A - 431.54 431.54Current AssetsInventories 14 3,338.22 (144.12) 3,194.10Financial Assets - -
Investments 8B 128.81 (128.81) -Trade Receivables 9B 30,436.35 (75.00) 30,361.35Cash &Cash Equivalents 15 2,850.87 (1,517.54) 1,333.33Bank Balances other than above 16 1,330.49 (48.94) 1,281.55Loans 10 12,788.23 (12,719.40) 68.83Others 11 0.13 3,994.82 3,994.95
Current Tax Assets 17 - 179.70 179.70Other Current Assets 13B 3,203.79 7,043.12 10,246.91Total 63,001.63 (3,263.38) 59,738.25EQUiTY AND LiABiLiTiESEquityEquity Share Capital 18A 1,000.00 - 1,000.00Other Equity 18B 12,643.09 410.50 13,053.59Non Controlling InterestLiabilitiesNon-current liabilitiesFinancial Liabilities -
Borrowings 501.72 (501.72) -Trade Payables 194.46 (194.46) -Other Financial Liabilities 21A 76.15 (76.15) -Provisions 22A 1,774.17 (2.93) 1,771.24
Other non-current liabilities 23A - - -Current liabilities _Financial Liabilities -
Borrowings 19 3,862.85 (553.21) 3,309.64Trade payables 20 33,017.74 (1,660.62) 31,357.12Other Financial Liabilities 21 - 3,116.16 3,116.16
Provisions 22B 1,167.40 (634.49) 532.91Current Tax Liabilities 24 - 160.74 160.74Other current liabilities 23 8,764.05 (3,327.20) 5,436.85Total Equity and Liabilities 63,001.63 (3,263.38) 59,738.25
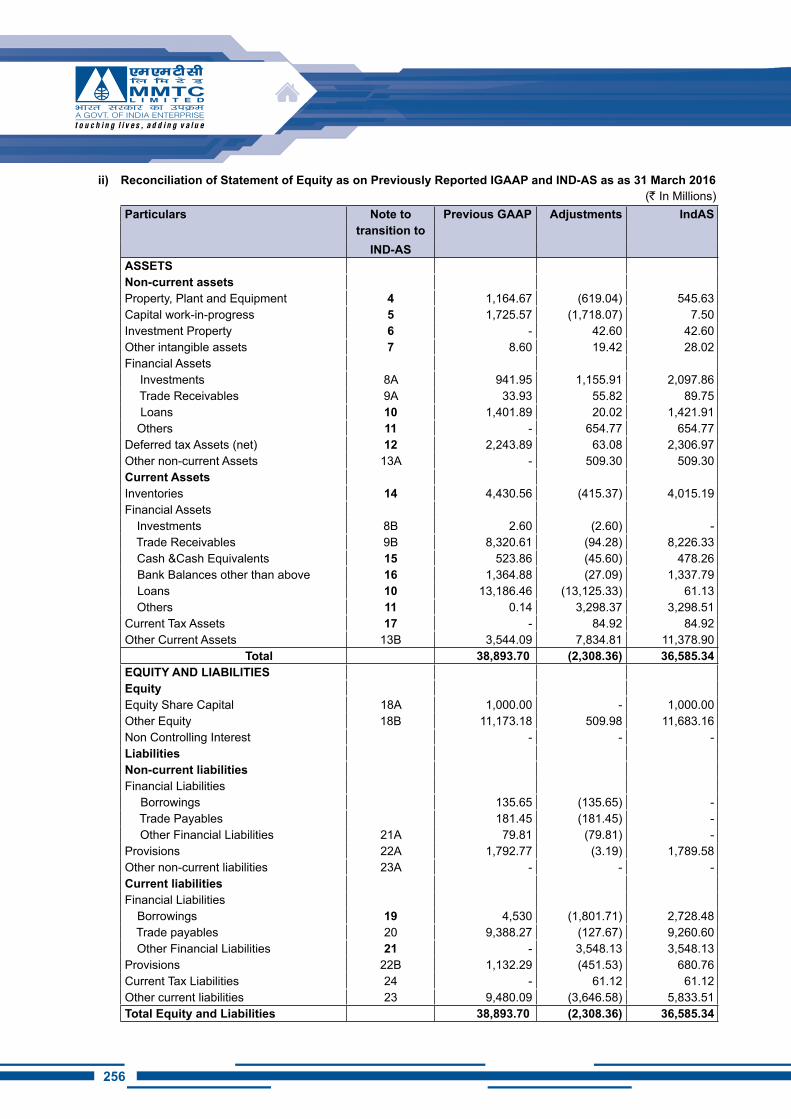
257256
ii) Reconciliation of Statement of Equity as on Previously Reported IGAAP and IND-AS as as 31 March 2016(` In Millions)
Particulars Note to Previous GAAP Adjustments IndAStransition to
iND-ASASSETSNon-current assetsProperty, Plant and Equipment 4 1,164.67 (619.04) 545.63Capital work-in-progress 5 1,725.57 (1,718.07) 7.50Investment Property 6 - 42.60 42.60Other intangible assets 7 8.60 19.42 28.02Financial Assets
Investments 8A 941.95 1,155.91 2,097.86Trade Receivables 9A 33.93 55.82 89.75Loans 10 1,401.89 20.02 1,421.91
Others 11 - 654.77 654.77Deferred tax Assets (net) 12 2,243.89 63.08 2,306.97Other non-current Assets 13A - 509.30 509.30Current AssetsInventories 14 4,430.56 (415.37) 4,015.19Financial Assets
Investments 8B 2.60 (2.60) -Trade Receivables 9B 8,320.61 (94.28) 8,226.33Cash &Cash Equivalents 15 523.86 (45.60) 478.26Bank Balances other than above 16 1,364.88 (27.09) 1,337.79Loans 10 13,186.46 (13,125.33) 61.13Others 11 0.14 3,298.37 3,298.51
Current Tax Assets 17 - 84.92 84.92Other Current Assets 13B 3,544.09 7,834.81 11,378.90
Total 38,893.70 (2,308.36) 36,585.34EQUiTY AND LiABiLiTiESEquityEquity Share Capital 18A 1,000.00 - 1,000.00Other Equity 18B 11,173.18 509.98 11,683.16Non Controlling Interest - - -LiabilitiesNon-current liabilitiesFinancial Liabilities
Borrowings 135.65 (135.65) -Trade Payables 181.45 (181.45) -Other Financial Liabilities 21A 79.81 (79.81) -
Provisions 22A 1,792.77 (3.19) 1,789.58Other non-current liabilities 23A - - -Current liabilitiesFinancial Liabilities
Borrowings 19 4,530 (1,801.71) 2,728.48Trade payables 20 9,388.27 (127.67) 9,260.60Other Financial Liabilities 21 - 3,548.13 3,548.13
Provisions 22B 1,132.29 (451.53) 680.76Current Tax Liabilities 24 - 61.12 61.12Other current liabilities 23 9,480.09 (3,646.58) 5,833.51Total Equity and Liabilities 38,893.70 (2,308.36) 36,585.34
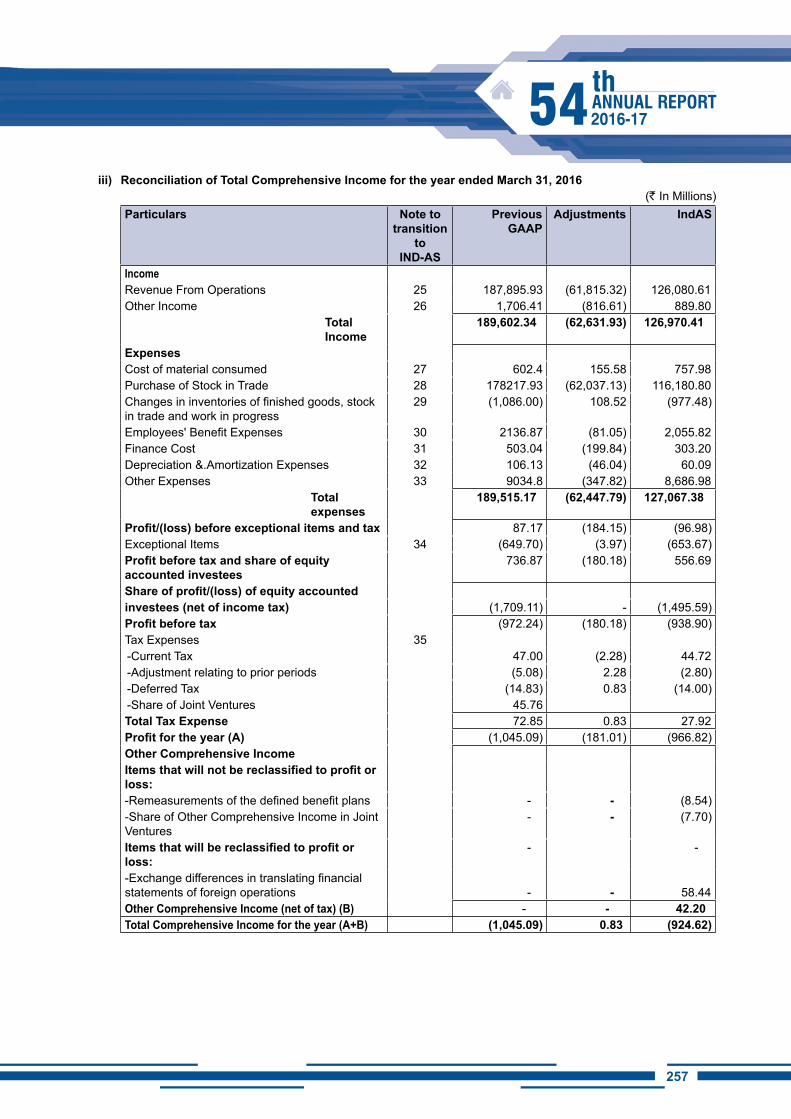
257256
iii) Reconciliation of Total Comprehensive Income for the year ended March 31, 2016(` In Millions)
Particulars Note totransition
toiND-AS
Previous GAAP
Adjustments IndAS
IncomeRevenue From Operations 25 187,895.93 (61,815.32) 126,080.61Other Income 26 1,706.41 (816.61) 889.80
Total income
189,602.34 (62,631.93) 126,970.41
ExpensesCost of material consumed 27 602.4 155.58 757.98Purchase of Stock in Trade 28 178217.93 (62,037.13) 116,180.80Changes in inventories of finished goods, stock in trade and work in progress
29 (1,086.00) 108.52 (977.48)
Employees' Benefit Expenses 30 2136.87 (81.05) 2,055.82Finance Cost 31 503.04 (199.84) 303.20Depreciation &.Amortization Expenses 32 106.13 (46.04) 60.09Other Expenses 33 9034.8 (347.82) 8,686.98
Total expenses
189,515.17 (62,447.79) 127,067.38
Profit/(loss) before exceptional items and tax 87.17 (184.15) (96.98)Exceptional Items 34 (649.70) (3.97) (653.67)Profit before tax and share of equity accounted investees
736.87 (180.18) 556.69
Share of profit/(loss) of equity accountedinvestees (net of income tax) (1,709.11) - (1,495.59)Profit before tax (972.24) (180.18) (938.90)Tax Expenses 35-Current Tax 47.00 (2.28) 44.72-Adjustment relating to prior periods (5.08) 2.28 (2.80)-Deferred Tax (14.83) 0.83 (14.00)-Share of Joint Ventures 45.76Total Tax Expense 72.85 0.83 27.92Profit for the year (A) (1,045.09) (181.01) (966.82)Other Comprehensive income Items that will not be reclassified to profit or loss:-Remeasurements of the defined benefit plans - - (8.54)-Share of Other Comprehensive Income in Joint Ventures
- - (7.70)
Items that will be reclassified to profit or loss:
- -
-Exchange differences in translating financial statements of foreign operations - - 58.44Other Comprehensive Income (net of tax) (B) - - 42.20Total Comprehensive Income for the year (A+B) (1,045.09) 0.83 (924.62)
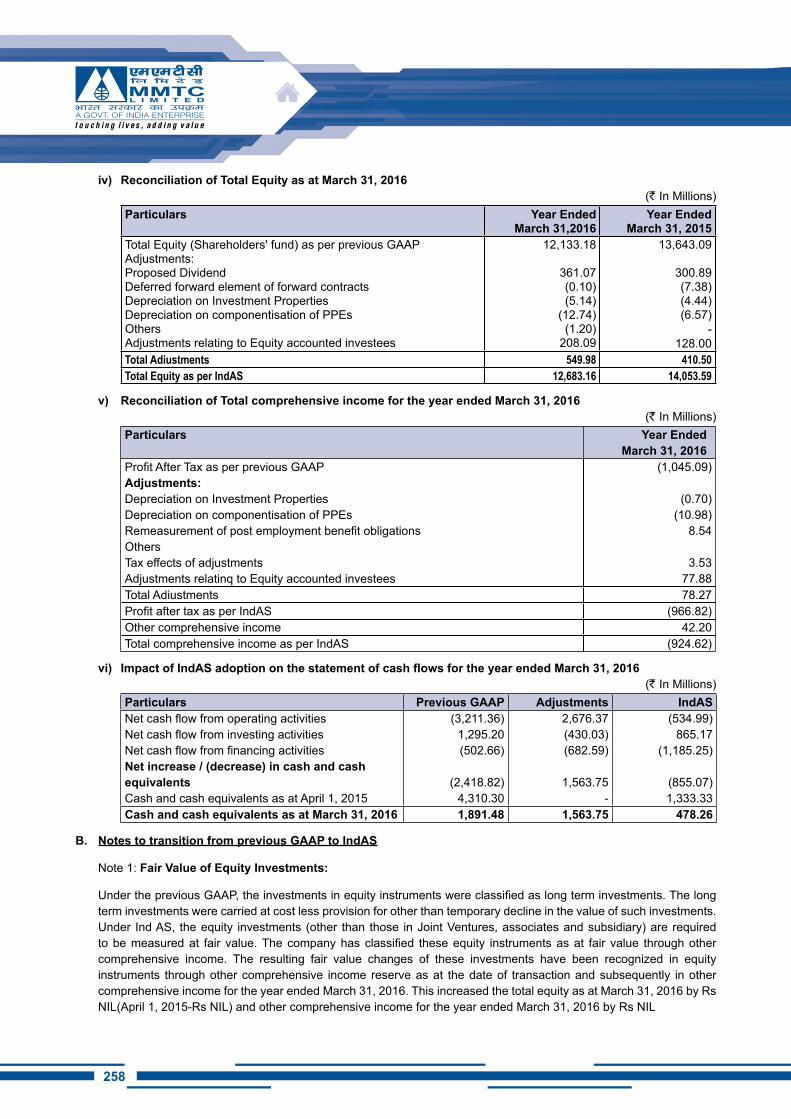
258
iv) Reconciliation of Total Equity as at March 31, 2016(` In Millions)
Particulars Year Ended March 31,2016
Year Ended March 31, 2015
Total Equity (Shareholders' fund) as per previous GAAP Adjustments: Proposed Dividend Deferred forward element of forward contracts Depreciation on Investment Properties Depreciation on componentisation of PPEs Others Adjustments relating to Equity accounted investees
12,133.18
361.07 (0.10) (5.14)
(12.74) (1.20)
208.09
13,643.09
300.89 (7.38) (4.44) (6.57)
-128.00
Total Adiustments 549.98 410.50Total Equity as per IndAS 12,683.16 14,053.59
v) Reconciliation of Total comprehensive income for the year ended March 31, 2016(` In Millions)
Particulars Year Ended March 31, 2016
Profit After Tax as per previous GAAP Adjustments:Depreciation on Investment Properties Depreciation on componentisation of PPEs Remeasurement of post employment benefit obligations Others Tax effects of adjustments Adjustments relatinq to Equity accounted investees
(1,045.09)
(0.70) (10.98)
8.54
3.5377.88
Total Adiustments 78.27Profit after tax as per IndAS (966.82)Other comprehensive income 42.20Total comprehensive income as per IndAS (924.62)
vi) Impact of IndAS adoption on the statement of cash flows for the year ended March 31, 2016(` In Millions)
Particulars Previous GAAP Adjustments IndASNet cash flow from operating activities Net cash flow from investing activities Net cash flow from financing activities Net increase / (decrease) in cash and cash equivalents Cash and cash equivalents as at April 1, 2015
(3,211.36) 1,295.20 (502.66)
(2,418.82) 4,310.30
2,676.37 (430.03) (682.59)
1,563.75-
(534.99) 865.17
(1,185.25)
(855.07) 1,333.33
Cash and cash equivalents as at March 31, 2016 1,891.48 1,563.75 478.26
B. Notes to transition from previous GAAP to IndAS
Note 1: Fair Value of Equity Investments:
Under the previous GAAP, the investments in equity instruments were classified as long term investments. The long term investments were carried at cost less provision for other than temporary decline in the value of such investments. Under Ind AS, the equity investments (other than those in Joint Ventures, associates and subsidiary) are required to be measured at fair value. The company has classified these equity instruments as at fair value through other comprehensive income. The resulting fair value changes of these investments have been recognized in equity instruments through other comprehensive income reserve as at the date of transaction and subsequently in other comprehensive income for the year ended March 31, 2016. This increased the total equity as at March 31, 2016 by Rs NIL(April 1, 2015-Rs NIL) and other comprehensive income for the year ended March 31, 2016 by Rs NIL
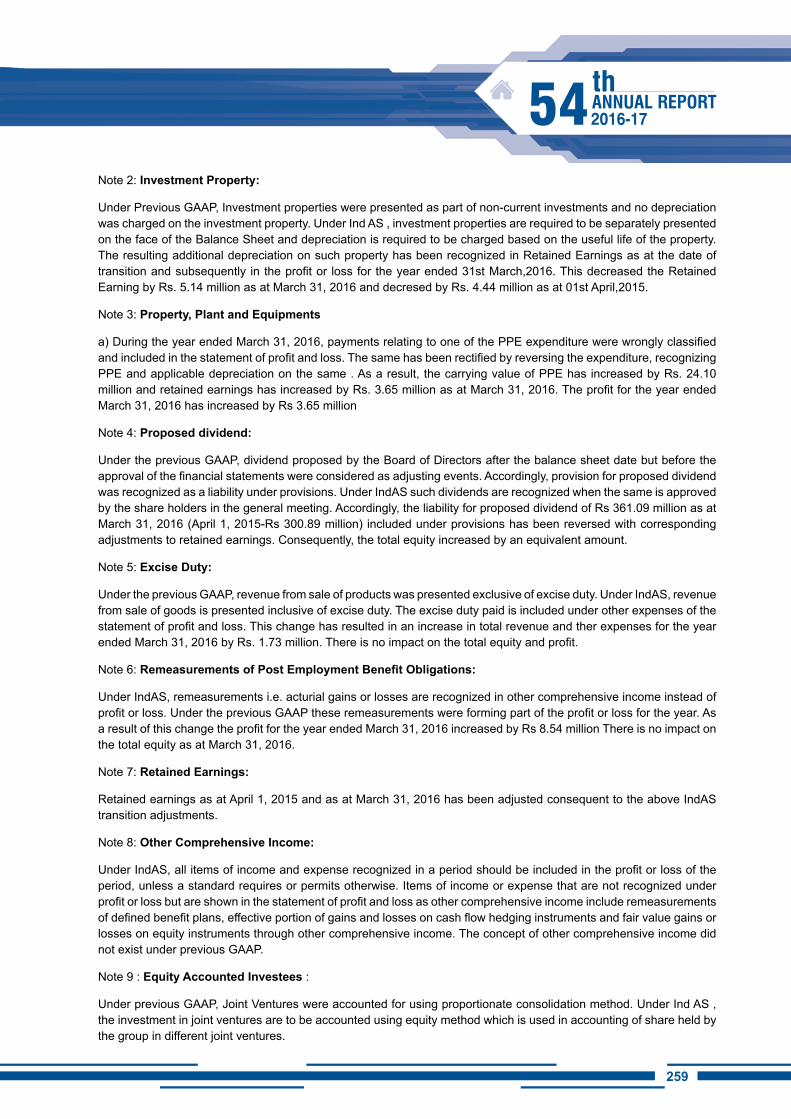
259258
Note 2: Investment Property:
Under Previous GAAP, Investment properties were presented as part of non-current investments and no depreciation was charged on the investment property. Under Ind AS , investment properties are required to be separately presented on the face of the Balance Sheet and depreciation is required to be charged based on the useful life of the property. The resulting additional depreciation on such property has been recognized in Retained Earnings as at the date of transition and subsequently in the profit or loss for the year ended 31st March,2016. This decreased the Retained Earning by Rs. 5.14 million as at March 31, 2016 and decresed by Rs. 4.44 million as at 01st April,2015.
Note 3: Property, Plant and Equipments
a) During the year ended March 31, 2016, payments relating to one of the PPE expenditure were wrongly classified and included in the statement of profit and loss. The same has been rectified by reversing the expenditure, recognizing PPE and applicable depreciation on the same . As a result, the carrying value of PPE has increased by Rs. 24.10 million and retained earnings has increased by Rs. 3.65 million as at March 31, 2016. The profit for the year ended March 31, 2016 has increased by Rs 3.65 million
Note 4: Proposed dividend:
Under the previous GAAP, dividend proposed by the Board of Directors after the balance sheet date but before the approval of the financial statements were considered as adjusting events. Accordingly, provision for proposed dividend was recognized as a liability under provisions. Under IndAS such dividends are recognized when the same is approved by the share holders in the general meeting. Accordingly, the liability for proposed dividend of Rs 361.09 million as at March 31, 2016 (April 1, 2015-Rs 300.89 million) included under provisions has been reversed with corresponding adjustments to retained earnings. Consequently, the total equity increased by an equivalent amount.
Note 5: Excise Duty:
Under the previous GAAP, revenue from sale of products was presented exclusive of excise duty. Under IndAS, revenue from sale of goods is presented inclusive of excise duty. The excise duty paid is included under other expenses of the statement of profit and loss. This change has resulted in an increase in total revenue and ther expenses for the year ended March 31, 2016 by Rs. 1.73 million. There is no impact on the total equity and profit.
Note 6: Remeasurements of Post Employment Benefit Obligations:
Under IndAS, remeasurements i.e. acturial gains or losses are recognized in other comprehensive income instead of profit or loss. Under the previous GAAP these remeasurements were forming part of the profit or loss for the year. As a result of this change the profit for the year ended March 31, 2016 increased by Rs 8.54 million There is no impact on the total equity as at March 31, 2016.
Note 7: Retained Earnings:
Retained earnings as at April 1, 2015 and as at March 31, 2016 has been adjusted consequent to the above IndAS transition adjustments.
Note 8: Other Comprehensive income:
Under IndAS, all items of income and expense recognized in a period should be included in the profit or loss of the period, unless a standard requires or permits otherwise. Items of income or expense that are not recognized under profit or loss but are shown in the statement of profit and loss as other comprehensive income include remeasurements of defined benefit plans, effective portion of gains and losses on cash flow hedging instruments and fair value gains or losses on equity instruments through other comprehensive income. The concept of other comprehensive income did not exist under previous GAAP.
Note 9 : Equity Accounted Investees :
Under previous GAAP, Joint Ventures were accounted for using proportionate consolidation method. Under Ind AS , the investment in joint ventures are to be accounted using equity method which is used in accounting of share held by the group in different joint ventures.
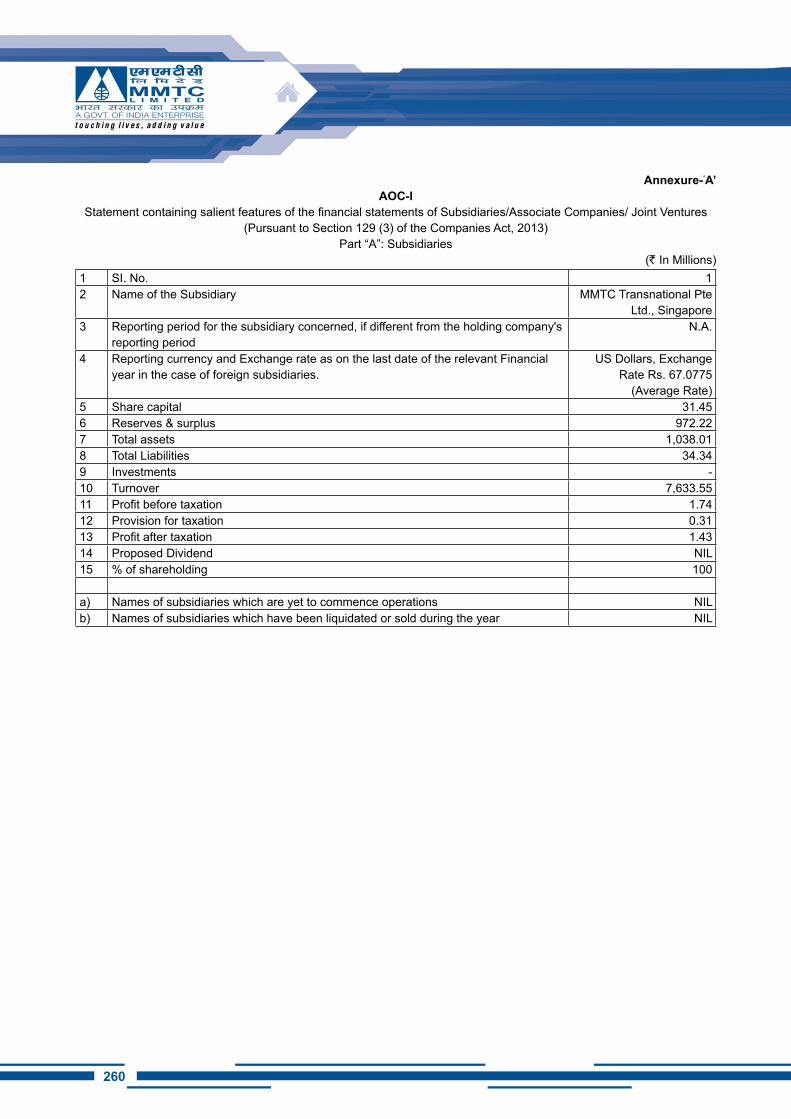
260
Annexure-‘A’AOC-i
Statement containing salient features of the financial statements of Subsidiaries/Associate Companies/ Joint Ventures (Pursuant to Section 129 (3) of the Companies Act, 2013)
Part “A”: Subsidiaries(` In Millions)
1 SI. No. 12 Name of the Subsidiary MMTC Transnational Pte
Ltd., Singapore3 Reporting period for the subsidiary concerned, if different from the holding company's
reporting periodN.A.
4 Reporting currency and Exchange rate as on the last date of the relevant Financial year in the case of foreign subsidiaries.
US Dollars, Exchange Rate Rs. 67.0775
(Average Rate)5 Share capital 31.456 Reserves & surplus 972.227 Total assets 1,038.018 Total Liabilities 34.349 Investments -10 Turnover 7,633.5511 Profit before taxation 1.7412 Provision for taxation 0.3113 Profit after taxation 1.4314 Proposed Dividend NIL15 % of shareholding 100
a) Names of subsidiaries which are yet to commence operations NILb) Names of subsidiaries which have been liquidated or sold during the year NIL
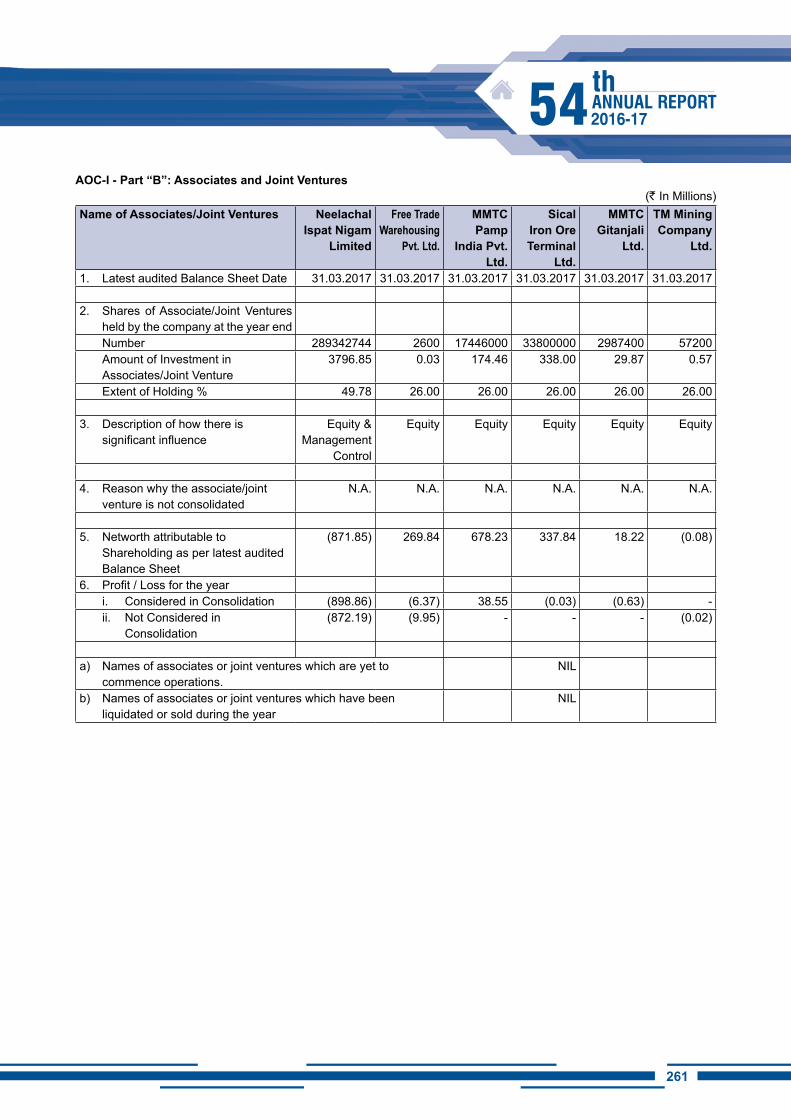
261260
AOC-I - Part “B”: Associates and Joint Ventures(` In Millions)
Name of Associates/Joint Ventures Neelachal Ispat Nigam
Limited
Free Trade Warehousing
Pvt. Ltd.
MMTC Pamp
India Pvt. Ltd.
Sical iron Ore Terminal
Ltd.
MMTC Gitanjali
Ltd.
TM Mining Company
Ltd.
1. Latest audited Balance Sheet Date 31.03.2017 31.03.2017 31.03.2017 31.03.2017 31.03.2017 31.03.2017
2. Shares of Associate/Joint Ventures held by the company at the year end
Number 289342744 2600 17446000 33800000 2987400 57200 Amount of Investment in
Associates/Joint Venture3796.85 0.03 174.46 338.00 29.87 0.57
Extent of Holding % 49.78 26.00 26.00 26.00 26.00 26.00
3. Description of how there is significant influence
Equity & Management
Control
Equity Equity Equity Equity Equity
4. Reason why the associate/joint venture is not consolidated
N.A. N.A. N.A. N.A. N.A. N.A.
5. Networth attributable to Shareholding as per latest audited Balance Sheet
(871.85) 269.84 678.23 337.84 18.22 (0.08)
6. Profit / Loss for the yeari. Considered in Consolidation (898.86) (6.37) 38.55 (0.03) (0.63) -ii. Not Considered in
Consolidation(872.19) (9.95) - - - (0.02)
a) Names of associates or joint ventures which are yet to commence operations.
NIL
b) Names of associates or joint ventures which have been liquidated or sold during the year
NIL
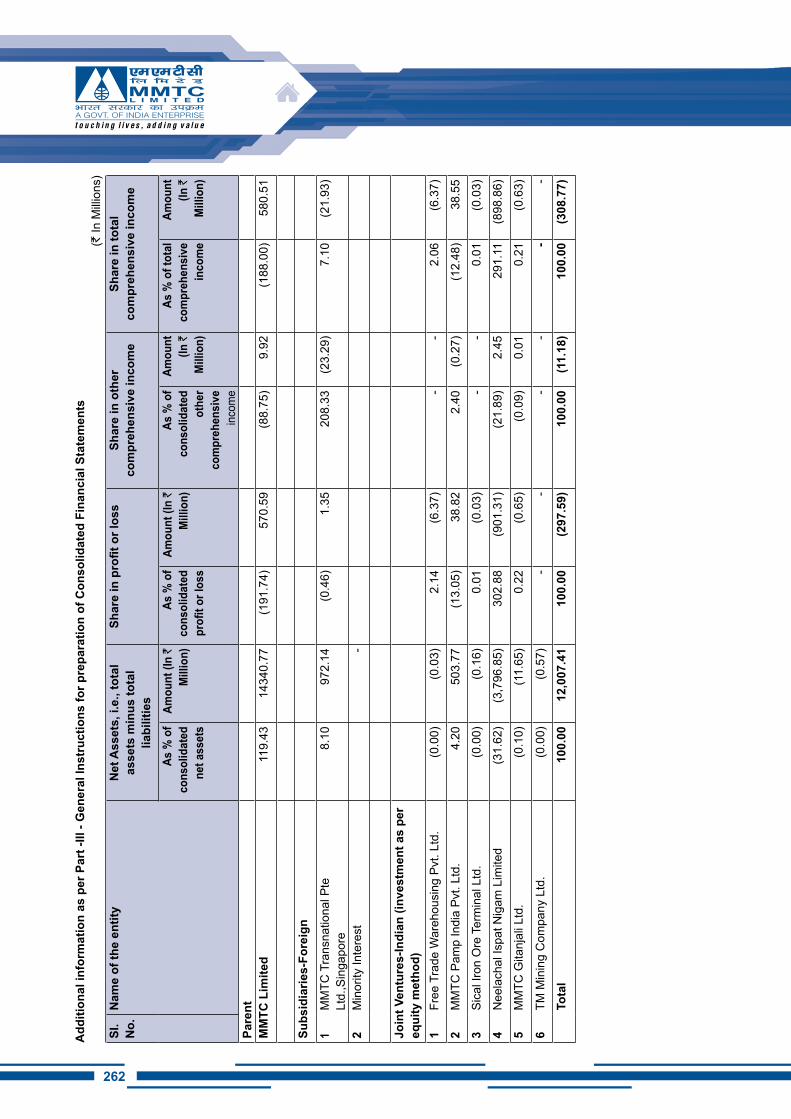
262
Add
ition
al in
form
atio
n as
per
Par
t -III
- G
ener
al In
stru
ctio
ns fo
r pre
para
tion
of C
onso
lidat
ed F
inan
cial
Sta
tem
ents
(` In
Milli
ons)
Si.
No.
Nam
e of
the
entit
yN
et A
sset
s, i.
e., t
otal
as
sets
min
us to
tal
liabi
litie
s
Shar
e in
pro
fit o
r los
sSh
are
in o
ther
co
mpr
ehen
sive
inco
me
Shar
e in
tota
l co
mpr
ehen
sive
inco
me
As %
of
cons
olid
ated
ne
t ass
ets
Amou
nt (i
n `
Mill
ion)
As %
of
cons
olid
ated
pr
ofit o
r los
s
Amou
nt (i
n `
Mill
ion)
As %
of
cons
olid
ated
ot
her
com
preh
ensi
ve
inco
me
Amou
nt
(in `
Mill
ion)
As %
of t
otal
co
mpr
ehen
sive
in
com
e
Amou
nt
(in `
Mill
ion)
Pare
ntM
MTC
Lim
ited
119.
4314
340.
77(1
91.7
4)57
0.59
(88.
75)
9.92
(188
.00)
580.
51
Subs
idia
ries-
Fore
ign
1M
MTC
Tra
nsna
tiona
l Pte
Lt
d.,S
inga
pore
8.10
972.
14(0
.46)
1.35
208.
33(2
3.29
)7.
10(2
1.93
)
2M
inor
ity In
tere
st-
Join
t Ven
ture
s-In
dian
(inv
estm
ent a
s pe
r eq
uity
met
hod)
1Fr
ee T
rade
War
ehou
sing
Pvt
. Ltd
.(0
.00)
(0.0
3)2.
14(6
.37)
--
2.06
(6.3
7)
2M
MTC
Pam
p In
dia
Pvt.
Ltd.
4.20
503.
77(1
3.05
)38
.82
2.40
(0.2
7)(1
2.48
)38
.55
3Si
cal I
ron
Ore
Ter
min
al L
td.
(0.0
0)(0
.16)
0.01
(0.0
3)-
-0.
01(0
.03)
4N
eela
chal
Ispa
t Nig
am L
imite
d(3
1.62
)(3
,796
.85)
302.
88(9
01.3
1)(2
1.89
)2.
4529
1.11
(898
.86)
5M
MTC
Gita
njal
i Ltd
.(0
.10)
(11.
65)
0.22
(0.6
5)(0
.09)
0.01
0.21
(0.6
3)
6TM
Min
ing
Com
pany
Ltd
.(0
.00)
(0.5
7)-
--
--
-
Tota
l10
0.00
12,0
07.4
110
0.00
(297
.59)
100.
00(1
1.18
)10
0.00
(308
.77)
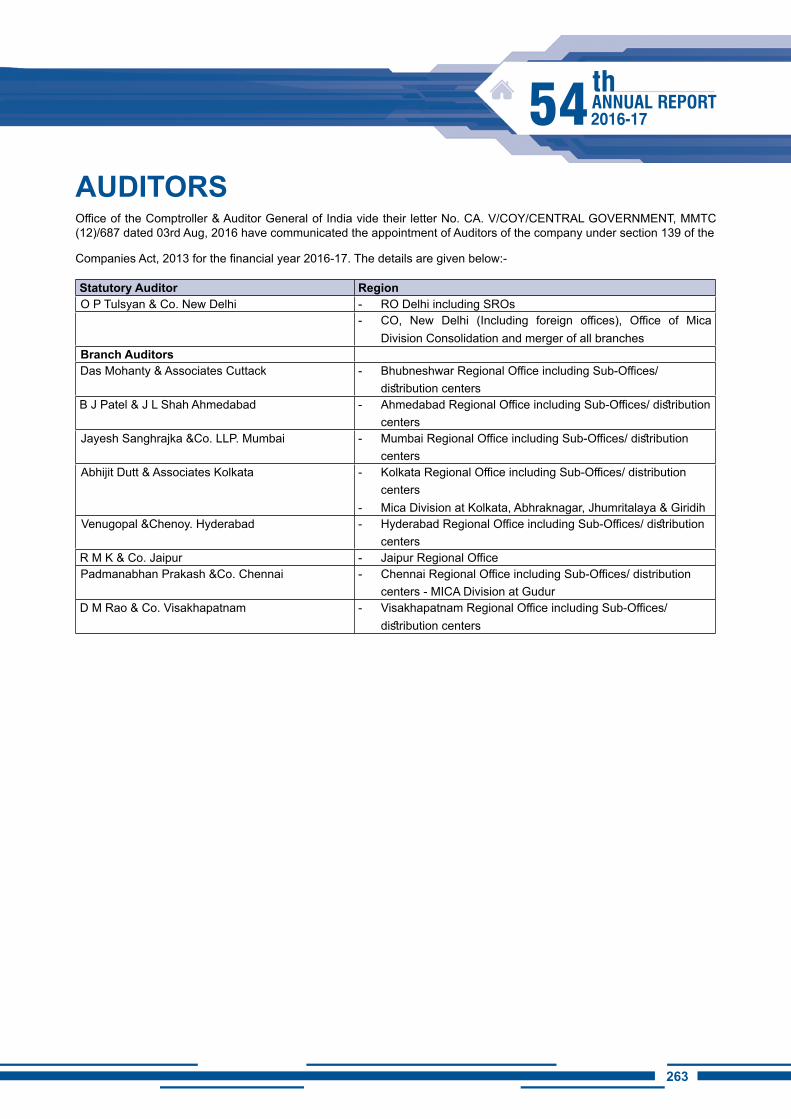
263262
AUDiTORSOffice of the Comptroller & Auditor General of India vide their letter No. CA. V/COY/CENTRAL GOVERNMENT, MMTC (12)/687 dated 03rd Aug, 2016 have communicated the appointment of Auditors of the company under section 139 of the
Companies Act, 2013 for the financial year 2016-17. The details are given below:-
Statutory Auditor RegionO P Tulsyan & Co. New Delhi - RO Delhi including SROs
- CO, New Delhi (Including foreign offices), Office of Mica Division Consolidation and merger of all branches
Branch AuditorsDas Mohanty & Associates Cuttack - Bhubneshwar Regional Office including Sub-Offices/
distribution centersB J Patel & J L Shah Ahmedabad - Ahmedabad Regional Office including Sub-Offices/ distribution
centersJayesh Sanghrajka &Co. LLP. Mumbai - Mumbai Regional Office including Sub-Offices/ distribution
centersAbhijit Dutt & Associates Kolkata - Kolkata Regional Office including Sub-Offices/ distribution
centers- Mica Division at Kolkata, Abhraknagar, Jhumritalaya & Giridih
Venugopal &Chenoy. Hyderabad - Hyderabad Regional Office including Sub-Offices/ distribution centers
R M K & Co. Jaipur - Jaipur Regional OfficePadmanabhan Prakash &Co. Chennai - Chennai Regional Office including Sub-Offices/ distribution
centers - MICA Division at GudurD M Rao & Co. Visakhapatnam - Visakhapatnam Regional Office including Sub-Offices/
distribution centers
264
MMTC Bankers
1. State Bank of India
2. hDFC Bank
3. Bank of Maharashtra
4. Union Bank of India
5. Standard Chartered Bank
6. Punjab National Bank
7. Indian Overseas Bank
8. iDBi Bank
9. Dena Bank
10. Indusind Bank
11. Oriental Bank of Commerce
12. AxiS Bank
13. iCiCi Bank
14. YES Bank
15. DBS
16. Kotak Mahindra Bank
17. ANZ Bank
18. hSBC Bank
19. Vijaya Bank
20. Andhra Bank
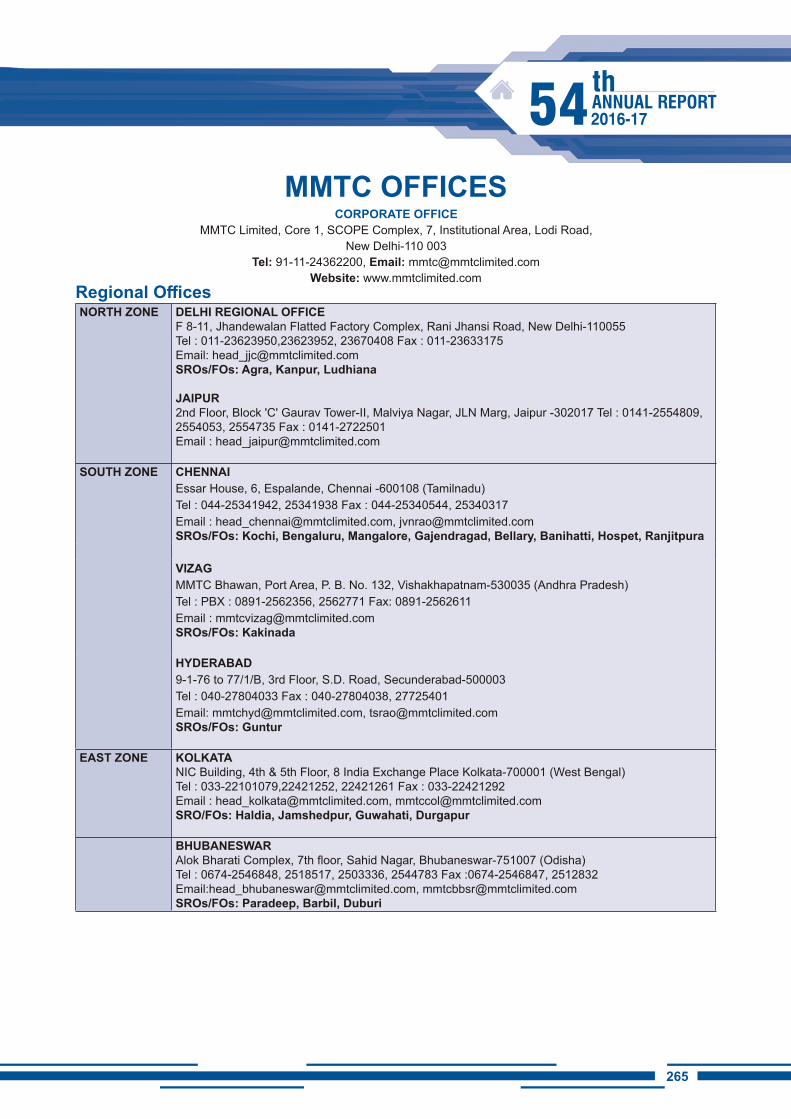
265264
MMTC OFFiCESCORPORATE OFFiCE
MMTC Limited, Core 1, SCOPE Complex, 7, Institutional Area, Lodi Road, New Delhi-110 003
Tel: 91-11-24362200, Email: [email protected]: www.mmtclimited.com
Regional OfficesNORTh ZONE DELhi REGiONAL OFFiCE
F 8-11, Jhandewalan Flatted Factory Complex, Rani Jhansi Road, New Delhi-110055Tel : 011-23623950,23623952, 23670408 Fax : 011-23633175Email: [email protected]/FOs: Agra, Kanpur, Ludhiana
JAiPUR2nd Floor, Block 'C' Gaurav Tower-II, Malviya Nagar, JLN Marg, Jaipur -302017 Tel : 0141-2554809, 2554053, 2554735 Fax : 0141-2722501Email : [email protected]
SOUTh ZONE ChENNAiEssar House, 6, Espalande, Chennai -600108 (Tamilnadu)Tel : 044-25341942, 25341938 Fax : 044-25340544, 25340317Email : [email protected], [email protected]/FOs: Kochi, Bengaluru, Mangalore, Gajendragad, Bellary, Banihatti, Hospet, Ranjitpura
ViZAGMMTC Bhawan, Port Area, P. B. No. 132, Vishakhapatnam-530035 (Andhra Pradesh)Tel : PBX : 0891-2562356, 2562771 Fax: 0891-2562611Email : [email protected]/FOs: Kakinada
hYDERABAD9-1-76 to 77/1/B, 3rd Floor, S.D. Road, Secunderabad-500003Tel : 040-27804033 Fax : 040-27804038, 27725401Email: [email protected], [email protected]/FOs: Guntur
EAST ZONE KOLKATANIC Building, 4th & 5th Floor, 8 India Exchange Place Kolkata-700001 (West Bengal) Tel : 033-22101079,22421252, 22421261 Fax : 033-22421292Email : [email protected], [email protected]/FOs: Haldia, Jamshedpur, Guwahati, Durgapur
BhUBANESWARAlok Bharati Complex, 7th floor, Sahid Nagar, Bhubaneswar-751007 (Odisha)Tel : 0674-2546848, 2518517, 2503336, 2544783 Fax :0674-2546847, 2512832Email:[email protected], [email protected]/FOs: Paradeep, Barbil, Duburi
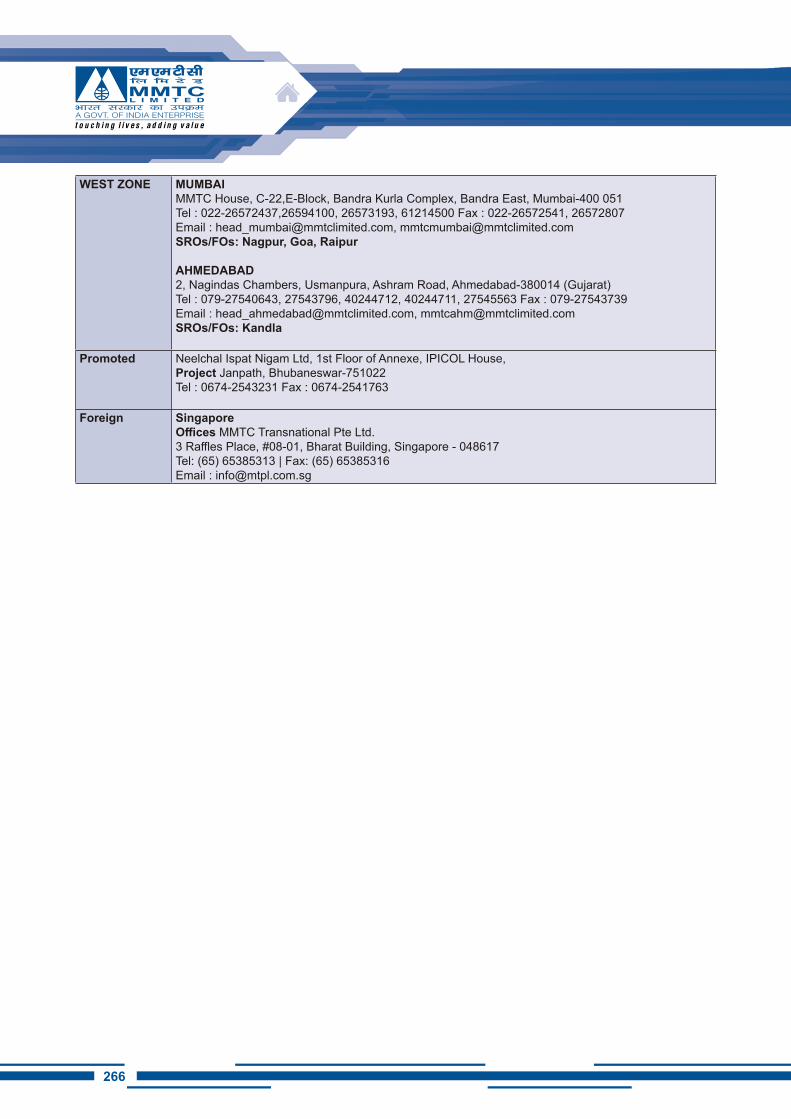
266
WEST ZONE MUMBAiMMTC House, C-22,E-Block, Bandra Kurla Complex, Bandra East, Mumbai-400 051Tel : 022-26572437,26594100, 26573193, 61214500 Fax : 022-26572541, 26572807Email : [email protected], [email protected]/FOs: Nagpur, Goa, Raipur
AhMEDABAD2, Nagindas Chambers, Usmanpura, Ashram Road, Ahmedabad-380014 (Gujarat)Tel : 079-27540643, 27543796, 40244712, 40244711, 27545563 Fax : 079-27543739Email : [email protected], [email protected]/FOs: Kandla
Promoted Neelchal Ispat Nigam Ltd, 1st Floor of Annexe, IPICOL House,Project Janpath, Bhubaneswar-751022Tel : 0674-2543231 Fax : 0674-2541763
Foreign Singapore Offices MMTC Transnational Pte Ltd.3 Raffles Place, #08-01, Bharat Building, Singapore - 048617Tel: (65) 65385313 | Fax: (65) 65385316Email : [email protected]

267266