Embed Size (px)
Citation preview

31 October 1963
SUMMA R Y R E P OR T
Volume 1
NASA Contract 5-2797
GPO PRICE $
CFSTI PRICE(S) $
Hard copy (HC).
Microfiche (M F)
ff653 July 65
SSD 31118R
r .................. "--_1i =I I
, HUGHES 'I I
I I• ..................... J
HU_HE5 AIRCRAFT COMPANY
6PACE" SYSTEMS DIVISION

11
it
f-
HUGHES AIRCRAPT COMPANY
AEROSPACE GROUP
SPACE SYSTEMS DIVISION
EL. SEGUNDO, CAL.IFORNIA
31 October 1963
i
SUBJECT:
TO:
Advanced Syncom Summary Technical Report
for Period May through October 1963
Contract NAS 5-2797
Mr. Robert J, Darcey
SYNCOM Project Manager
Goddard Space Flight Center, Code 6ZI
Greenbelt, Maryland
Attached are copies of the Advanced Syncom Summary
Technical Report for the period May through October 1963. This
seven-volume report provides engineering information summarizing
all elements of study, research and development, fabrication and
testing, and specification of subsystems and components conducted
during the report period. Engineering schematic, circuit,
mechanical, and product drawings prepared during this period
were transmitted separately and are not repeated in this report.
During the 6-month period reported here, the
engineering model structure (T-l) was subjected to qualification
level dynamic environmental loads; new communication transponder,
telemetry encoder, command decoder, central timer, phased array
control, and jet control circuit designs were completed; communication
system test equipment, control item test equipment, and synchronous
controller designs were established; alternate structural design
approaches were evaluated and a versatile structure selected and
designed; and feasibility demonstration tests were conducted on the
bipropellant reaction control system and propellant exhaustion test
runs were completed at simulated mission conditions on the
engineering model reaction control unit.
Advanced engineering models of the communication
transponders, phased array antenna, antenna control electronics,
and central timer were fabricated and tested. In addition, a welded
module model of the phased array control electronics was fabricated.

HUGHES AIRC_ COMPANY
Sources were evaluated for possible future procurement of high-
reliability components, and detailed component specifications
and requirements for inspection, test, serialization, burn-in,
and power aging were prepared.
Dynamic load tests were conducted on a solar panel
designed for the revised structure. Solar cell manufacturers
were surveyed and sample quantities of n on p cells were procured.
Flat plate nickel-cadmium cell batteries were obtained in sample
quantities for cycle tests under simulated stationary orbit mission
requirements.
HUGHES AIRCRAFT COMPANY
Paul E. Norsell
Manager, Systems DevelopmentAdvanced Syncom
cc: H. A. Zaret
Goddard Space Flight Center
Code Z41.4
Greenbelt, Maryland
u
W
J
T
_Jbll

w
Advanced SYNCOMIIIIII I
i
SSD 31118R
SUMMA R Y R EP OR T
Volume 1
NASA Contract 5-2797
APP ROV ED:
Manager, Systems
Advanced Syncom
Development
I HUGHES II
L ;HU6HES AIRCRAFT COMPANY
8PACE _VgTEMS DIVISION

fr_
I_
FIm
m
Lt
_m
im
iI
i

z
md
2 .
": !
r_
w
w
w
L_
i
CONTENTS
Page
1. INTRODUCTION ....................................................... 1-1
2. SPACECRAFT SYSTEM SUMMARY ....................................... 2-1
3. COMMUNICATION SYSTEM DESIGN
Requirements ..................................................... 3-1
Modes of Operation ................................................ 3-1
System Calculations ................................................ 3-2
Frequency Allocations and Interrelations ................................. 3-4
Special Studies .................................................... 3-5
RF Interference Analysis ............................................ 3-11
4. LAUNCH AND ORBIT CONSIDERATIONS
General Sequence of Events ........................................... 4-1
Fixed versus Variable Apogee Ignition Timer ............................. 4-2
Translation due to Initial Orientation Impulse ............................. 4-5
Orbital Perturbations duc to Sun and Moon ............................... 4-6
Justification for Spin Speed Control .................................... 4-10
Axial Jet Induced Nutation ........................................... 4-14
Emergency Procedures (Ascent Sequence) ............................... 4-18
Earth Sensor for Advanced Syncom .................................... 4-21
5. SPACECRAFT SYSTEM DESIGN
Spacecraft Block Diagram ........................................... 5-1
Communication Transponders ......................................... 5-1
General Physical Arrangement of Transponder ....................... 5-2
Minor Control Item Description .................................. 5-2
Regulators .................................................. 5-16
Communication Transmitters ......................................... 5-17
384H Traveling-Wave Tube ..................................... 5-17
Traveling-Wave Tube Power Supply ............................... 5-33
Ferrite RF Power Switch ....................................... 5-41
iii

Hughes Aircra]t Company
iv
Page
Communication Antenna System ....................................... 5-42
Phased Array Antenna System ................................... 5-42
Phased Array Control Electronics (PACE) .......................... 5-54
Receiver Antenna Development .................................. 5-77
Muhiplexers ................................................ 5-80
Telemetry and Command System ....................................... 5-81
Telemetry and Command Antenna System .......................... 5-81
Telemetry Transmitter ......................................... 5-82
Command Receiver ........................................... 5-87
Telemetry Encoder ............................................ 5-87
Command Decoder ........................................... 5-110
Command Allocation .......................................... 5-128
Central Timer ..................................................... 5-130
Progress Items ............................................... 5-131
Functional Description ........................................ 5-132
Block Diagram Description ..................................... 5-132
Core Frequency Scalers ........................................ 5-135
Product Design .............................................. 5-135
Circuit Descriptions ........................................... 5-135
Electrical Power ................................................... 5-145
Power Supply System Design .................................... 5-145
Battery Power System ......................................... 5-153
Solar Cell Assembler .......................................... 5-154
Electrical Power System Analog .................................. 5-154
Particulate Radiation Damage ................................... 5-157
Structure ........................................................ 5-167
General Arrangement and Structural Design ......................... 5-167
Structural Dynamic Test and Analysis ............................. 5-196
Mass Property Analysis ........................................ 5-196
Thermal Control ............................................. 5-198
Reaction Control System .................................................. 5-210
System Description ........................................... 5-210
Development Status ................................................. 5-216
Apogee Engine .................................................... 5-225
System Description ........................................... 5-225
Development Status ........................................... 5-225
M
==
i
[]
[]
i im
li
!m

t
t
|
z
= =
w
m
= =
L_
L...
Conlenls
.
7,
8°
9.
Page
RELIABILITY AND QUALITY ASSURANCE
Failure Mode Analysis .............................................. 6-1
Critical Component Test Plans ........................................ 6-6
Quality Assurance .................................................. 6-57
MATERIALS, PROCESSES, AND COMPONENTS
Spacecraft Bill of Material ............................................ 7-1
System Test Equipment .............................................. 7-1
Preferred Parts, Materials, and Processes ................................. 7-17
Radiation Environment Studies ........................................ 7-21
Material and Process Studies ........................................... 7-28
GROUND SUPPORT EQUIPMENT
Introduction ...................................................... 8-1
Synchronous Controller Auxiliary ...................................... 8-10
Transponder RF Test Set ............................................. 8-12
Major and Minor Control Item Test Positions ................................ 8-21
Digital Subsystem Major and Minor Control
Item Test Equipment ...................................................... 8-26
SPACECRAFT HANDLING EQUIPMENT
Weight,.CG, and Moment of Inertia Fixture ............................... 9-1
Systems Test and Spin Fixture ......................................... 9-2
Mobile Assembly Stand .............................................. 9-5
Balancing Machine .................. , .............................. 9-5
10. NEW TECHNOLOGY
New Items ........................................................ 10-1
Previous]y Reported Items ............................................ 10-1
Subcontracts ...................................................... 10-2
11. PROJECT REFERENCE REPORTS ......................................... 11-1

Imm
m
[]
|+l
[]
[]I
i+
R_U :
u
N_
W
L
i F
! _ ; =,
lilt
m
ami
E
m Em
m__ r
m _j_
m r5

1. INTRODUCTION
Li d
i.,,;
w
i __
w
F
7
m
Tile use of communication satellites provides
the practical solution to the need for greatly ex-
panded global communications capability. A
major effort of the United States Government and
of industry has been in process since the late
1950s to develop a satellite relay system at the
earliest possible time.
The National Aeronautics and Space Adminis-
tration, having management responsibility for
developing the space technology leading to a
communication satellite system, has investigated
nonsynchronous passive satellites and nonsyn-
chronous active repeater satellites. The Goddard
Space Flight Center Project Syncom is assigned
the synchronous-orbit active repeater satellite
investigations.
Under NASA Goddard Space Flight Center
Contract NAS5-1560, Hughes Aircraft Company
developed and constructed three Syncom space-
craft for launch from the Atlantic Missile Range
by Delta launch vehicles for conduct of inclined
synchronous-orbit communications experiments
during 1963. The Syncom spacecraft have dem-
onstrated a simple spin-stabilized, active repeater
satellite design capable of being placed in a syn-
chronous orbit. Similarly, it has been demon-
strated that a simple pulse jet control system can
provide the stationkeeping necessary to maintain
a synchronous orbit.
The Advanced Syncom spacecraft, currently
under study for feasibility and advanced tech-
nological development, will demonstrate the sta-
tionary, or equatorial, synchronous orbit with a
vehicle providing a relatively large, adaptable
payload capability, achievement of long life in
orbit, an electronically steerable antenna beam,
continuous wide-band communications, and new
multiple-access communications. Scientific instru-ments will be carried to measure the radiation
environment and to assess radiation damage oc-
curring during the orbiting process and through-
out satellite life in the synchronous, equatorialorbit.
The Advanced Syncom study program has in-
cluded research and development of engineering
models of a multielement phased array trans-
mitting antenna and associated control circuits;
a dual-mode communications transponder operat-
ing at 6-gc receiving frequency and 4-gc trans-
mitting frequency and providing alternate modes
of operation as a multi-channel SSB-PM mul-
tiple-access transponder or as a wide-band FM
frequency translation transponder; a traveling-
wave tube final power amplifier for the trans-
ponders; a spacecraft structure; and a bipropel-
lant rocket jet control system.
In May 1963, the NASA expanded the ad-
vanced technology program to include design
effort on all elements of the spacecraft and the
communication system test equipment. Currently
under way is the fabrication and testing of ad-
vanced engineering models of the communication
transponders, transmitting and receiving anten-
nas, and traveling-wave tube power amplifiers.
Breadboard circuits of the telemetry encoders
and command decoders are similarly in process.
The system test equipment being developed will
permit quantitative measurements of communi-
cation system performance to be obtained. The
above activities will be completed by the end ofOctober 1963.
r_
1-1

Hughes Aircraft Company
This Summary Report covers the technical
progress achieved during the contract period and
details the system configuration and specifications
resulting from system studies. The report isdivided into seven volumes:
Volume 1: Advanced Syncom Summary
Report
Volume 2: Major and Minor Control Item
Test Plans and In-process
Specifications
Volume 3: Interface Reports
Volume 4: System and Subsystem Per-
formance Requirements
Volume 5: System Test Plans
Volume 6: Engineering Data on Trans-
ponder Control Items
Volume 7: T-1 Structural Vibration Test
Report
dm
==
idl
i
I!_[]
m
[]
|J
_
B!g r
H
= =
m
1-2
m _Lg -'-
W -

2. SPACECRAFT SYSTEM SUMMARY
ii! !
t
I 3i
Tm_
w
L_
E
E
w
The Advanced Syncom satellites, as in the
Delta-launched Syncom, will utilize spin stabi-
lization for attitude stabilization. The spaeeeraft
physical parameters are increased over those of
Syncom to accommodate a large increase in com-
munications capacity. In addition, the self-
contained apogee injection stage removes
approximately 29 degrees of inclination from the
orbit while circularizing the elliptical transfer
orbit at the synchronous radius. The parameters
of an Advanced Syncom spacecraft are summar-
ized in Table 2-1. Figures 2-1 and 2-2 illustrate
the general arrangement and the structural en-
gineering model of the Advanced Syncom.
The communication capacity of each of the
satellite transl_onders is 600 two-way telephone
conversations. The design for each satellite con-
tains four such transponders, providing a total
system capacity through the satellite of 2400 two-
way voice channels. Alternately, the system canaccommodate television or other wide-bandwidth
signals through each of the transponders'
Ground station characteristics for which the
full communications capacity is achieved would
include an 85-foot-diameter antenna, a 10 kw
saturated power transmitter, and an 80 o K re-
ceiver.
Smaller stations can be used with a propor-
tionate reduction in capacity. With 40-foot-
diameter antennas and the same transmitters and
receivers, the voice channel capacity is reduced
to 120 two-way channels and the television signal
noise level, and therefore picture quality, fallsbelow CCIR standards.
The system has two alternate modes of opera-
tion possible in each assigned frequency band.The first mode accommodates a wide-band FM
transmission to the spacecraft, which translates
the signal-carrier frequency and repeats the sig-
TABLE 2-1. PARAMETERS OF ADVANCED SYNCOM
Physical configuration
Weight
Apogee injection motor
Control systems
Communications
Telemetry
Command
Electrical power
58-inch-diametercylinder
1518 poundsat launch
760 poundsin 24-hour,equatorialorbit
Solid propellant, JPL
Liquidbipropellant
Fuel..monomethylhydrazine
Oxidizer:nitrogen-tetroxide
Two independent systems: capacityper system adequate for correctinginitial errors and providing 3 yearsstationkeeping
Self-containedspinrate control
Fourindependentdual-modetransponders
Redundant&O-watt traveling-wavetube poweramplifiers in eachtransponder
8-db collinear array receivingantenna
18-db phasedarray transmittingantenna
6019, 6108, 6212, 6301 gc ground-to-spacecraft
3992, 4051, 4120, 4179 gc spacecraft-to-ground
Four 1.25-watt transmittersat 136.470or 136.980 mc
Fourencoders;GSFCPFM standard
Four receivers at 148.260 mc
Fourdecoders;GSFCFSK standard
147-watt, n-p solar cell array
650-watt-hour rechargeablenickel-cadmiumenergy storagesystem
2-1

,,,,.j.
Hughes ,4ircra# Company
J
THRUST TUBE
GROUND PLANE
RECEIVER ANTENNA
,PHASED ARRAY TRANSMITTER ANTENNA STACK
ANTENNA ELECTRONICS PACKAGE
WAVE TUBE
[]il
SOLAR CELL PANELS
QUADRANTELECTRI
OXIDIZER TANKS
FUEL TANKSy .
;PIN SPEED AND
ORIENTATION JET
SUN SENSORS• =
_ TR:CKING, TELEMETRY AND
COMMAND TURNSTILE ANTENNA
FIGURE 2-1, GENERAL INTERNAL ARRANGEMENT OF ADVANCED SYNCOM
2-2 j
m

! ;
= =
nal with no conversion in modulation. This mode
is used for television or other wide-band data
originating from a single station. The spacecraft
transponder mode for such signals is termed the
frequency translation mode.
The second mode of operation involves the
transmission, simultaneously from a large num-
ber of ground stations, of frequency division
•!t:_'-,_-_ 2. Spacecra/t System Summary
multiplexed, single-sideband, suppressed carrier
voice channels. The signals are converted into
phase modulation of a single carrier in the space-craft and are retransmitted back to all stations in
this form. This mode permits simultaneous two-
way interconnection of all combinations of the
ground stations. The spacecraft transponder mode
for these signals is termed the multiple accessmode.
w
w
E
_m
[:2
FIGURE 2-2. STRUCTURAL ENGINEERING MODEL OF ADVANCED SYNCOM
2.3

I
N
Iil
IHI
li
mB |
i
El t
N i111 _
i 7_i_i_!_-_ii_iII _̧ __Bu :
Ill
___ L
1il _
Eli
l IE
mm i_
II [
I_1 rr
Eli Fm _

| I
3. COMMUNICATION SYSTEM DESIGN
t_
t,..a
W
H
R
r_
L
REQUIREMENTS
The communications requirements which have
determined the system design are as follows:
Capacity: The system should accommodate
600 two-way voice channels or one monochromeor color television station in each of the four
assigned frequency bands. The voice channels
can originate from as many as 100 ground ter-
minals simultaneously and can accommodate
multiplexed teletype signals.
Quality: The quality of the communications
links should exceed the appropriate standards
established by the International Radio Consult-
ative Committee (CCIR) of the International
Telecommunication Union (ITU).
The assumed ground station characteristics
for which the full communications capacity isachieved are listed in Table 3-1.
Smaller stations can be used with a propor-
tionate reduction in capacity. With 40-foot-diameter antennas and the same transmitters and
TABLE 3-1. GROUND STATION CHARACTERISTICS
Transmitter (for each frequency assignment)
Saturated powerFrequencybandBandwidth
Diplexer lossFrequencystability
AntennaDiameter
Efficiency (transmittingand receiving)
Receiver
Noise temperature (all sources,includingantenna)
l0 kw6 kmc
25 mc--1 db
1 part in 10 '°, short term1 part in 10% long term
85 feet
54 percent
80oK
receivers as in Table 3-1, the voice channel
capacity is reduced to 120 two-way channels and
the television quality falls below CCIR standards.
The standards used to establish the design of
this system are given in Table 3-2. The use of
the CCIR standards in the design of this system
follows the procedures recommended by Bray.*
MODES OF OPERATION
The system has two alternate modes of oper-
ation possible in each assigned frequency band.The first mode accomodates a wide-band fre-
quency modulated transmission to the spacecraft,
which translates the signal carrier frequency and
repeats the signal with no conversion in modu-
lation. This mode is used for television or other
wide-band data originating from a single station.
The spacecraft transponder mode which accom-
modates such signals is termed the frequency
translation mode.
*W. J. Bray, "The Standardization of InternationalMicrowave Radio Relay Systems," Proceedings ofthe IEE, Part B, March 1961.
TABLE 3-2. COMMUNICATION SYSTEM STANDARDS
Television signal-to-noise ratioPeak-to-peak signal to weighted noise 51 db
TelevisionvideobandwidthMonochrome 4 mcColor 4.5 mc
Voice channelsTest tone/noise ratio 50 dbTotal channelbandwidth 4 kc
Voice portion of bandwidth 3.1 kc
Multiplexedteletype signalsMaximumerror in frequency 2 cps
3-1

,..jw
Hughes Aircraft Company I
The second mode of operation involves the
transmission simultaneously from a large num-
ber of ground stations of frequency division
multiplexed, single-sideband, suppressed carrier
voice channels. These signals are converted into
phase modulation of a single carrier in the space-
craft, and are retransmitted back to all stations
in this form. This mode permits simultaneous
two-way interconnection of all combinations of
the ground stations. The spacecraft transponder
mode which accommodates these signals is
termed the multiple access mode.
SYSTEM CALCULATIONS
FM Frequency Translation (TV). Tables 3-3
and 3-4 list the signal and noise levels at several
key points in the system when used for the relay-
ing of monochrome television signals. The over-
all peak-to-peak signal to weighted noise ratio is
54.2 db, which exceeds the CCIR standard by 3.2
db. The noise weighting factor and the appropri-
ate standard were interpolated from curves given
in the previously cited Bray report.
Single Sideband-Phase Modulation Multiple
Access (Voice). Tables 3-5 and 3-6 list the sig-
nal and noise levels at key points in the system
TABLE 3-3. GROUND TO SPACECRAFT,FREQUENCY MODULATION (33/)
Transmitter power 33.0 dbw
Diplexer loss --1.0 db
Ground antenna gain 62.1 db
Space attenuation --200.8 db
Receivingantenna gain 8.0 db
Off beam center allowance --1.5 db
Multiplexer and miscellaneousloss --3.0 db
Receivedcarrier power --]03.2 dbw
Receivernoisepower density --194.4 dbwlcps
Receivernoise bandwidth 74.0 db
Receivernoise power -- I20.4 dbw
Carrier/noise ratio 17.2 db
3-2
TABLE 3-4. SPACECRAFT TO GROUNDFREQUENCY MODULATION (TV)
Spacecraft transmitter power
Diplexer and phase shifter losses
Spacecraft antenna gain
Space attenuation
Off beam center allowance
Ground antenna gain
Received carrier power
Receivernoisepower density (80°10
Receiver bandwidth
Receiver noise power
Carrier/noise ratio
Carrier/noise ratio -- up link
Carrier/total noise ratio
Top modulation frequency
Modulation index, M
Improvement factor, 3M= 254(2)
Average signal-to-noise ratio
Noise weighting factor
Peak-to-peaksignal/weighted noise
6 dbw
--3 db
18 db
--197.1 db
2 db
58.4 db
--119.7 db
--209.62 dbwlcp.,
74.0 db
--135.6 dbw
15.9 db
17.2 db
13.5 db
4 mc
2.5
17.7 db
31.2 db
14 db
54.2 db
TABLE 3-5. GROUND TO SPACECRAFT,SIDEBAND MODULATION (VOICE)
SINGLE
Transmitter peak power capability 40 dbw
Transmitteraverage power 31.7 dbw
Channeltest tone power 18.9 dbw
Diplexer loss -- 1.0 db
Groundantenna gain 62.1 db
Space attenuation --20&8 db
Receivingantenna gain 8,0 db
Off beam center allowance --1.5 db
Multiplexer and miscellaneousloss --3.0 db
Received test tone power --]17,3 dbw
Recelvernoisepower density --194.4 dbwlcps
Channelbandwidth 34.9 db
Psophometricnoiseweighting factor --2.5 db
Receiver channel noise (weighted) --162.0 dbw
Test tone/fluctuation noise ratio 44.7 db
Test tone/intermodulation noise ratio 47.7 db
Test tone/noise ratio 42.9 db
m
l
Q
I
m
I
I
i
m
i r
i
I
i
=

%,_/w
t
t .
t_
H
r--
;5_m
i=,,,,,
= ,
L..,
r
=
TABLE 3-6. SPACECRAFT TO GROUND,PHASE MODULATION (VOICE)
Spacecraft transmitter power 6 dbw
Diplexerand phaseshifter losses --3 db
Spacecraftantenna gain 18 db
Space attenuation --197.1 db
Off beamcenter allowance --2 db
Groundantennagain 58.4 db
Received carrier power --119.7 dbw
Receivernoise power density(80°10 --209.6 dbw/cps
Receivernoise bandwidth(25 mc) 74.0 db
Receivernoisepower -- total --135.6 dbw
Carrier/total noise ratio 15.9 db
Weighted channelnoise power --177.2 dbw
Carrier/channel noiseratio 57.5 db
Channeltest tone modulationindex 0.35
Test tone/noise ratio 48.5 db
Transponder test tone/intermodulationnoise ratio 40,0 db
Overall link test tone/noise ratio 383 db
Compandorimprovementfactor 15 db
Overall link test tone/effective noiseratio 53.9 db
for conditions of full channel loading, when 600
two-way circuits are in use in each band. The
ground station calculations are for the worst
case, with all 600 conversations flowing through
one station. In computing the noise contributed
by various elements o:f the systems, intermodu-
lation noise as well as thermal noise was con-
sidered.
Two voice channel signal processing tech-
niques are employed. Echo suppressors are used
to prevent the annoying effect on the speaker of
delayed echoes produced by long transmission
delays and mismatched ground distribution net-
works. The newer type of suppressor, which
allows interruptions to be heard, are used to
allow smoother conversational exchanges. Com-
• 3. Communication System Design
pandors, consisting of a voice dynamic range
compressor at the transmitting end and a corre-
sponding expandor at the receiving end, are used
to substantially improve the capacity and quality
of the voice channels. Although tests have indi-
cated improvements of the order of 22 db in
signal-to-noise ratio through the use of com-
pandors, the conservative figure of 15 db is used
in the calculations to give adequate allowance
for the increased channel loading which occurs.
The calcuIations are based on the channel
loading factors and procedures given by Bray
and on the detailed anaIysis of this system given
by Braverman and Williams.* The resulting test
tone/noise ratio of 53.9 db exceeds CCIR stand-
ards by 3.9 db.
Frequency and Gain Adjustments. Because of
the stringent frequency error tolerances in the
single sideband mode, special consideration must
be given in the system design to meeting the
frequency stability requirements. The major
sources of frequency error are associated with
the spacecraft--its residual motion relative to
the earth produces a small but significant dop-
pler shift, and the transponder receiver oscillator
instability must also be taken into consideration.
The design philosophy employed has been to
accommodate both sources of spacecraft-induced
frequency errors by compensating adjustments
made continuously and automatically by the
ground stations through the use of transponded
pilot tones from each station. The same pilot
tones used for frequency control are used by
the ground stations to maintain gain control as
well, to achieve the desired test tone modulation
index in the spacecraft.
*D. Braverman and D. D. Williams, "SSB-PM Mul-tiple Access Communication System Analysis,"Hughes Aircraft Company TM 721, October 1962.
3-3

W
Hughes Aircra]t Companyi
FREQUENCY ALLOCATIONS AND INTER-
RELATIONS
Transponder Frequency Relationships. The
frequency relationships between the various parts
of the transponder are shown in Figure 3-1.
access system baseband is shown in Figure 3-2.*
Each of the four mastergroups consists of 300
voice channels (five supergroups) so that a total
of 1200 channels is represented in the figure.
The voice channel frequencies extend from 316
kc to 5.564 mc. Pilot frequencies may be added
Multiple Access Baseband Frequency Arrange-
ment. The frequency structure of the multiple*Taken from CCITT iind Plenary Assembly, New
Delhi, Redbook, Vol. III, 8-16, December 1960, p. 128.
t; RREQUENCY
MULTIPLIER _ MULTIPLIER t_, MASTERX 3 X32 OSCILLATOR
MODULATOR MULTIPLIERXl28
MULTIPLE ACCESS
FREQUENCY TRANSLATION
MIXER
195 f
MULTIPLIER
X5
t
]IIIIIIII
IF•_ LIMITER
65f
fMULTIPLIER
X32
MULTIPLIERx4 I
tf
65 MASTER
f OSCILLATOR
195 .
T_ v
BEACON
FIGURE 3-1. FREQUENCY DIAGRAM
HIGH LEVELMIXER
MULTIPLIERx2 I
12el OUTPUT
(IZB+ 61 if (BEACON)128"
34,
[]==lIII
|m
i
W i
m== Iml
i
!i
J
N .;w
r
r
Y
w E
mi F
u|W F

3. Communication System Design
B
|i
- i
w
!J
l
MASTER GROUP NUMBER
I 2 3 4
308 4287316 t636 2956 4332
4 5 6 7 8 4 5 6 7 8 4 5 6 7 8 4 5 6 7 8
SUPER GROUP NUMBER
FIGURE 3-2. MULTIPLE ACCESS BASEBAND
FREQUENCY ARRANGEMENT
to the lower end of the baseband, and one is
shown at 308 kc. The CCITT also allows a pilot
frequency at 4.287 mc, as indicated in Fig-ure 3-2.
SPECIAL STUDIES
Carrier Level in Multiple Access Mode as Func-tion of Modulation Index
Ratio of Carrier Power to Total Power as
Function of RMS Modulation Index. An analysis
was made of the ratio of carrier power to total
power as a function of rms modulation index
for a carrier phase-modulated by random noise.
In the multiple access mode of the spacecraft-
to-ground link the carrier is phase-modulated
by a signal with the characteristics of random
noise. To determine the feasibility of tracking
the carrier using a phase-locked tracking re-
ceiver, the amount of power in the carrier as a
function of the rms modulation index should be
determined. "
Assume a carrier is phase-modulated by ran-dom noise of bandwidth B. The rms modulation
index is therefore the rms value of the phase
deviation of the carrier:
rms modulation index --
or
peak modulation index M -- k/2
The mean square value of the modulation index
is proportional to signal power, which in this
case is proportional to the bandwidth B of the
modulating spectrum (noise).
_2=KB
It may be assumed that B is the sum of N
contiguous narrow bands of noise, each of width
B/N. Therefore each of the N bands contributes
O2/N to the mean square value of the modula-
tion index, or the rms modulation index due to
a narrow band is _/_--'/N. Now the power is
represented in each small noise band by a sine
wave of the same equivalent power of peak am-
plitude M,,. The peak modulation index is thus
The ratio of carrier power to total power in
a signal modulated by N sinusoidal subcarriers
is
N
P---_¢= H [Jo (Mn)]2Ptot ,,= 1
If all N signals have the same modulation
index M,
P___s__= [Jo (M)]ZNPtot
For small values of M, Jo(M) may be ap-
proximated by
M2Jo (M) = ] ---_-
Therefore
_ot_( 1 ----_-)2N = ( 1-2_-_'_2N4N/
/= _, 1 - 2N;/
To simplify this, consider the expression
In 1---_- _2Nln 1--_ _2N _2
__ ___o (for _--_-_small)
3-5

w
Hughes Aircra[t Companyu
i
Therefore
or
or
_--,_2,_1 - 2N] _ e-®'
10 log Pc _,,Ptot -- --4.34 decibels
This relationship is plotted in Figure 3-3.
Carrier Reduction in Multiple Access Mode.
A demonstration was made to show that, under
full modulation conditions, the carrier can be
used instead of a beacon for frequency control.The unmodulated carrier level was measured
and then modulated by a continuous 5-mc spec-
trum of noise simulating full modulation; the
drop in carrier level was noted.
The configuration used for the demonstration
(Figure 3-4) consists basically of:
1) HP-608A signal generator to determine
the power level of the modulating noise
simulating full modulation
2) Noise source to modulate the carrier
3) HP-431B power meter to monitor the
modulating signal
4) Spacecraft electronics under test
5) Panoramic SPA4a spectrum analyzer tomonitor the carrier level
6) HP-618 signal generator as a calibrated
source with which to compare the carrierlevel.
The demonstration procedure is as follows. A
single test signal from the HP-608A signal gen-
erator, adjusted for a peak modulation index of
1.6, determines the noise power level required
-4
_J
__ -s¢.klaJa
,2(.90j -16
-2O
-240 0.5 1,0 15 20 2.5
RMS MODULATION INDEX, RADIANS
FIGURE 3-3. RATIO OF CARRIER POWER TO TOTALPOWER AS FUNCTION OF RMS MODULATION INDEX
FOR CARRIER PHASE- MODULATED BY RANDOMNOISE
for full modulation. The reading on the power
monitor is noted and the test signal removed.
The unmodulated carrier level is observed on
the spectrum analyzer and a signal from the
HP-618 generator at the same level and fre-
quency is fed into the spectrum analyzer; the
reading on the calibrated dial of the generator,
which is equal to the strength of the unmodu-
lated carrier, is noted. The modulating noise
level is then increased until the power monitor
indicates the same level as the single test signal.
The height of the carrier is noted and the HP-
618 generator at the same frequency is again
fed into the spectrum analyzer and the dial ad-
justed until the signal level from the signal gen-
erator is the same as the fully modulated carrier.
The dial reading equals the modulated carrier
level. Subtracting the dial reading (in decibels)obtained from the unmodulated carrier from that
obtained for the modulated carrier gives the
drop in carrier level caused by full modulation.
The relative magnitude of sideband to carrier
for the test signal is calculated based on the
U
I
D
m
I
I
I
w
w
w
=
3-6

2
= :
L=="
= =
E_
w
L :
= :=W
3. Communication System Design
NOISE _OURCE 1
FILTER I
AMPLIFIER I
t
ATTENUATOR
tAMPLIFIER
'tAMPLIFIER
tGENERATOR
HP60BA
NOI_IE
POWlE R MONITOR
_ OIRECTIONAL_COUPLER
1IMPEDANCEMATCHINGNETWORK
AMPLIFIER
I POWERMETERHP4SIB
_._._JFIGURE 3-4.
,i i i ,
_.J STEPqATTEN UATOR rf
TRANSPO NDIER ELIECTRON ICB
PHASE HMODULATOR
tMASTER ]
OSCILLATOR
I MULTIPLIERX2
t
MULTIPLIER
X32
ISOLATOR
FILTER
ISOLATOR
i js ECTR°"ISIGNAL ANALYZERGENERATOR
HP618 SPA4o
DEMONSTRATION SETUP BLOCK DIAGRAM
determination that 40 test tones at a peak mod-
ulation index of 0.002 radian per test tone at
the output of the phase modulator will simulate
full modulation. At the output of the multiplier
chain, 0.002 X 2 X 32 X 2 peak radians per test
tone = 0.256 peak radians per test tone.
The equivalent test signal required to deter-
mine the necessary modulating noise level is
one in which the ratio of first sideband to carrier
at the output is thus 1.25. The power monitor
reading for the test signal was 1.24 milliwatts.
The unmodulated carrier level was --14 dbm.
By removing attenuation at step attenuator 1
in the noise source, noise modulation was in-
creased until the power monitor indicated 1.4
milliwatts (the closest level to 1.24 milliwatts
attainable due to the discrete steps of the attenu-
ator). The modulated carrier level was -- 22 dbm.
Therefore, the drop in carrier level was 8 dh.
Comparison o] Measured Carrier Levelwith Theoretical Carrier Level. When the test
signal was 1.24 milliwatts, the modulation index
was 1.6 radians (peak) or 1,15 radians rms.
However, when the noise modulation source was
substituted, it was necessary to increase the mod-
ulating power to 1.4 milliwatts. The resulting
rms modulation index was therefore
-- 1.15 1.,I] 1.41.2---_-- 1.22
or
_2 -- 1.49
3-7

Hughes Aircra[t Company U
In the analysis, it was shown that
Pc
10 log Ptot-- --4.34 O"decibels
z -- 6.5 decibels
This theoretical value agrees within 1.5 db ofthe measured value of --8 db.
Intermodulation and Thermal Noise in Ground-
to-Spacecraft Link. Tl:e noise at the output of the
Advanced Syncom ground receiving system will
be of several types, with thermal noise and in-
termodulation noise predominating. The CCIRmakes recommendations on the limits of the total
amount of system noise but does not attempt
to divide the allotted amount among individual
components of the system. As the system design
progresses, however, it becomes essential to as-
sign reasonable noise objectives to individual
system components, such as transmitters and re-
ceivers, based on both the state of the art in
component design and optimum theoretical de-
sign considerations. The latter is considered inthis discussion.
The Tenth Plenary Session of the CCIR ap-
proved a number of Study Group IV documents
relating to satellite communications. Document
No. 2173, Active Communication-Satellite Sys-
tems for Frequency Division Multiplex Telephony
--Allowable Noise Power in the Basic Hypo-
thetical Reference Circuit, recommends:
"1) that the psophometrieally weighted noise
power at a point of zero relative level
in any telephone circuit in the basic hy-
pothetical reference circuit as defined in
Recommendation... (Document 337)
should not exceed the provisional values
of 10,000 pW mean in any hour, and
2) that the higher noise levels that may be
tolerated for very small percentages of the
time should be the subject of further study;
3) that the following notes should be re-
garded as part of the Recommendation:
Note 1: Noise in the multiplex
equipments is excluded fromthe above."*
Only the 10,000-picowatt figure stated in the
above recommendation will be considered at
this time.
At the "point of zero relative level" men-
tioned in the CCIR recommendation, the level
of a test tone used as a reference signal hasbeen established as 0 dbm or 10 -3 watt. There-
fore, a test-tone-to-noise ratio (TT/Np) is estab-
lished, in effect, at the point of zero relativelevel. The value of this ratio is
TT _ 10-'_ = 105 or 50 db (3-1)Np 10,000 X 10 -12
By establishing a suitable test-tone level at the
output of the ground receiving system in the
Advanced Syncom system, it may be made a
point of zero relative Ievel, and therefore a pointat Which the test-tone-to-noise ratio should be
50 db.
The Advanced Syncom communications sys-
tem consists of two basic parts, the ground-to-
spacecraft link and the spacecraft-to'ground llnk.
It has been shown** that the noise contributed
by each of these links should be approximately
equal. In terms of the CCIR recommendation,
this means that about half of the total system
noise, or 5000 picowatts, should be assigned to
each link. Furthermore , since noise-to-test-tone
ratios in the overall system may be added di-
rectly
80,000 pW', one-minute mean, :for more_Additionai notes are omitted.
than 0.2 percent of any month; "'D. Braverman and D. D. Williams, op. cir.
3-8
i
u
[]
i i
H_
=
w
[]
J
U =-
H IE
_-= __--m |m

,,,_t
t.J
i ii,,,,d
ii
w
W
= :
! !
'U
= =
= =
= :
Since
_ Gs+ _'- s_----50db (3-2)
where
(T_) --noise-to-test-tone ratio at output ofo ground receiver
= noise-to-test-tone ratio in ground-to-os spacecraft link
= noise-to-test-tone ratio in spacecraft-so to-ground link
N(N)o.it is evident that
or ¸
(3.3)
-- 3 db -- 50 db -- -- 53 db
(3-4)
(T___)Gs = A-53 db (3-5)
The noise in Equation 3-5, however, is psopho-
metrically weighted noise power, and it is gen-
erally more convenient to use white gaussian
noise in analysis. Psophometrically weighted
noise has a level that is 2.5 db below that of
white gaussian noise because of the filter char-
acteristics of telephone circuits. Therefore, if N
in Equation 3-5 is interpreted as white noise,
T____) _-- 53 -- 2.5 = 50.5 db (3-6)GS
As will be shown later, this ratio, (TT/N)o_,
severely limits the permissible intermodulation
noise from the ground transmitter when the sys-
tem is statistically loaded with 600 channels.
The transmitter power tube design problem may
be eased considerably if the use of compandors
3. Communication System Design
is considered in the system. Compandors permit
a significant increase in the noise power level
while maintaining the output signal-to-noise
ratio at its original level, based on subjective
listener tests. A factor of 15 db is often used as
the compandor improvement factor, and this
appears to be a conservative value. Therefore,
(TT/N)Gs may be decreased by 15 db to give
(T___)Qs = 35.5 db (3-7)
The two main noise contributions in the
ground-to-spacecraft link are thermal noise at
the spacecraft receiver and intermodulation
noise at the ground transmitter. The CCIR ex-
cludes noise in the multiplex equipments from
the 10,000-picowatt noise limit. For the ground-
to-spacecraft link
(3-8)
where
N) = thermal noise-to-test-tone ratio at"-_ T spacecraft receiver
(___T) -- ground transmitter intermodulationx noise-to-test-tone ratio
It has been shown* that the following relations
result from an optimum system design, assuming
a statistically loaded, 600-channel system:
(N) _--'(N)--T 3 Cs(3-9)
1 N(3-10)
*Braverman and Williams, op cit, Equations 5-22 and5-23.
3-9

v
u
Hughes Aircraft Company
Therefore,
N(-_----)x ='-_1(-_--)Gs3 (3-11)
From Equation 3-7,i
(-_-T) zs = -- 35.5 db (3-12)
Therefore,
(-_T-T)x = -35.5 -4.8-- --40.3 db
or
and
( T____)x -- -4-40.3 db (3-13)
(-_T)_ "-- -- 35.5- 1.8 -- -- 37.3 db
or
(TT) -- -4- 37.3 db (3.14)--N-T
Equations 3-13 and 3-14 may be summarizedin words as follows:
1) Ground transmitter intermodulation noise.
The single-channel test-tone-to-intermodu-
lation-noise (unweighted) ratio at the out-
put of the ground transmitter should not
be less than -4-40.3 db if the compandor
improvement factor is 15 db.
2) Spacecraft receiver thermal noise. The
test-tone-to-thermal-noise (unweighted)
ratio at the spacecraft receiver in a noise
bandwidth of 3.1 kc should not be less
than 37.3 db if the compandor improve-ment factor is 15 db.
These results assume both an optimum choice
of test-tone power as derived by Braverman and
3-10
Williams and a statistically loaded, 600-channel
system.
The CCIR states that the test tone psophomet-
rically weighted noise ratio in a 600-channel
system can be converted to the noise power ratio
(NPR) by subtracting about 19 db from the
test tone to psophometrically weighted noiseratio.* The NPR is defined as the ratio of noise
in a freely transmitted band to that in the
measurement slot in which the noise at the input
to the transmitter is suppressed by at least 80 db.
It is often convenient to make NPR measure-
ments using a slot noise test equipment. There-
fore,
NPR = T(--xT-'_ -- 19 dh (3-15)\l'(/ PW
where (TT/N)_w- testtone to psophometric-
allyweighted noiseratio.
It is evident that the test tone to psophometri-
cally weighted noise ratio is 2.5 db greater than
the test tone to unweighted noise ratio. Therefore,
2.5 db should be added to all values of (TT/N)T
and (TT/N)x or other ratios including un-
weighted noise when using Equation 3-15.
Table 3-7 summarizes test tone to unweighted
noise ratios and noise power ratios in a statis-
tically loaded 600-channel system (ground-to-
spacecraft link) for several compandor im-
provement factor values.** If fewer channels
are used, the intermodulation noise per channelwill be less.
The ratios (TT/N)x, (TT/N)T, and NPR are
plotted as a function of compandor improvement
"W. J. Bray, op cit, p. 196.
")In Table 2-1 of the August 1963 Advanced SyncomMonthly Progress Report the psophometric weight-ing factor of 2.5 db should be added to all valuesin the NPR column. In Figure 2-1 of that report, theNPR curve should be raised by 2.5 db.
m
i
_jm
i
I
i
m
B
I
I
N
w
I
W
m

r
+ °
LJ
===1
t +
° ,
LJ
i_]|i
u
t
i
t ,
3. Communication System Design
TABLE 3-7. TEST-TONE-TO-UNWEIGHTED-NOISE AND NOISE POWER RATIOS FOR VARIOUSCOMPANDOR IMPROVEMENT FACTORS
CompandorImprovement
Factor,db
0
6
8.4
10
13
15
17
20
23
50.5
44.5
41.7
40.5
37.5
35.5
33.5
30.5
27.5
db
55.3
493
46.5
45.3
42.3
40.3
38.3
35.3
32.5
52.3
46.3
43.5
42.3
39.3
37.3
35.3
32.3
29.3
NPR at TransmitterOutput caused by
IntermodulationNoise, db
38.8
32.8
30.0
28.8
25.8
23.8
21.8
18.8
15.8
factor in Figure 3-5 for a 600-channel system. A
frequently used value of 30 db for NPR requires
a compandor improvement factor of about 8.4 db
in a statistically loaded, 600-channel system.
RF INTERFERENCE ANALYSIS
An analysis of possible areas and effects of
RF interference in the Advanced Syncom space-
craft has been made. Five segments of the in-
cluded frequency spectrum were uncovered to
which more than one frequency source contrib-
utes. The effects of these five frequency segments
on single quadrant and multiple quadrant opera-tion are delineated in Table 3-8.
This analysis does not include the effects of
intermediate harmonics and subharmonics gen-
erated by frequency multipliers nor does it take
into account undesired spectral componentsderived from nonlinear circuit elements. The
study of interference from these sources will be
accomplished during subsequent analyses.
In summary, although five areas of frequency
overlap were discovered, it is not expected that
any of these singly or in combination will signifi-
cantly degrade operation of the spacecraft.
RF interference between transponders is not
expected to be a problem for the following
reasons:
1) There is a large physical separation of
transponders, within the spacecraft (ap-
proximately 3.5 feet between adjacent
transponders and 5 feet between diametri-
cally opposed transponders).
2) All RF cabling between multiplexers,
traveling-wave tubes, and transponders
will be kept as short as possible and physi-
cally separate.
3) The transponder package will be enclosedin an RF shield.
RF interference within a transponder mode
will be minimized by RF shielding of circuit
elements, by keeping inter-element connections
as short as possible, and by judicious placementof circuit elements themselves.
RF interference between the multiple access
mode and frequency translation mode of one
transponder cannot exist since both modes of one
transponder can never be operated simultane-
ously.
3-11

',..j1
Hughes Aircra/t Company
6O
4s\
42
36
3O
24
\
120
\\
\ _ 'xl\ \
\
\POWER
\
\
RATIO
\
\\
\
3 6 9 12 15 18 21 24
COMPANDOR IMPROVEMENT FACTOR, DECIBELS
FIGURE 3-5. TEST TONE TO UNWEIGHTED NOISEAND NOISE POWER RATIOS IN GROUND-TO-
SPACECRAFT LINK FOR 600-CHANNELLOADING
Interference between the telemetry subcarrier
oscillator output, ¢2 angle counter, and com-
mand audio tones could present the following
problems:
1) After the command decoder has received
its word sync, command address, and com-
mand number, a continuous zero tone is
3-12
received until the execute tone is received.
If the zero tone frequency were to blot out
or bias the telemetry subcarrier oscillator
(SCO) output, incorrect telemetry infor-
mation (in particular, command verifica-
tion) would be transmitted.
2) Both the command address and command
number consists of 6-bit binary-coded
groups such that the probability of the
telemetry SCO generating a specific coded
group of ones and zeros is small, but doesexist.
3) The q,2 angle counter may interfere with
the telemetry SCO output and the com-
mand decoder audio inputs.
These interference areas are not expected to
cause a problem for the following reasons:
1) The command receiver/decoder, telemetry
encoder, telemetry transmitter, and qJ2
angle counter are all on physically sep-arate circuit boards.
2) The command receiver and decoder are
on the same circuit board. This arrange-
ment eliminates external 'routing and
minimizes the length of the audio signalconnection between the receiver and de-
coder.
3) Shielded wire will be used for the telem-
etry subcarrier oscillator output.
Table 3-9 is a compilation of frequencies ex-
isting in the spacecraft with discussions of over-
lapping spectra. In the five subdivisions of Tal_le
3-9, the five frequency segments in which inter-
ference might occur are displayed along with
notations of possible effects.
i
i
[]
m
i
1
m
|
il
i!
U_
_z
-± -
Ill "=

TABLE 3-8. FREQUENCY S
Frequency Spectrum
3.62 kc
]0.239 kc
MutualArea Single Quadrant Communication Effects
Multiple Access Frequency TranslationMultiple Acces.,
Multiple Acce.,
31.6491 mc
32.6479 mc
62.3764 mc
68.490 mc
3 1) Master oscillatoramplifier output f is inpassbandof doubleramplifier.
la) Master oscillatorquadrant II, is in IFpassband of quadrant I]b) Master oscillator fquadrant 111,is in IFpassband of quadrantsand I1.lc) Master oscillator f=quadrant IV, is in IFpassband of quadrants11t and II1. 1
2) X32 input is in passbandof limiter amplifier
la) Each master oscil/output frequency is in:passbandof all doubleamplifier outputs.]b) Passbands of all damplifiers overlap witFother,
1996.0448 mc
2092.1536 mc
4 1) Local oscillatorX32output f is in passbandofhigh-level X32 output.
4054.4640 mc
4184.3072 mc


PECTRUMOVERLAP SUMMARY
Multiple-Quadrant Communication Effects
,S
Frequency Translation --Frequency Translation
Multiple Access --Frequency Translation
Noncommunication Mutual Effects
TelemetryTransmitter --
MultipleAccess /
FrequencyTranslation Mutual Effects
]) "0" and "1" tones ofcommand signal are inoperating ranl_eof telemetrysubcarrier oscillator.
2) .#=angle counter registercan operate at frequenciesin operating range oftelemetry subcarrieroscillator.
3) _2 angle counter registercan operate at frequenciesidentical to command tonefrequencies for "0", "1",and "execute".
r
I,
lator
ouble_each
2a) Each X32 input f is inpassbandof all limiteramplifiers.2b) Passbandsof all limiteramplifiers overlap with eachother.
3a) Each multiple accessmaster oscillator f lies inpassbandof all frequencytranslation limiteramplifiers.3b) Each frequency trans-lation X32 input f is inpassbandof all multipleaccess doubler amplifiers3c) Passbandsof all multipleaccess doubler amplifiersoverlap with passbands ofall frequency translationlimiter amplifiers.
3) Both telemetry trans-mitter local oscillatorfrequencies are in passbandsof multiple access doubleramplifier and frequencytranslation limiter amplifiers.
la) Frequency translationX32 output f of quadrantI is in passbandof multipleaccess high-levelX32 output,quadrant I1.]b) Frequency translationX32 output f of quadrant IIis in passband of multipleaccess high.level X32 outputof quadrant I1.Ic) Frequency translationX32 output f of quadrant IIIis in passband of multipleaccess high-level X32 outputof quadrant IV.
la) X2 output f of quadrantI is in passband of thefrequency translation modeoutput of quadrant 11.
lb) X2 output f of quadrantI1 is in passband offrequency translation modeoutput of quadrant 1111.lc) X2 output f of quadrantIII is in passband offrequency translation modeoutput of quadrant IV.
la) X2 output f of quadrant1 is in passband of multipleaccess mode output ofquadrant II.
lb) X2 output f of quadrantII is in passband of multipleaccess mode output ofquadrant 111.lc) X2 output f of quadrantIII is in passband of multipleaccess mode output ofquadrant IV.
3-13

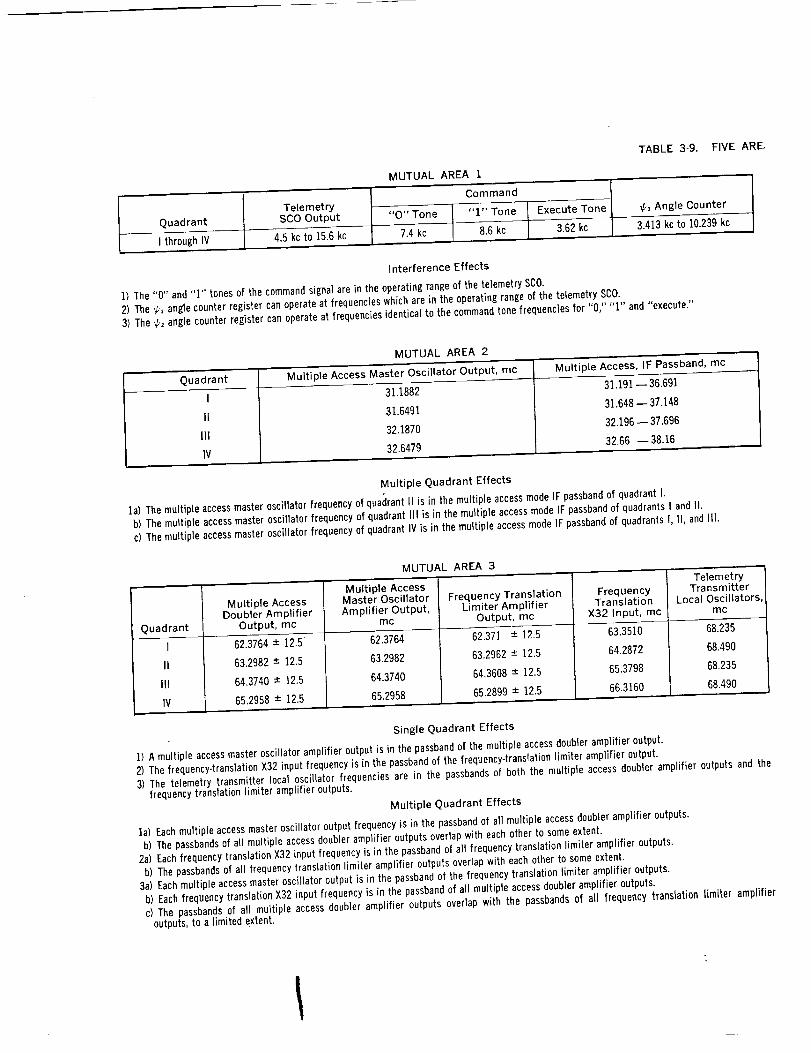
Quadrant
I throughIV
TelemetrySCO Output
4.5 kc to 15.6'kc
MUTUAL AREA 1
Command
'iO" :Tone "1" Tone
7.4 kc 8.6 kc'
TABLE 3-9. FIVE ARE,
@,Angle Counter
3.413kct; 10.239kc
Interference Effects
1) The "0" and "I" tones of the command signal are in the operating range of the telemetry SC0.2) The _ angle counter register can operate at frequencies which are in the operating range of the telemetry SCO.3) The _2 angle counter register can operate at frequencies identical to the command tone frequencies for "0," "1" and "execute."
MUTUAL AREA 2
Quadrant Multiple Access Master Oscillator Output, mc
I " 31.-1882
II 31.6491
II1 32.1870
1V 32.6479
Multiple Access, IF Passband, mc
31.191 -- 36.691
31.648--37.148
32.196--37.696
32.66 --38.16
Multiple Quadrant Effects
la) The multiple access master oscillator frequency of quadrant II is in the multiple access mode IF passband of quadrant I.b) The multiple access master oscillator frequency of quadrant III is in the multiple access mode IF passband of quadrants I and II.c] The multiple access master oscillator frequency of quadrant IV is in the multiple access mode IF passband of quadrants 1, II, and Ill.
Quadrant
I
II
III
1V
Multiple AccessDoubler Amplifier
Output, mc
-62.3764• 12563,2982 ± 12.5
64.3740 ± ]2.5
65,2958 ± ]2.5
MUTUAL AREA 3
Multiple AccessMaster OscillatorAmplifier Output,
mc
6 37 463.2982
64.3740
652958
Freq uency TranslationLimiter Amplifier
Output, me
62371 ]2.563.2962 ± ]2.5
64.3608 ± ]2.5
65.2899 ± 12.5
FrequencyTranslation
X32 Input, mc
• 63",35]0
64.2872
65,3796
66,3160
- TelemetryTra nsmitter
Local Oscillators,mc
68.2"35
6B.490
68.235
68.490
Single Quadrant Effects
1) A multiple access master oscillator amplifier output is in the passband of the multiple access doubler amplifier output.2) The frequency-translation X32 input frequency is in the passbandof the frequency-translation limiter amplifier output.3) The telemetry transmitter local oscillator frequencies are in the passbands of both the multiple access doubler amplifier outputs and the
frequency translation limiter amplifier outputs.
Multiple Quadrant Effects
la) Each multiple access master oscillator output frequency is in the passband of all multiple access doubler amplifier outputs.b) The passbands of all multiple access doubler amplifier outputs overlap with each other to some extent.
2a) Each frequency translation X32 input frequency is in the passband of all frequency translation I]miter amplifier outputs.b) The passbands of all frequency translation limiter amplifier outputs overlap with each other to some extent.
3a) Each multiple access master oscillator output is in the passband of the frequency translation limiter amplifier outputs.b) Each frequency translation X32 input frequency is in the passband of all multiple access doubler amplifier outputs.c) The passbands of all multiple accessdoubler amplifier outputs overlap with the passbands of all frequency translation limiter amplifier
outputs, to a limited extent.

T
=
m

AS OF SPECTRAL OVERLAP
MUTUAL AREA 4
Multiple Access Multiple AccessHigh Level X32 Local Oscillator X32 Frequency Translation
Quadrant Output, mc Output, mc X32 Output, rnc
I
II
Ill
IV
1996.0448 ± 12.5
2025.5424 ± 12.5
2059.9680 ± 12.5
2089.4656 ± 12.5
]996.0448
2025.5424
2059.9680
2089.4656
2027.2320
2057.1904
2092.1536
2122.1133
Single Quadrant Effect
1) The multiple access local oscillator X32 output is in the passbandof the multiple accesshigh level X32 output.
Multiple Quadrant Effects
la) The frequency translation X32 output of quadrant I is in the passbandof the multiple access high level X32 output of quadrant II.b) The frequency translation X32 output of quadrant II is in the passband of the multiple accesshigh level X32 output of quadrant II1.c) The frequency translation X32 output of quadrant I11is in the passbandof the multiple access high level X32 output of quadrant IV.
MUTUAL AREA 5
Quadrant
I
II
Ill
IV
Multiple Access ModeOutput, mc
3992.0896 ± 12.5
4051.0848 ± I2.5
4119.9360 ± I2.5
4178.9312 ± 12.5
Frequency Translation ModeOutput, mc
3992.0950 ± 12.5
4051.0846 ± I2.5
4119.9464 ± 12.5
4178.9367 ± 12.5
Frequency TranslationX2 Output, me
4054.4640
4114.3808
4184.3072
4244.2266
Multiple Quadrant Effects
la) The frequency translation X2 output of quadrant I is in the output signal bandwidth of both modes of quadrant II.b) The frequency translation X2 output of quadrant II is in the output signal bandwidth of both modes of quadrant III.c) The frequency translation X2 output of quadrant III is in the output signal bandwidth of both modesof quadrant IV.
3-15

=

• ',...j
i J3. Communication System Design
i •I...a
L_
[:
#
!w
w
I }
.' =
w
Table 3-10 is a complete list of frequencies
above 1.5 kc existing in the spacecraft. This fre-
quency table is divided into the following equip-
ment group frequency sources for each spacecraft
quadrant: multiple access mode, frequency
translation mode, telemetry transmitter, telem-
TABLE 3-10.
Equipment Group
Multiple accessmode
SignalSample Points*
QUADRANT I
etry encoder, command receiver, _,2 angle
counter, and central timer.
In addition to these tables, an RF spectrum
diagram (Figure 3-6) and explanatory func-
tional block diagrams (Figures 3-7 through
3-12) are presented.
FREQUENCY TABLE
Power _owerLevel, Level,
mw dbmFrequency,
mc
6019.325 MC
2.9 X 10-' --93.4I0-' --5O
100
II
1.6 X 10_7
240
353.9
-- INPUT FREQUENCY6019.325
31.I91 to36.69162.3764
1996.04483992.0896
31.188262.3764
I) f_
2) f_-- input to phase
2,9 X 10-_
30
7.5
9
1.6 X 10_400
10'N __
2350
7O3.9
1996.04485988.1344
modulator
3) Doubleramplifieroutput
41 High level X32 output5) foo,(antenna)
6) Master oscillator output7) Master oscillator
amplifier output8) Low level X32 output9) X3 output
Frequencytranslation 1) f,omode 2) Limiter amplifier output
SignalBeacon**
3) X2 output4) foo,(antenna)
Beacon output(antenna)'*
5) Master oscillatorfrequency
6) X32 input7) X32 output8) X3 output
Telemetry transmitter 1) Power amplifier2) Antenna output
Telemetryencoder Subcarrier oscillator
Commandreceiver 1) Localoscillator2) Command-- IF
3) Input signal4) Tones
ZeroOnesExecute
_, angle counter Output of angle encoderregister
Central timer Tuning fork oscillator
6019.325
62.371
47.51334054.4643992.0954006.953
I5.83776
63.35102027.2326081.696
68.235 2.5× 10_136.470 10'
0.0045 io 0.0450.0156 and0.00362
3
3
10-,o
_10
_10
_10
2O
10.4232
8.523.85
I5.55.94
--93.4
14.85
8.759.56
32
26
27
25.4518.5
5.9
343O
--13.5
4.94.9
-100
10IOlO
--13
--6
118.3129.95
148.26
0.00740.00860.00362
0.003413to _0.050.010239
0.001553 tA
*Forthe multiple accessantifrequencymodes the samplepointdesignationsare referencedfromFigure3-7.**Beaconoutputpowerlevels were computedn the absenceof a communicationssignal.
Bandwidth,mc
5.35.3
ll.O
16.0
25
25
25
25
FunctionalBlock
DiagramFigu re
3-6,3-7b
3-6, 3-7b3-6, 3-73-6, 3-7b3.6, 3-7b
3-6, 3-7b3-6, 3-7b
3.6, 3-7
3-6, 3-7a3-6, 3-7a3-6, 3-7a3-6, 3-73-6, 3-7a
3-6, 3-7a
3-6, 3-7a3-6, 3-7a3-6, 3-7a
_O.lO0 3-9_0.100 3-9
3-8
0.075
0.075
3-103-103-10
3-103-103-10
3-11
3-12
3-17

Hughes Aircraft Company
TABLE 3-10. (Continued)
Equipment Group
Multiple accessmode
Frequency translationmode
Telemetry transmitter
Telemetry encoder
Commandreceiver
_, angle counter
Central timer
Power PowerSignal Frequency, Level, Level,
Sample Points mc mw dbm
QUADRANT II- INPUT FREQUENCY 6108.275 MC
I) f,o
2) f_f-- input to phasemodulator
3) Doubleramplifier output
4) High level X32 output
5) fo_,(antenna)
6) Master oscillatoroutput
7) Master oscillatoramplifier output
8) Low level X32 output
9) X3 output
1) f,o
2) Limiter amplifier output
Signal
Beacon**
3) X2 output
4) fo=,(antenna)
Beaconoutput(antenna)**
5) Master oscillatorfrequency
6} X32 input
7) X32 output
8) X3 output
1) Power amplifier
2) Antenna output
Subcarrier oscillator
1) Local oscillator
2) Command-- IF
3) Input signal
4) Tones
Zero
Ones
Execute
Output of angle encoderregister
Tuningfork oscillator
6108.275
31.648 to37.48
63.2982
2025.5424
4051.0848
31.6491
63.2982
2025.5424
6076.6272
6108.275
62.2962
48.2154
4114.3808
4051.0846
4066.1654
16.07181
64.2872
2057.I904
6171.5712
68.235
136.470
0.0045to0.0]56 and0.00362
118.31
29.95
148.26
0.0074
0.0086
0.00362
0.003413to0.010239
0.001553
Bandwidth,mc
2.9 × 10-' --93.4
10-' --50
100 20
11 10.4
1.6 × I0' 32
7 8.5
240 23.9
35 15.5
3.9 5.9- ._
2.9 × I0 -_ --93.4
30 14.9
7.5 8.75
9 9.6
1.6 × 10³ 32
400 26
10' 272
350 25.5
70 18.5
3.9 5.9
2.5 X 10³ 34
10' 30
0.045 --13.5
3 4.9
3 4.9
10-'° --100
_10 10
_10 I0
_I0 10
_0.05 --13
¼ --6
5.3
5.3
11.0
16.0
25
25
25
25
_0.I00
_0.100
0.075
0.075
FunctionalBlock
DiagramFigure
3-6, 3-7b
3-6, 3-7b
3-6, 3-7
3-6, 3-7b
3-6, 3-7b
3-6, 3-7b
3-6, 3-7b
3-6, 3-7
3-6, 3-7a
3-6, 3-7a
3-6, 3-7a
3-6, 3-7
3-6, 3-7a
3-6, 3-7a
3-6, 3-7a
3-6, 3-7a
3-6, 3-7a
3-9
3-9
3-8
3-10
3-10
3-I0
3-10
3-10
3-I0
3-11
3-12
*For the multiple access and frequency modes, the sample point designations are referenced from Figure 3-7.
**Beacon output power levels were computed in the absence of a communications signal.
m
L_a=
M
i
:=..
__=,
l
I
_1_ ._
3-18 i

r _
3. Communication System Design
TABLE 3-10. (Continued)
Equipment GroupSignal
Sample Points
Power PowerFrequency, Level, Level,
mc mw dbm
QUADRANT Ill--INPUT FREQUENCY 6212.O5 MC
Bandwidth,mc
FunctionalBlock
DiagramFigure
Multiple access mode 1) f_o
2) f,-- input to phasemodulator
3) Doubler amplifieroutput
4) High level X32 output
5) fo_t(antenna)
6) Master oscillator output
7) Master oscillatoramplifier output
8) Low level X32 output
9) X3 output
Frequency translation I)mode 2) Limiter amplifier output
Signal
Beacon*
3) X2 output
4) fo,_ (antenna)
Beacon output(antenna)*
5) Master oscillatorfrequency
6) X32 input
7) X32 output
8) X3 output
6212,05
32.i96 to37.696
64.3740
2059.9680
4119.936
32.1870
64.3740
2059.9610
6179.9040
6212.05
64.3608
49.0349
4184.3072
4119.9464
4135.2723
16.34496
65.3798
2092.1536
6276.4608
2.9 × 10-_ --93.4 5.3 3-6, 3-7
10-' --50 5.3 3-6, 3-7b
100 20 11.0 3-6,3-7b
11 10.4 ]6.0 3-6, 3-7b
1.6 X 10_ 32 25 3-6,3-7
7 8,5 3-6,3-7b
240 23.93-6, 3-7b
35 15.5 3-6, 3-7b
3.9 5,9 3-6,3-7b
2.9 × 10-_ --93.4 25 3-6,3-7
30 14.9 25 3-6, 3-7a
7.5 8,75 3-6,3-7a
9 9,6 3-6,3-7a
1.6 × 10' 32 25 3-6, 3-7
400 26 3-6, 3-7a
l0 _2
350
70
3.9
Telemetry transmitter 1) Power amplifier 68.490 2.5 × 10_
2) Antenna output 136.980 I0'
Telemetry encoder Subcarrier oscillator 0.0045 to 0.0450.0156 and0.00362
Command receiver
¢, angle counter
Central timer
118.31
29.95
148.26
0.0074
0.0086
0.00362
0.003413to0.010239
0.001553
1) Local oscillator
2) Command--IF
3) Input signal
4) Tones
Zero
Ones
Execute
Output of angle encoderregister
Tuning fork oscillator
"Beacon output power levels were computed in the absence of a communications slgnal.
27 3-6, 3-7a
25.5 3-6, 3-7a
18.5 3-6, 3-7a
5.9 3-6, 3-7a
34 _0.100 3-9
30 _0.100 3-9
--13.5 3-8
3 4.9 3-10
3 4.9 0.075 3-10
10-'° --100 0.075 3-10
,--I0
_I0
_i0
_0.05
¼
I0
10
10
--13
--6
3-10
3-10
3-10
3-11
3-12
3-19

I
Hughes Aircra/t Company
TABLE 3-10. (Continued)
Equipment Group
Multiple accessmode
Frequencytranslationmode
Telemetry transmitter
Telemetryencoder
Commandreceiver
SignalSample Points
Frequency,mc
QUADRANT IV--INPUT
1) f;,
2) f,-- input to phasemodulator
3) Doubleramplifier output
4) High level X32 output
5) f_, (antenna}
6) Master oscillator output
7) Master oscillatoramplifier output
8) Low level X32 output
9) X3 output
6301.05
32.66 to38.16
65.2958
2089.4656
4178.9312
32.6479
65.2958
1) f_o
2) Limiter amplifieroutput
Signal
Beacon*
3) X2 output
4) fo=,(antenna)
Beaconoutput(antenna)*
5) Master oscillatorfrequency
6) X32 input7) X32 output8) X3 output
2089.4656
6268.3968
6301.05
65.2899
49.7370
4244.2266
4178.9367
4194.4896
16.57901
66.31602122.11336366.3399
68.490
136.980
0.0045 to0.0156 and0.00362
118.31
29.95
148.26
0.0074
0.0086
0.00362
1) Power amplifier
2) Antenna output
Power PowerLevel, Level,
mw dbm
FREQUENCY 6301.05 MC
--93.4
--50
I00 20
11 10.4
1.6 × 10_ 32
7 8.5
240 23.9
35 15.5
3.9 5.9
2.9 × 10-' --93.4
Bandwidth,mc
5.3
5.3
11.0
I6.0
25
25
30 14.9 25
7.5 14.9
9 9.6
1.6 × 10' 32 25
400 26
Subcarrier oscillator
¢2 angle counter 0.003413 to0.010239
Central timer 0.001553
"Beacon output power levels were computed in the absence of a communications signal.
10' 272
350 25.570 18.5
3.9 5.9
1) Local oscillator
2} Command-- IF
3) Input signal
4) Tones
Zero
Ones
Execute
Output of angle encoderregister
Tuning fork oscillator
2.5 × 10' 34 _0.100
10' 30 _0.100
0.045 --13.45
3 4.9
3 4.9
10.'° --100
_10 10
_10 10
_10 10
_0.05 --13
¼ --6
0.075
0.075
FunctionalBlock
DiagramFigure
3-6, 3-7
3-6, 3-7b
3-6, 3-7b
3-6, 3-7b
3-6, 3-7
3-6, 3-7b
3-6,3-7b
3-6, 3-7b
3-6, 3-7b
3-6, 3-7
3-6, 3qa
3-6, 3-7a
3-6, 3-7a
3-6, 3-7
3-6, 3-7a
3-6,3-7a
3-6,3-7a3-6, 3-7a3-6, 3-7a
3-9
3-9
3-8
3-10
3-10
3-10
3-10
3-10
3-10
3-11
3-12
3-20
J
[]
U
|
E
i
I

i ,
L.,
l,,.=i
i
50I4O
E
i_J
_o 20O.
J0
o
CENTRAL TIMER -6 dbm
r14,85 dbm QUAO
_/.::.:-... :.v. FT LOUTP
--50 dbm
" CMO "EXlFCUTE" TONECMD TONE _ "ZEROS"/r
_2 ANGLE COUNTER QUAD T--]3[-- MA BANOPASS --
AT INPUT TO
T/M ENCODER SCO PHASE MODULATOR
5 I0 IS
K_LOCYCLES
- IIII QUAOSI-=z_- MA MASTER
IIII osc,BE.QUADSz-_zl IIII
tN QUADS CMD IF FREQ I IIII
I -'r_" (BW 17 kcl Illlli iiii
2O
"_ MA DOUBLER
AMP OUTPUTSAND BANDWIDTH(20 dbm}
T/M TRANSMITTER ] / - I1_.../ "QUADST/M TRANS_
QUADS 1"-._FT • 32
INPUTS
QUADS Z-Z_ I _ Jl_ l I
FT LIMiTER AMP I I li I I
B_CON_ IQUADST-_Z"1 . JL J I.AMASTEB I I Iffl IoscAMP_jm,l_ji I I
40 60 80
FREQUENCY, MEGAC
E2o
llJ
30 --'
>
_1
0 IO
0
1980
IQUAD rMA H_GH L_VELXS2
OUTPUT ANDBANOWiOTH
QUAD Z MALOW LEVEL • 52
OUTPUT
2000
QUAD _ MA
LOW LEVE_S_OUTPUT
2020
OUAO Tr
MA HIGH LEVEL x32
OUTPUT ANDBANOWIDTH
QUADFT x32
OUTPUT
QUADFTx32OUTPUT
2040
QU
MA
OUBA
qu
LO_OU
2060
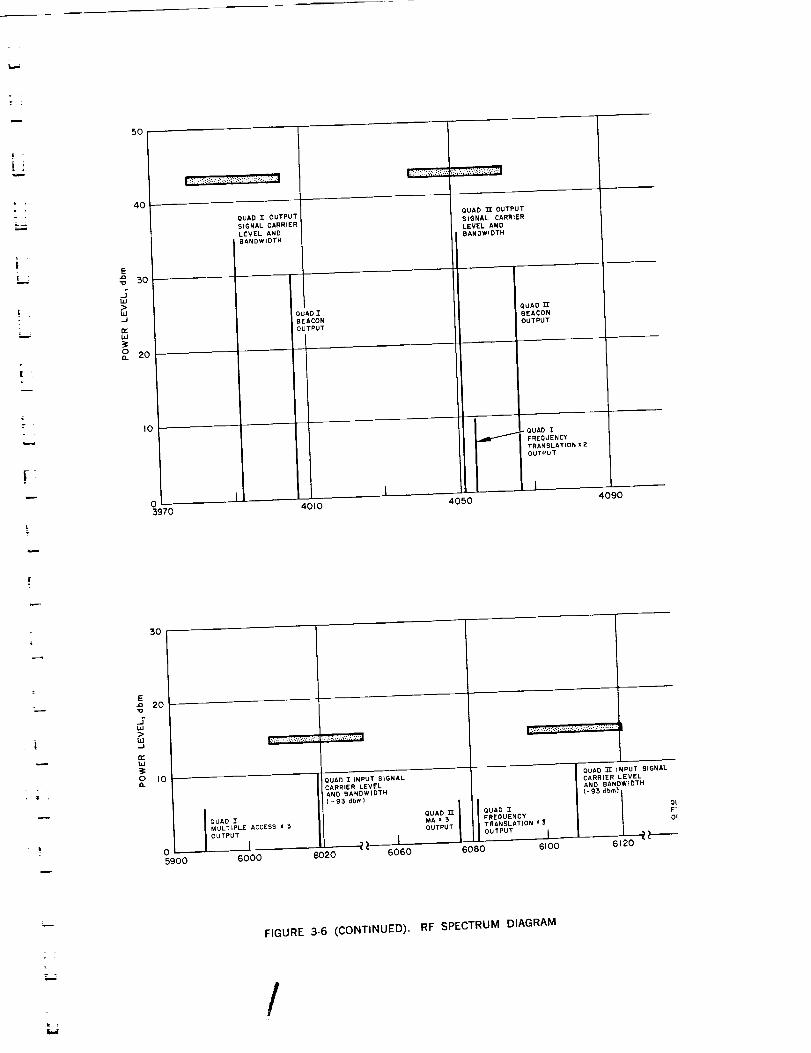
FREQUENCY, MEGAC'
FIGURE 3-6, RF SPECTRUM DIAGRAM

I
m
m
M
m
m
[]
[]
M
m
m E_M
U
U
k

S I -'_r
rNE'A R AMPLIFIERS
UTS
lITTER
LATOR
YCL ES
120
ouAos Z ANO = iT/M TRANSMITTER
OUTPUTS(sw I00 kc)
I QUADS i-'r="
LOCAL OSCILLATOR
CMID •RECEIVER
140
OUADSm AND TM
T/M TRANSMITTER
OUTPUTS(_WIOOk¢}
I OUADS Z _"m"
CMD RECEIVER
INPUT SIGNAL
-I00 dbm,
180 180
AOTrrHiGH LEVEL_32
TPUT AND
NDWIDTH
AD TM MA
LEVELx32TPUT
OUAD "t_ MA
LOW LEVEL x S;_OUTPUT
.., ........ ...... ....
QUADTg-MA HIGH LEVEL x
OUTPUT AND
BANDWIDTH
QUAD 11T
FTIS2OUTPUT
QUAO',Jm,-
FT X32OUTPUT
fCLES------Im-
2080 2100 2120 2140
3-21

_2
=
=
_7, 7r
L..,
5O
L-_
f.
f-w
L?
f
40
E
3O
_J
W
_ 2o
I0
3970
QUAD I OUTPUT
SIGNAL CARRtER
LEVEL ANO I
J BEACONPUT
OUAD _ OUTPUT
SIGNAL CARRIER
LEVEL ANDBANDWIDTH
QUAD TT
BEACONOUTPUT
GUAO I
FREQUENC_
TRANSLATION _2
4010 4050 4090
-_...
}
3O
E
= 20,o
bJ
b_
I,I
3
O IOn
o I5900
QUAD IMULTIPLE ACCESS x 3
OUTPUT
I6000
QUAD I iNPUT SIGNALCARRIER LEVELAND BANOWIDTH
( - 93 dbm)
6020 6060
IQUAD _ J QUAO I
MAx 3 I FREQUENCY
OUTPUT TRANSLAT(ON KS
OUTPUT I
6080 6100
OUAD TF INPUT SIGNALCARRIER LEVELAND BANDW_OTH(-93dbm)
QF
0
6120
m
L;
FIGURE 3-6 (CONTINUED). RF SPECTRUM DIAGRAM
/

ill
II
mm
F1
l
i
--_Ti i.m
II
_J
m
z_
li
IB
q.
m _
w L
it 2
z

_3
QUAD "n"
FT _2
OUTPUT
I
OUAD'I1"rOUTPUT
SIGNAL CARRIER
LEVEL ANO
BANDWIDTH
OUAO"_7OUTPUT
SIGNAL CARRIER
LEVEL AND
BANDWIDTH
QUADTn"
BEACON
OUTPUT
4130
FREQUENCY_ MEGACYCLES
4170
I
QUAD Trr
FTx2
OUTPUT
QUAD TM
BEACON
OUTPUT
QUAO'rv I
FT ¢2
OUTPUT
4210" 4250 4290
rK3 MA_
JTPU OUTPUT
6170 6190
FREQUENCY, MEGACYCLES
I62t0
OUAD _ INPUT SIGNAL
CARRIER LEVELAND BANDWIIDTH
6220
QUAt) "tRr iNPUT SIGNAL
CARRIER LEVELAND BANDWIDTH(-93 dbm)
QUAD "T_r
FTx3OUTPUT
6300 6320 6360
16570
I6390 6410
3-23

i!
!
ii
!
REE
|i
E
mm
_zrm_
E_
_L

!! L.J
-,...;
i ,
_J
Ii i_iw
| iJ
= += +[_-_
rid
E
=
,....
3. Communication System Design
I MULTIPLIER ]x3 --'_
FREQUENCY _ INPUTTRANSLATIONfIN(_ M1XER
MASTER O_
OSCILLATOR
FREQUENCIES
®
FT f IF
I HYBRID t
32 OUTPUT (_
L MULTIPLIER lx32
• 32 INPUT _)
MASTER ]OSCILLATOR
FT R
LIMITER-AMPLIFIE
INPUT
_I LMTER1 JL-t AMOL+,ERl [
FT
LIMITEN -
AMPLIFIER OUTPUT (_
JL MULTIPLIERx2
O FT= 2 OUTPUT
®
_,_ll_ FREQUENCY
OUTPUT TRANSLATION
MIXER rout E)
a) Frequency Translation Mode
.A 'IF ® 0
MULTIPLE
ACCESS fiN (_)
L DOUBLERAMPLIFIER
MA DOUBLER- MA HIGH--LEVEL
AMPLIFIER OUTPUT (_ x 32 OUTPUT (_)
I PHASE t-:MODULATOR
IF
MASTER
OSCILLATOR I i- IMA MASTER
OSCILLATOR OUTPUT (:E)
,,--I i ,, i_ MIXER _ x3 I_
MA x3 OUTPUT (_ MA LOW-LEVEL
x32 OUTPUT (_
MULTIPLIER
x2
MASTER
OSCILLATOR
AMPLIFIER
I MULTIPLIER
I x32
MA rOUT (_
MA MASTER
OSCILLATOR
AMPLIFIER
OUTPUT(_
b) Multiple Access Mode
FIGURE 3-7. SIMPLIFIED TRANSPONDER BLOCK DIAGRAM
3-25

Hughes Aircra/t Company
DATA iNPUTS COMMUTATOR
194 cp$ CLOCK FROM
CENTRAL TIMER
SUBCARRIER IOSCILLATOR0.045 mw
DC--DC
CONVERTER
COMMANO EXECUTE TONE
3,62 K Cpi
0.045 m* 1
J OUTPUTL---[ AMPUF,_!
{ _= SOLAR }.,_.__FROM SOLAR SENSOR
SENSORS AMPLIFIER
FIGURE 3-8. TELEMETRY ENCODER BLOCK DIAGRAM
b.....,,_To TELEMETRYTRANSMITTER
z
I
i
--==.T.
H
Ill
N
il
i
Ill
ill
j '
m
M °
i==
BIB =
W
3-26m

L.,;
|
• ]
;r_t'..'/
! Ei
k,_
_JI¢_
k_
IL_
=
I LOCALOSCILLATOR
68.2'55 mc
_lW 68.490 mc
PHASE
MODULATOR
1FROM TELEMETRY
ENCODER
148,260 mC ._
FROM TELEMETRY AND
COMMAND ANTENNA
OSCILLATOR
liB.310 mc
RFAMPLIFIER
3. Communication System Design
I FREQUENCY
POWERAMPLIFIER DOUBLER
t56.470 mc
156.980 mc _ TO TELEMETRY ANDCOMMAND ANTENNA
FIGURE 3-9. TELEMETRY TRANSMITTER BLOCK DIAGRAM
5mw
H MIXER H CRYSTAL H
FILTER
29.95 mc
AGCAMPLIFIER
IF
29,95 mc
AGC
DETECTOR
DETECTORTO COMMAND
DECODER0.6 k¢ -'ONES n
7,4 kc -"ZEROS"
3,62 k¢-*'EXECUTE"
(tO row)
FIGURE 3-10. COMMAND RECEIVER BLOCK DIAGRAM
3-27

Hughes Aircra/t Company
COMMAND
TIME OF DAY INHIBIT
_;._.,Lf _ T,.ERSELECTION
LOGIC
/
I NLIE/I,III lira _ FLIP-FLOP
FROM CENTRAL TIMER _ - /
L
f$ • SPACECRAFT SPiN RATE
FIGURE 3-11.
ANTENNA
REFERENCE POSIT)ON
FROM COMMAND DECODER
29f s
COUNT
vco
(3,413 kc TO IO.Z3S_
TO TELEMETRY ENCODER
I DIGITAL READOUT ENCODERS J
L--ll¢= ANGLE ENCODER REGISTER Iv I 12 FLIP-FLOPS
_1 PARALLEL TRANSFER GATE [
l ........ 1- II VARIABLE PHASE II OUTPUT COUNTER
BEAM POSITIONING CIRCUITS
¢,, ANGLE COUNTER BLOCK DIAGRAM
I TUNING FORK I I
OSCILLATOR
1553cps J I
CORE INPUT
AMPLIFIER
T:3f5 role _'O, lliC OUTPUT _,F'_,,EQ _F,R.ES_ .
TO APOGEE MOTOR _ LATCH _ _ uiv.lur.r(_ u,v,u._r(
D_iiVE R INPUT GATE I_ _
I I IS_ARAT,ON_ ,[ I
SWITCHES
FIGURE 3-I2, CENTRAL TIMER BLOCK DIAGRAM
TO PACE
2 gl min/pulse
TIME OF DAYCORREcTIoN
3-28
212f s
iJ
m
i
W-
i
Ill
=W
=Ill
L._-
: =
i -
w
i L
Ill
=

!; t
|_
r •L •
FA
4. LAUNCH AND ORBIT CONSIDERATIONS
L_
r
The following section summarizes the system-
oriented studies associated with the launch and
in-orbit procedures and events of the Advanced
Syncom mission. These studies were undertaken
to facilitate the specification of procedural, per-
formance, and spacecraft parameter require-
ments as early as possible.
GENERAL SEQUENCE OF EVENTS*
The Syncom spacecraft will be launched from
the Atlantic Missile Range (AMR) (28.5 degrees
latitude) at 93 degrees azimuth (_ east), using
an Atlas-Agena D with the Atlas and first Agena
burn to plac e the spacecraft in an 85 to 100 n.mi.
nominally circular orbit. A second Agena burn
at the first ascending node (second equatorial
crossing) will place the spin-stabilized spacecraft
into an elliptical transfer orbit with an apogee
radius equal to the synchronous orbit radius of
22,752.3 n. mi. An apogee boost is provided by a
JPL solid propellant motor fixed in the space-craft. The JPL motor is sized to the maximum
payload injection capability of the Agena for this
mission and the payload will be ballasted to this
requirement. After cutoff of the second Agena
burn, the Agena guidance package will program
a yaw angle of about 54 degrees to the right
of the flight path in the horizontal plane to pre-
align the third-stage apogee motor thrust axis
(Syncom spin axis) prior to spin-up and separa-
tion of the spacecraft from the expended Agena
stage. The spacecraft will then be spun at ]00
*A detailed description of the planned launch andin-orbit procedures and parameters is given in Section5 of "Syncom II Summary Report," March 1963.
rpm on the spin table mounted on the Agena,
and separated.
:ks it traverses the transfer orbit, the space-
craft will maintain the spin axis attitude estab-
lished by the Agena guidance system prior to
separation. This is the correct attitude for apogee
motor thrust to simultaneously accelerate the
spacecraft to circular synchronous velocity and
remove the 29,l-degree inclination when the
spacecraft reaches apogee at the stationary orbi-
tal radius. The final longitude attained at apogee
motor burnout will be about 93" W (over the
Pacific, west of Ecuador). If the apogee motor is
ignited at the second apogee crossing, the final
longitude will be about 112" E (West Borneo).
Other longitudes are also possible, depending on
the number of transfer orbit periods allowed
before apogee motor ignition or the node at which
tile Agena begins a second burn to leave the park-
ing orbit. Figure 4-1 illustrates the geometry ofthe launch for the case in which the transfer
ellipse is entered at the second node of the park-
ing orbit, and apogee boost is at the first apogee
of the transfer orbit. Figure 4-2 is a ground trace
of a similar ascent sequence studied by Lockheed
and launched from AMR at 93 degrees azimuth,
giving an initial inclination of 29.1 degrees and a
longitude at apogee boost of 93 ° W.
The satellite spin axis attitude and velocity are
controlled by a pulsed-jet control system based
on the same principles as the control system of
the present Delta-launched Syncom satellite.
Means for controlling the spacecraft spin speed
throughout the lifetime of the vehicle will be in-
corporated in the form of a spring-restrained
centrifugally actuated axial jet.
4-1

Hughes Aircra[t Company
t. ENTER PARKING ORBIT
INCLINATION : 29.1 °
ALTITUDE : 85-100N.Mt.
3, AGENA SECOND BURN _V_814Ofps
FLIGHT PATH ANGLE = 0 °
4, 53.8 ° AGENA RIGHT YAW
5. SPIN AND SEPARATE SYNCOM SPACECRAFT
i:#
I
I
6. TRANSFER ORBIT 5,25 hrs
"K APOGEE BOOST 6075 fps
AZIMUTH 65.3 °
LONGITUDE 93 ° W
2, AGENA SLAVE TO LOCAL
HORIZONTAL GYRO COMPASS
IN AZIMUTH
8. REORIENT SYNCOM 65.3 ° LEFT YAW
9. CORRECT TO PRECISE ORBIT
I0. MAINTAIN ORBIT FOR 3 YEARS MINIMUM
MI
_I
I
ira1
I "
FIGURE 4-1. ADVANCED
After apogee motor burning, the spacecraft
will be precessed through approximately 65
degrees in yaw until the spin axis is parallel to
the earth's spin axis. This attitude permits the
transmitting antenna beam to point at the earth
at all times, gives efficient solar power supply
illumination, and provides control of period and
elimination of orbital eccentricity by the velocity
control jet system. The orientation control jet
system, operated continuously rather than in a
pulsed mode, permits elimination of inclinationin this attitude.
FIXED VERSUS VARIABLE APOGEE IGNITIONTIMER
This discussion will assist in ascertaining the
errors in the synchronous orbit resulting from
planned changes of parking orbit altitude without
a corresponding correction in the time from
Agena D separation to apogee motor firing. The
4-2
SYNCOM LAUNCH SEQUENCE
noncorrectable timing device employed for
apogee motor firing is referred to as a fixed timer.
Tile use of such a fixed timer in conjunction
with any planned parking orbit altitude change
will necessarily result in apogee motor firing at
a time other than apogee; i.e., a timer error
exists. The purpose here, therefore, is to decide
if the magnitude of the resulting errors is signif-icant to the extent that a variable timer is re-
quired.
To obtain the magnitude of the resulting
errors, a Syncom 2 Keplerian apogee firing com-
puter program (FUSIT)* was used with Ad-
vanced Syncom apogee firing geometry (Figure
4-3) and run for a timer error of T = --"0, 1,
2,.... ]0 minutes. Other parameters used for
*"Syncom I 7090 Computer System Description-FUSIT," Hughes Aircraft Company, 5 September1962.
I L
11 '
I
-- =
J
J

4. Launch and Orbit Considerations
t
| ii=
= :
L_
E ;
t....
T =
6O
o_hJhJ
40uJ/%
uJ
_ 2o
I--<.J o
2O
4O
WOOMERA
h=94
,=,*J
AGENA SECOND BURN
4127 SEC h=94
SEC _ GOLDSTONE
h:1540\6825 SEC
4575 h=5414
h=488
I-5
s SINJECTION
• h=19,325
12,225 SEC
j_ h:13,800PROPOSED TRACKING SHIP
LOCATION 166.5 ° E LONG 0 °LAT
AGENA FIRST
BURN
NOMINAL IDEAL
LONGITUDE
h:88
h=88
PRETORIA
I I60 120 IBO
• STATIONS O_ TRACKINGALTITUDE, h, n, ml TELEMETRY
FIGURE 4-2.
I120
LONGITUDE, DEGREES
I I60 0 60
LOCKHEED MISSILES AND SPACE CO.
GROUND TRACE ASCENT SEQUENCE
the calculations are shown in Table 4-1. Residual
errors are present at T--0 due to inaccuracies
in nominal parameters.
The results of immediate interest are shown in
Table 4-2. An examination of the plot of l vdl
(velocity correction necessary to remove drift)
NORTH /
Vs '_ /_ _ _ ..Z _ EQUATOR
"_,w_: 29.'° _,_
w LO ALNO.,ZO.TA"X _ /N PLANE OF PAPER
o
FIGURE 4-3. APOGEE MOTOR BOOST GEOMETRY
TABLE 4-1. ORBITAL PARAMETERS
T at apogee = 0Transfer ellipse
Apogeeradius 22,752.3 n.mi.Apogeelongitude 93° W (descendingnode)Apogeevelocity, V, 5250 fps [0.863 n.mi.]sec)
Perigee radius _ 3529.7 n.mi. (88 n.mi. altitude)Perigee velocity _ 33,760 fpsSemimajor axis 13.141 n.mi.
Nominal period, _- 37,800 secondsInclination 29.1 degrees
Longitude of ascendingnode _ 166.5° E
Period _ 37,800 seconds(_10.51 hours)
Apogeeboost, _V,(descending node)_V, 6075 fpsBurning time _ 45 secondsV,, synchronousvelocity =- 10,087.5fpsElevation _ 0 degreesAzimuth 65.3 degreesfrom north (clockwise)
T
Timer setting _- ± N minute, N = O,1, 2...... 10
4,-3

,,._jg
Hughes Aircra/t Company
TABLE 4-2, EFFECTS OF TIMER SEI-FING ONPERIGEE CHANGE
i
aT Change in one-halfperiod (timer error)
T = 315 minutes 0ne-half nominal period
&rp Changein parkingorbit altitude
a = 13,141 n,ml. Nominal semimajoraxis
Ar, Changein synchronousradius
Aa ChangeIn semimajor axis
AT 3 _aT -2 a
Aa = Arp + _r,
Ar, =- 0
• _rp = _a
AT/T = (3/2) (Arp/a)
,_rp = (ATIT) (-_-23)(a)
"rp = (--_-) ( 3--_-5) (13,141) AT
,_rp = 27.8 n.ml./mln
versus T (time from apogee) (Figure 4-4) shows
that IVdl _ kT 2 where k _ 0.02 fps/min 2.
The 30- ascent guidance errors, including an
inherent 2-minute timer error, require a drift
velocity correction, IVal, of 120 fps.* The data
in Table 4-2 shows that, for a ± 10-minute timer
error, an additional [Vd[ of 1.79 fps is required.
This is an increase of approximately 1.49 per-
cent. Therefore, the additional timer error causes
an insignificant increase in the required drift ve-
locity correction.
An examination of the plot of the velocity
correction (Figure 4-5) necessary to remove in-
clination, V,, shows the AVe/AT _ 11.1 fps/min.
*"Syncom II Summary Report," Hughes SSD 3128R,NASA Contract 5-2797, 31 March 1963.
4-4
t-"
15e_
?,¢ _ I0
I_tL0 -
w> 05
l-
z
Sw OI
-8 -4
TIME FROM APOGEE, MINUTES
FIGURE 4-4. VELOCITY MAGNITUDE REQUIRED TOREMOVE DRIFT, lVdl, VERSUS TIME FROM APOGEE, T
A -+10-minute timer error requires an ad-
ditional [VII of 111 fps. This correction is of
significant value.
The significance of the additional velocity
correction required must be assessed with respect
to the change in planned parking orbit altitude
necessary to cause such a timer error. The cor-
relation of planned parking orbit altitude change
and resulting timer error is shown in Table 4-2.
Table 4-3 shows a 10-minute timer error will
result from a planned change in parking orbit
altitude of 278.0 n.mi. This is clearly an unreal-
istic change of plan. A more realistic change inaltitude would be at most 30 n.mi. For ease of
calculation, assume the change to be 27.8 n.mi.
This corresponds to a 1-minute timer error. The
resulting [V_[ is 0.046 fps and ]Vii is 11.7 fps.
tVo[ is clearly insignificant. [v,Iis a lo.a per-
cent increase in the IVl] of the 30" ascent guid-
ance errors, which is not significant.
This study indicates that errors resulting from
changes in planned parking orbit altitude with
g
g
i
W
g
W
U :
L
_ =
J
W

r....
k
|
t
| ,
t
J
[
_0o
5
z_ 50
oo--
'iow
_8
,f
I
/ -I0
I.O 2.5 50 75 IO.0
TIME FROM APOGEE, MINUTES
FIGURE 4-5. VELOCITY MAGNITUDE REQUIRED TO
REMOVE INCLINATION, IVii,VERSUS TIME ERROR
a fixed timer are not significant to the extent that
a variable timer is required. If it should be de-
sirable to reduce the slight change of [Vii result-
ing from the use of a fixed timer, a change can
be made in the Agena D yaw programmer, a
readily variable unit.
TRANSLATION DUE TO INITIAL ORIENTATIONIMPULSE
During an orientation maneuver, the axial jet
produces simultaneously both a torque and a
translatory impulse. Since any translation of the
spacecraft represents a potential need for sta-
tionkeeping control action, it is desirable to esti-
mate the magnitude of the translation impulse•
The greatest number of axial pulses fired in
one sequence is expected during initial orienta-
tion ('--'1250 pulses, calculated by means of the
orientation dynamics IBM computer model*).
*"Advanced Syncom Monthly Progress Report,"Hughes Aircraft Company, May 1963.
4. Launch and Orbit Considerations
TABLE 4-3. TIMER ERROR EFFECTS
Tfrom
Apogee,minutes
10
9
8
7
6
5
4
3
2
I
0
-1
-2
--3
-4
-5
-6
-7
--8
-9
-10
I ,',r, [, n.mi. I Vj I, fps
278.0 111
250.2 100
222.4 89.0
194.6 77.9
166.8 66.8
139.0 55.7
111.2 44.7
83.4 33.6
55.6 22.5
27.8 11.7
0 4.0
27.8 11.7
55.6 22.5
83.4 33.6
111.2 44.7
139,0 55.7
166.8 66.8
194.6 77.9
222.4 89.0
250,2 100
278.0 111
I V_ t, fps
1.79
1.46
1.16
0,842
0.66
0.465
0.306
0.186
0.093
0.046
0.0279
0.046
0.093
0.186
0.306
0.465
0.66
0.842
1.16
1.46
1.79
Eccentricity
0.023
0.021
0.019
0.016
0.014
0,011
0.0095
0,0071
0.0047
0.0023
0.00001
0.0023
0,0047
0.0071
0.0095
0.011
0.014
0.016
0.019
0.021
0,023
Thus, the calculation below assumes this num-
ber of impulses.
Starting with the basic assumptions that the
spin axis traces a great circle instead of a rhumb
line, and the large number of discrete jet pulses
closely approaches a continuum, the North-
component of the translation impulse (Fig-
ure 4-6) is
,r/S "Vo sin 0d00o
4-5

k_ j _ zV
I
Hughes Aircraft Company
N
| •
FIGURE 4-6. TRANSLATION IMPULSE DUE TO
INITIAl. ORIENTATION IMPULSE
where/_o (the inclination of the spin axis prior
to orientation) = 24.4* degrees and AVo =
18/1.145 = 15.72 fps/rad is 15.72 X 0.911 =
14.3 fps. (AV--18 fps is the equivalent AV
required of the control system for the orienta-
tion maneuver, and 90 degrees- 24.4 degrees
= 65.6 degrees = 1.145 radians is the preces-
sion angle.) It should be noted that this impulse
is always in a northerly direction.
14.3 fps is _12 percent of the estimated AV
(112 fps, 3o') required to correct for ascent
guidance inclination errors, and hence will be
taken into account in estimating total ,SV re-
quirements for the mission. Similarly,
,_V_a,t = _Vo cos 0 d 0 = ,aVo(1 -- sin 24.4
so degrees)
= (15.72) (O.587)
-- 9.23 fps
* (24.7 degrees -- 0.3 degree) -- initial geometricattitude minus inefficiency due to rhumb line pre-cessional motion.
ORBITAL PERTURBATIONS DUE TO SUN AND
MOON
This discussion describes a proposed method
of computing perturbations of a satellite orbit,
especially those due to the sun and moon. Ii: is
intended to implement this method for the IBM
7094 computer in the near future.
Nature of Method. The usual methods of
computing perturbations fall into two classes,
general and special perturbations. Use of gen-
eral perturbations has the advantage that ana-
lytic expressions are obtained, leading to the
ability to evaluate results for any value of the
time without computing for intervening times.
More important, an insight is obtained into the
general nature of the motion. However, a rather
overwhelming amount of labor is involved in
a development in general perturbations. Use of
special perturbations or numerical integration,
on the other hand, requires no heavy analysis
but also gives almost no physical insight into
the results. Furthermore, evaluation of position
and velocity at arbitrary times is computation-
ally inefficient.
The method planned is an intermediate ap-
proach which largely preserves the flexibility
and insight offered by general perturbations,
while avoiding the time-consuming (and, for all
but the experienced celestial mechanician, error-
promoting), series developments by taking ad-
vantage of the speed of modern computers. The
method rests on knowledge of the functional
form, that of general trigonometric series in the
time plus constant and secular terms, and of the
solutions obtained using general perturbations.
The coefficients are determined by numerically
fitting trigonometric series, whose frequencies
are determined analytically, to expressions giv-
ing the rates of change of the orbital elements.
4-6

I,,,,d
,,-=_
IK£_
= ,
t_
r,i
The resulting series may be integrated analyt-
ically. The method may be carried out for any
reference orbit (e.g., the orbit given by Brouw-
er's theory accounting for oblateness), and may
be iterated to obtain perturbations of any order,
with the restriction, however, that the number of
frequencies included is restricted by the capacity
and speed of the computer in simultaneous solu-
tion of the linear equations for determination
of the coefficients. The method may be termed
"semi-analytic" since the result is a closed-form
expression with coefficients determined by anumerical method which in itself does not rec-
ognize the analytic form of the perturbing po-
tential or the corresponding accelerations.
Analysis. Let E_ be a set of quantities defining
an osculating orbit. The E_ are constants for
Keplerian motion; the differential equations
which they satisfy for perturbed motion may
be written in the form of Gauss's variation
equations (e.g., Moulton, Celestial Mechanics,
pp 404-405) :
dEi _d--t- -- _Mu aj (4-1)
J
where the aj represent components of the per-
turbing acceleration and the M u are functions
of the E_ and the time. There may already be a
solution in which part of the perturbing accel-
eration is accounted for; say Eot taking into ac-
count aoj; in this case let
Then
El -- Eoi -4- Eli, aj -- ao_ -4- alj (4-2)
dEn __ _ Mu au (4-3)dt j
Equation 4-1 will provide the exact solution only
if the instantaneous values of the E_ are used in
evaluation of both the matrix Mu and the accel-
4. Launch and Orbit Considerations
erations aij. If constant values of the E_ are used
in the right-hand side of Equation 4-1, the re-
sulting solution includes only first-order pertur-
bations. If Equations 4-2 and 4-3 are used, with
the values of Eo_ substituted in the right-hand
member of Equation 4-3, the results will contain
some but not all of the second-order terms pro-
portional to products of aoj and alj. Physically,
the cumulative effect of the aoj, will be taken into
account in computing the future effect of the a_j,but not vice versa. Let it be assumed for the time
being that this order of accuracy is all that is
required.
In developments in general perturbations, it
is usual to develop Equation 4-1 or Equation 4-3
in series. When the perturbations are due either
to bodies other than the primary in the system
or to harmonics in the gravitational field of the
primary, the result is of the form
dEl..__2_l= Cll +dt k:l
Cltzk_ cos Wk t + Ci(2_+_) sin Wk t)(4-4)
The coefficients Cff are functions of the elements
only and not of the time. The W_ are linear com-
binations of the form
Wk -- _" Mki ni _- _ Lkj., Njm1 J,m
where the Ms and Ls are integers and, in the
case of first-order perturbations of an orbit by
other bodies in unperturbed Keplerian orbits,
the only n_ required is n and the only N_,_ are Nm
where n is the mean motion of the body consid-
ered and the N,,, are the mean motions of the
perturbing bodies. In the case where Equations
4-2 and 4-3 are used, the n_ include other fre-
quencies; for example, if the ao_ include oblate-
ness, the n, are linear combinations of the
4-7

w
Hughes A ircra/t Company
mean-mean motion and the mean motions of the
apogee and node. If a perturbing body is itself
perturbed, the corresponding Nm include similar
frequencies.
Rather than develop the expansion (Equation
4-4) analytically, the proposed method is to
solve for a limited set of the Ctf numerically.
This may be done by solution of the set of linear
equations resulting from numerical evaluation
of Equation 4-1 or 4-3 at a properly chosen setof values of the time. If more times are used
than the number of values of _, the Cl._ may be
determined by least squares.
Determination of the Clg requires the solution
of six sets of (2nt -4- 1) equations (or the inver-
sion of a square matrix with (2nt + 1) 2 ele-
ments when nt is the number of frequencies.
It is evident that some intelligence and judgment
(and possibly numerical experimentation) will
be required in the choice of the Wk as well as
of the times at which the rates of change of the
elements are evaluated; aliasing of frequenciesmust be considered.
Having the coefficients, it is easy to see that
(o)
Eli = Eli -4- Cn t + _.k=l
Ci(2k_ sinWkt Cl¢._k+l_ cosWkt) (4-5)Wk Wk
One further remark is needed. In putting down
the functional form, Equation 4-4, it was as-sumed that the set of elements used did not
introduce a factor proportional to the time. It
is usual in celestial mechanics to avoid this bythe use of an element such as o', such that the
mean anomaly M is given by
f_ lot k dt 'M = cr-4- ndt = o"-f- aS/----_
4-8
Considering only first-order perturbations with
a = aoo + al, this may be reduced to
k 3 -5/2 JlotM=_r+ _t----kaoo aldt3/2 2
aoo
and the coefficients in the series for the required
integral readily derived from that for al. How-
ever, some caution regarding initial conditions
is necessary.
For generality, suppose that Equations 4-2
and 4-3 are used. Let [o-1] and [a_] be any in-
definite integrals of
do-1 dal
d--t'- and --_-.
Then if o',, (o) and ao (o) are the osculating
elements at t = 0,
and
_l(t) = [crl(t)] -- [_1(o) ]
al(t) -- [al(t)] -- [al(o) ]
t kdtM = _,o(t) -f-_n(t) + [ao(t) -f- a_(t)] 3/2
or to the first order
let
r kdtM = _o(t) + _l(t) + [ao(t) ]3/2
3 k f[( )5/---T., [al(t) ] -- [al(o)] dt2 aoo
t kdtMo : *o(t) + [ao(t) ]3/2
and let [J] be any indefinite integral of [ax (t)].
J
g
mm
W
I
g
L
D
2_
m
I
i
g_
tlrmJ
t
[
°ti
HU
|
U ,J
i[
UHu

it,,,,,¢
= x-.sx
L_
U
= 4
H
Then
3 k 3 kM = M1 +al(t) -4- ----'S_,_ [al(o)] t 5j',
[J (t) ] -- [J(o) ]) (4-6)
High Order Perturbations. The solution
given by Equation 4-5 (plus the Eot, if Equation
4-3 is used) could be substituted back into Equa-
tion 4-1 and an iteration performed to obtain a
new set of equations of the form Equation 4-4.
Alternatively, the initial solution could be used
in place of Eo_ in Equations 4-2 and 4-3; this
would, however, be somewhat more complex as
the a,_ would now involve the differences of per-
turbing accelerations.
The initial numerical application of the meth-
od will be based on first-order results only, uti-
lizing Brouwer's formulation to obtain the Eo_.
A Property o/ the Method [or a Circular
Re/erence Orbit. Let a be the position angle rela-
tive to a fixed reference in unperturbed motion
in a circular reference orbit. Let 3k be the devia-
tion in position angle , iSr the deviation in radius,
and z the displacement normal to the reference
orbit. Let ao be the unperturbed semimajor axis,
no the mean motion. If the motion is linearized
about the reference orbit (e.g., Hughes Aircraft
Company TM 649, Dynamic Analysis and Design
o] the Synchronous Communication Satellite,
pp 5 []), it is possible to show that for unper-turbed motion
8r = 8a + rx cos ,_+ rr sin ,_
3 ofX = ao 8X = Xo -- -_- n 8. dt
-- 2rx sin a _ 2rr cos a
z -- Zx cos a -+-Z_-sin a
(4-7)
4. Launch and Orbit Considerations
where
(8,, rx, ry, Zx, Zr, Xo)
are constants. It is also possible to show that
in perturbed motion, these elements satisfy the
equations
dZx--no dt --a_sin
dZyno dt --a,cosa
dSa 2flkdt -- no
dXo __ 2ardt no
drx 2
dt no
dry 2
dt no
1ax cos a -- _ ar sin a
no
1ax sin a + _ ar COSa
rl o
(4-8)
where (at, a_, a_) are radial, tangential, and
normal perturbing accelerations respectively.
If the set in Equation 4-8 is developed in se-
ries, it is evident that the arguments of the trig-onometric functions have the form
Ma -4- _" LkJmNjmJ,m
and that the same is true of the indefinite integralsfor the elements. The conclusion is that once a
set of coefficients C_f is obtained a reference orbitfor which
a = ao + no t
the result can be extended to any choice of
ao. As an example, lunisolar perturbations of a
synchronous equatorial satellite may be found
from a single set of C_f independent of the lon-
gitude.
4-9

Hughes Aircra]t Company
2
JUSTIFICATION FOR SPIN SPEED CONTROL
The following study was undertaken to ex-
amine tile effects of jet damping, skew torque
(due to asymmetric transverse moments of in-
ertia), and jet thrust misalignments on the spin
speed history of the spacecraft throughout its
nominal operating time. Results summarized
below show that a spin speed change of 50 to
90 percent is not unlikely (.primarily due to jet
misalignment thrust components).
Summary. The effects of the jet misalignment
in spin speed negate the simplifying assumptions
made below for jet damping and skew-torque cal-
culations, but the general conclusions on the
necessity for spin speed control are still valid
from jet misalignment effects alone.
Awz
Jet damping (approximately _ _oz) -- 7.1 rpm
Skew torque - (approximately "_ _z2)
-4-10.6 rpm
Jet misalignments (assume 0.5 °,
0.5 ° , 0.25")
,X_ozA= 63.2
±_ozn-- 9.5
A,OZc= 10.5
_',_, = ±64.8 rpm
It should be noted that spin speedup minimizes
the skew-torque effect while increasing the jet
damping. Certainly speedup would cause the
spacecraft to exceed its structural design limita-
tions. Slowdown could bring spacecraft spin
speed to less than 10 rpm.
General Equations Including Jet Damping. By
the principle of angular momentum
_L.."
MQ = HQ (4-9)
4-10
GALILEAN FRAME
6
FIGURE 4-7. REFERENCE FRAMES
where _IQ is the applied vector moment and Ho
is the time derivative of the total angular mo-
mentum. The subscript Q indicates these quan-
tities are measured with respect to a point Q fixed
in the Galilean frame(_). Referring the angular
momentum to frame (_) (see Figure 4-7).
HQ = HB + [,_ X I-I_. (4-10)
If(_)is principal and dropping the subscripts(_
the well known forms appear*:
= Ao,x'_+ B,oyT+ Ccozk (4-11)
= 0,x + ,oYT+ o,z-
= (Jt_,x + A,_x)i + (I_,oy+ B_,y)j
+ (C,oz + C6z)k (4-12)
where
and
,_x = pitch rate, ,_:,-= yaw rate, and
_oz= roll rate,
*A, B, and C are pitch, yaw, and roll moments of in-ertia about body axes x, y, z.
I
I
i
I
ii
I
i
i
m
L-J i
mw
g
"-Z
u

i
-,,_j
4. Launch and Orbit Considerations
U
L_
w
w
L
w
Li
Li,t,..a
NOTE: By implication, B is assumed to remain
principal for the interval under consid-
eration. Combining, the Euler equations
are obtained for a system of particles of
varying inertia.
M. -- A_.. -- (B -- C)%... + Ao.
M, = C_,,-- (A -- B),o_,_+ _:,o,
(4-13)
NOTE: No particles are permitted to enter or
leave the system.
Equation 4-15 is next modified to account for
expulsion of mass. Let x_, y, z_ be the coordi-
nates of the itb point on body B where mass par-
ticles will leave the system.* Practically speaking,
they would be the coordinates of the ith jet. Noth-
ing is said of the orientation of this jet. The loss
of angular momentum from the system of par-
ticles due to the expulsion of Am_ is
where
±Ht = R_ X Am_'V_ (4-14)
Vl = coX P,._
aH_ = R_ X ±m_(o, X R_) (4-15)
".2-
Hi= dill Hi RIX dm,(.d-'-_--- = _ X R_) (4-16/
and since
"ni : XiT'_-- Y_+ z_ (4-17)
(Hi)_ (dmi_• = \--_--/[ (y_ + z,2) _,_-- xi yt o,y-- x, z, o,_3
-- __(dm,"_[(z_+x2) oy__ytz, o,__y, xtox](Ht),--\ dt /
"Rosser, "Mathematical Theory of Rocket Flight,"p. 11 (Principle V).
(Hl). ( dm,'_= \---_--] [(xf + y_) ,0, -- zi xt o, -- z, ytor]
(4-181
Note the symmetry of these equations which in-
dicates that only the exit position of the leaving
mass particles, without regard to exit direction,
determines the loss in angular momentum for tile
system of remaining particles (m_ is positive for
mass expulsion). Combining Equations 4-18 and
4-13 gives for N jets
M_ =A;o_-- (B--C) c0yo. +
N.
{A o_ + _ mi [ (y_ + z_) o_ -- x_yt o,y -- xt z, o,_]}l
(4-19a)
My = B_y-- (C--A) t0.o.+
N
{f_o,.+ X r_, [(z_ + x_) _,. -- y_zl 0,, -- y, x, ,,,,,1}
(4-19b)
M,= C,_-- (A--B) to_o,_+
N,{C o,_+ X m_ [ (x_ + y_) o,, -- z_x, _ -- zt y_o,_]}
1
(4-19c)
In Figure 4-8, showing the body Euler angle
and test geometry, the terms inside the braces
are the "jet damping" terms.
x_ -- 0, yl -- 2.16, zx -- 2.0x_ = 2.16, y= -- 0, z2 = 0
o,_-----pitch rate
o_ : yaw rate
o, = roll rate
0 "- nutation angle
6 : precession angle
_p--- spin angle
0... center of gravity
(_nch... axial jet
(_nches . .. radial jet
4-11

,,,..j
Hughes ,4ircra]t Company
Z
e
B A
N
FIGURE 4-8. BODY EULER ANGLE AND TESTGEOMETRY
Inertial Properties.
properties is given inTable 4-4.
An estimation of inertial
Tile vernier velocity corrections are:
Continuous-- axial jet 1013 fps
Pulsed -- axial jet 22
Subtotal 1035 fps
Pulsed -- radial jet 155
Total AV 1190 fps
87 percent
13 percent
100 percent
Nominal spacecraft mass in final orbit config-uration is
W_ AVml
log _ -- log- --m2 W2 g I_p
TABLE 4-4. INERTIAL PROPERTIES
Final orbit configuration*
Apogee motor burnout
A
lZZ,
W, slug- Ixx,pounds ft' slug-ft = R/P
618.3 55.8 50.3 1.11
754.4 69.7 57.2 1.22
136.1 13.9 6.9 0.11
*Completeblpropellantdepletion-- limit condition.
Assume
I.p = 250 seconds
log W1 __ 1190 -- 0.148W2 32.2 (250)
Wz = 754.4 e-a4s -- 754.4 (0.863)
= 651 pounds
_Wr,-om.,,-,L= 754.4 -- 651 = 103.4 pounds
aW._o._f 103.4-- -- 0.76
AW 136.1
Izz xo._t-'- 69.7 -- 0.76 (13,9) = 59.7
Ixx ,_oM= 57.2 -- 0.76 (6.9) = 52.0
R/P r_o_ = 1.22 -- 0.76 (0.11) -- 1.14
IZZ NOM -- 1.14Ix.-xNo_I
Average spacecraft properties during opera-
tion of jets are:
WAvE= 754.4 + 651/2 = 702.5 pounds
C = Izz ,v_ -- 69.7 + 59.1/2 = 64.4 slug-ft 2
A -- Ixx AVE= 57.2 + 52.0/2 = 54.6 slug-ft 2
RfP = 1.22 + 1.14/2 = 1.18
Rewriting Equation 4-19c:
C_z -- -- coz+ miI
_(x2 +y2)oJ, -- z,x,,.o, -- zff,%._ }
+ (A--B) _, _oy+ Mz
Assume that the variation of the quantities above
will be small so that a difference equation willsuffice.
iNm
i
B
B
U
mW
N_
I r
4-12
I

= =
E• 1
tlma 4. Launch and Orbit Considerations
L,,2
U
w
t]
i]k.i
I NI
[(xi 2 +yi 2) °3z-- zixi_x-- ziyi_y_ t
+ (A -- B) o,_oy At -+- Mz At
E(x, 2 +yt 2) COz-- ZtXiOJx-- ziyi_oy']}
+('A--B)°"°'YAt+-_-AtC
Consider the jet damping term in the braces{}
AC 59.1 -- 69.7-- o_ -- (10.47) -- -- 1.725 rad/see
C 64.4
Am1 = .87 (103.4) -" 90 pounds = 2.80 slugs
Am2 "-- .13 (103.4) = 13.4 pounds -- 0.416 slugs
For a body of symmetry subjected to a trans-
verse moment with negligible jet damping,
M_ = A_,_ -- ( A-- C) O,y_,_
M,. = A_,y + (A -- C) o,yo,_
0 = C,;_
_ox---- q wy=r _z=p
since
where
p--0 p=p0
M_'--A6 - (A--C) p0r
iMy=-iAr+ (A--C) poq i
MT_Mx + iMy = A_,-- iXp0o,
C--A
A
_o_ + ior-- q+ir
For MT constant
i MT
o-- o(0) etXPo t -}- _ (1 -- eiXpo t )
Neglecting the transcendental terms,
i M,tO x -_- iCOy --
Xpo A
M_ -- 2.16 (5.0)COy --
(C- A) p0 (9.8) 10.47
= -- 0.1055
-- z_yt _y = -- (2.0 (2.16) (-- 0.1055) = + 0.456
yl 2 _ = (2.16)-° 10.47 -- + 48.8
-- z, y, O,y+ y2, oz -- -_- 49.256
Aml [ (x12-[-y12) t°z-zlxlox-zlyl°y]
E= _ 49.26 = 2.15 rad/sec
Am2 E(Xo2Zr-Y22) t°_C. --zzxoo_--z2y2%.]
0.416
64.4 48.8_ = 0.316 rad/sec
A0_ZJETDAMPING-- E 1.725 + 2.15 + .316]
= -- 0.74 rad/sec = -- 7.1 rpm.
Since variation of o_, due to jet damping is only
7 percent, the previous assumptions concerning
small _, are permissible.
Consider the (A -- B/C) _ %At term. The ef-
fect of skew torque can be evaluated at this time
by assuming a variation in A and B and orienting
the axial jet in a most disadvantageous position.
A = 54.6 (0.975) = 53.2 sl-ft 2 (i.e. -- 2½ percent)
B = 54.6 (1.025) = 56.0 sl-ft -_ (i.e. -4- 21,/2 percent)
C = 64.4 sl-ft 2
4-13

",._,1
Hughes A ircra]t Company
A -- B \ (MT2) sin 4' cos 4)Ao_,-- C ) (C--A) (C--B) p02
Isin q, cos _ ] m,x = 0.5 worst case
(At)
702.5IAXIAL--- mAVA --
32.2(1035) : 22,500 Ib-sec
At -- 22,500 __ 4500 seconds5
1Ac°z]=( 56"0-53"2)" 64.4
(5(2.16))2.5
(64.4 -- 53.2) (64.4 -- 56.0) (10.47)2(45O0)
±o,== -4- 1.105 rad/sec = +---10.55 rpm
Thus the original assumptions are permitted since
only a ]01//.- percent change in coz is indicated.
In the (Mz/C)At term, Mz will be caused by
jet misalignments.
Consider the axial jet:
IAXrAL= M-xVA = 22,550 lb-sec
IA8A_A_=A--- C
Ao_z __ 22,550 (8A) 2.16 (. 60 )64.4 2_'(-_.3)"
= 126.5 rpm/degree misalignment
Consider the radial nozzle:
aVr_ -- 155 fps
702.5IRADIAL -- (155) = 3380 lb-sec
32.2
I_.,DIAL(81_)A_ozlt -- C
A,_zR-- 3380842.1664.4(62_7.3)
--- 18.9 rpm/degree misalignment
Ia ¢
C
4-14
3380 60
±_°'c -- 64.4(12) 2#
41.8 rpm/inch cg offset
AXIAL JET INDUCED NUTATION
Since the axial jet is operated in a synchro-
nously pulsed mode to generate precession torque
pulses and in a continuous (long pulse) mode
to generate a translational force, it is desirable
to estimate the maximum nutation angle, O.....
induced by either of the above modes. It is shown
that for a given roll-to-pitch moment of inertia
ratio Iz/I_, spin speed oJ_, and torque level No,
the value of 0_= after continuous axial jet oper-
ation may be greater (seven to eight times) than
the maximum nutation angle induced by a series
of spin synchronous torque pulses. Continuous
mode operation of the axial jet will result in the
maximum nutation angles for nominal and limit
parameters shown in Table 4-5.
Om=was computed using
2Nomax --
tOz 2 -- 1 I,
The nutation damper will asymptotically damp
tgm= to zero with an estimated damper time
--_ 5 minutes.constant, r,
TABLE 4-5. MAXIMUM NUTATION ANGLES FORNOMINAL AND LIMIT PARAMETERS
Parameter
Nominal Limit(50 percent) (100 percent)
Propellant PropellantDepletion Depletion
,_,, rprn 100 90
I=/L, 1.17 1.11
I=, slug-fP 62.8 55.83
No,ft-lb 10 6.5 (_ 3-poundthrust)
0.... degrees 0.97 1.36
Hu
m
[]
J
ii
i

m
|i
i i
iJ
x ,
[-iU
!=!
i i
It ¸
kJ
N
b
Mathematical Model. Considering the space-
craft as an undamped, spinning symmetrical
rigid body with constant spin speed _0_, whose
spin axis moment of inertia is greater than the
transverse moment of inertia, L > L = I,, the
• Euler equations of motion (in body coordinates
x, y, z) resulting from synchronous axial jet puls-
in (pulsing) may be represented in complex
form by (note:_ = (d/dt)o_)
-t- j_ _ n ; j = X/--1 (4-20)
_=(1-- I__[) ( I_ 2_r_ _ to_-- o_n_ 1 -- -_-)--_- < 0
(4-21)
i No q(m +k) _-, < t < ]
n = ° = I-'7; [q(m + k) -4- k] r,_;
; [q (m + k) -4- k] r, < t < |(q @ 1) (-m --_k) r, J
q = O, 1, 2 ..... v -- 1 (4-22)
where
= component of body angular velocity nor-mal to spin axis, radians per second
r, = spin period, seconds
-- 2_/o_ _< 0.8 seconds (75 rpm)
Wn--- nutation frequency, radians per second
n -- normalized torque, ft-lb/slug-ft 2
1= N/L = T-_ (N, + j N,)
k -- fraction or number of "jet-on" spin periodsper on-off cycle
>0
m m fraction or number of "jet-off" spin periodsper on-off cycle
>0
4. Launch and Orbit Considerations
k-- duty cycle of axial jet
m+k
q = running index of on-off cycles
=0,1,2 ..... F--1
v = total number of on-off cycles employed ina pulse series
For synchronous pulse torquing at the rate of
one pulse per spin period,
0<k<l
m-4-k= 1(4.23)
and v, the total number of pulses, is completed
in r--_ (1,- m) _'_ seconds. For the continuous
operating mode, however, the thrust history of
the axial jet is described by a single, long dura-
tion pulse of many spin periods, i.e.,
k>>l
m=0
(4.24)
and the action time of the axial jet 7_ = k 7"_
seconds,
A solution to Equation 4-20 for oJ is given by
to = Woe -lftr --[- 2nf_
sin(2kr'_fsin--_-_v// 2 (m -4-k)r_]
sin [--_- (m + k) r,]
where
fl (m+k)--m]r,e __j_- Iv
(4.25)
r -- total time for completion of pulse series
-- [v (m -Jr k) -- m] r,
too = initial component of body angular velocitynormal to spin axis (assumed zero)
4-15

Hughes Aircraft Company
Now since the subsequent nutation angle 0 is
given by
co co Ixtan 0 -- -- "_ 0 (4-26)
(o n U) Z I_
then from Equations 4-21 and 4-25,
tan 0 ,_ 0 -- o,o e -Jf_rO/rl
2N sin [,rk(1--_)'] _i, E_vcm + k)l- ( I_)]-f
c°'2 I" (1-- i_) sin [Tr (m + k) (1-- i_)]
X exp {--j-_-[v(m+ k)- m] r,} (4-27)
Pulsed Mode. For the case of one pulse per
spin cycle, (m + k -- 1), and O_o-- 0, Equation4-27 becomes
_z2I_(1-- I-_)sin[lr (1-- I_)]
e-j _ ¢_--m_7 (4-28)
The above expression may be further reduced by
examining the magnitude of
sin (-_ k r, ) -- sin [ Irk (1-- iI-_._)].
It is recalled that '
- °'('t) (It)kr,-" 1-- k r, -- _rk 1--2 -_-
4-16
For a 45-degree pulse width, k = 1/8, and since
[2 P -k r, < -_- (0.3) = 0.118 radian6.75 degrees
Thus
(2)2sin k r, _ k r, _2 N 2 N
(4.29)
where _H is the incremental change in the direc-
tion of the angular momentum vector H _ I, co,.
Hence Equation 4-28 becomes (neglecting the
phase angle)
8H/H(4-30)
Figure 4-9 shows a geometric construction of
the history of O during synchronous pulse
torquing of a typical stable configuration (I,/I_
= 1.2). When, in Equation 4-30
1 -- 2rv: ; r-- 1,2, 3,... ;
2(1--I.____ ) (4-31)
'"1E<'lallOl==-----H-sin ,- :t "i7
,_N 1
4I'_'z sin[_r (_--1)]
(4-32)
m
i
[]
I
Ill
I
N
I
Ib
== =
i

r
i
[7
L.]
ii_t a
i
w
Z_
=.=-Z_
t_
E2
=
L_
LJ
J
4. Launch and Orbit Considerations
LOCUS OF SPIN AXIS
_ O_o j_ 2n IF_ \ -J_.START LOCUSOFANGULARMOMENTUM, H (__ -- e--_" -f--_---sin(--_-r.l e (4-33)
/ " _ _ULSE NUMBER Since r, = k'r_ > > "r_, the small angle approxi-mation for 12k,rJ2 can no longer be invoked. For
__ example, if L/Ix = 1.2_kt_ / I, \ =
/ O_ ._._ _ = =k _1 -- -_) ='_" (4-34)I y/ _. _H =a PRECESSION ANGLE INCREMENT
1 _. _ ,3 H PER TORQUE PuLsE, when
\_ a4_ ._ _ _-<<'(ONEPULSEPERSPINCYCLE) 2r--1
k= (.____) ;r:0,1,2 ....... (4-35)iX t_4 y_-'_ 4 =i =a AZIMUTH ANGLE BETWEEN 2 -- 1
Y t _H OiAND _"
04/'_ H (_H.-_l'+ ¢I'.i-eZ,-, _ O_ = 2.5 ;r =0
X\/_ 5 " Cli_ICOS-I _ ]
o, '"/I _- ,,Ho, Thus for too = 0 in Equation 4-33 the expression
__o_ _: f°r [Si,,,x is appr°ximated bYV-'T --I
8 i = NUTATION ANGLE AFTER i th
PULSE, i.1,2,. .......
FIGURE 4-9. GEOMETRIC CONSTRUCTION OF
NUTATION ANGLE HISTORY DURING SYNCHRONOUS
PULSE TORQUING
where k = I/S.Some values of 0.....for N = 10
ft-lbs and k= l/s are given in Table 4-6 for typ-ical and worst case moment-of-inertia ratios and
spin speeds with I,. = 56.75 slug-ft 2 (bipropel-
lant depletion).
Continuous Mode. For a single, long duration
pulse, m = o, v = 1, "r = _', = k "r,,so that Equa-tions 4-25 and 4-26 reduce to
TABLE 4-6. MAXIMUM NUTATION ANGLE AFTER
PULSED MODE
Iz 6tilt 0tasxl
I, rpm degree
1.1 75 0.42
1.2 75 0.217
1.1 100 0.238
1.2 100 0.112
II 2o 2N).... -- -- ,, ( I__.: (4-36)
The ratio of Equation 4-36 to Equation 4-32shows
l'm" l.o..,, sin E" (I-_-- 1)- ]--8
I°-,,,,,-.> 6.9
<8
for 1 < l,/I. < 1.3. Thus it is seen that the worst
case hot gas jet induced nutation angle occurs
after continuous operation of the axial jet.
Table 4-7 contains some values of the maxi-
mum nutation angle 8...... induced by the axial jet
operated in the continuous mode. These values
are listed for various combinations of spin speed
to,, and roll-to-pitch moment of inertia I,/I., with
the additional conservative assumptions that the
torque, N = 10 ft-lb (maximum value) and
I, = 56.75 slug-ft 2 (minimum value).
4-17

Hughes Aircraft Company
TABLE 4-7.
_z, I...._, 0....rpm Ix degrees
75
75
100
75
100
75
100
100
1.I0 3.25 (2.11)**
1.13 2.50 (1,63)
1.10 1.82 (1.18)
1.22 1.48
1.13 1.40 (0.91)
1.30 1.09
1.22 0.83
1.30 0.61
MAXIMUM INDUCED NUTATION ANGLE,(0_o_)*
I
N, ! I,,
ft-lb _ slug-ft_
10 (6.5)** i 56.75
I0 (6.5) F 56.75
10 (6.5) [ 56.75i
10 I 56.75I
10 (6.5) [ 56.75
10 ! 56.7510 ! 56.75
10 i 56:75i
*Continuousmodeoperationof axial jet for over 2½ spin periods,**Parenthetical values correspondto final blow-downthrust level of
approximately3 pounds.
EMERGENCY PROCEDURES
(ASCENT SEQUENCE)
Some preliminary considerations are dis-
cussed in the following paragraphs of correct-
able booster-spacecraft failures that may occur
during the launch and ascent sequence beginning
with Agena second burn cutoff and terminating
when the spacecraft is initially placed on station
with normal spin axis attitude.
Failures associated with AGE, computer pro-
grams, and ground-based portions of the tel-
emetry and command subsystem will not be
considered at this point. Failures incurred by
Atlas-Agena equipment prior to Agena second
burn cutoff that may be corrected (in part) by
the spacecraft control system will be examined
as more information is made available on the
feasibility of such corrective procedures.
Table 4-8 is a tentative list of failures and
possible causes associated with their respectivenominal events in the order of their occurrence
(except, possibly, events 7 and 8). The third
column lists only the major components or sub-
systems involved in a particular failure although
some intrasubsystem failure modes may occur
without degrading the subsystem function. Fail-
4-18
ure of a subsystem in the spacecraft not listed in
Table 4-8 may require another control mode but
not a redundant subsystem. Qualitative fix
methods are described below after each nominal
event failure.
TABLE 4-8. CORRECTABLE FAILURES (TENTATIVE)-ASCENT SEQUENCE
NominalEvent
Agenasecondburn cutoff
Agena yawmaneuver
Spacecraftspinup
Spacecraftseparation
Apogeemotorignition
Spin axisorientation
In-plane velocitycorrection
Inclinationco_ection
Failure PossibleCriteria Cause
Agena velocity meterFueldepletion(excess orbitalenergy)
Final attitudeerror> 3degrees
Spin speed error,8_, > 25 rpm
Final attitudeerror > 3degrees
No change inorbital elements
Little or nochangeinattitude
Little or nochangein orbitalelements (driftrate)
Little or nochangein orbitalelements(inclination)
Programmer/inertialreference package,Agenaattitude jets,power supply
Spin table rockets, (cen-trifugal switch),SS/Dtimer, power supply
Tipoff
Timer, telemetry andcommandsubsystemigniter, power supply
Axial valves, telemetryand commandsubsystem,jet control electronics,power supply
Radial valves,telemetryand commandsubsystem,jet control electronics,power supply
Axial valves,telemetryand commandsubsystem,jet control electronics,power supply
Qualitative Fix Procedures
l) Agena second burn cutoff (fuel depletion)
a) Change apogee boost attitude and ig-
nition time to minimize orbital energy
deviation from nominal, consistent
with visibility requirements from tel-
emetry and command stations.*
*More detailed information on visibility from groundstations will be forthcoming after more definitivefuel depletion injection parameters are made avail-able.
m
J
J
I
I
!
!11
m
I
I
r
W
i
TZ-
_'--S_
I
= =

U|.._||i21
b) Use spacecraft hot gas system to cor-
rect subsequent synchronous orbit
period, eccentricity, and inclination
(where possible). Use axial jet* op-
erating in continuous (more efficient)
mode if velocity requirement is greater
than normal available velocity capa-
bility after allowance for longitude
stationkeeping.
2) Agent yaw maneuver
a) Reorient spin axis to proper attitude
before apogee boost using sun sensors
and polarization measurements (pan-
cake beam) to determine attitude.
3) Spacecraft spinup
a) Activate axial jet (continuous and
pulsed modes) after apogee motor
burn if spin speed is high.
b) Activate axial jet (continuous mode)
before apogee motor burn if spin speed
is low, and adjust attitude and/or ig-
nition time of apogee boost (if neces-
sary) to minimize deviation of orbital
energy from nominal.
4) Spacecraft separation (same as proce-
dure 2)
5) Apogee motor ignition
a) Determine probable failure cause from
telemetry data.
b) Select appropriate redundant mode or
subsystem and command apogee igni-
tion near first apogee consistent with
*With spin axis oriented in orbital plane.
4. Launch and Orbit ConsideratiOns
telemetry and command station visi-
bility.*
6) Spin axis orientation
a) Determine probable failure cause from
telemetry data.
b) Select appropriate redundant subsys-tem or mode and command orienta-
tion maneuver at favorable time of
day.
7) In-plane velocity correction (same as pro-
cedure 6 except radial jets are used)
8) Inclination correction (same as procedure
6 except axial jets are used in continuous
mode)
The following list delineates the probablesources of failure indication associated with each
nominal event in the general chronological order
of their availability. Only those sources marked
with a + are sufficient indications that a failure
has occurred, while the other sources are merely
necessary (though usually earlier) indications
of failure. More quantitative descriptions of the
failure indications will be forthcoming as the
orbital injection, tracking station, and spacecraft
design parameters become more definitive.**
Tentative Failure Indication Sources
1) Agena second burn cutoff (fuel depletion)
a) Agena guidance telemetry
b) FPS-16 data
*Usually, backup command firing can be initiated
close to the first apogee in the event of a timerfailure.
**The detailed description of failure mode proceduresand data will generally follow the format of "Syn-com I, A-26 Failure Mode Procedures and Data,"D. D. Williams, Hughes Aircraft Company, IDC,Revision I June 1963.
4-19

Hughes Aircraft Company
c) Range, range rate, and angle data
(transponder ON)
d) Minitrack data
e) GFSC orbital elements +
2) Agena yaw maneuver
a) Agena guidance telemetry
b) Spacecraft polarization (before spin-
up)
+ c) Spacecraft sun angle, q), determination
(after spinup)
3) Spacecraft spinup
a) Agena spin rate detection/telemetry
b) Spacecraft sun sensor/telemetry (spin
speed) +
c) Spacecraft radial accelerometer (if
available)
4) Spacecraft separation (tipoff)
a) Agena guidance telemetry
I b) Spacecraft sun angle (_) determina-+ tion
c) Polarization angle measurement
5) Apogee motor ignition
a) Spacecraft axial accelerometer (if
available)
b) Ground observer (weather and local
night time permitting)
c) Sun sensor telemetry (spin speed
speed change)
d) Solar panel power modulation (spin
speed change)
4-20
6)
e) Spacecraft temperature
f) GSFC orbital elements +
Spin axis orientation
a) Propellant tank pressure and solenoid
current
b) Axial jet chamber and propellant tank
temperature
c) Spin axis elements (_b angle and polar-
ization angle) +
7) In-plane velocity correction
a) Propellant tank pressure and solenoid
current
b) Radial jet chamber and propellant
tank temperature
c) GSFC orbital elements (period and ec-
centricity) +
8) Inclination correction
a) Propellant tank pressure
b) Axial jet chamber and propellant tank
temperature
c) GSFC orbital elements (inclination) +
In procedures 6, 7, and 8 a more detailed ex-
amination will be made of the sequence and type
of valve failures (stuck open or closed) of thefuel and oxidizer valves of both radial and axial
jets. This should lead to a more meaningful de-
lineation of corrective procedures for each type
of failure. For example, if during event 7, either
a fuel or an oxidizer valve (but not both) sticks
open then it is desirable to continue to operate
with this radial jet and suffer the moderate loss
in thrust effectiveness per pulse due to the low
counteracting thrust component resulting from
the fluid mass loss of the stuck-open valve; more-
m
II
i
w
M
i
N
i
i

i i 4. Launch and Orbit Considerations
= _J
= .
m ,!
= ,=y _
!1.
ii
=
i
over, the repeated on-off excitation of the valve
solenoid may free the stuck valve.
However, if one of the fuel or oxidizer valves
sticks closed then it is desirable to switch to the
redundant radial jet and associated propellant
supply. If, in addition, one of the valves in the
redundant radial jet sticks closed then the spin
axis is reoriented into the orbital plane (via
pulsed axial jet operation) so that the thrust vec-
tor of the axial jet (operating in the continuous
mode) is parallel or antiparallel to the orbit_ll
velocity vector depending on the desired longi-tude drift rate direction. Similar considerations
will be given to axial jet valve failures.
Recent estimates of propellant depletion
times* after a valve sticks open yield the fol-
lowing conservative values:
Propellant Load Depletion Timeat Valve Failure Oxidizer, hours Fuel
100 l_ercent 1.4 1.3
50 percent 0.75 0.70
Thus sufficient time exists to complete any ini-
tial ascent guidance correction function (in-plane
or inclination) after a valve sticks open. During
this time the failed jet thrust value decreases by
less than 45 percent of initial value.
EARTH SENSOR FOR ADVANCED SYNCOM
This discussion is an extension and refinement
of the concepts expressed in the section Earth
Sensor/or Syncom from the Advanced Syncom
Monthly Progress Report for April 1963. Re-
vised signal-to-noise-ratio calculations indicate
the feasibility of reducing the aperture size,
*J. M. Ferry, "Failure Analysis Advanced SyncomRCS Injector Value," Hughes Aircraft Company,IDC, 26 September 1963.
which in turn allows for a single objective rather
than the dual objective system considered pre-
viously. The earth sensor system in providing
a reference for the phased array control elec-
tronics (PACE) of Advanced Syncom, allowsfor elimination of the associated vernier beam
shifting circuits and the 2.81-minute clock as
reliability alternatives to the circuit complexity
required for earth sensor operation. Addition-
ally, the earth sensor provides attitude infor-
mation, and an earth centered reference for jet
firing control.
The basic earth sensor, which is sensitive to
infrared radiation in the 14 to 18 micron range,
consists of a silicon objective, the optic axis of
which is in the satellite equatorial plane and nor-
mal to the spin axis, and two thermistor detector
flake elements in the focal plane, with an angular
separation of ±6.5 degrees from the optic axis,
and coplanar with the spin axis (Figure 4-10).
LANE OF SOLAR SENSORS
F]13 deg
FIGURE 4-10. LOCATION OF EARTH SENSOR
4-21

m
Hughes Aircraft Company
As the satellite rotates, the focused infrared
image of the earth sweeps across the detectors,
generating pulses. If the optic axis of the earth
sensor passes through the center of the earth, both
pulses occur simultaneously.
Ad .DETECTOR
FIGURE 4-11. ILLUSTRATION FOR SENSITIVITY
CALCULATIONS
Sensitivity Calculations. Assume that in the
spectral band Ak, the earth effectively radiates
at a black body temperature T ° Kelvin (see Fig-
ure 4-11). Let N equal the total black body radi-
ance (watt/cm212), and r_equal the spectral utili-
zation factor (the fraction of the total energy in
A_.). The effective irradiance at the aperture is
H' = N _ _ (watts/cm 2) (4-37)
where 12 is the solid angle field of view in ste-
radians. The effective flux transmitted through
the objective is
F' = H' Aop (4-38)
where Ao is the area of the objective and p is the
transmissivity of the optics. The noise equivalent
power (the flux on the detector to produce a
signal-to-noise ratio of unity) of the detector is
reqated to the detectivity as =
NEP _ (Aa Af)D* (watts) (4-39)
where As is the detector area, and Af is the band-
width of the detector amplifier. The maximum
D* for a thermistor-bolometer in the usual bridge
circuit (active plus compensating flake) is
4.22
D* 0.8 X 10sv '_ (cm cps)_/watt (4-40)
where r is the detector time constant in millisec-
onds. The Voltage signal-to-noise ratio is there-
fore
S F'N-- NEP (4-41)
Substituting from Equations 4-38 and 4-39,
S _ N ,/_IAop D*. (4-42)"_-- (Adaf)
Assume the effective earth temperature as
210 ° K in the 14 to 18 micron range (the CO2
band). Then N- 3 X 10 -3 watts/cm212, and
-- 0.18. Let the field of view of each sensor be
1.3 degrees square. Then 12 -- a2 -- (1.3 X 1.75
X 10-2) 2-- 5.17 X 10 -_ steradians. Assume the
detector area is 10 -2 cm 2, and the detector time
constant 2.5 milliseconds. Then D* : 1.26 X l0 s
(cm eps)_/watt. Let p:0.3 (including the
bandpass filter), Af = 135 cps, and the signal-
to-noise ratio 30 db (31.6).
Solving for Ao,
S (Ad af) _ (4-43)Ao_ N N ,7_pD*
31.7 (10-:)(11.52)= (3Xi0 =s) (0.18) (5.17-Xi0 -a) (0:3) (1.26X 10s)
-- 0:35 cm 2
which is the area of the objective. The corre-
sponding diameter is 2x/'A-/cr or 0.667 cm
(0.262 inches). The limiting optical resolution
of the aperture at 18 microns is
d,- 1.22x radians (4:44)D
1.22(18)
6.67 X 103= 3.29 X 10 -s radian
= 0.188 degree
which is greater than the angular resolution as
limited by a 30-db signal-to-noise ratio.
U
J
|
|Wm
B
i
|
i
i
lib
a!Hi
u
[]
m
n

T f
! J
[]
L_
w
r-_
m
E_
The focal distance d_ is determined by the
proportion
0.01-- tan 1.3 degrees "- 0.0227
dt
dt = 0.44 cm
-- 0.173 inches
The focal ratio is 0.44/0.667 = f0.66 which
is not excessively low, and which is capable of
producing a reasonably sharp image over the
central 14.3-degree field of view of the objective.
From a knowledge of diameter and focal
length of the objective, an estimation may be
made of the size and weight of the earth sensor
exclusive of the electronics (Figure 4-12). The
optics and detectors are envisioned as being en-
closed in a tube about 1.5 cm long, and 1 cm in
diameter. The weight is less than I ounce.
FIGURE 4-12. CROSS SECTION OF EARTH SENSOR
OPTICAL UNIT
Analysis. If the spinaxis is normal to the earth
vehicle line, which is the desired orientation, both
fields of view will simultaneously intersect a line
of the earth. For small angular deviations fromthe desired orientation, there will be a time dif-
ference of this intersection. The geometry of the
situation is illustrated in Figure 4-13. Assume
that the fields of view of the sensors are of negli-
gible angular dimension. From a consideration
of Figure 4-13
d -- r (1 -- cos fl/2) (_-45)
4. Launch and Orbit Considerations
FIGURE 4-13. EARTH SENSOR SCAN GEOMETRY
cos/_/2 = _J 1 -- (--_) 2 (4-46)
d-- r (1 -- _/1 -- (_-) 2 (4-47)
±a_ r J (___)21- (4-48)
which represents the relationship between time
difference of pulses and pointing error.
Consider a square aperture of the above di-
mensions scanning across a uniform earth (see
Figure 4-14). The relative sensor output is
DIRECTION OF SCAN _
FIGURE 4-14. ILLUSTRATION FOR DEVELOPINGSTATIC OUTPUT OF DETECTOR-AMPLIFIER
4-23

,.j
Hughes Aircra[t Company
1.0
08
I-
t- 06
_ 0.4
0.2
0
-I0
ZI
-B -6 -4 -2
SATELLITE ROTATION ANGLE, DEGREES
FIGURE 4-15. STATIC OUTPUT OF DETECTOR-
AMPLIFIER
plotted as a function of angle for various chords
(Figure 4-15) in the absence of time constants,
in the detector or amplifier. These functions may
be approximated by ramp functions.
-- s_4____)(s____2)(s+ 1T1 T3 "_3
(4-49)
where rl is the cell time constant, and Tz and T3
are the lower and upper amplifier time constants.
The values for these parameters will be taken as
2.5, 4.56, and 0.94 milliseconds, respectively
(assuming an amplifier bandpass of 35 to 170
cps).
The response of the detector-amplifier to a
ramp function of K volts per second slope, and
duration _'4 seconds is
r,T3s(s.4_l)(s.4_l)(s+1"
(4-50)
4-24
The corresponding time function is readily ob-
tained by partial fraction expansion. It is
K [( )i-t/",.__)( )E°ut(tl---_I---T31 I 1 1 1
C -- t/r2
1 1 1 1 1
e- t/'r3
1 1"-I
T1 T2 T3 I
.1(4-51)
t -- T 4
(n T3) 1 1 -1 1
I_T2 1"1//_ 3 rl
t -- T 4
e T2
1 1+_k't'l T2 / k T3
+
t -- T 4
C T1
T2 t > "1"t
This time function is plotted in Figure 4-16 for
ramp function 5 of Figure 4-15 at a nominal spin
rate of 100 rpm. The leading edge of the pulse
may be used to trigger a threshold circuit set at
an appropriate level.
The basic signal processing applied to the
detector-amplifier pulses is illustrated in Figure
4-17. Threshold levels are set in two monostable
multivibrators triggered by the detector-ampli-
fiers. The outputs of these muhivibrators are
equal and opposite in magnitude and may be
determined by zener diodes. If the outputs Of the
two muhivibrators are summed together, a rec-
I
U
m
m
=_
g
i
m
u
u
b
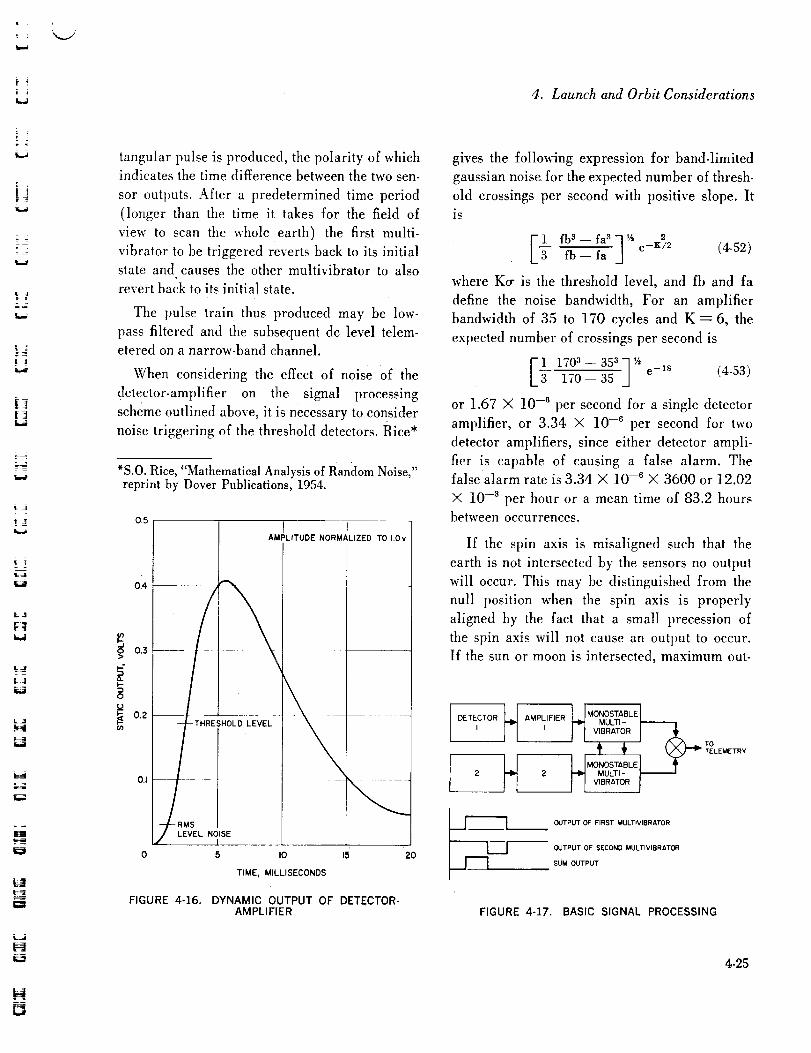
z ;t i
|J
L j= :
t_3 ,
K,d
_4= =
_t__
F!
L__,t
nN
H--.==_.
tangular pulse is produced, the polarity of which
indicates the time difference between the two sen-
sor outputs. After a predetermined time period
(longer than the time it takes for the field of
view to scan the whole earth) the first multi-
vibrator to be triggered reverts back to its initial
state and causes the other multivibrator to also
revert back to its initial state.
The pulse train thus produced may be low-
pass filtered and the subsequent de level telem-etered on a narrow-band channel.
When considering the effect of noise of the
detector-amplifier on the signal processing
scheme outlined above, it is necessary to consider
noise triggering of the threshold detectors. Rice*
*S.O. Rice, "Mathematical Analysis of Random Noise,"reprint by Dover Publications, 1954.
05 t IPLITUDE NORMALIZED TO I.Ov
0.4
o'}
ho> 0.3
0
_ 0.2
0.1 ! -
VEL NOISE
I .......
0 5 I0 15 20
TIME, MILLISECONDS
FIGURE 4-16. DYNAMIC OUTPUT OF DETECTOR-
AMPLIFIER
4. Launch and Orbit Considerations
gives the following expression for band-limited
gaussian noise for the expected number of thresh-
old crossings per second with positive slope. It
is
E1 fb3--fa3_ _ _3 fb -- fa e-X/2 (4-52)
where Ko" is the threshold level, and fb and fa
define the noise bandwidth, For an amplifier
bandwidth of 35 to 170 cycles and K = 6, the
expected number of crossings per second is
[1 170a -- 35_.'] '_3 170- 35 .J e-IS (4-53)
or 1.67 X 10 -6 per second for a single detector
amplifier, or 3.34 X 10 -6 per second for two
detector amplifiers, since either detector ampli-
fier is capable of causing a false alarm. The
false alarm rate is 3.34 X 10 -6 X 3600 or 12.02
X 10 -3 per hour or a mean time of 83.2 hours
between occurrences.
If the spin axis is misaligned such that the
earth is not intersected by the sensors no output
will occur. This may be distinguished from the
null position when the spin axis is properly
aligned by the fact that a small precession of
the spin axis will not cause an output to occur.
If the sun or moon is intersected, maximum out-
DETECTOR H AMPLIFIERI
m MONOSTABLE I
MULT_-
V'BRATOR I
'_ _ i (_ TEOLEMETRY
l I O OSTA"LEII-*IMULTJ-II
OUTPUT OF FIRST MULTIVIBRATOR
OUTPUT OF SECOND MULTIVIBRATOR
SUM OUTPUT
FIGURE 4-17. BASIC SIGNAL PROCESSING
4-25

Hughes .4ircra[t Company
put will occur, but only due to a single sensor
since the subtended angle (1/2 degree) is less
than the angular separation of the two sensors.
If only one sensor intersects the earth maxi-
mum output occurs, the polarity of which
indicates which direction to precess the spin axis.Situations could arise where one sensor inter-
sects the earth, the other the sun or moon, etc.,
but these conditions are predictable and none of
them give the same as the desired output pattern
near the null.
The sources of error affecting the pointing ac-
curacy are cell and amplifier noise, telemetry
link noise, non-uniformity of infrared emission
from earth, and boresight misalignment of the
optical axis. Since, as previously stated, in the
14 to 18 micron range of radiation the earth is a
reasonably uniform source, that contribution of
error may be taken as negligibly small, espe-
cially for a system utilizing edge detection.
A 30.0-db signal-to-noise ratio of the detector
amplifier places the rms noise level at 0.0316 of
the static (dc) output or about 0.0776 of the peak
dynamic output of the detector amplifier. At the
threshold level, the slope of the detector-ampli-
fier pulse is 0.125 volts per millisecond. The
uncertainty of when the threshold circuit is trig-
gered is then 0.0316/0.125 = 0.253 millisec-
ond as the deviation or 0.358 millisecond as the
deviation of the difference between the two de-
tector-amplifiers. This deviation is reduced by
two factors before entering the telemetry down
link, low-pass filtering of the muhivibrator pulse
and by the geometrical factor developed
previously.
The bandwidth of the detector-amplifier is
approximately 100 cycles wide. Since the space-
craft axis is not precessing, a 1-cps low-pass
filter may be used, giving a 10:1 reduction
4-26
of the time uncertainty. The time uncertainty is
then 0.0358 millisecond or 0.0215 degree at a
100-rpm spin rate.
As the angular separation of the optic axes
increases, the geometry further reduces the an-
gular uncertainty, but this improvement is par-
tially offset by decreasing attack angle of the
limb by the sensor field of view which reduces
the slope of the detector-amplifier pulse, corre-
spondingly increasing the time uncertainty.
A reasonable separation is taken as 13 degrees.
The improvement factor is then 0.434 as com-
puted from Equation 4-48. The transmitted an-
gular pointing error is then 0.00955 degree.
This very small error will be degraded by the
telemetry down link, if transmitted over a single
telemetry channel, because of the large dynamic
range of the signal. The largest signal trans-
mitted occurs when only a single sensor subtends
the earth, equivalent to ±18 degrees. If the peak
signal-to-noise ratio of the telemetry channel is
30 db, the rms noise error is about 1.1 degree
which is excessive. If a second telemetry channel
is scaled to 35 times the sensitivity of the first,
the three-sigma variance of the noise angle is 0.1
degree. Therefore the desirability of using two
telemetry channels is evident for course and fine
positioning of the spin axis.
Phased Array Antenna Control. The system of
phased array antenna control by the earth sensor
is illustrated in Figure 4-18. Pulses from either
detector may generate a reference pulse for
PACE, both of which occur simultaneously if
the attitude of the vehicle is correct. Since there
is a deviation of 0.358 millisecond on the time
occurrence of each pulse, assume the first pulse
provides the PACE reference. If P is the prob-
ability that one detection has occurred, then
P' -- 2P -- p2
W
U
m
g
[]n
g
m
[]n
U
W
U
mmmu
[]m
M
w
rt_
H
= =Iw
z
J
u

,._j
4. Launch and Orbit Considerations
r-SATELLITE
I[irIII---
l DETECTOR I I AMPLIFIERI I_ I
SIMPLIFIEDPACE ]l_J
I MONOSTABLE I
MULTI -
VIBRATOR
MONOSTARLEI
T-- MULTI - ',
VIBRATOR
)
SWITCH l NORMAL MODE91PSUEDO
_,d EARTH PULSE
COMMAND
RECEIVER
TOv TELEMETRY
1 l I PULSETELEMETRY _ PULSE CENTERING
RECEIVER _ AND
FILTERING
GROUND
I PHASE_- SHIFTER
lIEPHEMER'S HAS SH, ,N S,GNALJ lI COMPUTER PSEUDO MODE COMMAND
L_
=l COMMAND
ITRAN SM ITTER
FIGURE 4-18. SIGNAL PROCESSING FOR EARTH SENSOR CONTROL OF PHASED ARRAY ANTENNA ELECTRONICS
is the probability that at least one of the two
pulses has occurred. It follows that
p _. 1 .vri---_
Let P' --=0.25, 0.50, and 0.75. The correspond-
ing values P are 0.133, 0.293, and 0.500. Relat-
ing these probabilities to the cumulative normal
distribution, we find values of 1.1, 0.55, and 0.
The mean time of occurrence of the first pulse
is shifted ahead in time by 0.55/0.68 sigma or
0.808 sigma (0.289 millisecond or 0.1735 de-
gree). The deviation of the first pulse is 0.55/
0.68 or 0.808 as large as the deviation of either
pulse.
Assume the effective bandwidth of the PACE
loop is 1 cps. Then the expected one sigma devia-tion of the beam is 0.1735/135 or 0.01635 de-
gree.
Inhibit Mode. If the solar or lunar image is
incident upon either detector, an undesired pulse
is generated. The lunar surface is more energetic
in the 14 to 18 micron range than the earth, but
subtends a smaller angle than the earth, so the
4-27

Hughes Aircraft Company
1.3 degree field of view is not completely filled.The net result is that the lunar and terrestrial
images generate about the same amplitude pulse.
The declination of the sun from the satellite
equatorial plane is
_i = 23.45 degrees sin 2¢rt (4-56)
where t is the fractional time of year measured
from the vernal equinox. For a 1.3-degree field
of view located 6.5 degrees from the equatorial
plane, the sun will be in the field of view when its
declination lies between ±5.6 to ±7.4 degrees.
This means that the
Sun enters field of view 3 April
Sun leaves field of view 8 April
Sun enters field of view 3 September
Sun leaves field of view 8 September
Sun enters field of view 4 October
Sun leaves field of view 9 October
Sun enters field of view 3 March
Sun leaves field of view 8 March
Therefore, for about 20 days per year, at least
a portion of the sun is in one of the fields of
view. Allowing another 16 days per year as safety
margin, the primary operation will be unusable
for about 10 percent of the year due to the sun.
The orbit of the moon is inclined to ecliptic
by 5 degrees, with the nodes regressing once
around in 18.6 years. The moon will enter and
leave the fields of view four times per month,
each period being approximately 5/12 day, or10 hours in extent. The earth sensor is affected
only when the nodal crossings occur near the full
moon, since the infrared illumination of the
moon is considerably less at other times. Assum-
ing the moon has sufficient irradiance for one
4-28
half its orbit, centered around full, to cause earth
sensor response, the earth sensor will be inopera-
tive 5 percent of the time because of the moon,
allowing the same percentage safety margin as
in the solar case. The total average time in which
the sensor is affected by sun or moon is then
0.10 + 0.05 -- (0.10)(0.05) or 14.5 precent
of the time (53 days per year).
During this time, a ground generated "pseudo
earth pulse" operates PACE through the com-
mand system. The ground station maintains an
ephemeris of inhibit times for the sun and the
moon, and switches to the pseudo earth pulse
mode during those periods. Attitude information
is unavailable during inhibit periods. The ground
reference is the solar pulse.
it is of interest to estimate the beam jitter dur-
ing the pseudo earth pulse mode. Conservatively
assume a 30-db pulse signal-to-noise ratio re-
ceived at the command receiver in a 300-cps
bandwidth. For a pulse of approximately 6.6
milliseconds wide, let the slope of the leading
edge be 31.6/3.3 or 9.6 volts per millisecond as
a point where the threshold device is triggered.
The one sigma time deviation of the triggering
time is 1/9.6 or 0.104 millisecond. Assuming
once again a 1-cps effective bandwidth for the
PACE loop, the deviation is 0.104/V"3-_ or
0.006 millisecond which is 0.0036 degree as a
one-sigma beam deviation. This compares with
0.01635 degree for direct operation from theearth sensor.
Alternative System- Strip Detector. The sys-
tem outlined above provides attitude and antenna
beam reference information for an average of
85.5 percent of the time. During the remainder of
the time, the antenna beam is dependent on
ground control. The alternative system described
here reduces the percentage of the time the an-
II
t
II
ml
II
w
MU
m
i
Hi
II
n
EJ
I
i
u
u
illil

t
=
12-
;=,
-_=
w
= .
L_
L_4
u
D
0
FIGURE 4-19. OUTLINE 01L. STRIP AND SQUARE
DETECTOR ELEMENTS
tenna beam control is dependent on ground com-
ma'nd. Assume we have a rectangular field of
view about 1.3 degrees wide, and 5 degrees high,
centered about the satellite equator, and coplanar
with the spin axis (Figure 4-19). This calls fora thermistor detector element about 0.1 x 0.4 ram.
The lunar image will produce only one
quarter as much signal as previously because
of the larger field of view, and so will not
trip the threshold device. When the declination
of the sun is between ±2.75 degrees, it will be
in the field of view. Using Equation 4-56 it isfound that the
4. Launch and Orbit Considerations
Sun enters field of view 14 March
Sun leaves field of view 28 March
Sun enters field of view 14 September
Sun leaves field of view 28 September
or for about 28 days per year. Allowing another
22 days per year as safety margin, the sun will
be in the field of view 40 days per year.
If the plane of acceptance of one of the sun
sensors precedes the optic axis of the earth sen-
sor by a small angle, its output may indicate the
presence of the sun just prior to the solar image
entering the earth sensor field of view. This in-
dication may be used to inhibit the earth sensor
pulse. Let this inhibit period be eight detector
time constants, 20 milliseconds or 1/30 of a
satellite revolution. If the earth follows the sun
by less than 1/30 revolution, its signal will be
inhibited. The total time therefore that the earth
signal is unavailable is 40/30 or 1.33 days per
year. It is necessary to provide pseudo earth
pulse signals from midnight to 12:48 a.m., local
time at the subsatellite point, for 40 days per
year.
4-29

II
_3
kit
kl
_w

. °
5. SPACECRAFT SYSTEM DESIGN
t..,4
; 1
L ;
; |
L3
[Jt_3
|
SPACECRAFT BLOCK DIAGRAM
|
Figure 5-1 shows the latest configuration and
interconnection of the various spacecraft sub-
systems. The diagram includes all nonquadrant
equipment plus one set of quadrant equipment.
All interconnections are indicated for a space-
craft containing four identical quadrants of
communications and telemetry and command
equipment.
COMMUNICATION TRANSPONDERS
The transponder accepts the incoming RF sig-
nal at approximately 6 gc and processes it in
preparation for radiation by the transmitter at
approximately 4 gc. Two modes of operation,
either of which may be chosen by ground com-
mand, are available: a multiple access mode
and a frequency translation mode. A block dia-
gram including frequencies and power levels of
the complete transponder is shown in Figure 5-2.
Although many of the building blocks are the
same in the two modes, the operation of each is
quite different. For either mode, a low frequency
(UHF) oscillator is used to generate power re.
quired for frequency translation or other signal
operations. In both modes the oscillator signal
is multiplied up in frequency to provide the in-
put mixer local oscillator signal. In both modes,
intermediate frequency amplifiers are employed
to increase the signal power after mixing, and
in both modes regulators are provided to supply
a constant --24 volt input. The rest of the blocks
are unique to one mode because of the basic
difference in operation and purpose of eachmode.
The multiple access mode is designed to per-
mit the interconnection of a large number of
ground stations in a high channel capacity fre-
quency division multiplex system. In this mode,
the transponder serves as a telephone relay sta-
tion, and the CCIR standards of intermodulation
distortion plus maintaining each signal in an
assigned channel are of paramount importance.
An additional design goal is to share the space-
craft transmitted signal emciently independent
of the number of channels in use. These goals
are met by utilizing a single-sideband signal from
the ground transmitter, employing a very stable
oscillator in the spacecraft, and converting to a
phase modulated signal for transmission from
the spacecraft.
The received signals, after frequency conver-
sion by the input mixer, are amplified in a 5.3 mc
bandwidth amplifier centered at approximately
35 inc. The amplitude of the composite signalfluctuates in the same manner as a band limited
noise; hence this amplifier must be linear to pre-
vent excessive intermodulation. The output power
of this amplifier averages less than a microwatt,
however, and the required linearity is achievable.
It would be difficult to produce intermodulation
levels of importance at such low signal levels
even if the attempt were made to do so.
The amplified received signals and the trans-
mitter master oscillator reference are the inputs
to the IF phase modulator which performs the
modulation conversion. The operation of this
modulator is described with reference to Figure
5-3. The composite signal and reference carrier
are introduced into a hybrid transformer ar-
L
5-1

Hughes Aircraft Company
ranged so that the signal produces in-phase vec-
tors and the carrier out-of-phase vectors at out-
put terminals A and B. The limiters restrict the
resultant vectors to a constant amplitude, so that
its modulation is low index phase modulation.This action of the limiters creates the second
sideband characteristics of a phase-modulatedcarrier. The limited resultant vectors are added
in the output summing network in the ratio (/z q-
1 ) / (,a -- 1 ), causing the resultant vector's phase
shift to be increased by the factor s. This arrange-
ment permits the ratio of carrier to signal to be
high enough prior to limiting to keep intermodu-
lation products low, while permitting the modu-
lation index to be subsequently adjusted to the
level corresponding to the communication sys-
tem requirements. The output of the phase modu-
lator is muhiplied up in frequency and increased
in power level to provide the drive for the com-munication transmitter.
Tile frequency translation mode is designed
primarily for television or other wideband usage
in which one ground transmitter utilizes the com-
plete channel. In addition this mode provides a
beacon signal for ground station tracking. The
frequency translation mode has no inherent bea-
con as does tile muhiple access mode in which
the carrier is always present. The primary design
criteria for the frequency translation mode in-
cludes meeting the envelope delay distortion
specifications for color TV and providing suffi.
cient signal to the communication transmitter to
allow it to operate saturated for a wide range
of input signal levels.
In operation, the received signal is mixed and
converted to an intermediate frequency of ap-
proximately 60 mc, amplified and limited and
then mixed again for conversion to the transmit
frequency. The limiter serves the additional func-
tion of introducing the beacon signal and con-
5-2
trolling its level. Wide-band circuitry is utilized
throughout the signal chain so that the resultingusable bandwidth is 25 mc--sufficient to meet all
CCIR television standards.
General Physical Arrangement of Trans-
ponder. The general arrangement of the trans.
ponder in the spacecraft, can be described with
reference to the division of circuitry shown in
Figure 5-2. The receiver mixers, bandpass fil-ters, preamplifiers, and RF switches are located
in the antenna electronics compartment just aftof the apogee motor. The antenna electronics
package is 6.6 by 5.6 by 3.8 inches in size and
weighs approximately 2.25 pounds.
Each of the dual mode transponders mounts
in an assembly shown partially assembled in
Figures 5-4, 5-5, and 5-6. This assembly meas-
ures 5.00 by 11.25 by 18.00 inches. The various
transponder units are mounted on two aluminum
bulkheads supported at the corners by aluminum
angles. The entire package is fully enclosed in
0.016 inch aluminum sheet, which serves as RF
shielding and provides structural support. Weight
of the entire package is 15.50 pounds.
Minor Control Item Description
Circuits Common to Multiple Access and
Frequency Translation Mode.
• Input Mixer. The input mixer is shown
in Figure 5-7. Stripline circuitry is employed
for all signal paths. A 3-db etched circuit ring
hybrid introduces both the received signal and
local oscillator signal. 1N832AM glass diodes
develop the intermediate frequency difference
signal which is coupled out through RF chokes
to an OSM output connector. The mixer intro-
duces approximately 6.5 db loss and operates
with a noise figure of 9 db.
m
ID
I
nH
I
W
H_U
7-_- i
I
mW
W

E ,
w
m
! :
t
L ...... J
I
FIGURE 5-1. SPACECRAFT BLOCK DIAGRAM
/

w
mm
I
m
m
m mm
Ii
I
m
into
w
im
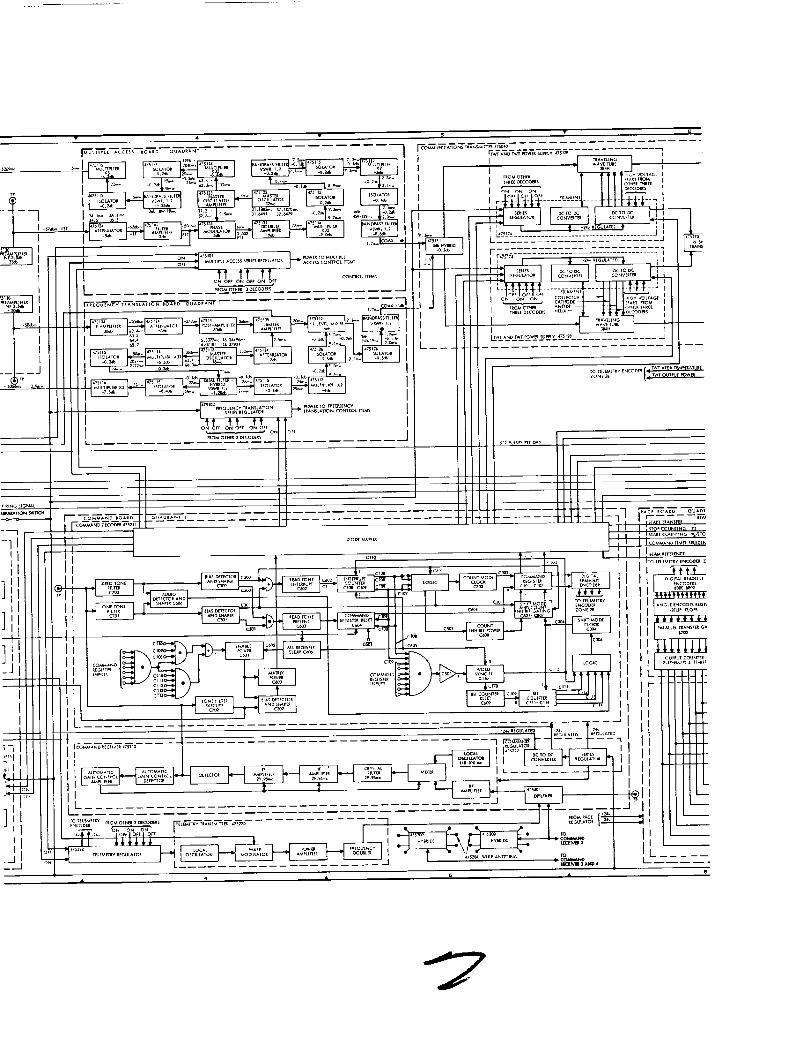
II
I
I
I
iJlIII
P ........................
Lr
II


iI _om otH_ tmEc 1
i aO_CODER5
L__
_/
q'HASEiH_F_E,
ON
orr
• o_ p_cE i ZONe BC
.........._ t_F.... l-ll
t4FTER I PHA_[ _ HIFTE_ I I HASE _ _I_P
-. --IL . __
I
I--
'ACe 2
,7iW
i-
(_HA_e
"--76 ......... o_ j
,. _oo_ ._
A, i[_
en
J I
_tNGS
3 rrllNOS
"-'4.
"7,
"7,
_ l, trnl
,,,,,,,,-_ to _o_nla_ 2


9
:EL_mY mcomR_E 2_
y Elm
:_AL
I
F_O_ CC_M_NaDtCOOm 3 ,mI_ 4
SE_ATFON
%
i SEP_ATIONSWITCH
_( 2B
_oM co,_v,A NnECODm 1ANO
?
CO.AND _mm wren
OUA_ANT _O. k OaAL S + _ 2T?-+ 0_+ 0 0 0 0
2 _2 0 0 0 I
3 01-_ | 0 0 I I+ 0;-+ 0 0 I 0
.... 1....i2 Q_2 I3 02_
n-i I it-1
_ J ....IH
imr .e.
i o o o
o1111os_oo
0_
ill
o
CO_M_NO _U_C_,ON C'tAL t
_ODE ON. MUITIP_tACCESS ,_oo[ orr, _-_ i
LATION NODE OFF _-3
t4H
,,..,_o+.o,, 1:I
s_
HIG_ VOLtaGE ON 7-I747-_
_c_ _*cE ON mR QU_N_ 0-ISffCIF_m, ALL OTHER
_kt PACEOF_ 2"1 I
ACCEPT _ h'T_NN,_ _O51T1¢ N II-2 I
m_SE SH_n_ CmlV_ _1-3
............... "2:R_OU_,TO_ OFF
ECLIm MOrn Cm_TI_N _-I T 0ON
ECLIF_E _ODE OPEIAT_CN i?-? I 0
÷_ COUNTt_ ON ;_-_ I
tEL[_mY mE_ET_y ON _-_
r_tm_Y c_r162
11-4
_ImO_Lt_NI _IIE _S I AN _,
t_+tc_ uP .oonFIlE +_<i_ J_, SysTEM 164? tl_C_u_ moDt3
FrRE _OlAL JET SYSTE_ 16-4
FIIIN_ FIRECONTI OL S_T_M 17-)CIICUIg _IBS
REL_S[ COh_r_OL _7-2SYSTEM LOCKING FINS
Tp : _ST ACC[$5 _INT
+ i +
i i i
FU_+_OFO j uP-rtO_ ) G*TEOW_J_
0
,I I
I0
o i io o o
i i o
oo+oo
ooi
0_'%-
i
o
1
5-3


1
:....-:
z ;
1
t--:
= ;
w
Bdb!
COMMANDS [ ON
OFF
SIGNAL
6019.325 mc
6108_27562t210
6301 05
COAX -13 db
59BB-Ib6269 mc
COMMANDS 'I ON
OFF
I[16
I I MULTIPLIER
_"r'' I ×_
115 4mW[_
ISOLATOR
-O2db
TEST
2 db B_
34.09, :
I '=; --I._._I ATTENUATOF
;-1....
104
._ INTER-
AMPLIFIEN
30 db :
II5
l ISOLATOR-0.2 db
-E116
_9_ _
-4.Sdb
OR
GATES
t_
FIGURE 5-2. TRANSPONDER BLOCK I
w

m
mm
U
m
)
i
)
i.
i
i
i
i
m
W
NH
ms
i
m_m,,I

OFF
J
FS2_8
18row
50db 8W_ 132m¢3rib 8W_lg mcFLAT_ 6 me
l 4.8 mc
34.55, 35.09, 35,55 met41
rf4
_ r_o_ i
62 4--l*6S 3mc
123
I AMF
31 2-_.32.6mc
i31
MULT{PLE ACCESS
FILTER _ PHASE
AMPLIFIER MODULATOR
12 db 3db
_4.1 34,5 35,1 35.5mc: 8W=55m¢
_26
9.Tmw
114
COAX - I db
COAX -I
3db BW_39mcFLATZ 25 mc
2 2row BANI
.....
_s'Jdb IFC _3T
20mw
TOR J
FREQUENCY TRANSLATION ..j
31AGRAM

1
i
g
LI
_w _r

COMMANDS
' 1125
i_-.°IWAVETUBE348 H
171 l 173
1
I 5 db FER
i 13row I" NYBRID $W-0.2 db -0
O 6row
174 l
I ; -I CONVERTER '- 1_i _JN ON OFF
J
COMMANDS
TELEMETRy
172
i_ 1 I 20-23db t
iE I 3 7w I OUAL 35wCH _ COUPLERdb ! I DETECTOR
.J I -o,,,b
I
TEST
193 Ifq. = _ o=l
(f") FT = 2 (' _')/_A
SIGNAL BEACON3992 09 mc 4006 95 m¢4051 08 _ 1641i9 94 4135 28 _ ]_ _ ,edb
'""""" LLi-40row rain
/ 3db BW_49mCI _'"' _"° /// 1
I " I _IBE_ON-_b_ S+STE_/
- I
'--FFt 'TR/_NSIEJNDERTRANSMITTERs
5-5

r
r

5. Spacecra/t System Design
SIGNAL-_
._ ] _t. C+S _l LIMITER
HYBRID _ CARRIERTRANSFORMER
III
FIGURE 5-3. IF PHASE MODULATOR OPERATION
FIGURE 5-5. FREQUENCY TRANSLATION MODE--ASSEMBLED
• X32 Multiplier. The X32 multiplier
used in both frequency translation and multiple
access modes is shown in Figure 5-8. Muhipli-
cation from 63.4 mc to 2027 me is performed in
five varactor diode doublers. Each doubler is a
push-push type, single ended at the input fre-
°'
a) Front View
FIGURE 5-4.
b) Side View
ASSEMBLED TRANSPONDER
FIGURE 5-6. MULTIPLE ACCESS MODE--ASSEMBLED
quency and push-pull at the doubled output fre-
quency. A pi-matching network couples directly
to the driving transistor through a short coaxial
section. Fixed bias is provided for the diodes.
This bias unit is included in the X32 package and
5-7

Hughes dircra/t Company
a) Assembled b) Disassembled to Show Stripline Circuits
FIGURE 5-7. INPUT MIXER
consists of a dc-dc converter which provides --+45
volts bias voltage for the diodes.
• X3 Multiplier. The X3 multiplier is
shown in Figure 5-9. The multiplier is con-
structed in rigid large X-band waveguide. The
input resonator employs a coaxial section for
tuning. A varactor diode is utilized to generate
the output signal which is coupled out from a
waveguide cavity. Fixed bias, obtained from the
X32 bias supply, is used to set the varactor op-
erating point.
• X2 Multiplier. The X2 multiplier is
shown in Figure 5-10. In the multiplier, adjust-
able capacitive input coupling is provided to a
stripline resonator with varactor diodes at one
end of the resonator. The output resonator is a
ridged waveguide cavity. Two varactor diodes
are series-connected across the output as a push-
push doubler. The diodes are driven--one to
cathode, one to anode--effectively in parallel
with respect to the input signal and in series
with respect to the output frequency. Fixed bias
is provided to the varactor diodes from the X32
bias supply -- RF chokes are placed on the bias
input lines to prevent interaction between the X2and X32 units.
• 6 gc Bandpass Filter. The 6 gc bandpass
filters (Figure 5-1i) are used in the receiver
local oscillator chains of both the frequency
translation and the multiple access transponders.
The filter is a dual cavity bandpass filter de-
signed to pass the local oscillator frequency and
reject spurious signals outside the passband,+!t
is constructed of two iriscoupied cyiindricaI"RF
cavities with probe input and output coupling.
Input and output impedance are 50 ohms. Band-
width at 3 db down is approximately i8 inc.
• Isolator. The 2 kmc and 4 kmc isolators
used in both transponder modes are shown in
Figures 5-12 and 5-13. The isolators have strip-
line Y-junctions with a magnetized ferrit e disc
at the center to provide circulation action. In-
sertion loss in the forward direction is approx-
imately 0.2 db and isolation at the center fre-
quency exceeds 30 db.
• IF Attenuator. The IF attenuator is con-
nected between the IF preamplifiers and the IF
postamplifiers, and between the beacon fre-
5-8
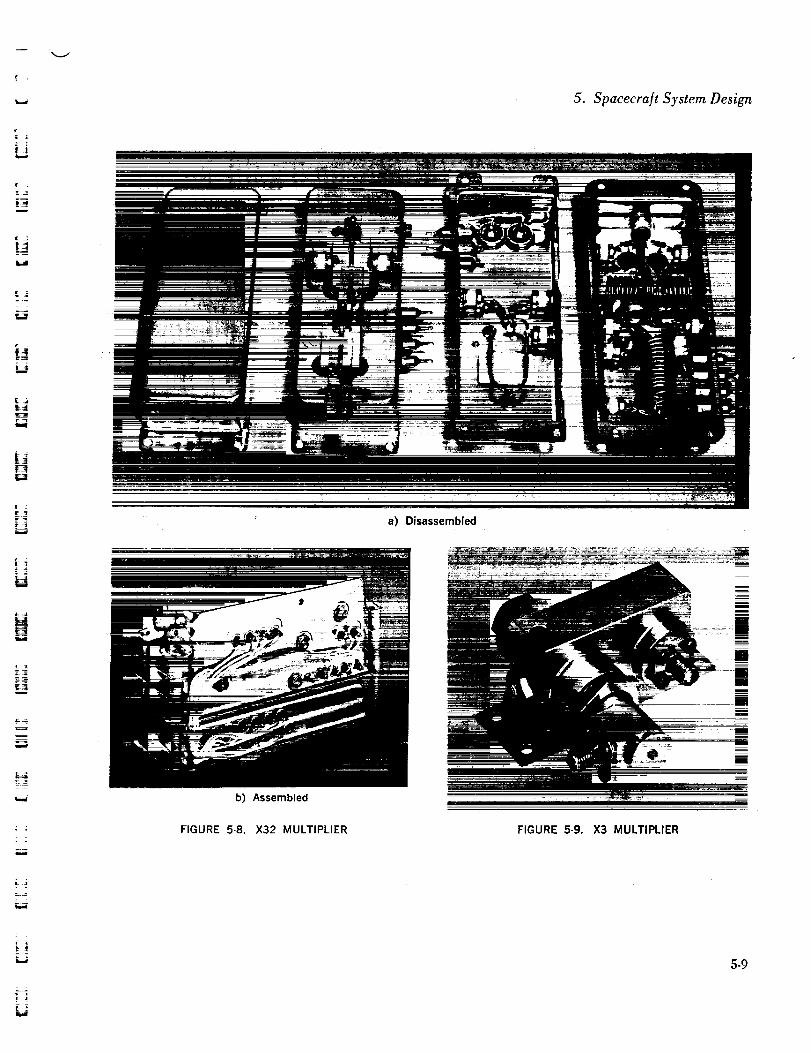
=4
= :
W
L_
w
H
w
u
2
w
b) Assembled
FIGURE 5-8. X32 MULTIPLIER
5. Spacecraft System Design
a) Disassembled
FIGURE 5-9. X3 MULTIPLIER
5-9

Hughes Aircraft Company
FIGURE 5-10. X2 MULTIPLIER
FIGURE 5-12. 2 KMC ISOLATOR
quency generator and the limiter amplifier. Its
purpose is to provide a fixed squelch and ampli-
tude threshold relative to the noise level by
adjusting the overall signal amplification. Sev-eral different attenuations are available for use
as system measurements dictate. The input and
output impedance is 50 ohms.
• 4 gc Bandpass Filters. A bandpass filter
is utilized at the output of each mode to reject
spurious signals before they can reach the trans-
5-10
FIGURE 5-I1. 6 GC BANDPASS FILTER
FIGURE5-13. 4 KMC ISOLATOR
mitter. The filter has the following specifications:
3 db bandwidth 39 mc
30 db bandwidth < 124 mc
Flat bandwidth _ 25 mc
Maximum loss 0.6 db
R
i
i
[]
|[][]
Umm
[]
i
N
I
m
_m
U
mm
B
i
W
Mm
t: i1

w
KEL_
FIm
I,,,d
( ]
!!
! t
ial
I1W
i: i
.J
FIGURE 5-14. REGULATOR-- FREQUENCYTRANSLATION TRANSPONDER
• Regulators. The regulators used for fre-
quency translation (Figure 5-14) and multiple
access (Figure 5-15) are similar series regu-
lators having nominal output of --24 volts at 126
milliamperes (3.02 watts) for the frequency
translation mode and 110 milliamperes (2.64
watts) for the multiple access mode. The regu-
lators require an additional 4 milliamperes for
operation. This current is independent of un-
regulated bus variations of --31 -4- 5 volts. The
power drawn from unregulated bus varies di-
rectly with input voltage as follows:
Frequency translation
P_Ax 36 volts X 114 milliamperes--2.47 watts
P_tN 26 X 114 milliamperes = 4.11 watts
Multiple Access
36 volts X 130 milliamperes -- 4.68 watts
26 volts X 130 milliamperes -- 3.38 watts
For load and line variations from 30 ° to 90 ° F,
the output voltage regulation should be 4-3 per-
cent or better for the frequency translation trans-
ponder, and ---+2 percent for the multiple access
transponder. (For details, see page 5-16.)
5. Spacecraft System Design
FIGURE 5-15. REGULATOR -- MULTIPLE ACCESSTRANSPONDER
FIGURE 5-16. CRYSTAL MASTER OSCILLATOR
Frequency Translation Mode Circuits
• Crystal Master Oscillator. The master os-
cillator (Figure 5-16) is an eight-transistor stable
RF source with outputs of approximately 65 and
48 mc. A crystal controlled transistor oscillator
provides a basic frequency of approximately 16
mc. The basic frequency is multiplied by four
and amplified to approximately 350 milliam-
peres to provide the 65 mc output to the X32
multiplier. The crystal master oscillator controls
5-11

Hughes Aircra]t Company
FIGURE 5-17. DUAL FILTER HYBRID
FIGURE 5-18. FREQUENCY TRANSLATIONPREAMPLIFIER
both the local oscillator frequency and the output
carrier frequency of the frequency translation
transponder. The 48 mc output is generated by
multiplying the basic frequency by three and
amplifying the signal to 3.2 milliwatts. This sig-
nal is routed through an attenuator to the limiter
amplifier to become ultimately the transponder
beacon frequency. The power supply require-
ments of this unit are --24 volts de -4- 1 percent
and --4 volts de -4-_1 percent.
FIGURE 5-19. FREQUENCY TRANSLATIONNTERMEDIATE AMPLIFIER
r .
• Dual Filter Hybrid. The dual filter hy-
brid (Figure 5-17) divides the 2000 mc signalfrom the oscillator-multiplier chain into two
equal parts and filters each half separately to
remove undesired harmonics and provide sepa-ration be'tween receiver and transmitter local os-
cillator chains. A quarter-wave stripline hybrid
is used to split the power; two identical three-
resonator bandpass filters provide the necessary
filtering.
The specifications for this unit are as follows:
Center frequency (fo)
Insertion loss (fo)
VSWR(fo)Rejection (fo -4- 40 mc)
Hybrid output ratio
Hybrid directivity (fo)Isolation between filters
(fo - 40 mc)
Weight
2112 mc
1.25 db maximum
1.20:1 maximum
40.0 db minimum
6.0 db ± 0.5 db
20.0 db minimum
90.0 db minimum
8 ounces maximum
• Intermediate Frequency Amplifiers. The
frequency translation preamplifier ilocated with
the antenna electronics), intermediate ampli-
fier, and postamplifier (Figures 5-18, 5-19, and
5-20) are transistorized amplifiers each of 30
db gain and 25 mc bandwidth. The preampli -_
=
I
tel
11
[]R
i
i
|
|m
m
Lr_---%t
MN
B
i
5-12
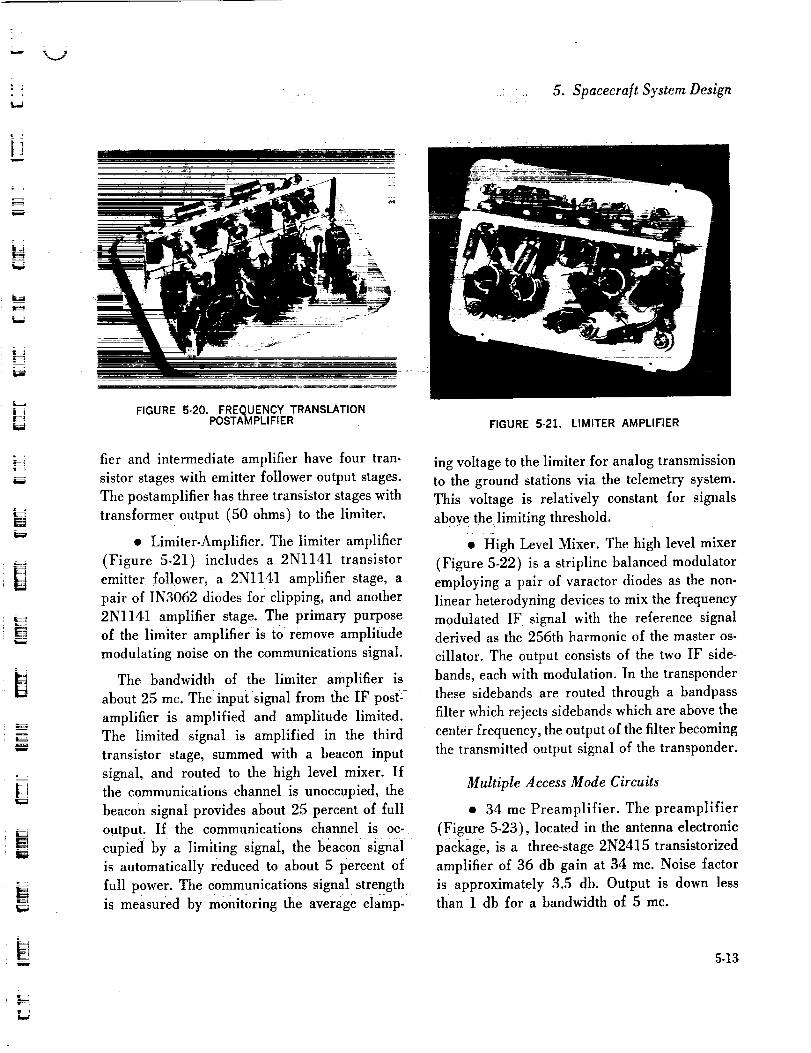
5. Spacecra]t System Design
L_
w
H
L
mw
_=_
[]
• i
w
FIGURE 5-20. FREQUENCY TRANSLATIONPOSTAMPLIFIER FIGURE 5-21. LIMITER AMPLIFIER
tier and intermediate amplifier have four tran-
sistor stages with emitter follower output stages.
The postamplifier has three transistor stages with
transformer output (50 ohms) to the limiter.
• Limiter-Amplifier. The limiter amplifier
(Figure 5-21) includes a 2Nl141 transistor
emitter follower, a 2Nl141 amplifier stage, a
pair of IN3062 diodes for clipping, and another
2Nl141 amplifier stage. The primary purpose
of the limiter amplifier is tO remove amplitude
modulating noise on the communications signal.
The bandwidth of the limiter amplifier is
about 25 mc. The input signal from the IF post:
amplifier is amplified and amplitude limited.
The limited signal is amplified in the third
transistor stage, summed with a beacon input
signal, and routed to the high level mixer. If
the communications channel is unoccupied, the
beacon signal provides about 25 percent of full
output. If the communications channel is oc-
ing voltage to the limiter for analog transmission
to the ground stations via the telemetry system.
This voltage is relatively constant for signals
abov e th e limiting threshold.
• High Level Mixer. The high level mixer
(Figure 5-22) is a stripline balanced modulator
employing a pair of varactor diodes as the non-
linear heterodyning devices to mix the frequency
modulated IF signal with the reference signal
derived as the 256th harmonic of the master os-
cillator. The output consists of the two IF side-
bands, each with modulation. In the transponder
these sidebands are routed through a bandpass
filter which rejects sidebands which are above the
center frequency, the output of the filter becoming
the transmitted output signal of the transponder.
Multiple Access Mode Circuits
• 34 mc Preamplifier. The preamplifier
(Figure 5-23), located in the antenna electronic
cupied by a limiting signal, the beacon-signal package, is a three-stage 2N2415 transistorized
is automatically reduced to about 5 percent of amplifier of 36 db gain at 34 mc. Noise factor
full power. The communications signal strength is approximately 3.5 db. Output is down less
is measured by monitoring the average clamp- than 1 db for a bandwidth of 5 inc.
5-13

Hughes Aircra/t Company
=_ #V
a) Assembled
i :_ :. _ - i I
[ llml/I iii ii ii i ul Illll
FIGURE 5-22. HIGH-LEVEL MIXER
b) Disassembled
l
B
li
z :
FIGURE 5-23. 34 MC PREAMPLIFIER
• Filter Amplifier. The filter amplifier,
which operates at 34 mc, is designed to pass fre-
quencies 250 kc above the carrier and upward
and reject frequencies from 200 kc below the
carrier and downward. The unit (Figure 5-24)
includes three notch circuits and three transistor
stages of amplification. Gain is 14 db.
5-14
FIGURE 5-24. FILTER AMPLIFIER
• Phase Modulator. The phase modulator
(Figure 5-25) is a four transistor stage device
that converts the amplitude modulated IF signal
to a phase modulated basic carrier signal that
is subsequently multiplied by a factor of 128 and
transmitted by the traveling-wave tube amplifier.
The input stage has two 2Nl141 transistors, both
common base connected. Signals are applied to
a hybrid transformer to provide in-phase output
--4
_=
m
m
=
l
m
[]U
m
u

5. Spacecraft System Design
L
t_L
K,J
E_
_4
|=,4E_
W
[]
FI
w
= ,
E
B
_:_ _i_:_i_ _i̧
FIGURE 5-25. PHASE MODULATOR
FIGURE 5-26. DOUBLER AMPLIFIER
signals from the IF input and 180 degrees out
of phase output signals for the master oscillator
input. The output of each transistor goes to a
pair of IN3062 limiting diodes. Outputs of thetwo limiters are added in a resistive network and
applied to the base of a 2N1408 grounded base
output stage. The output level is 1 milliwatt.
• Doubler Amplifier. The doubler ampli-
fier (Figure 5-26) includes a 2N1405 transistor
X2 multiPlier (32 mc to 64 mc) and three stages
of amplification using two 2Nl141 and one 2N
FIGURE 5-27. 32 MC MASTER OSCILLATOR
707A transistor. The signal input is approxi-
mately 32 mc phase-modulated up to 5 inc. Over-
all gain is 16 db.
• 32 mc Master Oscillator. The multiple
access mode oscillator is shown in Figure 5-27
in prefoam condition. In final form, the nonmag-
netic stainless steel block is surrounded by 1 inch
of foam to make a 4-inch cube. The 1.5 pound
block provides a long thermal time constant with
excellent short time frequency stability, prevent-
ing excess frequency drift during eclipse. The
unit has been designed for a drift rate not exceed-
ing 8 cps 2 at the receiver local oscillator fre-
quency (6 kmc). The 32 mc master oscillator
includes a crystal transistor oscillator and a
transistor buffer stage. The oscillator drives the
receiver local oscillator chain and also provides
a 32 mc inputto the phase modulator through
the master oscillator amplifier.
• Master Oscillator Amplifier. The master
oscillator amplifier (Figure 5-28) receives a sig-
5-15

Hughes .4ircra/t Company i
FIGURE 5-28. MASTER OSCILLATOR AMPLIFIER
nal of approximately 32 mc from the master
oscillator and provides two output signals, one
at 64 mc which is further multiplied to become
the receiver local oscillator frequency and an-
other at 32 mc which is provided to the phase
modulator to develop the transmitted carrier
frequency of the multiple access transponder.
Two 2N1405, one 2N777A, and one 2N1506
transistors are employed in the multiplier-am-
plifier.
Regulators
Multiple ,4ccess Mode Regulator. The mul-
tiple access mode regulator is a series regulator
supplying --24 volts from the --31 -4-5 volt un-
regulated bus. The output voltage tolerance is
"4-2 percent for toad, line, temperature, and ini-
tial adjustment. Full load is 126 milliamperes
and is composed of the loads listed in Table 5-1.
For testing convenience, full load has been de-
fined in the test specification as a 200 ohm
resistor. This enables the test procedure to be
identical with the frequency translation mode reg-
ulator (102 unit, I = 110 milliamperes at full
load).
5-16
TABLE 5'i. MULTIPLE ACCESS MODE REGULATORSLOAD ANALYSIS
Multiple Access Current,Transponder Receiver milliamperes
130 Preamplifier
141 Filter amplifier
122 Master oscillator
123 Master oscillator amplifier
131 Phase modulator
132 Doubler amplifier
114 X32 multiplier(2 units at 11 milliampereseach)
3.58
2.8
3.65
33.6
28.0
32.5
22.0
126.13
Test results on the first unit were comparable
to the breadboard results reported in the June
1963 Monthly Progress Report.* Load, line, and
temperature regulation on this unit are summa-rized in Table 5-2.
TABLE 5-2. MULTIPLE ACCESS MODE REGULATOR
VOLTAGE REGULATION
Regulation
iLoad
Line
Temperature
Total
Conditions
200 < R < oo ohmsV,° = -- 26 volts, T = 75" F
-- 36 < V,. < -- 26 voltsR -----200 ohms,T ----75" F
+30<T<+ 120° FR = 200 ohms,V_,= -- 26 volts
Load, line, and temperature
Measured A V
PercentMilli- ofvolts 24 Volts
21 0.0875
3 0.0125
63 0.262
87 0.362
The voltage temperature coefficient of this
unit was positive at -t-29 ppm/°F. However,
this coefficient may be positive or negative, de-
pending on differential amplifier tolerances. The
maximum measured temperature coefficients,
based on four differential amplifiers, were --37.5
<Kt<+29 ppm/°F.
*Syncom Monthly Progress Report, June 1963, p. 4-44and 4-46 and Table 4-14.
m
ta
i
IB
IB
m
i
BB
[]m
tt
m[]
= =
w
it=
w
i
Rl'
BB
u
U
I

=
L_r
The PARD was measured at 10 millivohs
peak-to-peak at full load. The term PARD is an
acronym standing for Periodic And Random
Deviations, recently introduced to the electronics
industry by the IEEE. Generally, it is the com-
bination of ripple and noise chargeable to the
supply. It does not include pertubations charge-
able to a "noisy" atmosphere or a switching load.
The latter would constitute dynamic load regu-lation.
Frequency Translation Mode Regulators
(102 Unit). This unit is a series regulator sup-
plying --24 volts from the --31 --+ 5 volt unreg-ulated bus. The output voltage tolerance is ±3
perceni for load, line, temperature, and initiai
adjustment. Full load is 110 milliamperes and
is composed of the loads listed in Table 5-3.
For testing convenience, full load has been de-
fined in the test specification as a 200-ohm
resistor. This enables the test procedure to be
identical with the muhiple access mode regu-
lator (101 unit, I = 120 microamperes at full
load).
Test results on the first two units were satis-
factory. Regulation data are given in Table 5-4,
as well as the average voltage temperature coeffi-
cient over the specified range and the maximumPARD.
COMMUNICATION TRANSMITTERS
384H Traveling-Wave Tube. During the re-
port period the primary effort was directed to
three general areas: additional tube developmeni,
quantity production of tubes and initiation of a
cathode life improvement program. A higher
gain traveling wave tube has been developed
without sacrificing stability, reliability, high
efficiency, or cathode life. All the design charac-
teristics of the 'traveling-wave tube have been
5. Spacecraft System Design
TABLE 5-3. FREQUENCY TRANSLATION MODEREGULATORS LOAD ANALYSIS
Frequency TranslationTransponder Receiver
110 Preamplifier
104 Intermediate amplifier
111 Postamplifier (less zener current)
109 Limiter amplifier
113 Master oscillator
114 X32 multiplier
Current,milliampere.,
7.34
7.34
8.8
28.0
47.7
11.0
110.18
TABLE 5-4. FREQUENCY TRANSLATION MODEREGULATOR PERFORMANCE
Regulation Conditions
Load 200 < R < oo ohmsV_o= -- 26 voltsand T = + 75 ° F
Line -- 36 < V_.< --_26 voltsR -----200 ohms
and T = -t- 75* F
Temper- A- 30 < T < + 120" Fature R = 200 ohms
and V_.---- -- 26 volts
Total 150 < R < oo ohms-- 36 < V,. < -- 26 volts
A- 30 <T < A- 120°F
PARD 150 < R < _¢ ohms-- 36 < V_. < -- 26 volts+30<T< + 120°F
Voltage temperature coefficient
Measured A V
S/N 1 S/N 2
Per- Per-cent. cent-
Milli- age Milli- agevolts of 24 volts of 24
12 0.050 8 0.033
2 0.008 1 0,004
426 1.772 163 0.679
440 1.830 172 0.716
9 millivolts 6 millivoltspeak-to-peak peak-to-peak
-- 197 -- 75.5ppml°F ppm/*F
tested and the results have been completely
evaluated. Methods to further improve perform-
ance of the present traveling-wave tube designhave been considered.
In the cathode life improvement program, the
cathode operating temperature of the 384H has
been accurately determined and is lower than
initially anticipated. Results of the cathode proc-
essing study verify that the tube will not fail
5-17

Hughes ,4 ircraft Company
due to loss of the zirconium activating agent.
The initial diodes have been constructed and
are operating in the diode test rack.
Development and Design. The present de-
sign of the 384H was based on following system
specifications:
Frequency
Du:s
Total dc power
consumption
(including heater
power)
Output power
Stability
Life
Weight
3.96 to 4.12 gc
CW
14.5 watts (maximum)
4.0 watts (minimum)
for all input power levelsfrom 0.4 to 0.7 milliwatt
Short circuit stable at all
frequencies and phases
50,000 hours
20 ounces (maximum)
Length 10 inches (maximum)
Cooling Via conduction to cold plate
Development was directed toward accommo-
dating changes in system requirements and re-
fining the design for production. The operating
RF input power of the traveling-wave tube was
changed from 1.0 milliwatt to 0.4 to 0.7 milli-
watt, increasing the required saturated gain from
36 to 40 db and imposing an input drive range
on the tube. The type of RF connectors were
changed from TNC to OSM. To assure repeat-
ability during the production run, the tube design
was refined by optimizing the helix pitch and
loss distribution and improving the impedance
match.
Table 5-5 lists the tubes constructed for this
development effort and summarizes the indi-vidual tube results. As indicated, tubes 32 and
33 were slightly longer than the previous tubes
and both met all the performance specifications.
Tube 32, with the same pitch as 384H-27, op-
erated at a helix voltage (V,,) of 1310 volts and
TABLE 5-5. DEVELOPMENT TUBES
Tube number Change from Previous Tube Test Results Status
31 Storage
32
33
34
35
36
Similar to tube 27 except for minor change inlossdistribution.
Same pitch as 27 except helix Is longer and lossdistribution modified.
Same as 32 except for 4 percent reduction inhelix pitch and slight change In loss distribution.
Same as 33 except for minor change in loss dis-tribution.
Same as 33 except for 2 percent increase inhelix pitch and modification of impedance match.
Sameas 34.
Constructed for previous specifications of 36 db.Tube met all specifications except gain was low(35db).
Tube met all specifications, but, efficiency wasnot sufficient to provide margin of safety in pro-ductionrun.
Tube met performance specifications, but outputpowerwas too marginal for productionrun.
Gain and power output low.
Tube met all performance specifications withreasonable margin of safety for production run.
Due to low insertion loss caused by distortedhelix, tube oscillated.
Storage
Storage
Storage
Scrapped(collectorbroke inpackaging)
Scrapped
D
U
n
i
==.
I
IDi
___mM
m
II
5-18

= _
r
ii
E _
iJ
r,-t
N
W
[]
H
m-a
E_
an anode voltage (V_) of 125 volts. While its
efficiency was within the requirements, the mar-
gin of safety was not considered sufficient for a
production design. Conversely, tube 33 had a
slightly smaller pitch and operated at Vh of 1200
volts and V, of 190 volts. The efficiency was
increased by this change, but the output power
was too marginal for this design to be considered
suitable for a production run. Consequently, tile
pitch of tube 35 was selected to be between those
of tubes 32 and 33.
The RF impedance match of tube 35 was im-
proved by a change in the rate and length of
the impedance tapered portions located on ti_e
ends of the helix. The loss distribution of tube
33 was repeated in tube 35. This particular dis-
tribution appears to produce greater stability
and dynamic range than other distributions With-
out decreasing gain or efficiency. The design of
384H-35 was selected for production.
To accommodate the OSM type connectors,
several modifications were necessary: the ex-
ternal portion of the tube impedance match was
modified, and, since the standard OSM connec-
tors were not mechanically adaptable to the
tube's pin match design, a modified version of
the standard OSM connector was used. The de-
sign of tube 384H-35 has been used and per-
formance tested on more than 20 tubes, and it
meets or exceeds with excellent repeatability all
the system requirements. The design parameters
are summarized in Table 5-6. A typical 384H
traveling-wave tube is shown in Figure 5-29.
Electrical Design and Performance. The
system requirements of high efficiency, high reli-
ability, and long life were the major factors in
the electrical design. To ensure high reliability,
it was desirable to take full advantage of con-
struction techniques developed in the earlier Syn-
5. Spacecraft System Design
FIGURE 5-29. 384H TRAVELING-WAVE TUBE
com program and, if possible, to use the same
parts. This was achieved by using a lower per-
veance gun. To attain the long life with a large
safety factor, a higher convergence gun was used.
High efficiency was achieved despite the antici-
pated drop in basic efficiency (efficiency before
collector depression) due to using a lower per-
veance gun, by improving the optics of the gun
and the focusing and collector design. The mini-
mum weight and size requirements were met
by using periodic permanent magnetic focusing
(PPM).
The helix structure design is similar to the
314H but scaled up in frequency and voltage.
Since the helix type traveling-wave tube is in-
herently a broad-band device with a peak output
at the center of its natural bandwidth, gradually
decreasing as the operating frequency moves
away from this center frequency, the natural
choice of an operating frequency for a narrow-
band high efficiency application is at this center
frequency. The 384H tube was designed in this
manner. Figures 5-32 and 5-33 illustrate this
"centering process" for this tube design. Figure
5-32 also indicates the variation of output power
with frequency for the two required levels of
input drive and Figure 5-33, the variation of
saturated beam efficiency with frequency for a
depressed collector voltage (V_ -- 700) and non-
depressed voltage (Vo = 0). The improved effi-
ciency of depressed over nondepressed voltage
5-19

Hughes ,4 ircra/t Company
TABLE 5-6. SUMMARY OF 384H DESIGN
PERFORMANCE(typical values)
Peakoutput power 4.4 to 5.0 watts
Saturated gain 40 db
Peakbeam efficiency 35 to 40 percent
VOLTAGESANDCURRENTS(typicalvalues)
See Figure5-30
Element
Cathode
Anode
Collector
Helix
Heater
Voltage
1290
160
-700
Ground
4.5
Current,milliamperes
20
0.08
19.0
1.0
0.260
ELECTRONGUN (continued)
Cathodematerial
Base High purity nickel with 0.1 percentzirconium;
Coating Double carbonate
Cathodecurrent density 125 ma/cm =
Estimatedwearout life 10 years
Gun perveance 0,34 microperv
FOCUSING
Type Periodic permanent magneticstructure
Magnetmaterial Platinum cobalt
Period 0,350 inch
Peakaxial field 900 gauss
DESIGN PARAMETERS(4.1 gc)
-ca 1.34
C 0.075
OC 0.24
Dielectric loading factor 0.73
Active helix wavelengths 25
ELECTRONGUN
Type Converging Pierce gun utilizingstacked self-aligning construction
Cathodetype Oxidecoating
operation is obtained by allowing the collector
power supply to recover a significant amount of=
beam power. The recovered power is equal to the
product of collector current times the amount of
voltage depress!on. The peak efficiency for pro-
duction tubes is typically 35 to 40 percent with
collector depression and 17 to 20 percent with-
out depression. Typical beam transmission with
full depression and at saturation is 94 to 97 per-
cent.
Figure 5-34 shows the typical variation in
gain with beam voltage, drive, and frequency.Thecurve for'Vh = 1175 is the maximum small
signal gain curve. As indicated, the maximum
RF STRUCTURE
Type Helix
Helix support Pressure assembly, triangulatedbarrel with ceramicrods
Impedancematch Tapered helix with step trans-former
MECHANICALFEATURES
Construction Metal ceramic
Weight 16.5 ounces
Length 9.25 inches
Outlinea'fid mounting See Figure5-31
small signal gain for this particular tube is about
54 db. The lower curves are for saturated and
small signal operation at the normal operating
beam voltages. The shift in frequency indicated
in the figure is always present when a tube is
overvohage, to obtain maximum efficiency.
Figure 5-35 shows log-log plots of output
power versus input power for the approximate
end points of the required bandwidth. The re-
quired power levels are indicated by light broken
lines. Peak efficiency and output power occur at
different drive levels for the two frequencies.
The heavy broken l_nes indicate the value of
gain in the linear (small signal) region.
5-20
=-
F.r_.
!
g
m
m
II
l
J
ll
i
mII
II
,,=_=
g
u
U
mlil
g
NI
m
t___t

5. Spacecra/t System Design
w
t _,
_J
U
M
H
dBROWN
4.5 v0.26omps
BROWN
CATHODE (20 maTYPICAL
YELLOW
HEUX-ANODE2me TYPICAL
COLLECTOR (18maTYPICAL
I /
160v
w
)
IN OUT
_m
FIGURE 5-30. TRAVELING-WAVE TUBE WIRING DIAGRAM
"1IIII
J
RED
+
59Ov
Figure 5-36 indicates the effect of anode volt-
age variation on the output power. Since anode
voltages are not large, small percentage varia-
tions are not critical. Conversely, variations in
cathode (helix or beam) potential are very crit-
ica!. To understand the problem, output pe r-formance over the frequency range and at the
require d input drive levels must be considered
simultaneously'
Figure 5-37 illustrates the output power sur-face of the 384H as a function of two variables:
frequency and input power. The surface of re-
quired performance is the 4.0 watt plane. The
points of high and low overall efficiency (includ-
ing heater power)i are indicated on the surface.
The change of drive required for saturated out-
put power as the frequency varies can be noted.
The lines of maximum power traverse the surface
from approximately the line (f=3.95 kmc,
P,n = 0.4 milliwatt) to the line (f = 4.20 kmc,
P1,--0.7 miiliwatt). To meet the minimum
power at the corners (f = 3.95, Pl° = 0.7 milli-
watt) and (f = 4.20, P,, = 0.4 milliwatt), satu-
rated power must be maintained between 4.4 to
4.8 watts. Figure 5-38 shows the effect of 4-1
percent beam voltage regulation on the output
power surface. As illustrated, the output drops
below the required value at the corners.
Since each traveling-wave tube will amplify
only one channel and beacon and have a separate
power supply, it was decided to split the fre-
quency range in half, one tube covering the range
3979.5 to 4066.2 mi. and the other the higher
frequency range 4119.9 to 4194.5 mi. No change
in tube design is required; each tube is merely
voltage tuned at two frequencies. Therefore, each
has two sets of operating voltages: one for 4.0
kmc operation and the other for 4.15 kmc opera-
tion. This solution allows the beam voltage regu-
lation to be increased to -4-1 percent without
sacrificing gain, efficiency, or output power.
Figures 5-39 and 5-40 illustrate this perform-
ance. Another advantage of the tuning operation
is that power output is slightly increased; typical
peak values range from 4.5 to 5.0 watts.
The 384I-I tube has an excellent impedance
match from 3.5 to 5.0 kmc. The percent voltage
reflection of the match is usually between 5 and
5-21

w
Hughes Aircraft Company
5.22
mI
_th,I
0
c_4"1
Zw
hCC
@
@
®
@
oJ
@
[
t:
O4
i
S
o t:¢_.
I
I
3rl
41t|
II
it
II
W"I"c_Z
¢/)
Z
ooo+1g,}
6
/
O4
L6
0 X
-2
W
O
BJ
I'--
7
W
m,
hi
h
m
J
m_u
m
J
I
U
_4
UM
w
U
m
J
I
N
U
[]W
rs
INJ
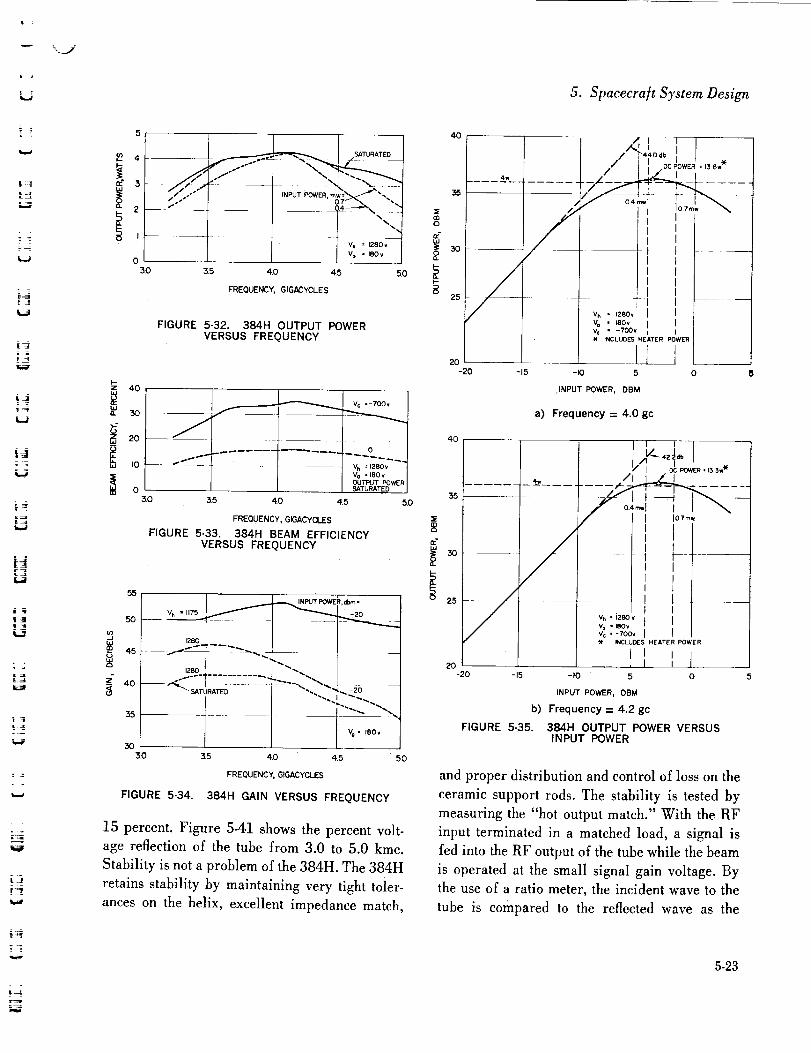
k
L2
& :;7
= =
U
iJ
i J
L_r_
L,J
E_:_l
L
-j
4 - - --
i J JI I I I v_--_eeo,
Vo = 180 vo L ] L I_ _°_,,o,_0 3.5 4D 4.5
FREQUENCY, GIGACYCLES
5.0
FIGURE 5-32. 384H OUTPUT POWERVERSUS FREQUENCY
F-Z 40
i,i
w
30
2O
I0
0i
3.0 3.5
v¢ =-700v
0
Vh = 1280v
Vo • 180vOUTPUT POWERSATURATED
4,0 4.5
FREQUENCY, GIGACYCLES
FIGURE 5-33. 384H BEAM EFFICIENCYVERSUS FREQUENCY
5.0
55
5o
/
-_ 45 --
Z 40
35
3O
3D
FIGURE 5-34.
J IF- ......
3.5 4.0 45 5.0
FREQUENCY, GIGACYCLES
384H GAIN VERSUS FREQUENCY
15 percent. Figure 5-41 shows the percent volt-
age reflection of the tube from 3.0 to 5.0 kmc.
Stability is not a problem of the 384H. The 384H
retains stability by maintaining very tight toler-
ances on the helix, excellent impedance match,
5. Spacecra]t System Design
4O
30
25
20
-20
4w/_4_40 db i I_
/ I I DCPOWER.I36w
/,..... t t ....
I tI II II I
v. • ,_so,I IVo • ,so, 1 IV¢ -700v
INCLUDES HEATER POWER
-15 -I0 5 0 5
INPUT POWER, DBM
a) Frequency = 4.0 gc
4o
35
30
25
i=
/ i/
/
2O
-20 -15
FIGURE 5-35.
t- 4I/ I I lob'm,
/" .........t!Vo • I_B(3_v_.-_oo,I I"W" INCLUOES HEATER POWER
I i i I
, I I ]
-I0 5 0
tNPUT POWER, DBM
b) Frequency = 4.2 gc
384H OUTPUT POWER VERSUSINPUT POWER
and proper distribution and control of loss on the
ceramic support rods. The stability is tested by
measuring the "hot output match." With the RF
input terminated in a matched load, a signal is
fed into the RF output of the tube while the beam
is operated at the small signal gain voltage. By
the use of a ratio meter, the incident wave to the
tube is compared to the reflected wave as the
5.23

_'4_, n 4, 05
v/J_"_OP 4.10
'%°%,,,
b) 1277 Volts
FIGURE 5-38. 384H HELIX VOLTAGE AT
+1 PERCENT REGULATION
5-24
__"X o__,L,.'" Stage I - Clean room assembly 2 m4.20 0.4 _ _\'"
Stage II - Bakeout process 4 ,_
Stage III -- Magnet assembly 2

\J
5. Spacecraft System Design
i.,..#
| J
6,0
5O
. 40
20
101240
I { I I IHELIX OPERATING ]
] VOLTAGE = 1273v ' RF POWER
J ] .... _ l ] INPUT row-
,?T,oZ __,,_l T 'f • 4 59c ]
vc" -6_'5 I / / I" TOTAL DC POWER {INCLUDING- F -7- -
HEATER} =13_w /
HELIX CURRENT = I 2 mo | ]
COLLECTOR CURRENT • 184mo | ]
1260 1280 1300 1320
HEL IX VOLTAGE,VOLTS
FIGURE 5-40. 384H OUTPUT POWER AS FUNCTION
OF HELIX VOLTAGES ADJUSTED FOR OPERATION IN
UPPER PART OF FREQUENCY BAND
Stage IV -- Focusing and RF
testing
Stage V -- Pre-aging 5
Stage VI - Refocusing and RF
testing 1
Stage VII -- Packaging 2
Stage VIII -- RF testing after
packaging 2
Stage IX - Environmental testing 4
Stage X -- Shipped 7
Qualification test 1
Transponder 4
Life test 2
The list includes only tubes that are still in proc-
ess and none that have dropped out because of
substandard performance or construction defects.
Two interruptions have delayed the planned
production schedule, but the consistent repeat-
ability of tube performance indicates that all
required tubes will be built and delivered on
time. The first interruption occurred before any
of the tubes had been packaged. The required
OSM RF connectors were not received on time.
The mechanical design of the tube package is
such that tubes cannot be packaged without the
connectors being installed. Consequently, after
several tubes had reached this stage production
was curtailed until the new connectors arrived.
The second delay was a temporary halt of the
production of standard tubes because a charging
problem was discovered. The charging phenom-
enon caused a slight power output variation that
was associated with a slow periodic helix current
variation. It was found that tubes with this varia-
tion had been constructed with improperly
cleaned ceramic windows, and the entire lot of
ceramics was scrapped and a new window put
into use. The magnitude of variation greatly de-
creased when tubes were pre-aged for 200 hours
after the initial focusing and then refocused.
Several experimental tubes were constructed in
an effort to learn the exact nature of the charging
phenomenon. To date, no significant data has
been obtained from these tubes. The change of
ceramics coupled with the pre-aging stage of
production appears to eliminate the problem.
After a 3-week delay, tube production was re-
sumed at an accelerated rate. During the delay
period, it was determined that the magnitude of
the output power variations would not affect per-
formance of the communication system.
Life Improvement Program. In a properly
designed vacuum tube, the ultimate or wearout
life is determined by eventual reduction of elec-tron emission from the cathode. An oxide cathode
consists of a nickel pellet coated with a mixture
of barium-strontium oxide (BaSr)O, usually
abbreviated as simply BaO. The cathode must beheated to 650 (' to 800°C to act as a useful
emitter. Pure BaO itself is a poor emitter; how-
ever, introduction of free barium atoms into the
5-25

Hughes ,4ircra[t Company
8
5-26
ozhi
O'
r,.,I.l.
t/)
00
LI.I
"I-
W
oz
a
80
z0t--onl..,ihU./
...,/
0
I-z,,i0
n,"W
-r
t_
8
t
¢.'
(f
q
z_" \_
,_o
f
J
fL..
I
(.
da. _"i.-
cC
o
o.
J.N3C)W3d 'NOI,I_)373':IW 30VI70A
ZL_I
C_W
b.
W
-I-0F-
i,i
oz
hi
I--0
O
z0im
U.I
h
...1
O
I--z
U.I0.
"r
gm
lil
m
I

5. Spacecraft System Design
. Z
BaO coating produces an active thermionic
emitter. During emission, the BaO coating acts
as an n-type, excess-inpurity semiconductor, with
Ba as the inpurity donor. Thus, an adequate levelof Ba donors must be maintained if emission is
to be preserved. This level is believed to be that
required to saturate the BaO coating, probably
less than 0.01 percent (by weight) of free bar-
ium. Unfortunately, the Ba atoms are continu-
ously being depleted through evaporation and
through chemical reaction with residual gas mol-
ecules and ions. (Even at a vacuum as good as
10 -9 Torr, there remain many billions of gas
molecules in the electron gun portion of the tube
alone.)
If emission is to be maintained, these lost Ba
atoms must be continuously replaced at a rate
equal to, or greater than, the sum of the evapora.
tion rate plus the gas "poisoning" rate. The re-
quired replacement Ba atoms are produced by
chemical reduction of the BaO coating molecules
to produce free Ba plus an oxide of the reducing
agent. The reducing agent consists of an impurity
element purposely introduced into the nickel
base-metal raw material before the cathode pellet
is fabricated. When the cathode is heated during
operation, this additive diffuses continuously
through the nickel pellet to the BaO coating
where it chemically reduces the coating to pro-
duce the required Ba atoms.
Based on this model of the oxide cathode, it is
clear that end of life will occur when the rate of
production of new Ba atoms falls below the rate
of poisoning loss of Ba atoms. According to the
diffusion dependency hypothesis,* the rate of
BaO reduction to free Ba is determined by the
rate at which the base metal additive arrives at
"See, for example, H. E. Kern, "Research on OxideCathodes," Bell Laboratories Record, December1960.
the BaO-nickel interface, and hence the Ba pro-
duction rate is controlled by the diffusion rate
of the additive through the base nickel. As the
additive is used up during life this diffusion rate
slowly decreases, until finally when the additive
concentration in the base metal has dropped to
50 or 60 percent of its original value, the dif-
fusion rate begins to drop quite rapidly. End oflife occurs when the additive diffusion rate is too
low to provide free barium at a rate which will
overcome barium losses.
The cathode material used in the 384H is a
very pure nickel alloy, containing 2 percent tung-
sten and 0.1 percent zirconium. The zirconium is
the active reducing agent. This additive has been
used for all Hughes space traveling-wave tubes to
date as well as for the BTL Telstar traveling-
wave tube. This choice is based on extensive ex-
perimental studies using various impurities which
indicate that Zr produces the highest activity for
the longest period of time.*
The diffusion rates for the 384H cathode were
calculated at the inception of the 384H program
with cathode temperature as the parameter. For
convenience the rate at which Zr arrives at the
BaO coating was plotted in terms of the rate of
Ba atom production that would result from the
availability of the arrived Zr. In order to estimate
end of life, a required minimum arrival rate must
be assumed equal to the expected rate at which
Ba atoms are being lost. Based on various acceler-
ated life studies, a conservative value is judged
to be 10 l° atoms/cm2/sec. Thus, based on the
diffusion-dependent life theory and the initially
determined range of cathode operating tempera-
tures (720 ° to 760°C) the calculated life of the
384H cathode is 140,000 to 220,000 hours.
_H. E. Kern and E. T. Graney, "Thermionic Emissionand Diffusion Studies on Zirconium - Doped NickelCathodes" Report on Twenty-Second Annual Con-ference, Physical Electronics, March 1962.
5-27

Hughes Aircraft Company
In order for the diffusion-dependent life theory
to apply, it must be certain that the amount of
BaO coating available is sufficient that the BaO
supply itself will not be depleted before the zir-
conium. Therefore the coating thickness and coat-
ing density are accurately measured on each cath-
ode used and the data recorded in the permanent
records kept for each tube. Calculations made for
the presently used coating density and thickness
indicate that more than adequate coating is avail-
able, so that this will not be the limiting factor.
The preceding discussion represents a much
idealized model of the oxide coated cathode, how-
ever, and the diffusion-dependent life theory has
not been completely verified on cathodes designed
for extremely long life since the time involved is
so great. However, accelerated life test data
obtained at other laboratories by purposely de-
signing cathodes with thinner base metal or with
faster acting additives have tended to verify the
life predicted by the theory. There is in fact some
doubt about the failure mechanism itself since in
at least one test the expec'ted reduction in additive
versus life was not observed.
The life theory described, which is the most
commonly accepted one, does not indicate any
dependence at all of cathode life on current
density. Nevertheless, considerable empirical
data from various other life test programs sug-
gest that life is a function of current density. In
fact, many estimates of cathode life are based on
such data, because experience and actual lifetests confirm that it is a reliable and conservative
way to predict cathode life. However, there issome indication that accelerated life tests on tube
types that had lower current densities showed a
more favorable required arrival rate at end of
life. In addition are various theories relating to
a possible dependence of life on cathode current
density which have to do with the electrical con-
5-28
ductivity of the coating. Some are reviewed in-
the introduction of a report by Hollister.*
Diode Program. In view of the design goal
of 5 years for the Advanced Syncom spacecraft
and discrepancies in the currently accepted cath-
ode life theories, a life improvement program
has been initiated to further understanding of
potential failure mechanisms. Present theoretical
understanding of the oxide coated cathode and
empirical data obtained from space tube pro-
grams are sufficient to assure that design of the
384H cathode will not fail due to normal deple-
tion of either the cathode coating or the zirconium
activating agent in the cathode base material.
However, as the part of the life improvement
program it is desirable to establish that cleaning
and processing of the tube parts, cathode coating
application, and processing and activation sched-
ules are adequate to ensure that full use of the
zirconium activating agent and barium oxide
coating is possible. It is also desirable to acceler-
ate eventual failure of the cathode in controlled.
tests to gain early knowledge of the long life fail-
ures to be expected and determine whether indi-
cations of eventual failure might occur during
the burn-in period of the 384H traveling-wave
tubes.
The life improvement program utilizes a rela-
tively inexpensive diode which is constructed and
operated under the same conditions as the 384H
traveling-wave tube. Except for the helix assem-
bly, the diodes have the same electron +gun, enve-
lope, and parts as the 384H. Therefore, the diode
cathodes have the same environment and operat-
ing conditions as the cathodes used in the actual
tube, ensuring that the data obtained from the
program will truly be representative of the 384H
cathode.
+"Some Effects of Ion Bombardment on the EmittingProperties of Oxide-Coating Cathodes," Cornell Uni-versity Research Report, EE 482.

= ,
tt
The primary variables under investigation are
cathode temperature, cathode thickness, and cur-
rent density. To determine the relationship be-
tween these variables and long life performance,
50 diodes, a diode life test rack, and power sup-
plies are being constructed.
• Cathode Temperature. The most critical
variable involved is the cathode temperature. Of
all the parameters measured in a tube, cathode
temperature is often the least precisely deter-
mined. Therefore, it was necessary to control and
reproduce the true cathode temperature within
-+-5°C and have a means of monitoring the cath-
ode temperature during the entire duration of the
life test program. To meet this requirement, plati-
num versus platinum -10 percent rhodium ther-
mocouples are being installed in each diode. To
minimize errors due to heat conduction losses,
2-mil-diameter thermocouple wire is being used.To ensure that the results obtained from the diode
life improvement program will be representative
of the 384H traveling-wave tube, the diodes are
processed under exactly the same conditions as
the 384H. During the bakeout, the vacuum enve-
lope is maintained at 500°C.
A method was developed to bring the thermo-
couple Wires out of the vacuum envelope without
degrading the integrity of the vacuum seal neces-
sary to obtain a "clean" environment. Two small
hollow molybdenum pins were brazed into the
ceramic wall of the diode, the thermocouple wire
running through the pins and copper-brazed in
place. Since the brazed joint introduces an extra-
neous junction in the thermocouple circuit, the
first diode built had two extra thermocouples built
into it. The first was placed at the brazed joint
(i.e., the extraneous junction) and the other was a
standard platinum versus platinum --10 percent
rhodium thermocouple attached to the cathode
alongside the regular thermocouple. The stand-
5. Spacecraft System Design
ard thermocouple was brought out of the vacuum
envelope, sealed in place with an epoxy resin,
and terminated in an ice bath reference junction.
Using this first diode, all these parameters have
been measured and the true cathode temperature
obtained very accurately by the standard thermo-
couple, thus enabling calibration of the brazed-
in thermocouple. The true cathode temperature
of each of the diodes can now be determined with-
in +--5°C.
From temperature measurements on the first
four diodes, it was determined that the 384H
cathode operates at a lower temperature than was
originally estimated (Figure 5-43). Since the
operating temperature of the cathode is indica-
tive of the poisoning atmosphere in the tube, the
results of this program substantiate the fact that
the poisoning atmosphere in the 384H is ex-
tremely low. This verifies the calculations that
barium oxide coating is more than adequate and
will not be depleted before the zirconium.
• Construction of Diode Cathodes. At the
inception of the life improvement program, itwas decided that one of the variables used to accel-
erate the failure of cathodes would be cathode
thickness. The life of the cathode would be calcu-
lated by the diffusion-dependent life theory for
2.0
I.S
_tt.6
n- 1.4w
wilg 1.2 _G CONDITIONS
I O _ HEATER VOLTAGE.4 5v
680 720 760 800 840
CATHODE TEMPERATURE, °C
FIGURE 5-43. 384H HEATER POWER VERSUSCATHODE TEMPERATURE
5-29

_j m
Hughes ,4ircraft Company
three different values of cathode thickness: nor-
mal, one-half normal, and one-quarter normal.
The cathode coating thickness and density will
be the same for all diodes. As the cathode is made
thinner it will contain less zirconium and produce
a shorter life. Thus it will be possible to confirm
the diffusion-dependent life theory.
A cross section of the cathode normally used in
the 384H is shown in Figure 5-44. The entire
cathode is machined from the 2 percent tungsten
--0.1 percent zirconium nickel alloy. The normal
thickness of the cathode is 16 mils (region A in
Figure 5-44. According to the diffusion theory,
if the thickness is reduced to 10 mils, the life will
be reduced from 26 years to 14 years. If the
thickness is reduced to 3 mils, the life will be re-
duced to 5 years. All these calculations are for
the normal operating cathode temperature. For
the thicknesses specified above, it seemed reason-
able to fabricate and build the diodes to these
specifications. However, the original calculations
ignored the effect of the side walls of the cathode
(region B in Figure 5-44). More detailed diffu-
sion calculations showed that as the temperatureof the cathode was raised to further accelerate
the failure of the cathode, the diffusion of zir-
conium out of region B will prevent the failure.
For example, a 3 mil thick cathode running at
the normal cathode operating temperature should
FIGURE 5-44. CROSS SECTION OF 384H CATHODE
5-30
fail after 5 years. When the operating tempera-
ture is increased to 480"C it should fail in 3months. At the normal operating temperature,
the effect of diffusion from region B would in-
crease the life by only 4 months. At 840* C, thelife of the cathode would be 2 years just by the
diffusion of zirconium from region B. It is there-
fore necessary to redesign the thinner cathodes.
The 3 mii thick cathode and the 10 rail thick
cathode are constructed as follows. Region B of
Figure 5-44 is made of 270 grade nickel, a
high purity nickel free from activating agents,
with a disk of the 2 percent tungsten- 0.1 per-
cent zirconium cathode alloy welded to it. This
disk is then machined to the required dimensions.
With the new design, it is felt that the diode pro-
gram will result in the data needed to verify the
diffusion-dependent theory of cathode behaviorl
All of the normal cathodes have been made.
Fifty one-half normal cathodes and fifty one-
quarter normal cathodes have been ordered. (The
10 mil cathods is considered one-half normal
cathode because its zirconium content will re-
duce the cathode life by a factor of 2; the 3 rail
cathode is considered a one-quarter cathode be-
cause its zirconium content should reduce the
cathode life by a factor , of approximately 4.)Ten of each have been received, and the balance
of the order is being machined to the final dimen-
sions.
• Cathode Cleaning Study. At the begin-
ning of the life improvement program, a thorough
study of the cathode cleaning process was started.It is known that certain elements such as sulfur,
silicon, and aluminum, when present in small
trace quantities on the order of a few hundredths
of a percent by weight, can "poison" a long life
cathode. Therefore, after the cathode is machined
to its final shape it must be cleaned. The cleaning
process should remove all contaminants and
I

= = 5. Spacecra/t System Design
degas and lower the carbon content of the cath-
ode with a minimum loss of the desired activating
agent (zirconium). To assure that goals were
being achieved, the cleaning process was divided
into three stages:
Stage i --chemical cleaning to remove
grease, surface film, and con-
taminants
Stage II -- wet hydrogen firing to lower thecarbon level
Stage III--surface etch, air oxidation, dry
hydrogen firing, and vacuum fir-
ing to remove embodied surface
contaminants not removed in
Stage I, prepare the cathode sur-
face for maximum adhesion of
the cathode coating, and degasthe cathode
Thirty standard 384H cathodes were then sent
through the cleaning process and a sample con-sisting of ten cathodes was removed after each
stage. The three samples were analyzed for com-
position and gas content. The results of these
analyses confirmed that stages I and III were ef-
fective, with no evidence of contamination pickup
or zirconium depletion. In stage II there was evi-
dence of some contamination pickup; the nitrogen
and oxygen content increased, and there was a
slight depletion of zirconium. However, the car-
bon and sulfur content was reduced to less than
ten parts per million for both elements, which is
an extremely low level. In stage III, the contam-
ination pickup was reduced to a su_ciently low
level to obviate any possible degradation of the
expected life of the 384H normal cathode. Diffu-
sion calculations also verified that the zirconium
loss was so slight that it would have no effect on
the life of the normal cathode.
Although the cleaning process was found to be
adequate for the normal 384H cathode, the con-
taminant pickup and zirconium depletion in stageII is a function of the thickness of the material
being cleaned. The 3 rail thick cathodes to be
used in the diode program would be contaminated
to an unacceptable level and the zirconium wouldbe reduced so much that these cathodes would be
useless. Therefore, immediate action was taken
to eliminate this problem. The source of contam-
ination has been traced to contaminants present
in the ceramic muffle of the wet hydrogen firingfurnace.
A different hydrogen furnace was taken apart,
cleaned, and reserved exclusively for processing
all space tube cathodes. This furnace was checked
for contamination by firing some thin samples of
270 nickel, in which it is easier to detect contam-
inations than in the nickel alloy used for the cath-
odes. It was calculated that the firing temperature
used in stage II was higher than necessary for theremoval of the carbon and that at a lower tem-
perature the zirconium depletion would be re-
duced to an insignificant level. Based on these
considerations a more optimum firing tempera-
ture was chosen. Thin samples have been fired
under these conditions and sent out for analysis.
The results had not been received at the time of
this report's publication. All of the normal cath-
odes required for the program have been proc-
essed and analyzed.
• Diode Life Test Procedure. In order to
obtain the life failure data in a reasonably short
period of time, the eventual failure of the cathodewill be accelerated in a controlled manner. This
will be accomplished by varying the cathode
thickness, cathode temperature, and cathode load-
ing in accordance with the following schedule:
1) Three normal cathodes to be run at normal
cathode temperature and normal cathode
5-31
Hughes Aircraft Company
current. Calculated theoretical life is 26
years. These diodes will serve as a controlto correlate diode results to the actual
384H tube.
2) Three normal cathodes to be run at an
elevated cathode temperature of 840°C
and normal cathode current. Calculated
theoretical life is 2 years.
3) Three normal cathodes to be run at an
elevated cathode temperature of 840"C
and three times normal cathode current.
4) Five one-half normal cathodes to be run at
an elevated cathode temperature of 840°Cand normal cathode current. Calculated
theoretical life is 1 year.
5) Five one-half normal cathodes to be run at
an elevated cathode temperature of 840"C
and three times normal cathode current.
6) Three one-quarter normal cathodes to be
run at normal cathode temperature and
normal cathode currents. Calculated theo-
retical life is 5 years.
7) Four one-quarter normal cathodes to be
run at an elevated cathode temperature of
800"C and normal cathode current. Cal-
culated theoretical life is 1 year.
8) Five one-quarter normal cathodes to be
run at an elevated cathode temperature of
840°C and normal cathode current. Cal.
culated theoretical life is 3 months.
The diffusion-dependent life theory was used
to calculate the results. Because the diffusion
dependent life theory is independent of current
density, the calculated theoretical life was notstated for items 3 and 5.
The diode life test rack used for the 314 and
349 diodes is now being modified. The power
5.32
supplies are being converted so that they will
provide the proper voltage for the 384H diodes.
The voltage regulation is being improved to meet
the standards of control necessary for the 384H
diode program. When completed, sufficient lifetest racks will be available to run 35 diodes. The
present capability is 25 diodes.
Traveling-Wave Tube Environmental Tests.
An Advanced Syncom traveling-wave tube, MTD
384H - No. 13, successfully passed qualification
test requirements. All electrical parameters of
the tube were checked before and after each test
to verify that the proper characteristics of the
tube were maintained. The tests were performed
in the following order:
1) Thermal vacuum. The tube was attached
to a mounting plate and the surface mount-
ing temperature varied as required. The
tube was operated continuously on dc
power and the RF amplification was
checked every 24 hours. Two tests, each of
72 hours duration, were made at1 X 10 -s
Torr and mounting surface temperatures
of 25" to 35* F and 165" to 175" F. After
the test, all parameters of the traveling-
wave tube were checked and no changes
were noted because of the test.
2) Vibration. The tube was subjected to thevibration environments in each of the three
orthogonal axes indicated below. The tube
was checked at the completion of each fre-
quency sweep.
Sinusoidal Vibration (logarithmic sweep)
Time,minutes
Frequency,cps
5-15
15-60
Thrust Axis,g, 0 to peak
0.25 inch DA
0.5 inch DA to
24.2, 15 g to
60 cps
0.75
1.00
!
!i
i4[]

_l _i
5. Spacecraft System Design
Frequency, Thrust Axis, Time,cps g, 0 to peak minutes
60-100 30 0.38
100-250 15 0.63
250-400 10 0.38
400-2000 7.5 1.20
Transverse Axis,g, 0 to peak
5-15 0.25 inch DA 0.75
15-25 0.5 inch DA 0.38
25-60 0.5 inch DA to 0.63
35, then 30 g
to 60 cps
60-250 15 1.00
250:400 10 0.38
400-2000 7.5 1.00
Random Vibration
Frequency, Time,cps All Axis, psd minutes
20-80 Flat 0.4 g2/cps 6
80-1280 Increasing 6from 0.4 to
0.07 ff/cps at1.22 db/octave
1280-2000 0.97 g2/cps 6
After the vibration tests, all parameters of
the traveling-wave tube were checked, and
no changes were noted because of test.
3) Shock and sustained acceleration - The
tube was subjected to a sine acceleration
pulse in each of the following orthogonal
axes:
Acceleration, g
Forward 30
Lateral 15
Duration,milliseconds
11
11
The tube was subjected to the followingacceleration environment:
Duration,Acceleration, g minutes
Thrust axis +30 10
(Z-Z) --30 10
Transverse +6 4
axis (X-X) --6 4
Transverse +6 4
axis (y-y) --6 4
After all these tests -- shock and sustained
acceleration -- all parameters of the trav-
eling-wave tube were checked and no
changes were noted because of the test.
4) Spin -- The tube was oriented on the spin
fixtures in a position approximating the
mounting angle on the spacecraft. Oper-
ated continuously on dc power, the tube
was subjected to 12 g acceleration at a
rotation of 150 rpm for 7 days.
Traveling-Wave Tube Power Supply. The
power requirements of each traveling-wave tube
(TWT) are supplied by a dc-to-dc converter and
a dc-to-ac inverter. The input power to the con-
verter and inverter is supplied by a series regu-
lator. The inverter supplies filament power,
while the converter supplies power to the tube
cathode, anode, and collector (the tube helix is
operated at ground potential). Both the inverter
and converter are saturable core square wave
oscillators. The converter has rectified outputs
and the inverter supplies approximately constant
power to the tube filament.
5-33

Hughes Aircraft Company
DC-to-DC Converter. The traveling-wave
tube high voltage dc-to-dc converter is a saturable
core square wave oscillator with three rectified
outputs. It is similar to the converter used in
Syncom 2 with the following exceptions:
1) An increase of approximaely 2:1 in volt-
age level has required a larger trans-former.
2) A larger output filter was required to
meet a more stringent ripple requirement.
This requirement is still 500 millivohs
peak-to-peak, the same as Syncom 2. How-
ever, the 2:1 higher voltage level requires
a 2:1 more stringent ripple specification.
Also, a larger percentage of filter weight
has been invested in inductors because of
the physical size of lO00-voh capacitors.
3) A larger input filter was employed to re-
duce the amplitude of switching transients
reaching the unregulated bus.
4) The diodes in the helix-collector and
collector-cathode circuits were changedfrom 500-voh to 825-voh diodes. The 825-
volt diodes have the additional advantage
of a faster recovery time.
5) The base drive current limiting resistor
was replaced by a sensistor which is a
7000 parts per million (ppm) per *C
temperature sensitive resistor. The sensis-
tot allows more base drive at low tem-
perature, and vice versa, compensating
for the change in switching transistor beta.
The first breadboard converter has been oper-
ated satisfactorily from --100" to 160°F. Fig-
ure 5-45 represents the effect of temperature
on full load output voltage and efficiency. Since
each TWT will require different voltages, the
per unit, (where 1 per unit----100 percent)
change due to temperature was of greater sig-
5-34
nificance than the actual voltage change.' There-
fore, the V versus t curves of Figure 5-45 have
been normalized with respect to the actual
voltages at 75"F. Also, there are two efficiency
curves in Figure 5-45. The curve indicating
86.1 percent efficiency at 75 ° F represents the
basic dc-to-dc converter. However, the extremely
light TWT anode circuit load will require a
bleeder resistor to prevent the filter capacitors
from charging up to the square wave leading
edge spike. When the dissipation in a 100-kilohm
bleeder resistor is charged to the supply (400
millivohs at 200 volts), the efficiency reduces
to 83.8 percent.
The converter is not a regulated power supply,
but derives its essentially constant output voltage
from the regulated input voltage. Changes in
TWT load current working against the inherent
output resistance of the converter causes some
change in output voltage. Figure 5-46 representsthe V versus I characteristics of the dc-to-dc
converter with constant input voltage. The three
9O
B8
IM
86
w
Ew
84
B2
I.Ce20k __. I I
_V %' _ VOLTAGECK %
IN K %, I--EFFICIENCY
"_ % VCK, COLLECTOR CATHODE
1.015 _,,_ _ - V&H,ANODE.HELI X --
VAH_ _ • VHK: HELIX-CATHODE
"_ • % VHC, HELIX -COLLECTOR
\ "., -_+-.. \-. = l
v.c.....---------"_",,--_ i Jiooo _ -- _, _ _.._.._
lOOk ANODE % X" _
BLEEDER CHARGED% _ _ ITO CONVERTER_ _ _-_
0995 ......... %- '___ _
0990 _
OO85
-IO0 -50 0 150 I00 150 200
TEMPERATURE, °F
FIGURE 5-45. CONVERTER EFFICIENCY ANDVOLTAGE AT FULL LOAD VERSUS TEMPERATURE
U
[]
Id[]

{
| ii J
|i
iJ
tlw
U
L
LJ
t
m
_= .
b
i.-
o
1.04
I.o2
1.00
0 98
0960 025 0.50 075 1.00 125
CURRENT PER UNIT, I
FIGURE 5-46. CONVERTER NORMALIZED VVERSUS I CURVES
__ IANODE-HELIX
COLLECTOR -CATHODE
" RO= 0038 --
HELIX- COLLECTOR
Ro, 0023
VOLTAGE vS I CURVE, "rA= 005 I B
XA = TWT ANODE CURRENT _" _
- I B, ANODE BLEEDER CURRENT ......
1,50
TABLE 5-7. TYPICAL TRAVELING-WAVE TUBEPOWER SUPPLY OUTPUT IMPEDANCE
Output
Anode-helix
Helix-collector
Collector-cathode
Helix-collector
OutputResistance,
kilohms per unit
5.8 0.0029
5.0 0.023
1.2 0.038
__ i
OutputCapacitance,microfarads
0.015
0.068
0.068
outputs of the Converter were tested one at a
time with the other two held at full load. Again
the curves have been normalized since each TWT
will require different voltages and currents. The
slope of the Figure 5-46 curves at V- 1.0
per unit and I = 1.0 per unit represents the per
unit output resistance Ro for small dc changes
in load. Dynamic load regulation will be gov-
erned primarily by the output filter frequency
response. This filter is an inductive input three-
section lattice for each output. At high frequency,
the capacitors across the output terminals will
predominate, and the output impedance will be
5. Spacecraft System Design
Z = 1/j¢oc. The de output resistances and capaci-
tances appear in Table 5-7.
The most sensitive voltage from the stand-
point of TWT operation is the helix-cathode voh-
age, which is the sum of the helix-collector and
collector-cathode output with the helix at ground
potential. This voltage should be held to ±1 per-cent of the rated value for initial adjustment
plus unregulated bus and temperature changes.
The TWT load changes during normal opera-
tion are considered negligible. Changes in the
cathode-helix voltage due to load regulation will
be much less than 1 percent. An initial adjust-
ment to within 0.1 percent of the desired value
should be possible for the helix-cathode output
by adjusting the series regulator output voltage
to compensate for all converter manufacturing
tolerances.
Unregulated bus voltage changes may be con-
sidered negligible. These changes are attenuated
on the order of 5000:1 by the series regulator.
Since the converter acts essentially as a linear
transformer, a change in the 24-voh input will
result in an equal percentage change in each of
the output voltages. An 8-volt unregulated busvariation can occur in normal operation, which
would result in a voltage change of 68 ppm in
each output.
The most significant factor affecting the TWT
voltages will be temperature. Figure 5-45 dem-
onstrates the converter inherent temperature reg-
ulation with constant input voltage. However, the
total TWT supply temperature regulation will
be the sum of the converter plus series regula-
tor temperature regulation. Figure 5-45 shows
the helix-cathode output to have a negative
temperature coefficient of approximately --59
ppm/*F for 30*F < T < 120°F. If ±0.8 per-
cent of the total ±1 percent tolerance is allowed
5-35

Hughes ,4 ircra/t Company
for temperature changes, this is a total voltage
change of 1.6 percent (16,000 ppm), or an over-
all coefficient of 178 ppm/°F for 30°F < T
< 120°F. Therefore, the regulator voltage tem-
perature coefficient can be +59 ± 178 ppm/°F.
If the series regulator were designed to have a
controlled positive temperature coefficient of
+59 ppm/°F, then extremely close control of the
TWT helix-cathode voltage could be achieved.
One breadboard of the present series regulator
design was measured and found to have a
negative temperature coefficient of approxi-
mately --30 ppm/°F over the range 30°F < T
< 120°F. However, there is some uncertainty
associated with the regulator temperature coef-
ficient. This is discussed at greater length in the
series regulator paragraphs below.
DC-to-,4C Inverter. The inverter, which pro-
vides approximately constant filament power, is
a conventional saturable core square wave oscil-
lator with a choke in series with the output.
Without the choke, the inverter would serve as
an ac square wave constant voltage source. The
choke serves to increase the source impedance
without dissipating power (neglecting the inci-
dental dissipation of the choke). The circuit
parameters are chosen such that, at the normal
operating point, changes in load resistance will
cause approximately equal but opposite changes
in voltage and current. A true constant power
source would have a hyperbolic volt-ampere
characteristic (P = EI). The volt-ampere char-
acteristic of this constant power source is made
tangent to the desired power hyperbola at theintersection of the inverter E versus I character-
istic and the hot filament load line.
A constant voltage source would allow a very
large in-rush current to a cold filament since
the cold filament resistance is usually muchlower than the hot resistance. To ease the thermal
5-36
shock, the Syncom 2 filaments were supplied
from a constant current source, however, this
required a much longer warmup time. The con-
stant powersource is a compromise between this
thermal shock and the long warmup time. In
addition, the most desirable f_lament supply is
one which keeps the filament temperature con-
stant. A constant power source accomplishes this
better than either a constant voltage source or a
constant current source. This is particularly de-
sirable during the latter life of the tube when thefilament hot resistance tends to decrease.
Consider a normalized power system with 1.0
per unit voltage and 1.0 per unit current, yield-
ing 1.0 per unit power dissipated in a 1.0 per
unit ohm resistor. If the voltage or current source
changes ±1 percent for a fixed 1.0 per unit ohm
resistor, the power will change approximately
2 percent, since (1.01) 2= 1.0201 and (0.99) 2
= 0.9801. However, experimental data on the
constant power source shows that a ±1 percent
change in input voltage will cause a change in
output power of only ±1.2 percent. The reason
for this is that the switching frequency varies
linearly with the input voltage, resulting in a
linear change in the output choke inductive re-
actance. As the voltage increases (decreases),
the ac current limiting of the choke simultane-
ously increases (decreases). Therefore, the out-
put power is more a linear function than a square
function of the input voltage.
Experimental data also show that for ±16
percent resistance changes about the normal
operating point, the product of rms voltage and
current of the constant power source will remain
within ±1 percent. The combined effect of ±1
percent voltage changes and ±16 percent resist-
ance changes is contrasted below for a contant
voltage, constant current, and constant power
source.
m
i
m
m
Hi
m
m
n
M
m
m
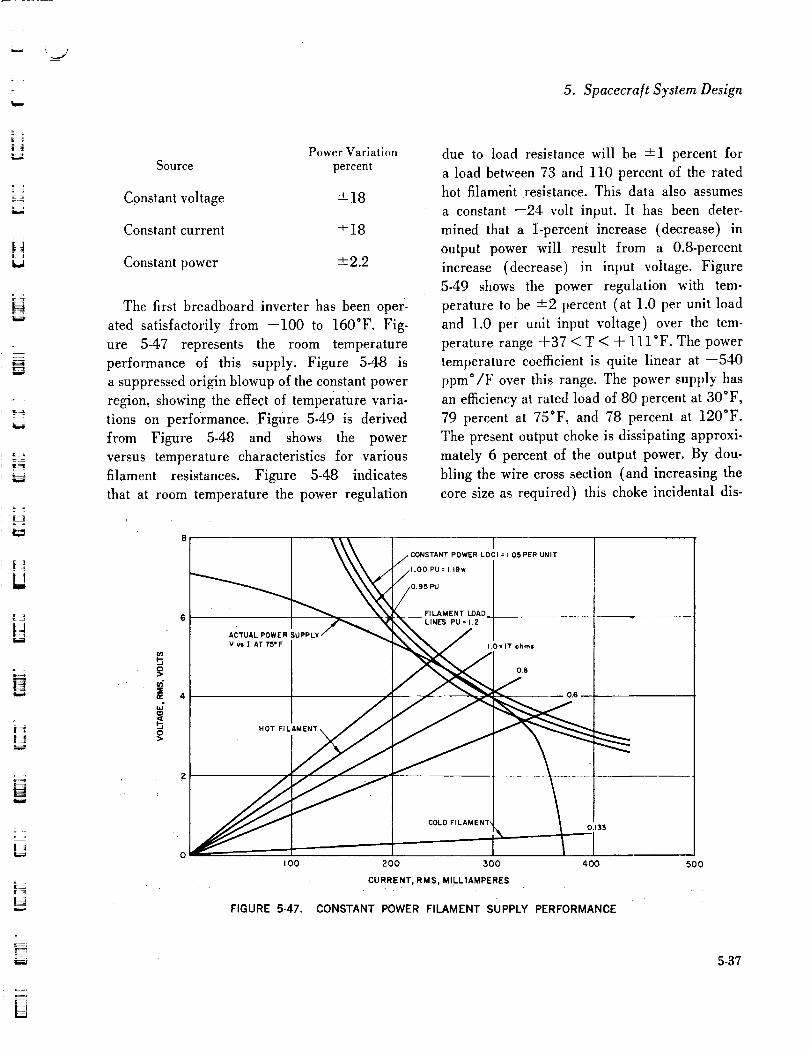
5. Spacecra]t System Design
w
:
| I
H
::..:.:
r=,.,
Power VariationSource percent
Constant voltage -4-18
Constant current ± 18
Constant power ±2.2
The first breadboard inverter has been oper-
ated satisfactorily from --100 to 160°F. Fig-
ure 5-47 represents the room temperature
performance of this supply. Figure 5-48 is
a suppressed origin blowup of the constant power
region, showing the effect of temperature varia-
tions on performance. Figure 5-49 is derived
from Figure 5-48 and shows the power
versus temperature characteristics for various
filament resistances. Figure 5-48 indicates
that at room temperature the power regulation
due to load resistance will be --+1 percent for
a load between 73 and 110 percent of the rated
hot filamefit resistance. This data also assumes
a constant --24 volt input. It has been deter-
mined that a 1-percent increase (decrease) in
output power will result from a 0.8-percent
increase (decrease) in input voltage. Figure
5-49 shows the power regulation with tem-
perature to be --2 percent (at 1.0 per unit load
and 1.0 per unit input voltage) over the tem-
perature range +37 < T < -4- 111°F. The power
temperature coefficient is quite linear at --540
ppm °/F over this range. The power supply has
an efficiency at rated load of 80 percent at 30°F,
79 percent at 75"F, and 78 percent at 120°F.
The present output choke is dissipating approxi-
mately 6 percent of the output power. By dou-
bling the wire cross section (and increasing the
core size as required) this choke incidental dis-
/:77L:::""+°'="°'+°""0,95 PU
_,_ FILAMENT LOAD ]
6 ,_. LINES PU=I.2 ,,w
+ .,,o=,.°+.
HOT FIL
2
0
0.133
IOO
FIGURE 5-47.
200 300 400
CURRENT, RMS, MILLIAMPERES
CONSTANT POWER FILAMENT SUPPLY PERFORMANCE
500
5-37
¢--+
Lii_;!

Hughes Aircraft Company
t_
bO 4,5>
J
4.0
o
5.5 ,
5.0_
. // /
/ .. /
3.5 /" /
/
3.0
200 240
// // ,,
/J
/1
f f/ / / _
/ ,/ / ._. / "1,2 PER UNITy / .
_.\ / 20"6 °hmSl -- / -
__ " _TO "UI''IO / / /
-loo I %% % %\N\280
_ACTUAL POWER SUPPLY
CONSTANT POWER LOCI= WATTS
I l I FILAMENT LOAOLINES, OHMS
/I
WATTS PER UNIT 1
1.05
320 360 400
CURRENT, RMS, MILLIAMPERES
FIGURE 5-48. CONSTANT POWER FILAMENT SUPPLY TEMPERATURE EFFECTS
1.08
1,04
I-
n,-
1,00
096
0.92
-i00 -50 0 50 I00 150
TEMPERATURE, ° F
FIGURE 5-49. CONSTANT POWER FILAMENT SUPPLYPOWER VERSUS TEMPERATURE FOR NOTED
FILAMENT RESISTANCE
sipation could be reduced to approximately 2
percent of the output, increasing the efficiency
4 percent.
In comparing the constant power filament sup-
ply with the Syncom 2 constant current supply,
the former has fewer parts, higher efficiency,
and quicker warmup time. A quantitative com-
parison appears in Table 5-8. The lower parts
count improves the overall reliability of the unit.
A higher efficiency results from employing a re-
actor in the ac portion of the circuit for current
limiting, instead of resistors and transistors in
the dc section as is done in the constant current
supply. A quicker warmup results from allowingmore current to the cold filament. However, the
inrush current is limited to 1.4 per unit for the
cold filament resistance of 0.13 per unit.
Series Regulator. A series regulator is em-
ployed to supply --24 volts to the TWT high
voltage converter and filament inverter. An aux-
5-38
m[]
im1m1
Hlil
|
1
1
1
[]
I
1
1
[]1

TABLE 5-8. POWER SUPPLY COMPARISON
Supply
Total parts
Efficiency, percent
Warmup time, seconds*
ConstantCurrent
22
64
46
ConstantPower
t4
79
28
*TIME REQUIRED TO REACH 90 PERCENT OF HOT FILAMENTVALUE,
iliary function is to operate the ferrite switch
when the regulator is turned on. The regulator
turns on and off in response to commands from
the command decoder. The normal sequence of
commands and the resulting response is as fol-lows:
1) Filament ON: This command turns on the
series regulator with the following results:
a) A current pulse of approximately 1
ampere for 5 milliseconds operates the
ferrite switch.
b) The filament inverter is automaticallyturned on.
c) The converter remains off.
2) HV ON: This command starts the high
voltage dc-to-dc converter. Sufficient timeis allowed for the TWT filament to warm
up before the converter is started.
3) TWT OFF: This command turns off the
series regulator which stops both the con-verter and filament inverter.
This series regulator is quite similar to the
one used in Syncom 2. Two features which havebeen added are:
1) An extra stage to the regulator loop by
replacing the 2N2151 control element
with a Darlington composed of a 2N1724
driven by a 2N1717. A 50-percent in-
crease in steady state load current plus
5. Spacecraft System Design
TABLE 5-9. TRAVELING-WAVE TUBE POWERSUPPLY LOAD ANALYSIS
Supply
Converter
Filament inverter
Series
Effi-TWT, ciency,watts percent
13.3 84
1.2 79
regulator total load
Series Regulators
Milli-Watts amperes
15.84 661
1.52 63
17.36 724
the 1-ampere pulse for the ferrite switch
necessitated this change.
2) An improved overcurrent limit circuit
which is independent of unregulated bus
voltage. The Syncom 2 method of limiting
output current by limiting the control ele-ment base drive would allow a 2:1 in-
crease in current for an unregulated busvariation from --26 to --36 volts. The
increased Advanced Syncom bus capacity
can allow --34 volts with the TWT on if
other loads are off. The control element
dissipation would be'excessive if the Syn-
corn 2 method were employed.
The maximum allowable TWT input, includ-
ing filament power, is 14.5 watts. With 1.2 watts
for filament power the converter load can be
13.3 watts. Neglecting the ferrite switch, the
steady state load on the series regulator is givenin Table 5-9.
There will be approximately 6 milliamperes
in the regulator control circuits, yielding a total
load of 730 milliamperes on the unregulated
bus. This current is independent of regulator
input voltage. Table 5-10 represents input, loss,
and efficiency data at various assumed unregu-
lated bus voltages for both the series regulators
and the total TWT power supply.
The first breadboard regulator exhibited a
total output voltage change of 20 millivolts from
5-39

Hughes Aircra[t Company
TABLE 5-10. INPUT, LOSS, ANDEFFICIENCY DATA*
Input volts
Output volts
Control element, volts
Input watts at 730 milliamperes
Efficiency, percent
Losses, watts
TWT supply efficiency, percent
TWT supply loss, watts
-26
-24
2
19.0
91.4
1.64
76.3
4.5
-30 -34
-24 -24
6 10
21.9 24.8
79.2 70.0
4.54 7.44
66.2 58.5
7.4 10.3i
*Series regulator only, unless TWT supply is specified.
no load to full load, or 0.083 percent. This
corresponds to an output resistance of Ro =0.036
ohms. With full load the output voltage varied
2 millivolts or 0.0083 percent, for an input
voltage variation of from --26 to --36 volts.The above results were at 75"F. With a --26
volt input and full load, the output voltage
changed 64 millivohs from 30 to 120*F with
a linear negative temperature coefficient of --30
ppm/*F. Figure 5-50 represents the room tem-
perature volt-ampere characteristic of this regu-
lator, and Figure 5-51 represents the effect of
temperature on no load and full load voltage,
output impedance, and the overcurrent limit.The overcurrent limit is defined as the current
flowing when the regulator output is --22 volts.
Figure 5-50 illustrates the regulator performance
with overload. The overcurrent feedback loop
overrides the voltage feedback loop, and the
device becomes a constant current source rather
than a constant voltage source.
The PARD ((Periodic And Random Devia-
tions) characteristics of the regulator are quite
good. With a 1.0 per unit resistive load, the
PARD was approximately 2 millivolts peak-
to-peak. With the actual switching loads oper-
ating, the output voltage pertubations increased.
The combination of PARD plus dynamic load
regulation on the --24 volt output of the series
5-40
i
-24.05 [ -30
-2400 -25
-23.95 tn -20
z_ -2390 _ Ld -15
L_
O
-23 85 > -10u_
-2380 - 5
-23 75 I
0 012 016
_ SCALE
/ /
I08ohms (MINIMUM
LOAD RESISTANCE FOR .,-"/"/_
-- REGULATOR TO- 7 /
REMAIN ON ) "_._.
/ /
/t
/
04 08
CURRENT, AMPERES
FIGURE 5-50. REGULATOR VOLT-AMPERECHARACTERISTICS
-24.7 OISr 18 j
I I
-245 ",.n 0"14] 1.4 .._
-24.4 _= 012 p¢n - "
_ ° _ui '_ i
g-243 _0.10 _'101 1 I_- 0:: _ NO LOAD, v
II,
-24.0 004 h
OUTPUT I
-239 002 L 02' ' RESISTANCE, Rof l
-100 -50 0 50 ,00 150
TEMPERATURE, °F
FIGURE 5-51. REGULATOR TEMPERATURECHARACTERISTICS
regulator was 6 millivohs peak-to-peak for the
filament inverter only and 30 millivolts peak-to-
peak for both the filament inverter and dc-to-dc
converter.
The regulator operated satisfactorily over the
range .100 < T < 160*F. As indicated above,
it exhibited a voltage temperature coefficient of
-30 ppm/*F over the range +30 < T < 120"F.
m
J
[]mu

5. Spacecraft System Design
However, this overall regulator temperature co-
efficient is dependent primarily on the positive
temperature coefficient of the zener reference can-
ceiling the effect of the first stage transistor base-
emitter junction negative temperature coefficient.
The TWT helix-cathode voltage should be held
to -4-1 percent for all variables except load
changes (the load is quite constant). In the con-
verter discussion above, it was determined that
the series regulator should have a voltage tem-
perature coefficient in the range -t-59- 178
ppm/°F, and that a coefficient of -4-59 ppm/°F
would cancel the inherent temperature coefficientof the converter. Because of the uncertainties
associated with the present reference circuit, a
temperature compensated circuit consisting of a
temperature compensating zener reference and
a differential amplifier comparator should be
used in this regulator. This decision was reached
too late to be incorporated in the present design,
however, the multiple access transponder regu-
lator has demonstrated the capability of this
circuit and no dimculties are anticipated. By
the addition of one sensistor (+7000 ppm/°C
resistor) of appropriate size to the voltage di-
vider, the desired positive temperature coefficientcan be realized.
Ferrite RF Power Switch. The ferrite switch
utilized to switch the selected traveling-wave
tube to the multiplexer input is essentially a
three-port circulator with provisions for re-
versing the magnetic field polarity (Figure
5-52). In this configuration, the circulator oper-
ates as a single-pole double-throw switch.
This switch requires a pulse of 21 watts of
power for a measured microwave switching
speed of about 2.5 milliseconds. The microwave
characteristics over a 200 mc bandwidth are 0.2
db maximum insertion loss between transmis-
sion terminals and 20 db minimum isolation.
"_i_ _ _ _L_ "_ _ _ _L_!I_:_ _ _ ...........................
FIGURE 5-52. RF TRANSMITTER SWITCH
Power is needed only to reverse the ferrite mag-
net polarity; once this is accomplished, no
further power is required.
Low insertion loss and switching power were
the main design objectives. Assuming optimum
circulator design, the limiting factor for lowest
possible insertion loss is determined by the
dielectric and magnetic losses of the garnet. For
low switching power, the number of ampere
turns per inch around the ferrite magnet must
be a minimum, which requires a low coercive
force ferrite magnet with good square loop prop-
erties. For the switch to operate with a low
coercive force magnet, the internal garnet must
have a low saturation magnetization and airgaps
in the magnetic circuit must be minimized.
The airgap in the magnetic circuit was de-
creased to 0.010 inch by using soft iron
wherever possible. The lowest saturation magnet-
ization garnet was used consistent with low
dielectric and magnetic losses and temperature
stability. A coercive force of 275 oersteds and
residual magnetism of 2040 gauss was specifi-
5-41
Hughes Aircraft Company
cally synthesized for use in this switch. The
proper flux density was obtained by varying the
cross-sectional area of the magnet and by wind-
ing 600 turns of No. 33 wire around the magnet.
The switch requires 0.87 ampere at 24 volts.
Engineering models of the RF switch have
been constructed. Insertion loss over the band
through the switch was measured as 0.15 db for
either switch position. Isolation between the two
input ports was better than 23 db over the totaltransmitter band.
3 db Hybrid. The 3 db hybrid is a four-port
stripline device connected between the outputs
of the multiple access and frequency translation
sections of the transponder and the traveling-
wave tubes. Its purpose is to split the RF output
from the operating transponder section and sup-
ply equal RF drive to both traveling-wave tubes,
only one of which has both drive and dc power
applied. All input and output impedances are50 ohms.
The unit weighs 1 ounce including 0.5 ounceof OSM connectors. The insertion loss from
either of the two input ports to each of the two
output ports is 3.0 ±0.5 db at 3980 mc and
4200 mc. The isolation between the two input
ports or the two output ports is at least 20 dbat 3980 mc and 4200 mc.
Telemetry and RF Coupler. The dual coupler
is a passive RF unit between the traveling-wave
tubes and the transmitter multiplexer. The dual
coupler provides 1/100 of the transmitter out-
put to a detector for telemetry monitoring pur-
poses and also proyides a means of testing the
RF output of the communications transmitter.
The detector is a coaxial diode that changes the
RF output sample to a negative dc voltage for
use by the telemetry encoder.
Units have been constructed for the engineer-
ing model. The measured insertion loss is 0.2 db.
5-42
The input VSWR is 1.18 and the coupling is
--20.8 db to the telemetry detector and -23.8
db to the RF output connector. With 4 watts
output from the traveling-wave tube, the detector
output will be --2.8 volts.
COMMUNICATION ANTENNA SYSTEM
Phased Array Antenna System. The complete
phased array antenna system is shown in block
form in Figure 5-53. A power splitter divides thetransmitter output signal into eight equal ampli-
tude, equal phase parts. The Outputs from the
splitter are applied to eight phase shifters, each
consisting of an input coupler, ferrite section,
and output coupler. The ferrite sections consist
of a tube of ferrite in a circular waveguide in-
side a four-pole, two-phase electromagnetic field
coil. The output couplers convert the RF output
of the ferrite sections into two equal amplitude
signals with different phase shifts and feed the
signals to diametrically opposite antenna ele-ments_ Sixteen antenna elements are symmetri-
cally arranged about the spin axis on a circle of
one wavelength radius. All of the elements are
continuously driven, but are individually phased
by the phase shifters in such a way that the
radiation tends to reinforce in a given direction.
The phase shifters are electronically controlled
by the PACE unit.
To facilitate testing and to optimize the final
antenna parameters, the 4-kmc transmitting an-tenna was first constructed in a breadboard
version. The input power divider was made in
stripline with TNC connectors. The input coupler
was a coaxial transition from a TNC connector
to a circular waveguide. The ferrite sections
were located inside the circular coil windings.
The output couplc;r used two TNC coaxial-to-
waveguide transitions. Coaxial cables connect
the output couplers to the antennas, with each

5. Spacecraft System Design
w
ROWERSPLITTER
_1 COUPLER
CONTROL
CIRCUITS
FIGURE 5-53. PHASED ARRAY
output coupler connected to two diametrically
opposite elements. The final stripline version
of the antenna is shown in Figure 5-54. This
version uses stripline-to-waveguide couplers for
both the input and output couplers and striplinerather than cables to feed the antenna elements.
The striplines have the advantages over coaxial
interconnections of fewer connectors, better
coupling to and from the phase shifters, better
control of line lengths, and lower losses. The hole
in the center of the array is for installation of
a receiving antenna, which is not shown.
The following paragraphs discuss the various
parts of the antenna and status of each part.
Power Divider. The power divider splits the
transmitter signal into eight equal amplitude, in-
phase signals to drive the eight phase shifters.
SECTION COUPLER
YPHASE
SHIFTERS
ANTENNA
ANTENNA
ANTENNA SYSTEM BLOCK DIAGRAM
The divider is fabricated in stripline and con-
sists of seven identical hybrid rings, each ring
being similar to a waveguide ring or "rat-race."
The power divider, or splitter, breadboard con-
figuration is shown in Figure 5-55 and the re-
designed configuration in Figure 5-56. The
stripline board shown in Figure 5-56 incorpo-
rates the input couplers to the ferrite sections
through a direct stripline-probe to waveguide
transition. Figure 5-57 is a close-up view of
the coupler probes. The redesigned stripline di-
electric is Duroid of 1_62inch thickness and the
ground plane spacing is 0.147 inch. Line widths
are chosen to give a characteristic impedance of
50 ohms. Figure 5-58 shows the divider before
the drilling was completed and without the input.
coupler probes.
Assuming all arms of the rings "see" matched
5.43

Hughes Aircraft Company
FIGURE 5-54. STRIPLINE VERSION OF PHASEDARRAY TRANSMITTING ANTENNA
loads, an input signal at arm 3 (or 2) splits into
two equal amplitude, in-phase signals at arms 2
and 4 (or 1 and 3) with nothing appearing at
arm 1 (or 4). An input to arm 4 (or 1) produces
equal amplitude, out-of-phase signals at arms 1
and 3 (or 2 and 4) with nothing appearing at
arm 2 (or 3). In Figure 5-56, the input at each
ring is applied through arm 3. Inputs at arms
2 and 4 would be by reflection from the connect-
ing arm and hybrid. The unused arms (1) of
the hybrids are terminated in resistive loads to
absorb any power which may be reflected back
into that arm. To ensure equal phase shifts to
all eight outputs of the power divider, symmetri-
cal connections are used and the hybrids are
cascaded so that each of the eight signals trav-
erses the same path length from input to output.
A systematic approach began with constructing
ill
FIGURE 5-55.
b) Complete Unit
BREADBOARD POWER DIVIDER
and optimizing an individual stripline hybrid
ring(Figure 5-59). The operation of the ring,
which was used in the divider shown in Figure
5-56, is excellent over the normal operating band
of about 3980 to 4200 mc.
Phase Shi/ters. As the antenna rotates, the
angles 0n vary, and therefore the required phase
shifts vary. Diametrically opposite elements have
opposite sense phase shifts. (They are not of
opposite phase in the usual sense, i.e., 180 de-
grees apart.) For an electrical radius R equal
5.44

..j
5. Spacecra/t System Design
a) Top View of Stripline Board
FIGURE 5-56.
b) Top Ground Plane
REDESIGNED STRIPLINE POWER DIVIDER
w
|!
UI=,._
W
a) Top View
FIGURE 5-57. INPUT COUPLER PROBES
b) Bottom View
to one wavelength, the resultant phase shift versus
time is
6, = --6,_.s = 2_" cos (o_t + n" 22.5 degrees)
where _ is the rotation rate of the antenna and
22.5 degrees is the angular separation of the
antenna elements (equal to 360 degrees/16).
The ferrite phase shifters are designed to pro-
duce this required phase shift and provide the
two opposite polarity phase-shifted signals. The
design is based on the adjustable phase changer
originally described in the article "Adjustable
Waveguide Phase Changer," by A. Gardner Fox,
published in the December 1947 issue of the
Proceedings o/the IRE. The phase shift is made
in circular waveguide, with the input coupler
exciting a TE,, mode in the guide. This is essen-
tially plane polarized in the plane of the input
probe. The ferrite section, with magnetic field
5-45

Hughes Aircra/t Company
FIGURE 5-58. POWER DIVIDER STRIPLINEBEFORE DRILLING
applied transversely by means of the external
"motor" winding, acts as a "half-wave plate"
which rotates the plane of polarization. The angle
of polarization rotation is equal to twice the angle
of field rotation. Thus unlimited phase shift can
be achieved with no moving parts.
The output coupler consists of a slow wave
structure in one plane, acting as a quarter-
wave plate, followed by two orthogonal coupling
probes. The output coupler converts circular
polarization to linear polarization. The plane-
polarized wave from the ferrite section can be
thought of as two counter-rotating circularly
polarized waves. After passing through the slow
wave structure, these components are converted
to orthogonal plane-polarized signals which cou-
ple to the two output probes. Thus rotation of
5-46
the polarization in the ferrite section is equiva-
lent to opposite polarity phase shifts of the two
counter-rotating circular components and there-
fore to opposite polarity phase shifts at the two
output probes. T}lus, rotation of the applied mag-
netic field results in phase shifts of the RF out-
puts. The use of the two-phase motor stator as an
electromagnetic field coil counteracts the factor
of two between field rotation and polarization, so
that output phase shift corresponds directly to
the rotation of the voltages applied to the motor.
The dimensions of the ferrite section are the
determining factor in the size of the phase
sbifters. After discussions with the ferrite manu-
facturer, Trans-Tech, Inc., a number of batches
of ferrite which they felt would work at 4 kmc
were made. These were tested in various config-
urations of inner and outer diameter and checked
for I0SS over the band and p01ariza!ion rotation
sensitivity. Eventually a configuration was
evolved in which the ferrite was 2.5 inches long,with an outer diameter of 1.15 inches and an
inner diameter of 0.625 inch. The inner tube
was filled with teflon, which helped to reduce
the low cutoff frequency. With this diameter, the
waveguide is cut off in air at 4 kmc and requiresa dielectric constant of about 3 or more to trans-
mit. The ferrite section had less than 1 db loss
in the test fixture.
The motor stators used to provide the mag-
netic field were purchased from the Skurka
Langdon Manufacturing Company. Initially,
these required about 100 milliamperes at 6 volts
to provide the 180-degree differential phase shift
in the ferrite necessary to make it a pure polari-
zation rotator. Subsequently, in the breadboard
configuration, the motor was redesigned with
more turns of finer wire, resulting in a require-
ment of about 40 milliamperes at 20 volts.
[]I
H
I
IM1i
ii
i
m_w
I
mI
i
I
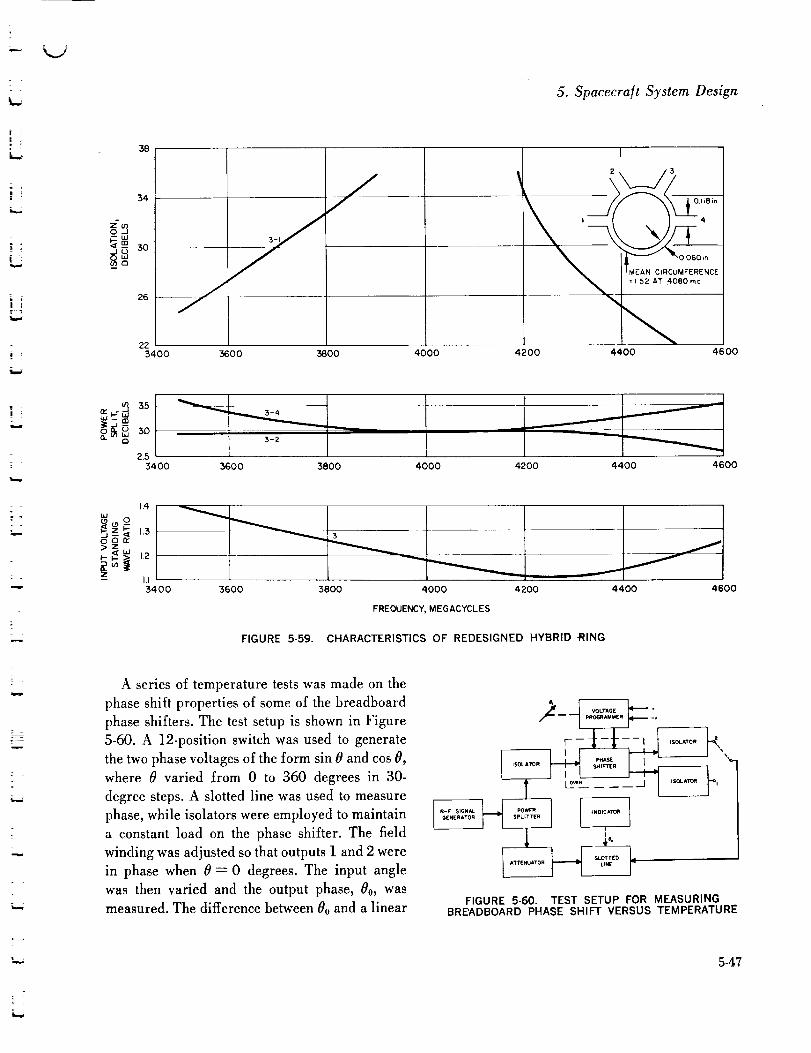
38
34
ibt)o.-J
26
223400
5. Spacecraft System Design
tn 3.5rr- .
25
3400
I
3600 3800 4000 4200 4400 4600
iiJ_o
>z
-- I.I3400
3-2
3600 3800 4000 4200 4400 4600
3600 3800 4000 4200 4400 4600
FREQUENCY, MEGACYCLES
FIGURE 5-59. CHARACTERISTICS OF REDESIGNED HYBRID -RING
A series of temperature tests was made on the
phase shift properties of some of the breadboard
phase shifters. The test setup is shown in Figure
5-60. A 12-position switch was used to generate
the two phase voltages of the form sin 8 and cos 8,
where _ varied from 0 to 360 degrees in 30-
degree steps. A slotted line was used to measure
phase, while isolators were employed to maintain
a constant load on the phase shifter. The field
winding was adjusted so that outputs I and 2 were
in phase when 8--0 degrees. The input angle
was then varied and the output phase, 80, was
measured. The difference between 80 and a linear
I¢=
L"' l
FIGURE 5-60. TEST SETUP FOR MEASURINGBREADBOARD PHASE SHIFT VERSUS TEMPERATURE
5-47

Hughes Aircra]t Company
"...j
output was calculated (see Figure 5-61). Five
phase shifters were tested at 0°C, 25°C, and 50°C
at 4170 inc. The phase difference (with arbitrary
zero position) was plotted vertically against input
angle. A number of factors were apparent from
these curves. All the phase shifters varied about
the same with temperature, increasing in length
about 80 degrees when the temperature was
raised from 25°C (room temperature) to 50°C
and decreasing about 180 degrees when the tem-
perature was lowered to 0°C. There was a varia-
tion in the deviation of output from the desired
linear relationship amounting to about 10 degrees
rms. The reason for the variation is not known
but could be nonsymmetry of field windings,
errors in control voltage, error in the measuring
procedure, _:esidual magnetization in the ferrites,
or misadjustment of the output couplers. It was
also observed, but not recorded, that the ampli-
tude of the phase shifters fluctuated as the input
voltages _were varied. It is expected that some of
the problems will be alleviated by the stripline
circuit. The general method of measurement ap-
pears to be satisfactory.
• Stripline Component Design. In the strip-
line version of the phase shifter, the input
NO I120
j -40
E
-120
b.
-IE) A
-2400 180 36O
NO. 2 NO3 NO.4 NO. 5 i
- __ #
!
0 180 360 0 180 360 0 180 360 0 i80
PROGRAMMED INPUT ANGLE, DEGREES
FIGURE 5-61. BREADBOARD PHASE SHIFTER PERFORMANCE VERSUS TEMPERATURE
,125"C
O'C
560
5-48
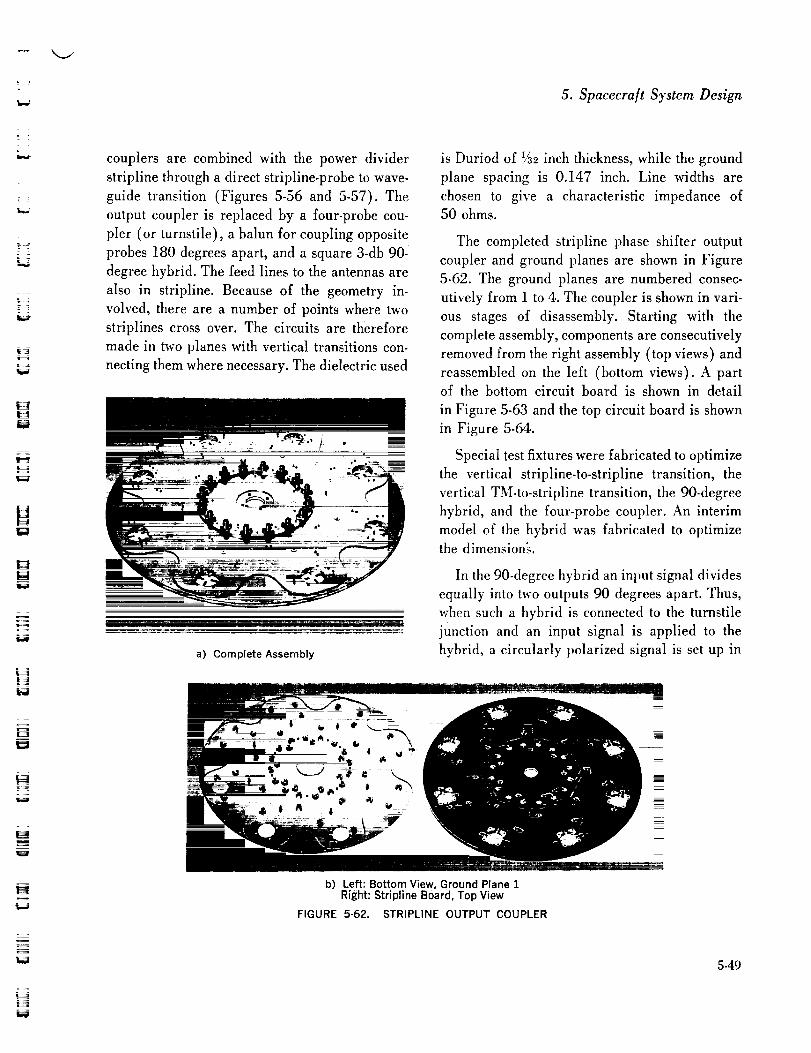
L
ll,,,,d
= =
:!3v_
i-J
r ==
H
[]
H
|ii!!i!!_
5. Spacecra]t System Design
couplers are combined with the power divider
stripline through a direct stripline-probe to wave-
guide transition (Figures 5-56 and 5-57). The
output coupler is replaced by a four-probe cou-
pler (or turnstile), a balun for coupling opposite
probes 180 degrees apart, and a square 3-db 90-
degree hybrid. The feed lines to the antennas are
also in stripline. Because of the geometry in-
volved, there are a number of points where two
striplines cross over. The circuits are therefore
made in two planes with vertical transitions con-
necting them where necessary. The dielectric used
a) Complete Assembly
is Duriod of _2 inch thickness, while the ground
plane spacing is 0.147 inch. Line widths are
chosen to give a characteristic impedance of50 ohms.
The completed stripline phase shifter output
coupler and ground planes are shown in Figure
5-62. The ground planes are numbered consec-
utively from 1 to 4. The coupler is shown in vari-
ous stages of disassembly. Starting with the
complete assembly, components are consecutively
removed from the right assembly (top views) and
reassembled on the left (bottom views). A partof the bottom circuit board is shown in detail
in Figure 5-63 and the top circuit board is shown
in Figure 5-64.
Special test fixtures were fabricated to optimize
the vertical stripline-to-stripline transition, the
vertical TM-to-stripline transition, the 90-degree
hybrid, and the four-probe coupler. An interim
model of the hybrid was fabricated to optimize
the dimensionL
In the 90-degree hybrid an input signal divides
equally into two outputs 90 degrees apart. Thus,
when such a hybrid is connected to the turnstile
junction and an input signal is applied to the
hybrid, a circularly polarized signal is set up in
b) Left: Bottom View, Ground Plane 1Right: Stripline Board, Top View
FIGURE 5-62. STRIPLINE OUTPUT COUPLER
5-49

Hughes Aircraft Company W
i
!
c) Left: Top Stripline Board, Bottom View
Right: Ground Plane 2, Top View
i
I
II
IB
lib
5-50
m
m
I r II !i_- -- "Lm_
d) Left: Ground Plane 3, Bottom View
Righti Bottom Stripline Board, Top View
[]
e) Left: Bottom Stripline Board, Bottom ViewRight, Ground Plane 4, Top View
FIGURE 5-62 (CONTINUED), STRIPLINE OUTPUT COUPLER
I
=
=_z_
t
Hm
i
M
!.==m
I
mIR
I
=m!
I
[]g
mm!
J
_m
iI

t_
w
5. Spacecraft System Design
a) Top View, without Ground Plane b) Bottom View, with Top Ground Plane and Top Board
FIGURE 5-63. BOTFOM STRIPLINE CIRCUIT BOARD
a) Bottom View b) With Top Ground Plane
FIGURE 5-64. TOP STRIPLINE CIRCUIT BOARD
the waveguide. If the signal is applied to the
other arm of the hybrid, a circularly polarized
signal of opposite sense is set up. Since the opera-
tion is reciprocal, circularly polarized signals of
opposite sense in the waveguide will couple sep-
arately to the two hybrid output terminals.
The four ground planes used in the output
coupler are die-stamped identically to the ground
planes for the power divider, although the hole
patterns are different. To ensure proper registra-
tion, the ground planes and circuit boards are
drilled identically with drill fixtures.
To match the control circuitry, the field coils
for the ferrite sections were changed to coils with
half the number of turns with twice the original
wire diameter. Thus, the new coils operate at
twice the current and half the voltage of the
original coils. This permits design of the power
amplifier circuits using nearly the optimum oper-
ating range for power transistors.
5-51
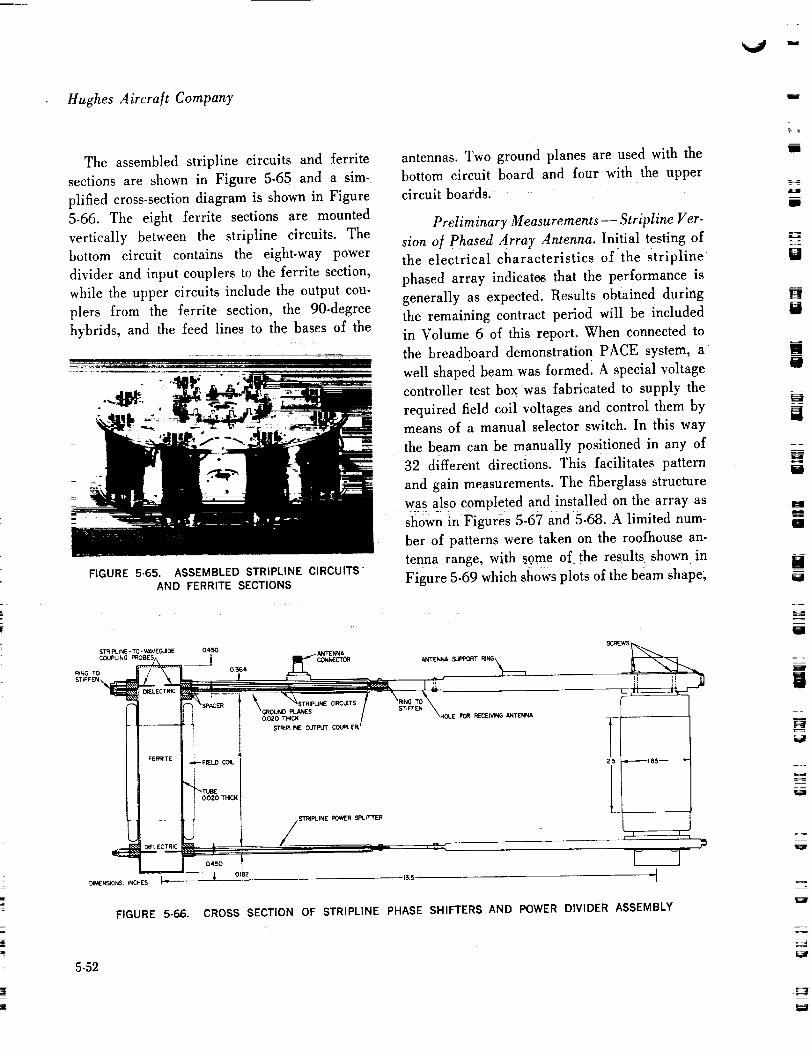
Hughes Aircra/t Company
The assembled stripline circuits and ferrite
sections are shown in Figure 5-65 and a sim-
plified cross-section diagram is shown in Figure
5-66. The eight ferrite sections are mounted
vertically between the stripline circuits. The
bottom circuit contains the eight-way power
divider and input couplers to the ferrite section,
while the upper circuits include the output cou-
plers from the ferrite section, the 90-degree
hybrids, and the feed lines to the bases of the
FIGURE 5-65. ASSEMBLED STRIPLINE CIRCUITS"
AND FERRITE SECTIONS
o
antennas. Two ground planes are used with the
bottom circuit board and four with the upper
circuit boards.
Preliminary Measurements- Stripline Fer-
sion of Phased Array Antenna. Initial testing of
the electrical characteristics of the Stripline
phased array indicates that the performance is
generally as expected. Results obtained during
the remaining contract period will be included
in Volume 6 of this report. When connected to
the breadboard demonstration PACE system, a
well shaped beam was formedl A special voltage
controller test box was fabricated to supply the
required field coil voltages and control them by
means of a manual selector switch. In this way
the beam can be manually positioned in any of
32 different directions. This facilitates pattern
and gain measurements. The fiberglass structure
was also completed_and installed on the array asshown in Figures 5-67 and 5-68. A limited num-
ber of patterns were taken on the roofhouse an-
tenna range, with sgme of the results shown in
Figure 5-69 which shows plots of the beam shape,
$1"_t_ *_ - TO - W_VEGLXDE 0450
COUPLING PROBES^
_G TO 0564t
2ER
FERRiTE _ FIELD COIL
"-TLtBE0020 THai,
i_ DIELECTRIC _
_450
_M('NSIONS, iNCHES !_ _- 0182
, i\
GROUNO_-_ES / STifFEN"X
-- _¢///,/STRIPLINE POWER SPLITTER
135
r _ ,
fl
FIGURE 5-66. CROSS SECTION OF STRIPLINE PHASE SHIFTERS AND POWER DIVIDER ASSEMBLY
5-52

F_
L_
L_
[_ --,.7,W
m'_ t
FIGURE 5-67. COMPLETE PHASED ARRAY "
ANTENNA
and Figure 5-70, which shows the relative gainvariation with main beam direction.
Measurement of the gains of the individual
antennas, also measured on the roofhouse range,are tabulated in Table 5-11. The theoretical
gain at design center frequency is just under
8 db. They are all matched to better than 1.5
VSWR so the reduced gain of 1 to 2 db is be-
lieved to be due to loss in the matching sectionsin the antennas. •
Measurement of the losses through the phase
shifters and stripline indicates the loss to be
between 1.5 and 2 db. Although the relative out-
puts of the 16 antenna connectors vary consider-
ably with the magnitude of the voltage applied
to the field windings, the measured main beam
gain varied less than 1 db for over 20 percent
variation in the supply voltages to the controller.
5. Spacecra/t System Design
FIGURE 5-68. CLOSEUP OF PHASED ARRAY
ANTENNA WITH FIBERGLASS STRUCTURE
From losses listed above, the gain is between14 and 15 db. There are additional losses due
to the mutual interaction between antennas which
shows up in two ways: 1) the input VSWR of an
antenna changes in the presence of other unex-
cited antennas from 1.5 to 2.5 and more, and
2) preliminary measurements made by discon-
necting one element of the array and measuring
the intercepted power show that about 0.5 db of
the power is absorbed by mutual coupling. Hence
the gain of this initial all-stripline assemblyshould be between 13 and 14 db. The measured
gain of the array at 4100 mc, compared to a
standard horn, was just over /3 db. Thus, al-
though the gain is lower than that attainable, the
source of each of the losses is known and it is ex-
5-53

Hughes Aircraft Company
i
DE_=___
W
1.0
0.8
- .6 ----
0.4
I 0.2
oleo Izo 6o o 6o 12o leo
HORIZONTAL ANGLE, DEGREES
a) Beam Peak at Element No. 1
t.0
0.8
0.6
0.4 m__
0.2
i_ 12o 6o o 6o 12o 18o
HORIZONTAL ANGLE, DEGREES
c) Beam Peak at Element No. 9
FIGURE 5-69.
1.0
060.4
0.2
180 t20 60 0 60 120 180
HORIZONTAL ANGLE, DEGREES
b) Beam Peak at Element No. 5
I0
08
E* 0.6
04 .....
..J
_ 0.2
t80 120 60 0 60 120 180
HORIZONTAL ANGLE, DEGREES
d) Beam Peak at Element No. 3
ANTENNA PATTERNS MEASURED AT 4100 MC
ilJ
° l l0 ()
ff oO_) 1) 1)
_ 0 0"' 0 0
J I 2 3 4 5hiOE
FIGURE 5-70.
o o(' () 0
+0 ) o 00
6 7 B 9 I0 II 12 13 14 15 16 17
ELEMENT NUMBER ALONG WHICH BEAM IS DIRECTED
MAIN BEAM VARIATION VERSUS DIRECTION OF MAIN BEAM
pected that they can be reduced by at least 2 db
to give a final net gain of nearly 16 db.
Phased Array Control Electronics (PACE)
PACE Development. The purpose of the
PACE is to generate the set of 16 voltages
A sin [2_r sin (oJ.t -{- B -4- -_--)]
A cos [2_ sin (o,.t + B + _)]
n = 0, 1...... 7
=, -- rotation frequency of sate]lite (rad/sec)
5-54
11
m
m
i
H
m1
z
m
1
1
l
L_
==
u
l
=
m
i -
LC :
l :

= =
I_ i
J
I[ 7
7 ....
U_t
| i
| ii!ii31t _
w_w
_- =
_J
which are required by the phase shifters. The
first design problem was the choice of a suitable
reference to supply the control electronics with
an indication of spin speed. A sun sensor identical
to the Syncom sun sensor was chosen because its
use permitted the development of the control elec-
TABLE 5-11. GAIN OF INDIVIDUAL ANTENNAS
Antenna
Number
1
2
3
4
5
6
8
9
10
11
12
13
14
15
16
Gain, decibels
4000 mc
= 6.2
6.7
6.7
6.4
5.9
6.6
6.5
6.7
6.7
6.6
6.7
6.7
6.4
6.2
6.6
4100 mc 4200 mc
5.9 7.3
7.1 7.I
7.0 7.1
6.3 7.1
6.7 6.9
7.3 7.1
6.6 7.0
6.8 7.1
6.8 7.1
6.3 7.1
6.8 7.0
6.3 7.0
6.9 7.2
6.9 7.1
6.3 6.8
5. Spacecra/t System Design
tronics with existing components. This choice
imposes considerations of time-varying geometry,
and if an infrared earth sensor is subsequently
developed, it can be used to advantage in the
control electronics.
Figure 5-71 is a block diagram of the PACE.
The frequency lock loop generates a pulse train
at frequency 2_L. The beam positioner counts
this frequency down and corrects for the relative
earth-sun rotation also experienced by the satel-
lite. The sine wave generator converts the beam
positioner output into the set of sinusoids
Asin o,_td-_q-0
n = 0, 1, 2 ..... 15.
The waveform generators convert these into the
required output waveforms which are then am-
plified to the current power and voltage level by
the phase shifter drivers. The loop generates
a frequency source at a precise muhiple of the
input frequency of the sun sensor pulses. A fre-
quency lock loop, as shown in Figure 5-72, was
the original choice as the best means to achieve
the frequency multiplication because of concern
=_:.: J
E_
r,_
_J
Liil
U
L-J
I PULSE/REV
FROM
SUNSENSOR
FROM
COMMAND
DECODER
FROM "I / POWER
COMMAND]" N-O--'_ TODECODER_ O REGULATORS
ALL SUBASSEMBLIES
s,._.S,N_,÷_- +_
(a__,2) OUTPUTCOUNTER S,N_+_--+e) COS[Z,,S,N(,o_+-0_---+0)]PULSES/REV 9 BINARY DIGITS (m=O,l,.. 151 (n = 0,1, 2, ... 7)
FREQUENCY BEAM SINE WAVE WAVE FORM SHIFTER
LOCK LOOP POSITIONER GENERATORS GENERATORS DRIVERS
[ PULSE/2 BI2 MIN----,--T TTIME OF DAY PHASE ADJUSTMENT,
CORRECTIONS FRO_ COMMAND
FROM CENTRAL I)ECOOE R
TIMERS
FIGURE 5-71. PACE BLOCK DIAGRAM"
2 TO FIELD WINDINGSOF FERRITE
PHASE SHIFTERS
5-55

Hughes Aircra/t CompanyW
that a continuous analog memory would have
excessive drift. Accordingly, the analog memory
was formed by a flip-flop register followed by
a digital-to-analog converter. The loop was called
VOUT=2N fl
CONTROLLED j w _ + 2 N
OSCILLATOR
ANALOG L
MEMORY ]
FIGURE 5-72.
SAMPLER
tSOLAR INPUT
PULSES = fs
FREQUENCY LOCK LOOP
the phase lock loop and its operation is explained
in detail in the March 1963, Summary Report.
As field effect transistor development pro-
gressed, a continuous analog memory became
feasible and the number of components to imple-
ment the loop could be significantly reduced.
The following is a detailed discussion of the
loop that was developed.
The frequency lock loop block diagram is given
in Figure 5-73. The primary function of the
loop is to generate pulses at a frequency 2_f,,
where fs is the spin frequency of the spacecraft.
The input reference is one pulse per revolution,
usually derived from the sun sensor but also
derived from the command decoder during
eclipses. Another output of the loop is 212f8, which
FROM I
FROM COMMAND
DECODER
A
FLIP-FLOP
FIt4
SUN SENSOR
AMPLIFIER
F302
INPUT REFRENCE
PULSES, f$
• FI 528
VOLTAGE
CONTROLLED
OSCILLATOR
F500
FLIP-FLOP
FIO0
AMPLIFIER
F7OIB
FILTER
F7OIA
RESET
AMPLIFIER
F301
RtFREQUENCY F 102
COUNTER
FLiP-FLOPS FI'2-__ /FIOI-FII2
Fsoo-PL_
i,'l_ 2_fl
I_ 21Zf i
ERROR _FlO0
PULSE
GATE
F700 Fi 13
FREQUENCY LOCK LOOP DIAGRAMFIGURE 5-73.
m
FII3 LOCK
LOG I C LOCK
F702
FLIP-FLOP
FI i3
ZII
u
!
II
i
II
l
tl
E=J
Im
W
=
llllf
W _
J
w
5-56
z

_j
5. Spacecra/t System Design
= =
t l.
H
i,d
= _
_4
L
is used for on-board measurement of the solar
aspect angle.
The input reference pulse triggers F100, caus-
ing it to change state with each pulse. When F100
goes from l to 0 the reset amplifier is triggered,
which resets the voltage-controlled Oscillator and
flip-flops FIO1 through Fl13 to 0. Flip-flops F10]
through Fl12 constitute a binary counter. At the
end of the 2_2th voltage-controlled oscillator cycle
after reset, Fl13 is set to 1. If the voltage-con-
trolled oscillator frequency is exactly 2_2f,, F100
will also be set to 1 at the same time, and there
will be 0 error. In general there will be some
timing error between FIO0 going to 1 and Fl13
going to 1, generating an output from the error
pulse gate. The logic of the error pulse gate isillustrated in the truth table of Table 5-12. When
TABLE 5-12. EBROR PULSE GATE TRUTH TABLE
FIO0 Fl13 Output
0 0 Decoupled0 1 --V1 0 +V
1 1 Decoupled
INPUT REFERENCE I
PULSES, f$ i
F,OO1i
I
1I
,,FII3 I '
fvc°>212fSlv ERROR +Vo II-V
• [FII3
fvco>zl2ts / +v° --j
V ERROR -V
FIGURE 5-74.
I
! ,
I__1
L
uii
rN
ERROR PULSE GATE WAVEFORMS
F100 and Fl13 are in the same state the output
of the error pulse gate is decoupled, through very
low leakage diodes, from the filter. When FIO0
and Fl13 are different, the output of the error
pulse gate is either --V or -4-V, depending on
which of the two possible combinations occurs.
Figure 5-74 shows the error pulse gate wave-
forms for both positive and negative errors.
The filter F701A has the configuration shown
in Figure 5-75. The filter integrates the error
pulses and provides loop compensation.
The amplifier F701B serves to unload the filter
and drive the voltage-controlled oscillator. The
schematic of amplifier F7OIB is shown in Figure
5-76. The very large input impedance of the
field effect transistor is utilized to unload the
filter. The amplifier F7OIB is essentially a source
follower circuit. Transistors Q1 and Q2 and zener
diode CR1 maintain a constant source-to-drain
voltage which minimizes the gate current. Zener
diode CR2 shifts the output level as required by
the voltage-controlled oscillator circuit.
The lock logic samples flip-flops F103 through
Fl13 shortly after FIO0 is set to 1. If F103
through Fl12 are all 0 and Fl13 is 1, the lock
logic output is set to 1, indicating the loop error
FROM ERRORPULSE GATE FT'O0 R2
0 ; "V_.
RI
-CI
TFIGURE 5-75.
1mm
TO AMPLIFIER 701B
i °C2
TFILTER F7OIA
5-57
LJ

Hughes Aircraft Company
INPUT FROM I
FILTER F701A J
OUTPUT TO
VOLTAGECONTROLLEDOSCILLATORFSO0
Y__.
CR2
Q
FIGURE 5-76. AMPLIFIER F7OIB
is less than one part in 29. The lock logic output
is telemetered in order to evaluate loop perform-
ance; it is also used to control the on-board
orbital control system.
Figure 5-77 is a block diagram of the beam
positioner, The function of the beam positioner
is to generate in digital form the instantaneous
rotational angle of the spacecraft with respect
to a selected reference. The inputs are a pulse
train from the frequency lock loop having 512
pulses per spacecraft revolution and a command
input for phase control.
The output counter is a nine-flip-flop binary
counter which counts the frequency lock loop
output F103. The period of the output counter
is equal to the spacecraft rotational period. The
nine-flip-flop angle encoder register stores the
phase reference of the output counter. The paral-
lel transfer gate is triggered by F103, the reset
amplifier of the frequency lock loop, which pulses
on alternate input reference pulses. Thus on every
second spacecraft rotation the contents of the
angle encoder register are parallel-transferred
to the output counter. Small errors of the fre-
quency lock loop are therefore not accumulated
as they would be if the phase of the output counter
were set less frequently.
The contents of the angle encoder register can
be incrementally adjusted by means of the com-
mand system. To aid in operation of the system
and to indicate performance the angle encoder
register contents are telemetered. The digital
radout encoders convert the contents of the angle
encoder register into three analog voltages which
are inputs to the telemetry encoder. Thus, to
operate the system, the telemetered contents of
the angle encoder register are noted and com-
pared with the desired phase angle; the appro-
priate number of increments are commanded to
obtain the desired phase. The res01ution of the
system is 360 degrees/29 or about 0.7 degree.
As the spacecraft orbits the earth, the angle
between the spacecraft-earth line changes at the
rate of about 360 degrees per 24 hours. Since
the phase of the beam positioner is referenced to
the spacecraft-sun line, maintaining the beam
pointed toward the earth requires compensation
for this time-varying geometry. Accordingly, the
angle encoder register is stepped at the rate
of 512 increments per 24 hours, or one pulse
every 2.812 minutes. These "time-of-day" correc-
tion pulses are generated by the spacecraft central
timer derived from a tuning fork reference oscil-lator.
The beam positioner output counter continu-
ously drives two 8-bit, digital-to-analog (D/A)
converters. The conversion is performed by
weighted resistor ladders, with inputs con-
trolled by the eight least significant bits of the
output counter through low offset transistor
Ik.&
U
U
H
l
i
I
HU
M
i
W
u
W
==-u
5-58_y__
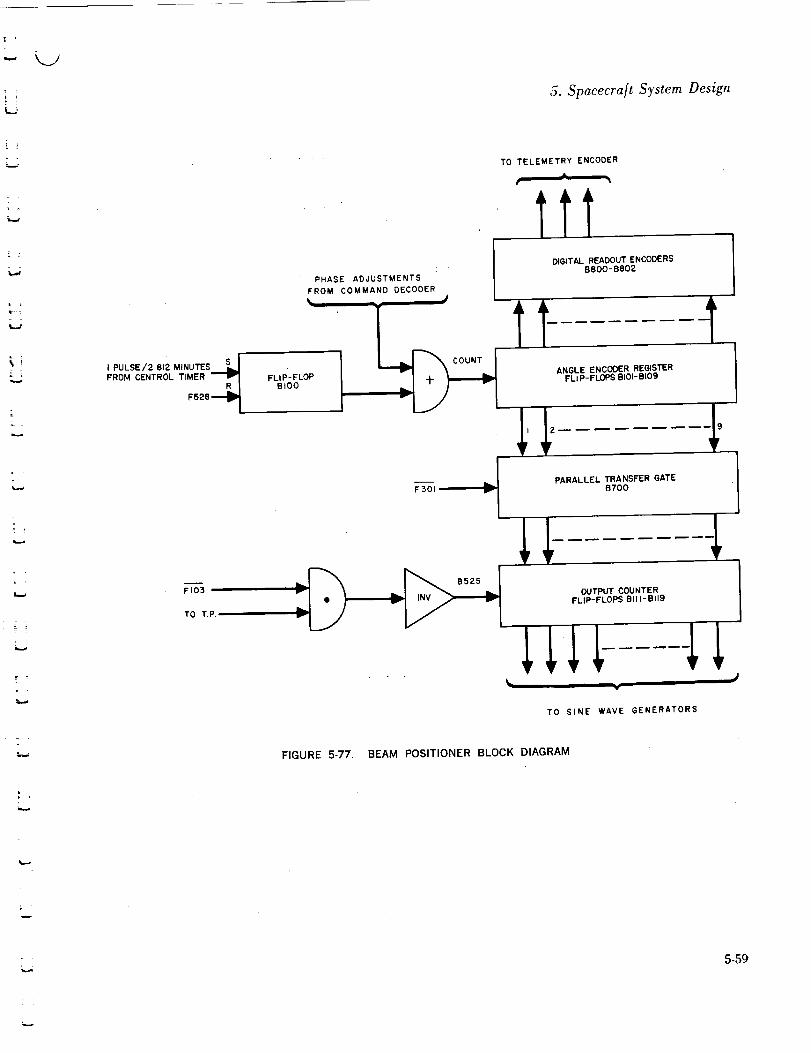
L.J
LJ
5. Spacecraft System Design
:....,
w
w
=
L
_PULSE/2.SI2M,NU_S LI
FROM CENTROL TIMER
• F528"_
PHASE ADJUSTMENTS
FROM COMMAND DECODER
FLIP-FLOP
BIO0
FSOI_
TO TELEMETRY ENCODER
A
_GITAL READOUT ENCODERS
8800-B802
ANGLE ENC(X)E'R REGISTER
FLI pmFLOPS BIOI-BI09
PARALLEL TRANSFER GATE
RTO0
_S525
r F r
OUTPUT COUNTER
FLIP-FLOPS BIll- Bl19
iiiY
, ,,/
TO SINE WAVE GENERATORS
FIGURE 5-77. BEAM POSITIONER BLOCK DIAGRAM
5-59

Hughes Aircra[t Company
switches. The first converter makes a normal
conversion while the output counter counts from
0 to half of full scale. During this half-cycle, the
output is a"staircase" which approaches a ramp,
traversing from --14 to +14 volts in 256 equal
voltage increments. When the most significant bit
of the output counter switches from 0 to 1, the
inputs to the ladder are switched from the normal
outputs of the output counter flip-flops to the com-
plementary outputs, the significance remaining
the same. Since the complementary outputs of a
counter counting up are the same as a counter
counting down, the converter steps from +14 to
--14 volts during the second half-cycle of the
output counter. When the output counter recycles,
a normal conversion is again made and the se-
quence described above is repeated. Figure
5-78 shows the output waveform and timing of
the first converter. The most significant bit of the
output counter is used as a gate to determine
L,=__ ONE CYCLE OF OUTPUT ____=,j
I COUNTER
III
I -1MOST SIGNIFICANT BIT
OF OUTPUT COUNTER
NORMAL
CONVERSION
14v J[I "_, /
Ii II
i I
o I /,I/
I /
I /
-14v J
CONVERSION
ON FLIP-FLOP
COMPLEMENTS
STEPS
%
/
OUTPUT VOLTAGE
OF FIRST
CONVERTER
FIGURE 5-78. OUTPUT VOLTAGE AND TIMING OFFIRST DIGITAL-TO-ANALOG CONVERTER
5-60
whether a normal or complementary conversion
is to be performed,
In order to generate the required output wave-
forms, a second signal must be derived from the
output counter. This waveform must have the
same form as the output of the first converter, but
must lead it in phase by 90 degrees. A timing gate
must be generated, which performs the selection
as to whether a normal or complementary con-
version is to be made. Figure 5-79 shows that
this gate is the simple logic combination 8.9 +
8.9, where 8 and 9 are the next-to-most and most
significant bits of the output counter. Figure
5-79 also shows the output waveform and timing
ONE CYCLE OF OUTPUT COUNTER
1 OR ONE SPACECRAFT SPIN PERIOD
I I
'o I
-14v J
I
NEXT-TO-MOST SIGNIFICANT BIT
OF OUTPUT COUNTER (BIT 8)
MOST SIGNIRCANT BIT
OF OUTPUT COUNTER (BIT 9}
FUNCTION '_&" GATE • _ + 9,"-8
NORMAL
CONVERSION
t !"t/_''"• COMPLEMENTARY
i t "'_'_"C ONVERSiON t ''l
/ I
• /I I
• i I
• % II I
%• ii I
I
OUTPUT VOLTAGE OF SECOND
ANALOG-TO -DIGITAL CONVERTER
FIGURE 5-79. OUTPUT VOLTAGE AND TIMING OFSECOND DIGITAL-TO-ANALOG CONVERTER
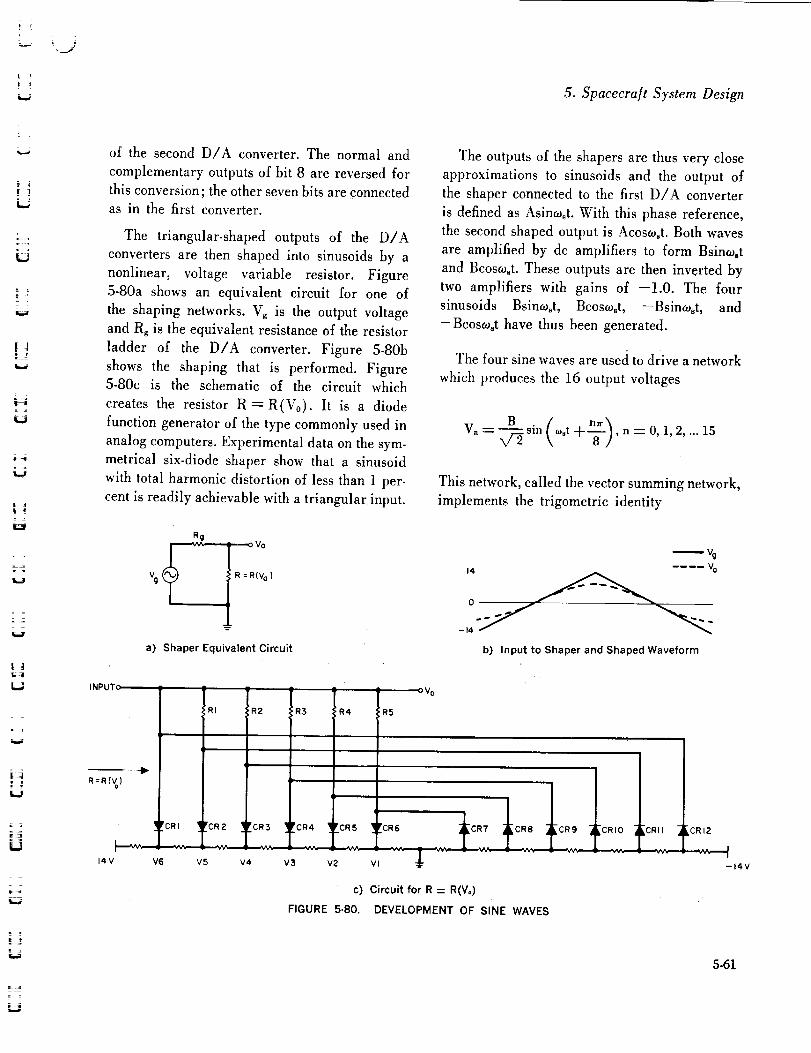
t
".J
5. Spacecra/t System Design
of the second D/A converter. The normal and
complementary outputs of bit 8 are reversed for
this conversion; the other seven bits are connected
as in the first converter.
The triangular-shaped outputs of the D/A
converters are then shaped into sinusoids by a
nonlinear, voltage variable resistor. Figure
5-80a shows an equivalent circuit for one of
the shaping networks. Vg is the output voltage
and Rg is the equivalent resistance of the resistor
ladder of the D/A converter. Figure 5-80b
shows the shaping that is performed. Figure5-80c is the schematic of the circuit which
creates the resistor R--R(Vo). It is a diode
function generator of the type commonly used in
analog computers. Experimental data on the sym-
metrical six-diode shaper show that a sinusoid
with total harmonic distortion of less than 1 per-
cent is readily achievable with a triangular input.
The outputs of the shapers are thus very close
approximations to sinusoids and the output of
the shaper connected to the first D/A converter
is defined as Asinw,t. With this phase reference,
the second shaped output is Acos_st. Both waves
are amplified by dc amplifiers to form Bsino_st
and Bcosw,t. These outputs are then inverted by
two amplifiers with gains of --l.0. The four
sinusoids Bsino_st, Bcos_t, --Bsin_t, and
--BcosoJ_t have thus been generated.
The four sine waves are used to drive a network
which produces the 16 output voltages
V._ BN/r_sin (o,,t-_-_-), n = O, 1, 2.... 15
This network, called the vector summing network,
implements the trigometric identity
Rg
(Vo)
]a) Shaper Equivalent Circuit
INPUTc
v
R=R(%
'R !R2 R3
14V V6 V5 V4 V3 V2
_vg14 .... V°
- 14
b) Input to Shaper and Shaped Waveform
FIGURE 5-80.
R5
c) Circuit for R= R(Vo)
DEVELOPMENT OF SINE WAVES
I[CRI I _CRI2
-14V
5-61

Hughes Aircra[t Company
A sin _o,t+ B cos ,o,t
= _ sin (to.t + tan --_)
An example showing the case for n -- 1 is given
in Figure 5-81. If the resistors are in the given
ratios the output will be as shown. Transistors
Q1 and Q2 form a complementary emitter fol-
lower which gives unity voltage gain and high
current gain and presents a high input impedance
to the input summing resistors. The 2 appears
in the equation because dach sine wave Source
loads the other. Each of the 16 phases is gen-
erated by the technique shown in Figure 5-8i.
The complete section from the low offset switches
to the 16 sine wave outputs is called the sine
wave generator subassembly and a block dia-
gram is shown in Figure 5-82.
It has been shown that each of the eight phase
shifters requires two signals of the form
1.0
A SIN tot
2.37
A COS _t
D sin _ 2_rsin
8.73
i
FIGURE 5-81.
v
!O2
i--V
EXAMPLE OF VECTOR SUMMINGNETWORK
5-62
and
n -- 0, 1,... 7 "
D cos E2_r sin (o,,t + --_ 0)_
n=0,1 .... 7
Normalized plots of these functions are shown in
Figure 5-83 for n = 0. The eight phases of these
waveforms are generated from the 16 sine waves
by unique waveform generators. To understand
the operation of these generators, consider the
standard diode AND gate shown in Figure 5-84a.
The output voltage is a diode drop above which-
ever input is at the more negative voltage; that is,
it selects the more negative of the two inputs
(lesser gate). Similarly, the output of the stand-
ard diode OR gate of Figure 5-84b is one diode
drop below the higher of the two input voltages
(greater gate).
The circuit which generates D cos [2_r sinco,t]
is shown in Figure 5-84c. Figure 5-84d shows
the two input waveforms and Figure 5-84e the
waveforms at A and B. The waveform at A is a
positive full rectified sine wave. It is formed by
taking the output from whichever input is higher
(greater gate). The waveform at B is a negative
full rectified sine wave and is formed by taking
the output from whichever input is lower (lesser
gate). The waveform at C is the waveform at
A shifted down in voltage by 8A of the input
amplitude. The signal at D is that at B shifted
up in voltage by ¼ of the input amplitude. These
waveforms are shown in Figure 5-84f. The
voltages at C and D are then combined in a
greater gate to produce the voltage at E which is
plotted in Figure 5-84g. Comparison of this
figure with Figure 5-84b shows that if the wave-
form at E is shaped to remove the sharp edges,
it is a close approximation to the required output.
This shaping is performed by the nonlinear resis-

L
U
+
_ ;tE
_o_
A
_tozll_
o0o _t
+
z
z,
+
_I_ _;z_-l____
4-
r,'Y
L
.J t,_
5. Spacecra/t System Design
+
i o: 0
z
z
u.Iz
I.d
u.iz
W
5-63

w
Hughes Aircraft Company
f(_t) 0
v" :3_r
f(_t) 0
-LO
a) Sin [2 _r sin (o_t)]
1.0 _Tr
-I .0
b) Cos [2 = sin (_t)]
F,IGURE 5-83. REQUIRED OUTPUT WAVEF'ORMS(NORMALIZED)
tor, R(Vo). The other required waveform is gen-erated in a similar manner.
Each of the signals created by the waveform
generators is then amplified to a voltage and
power level suitable for driving the phase shifters
by a potentiometric type dc amplifier.
An advanced engineering model of this system
was constructed on flat circuit cards. This model
was evaluated under severe environmental ex-
tremes and in general performed very well. It
was tested over a temperature range of --50 to
1250C. The input voltages of +24 volts 4-3 per-
cent were varied from ---20 to ±30 volts, and
noise spikes of 1 volt were introduced on the
power inputs. In addition, the input frequeney
was varied from % cps to 21_ cps, corresponding
to spacecraft spin speeds from 50 to 150 rpm.
For all of these conditions the advanced en-
gineering model operated within specification
over the temperature range from --50 to 100*C.
At 125°C, the loop error was less than 0.7 degree
only for spin speeds near 75 rpm. However, al-
though the performance was degraded the system
was still functioning. Table 5-13 is a summary
of the data taken. Lock is the time required for
the loop to achieve an error of less than 0.7
degree from turnon; error is the steady-state time
error after the loop has stabilized.
Since each pulse of the frequency lock loop
represents 360/4096 spacecraft degrees, it can
be used to count the angle in spacecraft degrees
between 4 and 42. A unit was developed for this
purpose composed of a flip-flop counter, control
circuitry, and the circuitry for converting the
digital bits into analog form for telemetering. The
42 counter counts the 4 -- 4_ angle as magnitude
(45 degrees) and sign.
Further improvements in the PACE circuitry
appear feasible. Studies in the following areas
are in progress.
1) Since the angle encoder register of the
beam positioner is used to prevent the accumula-
tion of errors over long periods of time, it could
be used for short periods to count the q, to 62
angle upon ground command. This could save
about 300 components per quadrant plus three
telemetry channels. Care must be taken so that
performance of this auxiliary function will not
compromise the reliability of the antenna control.
2) There is an alternate method of creating
the ramp voltages in the sine wave generators.
Referring to Figure 5-85, the precision one-shot
enables both current generators. However, only
the one selected by the flip-flop will supply cur-
rent to the capacitor. The constant current applied
to the capacitor for a fixed time supplies a fixed
charge to the capacitor, thus generating a fixed
AV each time the one-shot i s triggered. The clamp
circuit clamps the capacitor voltage at the ex-
treme end of the ramp to prevent accumulation
of errors. The flip-flop is controlled by the beam
positioner logic. The high input impedance am-
plifier generates the output at a reasonable im-
pedance level without loading the capacitor. A
breadboard of this subassembly has been built
5-64

5. Spacecra[t System Design
J_
B 4= I
LJ
• i
U
rt=
;it.J
t-t
ejo
e2o
. :_
:_
eo = e_ FOR e I < e2
% = ez FOR ez< e_
a) Lesser Gate
Oeo
eI o
e2o
."ft.7": "t
-v
eo =e I FOR e t > e z
eo =e z FOR e 2• e=
b) Greater Gate
Joeo
-v
I :: _ "%" i® ®'"
/+V
RCVo)
-V
c) Cos [2 _ sin (_t)] Generator
A-
-A
d) Input Waveforms
B
-B
'_""_,_ ,, .® ,,it/// '_'_'_, %, s/j/1//
e) Waveforms at@and(_
f) Waveforms at@and@
g) Waveform at@
FIGURE 5-84. DEVELOPMENT OF OUTPUT WAVEFORMS
5-65

M
Hughes Aircraft Company
(..)Z
tY0l.a.
t'r'm,tQ.
a.
0
0--I
0
0ml
>"
W
i.a.l
l.a-
o_
t,a..#
m
I
_ +_+ + +
,_ _ _ ._- .__ __ .__ .__-4- .E E E E E E
+ _,.__.__.-_
0_
0_ '_o, _.___
c_ c_+ +
.m .E .m ,_
E _ E
._ .__ .__ __ _ _
4- 4- 4- 4-
ta
.'-_. ,.. _ ,_, ,_
4- 4- 4- 4- 4-
+ . _ ._ _ _ _ -__.__ _ ._ _ ., "_ ._L.
6
o.=-_ __ _ _ _ _ _ _ _ _
5.66
u 6
3 =-_-F--
'_" o
_,_,,
,=-__ ._ _ -_
_ ®_'_._ I "_ _ _ _ +I
_t- E
• --.I.a t_
o 0 M_ o o
,__ • _" - _ _ _
o o. _ o. o
+ ,_ _ +_
•_ _ "_ _
=
i
i
mm
i
E
II
J
u
H
z
w
HW
u
M
II
II
H
II
i

5. Spacecra/t System Design
k J
2I
i i
lld
iJ
ii
IiU
_4m
• 1
q_
el"W
tl0
O3
¢0 _0 _- " " • "
I I _ I +
0
+ 8 _ _ o_
(J
t_t-i
+
tbhi--I
0
bo+
__ .=_ .m__ ,= .m ,m_.• 7 E E E E E
Oil. 0 0 0 "_" t_
"O.tl, 0
I I +
o o_ - _o o_(J
.E(%1
b0
+
"_o .__ "=--_ "=--_ ,EE "=-_ "_-
_¢ _ 2_ '_, ,s$ "_:_ , , ,._+
___ -- ._= ._=_, -_; .-=
eldE o o
5-67
L

Hughes Aircra/t Company
i
lul
FI03
ONE --
SHOT
CONSTANT
CURRENT
T CONTROL
_} FROM
FLIP- BEAMFLOP POSITIONER
LOGIC
CONTROL
CONSTANT I_
ENT__r
HIGH
INPUT
AMPLIFIER
¢OUTPUT
CLAMPCIRCUIT
$FIGURE 5-85. ALTERNATE RAMP GENERATOR
and is presently being evaluated. If the errors
can be held to a reasonable level, this technique
would reduce by about 150 the components per
quadrant and the power by about 1 watt.
3) The present frequency lock loop can have
a high loop gain even when in nominal lock. This
means that in the event of high extraneous sys-
tem noise or a lost solar pulse communications
might be degraded for periods Up to 90 seconds.
To prevent this, circuitry will be included to
limit the width of the error pulses once the loop
has achieved lock.
4) In order to evaluate PACE performance
during system test and flight, circuitry is being
added to provide an indication of the frequency
lock loop steady-state error. This will be in the
form of an analog voltage proportional to steady-state error and will be telemetered.
PACE Product Design
• Advanced Engineering Model. The ad-
vanced engineering model consisting of the
phased antenna control electronics (PACE), the
jet control electronics (JCE), the _bz angle coun-
ter, and the phase shifter drivers was designed on
open-form wired etched circuit cards. The
commercial components were designed onto 62
5-68
cards of 34 types resulting in a density of approx-
imately 48 components per card. Fifty-eight of
the cards were mounted in a two-section computer
type unit of existing design. The four remaining
cards, electrically simulating the quadrant inter-
face with three other quadrants, were mounted in
the unit designed for the Syncom 2 encoder and
decoder simulator. The wire lists for the units
were generated using an existing computer pro-
gram which provided the error checked wire list
and a signal usage list to obtain reductions in
both wiring and testing time.
• Spacecraft Module Construction. The
mass encapsulation technique of encapsulating
welded modules, the natural next generation of
Syncom techniques, was developed specifically
for Advanced Syncom digital electronics. It is a
technique whereby the individual welded mod-ules are mounted and connected to an etched cir-
cuit card, electrically tested as a subassembly,
and then encapsulated as a subassembly. This re-
suits in an environmentally sound unit requiring
little additional structural support in a space-
craft environment and reduces the encapsulationcosts.
The components are placed in a low density
rigid polyurethane component holder (HMS
16-1317), which has been epoxy impregnated to
increase strength and prevent flaking, and are
interconnected by resistance welding (HP31-5,
Grade A) nickel ribbon to the leads. The module
is then placed on a clear header plate and covered
with a vacuum formed, clear plastic protective
cover and electrically tested (see Figures 5-86,
5-87, and 5-88). Any possible handling dam-
age is thus prevented. After test the covers are
removed and the modules are soldered to an
etched circuit board (actual boards are shown
in Figure 5-89); the entire assembly has a
vacuum formed protective cover installed and is
m
[]
[]
|, T
N_
HJ
I Y
ii
Hi

i i
f,,,,,d
m
w
=_m
z
m
I-:t
i
i
U
i
tsml
=
FIGURE 5-86. MODULE BEING WELDED
then electrically tested. After electrical testing
the cover is removed and the assembly is placed
in the tooling and encapsulated (HP 16-9) with
a polyurethane foam (HMS 16-1287, Type IV).
There are several major advantages of this
system over those previously used. By encapsulat-
ing at the board level the number of encapsula-
tion processes required is reduced by as much as
15 to 1 and the number of tools required is pro-
portionately reduced. By encapsulating later in
the manufacturing cycle and having the ability
to electrically test entire subassemblies prior to
encapsulation, the probability of requiring repair
after encapsulation is reduced. The combination
of foam and etched board form a structurally
sound beam, eliminating the need for honeycomb
board supports required of previous systems and
reducing the weight of structure required. Theoutline of each of the modules is stenciled on the
encapsulating foam in addition to each module's
5. Spacecra/t System Design
part and serial number. Should repair of a mod-
ule become necessary, the foam surrounding the
module is cut, the module leads are unsoldered,
and the module is removed from the board. The
module is repaired or replaced, mounted on the
board, and the module area is refoamed and
restenciled.
• Spacecraft Electronic Quadrant Product
Design. The digital quadrant electronics equip-
ment is packaged into three quadrant boards each
11.25 by 18 by 1.130 inches. These three quad-
rant boards, the command board, the PACE
board, and the auxiliary board, are then inte-
grated with the transponder subassembly to form
the electronics quadrant.
The quadrant command board contains the
command decoder, command receiver, diplexer,
and command regulator. The quadrant PACE
board contains the frequency lock loop, beam
positioner, sine wave generator, and waveform
generator. The quadrant auxiliary board contains
the telemetry encoder, jet control electronics,
_'2 angle counter, central timer, and PACE
regulator.
Structure is very similar for all three quadrant
boards with the only changes being those required
by the different sizes of function blocks to bemounted. The structure consists of two 17.73-
inch-long right angle extrusions with flat cross
members 10.62 inches long bonded in place. A
sheet of 0.005 inch thick epoxy glass laminate is
bonded to the aluminum framework to provideinsulation for the etched function blocks.
A vibration test was made in which an etched
circuit board, similar in size to a Syncom 2 board
but mass encapsulated, was tested and the re-
sponses recorded. With this data a stress analy-
sis was performed which indicated a deflection of
0.160 inch maximum. This large amount of de-
flection was due to the ability of the angles to
5-69

Hughes Aircraft CompanyU
B
d
H
[]
[]M
m
i
!
r
FIGURE 5-87.
pivot. When the ends were fixed the deflection
was reduced to 0.032 inch. When a stress analysis
was made of the quadrant it was found that the
entire quadrant could flex from rectangular to
form a parallelogram about the mounting. Two
0.020-inch-thick aluminum shear panels, one on
the forward face and one on the outboard face
of the quadrant, were provided which eliminated
this condition. The weight of the three quadrant
boards will be approximately 10 pounds.
• Spacecraft Design of PACE Electronics.
The PACE circuits are designed with the fre-
-,r-
MODULE ASSEMBLY STEPS
quency lock loop, beam positioner, sine wavegenerator, and waveform generator placed on
the PACE quadrant board and the _'2 angle
counter on the auxiliary quadrant board. The
componentscootained in the first four listed sub-
systems are divided into four separate function
blocks. The PACE board contains 55 modules
of 28 types with an average component density
of 41 components per cubic inch at the module
level.
The advanced development module (ADM) of
the PACE quadrant board is now being welded in
5-70
_.-=
in
lid
i
U
i

" j
5. Spacecra]t System Design
R T
w
o .
I_|
m_
H
i
--4
W
U
FIGURE 5-88. MODULE READY FOR ENCAPSULATION
FIGURE 5-89. ETCHED CIRCUIT BOARDSFOR WELDED MODULES
module form and the fabrication is nearing com-
pletion. This model will allow evaluation of the
mass encapsulation technique and will permit
tests to ensure that the high impedance circuitry
in the PACE is not degraded by encapsulation.
Because of long delivery times, two of the mod-
ules were changed for this model so that readily
available components could be substituted. Three
weight simulation units have been fabricated
which will be vibrated with the transponder to
prove out the design.
All components used in the advanced develop-
men{ model were measured and tested prior to
use. Approximately 3000 components were eval-
5-71

Hughes Aircra[t Company
uated; the data is being analyzed and put into a
form for design use. All failures have been identi-
field and held for further study.
The compIete set of fabrication drawings for
the PACE unit are complete. The components
for the _,, angle counter have been designed
into 13 welded modules of eight types. All mod-
ule designs have been completed. The etched
board design will not be accomplished until a de-cision has been reached whether or not the beam
positioner counter will be time shared between
the beam positioner and _ angle counter.
• Phase Shifter Driver Product Design.
Two separate product designs of th e phase shifter
driver unit are being made. The first is an open-form, wired flat card breadboard unit to be used
with the ADM PACE, and the second is the flight
configuration spacecraft design.
frame. The solenoid driver heat sinks provide
adequate heat sink of the power amplifier out-
put transistors which dissipate 600 milliwatts.
]et Control Electronics. Since the beam posi-
tioner has phase information as to the direction
from the spacecraft to the earth, it can be utilized
in the reaction control system to provide for
pulsed operation of the jets at fixed angles with
respect to the earth line. The reference is the
center of the antenna beam which, it is assumed,
has already been aligned to be coincident with theearth line.
The jet control electronics (JCE) provides the
necessary electronic circuitry to operate the
bipropellant propulsion control subsystem. Its
modes of operation include operating the jets by
sequentially timed control pulses generated in
the spacecraft or permitting real time control of
The ADM design has 16 wired cards of four the jets with the use of the ground console syn-
types contained in a modified Syncom 2 telemetry
and command simulator frame with a 75-pin unit
connector. The output transistors requiring a heat
path whose thermal resistance is 33"C per watt
or less were equipped with commercial heat sinks.
The spacecraft phase shifter drivers are pack-
aged in two identical units each consisting of four
identical etched circuit boards containing a power
amplifier A(sin), a power amplifier B(cos),
a dc-to-dc converter, plus a fifth etched circuit
board containing the on-off drivers.
Welded module construction will be used
throughout except for physically large compo-
nents including one transformer, two inductors,
and one capacitor which will be mounted directlyto the circuit board. After each board is assem-
bled and tested it will be mass encapsulated in a
4 lb/ft '_ rigid polyurethane foam. The wiring of
the five boards and the 37-pin unit connector is
accomplished by point-to-point wiring and the
unit is then assembled in a thin walled aluminum
chronous controller.
With the logical use of the generated control
pulses and with the phased array antenna beam
centered on the earth, the radial jets can be pulsed
through 45 spacecraft degrees such that the direc-
tion of the average thrust vector of the radial jets
will be +90 or --90 degrees from the spacecraft-
earth line and the axial jets can be pulsed (90
degrees --B) from the spacecraft-earth line. The
angle B represents the angular displacement be-
tween the radial and axial jets (90 degrees ) . Bothaxial or both radial jets are pulsed during the
same spacecraft revolution so that the average
thrust direction of each coincides. For example,
one radial jet is pulsed at 90 degrees and after
one-half revolution the other radial jet will be
pulsed at 90 degrees. The number of pulses isdetermined by the time duration of the command
execute signal.
By rotating the antenna beam/9 degrees in the
direction of the spin sense, the radial and axial
5.72

\ ;
5. Spacecra]t System Design
E
_=
L
jets can be sequentially pulsed (+90 + 0 de-
grees) or (--90 +0 degrees) and (+90 degrees
--B + _ degrees), respectively, with respect to
the spacecraft-earth line.
The time reference for the sequential timing
circuitry is a counter which is earth-oriented.
That is, during normal operation the counter's
characteristics permit selection of a reference
point on the periphery of the spacecraft that will
always be coincident with the antenna beam when
the counter's content is 0. This counter is termed
the output counter and is contained in the beam
positioner electronics. It has a full scale count of
512 with each count representing 360/512 space-
craft degrees.
It is necessary at this point to establish a ref-
erence radial jet to be termed radial jet I. It will
be the first radial jet encountered while proceed-
ing in a counter-clockwise sense from the ref-
erence point and viewing the spacecraft from the
\
RADIALJET
67.5
/ AXIAL
I//_ET
/ B
REFERENCE90 POINT -90
EARTHDIRECTION
_B-ANGLE BETWEEN REFERENCE POINT AND RADIAL JET I
y-9Odeg CORRECTION PULSE DIRECTION, 45deg DURATION
,8-ANGLE BETWEEN RADIAL JETI AND AXIAL JETI, 90deg
FIGURE 5-90. JET REFERENCE DIAGRAM
antenna end. The reference jet is shown in Figure
5-90 along with other pertinent items and angles.
Since radial jet I is displaced ¢ degrees from
the reference point, it is necessary to detect a
count of 67.5 degrees + _/360 degrees times
512 to initiate the 90-degree pulse using radial
jet I. Detection of a count corresponding to 45
degrees of subsequent spacecraft rotation is used
to terminate the jet pulse. The jet pulse for a
--90 degree correction is obtained by detecting a
count of 67.5 degrees + 6 + 180 degrees/360
degrees times 512 to initiate the pulse and then
terminating the pulse after 45 degrees of sub-
sequent spacecraft rotation. These operations are
shown in Figure 5-91. Signals J100 and J101
are outputs of flip-flops and, as will be shown
later in the derivations of the logic equation, rep-
resent the +90 and --90-degree pulses for radial
jet I. Also shown are the waveforms for signals
Bl17, Bll8, and Bll9 which are the outputs of
the three most significant flip-flops of the beam
positioner output counter. Since all operations
occur at muhiples of 45 degrees after J100 is
set, then only some function of these three signals
need be used to control the set and reset input
gates o[ J100 and J101. The remaining count is
i I IIso--w---- t I
I I t
B,,Sk--9o I I I I L__I JI I I I I
BII7__
I I I i' I i II iI- =I I
J,O,t 67.5+ _B+ 180
DIMENSIONS IN DEGREES
FIGURE 5-91. JET PULSE ENVELOPE
5-73

Hughes Aircra[t Company
common to all four inputs and is used as a clock.
Also since a flip-flop is set or reset in a 45-degree
interval, the clock need only detect a fraction of
45 degrees or X as shown in Figure 5-91. Analyt-
ically X = _ -- 22.5 degrees. Also, a signal from
the frequency lock loop indicating that the output
counter is synchronous with spacecraft spin rate
and the signal corresponding to that portion of
the command word that selects the JCE are inputs
to the set gates of J100 and Jl01. This is neces-
sary to ensure that a pulse is generated only when
the JCE has been selected and the reference coun-
ter's signals are correct.
With the use of ground console synchronous
controller, a backup mode can be operated by
real time to pulse any jet for any duration such
that the direction of tile average thrust vector is
at any angle relative to the sun or earth lines.
The circuitry for this backup mode is independent
of the sequential timing circuitry.
Seven commands are necessary to control theJCE. The commands and the functions of each
are tabulated in Table 5-14.
• Pulse Mode Operation. The block dia-
gram of the jet control electronics is shown in
Figure 5-92. The operation is as follows.
When a pulse mode command (15-1, 15-2, or
15-3) is given, gate J5 goes high which in turn
enables gates J1 and J3. If F702P is high (fre-
quency lock loop is in "lock"), flip-flop J100
will be set when the beam positioner output court-
TABLE 5-14. JET CONTROL ELECTRONICS COMMANDS
Command Function
15-1
15-215-3
16-1
16-2
16-3
16-4
Fire axial jets -- pulse modeFire radial jets at +90 degrees= pulse modeFire radial jets at -90 degrees-- pulse modeFire axial jet No. 1 --backup modeFire radial jet No. 1 -- backupmode
Fire axial jet No.2-- backupmodeFire radial jet No. 2 -- backupmode
5-74
ter reaches the count 67.5 degrees + q_/360 de-
grees times 512 and will be reset 45 degrees later.
Flip-flop J101 will be set when the beam posi-
tioner output counter reaches the count 67.5 de-
grees ÷ 6 -4- 180 degrees/360 degrees times 512
and will be reset 45 degrees later. This generates
the timing envelopes for J100 and J101 shown in
Figure 5-91.
Also when a pulse mode command is given,
one of tile three latching amplifiers (J300, J301,
J302) is turned on. The outputs of these ampli-
fiers are gated together with the outputs of flip-
flops JlO0 and J]0l to fire a jet through a 45-
degree angle. The logic is as follows:
Axial No. 1 at +90 degrees --B = J300
Axial No. 2 at +90 degrees --B = J300
Radial No. 1 at +90 degrees = J301
Radial No. 1 at -90 degrees = J302
Radial No. 2 at +90 degrees = J302
Radial No. 2 at --90 degrees = J301
JlO0
JlO1
JlO0
J]0]
JlO0
JlOl
The latching amplifiers are used so that if the
command execute is removed before a 45-degree
pulse has been completed, the pulse will not be
terminated early. The latch control enables the
latching amplifiers only during the intervals when
one of the flip-flops Jl00 or Jl01 is set.
If one of the flip-flops J100 or J101 should fail
high, continuous firing of a jet could occur. The
redundant latch control turns off the latching am-
plifiers at each clock pulse to prevent this failuremode.
• Backup Mode Operation. As seen in Fig-
ure 5-92, the command decoder backup mode
command outputs are "ORed" together with the
pulse mode signal. The backup commands are
independent of the pulse mode timing circuitry.
The selected jet fires for the duration of the
command execute signal.I
U
-2

5. Spacecraft System Design
=
w
! '
w
_B-2 J5
IS-3
IS-i _ LATCHING
AMPLIFIER
I -
Spi___
15-3
tI
J 300
J301
IS-I p,,,,,_ vl _ - AXIAL "
+ JET k4) I
dSOO
J14
JlO0
. RE'UNmAN'IL TCHIDOi;i
JlOI _JI JIGI L_ d_6
FLIP- FLOP
JlOI
J 2iiF702P
(;119 •
$tl9
_6 - 0
J301
JIO_
JIOI
l CLOCK
BIIS
JtO0
I
RADIAL
,,lET NO,I
&XIALJET NO.
\
d17
FIGURE 5-92. JET CONTROL ELECTRONICS
TO
, SOLENOID
& MPLIF'IER9
5-75

Hughes ,4ircra/t Company
let Control Electronics Product Design. The
jet control electronics consists of components
packaged in three welded modules of the type
described in the PACE product design section.
The component density of the JCE is 32 com-
ponents per cubic inch at the module level.
Solenoid Drivers. The function of the sole-
noid driver is to perform as an electronic switch
to close the solenoid coil and unregulated bus
circuit loop. Its design criteria requires that a
sumciently high current pulse he provided to
saturate the solenoid and then supply a holding
current for the remainder of the jet fire pulse.
Also, component redundancy is such that fail-
ure of one component will not activate the jet
continuously.
The solenoid driver consists of two parallel
redundant preamplifiers, two redundant series
power switches, a capacitor multiplier, a voltage
limiter, and a current limiting resistor. The inter-
connection of these parts is shown in Figure
5-93. The operation is as follows.
When a signal is received from one of the jet
control electronics outputs, both preamplifiers
turn on and turn on both power switches. The
output goes high until the effective capacitance of
the capacitor multiplier has charged, at which
time the capacitor multiplier changes to an open
circuit. The output current then drops to a lower
holding current which is determined by the coil
resistance and the value of the series limiting
resistor.
The vohage limiter is used to limit the snap-
back voltage of the solenoid coils when the coils
are deenergized; the purpose of this is to protect
the transistors in the power switches. The output
waveforms are shown in Figure 5-94.
Solenoid Driver Product Design. The four
solenoid drivers will be designed into four iden-
tical units, each occupying a volume of 18 cubic
inches and weighing approximately 0.5 pound
each. Because of the high dissipation of this
unit (20 watts peak) and possible high duty
cycle, heat transfer was of prime concern inthis unit.
QUADRANT NO I
2
FROM JCE
3
4
- _ PREAMPLIFIER H
PREAMPLIFIER H
FIGURE 5-93.
CAPACITOR IMULTIPLIER
tTRANSISTOR
POWER SWITCH
tTRANSISTOR
POWER SWITCH
-2Bv
UNREGULATED BUS
SOLENOID DRIVER BLOCK DIAGRAM
: _ TO SOLENOID
COILS
VOLTAGE ILIMITER
1
w
[]
mI
|
=
i
5-76

! ,E= •
L.J
=
T :
i
t
h.--
t
o/fO
1>3v
]
1l--..----------
t 4
O) INPUT VOLTAGE
t o tq
I
I!
<-V12 t 3 20v_
I Ib) OUTPUT VOLTAGE
I
O --I-
I
I
I
i _, I
'i" il- , -i_; -- I -t_---t-- I
/ , , ,I I I
I I I I¢1 OUTPUT CURRENT
FIGURE 5-94, SOLENOID DRIVER WAVEFORMS
The mounting surface of the unit is attached
directly to the structure of the spacecraft and the
power transistors and diodes are mounted di-
rectly to the unit frame to provide the best pos-
sible heat path. The frame thickness of 0.040
was necessary to obtain the cross-sectional area
required to dissipate the heat in the output tran-
sistors (6 watts average). The power resistors,
whose characteristics are not as heat sensitive,
are mounted on aluminum brackets which are
then connected to the frame. The preamplifiercircuit is mounted on an etched circuit card with
the low dissipation components contained in a
welded module. The output transistors of the
preamplifiers, dissipating 300 millimeters each,
require heat sink; this is accomplished by bond-
ing a hard anodized aluminum heat sink to the
transistors with conductive epoxy and fasteningit to the frame with a screw.
5. Spacecra/t System Design
Interconnections between the etched circuit
board, the other circuit elements, and the 9-pin
unit connector are accomplished by point-to-
point wiring. After assembly and test of the unit
is accomplished, it is encapsulated in a 4 lb/ft _
rigid polyurethane foam, after which a cover is
bonded in place.
Receiver Antenna Development. The receiver
antenna is a six-element cloverleaf array. A
UHF cloverleaf antenna array (Proceedings of
IRE, December 1947, pp. 1556-1563) was scaled
to obtain the desired omnidirectional pattern
with horizontal polarization. A single cloverleaf
test section was used in the development. The
major considerations in scaling were 1) obtain-
ing the correct resonant frequency, 2) obtaining
the desired coupling from the single cloverleaf,
and 3) eliminating the stray currents flowing
along the outside of the coaxial line which give
rise to end-fire beams of approximately the same
amplitude as the desired broadside beam. Tenta-
tively, the design problems were solved as fol-
lows:
1) The resonant frequency problem was
solved first by decreasing the diameter of
the four loops constituting the cloverleaf.
However, this resulted in lower coupling.
2) The coupling from the cloverleaf was in-
creased to the desired amount by attach-
ing a strip of metal to the outer edges of
the loops of the cloverleaf.
3) The stray currents flowing on the outside
of the coaxial line were eliminated by at-
taching suppressor wires to the loops of the
cloverleaf at a point near where they
emerge from the coaxial line, and shorting
these suppressor wires to the outer surfaceof the coaxial line X/4 down the line in
each direction from the cloverleaf. An
5-77

Hughes .4 ircra[t Company
additional feature of the suppressor wireis that it acts as a vernier control on the fre-
quency. This control is accomplished by
varying the distance from the coaxial line
to where the suppressor wire is connected
to the loop.
A six-element cloverleaf array was fabricated
and tested for operation at 6300 mc with a 200-mc bandwidth.
Early in the development period, the fre-
quency and bandwidth requirements was changed
to a 300-mc band centered at approximately
6165 inc. A scaled model of the 6300-mc clover-
leaf array, designed to operate at the new center
frequency of 6165 mc (Figure 5-95), was fab-
ricated. After preliminary tests were made on this
array it was enclosed in a fiberglass sleeve hav-
ing a wall thickness of 0.015 inch. The purpose
of the sleeve is to add rigidity to the antenna and
to support it in its proper operating position. Test
results with this sleeve in place are shown in
Table 5-15. Typical antenna patterns are pre-
sented in Figure 5-96.
As shown by the figures in Table 5-15, several
problem areas still existed. A new array was
constructed utilizing a larger spacing between
TABLE 5-15. MEASUREMENTS FOR 6165 MC CLOVERLEAF ARRAY WITH FIBERGLASS
Frequency,mega cycles
60156065
61156165621562656315
VSWR
1.902.202.803.45
4.14.44.8
Omnidirec-tionality,decibels
0.50.90.61.1
0.4
0.90.4
AverageBeamwidth,
degreesBeam Tilt,
degrees
MeasuredGain,
decibels
18.8
18.4
18.1
18.1
17.918.5
17.4
3.02.22.4
1.62.41.31.9
8.07.96.7
6.55.95.64.5
;LEEVE
CorrectedGain,*
decibels
7.98.07.37.67.4
7.36.4
*This Is the measuredgain correctedfor mismatch'loss for an assumedVSWRof 2.0 to 1 acrossthe frequencyband.
5-78
FIGURE 5-95. COLLINEAR ARRAY RECEIVING CLOVERLEAF ANTENNA

,-, ,,,j
w
w
! I= =!,t
i !iii_i ff ;
f_l_ ¸ _
; Li
ii
_,.++_, +_
5. Spacecraft System Design
iANGLE, e ,DEGREES ANGLE,¢I),DEGREES
0
180 IBO
a) H-Plane, 6015 mc b) E-Plane, 6015 mc
ANGLE, e ,DEGREES
0
c) H-Plane, 6165 mc
90
ANGLE,_I, DEGREES
0
30
300 60
270 'I0i 20' 30_' ""_"_ RE 90
\,
d) E-Plane, 6165 mc
FIGURE 5-96. CLOVERLEAF ANTENNA PAI-I_,ERNS
5-79
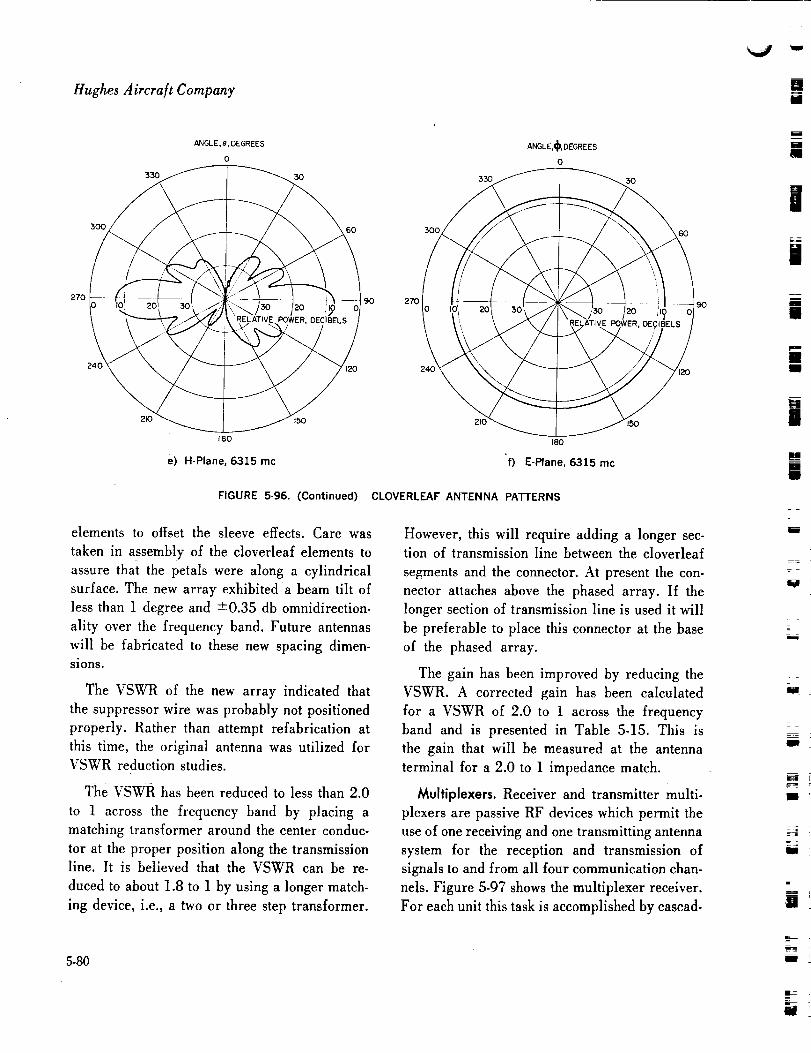
W
Hughes Aircraft Company
240 _ 120
210 _ fSO 210 ___///'150
tSO 180
e) H-Plane, 6315 mc "f) E-Plane, 6315 mc
FIGURE 5-96. (Continued)
elements to offset the sleeve effects. Care was
taken in assembly of the cloverleaf elements to
assure that the petals were along a cylindrical
surface. The new array exhibited a beam tilt of
less than 1 degree and ---0.35 db omnidirection-
ality over the frequency band. Future antennas
will be fabricated to these new spacing dimen-sions.
The VSWR of the new array indicated that
the suppressor wire was probably not positioned
properly. Rather than attempt refabrication at
this time, the original antenna was utilized for
VSWR reduction studies.
The VSWR has been reduced to less than 2.0
to 1 across the frequency band by placing a
matching transformer around the center conduc-
tor at the proper position along the transmission
line. It is believed that the VSWR can be re-
duced to about 1.8 to 1 by using a longer match-
ing device, i.e., a two or three step transformer.
CLOVERLEAF ANTENNA PATTERNS
However, this will require adding a longer sec-
tion of transmission line between the cloverleaf
segments and the connector. At present the con-
nector attaches above the phased array. If the
longer section of transmission line is used it will
be preferable to place this connector at the base
of the phased array.
The gain has been improved by reducing the
VSWR. A corrected gain has been calculated
for a VSWR of 2.0 to 1 across the frequency
band and is presented in Table 5-15. This is
the gain that will be measured at the antenna
terminal for a 2.0 to 1 impedance match.
Multiplexers. Receiver and transmitter multi-
plexers are passive RF devices which permit the
use of one receiving and one transmitting antenna
system for the reception and transmission of
signals to and from all four communication chan-
nels. Figure 5-97 shows the multiplexer receiver.
For each unit this task is accomplished by cascad-
i
IWI
m
i .
z
Ill
!
N
5.80 I ;

|
i ,
• i
LJ
i j
E
v
FIGURE 5-97. RECEIVER MULTIPLEXER
ing four filters along the path of a common rec-
tangular waveguide feedline.
The first three of these four filters following
the common antenna terminal are dual mode,
circularly polarized, directional, three-section
bandpass filters in circular waveguide which are
coupled to the broadwall of two rectangular wave-
guides, one of which is the common feedline and
the other the output.
The fourth filter is a three-section bandpass
filter for the receiver multiplexer and a four-
section filter for the transmitter multiplexer in
rectangular waveguide which terminates the com-
mon feedline. All output terminals and the com-
mon antenna terminal are via coaxial to-rectan-
gular waveguide transitions using OSM coaxial
connectors. Specifications for the multiplexers
are given in Table 5-16.
TELEMETRY AND COMMAND SYSTEM
Telemetry and Command Antenna System.
The telemetry and command antenna system in-
cludes the whip antennas, hybrid ba!uns, and
diplexers. For a four-quadrant spacecraft con-
figuration, two complete antenna groups are re-
quired. Each group is composed of eight whip
antennas, a dual hybrid balun, and two diplexers
interconnected as shown in Figure 5-98.
Each set of eight whips -- one set radial to the
spacecraft, and the other 30 degrees off the
5. Spacecraft System Design
TABLE 5-16. MULTIPLEXER SPECIFICATIONS
Center frequency, mcChannel1Channel2Channel3Channel4
Insertion loss,db (maximum)At foAt fo ± 17.5 mcAt fo ± 12.5 mc
At fo ± 15 mc
Bandwidth(1.3 VSWR),mc (minimum)
Rejection (fo ± 64 mc),db (minimum}
Weight,pounds (maximum)
Receiver Transmitter
60].9 39926108 40516212 4120
6301 4179
1.0 1.01.4
1.0
3.0
25 25
22 25
3.2 5.2
spin axis, as shown in Figures 5-99 and 5-100,
operates independently. Each whip is driven 45
degrees out of phase with the adjacent whip in
its set. The resulting patterns for each set at 136
mc and 148 mc are shown in Figure 5-101.
The hybrid balun configuration is shown sche-
matically in Figure 5-102. A photograph of the
hybrid balun is shown in Figure 5-103.
Each hybrid balun feed system has two input
connectors coupling energy from the two diplex-
ers and eight output connections for eight whip
antennas. The hybrid balun delivers equal power
from either of two telemetry transmitters to the
eight whips with 45 degrees phase difference
between adjacent whips. The phase sequence is
in the opposite direction for the two transmitters.
With this arrangement, power is not coupled
from one transmitter to another transmitter. Ex-
tra one-eighth wavelength sections are included
to prevent shorting of remaining whips if a Whip
is lost.
Telemetry and Command Diplexer. A fre-
quency diplexer is required to connect the
telemetry transmitter and command receiver to
5-81

.,j ..,
Hughes Aircra/t Company
TEST l.@w
t -0.5 db
X
156
_ t.2w A
DUAL I
136 TO 137m¢ m HYBRID
0.75w _ I BALUN I
148 TO 14@me _ 136 mc I-2.i db I
i
the antenna without introducing excessive trans-
mitter power into the receiver input. The rejec-
tion filter diplexer has the following characteris-
tics:
Transmitter to RF output inser-
tion loss at 136 mc 0.7 db
Receiver to RF input insertionloss at 148 mc 1.4 db
Transmitter to receiver isolation
at 136 mc
Transmitter to receiver isolation
at izi.8 mc 58 db
TELEMETRY
TRANSMITTER
136 mc
_
ENCODER
AUDIO
TELEMETRY
REGULATOR
BIAS
L I136 X TO A COMMAND DECODER
-0.7 db RECEIVER I v AUDIO
148 A TO R 148 mc / 2.2 v rmm
-1.4 db J 50% MOD-
TELEMETRY
,-1 a L r ,oo,oJ........
ENCODER
AUDIO
TELEMETRY
TEST I TRANSMITTER
FIGURE 5-98. RECEIVER-TRANSMITTER SUBSYSTEM
COMMAND
REGULATOR
COMMAND
REGULATOR
TELEMETRY
REGULATOR
BIAS
Telemetry Transmitter. The telemetry trans-
mitter (Figures 5-105 and 5-106) is identical to
the one utilized in Syncom 2 and no new develop-
ment work has been required to meet Advanced
Syncom objectives. The characteristics of the
transmitter are as follows:
Frequency 136.470 or136.980 mc
Output impedance 50 ohms
68 db RF power output ..... 1.6_watts _
Modulation index 0 to 2 radians
These characteristics are shown in Figure 5-104. Bandwidth >24 kc
5-82
ha
18
m
w
m
M
m
i =
i
f
k
$2J E
W
t
J )
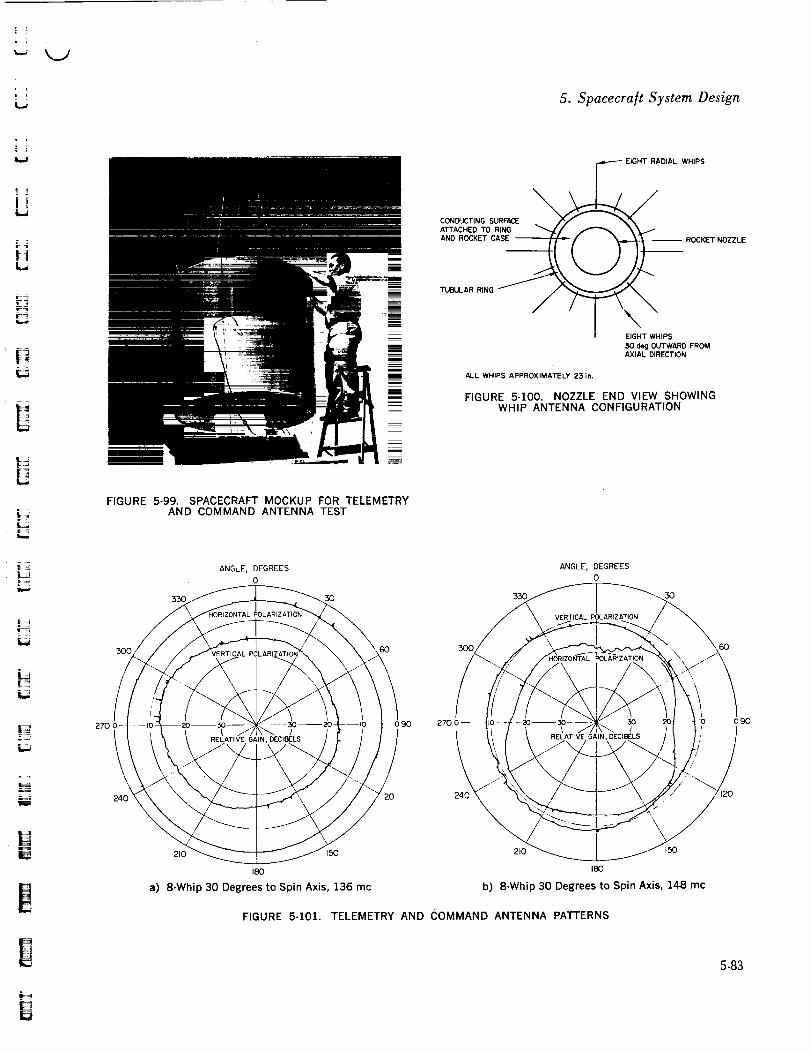
5. Spacecraft System Design
rW
H
r_
t_
L4
= .....
,..H
tiiii_
L
\CONDUCTING SURFACEATTACHED TO RING
AND ROCKET CASE
TUBULAR RING /
ADIAL WHIPS
___ ROCKEr NOZZLE
:50 deg OUTWARD FROMAXIAL DIRECTION
ALL WHIPS APPROXIMATELY 231n.
FIGURE 5-100. NOZZLE END VIEW SHOWINGWHIP ANTENNA CONFIGURATION
FIGURE 5-99. SPACECRAFT MOCKUP FOR TELEMETRYAND COMMAND ANTENNA TEST
ANGLE, DEGREES ANGLE, DEGREES
0 0
180 1130
a) 8-Whip 30 Degrees to Spin Axis, 136 mc b) 8-Whip 30 Degrees to Spin Axis, 148 mc
FIGURE 5-101. TELEMETRY AND COMMAND ANTENNA PAI-rERNS
5-83

HugAes Aircra/t Company
ANGLE, DEGREES
0
180
c) 8-Whip 30 Degrees to Spin Axis, 136 mc
ANGLE, DEGREES
0
3,:3O 3O
22_o_L-,B_----_ ____"-.X#_ __ __ ,_.L--.o9o
24O X
IBO
d) 8-Whip 30 Degrees to Spin Axis, 148 mc
ANGLE, DEGREES ANGLE, DEGREES
0 0
33O 30 33O 3O
270 0 90 270 90
240 120
180 180
e) 8-Whip 90 Degrees to Spin Axis, 136 mc f) 8-Whip 90 Degrees to Spin Axis, 148 mc
FIGURE 5-101. (Continued) TELEMETRY AND COMMAND ANTENNA PATTERNS
II
m
[]IIll
!atom
ii
_Ei
m
II
r_
wl
w
=_=
W
I
J
5-84 .,, L

*-.-; 1 7
!_
L_
!#
i !
L_
tL_
|>;i#
[¸;7¸7
£;]
5. Spacecra/t System Design
ANGL_', DEGREES;
0 ,_NGLE, DEGREEs
°
, ,d , /"
270 -
g) 8-Whip 90 Degrees to Spin Axis, 136 mc
h) 8-Whip 90 Degrees to Spin Axis, 148 mc
FIGURE 5-101, (Continued) TELEMETRY AND COMMAND ANTENNA PATTERNS
FIGURE 5-103. HYBRID BALUN
5-85

Hughes ,4 ircra/t Company= =
8O
OIl
J 60_J
W
_g
_ 4oZ0
I-
_J_ 20Z
o12o
• i
t30 140 150 160
FREOUENCY I MEGACYCLES
FIGURE 5-104. APPROXIMATE DIPLEXERCHARACTERISTICS
SIDE
170
Spurious output
Oscillator stability
Voltage
DC input power
Weight
Operating temperature
<--30 dbw
-+0.003 percent
-24 volts
6 watts
8 ounces each
20 to 130 ° F
The transmitter employs six transistors. The
crystal oscillator operates at 68 inc. The output
of the oscillator is phase-modulated by the en-
coder information and then amplified through
a four-stage RF amplifier. The final amplifier
output drives a balanced varactor doubler stage.
Fixed bias is applied to the doubler to correctly
|
FIGURE 5-105. TRANSMITTER TELEMETRY
M
===
I
r_
u
w
tf
w
u
w
W
W
!i..,. =
5-86
BE
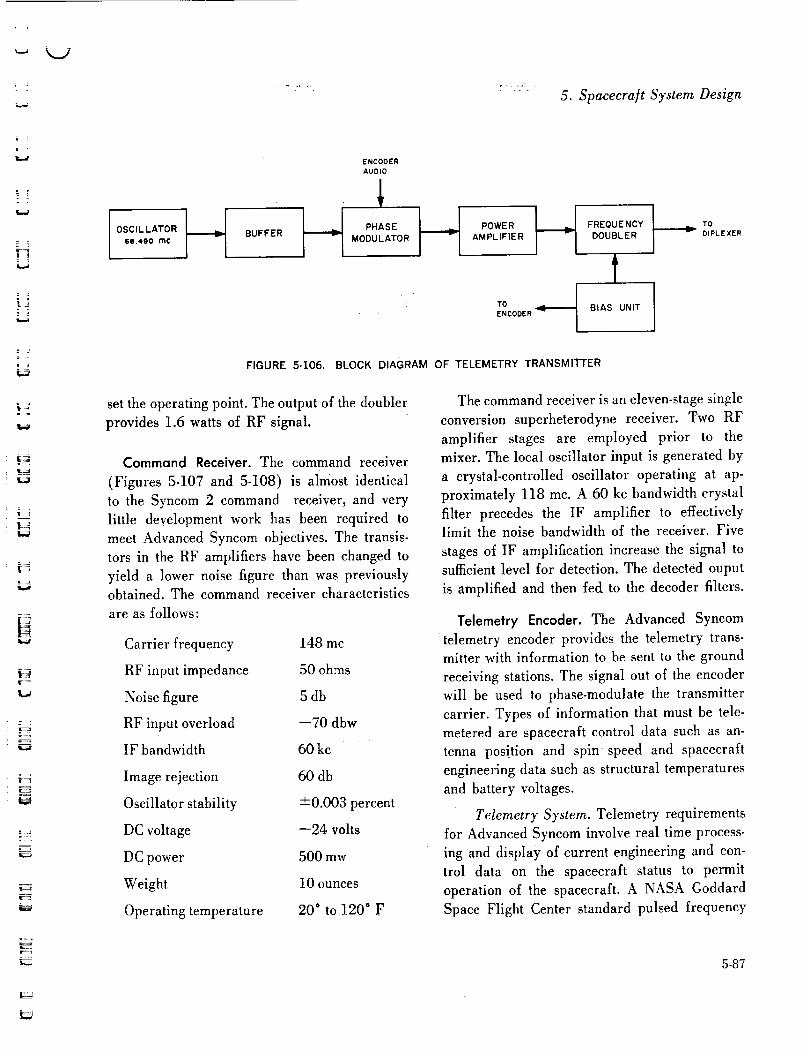
T
==
_ii_ii_.
E!!!!!Z_.
.. =_ %,
5. Spacecra/t System Design
I OSCILLATOR _._ BUFFER _1_68.490 mc
ENCOOER
AUDIO
PHASEMODULATOR ._ POWER
AMPLIFIER FREQUENCY _._DOUBLER
I
BIAS UNIT
TO
DIPLEXER
FIGURE 5-106. BLOCK DIAGRAM OF TELEMETRY TRANSMITTER
set the operating point. The output of the doubler
provides 1.6 watts of RF signal.
Command Receiver. The command receiver
(Figures 5-107 and 5-108) is almost identical
to the Syncom 2 command receiver, and very
little development work has been required to
meet Advanced Syncom objectives. The transis-
tors in the RF amplifiers have been changed to
yield a lower noise figure than was previouslyobtained. The command receiver characteristics
are as follows:
Carrier frequency 148 mc
RF input impedance 50 ohms
Noise figure 5 db
RF input overload --70 dbw
IF bandwidth 60 kc
Image rejection 60 db
Oscillator stability -4-0.003 percent
DC voltage --24 volts
DC power 500 mw
Weight 10 ounces
Operating temperature 20* to 120* F
The command receiver is an eleven-stage single
conversion superheterodyne receiver. Two RF
amplifier stages are employed prior to the
mixer. The local oscillator input is generated by
a crystal-controlled oscillator operating at ap-
proximately 118 mc. A 60 kc bandwidth crystal
filter precedes the IF amplifier to effectivelylimit the noise bandwidth of the receiver. Five
stages of IF amplification increase the signal to
su$cient level for detection. The detected ouput
is amplified and then fed to the decoder filters.
Telemetry Encoder. The Advanced Syncom
_telemetry encoder provides the telemetry trans-mitter with information to be sent to the ground
receiving stations. The signal out of the encoder
will be used to phase-modulate the transmitter
carrier. Types of information that must be tele-
metered are spacecraft control data such as an-
tenna position and spin speed and spacecraft
engineering data such as structural temperatures
and battery voltages.
Telemetry System. Telemetry requirements
for Advanced Syncom involve real time process-
ing and display of current engineering and con-
trol data on the spacecraft status to permit
operation of the spacecraft. A NASA Goddard
Space Flight Center standard pulsed frequency
5-87

Hughes ,4 ircra# Compa;zymm
II
illlr,
I
g
i
BiB
M
UI
jl
H
II
g
ul
izi i
j_
FIGURE 5-107. COMMAND RECEIVER
I OSCILLATOR
III,316 mc I
AMPLIFIER
tFROM
DWLEXER
5-88
liMIXER
- l,oc I AMPLIFIER
FILTER 2o.95 mc 29.e5 mc29.95 mc
AGC
FILTER H
FIGURE 5-108, BLOCK DIAGRAM OF COMMAND RECEIVER
DECODER
tAMPLIFIER I
t_Jj DETECTOR J
_4
U
g
U_
uu
H
H t

. .t i
ii.I
#
+ +,lj_+
• +
i +
+..+++
V
U
f_
modulation (PFM) system is utilized for this
data. In addition to the PFM data, other datamust be transmitted in real time: the solar sensor
pulses and the command execute tone with pro-
visions for modulation of the tone by signals in-
dicating that certain specific commands have been
performed.
PFM System. In the PFM system, the infor-
mation to be telemetered is encodedinto sub-
carrier oscillator frequencies according to a spec-
ified format. The frequency of the oscillator is
controlled by its input voltage which is the output
of transducers and other analog signal sources.
Time division multiplexing is used to accommo-
date the many inputs.
The format (Figure 5-109) consists of eight
frames with 16 channels per frame assigned as
follows:
Channel 0 Frame sync consisting of a Tsecond reference burst fol-
lowed by a 3T second sync
burst
Channels 1 to 7 Series of 2T second bursts
each preceded by a 2T second
reference burst
Channels 8 to 15 Continuous data burst
Durnig channels 8 to 15, the supercommutated
solar panel output and transponder receiver sig-
nal strength data are not interrupted by a ref-
erence burst, to preclude possible loss of infor-mation.
The system frequencies are as follows:
Information rate
Data frequency band ofsubcarrier oscillator
4.85 -_- 5 percentchannels/second
5.0 kc to 15.0 kc
5. Spacecraft System Design
1T = = 5.15 milliseconds
4(48.5)
Reference frequency 16.0 kc
Basic frame sync frequency 4.45 kc
To discriminate between frames, alternate sync
bursts are stepped up in frequency from 4.45 kc.
This stepped up frequency is the frame number
encoded into a corresponding digital input level.
The channel rate, which is a deviation from the
NASA standard of a nominal 50 channels per
second, was chosen because a stable 194 pps
output is available from the spacecraft centraltimer.
The encoder is shown in Figure 5-110. Time
selection of the data, reference, and sync bursts
is performed by the selection counter and diode
logic in conjunction with the commutator.
Logical combinations of the true and false
outputs of the nine stage counter (E101-E109)
determine which input is to be applied to the
subcarrier oscillator. Figure 5-111 indicates
the relation between the 9 bits of the selection
counter and the PFM format. The basic driving
frequency is the 194 pps central timer output.
A detailed description of the selection scheme
is presented in the following discussion.
The frequency of the subcarrier oscillator is
linearly controlled by the level of the dc input
voltage. Data band limits of 5 kc and 15 kc
correspond to 0 and --5 volt control levels.
During the data burst intervals, the data level
limiter, E801, restricts the input of the subcarrier
oscillator to the 0 to --5 volt range as required
by the NASA/GSFC specification. The reference
and sync are also generated by applying the
appropriate voltage levels to the subcarrier os-
cillator. These are obtained from the voltage
standard circuit, E703, which also provides the
5-89

_s_ W
Hughes ,4ircra/t Company
5-90
,__
0[i
(l: 1'2-
r
r
,i
u_
0
>-
_JW
I-.
u_
W
IJ_
IJiw w
U
u
H
i
==
u
I
W
W
W
w

t
|
L- \.,)
i
!
w
L...,
*'5_v DC/OCCONVERTER
pI I (PART OF TMBIAS UNIT )
-24v
VOLTAGE
STANDARDS
E703
-I.35v -2.55v -3.7'5v -5v -5.5v 0.275 -O,15v
',, jy-
TO COMMUTATOR
SECTIONS 1">4
TO TRANSDUCERS -24v
TRANSDUCER
EXCITATtON
E701
FROM SELECTION COUNTER
,.__x__.,
_..._
_'2 ANGLE I
COUNTER
GATE
E20B
1TIMING SIGNAL
TO
_2 ANGLE COUNTER
1f,,,_ J
, PULSE [ eu'_l
= FREQUENCY= MOOULAT_ON 12
DATA INPUTS COMMUTATOR
SECTION I
-- VOLTAGE '7
STANDARDS
_...._ _ _ _...._ 7 7
FROM SELECTION FROM SELECTION
GATE E203- 7 COUNTER
L_
-8v
REGULATOR
E704
L_
Z "
PULS FREQUENCYMODULATION 16 <
DATA INPUTS
VOLTAGE 3
STANDARDS
_..._T
2
FRAMES 2, 3
FROM SELECTION
GATE .E203-7
El02 O_
E200 O_ 1
7
F--_L_A_;°_;
[ 'DATA LEVEL
LIMITER
E801
IFREQUENCY 16MODULATION
DATA INPUTS
FROM (_1
VOLTAGE 3
STANDARDS
FROM SELECTION
COUNTER
t f==
! I ! ICHANNEL I E202
E201
FLIP-FLOP
FROM CENTRAL _ FLIP-IFLOP
TIMER 194 cpI - - _ -1 , EIOt
GATE
E601
1E203
-- W E_
FLIP-FLOP
t
_ FLIP-FLOPEl02
1
GATEE602
SbJ uJ
y"
SELECTION COUNTER
FLIP- FLOPS E I01 - 9 ARE COUNTER FLIP- FLOPS
GATES EGOI-8 ARE COUNTER INTERSTAGE GATES
FIGURE 5-110. TELEMETRY ENCODER BLOCK DIAGRAM
/

=-
i
i
[]I
[]U
[]|
Ii
I
m
-- ]
|
U
i|

",._t
COMMAND
EXECUTETONE 0'_='-
PHASE
MODULATOR
I= A MOUTLIPUT R L,_,.I_ TTOLE METR Y
"I EsooIT_'NSM'TTER
3.62 kc E804
FROM BIRROPELLANT
MOTOR SOLENOIDS
FROM SOUIBS
SOLAR
SENSOR
AMPLIFIER
E806
'0
FROM SOLAR SENSORS
SOLAR I
SENSOR
AMPLIFIER
E807
5
FRAMES 4, 5
FREQUENCYMODULATION 16
DATA INPUTS
-(yVOLTAGE 3
STANDARDS
:_...__ _..._7 w 7
ROM SELECTION FROM SELECTION
GATE E203-7 COUNTER
4
FRAMES 6, 7
_e eo_
7
FROM SELECTION
GATE E203 -7
w
o o o_
3
FROM SELECTION
COUNTER
1
6_5 E206
JIP -FLOP
J.IP -FLOP GATE
El03 E603
IE207
FLIP-FLOP
t
__ FLIP-FLOPEl09
--9_ FLIP- FLOP
E200 E200
t t
REFERENCE-SYNC
SELECT GATE
E2OO
XX__EIOI EIO2 El02 EIO3 _ E_
5-91


J
L,
L_J
K,9
!: 3
r--
5. Spacecra/t System Design
J94 pps
INPUT
LSB MS@
SYNC AND REFERENCE SELECT DATA CHANNEL SELECT FRAME SELECT
FIGURE 5-111. SELECTION COUNTER OUTPUT RELATION TO PFM FORMAT
TABLE 5-17. E703 OUTPUT AND DIGITAL LEVELS
E703
Output Digital Frequency,Voltage Level Megacycles
+ 0.275 -- 4,450
0 -- 5,000
-0.15 0000 5,300
- 1.35 0100 7,700
-2.55 1000 10,100
-3.75 I100 12,500
-5.00 -- 15,000
-5.50 -- 16,000
Use
Odd frame sync
Calibration
Frame 0 sync
Frame 2 syncand calibration
Frame 4 syncand calibration
Frame 6 sync
Calibration
Reference
telemetry calibration voltages. Table 5-17 lists
the dc output levels of E703 and the correspond-
ing digital levels and uses.
The telemetry transmitter bias unit supplies
the positive voltage (+12 volts) needed for the
4450 cps sync frequency. This voltage also per-
mits considerable simplification of the commu-
tator. The positive voltage required for the logical
"zero" state level of the selection counter is
also obtained from the transmitter bias unit. An
accurate --10 volt transducer excitation, ET01,
supplies a reference for the temperature and
pressure sensors. The q,., angle counter gate gen-
erates a negative-going trigger which is used as
the timing signal for resetting the angle counter.
The output of the subcarrier oscillator goes to the
output amplifier which provides an impedance
transformation before the signal is applied tothe transmitter.
• Selection Logic Description. The commu-
tator, consisting of four identical sections, per-
forms time-division-multiplexing of the PFM
inputs to generate the PFM format. The gating
signals are obtained from logical combination
of the counter outputs. Each commutator section
is selected, one at a time, for a period of 2
frames. The block diagram of a commutator
section is shown in Figure 5-112. Each block
represents one solid state switch in series con-
nection. There are two series switches between
any input voltage and the subcarrier oscillator.
The first-level switches are E2-E20, and the
second-level switch is El. When the commutator
section is selected, switch E1 is on continuously.
Only one of the first-level switches is on at any
given time. The input to switch E2 is a fixed
voltage corresponding to the reference frequency,
16.0 kc. The inputs to switches E3 and El2 are
fixed voltages corresponding to the frame sync
frequencies. The inputs to the other switches
come from the various transducers and voltage
sources. Figure 5-113 shows the series switch.
The commutator driver, E300, is a bootstrap
circuit which provides the base drive currentfor switch E1 and the selected first-level switch.
During the time for which the section is not
selected, the current supplied by the driver is
reduced by a factor of 2 since switch E1 is not
5-93

Hughes .4 ircra/t Company
EZO0 El02 EIO6
VOLTAGE REFERENCE
(FROM E703- PS) w {
EVEN FRAME
N1-3-xvOLTAGE SYNC
SEE NOTE 2 <
CHANNEL I
lE2-x I
E'200 E_07
E201 El07
IN2 IN3
E202 El07
NI-5-X ___3
£203 E t07
N2 N3
":3 Nt-6-X _
E204 Et07
Nt-7-X _3
E205 El07
5 NI-B-X _3
E206 El07
Nl-9-x _
E207 El07
Nt--tO- X 2.__ 3
Et06 E_07
Nt-II-X
%
8-15
I E3OO-X
COMMUTATOR
DRIVER
/P1-2 -X ==,.._
-IPI-3-X
Pl-4 -X
Pl-B-X
P1-6-X
Pl-7-X
I
PI-B-X
Pt-9-X
PI-IO-X
PI-II-X
'y-
COMMUTATOR
ELECTRONIC SWITCHES(20 PER SECTION)
NI
NI-I-X _3
EZO0 El07
pi-12-xL-_- _
E201 El07
p_-13-× i_,o ,,1_
E202 El07
pi-,4-xi_,___j_
E203 El07
PO-IS-X _
E204 El07
PI-IB-X i_,_ .. i_.
E205 EiO?'
P1-17-X _
E :" 06 El07
PHB-x i.2.22_2j _
E207 EIO7
pHg-x _
El06 El07
Pt-20-X _,
PI-I-X OUTPUT
(TO E801}
ODD FRAME
NI-I2-X
Nt -13-X
Nt-14 -X
NI-15-X
NI-16-X
Nl-i7-X
_l-Ie-X
NI-19 - X
N1-20-X
NOTES :
i) X DENOTES SECTION NUMBER : ie SWITCH IS OF SECTION 3 IS E-18-3
2)NI INPUTS TO E6-1 THROUGH EB-I ARE GROUND, ETO3-PI, ETO3-P2_ AND ETO3-P4 RESPECTIVELY
(4 SECTIONS PER ENCOOER)
FIGURE 5-112. COMMUTATOR SECTION
5-94
VOLTAGE SYNC
CHANNEL I
e -15
EI-X _NPUT5 (NI, N2)
SWITCH N2 N3NO,
EI-I El08 El09
El-2 EIOB EIO9
El-3 EIO8 EIO9
El-4 EIO8 El09
E300- x INPUTS
X NI N2
I El08 EtO9
2 E_O8 El09
3 EIO8 El09
4 El08 El09
V SYNC INPUTS (NI)
INPUT
SWITCH (FROM
NO. E703)
E3 -1 P7
E3-2 PI
E3 -3 P2
E3 -4 P3
EI2-t P6
E12-2 P6
EI2-3 P6
EI2-4 P6
V liil
am
II
H
Ill
=
II
i
im
a
i
|e_t
L_W
u
u
121
W
U
I
i
U

U o
t
w
Ii:7
|il= i
SWITCH E2-X
i DATA X988859-_
INPUT NI C
FD300
N2FD300
IhJN3 C _ ,
FD300
N4 C ILl ,
-24 v
L REQUIRED PER SECTION
TYPICAL SWITCH
Q
I DATA X988859_
INPUT NI C
FD300
N2 0 I_1Ilq
FD300
N3 0II,1
L8 REQUIRED PER SECTION
PRE-RELEASE
5. Spaeeera/t System Design
FROM COMMUTATORDRIVER
RIMi%CF
--7
fL
,IM'1%
CF
m_l
SWITCH El-XFO
IFD300
I ----I¢----ON_
IFD300
I _---14----ON_
I ,R_IM,1%
CF
I -24
LREQUIRED PERSECTION .
P'I
COMMON OUTPUT OFSWITCHES E2-E20
I COMMON OUTPUT OFFOUR COMMUTATOR
i SECTtONS
ITO SCO0 INPUT
FIGURE 5-113. COMMUTATOR ELECTRONIC SWITCH
5-95

Hughes Aircra/t Company
ON. The commutator nominally looks like an
infinite resistance to the signal source since noneof the base drive must be obtained from the com-
mutator input.
This selection scheme has two advantages over
the slightly simpler method of using a single
series electronic switch for coupling each input
to the subcarrier oscillator. One advantage is
that if a failure occurs causing the output of
a given switch to short to ground or to a power
supply, only one-fourth of the inputs are disabled
since the second level switch provides isolationbetween each set of two frames. A second advan-
tage accrues from the offset-vohage compensationof the two series switches.
Commutator section and channel select logicis shown in Table 5-18. The --8 volt state of an
input is a logical "one" and +4.5 volt state is a
logical "zero." Switches corresponding to chan-
nels 1 through 15 have two logic inputs (N.,, N3).
One input (El07, El07) selects between the odd
and even frames and the other, except for chan-
nels 8 to 15, is the output of the selection gatesE201-E207 as defined in Table 5-18. There is
no selection gate for channels 8 to 15 since only
one counter output is needed for ctiannel selec-
tion. The use of the channel select gates reduces
the number of logical inputs required at each
switch, resulting in minimum diode logic.
The E200 and its complement E200 are gating
signals for sync and reference selection and are
generated by gate E200. The logical equation is
E20-'_= (101.10"--2+ 102) (10--'3• 10"--_"105" 106)
These logical functions are needed because of
the unique format of channel 0.
Command Execute Tone. The method of the
transmission of the command execute tone and
the modulation information are as yet to be de-
termined. The major factors are the type of com-
5-96
CommutatorSection
1
2
3
4
TABLE 5-18. COMMUTATOR SECTION ANDCHANNEL SELECT LOGIC
FRAME SELECT LOGIC
Frames _0,1
2,3 108 I
4,5 108 I
6,7 108]
CHANNEL SELECT LOGIC
109
109
109
109
SelectionGate Channel D* E
E201 1 102 103
E202 2 102 103
E203 3 102 103
E204 4 102 103
E205 5 102 103
E206 6 102 103
E207 7 102 103
8-15
F G
104 105
104 105
104 105
104 105
104 105
104 105
104 105
H
106
106
106
106
106
106
106
106
*El02 differentiates between the reference and data portion ofchannels I to 7.
mand execute tone modulation to be used and
the number of discrete information levels which
must be detected. The real time modulating infor-
mation consists of the indications of bipropellant
motor firings. The command execute tone will be
modulated to at least five discrete levels; four of
the levels will represent firingeach of the four hi-
propellant motors and the fifth will represent all
other cases. The method for telemetering squib
firings is under investigation and may requireadditional discrete modulation levels. An investi-
gation of the number of discrete levels that can
be reliably detected at the ground stations for
phase, frequency, and amplitude modulation was
made, and the results are presented in the discus-
sion of the encoding and squib firing later in thissection.
H
ai
B
m
lib
|i
=mi
i
[][]
w
7--
_-_ _=

5. Spacecraft System Design
m
m
u
r
! Iw
litl
LJ
i
| |
it
So_ar Sensor Pulses. The solar sensor pulses
q, and q,2 are superimposed on the audio signal
and directl) phase-modulate the 136 mc trans-
mitter carrier. These pulses are telemetered for a
backup ground control mode of the pulsed jet
velocity and attitude control systems. The output
pulses from the qJ and q,,_ sensors are amplified
and shaped by the solar sensor amplifiers E806,
E807. The resulting output pulses are of the same
polarity but different amplitudes.
Specifications and Circuit Descriptions.
Schematics, descriptions, input requirements, and
output specifications of the telemetry encoder cir-
cuits are presented in this dicussion. All of the
circuits represent either preliminary configura-
tions or designs since the encoder breadboard
fabrication has not yet been completed. No cir-
cuit is given for the modulator, E804, since its
requirements are not yet defined. The data level
limiter configuration is also not yet firm.
• Reference-Sync Select Gate.The reference
syne select gate (Figure 5-114) generates the
logical functions required by the unique format
of the sync channel 0. The output E200 and its
complement, E200, are derived from the combi-
nation of the six least significant bits of the selec-
tion counter according to the logical equation;
E200 = (101. 102 + 102) (103- 104. 105. 106)
QI, Q2 and Q3, Q4 are inverters with a capability
of switching the capacitive loading within a few
microseconds for either change in state.
When the quantity (101 • 102 + 102) (103 •
104 • 105 • 106) is true, Q1 is off, so E200 isin the "zero" and E200 is in the "one" state.
When the above quantity !s false, the input gate
is decoupled from the inverter by the diodes
CR12 and CR13, and R5 provides base drive to
turn Q1 on. At this time, E200 is in the "one"
state and E200 is in the "zero" state.
The coupling from Q2 to Q3 through R7, R8
and C1 is designed to satisfy the constraints thatnot more than one commutator switch be selected
at any given time and that the time delay between
the selection of successive commutator input sig-nals be less than 3 microseconds.
The purpose of Q2 and Q4 emitter follower
output transistors is to provide fast output rise
times without dissipating an excessive amount of
power. The output specifications are as follows:
Rise time < 3 microseconds
Fall time < 3 microseconds
Current capability,
logical zero state 4.0 milliamperes minimum
• Commutator Driver Circuit. The purpose
of the commutator driver (Figure 5-115) is to
supply a fixed current to the collectors of the ON
commutators as a function of the input signal
voltage. The commutator then nominally looks
like an infinite resistance to the signal sourcesince none of the base drives must be obtained
from the commutator input.
If the frame select commutator is ON, N1 and
N2 are low and transistor Q3 will be ON; CR3will then be back-biased. In this mode the vari-
able load current demanded from P is generated
by maintaining the current supplied through R1
constant and allowing current drawn by Q2 to
vary as the signal voltage (V_) varies, yielding
a net output current which is dependent on V_. If
the frame select commutator is OFF, the driver
output current should be reduced by one-half by
turning Q3 OFF; the frame select commutator
(El-X) is then simulated by diode CR3 and
resistor R7 equivalent to the commutator base
resistor) is returned to the --24 volt supply.
5.97

Hughes Aircra/t Company_mn
IB
NtFROM El02 0
N2FROM E 103 C
N3FROM El04 C
FROM El05 C N4
N5FROM El06 0
N6FROM tOl 0
N7FROM 102 0
CRIb,Jy!
CR2, ll,,=! ,
CR5l=.Ji=,'1
CR4
Yl
CR5
p'l
R]
62K
5%,CC
-24
CR6
lu.J.IP'l
CR7h,JI_1
CR8J
ip- 1
CR9lIJ •P"I •
CRIO
ILl
CRIIluJp"l "
R3
62K
5% ,CC
CRI2
R2
160K
5%,CC
At-L DIODES ARE FD300PRE-RELEASE
FIGURE 5-114.
Therefore, it appears to the basic commutator
driver circuit as the same load when the frame
select commutator is ON.
The divider network of R2, R3, and CR2 de-
termines the base voltage of Q1. Diode CR2
adjusts for temperature variations in the base-
emitter drop of Q1. CR6 compensates for temper-ature variations in CR1. R3 is returned to the
--24 volt supply to compensate for variations in
i
R5
:390K :
5%,CC
? CRI3
R6
75K
5%,CC
988855-1
i
-By
R4
160K
5%, CC
Q2988855-1
R7
lOOK
5%,CC
CI
2?Opf5%,GLASS
, l{ ..• I_. "
R8
330K
5%, CC
-24 v
REFERENCE-SYNC SELECT GATE
12v
] R962K
5%,CC
CRI5
CRI6
04988855-1
P2E200
PI
0 E200
commutator base current due to supply varia-
tions.
• Counter Flip-Flop. The counter flip-flop
(Figure 5-116) is a four-transistor pedestal-
gated n-p-n type. The output transistors, Q3 and
Q4, provide the current drive for the capacitive
load during the transition from the one to thezero state. Their collectors are returned to the
+5 volt supply, clamping the output at this level.
[]
i
i
i
i
i
ii
i
U
i
i
i
n
5-98=.4
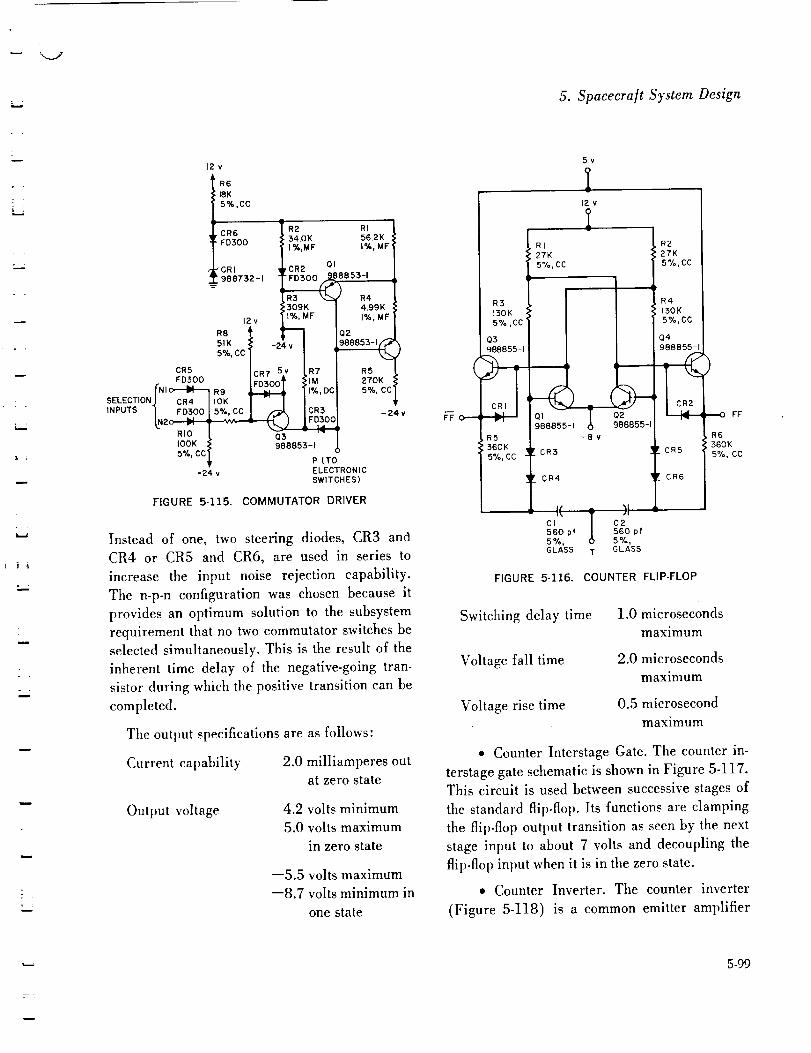
o
t ,
i .
i
= :
1
5. Spacecraft System Design
12
R6
',I8K
5%,CC
CR6 R2 RI
FDfO0 34.0K 56.2KI%,MF t%, MF
CRI ,CR2 (:;)1988732-1 "FDfO0 .._.8 B855-1
R3509K
12 v I%, MF
5%, CC /
cL%_ /CR? 5., tRT
| FD300 I 5%,CC I _ |CR3
INPUTS LN2_
CC_ P (TO
-24 v ELECTRONICSWITCHES)
FIGURE 5-115. COMMUTATOR DRIVER
R44.99K
I%, MF
!2
270K
5%, CC
-z4
Instead of one, two steering diodes, CR3 and
CR4 or CR5 and CR6, are used in series to
increase the input noise rejection capability.
The n-p-n configuration was chosen because it
provides an optimum solution to the subsystem
requirement that no two commutator switches be
selected simultaneously. This is the result of the
inherent time delay of the negative-going tran-
sistor during which the positive transition can be
completed.
Tile output specifications are
Current capability 2.0
as follows:
milliamperes out
at zero state
volts minimum
volts maximum
in zero state
Output voltage 4.25.0
--5.5 volts maximum
--8.7 voIts minimum in
one state
R3130K ,
5% ,CC
03
988855-J
i 360
5%, CC
5v
0
r2v
RI
27K
5°/o, CC
I
i
988855 1
- ¥
CR4
/ICI C2560 pf 560 pf5%, 5%,GLASS T GLASS
R2_' 27K
5%,CC
i
,R4.' 130K
5%,CC
Q4988855-1
r CR5
r CR6
FIGURE 5-116. COUNTER FLIP-FLOP
•---o FF
R6360K
5%, CC
Switching delay time
Voltage fall time
Voltage rise time
1.0 microseconds
maximum
2.0 microseconds
maximum
0.5 microsecond
maximum
• Counter Interstage Gate. The counter in-
terstage gate schematic is shown in Figure 5-117.
This circuit is used between successive stages of
the standard flip-flop. Its functions are clamping
the flip-flop output transition as seen by the next
stage input to about 7 volts and decoupling the
flip-flop input when it is in the zero state.
• Counter Inverter. The counter inverter
(Figure 5-118) is a common emitter amplifier
5-99

Hughes Aircraft Company
NC
CRIFD300
;; OP
RI150K5%, CC
PRE-RELEASE8PER ENCODER
FIGURE 5-117. COUNTER INTERSTAGE GATE
which inverts the positive output pulses of the
central timer. The negative output pulses of the
inverter are used to trigger the first selection
counter flip-flop. When the input to the counter
inverter is low, Q1 is kept off by the bias devel-
oped by the voltage division of R1 and R2.
The output of the inverter is then high. When the
input goes high, R1 is decoupled from the circuit
by the diode CR1, and R2 provides base drive to
turn Q1 on. At this time the output goes low.
The output specifications are as follows:
Waveform Negative pulses
Amplitude 7.1 volts - 10 percent
Output capability Will drive one count flip-
flop
• Output Amplifier. The output amplifier
provides impedance tranformation and voltage
amplitude adjustment for the PFM signal, the
solar sensor pulses, and the execute tone. The
circuit is a nonsaturating differential amplifier
with feedback control of the voltage gain. The
various inputs are resistively summed at the input
of one side of the differential amplifier. Since
this input is a virtual ground, mutual loading of
the various inputs will be small. The output im-
pedance of the amplifier will be less than 500
ohms. The amplified voltage swing of each input
is determined by the ratio of the summing resistor
and the amplifier feedback resistor.
5-100
RII00_
5%,CC
t2v}-----,w_ _+_ clI/zf50V, :1:20%
CRIFD300
R2:'OK5%, CC
R3200K5%,CC
QI988855-1
5v
PRE-RELEASE
FIGURE 5-118. COUNTER INVERTER
5%,cc
_P
The output specifications are as follows:
PFM signal 3 volts rms -4- 10
percent
q, pulse --4.5 volts -± 10 per-
cent
qJ.,pulse -2.25 volts +--10 per-
cent
Unmodulated command 3 volts rms -4- 10
execute tone percent
• Solar Sensor Amplifier. There is a sepa-
rate solar sensor amplifier for each of the q., and
q,., pulses. The output of the amplifier is a current
pulse which produces a voltage pulse at the out-
put of the differential output amplifier.
The circuit, shown in Figure 5-119, consists of
an amplifier stage and a shaper stage. Output
transistor Q2 is normally off with its base emitter
junction back-biased by about 5 volts. When the
positive input pulse occur°s, it is amplified and
inverted and applied at the base of Q2, forward-
biasing the base emitter junction and saturating
Q2. The voltage pulse at the collector of Q1 is
m
tram
!
i
J
[]
=
m
[]
m
i ?
W
4
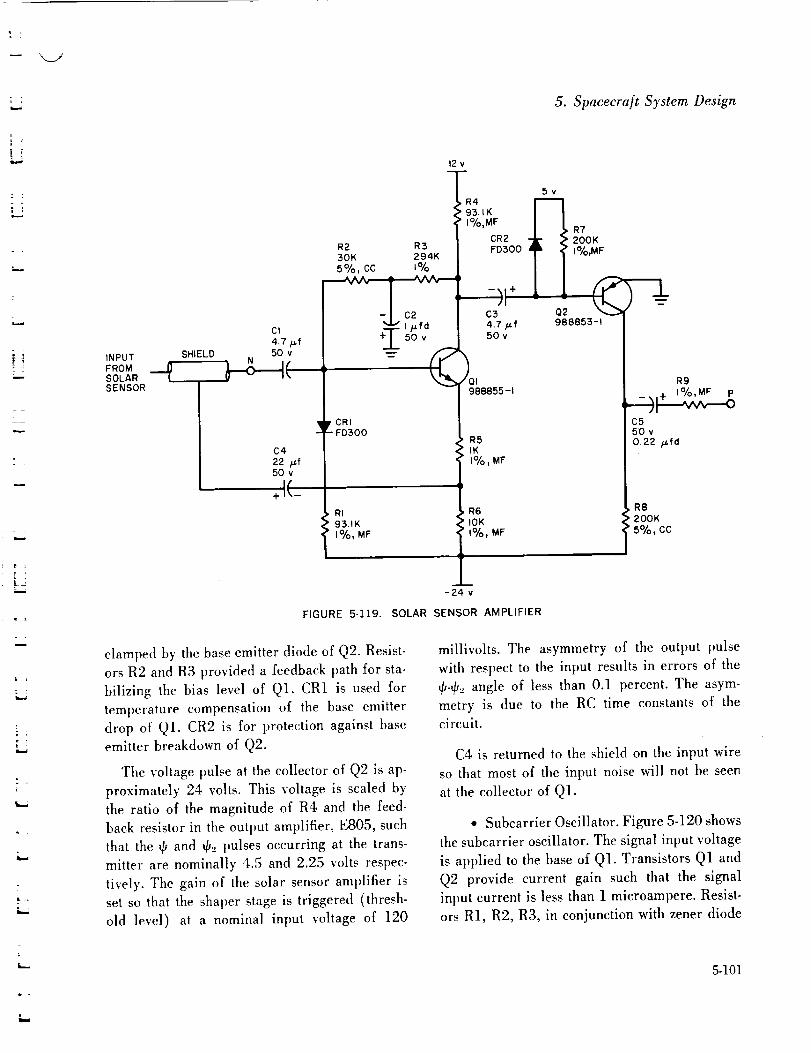
-_- 2 2-
w
L4
w
m
= ;
5. Spaeeera/t System Design
INPUTFROMSOLARSENSOR
SHIELD
CI
4.7/.s,f50 v
I(
C4
22 Ff50 v
+,I(_
R2 R330K 294K
5%, cc i%
- C2
£50v
, CRI- FD300
RI93.1K
[%, MF
12
5v
93. JK
I%,MF
CR2FD300
C3
4.7 p,f50v
?o,988855-1
R5IKI%, MF
R6IOK
I%, MF
R7200 K
I%,MF
988853-1
FIGURE 5-119. SOLAR SENSOR AMPLIFIER
R9
_ ,=%,MF p
C550 v
0.22 p, fd
R8200K
5%, CC
clamped by tile base emitter diode of Q2. Resist-
ors R2 and R3 provided a feedback path for sta-
bilizing the bias level of Q1. CR1 is used for
temperature compensation of the base emitter
drop of QI. CR2 is for protection against base
emitter breakdown of Q2.
The voltage pulse at the collector of Q2 is ap-
proximately 24 volts. This voltage is scaled by
the ratio of the magnitude of R4 and the feed-
back resistor in the output amplifier, E805, such
that the q, and q,._,pulses occurring at the trans-
mitter are nominally 4.5 and 2.25 volts respec-
tively. The gain of the solar sensor amplifier is
set so that the shaper stage is triggered (thresh-
old level) at a nominal input voltage of 120
millivolts. The asymmetry of the output pulse
with respect to the input results in errors of the
6-_2 angle of less than 0.1 percent. The asym-
metry is due to the RC time constants of thecircuit.
C4 is returned to the shield on the input wire
so that most of the input noise will not be seen
at the collector of Q1.
• Subcarrier Oscillator. Figure 5-120 shows
the subcarrier oscillator. The signal input voltage
is applied to the base of QI. Transistors Q1 and
Q2 provide current gain such that the signal
input current is less than 1 microampere. Resist-
ors R1, R2, R3, in conjunction with zener diode
5-101

Hughes Aircra/t Company
' i12v 05
QI CR4
C2 Q7
2
TO OUTPUTAMPLIFIER
FROM
COMMUTATOR
CONFIGURATION
RELEASE
,(
o_RIMFI
R2
Q3
CI MF
CRI ----24 v
R4MF
CR2
U
-24 v [][]
FIGURE 5-120. SUBCARRIER OSCILLATOR
H
[]
CR1, constitute a vohage divider and shifter.
Transistors Q3 and Q4 provide current gain.
Input-output specifications for the subcarrieroscillator are as follows: w
The output of the Q3-Q4 pair is the voltage
seen by the basic oscillator circuit--transistors
Q5 and Q6, resistors R4 and R7, capacitor C2,
and the magnetic core. The magnetic core is a
toroid constructed of square permalloy 80 (Mag-
netics, Inc.). This material was chosen to obtain
low coercive force, and hence low current, and
high squareness.
The basic oscillator output, at the collector
of Q6, is applied to inverter Q7. The inverter
provides voltage gain and produces a fixed ampli-
tude over the frequency band. The inverter output
is applied to a low-pass filter, then to the output
amplifier. Temperature- compensating compo-nents are not shown in the schematic.
5-102
Frequency
range
Transfer char-
acteristics
Linearity
Signal input
current
Output wave-form
,1.450 to 16,000 cps
f = 5000 (-+0.5 percent)
--2000 (+ 2 percent) V_,,
cps
Deviation from best straight line
less than 100 cps
Less than ] microampere
"Square wave" filtered by low-
pass filter with rolloff begin-
ning above 16 kc, down by at
least 3 db at 100 kc, contin-
uing at minimum rate of 2 db
- =
i
m
f_-_-

5. Spacecraft System Design
, =
I-
L_
• Transducer Excitation. The --10 volt
transducer excitation (Figure 5-121) is designed
to accept from 0 to 20 milliamperes current. Q1A
and Q1B form a differential amplifier. The base
of Q1A is at a fixed voltage set by temperature
compensated zener diode CR3. R], R9, and R2
form a voltage divider which establishes a volt-
age at the base of Q1B. Any variation in output
voltage is sensed at the base of Q1B by the
divider and amplified by QIB and QIA. Q2
further amplifies and inverts the signal, thus
driving Q3, the series element, in proper phase
to reduce the output voltage variation. Zener
diode CR2 establishes a regulated collector volt-
age for QIA. CR1 maintains the collector of QIB
at almost the same potential as the collector of
Q1A over the temperature range. C1 is a filter
capacitor for fast charging loads, and C2 reduces
12
R4
18K
5%,CC
--- R5 , , CR2
QZ 6S.SK:: ' 2N7OSZ
%_N988854_1- I%,MF' i,.; ;T cz i
___._ ,ooo,, _ ,.5%,GLASS CRI '
QIA FD300
CR3 988851-1
I I%,MF
R7
470.q.
5%,CC
-24v
-LRI .---_'69.8K
I I%,MF
_R9: SELECTEE
I%,MF
Cl+ _ I p.fD; "50v
TANT
LRz; SELECTEt_I%,MF VOUT! _o -IOv 4-0.25%
0 TO 20too
FIGURE 5-121. --i0 VOLT TRANSDUCER EXCITATION
the loop gain of the regulator at high frequencies
to prevent oscillations.
QIA and QIB are a pair of 988855-1 transis-
tors closely matched for V,_ and B. They are
both in a single TO-5 can, thus providing track-
ing of the critical parameters over temperature.
The nominal output voltage can be varied by
selecting the value for R9.
Output specifications are as follows:
Voltage --10 volts ---0.52 percent
Current 0 to 20 milliamperes
• --8 Volt Regulator. The --8 volt regu-
lator (Figure 5-122) is designed to accept from
0 to 15 milliamperes current. Q1 is an emitter
follower with the output voltage established by
c.2F0300
F0300
_,R5• 56K
1RI + / CI
,27K ,_,"_• I/_fD5%, - 50 vCC
988853-1
R320K5%,CC
,R2,IK
,+.. 5%,CC
VOUT-BY
'_ 1 98883B-2
R45.6K
:t5%,
I CO _ ,_ -24 v
PRE-RELEASE
FIGURE 5-122. --8 VOLT REGULATOR
5-103

Hughes Aircra/t Company
the series combination of a zener diode and two
forward-biased diodes connected to the base of
Q1. The two forward-biased diodes have tem-
perature coefficients of opposite sign from that
of the zener diode and are used for temperature
compensation and to increase the voltage output
level to that required for the encoder logical one
state. Q2 provides additional gain and tends to
reduce the output impedance. R2 and R3 pro-
vide short protection. C1 is a filter capacitor and
also prevents the regulator from oscillating.
Output specifications are as follows:
VoltageCurrent
--7.6 vohs ± 5 percent
15 milliamperes maximum
° Voltage Standards. The schematic of tile
voltage standards circuit is given in Figure 5-123.
The positive voltage used for odd frame sync is
generated at output P6 from a voltage divider
network. The divided reference voltage is estab-
lished by the temperature compensated zener
diode CR]. Initial tolerances of the zener diode
RII
0.1%, MF
RI
0.1%, MF
R2
0.1%, MF
R4
0.1%, MF
R5
0.1% MF
R60.1% MF
P7--.--o -0.5 v
PI---0 -1.35 v
P2---o-2.55 v
P3-3.75 v
P4._o -t5.00 v
P5•-.--o -5.50 v
12
R71%, MF
R8
(SELECTED) R 9
I%,MF I%,MF P6 ;w275 v
OUT
_CRI _ RIO
' 2NTOSZ/
-IOv
CONFIGURATION RELEASE
FIGURE 5-123. VOLTAGE STANDARDS
and resistors are cancelled by selection of thevalue for R8.
The negative voltages used for the reference,
even frame sync, and calibration are generated
from the voltage divider string consisting of
R1-R6 and Rll. The --10 volt reference voltageis the accurate transducer excitation.
° _'2 Angle Counter Gate. The _2 angle
counter gate (Figure 5-124) generates a nega-
tive-going timing signal, E208, which is used for
recycling the q.,., angle counter. The combination
of the four most significant bits of the output
counter according to the logical equation
E208 = El06 + E10"--"_+ _ + El09
generates a positive-going pulse during the first
half of frame 3. The q,._angle counter timing sig-
nal which is the trailing edge of the gate output
pulse, occurs two channels after the q-'2angle datahas been telemetered. At the cost of three addi-
tional diodes, the timing signal could be gen-
erated immediately after the _.; angle channels;
however, this is not necessary.
CL_RI FDSO0NIC trot
GR2
N2C Ld FDSO0
CR5 FDSO0NSC L=il
Cl_R4 ' FD300N4 C I'_1
RI5.6M5%, CC
P
0 TO _/2 ANGLE COUNTER
GATE INPUTS
E'O'i [E'O'I
FIGURE 5-124. ¢, ANGLE COUNTER GATE
mI
=
UBB
BB
i
r_l r
7
=
U
5-104_=
il
i

5. Spacecra/t System Design
2
[
. +
:i _
= =
-j
[i'!
U
r_ :::_-. +|ii i+ill
_ +
= =L
E_t
The value of the gate resistor, R1, is suffi-
ciently large that positive voltage spikes on the
output due to the finite delay and switching
times of the logical inputs will not falsely trigger
the ac-coupled input flip-flop of the _., angle
counter. That is, the RC time constant of the gate
resistor and the coupling capacitor of the flip-
flop is very long compared to the duration of
these voltage spikes.
Output specifications are as follows:
Amplitude 5.4 volts minimum7.2 volts maximum
Fail time 2.0 microseconds
maximum
Current capacity 1 milliampere minimum
dynamic
] milliampere minimum
static
• Temperature Sensor. The temperature
sensor (Figure 5-125) is a transducer used to
indicate the temperatures of various spacecraft
system components such as the structure, bipro-
pellant fuel, and traveling-wave tubes. The cir-
cuit consists of the actual sensing device, a therm-
istor, connected in parallel with one section of
the voltage divider composed of the fixed resistors
- iov
RI
I°/o, MF
R2
I°/o, MF
' ! 0 OUTPUT
RT
"_" T H ERMIS TOR
2__-=-
FIGURE 5-125. TEMPERATURE SENSOR
R1 and R2. Through selection of the values for
R1, R2 and the thermistor value at +25°C, the
output voltage of the sensor can be adjusted to
the 0 to --5 volt limits over the range of sensed
temperatures.
In the spacecraft system, each temperature
sensor receives its voltage excitation from the
encoder(s) which is sampling its output. Most of
the sensed temperature data must be capable of
being telemetered by any one of the quadrant
encoders. If a single sensor is used, the --10 volt
excitation of each telemetry encoder must be
decoupled from the others at the sensor circuit.
The temperature coefficient of the decoupling net-
work would require temperature compensation
in the sensor circuitry, resulting in a more com-
plex configuration. For this reason and for rea-
sons of reliability and accuracy, four separatesensors will be used instead of one for the areas
in which temperature data is common to all en-
coders. For temperatures that are unique to a
given encoder, only one sensor will be used. The
four sensors will be mounted on a plated brass
plate with the grounded ends common to the
plate. The four divider networks R1 and R2 will
be packaged with the encoder.
Power Summary. A power summary for
the encoder is given in Table 5-19. The total
power dissipated in the encoder is 1.18 wattsfor the worst case conditions indicated in the
table. This value includes the power dissipated
in the temperature sensor divider circuits which
will be packaged with the encoder and the power
drawn from the --24 volt supply by the telem-
etry bias unit due to the encoder loads on the
+12 and +5 volt outputs and the intervals in thebias unit itself.
Component Summary. The quantities of
components are summarized by type in Table
5-20.
5-105

,,j --
Hughes ,4 ircra/t Company
TABLE 5-19. POWER SUMMARY (PER UNIT)
|
SupplyTolerance
+ 12 Volt+ 12.0 ± 5
percent
+ 5 Volt+4.75 ± 5
percent
--10 Volt--10.0 ± 0.25
percent
--B Volt--7.6 ± 5
percent
Circuit
-Counter inverter
Counter flip-flops
Counter interstage gates
Selection gates
Reference-syncselectgate
Commutatorelectronicswitch
Commutator driver
Solar sensor amplifier
Subcarrier oscillator
Output amplifier
Modulator
Pressure transducers
Temperature sensors
Voltage standards
Telemetry bias unit
Losses
Load
-8 volt regulator
Transducer excitation
Data level limiter
Total for nominalconditions(Note 2)
Total for worst caseconditions(Note 2)
--24 Volt--24 ± 3percent
Maximum power dissipated per encoder (including temperature sensors and pressure transducers) = 1.18 watts
NOTES:
1) Temperature sensor power varies with sensed temperature. Power indicated assumes that sensed temperatures are such as to cause maximum
circuit power dissipation. Minimum dissipation is approximately V= that indicated.
2) Conditions for computing power are:
Nominal- Nominal resistance, nominal voltage
Worst case -- Maximum resistance maximum voltage for low usage circuits
Nominal resistance, maximum voltage for high usage c rcuits
i
m
[]
==m
im
[][]
|m
[]
Bm
i
i
m
i
i
i
=_m
z
[]mIB
5-106
i

L
=
=
J
v
TABLE 5-20. COMPONENT SUMMARY
QuantityRequired
47
2O
22
2
86
323
32
3121
93
73
7
2O
18
1
11
832
Component
Transistor
Transistor
TransistorTransistor
Transistor
Transistor
Diode
DiodeDiode
DiodeResistor
Resistor
Resistor
Resistor
Capacitor
Capacitor
Core
Thermistor
Description
988855-]
988853-i
988854-1988838-2
988851-1
988859-1
FD300
Zener988732-1Zener988732-2Zener988902-15percent,carbon
composition
1percent,depositedcarbon
1percent,metalfilm
0.1percent,metalfilmGlassormica
Solidtantalum
• Doppler Shift. In considering coherent
PSK modulation, the expected doppler shift is
of importance. An approximate expression has
been derived for the doppler shift for a synchro-nous vehicle :*
:ro e
Af -- )< 4.3 X 10'_e
where e is the orbital eccentricity and c the veloc-
ity of light, in feet per second. Just after apogee
engine firing, a three sigma estimation of e is
0.033, which includes the effect of orbital inclina-
tion errors. For a subcarrier tone of 3.6 kc, this
is (3.6 x 10 _) (33 x 10-3) (4.3 x 10 '_)/0.9843
x 10" or 0.52 x 10 -'_ cps. Additional doppler
shift is caused by orbital period error, but the
magnitude is negligible in comparison to that
*Advanced Syncom Monthly Progress Report, Feb-ruary 1963.
5. Spacecra]t System Design
caused by inclination and eccentricity. A doppler
shift of 0.52 x 10 -3 cps is equivalent to 360 de-
grees phase shift in 1925 seconds or 0.187 deg/
sec (11.2 deg/min).
• Coherent PSK. The received subcarrier
tone will be phase-shifted by discrete angles and
coherently retransmitted to the ground. The ex-
pected subcarrier tone signal to noise ratio on
the ground is 16.0 db in a 2.2 kc bandwidth.*
Assuming a ]-millisecond rise time filter is used
(]60 cycles), the signal-to-noise ratio is 27.39
db. The phase deviation is approximately
(N/S), .... radians or 2.44 degrees. The response
of the phase detector is from 0 to 80 cycles.
Assuming the subcarrier signal is to be phase-
shifted at 60-degree intervals (allowing five in-
puts and one zero reference input), the output
level of the phase detector must reach --- ]2.3
sigma for an adjacent sector to be falsely identi-
fied. This is clearly improbable.
Rice** has given the following expression,
relative to a band limited gaussian process, for
the number of threshold crossing with positive
slope per second:
• -- --K /2
N_ -- _ f_,__ f. e
where fb and f, define the upper and lower filter
cutoff frequencies, and K is the threshold factor.
For a low pass filter, the expression reduces to
N¢ = 0.577 fb e- x2/=
An arbitrary false alarm rate of ]0 -'_ per
second (mean time between false alarms of 1000
*Syncom Mark I Telemetry and Command SystemsAnalysis, January 1963.
**S.O. Rice, Mathematical Analysis o� Random Noise,reprint by Dover Publications, 1954.
5-107

Hughes Aircra]t Company
seconds) may now be assumed. The number of
times per second the upper or lower threshold
is crossed is
N_ -- 2(0.577) (80) e-K2/:_= 10-:_
Solving for K, 4.785 is obtained or a full sector
width of 4.785 x 2.44 x 2, or 23.3 degrees. There-
fore, 15 references may be transmitted, includingthe zero reference.
By decreasing the bandpass filter bandwdith,
a greater number of references may be trans-
mitted. Following the same line of reasoning, a
16 cycle bandwidth allows for 54 references, and
a 1.6 cycle bandwidth allows 199 references tobe transmitted. If 29 references are to be trans-
mitted, a filter bandwidth of 50.6 cycles is re-
quired.
A block diagram of this system is illustrated
in Figure 5-126. The necessity of frequent zero
references of the ground receiver due to changing
doppler shift may render a coherent PSK system
impractical. It is important to recognize that
I TONE L_ PHASE ]FILTER ] TICOMPARATOR I
t tDEMODULATOR VCO
VOLTAGE _.
RANGEDETECTOR
NO. 2
VOLTAGE
RANGEDETECTOR
NO.I
NO. 3
FIGURE 5-126. PSK ENCODE SYSTEM
t
5-108
only changes in the magnitude of the doppler
shift, not the doppler itself, is potentially cap-
able of causing trouble.
• FSK. The received subcarrier tone may
be frequency translated for a voltage-controlled
oscillator operated at various frequencies. It is
assumed, as previously, that the signals are
passed through 160 cycle filters and envelope de-
tected as to their presence or absence (Figure
5-127). Since the tone signal to noise ratio is
27.39 db, the tones may be detected with negli-
gible error probabilities. The stability of the
voltage-controlled oscillator is the primary de-
terming factor as to the number of references
which can be transmitted. The effect of doppler
shift (0.52 x 10 -'_ cps) is negligible.
• AM. The subcarrier tone is phase-modu-
lated on the satellite carrier with various devia-
tions, corresponding to reference inputs. A block
diagram of this system is shown in Figure 5-128.
Assuming the same parameters as previously, the
number of references which may be transmitted
is to be determined. The output of the subcarrier
demodulator is Rayleigh-distributed, which be-
DEMODULATOR FI LTERNO, I
FIGURE
ENVELOPETHRESHOLD
DETECTORNO.I
NO. 2
NO 5
NO. 4
NO. 2
•_ NO. 4
5-127. FSK ENCODE SYSTEM
L
I
muI
I
iBl
==g
m_
B
m
==J
[]
_JUl
u
I •
_I
, |

: -_.:;
! -q
q
Eiiiiii_
L
TONEFILTER
tPM
_EMODULATOR
ENVELOPE ___DETECTOR
VOLTAGE [
RANGEDETECTOR
NO. I
"_ NO. 2
NO. 3
-_ NO. 4
FIGURE 5-128. COMMUTATOR SECTION BLOCKDIAGRAM
haves as the normal distribution for moderately
large threshold levels. Solution of the equation
--K 2
(0.577) (80)(2) e = 10-'_
yields the threshold factor, as previously, where
K = 4.785. Assuming N references are to be
transmitted (including the calibrating reference),
it may be shown that
peak signal __ 2K(N--I)rms noise
which yields N = 4.46, or four levels (including
a calibration reference). For a 16 cps and a 1.6
eps bandwidth, 13 and 42 references may be
5. Spacecraft System Design
transmitted. The system is thus relatively in-
efficient as compared to coherent PSK.
The modulation indices must be chosen to give
equal incremental level changes at the receiver
demodulator. As an example, assume the maxi-
mum deviation of the satellite carrier is 1.2
radians. Considering only the first sideband pair,
J_ (1.2)= 0.4983. The first reference corres-
ponds to zero (no signal). The second reference
should be 0.4983 x 1/3 = 0.1661 = J_ (0.35).
The third reference should be 0.4983 x 2/3 =
0.3322 = J_ (0.70). The deviations for the four
levels should therefore be 0, 0.35, 0.70, and 1.20
radians.
• Adjustment of Data for Finite Signal-to-
Noise Ratio. The received subcarrier tone signal-to-noise ratio at the satellite is 32.2 db in a 200
cycle bandwidth. This depresses the received
tone slgnal-to-noise ratio by 1.02 db. Noiseless
transmitted tones will be assumed for FSK.
Table 5-21 summarizes the results for the three
systems considered.
• Degradation by Solar Pulse Transmission
During the period of solar pulse transmission,
which is short relative to the satellite spin period,
the subcarrier tone signal-to-noise ratio will be
degraded. Gating at the receiver may be em-
ployed during reception of the solar pulse to
prevent false alarm triggering during that period.
TABLE 5-21. RESULTS
SatelliteModulation Relative
of SpectralSubcarrier Occupancy
Coherent 1
PSKL____
FSK N
AM I
Total Levels Transmitted With 0.001False Alarms for Ground Received
Tone Noise Bandwidths of:
160 Cycles 16 Cycles 1.6 Cycles
13 48 177
SatelliteSu bca rrierModulator
Stable phase-shifting network
Stable voltage-controlled oscillator
ReceiverSubcarrier
Demodulator
Tone filter plus phase lock loop
N, limited only by oscillator stability Tone filters plus diode detectors
4 11 40 Linear amplitude modulator Linear amplitude demodulator
5-109
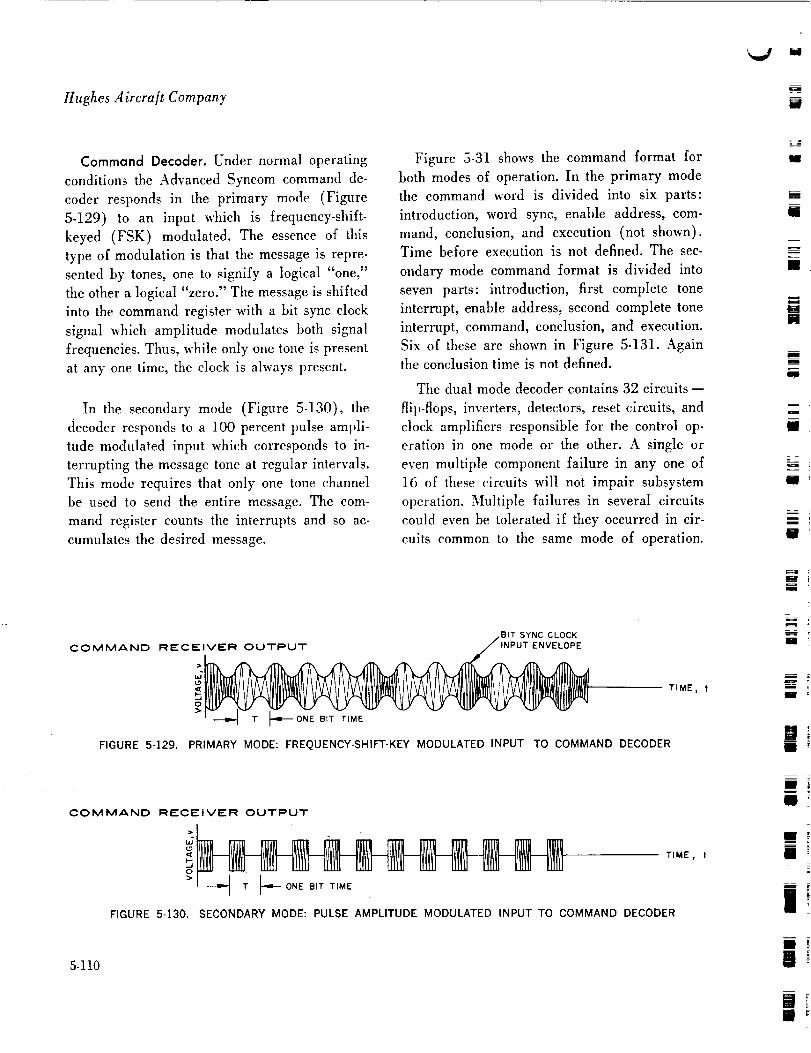
Hughes Aircraft Company W
Command Decoder. Under normal operating
conditions the Advanced Syncom command de-
coder responds in the primary mode (Figure
5-129) to an input which is frequency-shift-
keyed (FSK) modulated. The essence of this
type of modulation is that the message is repre-
sented by tones, one to signify a logical "one,"
the other a logical "zero." Tile message is shifted
into the command register with a bit sync clock
signal which amplitude modulates both signal
frequencies. Thus, while only one tone is present
at any one time, the clock is always present.
In the secondary mode (Figure 5-130), tile
decoder responds to a 100 percent pulse ampli-
tude modulated input which corresponds to in-
terrupting the message tone at regular intervals.
This mode requires that only one tone channel
be used to send the entire message. The com-
mand register counts the interrupts and so ac-
cumulates the desired message.
Figure 5-31 shows the command format for
both modes of operation. In the primary mode
the command word is divided into six parts:
introduction, word sync, enable address, com-
mand, conclusion, and execution (not shown).
Time before execution is not defined. The sec-
ondary mode command format is divided into
seven parts: introduction, first complete tone
interrupt, enable address, second complete tone
interrupt, command, conclusion, and execution.
Six of these are shown in Figure 5-131. Againthe conclusion time is not defined.
The dual mode decoder contains 32 circuits --
flip-flops, inverters, detectors, reset circuits, and
clock amplifiers responsible for the control op-
eration in one mode or the other. A single or
even multiple component failure in any one of
16 of these circuits will not impair subsystem
operation. Multiple failures in several circuits
could even be tolerated if they occurred in cir-
cuits common to the same mode of operation.
BIT SYNC CLOCK
INPUT ENVELOPECOMMAND RECEIVER OUTPUT
ONE BIT TIME
TIME, t
FIGURE 5-129. PRIMARY MODE: FREQUENCY-SHIm'KEY MODULATED INPUT TO COMMAND DECODER
=
i
=i
i
_JII
m
ml
i
II
i
illil
m
I
i ;
COMMAND RECEIVER OUTPUT
>
FIGURE 5-130,
TIME , t
SECONDARY MODE: PULSE AMPLITUDE MODULATED INPUT TO COMMAND DECODER
5-110
i
g_
I!
-_ --2
I

t=
L:
c ¸IE;
b,,,/
L
i t!!!!i
|
5. Spacecra/t System Design
PRIMARY MODE
10ooooo0ooooDieolo_ololoooooDIDO,o I I odeoto[+ooo/ooi+oINTRODUCTION
25 BITS
ALL ZEROS
---i L- -!- ____ o, uso,__-I'- l T UNDETERMINED NUMBER OF
WORD COMMAND BITS UNTIL EXECUTION
SYNC 6 BITS ALL ZEROS2 BITS
ENABLE
ADDRESS
6 BITS
TIME,t
SECONDARY MODE
11 !l L I_----- INTRODUCTION --_ FIRST ---_
25 BITS COMPLETE
NO MODULATION TONE
INTERRUPT
12 BITS
IT-_ SECOND -_
COMPLETE
TONEINTERRUPT
12 BITS
ENABLE
ADDRESS
I TO 64
BITS
FIGURE 5-13I. COMMAND DECODER COMMAND FORMAT
__---- TIME ,l
_..,,_--- CONCLUSION
COMPLETE
TONE
INTERRUPT
COMMAND
I TO 64BITS
In the 16 remaining control circuits, certain com-
ponents could fail without limiting operation
capability.
Figure 5-132 shows the input circuitry of the
decoder, the filters, and detectors, called C300,
C301, and C606 in the block diagram of Figure
5-133. Part a of Figure 5-132 shows the circui-
try necessary to synthesize the waveforms of part
b. The filters are double tuned and yield a Butter-
worth response with a bandwidth of 400 cycles.
The tone detectors provide minimum filter load-
ing and at the same time allow two independent
thresholds to be set. The first of these thresholds
is a voltage threshold, the second a period
threshold. The pull-in and dropout times of the
detector can be varied in a nearly independent
fashion. The tone detector requires that a signal
first exceed a given voltage threshold and then
be present for a specified period of time before
the output will change state. The output stages
of the tone detectors provide the voltage levels
and gain necessary to ensure response of the
digital circuits which follow.
The audio detector, like the tone detectors,
minimizes the loading of the filters. The first
stage of this detector amplifies the input voltage
linearly; the second detects the bit sync clock en-
velope shown in Figure 5-129. Stage three filters
the detected envelope, and the last stage shapes
the resultant sine wave (at bit sync frequency)
in a slightly unsymmetrical square wave.
Output waveforms for these circuits in both
modes of operation are shown in Figure 5-132b.
These waveforms are the inputs to the digital
circuits of the decoder.
5-111

V "-
Hughes ,4 ircra[t Company
5.112
w00
>-:
01
I
o
,T
..... 21 m ,,_
o "'"
0
ne"ol--0bJh-bJ
0
DZ
m
13Z
00
ffl
H.
az
i..---I
UJ
701"-
W
Nro
u_
b.
mi
__L
N
g
m
z_
i
m
Lo .
m
=
w
r_
m-..-.-.-.-.-.-.-.-._1._J

:. i-"
t _:_
_; ;5
_d
B
r_
w
5. Spacecraft System Design
o
IZ
t_
0
(aLIJt_
_3Z
0(J
CO
n.-
(.oE
5-113

Hughes .4ircra/t Company
The digital output waveforms of the tone and
audio detectors are repeated in Figures 5-134
and 5-135, along with the most important digital
waveforms of the primary and secondary modes,
respectively.
Primary Mode Operation. Before the initia-
tion of a command, it is assumed that the de-
coder sees nothing at the input; no words are
being sent. Initially, the outputs of the tone and
audio detectors are in the logical zero state. A
command is initiated from the ground, and it
enters the decoder according to the command
word format discussed above and shown in Fig-
ure 5-131.
The purpose of the introduction is to prepare
the decoder for operation. When the zero tone is
detected by C300, C300P1 will go to the logical
one state (the complement of C300P1, C300P2,
will go to tt_e zero state). The input AND gate to
the tone present detector (C603, shown in Figure
5-136 and in Figure 5-133), which is controlled
by the complements of C300 and C301, is caused
to go to low, and the first part of C603, a ramp
circuit, will begin its rundown. The rundown to
the threshold of the second part of C603, a
Schmitt trigger, requires 100 milliseconds nomi-
nally. When the threshold of the Schmitt is
crossed, the output of C603 makes a sharp nega-
tive transition. This transition, which occurs at
the input to the mode register clear and the com.
mand register reset circuits (C605 and C604
respectively, shown in Figures 5-137 and 5-138),
causes reset pulses to be generated which clear
the six command register flip-flops (C106 to
C101, Figure 5-139), tl_e interrupt counter flip-
flops (C108 and C109, Figure 5-140), the word
sync flip-flop (Cl10, Figure 5-141), and the
enable power circuit (C601, Figure 5-142). The
reset pulse is nominally 100 microseconds long;
it resets the flip-flops by pulling down the respee-
5-114
tive collectors to a sufficiently low voltage to
cause the flip-flop outputs to go into the zero
state.
When the reset pulses end, the decoder is
completely clear and is ready to receive the
desired message. The timing of the tone presentdetector and the reset circuits is such that the
resetting operation is complete 6 bit times before
the end of the introduction. As a result, zero will
be accumulated in the command register.
This accumulation is accomplished by shifting
into the command register, with the shift mode
clock (C304, Figure 5-143), the outputs of the
tone detectors. The input gating to the shift clock
is in the proper state to allow the shifting tooccur once the decoder has been cleared.
Following the introduction, the word sync
enters the decoder. The word sync is 2 bits long
and consists of a one followed by a zero. These
2 bits are shifted into command register flip-flops
C106 and C105. When C105 goes high, the
output of inverter C501 goes low causing the
word sync flip-flop to be set to the one state.
When Cll0 goes high, the secondary mode of
operation is completely disabled, and the nega-tive transition of Cl10 causes the bit counter
reset (C609, Figure 5-137) to clear the bit
counter (Clll to Cl14), resetting it to zero.
As mentioned above, the secondary mode of
operation is disabled when Cll0 goes high. This
is done by inhibiting the input to the interrupt
counter so that it will not register an interrupt
in the input waveforms. Since C108 and C109
were cleared during the introduction, the gate
which controls the output of the count mode
clock (C303, Figure 5-143) will ensure that itremains in the zero state.
During the time that the message is being put
into the decoder in the primary mode, there will
never be a complete interrupt in the outputs of
W
il
im
i
..-x
W
m

_ !
t J
t=,J
rt,., _
= X!:
LIL_
x.j
Hughes A ircra]t Company
C300P_
C301PI
C606P I
C603TPI
C603PI
C605TP2
C6041_P2
C 304 P I
C106
C105
CI04
C103
C;02
ClOI
CSOIPI
C609TP2
Clll
CII2
CII3
CII4
C601IPI
Cl08
C109
C602PI
WORDSYNC
INTRODUCTION I _ ADDRESSENABLE_ COMMAND _ CONCLUSION
kJ-121___f--l_r-t_I 2 3 4 5 6 7 B g IOH 12
r-Lr22-k__--I
I
I I
--7 r-k_f3_J-___
---1J-_, I
[ J
FIGURE 5-134. PRIMARY MODE WAVEFORMS
5-115

W_ W
5. Spacecra# System Design
5-116
C300P1 OR
C301PI
C603TPI,
C603PI
C602 TPI.
C 602 PI
C602 P2
C605TP2
C604]-P2
C 108
C 109
C 502 PI
C303PI
C60tTPI
C 601TPI
C 601PI
C :302 P2
C302NI
SECONDARY
MODE
C 302 NI
PRIMARY
MODE
SECONDARY MODE WAVEFORMS
--_ _I-_ FIRST TONE
] /'NTERRUPT'OB'TSlI ]--9- ENABLE ADDRESS
INTRODUCTION 25 BITS_- t I I TO 64 BITS ]
SECOND TONEINTERRUPT I0 BITS
_ CONCLUSION
I
U "" LI--_' LFI ., n ,, F
-7
I UI I I-
IJ I L
mB- mJ-U-LFU I
EXECUTE WAVEFORMS
PRIMARY AND SECONDARY
MODES
I L
NNNF-5o_,_OM'NAL_t
FIGURE 5-135. DECODER WAVEFORMS
i
mmIll
iltil
m
Ill
III
m
m
II
i
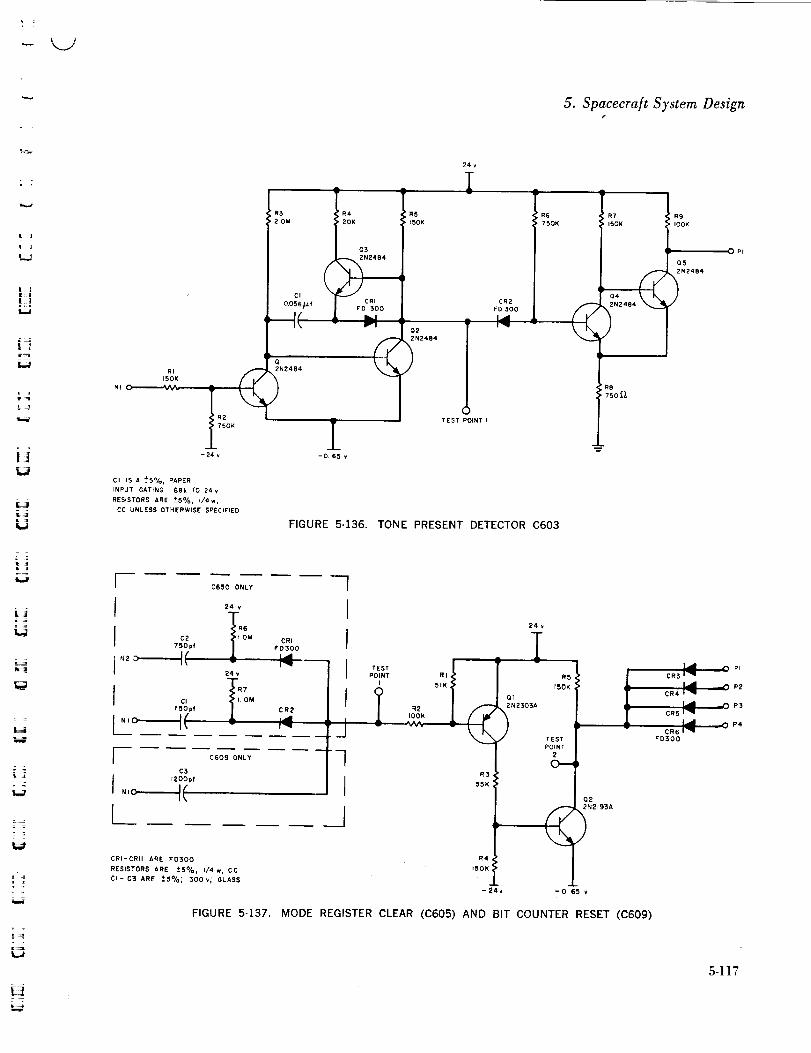
l i
! J
t:
r
w
......J
5. Spacecra/t System Design1
t R3
20M
RI
150K
R2
750K
-24 v
CI IS A -+5%, PAPER
INPUT GATING 68k TO 24 v
RESISTORS ARE _-5%_ I/4w,
CC UNLESS OTHERWISE SPECIFIED
24v
R4
20K
CI
o.ossF_
-4(
Q3
2N2484
CRI
2N24B4
R5
150K
O2
2N2484
TEST POINT I
OR2
FD 300
I R6
7flOK
!
FIGURE 5-136. TONE PRESENT DETECTOR C603
R7 R9
ISOK lOOK
Q5
N2484 _2N2484
AS
75o_
'OPl
C650 ONLY
I 24 v
C2 OM
750pf
I ,,%, "°"
L_,_--_(- _
lI
24
FO300
OR2
i-,ql
O3
1200pfI _,o..___(
C609 ONLY
IJ
]
CRI-CRH ARE FO300
RESISTORS ARE +5%, I/4 w, CC
CI- C3 ARE __5%; 30Or; GLASS
A
TEsPOINT RI
i 51K
R, )
R3
55K :
R4
_flOK
-24v
2N2303_
ISOK
TEST
O2
ZN2193A
-065 v
FIGURE 5-137. MODE REGISTER CLEAR (C605) AND BIT COUNTER RESET (C609)
_ Pi
CR5 I_II
I._ -_ P4
_O300
5-117

Hughes 14ircra/t Company
Iv
_50K IOMC3
CR4 L2OOpf CR6
TEST POINT I
24 v
R9
¢50K
-4,7v
PI
P2
P3
P4
P5
P6
CRI-CRI5 ARE FD300 Ol00ES
R£S_STORS A_( _5%, i/4w, cc
Ct-c3 ARE _5%_ 300 v_ GLASS
FIGURE 5-138. COMMAND REGISTER RESET (C604)
the tone detectors. When execution occurs, how-
ever, the input will be interrupted. Disabling
the count mode clock ensures that a spurious
change in the detector output will not alter the
contents of the command register when multiple
executions are necessary.
The detection of word sync establishes the
mode of operation and prepares the bit counter
to start counting from zero the number of bits
shifted into the command register. The bit
counter counts the bits by counting the negativetransitions of the shift mode clock.
Following the detection of word sync, the
enable address is shifted into the command
register. When the enabIe address is in the com-
mand register, the bit counter will have counte d
these 6 bits, and the gating that controls the
enable power circuit will allow it to sample the
contents of the command register. If the required
command register inputs are high, the enable
power circuit will come on, causing the command
register to be cleared by the command register
reset and the execute circuitry to be enabled so
that the presence of an execute tone will cause
execution of the contents of the command reg-ister.
The command follows the enable address into
the command register; and at its conclusion,
denoted by the occurrence of the twelfth bit
following word sync detection, the shift mode
input gating will be disabled by the bit counter.
5-118

5. Spacecra/t System Design
150K
TEST
BOfNT
C
CR5
m_
2_; v
T
R6
30X
04
2NBTI
N5
TEST
POINT
A
TEST
POINT
B
' RIO
2N2484
L_
r
CRS CR4TEST
POINT
O
CR7
TEST
POINT
E
TESTPOINT
G
P CR8
TESTTEST POINT
POINT p
-42v H
Cl C2
S60pf 560pf
I[ . '
CS NI C4
560pf 560pf
RESISTORS ARE 15%, I/4 w, CO
Cl-C4 ARE +-5%, 300v, GLASS
DiOOES CRI-CRIO ARE FD300
-42 v SURPLY IS: -42v
CRI_CR2
--47 v
TEST N2 TEST
POINT POINT
| J
FIGURE 5-139. COMMAND REGISTER FLIP-FLOP ELEMENT (C106-C101)
The conclusion follows the command and con-
sists of the continuous presence of a zero toiae.
The presence of this tone causes the entire com-
mand system to be insensitive to any changes
caused by outside interference or noise.
During the conclusion, the contents of the
command register will be telemetered to earth
for verification. If the command is correct, an
execute tone will be sent in place of the zero
tone. When this tone is detected by the execute
detector (C302, similar to C300 and C301), the
enable power circuit applies power to the diode
matrix (Figure 5-144), thus causing execution
of the contents of the command register. This
completes the command cycle in the primary
mode of operation. Once the zero tone is inter-
rupted, reapplication of either tone for 25 bittimes will cause the command decoder to be
cleared.
Secondary Mode Operation. Operation in
the secondary mode begins in the same manner
as in the primary mode. The introduction serves
5-119

Hughes Aircra]t Company
24v
I
560 pf T
I
R4
91K
I
.)N2484_ CR2 iQ2 _._ FDSO0 C2TB
560 pf
RESISTORS ARE CARBON COMPOSITION +-5%, 114 w
ALL CAPACITORS ARE GLASS, 30Or, 5%
FIGURE 5-140. STANDARD FLIP-FLOP (34/PACE)
24 v
1RI R491K 9_K
F"F_ _FF
R2 _ R3
Ct 82K QI / _ Q2 82K C2
560 pf _ _ 560 pf
s o.--_l _ _. ([) ( ]-Jr-__----o.I o, 1 ozJ_ T8 2N2484 "_r 2N2484 T-_ .L
[. CR2 T CR4
Iv Iv
RESISTORS ARE CARBON COMPOSITION --. 5%, I/4 "a
_.LL CAP".CiTORS ARE GLASS, 5%
ALL O_0OES ARE FD300'S
THIS FLIP-FLOP WILL BE USED FOR AIIO, AII3_ BlO0, JlO0 AND JlOl.
ttDOITtONAL iNPUT LOGIC WILL BE RELEt'SED SEPARATELY WHERE NEEDED
FIGURE 5-141. R-S FLIP-FLOP (5/PACE)
N3C
R3
24K
24v _ I%
CRI
FD-300
Q2
2N2eOI
RI36K
N2 C "_':_
R2
5/OK
R6ItOK
NI
R456K
I:K
5.6K Ira,
1200 pf _ R947K
===
_
QI2N2484
CR2
FD- 300
Q3
2N2801
OP2
::) TEST POINT I
042N2801
"_-'0 P_
RIO
56K
RESISTORS ARE "¢" 5%, I/4,_
N3 INPUT "OR" TERMS MU_I" HAVEA 6BK, 5%, I/4w "AND' RESISTOR
CI = GLASS) _ 5%, 988503-68
FIGURE 5-142. ENABLE POWER CIRCUIT (C601)
RItOO K
Nl(_
R2750 K
-Z4
24 v
R3_00 K
T
6 ',, (A!,
20 K
Pl
2N871
A
_5oo_
RESISTORS ¢ 5%, l/4, CC
FIGURE 5-143. COUNT MODE CLOCK (C303) ANDSHIFT MODE CLOCK (C304)
=
Jlimb L
qm
II :
II
il
5-120W
i#

\ .v
w....
| ;
t
)7
N
W-I
L
|_iiiL;ILI
U
U
tt,.,,_l
EI)J),I
5. Spacecra]t System Design
C_O2
C)"_i'
CIOZ CI02 CIO2 C)O2 C)O2
CIO4 ) ClO3
c_,
Ci0$,
C1061
C104_
C1061
c_-_,
CIO5 (
C)O4(
C106(
C104_
CI06,
C106
CIO4
CrO4
C800P6S -_ C800PBO
AAAA "ENABLE
I ( ! 4 POWER
_ _ _ -- _ _ I_ RG C8OOPXX
RESISTORS ARE 4-5%, i/4w,....... DIODES ARE FD-300
CBOOP27 USED DIRECTLYFROM COMMAND DECODER
| ( I OUTPUT.COMMANDS C800P28 THRU
CBOOP64 GO TO C305NI15 THRU C341NI.
I I
6BK
FIGURE 5-144. DIODE MATRIX (C800) PRELIMINARY CIRCUIT
the same purpose and accomplishes the same
thing in the same way. The only difference be-
tween the introduction for the two modes is in
the form of the output from the command re-
ceiver. In the secondary mode, the introduction
may be accomplished using either tone and the
input will be unmodulated.
As with the introduction, the message may be
sent with either tone since the secondary mode
requires only message tone for operation. At
the end of the introduction, the input tone is
interrupted completely for 12 bit times. With
this interrupt, all similarity to primary mode
operation ends. This interrupt corresponds to the
5-121

Hughes Aircra/t CompanyW
first complete tone interrupt shown in Figure
5-131.
When this tone interrupt occurs, the input gat-
ing to the tone interrupt detector (C602, Figure
5-145) will assume a zero state. The tone in-
terrupt detector operates similarly to the tone
present detector. The absence of an input causes
the first part, a ramp circuit, to run down and to
trigger a Schmitt, if the interrupt is sufficiently
long (60 milliseconds nominally). Then, pro-
vided that both interrupt counter flip-flops are
not in tile one state and the word sync flip-flop
is in the zero state, the negative transition at the
output of the tone interrupt detector will cause
the interrupt counter to change state.
The first complete tone interrupt will cause
C108 to go high enabling the count mode clock
input gating, and disabling the word sync flip-
flop input gating, the shift mode clock input
gating, and the count inhibit power circuit
(C608, Figure 5-146). When this occurs, the
primary mode is completely disabled.
Following the first complete tone interrupt, the
enable address is counted into the command reg-
R5
20M:
I%¢F
QI
NI 2N2484
-24_
24,
R4
Cl t
5%, PAPER,
2N2'_42 _ TE_ST
I POINT
i '-0 65,
750II
iNPUT GATE USES 68W TO 24v
_5F=RESISTORS ARE I/4W. CO, + °
UNLESS OTHERWISE SPECIFIED
FIGURE 5-145. TONE INTERRUPT DETECTOR (C602)
ister by the count mode clock, which follows
the output of the tone detector in operation.
Since the shift mode clock is gated into the zero
state, it cannot interfere with the count process.
When the desired number of counts has been
accumulated in the command register, the input
is again completely interrupted.
The second complete tone interrupt, like the
first, is 12 bits long. During this time the inter-
rupt detector will cause the interrupt counter to
change state, with C108 assuming the zero stateand C109 the one state. From the time that this
change occurs and before the resumption of the
pulse amplitude modulated input, the enable
power gating will be able to sample the contents
of the command register. If the contents corre-
spond to the correct enable address, the enable
power circuit will come on, clearing the com-
mand register and preparing the execute cir-
cuitry for the execution of the command.
At the conclusion of the second complete tone
interrupt, the pulse amplitude modulated inputis resumed and the command is counted into the
command register. When the required number
of counts have been entered, the input is com-
6v
RI CRI FD300
lOOK OINI _2N2836
R23OK
R3lOOK
-47v
RESISTORS ARE i5%, I/4w, CC
FIGURE 5-146. COUNT INHIBIT POWER (C608)
022N2838
C/ s0 PI
R4bOOK
4.?v
=
w
= =
W
Ij
: =
,J
5-122

5. Spacecra/t System Design
L J
E:::_
_]]:l
t_L,__
-_-{
!:?= :::'2
= .,..,,=
pletely interrupted again. The detection of this
interrupt will cause C108 to change to the one
state, disabling the count mode clock. The output
of inverter C505 will also go low, disabling the
input to the interrupt counter.
After the third interrupt, neither message tone
is sent until the decoder is to be cleared. The
contents of the command register are verified
via telemetry, and if the command contained
therein is correct, the execute tone is sent, causing
execution of the command. With the completion
of the command cycle, the decoder is cleared
by inserting the zero or one tone for 25 bit times.
General Information
• Circuits. The count inhibit power circuit,
(C608, Figure 5-146) is used to prevent the
command register from counting when operating
in the primary mode. The count mode clock, as
stated above, is disabled; but, since the command
register must be able to shift or count, there are
count connections between the command register
flip-flops which can cause problems when operat-
ing in the primary mode. For this reason, the
flip-flops are connected in a count configuration
through interstage gates between the flip-flops.
When operating in the primary mode, these gates
are disabled by the count inhibit power circuit.
The inverter, C504, is used to prevent com-
mands intended for other satellites from interfer-
ing with Advanced Syncom. When the command
is in the command register and the shift mode
clock is disabled by the bit counter, a continuous
zero tone will be present in the Advanced Syn-corn command format. If this zero tone is not
present and C301 goes high, the command reg-ister will be cleared. Differences between the
OGO forrnat and the Syncom format ensure that
a command intended for an OGO satellite will
not be executed in an Advanced Syncom satellite.
Two digital readout encoders are included in
the block diagram which encode the required
digital signal to a form suitable for use by the
telemetry encoder. The auxiliary power supplies
are necessary to optimize the design of the digi-
tal circuits, to increase power utilization effi-
ciency, and to minimize components. The execute
amplifier, C342, is used to couple the execute
tone directly to the telemetry encoder for directverification.
Not included in the block diagram, or as a
part of the actual command decoder circuit re-
leases, are several circuits which complete theinterface between the decoder and the rest of the
satellite. These circuits cause commands to be
executed in the subsystems affected when a sig-
nal is received from the decoder. There are two
types of interface coupling, ac and dc, as would
be expected. For the most part, the ac coupled
circuits (Figure 5-147 through 5-150) control
power regulators which supply subsystem po@er,
and which otherwise (if dc coupling were used)
would require voltage transformation to main-
tain control.
The improvement in reliability gained by
using ac coupling is great, considering that inter-
quadrant wire short circuits to ground will not
end control of the regulators. Where the outputs
of the decoder are dc coupled, there is no need
for voltage transformation and there is no prob-
lena with interquadrant shorts.
Detailed attention has been given to the design
of the drive circuits and output circuitry of the
decoder to ensure that noise generated in the
harness will not cause seemingly random execu-tions.
• Parts and Power. A total of 1217 parts
are used in the Advanced Syncom dual mode
command decoder. This parts count may vary
5-123

Hughes Aircra]t Company
TO ON TERMINAL
43K
Ct R IiNPUT lOG0 pf .OK I f
COMMAND _"" T • \K QI
OECOOER/ / /C2 "<2 2NB,i_:R8 R3 J -L82OPF
1 T FD3OO
-3i iSvRESISTORS ARE * 5%, I/4w
CJ -C2 ARE GLASS (CYFR) X988503 - SERIES, =_ 5%
FIGURE 5-147• REGULATOR ON DRIVER
_NPUT FROM
COMMAND
I pf IIOK
RESISTORS ARE _+5°/°, I/4.
CI- C2 ARE GLASS(CYFR},
x98Bfi03- SERIES,+5 %
FIGURE 5-148,
TO -6 2v REF'_SE_'E
_N - 24v REGULATOR
OR5INI317
17
24K
----0-24vREGUL ATOR
OUTPUT
CR2 R4• FO 300
Q2 CR3
FD3OOL2N2801
l _r_ OTO-24v/ REGULATOR
RSR5 CR4
OUTPUT430 K
R3TO OEF
16OK _ TERMINAL
t'w% Q_ ov -24i _'-I_ _NBTI REGULATOR
R2 ,J.-C2 _llr CRI
47K TFD300B2Opf FD300
1-3I ±5v
REGULATOR OFF DRIVER
+5 percent when final designs are complete. At
present these parts are broken down as follows:
Transistors ] 50
Diodes
Switching 471
Zener 6
Resistors
5 percent, 1/4 watt, C.C. 461
1 percent, 1/8 watt, C.F. 35
Capacitors:
5 percent glass or mica 72
5 percent paper 10
10 percent tantalum 5
Inductors, 1 percent toroid 7
Total 1217
5-124
R391K
CR2U_FD30O 8_4K
E_'2BOt
INPUT FROM 0047 ,_.f;
COMMAND RI I O04;pf"
[ .j: ,000°,4,q.T oo,.RESISTORS ARE +5%, I/4wC_-C2 ARE GLASS{CYFR).X9B8503 -SERIES,_5%, 300v -3
C3 TANTALUM, XSB8500-SERIES,+_I0%, 50v
HIGH VOLTAGE
TERMINAL
CRI
FD300
FIGURE 5-149. HIGH VOLTAGE ON DRIVER
iNPUT FROM
COMMAND
DECODER
° =[
R4
91K
_o_oo _o2 /_:_ / R61 I
L"r--" c3- / _--I o_I °4r _" "_,--_ 2N2e3a
RI CII
I_ "'" OFF TERMINAL
Iooo,f RZJ -Lcz ,L--. "'"1
RESISTORS ARE +5%. I/4w -slJ
C1-C2 ARE GLASS(CYFR), -24v+-1%XS88503-SERIES,_5%,+ 300v PACE SERIES REaULATOR
C3 TANTALUM, X988500- SERIES,.+JO°Io,50v
FIGURE 5-I50. REDUNDANT PACE OFF DRIVER
The total maximum stand-by power dissipatedin the decoder is 1.3 watts. The total maximum
power dissipated during the time that a com-
mand is being executed is 3.5 watts.
Summation o/Progress on Decoder. During
the design and development of the Advanced
Syncom command decoder, there was question
regarding the sensitivity of the decoder to raise-
command cycles. It was felt, for instance, that
an OGO spacecraft itself would present a prob-
lem by virtue of its presence and the control
of it through the same general command format
and console as that used for Advanced Syncom.
In addition to this problem, it became obviousthat it would be desirable to have some means
of preventing an enable power circuit from
'Jill
W
i
i
[][]
!
i
|ii
Bi
[]i
w
U
U
NI1
m
i
|m
_B[]
[]II

2
L_Y
-2 -
i -,i
U
LJH
Ez_
L _
L_
z _
L
IF::::1
U
coming on randomly because of a single bit
error in an enable address sent to another de-
coder. Finally, the problem of noise was con-
sidered with regard to its effect on either mode
of operation.
OGO has the greatest tendency to interfere
with Syncom only in the primary mode of opera-
tion. The output of the command receiver will
look essentially the same for either a Syncomor an OGO command. The difference between
the two commands, however, is in word length.The OGO command consists of a series of zero
bits followed by a single one, which is an OGO
word sync, and then by three decoder address
bits. The command is 10 bits long and is fol-
lowed by the command complement and a mini-mum of 11 zeros. The total number of bits to the
end of the command complement from word
sync is 24. Since Advanced Syncom, for a simi-
lar cycle, requires only 14 bits, the last 10 bits,
the command complement, would occur after
Syncom's cycle was concluded and the shift
mode clock was disabled. At this time, to con-
clude a command, Advanced Syncom requires
that a continuous zero tone be present. If this
does not occur, the Advanced Syncom decoder
command register will be cleared by the first one
bit which occurs after the disabling of the shift
mode clock. This is done by C504 in conjunction
with the command register reset, C604.
The advantage of detecting a single bit error
in the enable address is questionable because of
the number of parts required if a formal check
of some type is made on the command register
at the enable time. If the address is coded prop-
erly at the outset, a simple parity check can be
made by including all bits in the register in the
enable input gate and requiring that all ad-
dresses contain an odd number of ones; with no
increase in parts, a simple check can be made by
5. Spacecra/t System Design
sacrificing half of the available addresses. This
sacrifice of addresses appears reasonable since
32 addresses should be adequate.
The final problem considered was that of noise
interference. The effects of random noise on the
Advanced Syncom decoder were considered in
two parts. The first of these was the effect of noise
on the decoder during the time that an input is
present. It was found that the signal-to-noise
ratio of the command receiver in conjunction
with the decoder filters is adequate to ensure
that noise is not a significant problem.
The second part of the problem involves the
decoder when no input is present. It was found
that reasonable choice of thresholds in the de-
tectors would eliminate the major portion of the
problem. In general, the quantitative analyses
made on the decoder consider the receiver char-
acteristics, the decoder filter bandwidths, and the
detector design. They yield a quantitative proba-
bility that a detector will produce an erroneous
output. Design has been directed toward reducing
this probability to a minimum without impairing
operation. It should also be noted that the proba-
bility or" occurrence o[ individual false outputs
from the detector has no relationship to the se-
quence of outputs required before a false com-
mand could accumulate in the command register.
As a final, simple means of ensuring that
errors will not accumulate in the decoder, the
command register is cleared every 315 minutes
by an input from the central timer.
The preliminary design of the Advanced Syn-
corn decoder is complete. The design has been
tested on a subsystem level, and in all respects
it performs as it was designed. The last step in
the design is the evaluation of the breadboard.
This evaluation will be based on operation at
temperature extremes, in extremely noisy sur-
5-125

Hughes Aircra[t Company
roundings, and with inserted noise at each sub-
system input. The latter test should yield valuable
information regarding decoder sensitivity. The
decoder will also be evaluated with regard to
necessary input signal levels and modulationindex.
The command decoder has been mated with
the OGO console and been found to operate pro-
perly in the primary mode. The only exceptionto this statement is that the real time execute has
not, at this time, been implemented and tested.
Figure 5-151 shows the OGO console mated withthe command decoder.
The OGO standard has an NRZ, frequency-
shift-keyed modulated word format. The mes-
sage tones are amplitude modulated with a low
frequency sine wave which, when detected, serves
as a bit sync clock.
Real time execution was needed for the fol-
lowing functions:
a) Implementation of the backup mode of
the jet control electronics.
b) Implementation of beam adjustment bycomm and.
c) Implementation of beam control while
operating in an eclipse.
d) Verification of command prior to execu-
tion.
Telemetry Channel Allocations. During the
report period, the essential operational charac-
teristics of the Advanced Syncom telemetry
system were defined. The salient points are asfollows:
1) The telemetry system will be the GSFC
standard PFM system with approved modi-fications as listed below.
2) The format will be comprised of eightframes.
5-126
FIGURE 5-151. OGO CONSOLE
3) The reference frequency will be generated
by driving the vohage-control]ed oscillator
above 15.5 kc rather than by use of a
separate oscillator.
4) The bit rate will be 48.5 ---5 percent bits
per second.
5) The telemetry system will use two fre-
quencies -- 136.470 and 136.980 mc --
with at least one transmitter operating at
each frequency.
6) Provisions will be made in the telemetry
system for indicating actuation of bipro-
pellant salenoids and all squib firings.
7) Provisions wiI1 be made for indicating
q,, q,.,, and the execute pulse.
8) Each frame will be composed of 16 Chan-
nels as follows:
Channel 0 will be a frame sync.
Channels I through 7 will contain a
series of seven data bursts, each pre-
ceded by a reference burst.
Channels 8 through 15 will be a con-tinuous data burst.
9) The information format will be as shown
in Figure 5-152.
{|HI
I
r

v_
,,-i
uZ
>-0 _i-- u. --
z_
u_tzl
3: v_ =)
zZ_z •Z=_
_ _,_, Z _
_ U m
ZO,_..<
.Z CI
5. Spacecraft System Design
4ZU_Zwu.J
L
|¸¸¸5
k...
,,....
=
ZZ
U
zz*( 0 :I:
ZU w
I-
>-
i.--
Z
--0'
<
m
<
>-
[..-_
u_ z
.<
u_
0130
0
O<
z_=
zC_zo_
z_i.--
_0 _-
_z>_
o _-_Z :"_'-0_
_<zo_n
U
.<i-- i-P. 0 ..a<ZO== >
uJ
0 >---0
_._z _o<z>o
m
S
o')
d_ZZ
z_z
ZU
00_zu___
"--0
0uT<=
00 .Zu_
_'--- o0,_ 0 :_
_,r_o
8_ :__.z,
°J
zz=
zC_Z
-JI-
e¢
ili°
goz
>_mZ_
N_
i 1
I i -- _-
,--i--C3,
, , _,
I 0
' _ _i
, _ _
' 0 if"' Z
"J * I.-
0 ,
' _
-:-_-_--m
, _, _i
oto
_Q
T_-.-_o0 z
, ___-._
i
i
: _
, _i:
-_)
Z
• Z o
__oE< -0o
i C3
0:.-_
oOZ
>=_
===
,¢
0Z
<
.,=.
<uJ
r_
0
; z
rio
J_
O_ TM<"1 •
>__Z_
1
i
i
i
5zg
S
h,
=Ert"0It.
>..
re"
l--
bJ
:EU,J
.J
OJ
l-
Nt,O
LOrr
5-127

W
Hughes ,4 ircra/t Companym
W
10) The location of temperature sensors has
tentatively been decided upon, as shownin Table 5-22. A total of 16 sensors will
be included on each spacecraft. The fuel
and oxidizer tank sensors and traveling-
wave tube sensors are redundant for each
of the two telemetry encoder frequency
assignments.
Command Allocation. The format for the Ad-
vanced Syncom commands consists of three
major subdivisions: 1) word sync, 2) command
address, and 3) command number. A 6-bit sys-tem will be used for both tile address and the
command. The message format is described in
tile following paragraphs.
Word Sync. The word sync is used to define
the start time for the command which follows.
Word sync in the shift mode will be a series of
zeroes followed by a one and a zero. In the
count mode, a series of zeroes or ones followed
by a 10-bit time interrupt will designate the
word sync.
Command Address. The second 6 bits of the
command message will consist of a spacecraft
nunfl)er and a quadrant number for a specific
command system. The format is defined as
follows :
..... 16 5 14 131"i i ]\ I
most significant bit least significant bit
where bits 6, 5, 4, 3 are the spacecraft number,
and bits 2, ] are the quadrant number. This
format makes it possible to address a maximum
of 64 quadrants.
Command Number. The last group of six
bits of the command message will consist of the
command number. The format is defined as
follows :
5-128
TABLE 5-22. TEMPERATURE SENSORS
TelemetryEncoder
Sensor Description and Location Number 's
Reactioncontrolsystemi fuel I and IIandoxidizertanks
Near traveling-wavetube I and IIcollectori ribs 3 and 9
Solar panels
Nearradial jet I II
Near either endof vehicle I
Antennacruciform I
Sun sensor II
Aft bulkhead 1
Battery I
Apogeemotor mountingpoint II
Radialjet 1 mountingsurface II
Forwardshelf neartelemetry IItransmitter
Axial jet 1 mountingsurface I
*Telemetry encoder transmitter I operates at 136.470 me;
telemetry eneoder transmitter II operates at 136.980 inc.
5 4 3 2 ] I
/most significant bit least significant bit
Wilenever applicable, bits 6, 5, 4, 3 will desig-
nate the command type, and bits 2, 1 will des-
ignate the appropriate quadrant. The command
function must include capability to control each
quadrant where applicable. The command for-mat is shown in Table 5-23. For ease of dis-
cussion, a modified ocial representation of the
binary command is defined as follows:
1) The first digit !s zero or one and is identi-
cal to the most significant binary bit in the
register.
2) The second digit goes from zero to seven
and is the octal representation of the next
three most significant bits in the register.
3) The third digit goes from zero to four and
is the modified octal representation of the
m
ar
.---mI
i
I
I
I
iJ
I
m ;
W
UtU;
u !I
i '
w
R !Ot
W
U [
I r

5. Spacecraft System Design
I I
2_
w
L •_L4
Wi
TABLE 5-23. COMMAND FORMAT
Command Function
Modified Binary WordOctal
Command 6 5 4 3 2 1
Spares 00-1 000001
00-2 000010
00-3 000011
_d 000000
Transponder
Frequency translationmode on, multipleaccessmode off
01-1 000101
01-2 00011001-3 00011101-4 000100
Multiple accessmodeon,frequency translationmode off
02-1 00100102-2 00101002-3 001011
02-4 001000
Transponderoff 04-1 010001_-2 01001004-3 010011044 010000
Spares 03-1 00110103-2 001110
03-3 001111034 001100
Transmitter
Traveling-wave tube1 05-1 0 1 0 1 0 1filament on, 05-2 0 1 0 1 1 0traveling-wavetube2 05-3 0 1 0 I 1 1filament off 05-4 0 1 0 1 0 0
Traveling-wavetube2 06-1 0 1 1 0 0 1filament on, 06-2 0 1 1 0 1 0traveling-wavetubel 06-3 0 1 1 0 1 1filament off 06-4 0 1 1 0 0 0
Traveling-wavetube 07-1 0 1 1 1 0 1highvoltageon 07-2 0 1 1 1 1 0
07-3 0 1 1 1 I 107-4 0 1 1 I 0 0
PACE
PACEon for quadrant 10-1 1 0 0 0 0 1specified,all other 10-2 1 0 0 0 1 0PACEoff 10-3 1 0 0 0 1 1
10-4 1 00000
Command Function
PACEAll PACEoff
ModifiedOctal
Command
11-1
Accept antennaposition 11-2
Phase shifter driver 11-3
regulatoron
11-4Phaseshifter driverregulatoroff
Eclipsemodeoperationon
Eclipse mode operationoff
12-1
Spare
Telemetry
12-2
Central timer select 12-3
12-4
Telemetryon
Telemetry off
BipropellantsystemFire jets i and2,+90 degrees axial
Fire jets 1 and2,+90 degreesradial
Fire jets 1 and2,-90 degreesradialSpare
Bipropellant system
Fire axial jet,system1 (backupmode)Fire radial jet,system1 (backupmode)Fire axial jet,system2 (backupmode)Fire radial jet,system2 (backupmode)
Firing circuits
Fire control systemsquibsReleasecontrol
systemlockingpinsFire apogeeengineSpare
13-113-213-313-4
14-114-2
14-314-4
15-1
15-2
15-3
15-4
16-1
16-2
16-3
16-4
17-I17-2
17-317-4
BinawWo_
654321
100101
100110
100111
100100
lOlOO_
101010
101011
101000
101101
101110101111101100
110001110010110011
110000
110101
110110
110111
110100
111001
111010
111011
111000
111101
111110
111111111100
=___!
LJ
E
5-129

Hughes ,4 ircraft Company
W
last two or least significant bits in the
register. This digit defines the quadrant,
where applicable, quadrant 4 being repre-
sented by octal four but binary zero.
Examples:
Modified Octal to Binary
0 5 2 (Quadrant 2 traveling-
0 101 10 wave tube filament on)
Binary to Modified Octal
1 110 01
1 6 1 (Fire axial jet, system 1)
CENTRAL TIMER
The circuit design of the central timer is com-
plete and final circuits have been released. A
flat card engineering model of the central timer
was constructed and has operated successfully
over the temperature range, --20 to 65"C; the
design temperature range is 0 to 50"C. (See
Figures 5-153, 5-154, and 5-155.)
FIGURE 5-154. CIRCUIT CARD CONTAININGTHREE COUNT-OF-EIGHT STAGES
UNDERGOING CHECKOUT
i
i
W
IB
I
i
i
FIGURE 5-153. CIRCUIT CARD CONTAINING THREECOUNT-OF-EIGHT STAGES
5-130
FIGURE 5-155. CENTRAL TIMER ADVANCEDENGINEERING MODEL CHASSIS
I
I
Hu
B
.t i
I ii l
III.l
W
I !
i i
w
U
!
[ti t
I =
u
Other environmental tests (vibration and non-
operating temperature cycling) of the tuning fork
oscillator and scaler stages have also been
initiated.
Tests to determine the long-term stability of
intermediate counts within a core are also being
conducted. Although testing should continue for
many months, preliminary results indicate a
high level of core stability.
The method of packaging the central timer
is under investigation. It is very desirable to
have the size of a replacement core module as
small as possible, but because of the inherent
variability of magnetic characteristics between
cores (even from the same lot) and because of
the critical coupling required between scaler
stages, measures must be taken which provide
tight control of scaler stage-to-stage compati-
bility. The present design offers two packagingalternatives:
1) Make the replacement core module small
(only two or three scaler stages) and re-
quire a very stringent core selection and
adjustment procedure to ensure standard
module inputs and outputs.
2) Put all cores (ten) of a timer in a single
module and make this the replacement
core module. Each core is then adjustedto drive only the following core. With
this method, no selection or Standardizing
procedure is necessary.
Alternative 1 results in a small replacement
module, but at the expense of a very costly selec-
tion and adjustment procedure. Alternative 2
results in a relatively costly replacement module
but the adjustment procedure is quite simple.
A strong point for alternative 2 would be the
5. Spacecraft System Design
higher reliability of the ten-core module as com-
pared to all ordinary module, in that tile core
module has only ten parts and few internal cou-
nections. Such a module should also be relatively
insensitive to failures by input-output shorting
provided a current-limiting fuze is provided on
any external -12 volt supply used to test tile
scaler modules.
A third alternative for packaging the timer is
to provide relatively small core modules (three
to four stages), each with a shaper stage at its
input. This approach would give both a small
replacement module and a simple adjustment
procedure, at the expense of the seven additional
parts for the shaper stage. A new design for
this shaper stage is required but the effort shouldbe minor. No selection between alternatives has
yet been made.
Progress Items. During the report period the
following functional timer definitions have been
specified :
1) The timer outputs will be those indicatedabove.
2) Prior to separation, the last four scaler
stages will be held reset. This will then
result in an apogee timer error of q-0,
--21 seconds.
3) A flight plug will be incorporated in series
with the reset line to allow complete sys-
tem checkout of the central timer.
4) A test point will be provided at the input
to the seventh scaler stage. This point will
be driven externally to provide a rapid
checkout of the last three scaler stages,
the output latch, the apogee driver input
gate, and the apogee squib driver.
5-131

Hughes Aircra[t Company
Tests have been initiated to determine the
long-term stability of intermediate counts within
a core. The plan has been to incrementally in-
crease the time interval between full scale
counts and note whether there is a maximum time
interval beyond which unreliable operation re-
sults. To date, a sample of five count-of-eight
stages has been run to 80 minutes between full
scale counts. Each core has been cycled ten
times at that time interval. No miscounts (or
variations of the last pulse from its optimum
position on the O-H curve) have been observed.
Tests at 240 minutes between full-scale counts
are now being conducted. The data is not yet
complete, but again, no miscounts or variations
have been observed. Three count-of-eight stages
have been set to a count of four on a Friday
and power turned off for the weekend. On the
following Monday morning power was turned
on and each core was incremented to full scale.
In all cases, the proper count was observed with
the last pulse remaining optimumly positioned
on the q_-H curve.
Functional Description. The purpose of the
central timer in the Advanced Syncom space-
craft is to provide an accurate timing sourcewithin the vehicle which serves as a real time
reference for many spacecraft operations.
Four timers are provided per spacecraft, one
in each of the vehicle's four quadrants. Each
timer uses the command regulator -4-24 and -24
volt power supplies of its local quadrant. The
timers are complete within themselves, and thus
operate independently of one another.
The central timer generates the following tim-
ing functions:
1) An output is provided at 194.18 -- 0.02
percent pps, which serves as the teleme-
try encoder commutation clock frequency
for the local quadrant.
2) Output pulses at 2.8126 -4- 0.02 percent
minutes are provided as time-of-day cor-
rection inputs to the beam positioner ofeach PACE. To assure that a timer failure
will not disable the time-of-day correction
inputs for the beam positioner in that
quadrant, each timer's 2.81-minute out-
put is provided to all four PACEs. Thus
any of the four timers can be selected to
drive any of the four PACE beam posi-tioners.
3) The third output of the central timer is the
apogee motor enable signal which is gener-
ated 315.01 -t-0.06, --0.41 minutes after
spacecraft separation. Redundancy against
false triggering of the apogee motor due to
a premature timer output is provided, in
that a minimum of two timers must gener-
ate an enable output before the apogee
motor will be fired. Additionally, up to two
timers may fail completely and proper
apogee firing will still be maintained.
4) The final output of the central timer is a
command register reset signal which is
generated every 315.01 + 0.06 minutes.Its function is to reset the decoder com-
mand register every 315 minutes to ensure
against the generation of erroneous com-mands due to noise.
Block Diagram Description. The block diagram
of the central timer is shown in Figure 5-156.
All power is derived from command -t-24 volts
and command --24 volts which are on continu-
ously. The --12 volts is generated internally
and serves as the prime voltage supply for the
core scaler stages.
The real time reference for each timer is a
1553-cps tuning fork oscillator. The osqillator
output feeds into the core input amplifier which
squares the input sine wave and provides the
m
M
R
I
i
D
-3U
I
I
U
• J
m
m
5-132
w

s= °1!W
i[i
!! .'-_
L
L _I
[ :
COMMAND
24
COMMAND
-24 v
T910
REGULATOR
-24 v
-12v
T811
TIMER OUTPUT
BUFFER
24 v
T510
I TUNING FORK
OSCILLATOR
1555 cps
1J CORE INPUT H CORE PULSE
AMPLIFIER SHAPER
TSIO T610
TGIO
194 cp= OUTPUT TO
TIMER OUTPUT TELEMETRY ENCOOER
BUFFER COUNTER iNPUT GATE.(LOCAL QUADRANT ONLY)
COMMAND COMMAND
24 v --24 v
T T__TIMER 2 TI20
J (AS ABOVE)
ICOMMAND COMMAND _ [24 v --24 v TP2 R$2
(AS ABOVE)
_ TTIMER $ TISO
II
_TP3 RS5 [COMMAND COMMAND
_TP4 RS4 [
24 v -24 v
TIMER 4 TI40
{AS ABOVE)
L_ .......
RI = 680.Q
I%, 5W, W.W.
HUG. 986631-93
RESET WINDINE
,_k.____F
I
_TB21P
T720P
!
-,_ T831P
T730P
I
b'TB41P
,_ T740P
T710P T|
T72OP _ _7
\
T,,Op_ [___
T_30P_ /
T_Op---__//T_O__ V
APOGEEMOTO.DRIVEINPUT GATE
FIGURE 5-156. CENTRAL TIMER
n
/

u
HU
[]
i
II
w
LJum
i
_ J9

TIMER I TIIO
h=v
T210
TIMER OUTPUTINVERTER
T71O
k._ APOGEE TIMEROUTPUT LATCH
T21OP
T2= :515 rain T710P
24 vR2=LOM5%t/4 WCC
RSI
TO COMMANDDECODER(LOCAL QUAD)
TO APOGEEMOTOR DRIVERINPUT GATE
TelIP
T821P
T831P
T841P II
;-I
PACE I
TIMER
SELECTFF'S
(2 FF'S)
PACE 2
AS ABOVE
PACE 3
AS ABOVE
PAC E 4.
AS ABOVE
TIMER
SELECT
SWITCH
)_ FLIGHT PLUG
T200SEPARATERSWITCHES
/-31 vUNREG
r i
I APOGEE I
DR I VER
_.'_ 8UBASE_EMBLYNo.2
: I T,oo I_ l J
-_P'-_o _EE DRIVER 13UBAISSEMBLY
I
II-ooI I_ SQUIBDRIVER
I NO. Io
APOGEE MOTOR ISQUIB NO.I
t
L ....
1-31 v
NO. I TISO
_[ T901
SQUIBDRIVER
NO. Ib
II
-.-IIIJ
COMMAND FIRE NO, 2
II
i_ COMMAND
FiRE NO, I
J
5-133


i
11
t _sL a
k •
t,.....a
7
L ]t :
J
m
H
required current gain. This output then drives
the core pulse shaper which provides a fixed
volt-second area pulse into the first count-of-
eight core frequency scaler. Each scaler stage
in turn drives the following stage. The outputs
of the first and sixth count-of-eight stages drive
both the following stage and a timer output
buffer. The output of the last scaler stage drives
both the apogee motor output latch and the
timer output inverter. Two latches going high
enable the apogee squib drivers via the apogee
motor driver input gate.
The separation switches shown are required to
inhibit operation of the last four frequency
sealers until the Advanced Syneom spacecraft
separates from the Agena launch vehicle. The
actual number of separation switches to be used
has not yet been determined.
Core Frequency Scalers. The Advanced Syn-
corn central timer uses incrementally saturating
magnetic cores to perform the frequency scaling
operation. By nsing one shaper stage and nine
count stages, a frequency division of 8 _ X 7 a X
4 "°= 29.36(10) _ is obtained. The total number
of parts required is 70.
Product Design. The central timer, consisting
of components including a tuning fork and ten
tape-wound toroidal transformers, has been de-
signed into six welded encapsulated modules
of the type described in the PACE product de-
sign section. The component density of the six
welded modules is 19.5 components per cubic
inch and the weight of the timer will be approxi-
mately 1/_ pound.
The tuning fork is a vibrating device and is
affected by some portions of the Advanced Syn-
corn environment, the most severe of which are
spin acceleration and lateral vibration. The tun-
ing fork is oriented such that the response of the
5. Spacecraft System Design
tynes to spin acceleration (10 g) and lateral
vibration is minimized. The tuning fork, which
will be mounted as close as possible to the
quadrant attachments, will see an amplifica-
tion of twelve at the resonant frequency of the
unit (approximately 200 cps) resuhing in a
maximum response of 30 g. As a result of these
precautions the tuning fork will operate within
its required limits with adequate margins. Tile
Hughes specification for the tuning fork is now
being written.
The countdown of the tuning fork frequency
is accomplished by scalers, utilizing tape-wound
orthonol cores with count reductions as high as
8 to 1. The wound core is encapsulated as a
component to ensure low handling losses and
facilitate welded module fabrication. Three
scaler stages are packaged in a module with the
capability of fine tuning each core (a total of
three per module) with a two-turn winding in
the unencapsulated module stage. Hughes speci-
fications are now in progress for both the un-
wound core and the wound core package. The
product design of the timer will be completed
during this program.
Circuit Descriptions
Tuning Fork Oscillator. The tuning fork
oscillator circuit is shown in Figure 5-157.
Transistors Q3 and Q4 form a two-stage common
emitter amplifier. There is positive feedback
from the collector of Q4 to the base of Q3
through the tuning fork. The voltage transfer
ratio of the tuning fork, defined as the ratio of
pickup coil voltage to drive coil voltage, is
about 1:30 at the fork resonant frequency,
1553.446 cps. The voltage transfer ratio de-
creases very rapidly as the frequency is changed
from the resonant frequency. The frequencycharacteristic is similar to that of a tuned circuit
5.135

Hughes Aircra/t Company
P2
ITUNING FORK
47on
CRIFD300
Ol2N871
R239K
C8bI.O p.f
-24V o
RI651_
-24V a
24V
C2b C2a RI5
1.0 p.f 1.0p.f 51,_.
Q3
R6 2NB71Pl 1.05K
24V24V a
Q22N871
R42M
R9-7.0 v 40.2K
CR370 v
ZENER, ZI _24V0
RB33.2K
CR2FD200
Q42N871
DI
7RII16.2K
C46.8 ,._f -24V a
RI338.3K
Q52N871
)UTPUT
-24V a
t
FIGURE 5-157. TUNING FORK OSCILLATOR
with a Q of about 5000. When the power is
turned on, the loop gain at the fork frequency
is greater than unit (about 3) and oscilIations
build up. The magnitude of the oscillations
increases until the loop gain is reduced to exactly
unity by the automatic gain control (AGC)
circuitry. The oscillations build up to their
steady state value within several seconds after
the power is turned on.
The AGC depends on the fact that the voltage
gain of Q3 is approximately proportional to
its emitter current, because the unbypassed emit-
ter resistance, consisting of the smaII signal
resistance of the emitter junction and of the
diode CR2, is inversely proportionaI to theemitter current,
The output voltage is about 14 volts peak-to-
peak and is essentially sinusoidal. The voltageat the anode of the zener diode CR3 is about
--7 volts dc. The sinusoidaI output voltage ap-'
5-136
!-==
i
g
i
i
i
m[]
R
= =
i
2
i

i
5. Spacecraft System Design
t •
=
w
L
i[i
m
L_ ¸
pears at the anode of CR1 referenced about
--7 volts. When the power is first turned on,
CR1 is not conducting. As oscillations build up
to a sufficient level, CR1 conducts for a small
portion of each period. This rectified current is
filtered by C1 and amplified by Q1 and Q2.
A small increase in the output voltage beyond the
point necessary to make CR1 conduct causes a
relatively large increase in the emitter current
in Q2, a decrease in the emitter current in Q3,
and a corresponding decrease in the loop gain.
The output voltage stabilizes at the point where
the loop gain is exactly unity.
Power requirements: -t-24 volts, --24 volts
Input requirements: None
Output specifications: Approximately 14
volts peak-to-peak; essentially sinusoidal; fre-
quency 1553.446 cps _ 0.010 percent.
Core Input Amplifier. The core input am-
plifier (Figure 5-158) provides a square wave
RI
elN , ;
cI0.022 p.f
CRI
FIGURE 5-158.
l--=.
51K
R3
270_
-24v
R4
13K
,,_,._,0 e o
CORE INPUT AMPLIFIER
input to the core pulse shaper from the sine wave
output of the tuning fork oscillator. A Schmitt
trigger configuration of the amplifier is neces-
sary to provide both a rapidly falling output
edge and the required current gain.
The capacitively coupled input, C], provides
dc isolation between the tuning fork oscillator
and the core input amplifier. Resistor R1 serves
as the load of the tuning fork oscillator as well
as the Q1 base-drive resistor. Diode CR1 allows
the tuning fork oscillator to be symmetrically
loaded for both positive and negative-going half
cycles of the input.
Transistors Q1 and Q2 in conjunction with
resistors R2 and R3 form the Schmitt trigger.
Resistor R4 provides the output current to the
core pulse shaper.
Input requirements:
Voltage
Frequency
Output specifications:
to 50°C ambient.
Wave shape
Asymmetry
Voltage levels-
Low state
High state
Load
14 ± 5 volts peak-
to-peak sine wave
1553 cps, ± I per-
cent (for test)
1553.446 cps,
± 0.01 percent (for
timer operation)
Must be met for 0
Square wave
on time < 1.5
off time 1.0
--24 +1.3, --0 volts
--10.5 ±1.5 volts
when loaded
One core pulse
shaper
5.137

Hughes ,4ircra/t Company i
Output voltage < 0.5 microsecond
fall time (10 to 90 percent
points)
Core Pulse Shaper. A core pulse shaper
stage (Figure 5-159) is required to precede any
string of scaler stages to ensure that the initial
scaler stage receives properly shaped input
pulses. It is in effect a count-of-one scaler stage.
It. TI i1• " I
CR3 _, 02'_ -12 v
FD300_ 2N2,93AI
NI_2= 300 TURNS
N3_4=120 TURNS
N4_5= 120 TURNSN5_6 = 43 TURNS
NT_8=N8.9 = I TURNCORE: MAGNETICS, INC, NO. 80512-1/4A-MA, ORTHONOL
=
FIGURE 5-159. CORE PULSE SHAPER
The blocking oscillator of the shaper stage is
essentially the same as that of the scaler stages.
The main difference is the input configuration.
In operation, a positive voltage is impressed at
e,, which turns Q1 on and drives the core to satu-
ration. When this input voltage is removed and
Q1 turns off, the snap-back voltage generated
across winding N3_4 triggers the blocking oscil-
lator which generates a negative output pulse of
fixed volt-second area to the first scaler stage
(via winding Ns__). Diodes CR1 and CR2 are
required to limit the positive voltage spike which
appears at pin 8 on completion of the blocking
5-138
oscillator cycle. Limiting is necessary to prevent
this positive spike from coupling into the first
scaler stage.
Input requirements: Requires output of the
core input amplifier.
Waveform
Input high time
Input current
Input fall time
(voltage)
1553 cps -4- 1 percent
square wave (--12 to
--24 volts)
> 150 microseconds
> 0.67 milliampere
< 0.5 microsecond
(10 to 90 percent
points)
Must be met forOutput specifications:0 to 50"C ambient.
Waveform Negative 3-volt pulse
of approximately13 microseconds
duration from
quiescent level of--12 volts
Volt-second area 40 volt-microseconds
Core Frequency Scalers. Operation of the
core frequency scalers is based on the very square
0-H curve of orthonol-type, tape-wound cores.
Because of this characteristic, the 0-H curve of
a core can be incrementally stepped up, generat-
ing an output pulse only after a sufficient num-
ber of input pulses have been applied to cause
core saturation. At this time, the core resets
itself to the opposite saturation state and simul-
taneously generates an output pulse. The fre-
quency scaling factor for each stage is then
defined as the number of input pulses required
to saturate the core. For reliability considera-
tions, a count-of-eight is the maximum scaling
factor used for any one stage in the central timer.
HI
ii
I
|
|
i
i
I
i
IEi[]m
I
t !
[][]
i r
H!
i i

= ,
L2
; i
= =
° .
w
_J
!]
r
Ii.
R2eOUT 2
2N2193A _RI
-12v
RESET
+ -
T, II
OUT I
"_Q2 -12v
I 2N2193A
Ni-2 : 162 TURNS
N2.3:18 TURNS
N3_4:120 TURNS
N4_5= 42 TURNS
N6_7=NT.B=ITURN
N9_iO= 50 TURNS
CORE: MAGNETICS, INC, NO. BO512-1/4A-MA, ORTHONOL
FIGURE 5-160. CORE FREQUENCY SCALERCOUNT-OF-EIGHT STAGE
RESET
+
• II1,,.. • • ..
-12v -
NI_2= 162 TURNS
N2_3 = 18 TURNS
N3_4= 120 TURNS
N4_5= 42 TURNS
N6. 7 = N7_ 8 = I TURN
N9_IO= 50 TURNS
CORE: MAGNETICS, INC., NO. BOSI2-1/4A-MA, ORTHONOL
FIGURE 5-162. CORE FREQUENCY SCALERCOUNT-OF-FOUR STAGE
5. Spacecra/t System Design
[
Jl.
elN I _L_
QI2N2193A
-12
Nt_ z = 120 TURNS
NZ.3 = IB TURNS
N3_4=120 TURNS
N4_5= 42 TURNS
N6_7=NT_8=I TURN
Ng_IO= 50 TURNS
RESET
-F
• TI
1I
1,oo ---°.o0TI___i,_ Q 2 -12v
_'_ 2N219_1 _ R3
A3
50,Q 12 4.fl
CORE: MAGNETICS, INC, NO 80512-lI4A-MA, ORTHONOL
FIGURE 5-161. CORE FREQUENCY SCALER
COUNT-OF-SEVEN STAGE
The various stages used are shown in Figures
5-160, 5-161, and 5-162.
This discussion applies to all count stages,
but specifically refers to the count-of-eigi_t stage
shown in Figure 5-160.
The input voltage, et,, and output voltage
eo,,, _, quiesce at --12 volts witl_ a pulse level of
approximately --15 volts. The pulse width is
about 13 microseconds and the area of the pulse
is exactly 40 voh-microseconds. The input
40-volt-microsecond pulse is applied across
windings N_ 4 which increments the core up its
¢_-H curve. After the eighth input pulse the
blocking oscillator fires, which resets the core
to negative saturation and simultaneously gen-
erates an output 40-voh-microsecond pulse to
drive the next count stage. That a volt-second
area is proportional to an increment of flux,
A_, is apparent from the following equations.
5.139
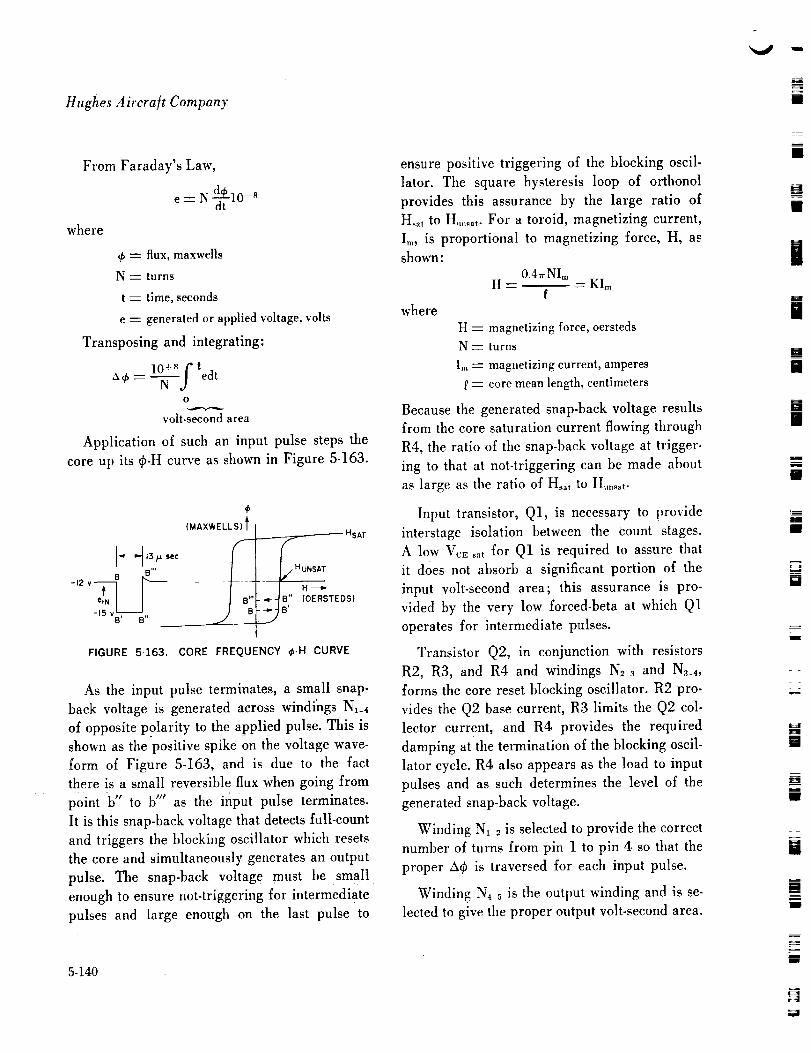
Hughes Aircraft Company
where
From Faraday's Law,
e = N -_-t 10-s
¢_--- flux, maxwells
N _ turns
t = time, seconds
e -- generated or applied voltage, volts
Transposing and integrating:
10+s 1" t,x__ _- d edt
O
volt-second area
Application of such an input pulse steps the
core up its q_-H curve as shown in Figure 5-163.
_t H- sec13
-12 v el_N B B"___
-15 VB, B"
(MAXWELLS) I
_ HSA-r
__jB'
FIGURE 5-163. CORE FREQUENCY @-H CURVE
As the input pulse terminates, a small snap-
back voltage is generated across windings N1_4
of opposite polarity to the applied pulse. This is
shown as the positive spike on the voltage wave-
form of Figure 5-163, and is due to the fact
there is a small reversible flux when going from
point b" to b" as the input pulse terminates.
It is this snap-back voltage that detects full-count
and triggers the blocki,_g oscillator which resets
the core and simultaneously generates an output
pulse. The snap-back voltage must be small
enough to ensure not-triggering for intermediate
pulses and large enough on the last pulse to
5-140
ensure positive triggering of the blocking oscil-
lator. The square hysteresis loop of orthonol
provides this assurance by the large ratio of
H,.t to H ..... t. For a toroid, magnetizing current,
Ira, is proportional to magnetizing force, H, as
shown:
0.4,rNImH -- -- KI,,
where
H = magnetizing force, oersteds
N -- turns
I,. -- magnetizing current, amperes
= core mean length, centimeters
Because the generated snap-back voltage results
from the core saturation current flowing through
R4, the ratio of the snap-back voltage at trigger-
ing to that at not-triggering can be made about
as large as the ratio of Hs_t to H ......_.
Input transistor, Q1, is necessary to provide
interstage isolation between the count stages.
A low VcE ,,t for Q1 is required to assure that
it does not absorb a significant portion of the
input volt-second area; this assurance is pro-
vided by the very low forced-beta at which Q1
operates for intermediate pulses.
Transistor Q2, in conjunction with resistors
R2, R3, and R4 and windings N_ 3 and Na-4,
forms the core reset blocking oscillator. R2 pro-
vides the Q2 base current, R3 limits the Q2 col-
lector current, and R4 provides the required
damping at the termination of the blocking oscil-
lator cycle. R4 also appears as the load to input
pulses and as such determines the level of the
generated snap-back voltage.
Winding N__2 is selected to provide the correct
number of turns from pin 1 to pin 4 so that the
proper A_ is traversed for each input pulse.
Winding N4_5 is the output winding and is se-
lected to give the proper output volt-second area.
,,,.,¢ m
i
B
[]
|B
|
![]
I
i
I
B
[]
_4
!
r--
U
[]
M
u
M
t
m!
iI
N

N
5. Spacecra/t System Design
£ :
_J
\
w
=_
m_tl
N
_'!Z_!I!!_
CRI
INPUT FROM elN F0300lIJ
PIN I OF FINAL 0It1SCALER STAGE
CR4zl ,A
TO SEPARATIONSWITCHES(-3Iv}
CR2 RI
C2
i p.f
+)1
*I _Ff
CR5
• Ldl' Fql
24
+)lR6 R716K 360K
R251K
R439K
_12"_R3
_ii-24 v
C4 C5
I Ff _/_f
02
2N2838
R8
_._200K
-24 v
--_C3
m
_1_
03
2N671
CR3FD300
TO APOGEE0 MOTOR DRIVER
INPUT GATES
FIGURE 5-164. APOGEE TIMER OUTPUT LATCH
Windings No 7 and NT_s are one-turn windings
which are used to fine-adjust the output pulse.
By proper interconnection, they can effectively
alter N4_5 by plus or minus two turns.
Reset winding, Ng__o, is necessary to provide
positive reset before separation of the Advanced
Syncom vehicle from the booster second stage.
Apogee Timer Output Latch. The apogee
timer output latch shown in Figures 5-164 and
5-165 is a bistable circuit utilizing complemen-
tary transistors in series to provide low power
dissipation in one of its stable states (the high
5-141

Hughes/lircra/t Company
F24 v FOR EACH "AND" i
GATE MUST BE I /
"COMMAND +24 v" OF
ONE OF ITS INPUT Jl
"AND" TERMS /_ t
"TTIOP C I C_RI• A t_l
,½I
CR3
I720P _
L.
INPUTS
FROM
APOGEE
TIMER
OUTPUT
LATCHES
FIGURE
4v
RI
33K
DR6
1II
I CR37 eOUT
^ TO APOGEE
i _', "MOTORDRIVERS
III
J
TTIOP O-J- 7
I SAMEAs I--ABOVE
T730PO'-" L
TTIOPO--J- q
I SAME AS HABOVE
T740PO--" L J
T720PO-J" .... 7
SAME AS FI ABOVE
T730PO_ L J
T720P O-J'- ]
I SAMEAS H'ABOVE
T740PO'- L ]
T730PO==J- ]
I SAMEAs I--ABOVET740P 0--" L ]
,-165. APOGEE MOTOR DRIVER INPUT GATE
state), in the low power state, both transistors
are off, while in the high power state, both tran-
sistors are on.
The function of the apogee timer output latch
is to provide a positive output voltage at a pre-
determined time after spacecraft separation.
This signal, in conjunction with the output of
one other latch, provides the enabling signal to
the apogee motor squib driver via the apogee
motor driver input gate. The input to the latch
is the output pulse, eouT _, of the last count-of-
four stage. The input signal is a 13-microsecond
pulse of approximately 12 volts magnitude. The
quiescent input voltage level is --12 volts.
Before separation, the latch is forced to the
low position by the unregulated -31 volt supply.
5.142
After separation, --24 volts holds the latch in
the low state until the input pulse appears. At
that time the latch swdtchesto the high (low
power) state. Since the latch is in the low state
for only a small fraction of the spacecraft life-
time, it is felt that this provides a highly efficient
circuit.
In the low state, Q1 and Q2 base current drive
is provided by I24 flowing through Q1 and Q2
and into R2. In the high state, off bias is pro-vided across the series connected base-emitter
junctions of Q1 and Q2 by the R2, R6, CR4
divider voltage developed at the base of Q2.
VB2 o. > + 2.0 volts
Transistor Q3, in conjunction with R7, R8, and
CR3, is provided as a safeguard against the
possibility of the latch going high should there
be a power failure in which --24 volts is lost
before +24 volts. If this does occur, Q3 turns on
and clamps the output to approximately -1-1 volt
(which is still a logical zero). In normal opera-
tion, the R7-R8 resistor divider keeps Q3 off.
Diode CR3 is necessary to prevent emitter-base
breakdown of Q3 during normal operation.
Input requirements: Requires output, eot:T 5,
of the last count-of-four stage.
Pulse voh_ge level
Quiescent voltage level
Pulse duration
> + 8 volts
-- 12 volts
10 micro-
seconds
minimum
and 16
micro-
seconds
maximum
between 50
percent
points
Ill
m
i
[]i
m
uI
II
i
|
i
Hli
U=__=Jt
w
I
m
[]lit
i!
IIil

l! L J
5. Spacecraft System Design
Output specifications: Must be met for 0 to50° C ambient.
Low state
Output voltage
Current capability
Loads
High state
Output voltage
Current
Capacitive loading
R251K
-- 9.5 volts
minimum
-- 13 volts
maximum
3 milli-
amperesmaximum
not including
preload
Two apogeemotor driver
input gates
+ 17.0 volts
maximum
+ 11.0 volts
minimum
0
_< 300 pf
total
24v
T1
R5200,_,
RI
etN (__ R4
FROM PIN IOF COUNT QI 120K
STAGE
----
'_CRI
_..1_ FOSO0
m
FIGURE 5-166. TIMER OUTPUT BUFFER
Output lead length
Number of connectors
between latch output and
input gate
Gating diodes
< 10 feet
10 X 20 pf
= 200 pf
<4
4 X 20 pf
= 80 pf
3X5pf
-- 15 pf
< 300 pf
total
Timer Output Buffer. The timer output buf-
fer, shown in Figures 5-166 and 5-167, is a
switching amplifier which generates a -4- 24 volt
output pulse of approximately 15 microseconds
duration for every input pulse from a count-of-
eight scaler stage. Its purpose is three-fold:
1) Provides interface isolation (an output
short will not affect timer operation)
2) Minimizes noise on interconnecting lines
(intermediate scaler pulses are not seen)
3) Provides a very fast rise-time pulse, suit-
able for clocking flip-flops
RZ39K
0 _
FIGURE 5-167.
24v
51K
. FD300
TIMER OUTPUT INVERTER
0
5-143

Hughes Aircra[t Company
Transistors, Q1 and Q2, in conjunction withresistors, R1.R4, and diode CR1, form a two-
stage switching amplifier. The npn-pnp configura-
tion was chosen because of the very low power
dissipation that could be attained for the quies-
cent state. Both stages are off in the quiescent state
and both are on only for the duration of the input
pulse. The power dissipation in both the 194-cps
and 2.81-minute output applications is essential-
ly zero. R5 provides current limiting in the event
of an output short.
Input requirements: Requires output, eor:r _,
of a count-of-eight stage.
Pulse voltage level _> 5 volts
Quiescent voltage level -- 12 volts
Pulse duration 10 micro-
seconds
minimum
and 16
micro-
seconds
maximum
between 50
percent
points
Output specifications: Must be met for 0 to
50"C ambient (Figure 5-168).
VoltagesPulsed
Quiescent
24 +--0.7
volts
0.0 + o.1,
- 0 volts
i 24 v.._-_OO/o POINT
'our I10% POINT-I-
05vI---_
FIGURE 5-168. TIMER OUTPUT BUFFER
OUTPUT SPECIFICATION
Rise time _< 0.5 micro-
second (10
to 90 percent
points)
Pulse width 10 <_ 1- <
30 micro-
seconds
(between
90 percent
points)
Output current up to 4milli-
amperes
(pulsed dc)
Output capacitance _< 300 pftotal
--12 Folt Regulator. The --12 volt reg-
ulator shown in Figure 5-169 is designed as a
current source. Zener diode CR1 establishes a
14-volt reference. R2 and R3 divides the zener
voltage down to -- 12 volts. Q1 is an emitter
follower with additional current gain provided
by Q2. When a load is applied at the output, the
emitter of Q1 tends to go positive with respect to
its base. This causes Q1 to conduct harder which
supplies more base drive current to Q2; due to
the increased base drive, Q2 conducts and absorbs
the load current through its collector. R5 and R7
protect the regulator against accidental shorts.
R6 allows Q1 to conduct a minimum collector
current under no-load conditions assuring that
the beta of Q1 will not go below a certain mini-
mum. Filter capacitor C1 prevents oscillations
and provides additional transient load capability.
Input requirements: Voltage: --24 +--0.7
Output specifications:
Output voltage: -- 12 ± 1 volts
Output current: 0 to 25 milliamperes dc;
60 milliamperes for 130
microseconds; 0 duty
cycle pulse
|i
5-144

i ;
= =
'f,,...
• = =
I,,....
L
|Jiil;;J
-L i
o
5. Spacecraft System Design
_LhCRI
RZ6.2K
< RI
i IlK
J-24
FIGURE 5-169.
i R3
56K
R4 4-
36K •
QI
2N2838
R6
5.6K
--12 VOLT REGULATOR
--CI
"_' 15/,¢ f
: 0
,R7' 270'2w
Squib Drivers. The squib drivers are used
to ignite three types of squibs: apogee motor; bi-
propellant reaction control system pin puller,
and bipropellant reaction control system valve
squibs. For these functions a squib driver circuit
was designed whictl can be driven by either the
output of the central timer or the output of the
command decoder. The output of each squib
driver is capable of driving one or two bridges
(two bridges per squib).
A functional diagram of the squib driver cir-
cuit is shown in Figure 5-170. When the input
signal goes high the switch turns on. When the
switched input signal has been present for more
than 1 second, the output of the filter triggers
the shaping circuit. The timing circuit is a resis-
tor-capacitor network which drives the current
amplifier with a pulse of sufficient width to fire
the squib. The current is amplified to a sumcient
level to fire the squib.
A breadboard of the squib driver circuit has
been tested over a temperature range of --25 °
to 75 °C. There was no degradation of perform-
ance in these tests. An engineering model of the
squib driver circuit has been built and it is
planned to mate it with the engineering modelsof the command decoder and central timer and
perform further tests.
Squib Driver Product Design. The concep-
'tual product design of the squib driver unit has
been accomplished; however, the detail design
will not be completed during this phase of the
program. The unit will contain twelve squib
drivers in a sheet metal frame occupying a vol-
ume of approximately 100 cubic inches. The low
power components of the driver circuit will be
designed in welded modules with the high dissi-
pation components mounted separately. Fourdrivers will be mounted to a circuit board which
will then be mass _encapsulated. Three identical
encapsulated circuit boards will then be enclosedin a thin sheet metal frame. Because of the short
duty cycle of the driver circuit, the thermal ca-
pacity of the components provide enough heat
handling capability so that little external heat
sinking is required.
ELECTRICAL POWER
Power Supply System Design. The power sys-
tem selected for Advanced Syncom uses radia-
tion-resistant, moderately high efficiency n on p
SWITCH H H H _u c°"""FILTER SHAPING TIMING J _IAMPLIFICATION OUTPUT
FIGURE 5-170. FUNCTIONAL DIAGRAM OF SQUIB DRIVER CIRCUIT
5-145

Hughes A ircra/t Company m
TABLE 5-24. CHARACTERISTICS OF ELECTRICALPOWER SYSTEM
Solar cell
Silicon n-p type
Air mass zero sunlightEfficiencyat ]40 mw/cm'and77 ° F with 0.030 covers installed 9 percentCell active area 1.8 cm'
Total numberof cells 23,436Total number of series strings 378
BatteryType Nickel-cadmiumNumber of batteries Four
Number of cells per battery 22Nominal cell rating 6 amp-hr
Maximum depth of discharge 20 percentAverage depth of discharge 12.7 percent
silicon solar cells as the primary energy source.
Satellite operation during eclipse periods is
maintained with electrical power from hermeti-
cally sealed nickel-cadmium storage batteries.
The use of proved and tested components assures
high confidence in satisfactory power system
component life for 5 years in orbit.
The major characteristics of the electrical
power system are summarized in Table 5-23,.
The power system, as shown in Figure 5-171,
consists of the following:
1) A solar array composed of fiat-mounted
n on p solar cells on fiberglass-faced,
aluminum honeycomb substrate panels.
Sixteen panels are used to form the outer
cylindrical surface of the spacecraft. Par-
allel interconnections at the cell level are
employed to enhance solar array reliabil-
ity. The physical wiring of the individual
cell groups has been segregated by con-
nection of alternate cell groups to provide
maximum system reliahility and flexibility.
2) Energy storage is provided for normal
spacecraft operation while in complete
eclipse. The storage system consists of
four, 22-celi nickel-cadmium batteries,
each connected to the spacecraft bus
5-146
SPACECRAFT BUS
is.Tj
_N02
NO. 2
NO3:
NO. 4:
FIGURE 5-171. ELECTRICAL POWER SYSTEM SCHEMATIC
through a diode. These batteries, in addi-
tion to supplying spacecraft power during
boost and eclipse periods, also provide
energy for pulse loads such as control
system valve solenoids and apogee motor
igniter.
3) Battery charging energy is supplied to
each battery directly from an isolated sec-
tion of each solar panel. Alternate sections
are connected to each battery to minimize
the battery charging current ripple. Bat-
tery charging during ground operation will
be accomplished by means of umbilical
connections to ground charging controls.
4) Disconnects are provided to prevent in-
advertent battery discharging by the com-
mand receivers prior to installation on the
booster and external power connection.
5) Each major electronic unit has a separate
voltage regulator or voltage regulator-
switch combination. The nominal voltage
at the equipment will be maintained at
- 24 volts. Each regulator unit input cir-
J
Img
I
gIii
I
m
ii
i iI
I
s=, .m
=
m
I
I
m
I
iJ

_t 5. Spacecra[t System Design
! •
L .
_s.==
L
= _
6)
cult; .will be current limiting to protect
the unregulated voltage supply bus from
excessive current requirements.
Each traveling-wave tube operates from
separate, regulated, high-voltage dc-dc
converter and filament power supplies.
A summary of power demands for the space-
craft is given in Table 5-25.
To evaluate the 3- to 5-year operational capa-
bility of the Advanced Syncom, the following
criteria and assumptions were considered:
1) Solar eclipse wilI occur twice annually for
a period of 48.5 days each eclipse. The
maximum time of eclipse for any 24-hour
period will be 1.18 hours (Figure 5-172).
a) Eclipse season (umbra) 20 = 2K arc
sin [sin S/sin i]
b) Eclipse season (umbra and penumbra)
2# -- 2K arc sin [sin (S + _ )/sin i]
e) Maximum time in eclipse, E = 2S/V
d) Maximum time in penumbra, Ep--
2K arc cos [cos (S + _)] X cos S -1
1.0 _-O.O I--
!o,'II i, ilMlVERNAL EOUIN X
i
o.4 [- --E soSTE:_E_'"
F- 0.240 80 120 160 200 240 2eo 320 360
DAY NUMBER
FIGURE 5-172 SHADOW TIME FOR SATELLITEIN 24-HOUR EQUATORIAL ORBIT
2# = eclipse season in degrees of arc
S = angular size of earth's shadow
i -- equatorial-to-ecliptic inclination
"- a constant angle
V = orbital angular speed
2) Maximum battery depth of discharge will
be limited to 20 percent of nominal bat-
tery capacity.
3) Leakage current of subsystem postregula-
tors- ON mode, 3.5 milliamperes, OFF
mode, negligible
4) Battery maximum charging rate and charg-
ing efficiency based on:
TABLE 5-25. POWER DISTRIBUTION PER BUS
iM=
L,
Item
Telemetry transmitter
Encoder
Commandreceiver
Digital electronics(PACE)
Phase shifters andpower amplifiers
Communicationtransponders
Traveling-wave tube (4-watt)
Total
Numberof Units
perQuadrant
1
1
I
1
One unit commonto bothbuses
1
2
Milli-amperesper Unit
245
27
27
30
620
75
693
MaximumNumberof Units
Operatin8per Bus
Bus 1
1,2
2
2
UnitsOperat ng
1,2
2
2
Load,ma
245
27
54
30
310
150
1386
2202*
Bus 2
UnitsOperating
1,2
2
2
Load,ma
54
310
150
1386
1900"
*Typicaltotals. Eitherbus can carryup to 2512 milliamperes.
r ¸ ,
5-147

Hughes Aircra[t Company
Four batteries necessary to supply com-
plete spacecraft electrical load during
maximum eclipse orbits.
Available battery charging time, 22.82
hours per orbit minimum.
Battery discharging time, 1.18 hours perorbit maximum.
5) Three ohm-cm n on p silicon solar cells
will be used.
6) Bus voltage is greater than --25.5 volts
at the input to the sub-system postregula-tors.
7) Solar panel temperature.
Normal incidence, ,8 = 0 degree: 75 q- 5/-- 10OF
Oblique incidence, /_--25 degrees: 60+ 5/--10*F
8) Battery temperature range: 30 to 120°F.
Solor Arroy. The solar array is composed of
23,436, 1 by 2 cm n-p silicon solar ceils con-
nected in series-parallel groups (Table 5-26).
Each series-parallel group is connected to the
spacecraft electrical bus with blocking diodes.
Series-parallel solar cell interconnections have
bee]] used to increase the electrical power system
reliability.
Within the physical constraints of the space-
craft envelope, it is possible to install the solar
cells on each panel in a manner to provide the
designed 27.2-volt output with a single row of
solar cells extending from the top to the bottom
of each panel. Only by developing the entire bus
voltage in this manner is it possible to provide
sufficient paralleling of cells to enhance system
reliability.
Low resistivity n-p cells are approximately ten
times more resistant to radiation damage than
p-n type cells. Although high-resistivity n-p cells
5-148
have even greater radiation resistance than low-
resistivity types, their output voltage is signif-
icantly lower, and their use would necessitate
a 10 percent increase in spacecraft length to ac-
complish the desired series-paralleling connec-tion of cells.
The solar cells are bonded to 16 lightweight,
fiberglass-faced, aluminum honeycomb panels.
Each panel is 22.2 by 26.25 inches and subtends
an arc of 0.79 radian. Four of the 16 panels used
have a slightly different cell layout to accommo-
date protrusion of the velocity control jet through
the panel. The quantity of series-connected solar
cells is determined by the individual cell charac-
teristics and the output voltage requirements.
TABLE 5-26. SOLAR ARRAY CHARACTERISTICS
Item
Total numberofcells per string
Total numberofcells per group
Total groupper bus
Total cells
Characteristics
Bus 1
62
186
54
10,044
See Figure5.7-3
Bus 2
62
186
56
10,416
BatteryChargeArray
(four perspacecraft)
62
186
4
744(x 4 = 23,436)
See Figure5.7-3
Weight of Solar Panels and Components
Solar cells 0.257 gram
Coverglass 0.300 gram
Adhesive(panel) 0.020 gram
Adhesive(coverglass) 0.005 gram
Z-tab 0.014 gram
Total 0.596 gram per solar cell
Diodes(248) 7.44 grams per spacecraft
Feedthroughs 33.6 gramsper spacecraft
Wiring harness 2 poundsat 32 ft/Ib
1 ohm/1000 feet
Solar panel weight 23.7 pounds per spacecraft
Bg
uII
im
I
- z
kl=
I
_I
il _
i
IIiw
I
m
i

u
r
[ 9
L
: _"22
W
-===
L =
|i4iiii_t
_!!!JFi!i_
Solar Array Output. The power output of
the solar panels is based on air mass zero, 77°F
temperature, and solar intensity of 140 mw/cm _.
Figure 5-173 shows only normal sun incidence
pe_'formance. Operation during the remaining
portions of the year (non-eclipse orbit) where
the sun incidence angle can increase to approxi-
mately 25 degrees is essentially the same as the
array operation shown with the normal incidence
angle, since the battery charge arrays then will
furnish power to the unregulated bus on demand
through the battery discharge diode.
Solar Array Reliability. The system relia-
bility studies have included a detailed formula-
tion of the expected solar array degradation due
to random failures occurring during the orbital
lifetime of the spacecraft. A technique for de-
termining the distribution of failures in a multi-
redundant solar cell configuration is described
and applied to the Advanced Syncom solar array.t
In general, a solar array may be described as
consisting of solar cell strings arranged in series-
parallel groups to provide the required current
output and voltage level for the spacecraft equip-
ments. In a muhiredundant solar array the
strings are interconnected to form alternate
series-parallel current paths so that each indi-
vidual cell failure would not cause the loss of
the output of a complete string. Thus, the muhi-
redundant configuration may be defined as con-
sisting of a number of solar cell groups each with
m rows of cells and n cells per row with each
cell interconnected in a series-parallel grid ar-
rangement. Individual cells are assumed to ex-
hibit the exponential failure distribution with
failures independently and randomly distributed
about the solar array.
The approach to the analysis will be to deter-
mine the expected failure distribution occurring
5. Spacecra]t System Design
in an individual cell group and then to apply the
result to the array.
The probability of survival (reliability of an
individual cell) is defined as
Peett = e -x*t (5-1)
where he is the cell failure rate and t is the orbital
mission time. The probability of failure of an
individual cell (q_.,) is one minus the probabil-
ity of survival, or
q¢_l : 1 -- pocu -- 1 -- e-X¢ t (5-2)
The probability of failure of r cells within a
row of the group may be expressed as the bi-
nomial probability distribution:
P(r) = (____) q,pn-_ (5-3)
The probability of s rows with exactly r failures
is the binomial probability distribution
P(s) : (-_) P(r)' Q(r) m-_ (5-4)
which may be approximated by the Poisson prob-
ability distribution
P(s) _ Imp(r) ]s e-mP(r)s! (5-5)
when rap(r) is large relative to P(r) and m is
large relative to mP(r). Note: Q(r) _ 1 - P(r).
The probability that at least one cell row will
have exactly r failures is one minus the proba-
bility of having no cell row with r failures:
P (at least one cell row with exactly r failures)= 1 -- P(s -'- o)= 1 -- Q(r)'- _ 1 -- e-me(_) (5-6)
This becomes the desired expression for the
probability that a muhiredundant series-parallel
cell group will have at least one cell row with
exactly r failures.
Multiplying this expression by N for the num-
ber of muhiredundant cell groups which com-
5-149

Hughes Aircra/t Company
prise the solar array and varying r yields the
expected number of cell groups E(g) having at
least one cell row with exactly r failures for any
orbital time t and cell failure rate Xe.
E(g) : IN 1 -- Q(r)m] _, N [1 -- e -raP(r) ]
(5-7)
The technique described may be applied to the
multiredundant Advanced Syncom solar array
configuration and used to determine the optimum
number of solar cells required to provide suffi-
cient power over the orbital lifetime of the space-
craft. Figure 5-174 presents the results of such
an analysis for the Advanced Syncom solar array
configuration consisting of 64 groups of cells
each with three multiredundant series-parallel
strings with three cells per row and 62 rows per
ceil group. This figure shows the expected num-
ber of series-parallel string groups having r ran-
dom failures as a function of orbital lifetime.
The derivation of the figure may be illustrated
by the following calculations for an orbital time
of 5 years and individual cell failure rate k¢ =
0.01 percent per thousand hours. The reliability
of an individual cell as expressed by Equation5-1 is:
Pc_, = 0.995618
and the unreliability being I minus the reliabilitybecomes
q,,_. = 1 -- 0.995618 -- 0.004382.
The probability of failure of (r) cells, as ex-
pressed by Equation 5-3, becomes (r -- 0,1,2,3) :
4O
3,O
¢/5
>o
20tLI
Ld
IO ...................
BUS VOLTAGE REQUIREMENTS
a) END OF CHARGE
b) START OF" CHARGE
BUS LOAD REQUIREMENTS
MAXIMUM CURRENT
c)END OF CHARGE
d)START OF CHARGE
I
I 2
BUS CURRENT AVAILABLE, AMPERES
a) Initial Design
I ,
r-N=
4o
® [,-_ 20 ]hl
,,, idZ I I
IO .........
3 0 t
I
I t
2
BUS CURRENT AVAILABLE,, AMPERES
b) 1-Year Operation
FIGURE 5-173, BUS NO. 1 PERFORMANCE
5-150
H
I
|
g
|
==M
[]
U
ml
i
I
m
lit
il

5. Spaceera/t System Design
|...=,!
w
m
w
I 2
BUS CURRENT AVAILABLE, AMPERES
C) 3-Year Operation
FIGURE 5-173 (Continued).
P(0) = p'_ -- 0.9869115 exactly zero failure
P(1) = 3p2q -- 0.0130310 exactly one failure
P (2) = 3pq 2 -- 0.0000574 exactly two failures
P(3) -- q'_ _ 0.0000001 exactly three failures
The probability that at least one row will have
exactly r failures may be written as Equation5-6:
P(r = 0) = 1 --[p(r + 1) -+-p(r --3) ] = 0.4422
P(r ----1) = 1 -- e-(_2)(°'°_3°3_) = 0.5542
P(r = 2) -- 1 -- e-(62)(°'°°°574) = 0.0036
P(r -- 3) --_ 1 -- e -(_2) (°'0°°°°°I) ----0.0000
The expected number of string groups having r
failures from Equation 5-7 becomes (N = 64) :
E(0) -- (54) (0.4422) = 28.30 _ 28
4O
3O
>o
2o
J
Io
I 2
BUS CURRENT AVAILABLE, AMPERES
d) 5-Year Operation
BUS NO. 1 PERFORMANCE
E(1) -----(64) (0.5542) = 35.47 _ 35
E(2) = (64) (0.0036) -- 0.23 _ 1
E(3) ---- (64) (0.0000) _ 0
This analysis shows that random failures will
be distributed so the probable occurrence of two
or three failures within any row of a string group
would be infrequent. Therefore, the solar array
output will "degrade gracefully" toward approx-
imately 0.67 maximum power, the loss of any
one cell per row in any group being approxi-
mately equal to the loss of 0.33 power output
of that group.
The 64 groups of cells used in this analysis
have been selected as representative of one of
two Advanced Syncom power supplies. The com-
5-151

Hughes Aircra]t Company
7O
r =
0
TIME IN ORBIT, YEARS
FIGURE 5-174. SOLAR ARRAY DEGRADATION
DUE TO RANDOM CELL FAILURES
bination of the results presented for the occur-rence of random failures with the effects on solar
cell lifetime due to radiation would result in a
characteristic plot of the expected solar array
output during the orbital lifetime and the op-
timization of the number (N) of cell groups.
This optimization would be based on the space-
craft power demand during the orbital mission
and the expected survival of some spacecraft be-
yond the average lifetime or mean-time-to-failure.
In addition to the assumption of an inde-
pendent and random distribution of solar cell
failures, a second assumption in applying this
model is that the primary failure mode of the
solar cell is an open circuit which occurs at ran-
dom with constant failure rate (_._ = 0.01 × 10 -5
failures per hour). The probability of an indi-
vidual solar cell failing in a short circuit is neg-
ligible, and shorts to ground within the array areassumed not to occur.
In the Advanced Syncom configuration, each
series-parallel string group will be connected to
the bus through an isolating diode whose primary
failure mode is a short circuit. Thus, the failure
of any diode will only increase the reverse cur-
rent leakage but will not cause the loss of power
from a complete series-parallel string group.
Therefore, these diodes are not included in the
model. The expected diode failure rate is less
than 10 -7 failure per hour, which indicates that
tile probability of all diodes surviving the 5-year
orbital mission time is extremely high and does
not significantly affect the model presented.
Procurement Schedule
• Solar Cells. 2400 low efficiency cells
have been ordered for the development panel.
The panel with solar cells applied is now beingassembled.
• Array Assembler. The assembler has
been received and is being checked out.
• Components and Materials. Most of the
components and materials listed are in-house.
The honeycomb (0.125-inch hex by 0.5-inch
thick curved) for the solar panels will be de-
livered 15 October 1963. Solar panel substrate
fabrication is complete, and the solar cells have
been received.
Fabrication Schedule. A panel using glass
to simulate solar cells has been fabricated for
vibration test.
A developmental panel with low efficiency
solar cells applied is to be completed 31 October
1963. The cells will be assembled using the new
solar array assembler.
5-152

v
, = ,
' .,Yir
= =El
iW
|!iii_
=
J! U
_ii!IiI:!
J_ r_,=.,I,
i! .....
Battery Power System. Battery cells of the
nickel-cadmium construction are used for energy
storage. Each battery has 22 series-connected
cells (Table 5-27).
Battery design depends on the bus voltage
needed, eclipse power load, depth of discharge,
solar array recharging rate, time available for
recharge, and reliability requirements. Twenty-
two nickel-cadmium cells are used as a minimum
number of cells to provide 25.5 volts to the elec-
tronic systems at the maximum depth of dis-
charge of 20 percent. A battery specification has
been written for the required design.
The current required from any one battery
will be a maximum of 1.03 amperes. The cell
utilizes flat-plate construction with both the input
and output terminals electrically insulated from
the cell case. A group of 12 cells interconnected
is shown in Figure 5-175.
FIGURE 5-175. GROUP OF 12 CELLS
The battery array charging capability is based
on the following conditions:
1) Battery cell size, 6 amp-hr, nickel-cad-
mium
2) Twenty-two series-connected ceils per bat-
tery
5. Spacecraft System ,Design
TABLE 5-27. DESIGN SPECIFICATIONS FOR NICKEL-CADMIUM BATTERY CELL
Type
Weight
Terminals
Capacity
Maximumcharge rate(with cutoff control)
Overchargecapability
Maximumcharge voltage
Cycle life
Environment
Sealed sintered plate
Less than 0.62 pound
Ceramic bushingsuitable for5-year usage
6.0 amp-hrat 75= F at 1.2 amperes4.8 amp-hrat 100 = F at 1.2 amperes4.8 amp-hrat 30° F at 1.2 amperes
5 amperes
0.6 ampere continuous
1.48 volts
10,000 minimumat 25 percent depth
30 to 120° F sustainedoperationSpace vacuumOperation in anyorientationVibration, shock,and accelerationtypical of spacecraft launchings
3) Depth of discharge during maximum
eclipse, 20 percent
4) Battery voltage (20 percent depth of dis-
charge) 26.4 volts
5) Minimum voltage to spacecraft regulators:
25.5 volts for proper regulation
6) Minimum charge current to batteries: 100
milliamperes to replace 100 percent of
the energy taken out during a maximum
eclipse (50 percent efficiency)
7) On-charge voltage at 100 milliamperes
charge rate
8) The battery array must be capable of
supplying 100 milliamperes at a voltage
greater than the on-charge voltage require-
ments
9) Two batteries per bus required for full
system operation
Battery charging is accomplished by using a
separate portion of the solar cell array. Power
will be supplied from the battery for 485 eclipse
5.153

Hughes .4ircra/t Company
periods in a 5-year span. Current requirements
during each of these days will vary as a function
of the time in the eclipse.
Three basic types of batteries are available for
space application; however, only one type has
the recharging cycle life necessary for the re-
quirement of 465 days in a 5-year period. Some
of the characteristics of the three basic types areas follows:
RechargeCell Eflqciency W-hr/lb. Cycle Life
Nickel-cadmium 0.65 10 9500
Silver-cadmium 0.70 13 100 to 1500
Silver-zinc 0.80 50 200
Battery Reliability. Recently reported re-
sults of the most extensive life cycling tests everconducted on nickel-cadmium cells indicates
that: 1) cell cycle life with shallow discharges is
considerably longer than cycle life at deep dis-
charges, and 2) cycle life is reduced by high and
low ambient temperatures. The data show that
for long life, depths of discharge should be kept
below 25 percent and battery temperaturesshould be maintained near 75* F. Advanced
Syncom batteries will be maintained near this
temperature by proper thermal design. At 20
percent depth-of-discharge, the 500 charge-
discharge cycles will be achieved with a high
degree of reliability.
Cycling tests have been conducted on Syncom
2 batteries and General Electric 12 amp-hr bat-
terids. These tests simulated the charge-discharge
cycle of typical orbital conditions. Figures 5-176
and 5-177 show the results of the tests on the
Syncom 2 batteries. Figures 5-178 and 5-179
show similar data on the General Electric cell.
5-154
The end of discharge voltage on these cells
should remain above 1.2 volts per cell at the
end of 500 cycles.
Solar Cell Assembler. A solar cell assem-
bler has been built by Hughes (Figure 5-180).
The machine automatically positions solar cells
on an assembly table and by induction soldering
connects a die-formed "zee" tab to the cells.
After the solder connections are completed, the
solar cell group is advanced one position and
the operation repeated. This process continues
until a three-parallel, 62-series group of solar
cells has been completed. In addition, a solar
panel jig has been designed to accept one Ad-
vanced Syncom solar panel. Groups of solar
ceils are positioned on the panel during the solar
cell-to-panel bonding operation.
Electrical Power System Analog. The array
performance characteristics, as shown in the
July progress report,_were mathematically con-
structed and therefore may contain minor errors
in the slope of the I-V curve. In an effort to deter-
mine exact system voltage margins (for battery
charging), a system analog was designed and
fabricated. The analog block diagram is shown
in Figure 5-181. The heart of the analog is an
amplifier designed to synthesize the output of an
16
15 ----
14
o_ 13
I ZZ g5 hlem CHARGE
I t 5 h_l B$CHARC_E0OI5 AMPERES CHARGEO 156rAMPERES 01$CHARGE
ONE CELL SHORTEO
END
OF
CHARGE
.__ _'CELI. _ _
'ooQO l O
_DN OO
END
OF
DISCHARGtE
v/CELL
20 25 30
CYCLE NUMBER
I
I oOO@Q')OoQG
I
0 5 I0
FIGURE 5-176. SYNCOM 2 BATTERY TEST
|
|
i
U
m
Im
W
lib
W
m
mE
_=,-

=
t
2
|i_!!ii
_i!iiiii
F_
W
o>
==
)-
W
5. Spacecra/t System Design
32
30_
28
26
24
22
20o
ON CHARGE 0.065 amp I.<.5 v/CELL
ON CHARGE 0.015 omp 1.40 v/CELL
OPEN CIRCUIT
0---
i
I [] DATE OF TEST 7/29/63 120 AMP DISCHARGE RATE
ROOM TEMPERATURE 75 ° F
20DATE OF TEST 7/30/63 120 AMP DISCHARGE RATE
ROOM TEMPERATURE 75 ° F
4- MINIMUM CAPACITY PER SPECIFICATION
2 4
DISCHARGETIME, HOURS
FIGURE 5-177. NICKEL-CADMIUM BATTERYDISCHARGE CURVE
\
6 8
'_¢00_>0¢00( 0000 0.000
)
°°O_oo°°_O°°o ooOo12 ..............
0 S
FIGURE 5-178,
kt ITrier F_CURE- ONECYCLEONlY
......>¢000 ¢000f0<>00
_OTc,to..l_iklrr'rEnvA|OU__ F
,ooooooro4::oozzu h,_c4_ _N¢us _i O_lc_U_lE T_
22 CELLIATTtRY IO oN CHAR_ V,_.I[LLJ
I0 15 20 29 30 3_
NUI_IIRR OF CYCLES
GENERAL ELECTRIC BATTERIES TEST
illuminated solar cell array of any number of
series and parallel connection to yield a desired
voltage and current. A portion (dependent on the
gain setting) of the amplifier output current isfed back to load the individual input solar cell.
In this manner, the amplifier output character-
istics can be made to exactly duplicate a large
solar array. The amplifier is shown in Figure
5-182.
Two such amplifiers have been constructed to-
gether with loads duplicating system loads such
as command receivers, PACE, traveling-wave
5-155
_!i!_•

V
Hughes Aircra/t Company
" I i I _ I/ , I ,f ...................
_ ° :_o °o° oo41 oo_
4 8 iz 16 z0 24 28 32
NUMBE'RO_ CYCLES
a) Cells 1 to 36
15
14Jd
12
0_8
I rI--CA_C_TY O_SCHA_ TEST
CHARGE DISCHAIR_ERAT£CHANGEDCHARGE4T 00_5 emDl "rE_E_ATUmE C_AME(R_tSCHARC,_ATO. ,20AM_ l J, _OT CYCUN6
-- -- _ _ o-_-q_ _3_>-
o
-,:-o.... __ooo,000< OO --
i r 4 ...............115htt _SCHA_E Tlbfl_0C4_ _r4 CHAI_G[CUm_NT
42 46 50 54 58 62 66 70
NUMBER OF CYCLES
b) Cells 38 to 70
FIGURE 5-179. SYNCOM BATTERY TEST
tube, etc. The system is now assembled and is in
final electrical checkout. The amplifier output
representing the battery charging array can be
modulated to simulate the actual output vari-
ation with spacecraft rotation of the spacecraft
array. (The battery charge array segments are
located 90 degrees apart; therefore, the current
available varies at four times the spacecraft spin
rate.)
The system analog will make posible rapid
determination of system performance levels un-
der any combination of the following variables:
5-156
FIGURE 5-180. SOLAR CELL ASSEMBLY MACHINE
N-P
SILICON
SOLAR
CELL
N-P
SILICON
SOLAR
CELL
} CONSTANT
LOAD CURRENT
I__CURRENT LOAOS
FEED BACK
_ __2-A._U_E. LO0,ODIODE
CURRENT
_AMPLI_ FEED BACK
ER
"1- 12 om_-hr
I 22 CELL BATTERY
FIGURE 5-181. ELECTRICAL POWER SYSTEMSANALOG BLOCK DIAGRAM
FIGURE 5-182. AMPLIFIER FOR SIMULATING
SOLAR SENSOR ARRAYS
H
I
M
ml
m
J
i
I
w

z r
i-=|
g_2
L:J
L_LJ_
H
= _
|511A
•iii ]
1) Number of series solar cells
2) Solar array temperature
3) Solar array performance degradation
(random cell failures, particulate radi-
ation, etc.)
4) Electronic load change
Particulate Radiation Damage. Radiation
damage theory (Reference 5-1) shows that high-
energy charged particles displace atoms in semi-
conductor crystals. These displacements then act
as recombination centers for electron-hole pairs.
In a photovoltaic cell, light creates holes andelectrons in the cell material which then diffuse
to the junction. The contact potential at the junc-
tion accelerates the holes and electrons to pro-duce a current. If holes and electrons recombine
at the recombination centers, they are not avail-
able to produce useful current. A characteristic
of semiconductor material is its lifetime, the
time it takes for the number of excess carriers
(e.g., holes and electrons created by the light) to
decay to 1/e of its maximum_alue by recombi-
nation. The lifetime of a material is clearly
shortened by introducing recombination centers
(Reference 5-2). In addition, the longer the life-
time, the more current produced. These prin-
ciples are detailed below for protons.
The short circuit current, L, is related to the
lifetime, r, as follows:
I,_ : K,Gex/'D-7: KlGeL 5-8
K, = constant for silicon
G = generation rate of carriers
e = electronic charge
D = diffusion constant for silicon
L = diffusion length for silicon
5. Spacecraft System Design
The number of displacements, N_, produced by
a flux of q) particles/cm 2 with energy, E, is
Ne = Kz4, f (E) 5-9
K= = constant for silicon
Although there are analytical expressions for
f(E) for protons and electrons, it will be more
useful to use empirical results in this report.
The lifetime is related to the number of dis-
placements as:
1 1-- + KaN,_ 5-10
"1" T o
ro "- lifetime of unirradiated material
Ka = constant for silicon
Therefore,
K,Gex/g--I.¢ --- 5-11
"-I- KaNd
and
I._-- K,Gek/d-'_,, El + K2Karo 6 f(E) ] -_ (5-12)
Equation 5-12 shows that the short circuit cur-
rent is reduced as the particle flux increases.
Equation 5-12 may be written in another form.
Let
Then:
I_Co 2
I_o = K,Gek/'_o
I = Karo [K',4, f(E) ] = KaroNa
(5-i3)
If the flux required to produce 25 percent degra-
dation is considered, then:
7/9 1--- K_o_F(E) (5-14)
4"-',_= K,.,Karo f(E)
Values of _)_,_have been found for different ener-
gies of protons and electrons (References 5-3
5-157

i
Hughes ,4 ircra/t Company
IC]2 ....
,n-p (I ohm-era]
_" p In I ,,, _, ',,,
2 I I _...,
i - ,I/-#/# /ff
##
#
IO I00
PROTON ENERGY, Ep, MEV
#/
I000
FIGURE 5-183. CRITICAL PROTON FLUX
through 5-14). These values are summarized in
Figures 5-183 and 5-184. Although most of the
experiments have been on silicon p-n cells, some
have been on n-p cells. Figures 5-183 and 5-184show them to be three times more radiation re-
sistant than their p-n counterparts. The difference
is due to the fact that most of the damage is done
in the bulk of the cell, not the diffused layer;
this is n-type silicon in p-n cells and p-type in
n-p cells. Since there are different impurities in
the two types, it is expected that different recom-
bination centers would be created, which would
not have equal effects on the carriers.
Both theory and experiment show that par-
ticles with energies below a threshold energy will
cause no displacements. For protons, this thresh-
old energy will cause no displacements. For
protons, this threshold is about 100 ev, but for
electrons, the threshold is 145 key for n-type
silicon and about 200 kev for p-type silicon.
Therefore, there is no damage to p-n cells by
electrons with energies below 145 kev, and none
5-158
i0_8
io17
1016 ....
,V,d
"_ n - p(l ohm - Cell)
.Ji.
J i015
_o
u
p
10 II
I013
0 0.5 1.0
ELECTRON ENERGY, MEV
FIGURE 5-184. CRITICAL ELECTRON FLUX
1.5
to n-p cells by electrons with energies below
200 key (References 5-9 and 5-11).
Solar Cell Degradation ]tom Non-Mono-
energetic Fluxes in Space. When a particle flux
has a distribution of energies, Equation 5-9 mustbe modified.
Ig/,
Nd _- / K-. f(E) dEdE,]
a, fi are energy limits of flux and
I,co =
) -1]=cf iF(E)
(5-9a)
d@ dEdE
L_11Bm
W
1
t
i
Y::
W °
r_m :

L.=
= =
E
L
q •
i
K.,-
C -- constant.
For convenience, let
\i,/
From Equation 5-13,
1
A2.5(E) _- C F--F-_¢25(E)
Since
then
dEA2_ -- dE q,2_ (E)tl
(5.15)
Equation 5-15 call be evaluated for trapped and
solar flare particles since (Ns(E) can be empiri-
cally derived from Figures 5-183 and 5.184.
A distribution spectrum is assumed of the
form:
Then
,b (> E) = A E-" a <_E<_ fl
d6/dE = -- n AE -''-1
and the total flux is
6T = A [a-" -- fl-"]
Therefore, the folIowing can be written:
E_n-1
d6/dE = -- n q,T
Hence,
A --net [" E -"q dE
Equation 5-16 may be written:
(5-16)
A(5-16a)
5. Spacecraft System Design
where
<4,25> --{1-11 __fl-n
f E-_-I-- n 6'.,5 (E)tI
dE
to arrive at the formula for Q'= 1- I_¢/I_¢o,
the fractional degradation of short circuit due to
the flux _ as seen in solar light.
<s_25>
The formula for Q" in Equation 5-17 is for short
circuit current degradation under sunlight. The
fractional degradation of efficiency cannot be
determined theoretically since the variation of
open circuit voltage with flux cannot be simply
determined. It is necessary to empirically derive
the efficiency degradation from laboratory ex-
periments (References 5-3, 5-5, and 5-15). It is
known from experiments that the degradation in
power is related to the short circuit current de.
gradation. Initially, using Equation 5-17, it wasdetermined that
Q=I_[-__( , ) _ ]-_<42._> -4- 1 (5.18)
where Q, the fractional degradation in efficiency,
fits all the data in References 5-3, 5-5, and 5-15.
Figures 5-185 and 5-186 were derived from
Equation 5-18 using various values of <_b2._>
for protons and electrons.
Experimental and Theoretical Comparison.
W. R. Cherry (Reference 5-18), using 1-mev
electrons and 4.6-mev protons, performed radi-
ation damage studies on solar cells. There is a
definite correlation between these experimental
results and results predicted in Figure 5-185and 5-186. Table 5-28 shows the correlation
between experiment and theory. The _ used was
5-159

V
Hughes Aircra/t Company
TABLE 5-28. EXPERIMENT AND THEORY CORRELATION
N&L)
:3JLt.
Z
O
8
t--
_z
Figure fromReference 5-18 Flux, Total
2x 10"
1 x 10"
2 x 10"
1 × 10"
3 x 10"
1 x 10 's
I × 10 '°
1 x 10"
I x I0 ''
Experimental
Protons
33
40
42
Percent Degradation
Electrons
54
58
34
Protons
31
38
4O
50
43
Theoretical
Electrons
53
57
36
49
46
ic_z
i0 tl
i0 lo
109
iOsK)O IO I
OEGRADATION, O, PERCENT
FIGURE 5-185. PROTON i_GRADATION EFFECTS
O.I
-=(._
w
bE
U
¢3
O
IO 18
ld 7
o:,_ [o_(_/_j_+ ,]-'/'
1015
iOI4
i X _..-"_
m;x IO N_'_"
IO 13
IOO IO I O.I
DEGRADATION, Q, PERCENT
FIGURE 5-186. ELECTRON DEGRADATION EFFECTS
5.160
I
_: =
U
i
L

t_
= =
i !
r
it
= •
r
L
?
L
r
taken from the curves of Reference 5-18 and used
as a basis for determining degradation from the
theoretical curves.
Syncom Radiation Damage Study. The
analysis of the space environment radiation
damage to Advanced Syncom solar cells was
performed under the following conditions:
1) Synchronous satellite orbit, altitude
22,000 miles
2) Satellite life, 6 years
3) Three n-p solar cells, 3 ohm-cm resistivity
4) Quartz shield parameter study, 6-, 30- and45-mil
For a radiation damage analysis of solar cells,
critical fluxes for both current and power degra-
dations for the various types of radiations should
be known. The lack of available experimentaldata on 3 ohm-cm solar cells necessitated the use
of the following approximations:
l) Critical integrated flux for protons=
_,." = 2 X 10¹¹ protons/cm 2
2) Critical integrated flux for electrons =
_.? = 2 X ]0 _ electrons/cm 2
Degradations Due to Solar Flares. Solar
flare data obtained from Reference 5-1 and rep-
resenting an average flux of protons for the
period 1947 to 1953 is as follows:
Proton Intensity,
Energy, mev Protons/cm 2 per year
5 4 × ]0 _°
10 1 X 10 _°
20 2 X 10 '_
30 1 X 10"
100 1 X lO s
5. Spacecra[t System Design
The number of flares considered was not given,
and relativistic flares were ignored.
1) A 6-mil quartz shield stops E<3-mev pro-
tons (Table 5-29)
_,,(E > 3 mev) _ 6 X 10 _° protons/cm 2
per year
(d_: _ 1 X 10 TM + 4 X lO _° + 1 X 10 _°
+ . . . _ 6 X 10 TM, using solar flare data)
2) A 30-rail quartz shield stops E < 15-mev
protons (Table 5-30)
G,(E > 15-mev) _ 1 X 10 TM protons/
cm 2 per year
(_ = _ 7 X 10" + 2 X 10" + 10" +
...,_1 X 10 l° )
TABLE 5-29. SOLAR FLARE DEGRADATION OF6-MIL SHIELD
Time,yea rs
1
2
3
4
5
6
_)sp
X 10"
0.6
1.2
1.8
2.4
3.0
3.6
Q_
per-cent
19
24
27
29
30
31
Qs r
per-cent
9.9
17.4
23
28
30*
31"
Qn
per-cent
6
8
10
1I
11.5
11.8
*Formula used is not good for _b--)q5 so the degradation was assumed
to be the same as the power degradation.
TABLE 5-30. SOLAR FLARE DEGRADATION OF30-MIL SHIELD
_)sp
x 10'*
Qt
per-cent
9
12
14
16
18
19
Qr r
per-cent
1.9
3.8
5.2
6.9
8.6
9.7
Q/r
per-cent
3
4
4.5
5
5.5
5-161

Hughes Aircraft Company
TABLE 5-31. SOLAR FLARE DEGRADATION OF45-MIL SHIELD
Time,years
_tp
x 10"
0.8
1.6
2.4
3.2
4.0
4.8
Q_
per-cent
2.6
3.8
4.6
5.2
5.8
6.3
QI Quf
per- per-cent cent
1.5 1.2
2.8 2.2
4.4 3.1
5.6 3.8
6.9 4.5
8.2 4.9
3) A 45-mil quartz shield stops E < 17 mev
protons Table 5-31)
qS(E > 17 mev) _ 8 X 10⁹ protons/cm =
per year
(_.,,, = _ 5 X lO s + 2 X ]0 9 + 109 +
... = 8 × 10 °)
Figure 5-185, with an estimated curve for
O_--2 X 10 _', was used to supply the power
degradation, Q. The fractional degradation of
short circuit current, Q', was computed using theformula
Q'=I 1,0I_¢__1__E1+9(<4,25>6 )]-_
Tile fractional degradation of open-circuit
voltage, Q', was found using Q' and Figure
5-187, with a plot of experimentally determined
current degradations against voltage degrada-tions.
Results of the solar flare degradations are sum-
marized in Figures 5-188 through 5-190.
Degradations Due to Trapped Radiations.
The data on the trapped or Van Allen radiationswere obtained from Reference 5-3. Data in-
cluded the following:
• Electrons
1) Tile 6-rail shield was assumed to stop elec-
trons of energy below 200 key and the
electron flux used was
_,, = 1 X 10" electrons/cm 2 per second
5-162
6O
/
/
/
/
0 5 25
!PROTON BOM6AROMENT DATA USED
I iIO 15
OPEN Cl RCUIT VOLTAGE DEGRADATION, O H, PERCENT
FIGURE 5-187. ESTIMATED RELATIONSHIP BETWEENOPEN CIRCUIT VOLTAGE DEGRADATION AND
SHORT CIRCUIT CURRENT DEGRADATION FORTHREE'OHM-CM N-P SOLAR CELLS
35
3O
25
o.
0 20
i
o
o.
IO
SHIELO,MIL = 6 /
/
//
_f/
/
jf
fv/ 45
I 2 3 4 5
TIME , YEARS
FIGURE 5-188. POWER DEGRADATION DUETO SOLAR FLARES
/
W
t=4
2
= _
rll
W
W
W
1

i
t
z
[][ ]
U
| 1
t I
i i
35
SH)ELD MIL = 6
30 f r
//
o_ 15
u
ui 30
I- IO --=
5
I-zw
_ 25 ....
_gI-
_ 20
O t 2 3 4 5 6
TIME ,YEARS
FIGURE 5-189. CURRENT DEGRADATION DUETO SOLAR FLARES
2) The 30- and 45-mil shields stop electronsE < 1 mev with electron fluxes of
_,_,----2 X 10 _ electrons/cm _ per second
• Protons. It was assumed that the various
shields under consideration stop all the Van
Allen protons at the synchronous altitude. The
degradations due to the trapped electrons were
computed in a manner similar to that for protons.
Figure 5-184 was used to find the power degra-
dation using the previously assumed critical flux
for electrons of 2 X 10 _'_ electrons/cm 2. Only
the power effects were determined because the
formula for the current degradation is invalid
for fluxes approaching the critical flux (Conclu-
sion). The results are shown in Tables 5-32 and
5-33 and Figure 5-191.
5. Spacecraft System Design
w¢J
-o
12
IO
I
j _.,._.._SHIELD,M#L : 8
30
) '
0 I 2 3 4 5
TIME, YEARS
FIGURE 5-190. VOLTAGE DEGRADATION DUETO SOLAR FLARES
f
TABLE 5-32. TRAPPED RADIATION DEGRADATIONOF 6-MIL SHIELD
Time,yea rs
1 3
2 6
3 9
4 12
5 15
6 18
Q,x 10'" percent
30
36
40
43
45
46
TABLE 5-33. TRAPPED RADIATION DEGRADATIONOF 30- AND 45-MIL SHIELDS
Time, #_ Q,years x 10" percent
7
14
21
28
35
42
7.5
10
11.5
13
14
15
5-163

Hughes Aircraft Company
5O
40 ---
6 30 --_ ....
o
o ! 2
SHIELD, MIL = 6
/f
!i
.... i
3,0 ANO 45
iii
I I4 5
TIME, YEARS
FIGURE 5-191. POWER DEGRADATION DUETO TRAPPED ELECTRONS
Degradations Due to Total Radiations. The
proton damage of solar flares and the trapped
electron damage are not directly additive. The
proton flux was converted to an equivalent elec-
tron flux (for solar cell damage) so tile combined
effects could be correctly considered. These
fluxes were then added and the appropriate de-
gradations determined from the total integrated
flux as in previous sections discussing solar flare
and trapped radiation degradations (Tables
5-3t through 5-36). The results are shown in
Figures 5-192 through 5-194.
The conversion factor for changing the proton
flux to an equivalent electron flux was 104 .
(4, = 4),,,x ]o
Conclusion. The final results of the radiation
damage analysis show the 6-rail shield to be un-
acceptable due to inordinate degradations. Thedifferences between the 30- and 45-mil covers
5-164
5O
SHIEL _ MIL
6
/
3 4 r, s
TIME, YEARS
FIGURE 5-192. POWER DEGRADATION INSPACE ENVIRONMENT
appear slight, so the 30-mil shield was recom-
mended. The final degradations expected are
presented in Figure 5-195.
The analysis performed was largely based on
estimated quantities. As more knowledge is
gained on the space environment and the critical
fluxes applicable to the cells in question, the un-
certainity of the results can be greatly reduced.
TABLE 5-34. TOTAL RADIATION DEGRADATIONOF 6-MIL SHIELD
Time,, x x xyears I10 ,* 10 ,s 10 '=
L_i3
6
9
12
15
18
1 6 0.06i
2 12 0.123 18 0.1_
i4 24 i 0.24
5 30 0.3C
6 36 O,3fi
(_total
x10"
3.06
6.12
9,18
12.2
I5.3
18.4i
Q, Q', Q,,,per- per- per-
cent cent cent
30 " *364O
43 i4546
*These were not computed because _c becomes much less than q_tntal andthe critical flux for power is not really the same as the critical fluxfor current.
i
z
W
F:
- .
: z
_2

5. Spacecraft System Design
TABLE 5-35. TOTAL RADIATION DEGRADATIONOF 30-MIL SHIELD
Time
years
1
2
3
4
5
6
(;6sp
x10"
1
2
3
4
5
6
x10"
1
2
3
4
5
6
x10"
0.7
1.4
2.1
2.8
3.5
4,2
¢ ..... [ Q Q', Q",
x I per- i per- ]per"
1o'"_¢ent __t tcent-
" i '°' I 3, r33,i135I ,1 i,3 I51i 1, I 86i '= i" / 1' 111'i °° I,,|19, 113,/'; I,o=1=,i,oo],, i
_- 15Zi,iL_
"6Z0
w
o I0
I-
_ //_5
_ st----
//
//
/
SN ;LD_ MIL:
30 J
........ p •
• //2
. /
//,/ ,
..... // ....
/i
. £ .....
1I !
............... _ __ J _ ____ _._
2 3 4 5 6
TIME, YEARS
FIGURE 5-193. CURRENT DEGRADATION INSPACE ENVIRONMENT
TABLE 5-36. TOTAL RADIATION DEGRADATIONOF 45-MIL SHIELD
(_p _lp "_) •
x x10'* 10'"
0 0,8
1.6 1.6
2.4 2.4
3.2 3.2
4.0 4.0
4.8 4.8J
Time,
years
1
2
3
4
5
6
0.7 1.5
1.4 3
2.1 4.5
2.8 6
3.5 7.5
4.2 9
pQe'r Q" Q"- per- per-cent cent cent
10 2.8 2.5
13 5.2 4
15 7.8 5
17 9.9 5.6
18.5 12.2 6.2
19.5 13.8 6.7I
5-1
Bibliography
Allen Rosen, "COMSAT Flight Environ-
ment."
5-2 B.J. O'Brien, "Radiation Belts," Scien-
tific American, Vol. 208, No. 5, May 1963.
I...-
_f
2_
3
I
0 I 2 3 4 5
TIME, YEARS
FIGURE 5-194. VOLTAGE DEGRADATION INSPACE ENVIRONMENT
6
5-165

Hughes ,4ircrafi Company
o_
o
_Jt_
2O
IO
x2Vz i /i
/ //
i
/
/SHORT CIRCUIT CURRENT
//
/
5_ -/j
/
i
iI
o I
"/OPEN CIRCUIT VOLTAGE
2 5 4 5
TIME, YEARS
PARTICULATE RADIATIONFIGURE 5-195.DEGRADATION
5-3 G. Dienes and G. H. Vineyard, "Radiation
Effects in Solids," lnterscienee, 1957.
5-4 J.J. Loferski and P. Rappaport, "Radia-
tion Damage in G, and S, by Carrier Life-
time changes," Phys. Rev. 111, 432
(1958).
5-5 K.T. Chow, E. A. Lodi, "Proton Damage
to Solar Cells," Lockheed Aircraft Corp.,
LMSD-703735, 1 August 1961.
5-6 W.L. Brown and G. L. Pearson, "Proton
Radiation Damage in S, Solar Cells,"
June 1960.
5-I66
5-7
5-8
5-9
5-10
5-11
5-12
5-13
5-14
5-15
5-16
5-17
5-18
J. M. Denney and R. G. Downing, "Ex-
perimental Proton Irradiation of Solar
Cells," STL Report 8986-0001-RU-000.
J. J. Loferski and P. Rappaport, "TheEffects of Radiation on Silicon Solar
Energy Converters," RCA Rev. 20,536
(1959).
W. L. Brown, "Semiconductor Radiation
Damage in Space," American Rocket So-
ciety Paper 1755-61.
J. J. Wysocki, et al, "High Temperature,
Improved Efficiency Photovohaic Solar
Energy Converter," Contract DA 36-039-
SC-78184.
J. J. Wysocki, et aI, "Semiconductor Pho-
tovoltaic Conversion," Contract DA 36-
039-SC-87417.
W. C. Dunkerly and H. F. Prochaska, "Ra-
diation Damage to Solar Cells," Hughes
Aircraft Company.
T. G. Barnes, et al, "Radiation Shielding
of Lunar Spacecraft," Astronautical Sci-
ence Rev., January-March 1961, Page 11.
R. G. Downing, "Electron Bombardment
of S, Solar Cells," ARS Paper 1294-60.
J. C. Fraser, et al, "Electron Irradiation
of Solar Cells," AIEE Paper CP60-1094.
W. R. Cherry, Goddard Space Flight Cen-
ter, Report No. X-636-110.
J. Bakker, "Radiation Induced Changes
in Silicon Photovohaic Cells," 1. o[ Appl
Physics, Vol. 33, No. 11, November 1962.
B. Ross, "Design Criteria for Satellite
Power Supplies Using Radiation Resistant
Solar Cells," Hoffman Electronic Cor-
poration.

5. Spacecra]t System Design
, i
STRUCTURE
General Arrangement and Structural Design,
The equipment and structures have been re-
arranged from the T-1 model to improve the
present vehicle and provide the maximum of
alternate payload flexibility. The principal ob-
jectives of this effort were reduction of structure
weight, maintenance of structure stiffness, in-
crease in space available for electronics com-
ponents, accommodation of the revised apogee
motor, increase in thermal conductivity of the
structure to reduce temperature of high heat
loss components, reduction of manufacturing
costs, increase in the ratio of roll axis moment
of inertia to pitch axis moment of inertia, and
improvement of installation and maintenance
access to all components.
The primary structure for the vehicle is sub-divided into three main sections: aft thrust tube
assembly, central thrust tube assembly, and for-
ward equipment support structure assembly. The
aft and central thrust tube assemblies are joined
in a single tube assembly. The forward equip-
ment support structure assembly is attached to
the tube assembly by bolted connections so that
it can be readily attached and removed. This ar-
rangement facilitates fabrication, assembly, and
maintenance of the spacecraft. The arrangement
of equipment and structure is shown in Figure
5-196. The bipropellant control system and its
relation to the spacecraft structure is illustrated
in Figure 5-197.
The aft face of the aft thrust tube assembly
attaches to the Agena-spaeecraft interconnect
structure by a V-band clamp. The interface con-
trol dimensions are shown in Figure 5-198. Radi-
al ribs of aluminum alloy are attached to the aft
thrust tube and are part of this assembly. The
radial ribs support the aft electronic components
and provide thermal paths for heat distribution.
The radial ribs also provide a structure to sup-
port the components that are not supported di-
rectly from the central tube structure. These
components include the control system fuel and
oxidizer tanks, battery assembly packages, boney-
comb solar panels, and aft hoist support fittings.
Ring frames are used forward and aft of the
radial ribs to provide balancing reaction to the
longitudinal loads in the ribs and distribute lat-
eral rib loads into the central tube structure. The
forward frame has additional stiffness to avoid
introducing deflection loads into the apogee motor
case. The antenna package and multiplexers are
supported inside the thrust tube by a two-beam
cruciform structure forward of the separation
plane. To attain accurate alignment of the apogee
motor thrust vector, the aft thrust tube assembly
is arranged so that the attach interface and the
apogee motor alignment face will be machined
in a single machine setup of the aft assembly.
The central structure is a thrust tube of alumi-
num alloy sheet with external longitudinal stif-
feners. This semimonocoque structure provides
support for the forward structure and the equip-
ment components adjacent to this structure which
include the electronic quadrant packages, supportfor the forward ends of the fuel and oxidizer
tanks for the control system, and forward support
for the battery packages. The longitudinal stif-
feners are magnesium and aluminum alloy, de-
pending on tile magnitude of the load to bedistributed into the thrust tube sheet. The for-
ward ends of the longitudinal stiffeners provide
for attachment of the removable forward equip-
ment support structure and the forward hoist
attach fittings. The diameter of the sheet thrust
tube provides clearance about the apogee motor
for a motor installation protective sleeve and forthermal insulation between the motor case and
the surrounding structure. The space envelope
and interface control drawing for the apogee
motor is shown in Figure 5-199.
5-167

h
Hughes Aircraft Company
22
The forward equipment support structure as-
sembly has an upper torus ring, an interconnect
tubular truss structure, and a ring frame at the
tie to the central thrust tube structure. The upper
torus ring is a sheet metal box section ring frame
to support the forward mounted equipment and
provide partial support for the solar panels. In-tereostals are installed within the box section at
aLL concentrated load points. Flanged lightening
holes are located in the box structure to provide
for inspection, maintenance, and repair during
test and qualification. No blind fasteners areused in this section. The intermediate truss struc-
ture is of tube members with riveted end fittings
and is fabricated in paired tube sections to pro-
vide accurate alignment of the forward structure
with minimum tooling.
A study was conducted to determine the opti-
mum structure arrangement for this interconnect
structure. The alternate arrangements includeda beaded sheet structure and a formed sheet
Vierendiel truss. The tubular truss arrangement
was selected on the basis of minimum weight,
minimum cost, and minimum deflection. The for-
ward equipment support structure is bolted tothe central thrust tube structure so that it is
removable. With the forward support structure
removed, the two unitized control systems may
be installed or replaced in the spacecraft as a
complete assembly without excessive deflection
of the interconnecting lines (Figure 5-200).
Each individual solar cell support panel is
supported by three attachment points spaced on
120 degree radial lines from the center of gravity
of the panel. Each attach point provides restraint
normal to the plane of the panel and, in the plane
of the panel, restraint perpendicular to the radial
line from the center of gravity. Two attachments
are ball and socket and the third is a slotted
groove so that no other restraint is applied to
5-168
the solar panel. This support arrangement (Fig-
ure 5-201) prevents the possible introduction of
loads into the panel from deflections of the
spacecraft primary structure. It also provides
a quick-disconnect means of solar panel instal-lation or removal without the use of tools.
The 16 solar panels are _/2 inch thick alumi-
num alloy honeycomb faced with fiberglass and
epoxy resin. Suitable panels are provided with
an opening to allow the velocity jets to project
through the face of the panel. The panel con-
figuration is located relative to the spacecraft
so as to place the velocity jets at the intersection
of adjacent panels, providing greater flexibility
in the longitudinal location of the velocity jets,
which must be located in the plane of the longi-
tudinal center of gravity of the spacecraft. If
subsequent design progress requires relocation
of the velocity jets, it can be accomplished withminimum effort.
Most of the details of the spacecraft dynamic
envelope in the modified Agena Nimbus shroud
have been finalized. They are illustrated in Fig:
ure 5-202.
Structural Dynamic Test and Analysis. Struc-
tural dynamics effort in this reporting period has
included testing of the T-1 structural model,
dynamic analyses of the T-1 and T-2 configura-
tions, and initiation of the solar panel develop-
ment vibration test.
Vibration tests were conducted on the T-1
structural model from period 25 April through
2 July 1963 at the Hughes Space Environmental
Simulation Laboratory using a Ling L-249 elec-
tromagnetic shaker. Test results are described in
Volume 7, Advanced Syncom Structural Vehicle
(T-l) Vibration Test Results.
The spacecraft qualification level tests were
conducted in accordance with the NASA test

=.-=
I
ii=
-I-'fAX
\
W
r,,,,a
.=_..
iw
U
AXIS
mini
_:-_
roll
/FIGURE 5-196. GENERAL ARRANGEMENT OF SPACECRAFT

L
m.i
m_
i
M
m
[]
i
mu
mira
p
ig
m

/,X AXIS
AXIAL ENGINE
RADIAL ENGINE
AXIS
AXIAL ENGINE
SUN SENSOR
LOOK A.N_E _P-_-
I 1 1 __
160.5 167.5 169.912
62.5 55.5 53,088
ST

i
!
zm
i

I
\\
//
J
_-'_I,-" Oi I 8 8
26.25 1
199.9
23.9
_,TIONS, INCHES
-D, ,.-0.40
J
225.0 LOCKHEED
0 HUGHES

=
12
_m

\
<©
© ©
7
5-169

i

;w
II
U
L;
m
U
ii
LJ
U
1.12 did
13
0.50
11.49 n
lea 0.01T, IR I 11.47 "-I 12_2_ 1:13 di.
6.0
6.305 D_ _/_
/--FILL AND DRAIN
PORT AND VALVE
1-14 UNF-3AJC_
DETAIL B BY _ 0.875 did BALL AND _6,39-- "
G 1"12 did BOSS -A-l--_1.13
TANK _ETAIL
-B-
RADIAL ENGINE DETAIL
0.876C
0.874C
3-32NEF12B T
FOi
L.a
z
UNIT 2 UNIT ITANK N0.2 TANK N0.2 TANK NO.I TANUNIT 2 UNIT I . UNIT 2 UNr
-'="i
,.,.,.=
W
llllm
FIGURE 5-197,
/BIPROPELLANT REACTION CONTROL SYSTEM Ih
!

Z
z
!
w
L_
lil
II
im11
ii
|
|UIMI
_m
liII
EllrEiRI
_1
u
w
IE
!-:¸1
Hlira

-B- IS DIAL INDICATORLOCATING SURFACE
F TAN _KID
_PACECRAFT
DETAIL A
RWARD
I
)IZERK NO.FI
o/_ ¸
TANK NO. 4 TANK NO.4UNIT 2 UNIT I
STALLED IN SPACECRAFT
I
I
TANK AND RADIAL
ENGINE Pt,.


_.-_/J ../J" I i
I
-23.498
_J• h
RADIAL ENGINE
FUEL
TANK NO.3
UNIT 2
OXIDIZERTANK NO. 3UNIT I
k LATCHING
SOLENOIDPREVALVE4 REQD
DIRECTION OFROTAT ION
FUEL
TANK NO. 4UNIT I
\
OXIDIZERTANK NO. 2UNIT 2
AXIAL ENGINE NO,


AXIAL ENGINE NO. 2
OXIDIZERNO. 4
UNIT 2
/
/
• PRESSURE BURST DIAPHRTRANSDUCER FILTER AND
SCREEN RELIEFVALVE
r
--60.O0-
J_i
\
OXIDIZERTANK NO. IUNIT I
ENGINE NO. I
49.00 dio
16.25
lT.(JO R
42.664 DIA
//
FUELTANK NO.IUNIT 2
TYP
FUELTANK NO.2UNIT I
(_
5.171
=

I

5. Spacecra[t System Design
I,....d
N
iiJ
U
|l
_-=..I
H
ms
w
I-ii
ii,il
L-I
3,090" 0i25
o.145 o.i,oo _/.,//
DETAIL A
2B.734 d_¢--28744
/0125 R
_0125 R
I -c- I O,TO ,oo
[]
SPACECRAFT
AGENA
NOTES :
1 STATIONS BASED ON LMSC AGENA STATIONS
[] SURFACE E TO BE PARALLEL TO SPIN TABLEpLANE OF ROTATION WITHIN 0.0025 TIR
[] DIA D TO BE CONCENTRIC TO SPIN TABLECENTER OF ROTATION WITHIN 0.006
4 MACHINED SURFACE TO BE 125 PER ASA
B,4.6.1 EXCEPT AS NOTED
FIGURE 5-198. SEPARATION PLANE INTERFACE
specifications given in Advanced Syncom Project
Notice 9, Revision B, rePeated in Table 5-37.
Random qualification tests were not conducted
(with two exceptions), and the spacecraft re-
sponse to random inputs has been calculated
from measured sinusoidal data. The test objec-
tives were accomplished. The strength and stiff-
hess adequacy of the spaceframe was verified,and data necessary to predict structural design
loads, component design loads, and qualification
vibration test levels were acquired.
There was no damage to the primary structure
during the test. Failures which occurred on the
secondary structure and components are listed
in Table 5-38. Design modifications have been
suggested to eliminate these failures on subse-
quent vehicles.
5-173

Hughes Aircra]t Company
TABLE 5-37. VIBRATION LEVELS FOR EVALUATIONOF ADVANCED SYNCOM STRUCTURE.
(Levels to be applied at separation interface)
Sinusoidal excitation,* three axes, logarithmic sweep at 2octaves per minute, 4.35 minutes duration.
5 to 15 cps 0.25 inch double amplitude
15 to 250 cps 3gpeak
250 to 400 cps 5 g peak
400 to 2000 cps 7.5 g peak
Random excitation,* three axes, 6 minutes duration per axis.
20 to 80 cps 0.04 g2/cps
80 to 1280 cps Increasingfrom 0.04 g2/cps at 0.61 dbper octave
1280 to 2000 cps 0.07 g_/cps
Torsional vibration, applied at separation plane and correctedto interface diameter assuming rigid body motion, sinusoidalexcitation, logarithmic sweep at ] octave per minute.
50 to 80 cps 7.5 g peak tangentialor5-foot diameter
*Exception may be taken where the predominant longitudinal andlateral frequencies are sufficiently decoupled from those of theAtlas/Agena with the spacecraft attached. In that case, the space-craft response at the center of gravity in the bandwidth of the pre-dominant frequency may be limited to that of the separation planeinput in the same predominant frequency bandwidth.
TABLE 5-38. T-1 QUALIFICATION LEVEL VIBRATIONTEST FAILURES
Description of Failure
Innerface sheet buckling of solar panelsS/N 2 and S/N 12, along restrained edges.
Failure of orientation rocket platformtruss located over quadrant 3 electronics.
Failure of orientation rocket platformtruss located over quadrant 1 electronics.
Failure of orientation rocket platformtruss located over quadrant 4 electronics.Orientation rocket truss is one that failedduring test 3, run 2. It had been repairedand installed in new position prior totest 5, run 2.
Innerface sheet buckling of solar panelsS/N 2 along restrained edge.
Failure of orientation rocket platformtruss located over quadrant 2 electronics.This truss failed during test 4, run 1. Ithad been repaired and installed in newposition on spacecraft prior to test 5,run t.
Sun sensor bracket (Hughes DrawingX209711, item 15) cracked.
Failure of several solar panels as de-scribed in test report.
5.174
TABLE 5-39. SPACECRAFT FUNDAMENTALFREQUENCY COMPARISON
(CYCLES PER SECOND)
Test T- 1 T-2Vibration Results (.Analytical) (Analytical)
Longitudinal
Lateral
130 135
49 48
139
5O
Development vibration test levels for com-
ponents have been derived from T-I test data.
The test spectra are given in Figures 5-203
through 5-207.
The fundamental frequencies found experi-
mentally during the vibration tests compare
closely with those derived analytically, as shown
in Table 5-39. The analytical studies were based
on a 10 degree of freedom lateral model and a
5 degree of freedom longitudinal model. In both
cases, the model was cantilevered from the Agena
interface.
The expected change in the fundamental
lateral frequency of T-2 for changes in thrust
tube gage is shown in Figure 5-208. Analytical
studies also yielded a torsional fundamental fre-
quency of 74 cps based on a 3 degree of freedom
model mounted at the Agena interface.
The response of the T-2 analytical model tosinusoidal base excitation has been obtained.
Lateral response curves are presented in Figure
5-209 for the rib and apogee motor mass center.
T-2 Solar Panel Vibration Test. Develop-
mental vibration tests are currently in progress
on the T-2 solar panels. The first three plate
modes of the panel have been determined, and
strain gages are being installed at points of maxi-
mum bending moment in these modes. Sinusoidal
frequency sweeps of 1 octave per minute were
performed from 5 to 2000 cps at 1//2 g input to
establish resonant frequencies of the panel.
Figure 5-210 shows the vibration fixture and
: =
-=
HIll
[]
I
[]
B
=-=
R
= =
[]
= =
i
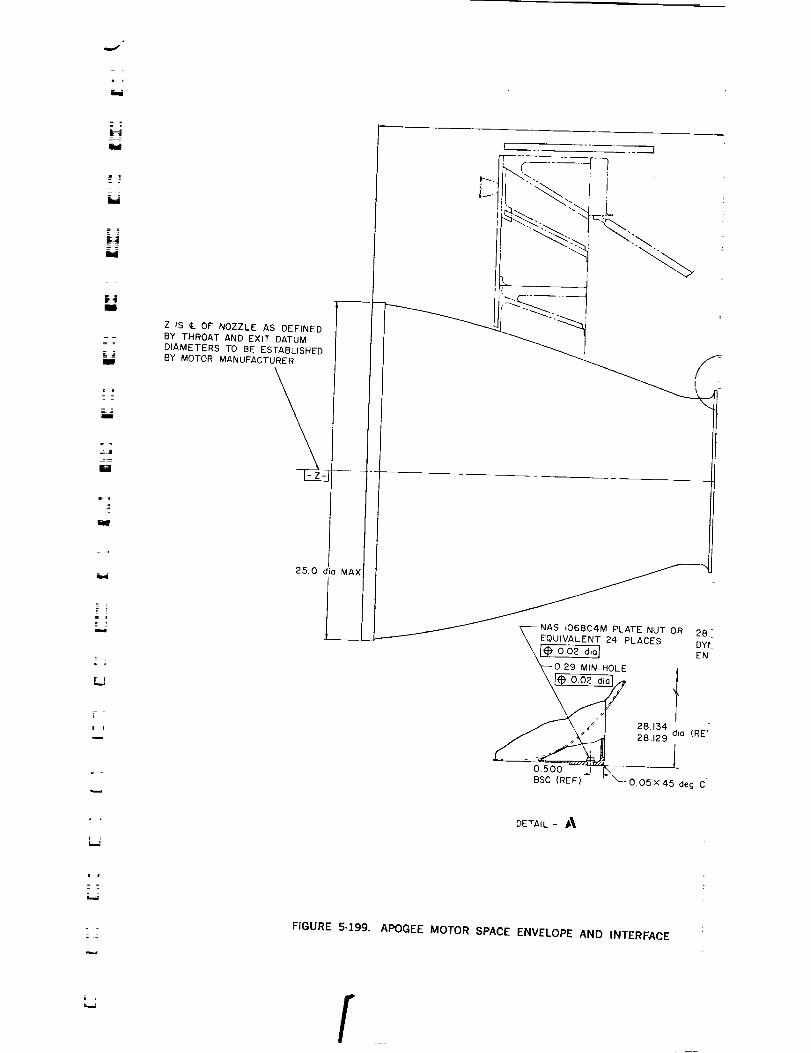
m
_-z-.
__- ,._
I
-z :,
m
u
° .
Z IS t,.. OF NOZZLE AS DEFINED
BY THROAT AND EXIT DATUMDIAMETERS TO BE ESTABLISHEDBY MOTOR MANUFACTURER
25.0 dio MAX
LL
11_ _".\i L
//
//
_/ _NAS 1068C4M PLATE NUT OR 28-\ EQUIVALENT 24 PLACES DYi
\l* 0.02_'°1 EN"_0,29 MIN HOLE t%
_ _8.1_ die (RE'
DETAIL- .A_
i ]
Z
LJ
FIGURE 5-199. APOGEE MOTOR SPACE ENVELOPE AND INTERFACE
f

11
|!
i
4_j
Im
II
|
H
F_
ii
I
m
LUn
l
z
m
IB
u
W
ind
II
I
m
U
IB
_a

.._/
-510 MAX
PROVISIONS FOR HOIST ADAPTERS IN THIS AREA.
ADAPTERS MUST FIT I(S} 125 CLEVIS SOCKET
(ELECTROLINE PRODUCTS, CANTON, OHIO)
\I die MAX
",IAMIC
L-i--°28.06 die MAX
1.25 MAX_
28.134 dio28129
(SEE DETAIL "A")
TING
?IRCUIT IC
IS ¢- OF "Y"-
90 deg -+0 deg TE
PLANE "X"
=)
HAM
2/t ELLIPSE (APPR(


_TOR
/ (BsSECE2D4ETP_IAC,,EA,S,)
;NITER
dio AT
)
SCHEMATIC OF IGNITERCABLE
MOMENT OF INERTIA MAXIMUM
Ib-in 2 PITCH
LOADED 112,500
B.O. 25,000
MINIMUM
ROLL
90,000
II,O00
)X)
1 6._ "Z" SHALL PASS THRU PLANE "X" WITHIN 0.03OF ¢,. "W"
2 ¢.. "Z" SHALL BE PERPENDICULAR TO PLANE "X"
WITHIN 0001 PER in
3. FULLY LOADED MOTOR WEIGHT SHALL NOTEXCEED 874,5 Ibs
[]STATIC MOMENT OF BURNED-OUT MOTOR ABOUTPLANE "X" SHALL NOT EXCEED 20111b-in
5 SEE TABLE FOR MOMENTS OF INERTIA
E'_OtA "V" INDICATES MAX ALLOWABLE EXCURSIONS
OF CASE iNCLUDING ECCENTRICITY AND
OVALITY WITH RESPECT TO & "W"
5-175

=

!
t...
.-.: .;
J_
tl
U
Eii_=
! !t.a
SUN SENSOR
PANEL ATTACH FITTING. ¢
ATTITUDE AND SPIN SPEEDCONTROL ROCKET
/
/, /
/ /
\SOLAR PANEL
FORWARD STRUCTURE ASSEMBLY
/
FLUID
FIGURE 5-200. EXPLODED VIEW ILLUSTRATING INSTALLATION OF BIPROPELLANT REACTION CONTROL SYSTEM
1

hl
FI
I
U
U
i
i
!

k_)
OXIDIZER TANK
\
\
FUEL TANK
VELOCITY CONTROL
ROCKET
FORWARD STRUCTURE A °
ATTACH POINTS
EQUALIZING

=
r__

_j
TANK ATTACH POINTS
\ELECTRONIC UNIT
SUPPORT BRACKETS
0 0
PRIMARY STRUCTURE ASSEMBLY
5-177


t
I,,,--,,
L_IL]
tT_:=:
L-J
N
F..,=_.
Hg
H
W
m
SOLAR PANELS
BRACKET ASSEMBLYFORSOLAR PANEL
BALL AND SOCKET
PANEL ATTACHMENT
FIGURE 5-201. SOLAR PANEL SUPPORT SYSTEM
5-179

Hughes Aircra/t Company_J
u
5-180
24.50 R
\
60.18 dio max \
PROTRUSION "B"_
50o .... _'2qPROTRUSION "B". /_IF_ _
500 dia
PROTRUSION "C"
2 PLACES
+Y
a_L ACEIx AXIS
ENVELOPE (REF)
WHIP ANTENNA
15 PLACES EOUALLY
SPACED AND SPRUNG
AGAINST SHROUD
//
///
t/
1
\
\\
+Z AXIS
I
I59.18 dia mox
@
\.,m_MODIFIED NIMBUS SHROUO
\
32 O0
SEPARATION
PLANE
6460 PORT
IN SHROUD
PACECRAFT
DYNAMIC ENVELOPE
(BASED ON SEPARATION
PLANE}
-_ PROTRUSION "A"
390
SEPARATIONPLANE
400
LI_ _ooo dio max
NOTES .*
1 STATIONS BASED ON LMSC AGENA STATIONS
2 LMSC SHROUD DYNAMIC ENVELOPE SHALL RE
DIMENSIONED RELATIVE TO SEPARATION PLANE AS
A FIXED L, kSE
FIGURE 5-202. AGENA SHROUD INTERFACE AND DYNAMIC ENVELOPE
1
U
[]lJ
m,..B
uH1
r_i
1
N1
=
l
u
w
m
1
= =
i
1

.'c =
kjK.-.
i ;
ii
LI
L ;
[J
t 2
_4
I00
5O
5. Spacecra/t System Design
I0
5
i
K3
"7
0002 in DOUBLE AMPLITUDE-.. i
/ 0.25 in DOUBLE AMPLITUDE
50 I00 500 I000
FREQUENCY, CYCLES PER SECOND
a) Longitudinal Sinusoidal
PERFORM ONE SWEEP
FROM 5 TO 2000 cps ATTWO OCTAVES PERMINUTE
DURATION= 435 rn_n
5OOO
c_o
5(?
PERFORM ONE SWEEP ON EACHOF _ LATER_CAL AXES WHICHARE PERPENDICULAR TOSPACECRAFT SPIN AXiS FROM 51_ 2OOOcps AT TWO _TAVESPE_ MINUTEDURATION = 4.35 rnin PER AXIS
_O:: iFIIi:::LE AMPLITUD?
,/5To,5o_ r5O }00 5O0 iO00 5OO0
FREQLENC:y, CYCLES PER SECOND
b) Lateral Sinusoidal
r-G
I0
05
TEST
50 I00 5OO IO00
FREQUENCY, CYCLES PER SECOND
c) Longitudinal Random
FIGURE5-203.
DURATK)N =6 mln
07
>:I-- 06
b_ 04
5 o3_ Qz
_%
°.'O
O
III
5OOO 400 8OO 1200 1600
= FREQUENCY, CYCLES PER SECOND
d) Lateral Random
QUALIFICATION TEST SPECTRA
Antenna component
2OO0
Figure 5-211 shows the panel installed on the
shaker. The panel is attached to the test fixture
at the same location as on the spacecraft using
proper supports. The mode shapes were deter-
mined for the first three resonances by monitoring
the output of an accelerometer mounted succes-
sively at various points on the concave side of
the panel. Figure 5-212 shows the node line
patterns for the first three frequencies.
Optimum locations for strain gages and accel-erometers have been determined for the forth-
coming qualification tests based on the results
of these modal surveys. The strain gage andaccelerometer locations which will be used in
the qualification tests are shown in Figure 5-212.
Qualification level tests will be performed in the
lateral (perpendicular to plane of panel) direc-
tion only, using the input levels derived from T-1
vibration test data. The test spectra are given in
Figure 5-207.
Solar Panel Acoustic Test. An acoustic test
of the solar panel is planned in which the panel
5-181

Hughes Aircra/t Company
I00
50
5
TWO OCTAVES PER MINUTE
" l DURATION = 4.35 rain
00004 in DOUBLE AMPLITUDE_
-- _O 21 in D_--BLE AMPLITUDE _I_
_ DOUBLE AMPLITUDE I_
t / 5To_5_.5<:' I00 500 IO(X;)
FREQUENCY, CYCLES PER SECOND
a) Longitudinal Sinusoidal
500O
1,0
(15
O/
O05
OCW
W_
• EST DURATION-6 mb
ICO 5O0
FRE_, C','O_ES _ SECOND
c) LongitudinalRandom
5OOW
o,o
5O
I
iO
ONE SWEEP ON EACHOF TWO LATERAL AXES WHICH
ARE !:_-'RPENOtCULAR TOSPACECRAFT SPIN AXIS, FROM5 TO 2000 cp$ AT TW_ OC_
003 in DOUBLE PER MINUTE
AI_L /"I r-"--I DIJRATION =4 35 rain PER AXiS
5 "tOP5 ¢pi in DOUBLEAMPLITUDE
50 iOO 500 _000
FREQUENCY, _ES PER SECOND
b) Lateral Sinusoidal
FIGURE 204.
go
O_I0 5O ICO 5OO It(X::,
FRe(XIE"NCy. CYCLES PER SEC.(_NO
d) Lateral Random
QUALIFICATION TEST SPECTRA
TES'i_ DURATION-6 rain
ON EACH OF TWOLATERAL AXES WHICHARff _ICULAR TOSPACECRAFT SPIN AXIS
50(10
Reaction control system -- axial jet
will be subjected to 150 db (re 0.0002 dynes/
cm 2) for 13.5 minutes. The environment will
consist of sinusoidal tones, swept logarithmically
at 0.6 octave per minute from 40 cps to 10,000
cps directed at normal incidence to the panel.
Arrangements are being completed with North
American Aviation in E1 Segundo for the use of
their acoustic test facility.
Structural Analysis. Structural analysis
effort in this report period has included prelim-
inary stiffness comparisons of the T-1 and T-3
thrust tubes*, analysis of the new solar panel con-
figuration and its associated hardware in prep-
aration for developmental vibration tests, and
the stress analysis required for support of the
structural design effort. Loads used for the analy-
sis are based on results of the T-1 developmental
*Advanced Syncom Summary Report, August 1963,
p. 4-35.
5.182

5. Spacecraft System Design
I00
50
PEi_FORM O_/E SWEEp FROM
5 TO 2000 cps AT TWOOCTAVES PER MINUTES
DURATION- 4.35 rain ----
0,02 in DOUBLE AMPL_U_
025 in DOUBLE _MPLITUDE
/sTOrScp, ]
IO 50 I00 500 I000
FREQUENCY, CYCLES PER SECONDS
50O0
a) Longitudinal Sinusoidal
DO
5OI_J_ PER MINUTE
DOUBLE AMPLITUDE,in,
22
IO 50 ¢)O 500 KX)O
PERFO_=tM ONE 'SWEEP ON EACH
OF" TWO LATERAL AXES WHICHARE PERPENDICULAR TO
-- SPACECRAFT SPIN AXIS, FROM 5
TO 2000 cp| AT TWO OCTAVES
500O
FREQUENCy, CYCLES PER SECO/_
b) Lateral Sinusoidal
=_- J
I.O
0,5
i °'005
0,01
TEST DURATION "6 rain
50 DO 500 IOCO
FREQUI_CY. CYCLES PER SECONO
c) LongitudinalRandom
FIGURE 5-205.
IO I I
I T_ DURATiON-6mIn ONEACH OF TWO LATERAL
Q5 ...... I -- AXES WHICH AREPERPENDICULAR TOSPACECRAFT SPIN AXIS
I
OOI __1
5000 I0 5O (00 500 _000
FR_, CYCLES PER SECONO
d) Lateral Random
QUALIFICATION TEST SPECTRAFueled bipropellant tank
_Q
TABLE 5-40. MARGINS OF SAFETY
Drawing MarginNumber Critical Stress of Safety
X209875X209813
X209788)(209788X209851X209849X209848X209871X209868
50O0
Local crippling clyinderBuckling flat sheetShear fastenerShear tube
BucklingCompressionShear
Local cripplingBuckling
+ 0.09+0.36+ 1.45+0,6t+0.26
High+3.39+0.25
+0.05
vibration test. An additional constraint con-
sidered in the sizing of members was stiffness.
Wherever possible, support members were sized
such that the component fundamental frequency
was not coincident with that of the spacecraft. A
summary of margins of safety is presented in
Table 5-40. A view showing the structural analy-
sis model is shown on the following page.
5-183

Hughes Aircra]t Company
5O
i '°5
5-184
" I
_3 50 I00 50O lO00
F_'_U_CY,CYCLESPERSECOND
a) Longitudinal Sinusoidal
t.0
05
OI
bO
FROM 5 TO 2COO cpsAT TW_ OCTAVESPER MUTEDURATION =4 35 rain
5O0O
K)O
50
I0
5
I
W3
.... L_ _
O012 in DOUBLE A/LI_%
/I
12, in DOt)BLE AM'LIT_E
/ 5TOm cp_ i
5O I0(3
FREQUENCY. CYCLf_ PER SECOND
b) Lateral Sinusoidal
P_RFORM ONE _ ONEACH OF TW_ LATERALAXES WHICH ARE
_ PERPENDICULAR TOSPACECRAFT SPiN AXIS,
FROM 5 TO 2000 cps ATTWO OCTA_S PER MINUT
DURATION=4 _ mln PERAXF3
1
-t50O I000 50O(3
i
"r_'r DL_ON =
i
!
I
50 iOO 500 IOOO
FFEQUENCY, CYCLES P_R
c) Longitudinal Random
FIGURE
50OO
1__Q5
I
Ol
_0 5O
III
!1
Io0
ITEST [XJRAI_, 6 rainON EACH OF "F_ LATERALAXES WHK_H ARE
r PERPENOIO, JLAR TOSPEECRAFT SP_ AXIS
Ii
L t_n50() 1000 5000
FREQUENCY, CYCLES PER _ECOND
d) LateralRandom
5-206. QUALIFICATION TEST SPECTRARib-mounted components
A
STATION" _ _
RING ASSEMBLY, _'/ _SEPARATtON RING X2_¢,)813
To.us __
SUN SENSOR X209868 X209851

r_w
= ==
+
I00
$do
5O
_ .
...... IEAMPLITUDE
PERFORM ONE SWEEP ON
] IONE LATERAL AXIS WHICHI US PERPENOICULAR TO
..... iI- -_SPACECRAFT SPIN AXIS,--
F FROM 5 TO 2000 cps AT
I II ITWOO_A_ESPER.,NUTE
'0,05 in DOUBLE AMPLITUDE ....
I0 50 I00 ,.500 I000 5000
FREQUENCY, CYCLES PER SECOND
a) Lateral Sinusoidal
>_-
Illi oo lll
IIIolH /
.+
_ TEST OURAT_N • 6 ml_
ON ONE AXIS WHrCH ISPERPENDICULAR TO
SPACECRAFT SPIN AXIS
0 400 800 1200 1600 2000
FREQUENCY, CYCLES PER SECOND
b) Lateral Random
FIGURE 5-207. QUALIFICATION TEST SPECTRA
Solar panel
z_ 60
n*
01
wr,.3>-U
>.-UZLIJ
5O
4O
300,O2 0.04
/
0.06
GAGE,INCHES
0.08
FIGURE 5-208. FUNDAMENTAL LATERAL FREQUENCYVERSUS GAGE OF THRUST TUBE
=
=
12
bj_
Er) a.WZ
j.J
5. Spacecraft System Design
ASSUMES p'OO5IN FIRST MODE
RESPONSE OF: STATION 33
_(TOP OF UPPER TUBE)
MOTOR CENTER OF MASS
Pt" -RESPONSE OF ErATION 14
3 iOFOFRIBs)
0 20 40 60 80
FREQUENCY, CYCLES PER SECOND
FIGURE 5-209. LATERAL RESPONSE OF T-2ANALYTICAL MODEL
FIGURE 5-210. SOLAR PANEL VIBRATIONTEST FIXTURE
FIGURE 5-211. SOLAR PANEL' VIBRATION
TEST SETUP
5-185
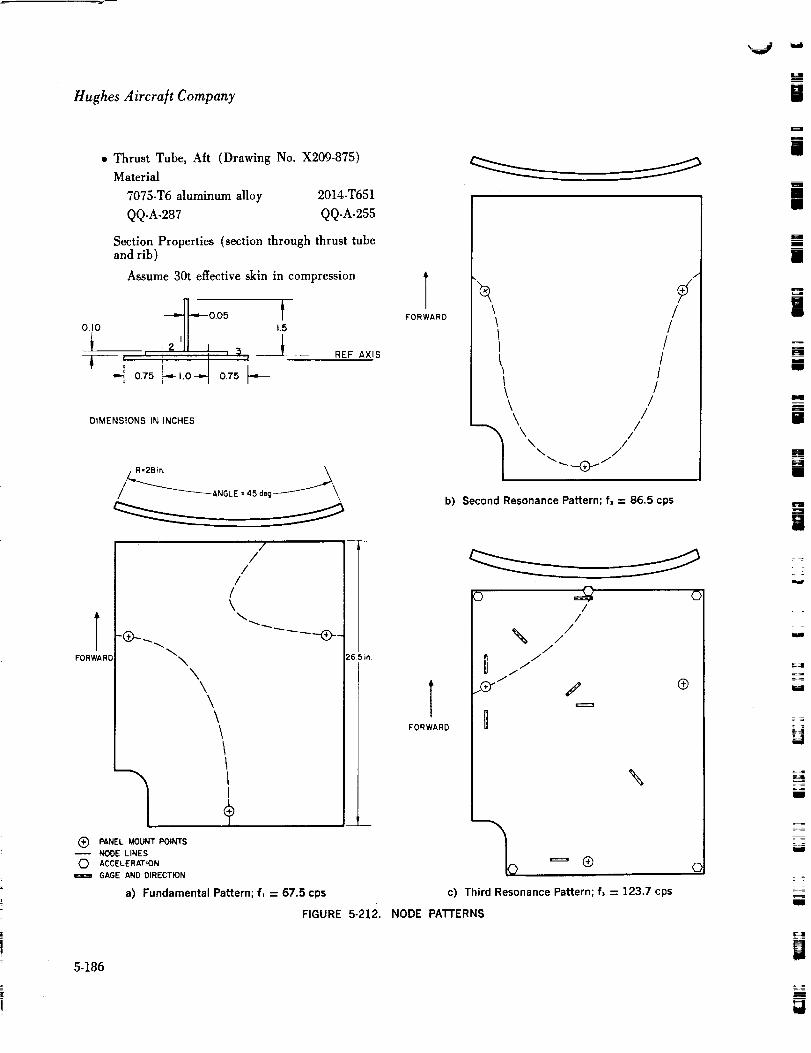
Hughes Aircraft Companym
B
• Thrust Tube, Aft (Drawing No. X209-875)
Material
7075-T6 aluminum alloy 2014-T651
QQ-A-287 QQ-A-255
Section Properties (section through thrust tube
and rib)
Assume 30t effective skin in compression
o,o ,_--oo0 It.5_ .12. _._ I
TFORWARD
DIMENSIONS IN INCHES
REF AXIS
ANGLE = 45 deg _
\\
\\\\
TFORWARD
II
\
I\\\
//
//
//
J
/t
///
/
i
imU
=mi
II
[]I
b) Second Resonance Pattern; f, = 86,5 cps
o _o o
//
//
/\
\
(_ PANEL MOUNT POINTS
NODE LINES
0 ACCELERATION
GAGE AND DIRECTION
a) Fundamental Pattern; f, = 157.5 cps
26 5 in,
TFORWARD
//
/\ /J
0 JJ
J
\
--_ '==3 ®
c) Third Resonance Pattern; f, = 123.7 cps
®
FIGURE 5-2!2. NODE PATTERNS
©
5-186

5. Spacecraft System Design
Item A y Ay Ay* Iox
1 1.4 X .050 0.070 0.85 0.0595 0.0505 0.0114
2 1.812 X .100 0.181 0.100 0.0181 0.0018
3 2.5 X .050 0.125 0.025 0.0031 - -
0.376 0.080-----70.0523 0.0114
m
y : 0.214 Ay 2 : 0.0173 0.0523
+ 0.0114
Ix = Ay 2 + Iox -- Ay 2 =
0.0637
--0.0173
0.0464 in 4
= x/0.0464/0.376
= 0.35
Total Effective Compression Area
A = 12 X 0.376 = 4.5 in 2
Effective Bending Section
A:5.887 in. z
_ :2.37 in.r. =599.4 In.4
321_
2 8
12 0 1(3tl
Assumptions
1) Entire tension side is effective
rib area : 0.251 in 2
2) Effective area in compression
A : 0.376 in 2
-- 0.214 inch
IREF AXIS
Item A y Ay Ay_ Iox
1 r X 14.34 × 0.050 2.250 9.14 20.6 188.0 43.52 0.2513 0.251 7.11 1.785 12.74 0.251 12.80 3.22 41.25 0.251 14.67 3.68 54.06 0.251 12.80 3.22 41.27 0.251 7.11 1.785 12.78 0.2519 0.376 -- 7.05 --2.65 18.7
10 0.376 --12.71 --4.79 60.911 0.376 --14.58 --5.48 79.912 0.376 --12.71 --4.79 60.913 0.376 -- 7.05 --2.65 18.7
5.887 13.93 588.9 43.5
y = 2.37 A_ = 33.0 Ix = 588.943.5
632.433.0
599.4 in'
Applied Loads
Assume 30 g lateral or longitudinal load atspacecraft cg
P = 1518 X 30 = 45,500 lb
Moment due to lateral load
M = 45,500 X (23.90 -- 3.5)
-- 927,000 in-lb
Calculated Stresses
P 45,500fc--
A 4.5--10,100 psi
Mc 927,000X (14.34+2.37)fB--
I
-- 25,900 psi
599.4
Allowable Stresses
•r_ E 7r_ X 10.5 X 10⁶FCoLuMN _
(L/C) 2 (10/.35) 2
bavg > 1.203-- 16.1
tar= 0.075
/61,000Fcc -- 34,000 X.]
_/67,00O
= 28,200 psi (see Figure 5-213)
>Fcy
5-187

it
!
_lughes A ircra[t Company
"1"
UZ
tlJ
r¢,el
CIto
tOtT)
Z
h0
tO
tO
0-rI..-
60
tt.
8O
20 • -
K3 K;
o IO
FIGURE 5-213.
,_.___K,/7 EFcc= _ 0.75 • cy
MATERIALS
7075-T6 AL. AL.
Fcy = 67,000 psiE = 10.5 x t06 psi
_'_ 6061-T6AL. AL.
= .55,000 psiFcv = I0.1 x 106 p=i
KI
20 30 40
b/t
ALLOWABLE CRIPPLING STRESSVERSUS b/t
Edge conditions:K, = 0.316 free-freeK, = 0.342 fixed-freeK, = 0.366 fixed-fixed
Margin of Safety
MS- 28,20025,900
1 = + 0.09
5O
• Ring, Separation (Drawing No. X209813)
Material
2014-T652 aluminum alloy
QQ-A.367
Section Properties
A -- 27r Rt.
-- 2 X _r X 14.41 X 0.085 -- 7.69 in z
I --- rrRat
-- r X 14.41 a X 0.085 -- 800 in'
Applied Loads
Assume 30g lateral or longitudinal load atspacecraft cg
P -- 1518 X 30 : 45,500 pounds
Moment Due to Lateral Load
M : 45,500 X 23.9 -- 1,090,OO0 in-lb
Calculated Stresses
P 45,500fc -- -- -- 5920 psi
A 7.69
5-188
Mc 1,090,000 X 14.41fB "--" _--
I 8OO
= 19,600 psi
Allowable Stresses
F.___c-- 0.871 En (R/t) = (L/R) n
0.871 X 10.5 X 106
(14.41/0.085) z.275(3.9/14'41) _5
= 26,800 psi
(For 99 percent Probability)
Margin of Safety
MS = .26'80019,600
1 : +0.36
• Rib Bulkhead Stiffener (Drawing No. X209788)
Material
Stiffeners: 7075-T6 AL AL
QQ-A-287
Basic rib: 2014-T651 AL AL
QQ-A-255
_-1 ]--,e,2 0.060
_1L_ o,oo+_
6.98
12.75 : 14.'5' ,' R_
H k 0.20
T%oo,,
-1o,o DIMENSIONSININCHES
v

5. Spacecra/t System Design
Applied loads, longitudinal
Load factor n, = dynamic + zero quasi-static
Load factor naAD = 6.7R (feet)
RL
DIMENSIONS IN INCHES
PL TWT :
PRAO. TWT =
Ru --
_M,, =
+
-4-
RL z
28.5 lb. X 27.0 = 769 pounds
(28.5 lb. X6.7 g/feet X 1.78 feet) ½
= 170 pounds (spin)
2.50 lb. X20.0 = 50 pounds
(2.50 lb. X 6.7 g/feet X 1.94 feet)
: 32.50 pounds (spin)
(3.60 lb X 14.0) 1/z = 25.2 pounds
(6.70 g/feet X 2.24 feet X 3.60
pounds) 1/3 : 18.0 pounds (spin)
25.2 -F 50.0 + 769 -- 844.2 pounds
9.92Ru -- 12.75 X 25.2 -- 8.95 X 50.0-- 6.98 X 769
8.72 X 32.50 -- 4.32 X 18.0-- 9.92 X 170 = 0
9.92R,: -- 321.0 -- 448.0- 5370 -- 285.0
78.0 -- 1685.0 : 9.92Rt. -- 8247.0 = 0
832.0 pounds
9.92Ri.- 8.95 X 50.0 -- 6.98 X 769-- 12.75 X 25.2
1.20 X 32.50 + 5.60 X 18.0 = 0
9.92RL -- 448.0 -- 5370.0 -- 321.0 4- 39.0
101.0 : 9.92RL -- 5797.0 = 0
585.0 pounds
Assumed Stiffener Check
Assume pressure tank loads are reacted bya plate 2.0 x 2.40 x 0.050, simply supportedeach edge.
f¢
o
a = 2.40 inches, b -- 2.0 inches, t -- 0.050 inches.
PL t,nk 769f_ -- -- -- 7690 psi
b X t 2.0 X 0.05
Allowable Stress
a 2.40-- -- 1.20
b 2.0
K = 3.62 (Reference 5-1, page 372)
FccR : KE (b) 2
Ft,, _ 65,000 psi for 2014 = T6
Fir : 59,000 psi
F¢._.= 61,000 psi
E -- 10.5 X 10" psi
Ec -- 10.7 X 10⁶ psi
Fccr_ = 3.62 X 1.07 X 6.25 X 108 = 24,200 psi
(Reference 5-2, page 3.2.1.0 (b))
Margin of Safety
MS--24.2
1 -- 2.157.69
5-189

Hughes Aircra[t Company
Shear Panel Check
qsm -- qMD --
Rv 844.2
h 9.92
85.01700 psi
0.050
-- 85.0 lb/in
Allowable Stress
Panel: MLGH 7.52 X 6.98 X 0.050
(see figure above)
a 7.52-- -- 1.075
b 6.98
K_ -- 7.6
FSCa _ K. E Ee = 1.07 X 10⁷ psi
F,ca -- 7.6 X 1.07 X 5.13 X 102 --- 4170 psi
(Reference 5-1, page 394)
Margin of Safety
4170MS--
17001 = 1.45
Flange-Crippling Check
Assume Rv as a compressive load.
AVLO --" 1.812 X 0.060 _ 0.1086 in 2
Ru = 834.0 pounds
834.0fc -- -- 7770.0 psi
0.1086
Allowable Stress
b 0.876--- -- 14.6 for Kz
t 0.060
Fcc _ 38,500 psi for 7075-T6
Fcy -- 67,000 psi 7075-T6
Fc_- -- 61,000 psi 2014-T6
Fc%=Fccj_ Fc''FcY1--38,500 0_.910
-- 38,500 X 0.954
Fcc._ -- 36,700 psi
(Figure 5-213)
5-190
Margin of Safety
36.7MS--
7.771 = 3.72
Rib-Thrust Tube Attachment
• MOTOR MTG RING
L CES,,_, I[ .MS20004 BOLT
/__., _ "_,../2 PLACES
A,TR,N ,"PLACESAN470AD.3__ _..j. _. \
8 PLACES ---_-_' 'NASI525-5
j/ 2 PLACES
SEPARATION RING V
THRUST TUBE
Assume upper cap load (Re) is reacted bymounting ring through the two AD5 rivets.
Assume lower cap load (R_.) is reacted by aftring and separation ring by eight AD3 rivets.
Shear (Rv) reacted by thrust tube by 14 AD5rivets.
Upper Cap
RL- --- 832 pounds
Shear 832-- -- 416
Rivet 2
Pounds
Rivet
Lower Cap
Assume RL -- Ru -" 832 pounds
Shear __ 832 __ 104.0 poundsRivet 8 rivet
Thrust Tube
Rv _- 844.2 pounds
Shear 844.2 __ 60.3 poundsRivet 14 rivet

Allowables
AN470AD3
Shear-- 247 --_ound
rivet
Bearing 0.020 7075-T6 sheet
(Reference 5-2, page 8.1.1.1.1(c) )
Bearing -- 192 X 1.44 = 277 poundrivet
(Reference 5-2, page 8.1.1.1.1 (e))
Bearing 0.050 2014-T6
Bearing -- 480 X 1.29 -- 619 poundrivet
AN470AD5
Shear = 675 poundrivet
Bearing 0.050 7075-T6 sheet
Bearing = 795 X 1.44 -- 1145pound
rivet
Margin of Safety
Upper Cap
675MS--
4160.1 = 0.61
Lower Cap
247MS -- -- 1 = 1.36
104.0
Thrust Tube
675MS -- -- 1 > 10
60.3
• Unit Assembly, Torus Support, Torus Ring
(Drawing No. X209851)
Material
2024-T4 aluminum alloyQQ-A-268
5. Spacecra/t System Design
Section Properties
O.Z5
0,0_'8
DIMENSIONS IN INCHES
A--" 2_r Rt
"- 2 X _ X 0.236 X 0.028 = 0.0415 in 2
I-- lrR3 t
---- _r X 0 .2363 X 0.028 = 0.001155 in 4
P : N/-_-" N/0"001155 -0"1670.0415
L/p = 17.5/0.167 "-- 105.0
Applied Loads
lS3 Ib
/ \Assume 30 percent of total lateral load is
resisted at one hi-pod
P = 0.30 X 610.2 : 183 pounds
a--b
a sin 17" 15' A- b sin 17" 15' = 183
2 a sin 17" 15' -" 183
a--310 pounds
Calculated Stresses
P 310fc -- -- -- 7460 psi
A 0.0415
P/Attach -- 310/2 : 155 pounds
5-191

Hughes Aircra/t Company
Allowable Stresses
_ EFc -- -- 9400 psi
(L/_) 2
Ps for AD3 rivet -" 217pounds
(Reference 5-2, page 8.1.1.1.1c)
Margins of Safety
9400MS_sn_ -- 1 "- + 0.26
7460
217MSRIvET -- -- 1 "-- + 0.40
155
P : 3}0 tb
• Fitting Lower Truss Subassembly, Torus Ring
(Drawing No. X209849)
Material
AZ60-A magnesium alloy
QQ-M-31
Section Properties259 Ib
ICJ8 Ib 'ql
/--.
5-192
A -- 0.32 X 0.31 = 0.099 inch _
Calculated Stress
P 310fc ---- -- -- 3130 psi
A 0.099
Allowable Stress
Fc_- -----30,000 psi (Reference 5-3)
Margin of Safety
MS__30, 0003130
1 --- high
• Fitting, Upper Truss Subassembly
(Drawing No. X209848)
Material
AZ60-A magnesium alloy
QQ-M-31
Section Properties
_i_0.152
\
183 Ib
A
Section A-A
P : _310 tb
DIMENSIONS IN INCHES

A "- 0.31 X 0.16 = 0.0495 in _
Calculated Stresses
P 310fc -- -- -- 6260 psi
AL 0.0495
P "183fs--
As 0.2 X 0.152 X 0.120
Allowable Stresses
Fc_ -- 0.39000 psi
Fsu -- 32000 psi
I 5020 psi
(Reference 5-3)
Margins of Safety
MSco_p- 30,000626O
22,OOOMSsHEAR--
5020
--1=,4,3.8
-- 1= -4- 3.39
• Ring Assembly, Torus
Material
2024-T4 sheet aluminum alloyQQ-A-355
Loads
Longitudinal loading condition.
Applied loads presented in Table 5-41.
*Use of this load for shear tearout of lug is conservative.
TABLE 5-41. APPLIED LOADSAll loadsapplied act forward longitudinally
_agni- Irude, I
ounds] NotationP, 33.6 ]t_ Solar
I3.2 I panelstoP' 3316 I torus tieP_ 2013 IA" AntennaP" 13.2 I to torusP' _'__'_=I tieP, 33.6 I
=-7= IS, SunP' ////"_J I sensortoP, I3.2 J torus tieP, 33.6 ]EN Rocket
20.3 [ motortoP,, A, 13.2 P,, A, 13.21 torustie
5. Spacecra/t System Design
Internal loads obtained by method presented
in Reference 5-4, page 319.
internal h)ads presented in Table 5-42.
TABLE 5-42. INTERNAL LOADS
StructureSection
A-A
B-B
Shear,pounds
17.00
31.00
BendingMoment,
in-Ib
161.50
1145.00
Torsion,in-lb
I31.28
200A3
TABLE 5-43. LOADS REACTIONAII reactions act aft longitudinally
Reaction
RI
R,R,R,
ReactionMagnitude,
pounds
-76.25-76.25-76.25-76.25
Reaction
R_
R_R,R,
Reaction
Magnitude,
pounds
-76.25-76.25-76.25-76.25
LOADS DIAGRAM
Load and Reaction Points Shown
View Looking Aft
x
PI \"P20 p_5
Pl 6;
13 TpI2
x
DIMENSIONS IN INCHES
5-193
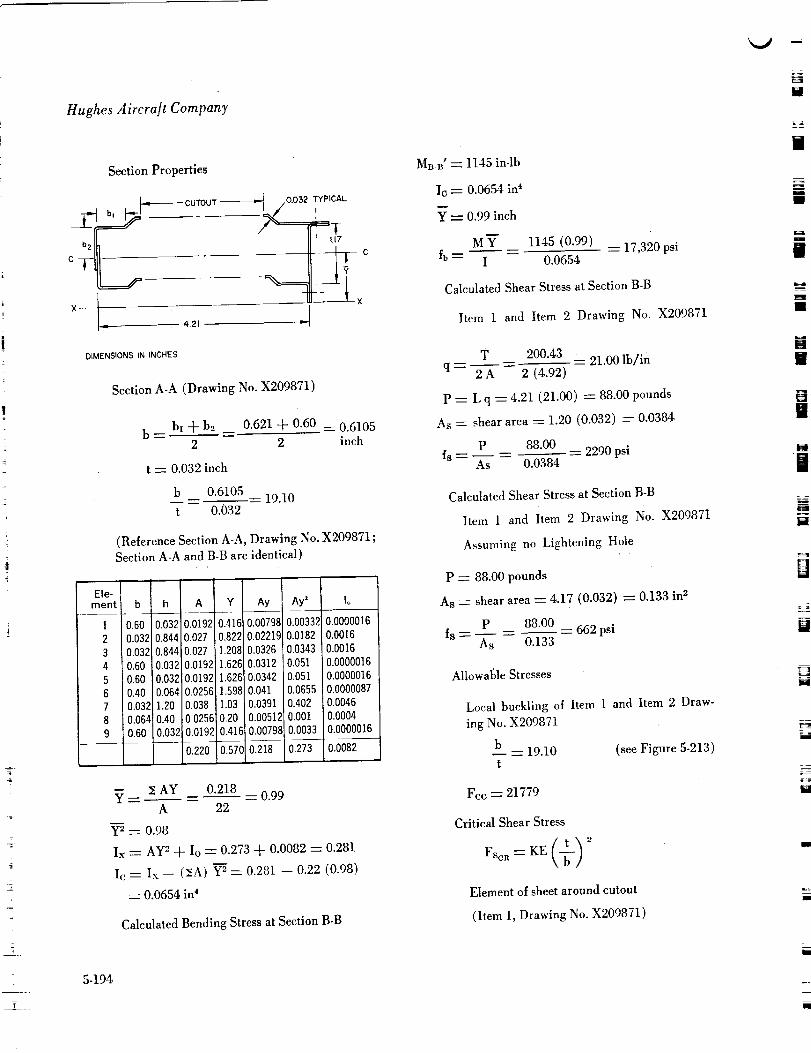
Hughes Aircra/t Company
Section Properties
CUTOUT --_-'-'_ 0.032 TYPICAL
,-'-t ", _! -'-. _L/ ,
DIMENSIONS IN INCHES
Section A-A (Drawing No. X20987I)
b -- bi -_ b2 __ 0.621 -I- 0.60 = 0.61052 2 inch
t -- 0.032 inch
b 0.6105--=_---19.10t 0.032
(Reference Section A-A, Drawing No. X209871 ;
Section A-A and B-B are identical)
,o- Io o o.oo oo, I 2 10.03210.S4410.02z10._210.0221910.01s210.0016I 3_ 10.03210.84410.0271!_08_10_26to.ou_i0.001_I 4 10.6010.03210.0_921!.6_2610.0312]0.05110.000001_I _ ]0._010.03210.0192!.-62910.034210.051i0.000001_I 6 JO.40JO.O64JO.0256,1.59810.04110.065510.0000087
7 10.03z11.2010.03B[1.0310.039110.40210.0046s I °'°64l°"4° I0.0256 0_.2010.0051210.00110.0004
, o io.o, Io,oo , lo.ooooo,
_ AY 0.218--- _ -- -- 0.99A 22
y2 = 0.98
Ix : AY e -4- Io : 0.273 -4- 0.0082 = 0.281
Ic : Ix -- (_A) y2 : 0.281 -- 0.22 (0.98)
: 0.0654 in 4
Calculated Bending Stress at Section B-B
5-194
Mz_' : 1145 in-lb
Io -- 0.0654 in 4
Y "-- 0.99 inch
MY
fb -- I
1145 (0.99)
0.0654--17,320 psi
Calculated Shear Stress at Section B-B
Item 1 and Item 2 Drawing No. X209871
T 200.43 -- 21.00 lb/inq.--2 A 2 (4.92)
P : L q -- 4.21 (21.00) - 88.00 pounds
As = shear area : 1.20 (0.032) : 0.0384
P 88.00fs -- _ -- -- 2290 psi
As 0.0384
Calculated Shear Stress at Section B-B
hem 1 and Item 2 Drawing No. X209871
Assuming no Lightening Hole
P:88.00 pounds
As--sheararea:4.17 (0.032) ---0.133in 2
P 88.O0fs-- -- _:662psi
As 0.133
Allowal_le Stresses
Local buckling of hem 1 and Item 2 Draw-
ing No. X209871
b-- 19.10 (see Figure 5-213)
t
Fcc--21779
Critical Shear Stress
FscR -- KE (_-) 2
Element of sheet around cutout
(Item 1, Drawing No. X209871)
%.v

".._./
J
tI__
j_
a 4.75-- -- 9.50
b 0.50
{l r_'lm**
L
From Reference 5-1, page 394
K -- 4.80
( 0.032 _2Fsc. -- 4.80 (10.5) X l06 \_/
Fsort -" 20 X 104 psi
From Reference 5-2, page 3.2.3.0(b)
Fs -- 0.6 Fty -- 28800 psi
Critical shear stress Item 1 and Item 2,
Drawing No. X209871 assuming no cutout.
4.'/5
FSCR = KE(+) 2 4.t7
DIMENSIONS IN INCHES
a 4.75-- 1.14
b 4.17
From Reference 5-1, page 394
K -" 7.75
Fscx-- 7.75 (10.5) X 10_ ( 0.032 _'-'k 4.17 /
FscR -- 4800 psi
5. Spacecraft System Design
Margins of Safety
Bending
21779MS'--_
17320
Shear
28800MS--
2290
"-- 1 : + 0.25
1--+11.50
48OOMS -- 662 1 -- -4- 6.25
• Support Assembly Sun Sensor
(Drawing No. X209868)
P2 LONGITUDINAL
fP3 LATERAL
_--u3
R7
t R R 3 R R2 R 4
Weight of sensor assembly only -- 0.26 pounds
Sign eonvention - positive shown
Design Conditions
I - Radial g -- -k- 84.8
Londitudinal g = 0
II - Radial g _ -k- 14.8
Longitudinal g _- -+- 70.0
III- Lateral g --- -4- 70
Londitudinal g -- 0
IV- Londitudinal g -- --_+73
Lateral g -- 0
V- Radial g -- 14.8
Lateral g -- -4- 70
Material
7075-TN AL AL sheet
QQ-A-283
t--0.025
5-195

T
Hughes Aircra[t Company
Section Properties Section A-A
o0.5;'1 O._SZ "_
NAi
= ]_
DIMENSIONS tN INCHES
I_A --- 4.7 (10 -4) in 4
Y --- 0.20 inch
A -- 0.026 in _
Critical Load Condition
Condition III
Ra -- R4 = 39.2 pounds
RG -- R7 = 10.8 pounds
Moment due to above loads at Section A-A
M -- 10.8 (7.5) -- 39.2 (1.13) : 36.7 in-lbs
Calculated Stresses
P 40f_.-- -- -- 1540 psi
A 0.026
MC 36.7 (.32)fi_ -- -- = 25,000 psi
I 4.7 (10 -4)
Allowable Stress
Fcc --28,000
for b/t -" 20 7075-T6 AL AL sheet (Figure 5-213)
Margin of Safety
fc=26,540 psi
MS_ 28'000 1=0.0526,540
• REFERENCES
5-1. Peery, D. J., Aircra]t Structures, McGraw-Hill Book Company, New York, New York, 1949.
5-196
5-2. Armed Forces Supply Support Center,"Strength of Metal Aircraft Elements," MIL-HDBK-5, Washington 25, DC, August 1962.
5-3. Magnesium Design Data Book, Dow MetalProducts 1957.
5-4. Den Hartog, J.P., Advanced Strength o] Ma-terials, McGraw-Hill Book Company, New York,New York, 1952.
Mass Property Analysis. The majority of the
mass properties engineering effort during the
Interim Contract period was expended to main-
tain the weight and roll-to-pitch (R/P) moment
of inertia ratio desired for the test model Ad-
vanced Syncom, HSX-302-T2. Configuration
changes were extensive, and the corresponding
weight values associated with these changes were
described in each of the Monthly Progress Re-
ports.
Configuration changes and updating of elec-
tronic component weights did not cause the space-
craft weight to exceed the specified 1518-pound
maximum weight of separation from the Altas/
Agena booster. The weight objective can be
achieved and maintained. The minimum R/P
objective of 1.10 for the final orbit condition
(after bipropellant depletion -- nominally seven
years) has been achieved but is difficult to main-
tain. Continued effort toward mass properties
control is necessary to prevent exceeding the
maximum spacecraft weight and to provide mass
distribution analyses that will ensure acceptable
R/P ratios.
A degradation of the R/P to a low of 1.05 for
the final orbit condition was noted in the July
Monthly Progress Report. Design changes that
contributed to the R/P degradation were:
1) Increasing length and thickness of solar
panels.
2) Increasing thickness of protective cover
glass of solar cells.
3) Increasing electronic subsystem weights.
kd
id
qII

=
4) Changing structure subassembly at the for-ward and aft extremities.
5) Relocating ballast and balance weights
from the center-of-gravity plane.
Various design changes to basically the same con-
figuration were analyzed to increase this R/P.The roll moment of inertia was considered as
optimum since the various components arelocated
as far outboard as possible; therefore, studies
were made to decrease the pitch moment of iner-
tia and its transfer distance to the spacecraft
center o1" gravity. Resulting design changes in-
cluded:
1) Shortening the solar panel length by re-
moving 1.50 inches from the forward end.
Solar cell strings were shortened by 2 cells
in each row of panels to accomplish this.
2) Shortening the aft ribs 0.8 inch.
3) Moving apogee motor and mount ring 0.8inch aft.
4) Moving the torus ring 1.25 inches aft and
adjusting associated components mounted
to it accordingly.
5) Mounting the telemetry transmitter and
regulator in forward area.
6) Mounting the wire harness in forward area.
7) Reducing weight.
8) Adjusting the spacecraft ceiater of gravity.
These design changes accounted for the R/P
of 1.ll given in the August report.
The September Progress Report included
ttughes calculated values of weight, balance, and
moment of inertia for the JPL apogee motor in
the prelaunch and burned-out conditions in lieu
of JPL estimates. Inclusion of the Hughes-cal-
culated values for the JPL apogee motor would
show a lower R/P ratio. Additional changes that
5. Spacecra/t System Design
were made in the structural configuration to
maintain the R/P ratio are as follows:
1) Moving torus 2.5 inches aft and adjusting
associated mounted components.
2) Mounting batteries +--2.0 inches from
spacecraft center of gravity.
3) Re-evaluating the wire harness for weight
and moving it forward of the center sub-
assembly.
4) Updating the electronic subsystem weights.
5) Increasing the thermal shield weight esti-
mate.
6) Redesigning the solar panel supports be-
cause of rotation of 221/_ degrees in panels
about spacecraft.
7) Making numerous design changes in struc-
ture.
The final orbit condition roll-to-pitch ratio given
in the September report was 1.10, which is still
being maintained.
A special study aimed at increasing the R/P
ratio was undertaken. It includes redesign of the
spacecraft center section and elimination of the
ribs in the aft area. Rib-mounted electronic units
were relocated to the aft face of the aft bulk-
head; a forward bulkhead was added to the cen-
ter section; the batteries were mounted to the
bulkheads in the center subassembly area; and
the quadrant packages were designed to incorpo-rate individual or sets of electronic boards. The
wiring harness was located aft of the quadrants
to prevent the center of gravity from moving into
the forward row of solar panels. A final orbit
R/P of 1.132 was obtained with the configuration
used in this special study. An increase to 1.145
was noted if the batteries were moved to within
+-- 2.0 inches from center of gravity and a lighter
gage torus assembly was used. It was apparent
5-197

Hughes Aircra/t Company
from these studies that the R/P of 1.20 for the
final orbit condition could not be achieved with
the current design parameters for the GFE apo-
gee motor.
The current mass property data for the Ad-
vanced Syncom Model HSX-302-T2 is listed in
Tables 5-44, 5-45 and 5-46.
TABLE 5-44. DETAILED DESCRIPTION OF WEIGHTCHANGES SINCE THE MONTHLY PROGRESS REPORT
FOR SEPTEMBER 1963
Description of Weight Change
WeightChange,pounds
Electronicsubsystem (+ 5.6)Revised estimate, electronic quadrants +1.8Revisedestimate, repackagedrib-mountedcomponents + 2.0Revised estimate, communicationsantenna +1.8
Wire harness subassembly (--I.1)Redesignedmainwire harness + 3.7Incorporate quadrant harnessesinto main harness --4.8
Power supplysubsystem (--0.1)
Batterycell weightbasedonspecification --0.5Revisedestimate, edgetreatment of substrate --1.4
Increasequantity of diodes + 1.8
Controlsubsystem (--6.1)AmendedMarquardt estimate to reflect latestfright spacecraft estimates --6.1
Structuresubsystem (+4.1)Aft subassembly, miscellaneouschanges + 0.3Redesigninsolar panel supports + 1.3New estimate quadrant packagemountingbrackets +2.2
Revised estimate, reaction control system tanksupports +0.5Revisedestimate, battery supports + 3.9Centersubassembly,miscellaneouschanges --0.50esign changes,trussassembly + 0.3Decrease ingageintorus assemblyplusmiscellaneous design changes --3.2Redesignof whip antennamount --0.7
Miscellaneoussubsystem (+20.0)Estimate for weight necessaryto maintainspacecraft center of gravity, roll-to-pitch ratio,and principalaxis +20.0
Ballast subsystem (--22.4)Decreasedin order that the maximumspacecraftweight may be maintained --22.4
Net weight change in payloadseparation 0.0
TABLE 5-45. CURRENT WEIGHT STATUSOF HSX 302-T2
Current Targett,w *, Weight, Weight,
Subsystem pounds pounds pounds ¢_ _ ¢= • =
Electronics + 5.6 184.1 157.4 0.302 0.171
Wireharness -- 1.1 14.9 16.4 0.024 0.010
Powersupply -- 0.1 112.6 112.5 0.I85 0.074
Controls(dry) -- 6.1 47.1 49.9 0.077 0,031
Propulsion 0 102.6 102.0 0.168 0.068
Structure + 4.1 I08.1 94.2 0.177 0.071
Miscel-laneous +20.0 37.8 14.5 0.062 0.025
Ballast : --22.4 2.8 62.5 0.005 0.002
Finalorbitcondi-tion 0.0 610,0 609.4 1.000 0,402
Roll-Current h ,,, h-,., to-Weight, Z-Z, slug- slug- Pitchpounds inches ft I ft' Ratio
Final orbitcondition 610.0 23.90 57.71 52.50 1.10
N, pressurant 2.6 ....N,H,-CH, fuel 51.6 ....N,O, oxidizer 81.9 ....
Total at apogeeburnout (746.1) 23,90 71.61 59.45 1.20
Apogeemotorpropellant 752.3 ....
Apogeemotorexpendables 19.6 ....
Total Payloadatseparation 1518.0 23.03 88.42 76.46 1.16
*Change in subsystem weight since last report.
**Ratio of subsystem weight to final orbit condition weight,
***Ratio of subsystem weight to total payload at separation.
Thermal Control. The main effort of the ther-
mal control task during this report period hasbeen to:
1) Specify a vehicle thermal control system
compatible with Syncom temperature re-
quirements, mission objectives, and all
modes of spacecraft operation
== !
I1
5-198 Ji

5. Spacecraft System Desigr_
fr,
TABLE 5-46. DETAILED WEIGHT BREAKDOWN FOR HSX-302-T2i
Component
Electronicssubsystem475025475220
475222
475125475174
475171475173475170
475172
475030250203
250202475103
475204475204475200
Weight,pounds
Electronic quadrantTelemetry transmitter
Regulator-- telemetryrib.mounted unitsantenna electronics
Traveling-wave tube (TWT)TWTpower supply3 db hybridRFswitchPhaseshift driver
Telemetry and test coupler,antenna compartmentCommunicationantenna
TransmittermultiplexerReceivermultiplexer
Directional receivercouplercoaxial cable,antenna subsystemWhipantennaWhipantennaBalun hybrid
(184.12)117.49"
2.00"
1.12"
8.308.75*
10.00"
0.25*1.08"4.00*0,52*
19.51"
5.25*2.86*0.06*0.15"
0.64*0.64*
1.50"Wire harness subsystem
475300 Main harness
Power supply subsystemX209799 ForwardbatteryX209799 Aft batteryX209781 Substrate-solar cellX209888 Solar ceil
Control subsystemAxial engineAxial engineSwivel mountSwivel mountRadial engineRadial engineRadiation shieldRadiation shieldThrust alignment motor
Thrust alignment motorTankReliefvalveRelief valve
Fill propellant valveSolenoid latch valve
Tubing and fittingsPressure transducer
Temperature transducerRadial restfictor (variable}Axial restrictor (variable)Radial filter
Axial filterMiscellaneous
(14.86)14.86"
(112.65)27.28*27.28*23.27**34.82**
(47.13)1.20"
1.20"1.66"
1.66"1.20"120"0.68*0.68*0.35*0.35*
26.96*0.76*0.76*1.92"0.80*3,30*1.40"0.05*0.23*
0.23*0.03*0,03*0.48*
Component
Apogeemotor subsystemX209749 Apogeemotor
Structure subsystemX209862 Aft subassembly
Separation ringAft thrust tube
Motormount ringRibs
FrameringAft bulkhead
Miscellaneoushardware
X209813X209875X209812X209896X209816X209882
X209862X209793
+ 879 Solar panel attachmentsX209863 Miscellaneous
X209883 Center subassemblyX209874 Center thrust tubeX209884 Tube stiffener
X209857 Zee support ringX209885 Quadrant supportX209883 Miscellaneoushardware
X209855 Solar panel retainer supportX209785 Solar panel retainerX209854 ForwardchannelsupportX209908 Radial enginesupportX209876 Forwardtank supportX209890 Aft tanksupport
Battery supportX209863 Miscellaneous hardwareX209850 Forward subassemblyX209851-1 Truss tube
X209848 Forward truss fittingsX209850 Forward fittings hardwareX209849 Aft truss fittingsX209850 Aft fittings hardwareX209853 Support channelX209871 Torus assemblyX209880 Solar panel supportX209863 Miscellaneous hardware
Wire harness support
Rib-mountedunits supportX209856 Communicationantenna supportX209902 Whipantenna support
Control subsystem supportMiscellaneous subsystem
X209866 Sun sensorPaint
Nutation damperX209909 Ground plane
X209111 GroundplaneX209910 Thermal barrier
Center-of-gravity controlCenter.of.gravity control
Weight,pounds
(102.59)
102.59"(108.07)
4.09**4.71"*5.34*
16.20"0.94**6.53*
0.87**
2.78**1.40"
5.65*5.68*0.32*2.24*0.78*3.92*
0.51"*1.80"
1.68"1.56"5.64*
14.64"3.10"
1.074*0.39**0.07*
0.66**0.I0"0.74*4.49**2.60**0.50*2.00*1.43"1.64"*0,65"1.35"
(37.79)1.15"3.00*2.00"0.87"1.77"4.00*0.40*
12.60"
5-199

Hughes Aircra]t Company
TABLE 5-46. (continued)
Component
Static-dynamic balanceStatic-dynamic balancePrincipal axis controlPrincipal axis controlR/P controlR/P control
Ballast subsystemAft ballastForwardballast
CurrentWeight, I Z-Z,
pounds _inchesi
Finalorbit 609.97 [ 23.90condition i
N, pressurization -- 2.60*
N,H,-CH_ fuel -- 51.61"
N,0, oxidizer -- --
Total at apogee 746.09 23.90burnout
Apogee motor 753.30* --propellant
Apogeemotor 19.61" --expendables
Payloadat 1518.00 23.03separation
Finalorbitcondition
Actual
Calculated
Estimated
Weight
0,
82.84
1435.16
]518.00
It-It
slug-ft'
57.71
i
71.61
m
88.46
Weight,pounds
2.69*2.31"0.87*1.13"
2.50*2.50*
(2.76)1.20"1.56"
Roll-I.... to-
slug- Pitchft' Ratio
52.50 1.10
59.45 120
76.46 1.16
Percent/1OO
0,
0.055
0.945
1.000
*Estimated.
**Calculated.
***Actual.
2) Determine subsystem temperature limits
during normal steady state orbital mode
3) Investigate vehicle transient response to
firing of the apogee and reaction control
motors
The thermal control system concept has been
specified and is based purely on the results of
analytical findings. A detailed nodal analytical
model has been developed to a point of approx-
imately 75 percent completion and is expected
to be completed and used extensively during the
early months of the Advanced Syncom develop-
ment and launch program. A single node vehicle
parametric analysis has been completed in which
the effects of solar orientation, vehicle power dis-
sipation, vehicle outside surface properties, etc.,
on spacecraft temperatures has been studied. A
vehicle thermal system analysis has been made
from which a preferred thermal control system
has been specified.
Subsystem thermal analytical studies have
been completed on generally an individual basis.
Reaction control system thermal analyses have
been performed for both the radial and axial jets.
Solar panels have been investigated for both the
steady state and eclipse modes of operation. The
apogee motor effect on the spacecraft has been
studied from the point of view of vehicle warmup
due to motor firing, motor plume effects on the
forward end of the spacecraft, and thermal
energy leakage rates from the vehicle through the
apogee motor during the normal orbital phase of
the spacecraft. The communications antenna has
been thermally analyzed to determine normal
orbital maximum and minimum temperatures
and antenna component heating during apogee
motor firing. The Advanced Syncom temperature
sensor locations and telemetry format have alsobeen established.
Vehicle Thermal Control System Analysis.
The Advanced Syncom spacecraft detailed nodal
thermal analysis has been partially completed.
A quarter section of the vehicle has been simu-
lated by a thermal network consisting of approx-
imately 60 nodes. The analytical model is shown
in Figure 5-214, indicating nodal locations and
nodal numbers. Much of the input data requiredhas been calculated and tabulated for future
llt
i
%
m
5-200- i
w
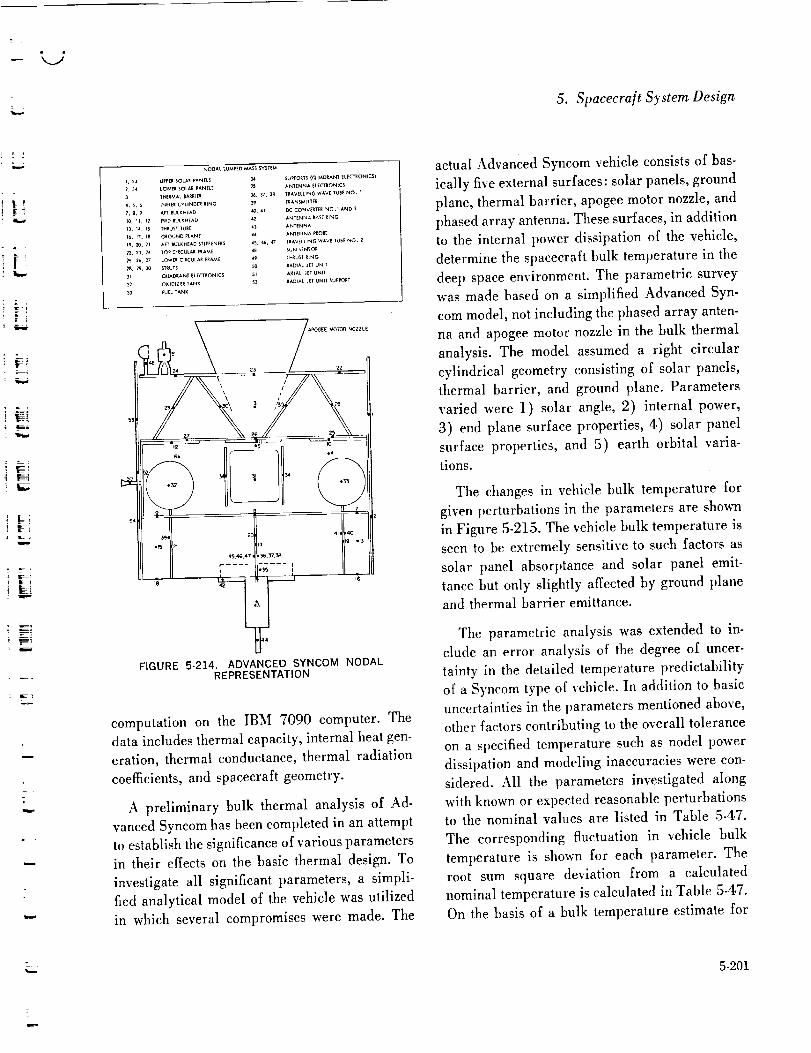
5. Spacecratt System Design
Ii
4i
i
_ E7
L_
_OOAL _uMP_O _w45$5YSTE_
i, 53 UtPERSOLAI PANELS 34 S_ORTS (OUAOeAN¢ ELE_KON_CS_
2, 54 tOWEl SOLAI FANELS 35 ANIENNA ELEC_ONIC_3 _HE_MAL_IIE_ _, 3?, 3_ ?mAVE_tINGW_VE T_I_ NO. 1
S, 5, 6 tNN_ CYUNDE_lIN_ 39 TIANS_IITE_
7, 8, 9 AF_ BULKMEAD _, 4_ DC CONVEITEI _O,1 AND 2
10, l I, _ _ BUtKHEAO 4_ ANTENN_ &AS__NG
13, _, 15 T_RUSTIUIE 4_ ANTENN_la, 17, 18 _OUNO _tA_E _ ANTENNA _O_E
I_, _, _i A_ _ULKHEAOSTIrF_N_ _5, _, _7 ImAVEttlNG W_VE IU_[ NO. 2
SUN_N_
_, 16r _ LOW_ ClIC_LAR FR_E _ YHRUS_I_NG
31 _UADtANI ELeCTrONICS _ AXtAL _ETUNI_
3_ OXlDIZ_I lANK 5_ IADI_L JETUNII 5UP_T
_UELT_
/bJ_),_EE MOTOR NOZZLE
I 51
_4
FIGURE 5-214. ADVANCED SYNCOM NODALREPRESENTATION
computation on the IBM 7090 computer. The
data includes thermal capacity, internal heat gen-
eration, thermal conductance, thermal radiation
coefficients, and spacecraft geometry.
A preliminary bulk thermal analysis of Ad-
vanced Syficom has been completed in an attempt
to establish the significance of various parameters
in their effects on the basic thermal design. To
investigate all significant parameters, a simpli-
fied analytical model of the vehicle was utilized
in which several compromises were made. The
actual Advanced Syncom vehicle consists of bas-
ically five external surfaces: solar panels, ground
plane, thermal barrier, apogee motor nozzle, and
phased array antenna. These surfaces, in addition
to the internal power dissipation of the vehicle,
determine the spacecraft bulk temperature in the
deep space environment. The parametric survey
was made based on a simplified Advanced Syn-
corn model, not including the phased array anten-
na and apogee motor nozzle in the bulk thermal
analysis. The model assumed a right circular
cylindrical geometry consisting of solar panels,
thermal barrier, and ground plane. Parameters
varied were 1) solar angle, 2) internal power,
3) end plane surface properties, 4) solar panel
surface properties, and 5) earth orbital varia-tions.
The changes in vehicle bulk temperature for
given perturbations in the parameters are shown
in Figure 5-215. The vehicle bulk temperature is
seen to be extremely sensitive to such factors as
solar panel absorptanee and solar panel emit-
tance but only slightly affected by ground planeand thermal barrier emittance.
The parametric analysis was extended to in-
clude an error analysis of the degree of uncer-
tainty in the detailed temperature predictability
of a Syncom type of vehicle. In addition to basic
uncertainties in the parameters mentioned above,
other factors contributing to the overall tolerance
on a specified temperature such as nodel power
dissipation and modeling inaccuracies were con-
sidered. All the parameters investigated along
with known or expected reasonable perturbationsto the nominal values are listed in Table 5-47.
The corresponding fluctuation in vehicle bulk
temperature is shown for each parameter. The
root sum square deviation from a calculated
nominal temperature is calculated in Table 5-47.
On the basis of a bulk temperature estimate for
5-201
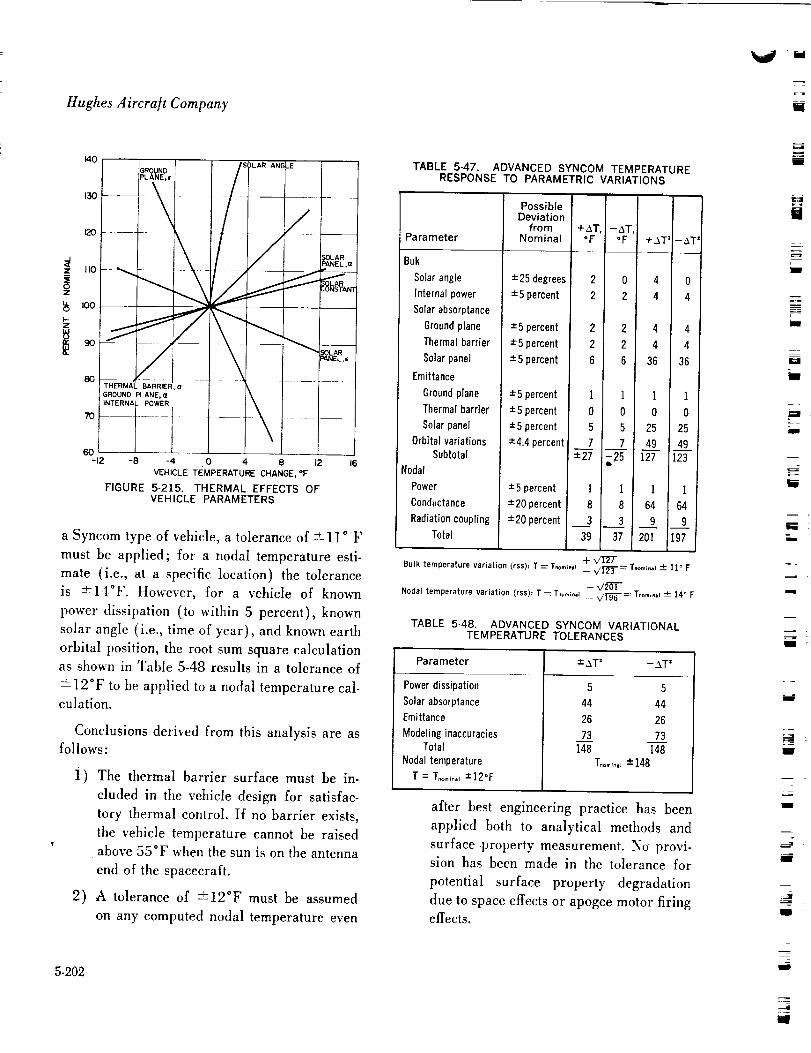
Hughes Aircra/t Company
140
130
120
z I10
z
" I000
F-z
SOLAR
' I't _-P-,__/
/ \\
\
THERMAL BARRIER, 0
GROUND PI_ANE, (;IiNTERNAL POWER
BO
7O
6O-12 -B -4 O 4 8 12
VEHICLETEMPERATURECHANGE,°F
FIGURE 5-215. THERMAL EFFECTS OFVEHICLE PARAMETERS
a Syncom type of vehicle, a tolerance of ±ll* F
must be applied; for a nodal temperature esti-
mate (i.e., at a specific location) the tolerance
is +-14*F. However, for a vehicle of known
power dissipation (to within 5 percent), known
solar angle (i.e., time of year), and known earth
orbital position, the root sum square calculationas shown in Table 5-48 results in a tolerance of
-12*F to be applied to a nodal temperature cal-culation.
Conclusions derived from this analysis are asfollows:
i) The thermal barrier surface must be in-
cluded in the vehicle design for satisfac-
tory thermal control. If no barrier exists,
the vehicle temperature cannot be raised
above 550F when the sun is on the antenna
end of the spacecraft.
2) A tolerance of -+12°F must be assumed
on any computed nodal temperature even
5.202
TABLE 5-47.RESPONSE TO PARAMETRIC VARIATIONS
Parameter
Buk
Solar angle
Internal power
Solar absorptance
(;roundplane
Thermal barrier
Solar panel
Emittance
Groundplane
Thermal barrier
Solar panel
Orbital variationsSubtotal
Nodal
Power
Conductance
Radiation coupling
Total
ADVANCED SYNCOM TEMPERATURE
+ AT = - AT'
PossibleDeviation
from +AT, i -AT,Nominal °F °F
+25 degrees 2 0 4 0
+ 5 percent 2 2 4 4
+5 percent 2 2 4 4
± 5 percent 2 2 4 4
"5 percent 6 6 36 36
±5 percent 1 1 1 1
•.5 percent 0 0 0 0
±5 percent 5 5 25 25
+4.4percent 7 I-7 49 i 49•.27 , ;25 127 123
ii
±5 percent 1 I 1 1
±20 percent 8 8 64 64
•.20percent . 3 _ 9
39 37 201 197L
Bulk temperature variation (rss): T _ T.omF.61 +-- "V_--'-- T.omi.,_ -----it ° F
+ _/2"0T"Nodal temperature variation (rss): T _-T.omr..= _ V' 919E'-----T.o.,_.=l ± ]4 ° F
TABLE 5-48. ADVANCED SYNCOM VARIATIONALTEMPERATURE TOLERANCES
Parameter
Power dissipation
Solar absorptance
Emittance
ModelinginaccuraciesTotal
Nodal temperature
T = l'.o._o,,+12°F
±,3.T' -_T'
5 5
44 44
26 26
73 73148 148
Too,_Fo._± 148
after best engineering practice has been
applied both to analytical methods and
surface .property measurement. No provi-sion has been made in the tolerance for
potential surface property degradation
due to space effects or apogee motor firingeffects.
i
i
U
i
J
m
U
lW
m
i
-]
i

t_ .
_" Although the space effects on thermal proper-
ties of proposed Advanced Syncom outside sur-
faces (ground plane, thermal barrier, solar cells,
etc.) are not known, an attempt has been made
to evaluate vehicle sensitivity to these possible
effects. A simplified analytical model of the Ad-
vanced Syncom spacecraft has been analyzed to
determine the effect on bulk temperature of pos-
sible changes in the surface nominal thermal
properties due to ultraviolet exposure, micro-
meteorite impingement, apogee motor blast, etc.
The analytical model was parametrically evalu-
ated for changes in solar absorptance and IR
t_'_ emittance of the thermal barrier, ground plane,
and solar panels. Results for various degrees of
degradation are shown in Figure 5-216 on a root
sum square temperature deviation basis. It can
be seen that significant temperature variations
can exist for relatively small surface degradation
J E_
30
5m_ _5
g
o 2
= .m
6
TIME AFTER LAUNCH, YEARS
FIGURE 5-216. SURFACE DEGRADATION EFFECTSON VEHICLE TEMPERATURES
I,i,i
5. Spacecra/t S)'stcrn Design
rates; i.e., at only 5 percent per year degradation
to all surfaces, a temperature variation of ap-
proximately 25 ° F can be expected to exist after
3 years.
In an attempt to determine the optimum ther-
mal control system for Advanced Syncom, a two-
surface or two-node analytical model of the
spacecraft has been utilized. The model approx-
imates the vehicle as consisting of solar panels
and vehicle bulk structure with only radiation
exchange occurring between the two. The analysis
has been performed with emphasis on determin-
ing 1 ) spacecraft orbital bulk temperature varia-
tions, 2) vehicle axial gradients at extreme sun
positions, 3) potential need for active thermal
control system, and 4) a general overall thermal
design concept.
Results have yielded vehicle bulk and solar
panel temperatures at high and low power for
three spacecraft configurations varying from the
Syncom 2 thermal control concept to the concept
of complete isolation of the spacecraft ends from
deep space. A preferred thermal control systemhas resulted and the recommendation has been
made to incorporate a completely passive thermal
control technique in the Advanced Syncom ve-
hicle design. Limiting conditions for the recom-
mended design have been specified, and major
areas of potential problems and uncertaintieshave been discussed.
The analytical model considered a cylindrical
vehicle as one node and cylindrical solar panels
as the other. The resulting equations were solved
for vehicle bulk and solar panel temperatures for
high and low power modes, solar angles of 90
-4- 25 degrees, and three configurations varying
from the Syncom 2 concept of enclosed ends to
the idealized concept of perfectly insulated ends.
Results are stlown in Figure 5-217 for the three
configurations at the high power mode condition.
5-203
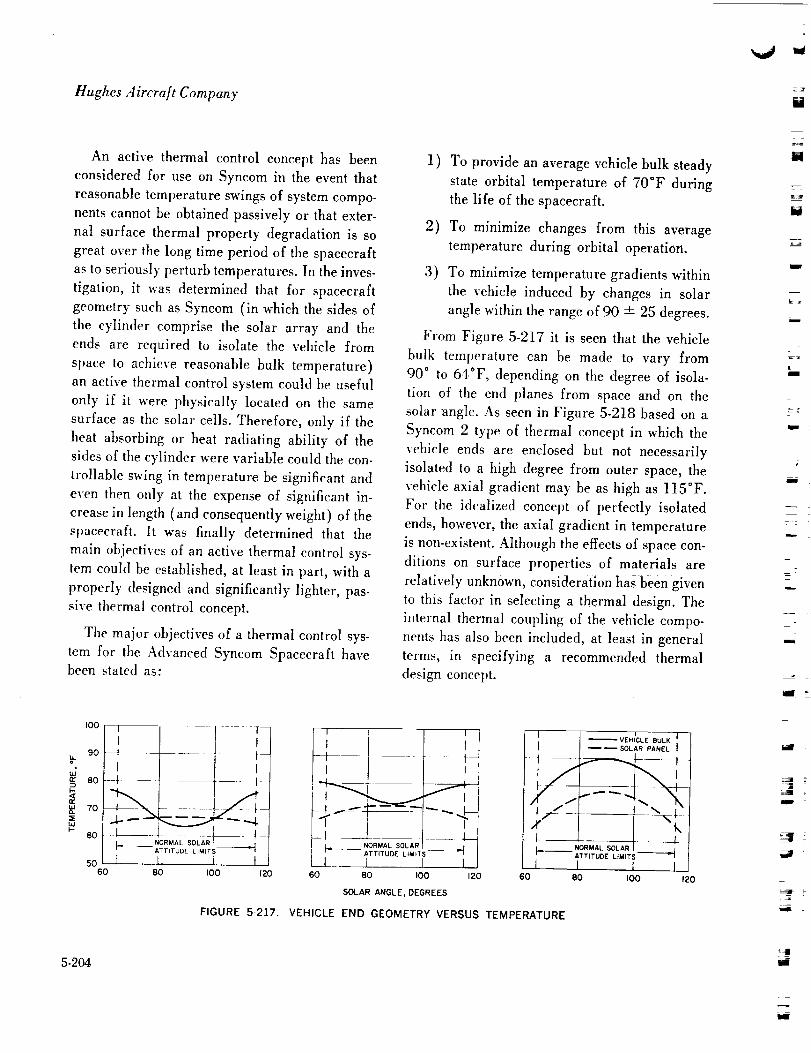
Hughes Aircra/t Company
An active thermal control concept has been
considered for use on Syneom in the event that
reasonable temperature swings of system compo-
nents cannot be obtained passively or that exter-
nal surface thermal property degradation is so
great over tile long time period of the spacecraft
as to seriously perturb temperatures. In the inves-
tigation, it was determined that for spacecraft
geometry such as Syncom (in which the sides of
the cylinder comprise the solar array and the
ends are required to isolate the vehicle from
space to achieve reasonable bulk temperature)
an active thermal control system could be useful
only if it were physically located on the same
surface as the solar cells. Therefore, only if the
heat absorbing or heat radiating ability of the
sides of the cylinder were variable could the con-
trollable swing in temperature be significant and
even then only at the expense of significant in-
crease in length (and consequently weight) of the
spacecraft. It was finally determined that the
main objectives of an active thermal control sys-
tem could be established, at least in part, with a
properly designed and significantly lighter, pas-
sive thermal control concept.
The major objectives of a thermal control sys-
tem for the Advanced Syneom Spacecraft havebeen stated as:
1) To provide an average vehicle bulk steady
state orbital temperature of 70°F during
the life of the spacecraft.
2) To minimize changes from this average
temperature during orbital operation.
3) To minimize temperature gradients within
the vehicle induced by changes in solar
angle within the range of 90 +- 25 degrees.
From Figure 5-217 it is seen that the vehicle
bulk temperature can be made to vary from
90 ° to 64°F, depending on the degree of isola-
tion of the end /)lanes from space and on the
solar "angle. As seen in Figure 5-218 based on a
Syncom 2 type of thermal concept in which the
vehicle ends are enclosed but not necessarily
isolated to a high degree from outer space, the
vehicle axial gradient may be as high as l15°F.
For the idealized concept of perfectly isolated
ends, however, the axial gradient in temperature
is non-existent. Although the effects of space con-
ditions on surface properties of materials are
relatively unknown, consideration has been given
to this factor in selecting a thermal design. The
internal thermal coupling of the vehicle compo-
nents has also been included, at least in general
terms, in specifying a recommended thermal
design concept.
I00
9O
dso
7o
60
5060
NORMAL SOLAR--ATTITUDE LIMITS
f [ L . .80 tOO
----T_
It-I
I-
I
_-'__.. NORMAL SOLAR I
ATTITUDE LIMITS
L_I I I
60 BO I00
SOLAR ANGLE, DEGREES
!t20
t I I _VlEH_OLE BULK I [
J I ----SOL;R_'A'_E_I |
I _- NORMAL SOLAR [ _-I
li i f60 BO tOO 120
FIGURE 5-217. VEHICLE END GEOMETRY VERSUS TEMPERATURE
5-204
N
M
=Y
=
_J

|]
li,..
I ;140
SUN DIREC TION
120IO0
5. Spacecraft System Design
SUN DIRECTION
___///
=
¶ W
IE
I--
8O
6O
4OT (NOMINAL)
2O
0
APOGEE SPiN AXIS LOCATIONMOTORNOZZLE
_\\\\\\\\\\\\\\\\\'_ ENGINEERING TOLERANCES
SUN DISTANCE VARIATIONS
IllliiiliillI PASSIVE EQUIPMENT TEMPERATURE RANGE (NOMINAL)
APPLIES TO PASSIVE EQUIPMENT ONLY
ASSUMES NO SURFACE THERMAL DEGRADATION
ANTENNAE L ECTRON ICS
FIGURE 5-218. ADVANCED SYNCOM VEHICLE ORBITAL TEMPERATURES WITHSYNCOM 2 TYPE THERMAL CONTROL SYSTEM
5-205
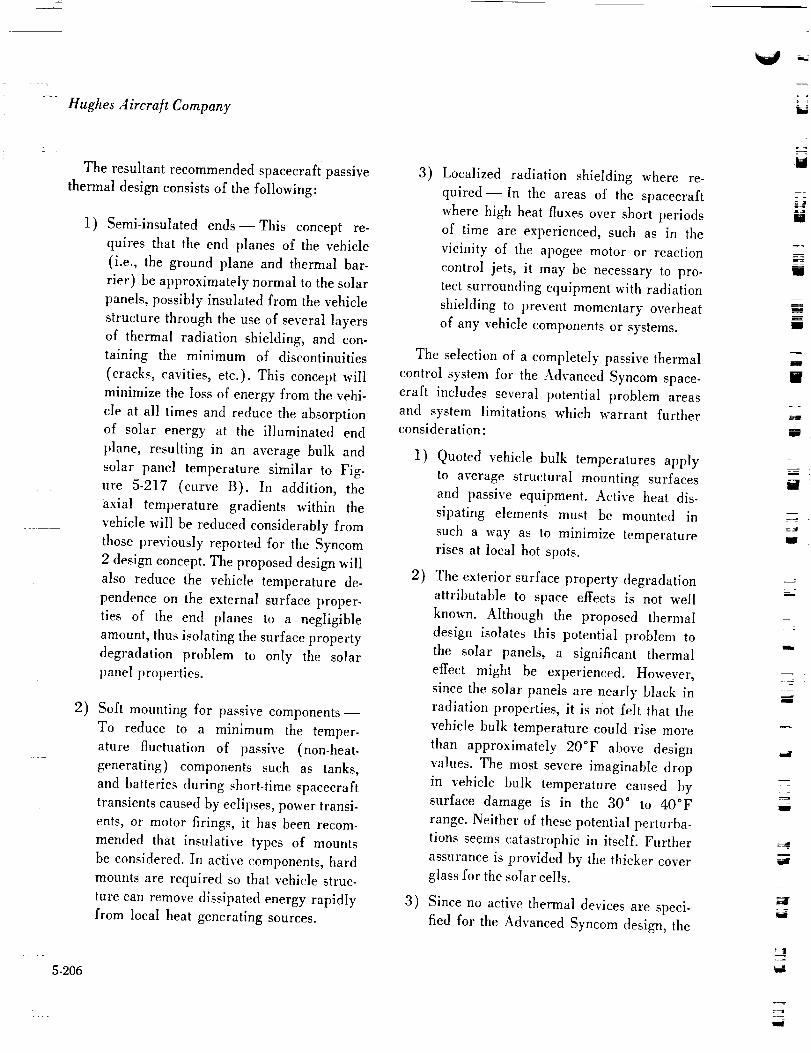
Hughes Aircraft Company
The resultant recommended spacecraft passive
thermal design consists of the following:
1) Semi-insulated ends--This concept re-
quires that the end planes of the vehicle
(i.e., the ground plane and thermal bar-
rier) be approximately normal to the solar
panels, possibly insulated from the vehicle
structure through the use of several layers
of thermal radiation shielding, and con-
taining the minimum of discontinuities
(cracks, cavities, etc.). This concept will
minimize the loss of energy from the vehi-
cle at all times and reduce the absorption
of solar energy at the illuminated end
plane, resulting in an average bulk and
solar panel temperature similar to Fig-
ure 5-217 (curve B). In addition, the
axial temperature gradients within the
vehicle will be reduced considerably from
those previously reported for the Syncom
2 design concept. The proposed design will
also reduce the vehicle temperature de-
pendence on the external surface proper-
ties of the end planes to a negligible
amount, thus isolating tbe surface property
degradation problem to only the solar
panel properties.
2) Soft mounting for passive components--
To reduce to a minimum the temper-
ature fluctuation of passive (non-heat-
generating) components such as tanks,
and batteries during short-time spacecraft
transients caused by eclipses, power transi-
ents, or motor firings, it has been recom-
mended that insulative types of mounts
be considered. In active components, hard
mounts are required so that vehicle struc-
ture can remove dissipated energy rapidly
from local heat generating sources.
5-206
3) Localized radiation shielding where re-
quired- In the areas of the spacecraft
where high heat fluxes over short periods
of time are experienced, such as in the
vicinity of the apogee motor or reaction
control jets, it may be necessary to pro-
tect surrounding equipment with radiation
shielding to prevent momentary overheat
of any vehicle components or systems.
The selection of a completely passive thermal
control system for the Advanced Syncom space-
craft includes several potential problem areas
and system limitations which warrant furtherconsideration:
1) Quoted vehicle bulk temperatures apply
to average structural mounting surfaces
and passive equipment. Active heat dis-
sipating elements must be mounted in
such a way as to minimize temperature
rises at local hot spots.
2) The exterior surface property degradation
attributable to space effects is not well
known. Although the proposed thermal
design isolates this potential problem to
the solar panels, a significant thermal
effect might be experienced. However,
since the solar panels are nearly black in
radiation properties, it is not felt that the
vehicle bulk temperature could rise more
than approximately 20°F above design
values. The most severe imaginable drop
in vehicle bulk temperature caused by
surface damage is in the 30 ° to 40°F
range. Neither of these potential perturba-
tions seems catastrophic in itself. Further
assurance is provided by the thicker cover
glass for the solar cells.
3) Since no active thermal devices are speci-
fied for the Advanced Syncom design, the
_---
IR
lid

5. Spacecraft System Design
t
=
4)
5)
quoted bulk temperature range applies
only in the region of solar angles between
65 and 115 degrees in reference to the
positive spin axis. No provision is made for
thermal control outside this solar region.
Vehicle internal temperatures during
eclipse transients are unknown at this time.
The degree of thermal coupling between
the vehicle and solar panel will determine
the rate of bulk temperature drop withtime.
External motor firing effects are as yet
unknown. Plume expansion for both the
apogee motor and the reaction control jets
has been partially investigated, but pres-
ent state-of-the-art knowledge of the total
effects is incomplete. Further analysis and
test is required to establish thermal pro-
tection requirements for the thermal bad'-
tier and solar panels.
Subsystem Thermal Studies
• Reaction Control System. Preliminary
thermal analysis of the Advanced Syncom axialreaction control nozzles has indicated maximum
and minimum steady state non-operating tem-
peratures of 0 and 90°F respectively. Calcula-
tions have been based on steady state orbit tem-
perature conditions at solar angles of 115 and
65 degrees respectively, and boundary tempera-
tures, where applicable, have been taken from
Syncom 2 analytical data.
Preliminary thermal analysis has been made
to determine radial engine temperatures and
insulation requirements. In accordance with spe-
cifications, the radial engine external package
temperature is not to exceed 200°F in order tolimit radiative heat transfer to the vehicle. No"
attempt was made to include vehicle heating
effects caused by the engine exhaust products
during firing. The only heat contribution was as-
sumed to be from the hot engine exhaust nozzle.
Preliminary tests of the radial reaction jet
performed at Marquardt indicated that steady
state temperature for the radiation slfield facing
the engine ranged from 1200°F at a point
opposite the nozzle exit to 1400°F at a point
opposite the throat. An analytical model was
assembled and steady state heat balances made
to determine engine assembly external tempera-
tures for various insulation configurations. With
the original opening of approximately 3 inches
in the solar panel, Marquardt tests t_ave indicated
temperatures of approximately 900°F at the ex-
ternal shroud of the engine assembly. The high
external temperatures probably resulted from
radiation or conduction from the nozzle tip to
the external shroud, across the uninsulated gap,
Since the opening in the soIar panel has been
increased to over 5 inches, the insulation can
be extended to the nozzle tip, and maximum tem-
peratures in the region of 200°F at the external
shroud are expected. This assumes that thermalconduction from tt_e inner radiation shield to
the external shroud can be eliminated or reduced
to a negligible quantity.
• Solar Panels. Calculations have been per-
formed on the Advanced Syncom solar panels to
determine the range of expected lemperature.
It is desirable to reduce the temperature level
of the panel to increase panel electrical output.
Since the orbital temperature level of the Ad-
vanced Syncom solar panel is basically a func-
tion of the solar absorptance and IR emittance
of the panels and the degree of thermal coupling
to the vehicle, investigations have been made to
determine the effect of varying the surface prop-
erties. Ahhough the solar cell properties them-
selves are the major factor in determining the
5-207

Hughes Aircra[t Company
kLo
tffee
llgtxlQ-
hiF-
panel temperature, the effect of the surface
properties of the material between and around
the individual cells is sometimes significant.
The surface substrate for the Syncom 2 solar
panels is a black paint (PT-401), of surface
properties ,_,o_,,= 0.92 and cir_= 0.85. If an
inorganic white paint such as the Hughes white
is used for the Advanced Syncom solar panel
painted regions (which account for nearly 10
percent of the total surface area), the tempera-
ture of the panels can be reduced nominally by
10" to 15*F based on the surface properties of<_,o,,,= 0.18 and ¢_n "--0.85. As the thickness of
the solar cell cover glass increases, however, the
significance of the painted areas diminishes to a
negligible amount.
Preliminary estimates have been made of the
eclipse cooldown rates for the Advanced Syncom
solar panel and battery. Figure 5-219 indicates
maximum expected cooling rates based on a
70 minute eclipse and previously calculated
Syncom 2 eclipse transient temperatures.
* Apogee Motor. A thermal analysis of
the energy transfer mechanism between the Ad-
vanced Syncom vehicle and apogee motor has
t "r--
\! !__)__j/_'t--- I1\ : 11 _ANE, /
', i
140-160
0 20 40 60 BO 100 120TIM(_,MINUTES
FIGURE 5-219. POWER SYSTEMS ECLIPSETEMPERATURES
5.208
been made with emphasis toward determining:
1) the need for radiation insulation between
the apogee motor and the vehicle thrust tube
and 2) the need for a conduction insulation ring
at the apogee motor mount point. Both types of
insulation have been investigated during two
modes of spacecraft operation: apogee motor
phase and orbital phase. The analysis utilized
a ten-node model shown schematically in Figure
5-220. The apogee motor, mounting ring, and
vehicle are simulated in an attempt to determine
effectiveness of both radiation and conduction
insulation in the system. The figure indicates the
vehicle temperature response to the given apogee
motor firing transient input. Although the anal-
ysis was only approximate in that the thermal net-
work was somewhat coarse and the nodal points
did not all reach their maximum temperatures
in the chosen time period, it is felt that there
is insufficient justification for the insulation ring
requirement.
The analysis also investigated the need for
the insulative motor mounting ring. It was deter-
mined that the heat loss from the vehicle through
the apogee motor is low (on the order of 1 to 2
watts) without tire insulating ring; hence again,
it is felt that no justification exists for tire ring
from a thermal standpoint.
The effect of the exhaust of the apogee motor
on the forward end of the Advanced Syncom
spacecraft has been partially investigated. The
total thermal effect from a solid rocket engine
is a combination of convective heat flux from
the hot gases and radiative heat flux from the
hot metal oxide particles in the exhaust plume
of the engine. A preliminary investigation of
the convective effects of the Advanced Syncom
apogee engine has indicated that convective heat-
ing of the forward end of the vehicle will be
of low magnitude.
V
Ut==l
il
i
iii
Ill
Iii'
ii
m
il
ill
--g
Ill
w
r

5. Spaeecra/t System Design
500
i "
b_
J
£r.
m
_ _ APOGEE ENGINE [
200 ....
fi
THRUST TUBE (21
QUADRANT ELECTRONICS'(1)" '
2 4 6 8 IO _2
TIME AFTER IGNITION, MINUTES
FIGURE 5-220. ESTIMATED TEMPERATURE RESPONSE DURING APOGEE ENGINE FIRING
(4
,,..,..,
.= :
An analytical method of treating the problem
of particle radiation from a solid rocket engine
exhaust plume has been devised and shown to
provide reasonable agreement with experimental
data where fluxes as high as 30 Btu/sec ft 2 were
measured. Radiation from the exhaust of solid
propellant engines is thought to originate mainly
from metal oxide particles formed in the com-
bustion process. The analytical approach pre-
supposes that these particles are the sole source
of radiation and that the total exhaust radiation
intensity may be computed simply by summing
the intensities of the individual particles.
Preliminary calculations have been made for
the Advanced Syneom vehicle which indicate amaximum radiation flux level of 2 Btu/see ft _
in the region of the sun sensors and axial jets.
They are based on the JPL apogee motor with
the current loading of aluminum in the pro-
pellant. Based on this flux rate and a burning
time of 46 seconds, a temperature rise from
80°F to a maximum of 250*F is expected to
occur in the sun sensors because of apogee motor
firing. Although the results of Syncom 2 apogee
motor firing tests at Tullahoma, Tennessee, in
June 2963 indicated an apparent temperature
5-209

Hughes Aircraft Company
reportedly reached by the sun sensors consider-
ably higher than 250°F, failure did occur in
one of the seven sensors. Consequently, further
investigation will be made to determine if an
immediate heating problem exists in the sun
sensors. The expected heating of the reaction
system axial jet in the same radiant flux field
has not as yet been considered.
• High Gain Antenna. The apogee motor
insulation analysis has been extended to include
the high gain antenna and cruciform portion of
the vehicle structure. The intent of the analysis
is to determine the temperature range of antenna
and cruciform region during normal orbital
operation and to determine the need for radia-
tion insulation between the apogee motor and
cruciform for protection of the antenna compo-
nents during apogee motor firing. Network input
parameters have been calculated for ultimate
computer solution of both the transient and
steady state problem.
• Temperature Sensors. Coordination meet-
ings have been held to discuss the location of
Advanced Syncom temperatur_ sensors. A total
of 16 sensors will be included on the vehicle.
Tentative general location of the sensors hasbeen established and is shown in Table 5-49.
The fuel and oxidizer tank sensors are repeated
in each of the two telemetry encoders, providing
11 temperature readings wiih each encoder.
REACTION CONTROL SYSTEM
Development of the reaction control system
for the Advanced Syncom satellite has been sub-
contracted to the Marquardt Corporation. De-
velopment began on 7 February 1963 and has
proceeded through a phase 1 and an interim pro-
gram covering demonstration of system feasi-
bility and propellant depletion tests with an en-
gineering model. A description of the reaction
5-210
TABLE 5-49. TEMPERATURE SENSORDESCRIPTION
Sensor Descriptionand Location
Reaction control system--fueland oxidizer tanks
Near traveling-wave tubecollector-- ribs 3 and 9
Solar panels
Near radial jet 1
Near either end of vehicle
Antenna cruciform
Sun sensor
Aft bulkhead
Battery
Apogee motor mounting pointRadial jet 1mountingsurface
Forward shelf neartelemetry transmitter
Axial jet I mounting surface
Number ofSensors
TelemetryEncoderNumber
I and II
I and II
II
I
I
II
II
IIII
control system and a summary of the technical
activities conducted during the interim program
are given here.
System Description. The storable hypergolic
liquid bipropellant reaction control system con-
sists of two completely independent control units,
each of which has equal propellant capacity for
accomplishment of the spacecraft control func-
tions. A schematic presentation of the proposed
control unit (two units per spacecraft) is pre-
sented in Figure 5-221.
Each control unit consists of the following
components:
1) A vernier velocity control thrust chamber
2) A spacecraft orientation and spin rate con-
trol tt_rust chamber
3) Two spherical fuel/propellant pressuranttanks
4) Two spherical oxidizer/pressurant tanks
Mm
U
[]
m
m
U
m
m
w
m
RIW
m
lmm
Ilw

td
!!
i-Ii i
F
it ,
" i
f
5. Spacecra/t Systemr Design
_RELIEF
_ VALVE
AND _ ./_ AND i
_RELIEF
_ VALVE
"_SQ U [ B OPERATED
RADIAL THRUST CHAMBER
FIGURE 5-22].
HEAT SHIELD
SWIVEL
\ZZZ_
/
PROPELL
VALVE
\AXIAL THRUST CHAMBER
REACTION CONTROL SYSTEM SCHEMATIC
ANT
5) Associated propellant supply lines and
tank pressurant fill and vent lines
6) Fluid filters
7) Fill, drain, vent, and isolation valves
8) A tank pressurant relief device (burst dia-
phram)
9) Appropriate instrumentation for in-flight
monitoring of propellant system pressures
and temperatures.
Each of the thrust chambers referred to here
consists of a combustion chamber, expansion noz-
zle, injector head, and two propellant control
solenoid valves with integral fixed flow orifices.
5-211

Hughes Aircraft Company
The two thrust chambers provided in each con-
trol unit are both functionally and dimensionally
identical. These thrust chambers are designed for
5 pounds nominal vacuum thrust at 90 psia com-
bustion chamber pressure with a 40:1 exit nozzle
expansion ratio. The combustion chamber (L* --
13 inches) and expansion nozzle are radiation
cooled and made from molybdenum alloy,
molybdenum-disilicide coated. The steady-state
operating temperature of the thrust chamber is
2800" F.
The injector configuration shown schematically
in Figure 5-222 is a single doublet with a fixed
orifice design and impingement angle to give op-
timum propellant momentum ratio, stream geom-
etry, and pressure drop. The injector head also
provides the mounting surfaces for the thrust
chamber, solenoid valves, heat shield (radial en-
gine only), and assembly mounting to the space-
craft. The injector head is made from stainless
steel and incorporates an insulated oxidizer pas-
sage designed to eliminate problems associated
with heat soak-back to the injector head from the
combustion chamber. Integral fixed orifices are
incorporated in each propellant control solenoid
valve to eliminate variations in required propel-
lant flow rates resulting from variations in propel-
lant supply line length and consequent pressure
drop.
The propellant supply system of each of the
control units consists of four fluid tanks (two oxi-
dizer, two fuel) of nominally equal volume,
associated propellant supply lines, fill, drain,
vent and isolation valves, and filters located up-
OXIDIZER
W .
i
5-212
VACUUM INSULATION
FIGURE 5-222. REACTION CONTROL SYSTEM INJECTOR
_y
iiiif
=,if
IIII!
_=

5. Spacecraft System Design
stream of each of the propellant control solenoidvalves to eliminate the admittance of dirt or con-
tamination to these valves. Each of the tanks is
made from 17-7PH steel and is a thin walled
vessel of 111/_ inches internal diameter. Each
tank is trunnion mounted to provide for pressure
deflections, tolerance accumulation, and support-
ing structural deflection. Tank construction is
accomplished by using heat-treated forged hemi.
spheres machined to correct thicknesses and then
girth welded. All tank fittings are machined inte-
gral with the respective hemisphere.
Stainless steel lines are used throughout the
system for propellant supply and pressurant
charging. Pressurant fill and drain valves are
provided at the top of each tank, a single valve
being used in each tank to accomplish both the
fill and drain functions. All propellant fill and
drain valves and pressurant fill and vent valves
are capped to minimize leakage of propellants
or pressurant. It should be noted that teflon parts
used in these valves are adequately protected
from space vacuum and space radiation effects
by the capped metal body in which they are con-
tained. A three-way valve (multiple inlet, com-
mon outlet, with all three ports normally closed)
is provided in both the oxidizer and fuel systems
to prevent the flow of propellants to the propellant
control solenoid valves before system use. This
three-way valve, operated by either of two squibs,
also serves to eliminate the possibility that
propellants will be transferred between pairs of
propellant tanks (between two fuel tanks or
between two oxidizer tanks) during maneuvers
associated with spacecraft orbit injection andorientation.
Each common pair of tanks has a relief valve/
burst disc assembly welded to the pressure equal-
izing line. The purpose of this device is to elimi-
nate any possibility of catastrophic failure of the
propellant tanks caused by over pressurization
and attendant destruction of the spacecraft.
The valve assembly, shown in Figure 5-223,consists of a burst disc and relief valve in series
with a filter between them. The disc, which forms
a gas tight welded seal, is exposed to the system
gas pressure on one side and ambient pressure
on the other side. The disc is designed to burst
within a pressure range well above the nominal
charging pressure of the system but still much
lower than the tank proof pressure. Thus, an
abnormal pressure excursion is required to burst
the disc.
Downstream of the disc, the filter serves to
trap any fragments resulting from ihe bursting
of the disc and to protect the relief valve from
system contaminants. The relief valve does not
function until the disc has burst. Its cracking
and reseat pressure ranges are between the sys-
tem pressure level and the disc burst pressure,
permitting it to vent the overpressure which
caused the disc to burst, but not allowing system
pressure to decay below operating levels. A
checkpoint is provided for testing the relief valve
function without damaging the burst disc.
The instrumentation used for in-flight monitor-
ing of propellant system pressures and tempera-
tures consists of absolute pressure transducers
and temperature probes. The absolute pressure
transducers are of the diaphragm type and com-
patible with MEN-5 and MMH propellants. Dia-
phragm-type transducers are chosen over bout-
don type transducers for ease of cleaning and
passivation, high frequency response, lower hys-
teresis, and compatibility with telemetering re-
quirements.
A propellant combination comprised of mixed
oxides of nitrogen (MEN-5) oxidizer and mono-
methyl hydrazine (MMH) fuel was selected to
satisfy the Advanced Syncom spacecraft bipro-
5-213

Hughes Aircrait Company
li
II
'd
I
POPPET_
FI LTER__z_ "
BURST DIAPHRAGM
# _
1
\ / 'I
II
II
II
!1
" I'
'
:i:!:!:i: .
FIGURE 5-223. RELIEF VALVE ASSEMBLY
RELIEF VALVE•,=l-,,-- CHECK PORT
pellant reaction control system storage, environ-
ment, and performance requirements specified in
Performance Specification X-254044. The nom-
inal design oxidizer/fuel (O/F) ratio is 1.62.
The choice of 1.62 as the nominal design O/F
ratio for the selected propellant combination
allows the use of equal volume oxidizer and fuel
tanks at equal pressurization levels to minimize
O/F variation as tank pressure decays. Although
5-214
the maximum theoretical specific impulse (I_p)
performance of the selected propellant combina-
tion occurs at an O/F ratio of 2.25 (See Figure
5-224, the maximum theoretical characteristic
velocity (C*) occurs at an O/F ratio of 1.75
with essentially negligible variation in theoretical
C* performance down to an O/F ratio of 1.62.
Experience with rocket engine configurations
similar to that used here has indicated that ex-
perimental engine performance more closely

k._.i
I J
1,,,4
;..j
L
f_
-"-'2 i
,x....-
follows theoretical "frozen" flow performance
than theoretical "shifting equilibrium" perform-
ance. The theoretical specific impulse is shown in
Figure 5-225. This can be explained by the fact
that the stay time in the engine exit nozzle is so
short that essentially no recombination or, at best,limited recombination of the dissociated exhaust
species occurs, Hence, maximum experimental
I,p performance occurs at approximately that
O/F ratio where theoretical C* performance op-
360
260
0
_-UOW
W <[ WI--
o
/ SHIFTING EQUILIBRIUM
CHAMBER PRESSURE = I00 pile
AMBIENT PRESSURE: 0 ps;oEXIT NOZZLE EXPANSION RATIO=40
l l
I 2 3 4 5
OXIDIZER/FUEL RATIO
FIGURE 5-224. MAXIMUM THEORETICALCHARACTERISTIC VELOCITY
5. Spacecra/t System Desigri
timizes, i.e. Over O/F range of 1.62 to 1.75. for
the selected propellant combination. Therefore,
the choice of equal volume propellants (at the
nominal environmental temperature of 70°F)
and an O/F ratio of 1.62 optimizes delivered per-
formance and overall system requirements.
Based on the thrust requirements and tank
design considerations, an initial tank pressurant
pressure of 300 psi was selected for the Ad-
vanced Syncom reaction control system. During
reaction control system operation, tank pressurant
pressure will decay steadily until a pressure of
149 psia is reached at the point of termination
of expulsion of the propellants. It should be noted
that the range of tank pressurant pressures re-
ferred to above is sufficiently high to suppress
the vapor pressure of the MON-5 or N204 oxi-
dizer and maintain it in the liquid state up to a
temperature of 145" F.
The axial engine (Figure 5-226) is mounted
on a centrifically operated swivel mechanism. The
device controls the spin speed of the vehicle to
100 rpm. The swivel mechanism is spring-biased
so that at 100 rpm the axial motor fires parallel
to the spin axis and imparts no spin moment.
- :_:_ .:350
i 340
u')
# 33o
320
LI..
_o
3O0
JI
SHIFTING EQUILIBRIUM
SHIFTING TO THROAT
FROZEN IN NOZZLE
AS/At =40/I
Po '" vocuum
Pc = 90 I_tO
1.4 L5 L6 L7
OXIDIZER/FUEL MIXTURE RATIO
FIGURE 5-225. THEORETICAL SPECIFIC IMPULSE
1.8
5-215

Hughes Aircraft Company
FIGURE 5-226. AXIAL ENGINE
At greater or lesser speeds, a spin moment can
be imparted to the vehicle by operating the axial
engine. The mechanism pivots on flexures thereby
eliminating any friction. Initially the mechanism
is locked in the axial position and is released
after spin up by a squib-actuated device. The
swivel mechanism is shown in Figure 5-227.
Development Status. The development status
of the Advanced Syncom bipropellant reaction
control system with respect to current spacecraft
requirements is summarized in this section. Mar-
quardt Corporation recently completed the ad-
vanced development phase of the Advanced Syn-
corn reaction control system development and
fabrication program. The final milestone of this
phase was a hot firing acceptance test of an en-
gineering model with a reaction control unit in-
stalled in a Hughes-supplied spacecraft structure
subassembly.
Subsequent changes in the design of the space-
craft structure will require redesign of some re-
action control system components. In addition,
FIGURE 5-227. SWWEL MECHANISM
certain components will require further refine-
ments to increase the reliability for flight models.
The following discussion describes the current
engineering model reaction control system, the
requirements for flight models, necessary changes
for system components, and additional develop-
mental testing required.
Performance. A tabulation of the current
Advanced Syncom engineering model perform-
ance and that required by Hughes Specification
X-254044 is presented in Table 5-50.
• Impulse. The reaction control system de-
sign requirement was to provide for a total
velocity increment of 2300 fps to a spacecraft
initially weighting 575 pounds (including the
fully loaded reaction control system), plus 600
lb-sec impulse for spin control. The resultant total
impulse was approximately 100 percent greater
5-216
M
g
g
llw
gl
M _
,,i
w
--d
W
U
J
W
W

i ;
5. Spacecra]t System Design
t
L.
L.:
g"I
TABLE 5-50. REACTION CONTROL SYSTEMPERFORMANCE
Initial EngineeringParameter Specification Model
Total impulse, pound-secondsThrust, pounds
MaximumMinimum
Response,millisecondsStartDecay
Missioneffective I,p, seconds(continuousand pulsing)
Duration, steadystate,minutes
Pulse centroid, repeatability,milliseconds
Total weight {exclusiveof brackets}, pounds
33,3O053
12]2
29O
14
±5 (single pulse:±1 (50 pulses)
186
30,60053
].5 (approximate}]5 (approximate)
Temperatures,oFAmbientTanksHeat shield
Electrical powerWattsVolts
Reliability
0 to 1304Oto 802OO
5024
0.995
239
3O
Lessthan ±5(not assessed)
19].
].5 to 13040 to 80380
29.524
Not determined
than that necessary to complete the Advanced
Syncom mission for 5 years. Complete system
redundancy was accomplished by providing two
separate propulsion units, each containing the
propellant quantities and system components
necessary to perform the mission. (The engineer-
ing mode] contains only one unit.)
Spacecraft weight after apogee motor burnout
was increased to 765 pounds during the advanced
development program. In addition, the required
290 mission specific impulse has not been
achieved. The current mission specific impulse of
the engineering model is 239 seconds, based on
an 80-percent steady-state/20-pereent one-sixth
pulsed mode duty cycle and a thrust decay from
5 to 3 pounds. The increased spacecraft weight
and reduced specific impulse, in effect, reduce
the system propellant redundancy by 30 percent
for a 5-year mission.
• Durability. The axial thrust chambers are
required to operate in the continuous, steady-
state mode for a 14-minute period and forrandom 1-minute intervals to accumulate a total
life of 80 minutes. Both radial and axial engines
are required to operate continuously in the pulse
mode for 11/_ hours.
The molybdenum disilicide coating of the
engineering model engines fails at approximately
3000 ° F. Once this coating is removed, the base
molybdenum alloy material is readily attacked
by the oxidizer. Injectors designed to provide the
290 mission specific impulse produced chamber
wall temperatures which exceeded the coating
operating temperature in less than 5 seconds of
steady-state operation. When the injector was re-
designed for reduced performance (260 seconds,
steady-state specific impulse), the current engi-
neering model axial engine demonstrated two
30-minute periods and one 13-minute period,
totalling 73 minutes of continuous steady-state
operation.
Pulse mode operation results in a chamber wall
temperature that does not exceed the operating
regime of the coating; therefore, no redesign of
the radial engine was necessary. During recent
tests, the radial engine with heat shield demon-
strated 80 minutes (clock time) of continuous
pulse mode operation plus intermittent pulsed
operation exceeding 11_ hour requirement.
• Response. A maximum response time of
12 milliseconds from start signal to 95 percent
of rated thrust and from shutdown signal to 5
percent of rated thrust is required. During engi-
neering model engine acceptance tests, a starting
response time of 21 to 23 milliseconds was dem-
onstrated with the radial engine. The reworked
axial engine demonstrated 45 to 50 milliseconds
starting response. Shutdown responses of approx-
imately 13 milliseconds for the radial and 35
5-217
IIF--_
Hughes Aircra]t Company
milliseconds for the axial were recorded. Some
of the recorded time can be attributed to instru-
mentation response. A tradeoff exists between
the starting and shutdown response by varying
the spring rate of the solenoid valve. In addition,
starting responses can be improved by relocating
the solenoid valve calibrating orifice. Therefore,
radial and axial engine response times are ex-
pected to be proven within the 12-millisecond re-
quirement by employing these adjustments and
using high response measuring techniques. Both
radial and axial engines have demonstrated a cen-
troidal pulse center repeatability of less than ---5
milliseconds between consecutive pulses.
Component Design
• Thrust Chamber. The engineering model
feasibility tests were conducted during the ad-
vanced development phase using a thrust chamber
configuration that delivered 280 seconds impulse
(measured) at the 5-pound thrust level. The
engines were found incapable of operating in
a continuous duty cycle because of the high
heating rates associated with the design. To alle-
viate this condition, a one-third duty cycle (1
second on, 2 seconds off) was chosen for firing
the axial engine during initial tests of the engi-
neering model. The radial engine is required to
operate only in a one-sixth duty cycle and did
not present an overheating problem. The engi-
neering model system feasibility tests were com-
pleted with these duty cycles without incident.
During a subsequent test phase at Marquardt,
additional system testing was required on the en-
gineering model in which the axial engine would
operate in a steady-state mode. The combustion
efficiency of the radial engine was reduced by
increasing the fuel injection orifice from 0.016
to 0.030 inch. Proper mixture ratio control was
maintained by adjusting the upstream orifices.
At the 5-pound thrust level, specific impulse
varied from 180 to 260 seconds, with evidence
of erratic burning occurring in the combustion
chamber. The phenomenon was caused by the
low pressure drop on the fuel side, which allowed
dynamic coupling between the combustion proc-
ess and the feed system. The fuel passage on a
second injector was drilled to 0.023 inch. This
new configuration was tested and produced stable
burning and a performance level of 248 seconds
at the 5-pound thrust level. This axial engine
was chosen to be used on the engineering model
for the two depletion tests of the interim program.
The radial engine remained unchanged from the
phase I effort in which the fuel orifice was 0.016inch and the oxidizer orifice was 0.019 inch
diameter.
A parallel research and development effort
at Marquardt has produced a thrust chamber
which is suitable for use in flight vehicles. A
comparison of the research and development
chamber and that used in the engineering model
is shown in Figure 5-228. The changes consist
of shortening the chamber length (from 3 inches
for the engineering model thrust chamber to 1.17
inches for the improved chamber) and adding
a short propellant premix section to the research
and development chamber.
The engine thrust is 5 pounds with a premix
chamber pressure of 106 psia. The propellant
supply pressure corresponding to this thrust level
is 300 psia. Since the system is a pressure decay
type, thrust will decrease in relation to the supply
pressure. The final propellant supply pressure
is 149 psia, producing a terminal thrust of 3
pounds at a chamber pressure of 69 psia. The
thrust decay range of 5 pounds to 3 pounds,
resulting from a decrease in tank pressure from
300 psia to 149 psia, results in a maximum pos-
sible total engine burning time of approximately
4260 seconds, as shown in Figure 5-229. Thrust
5-218 W

T
z ; 5. Spacecra]t System Design
L .
t =
=
°
L Jw
=
i ,
.%E HA..ER
ANT
RESEARCH AND DEVELOPMENT MODEL
FIGURE 5-228. THRUST CHAMBER COMPARISON
chamber life in excess of 110 minutes has been
documented for the Advanced Syncom config-uration.
Figure 5-230 presents specific impulse ver-sus thrust level as measured in altitude tests
during operation for the research and develop-
ment engines. The maximum, minimum, and
nominal curves represent the test data scatter
measured during tests of this engine. The meas-
ured specific impulse performance for the pro-
posed engine decreases from 280 seconds (nomi-
nal) at the 5-pound steady-state thrust level to
248 seconds (nominal) at the 3-pound steady-
state thrust level. In the pulsing mode, the specific
impulse varies between 240 seconds at the
5-pound thrust level to 190 seconds at the 3.0-
pound thrust level. Using the minimum level
of the steady-stale data and integrating over the
curves shown in Figure 5-230, a minimum
mission average Lp of 250 seconds is obtained.
z0o
z
0
u2
I-
1
3 4 5
THRUST, POUNDS f
FIGURE 5-229. MAXIMUM POSSIBLE TOTALENGINE BURNING TIME
Figure 5-231 presents measured thrust cham-
ber wall temperature of the unshielded engine
at the maximum temperature region along thecombustion chamber wall. The maximum com-
bustion chamber temperature is 3000* F. These
temperatures were determined during steady-state
firing operations only. The 0.1-second ON time
for the pulse mode is not sufficient to stabilize
chamber wall temperature. Therefore, the maxi-
mum temperature of 3000 ° F will not be reached
during the Advanced Syncom mission. The first
steady-state firing correction begins at a thrust
level of 4.6 pounds which corresponds to a
chamber wall temperature of 2880* F. At the
end of the first steady-state firing correction, the
chamber wall temperature has dropped to 2800*
F. Operation at these temperatures provides highconfidence that the thrust chamber will demon-
5-219

Hughes ,4 ircra[t Company
300
STEADY STATE OPERATION
MAXIMUM
I" 250
225
H
,J
a.
_uu.
200
PULSING OPERATION
I00 tel *'ON" TIME J
Y175
3 4 5
THRUST, POUNDSl
{ I I69 87. 5 I06
CHAMBER PRESSURE, Pc, POUNDS PER SQUARE INCH
FIGURE 5-230. SPECIFIC IMPULSE VERSUSTHRUST LEVEL
strate the required durability for performing
the Advanced Syncom mission.
The current engineering model axial and radial
engine performance results in a mission average
specific impulse of 239 seconds. Higher per-
formance can be obtained with these enginesonly at the expense of decreased thrust chamber
life. The improved thrust chamber, however,
provides a minimum mission average I8_ of 250
seconds which is equivalent to a propellant gainof approximately 10 pounds. In addition, the
improvements will provide a reduction in re-
3000
n,Ld
_ELU
2800
2600
2400
22003.5 4 4.5
THRUST, POUNDS f
FIGURE 5-231. MEASURED THRUST CHAMBERWALL TEMPERATURE
sponse time and will alleviate spacecraft installa-
tion and mounting problems.
• Solenoid Valves. Solenoid valves (Figure
5-232) currently used on the engineering mod-
el engines require two changes to meet Advanced
Syncom flight model specifications. The existing
design must be altered to include a filter element,
and an all-welded design must be developed.
Current engineering model valves were brazed
to facilitate assembly. The braze material used
is not compatible with the propellant long-term
storage requirement.
• Tanks. Reconfiguration of the Advanced
Syncom structure requires corresponding changes
in propellant tank design. The engineering model
tanks, currently mounted in a plane perpendic-
ular to the spin axis, are loaded through an aft
quick-disconnect fitting on the tank and pres-
surized through a forward quick-disconnect on the
pressure equalizing line. The redesigned structure
will require tanks mounted fore and aft, with
w
wt
i
t$I
B
I
Wi
u
Im
i
J
u
_ I
w
5-220W --

i
5. Spacecra]t System Design
t ,t
|J
|= =
COPPER WIRE COIL
STELLITE HARDFACE POPPET
NICKEL BRAZE JOINTS
CLOSURE WEL[ PROPELLANT FLOW
CALIBRATION ORIFICE
WITH SNAP RINGRETAINER
=
CLOSURE WELD RETURN SPRING
FILTERDYNATUBE FITTING
FIGURE 5-232. SOLENOID VALVES
one common loading and pressurizing fitting con-centric with the forward tank mount.
The engineering model tanks leaked through
the flanges of the 17-7 PH material fittings during
testing. The leakage was attributed to porosity
resulting from the elongated 17-7 grains being
oriented transversely to the flange. The tanks
were temporarily fixed by gold plating. Flight
hardware tanks with fittings fabricated such that
the flange grain structure is oriented longitud-
inally will be constructed.
• Heat Shield. A heat shield is required to
limit radial engine envelope temperatures as
presented to surrounding structural elements to
200" F. Based on preliminary thermal analysis,
a 5-inch-diameter heat shield envelope, including
insulation, is necessary to produce the required
thermal gradient. The engineering model struc-
ture provided only a 3-inch-diameter hole in the
solar panels through which the heat shield must
protrude; therefore, most of the insulation in the
vicinity of the panels had to be eliminated. The
redesigned structure includes a 51/_2-inch-diameter
hole. Although heat shield measurements were
made, a rigorous evaluation of the heat shield
was not performed during the advanced develop-
ment phase. Tests must be conducted to verify
analytical evaluation.
• Squib Valves. The engineering model re-
action control system contains a three-way squib-
actuated propellant prevalve. The purpose of this
valve is to eliminate the possibility of propellant
transfer between common tanks during prelaunch
and launch phases and to serve as a backup
safety device preventing premature or inadvert-
ent firing of the engines.
A disadvantage of the current valve design is
that without firing the squib actuator, it is not
possible to conduct a complete systems check.
In addition once the squib is fired, the valve can-
5.221

Hughes/lircra/t Company
not be reused. Two alternatives are being con-
sidered to assure adequate preflight systems
checks: 1) employ reusable squib-actuated valves
or latch solenoid valves instead of the squib
valves currently used and 2) eliminate the pre-.I
valve entirely. The second approach required
confirmation of range safety requirements with
respect to the Advanced Syncom and a detailed
study of propellant transfer characteristics duringlaunch.
• Spin Control Mechanism. The engineering
model spin control mechanism, illustrated in Fig-
ures 5-226 and 5-227, consists of the axial
engine assembly, the rigid bar frame to which it
is mounted, a base plate, and a vibration damper.
The bar frame is linked to the base plate by
flexure pivots and torsion bar springs. This type
of spring bias allows for transmittal of pro-
pellants through the bars without the tendency
of stress loading the lines at the solenoid and
spacecraft interfaces. During the launch sequence,the mechanism is locked in the nominal or 100-
rpm position (thrust axis parallel to the spin axis)
by two squib-actuated pin-pullers. To enhance
system reliability, the use of one pin-puller will
be investigated during the flight hardware phase.
Currently, a base plate adapter is required at
the spacecraft interface. A more optimum base
rplate-to-spacecraft attachment will be developed.
The reaction control system spin control mech-
anism employs a friction damper for engineering
model demonstrative purposes only. Various al-
ternative techniques for damping the mechanism
have been investigated; however, final selectionof a method has not been made.
Weights. A summary of the existing reaction
control system weight status and projected changes
is given in Table 5-51.
TABLE 5-51. REACTION CONTROL SYSTEM WEIGHT
Component
EngineHeatshieldSquibvalveFill anddrainFill andventRetief valvePressuretransducerTemperaturetransducerFilterVariablerestrictorSpincontrolmechanismTankTubing,fittingsDryunit weight
Quantity/Unit
2
2422222214
Weight/RCS Unit,
pounds
2.451.021.400.960.481.380.460.011.260.482.30
12.003.25
27.45
PredictedFlight
Weight,pounds
2.451.07
0.96
0.760.100.011.260.231.66
13.48
3.2__5525.23
Dry systemweight 50.46Propellant 130.000/Ferror 3.03Unusable propellantin lines 0.45ExpulsionefficiencyO/z percent) 0.64Propellantloading accuracy(V=percent) 0.64N_weight 1.36
Total systemweight 186.58
*Tobe removedonfutureunits.
Interim Progrom. Presented here is a synopsis
of the final report of the interim test program
conducted at Marquardt Corporation on the Ad-
vanced Syncom engineering model reaction con-
trol system. The contracted items of work were
to modify an axial engine to increase its dura-
bility and to conduct two propellant exhaustion
tests on the engineering model at altitude condi-
tions. The propellant exhaustion tests were to
provide mission impulse, mixture ratio, expulsion
efficiency, and spacecraft temperatures, as well
as operational experience on the system.
The axial engine on the engineering model as
delivered in phase I could not meet specification
steady-state durability requirements, although
at 5 pounds thrust, specific impulse was 280
seconds. To increase durability, combustion effi-
ciency was reduced by increasing the fuel injec-tion orifice from 0.016 inch to 0.030 inch
diameter, whereupon the fuel pressure drop de-
creased from 55 psi to approximately 10 psi.
5-222

L ,,
=
tL_
L :
L_L
k."
7
k...
-k..,
An orifice was installed upstream of the injector
to provide proper mixture ratio control, and the
engine was fired at the 5-pound thrust level.
Analysis of the performance data gave specific
impulses ranging from 180 seconds to 260 sec-
onds with evidence of combustion instability. This
phenomena was caused by the low injector pres-
sure drop, which allowed dynamic coupling be-
tween the combustion process and the fuel feed
system. A second injector fuel passage was drilled
to 0.023 inch. This new configuration was tested
and produced stable burning and a performance
level of 248 seconds at the 5-pound thrust level.
As flow and thrust were decreased (and the in-
jector pressure drop decreased), some resonant
burning was observed but at a much lower thrust
level than on the previous configuration. This
engine was used on the engineering model for
the two propellant exhaustion tests. The radial
engine had an injector configuration that delivers
a specific impulse of 280 seconds at the 5-pound
thrust level. The fact that this chamber operates
only in a pulsed mode permits operation periods
in excess of specification durability requirements.
Prior totesting, the engineering model was
instrumented such that the following data could
be obtained: chamber pressure, fuel and oxidizer
tank pressures and temperatures, six structure
interface temperatures, swivel mount angular
position versus spin speed, and propellant valvecurrent traces. In both tests the model was loaded
with 41 pounds of oxidizer and 25 pounds of fuel.
The tests were conducted at a cell pressure of
less than 0.15 psia, while the system was rotated
at a nominal 100 rpm. The tests were run to
simulate a worst case Syncom mission in the
following sequence:
1) 8000 pulses in a one-sixth duty cycle (0.1
second on, 0.5 second off) with the radial
engine
_ 5. Spacecra]t System Design
2) 1200 pulses in the one-sixth duty cycle with
the axial engine
3) 14 minutes of steady-state firing with the
axial engine
4) One pulse of 0.1 second duration with the
radial engine
5) 34 seconds of steady-state firing with the
axial engine
6) Alternate 4 and 5 above to depletion of the
fuel supply.
The first system test was conducted without
incident. Pressure versus thrust data, generated
from individual rocket acceptance tests, were
used to convert the system chamber pressure to
an equivalent specific impulse. Upon summing up
all the impulse bits, a total mission impulse of
17,112 lb-sec for the first test was obtained.
This gives an average mission impulse of 259
seconds for the loaded propellant weight of 66
pounds. At the conclusion of the test, it was
found that 3.75 pounds of oxidizer remained
and the fuel tanks were empty, giving a missionoxidizer-to-fuel mixture ratio of 1.49 for the com-
plete test. The test procedure required both fuel
and oxidizer tank pressures to be set to 300 psia;
however, the fuel tank was pressurized to 264
psi and the oxidizer tank to 294 psi. These errors
were attributed to a faulty pressure gage in the
loading equipment.
Thermocouples were located on the radial en-
gine heat shield, the axial engine swivel mount,
the propellant valves, and the thrust mounts.
During the 8000 pulses of the radial engine, the
outer surface of the heat shield rose to 370* F.
This is higher than the Hughes requirement of
200* F; however, this value wilI be significantly
reduced by changes incorporated in the flight
design.
5-223
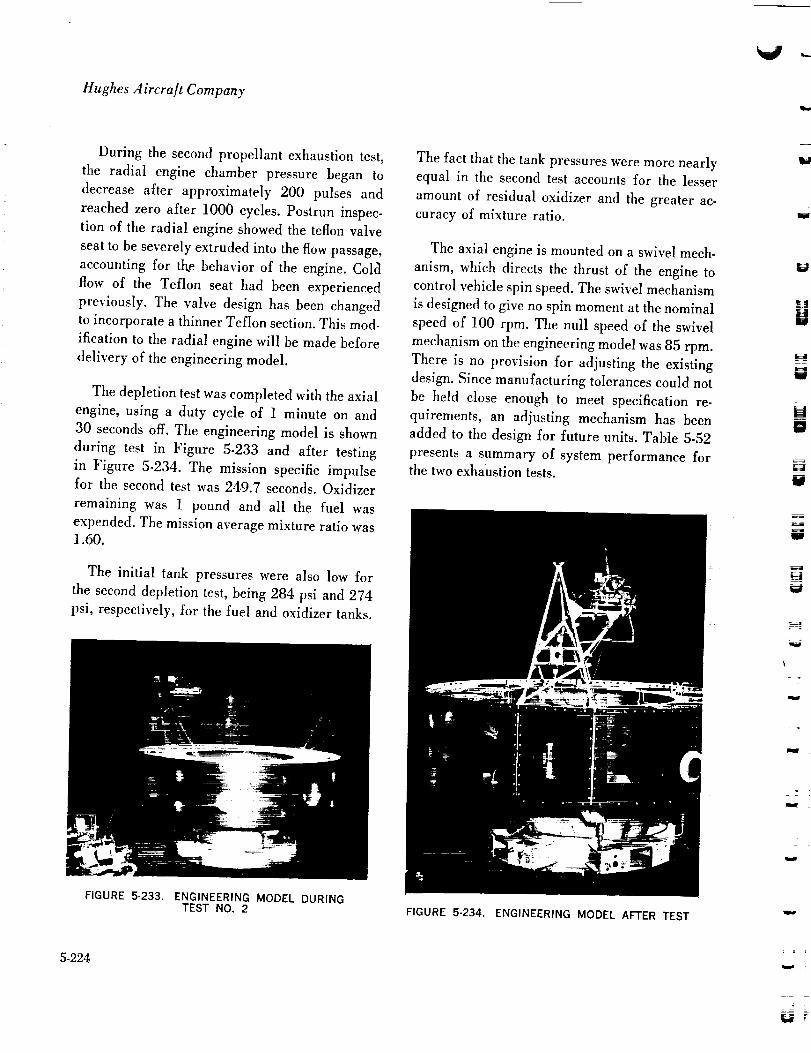
Hughes Aircra/t Company
During the second propellant exhaustion test,
the radial engine chamber pressure began to
decrease after approximately 200 pulses and
reached zero after 1000 cycles. Postrun inspec-
tion of the radial engine showed the teflon valve
seat to be severely extruded into the flow passage,
accounting for the behavior of the engine. Cola
flow of the Teflon seat had been experienced
previously. The valve design has been changed
to incorporate a thinner Teflon section. This mod-
ification to the radial engine will be made before
delivery of the engineering model.
The depletion test was completed with the axial
engine, using a duty cycle of I minute on and
30 seconds off. The engineering model is shown
during test in Figure 5-233 and after testing
in Figure 5-234. The mission specific impulsefor the second test was 249.7 seconds. Oxidizer
remaining was 1 pound and all the fuel was
expended. The mission average mixture ratio was1.60.
The initial tank pressures were also low for
the second depletion test, being 284 psi and 274
psi, respectively, for the fuel and oxidizer tanks.
The fact that the tank pressures were more nearly
equal in the second test accounts for the lesser
amount of residual oxidizer and the greater ac-
curacy of mixture ratio.
The axial engine is mounted on a swivel mech-
anism, which directs the thrust of the engine to
control vehicle spin speed. The swivel mechanism
is designed to give no spin moment at the nominal
speed of 100 rpm. The null speed of the swivel
mechanism on the engineering model was 85 rpm.
There is no provision for adjusting the existing
design. Since manufacturing tolerances could not
be held close enough to meet specification re-
quirements, an adjusting mechanism has been
added to the design for future units. Table 5-52
presents a summary of system performance forthe two exhaustion tests.
FIGURE 5-233. ENGINEERING MODEL DURING
TEST NO. 2 FIGURE 5-234. ENGINEERING MODEL AFTER TEST
5-224

, .: <
5. Spacecra[t System Design
T
=
E
K,,,,2
f •
°
= •
k
TABLE 5-52. SYSTEM PERFORMANCE SUMMARY
Propellantload,poundsOxidizerFuel
Propellantoff load,poundsOxidizerFuel
Mission0/FTotalengineburningtime,
secondsMissiontotal Impulse,Ib-secMissionaveragespecific
impulse,secondsPercentageof totalengine
burningtimeAxialengineRadialengine
Temperatures(maximum},*F
Test 119-20
September1963
41.025.0
3.750.01.49
4537.617112.89
259.3
822417.96
Test 225
September1963
41.0252
1.00,01.60
4329.316479.21
249.7
96.053,95
Heatshield 370Fuelvalve 255Radialengine(attach.boss) 270Swivelmount 185Spacecraft(axialenginetruss) 145
APOGEE ENGINE
System Description. The Advanced Syncom
apogee engine is to be supplied as GFE/NASA
and is being designed and fabricated by JPL. The
design evolved as a direct scale-up of the Syn-
com 2 apogee engine with the following excep-
tions :
1) The nozzle is bolted to the case flange
rather than threaded.
2) Attachment to the spacecraft will be by
means of shear bolts rather than tension
bolts.
• 3) The igniter will be a pyrogen rather than
a pyrotechnic type.
4) A contour nozzle will be utilized rather
than a conical nozzle.
The apogee engine is diagrammed in Figure
5-235. The engine consists of a 410 chromium
steel case, with a rolled and welded cylindrical
section, joined to drawn and machined elliptical
dome ends. The case is lined with a nitrile-base
rubber material (Gen-Gard V-52). Attachment
to the spacecraft thrust tube will be by means of
shear bolts through a head-end skirt located at
the case circumference. The igniter is a pyro-
gen type and incorporates redundant l-watt/l-
ampere squibs and ALCLO ignition material.
The nozzle is comprised of a graphite "G" car-
bon throat insert seated in a tape-wrapped com-
posite exit cone structure of modified phenolic
impregnated glass and carbon cloth. The propel-
lant is a JPL formulation.
Development Status. All materials utilized in
the Syncom 2 design have been carried over to
the Advanced Syncom apogee engine design; this
includes the case, insulation/liner, nozzle/insert,
and igniter materials. The capabilities of new
materials have been evaluated through subscale
engine tests using Syncom 2 apogee engine bard-
ware. As a result of these tests, based on observed
char depths, a modified phenolic was selected
as the optimum impregnating material for the
composite nozzle structure.
A series of igniter tests were conducted in a
special heavy-wall ignition test engine to estab-
lish the relative merits of pyrogen and pyrotech-
nic igniters and determine the optimum charge
of igniter material. These tests clearly demon-
strated the superiority of the pyrogen-type igni-
ter for the Advanced Syncom application. All
flight and heavy-wall component design effort has
been completed, including an optimized flight
nozzle contour. Subcontractors for the fabrication
of flight hardware, including cases and nozzle
body blanks, have been selected. Two cases and
one nozzle have been delivered. To maintain bet-
ter control of the physical and ballistic properties
of the propellant, a 150-gallon mixer was pur-
chased and is currently being installed at Ed-
5-225

Hughes Aircraft Company
INSULATION
AFT
CLOSURE
NOZZLE
DIMENSIONS IN INCHES
THROAT INSERT
28.01
MAXIMUM DIAMETER
t
54.0 REF
FIGURE 5-235. ADVANCED SYNCOM APOGEE ENGINE
23,5DIAMETER
wards Air Force Base. The use of this mixer will
permit loading an engine from one batch of pro-
pellant. Installation and checkout of the mixer
will be completed during 1963.
To date, three heavy-wall engine tests (Figure
5-236)have been conducted under ambient con-
ditions at EAFB. All were cast with multiple
propellant batches and contained approximately
655 pounds of propellant- somewhat less than
the flight engine design loading. The exterior
dimensions of the heavy-wall engine approximate
those of the flight engine; the extra wall and
insulation thicknesses therefore resulted in a
lower available loading volume. All tests were
completely successful from a performance stand-
point. In the initial test, however, the throat
insert cracked circumferentially just aft of the
throat. The nozzles in the other two tests, involv-
ing considerably different insert designs, per-
formed satisfactorily.
The ballistic data from the three tests were
very nearly identical. Maximum chamber pres-
sure was 240 -4-2 psia and occurred at 29.0 sec-
onds of operation; action time was 40.0 4-0.5
seconds; peak ignition pressure was 230 ---2
psia. Thrust data were not reduced because noz-
zle flow separation rendered it invalid. Nozzle
throat erosion did not exceed 1.05 percent in any
of the three tests. One additional test is planned
in the heavy-wall series, to be conducted in No-
vember 1963; the initial flight-weight engine test
will be conducted in December 1963. A typical
pressure-time trace is shown in Figure 5-237.
5.226
I
= .
I
g
U
J
treat
I
L_
rtmtP
W
W '
w
W

5. Spacecraft System Design
! -
t
FIGURE 5-236.
"''l_ LINER "= Z_ -__--_
_ _ OZZLE
.__j _ 0 tO _ 20
_--i CASE
ADVANCED SYNCOM APOGEE ENGINE
HEAVY WALL MODEL
50 4o
TIME, SECONDS
FIGURE 5-237. CHAMBER PRESSURE VERSUSTIME FOR HEAVY WALL MODEL
t
L .
:-,,_
L
L
5-227
k

W
_j
W
W
il

i
6. RELIABILITY AND QUALITY ASSURANCE
| i
i i
ii
i!
= :
FAILURE MODE ANALYSIS
A failure mode analysis has been completed
for the Advanced Syncom spacecraft on a sys-
tem and subsystem level. All inputs and outputsto minor control items were considered in the
analysis. The detailed analysis indicated there
was only one area in which a specific failurewould restllt in loss of communications. This
area included the RF input to the transponder
receivers, where a receiving antenna failure
could occur, and the RF connection between the
transmitter multiplexer and the power splitter.
In the case of the transponder, a failure of anyone of the series units would cause a failure of
that transponder mode. Although detailed fail-
ure mode analysis forms are not included, a de-
tailed analysis was performed which assured
that the transponders were "straightforward"and L10hidden or subtle effects were found.
Phased Array Control Unit. The phased array
control unit is designed with four redundant
systems, one in each quadrant. Some inter-
connections make it possible for some parts
of different quadrants to be operated together
as a system. This interconnection scheme tends
to increase the versatility of the spacecraft,
but it also adds new potential failure modes (pos-
sible shorts of interconnecting wires). The sub-
ject failure mode analysis revealed only one
area where all four quadrants were tied together
such that a short to ground would affect all of
them. This area is the "Timer Select, PACE
Lock, Beam Position" input to the telemetry en-
coder. A short to ground here would prevent
telemetering this information from any quad-
rant. This failure mode could be eliminated by
running separate interquadrant wires. All other
failures (except shorting the unregulated bus to
ground) are of an intraquadrant nature, even
though they may be caused by shorting inter-
quadrant wires. A typical example is the 2.81-
minute output of the central timer. A short to
ground of this wire (within a quadrant or
between quadrants) applies ground directly to
the command 24-voh line through tile transistor
in tile ouput buffer. This will then cause the
command regulator to turn off or burn out. The
transistor in the output buffer may also be dam-
aged. The addition of an output series resistor
to the output buffer could prevent the overloading
of the command regulator in the event of a short.
This same condition exists with the output buffer
for the 194-cps output from the central timer to
the telemetry encoder.
In general it was found that a short or an
open would affect only a small portion of the
system, and the four times redundant designcould tolerate several failures and still function.
Complete failure of the phased array control
electronics (PACE) is not catastrophic. After
such a failure, the antenna would still have a
gain of 8 db and illuminate the earth with a pan-
cake pattern so that the system would be able to
operate at redticed capability.
As part of the phased array control unit, the
jet control electronics (JCE) circuits are four
times redundant with a backup command foreach function. Thus in addition to on-board con-
trol of jet firing, direct ground command jet
firing is possible. However, these backup com-mands are connected from the command decoder
6-1

Hughes Aircra]t Company
to an OR gate in the output of the JCE. A short
or open at or beyond the output of this OR gate
would not only result in loss of the quadrant
JCE capability but would also prevent backup
operation in this quadrant. Separate wiring and
isolation for backup would correct this situation.
An open or short to ground at the input or
output to the squib driver circuits will not cause
squib firing. If the output were shorted to the
unregulated bus, the squib would blow. These
wires should be routed to prevent this type ofshort.
"rronsponder. Tile multiple access transponder
is essentially a series string of active and pas-
sive networks. A common master oscillator, with
output properly multiplied, provides the receiver
local oscillator signal and also the carrier for
the retransmission. A common -4-volt supply,
produced in the master oscillator amplifier, and
a common -24-volt regulated voltage out of the
series regulator provides all bias.
A failure mode analysis was made of the en-
tire transponder, with emphasis on catastrophic
failures and loss of bias or signal caused by
opens or shorts. Most failures can be summedas follows:
1) An open or a short anywhere on the -4-
volt bus will cause complete failure of a
transponder.
2) An open or a short anywhere on the -24-
volt bus will cause complete failure of
the transponder. A short wilI usually
cause the series regulator overload cir-
cuits to turn off the regulator and remove
most of the load from the spacecraft un-
regulated bus.
3) An open or a short in the received signal
anywhere from the output of the receiver
multiplexer to the input of the phase
modulator, P/N 475131, will cause a loss
of transponded intelligence, but the car-rier would still be transmitted. The same
result would occur if a short or open
occurred in the local oscillator signal
between the output of the master oscillator
amplifier, P/N 475123, and the input
to the mixer, P/N 475100.
4) An open or short in the carrier signal,
from tile output of the master oscillator,
P/N 475122, through the modulator, P/N
475131, and into the 3-db hybrid, P/N
475171, of the transmitter, will cause a
complete failure of the transponder. Thecarrier will be lost and cannot be utilized
as a beacon.
The frequency translation transponder is simi-
lar, and failures may be summed as follows:
1) An open or a short anywhere on the -4-
volt bus will cause complete failure of a
transponder.
2) An open or a short anywhere on the -24-
volt bus will cause complete failure of the
transponder. A short will usually cause
the series regulator overload circuits to
turn off the regulator and remove most
of the load from the spacecraft unreg-
ulated bus.
3) Any open or short between the receiver
multiplexer and the input to the limiter
amplifier, P/N 475104, would cause a loss
in intelligence transponded, but the bea-
con and carrier would still be present.
4) Any open or short between the master
oscillator, P/N 475113, output and the
dual filter hybrid would mean a complete
loss of the transponder, including beacon.
6.2

= ,._.,
6. Reliability and Quality Assurance
i
m
r
lw
5) Any open or short between the duaI filter
hybrid and the input mixer, P/N 475100,
would provide a loss of transponded in-
telligence but again the beacon would still
be operative.
6) Any open or short from the dual filter
hybrid to the 3-db hybrid, P/N 475171,
in the transmitter would cause a complete
transponder failure.
Assuming equal value for each of the four
multiple access transponders and four frequency
translation transponders, a loss of only onewould mean a redHction of 1/8 in mission
capability. This means of redundancy (i.e., mul-
tiple transponders) instead of redundant cir-
cuitry per transponder appears to be the most
judicial choice.
The only telemetry directly attached to the
transponders is the received signal strength of
the frequency translation transponders. This
would indicate a loss only if the transponder
failed completely, or if the receiver portion, in-
cluding the local oscillator string, failed. How-
ever, secondary telemetry clues to failure are
transmitter power, channel 4, 5, 6, and 7 of
frame 5, which would indicate a loss of power
if the carrier or beacon were lost, and bus cur-
rent, channel 1 and 4, frame 1, which could in-
dicate a change of current if the transponder was
or was not turning on.
In listing failures, the fact that identical fail-
ures may occur in any of the four quadrants
has been considered hut only one is listed. If
multiple failures were to occur, the effect on the
mission would be increased proportionately.
There are only two areas in which a single fail-
ure would cause a complete loss of the communi-
cation function, and one area where two failures
would cause complete loss.
A short or an open to the signal path from
the receiver antenna array with its coupling to
the multiplexer or to the connection between the
transmitter multiplexer and the power splitter
will cause a complete failure. However, the
physical construction in these areas is such
that any failure would be caused by severe phy-
sical damage from booster separation, etc., and
is not considered likely.
Two failures, one to each unregulated bus,
would cause complete failure. A permanent
short to ground of either bus will make one half
of the spacecraft inoperative. However, dividing
the bus further would remove allowance for
solar cell degradation. With the present two
buses, each feeding two quadrants, any degra-
dation of cell output will not prevent operation
of one quadrant by each. With one bus per quad-
rant, the same degradation, which is assumed
to be uniform over the solar cell areas, would
make all quadrants inoperative.
Telemetry and Command. No single open in
the telemetry and command subsystem wiring will
be catastrophic. In fact, the worst case of a single
open wire is the loss of a command regulatorwhich in turn means the loss of one command
receiver, one timer, one PACE, and the corn-
mutated data from one telemetry encoder. No
single short to ground will be catastrophic, the
worst case being a short in the unregulated bus
which will cause half the spacecraft to be in-
operative. The only catastrophic failure found
was the apogee motor fire signal from a com-
mand decoder output shorted to 24 volts, which
would fire the apogee motor.
In general, if an output of a command decoder
is opened, the other three decoders can still be
used. If an output to a regulator is shorted to
ground or the voltage is lowered, the function
will be executed, and from then on tbe other
i
6-3
=

Hughes Aircraft Company
three decoders must be used for that particular
function. A short to ground or lower voltage of
a fire signal, i.e. fire axial jet, will not be suffi-cient to cause the function to occur. A short to
a higher or positive voltage would appear as acontinuous command.
An open or short on an input to the telemetry
encoder will only cause the loss of that input,
except in the case of the pressure signals and
beam position. If a pressure excitation signal
or beam position signal is shorted to ground,
there would be no pressure, temperature, or
beam position readings from any telemetry.
Detailed Analysis. Table 6-1 is an example of
the detailed analysis of failure modes and effects
in all mission phases. The likelihood of a par-
ticular failure is not indicated. The majority of
failures considered were opens and shorts of in-
puts to a unit. In most cases this is a solder con-
nection. The failure rate of a solder connection
is 0.004 by 10-" failure per hour. This rate was
obtained from the Reliability Application and
Analysis Guide, Martin Company MI-60-50
(first revision).
The numbers assigned in the "degree" column
were based on the following assumptions con-
cerning weight of a four-quadrant spacecraft:
Mission Quadrant ItemPhase array control
electronics 0.5 0.12Communications
receiver 1.0 0.25Communications
transmitter 1.0 0.25
Telemetry regulator 1.0 0.25Telemetry encoder 0.92 0.23Telemetry
transmitter 1.0 0.25
Command regulator 1.0 0.25Command receiver 1.0 0.25Command decoder 1.0 0.25Jet control
electronics (0.5 (0.121 O.25 J
Backup control 0.5 _0.12Reaction control
system 1.0 -
0.25
0.12
0.12
0.120.250.23
0.250.250.250.25
0.120.12
0.5
TABLE 6-1. PACE BOARD
Function: Supplies controlled power to RF phase shifters in phased array antenna system
Part, Component, Unit, or Subsystem
identification Description
To auxiliary board, PACElock, beamquadrants 1 position, timerthrough4 select (typical
3 outputs)
Fromcommand Timer select,board quadrant 1 quadrant 1
(typical 4-quadrant inputs)
Failure ModeDescription
Short
Open
Short
Open
On Item
Outputgrounded.
No telemetryfrom thisquadrant.
This quadrantcannot selecttimer,
This quadrantcannot selecttimer.
Effects Description
On Mission Degree, 0 to 1.0
No telemetering 0.04of thisinformation.
Other quad- 0,01rants ok.
Remaining 0.12quadrants canselect timer inthis quadrant.
Remaining 0.12quadrantscanselect timer inthis quadrant.
TelemeteredIndication
F5/CI,C2,C3--no telemetry fortimer select,PACElock, orbeam position.
F5/C1, C2, C3--timer selectcommand willnot have beenexecuted.
6-4

TABLE 6-1 (continued)
6. Reliability and Quality Assurance
=. jm
K2
[i
= =
m
,,,...
n
rPart, Component, Unit, or Subsystem
Identification
To power amplifier
From_ sensor,quadrant 1
To auxiliary board,quadrant I
From auxiliaryboard, quadrant I
From auxiliaryboard, quadrant I
From auxiliaryboard, quadrant 1
Description
Summing net-work, output 1(typical 1 to 16outputs)
_, counterclock
Time-of-day cor-rection (typical4-quadrantinputs)
PACE, + 24 volts
PACE, - 24 volts
Failure ModeDescription
Short
Open
Short
Open
Short
Open
Short
Open
Short
Open
Short
Open
On Item
Input topower ampli-fier grounded.
No input topower ampli-fier fromthis quadrant.
No _ input.
No _ input.
This quadrant#2 anglecounterinoperative.
]
This quadrant¢_ anglecounterinoperative.
No time-of-daycorrectionfrom thisquadrant.
No time-of-day correctionfrom thisinput.
Quadrant 1PACEinop-erative.
Quadrant 1PACEinop-erative.
Quadrant 1PACEinop-erative.
Quadrant 1PACEinop-erative.
Effects Description
On Mission
One-half waveoutput to phaseshifter even ifother quadrantsused.
Other quadrantscan feed poweramplifiers.
This quadrantPACE,JCE,¢,anglecounterinoperative.
This quadrantPACE,JCE,¢,angle counterinoperative.
Other quad-rants ok.
Other quad-rants ok.
Telemetry andcommand, PACE,timer, commandregulator +24-volt outputshorted toground.
Other quadranttime-of-dayinputs may beused.
Other quadrantsmay be used.
Other quadrantsmay be used.
Other quadrantsmay be used.
Other quadrantsmay be used.
Degree, 0 to 1.0
0.06
0.03
0.12
0.I2
0.12
0.12
0.25
0.12
0.12
0.12
0.12
0.12
TelemeteredIndication
No telemeteredindication;however,beamwould dip twiceeach revolution.
F5/C1, C2, C3,F3/C3, C4, C5--lose PACElock._, angle erratic.
F31C3, C4, C5--_ angle registernot counting.
No telemetryor command forthis quadrant.
F5tC1, C2, C3--beam would notcorrect for timeof day
F5/C1, C2, C3--no PACElock,or beamposition.
F5tC1, C2, C3--no PACElock,or beamposition.
F5/C1, C2, C3--no PACElock,or beamposition.
F5IC1, C2, C3--no PACElock,or beamposition.
6-5

Hughes Hircra# Company
V i
H
i
TABLE 6-1 (continued)
Part, Component, Unit, or Subsystem
Identification
To auxiliaryboard, quadrant 1
To auxiliary board,quadrant 1
From commandboard, quadrant 1
From commandboard, quadrant 1
Description
Bl16 typical alsofor Bl17,_,B118, B-T_,Bl19, Bl19
PACElock
Antenna refer-ence position(typical 4-quadrant inputs)
Eclipse mode ON(typical 4-quadrant inputs)
Eclipse mode OFF(typical 4-quadrant inputs)
Failure ModeDescription
Short
Open
Short
Open
Short
Open
Short
Open
Short
Open
On Item
Quadrant 1PACEandJCEinop-erative.
Quadrant 1JCEcan fire
!erratically.
Quadrant 1iCE inop-erative.
Quadrant 1JCEcan fireerratically.
This quadrantinput cannotfeed beam)ositioner.
This quadrantmput cannotfeed)ositioner.
This quadrantcannot turneclipsemode on.
This quadrantcannotturneclipsemode on.
This quadrantcannot turneclipsemode off.
This quadrantlcannot turneclipsemode off.
Effects Description
On Mission Degree, O to 1.O
Other quad- 0.12rants ok.
Other quad- 0.12rants ok.
Other quad- 0.12rants ok.
Other quad- 0.12rants ok.
Other quad- 0.12rants ok.
Other quad- 0.12rants ok.
Other quad- 0.12rants ok.
Other quad- 0.12rantsok.
Other quad- 0.12rants ok.
Other quad- 0.12rants ok.
Telemetered]ndication
No telemeteredindication;phased arraybeam woulddip and drifterratically.
Pulse envelopewill indicateerratic orerroneous firing.
F5t01, C2, C3--PACElock lost.
Pulse envelopewill indicateerratic orerroneousfiring.
F5/CI, C2, C3--No change inbeam positionwhen com-manded.
F5/C1, C2, C3--No change inbeam positionwhen com-manded.
No telemeteredindication ofeclipse modeON or OFF.If commandfails, systemwill lose lockat later time(going in or outof eclipse).
i
U
[]
I!
|i
m
II
l
u
CRITICAL COMPONENT TEST PLANS
The critical component test plans specified
for the Advanced Syncom-program are pre-
sented on the following pages. Each plan details
6-6
the number of units required for criiical testing
and the routing of each unit. These tests are
designed to assure a maximum confidence level
for each critical item while holding to a mini-mum the number of units involved.
--4
L_i
I
===.L_
i

, J
L
_-..j
rL
CRITICAL TEST PLAN FOR SUN SENSORS
ADVANC ED SYNCOM
PREPARED
R. J. Parfltt
APPROVED l_.|_._
APPROVED
HUGHESAIRCRAFTCO.ClJLVER CITY, CALIF.
NUMBER
475302-6oi
CODEIDENT REV
NO. 825"F7
PAGE 1 OF6
DATE: 10/10/63
SPECIFICATION SHEET
6-7

68
INDEX
1.0
2.0
3.0
SCOPE
i.i Purpose
1.2 Description
APPLICABLE DOCUMENTS
REQUIPa_ENTS
3.1 General
3.2 Acceptance Tests
3.3 Qualification Test Cycling
3.4 Accelerated Life Test Program
3.5 Life Test
4.0 QUALITY ASSURANCE PROVISIONS
344
55
CRITICAL TEST PLAN FOR SUN SENSORS
ADVANCED SYNCOM
HUGHES AIRCRAFT CO.CULVE R CITY, CALIF.
NUMBER
475302-601
CODEIDENT rREVNO. 825T7
PAGE 2 OF 6
DATE 10/10/63
SPECIFICATION SHEET
Ul
[]
NB
[]
I!
I
i
[]
i
= =
mm
;: =
lib
i
ilil

_- k_J
1.0 SCOPE
i.i Pur_urgg_ - The purpose of this test plan is to establish
requirements and procedures for evaluating and demonstrating the operation
of the sun sensors under simulated launch orbit mission profiles of Advanced
Syneem.
1,2 Description - Each sun sensor is a device consisting of two
photovoltaic cells mounted in a mechanical housing that supports them and
masks them except for a finely defined field of view. Mounted on the
periphery of the satellite, they produce $ pulses each time their fields
of view pass the sun. These pulses are essential for spin rate control_
orientation control; and antenna phase control.
2.0 APPLICABLE DOCUMENTS
2.1 4753o2-1oo Hughes Drawing_ Sun Sensor Assembly
2.2 475302-6o0 Test Pla% Solar Sensors
2.3 4750o0-6oI Environmental Requirements for Qualifica-
tion Tests of Major Control Items and
Selected Minor Control Items
2.4 479o0o-6o2 Environmental Requirements for Flight
Spare Acceptance Tests of Major Control
Items and Selected Minor Control Items
2.5' 4750oo-6o7 Visual-Mechanical Inspection Require-
ments for Control Units
3.0 REQUIREMENTS
3.1 General - A minimum of 58 flight solar sensors shall be
procured. Of these 3 8 shall be used for the test program, and shall be
characteristic and identical in configuration to flight production units
and shall be inspected_ tested, and handled in the same manner as flight
production units.
During temperature-vacuum-spin testing each unit shall be
energized with a light source of known intensity in an attempt to simulate
sun input, and the electrical outputs shall be loaded to match the space-
craft load characteristics.
Signal outputs shall be monitored continually during tests for
any intermittencies or other indications of malfunctions.
CRITICAL TEST PLAN FOR SUN SENSORS
ADVANCED SYNCOM
HUGHES AIRCRAFT CO.CULVER CITY CALIF.
1
NUMBER
4753o2-6ol
CODE IDENT IREVNO. Q2577
PAGE 3 OF 6
DATE I0/10/6_
SPECJFJCATION SHEET
6-9
m
5.2 $ceeptance Tests
3.2.1 A representative sample of eight solar sensor assemblies will
be selected for the test program. Unit tests in accordance with test plan
475302-600 will initially be performed on the eight assemblies. Each shall
be subjected to one cycle of each of the following acceptance level environ-
ments:
3.2.2in the above
i) Shock and vibration
2) Thermal-vacut_n and spin
5) Bc_st acceleration
4) Acoustical Noise
Parameters of the test cycle environments shall be as specified
listed document 47_000-602.
3.2.3 A complete functional test shall be performed on each unit
following each of the environmental test exposures in accordance with Test
Plan 475502-600.
3.2.4 The eight sun sensor assemblies shall be divided into four
groups of two each, and shall be tested in the following order relative to
environments i, 2, 3, 4 as listed above.
3.2.5
unit shall be
testingj with
cyc Iing.
Group I I, 2, 3, 4
Group II 2, 3, h, i
Group III 3, i, i, 2
Group V 4, _j 2, 3
Upon completion of acceptance testing of all eight units, one
selected from each group to be placed on accelerated life
the second ,.nit from each group to Undergo qualification test
3.3 Qualification Test Cycling
3.5.1 Four sun sensor assemblies shall bf _uhJected to one cycle
each of the following qualification level envir<,ments.
I) Shock and vibration
2) Temperature-vacuum-spin
3) Boost and spin acceleration
4) Acoustical Noise
5.5.2 Parameters of the test cycle environment shall be as specified
by 479o0o-601.
3.3.3 A complete functional test shall be performed following each
of the environmental test exposures in accordance with Test Plan 475502-600.
NUMBER
CRITICAL TEST PLAN FOR SUN SENSORS
ADVANCED SYNCON 475302-_1
CODE IDENT IREVNO, 82ET7
HUGHES AIRCRAFT CO. PAGE4 o, 6
CULVE R CITY, CALIF. OATElO/lO/63
I
F--
i
i
SPECIFICATION SHEET
i
610i

-- kj
w
= ,
L_
3.3.4 The four sun sensor assemblies shall be tested in the following
o_der relative to environments I, 2, 3, and 4.
I) First unit i, 2, 3, i_, I
_) Second unit 23 3, 4_ i, 2
31 Third unit 5, 4, 1, 2, ,Fourth unit 4, I, 2, 3_ i_
3.4 Accelerated Life Test Program
3.4.1 Four sun sensor assemblies shall be subjected to concurrent
temperature-vacuum-spin tests under the following c onditions:
a) Under a vacuum of at least i0 "_ Tort, and under
calibrated simulated sunlight, and spinning_ the
temperature shall be cycled between the extreme
high and low temperature values as listed in
Environmental Requirements for Flight Spare
Acceptance Tests of Major Control Items and
Selected Minor Control Items, _7_OOO-602. The
temperature shall be cycled from high to low and
back to high in 1 hour, 40 minutes. The cycle shall
be completed 200 times.
b) The spin rate shall be in accordance with 47_OO0-602,
Environmental Requirements for Flight Spare Accepta_
Test of Major Control Items and Selected Minor Control
Items.
3.4.2 Each sun sensor shall successfully pass the requirements of
Test Plan _75302-600 upon completion of the test.
3.9 Life Test
3._.i Following successful completion of the acceptance test
program_ the same four units shall be operated under laboratory ambient
conditions for a period of at least I year.
3._.2 Each sensor shall be firmly mounted and its electrical
output shall be loaded to match the load offered by the spacecraft:
A simulated solar light source shall be mounted so as to excite the cells.
The source shall he cycled on and off at a rate of i00 cycles (simulating
the spin rate of the spacecraft).
CRITICAL TEST PLAN FOR SUN SENSORS
ADVANCED SYNCOM
HUGHES AIRCRAFT CO.CULVE R CITY, CALIF.
NUMBER
475302-601
CODE IDENT IREVNO. 82577
PAGE _ OF 6
DATE 10/10/63
SPECIFICATION SHEET
6-11

3.5.3 The four simulated light sources should be capable of
continuous operation for one year. If a light fails, the time count
will terminate, and resume when the light is repaired.
3.5.4 Each sun sensor output will be monitored at the beginning
of the test, and then monitored every 24 hours for two weeks_ with note
made of any change. If no change is noted, monitoring will be made once
every week for the rest of the year. If, at any time, a change is noted,
the output will be switched to a recorder, and will be continuously
monitored as long as it continues to change. If no further change is
noted within one week, continuous monitoring may be ended, and the
cell output may be checked once every 24 hours. If, after two weeks, no
further change is noted, checks may be be decreased to once a week.
4.0 QUALITY ASSURANCE PROVISIONS
Same as stated in test plan 475302-600
==-
B
|
m
I
mm
n
M
B
=
I
U
i
CRITICAL TEST PLAN FOR SUN SENSORS
ADVANCED SYNCOM
HUGHES AIRCRAFT CO.CULVER CITY, CALIF.
' NUMBER
475302-601
CODE IDENT IREVNO. 82577
PAGE 6 OF' 6
DATE I0/i0/63
==
SPECIFICATION SHEET
i
6-12 i

k._ _
i i-
IE J
E
L
!
CRITICAL TEST PLAN FOR PHASE SHIFTERS
PREPARED
APPROVED J i _ _,_
A_PROVED
APPROVED
HUGHESAIRORAFTCO.CULVER OlTY, OALIF.
NUMBER
475152-601
CODE IDENT REV
NO. 82577 t
PAGE 1 OF _,
DATE: 10-i0-63
SPECIFICATION SHEET
6-13

6-14
INDEX
1.0
2.0
3.0
4.0
SCOPE
1 .i Purgose
i. 2 Description
APPLICABLE
R_U_S
3.1 General
3.2 Ambient Pressure Test
3-3 Thermal Vacuum Tests3.k Qualification Vibration
QUALITY AS_/RANCE PROVISIONS
33
3
3344
5
CRITICAL TEST PLA_ FOR PHASE SHII_fERS
HUGHES AIRCRAFT CO.CULVER CITY CALIF.
1
NUMBER
475152-6OZ
COOE IDENT IREVN0,82S7"/
PAGE 2 OF 4
OATE 10-10-63
SPECIFICATION SHEET
U
mm
BB
Z
=
i
im
uli
I
Be
!
= ,
%--.
i.
1,0 SCOPE
I.I Purpose: The purpose of this test plan is to establish require-
ments and procedures for evaluation and demonstrating the operation of the Phase
Shifters under simulated launch and orbit mission profiles of Advanced Syncam.
1 2 Description: The phase shifter is a device consisting of an RF
input coupler, a tube of ferrite in a circular waveguide inside a four-pole, two
phase electromagnetic field coil, and an output coupler. An RF signal appl_ed to
the input port will leave the output port shifted in phase by _n amount determined
by the field coil current. The field coils are driven by slgmals from the phased-
array control electronics (PACE) which provide the correct phasing angles so that
the output of all the antenna elements are properly phased to form a bes_ directed
toward the earth.
2O APPLICABLE DOCUM]_TS
2_1 475152-100 Hughes Drawing, Phase Shifter
2.2 475152-600 Test Plan, RF Phase Shifter
2 3 A75000-601 Environmental Requirements for Qualifi-
cation Tests of Major Control Items and
Selected Minor Control Items
2._ h75000-602 Environmental Requirements for Fli_ht
Spare Acceptance Tests of Major Control
Items and Selected Minor Control Items
2.5 _75000-607 Visual-Mechanlcal Inspection Require-
ments for Control Items
2.6 475o3o-6oo Test Plan, Antenna, Communications
3. o REQUIREMENTS
3.1 General: A total of 66 flight phase shlfters will be produced.
Of these, 6 shall be selected for critical cc_ponent testing. They shall be character-
istic and identical in configuration to flight production units, and shall be inspected,
tested and handled in the same manner as flight production units.
Each phase shifter shall be numbered, one throu@h six, and shall
retain this identity throughout the critical testing.
3.2 Ambient Pressure Test:
i
%.
L
r -
CRITICAL TEST PLAN FOR PHASE SHIFTERS
HUGHES AIRCRAFT CO.CULVER CITY CALIF.
1
NUMBER
_75152-601
COOEIDENT IREVNO. B25"F/
_AGE 3 O_
OATE 10-10-63
SPECIFICATION SHEET
6-15

%m# w
3.2.1 After the six phase shifters have met the performance require-
ments of Test Plan 475152-600, they shall be subjected to temperature tests at
laboratory ambient pressure. Each phase shifter shall be mounted in a special
adapter, as used in Test Plan 475152-600, and the phase shift between the output
and the input shall be measured as a function of current through the motor stator
windlng.
RF losses and power outputs of the two outputs on each phase
shifter shall be measured and compared.
3.2.2. All readings shall be made at a stabilized 0 ° F and again at
stabilized 150 ° F.
3.3 Thermal Vacuum Tests:
3.3.1 Phase shifters numbers i# 2, 3 and 4 shall then be tested in
a thermal vacuum at a pressure of l0 -5 Torr or less. The phase shlfters shall be
mounted in a special adapter, as used in Test Plan 475152-600, and shall be stabil-
ized at a temperatur2 of 40o F for a period of 48 hours. The same performance
tests as in 3.2.1 above shall be repeated once every 24 hours.
5.5.2 The temperature shall then be increased to 130 ° F and stabilized,
and shall remain in this condition for 48 hours. The performance tests of 3.2.1
above shall be repeated once every2h hours.
3.4 Qualification Vibration:
3.h.l After completion of 3.2 and 3.3 above, phase shifters numbers
3, 4, 5 and 6 shall be subjected to qualification vibration environment as defined
in 475000-602. Performance tests shall be conducted in accordance with Test Plan
475152-600 before and after the vibration tests.
4.0 QUALITY ASSURANCE PROVISIONS
4.1 Same as stated in Test Plan 475152-600, RF Phase Shifter,
and Test Plan 475030-600, Antenna, Co_m_mications.
i
i
CRITICAL TEST PLAN FOR PHASE SHIFrERS
HUGHES AIRCRAFT CO.CULVER CITY CALIF.
!
NUMBER
475152-601
CODEIDENT IREVNO. B25_
PAGE 4 OF
DATE i0-i0-63
SPECIFICATION SHEET
6-16=
i
_J_

i ,
=
%..,
CRITICAL TEST PLAN FOR THE
CENTRAL TIMER
PREPARED
J. W. Babb
A_kPROVE_
APPROVED
HU6HE$AIRCRAFTCO.CULVERCITY, CALIF.
NUMBER
_75303-601
CODE IDENT REV
NO. 82577
PAGE 1 OF
DATE: i0-i0-63
,SPECIFICATION SHEET
6-17

INDEX
1.0
2.0
3.0
SCOPE
i .i Purpose:i.2 Description:
A/'PLICABLE DOCUMENTS
REQUIREKENTS
3.13,23.33._3.53.63.73.83.9
General:Test 8ample_:Temperature Cycling (Non-Operating) :Vibration and Shock:
Acceleration:_ois_:Start Tests:
Thermal-Vacuum, Temp. Cycling and Spin Tests:
Operating Life Test:
_.O QUALITY ASSURANCE PROVISIONS
33
3
N
J
HrU
N
[]mms
n
m
J
CRITICAL TEST PLAN FOR THE C_4TBAL TD4ER
HUGHES AIRCRAFT CO.CULVER CITY, CALIF.
SPECIFICATION SHEET
_NUMBER
475303-601
CODEIDENT I.Ev=NO, B25_
PAGE 2 OF _.
i
DATE 10-10-63
6-18
w

k_w
J
k.
|
i. 0 SCOPE
i.i _: It is the purpose of this test plan to evaluate and demon-
strate the operation of the central timer, P/N 475303, D/%der simulated Advanced
Syncom mission profiles (launch and orbit operation).
1.2 Description: The Advanced Syncom central timer (four per spacecraft)
has four separate functions to perform in the spacecraft. First, it provides select-
able time-of-day correction signals to the Phased Array Control Electronics at 2.81
minute Intervsls throughout the life of the vehicle. Second, it provides a 19_ cps
co_uutatlng clock frequency to the telemetry encoder throughout the life of the
vehicle. Third, the central timer provides an output to clear the command register
at 315 minute intervals throughout the life of the spacecraft. Fourth. it generates
the Apogee Motor Ignition Signal 315 minutes after separation frown the second stage
of the launch vehicle.
2.0 APPLICABLE DOCUMENTS
2.1 The following documents form a part of this test plan:
2.1.1 _753o3-60o Central Timer in Process Test Specification
2.1.2 4750o0-602 Env. Requirements for Kit. Spare Accept.
Tests of MaJ. Cont. Items and Sel. Minor
Cont. Items.
2. i. 3 b,75000-601 Env. Reqmts. for Qualification Tests of
Major Control Items and Selected Minor
Control Items.
3. o REQUIREMENTS
3. i General:
3.1.1 The central timers selected for this test shall be characteristic and
identical to the flight production units and shall be assembled, inspected, tested
and handled in the same manner as all flight production units.
3.1.2 Performance Tests in accordance with 475303-600 shall be conducted prior
to and after each environmental test.
3.2 Test Samples:
3.2.1 A representative sample of five timers shall be selected for thls test.
Two timers 1#ill be segregated after temperature cycling (non operating) for operating
llfe tests; the remaining three timers shall be subjected to the tests listed in
Paragraphs 3.4 through 3.9.
CRITICAL TEST PLAN FOR THE CENTRAL TIMER
HUGHES AIRCRAFT CO.CULVE R CITY, CALIF.
NUMBER
475303-601
CODE IDENT IREVNO, 82577 I
I PAGE 3 OF b,.
DATE 10-10-63
SPECIFICATION SHEET
6-19

3.3 Temperature Cyclin 6 (Non-operatic): All five timers will be temper-
ature cycled I00 times between the mi_ and maximum temperature limits as specified
in 475000-601. The purpose is to cause poorly constructed units to fall prematurelyso they may be culled.
3.4 Vibration and Shock: Three central timers shall be subjected to
vibration and shock levels called out in 475000-601, Environmental Requirements For
Qualification Tests of Major Control Items and Selected Minor Control Items. In addition
the three units shall be subjected to vibration and shock stresses at 11 and 2 times thelevels called for in 475000-601.
3.5 Acceleration: Spin and boost three units shall be subjected to
acceleration levels as specified in 475000-601. In addition these timers shall
be subjected to stresses at 11 and 2 times the levels ca/led out in 475000-601.
The units shall be spun at each level initially oriented such that the tuning fork
will be subjected to the same spin forces it will experience in the spacecraft.
3.6 Noise:
3.6.1 Acoustical Noise: The three timers shall be subjected to acoustical
noise levels specified in 475000-60!.
3.6.2 Electrical Noise: The timers shall be operated with a 3 volt peak-to-
peak square wave superimposed on the + 24 volt supply to ensure that electrical noise
on the supply lead will not cause the unit to malfunction.
3.7 Start Tests: The timers shall be subjected to start tests to ensure
that when power is removed and then is reapplied very slowly (at a rate not to exceed
i0 volts/min.), the oscillators will have sufficient loop gain to restart oscillation
at roc_ temperature. This test shall be repeated 5 times at the minimum and maximum
temperature specified in 475000-602.
3.8 Thermal-Vacuum; Temperature CTclin _ and Spin Test; The three timers
shall be operated in a thermal-vacuum of IXIO-5 Torr or less for 30 days. The heat sink
temperature shall be cycled at least 50 times between the miDimum and maxhuum temperature
limits as specified in 475000-602. The timers shall be subjected to spin acceleration
identical to that to which they are subjected in the spacecraft.
3.9 Operating Life Test: The two timers previously segregated (Paragraph
3.2.1) plus the timers which survived all the previous tests will be put on operating
llfe test. This test shall consist of electrically energizing each timer to simulate
actual operating conditions and monitoring the electrical parameters. The test dura-
tion shall be a minimum of three months. During the operating life test the heat sink
temperature shall be cycled from maximum to minimum (aS specified in 475601) daily.
4.0 QUALITY ASSURANCE PROVISIONS
Smme as stated in 475303-600, Central Timer In Process Test Specification.
CRITICAL TEST PLAN FOR THE C_FRAL TIMER
HUGHES AIRCRAFT CO.CULVER CITY, CALIF.
NUMBER
475303-601
CODEIDENT IREVNO. 825"F/
PAGE 4 OF 4
DATE i0-i0-6_
SPECIFICATION SHEET
.w--- _
6-20

i
CRITICAL TEST PLAN FOR TRAVELING-WAVE TUBE
ADVANCED SYNCOM
._.EPAR ED
J, C, Meyer
APPROVED
A_PROV_D
APPROVED
HIIGHESAIRCRAFT CO.CULVER CITY, CALIF.
NUMBER
47_125-601
CODE IDENT INO. 82577
REV
PAGE i OF
OATE: io/lo/63
SPECiF|CATION SHEET
6-21

6-22
INDEX
i.0 SCOPE
1.1 Purpose
1.2 Description
2.0 APPLICABLE DOCUMENTS
2.1 Test Specifications
3.0 REQUIK_4ENTS
3. I General
3.2 Power Aging
3.3 Cycling
3.4 Life Tests
4.0 QUALITY ASSURANCE PROVISIONS
3
33
CRITICAL TEST PLAN FOR TWT
ADVANCED SYNCOM
HUGHES AIRCRAFT CO.CULVE R CITY, CALIF.
NUMBER
475125-601
CODE IDENT [REVNO. 82577
PAGE 2 OF 5
DATE 10/10/63
SPECIFICATION SHEET
m
!BB
g
tm
glm
tl
i
| •
L.
%.
I ,
_|_
7
i.0 SCOPE
i.I _ - It is the purpose of this test plan to evaluate and
demonstrate the operation of travellng-wave tube (TWT) under simulated
Advanced Syncommission profiles (Launch and Orbit operation).
1.2 Description - The TWT amplifies the RF output of the Advanced
Syncom spacecraft to 4 watts over the frequency range of 5977 to 4194 mc.
2.0 APPLICABLE DOCUMENTS
2.1 Test Specifications
47_12_-600 Test Plan, TWT
475000-602 Environmental Requirements for Flight Spare
Acceptance Tests of Major Control Items and
Selected Minor Control Items.
475o00-6o 1
475ooo-6o7
Environmental Requirements for Qualification
Tests of Major Control Items and Selected
Minor Control Items.
Visual-Mechanlcal inspection Requirements
for Control Items.
3.0 REQUIRI_ENT s
3.1 Genera_____l- The TWTs selected for this test plan shall be
characteristic and identical to the flight production units and shall be
assembled, inspected_ tested and handled in the same manner as all flight
production units. There will be a total of 96 flight TWTs. Of these 56,
20 wlll be selected for flight use and 30 will be scheduled for the following
test program.
3.2 Power AKInK - After the tubes have met the requirements
called out in paragraph _.I._ Test Plan 475125-600, they will all be subjected
to a 2000 hour power aging test at laboratory ambient conditions. Each of
the 30 tubes will then be subjected to the expected launch environment which
will consist of vibration, shock, acceleration (boost and spin) and temperature.
The tubes will be operational during the environmental exposures and
performance in accordance with paragraph 4.1.2 of Test Plan 475125-600,
will be recorded prior and subsequent to each environmental exposure.
3._ Cycli_ - At the conclusion of the environmental exposure
each tube will be cycled 200 times. A cycle is defined as 15 minutes off_
19 minutes on. (The filaments to be turned on 4 minutes prior to applying
high voltages). The tubes shall meet the electrical performance requirements
of paragraph 4.1.2 of Test Plan 475125-600 at the conclusion of the cycling test.
NUMBER
CRITICAL TEST PLAN FOR TWT
ADVANCED SYNCOM
HUGHES AIRCRAFT CO.CULVER CITY, CALIF.
4751e5-601I
CODE 10ENT IREVNO. 82577 IPAGE _ OF
DATE i0/10/63L
m
SPECIFICATION SHEET
6-23

3.4 Life Tests - The 30 tubes will be sorted into 9 groups and
the following tests performed for a minimum of one year. The grouping and
tests to be performed on each group follows:
Group No. Tubes
1 3
Tes__._t
Cycling I hr. on, 1/4 hr. off (r mln.
heater warm-up).
2 3 Cycling I hr. on, I/4 hr. off (no heater
warm-up).
Continuous operation with base plate
temperature of 179 ° F.
Continuous operation with Flight type power
supply (475174-100 units). This group will
be subjected to 200 operational cycles
hot and cold temperatures (reference Test
Plan_47_000-602) under vacuum conditions
(i0 "D TorT or less). At the completion of
the thermal vacuum they will contlnue test
under laboratory ambient conditions.
Continuous operation at laboratory ambientconditions.
Same as group _ except collector voltage will
be adjusted to obtain 3 times the normal helix
current.
7 3 Stored at laboratorY ambient conditions. Each
tube to be operated once each 6 month for
sufficient time to check the performance in
accordance with ParagrAph 4.1.2 of Test Plan
47_12_-600.
3.4.1
2 Continuous operation with the RF output
shorted in such a manner as to result in
maximum reflected power.
3 Operate continuously at laboratory ambient
conditions with the cathode temperature
elevated (operate filament at 7 volts).
Description of expected results from llfe tests.
Group I tests - The attempt here is to see if on-off cyclesaffect the life of the tube.
M
M
mm
Z
liiI CC lilY, I--I|
CRITICAL TEST PLAN FOR TWT
ADVANCED SYNCOM
HUGHES AIRCRAFT CO.CULVER CITY, CALIF.
NUMBER
47_125-d01
CODE IDENT IREVNO. 825_ 1PAGE _ OF
OATE IO/lO/63
SPECIFICATION SHEET
6-24 i
2-

| l
; r
- i
F_
Grou_ 2 tests - To determine if there is any difference between
the life of tubes in Group I and % If there is notj it would result in a
considerable weight, part and complexity savings of the power supply.
operation.
- Determine the effects of high temperature
Group 4 tests - This test simulates the actual operation
of the tube with power supply. 200 cycles was chosen as the maximum number
of on-off cycles that any given tube would see in orbit.
Group 5 tests - This test simulates the normal operation and
will be the reference test from which the other tests can be compared.
Group 6 tests - This test will determine the effects of high
helix current on cathode wearout.
Group 7 tests - This test will determine the effects of non-
operation (simulating the redundant tube in the spacecraft).
Group 8 tests - This test is to determine the lifetime of the
attenuator.
Group 9 tests - This test is to determine the effects of
elevated heater temperature on the life of the tube. Hopefully, it will
result in data to verify accelerated testing.
3.4.2 In addition to the above tests_ i0 tubes fabricated during
the interim program have been selected and placed on life test at laboratory
ambient conditions.
3.4.3 Frequenc[ of Tube Performance RecordinK - Cathode activity
measurements in accordance with paragraph 4.1.24 of Test Plan 475125-600
will be made at i000 hours, 3000 hours, 5000 hours and 7000 hours and
then in steps of 3000 hours_ Complete electrical performance measurements
in accordance with paragraph 4.12 Test Plan 47512_-600 will he made at
2000 hours, _300 hours, 7000 hours and then in steps of 3000 hours.
4.0 QUALITY ASSURANCE PROVISIONS
Same as stated in Test Plan 479125-607.
z :
= ,
CRITICAL TEST PLAN FOR TWT
ADVANCED STNCOM
HUGHES AIRCRAFT CO.CULVER CITY, CALIF.
NUMBER
47512_-601
CODE IDENT IREVNO. 825"T7
PAGE _ OF
DATE 10/10/63
SPECIF|CAT|ON SHEET
6-25

PROPOSED CRITICAL TEST PLAN
FOR SQUIB DRIVERS
The squib driver circuits are constructed of standardproven solid state devices using techniques well within the"state-of-the-_rt" and therefore should not be considered as
critical components. H_wever, when the pyrotechnic switches(critical component) were designed out of the Advanced
Syncom System, it was suggested that the squib drivers besubstituted as a critical component. If, after careful
co{sideratlon, it is decided that the s_uib driver is a
critical item, the following is an outline of the test
program.
m
mD
|
U
TL
PREPARED
J. W. Babb
AP_ROVEO '_- _-_a
' A_PROVE [_
' APPROVEO
HUGHESAIRCRAFTCO.CULVER CITY, CALIF.
NUMBER
4753o6-6oz
CODE IDENT REV
NO, 82577
PAGE i OF 4
DATE: i0-i0-63
1412-CC NE¥. fl--61 SPECIFICATION SHEET
w
=
u
6-26W

l, ,I
t_
i
EL_
t_
J
L_
=
T ,
i
I.O
2.0
3.0
INDEX
SCOPE
i. i Purpose:
1.2 Description:
APPLICABLE DOCUMENTS
R_U_
3.13.23.33._3.53.63.7
General:
Test Samples:
Vibration and Shock:
Acceleration (Spin and Boost):
Noise:
Thermal Vacuum and Temperature Cycling:
Extended Storage Life Test:
_.0 QUALITY CONTROL PROVISIONS
33
k4
• /
S_ •
CRITICAL TEST PLAN FOR SQUIB DRIVERS
HUGHES AIRCRAFT CO.CULVER CITY CALIF.
t
SPECIFICATION SHEET
NUMBER
475306-601
CODEIDENT [REVN0.825_
PAGE _ OF
DATE 10-10-63
qm- 6-27

5----
W
i.0 SCOPE
i.I _: It is the purpose of this test plan to evaluate anddemonstrate the operation of the squib driver under simulated Advanced SyncomMission Profiles (launch and orbit operation).
1.2 Description: The squib drivers receive a fire signal input fromthe central timers or from the co_and decoder and supply power to the various
squibs in the Advanced Syncom spacecraft. These squib driver circuits are con-structed of standard proven solid state devices using techniques well within the"state of the art".
2.0 APPLICABLE DO_S
The following documents form a part of this test plan:
475306-6OO
475ooo-6o2
Squib Driver in Process Test Specification
Environmental Requirements For Flight SparesAcceptance Test of Major Control Items andSelected Minor Control Items
475ooo-601 Environmental Requirements for QualificationTests of Major Control Items and SelectedMinor Control Items.
3.0 ___UrRmm_s
3•i General:
3.I.i The squib drivers selected for this test shall be .characteristic
and identical to the flight production units and shall be assembled, inspected,tested and handled in the same manner as all flight production units.
3.1.2 Performance tests in accordance with 475306-600 shall be conducted
prior to and after each environmental test.
3.2 Test Samples: A representative sample of three squib drivers(each containing 4 separate driver circuits) shall be selected for this test.One squib driver will be segregated for extended storage llfe test. The two
remaining units shall be subjected to the tests listed in Paragraphs 3.3 through3.7. The drivers shall not fire randomly during any of the test environments.
3-3 Vibration and Shock: The two squib drivers shall be subjectedto vibration and shock levels as specified in 475000-601.
LJ
i
i
Im
I
!
|
Bg
B
m
i
CRITICAL TEST PIAN FOR SQUIB DRIVERS
HUGHES AIRCRAFT CO.CULVE R CITY, CALIF.
NUMBER
4753o6_01
CODE IDENT IREV
NO. 82577 IPAGE 3 OF
DATE iO-i0-63
ii
=
ill
SPECIFICATION SHEET
6-28W

r
i ;
3.4 Acceleration (Spin and Boost): The squib drivers shall be
subjected to the acceleration environments specified in _75000-601.
3.5 Noise:
3.5.1 Acoustical Noise: These units shall be subjected to the acoustical
noise levels as specified in 475000-601.
3.5.2 Electrical Noise: The squib drivers shall be operated with a
3 volt peak-to-peak square wave superimposed on the _ 2A volt supply to ensure
that electrical noise on the supply lead will not cause the unit to malfunction.
3.6 Thern_l Vacuum and Temperature Cycling: The two squib driver
packages shall be operated in thermal-v_cuumof 1 X 10⁻⁵ Torr or less for lO
days with the heat sink temperature cycled at least 50 times between the minimum
and maxi=am limits called out in _75000-602.
3.7 Extended Storage Life Test: The unit segregated in Paragraph
3.2 shall be stored at room temperature for a period of one year. Each month
it is to have power applied for 24 hours. None of the four circuits shall fire.
At the end of 24 hours an input fire signal is to be applied. All four circuits
must fire.
4.0 QUALITY CONTROL PROVISIONS
Same as stated in 475306-600.
L
¢.J
CRITICAL TE_ PLAN FOR SQUIB DRIVERS
HUGHES AIRCRAFT CO.CULVE R CITY, CALIF.
NUMBER
475306-601
COOE IDENT IREV
NO, 82577 IPAGE _ OF" 4
DATE i0-i0-63
SPECIFICATION SHEET
6-29

U
PHASE I TESTS OF BIPROPELLANT INJECTOR
SOLENOID VALVES
ADVANC ED SYNCOM
PREPARED
P. 3. Sensstock
APPROVED
HUGHESAIRCRAFTCO.CULVER CITY, CALIF.
NUMBER
479o00-608
CODE IDENT REV
NO. B2577
PAGE 1 OF
OAT_:zo/Io/63
I41|-CC R|V, 1|--I! SPECIFICATION SHEET
H
m
|
II
m
ili
_I
MII
w
w
MIW
6-30 j E

1
k_/
INDEX
I.0 SCOPE
i.i Purpose1.2 Description
2.0 APPLICABLE DOCUMENTS
3.o _UI_NTS
3. i General
5.2 Environmental Testing5.3 Endurance Testing
3
33
3
= =
PHASE I TESTS OF BIPROPELLANT INJECTORSOLENOID VALVESADVANCED SYNCOM
HUGHES AIRCRAFT CO.CULVE R CITY, CALIF.
NUMBER
k79ooo-6o8
CODE IDENT IREVNO. 82577
PAGE 2 OF 5
DATE 10/10/63
SPECIFICATION SHEET
6-31

1.0 SCOPE
I.I _ - It is the purpose Of this test plan to evaluate
and demonstrate the ability of the solenoid valves to withstand anticipated
envlrorm_ents and meet the required number of pulse cycles.
i.2 Description - The solenoid valve allows propellant to enter
the injector head when actuated,
2.0 APPLICABLE DOCt_LENTS
2.1 475000-602
2.2 475ooo-6oi
2.3 HTS 0612, ltev. A
2.4 475ooo-6o7
Environmental Requirements for Flight Spare
Acceptance Tests of Major Control items
and Selected Minor Control Items
_nvironmental Requirements for Qualifica-
tion Tests of Major Control It_,s and
Selected Minor Control Items
Marquardt Company Test Specification
Visual-Mechanical Inspection Requirementsfor Control Items
3.0 REqUIREHENTS
3.1
3.1.1 Four valves will be purphased from the Marquardt Company(DIC). These valves shaU be acceptance tested by _4C in accordance with
MTS 0612 prior to dellvery. Leakage shail not exceed i0 cc/hr of heliumat 300 psi. "
3.2 Environmental Testin_ - Two of the four valves will be
subjected to envlronmental testing. Advance Syncom solenoid drivers
(PN 475307-I00)wilI be used to actuate the valves. Response time shall
be measured Just prior to each leak test. The test will be conducted asfollows:
3.2.1 Vibration Tests - The two valves will be vibrated at the levels
listed in 47_000-6O2, Vibration will be applied at 4_ degrees to the
longitudinal axis with nitrogen at 300 psi connected to the input. During
vibration the valve will be checked for leakage. After each vibration
test, the valves will be pulsed _00 times (75 ms ON, 5_ ms OFF) with water
as the propellant. The valves will then be tested for leaks in accordance
with paragraph 3.1.2 of MTS 0612.
1011 C¢ RIV. t-(ll
PHASE I TESTS OF BIPROPELLANT INJECTOR
SOLENOID VALVES
ADVANCED SYNCOM
HUGHES AIRCRAFT CO.CULVE R CITY, CALIF.
NUMBER
475000-6O8
CODE IDENT IREV
NO. 82577 IPAGE 3 OF
DATE 10/10/63
SPECIFICATION SHEET
6-32 W
r _V

tJ
&,..
r -
_.2.2 Shock Test - The two valves will be subjected to a sixty-g
terminal peak sawtooth shock impulse of i_ ms duration. The test set-up
shall be the same as paragraph 3.2.1 and the same performance tests shall
be condudted at the 5eglnulng and conclusion of this test.
3.2.3 Spin Test - The two valves will be subjected to spin accelera-
tion equivalent to 150 rpm at a 30" radius with acceleration applied at an
angle of _ degrees to the longitudinal axis. The test set-up shall be
similar to paragraph 3.2.1. The valves will be pulsed _0 times during spin.
Upon completion of this test the valves will be tested for leaks in accordance
with paragraph 3.1.2 of MTS 0812.
3.2.4 High-Low Temperature Tests - The two valves shall then be
subjected to high-low temperature extremes.
3.2.4.1 General - The upstream pressure on the valves shall be
300 to 32_ psig. The downstream pressure during pulsing shall be 20 to
25 psi less than the upstream pressure. The downstream pressure during
soak and leak testing shall be 0 psig.
A pulse series shall consist of 2,_O0 pulses at 7_ ms ON and
525 ms OFF.
The propellant shall be water.
The valves shall be leak tested in accordance with
paragraph 3.1.2 of MTS 0612.
3.2._.2 After initial hook-up the valve will be operated for one
pulse series at ambient temperature and then tested for leaks. The
temperature shall then be changed to i00 ° F.
5.2.4.5 After a one-hour soak the valves will be tested for leaks,
operated one pulse series and tested for leaks. Then total leakage over
a 24 hour period shall be recorded. The valves will then be operated one
pulse aerie8 and tested for leaks.
3.2.4._ The valves will then be cooled to 33 ° F and paragraph 3.2.4.3
repeated.
5.2.4.5 The valves will then be heated to 200°F and paragraph 5.2.4.5
repeated.
3.3 Enduzance Testing - The other two valves will be teste_under the following conditions until both valves have been pulsed IO times.
5.5.1 The test will be run at ambient temperature with 65 ° F distilled
water under 20 to 29 pslg pressure.
PHASE I TESTS OF BIPROPELLANT INJECTOR
SOLENOID VALVES
ADVANCED SYNCOM
HUGHESCULVER
AIRCRAFT CO.CITY CALIF.
NUMBER
475OOO-6O8!
CODE IbENT IREV
NO, 82577 IPAGE 4 OF
DATE lO/lO/65
SPECIFICATION SHEET
6-33

3.3.2 The valve body temperature will be measured and recorded.
The tests will be stopped whenever the valve temperature exceeds 200 ° F.
After an appropriate cooling period, the tests will be continued.
3.3.3 The pulse rate shall be 75 ms ON 3 _25 ms OFF 3 except every
lO00th pulse shall be 14 minutes ON and 5 minutes OFF.
3.3.4 Leak tests shall be made at the following intervals: 10003
20003 4000, _000, 18,000, 32,000, _,000, 1283000 , 256,000, 512,000, and
at completion of test.
[]U
|
g
==
w
PHASE I TESTS OF BIPROPELLANT ZNJECTOR
SOLENOID VALVES
ADVANCe) SYNC_
HUGHES AIRCRAFT CO.CULVE R CITY, CALIF.
! NUMBER
_750o0-6o8
CODE IDENT IREVNO. 82577 IPAGE 5 OF 5
DATE lo/10/63
wl
fill CC NIEV. 1-lll SPEciFICATION SHEET
6-34
m

t..
i==
t
%..,.
%..
tw
CRITICAL TEST PLAN FOR BIPROPELLANT
INJECTOR SOLENOID VALVES
ADVANCED SYNCOM
PREPARED
P. J. Sengstock
APPROVED p9-)|- _._
:\2 J;!,_..u..A_ PROV, J_D
APPROVED
HUGHESAIRCRAFTCO.CULVER CITY, CALIF.
NUMBER
475o00-609
CODE IDENT REV
NO. 825'7"7
PAGE I OF
DATE: lo/lo/63
SPECIFICATION SHEET
6-35

6-36
1.0
2.0
3.0
INDEX
SCOPE
i.i Purpose
1.2 Description
APPLICABLE DOCUMENTS
RNQUIRm4ENTS
3.1 General
3.2 Test Samples
3.3 Acceptance Tests
3.4 Qualification Test Cycling
3.5 Environmental Life Tests
3.6 Extended Life Test
k.O QUALITY ASSURANCE PROVISIONS
CRITICAL TEST PLAN FOR _IPI_DI'_
INJECTOR SOLENOID VALVES
ADVANCED SYNCOM
HUGHES AIRCRAFT CO.CULVER CITY CALIF.
!
i NUMBER
47900O-6091
CODE IDENT IREVNO. 82577 IPAGE 2 OF
DATE 10/10/63
SPECIFICATION SHEET
!
imm
B
iimJ!
i
Im
.._c
W

LJ
i i
=
!!
&.J
? 7
w
I.O SCOPE
i.i Purpose - It is the purpose of this test plan to evaluate
and demonstrate the operation of the injector solenoid valves under
simulated Advance Syncom mission profile s (Launch and Orbit operation).
1.2 Description - The injector solenoid valves (eight per
spacecraft), control fuel, and oxidizer flow to the thrust chambers.
2.0 APPLICABLE DOCUMENTS
2.1 X254044, Rev. A Bipropellant Reaction Control
Specification
2.2 MTS O612, Rev. A The Marquardt Company Performance Test
Specification
2.3 475o00-602 Environmental Requirements for Flight Spare
Acceptance Tests of Major Control Items
Selected Minor Control Items
2.4 475ooo-6oi Environmental Requirements for Qualifica-
tion Tests of Major Control Items and
Selected Minor Control Items
2.5 475ooo-607 Visual-Mechanical Inspection Requirements
for Control Items
3.0 REQUIREMENTS
3.1 General
3.1.1 The test valves selected shall be characteristic and identical
in configuration to all flight production units and shall be assembled,
inspected, tested and handled in the same manner as all flight production
units.
5.1.2 Ad@anced Syncom solenoid drivers (475507-100) will be used to
energize the solenoid valves.
3.1.3 Performance tests in accordance with MTS 061_ shall be conducted,
as necessary to complete Table III (MTS O61_, page 7), prior to and after each
environment test.
3.2 Test Samples - A representative sample of 16 valve assemblies
will be selected for the test program. Performance tests will be initially
performed on all test specimens in accordance with the Performance Test
Specification, MTS 0612,
i
F_
CRITICAL TEST PLAN FOR BIPROPELLANT
INJECTOR SOLENOID VALVES
ADVANCED SYNCOM
HUGHES AIRCRAFT CO.CULVER CiTY CALIF.
1
SPECIFIcATIoN sHEET
NUMBER
47_000-609
CODE IDENT |REV
NO. e2S',r7 /PAGE 3 OF
DATE 10/10/63
i
i /
6-37
=

i
3.3 Acceptance Tests
3.3.1
four each and
at acceptance
The 16 valves shall be divided into four groups of
subjected to one cycle of each of the following environments
levels called out in 47.5000-602.
I) Shock and vibration
2) Acoustical noise
3) Boost acceleration
4) Thermal-vacuum and spin
3.3.2 During thermal-vacuum and spin the valves shall be pulsed
200 times at 75 milliseconds " " _25 msON_ "OFF".
3.3.5 During environments i, 2 and 3 the valves shall be tested
for leakage in accordance with MTS 0612, except the period shall be the
length of the test.
3.3.4 The four groups of valve assemblies shall be tested in the
following order relative to environments listed above:
Group Environment
i I, 2, _,, 42 I, 2, 3
3 3, _, i, 2
4 2, _, 3, I
5.3.5 Upon compietion of acceptance testing 3 one valve assembly
from each _roup will be placed on an environmental life test; the rest
will undergo qualification test cy_lng.
3.4 qualification Test Cyclin_
3.4.1 Twelve valve assemblies 3 upon completion of acceptance
tests, shall be subjected to the environments listed in the acceptance
tests according to the plan devised, except that qualification levels as
called out in 47_O00-601 will be used.
3.h.2 Subsequent to group qualification testing 3 one valve
assembly from each group will be placed on an environmental llfe test.
The remaining valve assemblies shall be subjected to additional cycles
of each environment of 3.4.1 as follows:
Group
i
Environment
i - (vibration duration shall be multiplied by
3 and 3 times as many shocks shall be
applied).
CRITICAL TEST PLAN FOR BIPROPELLANT
INJECTOR SOLENOID VALVES
ADVANCED SYNCOM
HUGHES AIRCRAFT CO.CULVER CITY, CALIF.
NUMBER
_75ooo-6o9
CODE IDENT ] REV
NO. 8257"7 IPAGE 4 OF 5
DATE lO/10/63
SPECIFICATION SHEET
6-38

|
l
U
| :
3.4.2 (continued)
Group Environment
2 - (duration shall be multiplied by 3)
3 " (test shall be repeated 3 times)
4 - (time shall be 168 hours)
3.5 Environmental Life Tests
3.5.1 One valve from the acceptance tests and one valve from the
qualification test shall be subjected to pulsing (see paragraph 3.5.5
at expected low temperatures (see 475000-602) with N204 as the propellant.
3.9.2 One valve from the acceptance test and one valve from the
qualification tests shall be subjected to pulsing (see paragraph 3.5.9)
at expected high temperatures (see 415000-602) with MMH as the propellant.
3-5.3 One valve from the acceptance tests and one valve from
the qualification tests shall be subjected to pulsing (see 10aragraph
3.5.9) at expected high temperatures (see 47_K)00-602) with N204 as the
propellant.
3.9.4 One valve from the acceptance tests and one valve from the
qualification tests shall be subjected to pulsing (see paragraph 3.5.5)
at expected high temperatures (see 47_000-602) with MMH as the propellant.
3.5.9 The valves shall be pulsed for 25,000 operations over a
30 day period. The pulsing operation will include at least two periods of
iO0 milliseconds "ON" 3 500 milliseconds "OFF" and two periods of 14 minutes
"ON".
3.5.6 Performance tests (see paragraph 3.1.3) shall be conducted
at 5_000 pulse intervals.
3.6 Extended Life Test
3.6.1 Following the environmental llfe testsj the valve assemblies
from 3.5 will be operated under ambient conditions with the same propellants
and pulsed for i0 pulses (iO0 milliseconds "ON", _O0 ms OFF) once a day
for at least 1 year.
3.6.2 Complete functional tests in accordance with MTS 0612 shall
be conducted once each month.
4.0 QUALITY ASSURANCE PROVISIONS
4.1 See 47_O00-607 .
CRITICAL TEST PLAN FOR BIPROPELLANT
INJECTOR SOLENOID VALVES
ADVANCED SYNCOM
HUGHES AIRCRAFT CO,CULVER CITY, CALIF.
NUMBER
475000-609
CODE IDENT I REV
NO, 82577 IPAGE 5 OF5
DATE 10/10/63
SPECIFICATION SHEET
6-39

CRITICAL TEST PLAN FOR BATTERIES
_ppRo_o
APPROVED
HUGHESOULVER
AIRCRAFTCO.CITY, CALIF.
NUMBER
475cc¢-ro(
CODE IDENT REV
NO. 825T7
PAGE I OF 5
DATE: I.',_-l-'T-:r 3
SPECIFICATION SHEET
W
6-40 r-ra¢_

i ,
= .
1.0 SCOPE
This specification covers the critical testing of the Advanced $yncom
batteries (P/N 47525h-IOO and h75255-iOO) and battery cells (P/N 250204).
i.I Pur oose: It is the purpose of this test to evaluate and demon-
strate the operation of the batteries under simulated Advanced Syncom mission
profiles (launch and orbit operation).
1.2 Descrlotlon: The enercD" storage system for the Advanced S_com
spacecraft inc]_os four parallel nlckel-cadmlum batteries consistaL_ of 22
hermetically seated, series-connected, six-ampere-hour cells. These batteries
provide:
I) Storage of electrical eneroqF for operation during the launch
_]ase and during eclipse.
2) Ener_L _ capacity for pulse loads such as the apogee motor
igniter and the bioropellant reaction control system solenoids.
Tqe batteries are considered critical since they require:
l) A detailed specification and control of the active elements
and mechanical 2roperties such as the seal.
2) A comprehensive selection and test pro6ram to meet the long
lifetime requirement.
A minimum of 88 cells _equivale:,t of four A_vanced Syncom batteries)
representative of flight hardware will be proctored For the test program.
2.0 APPT,ICABI,E DOC_<ENTS
30_3c-0oI
_75OOO-(O2
4750o0-607
Procurement Specification, Sealed Nickel-Cadmium
BatterF Cell, g.O Amp-Hr.
Advanced Syncom Battery Test Plan
Environmental Requirements for Qualification Tests
of _lajor Control Items and Selected Minor Control
Items
Environmental Requirements for Flight Spare
Acceptance Tests of Major Control Items and
Selected Minor Control Items
Visual-Mechanical Inspection Requirements for
Control Items.
L
I •
Critical Test Plan for Batteries
HUGHES AIRCRAFT CO.CULVER CITY CALIF.
I
NUMBER
475OOO-(Og
CODE IDENT ]REVNO. B25T7
PAGE 2 OF 5
DATE I0-17-63
SPECIFICATION SHEET
6-41

3. O REqUIR_!_TS
3.1 General: The test cells selected shall be characteristic and
identical in configuration to all flight production Lmits and shall be assembled,
inspected, tested, and handled in the same manner as all flight production units.
Procurement Acceptance Tests in accordance with Hughes Aircraft Company Procurement
Specification 30630-001 will be conducted on all test cells.
In addition, 20 cells will be subjected to the qualification tests of Hughes
Aircraft Company Procurement Specification 30630-001, paragraphs 4.h. 7 through 4.h.13.
3.2 Acceptance Tests: The 88 battery cells shall be divided into four
groups of 22 ceils each and subjected to one cycle of each of the following
environments in accordance with Test Plan Number 47500C-_02:
Environment i) Shock and vibration
Environment 2) Thermal-vacuum and spin
Environment 3) Boost acceleration
Environment h) Acoustical noise
Performance tests in accordance with Test Plan Number 475254-600, paragraph
4._2shall be conducted prior to, during, and after each environmental exposure.
The four groups of 22
to environments I, 2, 3, andi
Croup I
cells shall be tested in the following order relative
4.
i, 2, 3, 4
Group II 2, 3, h, i
Group III 3, h, I, 2
Group IV 4, i, 2, 3
Upon completion of acceptance te_ting, one-half of the units from each
group will be placed on an extended llfe test in accordance with paragraph 3.3 and the
second half of each group will undergo qualification test cycling in accordance
with paragraph 3.h.
3.3 Extended Life Test: Forty-four battery cells shall be subjected
to concurrent temperature, vacuum-spln tests under the following conditions:
i) Test to be conducted for a period of 30 days.
2) During the 30-day period the temperature shall be cycled between
the high and low temperatures referenced in Test Plan Number 475000-602. The
i
J
[]iI
Critical T st Plan for Batteries
HUGHES AIRCRAFT CO.CULVER CITY, CALIF.
NUMBER
475000-606
CODEIDENT IREVN0.82577
PAGE _ OF 5
DATE i0-17J3
i
[]
SPECIFICATION SHEET
6-42U
r_ Z
i

'- k_M
w
s
L.
g
i7
temperature cycling shall include at least 200 cycles while simulating the
expected temperature-tlme environment.
3) The spin rate and vacuum environments shall be in accordance
with Test Plan Number 475000-f02.
4) Actual operational electrical load cycling shall be programmed.
Battery cell performance, i.e., cell voltages, currents, and temperatures
shall be monitored and recorded during the above environmental exposure. A more
comprehensive performance check in accordance with _mragraph 4.1.2 of Test Plan
Number 475254-601 shall De made and recorded prior to and after the environmental
exposure.
Following the environmental life tests, the same cells shall be operated
with simulated spacecraft loading under laboratory ambient conditions for a
period of at least one year. Operational load cycllna is shown in the following
table. Performance tests in accordance with _ragraph 4.1.2 of Test Plan Number
h75254-600 shall be made at the end of cycles i, 41, h2, 82, and 83.
Charge Charge Discharge Discharge T_mp.
Cycles Current_ Time Current_ Time -F.
Amperes Amperes
1 0.165 70 days 0 0 75 °
2-ii 0.165 23.h hr 1.1 0.6 hr _O °
12-31 0.165 22.8 hr 1.1 1.2 hr iO °
32-41 0.165 23_4 hr 1.1 .C hr [_C0
42 0.165 140 days 0 0 75 °
43-52 0.165 23.h hr i.i 0.6 hr hO °
53-72 0.165 22.8 hr i.i 1.2 hr IO °
73-82 0.165 23.4 hr I.I 0._ hr 40 °
83 0.165 70 days O 0 75 °
Table I. Operational Load Cycling
3.h Qualification Test Cycling: Forty-four battery cells selected
upon completion of acceptance testing shall be subjected to one cycle of the
following qualification level environments in accordance with Test Plan Number
4750o0-601,
m
m
Critical q_o.st Plan for :_attefles
HUGHES AIRCRAFT CO.CULVER CITY CALIF.
NUMBER
_75oo0-6o_
CODEIDENT IREVNO, 825_
PAGE _ OF 5
DATE iO-17-(3
m..
SF_ECIFJCAT$ON SHEET
6-43

V im
Environment l)
Environment 2)
Environment 3)
Env{ronment 4)
Shock and vibration
Thermal vacuum and spin
Boost acceleration
Acoustical noise
The battery cells selected for the qualification test cycling shall be
divided into four groups and tested in the following environment of sequence:
Group I l, 2, 3, h
Group II 2, 3, h, 1
Group III 3, 4, I, 2
Group IV 4, _, 2, 3
Battery cell performance in accordance with paragraph 4.2.2(b) of Test
Plan N'mmber 475254-_00 shall be monitored and recorded during the above environ-
mental exposures. A more comprehensive perforr_nce check in accordance with
paragraph h.l.2 of Test Plan Number h75254-{00 shall be r_de and recorded prior
to and after each environmental exposure.
S_sequent to the above group qualification test cycling, battery cells
from each group shall be selected and subjected to one environment in accordance
with the level requirements in Test Plan Number 475000-601 as follows:
Croup I Environment 4 (Vibration and Shock)
Group II Environment 1 (Thermal Vacuum and Spin)
Group IZI Environment 2 (Boost Acceleration)
Croup IV Environment 3 (Acoustical Noise)
At the conclusion of each test, performance data in accordance with
paragraph I_.i.2 of Test Plan Eumber h7525h-CCO shall be recorded. Results of this
test will be submitted to the Project Reliability and Test Section for analysis.
h.O QUALITY ASSURANCE F_0VISIONS
Quality Assurance Provisions shall be in accordance with Test Plan
Number I_75000-607.
Lm
. =
Critical Test Plan for Batteries
HUGHES AIRCRAFT CO.CULVE R CITY, CALIF.
NUMBER
I_75CO0-_0C
!
CODE IDENT _REVNO. 82577 IPAGE 5 OF 5
OAT_ i0-17-f3
SP ECIIC'ICATION SHEET
6-44 N
r
m

\ #w
m
= :
lia
CRITICAL TEST PLAN FOR SEPARATION SWITCHES
ADVANC ED SYNCOM
PREPARED
J. C..Yeyer
APPROVED _': "_-_
APPROVED
APPROVED
HIJGHES41RCRAFTCO.ClJLVEIt CITY, CALIF.
SPECIFICATION SHEET
dhiC_
>LUn,
NUMBER
47.5000-501
CODE IDENT REV
NO. B25_
PAGE 1 OF 14
DATE: 10/10/63
6-45

646
INDEX
1.0
2.0
3.0
4.0
SCOPE
i. 1 Purpose
1.2 Description
APPLICABLE DOCUMENTS
REQUIREMENTS
3. l General
3.9 Performance Tests
3.3 Qualification Tests
QUALITY ASSURANCE PROVI SIONS
3
33
3
3
344
4
CRITICAL TEST PLAN FOR SEPARATION SWITCHES
ADVANCED SYNCOM
HUGHES AIRCRAFT CO.CULVE R CITY, CALIF.
NUMBER
475000-610
CODE IDENT I REVNO. 82577
PAGE 2 OF 4
DATE 10/[0/63
SPECIFICATION SHEET
hL
[]
|
i
m
mmII
|
li
ii
m
m=
m
[]
-__=_=
El
i
i
m
lm
![]
[]

! •
: \j
i
L-
L
i
m
1.0 SCOPE
This specification covers the critical testing of the Advanced
Syncom separation switches.
i.I Purpose - It is the purpose of this test to evaluate and
demonstrate the operation of the separation switches under simulated
Advanced Syncom mission profiles (launch and orbit operation).
1.2 Description - The separation switches (2 pole_ double
throw) have two functions in the spacecraft. Four switches_ one for
each central timer_ keeps reset voltage on the timers until separation
of the spacecraft from the Agena. Two switches apply ground to the
apogee motor squibs from launch to separation.
2.0 APPLICABLE DOCUMENTS
Procurement Specificationj Separation
Switches
475000-601 Environmental Requirements for Qualifica-
tion Tests of Major Control Items and
Selected Minor Control Items
475000 -602 Environmental Requirements for Flight
Spare Acceptance Tests of Major
Control Items and Selected Minor Control
Items
47_0oo-607 Visual-Mechanical Inspection Requirements
for Control Items
3,0 REQUIREMENTS
5.1 General - This test plan is based on the assumptions that
the nature of operation of the switches is "one-shot" and that the environ-
m,ents described are representative of mission conditions. Testing will
be accomplished to
I) Show the ability of the switch to operate under
expected mission conditions.
2) Demonstrate a reliability of 0.999 with a reasonable
confidence.
The switches used for this test will be from the same
manufacturing lot as those to be used in the flight spacecraft.
CRITICAL TEST PLAN FOR SEPARATION SWITCHES
ADVANCED SYNCOM
HUGHES AIRCRAFT CO.CULVER CITY, CALIF.
NUMBER
475000- 610
CODE IDENT REVNO. 82577
: PAGE _ OF 4
DATE I0/10/63
L..
SPECIFICATION SHEET
L
|,iL.
647

w
3.2 Performance Tests - A total of twelve switches will be
used for this test plan. Prior to beginning any test, each switch will
be tested in accordance with the requirements specified in Procurement
Specification No
3.3 Qualification Tests - The twelve switches will be subjected
to the following environments at the levels and durations as specified
in Test Plan No. 479OO0-601 except where changes are noted below.
Environments
i) Vibration (combined sinusoidal, random, and shock)
2) Acceleration (boost and spin)
3) Acoustical noise
4) Thermal-vaduum (12 hours with one cycle of highest
and lowest expected {emperatures)
5) Low-temperature operation
6) High-temperature operation
The thermal-vacuum environment is to be applied to all
of the twelve switches at one time. Subsequent to the thermal-vacuum
test "the switches will be divided into groups of two and tested as
follows:
Swit che s Environment s
2 units I, 2, 3, 5, 6
2 units I, 9, 3, 6, 5
2 units 2j 3, I, 5, 6
2 units 2, 3, i, 6,
e units 3, l, 2, 5, 6
2 units 3, i, 2, 63 5
Speci ficat ion
Each switch shall meet the requirements of Procurement
No. before and after each environment.
After the application of environments I, 9, and 3, each
switch will be operated for IOO cycles. Each switch will be operated
f0r I000 cycles under environments _ and 6;
4.0 QUALITY ASSURANCE PROVISIONS
Quality Assurance Provision shall be in accordance with Test Plan
Number 47_000-607.
CRITICAL TEST PLAN FOR SEPARATION SWITCHES
ADVANCED SYNCOM
HUGHES AIRCRAFT CO.CULVE R CITY, CALIF.
NUMBER
47500o -6]0
CODE IDENT REVNO. 82S77
PA_;E 4 OF" 4
I
zl
Emm
k_
i
I
D
[]m,,
i
W i
ji
m i
UJ
SPECIFICATION SHEET
6-48m
i c
i
m
Tz
w
_ .
PREPARED
R. J. Parfitt
_PP._OVED
AF_ROVEE_
APPROVED
CRITICAL TEST PIAN FOR SWITCH
RF TRANSMITTER
ADVANC ED SYNCOM
HUGHESAIRCRAFTCO.CULVER CITY, CALIF.
NUMBER
47_173-6oi
CODE|DENT REV
NO. 825T7
PAGE 1 OF J_
DATE: i,/10//63
SPECIFtCATION SHEET
T "
6-49
=_
I
INI)EX
1.0 SCOPE
I.I Purpose1.2 Description
9.0 APPLICABLE DOCUMENTS
3.o REQUIPa_ENTS
3.1 General
3.2 Acceptance Test
3.3 Life Test
3
33
3
334
II
Uhlm
III
m
II
B
i
II
ii
m
II '
mum
CRITICAL TEST PLAN FOR SWITCHj RF TRANSMITTERADVANCED SYNCOM
HUGHES AIRCRAFT CO.CULVE R CITY, CALIF.
NUMBER
_7_173-6oi: ; ::: N iI
CODE IDENT I REV
NO. 82577 lPAGE 2 OF,_ 4 ; " ! "
_.PEC] _iCATION SHEET
OATE iO/10/63
m
6.50 .....
m
!
§ii|

|i
-" T
= .
E
L_
f
1.0 SCOPE
I.i _ - The purpose of this test plan is to establish
requirements and procedures for evaluating and demonstrating the operation
of the transmitter RE switch under simulated launch and orbit mission
profiles of Advanced Syncom,
1.2 Description - The RF switch is a 3 port circulator where
the direction is controlled by the direction of a permanent magnetic
field. Switching is accomplished by applying current to an external coil,
which changes the direction of the magnetic field• The current is removed
after switching is accomplished. The switch provides a means of alternately
driving a colmnon antenna system with two different TWT's.
2.0 APPLICABLE DOCUMENTS
2.l 475000-607 Visual-Mechanlcal Inspection Requirements
for Control Units.
2.2 475175-600
e.5 47%00-601
Test Plan, RF Switch, Transmitter
Environmental Requirements for Qualifica-
tion Tests of Major Control Items and
Selected Minor Control Items
2.4 47[/300-602 Environmental Requirements for Flight
Spare Acceptance Tests of Major Control
Items and Selected Minor Control Items
5.0 REQUIREMENTS
3.1 General - A minimum of 21 flight 4 gc ferrite switches
shall be procurredj of which 4 shall be used for the test program. These
4 shall be characteristic and identical in configuration to flight
production units 3 and shall be handled, inspected, and tested in the same
manner as the flight production units.
3._ Acceptance Test - The 4 switches shall be subjected to
the following environments at the leveis specified in Test Plan No.
475000-602.
I) Vibration and shock (combined)
2) Acceleration (spin and boost)
3) Acoustical noise
4) Thermal-vacuum
Each switch will be identified by number and will be
subjected to the above environments in the following sequence.
CRITICAl. TEST PTA/ FOR SWITCH, RF TRAI, S_,iTTER
AD_AI CED S%q_CO_
HUGHES AIRCRAFT CO.CULVER CITY CALIF.
t
SPECIFICATION SHEET
NUMBER
475173-601
!CODE IDENT I REVNO. B2577 IBAGE _ OF
D AT E i0/i0/6]
6-51

Switch Number Environmental Sequence
I l, 2, 3, 4
2 2, 3, 4, i3 3, 4, i, 2
4 4, l, 2, 3
Performance tests in accordance with Test Plan 475173-600
shall be performed on each switch before and after subjection to each
environment.
3.3 Life Test - After successful completion of the environ-
mental tests 3 each switch shall be electrically cycled iO00 times. RF
measurements in accordance with Test Plan 475173-600 will be made after
each iO@ cycles.
4.0 QUALITY ASSURANCE PROVISIONS
Same as directed in Test Plan 475173-600.
am,
M
CRITICAL TEST PLAN FOR SWITCH_ RF TRANSMITTER
ADVANCED SYNCOM
HUGHES AIRCRAFT CO.CULVER CITY CALIF.
I
NUMBER
h7F173-6ol
CODEIDENT IREVNO. 82577
PAGE 4 OF 4
DATE 10/10/63
w
Ill
SPECIFICATION SHEET
Ill
6-52I
i

,.., k_/
:. r
- .7 7
L.J
%
k*_ [
CRITICAL TEST PLAN FOR SWITCH
R F R EC EIV ER
ADVANC ED SYNCOM
PREPARED
R. J. Parfltt
APPROVEO
A'P PRO',N_ D
APPROVED
HUQHESAIRCRAFTCO.ClILVER CITY, CALIF.
NUMBER
475tY6-6oI[
CODE IDENT i REV.
NO. 82577 /
PAGE l OF }4-
DATE: I0/]-0/6]
SPECIFICATION SHEET
6-53
6-54
Ih_EX
1.0 SCOPE
I.I Purpose
1.2 Description
2.0 APPLICABLE DOCUMENTS
3.0 REQUIREMENT S
3.1 General
3.2 Acceptance Tests
3.3 Life Test
h.O QUALITY ASSURANCE PROVISIONS
CRITICAL TEST PLAN FOR SWITCH, RF RECEIVER
ADVANCED S1_COM
HUGHES AIRCRAFT CO.CULVER CITY, CALIF.
NUMBER
4r{_t76--_t
ICODE IDENT I REV
NO. 82577 IPAGE 2 OF
DATE I0/10/6 3
SPECIFICATION SHEET
|
il
g
Fci
&_l
i _
m
m
J
l,..m

%
?
t
I.0 SCOPE
I.i Pur__u_r2_q_9_- The purpose of this test plan is to establish
requirements and procedures for e,raluating and demonstrating the
operation of the receiver RF switch under simulated launch and orbit
mission profiles of Advanced Syncom.
1.2 Description - The RF switch is a 3 port, 6 gc circulator wherethe direction is controlled by the direction of a permanent magneticfield. Switching is accomplished by applying current to an external coil 3which changes the direction of the magnetic field. The current is
removed after switching is accomplished. The switch provides a means ofalternately driving two receivers from a co_on RF input.
2.0 APPLICABLE DOCUMENTS
2.1 47_5000-607 Visual Mechanical Inspection Requirementsfor Control Units.
2.2 475176-600 Test Plan_ RF Switch, Receiver
2.3 475000-601 Environmental Requirements for QualificationTests of Major Control Items and SelectedMinor Control Items
2.4 475000-602 Environmental Requirements for Flight SpareAcceptance Tests of Major Control Items andSelected Minor Control Items.
3.0 REQUIREMENTS
3.1 General - A minimum of 21 flight 6 gc ferrite switches shallbe procured, of which 4 shall be used for the test program. These 4shall be characteristic and identical in configuration to the flight
production units, and shall be handled, inspected, and tested in thesame manner as the flight production units.
3.2 Acceptance Tests - The 4 switches shall be subjected to the
following environments_ _t the levels specified in Test Plan No. 475000-602.
i) Vibration and shock
2) Acceleration (spin and boost)
5) Acoustical noise
4) Thermal Vacuum
Each switch will be identified by number_ and will be subjectedto the above environments in the following sequence.
CRITICAL TEST PLAN =OR SWITCH_ RF RECEIVER
ADVANDED SYNCOM
HUGHES AIRCRAFT CO.CULVER CITY CALIF.
!
NUMBER
475176-dO1
CODE IDENT ] I_EVNO. 82577 IPAGE _ OF }I-
OATE lO/1O/63
SPECIFICATION SHEET
6-55

_m_ m
Switch Number Environmental Sequence
i I_ 2_ 3, k2 2, 3, k, i
3 3, 4, i, 2k k, i, 2, 3
Performance tests in accordance with Test Plan 475176-600shall be performed on each switch before and after subjection to eachenvironment.
5._ Life Test - After successful completion of the environmentaltests_ each switch shall be electrically cycled iOO0 times. RF measure-ments in accordance with Test Plan 479176-600 will be made after eachi00 cycles.
4.0 QUALITY ASSURANCE PROVISIONS
S_ne as stated in test plan 4"(51'(6-600.
i
i
g
i
mm
|
g
= =
w
CRITICAL TEST PLAN FOR SWITCH_ RF RECEIVERADVANCED SYNCOM
HUGHES AIRCRAFT CO.CULYER CITY CALIF.
t
NUMBER
475176-601
ICODE IDENT J REV
NO, 8257T IPAGE _ OF 4
DATE i0/i0/63I
SPECIFICATION SHEET
Lj _•
6-56
i
I
W

z ilt-,..-
_=_
L£
1.,,,,g
t_L_
[]
e
w
u
z
y
t
!,,¸,.¸,2
QUALITY ASSURANCE
The Quality Assurance effort during this phase
of the Advanced Syncom program has included
planning a quality program for the Development
and Launch Program, preparation of control
documents, evaluation of tentative suppliers, and
inspection of hardware. A concerted effort has
been devoted to complete revision and upgrading
of the E1 Segundo Quality Assurance Instructions
and Culver City Quality Control Instructions, to
provide for greater utilization of standard oper-
ating procedures and reduce the total number of
unique situations.
Quality Control Operations. A representative
of the Quality Control Supplier Evaluation
group has been actively participating in the sur-
vey of all suppliers of electronics parts to be used
in Advanced Syncom. Supplier quality control
systems were evaluated in terms of requirements
established in NPC 200-3. Suppliers that did not
meet these requirements were given conditional
or unapproved ratings and requests for corrective
action. Re-surveys will be conducted when com-
pletion of corrective action is indicated by the
supplier.
A facility survey of the Marquardt Corpora-
tion was performed in June 1963. Based on the
findings, Marquardt was given a conditional
rating. Marquardt Quality Control indicated that
corrective action will be completed by 20 Octo-
ber 1963. A preliminary Quality Control Plan
has been completed and a detail plan, which will
comply with NPC 200-2, will be submitted for
Phase II of the program. Engine and system tests
were monitored by Hughes Quality Control and
discrepancies noted. Hughes Aircraft Company
Statement of Work No. 170426, Revision E.,
dated 1 August 1963 waived Marquardt quality
control coverage for the remainder of the interim
6. Reliability and Quality Assurance
phase of the program. Marquardt Quality Con-
trol documentation to reflect acceptance of the
engineering model will not be prepared based on
this waiver.
In-process inspection has been performed on
the Advanced Syncom hardware fabricated and
assembled during this phase of the program. This
hardware is classified as experimental, requiring
only minimum controls and inspection.
Preprocurement Activities. The Quality As-
surance procurement efforts during this report
period involved participation in the ProcurementCommittee evaluation and source selection rec-
ommendation of suppliers for the Advanced Syn-com batteries and solar cells. In both cases RFPs
were sent to five suppliers. NASA Quality Publi-
cation NPC 200-3 was made applicable to both
of these procurements. The Quality evaluation of
each supplier was based on recent surveys, pro-
posal inputs, and the Quality Manuals of pro-
spective suppliers.
Quality Assurance Inspection Instructions. The
NASA requirements for inspection instructions
were analyzed during this period. Documentation
has been generated to state the criteria to be uti-
lized in the preparation and issuance of the in-
structions. Formal documentation will be
released shortly in the form of a Quality Assur-
ance Instruction (QAI).
Available hardware drawings have been
viewed to determine the need for specific docu-
mentation and provide a basis for the formula-tion of this documentation. At this time material
flow charts have not been finalized; consequently,
exact locations of in-process inspection oper-
ations cannot be defined. Every effort is being
expended toward assuring complete correlation
of the inspection operations with the total manu-
facturing effort.
6-57
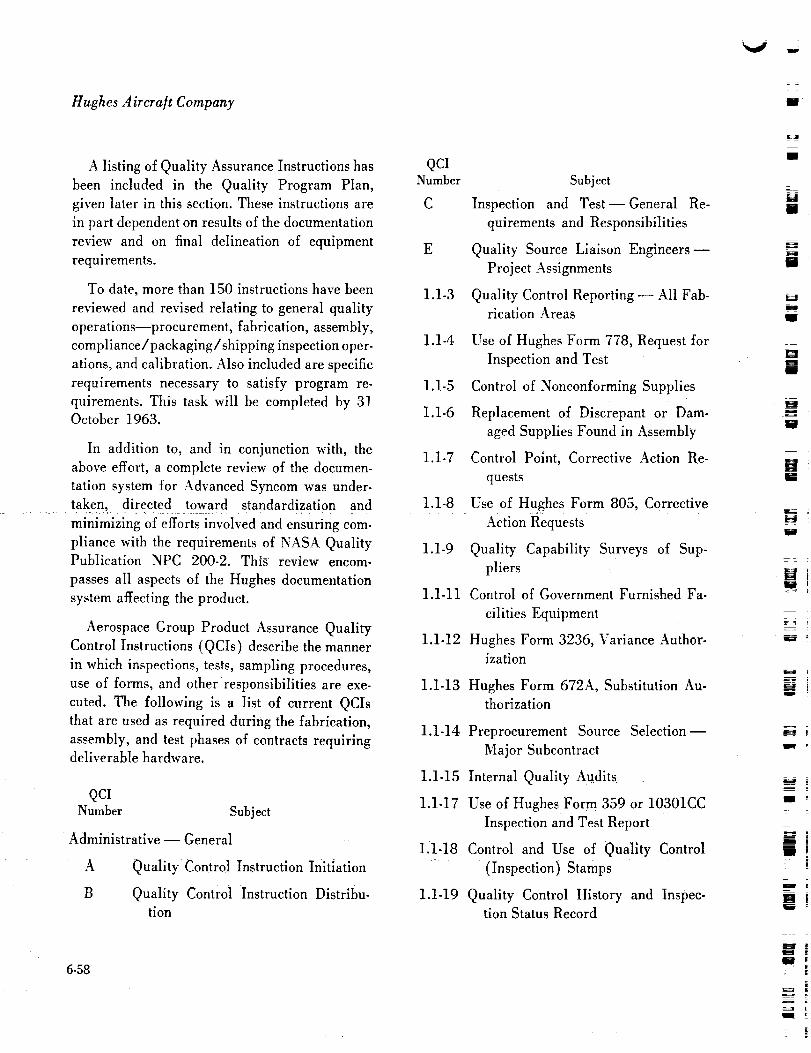
Hughes etircraft Company
A listing of Quality Assurance Instructions has
been included in the Quality Program Plan,
given later in this section. These instructions are
in part dependent on results of the documentation
review and on final delineation of equipment
requirements.
To date, more than 150 instructions have been
reviewed and revised relating to general quality
operations--procurement, fabrication, assembly,
compliance/packaging/shipping inspection oper-
ations, and calibration. Also included are specific
requirements necessary to satisfy program re-
quirements. This task will be completed by 31October 1963.
In addition to, and in conjunction with, the
above effort, a complete review of the documen-
tation system for Advanced Syncom was under-
taken, ' directed toward standardization and
minimizing of efforts involved and ensuring com-
pliance with the requirements of NASA Quality
Publication NPC 200-2. This review encom-
passes all aspects of the Hughes documentation
system affecting the product.
Aerospace Group Product Assurance Quality
Control Instructions (QCIs) describe the manner
in which inspections, tests, sampling procedures,
use of forms, and other responsibilities are exe.
cuted. The following is a list of current QCIs
that are used as required during the fabrication,
assembly, and test phases of contracts requiringdeliverable hardware.
QCI
Number Subject
Administrative -- General
A Quality Control Instruction Initiation
B Quality Control Instruction Distribu-tion
6-58
QCINumber Subject
C Inspection and Test--General Re-
quirements and Responsibilities
E Quality Source Liaison Engineers
Project Assignments
1.1-3 Quality Control Reporting-- All Fab-rication Areas
1.1-4 Use of Hughes Form 778, Request for
Inspection and Test
1.1-5 Control of Nonconforming Supplies
1.1-6 Replacement of Discrepant or Dam-
aged Supplies Found in Assembly
1.i-7 Control Point, Corrective Action Re-
quests
1.1-8 Use of Hughes Form 805, Corrective
Action Requests
1.1-9 Quality Capability Surveys of Sup-
pliers
1.1-11 Control of Government Furnished Fa-
cilities Equipment
1.1-12 Hughes Form 3236, Variance Author-
ization
1.1-13 Hughes Form 672A, Substitution Au-
thorization
1.1-14 Preprocurement Source Selection m
Major Subcontract
1.1-15 Internal Quality Audits
1.1-17 Use of Hughes Form 359 or 10301CC
Inspection and Test Report
1.1-18 Control and Use of Quality Control
(Inspection) Stamps
1.1-19 Quality Control History and Inspec-
tion Status Record
U
tJ
J
uII
lrsle
g
IB
mi
mII
m!
w
Wi
J
Hi
T
Rig '
!
m E
ii
!
Ill
I

i
L
itiir _ i2-.
' f,.d
i
QCINumber Subject
1.1-20 Use of Form 3065 Floor Inspection
Travel Copy
1.1-21 Document Control Center, Inspection,
and Test Section
Inspection Instruction
2.1-2 Etched Circuit Boards
2.1-3 Hughes-Furnished Subcontract Mate-
rials
2.1-4 Clean Room Control and Surveillance
2.1-5 Inspection of Micro Resistance Weld-
ing
2.1-6 Periodic Inspection of Stores andWarehouses
2.1-7 Workmanship Standards
2.1-8 Tooling Inspection
2.1-9 Final Inspection of Missiles and Space
Vehicles
2.1-10 Hughes Source Inspection--Inspec-tion and Test Section
2.1-11 Bearing Inspection
2.1-13 NASA Soldering High Reliability Con-
nections, MSFC-PROC-158B
Receiving and Shipping Inspection
2.2-1 Receiving Inspection Sampling Plan
2.2-2 Receiving Inspection Instruction Sheet
2.2-3 Raw Stock Receiving
2.2-4 Vendor Quality Rating System
2.2-6 Quality Control Reporting- Receiv-
ing Inspection
6. Reliability and Quality Assurance
QCINumber Subject
2.2-7 Receiving Inspection--General Re-
quirements and Responsibilities
2.2-8 Packaging and Shipping Inspection
2.2-9 Source Inspection--Supplier Evalu-
ation Section
2.2-11 Quality Control Screening of Scrap or
Salvable Material
2.2-12 High Reliability Receiving Inspection
2.2-13 Control of Damaged Government prop-
erty (GP) Receiving Inspection
2.2-14 Receiving Inspection of Government-
Furnished Property (GFP) and
Bailed Property (BP)
2.2-15 Quality Control Screening Procure-ment Documents
2.2-16 Evaluation of Special Process Sup-
pliers
2.2-17 Initial Review, Nonconforming, or
Discrepant Supplies/Material
2.2-18 Maintenance of Specification Files,
Receiving Inspection
2.2-19 Hughes Source Quality Surveillance,
Supplier Evaluation Section
4.1-3
4.1-4
Quality Assurance Engineering
4.1-1 Quality Operating Plan
4.1-2 Certification of Micro Resistance
Welding Operators
Certification of Metal Finishing Proc-
esses
Qualification/Certification of Heat
Treating
6-59

Hughes A ircra/t Company
V
U
QCI
Number Subject
4.1-5 Certification/Qualification of Class
"A" Welding Operators
4.1-7 Test Verification and Performance
4.1-8 Qualification of Micro Resistance
Welding Machines
4.1-9 Welding Inspection, Fusion
4.1-10 Heat Treating Inspection
4.1-11 Plating Inspection
4.1-12 Painting Inspection
4.1-13 Welding, Resistance, Inspector Quali-fication
4.1-14 Accuracy of Test Measurement Equip-ment
4.i-15 Qualification and Certification of Pene-
trant inspectors
4,i-16 Adhesive Bonding Inspection
4.1-17 Penetrant Inspection Type I and II
Project-oriented QCIs are prepared to provide
specific guidance for operating personnel. The
following preliminary Advanced Sync0m QCIs
have been prepared for the development and
launch phase of the Advanced Syncom program
and are included in the supplement.
3.12-0 Inspection Check List
3.13-1 Quality Requirenients
3.13-2 Screening Assist Work Authorizations
QCINumber Subject
3.13-6 Screening Work Orders
3.13.7 Control of Parts Pending Release ofReleased Prints
3.13-8 Control of Nonconforming Supplies
(will be prepared when MRB mem-
bership lists are available).
Inspection Planning Sheets (IPSs) are pre-
pared for specific processes, operations, and
critical assemblies. Inspection Planning Sheets
have been prepared for the following:
Hughes Process No.
4-99
4-112
4-142
9-24
16-41
16-80
16-9i
No HP
number
Subject
Nickel Plating, Electrolytic
Protective Paint System
Vacuum Deposit, Aluminum
Removal of Soldering Flux
Adhesive Bonding
Adhesive Bonding
Foam-in-Place
Welded Module
NoHP Welded Module/Board As-
number semblies
Quality Program Plan. The Advanced Syncom
Quality Program Plan is described on the fol-
lowing pages in its entirety:
Project Description. The Advanced Syncom
program includes development, fabrication, test,
and flight operations of Spacecraft to be orbited
3.I3-3 Screening Purchase Ordel"s by Aflas/Agena D launch Vehicles and operated
3.13-4 Receiving Inspection Purchased Parts in conjuncti0n with NASA communication ground
3.I3-5 Bonded Stores Inspection
stations for the performance
orbit exper{ments.
of stationary -- ....
6-60
U
M
i
Wu
u
M
t_u
m
U :
wiul
ui
|m
W
w
J
_. Em
I IE
Ul =
E
i

E
k.,d
L_JL_
L •
F3
E
EV_
[]
E
The program includes development of an ad-
vanced engineering model, a ground test model,
and four flight spacecraft. The engineering
model will be used to finalize the design of the
various subsystems and will therefore conform
as nearly as possible to flight hardware form
factors and weights. No power-aging or burned-in
components shall be specified for installation in
the engineering model.
The ground test (prototype) and flight models
will be fabricated and tested to formal drawings
and specifications. The prototype and flight mod-
els will be identical in all respects except that
prototype components will have a 240-hour
burn-in and flight components will have an addi-
tional 1260 hours of power aging.
The program also requires the fabrication of
twelve communication transponders and five
telemetry and command simulators for use in
integration and prelaunch testing of the ground
communications and telemetry and command sta-
tions. Level III Quality requirement s as definedin Table 6-2 shall be utilized for these items.
The spacecraft systems are divided into major
and minor control items as defined in the docu-
ment listing later in this section. Prior to accept-
ance for assembly into the spacecraft, tests will
be performed to assure unit compliance with
established specifications. Systems test equip-
ment will provide basic initial integration check-
out and detailed examination of system param-
eters.
Reference Documents. Except as noted in
the document listing, the following documents
serve as the basis for the Quality Program Plandescribed herein :
NPC 200-2 Quality Program Pro-
visions for Space Sys-tems Contractors
61 Reliability and Quality Assurance
TABLE 6-2. TASK BREAKDOWN BY QUALITYCONTROL LEVELS
F = Complete implementation
R = Implementation at project request
NA = Not applicable
Level Level LevelQuality Control Function I 11 III
Design review
Changecontrol
Inspectionand test planning
Inspection and test procedures
Statistical quality control
Training and personnel certifications
Quality standards
Supplier surveys
Purchaseorder screening
Source inspection
Receivinginspection
Supplier data
Supplier rating
Stores and material control
In-process inspection and test
Process certification
Final inspection and test
Calibration
Preservation, handling, packaging,and shipping
Evidence of inspection
Material review board
Failure report and corrective action
Quality assuranceauditsand reports
Control of Government-furnishedarticles
R
NA
R
R
R
F
R
R
F
R
F
F
NA
R
R
R
R
F
Fi
R R
F F
R F
R F
F F
F F
R F
F F
F F
R F
F F
F F
F F
F F
F F
F F
F F
F F
R F
F F
F F
F P
F F
E E
NPC 200-3
MSFC-PROC-158B
Inspection System Pro-
visions for Suppliers of
Space Materials, Parts,
Components, and Serv-
ices
Procedure for Soldering
of Electrical Connec-
tions (High Reliability)
6-61

Hughes Aircra/t Company
Mil-Std 105D Sampling Procedures
and Tables for Inspec-
tion by Attributes
Implementation of NASA documents shall be
accomplished through the use of Hughes Space
Systems Division Policies, Advanced Syncom
Project Bulletins, detailed implementing instruc-
tions issued by the Quality organizations, and
this Quality Program Plan. Those presently in
use are given in the document listing and nec-
essary additions and revisions will be made by
the use of Advanced Syncom Project Bulletinswhich will define the modification.
The Hughes Advanced Syncom Project Office
is responsible for compliance with all Quality
aspects of the contract. Reporting to the Ad-
vanced Syncom Program Manager is the Product
Effectiveness Department composed of Quality
Assurance, Reliability, and Test. This office pro-
vides for the preparation and implementation of
the quality program and for the coordination of
requirements, approvals, reports, and negoti-ations with the NASA.
Fabrication of Advanced Syncom subsystems
and systems, spacecraft system integration and
test, and spacecraft environmental testing occur
at both the Hughes Aircraft Company Culver
City, California and E1 Segundo, California, fa-
cilities. Since both facilities have a completely
staffed Quality Control organization, the Ad-
vanced Syncom Program shall utilize the serv-
ices of each group. Coordination of Quality
Control activities is accomplished between the
divisions by the Project Office and audited by the
Space Systems Division Quality Assurance or-
ganization. Detailed implementing documents
issued by the quality organizations show uni-
formity of purpose and direction during these
periods of transition and operation.
6-62
Design Controls
° Design Review. Quality Assurance re-
view of Engineering drawings, specifications, and
test plans is the direct responsibility of the
Quality Assurance representatives in the Syncom
Project. Additional Quality Assurance participa-
tion at all regularly scheduled design review
meetings will be as directed by this office. All
design reviews will be in accordance with SSD
Procedure 9-2.7 and EP 7-17.2, Design Review.
° Change Control. Hughes Aircraft Com-
pany operates an Engineering Change Control
System in accordance with procedures issued and
maintained by the Engineering Data Department
and published in the Engineering Procedures
Manual. The specific portion of the manual di-
rectly related to and in effect on Advanced Syn-
com is EP 7-10.2, Syncom Project--Engineering
Change Management. Quality departments shall
assure full compliance of hardware with effec-
tivities as specified in Engineering change docu-
ments on all Level II and III hardware, in ac-
cordance with Space Systems Division Procedure
9-3.3, Quality Assurance Change Control.
Quality Planning
• Inspection and Test Planning. The serv-
icing Quality Control Engineering sections will
prepare instructions describing the inspection
operations to be performed for all major control
items. Other inspection instructions will be pre-
pared to describe operations performed during
in-process, final, packaging, and shipping inspec-
tions. Items of a specialized nature or peculiar to
Advanced Syncom hardware will be given indi-
vidual attention by the issuance/modification of
Bulletins or Quality Control Instructions.
Fabrication operations shall be detailed in
shop travelers prepared by the Planning Section
of the Manufacturing organizations. In addition
L_

, _-_-
= ,
::,===_
w
= :
r ,
=
_-" •
r
to the operations, machine utilization, and tool-
ing required, quality requirements such as in-
spection and test points and process certifications
shall be specified. Prior to issuance, Planners
shall submit the travelers to the servicing Quality
Control Engineering group for concurrence with
the quality callouts. Though terminology for
travelers may differ within the Hughes divisions,
the practice of submitting these documents to
Quality Control is standardized. Formal imple-mentation occurs at Levels II and III.
• Levels of Quality Functions. To assure
adequate and economical control of product
quality, the functions as defined in this section
shall be adhered to. Three levels are used to pro-
vide quality levels compatible with the phase of
the program in terms of hardware development:
Level I
Level II
Level III
Mockups, breadboard, experimen-
tal, and ground support equip-
ment. (For the latter, training and
certification and Quality Assur-
ance audits and reports are at the
request of project.)
Developmental and engineering
Service test, prototype, qualifica-
tion, production, flight, and spares
Implementation of the Quality Control func-
tions varies in degree between these levels and
ranges from basic controls at the Level I phase to
full implementation of all Hughes Quality Con-
trol policies at the Level III phase. A detailedbreakdown of task versus level is shown in Table
6-2.
Level I items are those which are used to:
1) Prove the feasibility of a device, circuit,
equipment, system, or principle
6. Reliability and Quality Assurance
2) Demonstrate the technical soundness ofa basic idea.
Level II items are used to:
1) Establish technical requirements for en-
vironmental or flight vehicles
2) Evaluate conformance to performance
requirements of the specification
3) Demonstrate the reproducibility of the
equipment•
Level III items are used for:
1) Qualification
2) Service test
3) Flight
• Inspection/Test Procedures• Inspection
procedures shall be prepared by the cognizant
Quality Engineering departments. Test proce-
dures are prepared by the Quality Department
for those items for which they construct test
equipment (as described in work authorizations)
or by Engineering (where Engineering constructs
the test equipment)• These documents shall be
available at all applicable inspection/test sta-
tions•
• Statistical Quality Control. All electronic
components shall be tested 100 percent for criti-
cal electrical parameters, as defined by Hughes
specifications, either at the supplier or at Hughes.
Items which have had 100 percent testing and
source inspection at the supplier shall be sampled
at Hughes in accordance with Mil-Std 105D,
Table I, Level $4, AQL 0.4 for electrical param-
eters and Level $2, AQL 4.0 for visual/mechan-
ical parameters• Items which have not been
burned in or power aged at suppliers shall be
100 percent tested at Hughes for electrical pa-
rameters per specification verification and in-
spected for visual/mechanical parameters in ac-
cord with Table I, Level $2, AQL 4.0.
6-63
=

Hughes Aircraft Company W
Personnel Controls
• Training and Personnel Certification.
Training of personnel associated with the Ad-
vanced Syncom program will be on a continuous
basis for the duration of the contract. Training
will be accomplished through periodic on-the-jobinstruction and formal classroom effort on work-
manship requirements, NASA soldering tech-
niques, etc. A Hughes facility which has been
NASA approved and which utilizes instructors
certified to the requirements of MSFC-PROC-
158B shall train and certify all personnel utilized
on Advanced Syncom. While certification for
other special processes has been performed, new
personnel assigned to these tasks shall be certi-
fied in accordance with Hughes process specifi-cations.
• Standards. Standards of workmanship
other than as defined specifically on applicable
drawings and in Hughes specifications shall con-
sist of MSFC-PROC.158B, QCI 2.1-7, and por-
tions of the Space Project s Standard Practice
Handbook as specified by project bulletins.
Supplier Controls
• Supplier Surveys. Quality Engineering
will participate on all supplier survey opera-
tions. Surveys will be conducted in accordance
with Aerospace Group document, Quality Capa-
bility Survey of Suppliers (Q-60-1). The ma-
jority of the surveys required for Advanced
Syncom have been accomplished under similar
space programs currently under way at Hughes
(Syncom 2, Surveyor). Surveys are conducted
on both pre- and post-award bases. Suppliers
are to be resurveyed when conditions arise that
may invalidate a previous survey, such as
changes in management, products, processes,
quality requirements, etc. Surveys are to be con-
ducted for Level II and III hardware procure-ment.
6.64
• Purchase Order Screening. All purchase
orders issued by Hughes will be screened by
Quality Control Engineers to assure completeness
of requirements in accordance with QCI 2.2-15
and QAI 30-6-8. Appropriate Purchase Order
Quality attachments shall be included at this
review. Screening for completeness is also per-
formed on interdivisional procurement docu-ments.
• Source Inspection. Source inspection at
component suppliers and for all major and minor
control items shall be as directed by the Syncom
Project Office. The requirement for Hughes
source inspection will be incorporated in the pro-
curement document by means of the Standard
Attachment, Q-1.
• Receiving Inspection. Advanced Syncom
High Reliability parts specifications require
extensive testing to be done at the suppliers'
facilities, including prescreening, serialization,
screening, X-ray, burn-in, power aging, and data
submittal Parts entering receiving inspection
designated as high reliability items (by purchase
order) are to be processed in the followingm anner:
1) Receiving inspectors will remove a sample
quantity of pieces (see Statistical Quality
Control above) from the lot for high relia-
bility test. The remainder of the lot will be
placed in a "hold" area within receiving
inspection.
2) After high reliability testing is complete,
the parts will be sent to receiving inspec-
tion for return to the original lot.
3) Receiving inspection will hold the entire
lot until they have received a release notice
from the Components and Materials De-
partment.
i
mm
Umi
m
g
B
m
Iii|
t Ei i
IllI !
Bf
7_
_--==_
W
M
Y_j
J

6. Reliability and Quality Assurance
4) Receiving inspection will then deliver the
parts to bonded stores with the releasenotice.
All l_arts delivered to Advanced Syncom high
reliability purchase orders will have receiving
inspection as follows:
1) Parts will be counted and serial numbersverified.
2) All data and samples required to be de-
livered with the parts must be verified,
such as IBM cards, X-rays, and lead ma-
terial samples.
All off-the-shelf types of mechanical hardware
(i.e., fasteners) are to be sample inspected using
Mil-Std-105D, Table I, Inspection Level II, and
an AQL of 2.5.
All electrical parts not identified by high re-
liability purchase orders are to be 100 percent
tested in receiving inspection.
• Supplier Data. Data is to be submitted
to Hughes by all suppliers of high reliability
parts. This data will be delivered after 0, 240,
750, and 1500 hours of the burn-in and power
aging occurring at the suppliers. The majority of
the data will be in IBM card format. Receiving
inspection will forward all such data received to
the Components and Materials Department. All
data generated during the high reliability test-
ing shall also be forwarded to Components and
Materials. All other data submitted by suppliers
as evidence of acceptability- test data, X-rays,
certifications, physical/chemical reports, etc.-
shall be delivered to the Components Departmentand made available to authorized NASA and/or
Hughes personnel. Eventual filing of these docu-
ments will be in receiving inspection. The receiv-
ing inspector/tester will review all supplier data
for completeness, required entries, and compli-
ance with specification.
• Supplier Rating. The supplier rating sys-
tem as specified by the Hughes Aerospace Group
Supplier Control System shall be utilized for
Advanced Syncom. When the rating indicates an
undesirable trend, the servicing quality organi-
zations will immediately notify the Advanced
Syncom Product Effectiveness personnel, cogni-
zant procurement personnel, and Hughes source
inspector.
Fabrication and Assembly Controls
• Stores and Material Control. Bonded
storerooms with limited access will be utilized.
Items shall be so stored as to prevent damage
and to retain traceability to the purchase docu-
ment.
Kits for unit assemblies shall be prepared by
bonded stores, retaining traceability by means of
storeroom requisitions showing the control item
and serial number of the unit in which the parts
are installed. Quality organizations shall fulfill
their responsibilities regarding storeroom opera-
tions to comply with Space Systems Division Pro-
cedure 9-3.5.3 which includes scheduled audits
of the stores areas. In addition, kits shall be
periodically audited both after preparation and
in the assembly area. Raw stock shall be in-
spected and controlled in accordance with QCI
2.2-3, QcI 2.1-6, D.I. 38-27.
• In-Process Inspection and Test. Quality
shall detail points of inspection, types of inspec-
tions, and tests required, and assure their incor-
poration in the shop travelers. The inspectors will
utilize controlled drawings, specifications, work-
manship standards, and models as necessary to
assist in the performance of these inspection call-
outs. Particular emphasis is to be given to added
requirements as specified in Hughes Specification
475000-607. Implementing inspection instruc-
tions, maintained current, are to be supplied to
6-65

Hughes .4ircra/t Company
the inspector by Quality Engineering. History
records per QCI 1.1-19 initiated in this area are
to be used for data accumulation and analysis to
provide an active corrective-action system. In-
Process Inspection and Test is to be implemented
fully on Levels II and III items, but by project
request only on Level I items.
* Process Certification. Levels II and III
hardware will be fabricated using only fully
certified processes. Process certification records
are maintained by Quality Engineering. Certified
processes include, but are not limited to, welding,
soldering, heat treat, and plating. Processing and
certification will be accomplished in accordance
with Hughes Process Specifications and their
Quality Assurance provisions.
* Final Inspection and Test. Final inspec-
tion and test shall apply on all Level II and III
items. In those instances involving Level I hard-
ware deliverable from one Hughes division to
another, Quality Assurance will utilize existing
final inspection and test implementing docu-ments.
• Calibration. The Hughes Calibration
Laboratories are responsible for the mandatory
periodic maintenance and calibration of all in-
spection, test, and laboratory equipment and in-
struments. Since various equipments are used
at all phases of development, full implementa-
tion of the Hughes Calibration and Measurement
Standards System is to be accomplished at all
Levels. In addition, by means of Vendor Surveys,
Source Inspection, and procurement document
screening, Hughes Aircraft Company Quality
Engineers will verify that vendors have:
1) A satisfactory calibration system
2) Adequate calibration procedures
3) An effective policing policy
4) Equipment that correlates with Hughes
Aircraft Company and specification re-
quirements where duplicate testing is in-volved.
All calibration records are to be made available
to the NASA representative on request.
• Preservation, Handling, Packaging, and
Shipping. Although full implementation of pro-
cedures governing these operations will be ac-
complished at Level III only, it is mandatory that
Hughes personnel responsible for handling any
hardware exercise good judgment and acceptable
methods (reference test specifications). Hard-
ware delivered between Divisions will be pack-
aged to preclude damage and assure safe transit.
Final inspection will treat such items as deliver-able hardware.
• Evidence of Inspection. Hughes Quality
Control shall issue, maintain records for, and
assure individual traceability for all inspection
stamps. Stamps are designed to identify articles
that have undergone in-process, partial, or final
inspection, and functional test. The article will be
stamped unless it is impractical due to physical
limitations or will compromise the quality of the
part. When impractical, the stamps will be ap-
plied to accompanying documents or containers
and will be utilized at all levels where inspection
or test surveillance is required.
Product Effectiveness
• Material Review Board. The Advanced
Syncom Material Review Board will be operatedin accordance with the structure established in
NPC 200-2 for all Level II and Level III items.
The implementing document detailing exact func-
tions, membership, and scope will be prepared
as directed by the Project Office.
• Failure Reporting and Corrective Action.
Servicing Quality organizations are assigned
• .
L_
H
w
I
6-66

6. Reliability and Quality Assurance
responsibility for ensuring that all quality as-
pects of the contract are satisfied for correcting
discrepant conditions. This is accomplished by
the issuance of a corrective action request to the
applicable group, function, or supplier. Quality
will maintain files and records of the progress
and/or completion of the Corrective Action Re-
quest written for the Advanced Syncom program.
These servicing organizations will assure ade-
quate corrective action has taken place and by
regular audit will review completed actions to
assure that problems do not recur within the
program. Implementation will be for hardwareat Levels II and III.
• Quality Assurance Audit and Reports.
Quality audits will be conducted by independentaudit teams to assure conformance to contract
requirements, Hughes and Space Systems Divi-
sion procedures, and this program plan. Current
check lists shall be upgraded and used for these
audits. In addition to the audits conducted by the
independent teams, audits will also be made by
the Space Systems Division Product Effective-ness Staff. Results of all audits will be docu-
mented and distributed to cognizant management
personnel. Reaudits will be conducted in those
areas found to be deficient. Reports covering
the areas audited, results of the audits, and cor-
rective actions undertaken or completed as a
result of the audits will be submitted to the Proj-
ect Office and to the NASA in accordance with
Appendix B of NPC 200-2. Although the check-
lists will cover various aspects of the program
on a 100 percent basis, it is anticipated that the
audits will be conducted on a quarterly basis
utilizing approximately 25 percent of the list
each time. This will provide a complete coverage
annually. Audits will commence the first quarter
after contract go-ahead.
Government Property Controls
• Government Furnished Articles. Hughes
receiving inspection will inspect all Government-furnished articles intended for use on the Ad-
vanced Syncom program. This inspection will be
accomplished to the extent practical to detect
shipping damage, and to determine that items
are complete, qualified for end-use, and of
proper type, size, or grade. Adequate protection,
periodic inspections, and proper storage shall
be provided to minimize the possibility of dam-
age and/or deterioration. Any damage, malfunc-
tion, or condition that would render the item
unsuitable for its intended use on Advanced Syn-
corn shall be reported to the local NASA repre-
sentative and to Goddard Space Flight Center.
Documents, The following list of documents
shall be utilized in the performance of the Pro-
gram Plan:
QCI 1.1-12
QCI 1.1-13
OCI 1.1-17
QAI 30.3-1
QAI 30-3-1-778
QAI 30-3-1-805
QAI 30-3-1-898
QAI 30-3-1-1352
General
Hughes Form 3236, Variance Authorization
Hughes Form 672A, Substitution Authorization
Use of Hughes Form 359, Inspection and Test Report
Forms, Completion Instructions
Request for Inspection/Test
Corrective Action Request
Shipping Request
Calibration Failure Report
6-67

U
Hughes Aircraft Company
QAI 30-3-1-2581
QAI 30-3-1-3449
QAI 30-3-1-3515,9700
QAI 30-3-1-7159
QAI 30-3-1-7254
QAI 30-3-1-7295
QAI 30-3-1-7375
QAI 30-3-1-7550
QAI 30-3-1-7873
QAI 30-3-1-7888
QAI 30-3-1-9727
QAI 30-3-1-9831
QAI 30-3-1-9831B
QAI 30-3-1-QA-38
QAI 30-3-1-QA-44
QAI 30-3-1-QA-45
QAI 30-3-1-QA.46
QAI 30-3-1-QA-47
QAI 30-3-1-QA-50
QAI 30-3-1-T-2105
QAI 30-3-2
QAI 30-3-3
QAI 30-3-4
QAI 30-3-5
QAI 30-3-6
Equipment Due for Calibration
Receiving Results Form
Purchase Order/Receiving Report
Inspection and Test Report
Source Field Report
Vendor History Tag
Request for Supplier Corrective ActionVendor Permanent Record
Material Purge Request
Internal Survey Record
Internal Routing Instructions
Quality Control History Record
Inspection Status Tag
Tool Inspection Report
Quality Assurance Test Verification Report
DI Bonded Stores Inspection Log
SSD Raw Material Log
Procurement Review Log
Space Systems Quality Assurance-Defect Summary
Supplier Rating Record
Quality Assurance Terminology-Definitions
Safety Instructions
Housekeeping
Quality Assurance Labor Charges
QAI Preparation, Control and Distribution
QCI 4.1-1
QAP 3.0
Management
Space Systems Division Manual, Section 9, Product Effectiveness Procedures
Quality Control Operating Plan
Organization
EP 4-9
EP 7-17-1
EP 9-1
EP 7-10-2
Design and Development Control
Engineering Change Management- Development
Advance Syncom Project -- Engineering Data
Design Review
Syncom Project -- Engineering Change Management
=
J
_..2i
6-68J
m_

k.j
6. Reliability and Quality Assurance
L :
w
m--im__
=: ,
E
QCI 1.1-9
QcI 1.1-14QCI 2.2-16
Q-60-1
QCI 2.2.15
QcI 3.13-
QCB A
QCI 2.1-10
QCI 2.2-9
QcI 2.2-1
QcI 2.2-2
QcI 2.2-3
QcI 2.2-6
QcI 2.2-7
QcI 2.2-12
QcI 2.2-4
QAI 30-6-2
QAI 30-6-3
QAI 30-6-4
QAI 30-6-5
QAI 30-6-7
QAI 30-6-8
QAI 30-6-9
QAI 31-18-1
QAI 31-6-2
QcI 2.2-14
QcI 2.2-13
QAI 30-19-1
QcI 3.13
QcI 3.13
QcI 3.13
Control of Contractor Procured Material
Quality Capability Surveys of Suppliers
Preprocurement Source Selection - Major Subcontract
Evaluation of Special Process Suppliers
Quality Capability Survey of Suppliers
Quality Control Screening - Procurement Documents
Advanced Syncom -- Screening Purchase Orders for Subcontract Items
Air Force Policy Item List
Hughes Source Inspection -- Inspection and Test Section
Source Inspection - Supplier Evaluation Section
Receiving Inspection Sampling Plan
Receiving Inspection Instruction Sheet
Raw Stock Receiving Inspection
Quality Control Reporting - Receiving Inspection
Receiving Inspection -- General Requirements and Responsibilities
High Reliability Receiving Inspection
Vendor Quality Rating System
Vendor Supplied Test Data
Laboratory Analysis of Purchased Raw Materials or Parts, Receiving
Inspection and Test
Supplier Rating and Corrective Action System
Color Coding of Items Requiring Special Control
Hughes Source Inspection
Review of Procurement Documentation
Receiving Inspection of Space Projects Materials
Government Source Inspection Policy Lists, Distribution and Use
Quality Assurance Survey of Suppliers
Control of Government-Furnished Property (GFP)
Receiving Inspection of GFP and Bailed Property
Control of Damaged GFP -- Receiving Inspection
Control of Government Property
Control of Contractor-Fabricated Articles
Advanced Syncom -- Screening Manufacturing Requests for Quality Control
Requirements
Advanced Syncom -- Screening Work Orders for Quality Control
Requirements
Advanced Syncom -- Screening Assist Work Authorizations
6-69

Hughes .4ircrafl Company
QCI A
QCI 1.1-19
QcI c
QCI 4.1-7
QcI 2.1-9
QcI 3.13
QcI 2.1-5
QcI 4.1-3
QcI 4.1-4
QcI 4.1-8
QcI 4.1-9
QCI 4.1-10
QcI 4.1-11
QcI 4.1-12
QAI 30-15-3
QAI 30-16-5
QAI 38-9-2-1
QAI 38-9-5
QAI 38-15-1
QAI 38-16.1
QAI 38.9-6
QAI 38-9-6-3
QAI 38-9-6-2
QcI 1.1.5
QcI 2.2-11
QAI 30-18-2
QAI 38-18-2
QAI 38-18-2-2
QcI 1.1-10
QCI 2.1-8
QcI 4.1-14
QAI 30-5.1
6-70
Quality Control Instructions Initiation and Preparation
Quality Control History Record and Inspection Status Tag
Inspection and Test -General Requirements and ResponsibilitiesTest Verification
Final Inspection Of Missiles and Space Vehicles
Advanced Syncom Spacecraft Final Inspection and Shipping Requirements
Inspection of Micro-Resistance Welding
Certification of Metal Finishing Process
Qualification/Certification of Heat Treating
Qualification of Micro-Resistance Welding Machines
Welding Inspection, Fusion
Heat Treating Inspection
Plating Inspection
Painting Inspection
Weight TolerancesCorrosion Control
Review of Syncom Planning DocumentationTest Verification
Drawing and Change Control
Inspection of Thermal Paint
Inspection and Test - Space Systems Equipment
Advanced Syncom Spacecraft Final Inspection Requirements
Advanced Syncom Control Item Inspection Instructions
Nonconforming Material
Control of Nonconforming Supplies
Quality Control Screening of Scrap or Salvageable Material
Air Force Materials Review Quality Assurance Instructions (QAIs 30-18-2
through 30-18-2-18)
Note: Air Force MRB Quality Assurance Instructions are issued as a
separate manual
Space Systems Division Materials Review Quality Assurance Instructions
Special Project Supplement - Syncom Materials Review
Inspectio n , Measuring, and Test Equipment
Measurement and Test Equipment Surveys
Tooling Inspection
Accuracies of Test Measurement Equipment
Control of Measurement Accuracy
w
w
w
w
w
W

6. Reliability and Quality Assurance
i
QAI 30-5.2
QAI 30-5.3
QAI 30-5.5
QAI 30-5.6
QAI 30-6.6
Control of Measuring and Test Equipment and Calibration Indication Status
Control of Subcontractor's Measurement Equipment and Tooling
Calibration Data System Program and IBM Listing
Certification of Platform Scales for Outline and Mounting WeightMeasurements
Calibration and Control of Thermocouple Wire
L.z
_-4
_.j
iK..,.
QAI 30-12-1
QcI 2.1-6
QcI 2.2-8
QcI 3.13
QcI 3.13
QAI 38-9.1
QAI 38-3.1
QAI 38-9.4
QAI 38-10-1
QAI 38-9.3-1
QcI 2.2-1
QAI 30-8-2
QAI 30-8-3
QcI 4.1-2
QcI 4.1-5
QcI 4.1-13
QAI 30-16-1
QAI 30-16.2
QcI 1.1-7
QcI 1.1-8QCI 1.1-3
QAI 30-18-1
Inspection Stamps
Stamp Control
Preservation, Packaging, Handling, Storage, and Shipping
Periodic Inspection of Stores
Packaging and Shipping Inspection
Advanced Syncom -Bonded Stores Inspection
Advanced Syncom- Spacecraft Final Inspection and Shipping RequirementsGeneral Bonded Stores Procedures
Requirements for Environmentally Controlled Areas
Requirements for Protective Handling of Thermal Control Surfaces
Acceptance Inspection
Interdivisional Transfer of Syncom Control Items
Statistical Quality Control
Receiving Inspection Sampling Plan
Classification of Characteristics and Defects
Sampling Plans
Training and Certification of Personnel
Certification of Micro Resistance Welding Operators
Certification/Qualification of Class "A" Welding Operators
Welding, Resistance, Inspection Qualification
Verification and Certification of Progresses, Equipment and Personnel
Assembler and Inspector Certification
Data Reporting and Corrective Action
Control Point, Corrective Action Requests
Use of Hughes Form 805, Corrective Action Request
Quality Control Reporting- All Fabrication AreasCorrective Action Procedure
6-71

Hughes ,4 ircraft Company
QcI 1.1-15
QAI 30-20-1
QAI 38-20-1
Audits
Internal Quality Audits
Area Surveys
Area Surveys
Advanced Syncom Failure Reporting System.
A new form for reporting of trouble and failures
has been developed for use within the Aerospace
Group (Figure 6-1). The form has been pre-
pared to provide a standard system for use in
the Company. Trouble and failure reports (Fig-
ure 6-2) must be prepared as soon as an abnor-mal condition is verified and delivered to the
Syncom Project Reliability Off:ice immediately.
When a part is replaced, the old part is retained
for analysis; it is placed in an envelope and
attached to the Trouble and Failure Report.
Particularly important is retention of the part
serial number, since all parts have been exten-
sively tested before installation and can beidentified.
The Trouble and Failure Report is filled outas follows:
Block No.
1
2-9
2a
2b
2c
2d
3
4
5
6a,b,c
Omit.
To be completed by originator.
Advanced Syncom.
If applicable, give the spacecraft number:F-1.
From running time meter, determine lengthof time unit was in the spacecraft beforefailure or trouble was noted.
Number of times unit had been turned on.
Self-explanatory.
Self-explanatory.
Check if a second page is used. If otherTFRs have been written relative to the samesubject, list the number or numbers.
Major control item name, number, and se-rial number.
7a,b,c
8a,b,c
9
1011
12
12a
Minor control item name, number, and se-rial number.
Subassembly name, number, and serialnumber, such as a solenoid valve.
Describe in sufficient detail symptoms ofthe trouble. Do not use such terms as "unitdoes not work"; be specific.Omit.
To be completed by person locating thefailure cause. Give repair instructions here.
To be completed by person replacing anyparts. Quality Control inspection stamp isrequired after repair.Circuit symbol, such as Q3 or R1.
DESIGN/TEST
VERIFICATION
OF TROUBLE
I-4
UNIT REWORK
REPLACE PARTS
ATTACH FAULTY
PARTS
I-4
DESIGN/TEST
I-4
!UNIT TEST
RECORD BOOK
4
H TFR _-_
COPY I AND 4 ORIGINATOR
2 I ] r KEEPS COPY 3
PROJECT OFFICE
I HOLDS COPY 2 1
I UNTIL I AND I
1 4ARRIVE I
COPY I T
FOLLOW-UP BY PROJECT OFFICE:
• CORRELATE WITH OTHER TFR
• CORRELATE WITH COMPONENT HISTORY
• ANALYSIS OF FAULTY PARTS
• WRITE UP FINDINGS
• PREPARE CORRECTIVE ACTION REQUEST
• FOLLOW CORRECTIVE ACTION
• DISTRIBUTE COPIES OF TFR TO:
NASA
QUALITY CONTROL
ORIGINATOR
TEST RECORD FILES
PROdECT MANAGER
FIGURE 6-1. TROUBLE AND FAILURE REPORTFLOW DIAGRAM
M
U
==
IBI
[]IB
=
lib
U
U
I
W
W
w
w
flail
6-72

E
L J
F_
w
2
L=s
6' Reliability and Quality Assurance
TROUBLE & FAILURE REPORT No.
CONTINUATION SHEET L ...... ] ................
FIGURE 6-2.
_tftCT Of It_S(_
TROUBLE AND FAILURE REPORT
IECTIvT_o LO_ .u.lrw
6-73

Hughes .4 ircra/t CompanyW
E
I HUGHES iFAILURE REPORT No. 0000000
[]
FIGURE 6-2 (CONTINUED). TROUBLE AND FAILURE REPORT
Wl
II
II
6-74

w
= ,
6. Reliability and Quality Assurance
u
u
_t -i| 1
U
= :
Li
12b Hughes 988000-00 part number.
12c Serial number of new replacement part.
12d Manufacturer of the new part.
12e Omit. Will be completed in follow-up action.
12f Omit.
12g Receiving lot number. Obtained fromBonded Store Requisition.
13 To be completed by the cognizant designengineer after corrective action.
14 To be compIeted in follow-up.
15-20 To be completed by the Advanced SyncomProject Reliability Office.
21,22 Omit.
Distribution of copies of the Trouble and Fail-
ure Report is as follows:
1) Originator: Sends sheet 2 to the Advanced
Syncom Project Reliability Office; insertssheets 1 and 4 in the unit test record book
and sends faulty unit and test record book
2)
3)
4)
to repair area; retains copy number 3.
(Copies 1 and 4 must be kept together and
are used in Project Reliability Office
follow-up action.)
If the TFR covers an occurrence for which
no repair action is required, the originator
sends copies 1, 2, and 4 directly to the
Project Reliability Office.
After completion of repair, copies I and
4 (with notations as required in block 12)are returned to the unit test record book
with the unit for retest.
The design engineer who receives the re-
paired unit verifies the corrective action
with appropriate tests and completes block
13; he immediately sends copy 1 of the
TFR to the Project Reliability Office. Copy
4 is retained in the unit test record book.
,-3_
k.d
u
k..
i
k..,
6-75
w

Lm
W
I_II ¸
LI
ii
M
[]
miii
_ _ k _ _
I
II
w
u
zzI
nW
m

'7. MATERIALS, PROCESSES, AND COMPONENTS
.=_
;¢
r,.,.,
L_
E
SPACECRAFT BILL OF MATERIALS
The latest revision (10 October 1963) of the
spacecraft advanced bill of materials is givenin Table 7-1.
SYSTEM TEST EQUIPMENT
Advance Bill of Materials for Synchronous
Controller and Synchronous Controller Auxiliary
Special Components. The synchronous con-
troller and synchronous controller auxiliary con-
tain the following special components:
Manufacturer'sNumber Quantity
Transistors 2N914 109
2N1959 109
2N2510 11
2N708 10
2N1132 2
2N2185 4
2N2060 l
Diodes 1N3064 361
FD300 28
FZ1 7
1N967B 1
Capacitors (Glass) 180
Resistors Carbon composition,
_/_ watt, 5 percent 756
Miscellaneous (transformers, crystals,
tuning forks) 74
Standard Components. The synchronous con-
troller and synchronous controller auxiliary con-
tain a number of standard Hughes-manufactured
logic elements or cards, which were developed
for a test console and are in use in several pro-
grams. They include the following:
QuantityQuantity per
per SynchronousHughes Synchronous Controller
Card Name Number Controller Auxiliary
Flip-flop 477854 11 15
Logic amplifier Modified 7 10
Inverter 461303 2 1
Indicator driver 477860 3 20
Clock pulse
amplifier 461305 4 3
Gated pulse
generator 461359 4 1
Diode gate 461302 20 30
The elements listed above contain the follow-
ing parts:
TotalQuantity
Transistors
(Hughes) 928221-1 320
(Hughes) 928222-1 328
7-1

Hughes Aircraft Company
Diodes
(USN) 1N3064 4260
(Hughes) 925296-1 105
(Hughes) 925297-1 52
(ttughes) 925250-1 98
Resistors
RC07GFXXX 2900
RC42GFXXX 7
1/_ watt
carbon
composition
2 watt
carbon
composition
Capacitors
CY10CXXX 440 Glass
910007-221 54 Metallized
film
CY15CXXX 8 Glass
CS13AGXX 8 50 volt
tantalum
Panel Equipment. Panel equipment is asfollows:
Quantity
Digital readout, IEE type 120,000 24
Rotary switches
One deck nine-position Centralab 2029 2
Two deck four-position Centralab 2011 1
One deck six-position Centralab 2019 1
Backlighted microswitch
(Micro Series 2C27)
Subminiature toggle switches
(Microswitch Series 6AT)
3
7-2
Helipots IRC HD-150
Digiswitch (3-digit) (Series 300)
Textronix scopes (Model 555)
Frequency counter (Beckman Model 8370)
Meter (DCO-200 MA)
(Simpson 68F890)
Potentiometer Type A, 100 kilohm
(Clarostat CA1041)
Switch (Microswitch 6AT1)
Switch (Microswitch 6AT5)
Connector DE-9P
Coaxial connector (UG625B B/U)
Amplifier (Nexus) Type DAd
Trim potentiometer, 20 kilohm
Oven (Frequency Electronics Inc.
proportional control crystal)
Model FE-20-PC)
Card connectors 922214-1
Dials (Revodox No. 412)
Plug-in for Textronix scope
Type M
Type D
Current probe
Power supplies
+ 24 volt regulated (Transpae TR051)
-4- 28 volt unregulated
(Transpac F2B15)
1
93
2
2
2
3
1
1
1
2
2
1
3
2
6
The advance bill of materials for the commu-
nications panel is given in Table 7-2.
u
m

L ,, =
z=..,a
b_.
m
m===
L_
L
=_ .
)t,..,
h
Tra;si tors
]00 Inputmixer101 RegulatorXP, multiple
accessmode
102 RegulatorXP, frequencytranslation mode
104 Intermediate amplifier109 Limiter110 Preamplifier111 Postamplifier112 High level mixer
113 Master oscillator, frequencytranslation mode
114 X32 multiplier]]G X3 multiplier117 X2 multiplier118 Filter
122 Master oscillator,multiple accessmode
123 Amplifier, master oscillator130 Preamplifier]31 Phase modulator
132 Doubleramplifier141 Filter amplifier160 FACEregutator161 PACEdigital162 PACEpoweramplifier163 PACEregulator172 Telemetry monitor174 Traveling-wavetube
power supply201 Diplexer210 Command receiver211 Commanddecoder
212 Commandregulator220 Telemetry transmitter221 Telemetry encoder222 Telemetry regulator252 Solar panel253 Solar panel special300 Wiring harness302 Sun sensor303 Central timer
306 Squib driver307 Solenoid driver
206TemperaturesensorJet control electronics
_, angle counter
Total per spacecraft
_e3
2222233
16824
4424424
1421
4334
11
23
TABLE 7-1. SPACECRAFT BILL OF
12
44
1604
2412
65 10 160]2
2
2
8
6
2 32
2 4
426
33
32
4 12
51
3
4 60 8 90
!=,...
|L.. /

W
2 2 8
2 2
24 12 12 12 12 12 1248
48 1282 108 81 6 12
1640
_016_4
32 16
424 4
18 416 8
$ 40 32 40 16 126 85 I 6 12 6 16 8 12 4 12 12 24 16 12 8 2 4
_i_ !
v

7. Materials, Processes, and Components
MATERIALS
'/.3

Hughes Aircra/t Company
TABLE 7-1. (continued)
Diodes
P,,, /'_ I'_
100 Input mixer 4101 RegulatorXP, multiple 2
accessmode102 RegulatorXP, frequency 2
translation mode104 Intermediate amplifier 2109 Limiter 2
110 Preamplifier 2111 Postamplifier 2112 High level mixer 2113 Master oscillator, frequency 2
translation mode
114 X32 multiplier 6I16 X3 multiplier 4117 X2 multiplier 4118 Filter 4122 Master oscillator, 2
multiple accessmode123 Amplifier, master oscillator 2
130 Preamplifier 2131 Phase modulator 2
132 Doubler amplifier 2141 Filter amplifier 2160 PACEregulator 316I PACEdigital 3162 PACEpower amplifier 16163 PACEregulator 8
172 Telemetrymonitor 2174 Traveling.wavetube 4
power supply201 Diplexer 4210 Commandreceiver 4211 Commanddecoder 2
212 Commandregulator 4220 Telemetry transmitter 4
221 Telemetry encoder 2222 Telemetry regulator 4252 Solar panel 12 192253 Solar panel special 4 60300 Wiring harness 1302 Sun sensor 4303 Central timer 3306 Squib driver 3307 Solenoid driver 4 8
Temperature sensor 11206 Jet control electronics 2
_, angle counter 3t ....
Total per spacecraft 260
64
16
16
104 24 17 2
3 3
of_
e-I
11
I-4
2C
lC
19 7 15 2 2 4_
14
7-4

m
'...,
r
= .
|
TABLE 7-1. (continued)
esistors 988601-
ccL Ltl _ r._ o_ ,-_ o,i co ,d" It) Lo i_, co o_ o N
]00 Input mixer 4101 Regulator XP. multiple 2
access mode
102 Regulator XP, frequency 2translation mode
103 1
104 Intermediate amplifier 2 2109 Limffer 2110 Preamplifier 2 2111 Postamplifier 2112 High level mixer 2113 Master oscillator, frequency 2 2 2
translation mode]14 X32 multiplier 6116 X3 multiplier 4117 X2 multiplier 4118 Filter 4
122 Master oscillator, 2multiple accessmode
]23 Amplifier, master oscillator 2 2 2124 Attenuator 6 6
130 Preamplifier 2 2131 Phase modulator 2
132 Doubleramplifier 2 6141 Filter amplifier 2152, 53, 54 1
160 PACEregulator 316i PACEdigital 3162 PACEpower amplifier 16163 PACEregulator 8172 Telemetry monitor 2174 Traveling-wavetube 4 4
power supply201 Dipl_xer 4210 Commandreceiver 4 4211 Commanddecoder 2 922
212 Commandregulator 4220 Telemetry transmitter 422] Telemetry encoder 2 226222 Telemetry regulator 4252 Solar panel 14253 Solar panel special 2300 Wiring harness 1302 Sun sensor 4303 Central timer 3
306 Squib driver 3 208307 Solenoid driver 4 112
Jet control electronics 2 46
_, angle counter 3
Total per spacecraft14 6 J1518 I0
8 6
6 6 6 6
4 8 4
8 ;
3O
6 6 4 38 8 26 4 6 4 8 12 28 16
/

i
I
4 2 2
4 2 2
BB
U _
m =
n
L_
mm
U
3 6
36 48 222 33 3 6 3
3 3 48 21 6 8 24 3 3 30 24 3 3 3
4 4 16
i :
8 4
4 4 8
4 4
M
_ J
3 3 3 3 3 3 3 3
10
69 3 6 6 3 3
43 64 294 19 3 11 3 55 29 18 11 30 6 6 57 24 3 9 12 3 3 3 3 3 3
lib
BW
J
• I_w
mu

2 2 2
2 2 2
12 12 12 6
9 951 45 9 6 84 27 6 6 33 6 42 39 123 6 33 84 246 213 51 31 48 3 189
16 16
4 4 4 16 8 16 4
8 4 4 4 4 4
3 6 3 3 3 15 3 3 3 i 6=
8 8 816 16
15 3 6 39 48 6 96 81 3 30 3 54
25 67 88 9 34 88 37 19 9 36 10 113 56 178 13 52 84 374 1342 7i 3 84 22 243
•. -_[
mm
T

2 4
12
8
84
12
12
4I2
4
33 27 3
I2-
4 -- 2 2 33 2 27 2
I 9 2
28 90

4 2 2 2 2
4 2 2 2 2
8
8
4
2 2 2 2
16
3 3
4 2
4 44 4
2 6 24 2 2
3 3 3 3
24 3 3
16
16
4 4
4 28 8 4 24 4
12 4
19 24 23 10 36 37 6 39 16 38 19 26 5
7.5

Hughes ,4 ircra]t Company
TABLE 7-I. (continued)
9886oi -
Unit
100 Input mixer101 RegulatorXP, multiple
accessmode
102 RegulatorXP, frequencytranslation mooe
103
104 Intermediate amplifier109 Limiter
110 Preamplifier111 Postamplifier112 High level mixer113 Master oscillator, frequency
translation mode114 X32 multiplier116 X3 multiplier117 X2 multiplier118 Filter
122 Master oscillator,multiple access mode
123 Amplifier, master oscillator124 Attenuator
130 Preamplifier13i Phase modulator
132 Doubler amplifier141 Filter amplifier152, 53, 54
160 PACEregulator161 PACEdigitalI62 PACEpower amplifier163 PACEregulator172 Telemetry monitor174 Traveling-wave tube
power supply201 Diplexer210 Command receiver211 Command decoder
212 Command regulator220 Telemetry transmitter221 Telemetry encoder222 Telemetry regulator252 Solar panel253 Solar panel special300 Wiring harness302 Sun sensor303 Central timer
306 Squib driver307 Solenoid driver206 Jet control electronics
_, angle counter
Total per spacecraft
7-6
42 2 2 2
2 2 2 2
122 22222 2
6 12 12 124442 4
26
2 22 82 22 413 3 33 12 27 3
168 8
24 12 4
44 4 8244
24 4
3 6 3 33 6 3
4 423
53 23..1, ,
61 20 28
/
12
2O
12
31
12
19
24
32
4
24
96
=3
21 15
69
36
109

M
7_
N
g
I
_7
r_
--4
= =I
m
TABLE 7-1. (continued)_s .....
988-- _
"sO LO 0 ('0 _:) _- gO In h- Uq
=_ o o o o o o o g o o o o o gUnit _ _o _o _o _o _ _ _o _ _ _o
]00 Input mixer 4]01 Regulator XP, multiple 2
access mode
102 Regulator XP, frequency 2translation mode
103 1
104 Intermediate amplifier 2109 Limiter 2 2
I10 Preamplifier 2
111 Postamplifier 2112 High level mixer 2113 Master oscillator, frequency 2 2
translation mode
114 X32 multiplier 6116 X3 multiplier 4117 X2 multiplier 4118 Filter 4122 Master oscillator, 2
multiple access mode123 Amplifier, master oscillator 2124 6
130 Preamplifier 2131 Phase modulator 2132 Doubler amplifier 2141 Filter amplifier 2152, 53, 54 1160 PACEregulator 3161 PACEdigital 3152 PACEpower amplifier 1
]63 PACEregulator 8172 Telemetry monitor 2
174 Traveling-wave tube 4power supply
201 Diplexer 4210 Command receiver 421] Commanddecoder 2
212 Commandregulator 4220 Telemetry transmitter 4 8221 Telemetry encoder 2222 Telemetry regulator 4252 Solar panel253 Solar panel special300 Wiring harness302 Sun sensor303 Central timer 3
306 Squib driver 4307 Solenoid driver 4
Jet control electronics 2
¢, angle counter 3
Total per spacecraft I0 2 50
2
2
2 2
4 42 6
8
18
24
2
2
2
2 2
2
3 15 6
3
8 2 10 4 6 15 6 4 2 2 4 7
= = /

3
46
=_-318
±
•
-,;38613- 988624-
401 4;'2 17 20 124
988625- 988630 988631-
--9 11 37--49--18--93
3 3
16
4
16
4 4
]4 4
6 4 16 5 3 4 4 ]6
988613-- 69 988623--504
4 3
988611-
157 155 101
3 3 3
3 3 3
3 ? 354_292
2
3
3 2 3
i
m
Z.,
=[.:..
J
uil
m
m
B
_me
u
m
r_

7. Materials, Processes, and Components
g o o o o o g o o o o o o g _ ,o
2 2 2
2 2 2
2 2
33
4 4 4 4 4
4 4 48 4 4 4
4 4
48
4 4 12 24 32
19 2 5 8 4 4 4 8 4 8 4 8 [ 4 52 4 4 12 24 32
7-7

Hughes .4 ircra]t Company
TABLE 7-1. (continued)
_=,..t'_¢j
u_Cg.¢_, ¢J
¢:: ¢_,
Unit _ _u_
100 Input mixer 4101 RegutatorXP, multiple 2
access mode
]02 RegulatorXP, frequency 2translation mode
104 Intermediate amplifier 2109 Limiter 2ll0 Preamplifier 2111 Postamplifier 2112 High level mixer Z
113 Mast?r oscillator, frequency 2translation mode
114 X32 multiplier 6116 X3 multiplier 4117 X2 multiplier 4118 Filter 4122 Master oscillator, 2
multiple accessmode123 Amplifier, master oscillator 2130 Preamplifier 2131 Phase modulator 2
132 Doubler amplifier 2141 Filter amplifier 2160 PACEregulator 316l PACEdigital* 3
162 PACEpower amplifier 16163 PACEregulator 8
172 Telemetrymonitor 2174 Traveling-wave tube 4
power supply201 Diplexer 4210 Commandreceiver 4211 Commanddecoder 2212 Commandregulator 4220 Telemetry transmitter 4
221 Telemetry encoder 2222 Telemetry regulator 4252 Solar panel 14
253 Solar panel special 2300 Wiring harness 1302 Sun sensor 4303 Central timer 3306 Squib driver 3307 Solenoid driver 4
988610-
197 240 289 301 326 327 359 365 215 275 371
2 4
2
3 3
30 60 316 16
4 4
4 4
988623- 9
39 68 259 260 319 44]
6
[128 128 256
Temperaturesensor I1Jet control electronics 2¢, angle counter 3 3 3 3 12 24
Total per spacecraft 2 2 49 4 2 13 16 76 3 3 6 12 24 128 128 256 12
*In addition to the parts listed the following parts in various values are purchased in the quantities shownfor selection p._urpose-s;1 988610-
7-8

988502-
37 39 42 43 46 47 48 50 51 57 58 59 60 61 64 65 66 67 83 139 155 31 75 72 53 23
2 2
2 2 44
6 23
3 3 3 267 3 3 3 6 3 316 16
24 4
4 20 8
16
48
424
4
24
10
4 26 4 22 2 3 ]0 27 3 2 2 11 4 277 3
,J4 3 89 3 6 3 4
3 3
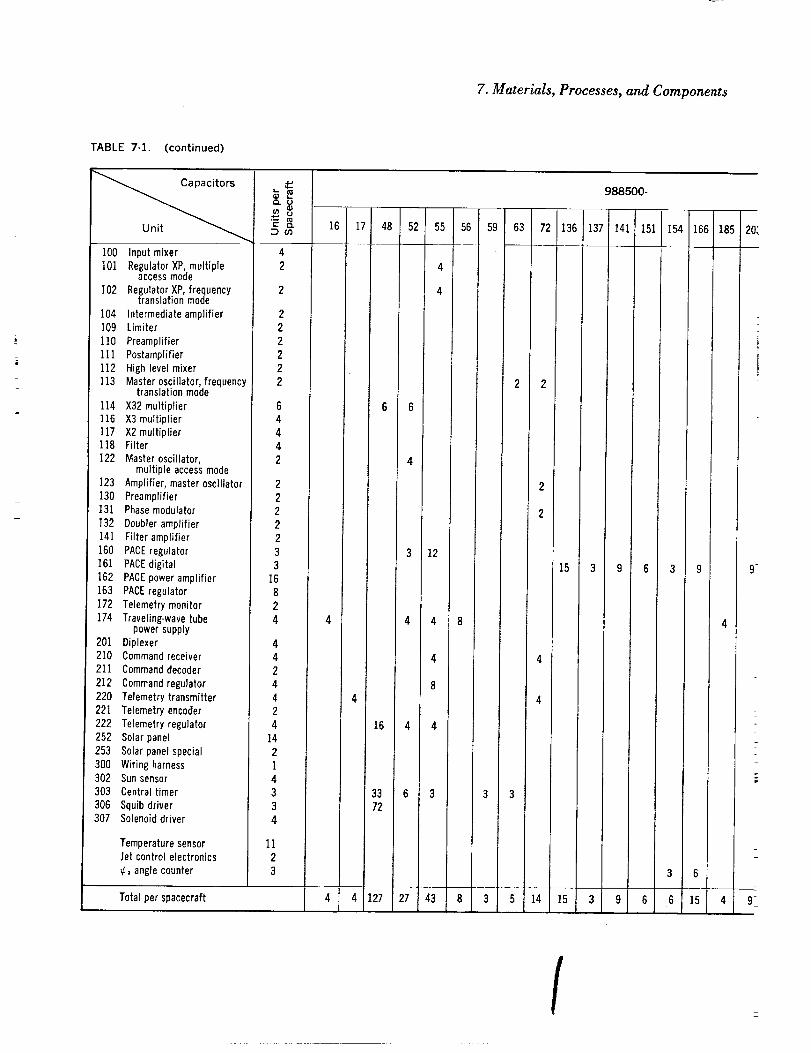
7. Materials, Processes, and Components
TABLE 7-1. (continued)
tors
I00 Input mixer101 RegulatorXP, multiple
accessmode
102 RegulatorXP, frequencytranslation mode
104 Intermediate amplifier109 Limiter
1]0 Preamplifier111 Postamplifier112 High level mixer113 Master oscillator, frequency
translation mode
114 X32 multiplier116 X3 multiplier]17 X2 multiplier118 Filter
I22 Master oscillator,multiple accessmode
123 Amplifier, master oscillator]30 Preamplifier131 Phase modulator
132 Doubleramplifier141 Filter amplifier160 PACEregulator161 PACEdigital
162 PACEpower amplifier163 PACEregulator172 Telemetry monitor174 Traveling-wavetube
power supply201 Diplexer2]0 Commandreceiver211 Commanddecoder
212 Commandregulator220 Telemetry transmitter221 Telemetry encoder
222 Telemetry regulator252 Solar panel253 Solar panel special300 Wiring harness302 Sun sensor303 Central timer306 Squib driver307 Solenoid driver
TemperaturesensorJet control electronics_, angle counter
2
22222
2
2222
33
I6824
4
424424
142143
34
1123
Total per spacecraft
16 17
4
16
3372
48
6 6
4
I52 55 I 56
4
4
12
4 4 8
4 4 127 27 43 8
988500-
59 63 72 136 137 141 151 154 166 185
2 2
3 3
15 3 9 6 3 9
3 6
3 5 14 15 3 9 6 6 15 4
2O:
9 _
9
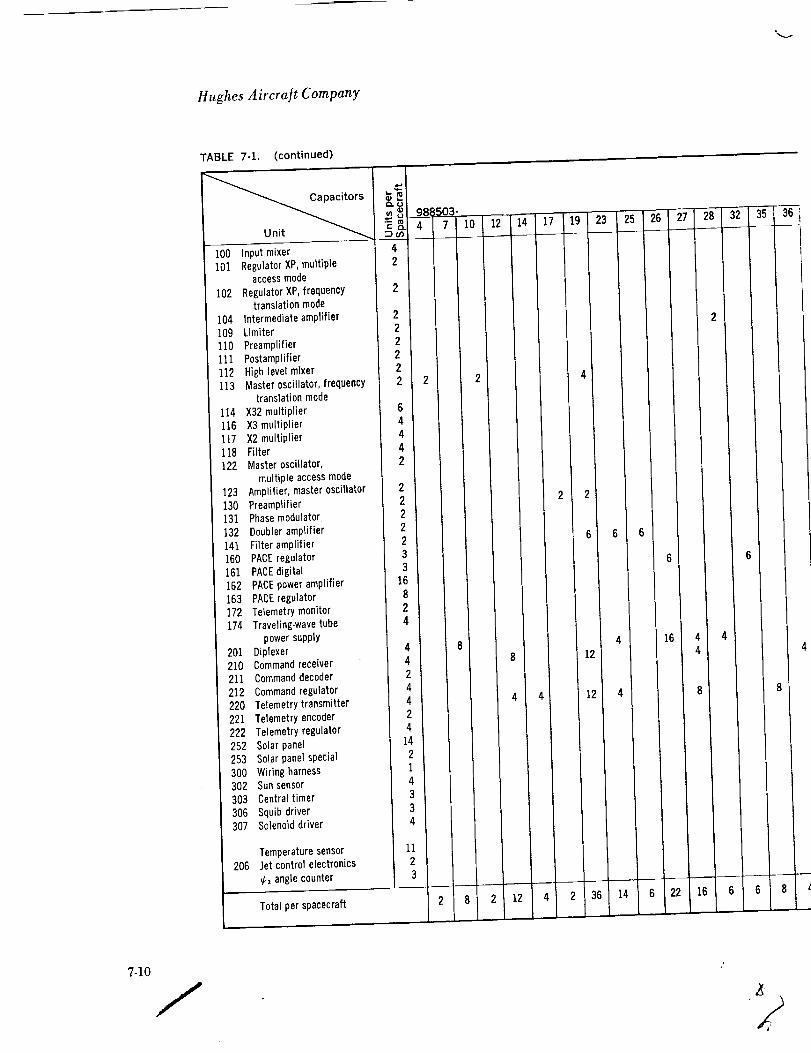
Hughes ¢1ircraJt Company
TABLE 7-1. (continued)
Unit _ ._, _
100 Input mixer 4101 RegulatorXP, multiple 2
accessmode
102 RegulatorXP, frequency 2translation mode
104 Intermediate amplifier 2109 Limiter 2
110 Preamplifier 2ili Postamplifier 2112 High level mixer 2113 Master oscillator, frequency 2
translation mode
114 X32 multiplier 6116 X3 multiplier 4117 X2 multiplier 4118 Filter 4
122 Master oscillator, 2multiple access mode
123 Amplifier, master oscillator 2]30 Preamplifier 2131 Phase modulator 2
132 Doubleramplifier 214i Filter amplifier 2160 PACEregulator 3161 PACEdigital 3
162 PACEpower amplifier 16163 PACEregulator 8172 Telemetry monitor 2174 Traveling-wave tube 4
power supply201 Diplexer 4210 Commandreceiver 4211 Commanddecoder 2
212 Commandregulator 4220 Telemetry transmitter 4
221 Telemetryencoder 2222 Telemetry regulator 4252 Solar panel 14253 Solar panel special 2300 Wiring harness 1302 Sun sensor 4303 Central timer 3
306 Squib driver 3307 Solenoid driver 4
206Temperature sensor 11.let control electronics 2
_ angle counter 3
988503-4 7 I0 12 14
4 4
17 19 23 25
12
6 6 6
12
26
16
Total per spacecraft 2 8 2 12 4 2 36 14 6 22 16
28 32 35
6 6 8
36
7-10

988501-
7-9

| r
: -= i
-= i
.=. •
L J
L J
W
=___
:.__.
i'
t..,
F -
TABLE 7-I. (co
100 Input mixer101 Regulator XF
accessm(
102 Regulator
104 Intermediah109 Limiter110 Preamplifier111 Postamplifie112 High level113 Master oscil
translatio114 X32 multipli116 X3 multiplie117 X2 multiplie118 Filter122 Master oscil
multiple123 Amplifier,130 Preamplifier131 Phasemodu132 Doubler am14t Filter am160 PACE regula161 PACEdigital162 PACEpower]63 PACEregula172 TelemetrI]74 Travelin
power sul201 Diplexer210 Command211 Commandd_212 Command
220 Telemetry221 Telemetry222 Telemetry252 Solar pane253 Solar panel
300 Wiring harm302 Sun sensor303 Central tim(306 Squib driver307 Solenoid dri
TemperatunJet control _
_, angle co
Total

w
U
m
ConnectorsOmni Spectra
C_I T-( r-q r-4 i--4 _-_
4 488
12
48
4424
612
4846
12 44 8
Cannon
988201-
o
CrystalsBliley Terminals
tn
2 2
10
10 4
1 1 4 12 2 4 2
24 6 1340
4 416
28
Im
i=
Ur_[]IB
B
u
mmIB
m
II
--Z ;t_J
W
i
mi
4 4 20 14
129
52 60 24 4 4 4 15 2 I 2 111340 44 4 4 12 2 28 4 2
mm !
U
Nlib
u '

J
Hughes .4 ircraJt Company
TABLE 7-1. (continued)
100 input mixer101 RegulatorXP, multiple
access mode102 Regulator XP,frequency
translation mode104 Intermediate amplifier109 Limiter
110 Preamplifier111 Postamplifier112 High level mixer113 Master oscillator, frequency
translation mode114 X32 multiplier116 X3 multiplier117 X2 multiplier118 Filter122 Master oscillator,
multiple access mode123 Amplifier, master oscillator124 Attenuator130 Preamplifier131 Phase modulator132 Doubleramplifier141 Filter amplifier160 PACEregulator161 PACEdigital162 PACEpower amplifier163 PACEregulator172 Telemetry monitor174 Traveling-wavetube
power supply201 Diplexer210 Command receiver211 Commanddecoder212 Commandregulator220 Telemetry transmitter221 Telemetry encoder222 Telemetry regulator252 Solar panel253 Solar panel special300 Wiring harness302 Sun sensor303 Central timer306 Squib driver307 Solenoid driver
152124
TemperaturesensorJet control electronics_, angle counter
153 154 CommandantennaAttenuator/%xilipry qu(]drantTotal per spacecraft
U_
Cq_
42
2
222222
64442
26222233
16824
4424424
14214334
1123
6
RF ChokesDeleva n
988670-
0 c_
162O1612
14 12 10 8
2 12
18 2
18
42O 4
6 18
4 4 4
4
44 56
4 72
10 4 4 4 48 2 188 _i2 62 64
22
16
30 16
It}
CoresMicrometals
• i"
34
6 6
24
6 -- 31
24
22 ] 30l _
7"1:)
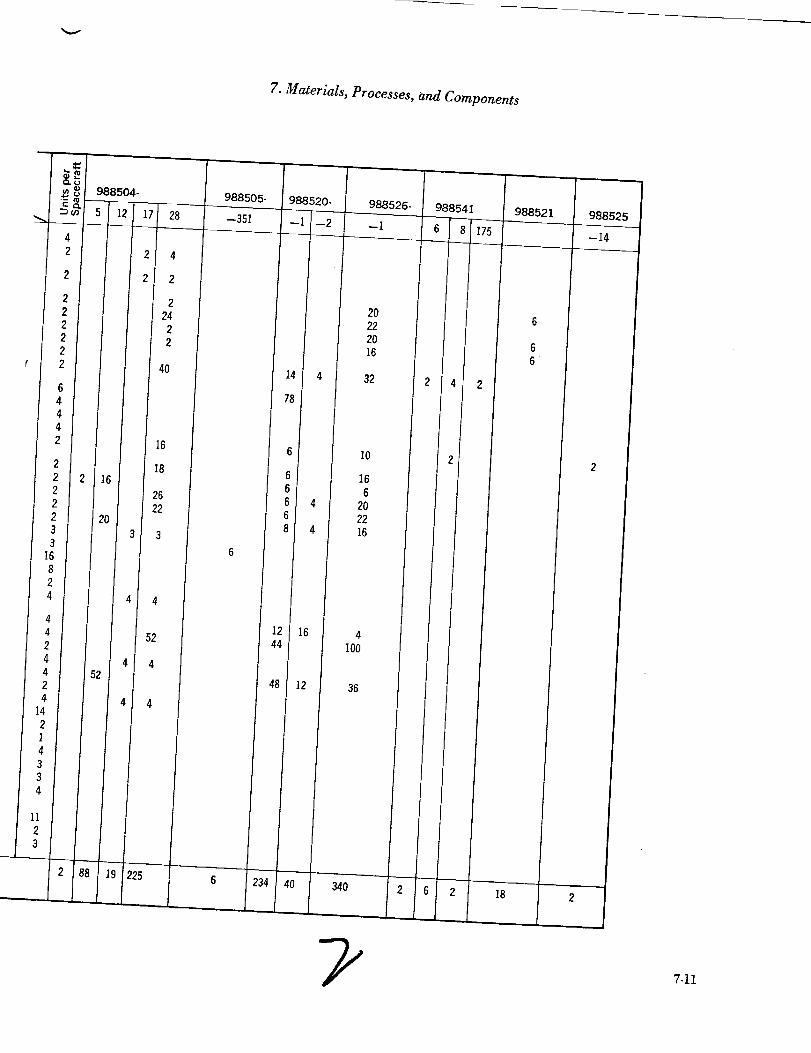
7. Materials, Processes, and Components
988504- 988505-
--351
988520.988526- 988541
--I
988521 988525
--14
4O
2022
2016
32
6
66
I0
16
6202216
4
I00
36
34018
7-11

-.,,,..
7. Materials, Processes, and Components
r •
w
;==j! ;
L
i../
|-_t ;
I
TABLE 7-2. COMMUNICATIONS PANEL ADVANCE BILL OF MATERIALS
Part Value
HIGH PASS
CapacitorCapacitorCapacitorCapacitorCapacitorCapacitor
CapacitorCapacitorInductor
Resistor
Resistor
Connector
FILTER-- X479670
21 pf7I pf20 pf9 pf
46 pf5.5 pf
16 pf41 pf
27 ohms
36 ohms
Q
CaPacitorCapacitorCapacitorDiodeConnectorConnectorResistor
PHASEDETECTOR--X479671
36 pf8.2 pf6.8 pf
Resistor
Resistor
510 ohms
10 kilohms
100 kilohms
Transformer
DRIVERAMPLIFIER-- X479672
CapacitorCapacitor
ConnectorConnector
DiodeInductorInductorInductorMeter
Resistor
Resistor
Resistor
Resistor
0.005 gfd
47 pf
UG625B/U
lO _h5.6 gh0.435 gh
56 ohms
3.3 kilohms
1.2 kilohms
430 ohms
Quan-Note tity
Special1/2watt carboncomposition1/=watt carboncompositionBNC
HD 5000
Multiple-pinBNC¼ watt 5percent carboncomposition¼ watt 5percentcarboncomposition¼ watt 5percentcarboncompositionHughesspecial
SpragueTHD-50Arco.ElmencoDMIOF-470K
Multiple-pinHugheslN1871EDelevan 1025-44Delevan 1025-38
Hughesspecial
¼ watt carboncomposition¼ watt carboncomposition¼ watt carboncomposition¼ watt carboncomposition
24
131
15
1
11
Part
Resistor
Resistor
Resistor
Resistor
Resistor
Resistor
Resistor
Resistor
TransformerTransistor
Value
4.7 kilohms
9.1 kilohms
16 ohms
220 ohms
5.6 kilobms
270 ohms
15 kilohms
750 ohms
LOWVOLTAGEPOWERSUPPLY--479673
Capacitor
CapacitorCapacitorDiode
Diode,zenerDiodeDiode
ConnectorTransmitterTransmitterTransmitterResistor
Resistor
Resistor
ResistorResistor
Resistor
Resistor
Resistor
Resistor
Transformer
2000 _f0.01 #f
15 _f
2 kilohms
2.2 kilohms
1 kilohm
2.5 kilohms10 kilohms
5.6 kJlohms
20 kilohms
]_.5kilohms
3 kilohms
115/26 volts,! ampere
Quan-Note tity
¼ watt carboncomposition 1¼ watt carboncomposition 1¼ watt carboncomposition 2¼ watt carboncomposition 2¼ watt carboncomposition 1¼ watt carboncomposition 1¼ watt carboncomposition l1/4watt carboncomposition 2Hughesspecial 42Nl141 6
50 volts150 volts50 volts
1N5401N756A1N4851N965B
2N1649
2N7222N 174
1 watt 5 percentcarboncompositionVzwatt 5percent carboncomposition1/2watt 5percentcarboncomposition1,/=watt variable¼ watt 5percent carboncompositionVzwatt 5percentcarboncomposition1/zwatt 5percentcarboncomposition1/=watt 5percent carboncomposition% watt 5percent carboncompositionF:40-X power
7-13

,,,j
Hughes _4ircra/t Company
TABLE 7-2 (continued)
Part Value
250 VOLT POWERSUPPLY--X479674
Capacitor
Choke
Resistor 250 kilohmsTransformer
Vacuumtube
Panel lampassembly
8/_f,450 volts,dc
14 henrys
Note
Thermador#7A141410 watt W. W.Thermador#5A61465U4GE47
I PHASEDETECTORAND ISO. AMPLIFIER--X479675
CapacitorCapacitorCapacitorCapacitor
CapacitorDiode
ConnectorConnector
InductorInductorTransistorTransistorResistor
Resistor
Resistor
Resistor
Select
Z2_,f510 pf
3.3 _f,35 volts dc0.01 _f
0.012 #HSelect
Select
lO0 ohms
2 kilohms
1 kilohm
7,5 kilohms
680 kilohms
510 kilohms
3.3 kilohms
11 ohms
5,1 kilohms
Resistor
Resistor
Resistor
Resistor
Resistor
Resistor
Tantalum
Multiple.pinCoaxial
2N]5062N1141
½ watt 5percent carboncomposition½ watt 5percentcarboncompositionV'zwatt 5percentcarboncompositionz/z watt 5percent carboncomposition½ watt 5percent carboncomposition½ watt 5percentcarboncomposition½ watt 5percent carboncomposition½ watt 5percentcarboncomposition½ watt 5percentcarboncomposition½ watt 5percent carboncomposition
Quan.tity
9212
14151
I21
10
l
2
1
1
l
1
I
I
l
Part Value Note
Resistor 160 kilohms ½ watt 5percent carboncomposition
Transformer Select
64 MC LIMITER AND DISC MODULE--X479676
Capacitor .005 pf SpragueTHD-50Capacitor 1-10 pf Johanson
3 pf
15 pf
4.7 #f
5 pf
33 pf
47 pf
UG-625B/U
lOgh5.6 _,h
0.5 _h
0.25 _,h
36 ohms
430 ohms
4.7 kilohms
56 ohms
47 ohms
16 ohms
220 ohms
3.3 kilohms
30 kilohms
200 ohms
6.2 kilohms
1.2 kilohms
Capacitor
Capacitor
Capacitor
Capacitor
Capacitor
Capacitor
ConnectorConnector
DiodesDiodesInductor
InductorInductor
Inductor
InductorMeterResistor
Resistor
Resistor
Resistor
Resistor
Resistor
Resistor
Resistor
Resistor
Resistor
Resistor
Resistor
JMC-2950Arco-ElmencoDM10F-O30KArco-ElmencoOMlOF-150K
Sprague150D474X9035A2Arco-ElmencoDMIOF-050
Arco-ElmencoDM10F-330K
Arco-ElmencoDMIOF-470K
Multiple-pin1NI871ElN750A
Delevan1025-44
Delevan1025-38
lIT Hughesspecial
8T Hughesspecial12T
¼ watt carboncomposition¼ watt carboncomposition¼ watt carboncomposition¼ watt carboncomposition¼ watt carboncomposition¼ watt carboncomposition¼ watt carboncomposition¼ watt carboncomposition¼ watt carboncomposition¼ watt carboncomposition¼ watt carboncomposition¼ watt carboncomposition
Quan-tity
33
4
1
1
1
1
2
13151
25
!
2]2
1
2
5
3
5
2
2
3
]
4
]
]
7-14

7. Materials, Processes, and Components
L
TABLE 7-2. (continued)
Part Value Note
Resistor
Resistor
Resistor
Resistor
Resistor
Resistor
Resistor
Resistor
Resistor
Resistor
Resistor
Resistor
Resistor
Resistor
Resistor
TransformerTransistorTransistorTransistor
1.0 kilohm
470 ohms
5 kilohms
51 ohms
100 ohms
560 ohms
15 kilohms
150 ohms
2.7 kilohms
18 kilohms
3 kilohms
10 kilohms
2.4 kilohms
5.1 kilohms
7.5 kilohms
watt carboncomposition¼ watt carbon
composition¼ watt carboncomposition¼ watt carboncomposition¼ watt carboncomposition¼ watt carboncomposition¼ watt carboncomposition¼ watt carboncomposition¼ watt carbon
composition¼ watt carboncomposition¼ watt carboncomposition¼ watt carboncomposition¼ watt carboncomposition¼ watt carboncomposition¼ watt carboncompositionHughesspecial2Nl141
2N7092N1195
CRYSTALVOLTAGE-CONTROLLEDOSCILLATOR--479677Capacitor
VaricapCrystal
oscillator
ZenerdiodeConnectorChokeChokeChoke
Transistor
I000 pf0.0047 _f
0.8-8.0 pf100 pf
0.01 #f56 pf22 M
0.005 _,f
3.9 volts
6.8 _,h15 _h
5.6/_h
Feedthrough
Variable
15 volts
MA 4325F
1N748ABNC
2N14052Nl1412N707A2N1506
Quan-tity
1
I
2
1
9
3
2
2
!
2
2
1
1
1
]4423
19
2471
13211
1
1
4
19
14
5
2
1
1
Part Value Note
Resistor
Resistor
Resistor
Resistor
Resistor
Resistor
Resistor
Resistor
Resistor
Resistor
Resistor
Resistor
Resistor
Resistor
Resistor
Resistor
Transformer
BALANCEDMODU
CapacitorCapacitorCapacitorCapacitorCapacitorCapacitor
CapacitorCapacitorCapacitorConnectorConnectorInductorResistor
Resistor
Resistor
1 kilohm
150 ohms
470 ohms
510 ohms
51 ohms
2 kilohms
10 kilohms
47 ohms
750 ohms
3.9 kilohms
1.6 kilohms
16 ohms
100 ohms
220 ohms
200 ohms
2 megohms
Quan-tity
Carboncomposition 6Carboncomposition 1Carboncomposition 2Carboncomposition 1Carboncomposition 1Carboncomposition 3Carboncomposition 4Carboncomposition 2Carboncomposition 1Carboncomposition 1Carboncomposition 1Carboncomposition 2Carboncomposition lCarboncomposition lCarboncomposition 1Carboncomposition 1
Special 8
.ATORAND PREAMPLIFIER--X479678
0.001 _f
120 pfSelect
0.05 #f
160 #f100 _f
7-45 _f0.02 #f
Select
Select75 ohms
2.7 kilohms
68 kilohms
Variable
FeedthroughVariable
CoaxialMultiple-pin
½ watt 5percent carboncompositionV2 watt 5percent carboncomposition1/2watt 5percent carboncomposition
I414111
231314
7-15

Hughes Aircra/t Company
TABLE 7-2. (continued)
Part
Resistor
Resistor
Resistor
Resistor
Resistor
Resistor
Resistor
Resistor
Resistor
Resistor
Resistor
ResistorResistorResistorTransformerTubeTubeTube
'FREQUENCY
Capacitor
Capacitor
Capacitor
CapacitorCapacitor
Capacitor
Capacitor
FeedthroughcapacitorVariablecapacitor
Value
1.2 kilohms
100 kilohms
68 ohms
47 kilohms
12 kilohms
1 kilohm
10 ohms
12 ohms
510 ohms
100 ohms
I5 kilohms51 ohms
Variable2.5 kilohmsVariable5 kilohms
Note
1/2watt 5percentcarboncomposition½ watt 5percentcarboncomposition½ watt 5percentcarboncomposition½ watt 5percentcarboncompositiont/_watt 5percentcarboncomposition½ watt 5percentcarboncomposition½ watt 5percentcarboncomposition½ watt 5percentcarboncomposition½ watt 5percentcarboncomposition½ watt 5percentcarboncomposition1 watt2 watts
V2wattSelect736066886CL6
TRANSLATIONTRANSMITTEF--X479679
100 pf Arco-ElmencoDMIOF-IO1K
47 pf Arco-ElmencoDMIOF-470K
51 pf Arco-ElmencoDMIOF-510K
0.005 _,f SpragueTHOSO1-10 pf Johanson
JMC-2950
Pacific Semi-conductorPC-124
10 _f, 35 volts Sprague150D106XOO50R2
0.8-8 pf
Quan.tity
1
3
1
2
1
2
2
1
1
11111
4121
2
1
211
3
3
2
2
1
Part Value Note
Connector,coaxialConnectorInductorInductor
Resistor
Resistor
Resistor
Resistor
Resistor
Resistor
Resistor
Resistor
ResistorVariable resistor
RotaryswitchTransformerPiezo electriccrystalTransistorDiodesIsolator
8andpassfilterTraveling-wavetube
X3 frequencymultiplierIsolator
BandpassfilterAttenuator
Coaxialconnectors
UG-625BIBM4S-LRN
5.6 _,h10 _,h
270 ohms
300 ohms
430 ohms
4,7 kilohms
9.1 kilohms
820 ohms
2.2 kilohms
2.5 kilohms
27 ohms
100 kilohmsPA-6010
64.7094 mc
Winchesterfour-pinDelevan 1025-38
Delevan 1025-44¼ watt carboncomposition¼ watt carboncomposition¼ watt carboncomposition¼ watt carboncomposition¼ watt carboncomposition¼ watt carboncomposition¼ watt carboncomposition¼ watt carboncomposition
Hughesspecial I
F700, InternationalCrystal2Nl141
Hughes475115RantecFS217
Huggins210E
Hughes475116MELABSXH 421
Hughes475118ARRA5-6684-50
!MISCELLANEOUSSYSTEMAND PANEL PARTS--479680
VariableattenuatorVariableattenuator
FilterMeter
Power supply
ARRA5684-50
ARRA5-6684-50RANTECFCXXX
Triplett 327PL+15, +24voltsdc Hughes--15, --24voltsdc Hughes+ 250 voltsdc,6.3 volts acHughes
Quan
tity .
1
4
3
I
2
1
1
1
1
2
2
1
21
3
1
3
2
2
1
1
1
1
I
1
27
1
23
5
I
1
1
m
m
ig
|i
J
J
igg
m
J
=_
= =r_
L_
W
U
7-16 w

v
7. Materials, Processes, and Components
TABLE 7-2 (continued)
Part
Traveling-wavetubeamplifierandpowersupplyTraveling-wavetubeamplifierandpowersupplyTraveling-wavetubeamplifierandpowersupplyResistor
Powerswitch
Bandpassfilter
Highpassfilter
X2 multiplier
Value
9.1kilohms
1 kilohm1.8kilohm
QuanNote try
Huggins210F 2
Huggins210E 1
Huggins309F 1V2watt carboncomposition 1Vzwattvariable 1t/2wattcarboncomposition IMS35058-21
Hughes475118(mod) 2
Hughesspecial 1
Hughes475126 2
PREFERRED PARTS, MATERIALS, AND
PROCESSES
Parts. The approved parts list remains as pub-
lished in the August 1963 Monthly Progress
Report. Of the 70 types presently listed in the
Advance Bill of Materials, 48 are fully qualified
to the requirements of their specifications, while
some others will have only certain added speci-
fication requirements to be verified.
The basic elements of parts selection are asfollows:
1) Use of only space-qualified parts con-
trolled by adequate documentation.
2) Addenda to existing Syncom and Surveyor
part specifications to provide power aging,
additional screening, etc., to enhance relia-
bility.
3) Thorough vendor surveys to evaluate
manufacturing controls.
4) Standardization efforts to minimize the
number of types of devices.
Part Value Note
IsolatorX32multiplier
X3multiplier
Mixer
Frequencydivider½Frequencydivider_2QphasedetectorPhasedetectorandisolatorsCrystalvoltage-controlledoscil-latoranddoubleramplifierBalancedmodulator
Quan-tity
Hughes475115 IHughes475114(rood) 1
Hughes475116(mod) 1Hughes475100(mod) 1Hughes475117(mod) 1Hughes475114(mod) 1Hughesspecial 1
Hughesspecial 1
Hughesspecial 1
Hughesspecial 1
This program has led to the following results:
1) Every potential supplier of parts has been
surveyed by part specialists and project,
materiel, and quality control personnel.
2) Detailed technical discussions and evalua-
tions of Syncom addenda have been con-
ducted with suppliers to determine their
willingness and ability to comply with pro-
posed _equirements and compatibility with
their in-house manufacturing methods. The
attempt has been to avoid unnecessarily
increasing costs by requiring actions on the
part of suppliers which are redundant to
their normal procedures.
3) Part specialists, working with designers,have reduced the total number of different
semiconductor devices from 76 to 53.
Though reliability gains cannot be ac-
curately assessed at this time, reduction
in device types will certainly increase
reliability control.
7-17

Hughes Aircra[t Company
Most of the parts procured to the specifications
will undergo a period of "burn-in" by th e vendor,
to eliminate parts that might fail early in use,
and a subsequent power-aging period, to deter-
mine the consistency of performance, drift, etc.
From 1.7 to 3 times the number of parts required
for flight spacecraft will be tested in this manner,
usually by the vendors, and data will be supplied
on each part, to be confirmed by acceptance test-
ing on receipt. The parts with the most consistent
performance will be selected for flight use, the
balance being used for ground equipment, simu-
lators, etc.
Parts Specifications. A new general speci-
fication covering reliability requirements for the
space environment has been prepared for pro-
curement of Advanced Syncom semiconductors.
The specification is a standard format and will
be accompanied by several tables establishing
exact requirements for a given part.
It is expected that existing 988XXX basic
specifications will gradually be replaced with
the new format. In the interim, procurement
of three-fourths of the Advanced Syncom require-
ments will be made with the basic specifications,
modified by an addendum that will result in the
same total effect as the standard specification.
The addendum consists of extracts from the
standard specifications; its preparation is com-
plete, and it has been incorporated in 38 speci-
fications to data.
Several parts specifications prepared for Ad-
vanced Syncom were included in the September
Monthly Report (pages 6-3 through 6-70). These
documents are selective examples of the entire
specification program.
OSM and Bendix RF Connectors. The
Bendix and Omni Spectra miniature RF con-
hectors are presently being evaluated. Problems
with connectors previously available were:
1) Galling of mating threads--aluminum
components showed excessive wear under
normal number of matings and unmatings.
2) Coarse mating thread- connectors be-
came unmated during vibration.
3) Grounding shields--shields could not be
grounded securely to the shells.
4) Noncaptivated contacts p center contacts
were being either pushed in or pulled out
on panel or bulkhead jacks.
5) Ease of assembly---connectors had many
components and were relatively difficultto assemble.
Bendix and Omni Spectra connectors eliminate
these problems by the following methods:
1) Use of stainless steel for shell material
decreases thread wear and galling.
2) Finer mating threads discourage uncou-
pling due to vibration.
3) Soldering to metal ferrule provides reli-
able grounding of shields.
4) All bulkhead and panel jacks have capi.vated conacts.
5) Fewer components minimize assembly
problems.
The Bendix and Omni Spectra series havethese characteristics:
Impedance 50 ohms
Cable RG-55B/U or teflon RF 142/U
for OSM type
RG-178/U for OSSM type
7-18

L
_4
E: ¸ !=
LI__i
7-,_;
|
r_ 2
LJ
Voltage
standing
wave ratio
Material
Finish
Size
l.l:l over a range of 2 to 10 gc
Shell, stainless steel; dielectric,
teflon
Gold plate per MIL-G-45204
1/_ size and weight of BNC type
Environmentally resistant construction
The Bendix and Omni Spectra connectors can
be mated interchangeably. Detailed information
on the mating faces has been submitted by both
vendors and mateability thus verified. All mate-
rials and finishes will be space-approved.
Figures 7-1 and 7-2 show the connectors,
both apart and mated. Figure 7-2 shows the
means by which the contact in the female jack
is captivated to prevent motion when the male
plug is inserted. Preliminary specifications are
being drafted, with both Bendix and Omni-
Spectra listed as sources.
Magnetic Parts. Design of magnetic parts
and fabrication of breadboard samples has pro-
ceeded as rapidly as circuit design criteria per-
mitted. The breadboard electrical designs for
such parts have been completed. Final design
for production and corresponding procurement/
production specifications will be completed dur-
ing subsequent phases of the program.
Newly Developed Parts. A small adjust-
able air capacitor of 0.1 to 1.0 pf range was not
initially available commercially; therefore, one
was designed and samples constructed for test.
A commercial vendor has since proposed a de-
sign and samples have been evaluated. It will
be covered by specification X988521.
A coaxial switch had been developed for use
in the Syncom 2 program but became available
too late for such use. It is being evaluated for
72Materials, Processes, and Components
a) _loe view
b) End View
c) Mated
FIGURE 7-1. BENDIX CONNECTORS
7-19

W
Hughes Aircraft Company
FIGURE 7-2. SECTIONAL VIEW OF MATEDOSM CONNECTORS
possible use in the Advanced Syncom program,
since it is smaller and lighter than the ferrite
switches presently contemplated. It is a hermeti-
cally sealed, latching type relay. Samples will
be procured equipped with OSM type connec-
tors for further evaluation in subsequent pro-
gram phases.
Materials. The following materials have been
evaluated and approved for Advanced Syncom
and are to be added to the list in Appendix B,
page B-49, of the April 1963 Monthly Progress
Report:
1) Epoxy syntactic foam covered by HP 16-
108, "Heat Resistant Syntactic Foam,
Application of." This material, devel-
oped by Hughes, is designed as a low-
density (32 to 35 lb/ft 3) filler in
load-bearing applications where shear,
compressive, and bearing stresses are
encountered. Minimum room tempera-
ture properties are as follows:
Tensile shear
(aluminum to
aluminum) 1750 psi minimum
Compression 6500 psi minimum
Modified epoxy adhesives covered by HP
16-111 "Adhesive Bonding, Reinforced,
2)
using Modified Epoxy Resins." This is
a Hughes-developed material, specifically
for bonding solar cells to a variety of
substrate materials over wide thermal
ranges, facilitating flat-mounting of cells,
and improving solar array reliability.
3) Modified, transparent epoxy material de-
signed to provide potted cable to con-
nector joints of superior flexibility and
capable of being readily repaired. The
material cures at room temperature and
is covered by HP 16-110 "Potting with
Flexible Epoxy Materials."
4) Improved hook-up wire covered by
HMS 2-1293, "Wire, Electrical, Insu-
lated, Copper Alloy, Modified Polyimide
Coated, 250 volts rms (For 200°C Serv-
ice)"-- teflon dielectric. It is available
in unshielded (Type I) or shielded and
jacketed Type II), Class I (silver coated,)
or Class II (nickel coated). Class II is
preferred for Syncom.
Processes. The following processes have been
developed and approved for Advanced Syncomand are to be added to the Preferred Processes
list in Appendix B, page B-77, of the April 1963
Monthly Progress Report.
Items 1, 2, and 3, under Materials, involved
the development of a process to properly em-
ploy the materials. These processes are now pre-
ferred, within their scope, for use on Syncom.In addition:
1) HP 14-30, "Process for Lead to Lead
Electronic Assembly," has been devel-
oped and released for comments.
2) Soldering per Mil-S-6872, except for
etched circuitry, has been replaced by theNASA-MSFC-158B.
il
g
==
u
Ii
_ti
UU
lIB
J
=
II
w
w
7-20

-; x.j
7. Materials, Processes, and Components
t
t ;
w
= :
r
E
_F!- °
=
r_
F •
U
3) HP 16-107, "Laminates, Structural,
Epoxy-Glass Fabric, Fabrication of," has
been developed to provide a reliable
process for reinforced plastics fabrica-
tion, at the same time utilizing resin sys-
tems approved for the space environment.
¢) HP 11-45, "Fusion Welding, Electron
Beam," has been prepared and releasedfor comments.
RADIATION ENVIRONMENT STUDIES
A test program was started to determine the
ionization effects of semiconductors used in the
Advanced Syncom spacecraft. Six types of semi-
conductors, representative of those used in the
Advanced Syncom spacecraft, have been selected
for the tests. Four are devices suspected of hay-
ing an unstable surface:
988821 (2N2185)
988825 (2N1041)
988828 (2N1405)
Si micro-alloy
Ge device
Ge device
988829 (2Nl141) Ge device
Two are devices that presumably have a stable
surface:
988718 (1N3062) Si device
988802 (2N871) planar Si device
With the exception of 2N1041, 12 of each of
these devices will be irradiated. Only six will
be used for 2N1041.
To obtain data in a short time, one of each of
the devices was irradiated at a rate 1.5 X 10 °
rads/hr from a cobalt source. After a cumulative
dose of 2.4 X 10⁵ rads, the 2N871 reverse cur-
rent increased by a factor of 5 (from 60 to 300
nanoamperes), and the 2N1405 increased from
170 to 400 nanoamperes. The remaining four
devices had increases of approximately 20 per-
cent. This increased leakage, however, will not
cause any difficulties in operation of the space-craft electronics since the circuits were sufficient-
ly derated.
The general program summarized in Table
7-3 will be followed except that the dose rates
will be changed to obtain as much information
as possible during the remainder of the con-
tractual period. It is anticipated that for each
type of device, a series of leakage measurements
will lead to a set of plots probably similar to
those shown in Figure 7-3, from which the
effects of low-dose-rate radiation on semiconduc-
tor surface phenomena can be determined. Fig-
ures 7-4 and 7-5 show the cobalt 60 radiation
source in which the semiconductors are being
irradiated.
Studies of Effects of Particle Radiation on
Parts. Two studies were made of radiation effects
on parts. One of the studies, "A Survey of the
TABLE 7-3. RADIATION PROGRAM SUMMARY
Major Group
Dose Rate 1.0 rads/hr
Subgroup a b c
Number ofSamples
Leakage-currentmeasurementataccumulateddose of (rads)
Photographs ofreverse charac-teristics at anaccumulateddoseof (rads)
Bias voltage(VcBor V.)
2N10412Nl1412N14052N2185l N30622N871
2 2 2
0, 10, 20, 50,100, 200, 500,10', 2 x 10'
O, 10, 100, I0'
Subgroup a
4O]31].
7IO0
22.5
10 rads/hr
a b c
2 2 2
0, I0, 100, 200,500, ].0', 2 x I0',5 x 10', I0',2 x 10'
O. i0,100,].0',10'
Subgroupb
8O262214
20090
7-21
U

!
Hughes Aircraft Company
_CBO
OR
(I R)
5 -
4 -
3
2
I
AT FIXED DOSE RATE
f Io. 5 Vo
I0 I00 103 I04
TOTAL DOSE, RAD
o)
3
TCBO
OR
(TR)
2
4AT FIXED VCB /
/
/ I RAD/H
IO I00 IO 3 I0 4
TOTAL DOSE, RAD
b)
3
AIcso z
-- AT GIVEN
I I I
2 3
VCB
c)
ATcBo 2
DOSE
I I
4 4
AT GIVENTOTAL DOSE
I
I 2 3
Vc B
d)
FIGURE 7-3. RADIATION-INDUCED LEAKAGE CURRENTS
Effects
con Solar Cells," presents a unique method,
based on defect density, for predicting the life-time of silicon solar ceils or semiconductor
devices in a combined field of electrons and pro-
of Electron and Proton Radiation on Siii- - flare' and cosmic-ray radiation has been roughly
tons l_aving a given energY/specirai distribution.
Silicon solar cell lifetime in Van Allen, solar
estimated using this method. These computations
are based on the best estimates available of the _
various energy spectra and energy-dependent
damage constant for diffusion lengths obtained
experimentally. Considerable uncertainty exists
in these life estimates, however, because of un-
u
i
mB
im
i
m
=
m
mi
m
a
i
U
miiP
i i
i'
7-22--4i
lid

L
t ; 7. Materials, Processes, and Components
is......,
|
!i
= ,
| ,
i,
L
w
FIGURE 7-4. COBALT 60 SOURCE USED INIRRADIATING SEMICONDUCTORS
certainties in the environmental conditions, in-
cluding flux, energy spectrum, and temporal
fluctuations at the Advanced Syncom altitude.
The other study, "The Ionization Effects on
Transistors Due to Particles Trapped in the Geo-
magnetic Field at Syncom Altitude," discusses
the effects of radiation on transistors and the
effects of different types of shielding. The study
is included on the following pages.
Ionization Effects Study. Surface effects of
ionizing radiation on transistors became a
familiar problem when the phenomenon was ob-
served in the transistors used in Telstar. Experi-mental results indicate that the total radiation
FIGURE 7-5. MOUNTING SEMICONDUCTORS INCOBALT 60 SOURCE
dose seems to be a more significant factor in
producing the effect than the dose rate (Refer-
ence 7-1). A rough estimate has been made tosee whether an accumulated radiation dose over
a 5-year period at Syncom altitude would cause
a significant surface effect on transistors. Be-
cause the size, energy spectrum, temporal fluctu-
ation, and recurrence frequency of solar-flare
proton events are unpredictable, only ionizing
radiation particles (electrons and protons)
trapped in the geomagnetic field at Syncom alti-
tude are considered. Permanent surface damage
caused by these particles is not considered.
• Technical Discussion. The surface effects
in question result from the ionization of gases
within a transistor encapsulation and the inter-
action between the ionized gas and the semicon-ductor surface.* When an electrical field is not
*Radiation particles penetrating the transistor encap-
sulation can directly cause permanent surface dam-
age, resulting in an increase in surface recombination
velocity and in a reduction of current gain. However,
the effects clue to this mechanism (disordering of the
lattice structure by atomic displacement) are not con-sidered here.
7-23

Hughes .4ircra]t Company
present, electron-ion pairs created by ionization
essentially recombine, and the surface phenome-
non would hardly be detectable. When a field
is present (as in a biased transistor), electrons
and ions will be collected at proper electrodes
(the semiconductor surfaces) and will form an
inversion layer. Sufficient accumulation of elec-
trons and ions at the surface, which causes an
appreciable change in the surface state, leads to
an ionic leakage (an increase in Icno). As a
result, the current gain will decrease. In this
sense, the effect is directly associated with ioni-
zation. Consequently, when the number of
electron-ion pairs produced by gamma-ray radi-
ation is correlated with the number of pairs pro-
duced by the charged particles in question, the
data regarding the surface effects on transistors
caused by gamma-ray radiation* is immediately
applicable to the present problem.
The great difficulty in determining the spaceradiation environment is due to the insufficient
amount of data dealing with the flux, energy
spectrum, and temporal fluctuations at a given
location. However, based on the assumptions
made in Reference 7-2, electron and proton
differential energy spectra at Syncom altitude
have been plotted in Figures 7-6 and 7-7.
If a transistor is encapsulated within an iron
case 10 mils thick, the cutoff energy becomes ap-
proximately 425 key for electrons (Reference
7-3) and nearly 10 mev for protons (Reference
7-4). Protons within the Van Allen radiation belt
at Syncom altitude are completely shielded from
the interior of the transistor by the iron transistorcase and will not contribute to the ionization of
gases within the encapsulation. Electron differ-
*The displacement cross section of gamma rays is very
small in comparison with that of protons or electrons,
although it depends entirely on the energy of bom-
barding particles or photons.
6
z
x"
.d
z
i0 7
i0s
10 5
}O4
iO 3
IO 2
c
iO l
SPECTRUM WITHOUT SHIELD
SPECTRUM AFTER
TRAVERSING IRON,IO MILS THICK
SPECTRUM AFTER
..-'TRAVERSING IRON,20 MILS THICK
io0 .... __
O.I 0.5 I.O 5
ELECTRON ENERGY, MEV
FIGURE 7-6. ELECTRON DIFFERENTIAL ENERGYSPECTRUM (AT SYNCOM ALTITUDE) BEFORE
AND AFTER TRAVERSING IRON SHEET
IO
entiaI energy spectra, after the electrons traverse
an iron sheet 10 mils thick and another 20 mils
thick, are plotted in Figure 7-6, based on the
energy-loss data of electrons in iron as plotted
in Figure 7-8 (Reference 7-3), assuming a
sharp cutoff. The energy loss is approximately300 key for 10 mils and 550 kev for 20 mils
of iron at the respective cutoff energy.
According to Figure 7-6, the number of elec-
trons penetrating an iron sheet 10 mils thick is
approximately 6 × 10³ electrons/cm2-sec. If the
encapsulated gas is nitrogen, the energy lost by
u
7-24

i _.j
7. Materials, Processes, and Components
io9
1o8
i0 7
,=UI.uqJ3t 106
Z
_ io _
x".J
.J
gbJ 10 4
n.-bJLI.I,
El
,o_
10 2
i01
0.1 0..5 5.01.0
PROTON ENERGY, MEV
FIGURE 7-7. PROTON DIFFERENTIAL ENERGYSPECTRUM AT SYNCOM ALTITUDE
these electrons traversing a unit path length can
be calculated with the aid of the electron energy
Ioss curve in nitrogen gas shown in Figure 7-8.
The electrons impart energy to nitrogen gas atthe rate of about 18 mev/sec in the first 1 cm
of travel. If the energy required to create a pair
of nitrogen ions is assumed to be 32 ev, about
5.7 X 100 ion pairs/cc-sec will be produced. This
ionizing power is equivalent to a gamma.ray
_6
_5
¢1>
i:0.01 0.1 0.5 I 5 I0
ELECTRON ENERGY, MEV
I
0.05
FIGURE 7-8. ELECTRON ENERGY LOSS IN IRONAND NITROGEN
dose of 2.3 X10 -_ rad/sec at the average
(gamma-ray) energy of 1.25 mev.* The dose
rate thus obtained is approximately 0.83 rads/
hr, and the accumulated dose after 5 years is
about 3.65 X 10⁴ rads.
Since the radiation dose of electrons is cor-
related with that of gamma rays (at the average
energy of 1.25 mev) through the number of ion
pairs created by ionization, the experimental
data obtained from the use of a cobalt-60 gamma
source (Reference 7-1) are applicable to the
present problem. Becausethe dose rate that the
Advanced Syncom wiII experience is much
smaller than the observed experimental dose rate
(by a factor of 10s), no simple conclusion can
be drawn from the data. For example, at a high
radiation dose rate (of the order of 105 rads/
hr), the increase in IcBo is proportional to the
accumulated dose (see Figure 7-9); however,
the effect of a low dose rate on Ic,o is completeIy
different in nature from that of a high dose rate,
as shown in Figure 7-10 (Reference 7-1).
When a device is removed from the radiation
field, its characteristics will partially recover.
*The true absorption coefficient of air at this energyis 2.67 X 102 cm2/g r.
7-25

Hughes ,4ircraft Company
J
lO.I
tO: • • • • to 4 • ,* s o10 sRADIATION DOS I: IN RADS
FIGURE 7-9. DOSE RATE EFFECTS ON Iclo AT HIGHDOSE RATES
The recovery time depends on the bias voltage.*
If the device is biased, recovery time will be
longer (days to weeks) than if no bias is applied
(hours to days). At an extremely low radiation
dose rate, the recovery processes would take
place while the generated ion pairs were simul-
taneously contributing to the change in the sur-
face state, resulting in a relatively small increase
in Icso. This may constitute a plausible explana-
tion for the phenomena observed in Figure 7-10.
Since the dose rate encountered at Syncom
altitude is smaller than the experimental data
shown in Figure 7-10 by about a factor of 10,
the IcBo of a transistor could increase to 10 -_
ampere. Thus, if the same device and bias condi-
tions were used in the Advanced Syncom system,
the effects would be negligibly small. If the ac-
*This phenomenon is not necessarily restricted totransistors. Semiconductors in general behave in asimilar manner when ionization, rather than atomicdisplacement, predominantly contributes to the phe-nomenon.
I0-1
I0*7
_ to.-•
gU
i.m
IO'•
VCB m ISV
EMITTER FLOATING
III
II
i v.4x_o s P_AOS/HR
II.I
III!
lIIIIIIII
II
II
Io MAO_,/MR_
10-10
IO • IO 3 10 4 IO a
FIGURE 7-10.
RADIATION DOSE IN RADS
DOSE RATE EFFECTS IN IcJo AT HIGHAND LOW DOSE RATES
cumulated dose (rather than the dose rate) is
regarded as a predominant factor for the degra-
dation, the IcBo could possibly increase to 10 -5
ampere at a large bias voltage (VcB -- 30 volts
in Figure 7-11). However, such an increase is
unlikely for this device since a lower dose rate
initiates a degradation at a higher integrated
dose, as shown in Figure 7-12.
As seen in Figure 7-11, the degradation of
IcBo greatly depends on collector bias voltage,since the ions created within the transistor en-
capsulation are more efficiently collected at the
surfaces under the influence of a higher field.
Therefore, a practical method of reducing the
surface effects on transistors is to reduce the
collector bias.
It should be emphasized that the experimental
data in Reference 7-1, on which the above discus-
sions are based, are restricted to a limited num-
ber of device types and show a large variation
7-26

7. Materials, Processes, and Components
=
L
L
L_
t_
t2 ;
i!
I
k_
10--4
/IO-b
10-s
<1,4
tO--a
tO -I
fo-SOI0 Z tO $ _0 4 10 5 10 4
RADIATION DOSE IN RAD._
FIGURE 7-11. DEPENDENCE OF DEGRADATION OFIc=o ON COLLECTOR BIAS
in the amount of change of IcBo. The effects of
ionizing radiation on Ic_o also depend upon the
device type, configuration, fabrication and proc-
essing techniques and primarily on the stability
of the pre-irradiated surface state. Experimental
evidence also indicates that a high-gain type of
transistor experiences a lesser degradation.
• Conclusions. If the transistor case is fab-
ricated from iron (10 mils thick), only electrons,
but not protons, trapped in the geomagnetic field
at the Syncom altitude would contribute to the
ionization of encapsulated gases. Although the
accumulated dose may become as high as
3.7 X 10 4 rads during the 5 years of life, the
dose rate would be small (less than 1 rad/hr)
and a shielding by the vehicle skin could reduce
the dose rate by a factor of 5 or more.
b,
er
WI,-
_z
_l__l / JF-54647 I
5R/hr tE_ITTERS FO_WAmD/ l
BIASED I
rI:47 // l
fOd
:
/
Z
1028
F-._4273
5R/hrEMITTER.S FORWARD--
BIASED
• "_ r't :43
/ *,o_lhr
/ 1"1=25
/ I --
_x ioSR/hr
• i _F-54273
EMITTERS
FLOATING
VCB:ISV
|l0. I I 5 10 30 50 70 90 95 99 99.9
PER CENT CHANGING AT OR BELOW THE INDICATED DOSE
FIGURE 7-12. DISTRIBUTION OF RADIATION DOSEAT INITIATION OF DEGRADATION
Since only meager experimental data are
available, an estimate of the effects of ionizing
radiation on all the transistor types selected for
Advanced Syncom cannot be made with great
confidence. Without any consideration of "self"
shielding by the vehicle skin, the accumulated
dose could possibly induce an appreciable change
in Icno for some types of devices. However, the
degradation rate could be made toIerable by
selecting proper device types (high-gain de-
vices), choosing an appropriate circuit design
(reduction of collector bias), or adopting the
proper aging or screening technique. When the
shielding effect by the vehicle skin and the low
7-27

Hughes A ircra]t Company
dose rate are considered, the degradation after
5 years would not be sufficient to cause a signifi-
cant circuit malfunction. The change in Icso
because of a temperature increase would prob-
ably be comparable to the effect caused by ioni-
zation.
In the foregoing discussions, the effects of
solar flare proton events have been completely
ignored. However, since the accumulated dosedue to electrons in the Van Allen radiation belt
is near or beyond the "initiation dose" for the
degradation of IcBo in some devices, a large
solar flare event would probably result in an
appreciable increase in IeBo before the end of
required Syncom life.
• Recommendations. Since the integrated
dose calculated is in the critical region in which
an appreciable degradation of Icso might be
caused, the following precautions are recom-mended:
1) The reduction of collector bias and case
potential
2) The selection of high-gain devices
3) The exercise of a proper aging or screen-
ing technique to eliminate devices with an
unstable surface state
To further assure dependable performance, the
following additional techniques can be employed:
4) The use of evacuated devices
5) The use of a thin shield
Simple engineering experiments are highlyrecommended to determine the difference in the
effects of high and low dose rates.
• References
7-1. D. S. Peck, R. R. Blair, W. L. Brown,
and F..M. Smits, "Surface Effects of
7-28
Radiation on Transistors," The Bell Sys-
tem Technical Journal, 42, 1963, p. 95.
7.2. H.Y. Tada, "A Survey of the Effects of
Electron and Proton Radiation on Silicon
Solar Cells," TM 755, Hughes Aircraft
Company, 1963.
7-3. A. T. Nelms, "Energy Loss and Range
of Electrons and Positrons," NBS Circu-
lar 577, United States Department of
Commerce, Washington, D.C., 1956.
7-4. J. H. Atkinson and B. H. Willis, "High
Energy Particle Data," University o]
California Radiation Laboratory Review
2426, 2, 1957.
MATERIAL AND PROCESS STUDIES
Material Developments. To optimize, within
the time limitations imposed, long-term reliability
of materials and processes for Advanced Syncom,
material development efforts were undertaken.
The tasks include solar cell materials and fabri-
cation evaluation, connector development, encap-
sulation materials development, and thermal
materials properties tests.
Solar Array Substrate Development. The
objectives of solar array substrate development
are 1) composite construction of optimum
strength-to-weight ratio, 2) improved panel re-
producibility and uniformity, and 3) elimination
of as many post-fabrication steps as possible. The
substrate incorporates 0.500-inch-thick alumi-
num honeycomb core, 1/8-inch cell, 0.0007-inch
foil. Faces are each three-ply No. ll2-Volan A
(each 3 rail) glass fabric, impregnated With an
epoxy resin system of moderate thixotropy to
assure uniform filleting at the core-facing inter-
face. To hold weight to a minimum, the convex
(outer) face is only two-ply at the time of sub-
strate fabrication. As discussed later, the third
ply is applied during the cell attachment process.
m
N
==
J
m!
U
m
II
|
Ill
U
rll
iBm
mi
F--
U
W
IlW
= =
it.._
i

! t
t _ t :
= = _.../
w
m
The substrate is fabricated in a female alu-
minum layup tool (Figure 7-13). The 0.5-inch-
high nails on the mold surface represent the
substrate periphery and permit net fabrication
7. Materials, Processes, and Components
(no trimming required). Edge closure is ac-
complished by cutting the bottom ply of fabric
(ply against mold surface) approximately 1
inch oversize in all directions. This ply is then
--=
a) Aluminum Cleaning Tool .. : : b) Inserting Glass Cloth into Tool£
c) Inserting Honeycomb into Glass-Cloth-Lined Tool
=
m
=
=
z ::---x- 1_ z: _z:- 7 : : :t: ..... ": :_
d) Preparation for Vacuum Oven Cure
FIGURE 7-13. SOLAR ARRAY SUBSTRATE FABRICATION
7-29

Hughes Aircra[t Company
lapped over the top ply of the inner (concave)
face, and the completed substrate is heat-cured
under vacuum pressure.
The solar cell strings (each string consists of
three cells in parallel by 62 cells long) are at-
tached to the substrate in the following manner.
One ply of 3-mil glass fabric slightly larger
than the cell string is impregnated with the epoxy
adhesive and positioned on the prepared sub-
strate. The cell string is then put in place and
positive pressure exerted by means of a clamped,
rubber-faced holddown pad.
Solar array reliability is significantly im-
proved by these processes. The unique edge-
closure permits "net" fabrication which elimi-
nates trimming and the need for the edge-fill
putty previously used; the result is an increase
in substrate uniformity and reliability. The cell
bonding system provides a reinforced bond line,
the optimum condition to resist thermal and
other environmental stresses. Adhesive weight
is also virtually eliminated since the reinforced
bond line becomes the integral third ply of the
outer face. This technique provides uniform
bond line thickness, which is important in assur-
ing uniform stress distribution. The finished
panel is shown in Figure 7-14. Because of the
high translucency of the resin system, photo-
graphic standards of acceptable and unaccepta-
ble core cell filleting have been established to
make substrate inspection simple and positive.
High Strength Epoxy Syntactic Foam devel-
opment. High strength epoxy syntactic foam was
developed to provide a space-compatible light-
weight potting material where relatively high
shear and bearing loads must be carried, such
as solar panel mounting inserts, etc. Its properties
are as follows:
Density 32 to 35 lbs/ft 3
Tensile shear strength 1750 psi (minimum)
7-30
a) Solar Ceils Being Mounted on Substrate
"7"1 • r'_-- _ ....
mDllmlq ....b) Closeup of Partially Completed Solar Panel
FIGURE 7-14. ATTACHMEN:I" OF SOLAR CELLSTO SUBSTRATE
Compressive strength 6500 psi (minimum)
The resin-hardener system is compatible with
laminating systems used by Hughes permitting
its use in wet layup construction. A specification
covering this material has been released.
Solar Cell to Substrate Adhesive Develop-
ment. A screening program was initiated to select
an adhesive capable of withstanding the environ-
mental and thermal stresses anticipated, whose
stress response would have no adverse effect on
either substrate or cell, such as cracking, bond
line failure, degrading of cell electrical charac-

L •
L--,
tt
|4[]
:_£
w
W
=
teristics, or condensation of polymer fractions.
Modified epoxies were considered first as a result
of the following considerations:
1) Their outstanding adhesion is well known.
2) A room temperature curing mechanism
would be highly desirable from a process-
ing standpoint.
3) A well formulated, highly crossIinked
epoxy system represents probably the most
stable organic material for space applica-
tions available today for temperatures upto 300°F.
4) Modification, or making the system more
flexible, was felt necessary to provide an
acceptably low second-order transition tem-
perature. It was also felt desirable that the
polymer, at this transition point, not as-
sume a crystalline structure. Such a struc-
ture, on thermal cycling, can induce a de-
crease in polymer integrity with an attend-ant loss of adhesion.
Screening tests were made of nine formula-
tions, each used to attach a cell to a small piece
of substrate. These samples were given 25 ther-
mal shock cycles from 260 ° to --320"F. These
extremes, well beyond the thermal environment
anticipated for Syncom, were selected because
two of the three test parameters were not repre-sentative of the actual mission. The minimum
practical test pressure, 10 -7 Torr, is significantly
higher than the 10 -_2 Torr expected in deepspace; the available test time of 2 months is
equivalent to only about 5 percent of the mini-
mum orbital life. The third test parameter, tem-
perature, remains the only factor capable of beingintensified.
By increasing the thermal range, it was felt
that greater confidence could be attached to the
test results. Specimens were visually and micro-
scopically examined for cell cracking, bond-line
7. Materials, Processes, and Components
cracking, and loss of adhesion. Surviving speci-
mens were then subjected to vacuum testing at10 -7 Torr and 260 ° F for determination of out-
gassing characteristics. Examination of the cool
glass walls of the test tube for evidence of con-
densate, and weight loss measurements were the
test criteria employed. One system utilizing a
modified epoxy exhibited no weight loss or evi-
dence of outgassing; two were marginal (light
fog film produced on walls). Two samples of the
surviving system were then subjected to 500 ther-
mal cycles from 250°F to --225°F at a rate of
thermal change of 20"F per minute. (The antic-
ipated rate of thermal change for Syncom's
entering and leaving the earth's penumbra is
10°F per minute; however, because of the re-
strictions of available calendar time, it was
decided that twice as many cycles at 20 ° F per
minute would provide more meaningful data.)
At each temperature extreme, the samples were
given a 10-minute stabilizing soak. Although the
test was designed for a cold extreme of --320" F
(liquid nitrogen), the --225 ° F limit was im-
posed by the radiative properties of the test
equipment. A specification covering this adhesive
system has been prepared.
A secondary aspect of this task was considera-
tion of the process to be employed for actual
production application of the cells to the sub-
strafes. The cells are preprocessed in strings three
cells wide by 62 cells long and are designed for
flat mounting. The bonding procedure selectedis as follows. The substrate convex or outer face
will consist of only two plies of glass fabric, not
three, at the time of substrate fabrication. This
third ply then becomes the cell adhesive "car-
rier" and is applied Concurrently with the cells.
This process offers several advantages:
1) Weight of cell to substrate adhesive is ineffect eliminated since the adhesive serves
7-31

Hughes ,4 ircralt Company
c-
also as the impregnant for the third plyof the outer face.
2) The glass fabric "carrier" serves not only
as a structural element of the composite
panel but also provides uniformity of
bond-line thickness, important in assuring
uniform stress distribution. The carrier
also permits close control of adhesive con-
tent, precluding excess squeeze-out of ad-hesive between cells and onto cell surfaces
which necessitates tedious cleanup. The
glass fabric also provides a reinforced
bondline, minimizing the effects of thermaland other environmental stresses on cells
or substrate.
Flexible Potting Compound for Cable to
Connector Joints. Eighteen material systems for
low voltage cable to connector potting were eval-
uated in an effort to provide a flexible, easy-to-use
insulating material that could be repaired witha minimum of effort. Three of these materials
were found suitable for the Syncom environment;
two were later rejected since they required heat
curing and thus did not lend themselves to field
repairing or simple processing.
The material selected is a Hughes Materials
Technology Department formulation utilizing
a blend of two epoxy resins, one of which imparts
flexibility to the polymer, and an amine cross-
linking agent which provides room temperature
curing capability.
The outstanding characteristics of the material
(Figure 7-15) are as follows:
• Tough, flexible compound with good
dielectric strength and superior handling resist-
ance when compared to conventional elastomers
or rigid epoxy materials.
• Easily mixed and applied by standard
techniques currently being used. With the use of
simple molds and a disposable syringe, individ-
7-32
a) Connector Potted with Material (Left)
and CloseuP of Material (R!sht)
b) Method of ApplyinR Material
FIGURE 7-15. FLEXIBLE CONNECTOR POTTINGMATERIAL
ual connectors can be potted on the bench or
attached to a wiring harness within the space-
craft.
• Cure mechanism permits removal of pot-
ting shells from connectors after 12 hours at
room temperature. Cure is complete within 36
hours.
• Repairability is enhanced because of
transparency of the material permitting cutting
directly to a questionable connection. Since the
l
m
[]N
J
U
m
I
i
mu

7. Materials, Processes, and Components
11m_
material is very tough, cutting for repairs is
performed with a knife-tipped soldering iron.
When the repair is completed, the compound ina more viscous form can be smoothed into the
cavity and permitted to cure. A specification
covering this material has been prepared.
Phased Array Control Electronics Encap-
sulation. To achieve a lightweight, repairable
system for encapsulation of a number of welded
modules mounted on a conventional circuit board,
a method has been developed incorporating ad-
vantages evolved from work performed on Syn-
corn 2 and Surveyor. Essentially, this system
utilizes conventional etched epoxy circuit boards
to which welded electronic modules are to be
soldered. Prior to mounting the modules, a thin
epoxylaminate is bonded to the top of the etched
board. This thin laminate has punched holes
exposing the etched circuit islands, yet prevent-
ing electrical shorting between the conductors ofthe board and those in the modules. The laminate
is bonded in place with a breakaway adhesive
that facilitates removal of single modules for
repair. Encapsulation is performed by placing
properly proportioned amounts of polyether type
foam-in-place compound into a polished mold,
then placing the board and welded module as-
sembly over the cavity and allowing the foam
to cover the circuitry. Once the foam is hardened,
the mold is removed. The foam material selected
will cure at room temperature and is completely
compatible with the Syncom environment. An
example is shown in Figure 7-16.
Repairs are made by cutting through the foam
on predetermined marked paths with a brassknife blade. Once the solder is removed from the
board-to-lead joint, the entire board is heated to
200°F for 5 minutes and the individually isolated
module is removed. Separation occurs at the
interface of the etched board and the separator
laminate bonded with the breakaway adhesive.
After a new module has been soldered to replace
the old one, the cut-out section is refoamed as in
the initial process. To protect the foamed unit
while it is being handled prior to assembly, a
plastic cover is used (Figure 7-17).
Thermal Control Surface Thermophysical
Properties. Tests were made to determine the
thermophysieal (solar absorptance, infrared emit-
tance) properties of various surfaces for passivethermal control. The data obtained is somewhat
limited but still useful for the purpose of space-
craft thermal analysis. All specimens were meas-
ured for solar acceptance (a) and infrared emit.
tance (E) before and after ultraviolet-vacuum
FIGURE 7-16. FOAM ENCAPSULATION
FIGURE 7-17. PLASTIC PROTECTIVE COVER FORFOAMED MODULE
7-33

Hughes Aircraft Company
exposure at five times solar intensity. Although
exposure time was short (approximately 250 so-
lar equivalent hours), it was considered adequate
to indicate any trend and rate of thermophysical
degradation.
Vapor deposited aluminum surfaces 2500 A,
thick have been studied. Three specimens were
measured indicating initial values of _--.08 and
-- 0.2. One specimen for angular solar absorp-
tance (o_) was measured at incident angles of
energy of 20 and 70 degrees for the full o_ spec-
trum. The results are shown in Table 7-4.
Organic White Paint. An evaluation has
been made to determine binder-pigment combi-
nations judged to be the most promising candi-
dates for thermal-control paint. Previous work
at Hughes and elsewhere in the industry has been
on commercially available binder-pigment com-
binations not originally formulated for use in
the space environment. Later polymer research
at Hughes and elsewhere holds promise for high-
purity solvent-washed binders which, when com-
pounded with equally high-purity pigments, will
provide organic coatings of highly acceptable
long-time ultraviolet stability, particularly with
TABLE 7-4. REFLECTANCE OF VAPOR DEPOSITED ALUMINUM
V
= =[]tm[]
Wavelength,microns
0.300.410.500.600.70
0.811.001.542.053.39
SpecimenReflectance
Reference Blackbody(Magnesium Oxide_
Reflectance
0.9200.9550.9100.8750.870
0.8500.9050.9771.000
-0.950
44.530
20 DEGREEANGLEOF SOLARINCIDENCE
0.9800.9850.9850.9800.980
0.9700.9800.9750.9450.920
48.850
Solar absorptance(=) = 0.128
I70 DEGREEANGLEOF SOLARINCIDENCE
SpecimenAbsolute
Reflectance
0.90160.94070.89640.85750.85260.82450.8869
0.95260.94500.9684
43.6156
0.3730.4570.5220.5940.6940.7750.9081.0951.387
2.166
0.8700.900
0.9100.9000.9000.9000.9200.9800.990
-0.9709.240
Solar absorptance= 0.101
I
0.9600.9700.9700.9750.980
0.9700.9800.9650.9550.940
9.665
0.83520.8730
0,88270.87750.88200.87300.9106
0.94570.94550.96918.9852
7-34

7. Materials, Processes, and Components
=
r
_.- .
Lt
It,... ¸
respect to solar absorptance---the most seriously
affected property.
The best of the combinations to date is a
titanium dioxide filled silicone-alkyd with an
initial o_ of 0.22. After 250 solar equivalent
hours of ultraviolet exposure, this value increased
to a -- 0.28, compared to the best value reported
in the literature or obtained at Hughes on other
binder-pigment combinations of o__-- 0.45 for the
same exposure time. This result is sufficiently
promising to warrant additional work.
Solar Cells. Cells of the type to be used on
Advanced Syncom (30-mil Coming 7940 fused
quartz bonded with Spectrolab ES-10 adhesive)
are currently in test. Data will include following:
1) o_and _ before and after 250 solar equiva-lent hours of ultraviolet irradiation
2) Angular a before and after irradiation
Since the solar array represents most of the ex-
ternal thermal control surface, these values are
important for thermal analysis.
Traveling.Wave Tube Potting Compound.
Tests have been made to determine the long-term
thermal stability under vacuum conditions of
the alumina-filled polyurethane compound used
for potting the collector portion of the traveling-wave tube. This material was formulated for and
used on the Syncom 2 program. Its properties
include maximum thermal conductivity, com-
patibility to space environment at tube operating
temperature, and sufficient flexibility to compen-
sate for the differentials in expansion and con-
traction of the various materials within the tube.
Thermal degradation of the compound would
probably induce a decrease in thermal conduc-
tivity, causing tube operating temperature to
rise, and a gradual loss of the polymer fractions
contributing flexibility, which could in turn cause
damaging stresses on components within the tube.
Thermal-vacuum aging tests were run for 6
months on six potted collector sections. The potted
sections were held at a constant temperature of
204* F, with the collector bases held at 172" F.
Polymer degradation was encountered in at least
two of the sections, although no adverse effect
was observed on the collector proper.
A parallel program was initiated to develop a
compound having higher temperature capability
and improved thermal stability with no sacrifice
in flexibility. An alumina-filled silicone material
met all requirements except for unacceptable out-
gassing characteristics. Although outgassing of
condensable material may or may not pose a
thermal control problem, in this case it would
certainly result in ultimate severe polymer de-
gradation because of the loss of these low-molecu-
lar-weight fractions. Therefore, consideration was
given to the possibility of hermetically sealing the
collector. This is currently in process together
with thermal-vacuum testing to determine the
efficacy of such a process. Tests will be completed
and data made available by the end of the re-
porting period.
Improved Electrical Hookup Wire. An im-
proved polyimide-coated FEP teflon-insulated
hookup wire has been evaluated and placed under
specification. It is available with either silver-
plated or nickel-plated conductors. This wire has
thinner insulation and improved processing for
application of the polyimide coating.
Battery Leak.Sealing and Dielectric Coat-
ing. A process has been developed for precluding
electrolyte leakage from battery terminals and
and fill-tube pinchoff, and at the same time apply-
ing an electrical insulation coating to the entire
battery case. A polyamide-epoxy resin system in
solvent solution is employed for the dip-coating
operation. This material is acceptable in the Syn-
|r
7-35

Hughes Aircraft Company
com environment and will cure under ambient
conditions.
Specifications. A specification covering the
electron-beam welding process is being prepared
and will be released by the end of the reporting
period. A process specification covering point-
to-point wiring and assembly procedures has been
prepared and will be released before the end of
the reporting period.
MATERIAL AND PROCESS STUDIES
3- to 5-Year Life Study. A study was under-
taken to determine methods of accelerated testing
which might permit prediction of 3- to 5-yearbehavior of materials with much shorter tests.
The study, conducted in May and June, involved
accelerated testing of three types of thermal-
control paint in exposure to different intensities
of ultraviolet light in vacuum. Two paints -- Sky-
spar and antimony trioxide in an inorganic,
silicate-base binder- were known to degrade
badly, by dii%rent mechanisms. The third- a
ceramic pigment in a silicate binder - developed
for use on the Surveyor program, was stable.
One of the less stable paints, with an organic
base, could be used on the inside of the spacecraft
where it would not be exposed to sunlight, while
the stable white could be used on the outside,
There would be a handling advantage, however,
if an organic-base paint, more rugged than the
inorganic-base paints, could also be used on the
outside. Unless a stable organic combination
could be found, however, the advantage would
0.6
0,4
d
h
0.2
u)
0
|- I ANTIMONY TRIOXIDE
PAINTSKYSPAN PAINTHUGHES INORGANICSURVEYOR WHITE PAINT
0 ix'_A 5X SOLAR INTENSITY
[3 tox)
PRESSURE: 2XlO -I TORR
[
..:..2.___ j) --
_-- __-- :.
5 I0 50 I00 500 I000
SOLAR EQUIVALENT HOURS
FIGURE 7-18. DEGRADATION OF THERMAL CONTROL PAINTS
5000
,,_
m
7-36

7. Materials, Processes, and Components
t
o _t....
_J
L
itl
be negated by the large change in solar absorp-
tance when the vehicle is in orbit.
Twenty-seven tests were completed on these
paints. Data from the tests are shown in Figure
7-18. The differences in rates and magnitudes
of degradation are evident. In the case of the
Skyspar paint (A423, color SA9185), the degra-
dation is believed to be primarily a function
of the organic binder. In the antimony trioxide
paint, the binder was an inorganic silicate, some-
what similar to that of the ttughes inorganic
binder paint, and the degradation may be a func-
tion of the pigment.
i
E_
LA
7-37

E3
_B
imm
m
M
J
w
ii
_m
W
p
k
m
w_
J
Im

I,,,.,
8. GROUND SUPPORT EQUIPMENT
INTRODUCTION
This section covers work on system support
equipment during the contract period. The work
included 1) development of systems test plans,
2) development of test equipment to implement
the system test plans, 3) development of major
and minor control item test equipment, and 4)
development of equipment for use at the groundcontrol sites.
The system test plans written under this con-tract are documented in Volume 5, System
Test Plans. Development of the test equip-
ment is discussed in detail in the supplement
to the September Monthly Report.
Discussed here are the two pieces of equip-
ment developed for use at the ground site, the
synchronous controller and the synchronous con-
troller auxiliary and the major and minor con-
trol item test equipments.
SYNCHRONOUS CONTROLLER
The synchronous controller (Figure 8-1) pro-
vides tile following major functions and equip-
ment:
1) Digital frequency loops which are locked
to the two telemetered sun sensor pulses
(4', 4',,) and circuitry to separate the two
pulses.
2) Measurement of the spin period (4"6) and
the orientation angle (4"4'2) utilizing the
frequency locked loops of item 1.
3) Control of the transmission of execute pul-
ses to the satellite at selectable spin phase
angles for backup operation of the jet con-
trol electronics.
4) Control of the transmission of 1 to 511 ex-
ecute pulses to adjust the phase of the
antenna beam.
5) Circuitry to provide "psuedo 4" pulses for
eclipse operation of the phased array
antenna.
6) Duration control of the execute tone for
operation of the primary mode of the jet
control system.
7) Controls and displays for operation of this
equipment.
The synchronous controller is packaged in two
units, one containing the execute control and the
execute pulse phase selector subsystem and the
other, the 4' and 4'2 digital locked loop. The exe-
cute control provides controls for selecting the
desired execute control mode and controlling the
execute timing. The execute pulse selector sub-
system contains the controls and circuitry to
allow creation of an execute pulse at the desired
angle relative to 4', lasting for the proper dura-
tion. Controls are also available for adjusting
the period and phase of pseudo 4' pulses used in
eclipse mode operations. Thc second unit con-
tains all of the controls for operating the 4' and
4'._, frequency locked loops. An oscilloscope is
available to aid the operator in adjusting the
period of tl_e frequency lock loops and phasing
the execute pulses for backup operation of the
spacecraft jets.
8-1

8. Ground Support Equipment
<_ _- -- - uO m
..... o
(n.._ i
N Q: ._,---
t i i--
-- 01-- [ ")'1
IO_
,it 4,
I-
_$_1 • --q
--J I
ww
-_<<
_21_1
8-2
o_°_$_ 8W:
0
o
) _ eO
,_
z_
1- w
le3 SS8# _" >
_>-
_3um_
- laj O.
JOo
= _,.*, ._o:
_-- . <[ml
4-++ +_
# 8#8
_ z_Eu
_J j z)<d=° o_=oo mz
_ _._E_
o
I
i
{
d_o

: ]
w
k,#
l,,,,d
R
t#d
_z_j
H_lghes ,'lircra/t Company
Execute Control Panel. A preliminary layout
of the execute control panel is shown in Figure
8-2. Basically, the execute control unit provides
the selection of one of the seven available execute
modes. Controls are also provided for initiating
and controlling the execute duration. The func-
tion of the various selector switches, pushbutton
switches, and displays are described below.
Execute Mode Selector. The execute mode
selector switch permits the selection of the follow-
ing execute modes:
1) Execute and clear spacecraft decoder
2) Execute and hold (no spacecraft decoder
clear)
3) Continuous execute
4) Normal control system mode for primary
control of the spacecraft control system
5) Real time mode for backup of the normal
control system mode
6) Antenna position mode to program a se-
lectable number of execute pulses for re-
positioning the spacecraft phased arraybeam
7) Eclipse mode to generate pseudo 4' pulses
for operation of the phased array beam
during eclipse
• Execute/Clear. A single execute pulse is
generated upon depressing the "execute" switch.
At the termination of the execute pulse, a suffici-
ent number of zero tones are transmitted for
clearing the spacecraft command register.
• Execute/Hold. A single execute pulse is
generated upon depressing the "execute" switch.
At the termination of the execute pulse, the trans-
mission of zero tones is inhibited, permitting the
command to remain in the spacecraft command
register.
• Continuous Execute. The execute dura-
tion is controlled by depressing and holding the
"execute" switch. The execute signal is term-
inated upon releasing the "execute" switch. No
spacecraft decoder clear signal is generated upon
releasing the switch.
• Normal Control System. The execute
signal is provided for control of tt_e spacecraft
primary jet control system. The "spin period/
pulses" switch is not effective in this mode since
only a pulsed execute signal is generated. The
execute pulse duration is equal to the spin period
and is generated synchronously with reception of
a telemetered 4'-t,ulse (6=0), and counted.
The number of execute pulses is preselected by
the setting of the decimal thumb wheel digi-
switch. The binary-coded-decimal "pulses to go"
readout displays the selected number of execute
pulses.
Two methods of initiating execute are avail-
able and are selectable by means of the alternateaction "manual�start on GMT" switch. Selection
of "manual" and depressing the "execute" switch
permits this mode to be initiated manually. Selec-
tion of "start on GMT" permits the execute to be
initiated at a specified Greenwich Meridian time.
In this case, the starting time is selected by meansof the minutes and seconds selector switches. The
"execute" switch must be depressed and helduntil the execute has been initiated at the selected
time.
• Real Time Jet Control Electronics Back-
up Mode. The execute signals are provided for
real time backup of the spacecraft jet control
electronics. The "spin periods/pulses" switch
permits the option of selecting a continuous
execute signal for a specified number of space-
craft spin periods or a pulsed execute at a
selected angle for a given number of spacecraft
spin periods.
8-3

wD
8. Ground Support Equipment
If the pulsed execute mode is selected, the
execute pulses are generated at a selectable phase
angle with respect to the occurrence of the _ sun
sensor pulse in the spacecraft. The desired phase
angle, plus a correction factor which takes into
account the propagation time to the spacecraft,
is selectable in 1 degree increments by means of
the q, phase selector switches. The method of
specifying the desired number of spin periods or
pulses and initiating the execute either manuallyor at a selected GMT is similar to that of the
normal control system.
• Position Antenna. This mode permits the
transmission of 1 to 511 execute pulses for ad-
justing the phase of the antenna beam. Each pulse
causes approximately 0.703 degree of beamrotation.
V-@2 ('DEGREES)
FI 2 s al
SYNCHRONOUS CONTROLLER
S/C ANTENNA GRD REFERENCE ANTENNA
POSITION (DEGREES) POSITION (DEGREES)
11 o s] I, o a!
MINUTES SECONDS
_P ,40 4, _ ,6 _ _P 4o50. -. _
2- -8 -
I" "9
d
t START TiME I
NUMBER OF
EXECUTE
HUNDREDS TENS UNITS
PULSES TO GO
I°_7°t.-I-Z-;E":,--T-;--_:"';,'-;q>,.,o oIJET PULSE CONTROL I
HUND#ED5 TENS UNITS
4 2 I B 4 z q B 4 Z I
'-----JET PULSE CONTROL 2
HUNDREDS TENS UNITS
,, ,2 4 '5 ,6 ,, s _
2 "8 S-- IOO
I" _/ "9 i" "9
O" "3 13" O' 0.5 0
J__ JET START ANGLE __J PSEUDO_/ PHASE
SELECTOR {DEGREES) ADVANCE
Do
@ESEI OPEDATE
666666666666666 6666 &
ECLIPSE MODE CONTROLS
l RCS MODEq
NORMALSYSTEMCON TDOL E lI" ......ODDS _ ....-,MSPACE EXECUTE__,,. o---- BACKUP MOI)E I
CRAFT EXECUTE _ \_'_ ANTENNACOMMAND t, HOLD ' 0_-- pO511 ION
MODE t x Ecur [ .._...¢ _ E_LIPS[I /. ELEA_ _ MODE
EXECUTE
MODE SELECTOR
EXECUTEDURAT ION
H
l
U
J
iii
m
m_
w
w
-z :
8-4
FIGURE 8-2. SYNCHRONOUS CONTROLLER EXECUTE CONTROL UNIT
il

i . t, i
Hughes Aircra/t Company
The desired number of antenna position in-
crements is selectable by means of the decimal
digiswitch. The method of initiating the execute
is similar to that of the normal control system
and real time jet control electronics backup
mode. The execute duration is automatically
generated in this mode, consisting of a 128-
cycle pulse t,_,in with a 50.percent duty cycle.
• Eclipse Mode. Pseudo q, pulses are trans-
mitted for eclipse operation of the spacecraft
phase d array antenna. Prior to initiating eclipsemode operation, pseudo qJ pulses are transmitted
to permit phasing. When the transponded execute
pulse (pseudo q,) period and phase are identical
to that of the telemetered I/, pulse, the operator
can initiate eclipse mode operation.
Depressing the "execute" swiich permits the
command, "eclipse mode operation on" to be
transmitted following termination of the first
pseudo _ pulse. The next pseudo 4' pulse executes
the command in the spacecraft command register
permitting eclipse mode operation to commence.
Execute Duration. The "execute duration"
is a calibrated potentiometer for controlling the
duration of the execute pulse. Control is effective
when the following execute modes have been
selected and initiated:
1) Execute/clear
2) Execute/hold
The execute duration is variable from 20 to
200 milliseconds with a detent for a 50-milli-
second duration.
Load Execute Counter. Depressing this
momentary action switch permits the number
selected on the digiswitch to be loaded into the
BCD execute counter. This switch is effective only
for the normal control system, real time backup,
and antenna position modes.
Spin Period/Pulses. This alternate action
switch is only effective when the real time jet
control electronics backup mode has been se-
lected. Selection of spin periods permits a con-
tinuous execute signal to be generated for a
specified number of spacecraft revolutions. Selec-
tion of pulses permits an execute pulse to be gen-
erated at a given phase angle with respect to the
occurrence of the _ pulse in the spacecraft. The
desired number of execute pulses or continuous
spin periods is preselected by the setting of the
decimal thumbwheel digiswitch.
Decimal ThumbwheeI Digiswitch. This
switch permits the selection of 1 to 511 execute
pulses when either the normal control system,
real time jet control electronics backup, or an-
tenna position mode has been selected. The
option is also available, when in the real time
jet control electronics backup mode, for selecting
a continuous execute for 1 to 511 spacecraft spin
periods.
Manual�Start on GMT. This switch permits
any execute to be initiated manually or at a
specified Greenwich Meridian time when either
the normal control system, real time, jet control
electronics backup, or antenna position mode has
been selected. This mode operates in conjunctionwith an external GMT clock.
Execute Stop. This alternate action switch
is effective only when either the normal control
system, real time backup, or antenna position
has been selected. Depressing the "execute stop"
switch permits countdown of the execute counter
to be inhibited. The BCD "pulses to go" readout
displays the remaining count in the execute
counter. If either the normal control system or
real time backup mode has been selected, jet
pulse counters 1 and 2 will display the number
of transponded executes from the spacecraft jet
system. Depressing the "execute stop" switch a
8-5

second time permits countdown of execute pulsesto resume.
Execute. Depending on the execute mode,
this switch initiates various types of executes.
The types of execute signal for the associatedexecute modes are as follows:
1) Single pulse, 20 to 200 milliseconds dura-
tion, for either execute/clear or execute/
hold execute modes.
2) Continuous execute signal when in the con-
tinuous execute mode and the execute
switch is held depressed.
3) Continuous execute signal for a specified
number of spacecraft revolutions when in
the real time jet control electronics backup
mode and the "spin periods/pulses" switch
is on "spin periods."
4) Multiple pulsed modes (normal control
system, real time jet electronics backup
mode, and position antenna).
Binary Coded Decimal Displays.
• Pulses To Go. The pulses to go readout
displays the number of execute pulses/spin
periods remaining to be executed in the followingmodes:
1) Normal control system and antenna posi-
tion modes (pulsed modes)
2) Real time jet control electronics backup
mode (spin periods/pulses)
• Jet Pulse Control 1 and 2. The jet pulse
control readouts disl)lay the number of trans-
ponded executes from the spacecraft jet system
when either the normal control system or real
time jet control electronics backup mode hasbeen selected.
8-6
8. Ground Support Equipment
• q,-t/,2. This readout displays thet/,-q, 2 angle
in degrees as decoded from the telemetry.
• Spacecraft Antenna Position. This read-
out displays the telemetered value of the space-
craft antenna beam position in degrees. The
display is updated during each commutation
cycle (approximately 2.5 seconds) of the telem-
etry encoder.
• Ground Reference Antenna Position. This
readout will display the ground computed an-
tenna position. The display will be manually
updated when antenna position increments are
transmitted to the spacecraft upon executing "ac-
cept antenna position" command. A correction
factor is automatically added to the existing
count approximately every 2.81 minutes.
Phase Selector Panel. The 6 phase selector
panel controls and displays provide the following
major functions:
1) Selection of a trigger pulse at 1-degree
increments with respect to the telemetered
pulse
2) Eclipse mode oscillator controls for pro-
viding pseudo q, pulses for eclipse opera-
tion of the spacecraft phased-array beam
The _/, phase control can be used to generate
an execute pulse in 1-degree increments relative
to _b for operation of control system in the back-
up mode. The desired 6 pulse is selected on the
set of three switches, indicated as "Psi Phase"
in Figure 8-2.
q, Tracker Panel Description. Figure 8-3 is a
preliminary drawing of the qJ tracker front panel.
Figure 8-1 (top left) is a diagram of the unit.
The tracker panel controls and displays provide
the following major functions:
1) Control for initial setup and operation of
the q, and t/,_ frequency lock loops

I }
! !
! 3
l.J
k:i
I3
|J
lid
U
Hughes Aircra/t Company
2) Displays for indicating the locked/un-
locked conditions of these frequency lock
loops
Frequency Lock Loop Controls and Dis-
plays. There is an identical set of controls and
displays associated with each of the frequency
lock loops. Since the function of the controls and
displays is the same for each frequency lock loop,
only one set is described.
• Input Amplifier Balance. The input
amplifier balance potentiometer permits adjust-
ment of the dc output level from the input ampli-fier.
• Voltage-Controlled Oscillator. The volt-
age-controlled oscillator helipot provides the con-
trol for locking the frequency lock loop to the
incoming frequency rate of the _ or _b2 pulses.
Varying the helipot permits control of the rate
and direction of precession of the input pulse
(modified _, or q,,_) relative to the gate pulses.
The loop is locked when the input pulse occurs
within the gating interval and remains there.
• Frequency Range Switch. The frequency
range toggle switch permits the selection of
course frequency ranges, high or low, from thevohage-controlled oscillator.
• Frequency Lock Loop Displays. Each
frequency lock loop employs two types of dis-
plays for indicating status of the frequency lock
loops. The indicator displays the status of the
reference frequency lock loop as "locked" or
"unlocked." The meters associated with each of
the frequency lock loops provide a visual indica-
tion of the stability of the locked loop. A stable
locked loop is indicated by pulsations close to
full scale deflection, a loop that is "pulling" or
near breaking lock is indicated by deflections on
the lower portion of the scale.
• Frequency Lock Loop Controls. The
potentiometers and toggle switches for prelim-
inary adjustment of the frequency lock loops are
located under a panel flap. Assuming the pre-
liminary adjustment procedure has been com-
pleted, the only precaution during operation is
to leave the "gate" switch ON and the integratorswitches at OPERATE.
Operation of Eclipse Mode Circuitry. The
eclipse mode circuits in the synchronous control-
ler are illustrated in Figure 8-4. A four-step
sequence, controlled by a four-position three-
pole selector switch (S1) prepares the system
for eclipse mode operation:
F__@_E-_s3
_P CONTR{I_
KaLAt_TE _al_ _V,171E
@ @
IMa_al,_EP_L t,l,_E
RAt,E_
LOW
©#vco
TRACKER
] I 2 CONTROb
IN'qEI_TEt_ _RBETIN_IJT
N_FT
I -- ml_ECPA"O_ --2
FIGURE 8-3. # TRACKER FRONT PANEL
8-7

V
8. Ground Support Equipment i
'_ IVAR,ASLE|(_ _ ONE-SHOT
_-!. lO'-50"r'lI
33 STAGE COUNTER
SIC_._ COUNT I T .... .-
I ,GATE I I ___OSCILLATOR
IAND SCHMI'TTL OUTPUT __1 / L' °1_ °1__
,., )RESETGATE -4.5v
RESET DPULSE
STAGE COUNTER....
FIGURE 8-4. ECLIPSE MODE CIRCUITS
PSEUDO
8-8
1) Reset: $1A---4.5 voltsS1B- closed
SIC- open
--4.5 volts applied through SIA resets all
counter flip-flops.
2) @period measurement: S1A- openS1B- closed
SIC- open
Pushbutton $2 is actuated and sets flip-
ftop-A. The next @(0) pulse from the _,
tracker sets flip-flop-B, while it and suc-
ceeding q,(0) pulses are counted in tile
lO-stage counter. With flip-flop-B set, the
count gate passes the 5-mc clock, which is
counted in the 33-stage counter.
Following the 1024th _,(0) pulse, an
output of the 10-stage counter resets flip-
flop-A, and the next (1025th) @(0) pulse
resets flip.ftop-B. The count gate has then
passed the 5-mc clock for 1024 q, periods,
and the 33-stage counter holds a count ofthe number of 5-mc clocks in this interval.
Its 23 most significant stages (which are
equipped with binary readout lamps)
therefore hold a count of the number of
5-mc clocks in one q, period. Using the
binary toggle switches provided, the same
count is selected from the 33-stage coun-
ter's 23 least significant stages to drive the
reset gate, so the reset one-shot will be
triggered each time that count is reached.

Hughes Aircra/t Company
[ :
k_
i '
3) Pseudo _bpulse phasing: S1A- reset pulse
S1B - open
SIC- closed
In its stable state, the variable one-shot
enables the count gate to pass the 5-mc
clock, which in turn drives the 33-stage
counter. As a result of the previous step,
the reset one-shot is triggered each time the
count reaches the number of 5-mc clocks
in one 4' period, and since the reset pulse it
generates resets the counter before the next
clock, the cmmtcr cycle time is exactly one
_/,period. The reset gate which triggers the
reset one-shot also triggers the pseudo
one-shot, so that a pseudo 6 pulse is also
generated each _bperiod.
The pseudo ,/, pulse causes an execute
tone to be transponded via the telemetry
link; this transponded execute tone is dis-
played on a 'scope together with the 4' out-
put of the telemetry receiver. Phasing the
pseudo 4' pulse consists of making the dis-
played pulse trains time-coincident, which
means in effect that a pseudo q, pulse ar-
rives at the spacecraft just as a sun sensor
pulse is generated. Phasing is accom-
plished by repeated actuations of pushbut-
ton $3 which trigger the variable one-shot.
The resuhing pulses, of 0.1 to 50 milli-
seconds duration depending on the setting
of tile variable timing resistance ($4),
disable the count gate so that no clocks
are passed in that interval. Succeeding
pseudo _ pulses are thereby delayed by
the sum of these pulse lengths. In practice,
when the transponded pseudo _b and re-
ceived _ pulse trains are initially far out
of phase, a few actuations of $3 with $4
set to 50 milliseconds will bring them
close; then the setting of $4 will be gradu-
ally reduced as further actuations of $3
are used to "zero in." There should be no
problem in achieving coincidence within
-+0.1 millisecond, which at the greatest
spin rate equals -+0.09 degree.
4) Eclipse mode operate: SIA - reset pulse
S1B - open
S1C- open
Upon completion of the foregoing steps, the
eclipse mode circuitry will be producing cor-
rectly timed and phased pseudo _, pulses, and the
eclipse mode operation ON command may be
transmitted and executed. The spacecraft will
then accept the pseudo q, pulse train as its space
reference for phased-array beam positioning.
This fourth position of S1 is provided so that the
6 period measuring circuits and pseudo 1/, phas-
ing circuits are disconnected during the eclipse,and inadvertent actuation of $2 or $3 will cause
no harm,
Synchronous Controller Circuits. Several cir-
cuits will be required to implement the synchron-
ous controller functions that are not available on
VATE circuit cards. Most occur in the digital
frequency lock loops and in the eclipse mode
portion of the unit. Some of the eclipse mode
circuits have been designed and breadboarded
and are presently being tested, including:
l) 5 mc crystal controlled oscillator
2) Counter flip-flop capable of 5 me operationwith a fan-in and fan-out of 23
3) 75 nanosecond one-shot with sufficient
drive to base-reset 23 counter stages
These circuits are used in the counter loop that
synthesizes a pseudo _b pulse train for eclipse
mode operation.
8-9
L

8. Ground Support Equipment
EXECUTE FROMSYNCHRONOUSCONTROLLER
FROM 12 BITADDRESS/COMMANDREGISTER
(Col - Cl21
CLEAR REGISTERSFROM HACGENERATOR
TELEMETEREDADDRESS/COMMANDFROM TELEMETRYPROCESSOR
TIMING SIGNALSFROM TELEMETRYPROCESSOR
._ TRANSMITTED
ADDRESS/COMMANDREGISTER
(TQI-TI2)
v
COMMAND VERI FlED •
I LOGIC
_; ;-I(COMMAND LOGIC' ;: ' - ='
I REGISTER I
"-_I {v°_-vm) I
I ADDRESS/ I
J COMMAND IA_" _ VERIFIED AND r
|ERRORD SPLAYSI
VERIFY
REGISTER
_ INPUT GATING
0UAORANT TENABLE BITS
I"_ VERIFY/ERRORLOGIC
__.1 oG,cANDl I_ ..I QUADRANT I I
-I ENABLE I I
I (DISPLAY II (DISPLAY I
ILIGHTDRIVERS)}I HTDRIV RS)I
OCTAL DISPLAY I OCTAL DISPLAY
I
VERIFIEDCOMMAND OR TRANSMITTEDIADDRESS ADDRESS
I I
__J
T
COMMANDDISPLAY
' I'
I LOGIC
(DISPLAY
LIGHT DRIVERS
OCTAL DISPLAY
TRANSMITTED
COMMAND
LOGIC I
(INPUT GATING-I
STATUS DISPLAY I
FLIP- FLOPS) I
XSRDO
I SETUPI STATUS
SETUP _AY
SWITCHES
CLEAR STATUS DISPLAY
"-'b
,F--
i LOGIC
(COMMAND
DISPLAY LIGHT
DRIVERS)
ISELF TEST
SELECTOR
FIGURE 8-5. SYNCHRONOUS CONTROLLER AUXILIARY
STATUS DISPLAY(FLIP-FLOPS AND
STATUS INDICATORS)
ISPACECRAFT
STATUS
ITO RECORDING,
_ TIMERS, ANDIMPULSECOUNTERS
SYNCHRONOUS CONTROLLER AUXILIARY
The synchronous controller auxiliary (Figure
8-5) is used in conjunction with an OGO com-
mand generator to operate the command subsys-
tem of an Advanced Syneom spacecraft. Figure
8-6 illustrates the front panel of this unit. The
function of the synchronous controller auxiliary
is to display:
1) Command loaded into the command gen-
erator (title)
2) Transmitted address and command (modi-
fied octal)
3) Verified address or command (modified
octal)
4) Address verification
8.10

I
r iz
U
t
kJ
i
U
L
U
Hughes A ircra/t Company
5) Command verification
6) Quadrant enabled
7) Spacecraft status
Displays
• Selected Command. This display showsthe title of the command loaded into the com-
mand generator. The titles will normally appear
white against a black" background, except in the
case of the irreversible commands when the titles
will appear red against a black background.
• Transmitted Address and Command. This
display shows the modified octal representationof the address and command entered into the
command generator.
• Verified Address or Command. This dis-
play will show the contents of the addressed
quadrant's command register in modified octal
during normal operation. It also has the capa-
bility of displaying the contents of any one of the
other three spacecraft command registers when
manually selected with the corresponding quad-rant enabled switch.
• Address Verification. This display willshow "verified" or "error" when the addressed
spacecraft quadrant corresponds or does not cor-
respond to the telemetered enabled quadrant.
This display will function only between trans-
mission of the command and transmission of the
execute.
• Command Verification. This display will
show if the telemetered contents of the spacecraft
command register correspond to the command
transmitted to the spacecraft. If they correspond,
"verified" will light; if not, "error" will light.
This display will function only between trans-
mission of the command and transmission of the
execute tone.
• Quadrant Enabled. This display will
show which spacecraft quadrant(s) is (are) en-
abled. It consists of four backlighted micro-
switches and will perform a secondary functionas described below under Controls.
• Spacecraft Status. This display shows
the current status of tt_e following subsystems on
board the spacecraft:
1) Telemetry on (quadrants 1, 2, 3, 4)
2) Traveling-wave tube 1 filament on (quad-
rants 1, 2, 3, 4)
3) Traveling-wave tube 2 filament on (quad-
rants 1, 2, 3, 4)
4) Traveling-wave tube high voltage on (quad-
rants 1, 2, 3, 4)
5) Multiple access mode on (quadrants 1, 2,
3, 4)
6) Frequency translation mode on (quad-
rants ], 2, 3, 4)
PACE on (quadrants 1, 2, 3, 4)7)
8) Phase shifter driver on
Controls
• Quadrant Enabled. These backlighted
switches provide a secondary function, by allow-
ing the operator to display the contents of any
spacecraft command register on the "verified
address/command" display.
• Clear Status. This switch allows the status
display to be compIetely cleared.
• Status Preset. These switches, one rotary
and four pushbuttons, are used to set up initial
status display conditions. The status item is first
selected on the rotary switch, then the desired
quadrants are lit by pressing the proper quad-rant buttons.
8-11

I
8. Ground Support Equipment
C
t i TRAN_ITTED
[TZ I)(I 3 I)ADDRESS COMMAND
QUAO_qANT _NAE_-EO VERIFIED COMMAND
ADE_ES£ COMMANO
ZD
,%_ .4,
,2- _ -HI
r-;-, ..... n S'&FE I_'
LHUGHESj - /...... -S_ELF -"
T_T
SYNCHROI_S CONTROLLER AUXILLIARY
]
TELEMETRYON
QUADRANT
I
SELECTEDCO.AND
r_ .SPACECPAFT STATUS-_.._-,_
I 2 3 4
T'B_EMETRY (_ (_ @ (_
TWTIr_LA_._@© @ @
TWT2rlLAMENT@@ @ @
TWTH_Va_T_@ @ @ @
_U__PLEEESS_E@ @ @ @
r_EQTRA.SLAT,ON_:_@@ @ @
pAC--_o.@@ @ @
POWEI_ AMPLIFIER REGULATOr@
STA]'US P R'EF_4T _
@ @ 2s",_'-,AI 2 %,[ "_,-
SA_.._'L.._/" --83 4
QUAD DISPLAY CONTP_I_
C
C
FIGURE 8-6. SYNCHRONOUS
• Self-Test. This switch will allow a com-
plete test of the projection displays and all
nonprojection-type indicators. As the switch is
rotated through the first 12 positions, the pro-
jection displays are sequentially lit. In the last
position, power is applied to all nonprojectionindicators.
TRANSPONDER RF TEST SET
The breadboard transponder RF test set is in
the final stages of assembly. A prereleased set
of schematics and an advanced bill of materials
have been prepared.
The breadboard configuration of this unit
consists of three panels, each 7 inches high,
plus four Huggins traveling-wave tubes, 5:t,_
inches high. A total of 42 inches of 19-inch rack
space is required for each transponder test set.
Four sets will be required to test one complete
four-quadrant spacecraft. Maximum utilization
CONTROLLER AUXILIARY FRONT PANEL
of existing commercial equipment and previ-
ously designed suhassemblies resulted in a
modular construction that is almost identical to
the block diagram (Figure 8-7).
Receivers. Two basic drawings are required to
combine all the schematic drawings in the testset:
1) Interconnections for receivers and multiple
access transmitters (Figure 8-8)
2) Schematic--frequency translation trans-
mitter (Figure 8-9)
These drawings show the interconnections be-
tween the modules and list the drawing, or part
numbers, for each module. A common receiver
is used for both modes and is shown on the draw-
ing with the multiple access transmitter.
The receiver input signal is connected to J1
and passes through a series of variable attenua-
tors, filters, traveling-wave tube amplifiers, iso-
8-12
:
b =
z
w
W
w
I
I
= =
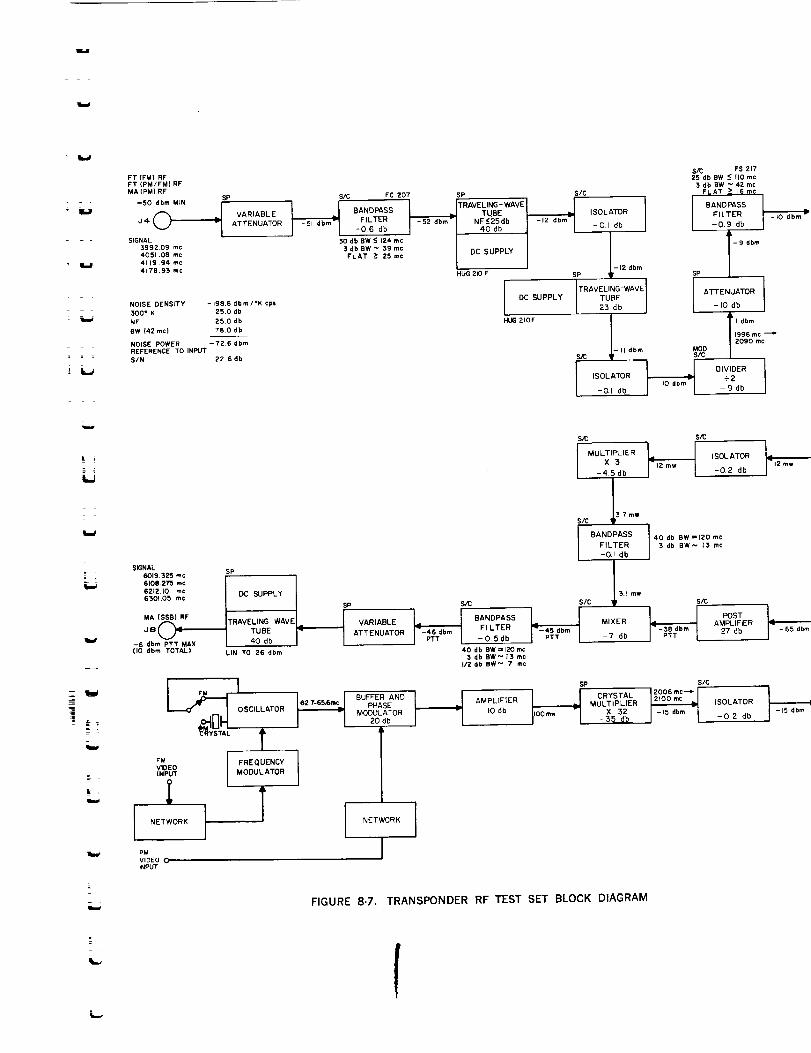
w
r,la
i,,,w
i = i
k _
=
FT (FM) RFFT (PM/FM} RFMA {PMI RF
-50 dbm MIN
SIGNAL
3992.09 mc403.1.06 mc
4119.94 mc
4178,93 mc
SP S/C FC 207
ATTENUATOR FILTER-06 db
30 db BW <- 124 mc
3 db BW _ 59 mcFLAT >- 25 mc
NOISE DENSITY - 198.6 db m/'K cps
300" K 23..0 db
NF 250 db
BW (42mc) 76.0 db
NOISE POWER -72.6 dbmREFERENCE TO INPUT
S/N 22.6 db
SP
TRAVELING - WAVE
TUBE
NF<-25db
40 db
DC SUPPLY
HUG 210 F
IHUG 21OF
DC SUPPLY
ISOLATOR I-01 db
/SP _-12 dbm
TRAVELING-WAVE
TUBE
23 db
I--II dbm MOD
_ SIC
ISOLATOR _H_-0, I db
SIGNAL SP6019.325 mC r I
6212.10 mc / DC SUPPLY /
6501.03. m¢SP
,, ITRAVEL'"GWAVEI I VAR,ABLEJ"L _ TUBE _ ATTENUATOR
-6 dbm_T MAX I 40 db I I
(10 dbm TOTAL) L}N TO 26 dbm
S..'C SiC
_ BANDPASS _FILTER
-O.Sdb
40 db BW =120 mc
3 db BW _ 13 mcI/2 db BW _ 7 mc
S."C FS 21725 db BW --'-<IlO mc
3 db BW _ 42 mc
Ft, AT -> 16 mc
BANDPASSFILTER
-0,9 db
SP T-9 dbm
[ II I dbm
1996 mc2090 m¢
DIVIDER_9÷2db I
s£ S.¢
I MULTIPLIER "t_ _X :5
-4.5 db
SIC 137 mw
BANDPASS I 40 db BW = t20 mC
I
FILTER J 3, db BW_ 13 mc-0.1 db
_L I BUFFER AND
PHASEMODULATOR
20 db
VIDEOINPUT
NETWORK r
OSCILLATOR
tFREQUENCY IMODULATOR
PM
VIDEO 0INPUT
NETWORK
AMPLIFIERI0 db
ISOLATOR-0.2 db
5.1 mw S/C
MIXER AMPLIFIER
-7 db 27 db
SP S/C
CRYSTAL 2006 m¢ --'_"MULTIPLiERx32 _ ISOLATOR-35 db -0.2 db
FIGURE 8-7. TRANSPONDER RF TEST SET BLOCK DIAGRAM
E
=

mm
W
il
bJ
W
m
j _
w
Im
W
i
l
LL__
U

_SIGNAL
IVGTH
62.4
,_ LOCK
ERROR SP S_
SIC C
_ - FS 218 " LAG. _= eW _< I,]2 m¢ AD
65 3 mc I
s/c _,
HUG 210

_m
l,
I
t
E
_L
r_
lr

AMPLIFIER
13rdb
J
FRIEQUENCY
ERROR
$P I OC
DISCRIMINATOR
I PT t P=_/V_} WDEO
NE_rWORK _------.-*_ .) Je
VIOEO 8W>-.5 mc
LOCK
_RF 3 db 8W MA (PM) VIOEO
)C _ 20 mc _IDEO FLAT 0.5 mc _ 5,3 me
_00_'C
_'TAL VOLTAGE I
_ONTROLLE{) JOSCILLATOR I
AM)=LIFI ,ER
31.)8_2 ,_¢
3L6491 mc
52.187p _c3,2,6479 mc
VIDEOOUTPUT
_2
MA (S$9) VIDEO
--.@o-,IDEO FLAT 0,5 m¢"e'5 3 m¢
/O_BANDPASSFILTER
-05db
]9 db BW=I20 mc3_b BW-42 m¢
1/_lb SW~Z_ mc
sP
VARIABLEAT TENUATOR
SfGrqAL5019,$25 me6108.275 m¢
6212,10 m¢
630L 05 me
FT (PM/FM) RF
",' dbm MAX
8-13

=
m
i
L
=

m
11il
mm
W
m
i
m
u
U
_i,er _=s
PZ"
ew_r_ m
Alma
z P3,£ J3'
pl_c
,eo i,_1
_LA_A
AY _
PL_
,,A, 0
m+l c,_ _pT.F_L_ __
IIIMALLlVl;
_" pIA_.r 1.1, I
_'rlm +o+l _
m,
c K,rer_
u
u
+°o ___
*w1'l'_ II
U
W
W
Id
NOTE:
/FIGURE 8-8. TRANSPONDER TEST RECEIVERS AND MULTIPLE ACCESS

w

_)--DAS:_ NUM_,I[R INDICA_'[S OIrFERENT FR[QvI[NCfI_I,
TRANSMITTER
8-1,5

l
k--I
_m
mq
_J
_ z_z

fal_
e i
I J
lil
U
i ,
_IPUTI C2S
, 005
C5
,T,_o LO0_T
,IT.o
_7
' 8_0
V_DEO
t NI_'U'I - _1
y_ _,4,7094 Mr' _"
cg 47 p_" i
5_ W
_2. LI
CB _:51PF
- CIL
L_
n
_fo
_AC PIN < ""
47_It5 <
m
i _ FIGURE 8-9. TRANSPONDER TEST SET FREQUENCY TRANSLATION TRANSMITTER

i
m
S
W
[]

f
V--___--] _
,DO5
C _¢o
F -J-LA - "
t c,4 _? ,o T'°°s
Z"7
1% 0 L_TO_
MEL;k_
P_O
_l_ _Z3 | PZ4
..2"_,., _-----_->_ _" _-_-_I___
311
TgdT-
_,tZ_I HUGG_N.'S '_I0£
N0"I",F...S: Q.JNLE5.50T_tRVVISE S_s.CWW_b')
). ALL RESISTOR$ IN OH_V_5 _14 V_/
?.,.ALL CAPACYTORS I_.I N'_FD.
@
8-17


-,_2
| ',
|F
w
m
7
w
=
2
=
z
Hughes dircra[t Company
lators, and frequency dividers until it arrives at
the 64-mc limiter and discriminator. During this
process, three significant events occur:
1) The signal is amplified. The incoming
signal may be as low as -50 dbm. The
variable attenuators (ATI and AT4), op-
erating in conjunction with the three pre-
adjusted and calibrated traveling-wave
tube amplifiers (TWT 1, 2, and 3) supply
a 4-milliwatt signal to the 64-mc limiter
and discriminator module.
2) The frequency range utilized by the space-
craft under test is selected by the pre-
tuned bandpass filters (FL 1 and FL 2),
which reject all oti_cr frequencies. These
filters are also used in the spacecraft.
3) The incoming signal frequency is reduced
from 4 kmc to 64 mc by dividing the
frequency first by 2, in A1, and then by
32, in A2. Tile exact frequency is obtained
by dividing the exact incoming carrier
frequency by 64. The 64-mc ]imiter and
discriminator are adjusted to the specific
frequency for tile transponder under test.
Tile two dividers, A1 and A2, are tile same as
the multipliers used in the spacecraft transpond-
ers. A multiplier may be used as a divider by
reversing the input and output connections, as
discussed in the August 1963 Advanced Syncom
Monthly Progress Report, Section 9, New Tech-
nology.
The RF signal, thus selected, amplified, and
frequency divided down to 64 me, is connected
into the 64-mc limiter and discriminator module.
This module performs four functions.
The first function is fulfilled by a two-stage
amplifier whose outputs are used to drive the
front panel signal strength meter (M-l) and to
drive the limiter. The limiter action is obtained
from four diodes (CR2, CR3, CR4, and CR5).
The "limited" signal is then amplified again by
a two-stage amplifier and split into two parts.
One part is passed through an emitter follower,
Qs, to the phase detector amplifier. The second
signal drives the discriminator. The discrim-
inator output passes through an emitter follower
to the video output jack, J32. After passing
through an impedance matching network, Z1,
this signal is the frequency translation video out-
put (for frequency-modulated signals) at JS.
The driver amplifier input is passed through
an emitter follower and two stages of amplifica-
/ion, and the output is again split into two parts.
Both parts are passed through emitter followers
and are connected to the two phase detectors at
P42 and P45. As a secondary function, a sample
of the two emitter followers signal is taken to
drive the front signal level meter.
The output of the Q phase detector is displayed
on panel meter M-3 and indicates the phase error
between the received signal and the reference
signal derived from the crystal voltage-controlled
oscillator and double amplifier. The same cir-
cuitry is utilized in the I phase detector and isola-
tion amplifier to produce an AFC vohage which
controls the crystal voltage-controlled oscillator
frequency.
The instantaneous deviation in the 64-mc
signal (the phase modulation of the signal), is
detected by the same circuit. The ae component
of the detected output is the video signal. The
video is split into two parts and amplified by the
isolation amplifier. One of the isolation ampli-
fier's output is connected to the phase-modulated
muhilde access video output jack, J9. The other
output -- the phase modulation frequency trans-
lation video-is connected through a compen-sation network to J]0.
8-19

8. Ground Support Equipment
A vital part of the phase detector is the fre-
quency servo loop formed by parts of the I phase
detector and the crystal voltage-controlled am-
plifier. The AFC voltage developed in the I phase
detector for controlling the frequency of the
crystal vohage-controlled oscillator is connected
into the oscillator at J54 and, by utilizing a vari-
cap (Cll) tunes the output circuit of the oscilla-
tor to the proper frequency. The frequency devi-
ation of the oscillator is limited to approximately
±1 kc. At this frequency (32 me), 1 kc corre-
sponds to a control of approximately 128 kc drift
in the received signal carrier frequency. A man-
ual frequency control is available on tile front
panel which allows the oscillator to be varied
over a greater frequency range.
Tests have been performed on the phase de-
tector to determine its operating characteristics.
It was experimentally determined that a signal
with a modulation index of 14_,._degrees (approx-
imately the modulation index per test tone) will
produce an output voltage of 0.35 volt (peak-to-
peak) ±1_._ db throughout the base range of
500 kc to 6 mc (at J9) in the multiple access
mode. Using the modulation index expected in
the frequency translation mode, the video output
(at J10) was measured at 4.8 volts (peak-to-
peak) ±11'_ db throughout the range from 100
cycles to 6 mc and was down only 3 db at 60
cycles. (It is a requirement to receive the 60-
cycle sync signal for TV reception.)
Two outputs are obtained from the 32-mc
oscillator. The first is amplified and connected
to the balanced modulator in the muhiple access
transmitter. The second is doubled in frequency,
split into two parts, and amplified. One of the
two outputs is connected (through J57) to the
frequency multiplier chain for the muhiple ac-
cess transmitter and the other through J58 to the
I phase detector as the reference signal.
When the receiver is operating normally and
is phase-locked to the incoming RF signal, the
front panel meters will read as follows:
ApproximateReading,
microamperes
Signal strength meter 200
Frequency error meter 0
Phase error meter 0
Phase lock meter 25
Multiple Access Transmitter. The muhiple ac-
cess transmitter is phase-locked to the received
carrier. The input to the frequency muhiplier,
X32 (at J59), is multiplied by 32 and then by
3 to produce a carrier frequency of 6400 mc.
Operation of this series of multipliers, bandpass
filters, and isolators is similar to that of the
receiver RF signal chain, but the frequency is
multiplied up instead of divided down. The result
is a 6400-mc carrier frequency input to the mixer
at J71.
The 32-mc carrier input to the balanced mod-
ulator and preamplifier, at J72, is modulated by
the video input at J73. Tile output from the
modulator is a double sideband surpressed car-
rier signal which is amplified and connected to
the high pass filter at J76.
The high pass filter consists of two stages of
tuned filters, separated by a tee pad. Both stages
are identical and are tuned to eliminate the lower
sideband frequency. The tee pad is used for
impedance matching. The output from the filter
is a single-sideband signal.
The single-sideband signal is amplified in the
postamplifier. The input is connected at a point
following C14, and the balance of the amplifier
is identical. The output from the postamplifier isconnected to the mixer at J81.
8-20

i_t Jv
k
L
t_'
L_
i
|
Hughes .4 ircra]t Company
The mixer and bandpass filter are spacecraft
parts. The mixer output is filtered to remove
spurious frequencies. The output of the filter is
a single sideband on a carrier of the proper
frequency for transmission to the spacecraft. The
signal is then passed through a variable atten-
uator (front panel control) to a traveling-wave
tube for final amplification and transmission to
the spacecraft.
Frequency Translation Transmitter. The fre-
quency translation transmitter receives the video
input at J1. A front panel switch is used to select
either phase or frequency modulation. In the
frequency modulation position, the frequency of
the oscillator is controlled by the feedback from
the RLC network, including a vari-cap, C10. To
modulate the carrier, the video input is applied
across C10 and Cll to ground. This video signal
causes a change in the capacitive reactance of
C10, and therefore a change in the oscillator
frequency. The result is an FM carrier output
from Q1.
In the phase modulation mode, the same prin-
ciple is utilized, but in a slightly different man-
ner. The oscillator is crystal-controlled in this
mode. The video is applied to the junction of two
vari-caps, C17 and C18, in the phase modulator
section of the module, resulting in phase modula-
tion of the carrier frequency.
The modulated carrier is then amplified and
connected to the frequency multiplier, X32. The
balance of the transmitter is a series consisting
of isolators, filters, attenuator, frequency multi-
plier, and traveling-wave tube amplifier which
operates in the same manner as the other trans-
mitter series. The output power level is con-
trolled by a variable attenuator.
Power Supply. Two of the power supplies are
regulated 24-voh supplies, one for +24 volts
dc and the other for --24 volts dc. An additional
regulator reduces the voltage to 15 volts. The
third power supply is a +250 voh dc unregu-
lated supply that also supplies 6.3 volts ac forvacuum tube filaments.
MAJOR AND MINOR CONTROL ITEM
TEST POSITIONS
This discussion covers the various test posi-
tions required to implement the major and minor
control item "in-process" test specification.
Major Control Items
Communication Transponder. The transpon-der test sets described earlier in this section will
be used to test the complete transponder. The
commercial equipment listed in Table 8-1 will be
used in conjunction with the transponder test set.
Communication Transmitter. The communi-
cation transmitter test position consists of a single
bay of test equipment and will be used to per-
form tests in accordance with the test plan for
the transmitter. The equipment that will be in-
cluded in this position is shown in Table 8-2.
Minor Control Items
Telemetry Transmitter. The telemetry trans-
mitter test position will consist of two bays of
test equipment and will be used to perform tests
on the 475220 telemetry transmitter in accord-
ance with in-process test specification 475220-
600. The equipment included in the test position
is listed in Table 8-3.
Command Receiver Test Position. The com-
mand receiver test position will consist of three
bays of test equipment and will be used to per-form tests on the 475200 command receiver in
accordance with in-process test specification
475210-600. The equipment to be included islisted in Table 8-4.
8-21
8. Ground Support Equipment
Regulator Test Position. The regulator test
position will consist of one bay of test equipment.
It will be used to perform tests on the followingminor control items in accordance with the ref-
erenced in-process test specifications:
TestSpecification
475101 Regulator, transponder,
multiple access mode 475101-600
475102 Regulator, transponder,
frequency translation mode 475102-600
475160 Regulator, phased array
(PACE) 475160-600
475163 Regulator, phased array
(power amplifier) 475163-600
475174 Power supply, traveling-wave tube 475174-600
475212 Regulator, command 475212-600
475222 Regulator, telemetry 475222-600
The equipment to be included is listed in Table8-5.
Master Oscillator Test Position. The mastez
oscillator test position consists of _'o bays of test
equipment and will be used to perform tests on
the following minor control items in accordance
with the referenced in-process test specifications:
475113 Master oscillator, 16 mc,
frequency translation mode
475122 Master oscillator, 32 mc,
multiple access mode
475123 Amplifier--master oscil-
lator, 32 mc, multiple accessmode
Test
Specification
475113-600
475122-600
475123-600
TABLE 8-1. TRANSPONDER COMMERCIALTEST EQUIPMENT
Quan-tity Description
Noisegenerator-- ALL07049,07050, 07111
Attenuator-- Kay Electric4320
Signal generator-- HP 618B
Spectrumanalyzer-- SPA4A
Five-baytest equipmentcabinet
Traveling-wavetube and power supply--Huggins 304
Traveling-wavetube and power supply--Huggins 210B
Traveling-wavetube andpower supply-- Huggins309B
Traveling-wavetube and power supply-- Hugglns210A
Frequencymeter-- HP G-532A
Scope-- Tektronix 555
Scope, plug-in- Tektronix H
Scope,plug-in- Tektronix L
SH_glnOal_sampler--Microlab HYION, HYIOB, HZION,
Test oscillator- HP 65OAR
ACvoltmeter-- Ballantine314-52
High frequencymixer-- HP 934A
Counter-- HP 5243L (rack mount)
Frequencyconverter-- HP 5251A
Frequencyconverter-- HP 5253A
Variableattenuator-- ARRA5684-50
Variable attenuator--ARRA 5-6684-50
Noise figure meter-- HP 340B
Noisereceiver-- Marconi TF 1225A
Noisegenerator-- MarconiTF 1226B
Bandstop filter unit-- MarconiTM 5774
Transfer oscillator-- HP 540B
Synchronizer-- BY15796
Regulatedpower supply-- ±24 volts
ClassC
Miscellaneousrack connectors
Runningtime meters and circuit breakers
Rackwiring and miscellaneouscables
The equipment to be included in the test posi-tion is listed in Table 8-6.
i
=_
U
il
8.22 m
m

\ ..v
Hughes d ircra]t Company
TABLE 8-2. COMMUNICATION TRANSMITTERTEST EQUIPMENT
Quan-tity Description
Power supply (traveling-wave tube)--Bertel Product
Spectrumanalyzer-- PanoramicSPA-4A
Calorimetric wattmeter-- HP 834
Power supplies-- H Lab 726AR
Single bay test equipmentcabinet
Class C
Miscellaneoustest rackconnectors
Runningtime meters andcircuit breakers
Rackwiring and miscellaneouscables
TABLE 8-3. TELEMETRY TRANSMITTERTEST EQUIPMENT
Quan-tity Description
Signal generator -- HP 608DR
Scope--Tektronix RM 503
Scope preamplifier -- Tektronix 53/54C
Scope preamplifier--Tektronix type LScope preamplifier--Tektronix type K
Counter-- HP 5245L
Frequency converter-- HP 5253B
Attenuator--Kay Lab No. 30-0
Noise figure meter-- HP H-S1-342ARVHF noise source-- HP 343A
Audio oscillator-- HP 200 CDR
Three baytest equipmentrack
Power supply-- H Lab 865B
Balancedmodulator-- GR 1000-P7
VTVM-- HP 412AR
Power supply--H Lab 7]IARPower meter -- HP 431
Sweep generator-- Telonic HD-5
Detector mount--Telonic
Spectrum analyzer-- PanoramicSPA-4ACoaxial attenuator--Microlab ADION, 10 db
Coaxial attenuator-- GR874G20, 20 db
Standing wave detector-- PRD219
Standing waveindicator-- HP415
ClassC
Hughes-fabricatedtelemetry transmitter
Miscellaneoustest rack connectors
Runningtime meters and circuit breakers
Rack wiring and miscellaneouscables
TABLE 8-4. COMMAND RECEIVERTEST EQUIPMENT
Quan-tity Description
Counter-- HP 5245L
Frequencyconverter -- HP 5253A
Spectrum analyzer-- Panoramic SPA-4A
Power meter-- HP 431B
Thermistor mount-- liP 478A
Attenuator-- Microlab
VTVM-- HP 410CR
Digital voltmeter-- HP 3440 with 3442
Power supply-- H Lab 726AR
Oscillator-- HP 205AGR
Receiver-- ClarkeAI67E
Two bay test position cabinet
Oscilloscope-- HP 130CR
ClassC
Miscellaneoustest rack connectors
Runningtime meters and circuit breakers
Rack wiring and miscellaneouscables
TABLE 8-5. REGULATOR TEST EQUIPMENT
Quan-tity Description
Power supply-- KepcoLabsNo. SC-36-2M
Power resistor decadebox-- Clarostat No. 240C
Decadebox-- Gen. RadioNo. 1432T
Voltmeter-- Triplett No. 327PL
Voltmeter--Weston No. 931
Reference, standarddc -- Polyranger
Sensitive resistorNo. 3-CEW-7A
Differential VTVM-- Fluke No. 801B
Precision voltage divider-- Fluke No. 80A-2
True rms voltmeter-- Fluke No. 910A
Oscilloscope -- Tektronix RM45
Scope preamplifier--Tektronix, type G
Milliammeter--Triplett No. 327PL
Microammeter-- Triplett No. 327PL
Ammeter -- Weston No. 931
Test equipment cabinet
Class C
Miscellaneous test rack connectors
Runningtime meter and circuit breakers
Rack wiring and miscellaneous cables
8-23

TABLE 8-6. MASTER OSCILLATOR TEST EQUIPMENT
Quan-tity Description
Spectrumanalyzer-- PanoramicSPA4ACounter-- HP 524CR
Counter, plug-in -- HP 525APowermeter-- HP 431BThermistor mount-- HP 478AVTVM-- HP 410C
Two baytest equipmentcabinetVOM-- TriplettPower supplies-- H lab No. 6242
ClassCMiscellaneous test rack connectors
Runningtime meters and circuit breakersRack wiring and miscellaneouscables
X2, X3 Multiplier Test Position. The X2,
X3 muhiplier test position will consist of four
bays of test equipment, and will be used to per-
form tests on the following minor control items
in accordance with the referenced in-process test
specifications:Test
Specification
475116 X3 multiplier 475116-600
475117 X2 multiplier 475117-600
The equipment to be included in the test posi-tion is listed in Table 8-7.
X32 Multiplier Test Position. The X32
multiplier test position will consist of one bay
of test equipment and will be used to perform
tests on the following minor control item in
accordance with the referenced in-process test
specification:
Test
Specification
475114 X32 multiplier (fre-
quency translation and mul-
tiple access modes) 475114-600
This position will also be used to perform
tests on the following groups of units:
8-24
8. Ground Support Equipment
Frequency translation local
oscillator group
Multiple access local oscillator
group
Muhiple access transmitter
group
TestSpecification
475025.601
475O25.602
475O25-6O3
The equipment to be included in the test posi-tion is listed in Table 8-8.
TABLE 8-7. X2, X3 MULTIPLIER TEST EQUIPMENT
Quan-tity Description
Spectrum analyzer-- PanoramicsSPA4A (rack mount)
Microwave oscillator--Gen. RadioNo. 1360A(rack mount)
Frequencymeter-- H.P. 536ALine attenuator -- ARRA2-3414-30Slotted line-- HP 605ACoaxtermination- BendixNo, 21-8011-63
Power meter-- HP431B
Power supplies-- H-LABNo. 6204Directionalcoupler-- NAROA3004Onebay test equipmentcabinetThermistor mount-- HP478AIsolator-- 2 kmc and 3706 kmc
Class C
Miscellaneoustest rack connectors
Runningtime meter and circuit breakersRackwiring andmiscellaneouscables
TABLE 8-B. X32 MULTIPLIER TEST EQUIPMENT
Quan-tity Description
One baytest equipmentcabinetSpectrum analyzer PolaradSA84WPower meter-- HP431B
Thermistormount-- HP487A
Power supply-- H LAB6204Attenuator-- MicrolabAC-20N
Directionalcoupler-- Narda 3002-10
Class C
Hughes-fabricatedbias supplyMiscellaneoustest rack connectors
Runningtime meter and circuit breaker
Rackwiring and miscellaneouscables
i
i
i

. • _- 2
v
:s -:
l
L
Hughes Aircraft Company
Intermediate Frequency Test Position. The
intermediate frequency test position consists of
two bays of test equipment and will be used to
perform tests on the following minor control
items in accordance with the referenced in-pro-
cess test specifications:Test
Specification475104 Intermediate amplifier,
64 mc
475109 Limiter, 64 mc
475110 Preamplifier, 64 mc
475111 Postamplifier, 64 mc
475130 Preamplifier, 32 mc
475131 Modulator, phase
32 mc 475131-600
475132 Amplifier, double,
64 mc 475132-600
475141 Filter, amplifier, 32 mc 475141-600
The equipment to be included in the test posi-tion is listed in Table 8-9.
475104-600
475109-600
47511O-600
475111-600
475130-600
TABLE 8-9. INTERMEDIATE FREQUENCY TESTPOSITION
Quan-tity Description
Spectrum analyzer-- PanoramicSPA4-ASignal generator-- HP608CRPower meter-- HP43]BThermistormount-- HP478ARFmillivoltmeter-- HP4IIARVTVM-- HP41OCR
Power supplies-- H LAB 865BKay attenuators-- No.30-0Noise figure meter-- HP342ANoise source-- HP343
Two bay test equipmentcabinetScope-- Tektronix•RM503
CLASS CMiscellaneoustest rack connectors
Runningtime meters and circuit breakersRack wiring and miscellaneouscables
Microwave Test Position A. Microwave test
position A will consist of three bays of test equip-
ment, and will be used to perform tests on the
following minor control items in accordance with
the referenced in-process test specifications:
475100 Mixer, input
475103 Receiver, directional
coupler, 20 db
475112 Mixer, high level
475118 Filter, 6 kmc, frequency
translation and multiple
access modes
475172 Monitor, telemetry
Rantec bandpass filters, 4 kmc
Rantec muhiplexer, receiver
Rantec multiplexer, transmitter
The equipment to be included in the test posi-tion is listed in Table 8-10.
TestSpecification
475100-600
475103-600
475112-600
475118-600
475172-600
FC207-600
FA106-600
FA107-600
Microwave Test Position B. Microwave test
position B will consist of three bays of test equip-
ment, and wiII be used to perform tests on the
following minor control items in accordance with
the referenced in-process test specifications:
Test
Specification
FS222-600Rantec dual filter hybrid, 2 kmc
Rantec bandpass filters, 2 _mc 16mc bandwidth FS217-600
Rantec bandpass filters, 2 kmc6 mc bandwidth FS218-600
The equipment to be included in the test posi-tion is listed in Table 8-11.
8-25
8. Ground Support Equipment
",,j
TABLE 8-i0. MICROWAVE TEST POStTION ATEST EQUIPMENT
Quan-tity Description
Three bay test equipment cabinetSweepgenerator (modified3.7 to 6.7 GC)-Alfred 633AR
Spectrumanalyzer-- PanoramicSPA-IONoise figure meter-- HP H-5]-342ARNoise source(waveguide)-- HP No. J-347APower meter-- HP 431B
Standingwave indicator-- HP 415CRSlotted line, BRM type (3-piece assembly)-MD No. I000 LX
Precision frequency meter-- HP J-532APrecision frequency meter-- HP G-532APrecision attenuator-- HP J-382APrecision attenuator-- HP G-382AVHF noisesource-- HP No. 343A
BRM coax to waveguideadapter-- MD No. 13,000,000BRM coax to waveguideadapter-- MD No. 13,000,003Ferrite circulator-- MD No. 16,100,010 (4.1 gc)Ferrite circulator-- MD No. 16,]00,010 (6.2 gc)Standard termination- MD No. 11,010,010Standard termination(minature)- C.S. No. 20025PStandard termination (miniature) -- C.S.No. 200251
BRM coax phaseshifter (4-6.3 gc)-- MD No. 2200CType N to J band waveguide adapter-- HP J281AType N to Gband waveguide adapter-- HP G281AThermistor mount -- HP 478A
Crystal detector mount -- HP420AType OSM coax to type N adapter (J)--O.S. No. 21020Type OSM coax to type N adapter (P)-- O.S. No. 21040Crystal detector mount- O.S. No. 20080 (4-1I gc)Pair, matched pair crystal detector mount-O.S. No. 20080M
Coax to type N circulator (4.05 gc)-- Melab No. HC405
Coaxto type N circulator (4.25 gc)- Melab No. HC625Precision attenuator set-- Weinschel No. AS-2
Variable coax attenuator (3.9 to 10 gc)--PRDNo. CXl110
Scope--Tektronix RM503 (P-7)X-Y recorder-- Moseley 135AR
Power supplies--14 LAB 865BTraveling-wave table amplifier (3.7 to 6.7 gc) --Alfred No. 5-542Oscillator (50-250 mc) -- G.R.1215B
Power supply-- G.R. 1201B
CLASSC
Miscellaneous test positionconnectors
Runningtime meters andcircuit breakers
Rackwiring and miscellaneous cables
Modularpower supplies
Current meters and test panels
TABLE 8-11. MICROWAVE TEST POSITION B
TEST EQUIPMENT
Quan-tity Description
Three bay test equipmentcabinetBRM type coax coupler,3 db-- MD No. 1200CBRM type coax coupler, 10 db-- MD No. 1200C
BRMtype coax coupler,20 db-- MO No. 1200CBRM type coax coupler,30 db-- MD No. 1200C
BRMtype coax coupler,6 db--MD No. 1200CBRM coax miniature isolator (4.1 gc)-MI) No. 17,000,001BRMcoax miniature isolator (6.2 gc)--MD No. 17,000,001
Sweep generator(1.7 to 3.7 gc) -- Alfred 632AVariable coax attenuator (0-60 db)-- Alfred No. E103
Traveling-wavetube amplifier (1.7 to 3.7 gc)--Alfred 502A
Receiver (30 mc IF with precision attenuation)--LELto LR 1410
Mixer preamplifier assembly(1.7 to 2.4 gc)LEL No. SAC-3-30-08-50
Broadband coax circulator (1.7 to 2.4 gc)--E and M No. LS 110 LYC
Frequencymeter (1-4 gc) -- HP 536APower supplies-- 14LAB 865BDirectional coupler, high directivity (1.9-4.0 gc)--HP 7770
Scope, dc--Tektronix RM 503BRMcoax slotted line- M.D. No. 1000-001Tunable detector mount-- FXRNo. B2OOARF power meter-- HP 431BCoax thermistor mount-- HP 478A
X-Y recorder-- Moseley No. 135 CMR with remoteelectronic pen control and rear input terminalsMatched pair crystal detector mounts- OSM20080Spectrum analyzer-- Panoramic SPA-4Ratio meter- HP416BAttenuator set--Weinschel AS-2
CLASS CMiscellaneous test rack connectors
Runningtime meters and circuit breakersRack wiring and miscellaneous cables
DIGITAL SUBSYSTEM MAJOR AND MINOR
CONTROL ITEM TEST EQUIPMENT
Module and Unit Test Equipment. During
the interim program, two testers were designfid
and fabricated : the PACE module tester and unit
tester. The module tester (Figure 8-10) has beenused to test about half of the welded modules
m
- --_=: 8.26
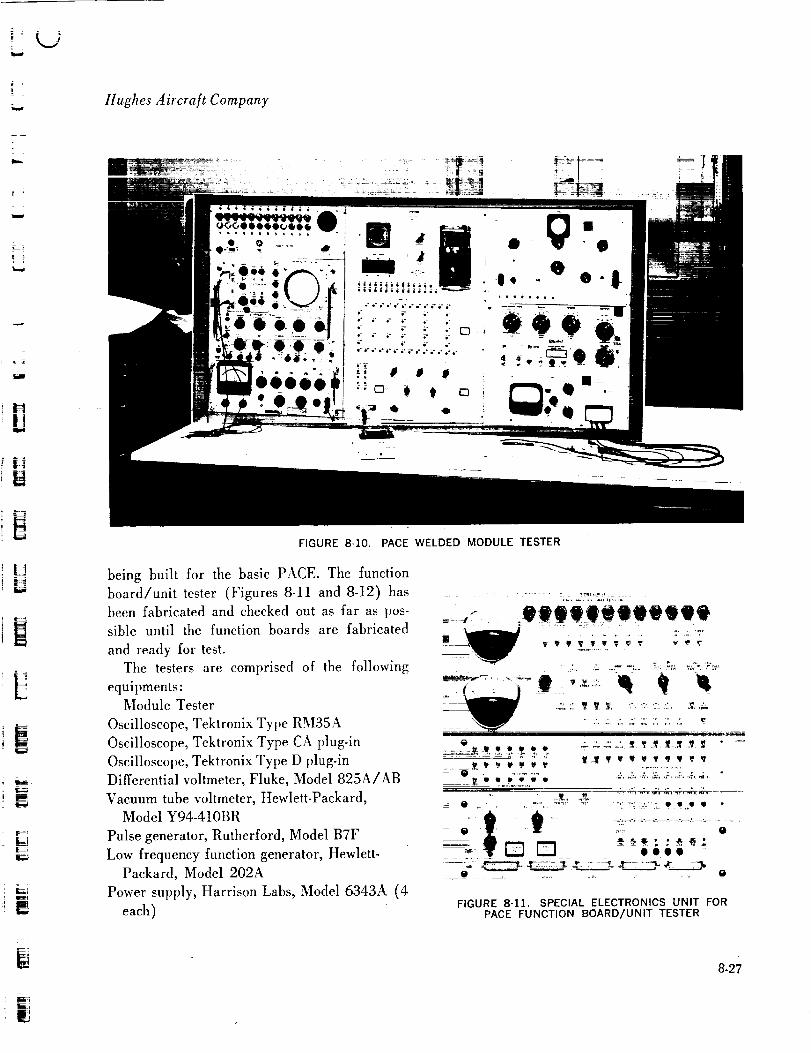
Hughes Aircra[t Company
L X
IM
i t4! =,=
[]
- =E
L_
FIGURE 8-10. PACE WELDED MODULE TESTER
being built for the basic PACE. The function
board/unit tester (Figures 8-11 and 8-12) has ,_.:,::., .......
been fabricated and checked out as far as pos- ._:- I!I!I_II_IIIsible until the function boards are fabricated :. _:r*'_'"
and ready for test. _ _' _ _' _ v _ _ _ _ _
The testers are comprised of the following _:::::: _:;. ::. -?":_- "_, _:.'_':i'.'_o
equipments: _ _
Module Tester
Oscilloscope, Tektronix Type RM35A
Oscilloscope, Tektronix Type CA plug-in
Oscilloscope, Tektronix Type D plug-in
Differential voltmeter, Fluke, Model 825A/AB
Vacuum tube voltmeter, Hewlett-Packard,
Model Y94-410BR
Pulse generator, Rutherford, Model B7F
Low frequency function generator, Hewlett-
Packard, Model 202A
Power supply, Harrison Labs, Model 6343A (4
each)
t ....
_: _.
eeee -
FIGURE 8-11. SPECIAL ELECTRONICS UNIT FORPACE FUNCTION BOARD/UNIT TESTER
8-27

8. Ground Support Equipment
Power supply, Harrison Labs, Model 6346A (6
each)
Power supply, Harrison Labs, Model 6347A (2
each)
Special electronics unit, Hughes-fabricatedFunction Board/Unlt Tester
Oscilloscope, Tektronix, Type RM45A
Oscilloscope, Tektronix, Type M plug-in
Oscilloscope, Tektronix, Type D plug-in
Electronic counter,Hewlett-Packard, Model5233L
Digital vohmeter, Beckman, Model 4011R
Low frequency function generator, Hewlett-
Packard, Model 202A
Power supply, Transpac, Model TR24R (2 each)
q'-q'2 simulator, Hughes
Special electronics unit, Hughes
In addition to the testers that have already
been built, the following testers will be required
for a production phase. A preliminary listing
of commercial test equipment requirements isincluded.
PACE module tester (similar to one already
built)Central timer module tester
Telemetry encoder module tester
Command decoder module tester
Synchronous controller card tester
Telemetry processor card tester
Command generator card testerSolenoid driver unit tester
Oscilloscope
Low frequency function generator
Power supply (36 volts at 2 amperes)
Squib driver unit tester
Oscilloscope
Differential
Power supply (60 volts at 10 amperes)
Central timer function board tester
Oscilloscope
Differential voltmeter
Audio frequency signal generator
Power supply (40 volts at 500 milliamperes)2 each
Power supply (36 volts at 1 ampere)
GeneraI purpose electronic counter
Telemetry subsystem function board/unit tester
Oscilloscope
Electronic counter
VTVM
Differential voltmeter
Power supply (24 volts at 500 milliamperes)
Power supply (36 volts at 1.5 amperes)
Command subsystem function board/unit tester
VHF signal generator
50-ohm step attenuator, t-db steps
50-ohm step attenuator, 10-db steps
Power Supply (40 volts at 2 amperes)
General purpose electronic counter (0 to 50 mc)
Frequency connector (500 mc)Power meter
Thermistor mount
Digital voltmeter
Connector, ac-to-dc
Oscilloscope
Synchronous controller unit tester
Oscilloscope
General purpose electronic counter
Power supply (50 volts at 15 amperes)2 each
Telemetry processor
Oscilloscope
VTVM
Printer
Strip chart recorder with preamplifiers
Random noise generator
Digital voltmeter
Command generator unit tester
OscilloscopeElectronic counter
Data generator
=_
i
i
J
w
rl
M
=
u
m
Ui
tU
i
W
8-28
r
w

Hughes .4ircra/t Company
Y-_2 SIMULATOR
v •
FIGURE 8-12. @-@,SIMULATOR
Four ovens will be necessary for temperature
cycling during in-process testing. The ovens willbe used with several of the testers and so are not
listed with any particular testers.
Auto-Tester. In view of past experience with
welded module testing, it is considered necessary
to use an automatic tester for the Advanced
Syncom flight fabrication program. The tester
selected is manufactured by Hughes Aircraft
Company and has been used on both the Polaris
and Minuteman programs. It is card program-
reed and is capable of making both static and
dynamic tests of a module.
The tester is built around two commercial
units: on EAI 5001 digital voltmeter for all
dc measurements and a DYMEC 5844C measur-
ing system for waveform analysis. The waveform
analysis includes rise time, fall time, delay time,
pulse width, and pulse amplitude measurements.
The card programmer controls application of
all power and loading, application of static or
dynamic inputs, and measurement and interpreta-
tion of all desired waveform parameters of themodule under test.
The tester is equipped with four programmable
power supplies to furnish both circuit power and
bias voltages to the module. A pulse generator
furnishes the required dynamic inputs. Loadcards are used with each module to furnish the
proper load conditions. Resistances can be in-
serted in series with each of the inputs to simu-
late the impedance levels the module would en-counter in actual use.
All measurements are converted to digital
quantities which are then compared to values
punched on the cards. The result of the compari-
son is conveyed to the operator by the lighting
of one of seven lamps. These lamps indicate
8-29
8. Ground Support Equipment
F
r
whether the value measured was within accept-
able Iimits or whether it was high or low. In addi-
tion, a printout is made for each measurement
so that a permanent record can be kept of each
module's performance.
The tester is capable of making as many as 80
tests a second, so that test time is greatly reduced.
Tests already conducted on modules for the Po-
laris program indicate that modules can be tested
in about one-eighth the time taken on a manual
tester. The fast testing rate also makes it feasible
to test more parameters for each module, so that
more marginal conditions can be detected and
corrected. This more severe testing will increase
the reliability of the flight versions.
A small amount of redesign in the present
tester is being accomplished to make it more
usable for Syncom circuits. This redesign in-
cludes extending the low frequency measure-
ment capability and implementing a more flexible
input/output section.
8-30

*LJ
L
9. SPACECRAFT HANDLING EQUIPMENT
During the reported program, design effort
was directed toward development of four major
items of ground handling equipment. No actual
hardware was required or fabricated during
this period. The following summary describes
the equipment and the related design effort.
WEIGHT, CG, AND MOMENT OF INERTIA
FIXTURE
A combination fixture which permits the meas-
urement of mass properties was developed. The
fixture consists of two parts: 1) a roll fixture
(Figure 9-1a) which attaches to the separation
LOAD CELL _5 _ 5
l ROLL
_/FIXTURE
i ,= 3
o)
PITCHFIXTURE
I _ ! ROLL
I
!
!
R
c)
FIGURE 9-1.
bl
L
J
I
I
I
I
COMBINATION WEIGHT, CENTER OF GRAVITY, AND MOMENT OF INERTIA EQUIPMENT
9-1

Hughes Aircraft Company
plane and 2) an additional structure which at-
taches to the motor mounting area (Figure 9-1b)
and is connected to the roll fixture, thus becoming
a fixture permitting measurement of moment of
inertia about the pitch and yaw axis. The frame
has provisions for attachment of cables from
which the spacecraft is suspended for determina-
tion of moment of inertia (Figure 9-1d). Two
hoists are used to rotate the spacecraft from roll
to pitch position (Figure 9-1c). The fixture in-
corporates a roller-bearing-supported index de-
vice which is used to rotate the spacecraft to
predetermined positions 45 degrees apart as
required. Weight and eg location is determined
by suspending the fixture-spacecraft combination
from load cells (Figure 9-2). The fixture is made
of aluminum, predominantly of welded construc-tion.
SYSTEMS TEST AND SPIN FIXTURE
A special fixture was designed to permit sys-
tems tests on a spinning spacecraft. As originally
required, the fixture was designed as a mobile
piece of equipment and incorporated a specially
designed trailer. The fixture was permanently
mounted on the trailer and surrounded by a
shrov.d which protected personnel from the spin-
ning spacecraft.
The mobility requirement was eliminated sub-
sequently, and a redesign of the supporting struc-
ture was necessary. A new enclosure, to replace
the shroud that was incorporated on the trailer,
was also required. All these tasks were com-
pleted, and the fixture is now designed to be
used in a permanent location.
The fixture (Figure 9-3) consists of a pylon
assembly suppor!ed on a tubular pedestal. The
pylon assembly is composed of a housing which
supports a drive shaft. A mounting ring is at-
tached to the shaft to permit installation of the
RI
"25"
s F
VF
!
I
JJ
/e"
i-
ws__
R2
-_ _-LOAD CELL
\D 0
I
_J_=_ SEPARATION PLANE
FIGURE 9-2. SPACECRAFT LONGITUDINAL CENTEROF GRAVITY MEASUREMENT
spacecraft on the fixture. A series of slip rings,
both low and high frequency, as well as a coaxial
rotary joint are incorporated in the pylon as-
sembly for test purposes.
To ensure that variations in rotational speed
do not exceed very narrow limits specified as
design objectives, a U.S. Motors Varidyne system
is used. The system consists of a power unit
which converts standard 60 cycle line power to
other frequencies and supplies the converted
and controlled frequency to a slave motor. The
slave motor rotates the drive shaft of the spin
test fixture through a V-belt drive. This system
permits a succession of stepless speed changes
within the desired range and assures maximum
speed stability, not affected by line voltage
changes, heating, or changes of electrical resist-
ance. A pulse generator and data link is included
in the system to provide accurate readout of rpm.
Nxg-2
I

J
FIGURE 9.1.
ADVANCED SYNCOM SPIN FIXTURE
F_

= =
J
£ i -
il
l
1
U
u
W
F4
ul
m
W
M_
W

, I ,?",_\ iI x_
IIIIIII


I
II i
! i! ,
!
I
Ito.oo
t


9. Spacecraft Handling Equipment
MOBILE ASSEMBLY STAND
A fixture to facilitate the assembly and instal-
lation of components within the spaceframe as
well as performance of various checkout opera-
tions was designed (Figure 9-4). A rigid steel
tubular frame supports a cantilever arm to which
the spacecraft is attached. The arm is pivoted oF
large bearings and may be rotated by a hand-
operated worm gear drive to place the spaceframe
in the desired working position. The axis of ro-
tation is located in the vicinity of the combined
arm and spaceframe center of gravity, thus re-
quiring minimum effort on the part of the opera-
tor. The stand is equipped with casters for mobil-
ity within the work area as well as transportation
within the plant. Brakes secure the stand in any
desired location.
BALANCING MACHINE
A special machine for dynamic balancing of
the spacecraft was designed. Two versions were
developed. The first (Figure 9-5), designed for
spacecraft mounting by the motor mount (i.e.,
bular A-frame supporting a cradle. The cradle
is attached to the A-frame by spring steel flexures
placed so as to pick up vibration in two different
planes. The lower end of the cradle contains a
turntable on which the spacecraft may bemounted. An electric motor drives the turntable
through a V-belt. A damper between the cradle
and the frame prevents excessive vibration build-
up. Electromagnetic dashpots pick up the unbal-ance and readout meters indicate both the amount
and the location of the unbalance. A railing at-
tached to the frame is provided for safety of
personnel.
Since this machine did not permit balancing
the spacecraft with the apogee motor attached, a
second version was designed. In this version, the
spacecraft is attached to the turntable by the
separation plane (antennas pointing down). This
balancer has the following significant differences
from the first version:
1) Mounting the spacecraft by the separation
plane is easier.
with the antenna pointing up) consists of a tu-
,<
FIGURE 9-4. MOBILE ASSEMBLY STAND FIGURE 9-5. BALANCING MACHINE
9-5

Hughes Aircra[t Company
2)
3)
Flat springs from which the cradle is sus-
pended may be varied in thickness, thus
tailoring the frequency of the cradle in a
manner permitting more accurate displace-
ment reading.
Rotation is provided by a U.S. Varidyne
variable frequency unit of the same type
as that used on the spin test machine. This
unit provides a very stable rotational speed
and, being mounted outside the balancer,
permits remote speed control (up to 200
feet away).
11
i -.
_2-2_7 7
4) An amplifier-filter eliminates all "noise"
voltages except those generated by unbal-
ance of the rotating spacecraft, providing
better accuracy.
5) Leveling screws are provided in the frame.
While this balancer was in design, a com-
mercial baiancer was proposed and a decision
made to purchase the commercial unit. A pre-
liminary statement of work and procurement
specification were prepared.
m
°
k
9-6

/
!! k j
10. NEW TECHNOLOGY
t_L_
L4
NEW ITEMS
Solar Array Fabrication Technique. A :fabri-
cation technique for the solar array has been de-
veloped which is believed to have several uniquefeatures. The combination of materials and tech-
niques used yields the highest known solar array
strength-to-weight ratio and improves the panel
reproducibility and uniformity. Of particular
significance is the method of fabricating the solar
cell strings by use of a machine developed spe-
cifically for this purpose and the cell-to-substrate
bonding method.
Details concerning the array fabrication are
contained in Section 7 of this report under Solar
Array Substrate Development and Solar Cell to
Substrate Adhesive Development.
Repairable Foam. An improved method of
potting modules in a repairable foam has been
developed. By this method, module repairs may
be made without damaging the modules or the
mounting board.
The mounting board is covered with a thinlaminate bonded to the board with a modified
epoxy polyamide breakaway adhesive. The poly-
urethane foam is marked with lines placed so
that cutting through the foam on the lines will
not damage the underlying structure or circuitry.
Thus, when repair is needed, the defective mod-ule is unsoldered from the board and the foam
is cut through the appropriate lines with a dull
brass knife to prevent cutting the etched board.The board is then heated to 200°F to weaken
the breakaway adhesive, and the cut foam block
is removed from the warm board. The laminate
stripped from the board is replaced with the
brcakaway adhesive and the repaired or replacedmodule is resoldered to the board. The board is
then refoamed to replace the foam cut away
during the module removal. To protect the
foamed unit during handling prior to assembly,
a plastic cover is used. (See Section 7, Figures
7-17 and %18.)
PREVIOUSLY REPORTED ITEMS
All items reported during the contract period
are summarized below. Innovations were reported
separately from items believed to constitute in-
ventions, in a special section of the Monthly Prog-
ress Report; inventions were reported directly
by the Hughes Patent Office. The dates shown re-
ferto the report in which the particular item
appeared or, in the case of inventions, to the re-
porting date of the item.
Innovations
Spacecraft Launch Rate and Availability : Fixed
Time Replacement Policy (Summary Report, 31
March 1963) --an analytical technique to deter-
mine satellite availability and replacement rate.
X3 Multiplier (Summary Report, 31 March
1963) -- a varactor muhiply-by-three device.
Output RF Power Switch (Summary Report, 31
Marcia 1963)- a ferrite switch, essentially a
three-port circulator with provisions for elec-
tronically reversing the permanent magnetic field
polarity, which operates as a single-pole double-throw switch.
10-1

Hughes Aircra/t Company
Horizon Scanners (May 1963)- a method
for determining the angle between the spin axis
and the equatorial plane by the use of earth sen.SOTS.
Whip Antenna Orientation (June 1963) -- an
orientation of whip antennas to produce an opti-
mum radiation pattern.
Solar Cell Support Panels Attachment (July
1963)- a mounting arrangement for the solar
panels that prevents deformation of the space-
craft from transmitting loads into the solar
panels.
: Divide.by-32 Circuit (August 1963) --an
efficient and Compact varactor divider consisting
-- of fly e d!vide-by-two stages operated in series,
each stage composed of a unique parallel arrange-ment of varactor diodes. The divider was de-
signed to operate with an input frequency in
the 2000-mc range.
Inventions
Resistance Soldering Technique for Solar Cell
Assemblies PD 5334 (1 March 1963) -- a tech-
nique for the automatic assembly of solar cells
into large matrix series-parallel combinations for
installation on substrate panels.
Triaxial Antenna PD 5513 (1 July 1963)
an antenna element utilizes complex feed slots
to improve the pattern and impedance match of
a horizontally poiariZe_t: antenna.-
Capacitor Error Trimmer PD 5548 (15 July
1963) -- an improved trimmer capacitor.
Varactor High Level Mixer PD 5623 (1 Octo-
ber 1963) --an efficient modulation device that
generates carrier suppressed double sidebands by
mixing two frequencies by the variable capaci-
tance effects provided by varactor diodes.
SUBCONTRACTS
During the contract period the following sub-
contracts have contained the Reporting of New
Technology and the Property Rights in Inventionsclauses:
Subcontractor: The Marquardt Corporation
16555 Saticoy Street
\Tan Nuys, California
Statement of Work: Phase I--To design, de-
velop, fabricate, test, and
deliver an engineering
model of the bipropellantreaction control unit.
Interim Program -- to con-duct tests to determine the
adequacy of the engineer-
ing model of the bipropel-
lant reaction control unit
and to modify the model to
permit steady-state opera-tion.
Completion Date: Phase I _ 15 July 1963
Interim Program -- 18 Oc-tober 1963
10-2

=
| i
t_- i
r;
_3
= ,
g-_
| J
IN
_7| 3
r_
11. PROJECT REFERENCE REPORTS
MAY 1963
• Advanced Syncom, Syncom II Test Plan,
Structural Design Evaluation--Engineering
Model HSX-302-T1, TP 30505-001, April
]963.
• Syncom II Project Notice No. 9, "Vibration
Levels for Evaluation of the Advanced Syn-
corn Structure," 16 April 1963.
• J. B. Beaumont, "Minutes of Meeting to
Establish Requirements for a Syncom II Sys-
tems Test Stand," IDC, 26 April 1963.
• M. C. Gazin, "Syncom Manufacturer Sur-
vey," IDC, 27 May 1963.
• J. C. Meyer, "Standardization of Semicon-
ductors," IDC, 23 May 1963.
• L. A. Gustafson, "Trip Report to Goddard
Space Flight Center," IDC, 20 May 1963.
• J'. G. Lotta, "Syncom II Apogee Motor Mass
Property Characteristics," IDC, 21 May 1963.
• R. A. Houghten, "Syncom II Coordination
Control Summary Report," IDC, 17 May1963.
• R. A. Houghten, "Syncom II Coordination
Control Summary Report," IDC, 10 May1963.
• A. T. Owens, "Ratio of Carrier Power to
Total Power as a Function of RMS Modu-
lation Index for a Carrier Phase Modulated
by Random Noise," IDC, 7 May 1963.
• E. H. Erath, "The Electron Flux in the Outer
Radiation Belt," IDC, 15 May 1963.
• W. C, Dunkerly, "Syncom II Procurement
Specification, Solar Cell."
• "Syncom II Power System Specification."
• A. G. Brtis, "Procurement Specification--
Sealed Nickel-Cadmium Battery Cell, 6.0
Amp.-Hr."
• A. G. Brtis, "Procurement Specification--
Sealed Nickel-Cadmium Battery Cell with
Full Charge Sensory Electrode 6.0 Amp.-
_-[ r ,''
• L. A. Gustafson, "T-1 Handling Procedures,"
IDC, 7 May 1963.
• C. V. Quella, "Qualification Testing of the
384-H TWT," Activity Report, 9 May 1963.
• J. G. Lotta, "Syncom II Weight Status Report
AJ 10-131 Liquid Apogee Motor (Toroidal
Tank)," IDC, 2 May 1963.
• J. G. Lotta, "Syncom II Weight Status HSX-
302 T-1 Spacecraft," IDC, 3 May 1963.
• R. N. Ely, "Syncom II Bi-Propellant System
Marquardt Proposal Evaluation," IDC, 29
April 1963.
• L. A. Greenbaum, "Spacecraft System Test
Access Points," IDC, 3 May 1963.
• C. G. Murphy, "Syncom II Spacecraft Engi-
neers," Syncom II Project Notice No. 11, 22
April 1963.
• C.G. Murphy, "Design Coordination Meetings_'
Syncom II Project Notice No. 13, 8 May 1963.
• C. G. Murphy, "Design Reviews," Syncom II
Project Notice No. 12, 8 May 1963.
• D. C. Mead, "Design Review Inventory, Jet
Control Electronics," 17 May 1963.
• D. C. Mead, "Design Review Inventory, Com-
mand Decoder," 10 May 1963.
U
11-1

Hughes Aircra[t Company
JUNE 1963
• P. J. Fisher, "Preferred Parts List, Hughes
Document 30505-004," 26 June 1963.
• H. A. Roth, "Temperatures of Syncom II
Axial Reaction Control Nozzles," IDC, 20
June 1953.
• "Syncom II Interface Data," LMSC Docu-
ment A376151, 18 June 1963.
• P. W. Michelsen, "Proposed Data Flow Data
Recording racume., IDC, 24 June 1963.
• L. V. Erdle, "Minutes of GSE Meeting for
Advanced Syncom Command Generator and
Telemetry Processor," IDC, 26 June 1963.
• P. R. Broward, "Minutes of Syncom II RCS
Interface Meeting," IDC, 21 June 1963.
• F. B. Bjorklund, "Syncom II Thermal Con-
trol Inputs," IDC, 20 June 1963.
• R. A. Houghten, "Syncom II Coordination
Control Summary Report," 21 June 1963.
• P. S. Dupont, "Revision to Syncom II Battery
Specifications," IDC, 20 June 1963.
• J. G. Lotta, "Syncom II Spin Balance
Machine Design Requirements," IDC, 20
June 1963.
-_ • P. E. Norsell, "Increase of Solar Panel
Length," 20 June 1963.
• P. S. Dupont, "Increase of Solar Panel
Length," IDC, 11 June 1963.
• M. E. Clay, "Syncom II Solar Panel Develop-
ment Dynamic Tests," IDC, 17 June 1963.
_ - i=_.ll _P. Wrzesinski, "Placement Of Solar Sen-sors Relative to the Radial Jets," 20 June
1963.
_ • J. P. Wrzesinski, "Solar Panel Weights," 20
June 1963.
• J. M. Ferry, "Coordination Meeting Syncom
II RCS Interface," IDC, 14 June 1963.
• L. A. Gustafson, "Control Items Located in
Each Quadrant," 19 June 1963.
I1-2
* P. E. Norsell, "Normally-Open Squib Con-
trolled Valve in Bipropellant System," 19
June 1963.
• P. M. Winslow, "Review of Marquardt Proc-
ess Specifications -- Syncom II," IDC, 15
June 1963.
• J. C. Meyer, "Semiconductors Used on Syn-
corn II Spacecraft," IDC, 19 June 1963.
• L. W. Geary, "Component Failure Rate Im-
provements," IDC, 12 June 1963.
• A. T. Owens, "Expected Value of the Period
During Which a Noise Signal Exceeds a
Given Threshold," IDC, 13 June 1963.
• K. B. Lambert, "Syncom II Revisions of Pre-
ferred Parts, Materials, Processes Lists," 14
June 1963.
• R. J. Smith, "Syncom II Power Amplifier
Regulators," IDC, 14 June 1963.
• R. A. Houghten, "Syncom II Coordination
Control Summary Report," 14 June 1963.
• P. S. Toorvald, "Syncom II Command De-
coder Regulators," IDC, 13 June 1963.
° J. G. Lotta, "Syncom II Mass Property
Data," IDC, 10 June 1963.
• A. T. Owens, "Report on GSFC Meeting Con-
cerning Ground Systems Tests," IDC, 12 June
1963.
• P. E. Norsell and J. W. Withers, "Syncom II
Project Mass Properties Engineering Pro-
gram," IDC, 11 June 1963.
• R. Lindgren, 'Syncom II Wiring Harness
Design," IDC, 12 June 1963.
• J. P. Wrzesinski, "Advanced Syncom PowerDistribution," 7 June 1963.
• R. A. Houghten, "Syncom II Coordination
Control Summary," 7 June 1963."-' t"• "Syncom II Conference nepor (conducted
at LMSC, Sunnyvale), 20 May 1963.
U
!-

= :
=4
k....'
/.J
| J
|J
t---]
u
_-:-
i •
= :
= __z_
• R. N. Ely, "Syncom II Solar Cell Test Pro-
gram," IDC, 10 June 1963.
• R. A. Houghten, "Syncom II Coordination
Control Summary Report," 24 May 1963.
• P. A. Rubin, "Minutes of GSE Meeting and
Design Objectives for Advanced Syncom
Command Generator and Telemetry Dis-
play," 5 June 1963.
• J. M. Ferry, "Tank Connectors for Syncom
1I Bipropellant System," IDC, 5 June 1963.
11. Project Re[erence Reports
• J. P. Wrzesinski, "Syncom II Power Distribu-
tion," 4 June 1963.
• A. J. McCall, "Recommended Tests of Syn-
corn II Solenoid to Determine Electrical In-
terface," IDC, 31 May 1963.
• "Mass Properties Control Program," Syncom
II Project Notice No. 15, 24 June 1963.
• "Statements of Work and Procurement Speci-
fications for Syncom II Subcontracts," Syn-
corn II Project Notice No. 14, 14 June 1963.
JULY 1963
• J. M. Ferry, "RCS Installation Procedures,"
IDC, 15 July 1963.
• K. Z. Bradford, "Syncom New Development
Coordination," IDC, 15 July 1963.
• R. A. Browne, "Report on Peak g Response
vs Frequency at Various Locations on the Ad-
vanced Syncom T-1 Spacecraft for Sinusoidal
Qualification Level Input at the Base of the
Thrust Tube," 17 July 1963.
• J. P. Wrzesinski, "Advanced Syncom Coor-
dination Control Summary Report," IDC,
19 July 1963.
• P. J. Fisher, "Advanced Syncom System Test
Equipment Wiring Specification," 22 July1963.
• P. J. Fisher, "Advanced Syncom System Test
Equipment Packaging Specification," 22 July1963.
• J. S. Culver, Trip Report -- LMSC, Sunny-
vale, Booster-Spacecraft Interface Coordina-
tion, 23 July 1963.
• L. Korba, "Weight Reduction Proposal," 15
July 1963.
• R. J. Smith, "Advanced Syncom Power Am-
plifier Regulators," IDC, 18 July 1963.
• P. A. Rubin, "Rosman II _ NASA Exper-
imental Communication Station," IDC, 17 July
1963.
• Paul E. Norsell, "384H-33 Compression
Curves," IDC, 17 July 1963.
• J. B. Beaumont, "Minutes of Advanced Syn-
com 3 July 1963 Meeting to Define RCS
Alignment Procedures," IDC, 10 July 1963.
• J. B. Beaumont, "Minutes of Advanced Syn-
corn 10 July Meeting for Requirements for
Velocity Jet Clearance Hole in Solar Panel,"
IDC, 10 July 1963.
• L. I. Ivey, "Advanced Syncom PACE Regula-
tors," IDC, 10 July 1963.
• F. B. Bjorklund, "Advanced Syncom Passive
Thermal Control System Sensitivity to Sur-
face Property," IDC, 8 July 1963.
• F. B. Bjorklund, "Advanced Syncom Prelim-
inary Thermal Analysis," IDC, 8 July 1963.
• L. W. Geary, "Advanced Syncom Parts Pro-
gram," IDC, 9 July 1963.
• J. M. Ferry, "Syncom II, Bi-Propellant En-
gine Durability," IDC, 9 July 1963.
• B. Finver, "Minutes of Syncom II RCS Inter-
face Meeting," IDC, 8 July 1963.
11-3

Hugh es A ircra[t Compan)"
• R. N. Ely, "Advanced Syncom Organic Ther-
mal Control of Solar Panels," IDC, 3 July
1963.
• J. G. Lotta, "Advanced Syncom Mass Property
Data," IDC, 3 July 1963.
• B. Finver, "Minutes of Advanced Syncom
RCS Interface Meeting," IDC, 28 June 1963.
• J. B. Beaumont, "Coordination Item Meeting
Report for Advanced Syncom Clearance Hole
for Velocity Jet," IDC, 3 July 1963.
• B. N. Smith, "Advanced Syncom Damper
Vibration Fixture," IDC, 28 June 1963.
• L. A. Gustafson, "Summary of LMSC-Hughes
Interface Meeting," IDC, 1 July 1963.
• T. Hudspeth, "Advanced Syncom Telemetry
and Command Antenna," IDC, 1 July 1963.
• I. Baker, "Structural Evaluation of Advanced
Syncom Solar Panel Designs," IDC, 28 June
1963.
• R. A. Houghten, "Advanced Syncom Coor-
dination Control Summary Report," IDC, 28
June 1963.
• R. A. Houghten, "Advanced Syncom Umbili-
cal Disconnect Time," IDC, 27 June 1963.
=
• D. T. Dupree, "Master Index-Advanced Elec-
tronic Ground Support Experiment," 1 July
1963.
• P. E. Norsell, "Apogee Motor Squib Access
Requirements," IDC, 28 June 1963.
• F. B. Bjorklund, "Advanced Syncom Solar
Panel Temperature Control," IDC, 27 June
1963.
• A. M. Liebschutz, "Semiconductors Used on
Advanced Syncom Spacecraft," IDC, 26 June
1963.
• "Reporting of New Technology" Syncom and
Advanced Syncom Project Notice No. 66
(Rev. A), 7 July 1963.
• "Use of Torq-Set Screws for Advanced Syn-
corn," Advanced Syncom Project Notice No.
16, 15 July 1963.
• "Telemetry System and Format" Advanced
Syncom Project Notice No. 17, 16 July 1963.
• "Telemetry System and Format" Advanced
Syncom Project Notice No. 17 (Rev. A), 29
July 1963.
• "Definition of Command System" Advanced
Syncom Project Notice No. 18, 17 July 1963.
AUGUST 1963
• J. G. Lotta, "Advanced Syncom Mass Prop- •
erty Data ItSX-302-T2," IDC, 27 August 1963.
• M. A. Borton, "Advanced Syncom T2 Solar
Panel Vibration Test Plan," IDC, 22 August1963. •
• J. G. Lotta, "Advanced Syncom Apogee •
Motor Mass Property Characteristics," IDC,
23 August 1963.
• J. G. Lotta, "Advanced Syncom Mass prop- •
erty Data HSX-302-T2," IDC, 23 August
1963.
J. G. Lotta, "Advanced Syncom Weight,
Longitudinal Center of Gravity, and Moment
of Inertia Test Equipment Design Require-
ments," IDC, 22 August 1963.
K. B. Lambert, "Status of Advanced Syncom
Parts Specifications," IDC, 23 August 1963.
P. E. Norsell, (Advanced Syncom Project
Notice) "Advanced Syncom Electronic Parts
Lists," 20 August 1963.
K. B. Lambert, "Advanced Syncom Parts,
Materials, Process Lists, 15 August Revi-
sions," IDC, 20 August 1963.
11-4

z
• i
il
i¸ i= •
! 1
iir
k.J
U
[]
t=_ 5E a
w
F
11. Proiect Re[erence Reports
* R. A. Browne, "Structural Dynamic Require-
ments for Advanced Syncom," IDC, 16 August1963.
• A. Burstein, "Installation of the Advanced
Syncom Reaction Control System," IDC, 16
August 1963.
• L. A. Gustafson, "Squib Firing Circuits,"
IDC, 16 August 1963.
• D. E. Creed, "Solar Cell Radiation Proper-
ties," IDC, 15 August 1963.
• L. A. Gustafson, "Advanced Syncom Tem-
perature Sensors," IDC, 14 August 1963.
• R. A. Browne, "Advanced Syncom Design
Loads and Structural Design Recommenda-
tions," IDC, 8 August 1963.
• F. B. Bjorklund, "Advanced Syncom Tem-
perature Sensors," IDC, 8 August 1963.
• C. H. Davis, "Minutes of Design Review of
Advanced Syncom Structure," 6 August
1963.
• F. B. Bjorklund, "Request for Advanced Syn-
corn Material Radiation Properties," IDC, 6
August 1963.
• It. P. Carlson, "Space Systems Quality As-
suranceDepartmental Instructions," IDC, 15
July 1963.
• P. J. Fisher, "Integration Subsystem Speci-
fication for Advanced Syncom;' 6 August 1963.
SEPTEMBER 1963
• J. B. Beaumont, "Trip Report, 4 September
1963, NASA Lewis Research Center for LMSC
Advanced Syncom Follow-On Study Final Re-
port Presentation," IDC, 12 September 1963.
• G. R. Blair and D. Horwitz, "Advanced Syn-
corn Material Radiation Properties," IDC, 8
September 1963.
• D.T. Dupree, "Master Index, Physical Ground
Support Equipment, Advanced Syncom," 26
August 1963.
• S. Fienberg, "Preliminary Release, Advanced
Synco _ Connector Pin Terminations," 17
September 1963.
• S. Fienbe_g, "Location of Quadrant Connec-
tors," IDC, 27 September 1963.
• P. J. Fisher, "Advanced Syncom System Test
Equipment Wiring Specification," 29 August1963.
• P° _* ; - ,, - . .J. Fisher, Revised Spacecraft Access Point
List," IDC, 3 September 1963.
• D. L. Frislie, "HP for the Assembly of Point-
to-Point Soldered Electronic Modules," TDC,
12 September 1963.
• L. A. Gustafson, "Solar Array Output Imme-
diately After an Eclipse," 17 September 1963.
• J. G. Lotta, "Advanced Syncom Mass Proper-
ties Data Configuration 3 SP Plus 2230," TDC,
3 September 1963.
• J. G. Lotta, "Analysis of Gisholt Vertical Bal-
ancing Machine for Advanced Syncom," IDC,
6 Sel)tember 1963.
• J.G. Lotta, "Advanced Syncom Mass Property
Data, HSX-302-T2," IDC, 10 September 1963.
• J.G. Lotta, "Advanced Syncom Mass Property
Data Configurations 4 through 8," IDC, 17
September 1963.
• P. E. Norsell, "Action Summary, Advanced
Syncom Project Meeting, 3 September," IDC,
9 September 1963.
11-5

Hughes ,4 irera[t Company
• P. E. Norsell, "Action Summary, Advanced
Syneom Project Meeting, 10 September 1963,"
IDC, 16 September 1963.
• P. E. Norsell, Supplementary Information,
NASA-GSFC-SII-002, "Procurement Specifi-
cation for a Frequency Modulation Ground
Transmitter," IDC, 12 September 1963.
• P. E. Norsell, "General Description of the
OGO Console," IDC, 12 September 1963.
• S. T. Plants, "Advanced Syncom Power Sup-
ply Loads," IDC, 24 September 1963.
• J. G. Read, "Advanced Syncom Wire Recom-
mendations," IDC, 18 September 1963.
• J, W. Vorndran, "Minutes of Design Review of
Advanced Syncom Telemetry Encoder," 28
Augus t 1963.
• Project Bulletin No. 2, "Control Item Test
Specification Formats," 5 September 1963.
• Project Bulletin No. 3, "Vitramon 0.01 Micro-
farad Capacitors) 988504-16, -32)," 5 Sep-tember 1963.
• Project Bulletin No. 4, "Placement of "OR"
Gates Diodes in Series Regulators," 17 Sep-tember 1963.
• Project Bulletin No. 5, "Definition of Com-
mand System" (Revises and replaces Ad-
vanced Syncom Project Notice 18, Revision
A), 18 September 1963.
• Project Bulletin No. 7, "Approved Parts List"
(Revises and replaces Advanced Syncom Proj-
ect Notice No. 21), 24 September 1963.
==11
OCTOBER 1963
• J. Snyder, "Specifications for the Synchronous •
Controller Auxiliaries," IDC, October 1963.
• C. F. Murray, "Results of Static Test of Syn-
com II Apogee Engine A-l," IDC, 20 Septem- •ber 1963.
• K_ P. Grab0wski, "Power Capabilities of the
384H TWT," IDC, 7 October 1963.
• N. W. Schaefler, "Advanced Syneom: The •
Eclipse Mode," IDC, 7 October 1963.
• J. G. Lotta, "Advanced Syncom -- Mass Prop- •
erty Data--Configurations 8 through 12," 7October 1963.
• P. S. DuPont, "Advanced Syncom, Electrical
Power System, Technical Report," Special
Report, 8 October 1963. •
• E. R. Shulsinger, "Arrangement of Quadrant
Boards," IDC, 26 September 1963.
• L. A. Gustafson, "Phase Shifter Driver Pack- •
aging and Encoder Voltage Source," IDC, 1October 1963.
11-6
J. Snyder, "Results of Discussions Regarding
Synchronous Controller," IDC, 30 September1963.
J. M. Ferry, "Failure Analysis, Advanced
Syncom RCS Injector Valve," IDC, 26 Sep-tember 1963.
A. Koury, "Battery Charge Indication," IDC,
30 September 1963.
L. I. Ivey, "Advanced Syncom Power Dissipa-
tion," IDC, 26 September 1963.
L. A. Davidson, "Failure Rates for Electronic
Parts," IDC, 27 August 1963.
M. J. Neufeld, "Attitude for Advanced Syn-
com Pencil Beam Pattern," IDC, 16 October
1963.
J. G. Lotta, "Advanced Syncom Electronic
Subsystem Weight Breakdown," IDC, 15 Octo-
ber 1963.
iz ,
U
i. !
U
U
U
b
U
!!
I :i t
| t
• R. T. Thurston, "Advanced Syncom Handling
Equipment Drawing List," IDC, 18 October1963.
• C. G. Walance, "Advanced Syncom Parts
Specifications," IDC, 18 October 1963.
• F. B. Bjorklund, "Advanced Syncom Material
Radiation Properties," IDC, 11 October 1963.
• C. G. Walance, "Advanced Syncom Status of
Specifications," IDC' 16 October 1963.
• L. S. Crane, "Threshold Levels and False
Alarm Rate for the Advanced Syncom Com-
mand Receiver," Technical Report, 14 October1963.
11. Project Re]erence Reports
k
• L.I. Ivey, "Advanced Syncom Telemetry Reg-
ulator," IDC, 15 October 1963.
• Advanced Syncom Project Bulletin No. 10,
"Engineering Change Management," 17 Octo-
ber 1963.
• Advanced Syncom Project Bulletin No. 9,
"OGO Console Outputs," 7 October 1963.
• Advanced Syncom Project Bulletin No. 6,
"Placement of Bipropellant Tanks and Jets and
Solar Sensors (Revised)," 4 October 1963.
11-7

L|u
aiD
Im
U
U
LL_____
rP_F--I
lib
LF_
I
tin
!
m


