Embed Size (px)
Citation preview

E);1`ON. MINERALS COMPANY
DST OFFICE•SOX 2180- HOUSTON,.TEXAS 77001 Environmental and Regulatory Afiairs
JAMES E. GILCHRIST- Manager
. "February 24, 1982
Docket No. 40-8102Tailings Basin Seepage Study forExxon's Highland Uranium Operations
U. S. Nuclear Regulatory CommissionWashington, D. C. 20555
Attention:. Mr. H. J.. Pettengill., Section Leader,Operati.ng, Faci.litiesSection II,Uranium Recovery'Licensing Branch
Gentlemen:
In accordance with license .conditipoe. number 34 of renewed (February O1', 1982)Source Material License No'..SUA-rl-39, enclosed are four copies of the "HighlandUranium Tailings Impoundment Seepage Study" report performed on the HighlandUranium Operations. tai.lings-" basin. The seepage study was undertaken byExxon
-i mnrd ct-questions relating to-th t of the
tailings basin on the surrounding environment; these questions were initially;-put forth .in your letter of.June 18, 1980 (reference number 1--questions number,
7, 8, and 9, see attachment)::,.ý and referred to in the subsequent references. in.-th-e attachment. These remainingq.uestions are adequately answered in' the enclosed:report, and the study indicates that there is no significant impact on thelin- e7n-vironment due to continued operation:of the Highland mill and its associated-tailingsbasin.
The seepage study was, i niti.-al!y contracted to Dames &.Moore (see reference.:..-.number 3) in July, 1980..Howeve.r, we terminated our contract for this study
,with Dames & Moore, and reassigned it to Exxon Production:Research. CompanyP(EPR) early in 1981. Exxon Production Research Company is an affiliate of
"- Exxon Corporation with, responsibility for research, development, and engineer-i.ng.. studies relating to discovery and production of petroleum, oil shale., coal,And other minerals. The Company performs research application work, fr the'operating affil iates of Exxon Corporation worldwide covering exploration (geology,geophysics, geochemistry)., drilling, mining, production, pipelining, offshorel.""operations, reservoir analysis, and arctic development. The EPR'research center..currently employs approximately 1,400 people.
A DIVISION OF EXXON CORPORATION

U..S.,Nuclear Regulatory Commission _2-¸ February 24, 1982
After you have reviewed this report and formulated questions Exxon-(EPR and,Highland staff.members) will be available to come to your offices tio make apresentation and answer yourýi qUesti ons at aý, time convenient'to all-. partiesinvoltved.
During the courseof-ýthe studyadditional•••ells were drilled in order toobtain .reliable and/or additional data. In light of this,, aong with ther esu l, ts of the.s-eepage study, we are currently re-evaluating our grou-ndwaterrmonitoring program to determine which wellsshould be used and whether or notany.,additional wells are ,needed. -.'We will-submit our revised groundwatersampl~ing .,system to you by June'l, 1982..
if.o.Y have ques~tions concernin:.g this matter, or wish: to make arrangementsfor a .presentation by 'Ex-xon, ,pl'ease contact Mr. H. Paul, Estey (telephone number7 71 3-895-1171 of °my. staff.
Sincerely,..
Notedi-Noted}ýý
IJEG:HPE :rn"s! Attachment (AsEnclosuresI (As

Attachment - References
1) June 18, 1980 letter from U. S. NRC (J. J. Linehan) to EMC(G. D. Ortloff).
2) July 3, 1980 letter from EMC (G. D. Ortloff) to U. S. NRC(J. J. Linehan).
3), September 8, 1980 letter from EMC (G. D. Ortloff) toU. S. NRC (J. J. Linehan).
4) October 16, 1980 letter from U. S. NRC (J. J. Linehan)to EMC (G. D. Ortloff).
5) November 10, 1980 letter from EMC (G. D. Ortloff) toU. S. NRC (J. J. Linehan).

E*,ON PRODUCTION RESEARCH COMPANYPOST OFFICE BOX 2189 - HOUSTON, TEXAS 77001
MINING AND SYNTHETIC FUELS DIVISION
C.H. HEWI1TMANAGER
February 10, 1982
Mr. G.L. WilhelmManager, U.S. OperationsExxon Minerals CompanyP.O. Box 3020Casper, WY 82602
Attention: Mr. Steve Morzenti
Dear Sir:
Attached is a copy of research application report EPR 5ES.82 entitled"Highland Uranium Tailings Impoundment Seepage Study". This reportaddresses questions posed by the Nuclear Regulatory Commission regardingthe amount and direction of seepage from the Highland Uranium tailingsimpoundment, the adequacy of the water-quality monitoring system near theimpoundment, and seepage into North Fork Box Creek.
Seepage from the impoundment increases at a rate of about 19 gpm(gallons per minute) per year after 1975, and reaches a maximum rate of.about 200 gpm in 1983. The mill is then shut down and, as the pond dries,seepage decreases at about 38 gpm per year. Seepage ceases in 1991 afterai-the-wat-er inthe phondand-ta-il htgs-hasether evaporate or di-fi-dinto underlying formations.
Maximum lateral movement of the seepage front will occur west of thepond, reaching the northern edge of Pit 2 about the year 1992. The seepagefront will move a maximum of 1300 feet southwest and 300 feet northwest ofthe impoundment. Migration of the acidic front is greatly attenuated. Itonly moves a maximum of about 500 feet from the pond.

Mr.. G.L. Wilhelm -2- 02/10/82
Vertical migration of the seepage front and acidic front is limited.The seepage front will, move vertically through the Tailings Dam and UpperOre Body Sands, but will not enter the Middle Ore Body Sand. The acidicfront will not migrate below the Tailings Dam Shale.
The existing water-quality monitoring system is adequate for de-tecting solute excursions from the impoundment. It is recommended thatthe results of this study continue to be compared to field data. Theinstallation of three new water-quality monitoring wells would enhancethe comparisons. Two wells, one completed in the Tailings Dam Sand andone completed in the Upper Ore Body Sand, should be located 1,500 feetsouth of Well XII. A third monitoring well should be completed in theTailings Dam Sand about 2,000 feet northwest of Well IX.
Ground-water seepage into North Fork Box Creek was calculated to beabout 25 gpm before the tailings impoundment was operational. Totalseepage downstream of the dam is not expected to exceed 40 gpm anytimeduring pond operation.
We welcome any questions or comments you may have concerning this
report.
Sincerely,
C. H. Hewitt
H. R. Melton
HRM/smb

Exxon Production Research Company
Highland Uranium Tailings Impoundment Seepage Study
PROJECT COORDINATION:
LABORATORY PROGRAM:
G. G. PETERS
G. B. DREHERE. M. SCHRAMMR. E. KLIMENTIDISM. J. KLOSTERMANJ. R. McGEE
GEOLOGIC MODELING: D. E. HAMILTON
FLOW MODELING: G.G. PETERST. J. CANNONR. J. MITROE. M. SCHRAMMD. E. TANG
FIELD PROGRAM: S. P. MORZENTI--- G-L__A-DAMS
G. M. GIBBSC. A. KUHARIC
CORE ANALYSES: R. C. SOMMERW. W. HARRIS
Mining and Synthetic Fuels Division
EPR.5ES.82
February 1982
The. research information contained herein is FORCOMPANY USE ONLY. Address any correspondenceconcerning this report to Technical Information -ReportsRoom, Exxon Production Research Company, P. 0. Box2189, Houston, Texas 77001.

CONTENTSPage
LIST OF FIGURES iv
LIST OF TABLES ix
ABSTRACT 1
1.0. EXECUTIVE SUMMARY 2
1.1. General 21.2. Conclusions 3
1.2.1. Comparison of Model Results to Field Data 31.2.2. Pond Seepage 41.2.3. Predicted Lateral Movement of Seepage and Acidic Fronts 41.2.4. Predicted Vertical Movement of Seepage and Acidic Fronts 41.2.5. Solute Migration 41.2.6. Seepage into North Fork Box Creek 5
1.3. Recommendations 6
2.0. INTRODUCTION 7
2.1.. Facility Operations 72.2. Geologic Setting 8
2.2.1. Physical Setting 82.2.2. Regional Geology 92.2.3. Local Geology 9
2.3. Hydrologic Setting 102.3.1. Climate 102.3.2. Recharge and Discharge 102.3.3. Infiltration 112.3.4. Field Program 12
3YO__GEITERAL APPROACH 13
3.1. Mechanisms Affecting Solute Movement at Highland 133.2. Study Approach 15
4.0. LABORATORY PROGRAM 18
4.1. Fluid and Rock Samples 184.2. Batch Experiments 194.3. Acid-Base Titrations 204.4. Column Flooding Experiment 214.5. Mineralogy 224.6. Interpretation of Laboratory Results 23
5.0. GEOLOGIC MODELING 24
5.1. Procedure 245.2. Geologic Data 255.3. Construction of the Two-Dimensional Stratigraphic Model 255.4. Construction of the Three-Dimensional Lithologic Model 265.5. Use of the Geologic Models 26
5.5.1. Cross Sectional Flow Models 275.5.2. Areal Flow Model 27
Page
6.0. FLOW MODELING 28
6.1. Cross Sectional Models 286.1.1. Purpose 286.1.2. Location and Discretization 306.1.3. Fluid and Rock Properties 31
6.1.3.1. Tailings Dam and Fowler Sands 32.6.1.3.2. Ore Body Sands 346.1.3.3. Shales 356.1.3.4. Surface Mine Backfill Material 376.1.3.5. Tailings 376.1.3.6. Property Averaging 38
6.1.4. Simulation Strategy 386.1.4.1. Initial and Boundary Conditions 386.1.4.2. Surface and Underground Mines 396.1.4.3. Tailings Impoundment 396.1.4.4. Solute Front Movement 41
6.1.5. Results 426.1.5.1. Solute Movement 426.1.5.2. Seepage 43
6.2. Areal Model 446.2.1. Purpose 456.2.2. Location and Discretization 466.2.3. Fluid and Rock Properties 466.2.4. Simulation Strategy 47
6.2.4.1. Initial and Boundary Conditions 486.2.4.2. Surface and Underground Mines 486.2.4.3. Tailings Impoundment 486.2.4.4. Solute Front Movement 49
6.2.5. Results 496.2.5.1. Solute Movement 496.2.5.2. Seepage into North Fork Box Creek 50
7T.ODtSCUSSION 5-1
7.1. Ground-Water Regulations Pertinent to Highland 517.2. Solute Categories 517.3. Solute Migration 52
7.3.1. Unregulated Solutes (Ca,K,Mg,Na,Si,Sr) 527.3.2. Radioactive Solutes (U,Th,Pb-210,Ra-226,U-238,Th-230) 537.3.3. Solutes that Exceed Regulatory Limits in Both 53
Acidic and Basic Environments (AI,Cr,Cu,Fe,Se)7.3.4. Solutes that Exceed Regulatory Limits in Acidic 54
Environments but not in Basic Environments(pH,As,Cd,Mn,Ni,Zn)
7.4. Comparison of Predicted Solute Migration to Field 54Data

Page8.0. SUMMARY 58
8.1. Results and Conclusions 598.1.1. Laboratory Program 59
8.1.1.1. Batch Test 598.1.1.2. Titration Experiments 608.1.1.3. Column Flooding Experiment 608.1.1.4. Mineralogical Analyses 61
8.1.2. Geologic Modeling 618.1.3. Flow Modeling 61
8.1.3.1. Cross-Sectional Models 618.1.3.2. Areal Model 62
'8.1.4. Solute Migration 63
REFERENCES 66
FIGURES
TABLES
APPENDIXES
A - Methods Used for Determining Element Concentrations A-Iand Performing Mineralogical Analyses
B - Summary of Core Analysis Data for the'Highland Ore Body Sands B-i
C - Highland Field Program C-i
C.1. Purpose and Scope of the Field Program 1972-1979 C-3C.2. Original Water Quality Monitoring Network C-4
C.2.1. Well Locations C-4C.2.2. Well Completion Information C-4C.2.3. Sampling C-5
C.2.3.1. Sampling Procedures C-5C.2.3.2. Summary of Data C-5
-- C-.-2-. 4__Deftctenci-es--and-Addi-t-i-on-a-l--D-t-a-Req i-red C-6C.2.4.1. Well Construction C-6C.2.4.2. Sampling C-6C.2.4.3. Analytical Techniques C-6C.2.4.4. New Data Needed C-7
C.3. 1980-81 Field Program C-7C.3.1. Purpose C-7C.3..2. Water Quality Monitor Wells C-8
C.3.2.1. Tailings Dam Monitor Well Location Rational C-8C.3.2.2. Well'Completion Specifications C-8
C.3.3. Regional Hydrologic Data C-9C.3.3.1. Permeabilities C-9C.3.3.2. Recharge-Discharge Areas C-9
C.3.4. Other Sampling C-10C.3.4.1. Soils and Soil Tests C-10C.3.4.2. Tailings Samples C-10C.3.4.3. Core Samples C-11C.3.4.4. Cuttings C-11C.3.4.5. Geologic Drill Hole Logs C-11C.3.4.6. Geophysical Drill Hole Logs C-11C.3.4.7. Bulk Samples or Geologic Units C-12
C.3.5. Summary of Field Program C-12
LIST OF FIGURES
Fig. 1 Regional Position of Powder River Basin(From Langen and Kidwell, 1970)
Fig. 2 Relief Map of Powder River Basin, Wyoming and Adjacent Mountains(From Wyoming Geological Assoc. Guidebook, 1958)
Fig. 3 Location and Layout of the Highland Uranium Operations(From Exxon Company, USA; 1973)
Fig. 4 Geologic Sequence of Powder River Basin(From Langen and Kidwell, 1970)
Fig. 5 Tailings Dam Shale Isopach(From Exxon Company, USA; 1973)
Fig. 6 Locations of Cross Sections A-A', B-B', And C-C'(From Exxon Company, USA; 1973)
Fig. 7 Cross Section A-A'(From Exxon Company, USA; 1973)
Fig. 8 Cross Section B-B'(From Exxon Company, USA; 1973)
Fig. 9 Cross Section C-C'
(From Exxon Company, USA; 1973)
Fig. 10 Local, Intermediate, and Regional Ground-Water Flow Systems
Fig. 11 Regional Flow System in the Upper Cretaceous Parkman Sandstone(-From-P-etroleum-Res-earch-Corp)
Fig. 12 Intermediate Flow System in the Vicinity of The Highland Mine
Fig. 13 Uranium-238 Radioactive Decay Series
Fig. 14 Concentrations of Various Elements, pH, and Eh, Versus ElapsedTime in Days From Batch Tests of Tailings Solution Over Four RockTypes.
Fig. 15 Titrations of Highland Tailings Solution by 0.015M Ca(OH) 2
Fig. 16 pH Versus'Pore Volumes of Tailings Solution Passed ThroughTailings Dam Sandstone
Fig. 17 Orientations and Coordinate System Used for the Cross-SectionalModels
iv

Fig. 18 Geology and Discretization of the West-East Cross Section
Fig. 19 Geology and Discretization of the Northwest-Southeast CrossSection
Fig. 20 Geology and Discretization of the Southwest-Northeast CrossSection
Fig. 21 )Anticipated Flow Patterns near Tailings Impoundment During
• M*n-i ng
Fig. 22 Locations of Wells and Borings
Fig. 23 Pumping Test Conducted in the Tailings Dam Sand at Well XXI
Fig. 24 Pumping Test Conducted in the Tailings Dam Sand at Well XII
Fig. 25 Pumping Test Conducted in the Tailings Dam Sand at Well VII
Fig. 26 Recovery Test Conducted in the Tailings Dam Sand at Well VII
Fig. 27 Air-Water Relative Permeability Data for Tailings Dam SandCore VIII (Vertical)
Fig. 28 Air-Water Relative Permeability Data for Tailings Dam SandCore XII (Horizontal)
Fig. 29 Air-Water Relative Permeability Data for Tailings Dam SandCore XII (Vertical)
Fig. 30 Air-Water Relative Permeability Data for Tailings Dam SandCore XX (Vertical).
Fig. 31 Air-Water Capillary Pressure Curves for Tailings Dam SandC ore•-VI-l-l-H~r-izont-a-l•-)i-il-l-H ori-zont-a-l-)-andX-X-(--Hor-i-ont-a-l-)--
Fig. 32 Pumping Test conducted in the Upper Ore Body Sand
at Well XX
Fig. 33 Pumping Test Conducted in the Middle Ore Body Sand at Well VI
Fig. 34 Shale Relative Permeability Data(From Battelle; 1980A)
Fig. 35 Shale Capillary Pressure Data(From Battelle; 1980A)
Fig. 36 Relative Permeability and Capillary Pressure Curves used forthe Surface Mine Backfill in the Cross-Sectional Models
Fig. 37 Pumping Test Results from a Well Completed in the SurfaceMine Backfill
v

Fig. 38 Tailings and Pond Liquor Buildup in the Cross Sections
Fig. 3 9 Area-Normalized Predicted Pond Seepage from the Cross SectionsGallons Per Minute Per Acre)
Fig. 40 Solute Movement Predictions forWest-East Cross Section.
Fig. 41 Solute Movement Predictions forNorthwest-Southeast Cross Section
Fig. 42 Solute-Movement Predictions forSouthwest-Northeast Cross Section
Fig. 43 Solute Movement Predictions forWest-East Cross Section
Fig. 44 Solute Movement Predictions forNorthwest-Southeast Cross Section
Fig. 45 Solute Movement Predictions forSouthwest-Northeast Cross Section
Fig. 46 Solute Movement Predictions forWest-East Cross Section
Fig. 47 Solute Movement Predictions forNorthwest-Southeast Cross Section
Fig. 48 Solute Movement Predictions forSouthwest-Northeast Cross Section
Fig. 49 Solute Movement Predictions forWest-East Cross Section
Fig. 50 Solute Movement Predictions forNorthwest-Southeast Cross Section
Fig. 51 Solute Movement Predictions forSouthwest-Northeast Cross Section
a Relative Velocity of
a Relative Velocity of
a Relative Velocity of
a Relative Velocity of
a Relative Velocity of
Relative Velocity of 0.
a Relative Velocity of
a Relative Velocity of
a Relative Velocity of
a Relative Velocity of
a Relative Velocity of
a Relative Velocity of
1.0
1.0
1.0
0.30
0.30
30
0.20
0.20
0.20
0.10
0.10
0.10
Fig. 52 Pond Seepage Rates Calculated by the Cross-Sectional Modelsand Input to the Areal Model
Fig. 53 Extent and Descretization of the Areal Model
Fig. 54 Relative Permeability Curve used to Account for UnconfinedFlow in the Tailings Dam Sand and the Surface Mine Backfill inthe Areal Model
Fig. 55 Pseudo-Capillary Pressure Curves Used to Account for GravityDrainage Between Blocks of Equal Elevation in the Areal Model
vi

Fig. 56 Solute MovementAreal Model
Fig. 57 Solute MovementAreal Model
Fig. 58 Solute MovementArealiModel
Fig. 59 Solute MovementAreal Model
Fig. 60 Solute MovementAreal Model
Predictions for a Relative Velocity of 1.0
Predictions for a Relative Velocity of 0.50
Predictions for a Relative Velocity of 0.30
Predictions for a Relative Velocity of 0.20
Predictions for a Relative Velocity of 0.10
Fig. 61 Solute Movement Toward the Outcrop After Regional Flow isRe-established for a relative velocity of 1.0 - Areal Model
Fig.12 Predicted Seepage into Box Creek - Areal Model
Fig6 Categories of Highland Solutes with Relation to Acidic Frontovement and Regulatory Status
Fig. 64 Comparison of the 1982 Unattenuated Solute Front PositionPredicted by the Areal Model to Calcium Concentrations Measuredin Monitor Wells Completed in the Tailings Dam Shale and Over-lying Formations.
Fig. 65 Comparison of the 1982 Unattenuated solute Front PositionPredicted by the Areal Model to Magnesium Concentrations Measuredin Monitor Wells Completed in the Tailings Dam Shale and Over-lying Formations
Fig. 66 Comparison of the 1982 Unattenuated Solute Front PositionPredicted by the Areal Model to Chloride Concentrations MeasurediWn-M6Titor Wells Completed in the Tailings Dam Shale and over-lying Formations.
Fig. 67 Comparison of the 1982 Unattenuated Solute Front PositionPredicted by the Areal Model to Calcium Concentrations Measuredin Monitor Wells Completed in the Ore Body Sands.
Fig. 68 Comparison of the 1982 Unattenuated Solute Front PositionPredicted by the Areal Model to Magnesium Concentrations Measuredin Monitor Wells Completed in the Ore Body Sands.
Fig. 69 Comparison of the 1982 Unattenuated Solute Front PositionPredicted by the Areal Model to Chloride Concentrations Measuredin Monitor Wells Completed in the Ore Body Sands.
Fig. 70 Comparisonthe Areal Modelin the Tailings
Fig. 71 Comparisonthe Areal Modelin the Ore Body
of the 1982 Acidic Front Position Predicted byto pH Measurements in Monitor Wells CompletedDam Shale and Overlying Formations.
of the 1982 Acidic Front Position Predicted byto pH Measurements in Monitor Wells CompletedSands.
vii

APPENDIX 8
Fig. B-1 Locations of borings used to determine permeability, porosity,and grain density of the Highland ore body sand.
APPENDIX C
Fig. C-I TDM Well Number E
Fig. C-2 TDM Well Number D
Fig. C-3 TDM Well Number C
Fig. C-4 TDM Well Number I
Fig. C-5 TDM Well Number II
Fig. C-6 TDM Well Number III
Fig. C-7 TDM Well Number IV
Fig. C-8 TDM Well Number V
Fig. C-9 TDM Well Number VI
Fig. C-10 TDM Well Number VII
Fig. C-li TDM Well Number VIII
Fig. C-12 TDM Well Number IX
Fig. C-13 TDM Well Number X
Fig. C-14 TDM Well Number XI
Fig. C-15 TDM Well Number XII
Fig. C-16 TDM Well Number XIX
Fig. C-17 TDM Well Number XX
Fig. C-18 TDM Well Number XXI
Fig. C-19 TDM Well Number D Replacement
Fig. C-20 TDM Well Number VI Replacement
vii
Fig. C-21 TDM Well Number XXIII
Fig. C-22 TDM Well Number XXIV
Fig. C-23 TDM Well Number XXV
Fig. C-24 TDM Well Number XXVI
Fig. C-25 TDM Well Number XXVII
Fig. C-26 TDM'Well Number XXVIII
Fig. C-27 TDM Well Number XXIX
Fig. C-28 TDM Well Number XXX
Fig. C-29 TDM Well Number RM-1
Fig. C-30 TDM Well Number RM-2
Fig. C-31 TDM Well Number RM-3
Fig. C-32 TDM Well Number RM-4
Fig. C-33 Typical pumping/monitoring well and observation well construction
Fig. C-34 Typical pumping/monitoring well and observation well construction
viii

LIST OF TABLES
Table I Concentrations of Major, Minor, and Trace Elements inAs-Received Materials
Table 2 Concentrations of Inorganic Constituents in Solution AfterBatch Tests of Highland Tailings Solution with Tailings Dam Sandstone
Table 3 Concentrations of Inorganic Constituents in Solution AfterBatch Tests of Highland Tailings Solution with Tailings Dam Shale
Table 4 Concentrations of Inorganic Constituents in Solution AfterBatch tests of Highland Tailings Solution with Ore Body Sandstone
Table 5 Concentrations of Inorganic Constituents in Solution AfterBatch Tests of Highland Tailings Solution with Ore Body Shale
Table 6 Concentrations of Cations in Highland Tailings SolutionAfter Titration by 0.015M Ca(OH)2 Solution
Table 7 Physical Characteristics of Tailings Dam Sandstone Column
Table 8 X-Ray Diffraction Results of Bulk and Clay Mineralogy ofShale Samples used in Batch experiments
Table 9 Results of Petrographic Analysis of Sandstone Samples
Table 10 Comparison of Specific Storage and Storage CoefficientValues for Highland Sands
Table 11 Laboratory Measurements of Porosity, Permeability, andGrain Density for the Tailings Dam Sand
Table 12 Comparison of Tailings Dam Sand Permeability Measured byGas and Water Flood
Table 13 Summary of Porosity, Permeability, and Grain Density forThe Ore Body Sands
Table 14 Properties of the Tailings Dam, Fowler, and Ore Body SandsUsed in the Cross-Sectional Models
Table 15 Summary of Porosity, Permeability, and Grain Density DataFor the Tailings Dam Shale
Table 16 Lithology of the Tailings Dam Shale - Core XII
Table 17 Lithology of the Tailings Dam Shale - Core XX
ix

Table 18 Properties of the Tailings Dam,,Fowler, and Ore Body Shalesused in the Cross-Sectional Models
Table 19 Properties of the Surface Mine Backfill Material Used inthe Cross-Sectional Models
Table 20 Distribution Coefficients and Relative Velocities for SolutesAt Highland Resulting from Contact with the Tailings Dam Sand,Tailings Dam Shale, Ore Body Sands,- and Ore Body Shales
Table 21 Properties of the Tailings Dam Sand and Surface Mine BackfillMaterial used in the Areal Model
Table 22 Applicable Groundwater Standards and Concentration Levelsof Interest
Table 23 Solutes Considered for use as Tracers for the 1.0 RelativeVelocity Front
x

APPENDIX A
Table A-i Summary of Atomic Adsorption Wavelengths and Flame TypesUsed for Analysis of Highland Tailings Solutions
APPENDIX B
Table B-1 Permeability, Porosity, andby Core Analysis of the Highland
Table B-2 Permeability, Porosity, andby Core Analysis of the Highland
Table B-3 Permeability, Porosity, andby Core Analysis of the Highland
Table B-4 Permeability, Porosity, andby Core Analysis of the Highland
Table B-5 Permeability, Porosity, andby Core Analysis of the Highland
Table B-6 Permeability, Porosity, andby Core Analysis of the Highland
Table B-7 Permeability, Porosity, andby Core Analysis of the Highland
Grain DensityOre Body Sand
Grain DensityOre Body Sand
Grain DensityOre Body Sand
grain DensityOre Body Sand
Grain DensityOre Body Sand
Grain DensityOre Body Sand
Grain DensityOre Body Sand
Data Obtained- Core 2700-0505
Data Obtained- Core 0815-C-4950
Data Obtained- Core 2700-2310
Data Obtained- Core 4260-0940
Data Obtained- Core 2650-C-0320
Data Obtained- Core 0865-0875
Data Obtained- Core 0600-0810
.Table B-8 Permeability, Porosity, and Grain Density Data Obtainedby-Core-Ana-li-s-of-thTe-Hig-ýrand-Ore-Body-Sand- -Core-34-50-3-440
APPENDIX C
Table
Table
Table
Table
Table
Table
C-I
C-2
C-3
C-4
C-5
C-6
Summary of Tailings Dam Monitor Wells
Example Water Quality Data Sheet
Summary of Packer Test Results
Undisturbed Tailings Samples
Undisturbed Core Samples
Cutting Samples in Plastic Bags
xi
ABSTRACT
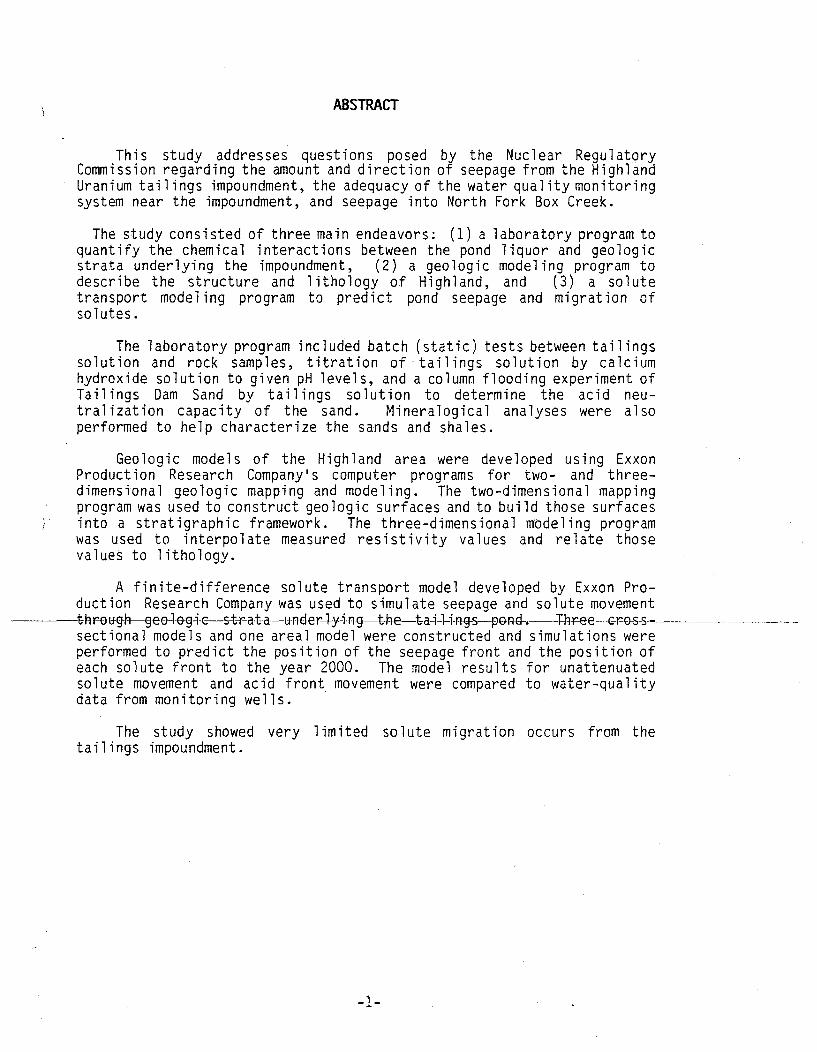
This study addresses questions posed by the Nuclear RegulatoryCommission regarding the amount and direction of seepage from the HighlandUranium tailings impoundment, the adequacy of the water quality monitoringsystem near the impoundment, and seepage into North Fork Box Creek.
The study consisted of three main endeavors: (1) a laboratory program toquantify the chemical interactions between the pond liquor and geologicstrata underlying the impoundment, (2) a geologic modeling program todescribe the structure and lithology of Highland, and (3) a solutetransport modeling program to predict pond seepage and migration ofsolutes.
The laboratory program included batch (static) tests between tailingssolution and rock samples, titration of -tailings solution by calciumhydroxide solution to given pH levels, and a column flooding experiment ofTailings Dam Sand by tailings solution to determine the acid neu-tralization capacity of the sand. Mineralogical analyses were alsoperformed to help characterize the sands and shales.
Geologic models of the Highland area were developed using ExxonProduction Research Company's computer programs for two- and three-dimensional geologic mapping and modeling. The two-dimensional mappingprogram was used to construct geologic surfaces and to build those surfacesinto a stratigraphic framework. The three-dimensional modeling programwas used to interpolate measured resistivity values and relate thosevalues to lithology.
A finite-difference solute transport model developed by Exxon Pro-duction Research Company was used to simulate seepage and solute movement
-th-roug~h-geol-g-ic-s-t-r-a-ta-aunFder-1-•ng-t-he-t•-a--i-ngs-pond•-. Th-ree-c-r--s
sectional models and one areal model were constructed and simulations wereperformed to predict the position of the seepage front and the position ofeach solute front to the year 2000. The model results for unattenuatedsolute movement and acid front movement were compared to water-qualitydata from monitoring wells.
The study showed very limited solute migration occurs from thetailings impoundment.
-1-
1.0. EXECUTIVE SUMMARY
1.1. GENERAL
This study was performed at the request of Exxon Minerals Company.The purpose of the study was to predict seepage and solute migration fromthe Highland Uranium Mill tailings impoundment in Converse County,Wyoming. The study results were used to address questions posed by theNuclear Regulatory Commission regarding the amount and direction ofseepage from the impoundment, the adequacy of the water-quality monitoringsystem near the impoundment, and seepage into North Fork Box Creek. Theimpoundment has been in continuous operation since October, 1972. It willbecome inactive following mill shutdown which is scheduled for December1983.
The study consisted of three main endeavors: (1) a laboratory programto quantify the chemical interactions between the pond liquor and geologicstrata underlying the impoundment, (2) a geologic modeling program todescribe the structure and lithology of Highland, and (3) a solutetransport modeling program to predict pond seepage and migration ofsolutes.
The laboratory program included batch (static) tests between tailingssolution and rock samples, titration of tailings solution by calciumhydroxide solution to given pH levels, and a column-flooding experiment ofTailings Dam Sand by tailings solution to determine the acid neu-tralization capacity of the sand. Mineralogical analyses were alsoperformed to help characterize the sands and shales..
Geologic models of the Highland area were developed using ExxonProduction Research Company's computer programs for two- and three--d-ime-s-iona-l-geo-oeeg-i-c-mapp-i-ng-and-monde-l-i-ng. -T-he-ttweo-d-imefts-i-n-a-l-ma-p ý-i-ngprogram was used to construct geologic surfaces and to build those surfacesinto a stratigraphic framework. The three-dimensional modeling programwas used to interpolate measured resistivity values and relate thosevalues to lithology.
A finite-difference solute transport model developed by Exxon Pro-duction Research Company was used to simulate seepage and solute movementthrough geologic strata underlying the tailings pond. Three cross-sectional models and one areal model were constructed and simulations wereperformed to predict the position of the seepage front and the position ofeach solute front to the year 2000. The model results for unattenuatedsolute movement and acid front movement were compared to water-qualitydata from monitoring wells.
-2-

The approach taken in this study to model solute movement has thefollowing advantages:
1. Chemical attenuation is based on data obtained by actuallycontacting the pond liquor with aquifer rock.
2. The chemical attenuation experiments are linked directly to theflow calculations by means of the relative velocites.
3. A wide range of relative velocity fronts are tracked whichprovides the flexibility to track any solute front for whichbatch test data is available.
4. Flow is calculated using a finite-difference simulator, whichhas the capability to model two fluid phases, nonhomogeneousporous media, and transient boundary conditions.
As will be discussed in the body of the report, the study approach
also has the following limitations:
1. Hydrodynamic dispersion is not calculated.
2. A simplified model (apparent distribution coefficient model) isused to account for the complex chemical reactions occurringbetween the pond liquor and the aquifer rock.
3. Radioactive decay and the generation of daughter products isonly qualitatively considered.
4. The solution mine pilot is not modeled.
1.2. CONCLUSIONS
This section summarizes the principal findings of thisst-uy-T-T-following subsections discuss a comparison of the model results to fielddata, pond seepage rates, lateral and vertical movement of seepage andacidic fronts, predicted movement of specific solutes, and seepage intoNorth Fork Box Creek.
1.2.1. Comparison of Model Results to Field Data
To evaluate the accuracy of this study, areal model predictions of theseepage and acidic front positions were compared to field data. Theseepage front was tracked by measuring calcium, magnesium, and chlorideconcentrations in monitoring wells. These solutes do not appear to reactwith any of the geologic units underlying the tailings impoundment andshould move as fast as the seepage front. The acidic front was trackedusing pH measurements.
-3-

The position of the seepage front predicted by the areal model is ingood agreement with monitor well data north and south of the pond. East ofthe pond, where fluid seeps into North Fork Box Creek along the outcroparea, solute migration is sometimes underestimated due to the finite-difference gridding (discretization) of the areal model. Tracer con-centrations in wells west of the pond indicate that the seepage front hastraveled about 1300 feet further west than predicted. The presence ofthese solutes may be caused by high permeability streaks or verticalleakage near the tailings discharge spigot.
The predicted position of the acidic front is in good agreement withmonitor well data north, west, and east of the pond. South of the pond themodel appears to slightly overpredict acidic front migration.
1.2.2. Pond Seepage
Total seepage from the tailings impoundment rises to about 100 gpm(gallons per minute) within a year after the pond is put into operation. By1974 seepage begins to decrease due to the buildup of low permeabilitytailings and reaches 50 gpm about 1975. Seepage then begins to increase asthe Water level rises and the cone of depression from surface mining lowersthe water potential under the pond. The seepage rate increases at about 19gpm per year until the maximum water level in the pond is obtained in 1983.The mill is then shut down and, as the pond dries, seepage decreases atabout 38 gpm per year. Seepage ceases in 1991 after all the water in thepond and tailings has either evaporated or drained into underlyingformations.
1.2.3. Predicted Lateral Movement of Seepage and Acidic Fronts
Maximum movement of the seepage front will occur west of the pond,•_ r eTahcbsnthe-nar-thern-edge-ofP-i•_2-aboutt-e-y-ar l92-.-T-hseeepfage-froi
will move a maximum of 1300 feet southwest and 300 feet northwest of thepond. Migration of the acidic front is. greatly attenuated. It only movesabout 500 feet from the pond.
1.2.4. Predicted Vertical Movement of Seepage and Acidic Fronts
Vertical movement of the seepage and acidic fronts is limited. Theseepage front will move vertically through the Tailings Dam and Upper OreBody Sands, but will not enter the Middle Ore Body Sand. The acidic frontwill not migrate below the Tailings Dam Shale.
1.2.5. Solute Migration
The following 18 regulated solutes were considered in this study: Al,As, Cd, Cr, Cu, Fe, H (pH), Mn, Ni, Se, Th (total), U (total), Zn, S04-,Pb-210, Ra-226, Th-230, and U-238. The following paragraphs discuss theirmovement.
-4-

The radioactive solutes studied are U (total), Th (total), Pb-210,Ra-226, U-238, and Th-230. All of these substances are strongly attenuatedby the Tailings Dam Sand and Shale. Vertical migration will not extendbelow the Tailings Dam Shale. Maximum horizontal movement is estimated tobe less than 100 feet from the pond.
The concentrations of As, Cd, Mn, Ni, and Zn in the pond liquor exceedregulatory limits in acidic solutions, but not in basic solutions.Therefore, migration of the acidic front is an important factor indetermining where these solutes exceed regulatory standards.
The acidic front moves vertically to near the bottom of the TailingsDam Shale but stops short of entering the Upper Ore Body Sand. Maximumhorizontal movement occurs west and southwest of the pond with Smaximumexcursions of about 800 feet. The concentrations of Cd, Mn, and Zn arecontrolled by pH. Their concentrations in the acidic zone are expected tobe approximately the same as they are in the tailings pond. Thoseconcentrations are 30 ppm, 45 ppm, and 3.2 ppm for Cd, Mn, and Zn,respectively.
Nickel is attenuated by the Tailings Dam Shale but not by any of theother formations. It is, anticipated that Ni will move areally through theTailings Dam Sand the same as Cd, Mn, and Zn, but will not penetratevertically into the Tailings Dam Shale. The concentration of Ni behind theacidic front should be about 1.4 ppm.
Arsenic is strongly attenuated by all geologic units considered inthis study. It will not move below the Tailings Dam Shale and maximumhorizontal migration will be about 175 feet to the west and southwest.
Aluminum, Cr, Cu, Fe, and Se exceed the most stringent regulatorylimits in both acidic and basic solutions. Chromium, Fe, and Se are verystrongly attenuated by both the sands and shales. Essentially no verticalor horizontal solute migration is expected. Copper, which is less stronglyattenuated by the geologic m-aterhs,-,is not expected-t-omigratbe low t-teTailings Dam Shale, and maximum horizontal movement will be less than 600feet to the west. Aluminum was not attenuated by the Tailings Dam or OreBody Sands. However, it was strongly attenuated by the Tailings Dam andOre Body Shales. A very conservative estimate of Al migration indicatesmaximum horizontal movement of about 1200 feet southwest of the pond.
1.2.6. Seepage into North Fork Box Creek
Seepage into North Fork Box Creek was calculated by the areal model.The results showed ground-water seepage downstream of the dam to be about25 gpm before the tailings pond was operational. During the first fewyears of pond operation, seepage increased from 25 to 33 gpm as a result ofseepage through the area where the Tailings Dam Sand was in direct contactwith the pond bottom. As the buildup of tailings on the contact areareduced the effective vertical permeability of the Tailings Dam Sand, andthe surface mine intercepted regional flow, seepage downstream of the dam
-5-
decreased to less than 20 gpm. Seepage increases from 20 gpm to 40 gpm asthe water level in the pond increases between 1977 and 1983. After 1983,seepage decreases as the pond dries and the tailings drain, reaching a Aminimum value of about 7 gpm. About 1993 the seepage begins to increase asregional flow is re-established.
Maximum westward solute migration occurs about the year 1992. By 1995regional flow has been re-established and.the solutes are swept eastwardtowards North Fork Box Creek at a velocity of about 35 feet per year. ThepH beneath the pond will rise as regional ground water reinvades the strataunderlying the pond. The rise in pH will precipitate many solutes fromsolution. The concentration of some solutes will also decrease due tocontinued adsorption onto the aquifer rocks.
Solutes that remain in solution will eventually be discharged intoNorth Fork Box Creek. The discharged solutes may; (1) move slowlydownstream towards Box Creek, (2) be left behind as solids due toevaporation along the seepage face, or (3) seep downward into outcroppingsands and shales.
1.3. RECOMMENDATIONS
It is recommended that the predictions made by the areal modelcontinue to be compared to field data. To enhance the comparisons, threenew water-quality monitoring wells should be installed. Two wells, onecompleted in the Tailings Dam Sand and one completed in the Upper Ore BodySand, should be located 1,500 feet south of Well XII. These wells will bebeyond the maximum extent of the seepage front predicted by the arealmodel. Background concentrations of the tracer solutes (Ca, Mg, and Cl) inthese wells will help verify that the areal model predicted maximum solutemigration.
A third monitoring well should be completed in the Tailings Dam Sandabut-2-0-fEet-nrTthwe-st-of-Wei-1-1-TTh-is-we-T-,-whi-chwtl-al-so-be-beyarndthe maximum extent of the predicted seepage front, will help determinewhether pond-level concentrations of solutes detected in Wells IX and Xresult from tailings being discharged west of the pond or from highpremeability streaks.
No additional modeling studies are recommended. The close agreementbetween the areal model predictions and monitor well data indicate that thechemical transport model adequately described solute movement.
Solute movement into North Fork Box Creek should be evaluated usingthe modeling results in conjunction with surface and ground-water moni-toring data. However, it is unlikely that' solute migration from the pondwill have a significant impact on North Fork Box Creek.
-6-

2.0. INTRODUCTION
The objective of this study was to simulate histor'ic and futureseepage and solute transport from the Highland uranium mine tailingsimpoundment. The study results were used to address questions posed bythe Nuclear Regulatory Commission regarding the amount and direction ofseepage from the impoundment, the adequacy of the water-quality monitor-ing system near the impoundment, and seepage into North Fork Box Creek.To conduct this study, familiarity with the facility operations (mine,mill, and tailings impoundment), regional and local geology, and thehydrologic setting was essential. The remainder of the introduction willgive an overview of each of these topics.
2.1. FACILITY OPERATIONS
In 1968, Exxon Minerals Company (then the Minerals Department ofHumble Oil and Refining Company) discovered a significant uranium depositin Converse County, 35 miles north of Douglas, Wyoming. The site of thisdiscovery became known as Exxon's Highland property. Recovery of uraniumore at Highland has primarily been by surface and underground mining.Some uranium has also been recovered by a pilot solution mine.
The surface mine was the first mine to be developed on the Highlandproperty. Overburden removal (stripping) began in September, 1970 withthe first ore being recovered in October, 1972. The surface mine has beenin operation continually since 1970 and is scheduled for shutdown inDecember, 1983.
In 1973, sinking of the Buffalo Shaft for access to undergroundming-beggan-•_In-L9J7_6telater-a-i d oelp-mentoftwo Ie-v-ei]s wa sinitiated. The track drift, located at a depth of 600 feet, was used forrail haulage and water control. Trackless development in ore occurred ata depth of 550 feet. Ore production commenced at the underground mine in1977 and was continued until shutdown in January, 1982 (Moe, 1979).
An in situ solution mine pilot was initiated in 1972 and expanded in1979. The solution mine had relatively little effect on the hydrologicsystem compared to the surface and underground mining operations, andtherefore was not considered in the study.
Highland's uranium mill uses a conventional acid leach-solventextraction process based on metallurgical technology widely accepted andpracticed in the uranium industry. The mill 'began production ofyellowcake in October 1972, processing ore at a rate of 2,200 tons perday. In 1974, the milling capacity was increased to 3,000 tons per day.The mill is scheduled for shutdown in December, 1983, when the surfacemining operation is completed.
-7-

The primary waste from the mill is called "tailings" which consist ofleached solids and liquid wastes. The tailings solids are composed mainlyof the sand, silt and clay particles which originally formed the ore rock.Since uranium constitutes a small fraction of the ore, the amount oftailings solids generated by the mill is nearly equal to the amount of oreprocessed. The tailings at Highland are acidic with a pH value of about2.
A typ~ical method of tailings disposal has been to slurry them into anatural depression which has been dammed at one end. At Highland, anerosional feature called North Fork Box Creek is used to store' thetailings. This facility is commonly referred to as the "Highland UraniumTailings Pond".
Once tailings are discharged to the pond the solid material sinks tothe bottom relatively quickly. Some particle size segregation occursbecause the fine-grained materials (slimes) are carried further from thedischarge spigots than the sand-sized materials (sands). To conservewater and reduce the water level in the pond, some of the pond liquid(liquor) is decanted and reused for mill process water. In addition tomill tailings, the pond is used to store water from the mine dewateringwells, mine seepage, and solution mine wastes.
When the mill closes in December of 1983, reclamation of the tailingspond will begin. The first reclamation objective will be to enhanceevaporation of the pond liquor. This will be accomplished by sprinklerswithin the pond area. Final reclamation of the pond will begin when thetailings have been dried sufficiently to support earth-moving equip-ment.
2.2. GEOLOGIC SETTING
The geology of the Powder River Basin is described by Langen andK-i-dweq--(-l-J97-O+.
2.2.1. Physical Setting
"The Powder River Basin includes an area of some 12,000square miles in northeastern Wyoming (Figures 1 and 2). It isa broad basin both structurally and topographically, which isbounded on the west by the Big Horn Mountains and Casper Arch,on the south by the Laramie Mountains and Hartville Uplift,and on the east by the Black Hills and less structuralfeatures. To the north, it passes into Montana where itgradually terminates.
"The terrain near Highland is typical of the Powder RiverBasin as a whole. Topographically, the region has moderaterelief consisting of sagebrush cover, rolling hills betweenflattopped highlands, and wide gentle drainages. Elevationsgenerally range from about 4,500 to 5,500 feet, with theexception of the Pumpkin Buttes which rise to an elevation of6,000 feet in the central part of the basin.
-8-

"Drainage in the western and northern parts of the basinis northward through the Powder River and its tributaries andis essentially along the structual basinal axis. In thesouthern part of the basin drainage is to the east, normal tothe structure,. and by way of the Cheyenne River and itstributaries. The Highland deposit is located on the northside of eastward flowing Box Creek, which is a tributary ofLance Creek."
2.2.2. Regional Geology
"The Powder River Basin is an asymmetric syncline with theaxis displaced several miles west of the basin center. Also,the trace of the basin axis on the Precambrian basement lies tothe east of the axis in the surface rocks. The Highlanddeposit is approximately parallel to the surface axis andabout two miles east of it.
"Dips are generally less than 3 degrees on the east side ofthe basin but become steep on the southwest and west sides nearthe basin margin. Local small-scale faulting has beenrecognized in the mineralized areas near Pumpkin Buttes,Monument Hill, and Box Creek, but no widespread extensivefaulting is known to occur. The mountain axes and major foldsof Wyoming started to develop late in the Cretaceous and werewell defined by the Paleocene."
2.2.3. Local Geology
The Highland uranium mine and associated tailings impoundment arelocated in the southern Powder River Basin, Converse County, Wyoming. TheHighland operation is contained in sections 17, 19, 20, 21, 22, 27, 28,29, and 30 of T36N., R72W., and sections 23 and 24 of T36N., R73W. asillustrated in Figure 3. The geologic sequence of the Powder River Basinis shown inFlgure 4-.The rok-i-sts-o--f-nterest in-this area lie in theupper Fort Union Formation. They are composed of interbedded fine-to-coarse grained sandstone, siltstone, claystone and lignite. Thestreams which deposited this material flowed northward into the basin andderived sediment from Mesozoic, Paleozoic, and Precambrian rocks of theLaramie and Granite mountains and from wind-blown volcanic debris of theAbsarokas to the west.
The Highland ore sands are, for this study, referred to as the Upper,Middle and Lower Ore Body Sands. These sands are laterally continuous inthe area of the tailings pond and mine pits but break up or "shale out" tothe north and east. Each ore sand has been interpreted to represent themigration of a large individual point bar system across the meander belt.A neck cutoff then returned the river to the center of the basin where theprocess was repeated. The three ore sands are separated by several feetof siltstones, claystones and lignites deposited in upper point bar,natural levee, and flood plain environments. In places this separatingmaterial has been removed due to channel scour and the ore sands are invertical contact.
-9-
The most consistent rock stratum encountered at Highland is locateddirectly above the Upper Ore Body Sand at an elevation of approximately5,120 feet near the tailings dam. This stratum is a shale and is referredto at Highland as the "Tailings Dam Shale". It outcrops in the valleyfloor at and downstream of the dam. This shale was reported to be in allborings that extended down to at least this elevation. As illustrated inFigures 5 through 9, the Tailings Dam Shale member is continuousthroughout the area except where it has been eroded in the creek bottom.
The first major sand immediately above the ore sands is referred toas the "Tailings Dam Sand". This sand was probably deposited by the samemechanism that deposited the Ore Body Sands. However, the Tailings DamShale, which separates the Tailings Dam Sand from the Upper Ore Sand, ismore laterally continuous than the material separating the individual oresands. Channel scour has not connected the Tailings Dam Sand and UpperOre Sands in the study area.
Several other sand bodies lie above and below the four sands justdescribed but are of little importance to the present study. Directlyabove the Tailings Dam Sand are several small discontinuous sands of theFort Union Formation, and higher in the section is a major sand of theWasatch Formation which is called the Fowler Sand at the Highland mine.Below the Lower Ore Sand are two sand units both of which are lesscontinuous than the ore sands.
2.3. HYDROLOGIC SETTING
2.3.1. Climate
The Highland property is in an area which has a semi-arid and coolclimate. Total precipitation averages about 12 inches per year withsno-wf-a]_l__r-angjn inghe3anper year. Average summertemperatures are in the high 60's and low 70's and average winter,temperatures are in the mid 20's. Extreme temperatures may exceed 1000 inthe summer and -40o in the winter. The average growing season isapproximately 120 days. The prevailing winds are estimated to be from thesouthwest about 24 percent of the time with an average wind speed of about13-14 miles per hour. The average evaporation rate is about 48 inches peryear.
2.3.2. Recharge and Discharge
Recharge and discharge studies of natural hydrologic systems arecommonly based on a model proposed by Hubbert (1940) in which topo-graphically high areas are "recharge zones" and low areas are "dischargezones". Water level data from the Highland area and regional studies byHagmaier (1971) indicate Hubbert's model is valid in the Powder RiverBasin. Toth (1963) expanded Hubbert's model by superimposing local,intermediate, and regional flow systems to better account for the effectsof topographic changes. The three types of flow systems are dif-
-10-

ferentiated by the lengths of the ground-water flow paths. Local systemshave flow paths ranging in length from a few thousand feet to severalthousand feet, intermediate systems range from several thousand feet toseveral miles, and regional systems range from several miles to severaltens of miles. Figure 10 illustrates the superposition of these threetypes of flow systems.
Regional flow through the upper Cretaceous Parkman Sandstone isshown in Figure 11. Although the Parkman Sandstone underlies the FortUnion Formation, it is likely that regional flow directions would besimilar in overlying formations. Note tlhat regional flow is_ to, thenortheast,, i,n the Highland,_area.
Intermediate flow in the Highland vicinity is from Blizzard Heightsto the North Fork Box Creek area as shown on Figure 12. Blizzard Heightsis a topographically high area about 5,600 feet above mean sea level andlocated about nine miles west of the tailings pond. North Fork Box Creekis directly east of the tailings pond (the upper reach of North Fork BoxCreek was dammed to form the tailings pond) and is at approximately 5,150feet. Figure 12 shows a generalized flow net construction betweenBlizzard Heights and North Fork Box Creek which represents preminingground-water flow.
It is assumed that the potentiometric levels in the Tailing DamSandstone, Ore Body Sandstones, and interspaced shale layers were equalin the predevelopment flow system. The flow net is in reasonableagreement with premining potentiometric water levels reported by Hagmaier(1971) and Dames and Moore (1972). In a semi-arid region like Highland,it would be expected that the potentiometric surface would be asignificant distance below the elevation of the recharge area and veryclose to the elevation of the discharge area. The flow net is consistentwith this expectation. It predicts the potentiometric surface to be 150feet below the elevation of Blizzard Heights. Also, it shows the watertable at the discharge area to be at nearly the same elevation as theg-rou n-d-surf-ace-(-aver-ag-e-e-l-ev-at-i-o n-of-abou-t-5T050-to--57-00-fee-t-).
There may be a local flow system between Highland Flats and NorthFork Box Creek (see Figure 12). Highland Flats is about two-and a halfmiles north of the tailings pond at an elevation of about 5,400 feet.However, the close proximity of Highland Flats to the 5,100 foottopographic contour to the east and Gumbo Draw to the southeast indicatesthat it would have little if any effect on the intermediate flow system.
2.3.3. Infiltration
The stratified nature of the sediments near the Highland Minecomplicates the estimation of infiltration. The most expedient andaccurate method of estimating infiltration at Highland is to use anumerical model. By modeling assumed (and physically reasonable)ground-water recharge and discharge rates it should be possible toreproduce potentiometric data measured in the field. This exercise wasundertaken by Dames and Moore (1980a) in the local recharge system between
-11-
Highland Flats and the Highland mine - North Fork Box Creek area. Theyreported infiltration rates of 0.8 inches per year in the Highland Flatsarea above elevations of 5,400 feet and 0.4 inches per year elsewhere.Since the climate does not change within the intermediate flow system, andthe geologic materials have similiar characteristics, the infiltrationrates cited by Dames and Moore should be applicable between BlizzardHeights and North Fork Box Creek.
2.3.4. Field Program
An extensive field program was conducted by Exxon Minerals Companyat Highland. The program was aimed at obtaining geologic and hydrologicsite descriptions and water-quality data.
The geologic program consisted of core analysis, geophysical log-ging, and geologic interpretation of the area. The hydrologic program wasdesigned to obtain hydraulic properities of the aquifiers and anunderstanding of regional ground-water flow. Hydraulic properties wereobtained by pump testing, packer testing, and core analyses. The regionalflow was determined by measuring water levels in observation wells.
The water-quality monitoring program consisted of a network ofmonitoring wells from which-water samples were obtained, analyzed, andcorrelated.
A complete description of the field program is given in Appendix C.
-12-

3.0. GENERAL APPROACH
The complexities of solute interaction with geologic formations andthe difficulties associated with describing ground-water flow in hydro-logic systems precludes exact analysis of solute transport. However, byexercising judgment and using simplified models of complex physicalsystems, reasonable estimates of solute movement can be obtained. Whenavailable, field data is used to check the accuracy of the model results.
This chapter provides an overview of the mechanisms affecting solutetransport at Highland and describes the methods and approximations usedin this study.
3.1. MECHANISMS AFFECTING SOLUTE MOVEMENT AT HIGHLAND
There are three contaminant transport mechanisms that will affectthe movement of solutes at Highland. These mechanisms are advection,hydrodynamic dispersion, and chemical and biochemical attenuation.
Advection (sometimes called convection) is the mechanism by whichsolutes are moved through the porous media by flowing ground water. Therate of movement of solutes by advection is equal to the average linearground-water velocity. To determine solute movement by advection, theflow regime must be known. Analytical solutions are available for verysimple flow situations. However, when attempting to calculate flow in acomplex geologic environment, like Highland, numerical (finite differenceor finite element) methods must be employed. A general purposefinite-difference reservoir simulator developed by Exxon ProductionResearch Company was used in this study. The simulator has the capabilityto solve one-, two-, or three-dimensional flow for one, two, or threefluid phases. In this analysis it was used in a two-dimensional, twophalsle m~ode.
Hydrodynamic dispersion is the phenomenon which causes a spreadingof the contaminant front. Hydrodynamic dispersion is caused by bothdynamic dispersivity and molecular diffusion. Dynamic dispersivity is aresult of small-scale heterogeneities in the porous media which causesome ground water to move faster and some slower than the average linearvelocity. Molecular diffusion is the result of collisions betweenmolecules and may be an important mode of solute transport in low-velocityflow regimes frequently associated with low-permeability materials.Commonly, a measure of both the dynamic dispersivity and moleculardiffusion is incorporated in a parameter called the coefficient ofhydrodynamic dispersion or the effective dispersion coefficient.
Although many contaminant transport studies consider hydrodynamicdispersion, there is frequently a fundamental flaw in their calculations.That flaw is well stated by Anderson (1979):
-13-

"It is well known that the magnitude of the measureddispersivity changes, depending on the scale to which themeasurements are taken. Laboratory experiments designed tomeasure dispersivity yield values in the range of 10-2 to 1centimeter, while dispersivities of 10 to 100 meters have beenobtained for field problems."
In other words, the dispersion coefficient depends on the flow pathlength. Modeling studies are often conducted using a dispersion coeffi-cient that was obtained for some arbitrary flow length, and has no realsignficance for the situation being analyzed.
The approach taken in this study was to postpone the calculation ofhydrodynamic dispersion and first consider advection and attenuationmechanisms. Had the results of this study indicated that dispersion wasimportant, it would have been incorporated into later modeling studies.The advantage of this strategy is that after analyzing the flow, we had aknowledge of the pertinent flow path lengths and, if required, could havedesigned dispersion coefficient field tests accordingly. The results ofthe flow analysis, which are described in Chapter 6, indicate thatmodeling hydrodynamic dispersion was not necessary because solute move-ments from the pond was areally restricted.
There are six major categories of chemical and biochemical reactionsthat can alter solute concentrations in ground water, namely adsorption-desorption reactions (including ion exchange), acid-base reactions, so-lution-precipitation reactions, oxidation-reduction reactions, ion pair-ing or complexation, and microbial cell synthesis. The large number ofpossible reactions combined with the myriad of chemical constituentsfound in waste ponds and natural ground water can make the chemicalanalysis of 6ontaminant transport problems extremely difficult.
To circumvent such difficulties, a relatively simple laboratory testi Gft e•-t-1--mp-lo--ed-The-test-mea-suresthe-cheri-ce-rea arr sak-ngplace between the solutes and the aquifer rock. The test is conducted byequlibrating known quantities of liquid (pond liquor) with aquifer rockand measuring the concentration of each solute in the pond liquor beforeand after contact with the rock. It is assumed that any soluteconcentration reduction in the pond liquor was caused by the soluteadsorbing onto the aquifer rock and any solute concentration increase wascaused by the solute desorbing from the aquifer rock. The results of suchan experiment are commonly expressed as an apparent distribution coeffi-cient which is the ratio of the mass of a solute on the rock to the massof a solute in the liquid. Distribution coefficients, together with thebulk density and porosity of the aquifer rock, are used to calculate thevelocity of a specific solute concentration front relative to the averagelinear velocity of the fluid leaving the tailings pond. Therefore, thechemical attenuation and advection components of solute movement can becalculated once the apparent distribution coefficients and the flow field(and hence, the fluid velocity field) in the vicinity of the pond areknown.
-14-
Finally, one additional attenuation mechanism is radioactive decay.One must be concerned with possible concentration reductions of radio-active solutes originally in the pond liquor and the generation andsubsequent decay of daughter products.
The radioactive constituents of interest in this study are uran-ium-238, thorium-230, radium-226, lead-210, and polonium-210. Uran-ium-238, radium-226, and thorium-230 have half-lives of 4.5 billionyears, 80,000 years, and 1622 years respectively. Since these half-livesare long compared to the length of the study, radioactive decay will notaffect the concentration of these isotopes and they are treated in thesame manner as stable elements.
Lead-210 has a half-life.of 22 years and is a daughter product ofradium-226. Lead-210 decays to a series of short-lived (fraction of asecond to days) daughter products and eventually forms polonium-210 whichhas a half-life of 138.4 days. Over the simulation period the concen-trations of lead-210 and polonium-210 will not change, since they are insecular equilibrium with the uranium series. The daughter product ofpolonium-210 is lead-206, which is stable. Its concentration willincrease as the polonium-210 decays. Figure 13 illustrates the uranium--238 radioactive series.
3.2. STUDY APPROACH
Having briefly described the important contaminant transport mechan-isms considered for Highland, the following text describes the calcula-tion procedure used to quantify solute movement.
The basis of the solute movement calculations will be the flowcalculations performed by the finite-difference reservoir simulator. Inaddition to calculating flow rates, the simulator uses a point trackingscheme to account for solute movement.
Po-nt-tra-cking-i-s-a-method-&whch-uses-c-a-l-u-te-d-ow-r-tes-and-watersaturations to simulate the movement of mathematical points through anaquifer. By defining a line of these points along the bottom of theseepage pond at the beginning of a simulation, the position of the meanrelative concentration (one-half the pond concentration) front of asolute can be determined at any time by connecting the mathematicalpoints. The point tracking scheme actually predicts piston-displacementtype flow. The assumptionthat hydrodynamic dispersion causes the con-taminant concentration to be symmetrically distributed about the meanconcentration allows us to state that we are tracking the mean relativeconcentration front. Dispersion will cause concentrations of solutesless than one-half the pond concentration to be ahead of the mean relativeconcentration front. This study does not calculate the positions of theselower concentration fronts.
-15-
It is well known that the mean relative concentration front of manysolutes does not move as fast as the average linear velocity of the pondliquor. This "retardation" is due to chemical reactions occurringbetween the solutes, the aquifer rock, and the native ground water. It isalso recognized that the advance of many solutes depends strongly upon thesolution acidity. Most solutes move much further in acidic environmentsthan in neutral or basic environments. It is, therefore, important todetermine the ability of the rock underlying the pond to buffer the acidictailings pond solution. This buffering capacity will control thevelocity and migration of various solute fronts relative to the pondliquor.
The determination of the buffering capacity of the aquifer rock andthe apparent distribution coefficients for various solutes were measuredin an experimental laboratory program. First, the buffering capacity ofthe Tailings Dam Sand was determined by column flooding rock samples withpond liquor. Second, apparent distribution coefficients for dissolvedsolids under acidic and neutral conditions were determined using theprocedure previously described. Finally, the apparent distributioncoefficients were used to calculate the relative velocity values ofvarious solute species.
The buffering capacity of the aquifer and the relative velocityvalues for the solutes are used with the flow rates calculated by the flowsimulator to predict the position of the mean relative concentrationfronts of the chemically reactive solutes as a function of time. This isa two step procedure. First, the titration data are combined with flowrates to determine how much of the underlying stratum was acidified bypond leakage. This area will represent the practical excursion boundaryfor many solutes which are efficiently removed from solution once theyleave the acidified zone. Having determined the movement of the acidiczone under the pond, the appropriate apparent distribution coefficientscan be selected (based upon whether the zone is acidic, neutral, or basic)and relative velocities calculated. The relative velocities can then bei-nc-orpor-ated-i-n-to-the-f-low-s-iml-atyr'-s-p-o-i-t-tracki--n-cheme. Th-s-sdone by multiplying the average linear fluid velocity by the relativevelocity of a solute concentration front before the mathematical point ismoved through the aquifer. Since the relative velocities of many of thesolutes are nearly the same, a series of relative velocity values wereused which reflected the values of individual solutes. This reduced thenumber of moving points without sacrificing accuracy. At any time duringthe simulation the points can be connected to provide the mean relativeconcentration front's position.
The approach taken in this study to model solute movement has thefollowing advantages:
1. Chemical attenuation is based on data obtained by actuallycontacting the pond liquor with aquifer rock.
2. The chemical attenuation experiments are linked directly to theflow calculations by means of the relative velocities.
-16-

3. A wide range of relative velocity fronts are tracked whichprovides the flexibility to track any solute front for whichbatch test data is available.
4. Flow is calculated using finite-difference simulator, which hasthe capability to model two fluid phases, nonhomogeneous porousmedia, and transient boundary conditions.
As mentioned previously, the study approach also has the following
limitations:
1. Hydrodynamic dispersion is not calculated.
2. A simplified model (apparent distribution coefficient model) isused to account for the complex chemical reactions occurringbetween the pond liquor and the aquifer rock.
3. Radioactive decay and the generation of daughter products isonly qualitatively considered.
Having outlined the strategy of this study, the following threechapters will be devoted to the technical details of the laboratoryprogram, the geologic modeling effort, and the flow simulation work.
-17-
4.0. LABORATORY PROGRAM
Laboratory studies of some of the chemical interactions which takeplace between Highland tailings solution and four rock units, namely theTailings Dam Sandstone, Tailings Dam Shale, Ore Body Sandstone, and OreBody Shale, which underlie the tailings pond were performed. The studiesincluded batch (static) tests between tailings solution and rock samples,titrations of tailings solution by calcium hydroxide solution to given pHlevels, and a column-flooding experiment of Tailings Dam Sandstone bytailings solution. Mineralogical analyses were also performed to helpcharacterize the sands and shales.
The batch tests were designed to determine the attenuation ofvarious elements in the tailings solution by each of the four rock types,and whether equilibrium of the attenuation reactions appear to have beenreached during the particular batch test.
The major cause of attenuation at Highland is believed to be thebuffering action of the rock samples which results in increased pH andsimultaneous precipitation from the tailings solution. To study this,titrations of tailings solution by 0.015 M Ca(OH) 2 were made to pH 3.5, 5,and 8, and resulting solutions were analyzed for the cations and anions ofinterest.
The final step in the laboratory program was to monitor the change incolumn effluent pH as tailings solution was pumped slowly through a columnpacked with disaggregated Tailings Dam Sandstone. This test provided anestimate of the capacity of this sandstone to neutralize tailingssolution.
__________.I.ELUIDANDROCK-SAMLES___
Samples of the Tailings Dam Sandstone and Tailings Dam Shale weretaken from Surface Mine 4 (Pit 4), Ore Body Sandstone and Ore Body Shalefrom Surface Mine 3 (Pit 3), and tailings solution from the discharge tubejust prior to entering the tailings pond (see Figure 3).
The results of inorganic analyses of the as-received rock materialsand Highland tailings solution are given in Table 1. Elemental and oxideconcentrations are given for the major (Al, Ca, Fe, K, Mg, Na, Si) andminor (Mn) constituents of the rock samples. Elemental concentrationswere determined by atomic absorption spectrometry. The relatively highsilica concentrations in the rock samples were determined by subtractingthe sum of all other major and minor rock constituents from 100 percent.There may be some calcite (calcium carbonate) present in the rock samplesthat is not detectable by x-ray diffraction analysis, but the errorinvolved in not accounting for calcite is small. All the other major andminor elements probably occur in aluminosilicates or quartz.
-18-

The as-received tailings solution has a pH of 2.4 and an Eh of 846 mv.The total milliequivalents of cations is 6% lower than the totalmilliequivalents of ani-ons on a relative basis. An error of this magnitudemight be accounted for in experimental error of analysis. However, at thetailings solution pH there may be some bisulfate present (10% or less ofthe sulfate) which would have the effect of decreasing the totalmilliequivalents of anions from 158 to about 138. The determination ofiron is for total iron with no regard for oxidation state. In the chargebalance calculation all iron was considered as ferric iron, but there mayhave been some ferrous iron present. The effect of ferrous iron is todecrease the number of milliequivalents of cations in the charge balance.The closeness of the charge balance indicates that the analysis wasrelatively complete and accurate. It appears that all major components ofthe tailings solution have been accounted for.
In the batch tests,. when the oven dried shales were used, the sampleswere initially quite hard, and could be disaggregated only with the aid ofa mortar and pestle. The sandstones, on the other hand, were easilydisaggregated. After a day or two of exposure to the tailings solution,the shale samples disintegrated to form beds of finely divided materials inthe bottoms of the flasks. The sandstones did not behave in this manner.Their average particle size was much larger than that of the shales. Therewas a notable decoloration of the solution in each flask, especially in theflasks containing shales. The color changed from straw yellow to almostclear.
4.2. BATCH EXPERIMENTS
Batch experiments were conducted in which 25 grams of rock sample wasexposed to 100 ml of tailings solution for up to 30 days. Subsamples ofeach of the four rock types (Tailings Dam Sandstone, Tailings Dam Shale,Ore Body Sandstone, Ore Body Shale) were crushed to -1/4" size beforedrying in an oven at 110 0C for 5 to 6 hours. After drying, the samples werest-or-ed-tn-d-te-atcc-at-or--vr-c-a-l-c-i-um-ch-l-or-i-d-e.
The batch-test solutions were analyzed by atomic absorption spec-trometry to determine cation concentrations and by ion chromatography forsulfate ion. Results of these analyses are given in Tables 2 through 5 andFigure 14. In the batch tests the pH changed from 2.4 in the as-receivedtailings solution to between 3 and 3.5 after 30 days of exposure to thevarious rock samples. Note that the concentrations of aluminum and siliconincreased in the solutions above the sandstones but decreased in thesolutions above the shales with increasing exposure time. The concentra-tions of calcium, magnesium, and strontium in solution increased withincreasing exposure time. The concentration increases of these threecations probably arise as a result of ion exchange reactions on clayminerals in which these cations are replaced by hydrogen ion.
Some cations were removed from solution. The concentration of iron,which probably precipitates as ferric hydroxide, decreased from 775 ppm inthe as-received tailings solution to between 25 and 125 ppm after 30 daysexposure. The solutions over the shales lost iron more rapidly than thoseover the sandstones. Chromium and copper decreased in all solutions.
-19-

Calcium and strontium seem to have reached saturation levels insolution. Strontium concentrations decreased sharply between 15 and 30days of exposure. This observation may be the expression of coprecipita-tion of strontium sulfate with gypsum.
4.3. ACID-BASE TITRATIONS
The buffering action of the rocks, resulting in simultaneous changein pH and precipitation is thought to be the prevalent mechanism inaltering the concentrations of the various constituents of the tailingssolution. To study this, titrations of the tailings solution by 0.015Mcalcium hydroxide were made. The calcium hydroxide solution was preparedby dissolving 1.11 grams of Ca(OH) 2 in deionized water in a one litervolumetric flask and was standardized with HCI solution. Aliquots oftailings solution were titrated in triplicate to pH 3.5, 5, and 8 by thestandard Ca(OH) 2 solution. After stable pH values were attained at thepredetermined levels, the solutions were filtered through 0.45pm Teflonfilters, then acidified with HN0 3. The solutions were stored inacid-washed polyethylene bottles. The filtered and acidified solutionsfrom the titrations were analyzed by atomic absorption spectrometry.Results of these analyses are shown in Table 6 and Figure 15.
Table 6 shows two columns of data for each pH level. In each case,the first column lists concentrations of cations in the diluted tailingssolution sample after titration to the given pH. The second column liststhe cation concentrations in tailings solution as if the pH of thetailings solution had been changed without dilution in order to approxi-mate the result of buffering the tailings solution by rock. In thecalculations no attempt was made to account for possible precipitationreactions or other removal mechanisms which are concentration dependent.
Magnesium, sodium, and potassium form somewhat stable ion pairs withsul1fat;i,_w hi-c-__i-f n.ort dissociateed ,causelow-deter-min.ations--f the-secations in high sulfate solutions. For the analyses, a 50 ml aliquot ofthe titrated tailings solution was transferred to a polyethylene bottleand 5 ml of 10% lanthanum chloride solution and 1 ml of nitric acid wereadded. Lanthanum chloride is added to the solutions because lanthanumforms a more stable ion pair with sulfate thereby releasing the othercations for analysis. During the progress of the titrations the sulfateion concentration was decreased by dilution and by precipitation asgypsum. At each stopping point an aliquot of fixed volume was withdrawnfrom the reaction vessel, and to this aliquot a given volume of lanthanumchloride solution was added. A greater proportion of sulfate ion wascombined in ion pairs with lanthanum as the sulfate concentrationdecreased. This resulted in apparent increases in magnesium, sodium andpotassium with increasing pH in the undiluted tailings solution.
®Registered trademark DuPont Company
-20-

In addition, ionization of. sodium and potassium in the atomicabsorption flame may also occur as in the following reaction:
Na° = Na+ + e-
When ionization occurs, the population of ground state atoms in the flamedecreases, thereby masking the ions from determination.
None of the regulated elements determined in the titrated tailingssolution were initially present at concentrations lower than the moststringent water quality standards which are described in Section 7.1 andlisted in Table 22. At pH 3.5 arsenic and zinc concentrations decreasedto a level below the limits. At pH 8 manganese, nickel, and cadmiumconcentrations were at or below the limits. No limits have beenestablished for potassium, magnesium, sodium, silicon, or strontium.Aluminum, iron, chromium, copper and selenium remained at concentrationsabove the limits at pH 8.
A discussion of the analytical methods used for determining elementconcentrations is given in Appendix A.
4.4. COLUMN FLOODING EXPERIMENT
A column flooding test was performed to provide an estimate of thecapacity of the Tailings Dam Sand to neutralize tailings solution. Thetest was conducted in a lucite cylinder with threaded end caps. Thecylinder was prepared to contain a one inch diameter by six inch longcolumn of disaggregated Tailings Dam Sandstone. Each end cap had fittingsfor directing solution flow through the sandstone column.
The sandstone was disaggregated and packed in the column in a slurryto exclude air. Table 7 lists the physical characteristics of thesandstone column. Distilled water was pumped through the column at 0.1ml/min, using a Waters Associate Model 45 liquid chromatography pump,until the effluent pH was stable (pH = 8.5). The influent stream waschanged from distilled water to tailings solution without introduction ofair. Influent flow rate, pressure drop across the column, and effluent pHwere monitored throughout the leaching test. Pressure and flow rate datawere output to a Digitec Model 3000 Datalogger and pH was continuouslyrecorded on a strip chart recorder. A flow-through pH cell wasconstructed by sealing a micro-combination pH electrode in a sidearm of a1/4" Nylon union-T fitting.
Figure 16 shows the dependence of effluent pH on volume of tailingssolution passed through the column of Tailings Dam Sandstone. Theeffluent pH stream was 7.7 after one pore volume of tailings solution hadpassed through the column, and 3.8 after passage of 4 pore volumes. Therewas a gradual decrease of pH to 3.2. These results indicate that theTailings Dam Sand has the capability to buffer the tailing solution.
-21-

At the end of the column leach there was a coating of what appears tobe ferric hydroxide on the sand grains throughout the length of thecolumn. Some fine-grained material, which had segregated to one end of thecolumn during packing, had no observable yellow coating. There was nomeasurable pressure drop across the core during the leaching experimentdespite the formation of the coating on the sand grains.
4.5. MINERALOGY
Samples of undried and oven-dried sandstones and shales in their as-received conditions and samples of sandstones and shales after exposureto the tailings solution in the batch experiments for three and thirtydays were submitted for mineralogical analyses.
No mineralogical differences were found between the undried andoven-dried shales other than dehydration of expandable clays upon drying,and subsequent collapse of the expandable clay matrices. The quantitiesof clay-sized material increased significantly upon drying.
Results of the mineralogical analyses are shown in Tables 8 and 9.Quartz., kaolinite, and mica were detected in all the bulk compositionshale samples. Smectite was detected in all samples except the bulkundried sandstones and shales'. Smectite was detectable in the bulk driedsamples because the concentration of the clay material increased uponwater loss. Gypsum was detected in the shale samples that had beenexposed to tailings solution, but not in the as-received shale samples.The weight percentage of gypsum in the samples was estimated by assumingthat all sulfur detected was present as gypsum. In the few samplesanalyzed there was an increase in gypsum concentration with exposuretime. The tailings solution evidently became saturated with calcium dueto alteration of mineral species or ion exchange, and-gypsum began toprecipitate from solution.
The sandstone s amples__u-d-r_•nt-aj e.nral]dec-rea.sevi-nav-eragegrainsize. Rock fragments originally present were broken down to individualmineral constituents. A yellow clay-like coating was gradually depositedon the grains. There was more of the coating on 30-day exposure samplesthan on 3-day samples, but there were lower concentrations of uranium,calcium, and potassium in the coating of the 30-day samples than the 3-daysamples. The yellow coating on the grains had silicon, iron, and aluminumas the~major cations, generally in the order Si> Fe>Al. Minor amountsof magnesium, potassium, calcium, sulfur, and titanium were detected atdifferent times.
There was the appearance of abundant silt-sized "clay clumps" con-sisting either of single crystals (i.e., quartz, feldspar, hornblende,muscovite) or poorly formed oxides (iron) and clays. There was also agradual alteration of iron- and magnesium-rich minerals to oxides and/orclays, and a gradual loss of feldspars through grain size reduction tosilt, or alteration to clays.
A discussion of the methods used for mineralogical analyses is givenin Appendix A.
-22-

4.6. INTERPRETATION OF LABORATORY RESULTS
The laboratory work shows that the four rock types analyzed havecapacity to buffer the Highland tailings solution and thereby cause thebulk of its dissolved solids burden to precipitate.
When tailings solution first comes into contact with geologic unitsunderlying the pond, the dissolved solids burden will be quickly reduceddue to the increase in pH. Continued flow of tailings solution into thiszone will cause the pH to decrease with the possible dissolution ofportions of the precipitate, and alteration of sandstone constituents.The species brought into solution at this zone will be carried forward tothe next zone of higher pH and be reprecipitated. There will be a generalretardation in the migration of the original dissolved solids burdenbehind the pH front. When the flow of tailings liquor has ceased andnative ground water reinvades the formations underlying the pond, the pHof the acidic area will increase, and dissolved solids will precipitate.

5.0. GEOLOGIC MODELING
w An accurate and complete geologic description of the Highland areawas an essential prerequisite to the flow calculations. There were twoaspects of the geology which were extremely important to predicting solutemovement: structure and stratigraphy.
The structure of the area has a significant impact on solute movement.The beds generally dip to the northwest at between one and three degrees(two and five percent). These dips are in the same range as the preminingpotentiometric surface which decreased from west to east at horizontalhydraulic gradients of between one and six percent. Since the Tailings DamSand will be unconfined near the outcrops, tailings pond, and surface mineduring parts of the simulation, the local geologic structure couldsignificantly affect horizontal ground water movement.
The stratigraphy of the sand and shale layers will clearly controlvertical solute movement. For example, the tailings impoundment is not indirect contact with any of the Ore Body Sands. To predict whether solutesmove into the Ore Body Sands, an accurate description of the Tailings DamShale and the interspaced Ore Body Shales was required. In addition toflow impedance considerations, the sands and shales have different atten-uation and neutralization characteristics. Knowledge of the thickness andcontinuity of the individual layers will enhance the prediction of solutemigration.
Geologic models of the Highland uranium mine were constructed usingExxon Production Research Company's computer programs for two- and three-dimensional geologic mapping and modeling. The two-dimensional mappingprogram is used to construct geologic surfaces and to build those surfacesinto a stratigraphic framework. Input to the two-dimensional program are_________coordinateloc.ai-o-ns-a-t-i-n-te-r-sec-t-i-osn-s-between-dr-iq-T-hol-esand-t-he-v-ar-io-usrock units. The resulting surfaces can be displayed as structural contourmaps or cross sections.
The three-dimensional modeling program is used to interpolate anycharacteristic that has been measured along a drill holeshaft, or workingface. Resistivity values were used at Highland. A variety of inter-polation techniques are available which can be used in either layered orisotropic situations or any mixture of the two. The resulting models canbe displayed in plan and cross section as well as evaluated for volume andtonnage.
5.1. PROCEDURE
Two geologic models were constructed; a fine-grid model (100-footsquare grid blocks) in the area of the pond and pits, and a coarse-gridmodel (500-foot square grid blocks) for the area within several miles ofthe mine site. Two models were required because the flow simulator is avariable-sized block modeling program and the geologic mapping, andmodeling programs are not. To model the detail needed by the flow
-24-

simulator near the pond and yet cover the area of interest would require athree-dimensional geologic model many millions of cells in size. Bybuilding two reasonably sized models, one coarse and one fine, the entirearea was modeled at the detail required.
Geologic model development involved data collection, construction ofthe two-dimensional stratigraphic model, and construction of the three-dimensional lithologic model. The following text describes each of thesesteps.
5.2. Geologic Data
The data used in constructing the geologic models came from contourmaps and drill hole geophysical logs (see Appendix C).
The information digitized from the contour maps included the pre-mining topography (1:2000), the base of Pit 1 (1:500), the base of Pit 2(1:500), and the present day topography (1:500)
Interpretation of electrical resistivity curves from 230 holesprovided the 'tops' picks for the various lithologic units of interest.The geologic picks were made at Highland and checked for errors usingcomputer displays from the two-dimensional program. Lithologic units usedin the modeling were the Tailings Dam Sand; the Tailings Dam Shale; theUpper, Middle, and Lower Ore Body Sands; and the interspaced Ore BodyShales.
Electrical resistivity curves from 77 of the 230 logs were digitizedat two-foot increments. The digitized curves provided the downholelithology information used in constructing the three-dimensional models.Single point resistiv.ity values were recorded downhole. The magnitude ofthe resistivity readings varied from one hole to the next because themeasurements were uncalibrated. Due to these variations all the logs werenormalized to a resistivity range between 0 and 100. A value of 0 wasa-s-s-umed-t-o-repres-en-t--a-pure--sh-a-ie-and-a-v-ca--ue-o-f--1-O-a-c-l-e-an-s-and -- Thecutoff value between a sand and shale was set at 45 which was the averagenormalized resistivity value of all intervals in all holes.
5.3. CONSTRUCTION OF THE TWO-DIMENSIONAL STRATIGRAPHIC MODEL
The Highland stratigraphic model consists of a series of two-dimensional surfaces (grids) each representing the top or base of astratigraphic unit. A two-dimensional surface was constructed by over-laying a grid on the original tops picks for a unit. The original tops datasurrounding each grid intersection were used in an inverse distancesquared interpolation to estimate the value for the intersection. Theresulting grid represents that particular geologic surface.
Prior to constructing the grids, nine additional "dummy" picks wereadded for each surface in the data set. These picks were required tocontrol the gridding process as it progressed away from the data. Duringgridding the first intersections to be assigned values are those near data
-25-

points. As the gridding continues, intersections progressively fartherfrom the data are assigned values. Because of this, a trend at the edge ofthe data going either up or down, although only a local feature, may beerroneously extrapolated to the edge of the grid. The addition ofsupplementary picks which reflect the regional trend minimize falseextrapolations.
The final geologically acceptable stratigraphic model was constructedby operating the individual preliminary grids against each other. Theunrefined grids were not geologically sensible because they were con-structed independently and sometimes crossed each other. To prevent this,each grid was operated against neighboring grids to produce properlyonlapped, truncated, or conformable surfaces.
One additonal geologic control placed on the grids during con-struction was to maintain a ten foot thickness of the Tailings Dam Shalethroughout the area. This control is based on the geologists' under-standing of the unit and was applied to prevent unrealistic pinch outscaused by data extrapolation. The ten foot minimum shale thickness was ingood agreement with wellbore data (see Figure 5).
5.4. CONSTRUCTION OF THE THREE-DIMENSIONAL LITHOLOGIC MODEL
A three-dimensional model of electrical resistivity was constructedusing the lithology simulator. The simulator adds the third dimension bygenerating a stack of blocks at each grid cell of the two-dimensionalmodel. Resistivity values are then assigned to all blocks by interpolatingand extrapolating well resistivity data using the inverse distanceweighting method. No values were assigned to blocks greater than 2.5 milesfrom a hole. Those blocks were assigned the resistivity characteristic ofthe particular stratigraphic unit in which they were located. For example,cells beyond the search limit and in a shale unit would be assigned a lowresistivity and those in a sand unit a high resistivity.
T -e--thrse-edrmen-s-ian-l--mo-de -of-r-rststi-vity-w&s--cnv-rt-ed--to--ltth -ology by designating all blQcks having resistivity values less than 45 asshales and those greater than or equal to 45 as sands.
Models of premining and present day lithology were obtained bysuperimposing the topographic surfaces of the premining and present daysituations on the results of the three-dimensional lithology simulator.
5.5. USE OF GEOLOGIC MODELS
Geologic models greatly enhanced our capability to evaluate theHighland geology, select representative cross sections, and construct flowmodels. The stratigraphic and lithologic models were used to defineformation structure and rock characteristics in the cross-sectional andareal flow models. The geologic displays that were generated are describedin the following paragraphs.
-26-

5.5,1. Cross-Sectional Flow Models
Several cross sections passing through a common point in the center ofthe tailings pond were generated from the geologic models. These crosssections were anaylzed and three were selected as being representative ofHighland. The representative cross sections, shown in Figures 17 - 20, hadorientations of west-east, 45 degrees west of north, and 45 degrees east ofnorth. These sections demonstrate the limited range of structure,formation thickness, and lithology seen in the study area.
Three displays were generated for each cross section. They consistedof the coarse model premining topography and geology, fine model preminingtopography and geology, and the fine model present day topography andgeology. The coarse model displays were only used in the portions of thesections not covered by the more detailed fine model. The fine modeldisplays covered the entire area of pits and pond and thus eliminated theneed for a present day coarse model display.
The stratigraphic models were used to establish a grid for the cross-sectional flow models, as will be discussed in Section 6.1.2. Eachhorizontal grid followed a separate geologic unit and varied in thicknessand depth from block to block. (See Figures 18 - 20).
The lithologic models were used to determine the sand and shalecontent of each block so average porosity and permeability values could becalculated.
5.5.2. Areal Flow Model
The areal flow model considered only the Tailings Dam Sand as will bediscussed in Section 6.2.1. The stratigraphic and lithologic models wereused to describe that unit over an area of approximately 30 square miles.
The stratigraphic fine- and coarse-grid models provided contour mapsof the Tailings Dam Sand's structural top, structural base, and thickness.These maps were used to input formation thickness and depth into the flowsimulator.
The lithologic model provided contour maps of the thickness of sandand shale lenses in the Tailings Dam Sand unit. These maps were used tocalculate average porosity and permeability values.
-27-

6.0. FLOW MODELING
The prediction of solute movement in this study uses the distributioncoefficient approach to model geochemical reactions. The model relateslaboratory adsorption/ desorption results to the velocity of a solutefront relative to the advective movement of ground water, as previouslydiscussed in Chapter 3. A finite-difference simulator was used tocalculate ground-water movement. The simulator calculated ground-waterpotentials and fluid fluxes in the vicinity of the tailings pond andtracked mathematical points by converting the fluxes to fluid velocities.Several sets of points were tracked simultaneously with each set beingretarded a different amount to account for geochemical reactions. Theretardation (relative velocity) factors were chosen based on results ofthe laboratory program.
This chapter discusses flow modeling at Highland. The chapter isdivided in two main sections: cross-sectional modeling and arealmodeling. The sections describe the purpose, the location and gridconstruction (discretization) the fluid and rock properties, the si-mulation strategy, and the results of the cross-sectional and arealmodels, respectively.
6.1. CROSS SECTIONAL MODELS
6.1.1. Purpose
The purpose of the cross-sectional models was fourfold:
__T oaluate-thevert-ical]movementof-s-lutes_£mmthe-t~a-]gsimpoundment to the underlying sands,
2. To calculate the horizontal movement of solutes between the pondand the surface and underground mines,
3. To estimate pond seepage as a function of time, and
4. To evaluate possible vertical communication of solutes betweensand units via the backfilled surface mine.
One of the important issues this study addressed was whether soluteswould move through the Tailings Dam Shale and enter one or more of the OreBody Sands. To accurately determine the extent of vertical solutemigration, the cross-sectional models included all of the stratigraphiclayers from above the maximum water level in the pond to at least the shaleunderlying the Lower Ore Sand. Although this approach required modeling upto 16 different geologic layers, it provided sufficient detail to allowaccurate simulation of vertical gradients caused by the impounded tailingsliquor and surface and underground mines.
-28-

It was also necessary to determine maximum horizontal migration. Apreliminary assessment of solute movement at Highland indicated thatmaximum ground-water gradients would exist between the pond and the minesand between the pond and the sand outcrops east of the tailings dam. It wasalso hypothesized that although a distorted radial flow field would bestdescribe water movement away from the pond, the flow field would beessentially linear between the tailings pond and the surface and under-ground mines. Figure 21 is a sketch of anticipated flow patterns throughthe Tailings Dam Sand near the tailings impoundment during mining. Byjudicial selection of cross-sections, horizontal flow from the pond to themines could be simulated using a linear flow model. Since part of the damis constructed through the Tailings Dam Sand, water in that unit will flowaround the dam's wings. The cross-sectional models will not correctlypredict flow around the dam in the Tailings Dam Sand because of the curvedflow lines. The linear flow assumption requires that the flow lines bestraight (this limitation is overcome by the areal flow model, as discussedin Section 6.2.1.). However, the calculated movement of solutes in allunderlying formations will be physically realistic. The models willprovide valuable insight regarding maximum horizontal solute movementbetween the pond and the mines in all geologic formations, and solutemovement between the pond and the outcrop for the units underlying theTailings Dam Sand.
Calculating seepage from the tailings impoundment is complicated bypartially saturated conditions, nonhomogeneous underlying formations, andtransient boundary conditions at the mines. To address unsaturated flow,the flow simulator was used in a two phase mode for the cross-sectionalcalculations. Laboratory analyses were conducted to determine therelative permeability and capillary pressure characteristics of thevarious geologic units. The nonhomogeneity was addressed by defining eachgeologic unit as a separate layer in the models and maintaining arelatively fine (250-foot) grid spacing near the tailings pond and mines.The lithology model was used to assign average sand and shale per-meabilities and porosities to each finite-difference block in the flowmoden-Fha-1-lyt e-htstortcal-ad-anttctpat-e-d-m-ntng-op-er-a-tim-were in-corporated in the cross-sectional models to insure the boundary conditionswere accurately simulated.
It was anticipated that the greatest solute movement would occurtowards the surface mine. If solutes migrated as far as the backfilledportions of the surface mine, they could possibly move down through thebackfill and eventually enter an underlying sand. To study this,backfilling and reinvasion of the pits by regional ground-water flow wassimulated.
In summary, the cross-sectional models were used to calculatevertical and horizontal solute movement, determine seepage rates emanatingfrom the pond, and evaluate possible solute movement through the surfacemine backfill. The following text describes details of the cross-sectional models.
-29-

6.1.2. Location and Discretization
The three-dimensional lithology model was used to generate crosssections at angle increments of 22.5 degrees. These cross sections wereused to determine similarities and differences between cross sections as afunction of orientation. Generally, the stratigraphy and lithology of thecross sections were similar regardless of orientation.
Three cross sections were selected which were oriented roughlyparallel to anticipated ground-water flow paths between the tailings pondand the mines. The cross-section orientations were; west-east (W-E), 45degrees west of north (NW-SE), and 45 degrees east of north (SW-NE). Theorientation and extent of the cross-sections are illustrated in Figure 17.The SW-NE and W-E cross sections intersect the surface mine where early andlate years of mining were conducted, respectively. The NW-SE cross sectionintersects the underground mine.
Figure 17 also shows the coordinate system used for this study. Theorigin is located at the center of the tailings pond. Length units of feetwere used with X-direction coordinate values increasing from west to eastand Y-coordinate values increasing from south to north. The W-E, NW-SE,and SW-NE cross sections had the following end point coordinates:
W-E (-37,750; 0) ; (7,750; 0)NW-SE (-16,970; 16,970) ; (10,600; -10,600)SW-NE (-17,325; -17,325) ; (11,125; 11,125)
The extent of each cross section was based on characteristics of theintermediate flow system. East of the. pond the cross sections terminatednear the outcrop of the Tailings Dam Sand. West of the pond they terminateda distance estimated to be beyond the maximum extent of the surface mine'seffect on the potentiometric surface.
T-he--ad-s--of-fn'fl-uvence--f-th-e-s"urf-a-c•--miwe was -est-iiit--d-b-y twomethods. First, average yearly seepage rates into the surface mine (577gpm) and average aquifer properties were input to an unconfined, steady-state flow equation. This method indicated a 1.7 mile radius of influence.Second, a mass balance was done in which the seepage rate in the pit equaledthe product of the infiltration rate and an area available for in-filtration. This method indicated a radius of influence of about 3.7miles.
Both of these methods were very approximate, but gave physicallyreasonable results. Based on these results the cross-sectional modelswere extended at least three miles west of the surface mine. Constantpotential boundary conditions were specified at both ends of each cross-sectional model. The ground-water potential east of the pond was set equalto the Tailings Dam Sand outcrop elevation. The potential west of the pondwas obtained by locating the end point of the cross section on theintermediate flow net (Figure 12) and interpolating between equipotentiallines.
-30-
Figures 18 - 20 show the cross sections and the finite-differencegrids which were superimposed to construct the flow models. Note that thelithology and stratigraphy of the cross sections are similar. Thehorizontal grid spacing was kept at 250 feet near the tailings pond and thesurface mines. Increased grid spacings (500-2000 feet) were used away fromthe pond. Vertical grid spacing was varied at each block to best representthe thickness of individual geologic units. Each main sand and shale unitwas gridded as a separate layer.
6.1.3. Fluid and Rock Properties
One of the most challenging tasks in modeling hydrologic systems isextending fluid and rock properties obtained from laboratory and fieldtests to represent a large, complex physical system. Fluid properties ofinterest include density, viscosity, and compressibility. Rock propertiesinclude porosity, permeability, relative permeability, capillary pres-sure, and compressibility. The remainder of this section will discuss theresults of the tests performed for Highland and state the fluid and rockproperties used in the study.
The movement of air, water, and tailings fluid were modeled atHighland. The properties of air and water are well documented in theliterature and testing was not required. The tailings fluid wassufficiently dilute to assume it had the same properties as the groundwater. Viscosities at standard conditions were used for air (.0179centipoise) and water (I centipoise). The density of air was input as afunction of pressure based on the ideal gas law. The water density was keptconstant at 1 g/cc (gram/cubic centimeter). The relatively low pressuresand moderate pressure changes considered in the simulation justify the useof the above pressure-volume relationships.
The compressibility of a confined aquifer is generally expressed as aspecific storage value or a confined storage coefficient. The specificstorage is the volume of water released from storage per unit aquifer-- lume-p-erl-i-t-preshs-uede-cead-d- The- Gfi-ne-f-ed-s-t-or- a-ge-ee-f-f-i-c-i-•ent-i-sthe specific storage multiplied by the aquifer thickness.
Specific storage values for the sand and shale units were calculatedusing typical rock and water compressibilities. This study used a specificstorage of 7.3 x 10⁻⁶ (l/ft) for sands and 2.2 x 10⁻⁶ (l/ft) for shales.The difference in the specific storage values reflects differences in sandand shale porosities.
The specific storage value calculated for the sand units can becompared to storage coefficient values measured in the field by con-sidering the formation thickness. Where the sand thickness was notreported, a 50-foot thickness was assumed. Table 10 compares the specificstorage value calculated by EPR to values obtained from well tests.
-31-

TABLE 10
Comparison of Specific Storage and
Storage Coefficient Values for Highland Sands
SpecificStorage(i/ft)
StorageCoefficient
(dimensionless)
FormationThickness
(ft.)
GeologicUnit
Reference
7.3 x 10⁻⁶
1.5 x 10⁻⁶
4.1 x i0- 7
2.0 x 10-7*
2.0 x 10-5
1.9 x10⁻⁵
3.6 x 10-4*
2.5 x1-4
6.3 x10⁻⁵
1.0 x 0-5
1.9 x10⁻⁴.
4.8 x10⁻⁴
50 EPR calculated
165
155
50
9.5
25
Golder Assoc. (1979)
Golder Assoc. (1979)
Dames & Moore (1980)
Exxon(Well .VI-1)
Exxon(Well VII-3)
Ore Body Sand(multiple completion)
Ore Body Sand(multiple completion)
Ore Body Sand(completion unknown)
Middle OreBody Sand
Tailings DamSand
*assumes a 50-foot sand thickness
Several types of tests were used to determine the rock properties includinglaboratory core tests and field pumping and packer tests. The followingparagraphs describe the results of these tests for the main geologic units andstate the values used in the models.
-6.T32-T•l i-l•n-gs-Yamand-Fowier Sands
Permeability values for the Tailings Dam andtFowler Sands were measured bypump tests, packer tests, and core analyses. The-locations of the wells andboreholes are shown in Figure 22. The results of three drawdown tests and arecovery test performed by Exxon Minerals Company (see Figures 23 - 26)conducted in Wells XXI (Tailings Dam Sand), XII (Tailings Dam Sand), and VII(Tailings Dam Sand - drawdown and recovery) indicate permeabilities of 1190,2220, 7930, and 7420 md (millidarcies)l, respectively. Packer tests conductedby Dames and Moore (1980) in the near surface material along the dam indicatepermeabilities of 2220 md and 1280 md at a depth of 19.8 feet in boring 12; 1630md at a depth of 9.7 feet in boring 13; 7500 m d at depth of 11.8 feet in boring8; and 1800 md at a depth of 19.5 feet in boring 9. Dames and Moore did notspecify the geologic units in which the packer tests were performed.
2 For the conditions at Highland, a permeability of 1 md is equivalent to ahydraulic conductivity of about 1 x 10⁻⁶ cm/sec or 1 ft/yr.
-3?-

Core tests were performed by ERCO Petroleum Services to determineporosity, horizontal and vertical permeabilities, air-water relative per-meabilities, and capillary pressure characteristics. The results of porosityand permeability tests conducted on Tailings Dam Sand cores are summarized inTable 11.
TABLE 11
Laboratory Measurements of Porosity, Permeability, and
Grain Density for the Tailings Dam Sand
Core Depth(feet) Porosity (%) Permeability (md) Grain Density(g/cc)(gas flood)Horiz. Vert.
VIII a 112.9-113.2 29.4 372 3177 2.60b 35.4
XII a 127.4-127.8 31.7 2804 2992 2.65b 34.5c 35.8
XX a 122.7-123.1 22.1 6390 5522 2.39
The lab analyses agree closely with results obtained in the field. Notethat the horizontal and vertical permeabilities are nearly the same in cores XIIand XX. This indicates that the Tailings Dam Sand may be isotropic. Visualinspection of the cores indicate that the Fowler and Tailings Dam Sands are veryfine- to medium-grained sands with varying amounts of silt and clay. Based onthe above data, an isotropic permeability of 2000 md was used in the models forthe Fowler and Tailings Dam Sands.
Figures 27 - 30 show the results of ERCO's air-water relative permeability-an-a-1yes-f-or-T-ai-l-n-gs-Damn-S-and-Go-re~s-V-I--I•-•-•X-II-an~d-X-X-----if-feren-ces-i-n--•t-he
curves are probably attributable to varying amounts of clay in the samples whichcould affect the overall, core wettability. The presence of clay is supported bygreatly decreased permeability measurements when water, instead of gas, wasused to flood the cores. The following decreases in permeability occurred:
TABLE 12
Comparison of Tailings Dam Sand Permeability
Measured by Gas and Water Floods
Permeability (md)
Core Gas flood Water flood
VIII (vertical) 3177 63XII (horizontal) 2804 1525XII (vertical) 2992 230
XX (vertical) 5522 757
-33-

Permeability reductions of approximately one order of magnitude ormore occurred in all cores except Core XII (horizontal). This indicatesthat Core XII (horizontal) was most representative of a clean sandstone.Therefore, the air-water relative permeability curve measured for thatcore was used to represent model blocks which were predominately sand-stone.
Figure 31 shows the results of ERCO's air-water capillary pressuretests for Cores VIII (horizontal), XII (horizontal), and XX (horizontal).The results of Core XII (horizontal) were taken to be representative of aclean sand because the core (1) showed the least permeability reductionwhen flooded with water, and (2) had a permeability to water close to thevalue selected to represent a clean sand in the models (1525 md vs. 2000md).
6.1.3.2. Ore Body Sands
Permeability, porosity, and grain density values for the Ore BodySands were measured by pump tests and core analyses. Pump tests wereperformed in Wells XX and VI which were completed in the Upper and Middle;and Middle Ore Body Sands, respectively. Results of these tests, shown inFigures 32 and 33, indicate permeabilities of 2060 and 6260 md, re-spectively.
Appendix B lists core analysis data taken at one-foot intervalsthrough the Ore Body Sands in seven core holes near the solution mine. Thedata indicate that permeabilities of individual cores range from milli-darcies to tens of thousands of millidarcies. The variation is probablydue to differences in the degree of cementation and the clay and siltcontent of the samples. However, when the permeabilities were arith-metically averaged over the entire core depth the following values wereobtained:
TABLE-I3
Summary of Porosity, Permeability, andGrain Density for the Ore Body Sands
Core Depth (feet) Porosity (%) Permeability (md) Grain Density (g/cc)
Horiz. Vert.
2700-0505 384-411 30.9 1672 3450 2.630865-0875 353-361 30.0 10360815-4950 695-764 25.6 22362700-2310 650-704 25.9 30794260-0940 627-659 30.0 32354260-0940 745-795 26.9 31032650-0320 367-400 31.0 2288 1687 2.610600-0810 633-667 25.6 834 626
-34-

Since these results are very similar to those obtained for theTailings Dam and Fowler Sands, a single set of properties were used torepresent all clean sands in the study. Those properties are listed inTable 14:
TABLE 14
Properties of the Tailings Dam, Fowler, andOre Body Sands Used in the Cross-Sectional Models.
Horizontal permeabilityVertical permeabilityPorosityGrain densityBulk densitySpecific StorageRelative permeabilityCapillary pressure
2000 md2000 md34 percent2.60 g/cc1.72 g/cc7.3 x 10- 6 (1/ft)Figure 28Figure 31 - Core XII (horizontal)
6.1.3.3. Shales
Permeability, porosity, and grain density values for the-TailingsDam Shale were measured by core analysis. The Tailings Dam Shale has verylow permeabilities and long term pump tests would have been required toobtain field permeability measurements. The results of the core analysescan be summarized as follows (see Figure 22 for core locations):
TABLE 15
Summary of Porosity, Permeability, andGrain Density for the Tailings Dam Shale
Core Depth(Feet)
Porosity Permeability(%) (md)
Grain Density(q/cc) Reference
Air
3.6
Water
111
44
XXXXa
bcdef'
60.575.580.585.535.540.5169.9-170.3169.0-169.5
1.09.30.100.150.03
14.010.920.3
11.0
2.49
Dames & MooreDames & MooreDames & MooreDames & MooreDames & MooreDames & MooreERCO (1981)Exxon Prod. RExxon Prod. RExxon Prod. RExxon Prod. RExxon Prod. RExxon Prod. R
(1980b)(1980b)(1980b)(1980b)(1980b)(1980b)
esearchesearchesearchesearchesearchesearch
2.59.0009
4.53 0*
* Core plug XXf was saturated with filtered tailings pond liquor.Permeability to the liquor was measured at an injection pressure of225 psig, and at atmospheric outlet pressure. The permeabilitymeasured over the first 24 and 48 hours was 0.003 and 0.004 md,respectively. No fluid flow occurred for the next 10 days.
-35-

The permeability of the shale samples ranged from impermeable toover 9 md. This range is probably caused by differing amounts of sand andclay in the shale. Tables 16 and 17 describe the lithology of sections ofCores XII and XX, respectively. Sections within the "shale" units includeclay, claystones, silt, very-fine to coarse sand, and gravel. A re-presentative permeability value for the shale units would consist of anaverage permeability of the materials composing them.
Two well accepted permeability averaging techniques are used de-pending on lithology and flow direction. Assuming the individual layersare areally extensive, arithmetic averaging would be used for horizontalpermeabilities and harmonic averaging for vertical permeabilities. Notethat the use of harmonic averaging generally results in an averagepermeability relatively close in value to the lowest permeability in theseries.
This study assumed an isotropic shale permeability of 1 md for boththe Tailings Dam and Ore Body Shales. This is probably a high estimate ofthe vertical permeability.
ERCO Petroleum Services performed relative permeability and capil-lary pressure tests on a Tailings Dam Shale sample taken between 169.9 and170.3 feet from Core XX. Although several plugs were cut from the core,they all cracked during testing. The cracks invalidated the test results.
To overcome this difficulty, rel'ative permeability and capillarypressure data reported by Battelle Northwest Labs (1980a) for shales atMorton Ranch were used in the Highland Study. These data are shown onFigures 34 and 35. The Morton Ranch site is located approximately fourmiles south of Highland. The geologic units tested at Morton ranch werefrom the Wasatch Formation which directly overlies the Fort UnionFormation. The saturated permeability of the Morton Ranch sample wasreported to be 1.3 md, which is very similar to the value used for Highland(1.0 md). It was assume-d-thth-slalereati-verpemeabliLy andcapillary pressure data obtained by Battelle for Morton Ranch wouldrepresent shales at Highland.
The shale properties used in the cross-sectional models are sum-marized in Table 18.
TABLE 18
Properties of the Tailings Dam, Fowler, andOre Body Shales Used in the Cross-Sectional Models
Horizontal permeability = 1 mdVertical permeability = 1 mdPorosity = 10 percentGrain density = 2.60 g/ccBulk density = 2.34 g/ccSpecific storage = 2.2 x 10⁻⁶(1/ft)Relative permeability = Figure 31Capillary pressure = Figure 32
-36-

6.1.3.4. Surface Mine Backfill Material
At the time of model construction the properties of the surface minebackfill had not been measured. Since vertical migration of solutesthrough the backfill was of primary concern, high values of vertical andhorizontal permeabilities were assumed. It was also assumed that thebackfill would be loosely compacted (compared to geologic formations) andhave a high porosity consisting of relatively large pores. The largepores would result in very weak capillary forces and promote segregationof air and water. To account for the segregated flow, relativepermeability pseudofunctions were used. The pseudofunctions accountedfor the change in transmissibility due to water level fluctuations. Thepseudo-relative permeability and capillary pressure curves used for thebackfill are shown in Figure 36.
The properties assumed for the backfill material are summarized inTable 19.
TABLE 19
Properties of the Surface Mine Backfill Material Usedin the Cross-Sectional Models
Horizontal permeability = 2000 mdVertical permeability = 2000 mdPorosity =,35 percentGrain density = 2.60 g/ccBulk density = 1.69 g/ccSpecific storage = 7.5 x 10⁻⁶ (I/ft)Relative permeability = Figure 36Capillary pressure = Figure 36
After the models were completed, an unconfined pump test was- -onduc-t-ed-i-n-the-baek-f-i----The-resu1-t-s-ef-t-ha-t--e-t-•-shew-n-F-i-gu-e-3 ,
indicate a permeability of 40 md. This low permeability will greatlyreduce any migration of solutes through the backfill predicted by the flowmodels.
6.1.3.5. Tailings
Four permeability tests were performed on tailings samples obtainedfrom the mill discharge pipe. The tailings were slurry packed into aSoiltest Compaction Permeameter. Filtered pond liquor with a pH of'2.3was used in all tests. The results of the first two tests indicatepermeabilities of 10.5 md and 11.0 md.
The second two tests were designed to study the effect of soluteprecipitation on permeability. The permeameter was sealed for aboutthree weeks to allow the tailings and pond liquor to react. Permeabilitytests were run again and yielded values of 8.9 md and 6.7 md. These valuesindicate permeability reductions of 15 and 39 percent, respectively.
-3 7-

Upon disassembly of the permeameter a yellow precipitate, probablyiron hydroxide, was observed. The permeability reductions were probablycaused by plugging of pore space in the tailings and the porous stone inthe permeameter by the precipitate. It is anticipated that thisphenomenon will occur near the bottom of the tailings impoundment andreduce seepage. However, because of the difficulty in quantifying longterm permeability reductions, precipitate plugging was not considered. Atailings permeability value of 10 md was used in the study.
6.1.3.6. Property Averaging
The rock properties described in this section represent a singletype of material (sand, shale, or backfill). In some model blocks two ormore materials exist. The following paragraph describes the averagingprocedure employed for nonhomogeneous blocks.
Each flow model block was evaluated for sand, shale,-and backfillcontent based on the lithologic model. The porosity and permeability ofthe blocks were then averaged using the typical material properties. Bothhorizontal and vertical average permeabilities were calculated. Gene-rally, arithmetic and harmonic averages were used for horizontal andvertical permeabilities, respectively. Porosities were averaged arith-metically.
6.1.4. Simulation Strategy
This section describes methods and approximations used to simulatethe initial and boundary conditions, the effects of the surface andunderground mines, the tailings pond, and the movement of the solutefronts with point tracking.
6.1.4.1. Initial and Boundary Conditions
The regional and intermediate premining flow systems are shown inFigures 11 and 12, respectively. As previously described, the inter-mediate flow system was used to determine the boundary conditions of thecross-sectional models by the following procedure.
The end points of each cross section were located on the flow net.The ground-water potential east of the pond was set equal to the TailingsDam Sand outcrop elevation. The potential west of the pond was obtainedby interpolating between equipotential lines on the flow net. Source-sink terms incorporated at the ends of the models would inject or producefluid if the block potential decreased or increased, respectively. Theamount of fluid injected or produced depended on the pressure drop in theblock and the transmissibility of the block.
The cross-sectional models were initialized to a level potentio-metric surface. The source-sink terms then injected or produced fluiduntil they reached their specified potentials. The NW-SE model was run
-38-

until the maximum pressure change in all blocks became negligible. Afterpremining regional flow was established, simulation of the tailings pondand underground mine was initiated.
Pond and surface mine simulation was initiated in the W-E and SW-NEmodels without first establishing premining flow. This was done becausethe surface mine was present near the beginning of both simulations anddominated the flow field. Premining flow would have relatively littleeffect on solute transport compared to potential gradients caused by thesurface mine. The proper boundary conditions were established early inthe simulation allowing ground water reinvasion of the backfilled surfacemine to be modeled.
6.1.4.2. Surface and Underground Mines
The effect of the open pits was simulated by defining source-sinkterms in all blocks representing the surface mine. The source-sink termsproduced sufficient fluid to maintain atomspheric air pressure in eachblock representing the mine . To simulate backfilling, the source-sinkterms were eliminated allowing water to reinvade the blocks. Backfillproperties listed in Table 19 were used in all blocks representing thebackfilled pits.
The underground mine was modeled in a similar manner except thepressure was specified above atmospheric. This prevented the need tosimulate air movement into the underground mine. This approximationshould have little, if any, effect on the calculation of solute movement.
6.1.4.3. Tailings Impoundment
To accurately calculate pond seepage and solute movement itnecessary to model the areal extent and depth of the pond liquor andthickness of the tailings as a function of time. The areal extentdepth of the pond liq pr-et-e-mne-d-the-a~r-eavaiablefo-rse-epae-anddriving force for fluid flow, respectively. The tailings depthimportant because it provided most of the resistance to flow leavingpond.
wastheand-the-wasthe
The areal extent and elevation of the pond liquor was obtained fromannual contour maps prepared by Exxon Minerals Company. The rate ofincrease in pond depth was used to calculate pond elevations from 1981till mill shutdown in December 1983.
To estimate the water level in the pond after mill shutdown a waterbalance was performed. The water balance considered precipitation,surface water runoff, natural evaporation, enhanced evaporation bysprinklers, and seepage. Calculations indicate that it will take aboutfive years for the pond to dry.
After-the standingtotal quantity of watervolume of tailings by asimulated until all the
pond liquor is gone the tailings must drain. Thein the tailings was estimated by multiplying the35 percent drainable porosity. Pond seepage waswater drained from the tailings.

The tailings thickness was derived from two contour maps of thetailings prepared in 1972 and 1980. The 1972 tailings elevations weresubtracted from the 1980 elevations to obtain a tailings isopach map. Thetailings thicknesses in intermediate years were then determined asfollows. Tailings were assumed to be evenly, distributed in theimpoundment. The tailings build-up was then prorated by the ratio of theyearly mill tonnage to the total mill tonnage over the eight year period.The tailings and pond liquor were assumed to build up at a constant ratefrom 1979 through 1983 when the mill is scheduled to shutdown. Thetailings and pond liquor levels for each cross-sectional model are shownin Figure 38.
Pond seepage was modeled using source terms. The quantity of fluidinjected into the formations underlying the pond was a function of waterpotential values and resistance factors specified for the source terms.The potential value reflected the depth of the pond liquor. Theresistance factor accounted for the tailings thickness and the fluid flowgeometry. A separate source term was specified for each 250-foot blockunderlying the pond. The potential value and resistance factor for eachsource term were respecified yearly to reflect changing pond conditions.
The high vertical permeability of the Tailings Dam Sand made itdesirable to model the area where it was in direct contact with the bottomof the tailings pond. The easiest way of accomplishing this was to havethe cross sections pass through the contact area. However, if all thecross sections passed through the contact area they would no longer beparallel to the flow lines between the pond and the pits. As discussedpreviously, the linear flow constraint requires that the cross sectionsand flow lines be parallel.
To resolve this dilemma the contact area was accounted for bymodifying the lithology of some blocks underlying the tailings pond in theW-E and SW-NE cross sections. The NW-SE cross section passed through thecontact area, therefore, its lithology did not need adjustment.
The W-E and SW-NE cross sections were adjusted by extending theTailings Dam Sand up to the pond bottom where thinning of the overlyingshale was evident. This approximation provided seepage rates into thesand and shale units for each 250-foot finite-difference block.
The seepage rates calculated by the cross-sectional models were usedto obtain total pond seepage by the following procedure. The area of thepond and tailings dam beach were calculated as a function of time. Thetotal area was then divided into two categories depending on whether theformation exposed on the pond bottom was Tailings Dam Sand or Fowler Sandand Shales.
Each cross sectional model block was identified as a "Tailings DamSand" or "Fowler" block based on the formation that block represented.The average yearly seepage rates for the Tailings Dam Sand blocks weresummed and divided by the total area of those blocks. This provided anaverage seepage rate per unit area into the Tailings Dam Sand. The unitseepage rates were multiplied by the total exposed area of the TailingsDam Sand to obtain total seepage into the sand. The same procedure wasrepeated for the Fowler Formation.
-40-

The unit seepage rates for the Tailings Dam Sand and Fowler Formationare shown in Figure 39 for the W-E, NW-SE, and SW-NE cross sections. Thedifference in the average rates can be attributed to differences inlithology, rate of tailings build-up, and proximity to mining operations.
6.1.4.4. Solute Front Movement
Chapter 3 discussed in detail the methodology used to track solutefronts. Briefly, tailings fluid and rock are put in a container andallowed to reach equilibrium. Analyses are performed to determinedistribution coefficients which are the ratio of the solute concentrationon the rock to the solute concentration in the liquid. Any solute not inthe liquid is assumed to have adsorbed on the rock, even though it may havebeen removed from solution by precipitation or other reactions. Thedistribution coefficient, porosity, and bulk density of the rock are usedto calculate the ratio of the solute front velocity to the average fluidvelocity.
Table 20 lists the distribution coefficients and relative velocitiesof solutes at Highland for the Tailings Dam Sand, Tailings Dam Shale, OreBody Sand, and Ore Body Shale. The values listed for lead-210 and radium-226 were obtained by Battelle (1980b) for the Wasatch Formation at MortonRanch. Because Battelle used Highland tailings liquor in their analysesand the Wasatch and Fort Union Formations are similar, it is assumed thatthe distribution coefficients and relative velocities will be applicableto Highland.
Negative distribution coefficients were calculated for severalelements when tailings solution was equilibrated over sedimentary mate-rials. A negative coefficient results when the equilibrium concentrationof a solute is higher than the initial fluid concentration. This could becaused by experimental error, particularly when concentration levels arenear the solute's detection limit. In some cases the negative dis-
- ~~tr-b-ut-i-n--coeff-i-ci-es-ia-itc-ate--di-s-so-lu-ttn-of-s-o-l-ute-s-b~y-tte-ta-i--i-ng-
solution. This appears to be the case for aluminum from sandstones;calcium, magnesium, and strontium from all rocks; and thorium and uraniumfrom the Ore Body Sand.
The solute transport model used in this study does not addresssolutes being desorbed or dissolved from rocks. The calculation of arelative velocity using a negative distribution coefficient leads toludicrous results. The model would predict the solute front moving in theopposite direction of ground-water flow. Physically, negative dis-tribution coefficients indicate that the solute front moves as fast as theground water and may have solute concentrations above the tailings pondconcentration due to dissolution. A relative velocity of 1.0 was assignedto solutes with negative distribution coefficients.
The wide range of relative velocities calculated for the solutesmade it impractical to track a set of points for each different relativevelocity. Instead, six sets of points were defined with relativevelocities of 1.0, 0.50, 0.30, 0.20, 0.10, and 0.05. These relativevelocity values were typical of those calculated for the solutes (SeeTable 20).
-41-

Since the actual relative velocities of the solutes were not used,solute fronts will be described in terms of the typical values. Forexample, potassium has a relative velocity of 0.062 in the Tailings DamSand. Although a relative velocity of 0.062 was not tracked, thepotassium front will be located between the 0.10 and 0.05 relativevelocity contours. Those contours are sufficiently close to make thisapproximation well within the uncertainty of the data.
Each set of points was initially located under the entire length ofthe tailings pond. Two points were defined in shale blocks and fourpoints in sand blocks. Point density was greater in sand blocks becauselarger seepage rates were anticipated to occur through the sand. Thenumber of points varied in each cross-sectional model. Typically aboutforty points were tracked for each relative velocity value.
6.1.5. Results
As stated in the beginning of this chapter, the cross-sectionalmodels were designed to address the following issues:
1. Evaluation of the vertical movement of solutes from the tailingsimpoundment to the underlying sands,
2. Calculation of the horizontal movement of solutes between thepond and the surface and underground mines,
3. Evaluation of possible vertical communication of solutes betweensand units via the backfilled surface mine, and
4. Estimation of pond seepage as a function of time.
This section will present the cross-sectional model results anddiscuss each of the above items.
Figures 40 - 42 show unattenuated solute movement for the W-E, SW-NE,and NW-SE cross sections, respectively. Note that the topography underthe pond has been modified to indicate where direct contact between thetailings pond and the Tailings Dam Sand has been superimposed into thecross section.
The unattenuated vertical movement results under the pond are verysimilar in all three cross sections. They indicate solutes move throughthe Tailings Dam Shale and into the Upper Ore Body Sand. Verticalmovement essentially stops in the shale separating the Upper and MiddleOre Body Sands. For example, between the years 1987 and 2000 the solutesmove a maximum of about 10 feet vertically. By the year 2000 the pond hascompletely drained and regional flow is re-established. Thus, it isunlikely that further vertical migration will occur.
-42-
The W-E and SW-NE cross sections predict significant verticalmovement near the western end of the pond. This probably reflects theinfluence of the surface mine. The same trend is predicted by the NW-SEsection, but it is probably caused by increased seepage where the tailingspond and Tailings Dam Sand are in contact.
The results show that the pond acts as a ground-water divide causinghorizontal solute movement away from the pond in both directions. Asdiscussed previously, horizontal movement towards the outcrop in theTailings Dam Sand will not be accurately predicted by the cross-sectionalmodels but will be accounted for by the areal model.
The W-E model predicts unattenuated solutes will reach a backfilledportion of Pit 2 about the year 1995. By that time the pond will be dryand regional flow re-established. It is unlikely that solutes willmigrate to lower sand formations. Unattenuated solute movement to thenorthwest and southeast is limited to a few hundred feet of the pond.
Figures 43 - 45 show solute movement attenuated at a velocityfraction of 0.3 for the W-E, SW-NE, and NW-SE cross sections, re-spectively. The 0.3 velocity fraction is significant since it representsa conservative estimate of acidic front migration. The estimate isconservative because although the acidic front moves at a somewhat highervelocity fraction in the Tailings Dam and Ore-Body Sands (0.485 and 0.423,respectively), it moves at a much lower velocity fraction in the TailingsDam and Ore Body Shales (0.085 and 0.141, respectively).
The results of all three cross-sections are again very similar. Theyindicate that the acidic front will not migrate below the Tailings DamShale. Horizontal migration is limited to the area directly under thepond. The significance of the acidic front position on the movement ofspecific solutes will be discussed in the next chapter.
Figures 46 - 51 show solute movement attenuated at velocityfr-ations-of-O.20-and-O.lO-for-th--•E-ESW-UE, -NW--SE across secfi-o ns,respectively. It is evident that very little solute migration occurs atthese small velocity fractions.
6.1.5.2. Seepage
The procedure used to calculate total seepage from the pond using theresults of the cross-sectional models was described earlier in thischapter. Figure 52 shows the results of those calculations. The totalseepage rates were in close agreement. They all.peaked in 1983 when thetailings pond was at its maximum depth., Maximum seepage ranged from 180gpm for the W-E model to 225 gpm for the NW-SE model. The models showdecreasing seepage after 1983 as the pond water level decreases duelargely to evaporation.
The SW-NE model shows a 110 gpm peak in seepage about 1973 which wasnot calculated by the other models. This probably results from the SW-NEcross section intersecting the early years of surface mining. The surface
-43-

mine would cause a drop in potential under the pond resulting in highvertical seepage rates. The rate decrease is likely a result of a rapiddecrease in effective vertical permeability due to tailings build-up.
The seepage appeared to be distributed over the entire area of thepond. It was anticipated that most of the seepage would occur through theTailings Dam Sand contact area. However, this area was covered by asignificant amount of relatively low permeability tailings which greatlydecreased the effective vertical permeability of the sand..
Figure 52 also shows the seepage rates used in the areal model. Theareal model rates were generally the average of the rates calculated bythe three cross-sectional models. However, from 1972-1976 seepage ratescalculated by the SW-NE model were used. This was done because the SW-NEmodel results best described seepage during the early years of surfacemining.
Figure 39 shows area normalized seepage rates into the Fowler Sandsand Shales and the&Tailings Dam Sand for the W-E, NW-SE, and SW-NE crosssections. Seepage rates into the Fowler Sands and Shales range between0.25 and 2.0 gpm per acre. Note that the cross-section results are fairlyconsistent.
A much larger variation exists for seepage into the Tailings DamSand. The SW-NE cross section shows normalized seepage rates above 8 gpmper acre early in the pond life. As previously discussed, this isprobably due to the effect of Pit 1 and the lack of tailings build-upduring the early years of pond operation. After 1977 the normalizedseepage rate drops to between 1 and 2 gpm per acre. These rates areconsistent with those calculated for the NW-SE cross section (1-3 gpm peracre).
The W-E cross-sectional model predicted normalized seepage rates ofbetween 6 and 7 gpm per acre from 1978 to 1985. These higher values are•ike-lo-y-a-re-ult-f er-sh-•e-stringer•- in-t[Te-ffntte-dtffe-ence--tcksrepresenting the Tailings Dam Sand in the W-E model. Note that althoughthe W-E model generally had the highest normalized seepage rate into theTailings Dam Sand, it had the lowest total seepage rate of the threecross-sectional models (Figure 39). This is because the W-E cross sectionpredicted lower normalized seepage rates for the Fowler Sands and Shales.Since most of the pond area is composed of these units, a majority of theseepage occurs through them.
6.2. AREAL MODEL
The cross-sectional models provided insight to vertical and hori-zontal solute movement, solute migration in the backfilled mines, andpond seepage. They indicated that unattenuated solutes would not reachany sands underlying the Upper Ore Body Sand, that horizontal solutemovement was areally restricted, and that some unattenuated solutes mightreach the backfilled surface mine. Maximum seepage from the pond wascalculated to be between 180 and 225 gpm and occurred, over the entirepond.
-44-

While the above results are encouraging, it is worthwhile to reviewsome of the limitations of the cross-sec iona1 models. The orientationsof the models were selected based upon an estimate of flow paths betweenthe pond and the mines (Figure 21). Since each cross-sectional modelsimulated flow along a streamline, the radial flow could be approximatedwith an areally linear model. However, errors in the assumed flow pathscould lead to incorrect predictions of horizontal solute movement. Also,the cross-sectional models could not follow the curved flow paths betweenthe pond and the outcrop area in the Tailings Dam Sand, thus invalidatingflow calculations east of the pond in that geologic unit.
Another uncertainty is the assumption that the Tailings Dam Shalehas an average vertical permeability of 1 md. Available data indicate thatthis is probably a high average value. Assigning this verticalpermeability to the Tailings Dam Shale will result in overprediction ofvertical solute movement. However, if the shale has a significantly loweraverage permeability or is impermeable, fluid leaving the pond would beforced to move horizontally rather than vertically. This could result inthe cross-sectional models underpredicting horizontal solute movement inthe Tailings Dam Sand.
Finally, the W-E and SW-NE cross-sectional models only simulatedoperation of the surface mine when it intersected the cross sections.This does not fully account for the complex effect the surface mine has onthe flow field as the mine progresses northwestward.
An areal model was used to overcome these limitations. The followingtext describes the purpose, the location and discretization, the fluidand rock properties, the simulation strategy, and the results of the arealmodel.
6.2.1. Purpose
The purpose of the areal model was twofold:
1. To predict the maximum horizontal movement of solutes and,
2. To overcome limitations of the cross-sectional models resultingfrom the linear flow assumption.
The prediction of maximum horizontal solute movement was accom-plished by assuming that all seepage calculated by the cross-sectionalmodels entered directly into the Tailings Dam Sand and the overlying andunderlying shales were impermeable. The cross-sectional models showedthat some fluid leaving the pond entered sand stringers above the TailingsDam Sand. These stringers were not areally extensive and the shalesurrounding them would serve to trap solutes. Also, over much of the pondany fluid reaching the Tailings Dam Sand would first have to migratethrough shale. Since the shales effectively adsorbed many solutes, thisfluid would be much cleaner than the pond liquor.
-45-

By assuming the overlying and underlying shales were impermeable,all fluid entering the Tailings Dam Sand was forced to move horizontallyaway from the pond, since it could not move downward to underlyingformations. This would lead to overprediction of horizontal movement.
The areal model provided greater flexibility than the cross-sectional models for simulating the surface mine and the outcrop area.Changing flow paths could be simulated as surface mining progressed.Also, the simulation could be conducted over the entire life of the mine.The ability of the areal model to calculate flow around the dam providedestimates of seepage into North Fork Box Creek.
6.2.2. Location and Discretization
The location and extent of the areal model, shown in Figure 53, wasbased on the geology and intermediate flow system at Highland. Theeastern model boundary was the Tailings Dam Sand outcrop. The westernmodel boundary was a north-south equipotential line. The location andpotential of this line was estimated by interpolating between the 5266-and 5300-foot equipotential lines shown in Figure 12. The north and southmodel boundaries were specified 16,500 and 13,500 feet from the pond,respectively. The boundaries were sufficiently far from the pond andsurface mine to avoid affecting flow patterns.
A variable-spaced grid, shown in Figure 53, was used for the arealmodel. A relatively fine grid of 500 feet was used in the vicinity of thepond and surface mine. Larger grid spacings of between 1000 and 2000 feetwere used towards the model boundaries.
6.2.3. Fluid and Rock Properties
A detailed description of the fluid and rock properties used for theHighland study were given in the cross-sectional modeling section. Theho +zont-a-l--perme-ab-l--t-y--poros-ity- gr-ai-n-den-s-i-t-yT--btui--k-derns-i-t-y-,andspecific storage values used in the cross-sectional models were also usedin the areal model.
The relative permeability curve used in the areal model for theTailings Dam Sand and surface mine backfill, is shown in Figure 54. Itaccounted for reductions in transmissivity due to unconfined flow ratherthan apparent permeability reductions due to partially saturated flow.Use of these relationships is justified for two reasons. First, thevertical permeabilities of the Tailings Dam Sand and mine backfillmaterial are high, causing vertical drainage to occur relatively quickly.Such rapid drainage will result in segregated flow of the air and waterphases. Second, the cross-sectional models have already accounted forthe unsaturated zone beneath the pond in determining seepage rates. Theseepage rates calculated by the cross-sectional models were used for theareal model. Knowing the pond seepage rates as a function of timeeliminated the need to use partially saturated flow relative permeabilitycurves under the pond in the areal model. The relative permeabilityfunctions were more effectively used to account for unconfined, se-gregated flow.
-46-

A similar argument can be made for the capillary pressure curves.The relatively large pores in the Tailings Dam Sand result in weakcapillary forces. As shown in Figure 31, most of the pores have drainedonly two feet (1 psi) above the water table. Rather than simulate actualcapillary forces, the capillary pressure term in the flow equations wasused to account for gravity drainage between blocks of equal elevation.This was accomplished by assuming segregated flow and relating grid-blocksaturations to the fractional height of the free water surface in theblock. By knowing the thickness of the grid block the saturation could berelated to a gravity driving force, as shown in Figure 55. Thus, gravityflow for blocks of equal elevation would be initiated by differences inblock saturations. Note that gravity flow between blocks of differentelevations but equal saturations is already incorporated in the gravityterm of the total fluid potential.
Properties of the Tailings, Dam Sand and surface mine backfillmaterial are listed in Table 21.
TABLE 21
Properties of the Tailings Dam Sand andSurface Mine Backfill Material Used
in the Areal Model
Tailings Dam Sand
Horizontal permeabilityPorosityGrain densityBulk densitySpecific storageRelative permeabilityCapillary pressure
= 2000 md= 34 percent= 2.60 g/cc= 1.72 g/cc= 7.3 x 10-6= Figure 54= Figure 55
(1/ft)
-S-urf-ac e MifeB-a-k-f-l-iMateriaI
Horizontal permeabilityPorosityGrain densityBulk densitySpecific storageRelative permeabilityCapillary pressure
2000 md35 percent2.60 g/cc1.69 g/cc7.5 x 10- 6 (1/ft)Figure 54Figure 55
6.2.4. Simulation Strategy
This section describes methods and approximations used to simulatethe initial and boundary conditions, the surface and underground mines,the tailings pond, and the movement of the solute fronts with pointtracking.
-47-

6.2.4.1. Initial and Boundary Conditions
The initial and boundary conditions for the areal model weredetermined from the intermediate flow system, shown in Figure 12. Themodel was initialized to a uniform potential of 5160 feet above mean sealevel. Potential specified source-sink terms were then used to establishboundary conditions. The western boundary of the model was kept at auniform potential of 5280 feet. This value was obtained from Figure 12 byinterpolating between the 5266- and 5300-foot equipotential lines toestimate the potential of the north-south trending equipotential line.Source-sink terms were also located along the Tailings Dam Sand outcropeast of the pond. The potential of each source-sink term was set to theoutcrop elevation of the Tailings Dam Sand.
The model was run for 500 days to establish regional flow. Themaximum grid-block pressure change was monitored during this period.Regional flow was considered to be established when the maximum pressurechange became negligible.
The north and south boundaries were specified sufficiently far fromthe pond and surface mine to avoid having an effect on flow patterns.Since the north and south model boundaries were roughly parallel to thewest-east flow lines, they were defined as no-flow boundaries.
6.2.4.2. Surface and Underground Mines
The open pits were simulated by defining source-sink terms in allblocks representing the surface mine. The source-sink terms producedfluid at a constant rate of about one percent of the grid block's initialwater content until the block reached residual water saturation. Thesource-sink term would then maintain that saturation. The locations ofactive source-sink terms were adjusted yearly to simulate the progressionof the surface mine. To simulate backfilling, use of the source-sinkterms was discontinued and water reinvaded the block. Backfill pro-perties were used in all blocks representing the surface mine.
It was not necessary to simulate the underground mine in the arealmodel. Grout was used to seal the Tailings Dam Sand from the verticalshaft, thus preventing the shaft from acting as an atmospheric boundarycondition. The lateral workings were all completed below the Tailings DamShale, and that unit was assumed impermeable. It is believed that theunderground mine had relatively little effect on-ground-water flow in theTailings Dam Sand.
6.2.4.3. Tailings Impoundment
In the areal model it was assumed that all seepage entered theTailings Dam Sand uniformly over the entire pond area. The seepage ratewas estimated using the results of the cross-sectional models, aspreviously described. After surface mine shutdown in December, 1983, theseepage rate was allowed to decrease in a manner similar to thatcalculated by the cross-sectional models. The seepage rate used tosimulate the tailings impoundment is compared to the cross-sectionalmodel results in Figure 52.
-48-

6.2.4.4. Solute Front Movement
The methodology used to track solute fronts for the cross-sectionalmodels was described earlier in this chapter. The same methodology wasused for the areal model. Sets of points with relative velocities of 1.0,0.50, 0.30, 0.20, 0.10, and 0.05 were specified around the tailings pond.Each set contained fifty individual points. By connecting these pointsthe approximate location of different solute fronts could be determined.
6.2.5. Results
This section presents results of the areal model. Specific topicsdiscussed are predictions of maximum horizontal movement of solutes andseepage rates in North Fork Box Creek.
6.2.5.1. Solute Movement
Figure 56 shows areal solute movement from 1972-1992 for a velocityfraction of 1.0. The areal model predicts that maximum unattenuatedsolute movement will occur west of the pond. Solutes will reach thenorthern edge of Pit 2 about 1992. This is similar to the results of theW-E cross-sectional model which predicted arrival about the year 1995.
Unattenuated solutes are predicted to move a maximum of 1300 feetsouthwest and 300 feet northwest of the pond. These predictions aregreater than the predictions of the cross-sectional models which showedlittle, if any areal movement past the pond boundary in those directions.
The areal and cross-sectional models show very similar trendsregarding the direction of solute movement. This is most apparent in theprediction of westward solute movement. The areal and W-E cross-sectional models both calculated the same extent of solute migration. Theareal model predicted solute arrival at Pit 2 about three years earlierthan the W-E cross-sectional model. This is expected considering the
_ cons.er-vat-ive-a-s-s-ump-t-ion-s-u-sed-i-n-t-he-a-re-al-made-l.
Figures 57 - 60 show areal solute movement for velocity fractions of0.5, 0.3, 0.2, and 0.1, respectively. As expected, the areal modelpredicts greater horizontal solute movement than the cross-sectionalmodels at these lower velocity fractions.
Figure 61 shows unattenuated solute movement from 1995-2010. By 1995regional flow has been re-established and the solutes are swept eastwardtowards the outcrop area at a velocity of about 35 feet per year.
The pH beneath the pond will rise as regional ground water reinvadesthe strata underlying the pond. The rise in pH will remove many solutesfrom solution. The concentration of solutes will also decrease due tocontinued adsorption onto the aquifer rocks.
Solutes that remain in solution will eventually be discharged intoNorth Fork Box Creek. The discharged solutes may; (1) move slowlydownstream towards Box Creek, (2) be left behind as solids due toevaporation along the seepage face, or (3) seep downward into outcroppingsands and shales. Attempts will be made to determine the fate of thesesolutes as more water quality data is obtained in North Fork Box Creek.
-49-

6.2.5.2. Seepage into North Fork Box Creek
The results of the flow models indicate that preferential solutemovement occurs westward towards the pits and eastward towards the NorthFork Box Creek outcrop area. In support of the latter, seeps can beobserved along the sides of North Fork Box Creek. Wet conditions alongthe bottom of the creek are evidenced by vegetation which includescattails near the dam. An objective of the modeling study was tocalculate seepage into North Fork Box Creek before, during, and after pondoperation.
Figure 62 shows calculated seepage rates into North Fork Box Creek asa function of time. Ground-water seepage was calculated to be about 25gpm before the pond was operational. During the first few years of pondoperation the seepage increased from 25 to 33 gpm as a result ofrelatively high seepage through the Tailings Dam Sand contact area. Asthe build up of tailings on the contact area reduced the effectivepermeability of the Tailings Dam Sand, and the cone of depression fromsurface mining intercepted regional flow, seepage decreased to below 20gpm.
Seepage into North Fork Box Creek increased from 20 gpm to 40 gpm asthe water level in the pond increased. Note that there is a slight lagtime (about six months) between maximum pond water level and maximumseepage into North Fork Box Creek.
Seepage decreases as the pond dries and the tailings drain, reachinga minimum value of about 7 gpm. The seepage then slowly increases after1993 as regional flow is re-established.
Seepage probably occurs further along the outcrop than is indicatedby Figures 56 - 61. The apparent seepage face along a narrow portion ofNorth Fork Box Creek predicted by the areal model is a result of spaced-s-9ret1-it-o-nin the modelW.I1nreality seepage prob-bby occurs in anelongated band parallel to the outcrop.
-50-

7.0. DISCUSSION
Previous chapters have described Highland's geology and hydrology,laboratory studies designed to quantify geochemical interactions betweenselected solutes and geologic materials, and ground-water flow modelingto determine the subsurface movement of tailings pond seepage. Thepurpose of this chapter is to use this information to describe themigration of specific solutes. The significance of this migration will bediscussed in relation to regulatory standards. The remainder of thischapter will discuss the following topics:
1. Ground-water regulations pertinent to Highland,
2. Categories of solutes,
3. Migration of solutes, and
4. Comparison of predicted solute migration to field data
7.1. GROUND-WATER REGULATIONS PERTINENT TO HIGHLAND
Table 22 summarizes standards described by the draft EnvironmentalProtection Agency (EPA)/Nuclear Regulatory Commission (NRC) Uranium MineTailings Control Act, the EPA drinking water standards, the WyomingDepartment of Environmental Quality (WY DEQ) ground water standards, andthe United States Code of Federal Regulations (CFR) pertinent to waterquality. The ranges of solute concentrations permitted by the variousstandards are also listed. All subsequent comparisons to the regulationswill refer to the lowest permissible concentration in those ranges.
Of the 38 solutes and parameters listed, the following 18 weres t-etd--for consideration at Highland: Al, As, Cd, Cr, Cu, Fe, pH, Mn,Ni, Se, Th (total), U (total), Zn, S04-2, Pb-210, Ra-226, Th-230, and U-238. In addition, six unregulated solutes were also studied: Ca, K, Mg,Na, Si, and Sr. It was felt that consideration of these 23 solutes and pHwould provide an adequate understanding of solute movement from thetailings impoundment. However, the study was formulated so that movementof any other solute could be calculated if batch and neutralization testswere performed. No additional. flow modeling would be required.
7.2. SOLUTE CATEGORIES
The solutes studied for Highland can be categorized according toregulatory status, attenuation properties when in contact with sand andshales, and ability to remain dissolved in acidic and basic solutions.Figure 63 categorizes the solutes studied for Highland.
-51-
The solutes were divided into two main categories: regulated andnonregulated. The regulated solutes were further subdivided depending onwhether they exceeded regulatory standards in both acidic and basicsolutions or in acidic solutions only. The relative velocities of thesolutes exceeding the regulatory standards were then compared to therelative velocity of the acidic front. Note that the acidic frontrelative velocity of 0.30 was assumed to be an average front movementthrough both sands and shales. The batch tests indicated that the acidicfront moved through the sands at a higher (.42-.49) relative velocity andthe shales at a lower (.09-.14) relative velocity.
Although the areal model only simulates flow in the Tailings DamSand, most seepage entering the sand must first flow through Fowler Sandsand Shales. Contact with shales in the Fowler Formation justifies the useof a relative velocity that reflects sand and shale attenuation pro-perties to track the acidic front. Furthermore, a comparison of Figures57 and 58 shows that there is little difference between front positionscalculated using a relative velocity of 0.30 (which reflects flow throughsands and shales) and a relative velocity of 0.50 (which reflects flowthrough sands only).
7.3. SOLUTE MIGRATION
This section discusses the movement of the 23 solutes considered inthis study. The solutes will generally be discussed as groups based onthe categorization scheme illustrated in Figure 63. An exception will bethe radioactive solutes which will be discussed as a separate group.
7.3.1. Unregulated Solutes (Ca, K, Mg, Na, Si, Sr)
The incentive for studying unregulated solutes was to identifytracer elements that could be used to verify the flow modeling resultswith field data. The appropriateness of using these solutes in the fieldverification program will be discussed later in the chapter.
The unregulated solutes considered in the study generally are notattenuated by any of the geologic materials. Exceptions are K and Siwhich are strongly attenuated by sands and shales, respectively. Figures40, 41, and 42 show unattenuated movement in the W-E, NW-SE, and SW-NEcross sections, respectively. All four unattenuated solutes (Ca, Mg, Na,Sr) will move through the Upper Ore Body Sand and be stopped by theunderlying shale. Figure 56 illustrates the maximum horizontal movementpredicted by the areal flow model.
Because K is strongly attenuated by the Tailings Dam Sand, it isunlikely that it will migrate any significant distance outside the FowlerFormation. Silicon is attenuated by shales and therefore will only enterthe Tailings Dam Sand where it is in direct contact with the pond bottom.Although Si will migrate within the Tailings Dam Sand, very littlemovement will occur into overlying or underlying shales.
-52-
7.3.2. Radioactive Solutes 2 (U, Th, Pb-210, Ra-226, U-238, Th-230)
As shown in Figure 63 and Table 14, all of the radioactive substancesconsidered in this study are strongly attenuated by the Tailings Dam Sandand Shale. The highest relative velocity reported for any of theradioactive solutes is 0.104 for U-238 in the Tailings Dam Sand. Figures49, 50, and 51 show that vertical solute migration for a relative velocityof 0.10 is limited to the upper half of the Tailings Dam Shale.
Figure 60 shows horizontal solute movement for the same velocityfraction. The greatest horizontal migration is westward where solutesmove a total of about 400 feet from 1972-1992. At this time the solutesreverse direction and move towards the outcrop. Note that most of theradioactive solutes will move only a small fraction of the distances shownin the above figures.
7.3.3. Solutes that Exceed Regulatory Limits in Both Acidic and BasicEnvironments (Al, Cr, Cu, Fe, Se)
Three of the five solutes in this cateogry, Cr, Fe, and Se, arestrongly attenuated by both the sands and the shales. The relativevelocities of these solutes are less than -or equal to 0.02 for allgeologic units. Solute migration is expected to be less than one-fifththe distances shown in Figures 49, 50, 51, and 60.
Cu is attenuated by all geologic materials studied for Highland. Ithas relative velocities of 0.156, 0.008, 0.088, and 0.010 in the TailingsDam Sand, Tailings Dam Shale, Ore Body Sands, and Ore Body Shales,respectively. Figures 46, 47, and 48 show the results of the cross-sectional models for a velocity fraction of 0.20. The migration of Cu isexpected to be considerably less than the region enclosed by the 0.20velocity fraction contour. As shown, Cu is not expected to migrate belowthe Tailings Dam Shale.
F-g ure-59-i-l-l-tstrats--are--l-s-o-l-te-maveme -or-a-vetoctty-fr-acti-o-nof 0.20. Again, the 0.20 relative velocity contour bounds the region ofCu migration. The figure shows that maximum migration occurs to the westwith the solute moving a total of about 600 feet from 1972-1992.
Aluminum is expected to move further than the other solutes in thiscategory. The batch tests indicated that Al was not attenuated by theTailings Dam or Ore Body Sands. However, it was strongly attenuated bythe Tailings Dam and Ore Body Shales (relative velocities of 0.005 and0.023, respectively).
Figures 40, 41, and 42 show vertical solute movement for a relativevelocity of 1.0. Because of high attenuation in the Tailings Dam Shale itis unlikely that Al will move through it. Therefore, Al should beconfined to the Tailings Dam and Fowler Sands.
2 The predicted 'Migration of Pb-210, Ra-226, U-238, and Th-230 is basedon analyses performed by Battelle (1980b) on the Wasatch Formationat Morton Ranch.
-53-

Horizontal movement of Al is difficult to predict. Although Al isnot attenuated by the Tailings Dam Sand, most pond seepage occurs throughthe Fowler Sands and Shales. Much of the pond fluid entering the TailingsDam Sand will have been cleansed of Al by the overlying Fowler Shales.Figure 56 shows an extremely conservative estimate of Al migration. Thelaboratory program predicts Al concentrations of 18 mg/l in the neu-tralized zone which exceeds the 5.0 mg/l EPA and WY DEQ water standardsfor livestock.
7.3.4. Solutes that Exceed Regulatory Limits in Acidic EnvironmentsBut Not in Basic Environments (pH, As, Cd, Mn, Ni, Zn)
Migration of the acidic front is an important factor in relating themovement of solutes in this category to regulatory standards. Severalsolutes (Cd, Mn, and Zn) are not attenuated by any of the geologic units.However, when pond water moves past the acidic front, the concentrationsof these solutes drop below the regulatory limits. Thus the acidic frontbounds the region where the solute concentrations exceed ground-waterregulations.
Figures 43, 44, and 45 illustrate movement of the acidic frontcalculated by the cross-sectional models, assuming the front moves at anaverage relative velocity of 0.30. The acidic front moves vertically tonear the bottom of the Tailings Dam Shale but stops short of entering theUpper Ore Body Sand. The cross-sectional models show limited horizontalmovement.
Figure 58 shows areal movement of the acidic front. Maximum movementoccurs west and southwest of the pond with maximum excursions of about 800feet. The above figures also denote where Cd, Mn, and Zn exceedregulatory limits. The concentrations of these solutes within the acidiczones are expected to be similar to those in the tailings pond. Thoseconcentrations are 30 ppm, 45 ppm, and 3.2 ppm for Cd, Mn, and Zn,r-e-s-pec-t-iel--y-.
Nickel is attenuated by the Tailings Dam Shale (relative velocity of0.066) but not by any of the other formations. It is anticipated that Niwill move areally through the Tailing Dam Sand the same as Cd, Mn, and Zn,but will not penetrate vertically into the Tailings Dam Shale. Theconcentration of Ni behind the acidic front should be about 1.4 ppm.
Arsenic is strongly attenuated by all geologic units considered inthis study. It is expected to move at a velocity fraction less than 0.05in all formations. Figures 49, 50, 51, and 60 show solute movement for arelative velocity of 0.10. Arsenic will migrate less than half thedistances shown, resulting in a total maximum horizontal movement ofabout 175 feet by 1992.
7.4. COMPARISON OF PREDICTED SOLUTE MIGRATION TO FIELD DATA
It is desirable to compare predicted solute migration with fielddata. Such comparisons indicate the validity of the model used to predictsolute transport and the appropriateness of data input to the model. Thefollowing text compares the results of this study to field data andprovides a foundation for future comparisons.
-54-

Two relative velocity fronts are of special interest; the 1.0 front,which describes unattenuated solute movement, and the 0.30 front, whichpredicts the position of the acidic zone. The acidic front is easilytracked by monitoring the pH in observation wells. The pond pH (2.4) isconsiderably lower than the pH of the ground water (above 7.0).
The unattenuated front is more difficult to track. It is necessaryto find a tracer which; (1) is not attenuated by the porous media, (2) hasa significantly higher concentration in the pond than in the ground water,and (3) is not dependent on pH.
Table 23 lists 11 solutes that were considered as tracers for the 1.0relative velocity front. Cadmium, Mn, Sr, Zn, and Si were eliminated fromconsideration because their concentrations were pH dependent. Potassiumand sulfate were eliminated because they had relative velocities otherthan 1.0. Sodium was eliminated because there was relatively littledifference between its concentration in the pond and the local groundwater. The remaining candidates were Ca, Mg, and Cl. Although Cl analyseswere not done for the batch tests it is generally a very good tracer.
The results of the batch tests indicate that Ca and Mg are notattenuated by any of the geologic units underlying the pond. Also, theconcentration of Mg only changed from 375 to 340 ppm when the tailingssolution was titrated to a pH of 8. This indicates that the concentrationof Mg is relatively insensitive to pH changes. The pH dependency of Cacould not be determined from the neutralization experiments since Ca(OH) 2was used to titrate the tailings liquor. Despite the uncertaintiesregarding Cl and Ca, it appears that, along with Mg, they are the besttracers for unattenuated solute movement.
Extensive water quality data has been taken at Highland over the pastfew years. However, many of the water-quality monitoring wells werecompleted in two or more zones and "grab" samples were obtained foranalysis. Multiple well completions and the sampling technique make itdTffTult to interpret the data.
An ambitious program was undertaken at Highland in 1981 to upgradethe water-quality monitoring program. Well completions were verifiedusing down-hole viewers, new monitor wells were drilled, and a geo-chemical consultant was retained to recommend proper sampling techniques.This new sampling program became operational in October, 1981 (seeAppendix C). The remainder of this section compares the results of theareal model to water-quality data obtained from the sampling programduring the last quarter of 1981.
A conclusive comparison would require data over a relatively longperiod of time. However, this preliminary comparison, which is limited totwo months of data, gives an indication of the accuracy of the modelpredictions and serves as an example of how the model results and fielddata can be compared.
-55-

Figure 64 shows the areal model results for 1982 overplotted on theCa water-quality data for the Tailings Dam Shale and all overlyingformations. Based on the limited data, the model appears to predictunattenuated solute movement north and south, of the pond accurately.East of the pond the model underpredicts solute movement near the outcrop.This is probably caused by describing the outcrop area as discrete blocksin the finite-difference model. Because of discretization, the modelpredicts water will seep from two points near the upstream end of NorthFork Box Creek. Actually, seepage is more spead out along the outcrop.
West of the pond the areal model predicts background concentrations:in Wells IX (Tailings Dam Sand) and X (Fowler Formation). Measured Caconcentrations in these wells are 601 and 489 ppm, respectively. Theseconcentrations are very similar to the pond concentration of 584 ppm.This indicates that the areal model underpredicted unattenuated solutemovement west of the pond.
Figure 65 displays the unattenuated areal model results withmeasured concentrations of Mg in the Tailings Dam Shale and overlyingformations. Data in Wells VII (Tailings Dam Sand), XIX (FowlerFormation), XXI (Tailings Dam Sand), and XII (Tailings Dam Sand), are inclose agreement with the areal model predictions. Data in Wells IX(Tailings Dam Sand) and X (Fowler Formation) have concentrations of 267and 151 ppm, respectively. These concentrations are between thebackground (1.5-15 ppm) and pond (375 ppm) concentrations. Data in WellsIX and X indicate that the areal model underpredicts unattenuated solutemovement west of the pond.
Figure 66 compares the areal model results for unattenuated solutesto measured Cl concentrations in the Tailings Dam Shale and overlyingformations. The comparison is favorable north and south of the pond.East of the pond the well data again indicate seepage is spread out alongthe outcrop area.
West of the pond tb•_con-c-entrat-n•_meas-r-ed i~nTalJin~g,_DamSa~nWell IX (26 ppm) and Fowler Well X (300 ppm) differ significantly. Thisdifference could be accounted for by Cl attenuation by the FowlerFormation or errors in sampling or analysis. After more data iscollected, Cl concentrations west of the pond will be better understood.
There are two likely reasons for the high Ca, Mg, and Cl con-centrations in wells near the western end of the pond. First, tailingshave been- discharged in the western part of the pond from 1972 to 1977.The high concentrations may be a result of vertical leakage of liquor tounderlying formations near the discharge spigot.
Second, a high permeability streak may exist in the Tailings Dam andFowler Sands which causes increased fluid flow west of the pond. Notethat the surface mine would intersect such high permeability streaks andprevent extensive fluid migration due to the low permeability of thebackfill. Although the areal model may underpredict westward solutemigration, the surface mine will limit solute excursions in thatdirection.
-56-

Figures 67 - 69 compare the areal model results to Ca, Mg, and Clconcentrations measured in the Upper and Middle Ore Body Sands, re-spectively. Note that the background levels for these solutes wereassumed to be the same as for the Tailings Dam Sand. Concentrations of allthree solutes measured in the Ore Body Sands indicate that backgroundconcentrations in the Tailings Dam Sand are representative of backgroundconcentrations in the Ore Body Sands.
The areal model predictions are in good agreement with the measuredconcentrations of all three solutes. The only area where the water-quality measurements indicate that solutes have exceeded model pre-dictions is near the outcrop. Again, this is probably due to spacediscretization in the areal model.
Figures 70 and 71 show the areal model predictions of acidic frontmovement (relative velocity of 0.30) and measured pH values for theformations above the Tailings Dam Shale and the Ore Body Sands,respectively. The only well completed above the Tailings Dam Shale thatthe model predicts will be within the acidic zone is Well XII, which isnear the southern edge of the pond. Measurements in Well XII indicate apH of 7.6 which is in the range of background values. This indicates thatthe areal model is overpredicting acidic front movement southwest of thepond.
In summary, areal model predictions of unattenuated solute andacidic front movement are in good agreement with monitor well data northand south of the pond. East of the pond where fluid seeps into North ForkBox Creek, solute migration is sometimes underestimated due to dis-cretization of the areal model. However, seepage does not seem to beextensive based on field data.
Calcium, Mg, and Cl concentrations, similar to those in the pond,were measured in Well X (Fowler Formation). Calcium and Mg were at pondconcentrations in Well IX (Tailings Dam Sand), and Cl was at backgroundconcentration. These data show that unattenuated solutes have traveledabout 1300 feet further west than predicted by the areal model for 1982.The presence of these solutes may be caused by high permeability streaksin the Tailings Dam and Fowler Sands or vertical leakage near the tailingsdischarge spigot. Calcium, Mg, and Cl were not detected in the Ore BodySands west of the pond.
Measurements of pH in Well XII (Tailings Dam Sand) indicate that theareal model overpredicted migration of the acidic front south of the pond.However, overall predictions of acidic front movement are generally ingood agreement with monitor well data.
-57-

8.0. SUMM1ARY
This study was performed at the request of Exxon Minerals Company. Thepurpose of the study was to predict seepage and solute migration from theHighland Uranium Mill tailings impoundment in Converse County, Wyoming.The study results were used to address questions posed by the NuclearRegulatory Commission regarding the amount and direction of seepage fromthe impoundment, the adequacy of the water-quality monitoring system nearthe impoundment, and seepage into North Fork Box Creek. The impoundmenthas been in continuous operation since October, 1972. It will becomeinactive when mill shutdown occurs in December 1983.
The study consisted of three main endeavors: (1) a laboratory programto quantify the chemical interactions between the pond liquor and geologicstrata underlying the impoundment, (2) a geologic modeling program todescribe the structure and lithology of Highland, and (3) a flow modelingprogram to calculate pond seepage and the migration of solutes.
The laboratory program included batch (static) tests between tailingssolution and rock samples, titration of tailings solution by calciumhydroxide solution to given pH levels, and a column flood of Tailings DamSandstone by tailings pond liquid. Mineralogical analyses were alsoperformed to help characterize the sands and shales.
Geologic models of the Highland area were developed using ExxonProduction Research Company's computer programs for two- and three-dimensional geologic mapping and modeling. The two-dimensional mappingprogram was used to construct geologic surfaces and to build those surfacesinto a stratigraphic framework. The three-dimensional modeling programwas used to interpolate measured resistivity values and relate thosevalues to lithology.
A finite-difference flow model developed by Exxon Production ResearchCompany was used to simulate seepage and solute movement through geologicstrata underlying the tailings pond. Three cross-sectional models and-oneareal model were constructed and simulations were performed to the year2000. The model results for unattenuated solute movement and acidic frontmovement were compared to water-quality data from monitoring wells.
The approach taken in this study to model solute movement has thefollowing advantages:
1. Chemical attenuation is based on data obtained by actuallycontacting the pond liquor with aquifer rock.
2. The chemical attenuation experiments are linked directly to theflow calculations by means of the relative velocities.
3. A wide range of relative velocity fronts are tracked whichprovides the flexibility to track any solute front for whichbatch test data is available.
-58-

4. Flow is calculated using a finite-difference simulator capableof modeling two fluid phases, nonhomogeneous porous media, andtransient boundary conditions.
As mentioned previously, the study approach also has the following
limitations:
1. Hydrodynamic dispersion is not calculated.
2. A simplified model (apparent distribution coefficient model) isused to account for the complex chemical reactions occurringbetween the pond liquor and the aquifer rock.
3. Radioactive decay and the generation of daughter products isonly qualitatively considered.
4. The solution mine pilot is not modeled.
8.1. RESULTS AND CONCLUSIONS
The results and conclusions obtained from the laboratory, geologicmodeling, and flow modeling programs can be summarized as follows:
8.1.1. Laboratory Program
8.1.1.1. Batch Tests
Results of the batch tests are given in Figure 14 and Tables 2 - 5.
1. Significant decreases occurred in the concentrations of As, Cr, Cu,Fe, and Se after 30 days of contact with Tailings Dam Sand, TailingsDam Shale, Ore Body Sand, and Ore Body Shale.
2. The concentrations of K, Mn, Na, and Zn were not significantlyaffected by contact with the four geologic materials.
3. The concentrations of Mg, Ca, and Cd increased after contact with thefour geologic materials.
4. The concentration of Si increased when contacted with Tailings DamSand and decreased when contacted with the other geologic materials.
5. The concentration of Ni decreased when contacted with the TailingsDam Shale and increased when contacted with the other geologicmaterials.
6. The concentration of Sr increased significantly when contacted withthe Tailings Dam Shale and remained about the same when contacted withthe other geologic materials. Increases in Sr concentration werenoticed after 3, 7, and 15 days of contact, but decreased between 15and 30 days of contact.
-59-

7. The concentration of Al decreased when contacted by the shales andincreased when contacted by the sands.
8. Thorium and uranium concentrations increased when contacted with theOre Body Sand and decreased when contacted with the other geologicmaterials.
9. The concentration of sulfate increased slightly when contacted withthe Ore Body Sand and decreased when contacted with the other geologicmaterials.
10. The pH of the tailing solution increased from 2.4 to between 3.2 and3.5 after 30 days of contact with the geologic materials.
11. The Eh decreased from 846 mv (millivolts) to between 618 and 712 mvafter 30 days of contact with the geologic materials.
8.1.1.2. Titration Experiments
Results of the titration experiments are given in Figure 15 and Table 6.
1. The concentrations of As, Ni, Zn, Al, Fe, Mn, Si, and Cd decreasedsignificantly when the tailings solution was titrated to a pH of 8.0.
2. The concentrations of Cr and Cu were relatively insensitive toincreasing pH.
3. The concentrations of Sr, K, Mg, and Na appeared to increase withincreasing pH. The apparent increases of K, Mg, and Na may have beencaused by masking of these cations by the high concentration ofsulfate in the tailings solution. During the progress of thetitrations, the sulfate ion concentration was decreased by dilutionand by precipitation as gypsum. The decreases in sulfate con-•entrat-io-nma-y-hvees••te-d-in-apparen-t__ncr-ease~sin_•,_Mg,_adNaconcentrations.
8.1.1.3. Column Flooding Experiment
Results of the column flooding experiment are given in Figure 16.
1. The Tailing Dam Sand has the capacity to neutralize tailingssolution.
2. When tailings solution at pH 2.4 was pumped through a column ofdisaggregated Tailings Dam Sand, effluent pH was 7.7, 5.8, 4.2, and3.8 after passage of 1, 2, 3, and 4 pore volumes of tailings solution,respectively.
-60-

8.1.1.4. Mineralogical Analyses
Results of the mineralogical analyses are given in Tables 8 and 9.
1. No mineralogical differences were found between undried and oven-dried shales other than dehydration of expandable clays upon drying,and subsequent collapse of the expandable clay matrices.
2. After being in contact with the geologic materials, the tailingssolution evidently became saturated with calcium due to alteration ofmineral species or ion exchange, and gypsum began to precipitate fromsolution.
3. Contact with tailings solution caused a general decrease in averagegrain size in the sandstone samples. Rock fragments originallypresent were broken down to individual mineral constituents.
4. During the batch tests a yellow clay-like coating was graduallydeposited on sand grains. There was more of the coating on 30-dayexposure samples than on 3-day samples, but there were lowerconcentrations of U, Ca, and K in the coating of the 30-day samplesthan the 3-day samples. The coating had Si, Fe, and Al as the majorcations, generally in the order Si >Fe>Al. Minor amounts of Mg, K,Ca, S, and Ti were detected at different times.
5. During the batch tests there was a gradual alteration of iron- andmagnesium-rich minerals to oxides and/or clays, and a gradual loss offeldspars through grain size reduction to silt, or alteration toclays.
__8__ .Z.Geo] ogicMode-ig
1. The Tailings Dam Shale is continuous around the pond except where ithas been eroded in North Fork Box Creek.
2. Three representative cross sections, which were orientated west-east,45 degrees west of north, and 45 degrees east of north, demonstratedthe limited range of structure, formation thickness, and lithologyseen in the study area.
8.1.3. Flow Modeling
8.1.3.1. Cross-Sectional Models
The results of the cross-sectional models are shown in Figures 40 - 52.
1. The pond acts as a ground-water divide causing horizontal solutemovement away from the pond in all directions.
-61-
2. Unattenuated solutes will move vertically through the Tailings Damand Upper Ore Body Sands, but will not enter the Middle Ore Body Sand.
3. The farthest migration of unattenuated solutes will occur west of thepond where they will reach the northern edge of Pit 2 abo.ut the year1995. By that time the pond will be dry and regional flow re-established. It is unlikely that solutes will migrate to lower sandformations through the backfilled pit.
4. Unattenuated solute movement to the northwest and southeast islimited to within a few hundred feet of the pond.
5. The acidic front (velocity fraction of 0.30) will not migrate belowthe Tailings Dam Shale.
6. Horizontal migration of the acidic front is limited to within 100 feetof the pond.
7. Very little solute movement occurs at velocity fractions below 0.20.
8. Total seepage from the tailings impoundment rises to about 100 gpm(gallons per minute) within a year after the pond is put into oper-ation. By 1974 seepage begins to decrease due to the buildup of lowpermeability tailings and reaches 50 gpm about 1975. Seepage thenbegins to increase as the water level rises and the cone of depressionfrom surface mining lowers the water potential under the pond. Theseepage rate increases at about 19 gpm per year until the maximumwater level in the pond is attained in 1983. The mill is then shutdown and, as the pond dries, seepage decreases at about 38 gpm peryear. Seepage ceases in 1991 after all the water in the pond andtailings has either evaporated or drained into underlying formations.
8.1.3.2. Areal Model
The results of the areal model are shown in Figures 56 - 62.
1. Maximum unattenuated solute movement will occur west of the pond,reaching the northern part of Pit 2 about the year 1992.
2. Unattenuated solutes will move a maximum of 1300 feet southwest and
300 feet northwest of the pond.
3. The acidic front moves a maximum of about 500 feet from the pond.
4. By 1995 regional flow will be re-established and the solutes will beswept eastward towards North Fork Box Creek at a velocity of about 35feet per year.
5. The pH beneath the pond will rise as regional ground water reinvadesthe strata underlying the pond. The rise in pH will remove manysolutes from solution. The concentration of some solutes will alsodecrease due to continued adsorption onto the aquifer rocks.
-62-

6. Solutes that remain in solution will eventually be discharged intoNorth Fork Box Creek. The discharged solutes may; (1) move slowlydownstream towards Box Creek, (2) be left behind as solids due toevaporation along the seepage face, or (3) seep downward intooutcropping sands and shales.
7. Ground-water seepage into North Fork Box Creek was about 25 gpm beforethe tailings pond was operational. During the first few years ofoperation seepage increased from 25 to 33 gpm as a result ofrelatively high seepage where the Tailings Dam Sand was in directcontact with the pond bottom. As the build up of tailings on thecontact area reduced the effective vertical permeability of theTailings Dam Sand, and the surface mine intercepted regional flow,seepage decreased to below 20 gpm. Seepage increases from 20 gpm to40 gpm as the water level in the pond increases between 1977 and 1983.After 1983, seepage decreases as the pond dries and the tailingsdrain, reaching a minimum value of about 7 gpm. About 1993 theseepage begins to increase as regional flow is re-established.
8.1.4. Solute Migration
1. The solutes, studied for Highland can be categorized according toregulatory status, attenuation properties when in contact with sandand shales, and ability to remain dissolved in acidic and basicsolutions. The categories used for this study are: unregulatedsolutes, radioactive solutes, solutes that exceed regulatory limitsin both acidic and basic environments, and solutes that exceedregulatory limits in acidic environments but not in basic en-vironments.
2. The unregulated solutes are Ca, K, Mg, Na, Si, and Sr. These solutesgenerally are not attenuated by any of the geologic units underlyingthe pond. Exceptions are K and Si which are strongly attenuated bys-and-s--and--s-h-es -- respecti-ve-y.
All four unattenuated solutes (Ca, Mg, Na, Sr) will move through theUpper Ore Body Sand and be stopped by the underlying shale. Maximumhorizontal movement will be about 1200 feet west and southwest of thepond.
Because K is strongly attenuated by the Tailings Dam Sand, it isunlikely that it will migrate any significant distance outside theFowler Formation. Silicon is attenuated by shales and thereforewill only enter the Tailings Dam Sand where it is in direct contactwith the pond bottom. Although Si will migrate within the TailingsDam Sand, very little movement will occur into overlying orunderlying shales.
3. The radioactive solutes are U (total), Th (total), Pb-210, Ra-226,U-238, and Th-230. All of these substances are strongly attenuatedby the Tailings Dam Sand and Shale. Vertical migration will notextend below the Tailings Dam Shale. Maximum horizontal movement isestimated to be less than 100 feet from the pond.
-63-

4. The solutes that exceed regulatory limits in both acidic and basicenvironments are Al, Cr, Cu, Fe, and Se.
Chromium, Fe, and Se are very strongly attenuated by both the sandsand shales. Essentially no vertical or horizontal solute migrationis expected.
Copper is attenuated by all geologic materials studied for Highland.It is not expected to migrate below the Tailings Dam Shale, andmaximum horizontal movement will be less than 600 feet to the west.
Aluminum is not attenuated by the Tailings Dam or Ore Body Sands.However, it is strongly attenuated by the Tailings Dam and Ore BodyShales. Most of the fluid seeping from the pond will be cleansed ofAl as it moves through the Fowler Shales (assuming the Fowler Shaleadsorbs Al as do the Tailings Dam and Ore Body Shales). A veryconservative estimate of Al migration indicates maximum horizontalmovement of about 1200 feet southwest of the pond. The laboratoryprogram predicts Al concentrations of 18 mg/l in neutral groundwater. This exceeds the 5.0 mg/l EPA and WY DEQ water standards forlivestock.
5. Thesolutes that exceed regulatory limits in acidic but not in basicenvironments are H (pH), As, Cd, Mn, Ni, and Zn.
Migration of the acidic front is an important factor in relating themovement of solutes in this category to regulatory standards.Several solutes (Cd, Mn, and Zn) are not attenuated by any of thegeologic units. However, when pond water moves past the acidicfront, the concentrations of these solutes drop below the regulatorylimits. Thus, the acidic front bounds the region where the soluteconcentrations exceed ground-water regulations.
The--cid-c-froint ymoves vertil-ly to near tieThUbtt-om-of-t-hie-Ta-ilnngsDam Shale but stops short of entering the Upper Ore Body Sand.Maximum horizontal movement occurs west and southwest of the pondwith maximum excursions of about 800 feet. The concentrations of Cd,Mn, and Zn within the acidic zone are expected to be approximatelythe same as they are in the tailings pond. Those concentrations are30 ppm, 45 ppm, and 3.2 ppm for Cd, Mn, and Zn, respectively.
Nickel is attenuated by the Tailings Dam Shale but not by any of theother formations. It is anticipated that Ni will move areallythrough the Tailings Dam Sand the same as Cd, Mn, and Zn, but will notpenetrate vertically into the Tailings Dam Shale. The concentrationof Ni behind the acidic front should be about 1.4 ppm.
Arsenic is strongly attenuated by all geologic units considered inthis study. It will not move below the Tailings Dam Shale andmaximum horizontal migration will be about 175 feet to the west andsouthwest.
-64-

6. To evaluate the accuracy of this study, areal model predictions ofthe seepage and acidic front positions were compared to field data.The seepage front was tracked by measuring calcium, magnesium, andchloride concentrations. These solutes do not appear to react withany of the geologic units underlying the tailings impoundment andshould move fast as the seepage front. The acidic front was trackedusing pH measurements.
The position of the seepge front predicted by the areal model was ingood agreement with monitor well data north and south of the pond.East of the pond, where fluid seeps into North Fork Box Creek alongthe outcrop area, solute migration is sometimes underestimated dueto the finite-difference gridding (discretization) of the arealmodel. Tracer concentrations in wells west of the pond indicate thatthe seepage front has traveled about 1300 feet further west thanpredicted.
The predicted position of the acidic front was in good agreement withmonitor well data north, west, and east of the pond. South of thepond the model appears to slightly overpredict acidic front mi-gration.
-65-

REFERENCES
Anderson, M.P., 1979; "Using Models to Simulate the Movement of ContaminantsThrough Ground-Water Flow Systems", CRC Critical Reviews in Environ-mental Control, V. 9, Issue 2, p. 24.
Batelle, 1980 a; "Model Assessment of Alternatives for Reducing Seepagefrom Uranium Mill Tailings at the Morton Ranch Site in CentralWyoming". Prepared for the Nuclear Regulatory Commission,Washington, D.C.
Batelle, 1980 b; "Interaction of Uranium Mill Tailings Leachate withSoils and Clay Liners". Prepared for the U.S. Nuclear RegulatoryCommission, Washington, D.C.
Dames & Moore, 1980 a; "Hydrologic Evaluation Pit 5 Lake Reclamation,Highland Uranium Mine, Converse County, Wyoming, for Exxon MineralsCompany, USA".
Dames & Moore, 1980 b; "Phase I Report - Highland Uranium Mill TailingsImpoundment Seepage Study for Exxon Minerals Company, USA.
ERCO Petroleum Services, 1981; "Special Core Analysis for Exxon ProductionResearch Company - Highland Well".
Exxon Company, USA, 1973; "Final Environmental Statement Related toOperation of the Highland Uranium Mill". Submitted to the U.S.Atomic Energy Commission, Docket No. 40-8102.
Golder Associates, 1979; "Report to Exxon Minerals Division HighlandUranium Mine on Hydrologic Parameters, Douglas, Wyoming".
Hagma-li77J.L,1971; "Groundwater Flow, Hydrochemistry, and UraniumDeposition in the Powder River Basin, Wyoming". University ofNorth Dakota PHD Dissertation.
Hubbert, M.K., 1940; "The Theory of Groundwater Motion", Jour. Geol.,V. 48, p. 785,944.
Langen, B.E. and A.L. Kidwell, 1970; "Geology and Geochemistry ofthe Highland Uranium deposit, Converse County, Wyoming", ExxonProprietary Report.
Masterson, W.L. and E.J. Slowinski, 1969; Chemical Principals, W.B.Saunders Company, Philidelphia, PA.
Moe, D.E., 1979; "Underground Mining Experience at Exxon's HighlandUranium Operations", in Third Annual Uranium Seminar, WyomingMining and Metals Section of AIME, pp. 134-137.
Toth, J., 1963; "A Theoretical Analysis of Groundwater Flow in SmallDrainage Basins", Jour. Geophys. Res., 68, pp. 4795-4812.
-66-

A1,111111ACANADAAL ET .SAS EAtC CHI0VAN .. "QItA ýN t.I- OA9O1A.
- \ - - UNITUDSTATIS
/ AWICLISTON EAlIl
AN
LIJ
\
- -- - - ----- -
$ct OAK -
rA A NG
A ASA
-I A A
A HIGHLANO ,
0 100
MILES
FIG. 1 REGIONAL POSITION OF POWDER RIVER BASIN(FROM LANGEN AND KIDWELL, 1970)

FIG. 2 RELIEF MAP OF POWDER RIVER BASIN, WYOMING AND ADJACENT MOUNTAINS(FROM WYOMING GEOLOGICAL ASSOC. GUIDEBOOK, 1958)

T
36
N
-NOTE: KERR McGEE'S SMITH UNDERGROUND MINE IS 8 h
NOTE: ROCKY MOUNTAIN ENERGYS BEAR CREEýK URANIMILL IS 12 MI. N-NW OF PLANT SITE
35 3632 3 %1 -9-1 34
NOTE: FACILITY & PITS ARE SHOWN AS GENERAL LOCATIONS ONLYI. I
R 72WR 73W
g SILVER KING MINES - TENNESSEE VALLEY AUT(SURFACE MINE UNDER DEVELOPMENT IN SEC-
IORITY SOUTH MORTON RANCH PROPERTYION IS, T 38 NR 72 W)
0 4000
FT" SURFACE OWNED OR CONTROLLED BY EXXOIN BY SURFACE AGREEMENTS
FIG. 3 LOCATION ANDILAYOUT OF THE HIGHLAND URANIUM OPERATIONS
(FR0M EXXON COMPANY, USA: 1973) 4o AJE
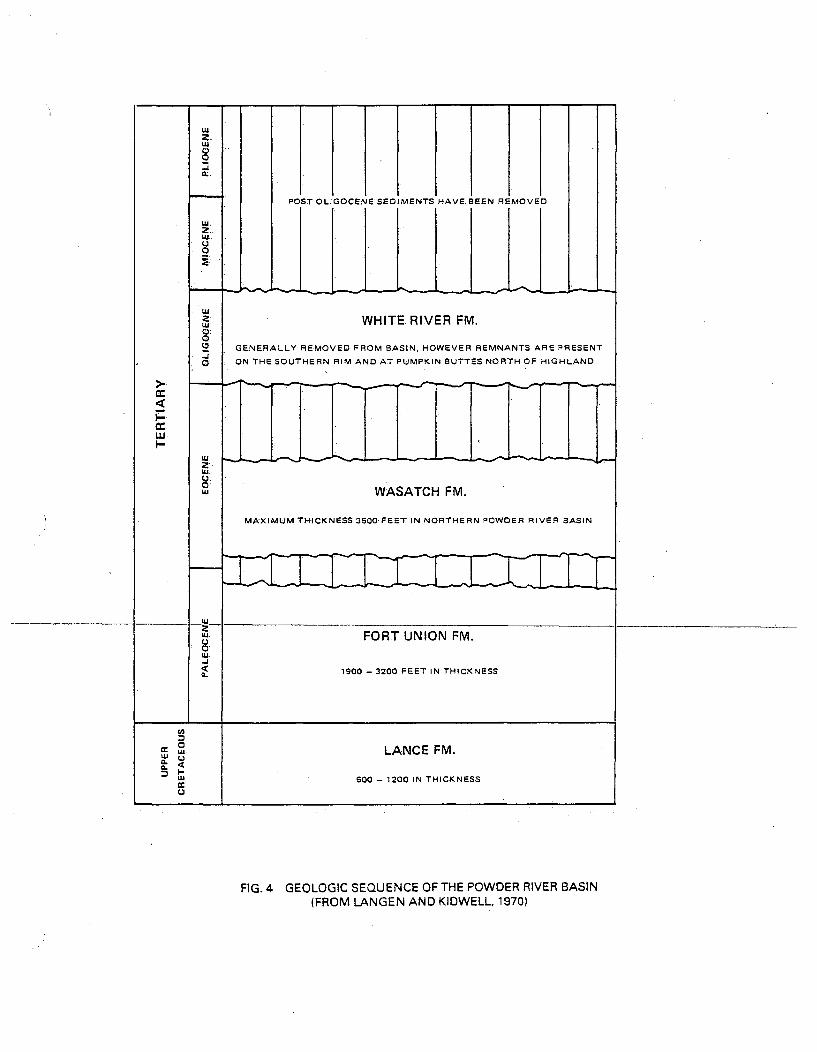
WHITE RIVER FM.
GENERALLY REMOVED FROM BASIN, HOWEVER REMNANTS ARE PRESENT
ON THE SOUTHERN RIM AND AT PUMPKIN BUTTES NORTH OF HIGHLAND
I--
I.-
WASATCH FM.
FORT UNION FM.
1900 - 3200 FEET IN THICKNESS
LANCE FM.
600 - 1200 IN THICKNESS
FIG. 4 GEOLOGIC SEQUENCE OF THE POWDER RIVER BASIN(FROM LANGEN AND KIDWELL, 1970)

LEGEND
TAILINGS IMPO
0 250
FEET
TAILINGS DAM SHALEISOPAC IH MAP%
DATE 3/5/71 T36N R72WNGEOL. W.C. DUKE G.L.A.
i. 5 TAILINGS DAM SHALE ISOPACH MAP(FROM EXXON COMPANY, USA; 1973)

(FT)
5200 - FOOT CONTOUR APPROXIMATES MAXIMUM POND EXTENT
FIG 6 ATIONS OF CROSS SECTIONS A-A', B-B', AND C-C'(FROM EXXON COMPANY, USA; 1973)

CROSS SECTION
N-W
A
A'6 43652400
SEC. 28
46 4236 42SEC. 28 SEC. 28
3966 36 3200 2B 24 2Q000100 j 1370 18 21 2575SEC,. 2 C. 27 SEC. 27 SEC. 27 SEC. 27
SEC. 21
I I
-"TAILING DAMTAILING POND
... .... ......-..
.. .... ..
TAILINGS DAM SHALEO" 600'
0' 60'HORIZONTAL SCALE
SD: VER-TI
-CAL A L--
-FEET FEET
DATE 3/2/7 1 T36N Fl72WGEOL. W.C. DUKE G.L.A
FIG 7 CROSS SECTION A-A'FROM EXXON COMPANY, USA; 1973)

CROSS SECTIONNORTHB
SQUTHB'
162:
SEC.
6250 48 3965 282 2200 1 0100 -222 SEC. 22 SEC. 27 SEC. 27 SEC. 27
- - TAILINGS POND 4 .7 ff,. .
------- - -T-------
.............
DAM SHALE---------------- --------................ ............... ............
..-.-.::::::::uPPER 6RE........................................
..... ......
...... ........
......... ft -__
............
.. ................. ..........
I
I1
...... -- -- - - DATE 3/2/71 T36N R72W
- -- -ii- - GEOL. W.C. DUKE B.R.H.
0VERTICAL SCALE
FEET
O 0 500'
HORIZONTAL SCALE [ I I IFEET
FIG 8 CROSS SECTION B-B'(FROM EXXON COMPANY, USA; 1973)

CROSS SECTION
NORTHC SOUTH
C.
48 44 4011 9 9
36 32 219 950 I(
SURFACE LINE
TAILINGS DAM CREST ELEV. 5200'
PROJECTED INTO LINE OF SECTION
BROWN, SANDY, SILTY SOIL
I WZTAILIMi ,S DAM SHAL" - ":'-r9
*AND
_ t- - 1: ,,i,,
Iif - -- 500. .. .-- . . .
.4.
- 4-HORIZONTAL SCALE
VERTICAL SCALE
I I -4
- +
t.
0 500L 1
0 FEET 50
FEET
TAILINGS DAM SHALE
DATE 3/2/71 T36 R72
GEOL. W.C. DUKE BRH
FIG 9 CROSS SECTION C-C'(FROM EXXON COMPANY, USA; 1973)

.... ... ... ... ... ... .. • .. ',,',', .', oo.,.•.,•_%•_ . • ,="•;..;,,:-•-';:1tA..i: i:: i :i i i i i i i iiii i i i } i i l .;•:;;;:.i;;; :: ... . '."' ." ..'.' ,.,.: : : : : : : : : : : : : : : : : : : : : : : :: : : : : : : :: : : : : : : : : : : : : : : .. . .. .... ..
, .. . I. .. .. .. .. . .. .. . .. ... .. . .. ... .. .. .... .o .o . o.
o RE IO .F .O A .YTE .OF ....G.OUN .-..A.. .RF.LO.W
IN EME .T sy T. . R U D-A E .FL ....... .......w
RE .O O .OF ..............
jREGION 0
FIG. 10 LOCAL, INTERI GROUND-WATER FLOW SYSTEMS

MONTNAI
Pow-DER7
w k\ s 0 N l 1E_ S
RIVE dV
Xi I*I' 4
lF1 TL4BASIN-7--1
II t/l •11 I I
C ~ ER)S T
MR, OVRNF#
.. N.. :,Y MiES -
zoo E
.I i~ 'J.
m
FIG. 11 REGIONAL FLOW SYSTEM IN THE UPPER CRETACEOUS PARKMAN SANDSTONE(FROM PETROLEUM RESEARCH CORP.)

R74W FI73V M-72Wy R71W.fi74Y A)3VR7W li
T37:N
T36.N
"Il'
•- i (HIGHLAND FLATS
5P15 5 OD
RECHARGE___
g-DISCHARGE -
AREA Box
LIMIT OF HIGHLANDS,,SAND SYSTEM
f" '.
iv V
)T037N
*T36N
T35N
T056N
R74W R73W f72W 071W
o 1 2
MILES
FIG. 12 INTERMEDIATI
* REPORTED BY HAGMAIER ,1971)0 REPORTED BY DAMES AND MOORE (1972)
FLOW SYSTEM IN THE VICINITY OF THE HIGHLAND MINE

238 u 4.51 x 10⁹ YR 2 3 4 Th 24.5 DAYS92 ALPHA - 90 BETA
234 1.14 MIN 234 233000YR 230 80,000 YR9 a L 9 2 3U LA Th91 BET 92 ALPHA 90 ALPHA
226 1622 YR 222 3.83 DAYS 218 3.05 MIN 214 26.8 MIN 214 19.7 MIN88- Ra po- Rn PO A- PH Pb - ETA8 Bi E88 ALPHA 86 ALPHA m 84 ALPHA 82 BETA 83 BETA
214 .00015 SEC
84 ALPHA
210 p 22 YRPb82 BETA
210 5.0 DAYS
83 BETA
210 140 DAYS 206ALPHA 82Pb STABLE"84 APA 8
EXPLANATION
MASS NUMBER HALF - LIFEPROTONS ELEMENT RADIATION EMITTED
FIG. 13 URANIUM-238 RADIOACTIVE DECAY SERIES

-0-
---. -0. .----
TAILINGS DAM SAND
TAILINGS DAM SHALE
ORE BODY SAND
ORE BODY SHALE775
Al ± 5%400
350
300
250
350
300
250
Ez0
z0U
200
200
150]1 b
700-
650.
600
Cs t 2%
150
100.. qa
100 50
"b
bbUf 0
0 3 7 15 30 0 3 7 15 30
ELAPSED TIME (DAYS)
FIG. 14 CONCENTRATIONSIOF VARIOUS ELEMENTS, pH AND Eh VERSUS ELAPSED TIME IN DAYSFROM BATCH TESTS OF TAILINGS SOLUTION OVER FOUR ROCK TYPES

TAILINGS DAM SAND
- - -_ TAILINGS DAM SHALE
OREBODYSAND
-- --- A- - •ORE BODY SHALE
100-
50.
0
zUz0U
300-
250-
200
K ± 5%
0 E---rk
500
450
400
350
100
50
Mn ± 6%
a 3 75 a
15 30Ut; . ,
0 3 7 15 30 0 3 7 15 30
Na t 2%
- - - - 30S 3 7 15 30
300-
250-
200-
150-
100-
Sit 5%
"'" 75
As ± 5%
b-:~ . . .
0 0 3 7 15 30 0 3 7 15 30
ELAPSED TIME (DAYS)
FIG. 14 (CONTINUED)

-- "l-5 -
TAILINGS DAM SAND
TAILINGS DAM SHALE
ORE BODY SAND
ORE BODY SHALE
40-
Cd ± 5% Cr t 20%
Ez0
LU
z0u
301
20
1.0-
0.6-
1.5
1.0
0.5
Cu t 10%
3 7 15 30 0 3 7 15 3007 3
0 3 7 15 30
2.5
2.0
1.5
1.0
150
100
50
0
So ±- 5%
Sr ± 10%
•- ,
I\
'I. • . ---- .
0 3 7 15 300 15 30 0 3 7 15 30
ELAPSED TIME (DAYS)
FIG. 14 (CONTINUED)

TAILINGS DAM SAND
-El'- TAILINGS DAM SHALE
------ OREBODYSAND
- - ORE BODY SHALE
Ez0
zwuz0L)
Th
7 01 Ti'
* 'L25 0 •
- -
20
15 a
10
0
00 5 3
300.
250 -
200
0
a *s
u
I|
i150 -
100 1I
Io
5
4
Zn ± 3%
50-Io
a
0 2I
0 3 7 16 30 0 3 7 15 30
ELAPSED TIME (DAYS)
FIG. 14 (CONTINUED)

-- 9--
TAILINGS DAM SAND
TAILINGS DAM SHALE
ORE BODY SAND
ORE BODY SHALE
z0u
8000
7000
6000
5000
4000
80O
800
750
700
650
6oo
pH4 -
3
2
A 1-A-I ....
20 3 15 30 0 3 7 15 30 0 3 7 15 30
ELAPSED TIME IDAYS)
FIG. 14 (CONTINUED)

z
z0
z0U
Zn
Ni
i
2Sr
2'
I ...........-
0
3 4 5 a 7 a
10
0
I
04 6 a 3 4 6 8
pH --
FIG. 15 TITRATIONS Of HIGHLAND TAILINGS SOLUTION BY 0.015M Ca(OH2 )

300
200
100
Al
Fe201
10 j
0143
50-
40-
30
K
Ez0
Luz0u
-J|l .|zu
3 4 5 6 73 4 5 6 7 a
Mn
4007
300,
.)nn
Mg
300'
200-
N!
|IN ,dr*W ....
3 4 6 6 3 4 5 6 7 87 a 5
PH -*-a
FIG. 15 (CONTINUED)

Cd
i00
50
0
Si
Ez0P
Iulz01)
. • '. . T
7 IU-3 4 5
Cr
40
30
20
10
0-
3 4 6 6 7 U
Cu
0,
43 6 76• 7 8a:
3 4 5
pH --
FIG. 15 (CONTINUED)

9.
8s
7
6
PH
5
i
4•
3
4 10
PORE VOLUMES
FIG. 16 pH VERSUS PORE VOLUMES OF TAILINGS SOLUTION
PASSED THROUGH TAILINGS DAM SANDSTONEI

LEGEND20.00m-
10.000
(In
z'10
0 uUwa
0-
-10,000.
-20.000-
FOWLER ARANCH '
:IUNDERGROUN6
MINE .IN MILL SITE
LIMITS OFDRAINAGEAREA
EX)XXON
PERMITAREA
F,. TAILINGSW POND
Ill"". SURFACE1= MINE
- ~ -4-4-
~7)
I-!
A
oI, 0
MILE
-30.000-
-40.000 -30.000 -20.000 10,000 20.000 30.000
AL COORDINATES
(FEET)
FIG. 17 ORIENTATIONS AND COORI SYSTEM USED FOR THE CROSS-SECTIONAL MODELS

x = -37,750
y = 0.0
_____________________________________ 7i7
17
16
15
14
13U)
120
9cr 11
c- 10
9
8
7
6
5
4
3
2
T ..
__________ 4 -
- .4 . . *1
t . .*
7 . .
- - - - - - - - - - - - - -4
23.

4 ~44*~'444.'4 '4
.4 . <tX *.*. 'V
' ~ 4'
.4- .4 -
-9 :~7;;~-.z4449~.~A . .4
'4~4.4 4' 4' - 4.
- 9" 44 ~ ~ .
.94....>. 4' 4-----------
------.--- - -
-744'.
499
.44
.9.444'Sc' . ..
44.4 '~ .~ .''a
-7777-74-7--
7-7 4474
.0
444.'... 444.
r.-,-9
"4.4
4 "V~ . .?.. 1..
'iA.
4'.
4, 4 4 .. 4*9.',
7
44~4~4
4 4i•I•I I•IL• •I•,• • ,• • •,•i • II ,L •- • I,• •
t•

N '-7"
'N N e5
it
98
HORIZO
FIG. 18 GEOLOGY ANDDISCRETIZ

4TAL GRID BLOCKS
!,TION OF THE WEST-EAST CROSS SECTION

40
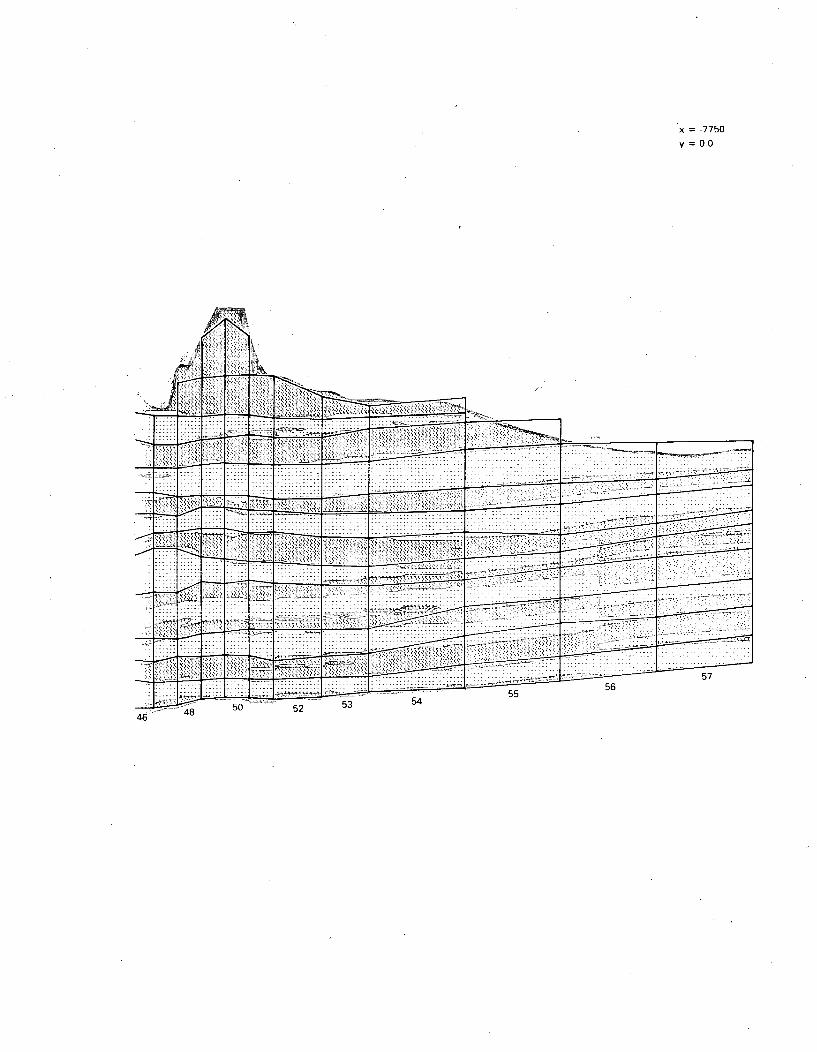
x = -7750
y = 0.0
4846'

x = -16,970y = 16,970
15x xxx~ >
5xx\xx X xxx 0x>-'x xx 'K- ~ x-r ~ xx~txx xxxxx>x~14xx-x*V..<x x x. x ~ x
13 x x xxx
xx x xx x12 xx \ xx x
0 x x xx
xx x x xxxx
xx< x0xx 10
xx 9 x x x x x
8 x x xrP< xxxx~x1@.< x
7x xx x x
x6x xx x xx. x
5x x x
4 x ...........
3 2 3x
1
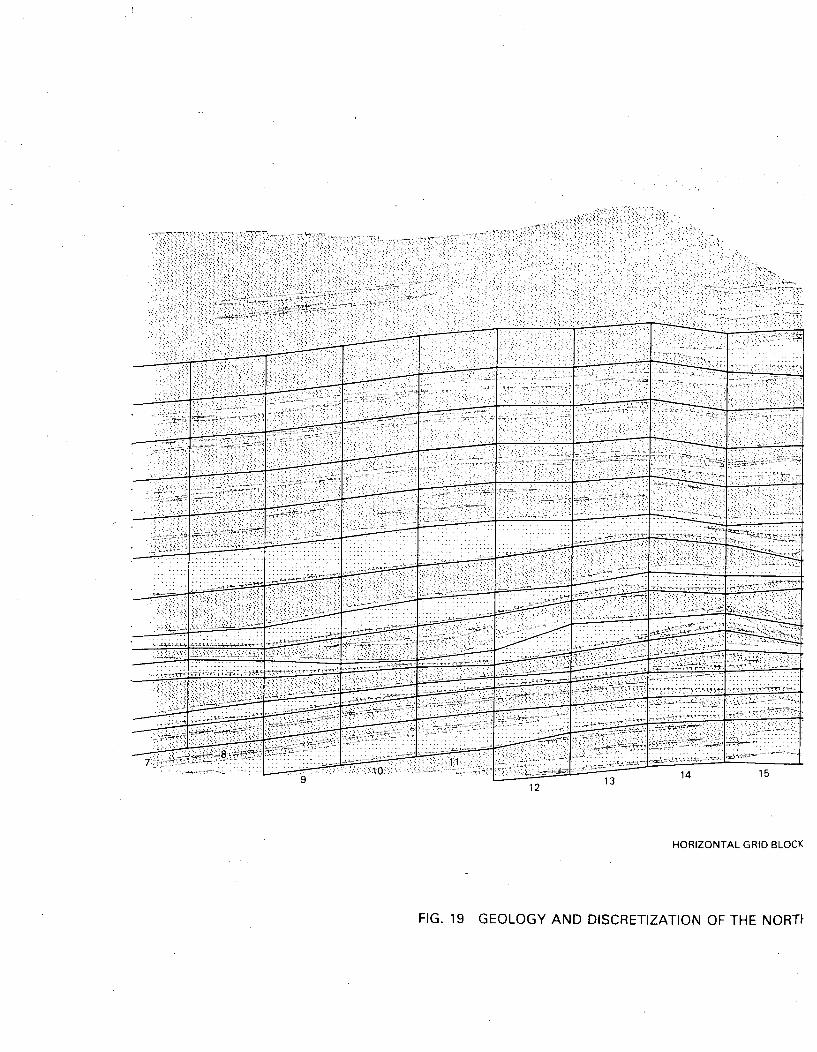
41.,4
'N .7V -
N 9
10,
11ii•i~ iiii
-----------------------
12 13 14 15
HORIZONTAL GRID BLOCK
FIG. 19 GEOLOGY AND DISCRETIZATION OF THE NORT"

-~ - V N
- ~N N
16 17
IWEST-SOUTHEAST CROSS SECTION

x = 5,600
y = -5,600
38 40 42

x- 17325y 17325
NNN' N'' NNN'NNN~NN''N
NNN''N'N~~NN~.NN Nx N,~N'NN
NNN XN N
- 'NNNNN'''.XNNXNNNN'N'NN\'XNXXXNXXV<
N'~N X''~X 'N N'NN~N"' X"N'N NN ' 'NNN
NN NN N NN NNX
'N'XN
NNNNN NX N. NNXNNNNNSVVVN'NXNN'N NNNXNNNXNNN'NQNNNN'' XN' NX'NXVNNN XX <N
'NN\NNNXNN '''N>,' XNXNN'NNNNN'XX\XXNNXNN N' .NN'NNNNXNX
~XN ' NN
'NNN N,>"''
N NN N' NN' N N N'~ NN XNN
'N' N' NV~ N*N'NN' NX'NNNNNN N" NXN'NXXXX~
XXNN ~NNXN'
N' 'NN' '< N 'NXNNX NXX X'NN~\NN''.N'N ,NNNN'VNN'XN'X~
~
N>~.N.X <~ N'XN' >IN N
NNXNXN\NNNN 'M~N
N'NXNXNNNNX'~N
''N NNNNN'N N XN " ' N N 'N 'N N' N'
N N ,NNNNNNNN '\N''XXNNXX N NNNNX' N "*' N N
~NNNN ~NX
N''' N ''XXX
0
m
14
13
-~12
11
10
~.N "XX "N N' 'NXNX'N\N'N ' N N 'N " XX N'
N' *N N' 'N XNN
- .XJN'.N'
'N'~N~'"'XNN'N'N'N'NN NN'''' NXXNXNNX\N'~X ~X' N'' NX'NNNX'NN"~'NN'XNX'NX' N'' XX ~NNN~XXNN'N' X'NXNNN' 'N *'' XN~.NN~>NN~N XN.XNXNNN NN~N ,>NXN'~NNNN'N'XN'XN'~XNN XXNXN NNXNN' XNN'"'NNNN'
~ N '~NZ~'N~NVN'2.X.N~, ~N~'N'~' N~N.X'
"'~r"N~"' N" N ~N''4""'"''NNN'N XXX
- NNNNN' N" XN'N"N'
""~Q' N"\ X'N'~N'NNNN 'N~NN' NX~NXNNNNN'XNN~~N
'XN'NN~
er ~>rN4
'i"" N"N
XX""4X'~ N~ ~NN~~~XNN> 'N' NX'~NXN'N"'
"""N' ~X~N<X N'
NXN~"~'~NNN'.~NNXNNNNNNNN. NNX'~X NX '~~' NNN'XXNNNN'XNN"N'XN"N'''N'NN' ~ ,N'N NXNNNXN
NNN.N.NXXNN XX ''NN'NNN~.,N'NN N' XNXXNXNNXN~..~'2N ~~NNN9
0•8
-• 6
:4'-4-
w
NNX N N
NNNXXX N ,N NNNX"NNN XN' NNXNN\N'' XXNNN'"NN'' N'
.~~NNN.N
NNNNNNNNN
N'' N'NX'NNNN'XN' NNX'XNNNX'~"'X'N' ~XN' ~NXX>~ NN"NNNN' NN''N'''NNNNN' NN NNNNN' NN"'
- "N"
3
2"~'~
N'.',NNNXXX~NN'~ NN "~N'~' NN'NXN'NNX' NNNNNNNNN N' NNNXN'N' XN'XNNN' 'NN
4fsvllrll -- 1N'NVNVXN"'( N>~ N»~~
"'N ~ I32

>:~:~
' '~-~
<<V~W-~ ~
\\O\ ''''V
~AV V~"V V~~V \V'
''"'V 'V \VV'
~V
4

z~ >A'~~V
77\\ V '
'K- ~-,~.' <K
\A''~
.\~(\ '2K'
KKA A '4
~KK' ~
'A K
KK 'K
K' K\'KKKF ~
* 'AK
K ''\"~ 'K 'K" ~ -~
. 4• "." .
77- 7''2K."...V.K:K.KX&4K.K~S 'K'.
K. K....
"AK.'
'<'V.
,~ 8
12 ' 11•K1' • 1 '2 ' . ' " -AK '"" " ""'' ""- • 'K,, ! i 'A " •1'! : ! :.
•!'• ,• -H • :•x•:', K' : ', K-, ."A :-,'' •' .- . . . . . . . . . . . . . ... .. .
.1..1.
HORIZOP
FIG. 20 GEOLOGY AND DISCRETIZATION C

28 -30~3~3 36 40 42 44 46
,L GRID BLOCKS low
THE SOUTHWEST-NORTHEAST CROSS SECTION
49 50 51 52 --

x = 11,125y.= 11,125
------------ -------~N, NW~~.NN>K
~~I~.AI~NN '~ ~' ''I'' ',\'A~ •~Y~IA N N -4~ - ~.,N' V XV N K'' NVN''''',N
'''N.'.,'
N"
N'NNX\ N NN N,XXN N N ~NNx
~
~ 1 .N~N>N:N'NI SNV~. N NN'' N' N.N'N'NNNA\'~A N, ~'' ''~ \NNN,.N',NNN' N>' 'N.' 'N
-I
N ~NA~ 1:.½• I N,.N)~NNTN 'N \\y. N\>\\~IXN\.L4 ',,.,N>'NNNX~NN
- 7 ,,
.___7 -. -4 '..','---..------' -- 4N,'
_______
.4'.'.NNNN'NN>N''NAN\ I, N',NXNNNN'NNNN
'N \N\ N','
7777771717\NN>iN.PNNN- Ei ii ii i iiii i ii i i
5954
NA'NNN.NN>'NNW>'~>'>NA'N>''''N
IN'N ''N N>'N>'N>~>~ N.NN>'N>.,>','N,'NN
± __________ L - L'"'" - ______________
53 55 56 57 58~

UNDERGROUND MINE
.e.WDDLuMnoINf_ PILOMINE MLO
PROBABLE MAXIMUM
AREAL EXTENT OF
POND WATER
AAREA OF DAM KEYED
INTO TAIUNGSDAM-SHALE
BAREA OF POND IN
COMMUNICATION WITHTHE TAILINGS DAM
SAND STONE
0 1000 2000
SCALE
FIG. 21 ANTICIPATED FLOW PATTERNS NEAR TAILINGS IMPOUNDMENT DURING MINING

+
878,000+
+ t N
876,000 +
+ +
+ +
-+ +
+ -t-
lx
+ +
+ +
+ +409.000
FEET
+
+
+ + + +
+ + A0 +± +
PROBABLE MAXIMUM AREAL
EXTENT OF POND WATERR I'xlxo 1l i 0
+ . +
XII
+
+ + + + +
0 VII
+ +OXXVI
+OD + +
+
OilOv
+
0111
+ +13
AREA Of DAM KEYED INTOTHE TAILINGS DAM SHALE
+
JOE0 VI
874,000 + + + +\AREA OF POND IN 'SCONTACTWITH THE VIIlTAILINGS DAM SAND
+ OIV + +
+407,000
+ +411,000
"; .,+ +4 13.000
F +415,000
0 PACKER TEST HOLEO MONITORING WELLo BORING LOCATION
+
22 LOCATIONS OF WELLS AND BORINGS
V.
NJ

2
0
4
6
z
08
10-
12
14-0.1
PUMP WELL XX!TAILINGS DAM SAND0 o 12 GALLONS PER MINUTEk = 1190 md
0
10 100 1000
TIME (MINUTES)
FIG. 23 TAILINGS DAM SAND AT WELL XXI

PUMP WELL XIITAILINGS DAM SANDQ ='12 GALLONS PER MINUTE
k = 2220 md4
It.
0 60•
4-0
10 100 1'
TIME (MINUTES)
FIG. 24 PUMPING FCONDUCTED IN THE TAILINGS DAM SAND AT WELL XII

0D
OBSERVATION WELL ViI - 3 (DRAWDOWN|TAILINGS DAM SAND0 = 8 GALLONS PER MINUTEk = 7930 mdS = 4.80 x 10-40
00
z
l..0
0.8
1.0
I 10 100 1000
TIME (MINUTES)
FIG. 25 PUMPING FCONDUCTED IN THE TAILINGS DAM SAND AT WELL VII

pLi-z0
ccIn
1000
TAILINGS DAM SAND AT WELL VII

0 20 40 60 80GAS SATURATION
FIG. 27 AIR-WATER RELATIVE PERMEABILITY DATA FOR TAILINGS DAM SANDCORE VIII (VERTICAL)

l .U
ql•
I .U If
CORE XII (HORIZONTAL)
WATER PERMEABILITY, 1525.60 md
POROSITY, 35.89/oRESIDUAL WATER SATURATION, 76.6%0.8
I-o
-.1
zw
wr0u
MJ.
0.6
krw
0.4 "-
krg
I
0 20 40
GAS SATURATION
60 8o
FIG. 28 AIR-WATER RELATIVE PERMEABILITY DATA FOR TAILINGS DAM SANDCORE XII (HORIZONTAL)

0.8
CORE XII (VERTICAL)
WATER PERMEABILITY, 234.43 mdPOROSITY, 34.5%
RESIDUAL WATER SATURATION, 88.9%
t. 0.6.Jm
u.a
lie
Srw:
uJn- 0,4.
0.2
krg
0 20 40 60 8
GAS SATURATION
FIG. 29 AIR-WATER RELATIVE PERMEABILITY DATA FOR TAILINGS DAM SANDCORE XII (VERTICAL)
80

1.0
0.8CORE XX (VERTICAL)WATER PERMEABILITY, 757,11 md
POROSITY, 29.9%
RESIDUAL WATER SATURATION, 82.2%
wi
0.6
krwv
0.4.
0.2 krg
I I Iu
0 20 40
GAS SATURATION
60 80
FIG. 30 AIR-WATER RELATIVE PERMEABILITY DATA FOR TAILINGS DAM SANDCORE XX (VERTICAL)

SELECTEDTO REPRESENT
SANDS
CORE VIII (HORIZONTAL)k = 370 md
•-a-~-CORE XIl (HORIZONTAL)k = 2800 mdw
9CORE XX (HORIZONTAL)k = 6390 mdw
U),w
cc
_j
_.l
0 20 40 100
WATER SATURATION (PERCENT)
FIG. 31 AIR-WATER CAPILLARY PRESSURE CURVES FOR TAILINGS DAM SANDCORES VIII (HORIZONTAL), XII (HORIZONTAL), AND XX (HORIZONTAL)

PUMP WELL XXUPPER AND MIDDLE ORE BODY SAND0 9.6 GALLONS PER MINUTEk 2060 md
0
__4
LL
z.0:0
6
0
81
I 10 100 1000
TIME (MINUTES)
FIG. 32 IN THE UPPER AND MIDDLE ORE BODY SAND AT WELL XX

0-
2
4
IL,
z
00
6
8-
100.1
OBSERVATION WELL VI - 1MIDDLE ORE BODY SANDQ = 12 GALLONS PER MINUTEk = 6260 mdS = 1.90 x 10-
4(
0
TIME (MINUTES)
FIG. 33 IN THE MIDDLE ORE BODY SAND AT WELL VI

Lu
CL
La
00 20
WATER SATURATION (PERCENT)
FIG. 34 SHALE RELATIVE PERMEABILITY DATA(FROM BATTELLE; 1980a)

en 8U)Lu
4-J
00 20 40 60 80
WATER SATURATION (PERCENT)
FIG. 35 SHALE CAPILLARY PRESSURE DATA(FROM BATTELLE; 1980a)

0.5&
S 25, 50 .75 1.0)
f&A ,ATURATION
12 -
n 9"aJ.
a-
-J
C,.
3"
025
WATER SATURATION
FIG.36 PSEUDO-RELATIVE PERMEABILITY AND PSEUDO-CAPILLARY PRESSURE CURVESUSED FOR THE SURFACE MINE BACKFILL IN THE CROSS SECTIONS

40
BACKFILL PUMP TEST (UNCONFINED)
Q = 4 GALLONS PER MINUTEk = 42 md
DATA WAS ADJUSTED TO ACCOUNT FOR CONDITIONS
LL
z
0
0gO
I
il
4 0
l
10000.5 I
TIME (MINUTES)
100
FIG. 37 PUMPING TEST FROM A WELL COMPLETED IN THE SURFACE MINE BACKFILL

5300
........
LU
-520
Lu 7
-- 5150 17
- 5100
NW - SE CROSS SECTION
5300
5250
tz -1981 .... . .. .. ..z 1970
S5200
5150
-5100W - E CROSS SECTION
-5300 -
r-
-5150
E 1981z0r- -5200 i..
5 1977
_W R E 175
515 797
1979
- 5100 1977SW - NE CROSS SECTION • 17
1973
FIG. 38 TAILINGS AND POND LIQUOR BUILD-UP IN THE CROSS SECTIONS

8
W-E CROSS SECTION
" TAILINGS DAM SANDo TAILINGS DAM SHALE
,<
LIx
I=-
z
z0'
-,J
(0
72 76 77 78 79 80 81 82 83 84 85 86 87 88 89 90 91 92
YEAR
SW-NE CROSS SECTION
O3 TAILINGS DAM SAND
o TAILINGS DAMSHALELu
Lu 6
z
w
z 4
2
0 I - I - I - 4 1 a a " 1 1 i 4 I a i 1 1 1 1 i73 74 75 76 77 78 79 80 81 82 83 84 85 86 87 88 89 90 91 92
uj YEAR
U.4- NW-SE CROSS SECTION
•m /E3 TAILINGS DAM SAND
0 TAILINGS DAM SHALE
z
2 2
w
z
0
72 73 74 75 76 77 78 79 80 81 82 83 84 85 86 87 88 89 90 91 92
YEAR
FIG. 39 AREA-NORMALIZED PREDICTED POND SEEPAGE FROM THE CROSS SECTIONS(GALLONS PER MINUTE PER ACRE)

5300 -STREAM BED PROJECTED014TO SECTION
r MAXIMUM P OND ELEVATION =5227'
5200 - -. . - - - _
SURFACE MINE TAILINGS POND
-- t LmTON -
5100 - - -
. . . . .. . . -o-O-O- -°-o-°-,-.-.-.-. -. -. -. . . . . . . .
4900......................... . .. .
-: T I I. . ........ .. ...................-. • . ....... .- . . . . . .I:: : : : : : : :: : : : : : : : : : : : .. ..-.. ... _- - _ . • .. -. - , . . .: . . . . . . . . . . ... _= •... . .
510 0 0
-EE -FEET-- -- - - - - - -
V I .......CAL ORZ O.NTALSCAL: .• ~ ~ ~ ~ ~ ~ ~ ~ ~ ~ ~ ~ ~ ~ ~ ....... .. ... , .. .... .. .. .. .. . . . . -. . r _ ._. ,. ... . . .- ... . . . . . . .. .-. • - - , . - - - .
4 e o o ~ ~~ ...__ _ _ __ ._ _ . . ._ . _ _ .. ............ ... . . . £ .. . -. _ .. . .. .. . .; -. . . . . . . . . .. • . . . . • q ;• • • • . . • . . . . : ... ..: . .:: + .: .: .::... . ... . .. ..... ..• . .. .. . . . ..... . ,- . . ... , .._ ._ ., ,-. -- -_..-. . . .UPPE OR BOD .... . . .
................... 7 .. . . •. .. .. "--. .. -- -• _ _".. ....-__ - .. '. '.'.'.'.'.'.'.'.'. ' . .. . .'. '. ,. '. ....... .'- . .' ' ' ... .. . ... ......... . . .. . .. . ...48000_]-'- --- L • .-' .::'.' . .. .. ..''.'- .. . . .
...... ............ .. . .. .. . .. .. . .. .. . .. .. .
..... ..... ..... ..... ..... ..... ..... ....

5400--
b300
ROADFILL
--- .MAXIMUM POND ELEVATION 52.27'
5200--PN" " .
- - -..-.......{ .. .....-
''.-'.. .. .. .. .. .. .. .............-. . ." .. . . . . . . . . .... .. . . . ...- : . ". .. . . . .. _ ••......... .,.....................::: ::: ::: ::: :: ::: ::: ::: : . . .. . . . .. .... -" _ , . . . . . ... .....
• ,'•....'.:.: :.'. .-. '. .- ,' '.'.'..... ...
48•J0--•-•~~~~~~~. .............. PEICINSFO RLTIEVEOIT F
..4. -o -N-R- -I-S--- -O-T........ ........ T...
MIDL 00 BOD SAN.0.... . .. --! - - - - -. . . .5-00 - 1 - -- - - - -- - - - - - - - - - -EE-T... ....... .... .. ... ...... .... .... -C L - S- - A L- -E- -

STREAM BED PROJECTED INTO CROSS SECTION
5300---~~i. -. ---......
SURFACE MINE ..........
MAXIMUMPONDELEVATION = 5227* - - -
520----------------------------- -------__
SANDD
510-TAILINGS DAM
UPPER ORE BODY
MIDDLE ORE
5000------------------------
.......................... ........... . . ."...'",."..........".....-.........'."....'-,..,......,.•.-...
i~~~ -i~ -i i --: ! ------------
....................................... :......
...................................... ,........
...................................
S A ND- -== == = == = = = = = = = = = = == = = = = = == = = = = = = = = = --' -' " -- ''--'-" " " - "
.......................................
FIG. 42 SOLUTE MO•VEMENT PREDICTIONS FOR A RELATIVE VELOCITY OF 1.0
SOCITH WEST-NORTHEAST CROSS SECTION
0 1 O00 500
VERTICA SCAL ... ...... ____
UPPER OAE BOY . .HORIZONTAL SCALE.
FEET "FEET

STREAM BED PROJECTEDINTO SECTION
R797'
6 2 0 0 - -_ -_• _ _- --- -- -_- -.. . . . . .SURFACE MINETA•1ILINGS POND
..:~~~~~ ~~~ ..... bc• :: ::::::::::::::::::::::::::::::::::: : : :::... .. .... --- - ------- ... "' " - :- :- :- :.--:::;;:;;::: '',-,,.,,-,,,.;, -- ,.............. ... ..... -..-........ .----...-....-....";: • :•• _ .... , ........................... - - - - - -......... ,....................... . . . . . . . .- ,. . . . .° %. ..... .... SAN .................. * ...... I .... ..........•:::::••••••::::••••••••••••••••••••••••••••......-.••::••••••:•••••::::•••••••••••••••••••••
. . . . . . . . . . . . . . . . . .. ... . . . . .- .. . . ... . . . -4 - - - -" -` - - -:` •• ` • :-4 9- --00 ---- ] - -
- ---... . . . . . .' ' ' ' ' 'i_
-- -- -- ---- - - -- -- -- - - -:':'"'"'"'"""'"'"'"'"'"'"'"'"'"'"'"'""'"'"'"~~ ""-•"'' '" '-"""". ... .:- .- '- .-- .- .- .._ ._ _.' .. --. .-- .-. .. .. ... . . ..-- .- .- .- .......
_- _ _ .:. ::., :: ::-.. .. . •. .'-.'-.'...... ...... .. . . ...............__..--..........-.......
4800R OR BP" -.. . ... .. . .. .
500 -0 . .50.. . . .. 0... ... . . .... . . . . . .. .. . .. . .. .. . .. .
FEE -FEET-- - - - - ------- ICA -C L H-ION A -SCALE - ........... --------

5400--
5300-
ROAD/FILL
- -- MAXIMUM POND ELEVATION =5227' ,
520-PONDDA
7MATO -:.:::: . . .-"-"'":"
•..- . .- ..:. ........-......:.:.::::- ..'-.:- ---:- -. . . ...... .. . .. ... .. . .!!i!iii........!.:.. .. .......................... : -:
. . . . . . ... . . . . . °. . . . . ......... . . . .. ....... ... ... .
"L ." " '" " • ,.. ...... ......_... . . . . . ..... • .-.'.'.'.' .. ........ ...................:
. . . . .. .. _.. ................... . . . . -,, -, - - .- ,.-.. . , - - .-• - . " '.. : : :: : t -a •? . '. .. . . _- _ _. .. .. ... •...... --. ............ ,...... - .. - , , -. . .-..............- -......... ..... -.......... ...
."° .. .. .. .. .. .... .. .. .. ..... .. .. .. .. 44 .... .... .... .. .. .. .. . .....IO S F R A E A I E E O I Y F 0 347oo- -N- -R- -H- - -MID LEO RT E A CROSOEDYO
500 -0 - -500 -- - -. . .. . . . . . . .- -- --- - - -
-• E -FE - --ET - - -.... C~ .C L .O I O N A .SCALE .- - - - - - .......

5400- STREAM BED PROJECTED INTO CROSS SECTION
5300--
SURFACE MINE -.- -"-'- - - - - -
b0---TAILNS DAM - ::-:
BO YSAND •: -''_:•:
. . . . .. -- --" -'. -' ...... - -'-- -. -'- - -- -. "
. .... ".• . :... . . .. . ..... ........_ _ .•• ... _._.. =._._...-.-__..........>.::••..-.-
- -- FIG.- 45 SOUT - OE N PREDICTIONS FORLE REATI VE VELOCIT OF 0.30- --
VETA SL E - -- - - - ----- O•RIZONTAL S CA
--- FOWER FEETwk
•~ .. . . .. . . . -. . . . .. .-. . . . . . :. . . . - . .. . ..- .. . . . . . . - . . . .- - -... ....
. . ...'• ' : - - - - - - - - - - - - - - - - - -... . . . . . . . . . . . .-. . . . . . ._
610 TAIING DA .... ... 00......VETIA -CL - - H-IONA -CL - -J .. ..
SHALE -FEET .. ... . . . .. . . . . . .. . . . . . . .

STREAM BED PROJECTEDINTO SECTION
MAXIMUM
5200-SURFACE MINE
TAILINGS POND--FOWLER FORMATIO
--- ------- -~---- -____ - - -- -- - - - - - - --
:..... ...............
TAILI.... NG DA --
-:,T A L IN G . . . • • ° °°.o..°... . ... . ... ,• •o° ' ' '. o - .° ' ° °
4800-
_ - .... . . . .. . . .. ~~~~~ .;.•
. •. . . . . .` :: ::: .•• :: ::: . .. .. ... ........ .......
•~ -.. .- , . . , . . , '. . . . . . . . . : ' - - - - .- - .- . . . . . .. ' . . . .' - ' '. . : :. . :...... . . . . . ..... . .. ..-.-. .....
* . ..==S =14 A ==E =. ....... = =. '. ...: . . . . . . . ..
..... ..
.... . . .
480 - . .. . ... .. ..
FIG. 46 SOLUTE MOVtEMENT PREDICTIONS FOR A RELATIVE VELOCITY OF 0.20WEST-EAST CROSS SECTION
0 10 oo 500
FEET FEETVERTICAL SCALE BORIZONTAL SCALE

5400 -
5300 -!1
ROAD L--- X,,LIM POND ELEVATION 6227'
6200- "pN
.. .. .- . .. -• - . . .- - ,- --~ - -. . . .-,H
... ....-..-..-.- ::::ii• • _ •----- •
....- • .. • .: < .. •.• .= ....... ,.••.....:::i!:::........ .. .. ........ . ... _-_- .. . . -- --.-- _. -. .. • ,
- - . . .. . , . . ,' , • .' % ' % T ' . ,' '. '• ' . .'. . .. . . . . . . ..•... . . . . . . . .
TAI0
--- .. . . .
:.":-::.""p""""' "O ý " -- . . .. . ..... ..-.... ,'..' :'" " ' ::: " " " " -.. .- - - -. . ...... . . ... ..... . .
FI. 7 OLT M VEEN OREDICTODYSN D,"" " -O -REATV VEOCT O- -.2-- ............. ... -NO TH -ETS UT E S -R S -SEC---TION--- --- .
.. . . ... - - -500 -- - -- - -- - -- - - - - - - -
...... . .. .. .. ...E H. .I. .1-A ..S.. . ... .. .VERTICALi OREA3OD

5400- STREAM RED PROJECTED INTO CROSS SECTION
5300--
SURFACE MINE -- -- - - - - ..-
UPE OR -BODY OMAIN
5-000---------------------------:T----
TAIIN.. AM... ... .~- ----- ---=-"- --"- --==:='====='======''=='=----- - - - - - - - - - - - - - - - - - - - - --:'::::': -•==.===•============.====•==iiiiiiii•i•iiii•iiii----------------------
A. . ... . .................. .............
SHALE ~~- - -- - - - --- -. -=: ::::::::::::::::::`::::::::::::::::: : :::::;:::°::: :: : .- ....-... _' .....--- •--••• • -- -'-•-':
S D....... ............... . I .... ...... . . . . . . . . . . . .. .. . .M IDDLE ORE I':'.'':':.:"" " -- --- • . . . .; .• . . ......................... . .. ... Z -_- - -Z- - - -.. . . . . ..--
51 0.AI I G D A- -. ---- -•:••• •: ::•• :• .:2..:•.•.... . .--- --- -- . . . . .. .............................................. ..-- -_ - -. -. ===.==.===.==.===.===.===.===.===.==.===.===.===.=== .=======.
S H A LE= . = =. ================ ==.= ===========.== . -..... . ... .. .. . .. .... . . . . ... . .. _-
VRCEA SOREEBODY S ... OE. . ................ . .FEET......E.,.T... IE......••....... ...........
.. .. .. .. .. .... .. ..........! .... .... ........_i - --.-.... .... .......- ........- .-F_-_-~~~~~~~~~~ ~~~~~ .-_._-_- .- ..._ .• ..-_ -. .._ .. .. . .- .- -. -. . .. ... ... .. . . `=•: : ;:=; .=== ==============•;•. ,_ -,,_, , • •_ = • r... .- ... :.. ... ...:.: .., _ _ ._ .. ...__ __ __ ___.
:- - . . , . - .. . .- . . . . .: . ... . . . ." . .' .- -. • .. • • -. ;. '. '. . . . . '" . . - ' ' '. .'. .. . ...• ~ ~ ~ ~ ~ ~ ~ ~ ~ ~ ~ ~ ~ ........... ..-...-...'..'.. ......,............. .....:::....::::....:;: •
FIG.... 4. .SO..LUTE. .. .VM N .RDCIN .O .REATV VEO .T . 0.2.- ~ ~ ~ ~ ~ ~ ~ ~ ~ S -TW S-OTES -RS -SECT----ION ---- ..... ....
o . o. ..500 ......- - ......-VET .A .C L ...O IONA .C L .. .
FEET FE.. . . - - - - - - - - - - - - - -T . .

5300- S iTREAM BlED PROJECTEDINTO SECTION
5200 - --AM4
SURFACE MINE - -TAILINGS POND.............-..-.-....-.-....-....-.. .. ... ... .. .... .. .........
==== ===================..........=....=======.=.........======........=..... ... .. .... ...==========.=..=..=..=========.====..=.=....=:T-~~~~~~~~~ __-... ........ ... .. . :.. .-.:::: . • J.:.. .:-.T:!:..:-T:..:...::i .7:u : -Z•ooo - •-•:":::- - _,• ; • .....-• ,:. -... .. -. . . ., :.:.. ---- - .:-- '"- - "-- --- -- --- - - - -_- • - -" '- - "- "----- -_ - --' -... . ..•; . ... :. .. .... . ........ -• -•. - - : - - - - -- - - .; ` : -''-",,'---•'---''.."''" -''- ---.: : : : :~~ ~ ~~~~~ -O~ f d • - - - - -: -- -- - -'; : - : - : :- : '-" ' - "-- " " : - - - ---- - " - - - - -- - ---- " -- --: -- ---•• :•:- - -. • - - -- - -_-- - -- - ------ - -:-:-:-:- - -:-:-:-:-:-- -:-:-:--:-:-:-:-:- -:-:-:---:-:-:-:-:::::-:-::::::::-:-:-:-:-- :-:- :
-_•_- +-- • ... -. •...... .: .. ...- _.-'.-.-.'.. '.-....'..-'. •*------ ..• +.:........- .. ..
............. . 49 SO U E....ME..R..TIN..R..E.TIEVE OCT O 01.. ,.VPPER OE BODYWEST -E S -R S - SEC------TION.. ......
.. .. .. .. .. . - -500-- - --... .. ... .. - -_ - --- -- - -- -. .. . . . -- ---- - - - --.. .. . .. . .. . .. . ,EET.. .. . ...... ... ... ... ... .. ........................

5400 -
ROAD/ FILL-- -- MAXIMUM POND ELEVATION 6 227'
05....... PO N D"
--- -- - - - •- ... .''''''''.::::;;;::-;::. :1:'''" . ._- -- --
••" :" -':':: "'....... . ....• -.. ,' '.".. . ,. ...-.. --.... • - ................. -....o. ...- .: " " " .- "_: .. . . . . . . . . . .....'" " '. ...... . ........... .:. ..::.:: : :: : :: :: : :: : : : ::: :_• . . . .. . . . -_- .• .... . ............................................. ======
-_- _ . .. . .. .. . ;• • . .. :.: :.::. .:. ....... :...-.-.- .. ..... .. .. . ... ...... . . . .. .•....................... . .. . ...
.4. ... .. -•- ---- -
57000- ..................... -R S -SECT --- --ION--- ---
.. . . . .. .. . ... .. . . . . . . -500 - - - - -.. ... . .. --... ... ...
.. .. . .... . .. .VERT"Rl SCAL %ORZO TA SCALE'*S **' ..............

5400-- STREAM BED PROJECTED INTO CROSS SECTION
-•', - - -- -- - -- - -FO EROMA N_ MAXIMUM POND ELEVATION 5227 -'_"--"•"'"_""_.''- ••
•2oo-~ ~~~~~ -• --_-_-- -_- -- --. O --===============
T A IL IN G S D A M -.. . . . - -. . . . . ." . .' .' ' ' . . ,. .. . ' ' ,' . . . ." • . . . . . .... .X. . . . . . . . . .
SA N D.. . .- - - - - - - - - - - - - - - - - - - - - - -
6100-- TAILINGS DAM - - - - - - - --" - -• -'- ------'- --- •--- ..." -- -"....... "". "" " "::" "•.• • • •.•° % ``.`.; • •.;. . -
SHAALLE- - - -=. -== -= - - ........................... ............=•= ... • = =• .;. . .. .. .. .. •. . . .. .... ,........
SAND
MIDDLE ORE . . . . . ... . . . . . ....o. .o ::::::::::::::::::::::::::::::::::::::::: ::::::::: :::: . .... .. ...~~~. ........ - -- - -.; -iiiii -iiiiii -i -iii -i~ ii iiiii iiiiiii~ i: : : ... .. .:.:- .T :..._.=. ....... : ...... .... L....... ................. . . •. .. :. : : .:......• 2 ...... ...',.,.,. .' '.......'.... ._ _ _ " "" -' -LO W E. .. . .. . .. .OR O Y S N ' ' ' " " " ''"''"''' " " " ' ' ' ' " ' ' " " • ; ... . . . . .. .... .... . . . . . .. . . . . . . .
.. .. .. . .. ... .. . . ... •...<. • ......•: .. ..: ., . .• . :, • - : - - - - - - - -_-- - - ..... . ..... ... .. ... . .. ...... . . _ -.. -..- -.
• ' ' • . . . . .. . . . . . . . _ . ... ..-.. ...........,........ .. - .• '•'!":" -' •~~... ......... . .. ....:..'..'-':! ''::-' ..... . ...... - -.. -. ,-. . . ._ - -. . . . .. _. . . . .. . . .. .....- -.- - _ -,.. . . ... . .. ..... .. . ... .. . . ..... •.. . . . . . . .. . . .... . . . . . . . . . . . . . . . . . . .. . . . . . . . . . . . . . . . . . . . . ° .
. . .. . • . . .. . . . . . . . . . . .. . . . . . . . . . . . . . . . . . . . . . .' , . ' . , ' . • ' .
LO W ER O RE-,.. BO D Y SA N D : • ... :. . .... .............. •..... "'-'''•.. .... -. -. . -. -.-- -- ... -.. . . . .. . . .- - .....-.- - .. - .- -.... - - - - - .-.- -, - -.. -, - - - -.., •
..... ... ... . ..... ..... ........ ...................--- -- - - - - - - -. .. . . . . . . . ....
F-G 5- SO UT MO-M N -R DC IN -O - -E TV VE-CT -F -0.10 ----- ---- .................. .... .. ...... ............
.0 ........... - -0 - -50-0 ------------4900CA ....... .. . .. .. . - --- H -ION A - C L - -
.. . . .. .. . ... . .. .. . .. .E... .
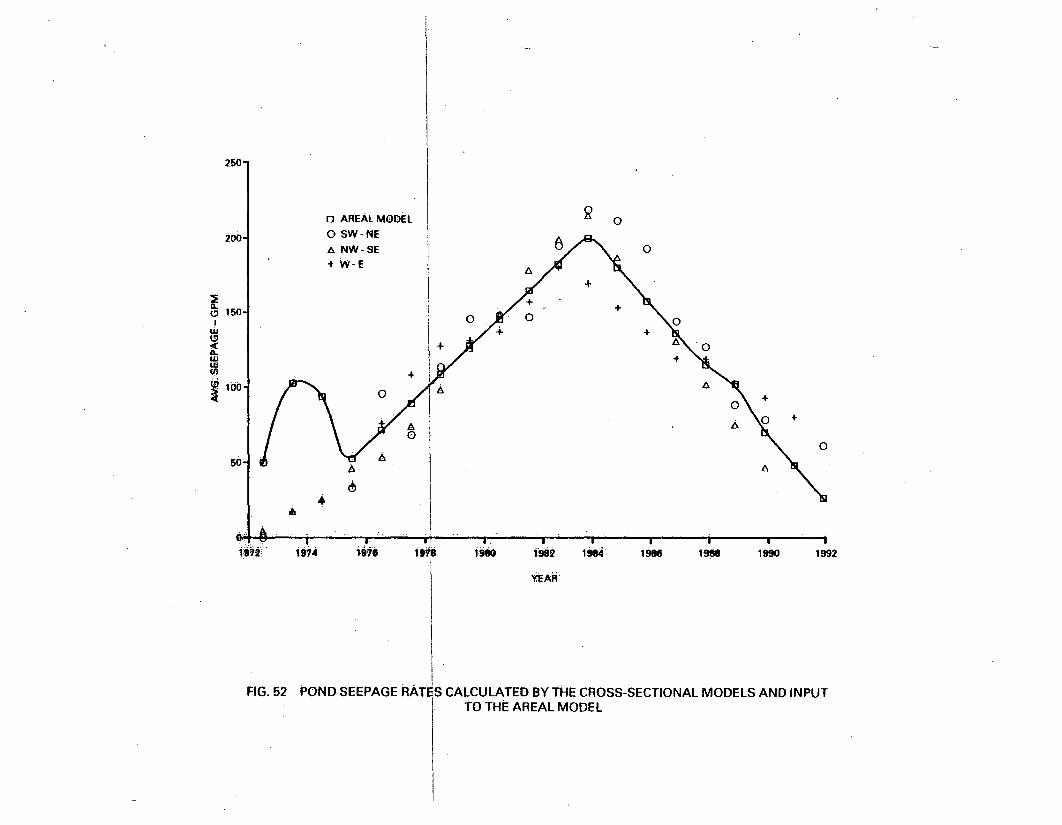
20 AREAL MODEL
o SW-NEA NW-SE4 W-E
0
6 0
A
2.ILl
+0
-4- +
0+
+
I&+
0
0
FIG. 52 POND SEEPAGE RA"
io9a i98 i44 1986 1988 1990 1992
YEAR
CALCULATED BY THE CROSS-SECTIONAL MODELS AND INPUTTO THE AREAL MODEL

HORIZONTAL GRID BLOCKS10 12 14 16 11 20 22 24 26 O2 30 32 34I 4 6 38
1.1nuu Fýi F 4 rým4 -4-:4 t-i F=,- F
36
10000-
5000-
__ __ _ -- 'Li _ __~l
f___ II ii 1111 iii II 11 N!
____ ___ - Li~ IA ~ h~A,4-IE FA~ ~F ~~I1_____ _____ -I- J-~---4--4-J L I I I I -
UI r. . . I I . . I - . . . - . I I - I . . . ý . - - 94 1 W-1w, 12 C3
-4- 4-f--I-------4---~I- III ~
IJ PIT I F4j 1 1L:ý\, SAND OUTCROP
34
32
30
28
26 c0
24 9_a22 •
20
16>
14
12
10
8
6
4
2
1 t--i---1--~-t-r-t H I 111.1 III III,,I j ,nLu'innlAM.flrAtIt
-I-
-10000-
-15000-
r -
__Ir - ____
F - ___ _\
-itibu . . . . . . . . . . . .-210000 -15000 10I00 -5000
55000 10000
0._L.p0FEET
FIG. 53 E TENT AND DESCRETIZATION OF THE AREAL MODEL

1.0
0.75I-
(~n
w(L
Lu
_j
w
I-l
w
Kr. =.l;.O (sw -Sw41 -SWO
0.50
0.25
0.00 .20 .40 .60 .80 1.0
GAS SATURATION
FIG. 54 PSEUDO-RELATIVE PERMEABILITY CURVE USED TO ACCOUNT FOR UNCONFINED FLOWIN THE TAILINGS DAM SAND AND THE SURFACE MINE BACKFILL IN THE AREAL MODEL

Hf(71"' 1/21JP,.g
+ 2t
PC 0:
1.0WATER SATURATION
FIG. 55 PSEUDO-CAPILLARY PRESSURE CURVES USED TO ACCOUNT FOR GRAVITY DRAINAGEBETWEEN BLOCKS OF EQUAL ELEVATION IN THE AREAL MODEL

PROBABLE MAXIMUMAREAL EXTENT OF
PONDWATER
NI
PIT-3
AREA OF DAM KEYED
INTO TALINGS
DAM SHALE
PIT-2
TAILINOS DAM SAND
OUTCROP AREA
AREA OF POND
IN CONTACT WITH
THE TAILINGS DAMSAND
0 1000
FEET
FIG. 56 SOLUTE MOVEME NT PREDICTIONS FOR A RELATIVE VELOCITY OF 1.0AREAL MODEL
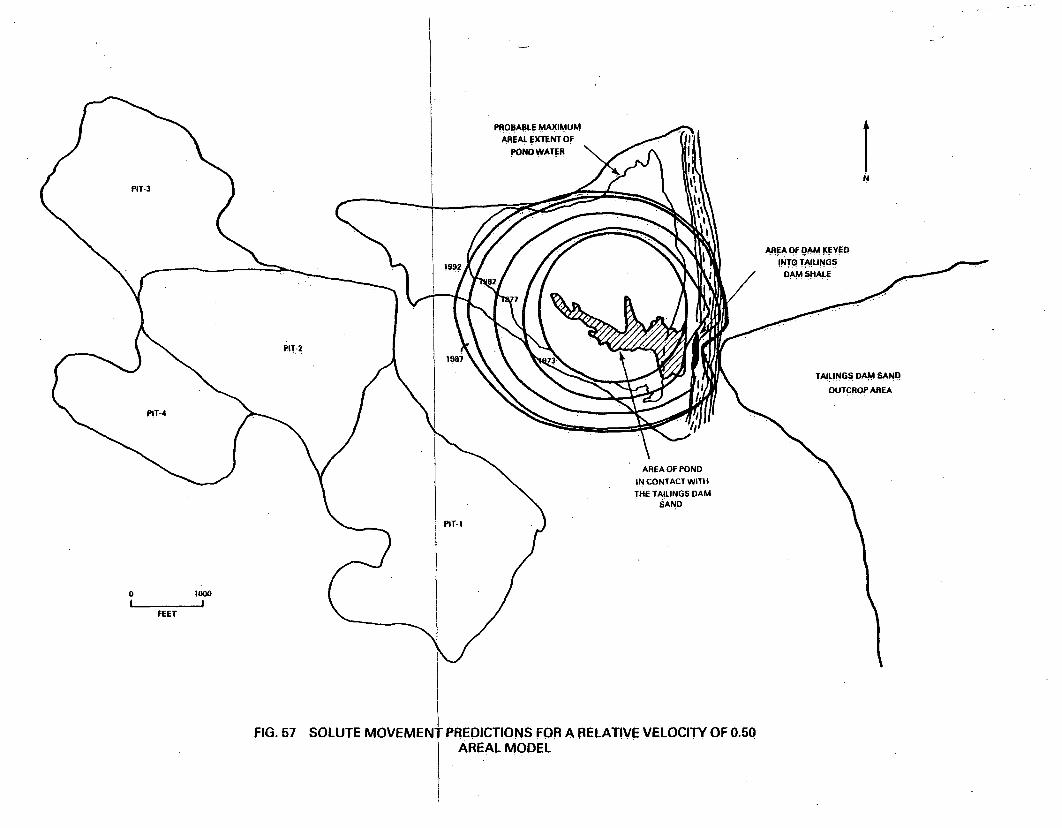
P"OBABLE MAXIMUMAREAL EXTENT OF
POND WATER
NIPIT-3
AREA OF DAM KEYED
INTO TALIN.GS
DAM SHALE
PIT-2
TAIUNGS DAM SAND
OUTCROP AREA
AREA OF POND
IN CONTACT WITH
THE TAILINGS DAMSAND
0 1000
FEET
FIG. 57 SOLUTE * PREDICTIONS FOR A RELATIVE VELOCITY OF 0.50AREAL MODEL

PROBABLE MAXIMUMAREA. eXTENT OF
POND WATER
NI
PIT-3
AREA OF DAM KEYEDINTO TAILINGS
DAM SHALE
PIT-2
TAILINGS DAM SAND
OUTCROP AREA
AREA OF PONDIN CONTACT WITH
THE TAILINGS DAMSAND
PIT-A
0 1000F IFEET
FIG. 58 SOLUTE PREDICTIONS FOR A RELATIVE VE~iOCITY OF 0.30AREAL MODEL

PROWAULE MAXIMUMAREAL EXTENT OF
POND WATER
NI
PIT-3
AREA OF DAM KEYEDINTO TAILINGS
DAM SHALE
PIT-2
TAILINGS DAM SAND
OUTCROP AREA
AREA OF PONDIN CONTACT WITH
THE TAILINGS DAMSAND
FE ooo
FEET
FIG. 59 SOLUTE " PREDICTIONS FOR A RELATIVE VELOCITY OF 0.20AREAL MODEL

PROBABLE MAXIMUMAREAL EXTENT OF
POND WATER
NIPIT-3
AREA OF DAM KEYED
INTO TAILINGSDAM SHALE
PIT-2
TAILINGS DAM SAND
OUTCROP AREA
AREA OF POND
IN CONTACT WITH
THE TAILINGS DAMSAND
PIT-I
FEET
FIG. 60 SOLUTE PREDICTIONS FOR A RELATIVE VELOCITY OF 0.1AREAL MODEL

PROABLE MAXIMUMAREAL EXTENT OF
POND WATER
NIPIT-3
AREA 0f DAM KEYEDINT 0 TAILINGS
PAM SHALE
PiT-2
TAIUNGS DAM SAND
OUTCROP AREA
AREA OF POND
IN CONTACT WITH
THE TAILINGS DAMSAND
0 1000
FEET
FIG. 61 SOLUTE MOVEMENT TOWARD THE OUTCROP AFTER REGIONAL FLOW IS RE-ESTABLISHEDFOR A RELAlIIVE VELOCITY OF 1.0 - AREAL MODEL
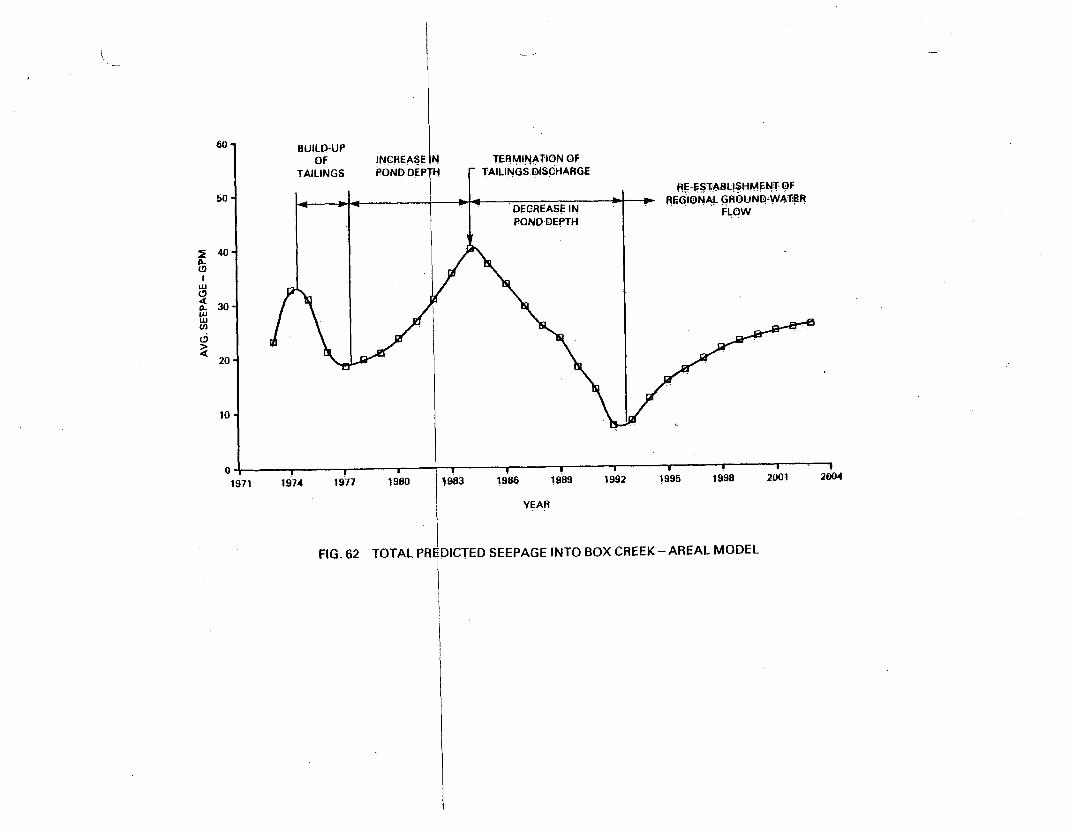
60
50
BUILD-UPoF
TAILINGSTERMINATION OF
TAILINGSDISCHARGE
REESTABLISHMENT OFREGIONAL GROUND-WATERFLOW
2
Lu
d
40
30
20
10
1989 1992 1995 19981971 1974
YEAR
FIG. 62 TOTAL )TSEEPAGE INTO BOX CREEK- AREAL MODEL

ABOVE LIMI
RELA
SAND
jVý
(ASSUMED pH FRONT RELATIVE
FASTER SLO'A
Al 0.30 >V.SO4 so,/
0.20> . >1Vf
0.10 > v-T CrYf
V. VELOCITY OF THE SOLLVf VELOCITY OFTHE FLUIC

SOLUTES CONSIDERED
AI.As.Ca Cd CI Cr Cu Fe H(pH) K Mg Mn Na Ni Si Sr Th U Zn SO4 Pb-210*
I.I
REGULATED
Al As Cd Cr Cu Fe H(pH) Mn Ni Th-230 U-238 Zn SO4 Pb-210 Ra-226Th-230 U-238
I . I:IN ACIDIC (2.2) ENVIORNMENT AND
ýSIC (8.0) ENV-IORN.MENTAl Cr Cu FeRa-226 SO 4 CI
/E VELOCITY LOUTES (-)
SHALE
v= 0.30
IBELOW LIMIT IN-ACIDIC
AND BASIC ENVIORNMENT
U-238
RELATIVE VELOCITY
IABOVE LIMIT IN ACIDIC (2.2:
BUT BELOW LIMIT IN BASIC (8
As Cd H(pH) Mn Ni Zn Th
SAND
Vs=V- 0.10
SHALE
V = 0.04
SAND
V, = 0.30
;LOCITY) (ASSUMED pH FRONT RELATIVE VELOCITY)" I ........ j
ASSUMED pH FRONT RELATIVE VELOCITY AS(
r---
R
:0.20
FASTER SLOWERFASTER
Cd Mn Ni Zn
SLOWER
Ms0.30 > • > 0.200.30> y > 0.20
0.20> I> 0.110 Cu
e Ra-226
0.20> • >0.1
0 C R0.1 A ICr Cu FeRa-226 SO4
0.1 > As Th-230 Pb-210
FIG. 63 CATEGORIES OF HIGHLAND SOLUTES WITH RELATFRONT MOVEMENT AND THE MOST STRINGENT REGULAT

1-226* Th-230* U-238*
NOT REGULATED
Ca K Mg Na Si SrRELATIVE VELOCITY OF SOLUTES (v)
INVIRONMENT
) ENVIRONMENT
30" Pb-210*
SHALE
= 0.30
!MED pH FRONT RELATIVE VELOCITY
FASTER SLOWER
Cd Mn Zn 0.30 > > 0.20V,
0.20 > • >0.1
0.1 > • As Ni Th-220 Pb-210
SAND
Vs= 1.0 CaMgNaSiSr
1.0 > V > 0.30Vs
0.30 > Vý > 0.20Vs
0.20 > > 0.1
V,
SHALE
v= 1.0 CaKMg NaSr
1.0> • > 0.30Vf
0.30 > V, > 0.20Vs
0.20 > V- > 0.1
0.1 >v Si.] f S
*BASED ON RESULTS BY BATTELLE (1980b) FOR WASATCH FORMATION AT MORTON RANCH
IN TO ACIDICRY STATUS

a TDSS RM3 10
- 878600
- 876000
- 674000
- 8720000
FEET
i404000
FIG. 64 COMPARISON OF THE 191BY THE AREAL MODEL TO CALCI
COMPLETED IN THE TAIl
2 UNATTENUATED SOLUTE FRONT POSITION PREDICTEDJM CONCENTRATIONS MEASURED IN MONITOR WELLSINGS DAM SHALE AND OVERLYING FORMATIONS

6 TDSS RM3 1.5
-87800
- 874000
872000
0 1000
FEET
1404000
FIG. 65 COMPARISON 0BY THE AREAL MODEL T(
COMPLETED IN '
F THE 1982 UNATTENUATED SOLUTE FRONT POSITION PREDICTEDI MAGNESIUM CONCENTRATIONS MEASURED IN MONITOR WELLS'iHE TAILINGS DAM SHALE AND OVERLYING FORMATIONS

- 878CW0
0 TDSS RM3 24 - 876000
0 lowO
FEET1
1404000
FIG. 66 COMPARISONBY THE AREAL MODEL
COMPLETED I1
3F THE 1982 UNATTENUATED SOLUTE FRONT POSITION PREDICTEDTO CHLORIDE CONCENTRATIONS MEASURED IN MONITOR WELLSI THE TAILINGS DAM SHALE AND OVERLYING FORMATIONS
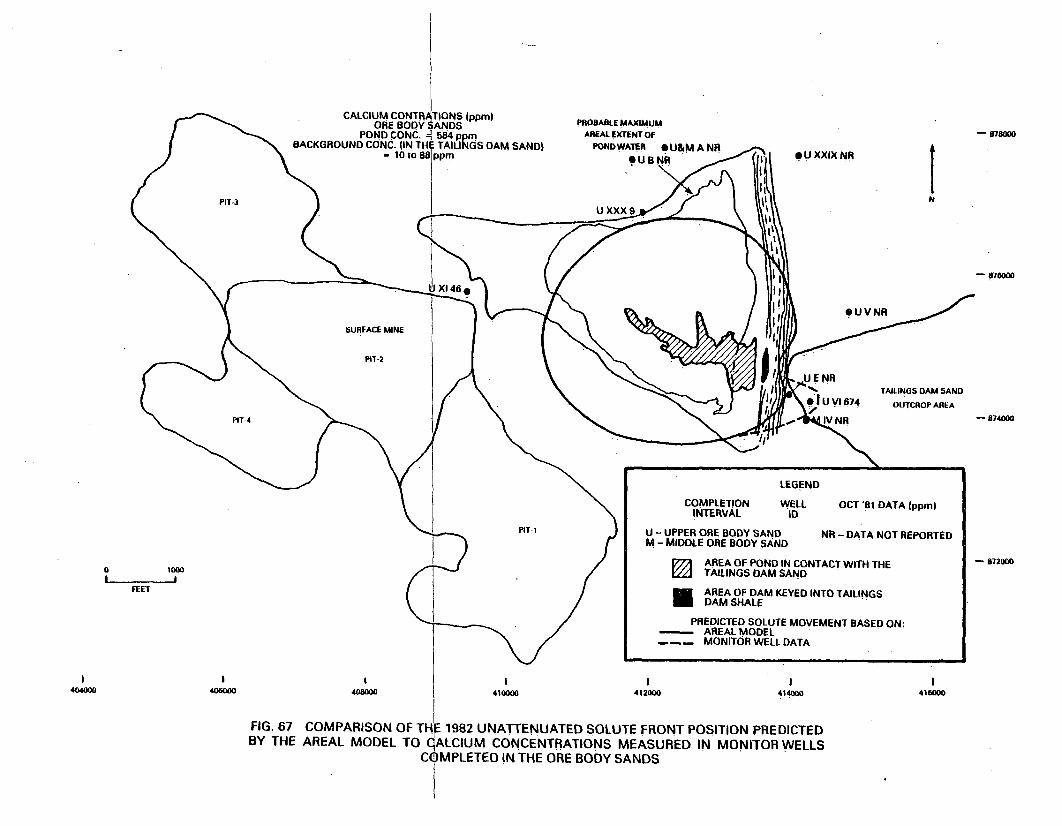
- 878000
- 874000
-812000
a 1000I .. J
FEET
1404000
1982 UNATTENUATED SOLUTE FRONT POSITION PREDICTED,LCIUM CONCENTRATIONS MEASURED IN MONITOR WELLSMIPLETED IN THE ORE BODY SANDS

87860
874000
-872000
1000
FEET
I
FIG. 68 COMPARISON OF THE 1!BY THE AREAL MODEL TO MAGN
COMPI
182 UNATTENUATED SOLUTE FRONT POSITION PREDICTED-ESIUM CONCENTRATIONS MEASURED IN MONITOR WELLSLETED IN THE ORE BODY SANDS

PROBABLE MAXIMUM
AREAL EXTENT OFPOND WATER 0 U XXIX N I
PIT-3N
U XXX
SU V NR
SURFACE MINE
8 678000
0- 74000
"- 812000
PIT-2
TAILINGS DAM SAND
vI U A275''150 OUTCHOPLAREA
LEGEND
PIT-
0 1000L EFEET
COMPLETION WELL OCT '81 DATAINTERVAL ID DEC '81 DATA
U - UPPER ORE BODY SAND NR - DATA NOT RIM - MIDDLE ORE BODY SAND
SAREA OF POND IN CONTACT WITH THETAILINGS DAM SAND
E AREA OF DAM KEYED INTO TAILINGSDAM SHALE
PREDICTED SOLUTE MOVEMENT BASED ON:-- AREAL MODEL
- - - MONITOR WELL DATA
|ppm)
(ppml
EPORTED
0404000
1406"0
0408000
1410000
I41i200
I 1416000
414000
FIG. 69 COMPARISON OF THE 1982JUNATTENUATED SOLUTE FRONT POSITION PREDICTED BY THE AREALMODEL TO CHLORIDE CONCENTRATIONS MEASURED IN MONITOR WELLS COMPLETED IN THE ORE BODY SANDS

- a8o80
0 TDSS RM3 8.9
a 1000
FEET
- 878000
- 874000
- 872000
441404000
FIG. 70 COMPARISON OF 1TO pH MEASUREMEUI
"HE 1982 ACIDIC FRONT POSITION PREDICTED BY THE AREAL MODELTS IN THE MONITOR WELLS COMPLETED IN THE TAILINGS DAM
SHALE AND OVERLYING FORMATIONS

'SANDSPROBABLE MAXIMUM
AR I'EALEXTENT4O
POND WATER* U&M A OUXXIXNR
I
PIT-3
NI
U XXX 10.6
OUVNR
SURFACE MINE
-- 816000
- 8760W0
- 874000
- 872000
PIT-2
TAILINGS DAM SAND
OUTCROP AREA
LEGEND
PITA1
0 1000I EFEET
COMPLETION WELL OCT '81 DATA (IINTERVAL ID
U - UPPER ORE BODY SAND NR - DATA NOT REPM - MIDDLE ORE BODY SAND
AREA OF POND IN CONTACT WITH THETAILINGS DAM SAND
AREA OF DAM KEYED INTO TAILINGSDAM SHALE
PREDICTED pH FRONT MOVEMENT BASED ON:AREAL MODEL
- --- MONITOR WELL DATA
PORTED
ppmn)
0404000
1406"O 4080 410000
I 1414000
041W00
412000
FIG. 71 COMPARISON OFMODEL TO pH MEASUREM
1982 ACIDIC FRONT POSITION PREDICTED BY THE AREALIN MONITOR WELLS COMPLETED IN THE ORE BODY SANDS

Concentral -ionsin
ELEMENT
A]CaFeKMgMnNaSi*AsCdCrCuNiSeSrThUZnClS04 - 2
Loss onIgnitionTotalpH1Eli
TAILINGS DAMSANDSTONE
Elemental Oxide
6.15%0.88%3.04%2.26%0.82%0.020%1.90%
35.08%9.70. 3 ppb
5212
30.3
9810
10331
11.62%1.23%
4.35%2.72%1.36%0.026%2.56%
75.03%
(ConcenTratio
TAILINGS DAMSHALE
Elemental Oxfide
8.80% 16163%0.52% 0 73%2.16% 3.09%1.60% 1192%0.66% 1109%0.008% 01010%1.00% 1 35%
74.18% 34168%1.50.4 ppb
8248
. TABLE 1of Major, Minor and Trace ElementsAs Received Materials
ns in ppm unless otherwise noted)
HIGHLAND HIGHLANDSANDSTONE SHALE
Elemental Oxide Elemental Oxide
MOST STRINGENTHIGHLAND WATER QUALITY STANDARDS
TAILINGS SOLUTION (SEE TABLE 22)
5.95%1.26%3.28%1.94%1.10%0.040%1.82%
33.63%8.80. 1 ppb
56820.2
104
45
11.25%1.76%4.69%2.34%1.82%0.052%2.45%
71.94%
3.98%0.34%1. 28%1.88%0.44%0.010%0.48%
39.00%0.90. 1 ppb
401421.0
551010
3.2
7.52%0.48%1.83%2.26%0.73%0.013%0.65%
83.42%
261584775
42375
45262240
78. ppb30. ppb
1.21.11.4
126. ppb0.500.829.1
217.5
7580.
50.7
40101080
5.0No Limit
0.3No LimitNo Limit
0.05No LimitNo Limit
50. ppb10. ppb0.050.200.210. ppb
No Limit2,000. pCi/i
5.2.0
100.
200.
6.5-8.5No Limit
26
1.1%109.00%
1 0%100 JOO%
3.7%100.00%
3.1%100.00%
2.4846.mv
Meq. CationsMeq. anions
149158

TABLE 2
Concentrations of Inorganic ConstituentsIn Solution After Batch Tests of Highland
Tailings Solution With Tailings Dam Sandstone(All Concentrations in ppm Unless Otherwise Noted)
InitialElement Concentration
Most StringentWater Quality Standards
3 day .7 day 15 day 30 day (see Table 22)
AlCaFeKMgMnNaSiAs (ppb)Cd (ppb)CrCuNiSe (ppb)SrThUZnS04-L
pHEh (my)
261.584.775.42.
375.45.
262.240.
78.30.
1.21.11.4
126.0.50.829.13.2
7580.
2.4846.
336.651.354.41.
423.45.
260.265.9.5
30.0.81.11.8
31..3.21.56.53.6
6030.
2.8694.
367.660.261.
34.445.
47.263.292.
0.629.
0.71.01.9
19.2.91.35.13.6
6880.
2.9818.
370.624..146.
474.49.
264.274.>0.534.
0.40.91.9
18.2.91.0GC.2
3.76000.
3.0670.
361.638.124.
24.4.97.
50.266.279.
34.0.20.82.0
32.0.60.45.43.8
5940.
3.2Ki8.
5.0No Limit
0.3
No LimitINc Limit
0.05No LimitNo Limit
50. ppb10. ppb0.050.20.2
10. ppbNo Limit2000 pCi/l
5.02.0
200.
6.5-8.5No Limit
-- Not determined

TABLE 3
Concentrations ofIn Solution AfterTailings Solution
Inorganic ConstituentsBatch Tests of HighlandWith Tailings Dam Shale
InitialElement Concentration
Most StringentWater Qual ity Standards
3 day 7 day 15 day 30 day (see Table 22)
AlCaFeKMgMnNaSiAs (plCd ( pCrCuNiSe (plSrThUZnS04-2
pb)pb)
261.584.775.
42.375.
45.262.240.
78.30.1.21.11.4
126.0.50.829.13.2
7580.
146.656.
89.74.
386.36
297.191.
1.227.
0.21.01.2
29.6.51.03.r3.0
4030.
117.630.
58.75.
409.36.
298.147.<0.524.
0.10.91.6
17.8.00.81.93.2
4580.
138.646.
27.55.
42438.
293.156.
1.641.
0.10.81.7
12.7.40.33.24.0
4810.
87.641.124.
55.411.do.
290.90.<0.532.0.020.51.2
24.4.8
<0.051.83.3
4570.
3.5
5.0No Limit
0.3No LimitNo Limit
0.05No LimitNo Limit
50. ppb10. ppb0.050.20.2
10. ppbNo Limit2000 pCi/l
5.02.0
200.
6.5-8.5
pb)
pH 2.4 3.2 3.4 3.2- Eh-(-mv-'--846-. 645-. 7-7-7-.--6.50,.- -6-1-4-. - No-L-i-m-i-t

TABLE 4
Concentrations of Inorganic ConstituentsIn Solution After Batch Tests of HiqhlandTailings Solution With Ore Body Sandstone
(All Concentrations in ppm Unless Otherwise Noted)
InitialElement Concentration
Most StringentWater Quality Standards
(see Table 22)3 day 7 day 15 day 30 day
AlCaFeKMgMnNaSiAsCdCrCu
261.584.775.
42375.45.
262.240.78.30.
1.21..1
318.724.252.
48.408.
52..272.265.
5.531.
0.81.1
340.682.225.
46.418.
51.270.261.
0.929.
0.61.0
336.651.111.
38.445.
54.267.222.
32.0.30.9
321.646.
23.39.
424.56.
274.203.
2.634.
0.10.7
(ppb)(ppb)
5..0No Limit
0.3No LimitNo Limit
0.05No LimitNo Limit
50. ppb10. ppb0.050.20.2
10. ppbNo Limit2000 pCi/l
5.02.0
Ni 1.4 1.8 1.7 1.8 1.Se (ppb) 126. 35. 32. 29. --
Sr 0.5 3.1 2.9 3.2 0.Th 0.82 71. 21. 22. 27.U 9.1 247. 203. 205. 267.Zn 3.2 3.6 3.4 3.6 3.-SO--2 -7580. 6f830._65-10---6090.-- 75-i-0.
8
7
5
pHEh (mv)
2.4846.
2.9749.
3.0757.
3.0656.
3.3676.
CUU.
6.5-8.5NO Limit
-- Not determined

TABLE 5
Concentrations of Inorganic ConstituentsIn Solution After Batch Tests of HighlandTailings Solution With Ore Body Shale
(All Concentrations in ppm Unless Otherwise Noted)
InitialElement Concentration
Most StringentWater Quality Standards
(see Table 22)3 day 7 day 15 day 30 day
Al 261.Ca 584.Fe 775.K 42.Mg 375.Mn 45.Na 262.Si 240.As (ppb) 78.Cd (ppb) 30.Cr 1.2Cu 1.1Ni 1.4Se (ppb) 126.Sr 0.5Th 0.82U 9.1Zn 3.2
S04-2 7580.
195.640.
76.58.
400.44.
269.197.<0.531.
0.30.91.5
77.4.24.7
16.3.5
4570.
3.1717.
157.625..
40.57.
399.46.
270.138.
0.727.
0.10.71.6
11..4.84.1
16.3.4
5380.
3.6768.
183.633.
21.59.
412.45.
270.157.
i.137.
0.20.61.6
29.5.02.3
11.3.8
4420.
3.4676.
181.642.25.54.
436.46.
274.175.
<0.537.0.10.52.2
25.1.62.0
10.4.2
5-8007.
3.2712.
5.0No Limit
0.3No LimitNo Limit
0.05No LimitNo Limit
50. ppb10. ppb0.050.20.2
10. ppbNo Limit2000 pCi/l
5.02.0
2-00.
6.5-8.5No Limit
pHEh (mv)
2.4846.

Concentrations of Cations in Highland TailingsColumns List Concentrations in the Aliquots T
Correcting for Dilution By The Titrant.
TABLE 6
Solution After Titration by 0.O15M (Ca(OH) 2 Solution. The "Diluted"aken for Analysis. The "Corrected" Columns List Concentrations After
(All Concentrations Are Shown in ppm Unless Otherwise Noted).
Initial pHConcentration DilutedElement
AlFeKMgMnNaSiAsCdCrNiSeSrZn
26177542
37545
26224078301.21.4
126.0.53.2
1097.7
13110
1288450.6
170. 3**
0.41.11.61.0
3.5Corrected*
2201626
22025
18092
1.235
0.51.02.33.32.0
pH 5Diluted
4.20.48.7
736.3
5914_0.5
9.20.05**0.3
_0.51.30.6
Corrected
171.5
36300
2624060
< 2.38
0.21.3
- 4.5.52.4
Diluted
2.80.37.0
52<0.0146
1.31.i-<0.3
0.09**0.041.71.0
f_0.02
H8Corrected
182.1
46340<o0.6
3108.77.5
- 1.80.60.2
11.6.6
<0.13
Most StringentWater Quality Standard
(see Table 22)
5.00.3
No LimitNo Limit
0.05No LimitNo Limit
50.ppb10. ppb
0.20.210. ppb
No Limit2.0
(ppb)
(ppb)
*Correct = Concentration of element inoriginal sample (i.e. c(Vo + VT)/Vo
diluted sample x (volume of original sample + volume of titrant)/Volume of
**Determined concentration is near detection limilt

TABLE 7
Physical Characteristics ofTail ings Dam Sandstone Column
DiameterLengthWeight of SandBulk DensityGrain DensityPorosityPore Volume
2.2 cm (0.875 in)15.2 cm (6 in)85.105 g
1.47 g/cm32.51 g/cm3
0.4224.07 cm3

X-ray diffraction rin batch experiments.
esul,Co
TABLE 8:s of bulk and clay mineralogy of shale samples usedistituents are listed in order of decreasing abundance
TAILINGS DAM SHALE ORE-BODY SHALE
undried dried 3-day 30day undried dried 3-day 30-day
Bulk qtz, kaol, qtz, smect, qtz,smect, qtz, gyps, qtz, feld, qtz, feld, qtz, feld, qtz, feld,Composition mica kaol, mica gyps, mica smect, mica, mica, kaol smect, mica gyps, smect, gyps, smect,
kaol kaol kaol mica, kaol mica, kaol
Clay Fraction smect, kaol, smect, kaol smect, kaol,smect, kaol smect, kaol, smect, kaol, smect, kaol, smect, kaol,(less than mica mica mica ica, feld mica mica, feld mica, feld mica, feld5pm)
Weight % Clay 89.1% 84.8% 76.5% 31% 33% 35.1%fraction(estimate)
Weight % - 1.50 2.8% - 2.0% 2.2%gypsum(estimate)
TAILINGS DAM ORE-BODYSANDSTONE SANDSTONE(undried) (undried)
Bulk qtz, feld, qtz, feld,Composition nica, kaol
Clay Fractio smect, kaol smect, kaol(less than 5]m) nica mica
Weight % Clayfraction (estimate) 2.9% 12.4%
qtzsmectkaolmicafeldgyps
quartzsmectitek ao 1 in itemicafeldspargypsum

TABLE 9
Results of Petrographic Analysis of SandstoneSamples (As Percent of Total Measured on Sample)
MineralsTailings Dam
Sandstone
*Tailings DamSandstone
Rock FragmentsOre BodySandstone
*Ore Body.Sandstone
Rock Fragments
Quartz
K-feldspar
Plagioclase
RockFragments*
Mica
Clay
Chert
Biotite
Opaques
Clino-pyroxenes
24
15
6
44
1
35
21
11
27
3
2
43
6
8
28
1
13
1.5
34
7
19
9 38
1
1

SpecificStorage(1/ft)
7.3 x 10⁻⁶
1.5 x 10⁻⁶
4.1 x0-7
2.0 x10⁻⁷
2.0 x10⁻⁵
1.9 x10⁻⁵
*assumes a
TABLE 10
Comparison of Specific Storage and
Storage Coefficient Values for Highland Sands
Storage FormationCoefficient Thickness
(dimensionless) (ft.) Reference
3.6 x 10-4* 50 EPR calculated
2.5 x 10⁻⁴ 165 Golder Assoc. (197
6.3 x 10⁻⁵ 155 Golder Assoc. (197
1.0 x 10⁻⁵ 50 Dames & Moore (198
1.9 x 10⁻⁴ 9.5 Exxon(Well VI-I)
4.8 x 10⁻⁴ 25 Exxon(Well VII-3)
50-foot sand thickness
GeologicUnit
'9)
'9)
0)
Ore Body Sand(multiple completion)
Ore Body Sand(multiple completion)
Ore Body Sand(completion unknown)
Middle OreBody-Sand
Tailings DamSand

TABLE 11
Laboratory Measurements of Porosity, Permeability, and
Grain Density for the Tailings Dam Sand
Core Depth(feet) Porosity (%) Permeability (md)(gas flood)Horiz. Vert.
Grain Density(g/cc)
VIII ab
XII abC
XX a
112.9-113.2
127.4-127.8
122.7-123.1
29..435.431.734.535.822.1
372 3177
2804 2992
6390 5522
2.60
2.65
2.39

TABLE 12
Comparison of Tailings Dam Sand Permeability
Measured by Gas and Water Floods
Permeability (md)
Core Gas flood Water flood
VIII (vertical) 3177 63XII (horizontal) 2804 1525XII (vertical) 2992 230
XX (vertical) 5522 757

TABLE 13
Summary of Porosity, Permeability, andGrain Density for the Ore Body Sands
Core Depth (feet) Porosity (%) Permeability (md) Grain Density (g/cc)
Horiz. Vert.
2700-05050865-08750815-49502700-23104260-09404260-09402650-03200600-0810
384-411353-361695-764650-704627-659745-795367-400633-667
30.930.025.625.930.026.931.025.6
1672103622363079323531032288
834
3450
1687626
2.63
2.61
Since these results are very similar to those obtained for theTailings Dam and Fowler Sands, a single set of properties were used torepresent all clean sands in the study. Those properties are listed inTable 14:
TABLE 14
Properties of the Tailings Dam, Fowler, andOre Body Sands Used in the Cross-Sectional Models.
Horizontal permeabilityVertical permeabilityPorosityGrain densityBulk densitySpecific StorageRelative permeabilityCapillary pressure
= 2000 md= 2000 md= 34 percent= 2.60 g/cc= 1.72 g/cc= 7.3 x 10⁻⁶ (1/ft)= Figure 28= Figure 31 - Core XII (horizontal)
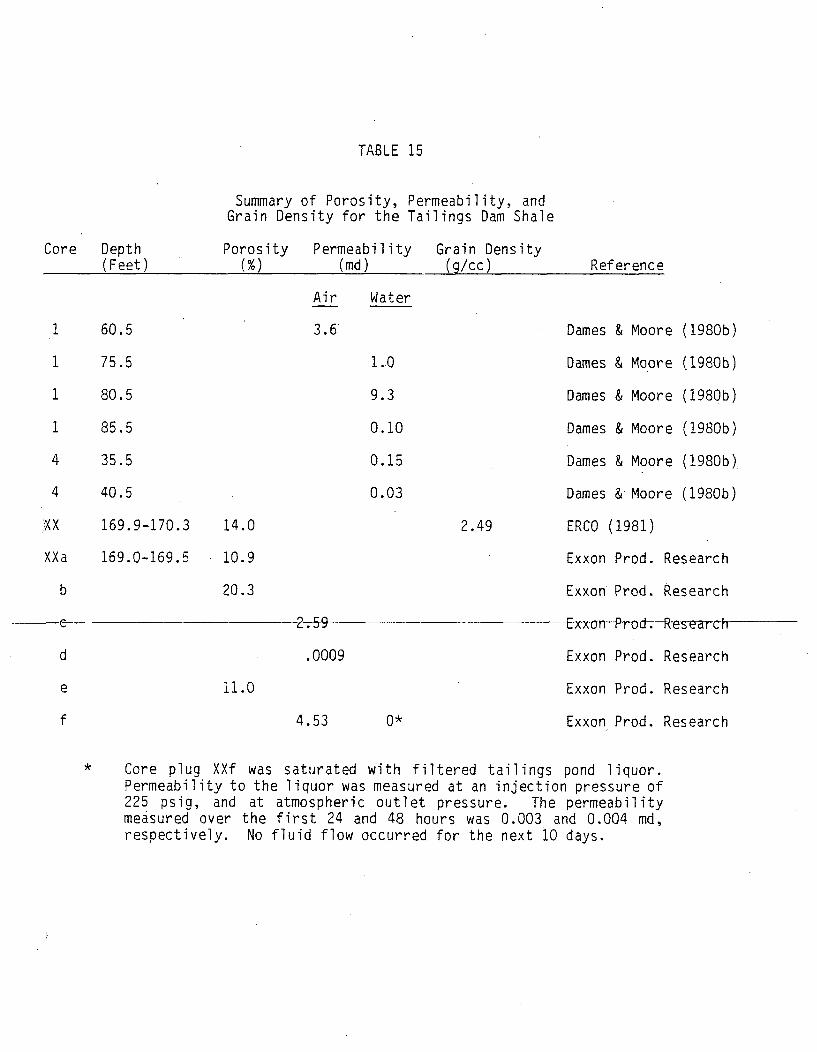
TABLE 15
Core Depth(Feet)
Summary of Porosity, Permeability, andGrain Density for the Tailings Dam Shale
Porosity Permeability Grain Density
(%) (md) (g/cc)
Air Water
Reference
1
4
4
XX
XXa
b
60.5
75.5
80.5
85.5
35.5
40.5
169.9-170.3
169.0-169.5
3.6
1.0
9.3
0.10
0.15
0.03
14.0
10.9
20.3
2.49
Dames & Moore
Dames & Moore
Dames & Moore
Dames & Moore
Dames & Moore
Dames & Moore
ERCO (1981)
Exxon Prod. RE
Exxon Prod. RE
-E-x-xoTn-P'rodTR-E
Exxon Prod. RE
Exxon Prod. RE
Exxon Prod. RE
(1980b)
(1980b)
(1980b)
(1980b)
(1980b)
(1980b)
esearch
esearch
es-earch-
esearch
esearch
esearch
-2.59
.0009d
e 11.0
f 4.53 0*
Core plug XXf was saturated with filtered tailings pond liquor.Permeability to the liquor was measured at an injection pressure of225 psig, and at atmospheric outlet pressure. The permeabilitymeasured over the first 24 and 48 hours was 0.003 and 0.004 md,respectively. No fluid flow occurred for the next 10 days.

Table 16
Shale Lithology
Core XII 0 - 120.0 Feet
DEPTH DESCRIPTION
0-15'
15-20'
20-25'
25-30'
30-40'
40-43'
43-48.5'?-1.3'
.6'
51.9-56.6'
56 -60'
60-63.4
67.2-68.3
68.8-72.8'
72.8-86.8
87-90'
90-100'
100-1.15
115-120'
Brown silty clay moist
Grey silty clay
Grey-green silty clay
Grey-green silty clay
Brown clayey fine sand to silt
Brown clayey sand
Core lost
Brown clayey silt to fine sand
Grey claystone
Grey claystone
Altern atirig finesdans-nesan.dclay-stonEs
Grey to black carbonsceous
Grey silty claystone w/carbonsceous steaks
Grey silty claystone to siltstone at base
Grey to green claystone and silty claystone
Very porous, weakly induratedfeldspathic medium sandstone
Grey clay moist
Grey and brown silty clay and clayey silt - moist
Gray and brown silty clay and clayey silt - moist

Table 17
Shale Lithology
CORE XX L25.0 to 167.5
DEPTH DESCRIPTION
125-130
130-135
135'140
140-155
155-160
161-162.9
162.9-165
165-169.9
Silty Claystone
Clayey sand to very coarse sand to gravel
Clayey very coarse sand to gravel
Silty grey clay
_Gr-ey-c]_ay-
Gray claystone
Core loss
Grey to grey green claystone

TABLE 18
Properties of the Tailings Dam, Fowler, andOre Body Shales Used in the Cross-Sectional Models
Horizontal permeabilityVertical permeabilityPorosityGrain densityBulk densitySpecific storageRelative permeabilityCapillary pressure
1 md1 md10 percent2.60 g/cc2.34 g/cc2.2 x 10- 6 (1/ft)Figure 31Figure 32

TABLE 19
Properties of the Surface Mine Backfill Material Usedin the Cross-Sectional Models
Horizontal permeabilityVertical permeabilityPorosityGrain densityBulk densitySpecific storageRelative permeabilityCapillary pressure
= 2000 md= 2000 md= 35 percent= 2.60 g/cc= 1.69 g/c.c= 7.5 x 10-6= Figure 36= Fioure 36
(l/ft)

TABLE 20
Distribution Coefficients and Relative VelocitiesTailings Dam Shz
Distribution Coefficient
(ml)
For Solutes at Highland Resulting from Contact with the Tailings Dam Sand,le, Ore Body Sands, and Ore Body Shales.
Relative Velocity
(solute front velocity)(fluid velocity)
Solute
AlAsCaCdCrCuFeHKMgMnNaNiSeSiSrZnS04-2
ThU
Pb-210*Ra-226*Th-230*
U-238*
pll**Eh**
TailingsDam Sand
-1.094.00
-0.34-- 0.4720.51.07
20.90.213.00
-0.96-0.43-0.06-1.0911.8-0.38-0.68-0.620.875.332.70
68..18.1.91.7
3.2619.
TailingsDam Shale
7.99776.-0.36-0.25
320.5.46
118.0.46
-0.97-0.35-0.45-0.380.60
17.06.62
-3.56-0.661.59
61.617.513.10.1.11.0
3.5614.
Ore-BocSand
y
-1 .0-0.38-0.4739.01
129. 10.21,0. 2ý
-0.42-0.81
-0.7213.410.T7-1.04-0.2
0.014-3.80-3.7768.18.1.91.7
3.3676.
Ore-BodyShales
1.82776.-0.36-0.7637.94.12
119.0.26
-0.88-0.56-0.13-0.16-1.2416.21.57
-2.68-0.890.94
-2.37-0.2513.10.1.11.0.
TailingsDam Sand
1.000.048
1.001.000.0100.1560.0090.4850.0621.001.001.001.000.0161.001.001.000.1850.0360.0680.0030.0110.0940.104
TailingsDam Shale
0.0055x10_5
1.001.00
1x10-40.008
4x0-40.0851.001.001.001.000.0660.0030.0061.001.000.026
7x10-40.0020.0030.0040.0370.041
Ore-Body Ore-BodySands Shales
1.000.0021.001.00
0.0050.0880.0020.4230.4051.001.001.001.000.0140.2151.001.000.851.001.000.0030.0110.0940.104
0.0235x10⁻⁵
1.001.000.0010.010
3x10-40.1411.001.001.001.001.000.0030.0261.001.000.0431.001.000.0030.0040.0370.041
3.3712.
* Distribution coefficients obtained by**Value after 30 days contact period
Battelle (198( B) for Morton Ranch

TABLE 21
Properties ofSurface Mir
in
Horizontal permeabilityPorosityGrain densityBulk densitySpecific storageRelative permeabilityCapillary pressure
the Tailinas Dam Sand andne Backfill Material Used
the Areal Model
= 2000 md= 34 percent= 2.60 g/cc
1.72 g/cc= 7.3 x 10⁻⁶ (l/ft)= Figure 54= Figure 55
Surface Mine Backfill Material
Horizontal permeabilityPorosityGrain densityBulk densitySpecific storageRelative permeabilityCapillary pressure
= 2000 md= 35-percent= 2.60 g/cc= 1.69 g/cc= 7.5 x 10- 6 (l/ft)= Figure 54= Figure 55

TABL>ý..
APPLICABLE GROUNDWATER STANDARDS AND
t EPA/NRC AP ICABLE DRINKIIlG
C2CONCENTRATION LEVELS OF INTEREST
Dra f l;ATER STANDARnS (rig/I)UIITCA (mg/o)Inactive Sites
EPA Drinking liater Standards WY DEQ Proposed GW StandardsPrimary Secohdary Livestock Domestic Aqric Livestock
USNRC10 CFRPart 20
GroundwaterConcentrationLevels (mg/i)Of InterestSoecies
Aluminum (Al)A mmonia (NH3Arsenic (Asl
Barium (0a)Beryllium (Be)Boron (B)Cadmium (Cd)Chromium (Cr)Cobalt (Co)Copper (Cu)Cyanide (CN)Fltoride (F)Hydrogen Sulfide (H2S)Lithium (Li)Lead (Pb)Mercury (Hg)Molybdenum (Mo)Nickel (NI)Nitrate (as N)Nitrite (as N)Selenium (Se)Silver (A9)Vanadium IV)Zinc (Zn)Chloride (Cl)Iron (Fe)Manganese (Hn)PhSulfate (SO)TOSUranium URa-226,228Gross aThorium-230Gross oLead-210
0.051.0
0.010.050.05
0.050.0021.00.210.0
0.010.05
0.051.0
0.010.05
0.051.4-2.4
0.050.002
10.0
0.010.05
TTI
1
5.0250.0
0.05
6.5-Q.5250.0500.0
5.0
0.2
5.00.051.0
0.5
2.0
0.10.01
0.05
25.02000.0
3000.0
0.50.051.0
0.750.010.05
1.00.2
1.4-2.40.05
0.050.002
10.11.00.010.05
5.0250.0
0.30.05
6.5-8.5250.0500.0
5.0
0.1
0.1
0.750.010.100.050.20
2.55.0
0.2
0.02
0.A2.0
I00.05.00.2
4.5-9.0200.0
2000.0
5.0
'0.2
5.00.050.051.00.50
0.10
5.00.5
0.05-0.201.00.1
0.75-5.00.01-0.050.05-1.00.05-1.00.20-1.00.05-0.201.4 -2.4
0.052.5
0.05-5.00.002-0.01
1.00.210.0
1 .0-10.00.01-0.05
0.0S0.10
2.0-25.0100.0-2000.0
0.3-5.00.05-0.24.5-9.0
200.0-3000.0500.0-5000.0
5 mg/l, 44.3 mg/I5-30 pCi/I
15 pCI/I2000 pCI/I
30 pCI/I
10A.0.05
0.125.0
2000.0
6.5-8.53000.05000.0
4473 mg/I
5.0 pCi/i15.0 pCI/I
5.0
15.0
30.0
pCi/IpCI/I
pCI/I
5.0 mgtI5.0 pCi/I
15.0 pCi/I
5.05.0
15.0
mg/IpCi/ipC.i / i
5.05.0
15.0
mg/IpCi/lpCI/l
44.330.0
2000.0
mo/lpCI/i
pCi/I

Table 23
SOLUTES CONSIDERED FOR USE AS TRACERS FOR THE1.0 RELATIVE VELOCITY FRONT
Solute
CaCdMgMnNaSrZnCl
KS iS04- 2
PondConcentration
mg/i
584..030
375.45.
262.0.503.2
218.42.
240.7580.
BackgrouiConcentrat
mg/I
10 - 88
1.5 1,
114 - 1S
15 - 4C7 - 10
idion Tailings
Dam Sand
I
4
1.01.01.01.01.01.01.0ND0.0621.00
0.185
RelativeTailingsDam Shale
1.01.01.01.01.01.01.0ND1.000.0060.026
VelocityOre Body
Sand
1.01.01.01.01.01.01.0ND0.4050.215
0.85
Ore BodyShale
1.01.01.01.01.01.01.0ND1.000.026
MeasuredConcentration
at pH=8
.0018340.
0.06310.
6.60.13
279.46.
8.7
150 - 500 0.043 7580.

APPENDIX A
Methods Used for Determining Element Concentrations andPerforming Mineralogical Analyses
I. Analytical Methods for Determining Element Concentrations
A. Atomic Absorption Spectrometry
The following elements were determined in the filtrates andcontrols from the batch tests and titrations, the as-received tailings solution, and the rock samples: Al, Ca,Fe, K, Mg, Mn, Na, Si, As, Cd, Cr, Cu, Ni, Se, Sr, Th, U, andZn. All elements, except Th and U were determined by atomicabsorption spectrometry (AAS), using a Perkin-Elmer Model5000 spectrometer for flame and hydride determinations anda Perkin-Elmer Model 703 spectrometer for heated graphiteatomizer (HGA) determinations. Arsenic and selenium weredetermined as hydrides, and cadmium was determined usingthe heated graphite atomizer. Thorium and uranium weredetermined by Analytical Consulting Services, Houston,Texas using a d.c. plasma emission spectrometer.
The major (Al, Ca, Fe, K, Mg, Na, Si) and minor (Mn) elementconcentrations were determined in accordance with StandardMethod D3682 of the American Society of Testing andMaterials (ASTM), "Standard Test Method for Major and MinorElements in Coal and Coke Ash by Atomic Absorption." In theprocedure, 0.1 gram of rock sample was fused with one gramof lithium tetraborate (Li 2 B4 07 ). After fusion the fusioncake was dissolved in 5% HCI solution prior to atomicabsorption analysis. Lanthanum chloride solution was addedto re ease some elements, for example, magnesium, from ionpair formation.
For trace elements (As, Cd, Cr, Cu, Ni, Se, Sr, Th, U, andZn) the ASTM "Standard Test Method for Trace Elements inCoal and Coke Ash by Atomic Absorption," D3683, wasfollowed. In this method, 0.2 gram of a rock sample wasdissolved in a small volume of hydrofluoric, hydrochloric,and nitric acids in a sealed linear polyethylene bottle.After the dissolution, boric acid solution was added tocomplex excess hydrofluoric acid.
Analytical standards for major and minor elements wereprepared in 10-3M H2 SO4 to approximate the tailings solu-tion matrix,, however, trace element standards were preparedin 1% HNO 3 solution. Nitric acid was used for trace elementstandards because the solutions used for analyses weredilute enough that H2 SO4 effects were not significant.
A-I

A summary of the analytical wavelengths and flame typesused is given in Table A-I.
B. Ion Chromatography
Sulfate concentrations in each of the batch test andtitration filtrates were determined by ion chromatographyusing a Dionex Model 16 Ion Chromatograph. The eluentstream was 0.0024M NaHC0 3 plus O.003M Na2 CO3.
II. Mineralogical Analyses
A. Petrography
Random samples of each sandstone were impregnated withclear epoxy and thin sectioned for examination on astandard petrographic microscope. Two hundred point countswere made on each of two thin sections cut from the TailingsDam Sandstone and Highland Sandstone after no tailingssolution treatment, 3-day treatment, and 30-day treatment,using a petrographic microscope to note qualitative dif-ferences (such as texture, grain size, mineralogy, andgrain preservation) between these samples and the as-received sandstones.
B. X-ray Diffraction
The as-received sandstones and shales, and the dry, 3-daytreatment, and 30-day treatment Tailings Dam and Highlandshales were analyzed by x-ray diffraction spectrometry.Each sample was scanned for bulk composition. The lessthan 5m clay fractions of the shale samples were sepa-rated from suspension by gravity sedimentation. An esti-ma-t-e-e-f--weght--perc-en-t-c~---ay-w-as--ob-t-ai-ne-d--y-wetgh-n~g-bothi
settled and suspended fractions. Samples were prepared onglass slides for examination by x-ray diffraction using CuKa radiation. These mounts were then heated to 550 0 Cand re-examined by x-ray diffraction to confirm the pre-sence of kaolinite and the absence of chlorite. Anotherset of mounts were treated with ethylene glycol to detectthe expandable smectite clay minerals.
C. Energy Dispersive X-ray Fluorescence Elemental Analysis
Chemical analysis on scanning electron microscope is per-formed by measuring the energy and intensity distributionof the x-ray signal generated by a focused beam ofelectrons. The energy-dispersive spectrometer measures x-ray energy directly, producing a spectrum of relativeintensity versus energy. The spectrum produced is used forqualitative analysis.
A-2

TABLE A-1
Summary of Atomic Absorption Wavelengths andFlame Types Used for Analysis of Highland Tailings Solutions.
Element
Al
Ca
Fe
K
Mg
Mn
Na
Si
As
Cd
Cr
Cu
Ni
Se
Sr
Zn
Wavelength (nm)
309.3
422..7
248..3
766.5
285.2
279.5
589.0
251.6
193.7
228.8
357.9
324.8
232.0
196.0
460.7
213.9
Flame
N20/C 2 H2
Air/C 2 H2
Air/C 2 H2
Air/C 2 H2
Air/C 2H2
Air/C 2H2
Air/C 2H2
N2 0/C 2 H2
hydride
HGA*
Air/C2H2
Air/C 2H2
Air/C 2 H2
hydride
Air/C 2 H2
Air/C 2 H2
*HGA = heated graphite atomizer

APPENDIX B
Summary of Core Analysis Data for theHighland Ore Body Sands
Permeability, porosity, and grain density data were obtainedfor eight Ore Body Sand cores at Highland. The locations of thosecores are shown in Figure B-I. The core analysis data aresummarized in Tables B-1 through. B-8.
The data show that permeability varies from less than onemillidarcy to over ten darcies. This variation is probably causedby shale stringers and differing amounts of clay and silt in thesands. Arithmetically averaged permeabilities are between 0.6 and3.4 darcies. The sands appear to be isotropic.
Porosity varies from less than 10 percent to over 40 percent.Again, this variation is probably due to differing amounts ofshale, clay, and silt in the sands.
Measured grain densities showed little variation and weregenerally about 2.65 grams per cubic centimeter.
B-i

T36N
) BORING LOCATION03
MILE-SURFACE OWNED OR
CONTROLLED BY EXXON
SURFACE AGREEMENTS
FIG. B-1 LOCATIONS USED TO DETERMINE PERMEABILITY, POROSITY, AND GRAIN DENSITYOF TlE HIGHLAND ORE BODY SAND

Table B-1
PERMEABILITY, POROSITY, AND GRAIN DENSITY DATAOBTAINED BY CORE ANALYSIS OF THE HIGHLAND ORE BODY SAND
CORE 2700-0505 SECTION 21 T36N R72W
Core Depth(Feet)
Air Permeability,mdHorizontal Vertical
Porosity(Percent)
Grain Density(gm/cc)
384-85385-86386-8738 7-88388 -8 9389-90390-91391-92392-93393-94394-95395-96396-97397-98398-993-9-40&400-01401-02402-03403-04404-05405-06406-07407-08408-09409-10410-11
3.727.,57
242.328.
1623.1216.
355.1992.1725.5576.3031.3353.4938.8465.1553.-64-5-i--
2065.215.43.
1109.3958.
26.1255.518.316.582.
20.
9.984.38
29.137.885.
1110.1295.1688.835.
6020.12369.6639.
10648.8839.
21524.-40-.
693.20.
217.403.
61.533..328.
1576.16830.
36.1.44
25.627.134.132.234.133.330.333.033.531.935.230.730.030.033.4
32.123.629.432.033.029.130.731.130.624.829.3
2.652.662.652.652.632.642.642.642.642.632.632.622.622.632.63-2_65
2.642.602.612.622.602.622.622.632.592.652.67
Arithmetic Average 1672. 3450. 30.9 2.63

Table B-2
PERMEABILITY, POROSITY, AND GRAIN DENSITY DATAOBTAINED BY CORE ANALYSIS OF THE HIGHLAND ORE BODY SAND
CORE 0815-C-4950 SECTION 20 T36N R72W
Core Depth(Feet)
695-96696-97697-98698-99699-700700-01701-02702-03703-04704-05705-06706-07707-08708-09809-10710-11
-- 7-1-M-2--
712-13713-14714-15715-16716-17717-18718-19719-20720-21721-22722-23723-24724-25725-26
Air Permeability,mdHorizontal Vertical
7.80150.
1225.1250.1500.1600.1850.2000.
230.1650.
245.690.
1950.1110.1790..1075.
-2-O0.2800.2100.2540.
U.T.U.T.
4000.+4000.+
0.302850.
25.2.851.260.951.60
Porosity(Percent)
Grain Density(gm/cc)
21.829.031.331.4
.29.432.131.733.025.927.126.120.226.432.229.131.0
-3i.930.735.131.033.432.133.028.77.5
27.923.318.013.815.014.2
Note: U.T. = Unsuitable for testing

Table B-2Continued
PERMEABILITY, POROSITY, AND GRAIN DENSITY DATAOBTAINED BY CORE ANALYSIS OF THE HIGHLAND ORE BODY SAND
CORE 0815-C-4950 SECTION 20 T36N R72W
Core Depth(Feet)
Air Permeability,.mdHorizontal Vertical
Porosity(Percent)
Grain Density(gm/cc)
726-27727-28728-29729-30730-31731-32732-33733-34734-35735-36736-37737-38738-39739-40740-41
-7-4i-1-4-2_
742-43743-44744-45745-46746-47747-48748-49749-50750-51751-52759-60760-61761-62762-63763-64764-64
1.802.50
308.4000.+4000.+2950.3300.3850.3140.1225.1045.4000.+4000.+-4-000+
4000.+3450.3100.4000.+4000.+4000.+4000.+4000.4000.+4000.+4000.+4000.+4000.+4000.+
0.60
14.821.129.726.127.926.121.227.127.228.124.218.326.227.228.327-. 527.824.722..221.626.128 ..925.124.029.130.323.623.619.321.621.811.7

Table B-3
PERMEABILITY, POROSITY, AND GRAIN DENSITY DATAOBTAINED BY CORE ANALYSIS OF THE HIGHLAND ORE BODY SAND
CORE 2700-C2310 SECTION 21 T36N R72W
Core Depth(Feet)
650-51651-52652-53653-54654-55655-56656-57657-58658-59659-60660-61661-62662-63663-64664-65665-66666-67667 -68668 -69669-70670-71671-72672-73673-74674-75675-76676-77677-78678-79679-80
Air Permeability,mdHorizontal Vertical
4000.+1766.2548.3657.3950.4000.+4000.+4000.+4000.+4000.+4000.+3716.
U.T.U.T.
4000.+3849.1233.__- ---4000.+4000.+4000.+4000.+4000.+4000.+
U.T.U.T.
1405.35.
4000.-+4000.+4000.+
Porosity(Percent)
34..231.731.930.828.726.925.928.926.725.226.921.8U.T.U.T.22.520.623-1-23.725.722.721.920.821.4U.T.U.T.17.313.027.626.623.8
Grain Density(gm/cc)
Note: U.T. = Unsuitable for testing

Table B-3Continued
PERMEABILITY, POROSITY, AND GRAIN DENSITY DATAOBTAINED BY CORE ANALYSIS OF THE HIGHLAND ORE BODY SAND
CORE 2700-2310 SECTION 21 T36N R72W
Core Depth(Feet)
680-81681-82682-83683-84684-85685-86686-87687-88688-8968 9-90690-91691-92692-93693-94694-95695 -96696-97697 -98698-99699-700700-01701-02702-03703 -04
Air Permeability,mdHorizontal Vertical
3940.2062.2566.1471.2144.752.
2144.4000.+4000.+4000.+
2.502029.3047.2472.4000.+2655.1390.
75.4000.+4000.+
U.T.U.T.
3809.U.T.
Porosity(Percent)
29.428.029.427.226.823.227.124.731.026.98.2
32.329.932.831.931.029.217.134.028.8U.T.U.T.20.3U.T.
Grain Density(gm/cc)
Arithmetic Average 25.9
Note: U.T. = Unsuitable for testing

Table B-4
PERMEABILITY, POROSITY, AND GRAIN DENSITY DATAOBTAINED BY CORE ANALYSIS OF THE HIGHLAND ORE BODY SAND
CORE 4260-0940 SECTION 21 T36N R72W
Core Depth Air Permeability,md Porosity Grain Density(Feet) Horizontal Vertical (Percent) (gm/cc)
627-28 1464 31.5'628-29 302. 30.5629-30 U.T. 35.5630-31 4000.+ 31.7631-32 4000.+ 34.2632-33 4000.+ 32.5633-34 4000.+ 32.9634-35 3805. 31.2635-36 4000.+ 31.9636-37 4000.+ 34.9637-38 4000.+ 31.9638--39 4000.+ 32.4.639-40 4000.+ 32.1640-41 U.T. U.T.641-42 U.T. U.T.642-43 4000.+ 25.46T-3-44 4000-. 25_T644-45 U.T. U.T.645-56 U.T. U.T.646-47 U.T. U.T.647-48 U.T. U.T.648-49 4000.+ 30.8649-50 U.T. U.T.650-51 U.T. U.T.651-52 4000.+ 29.1652-53 U.T. U.T.653-54 U.T. U.T.654-55 2510. 25.6655-56 4000.+ 22.6656-57 3850. 21.6657-58 8.90 28.5658-59 2.82 26.9
Note: U.T. = Unsuitable for testing

Table B-4Continued
PERMEABILITY, POROSITY, AND GRAIN DENSITY DATAOBTAINED BY CORE ANALYSIS OF THE HIGHLAND ORE BODY SAND
CORE 4260-0940 SECTION 21 T36N R72W
Core Depth Air Permeability,md Porosity Grain Density(Feet) Horizontal Vertical (Percent) (gm/cc)
745-46 1598 29.7746-47 4000.+ 32.0747-48 1116. 30.9748-49 1652. 30.5749-50 4000.+ 32.5750-51 4000.+ 30.9751-52 4000.+ 26.8752-53 2.41 7.7753-54 U.T. U.T.754-55 U.T. U.T.755-56 4000.+ 31.3756ý-57 4000.+ 27.6757-58 4000.+ 28.7758-59 4000.+ 32.3759-60 4000.+ 27.47-60-6" 40O-+ 2-7V761-62 4000.+ 26.5762-63 4000.+ 27.6763-64 4000.+ 27.6764-65 4000.+ 27.0765-66 4000.+ 30.9766-67 4000.+ 29.7767-68 4000.+ 29.4768-69 894. 23.4769-70 4000.+ 24.9770-71 4000.+ 27.9771-72 4000.+ 26.5772-73 4000.+ 26.5
Note: U.T. = Unsuitable for testing

Table B-4Continued
PERMEABILITY, POROSITY, AND GRAIN DENSITY DATAOBTAINED BY CORE ANALYSIS OF THE HIGHLAND ORE BODY SAND
CORE 4260-0940 SECTION 21 T36N R72W
Core Depth Air Permeability,md Porosity Grain Density(Feet) Horizontal Vertical (Percent) (gm/cc)
773-74 3140 26.2774-75 4000.+ 24.4775-76 2062. 20.9776-77 2566. 24.0777-78 1917. 26.2778-79 U.T. U.T.779-80 U.T. U.T.780-81 U.T. U.T.781-82 U.T. U.T.782-83 U.T. U.T.783-84 4000.+ 27.8784-85 3688. 28.0785-86 4000.+ 28.3786-87 4000.+ 29.6787-88 4000.+ 29.2788 -89 12-49_. 2-9-789-90 245. 21.8790-91 U.T. U.T.791-92 U.T. U.T.792-93 0.71 19.6793-94 2.30 17.3794-95 U.T. U.T.
Note: U.T. = Unsuitable for testing

Table B-5
PERMEABILITY, POROSITY, AND GRAIN DENSITY DATAOBTAINED BY CORE ANALYSIS OF THE HIGHLAND ORE BODY SAND
CORE 2650-C-0320 SECTION 21 T36N R72W
Core Depth Air Permeability,md Porosity Grain Density(Feet.) Horizontal Vertical (Percent) (gm/cc)
367-68 318. 1.44. 24.0 2.64368-69 5.13 2.28 22.2 2.6436 9-70 84. 2.83 23.2 2.65370-71 8.33 6.0 27.0 2.63371-72 238. 32. 26.7 2.65,372-73 519. 317. 33.3 2.65373-74 708. 403. 33.9 2.63374-75 1267. 1266. 34.2 2.63375-76 1652. 1204. 33.7 2.63376-77 1638. 855. 33.9 2.62377-78 2202 1433. 34.3 2.64378-79 2511. 1123. 35.5 2.64379-80 2808. 1906. 36.5 2.64380-81 6047. 3393. 41.0 2.60381-82 5527. 4712. 40.1 2.62383-84 11705. 15.3 39.8 2.58384-8-5 561, 6-7370 36--3 27.62385-86 5592. 1957. 38.1 2.62386-87 156. 63. 27.7 2.63387-88 2275. 1875. 32.2 2.62388-89 1524. 1091. 31.4 2.63389-90 3040. 3377. 32.6 2.63390-91 3027. 3686. 32.7 2.64391-92 4177. 4177. 33.0 2.63392-93 2286. 3515. 33.7 2.64393-94 4560. 3505. 34.6 2.63394-95 34. 42. 27.1 2.63395-96 1457. 2986. 33.1 2.64396-97 2048. 3791. 32.6 2.63397-98 2901. 1062. 32.1 2.61398-99 142. 961. 29.8 2.63399-400 0.94 0.23 16.9 2.71
Arithmetic Average 2288. 1687. 31.0 2.61

Table B-6
PERMEABILITY, POROSITY, AND GRAIN DENSITY DATAOBTAINED BY CORE ANALYSIS OF THE HIGHLAND ORE BODY SAND
CORE 0865-0875 SECTION 21 T36N R72W
Core Depth(Feet)
353-54354-55355-56356-57357-58358-59359-60360-61
Air Permeability,mdHorizontal Vertical
Porosity(Percent)
Grain Density(gm/cc)
720.875.
1470.1233.1510.970.775.733.
29.131.730.831.331.830.826.527.9
Arithmetic Average 1036. 30.0

Table B-7
PERMEABILITY, POROSITY, AND GRAIN DENSITY DATAOBTAINED BY CORE ANALYSIS OF THE HIGHLAND ORE BODY SAND
CORE 0600-0810 SECTION 24 T36N R73W
Core Depth(Feet)
Air Permeability,mdHorizontal Vertical
Porosity(Percent)
Grain Density(gm/cc)
633-34634-35635-36636-37637-38638-39655-56656-57657-58658-59659-660660-61661-62662-63663-64664-65665-66666-67
U.T.U.T.U.T.80.
208.164.820.
1493.538.280.
1659.527.831.
U.T.U.T.
1936.7_41-.-
1567.
834.
U.T.U.T.U.T.55.
200.144.751.843.247.130.
1436.477.682.
U.T.U.T.
1564.___6_73_.
936.
626.
U.T.U.T.U.T.25.026.628.023.624.123.420.724.728.625.4U.T.U.T.29.924-0_28.3
25.6Arithmetic Average
Note: U.T. = Unsuitable for testing

Table B-8
PERMEABILITY, POROSITY, AND GRAIN DENSITY DATAOBTAINED BY CORE ANALYSIS OF THE HIGHLAND ORE BODY SAND
CORE 3450-3440 SECTION 21 T36N R72W
Core Depth Air Permeability,md Porosity Grain Density(Feet) Horizontal Vertical (Percent) (gm/cc)
652-53 28. U.T. 28.5653-54 40. U.T. 29.6654-55 0.50 0.46 8.5655-56 0.1.5 0.05 8.8656-57 58. 8.60 27.3657-58 U.T. U.T. 16.5666-67 U.T. U.T. 29.3667-68 U.T. U.T. 28.6668-69 U.T. U.T. 27.9669-70 35. 14. 26.5670-71 59. 29. 28.6671-72 80. U.T. 30.0672-73 U.T. U.T. 25.8673-74 38. 43. 25.1674-75 15. U.T. 28.6675-76 U.T. U.T. 26.86-76---7-7- 80- - 20 .- 2-9-.6677-78 28. 8.50 19.8
Note: U.T. = Unsuitable for testing.

APPENDIX C
HIGHLAND FIELD PROGRAM
C-I

C.l. Purpose and Scope of the Field Program 1972-1979
C.2. Original Water Quality Monitoring Network
C.2.1. Well LocationsC.2.2. Well Completion InformationC.2,3. Sampling
C.2.3.1. Sampling ProceduresC.2.3.2. Summary of Data
C.2.4. Deficiencies and Additional Data Required
C.2.4.1. Well ConstructionC.2.4.2. SamplingC.2.4.3. Analytical TechniquesC.2.4.4 New Data Needed
C.3 1980-81 Field Program
C.3.1. PurposeC.3.2. Water Quality Monitor Wells
C.3.2.1. TDM Well Location RationaleC.3.2.2. Well Completion Specifications
C.3.3. Regional Hydrologic Data
C.3.3.1. PermeabilitiesC.3.3.2. Recharge-Discharge Areas
C.3.4. Other Sampling
C.3.4.1. Soils and Soil TestsC-3-4 2 a--i.ngs -p e sC.3.4.3 Core SamplesC.3.4.4 CuttingsC.3.4.5. Geologic Drill Hole LogsC.3.4.6. Geophysical Drill Hole LogsC.3.4.7. Bulk Samples of Geologic Units
C.3.5. Field Program Summary
C-2

C.I1 Purpose and Scope of the Field Program 1972-1979
Background
Potential seepage from the Highland Tailings Impoundment hasbeen a concern to Exxon Minerals Company (formerly MineralsDepartment, Humble Oil & Refining Company) since 1970 whendesign work on the tailings dam was underway. (Dames & Moore,1970).
A formal ground water monitoring program was proposed in 1971and subsequently incorporated into the Final EnvironmentalStatement for "The Highland Uranium Mill" (U.S. AEC, 1973).Monitoring of the original four wells began in 1972 prior tothe deposition of tailings in the basin in October, 1972. Afifth monitor well was installed in 1974. In 1977, fiveadditional wells were completed around the tailings impoundmentto monitor potential seepage, bringing the monitoring networkto ten wells. Figure 22 has locations of the monitor-wellsand Table C-1 summarizes location data.
Purpose and Scope
The purpose of the above mentioned wells was to monitor potentialseepage from the tailings impoundment:
o through the toe of the tailings damo through the dam abutments and sides of the reservoiro through the Tailings Dam Shale and into lower sands.
(Exxon, 1977)
The scope of the work included the completion of the wells atdiscrete intervals above and below the Tailings Dam Shale,which is considered to be the major seepage control feature inthe-l-oc-a-l--s-tr-a-t-ggrap- hy--A1-so-i-nc-lu ded-i-n-the-p-rog-ram-wa-speriodic sampling of the wells for possible seepage and theanalysis of the collected data.
The descriptions of the well completions, sampling techniques,and data evaluation are discussed in subsequent sections ofthis report.
C-3

C.2. Original Water Quality Monitoring Network
C.2.1. Well Locations
Two of the first five Tailings Dam Monitor (TDM) wells, A andB, were drilled north of the tailings impoundment and three ofthe first five TDM wells were drilled on the downstream sideof the tailings dam. TDM-E was drilled very close to thechannel of the impounded intermittent stream. TDM-C wasdrilled near the south abutment. of the tailings dam and TDM-Dwas drilled nearly opposite the center of the tailings dam.TDM's I through V were drilled downstream of the tailings damto fill in gaps in the original network of five wells. Thelocations are shown on Figure 22.
C.2.2. Well Completion Information
To verify the screened interval data of the ten original TDMwells, the eight TDM wells with 4" casing were TV cameralogged in 1980. Two TDM's, A and B, had 2" casing and couldnot be TV camera logged. The camera logs provided depths fromthe collar to the screened intervals and the total well depthor the depth to fill or sediment in the casings.
During the 1981 field program, probe holes were drilled andvery carefully geophysically logged in five areas near theother TDM wells downstream from the tailings dam. All probeholes and TDM wells were surveyed to establish collar elevation.Geologic formations were correlated between probe holes andthen correlated to the eight TDM wells nearby that had been TVcamera logged. The projected elevations of the contacts ofthe geologic formations were compared to the elevations of thescreened intervals in the 1972, 1974, and 1977 TDM wells todetermine which geologic formations were screened in eachwe 1.
Cross sectional drawings of the eight original TDM wells thatwere camera logged are attached in Figures C-l to C-8.
TDM wells C and D were screened above the Tailings Dam Shaleand TDM well E was screened below the Tailings Dam Shale. Theintent of these wells, and wells A and B, was to detectseepage above or below the floor of the tailings impoundmentin multiple screened wells that penetrated all geologicformations that had reasonable potential to carry seepage.
TDM wells I through V were intended to be screened in asingle geologic formation. The amount of fill or sediment inthe wells makes the total screened interval difficult todetermine. TDM II is screened 2 feet or more into the TailingsDam Shale, and extends upward to the lower contact of theTailings Dam Sandstone. Since the shales transmit only verysmall amounts of water, the water produced in TDM II is mostlikely coming from the Tailings Dam Sandstone. TDM IV isscreened up to the lower contact of the 45 Shale as well asin the intended completion in the 40 Sandstone.
C-4

C.2.3. Sampling
C.2.3.1. Sampling Procedures
Procedures for sampling monitor wells prior to June, 1981,involved obtaining a grab sample from the well by two methods.Most of the monitor wells were sampled with a bail. The bailconsisted of two-inch black iron pipe with a capped bottomend. The well was bailed until sufficient sample was obtained.The second method involved the use of an air compressor to airlift the wells with small casing diameters. In both methods,a one gallon sample was collected from the well and taken tothe laboratory. At the lab the water was filtered through #40Whatman paper and preserved for the required analyses.
Due to inconsistency in the records, the sampling frequency ofthe monitor wells is difficult to determine for early years oftailings disposal. Since 1977, sampling has followed aspecific schedule. TDM wells A, B, D, E, and I requiredmonthly radium-226, thorium-230 and total uranium analysis.TDM wells II through V required monthly radium-226 and totaluranium with thorium-230 being analyzed only once a year. Allwells were sampled quarterly for major anions/cations andtrace metals. These parameters usually included pH, sodium,potassium, calcium, magnesium, sulfate,. chloride, bicarbonate,T.D.S., arsenic and selenium. After 1977 the Wyoming DEQ, LQDrequired analysis of pH, T.D.S., total iron, nitrate, sulfate,molybdenum, total uranium, and radium-226 twice a year. Thoseparameters not already sampled on a more frequent basis wereincorporated into the bi-annual sampling schedule.
C.2.3.2. Summary of Data
Baseline data is on file for TDM's A, B, and E. Sampling ofthese TDM's began in July, 1972, and tailings d-ilsposadid notbegin until October, 1972. This data consists of anion/cation and radiological analyses. These files are maintainedat Highland.
The hydrology data base on the Highland Uranium Operations'HP-3000 computer includes water quality data from April, 1974through June, 1980. It is currently being expanded to includebaseline 1972 to 1974 data and June, 1980 to present data.Once the hydrology data base is updated, it will facilitateevaluation of all water quality data and summary statistics,time vs. concentration graphs, and other statistical analysesof these data will be possible.
For each sampling site the major ions, trace constituents, andradionuclides are reported. An example listing from TDM A(sample site 9) from 1974 is included in Table C-2. Elementsnot analyzed in a specific month are flagged with an asterisk;those below limits of detection are flagged with a "%". Theexample shows radionuclide analyses monthly and major andtrace constituent analyses performed quarterly.
C-5

C.2.4. Deficiencies and Additional Required Data
The original ten TDM wells served their purpose as "earlywarning indicators" of seepage but were not adequate for adetailed hydrological study of the tailings impoundment andthe geologic formations that might be affected.
C.2.4.1. Well Construction
The multiple screened TDM wells and the TDMwells screened allthe way to the contact with another geologic formation couldnot be used to construct potentiometric maps for the severalgeologi~c formations of interest. The water levels in thesewells were a composite of the two or more geologic formationsopen to the well screens. Also, the water samples collectedfrom these wells were a composite of the water qualities ofthe two or more geologic formations open to the well screens.
The first five TDM wells were cased with steel pipe and thesecond five TDM wells were cased with PVC pipe. All of theseTDM wells were constructed with slotted pipe for well screenwith no gravel pack. The fill or sediment observed in TVcamera logs of these wells indicates that the slots were toocoarse and that the geologic formations were not as wellconsolidated as they were thought to be.
C.2.4.2. Sampling
Water quality samples collected from the original TDM wellswere of questionable value for a detailed hydrologic study.The problem of composite water samples has already beendiscussed. The effect of fill or sediment in the bottom ofthe wells was unknown but leaching of minerals from the fillwas possible. The steel well casings rusted and contributed
-to=-t-he-i-i-o n-c-on-ten-t--o-f-wa-t-e-r--samp$ e-s.
Finally, the water sampling methods cast doubt on the watersample analyses. TDM's A and B had to be air lifted since the2" casings were too small for any other method of sampling.Air lifting has the potential of oxidizing elements in thewater sample and changing the water sample's chemical composi-tion. The remaining eight TDM wells were sampled with abailer made from a piece of steel pipe and a rope. Thebailer and rope were not rinsed between wells and were usuallydropped on the dirt beside the well after the sample waspoured from the bailer. This introduced surface soils intothe wells with unknown impact on water quality.
C.2.4.3. Analytical Technique
Prior to 1977 all water analyses were performed by a contractlaboratory. Highland started in-house radiological assays fortotal uranium, radium-226, and thorium-230 in 1977; .however, aQuality Assurance (Q.A.) program was not started until 1979.It was not until 1981 that an approved Q.A. program was finalized.With the Q.A. program, we can demonstrate the accuracy of ourmethods.
C-6

C.2.4.4. New Data Needed
An accurate assessment of the hydrologic and hydrogeochemicalsystems in the tailings basin area required a network of wellsscreened in single geologic formations. These single zonecompletion wells would provide accurate information todetermine water levels, potentiometric maps and hydrogeo-chemical data for each geologic formation of interest. Also,these new wells could be pump tested by a portable submersibleturbine pump to allow calculation of the permeability of thewater bearing formations which were needed to calculateground water velocities.
C.3. 1980-81 Field Program
C.3.1. Purpose of 1980-81 Field Program
The primary objective of the 1980-81 field program was tocollect site-related field data required to characterize thetailings basin hydrology and related seepage. The programgoals were to:
o develop both regional and local field data required formodeling
o obtain samples for laboratory testingo expand and modify the existing ground water monitoring
system with its identified deficiencies.o expand knowledge of the geology detail in the tailings
basin region.
To meet these goals, the. following general activities wereconducted:
o drilled regional hydrology wells to determine potentio-metric surfaces for each aquifer
o drilled additional water quality monitor wells around thetailings basin to provide solute-transport informationfor each aquifer
o ran pump tests and packer tests to determine hydrologicparameters of the various aquifers.
o made geophysical logs of the drill holes to providedetailed geology and correlations and insure hole completionsin the proper aquifers
o sampled soil types to determine chemical and hydrologicparameters
o sampled tailings and tailings solutions to determinephysical and chemical characteristics
o coring to provide drill core samples for laboratorydetermination of hydrologic parameters and chemicaltesting
o bulk field sampling of each geologic unit for laboratorydetermination of fluid-rock chemical interactions
o established an adequate long term monitoring program
C-7

This extensive field program required field work in Fall 1980and Summer 1981 to complete. We believe that the data collectedduring these two drilling programs satisfies the statedobjectives of the field program and provides high qualityinput data for the laboratory and modeling studies.
C.3.2. Water Quality Monitor Wells
In 1980 and 1981, a well drilling and data collection programwas completed to correct the deficiencies in the original TDMwell network. These new wells provided the needed water leveland permeability data and were designed with 5" casing topermit easy pumping with a-standard 3-3/4" submersible pumpfor water quality samples.
C.3.2.1. TDM Well Location Rationale
The well drilling and data collection program concentrated onmonitoring water bearing geologic formations downstream of thetailings dam and on the perimeter of the tailings impoundment.The locations of the new TDM wells are shown on Figure 22,main text. The wells were located in areas judged to be mostlikely for seepage to occur. Table C-1 summarizes the locationsof the 1980 and 1981 tailings dam monitor wells.
C.3.2.2. Well Completion Specifications
TDMwells VI, VII, VIII and IX,. X, XI, XII, XIX, XX, and XXIwere designed and drilled in 1980 by a contractor geotechnicalfirm. Figures C-9 through C18 show the completion intervalsof these wells. These wells have 5" PVC well screen with 0.02inch slots and 5" PVC well casing. The gravel pack used wasuniform grain size #10 silica sand with a particle size ofapproximately 1/10 inch. Bentonite pellets were placed abovet hegravepac k_a s-aifo-rma-t-ionwaaiefrs-ea]_.-_kceemne-t-n dbentonite grout was then pumped behind the casing from the topof the bentonite seal to a minimum of 30 feet above the comple-tion interval. The well casings were cut off 3-1/2 feet abovethe ground and an 8" steel pipe was set over the PVC casingand cemented into the ground to protect the PVC casing. Allwells were set with vented, removeable PVC caps. Observationwells were similarly constructed with 2 inch casing. Fourobservation wells are at site VII and one is at site VIII.Figure C-33 diagrams the completion specifications of thesewells.
TDM wells D (replacement), VI (replacement) XXX (replaces XX),XXIII, XXIV, XXV, XXVI, XXVII, XXVIII and XXIX were designedand drilled in 1981 by Exxon. Figures C-19 through C-28 showthe completion intervals in these wells. All of these wellsexcept XXIV, XXVI, XXVII, RM-3 and RM-4 have 5" PVC wellscreen with 0.02 inch slots adapted to 4-1/2 inch fiberglasswell casing. The other wells have 5" PVC well casing. Thegravel packs used in the 1981 field program were the same asthat used in the TDM wells drilled in 1980. The bentonite
C-8

seal and grout used along with the above ground well protectionwere similar to that used in the prior year. Observationwells with 2 inch casing were installed at VI, XXIII, XXIV,XXVII, XXVIII, and XXIX. Figure C-34 diagrams the completionspecifications of these 5 inch and 2 inch wells.
To complete the 1981 field drilling program, four regionalmonitor (RM) wells were installed to determine regional ground-water gradients in the Highland Operations area. These wellswere completed in the Tailings Dam Sandstone, and this data wasused in the seepage study. Figures C-28 through C-32 show thecompleted intervals for these wells.
C.3.3. Regional Hydrologic Data
In order to model ground water flow in the tailings basin, theformation permeabilities, recharge and discharge areas had tobe determined.
C.3.3.1. Permeabilities
Five of the holes drilled for TDM wells had packer tests runon the bore hole before screen and casing were installed.These packer tests provided a good general idea of geologicformation permeabilities and are summarized in Table C-3.
In addition to the packer tests, rock cores taken from holesdrilled for TDM wells were sent to testing laboratories tomeasure formation permeabilities under controlled conditions.These data are in Chapter 6, Flow Modeling.
Finally, in-place, long-term formation permeabilities weremeasured by pumping tests run in the TDM and RM wells. Thepumping tests in the water bearing formations resulted inc l-ac-eu r -p eil--fr -r-•bout--36.4--g-a-oISper day per square foot. The other permeability measurementsgenerally agreed with the pumping test permeabilities. Nopumping test was possible in the Tailings Dam Shale. Arelatively high and conservative permeability of 0.0001 darciesor about 0.0018 gallons per day per square foot was selectedfrom core permeability data. The pump test results are summar-ized in Chapter 6, Flow Modeling.
C.3.3.2. Recharge/Discharge Areas
Intensive geologic mapping and drill hole log data establishedthe outcrop area of the geologic formations important to thisstudy. The formations outcrop very close to the downstreamside of the tailings dam as shown in Figures 40 through 51,main text. This outcrop area is the regional discharge areafor the Highland ore sandstones and the Tailings Dam Sandstone.
C-9

The recharge area for the same geologic formations was determinedto .be the topographic high west of the mining area and knownas Blizzard Heights. This determination was based on siteexperience and accepted ground water flow system theory alongwith work by Dames & Moore (1980) and Haigmaier (1971).
Flow net analysis based on the above information indicates quantities,flow directions and water levels consistent with actual waterlevels measured in the field. This flow net is depicted inFigure 12...
C. 3.4.. Other Sampling
A major part of the field program centered around the waterquality and regional hydrology sampling discussed in SectionC.3.1. and C.3.2. In addition, information on the soils,tailings, drill cores, drill cuttings, geologic drill holelogs, geophysical drill hole logs, and bulk samples of eachrock unit were collected as input for the seepage studylaboratory and modelling work.
C.,3.4.1. Soils and Soil Tests
The subsurface soil, embankment, tailings and ground waterconditions in.the area of the tailings basin were exploredduring two investigations by Dames & Moore in 1970 and 1977.The. 1977 investigation consisted of drilling two explorationborings, three survey borings, and three field permeabilityborings. The borings were drilled to depths ranging from 4 to11 feet. Fourteen test pits. were also excavated to depths.ranging from 4 to 11 feet. The borings and test pits werelocated from 1000 feet south to 3000 feet north of the tailingsdam (Dames & Moore, 1977).
S-i-x--i-ng-l-e-pa cker-permeSbfli-ty-tests-were-run-i-n--te-e-birtnto determine near-surface soil permeabilities. These datahave been used in the flow modeling.
Soil samples from these borings and test pits were analyzed inthe laboratory for soil type, moisture, density, liquidlimit, plasticity limit, compaction, and permeability. Theseresults are tabulated in the Dames & Moore studies and wereused in the seepage study.
C.3.4.2. Tailings Samples
Two borings in the tailings basin, Q-1 and R-I, were drilledto provide samples of tailings and tailings fluid at variousdepths. The locations are shown in Figure 22 of the text. Atotal of 37 undisturbed tailings samples from 2 feet to 86.5feet in depth were collected. Table C-4 lists the samples anddepths. Additionally, tailings were obtained from the milldischarge pipe for laboratory permeameter testing. The samplesare referenced in Chapter 6 of the report.
C-10

C.3.4.3. Core Samples
During the 1980 drill program, 366.1 feet were sampled with 3inch cores for laboratory permeability tests and geologiclogging. These cored intervals are summarized below:
Monitor Footage TotalWell Number Cored Depth
VI 65.6 85.6VII-2 58 78VII I 71 130X 41.4 101.4XII 51.9 150.6XX 78.2 235
366.1 780.6
These cored intervals of the total drill hole were selected toprovide samples in all shale and sandstone units. The coreswere stored in plastic bags and sealed steel cans. Table C5lists the core sample data. The laboratory data from thesecores are contained in Chapter 6, Flow Modeling.
C.3.4.4. Cuttings
Samples of drill cuttings were collected from all drilledmonitor and observation wells. Samples were taken for every 5foot interval and stored in plastic bags. These samples wereused principally for geologic logging and sample descriptionto correlate with geophysical drill logs. The grab samplesalso provided a physical record of the geology which will beretained until completion of the seepage analysis. Thesecutting intervals are detailed in Table C-6.
C. 3 -4-5--. elog TDrTI-T-FF6el6Lo gs
Based on the sampled cuttings, geologic drill hole logs at ascale of 1 inch = 2.5 feet for each monitor and observationwell were prepared to include rock type, sample color, texture,and grain size. For cored intervals, similar logs were madeto include hardness and structure,. These logs were used withthe geophysical drill hole logs to correlate rock units fromhole to hole and to select proper completion intervals.
C.3.4.6. Geophysical Drill Hole Logs
A Century Compu-Logger logging tool was used to log drillholes in the immediate vicinity of all the monitor wells. TheCentury logs provide a high quality record which were used tocorrelate stratigraphy throughout the tailings basin area, totie the geology back into the detailed mine geology to thewest, to make proper geologic unit picks, and to insure wellcompletions in the desired geologic units. The Century Geophysicallogging records provided the basic geology framework that wasneeded for the Geologic Modeling described in Chapter'5.
C-ll

C.3.4.7. Bulk Samples of Geologic Units
Bulk samples of the geologic units were needed for the fluid-rock interaction chemistry analyses. Tailings Dam Sand andTaili'ngs Dam Shale samples were collected in March, 1981, inthe Pit 4 area during the stripping of these rocks from off ofthe underlying ore sands. Samples of Ore Body Sands and OreBody Shales were collected in March, 1981, in the Pit 3 miningarea. These samples have been used in the Laboratory Programdiscussed in Chapter 4.
C.3.5. Field Program Summary
From the initial seepage monitoring of the tailings basinarea in 1972, the scope of the program has been significantlyexpanded and improved. This has resulted in improved under-standing of the tailings basin hydrology, and additional datawith which to quantitatively characterize and model groundwater solute. transport.
The current monitor system provides high quality water chemistrydata. from each aquifer. The sampling program was upgraded in1977 as discussed in section C.2.3. Since completion of the1980 and 1981 monitor well network, an expanded sampling programwas started and will continue. Analytical techniques havebeen improved and our laboratory is now participating in anapproved quality assurance program.
Collection of water quality information from around the HighlandUranium Operation tailings basin will be continued and willprovide additional data to more fully characterize area hydrology.
C-12

REFERENCES
Dames & Moore, 1979; "Report of Tailings Dam Study, Highland UraniumMine near Casper, Wyoming, for Humble Oil & Refining Company".
Humble Oil & Refining Company, 1971; "Applicant's Environmental Report,Highland Uranium Mill, Converse County, Wyoming".
U.S. Atomic Energy Commission, 1973; "Final Environmental StatementRelated to Operation of the Highland Uranium Mill by the ExxonCompany, U.S.A. (Formerly Humble Oil & Refining Company) DocketNo. 40-8102".
Exxon Company, U.S.A., 1977; "Applicant's Response to-NRC Questions,Modifications to Tailings Dam Centerline Design, Amendment toSource Material License, SUA 1139, Docket No. 40-8102".
Dames and Moore, 1977; Proposal for Phase I Detailed Site Selection,Future Tailings Pond, for Exxon Company, U.S.A.
Dames and Moore, 1980; Hydrologic evaluation,, Pit 5 Lake Reclamation,Highland Uranium Mine, Converse County, Wyoming, for Exxon MineralsCompany.
Hagmaier, J.L., 1971; Groundwater flow, hydrogeochemistry, and uraniumdeposition in the Powder River Basin, Wyoming, Univ. of NorthDakota Ph.D. dissertation.
C-13

FIGURE. C- I
TDM WELL NUMBER E
6-25-72
WELL COMPLETION LITHOLOGY
SCREEN VISIBLE 77' TO 89'
TOTAL DEPTH UNKNOWN, 89' OR MORE.WELLTOO SMALL AND CROOKED TO PUMPFILL TO 89'
30
TD SHALE
55
C,0-4
0z
___________ I 55 .1~
4- O
4
77
89F
50SS
89
1.
LEGEI
7 -
7LI
NO
BACKFILL
ALLUVIAL FILL
GROUT,
BENTONITE
SCREENED INTERVAL
GRAVEL
SANDSTONE
SI LTSTONE
S
* 6*
Sl-tALE

FIGURE C-2
TDM WELL NUMBER D
12-6-74
WELL COMPLETION LITHOLOGY
SCREEN VISIBLE 21' TO 51'; OTHER ZONES?TOTAL DEPTH UNKNOWN, REPORTED TO BE 80'tWELL PUMPS -1/2 GPMFILL TO 51'
* WELL ABANDONED NOW AND GROUNTED FULL
21
30
TDSS
70
LEGE
BFF//
F°°"°
['- '::
NO
BACKFILL
ALLUVIAL FILL
GROUT
BENTONITE
SCREENED INTERVAL
GRAVEL
SANDSTONE
SI LTS TONE
TDSHALE
80t 80_
S HALE

FIGURE C-3
TDM WELL NUMBER C
i2 - 15-74
WELL COMPLETION LITHOLOGY
0Z1
SCREEN VISIBLE 12'T028';
OTHER ZONESP TOTAL-DEPTHUNKNOWN, REPORTED TO BE 60'tWELL IS DRY
FILL TO 34'12
28
34
12?
TDSS I,
a
33
F
TD SHALE
54.5
50SS
LEGEND
~~BA
W A AL
FxO, 7g GR
°•,o°o GR
IF SA
SH
~~SH
CKFILL
LUVIAL FILL
'OUT
NTONITE
REENED INTERVAL
AVEL
NDSTONE
LTS TONE
ALE

FIGURE C-4
TDM WELL NUMBER
9-3-77
WELL COMPLETION LITHOLOGY
SCREEN VISIBLE 81' TO 83'TOTAL DEPTH UNKNOWN, 83' OR MOREWELL PUMPS 2GPMFILL TO 83'
CD0-J
45?
TDSS
I 1 ]
9I
LEGE
BACKFILL
ALLUVIAL FILL
GROUT
BENTONITE
SCREENED INTERVAL
GRAVEL
SANDSTONE
SI LTS TONE
NDL
8183 83
Sl"HALE

FIGURE C-5
TDM WELL NUMBER
9-3-77
I1.
WELL COMPLETION LITHOLOGY
SCREEN IS VISIBLE 57' TO 59'
TOTAL DEPTH UNKNOWN, 59' OR MOREWELL PUMPS 2 GPMFILL TO 59'
0-J
0z
-I-
48?
TDSS
5.7TD SHALE
59
,. S
LEGEI
I F 7
Ix ,, x
L21://
ND
BACKFILL
ALLUVIAL FILL
GROUT
BENTONITE
SCREENED INTERVAL
GRAVEL
SANDSTONE
SI LTS TONE
57
59? F
SF-IALE
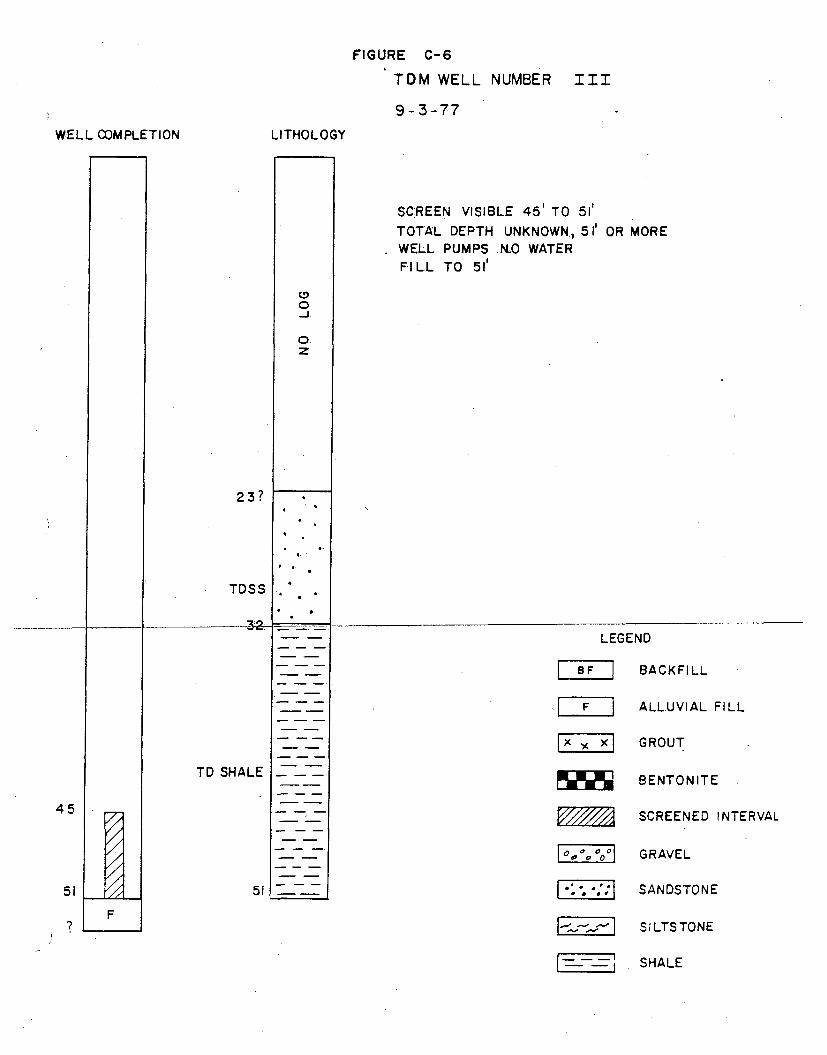
FIGURE C-6
TDM WELL NUMBER III
9-3-77
WELL COMPLETION LITHOLOGY
SC REEN VISIBLE 45' TO 51'TOTAL DEPTH UNKNOWN, 51' OR MOREWELL PUMPS .N.0 WATERFILL TO 51'
(D0-J
0:z
23?
TDS S
i
4
II ___~2II I
45
51
7
77I
F
TD SHALE
51
LEGEI
IRBF
wim-
F/oo/
ND
BACKFILL
ALLUVIAL FILL
GROUT
BENTONITE
SCREENED INTERVAL
GRAVEL
SANDSTONE
SI LTS TONE
SH"iALE

FIGURE C-7
TDM WELL NUMBER ±V
9-3-77
WELL COMPLETION LITHOLOGY
SCREEN REPORTED TO BE 83' TO 88'TOTAL DEPTH UNKNOWN, 88' OR MORE
WELL PUMPS 12 GPMFILL TO 80'
(.0-J
0Z,
I -I--
65?
45 SHALE
83
4.0SS * I
LEGE
wN
ND
BACKFILL
ALLUVIAL FILL
GROUT
BENTONITE
SCREENED INTERVAL
GRAVEL
SANDSTONE
SI LTS TONE
80
83BF
F
SH ALE

FIGURE C-8
TDM WELL NUMBER V
9-3-77
WELL COMPLETION LITHOLOGY
40?
65
50 SS
79
(D0-J
0Z
SCREENED VISIBLE 76' TO 79'TOTAL DEPTH UNKNOWN, 79' OR MOREWELL PUMPS 12 GPMFILL TO 79'
LEGEND
SBF BACKFILL
F ALLUVIAL FILL
xGROUT
BENTONITE
SCREENED INTERVAL
0• ° GRAVEL
SANDSTONE
[ SI LTSTONE
SHALE
Ilo
I i
76
79
7 F
ft

FIGURE C-9
TDM WELL NUMBER VI
9-18-80
WELL COMPLETION
5.0
B&F
LITHOLOGY
0Z'
0 .
|, S
13.0
50.5
51.0
X
XX
x
x'A
.x
x
19.5
45.5
4,
4". 0.
0* *'
X 50x
x
xx
X
I
II ,6*
0-
,- -. *-
* - ~- -..-
- -~-
- - ~-I I
0 0
0
0
D
531.0
82.0
85.6
0 /
0/
// 9
0¢//
61.5
85.6
-~ -
-.- ,%- -'.-
- ,- -,--
V~~'
4
* .
44
D
45
404
LEGEI
0---o
ND
BACKFILL
ALLUVIAL FILL
GROUT
BENTONITE
SCREENED INTERVAL
GRAVEL
SANDSTONE
SI LTS TONE
4. P
-Eg=
SHSALE

FIGURE C-10
TDM WELL NUMBER VII
10-22-80
WELL COMPLETION
Xx
LITHOLOGY
*,
xx
x
17.0
41.0
&~
, ..
S.
S.
0-
S..
41.512. 0
X
0
000r
0 /I
0$.
50.0
S.
S
0
0
0
0
0
0
0
.. S.
S
0~ S
0
TDSS
0:
0
75.0
90.0
0
LEGE
l F 7
{.oo
ND
BACKFILL
ALLUVIAL FILL
GROUT
BENTONITE
SCREENED INTERVAL
GRAVEL
SANDSTONE
SI LTS TONE
BF* e
I I
90.0
SH ALE

FIGURE C-II
TDM WELL NUMBER
9-23-80
VIII
WELL COMPLETION
X5.0 • •
LITHOLOGY
BF
27.0
71 .5
72.0
78.0
Xx
CD0-J
0Z,
,~
0Q g,~0'4 77
8BF
10-~ -F I
0
0
0
0
82.0
98.0
122.0
130.0
- - -
- n
- -,- ,'-
9* .
* I
UU.
U.
U
0 TDSS
LEGE
mroom
LZI-
ND
BACKFILL
ALLUVIAL FILL
GROUT
BENTONITE
SCREENED INTERVAL
GRAVEL
SANDSTONE
SILTSTONE
0:120.0
130.0
SHSALE

FIGURE C-12
TDM WELL NUMBER IX
10-27-80
WELL COMPLETION
2.0 f
LITHOLOGY
BF
)( A
55.0
98.099.0
105.0
X
(D0J
0z
.:
oo o
0
0o
0•Oi
I
V
99.0
0
TDSS0.
S
0
144-.0145.0150.0
181.0
8 F
0
f I'* * ~
LEGEt
8 F
wrr-7
LJz1
ND
BACKFI LL.
ALLUVIAL FILL
GROUT
BENTONITE
SCREENED INTERVAL
GRAVEL
SANDSTONE
SI LTS TONE
SHALE
175.0
18 1.0
SH""IALE

FIGURE C-13
TDM WELL NUMBER X
10-3-80WELL COMPLETION
A A(
x)K )(~~.
X
x A 'A
29.00
0
35.0 0 o
0
,.0
0
0 0/,.
LITHOLOGY
00-J
0z
f--'a-4- aI
ID
0
0
0
o F
LEGEND
-13F BA
F AL
X~(X GR
8BE
-Sc
,", o° GR
.:-::7 SA
SIL[-...- sM
CKFI LL
LUVIAL FILL
OUT
NTONITE
REENED INTERVAL
AVEL
NDSTONE
LTSTONE
95.0
I 01.4*
99.0
101.4 TDSS
ALE

FIGURE C-14
TDM WELL. NUMBER XTI
10-29-80WELL COMPLETION
2.0 -
LITHOLOGY
0
Z,
99-0
TDS:S
x
x'
171 .5172.0r77.0
207.0
220.0
x
CD o
oo
BF
144.0
175.0
208.5
220.0
aa
S
Up.
ap.
* Va
ae
50
LEGE
Lx17 7lEA-li:
ND
BACKFILL
ALLUVIAL FILL
GROUT
BENTONITE
SCREENED INTERVAL
GRAVEL
SANDSTONE
SI LTSTONE
SH ALE

FIGURE C-15TDM WELL NUMBER Xii
9-29-80WELL COMPLETION
2.0 x •
LITHOLOGY
0-.
z.
B.F
x53.5
00 I•
x x
I'
i -- -i i
99.0
105.0
146.0
150.6
00
0
0
0"0 ,0
9.9.0
T DSS
I
LEGE
IBFI
X 'A
Io,,°o°
EZI " .-
NO
BACKFILL
ALLUVIAL FILL
GROUT
BENTONITE
SCREENED INTERVAL
GRAVEL
SANDSTONE
SILTSTONE
O: •
145.0
150.6
SH ALE

FIGURE C-16TDM WELL NUMBER XIX
10-,15- 80WELL COMPLETION
.05 . .. .
3.0 F
LITHOLOGY
22.0
50.0
gi-
64.4
LEGEND
84.4
xcx
BACKFILL
ALLUVIAL FILL
92.0GROUT
BENTONITE
TDSS SCREENED INTERVAL
GRAVEL
120.0 120.0 LIZ: SANDSTONE
SI LTS TONE
S . ;SHALE
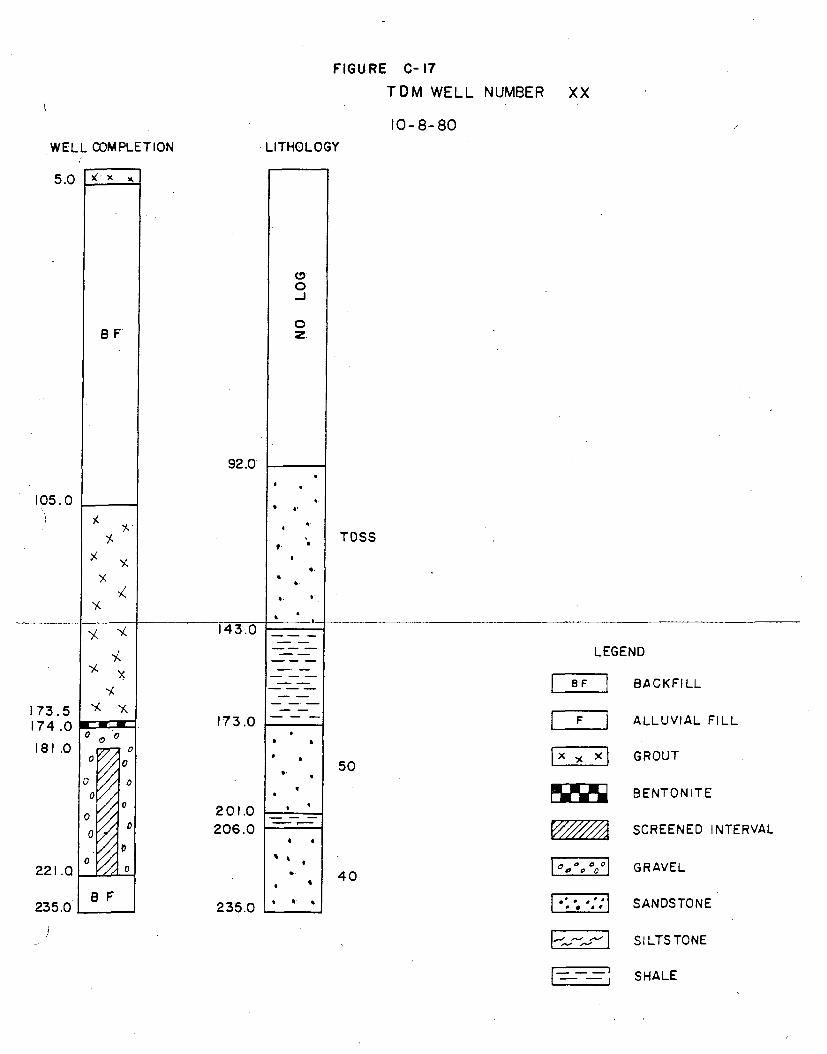
FIGURE C-17
TDM WELL NUMBER XX
10-8-80
WELL COMPLETION
5.0 x
LITHOLOGY
CD0-J
0Z,BF
92.0
105.0
9.
9.
TDSS
173.5174.0
181 .0
221.0
235.0
00,
0
0 0
0
14-3.0
173.0
201.0206.0
235.0
S
S.
S
eel
a
50
LEGEl
LF_
NID
BACKFILL
ALLUVIAL FILL
GROUT
BENTONITE
SCREENED INTERVAL
GRAVEL
SANDSTONE
S I LTS TONE
40
SHSALE

FIGURE C- 18TDM WELL NUMBER xxi
10-14-80WELL COMPLETION
8F
33.0
87-588.0
95.0
x
x
LITHOLOGY
0
0Z1
x
'A
xX
0o
00
0
H UI00
0
0/
0)0
/
/o/
92.0
I. I
* S
.- S.
0*
* S.
TOSS
LEGEI
w
F,---,
ND
BACKFILL
ALLUVIAL FILL
GROUT
BENTONITE
SCREENED INTERVAL
GRAVEL
SANDSTONE
SI LTS TONE
140.0
143.0
150.0
6
143.0
150.0
SH"IALE

FIGURE C-19
TDM WELL NUMBER
8-18-81LITHOLOGY
D REPLACEMENT
WELL COMPLETION
SCREEN INSTALLED AND GRAVEL PACKED 51'TO 56'TOTAL DEPTH IS 56'
WELL PUMPS 12 GPMNO FILL
30.0
TDSS
50.5
51.0
E.F
F17 -- --0
GROUT
BACKFI LL
BENTONITE
SCREENED INTERVAL
ALLUVIAL FILL
GRAVEL
SANDSTONE56.0
SI LTS TONE
SHALE

FIGURE 0-20TDM WELL NUMBER
8-10-81LITHOLOGY
VI REPLACEMENT
WELL COMPLETION
F
20*
33.033.5
35.0 50SS
LEGEND
~~BA
xGF
BBE
V/////Asc
~GF
SA
[---i
ROUT
,CKFI LL
'NTONITE
LUVIAL FILL
REENED INTERVAL
lAVEL
40.0 40.0 NNDSTONE
LTS TONE
IALE

FIGURE C- 2 1
TDM WELL NUMBER XXIII
8-6-81WELL COMPLETION LITHOLOGY
F
x
x
I0
0 ,
a z
x
a"
6 •
VI -'s- I *I- U-I.
28.028.5
30.0
35.0
X0x
00o0
S.
01
LEGE]
EIIZ:/
ND
BACKFILL
ALLUVIAL FILL
GROUT
BENTONITE
SCREENED INTERVAL
GRAVEL
SANDSTONE
SILTS TONE
TOSS
35.0
I
Sl.SALE
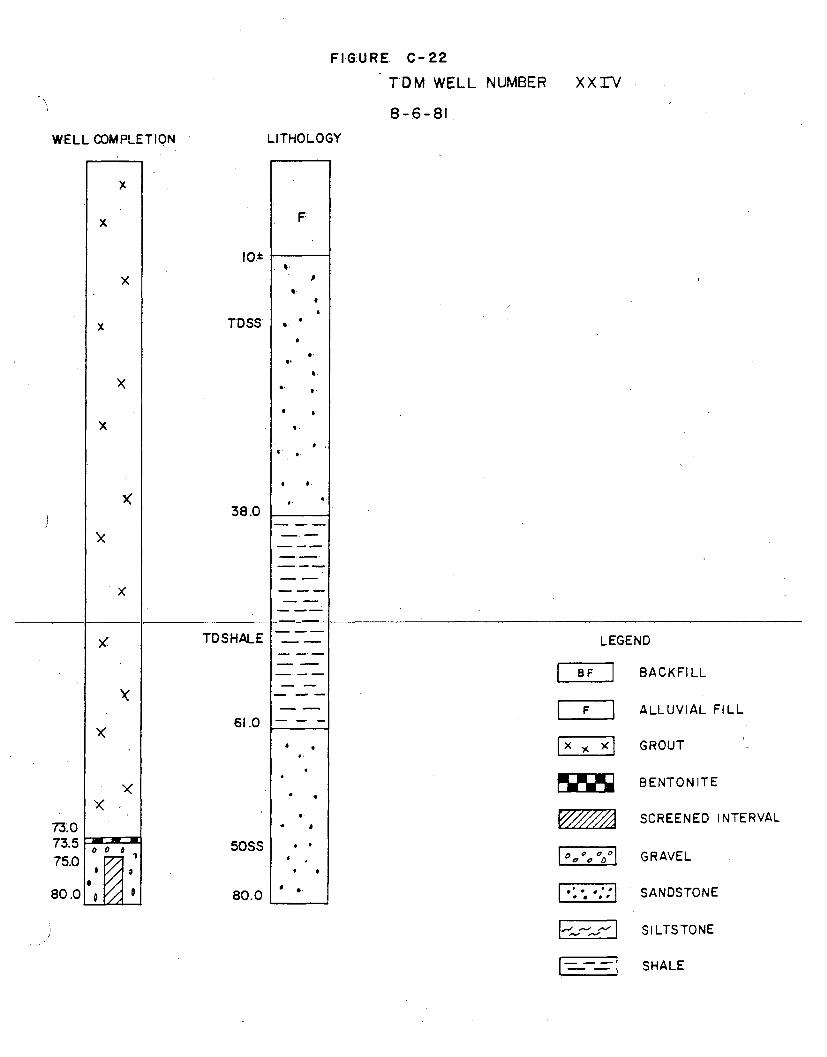
FIGURE C-22
TDM WELL NUMBER
8-6-81
XXrV
WELL COMPLETION
F--x
LITHOLOGY
F
X
x
x
10ot
TOSS
38.0
I,
S.
S.
73.073.575.0
80.0
X
x
TDSHALE
61.0
50SS
80.0
* a.
* S
* S
a
LEGE!
w ,iND
BACKFILL
ALLUVIAL FILL
GROUT
BENTONITE
SCREENED INTERVAL
GRAVEL
SANDSTONE
SI LTS TONE
SFHALE

FIGURE C-23
TDM WELL NUMBER
8-10-81
LITHOLOGY
xxv
WELL COMPLETION
F
18t
23.524.024.5
LEGEt
aFt
7ix, 7:0[o,,o 1o°
LLUVIAL FILL
GROUT
BENTONITE
BACKFI LL
SCREENED INTERVAL
TDSS GRAVEL
27.0 27"0 SANDSTONE
SI LTSTONE
SHALE

FIGURE C-24
TDM WELL NUMBER
8-11-81
XXVi
WELL COMPLETION LITHOLOGY
20*
45.045.547.0
LEGEI
x L,
F1,7,0"
r 7.,°°°_7
_LUVIAL FILL
GROUT
BENTONITE
BACKFILL
SCREENED INTERVAlTDSS
GRAVEL
52.0 52.0 SANDSTONE
S I LTS TONE
SHALE

FIGURE C-25TDM WELL NUMBER.
8-14-81
LITHOLOGY
.xxvii
WELL COMPLETION
F
30.0
FOWLER SS
39.540.0.
LEGEt
[1 117[ Z I
GROUT
BENTONITE
BACKFILL
LLUVIAL FILL
SCREENED INTERVAL
GRAVEL
SANDSTONE45.0 45.0
SI LTS TONE
SHALE

FIGURE C-26TDM WELL NUMBER XXVIII
8- 13-81WELL COMPLETION LITHOLOGY
30.0
FOWLER SS
55.0
LEGEND
F i BA
~jAL
~GR
7 BE
-sc
ae~o~o0C GR
• S "I SA
SH
hCKFILL
LUVIAL FILL
OUT
NTONITE
71.071.5710
REENED INTERVAL
TDSS AVEL
78O 78.0 NDSTONE
LTSTONE
ALE

FIGURE C-27
TDM WELL NUMBER
8-12-81
XXiX
WELL COMPLETION
x
LITHOLOGY
Fx
'A
x
X,
ALLUVIUM;
30.0
FOWLER SS
55.0
TDSS
x
i 4
I.
a'
4.
7x
×x
I,
x*I- I I
x
x
x
99.0
TD SHALE
131.0
50SS
145.0
* I
* I
* a- g
* I. *
I * *
x
LEGE]
MEEwL.
IZ--"
ND
BACKFILL
ALLUVIAL FILL
GROUT
BENTONITE
SCREENED INTERVAl
GRAVEL
SANDSTONE
SILTSTONE
139.5140.0
145.0
S• iALE

FIGURE C-28
TDM WELL NUMBER
8-20-81
LITHOLOGY
xxx
WELL COMPLETION
F
92.0
TDSS
143.0
Tf SHALE
LEGEND
W AL
~ GF
8BE
-sc
[ 00°°%° GF
SAt"'.'::] sl
[ -- - ] sH
_LUVIAL FILL
ROUT
,CKFI LL
"NTONITE
173.0 REENED INTERVAL
186.0186.5188.0193.0
50SS RAVEL
193.0 ,NDSTONE
LTSTONE
IALE

FIGURE C-29
TDM WELL NUMBER RM-I
8-3-81
WELL COMPLETION
x
x
LITHOLOGY
0D0--
0Z
)c
x
- + -*--*--~,-- I- - - f
xx
LEGE
w , l
Ix •, ,,A
ND
BACKFILL
ALLUVIAL FILL
GROUT
BENTONITE
SCREENED INTERVAL
GRAVEL
SANDSTONE
SI LTS TONE
338.0338.5340.0345.0
334.0TOSS345.0
* V* . S S
SHIALE
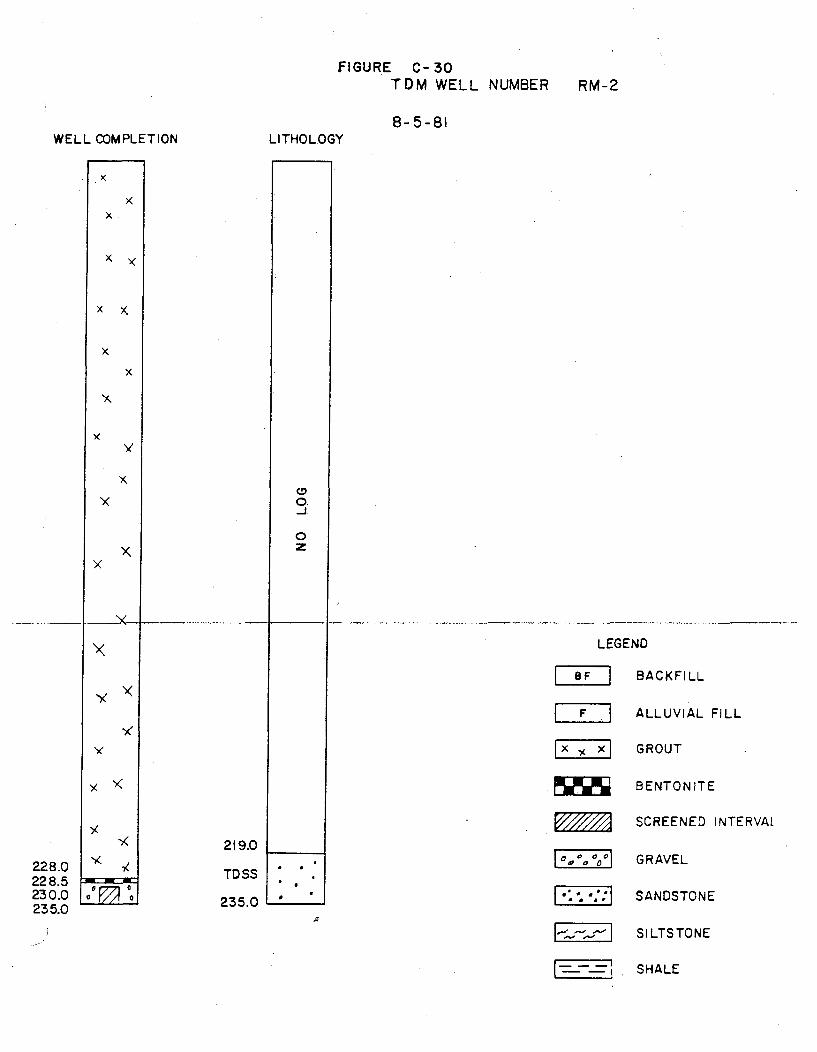
FIGURE C- 30TDM WELL NUMBER RM-2
8-5-81WELL COMPLETION
[x7
LITHOLOGY
X
x
x
Y00-i
0zx
-,\ - -
'K LEGEND
WAL
IX%) , GF
BBE
- S sc
•sS
,CKFILL
_LUVIAL FILL
:OUT
"NTONITE
REENED INTERVAL
rAVEL
,NDSTONE
LTS TONE
228.0228.5230.0235.0
219.0
TDSS
235.04
IALE

FIGURE C- 31TDM WELL NUMBER RM-3
7-23-81WELL COMPLETION LITHOLOGY
x
X
X
x
XC
x0-J
0z
x
4- 4- I I-
x
I
00,
LEGE
LF
w--
ND
BACKFILL
ALLUVIAL FILL
GROUT
BENTONITE
SCREENED INTERVAL
GRAVEL
SANDSTONE
SI LTS TONE
184.5185.0188.0
193.0
182.0TDSS193.0
* 0
0
/
SH"IALE

FIGURE C-32
TDM WELL NUMBER
7-22-81
LITHOLOGY
RM-4
WELL COMPLETION
(D0-J
0Zý.
35±
50.0
LEGEND
Z Z AL
{x•( I GE
8BE
-sc
o•,°o %° GF
SI
LUVIAL FILL
ROUT
-NTONITE
•CKFILL
REENED INTERVAL
TOSS RAVEL
55.0 55.0 ,NDSTONE
LTSTONE
IALE
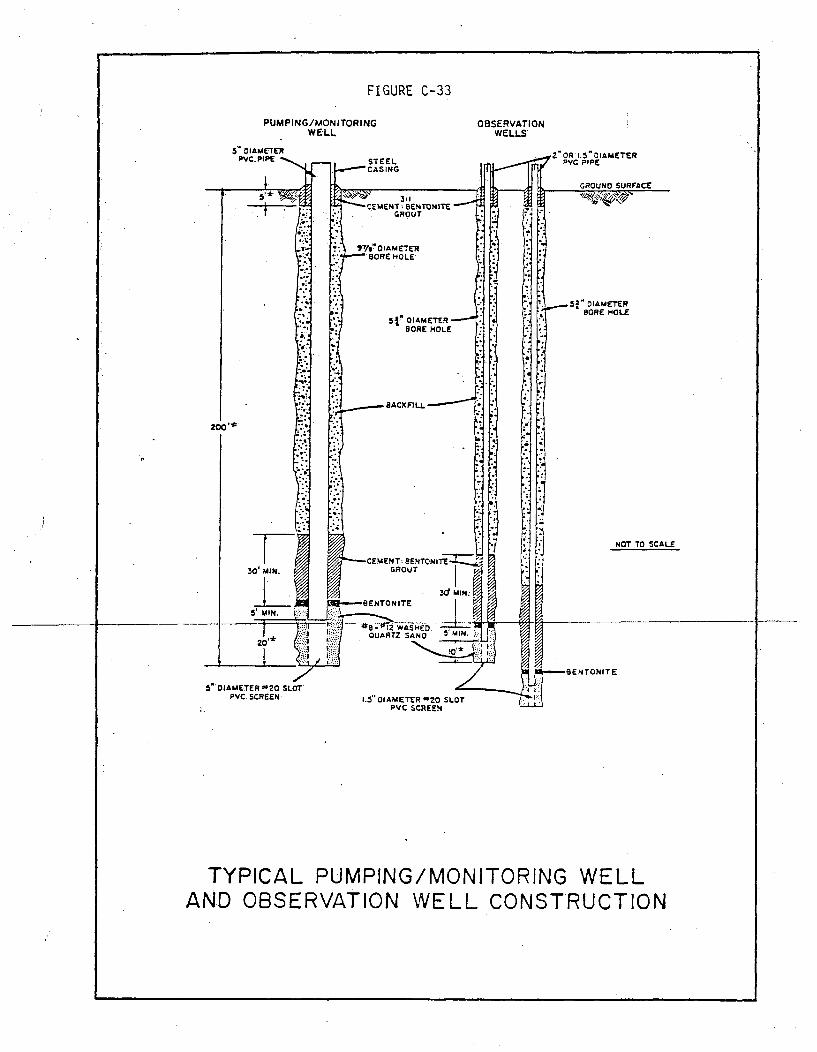
FIGURE C-33
PUMPING/MONITORINGWELL
OBSERVATIONWELLS
OR 1.5" OIAMETERPVC PIPESTEEL
CASING
NOT TO SCALE
20
5" DIAMETER -20 SLOTPVC SCREEN
IENTONITE
1.5" DIAMETER ft2O SLOTPVC SCREEN
TYPICAL PUMPING/MONITORING WELLAND OBSERVATION WELL CONSTRUCTION

FIGURE C-34
PUMPINB /MONTOR/NSWVELL
OBSERVATIONWE4.4S
OR 1.5' DIAMETERPVC PIPE
718 DIAMETERORE HOLE
5"-5/e /AMErERBORE HOLE - HOL E
NOT 7o SCALE3:1
5'DIAM6TER NO. 20 SLOT*1C SCREEN ,5"DIAMETER NO. .0 SLO"
PVC SCREEN
TYPICAL PUMPING/MONITORING WELLAND OBSERVATION WELL CONSTRUCTION

TABLE C-i
OF TAILINGS DAM MONITOR WELLSSUMMARY
WELLNAME
DATEDRILLED
TDM ATDM B
LTDM ETDM DTDM C
I TDM ITDM IITDM IIITDM IVTDM VTDM VITDM VIITDM VIIITDM IXTDM XTDM XITDM XIITDM XIXTDM XXTDM XXITDM D Repl.TDM VI ReplTDM XXIIITDM XXIVTDM XXVTDM XXVITDM XXVIITDM XXVIIITDM XXIXTDM XXXRM 1RM•-2
RM 3RMf4
1972197219721972197419771977197719771977198019801980198019801980198019801980198019811981198119811981198119811981198119811981198119811981
TOTALDEPTH
3102901058080806040908085.690
130181101.4220150.61202351505640358027524578
14519334523519355
COLLAREVEVATION
5285519651705177517651935173514851505144511551845261523052305230526352385236523751775113518051795161516852005200520152375341528952565154
NORTHING
877971878026874421876008873488876775875370874700874090875406874195876520873777875580875630875600874254876929876955876950876008874176873271873262875165876129877255877262877279876922878459877037875999871161
EASTING
4119774121964138384141784-1.4174.414310414530414620414170415003414445414181412814410121410100410102411750412049412086412068414183414440414264414365415138414594414254414255414251412068400395401325402001406802
FORMATIONCOMPLETED IN
*TDSSTDSS50 SSTDSSTDSSTDSSTDSH/TDSSTDSH, 50 SS?40 SS50 SS40 SSTDSSTDSSTDSS, TDSHAbove TDSS50 SSTDSSAbove TDSS50 and 40 SSTDSSTDSS50 SSTDSS50 SSTDSSTDSSFowl erTDSS50 SS50 SSTDSSTDSSTDSSTDSS
OBSERV.WELLS
VI-1,2,3VI i-1,2,3,4VIII-1
OLDNAME
9101115161718192021
XXIII-1XXIV-1
XXVII-iXXVIII-1XXIX-1
FowlerTDSSTDSH50 SS40 SS
Fowler Sandstones and ShaleTailings Dam SandstoneTailings Dam Shale50 Sandstone, Upper Ore Sand40 Sandstone, Middle Ore Sand
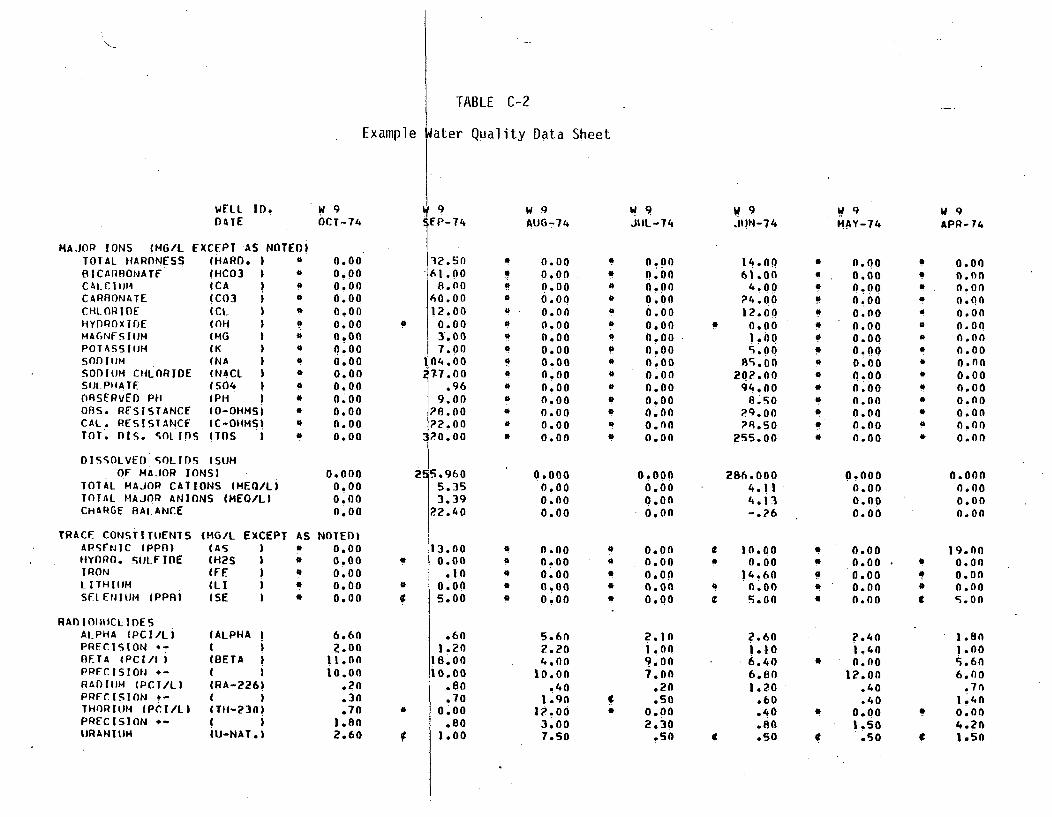
TABLE C-2
Example Water Quality Data Sheet
WELL ID.DATE
MAJOR IONS (MG/ITOTAL HARDNESSB ICARRONATFC AL C 1104CARONATECHLORIDEHY•ROXIDEMAGNFSIIJMPOTASSIUMSODIUMSODIUM CHLORIDESIJU.PHATEORSERVED P11OHS. RESISTANCECAL. RESISTANCETOT. DIS. SOL ID
EXCEPT AS NOTED)(HARD. )(HCO3 )ICA(C03(CL I(OH I
(MG i(K(NA(NACL I
(PH(O-OHMS}IC-OHMS)(TOS )
aaaaaa*
aa*
a*
a*
a
W 9OCT-74
0.000.000.000.000.000.000.00(V.00
0.000.000.000.000.*000.*00
0.0000.*000.000.00
NOTED)0.000.000.000.000.00
a
94P-74
32.5061.008.00
60.0012.000.003.007.00
04.0077.00
.969.00
?8.00?2.00?0.00
alat
a}
a
*1
a*i
aaa
DISSOLVED SOLIDS (SUMOF MAJOR IONS)
TOTAL MAJOR CATIONS IMEQ/L)TOTAL MAJOR ANIONS (MEW/L)CHARGE BAIANCE
5.9605.353.39
22.40
w .AUG-74
0.000.000.000.000.000.00
0.00
0.000.000.00
0.000.000.000.00
0.000
0.00
0.000.00
0.0000.00
0.00
5.602.204.0010.00
.401.90
I?.003.007OO0
aa,a.aI
aIaa
0.00
0.000.000.00
0.000.00.000.000.000.000.000.00
0.00
w 9JIlL-7i4
W 9JUN-74
14.*006i .004.00P4.00612.00
p 0.001.00
scoo8S?.00904.00
8.5029.0079.50
255.00
W8. 0004.114.13
-•.26
aaaa*aaaaaaaaaa
MAY-74
0.000.000.00q.O00.00
0.*000.000.000.000.000.00
0.000.*000.00
0.0000.*00
(Y.0000.00
0.000.00
0.000.0001.00
0.000.00
a
aaaaB
aaaaaaaa
W 9APR- 74
0.00
0.0001.0001.00O.On
0. 000.000.000.000.000.00
0.00
0.00
0.00
0.0000.000.*00
19.00o0.000.000.009.O0
0.0000.000.00
* 0.00
TRACE CONSTITUENTSAPSFNIC (PPA)HYDRO. SULFIDEIRONLITHIIUMSEtLNIU1M (PPAI
RAD lOUUtCLIDESALPHA (PCI/LiPRECISION .-
BETA (PCI/I iPRFCISION *-
RADIUM (PCT/LIPRECISION *-
THORIUM (PkI/L)PRECISION *-URANIUM
(MG/L(AS(H2S(FEILI(SE
EXCEPT ASa.ataaa
a
(ALPHA II I(BETA( I
(RA-226)( )
(TH-230}I iiU-NAT.)
6.602.00
11.0010.00
.2n
.30
.7o1.802.60
13.000.00
.100.005.00
.601.20
18.0010.00
.80
.700.00
.801.00
aa4aa
aal
0!
0.00
o.000.000.00
ia
10.000.00
14.60on. 0
5.00
a
* aaC
2.101.009.007.00
.20
.500.00
2.30.50
2.601.106.406.801.20
.60.40.80
9 *50
P.401.40
a 0.00
12.00.40.40
e 0.00
1 .50SO.5
1.8n1.00
s.606.00
.7n
* 0.004.20
* 1.50

TABLE C3
SUiMARY OF PACKER TEST RESULTS
Well No. Interval (ft)
VI- i
VII
VIII-].
45556575
354555.6574
355060
100110
4093
105
556575
-85-
55657585
4555657584
456070
110120
50120120
Permeability (ft/yr)
0.0.*
<2.6<2.4
0.*
.870.*
.150. *
0.*
.93
.52
0.7.9
14.12.
3.9
XIX
IX 657585-95-
18.2.60.*
* No measurable inflow during test

TABLE C4
UNDISTURBED TAILINGS SAMPLES
Boring
Q-1
Sample No.
1
2.34567891011121.3141516171.819
Depth (ft)
25
7.51012.517.52022.525.027.530.032.535.037.543.045.049.051.555.0
R- 1 1234
-5-
6789101112131415161718
81015202.530354045505560657075808586.5

TABLE C 5
UNDISTURBED CORE SAMPLES IN PLASTIC CONTAINERS
Well No.
VI
Sample No.
1234567'8
Interval
VII-2 12345
45.246.847.850..O49.871.772.372.9
44.653.456.261.265.3
34.134.638.843.9.50.769.776.0
107.2-LL4-2-122.3
61.062.269.1
VIII 123456789
10
- 45.7- 47.2- 48.3- 50.4- 50.2- 72.1- 72.7- 73.2
- 45..0- 53.9- 56..7- 61.7- 65.8
- 34.6- 35.0- 39.1- 44.4- 51.2.- 70.2- 76.5- 107.7-Lb14-r6- 122.7
- 61.5- 62.7- 69.6
- 56.8- 62.4- 80.0- 121.2- 131.8- 150.2- 67.2- 140.7
X
XII
12
3
12345678
56.361.979.5
120.8131.3149.7
66.7140.2
Continued
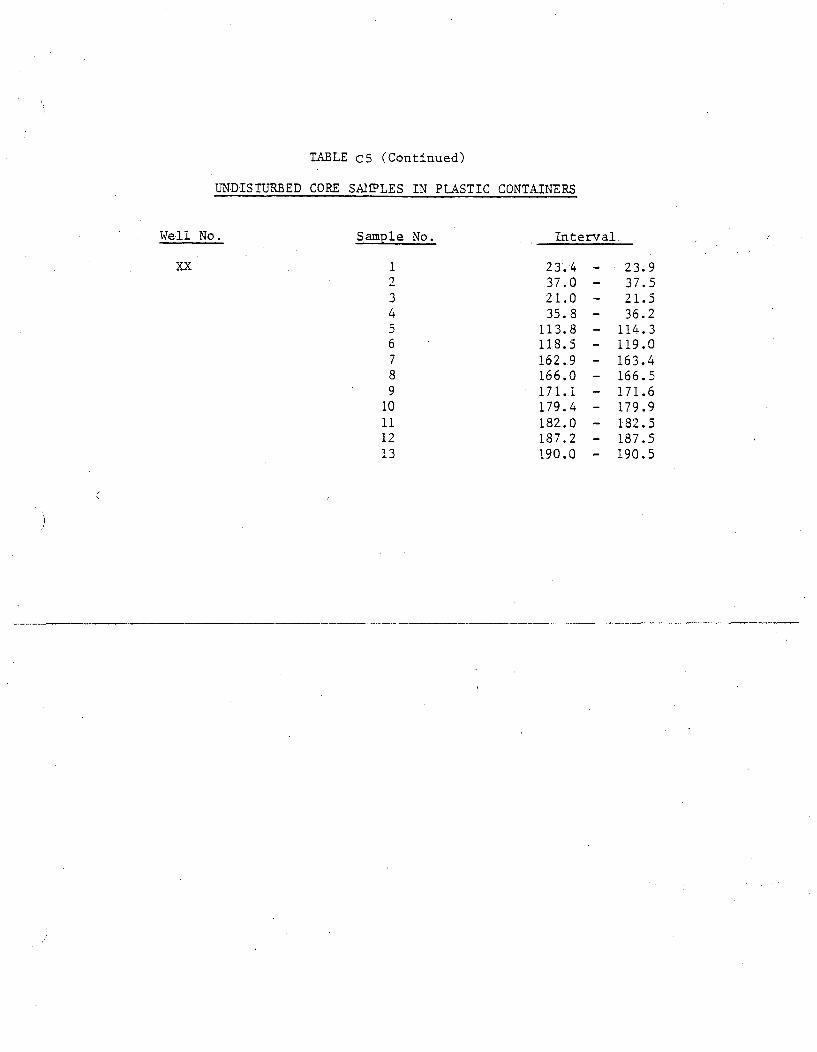
TABLE C5 (Continued)
UNDISTURBED CORE SAI•LES IN PLASTIC CONTAINERS
Well No. Sample No. Interval
XX 1 23.4 - 23.92 37.0 - 37.53 21.0 - 21.54 35.8 - 36.25 113.8 - 114.36 118.5 - 119.07 162.9 - 163.48 166.0 - 166.59 171..l - 171.6
10 179.4 - 179.911 182.0 - 182.512 187.2 - 187.513 190.0 - 190.5

TABLE C5 (Continued)
CORE SAŽWLES IN CORE BOXES
Well No.
VI
Interval (ft)
20.0 - 46.746.7 - 70.670.6 - 85.6
VII
VIII
20.028.044.056.770.081.1
0.038.748.258.268.280.0
114.0
0.072.082.092.3
28.044.056.770.078.0
125.0
38.748.258.268.278.0
114.0130.0
72.082.092.0
101.4
x
92.3 101.4
XII
XX
0.057.970.8
125.0
0.030.540.3
116.3169.5182.5194.8
57.970.881.1
138.7
30.540.3
116.3126.3182.5194.8235.0

TABLE C5 (Continued)
DISTURBED CORE SAMPLES IN SEALED STEEL C ONTAINE P•qCONTAINERS
Well No. Sample No. Interval
VI
VII
123456
123456
123456
123
41.246.252. 6'65.070.684.9
30.142.052.562.365.072.7
33.838.762.265.8
101.3118.0
60.061.566.0
41.546.653.065.371.185.3
30.442.452.762.565.573.0
34.238.862.666.2
102.6118.7
61.062.266.9
VIII
x
XII 123
12345678910
55.066.0
120.0
25.228.143.7111.0160.0171.6178.4181.0187.5189.6190.5
55.466.7
120.8
26.128.844.5
112.0161.0172.4179.4182.0188.5190191.2

TABLE C6
CUTTING SA2MLES IN PLASTIC BAGS
Well No. Depth (ft)
Vi-1 05
10152025303540455055606570758O85
051015-20-
2530354045505560657075808590
VII
/ Continued

TABLE C6 (Continued)
CUTTING SAMPLES IN PLASTIC BAGS
Well No. Depth (ft)
VII-I 05101520253035404550556065707580
05101520
30354045505560657075
VII-3
Continued

TABLE C6 (Continued)
CUTTING SAMPLES IN PLASTIC BAGS
Well No. Depth (ft)
VII-4 51015202530354045505560657075
:80859095
100105110115
125130135140145150155160165170
Continued

TABLE Cb (Continued)
CUTTING SAkPLES IN PLASTIC BAGS
Well No. Depth (ft)
IX 05
10152.0253035404550556065707580
.859095
100105110115
2107125130135140145150155160
XI 05
1015202530
Continued

TABLE C6 (Continued)
CUTTING SAMPLES IN PLASTIC BAGS
Well No. Depth (ft)
XI 35404550556065707580859095
100105110115120125130135140145
155160165170175180185190195200205210215220
Continued

TABLE C6 (Continued)
CUTTING SA!APLES IN PLASTIC BAGS
Well No. Depth (ft)
XIX .510152025303540455055606570
xxi 5.101520253035404550556065707580859095100105110115120125
Continued

TABLE C6 (Continued)
CUTTING SAMPLES IN PLASTIC BAGS
Well No.
XXI
Depth (ft)
130135140145150
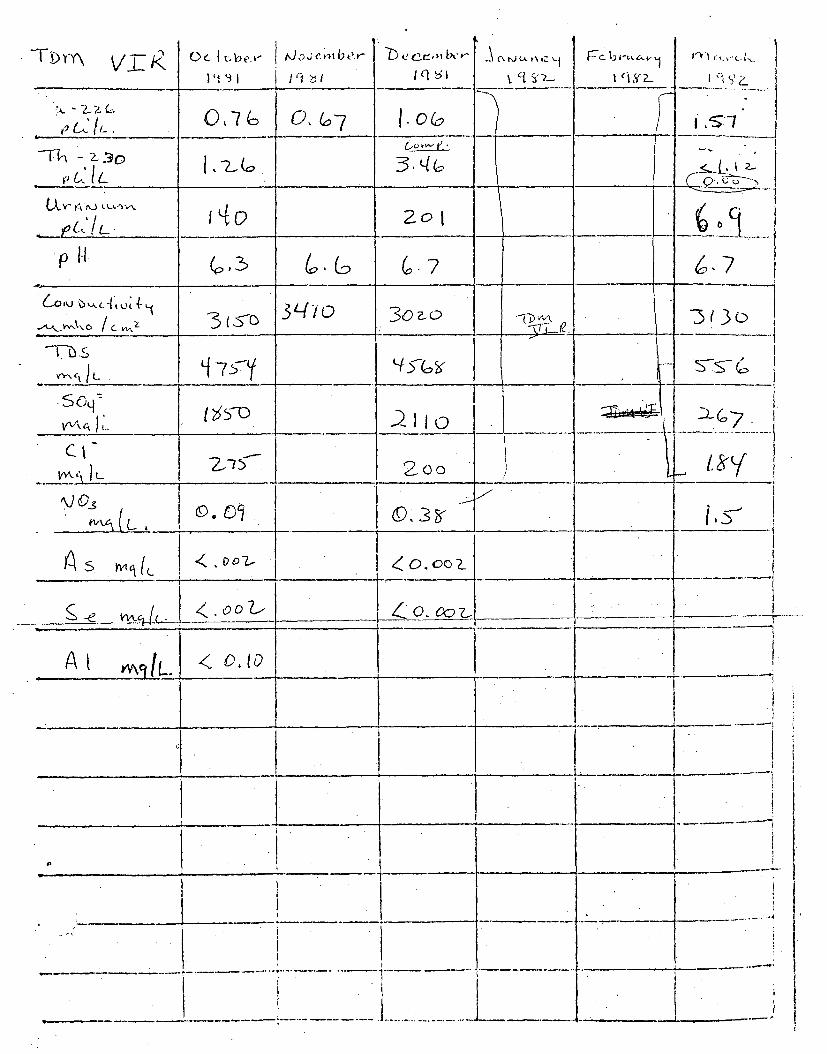
-T!)AY VTUQý I b~t'~
1'1 4~3
C,, I . ) e._.Y- ,ctf"s bcrk-I. Ct S, -z_
'1~'i' L
(I
i
A.
~9 L,.. IL.0 0, t7 I.0(0
I ~
L, I L
n-% r I, -7_ _ - _
_________,' t.-.- 2109 .Z_
C" I-. L27-5 j 2..oc~ __ _oo_
Aj ___ __ __
i
.I
t
SLo_ II f. AD?.- / 0.. &~)7
- .• - , , rv _ ~ I4--. -- -z
A wV4L. 0,10
J ~.- a
______________ _____ 4 r
p .,....
*1~
- 4 ----..-.-- ~~~~~1~ 1~ ---- 1
K

. - 0-/V7- Qc I oc. "I 193
.~ C r~1 b e/9 ~sI / q s
A ýi 4-rI C1g ff -
- L I o_02 (I fLn © .-- r
2- 3oL
U~l .
0() lI= 0. z.~')
p7. 7.0o 7,0 _-,._
5O3-- .
IaIL1 _____>- • C.
-,7 (, !2 11 - ) 5 -C
Y-Y\ C,[< L <0 ! Z o o
I; 50v4I ____ ___ _____________________________*
.0 , od- / r0j On -________ ____ __ -V_____ ___~1~~
Au i výli e0 0(o
I___ ____ ____ ____ I
4
S /
4--- __________

-T-D M Ccl O~~!I~
'~~3 I
b: e$t b cqCtd,-C, - A j L
rc Lt Z)
I- S,4VLA -. A I -I (Vyt
.-
~ (<Ii-.. tiH
IA. ____ __,,. . .(z
SOq--yv41 I,_____o , __•
CI
. fC I .
S e _ _ _ _ _ _,0_ _ __ _ _ _
'I

7*~ 0 I- |ve,-
CI 31I
Jc~e~i terId ~
Ib ell~
I q ý51C, .j .A" I
IJ~ ~ £~..4---- .4 I - I I-
.~
~4a.jL. 1.2_L7 •~.C
IL 33c 7-
P t .• 2ý (D Y-7.
p--/__ L, !________ o- --
(O 0a - c"I$O .. 5
v•,, L ______o __ ___ '
d --I -L
C Q.'. . !~~
/ / C) x-,-7LI :• p e 44, /k--. . ... 4 1 I
I
6040 1 1 ______ ___
_____ ___ 9. ___ *1~ __ ___ ___ __
4- __ ____ ____ __
__________________________________ _____________________ I _______________________ ______________________
_ __ _ _ __ __.11111.

Tjyy\ 'XL OC, I 'o ýq C.
191 ý3 I
t vco 4 c ?i
/ rl Ic Ik! weM L A ~ ~
~L ¶~' z. I C-IL
K.- Cý - '1
4 1 I -I.-I ~ ~, ,'
b'( 'L3.tf I --:Tý)-
I Li .1 __________ p~'-ts2
tA V- A ,j LLIV'.
_ -tyAI.- /c5Ž _ __ _ __ ,__ __ _
T~hs
- - . ....
Y-r , C,• ) L VV' c.... _ _ _ _ _ _ _ _ _ _
/1. ;mi' --- _Oo_
<.Se)ývILJ -<ODo -z-
+ + _____________I
fIt Yt4~j/L~ -4 O~(QI -- _______ _______ _____
_____ I ___ ____ ___ ___ ___ ___ I
_________ I _____ _____ ______ ______ ______ ___
I _________ _________________ ---.--
___________________________________ ________________________ I _____________ ___________________ ____________________
-4 ___________--

CcH 3
ct l e -1
19 16 .I cl ý51A (. t I
T~. 17-4-
11c5<
.. . I,.L .__ _ . . ... _ _ _ _ 0
L q. c, -7 ,s(< .pH (p.7
3(,-70 3770 372 0"
_____
M4L •, ,. 0~.0 o?.-o _ _ _
Se_-__ &-, 4ý Q.(o4I I
~~~~~~~1A4l "f I4-LS0,. 1 0
1 .1______________________ I--________ _________ ________
A I.. __ ~. ___ .4. __
II, - ' .4 F----
__________ 4 i-. 4.-.-
1.

I tý
Il : 11Q 0 c rk) b e
ICl ý51
b ec e- 1,L
Iq :: ýCA r -
t Z
R~. ~ VL~4~ (~*4~~(.
I CIj ~
4- -.J- 4 -. 4--. -. 4.-
'~.
cC ('-. !.7?-5-
., p6 L O,_ _ :2 .7?S
•,,•,-,.:• 5•0 •Y-7 $1,6sY• .'4._A ,.kV o /c(:: 3
VA'ju V o So____ _-__-__
_ A -j," •L "'kill"
1%s ThL• ______ < o.oo7-_ _ __ _ _
. .-. . .. ..'. .... - __ __• =_, =_ _
§ K 4- n an Z-
___.-.--'-~-.=.-------... 2.~~ j -____ ___ ____ ___
____ __ I ___ __ __
P
+ -4---- + -- j-. 4. ________________
4*~L -

T D r ,y.IW..,I0'~. Lo~e.~
Ici ~
tJ 0.,, d mx b cv/qcrl
jq s;i• .,J LA. I , L
£ l, <dZ_.&~~IA 4~
I '~Z~
(L~-~
I I -I-A.
C~ IL. 1.0 '
"--1--• - - d0
12-1
Je•,3 I.IL_ _ _ _ _ __"_ __ _ _ -_ _ -_ _
Ii
_ _ _ _ _ _ _ _ _ _ _
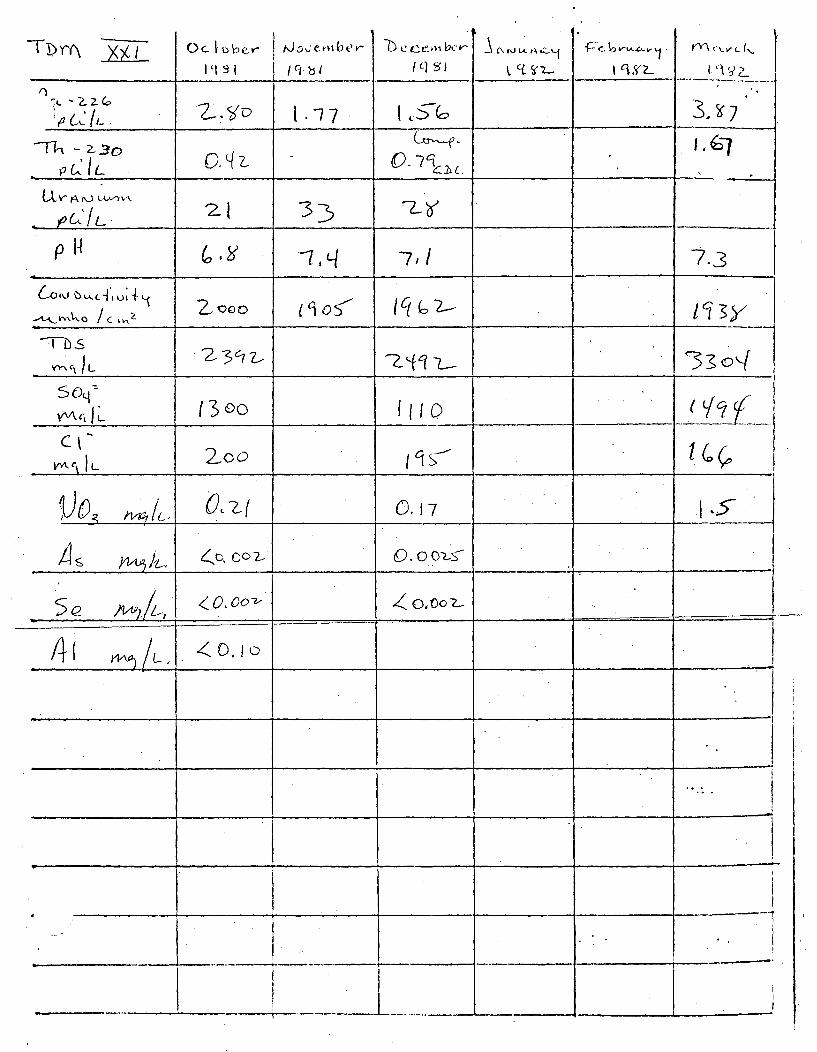
O e- IILev
1'119Ij .c 'Ibvl
m51- 6
cx'~1' kr-
I'] ~; IA C A~ j'ZI --
v-wc.~.-
I C~<~ c~ ~ ~
- - ____-___....____ __-
Th-1c. O. f -7cj .
IX v" l vl.,,.
,Aý VN'ý a J
pH I-(,. q7, i 7.3]
..,.,,.,.o /.,• __________s"I• • .. ______ ___._
,,, L . . . ._ _ I . .-
•0• I, :Zoo0.ool •IL co2-
O, ~(D 17o.. I ,.S
j ...... ,, . .. . .7,
r14~/U, <O. Io
L . .. . ...... •.,..,,
__ _ 11
tI1

T-rcD y\y Oit I bev- t Cý c, I b9(e r-
/"I ý:5
C(ro'l bc V
(I q sA Cý hj " VN Zý
Ct
F c ..'. r-~\ ~v~Li\
c~ ~,
4. -4. 4
.- .-Z -I
O)'2_ , 3 __to .... _.-
.... ~J L It 3
pU
.--¶A.rv,.o / c •,~
T-s.s .
... x ,IL 1_____,
m0A IL ?____ __ _ _ _ _ _ _
IIN /6- 4 o.o07.Ii
A-t .~tj L,
_____________________ 1 ______________ _____________ ______________ ______________ T ____________
.7_____ _____ I _____ .

() e V ,.V-19q31 / I
11 19L Ij ' rz"-'- '1
I qs'?
~(A:11~. 1.17
OY . C- I
nI
.4- -4 *1 t
-Tk- zILý 2_ .qe
(U... f,-
mk•, ,ý ý
13 • j'0 0 0Y. ,
, ,
• .- 9.', X,..o /C v ___,__
S ..
el_
~'6~ -----O-Soaý-________________________________ A
Al #1A~/L, _________ _________
____ ___ ___ I _____________ ______ -- I
-- -- t - I

-T D r\X -i C1 tIfe.,-11191
&k"; c ri: b e
11)161
Ce $•it- "i y%'7--
4-a A~-
I 'iS'Z.
(Y\ ~ 4 j~
I I y
i 0 -- -3 3
Oat(-L. 0 332 _ _ _ '- l zL.
-Tk ,- 20- 4 l.S3
< i:v~
p 14tIg .,3/-L J
(U , Ll , - " 7oo 57 -11_ "•'s1•, II ([7• _____--____ _-
-- I,-b --
.1 .C , .. L . q o
II
I L 00
Met IL

Y)^\l -v04 L~5c~
I '~I :~c VI e I- C - if,,*IhI
I1(5A Cý Pi UL A tz
t "i Yý- I C'1sz
.- -ZZL. ~iX8t I .q -
I •a._
" "-4-.---- 4 + 9-
-Th -~.mpUlL 4 I.83
• _._ • -
LA. L
PU I- JO. IIL ___ _ Io.5-
S~q--
,(o73,lil-1 T, .. .. ..
1'
/h ~~'6t 4 4 .9.
-51--"4'-
n .ooz
-, _____ _____ ______
____________________________________________ ____________________________ ______________________________ ___________________________ _____________________________ _____________________________ _____________________________I
-- I
__-~_ __- -j

Tt) YY\ -7Tý -JxVCl b1
(') ~. C .11 eIC, ?il q ]
Al tJL O zL liýrZ I al•.
I'Y~ C~~(
%A L 71w L,03o-Th., - 35 <I,
vv(, ; 357
V V\cjL _ _ ____ . _....
4. 0 . O~s -
________________________ I _______________ ________________ ________________ ________________ -~
__ __ I _____ _____ _____
~LLL _____ ____

T-Dyyý -- 04,i 1o be. k
19 31I It 1 a
I
Iq ý;IAC\ tI " N ?-.-
t Ci YZ q~Q.ryc' t ý ~L. (
cx7L/
A c, ' . . .I I
AIo I-LCtw< I, ___--_____.__.____ ___
Y0,(7
4$ <- o.oo2. ___ _ 4.o o ___)_ __ 0....1'
1W~~. GKF~•I ____ ____ ____ ___
____ __ I __ __ __ I
__________ ______ _______ I _______ ___
________I _______ ___ 7
-__________________ - 1-.------.-.----..--..-.--------. -.- - .-.-.----.----

EXXON MINERALS COMPANYHIGHLAND URANIUA OPERATIONS
STANDARD STRATIGRAPHIC SECTION
*1
*1
• " VollIman •L-1 Marker InterbeddedL• -krSandstone
andShale
Fowler Sandstone(FS)
Fowler Shale (FSH)
Tailings Dam Sandstone(TDS)
20-50'
Tailings Dam Shale(TDSH)20-60'
50 Sandstone
20-50'
45 Shale;, 5-15'
40 Sandstone(Middle)
_________________20 -0'
35 Shale'" .... "10-20'... . .. .... 30 Sandstone
'-' '"-(Lower).~*** 20-5O'
.•.? -. 325 Shale
_______0-20,
.- -20 Sandstone
J - .(A Sand) 0-20'
15 Shale_ _ -. __ I 10-30 '
1. . 10 Sandstone
'7 (B Sand)
..--- _ _ _ _ _ _ _
U-4F--CE
La(-3
LUor:
Ai.~
-1K
•L¢:÷- •1•. i & i:;• -¢ • I •,,: L .i._i ... ... .". '....
71
50
------- .i... i
• ;;i'~~ ~ ~~~~ .. ...x•-':;• , P', ....... .. . . ......'.:---.•-<
V.-IT T[ • :!'•I'!::7.-T ': I :-. ":" " TT !r:': •
W:- .-- ..1..-.-
.N .......
d
360