Embed Size (px)
Citation preview
2008 ANNUAL FINANCIAL REPORT
07–08
150 YEARSOF PERFORMANCE
fy(i) INFO
RM
ATIO
N
National Australia Bank LimitedABN 12 004 044 937
This 2008 annual fi nancial report is lodged with the Australian Securities and Investments Commission and ASX Limited.
National Australia Bank Limited (NAB) is publicly listed in Australia and overseas. This report contains information prepared on the basis of the Banking Act 1959 (Cth), Corporations Act 2001 (Cth) and Australian equivalents to International Financial Reporting Standards. The Group de-registered from the United States Securities Exchange Commission (SEC) effective 20 September 2007. Accordingly, the NAB is not required to include SEC related disclosures in this fi nancial report for either the current or comparative fi nancial years.
NAB no longer produces a concise report under s314(2) of the Corporations Act 2001 (Cth), and instead compiles a non-statutory shareholder review.
To view the annual fi nancial report online, visit www.nabgroup.com. Alternatively, to arrange for a copy to be sent to you free of charge, call Shareholder Services on 1300 367 647 from within Australia, or +61 3 9415 4299 from outside Australia.
Nothing in this report is, or should be taken as, an offer of securities in NAB for issue or sale, or an invitation to apply for the purchase of such securities.
All fi gures in this document are in Australian dollars unless otherwise stated.
Table of contents
2008 Annual Financial Report 1
Report of the directors 2 27 Life policy liabilities 79
Remuneration report 13 28 Current and deferred tax liabilities 80
Corporate governance 32 29 Provisions 81
Financial report 39 30 Bonds, notes and subordinated debt 82
Income statement 40 31 Other debt issues 84
Balance sheet 41 32 Defined benefit pension scheme assets and liabilities 84
Recognised income and expense statement 42 33 Other liabilities 86
Cash flow statement 43 34 Contributed equity 87
Notes to the financial statements 44 35 Reserves 89
1 Principal accounting policies 44 36 Retained profits 90
2 Segment information 56 37 Shares, performance options and performance rights 91
3 Net interest income 59 38 Average balance sheets and related interest 95
4 Other income 60 39 Interest rate risk 97
5 Operating expenses 61 40 Notes to the cash flow statement 100
6 Income tax expense 62 41 Particulars in relation to controlled entities 102
7 Dividends and distributions 62 42 Contingent liabilities and credit commitments 103
8 Earnings per share 63 43 Financial risk management 109
9 Cash and liquid assets 64 44 Fair value of financial instruments 122
10 Due from other banks 64 45 Operating leases 124
11 Trading and hedging derivative assets and liabilities 65 46 Capital expenditure commitments 125
12 Trading securities 68 47 Related party disclosures 125
13 Investments - available for sale 68 48 Equity instrument holdings of key management personnel 128
14 Investments - held to maturity 69 49 Remuneration of external auditor 130
15 Investments relating to life insurance business 69 50 Fiduciary activities 130
16 Other financial assets at fair value 69 51 Life insurance business disclosures 131
17 Loans and advances 70 52 Capital adequacy 136
18 Provisions for doubtful debts 72 53 Events subsequent to balance date 136
19 Asset quality disclosures 73 Directors’ declaration 137
20 Property, plant and equipment 74 Independent auditor's report 138
21 Investments in controlled entities 75 Shareholder information 139
22 Goodwill and other intangible assets 76 Supplementary information - Capital adequacy 143
23 Deferred tax assets 77 Supplementary information - Disclosure on special purpose entities 147
24 Other assets 78Glossary 153
25 Other financial liabilities at fair value 78
26 Deposits and other borrowings 78
Report of the directors
National Australia Bank2
The directors of National Australia Bank Limited (Company) present their report, together with the financial statements of the Group, being the Company and its controlled entities, for the year ended 30 September 2008.
The directors of the Company have a significant responsibility with respect to the integrity of external reporting. This involves reviewing and monitoring, with the assistance of the Audit Committee and management, the processes, controls and procedures which are in place to maintain the integrity of the Group’s financial statements. Further details of the role of the Board and its committees can be found in the Corporate Governance section and on the Group’s website www.nabgroup.com.
Principal activities and significant changes in nature of activities
The principal activities of the Group during the year were banking services, credit and access card facilities, leasing, housing and general finance, international banking, investment banking, wealth management, funds management, life insurance, and custodian, trustee and nominee services.
Review of operations and Group results
Financial performance summary Group 2008
$m 2007
$m Net interest income 11,098 9,746 Net life insurance income (1,817) 1,758 Other income 3,849 4,525 Operating expenses (7,280) (7,412) Charge to provide for doubtful debts (2,703) (790)
Profit before income tax expense 3,147 7,827 Income tax expense (39) (2,255) Net profit 3,108 5,572 Net (profit)/loss attributable to minority
interest
1,428 (994) Net profit attributable to members of
the Company
4,536 4,578 Net profit attributable to members of the Company of $4,536 million in 2008, decreased $42 million or 0.9% compared with 2007.
Net interest income of $11,098 million in 2008, was $1,352 million or 13.9% higher than 2007. This includes an increase of $436 million from larger interest-spread differentials between international and Australian interest rates. This was fully offset by fair value movements of the derivatives hedging short term funding in Other income.
The underlying increase of $916 million or 9.4% reflects lending and deposit volume growth and good margin management, particularly in Australia Banking. nabCapital made a strong contribution from origination and Markets activity. Volume growth is offset by a decline in the Group net interest margin from 2.27% to 2.19% due to competitive pressures on deposit margins, increased funding costs through increased credit spreads and increased basis risk through the market disruption. Increased borrowing costs due to higher pricing within global funding markets contributed $369 million of this decrease in the Group net interest income; however, repricing initiatives partially mitigated this impact.
Net life insurance income decreased $3,575 million from $1,758 million in 2007 to $(1,817) million in 2008. Negative investment market experience within domestic and global financial markets during the 2008 year has resulted in:
a reduction in investment revenue attributable to unit linked investments and life insurance business that is largely offset by movements in amounts owing to policyholders; and
a reduction in investment revenue attributable to equity investment holdings in consolidated trusts. The minority interest holders of the trusts share in these losses; their share is reflected as the Net loss attributable to minority interest and therefore increases Net profit attributable to members of the Company.
Other income of $3,849 million in 2008, was $676 million or 14.9% lower than 2007. Excluding the impact of fair value movements on derivatives hedging short-term funding of $436 million which is offset within net interest income, other operating income was down $240 million or 5.3%. This outcome is a combination of the following factors:
Gains less losses on financial instruments at fair value decreased $718 million. Excluding the impact of the negative spread on derivatives used to hedge foreign denominated short-term funding (which is offset in net interest income), the decrease was $282 million or 47%. This is attributable to nabCapital including through the hedge costs of securitisation conduit risk mitigation trades, an increase in impairment charges on Investments – available for sale and credit adjustment on derivatives, and is partially offset by: - a gain on sale of shares allocated by Visa Inc upon its
initial public offering; - strong sales performance in the Markets division. This
was driven by increased deal flow from clients seeking risk management products in light of the credit environment and market volatility and the success of the cross-sell strategy to all client segments; and
- trading gains delivered through favourable positioning in volatile markets particularly during the first half.
Other operating income was $42 million or 1.1% higher than 2007. This is attributable to: - higher fees and commissions, predominantly in Australia
Banking from volume growth and repricing initiatives that better align price to the current risk settings; partially offset by
- the sale of the portfolio of operating leases in the UK during December 2007 as a strategic divestment of a non-core activity, resulting in a $48 million reduction in lease rental income.
Operating expenses of $7,280 million in 2008 were $132 million or 1.8% lower than 2007. This outcome reflects:
an $87 million reduction in personnel expenses mainly as performance based remuneration decreased in line with the financial performance of the Group during the year; partially offset by
the impact of the acquisition of Great Western Bancorporation.
The charge to provide for doubtful debts of $2,703 million in 2008, was $1,913 million higher than 2007. This increase was driven by a $1,011 million provision for Asset Backed Securities Collateralised Debt Obligations (ABS CDOs) exposure, increased specific provisions for a small number of corporate customers and deterioration in economic conditions in all regions (most notably the UK). The charge also includes an economic cycle adjustment of $214 million to strengthen the Group’s balance sheet to withstand current economic volatility.
Income tax expense of $39 million in 2008, was $2,216 million lower than 2007. Income tax expense on profit excluding that attributable to the statutory funds of the life insurance business
Report of the directors
2008 Annual Financial Report 3
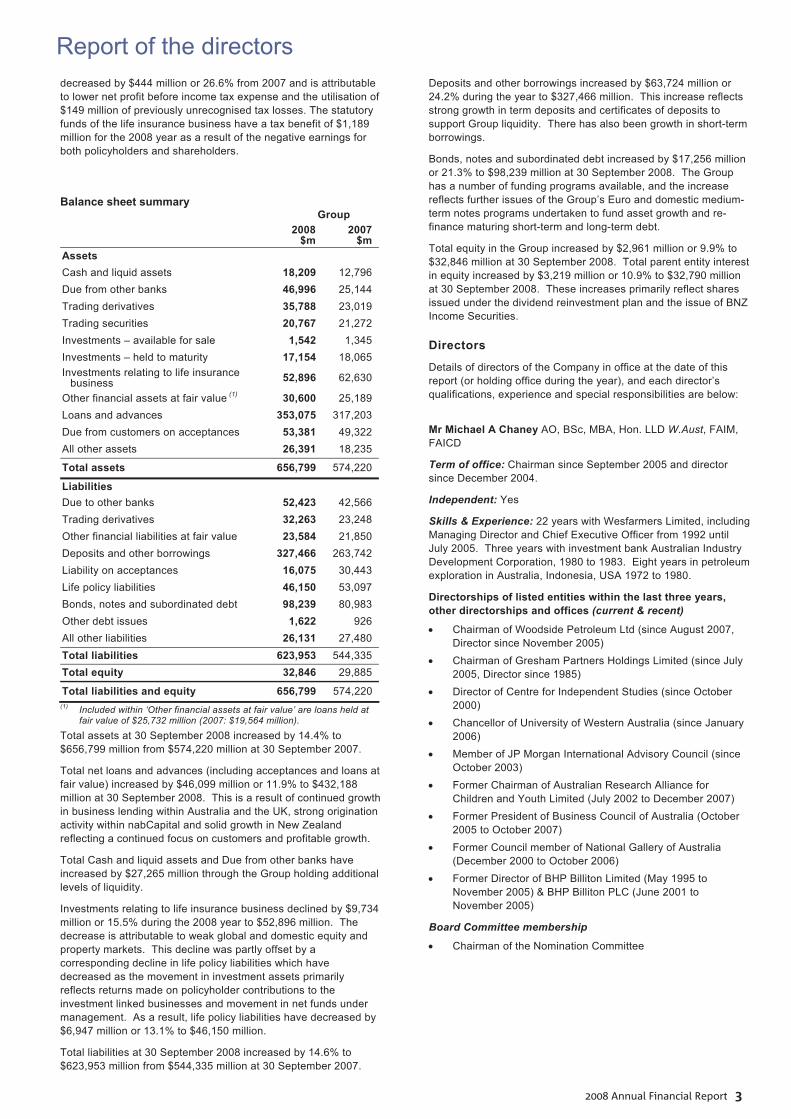
decreased by $444 million or 26.6% from 2007 and is attributable to lower net profit before income tax expense and the utilisation of $149 million of previously unrecognised tax losses. The statutory funds of the life insurance business have a tax benefit of $1,189 million for the 2008 year as a result of the negative earnings for both policyholders and shareholders.
Balance sheet summary Group
2008 $m
2007$m
Assets Cash and liquid assets 18,209 12,796 Due from other banks 46,996 25,144 Trading derivatives 35,788 23,019 Trading securities 20,767 21,272 Investments – available for sale 1,542 1,345 Investments – held to maturity 17,154 18,065 Investments relating to life insurance
business 52,896 62,630
Other financial assets at fair value (1) 30,600 25,189 Loans and advances 353,075 317,203 Due from customers on acceptances 53,381 49,322 All other assets 26,391 18,235
Total assets 656,799 574,220
Liabilities Due to other banks 52,423 42,566 Trading derivatives 32,263 23,248 Other financial liabilities at fair value 23,584 21,850 Deposits and other borrowings 327,466 263,742 Liability on acceptances 16,075 30,443 Life policy liabilities 46,150 53,097 Bonds, notes and subordinated debt 98,239 80,983 Other debt issues 1,622 926 All other liabilities 26,131 27,480 Total liabilities 623,953 544,335 Total equity 32,846 29,885
Total liabilities and equity 656,799 574,220 (1) Included within ‘Other financial assets at fair value’ are loans held at
fair value of $25,732 million (2007: $19,564 million).
Total assets at 30 September 2008 increased by 14.4% to $656,799 million from $574,220 million at 30 September 2007.
Total net loans and advances (including acceptances and loans at fair value) increased by $46,099 million or 11.9% to $432,188 million at 30 September 2008. This is a result of continued growth in business lending within Australia and the UK, strong origination activity within nabCapital and solid growth in New Zealand reflecting a continued focus on customers and profitable growth.
Total Cash and liquid assets and Due from other banks have increased by $27,265 million through the Group holding additional levels of liquidity.
Investments relating to life insurance business declined by $9,734 million or 15.5% during the 2008 year to $52,896 million. The decrease is attributable to weak global and domestic equity and property markets. This decline was partly offset by a corresponding decline in life policy liabilities which have decreased as the movement in investment assets primarily reflects returns made on policyholder contributions to the investment linked businesses and movement in net funds under management. As a result, life policy liabilities have decreased by $6,947 million or 13.1% to $46,150 million.
Total liabilities at 30 September 2008 increased by 14.6% to $623,953 million from $544,335 million at 30 September 2007.
Deposits and other borrowings increased by $63,724 million or 24.2% during the year to $327,466 million. This increase reflects strong growth in term deposits and certificates of deposits to support Group liquidity. There has also been growth in short-term borrowings.
Bonds, notes and subordinated debt increased by $17,256 million or 21.3% to $98,239 million at 30 September 2008. The Group has a number of funding programs available, and the increase reflects further issues of the Group’s Euro and domestic medium-term notes programs undertaken to fund asset growth and re-finance maturing short-term and long-term debt.
Total equity in the Group increased by $2,961 million or 9.9% to $32,846 million at 30 September 2008. Total parent entity interest in equity increased by $3,219 million or 10.9% to $32,790 million at 30 September 2008. These increases primarily reflect shares issued under the dividend reinvestment plan and the issue of BNZ Income Securities.
Directors
Details of directors of the Company in office at the date of this report (or holding office during the year), and each director’s qualifications, experience and special responsibilities are below:
Mr Michael A Chaney AO, BSc, MBA, Hon. LLD W.Aust, FAIM, FAICD
Term of office: Chairman since September 2005 and director since December 2004.
Independent: Yes
Skills & Experience: 22 years with Wesfarmers Limited, including Managing Director and Chief Executive Officer from 1992 until July 2005. Three years with investment bank Australian Industry Development Corporation, 1980 to 1983. Eight years in petroleum exploration in Australia, Indonesia, USA 1972 to 1980.
Directorships of listed entities within the last three years, other directorships and offices (current & recent)
Chairman of Woodside Petroleum Ltd (since August 2007, Director since November 2005)
Chairman of Gresham Partners Holdings Limited (since July 2005, Director since 1985)
Director of Centre for Independent Studies (since October 2000)
Chancellor of University of Western Australia (since January 2006)
Member of JP Morgan International Advisory Council (since October 2003)
Former Chairman of Australian Research Alliance for Children and Youth Limited (July 2002 to December 2007)
Former President of Business Council of Australia (October 2005 to October 2007)
Former Council member of National Gallery of Australia (December 2000 to October 2006)
Former Director of BHP Billiton Limited (May 1995 to November 2005) & BHP Billiton PLC (June 2001 to November 2005)
Board Committee membership
Chairman of the Nomination Committee
Report of the directors
National Australia Bank4
Mr John M Stewart BA, ACII, FCIB
Term of office: Director since August 2003. Managing Director and Group Chief Executive Officer from February 2004.
Independent: No
Skills & Experience: 27 years in banking and finance in the United Kingdom including four years as Group Chief Executive of Woolwich PLC until its acquisition by Barclays PLC in 2000 when he was appointed Deputy Group Chief Executive of Barclays PLC.
Directorships of listed entities within the last three years, other directorships and offices (current & recent)
Director of Telstra Corporation Limited (since April 2008) Chairman of Australian Bankers’ Association (since July
2007) Director of Business Council of Australia (since August 2005)
Mrs Patricia A Cross BSc (Hons), FAICD, FAIM
Term of office: Director since December 2005.
Independent: Yes
Skills & Experience: 25 years in international banking and finance, including management and senior executive roles in Europe, the United States and Australia with Chase Manhattan Bank, Banque Nationale de Paris and National Australia Bank. Mrs Cross is a Fellow of the Finance and Treasury Association and was a founding member of the Financial Sector Advisory Council to the Federal Treasurer serving for five years until 2003. In 2003, she received a Centenary Medal for service to Australian society through the finance industry.
Directorships of listed entities within the last three years, other directorships and offices (current & recent)
Director of Wesfarmers Limited (since February 2003) Director of Qantas Airways Limited (since January 2004) Director of Murdoch Childrens Research Institute (since
August 2005) Director of Methodist Ladies College, Melbourne (since
January 2008)
Board Committee membership
Chairman of the Remuneration Committee Member of the Risk Committee Member of the Nomination Committee
Mr Ahmed Fahour BEc (Hons), MBA, FAIM
Term of office: Director since October 2004. Chief Executive Officer, Australia since September 2004.
Independent: No
Skills & Experience: 21 years in economics and finance. He was Chief Executive Officer, Australia and New Zealand, Citigroup in 2004, and has held senior management positions in Citigroup from 2000 to 2004 including Chief Executive Officer, Citigroup Alternative Investments and Vice Chairman of Citigroup Investment Ltd. Previously Managing Director, iFormation Private Equity Group and a director of Boston Consulting Group. He is an honorary Business Ambassador for Melbourne’s North. He is also a Director of National Wealth Management Holdings Limited, MLC Holdings Limited and Serv Co Pty Ltd (subsidiaries of the Company).
Directorships of listed entities within the last three years, other directorships and offices (current & recent)
Director of Rip Curl Group Pty Ltd (since July 2004) Director of Rip Curl Property Pty Ltd (since September 2007) Director of NASDAQ DIFX (since March 2008)
Director of The Australian Social Inclusion Board (since May 2008)
Mr Daniel T Gilbert AM, LLB
Term of office: Director since September 2004.
Independent: Yes
Skills & Experience: Over 30 years in commercial law, specialising in technology and corporate law.
Directorships of listed entities within the last three years, other directorships and offices (current & recent)
Managing Partner of Gilbert + Tobin (which he co-founded in 1988)
Former Chairman of Australian Film, Television and Radio School (from 2000 to July 2006)
Former Director of Bangarra Dance Theatre (from 1998 to March 2006)
Councillor of Australian Business Arts Foundation
Board Committee membership
Member of the Remuneration Committee Member of the Nomination Committee
Mr Paul J Rizzo BCom, MBA
Term of office: Director since September 2004.
Independent: Yes
Skills & Experience: 38 years in banking and finance. Formerly Dean and Director of Melbourne Business School from 2000 to 2004, Group Managing Director, Finance and Administration, Telstra Corporation Limited from 1993 to 2000, senior roles at Commonwealth Bank of Australia from 1991 to 1993, Chief Executive Officer of State Bank of Victoria in 1990 and 24 years with Australia and New Zealand Banking Ltd from 1966 to 1990.
Directorships of listed entities within the last three years, other directorships and offices (current & recent)
Director of BlueScope Steel Limited (since May 2002) Consultant Director to Mallesons Stephen Jaques (since
August 2002) Chairman of the Foundation for Very Special Kids (since July
2004) Chairman of the Audit Committee for the Australian
Government Department of Defence (since February 2008) Former Director of Villa Maria Society (from July 2006 to
August 2008)
Board Committee membership
Chairman of the Risk Committee Member of the Audit Committee Member of the Nomination Committee
Ms Jillian S Segal AM, BA, LLB, LLM (Harvard), FAICD
Term of office: Director since September 2004.
Independent: Yes
Skills & Experience: 20 years as a lawyer and regulator, most recently at the Australian Securities and Investments Commission from 1997 to 2002 as Commissioner and then Deputy Chairman and as Chairman of the Board of the Banking & Financial Services Ombudsman from 2002 to 2004. She was an environmental and corporate partner and consultant at Allen Allen & Hemsley and worked for Davis Polk & Wardwell in New York.
Report of the directors
2008 Annual Financial Report 5
Directorships of listed entities within the last three years, other directorships and offices (current & recent)
Director of ASX Limited (since July 2003) Director of ASX Market Supervision Limited (since July 2006) Member of Australia Council’s Major Performing Arts Board
(since February 2003) Member of University of New South Wales Council (since
February 2006) President of the Administrative Review Council (since
September 2005) Member of General Sir John Monash Foundation Member of Sydney Advisory Council of the Centre for Social
Impact
Board Committee membership
Member of the Risk Committee Member of the Remuneration Committee Member of the Nomination Committee
Mr John G Thorn FCA, FAICD
Term of office: Director since October 2003.
Independent: Yes
Skills & Experience: 37 years in professional services with PricewaterhouseCoopers, over 20 years as a partner responsible for significant international and Australian clients. Australian National Managing Partner and a member of the Global Audit Management Group until 2003.
Directorships of listed entities within the last three years, other directorships and offices (current & recent)
Director of Amcor Limited (since December 2004) Director of Caltex Australia Limited (since June 2004) Director of Salmat Limited (since September 2003)
Board Committee membership
Chairman of the Audit Committee Member of the Nomination Committee
Mr Geoffrey A Tomlinson BEc
Term of office: Director since March 2000.
Independent: Yes
Skills & Experience: 29 years with the National Mutual Group, six years as Group Managing Director and Chief Executive Officer until 1998. He is also the Chairman of National Wealth Management Holdings Limited, MLC Limited and MLCI Limited (subsidiaries of the Company).
Directorships of listed entities within the last three years, other directorships and offices (current & recent)
Chairman of Programmed Maintenance Services Limited (since August 1999)
Director of Amcor Limited (since March 1999) Former Chairman of Dyno Nobel Limited (from February
2006 to June 2008) Former Deputy Chairman of Hansen Technologies Ltd (from
March 2000 to February 2006) Former Director of Funtastic Limited (from May 2000 to May
2006) Former Director of Mirrabooka Investments Limited (from
February 1999 to March 2006)
Board Committee membership
Member of the Audit Committee Member of the Nomination Committee
Mr Michael J Ullmer BSc (Maths) (Hons), FCA, SF Fin
Term of office: Director since October 2004. Finance Director from September 2004 to December 2007 when he was appointed Deputy Group CEO.
Independent: No
Skills & Experience: 36 years in banking and finance, including seven years with Commonwealth Bank of Australia as Group Executive, Institutional and Business Services from 2002 to 2004 and Group Executive, Financial and Risk Management from 1997 to 2002. Formerly partner of Coopers & Lybrand from 1992 to 1997 and 20 years with KPMG including partner from 1982 to 1992. He is also a Director of Bank of New Zealand and Great Western Bank (subsidiaries of the Company).
Directorships of listed entities within the last three years, other directorships and offices (current & recent)
Director of Foster’s Group Limited (since June 2008) Director of Melbourne Symphony Orchestra (since February
2007) Member of European Australian Business Council
Sir Malcolm Williamson
Term of office: Director since May 2004.
Independent: Yes
Skills & Experience: 50 years in banking and finance in the United Kingdom and the United States. He served with Barclays PLC from 1957 to 1985, reaching the position of Regional General Manager, London. This was followed by a period as a member of the Post Office board and Managing Director of Girobank PLC. In 1989, he joined Standard Chartered PLC and became Group Chief Executive. In 1998, he moved to the United States and took up the role of President and Chief Executive Officer of Visa International, which he held until 2004. He is also Chairman of National Australia Group Europe Limited and Clydesdale Bank PLC, since June 2004 (subsidiaries of the Company).
Directorships of listed entities within the last three years, other directorships and offices (current & recent)
Chairman of Signet Group PLC (Director since November 2005)
Director JP Morgan Cazenove Holdings (since April 2005) Chairman of CDC Group PLC (Director since January 2004) Director of The Prince of Wales International Business
Leaders Forum (since February 2006) Director of G4S PLC (from May 2004 to May 2008) Deputy Chairman and Senior Independent Director of
Resolution PLC (from September 2005 to May 2008) Former Chairman of Britannic Group (from October 2004 to
September 2005) Chairman of The Prince’s Youth Business International
(since August 2008) Chairman of Cass Business School’s Strategy and
Development Board (since August 2008)
Board Committee membership
Member of the Risk Committee (effective 1 November 2008) Member of the Nomination Committee
Report of the directors
National Australia Bank6
Board changes
Mr Peter JB Duncan BE (Chem) (1st Class Hons), DBS (with Distinction)
Term of office: Director from November 2001 to 31 July 2008. Mr Peter Duncan retired as a non-executive director and Chairman of the Remuneration Committee on 31 July 2008. (Mrs Patricia Cross was appointed Chairman of the Remuneration Committee upon Mr Duncan’s retirement).
Skills & Experience: 36 years with Royal Dutch/Shell Group of companies, including senior finance and general management positions in Australia, New Zealand, South America, Europe and South East Asia. He was Chairman of the Shell Group of Companies in Australia and New Zealand. Former Chairman of the Australian Institute of Petroleum.
Directorships of listed entities within the last three years, other directorships and offices (current)
Chairman of the Cranlana Program Foundation (since September 2006)
Chairman of Scania Australia Pty Limited (since August 2003)
Director of Orica Limited (since June 2001) Governor of the Committee for the Economic Development of
Australia (CEDA) (since March 2003)
Mr Thomas (Kerry) McDonald BCom, MCom (Hons), DCom (hc), AFID, FNZIM
Term of office: Director from December 2005 to 7 November 2008. Mr Kerry McDonald retired as a non-executive director and member of the Audit Committee on 7 November 2008.
Independent: Yes
Skills & Experience: 40 years in economic consulting, energy, resources, logistics and banking in Australia and New Zealand with a particular interest in organisation performance and improvement.
He was a senior executive of Comalco from 1981 and a Managing Director and member of the Comalco Group Executive Committee from 1988 to 2000. He was also Chairman of Bank of New Zealand, Director since August 1991 (a subsidiary of the Company).
Directorships of listed entities within the last three years, other directorships and offices (current & recent)
Director (Chairman) of Opus International Consultants Ltd (since April 2007)
Director of Leighton Contractors Pty Ltd (since July 2007) Deputy Chairman of NZ Institute of Economic Research
(since October 2002) Director (Chairman) OceanaGold Holdings New Zealand
Limited Institute of Directors (New Zealand), National Council and
Vice President Board of Trustees, WWF New Zealand Former Director/Vice Chairman of OceanaGold Limited (from
December 2003 to May 2008) Former Director of Ports of Auckland Limited (from August
2002 to July 2007) Former Director of Carter Holt Harvey Limited (from April
1996 to January 2006)
Company Secretaries
Details of company secretaries of the Company in office at the date of this report, and each company secretary’s qualifications and experience are below:
Ms Michaela J Healey LLB, FCIS was appointed Company Secretary in April 2006. She has experience in a range of legal, business and corporate affairs roles in listed companies and was formerly Company Secretary of Orica Limited and North Limited. The Company Secretary advises and supports the Board to enable the Board to fulfil its role.
Mr Nathan Butler LLB (Hons), LLM, BA (Jur) joined the Group in 2001, and was appointed Acting Chief General Counsel in March 2008, having previously been the Deputy Chief General Counsel. Mr Butler was appointed as a company secretary in May 2008. He has advised the Group on a wide range of strategic, corporate, governance and regulatory matters and is a member of senior risk management committees within the Group.
Directors’ and officers’ indemnity The Company’s constitution Article 20.1 of the Company’s constitution provides that to the maximum extent permitted by law and without limiting the Company’s power, the Company may indemnify any current or former officer out of the property of the Company against:
any liability incurred by the person in the capacity as an officer (except a liability for legal costs);
legal costs incurred in defending or resisting (or otherwise in connection with) proceedings, whether civil or criminal or of an administrative or investigatory nature, in which the officer becomes involved because of that capacity;
legal costs incurred in connection with any investigation or inquiry of any nature (including, without limitation, a royal commission) in which the officer becomes involved (including, without limitation, appearing as a witness or producing documents) because of that capacity; and
legal costs incurred in good faith in obtaining legal advice on issues relevant to the performance of their functions and discharge of their duties as an officer, if that expenditure has been approved in accordance with the Board’s charter,
except to the extent that: the Company is forbidden by law to indemnify the person
against the liability or legal costs; or an indemnity by the Company of the person against the
liability or legal costs, if given, would be made void by law.
Under Article 20.2, the Company may pay or agree to pay, whether directly or through an interposed entity, a premium for a contract insuring a person who is or has been an officer against liability incurred by the person in that capacity, including a liability for legal costs, unless:
the Company is forbidden by law to pay or agree to pay the premium; or
the contract would, if the Company paid the premium, be made void by law.
The Company may enter into an agreement with a person referred to in articles 20.1 and 20.2 with respect to the subject matter of those articles. Such an agreement may include provisions relating to rights of access to the books of the Company.
In the context of Article 20, “officer” means a Director, Secretary or senior manager of the Company or of a related body corporate of the Company.
The Company has executed deeds of indemnity in favour of each director of the Company and certain non-executive directors of related bodies corporate of the Company. Some companies within the Group have extended equivalent deeds of indemnity in favour of directors of those companies.
Directors’ and officers’ insurance
During the year, the Company, pursuant to Article 20, paid a premium for a contract insuring all directors, secretaries, executive officers and officers of the Company and of each related
Report of the directors
2008 Annual Financial Report 7
body corporate of the Company. The insurance does not provide cover for the independent auditors of the Company or of a related body corporate of the Company.
In accordance with usual commercial practice, the insurance contract prohibits disclosure of details of the nature of the liabilities covered by the insurance, the limit of indemnity and the amount of the premium paid under the contract.
Dividends
The directors have declared a final dividend of 97 cents per fully paid ordinary share, 100% franked, payable on 17 December 2008. The proposed payment amounts to approximately $1,670 million.
Dividends paid since the end of the previous financial year:
the final dividend for the year ended 30 September 2007 of 95 cents per fully paid ordinary share, 100% franked, paid on 18 December 2007. The payment amount was $1,540 million.
the interim dividend for the year ended 30 September 2008 of 97 cents per fully paid ordinary share, 100% franked, paid on 10 July 2008. The payment amount was $1,584 million.
Information on the dividends paid and declared to date is contained in note 7 to the financial report.
The franked portion of these dividends carries imputation tax credits at a tax rate of 30%, reflecting the current Australian company tax rate of 30%.
The extent to which future dividends will be franked, for Australian taxation purposes, will depend on a number of factors, including the proportion of the Group’s profits that will be subject to Australian income tax and any future changes to Australia’s business tax system.
Significant changes in the state of affairs Senior executive appointments On 31 July 2008 the Company announced the appointment of Cameron Clyne as Group Chief Executive Officer Designate from 1 October 2008 to 31 December 2008 and Group Chief Executive Officer from 1 January 2009.
On 4 September 2008 the Company announced the appointment of Bruce Munro as Group Chief Risk Officer Designate from 1 October 2008 to 31 December 2008 and Group Chief Risk Officer from 1 January 2009.
Recent market conditions The recent adverse conditions in global financial markets have resulted in a significant increase in funding costs and a general tightening of available liquidity. This has placed significant pressure on the financial performance and capital positions of international banks and other financial institutions.
These market conditions have adversely impacted the Group. In 2008, a provision of approximately $1 billion was established in respect of the Group’s ABS CDO exposures to reflect the uncertain economic environment and the severe deterioration in conditions in the US housing markets.
In the face of the current global financial market conditions, international governments (including those of the United States, United Kingdom, and New Zealand) have taken various measures to support the global banking system including in some cases supporting financial institutions in recapitalising and gaining access to retail and wholesale borrowings. The precise details of the various international plans are not yet clear, and in some cases, have not been approved by the relevant legislator. Accordingly, they may not be fully implemented in their current form.
Consistent with these measures, in October 2008, the Australian Parliament passed the Financial System Legislation Amendment
(Financial Claims Scheme and Other Measures) Act 2008 as part of a package of measures aimed at supporting the Australian financial system.
Bell Group The Company is one of 20 banks involved in the Bell Group legal proceedings. The proceedings have been brought by various parties, including the liquidators of several Bell Group companies, seeking to challenge the banks’ prior receipt of proceeds from the realisation of Bell Group assets. On 28 October 2008, the Supreme Court of Western Australia delivered a lengthy judgment on the matter.
The impact of the legal proceedings to the Group is not fully ascertainable at the date of this report, and will depend on various factors including further analysis of the judgment, the actual Court orders and the impact of the judgment on various stakeholders involved in the proceedings.
Acquisition of Great Western Bank On 3 June 2008, the Group completed the acquisition of Great Western Bancorporation, the holding company of Great Western Bank, a regional bank based in Sioux Falls, South Dakota. Great Western Bank is now in a position to leverage the strength of the agribusiness relationship model in the United States.
Credit rating During the year ended 30 September 2008 the Group’s long term credit rating was maintained by Standard & Poor’s at “AA”. In November 2008 Standard & Poor’s upgraded the Group to a stable outlook.
Events subsequent to balance date On 10 November 2008, the Group announced its successful completion of an institutional placement of 150 million new ordinary shares at $20 per share, to raise $3 billion of new equity capital. The new shares will not be entitled to the final dividend for the year ended 30 September 2008.
Settlement of the institutional placement was completed on 14 November 2008 with the shares to be allotted and quoted on the ASX on 17 November 2008.
On 10 November 2008, the Group also announced its intention to offer retail shareholders the opportunity to participate in a non-underwritten share purchase plan (SPP) at the institutional placement price of $20 per share. Details in respect of the SPP have not been finalised as at the date of this report.
As a result of these capital management initiatives, the Group will not underwrite its 2008 final dividend reinvestment plan shortfall.
Future developments In the opinion of the directors, disclosure of any further future developments would be likely to result in unreasonable prejudice to the interests of the Group.
Proceedings on behalf of the Company There are no proceedings brought or intervened in, or applications to bring or intervene in proceedings, on behalf of the Company by a member or other person entitled to do so under section 237 of the Corporations Act 2001 (Cth).
Environmental regulation The operations of the Group are not subject to any site specific environmental licences or permits which would be considered as particular or significant environmental regulation under laws of the Australian Commonwealth Government or of an Australian state or territory. However, as the Group’s operations at its main Melbourne-based data centre constitute a Scheduled Activity for the purposes of the Environmental Protection (Environment and Resources Efficiency Plan) Regulations 2007 (Vic), the Group is subject to registration, annual reporting and environment and resource efficiency planning requirements under the Environment
Report of the directors
National Australia Bank8
Protection Act 1970 (Vic). The Group is complying with these requirements.
The operations of the Group are also subject to the Energy Efficiency Opportunities Act 2006 (Cth) and the National Greenhouse and Energy Reporting Act 2007 (Cth) as part of the legislative response to climate change. Whilst this legislation is not particular to the Group or significant in its impact, the Group is complying with its requirements.
In 2008, the Company undertook a series of energy efficiency opportunities assessments as per the requirements of the Energy Efficiency Opportunities Act 2006 (Cth). In Australia, the total vehicle fleet and building related energy use is 713,697 gigajoules (GJ), which is approximately 66% of the Group’s total.
To date, the Company has assessed energy efficiency opportunities in 40% of the building portfolio by energy use. During 2008, the Company completed assessments of six large office buildings and representative assessments of under awning signage illumination across the retail network and desktop and laptop computers. In all energy use assessments completed to date, the Company has identified potential energy efficiency savings of 109,873 GJ, which have up to a four year payback. Of these assessments, the Company has implemented equivalent to 48,488 GJ of savings, and intend to implement a further 60,043 GJ of savings by December 2009. More information about the Company’s participation in the energy efficiency opportunities program is available at both www.nabgroup.com and www.nab.com.au.
As a lender, the Group can also incur environmental liabilities arising from the operations of its borrowers and as a result it has developed credit policies to ensure that this risk is managed appropriately.
In addition to responding to regulatory requirements, the Group can perform a key role, as a global provider of financial products and services in contributing to the environmental sustainability of the communities in which it operates. The Group’s approach to environmental sustainability and management of direct and indirect environmental impacts is outlined in its environmental policy at www.nabgroup.com. Further information on the Group’s environmental management and commitments is outlined in the
2008 Corporate Responsibility Review and associated online Corporate Responsibility reporting available at www.nabgroup.com.
Rounding of amounts
Pursuant to Class Order 98/100 made by the Australian Securities and Investments Commission (ASIC) on 10 July 1998, the Company has rounded off amounts in this report and the accompanying financial report to the nearest million dollars, except where indicated.
Executive performance options and performance rights
Performance options and performance rights are granted by the Group under the National Australia Bank Executive Share Option Plan No. 2 (executive share option plan) and the National Australia Bank Performance Rights Plan (performance rights plan). The executive share option plan was approved by shareholders at the annual general meeting in January 1997, and the performance rights plan at the 2002 annual general meeting. Refer to the remuneration report for a description of the key terms and conditions of the executive share option plan and the performance rights plan.
All performance options and performance rights that have not expired are detailed below. Each performance option or performance right is for one fully paid ordinary share in the Company.
The Company is moving to a policy of generally providing performance shares rather than options and rights as long-term incentives. Going forward, performance options and rights will predominantly only be offered to key senior executives of the Company. Refer to the remuneration report for a description of the key terms and conditions of the long-term incentive shares.
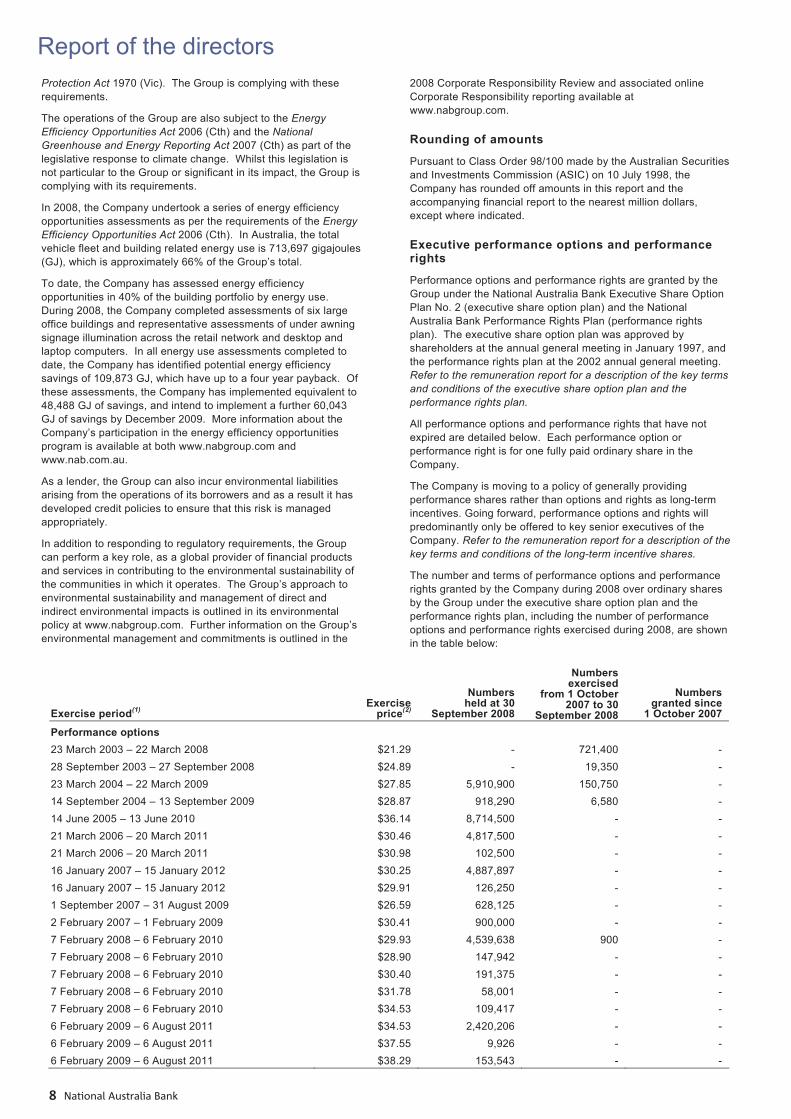
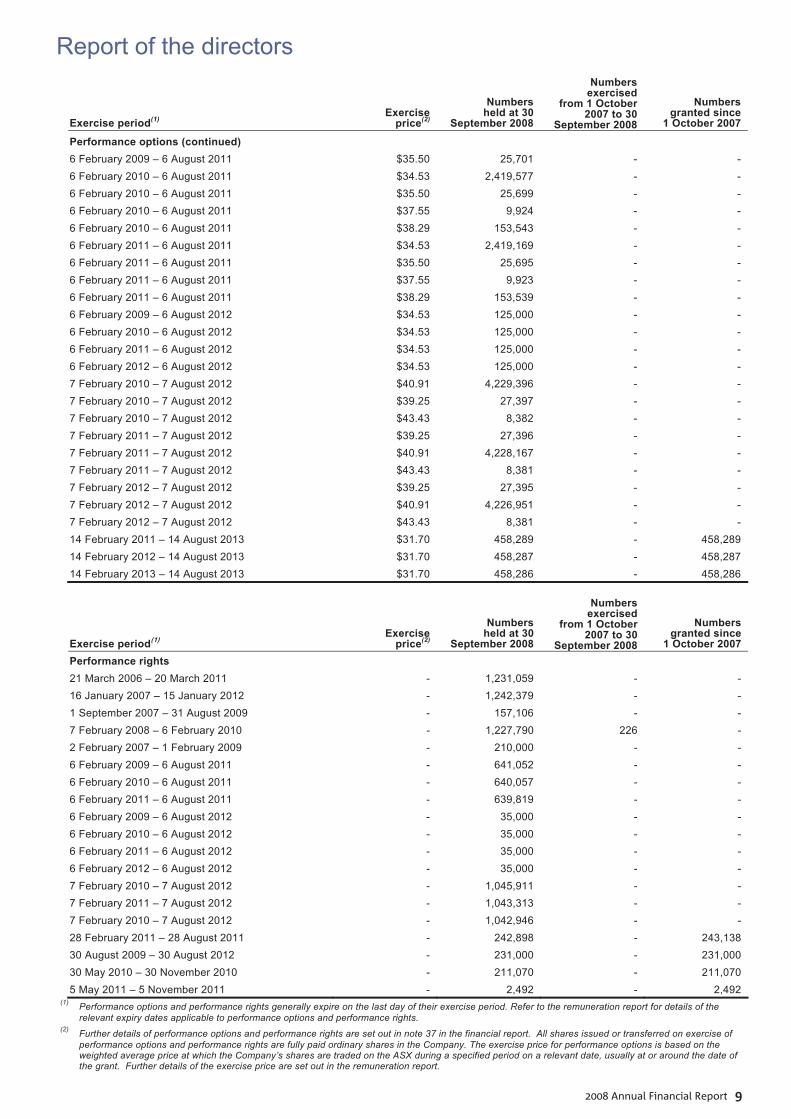
The number and terms of performance options and performance rights granted by the Company during 2008 over ordinary shares by the Group under the executive share option plan and the performance rights plan, including the number of performance options and performance rights exercised during 2008, are shown in the table below:
Exercise period(1) Exercise
price(2)
Numbers held at 30
September 2008
Numbers exercised
from 1 October 2007 to 30
September 2008
Numbers granted since
1 October 2007
Performance options 23 March 2003 – 22 March 2008 $21.29 - 721,400 - 28 September 2003 – 27 September 2008 $24.89 - 19,350 - 23 March 2004 – 22 March 2009 $27.85 5,910,900 150,750 - 14 September 2004 – 13 September 2009 $28.87 918,290 6,580 - 14 June 2005 – 13 June 2010 $36.14 8,714,500 - - 21 March 2006 – 20 March 2011 $30.46 4,817,500 - - 21 March 2006 – 20 March 2011 $30.98 102,500 - - 16 January 2007 – 15 January 2012 $30.25 4,887,897 - - 16 January 2007 – 15 January 2012 $29.91 126,250 - - 1 September 2007 – 31 August 2009 $26.59 628,125 - - 2 February 2007 – 1 February 2009 $30.41 900,000 - - 7 February 2008 – 6 February 2010 $29.93 4,539,638 900 - 7 February 2008 – 6 February 2010 $28.90 147,942 - - 7 February 2008 – 6 February 2010 $30.40 191,375 - - 7 February 2008 – 6 February 2010 $31.78 58,001 - - 7 February 2008 – 6 February 2010 $34.53 109,417 - - 6 February 2009 – 6 August 2011 $34.53 2,420,206 - - 6 February 2009 – 6 August 2011 $37.55 9,926 - - 6 February 2009 – 6 August 2011 $38.29 153,543 - -
Report of the directors
2008 Annual Financial Report 9
Exercise period(1) Exercise
price(2)
Numbers held at 30
September 2008
Numbers exercised
from 1 October 2007 to 30
September 2008
Numbers granted since
1 October 2007
Performance options (continued) 6 February 2009 – 6 August 2011 $35.50 25,701 - - 6 February 2010 – 6 August 2011 $34.53 2,419,577 - - 6 February 2010 – 6 August 2011 $35.50 25,699 - - 6 February 2010 – 6 August 2011 $37.55 9,924 - - 6 February 2010 – 6 August 2011 $38.29 153,543 - - 6 February 2011 – 6 August 2011 $34.53 2,419,169 - - 6 February 2011 – 6 August 2011 $35.50 25,695 - - 6 February 2011 – 6 August 2011 $37.55 9,923 - - 6 February 2011 – 6 August 2011 $38.29 153,539 - - 6 February 2009 – 6 August 2012 $34.53 125,000 - - 6 February 2010 – 6 August 2012 $34.53 125,000 - - 6 February 2011 – 6 August 2012 $34.53 125,000 - - 6 February 2012 – 6 August 2012 $34.53 125,000 - - 7 February 2010 – 7 August 2012 $40.91 4,229,396 - - 7 February 2010 – 7 August 2012 $39.25 27,397 - - 7 February 2010 – 7 August 2012 $43.43 8,382 - - 7 February 2011 – 7 August 2012 $39.25 27,396 - - 7 February 2011 – 7 August 2012 $40.91 4,228,167 - - 7 February 2011 – 7 August 2012 $43.43 8,381 - - 7 February 2012 – 7 August 2012 $39.25 27,395 - - 7 February 2012 – 7 August 2012 $40.91 4,226,951 - - 7 February 2012 – 7 August 2012 $43.43 8,381 - - 14 February 2011 – 14 August 2013 $31.70 458,289 - 458,289 14 February 2012 – 14 August 2013 $31.70 458,287 - 458,287 14 February 2013 – 14 August 2013 $31.70 458,286 - 458,286
Exercise period(1) Exercise
price(2)
Numbers held at 30
September 2008
Numbers exercised
from 1 October 2007 to 30
September 2008
Numbers granted since
1 October 2007 Performance rights 21 March 2006 – 20 March 2011 - 1,231,059 - - 16 January 2007 – 15 January 2012 - 1,242,379 - - 1 September 2007 – 31 August 2009 - 157,106 - - 7 February 2008 – 6 February 2010 - 1,227,790 226 - 2 February 2007 – 1 February 2009 - 210,000 - - 6 February 2009 – 6 August 2011 - 641,052 - - 6 February 2010 – 6 August 2011 - 640,057 - - 6 February 2011 – 6 August 2011 - 639,819 - - 6 February 2009 – 6 August 2012 - 35,000 - - 6 February 2010 – 6 August 2012 - 35,000 - - 6 February 2011 – 6 August 2012 - 35,000 - - 6 February 2012 – 6 August 2012 - 35,000 - - 7 February 2010 – 7 August 2012 - 1,045,911 - - 7 February 2011 – 7 August 2012 - 1,043,313 - - 7 February 2010 – 7 August 2012 - 1,042,946 - - 28 February 2011 – 28 August 2011 - 242,898 - 243,138 30 August 2009 – 30 August 2012 - 231,000 - 231,000 30 May 2010 – 30 November 2010 - 211,070 - 211,070 5 May 2011 – 5 November 2011 - 2,492 - 2,492
(1) Performance options and performance rights generally expire on the last day of their exercise period. Refer to the remuneration report for details of the relevant expiry dates applicable to performance options and performance rights.
(2) Further details of performance options and performance rights are set out in note 37 in the financial report. All shares issued or transferred on exercise of performance options and performance rights are fully paid ordinary shares in the Company. The exercise price for performance options is based on the weighted average price at which the Company’s shares are traded on the ASX during a specified period on a relevant date, usually at or around the date of the grant. Further details of the exercise price are set out in the remuneration report.
Report of the directors
National Australia Bank10
Performance options and performance rights on issue and number exercised
There are currently 54,326,084 performance options and 9,900,306 performance rights which are exercisable, or may become exercisable in the future, under the respective plans.
There were 899,206 fully paid ordinary shares of the Company issued during the year as a result of performance options and performance rights granted being exercised, for a total consideration of $20,255,743. There were no fully paid ordinary shares of the Company issued since the end of the year as a result of performance options and performance rights granted being exercised.
Persons holding performance options and performance rights are entitled to participate in certain capital actions by the Company (such as rights issues and bonus issues) in accordance with the terms of the ASX Listing Rules which govern participation in such actions by holders of options granted by listed entities. The terms of the performance options and the performance rights reflect the requirements of the ASX Listing Rules in this regard.
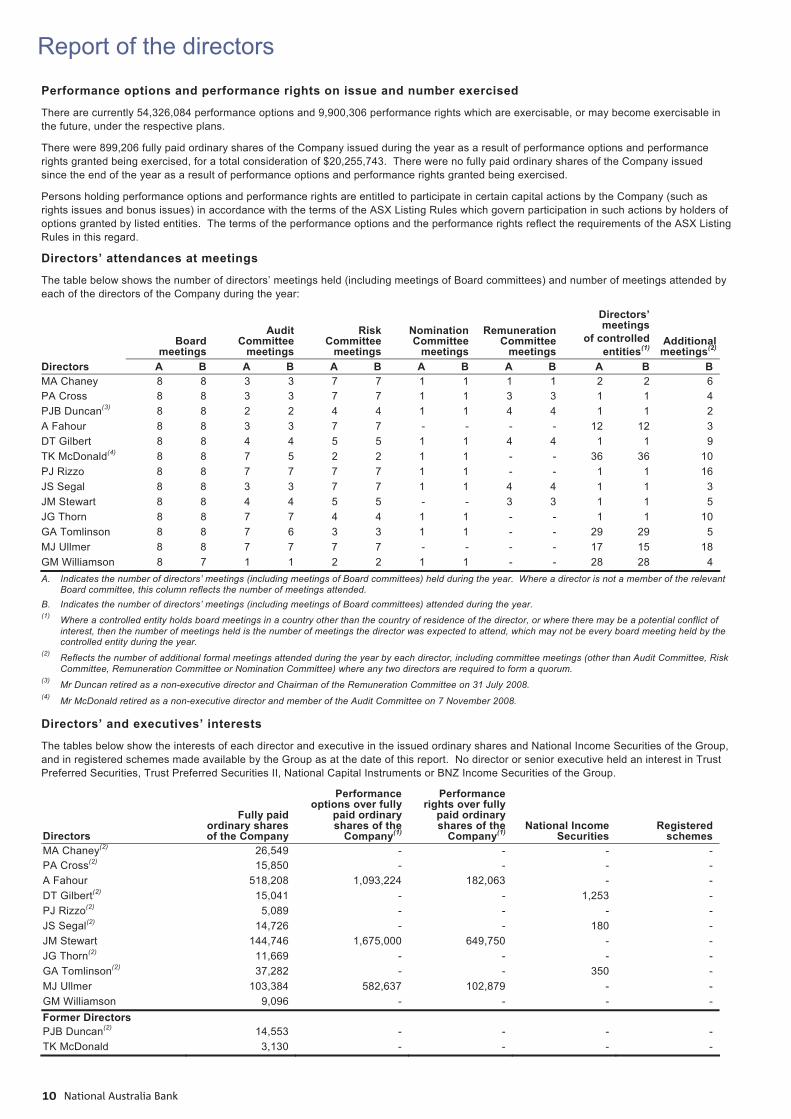
Directors’ attendances at meetings
The table below shows the number of directors’ meetings held (including meetings of Board committees) and number of meetings attended by each of the directors of the Company during the year:
Board meetings
Audit Committee
meetings
RiskCommittee
meetings
Nomination Committee
meetings
Remuneration Committee
meetings
Directors’ meetings
of controlled entities(1)
Additional meetings(2)
Directors A B A B A B A B A B A B B MA Chaney 8 8 3 3 7 7 1 1 1 1 2 2 6 PA Cross 8 8 3 3 7 7 1 1 3 3 1 1 4 PJB Duncan(3) 8 8 2 2 4 4 1 1 4 4 1 1 2 A Fahour 8 8 3 3 7 7 - - - - 12 12 3 DT Gilbert 8 8 4 4 5 5 1 1 4 4 1 1 9 TK McDonald(4) 8 8 7 5 2 2 1 1 - - 36 36 10 PJ Rizzo 8 8 7 7 7 7 1 1 - - 1 1 16 JS Segal 8 8 3 3 7 7 1 1 4 4 1 1 3 JM Stewart 8 8 4 4 5 5 - - 3 3 1 1 5 JG Thorn 8 8 7 7 4 4 1 1 - - 1 1 10 GA Tomlinson 8 8 7 6 3 3 1 1 - - 29 29 5 MJ Ullmer 8 8 7 7 7 7 - - - - 17 15 18 GM Williamson 8 7 1 1 2 2 1 1 - - 28 28 4 A. Indicates the number of directors’ meetings (including meetings of Board committees) held during the year. Where a director is not a member of the relevant
Board committee, this column reflects the number of meetings attended. B. Indicates the number of directors’ meetings (including meetings of Board committees) attended during the year. (1) Where a controlled entity holds board meetings in a country other than the country of residence of the director, or where there may be a potential conflict of
interest, then the number of meetings held is the number of meetings the director was expected to attend, which may not be every board meeting held by the controlled entity during the year.
(2) Reflects the number of additional formal meetings attended during the year by each director, including committee meetings (other than Audit Committee, Risk Committee, Remuneration Committee or Nomination Committee) where any two directors are required to form a quorum.
(3) Mr Duncan retired as a non-executive director and Chairman of the Remuneration Committee on 31 July 2008. (4) Mr McDonald retired as a non-executive director and member of the Audit Committee on 7 November 2008.
Directors’ and executives’ interests
The tables below show the interests of each director and executive in the issued ordinary shares and National Income Securities of the Group, and in registered schemes made available by the Group as at the date of this report. No director or senior executive held an interest in Trust Preferred Securities, Trust Preferred Securities II, National Capital Instruments or BNZ Income Securities of the Group.
Directors
Fully paid ordinary shares of the Company
Performance options over fully
paid ordinary shares of the
Company(1)
Performance rights over fully
paid ordinary shares of the
Company(1) National Income
Securities Registered
schemes MA Chaney(2) 26,549 - - - - PA Cross(2) 15,850 - - - - A Fahour 518,208 1,093,224 182,063 - - DT Gilbert(2) 15,041 - - 1,253 - PJ Rizzo(2) 5,089 - - - - JS Segal(2) 14,726 - - 180 - JM Stewart 144,746 1,675,000 649,750 - - JG Thorn(2) 11,669 - - - - GA Tomlinson(2) 37,282 - - 350 - MJ Ullmer 103,384 582,637 102,879 - - GM Williamson 9,096 - - - - Former Directors PJB Duncan(2) 14,553 - - - - TK McDonald 3,130 - - - -
Report of the directors
2008 Annual Financial Report 11
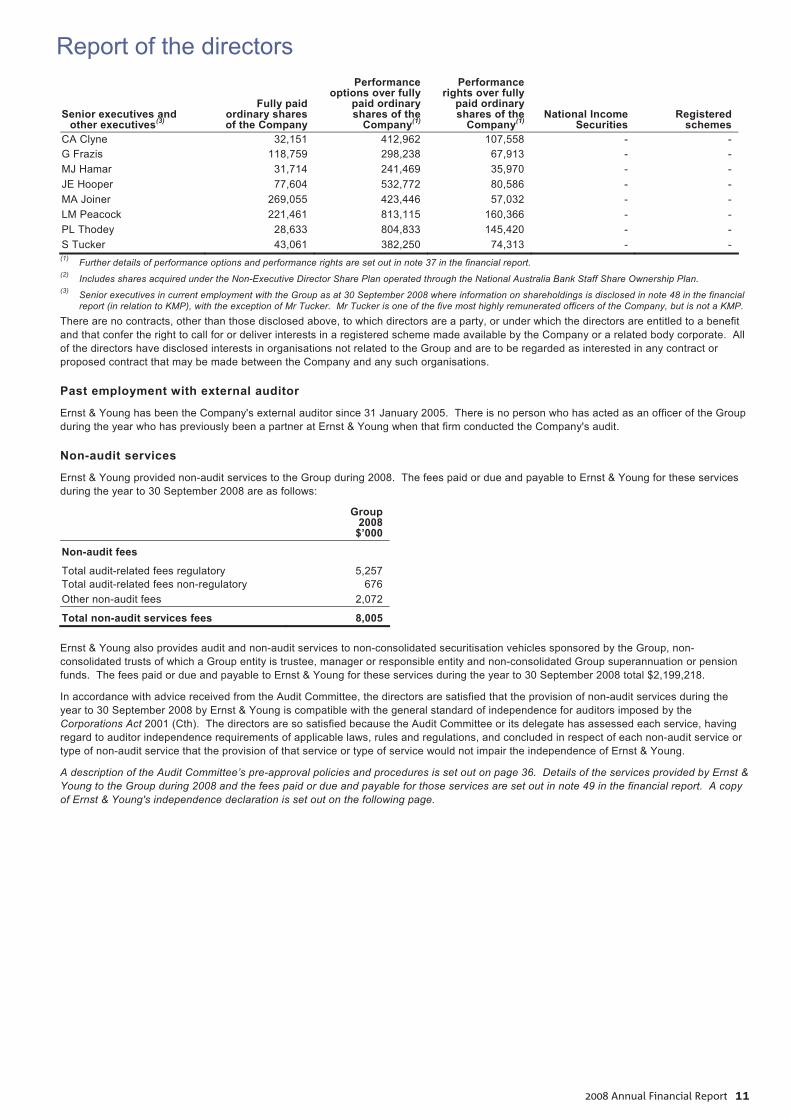
Senior executives and other executives(3)
Fully paid ordinary shares of the Company
Performance options over fully
paid ordinary shares of the
Company(1)
Performance rights over fully
paid ordinary shares of the
Company(1) National Income
Securities Registered
schemes CA Clyne 32,151 412,962 107,558 - - G Frazis 118,759 298,238 67,913 - - MJ Hamar 31,714 241,469 35,970 - - JE Hooper 77,604 532,772 80,586 - - MA Joiner 269,055 423,446 57,032 - - LM Peacock 221,461 813,115 160,366 - - PL Thodey 28,633 804,833 145,420 - - S Tucker 43,061 382,250 74,313 - - (1) Further details of performance options and performance rights are set out in note 37 in the financial report. (2) Includes shares acquired under the Non-Executive Director Share Plan operated through the National Australia Bank Staff Share Ownership Plan. (3) Senior executives in current employment with the Group as at 30 September 2008 where information on shareholdings is disclosed in note 48 in the financial
report (in relation to KMP), with the exception of Mr Tucker. Mr Tucker is one of the five most highly remunerated officers of the Company, but is not a KMP.
There are no contracts, other than those disclosed above, to which directors are a party, or under which the directors are entitled to a benefit and that confer the right to call for or deliver interests in a registered scheme made available by the Company or a related body corporate. All of the directors have disclosed interests in organisations not related to the Group and are to be regarded as interested in any contract or proposed contract that may be made between the Company and any such organisations.
Past employment with external auditor
Ernst & Young has been the Company's external auditor since 31 January 2005. There is no person who has acted as an officer of the Group during the year who has previously been a partner at Ernst & Young when that firm conducted the Company's audit.
Non-audit services
Ernst & Young provided non-audit services to the Group during 2008. The fees paid or due and payable to Ernst & Young for these services during the year to 30 September 2008 are as follows:
Group2008
$’000
Non-audit fees
Total audit-related fees regulatory 5,257 Total audit-related fees non-regulatory 676 Other non-audit fees 2,072
Total non-audit services fees 8,005 Ernst & Young also provides audit and non-audit services to non-consolidated securitisation vehicles sponsored by the Group, non-consolidated trusts of which a Group entity is trustee, manager or responsible entity and non-consolidated Group superannuation or pension funds. The fees paid or due and payable to Ernst & Young for these services during the year to 30 September 2008 total $2,199,218.
In accordance with advice received from the Audit Committee, the directors are satisfied that the provision of non-audit services during the year to 30 September 2008 by Ernst & Young is compatible with the general standard of independence for auditors imposed by the Corporations Act 2001 (Cth). The directors are so satisfied because the Audit Committee or its delegate has assessed each service, having regard to auditor independence requirements of applicable laws, rules and regulations, and concluded in respect of each non-audit service or type of non-audit service that the provision of that service or type of service would not impair the independence of Ernst & Young.
A description of the Audit Committee’s pre-approval policies and procedures is set out on page 36. Details of the services provided by Ernst & Young to the Group during 2008 and the fees paid or due and payable for those services are set out in note 49 in the financial report. A copy of Ernst & Young's independence declaration is set out on the following page.
Report of the directors
National Australia Bank12
Auditor’s Independence Declaration to the directors of National Australia Bank Limited
In relation to our audit of the financial report of National Australia Bank Limited (the Company) and the entities it controlled during the year (the Group) for the financial year ended 30 September 2008, to the best of my knowledge and belief, there have been no contraventions of the auditor independence requirements of the Corporations Act 2001 (Cth) or any applicable code of professional conduct.
Ernst & Young
A.J. (Tony) Johnson
Partner
14 November 2008
Ernst & Young Building8 Exhibition StreetMelbourne VIC 3000 AustraliaGPO Box 67 Melbourne VIC 3001Tel: +61 3 9288 8000Fax: + 61 3 8650 7777www.ey.com/au
2008 Annual Financial Report 13
Report of the directorsRemuneration report
1
Index of terms and abbreviations used in this report An index of key terms and abbreviations used in the Remuneration Report is shown at the end of the report, on page 30. The first use of each term is shown in bold within the text of the report.
Remuneration Committee The Remuneration Committee is a committee of the Board. Its charter (which is approved by the Board) sets out the membership, responsibilities, authority and activities of the Committee. The full charter is available online at www.nabgroup.com.
The Committee:
monitors the Group’s reward strategy framework so that it continues to attract and retain top talent to deliver superior performance, motivates employees to pursue the long-term growth and success of the Group, and demonstrates a clear relationship between individual performance and reward;
approves policies for the Group’s leaders in relation to reward, recruitment, retention, and succession planning;
determines Total Reward outcomes for the Group Chief Executive Officer and executive directors;
recommends appropriate remuneration for non-executive directors;
determines the Group’s short-term incentive (STI) pools based on Company performance; and
assists the Board in monitoring the culture of the Group, the framework for measuring the Group’s behavioural standards, and diversity in the workplace.
Committee members at 30 September 2008 were Mrs Patricia Cross (Chairman), Ms Jillian S Segal and Mr Daniel T Gilbert.
Mr Duncan, who retired from the Board on 31 July 2008, was Chairman of the Committee until his retirement. Mrs Cross was appointed to the Committee as Chairman from 31 July 2008.
The Committee invites the Chairman of the Board and members of the management team to assist its deliberations (except concerning their own remuneration). It takes specialist remuneration advice during the year from external advisers, as appropriate.
Reward philosophy The Group’s philosophy is to manage a Total Reward framework designed to:
link employee rewards to creating sustainable value for shareholders;
attract, recognise and foster top talent; recognise capabilities and promote opportunities for career
and professional development; motivate people with energy and passion; reward those who deliver superior performance; provide fair and consistent rewards, benefits and conditions
within an integrated global strategy; provide rewards that are competitive within the global
markets in which the Group operates; and build a partnership between employees and other
shareholders through employee ownership of Company shares and securities.
Remuneration and Risk Alignment The Committee is aware of the recent regulatory focus on alignment of remuneration policies with sound risk management systems and with the organisation’s stated risk appetite. The Committee notes that this is an important principle and has reviewed the Group’s reward framework against guidelines and rules recently published by the UK Financial Services Authority,
US Department of Treasury, Financial Stability Forum and other bodies.
The Committee considers that the Company’s remuneration framework is aligned with those guidelines but will keep the matter under close review. When the Australian Prudential Regulation Authority (APRA) releases its expected guidelines in the next few months, they will provide a further benchmark against which to assess the Company’s Total Reward philosophy and framework.
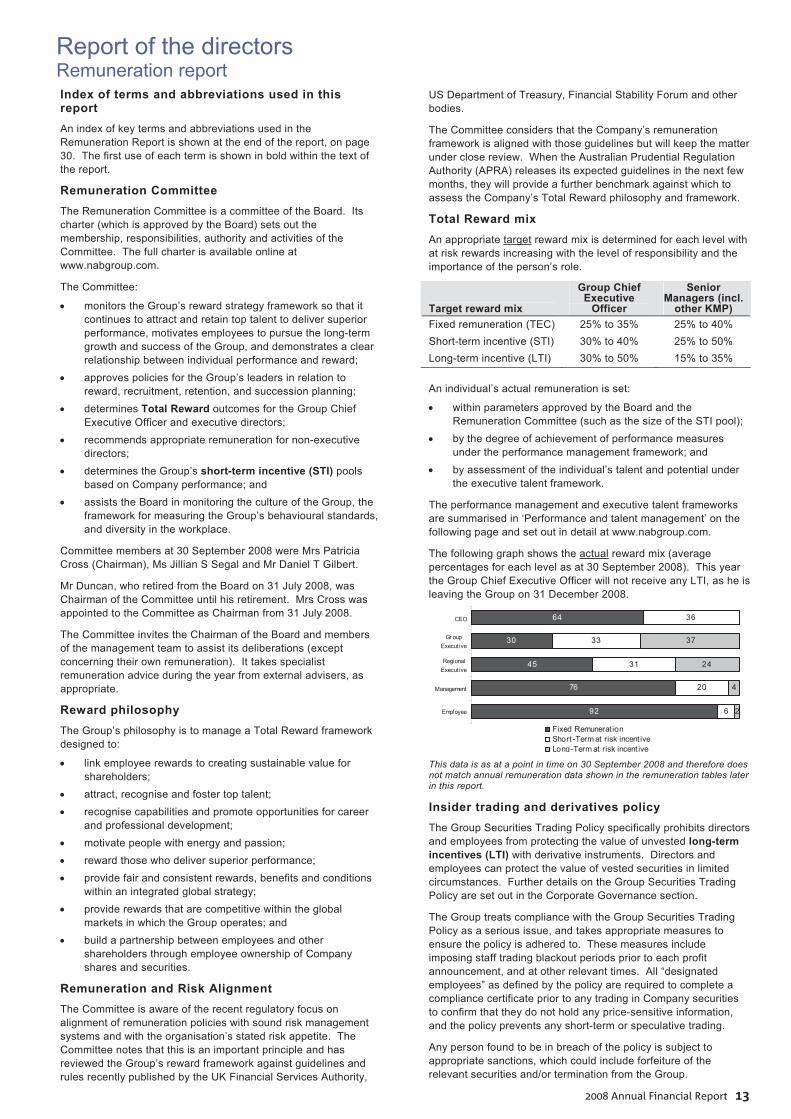
Total Reward mix An appropriate target reward mix is determined for each level with at risk rewards increasing with the level of responsibility and the importance of the person’s role.
Target reward mix
Group Chief Executive
Officer
Senior Managers (incl.
other KMP) Fixed remuneration (TEC) 25% to 35% 25% to 40% Short-term incentive (STI) 30% to 40% 25% to 50% Long-term incentive (LTI) 30% to 50% 15% to 35% An individual’s actual remuneration is set:
within parameters approved by the Board and the Remuneration Committee (such as the size of the STI pool);
by the degree of achievement of performance measures under the performance management framework; and
by assessment of the individual’s talent and potential under the executive talent framework.
The performance management and executive talent frameworks are summarised in ‘Performance and talent management’ on the following page and set out in detail at www.nabgroup.com.
The following graph shows the actual reward mix (average percentages for each level as at 30 September 2008). This year the Group Chief Executive Officer will not receive any LTI, as he is leaving the Group on 31 December 2008.
64
30
45
76
92
36
33
31
20
6
37
24
4
2
CEO
Gr oupExecutive
RegionalExecutive
Management
Employee
Fixed Remunerat ionShort -Term at risk incent iveLong-Term at risk incent ive
This data is as at a point in time on 30 September 2008 and therefore does not match annual remuneration data shown in the remuneration tables later in this report.
Insider trading and derivatives policy The Group Securities Trading Policy specifically prohibits directors and employees from protecting the value of unvested long-term incentives (LTI) with derivative instruments. Directors and employees can protect the value of vested securities in limited circumstances. Further details on the Group Securities Trading Policy are set out in the Corporate Governance section.
The Group treats compliance with the Group Securities Trading Policy as a serious issue, and takes appropriate measures to ensure the policy is adhered to. These measures include imposing staff trading blackout periods prior to each profit announcement, and at other relevant times. All “designated employees” as defined by the policy are required to complete a compliance certificate prior to any trading in Company securities to confirm that they do not hold any price-sensitive information, and the policy prevents any short-term or speculative trading.
Any person found to be in breach of the policy is subject to appropriate sanctions, which could include forfeiture of the relevant securities and/or termination from the Group.
Report of the directors
National Australia Bank142
Key Management Personnel (KMP)
The following pages outline the current performance and reward framework for those Key Management Personnel (KMP) who are executives of the Group and the Company as listed on page 19.
The reward philosophy and remuneration framework for the KMP who are non-executive directors is shown from page 27.
Performance and talent management
The performance management framework includes:
setting ‘quality gates’, which are threshold measures for compliance and behaviour expected from each employee;
setting corporate key performance indicators for the Group, which roll down into an individual balanced scorecard of measures for each KMP; and
a peer review process where the Group CEO compares and calibrates the performance of his collective Group reports.
Each scorecard is a balance of measures including financial, customer, community, employees, process improvements and quality. The measures are selected for their alignment to the Group’s direction. Through the scorecard approach and the subsequent peer review the STI programme is structured to reward the highest achievers against key individual, business and Group performance outcomes.
The performance management process is followed with assessment under the executive talent framework. This considers an individual’s capability, potential, and identifies KMP who can most contribute to the organisation’s performance through their strong leadership behaviour as well as performance. An individual’s talent score will determine their eligibility for an LTI reward and the amount granted. Through this process, individual LTI allocations transparently recognise current contribution, future capability and potential contribution to the Group’s performance over coming years.
The combination of the performance management and executive talent frameworks are designed to drive superior rewards for individuals who have the best relative performance and potential with:
fixed remuneration levels set at a higher market percentile and in the higher part of the range;
a greater STI multiple; and a larger LTI reward
as set out in more detail in the following sections.
Total Reward framework
Fixed remuneration
Total Employment Compensation (TEC) is the Group’s primary measure of fixed remuneration and is generally reviewed annually. The Group targets fixed remuneration at the market median (50th percentile) being paid in the finance industry in the global markets in which the Group operates.
For KMP ranked with the higher scores under the performance management framework, individual fixed remuneration may be linked to higher fixed remuneration market measures (55th to 60th percentiles) rather than to median market measures. For all employees, individual remuneration is set between 80% and 120% around the applicable market percentile, with the 100% to 120% part of the range being limited to exceptional circumstances and higher scoring performers.
Short-term incentives (STI)
STI targets and measures: STI targets and performance measures for the executive directors are determined by the Board, and by the Group Chief Executive Officer for other executive KMP. An STI target is set for each KMP with reference to external relativities (set between the median and upper quartile of the relevant market) and internal relativities, and is earned for ‘on-target’ individual and Group performance, subject to passing the ‘quality gates’ as described opposite.
Actual annual STI rewards reflect both individual performance (as described below) and business performance (which is reflected by the funded STI pool described in ‘Size of the STI reward pool’ on the following page).
Individual performance: The Board assesses the performance of the Group Chief Executive Officer against his scorecard of key performance measures. It may award an STI reward for exceptional individual performance of up to 1.5 times STI target.
The Group Chief Executive Officer assesses the performance of the other KMP against their individual scorecards and then against the scorecard outcomes for their peers, and applies an individual STI multiple of between zero and 2.0 (for exceptional individual performance). Only the most outstanding performers may receive an STI Multiple of more than 1.6. The total for all employees is limited to the size of the funded STI pool.
Delivery of STI rewards: Apart from any STI reward resulting from business out-performance (as provided by the funded STI pool), individuals receive any STI reward above their STI target as above-target shares (subject to legal or tax constraints and to nominal threshold values). KMP located in Australia may also express a preference to receive a portion of the rest of their STI reward (up to their target) in cash, superannuation contributions or in up-to-target shares.
Executive directors receive at least half of any STI reward in Company shares under these programmes (subject to any required shareholder approval).
The Remuneration Committee believes the restrictions and forfeiture conditions on the STI shares (as set out in the Index of Key Terms) instil an appropriate focus on business performance beyond the current year, help to ensure that targets are consistently achieved and encourage an appropriate level of shareholding by KMP.
Long-term incentive (LTI) LTI targets are set between the median and upper quartile of the relevant market. Actual rewards are determined by talent and potential assessments under the executive talent framework (described opposite, in ‘Performance and talent management’). Continued LTI allocations are therefore not guaranteed.
Performance shares: LTI performance shares were offered for the first time in February 2008 (as outlined in the 2007 Remuneration Report), and KMP were provided approximately half of the value of their LTI in this form. Due to jurisdictional issues, KMP located in New Zealand received equivalent value in the form of LTI performance rights (with the same performance hurdle and similar terms).
The LTI performance shares are held in trust with restrictions on trading for a minimum of 3 years, and the forfeiture conditions include if the performance hurdles are not met, as set out in ‘LTI reward in performance shares’ on the following page (the corresponding LTI performance rights would not vest).
Report of the directors
2008 Annual Financial Report 153
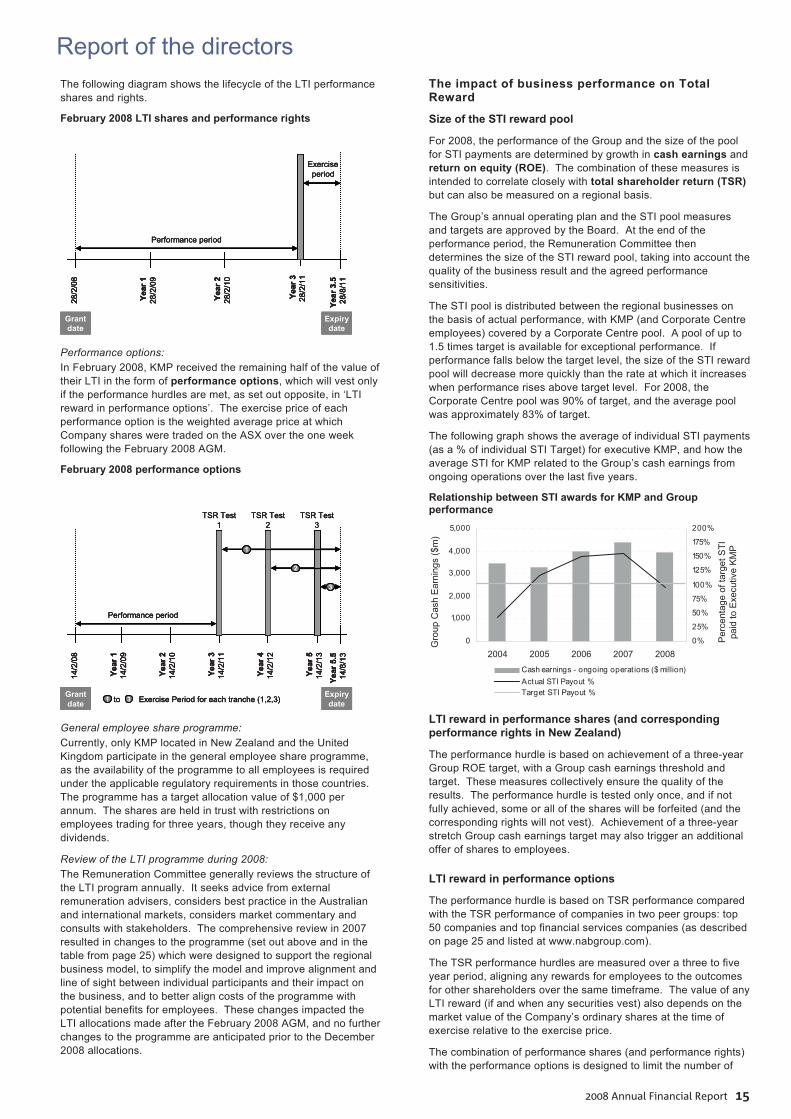
The following diagram shows the lifecycle of the LTI performance shares and rights.
February 2008 LTI shares and performance rights
Performance options: In February 2008, KMP received the remaining half of the value of their LTI in the form of performance options, which will vest only if the performance hurdles are met, as set out opposite, in ‘LTI reward in performance options’. The exercise price of each performance option is the weighted average price at which Company shares were traded on the ASX over the one week following the February 2008 AGM.
February 2008 performance options
General employee share programme: Currently, only KMP located in New Zealand and the United Kingdom participate in the general employee share programme, as the availability of the programme to all employees is required under the applicable regulatory requirements in those countries. The programme has a target allocation value of $1,000 per annum. The shares are held in trust with restrictions on employees trading for three years, though they receive any dividends.
Review of the LTI programme during 2008: The Remuneration Committee generally reviews the structure of the LTI program annually. It seeks advice from external remuneration advisers, considers best practice in the Australian and international markets, considers market commentary and consults with stakeholders. The comprehensive review in 2007 resulted in changes to the programme (set out above and in the table from page 25) which were designed to support the regional business model, to simplify the model and improve alignment and line of sight between individual participants and their impact on the business, and to better align costs of the programme with potential benefits for employees. These changes impacted the LTI allocations made after the February 2008 AGM, and no further changes to the programme are anticipated prior to the December 2008 allocations.
The impact of business performance on Total Reward
Size of the STI reward pool
For 2008, the performance of the Group and the size of the pool for STI payments are determined by growth in cash earnings and return on equity (ROE). The combination of these measures is intended to correlate closely with total shareholder return (TSR) but can also be measured on a regional basis.
The Group’s annual operating plan and the STI pool measures and targets are approved by the Board. At the end of the performance period, the Remuneration Committee then determines the size of the STI reward pool, taking into account the quality of the business result and the agreed performance sensitivities.
The STI pool is distributed between the regional businesses on the basis of actual performance, with KMP (and Corporate Centre employees) covered by a Corporate Centre pool. A pool of up to 1.5 times target is available for exceptional performance. If performance falls below the target level, the size of the STI reward pool will decrease more quickly than the rate at which it increases when performance rises above target level. For 2008, the Corporate Centre pool was 90% of target, and the average pool was approximately 83% of target.
The following graph shows the average of individual STI payments (as a % of individual STI Target) for executive KMP, and how the average STI for KMP related to the Group’s cash earnings from ongoing operations over the last five years.
Relationship between STI awards for KMP and Group performance
0
1,000
2,000
3,000
4,000
5,000
2004 2005 2006 2007 2008
Year
0%
25%
50%
75%
100%
125%
150%
175%
200%
Cash earnings - ongoing operat ions ($ million)Actual STI Payout %Target STI Payout %
LTI reward in performance shares (and corresponding performance rights in New Zealand)
The performance hurdle is based on achievement of a three-year Group ROE target, with a Group cash earnings threshold and target. These measures collectively ensure the quality of the results. The performance hurdle is tested only once, and if not fully achieved, some or all of the shares will be forfeited (and the corresponding rights will not vest). Achievement of a three-year stretch Group cash earnings target may also trigger an additional offer of shares to employees.
LTI reward in performance options
The performance hurdle is based on TSR performance compared with the TSR performance of companies in two peer groups: top 50 companies and top financial services companies (as described on page 25 and listed at www.nabgroup.com).
The TSR performance hurdles are measured over a three to five year period, aligning any rewards for employees to the outcomes for other shareholders over the same timeframe. The value of any LTI reward (if and when any securities vest) also depends on the market value of the Company’s ordinary shares at the time of exercise relative to the exercise price.
The combination of performance shares (and performance rights) with the performance options is designed to limit the number of
Per
cent
age
of ta
rget
STI
pa
id to
Exe
cutiv
e KM
P
Gro
up C
ash
Ear
ning
s ($
m)
Year
3.5
28/8
/11
28/2
/08
Year
128
/2/0
9
Year
228
/2/1
0
Year
328
/2/1
1
Performance period
Exercise period
Grantdate
Expirydate
Year
3.5
28/8
/11
28/2
/08
Year
128
/2/0
9
Year
228
/2/1
0
Year
328
/2/1
1
Performance period
Exercise period
Grantdate
Expirydate
Year
3.5
28/8
/11
Year
3.5
28/8
/11
28/2
/08
28/2
/08
Year
128
/2/0
9Ye
ar 1
28/2
/09
Year
228
/2/1
0Ye
ar 2
28/2
/10
Year
328
/2/1
1Ye
ar 3
28/2
/11
Performance period
Exercise period
Grantdate
Expirydate
Year
5.5
14/8
/13
14/2
/08
Year
114
/2/0
9
Year
214
/2/1
0
Year
514
/2/1
3
Performance period
TSR Test 3
Grantdate
Expirydate
Year
314
/2/1
1
Year
414
/2/1
2
3
1
2
TSR Test 2
TSR Test 1
1 3to Exercise Period for each tranche (1,2,3)
Year
5.5
14/8
/13
14/2
/08
Year
114
/2/0
9
Year
214
/2/1
0
Year
514
/2/1
3
Performance period
TSR Test 3
Grantdate
Expirydate
Year
314
/2/1
1
Year
414
/2/1
2
3
1
2
TSR Test 2
TSR Test 1
1 3to Exercise Period for each tranche (1,2,3)
Year
5.5
14/8
/13
Year
5.5
14/8
/13
14/2
/08
14/2
/08
Year
114
/2/0
9Ye
ar 1
14/2
/09
Year
214
/2/1
0Ye
ar 2
14/2
/10
Year
514
/2/1
3Ye
ar 5
14/2
/13
Performance period
TSR Test 3
Grantdate
Expirydate
Year
314
/2/1
1Ye
ar 3
14/2
/11
Year
414
/2/1
2Ye
ar 4
14/2
/12
3
1
2
TSR Test 2
TSR Test 1
1 3to Exercise Period for each tranche (1,2,3)
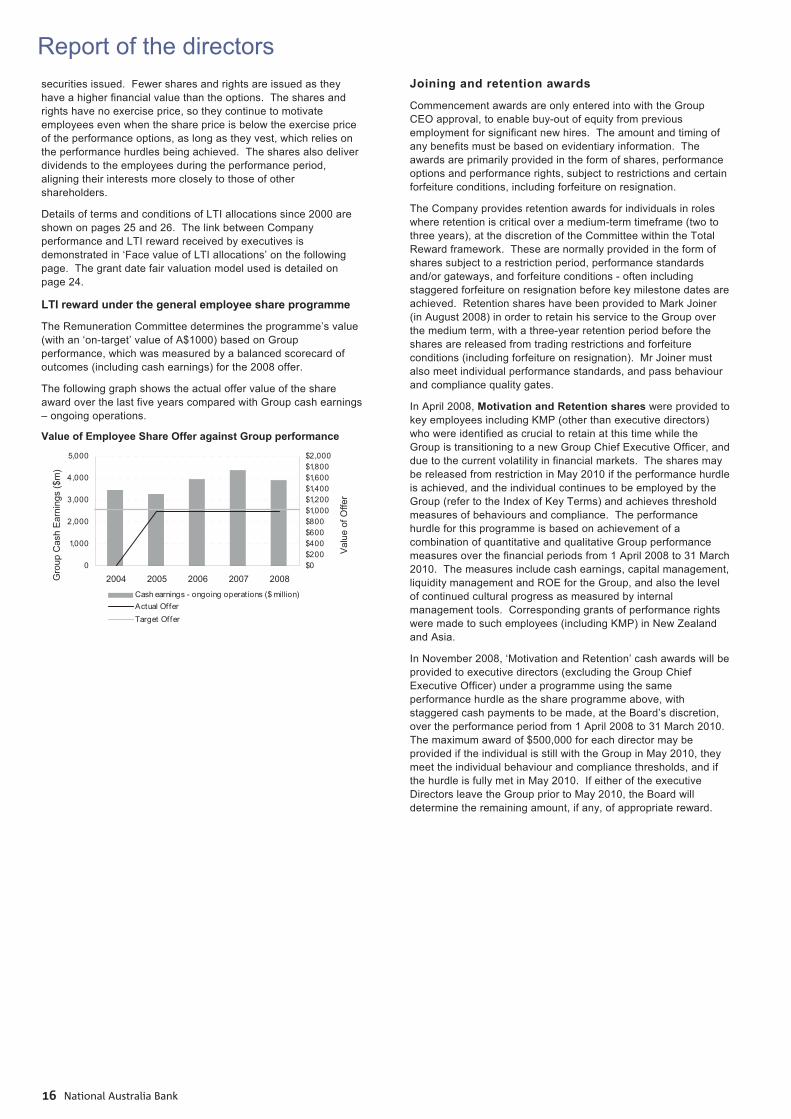
Report of the directors
National Australia Bank164
securities issued. Fewer shares and rights are issued as they have a higher financial value than the options. The shares and rights have no exercise price, so they continue to motivate employees even when the share price is below the exercise price of the performance options, as long as they vest, which relies on the performance hurdles being achieved. The shares also deliver dividends to the employees during the performance period, aligning their interests more closely to those of other shareholders.
Details of terms and conditions of LTI allocations since 2000 are shown on pages 25 and 26. The link between Company performance and LTI reward received by executives is demonstrated in ‘Face value of LTI allocations’ on the following page. The grant date fair valuation model used is detailed on page 24.
LTI reward under the general employee share programme
The Remuneration Committee determines the programme’s value (with an ‘on-target’ value of A$1000) based on Group performance, which was measured by a balanced scorecard of outcomes (including cash earnings) for the 2008 offer.
The following graph shows the actual offer value of the share award over the last five years compared with Group cash earnings – ongoing operations.
Value of Employee Share Offer against Group performance
0
1,000
2,000
3,000
4,000
5,000
2004 2005 2006 2007 2008$0$200$400$600$800$1,000$1,200$1,400$1,600$1,800$2,000
Cash earnings - ongoing operat ions ($ million)Actual Of ferTarget Offer
Joining and retention awards
Commencement awards are only entered into with the Group CEO approval, to enable buy-out of equity from previous employment for significant new hires. The amount and timing of any benefits must be based on evidentiary information. The awards are primarily provided in the form of shares, performance options and performance rights, subject to restrictions and certain forfeiture conditions, including forfeiture on resignation.
The Company provides retention awards for individuals in roles where retention is critical over a medium-term timeframe (two to three years), at the discretion of the Committee within the Total Reward framework. These are normally provided in the form of shares subject to a restriction period, performance standards and/or gateways, and forfeiture conditions - often including staggered forfeiture on resignation before key milestone dates are achieved. Retention shares have been provided to Mark Joiner (in August 2008) in order to retain his service to the Group over the medium term, with a three-year retention period before the shares are released from trading restrictions and forfeiture conditions (including forfeiture on resignation). Mr Joiner must also meet individual performance standards, and pass behaviour and compliance quality gates.
In April 2008, Motivation and Retention shares were provided to key employees including KMP (other than executive directors) who were identified as crucial to retain at this time while the Group is transitioning to a new Group Chief Executive Officer, and due to the current volatility in financial markets. The shares may be released from restriction in May 2010 if the performance hurdle is achieved, and the individual continues to be employed by the Group (refer to the Index of Key Terms) and achieves threshold measures of behaviours and compliance. The performance hurdle for this programme is based on achievement of a combination of quantitative and qualitative Group performance measures over the financial periods from 1 April 2008 to 31 March 2010. The measures include cash earnings, capital management, liquidity management and ROE for the Group, and also the level of continued cultural progress as measured by internal management tools. Corresponding grants of performance rights were made to such employees (including KMP) in New Zealand and Asia.
In November 2008, ‘Motivation and Retention’ cash awards will be provided to executive directors (excluding the Group Chief Executive Officer) under a programme using the same performance hurdle as the share programme above, with staggered cash payments to be made, at the Board’s discretion, over the performance period from 1 April 2008 to 31 March 2010. The maximum award of $500,000 for each director may be provided if the individual is still with the Group in May 2010, they meet the individual behaviour and compliance thresholds, and if the hurdle is fully met in May 2010. If either of the executive Directors leave the Group prior to May 2010, the Board will determine the remaining amount, if any, of appropriate reward.
Gro
up C
ash
Ear
ning
s ($
m)
Val
ue o
f Offe
r
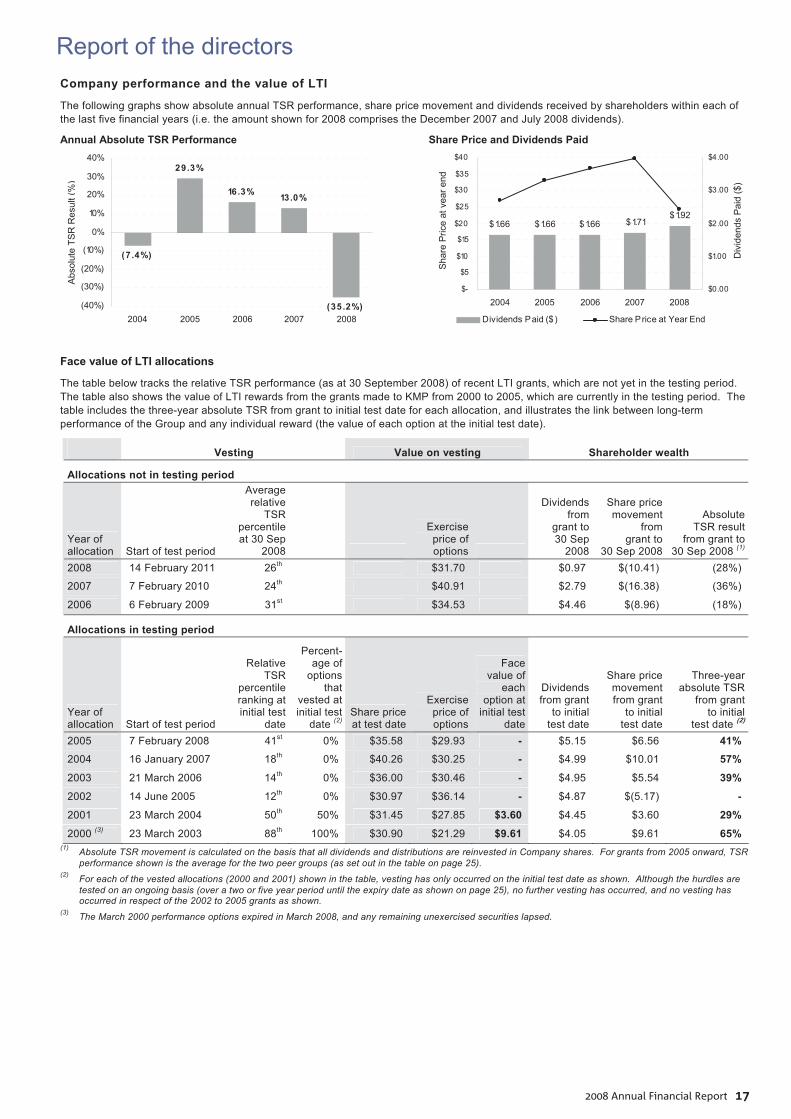
Report of the directors
2008 Annual Financial Report 175
Company performance and the value of LTI
The following graphs show absolute annual TSR performance, share price movement and dividends received by shareholders within each of the last five financial years (i.e. the amount shown for 2008 comprises the December 2007 and July 2008 dividends).
Annual Absolute TSR Performance
(7 .4%)
29.3%
16.3% 13.0%
(35.2%)(40%)
(30%)
(20%)
(10%)
0%
10%
20%
30%
40%
2004 2005 2006 2007 2008
Share Price and Dividends Paid
$1.66 $1.66 $1.66 $1.71$1.92
$-
$5
$10
$15
$20
$25
$30
$35
$40
2004 2005 2006 2007 2008$0.00
$1.00
$2.00
$3.00
$4.00
Dividends Paid ($ ) Share Price at Year End
Face value of LTI allocations
The table below tracks the relative TSR performance (as at 30 September 2008) of recent LTI grants, which are not yet in the testing period. The table also shows the value of LTI rewards from the grants made to KMP from 2000 to 2005, which are currently in the testing period. The table includes the three-year absolute TSR from grant to initial test date for each allocation, and illustrates the link between long-term performance of the Group and any individual reward (the value of each option at the initial test date).
Vesting Value on vesting Shareholder wealth
Allocations not in testing period
Year of allocation Start of test period
Average relative
TSR percentile at 30 Sep
2008
Exercise price of options
Dividends from
grant to 30 Sep
2008
Share price movement
from grant to
30 Sep 2008
Absolute TSR result
from grant to 30 Sep 2008 (1)
2008 14 February 2011 26th $31.70 $0.97 $(10.41) (28%)
2007 7 February 2010 24th $40.91 $2.79 $(16.38) (36%)
2006 6 February 2009 31st $34.53 $4.46 $(8.96) (18%)
Allocations in testing period
Year of allocation Start of test period
Relative TSR
percentile ranking at initial test
date
Percent-age of
options that
vested at initial test
date (2) Share price at test date
Exercise price of options
Face value of
each option at
initial test date
Dividends from grant
to initial test date
Share price movement from grant
to initial test date
Three-year absolute TSR
from grant to initial
test date (2)
2005 7 February 2008 41st 0% $35.58 $29.93 - $5.15 $6.56 41% 2004 16 January 2007 18th 0% $40.26 $30.25 - $4.99 $10.01 57%
2003 21 March 2006 14th 0% $36.00 $30.46 - $4.95 $5.54 39%
2002 14 June 2005 12th 0% $30.97 $36.14 - $4.87 $(5.17) -
2001 23 March 2004 50th 50% $31.45 $27.85 $3.60 $4.45 $3.60 29%
2000 (3) 23 March 2003 88th 100% $30.90 $21.29 $9.61 $4.05 $9.61 65% (1) Absolute TSR movement is calculated on the basis that all dividends and distributions are reinvested in Company shares. For grants from 2005 onward, TSR
performance shown is the average for the two peer groups (as set out in the table on page 25). (2) For each of the vested allocations (2000 and 2001) shown in the table, vesting has only occurred on the initial test date as shown. Although the hurdles are
tested on an ongoing basis (over a two or five year period until the expiry date as shown on page 25), no further vesting has occurred, and no vesting has occurred in respect of the 2002 to 2005 grants as shown.
(3) The March 2000 performance options expired in March 2008, and any remaining unexercised securities lapsed.
Abs
olut
e TS
R R
esul
t (%
)
Sha
re P
rice
at y
ear e
nd
Div
iden
ds P
aid
($)
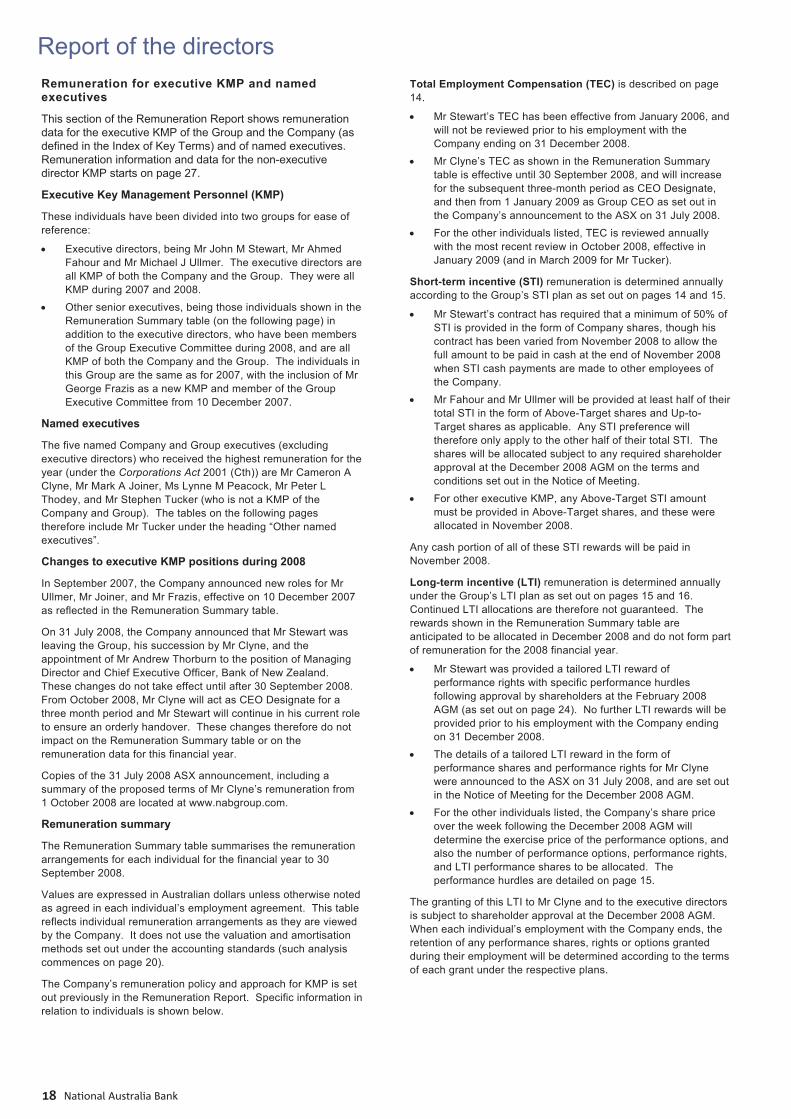
Report of the directors
National Australia Bank186
Remuneration for executive KMP and named executives
This section of the Remuneration Report shows remuneration data for the executive KMP of the Group and the Company (as defined in the Index of Key Terms) and of named executives. Remuneration information and data for the non-executive director KMP starts on page 27.
Executive Key Management Personnel (KMP)
These individuals have been divided into two groups for ease of reference:
Executive directors, being Mr John M Stewart, Mr Ahmed Fahour and Mr Michael J Ullmer. The executive directors are all KMP of both the Company and the Group. They were all KMP during 2007 and 2008.
Other senior executives, being those individuals shown in the Remuneration Summary table (on the following page) in addition to the executive directors, who have been members of the Group Executive Committee during 2008, and are all KMP of both the Company and the Group. The individuals in this Group are the same as for 2007, with the inclusion of Mr George Frazis as a new KMP and member of the Group Executive Committee from 10 December 2007.
Named executives
The five named Company and Group executives (excluding executive directors) who received the highest remuneration for the year (under the Corporations Act 2001 (Cth)) are Mr Cameron A Clyne, Mr Mark A Joiner, Ms Lynne M Peacock, Mr Peter L Thodey, and Mr Stephen Tucker (who is not a KMP of the Company and Group). The tables on the following pages therefore include Mr Tucker under the heading “Other named executives”.
Changes to executive KMP positions during 2008
In September 2007, the Company announced new roles for Mr Ullmer, Mr Joiner, and Mr Frazis, effective on 10 December 2007 as reflected in the Remuneration Summary table.
On 31 July 2008, the Company announced that Mr Stewart was leaving the Group, his succession by Mr Clyne, and the appointment of Mr Andrew Thorburn to the position of Managing Director and Chief Executive Officer, Bank of New Zealand. These changes do not take effect until after 30 September 2008. From October 2008, Mr Clyne will act as CEO Designate for a three month period and Mr Stewart will continue in his current role to ensure an orderly handover. These changes therefore do not impact on the Remuneration Summary table or on the remuneration data for this financial year.
Copies of the 31 July 2008 ASX announcement, including a summary of the proposed terms of Mr Clyne’s remuneration from 1 October 2008 are located at www.nabgroup.com.
Remuneration summary
The Remuneration Summary table summarises the remuneration arrangements for each individual for the financial year to 30 September 2008.
Values are expressed in Australian dollars unless otherwise noted as agreed in each individual’s employment agreement. This table reflects individual remuneration arrangements as they are viewed by the Company. It does not use the valuation and amortisation methods set out under the accounting standards (such analysis commences on page 20).
The Company’s remuneration policy and approach for KMP is set out previously in the Remuneration Report. Specific information in relation to individuals is shown below.
Total Employment Compensation (TEC) is described on page 14.
Mr Stewart’s TEC has been effective from January 2006, and will not be reviewed prior to his employment with the Company ending on 31 December 2008.
Mr Clyne’s TEC as shown in the Remuneration Summary table is effective until 30 September 2008, and will increase for the subsequent three-month period as CEO Designate, and then from 1 January 2009 as Group CEO as set out in the Company’s announcement to the ASX on 31 July 2008.
For the other individuals listed, TEC is reviewed annually with the most recent review in October 2008, effective in January 2009 (and in March 2009 for Mr Tucker).
Short-term incentive (STI) remuneration is determined annually according to the Group’s STI plan as set out on pages 14 and 15.
Mr Stewart’s contract has required that a minimum of 50% of STI is provided in the form of Company shares, though his contract has been varied from November 2008 to allow the full amount to be paid in cash at the end of November 2008 when STI cash payments are made to other employees of the Company.
Mr Fahour and Mr Ullmer will be provided at least half of their total STI in the form of Above-Target shares and Up-to-Target shares as applicable. Any STI preference will therefore only apply to the other half of their total STI. The shares will be allocated subject to any required shareholder approval at the December 2008 AGM on the terms and conditions set out in the Notice of Meeting.
For other executive KMP, any Above-Target STI amount must be provided in Above-Target shares, and these were allocated in November 2008.
Any cash portion of all of these STI rewards will be paid in November 2008.
Long-term incentive (LTI) remuneration is determined annually under the Group’s LTI plan as set out on pages 15 and 16. Continued LTI allocations are therefore not guaranteed. The rewards shown in the Remuneration Summary table are anticipated to be allocated in December 2008 and do not form part of remuneration for the 2008 financial year.
Mr Stewart was provided a tailored LTI reward of performance rights with specific performance hurdles following approval by shareholders at the February 2008 AGM (as set out on page 24). No further LTI rewards will be provided prior to his employment with the Company ending on 31 December 2008.
The details of a tailored LTI reward in the form of performance shares and performance rights for Mr Clyne were announced to the ASX on 31 July 2008, and are set out in the Notice of Meeting for the December 2008 AGM.
For the other individuals listed, the Company’s share price over the week following the December 2008 AGM will determine the exercise price of the performance options, and also the number of performance options, performance rights, and LTI performance shares to be allocated. The performance hurdles are detailed on page 15.
The granting of this LTI to Mr Clyne and to the executive directors is subject to shareholder approval at the December 2008 AGM. When each individual’s employment with the Company ends, the retention of any performance shares, rights or options granted during their employment will be determined according to the terms of each grant under the respective plans.
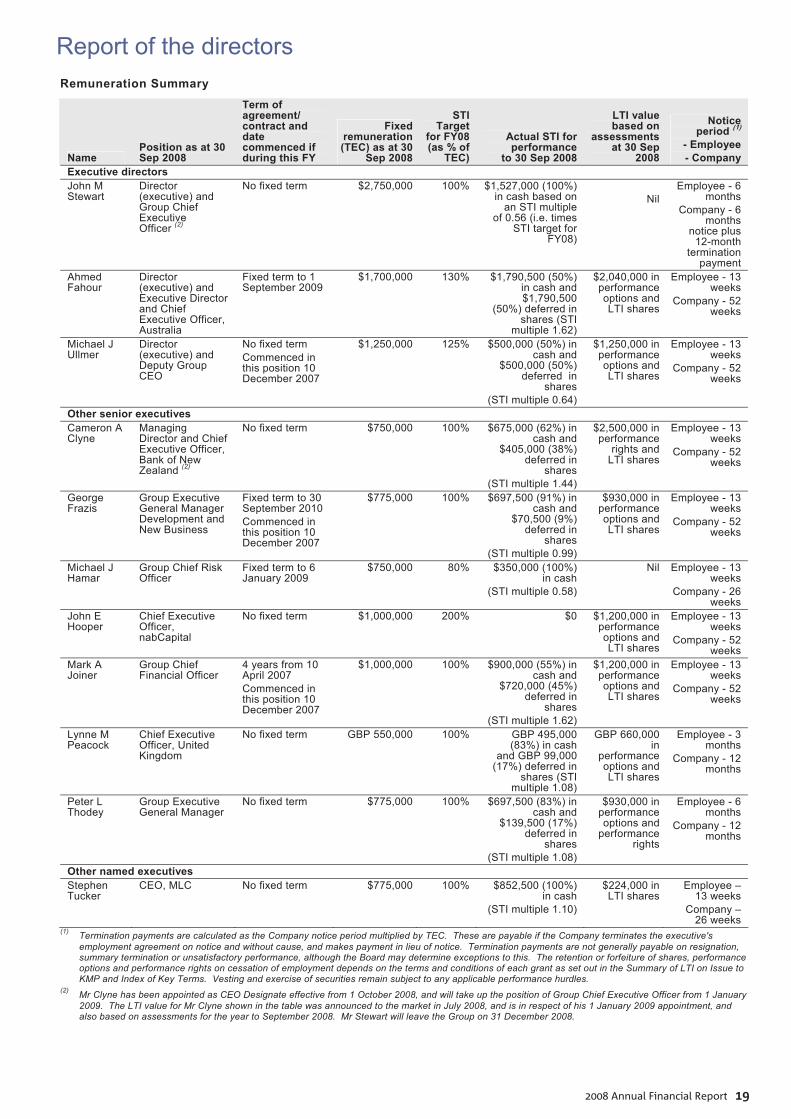
Report of the directors
2008 Annual Financial Report 197
Remuneration Summary
Name Position as at 30 Sep 2008
Term of agreement/ contract and date commenced if during this FY
Fixed remuneration (TEC) as at 30
Sep 2008
STI Target
for FY08 (as % of
TEC)
Actual STI for performance
to 30 Sep 2008
LTI value based on
assessments at 30 Sep
2008
Notice period (1)
- Employee - Company
Executive directors John M Stewart
Director (executive) and Group Chief Executive Officer (2)
No fixed term
$2,750,000 100% $1,527,000 (100%) in cash based on
an STI multiple of 0.56 (i.e. times
STI target for FY08)
Nil
Employee - 6 months
Company - 6 months
notice plus 12-month
termination payment
Ahmed Fahour
Director (executive) and Executive Director and Chief Executive Officer, Australia
Fixed term to 1 September 2009
$1,700,000 130% $1,790,500 (50%) in cash and $1,790,500
(50%) deferred in shares (STI
multiple 1.62)
$2,040,000 in performance options and LTI shares
Employee - 13 weeks
Company - 52 weeks
Michael J Ullmer
Director (executive) and Deputy Group CEO
No fixed term Commenced in this position 10 December 2007
$1,250,000 125% $500,000 (50%) in cash and
$500,000 (50%) deferred in
shares (STI multiple 0.64)
$1,250,000 in performance options and LTI shares
Employee - 13 weeks
Company - 52 weeks
Other senior executives Cameron A Clyne
Managing Director and Chief Executive Officer, Bank of New Zealand (2)
No fixed term $750,000 100% $675,000 (62%) in cash and
$405,000 (38%) deferred in
shares (STI multiple 1.44)
$2,500,000 in performance
rights and LTI shares
Employee - 13 weeks
Company - 52 weeks
George Frazis
Group Executive General Manager Development and New Business
Fixed term to 30 September 2010 Commenced in this position 10 December 2007
$775,000 100% $697,500 (91%) in cash and
$70,500 (9%) deferred in
shares (STI multiple 0.99)
$930,000 in performance options and LTI shares
Employee - 13 weeks
Company - 52 weeks
Michael J Hamar
Group Chief Risk Officer
Fixed term to 6 January 2009
$750,000 80% $350,000 (100%) in cash
(STI multiple 0.58)
Nil Employee - 13 weeks
Company - 26 weeks
John E Hooper
Chief Executive Officer, nabCapital
No fixed term
$1,000,000 200% $0 $1,200,000 in performance options and LTI shares
Employee - 13 weeks
Company - 52 weeks
Mark A Joiner
Group Chief Financial Officer
4 years from 10 April 2007 Commenced in this position 10 December 2007
$1,000,000 100% $900,000 (55%) in cash and
$720,000 (45%) deferred in
shares (STI multiple 1.62)
$1,200,000 in performance options and LTI shares
Employee - 13 weeks
Company - 52 weeks
Lynne M Peacock
Chief Executive Officer, United Kingdom
No fixed term GBP 550,000 100% GBP 495,000 (83%) in cash
and GBP 99,000 (17%) deferred in
shares (STI multiple 1.08)
GBP 660,000 in
performance options and LTI shares
Employee - 3 months
Company - 12 months
Peter L Thodey
Group Executive General Manager
No fixed term $775,000 100% $697,500 (83%) in cash and
$139,500 (17%) deferred in
shares (STI multiple 1.08)
$930,000 in performance options and
performance rights
Employee - 6 months
Company - 12 months
Other named executives Stephen Tucker
CEO, MLC No fixed term $775,000 100% $852,500 (100%) in cash
(STI multiple 1.10)
$224,000 in LTI shares
Employee – 13 weeks
Company – 26 weeks
(1) Termination payments are calculated as the Company notice period multiplied by TEC. These are payable if the Company terminates the executive's employment agreement on notice and without cause, and makes payment in lieu of notice. Termination payments are not generally payable on resignation, summary termination or unsatisfactory performance, although the Board may determine exceptions to this. The retention or forfeiture of shares, performance options and performance rights on cessation of employment depends on the terms and conditions of each grant as set out in the Summary of LTI on Issue to KMP and Index of Key Terms. Vesting and exercise of securities remain subject to any applicable performance hurdles.
(2) Mr Clyne has been appointed as CEO Designate effective from 1 October 2008, and will take up the position of Group Chief Executive Officer from 1 January 2009. The LTI value for Mr Clyne shown in the table was announced to the market in July 2008, and is in respect of his 1 January 2009 appointment, and also based on assessments for the year to September 2008. Mr Stewart will leave the Group on 31 December 2008.
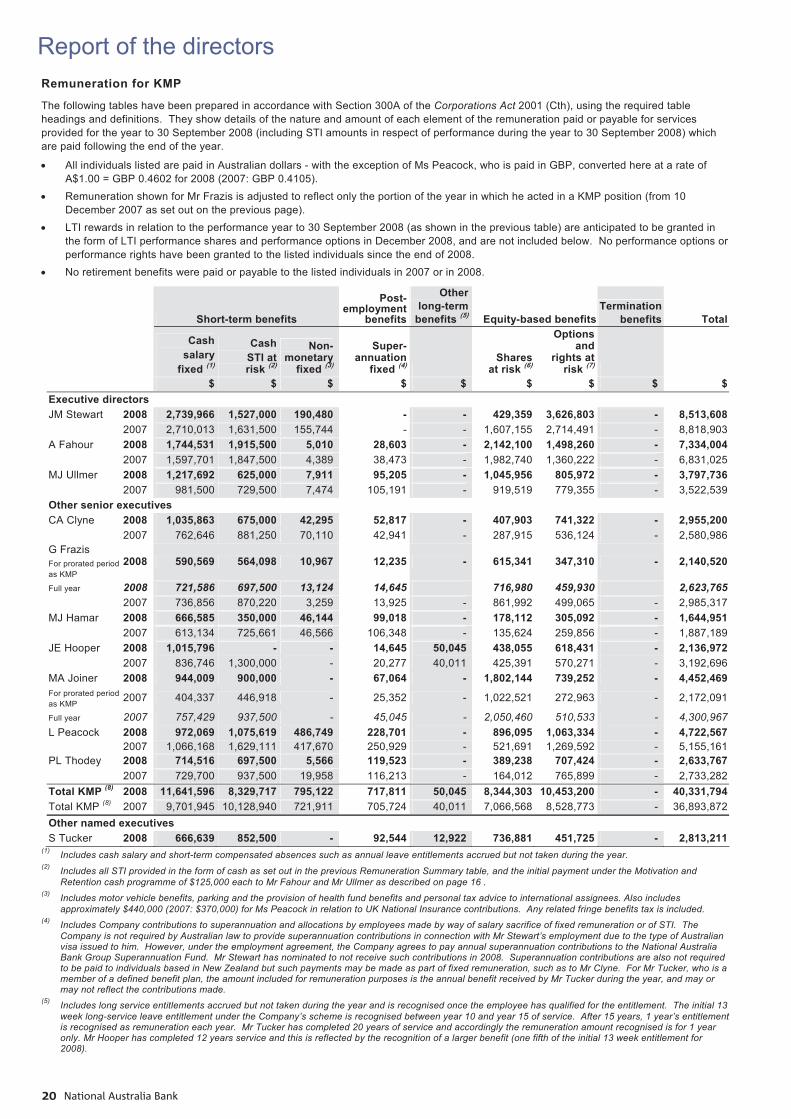
Report of the directors
National Australia Bank208
Remuneration for KMP
The following tables have been prepared in accordance with Section 300A of the Corporations Act 2001 (Cth), using the required table headings and definitions. They show details of the nature and amount of each element of the remuneration paid or payable for services provided for the year to 30 September 2008 (including STI amounts in respect of performance during the year to 30 September 2008) which are paid following the end of the year.
All individuals listed are paid in Australian dollars - with the exception of Ms Peacock, who is paid in GBP, converted here at a rate of A$1.00 = GBP 0.4602 for 2008 (2007: GBP 0.4105).
Remuneration shown for Mr Frazis is adjusted to reflect only the portion of the year in which he acted in a KMP position (from 10 December 2007 as set out on the previous page).
LTI rewards in relation to the performance year to 30 September 2008 (as shown in the previous table) are anticipated to be granted in the form of LTI performance shares and performance options in December 2008, and are not included below. No performance options or performance rights have been granted to the listed individuals since the end of 2008.
No retirement benefits were paid or payable to the listed individuals in 2007 or in 2008.
Short-term benefits
Post-employment
benefits
Otherlong-term
benefits (5) Equity-based benefits Termination
benefits Total
Cash salary
fixed (1)
Cash STI at risk (2)
Non-monetary
fixed (3)
Super-annuation
fixed (4)Shares
at risk (6)
Options and
rights at risk (7)
$ $ $ $ $ $ $ $ $Executive directors JM Stewart 2008 2,739,966 1,527,000 190,480 - - 429,359 3,626,803 - 8,513,608 2007 2,710,013 1,631,500 155,744 - - 1,607,155 2,714,491 - 8,818,903A Fahour 2008 1,744,531 1,915,500 5,010 28,603 - 2,142,100 1,498,260 - 7,334,004 2007 1,597,701 1,847,500 4,389 38,473 - 1,982,740 1,360,222 - 6,831,025MJ Ullmer 2008 1,217,692 625,000 7,911 95,205 - 1,045,956 805,972 - 3,797,736 2007 981,500 729,500 7,474 105,191 - 919,519 779,355 - 3,522,539Other senior executives CA Clyne 2008 1,035,863 675,000 42,295 52,817 - 407,903 741,322 - 2,955,200 2007 762,646 881,250 70,110 42,941 - 287,915 536,124 - 2,580,986G Frazis For prorated period as KMP
2008 590,569 564,098 10,967 12,235 - 615,341 347,310 - 2,140,520
Full year 2008 721,586 697,500 13,124 14,645 716,980 459,930 2,623,765 2007 736,856 870,220 3,259 13,925 - 861,992 499,065 - 2,985,317MJ Hamar 2008 666,585 350,000 46,144 99,018 - 178,112 305,092 - 1,644,951 2007 613,134 725,661 46,566 106,348 - 135,624 259,856 - 1,887,189JE Hooper 2008 1,015,796 - - 14,645 50,045 438,055 618,431 - 2,136,972 2007 836,746 1,300,000 - 20,277 40,011 425,391 570,271 - 3,192,696MA Joiner 2008 944,009 900,000 - 67,064 - 1,802,144 739,252 - 4,452,469For prorated period as KMP
2007 404,337 446,918 - 25,352 - 1,022,521 272,963 - 2,172,091
Full year 2007 757,429 937,500 - 45,045 - 2,050,460 510,533 - 4,300,967L Peacock 2008 972,069 1,075,619 486,749 228,701 - 896,095 1,063,334 - 4,722,567 2007 1,066,168 1,629,111 417,670 250,929 - 521,691 1,269,592 - 5,155,161PL Thodey 2008 714,516 697,500 5,566 119,523 - 389,238 707,424 - 2,633,767 2007 729,700 937,500 19,958 116,213 - 164,012 765,899 - 2,733,282Total KMP (8) 2008 11,641,596 8,329,717 795,122 717,811 50,045 8,344,303 10,453,200 - 40,331,794Total KMP (8) 2007 9,701,945 10,128,940 721,911 705,724 40,011 7,066,568 8,528,773 - 36,893,872Other named executives S Tucker 2008 666,639 852,500 - 92,544 12,922 736,881 451,725 - 2,813,211
(1) Includes cash salary and short-term compensated absences such as annual leave entitlements accrued but not taken during the year. (2) Includes all STI provided in the form of cash as set out in the previous Remuneration Summary table, and the initial payment under the Motivation and
Retention cash programme of $125,000 each to Mr Fahour and Mr Ullmer as described on page 16 . (3) Includes motor vehicle benefits, parking and the provision of health fund benefits and personal tax advice to international assignees. Also includes
approximately $440,000 (2007: $370,000) for Ms Peacock in relation to UK National Insurance contributions. Any related fringe benefits tax is included. (4) Includes Company contributions to superannuation and allocations by employees made by way of salary sacrifice of fixed remuneration or of STI. The
Company is not required by Australian law to provide superannuation contributions in connection with Mr Stewart’s employment due to the type of Australian visa issued to him. However, under the employment agreement, the Company agrees to pay annual superannuation contributions to the National Australia Bank Group Superannuation Fund. Mr Stewart has nominated to not receive such contributions in 2008. Superannuation contributions are also not required to be paid to individuals based in New Zealand but such payments may be made as part of fixed remuneration, such as to Mr Clyne. For Mr Tucker, who is a member of a defined benefit plan, the amount included for remuneration purposes is the annual benefit received by Mr Tucker during the year, and may or may not reflect the contributions made.
(5) Includes long service entitlements accrued but not taken during the year and is recognised once the employee has qualified for the entitlement. The initial 13 week long-service leave entitlement under the Company’s scheme is recognised between year 10 and year 15 of service. After 15 years, 1 year’s entitlement is recognised as remuneration each year. Mr Tucker has completed 20 years of service and accordingly the remuneration amount recognised is for 1 year only. Mr Hooper has completed 12 years service and this is reflected by the recognition of a larger benefit (one fifth of the initial 13 week entitlement for 2008).
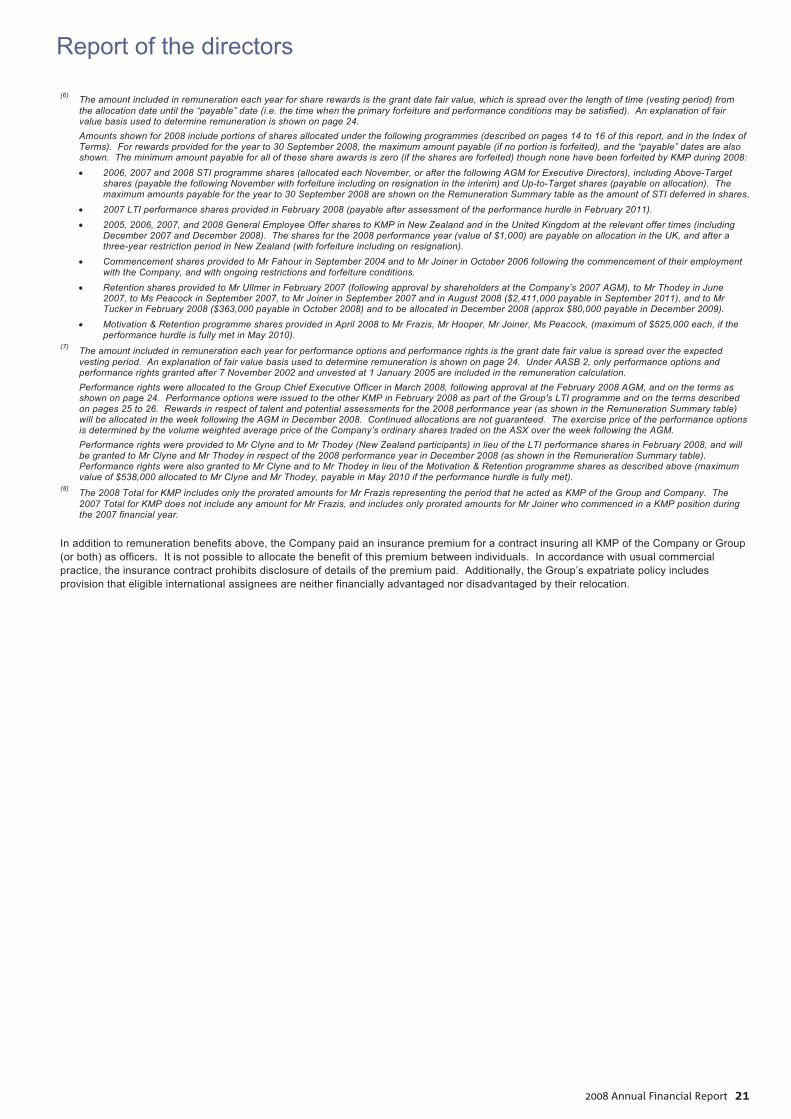
Report of the directors
2008 Annual Financial Report 219
(6) The amount included in remuneration each year for share rewards is the grant date fair value, which is spread over the length of time (vesting period) from
the allocation date until the “payable” date (i.e. the time when the primary forfeiture and performance conditions may be satisfied). An explanation of fair value basis used to determine remuneration is shown on page 24. Amounts shown for 2008 include portions of shares allocated under the following programmes (described on pages 14 to 16 of this report, and in the Index of Terms). For rewards provided for the year to 30 September 2008, the maximum amount payable (if no portion is forfeited), and the “payable” dates are also shown. The minimum amount payable for all of these share awards is zero (if the shares are forfeited) though none have been forfeited by KMP during 2008: 2006, 2007 and 2008 STI programme shares (allocated each November, or after the following AGM for Executive Directors), including Above-Target
shares (payable the following November with forfeiture including on resignation in the interim) and Up-to-Target shares (payable on allocation). The maximum amounts payable for the year to 30 September 2008 are shown on the Remuneration Summary table as the amount of STI deferred in shares.
2007 LTI performance shares provided in February 2008 (payable after assessment of the performance hurdle in February 2011). 2005, 2006, 2007, and 2008 General Employee Offer shares to KMP in New Zealand and in the United Kingdom at the relevant offer times (including
December 2007 and December 2008). The shares for the 2008 performance year (value of $1,000) are payable on allocation in the UK, and after a three-year restriction period in New Zealand (with forfeiture including on resignation).
Commencement shares provided to Mr Fahour in September 2004 and to Mr Joiner in October 2006 following the commencement of their employment with the Company, and with ongoing restrictions and forfeiture conditions.
Retention shares provided to Mr Ullmer in February 2007 (following approval by shareholders at the Company’s 2007 AGM), to Mr Thodey in June 2007, to Ms Peacock in September 2007, to Mr Joiner in September 2007 and in August 2008 ($2,411,000 payable in September 2011), and to Mr Tucker in February 2008 ($363,000 payable in October 2008) and to be allocated in December 2008 (approx $80,000 payable in December 2009).
Motivation & Retention programme shares provided in April 2008 to Mr Frazis, Mr Hooper, Mr Joiner, Ms Peacock, (maximum of $525,000 each, if the performance hurdle is fully met in May 2010).
(7) The amount included in remuneration each year for performance options and performance rights is the grant date fair value is spread over the expected vesting period. An explanation of fair value basis used to determine remuneration is shown on page 24. Under AASB 2, only performance options and performance rights granted after 7 November 2002 and unvested at 1 January 2005 are included in the remuneration calculation. Performance rights were allocated to the Group Chief Executive Officer in March 2008, following approval at the February 2008 AGM, and on the terms as shown on page 24. Performance options were issued to the other KMP in February 2008 as part of the Group's LTI programme and on the terms described on pages 25 to 26. Rewards in respect of talent and potential assessments for the 2008 performance year (as shown in the Remuneration Summary table) will be allocated in the week following the AGM in December 2008. Continued allocations are not guaranteed. The exercise price of the performance options is determined by the volume weighted average price of the Company’s ordinary shares traded on the ASX over the week following the AGM.
Performance rights were provided to Mr Clyne and to Mr Thodey (New Zealand participants) in lieu of the LTI performance shares in February 2008, and will be granted to Mr Clyne and Mr Thodey in respect of the 2008 performance year in December 2008 (as shown in the Remuneration Summary table). Performance rights were also granted to Mr Clyne and to Mr Thodey in lieu of the Motivation & Retention programme shares as described above (maximum value of $538,000 allocated to Mr Clyne and Mr Thodey, payable in May 2010 if the performance hurdle is fully met).
(8) The 2008 Total for KMP includes only the prorated amounts for Mr Frazis representing the period that he acted as KMP of the Group and Company. The 2007 Total for KMP does not include any amount for Mr Frazis, and includes only prorated amounts for Mr Joiner who commenced in a KMP position during the 2007 financial year.
In addition to remuneration benefits above, the Company paid an insurance premium for a contract insuring all KMP of the Company or Group (or both) as officers. It is not possible to allocate the benefit of this premium between individuals. In accordance with usual commercial practice, the insurance contract prohibits disclosure of details of the premium paid. Additionally, the Group’s expatriate policy includes provision that eligible international assignees are neither financially advantaged nor disadvantaged by their relocation.
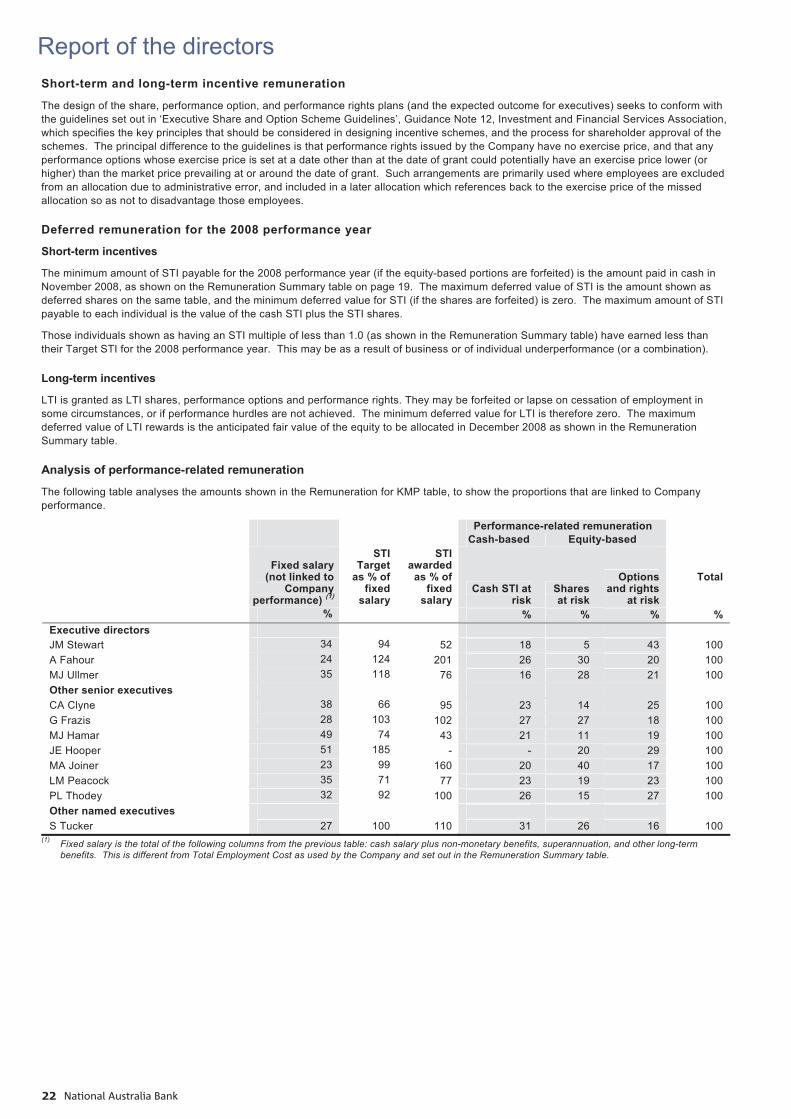
Report of the directors
National Australia Bank2210
Short-term and long-term incentive remuneration
The design of the share, performance option, and performance rights plans (and the expected outcome for executives) seeks to conform with the guidelines set out in ‘Executive Share and Option Scheme Guidelines’, Guidance Note 12, Investment and Financial Services Association, which specifies the key principles that should be considered in designing incentive schemes, and the process for shareholder approval of the schemes. The principal difference to the guidelines is that performance rights issued by the Company have no exercise price, and that any performance options whose exercise price is set at a date other than at the date of grant could potentially have an exercise price lower (or higher) than the market price prevailing at or around the date of grant. Such arrangements are primarily used where employees are excluded from an allocation due to administrative error, and included in a later allocation which references back to the exercise price of the missed allocation so as not to disadvantage those employees.
Deferred remuneration for the 2008 performance year
Short-term incentives
The minimum amount of STI payable for the 2008 performance year (if the equity-based portions are forfeited) is the amount paid in cash in November 2008, as shown on the Remuneration Summary table on page 19. The maximum deferred value of STI is the amount shown as deferred shares on the same table, and the minimum deferred value for STI (if the shares are forfeited) is zero. The maximum amount of STI payable to each individual is the value of the cash STI plus the STI shares.
Those individuals shown as having an STI multiple of less than 1.0 (as shown in the Remuneration Summary table) have earned less than their Target STI for the 2008 performance year. This may be as a result of business or of individual underperformance (or a combination).
Long-term incentives
LTI is granted as LTI shares, performance options and performance rights. They may be forfeited or lapse on cessation of employment in some circumstances, or if performance hurdles are not achieved. The minimum deferred value for LTI is therefore zero. The maximum deferred value of LTI rewards is the anticipated fair value of the equity to be allocated in December 2008 as shown in the Remuneration Summary table.
Analysis of performance-related remuneration
The following table analyses the amounts shown in the Remuneration for KMP table, to show the proportions that are linked to Company performance.
Performance-related remuneration Cash-based Equity-based
Fixed salary
(not linked to Company
performance) (1)
STI Target
as % of fixed
salary
STI awarded
as % of fixed
salary Cash STI at
risk Shares at risk
Options and rights
at risk
Total
% % % % % Executive directors JM Stewart 34 94 52 18 5 43 100 A Fahour 24 124 201 26 30 20 100 MJ Ullmer 35 118 76 16 28 21 100 Other senior executives CA Clyne 38 66 95 23 14 25 100 G Frazis 28 103 102 27 27 18 100 MJ Hamar 49 74 43 21 11 19 100 JE Hooper 51 185 - - 20 29 100 MA Joiner 23 99 160 20 40 17 100 LM Peacock 35 71 77 23 19 23 100 PL Thodey 32 92 100 26 15 27 100 Other named executives S Tucker 27 100 110 31 26 16 100
(1) Fixed salary is the total of the following columns from the previous table: cash salary plus non-monetary benefits, superannuation, and other long-term benefits. This is different from Total Employment Cost as used by the Company and set out in the Remuneration Summary table.
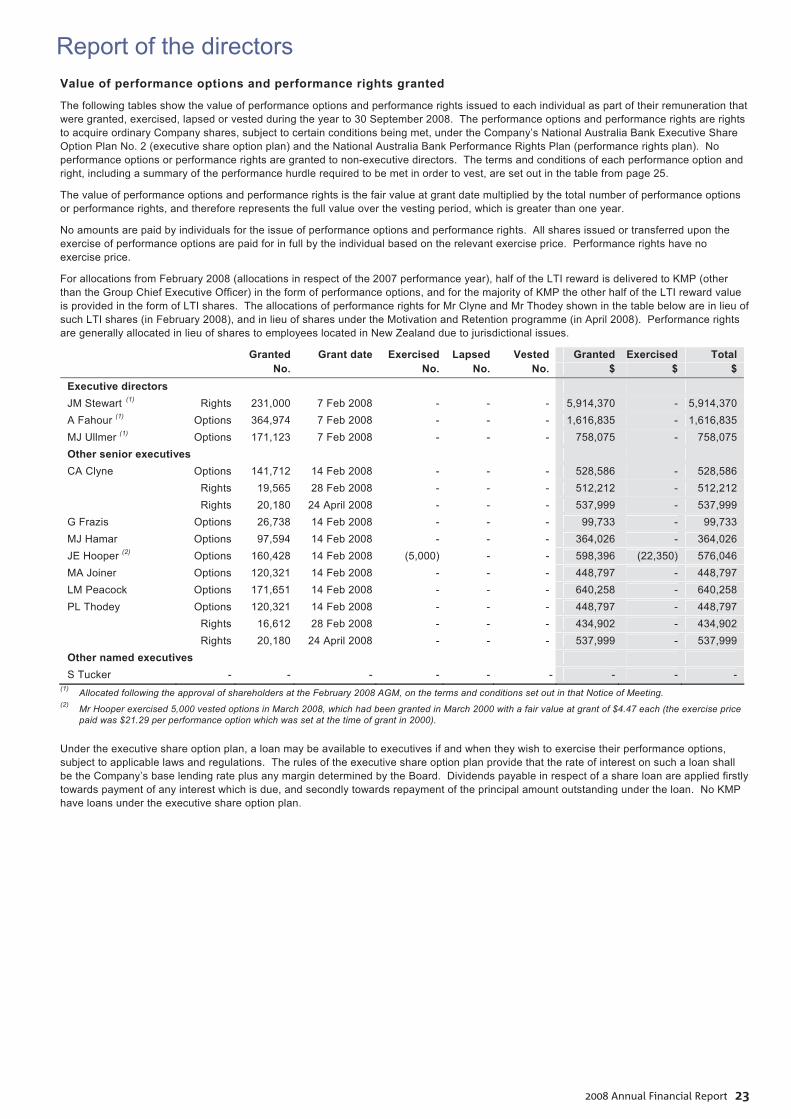
Report of the directors
2008 Annual Financial Report 2311
Value of performance options and performance rights granted
The following tables show the value of performance options and performance rights issued to each individual as part of their remuneration that were granted, exercised, lapsed or vested during the year to 30 September 2008. The performance options and performance rights are rights to acquire ordinary Company shares, subject to certain conditions being met, under the Company’s National Australia Bank Executive Share Option Plan No. 2 (executive share option plan) and the National Australia Bank Performance Rights Plan (performance rights plan). No performance options or performance rights are granted to non-executive directors. The terms and conditions of each performance option and right, including a summary of the performance hurdle required to be met in order to vest, are set out in the table from page 25.
The value of performance options and performance rights is the fair value at grant date multiplied by the total number of performance options or performance rights, and therefore represents the full value over the vesting period, which is greater than one year.
No amounts are paid by individuals for the issue of performance options and performance rights. All shares issued or transferred upon the exercise of performance options are paid for in full by the individual based on the relevant exercise price. Performance rights have no exercise price.
For allocations from February 2008 (allocations in respect of the 2007 performance year), half of the LTI reward is delivered to KMP (other than the Group Chief Executive Officer) in the form of performance options, and for the majority of KMP the other half of the LTI reward value is provided in the form of LTI shares. The allocations of performance rights for Mr Clyne and Mr Thodey shown in the table below are in lieu of such LTI shares (in February 2008), and in lieu of shares under the Motivation and Retention programme (in April 2008). Performance rights are generally allocated in lieu of shares to employees located in New Zealand due to jurisdictional issues.
Granted Grant date Exercised Lapsed Vested Granted Exercised Total No. No. No. No. $ $ $
Executive directors JM Stewart (1) Rights 231,000 7 Feb 2008 - - - 5,914,370 - 5,914,370 A Fahour (1) Options 364,974 7 Feb 2008 - - - 1,616,835 - 1,616,835 MJ Ullmer (1) Options 171,123 7 Feb 2008 - - - 758,075 - 758,075 Other senior executives CA Clyne Options 141,712 14 Feb 2008 - - - 528,586 - 528,586 Rights 19,565 28 Feb 2008 - - - 512,212 - 512,212 Rights 20,180 24 April 2008 - - - 537,999 - 537,999 G Frazis Options 26,738 14 Feb 2008 - - - 99,733 - 99,733 MJ Hamar Options 97,594 14 Feb 2008 - - - 364,026 - 364,026 JE Hooper (2) Options 160,428 14 Feb 2008 (5,000) - - 598,396 (22,350) 576,046 MA Joiner Options 120,321 14 Feb 2008 - - - 448,797 - 448,797 LM Peacock Options 171,651 14 Feb 2008 - - - 640,258 - 640,258 PL Thodey Options 120,321 14 Feb 2008 - - - 448,797 - 448,797 Rights 16,612 28 Feb 2008 - - - 434,902 - 434,902 Rights 20,180 24 April 2008 - - - 537,999 - 537,999 Other named executives S Tucker - - - - - - - - -
(1) Allocated following the approval of shareholders at the February 2008 AGM, on the terms and conditions set out in that Notice of Meeting. (2) Mr Hooper exercised 5,000 vested options in March 2008, which had been granted in March 2000 with a fair value at grant of $4.47 each (the exercise price
paid was $21.29 per performance option which was set at the time of grant in 2000).
Under the executive share option plan, a loan may be available to executives if and when they wish to exercise their performance options, subject to applicable laws and regulations. The rules of the executive share option plan provide that the rate of interest on such a loan shall be the Company’s base lending rate plus any margin determined by the Board. Dividends payable in respect of a share loan are applied firstly towards payment of any interest which is due, and secondly towards repayment of the principal amount outstanding under the loan. No KMP have loans under the executive share option plan.
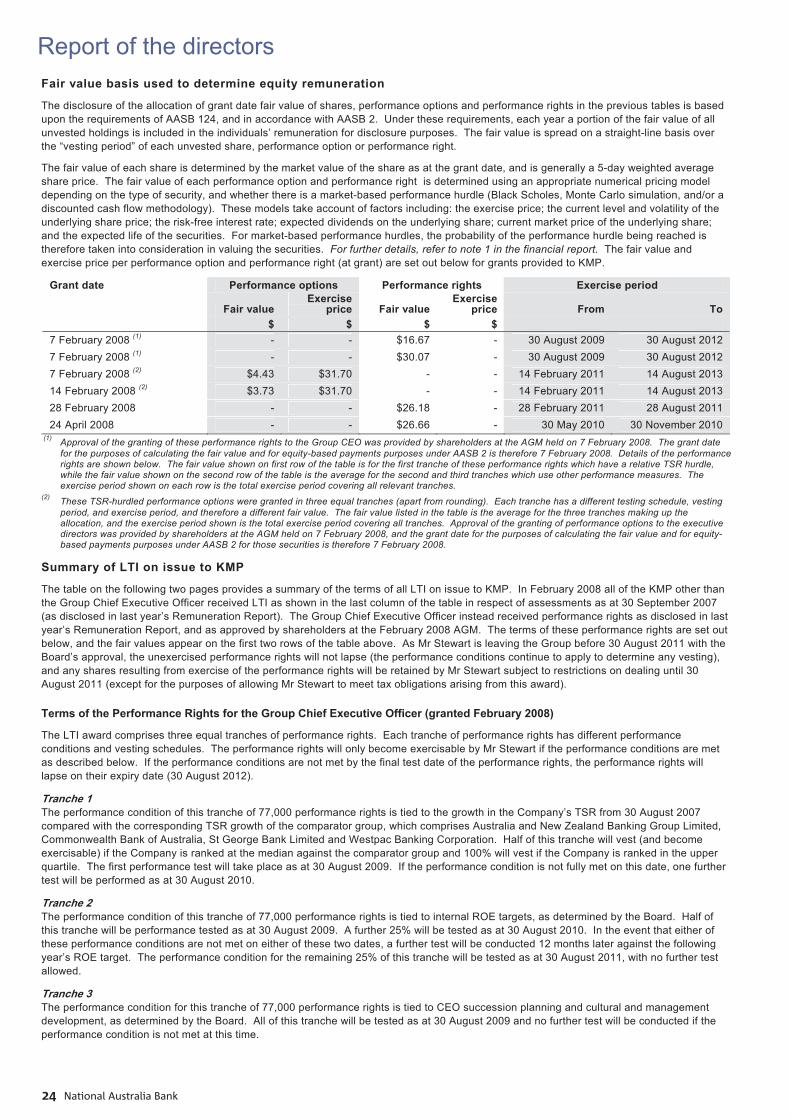
Report of the directors
National Australia Bank2412
Fair value basis used to determine equity remuneration
The disclosure of the allocation of grant date fair value of shares, performance options and performance rights in the previous tables is based upon the requirements of AASB 124, and in accordance with AASB 2. Under these requirements, each year a portion of the fair value of all unvested holdings is included in the individuals’ remuneration for disclosure purposes. The fair value is spread on a straight-line basis over the “vesting period” of each unvested share, performance option or performance right.
The fair value of each share is determined by the market value of the share as at the grant date, and is generally a 5-day weighted average share price. The fair value of each performance option and performance right is determined using an appropriate numerical pricing model depending on the type of security, and whether there is a market-based performance hurdle (Black Scholes, Monte Carlo simulation, and/or a discounted cash flow methodology). These models take account of factors including: the exercise price; the current level and volatility of the underlying share price; the risk-free interest rate; expected dividends on the underlying share; current market price of the underlying share; and the expected life of the securities. For market-based performance hurdles, the probability of the performance hurdle being reached is therefore taken into consideration in valuing the securities. For further details, refer to note 1 in the financial report. The fair value and exercise price per performance option and performance right (at grant) are set out below for grants provided to KMP.
Grant date Performance options Performance rights Exercise period
Fair value Exercise
price Fair value Exercise
price From To $ $ $ $ 7 February 2008 (1) - - $16.67 - 30 August 2009 30 August 2012 7 February 2008 (1) - - $30.07 - 30 August 2009 30 August 2012 7 February 2008 (2) $4.43 $31.70 - - 14 February 2011 14 August 2013 14 February 2008 (2) $3.73 $31.70 - - 14 February 2011 14 August 2013 28 February 2008 - - $26.18 - 28 February 2011 28 August 2011 24 April 2008 - - $26.66 - 30 May 2010 30 November 2010
(1) Approval of the granting of these performance rights to the Group CEO was provided by shareholders at the AGM held on 7 February 2008. The grant date for the purposes of calculating the fair value and for equity-based payments purposes under AASB 2 is therefore 7 February 2008. Details of the performance rights are shown below. The fair value shown on first row of the table is for the first tranche of these performance rights which have a relative TSR hurdle, while the fair value shown on the second row of the table is the average for the second and third tranches which use other performance measures. The exercise period shown on each row is the total exercise period covering all relevant tranches.
(2) These TSR-hurdled performance options were granted in three equal tranches (apart from rounding). Each tranche has a different testing schedule, vesting period, and exercise period, and therefore a different fair value. The fair value listed in the table is the average for the three tranches making up the allocation, and the exercise period shown is the total exercise period covering all tranches. Approval of the granting of performance options to the executive directors was provided by shareholders at the AGM held on 7 February 2008, and the grant date for the purposes of calculating the fair value and for equity-based payments purposes under AASB 2 for those securities is therefore 7 February 2008.
Summary of LTI on issue to KMP
The table on the following two pages provides a summary of the terms of all LTI on issue to KMP. In February 2008 all of the KMP other than the Group Chief Executive Officer received LTI as shown in the last column of the table in respect of assessments as at 30 September 2007 (as disclosed in last year’s Remuneration Report). The Group Chief Executive Officer instead received performance rights as disclosed in last year’s Remuneration Report, and as approved by shareholders at the February 2008 AGM. The terms of these performance rights are set out below, and the fair values appear on the first two rows of the table above. As Mr Stewart is leaving the Group before 30 August 2011 with the Board’s approval, the unexercised performance rights will not lapse (the performance conditions continue to apply to determine any vesting), and any shares resulting from exercise of the performance rights will be retained by Mr Stewart subject to restrictions on dealing until 30 August 2011 (except for the purposes of allowing Mr Stewart to meet tax obligations arising from this award).
Terms of the Performance Rights for the Group Chief Executive Officer (granted February 2008)
The LTI award comprises three equal tranches of performance rights. Each tranche of performance rights has different performance conditions and vesting schedules. The performance rights will only become exercisable by Mr Stewart if the performance conditions are met as described below. If the performance conditions are not met by the final test date of the performance rights, the performance rights will lapse on their expiry date (30 August 2012).
Tranche 1 The performance condition of this tranche of 77,000 performance rights is tied to the growth in the Company’s TSR from 30 August 2007 compared with the corresponding TSR growth of the comparator group, which comprises Australia and New Zealand Banking Group Limited, Commonwealth Bank of Australia, St George Bank Limited and Westpac Banking Corporation. Half of this tranche will vest (and become exercisable) if the Company is ranked at the median against the comparator group and 100% will vest if the Company is ranked in the upper quartile. The first performance test will take place as at 30 August 2009. If the performance condition is not fully met on this date, one further test will be performed as at 30 August 2010.
Tranche 2 The performance condition of this tranche of 77,000 performance rights is tied to internal ROE targets, as determined by the Board. Half of this tranche will be performance tested as at 30 August 2009. A further 25% will be tested as at 30 August 2010. In the event that either of these performance conditions are not met on either of these two dates, a further test will be conducted 12 months later against the following year’s ROE target. The performance condition for the remaining 25% of this tranche will be tested as at 30 August 2011, with no further test allowed.
Tranche 3 The performance condition for this tranche of 77,000 performance rights is tied to CEO succession planning and cultural and management development, as determined by the Board. All of this tranche will be tested as at 30 August 2009 and no further test will be conducted if the performance condition is not met at this time.
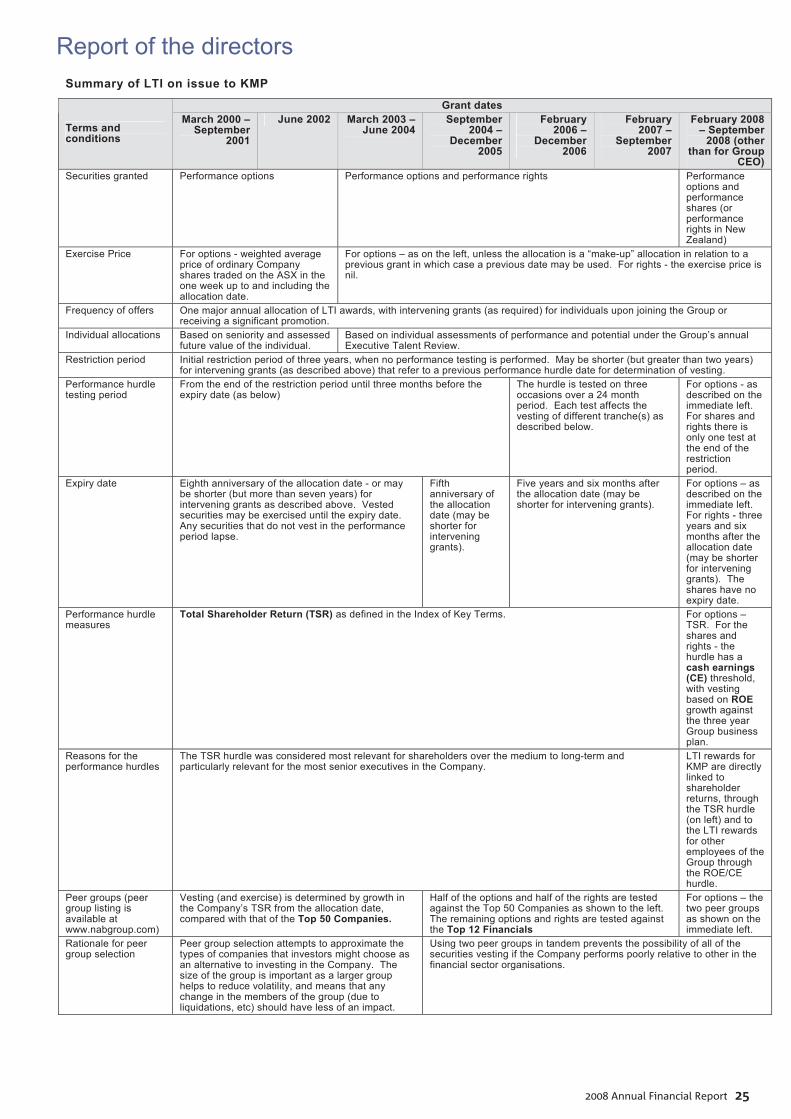
Report of the directors
2008 Annual Financial Report 2513
Summary of LTI on issue to KMP
Grant dates
Terms and conditions
March 2000 – September
2001
June 2002 March 2003 – June 2004
September 2004 –
December 2005
February 2006 –
December 2006
February 2007 –
September 2007
February 2008 – September
2008 (other than for Group
CEO) Securities granted Performance options Performance options and performance rights Performance
options and performance shares (or performance rights in New Zealand)
Exercise Price For options - weighted average price of ordinary Company shares traded on the ASX in the one week up to and including the allocation date.
For options – as on the left, unless the allocation is a “make-up” allocation in relation to a previous grant in which case a previous date may be used. For rights - the exercise price is nil.
Frequency of offers One major annual allocation of LTI awards, with intervening grants (as required) for individuals upon joining the Group or receiving a significant promotion.
Individual allocations Based on seniority and assessed future value of the individual.
Based on individual assessments of performance and potential under the Group’s annual Executive Talent Review.
Restriction period Initial restriction period of three years, when no performance testing is performed. May be shorter (but greater than two years) for intervening grants (as described above) that refer to a previous performance hurdle date for determination of vesting.
Performance hurdle testing period
From the end of the restriction period until three months before the expiry date (as below)
The hurdle is tested on three occasions over a 24 month period. Each test affects the vesting of different tranche(s) as described below.
For options - as described on the immediate left. For shares and rights there is only one test at the end of the restriction period.
Expiry date Eighth anniversary of the allocation date - or may be shorter (but more than seven years) for intervening grants as described above. Vested securities may be exercised until the expiry date. Any securities that do not vest in the performance period lapse.
Fifth anniversary of the allocation date (may be shorter for intervening grants).
Five years and six months after the allocation date (may be shorter for intervening grants).
For options – as described on the immediate left. For rights - three years and six months after the allocation date (may be shorter for intervening grants). The shares have no expiry date.
Performance hurdle measures
Total Shareholder Return (TSR) as defined in the Index of Key Terms. For options – TSR. For the shares and rights - the hurdle has a cash earnings (CE) threshold, with vesting based on ROE growth against the three year Group business plan.
Reasons for the performance hurdles
The TSR hurdle was considered most relevant for shareholders over the medium to long-term and particularly relevant for the most senior executives in the Company.
LTI rewards for KMP are directly linked to shareholder returns, through the TSR hurdle (on left) and to the LTI rewards for other employees of the Group through the ROE/CE hurdle.
Peer groups (peer group listing is available at www.nabgroup.com)
Vesting (and exercise) is determined by growth in the Company’s TSR from the allocation date, compared with that of the Top 50 Companies.
Half of the options and half of the rights are tested against the Top 50 Companies as shown to the left. The remaining options and rights are tested against the Top 12 Financials
For options – the two peer groups as shown on the immediate left.
Rationale for peer group selection
Peer group selection attempts to approximate the types of companies that investors might choose as an alternative to investing in the Company. The size of the group is important as a larger group helps to reduce volatility, and means that any change in the members of the group (due to liquidations, etc) should have less of an impact.
Using two peer groups in tandem prevents the possibility of all of the securities vesting if the Company performs poorly relative to other in the financial sector organisations.
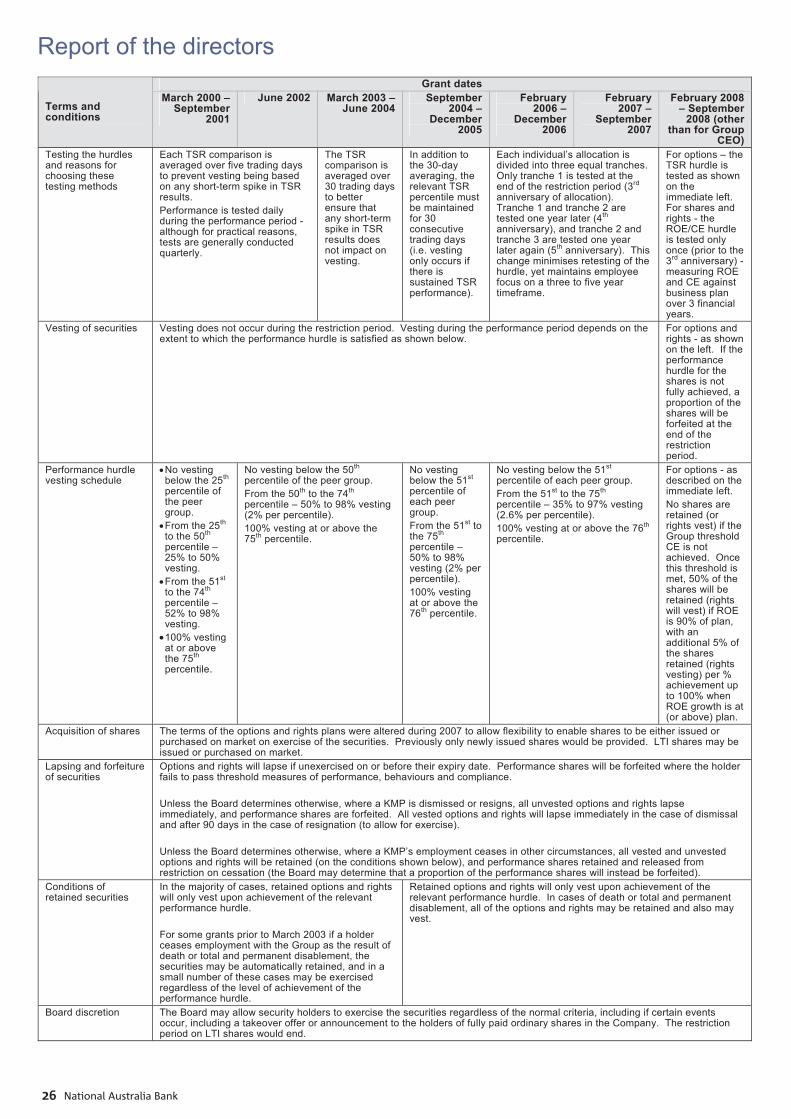
Report of the directors
National Australia Bank2614
Grant dates
Terms and conditions
March 2000 – September
2001
June 2002 March 2003 – June 2004
September 2004 –
December 2005
February 2006 –
December 2006
February 2007 –
September 2007
February 2008 – September
2008 (other than for Group
CEO) Testing the hurdles and reasons for choosing these testing methods
Each TSR comparison is averaged over five trading days to prevent vesting being based on any short-term spike in TSR results. Performance is tested daily during the performance period - although for practical reasons, tests are generally conducted quarterly.
The TSR comparison is averaged over 30 trading days to better ensure that any short-term spike in TSR results does not impact on vesting.
In addition to the 30-day averaging, the relevant TSR percentile must be maintained for 30 consecutive trading days (i.e. vesting only occurs if there is sustained TSR performance).
Each individual’s allocation is divided into three equal tranches. Only tranche 1 is tested at the end of the restriction period (3rd anniversary of allocation). Tranche 1 and tranche 2 are tested one year later (4th anniversary), and tranche 2 and tranche 3 are tested one year later again (5th anniversary). This change minimises retesting of the hurdle, yet maintains employee focus on a three to five year timeframe.
For options – the TSR hurdle is tested as shown on the immediate left. For shares and rights - the ROE/CE hurdle is tested only once (prior to the 3rd anniversary) - measuring ROE and CE against business plan over 3 financial years.
Vesting of securities Vesting does not occur during the restriction period. Vesting during the performance period depends on the extent to which the performance hurdle is satisfied as shown below.
For options and rights - as shown on the left. If the performance hurdle for the shares is not fully achieved, a proportion of the shares will be forfeited at the end of the restriction period.
Performance hurdle vesting schedule
No vesting below the 25th percentile of the peer group. From the 25th to the 50th percentile – 25% to 50% vesting. From the 51st to the 74th percentile – 52% to 98% vesting. 100% vesting at or above the 75th percentile.
No vesting below the 50th percentile of the peer group. From the 50th to the 74th percentile – 50% to 98% vesting (2% per percentile). 100% vesting at or above the 75th percentile.
No vesting below the 51st percentile of each peer group. From the 51st to the 75th percentile – 50% to 98% vesting (2% per percentile). 100% vesting at or above the 76th percentile.
No vesting below the 51st percentile of each peer group. From the 51st to the 75th percentile – 35% to 97% vesting (2.6% per percentile). 100% vesting at or above the 76th percentile.
For options - as described on the immediate left. No shares are retained (or rights vest) if the Group threshold CE is not achieved. Once this threshold is met, 50% of the shares will be retained (rights will vest) if ROE is 90% of plan, with an additional 5% of the shares retained (rights vesting) per % achievement up to 100% when ROE growth is at (or above) plan.
Acquisition of shares The terms of the options and rights plans were altered during 2007 to allow flexibility to enable shares to be either issued or purchased on market on exercise of the securities. Previously only newly issued shares would be provided. LTI shares may be issued or purchased on market.
Lapsing and forfeiture of securities
Options and rights will lapse if unexercised on or before their expiry date. Performance shares will be forfeited where the holder fails to pass threshold measures of performance, behaviours and compliance. Unless the Board determines otherwise, where a KMP is dismissed or resigns, all unvested options and rights lapse immediately, and performance shares are forfeited. All vested options and rights will lapse immediately in the case of dismissal and after 90 days in the case of resignation (to allow for exercise). Unless the Board determines otherwise, where a KMP’s employment ceases in other circumstances, all vested and unvested options and rights will be retained (on the conditions shown below), and performance shares retained and released from restriction on cessation (the Board may determine that a proportion of the performance shares will instead be forfeited).
Conditions of retained securities
In the majority of cases, retained options and rights will only vest upon achievement of the relevant performance hurdle. For some grants prior to March 2003 if a holder ceases employment with the Group as the result of death or total and permanent disablement, the securities may be automatically retained, and in a small number of these cases may be exercised regardless of the level of achievement of the performance hurdle.
Retained options and rights will only vest upon achievement of the relevant performance hurdle. In cases of death or total and permanent disablement, all of the options and rights may be retained and also may vest.
Board discretion The Board may allow security holders to exercise the securities regardless of the normal criteria, including if certain events occur, including a takeover offer or announcement to the holders of fully paid ordinary shares in the Company. The restriction period on LTI shares would end.
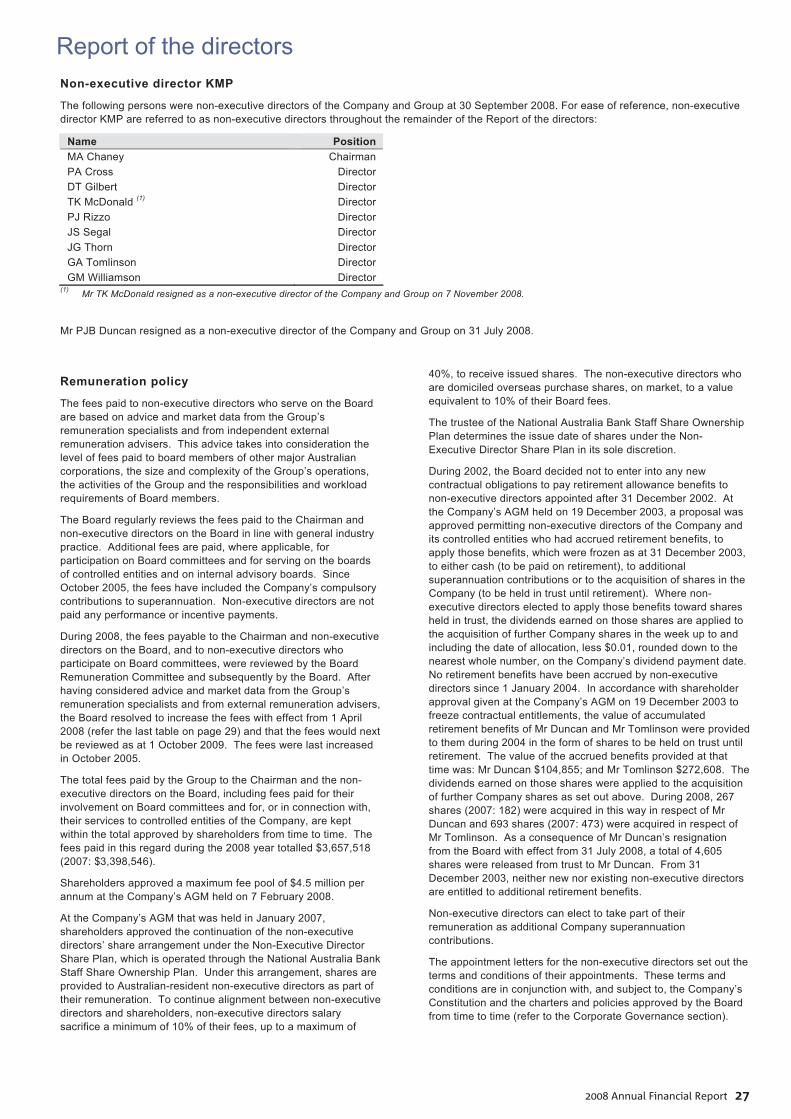
Report of the directors
2008 Annual Financial Report 2715
Non-executive director KMP
The following persons were non-executive directors of the Company and Group at 30 September 2008. For ease of reference, non-executive director KMP are referred to as non-executive directors throughout the remainder of the Report of the directors:
Name Position MA Chaney Chairman PA Cross Director DT Gilbert Director TK McDonald (1) Director PJ Rizzo Director JS Segal Director JG Thorn Director GA Tomlinson Director GM Williamson Director
(1) Mr TK McDonald resigned as a non-executive director of the Company and Group on 7 November 2008.
Mr PJB Duncan resigned as a non-executive director of the Company and Group on 31 July 2008.
Remuneration policy
The fees paid to non-executive directors who serve on the Board are based on advice and market data from the Group’s remuneration specialists and from independent external remuneration advisers. This advice takes into consideration the level of fees paid to board members of other major Australian corporations, the size and complexity of the Group’s operations, the activities of the Group and the responsibilities and workload requirements of Board members.
The Board regularly reviews the fees paid to the Chairman and non-executive directors on the Board in line with general industry practice. Additional fees are paid, where applicable, for participation on Board committees and for serving on the boards of controlled entities and on internal advisory boards. Since October 2005, the fees have included the Company’s compulsory contributions to superannuation. Non-executive directors are not paid any performance or incentive payments.
During 2008, the fees payable to the Chairman and non-executive directors on the Board, and to non-executive directors who participate on Board committees, were reviewed by the Board Remuneration Committee and subsequently by the Board. After having considered advice and market data from the Group’s remuneration specialists and from external remuneration advisers, the Board resolved to increase the fees with effect from 1 April 2008 (refer the last table on page 29) and that the fees would next be reviewed as at 1 October 2009. The fees were last increased in October 2005.
The total fees paid by the Group to the Chairman and the non-executive directors on the Board, including fees paid for their involvement on Board committees and for, or in connection with, their services to controlled entities of the Company, are kept within the total approved by shareholders from time to time. The fees paid in this regard during the 2008 year totalled $3,657,518 (2007: $3,398,546).
Shareholders approved a maximum fee pool of $4.5 million per annum at the Company’s AGM held on 7 February 2008.
At the Company’s AGM that was held in January 2007, shareholders approved the continuation of the non-executive directors’ share arrangement under the Non-Executive Director Share Plan, which is operated through the National Australia Bank Staff Share Ownership Plan. Under this arrangement, shares are provided to Australian-resident non-executive directors as part of their remuneration. To continue alignment between non-executive directors and shareholders, non-executive directors salary sacrifice a minimum of 10% of their fees, up to a maximum of
40%, to receive issued shares. The non-executive directors who are domiciled overseas purchase shares, on market, to a value equivalent to 10% of their Board fees.
The trustee of the National Australia Bank Staff Share Ownership Plan determines the issue date of shares under the Non-Executive Director Share Plan in its sole discretion.
During 2002, the Board decided not to enter into any new contractual obligations to pay retirement allowance benefits to non-executive directors appointed after 31 December 2002. At the Company’s AGM held on 19 December 2003, a proposal was approved permitting non-executive directors of the Company and its controlled entities who had accrued retirement benefits, to apply those benefits, which were frozen as at 31 December 2003, to either cash (to be paid on retirement), to additional superannuation contributions or to the acquisition of shares in the Company (to be held in trust until retirement). Where non-executive directors elected to apply those benefits toward shares held in trust, the dividends earned on those shares are applied to the acquisition of further Company shares in the week up to and including the date of allocation, less $0.01, rounded down to the nearest whole number, on the Company’s dividend payment date. No retirement benefits have been accrued by non-executive directors since 1 January 2004. In accordance with shareholder approval given at the Company’s AGM on 19 December 2003 to freeze contractual entitlements, the value of accumulated retirement benefits of Mr Duncan and Mr Tomlinson were provided to them during 2004 in the form of shares to be held on trust until retirement. The value of the accrued benefits provided at that time was: Mr Duncan $104,855; and Mr Tomlinson $272,608. The dividends earned on those shares were applied to the acquisition of further Company shares as set out above. During 2008, 267 shares (2007: 182) were acquired in this way in respect of Mr Duncan and 693 shares (2007: 473) were acquired in respect of Mr Tomlinson. As a consequence of Mr Duncan’s resignation from the Board with effect from 31 July 2008, a total of 4,605 shares were released from trust to Mr Duncan. From 31 December 2003, neither new nor existing non-executive directors are entitled to additional retirement benefits.
Non-executive directors can elect to take part of their remuneration as additional Company superannuation contributions.
The appointment letters for the non-executive directors set out the terms and conditions of their appointments. These terms and conditions are in conjunction with, and subject to, the Company’s Constitution and the charters and policies approved by the Board from time to time (refer to the Corporate Governance section).
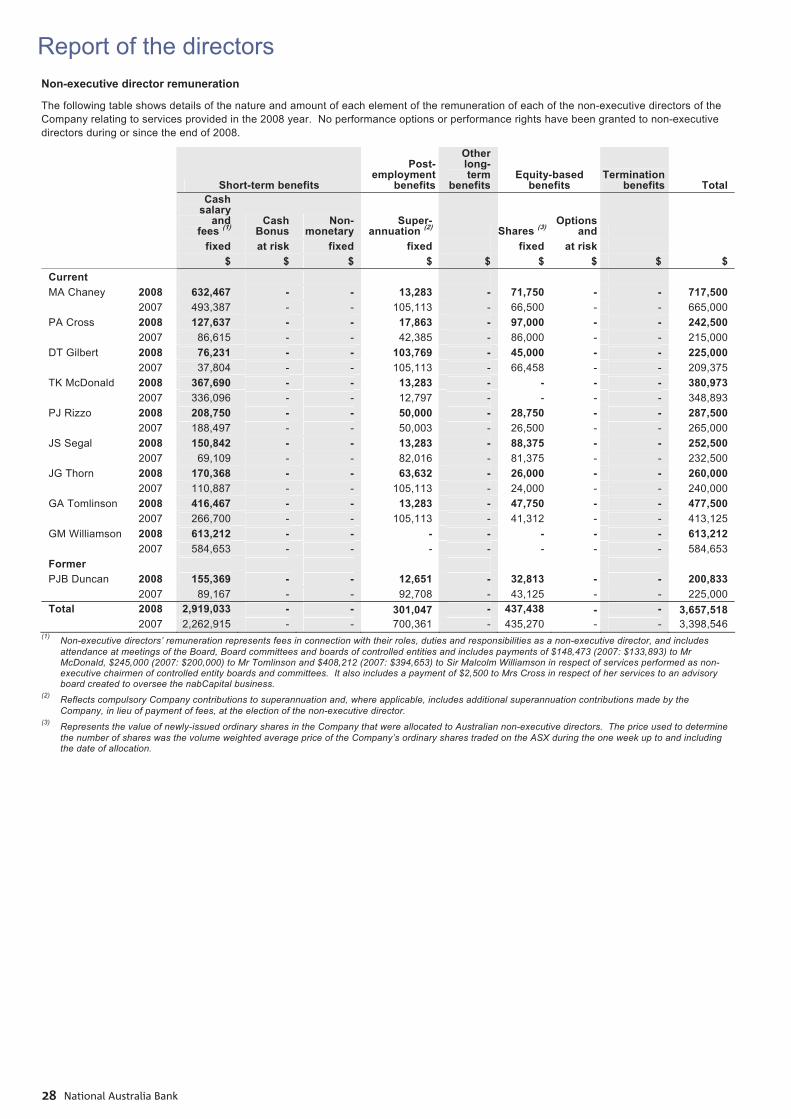
Report of the directors
National Australia Bank2816
Non-executive director remuneration
The following table shows details of the nature and amount of each element of the remuneration of each of the non-executive directors of the Company relating to services provided in the 2008 year. No performance options or performance rights have been granted to non-executive directors during or since the end of 2008.
Short-term benefits
Post-employment
benefits
Other long-term
benefits Equity-based
benefits Termination
benefits Total
Cash salary
and fees (1)
Cash Bonus
Non-monetary
Super- annuation (2) Shares (3)
Options and
fixed at risk fixed fixed fixed at risk $ $ $ $ $ $ $ $ $
Current MA Chaney 2008 632,467 - - 13,283 - 71,750 - - 717,500 2007 493,387 - - 105,113 - 66,500 - - 665,000 PA Cross 2008 127,637 - - 17,863 - 97,000 - - 242,500 2007 86,615 - - 42,385 - 86,000 - - 215,000 DT Gilbert 2008 76,231 - - 103,769 - 45,000 - - 225,000 2007 37,804 - - 105,113 - 66,458 - - 209,375 TK McDonald 2008 367,690 - - 13,283 - - - - 380,973 2007 336,096 - - 12,797 - - - - 348,893 PJ Rizzo 2008 208,750 - - 50,000 - 28,750 - - 287,500 2007 188,497 - - 50,003 - 26,500 - - 265,000 JS Segal 2008 150,842 - - 13,283 - 88,375 - - 252,500 2007 69,109 - - 82,016 - 81,375 - - 232,500 JG Thorn 2008 170,368 - - 63,632 - 26,000 - - 260,000 2007 110,887 - - 105,113 - 24,000 - - 240,000 GA Tomlinson 2008 416,467 - - 13,283 - 47,750 - - 477,500 2007 266,700 - - 105,113 - 41,312 - - 413,125 GM Williamson 2008 613,212 - - - - - - - 613,212 2007 584,653 - - - - - - - 584,653 Former PJB Duncan 2008 155,369 - - 12,651 - 32,813 - - 200,833 2007 89,167 - - 92,708 - 43,125 - - 225,000 Total 2008 2,919,033 - - 301,047 - 437,438 - - 3,657,518 2007 2,262,915 - - 700,361 - 435,270 - - 3,398,546
(1) Non-executive directors’ remuneration represents fees in connection with their roles, duties and responsibilities as a non-executive director, and includes attendance at meetings of the Board, Board committees and boards of controlled entities and includes payments of $148,473 (2007: $133,893) to Mr McDonald, $245,000 (2007: $200,000) to Mr Tomlinson and $408,212 (2007: $394,653) to Sir Malcolm Williamson in respect of services performed as non-executive chairmen of controlled entity boards and committees. It also includes a payment of $2,500 to Mrs Cross in respect of her services to an advisory board created to oversee the nabCapital business.
(2) Reflects compulsory Company contributions to superannuation and, where applicable, includes additional superannuation contributions made by the Company, in lieu of payment of fees, at the election of the non-executive director.
(3) Represents the value of newly-issued ordinary shares in the Company that were allocated to Australian non-executive directors. The price used to determine the number of shares was the volume weighted average price of the Company’s ordinary shares traded on the ASX during the one week up to and including the date of allocation.
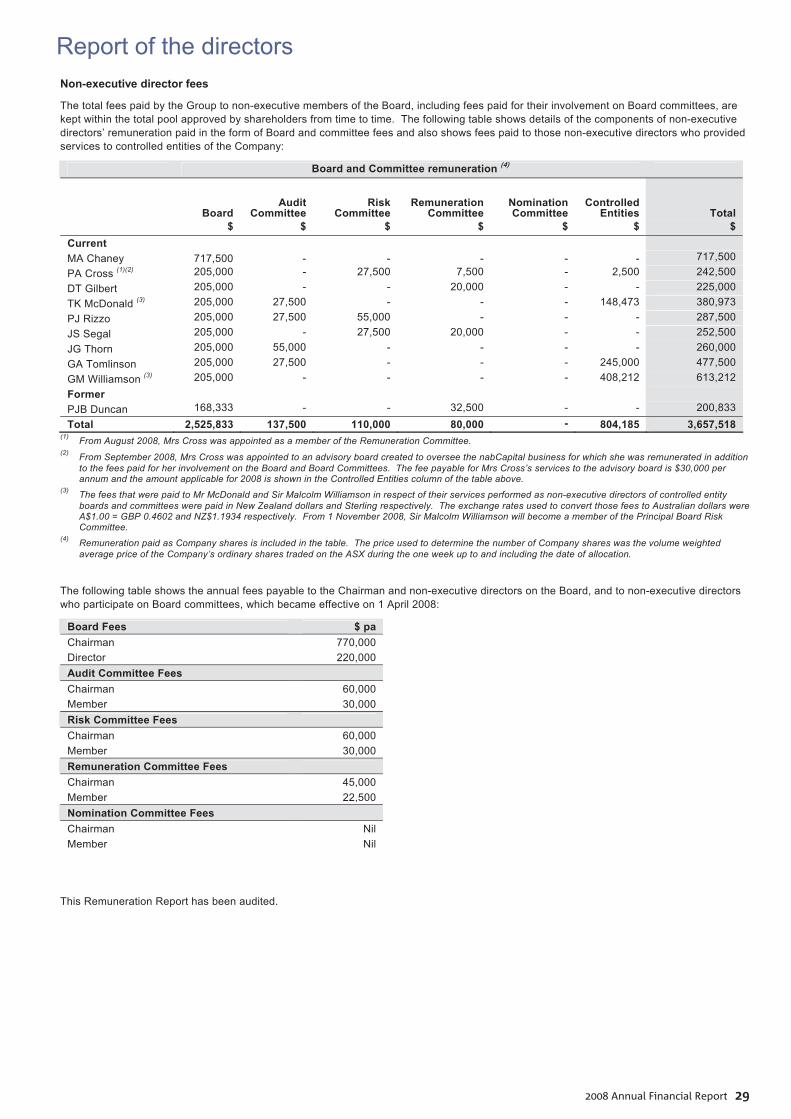
Report of the directors
2008 Annual Financial Report 29
17
Non-executive director fees
The total fees paid by the Group to non-executive members of the Board, including fees paid for their involvement on Board committees, are kept within the total pool approved by shareholders from time to time. The following table shows details of the components of non-executive directors’ remuneration paid in the form of Board and committee fees and also shows fees paid to those non-executive directors who provided services to controlled entities of the Company:
Board and Committee remuneration (4)
Board Audit
Committee Risk
Committee Remuneration
Committee Nomination Committee
Controlled Entities Total
$ $ $ $ $ $ $ Current MA Chaney 717,500 - - - - - 717,500 PA Cross (1)(2) 205,000 - 27,500 7,500 - 2,500 242,500 DT Gilbert 205,000 - - 20,000 - - 225,000 TK McDonald (3) 205,000 27,500 - - - 148,473 380,973 PJ Rizzo 205,000 27,500 55,000 - - - 287,500 JS Segal 205,000 - 27,500 20,000 - - 252,500 JG Thorn 205,000 55,000 - - - - 260,000 GA Tomlinson 205,000 27,500 - - - 245,000 477,500 GM Williamson (3) 205,000 - - - - 408,212 613,212 Former PJB Duncan 168,333 - - 32,500 - - 200,833 Total 2,525,833 137,500 110,000 80,000 - 804,185 3,657,518
(1) From August 2008, Mrs Cross was appointed as a member of the Remuneration Committee. (2) From September 2008, Mrs Cross was appointed to an advisory board created to oversee the nabCapital business for which she was remunerated in addition
to the fees paid for her involvement on the Board and Board Committees. The fee payable for Mrs Cross’s services to the advisory board is $30,000 per annum and the amount applicable for 2008 is shown in the Controlled Entities column of the table above.
(3) The fees that were paid to Mr McDonald and Sir Malcolm Williamson in respect of their services performed as non-executive directors of controlled entity boards and committees were paid in New Zealand dollars and Sterling respectively. The exchange rates used to convert those fees to Australian dollars were A$1.00 = GBP 0.4602 and NZ$1.1934 respectively. From 1 November 2008, Sir Malcolm Williamson will become a member of the Principal Board Risk Committee.
(4) Remuneration paid as Company shares is included in the table. The price used to determine the number of Company shares was the volume weighted average price of the Company’s ordinary shares traded on the ASX during the one week up to and including the date of allocation.
The following table shows the annual fees payable to the Chairman and non-executive directors on the Board, and to non-executive directors who participate on Board committees, which became effective on 1 April 2008:
Board Fees $ pa Chairman 770,000 Director 220,000 Audit Committee Fees Chairman 60,000 Member 30,000 Risk Committee Fees Chairman 60,000 Member 30,000 Remuneration Committee Fees Chairman 45,000 Member 22,500 Nomination Committee Fees Chairman Nil Member Nil
This Remuneration Report has been audited.
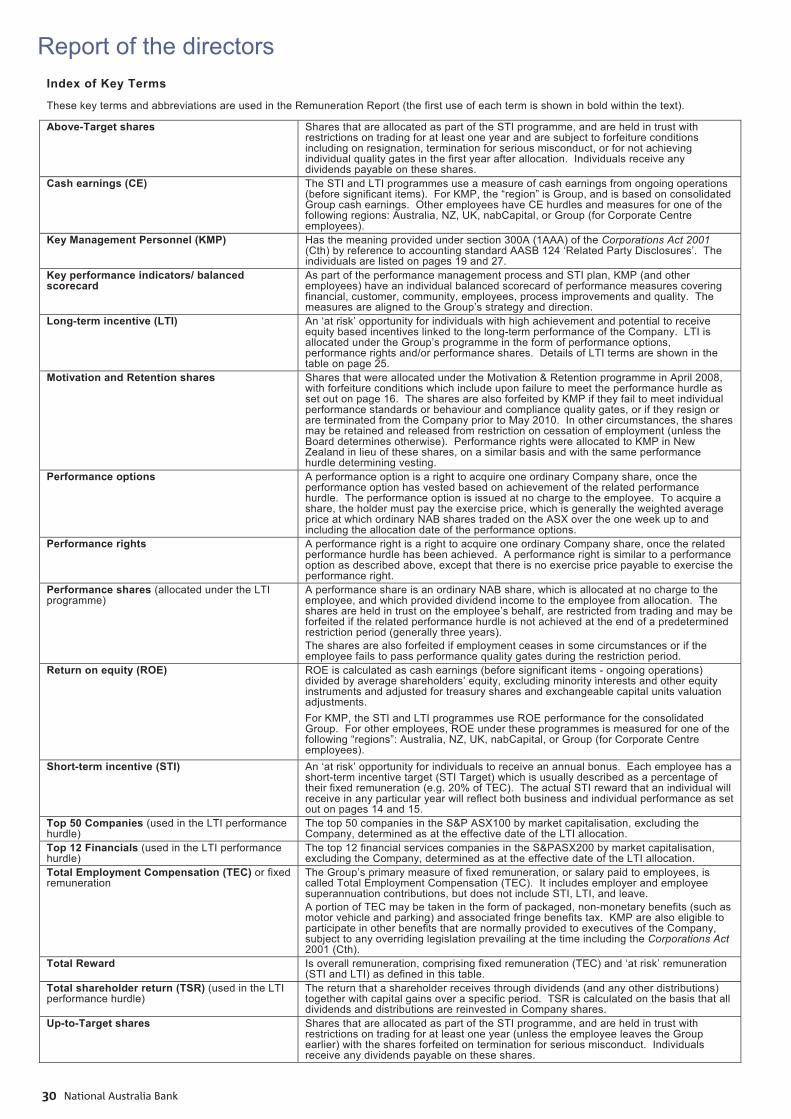
Report of the directors
National Australia Bank3018
Index of Key Terms
These key terms and abbreviations are used in the Remuneration Report (the first use of each term is shown in bold within the text).
Above-Target shares
Shares that are allocated as part of the STI programme, and are held in trust with restrictions on trading for at least one year and are subject to forfeiture conditions including on resignation, termination for serious misconduct, or for not achieving individual quality gates in the first year after allocation. Individuals receive any dividends payable on these shares.
Cash earnings (CE) The STI and LTI programmes use a measure of cash earnings from ongoing operations (before significant items). For KMP, the “region” is Group, and is based on consolidated Group cash earnings. Other employees have CE hurdles and measures for one of the following regions: Australia, NZ, UK, nabCapital, or Group (for Corporate Centre employees).
Key Management Personnel (KMP) Has the meaning provided under section 300A (1AAA) of the Corporations Act 2001 (Cth) by reference to accounting standard AASB 124 ‘Related Party Disclosures’. The individuals are listed on pages 19 and 27.
Key performance indicators/ balanced scorecard
As part of the performance management process and STI plan, KMP (and other employees) have an individual balanced scorecard of performance measures covering financial, customer, community, employees, process improvements and quality. The measures are aligned to the Group’s strategy and direction.
Long-term incentive (LTI) An ‘at risk’ opportunity for individuals with high achievement and potential to receive equity based incentives linked to the long-term performance of the Company. LTI is allocated under the Group’s programme in the form of performance options, performance rights and/or performance shares. Details of LTI terms are shown in the table on page 25.
Motivation and Retention shares Shares that were allocated under the Motivation & Retention programme in April 2008, with forfeiture conditions which include upon failure to meet the performance hurdle as set out on page 16. The shares are also forfeited by KMP if they fail to meet individual performance standards or behaviour and compliance quality gates, or if they resign or are terminated from the Company prior to May 2010. In other circumstances, the shares may be retained and released from restriction on cessation of employment (unless the Board determines otherwise). Performance rights were allocated to KMP in New Zealand in lieu of these shares, on a similar basis and with the same performance hurdle determining vesting.
Performance options A performance option is a right to acquire one ordinary Company share, once the performance option has vested based on achievement of the related performance hurdle. The performance option is issued at no charge to the employee. To acquire a share, the holder must pay the exercise price, which is generally the weighted average price at which ordinary NAB shares traded on the ASX over the one week up to and including the allocation date of the performance options.
Performance rights A performance right is a right to acquire one ordinary Company share, once the related performance hurdle has been achieved. A performance right is similar to a performance option as described above, except that there is no exercise price payable to exercise the performance right.
Performance shares (allocated under the LTI programme)
A performance share is an ordinary NAB share, which is allocated at no charge to the employee, and which provided dividend income to the employee from allocation. The shares are held in trust on the employee’s behalf, are restricted from trading and may be forfeited if the related performance hurdle is not achieved at the end of a predetermined restriction period (generally three years). The shares are also forfeited if employment ceases in some circumstances or if the employee fails to pass performance quality gates during the restriction period.
Return on equity (ROE) ROE is calculated as cash earnings (before significant items - ongoing operations) divided by average shareholders’ equity, excluding minority interests and other equity instruments and adjusted for treasury shares and exchangeable capital units valuation adjustments. For KMP, the STI and LTI programmes use ROE performance for the consolidated Group. For other employees, ROE under these programmes is measured for one of the following “regions”: Australia, NZ, UK, nabCapital, or Group (for Corporate Centre employees).
Short-term incentive (STI) An ‘at risk’ opportunity for individuals to receive an annual bonus. Each employee has a short-term incentive target (STI Target) which is usually described as a percentage of their fixed remuneration (e.g. 20% of TEC). The actual STI reward that an individual will receive in any particular year will reflect both business and individual performance as set out on pages 14 and 15.
Top 50 Companies (used in the LTI performance hurdle)
The top 50 companies in the S&P ASX100 by market capitalisation, excluding the Company, determined as at the effective date of the LTI allocation.
Top 12 Financials (used in the LTI performance hurdle)
The top 12 financial services companies in the S&PASX200 by market capitalisation, excluding the Company, determined as at the effective date of the LTI allocation.
Total Employment Compensation (TEC) or fixed remuneration
The Group’s primary measure of fixed remuneration, or salary paid to employees, is called Total Employment Compensation (TEC). It includes employer and employee superannuation contributions, but does not include STI, LTI, and leave. A portion of TEC may be taken in the form of packaged, non-monetary benefits (such as motor vehicle and parking) and associated fringe benefits tax. KMP are also eligible to participate in other benefits that are normally provided to executives of the Company, subject to any overriding legislation prevailing at the time including the Corporations Act 2001 (Cth).
Total Reward Is overall remuneration, comprising fixed remuneration (TEC) and ‘at risk’ remuneration (STI and LTI) as defined in this table.
Total shareholder return (TSR) (used in the LTI performance hurdle)
The return that a shareholder receives through dividends (and any other distributions) together with capital gains over a specific period. TSR is calculated on the basis that all dividends and distributions are reinvested in Company shares.
Up-to-Target shares Shares that are allocated as part of the STI programme, and are held in trust with restrictions on trading for at least one year (unless the employee leaves the Group earlier) with the shares forfeited on termination for serious misconduct. Individuals receive any dividends payable on these shares.

Report of the directors
2008 Annual Financial Report 31
Directors’ signatures
This report of directors signed in accordance with a resolution of the directors:
Michael A Chaney John M Stewart
Chairman Group Chief Executive Officer
14 November 2008
Corporate governance
National Australia Bank32
The Board of directors of the Company is responsible for the governance of the Company and its controlled entities. Good corporate governance is a fundamental part of the culture and the business practices of the Group. The key aspects of the Group’s corporate governance framework and main corporate governance practices for the 2008 year are outlined in this section.
The roles of the Board and management The Board has adopted a formal charter that details the functions and responsibilities of the Board which may be found on the Group’s website.
The Board’s most significant responsibilities are:
Stakeholder interests guiding the Group to deliver long-term sustainable returns for
shareholders and having regard to the interests of customers, regulators, staff and the communities in which the Group operates;
guiding consistent business performance, behaviour, transparency and accountability; and
reviewing and monitoring corporate governance and corporate social responsibility throughout the Group;
Strategy reviewing, approving and monitoring corporate strategy and
plans; making decisions concerning the Group’s capital structure and
dividend policy; and reviewing, approving and monitoring major investment and
strategic commitments;
Performance reviewing business results; and monitoring budgetary controls;
Integrity of external reporting reviewing and monitoring the processes, controls and
procedures which are in place to maintain the integrity of the Group’s accounting and financial records and statements; and
reviewing and monitoring reporting to shareholders and regulators, including the provision of objective, comprehensive, factual and timely information to the various markets in which the Company’s securities are listed;
Risk management and compliance monitoring and reviewing the risk management processes, the
Group’s risk profile and processes for compliance with prudential regulations and standards and other regulatory requirements; and
reviewing and monitoring processes for the maintenance of adequate credit quality;
Executive review, succession planning and culture approving key executive appointments and remuneration, and
monitoring and reviewing executive succession planning; reviewing and monitoring the performance of the Group Chief
Executive Officer and senior management; and monitoring and influencing the Group’s culture, reputation and
ethical standards; and
Board performance monitoring Board composition, director selection, Board
processes and performance with the Nomination Committee’s guidance.
The Board has reserved certain powers to itself and delegated authority and responsibility to the Group Chief Executive Officer to
manage the day-to-day affairs of the Group. These authorities are broad ranging and may be sub-delegated. Delegations are subject to strict limits. The Group Chief Executive Officer’s authorities and responsibilities include:
development and implementation of Board approved strategies; the achievement of operational plans within both a
comprehensive risk management framework and the corporate principles; and
sound relationship management with the Group’s stakeholders.
Composition of the Board The Board requires that each of its directors possess unquestionable integrity and good character. The Nomination Committee identifies other appropriate skills and characteristics required for the Board and individual directors in order for the Company to fulfil its goals and responsibilities to shareholders and other key stakeholders.
The composition of the Board is based on the following factors:
the Board will be of a size to assist in efficient decision making; the Chairman of the Board should be an independent non-
executive director; the Chairman must not be a former executive officer of the
Group; the Board should comprise a majority of independent non-
executive directors; and the Board should comprise directors with a broad range of
expertise, skills and experience from a diverse range of backgrounds including sufficient skills and experience appropriate to the Group’s business.
The Board is composed of a majority of independent non-executive directors. There are three executive directors and eight independent non-executive directors. The role of Chairman and that of Group Chief Executive Officer are held by two separate individuals. The Chairman is an independent non-executive director and the Group Chief Executive Officer is an executive director. The other executive directors are the Executive Director and Chief Executive Officer, Australia and the Group Deputy CEO.
In 2006, APRA introduced Prudential Standard 520. This requires directors, senior management and auditors of an authorised deposit-taking institution to be assessed to determine whether or not they have the appropriate skills, experience and knowledge to perform their role. They also need to be able to establish that they have acted with honesty and integrity.
A ‘Fit and Proper’ policy that meets the requirements of the Prudential Standard has been approved by the Board and implemented by the Company. The assessment process includes police checks and confirming the authenticity of academic records and employment history. All ‘responsible persons’, as defined by the standard, have been assessed as meeting the criteria to ensure that they are ‘fit and proper’.
The skills, experience, expertise and commencement dates of the directors are set out in the report of the directors.
Independence of directors Directors are expected to bring independent views and judgment to Board deliberations. An independent director must be independent of management and free to exercise unfettered and independent judgment. They must provide all relevant information to allow a regular assessment of their independence.
In assessing whether a director is independent, the Board has regard to the standards it has adopted that reflect the independence requirements of applicable laws, rules and regulations, including the revised ASX Corporate Governance Council Principles and Recommendations published in August 2007 (revised ASX CGC Principles).

Corporate governance
2008 Annual Financial Report 33
The Board considers that all of the non-executive directors are independent. In determining independence, each non-executive director is required to make an annual disclosure of information to the Board. Any assessment of independence for a non-executive director who does not meet the independence standards adopted by the Board will be specifically explained.
The Board has procedures in place to ensure it operates independently of management. This is achieved by the non-executive directors meeting together in the absence of management at every scheduled Board & Board Committee meeting.
The independent directors are identified (with their period in office) in the report of the directors.
Disclosure of related party transactions is set out in note 47 in the financial report.
Appointment and re-election of Board members The process for appointing a director is that, when a vacancy exists, the Nomination Committee identifies candidates with the appropriate expertise and experience, using external consultants as appropriate. The most suitable candidate is appointed by the Board but must stand for election by the shareholders at the next annual general meeting of the Company.
The Company has formal letters of appointment for each of its directors, setting out the key terms and conditions of the appointment.
The process for re-election of a director is in accordance with the Company’s Constitution, which requires that, other than the Group Chief Executive Officer and those directors appointed during the year, directors are required to retire after three years and are eligible to stand for re-election. Directors appointed during the year to fill any vacancy must retire and stand for election.
Before each annual general meeting, the Board assesses the performance of each director due to stand for re-election, and the Board decides whether to recommend to the shareholders that they vote in favour of the re-election of each director.
The Board has set a limit of 10 years for which an individual may serve as a director, subject to an annual review after this period. The Board regards this as an appropriate period of service. (The commencement dates of the directors are set out in the report of the directors on pages 3 to 6).
Induction and continuing education Management, working with the Board, provides an orientation program for new directors. The program includes discussions with executives and management, reading material, tutorials and workshops. These cover the Group’s strategic plans, its significant financial, accounting and risk management issues, its compliance programs, its Code of Conduct, its management structure, its internal and external audit programs, and directors’ rights, duties and responsibilities.
Management periodically conducts additional presentations and tutorial sessions for directors about the Group, and the factors impacting, or likely to impact, on its businesses. These assist the non-executive directors to gain a broader understanding of the Group. Directors are also encouraged to keep up to date on topical issues.
Board meetings The number of Board meetings and each director’s attendance at those meetings are set out in the report of the directors. Directors are expected to prepare adequately for, attend and participate at Board meetings and meetings of committees. Directors are also expected to attend site visits. The Board meets once a year in each of the United Kingdom and New Zealand, where the Company has
significant business interests. This allows directors to meet customers, employees and other stakeholders.
Performance of Board, its committees and individual directors The Board conducts an annual assessment of the performance and effectiveness of the Board as a whole and of its committees. Performance of each committee of the Board is initially discussed and reviewed within each committee and then subsequently reviewed as part of the Board’s annual assessment.
External experts are engaged as required to review aspects of the Board’s activities and to assist in a continuous improvement process to enhance the effectiveness of the Board. Results of the evaluations are compiled by an external expert to include a quantitative and qualitative analysis, and a written report is provided to the Chairman to review the performance of the Board. The external expert’s report disclosing the results and the various issues for discussion and recommendations for initiatives are presented to the Board for discussion. Each director participates in individual interviews with the Chairman.
This process implemented by the Board is designed to assist the Board in fulfilling its functions and ensuring that it remains an effective decision-making body.
In 2008, performance evaluation for the Board, its committees and the individual directors has taken place in accordance with the process disclosed in this report.
Remuneration of directors Shareholders determine the maximum annual aggregate of remuneration that may be provided to non-executive directors of the Company. From this amount, the individual directors are remunerated based on a philosophy of compensating the directors towards the upper quartile of the general market, having regard to the size and complexity of the Group.
The Remuneration Committee receives advice from independent experts on appropriate levels of director remuneration and guides the Board in this regard.
The total directors’ remuneration is disclosed as part of the shareholder approved aggregate amount and includes the Company’s statutory superannuation contribution.
The remuneration policy for the Board and the remuneration of each director is set out in the remuneration report which forms part of the report of the directors, and in note 47 in the financial report.
Performance & Remuneration of senior executives The Company’s performance management framework covers all senior executives of the Group, and entails the setting of a balanced scorecard of Key Performance Indicators (including both financial and non-financial measures), and threshold measures for compliance and behaviour (‘quality gates’) for each individual for the performance year. Performance discussions are conducted quarterly between each senior executive and their manager, with a formal mid year and end of year review process comparing and calibrating the performance of peers.
A more detailed description of the process for evaluating the performance of Key Management Personnel and the remuneration policy for Key Management Personnel are set out in the remuneration report.
Conflicts of interest Directors are expected to avoid any action, position or interest that conflicts or appears to conflict with an interest of the Group. A director who has a material personal interest in a matter relating to the Group’s affairs must notify the other directors of that interest.
The Corporations Act 2001 (Cth) together with the Company’s Constitution require that a director who has a material personal
Corporate governance
National Australia Bank34
interest in a matter that is being considered at a directors’ meeting cannot be present while the matter is being considered at the meeting or vote on the matter, except in the following circumstances:
the directors without a material personal interest in the matter have passed a resolution that identifies the director, the nature and extent of the director’s interest in the matter and its relation to the affairs of the Company, which states that the remaining directors are satisfied that the interest should not disqualify the director from voting or being present;
ASIC has made a declaration or order under the Corporations Act 2001 (Cth), which permits the director to be present and vote even though the director has a material personal interest;
there are not enough directors to form a quorum for a directors’ meeting because of the disqualification of the interested directors, in which event one or more of the directors (including a director with a material personal interest) may call a general meeting to address the matter; and
the matter is of a type which the Corporations Act 2001 (Cth) specifically permits the director to vote upon and to be present at a directors’ meeting during consideration of the matter notwithstanding the director’s material personal interest.
Even though the Corporations Act 2001 (Cth) and the Company’s Constitution allow these exceptions, the Group’s corporate governance standards provide that when a potential conflict of interest arises, the director concerned does not receive copies of the relevant Board papers and withdraws from the Board meeting while such matters are considered. Accordingly, in such circumstances the director concerned takes no part in discussions and exercises no influence over other members of the Board. If a significant conflict of interest with a director exists and cannot be resolved, the director is expected to tender his or her resignation after consultation with the Chairman.
Financial services are provided to directors under terms and conditions that would normally apply to the public. The provision of financial services to directors is subject to any applicable legal or regulatory restrictions, including the Corporations Act 2001 (Cth).
Refer to note 47 in the financial report for further information.
Transactions with related and other non-independent parties In the year to 30 September 2008, the Group had a number of related party transactions (refer to note 47 in the financial report). These transactions were made in the ordinary course of business and were made on substantially the same terms, including interest rates and collateral, as those prevailing at the time for comparable transactions with other persons or charged on the basis of equitable rates agreed between the parties. These transactions did not involve more than the normal risk of collectability or present other unfavourable features.
Other non-independent parties are parties that are able to negotiate terms of transactions that are not on an arm’s length basis, but do not meet the definition of a related party. The Group is not aware of any relationships or transactions with such parties that would materially affect its financial position or results of operations.
Access to management Board members have complete and open access to management.
The Group Company Secretary provides advice and support to the Board and is responsible for the Group’s day-to-day governance framework.
Access to independent professional advice Written guidelines entitle each director to seek independent professional advice at the Company’s expense, with the prior approval of the Chairman.
The Board can conduct or direct any investigation to fulfil its responsibilities and can retain, at the Company’s expense, any legal, accounting or other services, it considers necessary to perform its duties.
Confidential information The directors regard the confidentiality of customer information as highly important. The Group has a written policy about preserving confidentiality and fosters a culture to prevent the disclosure of confidential customer information outside the Group or the use of that information for the financial gain of any other entity (including any entity with which a director has an association).
Restrictions on dealings in securities Directors, officers and employees are subject to the Corporations Act 2001 (Cth) restrictions on applying for, acquiring and disposing of securities in, or other relevant financial products of, the Company (or procuring another person to do so), if they are in possession of inside information. Inside information is information which is not generally available, and which if it were generally available, a reasonable person would expect it to have a material effect on the price or value of the securities in, or other relevant financial products of, the Group.
The Company has an established policy relating to trading in the Company’s securities by directors, officers and employees. Directors, officers and employees are prohibited from trading in the Company’s securities during prescribed blackout periods prior to the release of the Group’s annual and half-yearly results announcements. Directors, officers and certain employees are further required to notify their intention to trade in the Company’s securities prior to trading.
There are also legal restrictions on insider trading imposed by the laws of other jurisdictions that apply to the Group and its directors, officers and employees.
The Group expressly prohibits directors, officers and employees:
taking derivatives over unvested performance based remuneration or short-term trading in any Company securities; and
trading in the shares of any other entity if inside information on such entity comes to their attention by virtue of their position as a director, officer or employee of the Group.
Shareholding requirements Within two months of appointment, a director must hold at least 2,000 fully paid ordinary shares in the Company. Non-executive directors must receive or acquire at market prices the equivalent of at least 10% and up to 40% of their annual remuneration in the form of shares in the Company. Under the National Australia Bank Staff Share Ownership Plan, Australian resident directors are provided these shares by salary sacrifice as approved by shareholders. Executive directors may receive shares, performance options and performance rights as approved by shareholders.
Details of all shareholdings by directors in the Company are set out in the report of the directors and note 48 in the financial report.
Board and committee operations
Board and committee agendas
Board and committee agendas are structured to assist the Board to meet its significant responsibilities. This includes the Board’s consideration of strategy and the approval and monitoring of financial and other goals. The Board receives a detailed overview of the performance and significant issues faced by each business and the major risk elements for review.
Directors receive and discuss detailed financial, operational and strategy reports from management.
Corporate governance
2008 Annual Financial Report 35
Clear guidelines have been established to enable matters raised by regulators to be promptly and effectively addressed and referred to the Board if necessary.
Board committees
To help it carry out its responsibilities, the Board has established the following committees and has adopted charters setting out the matters relevant to the composition, responsibilities and administration of these committees:
Risk Committee; Audit Committee; Remuneration Committee; and Nomination Committee.
Other matters of special importance in relation to which Board committees are established include consideration of borrowing programs, projects, capital strategies, major investments and commitments and capital expenditure.
The qualifications of each committee’s members and the number of meetings they attended during the 2008 period are set out in the report of directors.
Risk Committee Membership The members of the Risk Committee are:
Mr Paul Rizzo (Chairman); Ms Jillian Segal; and Mrs Patricia Cross.
The members of the Risk Committee have a range of different backgrounds, skills and experience, to enable them to have oversight of the operational, financial and strategic risk profile of the Group.
Sir Malcolm Williamson was appointed a member of the Committee effective 1 November 2008.
Responsibilities and Risk Committee charter The roles, responsibilities, composition and membership requirements are documented in the Risk Committee charter, approved by the Board, which may be found on the Group’s website.
The Risk Committee’s responsibilities include:
review and oversight of the risk profile of the Group within the context of the Board determined risk appetite;
making of recommendations to the Board concerning the Group’s risk appetite and particular risks or risk management practices of concern to the Committee;
review of management’s plans for mitigation of the material risks faced by the various business units of the Group; and
promotion of awareness of a risk based culture and the achievement of a balance between risk minimisation and reward for risks accepted.
Activities during the year At each scheduled meeting, the Risk Committee received a report from the Group Chief Risk Officer and updates in relation to key matters from the general managers of the Group’s key risk functions, being Credit and Portfolio Management, Traded Market Risk, Non-Traded Market Risk and Operational Risk. The Group’s capital management position was also reviewed on a regular basis with the Group Treasurer. These were in addition to updates provided on topical issues by senior management as required.
The Group has continued to strengthen its risk management processes. Key activities undertaken by the Risk Committee during the year include:
review of the Group’s key risks and risk management framework as developed by management;
review of the annual strategic plan; approval of the budget and headcount of the Group’s risk
management function; review of the Group’s 2008 risk appetite statement; review of the key outcomes from the Group’s risk scenario
analysis process and impact on the Group’s risk profile; review of the certifications from management in relation to the
Group’s compliance with applicable prudential standard obligations;
review of the certifications and assurances from internal audit and management in relation to the effectiveness of the Group’s internal controls and risk management framework;
meetings with the Group Chief Risk Officer without the presence of other members of management; and
joint meetings of the Group’s New Zealand and United Kingdom board risk committees to consider key local risk issues.
Senior representatives from the Company’s external auditor, Ernst & Young and Internal Audit attended every scheduled meeting of the Risk Committee throughout the period.
The Risk Committee met seven times during the year.
More comprehensive details in relation to the Group’s risk oversight and management of its material business risks are available on the Company’s website.
Audit Committee Membership The members of the Audit Committee are:
Mr John Thorn (Chairman); Mr Kerry McDonald; Mr Paul Rizzo; and Mr Geoffrey Tomlinson.
Mr Kerry McDonald retired as a member of the Committee effective 7 November 2008.
All members of the Audit Committee must be independent non-executive directors. Independence for these purposes is determined in accordance with the standard adopted by the Board, which reflects the independence requirements of applicable laws, rules and regulations, including those of the ASX Corporate Governance Principles.
It is considered appropriate that members of the Audit Committee be financially literate and have a range of different backgrounds, skills and experience, having regard to the operations, and financial and strategic risk profile, of the Group. The Board recognises the importance of the Audit Committee having at least one member with appropriate accounting or financial expertise, as required by applicable laws, governance principles, recommendations and listing standards. All members of the Audit Committee are financially literate.
Members are appointed for an initial term of three years. The Audit Committee must consist of at least three members. Membership is reviewed every three years. Periodic rotation is encouraged so that no more than one Committee member each year resigns as a result of periodic rotation.
The Chairman of the Board cannot be a member of the Audit Committee.
Audit Committee finance professional Although the Board has determined that Mr Thorn has the requisite attributes defined under applicable governance principles and recommendations, his responsibilities are the same as those of the other Audit Committee members.
He is not an auditor or accountant for the Company, does not perform ‘field work’ and is not an employee of the Company. The
Corporate governance
National Australia Bank36
Audit Committee is responsible for the oversight of management in the preparation of the Group’s financial statements and financial disclosures. The Audit Committee relies on the information provided by management and the external auditor. The Audit Committee does not have the duty to plan or conduct audits or to determine that the Group’s financial statements and disclosures are complete and accurate. These are the responsibility of management and the external auditor.
Responsibilities and Audit Committee charter The Audit Committee’s role, responsibilities, composition and membership requirements are documented in the Audit Committee charter, which the Board has approved and may be found on the Group’s website.
The Audit Committee is responsible for review and oversight of:
the integrity of the accounting and financial reporting processes of the Group;
the Group’s external audit; the Group’s internal audit; and compliance with applicable accounting standards to give a true
and fair view of the financial position and performance of the Group.
The Audit Committee met seven times during the year.
The Audit Committee has the authority to conduct or direct any investigation required to fulfil its responsibilities and has the ability to retain, at the Company’s expense, such legal, accounting or other advisers, consultants or experts as it considers necessary from time to time in the performance of its duties.
Activities during the year Key activities undertaken by the Audit Committee during the year include:
review of the scope of the annual audit plans for 2008 of the external auditor and internal auditor and oversight of the work performed by the auditors throughout the year;
review of significant accounting, financial reporting and other issues raised by the internal and external auditors;
review of the performance and independence of the external auditor and internal auditor together with their assurance that all applicable independence requirements were met;
holding of separate meetings without the presence of management with the Group General Manager, Internal Audit and key partners from the external auditor, Ernst & Young;
consideration and recommendations to the Board on significant accounting policies and areas of accounting judgment; and
review and recommendations to the Board for the adoption of the Group’s half-year and annual financial statements.
Senior representatives from Ernst & Young and Internal Audit attended every scheduled meeting of the Audit Committee throughout the period. A meeting of the Group’s regional audit committee Chairmen was held in September 2008 at which key finance related issues from a regional and Group perspective were considered.
Access to the Committee To draw appropriate matters to the attention of the Committee, the following individuals have direct access to the Committee: Group Chief Executive Officer; Group Chief Financial Officer; Deputy Group CEO; General Manager Group Finance; Group Chief Risk Officer; Group General Counsel; Chief Audit Officer and the external auditor. ‘Direct access’ means that the person has the right to approach the Committee without having to proceed via normal reporting line protocols.
Other employees of the Group may have access to the Audit Committee through the ‘Whistleblower Protection Program’. Refer to page 38 for further information on the ‘Whistleblower Protection Program’.
Confidential financial submissions The Audit Committee has established procedures for the receipt, retention and treatment of complaints regarding accounting, internal accounting controls or auditing matters. It is a responsibility of the Audit Committee to ensure that employees can make confidential, anonymous submissions regarding such matters (refer to the ‘Whistleblower Protection Program’ section on page 38 for further information).
External auditor The Audit Committee is responsible for the selection, evaluation, compensation and, where appropriate, replacement of the external auditor, subject to shareholder approval where required.
The Audit Committee ensures that the lead external audit partner and concurring review partner rotate off the Group’s audit at least every five years and that they are not reassigned to the Group’s audit for another five years.
The Audit Committee meets with the external auditor throughout the year to review the adequacy of the existing external audit arrangements with particular emphasis on the scope, quality and independence of the audit.
The Audit Committee receives assurances from the external auditor that they meet all applicable independence requirements.
Internal audit The Audit Committee is responsible for assessing whether the Internal Audit function is independent of management and is adequately staffed and funded. The Committee also assesses the performance of the Chief Audit Officer, Internal Audit and may recommend to the Board, the appointment and dismissal of this officer.
Audit Committee pre-approval policies and procedures The Audit Committee is responsible for the oversight of the work of the external auditor. To assist it in discharging its oversight responsibility, the Audit Committee has adopted a Group External Auditor Independence Policy which requires, among other things, pre-approval of all audit and non-audit services to be provided by the external auditor. The Group External Auditor Independence Policy incorporates auditor independence requirements of applicable laws, rules and regulations and applies these throughout the Group.
In accordance with the Group External Auditor Independence Policy, the external auditor may only provide a service to the Group if:
the external auditor is not prohibited from providing that service by applicable auditor independence laws, rules and regulations;
in the opinion of the Audit Committee or its delegate, the service does not otherwise impair the independence of the external auditor;
in the opinion of the Audit Committee or its delegate, there is a compelling reason for the external auditor to provide the service; and
the service is specifically pre-approved by the Audit Committee or delegate.
In accordance with the Group External Auditor Independence Policy, the Group will not employ a current or former partner or professional employee of the external auditor when prohibited by applicable independence laws, rules or regulations.
The Audit Committee may set an annual fee limit for each type of audit or non-audit service to be provided by the external auditor. Unless the Audit Committee approves otherwise, the fees paid or due and payable to the external auditor for the provision of non-audit services in any financial year must not exceed the fees paid or due and payable to the external auditor for audit services in that year.
The Audit Committee may delegate to one or more of its membership or to management as it sees fit, the authority to pre-approve audit and related audit services to be provided by the

Corporate governance
2008 Annual Financial Report 37
external auditor. The decision of any delegate to specifically pre-approve any audit or audit related service is presented to the Audit Committee at its next scheduled meeting. The Audit Committee has delegated the authority to pre-approve audit and non-audit services to the Audit Committee Chairman and certain members of management where the services meet specific requirements and fee limits as approved by the Audit Committee. Other non-audit services are required to be approved by the Audit Committee Chairman.
Details of the services provided by Ernst & Young to the Group and the fees paid or due and payable for those services are set out in the report of the directors and note 49 in the financial report.
Remuneration Committee Membership The Remuneration Committee’s members are:
Mrs Patricia Cross (Chairman); Mr Daniel Gilbert; and Ms Jillian Segal.
Mr Peter Duncan retired as Chairman of the Remuneration Committee on 31 July 2008.
Responsibilities and Remuneration Committee charter The Remuneration Committee’s role, responsibilities, composition and membership requirements are documented in a Remuneration Committee charter, approved by the Board, which is available on the Group’s website.
The responsibilities of the Remuneration Committee are to:
oversee the Group’s general remuneration strategy; monitor, review and make recommendations to the Board
concerning: - remuneration policy and Total Reward for the Group Chief
Executive Officer and for senior executives who report directly to him;
- remuneration arrangements for non-executive Board directors (as listed on page 27);
- arrangements for recruiting, retaining and terminating senior executives; and
- key appointments and proposals for the executive succession planning process; and
support the Board with monitoring the Group’s culture, and the process for managing behaviours against quality gates and standards.
The remuneration policy for senior executives is set out in the remuneration report.
Activities during the year Key activities undertaken by the Remuneration Committee during the year include:
reviewing and recommending to the Board the remuneration package for the Group Chief Executive Officer and other senior executives;
reviewing and recommending to the Board the incentives payable to senior executives based on performance criteria structured to increase shareholder value;
reviewing employee equity plans and allocations; reviewing remuneration of non-executive directors of subsidiary
companies; reviewing and monitoring the Group’s people and culture
dashboard at regular intervals; and monitoring the Group’s efforts to improve diversity in the
workforce.
Nomination Committee Membership The Nomination Committee’s members are:
Mr Michael Chaney (Chairman); Mrs Patricia Cross; Mr Daniel Gilbert; Mr Kerry McDonald; Mr Paul Rizzo; Ms Jillian Segal; Mr John Thorn; Mr Geoffrey Tomlinson; and Sir Malcolm Williamson.
Mr Kerry McDonald retired as a member of the Committee effective 7 November 2008.
All members of the Nomination Committee are independent directors.
Responsibilities and Nomination Committee charter The Nomination Committee’s role, responsibilities, composition and membership requirements are documented in a Nomination Committee charter, approved by the Board, which is available on the Group’s website.
The Nomination Committee is responsible for review and oversight of:
Board performance and the methodology for Board performance reviews;
Board and Committee membership and composition; and succession planning for the Board and senior management.
Activities during the year Key activities undertaken by the Nomination Committee during the year include:
review of the methodology for the annual Board performance review;
assessment of the appropriate size and composition of the Board;
succession planning for non-executive directors; and review of Committee membership.
Controlled entities
The activities of every company in the Group are overseen by its own board of directors. Mr Geoffrey Tomlinson is the Chairman of National Wealth Management Holdings Limited, and certain wealth management controlled entities. Sir Malcolm Williamson is the Chairman of National Australia Group Europe Limited and Clydesdale Bank PLC. Mr Kerry McDonald was Chairman of Bank of New Zealand until his retirement on 7 November 2008. Mr Michael Ullmer is Chairman of Great Western Bank. The Board’s confidence in the activities of a controlled entity board is based on having a high quality controlled entity board committed to the Group’s objectives.
There is a standing invitation to all of the Company’s directors to attend any board meeting of a controlled entity through consultation with the Chairman. Such visits are undertaken to develop a broader understanding of the Group’s total operations.
Communicating with shareholders Strategy The Group aims to be open and transparent with all stakeholders, including the owners of the business – the shareholders. Information is communicated to shareholders regularly through a range of forums and publications, and online. These include:
the Company’s annual general meeting; notices and explanatory memoranda of annual general
meetings;
Corporate governance
National Australia Bank38
the annual financial report (for those shareholders who have requested a copy) which is located on the Group’s website;
the annual shareholder review; disclosures to the stock exchanges on which the Company’s
securities are listed and to ASIC; letters from the Chairman to specifically inform shareholders of
key matters of interest; and the Group’s website where there is a Shareholder Centre and
News Centre which provides access to Company announcements, media releases, previous years’ financial results and investor presentations.
In response to the feedback received from shareholders in surveys and focus groups, the Company has sought to further improve the style and content of its shareholder communications. The Company has produced a shorter, simpler shareholder communication featuring the highlights of the financial year and a summary of business performance.
Meetings The notice of annual general meeting details the business to be considered by shareholders and details about each candidate standing for election or re-election as a director of the Company. For those shareholders who are unable to attend the meeting, the Company provides a webcast. The Company’s external auditor attends the meeting to answer shareholder questions about the conduct of the audit and the preparation and content of the auditor’s report.
Continuous disclosure The Company’s policy is that shareholders are informed of all major developments that impact the Group. There is a detailed disclosure policy in place, which is intended to maintain the market integrity and market efficiency of the Company’s securities. The policy may be found on the Group’s website.
The Company has established written guidelines and procedures to supplement the disclosure policy which are designed to manage the Company’s compliance with the continuous disclosure obligations to the various stock exchanges on which the Company’s securities are listed (including the ASX) and to attribute accountability at a senior executive level for that compliance.
ASX CGC Principles
The Company has complied with the revised ASX CGC Principles published in August 2007.
In accordance with Recommendation 7.2 of the revised ASX CGC Principles, the Board has received a report from management on the effectiveness of the Company’s management of its material business risks.
Further, the Board received the relevant declarations required under section 295A of the Corporations Act 2001 (Cth) and the relevant assurances required under Recommendation 7.3 of the revised ASX CGC Principles.
Promote ethical and responsible decision-making
The Board has developed with management a set of Corporate Principles, as the basis for the Group’s core beliefs and values. The five principles are:
we will be open and honest; we take ownership and hold ourselves accountable (for all of
our actions); we expect teamwork and collaboration across our organisation
for the benefit of all stakeholders; we treat everyone with fairness and respect; and we value speed, simplicity and efficient execution of our
promises.
The Group’s reward strategy and performance management process are aligned to the Group’s Principles.
The Company has a Code of Conduct which requires the observance of strict ethical guidelines. The Code of Conduct applies to all employees of the Group, as well as to directors, and temporary workers. In addition, the Board charter also governs the conduct of the Board and each director.
The Code of Conduct covers:
personal conduct; honesty; relations with customers; prevention of fraud; financial advice to customers; conflict of interest; and disclosure.
The Corporate Principles together with the Company’s Code of Conduct, emphasise the practices necessary to maintain confidence in the Company’s integrity and those practices necessary to take into account the Company’s legal obligations and the reasonable expectations of the Company’s stakeholders.
All Australian employees must complete mandatory compliance training in a range of topics, including the Code of Conduct, the Code of Banking Practice, privacy and trade practices.
The Group regularly reviews its relationships with the external suppliers of goods and services. The due diligence process for potential major suppliers must take into account consideration of factors such as ethical, environmental, human rights, and work place relations.
The Board supports the code of conduct issued by the Australian Institute of Company Directors.
The Group has also adopted a code of conduct for financial professionals which applies to the Group Chief Executive Officer, Group Chief Financial Officer and all employees serving in finance, accounting, tax or investor relations roles. This code of conduct is available on the Group’s website.
The Company supports the Code of Banking Practice 2004 of the Australian Bankers’ Association, which includes:
major commitments and obligations to customers; principles of conduct; and the roles and responsibilities of an independent external body,
the Code Compliance Monitoring Committee, which investigates complaints about non-compliance with this Code.
The Corporate Principles and Code of Conduct are available on the Group’s website.
Whistleblower Protection Program
The Group has a Whistleblower Protection Program for confidential reporting of unacceptable or undesirable conduct. The system enables disclosures to be made to a protected disclosure officer by the Group’s employees, or, where applicable, if the matter is highly sensitive and the employee believes it more appropriate, directly to the Audit Committee.
The Group does not tolerate incidents of fraud, corrupt conduct, adverse behaviour, legal or regulatory non-compliance, or questionable accounting and auditing matters by its employees.
The Company will take all reasonable steps to protect a person who comes forward to disclose unacceptable or undesirable conduct, including disciplinary action, or potentially resulting in dismissal, of any person taking reprisals against them.
Staff are also urged to escalate any issues they believe could have a material impact on the Group’s profitability, reputation, governance or compliance.
Financial report
2008 Annual Financial Report 39
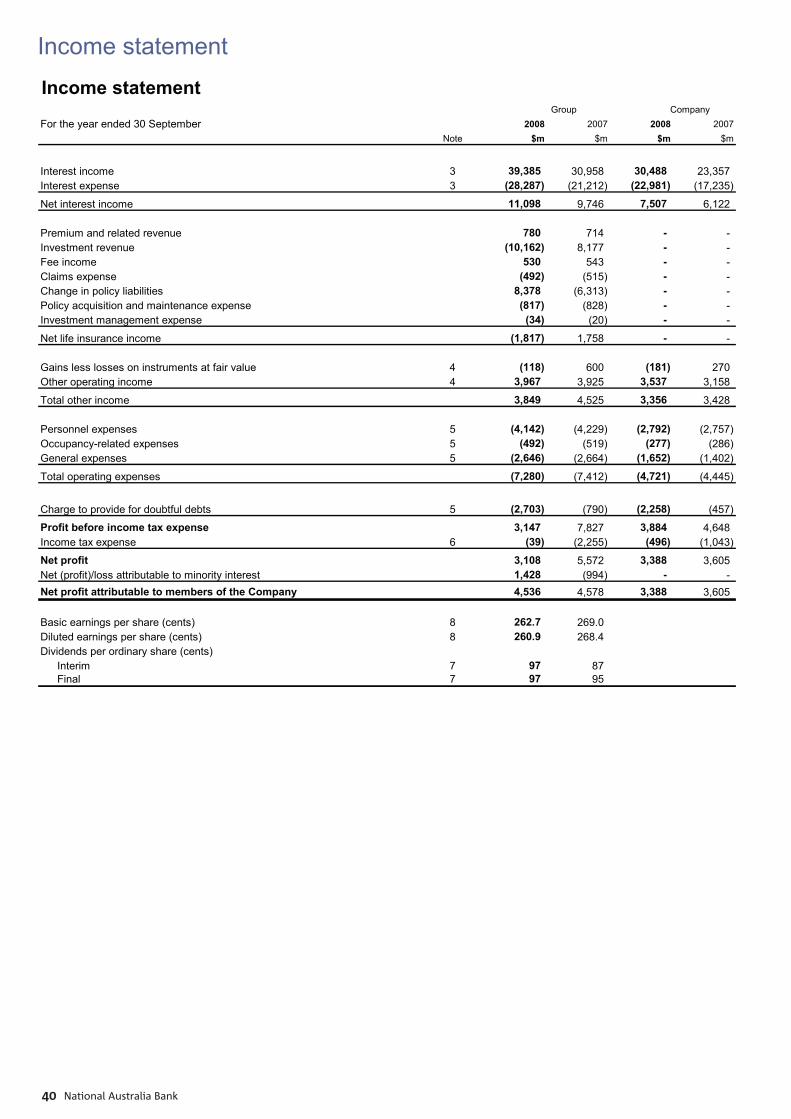
National Australia Bank40
Income statementIncome statement_
For the year ended 30 September 2008 2007 2008 2007Note $m $m $m $m
Interest income 3 39,385 30,958 30,488 23,357 Interest expense 3 (28,287) (21,212) (22,981) (17,235)
Net interest income 11,098 9,746 7,507 6,122
Premium and related revenue 780 714 - - Investment revenue (10,162) 8,177 - - Fee income 530 543 - - Claims expense (492) (515) - - Change in policy liabilities 8,378 (6,313) - - Policy acquisition and maintenance expense (817) (828) - - Investment management expense (34) (20) - -
Net life insurance income (1,817) 1,758 - -
Gains less losses on instruments at fair value 4 (118) 600 (181) 270 Other operating income 4 3,967 3,925 3,537 3,158
Total other income 3,849 4,525 3,356 3,428
Personnel expenses 5 (4,142) (4,229) (2,792) (2,757) Occupancy-related expenses 5 (492) (519) (277) (286) General expenses 5 (2,646) (2,664) (1,652) (1,402)
Total operating expenses (7,280) (7,412) (4,721) (4,445)
Charge to provide for doubtful debts 5 (2,703) (790) (2,258) (457)
Profit before income tax expense 3,147 7,827 3,884 4,648 Income tax expense 6 (39) (2,255) (496) (1,043)
Net profit 3,108 5,572 3,388 3,605 Net (profit)/loss attributable to minority interest 1,428 (994) - - Net profit attributable to members of the Company 4,536 4,578 3,388 3,605
Basic earnings per share (cents) 8 262.7 269.0 Diluted earnings per share (cents) 8 260.9 268.4 Dividends per ordinary share (cents)
Interim 7 97 87 Final 7 97 95
Group Company
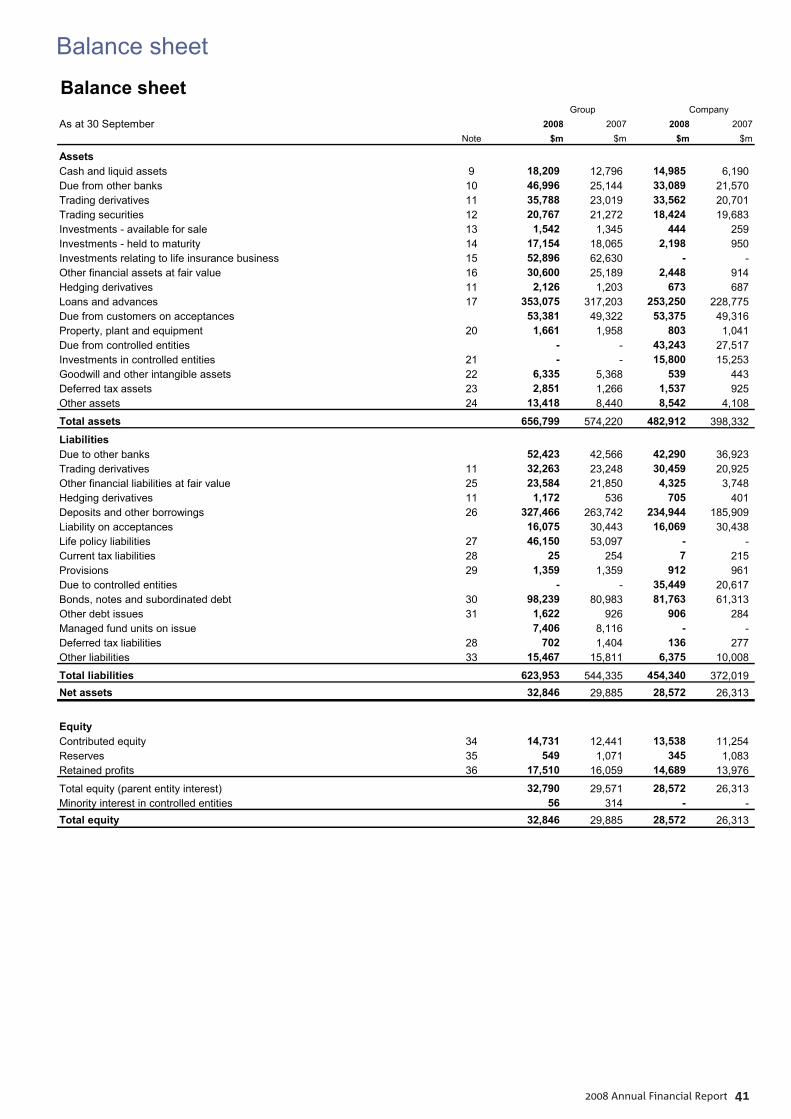
2008 Annual Financial Report 41
Balance sheetBalance sheet_
As at 30 September 2008 2007 2008 2007Note $m $m $m $m
AssetsCash and liquid assets 9 18,209 12,796 14,985 6,190 Due from other banks 10 46,996 25,144 33,089 21,570 Trading derivatives 11 35,788 23,019 33,562 20,701 Trading securities 12 20,767 21,272 18,424 19,683 Investments - available for sale 13 1,542 1,345 444 259 Investments - held to maturity 14 17,154 18,065 2,198 950 Investments relating to life insurance business 15 52,896 62,630 - - Other financial assets at fair value 16 30,600 25,189 2,448 914 Hedging derivatives 11 2,126 1,203 673 687 Loans and advances 17 353,075 317,203 253,250 228,775 Due from customers on acceptances 53,381 49,322 53,375 49,316 Property, plant and equipment 20 1,661 1,958 803 1,041 Due from controlled entities - - 43,243 27,517 Investments in controlled entities 21 - - 15,800 15,253 Goodwill and other intangible assets 22 6,335 5,368 539 443 Deferred tax assets 23 2,851 1,266 1,537 925 Other assets 24 13,418 8,440 8,542 4,108
Total assets 656,799 574,220 482,912 398,332
LiabilitiesDue to other banks 52,423 42,566 42,290 36,923 Trading derivatives 11 32,263 23,248 30,459 20,925 Other financial liabilities at fair value 25 23,584 21,850 4,325 3,748 Hedging derivatives 11 1,172 536 705 401 Deposits and other borrowings 26 327,466 263,742 234,944 185,909 Liability on acceptances 16,075 30,443 16,069 30,438 Life policy liabilities 27 46,150 53,097 - - Current tax liabilities 28 25 254 7 215 Provisions 29 1,359 1,359 912 961 Due to controlled entities - - 35,449 20,617 Bonds, notes and subordinated debt 30 98,239 80,983 81,763 61,313 Other debt issues 31 1,622 926 906 284 Managed fund units on issue 7,406 8,116 - - Deferred tax liabilities 28 702 1,404 136 277 Other liabilities 33 15,467 15,811 6,375 10,008
Total liabilities 623,953 544,335 454,340 372,019 Net assets 32,846 29,885 28,572 26,313
EquityContributed equity 34 14,731 12,441 13,538 11,254 Reserves 35 549 1,071 345 1,083 Retained profits 36 17,510 16,059 14,689 13,976
Total equity (parent entity interest) 32,790 29,571 28,572 26,313 Minority interest in controlled entities 56 314 - - Total equity 32,846 29,885 28,572 26,313
Group Company
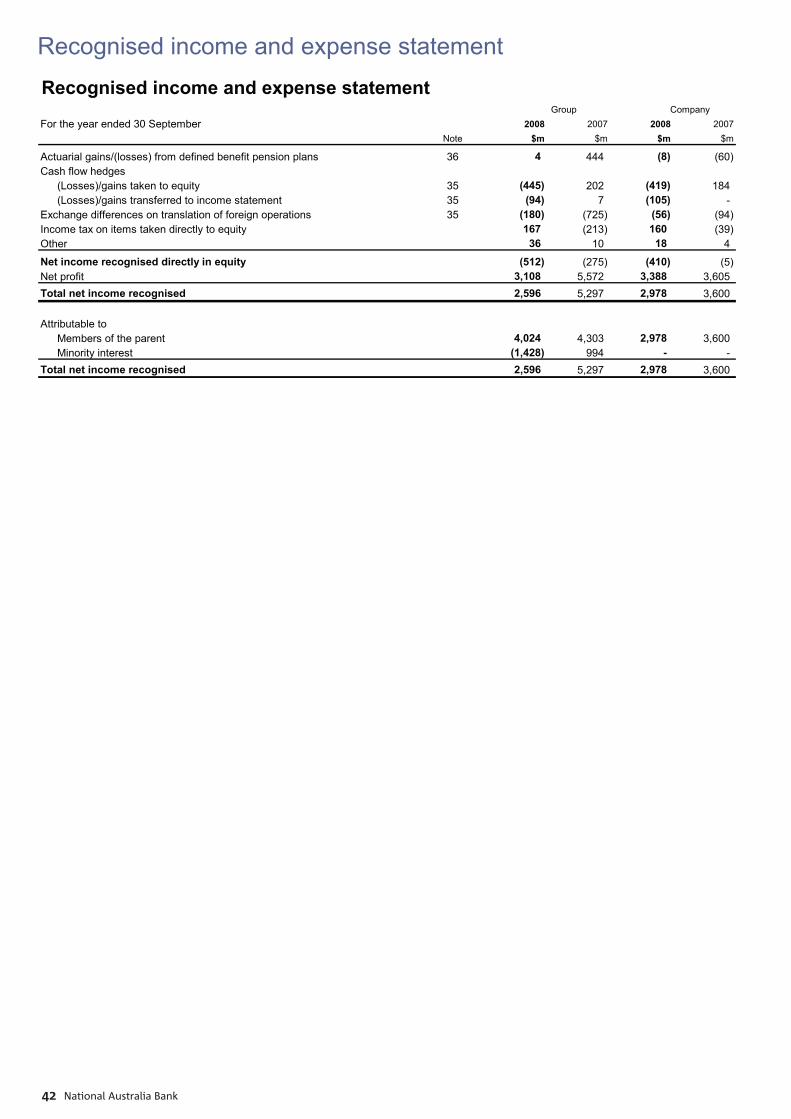
National Australia Bank42
Recognised income and expense statementRecognised income and expense statement_
For the year ended 30 September 2008 2007 2008 2007Note $m $m $m $m
Actuarial gains/(losses) from defined benefit pension plans 36 4 444 (8) (60) Cash flow hedges
(Losses)/gains taken to equity 35 (445) 202 (419) 184 (Losses)/gains transferred to income statement 35 (94) 7 (105) -
Exchange differences on translation of foreign operations 35 (180) (725) (56) (94) Income tax on items taken directly to equity 167 (213) 160 (39) Other 36 10 18 4
Net income recognised directly in equity (512) (275) (410) (5) Net profit 3,108 5,572 3,388 3,605 Total net income recognised 2,596 5,297 2,978 3,600
Attributable toMembers of the parent 4,024 4,303 2,978 3,600 Minority interest (1,428) 994 - -
Total net income recognised 2,596 5,297 2,978 3,600
Group Company
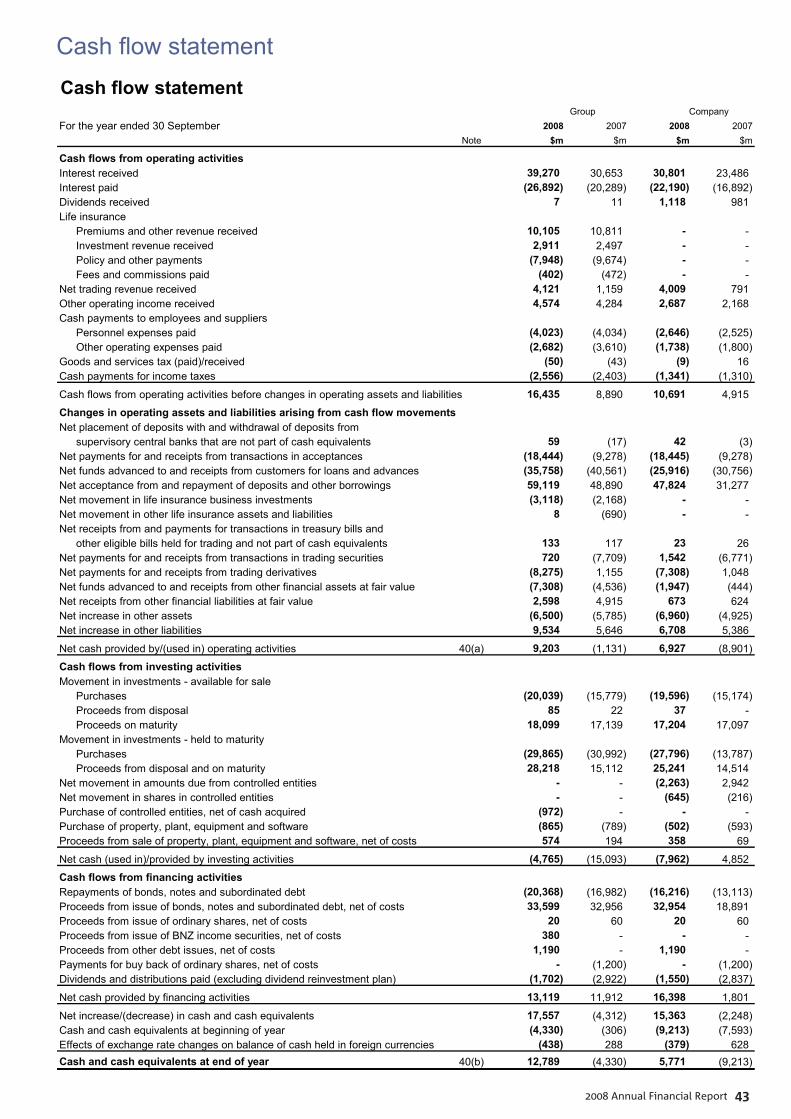
2008 Annual Financial Report 43
Cash fl ow statementCash flow statement_
For the year ended 30 September 2008 2007 2008 2007Note $m $m $m $m
Cash flows from operating activitiesInterest received 39,270 30,653 30,801 23,486 Interest paid (26,892) (20,289) (22,190) (16,892) Dividends received 7 11 1,118 981 Life insurance
Premiums and other revenue received 10,105 10,811 - - Investment revenue received 2,911 2,497 - - Policy and other payments (7,948) (9,674) - - Fees and commissions paid (402) (472) - -
Net trading revenue received 4,121 1,159 4,009 791 Other operating income received 4,574 4,284 2,687 2,168 Cash payments to employees and suppliers
Personnel expenses paid (4,023) (4,034) (2,646) (2,525) Other operating expenses paid (2,682) (3,610) (1,738) (1,800)
Goods and services tax (paid)/received (50) (43) (9) 16 Cash payments for income taxes (2,556) (2,403) (1,341) (1,310)
Cash flows from operating activities before changes in operating assets and liabilities 16,435 8,890 10,691 4,915
Changes in operating assets and liabilities arising from cash flow movementsNet placement of deposits with and withdrawal of deposits from
supervisory central banks that are not part of cash equivalents 59 (17) 42 (3) Net payments for and receipts from transactions in acceptances (18,444) (9,278) (18,445) (9,278) Net funds advanced to and receipts from customers for loans and advances (35,758) (40,561) (25,916) (30,756) Net acceptance from and repayment of deposits and other borrowings 59,119 48,890 47,824 31,277 Net movement in life insurance business investments (3,118) (2,168) - - Net movement in other life insurance assets and liabilities 8 (690) - - Net receipts from and payments for transactions in treasury bills and
other eligible bills held for trading and not part of cash equivalents 133 117 23 26 Net payments for and receipts from transactions in trading securities 720 (7,709) 1,542 (6,771) Net payments for and receipts from trading derivatives (8,275) 1,155 (7,308) 1,048 Net funds advanced to and receipts from other financial assets at fair value (7,308) (4,536) (1,947) (444) Net receipts from other financial liabilities at fair value 2,598 4,915 673 624 Net increase in other assets (6,500) (5,785) (6,960) (4,925) Net increase in other liabilities 9,534 5,646 6,708 5,386
Net cash provided by/(used in) operating activities 40(a) 9,203 (1,131) 6,927 (8,901)
Cash flows from investing activitiesMovement in investments - available for sale
Purchases (20,039) (15,779) (19,596) (15,174) Proceeds from disposal 85 22 37 - Proceeds on maturity 18,099 17,139 17,204 17,097
Movement in investments - held to maturityPurchases (29,865) (30,992) (27,796) (13,787) Proceeds from disposal and on maturity 28,218 15,112 25,241 14,514
Net movement in amounts due from controlled entities - - (2,263) 2,942 Net movement in shares in controlled entities - - (645) (216) Purchase of controlled entities, net of cash acquired (972) - - - Purchase of property, plant, equipment and software (865) (789) (502) (593) Proceeds from sale of property, plant, equipment and software, net of costs 574 194 358 69
Net cash (used in)/provided by investing activities (4,765) (15,093) (7,962) 4,852
Cash flows from financing activitiesRepayments of bonds, notes and subordinated debt (20,368) (16,982) (16,216) (13,113) Proceeds from issue of bonds, notes and subordinated debt, net of costs 33,599 32,956 32,954 18,891 Proceeds from issue of ordinary shares, net of costs 20 60 20 60 Proceeds from issue of BNZ income securities, net of costs 380 - - - Proceeds from other debt issues, net of costs 1,190 - 1,190 - Payments for buy back of ordinary shares, net of costs - (1,200) - (1,200) Dividends and distributions paid (excluding dividend reinvestment plan) (1,702) (2,922) (1,550) (2,837)
Net cash provided by financing activities 13,119 11,912 16,398 1,801
Net increase/(decrease) in cash and cash equivalents 17,557 (4,312) 15,363 (2,248) Cash and cash equivalents at beginning of year (4,330) (306) (9,213) (7,593) Effects of exchange rate changes on balance of cash held in foreign currencies (438) 288 (379) 628 Cash and cash equivalents at end of year 40(b) 12,789 (4,330) 5,771 (9,213)
Group Company
National Australia Bank44
Notes to the fi nancial statements1 Principal accounting policies
The financial report of National Australia Bank Limited (Company) and its controlled entities during the year (Group) for the year ended 30 September 2008 was authorised for issue in accordance with a resolution of the directors on 14 November 2008.
(a) Basis of preparation
This general purpose financial report has been prepared in accordance with the requirements of the Corporations Act 2001 (Cth), Australian Accounting Standards and Australian Accounting Interpretations of the Australian Accounting Standards Board (AASB). The financial statements have been prepared under the historical cost convention, as modified by the application of fair value measurements required by the relevant accounting standards. These accounting policies have been consistently applied throughout the Group.
The preparation of financial statements in conformity with Australian equivalents to International Financial Reporting Standards (AIFRS) requires the use of certain critical accounting estimates and assumptions that affect the reported amounts of assets, liabilities, revenues and expenses, and the disclosed amount of contingent liabilities. Assumptions made at each balance sheet date, (e.g. the calculation of provisions for doubtful debts, defined benefit pensions and fair value adjustments), are based on best estimates at that date. Although the Group has internal control systems in place to ensure that estimates are reliably measured, actual amounts may differ from those estimates. It is not anticipated that such differences would be material.
Comparative amounts have been reclassified to accord with changes in presentations made in 2008, except where otherwise stated.
Certain key terms used in this financial report are defined in the glossary.
(b) Statement of compliance
Australian Accounting Standards, include AIFRS. Compliance with AIFRS ensures that the financial report of National Australia Bank Limited complies with International Financial Reporting Standards (IFRS).
(c) Early adoptions
The Group elected to early adopt AASB 8 “Operating Segments” and AASB 2007-3 “Amendments to Australian Accounting Standards arising from AASB 8” in the previous year. The application of these standards is not mandatory for the Group until the financial year commencing 1 October 2009. The Group has not elected to early adopt any accounting standards or amendments in the current year.
(d) Recently issued accounting standards to be applied in future reporting periods
The AASB has issued new standards, amendments and interpretations that were available for adoption, but not mandatory, for the 30 September 2008 reporting period. In some cases, these amendments relate to items which are not applicable to the Group. Those amendments which are applicable and which are likely to have an impact on the Group's disclosures but have not yet been applied by the Group in preparing this financial report are:
AASB 101 “Presentation of Financial Statements” (September 2007) (AASB 101) supersedes the previous version of AASB 101 and makes changes to nomenclature and content of the financial statements, including the presentation of a statement of comprehensive income;
AASB 2007-8 “Amendments to Australian Accounting Standards arising from AASB 101” (September 2007) (AASB 2007-8) and AASB 2007-10 “Further Amendments to Australian Accounting Standards arising from AASB 101” (December 2007) (AASB 2007-10) both amend numerous standards arising from the application of AASB 101;
AASB 2008-1 “Amendments to Australian Accounting Standard – Share based Payments: Vesting Conditions and Cancellations” (February 2008) (AASB 2008-1) clarifies that vesting conditions comprise service conditions and performance conditions only and that other features of a share based payment transaction are not vesting conditions. It also clarifies that all cancellations should receive the same accounting treatment;
AASB 2008-2 “Amendments to Australian Accounting Standards – Puttable Financial Instruments and Obligations Arising on Liquidation” (March 2008) (AASB2008-2) introduces an exception to the definition of a financial liability to classify as equity instruments certain puttable financial instruments that impose an obligation to deliver a pro-rata share of net assets only upon liquidation;
AASB 3 “Business Combinations” (March 2008) (AASB 3) makes certain amendments to accounting for business combinations;
AASB 127 “Consolidated and Separate Financial Statements” (March 2008) (AASB 127) makes changes to accounting for non-controlling interests and loss of control;
AASB 2008-3 “ Amendments to Australian Accounting Standards arising from AASB 3 and AASB 127” ( March 2008) (AASB 2008-3) amends numerous standards arising from the application of AASB 3 and AASB 127;
AASB 2008-5 “Amendments to Australian Accounting Standards arising from the Annual Improvements Project” (July 2008) (AASB 2008-5) and AASB 2008-6 “Further Amendments to Australian Accounting Standards arising from the Annual Improvements Project” (July 2008) (AASB 2008-6) detail numerous non-urgent but necessary changes to accounting standards arising from the IASB’s annual improvements project;
AASB 2008-7 “Amendments to Australian Accounting Standards – Cost of an Investment in a Subsidiary, Jointly Controlled Entity or Associate” (July 2008) (AASB 2008-7) amends several standards arising from amendments to AASB 1 and AASB 127;
AASB 2008-8 “Amendments to Australian Accounting Standards – Eligible Hedged Items” (August 2008) (AASB 2008-8) amends AASB 139 and clarifies how the principles that determine whether a hedged risk or portion of cash flows is eligible for designation as a hedged item should be applied in particular situations;
AASB Interpretation 13 “Customer Loyalty Programmes” (August 2007) (Interpretation 13) clarifies the accounting for certain types of customer loyalty programmes;
AASB Interpretation 14 “AASB 119 – The Limit on a Defined Benefit Asset, Minimum Funding Requirements and their Interaction” (August 2008) (Interpretation 14) provides guidance on the amount of surplus that can be recognised as an asset by an employer sponsor of a defined benefit pension scheme;
AASB Interpretation 16 “Hedges of a Net Investment in a Foreign Operation” (August 2008) (Interpretation 16) provides clarifying guidance on several issues in accounting for the hedge of a net investment in a foreign operation in an entity’s consolidated financial statements.
Notes to the fi nancial statements
2008 Annual Financial Report 45
1 Principal accounting policies (continued) The Group has not yet determined the reporting periods for which AASB 3, AASB 101, AASB 2007-8, AASB 2007-10, AASB 2008-1, AASB 2008-2, AASB 2008-3, AASB 2008-5 and 2008-7 will be applied. Interpretations 13, 14 and 16 will be applied from 1 October 2008. The initial application of these standards, amendments and interpretations is not expected to have a material impact on the financial results of the Company or the Group.
On 1 October 2007 the Group adopted AASB 7 “Financial Instruments: Disclosures”. As a consequence of adopting AASB 7, the Group has modified the presentation of its income statement to include a line item disclosing fee income for life insurance business. The prior period comparative disclosures have been adjusted to reflect this amendment. Various other disclosures have been updated, including changes to comparatives, to reflect the requirements of this standard.
(e) Currency of presentation
All amounts are expressed in Australian dollars unless otherwise stated.
(f) Rounding of amounts
In accordance with Australian Securities and Investments Commission Class Order 98/100 dated 10 July 1998, all amounts have been rounded to the nearest million dollars, except where indicated.
(g) Principles of consolidation
Controlled entities
The consolidated financial report comprises the financial report of the Company and its controlled entities. Controlled entities are all those entities (including special purpose entities) over which the Company has the power to govern the financial and operating policies so as to obtain benefits from their activities. Special purpose entities require consolidation in circumstances such as those where the Group has access to the majority of the residual income or is exposed to the majority of the residual risk associated with the special purpose entity.
An assessment of control, and in respect of special purpose entities an assessment of the Group’s exposure to the majority of residual income or majority of residual risk are performed on an ongoing basis.
Entities are consolidated from the date on which control is transferred to the Company. They are de-consolidated from the date that control ceases. The effects of transactions between entities within the Group are eliminated in full upon consolidation.
External interest in the equity and results of the entities that are controlled by the Company are shown as a separate item, Managed fund units on issue, in the consolidated financial report.
Statutory funds of the Group’s life insurance business have been consolidated into the financial report. The financial report consolidates all of the assets, liabilities, revenues and expenses of the statutory funds and non-statutory fund life insurance business irrespective of whether they are designated as relating to policyholders or shareholders. In addition, where the Group’s life insurance statutory funds have the capacity to control managed investment schemes, the Group has consolidated all of the assets, liabilities, revenues and expenses of these managed investment schemes.
Investments in controlled entities are recorded at cost less any provision for impairment.
Change in accounting policy
The market dislocation in the asset-backed commercial paper market has changed the nature of the liquidity facilities provided by the Group to special purpose entities. This has caused the Group to review its existing accounting policy in relation to consolidation as it applies to special purpose entities. The result of this review is that the Group is changing its accounting policy which will result in the consolidation of the NAB-sponsored conduits.
Previously, an assessment of control and of exposure to the majority of risks and rewards arising from a special purpose entity was performed at the time of the initial investment in the entity and subsequently if there was a structural change in the relationship between the Group and the entity.
This policy has been changed such that in addition to assessing consolidation at inception and upon structural change, an assessment of consolidation is performed on an ongoing basis. In accordance with the requirements of AASB 108 “Accounting Policies, Changes in Accounting Estimates and Errors”, this change reflects the expected future direction of consolidation requirements under IFRS, is consistent with the IASB’s response to the recommendations of the Financial Stability Forum report, is in line with the treatment of certain other international banks, and meets current market expectations.
The policy has been changed for the current financial year and has been applied retrospectively as is required by accounting standards. Comparative information in relation to the 2007 financial year has been restated accordingly. The Group has applied a consistent and uniform assessment of credit and other appropriate processes to the assets and liabilities of the conduits, consistent with those applied to all other Group assets held to maturity and liabilities.
The following tables summarise the adjustments to each financial statement line item affected by the change in accounting policy. There is no material impact on the income statement, recognised income and expense statement or earnings per share.
Balance sheet (extract)
As at 30 September 2007
$mNet assets - as reported 29,885Adjustment to: Investments – held to maturity 13,049 Loans and advances (3,667) Other assets 204Adjustment to total assets 9,586Adjustment to: Deposits and other borrowings (9,517) Other liabilities (69)Adjustment to total liabilities (9,586)Net assets – as adjusted 29,885
Cash flow statement (extract)
Year to 30September 2007
$mNet (decrease)/increase in cash and cash
equivalents - as reported (4,312)Adjustment to: Net funds advanced to and receipts from
customers for loans and advances 3,667 Net acceptance from and repayment
of deposits and other borrowings 9,517
Net (increase)/decrease in other assets (204) Net increase in other liabilities 69 Movement in investments - held to
maturity (purchases) (13,049)Net (decrease)/increase in cash and
cash equivalents – as adjusted (4,312)
Notes to the fi nancial statements
National Australia Bank46
1 Principal accounting policies (continued)
(h) Foreign currency translation (i) Functional and presentation currency Items included in the financial statements of each of the Group’s entities are measured using the currency of the primary economic environment in which the entity operates (functional currency). The consolidated financial report is presented in Australian dollars, which is the Company’s functional and presentation currency.
(ii) Transactions and balances Foreign currency transactions are translated into the functional currency using the exchange rates prevailing at the dates of the transactions. Foreign exchange gains and losses resulting from the settlement of such transactions and from the translation at year-end exchange rates of monetary assets and liabilities denominated in foreign currencies are normally recognised in the income statement. Such gains and losses will be deferred in equity as qualifying cash flow hedges and qualifying net investment hedges where applicable. Non-monetary items are translated using the exchange rate at the date of the initial recognition of the asset or liability.
(iii) Controlled entities The results and financial position of all Group entities that have a functional currency different from the Group’s presentation currency are translated into the presentation currency as follows:
assets and liabilities are translated at the closing rate at the date of the balance sheet;
income and expenses are normally translated at average exchange rates for the period; and
all resulting exchange differences are recognised as a separate component of equity in the foreign currency translation reserve.
On consolidation, exchange differences arising from the translation of the net investment in foreign entities, and of borrowings and other foreign currency instruments designated as hedges of such investments, are taken to the foreign currency translation reserve. When a foreign operation is sold, such exchange differences are recognised in the income statement as part of the gain or loss on sale.
(i) Fair value measurement
Fair value is defined as the amount for which an asset could be exchanged or a liability settled, between willing parties in an arm’s length transaction.
Where the classification of a financial asset or liability requires it to be stated at fair value, wherever possible, the fair value is determined by reference to the quoted bid or offer price in the most advantageous active market to which the Group has immediate access. An adjustment for credit risk is also incorporated into the fair value as appropriate.
Fair value for a net open position that is a financial liability quoted in an active market is the current offer price, and for a financial asset the bid price, multiplied by the number of units of the instrument held or issued.
Where no such active market exists for the particular asset or liability, the Group uses a valuation technique to arrive at the fair value, including the use of transaction prices obtained in recent arm’s length transactions, discounted cash flow analyses, option pricing models and other valuation techniques based on market conditions and risks existing at balance date. In doing so, fair value is estimated using a valuation technique that makes maximum use of observable market inputs and places minimal reliance upon entity-specific inputs.
The best evidence of the fair value of a financial instrument at initial recognition is the transaction price (i.e. the fair value of the consideration given or received) unless the fair value of that instrument is evidenced by comparison with other observable current market transactions in the same instrument (i.e. without modification or repackaging) or based on a valuation technique whose variables include only data from observable markets. When such evidence exists, the Group recognises the profit on initial recognition (i.e. on day one).
Assets
(j) Cash and cash equivalents
For the purposes of the cash flow statement, cash and cash equivalents comprise short-term, highly liquid investments that are readily convertible to known amounts of cash and are subject to an insignificant risk of changes in value. They are held for the purposes of meeting short-term cash commitments (rather than for investment or other purposes) and include cash and liquid assets, amounts due from other banks including securities held under reverse repurchase agreements, and short-term government securities.
(k) Repurchase and reverse repurchase agreements
Securities sold subject to repurchase agreements are retained in their respective balance sheet categories. The counterparty liability is included in amounts due to other banks, deposits from banks, other deposits or deposits due to customers, as appropriate based upon the counterparty to the transaction.
Securities purchased under agreements to resell are accounted for as collateralised loans. The difference between sale and repurchase price is treated as interest and accrued over the life of the agreements using the effective interest method. Such amounts are normally classified as deposits with other banks or cash and cash equivalents. Securities lent to counterparties are also retained in the financial statements. Securities borrowed are not recognised in the financial statements unless they are sold to third parties in which case the purchase and sale are recorded with the gain or loss included in trading income. The obligation to return securities borrowed is recorded at fair value as a trading liability.
(l) Derivative financial instruments and hedge accounting
All derivatives are recognised in the balance sheet at fair value on trade date. All derivatives are classified as trading except where they are designated as a part of an effective hedge relationship and classified as hedging derivatives. The carrying value of a derivative is remeasured at fair value throughout the life of the contract. The fair value of derivatives is determined by calculating the expected cash flows under the terms of each specific contract, discounted back to present value. The expected cash flows for each contract are determined either directly by reference to actual cash flows implicit in observable market prices or through modelling cash flows using appropriate financial markets pricing models. Derivatives are carried as assets when the fair value is positive and as liabilities when the fair value is negative.
The method of recognising the resulting fair value gain or loss on a derivative depends on whether the derivative is designated as a hedging instrument, and if so, the nature of the item being hedged. The Group designates certain derivatives as:
hedges of the fair value of recognised assets or liabilities or firm commitments (fair value hedges);
hedges of highly probable future cash flows attributable to a recognised asset or liability, or a highly probable forecast transaction (cash flow hedges); or
hedges of net investments in foreign operations.
Notes to the fi nancial statements
2008 Annual Financial Report 47
1 Principal accounting policies (continued)
Hedge accounting is used for derivatives designated in this way provided certain criteria are met.
The Group documents, at the inception of the transaction, the relationship between hedging instruments and hedged items, the risk being hedged and the Group’s risk management objective and strategy for undertaking these hedge transactions. The Group also documents how effectiveness will be measured throughout the life of the hedge relationship. In addition, the Group also documents its assessment, both at hedge inception and on an ongoing basis, of whether the derivatives that are used in hedging transactions are highly effective in offsetting changes in fair values or cash flows of hedged items.
(i) Fair value hedges Subsequent to initial designation, changes in the fair value of derivatives that are designated and qualify as fair value hedges are recorded in the income statement, together with any changes in the fair value of the hedged asset or liability that are attributable to the hedged risk. The movement in fair value of the hedged item attributable to the hedged risk is made as an adjustment to the carrying value of the hedged asset or liability.
When a hedging instrument expires or is sold, or when a hedge no longer meets the criteria for hedge accounting, the adjustment to the carrying amount of a hedged item is amortised to the income statement on an effective yield basis. Where the hedged item is derecognised from the balance sheet, the adjustment to the carrying amount of the asset or liability is immediately transferred to the income statement.
(ii) Cash flow hedges The effective portion of changes in the fair value of derivatives that are designated and qualify as cash flow hedges are recognised in the cash flow hedge reserve within equity. The gain or loss relating to the ineffective portion is recognised immediately in the income statement. The carrying value of the hedged item is not adjusted. Amounts accumulated in equity are transferred to the income statement in the period(s) in which the hedged item will affect profit or loss (e.g. when the forecast hedged variable cash flows are recognised within the income statement).
When a hedging instrument expires or is sold, or when a hedge no longer meets the criteria for hedge accounting, any cumulative gain or loss existing in equity at that time remains in equity and is recognised in the income statement when the forecast transaction is ultimately recognised in the income statement. When a forecast transaction is no longer expected to occur, the cumulative gain or loss that was recognised in equity is immediately transferred to the income statement.
(iii) Net investment hedges Hedges of net investments in foreign operations are accounted for similarly to cash flow hedges. Any gain or loss on the hedging instrument relating to the effective portion of the hedge is recognised in equity; the gain or loss relating to the ineffective portion is recognised immediately in the income statement. Gains and losses accumulated in equity are included in the income statement when the foreign operation is disposed.
(iv) Derivatives that do not qualify for hedge accounting Certain derivative instruments do not qualify for hedge accounting. This could occur for two reasons:
the derivative is held for the purpose of short-term profit taking; or
the derivative is held to economically hedge an exposure but does not meet the accounting criteria for hedge accounting.
In both of these cases, the derivative is classified as a trading derivative.
Certain derivatives embedded in financial instruments are treated as separate derivatives when their economic characteristics and risks are not clearly and closely related to those of the host contract and the host contract is not carried at fair value through profit and loss. These embedded derivatives are separately measured at fair value with changes in fair value recognised in the income statement.
(m) Items classified as fair value through profit and loss
Purchases and sales of financial assets classified within fair value through profit and loss are recognised on trade date, being the date that the Group is committed to purchase or sell a financial asset.
(i) Financial assets held for trading A financial asset is classified as held for trading if it is acquired principally for the purpose of selling in the near term, or forms part of a portfolio of financial instruments that are managed together and for which there is evidence of short-term profit taking, or it is a derivative not in a qualifying hedge relationship.
Assets held for trading purposes are classified as trading derivatives or trading securities within the balance sheet.
(ii) Financial instruments designated at fair value through profit and loss
Upon initial recognition, financial assets may be designated as held at fair value through profit and loss. Financial assets classified as fair value through profit and loss are initially recognised at fair value, with transaction costs being recognised in the income statement immediately. Subsequently, they are measured at fair value with gains and losses recognised in the income statement as they arise.
Restrictions are placed on the use of the designated fair value option and the classification can only be used in the following circumstances:
if a host contract contains one or more embedded derivatives, the Group may designate the entire contract as being held at fair value;
designating the instruments will eliminate or significantly reduce measurement or recognition inconsistencies (i.e. eliminate an accounting mismatch) that would otherwise arise from measuring assets or liabilities on a different basis; or
assets and liabilities are both managed and their performance is evaluated on a fair value basis in accordance with documented risk management and investment strategies.
(iii) Assets relating to life insurance businesses Refer to note 1(p) Assets relating to life insurance businesses for further details.
(n) Investments – available for sale
Available for sale investments are non-derivative financial assets that are designated as available for sale or are not categorised into any of the categories of:
fair value through profit and loss; loans and receivables; or held to maturity.
Available for sale investments primarily comprise debt securities.
Available for sale investments are initially recognised at fair value including direct and incremental transaction costs. They are subsequently held at fair value. Gains and losses arising from
Notes to the fi nancial statements
National Australia Bank48
1 Principal accounting policies (continued)
changes in fair value are included in the available for sale investments reserve within equity until sale when the cumulative gain or loss is transferred to the income statement. Upon disposal or impairment, the accumulated change in fair value within the available for sale investments reserve is recognised in the income statement.
(o) Investments – held to maturity
Held to maturity investments are non-derivative financial assets with fixed or determinable payments that the Group has the intention and ability to hold to maturity. Held to maturity assets are initially recognised at fair value and subsequently recorded at amortised cost using the effective interest method.
(p) Assets relating to life insurance businesses
Assets held by the Group’s life insurance businesses are recorded as follows:
(i) Assets backing policy liabilities All assets held in statutory funds are considered to back policy liabilities and are therefore classified as fair value through profit and loss.
(ii) Restrictions on assets The assets and liabilities held in the statutory funds of the Australian life insurance business are subject to the restrictions of the Life Insurance Act 1995 (Cth) and the constitutions of the life insurance entities. The main restrictions are that the assets in a statutory fund can only be used to meet the liabilities and expenses of that fund, to acquire investments to further the business of the fund, or to make profit distributions when solvency and capital adequacy requirements of the Life Insurance Act 1995 (Cth) are met. Therefore, assets held in statutory funds are not available for use by other parts of the Group’s business other than any profits generated in the statutory funds.
(q) Loans and advances
Loans and advances are non-derivative financial assets with fixed or determinable payments that are not quoted in an active market.
Loans and advances are initially recognised at fair value including direct and incremental transaction costs. They are subsequently recorded at amortised cost, using the effective interest method, net of any provision for doubtful debts. They are derecognised when the rights to receive cash flows have expired or the Group has transferred substantially all the risks and rewards of ownership.
As noted above, in certain limited circumstances the Group applies the fair value measurement option to financial assets. This option is applied to loans and advances where there is an embedded derivative within the loan contract and the Group has entered into a derivative to offset the risk introduced by the embedded derivative. The loan is designated as being carried at fair value through profit and loss to offset the movements in the fair value of the derivative within the income statement. When this option is applied, the asset is included within other financial assets at fair value and not loans and advances.
Where a loan is held at fair value, a statistical-based calculation is used to estimate expected losses attributable to adverse movements in credit on the assets held. This adjustment to the credit quality of the asset is then applied to the carrying value of the loan held at fair value.
(r) Impairment
(i) Financial assets The Group assesses at each balance sheet date whether there is objective evidence that a financial asset or a portfolio of financial assets is impaired. A financial asset or portfolio of financial assets is impaired and impairment losses are incurred if there is objective evidence of impairment as a result of one or more loss events that occurred after the initial recognition of the asset and prior to the balance sheet date (a loss event) and it is considered that the loss event has had an impact on the estimated future cash flows of the financial asset (or the portfolio) that can be reliably estimated.
The Group first assesses whether objective evidence of impairment exists individually for financial assets that are individually significant, and individually or collectively for financial assets that are not individually significant. If the Group determines that no objective evidence of impairment exists for an individually assessed financial asset, whether significant or not, it includes the asset in a group of financial assets with similar credit risk characteristics and collectively assesses them for impairment. Assets that are individually assessed for impairment and for which an impairment loss is or continues to be recognised are not included in a collective assessment of impairment.
For loans and advances and held to maturity investments, the amount of impairment loss is measured as the difference between the asset's carrying amount and the present value of estimated future cash flows discounted at the asset's original effective interest rate. The amount of the loss is recognised using a provision account.
For the purposes of a collective evaluation of impairment, financial assets are grouped on the basis of similar risk characteristics.
Future cash flows in a group of financial assets that are collectively evaluated for impairment are estimated on the basis of the contractual cash flows of the assets in the group and historical loss experience for assets with credit risk characteristics similar to those in the group. Historical loss experience is adjusted based on current observable data. In addition, the Group uses its experienced judgement to estimate the amount of an impairment loss. The use of such judgements and reasonable estimates is considered by management to be an essential part of the process and does not impact reliability.
The methodology and assumptions used for estimating future cash flows are reviewed regularly to reduce any differences between loss estimates and actual loss experience.
Following impairment, interest income is recognised on the unwinding of the discount from the initial recognition of impairment.
When an asset is uncollectible, it is written off against the related provision. Such assets are written off after all the necessary procedures have been completed and the amount of the loss has been determined. Subsequent recoveries of amounts previously written off reduce the amount of the expense in the income statement.
If, in a subsequent period, the amount of the impairment loss decreases and the decrease can be related objectively to an event occurring after the impairment was recognised, the previously recognised impairment loss is reversed by adjusting the provision account. The amount of the reversal is recognised in the income statement.
In the case of equity instruments classified as available for sale, the Group seeks evidence of a significant or prolonged decline in the fair value of the security below its cost to determine whether impairment exists. In the case of debt instruments classified as available for sale, impairment is assessed based on the same
Notes to the fi nancial statements
2008 Annual Financial Report 49
1 Principal accounting policies (continued)
criteria as for other financial assets. Where such evidence exists, the cumulative net loss that has been previously recognised directly in equity is recognised in the income statement. Reversals of impairment of debt securities classified as available for sale are recognised in the income statement. Reversals of impairment of equity instruments classified as available for sale are not recognised in the income statement, but rather directly in equity.
(ii) Non-financial assets Assets with an indefinite useful life, including goodwill, are not subject to amortisation and are tested on an annual basis for impairment, and additionally whenever an indication of impairment exists. Assets that are subject to amortisation are reviewed for impairment whenever events or changes in circumstances indicate that the carrying amount may not be recoverable. An impairment loss is recognised for the amount by which the carrying amount of an asset exceeds its recoverable amount.
The recoverable amount of an asset is the higher of its fair value less costs to sell or its value in use.
For assets that do not generate largely independent cash inflows, the recoverable amount is determined for the cash generating unit to which that asset belongs. Management judgement is applied to identify cash generating units (which are determined according to the lowest level of aggregation for which an active market exists, as this evidences the assets involved create largely independent cash inflows). Each of these cash generating units is represented by an operating segment or a subdivision of an operating segment.
(s) Acceptances
The Group’s liability arising from the acceptance of bills of exchange and the asset under acceptance representing the claims against its customer are measured initially at fair value and subsequently at amortised cost. When the Group discounts its own acceptance, the acceptance liability is derecognised. When the Group rediscounts its own acceptance, an acceptance liability is re-recognised and the asset remains recognised as an acceptance. The difference between the purchase and sale of the Group’s own acceptance gives rise to realised profits and losses that are recognised in the income statement. Bill acceptance fees are deferred and amortised on an effective yield basis over the life of the instrument.
(t) Property, plant and equipment
Land and buildings are measured at fair value and are revalued on a rolling three year cycle, effective 31 July, by directors to reflect fair values. Directors’ valuations are based on advice received from independent valuers. Such valuations are performed on an open market basis, being the amounts for which the assets could be exchanged between a knowledgeable, willing buyer and a knowledgeable, willing seller in an arm’s length transaction at the valuation date. Newly acquired property assets are held at cost (i.e. equivalent to fair value due to their recent acquisition) until the time of the next annual review, a period not exceeding 12 months.
Revaluation increments are credited directly to the asset revaluation reserve. However, the increment will be recognised in the income statement to the extent it reverses a revaluation decrement previously recognised as an expense for a specific asset. Revaluation decrements are charged against the asset revaluation reserve to the extent that they reverse previous revaluation increments for a specific asset. Any excess is recognised as an expense in the income statement. This policy is applied to assets individually. Revaluation increases and decreases are not offset, even within a class of assets, unless they relate to the same asset.
Other items of plant and equipment are carried at cost, less accumulated depreciation and any impairment losses. The cost of plant and equipment includes an obligation for removal of the asset or restoration of the site where such an obligation exists and if that cost can be reliably estimated.
With the exception of freehold land, all items of property, plant and equipment are depreciated or amortised using the straight-line method at the rates appropriate to its estimated useful life to the Group. For major classes of property, plant and equipment, the annual rates of depreciation or amortisation are:
buildings – 3.3%; leasehold improvements – up to 10%; furniture, fixtures and fittings and other equipment – from
10% to 20%; motor vehicles – 20%; personal computers – 33.3%; and other data processing equipment – from 20% to 33.3%.
Assets’ residual values and useful lives are reviewed, and adjusted if appropriate, at each reporting date.
Gains or losses on the disposal of property, plant and equipment, which are determined as the difference between the net sale proceeds, if any, and the carrying amount at the time of sale are included in the income statement.
Any realised amounts in the asset revaluation reserve are transferred directly to retained profits.
(u) Leases (i) As lessee The leases entered into by the Group as lessee are primarily operating leases. Operating lease rentals are charged to the income statement on a straight-line basis over the term of the lease.
When an operating lease is terminated before the end of the lease period, any payment made to the lessor by way of penalty is recognised as an expense in the income statement in the period of termination.
(ii) As lessor Leases entered into by the Group as lessor, where the Group transfers substantially all the risks and rewards of ownership to the lessee are classified as finance leases. The net investment in the lease, which is comprised of the present value of the lease payments including any guaranteed residual value and initial direct costs, is recognised within loans and advances. The difference between the gross receivable and the present value of the receivable is unearned income. Income is recognised over the term of the lease using the net investment method (before tax), reflecting a constant periodic rate of return.
Assets leased under operating leases are included within property, plant and equipment at cost and depreciated over the life of the lease after taking into account anticipated residual values. Operating lease rental income is recognised within other operating income in the income statement on a straight-line basis over the life of the lease. Depreciation is recognised within the income statement consistent with the nature of the asset.
(v) Goodwill and other intangible assets (i) Goodwill Goodwill arises on the acquisition of an entity and represents the excess of the fair value of the purchase consideration and direct costs of making the acquisition over the fair value of the Group’s share of the net assets at the date of the acquisition. For the purposes of impairment testing, goodwill has been allocated to
Notes to the fi nancial statements
National Australia Bank50
1 Principal accounting policies (continued)
cash generating units that benefit from the synergies of the acquisition.
(ii) Software costs The identifiable and directly associated external and internal costs of acquiring and developing software are capitalised and recognised as an intangible asset where the software is controlled by the Group, and where it is probable that future economic benefits that exceed its cost will flow from its use over more than one year. Costs associated with maintaining software are recognised as an expense as incurred.
Capitalised software costs and other intangible assets are amortised on a straight-line basis over their expected useful lives: usually, this is between three and five years.
Computer software and other intangible assets are stated at cost less amortisation and impairment losses, if any.
(iii) Intangible assets acquired in a business combination Intangible assets acquired in a business combination are identified and recognised separately from goodwill where they satisfy the definition of an intangible asset and their fair values can be measured reliably. Subsequent to acquisition they are reported at cost less accumulated amortisation and accumulated impairment losses. Amortisation is charged on a straight line basis over their estimated useful lives which varies from three to 15 years.
(w) Business combinations
The purchase method of accounting is used for all business combinations. Cost is measured as the fair value of assets given, equity instruments issued or liabilities incurred or assumed at the date of exchange plus costs directly attributable to the acquisition. Where settlement of any part of any cash consideration is deferred, the amounts payable in the future are discounted to their present value as at the date of exchange. Identifiable assets acquired and liabilities and contingent liabilities assumed in a business combination are measured initially at their fair values at acquisition date. The excess of the cost of acquisition over the Group’s share of the identifiable net assets of the subsidiary acquired is recorded as goodwill.
(x) Investment property
Investment property is property held either to earn rental income or for capital appreciation or both. Investment property is measured at fair value with any increments or decrements being recognised in other operating income. Valuations are carried out annually by professional valuers.
Liabilities
(y) Due to other banks
Due to other banks includes deposits, vostro balances, repurchase agreements and settlement account balances due to other banks. These items are brought to account at the gross value of the outstanding balance.
(z) Financial liabilities
Financial liabilities comprise items such as due to other banks, due to customers, liabilities on acceptances, trading liabilities, and deposits and other borrowings. Financial liabilities may be held at fair value through profit and loss or at amortised cost.
A financial liability is recognised in the balance sheet when the Group becomes a party to the contractual provisions of the instrument. A financial liability is derecognised from the balance sheet when the Group has discharged its obligation or the contract is cancelled or expires.
When a financial liability is recognised, initially it is measured at its fair value plus transaction costs, unless the financial instrument is designated as fair value through profit and loss.
Items held at fair value through profit and loss comprise both items held for trading and items specifically designated as fair value through profit and loss at initial recognition. Financial liabilities held at fair value through profit and loss are initially recognised at fair value, with transaction costs being recognised immediately in the income statement. Subsequently, they are measured at fair value and any gains and losses are recognised in the income statement as they arise.
Where a liability is held at fair value, the movement in fair value attributable to changes in the Group’s own credit quality is calculated through reference to an observable market rate where available or the derivation of a credit adjustment based upon observable market inputs. This adjustment to the credit quality of the liability is then applied to the carrying value of the liability held at fair value.
Bonds, notes and subordinated debt are held at fair value where an accounting mismatch is significantly reduced or eliminated that would otherwise occur if the liability was measured on another basis.
Financial liabilities may be designated as fair value through profit and loss providing they meet the same criteria set down in note 1(m).
A financial liability is classified as held for trading if it is incurred principally for the purpose of selling in the near term, or forms part of a portfolio of financial instruments that are managed together and for which there is evidence of short-term profit taking, or it is a derivative that is not in a qualifying hedge relationship.
(aa) Deposits and other borrowings
Deposits and other borrowings include non-interest-bearing deposits redeemable at call, on-demand and short-term deposits lodged for periods of less than 30 days, certificates of deposit, interest-bearing deposits, debentures and other funds raised publicly by borrowing corporations. These items are brought to account at the gross value of the outstanding balance.
(bb) Life policy liabilities
Life policy liabilities in the Group’s balance sheet and the change in policy liabilities disclosed as an expense have been calculated in accordance with guidance provided by APRA’s Prudential Standard LPS1.04 “Valuation of Policy Liabilities”.
(i) Life insurance contracts Policy liabilities from insurance contracts are measured predominantly using the projection method which is the net present value of estimated future policy cash flows. Future cash flows incorporate investment income, premiums, expenses, redemptions and benefit payments (including bonuses). The accumulation method may be used only where the result would not be materially different to the projection method.
Unvested policyholder benefits represent amounts that have been allocated to certain non-investment-linked policyholders that have not yet vested with specific policyholders.
The measurement of policy liabilities is subject to actuarial assumptions. Assumptions made in the calculation of policy liabilities at each balance date are based on best estimates at that date. The assumptions include the benefits payable under the policies on death, disablement or surrender, future premiums, investment earnings and expenses. Best estimate means that assumptions are neither optimistic nor pessimistic but reflect the most likely outcome. The assumptions used in the calculation of the policy liabilities are reviewed at each balance sheet date.

Notes to the fi nancial statements
2008 Annual Financial Report 51
1 Principal accounting policies (continued)
Deferred acquisition costs are presented as an offset in policy liabilities.
To the extent that the benefits under life insurance contracts are not contractually linked to the performance of the assets held, the life insurance liabilities are discounted for the time value of money using risk-free discount rates based on current observable, objective rates that relate to the nature, structure and term of the future obligations. Where the benefits under life insurance contracts are contractually linked to the performance of the assets held, the life insurance liabilities shall be discounted using discount rates based on the market returns on assets backing life insurance liabilities.
For reinsurance contracts, the Group retains the primary obligation of the underlying life insurance contract.
(ii) Life investment contracts Policy liabilities for investment contracts are measured at fair value, with this value determined as equal to or greater than the surrender value of the policy. The discount rate reflects the return on assets backing the liabilities.
(cc) Provisions
Provisions are recognised when a legal or constructive obligation exists as a result of a past event, it is probable that an outflow of economic benefits will be necessary to settle the obligation and it can be reliably estimated. Provisions are not discounted to the present value of their expected net future cash flows except where the time value of money is considered material.
Contingent liabilities are possible obligations whose existence will be confirmed only by uncertain future events or present obligations where the transfer of economic benefits is not probable or cannot be reliably measured. Contingent liabilities are not recognised in the balance sheet but are disclosed unless the likelihood of payment is remote.
(i) Operational risk events Provisions for operational risk event losses are raised for losses incurred by the Group which do not relate directly to amounts of principal outstanding for loans and advances.
The amount recognised as a provision is the best estimate of the consideration required to settle the present obligation as at the reporting date, taking into account the risks and uncertainties that surround the events and circumstances that affect the provision.
(ii) Restructuring costs Provisions for restructuring costs include provisions for expenses incurred but not yet paid and future expenses that will arise as a direct consequence of decisions already made. A provision for restructuring costs is only made where the Group has made a commitment and entered into an obligation such that it has no realistic alternative but to carry out the restructure and make future payments to settle the obligation. Provision for restructuring costs is only recognised when a detailed plan has been approved and the restructuring has either commenced or has been publicly announced. This includes the cost of staff termination benefits and surplus leased space. Costs related to ongoing activities are not provided for.
(dd) Financial guarantees
The Group provides guarantees in its normal course of business on behalf of its customers. Guarantees written are conditional commitments issued by the Group to guarantee the performance of a customer to a third party. Guarantees are primarily issued to support direct financial obligations such as commercial bills or other debt instruments issued by a counterparty. It is the credit rating of the Group as a guarantee provider that enhances the
marketability of the paper issued by the counterparty in these circumstances.
The financial guarantee contract is initially recorded at fair value which is equal to the premium received, unless there is evidence to the contrary. Subsequently, the Group records and measures the financial guarantee contract at the higher of:
where it is likely the Group will incur a loss as a result of issuing the contract, a liability is recognised for the estimated amount of the loss payable; and
the amount initially recognised less, when appropriate, amortisation of the fee which is recognised over the life of the guarantee.
(ee) Employee benefits
Wages and salaries, annual leave and other employee entitlements expected to be paid or settled within 12 months of providing the service are measured at their nominal amounts using remuneration rates that the Group expects to pay when the liabilities are settled.
Employee entitlements to long service leave are accrued using an actuarial calculation, based on legal and contractual entitlements and assessments having regard to staff departures, leave utilisation and future salary increases.
All other employee entitlements that are not expected to be paid or settled within 12 months of the reporting date are measured at the present value of net future cash flows.
Employees of the Group are entitled to benefits on retirement, disability or death, from the Group’s superannuation plans. The Group operates pension plans which have both defined benefit and defined contribution components.
The defined contribution plans receive fixed contributions from Group companies and the Group’s obligation for contributions to these plans are recognised as an expense in the income statement as incurred. Prepaid contributions are recognised as an asset to the extent that a cash refund or a reduction in the future payment is available.
The defined benefit plans provide defined lump sum benefits based on years of service and a salary component determined in accordance with the specific plan. An asset or liability in respect of defined benefit superannuation plans is recognised in the balance sheet and is measured as the present value of the defined benefit obligation less the fair value of the superannuation fund’s assets at the reporting date.
The present value of the defined benefit obligations for each plan is discounted by either the government bond rate, or the average AAA credit rated bond rate for bonds that have maturity dates approximating to the terms of the Group’s obligations. The present value of the defined benefit obligations is calculated every three years using the projected unit credit method and updated on an annual basis for material movements in the plan position.
The Group does not offset pension assets and liabilities arising from different defined benefit plans. Past service costs are recognised immediately in income. The Group’s policy where actuarial gains and losses arise as a result of actual experience is to fully recognise such amounts directly in retained profits.
Future taxes that are funded by the entity and are part of the provision of existing benefit obligations are taken into account in measuring the net liability or asset.
(ff) Trustee and funds management activities
The Group acts as trustee, custodian or manager of a number of funds and trusts, including superannuation and approved deposit
Notes to the fi nancial statements
National Australia Bank52
1 Principal accounting policies (continued)
funds, and wholesale and retail investment trusts. Where the Group does not have direct or indirect control of these funds and trusts as defined by AASB 127 “Consolidated and Separate Financial Statements”, the assets and liabilities are not included in the consolidated financial statements of the Group. When controlled entities, as responsible entities or trustees, incur liabilities in respect of their activities, a right of indemnity exists against the assets of the applicable trusts and funds. Where these assets are determined to be sufficient to cover liabilities, and it is not probable that the controlled entities will be required to settle them, the Group does not include the liabilities in the consolidated financial statements.
Commissions and fees earned in respect of the Group’s trust and funds management activities are included in the income statement.
(gg) Securitisation
Through its loan securitisation program, the Group packages and sells loans (principally housing mortgage loans) as securities to investors through a series of securitisation vehicles. The Group is entitled to any residual income of the vehicles after all payments to investors and costs of the program have been met. The Group is considered to hold the majority of the residual risks and benefits within the vehicles and all relevant financial assets continue to be held on the Group balance sheet, and a liability recognised for the proceeds of the funding transaction.
In addition to its loan securitisation program, the Group has various contractual relationships with entities that undertake securitisation of third party assets. The Group sponsors, manages and provides liquidity facilities and derivative contracts to these securitisation conduits.
(hh) Income tax
Income tax expense (or revenue) is the tax payable (or receivable) on the current period’s taxable income based on the applicable tax rate in each jurisdiction adjusted by changes in deferred tax assets and liabilities. Income tax expense is recognised in the income statement except to the extent that it related to items recognised directly in equity, in which case it is recognised in equity.
Current tax liability is the expected tax payable on the taxable income for the year, using tax rates enacted or substantively enacted at the balance sheet date, and any adjustment to tax payable in respect of previous years.
Deferred tax assets and liabilities are recognised for temporary differences arising between the tax bases of assets and liabilities and their carrying amounts in the consolidated financial statements. Deferred income tax is determined using tax rates (and laws) that have been enacted or substantially enacted by the balance sheet date and are expected to apply when the related deferred income tax asset is realised or the deferred income tax liability is settled.
Deferred tax assets are only recognised for temporary differences, unused tax losses and unused tax credits if it is probable that future taxable amounts will arise to utilise those temporary differences and losses.
The effects of income taxes arising from asset revaluation adjustments are recognised directly in the asset revaluation reserve where relevant. Deferred tax assets and liabilities related to fair value remeasurement of available for sale investments and cash flow hedges, which are charged or credited directly to equity, are also credited or charged directly to equity. The tax associated with these transactions will be recognised in the income statement at the same time as the underlying transaction.
For life insurance business, taxation is not based on the concept of profit. Special legislative provisions apply to tax policyholders and shareholders on different bases. According to the class of business to which their policies belong, policyholders have their investment earnings taxed at the following rates in Australia:
superannuation policies – 15%; annuity policies – 0%; or non-superannuation investment policies – 30%.
The life insurance business shareholders’ funds are taxed at the company rate of 30% on fee income and profit arising from insurance risk policies less deductible expenses.
Tax consolidation
The Group and its wholly owned Australian resident entities have formed a tax-consolidated group with effect from 1 October 2002 and are therefore taxed as a single entity from that date. The head entity within the tax-consolidated group is National Australia Bank Limited.
Current tax expense/income and deferred tax assets and liabilities arising from temporary differences of the members of the tax-consolidated group are recognised in the separate financial statements of the members of the tax-consolidated group using the ‘group allocation’ approach.
Any current tax liabilities/assets and deferred tax assets arising from unused tax losses of the subsidiaries are assumed by the head entity in the tax-consolidated group and are recognised as amounts payable to/receivable from other entities in the tax-consolidated group in conjunction with any tax funding arrangement amounts. The inter-entity payable/receivable is at call. Any difference between these amounts is recognised by the Company as an equity contribution or distribution.
The members of the tax-consolidated group have entered into a tax funding arrangement that sets out the funding obligations of members of the tax-consolidated group in respect of tax amounts. Contributions to fund the current tax liabilities are payable in accordance with the tax funding arrangement and reflect the timing of the head entity’s obligation to make payments for tax liabilities to the relevant tax authorities.
(ii) Bonds, notes and subordinated debt and other debt issues
Bonds, notes and subordinated debt and other debt issues are short and long-term debt issues of the Group including commercial paper, notes, term loans, medium-term notes, mortgage backed securities and other discrete debt issues. Debt issues are typically recorded at amortised cost using the effective interest method. Premiums, discounts and associated issue expenses are recognised using the effective interest method through the income statement from the date of issue to accrete the carrying value of securities to redemption values by maturity date. Interest is charged to the income statement using the effective interest method. Embedded derivatives within debt instruments must also be separately accounted for where not closely related to the terms of the host debt instrument. These embedded derivative instruments are recorded at fair value with gains and losses on the embedded derivative recorded in the income statement.
Where debt issues are classified as held at fair value through profit and loss, they are initially recognised at fair value, with transaction costs being recognised immediately in the income statement. Subsequently, they are measured at fair value and any gains and losses are recognised in the income statement as they arise.
Notes to the fi nancial statements
2008 Annual Financial Report 53
1 Principal accounting policies (continued)
Equity
(jj) Contributed equity
Ordinary shares are classified as equity. Incremental costs directly attributable to the issue of new shares or options are directly included within equity. Holders of ordinary shares are entitled to receive dividends as declared from time to time and are entitled to one vote on a show of hands or, on a poll, one vote for each fully paid ordinary share held at shareholders’ meetings. The Company’s ordinary shares do not have a par value. In the event of a winding-up of the Company, ordinary shareholders rank after all other shareholders and creditors and are fully entitled to any residual proceeds of liquidation.
(kk) Reserves (i) General reserve The general reserve includes statutory funds’ retained profits from the Group’s life insurance business. Profits from the statutory funds are not immediately available for distribution. These profits will only be available after the respective life company’s board has approved the transfer of surpluses from the statutory funds to the shareholders’ fund.
(ii) Asset revaluation reserve The asset revaluation reserve includes revaluation increments and decrements arising from the revaluation of properties.
(iii) Foreign currency translation reserve The foreign currency translation reserve records the foreign currency differences arising from the translation of foreign operations, the translation of transactions that hedge the Company’s net investment in a foreign operation or the translation of foreign currency monetary items forming part of the net investment in a foreign operation.
(iv) Cash flow hedge reserve The cash flow hedge reserve records the fair value revaluation of derivatives designated as cash flow hedging instruments.
(v) Equity based payments reserve The equity based payments reserve records the value of equity benefits provided to employees and directors as part of their remuneration.
(ll) Treasury shares
If a controlled entity acquires shares in the Company (treasury shares), the cost of the acquired shares is recognised as a deduction from share capital. Dividends on treasury shares are not credited to income, but eliminated on consolidation. Gains and losses on sale of treasury shares are accounted for as adjustments to issued capital and not part of income.
Certain statutory funds of the Group’s life insurance business hold investments in the Company. As these statutory funds are consolidated into the financial report, such investments held in the Company are accounted for as treasury shares. Additionally, shares purchased on-market to meet the requirements of employee incentive schemes, and held in trust by a controlled entity of the Company, are likewise accounted for as treasury shares.
Income and expense recognition
(mm) Interest income
Interest income is recognised in the income statement using the effective interest method.
The effective interest method is a method of calculating the amortised cost using the effective interest rate of a financial asset
or financial liability. The effective interest rate is the rate that exactly discounts the estimated stream of future cash payments or receipts over the expected life of the financial instrument or, when appropriate, a shorter period to the net carrying amount of the financial asset or liability.
Loan origination fees are recognised as income over the life of the loan as an adjustment of yield. Commitment fees are deferred until the commitment is exercised and are recognised over the life of the loan as an adjustment of yield or, if unexercised, recognised as income upon expiration of the commitment. Where commitment fees are retrospectively determined and nominal in relation to market interest rates on related loans, commitment fees are recognised as income when charged. Where the likelihood of exercise of the commitment is remote, commitment fees are recognised as income over the commitment period. Loan-related administration and service fees are recognised as income over the period of service. Credit card fees are recognised as income over the card usage period. Syndication fees are recognised as income after certain retention, timing and yield criteria are satisfied.
Direct loan origination costs are netted against loan origination fees and the net amount recognised as income over the life of the loan as an adjustment of yield. All other loan-related costs are expensed as incurred.
(nn) Life insurance business
The Group conducts its life insurance business through a number of controlled entities including MLC Lifetime Company Limited, MLC Limited and BNZ Life Insurance Limited.
(i) Types of business The Australian life insurance operations of the Group consist of investment-linked business and non-investment-linked business, which are conducted in separate statutory funds as required under the Life Insurance Act 1995 (Cth). The overseas life insurance operations of the Group consist primarily of non-investment-linked business.
Life investment contracts include investment-linked contracts where policyholders’ investments are held within the statutory funds and policyholders’ returns are directly linked to the investment performance of the assets in that fund. The policyholder bears all the risks and rewards of the investment performance. The policyholder has no direct access to the specific assets; however, the policy value is calculated by reference to the market value of the statutory fund’s assets. Investment-linked business includes superannuation and allocated pension business. Fee income is derived from the administration of investment-linked policies and funds.
Life insurance contracts involve the acceptance of significant insurance risk. Insurance risk is defined as significant if an insured event could cause an insurer to pay significant additional benefits in any scenario that has commercial substance. Any products sold by a life insurer that do not meet the definition of a life insurance contract are classified as life investment contracts. Insurance contracts include those where an insured benefit is payable on the occurrence of a specified event such as death, injury or disability caused by accident or illness or, in the case of an annuity, the continuance of the annuitant’s life or the expiry of the annuity term. The benefit payable is not directly referable to the market value of the fund’s assets.
Non-investment-linked business includes traditional whole of life and endowment policies (where the risks and rewards generally are shared between policyholders and shareholders) and risk policies such as death, disability and income insurance (where the shareholder bears all the financial risks).
Notes to the fi nancial statements
National Australia Bank54
1 Principal accounting policies (continued)
(ii) Allocation of profit Life insurance contracts Profits are brought to account in the statutory funds on a Margin on Services basis (MoS). Under MoS, profit is recognised as fees are received and services are provided to policyholders over the life of the contract that reflects the pattern of risk accepted from the policyholder. When fees are received but the service has not been provided, the profit is not recorded at the point of sale. Losses are expensed when identified.
Consistent with the principle of deferring unearned profit is the requirement to defer expenditure associated with the deferred profit. MoS permits costs associated with the acquisition of life insurance policies to be charged to the income statement over the period that the policy will generate profits. However, costs may only be deferred to the extent that a policy is expected to be profitable.
Profits arising from policies comprising non-investment-linked business are based on actuarial assumptions, and calculated as the excess of premiums and investment earnings less claims, operating expenses and the amortisation of acquisition costs that will be incurred over the estimate life of the policies. The profit is systematically recognised over the estimated time period the policy will remain in force.
Certain policies are entitled to share in the profits that arise from the non-investment-linked business. This profit sharing is governed by the Life Insurance Act 1995 (Cth) and the life insurance companies’ constitutions. This profit sharing amount is treated as an expense in the income statement.
Life investment contracts Profit from investment-linked business is derived as the excess of the fees earned by the shareholder for managing the funds invested over operating expenses.
(iii) Premium and related revenue Life insurance contracts Premiums are separated into their revenue and liability components. Premium amounts earned by providing services and bearing risks, including protection business, are treated as revenue. Other premium amounts received, net of initial fee income, which are akin to deposits, are recognised as an increase in policy liabilities.
Premiums with a regular due date are recognised as revenue on a due basis. Premiums with no due date are recognised as revenue or an increase in policy liabilities on a cash received basis. Premiums due before the end of the year but not received at balance date are included as outstanding premiums receivable. Premiums due after but received before the end of the year are accounted for as premiums in advance.
Life investment contracts The initial fee, which is the difference between the premium received and the initial surrender value, is recognised as fee income. For the Group’s investment contracts, all premiums are recognised as an increase in policy liabilities.
(iv) Investment revenue Dividend and interest income is brought to account on an accruals basis when the life insurance controlled entity obtains control of the right to receive the dividend or interest income.
Net realised and unrealised profits and losses represent changes in the measurement of fair values in respect of all investments recognised at fair value and are recognised in the income statement in the period in which they occur.
(v) Claims expense Claims are recognised when the liability to a policyholder under a policy contract has been established or upon notification of the insured event, depending on the type of claim. Claims are separated into their expense and liability components.
Life insurance contracts Claims incurred that relate to the provision of services and bearing of risks are treated as expenses and are recognised on an accruals basis.
Life investment contracts Claims incurred in respect of investment contracts, which are in the nature of investment withdrawals, are recognised as a reduction in policy liabilities. For investment contracts, all claims are recognised as a decrease in policy liabilities.
(vi) Basis of expense apportionment All expenses charged to the income statement are equitably apportioned to the different classes of business in accordance with Division 2 of Part 6 of the Life Insurance Act 1995 (Cth) as follows:
expenses and other outgoings that relate specifically to a particular statutory fund have been directly charged to that fund; and
expenses and other outgoings (excluding commissions, medical fees and stamp duty relating to the policies which are all directly allocated) have been apportioned between each statutory fund and shareholders’ fund.
Expenses are apportioned between classes of business by first allocating the expenses to major functions and activities, including sales support and marketing, new business processing and policyholder servicing. Expenses are then allocated to classes of products using relevant activity cost drivers, including commissions, policy counts, funds under management and benchmark profit; and investment income, profits and losses on sale of property, plant and equipment, profits and losses on sale of investments, and appreciation and depreciation of investments have been directly credited or charged to the appropriate statutory fund or shareholders’ fund.
(vii) Deferred acquisition costs The extent to which policy acquisition costs are deferred varies according to the classification of the contract acquired (either life insurance or life investment).
Life insurance contracts The costs incurred in selling or generating new business include adviser fees, commission payments, application processing costs, relevant advertising costs and costs for promotion of products and related activities. These costs are deferred to the extent they are deemed recoverable in the premiums or policy charges (as appropriate for each policy class). Acquisition costs deferred are amortised over the period that they will be recovered from premiums or policy charges.
Life investment contracts The incremental costs incurred in selling or generating new business are expensed as incurred.
(oo) Dividend income
Dividend income is recorded in the income statement on an accruals basis when the Group’s right to receive the dividend is established.
(pp) Fees and commissions
Unless included in the effective interest calculation, fees and commissions are recognised on an accruals basis when the
Notes to the fi nancial statements
2008 Annual Financial Report 55
1 Principal accounting policies (continued)
service has been provided or on completion of the underlying transaction.
Asset management fees related to investment funds are recognised over the period the service is provided. The same principle is applied to the recognition of income from wealth management, financial planning and custody services that are continuously provided over an extended period of time. Account keeping charges, credit card fees, money transfer fees and loan servicing fees are recognised in the period the service is provided.
(qq) Gains less losses on instruments at fair value
Gains less losses on instruments at fair value comprises fair value gains and losses from four distinct activities:
trading derivatives; trading securities; instruments designated in hedge relationships; and other assets and liabilities designated at fair value through
profit and loss.
In general, gains less losses on trading derivatives recognises the full change in fair value of the derivatives inclusive of interest income and expense. However, in cases where the trading derivative is economically offsetting movements in the fair value of an asset or liability designated as being carried at fair value through profit and loss, the interest income and expense attributable to the derivatives is recorded within net interest income and not part of the fair value movement of the trading derivative.
Interest income and expense on trading securities are reported within interest income.
Gains less losses on hedging assets, liabilities and derivatives designated in hedge relationships recognises fair value movements on both the hedged item and hedging derivative in a fair value hedge relationship, and hedge ineffectiveness for both fair value and cash flow hedge relationships. Interest income and expense on both hedging instruments and instruments designated as fair value through profit and loss at initial recognition are recognised in net interest income.
Gains less losses on financial assets and liabilities designated at fair value through profit and loss recognises fair value movements (excluding interest) on those items designated as fair value through profit and loss at inception.
(rr) Equity-based compensation
The Group provides equity-based compensation to its employees in respect of services received. The value of the services received is measured by reference to the grant date fair value of the shares, performance options or performance rights provided to employees. The fair value expense of each tranche of shares, performance options or performance rights granted is recognised in the income statement on a straight-line basis, adjusted for forfeitures, over the period that the services are received by the Group, (the vesting period), with a corresponding increase in reserves.
The fair value of share plans granted is generally determined by reference to the weighted average Company share price in the week up to, and including, the date on which the shares were granted. Existing employee share plans are linked to internal performance or service conditions and vest when these conditions are satisfied.
The fair value and expected vesting period of the performance options and performance rights granted are determined using a simulated version of the Black-Scholes model. The simulation approach allows the valuation to take into account both the probability of achieving the market-based performance hurdle
required for the performance options or performance rights to vest and the potential for early exercise of vested performance options or performance rights.
The key assumptions and inputs for the valuation model are the exercise price of the performance option or performance right, the expected volatility of the Company’s share price, the risk-free interest rate and the expected dividend yield on the Company’s shares for the life of the performance options and performance rights. When estimating expected volatility, historic daily share prices are analysed to arrive at annual and cumulative historic volatility estimates (which may be adjusted for any abnormal periods or non-recurring significant events). Trends in the data are analysed to estimate volatility movements in the future for use in the numeric pricing model.
Expected time to vesting (from grant date) of each performance option and performance right is an output of the valuation model, along with the fair valuations of the performance options and performance rights.
Non-market-based performance hurdles are not taken into account when determining the fair value and expected time to vesting of performance options and performance rights. Instead, non-market-based performance conditions are taken into account by adjusting the number of performance options and performance rights included in the measurement of the expense so that ultimately, the amount recognised in the income statement reflects the number of performance options or performance rights that actually vest.
(ss) Goods and services tax
Revenues, expenses and assets are recognised net of the amount of goods and services tax or other value-added tax, except where the tax incurred is not recoverable from the relevant taxation authority. In these circumstances, the tax is recognised as part of the expense or the cost of acquisition of the asset.
Receivables and payables are stated at an amount with tax included. The net amount of tax recoverable from, or payable to, the relevant taxation authority is included within other assets or other liabilities.
Cash flows are included in the cash flow statement on a gross basis. The tax component of cash flows arising from investing and financing activities which is recoverable from, or payable to, the relevant taxation authority is classified as operating cash flows.
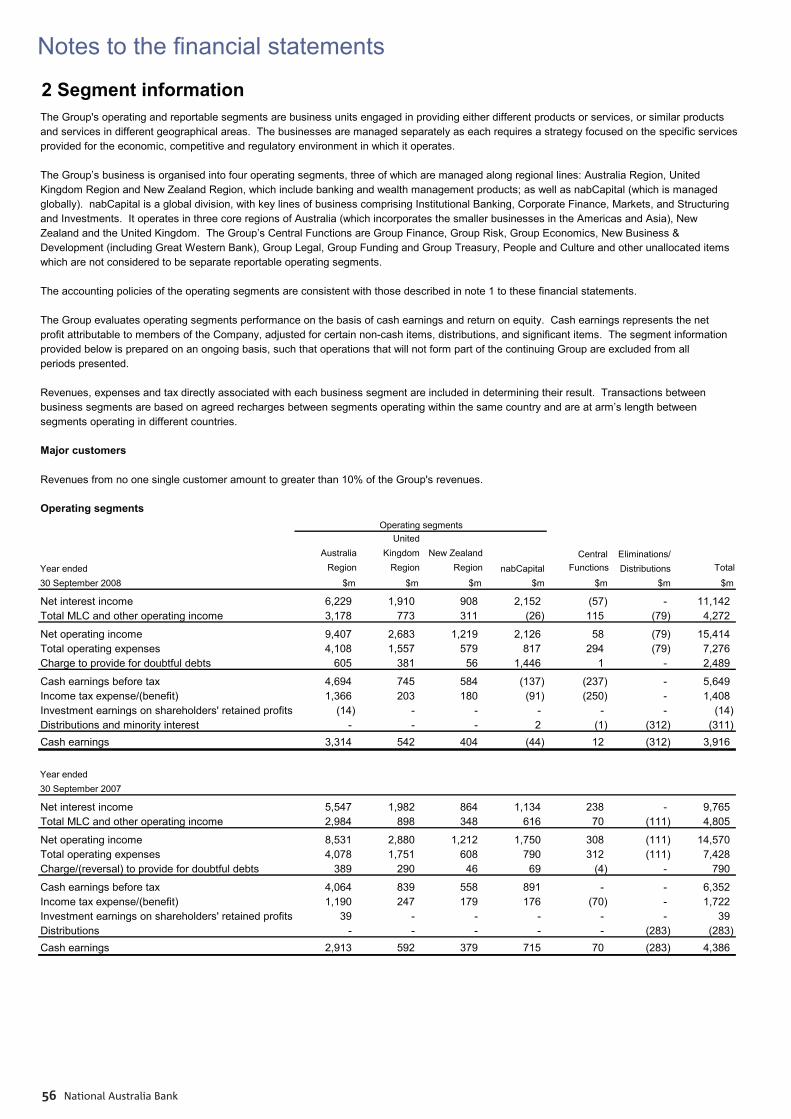
Notes to the fi nancial statements
National Australia Bank56
2 Segment informationThe Group's operating and reportable segments are business units engaged in providing either different products or services, or similar productsand services in different geographical areas. The businesses are managed separately as each requires a strategy focused on the specific servicesprovided for the economic, competitive and regulatory environment in which it operates.
The Group’s business is organised into four operating segments, three of which are managed along regional lines: Australia Region, United Kingdom Region and New Zealand Region, which include banking and wealth management products; as well as nabCapital (which is managedglobally). nabCapital is a global division, with key lines of business comprising Institutional Banking, Corporate Finance, Markets, and Structuringand Investments. It operates in three core regions of Australia (which incorporates the smaller businesses in the Americas and Asia), NewZealand and the United Kingdom. The Group’s Central Functions are Group Finance, Group Risk, Group Economics, New Business &Development (including Great Western Bank), Group Legal, Group Funding and Group Treasury, People and Culture and other unallocated itemswhich are not considered to be separate reportable operating segments.
The accounting policies of the operating segments are consistent with those described in note 1 to these financial statements.
The Group evaluates operating segments performance on the basis of cash earnings and return on equity. Cash earnings represents the netprofit attributable to members of the Company, adjusted for certain non-cash items, distributions, and significant items. The segment informationprovided below is prepared on an ongoing basis, such that operations that will not form part of the continuing Group are excluded from allperiods presented.
Revenues, expenses and tax directly associated with each business segment are included in determining their result. Transactions betweenbusiness segments are based on agreed recharges between segments operating within the same country and are at arm’s length betweensegments operating in different countries.
Major customers
Revenues from no one single customer amount to greater than 10% of the Group's revenues.
Operating segments_Operating segments
United Australia Kingdom New Zealand Central Eliminations/
Year ended Region Region Region nabCapital Functions Distributions Total
30 September 2008 $m $m $m $m $m $m $m
Net interest income 6,229 1,910 908 2,152 (57) - 11,142 Total MLC and other operating income 3,178 773 311 (26) 115 (79) 4,272
Net operating income 9,407 2,683 1,219 2,126 58 (79) 15,414 Total operating expenses 4,108 1,557 579 817 294 (79) 7,276 Charge to provide for doubtful debts 605 381 56 1,446 1 - 2,489
Cash earnings before tax 4,694 745 584 (137) (237) - 5,649 Income tax expense/(benefit) 1,366 203 180 (91) (250) - 1,408 Investment earnings on shareholders' retained profits (14) - - - - - (14) Distributions and minority interest - - - 2 (1) (312) (311) Cash earnings 3,314 542 404 (44) 12 (312) 3,916
_Year ended30 September 2007
Net interest income 5,547 1,982 864 1,134 238 - 9,765 Total MLC and other operating income 2,984 898 348 616 70 (111) 4,805
Net operating income 8,531 2,880 1,212 1,750 308 (111) 14,570 Total operating expenses 4,078 1,751 608 790 312 (111) 7,428 Charge/(reversal) to provide for doubtful debts 389 290 46 69 (4) - 790
Cash earnings before tax 4,064 839 558 891 - - 6,352 Income tax expense/(benefit) 1,190 247 179 176 (70) - 1,722 Investment earnings on shareholders' retained profits 39 - - - - - 39 Distributions - - - - - (283) (283) Cash earnings 2,913 592 379 715 70 (283) 4,386
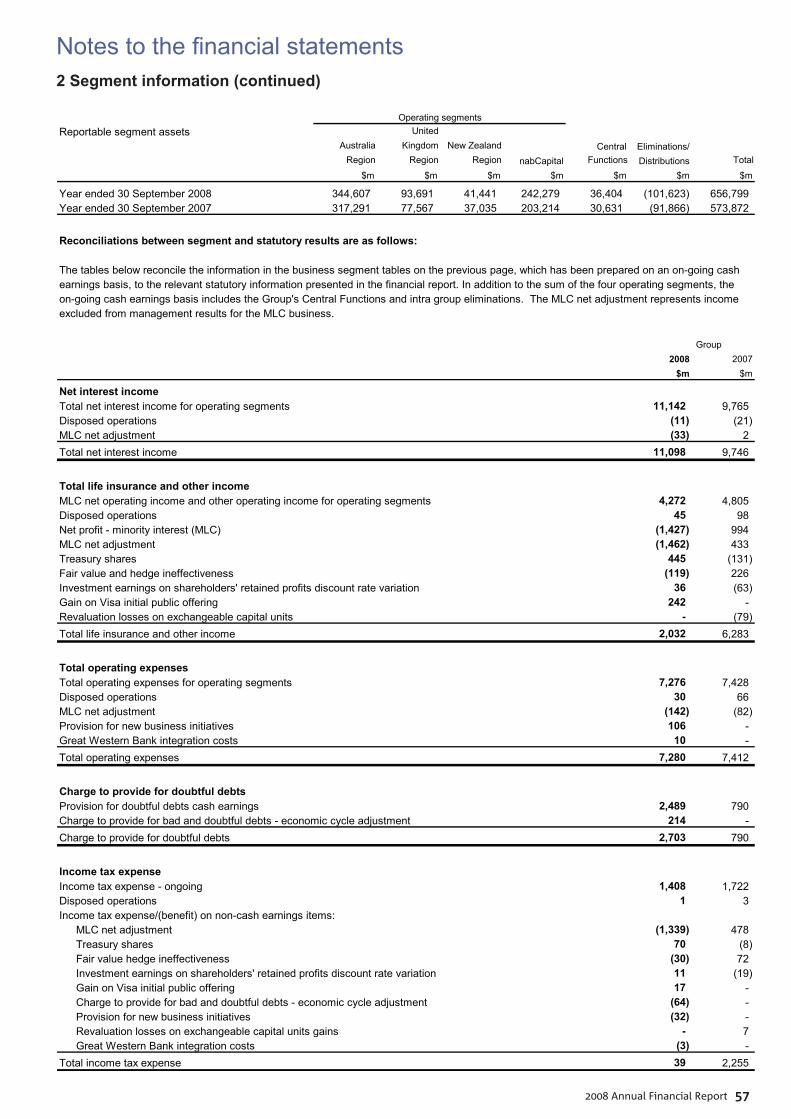
Notes to the fi nancial statements
2008 Annual Financial Report 57
2 Segment information (continued)
Operating segmentsReportable segment assets United
Australia Kingdom New Zealand Central Eliminations/Region Region Region nabCapital Functions Distributions Total
$m $m $m $m $m $m $m
Year ended 30 September 2008 344,607 93,691 41,441 242,279 36,404 (101,623) 656,799 Year ended 30 September 2007 317,291 77,567 37,035 203,214 30,631 (91,866) 573,872
Reconciliations between segment and statutory results are as follows:
The tables below reconcile the information in the business segment tables on the previous page, which has been prepared on an on-going cashearnings basis, to the relevant statutory information presented in the financial report. In addition to the sum of the four operating segments, theon-going cash earnings basis includes the Group's Central Functions and intra group eliminations. The MLC net adjustment represents incomeexcluded from management results for the MLC business.
_
2008 2007$m $m
Net interest incomeTotal net interest income for operating segments 11,142 9,765 Disposed operations (11) (21) MLC net adjustment (33) 2 Total net interest income 11,098 9,746
Total life insurance and other income MLC net operating income and other operating income for operating segments 4,272 4,805 Disposed operations 45 98 Net profit - minority interest (MLC) (1,427) 994 MLC net adjustment (1,462) 433 Treasury shares 445 (131) Fair value and hedge ineffectiveness (119) 226 Investment earnings on shareholders' retained profits discount rate variation 36 (63) Gain on Visa initial public offering 242 - Revaluation losses on exchangeable capital units - (79) Total life insurance and other income 2,032 6,283
Total operating expensesTotal operating expenses for operating segments 7,276 7,428 Disposed operations 30 66 MLC net adjustment (142) (82) Provision for new business initiatives 106 - Great Western Bank integration costs 10 - Total operating expenses 7,280 7,412
Charge to provide for doubtful debtsProvision for doubtful debts cash earnings 2,489 790 Charge to provide for bad and doubtful debts - economic cycle adjustment 214 - Charge to provide for doubtful debts 2,703 790
Income tax expenseIncome tax expense - ongoing 1,408 1,722 Disposed operations 1 3 Income tax expense/(benefit) on non-cash earnings items:
MLC net adjustment (1,339) 478 Treasury shares 70 (8) Fair value hedge ineffectiveness (30) 72 Investment earnings on shareholders' retained profits discount rate variation 11 (19) Gain on Visa initial public offering 17 - Charge to provide for bad and doubtful debts - economic cycle adjustment (64) - Provision for new business initiatives (32) - Revaluation losses on exchangeable capital units gains - 7 Great Western Bank integration costs (3) -
Total income tax expense 39 2,255
Group
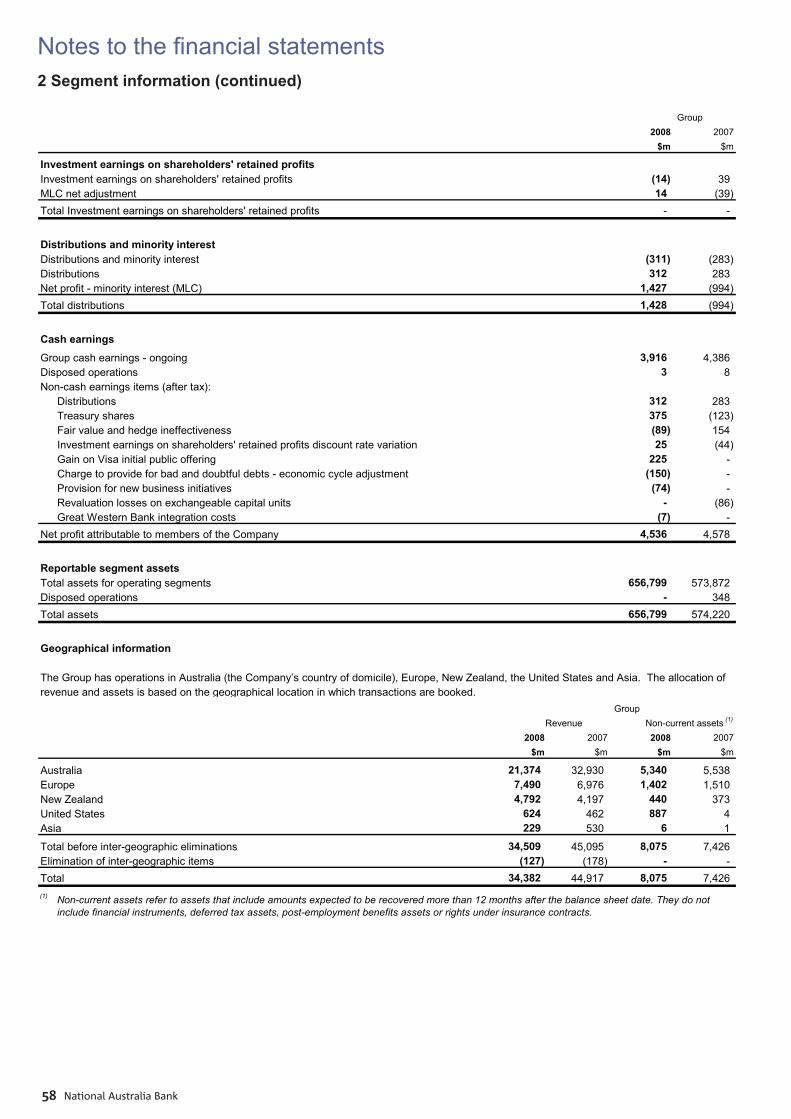
Notes to the fi nancial statements
National Australia Bank58
2 Segment information (continued)
2008 2007$m $m
Investment earnings on shareholders' retained profitsInvestment earnings on shareholders' retained profits (14) 39 MLC net adjustment 14 (39) Total Investment earnings on shareholders' retained profits - -
Distributions and minority interestDistributions and minority interest (311) (283) Distributions 312 283 Net profit - minority interest (MLC) 1,427 (994) Total distributions 1,428 (994)
Cash earnings
Group cash earnings - ongoing 3,916 4,386 Disposed operations 3 8 Non-cash earnings items (after tax):
Distributions 312 283 Treasury shares 375 (123) Fair value and hedge ineffectiveness (89) 154 Investment earnings on shareholders' retained profits discount rate variation 25 (44) Gain on Visa initial public offering 225 - Charge to provide for bad and doubtful debts - economic cycle adjustment (150) - Provision for new business initiatives (74) - Revaluation losses on exchangeable capital units - (86) Great Western Bank integration costs (7) -
Net profit attributable to members of the Company 4,536 4,578
Reportable segment assets Total assets for operating segments 656,799 573,872 Disposed operations - 348 Total assets 656,799 574,220
Geographical information
The Group has operations in Australia (the Company’s country of domicile), Europe, New Zealand, the United States and Asia. The allocation ofrevenue and assets is based on the geographical location in which transactions are booked. _
2008 2007 2008 2007$m $m $m $m
Australia 21,374 32,930 5,340 5,538 Europe 7,490 6,976 1,402 1,510 New Zealand 4,792 4,197 440 373 United States 624 462 887 4 Asia 229 530 6 1
Total before inter-geographic eliminations 34,509 45,095 8,075 7,426 Elimination of inter-geographic items (127) (178) - - Total 34,382 44,917 8,075 7,426 (1) Non-current assets refer to assets that include amounts expected to be recovered more than 12 months after the balance sheet date. They do not
include financial instruments, deferred tax assets, post-employment benefits assets or rights under insurance contracts.
Group Revenue
Group
Non-current assets (1)
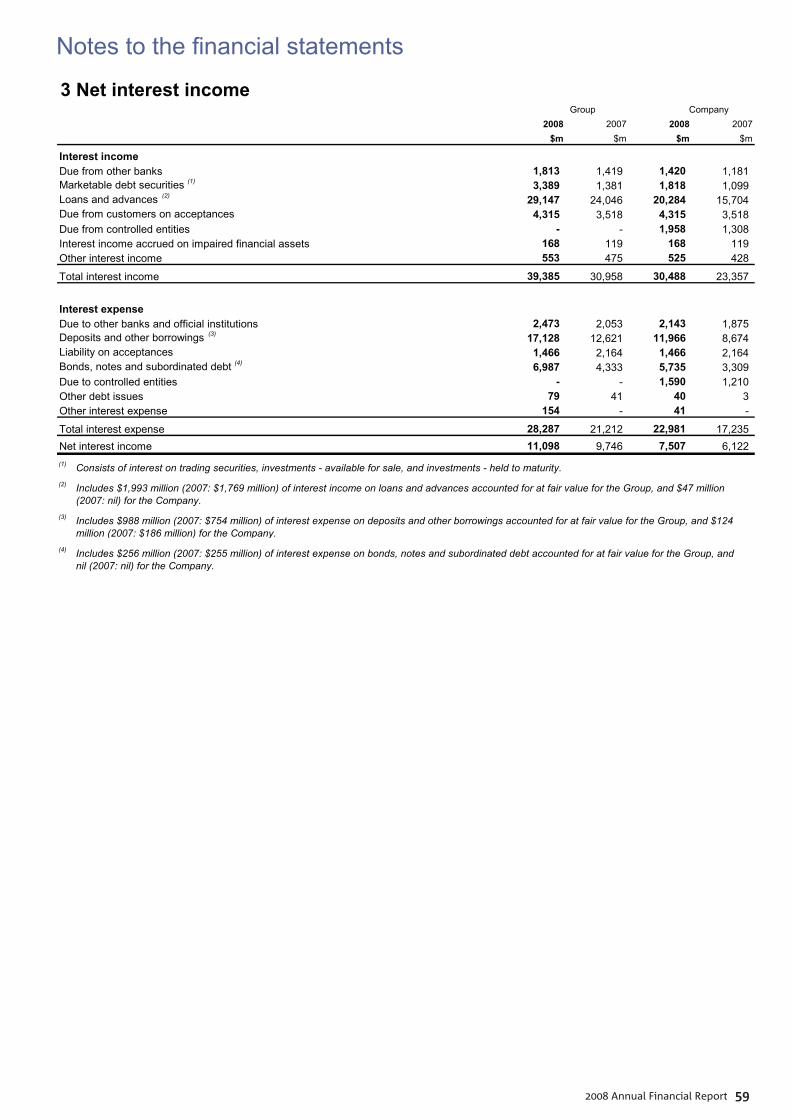
Notes to the fi nancial statements
2008 Annual Financial Report 59
3 Net interest income_
2008 2007 2008 2007$m $m $m $m
Interest incomeDue from other banks 1,813 1,419 1,420 1,181 Marketable debt securities (1) 3,389 1,381 1,818 1,099 Loans and advances (2) 29,147 24,046 20,284 15,704 Due from customers on acceptances 4,315 3,518 4,315 3,518 Due from controlled entities - - 1,958 1,308 Interest income accrued on impaired financial assets 168 119 168 119 Other interest income 553 475 525 428
Total interest income 39,385 30,958 30,488 23,357
Interest expenseDue to other banks and official institutions 2,473 2,053 2,143 1,875 Deposits and other borrowings (3) 17,128 12,621 11,966 8,674 Liability on acceptances 1,466 2,164 1,466 2,164 Bonds, notes and subordinated debt (4) 6,987 4,333 5,735 3,309 Due to controlled entities - - 1,590 1,210 Other debt issues 79 41 40 3 Other interest expense 154 - 41 -
Total interest expense 28,287 21,212 22,981 17,235 Net interest income 11,098 9,746 7,507 6,122 (1) Consists of interest on trading securities, investments - available for sale, and investments - held to maturity.(2) Includes $1,993 million (2007: $1,769 million) of interest income on loans and advances accounted for at fair value for the Group, and $47 million
(2007: nil) for the Company.(3) Includes $988 million (2007: $754 million) of interest expense on deposits and other borrowings accounted for at fair value for the Group, and $124
million (2007: $186 million) for the Company.(4) Includes $256 million (2007: $255 million) of interest expense on bonds, notes and subordinated debt accounted for at fair value for the Group, and
nil (2007: nil) for the Company.
Group Company
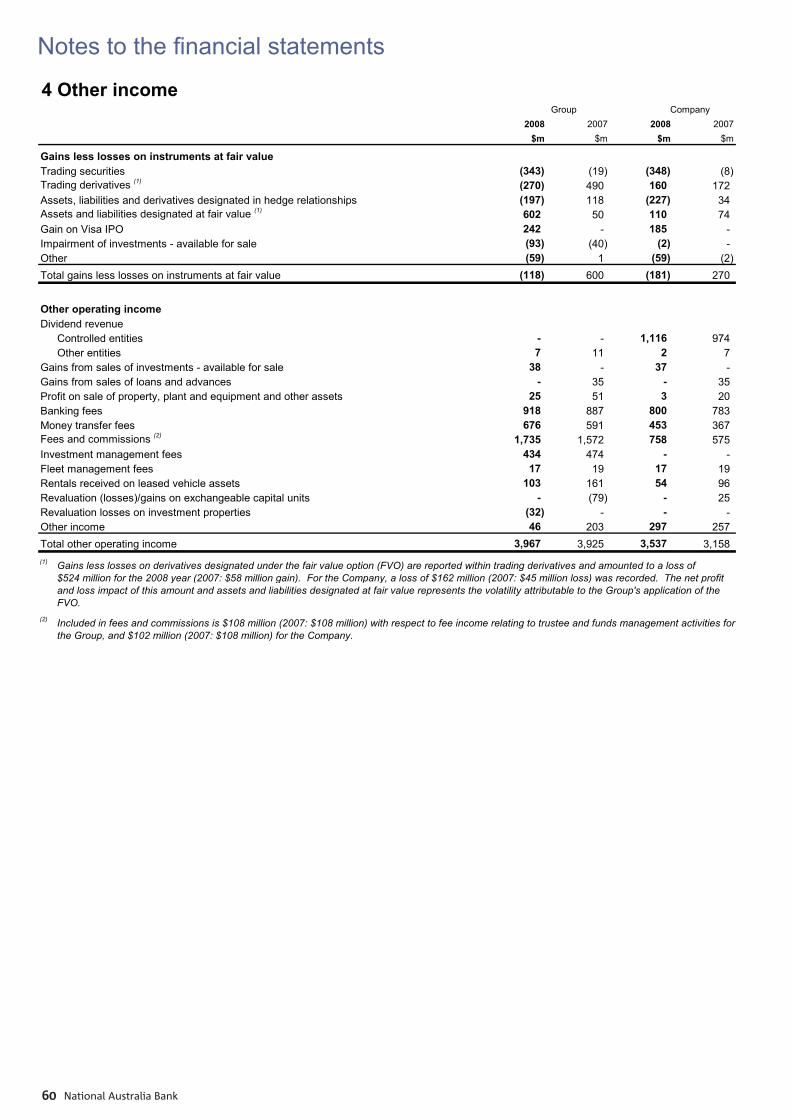
Notes to the fi nancial statements
National Australia Bank60
4 Other income_
2008 2007 2008 2007$m $m $m $m
Gains less losses on instruments at fair valueTrading securities (343) (19) (348) (8) Trading derivatives (1) (270) 490 160 172 Assets, liabilities and derivatives designated in hedge relationships (197) 118 (227) 34 Assets and liabilities designated at fair value (1) 602 50 110 74 Gain on Visa IPO 242 - 185 - Impairment of investments - available for sale (93) (40) (2) - Other (59) 1 (59) (2) Total gains less losses on instruments at fair value (118) 600 (181) 270
Other operating incomeDividend revenue
Controlled entities - - 1,116 974 Other entities 7 11 2 7
Gains from sales of investments - available for sale 38 - 37 - Gains from sales of loans and advances - 35 - 35 Profit on sale of property, plant and equipment and other assets 25 51 3 20 Banking fees 918 887 800 783 Money transfer fees 676 591 453 367 Fees and commissions (2) 1,735 1,572 758 575 Investment management fees 434 474 - - Fleet management fees 17 19 17 19 Rentals received on leased vehicle assets 103 161 54 96 Revaluation (losses)/gains on exchangeable capital units - (79) - 25 Revaluation losses on investment properties (32) - - - Other income 46 203 297 257 Total other operating income 3,967 3,925 3,537 3,158 (1) Gains less losses on derivatives designated under the fair value option (FVO) are reported within trading derivatives and amounted to a loss of
$524 million for the 2008 year (2007: $58 million gain). For the Company, a loss of $162 million (2007: $45 million loss) was recorded. The net profitand loss impact of this amount and assets and liabilities designated at fair value represents the volatility attributable to the Group's application of theFVO.
(2) Included in fees and commissions is $108 million (2007: $108 million) with respect to fee income relating to trustee and funds management activities forthe Group, and $102 million (2007: $108 million) for the Company.
Group Company
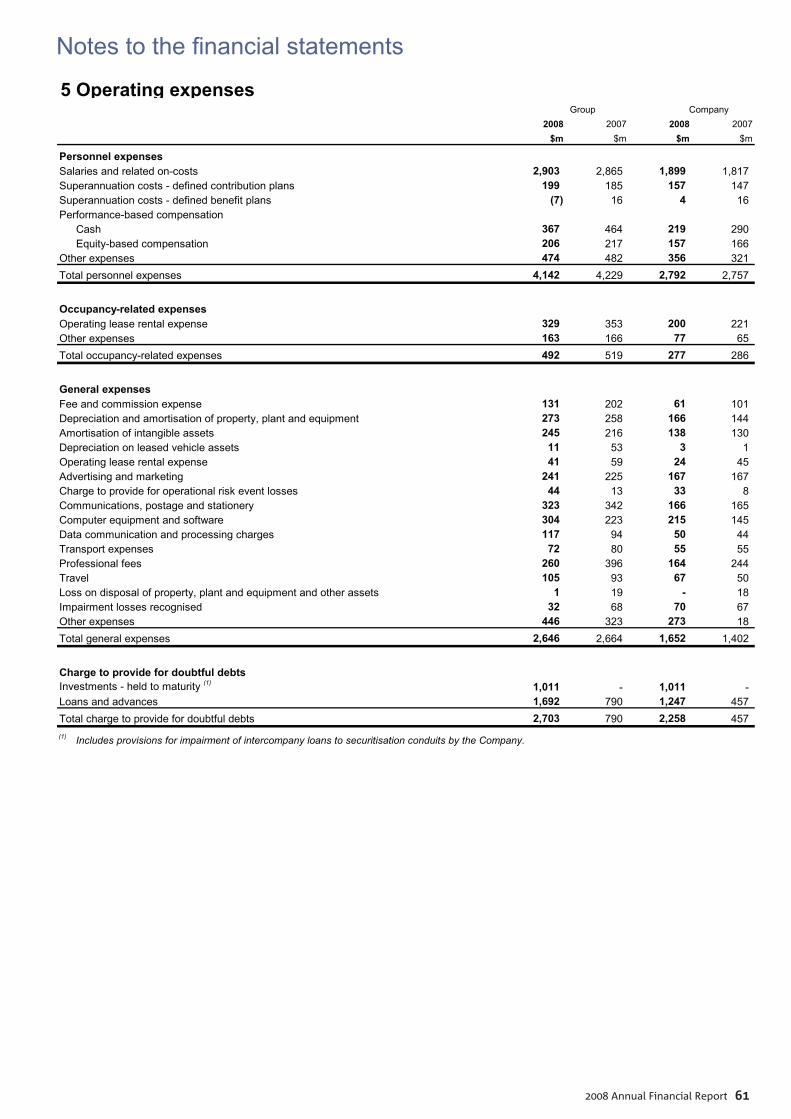
Notes to the fi nancial statements
2008 Annual Financial Report 61
5 Operating expenses
2008 2007 2008 2007$m $m $m $m
Personnel expensesSalaries and related on-costs 2,903 2,865 1,899 1,817 Superannuation costs - defined contribution plans 199 185 157 147 Superannuation costs - defined benefit plans (7) 16 4 16 Performance-based compensation
Cash 367 464 219 290 Equity-based compensation 206 217 157 166
Other expenses 474 482 356 321 Total personnel expenses 4,142 4,229 2,792 2,757
Occupancy-related expensesOperating lease rental expense 329 353 200 221 Other expenses 163 166 77 65 Total occupancy-related expenses 492 519 277 286
General expensesFee and commission expense 131 202 61 101 Depreciation and amortisation of property, plant and equipment 273 258 166 144 Amortisation of intangible assets 245 216 138 130 Depreciation on leased vehicle assets 11 53 3 1 Operating lease rental expense 41 59 24 45 Advertising and marketing 241 225 167 167 Charge to provide for operational risk event losses 44 13 33 8 Communications, postage and stationery 323 342 166 165 Computer equipment and software 304 223 215 145 Data communication and processing charges 117 94 50 44 Transport expenses 72 80 55 55 Professional fees 260 396 164 244 Travel 105 93 67 50 Loss on disposal of property, plant and equipment and other assets 1 19 - 18 Impairment losses recognised 32 68 70 67 Other expenses 446 323 273 18 Total general expenses 2,646 2,664 1,652 1,402
Charge to provide for doubtful debtsInvestments - held to maturity (1) 1,011 - 1,011 - Loans and advances 1,692 790 1,247 457 Total charge to provide for doubtful debts 2,703 790 2,258 457 (1) Includes provisions for impairment of intercompany loans to securitisation conduits by the Company.
Group Company
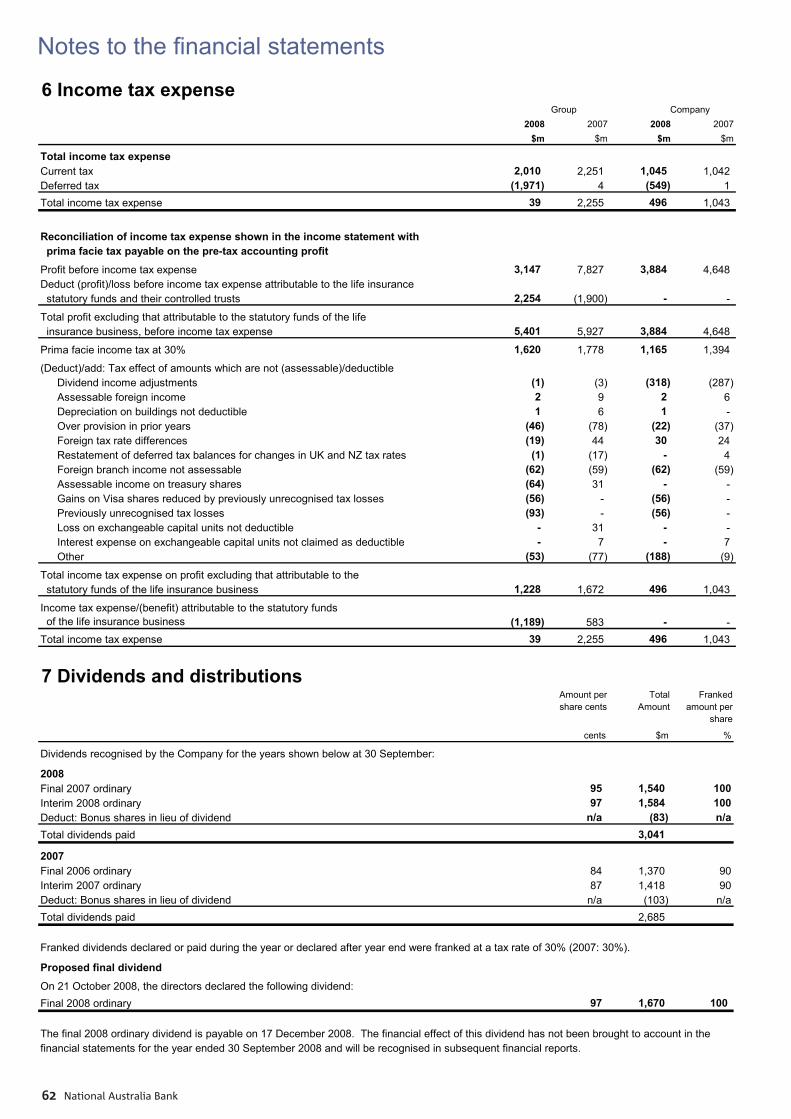
Notes to the fi nancial statements
National Australia Bank62
6 Income tax expense2008 2007 2008 2007
$m $m $m $m
Total income tax expenseCurrent tax 2,010 2,251 1,045 1,042 Deferred tax (1,971) 4 (549) 1 Total income tax expense 39 2,255 496 1,043
Reconciliation of income tax expense shown in the income statement with prima facie tax payable on the pre-tax accounting profit
Profit before income tax expense 3,147 7,827 3,884 4,648 Deduct (profit)/loss before income tax expense attributable to the life insurance statutory funds and their controlled trusts 2,254 (1,900) - -
Total profit excluding that attributable to the statutory funds of the life insurance business, before income tax expense 5,401 5,927 3,884 4,648
Prima facie income tax at 30% 1,620 1,778 1,165 1,394
(Deduct)/add: Tax effect of amounts which are not (assessable)/deductibleDividend income adjustments (1) (3) (318) (287) Assessable foreign income 2 9 2 6 Depreciation on buildings not deductible 1 6 1 - Over provision in prior years (46) (78) (22) (37) Foreign tax rate differences (19) 44 30 24 Restatement of deferred tax balances for changes in UK and NZ tax rates (1) (17) - 4 Foreign branch income not assessable (62) (59) (62) (59) Assessable income on treasury shares (64) 31 - - Gains on Visa shares reduced by previously unrecognised tax losses (56) - (56) - Previously unrecognised tax losses (93) - (56) - Loss on exchangeable capital units not deductible - 31 - - Interest expense on exchangeable capital units not claimed as deductible - 7 - 7 Other (53) (77) (188) (9)
Total income tax expense on profit excluding that attributable to the statutory funds of the life insurance business 1,228 1,672 496 1,043
Income tax expense/(benefit) attributable to the statutory funds of the life insurance business (1,189) 583 - - Total income tax expense 39 2,255 496 1,043
Group Company
7 Dividends and distributionsAmount per share cents
Total Amount
Franked amount per
share
cents $m %
Dividends recognised by the Company for the years shown below at 30 September:
Final 2007 ordinary 95 1,540 100Interim 2008 ordinary 97 1,584 100Deduct: Bonus shares in lieu of dividend n/a (83) n/aTotal dividends paid 3,041
Final 2006 ordinary 84 1,370 90Interim 2007 ordinary 87 1,418 90Deduct: Bonus shares in lieu of dividend n/a (103) n/aTotal dividends paid 2,685
Franked dividends declared or paid during the year or declared after year end were franked at a tax rate of 30% (2007: 30%).
Proposed final dividend
On 21 October 2008, the directors declared the following dividend:Final 2008 ordinary 97 1,670 100
The final 2008 ordinary dividend is payable on 17 December 2008. The financial effect of this dividend has not been brought to account in thefinancial statements for the year ended 30 September 2008 and will be recognised in subsequent financial reports.
2007
2008
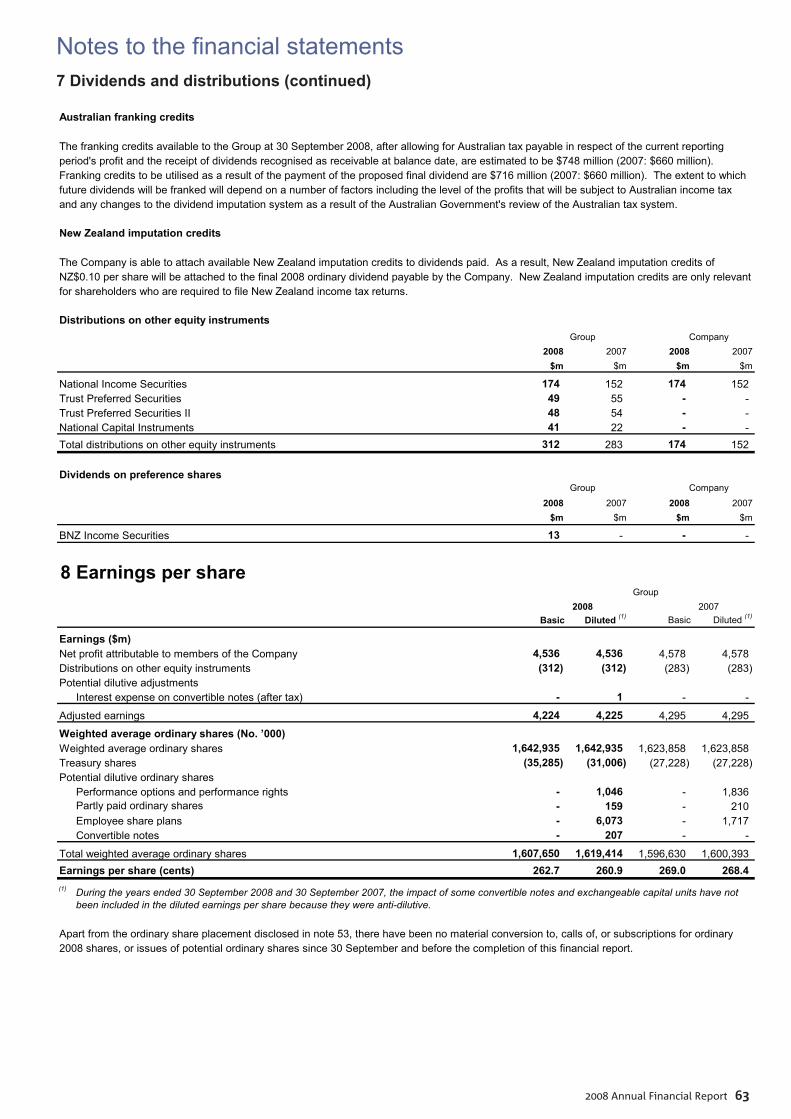
Notes to the fi nancial statements
2008 Annual Financial Report 63
7 Dividends and distributions (continued)
Australian franking credits
The franking credits available to the Group at 30 September 2008, after allowing for Australian tax payable in respect of the current reportingperiod's profit and the receipt of dividends recognised as receivable at balance date, are estimated to be $748 million (2007: $660 million).Franking credits to be utilised as a result of the payment of the proposed final dividend are $716 million (2007: $660 million). The extent to whichfuture dividends will be franked will depend on a number of factors including the level of the profits that will be subject to Australian income taxand any changes to the dividend imputation system as a result of the Australian Government's review of the Australian tax system.
New Zealand imputation credits
The Company is able to attach available New Zealand imputation credits to dividends paid. As a result, New Zealand imputation credits ofNZ$0.10 per share will be attached to the final 2008 ordinary dividend payable by the Company. New Zealand imputation credits are only relevantfor shareholders who are required to file New Zealand income tax returns.
Distributions on other equity instruments_
2008 2007 2008 2007$m $m $m $m
National Income Securities 174 152 174 152 Trust Preferred Securities 49 55 - - Trust Preferred Securities II 48 54 - - National Capital Instruments 41 22 - - Total distributions on other equity instruments 312 283 174 152
Dividends on preference shares
2008 2007 2008 2007$m $m $m $m
BNZ Income Securities 13 - - -
Group Company
Group Company
8 Earnings per share
Basic Diluted (1) Basic Diluted (1)
Earnings ($m)Net profit attributable to members of the Company 4,536 4,536 4,578 4,578 Distributions on other equity instruments (312) (312) (283) (283) Potential dilutive adjustments
Interest expense on convertible notes (after tax) - 1 - -
Adjusted earnings 4,224 4,225 4,295 4,295
Weighted average ordinary shares (No. ’000)Weighted average ordinary shares 1,642,935 1,642,935 1,623,858 1,623,858 Treasury shares (35,285) (31,006) (27,228) (27,228) Potential dilutive ordinary shares
Performance options and performance rights - 1,046 - 1,836 Partly paid ordinary shares - 159 - 210 Employee share plans - 6,073 - 1,717 Convertible notes - 207 - -
Total weighted average ordinary shares 1,607,650 1,619,414 1,596,630 1,600,393 Earnings per share (cents) 262.7 260.9 269.0 268.4 (1) During the years ended 30 September 2008 and 30 September 2007, the impact of some convertible notes and exchangeable capital units have not
been included in the diluted earnings per share because they were anti-dilutive.
Apart from the ordinary share placement disclosed in note 53, there have been no material conversion to, calls of, or subscriptions for ordinary 2008 shares, or issues of potential ordinary shares since 30 September and before the completion of this financial report.
Group 2008 2007
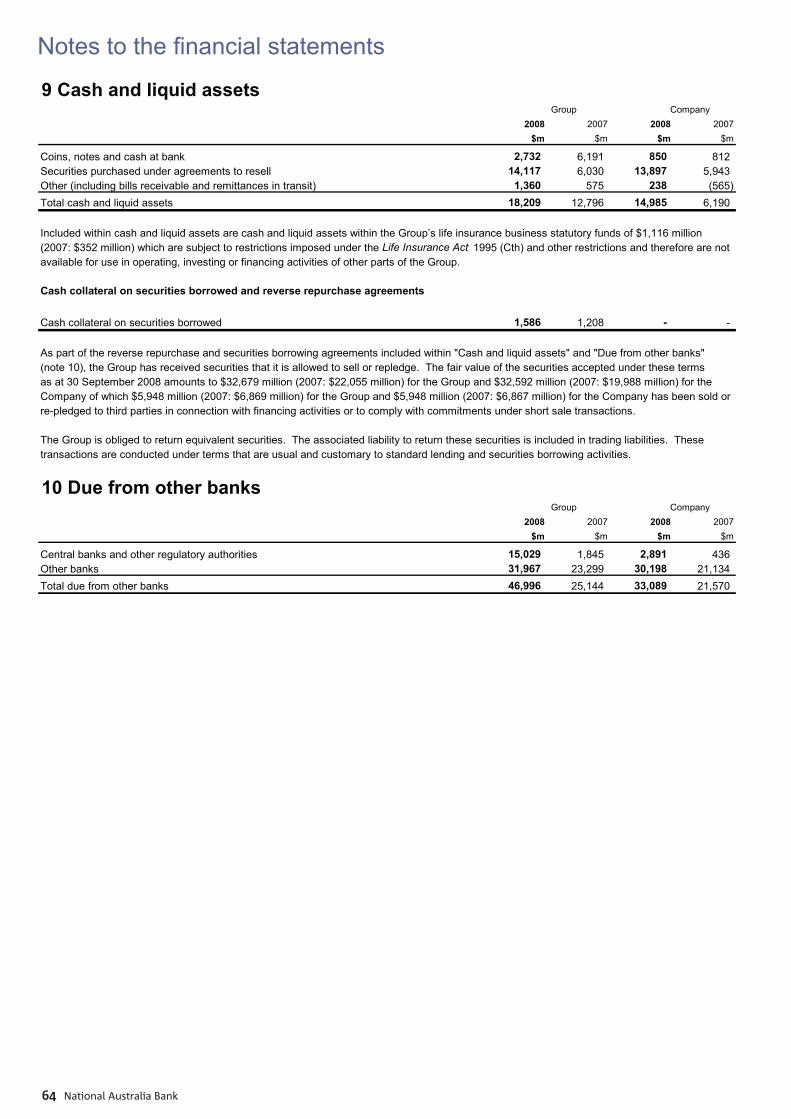
Notes to the fi nancial statements
National Australia Bank64
9 Cash and liquid assets2008 2007 2008 2007
$m $m $m $m
Coins, notes and cash at bank 2,732 6,191 850 812 Securities purchased under agreements to resell 14,117 6,030 13,897 5,943 Other (including bills receivable and remittances in transit) 1,360 575 238 (565) Total cash and liquid assets 18,209 12,796 14,985 6,190
available for use in operating, investing or financing activities of other parts of the Group.
Cash collateral on securities borrowed and reverse repurchase agreements
Cash collateral on securities borrowed 1,586 1,208 - -
As part of the reverse repurchase and securities borrowing agreements included within "Cash and liquid assets" and "Due from other banks" (note 10), the Group has received securities that it is allowed to sell or repledge. The fair value of the securities accepted under these termsas at 30 September 2008 amounts to $32,679 million (2007: $22,055 million) for the Group and $32,592 million (2007: $19,988 million) for theCompany of which $5,948 million (2007: $6,869 million) for the Group and $5,948 million (2007: $6,867 million) for the Company has been sold orre-pledged to third parties in connection with financing activities or to comply with commitments under short sale transactions.
The Group is obliged to return equivalent securities. The associated liability to return these securities is included in trading liabilities. Thesetransactions are conducted under terms that are usual and customary to standard lending and securities borrowing activities.
Group Company
Included within cash and liquid assets are cash and liquid assets within the Group’s life insurance business statutory funds of $1,116 million (2007: $352 million) which are subject to restrictions imposed under the Life Insurance Act 1995 (Cth) and other restrictions and therefore are not
10 Due from other banks2008 2007 2008 2007
$m $m $m $m
Central banks and other regulatory authorities 15,029 1,845 2,891 436 Other banks 31,967 23,299 30,198 21,134 Total due from other banks 46,996 25,144 33,089 21,570
Group Company
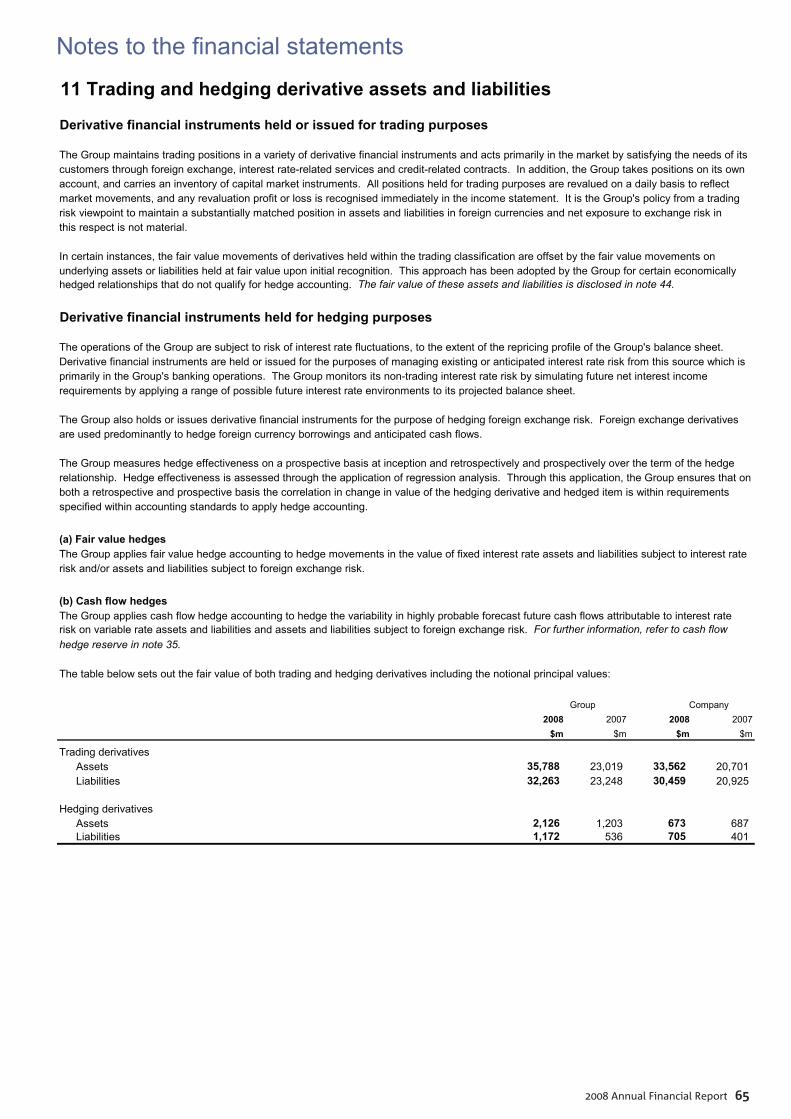
Notes to the fi nancial statements
2008 Annual Financial Report 65
11 Trading and hedging derivative assets and liabilities
Derivative financial instruments held or issued for trading purposes
The Group maintains trading positions in a variety of derivative financial instruments and acts primarily in the market by satisfying the needs of itscustomers through foreign exchange, interest rate-related services and credit-related contracts. In addition, the Group takes positions on its ownaccount, and carries an inventory of capital market instruments. All positions held for trading purposes are revalued on a daily basis to reflectmarket movements, and any revaluation profit or loss is recognised immediately in the income statement. It is the Group's policy from a tradingrisk viewpoint to maintain a substantially matched position in assets and liabilities in foreign currencies and net exposure to exchange risk in this respect is not material.
In certain instances, the fair value movements of derivatives held within the trading classification are offset by the fair value movements onunderlying assets or liabilities held at fair value upon initial recognition. This approach has been adopted by the Group for certain economicallyhedged relationships that do not qualify for hedge accounting. The fair value of these assets and liabilities is disclosed in note 44.
Derivative financial instruments held for hedging purposes
The operations of the Group are subject to risk of interest rate fluctuations, to the extent of the repricing profile of the Group's balance sheet. Derivative financial instruments are held or issued for the purposes of managing existing or anticipated interest rate risk from this source which isprimarily in the Group's banking operations. The Group monitors its non-trading interest rate risk by simulating future net interest incomerequirements by applying a range of possible future interest rate environments to its projected balance sheet.
The Group also holds or issues derivative financial instruments for the purpose of hedging foreign exchange risk. Foreign exchange derivativesare used predominantly to hedge foreign currency borrowings and anticipated cash flows.
The Group measures hedge effectiveness on a prospective basis at inception and retrospectively and prospectively over the term of the hedgerelationship. Hedge effectiveness is assessed through the application of regression analysis. Through this application, the Group ensures that onboth a retrospective and prospective basis the correlation in change in value of the hedging derivative and hedged item is within requirementsspecified within accounting standards to apply hedge accounting.
(a) Fair value hedgesThe Group applies fair value hedge accounting to hedge movements in the value of fixed interest rate assets and liabilities subject to interest raterisk and/or assets and liabilities subject to foreign exchange risk.
(b) Cash flow hedgesThe Group applies cash flow hedge accounting to hedge the variability in highly probable forecast future cash flows attributable to interest raterisk on variable rate assets and liabilities and assets and liabilities subject to foreign exchange risk. For further information, refer to cash flowhedge reserve in note 35.
The table below sets out the fair value of both trading and hedging derivatives including the notional principal values:_
2008 2007 2008 2007$m $m $m $m
Trading derivativesAssets 35,788 23,019 33,562 20,701 Liabilities 32,263 23,248 30,459 20,925
Hedging derivativesAssets 2,126 1,203 673 687 Liabilities 1,172 536 705 401
Group Company
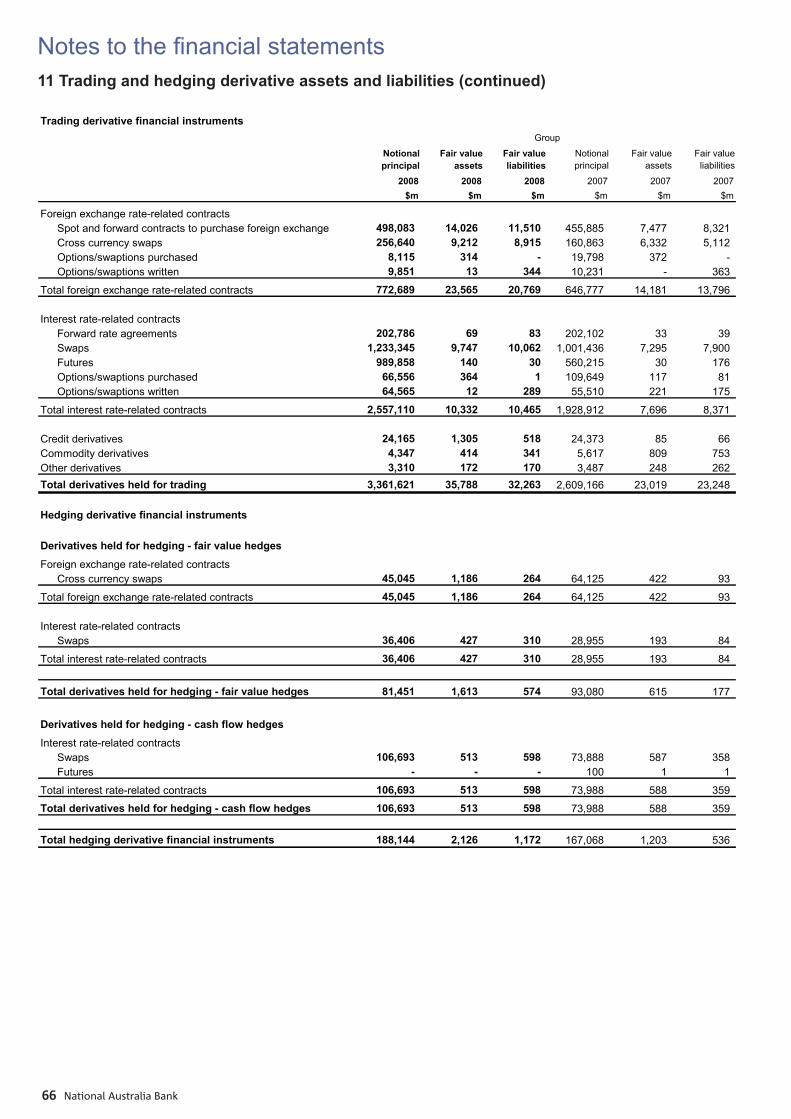
Notes to the fi nancial statements
National Australia Bank66
11 Trading and hedging derivative assets and liabilities (continued)
Trading derivative financial instruments_Group
Notional principal
Fair value assets
Fair value liabilities
Notional principal
Fair value assets
Fair value liabilities
2008 2008 2008 2007 2007 2007$m $m $m $m $m $m
Foreign exchange rate-related contractsSpot and forward contracts to purchase foreign exchange 498,083 14,026 11,510 455,885 7,477 8,321 Cross currency swaps 256,640 9,212 8,915 160,863 6,332 5,112 Options/swaptions purchased 8,115 314 - 19,798 372 - Options/swaptions written 9,851 13 344 10,231 - 363
Total foreign exchange rate-related contracts 772,689 23,565 20,769 646,777 14,181 13,796
Interest rate-related contractsForward rate agreements 202,786 69 83 202,102 33 39 Swaps 1,233,345 9,747 10,062 1,001,436 7,295 7,900 Futures 989,858 140 30 560,215 30 176 Options/swaptions purchased 66,556 364 1 109,649 117 81 Options/swaptions written 64,565 12 289 55,510 221 175
Total interest rate-related contracts 2,557,110 10,332 10,465 1,928,912 7,696 8,371
Credit derivatives 24,165 1,305 518 24,373 85 66 Commodity derivatives 4,347 414 341 5,617 809 753 Other derivatives 3,310 172 170 3,487 248 262 Total derivatives held for trading 3,361,621 35,788 32,263 2,609,166 23,019 23,248
Hedging derivative financial instruments
Derivatives held for hedging - fair value hedges
Foreign exchange rate-related contractsCross currency swaps 45,045 1,186 264 64,125 422 93
Total foreign exchange rate-related contracts 45,045 1,186 264 64,125 422 93
Interest rate-related contractsSwaps 36,406 427 310 28,955 193 84
Total interest rate-related contracts 36,406 427 310 28,955 193 84
Total derivatives held for hedging - fair value hedges 81,451 1,613 574 93,080 615 177
Derivatives held for hedging - cash flow hedges
Interest rate-related contractsSwaps 106,693 513 598 73,888 587 358 Futures - - - 100 1 1
Total interest rate-related contracts 106,693 513 598 73,988 588 359
Total derivatives held for hedging - cash flow hedges 106,693 513 598 73,988 588 359
Total hedging derivative financial instruments 188,144 2,126 1,172 167,068 1,203 536
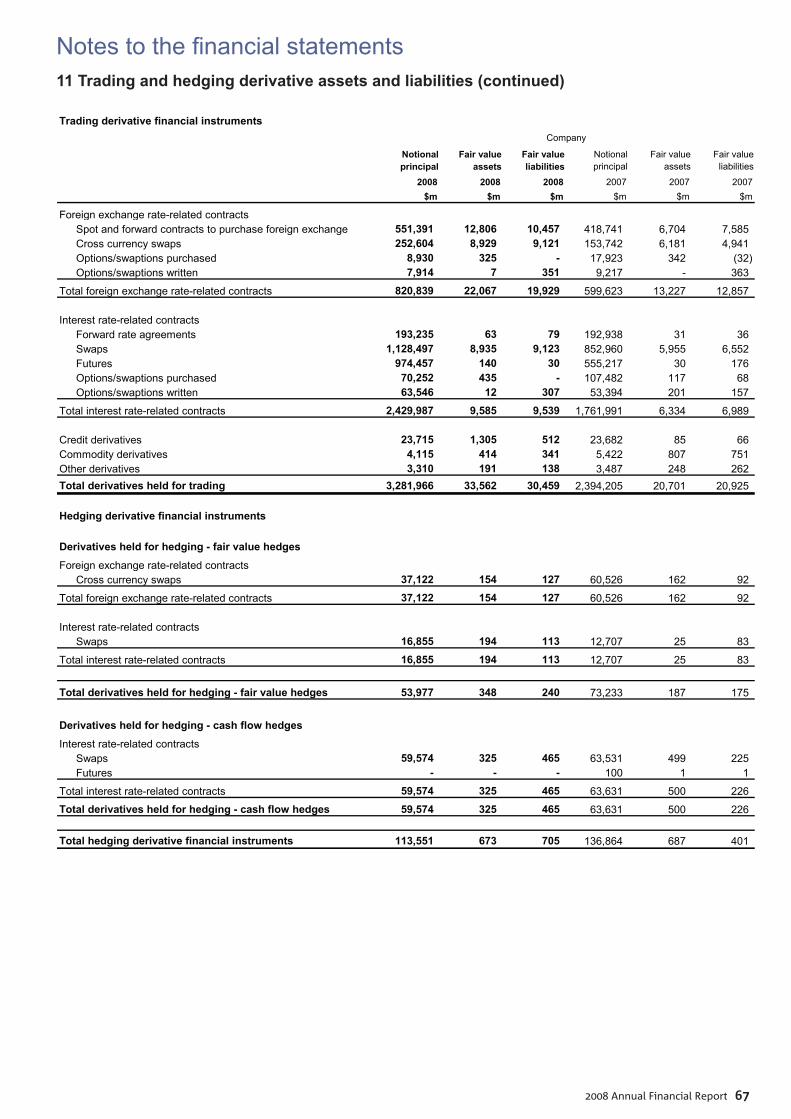
Notes to the fi nancial statements
2008 Annual Financial Report 67
11 Trading and hedging derivative assets and liabilities (continued)
Trading derivative financial instruments_Company
Notional principal
Fair value assets
Fair value liabilities
Notional principal
Fair value assets
Fair value liabilities
2008 2008 2008 2007 2007 2007$m $m $m $m $m $m
Foreign exchange rate-related contractsSpot and forward contracts to purchase foreign exchange 551,391 12,806 10,457 418,741 6,704 7,585 Cross currency swaps 252,604 8,929 9,121 153,742 6,181 4,941 Options/swaptions purchased 8,930 325 - 17,923 342 (32) Options/swaptions written 7,914 7 351 9,217 - 363
Total foreign exchange rate-related contracts 820,839 22,067 19,929 599,623 13,227 12,857
Interest rate-related contractsForward rate agreements 193,235 63 79 192,938 31 36 Swaps 1,128,497 8,935 9,123 852,960 5,955 6,552 Futures 974,457 140 30 555,217 30 176 Options/swaptions purchased 70,252 435 - 107,482 117 68 Options/swaptions written 63,546 12 307 53,394 201 157
Total interest rate-related contracts 2,429,987 9,585 9,539 1,761,991 6,334 6,989
Credit derivatives 23,715 1,305 512 23,682 85 66 Commodity derivatives 4,115 414 341 5,422 807 751 Other derivatives 3,310 191 138 3,487 248 262 Total derivatives held for trading 3,281,966 33,562 30,459 2,394,205 20,701 20,925
Hedging derivative financial instruments
Derivatives held for hedging - fair value hedges
Foreign exchange rate-related contractsCross currency swaps 37,122 154 127 60,526 162 92
Total foreign exchange rate-related contracts 37,122 154 127 60,526 162 92
Interest rate-related contractsSwaps 16,855 194 113 12,707 25 83
Total interest rate-related contracts 16,855 194 113 12,707 25 83
Total derivatives held for hedging - fair value hedges 53,977 348 240 73,233 187 175
Derivatives held for hedging - cash flow hedges
Interest rate-related contractsSwaps 59,574 325 465 63,531 499 225 Futures - - - 100 1 1
Total interest rate-related contracts 59,574 325 465 63,631 500 226
Total derivatives held for hedging - cash flow hedges 59,574 325 465 63,631 500 226
Total hedging derivative financial instruments 113,551 673 705 136,864 687 401
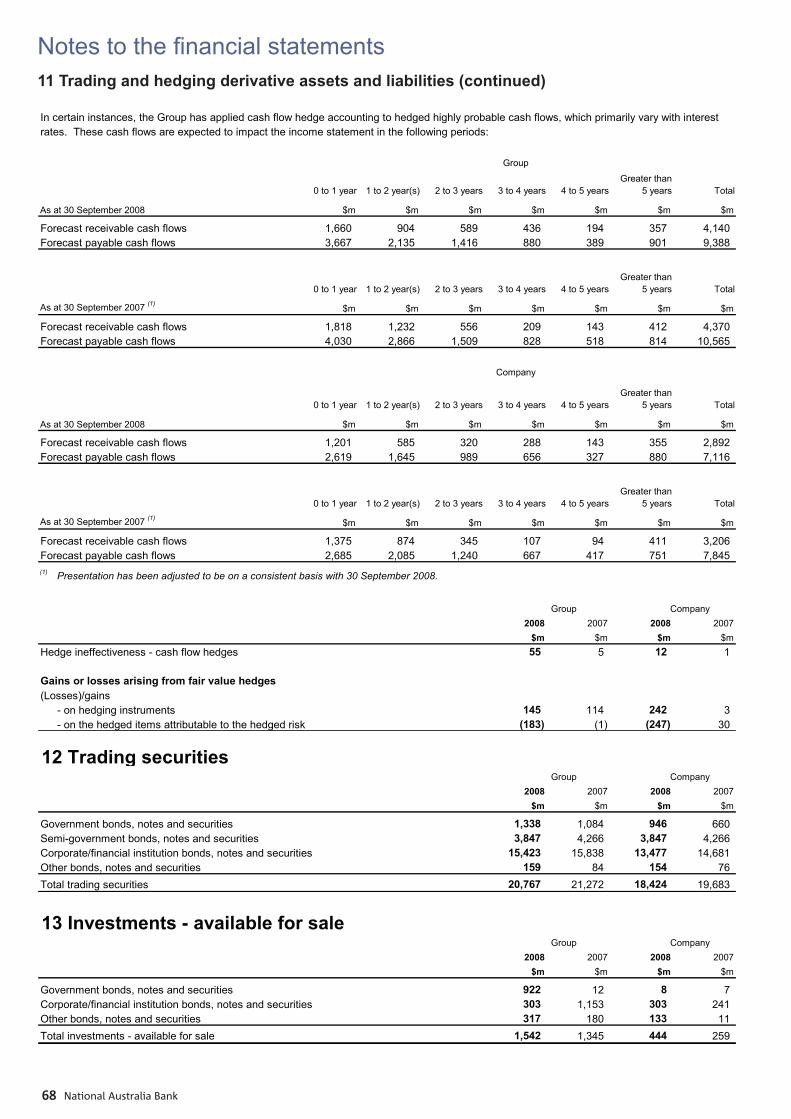
Notes to the fi nancial statements
National Australia Bank68
11 Trading and hedging derivative assets and liabilities (continued)
In certain instances, the Group has applied cash flow hedge accounting to hedged highly probable cash flows, which primarily vary with interestrates. These cash flows are expected to impact the income statement in the following periods:
_
0 to 1 year 1 to 2 year(s) 2 to 3 years 3 to 4 years 4 to 5 yearsGreater than
5 years Total
As at 30 September 2008 $m $m $m $m $m $m $m
Forecast receivable cash flows 1,660 904 589 436 194 357 4,140 Forecast payable cash flows 3,667 2,135 1,416 880 389 901 9,388
0 to 1 year 1 to 2 year(s) 2 to 3 years 3 to 4 years 4 to 5 yearsGreater than
5 years Total
As at 30 September 2007 (1) $m $m $m $m $m $m $m
Forecast receivable cash flows 1,818 1,232 556 209 143 412 4,370 Forecast payable cash flows 4,030 2,866 1,509 828 518 814 10,565
_
0 to 1 year 1 to 2 year(s) 2 to 3 years 3 to 4 years 4 to 5 yearsGreater than
5 years Total
As at 30 September 2008 $m $m $m $m $m $m $m
Forecast receivable cash flows 1,201 585 320 288 143 355 2,892 Forecast payable cash flows 2,619 1,645 989 656 327 880 7,116
0 to 1 year 1 to 2 year(s) 2 to 3 years 3 to 4 years 4 to 5 yearsGreater than
5 years Total
As at 30 September 2007 (1) $m $m $m $m $m $m $m
Forecast receivable cash flows 1,375 874 345 107 94 411 3,206 Forecast payable cash flows 2,685 2,085 1,240 667 417 751 7,845 (1) Presentation has been adjusted to be on a consistent basis with 30 September 2008.
_
2008 2007 2008 2007$m $m $m $m
Hedge ineffectiveness - cash flow hedges 55 5 12 1
Gains or losses arising from fair value hedges(Losses)/gains
- on hedging instruments 145 114 242 3 - on the hedged items attributable to the hedged risk (183) (1) (247) 30
Group Company
Group
Company
12 Trading securities2008 2007 2008 2007
$m $m $m $m
Government bonds, notes and securities 1,338 1,084 946 660 Semi-government bonds, notes and securities 3,847 4,266 3,847 4,266 Corporate/financial institution bonds, notes and securities 15,423 15,838 13,477 14,681 Other bonds, notes and securities 159 84 154 76 Total trading securities 20,767 21,272 18,424 19,683
Group Company
13 Investments - available for sale2008 2007 2008 2007
$m $m $m $m
Government bonds, notes and securities 922 12 8 7 Corporate/financial institution bonds, notes and securities 303 1,153 303 241 Other bonds, notes and securities 317 180 133 11 Total investments - available for sale 1,542 1,345 444 259
Group Company
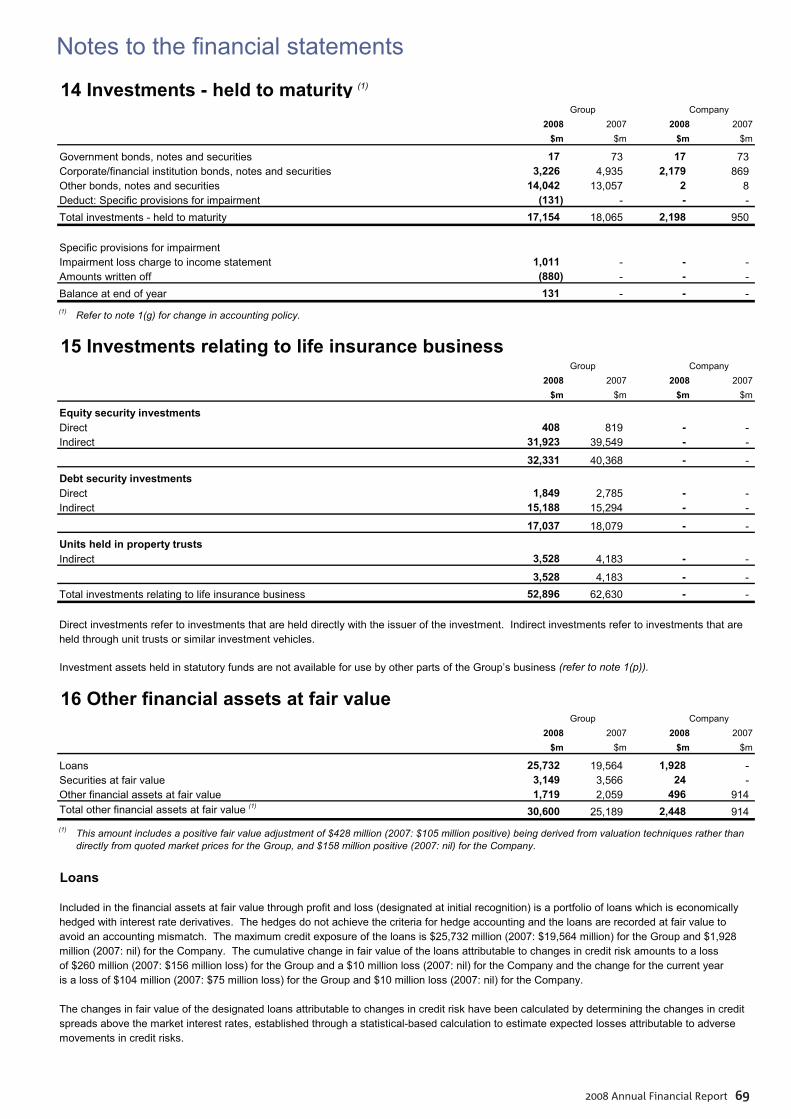
Notes to the fi nancial statements
2008 Annual Financial Report 69
15 Investments relating to life insurance business2008 2007 2008 2007
$m $m $m $m
Equity security investmentsDirect 408 819 - - Indirect 31,923 39,549 - -
32,331 40,368 - -
Debt security investmentsDirect 1,849 2,785 - - Indirect 15,188 15,294 - -
17,037 18,079 - -
Units held in property trustsIndirect 3,528 4,183 - -
3,528 4,183 - - Total investments relating to life insurance business 52,896 62,630 - -
Direct investments refer to investments that are held directly with the issuer of the investment. Indirect investments refer to investments that areheld through unit trusts or similar investment vehicles.
Investment assets held in statutory funds are not available for use by other parts of the Group’s business (refer to note 1(p)).
Group Company
16 Other financial assets at fair value2008 2007 2008 2007
$m $m $m $m
Loans 25,732 19,564 1,928 - Securities at fair value 3,149 3,566 24 - Other financial assets at fair value 1,719 2,059 496 914 Total other financial assets at fair value (1) 30,600 25,189 2,448 914 (1) This amount includes a positive fair value adjustment of $428 million (2007: $105 million positive) being derived from valuation techniques rather than
directly from quoted market prices for the Group, and $158 million positive (2007: nil) for the Company.
Loans
Included in the financial assets at fair value through profit and loss (designated at initial recognition) is a portfolio of loans which is economicallyhedged with interest rate derivatives. The hedges do not achieve the criteria for hedge accounting and the loans are recorded at fair value toavoid an accounting mismatch. The maximum credit exposure of the loans is $25,732 million (2007: $19,564 million) for the Group and $1,928million (2007: nil) for the Company. The cumulative change in fair value of the loans attributable to changes in credit risk amounts to a lossof $260 million (2007: $156 million loss) for the Group and a $10 million loss (2007: nil) for the Company and the change for the current year is a loss of $104 million (2007: $75 million loss) for the Group and $10 million loss (2007: nil) for the Company.
The changes in fair value of the designated loans attributable to changes in credit risk have been calculated by determining the changes in creditspreads above the market interest rates, established through a statistical-based calculation to estimate expected losses attributable to adverse movements in credit risks.
Group Company
14 Investments - held to maturity (1)
2008 2007 2008 2007$m $m $m $m
Government bonds, notes and securities 17 73 17 73 Corporate/financial institution bonds, notes and securities 3,226 4,935 2,179 869 Other bonds, notes and securities 14,042 13,057 2 8 Deduct: Specific provisions for impairment (131) - - - Total investments - held to maturity 17,154 18,065 2,198 950
Specific provisions for impairment Impairment loss charge to income statement 1,011 - - - Amounts written off (880) - - - Balance at end of year 131 - - - (1) Refer to note 1(g) for change in accounting policy.
Group Company
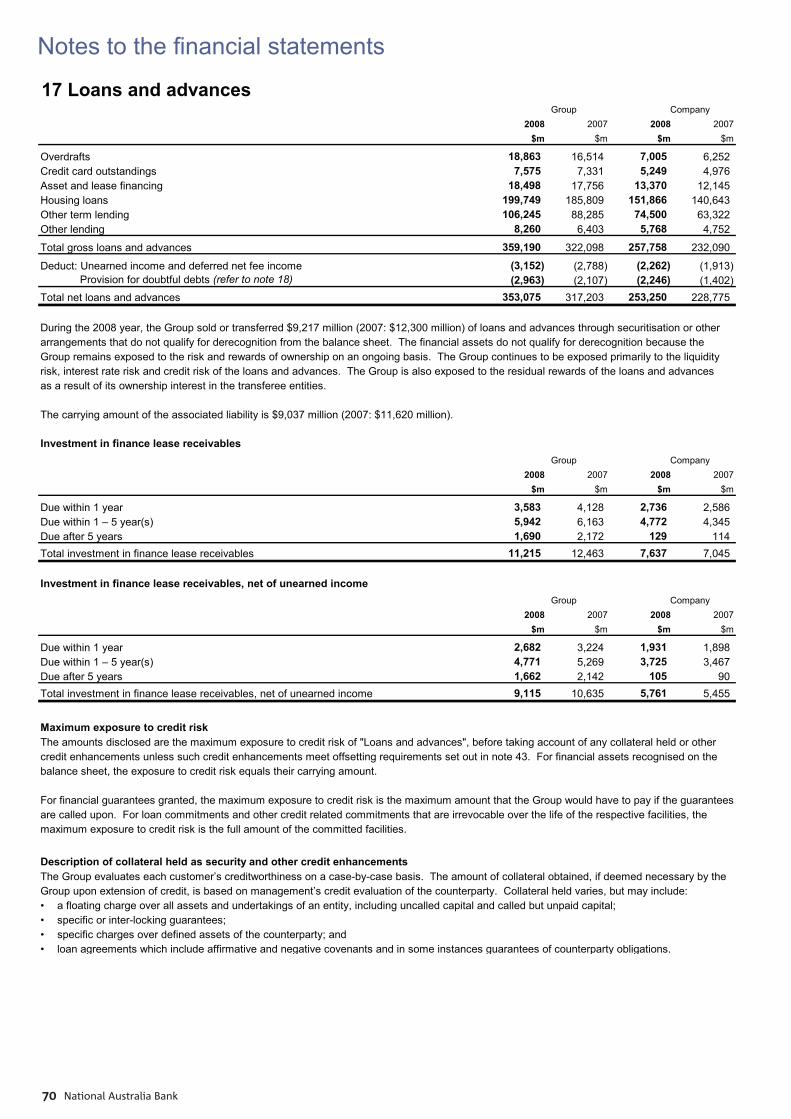
Notes to the fi nancial statements
National Australia Bank70
17 Loans and advances
2008 2007 2008 2007$m $m $m $m
Overdrafts 18,863 16,514 7,005 6,252 Credit card outstandings 7,575 7,331 5,249 4,976 Asset and lease financing 18,498 17,756 13,370 12,145 Housing loans 199,749 185,809 151,866 140,643 Other term lending 106,245 88,285 74,500 63,322 Other lending 8,260 6,403 5,768 4,752
Total gross loans and advances 359,190 322,098 257,758 232,090
Deduct: Unearned income and deferred net fee income (3,152) (2,788) (2,262) (1,913) Provision for doubtful debts (refer to note 18) (2,963) (2,107) (2,246) (1,402) Total net loans and advances 353,075 317,203 253,250 228,775
During the 2008 year, the Group sold or transferred $9,217 million (2007: $12,300 million) of loans and advances through securitisation or otherarrangements that do not qualify for derecognition from the balance sheet. The financial assets do not qualify for derecognition because theGroup remains exposed to the risk and rewards of ownership on an ongoing basis. The Group continues to be exposed primarily to the liquidityrisk, interest rate risk and credit risk of the loans and advances. The Group is also exposed to the residual rewards of the loans and advancesas a result of its ownership interest in the transferee entities.
The carrying amount of the associated liability is $9,037 million (2007: $11,620 million).
Investment in finance lease receivables_
2008 2007 2008 2007$m $m $m $m
Due within 1 year 3,583 4,128 2,736 2,586 Due within 1 – 5 year(s) 5,942 6,163 4,772 4,345 Due after 5 years 1,690 2,172 129 114 Total investment in finance lease receivables 11,215 12,463 7,637 7,045
Investment in finance lease receivables, net of unearned income_
2008 2007 2008 2007$m $m $m $m
Due within 1 year 2,682 3,224 1,931 1,898 Due within 1 – 5 year(s) 4,771 5,269 3,725 3,467 Due after 5 years 1,662 2,142 105 90 Total investment in finance lease receivables, net of unearned income 9,115 10,635 5,761 5,455
Maximum exposure to credit riskThe amounts disclosed are the maximum exposure to credit risk of "Loans and advances", before taking account of any collateral held or othercredit enhancements unless such credit enhancements meet offsetting requirements set out in note 43. For financial assets recognised on thebalance sheet, the exposure to credit risk equals their carrying amount.
For financial guarantees granted, the maximum exposure to credit risk is the maximum amount that the Group would have to pay if the guaranteesare called upon. For loan commitments and other credit related commitments that are irrevocable over the life of the respective facilities, themaximum exposure to credit risk is the full amount of the committed facilities.
Description of collateral held as security and other credit enhancementsThe Group evaluates each customer’s creditworthiness on a case-by-case basis. The amount of collateral obtained, if deemed necessary by theGroup upon extension of credit, is based on management’s credit evaluation of the counterparty. Collateral held varies, but may include:• a floating charge over all assets and undertakings of an entity, including uncalled capital and called but unpaid capital;• specific or inter-locking guarantees; • specific charges over defined assets of the counterparty; and• loan agreements which include affirmative and negative covenants and in some instances guarantees of counterparty obligations.
Group Company
Group Company
Group Company
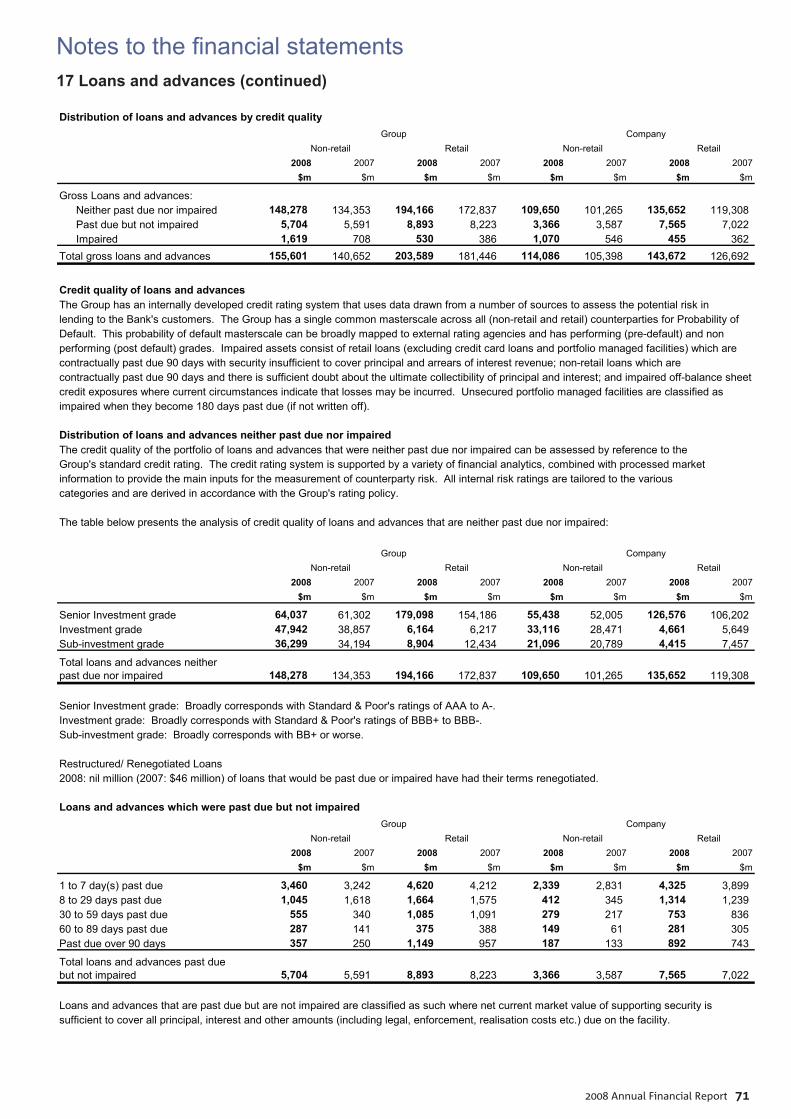
Notes to the fi nancial statements
2008 Annual Financial Report 71
17 Loans and advances (continued)
Distribution of loans and advances by credit quality_
2008 2007 2008 2007 2008 2007 2008 2007$m $m $m $m $m $m $m $m
Gross Loans and advances:Neither past due nor impaired 148,278 134,353 194,166 172,837 109,650 101,265 135,652 119,308 Past due but not impaired 5,704 5,591 8,893 8,223 3,366 3,587 7,565 7,022 Impaired 1,619 708 530 386 1,070 546 455 362
Total gross loans and advances 155,601 140,652 203,589 181,446 114,086 105,398 143,672 126,692
Credit quality of loans and advancesThe Group has an internally developed credit rating system that uses data drawn from a number of sources to assess the potential risk inlending to the Bank's customers. The Group has a single common masterscale across all (non-retail and retail) counterparties for Probability ofDefault. This probability of default masterscale can be broadly mapped to external rating agencies and has performing (pre-default) and nonperforming (post default) grades. Impaired assets consist of retail loans (excluding credit card loans and portfolio managed facilities) which arecontractually past due 90 days with security insufficient to cover principal and arrears of interest revenue; non-retail loans which arecontractually past due 90 days and there is sufficient doubt about the ultimate collectibility of principal and interest; and impaired off-balance sheetcredit exposures where current circumstances indicate that losses may be incurred. Unsecured portfolio managed facilities are classified asimpaired when they become 180 days past due (if not written off).
Distribution of loans and advances neither past due nor impairedThe credit quality of the portfolio of loans and advances that were neither past due nor impaired can be assessed by reference to theGroup's standard credit rating. The credit rating system is supported by a variety of financial analytics, combined with processed marketinformation to provide the main inputs for the measurement of counterparty risk. All internal risk ratings are tailored to the variouscategories and are derived in accordance with the Group's rating policy.
The table below presents the analysis of credit quality of loans and advances that are neither past due nor impaired:_
2008 2007 2008 2007 2008 2007 2008 2007$m $m $m $m $m $m $m $m
Senior Investment grade 64,037 61,302 179,098 154,186 55,438 52,005 126,576 106,202 Investment grade 47,942 38,857 6,164 6,217 33,116 28,471 4,661 5,649 Sub-investment grade 36,299 34,194 8,904 12,434 21,096 20,789 4,415 7,457
Total loans and advances neither past due nor impaired 148,278 134,353 194,166 172,837 109,650 101,265 135,652 119,308
Senior Investment grade: Broadly corresponds with Standard & Poor's ratings of AAA to A-.Investment grade: Broadly corresponds with Standard & Poor's ratings of BBB+ to BBB-.Sub-investment grade: Broadly corresponds with BB+ or worse.
Restructured/ Renegotiated Loans2008: nil million (2007: $46 million) of loans that would be past due or impaired have had their terms renegotiated.
Loans and advances which were past due but not impaired_
2008 2007 2008 2007 2008 2007 2008 2007$m $m $m $m $m $m $m $m
1 to 7 day(s) past due 3,460 3,242 4,620 4,212 2,339 2,831 4,325 3,899 8 to 29 days past due 1,045 1,618 1,664 1,575 412 345 1,314 1,239 30 to 59 days past due 555 340 1,085 1,091 279 217 753 836 60 to 89 days past due 287 141 375 388 149 61 281 305 Past due over 90 days 357 250 1,149 957 187 133 892 743
Total loans and advances past duebut not impaired 5,704 5,591 8,893 8,223 3,366 3,587 7,565 7,022
Loans and advances that are past due but are not impaired are classified as such where net current market value of supporting security issufficient to cover all principal, interest and other amounts (including legal, enforcement, realisation costs etc.) due on the facility.
Group Company Non-retail Retail Non-retail Retail
Group Company Non-retail Retail Non-retail Retail
Group Company Non-retail Retail Non-retail Retail
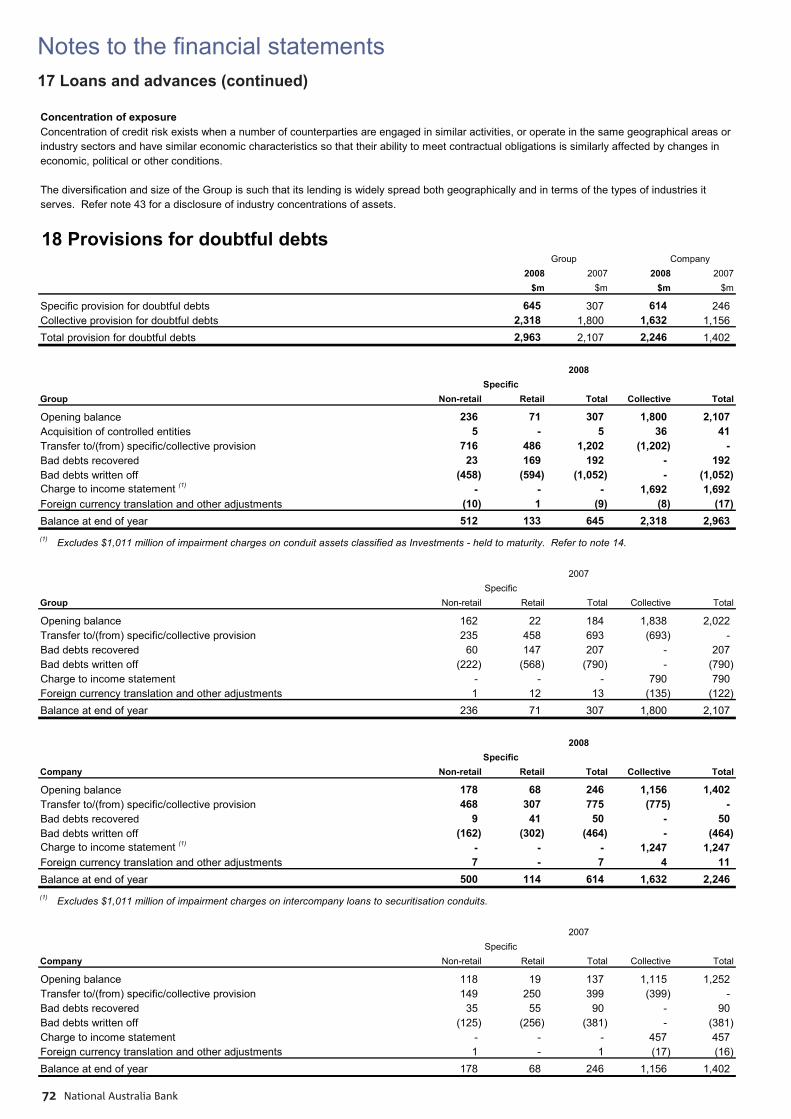
Notes to the fi nancial statements
National Australia Bank72
17 Loans and advances (continued)
Concentration of exposureConcentration of credit risk exists when a number of counterparties are engaged in similar activities, or operate in the same geographical areas orindustry sectors and have similar economic characteristics so that their ability to meet contractual obligations is similarly affected by changes ineconomic, political or other conditions.
The diversification and size of the Group is such that its lending is widely spread both geographically and in terms of the types of industries itserves. Refer note 43 for a disclosure of industry concentrations of assets.
18 Provisions for doubtful debts_
2008 2007 2008 2007$m $m $m $m
Specific provision for doubtful debts 645 307 614 246 Collective provision for doubtful debts 2,318 1,800 1,632 1,156 Total provision for doubtful debts 2,963 2,107 2,246 1,402
_
Group Non-retail Retail Total Collective Total
Opening balance 236 71 307 1,800 2,107 Acquisition of controlled entities 5 - 5 36 41 Transfer to/(from) specific/collective provision 716 486 1,202 (1,202) - Bad debts recovered 23 169 192 - 192 Bad debts written off (458) (594) (1,052) - (1,052) Charge to income statement (1) - - - 1,692 1,692 Foreign currency translation and other adjustments (10) 1 (9) (8) (17) Balance at end of year 512 133 645 2,318 2,963 (1) Excludes $1,011 million of impairment charges on conduit assets classified as Investments - held to maturity. Refer to note 14.
_
Group Non-retail Retail Total Collective Total
Opening balance 162 22 184 1,838 2,022 Transfer to/(from) specific/collective provision 235 458 693 (693) - Bad debts recovered 60 147 207 - 207 Bad debts written off (222) (568) (790) - (790) Charge to income statement - - - 790 790 Foreign currency translation and other adjustments 1 12 13 (135) (122) Balance at end of year 236 71 307 1,800 2,107
_
Company Non-retail Retail Total Collective Total
Opening balance 178 68 246 1,156 1,402 Transfer to/(from) specific/collective provision 468 307 775 (775) - Bad debts recovered 9 41 50 - 50 Bad debts written off (162) (302) (464) - (464) Charge to income statement (1) - - - 1,247 1,247 Foreign currency translation and other adjustments 7 - 7 4 11 Balance at end of year 500 114 614 1,632 2,246 (1) Excludes $1,011 million of impairment charges on intercompany loans to securitisation conduits.
_
Company Non-retail Retail Total Collective Total
Opening balance 118 19 137 1,115 1,252 Transfer to/(from) specific/collective provision 149 250 399 (399) - Bad debts recovered 35 55 90 - 90 Bad debts written off (125) (256) (381) - (381) Charge to income statement - - - 457 457 Foreign currency translation and other adjustments 1 - 1 (17) (16) Balance at end of year 178 68 246 1,156 1,402
2007
Group Company
2008 Specific
2007
2008
Specific
Specific
Specific
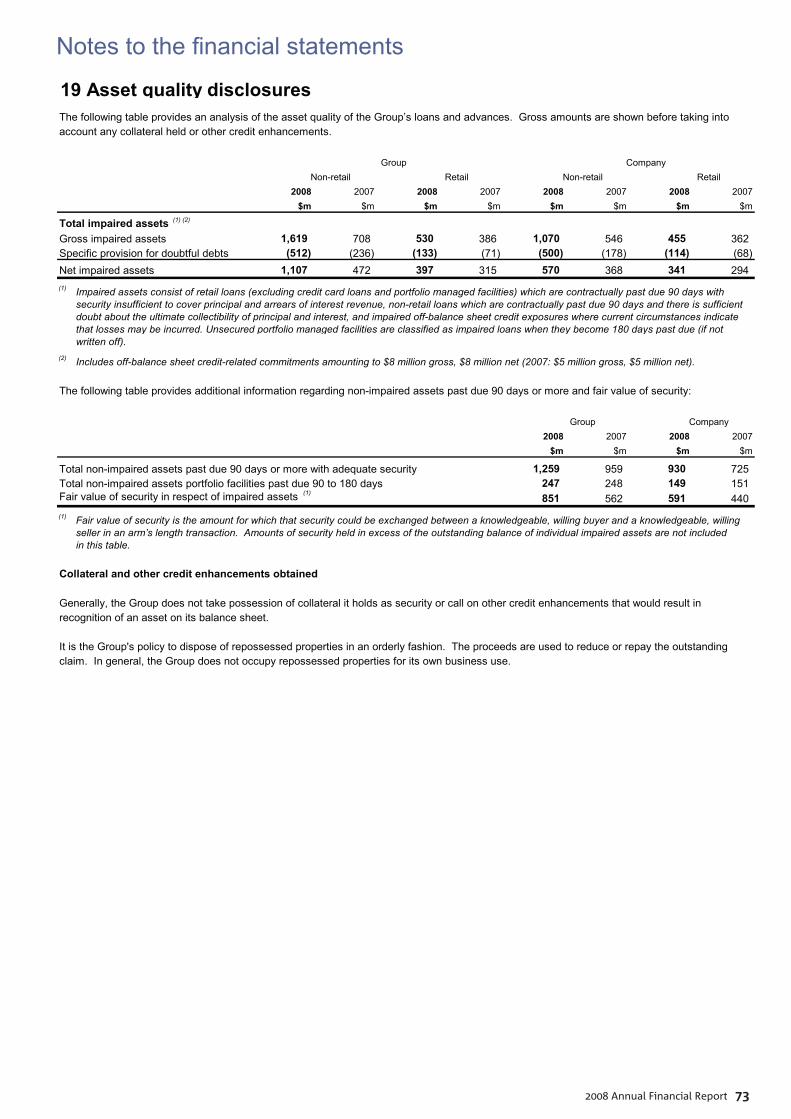
Notes to the fi nancial statements
2008 Annual Financial Report 73
19 Asset quality disclosuresThe following table provides an analysis of the asset quality of the Group’s loans and advances. Gross amounts are shown before taking into account any collateral held or other credit enhancements.
_
2008 2007 2008 2007 2008 2007 2008 2007$m $m $m $m $m $m $m $m
Total impaired assets (1) (2)
Gross impaired assets 1,619 708 530 386 1,070 546 455 362 Specific provision for doubtful debts (512) (236) (133) (71) (500) (178) (114) (68) Net impaired assets 1,107 472 397 315 570 368 341 294 (1) Impaired assets consist of retail loans (excluding credit card loans and portfolio managed facilities) which are contractually past due 90 days with
security insufficient to cover principal and arrears of interest revenue, non-retail loans which are contractually past due 90 days and there is sufficient doubt about the ultimate collectibility of principal and interest, and impaired off-balance sheet credit exposures where current circumstances indicate that losses may be incurred. Unsecured portfolio managed facilities are classified as impaired loans when they become 180 days past due (if notwritten off).
(2) Includes off-balance sheet credit-related commitments amounting to $8 million gross, $8 million net (2007: $5 million gross, $5 million net).
The following table provides additional information regarding non-impaired assets past due 90 days or more and fair value of security:_
2008 2007 2008 2007$m $m $m $m
Total non-impaired assets past due 90 days or more with adequate security 1,259 959 930 725 Total non-impaired assets portfolio facilities past due 90 to 180 days 247 248 149 151 Fair value of security in respect of impaired assets (1) 851 562 591 440 (1) Fair value of security is the amount for which that security could be exchanged between a knowledgeable, willing buyer and a knowledgeable, willing
seller in an arm’s length transaction. Amounts of security held in excess of the outstanding balance of individual impaired assets are not included in this table.
Collateral and other credit enhancements obtained
Generally, the Group does not take possession of collateral it holds as security or call on other credit enhancements that would result in recognition of an asset on its balance sheet.
It is the Group's policy to dispose of repossessed properties in an orderly fashion. The proceeds are used to reduce or repay the outstandingclaim. In general, the Group does not occupy repossessed properties for its own business use.
Group Company
Group Company Non-retail Retail Non-retail Retail
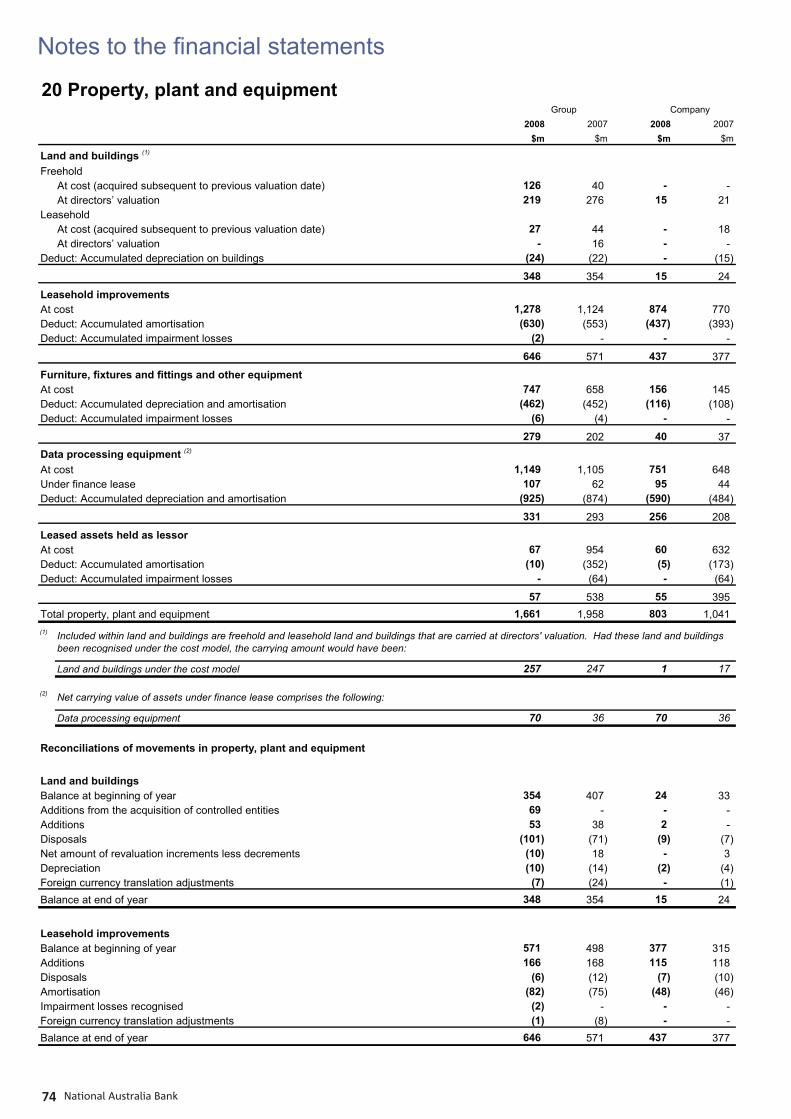
Notes to the fi nancial statements
National Australia Bank74
20 Property, plant and equipment2008 2007 2008 2007
$m $m $m $m
Land and buildings (1)
FreeholdAt cost (acquired subsequent to previous valuation date) 126 40 - - At directors’ valuation 219 276 15 21
LeaseholdAt cost (acquired subsequent to previous valuation date) 27 44 - 18 At directors’ valuation - 16 - -
Deduct: Accumulated depreciation on buildings (24) (22) - (15)
348 354 15 24
Leasehold improvementsAt cost 1,278 1,124 874 770 Deduct: Accumulated amortisation (630) (553) (437) (393) Deduct: Accumulated impairment losses (2) - - -
646 571 437 377
Furniture, fixtures and fittings and other equipmentAt cost 747 658 156 145 Deduct: Accumulated depreciation and amortisation (462) (452) (116) (108) Deduct: Accumulated impairment losses (6) (4) - -
279 202 40 37 Data processing equipment (2)
At cost 1,149 1,105 751 648 Under finance lease 107 62 95 44 Deduct: Accumulated depreciation and amortisation (925) (874) (590) (484)
331 293 256 208
Leased assets held as lessorAt cost 67 954 60 632 Deduct: Accumulated amortisation (10) (352) (5) (173) Deduct: Accumulated impairment losses - (64) - (64)
57 538 55 395 Total property, plant and equipment 1,661 1,958 803 1,041 (1) Included within land and buildings are freehold and leasehold land and buildings that are carried at directors' valuation. Had these land and buildings
been recognised under the cost model, the carrying amount would have been:
Land and buildings under the cost model 257 247 1 17
(2) Net carrying value of assets under finance lease comprises the following:
Data processing equipment 70 36 70 36
Reconciliations of movements in property, plant and equipment
Land and buildingsBalance at beginning of year 354 407 24 33 Additions from the acquisition of controlled entities 69 - - - Additions 53 38 2 - Disposals (101) (71) (9) (7) Net amount of revaluation increments less decrements (10) 18 - 3 Depreciation (10) (14) (2) (4) Foreign currency translation adjustments (7) (24) - (1) Balance at end of year 348 354 15 24
Leasehold improvementsBalance at beginning of year 571 498 377 315 Additions 166 168 115 118 Disposals (6) (12) (7) (10) Amortisation (82) (75) (48) (46) Impairment losses recognised (2) - - - Foreign currency translation adjustments (1) (8) - - Balance at end of year 646 571 437 377
Group Company
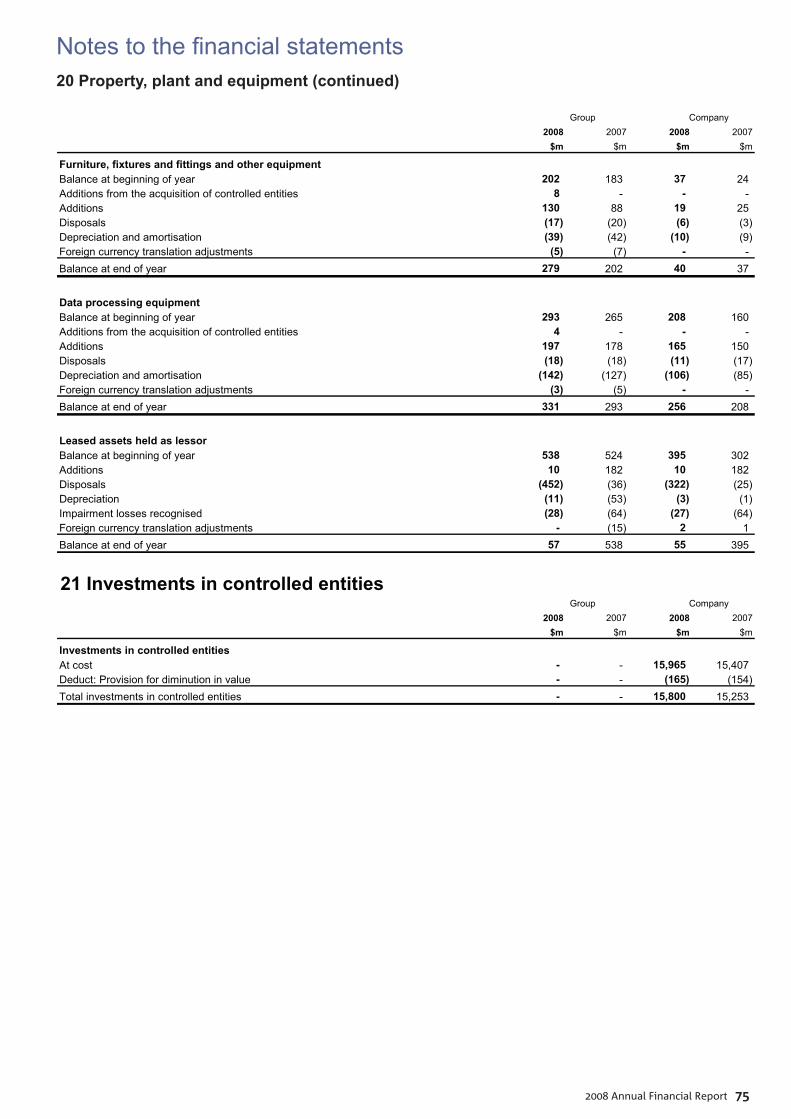
Notes to the fi nancial statements
2008 Annual Financial Report 75
20 Property, plant and equipment (continued)
2008 2007 2008 2007$m $m $m $m
Furniture, fixtures and fittings and other equipmentBalance at beginning of year 202 183 37 24 Additions from the acquisition of controlled entities 8 - - - Additions 130 88 19 25 Disposals (17) (20) (6) (3) Depreciation and amortisation (39) (42) (10) (9) Foreign currency translation adjustments (5) (7) - - Balance at end of year 279 202 40 37
Data processing equipmentBalance at beginning of year 293 265 208 160 Additions from the acquisition of controlled entities 4 - - - Additions 197 178 165 150 Disposals (18) (18) (11) (17) Depreciation and amortisation (142) (127) (106) (85) Foreign currency translation adjustments (3) (5) - - Balance at end of year 331 293 256 208
Leased assets held as lessorBalance at beginning of year 538 524 395 302 Additions 10 182 10 182 Disposals (452) (36) (322) (25) Depreciation (11) (53) (3) (1) Impairment losses recognised (28) (64) (27) (64) Foreign currency translation adjustments - (15) 2 1 Balance at end of year 57 538 55 395
Group Company
21 Investments in controlled entities_
2008 2007 2008 2007$m $m $m $m
Investments in controlled entitiesAt cost - - 15,965 15,407 Deduct: Provision for diminution in value - - (165) (154) Total investments in controlled entities - - 15,800 15,253
Group Company
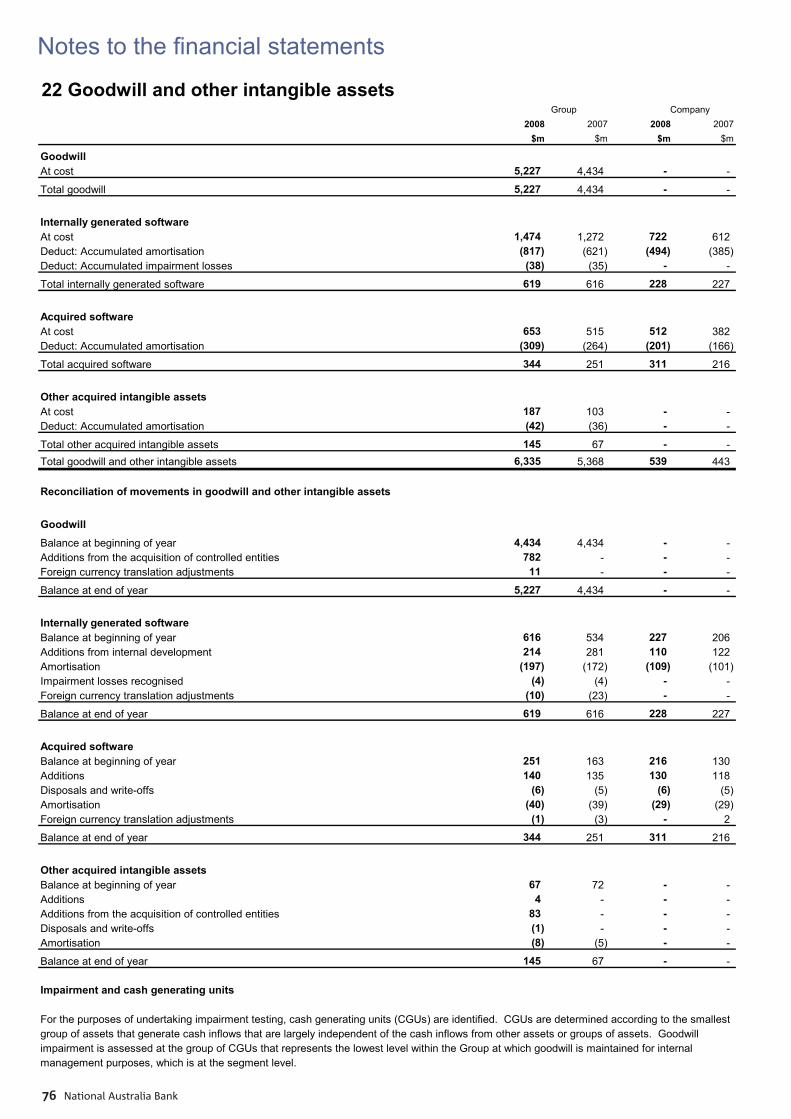
Notes to the fi nancial statements
National Australia Bank76
22 Goodwill and other intangible assets_
2008 2007 2008 2007$m $m $m $m
GoodwillAt cost 5,227 4,434 - -
Total goodwill 5,227 4,434 - -
Internally generated softwareAt cost 1,474 1,272 722 612 Deduct: Accumulated amortisation (817) (621) (494) (385) Deduct: Accumulated impairment losses (38) (35) - -
Total internally generated software 619 616 228 227
Acquired softwareAt cost 653 515 512 382 Deduct: Accumulated amortisation (309) (264) (201) (166)
Total acquired software 344 251 311 216
Other acquired intangible assetsAt cost 187 103 - - Deduct: Accumulated amortisation (42) (36) - -
Total other acquired intangible assets 145 67 - - Total goodwill and other intangible assets 6,335 5,368 539 443
Reconciliation of movements in goodwill and other intangible assets
Goodwill
Balance at beginning of year 4,434 4,434 - - Additions from the acquisition of controlled entities 782 - - - Foreign currency translation adjustments 11 - - -
Balance at end of year 5,227 4,434 - -
Internally generated softwareBalance at beginning of year 616 534 227 206 Additions from internal development 214 281 110 122 Amortisation (197) (172) (109) (101) Impairment losses recognised (4) (4) - - Foreign currency translation adjustments (10) (23) - -
Balance at end of year 619 616 228 227
Acquired softwareBalance at beginning of year 251 163 216 130 Additions 140 135 130 118 Disposals and write-offs (6) (5) (6) (5) Amortisation (40) (39) (29) (29) Foreign currency translation adjustments (1) (3) - 2
Balance at end of year 344 251 311 216
Other acquired intangible assetsBalance at beginning of year 67 72 - - Additions 4 - - - Additions from the acquisition of controlled entities 83 - - - Disposals and write-offs (1) - - - Amortisation (8) (5) - -
Balance at end of year 145 67 - -
Impairment and cash generating units
For the purposes of undertaking impairment testing, cash generating units (CGUs) are identified. CGUs are determined according to the smallestgroup of assets that generate cash inflows that are largely independent of the cash inflows from other assets or groups of assets. Goodwillimpairment is assessed at the group of CGUs that represents the lowest level within the Group at which goodwill is maintained for internalmanagement purposes, which is at the segment level.
Group Company
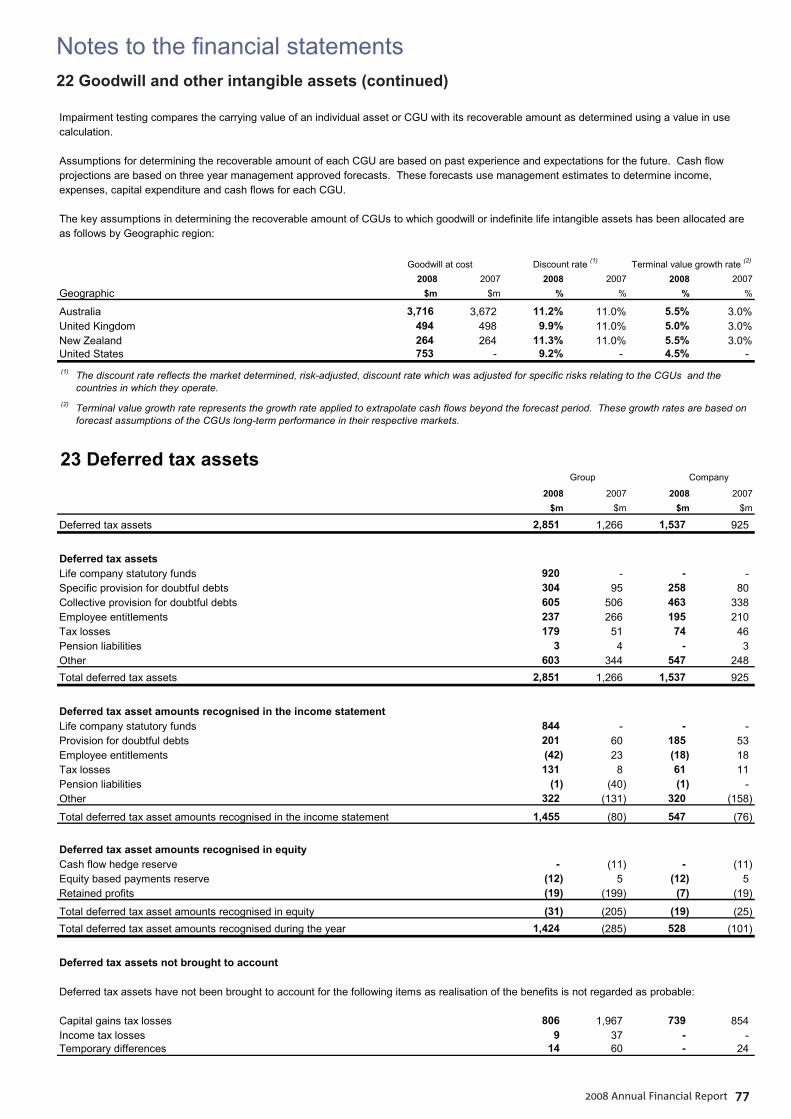
Notes to the fi nancial statements
2008 Annual Financial Report 77
22 Goodwill and other intangible assets (continued)
Impairment testing compares the carrying value of an individual asset or CGU with its recoverable amount as determined using a value in usecalculation.
Assumptions for determining the recoverable amount of each CGU are based on past experience and expectations for the future. Cash flowprojections are based on three year management approved forecasts. These forecasts use management estimates to determine income,expenses, capital expenditure and cash flows for each CGU.
The key assumptions in determining the recoverable amount of CGUs to which goodwill or indefinite life intangible assets has been allocated areas follows by Geographic region:
_
2008 2007 2008 2007 2008 2007Geographic $m $m % % % %
Australia 3,716 3,672 11.2% 11.0% 5.5% 3.0%United Kingdom 494 498 9.9% 11.0% 5.0% 3.0%New Zealand 264 264 11.3% 11.0% 5.5% 3.0%United States 753 - 9.2% - 4.5% - (1) The discount rate reflects the market determined, risk-adjusted, discount rate which was adjusted for specific risks relating to the CGUs and the
countries in which they operate.(2) Terminal value growth rate represents the growth rate applied to extrapolate cash flows beyond the forecast period. These growth rates are based on
forecast assumptions of the CGUs long-term performance in their respective markets.
Discount rate (1) Terminal value growth rate (2)Goodwill at cost
23 Deferred tax assets2008 2007 2008 2007
$m $m $m $m
Deferred tax assets 2,851 1,266 1,537 925
Deferred tax assetsLife company statutory funds 920 - - - Specific provision for doubtful debts 304 95 258 80 Collective provision for doubtful debts 605 506 463 338 Employee entitlements 237 266 195 210 Tax losses 179 51 74 46 Pension liabilities 3 4 - 3 Other 603 344 547 248 Total deferred tax assets 2,851 1,266 1,537 925
Deferred tax asset amounts recognised in the income statementLife company statutory funds 844 - - - Provision for doubtful debts 201 60 185 53 Employee entitlements (42) 23 (18) 18 Tax losses 131 8 61 11 Pension liabilities (1) (40) (1) - Other 322 (131) 320 (158)
Total deferred tax asset amounts recognised in the income statement 1,455 (80) 547 (76)
Deferred tax asset amounts recognised in equityCash flow hedge reserve - (11) - (11) Equity based payments reserve (12) 5 (12) 5 Retained profits (19) (199) (7) (19)
Total deferred tax asset amounts recognised in equity (31) (205) (19) (25) Total deferred tax asset amounts recognised during the year 1,424 (285) 528 (101)
Deferred tax assets not brought to account
Deferred tax assets have not been brought to account for the following items as realisation of the benefits is not regarded as probable:
Capital gains tax losses 806 1,967 739 854 Income tax losses 9 37 - - Temporary differences 14 60 - 24
Group Company
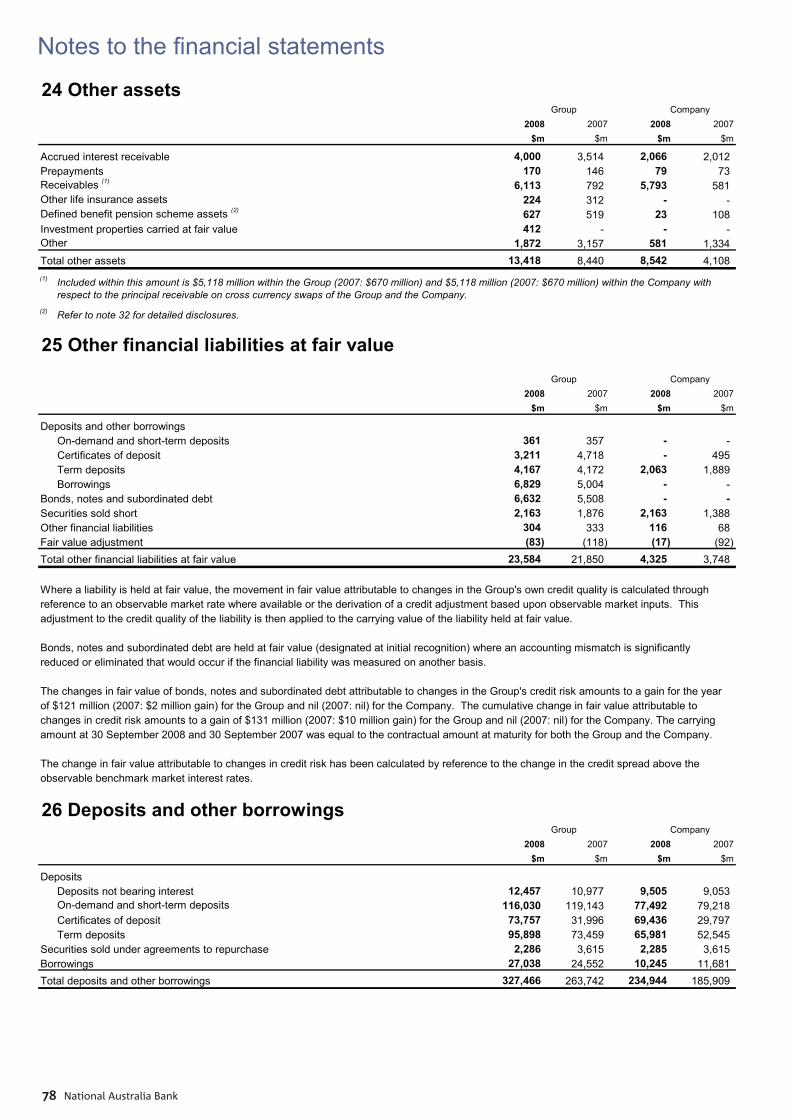
Notes to the fi nancial statements
National Australia Bank78
24 Other assets2008 2007 2008 2007
$m $m $m $m
Accrued interest receivable 4,000 3,514 2,066 2,012 Prepayments 170 146 79 73 Receivables (1) 6,113 792 5,793 581 Other life insurance assets 224 312 - - Defined benefit pension scheme assets (2) 627 519 23 108 Investment properties carried at fair value 412 - - - Other 1,872 3,157 581 1,334 Total other assets 13,418 8,440 8,542 4,108 (1) Included within this amount is $5,118 million within the Group (2007: $670 million) and $5,118 million (2007: $670 million) within the Company with
respect to the principal receivable on cross currency swaps of the Group and the Company.(2) Refer to note 32 for detailed disclosures.
Group Company
25 Other financial liabilities at fair value
2008 2007 2008 2007$m $m $m $m
Deposits and other borrowingsOn-demand and short-term deposits 361 357 - - Certificates of deposit 3,211 4,718 - 495 Term deposits 4,167 4,172 2,063 1,889 Borrowings 6,829 5,004 - -
Bonds, notes and subordinated debt 6,632 5,508 - - Securities sold short 2,163 1,876 2,163 1,388 Other financial liabilities 304 333 116 68 Fair value adjustment (83) (118) (17) (92) Total other financial liabilities at fair value 23,584 21,850 4,325 3,748
Where a liability is held at fair value, the movement in fair value attributable to changes in the Group's own credit quality is calculated throughreference to an observable market rate where available or the derivation of a credit adjustment based upon observable market inputs. Thisadjustment to the credit quality of the liability is then applied to the carrying value of the liability held at fair value.
Bonds, notes and subordinated debt are held at fair value (designated at initial recognition) where an accounting mismatch is significantly reduced or eliminated that would occur if the financial liability was measured on another basis.
The changes in fair value of bonds, notes and subordinated debt attributable to changes in the Group's credit risk amounts to a gain for the yearof $121 million (2007: $2 million gain) for the Group and nil (2007: nil) for the Company. The cumulative change in fair value attributable tochanges in credit risk amounts to a gain of $131 million (2007: $10 million gain) for the Group and nil (2007: nil) for the Company. The carryingamount at 30 September 2008 and 30 September 2007 was equal to the contractual amount at maturity for both the Group and the Company.
The change in fair value attributable to changes in credit risk has been calculated by reference to the change in the credit spread above the observable benchmark market interest rates.
Group Company
26 Deposits and other borrowings_
2008 2007 2008 2007$m $m $m $m
DepositsDeposits not bearing interest 12,457 10,977 9,505 9,053 On-demand and short-term deposits 116,030 119,143 77,492 79,218 Certificates of deposit 73,757 31,996 69,436 29,797 Term deposits 95,898 73,459 65,981 52,545
Securities sold under agreements to repurchase 2,286 3,615 2,285 3,615 Borrowings 27,038 24,552 10,245 11,681 Total deposits and other borrowings 327,466 263,742 234,944 185,909
Group Company
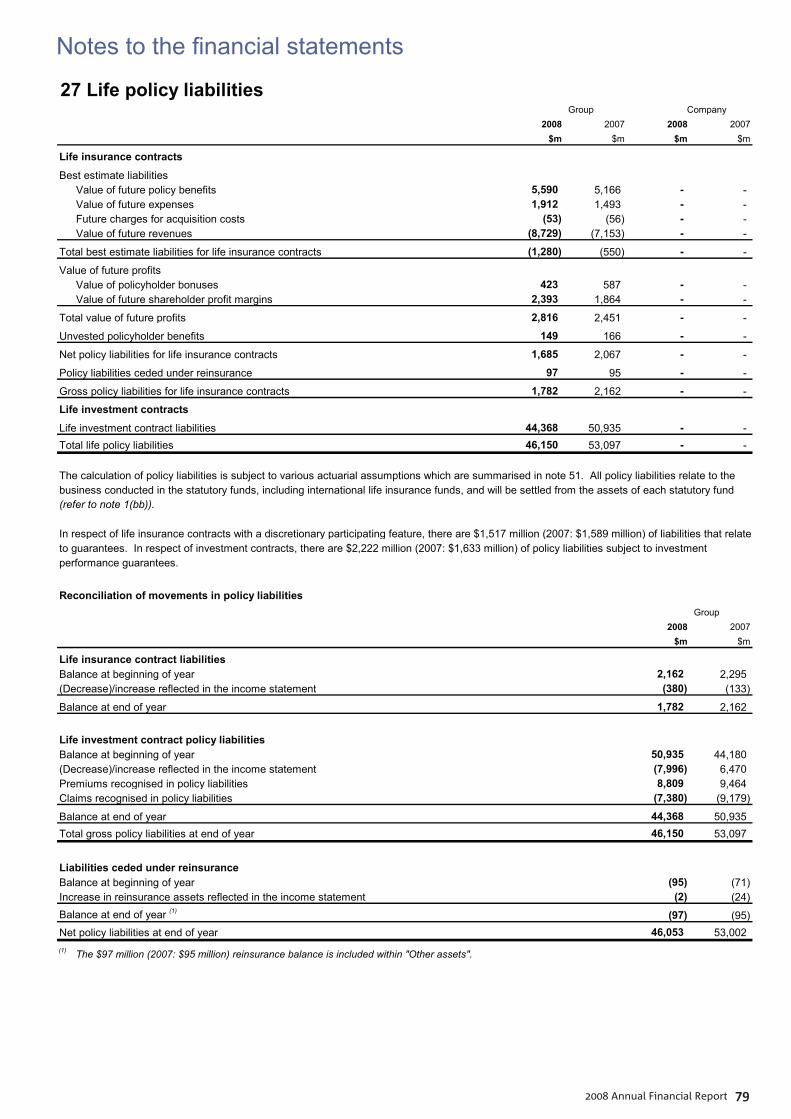
Notes to the fi nancial statements
2008 Annual Financial Report 79
27 Life policy liabilities2008 2007 2008 2007
$m $m $m $m
Life insurance contracts
Best estimate liabilitiesValue of future policy benefits 5,590 5,166 - - Value of future expenses 1,912 1,493 - - Future charges for acquisition costs (53) (56) - - Value of future revenues (8,729) (7,153) - -
Total best estimate liabilities for life insurance contracts (1,280) (550) - -
Value of future profitsValue of policyholder bonuses 423 587 - - Value of future shareholder profit margins 2,393 1,864 - -
Total value of future profits 2,816 2,451 - -
Unvested policyholder benefits 149 166 - -
Net policy liabilities for life insurance contracts 1,685 2,067 - -
Policy liabilities ceded under reinsurance 97 95 - -
Gross policy liabilities for life insurance contracts 1,782 2,162 - -
Life investment contracts
Life investment contract liabilities 44,368 50,935 - - Total life policy liabilities 46,150 53,097 - -
The calculation of policy liabilities is subject to various actuarial assumptions which are summarised in note 51. All policy liabilities relate to thebusiness conducted in the statutory funds, including international life insurance funds, and will be settled from the assets of each statutory fund(refer to note 1(bb)).
In respect of life insurance contracts with a discretionary participating feature, there are $1,517 million (2007: $1,589 million) of liabilities that relateto guarantees. In respect of investment contracts, there are $2,222 million (2007: $1,633 million) of policy liabilities subject to investmentperformance guarantees.
Reconciliation of movements in policy liabilities_
2008 2007$m $m
Life insurance contract liabilitiesBalance at beginning of year 2,162 2,295 (Decrease)/increase reflected in the income statement (380) (133)
Balance at end of year 1,782 2,162
Life investment contract policy liabilitiesBalance at beginning of year 50,935 44,180 (Decrease)/increase reflected in the income statement (7,996) 6,470 Premiums recognised in policy liabilities 8,809 9,464 Claims recognised in policy liabilities (7,380) (9,179)
Balance at end of year 44,368 50,935 Total gross policy liabilities at end of year 46,150 53,097
Liabilities ceded under reinsuranceBalance at beginning of year (95) (71) Increase in reinsurance assets reflected in the income statement (2) (24) Balance at end of year (1) (97) (95) Net policy liabilities at end of year 46,053 53,002 (1) The $97 million (2007: $95 million) reinsurance balance is included within "Other assets".
Group Company
Group
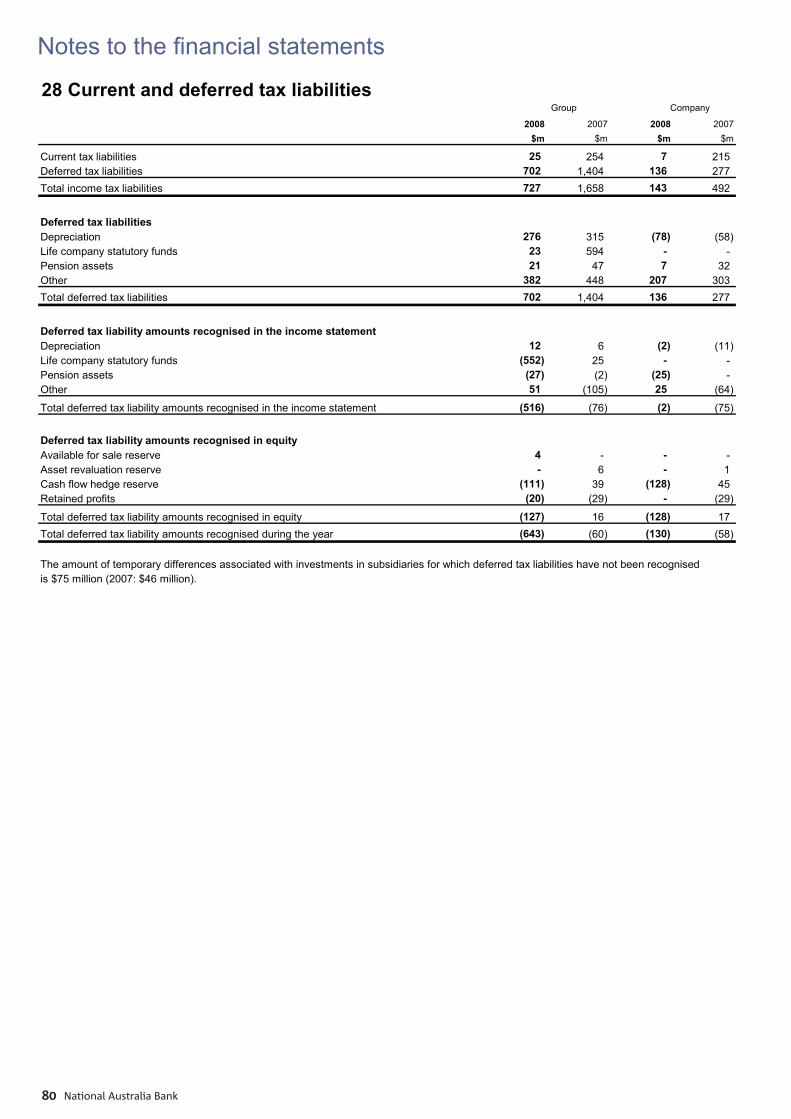
Notes to the fi nancial statements
National Australia Bank80
28 Current and deferred tax liabilities2008 2007 2008 2007
$m $m $m $m
Current tax liabilities 25 254 7 215 Deferred tax liabilities 702 1,404 136 277 Total income tax liabilities 727 1,658 143 492
Deferred tax liabilitiesDepreciation 276 315 (78) (58) Life company statutory funds 23 594 - - Pension assets 21 47 7 32 Other 382 448 207 303 Total deferred tax liabilities 702 1,404 136 277
Deferred tax liability amounts recognised in the income statementDepreciation 12 6 (2) (11) Life company statutory funds (552) 25 - - Pension assets (27) (2) (25) - Other 51 (105) 25 (64)
Total deferred tax liability amounts recognised in the income statement (516) (76) (2) (75)
Deferred tax liability amounts recognised in equityAvailable for sale reserve 4 - - - Asset revaluation reserve - 6 - 1 Cash flow hedge reserve (111) 39 (128) 45 Retained profits (20) (29) - (29)
Total deferred tax liability amounts recognised in equity (127) 16 (128) 17 Total deferred tax liability amounts recognised during the year (643) (60) (130) (58)
The amount of temporary differences associated with investments in subsidiaries for which deferred tax liabilities have not been recognised is $75 million (2007: $46 million).
Group Company
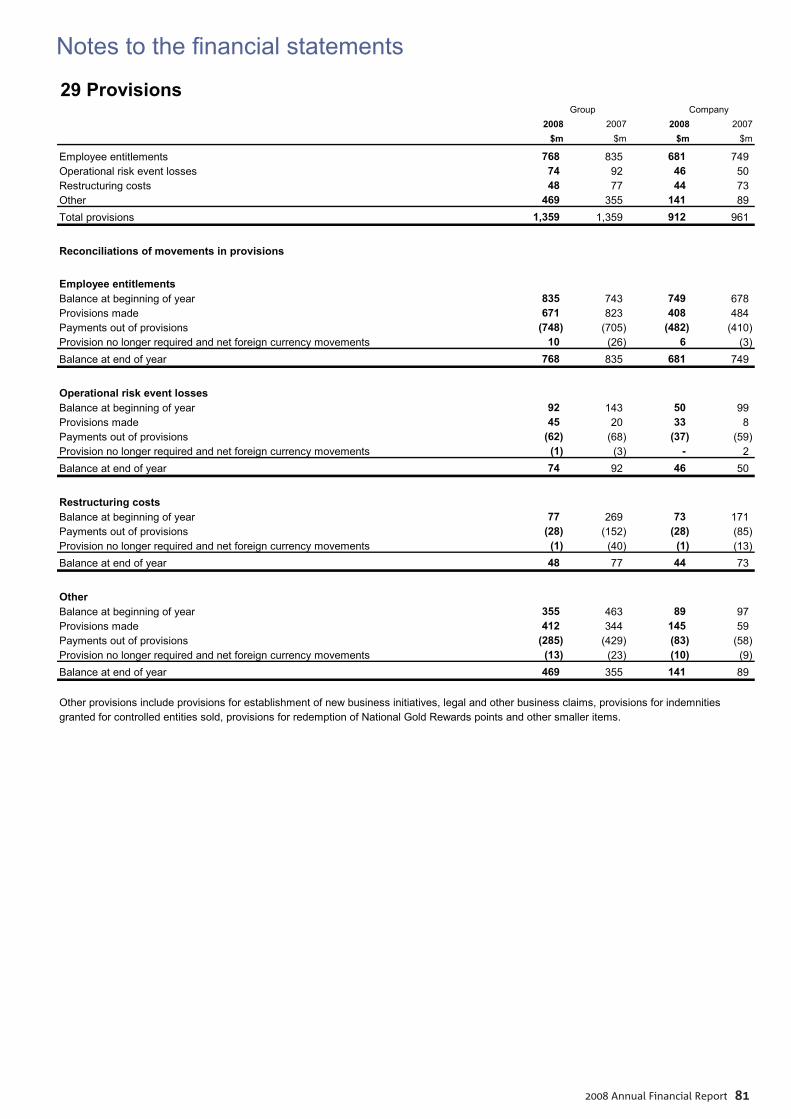
Notes to the fi nancial statements
2008 Annual Financial Report 81
29 Provisions_
2008 2007 2008 2007$m $m $m $m
Employee entitlements 768 835 681 749 Operational risk event losses 74 92 46 50 Restructuring costs 48 77 44 73 Other 469 355 141 89 Total provisions 1,359 1,359 912 961
Reconciliations of movements in provisions
Employee entitlementsBalance at beginning of year 835 743 749 678 Provisions made 671 823 408 484 Payments out of provisions (748) (705) (482) (410) Provision no longer required and net foreign currency movements 10 (26) 6 (3) Balance at end of year 768 835 681 749
Operational risk event lossesBalance at beginning of year 92 143 50 99 Provisions made 45 20 33 8 Payments out of provisions (62) (68) (37) (59) Provision no longer required and net foreign currency movements (1) (3) - 2 Balance at end of year 74 92 46 50
Restructuring costsBalance at beginning of year 77 269 73 171 Payments out of provisions (28) (152) (28) (85) Provision no longer required and net foreign currency movements (1) (40) (1) (13) Balance at end of year 48 77 44 73
OtherBalance at beginning of year 355 463 89 97 Provisions made 412 344 145 59 Payments out of provisions (285) (429) (83) (58) Provision no longer required and net foreign currency movements (13) (23) (10) (9) Balance at end of year 469 355 141 89
Other provisions include provisions for establishment of new business initiatives, legal and other business claims, provisions for indemnitiesgranted for controlled entities sold, provisions for redemption of National Gold Rewards points and other smaller items.
Group Company
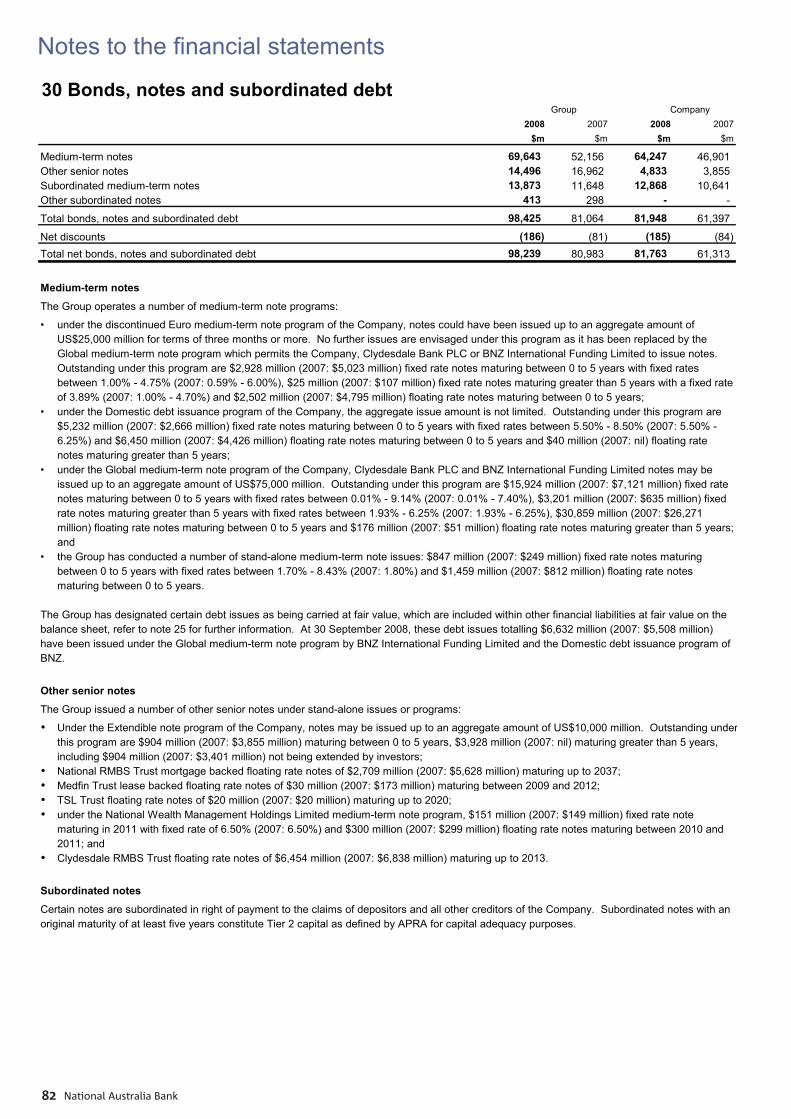
Notes to the fi nancial statements
National Australia Bank82
30 Bonds, notes and subordinated debt_
2008 2007 2008 2007$m $m $m $m
Medium-term notes 69,643 52,156 64,247 46,901 Other senior notes 14,496 16,962 4,833 3,855 Subordinated medium-term notes 13,873 11,648 12,868 10,641 Other subordinated notes 413 298 - -
Total bonds, notes and subordinated debt 98,425 81,064 81,948 61,397
Net discounts (186) (81) (185) (84) Total net bonds, notes and subordinated debt 98,239 80,983 81,763 61,313
Medium-term notes
The Group operates a number of medium-term note programs:
• under the discontinued Euro medium-term note program of the Company, notes could have been issued up to an aggregate amount ofUS$25,000 million for terms of three months or more. No further issues are envisaged under this program as it has been replaced by theGlobal medium-term note program which permits the Company, Clydesdale Bank PLC or BNZ International Funding Limited to issue notes. Outstanding under this program are $2,928 million (2007: $5,023 million) fixed rate notes maturing between 0 to 5 years with fixed ratesbetween 1.00% - 4.75% (2007: 0.59% - 6.00%), $25 million (2007: $107 million) fixed rate notes maturing greater than 5 years with a fixed rateof 3.89% (2007: 1.00% - 4.70%) and $2,502 million (2007: $4,795 million) floating rate notes maturing between 0 to 5 years;
• under the Domestic debt issuance program of the Company, the aggregate issue amount is not limited. Outstanding under this program are$5,232 million (2007: $2,666 million) fixed rate notes maturing between 0 to 5 years with fixed rates between 5.50% - 8.50% (2007: 5.50% -6.25%) and $6,450 million (2007: $4,426 million) floating rate notes maturing between 0 to 5 years and $40 million (2007: nil) floating ratenotes maturing greater than 5 years;
• under the Global medium-term note program of the Company, Clydesdale Bank PLC and BNZ International Funding Limited notes may beissued up to an aggregate amount of US$75,000 million. Outstanding under this program are $15,924 million (2007: $7,121 million) fixed rate notes maturing between 0 to 5 years with fixed rates between 0.01% - 9.14% (2007: 0.01% - 7.40%), $3,201 million (2007: $635 million) fixedrate notes maturing greater than 5 years with fixed rates between 1.93% - 6.25% (2007: 1.93% - 6.25%), $30,859 million (2007: $26,271 million) floating rate notes maturing between 0 to 5 years and $176 million (2007: $51 million) floating rate notes maturing greater than 5 years; and
• the Group has conducted a number of stand-alone medium-term note issues: $847 million (2007: $249 million) fixed rate notes maturingbetween 0 to 5 years with fixed rates between 1.70% - 8.43% (2007: 1.80%) and $1,459 million (2007: $812 million) floating rate notesmaturing between 0 to 5 years.
The Group has designated certain debt issues as being carried at fair value, which are included within other financial liabilities at fair value on thebalance sheet, refer to note 25 for further information. At 30 September 2008, these debt issues totalling $6,632 million (2007: $5,508 million)have been issued under the Global medium-term note program by BNZ International Funding Limited and the Domestic debt issuance program ofBNZ.
Other senior notes
The Group issued a number of other senior notes under stand-alone issues or programs:
• Under the Extendible note program of the Company, notes may be issued up to an aggregate amount of US$10,000 million. Outstanding underthis program are $904 million (2007: $3,855 million) maturing between 0 to 5 years, $3,928 million (2007: nil) maturing greater than 5 years,including $904 million (2007: $3,401 million) not being extended by investors;
• National RMBS Trust mortgage backed floating rate notes of $2,709 million (2007: $5,628 million) maturing up to 2037; • Medfin Trust lease backed floating rate notes of $30 million (2007: $173 million) maturing between 2009 and 2012; • TSL Trust floating rate notes of $20 million (2007: $20 million) maturing up to 2020; • under the National Wealth Management Holdings Limited medium-term note program, $151 million (2007: $149 million) fixed rate note
maturing in 2011 with fixed rate of 6.50% (2007: 6.50%) and $300 million (2007: $299 million) floating rate notes maturing between 2010 and2011; and
• Clydesdale RMBS Trust floating rate notes of $6,454 million (2007: $6,838 million) maturing up to 2013.
Subordinated notes
Certain notes are subordinated in right of payment to the claims of depositors and all other creditors of the Company. Subordinated notes with anoriginal maturity of at least five years constitute Tier 2 capital as defined by APRA for capital adequacy purposes.
Group Company
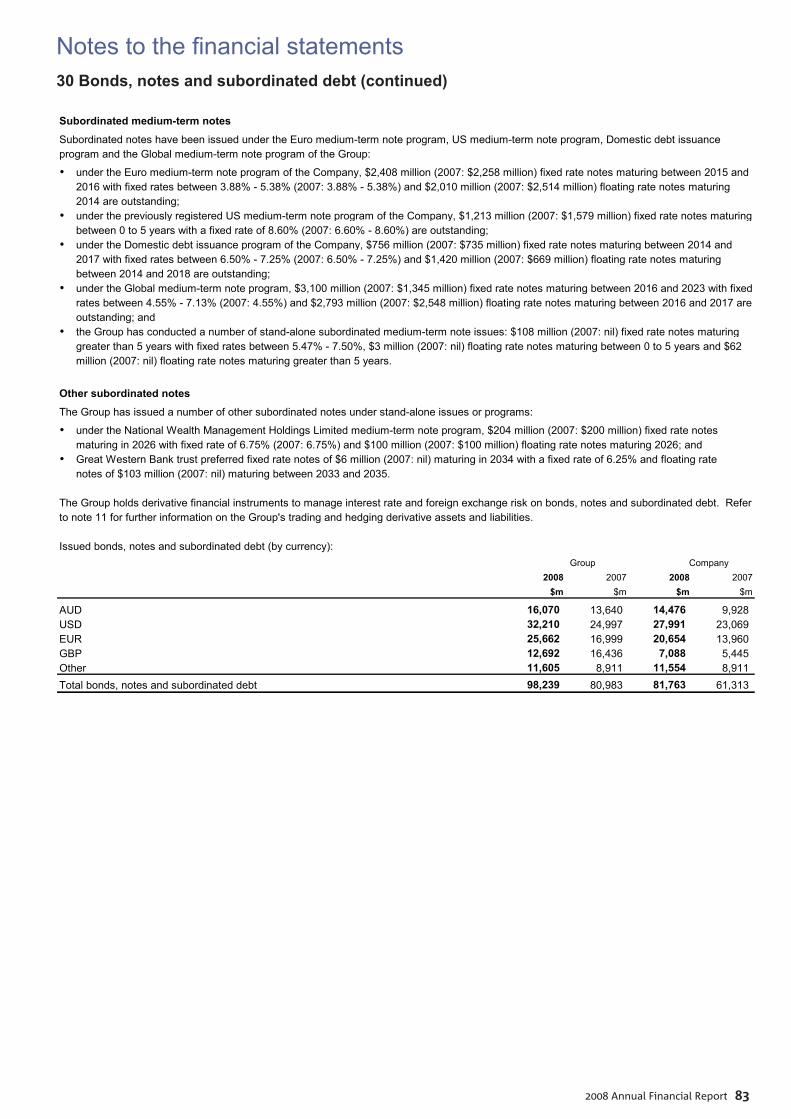
Notes to the fi nancial statements
2008 Annual Financial Report 83
30 Bonds, notes and subordinated debt (continued)
Subordinated medium-term notes
Subordinated notes have been issued under the Euro medium-term note program, US medium-term note program, Domestic debt issuance program and the Global medium-term note program of the Group:
• under the Euro medium-term note program of the Company, $2,408 million (2007: $2,258 million) fixed rate notes maturing between 2015 and2016 with fixed rates between 3.88% - 5.38% (2007: 3.88% - 5.38%) and $2,010 million (2007: $2,514 million) floating rate notes maturing2014 are outstanding;
• under the previously registered US medium-term note program of the Company, $1,213 million (2007: $1,579 million) fixed rate notes maturingbetween 0 to 5 years with a fixed rate of 8.60% (2007: 6.60% - 8.60%) are outstanding;
• under the Domestic debt issuance program of the Company, $756 million (2007: $735 million) fixed rate notes maturing between 2014 and2017 with fixed rates between 6.50% - 7.25% (2007: 6.50% - 7.25%) and $1,420 million (2007: $669 million) floating rate notes maturing between 2014 and 2018 are outstanding;
• under the Global medium-term note program, $3,100 million (2007: $1,345 million) fixed rate notes maturing between 2016 and 2023 with fixedrates between 4.55% - 7.13% (2007: 4.55%) and $2,793 million (2007: $2,548 million) floating rate notes maturing between 2016 and 2017 are outstanding; and
• the Group has conducted a number of stand-alone subordinated medium-term note issues: $108 million (2007: nil) fixed rate notes maturinggreater than 5 years with fixed rates between 5.47% - 7.50%, $3 million (2007: nil) floating rate notes maturing between 0 to 5 years and $62million (2007: nil) floating rate notes maturing greater than 5 years.
Other subordinated notes
The Group has issued a number of other subordinated notes under stand-alone issues or programs:
• under the National Wealth Management Holdings Limited medium-term note program, $204 million (2007: $200 million) fixed rate notesmaturing in 2026 with fixed rate of 6.75% (2007: 6.75%) and $100 million (2007: $100 million) floating rate notes maturing 2026; and
• Great Western Bank trust preferred fixed rate notes of $6 million (2007: nil) maturing in 2034 with a fixed rate of 6.25% and floating ratenotes of $103 million (2007: nil) maturing between 2033 and 2035.
The Group holds derivative financial instruments to manage interest rate and foreign exchange risk on bonds, notes and subordinated debt. Referto note 11 for further information on the Group's trading and hedging derivative assets and liabilities.
Issued bonds, notes and subordinated debt (by currency):_
2008 2007 2008 2007$m $m $m $m
AUD 16,070 13,640 14,476 9,928 USD 32,210 24,997 27,991 23,069 EUR 25,662 16,999 20,654 13,960 GBP 12,692 16,436 7,088 5,445 Other 11,605 8,911 11,554 8,911 Total bonds, notes and subordinated debt 98,239 80,983 81,763 61,313
Group Company
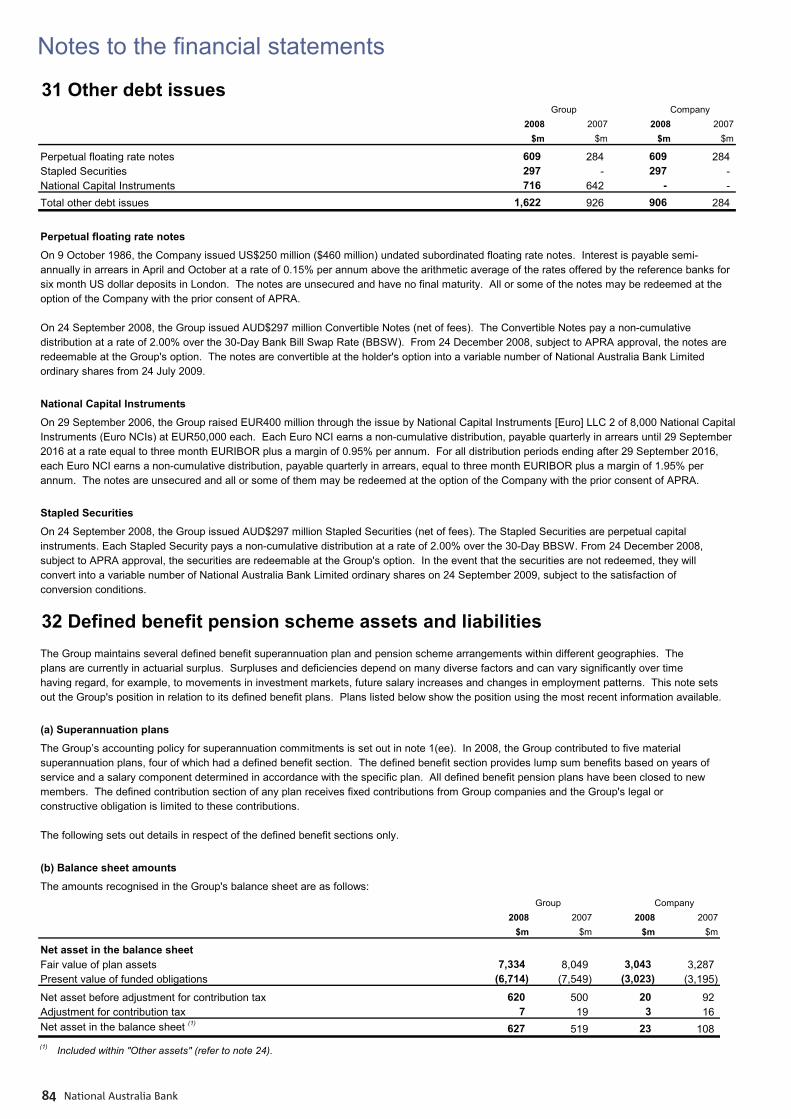
Notes to the fi nancial statements
National Australia Bank84
31 Other debt issues_
2008 2007 2008 2007$m $m $m $m
Perpetual floating rate notes 609 284 609 284 Stapled Securities 297 - 297 - National Capital Instruments 716 642 - - Total other debt issues 1,622 926 906 284
Perpetual floating rate notes
On 9 October 1986, the Company issued US$250 million ($460 million) undated subordinated floating rate notes. Interest is payable semi-annually in arrears in April and October at a rate of 0.15% per annum above the arithmetic average of the rates offered by the reference banks for six month US dollar deposits in London. The notes are unsecured and have no final maturity. All or some of the notes may be redeemed at the option of the Company with the prior consent of APRA.
On 24 September 2008, the Group issued AUD$297 million Convertible Notes (net of fees). The Convertible Notes pay a non-cumulativedistribution at a rate of 2.00% over the 30-Day Bank Bill Swap Rate (BBSW). From 24 December 2008, subject to APRA approval, the notes areredeemable at the Group's option. The notes are convertible at the holder's option into a variable number of National Australia Bank Limitedordinary shares from 24 July 2009.
National Capital Instruments
On 29 September 2006, the Group raised EUR400 million through the issue by National Capital Instruments [Euro] LLC 2 of 8,000 National CapitalInstruments (Euro NCIs) at EUR50,000 each. Each Euro NCI earns a non-cumulative distribution, payable quarterly in arrears until 29 September 2016 at a rate equal to three month EURIBOR plus a margin of 0.95% per annum. For all distribution periods ending after 29 September 2016,each Euro NCI earns a non-cumulative distribution, payable quarterly in arrears, equal to three month EURIBOR plus a margin of 1.95% per annum. The notes are unsecured and all or some of them may be redeemed at the option of the Company with the prior consent of APRA.
Stapled Securities
On 24 September 2008, the Group issued AUD$297 million Stapled Securities (net of fees). The Stapled Securities are perpetual capitalinstruments. Each Stapled Security pays a non-cumulative distribution at a rate of 2.00% over the 30-Day BBSW. From 24 December 2008, subject to APRA approval, the securities are redeemable at the Group's option. In the event that the securities are not redeemed, they will convert into a variable number of National Australia Bank Limited ordinary shares on 24 September 2009, subject to the satisfaction of conversion conditions.
Group Company
32 Defined benefit pension scheme assets and liabilitiesThe Group maintains several defined benefit superannuation plan and pension scheme arrangements within different geographies. Theplans are currently in actuarial surplus. Surpluses and deficiencies depend on many diverse factors and can vary significantly over timehaving regard, for example, to movements in investment markets, future salary increases and changes in employment patterns. This note setsout the Group's position in relation to its defined benefit plans. Plans listed below show the position using the most recent information available.
(a) Superannuation plans
The Group’s accounting policy for superannuation commitments is set out in note 1(ee). In 2008, the Group contributed to five materialsuperannuation plans, four of which had a defined benefit section. The defined benefit section provides lump sum benefits based on years ofservice and a salary component determined in accordance with the specific plan. All defined benefit pension plans have been closed to newmembers. The defined contribution section of any plan receives fixed contributions from Group companies and the Group's legal orconstructive obligation is limited to these contributions.
The following sets out details in respect of the defined benefit sections only.
(b) Balance sheet amounts
The amounts recognised in the Group's balance sheet are as follows:_
2008 2007 2008 2007$m $m $m $m
Net asset in the balance sheetFair value of plan assets 7,334 8,049 3,043 3,287 Present value of funded obligations (6,714) (7,549) (3,023) (3,195)
Net asset before adjustment for contribution tax 620 500 20 92 Adjustment for contribution tax 7 19 3 16 Net asset in the balance sheet (1) 627 519 23 108 (1) Included within "Other assets" (refer to note 24).
Group Company
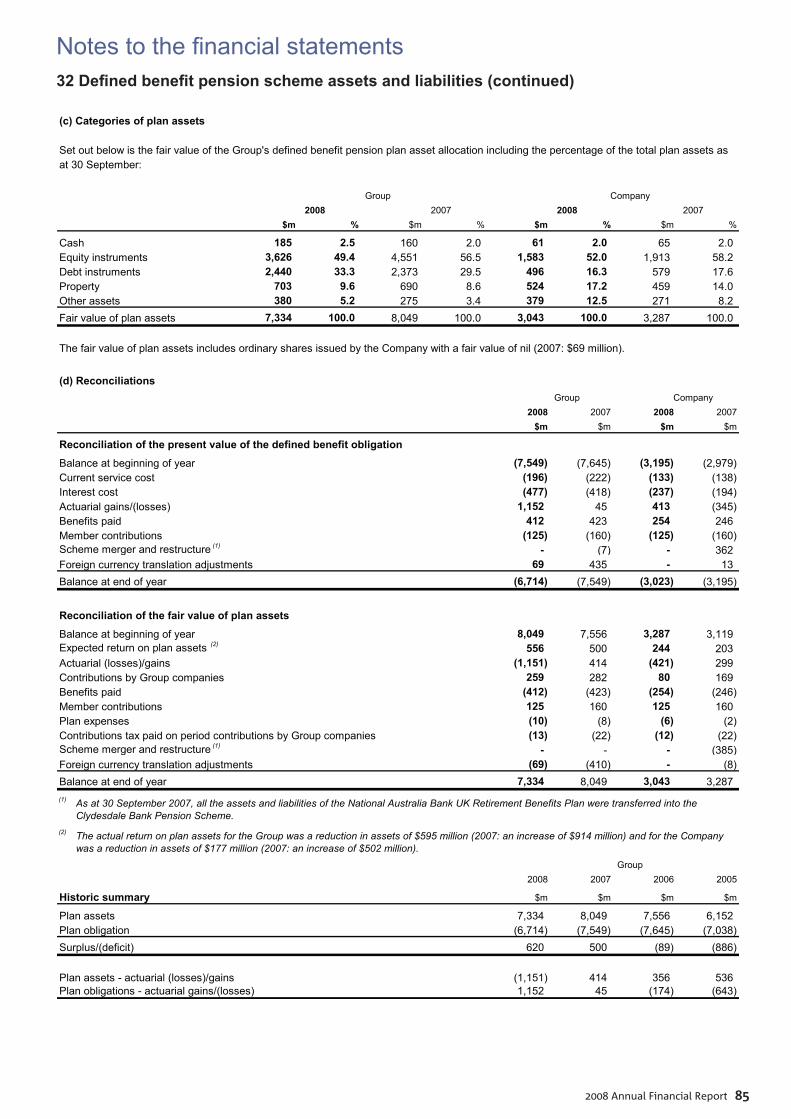
Notes to the fi nancial statements
2008 Annual Financial Report 85
32 Defi ned benefi t pension scheme assets and liabilities (continued)
(c) Categories of plan assets
Set out below is the fair value of the Group's defined benefit pension plan asset allocation including the percentage of the total plan assets asat 30 September:
_
$m % $m % $m % $m %
Cash 185 2.5 160 2.0 61 2.0 65 2.0 Equity instruments 3,626 49.4 4,551 56.5 1,583 52.0 1,913 58.2 Debt instruments 2,440 33.3 2,373 29.5 496 16.3 579 17.6 Property 703 9.6 690 8.6 524 17.2 459 14.0 Other assets 380 5.2 275 3.4 379 12.5 271 8.2 Fair value of plan assets 7,334 100.0 8,049 100.0 3,043 100.0 3,287 100.0
The fair value of plan assets includes ordinary shares issued by the Company with a fair value of nil (2007: $69 million).
(d) Reconciliations_
2008 2007 2008 2007$m $m $m $m
Reconciliation of the present value of the defined benefit obligation
Balance at beginning of year (7,549) (7,645) (3,195) (2,979) Current service cost (196) (222) (133) (138) Interest cost (477) (418) (237) (194) Actuarial gains/(losses) 1,152 45 413 (345) Benefits paid 412 423 254 246 Member contributions (125) (160) (125) (160) Scheme merger and restructure (1) - (7) - 362 Foreign currency translation adjustments 69 435 - 13 Balance at end of year (6,714) (7,549) (3,023) (3,195)
Reconciliation of the fair value of plan assets
Balance at beginning of year 8,049 7,556 3,287 3,119 Expected return on plan assets (2) 556 500 244 203 Actuarial (losses)/gains (1,151) 414 (421) 299 Contributions by Group companies 259 282 80 169 Benefits paid (412) (423) (254) (246) Member contributions 125 160 125 160 Plan expenses (10) (8) (6) (2) Contributions tax paid on period contributions by Group companies (13) (22) (12) (22) Scheme merger and restructure (1) - - - (385) Foreign currency translation adjustments (69) (410) - (8) Balance at end of year 7,334 8,049 3,043 3,287 (1) As at 30 September 2007, all the assets and liabilities of the National Australia Bank UK Retirement Benefits Plan were transferred into the
Clydesdale Bank Pension Scheme.(2) The actual return on plan assets for the Group was a reduction in assets of $595 million (2007: an increase of $914 million) and for the Company
was a reduction in assets of $177 million (2007: an increase of $502 million)._
2008 2007 2006 2005
Historic summary $m $m $m $m
Plan assets 7,334 8,049 7,556 6,152 Plan obligation (6,714) (7,549) (7,645) (7,038) Surplus/(deficit) 620 500 (89) (886)
Plan assets - actuarial (losses)/gains (1,151) 414 356 536 Plan obligations - actuarial gains/(losses) 1,152 45 (174) (643)
2008 2007 2008 2007 Group Company
Group Company
Group
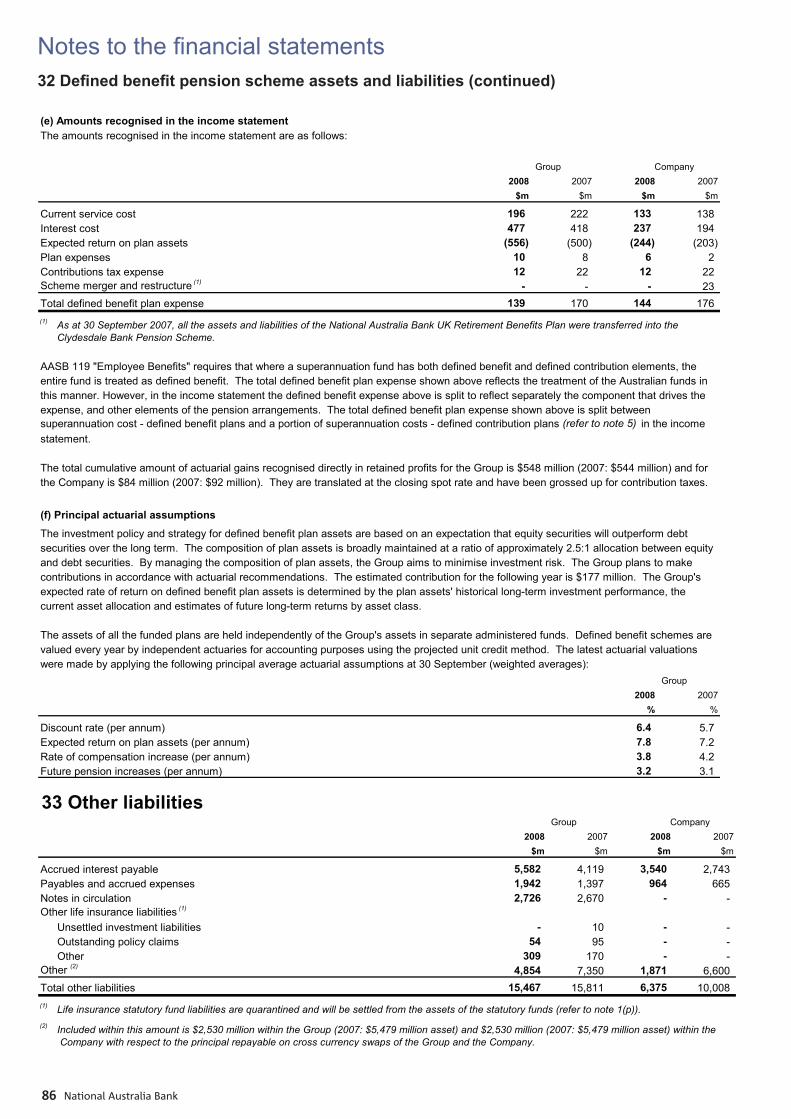
Notes to the fi nancial statements
National Australia Bank86
32 Defi ned benefi t pension scheme assets and liabilities (continued)
33 Other liabilities_
2008 2007 2008 2007$m $m $m $m
Accrued interest payable 5,582 4,119 3,540 2,743 Payables and accrued expenses 1,942 1,397 964 665 Notes in circulation 2,726 2,670 - - Other life insurance liabilities (1)
Unsettled investment liabilities - 10 - - Outstanding policy claims 54 95 - - Other 309 170 - -
Other (2) 4,854 7,350 1,871 6,600 Total other liabilities 15,467 15,811 6,375 10,008 (1) Life insurance statutory fund liabilities are quarantined and will be settled from the assets of the statutory funds (refer to note 1(p)).(2) Included within this amount is $2,530 million within the Group (2007: $5,479 million asset) and $2,530 million (2007: $5,479 million asset) within the
Company with respect to the principal repayable on cross currency swaps of the Group and the Company.
Group Company
(e) Amounts recognised in the income statementThe amounts recognised in the income statement are as follows:
_
2008 2007 2008 2007$m $m $m $m
Current service cost 196 222 133 138 Interest cost 477 418 237 194 Expected return on plan assets (556) (500) (244) (203) Plan expenses 10 8 6 2 Contributions tax expense 12 22 12 22 Scheme merger and restructure (1) - - - 23 Total defined benefit plan expense 139 170 144 176 (1) As at 30 September 2007, all the assets and liabilities of the National Australia Bank UK Retirement Benefits Plan were transferred into the
Clydesdale Bank Pension Scheme.
AASB 119 "Employee Benefits" requires that where a superannuation fund has both defined benefit and defined contribution elements, theentire fund is treated as defined benefit. The total defined benefit plan expense shown above reflects the treatment of the Australian funds inthis manner. However, in the income statement the defined benefit expense above is split to reflect separately the component that drives theexpense, and other elements of the pension arrangements. The total defined benefit plan expense shown above is split betweensuperannuation cost - defined benefit plans and a portion of superannuation costs - defined contribution plans (refer to note 5) in the incomestatement.
The total cumulative amount of actuarial gains recognised directly in retained profits for the Group is $548 million (2007: $544 million) and for the Company is $84 million (2007: $92 million). They are translated at the closing spot rate and have been grossed up for contribution taxes.
(f) Principal actuarial assumptions
The investment policy and strategy for defined benefit plan assets are based on an expectation that equity securities will outperform debtsecurities over the long term. The composition of plan assets is broadly maintained at a ratio of approximately 2.5:1 allocation between equityand debt securities. By managing the composition of plan assets, the Group aims to minimise investment risk. The Group plans to makecontributions in accordance with actuarial recommendations. The estimated contribution for the following year is $177 million. The Group'sexpected rate of return on defined benefit plan assets is determined by the plan assets' historical long-term investment performance, thecurrent asset allocation and estimates of future long-term returns by asset class.
The assets of all the funded plans are held independently of the Group's assets in separate administered funds. Defined benefit schemes arevalued every year by independent actuaries for accounting purposes using the projected unit credit method. The latest actuarial valuationswere made by applying the following principal average actuarial assumptions at 30 September (weighted averages):_
2008 2007% %
Discount rate (per annum) 6.4 5.7 Expected return on plan assets (per annum) 7.8 7.2 Rate of compensation increase (per annum) 3.8 4.2 Future pension increases (per annum) 3.2 3.1
Group
Group Company
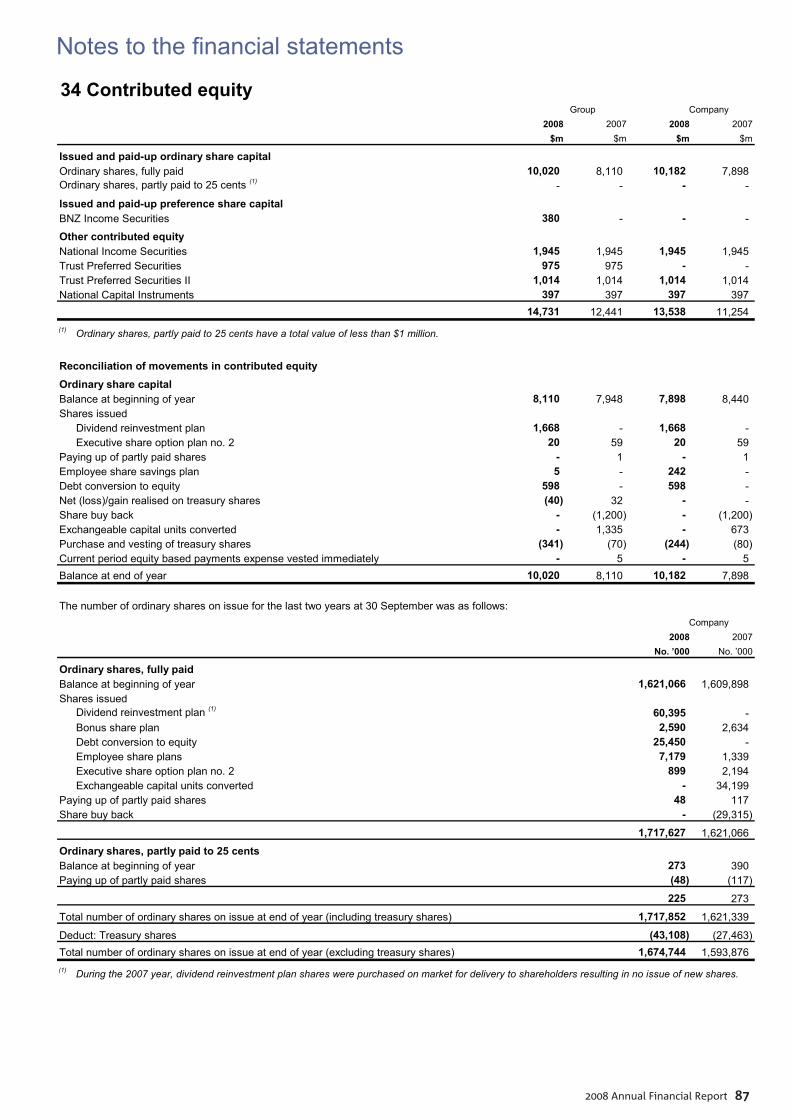
Notes to the fi nancial statements
2008 Annual Financial Report 87
34 Contributed equity2008 2007 2008 2007
$m $m $m $m
Issued and paid-up ordinary share capitalOrdinary shares, fully paid 10,020 8,110 10,182 7,898 Ordinary shares, partly paid to 25 cents (1) - - - -
Issued and paid-up preference share capitalBNZ Income Securities 380 - - -
Other contributed equityNational Income Securities 1,945 1,945 1,945 1,945 Trust Preferred Securities 975 975 - - Trust Preferred Securities II 1,014 1,014 1,014 1,014 National Capital Instruments 397 397 397 397
14,731 12,441 13,538 11,254 (1) Ordinary shares, partly paid to 25 cents have a total value of less than $1 million.
Reconciliation of movements in contributed equityOrdinary share capitalBalance at beginning of year 8,110 7,948 7,898 8,440 Shares issued
Dividend reinvestment plan 1,668 - 1,668 - Executive share option plan no. 2 20 59 20 59
Paying up of partly paid shares - 1 - 1 Employee share savings plan 5 - 242 - Debt conversion to equity 598 - 598 - Net (loss)/gain realised on treasury shares (40) 32 - - Share buy back - (1,200) - (1,200) Exchangeable capital units converted - 1,335 - 673 Purchase and vesting of treasury shares (341) (70) (244) (80) Current period equity based payments expense vested immediately - 5 - 5 Balance at end of year 10,020 8,110 10,182 7,898
The number of ordinary shares on issue for the last two years at 30 September was as follows:_
2008 2007No. ’000 No. ’000
Ordinary shares, fully paidBalance at beginning of year 1,621,066 1,609,898 Shares issued
Dividend reinvestment plan (1) 60,395 - Bonus share plan 2,590 2,634 Debt conversion to equity 25,450 - Employee share plans 7,179 1,339 Executive share option plan no. 2 899 2,194 Exchangeable capital units converted - 34,199
Paying up of partly paid shares 48 117 Share buy back - (29,315)
1,717,627 1,621,066
Ordinary shares, partly paid to 25 centsBalance at beginning of year 273 390 Paying up of partly paid shares (48) (117)
225 273
Total number of ordinary shares on issue at end of year (including treasury shares) 1,717,852 1,621,339
Deduct: Treasury shares (43,108) (27,463) Total number of ordinary shares on issue at end of year (excluding treasury shares) 1,674,744 1,593,876 (1) During the 2007 year, dividend reinvestment plan shares were purchased on market for delivery to shareholders resulting in no issue of new shares.
Group Company
Company
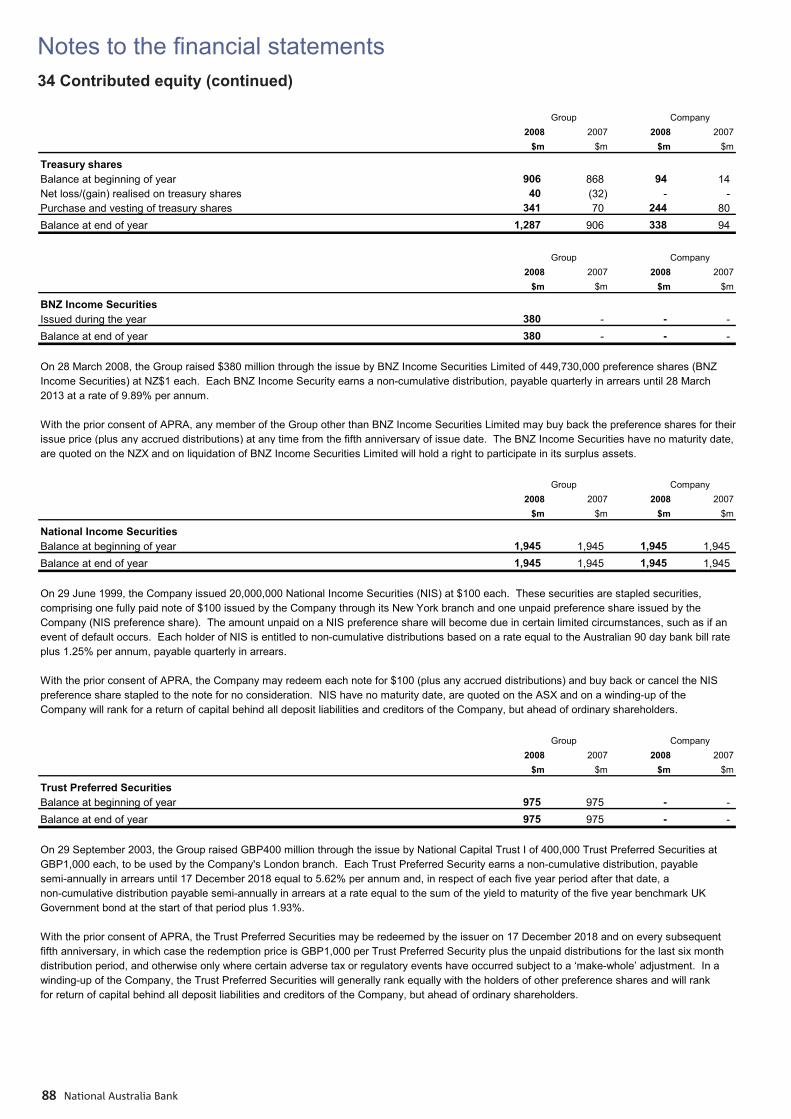
Notes to the fi nancial statements
National Australia Bank88
34 Contributed equity (continued)
2008 2007 2008 2007$m $m $m $m
Treasury sharesBalance at beginning of year 906 868 94 14 Net loss/(gain) realised on treasury shares 40 (32) - - Purchase and vesting of treasury shares 341 70 244 80 Balance at end of year 1,287 906 338 94
_
2008 2007 2008 2007$m $m $m $m
BNZ Income SecuritiesIssued during the year 380 - - - Balance at end of year 380 - - -
On 28 March 2008, the Group raised $380 million through the issue by BNZ Income Securities Limited of 449,730,000 preference shares (BNZIncome Securities) at NZ$1 each. Each BNZ Income Security earns a non-cumulative distribution, payable quarterly in arrears until 28 March 2013 at a rate of 9.89% per annum.
With the prior consent of APRA, any member of the Group other than BNZ Income Securities Limited may buy back the preference shares for theirissue price (plus any accrued distributions) at any time from the fifth anniversary of issue date. The BNZ Income Securities have no maturity date,are quoted on the NZX and on liquidation of BNZ Income Securities Limited will hold a right to participate in its surplus assets.
_
2008 2007 2008 2007$m $m $m $m
National Income SecuritiesBalance at beginning of year 1,945 1,945 1,945 1,945 Balance at end of year 1,945 1,945 1,945 1,945
On 29 June 1999, the Company issued 20,000,000 National Income Securities (NIS) at $100 each. These securities are stapled securities,comprising one fully paid note of $100 issued by the Company through its New York branch and one unpaid preference share issued by theCompany (NIS preference share). The amount unpaid on a NIS preference share will become due in certain limited circumstances, such as if anevent of default occurs. Each holder of NIS is entitled to non-cumulative distributions based on a rate equal to the Australian 90 day bank bill rateplus 1.25% per annum, payable quarterly in arrears.
With the prior consent of APRA, the Company may redeem each note for $100 (plus any accrued distributions) and buy back or cancel the NISpreference share stapled to the note for no consideration. NIS have no maturity date, are quoted on the ASX and on a winding-up of theCompany will rank for a return of capital behind all deposit liabilities and creditors of the Company, but ahead of ordinary shareholders.
_
2008 2007 2008 2007$m $m $m $m
Trust Preferred SecuritiesBalance at beginning of year 975 975 - - Balance at end of year 975 975 - -
On 29 September 2003, the Group raised GBP400 million through the issue by National Capital Trust I of 400,000 Trust Preferred Securities atGBP1,000 each, to be used by the Company's London branch. Each Trust Preferred Security earns a non-cumulative distribution, payablesemi-annually in arrears until 17 December 2018 equal to 5.62% per annum and, in respect of each five year period after that date, anon-cumulative distribution payable semi-annually in arrears at a rate equal to the sum of the yield to maturity of the five year benchmark UKGovernment bond at the start of that period plus 1.93%.
With the prior consent of APRA, the Trust Preferred Securities may be redeemed by the issuer on 17 December 2018 and on every subsequentfifth anniversary, in which case the redemption price is GBP1,000 per Trust Preferred Security plus the unpaid distributions for the last six monthdistribution period, and otherwise only where certain adverse tax or regulatory events have occurred subject to a ‘make-whole’ adjustment. In awinding-up of the Company, the Trust Preferred Securities will generally rank equally with the holders of other preference shares and will rankfor return of capital behind all deposit liabilities and creditors of the Company, but ahead of ordinary shareholders.
Group Company
Group Company
Group Company
Group Company
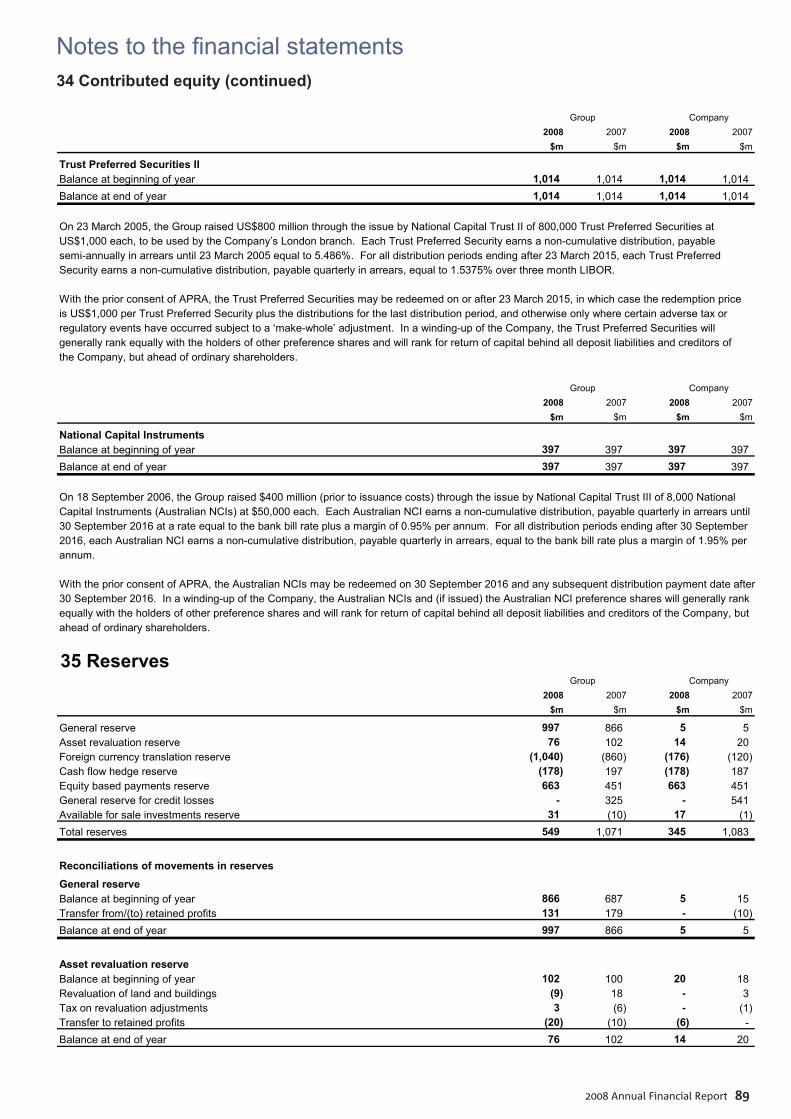
Notes to the fi nancial statements
2008 Annual Financial Report 89
34 Contributed equity (continued)
2008 2007 2008 2007$m $m $m $m
Trust Preferred Securities IIBalance at beginning of year 1,014 1,014 1,014 1,014 Balance at end of year 1,014 1,014 1,014 1,014
On 23 March 2005, the Group raised US$800 million through the issue by National Capital Trust II of 800,000 Trust Preferred Securities atUS$1,000 each, to be used by the Company’s London branch. Each Trust Preferred Security earns a non-cumulative distribution, payablesemi-annually in arrears until 23 March 2005 equal to 5.486%. For all distribution periods ending after 23 March 2015, each Trust PreferredSecurity earns a non-cumulative distribution, payable quarterly in arrears, equal to 1.5375% over three month LIBOR.
With the prior consent of APRA, the Trust Preferred Securities may be redeemed on or after 23 March 2015, in which case the redemption priceis US$1,000 per Trust Preferred Security plus the distributions for the last distribution period, and otherwise only where certain adverse tax orregulatory events have occurred subject to a ‘make-whole’ adjustment. In a winding-up of the Company, the Trust Preferred Securities willgenerally rank equally with the holders of other preference shares and will rank for return of capital behind all deposit liabilities and creditors ofthe Company, but ahead of ordinary shareholders.
_
2008 2007 2008 2007$m $m $m $m
National Capital InstrumentsBalance at beginning of year 397 397 397 397 Balance at end of year 397 397 397 397
On 18 September 2006, the Group raised $400 million (prior to issuance costs) through the issue by National Capital Trust III of 8,000 NationalCapital Instruments (Australian NCIs) at $50,000 each. Each Australian NCI earns a non-cumulative distribution, payable quarterly in arrears until30 September 2016 at a rate equal to the bank bill rate plus a margin of 0.95% per annum. For all distribution periods ending after 30 September 2016, each Australian NCI earns a non-cumulative distribution, payable quarterly in arrears, equal to the bank bill rate plus a margin of 1.95% perannum.
With the prior consent of APRA, the Australian NCIs may be redeemed on 30 September 2016 and any subsequent distribution payment date after30 September 2016. In a winding-up of the Company, the Australian NCIs and (if issued) the Australian NCI preference shares will generally rankequally with the holders of other preference shares and will rank for return of capital behind all deposit liabilities and creditors of the Company, butahead of ordinary shareholders.
Company
Group Company
Group
35 Reserves2008 2007 2008 2007
$m $m $m $m
General reserve 997 866 5 5 Asset revaluation reserve 76 102 14 20 Foreign currency translation reserve (1,040) (860) (176) (120) Cash flow hedge reserve (178) 197 (178) 187 Equity based payments reserve 663 451 663 451 General reserve for credit losses - 325 - 541 Available for sale investments reserve 31 (10) 17 (1) Total reserves 549 1,071 345 1,083
Reconciliations of movements in reservesGeneral reserveBalance at beginning of year 866 687 5 15 Transfer from/(to) retained profits 131 179 - (10) Balance at end of year 997 866 5 5
Asset revaluation reserveBalance at beginning of year 102 100 20 18 Revaluation of land and buildings (9) 18 - 3 Tax on revaluation adjustments 3 (6) - (1) Transfer to retained profits (20) (10) (6) - Balance at end of year 76 102 14 20
Group Company
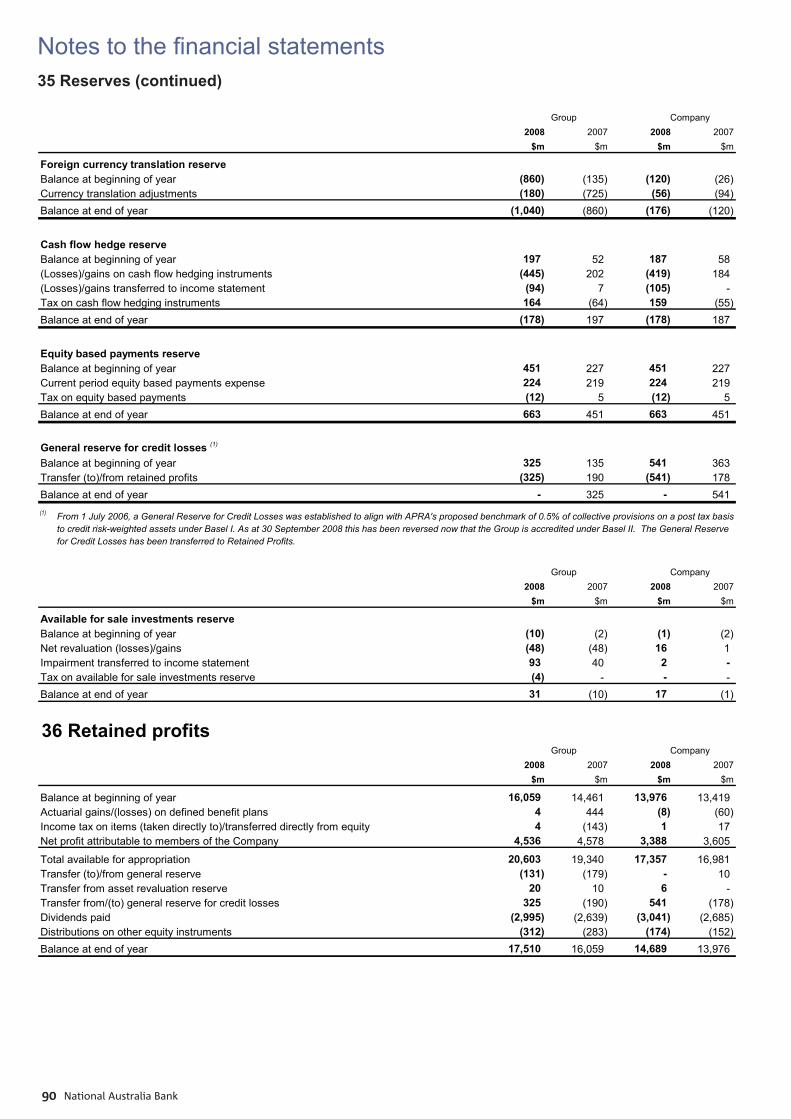
Notes to the fi nancial statements
National Australia Bank90
35 Reserves (continued)
36 Retained profits_
2008 2007 2008 2007$m $m $m $m
Balance at beginning of year 16,059 14,461 13,976 13,419 Actuarial gains/(losses) on defined benefit plans 4 444 (8) (60) Income tax on items (taken directly to)/transferred directly from equity 4 (143) 1 17 Net profit attributable to members of the Company 4,536 4,578 3,388 3,605
Total available for appropriation 20,603 19,340 17,357 16,981 Transfer (to)/from general reserve (131) (179) - 10 Transfer from asset revaluation reserve 20 10 6 - Transfer from/(to) general reserve for credit losses 325 (190) 541 (178) Dividends paid (2,995) (2,639) (3,041) (2,685) Distributions on other equity instruments (312) (283) (174) (152) Balance at end of year 17,510 16,059 14,689 13,976
Group Company
2008 2007 2008 2007$m $m $m $m
Foreign currency translation reserveBalance at beginning of year (860) (135) (120) (26) Currency translation adjustments (180) (725) (56) (94) Balance at end of year (1,040) (860) (176) (120)
Cash flow hedge reserveBalance at beginning of year 197 52 187 58 (Losses)/gains on cash flow hedging instruments (445) 202 (419) 184 (Losses)/gains transferred to income statement (94) 7 (105) - Tax on cash flow hedging instruments 164 (64) 159 (55) Balance at end of year (178) 197 (178) 187
Equity based payments reserveBalance at beginning of year 451 227 451 227 Current period equity based payments expense 224 219 224 219 Tax on equity based payments (12) 5 (12) 5 Balance at end of year 663 451 663 451
General reserve for credit losses (1)
Balance at beginning of year 325 135 541 363 Transfer (to)/from retained profits (325) 190 (541) 178 Balance at end of year - 325 - 541 (1) From 1 July 2006, a General Reserve for Credit Losses was established to align with APRA's proposed benchmark of 0.5% of collective provisions on a post tax basis
to credit risk-weighted assets under Basel I. As at 30 September 2008 this has been reversed now that the Group is accredited under Basel II. The General Reserve for Credit Losses has been transferred to Retained Profits.
2008 2007 2008 2007$m $m $m $m
Available for sale investments reserveBalance at beginning of year (10) (2) (1) (2) Net revaluation (losses)/gains (48) (48) 16 1 Impairment transferred to income statement 93 40 2 - Tax on available for sale investments reserve (4) - - - Balance at end of year 31 (10) 17 (1)
Group Company
Group Company
Notes to the fi nancial statements
2008 Annual Financial Report 91
37 Shares, performance options and performance rightsThe Group’s employee equity plans provide Company shares to employees of the Group, and to non-executive directors of the Company, andperformance options and performance rights to senior employees of the Group. Each plan allows employees of the Group to be invited toparticipate in the offers under the relevant plan. Employee equity plans may be specific to employees in a particular region under the terms ofthe plan (e.g. NZ staff share allocation plan). The Board determines the maximum number of shares, performance options or performance rights offered, and where required, the formula tobe used in calculating the price per share. Each plan provides that the total number of shares issued in the last five years under the Company’semployee share, performance option or performance right plans and the total number of outstanding performance options and performancerights granted under its plans, including any proposed offer, must not exceed 5% of the number of shares in the issued share capital of theCompany at the time of the proposed offer. The calculation does not include offers or grants made of shares, performance options orperformance rights acquired as a result of an offer made to a person situated outside Australia at the time of the offer or offers which did notrequire disclosure under section 708 of the Corporations Act 2001 (Cth), otherwise than as a result of relief granted by ASIC. Under ASX ListingRules, shares, performance options and performance rights may not be issued to Company directors under an employee incentive schemewithout specific shareholder approval.
Equity-based programs for employees
Equity-based programs offered to employees form part of the Group’s remuneration strategy in rewarding current and future contribution tothe Group’s performance and strengthening the link between value created for shareholders and rewards for employees. Generally, underthe terms of each offer there is a minimum holding period and under some offers employees may be able to nominate a longer holding period. During this period, the shares are held in trust and cannot be dealt with by the employee. There may be forfeiture conditions particular toequity-based programs as described below.
Salary sacrifice shares are allocated to United Kingdom and Australian employees when they nominate to contribute aportion of their gross salary to receive Company shares. Shares are allocated monthly under the UK program, and quarterly under theAustralian program. The Australian program provides an effective discount of 5% on the share purchase price, up to a maximum amount of$1,500 p.a. These shares are subject to forfeiture on serious misconduct involving dishonesty.
Short-term incentives (STI) may be provided under the Up-to-Target, Above-Target or Exceptional Behaviour program to employeesfor their individual and business performance as applicable. Australian employees may be provided their Up-to-Target STI component in theform of shares, cash or superannuation, depending on employee preference. Employees are generally required to take any Above-Target STI inCompany shares for awards in excess of $500 (different limits may apply in countries outside Australia). In addition, shares are offered toemployees in the Australian Region who demonstrate exceptional behaviour. Up-to-Target shares are forfeited during the holding period if theemployee is terminated for serious misconduct involving dishonesty. Above-Target shares are forfeited during the first year and ExceptionalBehaviour shares during the first three years after allocation if the employee resigns or fails to pass both quality gates (behaviour andcompliance) in respect of their performance review at the end of the following financial year or is terminated for serious misconduct. For furtherdetails on STI awards granted to the executive directors of the Company, refer to the Remuneration report.
Enterprise Agreement shares are provided to designated groups of Australian employees in accordance with the provisionsof the 2006 – 2009 NAB Enterprise Agreement. Eligible employees are offered a portion of the value of their Total Employment Compensation in the form of shares up to a maximum amount per employee, as set out under the Agreement. The terms of the offer include forfeiture uponresignation or summary termination before specified key dates.
Commencement and recognition and retention shares respectively enable the buy-out of equity from previous employment,based on evidentiary information, for significant new hires or provide retention awards for key individuals in roles where retention is critical over amedium-term timeframe. The shares may be subject to individual and business performance hurdles including behaviour and compliance qualitygates, regional ROE and cash earnings, and internal qualitative measures. The shares are subject to forfeiture, or staggered forfeiture, if theparticipant resigns or retires before specified key dates or key milestones are achieved, or if the individual engages in a breach of the Company’sCode of Conduct (or other applicable standards set from time to time) or in the event of misconduct.
General employee shares up to a value of $1,000 of Company shares are offered to each eligible employee when the Group’sperformance is on target, measured against a scorecard of objectives for the financial year. These shares are held in trust restricted fromdealing for three years and in Australia are not subject to forfeiture. In NZ, the shares are effectively forfeited if the employee voluntarily ceasesemployment with the Group before the end of three years and in the UK these shares are forfeited if an employee is summarily dismissed priorto the end of three years.
Long-term incentive shares have attached performance hurdles designed to align any rewards for employees to the outcomes of the Group over a long-term timeframe and are subject to forfeiture if performance hurdles are not met. The shares are also forfeited if employmentceases in some circumstances or if the employee fails to pass performance quality gates during the restriction period. Long-term shares includeAmerican depositary receipts (ADRs) or shares allocated to US employees in lieu of performance rights. Other long-term incentive shares willbe allocated to key individuals of the Group with reference to future performance hurdles subject to Board approval.
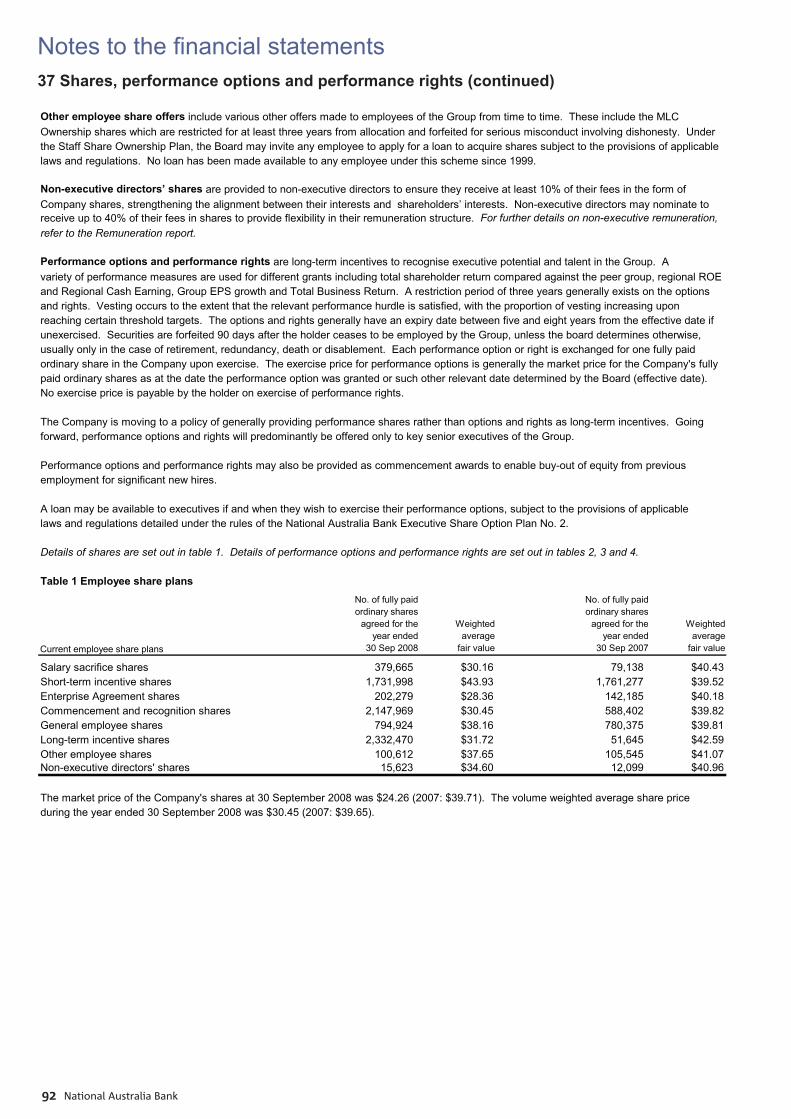
Notes to the fi nancial statements
National Australia Bank92
37 Shares, performance options and performance rights (continued)
Other employee share offers include various other offers made to employees of the Group from time to time. These include the MLC Ownership shares which are restricted for at least three years from allocation and forfeited for serious misconduct involving dishonesty. Underthe Staff Share Ownership Plan, the Board may invite any employee to apply for a loan to acquire shares subject to the provisions of applicablelaws and regulations. No loan has been made available to any employee under this scheme since 1999.
Non-executive directors’ shares are provided to non-executive directors to ensure they receive at least 10% of their fees in the form of Company shares, strengthening the alignment between their interests and shareholders’ interests. Non-executive directors may nominate toreceive up to 40% of their fees in shares to provide flexibility in their remuneration structure. For further details on non-executive remuneration,refer to the Remuneration report.
Performance options and performance rights are long-term incentives to recognise executive potential and talent in the Group. Avariety of performance measures are used for different grants including total shareholder return compared against the peer group, regional ROEand Regional Cash Earning, Group EPS growth and Total Business Return. A restriction period of three years generally exists on the optionsand rights. Vesting occurs to the extent that the relevant performance hurdle is satisfied, with the proportion of vesting increasing uponreaching certain threshold targets. The options and rights generally have an expiry date between five and eight years from the effective date ifunexercised. Securities are forfeited 90 days after the holder ceases to be employed by the Group, unless the board determines otherwise,usually only in the case of retirement, redundancy, death or disablement. Each performance option or right is exchanged for one fully paidordinary share in the Company upon exercise. The exercise price for performance options is generally the market price for the Company's fullypaid ordinary shares as at the date the performance option was granted or such other relevant date determined by the Board (effective date). No exercise price is payable by the holder on exercise of performance rights.
The Company is moving to a policy of generally providing performance shares rather than options and rights as long-term incentives. Goingforward, performance options and rights will predominantly be offered only to key senior executives of the Group.
Performance options and performance rights may also be provided as commencement awards to enable buy-out of equity from previousemployment for significant new hires.
A loan may be available to executives if and when they wish to exercise their performance options, subject to the provisions of applicablelaws and regulations detailed under the rules of the National Australia Bank Executive Share Option Plan No. 2.
Details of shares are set out in table 1. Details of performance options and performance rights are set out in tables 2, 3 and 4.
Table 1 Employee share plans_
Current employee share plans
No. of fully paidordinary shares
agreed for theyear ended
30 Sep 2008
Weighted average
fair value
No. of fully paidordinary shares
agreed for theyear ended
30 Sep 2007
Weighted average
fair value
Salary sacrifice shares 379,665 $30.16 79,138 $40.43Short-term incentive shares 1,731,998 $43.93 1,761,277 $39.52Enterprise Agreement shares 202,279 $28.36 142,185 $40.18Commencement and recognition shares 2,147,969 $30.45 588,402 $39.82General employee shares 794,924 $38.16 780,375 $39.81Long-term incentive shares 2,332,470 $31.72 51,645 $42.59Other employee shares 100,612 $37.65 105,545 $41.07Non-executive directors' shares 15,623 $34.60 12,099 $40.96
The market price of the Company's shares at 30 September 2008 was $24.26 (2007: $39.71). The volume weighted average share priceduring the year ended 30 September 2008 was $30.45 (2007: $39.65).
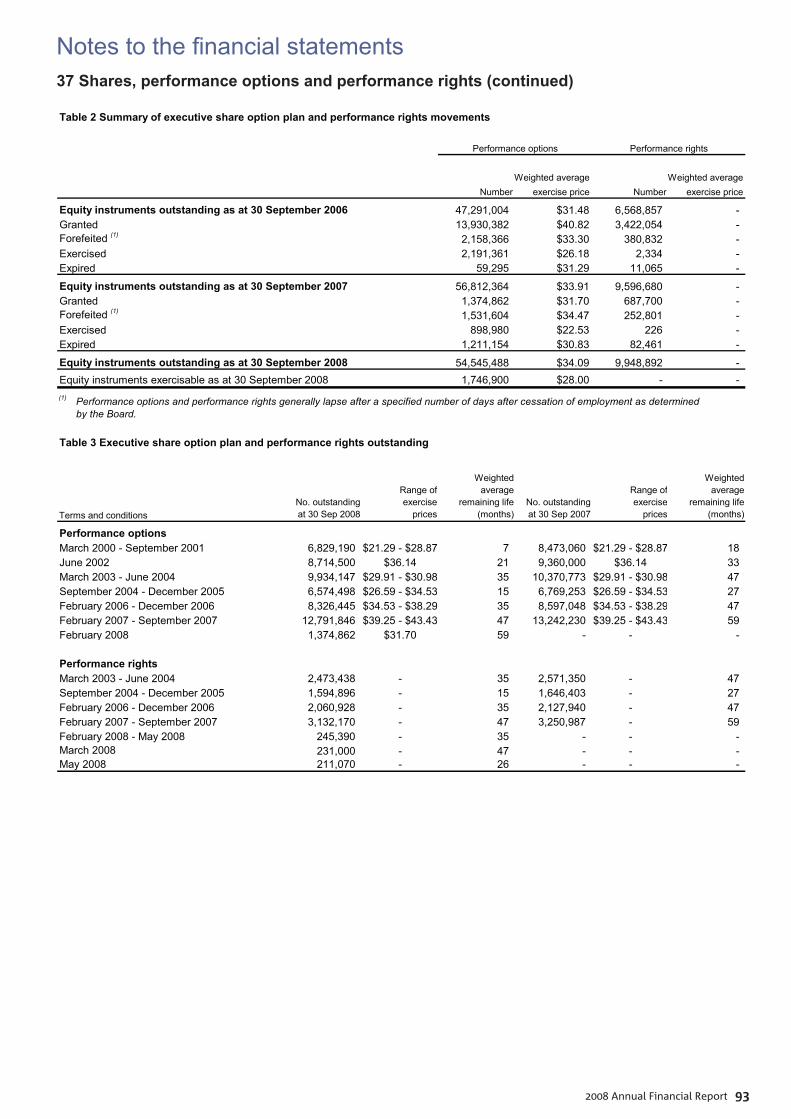
Notes to the fi nancial statements
2008 Annual Financial Report 93
37 Shares, performance options and performance rights (continued)
Table 2 Summary of executive share option plan and performance rights movements_
Performance options Performance rights
Weighted average Weighted averageNumber exercise price Number exercise price
Equity instruments outstanding as at 30 September 2006 47,291,004 $31.48 6,568,857 - Granted 13,930,382 $40.82 3,422,054 - Forefeited (1) 2,158,366 $33.30 380,832 - Exercised 2,191,361 $26.18 2,334 - Expired 59,295 $31.29 11,065 -
Equity instruments outstanding as at 30 September 2007 56,812,364 $33.91 9,596,680 - Granted 1,374,862 $31.70 687,700 - Forefeited (1) 1,531,604 $34.47 252,801 - Exercised 898,980 $22.53 226 - Expired 1,211,154 $30.83 82,461 -
Equity instruments outstanding as at 30 September 2008 54,545,488 $34.09 9,948,892 - Equity instruments exercisable as at 30 September 2008 1,746,900 $28.00 - - (1) Performance options and performance rights generally lapse after a specified number of days after cessation of employment as determined
by the Board.
Table 3 Executive share option plan and performance rights outstanding_
Terms and conditionsNo. outstandingat 30 Sep 2008
Range ofexercise
prices
Weightedaverage
remaining life(months)
No. outstandingat 30 Sep 2007
Range ofexercise
prices
Weightedaverage
remaining life(months)
Performance optionsMarch 2000 - September 2001 6,829,190 $21.29 - $28.87 7 8,473,060 $21.29 - $28.87 18 June 2002 8,714,500 $36.14 21 9,360,000 $36.14 33 March 2003 - June 2004 9,934,147 $29.91 - $30.98 35 10,370,773 $29.91 - $30.98 47 September 2004 - December 2005 6,574,498 $26.59 - $34.53 15 6,769,253 $26.59 - $34.53 27 February 2006 - December 2006 8,326,445 $34.53 - $38.29 35 8,597,048 $34.53 - $38.29 47 February 2007 - September 2007 12,791,846 $39.25 - $43.43 47 13,242,230 $39.25 - $43.43 59 February 2008 1,374,862 $31.70 59 - - -
Performance rightsMarch 2003 - June 2004 2,473,438 - 35 2,571,350 - 47 September 2004 - December 2005 1,594,896 - 15 1,646,403 - 27 February 2006 - December 2006 2,060,928 - 35 2,127,940 - 47 February 2007 - September 2007 3,132,170 - 47 3,250,987 - 59 February 2008 - May 2008 245,390 - 35 - - - March 2008 231,000 - 47 - - - May 2008 211,070 - 26 - - -
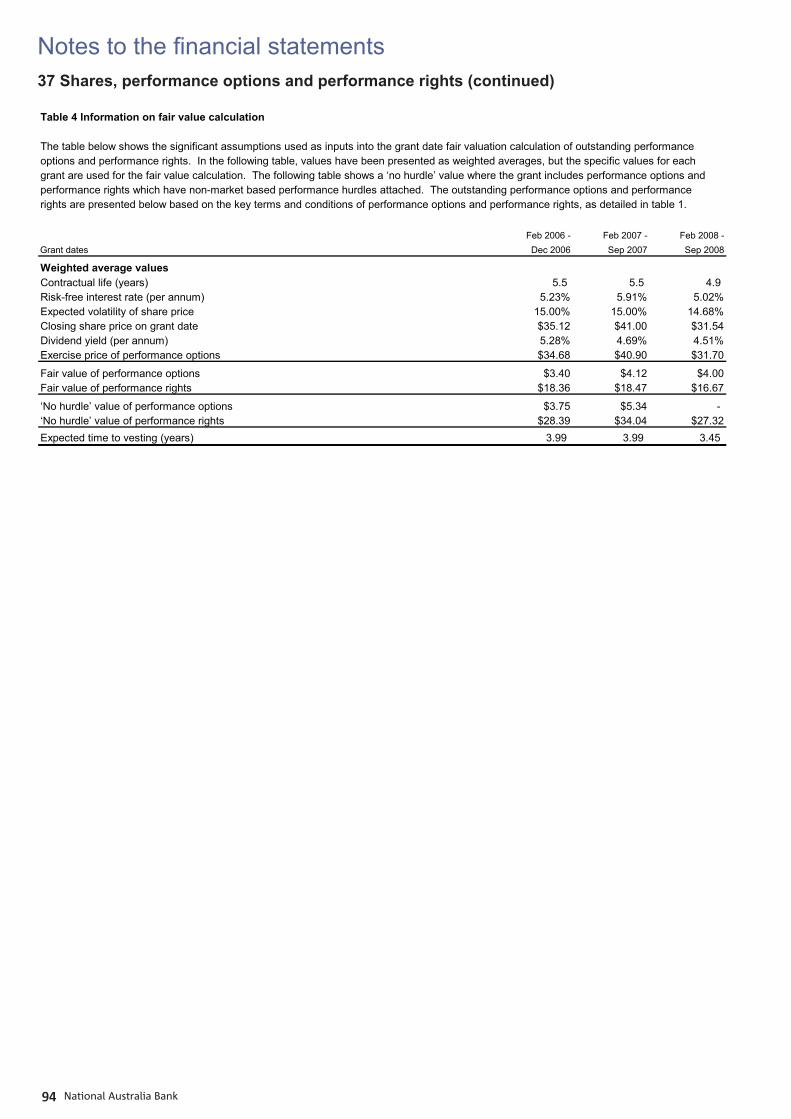
Notes to the fi nancial statements
National Australia Bank94
37 Shares, performance options and performance rights (continued)
Table 4 Information on fair value calculation
The table below shows the significant assumptions used as inputs into the grant date fair valuation calculation of outstanding performanceoptions and performance rights. In the following table, values have been presented as weighted averages, but the specific values for eachgrant are used for the fair value calculation. The following table shows a ‘no hurdle’ value where the grant includes performance options andperformance rights which have non-market based performance hurdles attached. The outstanding performance options and performancerights are presented below based on the key terms and conditions of performance options and performance rights, as detailed in table 1.
_Feb 2006 - Feb 2007 - Feb 2008 -
Grant dates Dec 2006 Sep 2007 Sep 2008
Weighted average valuesContractual life (years) 5.5 5.5 4.9Risk-free interest rate (per annum) 5.23% 5.91% 5.02%Expected volatility of share price 15.00% 15.00% 14.68%Closing share price on grant date $35.12 $41.00 $31.54Dividend yield (per annum) 5.28% 4.69% 4.51%Exercise price of performance options $34.68 $40.90 $31.70
Fair value of performance options $3.40 $4.12 $4.00Fair value of performance rights $18.36 $18.47 $16.67
‘No hurdle’ value of performance options $3.75 $5.34 -‘No hurdle’ value of performance rights $28.39 $34.04 $27.32Expected time to vesting (years) 3.99 3.99 3.45
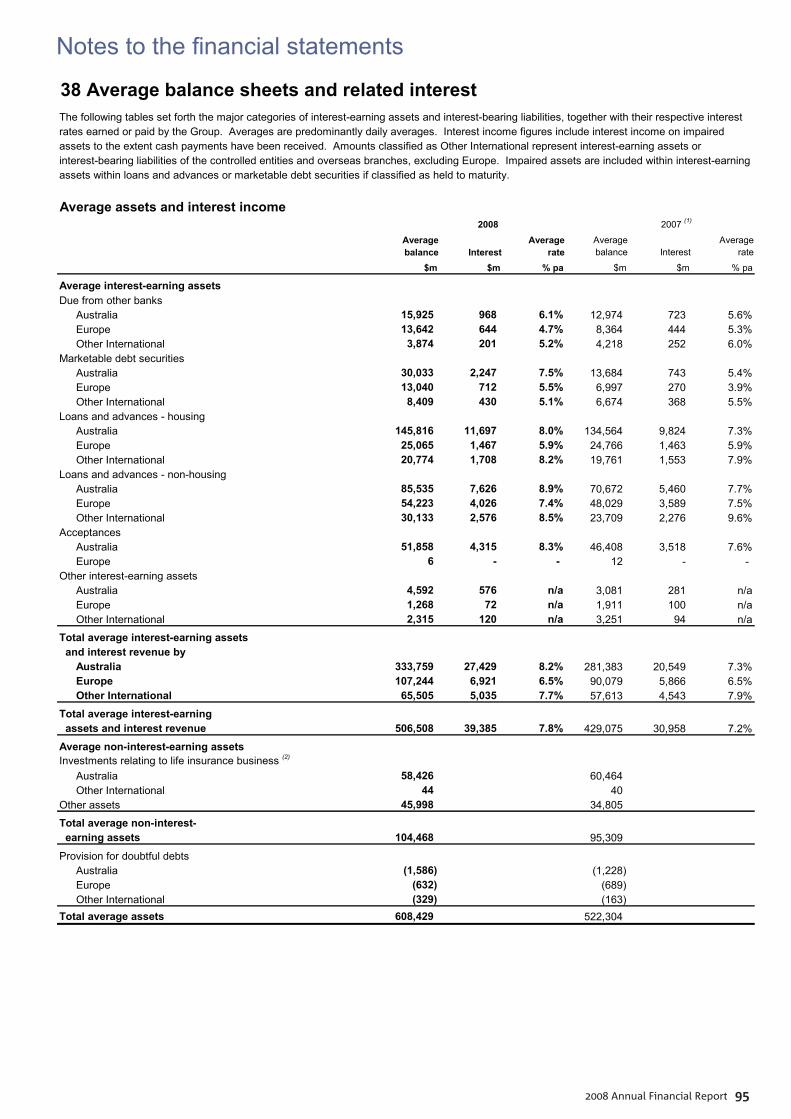
Notes to the fi nancial statements
2008 Annual Financial Report 95
38 Average balance sheets and related interestThe following tables set forth the major categories of interest-earning assets and interest-bearing liabilities, together with their respective interestrates earned or paid by the Group. Averages are predominantly daily averages. Interest income figures include interest income on impairedassets to the extent cash payments have been received. Amounts classified as Other International represent interest-earning assets orinterest-bearing liabilities of the controlled entities and overseas branches, excluding Europe. Impaired assets are included within interest-earningassets within loans and advances or marketable debt securities if classified as held to maturity.
Average assets and interest income
Average balance Interest
Averagerate
Average balance Interest
Averagerate
$m $m % pa $m $m % pa
Average interest-earning assetsDue from other banks
Australia 15,925 968 6.1% 12,974 723 5.6%Europe 13,642 644 4.7% 8,364 444 5.3%Other International 3,874 201 5.2% 4,218 252 6.0%
Marketable debt securities Australia 30,033 2,247 7.5% 13,684 743 5.4%Europe 13,040 712 5.5% 6,997 270 3.9%Other International 8,409 430 5.1% 6,674 368 5.5%
Loans and advances - housingAustralia 145,816 11,697 8.0% 134,564 9,824 7.3%Europe 25,065 1,467 5.9% 24,766 1,463 5.9%Other International 20,774 1,708 8.2% 19,761 1,553 7.9%
Loans and advances - non-housingAustralia 85,535 7,626 8.9% 70,672 5,460 7.7%Europe 54,223 4,026 7.4% 48,029 3,589 7.5%Other International 30,133 2,576 8.5% 23,709 2,276 9.6%
AcceptancesAustralia 51,858 4,315 8.3% 46,408 3,518 7.6%Europe 6 - - 12 - -
Other interest-earning assetsAustralia 4,592 576 n/a 3,081 281 n/aEurope 1,268 72 n/a 1,911 100 n/aOther International 2,315 120 n/a 3,251 94 n/a
Total average interest-earning assets and interest revenue by
Australia 333,759 27,429 8.2% 281,383 20,549 7.3%Europe 107,244 6,921 6.5% 90,079 5,866 6.5%Other International 65,505 5,035 7.7% 57,613 4,543 7.9%
Total average interest-earning assets and interest revenue 506,508 39,385 7.8% 429,075 30,958 7.2%
Average non-interest-earning assetsInvestments relating to life insurance business (2)
Australia 58,426 60,464 Other International 44 40
Other assets 45,998 34,805
Total average non-interest- earning assets 104,468 95,309
Provision for doubtful debtsAustralia (1,586) (1,228) Europe (632) (689) Other International (329) (163)
Total average assets 608,429 522,304
2008 2007 (1)
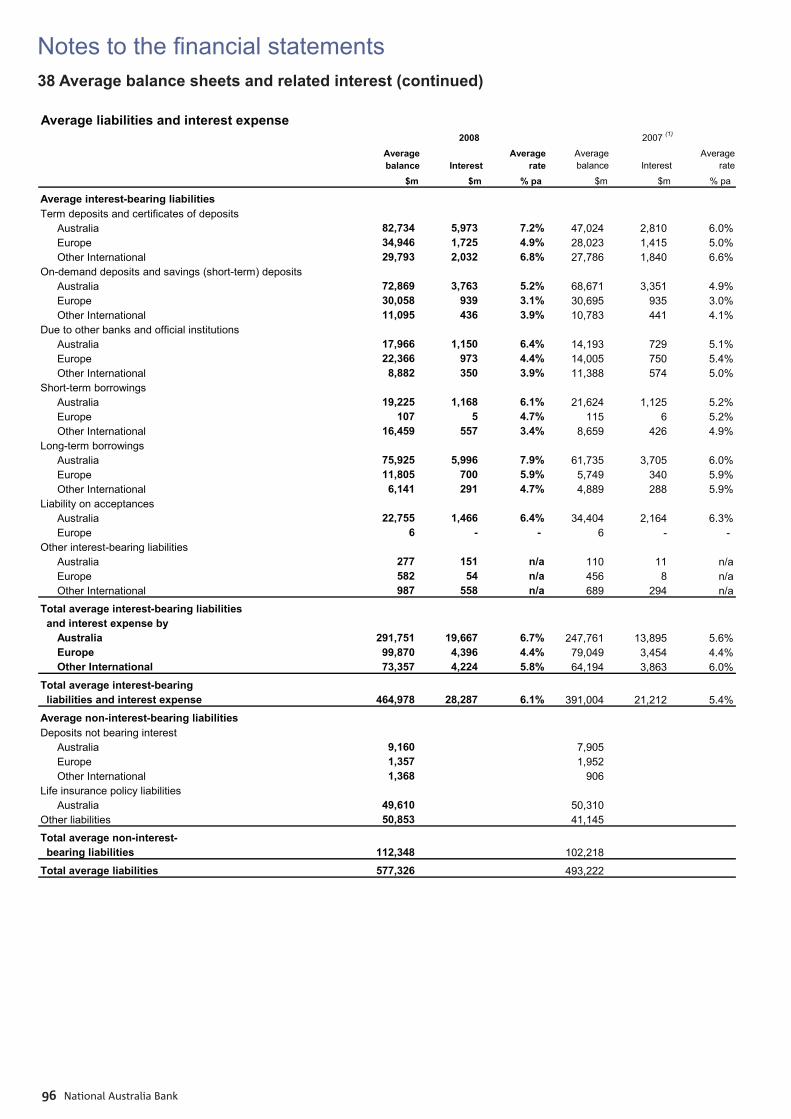
Notes to the fi nancial statements
National Australia Bank96
38 Average balance sheets and related interest (continued)
Average liabilities and interest expense
Average balance Interest
Averagerate
Average balance Interest
Averagerate
$m $m % pa $m $m % pa
Average interest-bearing liabilitiesTerm deposits and certificates of deposits
Australia 82,734 5,973 7.2% 47,024 2,810 6.0%Europe 34,946 1,725 4.9% 28,023 1,415 5.0%Other International 29,793 2,032 6.8% 27,786 1,840 6.6%
On-demand deposits and savings (short-term) depositsAustralia 72,869 3,763 5.2% 68,671 3,351 4.9%Europe 30,058 939 3.1% 30,695 935 3.0%Other International 11,095 436 3.9% 10,783 441 4.1%
Due to other banks and official institutionsAustralia 17,966 1,150 6.4% 14,193 729 5.1%Europe 22,366 973 4.4% 14,005 750 5.4%Other International 8,882 350 3.9% 11,388 574 5.0%
Short-term borrowings Australia 19,225 1,168 6.1% 21,624 1,125 5.2%Europe 107 5 4.7% 115 6 5.2%Other International 16,459 557 3.4% 8,659 426 4.9%
Long-term borrowingsAustralia 75,925 5,996 7.9% 61,735 3,705 6.0%Europe 11,805 700 5.9% 5,749 340 5.9%Other International 6,141 291 4.7% 4,889 288 5.9%
Liability on acceptancesAustralia 22,755 1,466 6.4% 34,404 2,164 6.3%Europe 6 - - 6 - -
Other interest-bearing liabilities Australia 277 151 n/a 110 11 n/aEurope 582 54 n/a 456 8 n/aOther International 987 558 n/a 689 294 n/a
Total average interest-bearing liabilities and interest expense by
Australia 291,751 19,667 6.7% 247,761 13,895 5.6%Europe 99,870 4,396 4.4% 79,049 3,454 4.4%Other International 73,357 4,224 5.8% 64,194 3,863 6.0%
Total average interest-bearing liabilities and interest expense 464,978 28,287 6.1% 391,004 21,212 5.4%
Average non-interest-bearing liabilitiesDeposits not bearing interest
Australia 9,160 7,905 Europe 1,357 1,952 Other International 1,368 906
Life insurance policy liabilitiesAustralia 49,610 50,310
Other liabilities 50,853 41,145
Total average non-interest- bearing liabilities 112,348 102,218
Total average liabilities 577,326 493,222
2008 2007 (1)
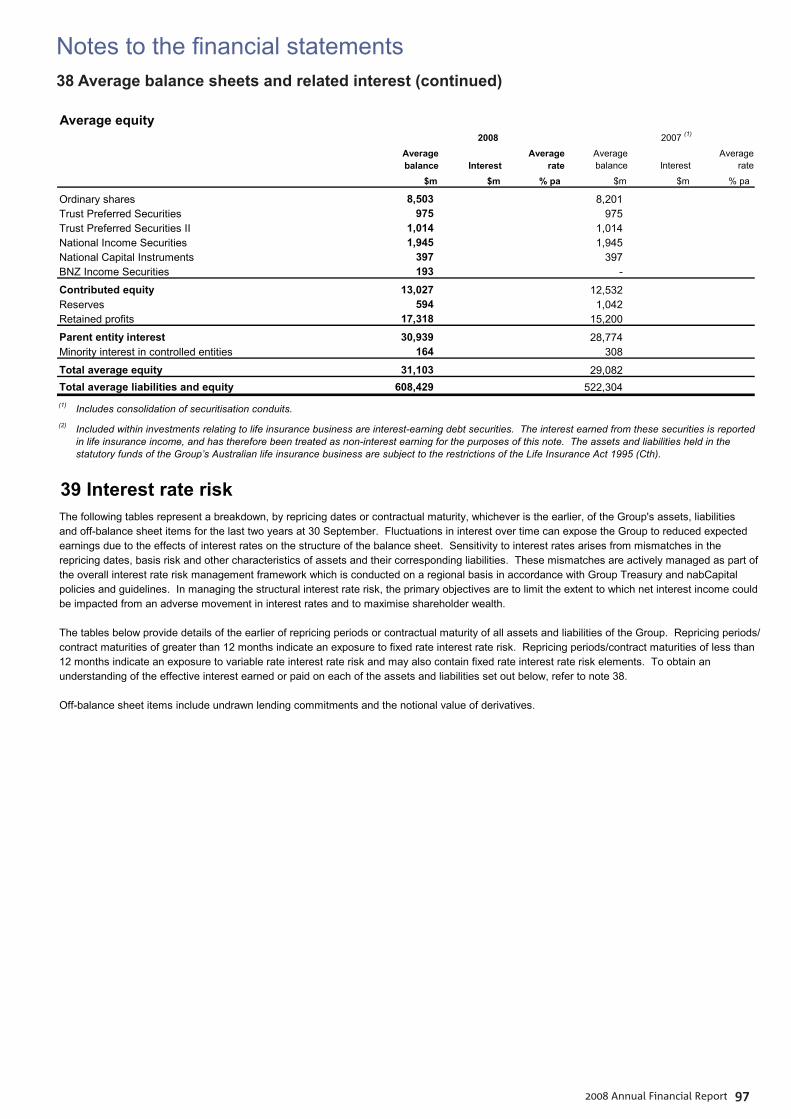
Notes to the fi nancial statements
2008 Annual Financial Report 97
38 Average balance sheets and related interest (continued)
Average equity
Average balance Interest
Averagerate
Average balance Interest
Averagerate
$m $m % pa $m $m % pa
Ordinary shares 8,503 8,201 Trust Preferred Securities 975 975 Trust Preferred Securities II 1,014 1,014 National Income Securities 1,945 1,945 National Capital Instruments 397 397 BNZ Income Securities 193 -
Contributed equity 13,027 12,532 Reserves 594 1,042 Retained profits 17,318 15,200
Parent entity interest 30,939 28,774 Minority interest in controlled entities 164 308
Total average equity 31,103 29,082 Total average liabilities and equity 608,429 522,304 (1) Includes consolidation of securitisation conduits.(2) Included within investments relating to life insurance business are interest-earning debt securities. The interest earned from these securities is reported
in life insurance income, and has therefore been treated as non-interest earning for the purposes of this note. The assets and liabilities held in thestatutory funds of the Group’s Australian life insurance business are subject to the restrictions of the Life Insurance Act 1995 (Cth).
2008 2007 (1)
39 Interest rate riskThe following tables represent a breakdown, by repricing dates or contractual maturity, whichever is the earlier, of the Group's assets, liabilities and off-balance sheet items for the last two years at 30 September. Fluctuations in interest over time can expose the Group to reduced expected earnings due to the effects of interest rates on the structure of the balance sheet. Sensitivity to interest rates arises from mismatches in the repricing dates, basis risk and other characteristics of assets and their corresponding liabilities. These mismatches are actively managed as part of the overall interest rate risk management framework which is conducted on a regional basis in accordance with Group Treasury and nabCapital policies and guidelines. In managing the structural interest rate risk, the primary objectives are to limit the extent to which net interest income couldbe impacted from an adverse movement in interest rates and to maximise shareholder wealth.
The tables below provide details of the earlier of repricing periods or contractual maturity of all assets and liabilities of the Group. Repricing periods/contract maturities of greater than 12 months indicate an exposure to fixed rate interest rate risk. Repricing periods/contract maturities of less than12 months indicate an exposure to variable rate interest rate risk and may also contain fixed rate interest rate risk elements. To obtain anunderstanding of the effective interest earned or paid on each of the assets and liabilities set out below, refer to note 38.
Off-balance sheet items include undrawn lending commitments and the notional value of derivatives.
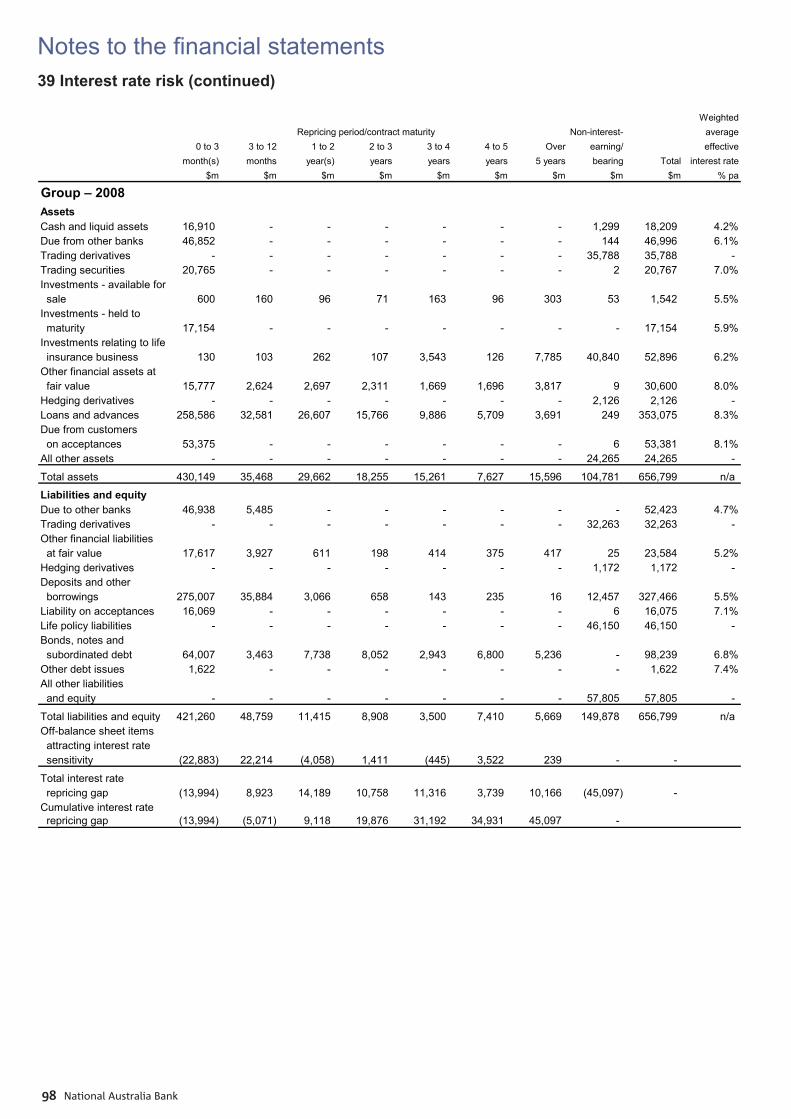
Notes to the fi nancial statements
National Australia Bank98
39 Interest rate risk (continued)
WeightedNon-interest- average
0 to 3 3 to 12 1 to 2 2 to 3 3 to 4 4 to 5 Over earning/ effectivemonth(s) months year(s) years years years 5 years bearing Total interest rate
$m $m $m $m $m $m $m $m $m % pa
Group – 2008AssetsCash and liquid assets 16,910 - - - - - - 1,299 18,209 4.2%Due from other banks 46,852 - - - - - - 144 46,996 6.1%Trading derivatives - - - - - - - 35,788 35,788 - Trading securities 20,765 - - - - - - 2 20,767 7.0%Investments - available for sale 600 160 96 71 163 96 303 53 1,542 5.5%Investments - held to maturity 17,154 - - - - - - - 17,154 5.9%Investments relating to life insurance business 130 103 262 107 3,543 126 7,785 40,840 52,896 6.2%Other financial assets at fair value 15,777 2,624 2,697 2,311 1,669 1,696 3,817 9 30,600 8.0%Hedging derivatives - - - - - - - 2,126 2,126 - Loans and advances 258,586 32,581 26,607 15,766 9,886 5,709 3,691 249 353,075 8.3%Due from customers on acceptances 53,375 - - - - - - 6 53,381 8.1%All other assets - - - - - - - 24,265 24,265 -
Total assets 430,149 35,468 29,662 18,255 15,261 7,627 15,596 104,781 656,799 n/a
Liabilities and equityDue to other banks 46,938 5,485 - - - - - - 52,423 4.7%Trading derivatives - - - - - - - 32,263 32,263 - Other financial liabilities at fair value 17,617 3,927 611 198 414 375 417 25 23,584 5.2%Hedging derivatives - - - - - - - 1,172 1,172 - Deposits and other borrowings 275,007 35,884 3,066 658 143 235 16 12,457 327,466 5.5%Liability on acceptances 16,069 - - - - - - 6 16,075 7.1%Life policy liabilities - - - - - - - 46,150 46,150 - Bonds, notes and subordinated debt 64,007 3,463 7,738 8,052 2,943 6,800 5,236 - 98,239 6.8%Other debt issues 1,622 - - - - - - - 1,622 7.4%All other liabilities and equity - - - - - - - 57,805 57,805 -
Total liabilities and equity 421,260 48,759 11,415 8,908 3,500 7,410 5,669 149,878 656,799 n/aOff-balance sheet items attracting interest rate sensitivity (22,883) 22,214 (4,058) 1,411 (445) 3,522 239 - -
Total interest rate repricing gap (13,994) 8,923 14,189 10,758 11,316 3,739 10,166 (45,097) - Cumulative interest rate repricing gap (13,994) (5,071) 9,118 19,876 31,192 34,931 45,097 -
Repricing period/contract maturity
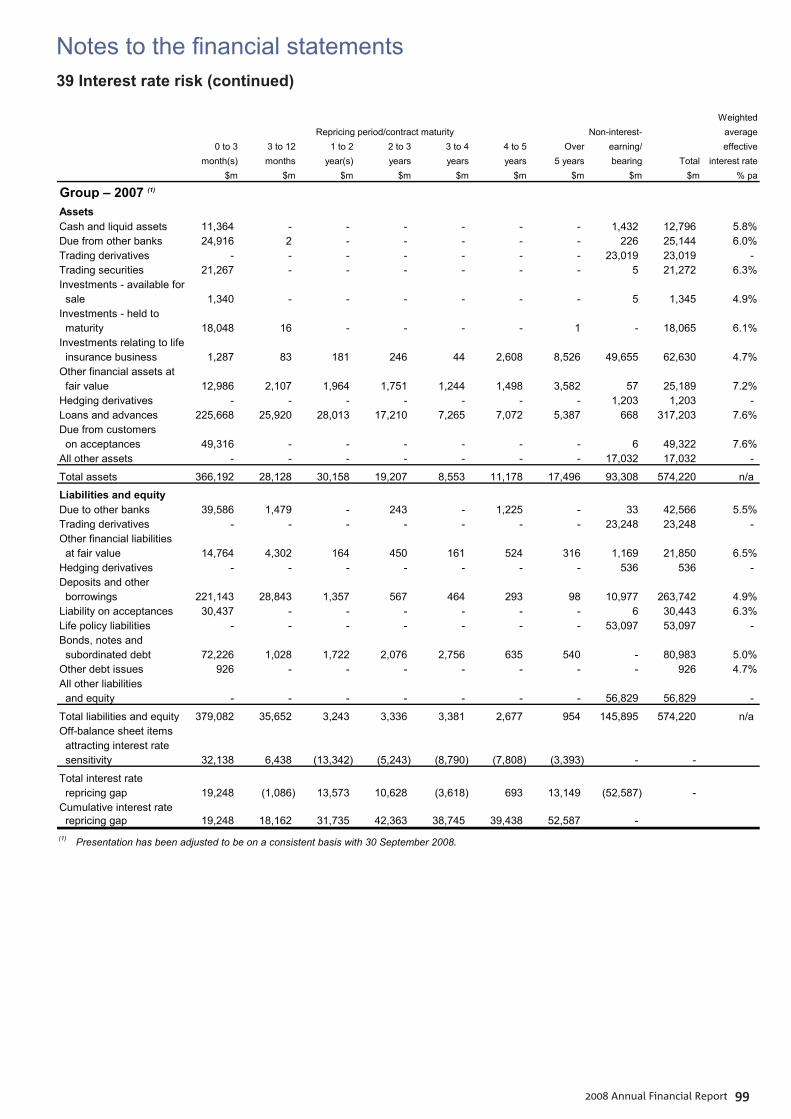
Notes to the fi nancial statements
2008 Annual Financial Report 99
39 Interest rate risk (continued)
WeightedNon-interest- average
0 to 3 3 to 12 1 to 2 2 to 3 3 to 4 4 to 5 Over earning/ effectivemonth(s) months year(s) years years years 5 years bearing Total interest rate
$m $m $m $m $m $m $m $m $m % pa
Group – 2007 (1)
AssetsCash and liquid assets 11,364 - - - - - - 1,432 12,796 5.8%Due from other banks 24,916 2 - - - - - 226 25,144 6.0%Trading derivatives - - - - - - - 23,019 23,019 - Trading securities 21,267 - - - - - - 5 21,272 6.3%Investments - available for sale 1,340 - - - - - - 5 1,345 4.9%Investments - held to maturity 18,048 16 - - - - 1 - 18,065 6.1%Investments relating to life insurance business 1,287 83 181 246 44 2,608 8,526 49,655 62,630 4.7%Other financial assets at fair value 12,986 2,107 1,964 1,751 1,244 1,498 3,582 57 25,189 7.2%Hedging derivatives - - - - - - - 1,203 1,203 - Loans and advances 225,668 25,920 28,013 17,210 7,265 7,072 5,387 668 317,203 7.6%Due from customers on acceptances 49,316 - - - - - - 6 49,322 7.6%All other assets - - - - - - - 17,032 17,032 -
Total assets 366,192 28,128 30,158 19,207 8,553 11,178 17,496 93,308 574,220 n/a
Liabilities and equityDue to other banks 39,586 1,479 - 243 - 1,225 - 33 42,566 5.5%Trading derivatives - - - - - - - 23,248 23,248 - Other financial liabilities at fair value 14,764 4,302 164 450 161 524 316 1,169 21,850 6.5%Hedging derivatives - - - - - - - 536 536 - Deposits and other borrowings 221,143 28,843 1,357 567 464 293 98 10,977 263,742 4.9%Liability on acceptances 30,437 - - - - - - 6 30,443 6.3%Life policy liabilities - - - - - - - 53,097 53,097 - Bonds, notes and subordinated debt 72,226 1,028 1,722 2,076 2,756 635 540 - 80,983 5.0%Other debt issues 926 - - - - - - - 926 4.7%All other liabilities and equity - - - - - - - 56,829 56,829 -
Total liabilities and equity 379,082 35,652 3,243 3,336 3,381 2,677 954 145,895 574,220 n/aOff-balance sheet items attracting interest rate sensitivity 32,138 6,438 (13,342) (5,243) (8,790) (7,808) (3,393) - -
Total interest rate repricing gap 19,248 (1,086) 13,573 10,628 (3,618) 693 13,149 (52,587) - Cumulative interest rate repricing gap 19,248 18,162 31,735 42,363 38,745 39,438 52,587 - (1) Presentation has been adjusted to be on a consistent basis with 30 September 2008.
Repricing period/contract maturity
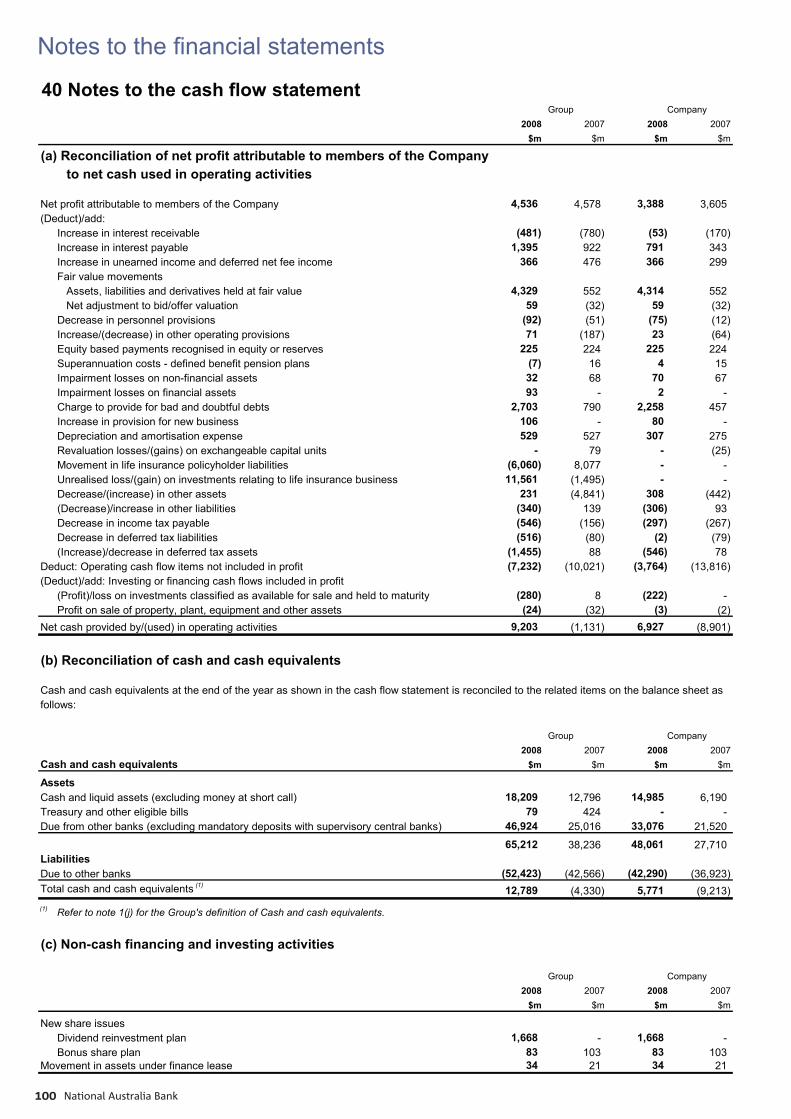
Notes to the fi nancial statements
National Australia Bank100
40 Notes to the cash flow statement_
2008 2007 2008 2007$m $m $m $m
(a) Reconciliation of net profit attributable to members of the Company to net cash used in operating activities
Net profit attributable to members of the Company 4,536 4,578 3,388 3,605 (Deduct)/add:
Increase in interest receivable (481) (780) (53) (170) Increase in interest payable 1,395 922 791 343 Increase in unearned income and deferred net fee income 366 476 366 299 Fair value movements Assets, liabilities and derivatives held at fair value 4,329 552 4,314 552 Net adjustment to bid/offer valuation 59 (32) 59 (32) Decrease in personnel provisions (92) (51) (75) (12) Increase/(decrease) in other operating provisions 71 (187) 23 (64) Equity based payments recognised in equity or reserves 225 224 225 224 Superannuation costs - defined benefit pension plans (7) 16 4 15 Impairment losses on non-financial assets 32 68 70 67 Impairment losses on financial assets 93 - 2 - Charge to provide for bad and doubtful debts 2,703 790 2,258 457 Increase in provision for new business 106 - 80 - Depreciation and amortisation expense 529 527 307 275 Revaluation losses/(gains) on exchangeable capital units - 79 - (25) Movement in life insurance policyholder liabilities (6,060) 8,077 - - Unrealised loss/(gain) on investments relating to life insurance business 11,561 (1,495) - - Decrease/(increase) in other assets 231 (4,841) 308 (442) (Decrease)/increase in other liabilities (340) 139 (306) 93 Decrease in income tax payable (546) (156) (297) (267) Decrease in deferred tax liabilities (516) (80) (2) (79) (Increase)/decrease in deferred tax assets (1,455) 88 (546) 78
Deduct: Operating cash flow items not included in profit (7,232) (10,021) (3,764) (13,816) (Deduct)/add: Investing or financing cash flows included in profit
(Profit)/loss on investments classified as available for sale and held to maturity (280) 8 (222) - Profit on sale of property, plant, equipment and other assets (24) (32) (3) (2)
Net cash provided by/(used) in operating activities 9,203 (1,131) 6,927 (8,901)
(b) Reconciliation of cash and cash equivalents
Cash and cash equivalents at the end of the year as shown in the cash flow statement is reconciled to the related items on the balance sheet asfollows:
_
2008 2007 2008 2007Cash and cash equivalents $m $m $m $m
AssetsCash and liquid assets (excluding money at short call) 18,209 12,796 14,985 6,190 Treasury and other eligible bills 79 424 - -Due from other banks (excluding mandatory deposits with supervisory central banks) 46,924 25,016 33,076 21,520
65,212 38,236 48,061 27,710 LiabilitiesDue to other banks (52,423) (42,566) (42,290) (36,923) Total cash and cash equivalents (1) 12,789 (4,330) 5,771 (9,213) (1) Refer to note 1(j) for the Group's definition of Cash and cash equivalents.
(c) Non-cash financing and investing activities_
2008 2007 2008 2007$m $m $m $m
New share issuesDividend reinvestment plan 1,668 - 1,668 -Bonus share plan 83 103 83 103
Movement in assets under finance lease 34 21 34 21
Group Company
Group Company
Group Company
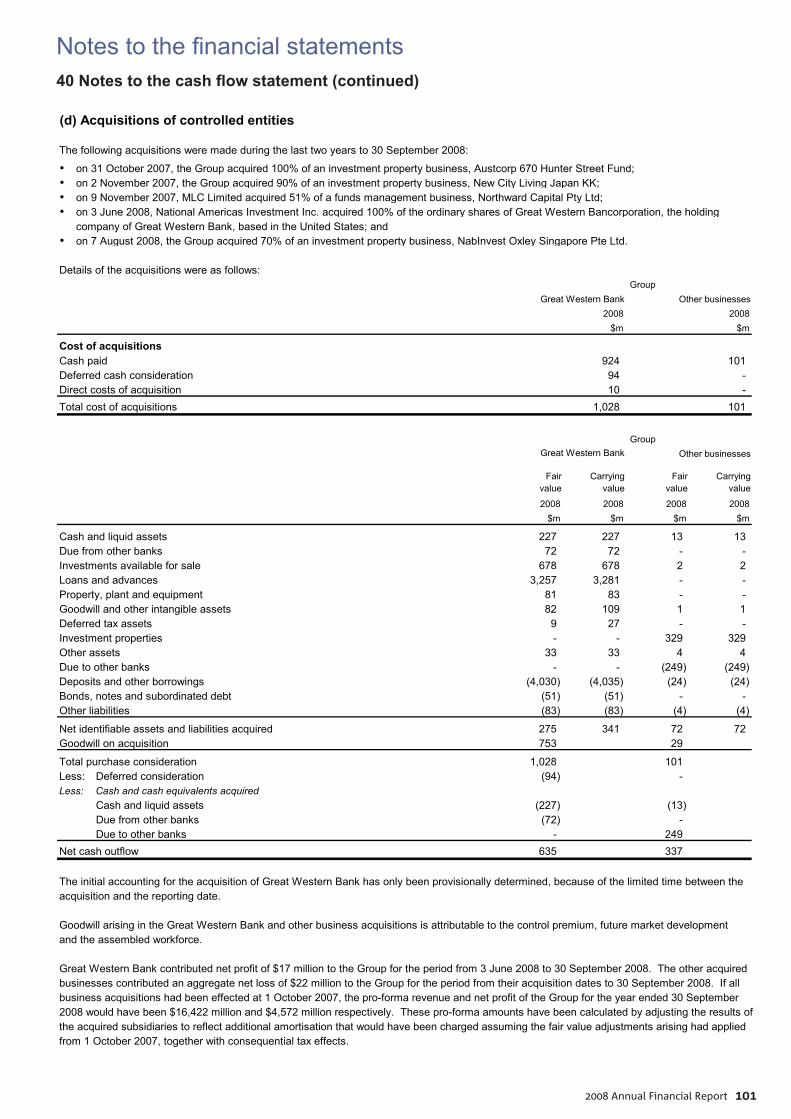
Notes to the fi nancial statements
2008 Annual Financial Report 101
40 Notes to the cash fl ow statement (continued)
(d) Acquisitions of controlled entities
The following acquisitions were made during the last two years to 30 September 2008:
• on 31 October 2007, the Group acquired 100% of an investment property business, Austcorp 670 Hunter Street Fund;• on 2 November 2007, the Group acquired 90% of an investment property business, New City Living Japan KK;• on 9 November 2007, MLC Limited acquired 51% of a funds management business, Northward Capital Pty Ltd; • on 3 June 2008, National Americas Investment Inc. acquired 100% of the ordinary shares of Great Western Bancorporation, the holding
company of Great Western Bank, based in the United States; and• on 7 August 2008, the Group acquired 70% of an investment property business, NabInvest Oxley Singapore Pte Ltd.
Details of the acquisitions were as follows:
Cost of acquisitionsCash paid 924 101 Deferred cash consideration 94 -Direct costs of acquisition 10 -Total cost of acquisitions 1,028 101
_
Fair value
Carrying value
Fair value
Carrying value
2008 2008 2008 2008$m $m $m $m
Cash and liquid assets 227 227 13 13 Due from other banks 72 72 - -Investments available for sale 678 678 2 2 Loans and advances 3,257 3,281 - -Property, plant and equipment 81 83 - -Goodwill and other intangible assets 82 109 1 1 Deferred tax assets 9 27 - - Investment properties - - 329 329 Other assets 33 33 4 4 Due to other banks - - (249) (249) Deposits and other borrowings (4,030) (4,035) (24) (24) Bonds, notes and subordinated debt (51) (51) - - Other liabilities (83) (83) (4) (4)
Net identifiable assets and liabilities acquired 275 341 72 72 Goodwill on acquisition 753 29
Total purchase consideration 1,028 101 Less: Deferred consideration (94) -Less: Cash and cash equivalents acquired
Cash and liquid assets (227) (13) Due from other banks (72) - Due to other banks - 249
Net cash outflow 635 337
The initial accounting for the acquisition of Great Western Bank has only been provisionally determined, because of the limited time between the acquisition and the reporting date.
Goodwill arising in the Great Western Bank and other business acquisitions is attributable to the control premium, future market developmentand the assembled workforce.
Great Western Bank contributed net profit of $17 million to the Group for the period from 3 June 2008 to 30 September 2008. The other acquired businesses contributed an aggregate net loss of $22 million to the Group for the period from their acquisition dates to 30 September 2008. If allbusiness acquisitions had been effected at 1 October 2007, the pro-forma revenue and net profit of the Group for the year ended 30 September2008 would have been $16,422 million and $4,572 million respectively. These pro-forma amounts have been calculated by adjusting the results ofthe acquired subsidiaries to reflect additional amortisation that would have been charged assuming the fair value adjustments arising had applied from 1 October 2007, together with consequential tax effects.
Group
Great Western Bank Other businesses Group
Great Western Bank Other businesses2008
$m2008
$m
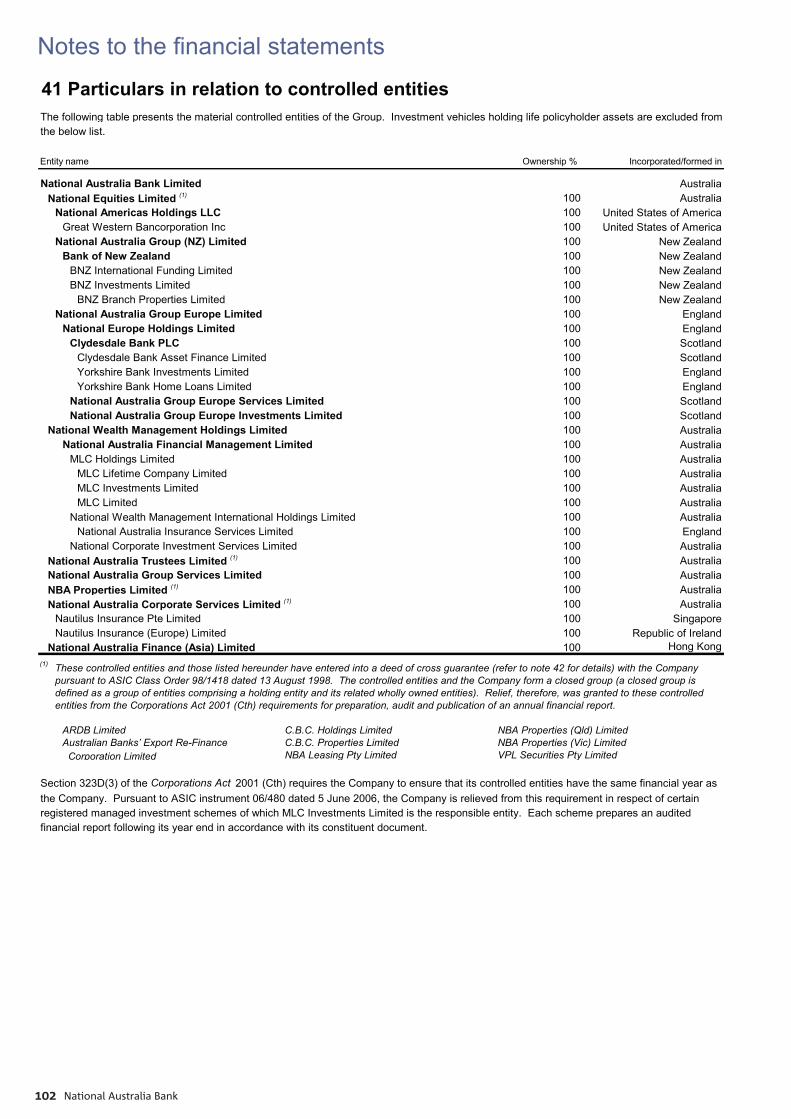
Notes to the fi nancial statements
National Australia Bank102
41 Particulars in relation to controlled entitiesThe following table presents the material controlled entities of the Group. Investment vehicles holding life policyholder assets are excluded fromthe below list.
Entity name Ownership % Incorporated/formed in
National Australia Bank Limited AustraliaNational Equities Limited (1) 100 Australia
National Americas Holdings LLC 100 United States of AmericaGreat Western Bancorporation Inc 100 United States of America
National Australia Group (NZ) Limited 100 New ZealandBank of New Zealand 100 New Zealand
BNZ International Funding Limited 100 New ZealandBNZ Investments Limited 100 New Zealand
BNZ Branch Properties Limited 100 New ZealandNational Australia Group Europe Limited 100 England
National Europe Holdings Limited 100 EnglandClydesdale Bank PLC 100 Scotland
Clydesdale Bank Asset Finance Limited 100 ScotlandYorkshire Bank Investments Limited 100 EnglandYorkshire Bank Home Loans Limited 100 England
National Australia Group Europe Services Limited 100 ScotlandNational Australia Group Europe Investments Limited 100 Scotland
National Wealth Management Holdings Limited 100 AustraliaNational Australia Financial Management Limited 100 Australia
MLC Holdings Limited 100 AustraliaMLC Lifetime Company Limited 100 AustraliaMLC Investments Limited 100 AustraliaMLC Limited 100 Australia
National Wealth Management International Holdings Limited 100 AustraliaNational Australia Insurance Services Limited 100 England
National Corporate Investment Services Limited 100 AustraliaNational Australia Trustees Limited (1) 100 AustraliaNational Australia Group Services Limited 100 AustraliaNBA Properties Limited (1) 100 AustraliaNational Australia Corporate Services Limited (1) 100 Australia
Nautilus Insurance Pte Limited 100 SingaporeNautilus Insurance (Europe) Limited 100 Republic of Ireland
National Australia Finance (Asia) Limited 100 Hong Kong(1) These controlled entities and those listed hereunder have entered into a deed of cross guarantee (refer to note 42 for details) with the Company
pursuant to ASIC Class Order 98/1418 dated 13 August 1998. The controlled entities and the Company form a closed group (a closed group is defined as a group of entities comprising a holding entity and its related wholly owned entities). Relief, therefore, was granted to these controlled entities from the Corporations Act 2001 (Cth) requirements for preparation, audit and publication of an annual financial report.
ARDB Limited C.B.C. Holdings Limited NBA Properties (Qld) LimitedAustralian Banks’ Export Re-Finance C.B.C. Properties Limited NBA Properties (Vic) Limited Corporation Limited NBA Leasing Pty Limited VPL Securities Pty Limited
Section 323D(3) of the Corporations Act 2001 (Cth) requires the Company to ensure that its controlled entities have the same financial year asthe Company. Pursuant to ASIC instrument 06/480 dated 5 June 2006, the Company is relieved from this requirement in respect of certainregistered managed investment schemes of which MLC Investments Limited is the responsible entity. Each scheme prepares an auditedfinancial report following its year end in accordance with its constituent document.
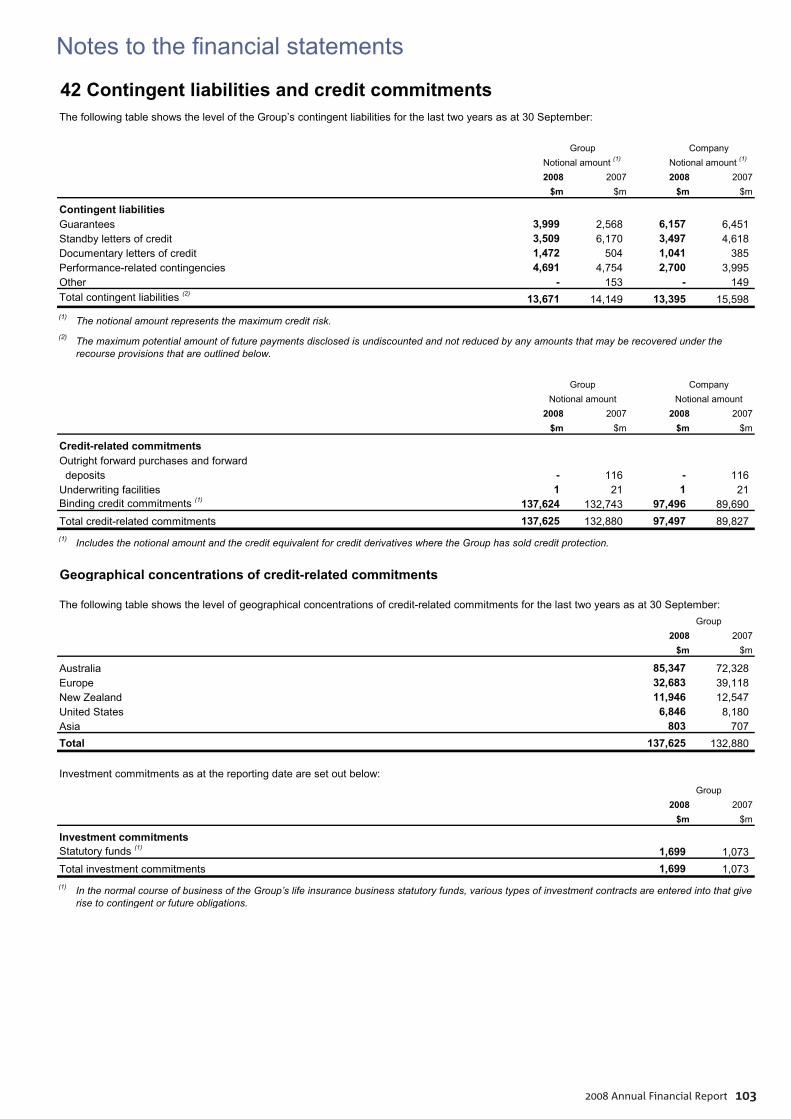
Notes to the fi nancial statements
2008 Annual Financial Report 103
42 Contingent liabilities and credit commitmentsThe following table shows the level of the Group’s contingent liabilities for the last two years as at 30 September:
_
2008 2007 2008 2007$m $m $m $m
Contingent liabilitiesGuarantees 3,999 2,568 6,157 6,451 Standby letters of credit 3,509 6,170 3,497 4,618 Documentary letters of credit 1,472 504 1,041 385 Performance-related contingencies 4,691 4,754 2,700 3,995 Other - 153 - 149 Total contingent liabilities (2) 13,671 14,149 13,395 15,598 (1) The notional amount represents the maximum credit risk.(2) The maximum potential amount of future payments disclosed is undiscounted and not reduced by any amounts that may be recovered under the
recourse provisions that are outlined below._
2008 2007 2008 2007$m $m $m $m
Credit-related commitmentsOutright forward purchases and forward deposits - 116 - 116 Underwriting facilities 1 21 1 21 Binding credit commitments (1) 137,624 132,743 97,496 89,690 Total credit-related commitments 137,625 132,880 97,497 89,827 (1) Includes the notional amount and the credit equivalent for credit derivatives where the Group has sold credit protection.
Geographical concentrations of credit-related commitments
The following table shows the level of geographical concentrations of credit-related commitments for the last two years as at 30 September:_
2008 2007$m $m
Australia 85,347 72,328 Europe 32,683 39,118 New Zealand 11,946 12,547 United States 6,846 8,180 Asia 803 707 Total 137,625 132,880
Investment commitments as at the reporting date are set out below: _
2008 2007$m $m
Investment commitmentsStatutory funds (1) 1,699 1,073 Total investment commitments 1,699 1,073 (1) In the normal course of business of the Group’s life insurance business statutory funds, various types of investment contracts are entered into that give
rise to contingent or future obligations.
Group Company Notional amount (1) Notional amount (1)
Group Company
Group
Group
Notional amount Notional amount
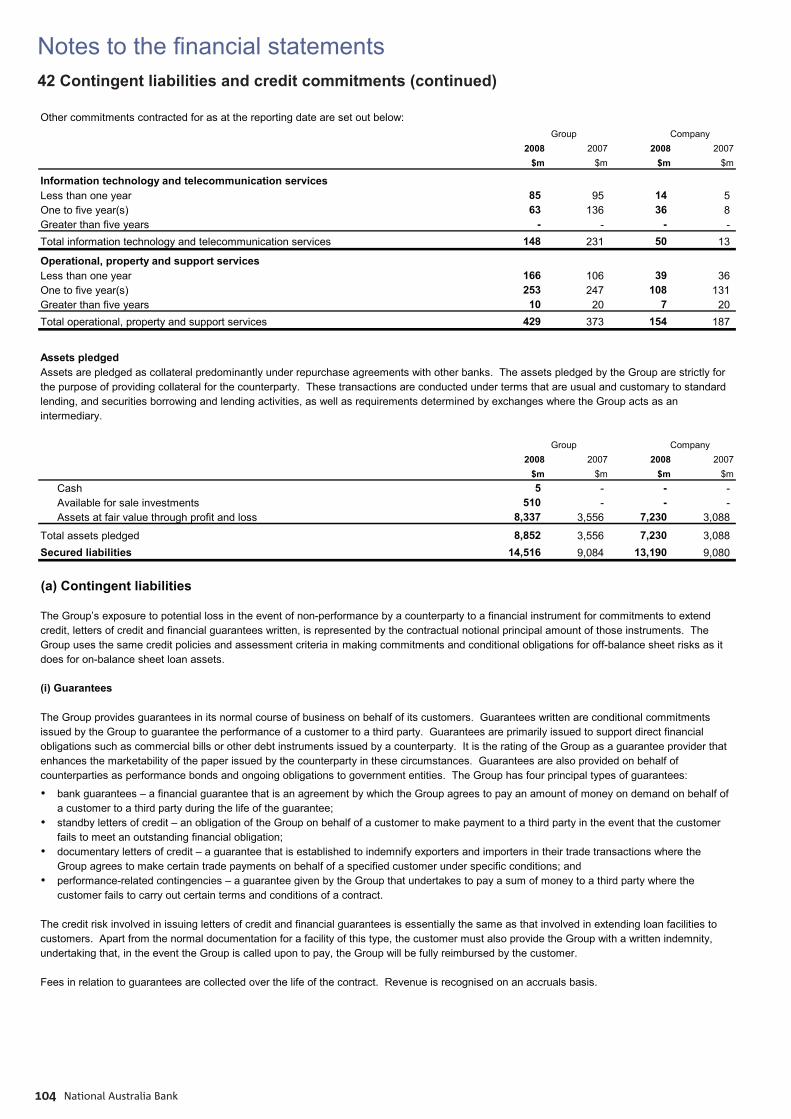
Notes to the fi nancial statements
National Australia Bank104
42 Contingent liabilities and credit commitments (continued)
Other commitments contracted for as at the reporting date are set out below: _
2008 2007 2008 2007$m $m $m $m
Information technology and telecommunication servicesLess than one year 85 95 14 5 One to five year(s) 63 136 36 8 Greater than five years - - - - Total information technology and telecommunication services 148 231 50 13
Operational, property and support servicesLess than one year 166 106 39 36 One to five year(s) 253 247 108 131 Greater than five years 10 20 7 20 Total operational, property and support services 429 373 154 187
_
Assets pledgedAssets are pledged as collateral predominantly under repurchase agreements with other banks. The assets pledged by the Group are strictly forthe purpose of providing collateral for the counterparty. These transactions are conducted under terms that are usual and customary to standardlending, and securities borrowing and lending activities, as well as requirements determined by exchanges where the Group acts as anintermediary.
2008 2007 2008 2007$m $m $m $m
Cash 5 - - - Available for sale investments 510 - - - Assets at fair value through profit and loss 8,337 3,556 7,230 3,088
Total assets pledged 8,852 3,556 7,230 3,088 Secured liabilities 14,516 9,084 13,190 9,080
(a) Contingent liabilities
The Group’s exposure to potential loss in the event of non-performance by a counterparty to a financial instrument for commitments to extendcredit, letters of credit and financial guarantees written, is represented by the contractual notional principal amount of those instruments. TheGroup uses the same credit policies and assessment criteria in making commitments and conditional obligations for off-balance sheet risks as itdoes for on-balance sheet loan assets.
(i) Guarantees
The Group provides guarantees in its normal course of business on behalf of its customers. Guarantees written are conditional commitmentsissued by the Group to guarantee the performance of a customer to a third party. Guarantees are primarily issued to support direct financialobligations such as commercial bills or other debt instruments issued by a counterparty. It is the rating of the Group as a guarantee provider thatenhances the marketability of the paper issued by the counterparty in these circumstances. Guarantees are also provided on behalf ofcounterparties as performance bonds and ongoing obligations to government entities. The Group has four principal types of guarantees:
• bank guarantees – a financial guarantee that is an agreement by which the Group agrees to pay an amount of money on demand on behalf ofa customer to a third party during the life of the guarantee;
• standby letters of credit – an obligation of the Group on behalf of a customer to make payment to a third party in the event that the customerfails to meet an outstanding financial obligation;
• documentary letters of credit – a guarantee that is established to indemnify exporters and importers in their trade transactions where theGroup agrees to make certain trade payments on behalf of a specified customer under specific conditions; and
• performance-related contingencies – a guarantee given by the Group that undertakes to pay a sum of money to a third party where thecustomer fails to carry out certain terms and conditions of a contract.
The credit risk involved in issuing letters of credit and financial guarantees is essentially the same as that involved in extending loan facilities tocustomers. Apart from the normal documentation for a facility of this type, the customer must also provide the Group with a written indemnity,undertaking that, in the event the Group is called upon to pay, the Group will be fully reimbursed by the customer.
Fees in relation to guarantees are collected over the life of the contract. Revenue is recognised on an accruals basis.
Group Company
Group Company
Notes to the fi nancial statements
2008 Annual Financial Report 105
42 Contingent liabilities and credit commitments (continued)
(ii) Clearing and settlement obligations
The Company is subject to a commitment in accordance with the rules governing clearing and settlement arrangements contained in the AustralianPayments Clearing Association Limited Regulations for the Australian Paper Clearing System, the Bulk Electronic Clearing System, the ConsumerElectronic Clearing System and the High Value Clearing System which could result in a credit risk exposure and loss in the event of a failure tosettle by a member institution. The Company also has a commitment in accordance with the Austraclear System Regulations and the ContinuousLinked Settlement Bank Rules to participate in loss-sharing arrangements in the event that another financial institution fails to settle.
(iii) Inter-bank deposit agreement
The Company is a party to an inter-bank deposit agreement between the four major Australian banks. Each participant, including the Company,has a maximum commitment to provide a deposit of an amount of up to $2,000 million, for a period of 30 days, to any other participant experiencing liquidity problems. Repayment of the deposit by the recipient bank may be by cash or by transfer of mortgages securing eligiblehousing loans to the value of the deposit. The agreement is certified by APRA as an industry support contract under section 11CB of the BankingAct 1959 (Cth).
(iv) Legal proceedings
Entities within the Group are defendants from time to time in legal proceedings arising from the conduct of their business.
There are contingent liabilities in respect of claims, potential claims and court proceedings against entities of the Group. The aggregate ofpotential liability in respect thereof cannot be accurately assessed.
(v) Contingent liability – amended assessments from the Australian Taxation Office – exchangeable capital units capital raising
The Group announced in February 2004 and May 2005 that it had received amended assessments from the Australian Taxation Office (ATO)which seek to disallow interest deductions on exchangeable capital units (ExCaps) for the tax years 1997 to 2003 and deductions for certainissue costs for the years 1998 to 2001. The ATO assessments are for $298 million of primary tax and interest and penalties of $254 million(after-tax), a total of $552 million (after-tax). As previously advised, should the ATO also disallow issue costs claimed in 2002 and 2003, thefurther primary tax assessed would be approximately $2 million. Interest and penalties may also be imposed.
As previously announced in May 2007, the ATO has also issued amended assessments to disallow deductions claimed for the payment ofmanagement fees associated with the ExCaps for years 1997 to 2003. These additional ATO assessments are for $9 million of primary tax andinterest and penalties of $7 million (after tax), a total of $16 million (after-tax).
The ATO has advised the Group that it has reviewed the amount of interest imposed and as a result of this review it has decided to remit interestby applying reduced rates for all years, except the 2004 year.
In accordance with ATO practice on disputed assessments, the Group has paid 50% of the amounts owing under the amended assessments, atotal of $307 million. These payments have been recognised as an asset by the Group in its accounts, included within other assets, on the basisthat the Group expects recovery of the amount paid to the ATO. Interest may accrue on the unpaid disputed amounts. The Group has nottax-effected interest paid on the ExCaps after 1 October 2003 whilst the tax treatment is in dispute. As the ExCaps have now been redeemed noadditional income tax expense arose for the 2008 year (compared to additional income tax expense of $7 million in the 2007 year).
The Group disputes the amended assessments for the ExCaps and intends to pursue all necessary avenues of objection and appeal. Objectionsagainst the amended assessments have been lodged but as yet have not been determined. No provision has been raised for this matter.
(vi) Contingent liability – amended assessments from the New Zealand Inland Revenue Department – structured financetransactions
The New Zealand Inland Revenue Department (IRD) is carrying out a review of certain structured finance transactions in the banking industry.
As part of this review, subsidiaries of the Group have received amended tax assessments for the 1998 to 2005 years from the IRD with respectto certain structured finance transactions. The amended assessments are for income tax of approximately NZ$416 million. As at 30 September2008, interest of NZ$217 million (net of tax) would be payable on this amount. The possible application of penalties has yet to be considered bythe IRD.
The New Zealand Government introduced new legislation, effective 1 July 2005, which addresses their concerns with banks entering into thesetransactions. All of the structured finance transactions of the Group’s subsidiaries that are the subject of the IRD’s review were terminated bythat date. The Group is confident that its position in relation to the application of the taxation law is correct and it is disputing the IRD’s position with respect to these transactions. The Group has legal opinions that confirm that the transactions complied with New Zealand tax law. Thetransactions are similar to transactions undertaken by other New Zealand banks. The Group has commenced legal proceedings to challenge theIRD’s assessments.
The financial effect of the unpaid balance of the amounts owing under the amended assessments has not been brought to account in the financialstatements for the year ended 30 September 2008.
Notes to the fi nancial statements
National Australia Bank106
42 Contingent liabilities and credit commitments (continued)
(vii) Contingent liability – Wealth Management reinsurance
The ATO continues its review of a reinsurance contract entered into by the Australian Wealth Management business in the 1998 tax year andamended in the 2000 tax year. The ATO previously expressed the view that expenditure incurred under the reinsurance contract was notdeductible under certain technical provisions of the tax law.
In August 2007, the ATO concluded its review of this matter and issued amended assessments to the Wealth Management subsidiaries that wereparties to the reinsurance contract.
The ATO assessments were for $54 million of primary tax and interest and penalties of $16 million (after tax), a total of $70 million (after tax). Inaccordance with ATO practice on disputed assessments, the Group has paid 50% of the amounts owing under the amended assessments. Thispayment has been recognised as an asset by the Group in its accounts as at 30 September 2008 on the basis that the Group expects fullrecovery of the amount paid to the ATO. Interest may accrue on the unpaid disputed amount. No provision has been raised for this matter.
Objections have been lodged disputing the ATO’s amended assessments. The objections are currently being considered by the ATO. The Grouphas made further submissions to the ATO in support of its position. The ATO is expected to determine the objections shortly. Should the objectionbe determined unfavourably by the ATO, the Group intends to pursue all necessary avenues of appeal.
(viii) Contingent liability – Financial Services Compensation Scheme
In late September, after breaching regulatory requirements, Bradford & Bingley (B&B) was taken into public ownership. The cost of guaranteeingB&B's deposits will be met by the Financial Services Compensation Scheme, of which the Clydesdale Bank is a member. At present we do nothave clarity upon the financial implications for the Group, as the value at which any future levy may be raised is dependent upon the futureperformance of the B&B loan portfolio.
(ix) Government Guarantee Schemes in Australia, New Zealand and United Kingdom
The recent adverse conditions in global financial markets have resulted in a significant increase in funding costs and a general tightening ofavailable liquidity. This has placed significant pressure on the financial performance and capital positions of international banks and other financialinstitutions.
These market conditions have adversely impacted the Group. In 2008, a provision of approximately $1 billion was established in respect of theGroup's ABS CDO exposures to reflect the uncertain economic environment and the severe deterioration in conditions in the U.S. housing markets.
In the face of the current global financial market conditions, international governments (including those of the United States, United Kingdom andNew Zealand) have taken various measures to support the global banking system, including in some cases supporting financial institutions inrecapitalising and gaining access to retail and wholesale borrowings. The precise details of the various international plans are not yet clear and,in some cases, have not been approved by the relevant legislator. Accordingly, they may not be fully implemented in their current form.
Consistent with these measures, in October 2008, the Australian Parliament passed the Financial System Legislation Amendment (FinancialClaims and Other Measures) Act 2008 as part of a package of measures aimed at supporting the Australian financial system.
(x) Bell Group Holdings
The Company is one of 20 banks involved in the Bell Group legal proceedings. The proceedings have been brought by various parties, includingthe liquidators of several Bell Group companies, seeking to challenge the banks' prior receipt of proceeds from the realisation of Bell Groupassets. On 28 October 2008, the Supreme Court of Western Australia delivered a lengthy judgment on the matter.
The impact of the legal proceedings to the Group is not fully ascertainable at the date of this report, and will depend on various factors includingfurther analysis of the judgment, the actual Court orders and the impact of the judgment on various stakeholders involved in the proceedings.
(xi) Refund of current account fees and associated costs regarding the Office of Fair Trading (OFT) investigation
The Office of Fair Trading (OFT) investigation into the operation of the personal current account market in the UK was published on 16 July 2008 and highlighted perceived issues of transparency and switching. The OFT has invited responses by 31 October 2008 and will consult furtherwith the banking industry, consumer groups and the government to decide on what steps need to be taken and by whom. In parallel with themarket study, the OFT has been undertaking a cost study in relation to a number of banks to inform an assessment of whether charges are fairunder the Unfair Terms in Consumer Contracts Regulations 1999.
The bank charges legal test case also continues. In July 2008 the Court heard argument on two aspects namely, whether the initial finding thatcurrent terms and conditions are capable of an assessment under the Regulations applies to historic terms and conditions and, secondly, whethercertain historic terms and conditions amount to penalties at common law. On 8 October 2008 the Judge ruled that the bank was entitled to adeclaration that none of its terms and conditions examined by the Court amount to penalties at common law.
Notes to the fi nancial statements
2008 Annual Financial Report 107
42 Contingent liabilities and credit commitments (continued)
The appeal against the finding made by the Court in April to the effect that the terms and conditions are capable of being assessed for fairnessunder the Regulations has been held and the bank is awaiting judgement. In the meantime, the FSA has extended the waiver (under theterms of which Banks do not have to process claims for a return of charges where no financial hardship is involved) until January 2009.
The Group does not consider that the outcome of any proceedings, either individually or in aggregate, is likely to have a material effect on itsfinancial position. Where appropriate, provisions have been made.
(b) Credit-related commitments
Binding commitments to extend credit are agreements to lend to a customer as long as there is no violation of any condition established in thecontract. Commitments generally have fixed expiration dates or other termination clauses and may require payment of a fee by the customer. Since many of the commitments are expected to expire without being drawn down, the total commitment amounts do not necessarily representfuture cash requirements. The Group evaluates each customer’s creditworthiness on a case-by-case basis. The amount of collateral obtained, ifdeemed necessary by the Group upon extension of credit, is based on management’s credit evaluation of the counterparty. Collateral held varies,but may include:
• a floating charge over all assets and undertakings of an entity, including uncalled capital and called but unpaid capital;• specific or inter-locking guarantees; • specific charges over defined assets of the counterparty; and• loan agreements which include affirmative and negative covenants and in some instances guarantees of counterparty obligations.
(c) Parent entity guarantees and undertakings
Excluded from the Group amounts disclosed above are the following guarantees and undertakings to entities in the Group:
• commercial paper issued by National Australia Funding (Delaware), Inc. totalling $9,335 million (2007: $3,354 million) is guaranteed by theCompany;
• from time to time, the Company provides letters to the UK Financial Services Authority in relation to its controlled entity Clydesdale Bank PLC. The letters acknowledge that the Company will make up any regulatory capital deficiency in Clydesdale Bank PLC as a result of losses onexposures to certain designated parties. As at 30 September 2008, the only such letter related to facilities provided by Clydesdale Bank PLCto its wholly owned controlled entity Clydesdale Bank Asset Finance Limited;
• the Company will indemnify each customer of National Nominees Limited against any loss suffered by reason of National Nominees Limitedfailing to perform any obligation undertaken by it to a customer;
• bonds issued by National Australia Finance (Hong Kong) plc totalling GBP250 million are guaranteed by the Company; • the Company has agreed to provide a guarantee and indemnity with respect to the obligations of NBA Properties (Vic) Limited under the leases
and car park licences of the Group's premises at 800 and 808 Bourke Street, Docklands, Melbourne;• National Australia Bank Limited (NABL) and National Wealth Management Services Limited (NWMSL) have been granted licences by the
Safety, Rehabilitation and Compensation Commission (the Commission) to operate as self-insurers under the Commonwealth GovernmentComcare Scheme. Under these arrangements, NABL has agreed that in the event it is proposed that NWMSL no longer continue as a whollyowned subsidiary of NABL, NABL will provide the Commission with a guarantee of the then current workers' compensation liabilities ofNWMSL;
• the Company has provided a guarantee of the obligations of National Australia Group Services Limited (a wholly owned controlled entity)pursuant to the sale agreement relating to the sale of the Custom Fleet business. In certain limited circumstances, the Company may also berequired to guarantee the obligations of National Europe Holdings Limited (a wholly owned controlled entity) under that sale agreement. Theprimary ongoing obligations of these companies under the sale agreement relate to warranties and indemnities to the buyers consistent withagreements of this nature; and
• pursuant to ASIC Class Order 98/1418 dated 13 August 1998, relief was granted to certain controlled entities (refer to note 41, footnote (1))from the Corporations Act 2001 (Cth) requirements for preparation, audit and publication of annual financial reports. It is a condition of theClass Order that the Company and each of the controlled entities enter into a deed of cross guarantee. The effect of the deed is that theCompany guarantees to each creditor payment in full of any debt in the event of winding-up of any of the controlled entities under certainprovisions of the Corporations Act 2001 (Cth). If a winding-up occurs under other provisions of the Act, the Company will only be liable in theevent that after six months any creditor has not been paid in full. The controlled entities have also given similar guarantees in the event that theCompany is wound up. The table below presents consolidated pro forma income statements and balance sheets for the Company andcontrolled entities which are party to the deed, after eliminating all transactions between parties to the deed, which is known as a closedgroup.
It is not envisaged that any material unrecorded loss is likely to arise from any of the transactions described in this note.
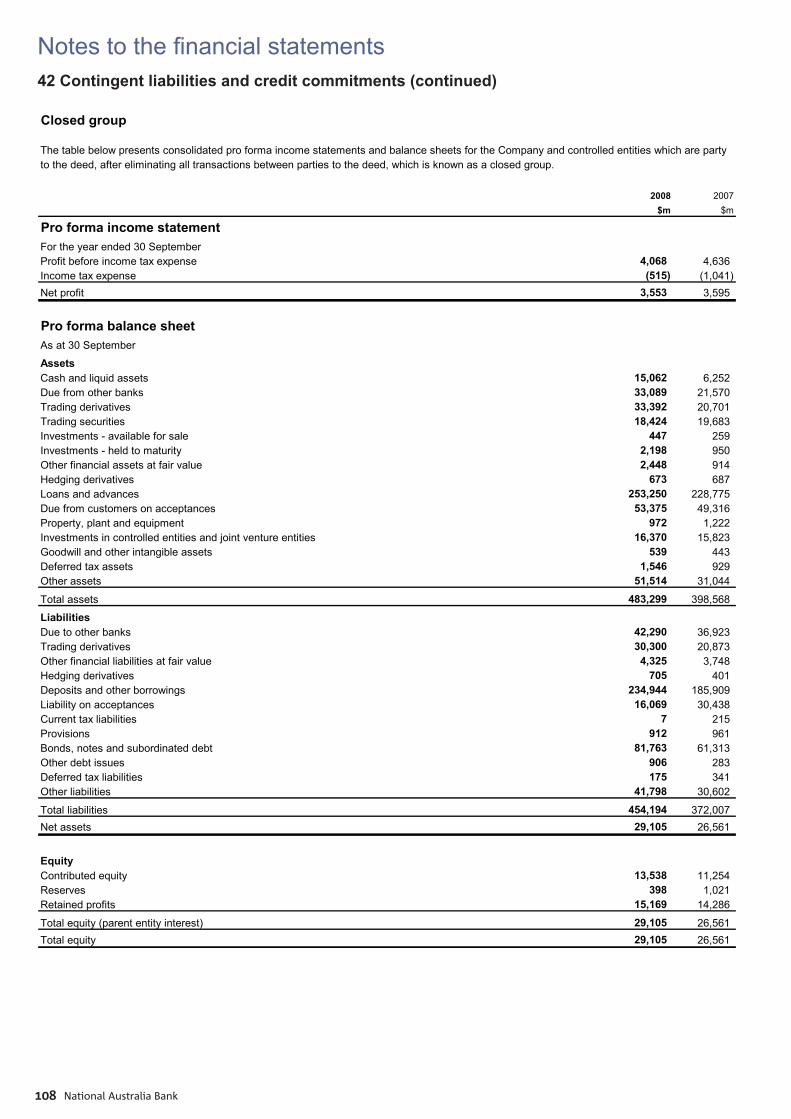
Notes to the fi nancial statements
National Australia Bank108
42 Contingent liabilities and credit commitments (continued)
Closed group
The table below presents consolidated pro forma income statements and balance sheets for the Company and controlled entities which are partyto the deed, after eliminating all transactions between parties to the deed, which is known as a closed group.
2008 2007$m $m
Pro forma income statementFor the year ended 30 September Profit before income tax expense 4,068 4,636 Income tax expense (515) (1,041) Net profit 3,553 3,595
Pro forma balance sheetAs at 30 September
AssetsCash and liquid assets 15,062 6,252 Due from other banks 33,089 21,570 Trading derivatives 33,392 20,701 Trading securities 18,424 19,683 Investments - available for sale 447 259 Investments - held to maturity 2,198 950 Other financial assets at fair value 2,448 914 Hedging derivatives 673 687 Loans and advances 253,250 228,775 Due from customers on acceptances 53,375 49,316 Property, plant and equipment 972 1,222 Investments in controlled entities and joint venture entities 16,370 15,823 Goodwill and other intangible assets 539 443 Deferred tax assets 1,546 929 Other assets 51,514 31,044
Total assets 483,299 398,568
LiabilitiesDue to other banks 42,290 36,923 Trading derivatives 30,300 20,873 Other financial liabilities at fair value 4,325 3,748 Hedging derivatives 705 401 Deposits and other borrowings 234,944 185,909 Liability on acceptances 16,069 30,438 Current tax liabilities 7 215 Provisions 912 961 Bonds, notes and subordinated debt 81,763 61,313 Other debt issues 906 283 Deferred tax liabilities 175 341 Other liabilities 41,798 30,602
Total liabilities 454,194 372,007 Net assets 29,105 26,561
EquityContributed equity 13,538 11,254 Reserves 398 1,021 Retained profits 15,169 14,286
Total equity (parent entity interest) 29,105 26,561 Total equity 29,105 26,561
Notes to the fi nancial statements
2008 Annual Financial Report 109
43 Financial risk management
Strategy in using financial instruments
By their nature, the Group’s activities are principally related to the use of financial instruments including derivatives. The Group accepts depositsfrom customers at both fixed and floating rates, and for various periods, and seeks to earn above-average interest margins by investing thesefunds in high quality assets. The Group seeks to increase these margins by consolidating short-term funds and lending for longer periods athigher rates, while maintaining sufficient liquidity to meet all claims that might fall due.
The Group also seeks to raise its interest margins by obtaining above-average margins, net of allowances, through lending to commercial andretail borrowers with a range of credit standing. Such exposures involve not just on-balance sheet loans and advances, but the Group alsoenters into guarantees and other commitments such as letters of credit and performance and other bonds.
The Group also trades in financial instruments where it takes positions in exchange traded and over-the-counter instruments, includingderivatives, to take advantage of short-term market movements in currency, interest rate and commodity prices. The Board places trading limitson the level of exposure that can be taken. With the exception of specific hedging arrangements, foreign exchange and interest rate exposuresassociated with these derivatives are normally offset by entering into counter-balancing positions, thereby controlling the variability in the net cashamounts required to liquidate market positions.
(a) Fair value hedgesThe Group hedges part of its existing interest rate and foreign currency risk resulting from any potential decrease in the fair value of fixed rateassets or increase in fair value of fixed rate liabilities attributable to both interest rate and foreign currency risk denominated both in local andforeign currencies using interest rate, cross currency interest rate and cross currency swaps. The net fair value of these swaps is disclosed innote 11.
(b) Cash flow hedgesThe Group hedges a portion of the variability in future cash flows attributable to the interest rate risk of variable interest rate assets and liabilities,using interest rate swaps, forward rate agreements and futures contracts. The Group also utilised derivatives to hedge a portion of the variabilityin future cash flows attributable to foreign exchange risk, created by assets, liabilities and forecast transactions denominated in a foreign currency.
There were no forecasted transactions for which cash flow hedge accounting had to be ceased in 2008 as a result of the hedge accountingcriteria no longer being met.
(c) Hedges of net investments in foreign operationsAt 30 September 2008, a borrowing of GBP757 million (2007: GBP675 million) has been designated as a hedge of a net investment in a subsidiarywith a GBP functional currency. The hedge has been designated to protect against the Group's exposure to foreign exchange risk on thisinvestment. The fair value of the borrowing is GBP757 million (2007: GBP675 million).
Any gains or losses on the translation of this borrowing are transferred to equity to offset any gains or losses on translation of the net investmentin the subsidiary. For the year ended 30 September 2008, there was no hedge ineffectiveness (2007: nil) recognised in profit or loss on hedgesof net investments in foreign operations.
Credit risk
Credit is defined as any transaction that creates an actual or potential obligation for a borrower to pay the Group. Credit risk is the potential thata borrower will fail to meet its obligations to the Group in accordance with agreed terms.
The Group structures the levels of credit risk it undertakes by placing limits on the amount of risk accepted in relation to one borrower, or groupsof borrowers, and to geographical and industry segments. Such risks are monitored on a revolving basis and are subject to an annual or morefrequent review.
Exposure to credit risk is managed through regular analysis of the ability of borrowers and potential borrowers to meet interest and capitalrepayment obligations and by changing these lending limits where appropriate. Exposure to credit risk is also managed in part by obtainingcollateral and corporate and personal guarantees.
(a) DerivativesThe Group maintains control limits on net open derivative positions (i.e. the difference between purchase and sale contracts), by both amount andterm. At any one time, the amount subject to credit risk is limited to the current fair value of instruments that are favourable to the Group (i.e.assets where their fair value is positive), which in relation to derivatives is only a small fraction of the contract, or notional values used to expressthe volume of instruments outstanding. This credit risk exposure is managed as part of the overall lending limits with customers, together withpotential exposures from market movements.
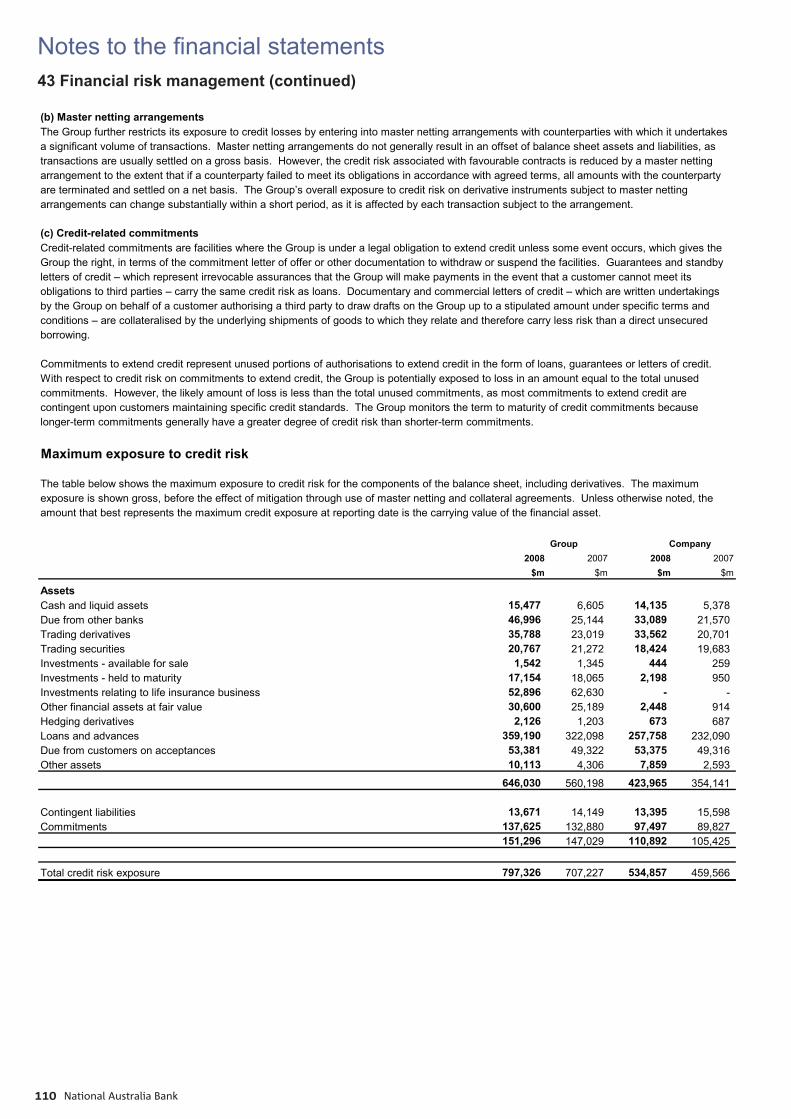
Notes to the fi nancial statements
National Australia Bank110
43 Financial risk management (continued)
(b) Master netting arrangementsThe Group further restricts its exposure to credit losses by entering into master netting arrangements with counterparties with which it undertakesa significant volume of transactions. Master netting arrangements do not generally result in an offset of balance sheet assets and liabilities, astransactions are usually settled on a gross basis. However, the credit risk associated with favourable contracts is reduced by a master nettingarrangement to the extent that if a counterparty failed to meet its obligations in accordance with agreed terms, all amounts with the counterpartyare terminated and settled on a net basis. The Group’s overall exposure to credit risk on derivative instruments subject to master nettingarrangements can change substantially within a short period, as it is affected by each transaction subject to the arrangement.
(c) Credit-related commitmentsCredit-related commitments are facilities where the Group is under a legal obligation to extend credit unless some event occurs, which gives theGroup the right, in terms of the commitment letter of offer or other documentation to withdraw or suspend the facilities. Guarantees and standbyletters of credit – which represent irrevocable assurances that the Group will make payments in the event that a customer cannot meet itsobligations to third parties – carry the same credit risk as loans. Documentary and commercial letters of credit – which are written undertakingsby the Group on behalf of a customer authorising a third party to draw drafts on the Group up to a stipulated amount under specific terms andconditions – are collateralised by the underlying shipments of goods to which they relate and therefore carry less risk than a direct unsecuredborrowing.
Commitments to extend credit represent unused portions of authorisations to extend credit in the form of loans, guarantees or letters of credit. With respect to credit risk on commitments to extend credit, the Group is potentially exposed to loss in an amount equal to the total unusedcommitments. However, the likely amount of loss is less than the total unused commitments, as most commitments to extend credit arecontingent upon customers maintaining specific credit standards. The Group monitors the term to maturity of credit commitments becauselonger-term commitments generally have a greater degree of credit risk than shorter-term commitments.
Maximum exposure to credit risk
The table below shows the maximum exposure to credit risk for the components of the balance sheet, including derivatives. The maximumexposure is shown gross, before the effect of mitigation through use of master netting and collateral agreements. Unless otherwise noted, theamount that best represents the maximum credit exposure at reporting date is the carrying value of the financial asset.
_
2008 2007 2008 2007$m $m $m $m
AssetsCash and liquid assets 15,477 6,605 14,135 5,378 Due from other banks 46,996 25,144 33,089 21,570 Trading derivatives 35,788 23,019 33,562 20,701 Trading securities 20,767 21,272 18,424 19,683 Investments - available for sale 1,542 1,345 444 259 Investments - held to maturity 17,154 18,065 2,198 950 Investments relating to life insurance business 52,896 62,630 - - Other financial assets at fair value 30,600 25,189 2,448 914 Hedging derivatives 2,126 1,203 673 687 Loans and advances 359,190 322,098 257,758 232,090 Due from customers on acceptances 53,381 49,322 53,375 49,316 Other assets 10,113 4,306 7,859 2,593
646,030 560,198 423,965 354,141
Contingent liabilities 13,671 14,149 13,395 15,598 Commitments 137,625 132,880 97,497 89,827
151,296 147,029 110,892 105,425
Total credit risk exposure 797,326 707,227 534,857 459,566
Group Company
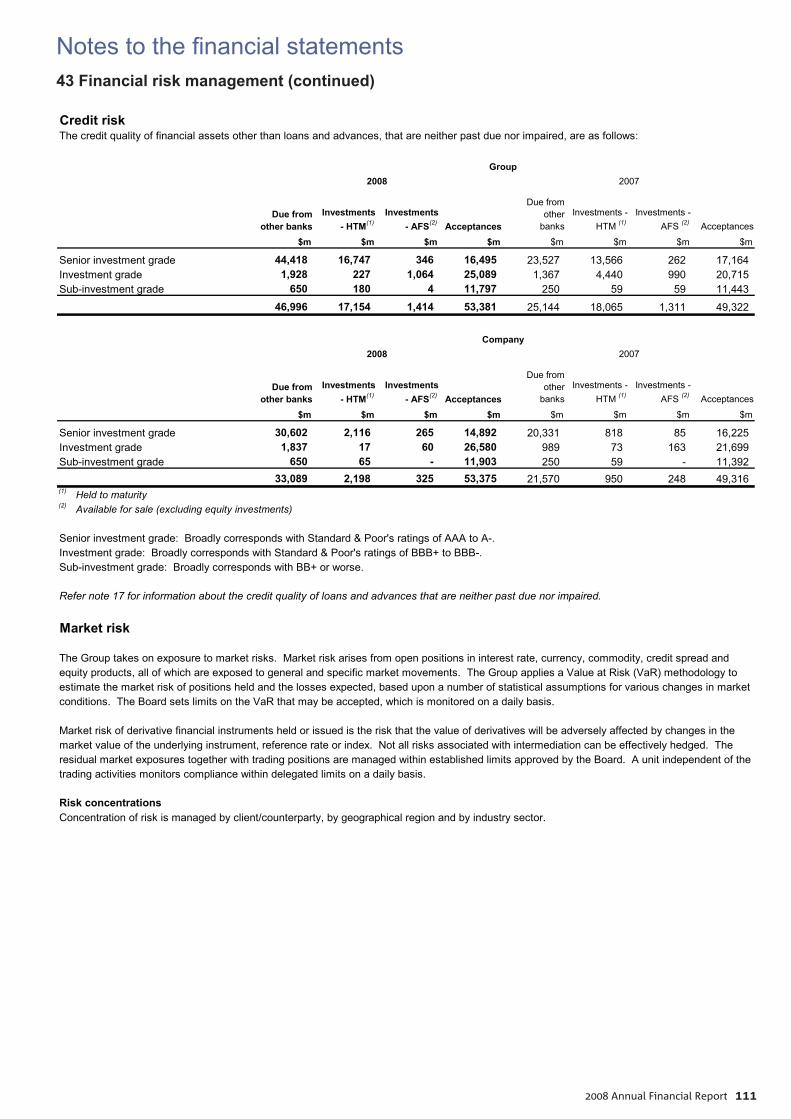
Notes to the fi nancial statements
2008 Annual Financial Report 111
43 Financial risk management (continued)
Credit riskThe credit quality of financial assets other than loans and advances, that are neither past due nor impaired, are as follows:
_
Due from other banks
Investments - HTM(1)
Investments - AFS(2) Acceptances
Due from other
banksInvestments -
HTM (1)Investments -
AFS (2) Acceptances
$m $m $m $m $m $m $m $m
Senior investment grade 44,418 16,747 346 16,495 23,527 13,566 262 17,164 Investment grade 1,928 227 1,064 25,089 1,367 4,440 990 20,715 Sub-investment grade 650 180 4 11,797 250 59 59 11,443
46,996 17,154 1,414 53,381 25,144 18,065 1,311 49,322 _
Due from other banks
Investments - HTM(1)
Investments - AFS(2) Acceptances
Due from other
banksInvestments -
HTM (1)Investments -
AFS (2) Acceptances
$m $m $m $m $m $m $m $m
Senior investment grade 30,602 2,116 265 14,892 20,331 818 85 16,225 Investment grade 1,837 17 60 26,580 989 73 163 21,699 Sub-investment grade 650 65 - 11,903 250 59 - 11,392
33,089 2,198 325 53,375 21,570 950 248 49,316 (1) Held to maturity(2) Available for sale (excluding equity investments)
Senior investment grade: Broadly corresponds with Standard & Poor's ratings of AAA to A-.Investment grade: Broadly corresponds with Standard & Poor's ratings of BBB+ to BBB-.Sub-investment grade: Broadly corresponds with BB+ or worse.
Refer note 17 for information about the credit quality of loans and advances that are neither past due nor impaired.
Market risk
The Group takes on exposure to market risks. Market risk arises from open positions in interest rate, currency, commodity, credit spread andequity products, all of which are exposed to general and specific market movements. The Group applies a Value at Risk (VaR) methodology toestimate the market risk of positions held and the losses expected, based upon a number of statistical assumptions for various changes in marketconditions. The Board sets limits on the VaR that may be accepted, which is monitored on a daily basis.
Market risk of derivative financial instruments held or issued is the risk that the value of derivatives will be adversely affected by changes in themarket value of the underlying instrument, reference rate or index. Not all risks associated with intermediation can be effectively hedged. Theresidual market exposures together with trading positions are managed within established limits approved by the Board. A unit independent of thetrading activities monitors compliance within delegated limits on a daily basis.
Risk concentrationsConcentration of risk is managed by client/counterparty, by geographical region and by industry sector.
2008 2007
Group2008 2007
Company
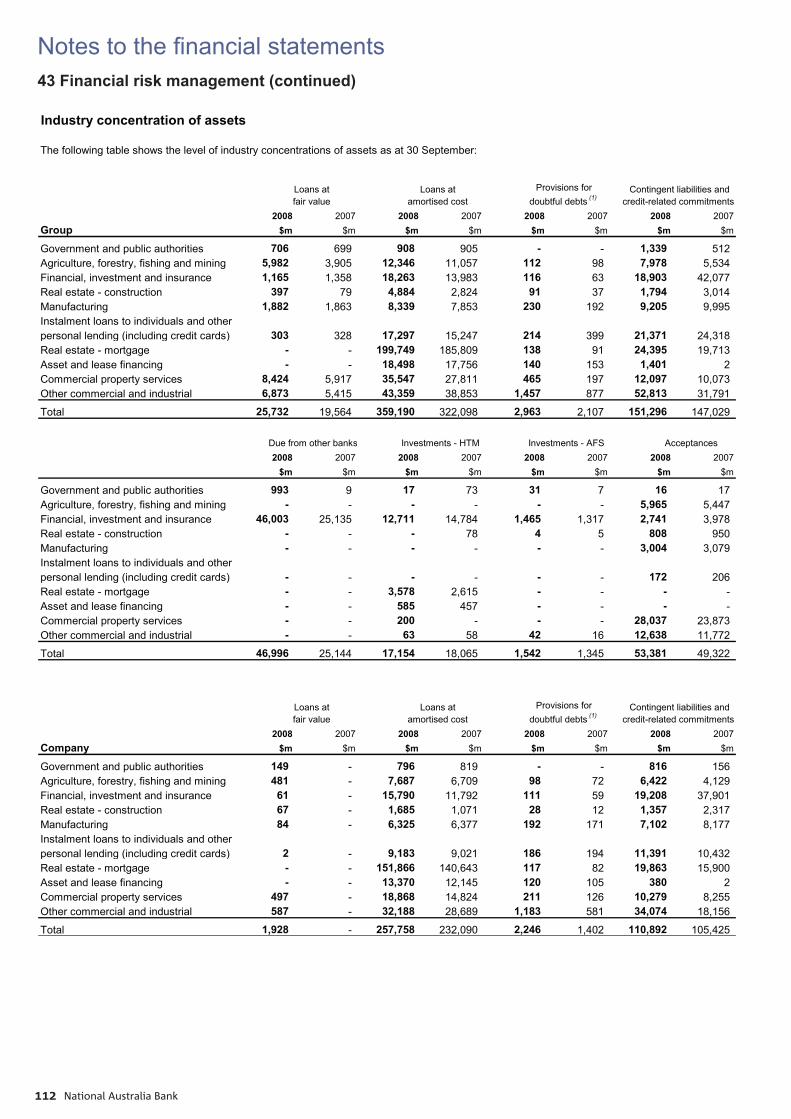
Notes to the fi nancial statements
National Australia Bank112
43 Financial risk management (continued)
Industry concentration of assets
The following table shows the level of industry concentrations of assets as at 30 September:_
2008 2007 2008 2007 2008 2007 2008 2007Group $m $m $m $m $m $m $m $m
Government and public authorities 706 699 908 905 - - 1,339 512 Agriculture, forestry, fishing and mining 5,982 3,905 12,346 11,057 112 98 7,978 5,534 Financial, investment and insurance 1,165 1,358 18,263 13,983 116 63 18,903 42,077 Real estate - construction 397 79 4,884 2,824 91 37 1,794 3,014 Manufacturing 1,882 1,863 8,339 7,853 230 192 9,205 9,995 Instalment loans to individuals and otherpersonal lending (including credit cards) 303 328 17,297 15,247 214 399 21,371 24,318 Real estate - mortgage - - 199,749 185,809 138 91 24,395 19,713 Asset and lease financing - - 18,498 17,756 140 153 1,401 2 Commercial property services 8,424 5,917 35,547 27,811 465 197 12,097 10,073 Other commercial and industrial 6,873 5,415 43,359 38,853 1,457 877 52,813 31,791
Total 25,732 19,564 359,190 322,098 2,963 2,107 151,296 147,029 _
2008 2007 2008 2007 2008 2007 2008 2007$m $m $m $m $m $m $m $m
Government and public authorities 993 9 17 73 31 7 16 17 Agriculture, forestry, fishing and mining - - - - - - 5,965 5,447 Financial, investment and insurance 46,003 25,135 12,711 14,784 1,465 1,317 2,741 3,978 Real estate - construction - - - 78 4 5 808 950 Manufacturing - - - - - - 3,004 3,079 Instalment loans to individuals and otherpersonal lending (including credit cards) - - - - - - 172 206 Real estate - mortgage - - 3,578 2,615 - - - - Asset and lease financing - - 585 457 - - - - Commercial property services - - 200 - - - 28,037 23,873 Other commercial and industrial - - 63 58 42 16 12,638 11,772
Total 46,996 25,144 17,154 18,065 1,542 1,345 53,381 49,322
_
2008 2007 2008 2007 2008 2007 2008 2007Company $m $m $m $m $m $m $m $m
Government and public authorities 149 - 796 819 - - 816 156 Agriculture, forestry, fishing and mining 481 - 7,687 6,709 98 72 6,422 4,129 Financial, investment and insurance 61 - 15,790 11,792 111 59 19,208 37,901 Real estate - construction 67 - 1,685 1,071 28 12 1,357 2,317 Manufacturing 84 - 6,325 6,377 192 171 7,102 8,177 Instalment loans to individuals and otherpersonal lending (including credit cards) 2 - 9,183 9,021 186 194 11,391 10,432 Real estate - mortgage - - 151,866 140,643 117 82 19,863 15,900 Asset and lease financing - - 13,370 12,145 120 105 380 2 Commercial property services 497 - 18,868 14,824 211 126 10,279 8,255 Other commercial and industrial 587 - 32,188 28,689 1,183 581 34,074 18,156
Total 1,928 - 257,758 232,090 2,246 1,402 110,892 105,425
Investments - AFS Acceptances
Contingent liabilities and credit-related commitments
Provisions for doubtful debts (1)
Loans at fair value
Loans at amortised cost
Provisions for doubtful debts (1)
Contingent liabilities and credit-related commitments
Due from other banks
Loans at fair value
Loans at amortised cost
Investments - HTM
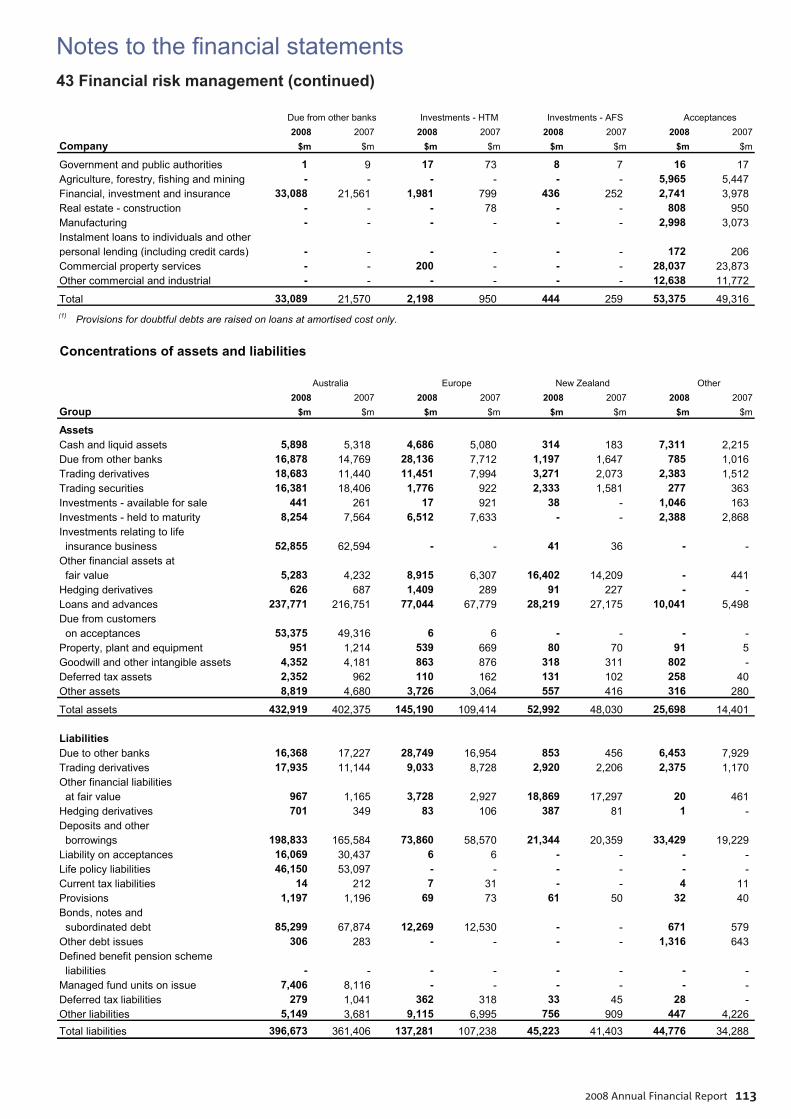
Notes to the fi nancial statements
2008 Annual Financial Report 113
43 Financial risk management (continued)
2008 2007 2008 2007 2008 2007 2008 2007Company $m $m $m $m $m $m $m $m
Government and public authorities 1 9 17 73 8 7 16 17 Agriculture, forestry, fishing and mining - - - - - - 5,965 5,447 Financial, investment and insurance 33,088 21,561 1,981 799 436 252 2,741 3,978 Real estate - construction - - - 78 - - 808 950 Manufacturing - - - - - - 2,998 3,073 Instalment loans to individuals and otherpersonal lending (including credit cards) - - - - - - 172 206 Commercial property services - - 200 - - - 28,037 23,873 Other commercial and industrial - - - - - - 12,638 11,772
Total 33,089 21,570 2,198 950 444 259 53,375 49,316 (1) Provisions for doubtful debts are raised on loans at amortised cost only.
Concentrations of assets and liabilities
2008 2007 2008 2007 2008 2007 2008 2007Group $m $m $m $m $m $m $m $m
AssetsCash and liquid assets 5,898 5,318 4,686 5,080 314 183 7,311 2,215 Due from other banks 16,878 14,769 28,136 7,712 1,197 1,647 785 1,016 Trading derivatives 18,683 11,440 11,451 7,994 3,271 2,073 2,383 1,512 Trading securities 16,381 18,406 1,776 922 2,333 1,581 277 363 Investments - available for sale 441 261 17 921 38 - 1,046 163 Investments - held to maturity 8,254 7,564 6,512 7,633 - - 2,388 2,868 Investments relating to life insurance business 52,855 62,594 - - 41 36 - - Other financial assets at fair value 5,283 4,232 8,915 6,307 16,402 14,209 - 441 Hedging derivatives 626 687 1,409 289 91 227 - - Loans and advances 237,771 216,751 77,044 67,779 28,219 27,175 10,041 5,498 Due from customers on acceptances 53,375 49,316 6 6 - - - - Property, plant and equipment 951 1,214 539 669 80 70 91 5 Goodwill and other intangible assets 4,352 4,181 863 876 318 311 802 - Deferred tax assets 2,352 962 110 162 131 102 258 40 Other assets 8,819 4,680 3,726 3,064 557 416 316 280
Total assets 432,919 402,375 145,190 109,414 52,992 48,030 25,698 14,401
LiabilitiesDue to other banks 16,368 17,227 28,749 16,954 853 456 6,453 7,929 Trading derivatives 17,935 11,144 9,033 8,728 2,920 2,206 2,375 1,170 Other financial liabilities at fair value 967 1,165 3,728 2,927 18,869 17,297 20 461 Hedging derivatives 701 349 83 106 387 81 1 - Deposits and other borrowings 198,833 165,584 73,860 58,570 21,344 20,359 33,429 19,229 Liability on acceptances 16,069 30,437 6 6 - - - - Life policy liabilities 46,150 53,097 - - - - - - Current tax liabilities 14 212 7 31 - - 4 11 Provisions 1,197 1,196 69 73 61 50 32 40 Bonds, notes and subordinated debt 85,299 67,874 12,269 12,530 - - 671 579 Other debt issues 306 283 - - - - 1,316 643 Defined benefit pension scheme liabilities - - - - - - - - Managed fund units on issue 7,406 8,116 - - - - - - Deferred tax liabilities 279 1,041 362 318 33 45 28 - Other liabilities 5,149 3,681 9,115 6,995 756 909 447 4,226 Total liabilities 396,673 361,406 137,281 107,238 45,223 41,403 44,776 34,288
Acceptances Investments - AFS Investments - HTM Due from other banks
Australia Europe New Zealand Other
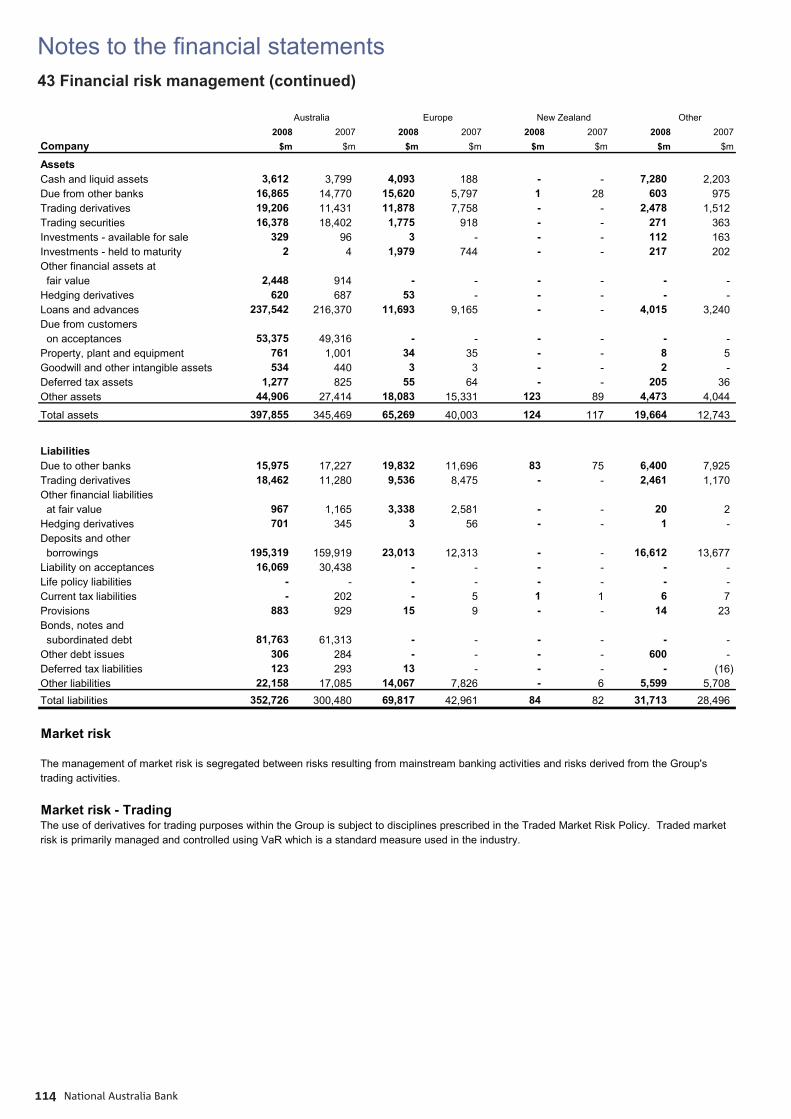
Notes to the fi nancial statements
National Australia Bank114
43 Financial risk management (continued)
2008 2007 2008 2007 2008 2007 2008 2007Company $m $m $m $m $m $m $m $m
AssetsCash and liquid assets 3,612 3,799 4,093 188 - - 7,280 2,203 Due from other banks 16,865 14,770 15,620 5,797 1 28 603 975 Trading derivatives 19,206 11,431 11,878 7,758 - - 2,478 1,512 Trading securities 16,378 18,402 1,775 918 - - 271 363 Investments - available for sale 329 96 3 - - - 112 163 Investments - held to maturity 2 4 1,979 744 - - 217 202 Other financial assets at fair value 2,448 914 - - - - - - Hedging derivatives 620 687 53 - - - - - Loans and advances 237,542 216,370 11,693 9,165 - - 4,015 3,240 Due from customers on acceptances 53,375 49,316 - - - - - - Property, plant and equipment 761 1,001 34 35 - - 8 5 Goodwill and other intangible assets 534 440 3 3 - - 2 - Deferred tax assets 1,277 825 55 64 - - 205 36 Other assets 44,906 27,414 18,083 15,331 123 89 4,473 4,044
Total assets 397,855 345,469 65,269 40,003 124 117 19,664 12,743
LiabilitiesDue to other banks 15,975 17,227 19,832 11,696 83 75 6,400 7,925 Trading derivatives 18,462 11,280 9,536 8,475 - - 2,461 1,170 Other financial liabilities at fair value 967 1,165 3,338 2,581 - - 20 2 Hedging derivatives 701 345 3 56 - - 1 - Deposits and other borrowings 195,319 159,919 23,013 12,313 - - 16,612 13,677 Liability on acceptances 16,069 30,438 - - - - - - Life policy liabilities - - - - - - - - Current tax liabilities - 202 - 5 1 1 6 7 Provisions 883 929 15 9 - - 14 23 Bonds, notes and subordinated debt 81,763 61,313 - - - - - - Other debt issues 306 284 - - - - 600 - Deferred tax liabilities 123 293 13 - - - - (16) Other liabilities 22,158 17,085 14,067 7,826 - 6 5,599 5,708 Total liabilities 352,726 300,480 69,817 42,961 84 82 31,713 28,496
Market risk
The management of market risk is segregated between risks resulting from mainstream banking activities and risks derived from the Group'strading activities.
Market risk - TradingThe use of derivatives for trading purposes within the Group is subject to disciplines prescribed in the Traded Market Risk Policy. Traded marketrisk is primarily managed and controlled using VaR which is a standard measure used in the industry.
Australia Europe New Zealand Other
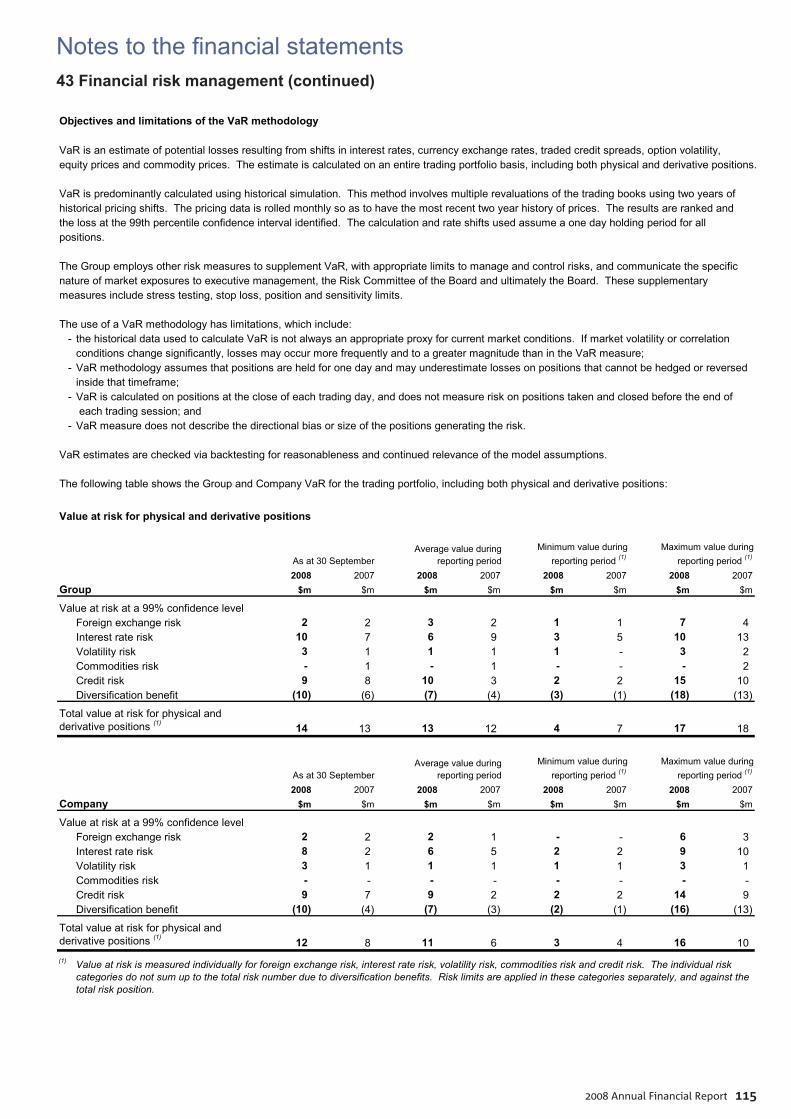
Notes to the fi nancial statements
2008 Annual Financial Report 115
43 Financial risk management (continued)
Objectives and limitations of the VaR methodology
VaR is an estimate of potential losses resulting from shifts in interest rates, currency exchange rates, traded credit spreads, option volatility, equity prices and commodity prices. The estimate is calculated on an entire trading portfolio basis, including both physical and derivative positions.
VaR is predominantly calculated using historical simulation. This method involves multiple revaluations of the trading books using two years ofhistorical pricing shifts. The pricing data is rolled monthly so as to have the most recent two year history of prices. The results are ranked andthe loss at the 99th percentile confidence interval identified. The calculation and rate shifts used assume a one day holding period for allpositions.
The Group employs other risk measures to supplement VaR, with appropriate limits to manage and control risks, and communicate the specificnature of market exposures to executive management, the Risk Committee of the Board and ultimately the Board. These supplementarymeasures include stress testing, stop loss, position and sensitivity limits.
The use of a VaR methodology has limitations, which include:- the historical data used to calculate VaR is not always an appropriate proxy for current market conditions. If market volatility or correlation
conditions change significantly, losses may occur more frequently and to a greater magnitude than in the VaR measure;- VaR methodology assumes that positions are held for one day and may underestimate losses on positions that cannot be hedged or reversed
inside that timeframe;- VaR is calculated on positions at the close of each trading day, and does not measure risk on positions taken and closed before the end of
each trading session; and- VaR measure does not describe the directional bias or size of the positions generating the risk.
VaR estimates are checked via backtesting for reasonableness and continued relevance of the model assumptions.
The following table shows the Group and Company VaR for the trading portfolio, including both physical and derivative positions:
Value at risk for physical and derivative positions
As at 30 September2008 2007 2008 2007 2008 2007 2008 2007
Group $m $m $m $m $m $m $m $m
Value at risk at a 99% confidence levelForeign exchange risk 2 2 3 2 1 1 7 4 Interest rate risk 10 7 6 9 3 5 10 13 Volatility risk 3 1 1 1 1 - 3 2 Commodities risk - 1 - 1 - - - 2 Credit risk 9 8 10 3 2 2 15 10 Diversification benefit (10) (6) (7) (4) (3) (1) (18) (13)
Total value at risk for physical andderivative positions (1) 14 13 13 12 4 7 17 18
As at 30 September2008 2007 2008 2007 2008 2007 2008 2007
Company $m $m $m $m $m $m $m $m
Value at risk at a 99% confidence levelForeign exchange risk 2 2 2 1 - - 6 3 Interest rate risk 8 2 6 5 2 2 9 10 Volatility risk 3 1 1 1 1 1 3 1 Commodities risk - - - - - - - -Credit risk 9 7 9 2 2 2 14 9 Diversification benefit (10) (4) (7) (3) (2) (1) (16) (13)
Total value at risk for physical and derivative positions (1) 12 8 11 6 3 4 16 10 (1) Value at risk is measured individually for foreign exchange risk, interest rate risk, volatility risk, commodities risk and credit risk. The individual risk
categories do not sum up to the total risk number due to diversification benefits. Risk limits are applied in these categories separately, and against thetotal risk position.
Average value during reporting period
Minimum value during reporting period (1)
Maximum value during reporting period (1)
Average value during reporting period
Minimum value during reporting period (1)
Maximum value during reporting period (1)
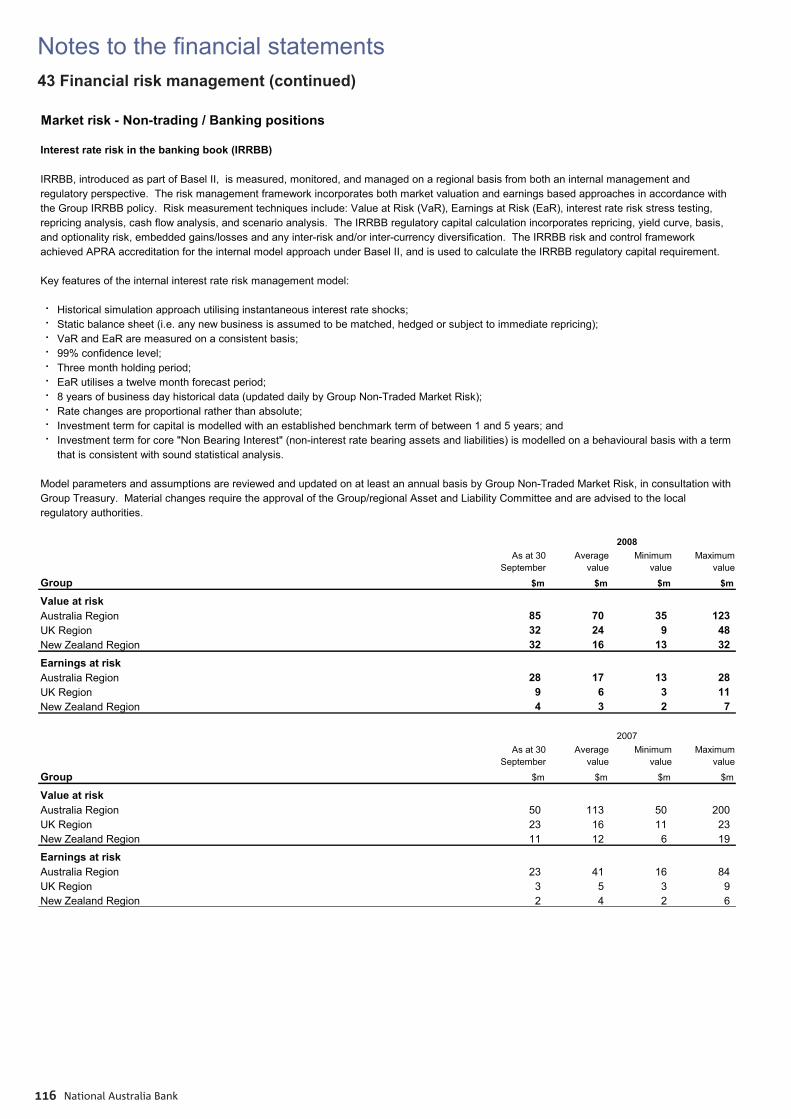
Notes to the fi nancial statements
National Australia Bank116
43 Financial risk management (continued)
Market risk - Non-trading / Banking positions
Interest rate risk in the banking book (IRRBB)
IRRBB, introduced as part of Basel II, is measured, monitored, and managed on a regional basis from both an internal management andregulatory perspective. The risk management framework incorporates both market valuation and earnings based approaches in accordance with the Group IRRBB policy. Risk measurement techniques include: Value at Risk (VaR), Earnings at Risk (EaR), interest rate risk stress testing,repricing analysis, cash flow analysis, and scenario analysis. The IRRBB regulatory capital calculation incorporates repricing, yield curve, basis,and optionality risk, embedded gains/losses and any inter-risk and/or inter-currency diversification. The IRRBB risk and control frameworkachieved APRA accreditation for the internal model approach under Basel II, and is used to calculate the IRRBB regulatory capital requirement.
Key features of the internal interest rate risk management model:
· Historical simulation approach utilising instantaneous interest rate shocks;· Static balance sheet (i.e. any new business is assumed to be matched, hedged or subject to immediate repricing);· VaR and EaR are measured on a consistent basis;· 99% confidence level;· Three month holding period;· EaR utilises a twelve month forecast period;· 8 years of business day historical data (updated daily by Group Non-Traded Market Risk);· Rate changes are proportional rather than absolute;· Investment term for capital is modelled with an established benchmark term of between 1 and 5 years; and· Investment term for core "Non Bearing Interest" (non-interest rate bearing assets and liabilities) is modelled on a behavioural basis with a term
that is consistent with sound statistical analysis.
Model parameters and assumptions are reviewed and updated on at least an annual basis by Group Non-Traded Market Risk, in consultation withGroup Treasury. Material changes require the approval of the Group/regional Asset and Liability Committee and are advised to the localregulatory authorities.
As at 30 September
Averagevalue
Minimum value
Maximum value
Group $m $m $m $m
Value at riskAustralia Region 85 70 35 123 UK Region 32 24 9 48 New Zealand Region 32 16 13 32 Earnings at riskAustralia Region 28 17 13 28 UK Region 9 6 3 11 New Zealand Region 4 3 2 7
As at 30 September
Averagevalue
Minimum value
Maximum value
Group $m $m $m $m
Value at riskAustralia Region 50 113 50 200 UK Region 23 16 11 23 New Zealand Region 11 12 6 19
Earnings at riskAustralia Region 23 41 16 84 UK Region 3 5 3 9 New Zealand Region 2 4 2 6
2007
2008
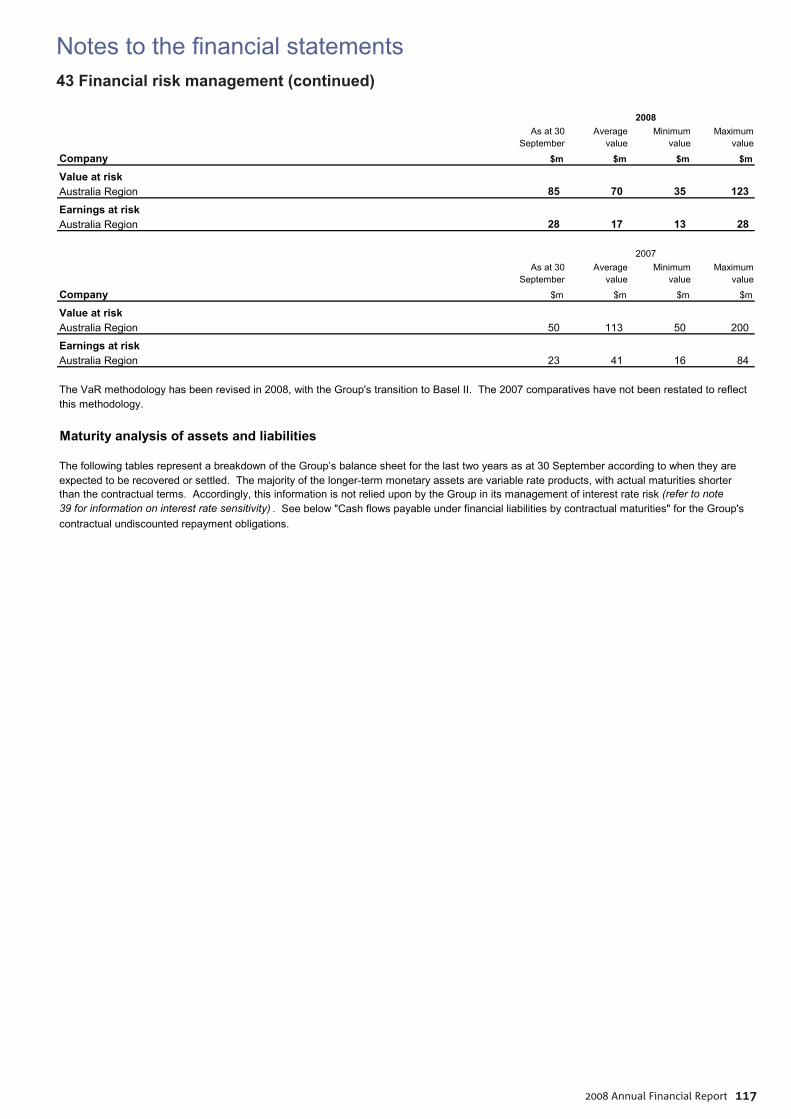
Notes to the fi nancial statements
2008 Annual Financial Report 117
43 Financial risk management (continued)
As at 30 September
Averagevalue
Minimum value
Maximum value
Company $m $m $m $m
Value at riskAustralia Region 85 70 35 123 Earnings at riskAustralia Region 28 17 13 28
As at 30 September
Averagevalue
Minimum value
Maximum value
Company $m $m $m $m
Value at riskAustralia Region 50 113 50 200
Earnings at riskAustralia Region 23 41 16 84
The VaR methodology has been revised in 2008, with the Group's transition to Basel II. The 2007 comparatives have not been restated to reflectthis methodology.
Maturity analysis of assets and liabilities
The following tables represent a breakdown of the Group’s balance sheet for the last two years as at 30 September according to when they areexpected to be recovered or settled. The majority of the longer-term monetary assets are variable rate products, with actual maturities shorterthan the contractual terms. Accordingly, this information is not relied upon by the Group in its management of interest rate risk (refer to note39 for information on interest rate sensitivity) . See below "Cash flows payable under financial liabilities by contractual maturities" for the Group'scontractual undiscounted repayment obligations.
2008
2007
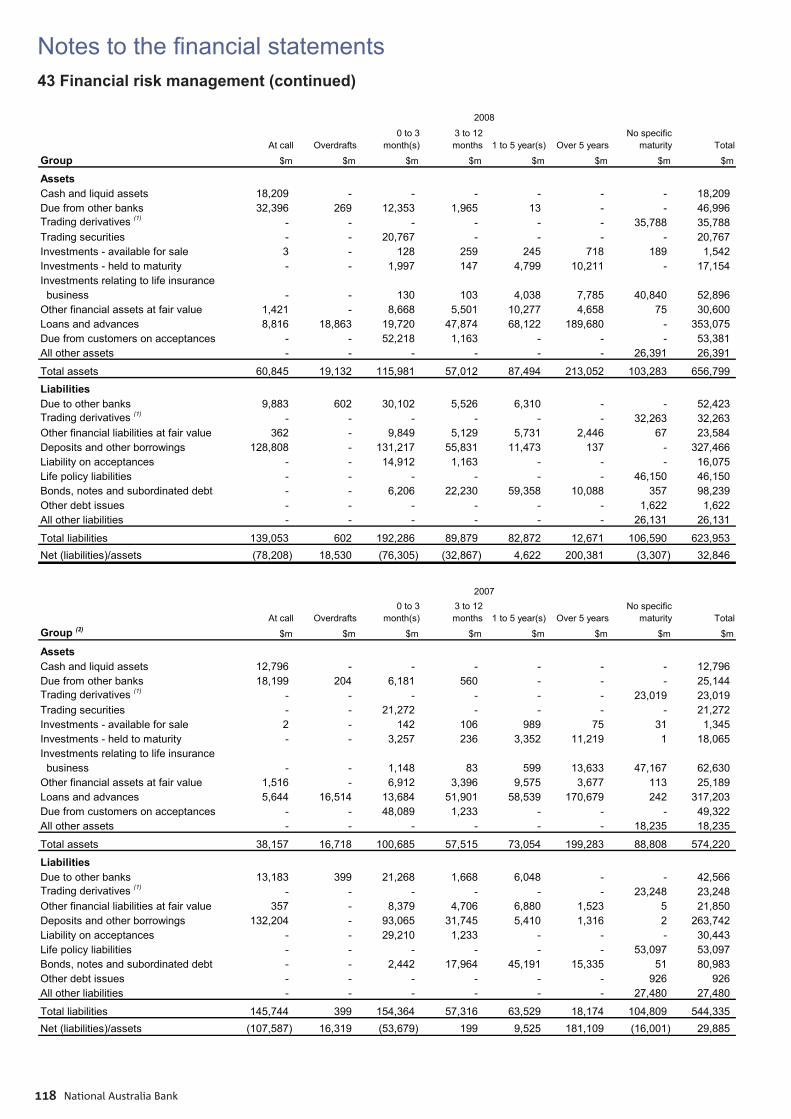
Notes to the fi nancial statements
National Australia Bank118
43 Financial risk management (continued)
2008
At call Overdrafts0 to 3
month(s)3 to 12 months 1 to 5 year(s) Over 5 years
No specific maturity Total
Group $m $m $m $m $m $m $m $m
AssetsCash and liquid assets 18,209 - - - - - - 18,209 Due from other banks 32,396 269 12,353 1,965 13 - - 46,996 Trading derivatives (1) - - - - - - 35,788 35,788 Trading securities - - 20,767 - - - - 20,767 Investments - available for sale 3 - 128 259 245 718 189 1,542 Investments - held to maturity - - 1,997 147 4,799 10,211 - 17,154 Investments relating to life insurance business - - 130 103 4,038 7,785 40,840 52,896 Other financial assets at fair value 1,421 - 8,668 5,501 10,277 4,658 75 30,600 Loans and advances 8,816 18,863 19,720 47,874 68,122 189,680 - 353,075 Due from customers on acceptances - - 52,218 1,163 - - - 53,381 All other assets - - - - - - 26,391 26,391
Total assets 60,845 19,132 115,981 57,012 87,494 213,052 103,283 656,799 LiabilitiesDue to other banks 9,883 602 30,102 5,526 6,310 - - 52,423 Trading derivatives (1) - - - - - - 32,263 32,263 Other financial liabilities at fair value 362 - 9,849 5,129 5,731 2,446 67 23,584 Deposits and other borrowings 128,808 - 131,217 55,831 11,473 137 - 327,466 Liability on acceptances - - 14,912 1,163 - - - 16,075 Life policy liabilities - - - - - - 46,150 46,150 Bonds, notes and subordinated debt - - 6,206 22,230 59,358 10,088 357 98,239 Other debt issues - - - - - - 1,622 1,622 All other liabilities - - - - - - 26,131 26,131
Total liabilities 139,053 602 192,286 89,879 82,872 12,671 106,590 623,953 Net (liabilities)/assets (78,208) 18,530 (76,305) (32,867) 4,622 200,381 (3,307) 32,846
_2007
At call Overdrafts0 to 3
month(s)3 to 12 months 1 to 5 year(s) Over 5 years
No specific maturity Total
Group (2) $m $m $m $m $m $m $m $m
AssetsCash and liquid assets 12,796 - - - - - - 12,796 Due from other banks 18,199 204 6,181 560 - - - 25,144 Trading derivatives (1) - - - - - - 23,019 23,019 Trading securities - - 21,272 - - - - 21,272 Investments - available for sale 2 - 142 106 989 75 31 1,345 Investments - held to maturity - - 3,257 236 3,352 11,219 1 18,065 Investments relating to life insurance business - - 1,148 83 599 13,633 47,167 62,630 Other financial assets at fair value 1,516 - 6,912 3,396 9,575 3,677 113 25,189 Loans and advances 5,644 16,514 13,684 51,901 58,539 170,679 242 317,203 Due from customers on acceptances - - 48,089 1,233 - - - 49,322 All other assets - - - - - - 18,235 18,235
Total assets 38,157 16,718 100,685 57,515 73,054 199,283 88,808 574,220
LiabilitiesDue to other banks 13,183 399 21,268 1,668 6,048 - - 42,566 Trading derivatives (1) - - - - - - 23,248 23,248 Other financial liabilities at fair value 357 - 8,379 4,706 6,880 1,523 5 21,850 Deposits and other borrowings 132,204 - 93,065 31,745 5,410 1,316 2 263,742 Liability on acceptances - - 29,210 1,233 - - - 30,443 Life policy liabilities - - - - - - 53,097 53,097 Bonds, notes and subordinated debt - - 2,442 17,964 45,191 15,335 51 80,983 Other debt issues - - - - - - 926 926 All other liabilities - - - - - - 27,480 27,480
Total liabilities 145,744 399 154,364 57,316 63,529 18,174 104,809 544,335 Net (liabilities)/assets (107,587) 16,319 (53,679) 199 9,525 181,109 (16,001) 29,885
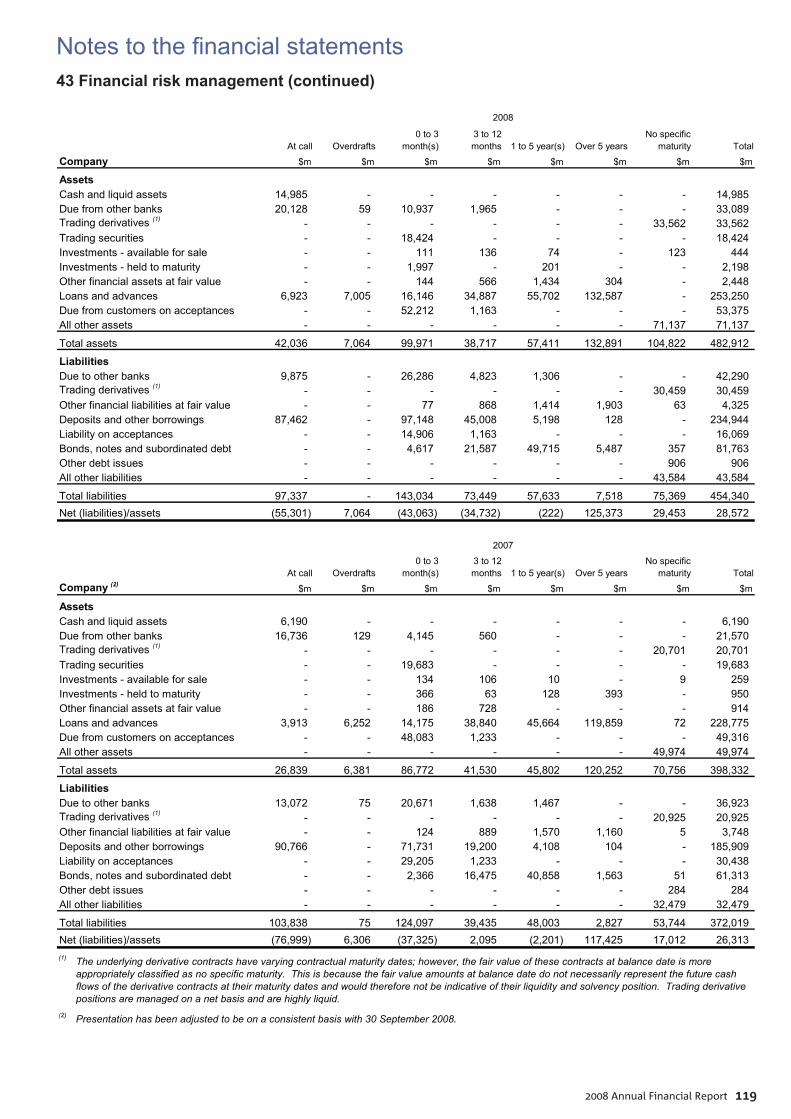
Notes to the fi nancial statements
2008 Annual Financial Report 119
43 Financial risk management (continued)
2008
At call Overdrafts0 to 3
month(s)3 to 12 months 1 to 5 year(s) Over 5 years
No specific maturity Total
Company $m $m $m $m $m $m $m $m
AssetsCash and liquid assets 14,985 - - - - - - 14,985 Due from other banks 20,128 59 10,937 1,965 - - - 33,089 Trading derivatives (1) - - - - - - 33,562 33,562 Trading securities - - 18,424 - - - - 18,424 Investments - available for sale - - 111 136 74 - 123 444 Investments - held to maturity - - 1,997 - 201 - - 2,198 Other financial assets at fair value - - 144 566 1,434 304 - 2,448 Loans and advances 6,923 7,005 16,146 34,887 55,702 132,587 - 253,250 Due from customers on acceptances - - 52,212 1,163 - - - 53,375 All other assets - - - - - - 71,137 71,137
Total assets 42,036 7,064 99,971 38,717 57,411 132,891 104,822 482,912
LiabilitiesDue to other banks 9,875 - 26,286 4,823 1,306 - - 42,290 Trading derivatives (1) - - - - - - 30,459 30,459 Other financial liabilities at fair value - - 77 868 1,414 1,903 63 4,325 Deposits and other borrowings 87,462 - 97,148 45,008 5,198 128 - 234,944 Liability on acceptances - - 14,906 1,163 - - - 16,069 Bonds, notes and subordinated debt - - 4,617 21,587 49,715 5,487 357 81,763 Other debt issues - - - - - - 906 906 All other liabilities - - - - - - 43,584 43,584
Total liabilities 97,337 - 143,034 73,449 57,633 7,518 75,369 454,340 Net (liabilities)/assets (55,301) 7,064 (43,063) (34,732) (222) 125,373 29,453 28,572
_2007
At call Overdrafts0 to 3
month(s)3 to 12 months 1 to 5 year(s) Over 5 years
No specific maturity Total
Company (2) $m $m $m $m $m $m $m $m
AssetsCash and liquid assets 6,190 - - - - - - 6,190 Due from other banks 16,736 129 4,145 560 - - - 21,570 Trading derivatives (1) - - - - - - 20,701 20,701 Trading securities - - 19,683 - - - - 19,683 Investments - available for sale - - 134 106 10 - 9 259 Investments - held to maturity - - 366 63 128 393 - 950 Other financial assets at fair value - - 186 728 - - - 914 Loans and advances 3,913 6,252 14,175 38,840 45,664 119,859 72 228,775 Due from customers on acceptances - - 48,083 1,233 - - - 49,316 All other assets - - - - - - 49,974 49,974
Total assets 26,839 6,381 86,772 41,530 45,802 120,252 70,756 398,332
LiabilitiesDue to other banks 13,072 75 20,671 1,638 1,467 - - 36,923 Trading derivatives (1) - - - - - - 20,925 20,925 Other financial liabilities at fair value - - 124 889 1,570 1,160 5 3,748 Deposits and other borrowings 90,766 - 71,731 19,200 4,108 104 - 185,909 Liability on acceptances - - 29,205 1,233 - - - 30,438 Bonds, notes and subordinated debt - - 2,366 16,475 40,858 1,563 51 61,313 Other debt issues - - - - - - 284 284 All other liabilities - - - - - - 32,479 32,479
Total liabilities 103,838 75 124,097 39,435 48,003 2,827 53,744 372,019 Net (liabilities)/assets (76,999) 6,306 (37,325) 2,095 (2,201) 117,425 17,012 26,313 (1) The underlying derivative contracts have varying contractual maturity dates; however, the fair value of these contracts at balance date is more
appropriately classified as no specific maturity. This is because the fair value amounts at balance date do not necessarily represent the future cash flows of the derivative contracts at their maturity dates and would therefore not be indicative of their liquidity and solvency position. Trading derivative positions are managed on a net basis and are highly liquid.
(2) Presentation has been adjusted to be on a consistent basis with 30 September 2008.
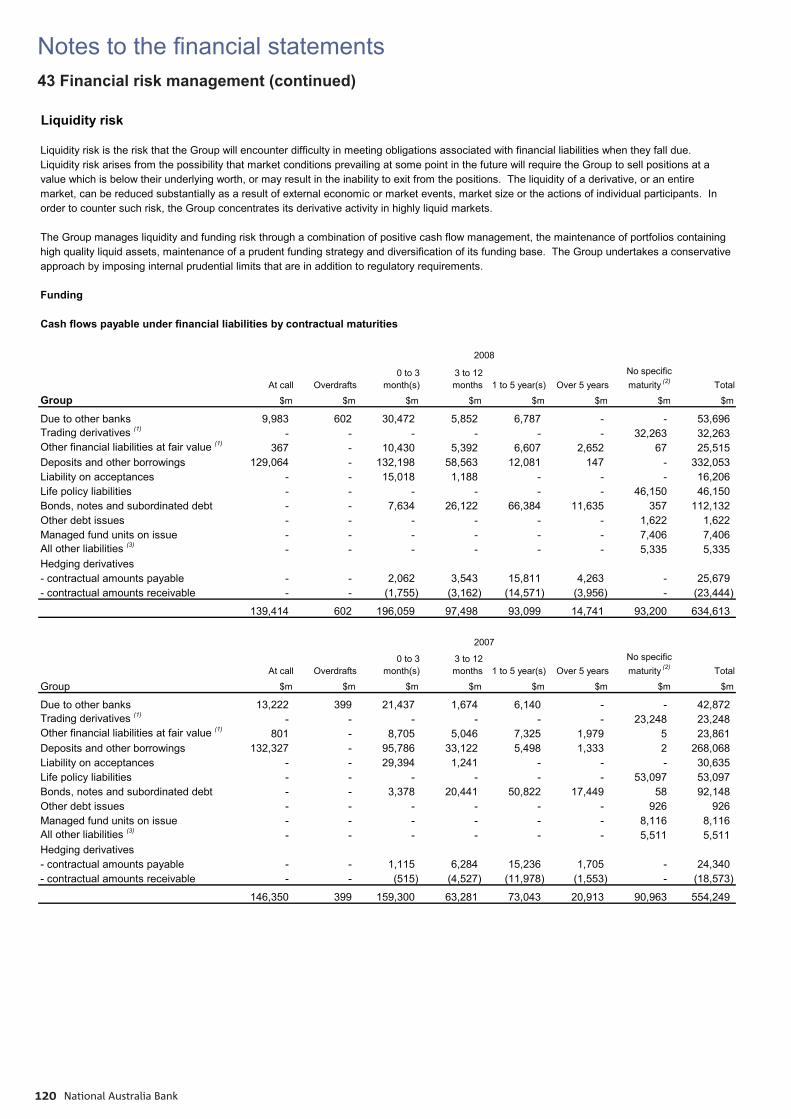
Notes to the fi nancial statements
National Australia Bank120
43 Financial risk management (continued)
Liquidity risk
Liquidity risk is the risk that the Group will encounter difficulty in meeting obligations associated with financial liabilities when they fall due.Liquidity risk arises from the possibility that market conditions prevailing at some point in the future will require the Group to sell positions at avalue which is below their underlying worth, or may result in the inability to exit from the positions. The liquidity of a derivative, or an entiremarket, can be reduced substantially as a result of external economic or market events, market size or the actions of individual participants. Inorder to counter such risk, the Group concentrates its derivative activity in highly liquid markets.
The Group manages liquidity and funding risk through a combination of positive cash flow management, the maintenance of portfolios containinghigh quality liquid assets, maintenance of a prudent funding strategy and diversification of its funding base. The Group undertakes a conservativeapproach by imposing internal prudential limits that are in addition to regulatory requirements.
Funding
Cash flows payable under financial liabilities by contractual maturities_
2008
At call Overdrafts0 to 3
month(s)3 to 12 months 1 to 5 year(s) Over 5 years
No specific maturity (2) Total
Group $m $m $m $m $m $m $m $m
Due to other banks 9,983 602 30,472 5,852 6,787 - - 53,696 Trading derivatives (1) - - - - - - 32,263 32,263 Other financial liabilities at fair value (1) 367 - 10,430 5,392 6,607 2,652 67 25,515 Deposits and other borrowings 129,064 - 132,198 58,563 12,081 147 - 332,053 Liability on acceptances - - 15,018 1,188 - - - 16,206 Life policy liabilities - - - - - - 46,150 46,150 Bonds, notes and subordinated debt - - 7,634 26,122 66,384 11,635 357 112,132 Other debt issues - - - - - - 1,622 1,622 Managed fund units on issue - - - - - - 7,406 7,406 All other liabilities (3) - - - - - - 5,335 5,335 Hedging derivatives- contractual amounts payable - - 2,062 3,543 15,811 4,263 - 25,679 - contractual amounts receivable - - (1,755) (3,162) (14,571) (3,956) - (23,444)
139,414 602 196,059 97,498 93,099 14,741 93,200 634,613 _
2007
At call Overdrafts0 to 3
month(s)3 to 12 months 1 to 5 year(s) Over 5 years
No specific maturity (2) Total
Group $m $m $m $m $m $m $m $m
Due to other banks 13,222 399 21,437 1,674 6,140 - - 42,872 Trading derivatives (1) - - - - - - 23,248 23,248 Other financial liabilities at fair value (1) 801 - 8,705 5,046 7,325 1,979 5 23,861 Deposits and other borrowings 132,327 - 95,786 33,122 5,498 1,333 2 268,068 Liability on acceptances - - 29,394 1,241 - - - 30,635 Life policy liabilities - - - - - - 53,097 53,097 Bonds, notes and subordinated debt - - 3,378 20,441 50,822 17,449 58 92,148 Other debt issues - - - - - - 926 926 Managed fund units on issue - - - - - - 8,116 8,116 All other liabilities (3) - - - - - - 5,511 5,511 Hedging derivatives- contractual amounts payable - - 1,115 6,284 15,236 1,705 - 24,340 - contractual amounts receivable - - (515) (4,527) (11,978) (1,553) - (18,573)
146,350 399 159,300 63,281 73,043 20,913 90,963 554,249
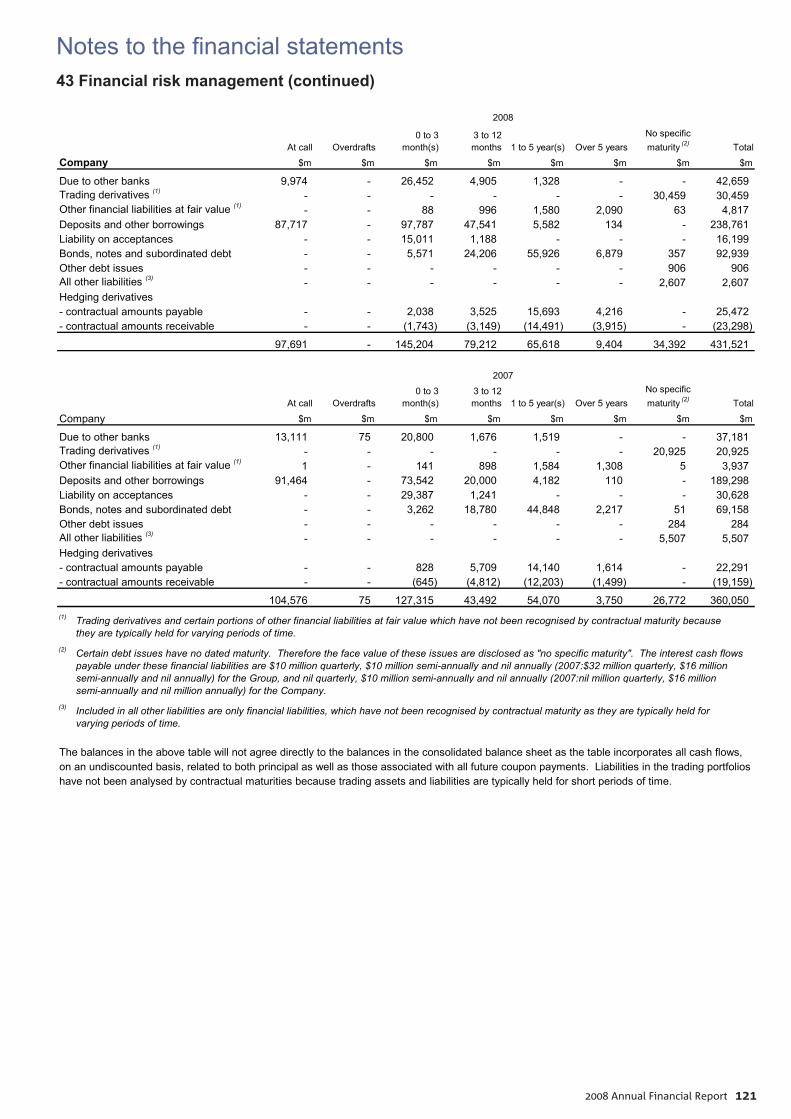
Notes to the fi nancial statements
2008 Annual Financial Report 121
43 Financial risk management (continued)
2008
At call Overdrafts0 to 3
month(s)3 to 12 months 1 to 5 year(s) Over 5 years
No specific maturity (2) Total
Company $m $m $m $m $m $m $m $m
Due to other banks 9,974 - 26,452 4,905 1,328 - - 42,659 Trading derivatives (1) - - - - - - 30,459 30,459 Other financial liabilities at fair value (1) - - 88 996 1,580 2,090 63 4,817 Deposits and other borrowings 87,717 - 97,787 47,541 5,582 134 - 238,761 Liability on acceptances - - 15,011 1,188 - - - 16,199 Bonds, notes and subordinated debt - - 5,571 24,206 55,926 6,879 357 92,939 Other debt issues - - - - - - 906 906 All other liabilities (3) - - - - - - 2,607 2,607 Hedging derivatives- contractual amounts payable - - 2,038 3,525 15,693 4,216 - 25,472 - contractual amounts receivable - - (1,743) (3,149) (14,491) (3,915) - (23,298)
97,691 - 145,204 79,212 65,618 9,404 34,392 431,521 _
2007
At call Overdrafts0 to 3
month(s)3 to 12 months 1 to 5 year(s) Over 5 years
No specific maturity (2) Total
Company $m $m $m $m $m $m $m $m
Due to other banks 13,111 75 20,800 1,676 1,519 - - 37,181 Trading derivatives (1) - - - - - - 20,925 20,925 Other financial liabilities at fair value (1) 1 - 141 898 1,584 1,308 5 3,937 Deposits and other borrowings 91,464 - 73,542 20,000 4,182 110 - 189,298 Liability on acceptances - - 29,387 1,241 - - - 30,628 Bonds, notes and subordinated debt - - 3,262 18,780 44,848 2,217 51 69,158 Other debt issues - - - - - - 284 284 All other liabilities (3) - - - - - - 5,507 5,507 Hedging derivatives- contractual amounts payable - - 828 5,709 14,140 1,614 - 22,291 - contractual amounts receivable - - (645) (4,812) (12,203) (1,499) - (19,159)
104,576 75 127,315 43,492 54,070 3,750 26,772 360,050 (1) Trading derivatives and certain portions of other financial liabilities at fair value which have not been recognised by contractual maturity because
they are typically held for varying periods of time.(2) Certain debt issues have no dated maturity. Therefore the face value of these issues are disclosed as "no specific maturity". The interest cash flows
payable under these financial liabilities are $10 million quarterly, $10 million semi-annually and nil annually (2007:$32 million quarterly, $16 millionsemi-annually and nil annually) for the Group, and nil quarterly, $10 million semi-annually and nil annually (2007:nil million quarterly, $16 millionsemi-annually and nil million annually) for the Company.
(3) Included in all other liabilities are only financial liabilities, which have not been recognised by contractual maturity as they are typically held forvarying periods of time.
The balances in the above table will not agree directly to the balances in the consolidated balance sheet as the table incorporates all cash flows,on an undiscounted basis, related to both principal as well as those associated with all future coupon payments. Liabilities in the trading portfolioshave not been analysed by contractual maturities because trading assets and liabilities are typically held for short periods of time.
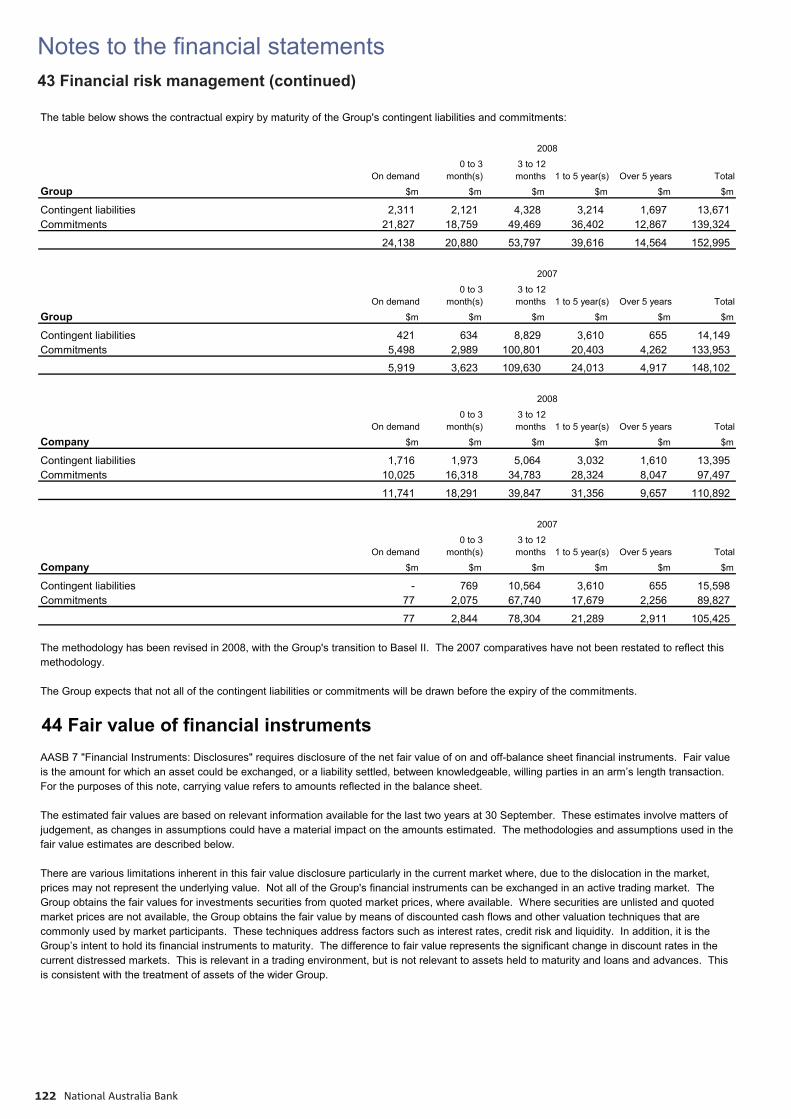
Notes to the fi nancial statements
National Australia Bank122
43 Financial risk management (continued)
44 Fair value of financial instrumentsAASB 7 "Financial Instruments: Disclosures" requires disclosure of the net fair value of on and off-balance sheet financial instruments. Fair valueis the amount for which an asset could be exchanged, or a liability settled, between knowledgeable, willing parties in an arm’s length transaction. For the purposes of this note, carrying value refers to amounts reflected in the balance sheet.
The estimated fair values are based on relevant information available for the last two years at 30 September. These estimates involve matters ofjudgement, as changes in assumptions could have a material impact on the amounts estimated. The methodologies and assumptions used in thefair value estimates are described below.
There are various limitations inherent in this fair value disclosure particularly in the current market where, due to the dislocation in the market,prices may not represent the underlying value. Not all of the Group's financial instruments can be exchanged in an active trading market. TheGroup obtains the fair values for investments securities from quoted market prices, where available. Where securities are unlisted and quotedmarket prices are not available, the Group obtains the fair value by means of discounted cash flows and other valuation techniques that arecommonly used by market participants. These techniques address factors such as interest rates, credit risk and liquidity. In addition, it is theGroup’s intent to hold its financial instruments to maturity. The difference to fair value represents the significant change in discount rates in thecurrent distressed markets. This is relevant in a trading environment, but is not relevant to assets held to maturity and loans and advances. Thisis consistent with the treatment of assets of the wider Group.
The table below shows the contractual expiry by maturity of the Group's contingent liabilities and commitments:_
On demand0 to 3
month(s)3 to 12 months 1 to 5 year(s) Over 5 years Total
Group $m $m $m $m $m $m
Contingent liabilities 2,311 2,121 4,328 3,214 1,697 13,671 Commitments 21,827 18,759 49,469 36,402 12,867 139,324
24,138 20,880 53,797 39,616 14,564 152,995 _
On demand0 to 3
month(s)3 to 12 months 1 to 5 year(s) Over 5 years Total
Group $m $m $m $m $m $m
Contingent liabilities 421 634 8,829 3,610 655 14,149 Commitments 5,498 2,989 100,801 20,403 4,262 133,953
5,919 3,623 109,630 24,013 4,917 148,102 _
On demand0 to 3
month(s)3 to 12 months 1 to 5 year(s) Over 5 years Total
Company $m $m $m $m $m $m
Contingent liabilities 1,716 1,973 5,064 3,032 1,610 13,395 Commitments 10,025 16,318 34,783 28,324 8,047 97,497
11,741 18,291 39,847 31,356 9,657 110,892 _
On demand0 to 3
month(s)3 to 12 months 1 to 5 year(s) Over 5 years Total
Company $m $m $m $m $m $m
Contingent liabilities - 769 10,564 3,610 655 15,598 Commitments 77 2,075 67,740 17,679 2,256 89,827
77 2,844 78,304 21,289 2,911 105,425
The methodology has been revised in 2008, with the Group's transition to Basel II. The 2007 comparatives have not been restated to reflect thismethodology.
The Group expects that not all of the contingent liabilities or commitments will be drawn before the expiry of the commitments.
2008
2007
2008
2007
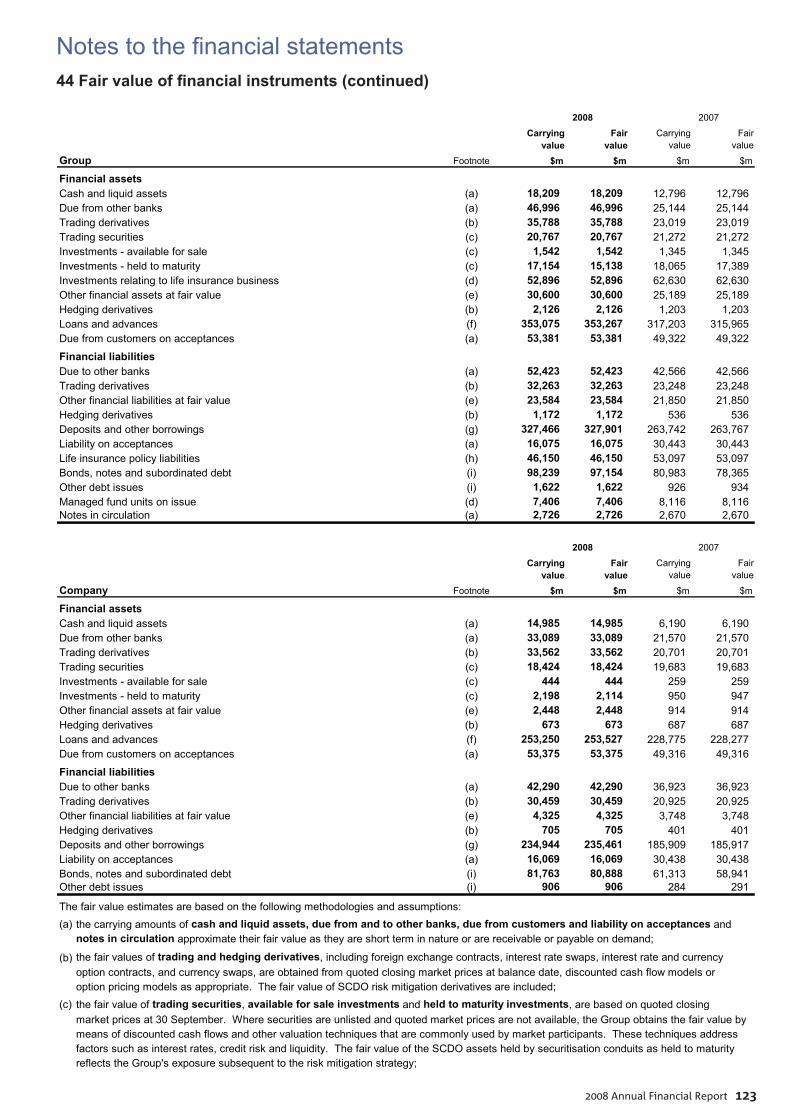
Notes to the fi nancial statements
2008 Annual Financial Report 123
Carrying value
Fair value
Carrying value
Fair value
Group Footnote $m $m $m $m
Financial assetsCash and liquid assets (a) 18,209 18,209 12,796 12,796 Due from other banks (a) 46,996 46,996 25,144 25,144 Trading derivatives (b) 35,788 35,788 23,019 23,019 Trading securities (c) 20,767 20,767 21,272 21,272 Investments - available for sale (c) 1,542 1,542 1,345 1,345 Investments - held to maturity (c) 17,154 15,138 18,065 17,389 Investments relating to life insurance business (d) 52,896 52,896 62,630 62,630 Other financial assets at fair value (e) 30,600 30,600 25,189 25,189 Hedging derivatives (b) 2,126 2,126 1,203 1,203 Loans and advances (f) 353,075 353,267 317,203 315,965 Due from customers on acceptances (a) 53,381 53,381 49,322 49,322
Financial liabilitiesDue to other banks (a) 52,423 52,423 42,566 42,566 Trading derivatives (b) 32,263 32,263 23,248 23,248 Other financial liabilities at fair value (e) 23,584 23,584 21,850 21,850 Hedging derivatives (b) 1,172 1,172 536 536 Deposits and other borrowings (g) 327,466 327,901 263,742 263,767 Liability on acceptances (a) 16,075 16,075 30,443 30,443 Life insurance policy liabilities (h) 46,150 46,150 53,097 53,097 Bonds, notes and subordinated debt (i) 98,239 97,154 80,983 78,365 Other debt issues (i) 1,622 1,622 926 934 Managed fund units on issue (d) 7,406 7,406 8,116 8,116 Notes in circulation (a) 2,726 2,726 2,670 2,670
_
Carrying value
Fair value
Carrying value
Fair value
Company Footnote $m $m $m $m
Financial assetsCash and liquid assets (a) 14,985 14,985 6,190 6,190 Due from other banks (a) 33,089 33,089 21,570 21,570 Trading derivatives (b) 33,562 33,562 20,701 20,701 Trading securities (c) 18,424 18,424 19,683 19,683 Investments - available for sale (c) 444 444 259 259 Investments - held to maturity (c) 2,198 2,114 950 947 Other financial assets at fair value (e) 2,448 2,448 914 914 Hedging derivatives (b) 673 673 687 687 Loans and advances (f) 253,250 253,527 228,775 228,277 Due from customers on acceptances (a) 53,375 53,375 49,316 49,316
Financial liabilitiesDue to other banks (a) 42,290 42,290 36,923 36,923 Trading derivatives (b) 30,459 30,459 20,925 20,925 Other financial liabilities at fair value (e) 4,325 4,325 3,748 3,748 Hedging derivatives (b) 705 705 401 401 Deposits and other borrowings (g) 234,944 235,461 185,909 185,917 Liability on acceptances (a) 16,069 16,069 30,438 30,438 Bonds, notes and subordinated debt (i) 81,763 80,888 61,313 58,941 Other debt issues (i) 906 906 284 291
The fair value estimates are based on the following methodologies and assumptions:(a) the carrying amounts of cash and liquid assets, due from and to other banks, due from customers and liability on acceptances and
notes in circulation approximate their fair value as they are short term in nature or are receivable or payable on demand;
(b) the fair values of trading and hedging derivatives, including foreign exchange contracts, interest rate swaps, interest rate and currencyoption contracts, and currency swaps, are obtained from quoted closing market prices at balance date, discounted cash flow models oroption pricing models as appropriate. The fair value of SCDO risk mitigation derivatives are included;
(c) the fair value of trading securities, available for sale investments and held to maturity investments, are based on quoted closing market prices at 30 September. Where securities are unlisted and quoted market prices are not available, the Group obtains the fair value by means of discounted cash flows and other valuation techniques that are commonly used by market participants. These techniques address factors such as interest rates, credit risk and liquidity. The fair value of the SCDO assets held by securitisation conduits as held to maturityreflects the Group's exposure subsequent to the risk mitigation strategy;
2008 2007
2008 2007
44 Fair value of fi nancial instruments (continued)
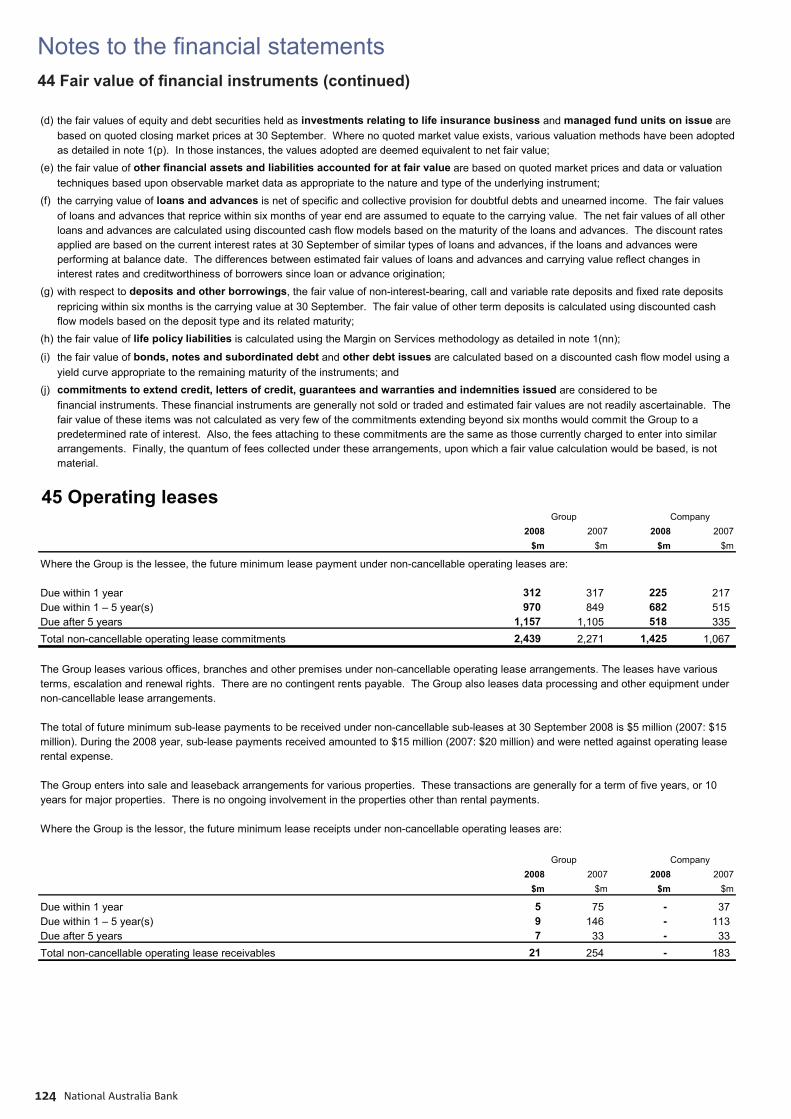
Notes to the fi nancial statements
National Australia Bank124
44 Fair value of fi nancial instruments (continued)
45 Operating leases_
2008 2007 2008 2007$m $m $m $m
Where the Group is the lessee, the future minimum lease payment under non-cancellable operating leases are:
Due within 1 year 312 317 225 217 Due within 1 – 5 year(s) 970 849 682 515 Due after 5 years 1,157 1,105 518 335 Total non-cancellable operating lease commitments 2,439 2,271 1,425 1,067
The Group leases various offices, branches and other premises under non-cancellable operating lease arrangements. The leases have variousterms, escalation and renewal rights. There are no contingent rents payable. The Group also leases data processing and other equipment undernon-cancellable lease arrangements.
The total of future minimum sub-lease payments to be received under non-cancellable sub-leases at 30 September 2008 is $5 million (2007: $15million). During the 2008 year, sub-lease payments received amounted to $15 million (2007: $20 million) and were netted against operating leaserental expense.
The Group enters into sale and leaseback arrangements for various properties. These transactions are generally for a term of five years, or 10years for major properties. There is no ongoing involvement in the properties other than rental payments.
Where the Group is the lessor, the future minimum lease receipts under non-cancellable operating leases are:_
2008 2007 2008 2007$m $m $m $m
Due within 1 year 5 75 - 37 Due within 1 – 5 year(s) 9 146 - 113 Due after 5 years 7 33 - 33 Total non-cancellable operating lease receivables 21 254 - 183
Group Company
Group Company
(d) the fair values of equity and debt securities held as investments relating to life insurance business and managed fund units on issue arebased on quoted closing market prices at 30 September. Where no quoted market value exists, various valuation methods have been adoptedas detailed in note 1(p). In those instances, the values adopted are deemed equivalent to net fair value;
(e) the fair value of other financial assets and liabilities accounted for at fair value are based on quoted market prices and data or valuationtechniques based upon observable market data as appropriate to the nature and type of the underlying instrument;
(f) the carrying value of loans and advances is net of specific and collective provision for doubtful debts and unearned income. The fair valuesof loans and advances that reprice within six months of year end are assumed to equate to the carrying value. The net fair values of all otherloans and advances are calculated using discounted cash flow models based on the maturity of the loans and advances. The discount ratesapplied are based on the current interest rates at 30 September of similar types of loans and advances, if the loans and advances wereperforming at balance date. The differences between estimated fair values of loans and advances and carrying value reflect changes ininterest rates and creditworthiness of borrowers since loan or advance origination;
(g) with respect to deposits and other borrowings, the fair value of non-interest-bearing, call and variable rate deposits and fixed rate depositsrepricing within six months is the carrying value at 30 September. The fair value of other term deposits is calculated using discounted cashflow models based on the deposit type and its related maturity;
(h) the fair value of life policy liabilities is calculated using the Margin on Services methodology as detailed in note 1(nn);
(i) the fair value of bonds, notes and subordinated debt and other debt issues are calculated based on a discounted cash flow model using ayield curve appropriate to the remaining maturity of the instruments; and
(j) commitments to extend credit, letters of credit, guarantees and warranties and indemnities issued are considered to befinancial instruments. These financial instruments are generally not sold or traded and estimated fair values are not readily ascertainable. Thefair value of these items was not calculated as very few of the commitments extending beyond six months would commit the Group to apredetermined rate of interest. Also, the fees attaching to these commitments are the same as those currently charged to enter into similararrangements. Finally, the quantum of fees collected under these arrangements, upon which a fair value calculation would be based, is notmaterial.
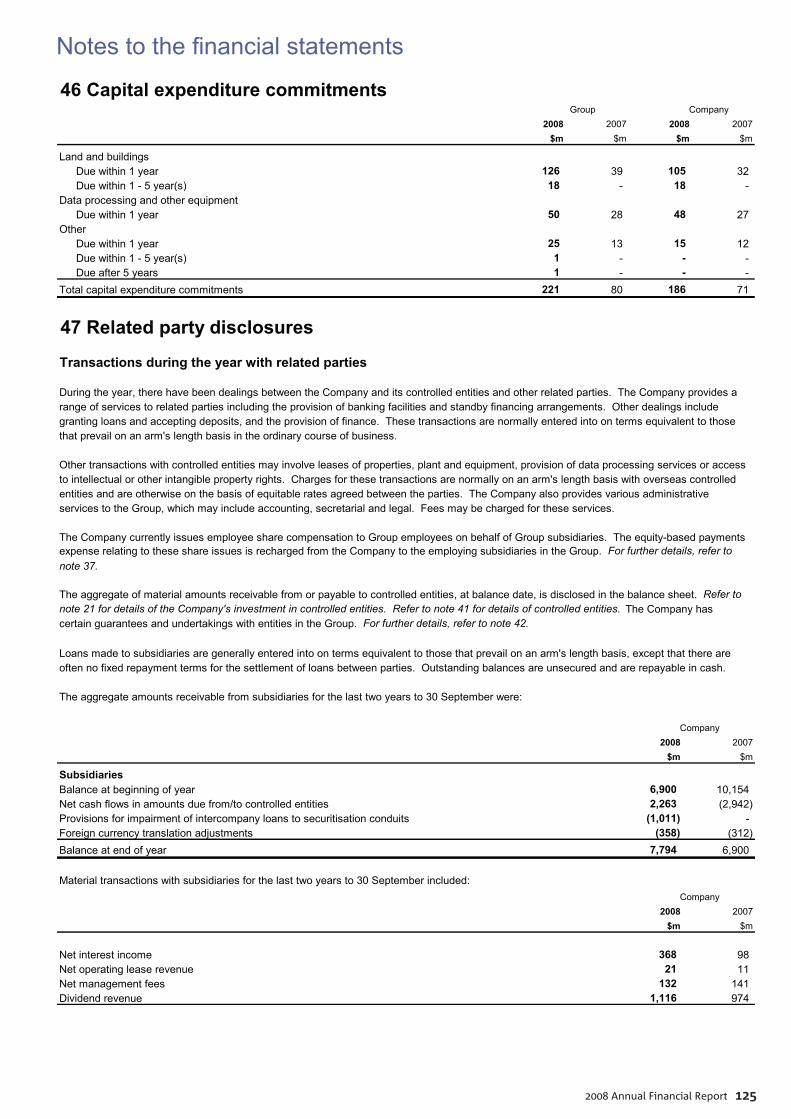
Notes to the fi nancial statements
2008 Annual Financial Report 125
46 Capital expenditure commitments_
2008 2007 2008 2007$m $m $m $m
Land and buildingsDue within 1 year 126 39 105 32 Due within 1 - 5 year(s) 18 - 18 -
Data processing and other equipmentDue within 1 year 50 28 48 27
OtherDue within 1 year 25 13 15 12 Due within 1 - 5 year(s) 1 - - - Due after 5 years 1 - - -
Total capital expenditure commitments 221 80 186 71
Group Company
47 Related party disclosures
Transactions during the year with related parties
During the year, there have been dealings between the Company and its controlled entities and other related parties. The Company provides arange of services to related parties including the provision of banking facilities and standby financing arrangements. Other dealings includegranting loans and accepting deposits, and the provision of finance. These transactions are normally entered into on terms equivalent to thosethat prevail on an arm's length basis in the ordinary course of business.
Other transactions with controlled entities may involve leases of properties, plant and equipment, provision of data processing services or accessto intellectual or other intangible property rights. Charges for these transactions are normally on an arm's length basis with overseas controlledentities and are otherwise on the basis of equitable rates agreed between the parties. The Company also provides various administrativeservices to the Group, which may include accounting, secretarial and legal. Fees may be charged for these services.
The Company currently issues employee share compensation to Group employees on behalf of Group subsidiaries. The equity-based paymentsexpense relating to these share issues is recharged from the Company to the employing subsidiaries in the Group. For further details, refer tonote 37.
The aggregate of material amounts receivable from or payable to controlled entities, at balance date, is disclosed in the balance sheet. Refer tonote 21 for details of the Company's investment in controlled entities. Refer to note 41 for details of controlled entities. The Company hascertain guarantees and undertakings with entities in the Group. For further details, refer to note 42.
Loans made to subsidiaries are generally entered into on terms equivalent to those that prevail on an arm's length basis, except that there areoften no fixed repayment terms for the settlement of loans between parties. Outstanding balances are unsecured and are repayable in cash.
The aggregate amounts receivable from subsidiaries for the last two years to 30 September were: _
2008 2007$m $m
SubsidiariesBalance at beginning of year 6,900 10,154 Net cash flows in amounts due from/to controlled entities 2,263 (2,942) Provisions for impairment of intercompany loans to securitisation conduits (1,011) - Foreign currency translation adjustments (358) (312) Balance at end of year 7,794 6,900
Material transactions with subsidiaries for the last two years to 30 September included:_
2008 2007$m $m
Net interest income 368 98 Net operating lease revenue 21 11 Net management fees 132 141 Dividend revenue 1,116 974
Company
Company
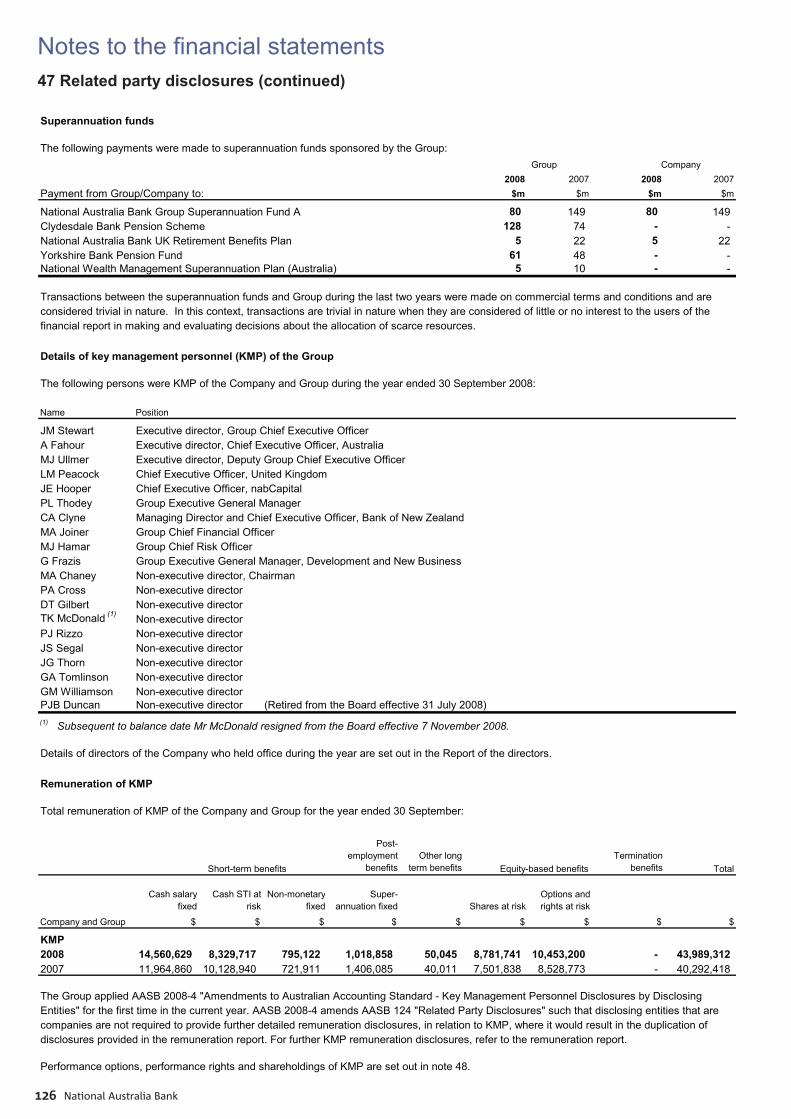
Notes to the fi nancial statements
National Australia Bank126
47 Related party disclosures (continued)
Superannuation funds
The following payments were made to superannuation funds sponsored by the Group:_
2008 2007 2008 2007Payment from Group/Company to: $m $m $m $m
National Australia Bank Group Superannuation Fund A 80 149 80 149 Clydesdale Bank Pension Scheme 128 74 - - National Australia Bank UK Retirement Benefits Plan 5 22 5 22 Yorkshire Bank Pension Fund 61 48 - - National Wealth Management Superannuation Plan (Australia) 5 10 - -
Transactions between the superannuation funds and Group during the last two years were made on commercial terms and conditions and areconsidered trivial in nature. In this context, transactions are trivial in nature when they are considered of little or no interest to the users of thefinancial report in making and evaluating decisions about the allocation of scarce resources.
Details of key management personnel (KMP) of the Group
The following persons were KMP of the Company and Group during the year ended 30 September 2008:_
Name Position
JM Stewart Executive director, Group Chief Executive OfficerA Fahour Executive director, Chief Executive Officer, AustraliaMJ Ullmer Executive director, Deputy Group Chief Executive OfficerLM Peacock Chief Executive Officer, United KingdomJE Hooper Chief Executive Officer, nabCapitalPL Thodey Group Executive General ManagerCA Clyne Managing Director and Chief Executive Officer, Bank of New ZealandMA Joiner Group Chief Financial OfficerMJ Hamar Group Chief Risk OfficerG Frazis Group Executive General Manager, Development and New BusinessMA Chaney Non-executive director, ChairmanPA Cross Non-executive directorDT Gilbert Non-executive directorTK McDonald (1) Non-executive directorPJ Rizzo Non-executive directorJS Segal Non-executive directorJG Thorn Non-executive directorGA Tomlinson Non-executive directorGM Williamson Non-executive directorPJB Duncan Non-executive director (Retired from the Board effective 31 July 2008)(1) Subsequent to balance date Mr McDonald resigned from the Board effective 7 November 2008.
Details of directors of the Company who held office during the year are set out in the Report of the directors.
Remuneration of KMP
Total remuneration of KMP of the Company and Group for the year ended 30 September:_
Post-employment
benefitsOther long
term benefitsTermination
benefits Total
Cash salary fixed
Cash STI at risk
Non-monetary fixed
Super- annuation fixed Shares at risk
Options and rights at risk
Company and Group $ $ $ $ $ $ $ $ $
KMP2008 14,560,629 8,329,717 795,122 1,018,858 50,045 8,781,741 10,453,200 - 43,989,312 2007 11,964,860 10,128,940 721,911 1,406,085 40,011 7,501,838 8,528,773 - 40,292,418
The Group applied AASB 2008-4 "Amendments to Australian Accounting Standard - Key Management Personnel Disclosures by DisclosingEntities" for the first time in the current year. AASB 2008-4 amends AASB 124 "Related Party Disclosures" such that disclosing entities that arecompanies are not required to provide further detailed remuneration disclosures, in relation to KMP, where it would result in the duplication ofdisclosures provided in the remuneration report. For further KMP remuneration disclosures, refer to the remuneration report.
Performance options, performance rights and shareholdings of KMP are set out in note 48.
Short-term benefits Equity-based benefits
Group Company
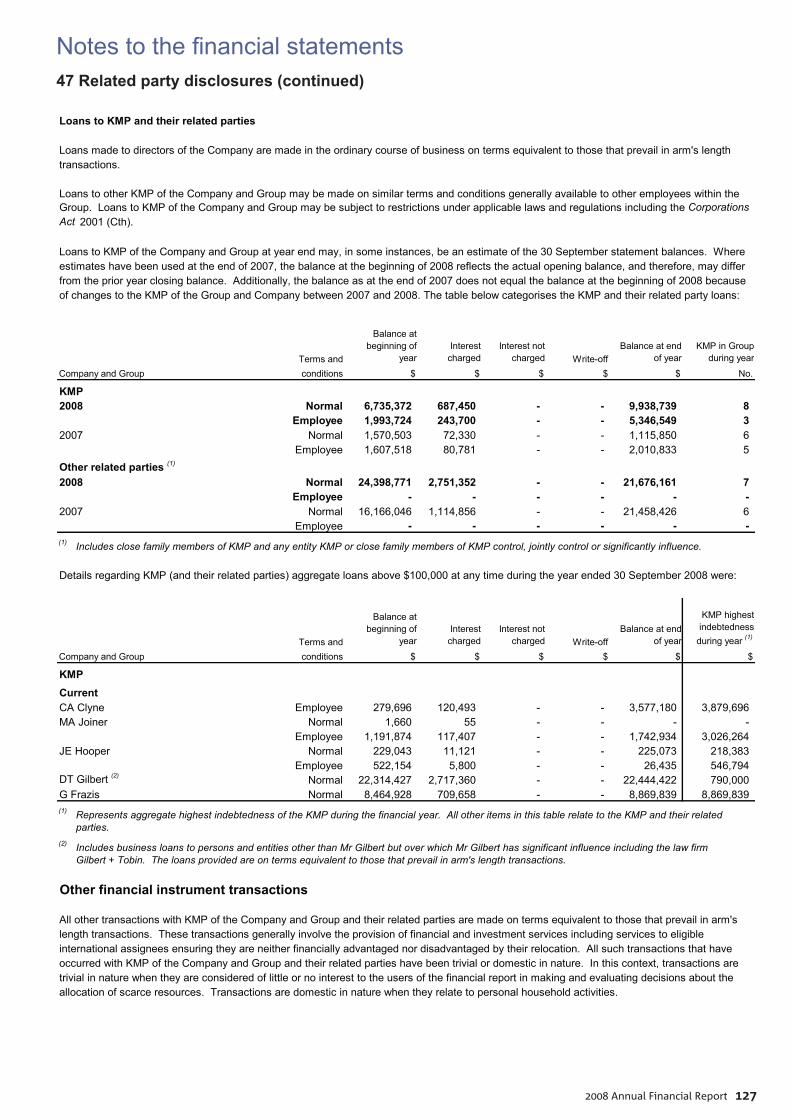
Notes to the fi nancial statements
2008 Annual Financial Report 127
47 Related party disclosures (continued)
Loans to KMP and their related parties
Loans made to directors of the Company are made in the ordinary course of business on terms equivalent to those that prevail in arm's lengthtransactions.
Loans to other KMP of the Company and Group may be made on similar terms and conditions generally available to other employees within theGroup. Loans to KMP of the Company and Group may be subject to restrictions under applicable laws and regulations including the CorporationsAct 2001 (Cth).
Loans to KMP of the Company and Group at year end may, in some instances, be an estimate of the 30 September statement balances. Whereestimates have been used at the end of 2007, the balance at the beginning of 2008 reflects the actual opening balance, and therefore, may differfrom the prior year closing balance. Additionally, the balance as at the end of 2007 does not equal the balance at the beginning of 2008 becauseof changes to the KMP of the Group and Company between 2007 and 2008. The table below categorises the KMP and their related party loans:
_
Terms and
Balance at beginning of
yearInterest
chargedInterest not
charged Write-offBalance at end
of yearKMP in Group
during year
Company and Group conditions $ $ $ $ $ No.
KMP 2008 Normal 6,735,372 687,450 - - 9,938,739 8
Employee 1,993,724 243,700 - - 5,346,549 3 2007 Normal 1,570,503 72,330 - - 1,115,850 6
Employee 1,607,518 80,781 - - 2,010,833 5 Other related parties (1) 2008 Normal 24,398,771 2,751,352 - - 21,676,161 7
Employee - - - - - - 2007 Normal 16,166,046 1,114,856 - - 21,458,426 6
Employee - - - - - - (1) Includes close family members of KMP and any entity KMP or close family members of KMP control, jointly control or significantly influence.
Details regarding KMP (and their related parties) aggregate loans above $100,000 at any time during the year ended 30 September 2008 were:_
Terms and
Balance at beginning of
yearInterest
chargedInterest not
charged Write-offBalance at end
of year
KMP highest indebtedness
during year (1)
Company and Group conditions $ $ $ $ $ $
KMPCurrentCA Clyne Employee 279,696 120,493 - - 3,577,180 3,879,696 MA Joiner Normal 1,660 55 - - - -
Employee 1,191,874 117,407 - - 1,742,934 3,026,264 JE Hooper Normal 229,043 11,121 - - 225,073 218,383 Employee 522,154 5,800 - - 26,435 546,794 DT Gilbert (2) Normal 22,314,427 2,717,360 - - 22,444,422 790,000 G Frazis Normal 8,464,928 709,658 - - 8,869,839 8,869,839 (1) Represents aggregate highest indebtedness of the KMP during the financial year. All other items in this table relate to the KMP and their related
parties.(2) Includes business loans to persons and entities other than Mr Gilbert but over which Mr Gilbert has significant influence including the law firm
Gilbert + Tobin. The loans provided are on terms equivalent to those that prevail in arm's length transactions.
Other financial instrument transactions
All other transactions with KMP of the Company and Group and their related parties are made on terms equivalent to those that prevail in arm'slength transactions. These transactions generally involve the provision of financial and investment services including services to eligibleinternational assignees ensuring they are neither financially advantaged nor disadvantaged by their relocation. All such transactions that haveoccurred with KMP of the Company and Group and their related parties have been trivial or domestic in nature. In this context, transactions aretrivial in nature when they are considered of little or no interest to the users of the financial report in making and evaluating decisions about theallocation of scarce resources. Transactions are domestic in nature when they relate to personal household activities.
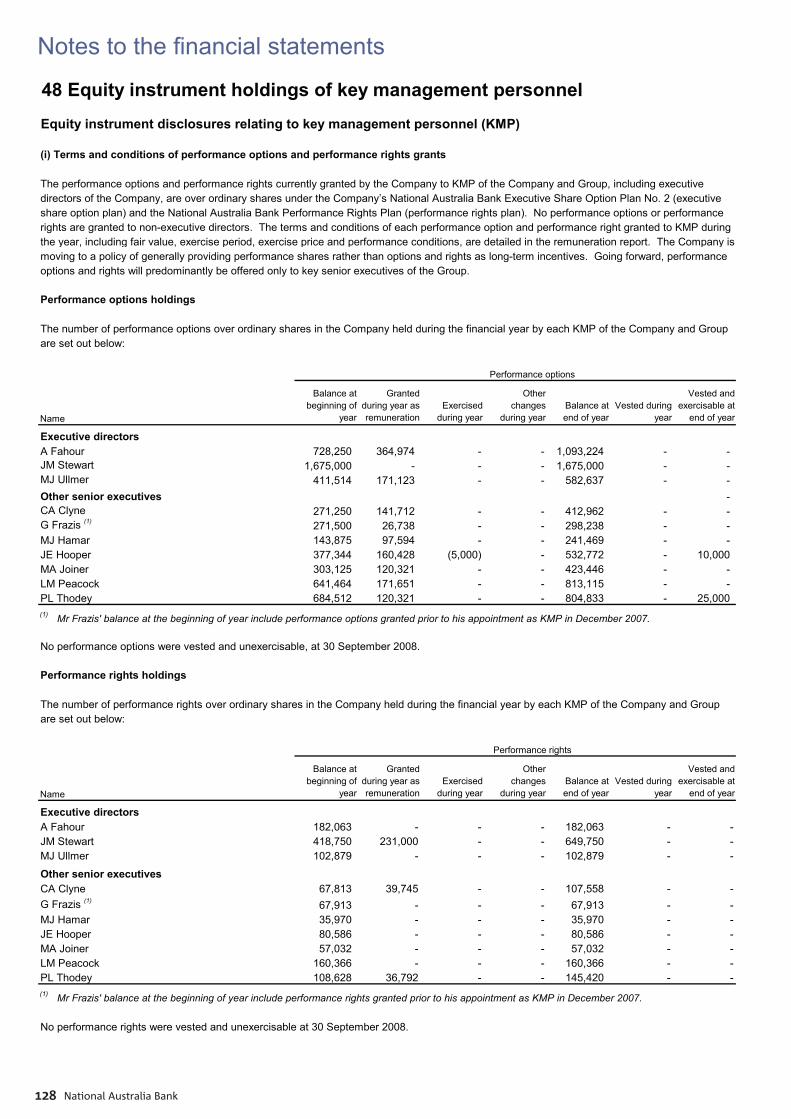
Notes to the fi nancial statements
National Australia Bank128
48 Equity instrument holdings of key management personnelEquity instrument disclosures relating to key management personnel (KMP)
(i) Terms and conditions of performance options and performance rights grants
The performance options and performance rights currently granted by the Company to KMP of the Company and Group, including executivedirectors of the Company, are over ordinary shares under the Company’s National Australia Bank Executive Share Option Plan No. 2 (executiveshare option plan) and the National Australia Bank Performance Rights Plan (performance rights plan). No performance options or performancerights are granted to non-executive directors. The terms and conditions of each performance option and performance right granted to KMP duringthe year, including fair value, exercise period, exercise price and performance conditions, are detailed in the remuneration report. The Company ismoving to a policy of generally providing performance shares rather than options and rights as long-term incentives. Going forward, performanceoptions and rights will predominantly be offered only to key senior executives of the Group.
Performance options holdings
The number of performance options over ordinary shares in the Company held during the financial year by each KMP of the Company and Groupare set out below:
_
Name
Balance at beginning of
year
Granted during year as remuneration
Exercised during year
Other changes
during yearBalance at end of year
Vested during year
Vested and exercisable at
end of year
Executive directorsA Fahour 728,250 364,974 - - 1,093,224 - -JM Stewart 1,675,000 - - - 1,675,000 - -MJ Ullmer 411,514 171,123 - - 582,637 - -Other senior executives -CA Clyne 271,250 141,712 - - 412,962 - -G Frazis (1) 271,500 26,738 - - 298,238 - -MJ Hamar 143,875 97,594 - - 241,469 - -JE Hooper 377,344 160,428 (5,000) - 532,772 - 10,000 MA Joiner 303,125 120,321 - - 423,446 - -LM Peacock 641,464 171,651 - - 813,115 - -PL Thodey 684,512 120,321 - - 804,833 - 25,000 (1) Mr Frazis' balance at the beginning of year include performance options granted prior to his appointment as KMP in December 2007.
No performance options were vested and unexercisable, at 30 September 2008.
Performance rights holdings
The number of performance rights over ordinary shares in the Company held during the financial year by each KMP of the Company and Groupare set out below:
_
Name
Balance at beginning of
year
Granted during year as remuneration
Exercised during year
Other changes
during yearBalance at end of year
Vested during year
Vested and exercisable at
end of year
Executive directorsA Fahour 182,063 - - - 182,063 - -JM Stewart 418,750 231,000 - - 649,750 - -MJ Ullmer 102,879 - - - 102,879 - -
Other senior executivesCA Clyne 67,813 39,745 - - 107,558 - -G Frazis (1) 67,913 - - - 67,913 - -MJ Hamar 35,970 - - - 35,970 - -JE Hooper 80,586 - - - 80,586 - -MA Joiner 57,032 - - - 57,032 - -LM Peacock 160,366 - - - 160,366 - -PL Thodey 108,628 36,792 - - 145,420 - -(1) Mr Frazis' balance at the beginning of year include performance rights granted prior to his appointment as KMP in December 2007.
No performance rights were vested and unexercisable at 30 September 2008.
Performance options
Performance rights
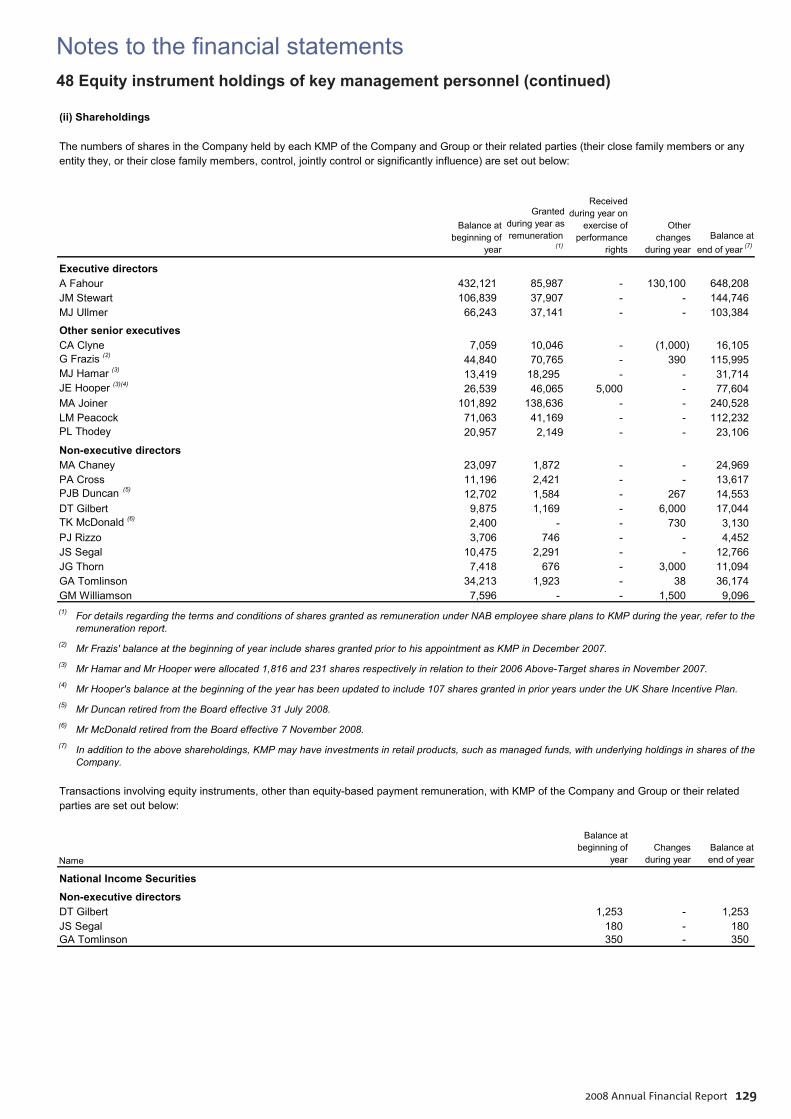
Notes to the fi nancial statements
2008 Annual Financial Report 129
48 Equity instrument holdings of key management personnel (continued)
(ii) Shareholdings
The numbers of shares in the Company held by each KMP of the Company and Group or their related parties (their close family members or anyentity they, or their close family members, control, jointly control or significantly influence) are set out below:
_
Balance at beginning of
year
Granted during year as remuneration
(1)
Received during year on
exercise of performance
rights
Other changes
during yearBalance at
end of year (7)
Executive directorsA Fahour 432,121 85,987 - 130,100 648,208 JM Stewart 106,839 37,907 - - 144,746 MJ Ullmer 66,243 37,141 - - 103,384
Other senior executivesCA Clyne 7,059 10,046 - (1,000) 16,105 G Frazis (2) 44,840 70,765 - 390 115,995 MJ Hamar (3) 13,419 18,295 - - 31,714 JE Hooper (3)(4) 26,539 46,065 5,000 - 77,604 MA Joiner 101,892 138,636 - - 240,528 LM Peacock 71,063 41,169 - - 112,232 PL Thodey 20,957 2,149 - - 23,106
Non-executive directors MA Chaney 23,097 1,872 - - 24,969 PA Cross 11,196 2,421 - - 13,617 PJB Duncan (5) 12,702 1,584 - 267 14,553 DT Gilbert 9,875 1,169 - 6,000 17,044 TK McDonald (6) 2,400 - - 730 3,130 PJ Rizzo 3,706 746 - - 4,452 JS Segal 10,475 2,291 - - 12,766 JG Thorn 7,418 676 - 3,000 11,094 GA Tomlinson 34,213 1,923 - 38 36,174 GM Williamson 7,596 - - 1,500 9,096 (1) For details regarding the terms and conditions of shares granted as remuneration under NAB employee share plans to KMP during the year, refer to the
remuneration report.(2) Mr Frazis' balance at the beginning of year include shares granted prior to his appointment as KMP in December 2007.(3) Mr Hamar and Mr Hooper were allocated 1,816 and 231 shares respectively in relation to their 2006 Above-Target shares in November 2007.(4) Mr Hooper's balance at the beginning of the year has been updated to include 107 shares granted in prior years under the UK Share Incentive Plan.(5) Mr Duncan retired from the Board effective 31 July 2008.(6) Mr McDonald retired from the Board effective 7 November 2008.(7) In addition to the above shareholdings, KMP may have investments in retail products, such as managed funds, with underlying holdings in shares of the
Company.
Transactions involving equity instruments, other than equity-based payment remuneration, with KMP of the Company and Group or their relatedparties are set out below:
_
Name
Balance at beginning of
yearChanges
during yearBalance at end of year
National Income SecuritiesNon-executive directorsDT Gilbert 1,253 - 1,253 JS Segal 180 - 180 GA Tomlinson 350 - 350
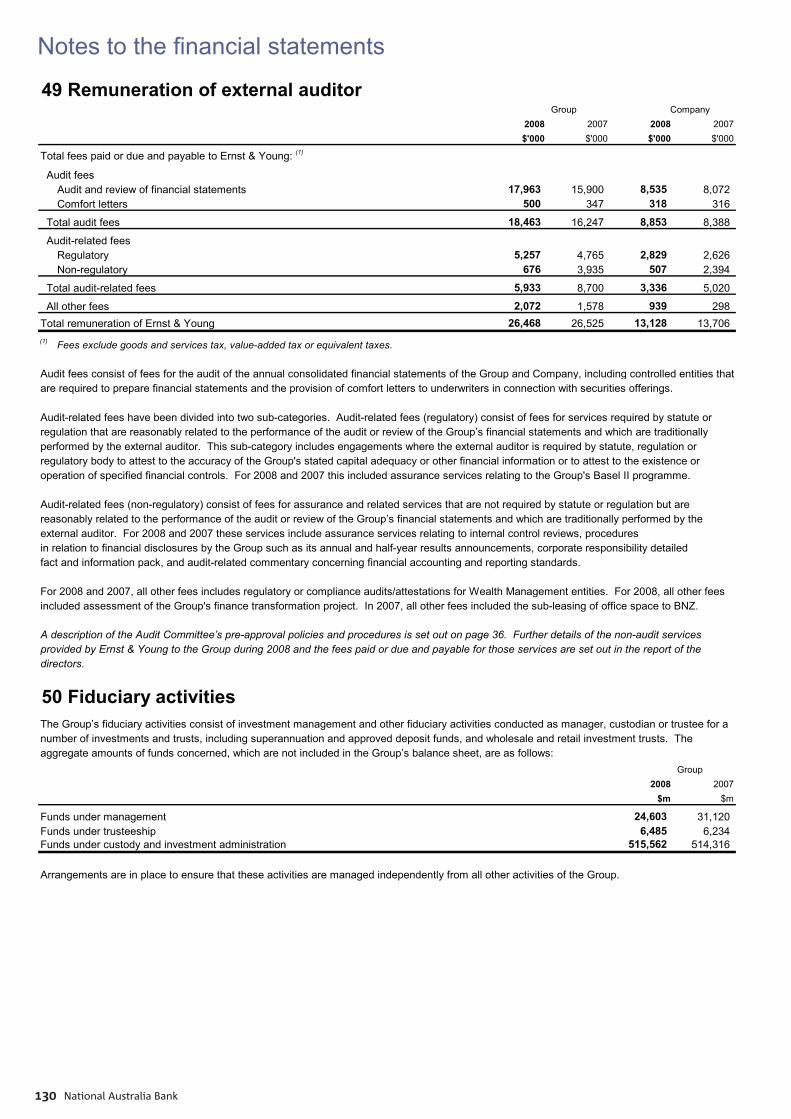
Notes to the fi nancial statements
National Australia Bank130
50 Fiduciary activitiesThe Group’s fiduciary activities consist of investment management and other fiduciary activities conducted as manager, custodian or trustee for anumber of investments and trusts, including superannuation and approved deposit funds, and wholesale and retail investment trusts. Theaggregate amounts of funds concerned, which are not included in the Group’s balance sheet, are as follows:_
2008 2007$m $m
Funds under management 24,603 31,120 Funds under trusteeship 6,485 6,234 Funds under custody and investment administration 515,562 514,316
Arrangements are in place to ensure that these activities are managed independently from all other activities of the Group.
Group
49 Remuneration of external auditor2008 2007 2008 2007$'000 $'000 $'000 $'000
Total fees paid or due and payable to Ernst & Young: (1)
Audit feesAudit and review of financial statements 17,963 15,900 8,535 8,072 Comfort letters 500 347 318 316
Total audit fees 18,463 16,247 8,853 8,388
Audit-related fees Regulatory 5,257 4,765 2,829 2,626 Non-regulatory 676 3,935 507 2,394
Total audit-related fees 5,933 8,700 3,336 5,020
All other fees 2,072 1,578 939 298 Total remuneration of Ernst & Young 26,468 26,525 13,128 13,706 (1) Fees exclude goods and services tax, value-added tax or equivalent taxes.
Audit fees consist of fees for the audit of the annual consolidated financial statements of the Group and Company, including controlled entities thatare required to prepare financial statements and the provision of comfort letters to underwriters in connection with securities offerings.
Audit-related fees have been divided into two sub-categories. Audit-related fees (regulatory) consist of fees for services required by statute orregulation that are reasonably related to the performance of the audit or review of the Group’s financial statements and which are traditionallyperformed by the external auditor. This sub-category includes engagements where the external auditor is required by statute, regulation orregulatory body to attest to the accuracy of the Group's stated capital adequacy or other financial information or to attest to the existence oroperation of specified financial controls. For 2008 and 2007 this included assurance services relating to the Group's Basel II programme.
Audit-related fees (non-regulatory) consist of fees for assurance and related services that are not required by statute or regulation but arereasonably related to the performance of the audit or review of the Group’s financial statements and which are traditionally performed by theexternal auditor. For 2008 and 2007 these services include assurance services relating to internal control reviews, proceduresin relation to financial disclosures by the Group such as its annual and half-year results announcements, corporate responsibility detailedfact and information pack, and audit-related commentary concerning financial accounting and reporting standards.
For 2008 and 2007, all other fees includes regulatory or compliance audits/attestations for Wealth Management entities. For 2008, all other fees included assessment of the Group's finance transformation project. In 2007, all other fees included the sub-leasing of office space to BNZ.
A description of the Audit Committee’s pre-approval policies and procedures is set out on page 36. Further details of the non-audit servicesprovided by Ernst & Young to the Group during 2008 and the fees paid or due and payable for those services are set out in the report of thedirectors.
Group Company
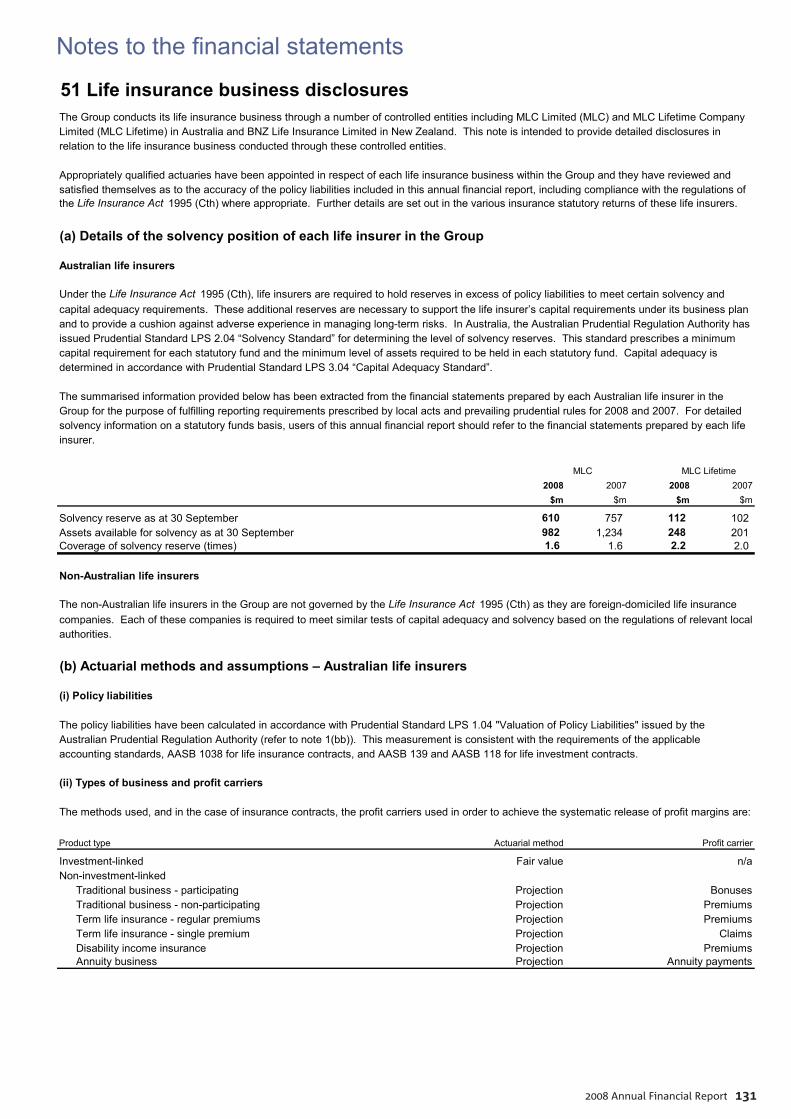
Notes to the fi nancial statements
2008 Annual Financial Report 131
51 Life insurance business disclosuresThe Group conducts its life insurance business through a number of controlled entities including MLC Limited (MLC) and MLC Lifetime CompanyLimited (MLC Lifetime) in Australia and BNZ Life Insurance Limited in New Zealand. This note is intended to provide detailed disclosures in relation to the life insurance business conducted through these controlled entities.
Appropriately qualified actuaries have been appointed in respect of each life insurance business within the Group and they have reviewed andsatisfied themselves as to the accuracy of the policy liabilities included in this annual financial report, including compliance with the regulations ofthe Life Insurance Act 1995 (Cth) where appropriate. Further details are set out in the various insurance statutory returns of these life insurers.
(a) Details of the solvency position of each life insurer in the Group
Australian life insurers
Under the Life Insurance Act 1995 (Cth), life insurers are required to hold reserves in excess of policy liabilities to meet certain solvency andcapital adequacy requirements. These additional reserves are necessary to support the life insurer’s capital requirements under its business planand to provide a cushion against adverse experience in managing long-term risks. In Australia, the Australian Prudential Regulation Authority hasissued Prudential Standard LPS 2.04 “Solvency Standard” for determining the level of solvency reserves. This standard prescribes a minimumcapital requirement for each statutory fund and the minimum level of assets required to be held in each statutory fund. Capital adequacy isdetermined in accordance with Prudential Standard LPS 3.04 “Capital Adequacy Standard”.
The summarised information provided below has been extracted from the financial statements prepared by each Australian life insurer in theGroup for the purpose of fulfilling reporting requirements prescribed by local acts and prevailing prudential rules for 2008 and 2007. For detailedsolvency information on a statutory funds basis, users of this annual financial report should refer to the financial statements prepared by each lifeinsurer.
_ MLC Lifetime
2008 2007 2008 2007$m $m $m $m
Solvency reserve as at 30 September 610 757 112 102 Assets available for solvency as at 30 September 982 1,234 248 201 Coverage of solvency reserve (times) 1.6 1.6 2.2 2.0
Non-Australian life insurers
The non-Australian life insurers in the Group are not governed by the Life Insurance Act 1995 (Cth) as they are foreign-domiciled life insurancecompanies. Each of these companies is required to meet similar tests of capital adequacy and solvency based on the regulations of relevant localauthorities.
(b) Actuarial methods and assumptions – Australian life insurers
(i) Policy liabilities
The policy liabilities have been calculated in accordance with Prudential Standard LPS 1.04 "Valuation of Policy Liabilities" issued by theAustralian Prudential Regulation Authority (refer to note 1(bb)). This measurement is consistent with the requirements of the applicable accounting standards, AASB 1038 for life insurance contracts, and AASB 139 and AASB 118 for life investment contracts.
(ii) Types of business and profit carriers
The methods used, and in the case of insurance contracts, the profit carriers used in order to achieve the systematic release of profit margins are:_
Product type Actuarial method Profit carrier
Investment-linked Fair value n/aNon-investment-linked
Traditional business - participating Projection BonusesTraditional business - non-participating Projection PremiumsTerm life insurance - regular premiums Projection PremiumsTerm life insurance - single premium Projection ClaimsDisability income insurance Projection PremiumsAnnuity business Projection Annuity payments
MLC
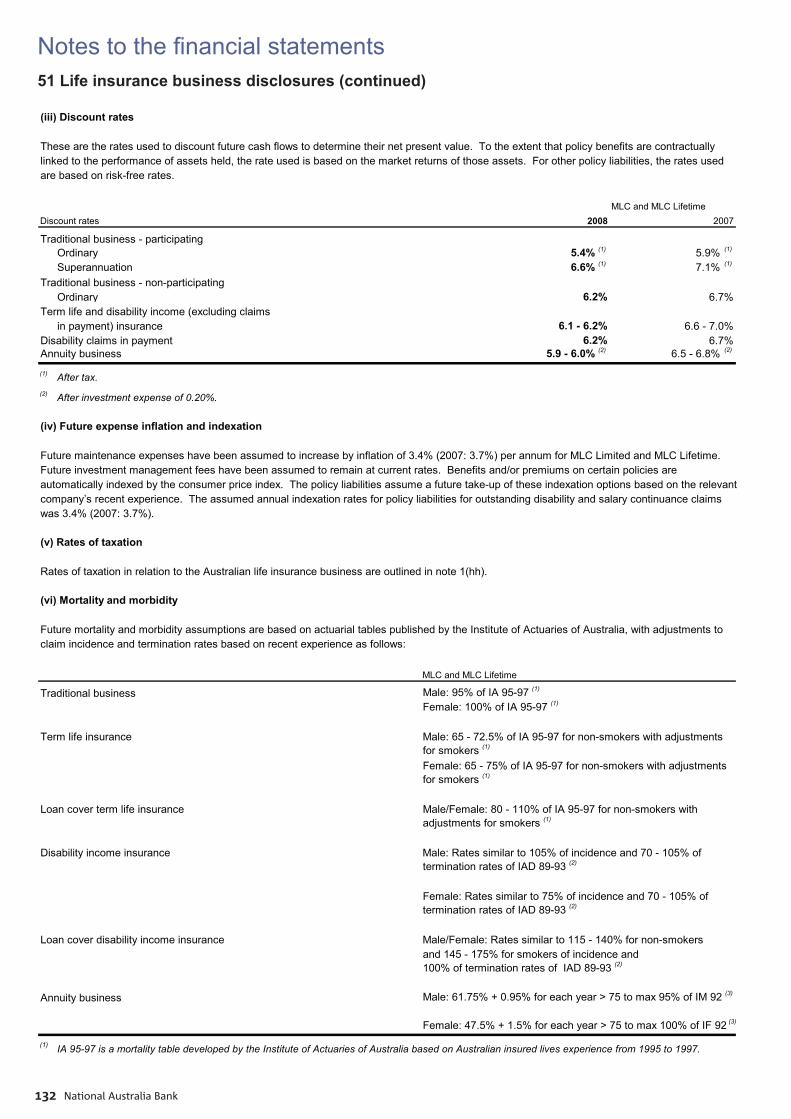
Notes to the fi nancial statements
National Australia Bank132
51 Life insurance business disclosures (continued)
(iii) Discount rates
These are the rates used to discount future cash flows to determine their net present value. To the extent that policy benefits are contractuallylinked to the performance of assets held, the rate used is based on the market returns of those assets. For other policy liabilities, the rates usedare based on risk-free rates.
_
Discount rates 2008 2007
Traditional business - participatingOrdinary 5.4% (1) 5.9% (1)
Superannuation 6.6% (1) 7.1% (1)
Traditional business - non-participatingOrdinary 6.2% 6.7%
Term life and disability income (excluding claims in payment) insurance 6.1 - 6.2% 6.6 - 7.0%
Disability claims in payment 6.2% 6.7%Annuity business 5.9 - 6.0% (2) 6.5 - 6.8% (2)
(1) After tax.(2) After investment expense of 0.20%.
(iv) Future expense inflation and indexation
Future maintenance expenses have been assumed to increase by inflation of 3.4% (2007: 3.7%) per annum for MLC Limited and MLC Lifetime. Future investment management fees have been assumed to remain at current rates. Benefits and/or premiums on certain policies areautomatically indexed by the consumer price index. The policy liabilities assume a future take-up of these indexation options based on the relevantcompany’s recent experience. The assumed annual indexation rates for policy liabilities for outstanding disability and salary continuance claimswas 3.4% (2007: 3.7%).
(v) Rates of taxation
Rates of taxation in relation to the Australian life insurance business are outlined in note 1(hh).
(vi) Mortality and morbidity
Future mortality and morbidity assumptions are based on actuarial tables published by the Institute of Actuaries of Australia, with adjustments toclaim incidence and termination rates based on recent experience as follows:
_ MLC and MLC Lifetime
Traditional business Male: 95% of IA 95-97 (1)
Female: 100% of IA 95-97 (1)
Term life insurance Male: 65 - 72.5% of IA 95-97 for non-smokers with adjustments for smokers (1)
Female: 65 - 75% of IA 95-97 for non-smokers with adjustments for smokers (1)
Loan cover term life insurance Male/Female: 80 - 110% of IA 95-97 for non-smokers withadjustments for smokers (1)
Disability income insurance Male: Rates similar to 105% of incidence and 70 - 105% oftermination rates of IAD 89-93 (2)
Female: Rates similar to 75% of incidence and 70 - 105% oftermination rates of IAD 89-93 (2)
Loan cover disability income insurance Male/Female: Rates similar to 115 - 140% for non-smokersand 145 - 175% for smokers of incidence and100% of termination rates of IAD 89-93 (2)
Annuity business Male: 61.75% + 0.95% for each year > 75 to max 95% of IM 92 (3)
Female: 47.5% + 1.5% for each year > 75 to max 100% of IF 92 (3)
(1) IA 95-97 is a mortality table developed by the Institute of Actuaries of Australia based on Australian insured lives experience from 1995 to 1997.
MLC and MLC Lifetime
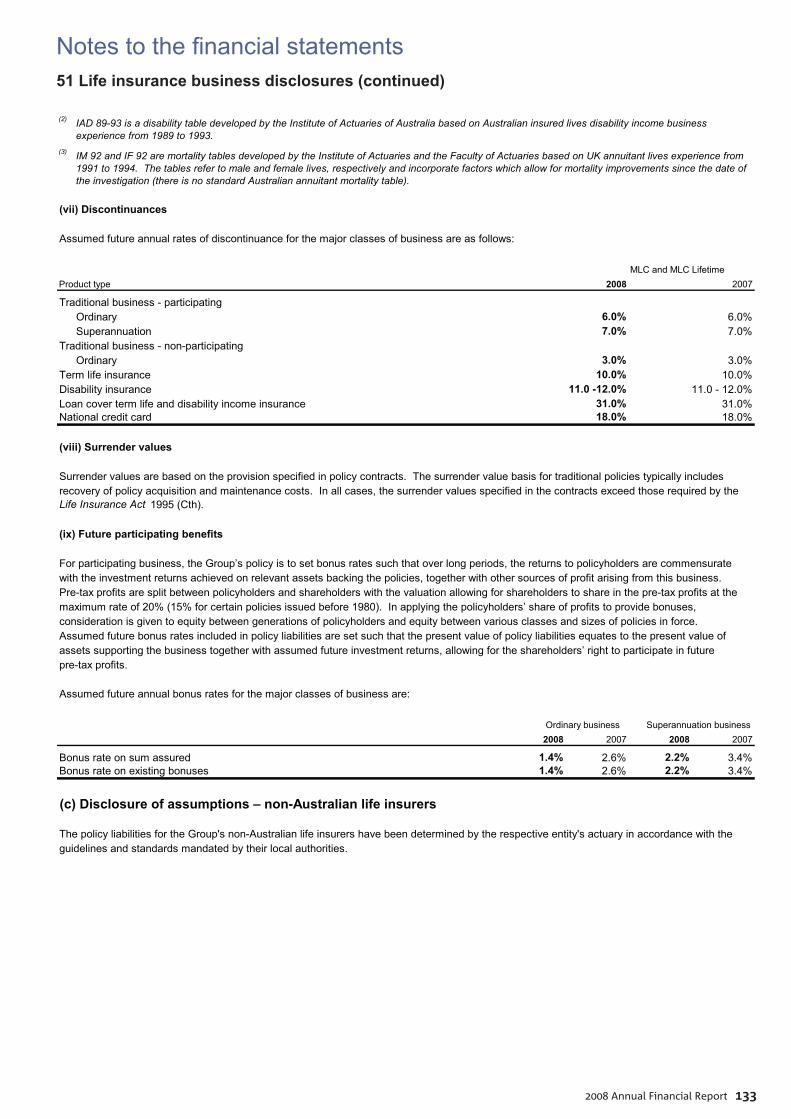
Notes to the fi nancial statements
2008 Annual Financial Report 133
51 Life insurance business disclosures (continued)
(2) IAD 89-93 is a disability table developed by the Institute of Actuaries of Australia based on Australian insured lives disability income businessexperience from 1989 to 1993.
(3) IM 92 and IF 92 are mortality tables developed by the Institute of Actuaries and the Faculty of Actuaries based on UK annuitant lives experience from1991 to 1994. The tables refer to male and female lives, respectively and incorporate factors which allow for mortality improvements since the date ofthe investigation (there is no standard Australian annuitant mortality table).
(vii) Discontinuances
Assumed future annual rates of discontinuance for the major classes of business are as follows:_
Product type 2008 2007
Traditional business - participating Ordinary 6.0% 6.0%Superannuation 7.0% 7.0%
Traditional business - non-participatingOrdinary 3.0% 3.0%
Term life insurance 10.0% 10.0%Disability insurance 11.0 -12.0% 11.0 - 12.0%Loan cover term life and disability income insurance 31.0% 31.0%National credit card 18.0% 18.0%
(viii) Surrender values
Surrender values are based on the provision specified in policy contracts. The surrender value basis for traditional policies typically includesrecovery of policy acquisition and maintenance costs. In all cases, the surrender values specified in the contracts exceed those required by theLife Insurance Act 1995 (Cth).
(ix) Future participating benefits
For participating business, the Group’s policy is to set bonus rates such that over long periods, the returns to policyholders are commensuratewith the investment returns achieved on relevant assets backing the policies, together with other sources of profit arising from this business. Pre-tax profits are split between policyholders and shareholders with the valuation allowing for shareholders to share in the pre-tax profits at themaximum rate of 20% (15% for certain policies issued before 1980). In applying the policyholders’ share of profits to provide bonuses,consideration is given to equity between generations of policyholders and equity between various classes and sizes of policies in force. Assumed future bonus rates included in policy liabilities are set such that the present value of policy liabilities equates to the present value ofassets supporting the business together with assumed future investment returns, allowing for the shareholders’ right to participate in futurepre-tax profits.
Assumed future annual bonus rates for the major classes of business are:_
2008 2007 2008 2007
Bonus rate on sum assured 1.4% 2.6% 2.2% 3.4%Bonus rate on existing bonuses 1.4% 2.6% 2.2% 3.4%
(c) Disclosure of assumptions – non-Australian life insurers
The policy liabilities for the Group's non-Australian life insurers have been determined by the respective entity's actuary in accordance with theguidelines and standards mandated by their local authorities.
Ordinary business Superannuation business
MLC and MLC Lifetime
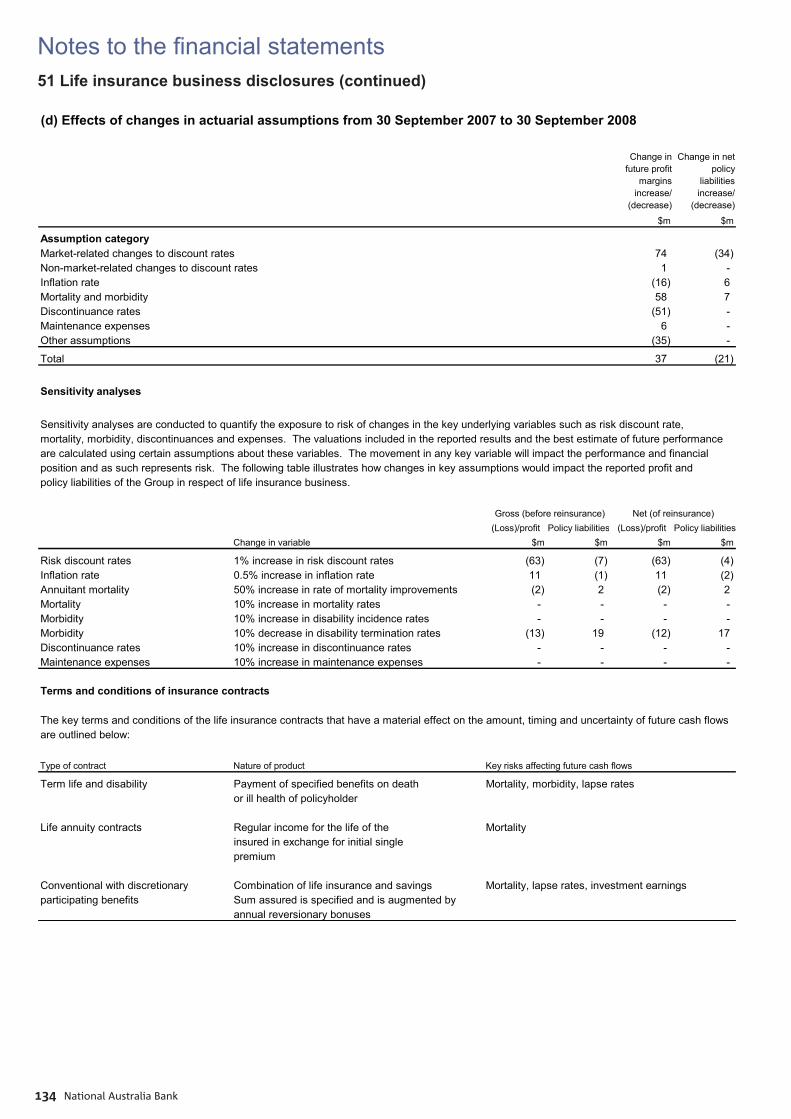
Notes to the fi nancial statements
National Australia Bank134
51 Life insurance business disclosures (continued)
(d) Effects of changes in actuarial assumptions from 30 September 2007 to 30 September 2008
Change in future profit
margins increase/
(decrease)
Change in net policy
liabilities increase/
(decrease)
$m $m
Assumption categoryMarket-related changes to discount rates 74 (34) Non-market-related changes to discount rates 1 - Inflation rate (16) 6 Mortality and morbidity 58 7 Discontinuance rates (51) - Maintenance expenses 6 - Other assumptions (35) -
Total 37 (21)
Sensitivity analyses
Sensitivity analyses are conducted to quantify the exposure to risk of changes in the key underlying variables such as risk discount rate,mortality, morbidity, discontinuances and expenses. The valuations included in the reported results and the best estimate of future performanceare calculated using certain assumptions about these variables. The movement in any key variable will impact the performance and financialposition and as such represents risk. The following table illustrates how changes in key assumptions would impact the reported profit and policy liabilities of the Group in respect of life insurance business.
_
(Loss)/profit Policy liabilities (Loss)/profit Policy liabilitiesChange in variable $m $m $m $m
Risk discount rates 1% increase in risk discount rates (63) (7) (63) (4) Inflation rate 0.5% increase in inflation rate 11 (1) 11 (2) Annuitant mortality 50% increase in rate of mortality improvements (2) 2 (2) 2 Mortality 10% increase in mortality rates - - - - Morbidity 10% increase in disability incidence rates - - - - Morbidity 10% decrease in disability termination rates (13) 19 (12) 17 Discontinuance rates 10% increase in discontinuance rates - - - - Maintenance expenses 10% increase in maintenance expenses - - - -
Terms and conditions of insurance contracts
The key terms and conditions of the life insurance contracts that have a material effect on the amount, timing and uncertainty of future cash flowsare outlined below:
_Type of contract Nature of product Key risks affecting future cash flows
Term life and disability Payment of specified benefits on death Mortality, morbidity, lapse ratesor ill health of policyholder
Life annuity contracts Regular income for the life of the Mortalityinsured in exchange for initial singlepremium
Conventional with discretionary Combination of life insurance and savings Mortality, lapse rates, investment earningsparticipating benefits Sum assured is specified and is augmented by
annual reversionary bonuses
Net (of reinsurance) Gross (before reinsurance)
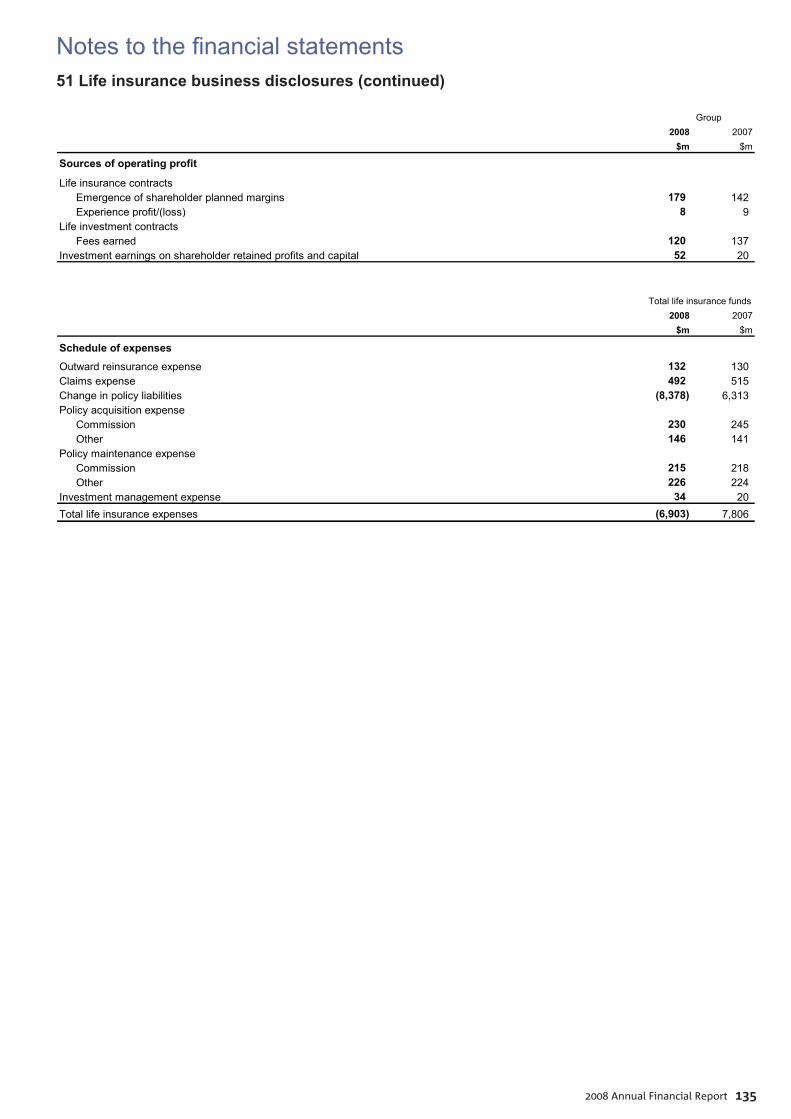
Notes to the fi nancial statements
2008 Annual Financial Report 135
51 Life insurance business disclosures (continued)
2008 2007$m $m
Sources of operating profit
Life insurance contractsEmergence of shareholder planned margins 179 142 Experience profit/(loss) 8 9
Life investment contractsFees earned 120 137
Investment earnings on shareholder retained profits and capital 52 20
_
2008 2007$m $m
Schedule of expenses
Outward reinsurance expense 132 130 Claims expense 492 515 Change in policy liabilities (8,378) 6,313 Policy acquisition expense
Commission 230 245 Other 146 141
Policy maintenance expenseCommission 215 218 Other 226 224
Investment management expense 34 20 Total life insurance expenses (6,903) 7,806
Total life insurance funds
Group
Notes to the fi nancial statements
National Australia Bank136
52 Capital adequacy As an authorised deposit-taking institution (ADI), the National Australia Bank Limited is subject to regulation by APRA under the authority of the Banking Act 1959. APRA has set minimum regulatory capital requirements for banks that are consistent with the Basel Accord issued by the Basel Committee on Banking Supervision.
The Group’s capital structure comprises various forms of capital. For regulatory purposes, capital has two base elements, eligible Tier 1 and Tier 2 capital, from which certain deductions are made to arrive at net Tier 1 and net Tier 2 capital. Tier 1 capital is made up of largely what is presented in the financial accounts being shareholders equity. From this a number of elements must be deducted such as goodwill. As such it is sometimes also referred to as core equity. Tier 2 capital is the next group that when combined with Tier 1 capital represents the total capital available to support the Group from a regulatory view against unexpected losses. It generally includes long term subordinated debt and unrealised market gains.
APRA has set minimum ratios that compare the regulatory capital with risk-weighted assets (on and off balance sheet). Australian banks are required to maintain a minimum ratio of Total Capital base to total risk-weighted assets of 8.0%, of which a minimum of 4.0% must be held in Tier 1 capital. The numerator of the ratio is the Total Capital base. The denominator of the ratio is the total risk-weighted asset exposure (i.e. the sum of all credit, operational, IRRBB and market risk-weighted exposure).
In addition to the minimum total capital base ratio described above, APRA sets a Prudential Capital Ratio at a level proportional to an ADI’s overall risk profile. A breach of the required ratios under the prudential standards may trigger legally enforceable directions by APRA, which can include a direction to raise additional capital or to cease business.
Under guidelines issued by APRA, life insurance and funds management entities activities are excluded from the calculation of Basel II risk-weighted assets and the related controlled entities are deconsolidated for the purposes of calculating capital adequacy. The intangible component of the investment in these controlled entities is deducted from Tier 1 capital with the balance of the investment deducted 50% from Tier 1 and 50% from Tier 2 under Basel II. Additionally any profits from these activities included in the Group’s results are excluded from the determination of Tier 1 capital to the extent they have not been remitted to the Company.
Capital ratios are monitored against internal capital targets that are set over and above minimum capital requirements set by the Principal Board. Target ranges are set by reference to factors such as the risk appetite of the Principal Board, and market, regulatory and rating agencies expectations. The Group’s Tier 1 target range is greater than 7% in the current market, and above 5% for the Adjusted Common Equity ratio.
53 Events subsequent to balance dateCapital raising
On 10 November 2008, the Group announced its successful completion of an institutional placement of 150 million new ordinary shares at $20 pershare, to raise $3 billion of new equity capital. The new shares will not be entitled to the final dividend for the year ended 30 September 2008.
Settlement of the institutional placement was completed on 14 November 2008 with the shares to be allotted and quoted on the ASX on17 November 2008.
On 10 November 2008, the Group also announced its intention to offer retail shareholders the opportunity to participate in a non-underwrittenshare purchase plan (SPP) at the institutional placement price of $20 per share. Details in respect of the SPP have not been finalised as at the date of this report.
As a result of these capital management initiatives, the Group will not underwrite its 2008 final dividend reinvestment plan shortfall.
Credit rating
In November 2008, Standard & Poor’s upgraded the Group’s outlook from “negative” to “stable” and affirmed the Group’s “AA” rating.

Directors’ declaration
2008 Annual Financial Report 137
The directors of National Australia Bank Limited declare that:
1. (a) in the opinion of the directors, the financial statements and the notes thereto as set out on pages 40 to 136 comply with Accounting Standards in Australia and the Corporations Act 2001 (Cth);
(b) in the opinion of the directors, the financial statements and notes thereto give a true and fair view of the financial position of the Company and the Group as at 30 September 2008, and of the performance of the Company and the Group for the year ended 30 September 2008;
(c) in the opinion of the directors, at the date of this declaration, there are reasonable grounds to believe that the Company will be able to pay its debts as and when they become due and payable; and
(d) the directors have been given the declarations required by section 295A of the Corporations Act 2001 (Cth); and
2 there are reasonable grounds to believe that the Company and certain controlled entities will, as a group, be able to meet any obligations or liabilities to which they are or may become subject by virtue of the deed of cross guarantee between the Company and those controlled entities pursuant to Australian Securities and Investments Commission Class Order 98/1418 dated 13 August 1998 (refer to notes 41 and 42 to the financial statements for further details).
Dated this 14th day of November 2008 and signed in accordance with a resolution of the directors:
Michael A Chaney John M Stewart Chairman Group Chief Executive Officer
National Australia Bank138
Ernst & Young
Report on the Financial Report
We have audited the accompanying financial report of National Australia Bank Limited (the Company), which comprises the balance sheet as at 30 September 2008, and the income statement, recognised income and expense statement and cash flow statement for the year ended on that date, a summary of significant accounting policies, other explanatory notes and the directors’ declaration of the consolidated entity comprising the Company and the entities it controlled (the Group) at the year’s end or from time to time during the financial year.
Directors’ Responsibility for the Financial Report
The directors of the Company are responsible for the preparation and fair presentation of the financial report in accordance with the Australian Accounting Standards (including the Australian Accounting Interpretations) and the Corporations Act 2001 (Cth). This responsibility includes establishing and maintaining internal controls relevant to the preparation and fair presentation of the financial report that is free from material misstatement, whether due to fraud or error; selecting and applying appropriate accounting policies; and making accounting estimates that are reasonable in the circumstances. In Note 1, the directors also state that the financial report, comprising the financial statements and notes, complies with International Financial Reporting Standards as issued by the International Accounting Standards Board.
Auditor’s Responsibility
Our responsibility is to express an opinion on the financial report based on our audit. We conducted our audit in accordance with Australian Auditing Standards. These Auditing Standards require that we comply with relevant ethical requirements relating to audit engagements and plan and perform the audit to obtain reasonable assurance whether the financial report is free from material misstatement.
An audit involves performing procedures to obtain audit evidence about the amounts and disclosures in the financial report. The procedures selected depend on our judgment, including the assessment of the risks of material misstatement of the financial report, whether due to fraud or error. In making those risk assessments, we consider internal controls relevant to the entity’s preparation and fair presentation of the financial report in order to design audit procedures that are appropriate in the circumstances, but not for the purpose of expressing an opinion on the effectiveness of the entity’s internal controls. An audit also includes evaluating the appropriateness of accounting policies used and the reasonableness of accounting estimates made by the directors, as well as evaluating the overall presentation of the financial report.
We believe that the audit evidence we have obtained is sufficient and appropriate to provide a basis for our audit opinion.
Independence
In conducting our audit we have met the independence requirements of the Corporations Act 2001 (Cth). We have given to the directors of the Company a written Auditor’s Independence Declaration, a copy of which is included in the Report of the directors. In addition to our audit of the financial report, we were engaged to undertake the services disclosed in the notes to the financial statements. The provision of these services has not impaired our independence.
Auditor’s Opinion
In our opinion:
1 the financial report of National Australia Bank Limited is in accordance with the Corporations Act 2001, including:
(i) giving a true and fair view of the financial position of the Company and the Group at 30 September 2008 and of their performance for the year ended on that date; and
(ii) complying with Australian Accounting Standards (including the Australian Accounting Interpretations) and the Corporations Regulations 2001.
2 the financial report also complies with International Financial Reporting Standards as issued by the International Accounting Standards Board.
Report on the Remuneration Report
We have audited the Remuneration Report included in pages 13 to 30 of the Report of the directors for the year ended 30 September 2008. The directors of the Company are responsible for the preparation and presentation of the Remuneration Report in accordance with section 300A of the Corporations Act 2001 (Cth). Our responsibility is to express an opinion on the Remuneration Report, based on our audit conducted in accordance with Australian Auditing Standards.
Auditor’s Opinion
In our opinion the Remuneration Report of National Australia Bank Limited for the year ended 30 September 2008, complies with section 300A of the Corporations Act 2001 (Cth).
Ernst & Young Building8 Exhibition StreetMelbourne VIC 3000 AustraliaGPO Box 67 Melbourne VIC 3001Tel: +61 3 9288 8000Fax: + 61 3 8650 7777www.ey.com/au
Independent auditor’s report to the members of National Australia Bank Limited
Melbourne, Australia 14 November 2008
Liability limited by a scheme approved under Professional Standards Legislation
A.J. (Tony) Johnson Partner
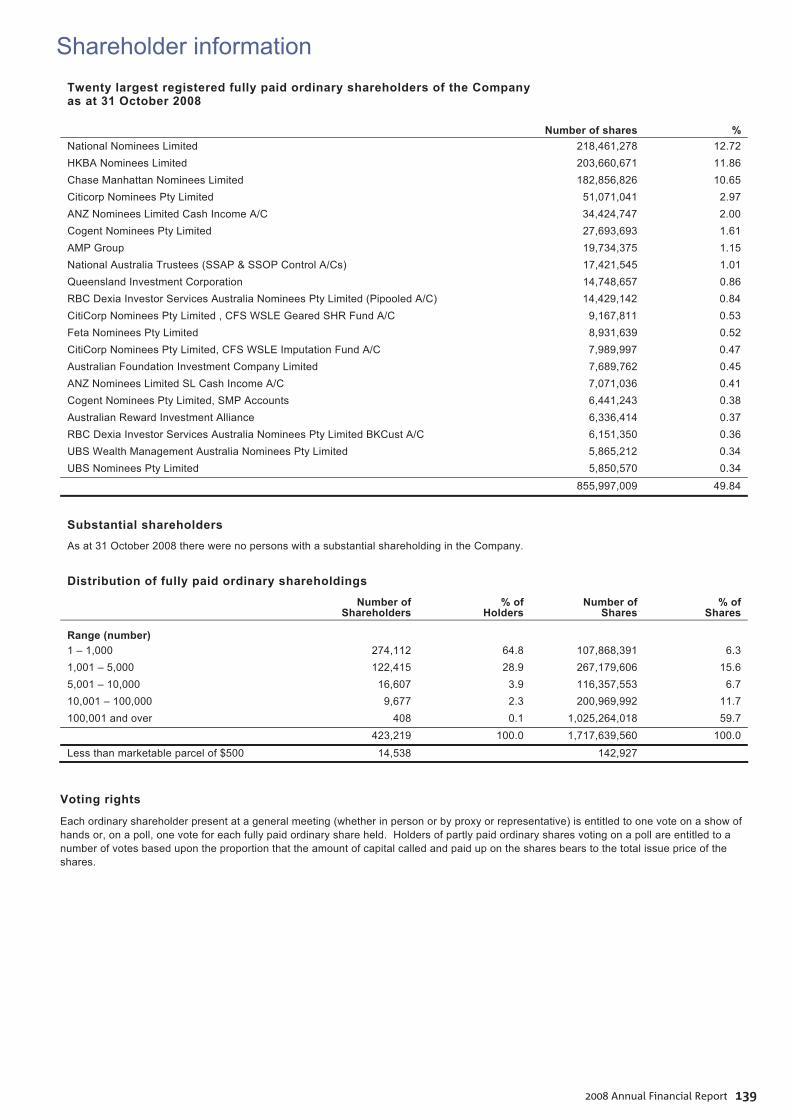
Shareholder information
2008 Annual Financial Report 139
Twenty largest registered fully paid ordinary shareholders of the Company as at 31 October 2008
Number of shares % National Nominees Limited 218,461,278 12.72 HKBA Nominees Limited 203,660,671 11.86 Chase Manhattan Nominees Limited 182,856,826 10.65 Citicorp Nominees Pty Limited 51,071,041 2.97 ANZ Nominees Limited Cash Income A/C 34,424,747 2.00 Cogent Nominees Pty Limited 27,693,693 1.61 AMP Group 19,734,375 1.15 National Australia Trustees (SSAP & SSOP Control A/Cs) 17,421,545 1.01 Queensland Investment Corporation 14,748,657 0.86 RBC Dexia Investor Services Australia Nominees Pty Limited (Pipooled A/C) 14,429,142 0.84 CitiCorp Nominees Pty Limited , CFS WSLE Geared SHR Fund A/C 9,167,811 0.53 Feta Nominees Pty Limited 8,931,639 0.52 CitiCorp Nominees Pty Limited, CFS WSLE Imputation Fund A/C 7,989,997 0.47 Australian Foundation Investment Company Limited 7,689,762 0.45 ANZ Nominees Limited SL Cash Income A/C 7,071,036 0.41 Cogent Nominees Pty Limited, SMP Accounts 6,441,243 0.38 Australian Reward Investment Alliance 6,336,414 0.37 RBC Dexia Investor Services Australia Nominees Pty Limited BKCust A/C 6,151,350 0.36 UBS Wealth Management Australia Nominees Pty Limited 5,865,212 0.34 UBS Nominees Pty Limited 5,850,570 0.34
855,997,009 49.84
Substantial shareholders As at 31 October 2008 there were no persons with a substantial shareholding in the Company.
Distribution of fully paid ordinary shareholdings
Number of Shareholders
% of Holders
Number of Shares
% of Shares
Range (number)
1 – 1,000 274,112 64.8 107,868,391 6.3 1,001 – 5,000 122,415 28.9 267,179,606 15.6 5,001 – 10,000 16,607 3.9 116,357,553 6.7 10,001 – 100,000 9,677 2.3 200,969,992 11.7 100,001 and over 408 0.1 1,025,264,018 59.7 423,219 100.0 1,717,639,560 100.0 Less than marketable parcel of $500 14,538 142,927
Voting rights
Each ordinary shareholder present at a general meeting (whether in person or by proxy or representative) is entitled to one vote on a show of hands or, on a poll, one vote for each fully paid ordinary share held. Holders of partly paid ordinary shares voting on a poll are entitled to a number of votes based upon the proportion that the amount of capital called and paid up on the shares bears to the total issue price of the shares.
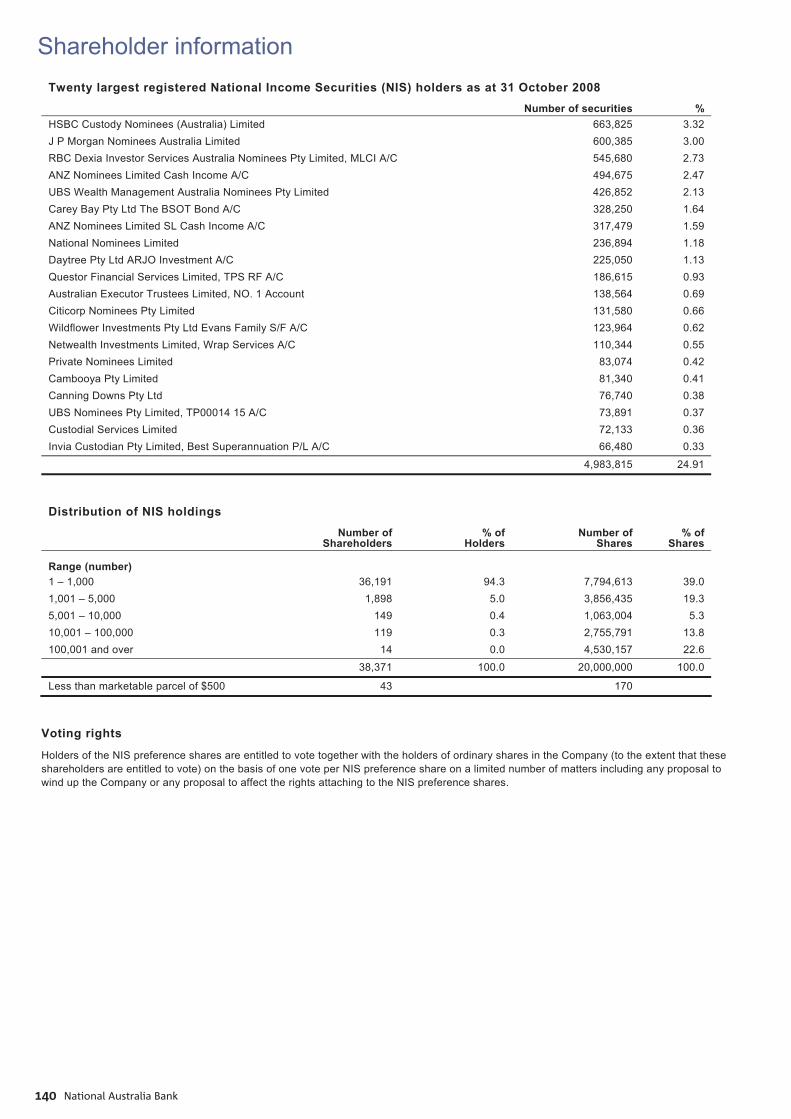
Shareholder information
National Australia Bank140
Twenty largest registered National Income Securities (NIS) holders as at 31 October 2008 Number of securities %
HSBC Custody Nominees (Australia) Limited 663,825 3.32 J P Morgan Nominees Australia Limited 600,385 3.00 RBC Dexia Investor Services Australia Nominees Pty Limited, MLCI A/C 545,680 2.73 ANZ Nominees Limited Cash Income A/C 494,675 2.47 UBS Wealth Management Australia Nominees Pty Limited 426,852 2.13 Carey Bay Pty Ltd The BSOT Bond A/C 328,250 1.64 ANZ Nominees Limited SL Cash Income A/C 317,479 1.59 National Nominees Limited 236,894 1.18 Daytree Pty Ltd ARJO Investment A/C 225,050 1.13 Questor Financial Services Limited, TPS RF A/C 186,615 0.93 Australian Executor Trustees Limited, NO. 1 Account 138,564 0.69 Citicorp Nominees Pty Limited 131,580 0.66 Wildflower Investments Pty Ltd Evans Family S/F A/C 123,964 0.62 Netwealth Investments Limited, Wrap Services A/C 110,344 0.55 Private Nominees Limited 83,074 0.42 Cambooya Pty Limited 81,340 0.41 Canning Downs Pty Ltd 76,740 0.38 UBS Nominees Pty Limited, TP00014 15 A/C 73,891 0.37 Custodial Services Limited 72,133 0.36 Invia Custodian Pty Limited, Best Superannuation P/L A/C 66,480 0.33
4,983,815 24.91
Distribution of NIS holdings Number of
Shareholders % of
Holders Number of
Shares % of
Shares
Range (number)
1 – 1,000 36,191 94.3 7,794,613 39.0 1,001 – 5,000 1,898 5.0 3,856,435 19.3 5,001 – 10,000 149 0.4 1,063,004 5.3 10,001 – 100,000 119 0.3 2,755,791 13.8 100,001 and over 14 0.0 4,530,157 22.6 38,371 100.0 20,000,000 100.0
Less than marketable parcel of $500 43 170
Voting rights
Holders of the NIS preference shares are entitled to vote together with the holders of ordinary shares in the Company (to the extent that these shareholders are entitled to vote) on the basis of one vote per NIS preference share on a limited number of matters including any proposal to wind up the Company or any proposal to affect the rights attaching to the NIS preference shares.
Shareholder information
2008 Annual Financial Report 141
National Australia Bank Limited
Chairman Group Chief Executive Mr Michael A Chaney Mr John M Stewart AO, BSc, MBA, Hon. LLD W. Aust, BA, ACII, FCIB FAIM, FAICD
Deputy Group Chief Executive Officer Group Chief Financial Officer Mr Michael J Ullmer Mr Mark A Joiner BSc (Maths) (Hons), FCA, SF Fin ACA, MBA
Senior executive appointments
On 31 July 2008 the Company announced the appointment of Cameron Clyne as Group Chief Executive Officer Designate from 1 October2008 to 31 December 2008 and Group Chief Executive Officer from 1 January 2009.
On 4 September 2008 the Company announced the appointment of Bruce Munro as Group Chief Risk Officer Designate from 1 October 2008 to 31 December 2008 and Group Chief Risk Officer from 1 January 2009.
Registered office Auditor Company Secretary 34th Floor Ernst & Young Ms Michaela J Healey 500 Bourke Street 8 Exhibition Street LLB, FCIS Melbourne Victoria 3000 Melbourne Victoria 3000 Australia Australia Tel: 1300 367 647 Tel: +61 3 9288 8000 Fax: +61 3 8650 7777
Shareholders’ centre internet service
The Group’s website at www.nabgroup.com has a dedicated separate section where shareholders can gain access to a wide range of information, including copies of recent announcements, annual financial reports and useful forms from the Share Registry, including change of address forms. Email: [email protected]
Shareholders’ centre information line
There is a convenient 24 hours a day, 7 days a week automated service (Australia only). To obtain the current balance of your ordinary shareholding and relevant dividend payment details, telephone 1300 367 647 (Australia) or +61 3 9415 4299 (outside Australia).
Contact details
These services are secured to protect your interests. In all communications with the Share Registry, please ensure you quote your security holder reference number (SRN), or in case of broker sponsored shareholders, your holder identification number (HIN).
Principal share register UK share register United States ADR depositary, Transfer agent and registrar
Computershare Investor Services Pty Limited Computershare Investor Services PLC The Bank of New York Mellon Yarra Falls The Pavilions Investor Services 452 Johnston Street Bridgwater Road PO Box 11258 Abbotsford Victoria 3067 Bedminster Down Church Street Station Australia Bristol BS99 7NH New York NY 10286 - 1258 United Kingdom United States of America Postal address:
GPO Box 2333 Tel: (0870) 703 0197 US Toll Free Melbourne Victoria 3001 Fax: (0870) 703 6101 Tel: 1-888-269-2377 Australia Tel: +1 201 680 6825 (outside US)
Local call: 1300 367 647 Website: www.nabgroup.com Email: [email protected] Fax: (03) 9473 2500 Website: www.adrbnymellon.com
Telephone and fax (outside Australia): Tel: +61 3 9415 4299; Fax: +61 3 9473 2500 Email: [email protected]
Shareholder information
National Australia Bank142
Official quotation
Fully paid ordinary shares of the Company are quoted on the following stock exchanges:
Australian Securities Exchange; and New Zealand Exchange.
The Group has also issued:
National Income Securities which are quoted on the stock market of the Australian Securities Exchange; BNZ Income Securities which are quoted on NZDX the New Zealand Exchange; Trust Preferred Securities, National Capital Instruments, Medium Term Notes, Mortgage Backed Securities and Subordinated Bonds
which are quoted on the Luxembourg Stock Exchange; Trust Preferred Securities II which are quoted on the stock market of the Channel Islands Stock Exchange; Undated Subordinated Floating Rate Notes which are listed on the London Stock Exchange; Medium Term Notes which are listed on the Swiss Stock Exchange; Medium Term Notes and Mortgage Backed Securities which are listed on the Australian Securities Exchange; and Subordinated Bonds which are listed on the NZDX of the New Zealand Exchange.
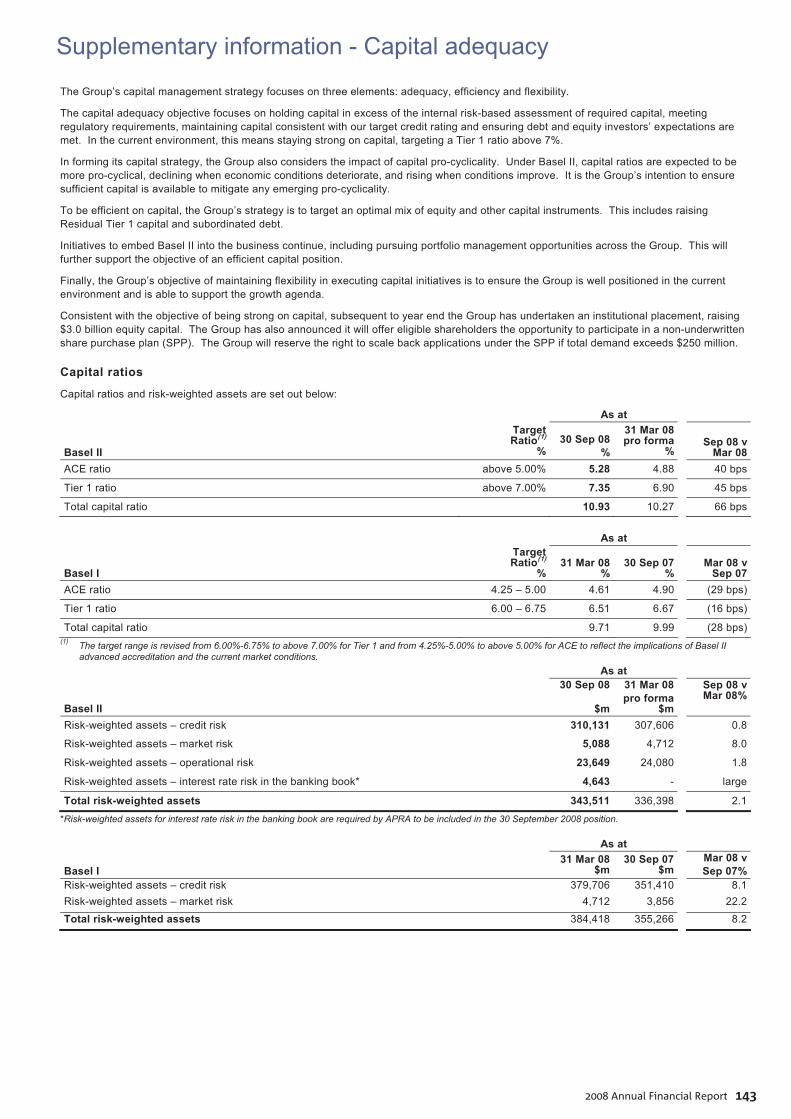
Supplementary information - Capital adequacy
2008 Annual Financial Report 143
The Group’s capital management strategy focuses on three elements: adequacy, efficiency and flexibility.
The capital adequacy objective focuses on holding capital in excess of the internal risk-based assessment of required capital, meeting regulatory requirements, maintaining capital consistent with our target credit rating and ensuring debt and equity investors’ expectations are met. In the current environment, this means staying strong on capital, targeting a Tier 1 ratio above 7%.
In forming its capital strategy, the Group also considers the impact of capital pro-cyclicality. Under Basel II, capital ratios are expected to be more pro-cyclical, declining when economic conditions deteriorate, and rising when conditions improve. It is the Group’s intention to ensure sufficient capital is available to mitigate any emerging pro-cyclicality.
To be efficient on capital, the Group’s strategy is to target an optimal mix of equity and other capital instruments. This includes raising Residual Tier 1 capital and subordinated debt.
Initiatives to embed Basel II into the business continue, including pursuing portfolio management opportunities across the Group. This will further support the objective of an efficient capital position.
Finally, the Group’s objective of maintaining flexibility in executing capital initiatives is to ensure the Group is well positioned in the current environment and is able to support the growth agenda.
Consistent with the objective of being strong on capital, subsequent to year end the Group has undertaken an institutional placement, raising $3.0 billion equity capital. The Group has also announced it will offer eligible shareholders the opportunity to participate in a non-underwritten share purchase plan (SPP). The Group will reserve the right to scale back applications under the SPP if total demand exceeds $250 million.
Capital ratios
Capital ratios and risk-weighted assets are set out below:
As at
Basel II
TargetRatio(1)
%
30 Sep 08
%
31 Mar 08 pro forma
%Sep 08 v
Mar 08ACE ratio above 5.00% 5.28 4.88 40 bps
Tier 1 ratio above 7.00% 7.35 6.90 45 bps
Total capital ratio 10.93 10.27 66 bps
As at
Basel I
TargetRatio(1)
%31 Mar 08
% 30 Sep 07
%Mar 08 v
Sep 07ACE ratio 4.25 – 5.00 4.61 4.90 (29 bps)
Tier 1 ratio 6.00 – 6.75 6.51 6.67 (16 bps)
Total capital ratio 9.71 9.99 (28 bps)(1) The target range is revised from 6.00%-6.75% to above 7.00% for Tier 1 and from 4.25%-5.00% to above 5.00% for ACE to reflect the implications of Basel II
advanced accreditation and the current market conditions. As at
Basel II
30 Sep 08
$m
31 Mar 08pro forma
$m
Sep 08 vMar 08%
Risk-weighted assets – credit risk 310,131 307,606 0.8
Risk-weighted assets – market risk 5,088 4,712 8.0
Risk-weighted assets – operational risk 23,649 24,080 1.8
Risk-weighted assets – interest rate risk in the banking book* 4,643 - large
Total risk-weighted assets 343,511 336,398 2.1
*Risk-weighted assets for interest rate risk in the banking book are required by APRA to be included in the 30 September 2008 position.
As at
Basel I 31 Mar 08
$m 30 Sep 07
$mMar 08 vSep 07%
Risk-weighted assets – credit risk 379,706 351,410 8.1Risk-weighted assets – market risk 4,712 3,856 22.2Total risk-weighted assets 384,418 355,266 8.2
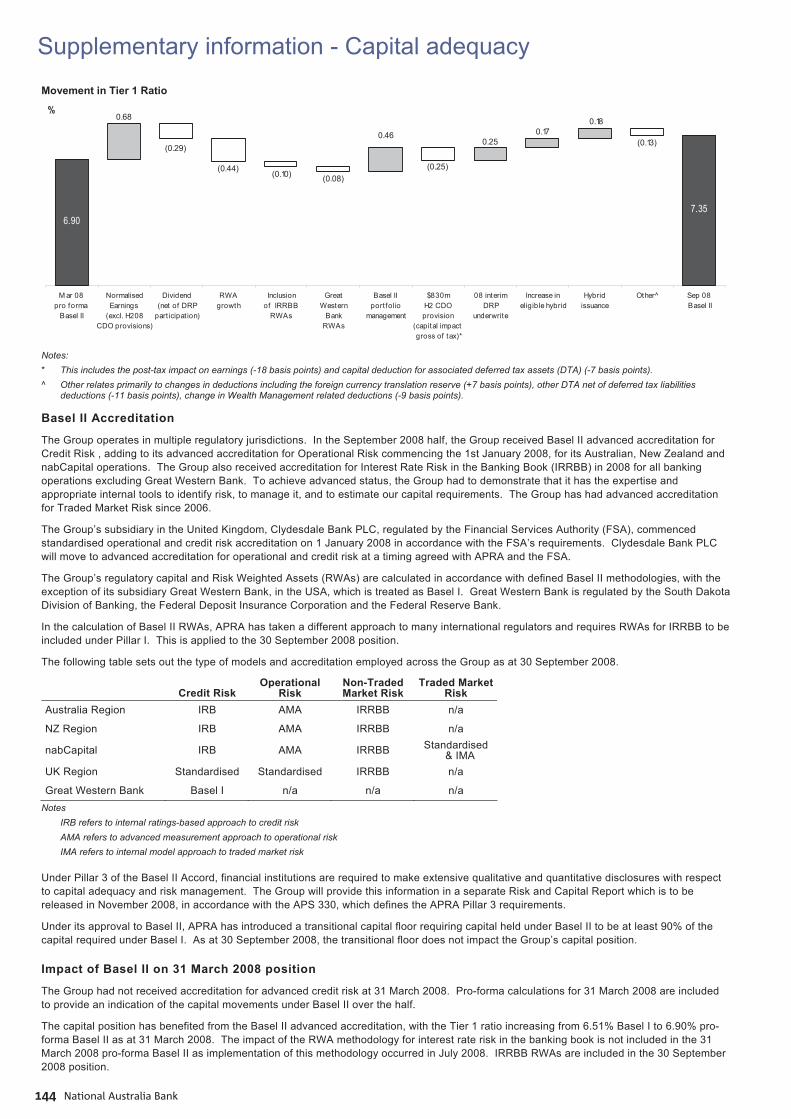
Supplementary information - Capital adequacy
National Australia Bank144
Movement in Tier 1 Ratio
6.90 7.35
0.250.17
0.18
0.46
0.68
(0.13)
(0.25)
(0.08) (0.10) (0.44)
(0.29)
M ar 08 pro forma
Basel II
NormalisedEarnings
(excl. H208CDO provisions)
Dividend (net of DRP
part icipat ion)
RWAgrowth
Inclusionof IRRBB
RWAs
GreatWestern
BankRWAs
Basel II portfolio
management
$830mH2 CDO provision
(capital impact gross of tax)*
08 interimDRP
underwrite
Increase in eligible hybrid
Hybridissuance
Other^ Sep 08 Basel II
%
Notes: * This includes the post-tax impact on earnings (-18 basis points) and capital deduction for associated deferred tax assets (DTA) (-7 basis points). ^ Other relates primarily to changes in deductions including the foreign currency translation reserve (+7 basis points), other DTA net of deferred tax liabilities
deductions (-11 basis points), change in Wealth Management related deductions (-9 basis points).
Basel II Accreditation
The Group operates in multiple regulatory jurisdictions. In the September 2008 half, the Group received Basel II advanced accreditation for Credit Risk , adding to its advanced accreditation for Operational Risk commencing the 1st January 2008, for its Australian, New Zealand and nabCapital operations. The Group also received accreditation for Interest Rate Risk in the Banking Book (IRRBB) in 2008 for all banking operations excluding Great Western Bank. To achieve advanced status, the Group had to demonstrate that it has the expertise and appropriate internal tools to identify risk, to manage it, and to estimate our capital requirements. The Group has had advanced accreditation for Traded Market Risk since 2006.
The Group’s subsidiary in the United Kingdom, Clydesdale Bank PLC, regulated by the Financial Services Authority (FSA), commenced standardised operational and credit risk accreditation on 1 January 2008 in accordance with the FSA’s requirements. Clydesdale Bank PLC will move to advanced accreditation for operational and credit risk at a timing agreed with APRA and the FSA.
The Group’s regulatory capital and Risk Weighted Assets (RWAs) are calculated in accordance with defined Basel II methodologies, with the exception of its subsidiary Great Western Bank, in the USA, which is treated as Basel I. Great Western Bank is regulated by the South Dakota Division of Banking, the Federal Deposit Insurance Corporation and the Federal Reserve Bank.
In the calculation of Basel II RWAs, APRA has taken a different approach to many international regulators and requires RWAs for IRRBB to be included under Pillar I. This is applied to the 30 September 2008 position.
The following table sets out the type of models and accreditation employed across the Group as at 30 September 2008.
Credit Risk Operational
Risk Non-Traded Market Risk
Traded Market Risk
Australia Region IRB AMA IRRBB n/a
NZ Region IRB AMA IRRBB n/a
nabCapital IRB AMA IRRBB Standardised & IMA
UK Region Standardised Standardised IRRBB n/a
Great Western Bank Basel I n/a n/a n/a Notes
IRB refers to internal ratings-based approach to credit risk AMA refers to advanced measurement approach to operational risk IMA refers to internal model approach to traded market risk
Under Pillar 3 of the Basel II Accord, financial institutions are required to make extensive qualitative and quantitative disclosures with respect to capital adequacy and risk management. The Group will provide this information in a separate Risk and Capital Report which is to be released in November 2008, in accordance with the APS 330, which defines the APRA Pillar 3 requirements.
Under its approval to Basel II, APRA has introduced a transitional capital floor requiring capital held under Basel II to be at least 90% of the capital required under Basel I. As at 30 September 2008, the transitional floor does not impact the Group’s capital position.
Impact of Basel II on 31 March 2008 position
The Group had not received accreditation for advanced credit risk at 31 March 2008. Pro-forma calculations for 31 March 2008 are included to provide an indication of the capital movements under Basel II over the half.
The capital position has benefited from the Basel II advanced accreditation, with the Tier 1 ratio increasing from 6.51% Basel I to 6.90% pro-forma Basel II as at 31 March 2008. The impact of the RWA methodology for interest rate risk in the banking book is not included in the 31 March 2008 pro-forma Basel II as implementation of this methodology occurred in July 2008. IRRBB RWAs are included in the 30 September 2008 position.
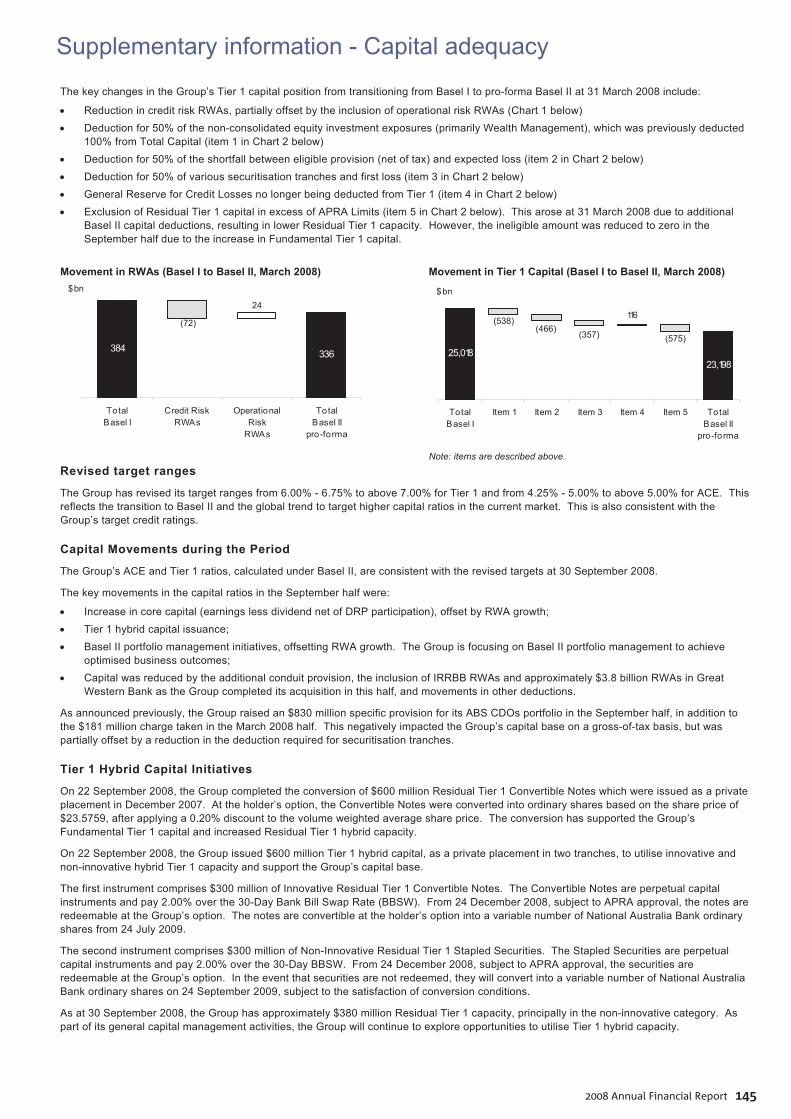
Supplementary information - Capital adequacy
2008 Annual Financial Report 145
The key changes in the Group’s Tier 1 capital position from transitioning from Basel I to pro-forma Basel II at 31 March 2008 include:
Reduction in credit risk RWAs, partially offset by the inclusion of operational risk RWAs (Chart 1 below) Deduction for 50% of the non-consolidated equity investment exposures (primarily Wealth Management), which was previously deducted
100% from Total Capital (item 1 in Chart 2 below) Deduction for 50% of the shortfall between eligible provision (net of tax) and expected loss (item 2 in Chart 2 below) Deduction for 50% of various securitisation tranches and first loss (item 3 in Chart 2 below) General Reserve for Credit Losses no longer being deducted from Tier 1 (item 4 in Chart 2 below) Exclusion of Residual Tier 1 capital in excess of APRA Limits (item 5 in Chart 2 below). This arose at 31 March 2008 due to additional
Basel II capital deductions, resulting in lower Residual Tier 1 capacity. However, the ineligible amount was reduced to zero in the September half due to the increase in Fundamental Tier 1 capital.
Movement in RWAs (Basel I to Basel II, March 2008)
384 336
(72)
24
TotalBasel I
Credit RiskRWAs
OperationalRisk
RWAs
TotalBasel II
pro-forma
$bn
Movement in Tier 1 Capital (Basel I to Basel II, March 2008)
25,01823,198
(538)(466)
(357) (575)
116
TotalBasel I
Item 1 Item 2 Item 3 Item 4 Item 5 TotalBasel II
pro-forma
$bn
Note: items are described above.
Revised target ranges
The Group has revised its target ranges from 6.00% - 6.75% to above 7.00% for Tier 1 and from 4.25% - 5.00% to above 5.00% for ACE. This reflects the transition to Basel II and the global trend to target higher capital ratios in the current market. This is also consistent with the Group’s target credit ratings.
Capital Movements during the Period
The Group’s ACE and Tier 1 ratios, calculated under Basel II, are consistent with the revised targets at 30 September 2008.
The key movements in the capital ratios in the September half were:
Increase in core capital (earnings less dividend net of DRP participation), offset by RWA growth; Tier 1 hybrid capital issuance; Basel II portfolio management initiatives, offsetting RWA growth. The Group is focusing on Basel II portfolio management to achieve
optimised business outcomes; Capital was reduced by the additional conduit provision, the inclusion of IRRBB RWAs and approximately $3.8 billion RWAs in Great
Western Bank as the Group completed its acquisition in this half, and movements in other deductions.
As announced previously, the Group raised an $830 million specific provision for its ABS CDOs portfolio in the September half, in addition to the $181 million charge taken in the March 2008 half. This negatively impacted the Group’s capital base on a gross-of-tax basis, but was partially offset by a reduction in the deduction required for securitisation tranches.
Tier 1 Hybrid Capital Initiatives
On 22 September 2008, the Group completed the conversion of $600 million Residual Tier 1 Convertible Notes which were issued as a private placement in December 2007. At the holder’s option, the Convertible Notes were converted into ordinary shares based on the share price of $23.5759, after applying a 0.20% discount to the volume weighted average share price. The conversion has supported the Group’s Fundamental Tier 1 capital and increased Residual Tier 1 hybrid capacity.
On 22 September 2008, the Group issued $600 million Tier 1 hybrid capital, as a private placement in two tranches, to utilise innovative and non-innovative hybrid Tier 1 capacity and support the Group’s capital base.
The first instrument comprises $300 million of Innovative Residual Tier 1 Convertible Notes. The Convertible Notes are perpetual capital instruments and pay 2.00% over the 30-Day Bank Bill Swap Rate (BBSW). From 24 December 2008, subject to APRA approval, the notes are redeemable at the Group’s option. The notes are convertible at the holder’s option into a variable number of National Australia Bank ordinary shares from 24 July 2009.
The second instrument comprises $300 million of Non-Innovative Residual Tier 1 Stapled Securities. The Stapled Securities are perpetual capital instruments and pay 2.00% over the 30-Day BBSW. From 24 December 2008, subject to APRA approval, the securities are redeemable at the Group’s option. In the event that securities are not redeemed, they will convert into a variable number of National Australia Bank ordinary shares on 24 September 2009, subject to the satisfaction of conversion conditions.
As at 30 September 2008, the Group has approximately $380 million Residual Tier 1 capacity, principally in the non-innovative category. As part of its general capital management activities, the Group will continue to explore opportunities to utilise Tier 1 hybrid capacity.

Supplementary information - Capital adequacy
National Australia Bank146
Dividend Reinvestment Plan (DRP) Initiatives
In July 2008, the Group underwrote the shortfall of the 2008 interim DRP participation to 100%. This generated approximately $850 million Tier 1 capital and is included in the Group’s 30 September 2008 capital position (25 basis points).
For the 2008 final dividend, the Group will offer a discount on the DRP (with no participation limit) and therefore the final dividend accrual is reduced by an amount equal to 41% of the final dividend to reflect assumed DRP participation. This assumption is consistent with the 2008 interim dividend experience.
The Group is focusing on being strong on capital given ongoing global economic uncertainty. Consistent with this objective, the Group raised capital equal to the DRP shortfall on the Group’s 2008 interim dividend payment. Following the Group’s equity placement, it has been announced that the previously announced underwrite of the DRP shortfall for the 2008 final dividend will not take place.
Lower Tier 2 Capital Initiatives
In the September half, the Group redeemed US$300 million Lower Tier 2 subordinated notes on the call date.
The impact of the redemption is offset by approximately A$1.6 billion new Lower Tier 2 issuance in this half. The issuance includes £350 million and €500 million 15-year non-call 10 year subordinated notes. The issuance has supported the Group’s Total Capital position.
Supplementary information - Disclosure on special purpose entities
2008 Annual Financial Report 147
The following supplementary disclosures are based on Financial Stability Forum (FSF) recommendations that were included in its report dated 7 April 2008 entitled Enhancing Market and Institutional Resilience.
(a) Special purpose entities (SPEs)
Controlled entities are those entities, including special purpose entities (SPEs), over which the Group has the power to govern the financial and operating policies so as to obtain benefits from their activities. Control rather than ownership interest is the sole criterion for determining a parent entity relationship. SPEs require consolidation in circumstances such as those where the Group has access to the majority of the residual income or is exposed to the majority of the residual risk associated with the SPE.
These supplementary disclosures focus on the exposure of the Group through its use of SPEs for various types of programmes (both on and off balance sheet) including: Securitisation SPEs. Funding program SPEs. Other SPEs.
(b) Securitisation SPEs
Objectives
The Group engages in securitisation activities for two purposes: Securitisation activities for business purposes, including arranging and managing securitisations for third parties (clients) as well as
securities arbitrage (funding of purchased assets) activities, primarily through SPEs (conduits) that provide funding for multiple transactions.
Securitisation of its own assets for funding and liquidity purposes, primarily for risk and capital management reasons. These transactions have always been recorded on the balance sheet since the adoption of AIFRS as the derecognition criteria is not met. Refer note 17 to the Financial Report
The first category represents third-party asset securitisation SPEs. The Group’s participation in these SPEs is discussed below.
Third party asset securitisation SPEs NAB sponsored multi-seller SPEs for client securitisation assets and third party transactions
For these transactions, securitisation structures are established by the Group, comprising one or numerous SPEs to purchase and fund customer assets, including in securitised form, as well as rated securities arbitrage assets (purchased assets). Each SPE funds the acquisition of assets by the issuance of debt securities directly into the market or via an issuing entity. Securities issued to external investors are usually in the form of commercial paper and medium term notes. Standby liquidity facilities are typically made available to the SPE to fund acquired assets in the event that commercial paper cannot be reissued to external investors. Ordinary equity in the SPE is typically held by a third party.
Most of the transactions in which the Group is involved are asset backed commercial paper (ABCP) transactions through its sponsored conduits Titan Securitisation, TSL (USA) Inc, Quasar Securitisation, CentreStar and MiraStar Securitisation. The Group undertakes one or more of the following roles of arranger, manager (through wholly-owned subsidiaries), standby liquidity provider, asset liquidity provider, warehouse facilities and derivative provider and dealer for these transactions.
The NAB sponsored conduits have now been consolidated in the financial statements as a consequence of a change to the Group’s existing accounting policy on consolidation. Full details on this change in accounting policy are provided in note 1(g) to the Financial Report.
Non-NAB sponsored conduits for third parties securitisation assets
For these transactions, securitisation SPEs are established by market participants, other than the Group, to acquire and fund various assets by issuing securities to external investors. The Group’s role is limited to provision of standby liquidity facilities and, in some cases, other support facilities to fund acquired assets in the event that commercial paper cannot be reissued to external investors. These entities are generally not consolidated, with liquidity facilities being included in loans and advances.
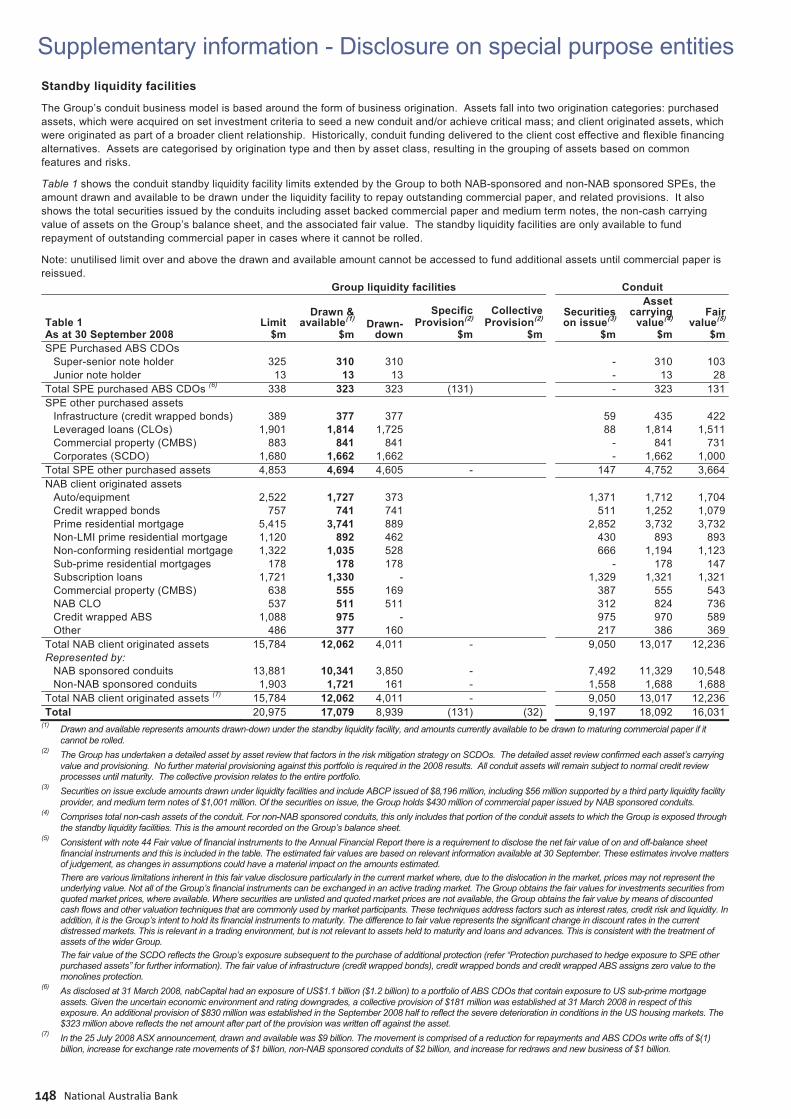
Supplementary information - Disclosure on special purpose entities
National Australia Bank148
Standby liquidity facilities
The Group’s conduit business model is based around the form of business origination. Assets fall into two origination categories: purchased assets, which were acquired on set investment criteria to seed a new conduit and/or achieve critical mass; and client originated assets, which were originated as part of a broader client relationship. Historically, conduit funding delivered to the client cost effective and flexible financing alternatives. Assets are categorised by origination type and then by asset class, resulting in the grouping of assets based on common features and risks.
Table 1 shows the conduit standby liquidity facility limits extended by the Group to both NAB-sponsored and non-NAB sponsored SPEs, the amount drawn and available to be drawn under the liquidity facility to repay outstanding commercial paper, and related provisions. It also shows the total securities issued by the conduits including asset backed commercial paper and medium term notes, the non-cash carrying value of assets on the Group’s balance sheet, and the associated fair value. The standby liquidity facilities are only available to fund repayment of outstanding commercial paper in cases where it cannot be rolled.
Note: unutilised limit over and above the drawn and available amount cannot be accessed to fund additional assets until commercial paper is reissued. Group liquidity facilities Conduit
Table 1 As at 30 September 2008
Limit $m
Drawn &available(1)
$mDrawn-
down
SpecificProvision(2)
$m
CollectiveProvision(2)
$m
Securities on issue(3)
$m
Asset carrying
value(4)
$m
Fair value(5)
$mSPE Purchased ABS CDOs Super-senior note holder 325 310 310 - 310 103 Junior note holder 13 13 13 - 13 28Total SPE purchased ABS CDOs (6) 338 323 323 (131) - 323 131SPE other purchased assets Infrastructure (credit wrapped bonds) 389 377 377 59 435 422 Leveraged loans (CLOs) 1,901 1,814 1,725 88 1,814 1,511 Commercial property (CMBS) 883 841 841 - 841 731 Corporates (SCDO) 1,680 1,662 1,662 - 1,662 1,000Total SPE other purchased assets 4,853 4,694 4,605 - 147 4,752 3,664NAB client originated assets Auto/equipment 2,522 1,727 373 1,371 1,712 1,704 Credit wrapped bonds 757 741 741 511 1,252 1,079 Prime residential mortgage 5,415 3,741 889 2,852 3,732 3,732 Non-LMI prime residential mortgage 1,120 892 462 430 893 893 Non-conforming residential mortgage 1,322 1,035 528 666 1,194 1,123 Sub-prime residential mortgages 178 178 178 - 178 147 Subscription loans 1,721 1,330 - 1,329 1,321 1,321 Commercial property (CMBS) 638 555 169 387 555 543 NAB CLO 537 511 511 312 824 736 Credit wrapped ABS 1,088 975 - 975 970 589 Other 486 377 160 217 386 369Total NAB client originated assets 15,784 12,062 4,011 - 9,050 13,017 12,236Represented by: NAB sponsored conduits 13,881 10,341 3,850 - 7,492 11,329 10,548 Non-NAB sponsored conduits 1,903 1,721 161 - 1,558 1,688 1,688Total NAB client originated assets (7) 15,784 12,062 4,011 - 9,050 13,017 12,236Total 20,975 17,079 8,939 (131) (32) 9,197 18,092 16,031
(1) Drawn and available represents amounts drawn-down under the standby liquidity facility, and amounts currently available to be drawn to maturing commercial paper if it cannot be rolled.
(2) The Group has undertaken a detailed asset by asset review that factors in the risk mitigation strategy on SCDOs. The detailed asset review confirmed each asset’s carrying value and provisioning. No further material provisioning against this portfolio is required in the 2008 results. All conduit assets will remain subject to normal credit review processes until maturity. The collective provision relates to the entire portfolio.
(3) Securities on issue exclude amounts drawn under liquidity facilities and include ABCP issued of $8,196 million, including $56 million supported by a third party liquidity facility provider, and medium term notes of $1,001 million. Of the securities on issue, the Group holds $430 million of commercial paper issued by NAB sponsored conduits.
(4) Comprises total non-cash assets of the conduit. For non-NAB sponsored conduits, this only includes that portion of the conduit assets to which the Group is exposed through the standby liquidity facilities. This is the amount recorded on the Group’s balance sheet.
(5) Consistent with note 44 Fair value of financial instruments to the Annual Financial Report there is a requirement to disclose the net fair value of on and off-balance sheet financial instruments and this is included in the table. The estimated fair values are based on relevant information available at 30 September. These estimates involve matters of judgement, as changes in assumptions could have a material impact on the amounts estimated. There are various limitations inherent in this fair value disclosure particularly in the current market where, due to the dislocation in the market, prices may not represent the underlying value. Not all of the Group’s financial instruments can be exchanged in an active trading market. The Group obtains the fair values for investments securities from quoted market prices, where available. Where securities are unlisted and quoted market prices are not available, the Group obtains the fair value by means of discounted cash flows and other valuation techniques that are commonly used by market participants. These techniques address factors such as interest rates, credit risk and liquidity. In addition, it is the Group’s intent to hold its financial instruments to maturity. The difference to fair value represents the significant change in discount rates in the current distressed markets. This is relevant in a trading environment, but is not relevant to assets held to maturity and loans and advances. This is consistent with the treatment of assets of the wider Group.
The fair value of the SCDO reflects the Group’s exposure subsequent to the purchase of additional protection (refer “Protection purchased to hedge exposure to SPE other purchased assets” for further information). The fair value of infrastructure (credit wrapped bonds), credit wrapped bonds and credit wrapped ABS assigns zero value to the monolines protection.
(6) As disclosed at 31 March 2008, nabCapital had an exposure of US$1.1 billion ($1.2 billion) to a portfolio of ABS CDOs that contain exposure to US sub-prime mortgage assets. Given the uncertain economic environment and rating downgrades, a collective provision of $181 million was established at 31 March 2008 in respect of this exposure. An additional provision of $830 million was established in the September 2008 half to reflect the severe deterioration in conditions in the US housing markets. The $323 million above reflects the net amount after part of the provision was written off against the asset.
(7) In the 25 July 2008 ASX announcement, drawn and available was $9 billion. The movement is comprised of a reduction for repayments and ABS CDOs write offs of $(1) billion, increase for exchange rate movements of $1 billion, non-NAB sponsored conduits of $2 billion, and increase for redraws and new business of $1 billion.
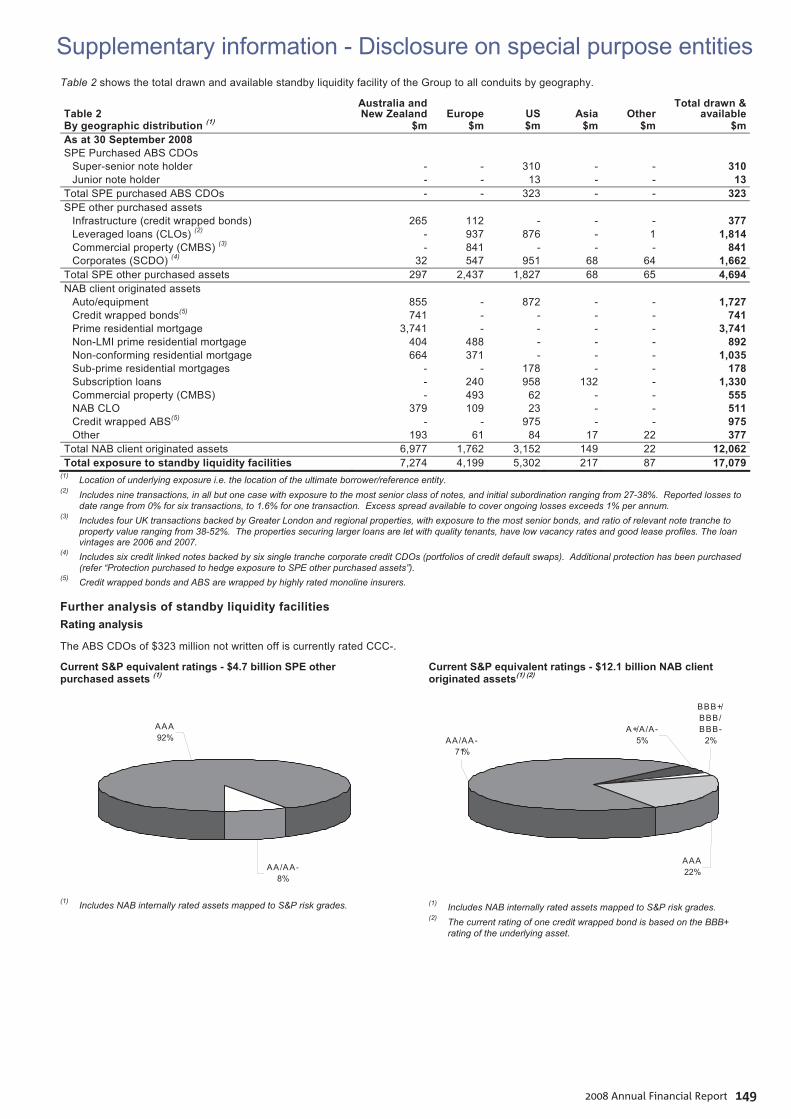
Supplementary information - Disclosure on special purpose entities
2008 Annual Financial Report 149
Table 2 shows the total drawn and available standby liquidity facility of the Group to all conduits by geography.
Table 2 By geographic distribution (1)
Australia and New Zealand
$mEurope
$mUS$m
Asia $m
Other $m
Total drawn & available
$mAs at 30 September 2008 SPE Purchased ABS CDOs Super-senior note holder - - 310 - - 310 Junior note holder - - 13 - - 13Total SPE purchased ABS CDOs - - 323 - - 323SPE other purchased assets Infrastructure (credit wrapped bonds) 265 112 - - - 377 Leveraged loans (CLOs) (2) - 937 876 - 1 1,814 Commercial property (CMBS) (3) - 841 - - - 841 Corporates (SCDO) (4) 32 547 951 68 64 1,662Total SPE other purchased assets 297 2,437 1,827 68 65 4,694NAB client originated assets Auto/equipment 855 - 872 - - 1,727 Credit wrapped bonds(5) 741 - - - - 741 Prime residential mortgage 3,741 - - - - 3,741 Non-LMI prime residential mortgage 404 488 - - - 892 Non-conforming residential mortgage 664 371 - - - 1,035 Sub-prime residential mortgages - - 178 - - 178 Subscription loans - 240 958 132 - 1,330 Commercial property (CMBS) - 493 62 - - 555 NAB CLO 379 109 23 - - 511 Credit wrapped ABS(5) - - 975 - - 975 Other 193 61 84 17 22 377Total NAB client originated assets 6,977 1,762 3,152 149 22 12,062Total exposure to standby liquidity facilities 7,274 4,199 5,302 217 87 17,079
(1) Location of underlying exposure i.e. the location of the ultimate borrower/reference entity. (2) Includes nine transactions, in all but one case with exposure to the most senior class of notes, and initial subordination ranging from 27-38%. Reported losses to
date range from 0% for six transactions, to 1.6% for one transaction. Excess spread available to cover ongoing losses exceeds 1% per annum. (3) Includes four UK transactions backed by Greater London and regional properties, with exposure to the most senior bonds, and ratio of relevant note tranche to
property value ranging from 38-52%. The properties securing larger loans are let with quality tenants, have low vacancy rates and good lease profiles. The loan vintages are 2006 and 2007.
(4) Includes six credit linked notes backed by six single tranche corporate credit CDOs (portfolios of credit default swaps). Additional protection has been purchased (refer “Protection purchased to hedge exposure to SPE other purchased assets”).
(5) Credit wrapped bonds and ABS are wrapped by highly rated monoline insurers.
Further analysis of standby liquidity facilities Rating analysis
The ABS CDOs of $323 million not written off is currently rated CCC-.
Current S&P equivalent ratings - $4.7 billion SPE other purchased assets (1)
AAA92%
AA/AA-8%
(1) Includes NAB internally rated assets mapped to S&P risk grades.
Current S&P equivalent ratings - $12.1 billion NAB client originated assets(1) (2)
AA/AA-71%
AAA22%
A+/A/A-5%
BBB+/BBB/BBB-
2%
(1) Includes NAB internally rated assets mapped to S&P risk grades. (2) The current rating of one credit wrapped bond is based on the BBB+
rating of the underlying asset.
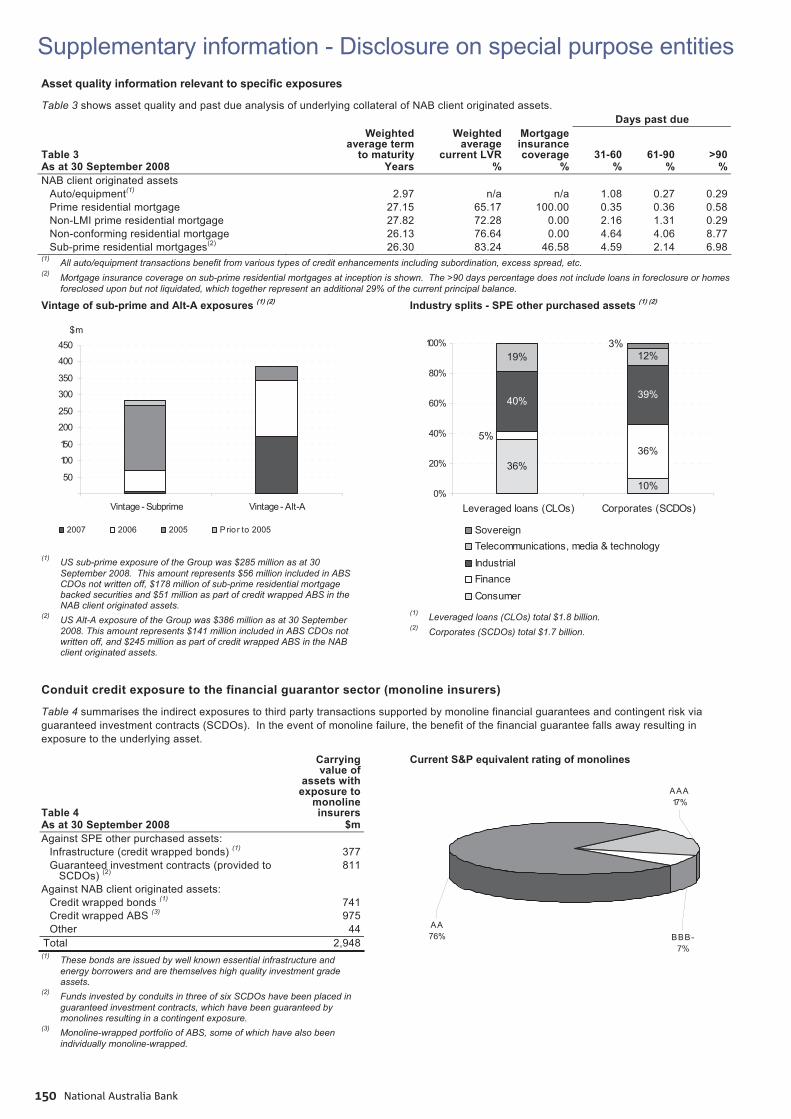
Supplementary information - Disclosure on special purpose entities
National Australia Bank150
Asset quality information relevant to specific exposures
Table 3 shows asset quality and past due analysis of underlying collateral of NAB client originated assets. Days past due
Table 3 As at 30 September 2008
Weighted average term
to maturityYears
Weighted average
current LVR%
Mortgage insurance coverage
% 31-60
% 61-90
%>90
%NAB client originated assets Auto/equipment(1) 2.97 n/a n/a 1.08 0.27 0.29 Prime residential mortgage 27.15 65.17 100.00 0.35 0.36 0.58 Non-LMI prime residential mortgage 27.82 72.28 0.00 2.16 1.31 0.29 Non-conforming residential mortgage 26.13 76.64 0.00 4.64 4.06 8.77 Sub-prime residential mortgages(2) 26.30 83.24 46.58 4.59 2.14 6.98(1) All auto/equipment transactions benefit from various types of credit enhancements including subordination, excess spread, etc. (2) Mortgage insurance coverage on sub-prime residential mortgages at inception is shown. The >90 days percentage does not include loans in foreclosure or homes
foreclosed upon but not liquidated, which together represent an additional 29% of the current principal balance.
Vintage of sub-prime and Alt-A exposures (1) (2)
50
100
150
200
250
300
350
400
450
Vintage - Subprime Vintage - Alt-A
$m
2007 2006 2005 Prior to 2005
(1) US sub-prime exposure of the Group was $285 million as at 30
September 2008. This amount represents $56 million included in ABS CDOs not written off, $178 million of sub-prime residential mortgage backed securities and $51 million as part of credit wrapped ABS in the NAB client originated assets.
(2) US Alt-A exposure of the Group was $386 million as at 30 September 2008. This amount represents $141 million included in ABS CDOs not written off, and $245 million as part of credit wrapped ABS in the NAB client originated assets.
Industry splits - SPE other purchased assets (1) (2)
36%
10%
36%
40% 39%
19% 12%
5%
3%
0%
20%
40%
60%
80%
100%
Leveraged loans (CLOs) Corporates (SCDOs)
SovereignTelecommunications, media & technologyIndustrialFinanceConsumer
(1) Leveraged loans (CLOs) total $1.8 billion. (2) Corporates (SCDOs) total $1.7 billion.
Conduit credit exposure to the financial guarantor sector (monoline insurers)
Table 4 summarises the indirect exposures to third party transactions supported by monoline financial guarantees and contingent risk via guaranteed investment contracts (SCDOs). In the event of monoline failure, the benefit of the financial guarantee falls away resulting in exposure to the underlying asset.
Table 4 As at 30 September 2008
Carrying value of
assets with exposure to
monoline insurers
$mAgainst SPE other purchased assets: Infrastructure (credit wrapped bonds) (1) 377 Guaranteed investment contracts (provided to
SCDOs) (2) 811
Against NAB client originated assets: Credit wrapped bonds (1) 741 Credit wrapped ABS (3) 975 Other 44Total 2,948
(1) These bonds are issued by well known essential infrastructure and energy borrowers and are themselves high quality investment grade assets.
(2) Funds invested by conduits in three of six SCDOs have been placed in guaranteed investment contracts, which have been guaranteed by monolines resulting in a contingent exposure.
(3) Monoline-wrapped portfolio of ABS, some of which have also been individually monoline-wrapped.
Current S&P equivalent rating of monolines
BBB-7%
AAA17%
AA76%
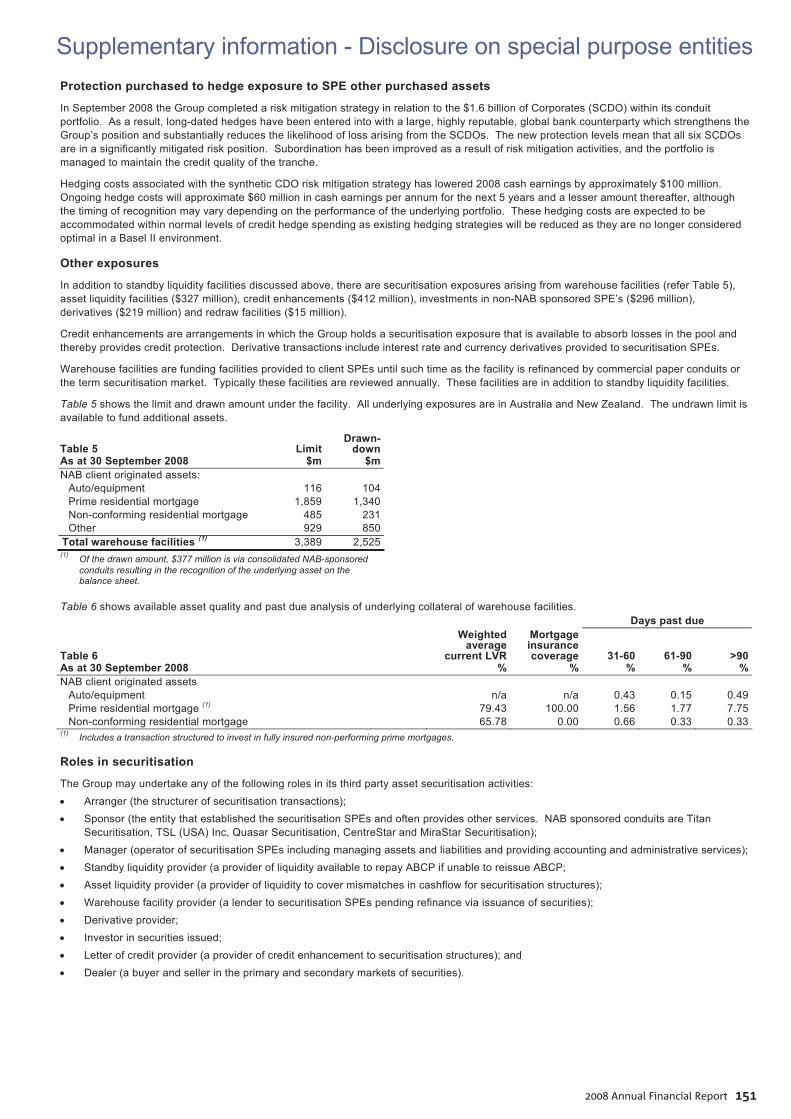
Supplementary information - Disclosure on special purpose entities
2008 Annual Financial Report 151
Protection purchased to hedge exposure to SPE other purchased assets
In September 2008 the Group completed a risk mitigation strategy in relation to the $1.6 billion of Corporates (SCDO) within its conduit portfolio. As a result, long-dated hedges have been entered into with a large, highly reputable, global bank counterparty which strengthens the Group’s position and substantially reduces the likelihood of loss arising from the SCDOs. The new protection levels mean that all six SCDOs are in a significantly mitigated risk position. Subordination has been improved as a result of risk mitigation activities, and the portfolio is managed to maintain the credit quality of the tranche.
Hedging costs associated with the synthetic CDO risk mitigation strategy has lowered 2008 cash earnings by approximately $100 million. Ongoing hedge costs will approximate $60 million in cash earnings per annum for the next 5 years and a lesser amount thereafter, although the timing of recognition may vary depending on the performance of the underlying portfolio. These hedging costs are expected to be accommodated within normal levels of credit hedge spending as existing hedging strategies will be reduced as they are no longer considered optimal in a Basel II environment.
Other exposures
In addition to standby liquidity facilities discussed above, there are securitisation exposures arising from warehouse facilities (refer Table 5), asset liquidity facilities ($327 million), credit enhancements ($412 million), investments in non-NAB sponsored SPE’s ($296 million), derivatives ($219 million) and redraw facilities ($15 million).
Credit enhancements are arrangements in which the Group holds a securitisation exposure that is available to absorb losses in the pool and thereby provides credit protection. Derivative transactions include interest rate and currency derivatives provided to securitisation SPEs.
Warehouse facilities are funding facilities provided to client SPEs until such time as the facility is refinanced by commercial paper conduits or the term securitisation market. Typically these facilities are reviewed annually. These facilities are in addition to standby liquidity facilities.
Table 5 shows the limit and drawn amount under the facility. All underlying exposures are in Australia and New Zealand. The undrawn limit is available to fund additional assets.
Table 5 As at 30 September 2008
Limit $m
Drawn-down
$mNAB client originated assets: Auto/equipment 116 104 Prime residential mortgage 1,859 1,340 Non-conforming residential mortgage 485 231 Other 929 850Total warehouse facilities (1) 3,389 2,525
(1) Of the drawn amount, $377 million is via consolidated NAB-sponsored conduits resulting in the recognition of the underlying asset on the balance sheet.
Table 6 shows available asset quality and past due analysis of underlying collateral of warehouse facilities. Days past due
Table 6 As at 30 September 2008
Weighted average
current LVR%
Mortgage insurance coverage
% 31-60
% 61-90
%>90
%NAB client originated assets Auto/equipment n/a n/a 0.43 0.15 0.49 Prime residential mortgage (1) 79.43 100.00 1.56 1.77 7.75 Non-conforming residential mortgage 65.78 0.00 0.66 0.33 0.33(1) Includes a transaction structured to invest in fully insured non-performing prime mortgages.
Roles in securitisation
The Group may undertake any of the following roles in its third party asset securitisation activities: Arranger (the structurer of securitisation transactions); Sponsor (the entity that established the securitisation SPEs and often provides other services. NAB sponsored conduits are Titan
Securitisation, TSL (USA) Inc, Quasar Securitisation, CentreStar and MiraStar Securitisation); Manager (operator of securitisation SPEs including managing assets and liabilities and providing accounting and administrative services); Standby liquidity provider (a provider of liquidity available to repay ABCP if unable to reissue ABCP; Asset liquidity provider (a provider of liquidity to cover mismatches in cashflow for securitisation structures); Warehouse facility provider (a lender to securitisation SPEs pending refinance via issuance of securities); Derivative provider; Investor in securities issued; Letter of credit provider (a provider of credit enhancement to securitisation structures); and Dealer (a buyer and seller in the primary and secondary markets of securities).
Supplementary information - Disclosure on special purpose entities
National Australia Bank152
Accounting Treatment
In general, facilities provided to securitisations are treated the same way as facilities to any other borrower or counterparty.
Interest and line fees received are treated as revenue in the period in which they are accrued. Arrangement fees are treated as revenue and recognised as revenue over the life of the securitisation transaction. Derivatives such as interest rate swaps, basis swaps or cross-currency swaps have the same accounting treatment as non-securitisation derivatives.
The Group has changed its accounting policy in relation to consolidation. Under this revised policy, NAB sponsored securitisation conduits are consolidated by the Group. Refer to note 1(g) to the Financial Report for full details of the change in accounting treatment.
(c) Funding program SPEs
The Group has established programs to raise funding from the issue of equity instruments or debt instruments.
Material funding programs of the Group that use SPEs as at 30 September 2008 are as follows:
Table 7 As at 30 September 2008 $mTrust Preferred Securities 975Trust Preferred Securities II 1,014National Capital Instruments 397BNZ Income Securities 380 The SPEs used in the above funding programs are controlled by the Group under Australian Equivalent to International Financial Reporting Standards (AIFRS) and are recorded on-balance sheet as equity items of the Group.
Other funding programs of the Group do not use SPEs and are recorded in the books of the Company. Further details on funding programs can be found at www.nabgroup.com.
Securitisation of own assets are included in note 17 to the Financial Report.
(d) Other SPEs
nabCapital is involved in transactions that involve the use of SPEs. All of these SPEs are recorded on the balance sheet.
Table 8 As at 30 September 2008 $m Consolidated SPEs Investments in debt securities 4,040 Investments in property trusts 540 Funding transactions (5,514) Lease finance 1,444 The Group invests in debt instruments through various SPEs, mainly in the form of Bonds, Certificates of Deposits and Loans. The assets within the portfolio are subject to the Group’s normal credit approval and review processes and all assets continue to perform.
The Group also utilises SPEs to invest in a range of property trusts and other property related investments as well as a means to access alternate sources of funding.
Lease Financing involves extending finance to clients in order to meet their particular asset financing requirements mainly in the mining, mobile infrastructure and transport industries.
Glossary
2008 Annual Financial Report 153
Term used Brief description AASB Australian Accounting Standards Board ADR American depositary receipt AIFRS Australian equivalents to International Financial Reporting Standards APRA Australian Prudential Regulation Authority ASIC Australian Securities and Investments Commission ASX Australian Securities Exchange Cash earnings A key performance measure and financial target used by the Group. It does not refer to any amount represented
on a Cash Flow Statement. Company National Australia Bank Limited Group National Australia Bank Limited and its controlled entities NAB National Australia Bank Limited nabCapital Formerly Institutional Markets & Services (IMS) NZ New Zealand SCDO Synthetic Collateralised Debt Obligation SEC Securities and Exchange Commission UK United Kingdom US United States of America

This page has been intentionally left blank
National Australia Bank154

This page has been intentionally left blank
2008 Annual Financial Report 155

This page has been intentionally left blank
National Australia Bank156

National Australia Bank Limited Group Offi ces500 Bourke Street(GPO Box 84A)Melbourne Vic 3000AustraliaIf calling within Australia 1300 889 398 Tel: +61 3 8641 9083Fax: +61 3 8641 4927www.nabgroup.comwww.national.com.au
New York Branch28th Floor, 245 Park AvenueNew York NY 10167United States of AmericaTel: +1 212 916 9500Fax: +1 212 983 1969
National Australia Group Europe Limited88 Wood StreetLondon EC2V 7QQEnglandUnited KingdomTel: +44 (0)20 7710 2100Fax: +44 (0)20 7710 1351
National Wealth Management Holdings LimitedGround Floor, MLC Building105 – 153 Miller StreetNorth Sydney NSW 2060AustraliaTel: +61 2 9957 8000Fax: +61 2 9966 3295
Hong Kong BranchLevel 27 One Pacifi c Place88 QueenswayHong KongTel: + 852 2822 9800Fax: + 852 2822 9801Tel: + 852 2826 8111(HK Branch)Fax: + 852 2845 9251(HK Branch)www.nabasia.com
London Branch88 Wood Street,London EC2V 7QQEnglandUnited KingdomTel: +44 (0)20 7710 2100Fax: +44 (0)20 7710 1351
MLC LimitedGround Floor, MLC Building105 – 153 Miller StreetNorth Sydney NSW 2060AustraliaTel: +61 2 9957 8000Fax: +61 2 9966 3295MLC Adviser Hotline: 133652www.mlc.com.au
Singapore Branch 5 Temasek Boulevard#15-01 Suntec Tower FiveSingapore 038985Tel: + 65 6419 6800Fax: + 65 6338 0039www.nabasia.com
Clydesdale Bank PLC30 St Vincent PlaceGlasgow G1 2HLScotlandUnited KingdomTel: +44 141 248 7070Fax: +44 141 204 0828www.cbonline.co.uk
National Australia Financial Management LimitedGround Floor, MLC Building105 – 153 Miller StreetNorth Sydney NSW 2060AustraliaTel: +61 2 9957 8000Fax: +61 2 9966 3295
Tokyo BranchMitsui Nigokan2-1-1 Nihonbashi MuromachiChuo-kuTokyo 103-0022JapanTel: + 81 3 3241 8781Fax: + 81 3 3241 8951www.nabasia.com/tokyo
Clydesdale Bank PLC trading as Yorkshire Bank20 Merrion WayLeeds LS2 8NZEnglandUnited KingdomTel: +44 113 807 2000Fax: +44 113 807 2115www.ybonline.co.uk
NAB Custodian Services12/500 Bourke Street(GPO Box 1406)Melbourne Vic 3001AustraliaTel: +61 3 8641 3500Fax: +61 1300 556 414SWIFT: NATAAU3303Xwww.nationalncs.com
Beijing Representative Offi ce2326 China World Tower OneChina World Trade CenterNo. 1 Jian Guo Men Wai AvenueBeijing 100004People’s Republic of ChinaTel: +86 10 6505 2255Fax: +86 10 6505 7156
Bank of New ZealandLevel 8, BNZ Tower125 Queen StreetAucklandNew ZealandTel: +64 9 375 1300Fax: +64 9 375 1023www.bnz.co.nz
Great Western Bank100 N. Phillips Ave.Sioux Falls, SD 57104South DakotaUnited States of AmericaTel: +1 605 334.2548Fax: +1 605 339.8862www.greatwesternbank.com
National Australia Trustees LimitedLevel 5800 Bourke StreetDocklands Vic 3008Correspondence to:Docklands 2506 UB(GPO Box 247)Melbourne Vic 3001AustraliaTel: 1800 036 172Tel: +61 3 8634 1323 (Int’l only)Fax: +61 3 8634 4455
India Representative Offi ceNational Australia BankSuite # 1235,Trident Towers,Nariman Point,Mumbai 400 021IndiaTel: +91 22 6630 7254Fax: +91 22 6630 6016www.nabasia.com
PRINCIPAL ESTABLISHMENTS

www.nabgroup.com
2008 A
NN
UA
L FINA
NC
IAL REPO
RT
NAB61235A1108


