Embed Size (px)
Citation preview

Proceedings of PVP2008
2008 ASME Pressure Vessels and Piping Division Conference July 27-31, 2008, Chicago, Illinois, USA
PVP2008-61115
A NEW TIGHTENING METHODOLOGY FOR GASKETED JOINTS BASED ON NONLINEAR FINITE ELEMENT ANALYSIS
Sayed A. Nassar, Zhijun Wu, Xianjie Yang Fastening and Joining Research Institute (FAJRI)
Department of Mechanical Engineering Oakland University, Rochester, Michigan 48309 USA
ABSTRACT
A three dimensional nonlinear finite element model is developed for achieving a uniform clamp load in gasketed bolted joints. The model is used for both multiple and single pass tightening patterns. Geometric nonlinearity of the gasket is taken into account and plastic model parameters are experimentally determined. The effect of the tightening pattern, gasket loading and unloading history, and the preload level is investigated. The validity of the FEA methodology is experimentally verified. This study helps improve the reliability of gasketed bolted joints by minimizing the bolt-to-bolt clamp load variation caused by elastic interaction among the various bolts in the joint during initial joint bolt-up. Keywords: elastic interaction, multi-pass tightening, single-pass tightening, gasketed flange. 1. INTRODUCTION
When a group of bolts are tightened in a gasketed joint, the elongation of each individual bolt causes it to structurally interact with other bolts in the same joint. As other bolts are subsequently tightened, the tension in previously tightened bolts is changed, most often reduced. After all bolts have been tightened, bolt tensions are no longer uniform. This phenomenon is referred to as elastic interaction [1]. Bibel and Ezell [2] and Bibel and Eric [3] reported that the elastic interaction caused some bolts in the flange to lose up to 98% of their initial preloads when adjacent bolts were subsequently tightened.
It is well known that it is extremely difficult to achieve uniform bolt preloads in a gasketed joint with multiple bolts due to the combined effect of elastic interaction and gasket creep relaxation. Nonuniform and insufficient bolt loads in a flanged
joint often increase the risk of leakage and/or fatigue failure under service loading. In practice, multi-pass bolt-up operation is usually conducted to achieve a more uniform bolt load. Kumakura and Saito [4] carried out two new multi-pass tightening patterns for pipe flanges. They reported that the proposed tightening method is effective to achieve uniform bolt tensions with multi-pass tightening strategy. Fukuoka and Takaki [5] presented a numerical approach to estimate the scatter in bolt preloads and to achieve uniform bolt preloads when tightening the bolts one by one using single-pass tightening of pipe flanges with an aluminum gasket. Takaki and Fukuoka [6] studied the effect of preload level and flange size on multi-pass tightening of bolted flanges with a compressed asbestos sheet gasket by conducting finite element bolt-up simulation. However, their FEA simulation results were not experimentally verified. Takaki and Fukuoka [7] determined the clamping forces in each pass using the elastic interaction coefficient method for a two-pass bolting up operation. They also concluded that three or four passes are required in order to achieve the desired uniform preloads in a gasketed flange.
Although some researchers have proposed some models
to predict the bolt tightening preloads of a gasketed joint [2, 7, 8], most of the models are based on an elastic deformation assumption of the gasket. However, many gasket materials often exhibit significant inelastic deformation even under relatively small loads.
In this study, a more accurate finite element model for
multi-pass and single-pass bolt tightening operations is introduced. A new tightening methodology of gasketed joint based on three-dimensional nonlinear finite element simulation is proposed, in order to explore the tightening strategies for achieving the uniformity of the desired bolt preload with
1 Copyright © 2008 by ASME

minimum scatter. The deformation behavior of the gasket material (flexible graphite) is described by an isotropic plastic model. The geometric nonlinearity of the gasket is taken into account. The plastic model parameters are experimentally determined using compressive testing. The effect of tightening pattern, gasket loading and unloading history and the preload level is investigated. Experimental verification of the FEA results provided. The special case of a single-pass tightening with an elastic gasket is also developed and discussed. 2. PLASTIC MODEL OF GASKET MATERIAL (FLEXIBLE GRAPHITE)
The stress-strain relationship of the Flexible Graphite gasket material used in this study is experimentally developed using compression tests on a MTS® machine. Figure 1 shows the test data on the loading and unloading history of the gasket material. It is observed that the gasket material exhibits nonlinear behavior even at low levels of compressive stress. Test data also shows that the material has a hysteresis loop during the unloading/loading cycles. In this FEA study, the gasket unloading is approximated by the dotted linear behavior depicted Figure1.
ABAQUS [9] is used in this study for the nonlinear
analysis of the gasket behavior. The gasket material model is based on assuming that the gasket material is isotropic, and that the gasket strain increment ijdε is the sum of an elastic and
plastic strain increments eijdε and p
ijdε , respectively, as given by equation (1).
pij
eijij ddd εεε += (1)
Based on 3-D Hooke’s law, the elastic strain increment component is given by
ijmije
ij dEG
dd δσνσε 3
2−= (2)
where E , G , and ν , are respectively, the Young’s modulus, shear modulus and Poisson’s ratio of the gasket material, ijdσ
is the stress increment, and mdσ is the hydrostatic stress increment. After the gasket material has yielded, the plastic constitutive equation is used. A Von Mises plastic hardening function φ is given by [10] as follows
( ) ( ) 023
=−⋅=−= ∫∫ pijij
p dSSd εψεψσφ (3)
where ijij SS ⋅=23σ is the equivalent stress, ijS is the
deviatoric stress, )(∫ pdεψ is the isotropic hardening function
2
with respect to cumulative plastic strain, and pdε is the equivalent plastic stain increment. Based on the associated normal plastic flow law for the plastic potential shown in Eq. (3), the plastic strain increment p
ijdε is given by [10] as follows
ijij
pp
ij SdSddσσ
ψσεε ⋅
′==
23
23 (4)
where pddεψψ =′ . For the case of monotonic stress, the
derivative ψ ′ simplifies to pddεσψ =′ , which is the slope of
theσ - pε curve (Figure1). 3. FINITE ELEMENT SIMULATION
A nonlinear three-dimensional finite element analysis that simulates the multi-pass bolt-up strategy of gasketed bolted joints is carried out using a five-bolted joint with a flexible graphite gasket as shown in Figure 2. 3.1 Finite Element Model for Gasketed Joint
In this study, Steel bolts (Class 10.9) and joints are loaded in their linear elastic range; Young’s modulus and Poision’s ratio are set to be 200GPa and 0.3, respectively. Material properties of the flexible graphite gasket are experimentally determined using a compression test (Figure1). The simplified isotropic plastic model for the gasket material is shown in section 2. Contact conditions are used at the gasket/joint, joint/nut, and joint/bolt interfaces. 8-node linear brick with reduced integration elements (C3D8R) are used in this model, which includes 10228 elements and 15046 nodes. Static procedure is used in the process of tightening simulation. 3.2 Bolt Load Function in ABAQUS/Standard
In this study, the commercial finite element analysis software ABAQUS/Standard is used [9]. The software provides a special function to simulate bolt loading, as shown in Figure 3. The bolt pre-tensioning is simulated by adding a pre-tension on the bolt cross-section. By modifying the length of elements which are in the region ABCD and keeping the length of fastener constant, ABAQUS/Standard can achieve the prescribed amount of pre-tension. In later steps, further length changes of the ABCD elements can be prevented by fixing those elements at current lengths so that the bolt acts as a standard, deformable component which is compatible with the deformation of the bolted joint assembly during the subsequent loading of various bolts. The assembly load is transmitted across the pre-tension section by means of the pre-tension node. 3.3 Finite Element Simulation Process
Copyright © 2008 by ASME

A five-bolted joint with a flexible graphite gasket, as shown in Figure 2, is used in this study. The necessary boundary conditions are applied in order to prevent rigid body motion of the model. Multi-pass sequential (1-2-3-4-5) and star (1-3-5-2-4) tightening patterns is used in either (Figure 4) in order to investigate their effect on the bolt tension variations. Individual tightening of each bolt is accomplished to the desired preload level in each step. All bolts are tightened to the target preload one-by-one during each pass. Two levels of target fastener preload are studied, namely, 3000 lb and 5000 lb. These levels correspond to 19% and 31.6% of the M12×1.75 Class 10.9 bolt proof load, respectively.
4. EXPERIMENTAL SET-UP AND VERIFICATION
Figure 5 illustrates the experimental set-up for verifying the nonlinear finite element simulation and its validity for the proposed multi-pass bolt-up strategy. The set-up includes a data acquisition system, a digital torque wrench, and five-bolted gasketed joints with force washers for monitoring bolt preloads. The force washer precision is ±5%; the precision of the torque wrench is irrelevant since the wrench was used to produce the desired bolt tension as indicated directly by the force washer. The flanged joint is made of 4140 steel flanges with a special design to prevent bolt heads from rotating during the tightening process. The bolt tightening is accomplished by using a high precision digital torque wrench for achieving the desired bolt tension as indicated by the respective force washer (load cell). In each pass, bolts are tightened one by one following the same pattern used in the initial pass. The bolt tension variations are recorded in real-time using the data acquisition system that is connected to the force washers in various bolts.
The gasket material is flexible graphite which has high
temperature and chemical characteristics of graphite as well as added characteristics of flexibility, conformability, and resilience. These unique properties make flexible graphite gaskets more suitable for the high temperature and corrosive applications [11]. Sheet gasket material is cut into a round shape with an inner diameter of 3 in. and an outer diameter of 6 in. Five equally spaced holes are punched in the gasket along a 4.5in. diameter bolt circle. 5. RESULTS AND DISCUSSION
Finite element and experimental data are presented and compared each other in the following sections. The effect of the studied parameters on achieving the desired level of uniform clamp load, using a multi-pass tightening strategy, is investigated. Parameters include the tightening pattern, gasket loading and unloading history, and the fastener preload level. Each bolt is tightened to the full target preload in each pass. 5.1 Effect of Tightening Pattern
Figure 4 shows both the sequential (1-2-3-4-5) and star (1-3-5-2-4) tightening patterns that are investigated in this section for their effect on the bolt tension. Figure 6 shows both the FEA and experimental results for a sequential tightening
3
pattern (1-2-3-4-5) to a target bolt preload of 5000lb. At the end of the first pass, the FEA model yields a mean residual bolt tension of 3547 lb with a 1-σ scatter of 29.8% (around the mean residual value). The corresponding experimental data yields a mean residual bolt tension of 3288 lb and a 1-σ scatter of 28.0%. For both the FEA and the experimental results, the mean bolt tension is increased with the number of passes, while the 1-σ scatter is decreased. At the end of the fourth tightening pass, the FEA mean bolt tension is 4896 lb; the 1-σ scatter reduces to 1.5%. The corresponding experimental data on the mean bolt tension and the 1-σ scatter are 4803 lb and 3.3%, respectively. The FEA model results correlate well with the experimental data. Figure 7 shows both the FEA and experimental results for a star tightening pattern (1-3-5-2-4) to a target bolt preload of 5000lb. At the end of the first pass, the FEA model yields a mean residual bolt tension of 3386 lb with a 1-σ scatter of 56.9%. The corresponding experimental data yields a mean residual bolt tension of 3205 lb and a 1-σ scatter of 53.9%. For both the FEA and the experimental results, the mean bolt tension is increased with the number of passes, while the 1-σ scatter is decreased. At the end of the fourth tightening pass, the FEA mean residual bolt tension achieves 4850 lb and the 1-σ scatter reduces to 3.1%, while the experimental mean residual bolt tension achieves 4739 lb and the 1-σ scatter reduces to 3.7%. The FEA model results correlates well with the experimental data.
The FEA and experimental results for four-pass tightening
using sequential and star patterns are shown in Figure8 and 9, respectively. Although the 1-σ scatter at the first pass of a star tightening pattern is much higher than that of sequential tightening, the mean bolt tension approaches to target 5000 lb preload at the end of fourth pass with a very small scatter. The FEA results for both sequential and star tightening patterns are in good agreement with the corresponding experimental data.
Based on the above results, the finite element simulation
accurately predicts the residual bolt tension. The FEA and experimental results show that the proposed multi-pass tightening strategy with both sequential and star tightening patterns can achieve a uniform distribution of bolt tension in the studied joint with a flexible graphite gasket. 5.2 Effect of gasket loading and unloading History (gasket hysteresis)
As the gasket is an elastoplastic material, it will have certain level of plastic deformation after the flanges are clamped with bolt-up operation. The plastic deformation behavior is dependent on the loading history. Upon the loosening of a previously tightened joint in plastic deformation has accumulated in the gasket. For a previously tightened and loosened joint, the subsequent tightening of a bolt will compress the gasket in a linear fashion up until the previous bolt preload level has been achieved; gasket compression is relatively smaller compared to its previous compression. This will cause a significantly different level of elastic interaction between
Copyright © 2008 by ASME
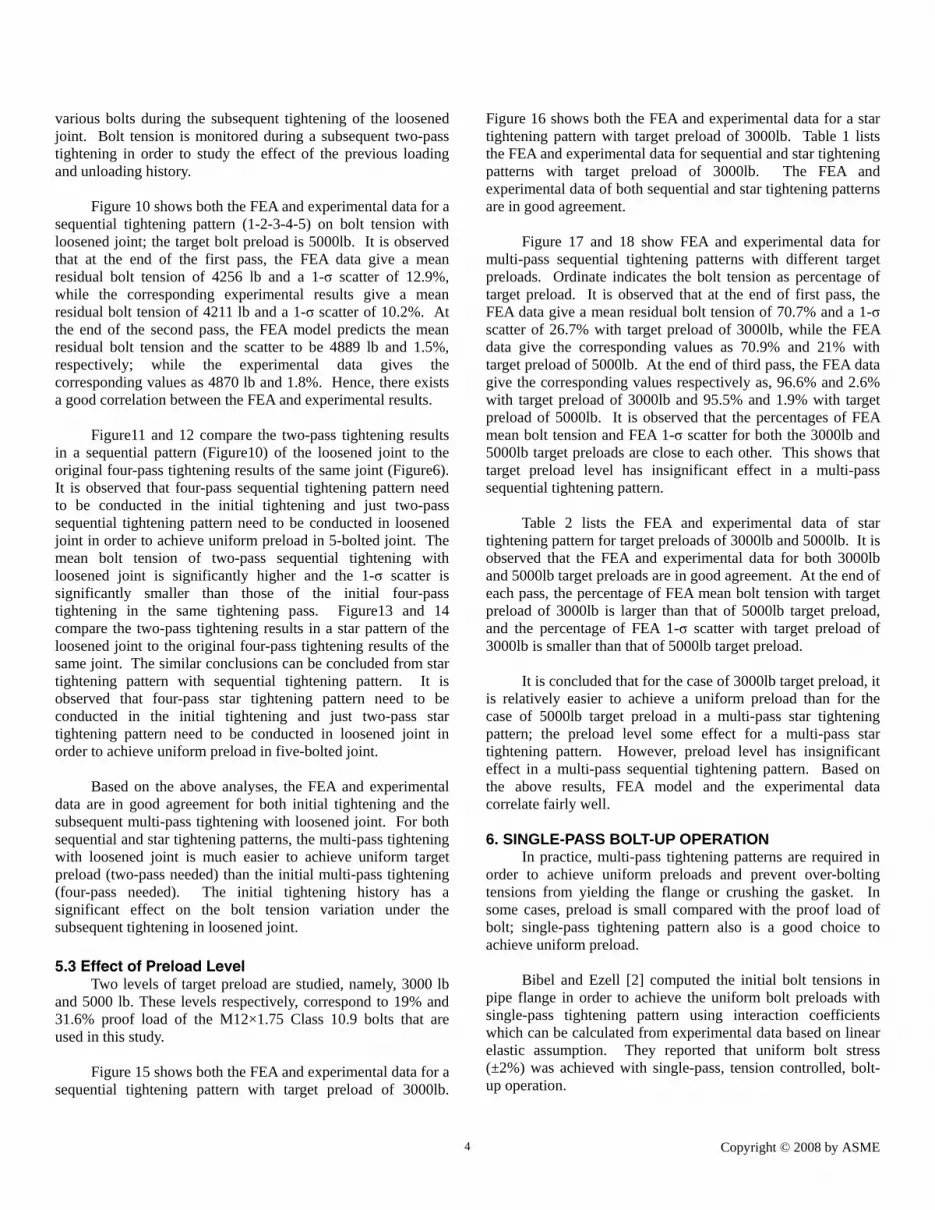
various bolts during the subsequent tightening of the loosened joint. Bolt tension is monitored during a subsequent two-pass tightening in order to study the effect of the previous loading and unloading history.
Figure 10 shows both the FEA and experimental data for a
sequential tightening pattern (1-2-3-4-5) on bolt tension with loosened joint; the target bolt preload is 5000lb. It is observed that at the end of the first pass, the FEA data give a mean residual bolt tension of 4256 lb and a 1-σ scatter of 12.9%, while the corresponding experimental results give a mean residual bolt tension of 4211 lb and a 1-σ scatter of 10.2%. At the end of the second pass, the FEA model predicts the mean residual bolt tension and the scatter to be 4889 lb and 1.5%, respectively; while the experimental data gives the corresponding values as 4870 lb and 1.8%. Hence, there exists a good correlation between the FEA and experimental results.
Figure11 and 12 compare the two-pass tightening results
in a sequential pattern (Figure10) of the loosened joint to the original four-pass tightening results of the same joint (Figure6). It is observed that four-pass sequential tightening pattern need to be conducted in the initial tightening and just two-pass sequential tightening pattern need to be conducted in loosened joint in order to achieve uniform preload in 5-bolted joint. The mean bolt tension of two-pass sequential tightening with loosened joint is significantly higher and the 1-σ scatter is significantly smaller than those of the initial four-pass tightening in the same tightening pass. Figure13 and 14 compare the two-pass tightening results in a star pattern of the loosened joint to the original four-pass tightening results of the same joint. The similar conclusions can be concluded from star tightening pattern with sequential tightening pattern. It is observed that four-pass star tightening pattern need to be conducted in the initial tightening and just two-pass star tightening pattern need to be conducted in loosened joint in order to achieve uniform preload in five-bolted joint.
Based on the above analyses, the FEA and experimental
data are in good agreement for both initial tightening and the subsequent multi-pass tightening with loosened joint. For both sequential and star tightening patterns, the multi-pass tightening with loosened joint is much easier to achieve uniform target preload (two-pass needed) than the initial multi-pass tightening (four-pass needed). The initial tightening history has a significant effect on the bolt tension variation under the subsequent tightening in loosened joint. 5.3 Effect of Preload Level
Two levels of target preload are studied, namely, 3000 lb and 5000 lb. These levels respectively, correspond to 19% and 31.6% proof load of the M12×1.75 Class 10.9 bolts that are used in this study.
Figure 15 shows both the FEA and experimental data for a
sequential tightening pattern with target preload of 3000lb.
4
Figure 16 shows both the FEA and experimental data for a star tightening pattern with target preload of 3000lb. Table 1 lists the FEA and experimental data for sequential and star tightening patterns with target preload of 3000lb. The FEA and experimental data of both sequential and star tightening patterns are in good agreement.
Figure 17 and 18 show FEA and experimental data for
multi-pass sequential tightening patterns with different target preloads. Ordinate indicates the bolt tension as percentage of target preload. It is observed that at the end of first pass, the FEA data give a mean residual bolt tension of 70.7% and a 1-σ scatter of 26.7% with target preload of 3000lb, while the FEA data give the corresponding values as 70.9% and 21% with target preload of 5000lb. At the end of third pass, the FEA data give the corresponding values respectively as, 96.6% and 2.6% with target preload of 3000lb and 95.5% and 1.9% with target preload of 5000lb. It is observed that the percentages of FEA mean bolt tension and FEA 1-σ scatter for both the 3000lb and 5000lb target preloads are close to each other. This shows that target preload level has insignificant effect in a multi-pass sequential tightening pattern.
Table 2 lists the FEA and experimental data of star
tightening pattern for target preloads of 3000lb and 5000lb. It is observed that the FEA and experimental data for both 3000lb and 5000lb target preloads are in good agreement. At the end of each pass, the percentage of FEA mean bolt tension with target preload of 3000lb is larger than that of 5000lb target preload, and the percentage of FEA 1-σ scatter with target preload of 3000lb is smaller than that of 5000lb target preload.
It is concluded that for the case of 3000lb target preload, it
is relatively easier to achieve a uniform preload than for the case of 5000lb target preload in a multi-pass star tightening pattern; the preload level some effect for a multi-pass star tightening pattern. However, preload level has insignificant effect in a multi-pass sequential tightening pattern. Based on the above results, FEA model and the experimental data correlate fairly well. 6. SINGLE-PASS BOLT-UP OPERATION
In practice, multi-pass tightening patterns are required in order to achieve uniform preloads and prevent over-bolting tensions from yielding the flange or crushing the gasket. In some cases, preload is small compared with the proof load of bolt; single-pass tightening pattern also is a good choice to achieve uniform preload.
Bibel and Ezell [2] computed the initial bolt tensions in
pipe flange in order to achieve the uniform bolt preloads with single-pass tightening pattern using interaction coefficients which can be calculated from experimental data based on linear elastic assumption. They reported that uniform bolt stress (±2%) was achieved with single-pass, tension controlled, bolt-up operation.
Copyright © 2008 by ASME
In this study, a new finite element methodology for linear elastic gasket material is proposed to achieve uniform preload with single-pass tightening pattern. The elastic Young’s modulus and Poision’s ratio of gasket material are set to be 100MPa and 0.3, respectively. The same modeling and loading approach with multi-pass tightening patterns would be conducted. For single-pass tightening strategy, it is the point to predict initial bolt preloads to achieve uniform preloads after single-pass tightening pattern. The following FEA procedure is used to predict the initial bolt preloads for star tightening pattern. Firstly, all of bolts are tightened to the uniform preload of 5000 lb simultaneously; the bolt tensions of the other bolts change due to elastic interaction when completely loosen Bolt 4. Then, the bolt tensions of Bolt 1, 3 and 5 change when completely loosen Bolt 2; repeating the above procedures until all the bolts are loosened. The initial preloads can be determined at the end of loosens according to the loosening sequence 4-2-5-3-1. This procedure is the inverse of the single-pass star tightening pattern. Figure19 shows the procedure in which the initial preloads with single-pass star tightening pattern can be obtained. The initial preloads with sequential tightening pattern can be obtained using the similar procedure. Table 3 lists initial preloads with single-pass sequential and star tightening patterns with target preload of 5000lb. Using those initial preloads, Figure 20 and 21 show the bolt tension variations with single-pass sequential and star tightening patterns with target preload of 5000lb. The scatter of FEA bolt tensions is less than 2% which is mainly due to the truncations. Based on the above analysis, the FEA single-pass tightening methodology may be effectively utilized for achieving a uniform preload in a bolted flange with elastic gasket. 7. CONCLUSIONS
A nonlinear 3-D finite element model is used to develop a more reliable tightening methodology that produces a uniform clamp load in gasketed joints. The new methodology is applicable to both multiple and single pass tightening patterns. The proposed FEA model results correlates well with the experimental data provided in this study.
The FEA model clearly illustrates the elastic interaction between the various bolts and the residual bolt tension at the end of each tightening pass. As the number of tightening passes is increased, the mean value of the bolt tension rapidly approaches the desired level of a uniform bolt tension, while the tension scatter is rapidly diminished. This is true for both the sequential and star pattern tightening strategies. For the studied joint, the FEA model has correctly predicted the achievement of 97% of the desired target uniform preload with a 1- σ scatter of 3%. This is true regardless of whether a sequential or a star-pattern tightening procedure is employed.
The FEA model has also been successfully used to
illustrate the behavior of a completely loosened joint during its subsequent re-tightening. Previous loading history (tightening) has resulted in reaching 98% of the target uniform preload with
5
a minimal 1- σ scatter of 1.5% at the end of a two-pass re-tightening process.
Finally, the special case of a linear FEA model
approximation has also been introduced to achieve the desired uniform bolt tension in a single-pass, using either a sequential or a star-pattern procedure. For the studied joint, some bolts had to be over-tightened by 38% more than the desired level of a uniform bolt tension. Obviously, the linear model assumes that no yielding has occurred in the bolts and/or the joint components.
REFERENCES [1] Bickford, J. H. and Nassar, S., 1998, “Handbook of Bolts and Bolted Joints”, Marcel Dekker, New York [2] Bibel, G.D. and Ezell, R. M., 1996, “bolted flange assembly: preliminary elastic interaction data and improved bolt-up procedures,” Welding Research Council Bulletin, 408, pp.1-27 [3] Bibel, G.D. and Eric M. W, 1994, “flange bolt-up simulation using 3-D finite element modeling,” ASME PVP-Vol. 274, pp.63-82 [4] Susumu Kumakura, and Kumiko Saito, 2003, “Tightening Sequence for Bolted Flange Joint Assembly,” ASME PVP-Vol. 457, pp.9-16 [5] Fukuoka, T., and Takaki, T., 2001, “Finite Element Simulation of Bolt-Up Process of Pipe Flange Connections,” Journal of Pressure Vessel Technology, ASME Transactions, 123, pp.282-287. [6] Takaki, T., and Fukuoka, T., 2002, “Systematical FE Analysis of Bolt Assembly Process of Pipe Flange Connections,” ASME PVP-Vol. 433, pp.147-152 [7] Takaki, T., and Fukuoka, T., 2004, “Effective Bolting up Procedure Using Finite Element Analysis and Elastic Interaction Coefficient Method,” ASME PVP-Vol. 478, pp.155-162 [8] Alkelani, A.A., Nassar, S.A., Housari, B.A., 2007, “A Novel Formulation of Elastic Interaction in Gasketed Bolted Joints,” Proceedings of the ASME PVP2007-26084 [9] ABAQUS Analysis User’s Manual, Version 6.5, 2004, Hibbitt, Karlsson & Sorensen, Inc. [10] Han Weimin, 1999, “plasticity: mathematical theory and numerical analysis”, Springer, New York [11] Nassar, S.A., Alkelani, A.A., 2006, “Clamp Load Loss due to Elastic Interaction and Gasket Creep Relaxation in bolted Joint,” Journal of Pressure Vessel Technology, ASME Transactions, 128, pp. 394–401.
Copyright © 2008 by ASME

0
0.5
1
1.5
2
2.5
3
3.5
4
4.5
5
0 0.05 0.1 0.15 0.2 0.25 0.3 0.35 0.4
Strain
Stre
ss(M
Pa)
simplified gasket behaviortest data
Fig. 1 Stress-Strain relationship of the Flexible Graphite
gasket
Fig. 2 Finite element model
Flange Gasket Bolts
6
Fig. 3 Illustration of bolt loading function in
ABAQUS/Standard
Fig. 4 Sequential and star tightening patterns
Fig. 5 Experimental test set-up
Pre-tension node
Elements chosen by user to describe the pre-tension section
D
B
C
A
Pre-tension section
Five-bolt gasketed joints Force washers
Data acquisition system High precision digital torque wrench
Copyright © 2008 by ASME

0
1000
2000
3000
4000
5000
6000
0 100 200 300 400 500 600
Time (s)
Bolt
Tens
ion
(lbs)
FEA.bolt1FEA.bolt2FEA.bolt3FEA.bolt4FEA.bolt5EXP.bolt1EXP.bolt2EXP.bolt3EXP.bolt4EXP.bolt5
21 3 4 5
pass 1 pass 2 pass 3 pass 4
Fig. 6 The FEA and experimental bolt tension variation of sequential tightening pattern
0
1000
2000
3000
4000
5000
6000
0 100 200 300 400 500 600 700
Time (s)
Bol
t Ten
sion
(lbs
)
FEA.bolt1FEA.bolt2FEA.bolt3FEA.bolt4FEA.bolt5EXP.bolt1EXP.bolt2EXP.bolt3EXP.bolt4EXP.bolt5
1 3 5 2 4
pass 1 pass 4pass 3pass 2
Fig.7 The FEA and experimental bolt tension variation of star tightening pattern
Copyright © 2008 by ASME 7

3000
3400
3800
4200
4600
5000
0 1 2 3 4 5pass number
mea
n bo
lt te
nsio
n/lb
s
mean EXP.SEQ
mean FEA.SEQmean EXP.STAR
mean FEA.STAR
Fig.8 Mean bolt tension vs. tightening passes with
sequential and star patterns
0
10
20
30
40
50
60
0 1 2 3 4 5
Pass Number
1 -σ
Sca
tter (
% o
f mea
n te
nsio
n) scatter EXP.SEQ
scatter FEA.SEQscatter EXP.STAR
scatter FEA.STAR
Fig.9 1-� tension scatter vs. tightening passes with
sequential and star patterns
0
1000
2000
3000
4000
5000
6000
0 50 100 150 200 250 300Time (s)
Bol
t Ten
sion
(lbs
)
FEA.bolt1FEA.bolt2FEA.bolt3FEA.bolt4FEA.bolt5EXP.bolt1EXP.bolt2EXP.bolt3EXP.bolt4EXP.bolt5
1 2 3 4 5
pass 1 pass 2
Fig.10 The FEA and experimental bolt tension variation of
sequential tightening with loosened joint
8
3000
3400
3800
4200
4600
5000
0 1 2 3 4 5
Pass Number
mea
n B
olt T
ensi
on (l
bs)
EXP.original tighteningFEA.original tightening
EXP.tighteing in loosened jointFEA.tightening in loosened joint
Fig.11 Mean bolt tension vs. tightening passes with
sequential pattern
0
5
10
15
20
25
30
35
0 1 2 3 4 5
Pass Number
1 -σ
Sca
tter (
% o
f mea
n te
nsio
n) EXP.original tighteningFEA.original tighteningEXP.tightening in loosened jointFEA.tightening in loosened joint
Fig.12 1-� tension scatter vs. tightening passes with
sequential pattern
3000
3400
3800
4200
4600
5000
0 1 2 3 4 5
Pass Number
Mea
n Bo
lt Te
nsio
n (lb
s)
EXP.original tightening
FEA.original tightening
EXP.tightening in loosened joint
FEA.tightening in loosened joint
Fig.13 Mean bolt tension vs. tightening passes with star
pattern
0
10
20
30
40
50
60
0 1 2 3 4 5
Pass Number
1 -σ
Sca
tter
(% o
f Mea
n Te
nsio
n) EXP.original tighteningFEA.original tightening
EXP.tightening in loosened jointFEA.tightening in loosened joint
Fig.14 1-� tension scatter vs. tightening passes with star
patter
Copyright © 2008 by ASME

0
500
1000
1500
2000
2500
3000
3500
0 100 200 300 400 500Time (s)
Bol
t Ten
sion
(lbs
)
FEA.bolt1FEA.bolt2FEA.bolt3FEA.bolt4FEA.bolt5EXP.bolt1EXP.bolt2EXP.bolt3EXP.bolt4EXP.bolt5
pass 1 pass 3pass 2
1 2 3 4 5
Fig.15 The FEA and experimental bolt tension variation of sequential tightening pattern
0
500
1000
1500
2000
2500
3000
3500
4000
0 50 100 150 200 250 300 350Time (s)
Bol
t Ten
sion
(lbs
)
FEA.bolt1FEA.bolt2FEA.bolt3FEA.bolt4FEA.bolt5EXP.bolt1EXP.bolt2EXP.bolt3EXP.bolt4EXP.bolt5
1 4253
pass 1 pass 3pass 2
Fig.16 The FEA and experimental bolt tension variation of star tightening pattern
Copyright © 2008 by ASME 9

60.0
65.0
70.0
75.0
80.0
85.0
90.0
95.0
100.0
0 1 2 3 4 5
Pass Number
Mea
n B
olt T
ensi
on a
s %
of
Pre
load
avg. EXP.3000lbavg. FEA.3000lb
avg. EXP.5000lb
avg. FEA.5000lb
Fig.17 Mean bolt tension (percentage of preload) vs.
tightening passes with sequential pattern
0
5
10
15
20
25
30
0 1 2 3 4 5Pass Number
1-σ
Tens
ion
Sca
tter a
s %
of
Prel
oad
scatter EXP.3000lb
scatter FEA.3000lb
scatter EXP.5000lb
scatter FEA.5000lb
Fig.18 1-� tension scatter (percentage of preload) vs.
tightening passes with sequential pattern
0
1000
2000
3000
4000
5000
6000
7000
8000
0 1 2 3 4 5 6 7Time
Bol
t Ten
sion
(lbs
)
bolt1bolt2bolt3bolt4bolt5
4 1352
Fig.19 Unloading procedure with single-pass star pattern
0
1000
2000
3000
4000
5000
6000
7000
8000
0 1 2 3 4 5 6Time
Bolt
Tens
ion
(lbs)
bolt1bolt2bolt3bolt4bolt5
1 4253
10
Fig.20 Star single-pass tightening with 5000lb target preload
0
1000
2000
3000
4000
5000
6000
7000
0 1 2 3 4 5 6Time
Bolt
Tens
ion
(lbs)
bolt1bolt2bolt3bolt4bolt5
1 5432
Fig.21 Sequential single-pass tightening with 5000lb target
preload
Copyright © 2008 by ASME

Table 1 Mean Bolt Tension and 1-� Tension Scatter with Target Preload of 3000lb Mean residual bolt tension (lb) 1 -σ Scatter (% of Mean Tension) Tightening
pattern
Pass
number FEA results Experimental results FEA results Experimental results
1 2122 2123 37.7 30.9
2 2699 2629 7.4 9.9
sequential 3 2898 2829 2.7 4.0
1 2235 2361 42.3 32.2
2 2844 2853 7.3 6.5 star 3 2987 2938 2.1 2.5
Table 2 Mean Bolt Tension and 1-� Tension Scatter with Star Tightening Pattern Mean residual bolt tension (percentage of preload) 1-σ tension scatter (percentage of preload) Target preload
(lb)
Pass
number FEA Experimental FEA Experimental
1 74.5 78.7 31.5 25.3
2 94.8 95.1 7.0 6.2
3000 3 99.6 97.9 2.1 2.4
1 67.7 64.1 38.5 34.6
2 87.4 82.9 14.3 17.1
3 94.3 91.8 5.9 6.5 5000 4 97.0 94.8 3.0 3.5
Table 3 Initial Tightening Preloads with Single-pass Tightening Pattern with Target Preload of 5000lb
Initial loading (lb) Tightening pattern
Bolt1 Bolt 2 Bolt3 Bolt4 Bolt5
star 6432 4708 6915 5000 5775
Sequential 6353 5495 6011 6079 5000
Copyright © 2008 by ASME 11


![Visual Basic 2008 [2008] ¿Qué es Visual Basic Express](https://img.pdfslide.net/doc/110x75/6317872c831644824d038800/visual-basic-2008-2008-que-es-visual-basic-express.jpg)


