Embed Size (px)
Citation preview
Draft
1 INTRODUCTION Clayey soils tend to shrink and crack when subject to desiccation. This phenomenon is quite common in nature and there are many published works on the subject (Chertkov, 2002, Hu, et al., 2008, Kodikara, et al., 2000, Kodikara, et al., 2004, Lakshmikantha, et al., 2007, Lakshmikantha, et al., 2009, 2012, Morris, et al., 1992, Péron, et al., 2009, Vogel, et al., 2005). However, until the development of unsaturated soil mechanics the problem has not been analyzed considering the parameters that govern the behavior of soil in the unsaturated state, primarily suction. Tensile strength (suction dependent) and fracture toughness are shown as the most relevant parameters (Ávila, et al., 2002, Lakshmikantha, et al., 2012), but a definite model explaining that process is yet to be formulated.
In laboratory tests many cracks appear on the top boundary of soil specimens but there are others than are not visible. Various experiments have shown that cracks may start at any point within the specimen (Cuadrado, 2013, Lakshmikantha, 2009, Lakshmikantha, et al., 2013). To detect the cracks that start at the bottom boundary or within the sample one would need sophisticated techniques such as X-ray, magnetic resonance or electrical resistivity tomogra-phy (Hassan and Toll, 2013, Mukunoki, et al., 2010, Otani and Obara, 2004, Samoulian, et al., 2003), usually very expensive and involving very complicated setups. However, detection of those non-visible cracks is important because cracking due to drying in soils is a very
GROUND PENETRATING RADAR SYSTEM FOR DETECTION OF DESICCATION CRACKS IN SOILS
P.C. Prat, A. Ledesma, A. Cuadrado and H. Levatti Dept. of Geotechnical Engineering and Geosciences, UPC-BARCELONATECH, Barcelona, Spain
ABSTRACT: In this paper we explore a relatively simple, non-destructive, indirect tech-nique using a ground penetrating radar (GPR) system to detect cracks that form and propa-gate inside a soil specimen during desiccation. Although GPR devices have been used for multiple applications, their use in the detection of small cracks (few millimeters wide), has not been demonstrated yet. The experiments and the methodology used to test the accuracy of a small commercial GPR device for crack identification are described. The main objective was to identify what type of signals and what crack width can be detected using the GPR de-vice. The results indicate that cracks of one or two millimeters wide can be detected depend-ing on its position and shape. On the other hand, sub-millimeter cracks are undetectable with the currently existing devices in the market. In spite of the limitations the GPR method can be useful to find time-related bounds of when the cracks appear, and to point at their location. Because the GPR systems are in constant evolution this technique could become a very versa-tile and convenient method to scan soils under different kinds of processes both in the labora-tory and in the field.
249
Draft
complex three-dimensional process and the study cannot limit itself to the outer visible cracks.
In this paper we explore a relatively simple, non-destructive, indirect technique using a ground penetrating radar (GPR) system to detect cracks that form and propagate within the specimen during desiccation. While surface cracking allows following the evolution of the external cracking pattern with time, the GPR technique may be helpful to detect the cracks within the soil. Only complete monitoring of those inner cracks will help in explaining the phenomenon with greater accuracy. However, although GPR devices have been used for mul-tiple applications, their use in the detection of small cracks (few millimeters wide), has not been demonstrated yet. Because the ground is formed by three distinct phases (water, gas and solid) during the drying process, and the changes in time of each phase modify the soil’s elec-tromagnetic properties, there is added difficulty to the interpretation of the results of this method.
The experiments and the methodology used to test the accuracy of a small commercial GPR device for crack identification are described. The main objective was to identify what type of signals and what crack width can be detected using the GPR device. The results indi-cate that cracks of one or two millimeters wide can be detected depending on its position and shape. On the other hand, sub-millimeter cracks are undetectable with the currently existing devices in the market.
In spite of these limitations the GPR method can be useful to find time-related bounds of when the cracks appear, and to point at their location.
2 GPR FUNDAMENTALS The GPR is a nondestructive technique that uses electromagnetic pulses to detect reflect-
ing surfaces inside the soil allowing imaging buried objects, stratigraphy and other soil fea-tures at shallow depths, providing continuous, real-time profiles of the subsurface. Normally the equipment consists of a computerized control system connected to antennas which are moved slowly along the ground surface to produce a continuous subsurface profile. One an-tenna emits the electromagnetic pulses and a second one records the reflected signal from the objects, discontinuities or other features inside the soil.
The reflected wave originates from changes in the electromagnetic properties of the soil that may be caused by variations in water content, density changes due to the presence of stratigraphic surfaces and discontinuities, or voids existing in the path of the pulse. Therefore the success of the technique relies to great extent on a sufficient dielectric contrast at the crack location to produce a clear reflected signal. The penetration depth of the pulses, and data resolution, depend on the wavelength and the soil’s dielectric constant. These parameters are mainly controlled by the soil’s moisture content. The depth and resolution are inversely proportional magnitudes: increasing the antenna’s frequency a better resolution is obtained but the depth is smaller.
The theoretical background of the method is the theory of electromagnetic fields, de-scribed by Maxwell’s equations (1), and the constitutive equations (2):
; 0; ; (1)
; ; (2)
250
Draft
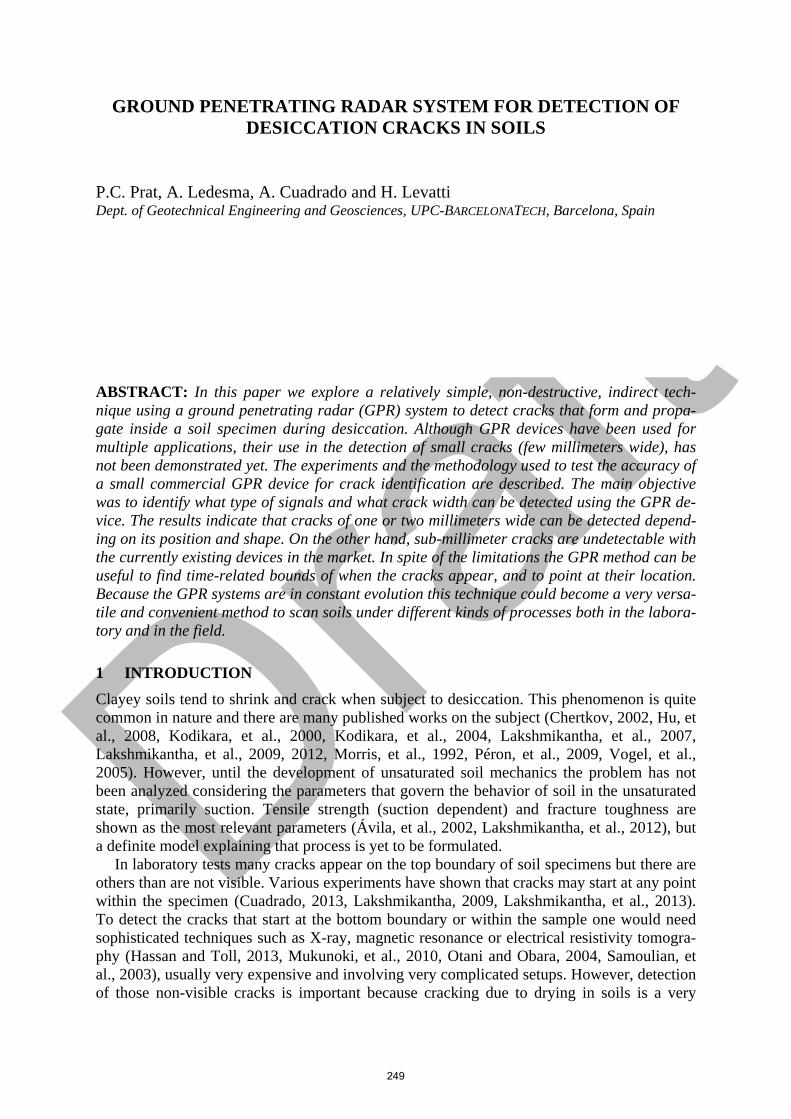
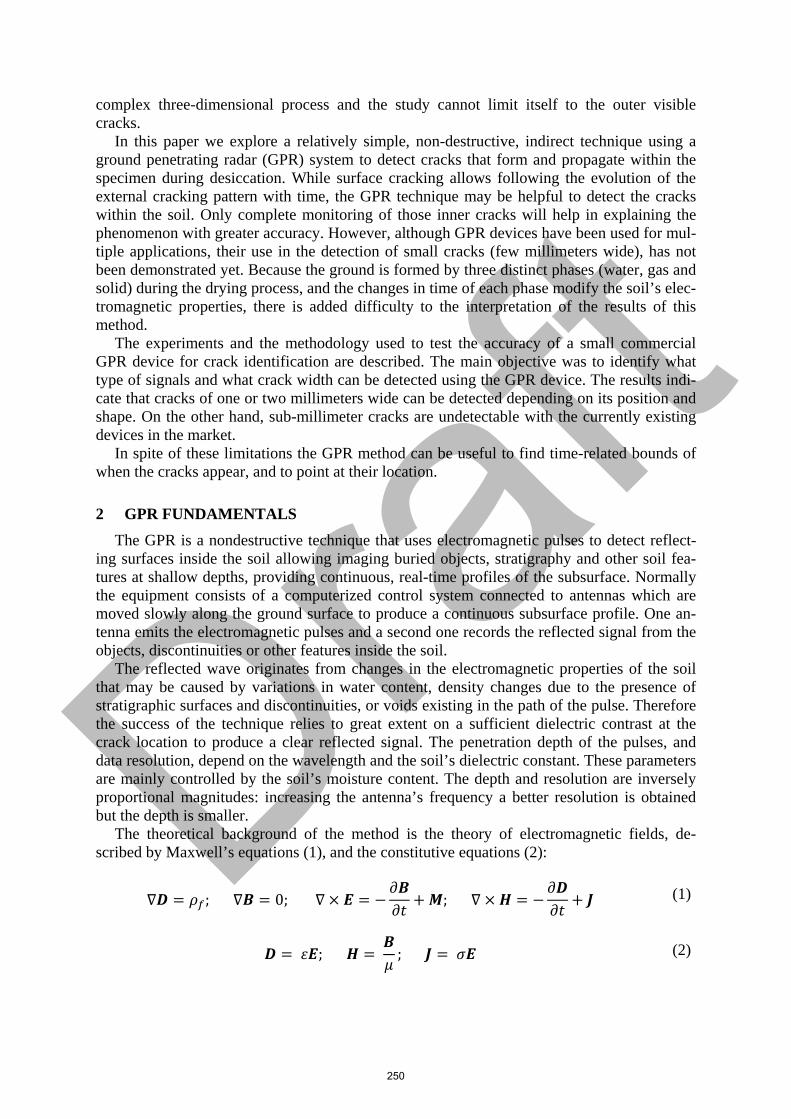
Fig. 1. StructureScan Mini® Fig.2. Soil specimen and methacrylate plate with scanning grid
where = electric field, = magnetic field, = electric displacement field, = magnetic induction, = free current density, = magnetization field and = free charge density. The parameters that appear in Eqs. (2) describe the electromagnetic properties of the medium and are: (dielectric permittivity), (magnetic permeability) and (electric conductivity).
The use of the GPR is based on the dielectric permittivity , which represents the permit-tivity of an electromagnetic pulse through the medium, compared to the void permittivity. It is a non-dimensional parameter that depends on the electric conductivity and the thickness of the layer. For most of the materials in the ground this parameter has a value between 1 (air) and 81 (water). The GPR produces results by detecting wave reflections produced while the wave crosses the boundary between two materials with different dielectric constants.
Soils are often mixtures of different types of materials. Separately, each element has its own electromagnetic properties. Together, they form a medium where the dielectric permit-tivity, magnetic permeability, and electric conductivity depend on the properties of each ma-terial and its percentage in the mixture. There are several models that characterize these mix-tures, which can also be used when considering a medium consisting of a single solid materi-al, plus water and air (Pérez, 2001).
Electromagnetic waves propagate in water at very low speed and with high attenuation. The dielectric permittivity of water is large (around 80 but variable with temperature and mineral composition) and the high permittivity contrast with the other materials that make up the soil makes water a key element in the average propagation speed of electromagnetic waves in soils. Studies have shown (Knoll and Knight, 1994) that with the usual frequencies used for GPR the dielectric permittivity as well as the electric conductivity of the soil in-creases with the degree of saturation.
In addition to the degree of saturation, other properties such as particle size and porosity have also an impact in the average value of those parameters.
3 GPR DEVICE AND EXPERIMENTAL PROGRAM The GPR device used in the present work is a small compact unit, model StructureScan Mini® manufactured by Geophysical Survey Systems Inc. (Fig. 1). The antenna’s nominal frequency is 1600 MHz allowing a depth penetration up to about 40 cm, although for soils those values may change considerably depending on the clay’s mineral composition and wa-ter content.
251
Draft
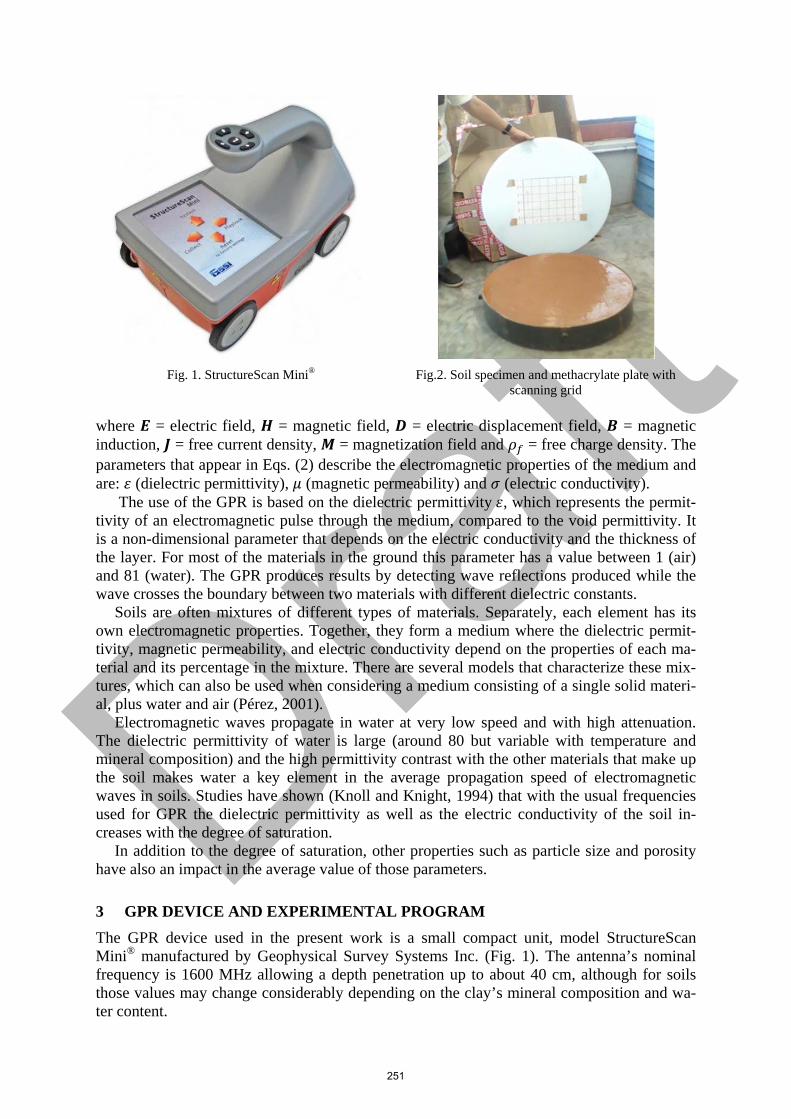
Fig. 3. Block test: (a) mold with strips inserted; (b) after pouring slurry; (c) surface cracks at 30 days
The device is a self-contained unit where both emitting and receiving antennas are located.
It has four wheels that allow easy displacement and provides reading the distance traveled during the exploration. The path is guided by three laser beams, one to the front and two to the sides. Unfortunately many of the parameters that might be helpful to adjust for soils can-not be modified by the user during recording, and their impact must be introduced during post-processing using the accompanying dedicated software RADAN® (GSSI, 2009), which is designed to process, view, and document 2D and 3D data sets collected with the Struc-tureScan Mini®. The software allows customizing the size and colors of targets, use of multi-ple transform options, background removal filtering, data migration, gain control, and adjust-ing the parameters to suit the soil’s characteristics.
The soil used in the experiments is a well-known Barcelona silty clay (Barrera, 2002). It is a fine-grain soil, with 60% passing the #200 sieve and unit weight of particles = 27 kN/m3, liquid limit = 32, and plastic limit = 16. Two types of tests have been conducted: with cylindrical and rectangular block specimens.
For the first type of tests the specimen was a soil cylinder of 80 cm in diameter and 10 cm thick. The clay, initially slurry, was poured in the mold and was left to dry in a controlled laboratory environment (24oC and 60% relative humidity) for 36 days. The specimen was scanned periodically using the GPR device in order to detect developing cracks within the sample. Attempts were made to calibrate as much as possible the available device parameters to accommodate the evolving soil’s characteristics. To allow the displacement of the GPR, a 1 cm-thick methacrylate plate was placed on top of the specimen during scanning. The scan-ning area consisted of a 30 cm 30 cm grid, with a 5 cm separation between lines, providing 7 lanes in two orthogonal directions. Figure 2 shows the soil specimen immediately after been poured in the mold and the methacrylate plate with the scanning grid.
The second type of tests was conducted on specimens made using a rectangular planter pot, of the type commonly found in garden stores. The purpose was to determine the mini-mum crack opening that the GPR device can detect. The specimen shape allowed the use of less amount of soil for the required specimen depth. Several artificial cracks were induced in the specimen, both horizontal and vertical, by means of rectangular wood or metal strips of several thicknesses (between 2 and 6 mm). After the strips were inserted in the mold (Fig. 3a), the slurry was poured and left to dry in an open-air environment (Fig. 3b). After one month of drying some cracks had appeared on the surface (Fig. 3c) and the consistency of the specimen was hard enough to perform the GPR scan. This was conducted in the direction parallel to the longest side of the specimen (from right to left in the figure).
4 RESULTS AND DISCUSSION The purpose of the experiments was two-fold: with the cylindrical specimen the objective was to determine the ability of the GPR to detect internal cracks and how they are shown as a result of the GPR scan, while with the rectangular block specimen the objective was to de-termine the range of crack width that can be detected with the method.
252
Draft
Day 1 Day 8 Day 15 Day 22 Day 29
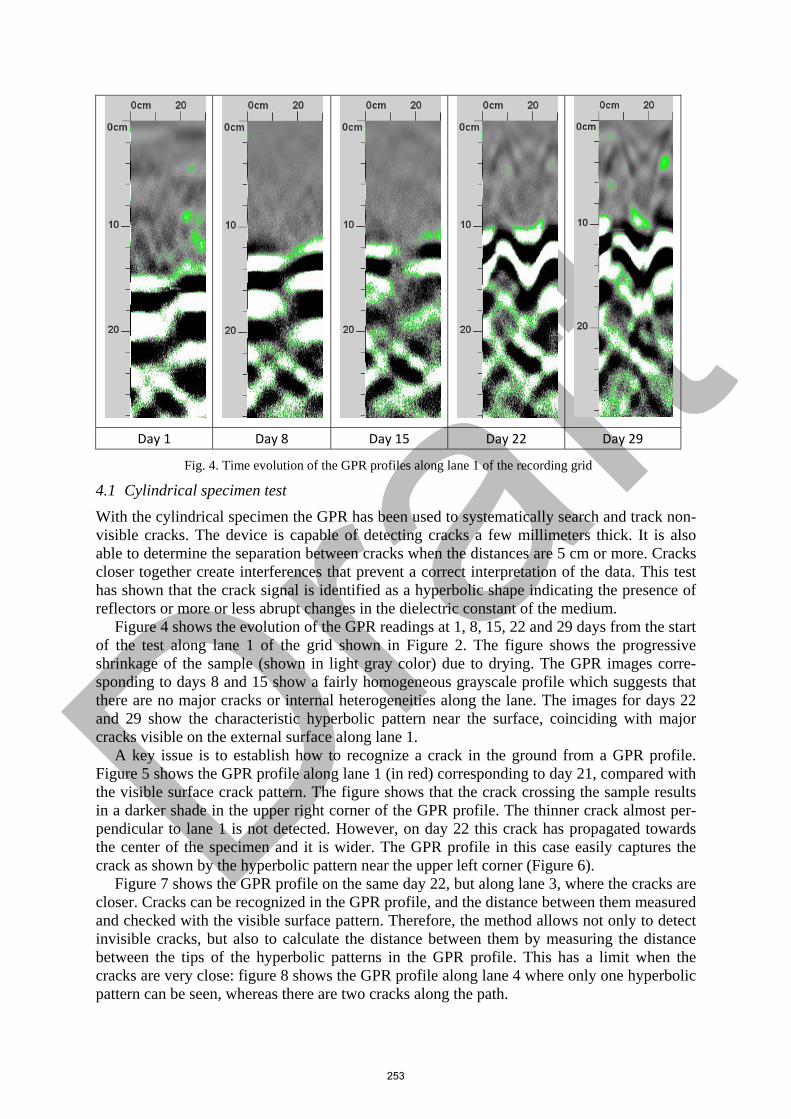
Fig. 4. Time evolution of the GPR profiles along lane 1 of the recording grid
4.1 Cylindrical specimen test With the cylindrical specimen the GPR has been used to systematically search and track non-visible cracks. The device is capable of detecting cracks a few millimeters thick. It is also able to determine the separation between cracks when the distances are 5 cm or more. Cracks closer together create interferences that prevent a correct interpretation of the data. This test has shown that the crack signal is identified as a hyperbolic shape indicating the presence of reflectors or more or less abrupt changes in the dielectric constant of the medium.
Figure 4 shows the evolution of the GPR readings at 1, 8, 15, 22 and 29 days from the start of the test along lane 1 of the grid shown in Figure 2. The figure shows the progressive shrinkage of the sample (shown in light gray color) due to drying. The GPR images corre-sponding to days 8 and 15 show a fairly homogeneous grayscale profile which suggests that there are no major cracks or internal heterogeneities along the lane. The images for days 22 and 29 show the characteristic hyperbolic pattern near the surface, coinciding with major cracks visible on the external surface along lane 1.
A key issue is to establish how to recognize a crack in the ground from a GPR profile. Figure 5 shows the GPR profile along lane 1 (in red) corresponding to day 21, compared with the visible surface crack pattern. The figure shows that the crack crossing the sample results in a darker shade in the upper right corner of the GPR profile. The thinner crack almost per-pendicular to lane 1 is not detected. However, on day 22 this crack has propagated towards the center of the specimen and it is wider. The GPR profile in this case easily captures the crack as shown by the hyperbolic pattern near the upper left corner (Figure 6).
Figure 7 shows the GPR profile on the same day 22, but along lane 3, where the cracks are closer. Cracks can be recognized in the GPR profile, and the distance between them measured and checked with the visible surface pattern. Therefore, the method allows not only to detect invisible cracks, but also to calculate the distance between them by measuring the distance between the tips of the hyperbolic patterns in the GPR profile. This has a limit when the cracks are very close: figure 8 shows the GPR profile along lane 4 where only one hyperbolic pattern can be seen, whereas there are two cracks along the path.
253
Draft
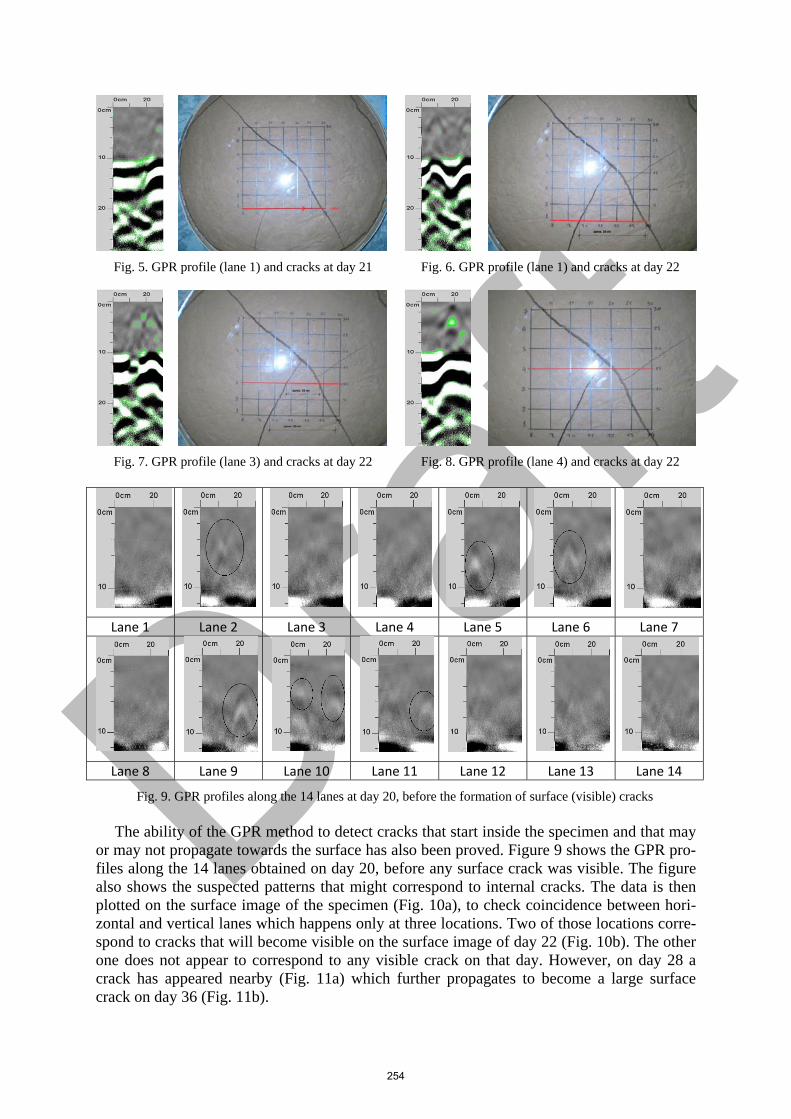
Fig. 5. GPR profile (lane 1) and cracks at day 21 Fig. 6. GPR profile (lane 1) and cracks at day 22
Fig. 7. GPR profile (lane 3) and cracks at day 22 Fig. 8. GPR profile (lane 4) and cracks at day 22
Lane 1 Lane 2 Lane 3 Lane 4 Lane 5 Lane 6 Lane 7
Lane 8 Lane 9 Lane 10 Lane 11 Lane 12 Lane 13 Lane 14
Fig. 9. GPR profiles along the 14 lanes at day 20, before the formation of surface (visible) cracks
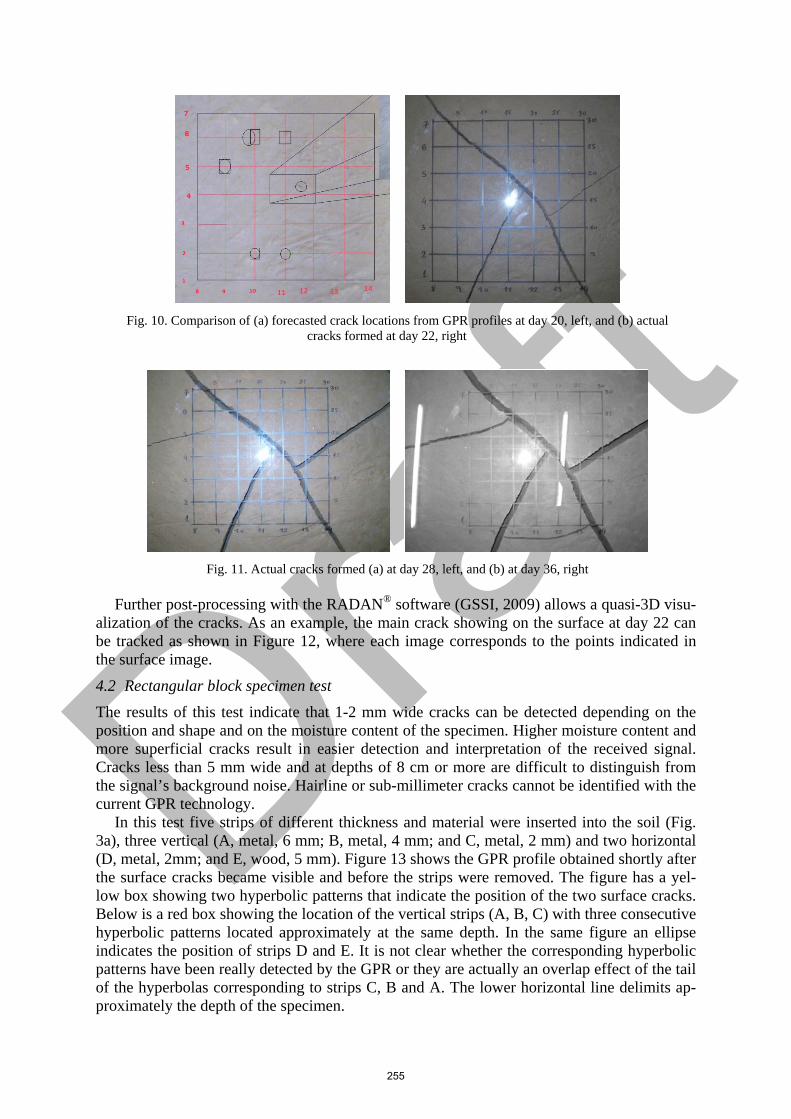
The ability of the GPR method to detect cracks that start inside the specimen and that may or may not propagate towards the surface has also been proved. Figure 9 shows the GPR pro-files along the 14 lanes obtained on day 20, before any surface crack was visible. The figure also shows the suspected patterns that might correspond to internal cracks. The data is then plotted on the surface image of the specimen (Fig. 10a), to check coincidence between hori-zontal and vertical lanes which happens only at three locations. Two of those locations corre-spond to cracks that will become visible on the surface image of day 22 (Fig. 10b). The other one does not appear to correspond to any visible crack on that day. However, on day 28 a crack has appeared nearby (Fig. 11a) which further propagates to become a large surface crack on day 36 (Fig. 11b).
254
Draft
Fig. 10. Comparison of (a) forecasted crack locations from GPR profiles at day 20, left, and (b) actual cracks formed at day 22, right
Fig. 11. Actual cracks formed (a) at day 28, left, and (b) at day 36, right
Further post-processing with the RADAN® software (GSSI, 2009) allows a quasi-3D visu-
alization of the cracks. As an example, the main crack showing on the surface at day 22 can be tracked as shown in Figure 12, where each image corresponds to the points indicated in the surface image.
4.2 Rectangular block specimen test The results of this test indicate that 1-2 mm wide cracks can be detected depending on the position and shape and on the moisture content of the specimen. Higher moisture content and more superficial cracks result in easier detection and interpretation of the received signal. Cracks less than 5 mm wide and at depths of 8 cm or more are difficult to distinguish from the signal’s background noise. Hairline or sub-millimeter cracks cannot be identified with the current GPR technology.
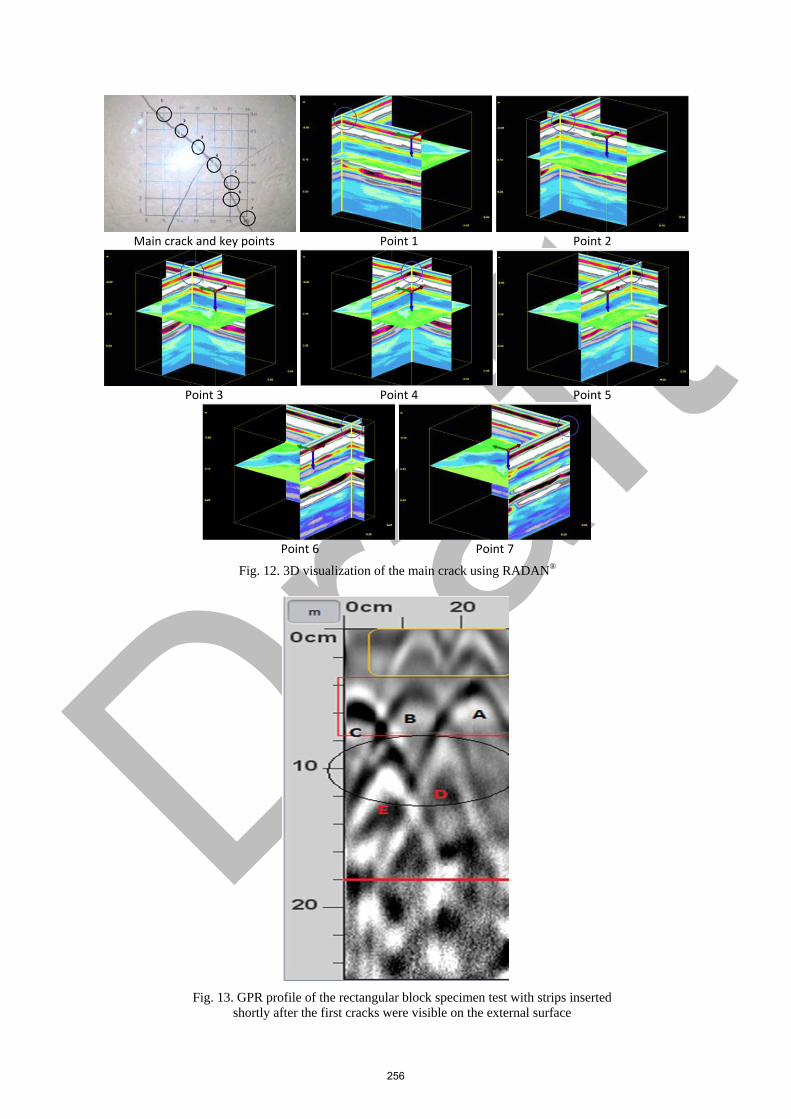
In this test five strips of different thickness and material were inserted into the soil (Fig. 3a), three vertical (A, metal, 6 mm; B, metal, 4 mm; and C, metal, 2 mm) and two horizontal (D, metal, 2mm; and E, wood, 5 mm). Figure 13 shows the GPR profile obtained shortly after the surface cracks became visible and before the strips were removed. The figure has a yel-low box showing two hyperbolic patterns that indicate the position of the two surface cracks. Below is a red box showing the location of the vertical strips (A, B, C) with three consecutive hyperbolic patterns located approximately at the same depth. In the same figure an ellipse indicates the position of strips D and E. It is not clear whether the corresponding hyperbolic patterns have been really detected by the GPR or they are actually an overlap effect of the tail of the hyperbolas corresponding to strips C, B and A. The lower horizontal line delimits ap-proximately the depth of the specimen.
255
Draft
Main crack and key points Point 1 Point 2
Point 3 Point 4 Point 5
Point 6 Point 7
Fig. 12. 3D visualization of the main crack using RADAN®
Fig. 13. GPR profile of the rectangular block specimen test with strips inserted
shortly after the first cracks were visible on the external surface
256
Draft
5 CONCLUSIONS A relatively simple non-destructive indirect technique using a ground penetrating radar (GPR) for detecting crack formation and propagation within soil specimens during drying has been developed and discussed in this paper. While surface cracks allow tracking the evolution of the external cracking pattern over time, the GPR technique can be used to explain the phe-nomenon of cracking more accurately by allowing a more comprehensive monitoring of the internal cracks. This is a novel technique in the case of soil cracking, although GPR devices have been used for many applications previously. For soils, the interpretation of the results obtained by this technique is complex because during the drying process its electromagnetic properties do not remain constant over time due to the changes that occur in each of the mate-rial’s phases.
Two types of tests have been conducted. The first was performed on a cylindrical speci-men of 80 cm in diameter and 10 cm thick, which was monitored using the GPR to identify non-visible internal cracks. The GPR is capable of detecting cracks a few millimeters thick, as well as to determine the separation between cracks when the distance is approximately more than 5 cm. Closer cracks create interferences that prevent the correct interpretation of the data. This test has shown that the crack signal is identified with a hyperbolic pattern in the GPR profiles indicating the presence of reflectors or abrupt changes in the dielectric constant of the medium.
A second type of test has been conducted to characterize the minimum crack thickness that the GPR is capable to detect. This test was carried on a rectangular block specimen where strips of different materials and thickness were inserted to create artificial cracks. The results indicate that the cracks of one or two millimeters in width can be detected depending on its position and shape and on the moisture content of the specimen. For now, hairline or sub-millimeter cracks cannot be identified with the technique and equipment used.
Despite the drawbacks and that it is not possible to clearly identify the origin of a crack, the technique does allow to establish an upper-bound of the instant when the crack occurs, once it has reached sufficient thickness to be detected. This allows for a better understanding on the relationship between the soil’s parameters and crack formation.
The GPR technique that has been developed shows good promise but still has some limita-tions with current technology. However, by combining the capabilities of the GPR with tradi-tional systems for testing drying soils, the prediction and understanding of the reasons and the ways in which the soil shrinks and then cracks initiate and propagate can be greatly im-proved. A key advantage of the GPR system is its low cost compared to other systems such as X-rays, CT scans and MRIs. Its portability and ease of use and continuous evolution makes it a good choice to work in the field and in the laboratory.
ACKNOWLEDGEMENT Financial support from research grants BIA2009-08341, awarded by the former Spanish Min-istry of Science and Innovation, and BIA2012-36498, awarded by the Spanish Ministry of Economy and Competitiveness, is gratefully acknowledged.
REFERENCES Ávila, G., Ledesma, A., and Lloret, A. (2002). Measurement of fracture mechanics
parameters for the analysis of cracking in soils. Proc., 3rd International Conference on Unsaturated Soils - UNSAT 2002, Swets & Zeitlinger, 547-552.
Barrera, M. (2002). Estudio experimental del comportamiento hidro-mecánico de suelos colapsables. Ph.D. Thesis, UPC-BarcelonaTech.
257
Draft
Chertkov, V. Y. (2002). Modelling cracking stages of saturated soils as they dry and shrink. European Journal of Soil Science, 53, 105-118.
Cuadrado, A. (2013). Detección de grietas por desecación en arcillas mediante GPR. Master Thesis, UPC-BarcelonaTech.
GSSI (2009). RADAN® Manual. Geophysical Survey Systems, Inc., Salem, NH, USA. Hassan, A., and Toll, D. G. (2013). Electrical resistivity tomography for characterizing
cracking of soils. Proc., GeoCongress 2013 - Stability and Performance of Slopes and Embankments III, American Society of Civil Engineers, 818-827.
Hu, L. B., Hueckel, T., Péron, H., and Laloui, L. (2008). Modeling Evaporation, Shrinkage and Cracking of Desiccating Soils. Proc., IACMAG 12, IIT Mumbai, 1083-1090.
Knoll, M. D., and Knight, R. (1994). Relationships between dielectric and hydrogeologic properties of sand-clay mixtures. Proc., Fifth International Conference on Ground Penetrating Radar, Waterloo Centre for Groundwater Research, 45-61.
Kodikara, J., Barbour, S. L., and Fredlund, D. G. (2000). Desiccation cracking of soil layers. Proc., Unsaturated Soils for Asia, Balkema, 693-698.
Kodikara, J. K., Nahlawi, H., and Bouazza, A. (2004). Modelling of curling in desiccation clay. Canadian Geotechnical Journal, 41, 560-566.
Lakshmikantha, M. R. (2009). Experimental and theoretical analysis of cracking in drying soils. Ph.D. Thesis, UPC-BarcelonaTech.
Lakshmikantha, M. R., Prat, P. C., and Ledesma, A. (2007). Characterization of crack networks in desiccating soils using image analysis techniques. Proc., Numerical Models in Geomechanics X, Balkema, London, 167-176.
Lakshmikantha, M. R., Prat, P. C., and Ledesma, A. (2009). Image analysis for the quantification of a developing crack network on a drying soil. Geotech. Test. J., 32(6), 505-515.
Lakshmikantha, M. R., Prat, P. C., and Ledesma, A. (2012). Experimental evidences of size-effect in soil cracking. Canadian Geotechnical Journal, 49(3), 264-284.
Lakshmikantha, M. R., Reig, R., Prat, P. C., and Ledesma, A. (2013). Origin and mechanism of cracks seen at the bottom of a desiccating soil specimen. Proc., GeoCongress 2013 - Stability and Performance of Slopes and Embankments III, American Society of Civil Engineers, 790-799.
Morris, P. H., Graham, J., and Williams, D. J. (1992). Cracking in drying soils. Canadian Geotechnical Journal, 29, 263-277.
Mukunoki, T., Otani, J., Maekawa, A., Camp, S., and Gourc, J. P. (2010). Investigation of crack behavior on cover soils at landfill using X-ray CT. Advances in X-ray Tomography for Geomaterials, J. Desrues, G. Viggiani, and P. Bésuelle, eds., John Wiley & Sons, 213-219.
Otani, J., and Obara, Y. (2004). X-ray CT for geomaterials: Soils, Concrete, Rocks. Swets & Zeitlinger.
Pérez, V. (2001). Radar de subsuelo. Evaluación para aplicaciones en arqueología y en patrimonio histórico-artístico. Ph.D. Thesis, UPC-BarcelonaTech.
Péron, H., Hueckel, T., Laloui, L., and Hu, L. B. (2009). Fundamentals of desiccation cracking of fine-grained soils: experimental characterisation and mechanisms identification. Canadian Geotechnical Journal, 46(10), 1177-1201.
Samoulian, A., Cousin, I., Richard, G., Bruand, A., and Tabbagh, A. (2003). Electrical resistivity imaging for detecting soil cracking at the centimetric scale. Soil Science Society of America Journal, 67(5), 1319-1326.
Vogel, H. J., Hoffmann, H., and Roth, K. (2005). Studies of crack dynamics in clay soil. I: Experimental methods, results and morphological quantification. Geoderma, 125(3-4), 203-211.
258


