Embed Size (px)
Citation preview
2013 Water System Master Plan Update Final Report November 2013 KWL Project No. 102.119-302 Prepared for:
EPCOR White Rock Water Inc.
Prepared by:
Kerr Wood Leidal Associates Ltd.
1
EPCOR WHITE ROCK WATER INC. 2013 Water System Master Plan Update
Final Report November 2013
102.119-300
Contents 1. Introduction .............................................................................................................. 1-1 1.1 Scope of Report ..................................................................................................................................... 1-1 1.2 Acknowledgements ............................................................................................................................... 1-1 1.3 Reports Referenced .............................................................................................................................. 1-1 1.4 Abbreviations Used ............................................................................................................................... 1-3
2. Model Update ........................................................................................................... 2-1 2.1 Water System Description .................................................................................................................... 2-1 2.2 Evolution of EWR’s Water Model ......................................................................................................... 2-1 2.3 Model Updates ....................................................................................................................................... 2-1 2.4 Pipe Inventory ........................................................................................................................................ 2-3 2.5 Pending Supply System Upgrades ...................................................................................................... 2-3
3. Existing Demands .................................................................................................... 3-1 3.1 System Demands .................................................................................................................................. 3-1 3.2 Metered Water Usage ............................................................................................................................ 3-2 3.3 Non-Revenue Water and Leakage Assessment ................................................................................. 3-3 3.4 Per Capita Consumption ...................................................................................................................... 3-4 3.5 Existing Demand Summary .................................................................................................................. 3-4
4. Future Demands ...................................................................................................... 4-1 4.1 Overall Growth Forecast....................................................................................................................... 4-1 4.2 Industrial, Commercial, and Institutional (ICI) Growth ...................................................................... 4-1 4.3 City of Surrey and Semiahmoo First Nation Customers ................................................................... 4-1 4.4 Additional Demands Due to Growth .................................................................................................... 4-2 4.5 Distribution of Additional Demands .................................................................................................... 4-2 4.6 Summary of Demand Scenarios .......................................................................................................... 4-3
5. Design Criteria ......................................................................................................... 5-1 5.1 Pressure ................................................................................................................................................. 5-1 5.2 Required Fire Flow ................................................................................................................................ 5-1 5.3 Cost Basis .............................................................................................................................................. 5-2
6. Evaluation of Existing System ................................................................................ 6-1 6.1 Supply..................................................................................................................................................... 6-1 6.2 Storage ................................................................................................................................................... 6-3 6.3 System Pressure ................................................................................................................................... 6-4 6.4 Available Fire Flow ................................................................................................................................ 6-4 6.5 Pipe Replacement ................................................................................................................................. 6-4 6.6 Meter Replacement ............................................................................................................................... 6-6
7. Recommended Capital Tasks ................................................................................. 7-1 7.1 Task Labeling ........................................................................................................................................ 7-1 7.2 Capital Plan Tasks ................................................................................................................................. 7-1 7.3 Review of Existing Recommendations ............................................................................................... 7-5 7.4 New Projects .......................................................................................................................................... 7-6 7.5 Model Results with Upgrades .............................................................................................................. 7-6
8. Conclusions ............................................................................................................. 8-1
2 102.119-300
EPCOR WHITE ROCK WATER INC. 2013 Water System Master Plan Update
Final Report November 2013
8.1 Summary ................................................................................................................................................ 8-1 8.2 Recommended 2014-2017 Program .................................................................................................... 8-1 8.3 Report Submission ............................................................................................................................... 8-2
Figures Figure 2-1: Water Supply Facility System Schematic .................................................................................... 2-5 Figure 3-1: Peak Day Water Use Trends .......................................................................................................... 3-2 Figure 4-1: City of White Rock Official Community Plan Development Permit Areas ................................ 4-4 Figure 6-1: Peak Hour Pressure with Future Demands .................................................................................. 6-8 Figure 6-2: Available Fire Flows with Future Demands ................................................................................. 6-9 Figure 6-3: Water Main Break Locations (2000 to 2012) ............................................................................... 6-10 Figure 7-1: Recommended Water System Upgrades ..................................................................................... 7-4 Figure 7-2: Peak Hour Pressure with Future Demands and Recommended Upgrades .............................. 7-7 Figure 7-3: Available Fire Flows with Future Demands and Recommended Upgrades ............................. 7-8 Tables Table 2-1: Model Updates .................................................................................................................................. 2-2 Table 2-2: Inventory of Water Mains (Length in m) ......................................................................................... 2-3 Table 2-3: Future System Components From TWQM Plan ............................................................................ 2-3 Table 3-1: 2012 Monthly Flow Totals ................................................................................................................ 3-1 Table 3-2: NRW Adjustment .............................................................................................................................. 3-3 Table 3-3: Existing Demand Summary ............................................................................................................. 3-5 Table 4-1: Additional Base Demands Due To Growth .................................................................................... 4-2 Table 4-2: Distribution of Growth Demands (PE) ............................................................................................ 4-3 Table 4-3: EWR Demands (All Demands in L/s) .............................................................................................. 4-3 Table 5-1: Pressure Design Criteria ................................................................................................................. 5-1 Table 5-2: Fire Flow Design Criteria ................................................................................................................. 5-1 Table 5-3: Standard Unit Costs ......................................................................................................................... 5-3 Table 6-1: Supply Capacity of Groundwater Wells in the EWR Water System ............................................ 6-1 Table 6-2: Demand Versus Capacity ................................................................................................................ 6-2 Table 6-3: Summary of Break History 2000-2012 ............................................................................................ 6-5 Table 7-1: Recommended Improvements (2014 to 2017) ............................................................................... 7-2 Table 7-2: Review of Existing Recommendations (from 2010 Master Plan) ................................................ 7-5 Appendix Appendix A: Capital Project Justification Sheets
Section 1
Introduction
1-1
EPCOR WHITE ROCK WATER INC. 2013 Water System Master Plan Update
Final Report November 2013
102.119-300
1. Introduction
1.1 Scope of Report The goal of the 2013 Water System Master Plan update is to create a plan suitable to address distribution system capital planning needs for EPCOR White Rock Water’s (EWR) upcoming 4-year rate filing. The scope of this project includes:
• Existing system model update; • Proposed system model update; • Source flow update; • Service meter data review; • Water main break history update; • Develop a future growth model scenario; • Hydraulic performance analysis; and • Capital plan update.
1.2 Acknowledgements The project team and contributors to this project are listed below. This project could not have been completed without timely contributions and assistance of all those listed.
EPCOR Betty Icharia Utility Manager Debbie Servais Administrative Assistant Kirsch Uppal Billing Coordinator Simon Pither Lead Operator Dean Brown Operator Jun Nono Operator AL Agustin Operator Stephen Craik Director of Quality Assurance and Environment Susan Ancel Director of Water Distribution and Transmission Lee Jenkins Senior Manager BC Operations Vince Corkery Director of Municipal Operations
1.3 Reports Referenced 1. American Water Works Association / International Water Association. IWA/AWWA Water Audit
Method, <http://www.awwa.org/Resources/WaterLossControl.cfm?ItemNumber=48055&showLogin=N>, 2010.
2. American Water Works Association / International Water Association. AWWA M36 Manual, Water Audits and Loss Control Programs, Third Edition.
3. The City of White Rock, Official Community Plan, Bylaw #1638.
4. Duovac, Steven. Drinking Water Source Assessment Summary Report, White Rock, Government of British Columbia – Ministry of Health and South Fraser Health Region, February 2001.
5. EPCOR Water Services Inc. Edmonton’s Water Supply, May, 2010.
1-2 102.119-300
EPCOR WHITE ROCK WATER INC. 2013 Water System Master Plan Update
Final Report November 2013
6. Insurer’s Advisory Organization Inc., Fire Underwriter’s Survey Water Supply for Public Fire Protection, 1999.
7. Kerr Wood Leidal Associates Ltd. / Piteau Associates Engineering Inc., EPCOR White Rock Water Inc. Well Source Review, KWL file 102.090, 2010.
8. Kerr Wood Leidal Associates Ltd., Technical Memorandum – Assessment of Water Supply to the Town Center, May 7, 2001.
9. Kerr Wood Leidal Associates Ltd., Technical Memorandum – City of White Rock Proposed Fire Protection Sprinklering Bylaw – Review of Adequacy of Infrastructure and Expected Ratepayer Costs, File 102.048, May 31, 2002.
10. Kerr Wood Leidal Associates Ltd., Water System Master Plan Update - Draft Report, October 2003.
11. Kerr Wood Leidal Associates Ltd., White Rock Utilities Ltd. – Report on the Water Supply and Distribution System, August 1987.
12. Kerr Wood Leidal Associates Ltd., EPCOR White Rock Water Inc. Energy Feasibility Study, KWL file 102.088, March 2010.
13. Kerr Wood Leidal Associates Ltd., EPCOR White Rock Water Inc. 2010 Water System Master Plan Update, KWL file 102.087, December 2010.
14. NRC /AECOM, National Water & Wastewater Benchmarking Initiative, 2009 Public Report, July 23, 2009.
15. NSF International, Drinking Water System Components Health Effects, ANSI/NSF 61 – 199a.
16. Piteau Associates Engineering Inc., Redevelopment of Oxford Well No. 3, December 21, 2012.
17. SCM Risk Management Services Inc., Fire Department Operational Study – Fire Underwriters Survey – City of White Rock, 2009.
18. Stantec Consulting Ltd., EPCOR White Rock – Arsenic Water Treatment Conceptual Study, December, 2009.
19. Stantec Consulting Ltd., White Rock Water Upgrades – Merklin Tower Reservoir Upgrades, November 2009.
20. Stantec Consulting Ltd., EPCOR White Rock Water System Upgrade Concept Design Report, June 2012.
21. Michael D. Yee, Economic Analysis for Replacing Residential Meters, AWWA Journal, July 1999.
1-3
EPCOR WHITE ROCK WATER INC. 2013 Water System Master Plan Update
Final Report November 2013
102.119-300
1.4 Abbreviations Used The following abbreviations have been used throughout the report.
BD Base Demand (Typical Indoor Winter Water Usage) ca Capita (Person) CARL Current Annual Real Losses CI Cast Iron Water Main COM Commercial DI Ductile Iron Water Main EWR EPCOR White Rock Water Inc. GD Geodetic Datum ha Hectare HGL Hydraulic Grade Line HP Horsepower ICI Industrial, Commercial and Institutional ILI Infrastructure Leakage Index IND Industrial INST Institutional KWL Kerr Wood Leidal Associates Ltd. MDD Maximum Day Demand MF Multifamily ML Mega Litre (106 L) PE Population Equivalent PHD Peak Hour Demand PRV Pressure Reducing Valve PRS Pressure Reducing Station RES Residential SCADA Supervisory Control and Data Acquisition SD Seasonal Demand (Irrigation Demand on MDD; BD+SD = MDD) SF Single Family TDH Total Dynamic Head TWL Top Water Level TWQM Total Water Quality Management UARL Unavoidable Annual Real Losses VFD Variable Frequency Drive
Section 2
Model Update
2-1
EPCOR WHITE ROCK WATER INC. 2013 Water System Master Plan Update
Final Report November 2013
102.119-300
2. Model Update
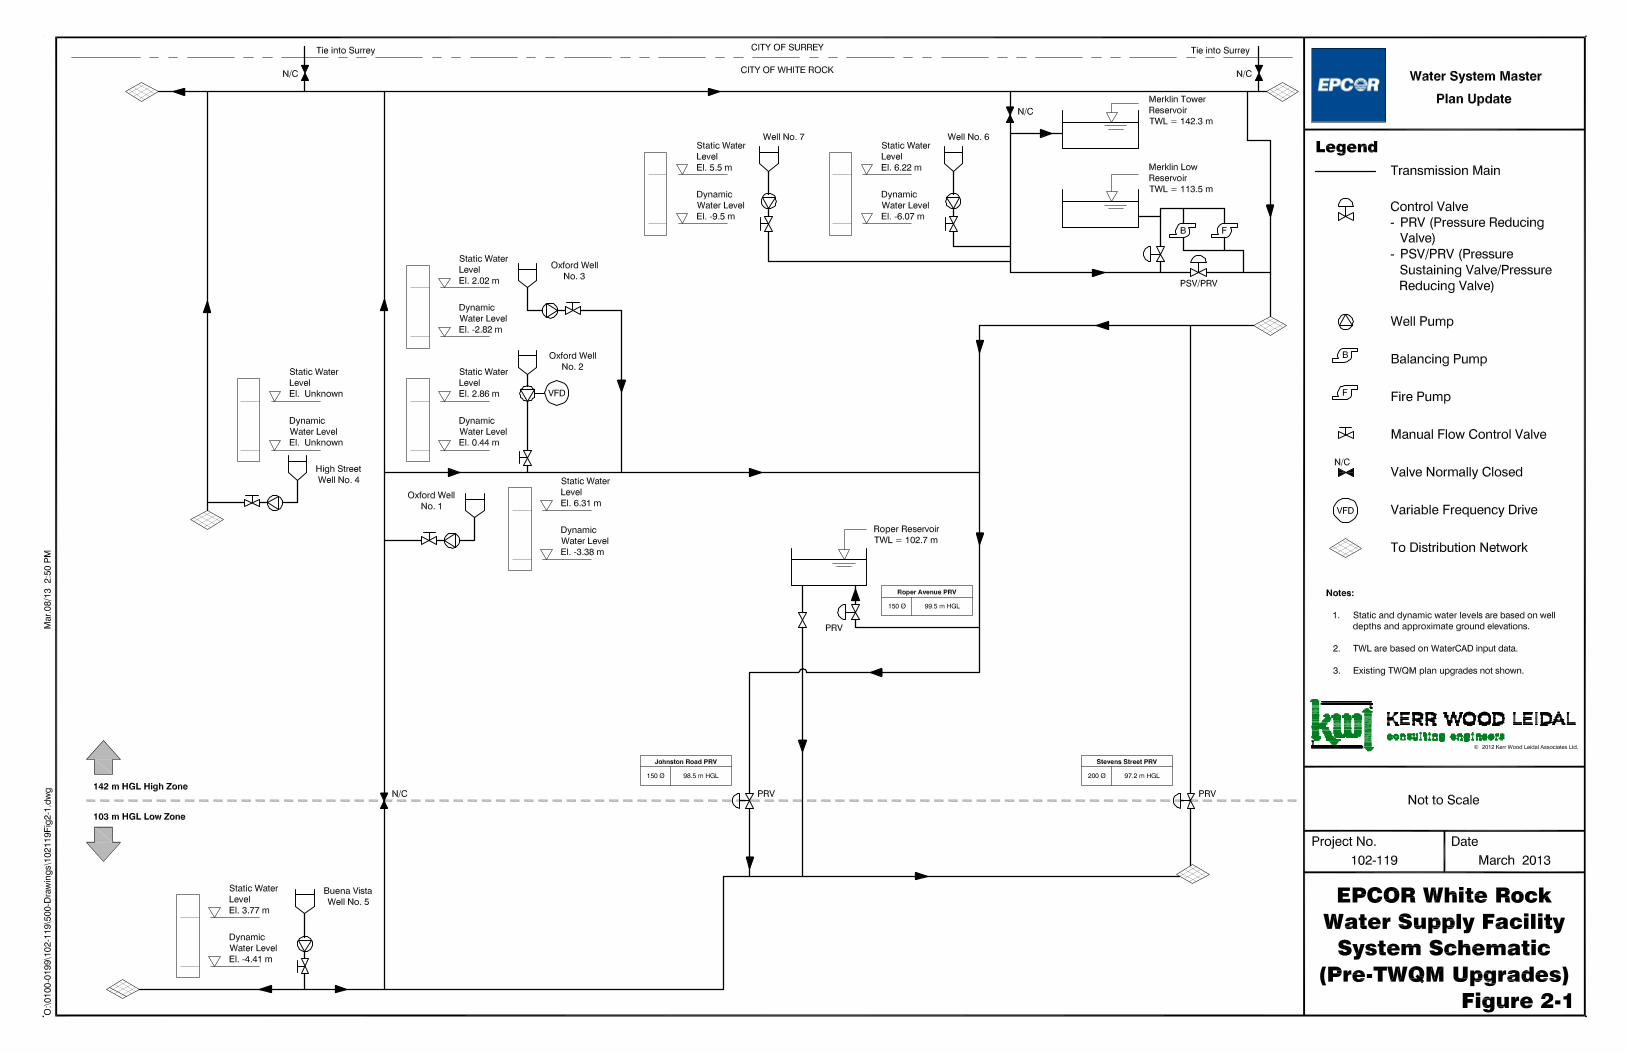
2.1 Water System Description The water system owned and operated by EWR supplies water to the City of White Rock as well as the surrounding area, including a portion of Surrey (located on North Bluff Ave.) and the Semiahmoo First Nation. The major supply facilities in the existing EWR water distribution system include:
• Seven groundwater wells; • The Merklin booster pump station (2 booster pumps, 1 electric fire pump, and 1 diesel fire pump); • The Roper Reservoir; • The Merklin Low Reservoir; • The Merklin High Reservoir; and • Three pressure reducing valve stations (PRS) on Roper Ave., Stevens St., and Johnston Rd.
The water service area is divided into the High Pressure Zone and the Low Pressure Zone. The High Pressure Zone is supplied by the Oxford Wells (Well 1, 2 and 3), High St. Well (Well 4) and the Merklin Wells (Well 6 and 7). The Low Zone is supplied by the Buena Vista Well (Well 5) and from the High Zone via. the three PRS.
A schematic of the water system is shown on Figure 2-1.
The schematic does not include upgrades that are planned as part of the Total Water Quality Management upgrades [20]. As discussed below, these proposed upgrades are included in the water model.
2.2 Evolution of EWR’s Water Model The existing model was developed by Kerr Wood Leidal Associates Ltd. (KWL) in 1986 using WATER hydraulic modelling software. In 1995 and 1996, the model was rebuilt using the WATERWORKS software. At that time, demands were updated, and the model was calibrated.
In 1999, the model was converted to Haestad Methods Cybernet version 3. In 2002/2003, the model was updated with new demands and minor piping upgrades and converted to WaterCAD version 5.0. The EWR system model has been upgraded since 2003 to reflect various piping upgrades. As part of the 2010 Water System Master Plan Update, the model was rebuilt using WaterCAD version 8 with a GIS-based piping network.
The model version used in the analysis for this report is WR_v41.wtg.
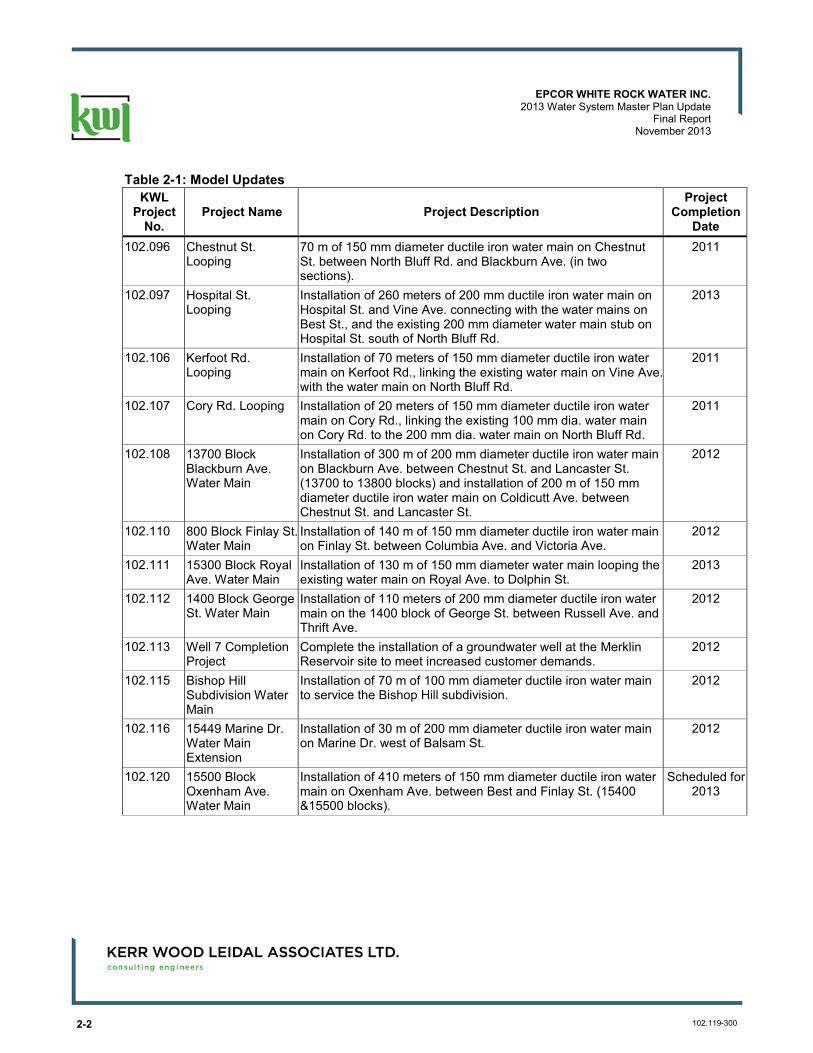
2.3 Model Updates The updates to the model completed for this report are summarized in Table 2-1. Note that the projects scheduled to be completed in 2013 were included in the model update for the existing system.
2-2 102.119-300
EPCOR WHITE ROCK WATER INC. 2013 Water System Master Plan Update
Final Report November 2013
Table 2-1: Model Updates KWL
Project No.
Project Name Project Description Project
Completion Date
102.096 Chestnut St. Looping
70 m of 150 mm diameter ductile iron water main on Chestnut St. between North Bluff Rd. and Blackburn Ave. (in two sections).
2011
102.097 Hospital St. Looping
Installation of 260 meters of 200 mm ductile iron water main on Hospital St. and Vine Ave. connecting with the water mains on Best St., and the existing 200 mm diameter water main stub on Hospital St. south of North Bluff Rd.
2013
102.106 Kerfoot Rd. Looping
Installation of 70 meters of 150 mm diameter ductile iron water main on Kerfoot Rd., linking the existing water main on Vine Ave. with the water main on North Bluff Rd.
2011
102.107 Cory Rd. Looping Installation of 20 meters of 150 mm diameter ductile iron water main on Cory Rd., linking the existing 100 mm dia. water main on Cory Rd. to the 200 mm dia. water main on North Bluff Rd.
2011
102.108 13700 Block Blackburn Ave. Water Main
Installation of 300 m of 200 mm diameter ductile iron water main on Blackburn Ave. between Chestnut St. and Lancaster St. (13700 to 13800 blocks) and installation of 200 m of 150 mm diameter ductile iron water main on Coldicutt Ave. between Chestnut St. and Lancaster St.
2012
102.110 800 Block Finlay St. Water Main
Installation of 140 m of 150 mm diameter ductile iron water main on Finlay St. between Columbia Ave. and Victoria Ave.
2012
102.111 15300 Block Royal Ave. Water Main
Installation of 130 m of 150 mm diameter water main looping the existing water main on Royal Ave. to Dolphin St.
2013
102.112 1400 Block George St. Water Main
Installation of 110 meters of 200 mm diameter ductile iron water main on the 1400 block of George St. between Russell Ave. and Thrift Ave.
2012
102.113 Well 7 Completion Project
Complete the installation of a groundwater well at the Merklin Reservoir site to meet increased customer demands.
2012
102.115 Bishop Hill Subdivision Water Main
Installation of 70 m of 100 mm diameter ductile iron water main to service the Bishop Hill subdivision.
2012
102.116 15449 Marine Dr. Water Main Extension
Installation of 30 m of 200 mm diameter ductile iron water main on Marine Dr. west of Balsam St.
2012
102.120 15500 Block Oxenham Ave. Water Main
Installation of 410 meters of 150 mm diameter ductile iron water main on Oxenham Ave. between Best and Finlay St. (15400 &15500 blocks).
Scheduled for 2013
2-3
EPCOR WHITE ROCK WATER INC. 2013 Water System Master Plan Update
Final Report November 2013
102.119-300
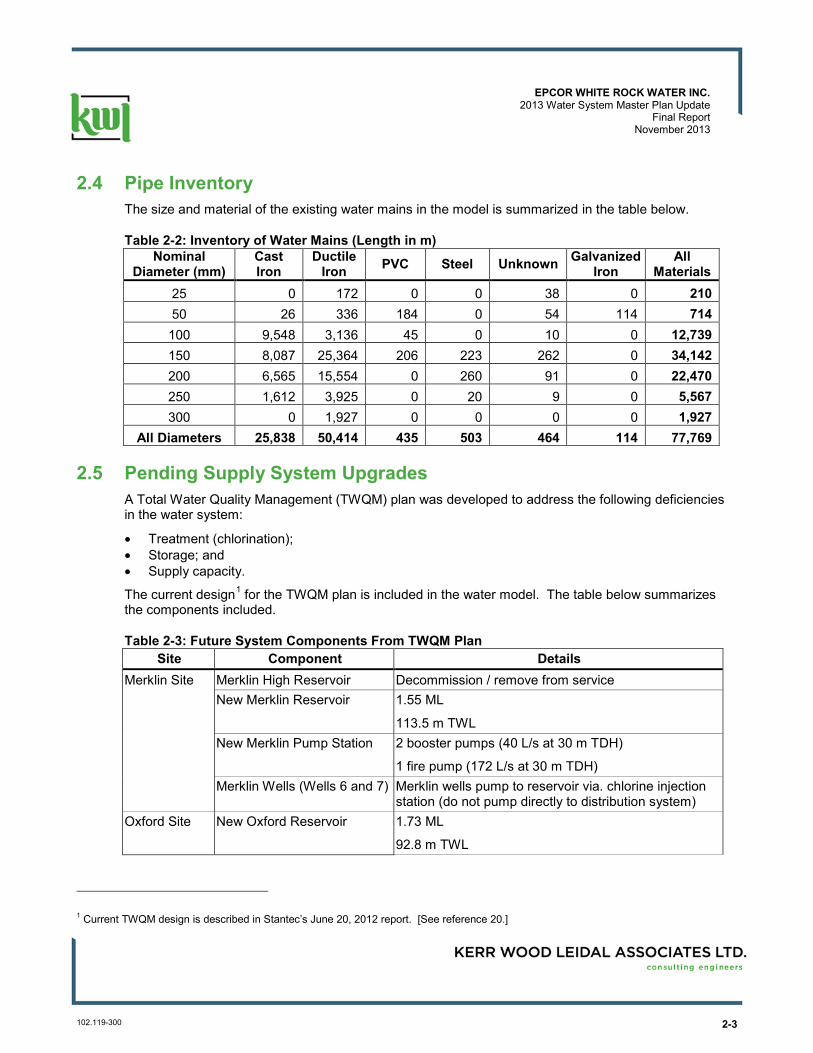
2.4 Pipe Inventory The size and material of the existing water mains in the model is summarized in the table below.
Table 2-2: Inventory of Water Mains (Length in m) Nominal
Diameter (mm) Cast Iron
Ductile Iron PVC Steel Unknown Galvanized
Iron All
Materials 25 0 172 0 0 38 0 210 50 26 336 184 0 54 114 714 100 9,548 3,136 45 0 10 0 12,739 150 8,087 25,364 206 223 262 0 34,142 200 6,565 15,554 0 260 91 0 22,470 250 1,612 3,925 0 20 9 0 5,567 300 0 1,927 0 0 0 0 1,927
All Diameters 25,838 50,414 435 503 464 114 77,769
2.5 Pending Supply System Upgrades A Total Water Quality Management (TWQM) plan was developed to address the following deficiencies in the water system:
• Treatment (chlorination); • Storage; and • Supply capacity.
The current design1 for the TWQM plan is included in the water model. The table below summarizes the components included.
Table 2-3: Future System Components From TWQM Plan Site Component Details
Merklin Site Merklin High Reservoir Decommission / remove from service New Merklin Reservoir 1.55 ML
113.5 m TWL New Merklin Pump Station 2 booster pumps (40 L/s at 30 m TDH)
1 fire pump (172 L/s at 30 m TDH) Merklin Wells (Wells 6 and 7) Merklin wells pump to reservoir via. chlorine injection
station (do not pump directly to distribution system) Oxford Site New Oxford Reservoir 1.73 ML
92.8 m TWL
1 Current TWQM design is described in Stantec’s June 20, 2012 report. [See reference 20.]
2-4 102.119-300
EPCOR WHITE ROCK WATER INC. 2013 Water System Master Plan Update
Final Report November 2013
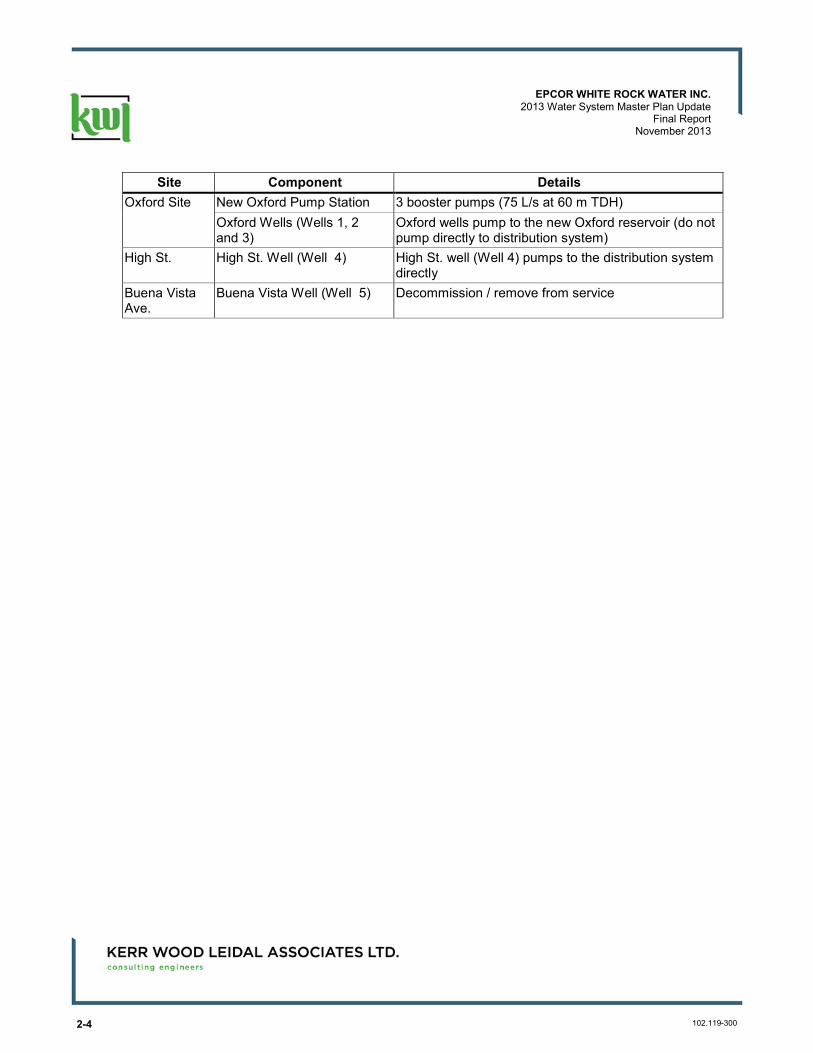
Site Component Details Oxford Site New Oxford Pump Station 3 booster pumps (75 L/s at 60 m TDH)
Oxford Wells (Wells 1, 2 and 3)
Oxford wells pump to the new Oxford reservoir (do not pump directly to distribution system)
High St. High St. Well (Well 4) High St. well (Well 4) pumps to the distribution system directly
Buena Vista Ave.
Buena Vista Well (Well 5) Decommission / remove from service
Section 3
Existing Demands
3-1
EPCOR WHITE ROCK WATER INC. 2013 Water System Master Plan Update
Final Report November 2013
102.119-300
3. Existing Demands
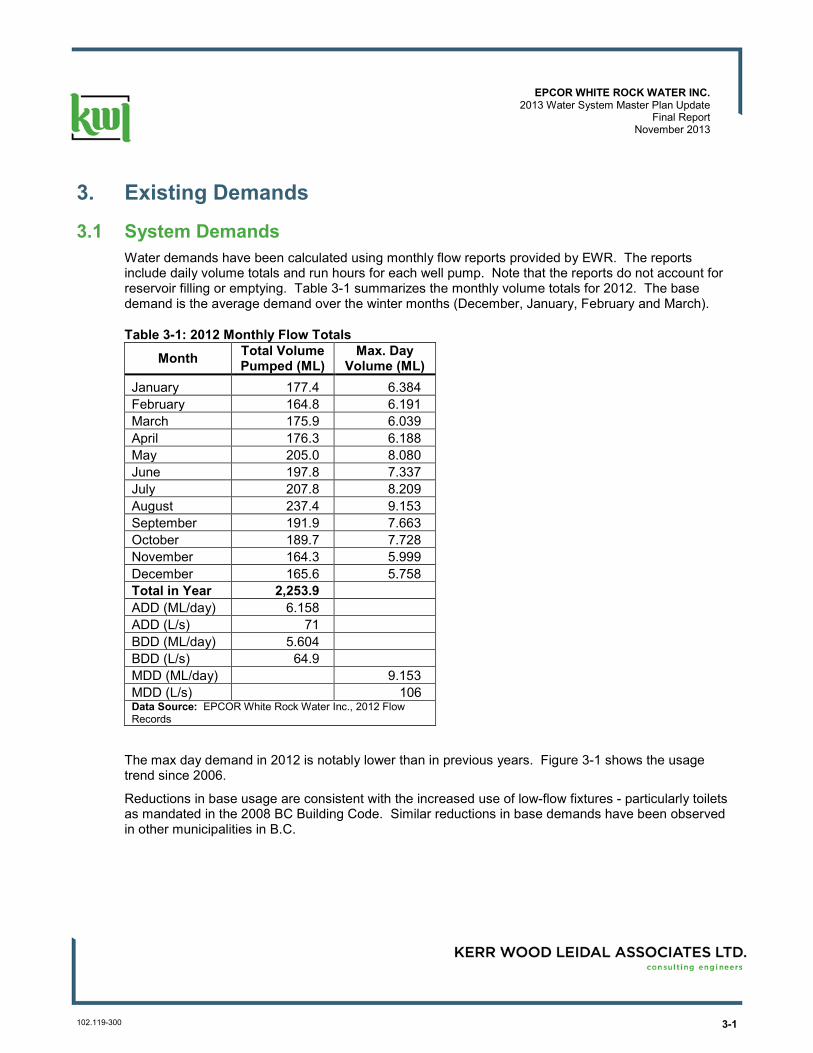
3.1 System Demands Water demands have been calculated using monthly flow reports provided by EWR. The reports include daily volume totals and run hours for each well pump. Note that the reports do not account for reservoir filling or emptying. Table 3-1 summarizes the monthly volume totals for 2012. The base demand is the average demand over the winter months (December, January, February and March).
Table 3-1: 2012 Monthly Flow Totals
Month Total Volume Pumped (ML)
Max. Day Volume (ML)
January 177.4 6.384 February 164.8 6.191 March 175.9 6.039 April 176.3 6.188 May 205.0 8.080 June 197.8 7.337 July 207.8 8.209 August 237.4 9.153 September 191.9 7.663 October 189.7 7.728 November 164.3 5.999 December 165.6 5.758 Total in Year 2,253.9 ADD (ML/day) 6.158 ADD (L/s) 71 BDD (ML/day) 5.604 BDD (L/s) 64.9 MDD (ML/day) 9.153 MDD (L/s) 106 Data Source: EPCOR White Rock Water Inc., 2012 Flow Records
The max day demand in 2012 is notably lower than in previous years. Figure 3-1 shows the usage trend since 2006.
Reductions in base usage are consistent with the increased use of low-flow fixtures - particularly toilets as mandated in the 2008 BC Building Code. Similar reductions in base demands have been observed in other municipalities in B.C.
3-2 102.119-300
EPCOR WHITE ROCK WATER INC. 2013 Water System Master Plan Update
Final Report November 2013
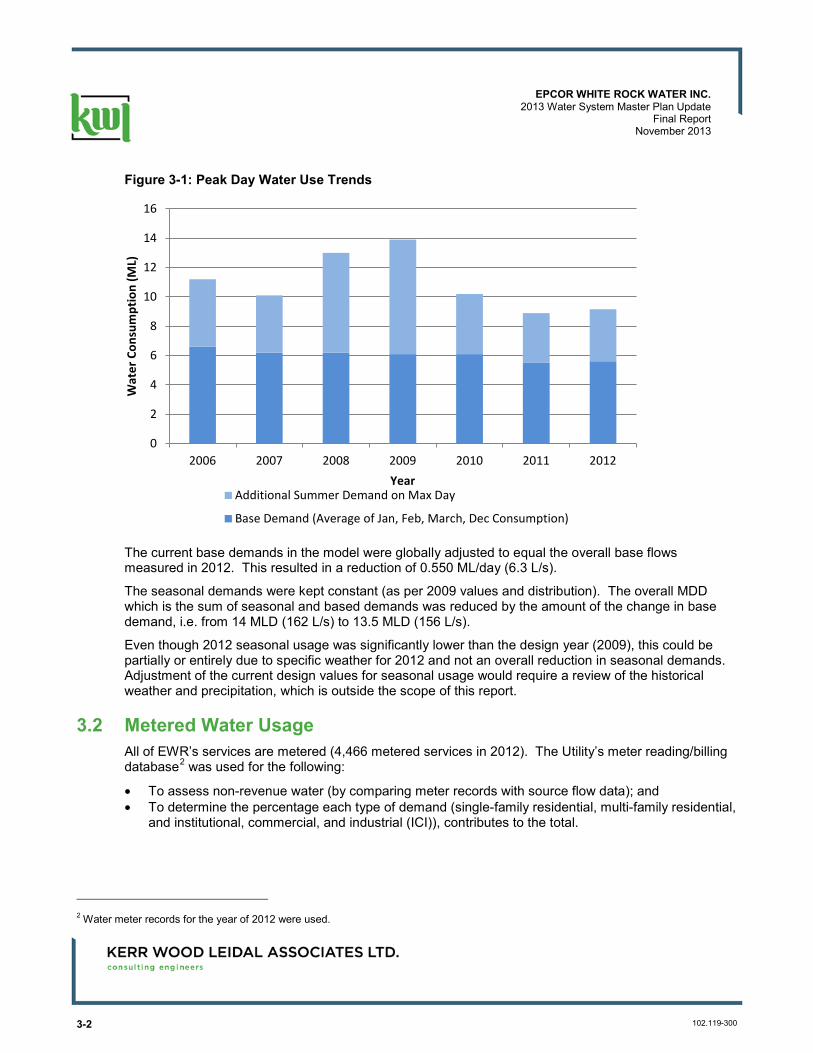
Figure 3-1: Peak Day Water Use Trends
The current base demands in the model were globally adjusted to equal the overall base flows measured in 2012. This resulted in a reduction of 0.550 ML/day (6.3 L/s).
The seasonal demands were kept constant (as per 2009 values and distribution). The overall MDD which is the sum of seasonal and based demands was reduced by the amount of the change in base demand, i.e. from 14 MLD (162 L/s) to 13.5 MLD (156 L/s).
Even though 2012 seasonal usage was significantly lower than the design year (2009), this could be partially or entirely due to specific weather for 2012 and not an overall reduction in seasonal demands. Adjustment of the current design values for seasonal usage would require a review of the historical weather and precipitation, which is outside the scope of this report.
3.2 Metered Water Usage All of EWR’s services are metered (4,466 metered services in 2012). The Utility’s meter reading/billing database2 was used for the following:
• To assess non-revenue water (by comparing meter records with source flow data); and • To determine the percentage each type of demand (single-family residential, multi-family residential,
and institutional, commercial, and industrial (ICI)), contributes to the total.
2 Water meter records for the year of 2012 were used.
0
2
4
6
8
10
12
14
16
2006 2007 2008 2009 2010 2011 2012
Wat
er C
onsu
mpt
ion
(ML)
Year Additional Summer Demand on Max Day
Base Demand (Average of Jan, Feb, March, Dec Consumption)
3-3
EPCOR WHITE ROCK WATER INC. 2013 Water System Master Plan Update
Final Report November 2013
102.119-300
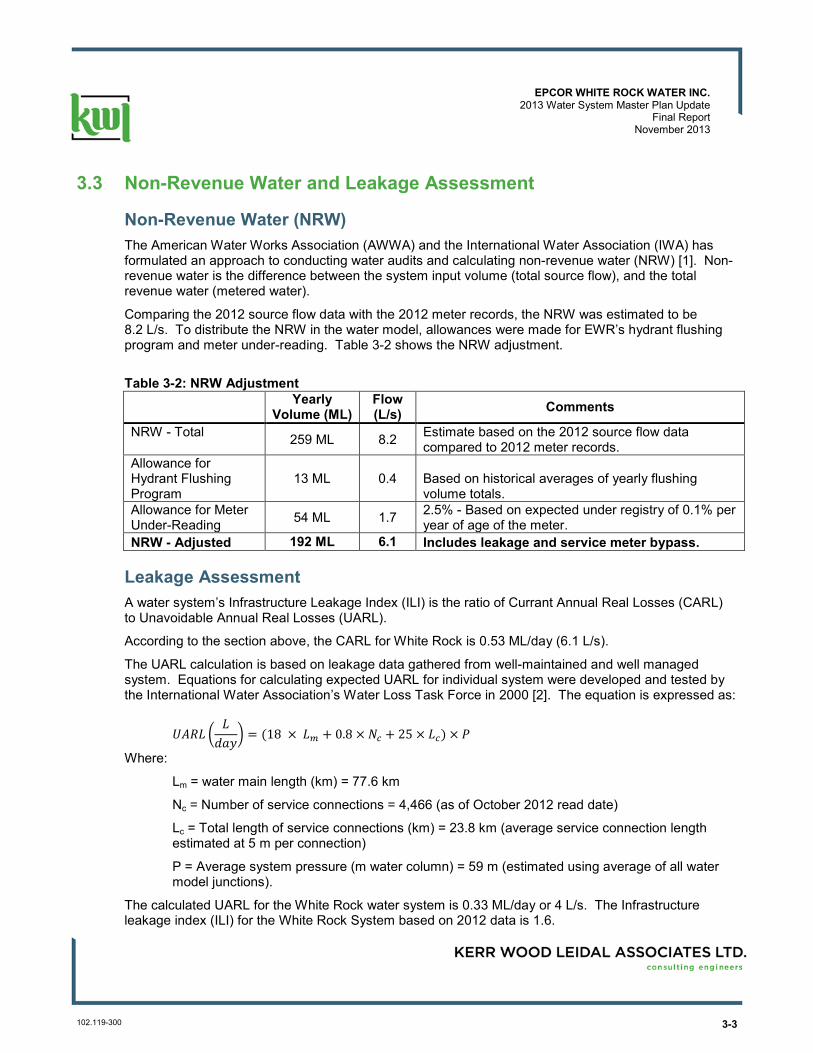
3.3 Non-Revenue Water and Leakage Assessment
Non-Revenue Water (NRW) The American Water Works Association (AWWA) and the International Water Association (IWA) has formulated an approach to conducting water audits and calculating non-revenue water (NRW) [1]. Non-revenue water is the difference between the system input volume (total source flow), and the total revenue water (metered water).
Comparing the 2012 source flow data with the 2012 meter records, the NRW was estimated to be 8.2 L/s. To distribute the NRW in the water model, allowances were made for EWR’s hydrant flushing program and meter under-reading. Table 3-2 shows the NRW adjustment.
Table 3-2: NRW Adjustment
Yearly Volume (ML)
Flow (L/s) Comments
NRW - Total 259 ML 8.2 Estimate based on the 2012 source flow data compared to 2012 meter records.
Allowance for Hydrant Flushing Program
13 ML 0.4 Based on historical averages of yearly flushing volume totals.
Allowance for Meter Under-Reading 54 ML 1.7 2.5% - Based on expected under registry of 0.1% per
year of age of the meter. NRW - Adjusted 192 ML 6.1 Includes leakage and service meter bypass.
Leakage Assessment A water system’s Infrastructure Leakage Index (ILI) is the ratio of Currant Annual Real Losses (CARL) to Unavoidable Annual Real Losses (UARL).
According to the section above, the CARL for White Rock is 0.53 ML/day (6.1 L/s).
The UARL calculation is based on leakage data gathered from well-maintained and well managed system. Equations for calculating expected UARL for individual system were developed and tested by the International Water Association’s Water Loss Task Force in 2000 [2]. The equation is expressed as:
ܮܴܣܷ ൬ ܮ൰ݕܽ݀ = ܮ × 18) + 0.8 × ܰ + 25 × (ܮ × ܲ
Where:
Lm = water main length (km) = 77.6 km
Nc = Number of service connections = 4,466 (as of October 2012 read date)
Lc = Total length of service connections (km) = 23.8 km (average service connection length estimated at 5 m per connection)
P = Average system pressure (m water column) = 59 m (estimated using average of all water model junctions).
The calculated UARL for the White Rock water system is 0.33 ML/day or 4 L/s. The Infrastructure leakage index (ILI) for the White Rock System based on 2012 data is 1.6.
3-4 102.119-300
EPCOR WHITE ROCK WATER INC. 2013 Water System Master Plan Update
Final Report November 2013
ILI is used as a performance indicator for water loss management. A worldwide comparison of water audit ILI results [2] showed that utilities had a median ILI of 2.94 and an average ILI of 4.38. ILI rates for well-managed systems (with established best management practices for lowering water losses), are typically around 2. Costs for lowering ILI rates below 2 increase exponentially.
3.4 Per Capita Consumption Statistics Canada’s 2011 Census indicates a population of 19,339 people for the City of White Rock. In addition to the City of White Rock, EWR also supplies water to homes in Surrey and the Semiahmoo First Nation. There are approximately 85 metered lots in Surrey, corresponding to a population of 213 based on 2.5 persons per single family lot. The total serviced population for EWR is estimated at 19,552 people.
Population equivalents (PE) for commercial usages were derived based on the percentage of the metered winter commercial usage to the total winter residential usage. A total service population for EWR is estimated at 25,186 PE (including 19,552 people and 5,634 PE for commercial).
The population living on the Semiahmoo First Nation Reserve is 110, according to Aboriginal Affairs and Northern Development Canada. The Semiahmoo First Nation’s water demand is included in the commercial category as population equivalents (PE) because the water meter is in the commercial category. One hundred and seventy four (174) of the total 5,634 commercial PE are attributed to the Semiahmoo First Nation.
Based on the above and actual meter readings (with allowance for meter under-reading), the base (winter) consumption is 202 L/PE/day for 2012. The per capita consumption value has decreased since the last master plan update by 13% (233 L/PE/day calculated from 2009 data).
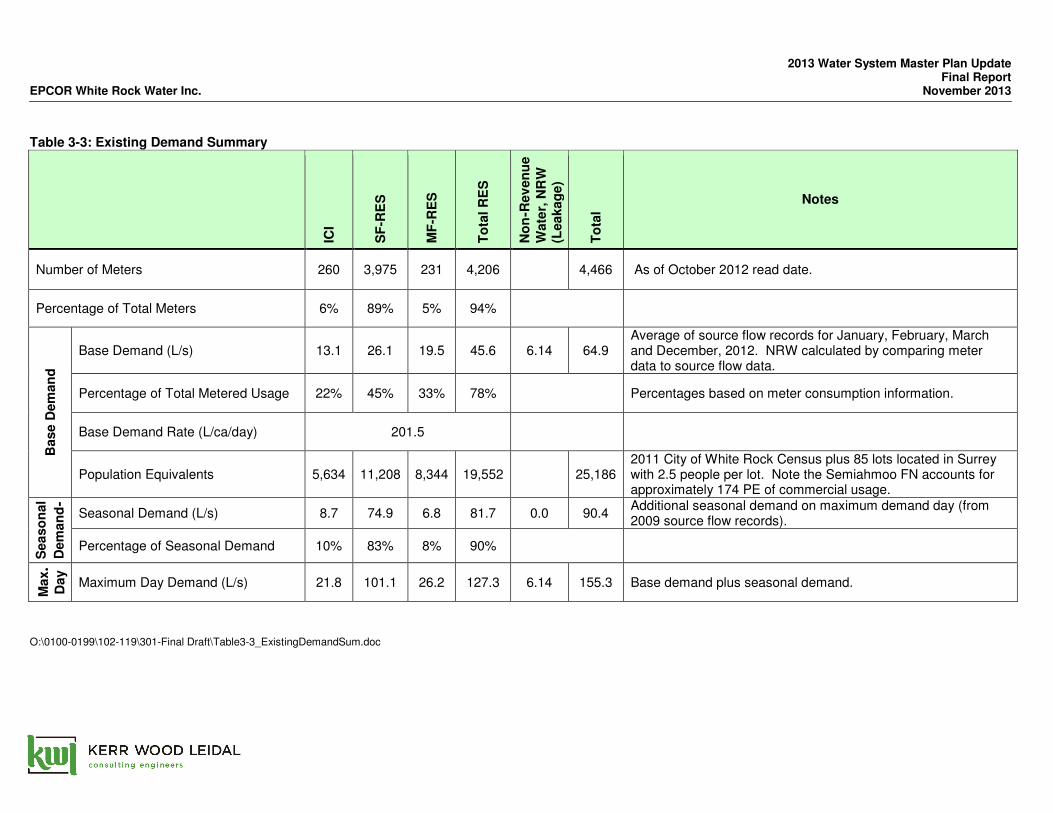
3.5 Existing Demand Summary Existing demands for the system are summarized in Table 3-3.
2013 Water System Master Plan Update Final Report EPCOR White Rock Water Inc. November 2013
Table 3-3: Existing Demand Summary
ICI
SF
-RE
S
MF
-RE
S
To
tal R
ES
No
n-R
ev
en
ue
Wate
r, N
RW
(L
eakag
e)
To
tal Notes
Number of Meters 260 3,975 231 4,206
4,466 As of October 2012 read date.
Percentage of Total Meters 6% 89% 5% 94%
Base D
em
an
d
Base Demand (L/s) 13.1 26.1 19.5 45.6 6.14 64.9 Average of source flow records for January, February, March and December, 2012. NRW calculated by comparing meter data to source flow data.
Percentage of Total Metered Usage 22% 45% 33% 78%
Percentages based on meter consumption information.
Base Demand Rate (L/ca/day) 201.5
Population Equivalents 5,634 11,208 8,344 19,552
25,186 2011 City of White Rock Census plus 85 lots located in Surrey with 2.5 people per lot. Note the Semiahmoo FN accounts for approximately 174 PE of commercial usage.
Sea
so
nal
Dem
an
d-
Seasonal Demand (L/s) 8.7 74.9 6.8 81.7 0.0 90.4 Additional seasonal demand on maximum demand day (from 2009 source flow records).
Percentage of Seasonal Demand 10% 83% 8% 90%
Max.
Day
Maximum Day Demand (L/s) 21.8 101.1 26.2 127.3 6.14 155.3 Base demand plus seasonal demand. O:\0100-0199\102-119\301-Final Draft\Table3-3_ExistingDemandSum.doc
Section 4
Future Demands
4-1
EPCOR WHITE ROCK WATER INC. 2013 Water System Master Plan Update
Final Report November 2013
102.119-300
4. Future Demands
4.1 Overall Growth Forecast The City of White Rock released its Official Community Plan (OCP) in 2008. The OCP was based on the 2006 Census population for White Rock of 18,755. The OCP forecasted that the population would increase 190 people per year, to a population of 23,505 in 2031. The 2011 Census indicates a population of 19,339 for the City of White Rock, representing an average growth of 117 people/year.
The 2010 Master Plan Update used the OCP growth prediction, and the 2010 per capita base usage rate (233 L/PE/day) to determine a 2031 MDD of 180 L/s (note seasonal demands brought in separately).
For the purpose of this Master Plan Update, a forecast MDD of 180 L/s will be maintained. Using the 202 L/PE/day base use rate, the forecast MDD corresponds to either of the following growth scenarios:
• 26,649 population in 2031 with a growth rate of 366 people per year from 2011; or • 26,649 population in 2049 with a growth rate of 190 people per year from 2011.
For convenience, the 180 L/s value is referenced as a year 2049 forecast (consistent with OCP forecast).
The 180 L/s / 26,649 population forecast assumes:
• No additional growth in services beyond the White Rock City Limits; • ICI base usage continues to be 20% of overall system base demands (as per existing); and • Seasonal demands stay constant on the basis that overall irrigated green area is not expected to
increase and irrigation application rates per acre of green area do not increase. It is noted that the demand forecast of 180 L/s is only 15% greater than the current estimate of maximum day demand (156 L/s).
4.2 Industrial, Commercial, and Institutional (ICI) Growth Currently commercial usage accounts for 20% of overall system base demands. No significant industrial land use exists for White Rock. It has been assumed that the ICI usage will continue to form the same percentage of the total system demands.
4.3 City of Surrey and Semiahmoo First Nation Customers In addition to the City of White Rock residents, EWR also has 85 services to the City of Surrey. It is estimated that these services account for approximately 213 residents. It is assumed that the number of non-White Rock residential customers will not change significantly over the period of the Master Plan.
In addition to the City of White Rock commercial services, EWR also has a commercial service to the Semiahmoo First Nation. It has been assumed that the commercial usage will not change significantly over the period of the Master Plan.
4-2 102.119-300
EPCOR WHITE ROCK WATER INC. 2013 Water System Master Plan Update
Final Report November 2013
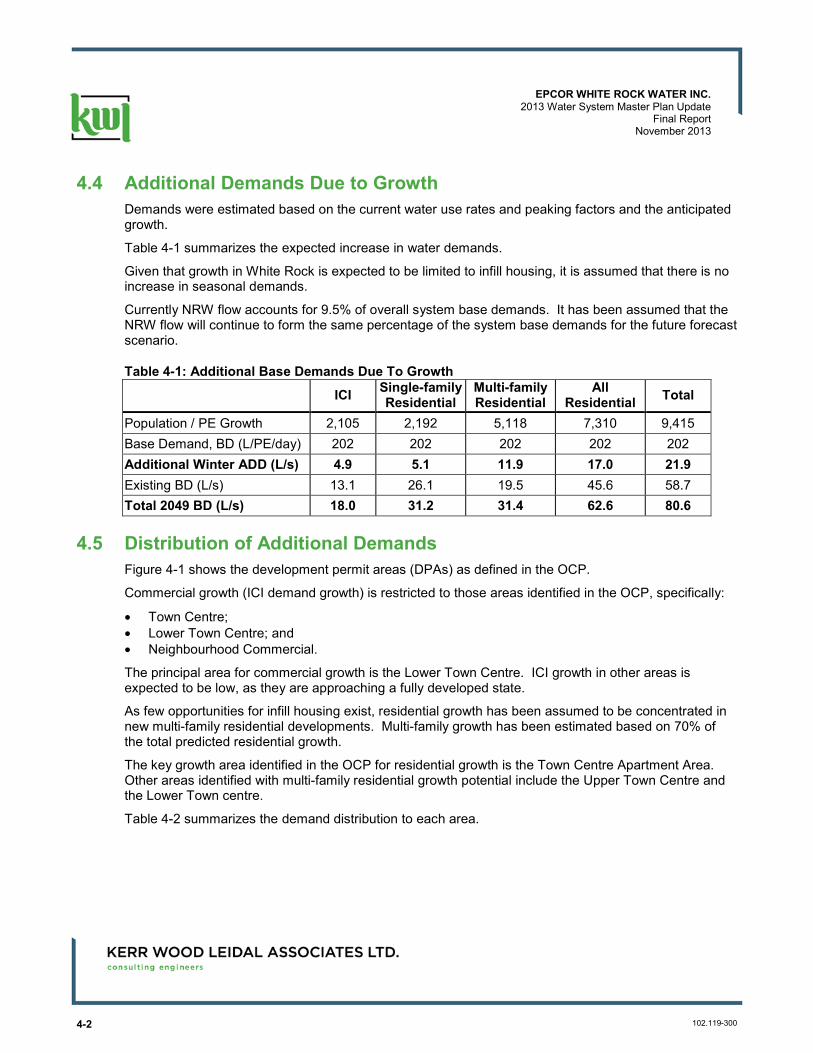
4.4 Additional Demands Due to Growth Demands were estimated based on the current water use rates and peaking factors and the anticipated growth.
Table 4-1 summarizes the expected increase in water demands.
Given that growth in White Rock is expected to be limited to infill housing, it is assumed that there is no increase in seasonal demands.
Currently NRW flow accounts for 9.5% of overall system base demands. It has been assumed that the NRW flow will continue to form the same percentage of the system base demands for the future forecast scenario.
Table 4-1: Additional Base Demands Due To Growth
ICI Single-family Residential
Multi-family Residential
All Residential Total
Population / PE Growth 2,105 2,192 5,118 7,310 9,415 Base Demand, BD (L/PE/day) 202 202 202 202 202 Additional Winter ADD (L/s) 4.9 5.1 11.9 17.0 21.9 Existing BD (L/s) 13.1 26.1 19.5 45.6 58.7 Total 2049 BD (L/s) 18.0 31.2 31.4 62.6 80.6
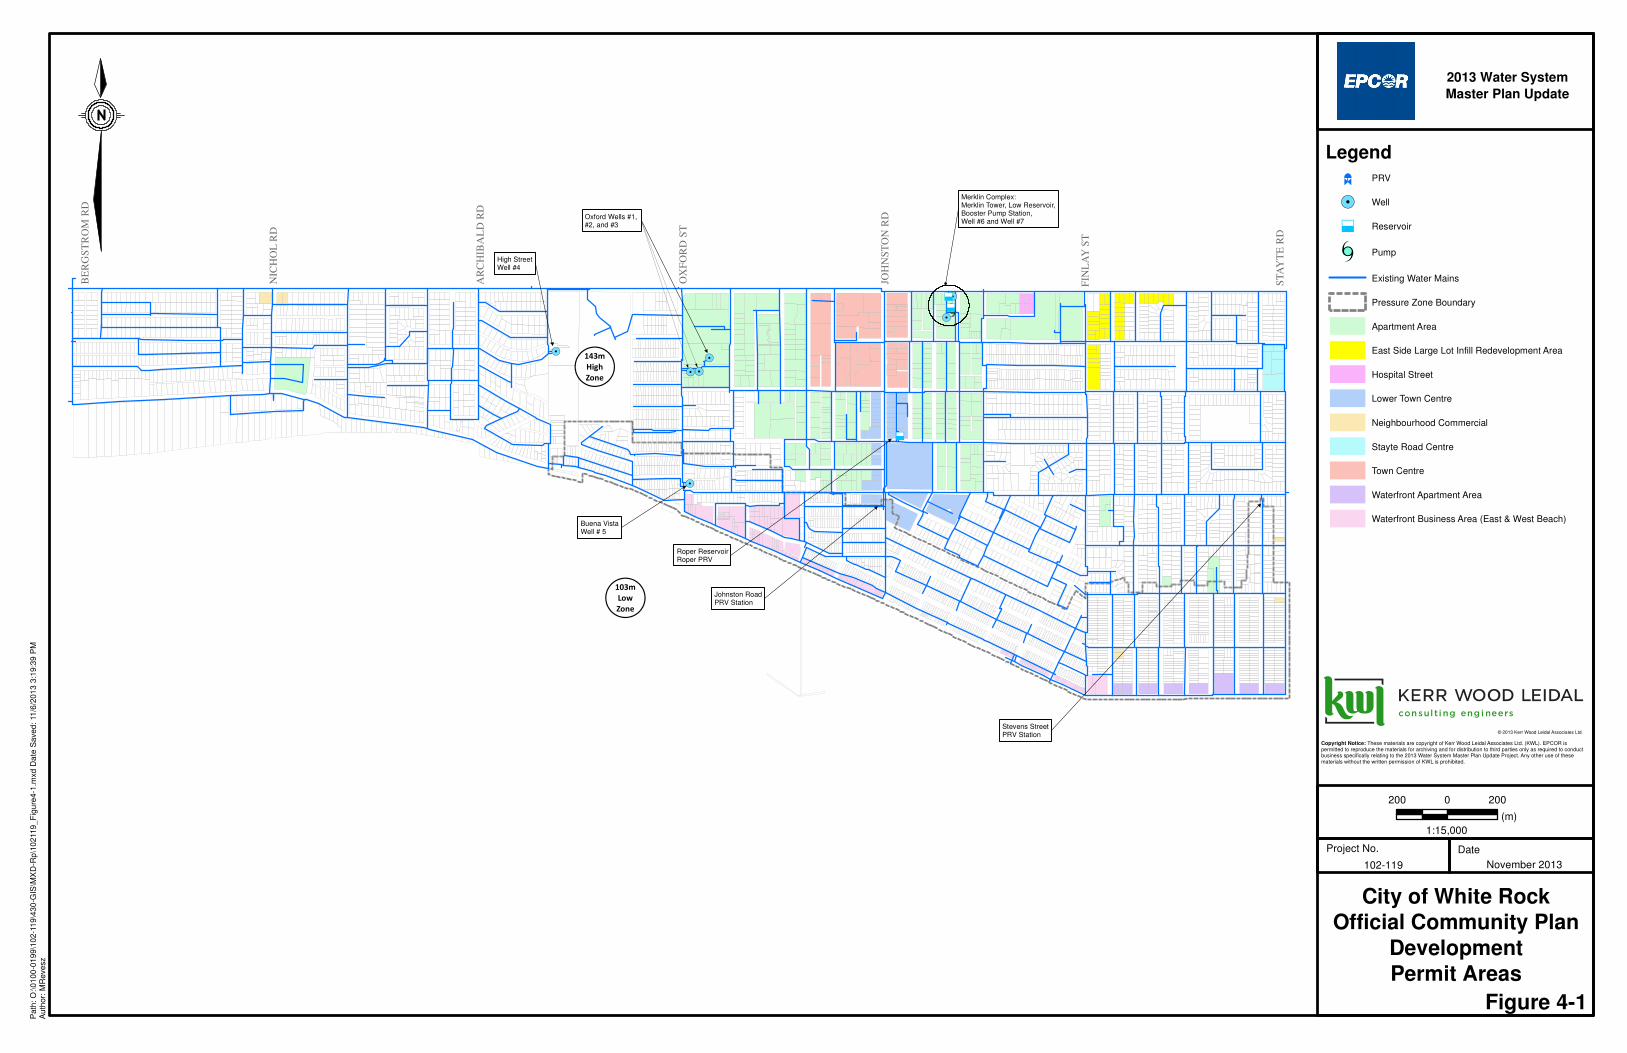
4.5 Distribution of Additional Demands Figure 4-1 shows the development permit areas (DPAs) as defined in the OCP.
Commercial growth (ICI demand growth) is restricted to those areas identified in the OCP, specifically:
• Town Centre; • Lower Town Centre; and • Neighbourhood Commercial.
The principal area for commercial growth is the Lower Town Centre. ICI growth in other areas is expected to be low, as they are approaching a fully developed state.
As few opportunities for infill housing exist, residential growth has been assumed to be concentrated in new multi-family residential developments. Multi-family growth has been estimated based on 70% of the total predicted residential growth.
The key growth area identified in the OCP for residential growth is the Town Centre Apartment Area. Other areas identified with multi-family residential growth potential include the Upper Town Centre and the Lower Town centre.
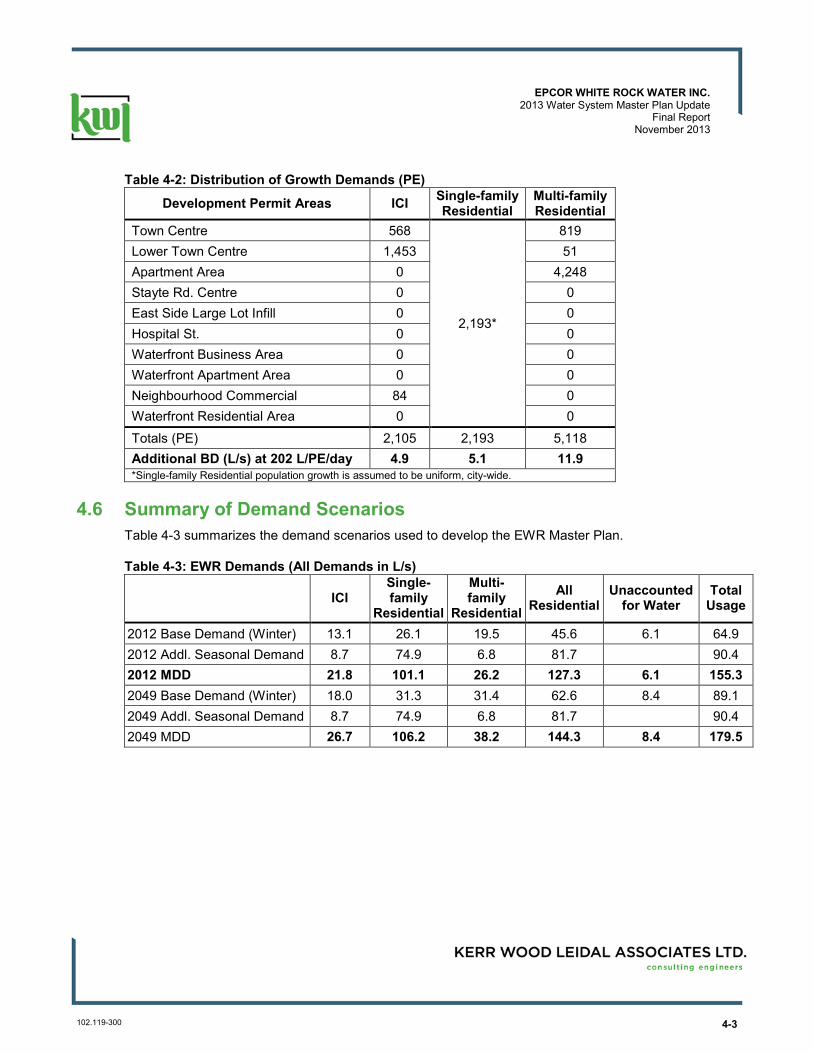
Table 4-2 summarizes the demand distribution to each area.
4-3
EPCOR WHITE ROCK WATER INC. 2013 Water System Master Plan Update
Final Report November 2013
102.119-300
Table 4-2: Distribution of Growth Demands (PE)
Development Permit Areas ICI Single-family Residential
Multi-family Residential
Town Centre 568
2,193*
819 Lower Town Centre 1,453 51 Apartment Area 0 4,248 Stayte Rd. Centre 0 0 East Side Large Lot Infill 0 0 Hospital St. 0 0 Waterfront Business Area 0 0 Waterfront Apartment Area 0 0 Neighbourhood Commercial 84 0 Waterfront Residential Area 0 0 Totals (PE) 2,105 2,193 5,118 Additional BD (L/s) at 202 L/PE/day 4.9 5.1 11.9 *Single-family Residential population growth is assumed to be uniform, city-wide.
4.6 Summary of Demand Scenarios Table 4-3 summarizes the demand scenarios used to develop the EWR Master Plan.
Table 4-3: EWR Demands (All Demands in L/s)
ICI Single-family
Residential
Multi-family
Residential All
Residential Unaccounted
for Water Total
Usage
2012 Base Demand (Winter) 13.1 26.1 19.5 45.6 6.1 64.9 2012 Addl. Seasonal Demand 8.7 74.9 6.8 81.7 90.4 2012 MDD 21.8 101.1 26.2 127.3 6.1 155.3 2049 Base Demand (Winter) 18.0 31.3 31.4 62.6 8.4 89.1 2049 Addl. Seasonal Demand 8.7 74.9 6.8 81.7 90.4 2049 MDD 26.7 106.2 38.2 144.3 8.4 179.5
Project No. Date
ÏÎÏÎ!."
e
"
e
"
e
!.!.
!.!.
!.
!.
!(143mHighZone
!(103mLowZone
Oxford Wells #1, #2, and #3
!
Merklin Complex:Merklin Tower, Low Reservoir,Booster Pump Station, Well #6 and Well #7
Buena VistaWell # 5
Roper ReservoirRoper PRV
Johnston RoadPRV Station
Stevens StreetPRV Station
NIC
HO
L R
D
AR
CH
IBA
LD
RD
OX
FO
RD
ST
JO
HN
ST
ON
RD
BE
RG
ST
RO
M R
D
ST
AY
TE
RD
FIN
LA
Y S
T
High StreetWell #4
Legend
Pa
th: O
:\0
10
0-0
19
9\1
02
-11
9\4
30
-GIS
\MX
D-R
p\1
02
119
_F
igu
re4
-1.m
xd D
ate
Sa
ved
: 11
/6/2
01
3 3
:19
:39
PM
Au
thor:
MR
eve
sz
Copyright Notice: These materials are copyright of Kerr Wood Leidal Associates Ltd. (KWL). EPCOR ispermitted to reproduce the materials for archiving and for distribution to third parties only as required to conductbusiness specifically relating to the 2013 Water System Master Plan Update Project. Any other use of thesematerials without the written permission of KWL is prohibited.
© 2013 Kerr Wood Leidal Associates Ltd.
102-119
City of White RockOfficial Community Plan
DevelopmentPermit Areas
200 2000
(m)
November 2013
Figure 4-1
1:15,000
&hJ
¨
PRV
!. Well
"
e
Reservoir
ÏÎ Pump
Existing Water Mains
Pressure Zone Boundary
Apartment Area
East Side Large Lot Infill Redevelopment Area
Hospital Street
Lower Town Centre
Neighbourhood Commercial
Stayte Road Centre
Town Centre
Waterfront Apartment Area
Waterfront Business Area (East & West Beach)
2013 Water System Master Plan Update
Section 5
Design Criteria
5-1
EPCOR WHITE ROCK WATER INC. 2013 Water System Master Plan Update
Final Report November 2013
102.119-300
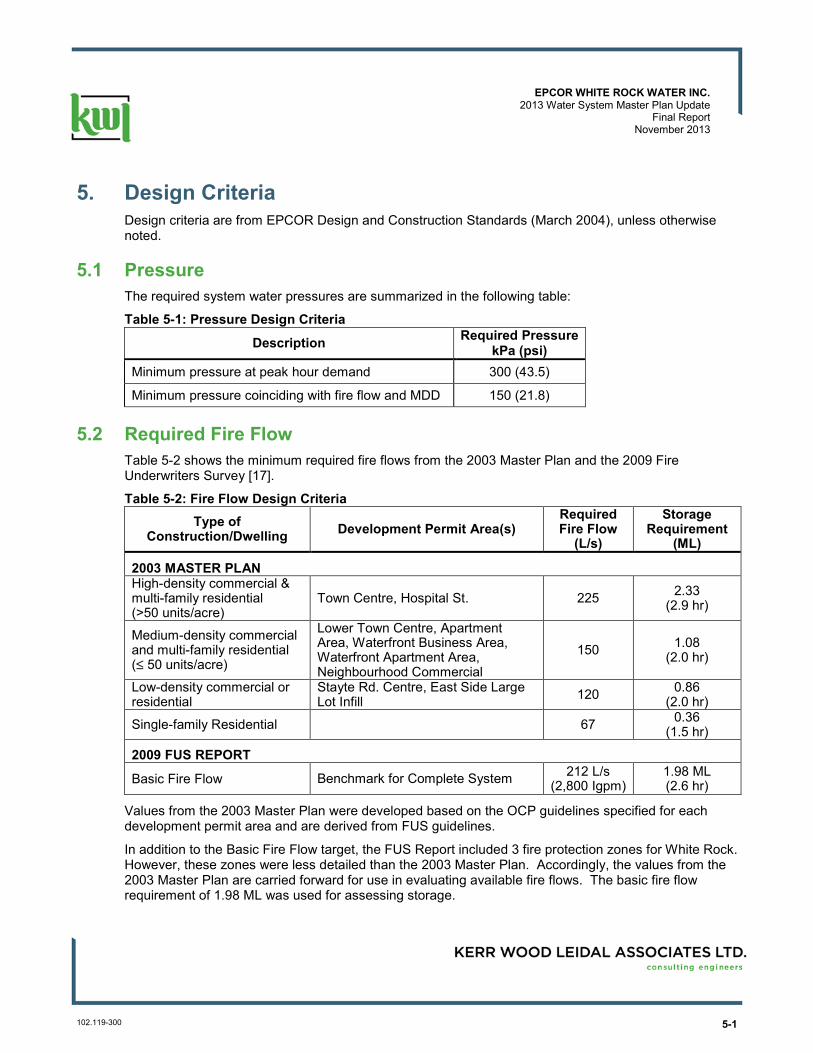
5. Design Criteria Design criteria are from EPCOR Design and Construction Standards (March 2004), unless otherwise noted.
5.1 Pressure The required system water pressures are summarized in the following table:
Table 5-1: Pressure Design Criteria
Description Required Pressure kPa (psi)
Minimum pressure at peak hour demand 300 (43.5)
Minimum pressure coinciding with fire flow and MDD 150 (21.8)
5.2 Required Fire Flow Table 5-2 shows the minimum required fire flows from the 2003 Master Plan and the 2009 Fire Underwriters Survey [17].
Table 5-2: Fire Flow Design Criteria Type of
Construction/Dwelling Development Permit Area(s) Required Fire Flow
(L/s)
Storage Requirement
(ML)
2003 MASTER PLAN High-density commercial & multi-family residential (>50 units/acre)
Town Centre, Hospital St. 225 2.33 (2.9 hr)
Medium-density commercial and multi-family residential (! 50 units/acre)
Lower Town Centre, Apartment Area, Waterfront Business Area, Waterfront Apartment Area, Neighbourhood Commercial
150 1.08 (2.0 hr)
Low-density commercial or residential
Stayte Rd. Centre, East Side Large Lot Infill 120 0.86
(2.0 hr)
Single-family Residential 67 0.36 (1.5 hr)
2009 FUS REPORT
Basic Fire Flow Benchmark for Complete System 212 L/s (2,800 Igpm)
1.98 ML (2.6 hr)
Values from the 2003 Master Plan were developed based on the OCP guidelines specified for each development permit area and are derived from FUS guidelines.
In addition to the Basic Fire Flow target, the FUS Report included 3 fire protection zones for White Rock. However, these zones were less detailed than the 2003 Master Plan. Accordingly, the values from the 2003 Master Plan are carried forward for use in evaluating available fire flows. The basic fire flow requirement of 1.98 ML was used for assessing storage.
5-2 102.119-300
EPCOR WHITE ROCK WATER INC. 2013 Water System Master Plan Update
Final Report November 2013
It is noted that in some situations, higher fire flows may be required for specific buildings (either existing or proposed) where the building’s size or style of construction differs significantly from the normals for that area.
Fire flow requirements are verified with the City of White Rock during the development water servicing review process. The City of White Rock has jurisdiction for identifying required fire protection levels.
5.3 Cost Basis Costs are estimated based on the 2013 construction year. No allowance has been provided in these figures for escalation in subsequent years. The cost opinions in the report are indicative and have been prepared for long-term budgeting purposes only (i.e. 4-year Plan). Unit prices are based on recent costs for similar facilities; however, no detailed quantity take-offs or equipment selection has been completed.
Some costs for capital tasks are based on estimates from previous reports.
Cost opinions for water main construction are Class “C”, based on EWR typical costs, vendor quotes, and typical values for similar projects.
Costs reflect typical scope of work for a distribution main. Water main cost opinions include allowances for:
ͻ Fittings, and isolation valves including thrust restraint; ͻ Reconnection of existing water services; and ͻ Road restoration (one lane of the roadway).
Costs for hydrants, and tie-in (includes flushing and disinfection) are included separately for each task.
Cost opinions for facilities upgrades and studies are Class “D” or provisional estimates, as shown on individual capital project justification sheets. Class “D” estimates are preliminary which, due to little or no site information, indicates the approximate magnitude of cost of the proposed project, based on the EWR broad requirements. These cost opinions may be derived from lump sum or unit costs for a similar project.
The following generic allowance was applied to all water main construction projects:
ͻ 20% engineering; ͻ 10% overhead / administration; and ͻ 20% contingencies.
For all projects besides water main construction projects, allowances were assigned on a project specific basis (i.e. not the same as the above percentages). Some project cost opinions are the result of work by other consultants.
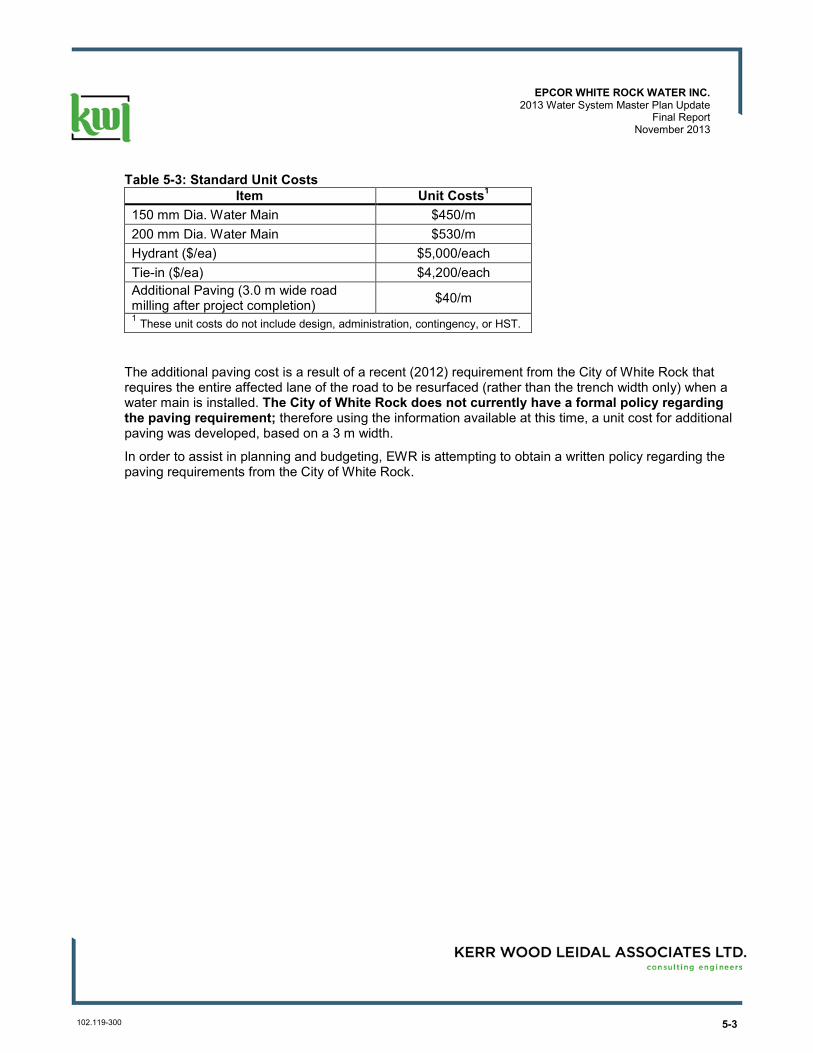
Costs for water main construction tasks were developed using the unit rates given in Table 5-3.
5-3
EPCOR WHITE ROCK WATER INC. 2013 Water System Master Plan Update
Final Report November 2013
102.119-300
Table 5-3: Standard Unit Costs Item Unit Costs1
150 mm Dia. Water Main $450/m 200 mm Dia. Water Main $530/m Hydrant ($/ea) $5,000/each Tie-in ($/ea) $4,200/each Additional Paving (3.0 m wide road milling after project completion) $40/m 1 These unit costs do not include design, administration, contingency, or HST.
The additional paving cost is a result of a recent (2012) requirement from the City of White Rock that requires the entire affected lane of the road to be resurfaced (rather than the trench width only) when a water main is installed. The City of White Rock does not currently have a formal policy regarding the paving requirement; therefore using the information available at this time, a unit cost for additional paving was developed, based on a 3 m width.
In order to assist in planning and budgeting, EWR is attempting to obtain a written policy regarding the paving requirements from the City of White Rock.
Section 6
Evaluation of Existing System
6-1
EPCOR WHITE ROCK WATER INC. 2013 Water System Master Plan Update
Final Report November 2013
102.119-300
6. Evaluation of Existing System
6.1 Supply
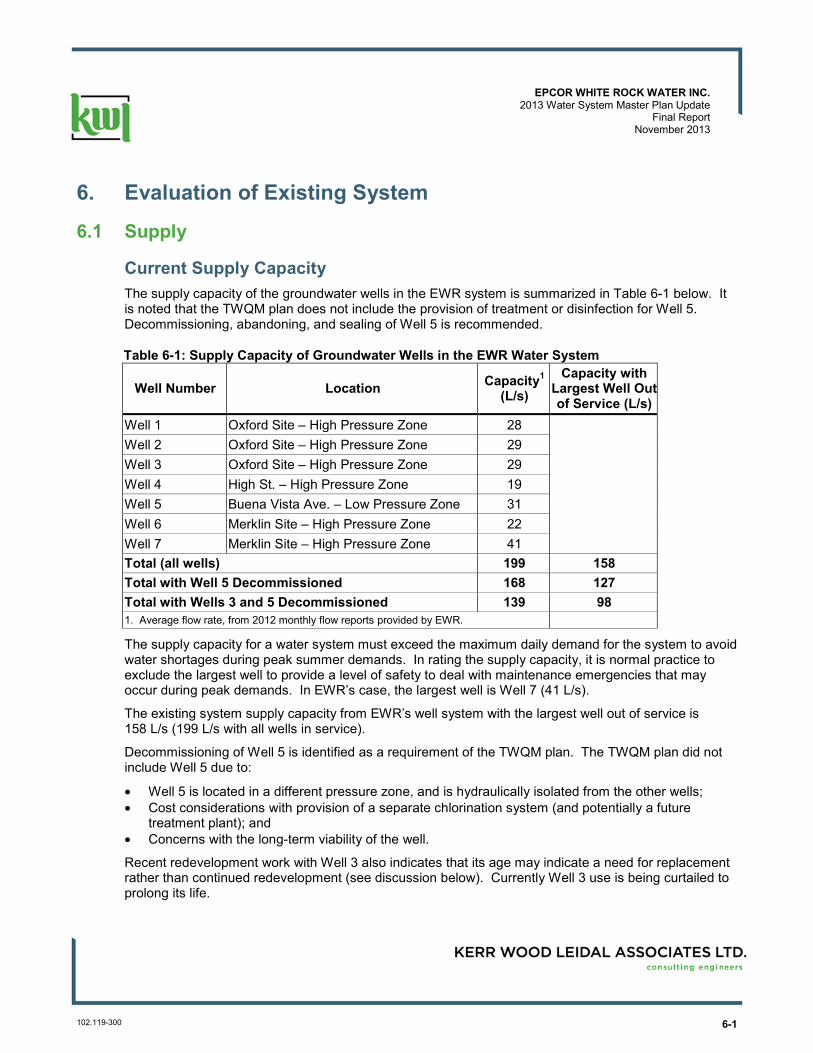
Current Supply Capacity The supply capacity of the groundwater wells in the EWR system is summarized in Table 6-1 below. It is noted that the TWQM plan does not include the provision of treatment or disinfection for Well 5. Decommissioning, abandoning, and sealing of Well 5 is recommended.
Table 6-1: Supply Capacity of Groundwater Wells in the EWR Water System
Well Number Location Capacity1
(L/s) Capacity with
Largest Well Out of Service (L/s)
Well 1 Oxford Site – High Pressure Zone 28 Well 2 Oxford Site – High Pressure Zone 29 Well 3 Oxford Site – High Pressure Zone 29 Well 4 High St. – High Pressure Zone 19 Well 5 Buena Vista Ave. – Low Pressure Zone 31 Well 6 Merklin Site – High Pressure Zone 22 Well 7 Merklin Site – High Pressure Zone 41 Total (all wells) 199 158 Total with Well 5 Decommissioned 168 127 Total with Wells 3 and 5 Decommissioned 139 98 1. Average flow rate, from 2012 monthly flow reports provided by EWR.
The supply capacity for a water system must exceed the maximum daily demand for the system to avoid water shortages during peak summer demands. In rating the supply capacity, it is normal practice to exclude the largest well to provide a level of safety to deal with maintenance emergencies that may occur during peak demands. In EWR’s case, the largest well is Well 7 (41 L/s).
The existing system supply capacity from EWR’s well system with the largest well out of service is 158 L/s (199 L/s with all wells in service).
Decommissioning of Well 5 is identified as a requirement of the TWQM plan. The TWQM plan did not include Well 5 due to:
• Well 5 is located in a different pressure zone, and is hydraulically isolated from the other wells; • Cost considerations with provision of a separate chlorination system (and potentially a future
treatment plant); and • Concerns with the long-term viability of the well.
Recent redevelopment work with Well 3 also indicates that its age may indicate a need for replacement rather than continued redevelopment (see discussion below). Currently Well 3 use is being curtailed to prolong its life.
6-2 102.119-300
EPCOR WHITE ROCK WATER INC. 2013 Water System Master Plan Update
Final Report November 2013
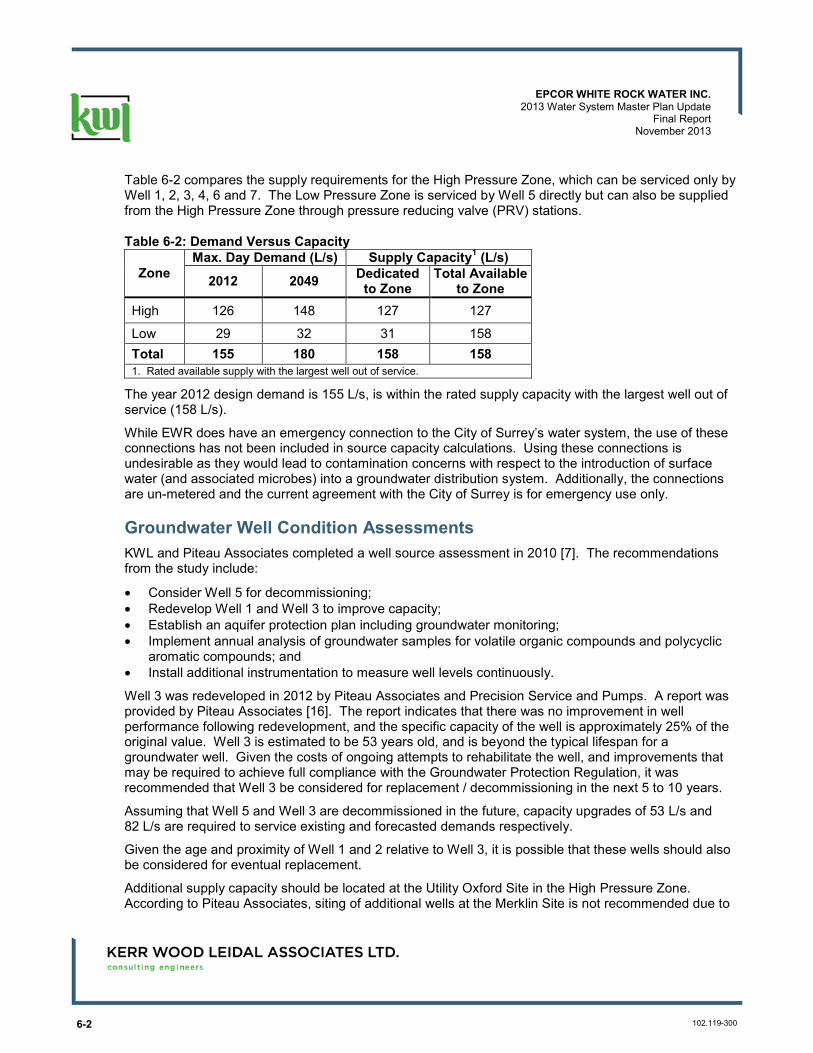
Table 6-2 compares the supply requirements for the High Pressure Zone, which can be serviced only by Well 1, 2, 3, 4, 6 and 7. The Low Pressure Zone is serviced by Well 5 directly but can also be supplied from the High Pressure Zone through pressure reducing valve (PRV) stations.
Table 6-2: Demand Versus Capacity
Zone Max. Day Demand (L/s) Supply Capacity1 (L/s)
2012 2049 Dedicated to Zone
Total Available to Zone
High 126 148 127 127
Low 29 32 31 158 Total 155 180 158 158 1. Rated available supply with the largest well out of service.
The year 2012 design demand is 155 L/s, is within the rated supply capacity with the largest well out of service (158 L/s).
While EWR does have an emergency connection to the City of Surrey’s water system, the use of these connections has not been included in source capacity calculations. Using these connections is undesirable as they would lead to contamination concerns with respect to the introduction of surface water (and associated microbes) into a groundwater distribution system. Additionally, the connections are un-metered and the current agreement with the City of Surrey is for emergency use only.
Groundwater Well Condition Assessments KWL and Piteau Associates completed a well source assessment in 2010 [7]. The recommendations from the study include:
• Consider Well 5 for decommissioning; • Redevelop Well 1 and Well 3 to improve capacity; • Establish an aquifer protection plan including groundwater monitoring; • Implement annual analysis of groundwater samples for volatile organic compounds and polycyclic
aromatic compounds; and • Install additional instrumentation to measure well levels continuously.
Well 3 was redeveloped in 2012 by Piteau Associates and Precision Service and Pumps. A report was provided by Piteau Associates [16]. The report indicates that there was no improvement in well performance following redevelopment, and the specific capacity of the well is approximately 25% of the original value. Well 3 is estimated to be 53 years old, and is beyond the typical lifespan for a groundwater well. Given the costs of ongoing attempts to rehabilitate the well, and improvements that may be required to achieve full compliance with the Groundwater Protection Regulation, it was recommended that Well 3 be considered for replacement / decommissioning in the next 5 to 10 years.
Assuming that Well 5 and Well 3 are decommissioned in the future, capacity upgrades of 53 L/s and 82 L/s are required to service existing and forecasted demands respectively.
Given the age and proximity of Well 1 and 2 relative to Well 3, it is possible that these wells should also be considered for eventual replacement.
Additional supply capacity should be located at the Utility Oxford Site in the High Pressure Zone. According to Piteau Associates, siting of additional wells at the Merklin Site is not recommended due to
6-3
EPCOR WHITE ROCK WATER INC. 2013 Water System Master Plan Update
Final Report November 2013
102.119-300
interference with the current wells (Well 6 and 7) at that site. Installation of the well at other sites is possible but would require additional work to satisfy the disinfection and treatment requirements.
An engineering study is recommended to determine the best strategy for new well development at the Utility Oxford Site to supply the new Oxford Reservoir.
With the addition of a new reservoir at the Utility Oxford Site, the well pumps (Well 1, 2, and 3) will be discharging to a lower HGL. Replacement of the well pumps with pumps suitably sized to the new design condition is recommended. It is expected that this will optimize efficiency and energy consumption. Alternately, wells could be fitted with variable frequency drives, set to reduced operating speeds to meet the lower head required. It is noted that Well 2 already is equipped with a VFD.
Consideration of future treatment requirements for Arsenic and Manganese is considered in the 2012 Stantec report. [20]
Water Conservation Supply requirements are based on current unit usage rates. It is noted that:
ͻ Average per capita consumption is already low (315 L/ca/day average, including NRW and ICI, compared to Metro Vancouver’s usage consumption of 503 L/ca/day); and
ͻ EWR has limited authority to impose water use restrictions3.
Water conservation opportunities may exist, however, no allowance has been made in the capital plan for the implementation of water conservation measures. If a water conservation study identified practical methods for reducing water demands (demand-side management) significantly, it may be possible to postpone supply-side improvement capital tasks accordingly.
6.2 Storage The following storage requirements for forecasted demands are reproduced from the 2010 Water System Master Plan Update [13].
Required Balancing Storage: 15.55 MLD (180 L/s) x 16% = 2.49 ML Required Fire Storage: 212 L/s for 2.6 hours = 1.98 ML Required Emergency Storage: 25% of above storage = 1.12 ML Pump Control: = 0.46 ML Total Required = 6.05 ML Available Storage: Merklin Low Reservoir = 1.63 ML Merklin High Reservoir = 1.73 ML Roper Reservoir (Low Zone) = 1.14 ML Total Available = 4.50 ML Deficiency = 1.55 ML
The storage deficiency is addressed in the TWQM plan as follows:
• The Merklin High Reservoir (1.73 ML) will be decommissioned;
3 Compared with a municipality, which has the power to enact compulsory water conservation measures as bylaws.
6-4 102.119-300
EPCOR WHITE ROCK WATER INC. 2013 Water System Master Plan Update
Final Report November 2013
• A new 1.73 ML reservoir will be constructed on the Oxford site; and • A new 1.55 ML reservoir will be constructed on the Merklin site.
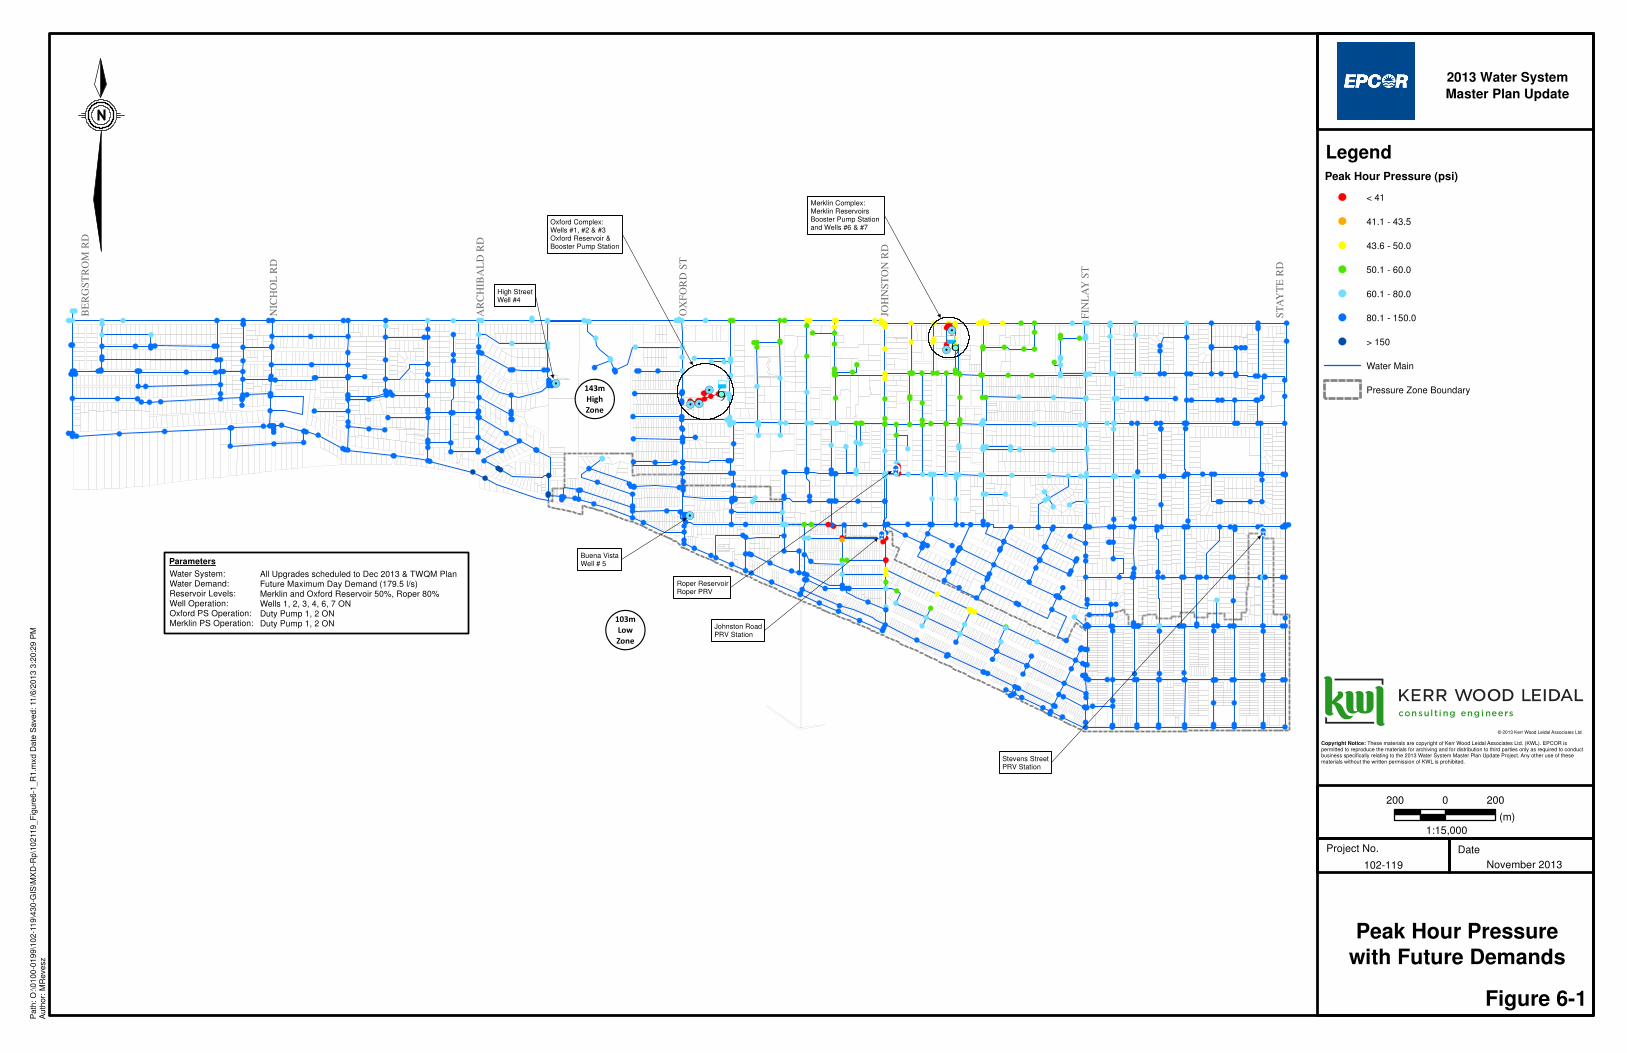
6.3 System Pressure Figure 6-1 shows peak hour pressures with future maximum day demands. Modelling indicates that there are peak hour pressure deficiencies (pressure is less than 43.5 psi) on Beachview Ave., between Foster St. and Johnston Rd.
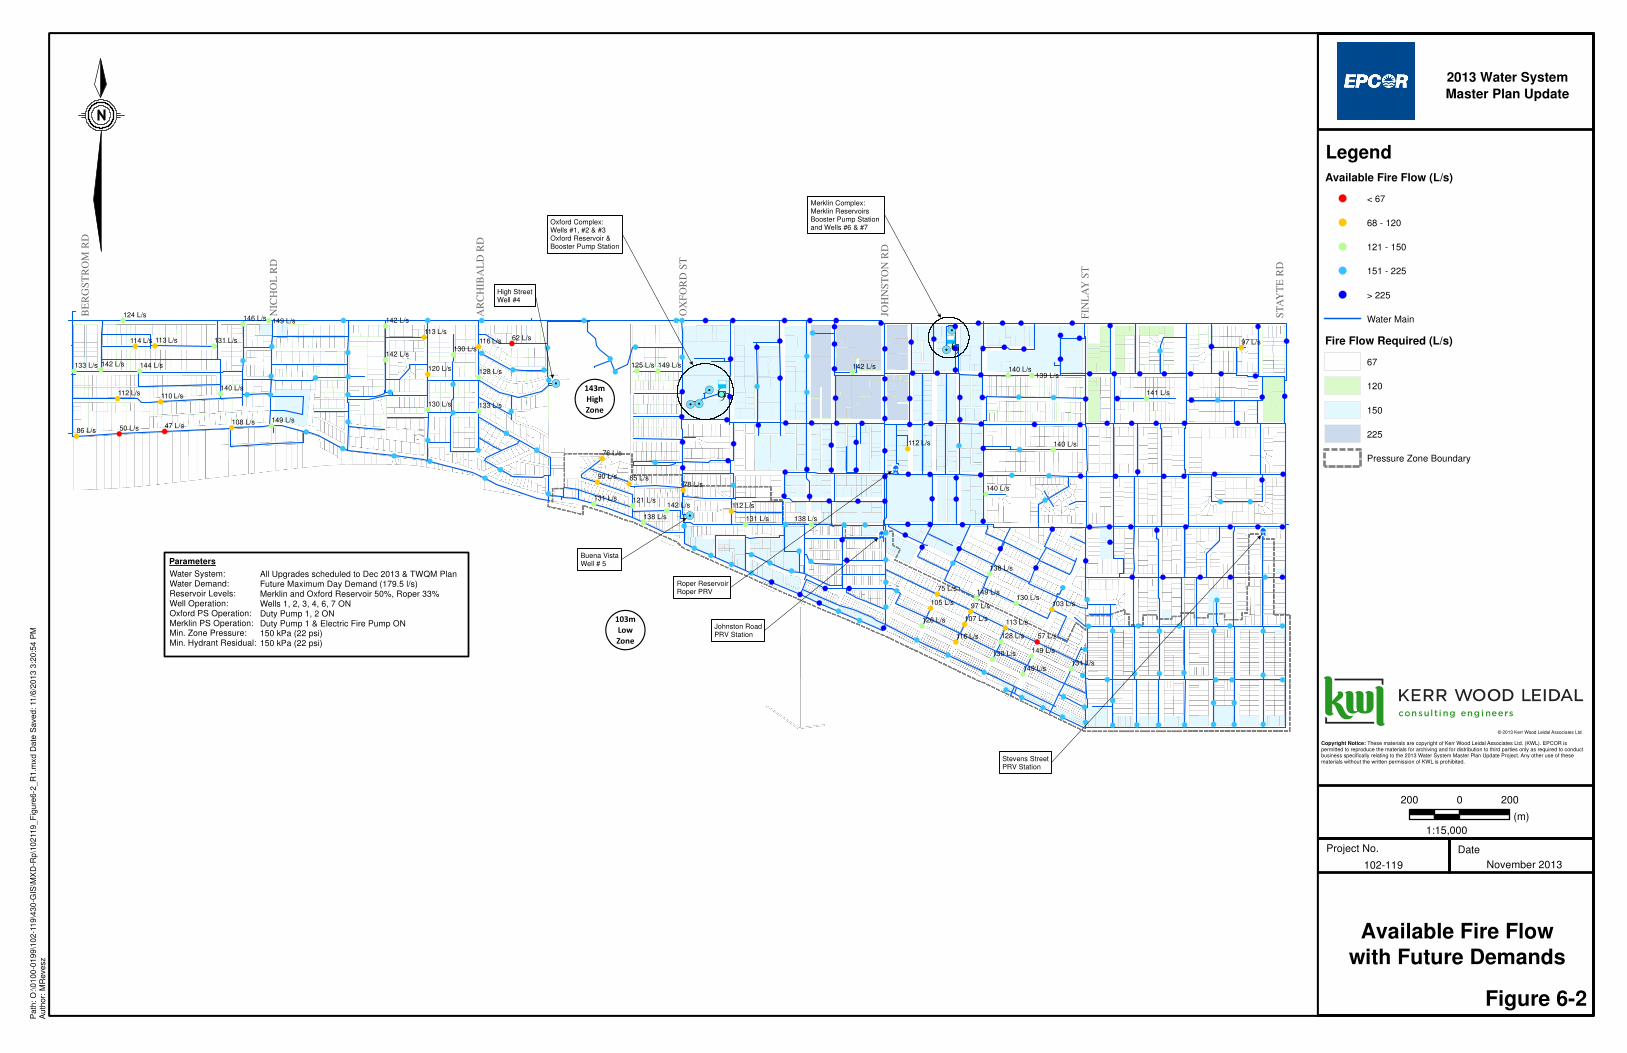
6.4 Available Fire Flow Figure 6-2 shows the available fire flow with future maximum day demands. Modelling indicates that there are fire flow deficiencies at the following locations:
• Marine Dr., between Bergstrom Rd. and Nichol Rd. (50 L/s available, 67 L/s required); • Saturna Dr., between Archibald Rd. and High St. (62 L/s available, 67 L/s required); • Martin St., between North Bluff Rd. and Thrift Ave. (180 L/s available, 225 L/s required); and • Columbia Ln. at Balsam St. (57 L/s available, 67 L/s required).
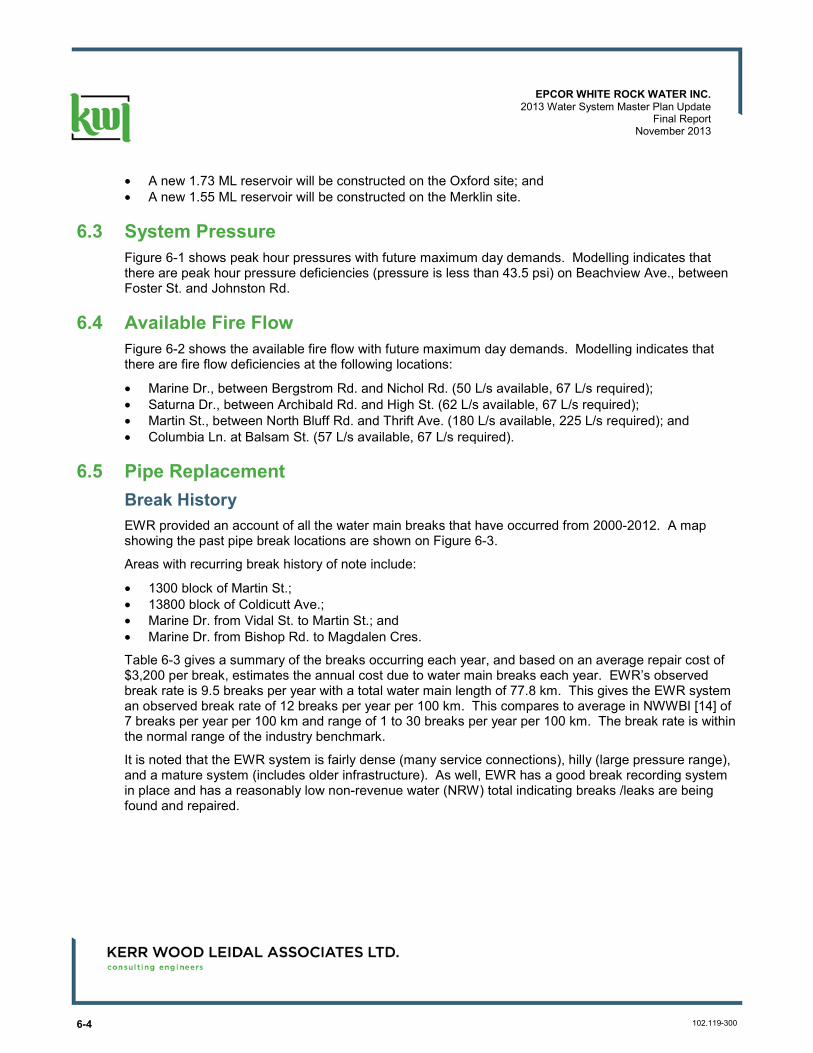
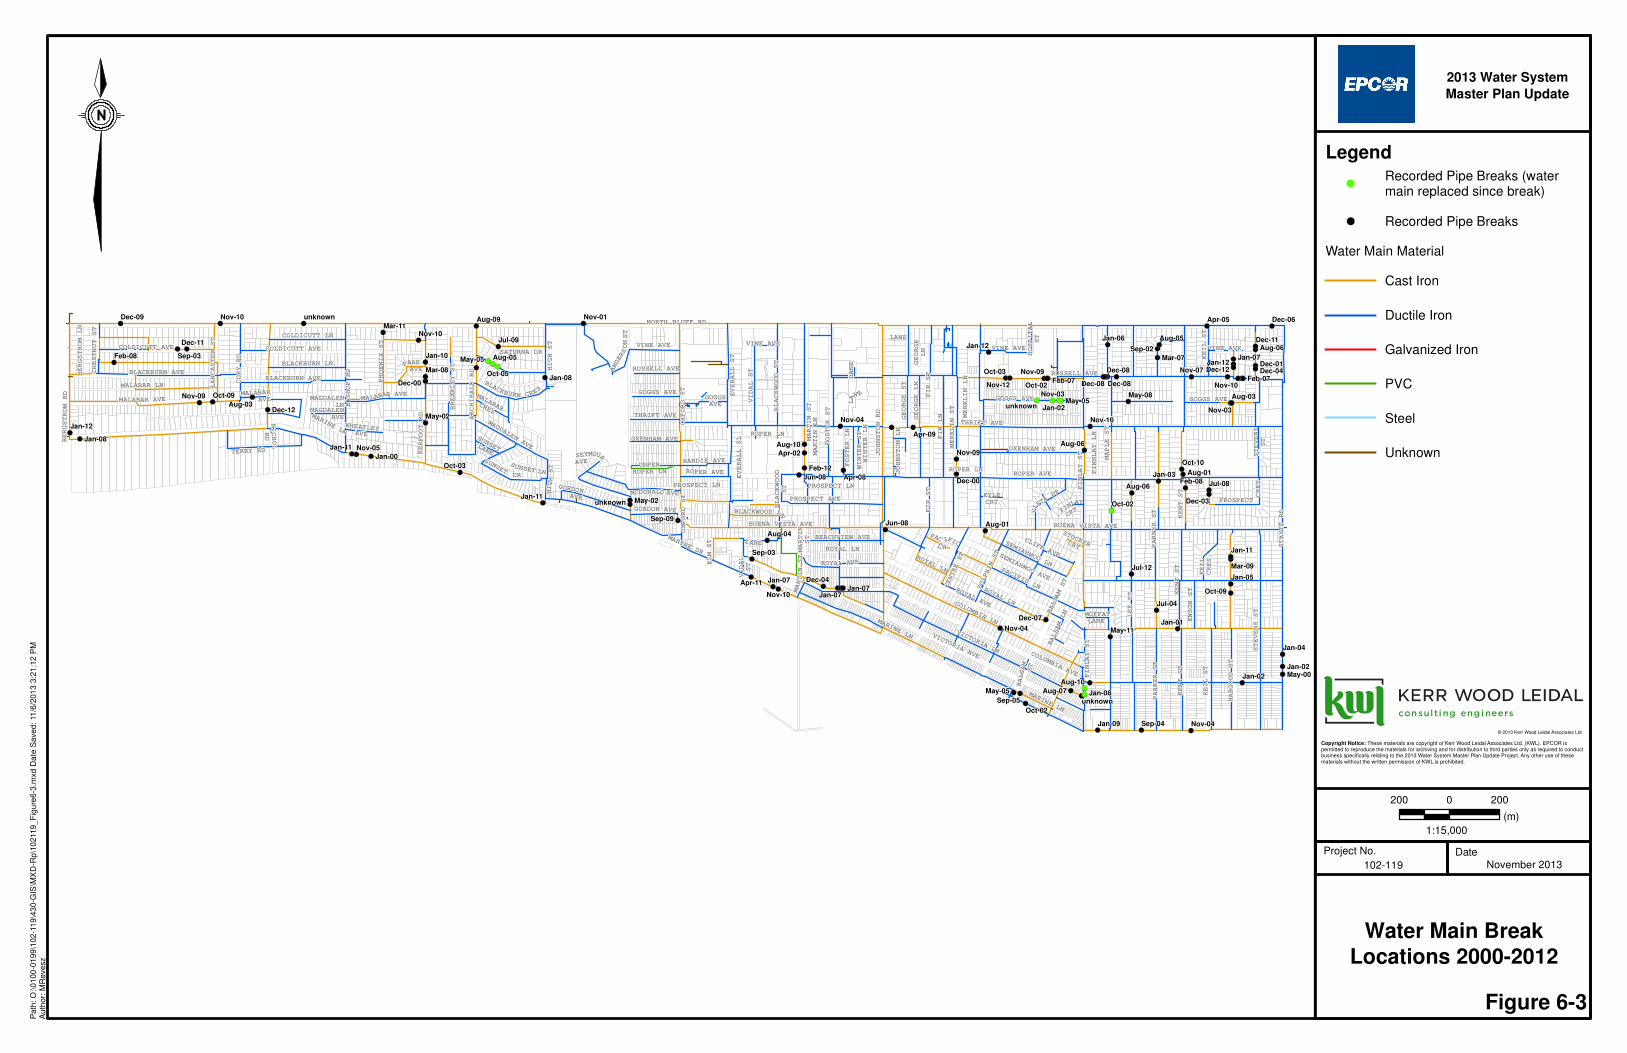
6.5 Pipe Replacement Break History EWR provided an account of all the water main breaks that have occurred from 2000-2012. A map showing the past pipe break locations are shown on Figure 6-3.
Areas with recurring break history of note include:
• 1300 block of Martin St.; • 13800 block of Coldicutt Ave.; • Marine Dr. from Vidal St. to Martin St.; and • Marine Dr. from Bishop Rd. to Magdalen Cres.
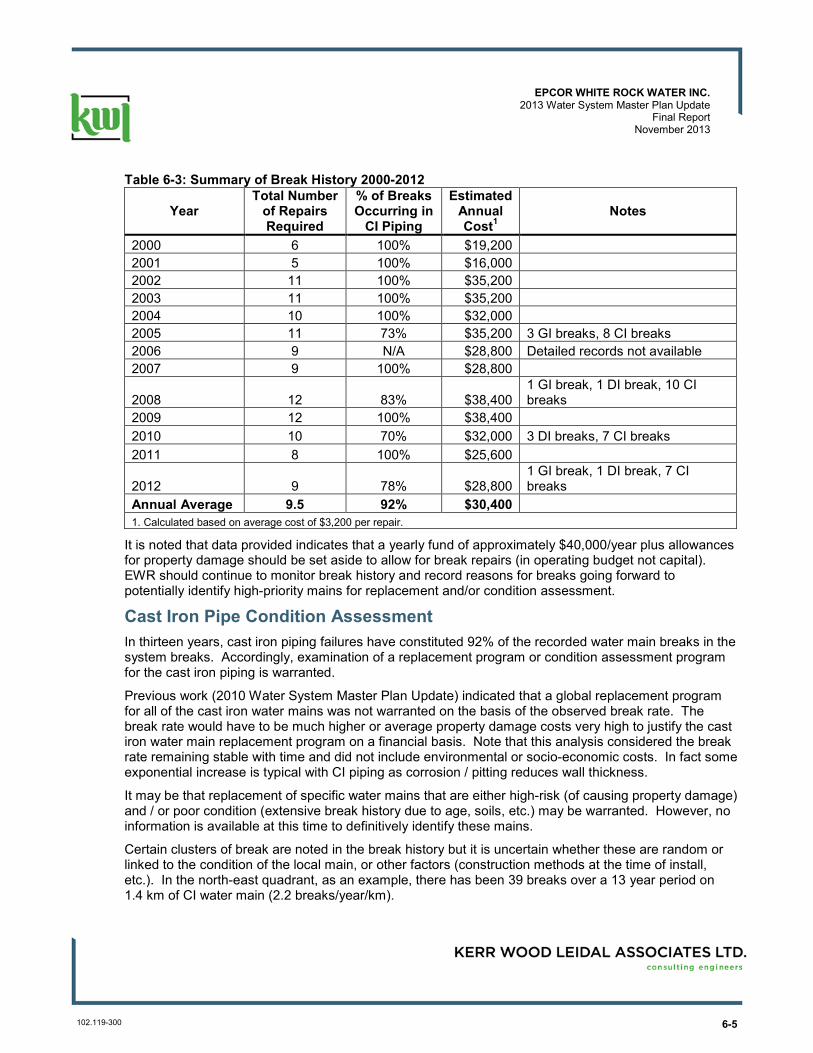
Table 6-3 gives a summary of the breaks occurring each year, and based on an average repair cost of $3,200 per break, estimates the annual cost due to water main breaks each year. EWR’s observed break rate is 9.5 breaks per year with a total water main length of 77.8 km. This gives the EWR system an observed break rate of 12 breaks per year per 100 km. This compares to average in NWWBI [14] of 7 breaks per year per 100 km and range of 1 to 30 breaks per year per 100 km. The break rate is within the normal range of the industry benchmark.
It is noted that the EWR system is fairly dense (many service connections), hilly (large pressure range), and a mature system (includes older infrastructure). As well, EWR has a good break recording system in place and has a reasonably low non-revenue water (NRW) total indicating breaks /leaks are being found and repaired.
6-5
EPCOR WHITE ROCK WATER INC. 2013 Water System Master Plan Update
Final Report November 2013
102.119-300
Table 6-3: Summary of Break History 2000-2012
Year Total Number
of Repairs Required
% of Breaks Occurring in
CI Piping
Estimated Annual Cost1
Notes
2000 6 100% $19,200 2001 5 100% $16,000 2002 11 100% $35,200 2003 11 100% $35,200 2004 10 100% $32,000 2005 11 73% $35,200 3 GI breaks, 8 CI breaks 2006 9 N/A $28,800 Detailed records not available 2007 9 100% $28,800
2008 12 83% $38,400 1 GI break, 1 DI break, 10 CI breaks
2009 12 100% $38,400 2010 10 70% $32,000 3 DI breaks, 7 CI breaks 2011 8 100% $25,600
2012 9 78% $28,800 1 GI break, 1 DI break, 7 CI breaks
Annual Average 9.5 92% $30,400 1. Calculated based on average cost of $3,200 per repair.
It is noted that data provided indicates that a yearly fund of approximately $40,000/year plus allowances for property damage should be set aside to allow for break repairs (in operating budget not capital). EWR should continue to monitor break history and record reasons for breaks going forward to potentially identify high-priority mains for replacement and/or condition assessment.
Cast Iron Pipe Condition Assessment In thirteen years, cast iron piping failures have constituted 92% of the recorded water main breaks in the system breaks. Accordingly, examination of a replacement program or condition assessment program for the cast iron piping is warranted.
Previous work (2010 Water System Master Plan Update) indicated that a global replacement program for all of the cast iron water mains was not warranted on the basis of the observed break rate. The break rate would have to be much higher or average property damage costs very high to justify the cast iron water main replacement program on a financial basis. Note that this analysis considered the break rate remaining stable with time and did not include environmental or socio-economic costs. In fact some exponential increase is typical with CI piping as corrosion / pitting reduces wall thickness.
It may be that replacement of specific water mains that are either high-risk (of causing property damage) and / or poor condition (extensive break history due to age, soils, etc.) may be warranted. However, no information is available at this time to definitively identify these mains.
Certain clusters of break are noted in the break history but it is uncertain whether these are random or linked to the condition of the local main, or other factors (construction methods at the time of install, etc.). In the north-east quadrant, as an example, there has been 39 breaks over a 13 year period on 1.4 km of CI water main (2.2 breaks/year/km).
6-6 102.119-300
EPCOR WHITE ROCK WATER INC. 2013 Water System Master Plan Update
Final Report November 2013
Another potential justification for replacement of specific mains would be adjacent construction by the City of White Rock (which would reduce road reconstruction costs). Typical road reconstruction costs may form 20% of a water main replacement project. With the current break rates and costs, this alone would not be sufficient reason to replace a typical cast iron water main.
To better manage the cast iron water main asset class, a condition assessment program is recommended. A pilot condition assessment program that includes non-destructive inline inspection using a ‘smart pigging’ device such as PICA’s See Snake is recommended.
A condition assessment program would provide the following benefits:
• Identification of current pipe condition;
• Identification of leaks;
• Pre-emptive point repairs at areas identified with extensive localized wall loss;
• Enables informed decisions on pipe rehabilitation vs. continuing with point repairs for pipes inspected;
• Where pipe rehabilitation is indicated, inspection data provides additional information to determine method of rehabilitation, i.e. lining vs. replacement; and
• Enables extrapolation of results to a larger area.
The following program is recommended in the short term (next 3 years):
• 2 km of cast iron pipe inspection; and • Estimated cost: $120,000 (for field inspection and summary report for piping inspected includes
engineering, and EWR internal costs to support program).
Water Main Asset Management Study Following the pilot cast iron condition assessment program, a water main asset management study is recommended. The study would review asset classes, maintenance history (breaks, etc.), and condition information (including pilot program results) to determine a sustainable asset management program for the utilities water mains.
Water Main Replacement Following the condition assessment and asset management programs, it is anticipated that a number of water mains will be recommended for replacement. Based on the previous break history, EWR staff has identified four water mains for potential replacement:
• 1300 Block of Martin St.; • 13800 Block of Coldicutt Ave.; • Marine Dr. from Vidal St. to Martin St.; and • Marine Dr. from Bishop Rd. to Magdalen Cres.
6.6 Meter Replacement There are 4,466 meters in the EWR system according to the 2012 meter records. It is estimated that about 60% of these meters have been replaced since 1994. The remaining 40% are estimated to be between 20 and 50 years old. Older meters may continue to function but wear will cause them to under
6-7
EPCOR WHITE ROCK WATER INC. 2013 Water System Master Plan Update
Final Report November 2013
102.119-300
record resulting in loss of revenue. Industry meter quality assurance programs indicate an optimum age to replace a water meter is 30 years [21].
The existing older meters must be read by physical access to the meter chamber or meter box. The readings are manually recorded and later transcribed into the billing system. Replacement meters have electronic touch read capability. Readings can be taken quickly and can be electronically uploaded into the billing software.
Completion of the current cycle of meter replacement over a 10 year period will require 178 meters per year (1,780 meters total). Allowing for 38 meters per year to be replaced through redevelopment, leaves 140 per year to be replaced by the current program. The historic average cost per meter replacement is $650 per meter (including overhead and labour costs, and allowing for a nominal number of large / expensive meter installs).
Project No. Date
"
e
&hJ
¨
&hJ
¨
&hJ¨
"
e
ÏÎ
ÏÎ
!.!.
!.!.
!.
!.
!.
!(143mHighZone
!(103mLowZone
Oxford Complex:Wells #1, #2 & #3Oxford Reservoir &Booster Pump Station
Buena VistaWell # 5
Roper ReservoirRoper PRV
Johnston RoadPRV Station
Stevens StreetPRV Station
Water System:Water Demand:Reservoir Levels:Well Operation:Oxford PS Operation:Merklin PS Operation:
All Upgrades scheduled to Dec 2013 & TWQM PlanFuture Maximum Day Demand (179.5 l/s)Merklin and Oxford Reservoir 50%, Roper 80%Wells 1, 2, 3, 4, 6, 7 ONDuty Pump 1, 2 ONDuty Pump 1, 2 ON
Parameters
NIC
HO
L R
D
AR
CH
IBA
LD
RD
OX
FO
RD
ST
JO
HN
ST
ON
RD
BE
RG
ST
RO
M R
D
ST
AY
TE
RD
FIN
LA
Y S
T
Merklin Complex:Merklin Reservoirs Booster Pump Station and Wells #6 & #7
High StreetWell #4
Legend
Pa
th: O
:\0
10
0-0
19
9\1
02
-11
9\4
30
-GIS
\MX
D-R
p\1
02
119
_F
igu
re6
-1_R
1.m
xd
Da
te S
ave
d:
11/6
/20
13
3:2
0:2
9 P
MA
uth
or:
MR
eve
sz
Copyright Notice: These materials are copyright of Kerr Wood Leidal Associates Ltd. (KWL). EPCOR ispermitted to reproduce the materials for archiving and for distribution to third parties only as required to conductbusiness specifically relating to the 2013 Water System Master Plan Update Project. Any other use of thesematerials without the written permission of KWL is prohibited.
© 2013 Kerr Wood Leidal Associates Ltd.
102-119
Peak Hour Pressurewith Future Demands
200 2000
(m)
November 2013
Figure 6-1
1:15,000
Peak Hour Pressure (psi)
< 41
41.1 - 43.5
43.6 - 50.0
50.1 - 60.0
60.1 - 80.0
80.1 - 150.0
> 150
Water Main
Pressure Zone Boundary
2013 Water System Master Plan Update
Project No. Date
"
e
&hJ
¨
&hJ
¨
&hJ¨
"
e
ÏÎ
ÏÎ
!.!.
!.!.
!.
!.
!.
!(143mHighZone
!(103mLowZone
Oxford Complex:Wells #1, #2 & #3Oxford Reservoir &Booster Pump Station
Buena VistaWell # 5
Roper ReservoirRoper PRV
Johnston RoadPRV Station
Stevens StreetPRV Station
Water System:Water Demand:Reservoir Levels:Well Operation:Oxford PS Operation:Merklin PS Operation:Min. Zone Pressure:Min. Hydrant Residual:
All Upgrades scheduled to Dec 2013 & TWQM PlanFuture Maximum Day Demand (179.5 l/s)Merklin and Oxford Reservoir 50%, Roper 33%Wells 1, 2, 3, 4, 6, 7 ONDuty Pump 1, 2 ONDuty Pump 1 & Electric Fire Pump ON150 kPa (22 psi)150 kPa (22 psi)
Parameters
NIC
HO
L R
D
AR
CH
IBA
LD
RD
OX
FO
RD
ST
JO
HN
ST
ON
RD
BE
RG
ST
RO
M R
D
ST
AY
TE
RD
FIN
LA
Y S
T
Merklin Complex:Merklin Reservoirs Booster Pump Station and Wells #6 & #7
High StreetWell #4
142 L/s 140 L/s139 L/s
112 L/s 140 L/s
140 L/s
124 L/s142 L/s
62 L/s
149 L/s125 L/s
113 L/s114 L/s 116 L/s
141 L/s
149 L/s
131 L/s130 L/s
113 L/s
144 L/s128 L/s
142 L/s133 L/s
142 L/s
110 L/s
120 L/s
140 L/s112 L/s
138 L/s
146 L/s
133 L/s
47 L/s
97 L/s
108 L/s
149 L/s130 L/s
50 L/s149 L/s
75 L/s
86 L/s
130 L/s
97 L/s
138 L/s
105 L/s 103 L/s
113 L/s107 L/s
57 L/s
126 L/s
128 L/s
76 L/s
116 L/s
149 L/s
78 L/s
112 L/s
131 L/s
130 L/s
131 L/s149 L/s
90 L/s 85 L/s
131 L/s 121 L/s142 L/s
138 L/s
Legend
Pa
th: O
:\0
10
0-0
19
9\1
02
-11
9\4
30
-GIS
\MX
D-R
p\1
02
119
_F
igu
re6
-2_R
1.m
xd
Da
te S
ave
d:
11/6
/20
13
3:2
0:5
4 P
MA
uth
or:
MR
eve
sz
Copyright Notice: These materials are copyright of Kerr Wood Leidal Associates Ltd. (KWL). EPCOR ispermitted to reproduce the materials for archiving and for distribution to third parties only as required to conductbusiness specifically relating to the 2013 Water System Master Plan Update Project. Any other use of thesematerials without the written permission of KWL is prohibited.
© 2013 Kerr Wood Leidal Associates Ltd.
102-119
Available Fire Flowwith Future Demands
200 2000
(m)
November 2013
Figure 6-2
1:15,000
Available Fire Flow (L/s)
< 67
68 - 120
121 - 150
151 - 225
> 225
Water Main
Fire Flow Required (L/s)
67
120
150
225
Pressure Zone Boundary
2013 Water System Master Plan Update
Project No. Date
!(
!(
!(
!( !(!(
!(
!( !(
!(
!(!(
!(
!(
!(!(!(
!(
!(
!(!(
!(
!(
!(
!(
!(
!(
!( !(!(!(
!(
!( !( !(
!(
!(
!(
!(
!(
!( !(!(!(
!(!(!(
!(
!(!(
!(
!(!(!(
!(
!(
!(
!(!(!(!(
!(
!(
!(
!(
!(
!( !(
!(
!(
!(
!(
!(!(
!(
!(!(
!(
!(!(
!( !(
!(!(!(
!(!(
!(
!(
!(
!(!(
!(
!(
!(
!(
!(
!(
!(
!(
!(
!(
!(
!(
!(
!(
!(
!(
!(
!(
!(
!(
!(
!(
!(
!(
!(
!( !(
!(
!(
!(
!(
!(
!(
!(
!(
!(
THRIFT AVE
GEORGE ST
MARINE DR
KERFOOT RD
NORTH BLUFF RD
VICTORIA AVE
ARCHIBALD RD
COLUMBIAAVE
CORY RD
BUENA VISTA AVE
MAGDALEN
LN
CENTRE ST
MARTIN
ST
SUNSETDR
HIGH ST
BISHOP RD
DOLPHIN ST
FINLAY ST
ROYAL AVE
VINE AVE
MARTIN
ST CLIFF
AVE
BUENA VISTA AVE
RUSSELL AVE
MERKLIN ST
HIGH
ST
FINLAY ST
ROPER AVE
LANCASTER ST
BALSAM ST
ROPER LN
BALSAM
ST
BLACKWOOD LN
CHESTNUT ST
STAYTE RD
STEVENS ST
FOSTER ST
MARTIN ST
VIDAL ST
BLACKWOOD
ST
COLUMBIA LN
MAGDALEN AVE
LANE
BLACKBURN AVE
GORDONAVE
LANE
PHOENIX ST
VIDAL
ST
FINLAY
CRT
STOCKERCRT
TERRY RD
KYLE
CRT
NICHOL
RD
ELM ST
SEMIAHMOOAVE
GEORGE
LN
SEYMOUR
AVE
VINE AVE
BALSAM LN
MAPLE ST
KEIL
CRES
PROSPECT LN
PROSPECT AVE
HOSPITAL
ST
VICTORIA LN
KEIL ST
VINE AVE
MARINE LN
MALABAR AVE
ROPER LN
PARK
AVE
GOGGS
AVE
MARTIN LN
MALABAR
AVE
SUNSETLANE
BLACKBURN AVE
COLDICUTT AVE
STEVENS
ST
BREARLEY ST
VI
STADR
MARINE LN
MALABARCRESMAGDALEN
AVE MERKLIN LN
PROSPECT LN
SUNSET LN
WHEATLEYAVE
WINTER LN
ROYAL LN
BEACHVIEW AVE
ROYAL LN
ROYAL LN
RUSSELL AVE
PAC IFICL N
MALABAR AVE
ROYAL AVE
GOGGS AVE
L ANE
MCDONALD AVE
THRIFT AVE
UPPER
ROPER LN
OXENHAM AVE
GEORGE LN
MARINE LN
FIR LN
PARKER ST
KEIL ST
KENT ST
HABGOOD ST
KENT ST
LEE ST
HARDIE AVE
VINE AVE
FINNLAY LN
PARKER ST
BERGSTROM LN
EWSON ST
KENT ST
ROPER AVE
FOSTER LN
WINTER ST
JOHNSTON LN
GORDON AVE
LA
N EGOGGS AVE
COLDICUTT LN
BLACKBURN LN
SATURNA DR
BLACKBURN CRES
GOGGS AVE
OXENHAM AVE
COLDICUTT AVE
MALABAR LN
OXFORD ST
BERGSTROM RD
OXFORD ST
JOHNSTON RD
FIR ST
FIR ST
EVERALL ST
BLACKWOOD ST
MOFFAT
LANE
ANDERSONST
PROSPECT
CRES
SEMIAHMOO LN
PACIFIC LN
EVERALL SLJan-08
Feb-08 Sep-03
Nov-09 Oct-09Aug-03
unknown
Nov-05Jan-00
May-02
Dec-00
Mar-08
Oct-03
Aug-09
May-05 Aug-05
Oct-05
Jul-09
Jan-08
May-02unknown
Sep-09
Sep-03
Jan-07
Aug-04
Jun-08
Apr-02
Dec-04
Jan-07Jan-07
Apr-08
Nov-04
Apr-09
Dec-00
Nov-09
Aug-01
Nov-04
Oct-03
unknown
Nov-03
Jan-02May-05
Nov-09Feb-07
Oct-02
Dec-07
May-05
Sep-05
Oct-02
Aug-07
unknownJan-08
Jan-09
Aug-06
Dec-08
Dec-08
Dec-08
Jan-06
May-08
Aug-06
Oct-02
Sep-04 Nov-04
Jul-04
Oct-09
Jan-05
Mar-09
Jan-03Feb-08
Aug-01
Jul-08
Dec-03
Mar-07
Aug-05
Sep-02
Nov-07
Aug-03
Nov-03
Feb-07
Jan-07
Apr-05
Aug-06
Dec-01Dec-04
Dec-06
May-00
Jan-01
Nov-01
Jan-02
Jan-02
Jan-04
Jun-08
Dec-09
Jan-10
Aug-10
Aug-10
Oct-10
Nov-10
Nov-10
Nov-10
Nov-10
Nov-10
Jan-11
Jan-11
Jan-11
Mar-11
Apr-11
May-11
Dec-11 Dec-11
Jan-12
Jan-12
Jan-12
Feb-12
Jul-12
Nov-12
Dec-12
Dec-12
Legend
Pa
th: O
:\0
10
0-0
19
9\1
02
-11
9\4
30
-GIS
\MX
D-R
p\1
02
119
_F
igu
re6
-3.m
xd D
ate
Sa
ved
: 11
/6/2
01
3 3
:21
:12
PM
Au
thor:
MR
eve
sz
Copyright Notice: These materials are copyright of Kerr Wood Leidal Associates Ltd. (KWL). EPCOR ispermitted to reproduce the materials for archiving and for distribution to third parties only as required to conductbusiness specifically relating to the 2013 Water System Master Plan Update Project. Any other use of thesematerials without the written permission of KWL is prohibited.
© 2013 Kerr Wood Leidal Associates Ltd.
102-119
Water Main BreakLocations 2000-2012
200 2000
(m)
November 2013
Figure 6-3
1:15,000
Recorded Pipe Breaks (watermain replaced since break)
!( Recorded Pipe Breaks
Water Main Material
Cast Iron
Ductile Iron
Galvanized Iron
PVC
Steel
Unknown
2013 Water System Master Plan Update
Section 7
Recommended Capital Tasks
7-1
EPCOR WHITE ROCK WATER INC. 2013 Water System Master Plan Update
Final Report November 2013
102.119-300
7. Recommended Capital Tasks
7.1 Task Labeling Capital tasks have been labelled using a three part identifier (ex. E-Hi-1). The first part of the identifier identifies the nature of the primary justification for the task. Justification abbreviations are as follows:
E – Existing fire flow and/or pressure deficiency;
F – Future fire flow and/or pressure deficiency;
O – Operational/reliability concern;
P – System planning/monitoring;
Q – Water quality program; and
S – Supply or storage deficiency (to meet future demands).
The second part of the identifier identifies the zone that the improvement primarily applies to. Zone abbreviations are as follows:
C – Comprehensive program;
Hi – High Pressure Zone; and
Lo – Low Pressure Zone.
The third part of the identifier is a unique label for that task.
7.2 Capital Plan Tasks Justification sheets have been created for each of the projects. Projects have been prioritized as follows:
• Recommended Capital Projects (2014 – 2017): These projects are recommended to be included in the 2014 to 2017 Capital Plan.
• Annual Programs: Programs that will be carried out on an annual basis.
• Capital Projects Deferred (Beyond 2017): These capital projects are recommended to address system deficiencies. However they are lower priority and are recommended to be deferred beyond 2017.
Work that is part of the Total Water Quality Management plan is not included. Similarly, work scheduled for 2013 completion is not included.
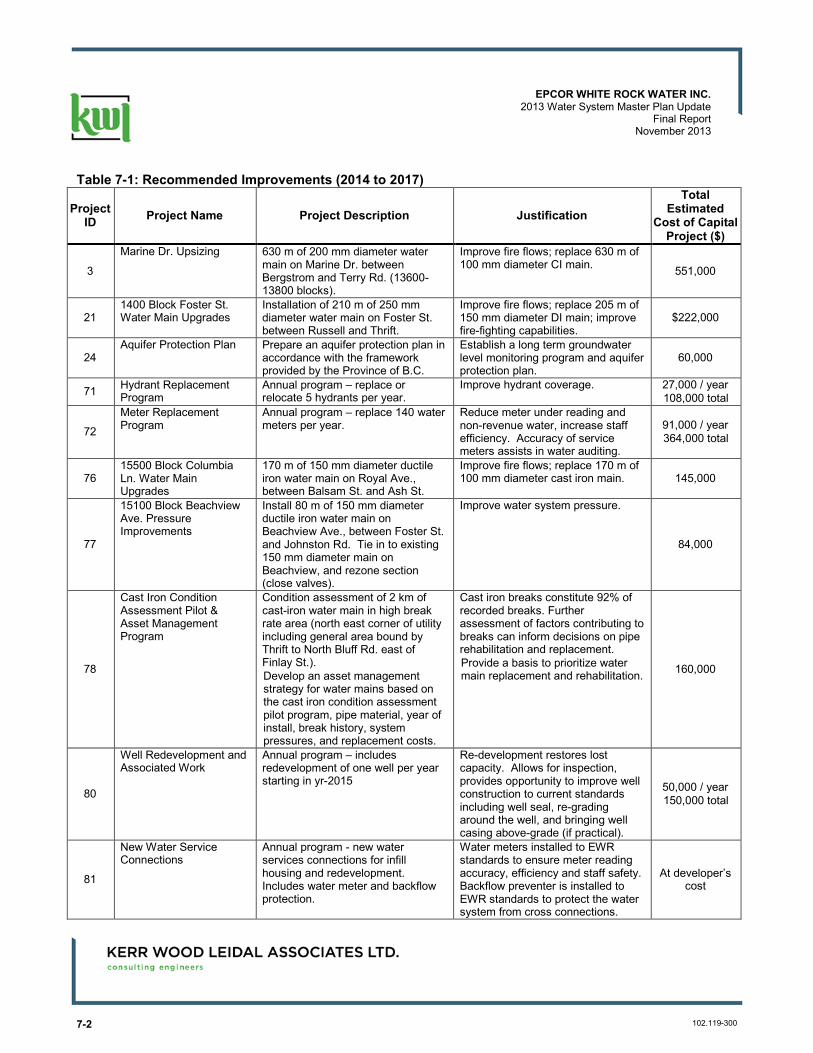
All recommended improvements to be included in Master Plan are presented on Figure 7-1. Capital projects recommended to be included in the 2014 to 2017 rate filing period are summarized in Table 7-1.
The capital plan does not include ongoing operations and maintenance programs such as:
• Reservoir cleaning and routine maintenance; • Water main repairs required due to leaks/emergencies; and • Leak detection program(s).
7-2 102.119-300
EPCOR WHITE ROCK WATER INC. 2013 Water System Master Plan Update
Final Report November 2013
Table 7-1: Recommended Improvements (2014 to 2017)
Project ID Project Name Project Description Justification
Total Estimated
Cost of Capital Project ($)
3
Marine Dr. Upsizing 630 m of 200 mm diameter water main on Marine Dr. between Bergstrom and Terry Rd. (13600-13800 blocks).
Improve fire flows; replace 630 m of 100 mm diameter CI main. 551,000
21 1400 Block Foster St. Water Main Upgrades
Installation of 210 m of 250 mm diameter water main on Foster St. between Russell and Thrift.
Improve fire flows; replace 205 m of 150 mm diameter DI main; improve fire-fighting capabilities.
$222,000
24 Aquifer Protection Plan Prepare an aquifer protection plan in
accordance with the framework provided by the Province of B.C.
Establish a long term groundwater level monitoring program and aquifer protection plan.
60,000
71 Hydrant Replacement Program
Annual program – replace or relocate 5 hydrants per year.
Improve hydrant coverage. 27,000 / year 108,000 total
72
Meter Replacement Program
Annual program – replace 140 water meters per year.
Reduce meter under reading and non-revenue water, increase staff efficiency. Accuracy of service meters assists in water auditing.
91,000 / year 364,000 total
76 15500 Block Columbia Ln. Water Main Upgrades
170 m of 150 mm diameter ductile iron water main on Royal Ave., between Balsam St. and Ash St.
Improve fire flows; replace 170 m of 100 mm diameter cast iron main. 145,000
77
15100 Block Beachview Ave. Pressure Improvements
Install 80 m of 150 mm diameter ductile iron water main on Beachview Ave., between Foster St. and Johnston Rd. Tie in to existing 150 mm diameter main on Beachview, and rezone section (close valves).
Improve water system pressure.
84,000
78
Cast Iron Condition Assessment Pilot & Asset Management Program
Condition assessment of 2 km of cast-iron water main in high break rate area (north east corner of utility including general area bound by Thrift to North Bluff Rd. east of Finlay St.). Develop an asset management strategy for water mains based on the cast iron condition assessment pilot program, pipe material, year of install, break history, system pressures, and replacement costs.
Cast iron breaks constitute 92% of recorded breaks. Further assessment of factors contributing to breaks can inform decisions on pipe rehabilitation and replacement. Provide a basis to prioritize water main replacement and rehabilitation. 160,000
80
Well Redevelopment and Associated Work
Annual program – includes redevelopment of one well per year starting in yr-2015
Re-development restores lost capacity. Allows for inspection, provides opportunity to improve well construction to current standards including well seal, re-grading around the well, and bringing well casing above-grade (if practical).
50,000 / year 150,000 total
81
New Water Service Connections
Annual program - new water services connections for infill housing and redevelopment. Includes water meter and backflow protection.
Water meters installed to EWR standards to ensure meter reading accuracy, efficiency and staff safety. Backflow preventer is installed to EWR standards to protect the water system from cross connections.
At developer’s cost
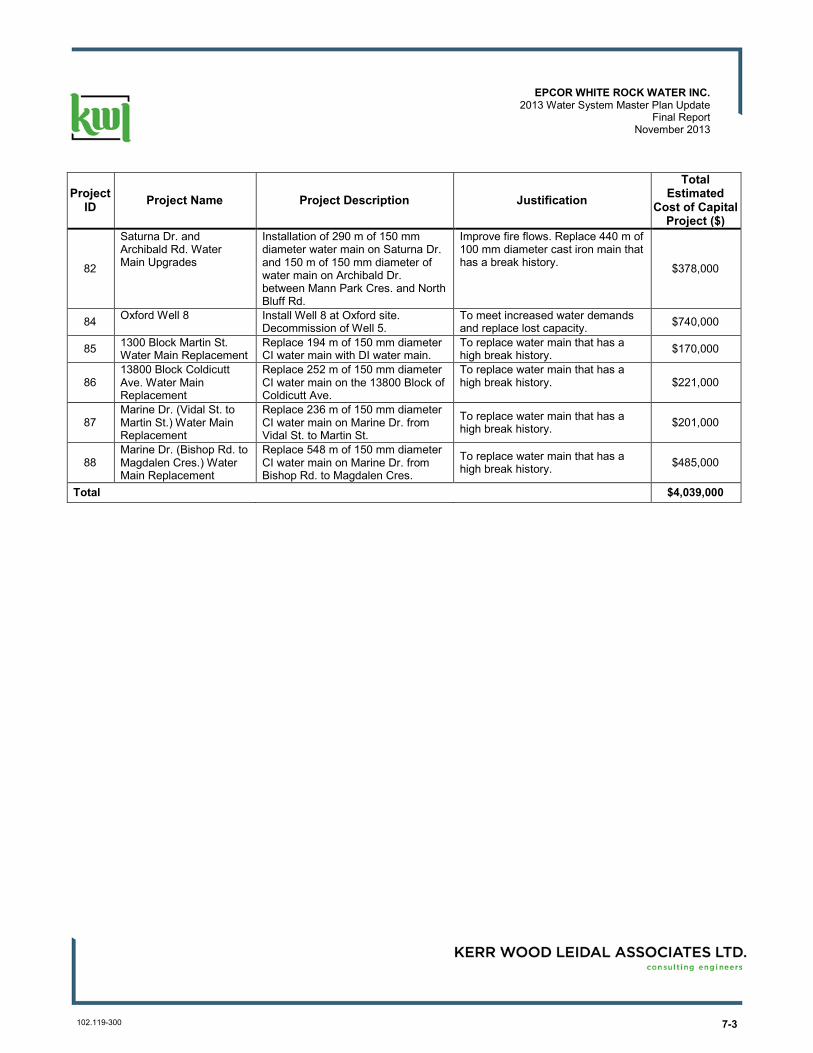
7-3
EPCOR WHITE ROCK WATER INC. 2013 Water System Master Plan Update
Final Report November 2013
102.119-300
Project ID Project Name Project Description Justification
Total Estimated
Cost of Capital Project ($)
82
Saturna Dr. and Archibald Rd. Water Main Upgrades
Installation of 290 m of 150 mm diameter water main on Saturna Dr. and 150 m of 150 mm diameter of water main on Archibald Dr. between Mann Park Cres. and North Bluff Rd.
Improve fire flows. Replace 440 m of 100 mm diameter cast iron main that has a break history. $378,000
84 Oxford Well 8 Install Well 8 at Oxford site. Decommission of Well 5.
To meet increased water demands and replace lost capacity. $740,000
85 1300 Block Martin St. Water Main Replacement
Replace 194 m of 150 mm diameter CI water main with DI water main.
To replace water main that has a high break history. $170,000
86 13800 Block Coldicutt Ave. Water Main Replacement
Replace 252 m of 150 mm diameter CI water main on the 13800 Block of Coldicutt Ave.
To replace water main that has a high break history. $221,000
87 Marine Dr. (Vidal St. to Martin St.) Water Main Replacement
Replace 236 m of 150 mm diameter CI water main on Marine Dr. from Vidal St. to Martin St.
To replace water main that has a high break history. $201,000
88 Marine Dr. (Bishop Rd. to Magdalen Cres.) Water Main Replacement
Replace 548 m of 150 mm diameter CI water main on Marine Dr. from Bishop Rd. to Magdalen Cres.
To replace water main that has a high break history. $485,000
Total $4,039,000
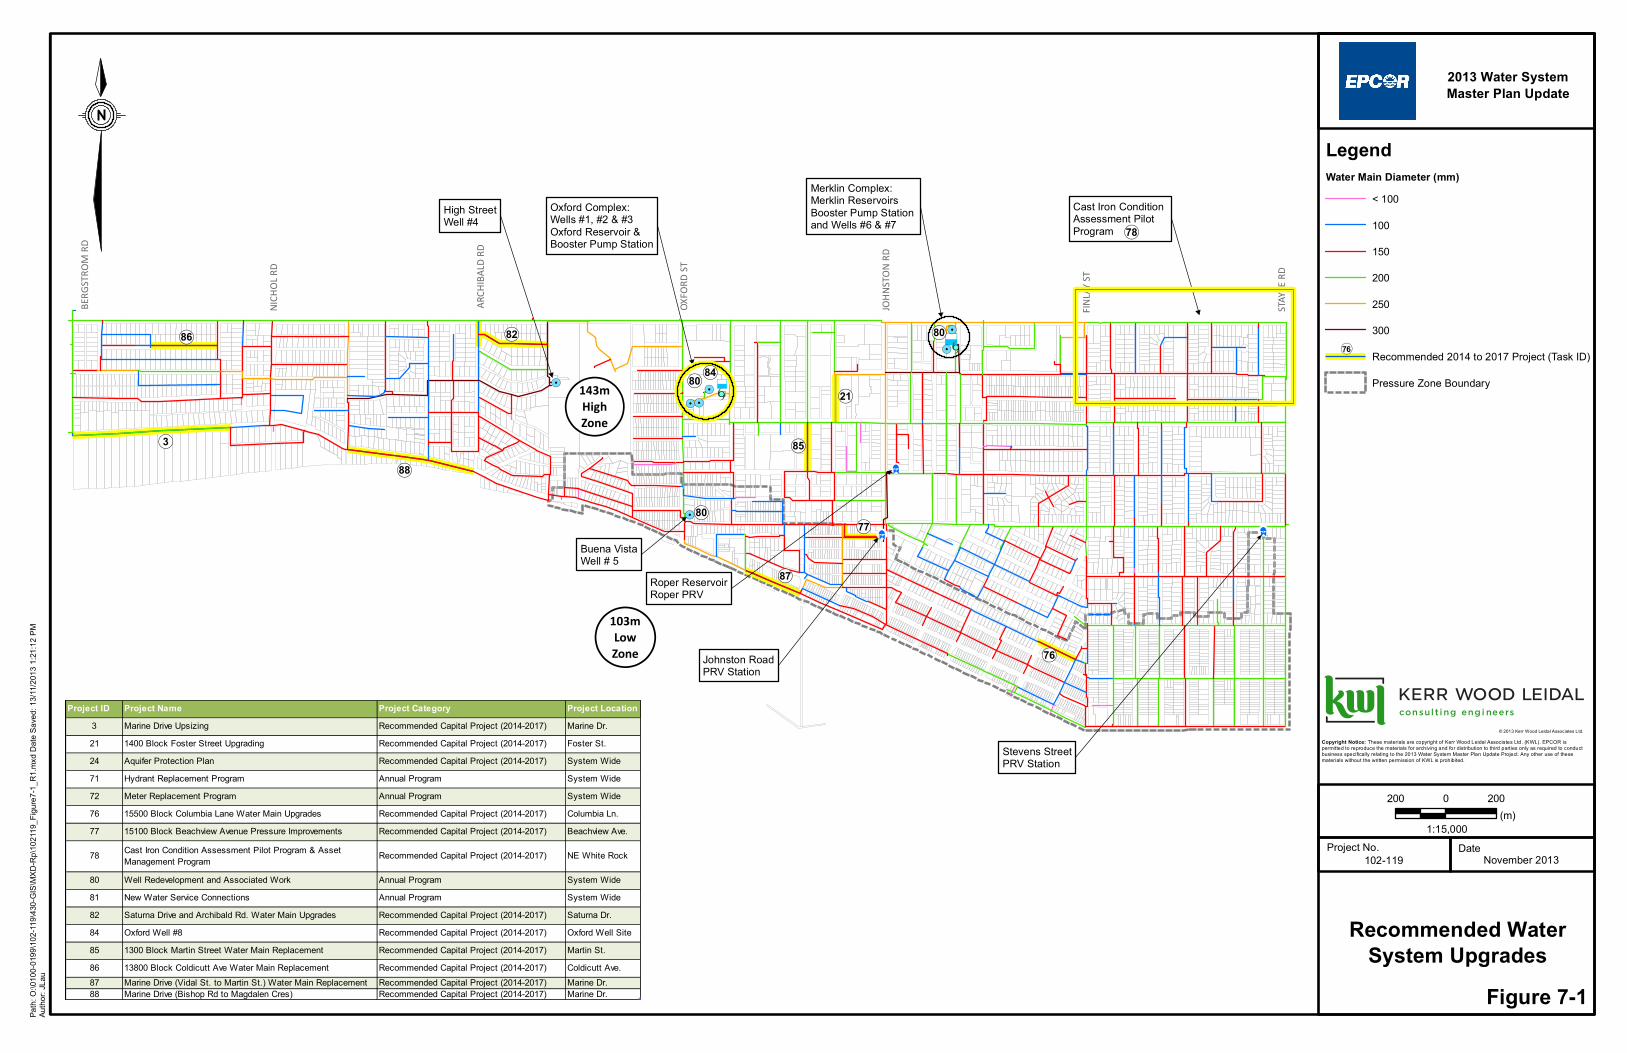
LegendWater Main Diameter (mm)
< 100
100
150
200
250
300
Recommended 2014 to 2017 Project (Task ID)
Pressure Zone Boundary
Project No. Date
"
e
&hJ¨
&hJ
¨
&hJ¨
"
e
ÏÎ
ÏÎ
!.!.
!.!.
!.
!.
!.
!(143mHighZone
!(103mLowZone
Oxford Complex:Wells #1, #2 & #3Oxford Reservoir &Booster Pump Station
Merklin Complex:Merklin Reservoirs Booster Pump Station and Wells #6 & #7
Buena VistaWell # 5
Roper ReservoirRoper PRV
Johnston RoadPRV Station
Stevens StreetPRV Station
!(3
!(80
!(80
!(80
!(76
!(77
NIC
HO
L RD
ARCH
IBAL
D R
D
OXFO
RD S
T
JOH
NST
ON
RD
BERG
STRO
M R
D
STAY
TE R
D
FIN
LAY
ST
High StreetWell #4
Cast Iron Condition Assessment Pilot Program !(78
!(84
!(86
!(85
!(87
!(21
!(88
!(82
Path
: O:\0
100-
0199
\102
-119
\430
-GIS
\MX
D-R
p\10
2119
_Fig
ure7
-1_R
1.m
xd D
ate
Sav
ed: 1
3/11
/201
3 1:
21:1
2 P
MAu
thor
: JLa
u
Copyright Notice: These materials are copyright of Kerr Wood Leidal Associates Ltd. (KWL). EPCOR ispermitted to reproduce the materials for archiving and for distribution to third parties only as required to conductbusiness specifically relating to the 2013 Water System Master Plan Update Project. Any other use of thesematerials without the written permission of KWL is prohibited.
© 2013 Kerr Wood Leidal Associates Ltd.
102-119
Recommended WaterSystem Upgrades
200 2000(m)
November 2013
Figure 7-1
1:15,000
2013 Water System Master Plan Update
¬«76
Project ID Project Name Project Category Project Location
3 Marine Drive Upsizing Recommended Capital Project (2014-2017) Marine Dr.
21 1400 Block Foster Street Upgrading Recommended Capital Project (2014-2017) Foster St.
24 Aquifer Protection Plan Recommended Capital Project (2014-2017) System Wide
71 Hydrant Replacement Program Annual Program System Wide
72 Meter Replacement Program Annual Program System Wide
76 15500 Block Columbia Lane Water Main Upgrades Recommended Capital Project (2014-2017) Columbia Ln.
77 15100 Block Beachview Avenue Pressure Improvements Recommended Capital Project (2014-2017) Beachview Ave.
78 Cast Iron Condition Assessment Pilot Program & Asset Management Program
Recommended Capital Project (2014-2017) NE White Rock
80 Well Redevelopment and Associated Work Annual Program System Wide
81 New Water Service Connections Annual Program System Wide
82 Saturna Drive and Archibald Rd. Water Main Upgrades Recommended Capital Project (2014-2017) Saturna Dr.
84 Oxford Well #8 Recommended Capital Project (2014-2017) Oxford Well Site
85 1300 Block Martin Street Water Main Replacement Recommended Capital Project (2014-2017) Martin St.
86 13800 Block Coldicutt Ave Water Main Replacement Recommended Capital Project (2014-2017) Coldicutt Ave.
87 Marine Drive (Vidal St. to Martin St.) Water Main Replacement Recommended Capital Project (2014-2017) Marine Dr.88 Marine Drive (Bishop Rd to Magdalen Cres) Recommended Capital Project (2014-2017) Marine Dr.
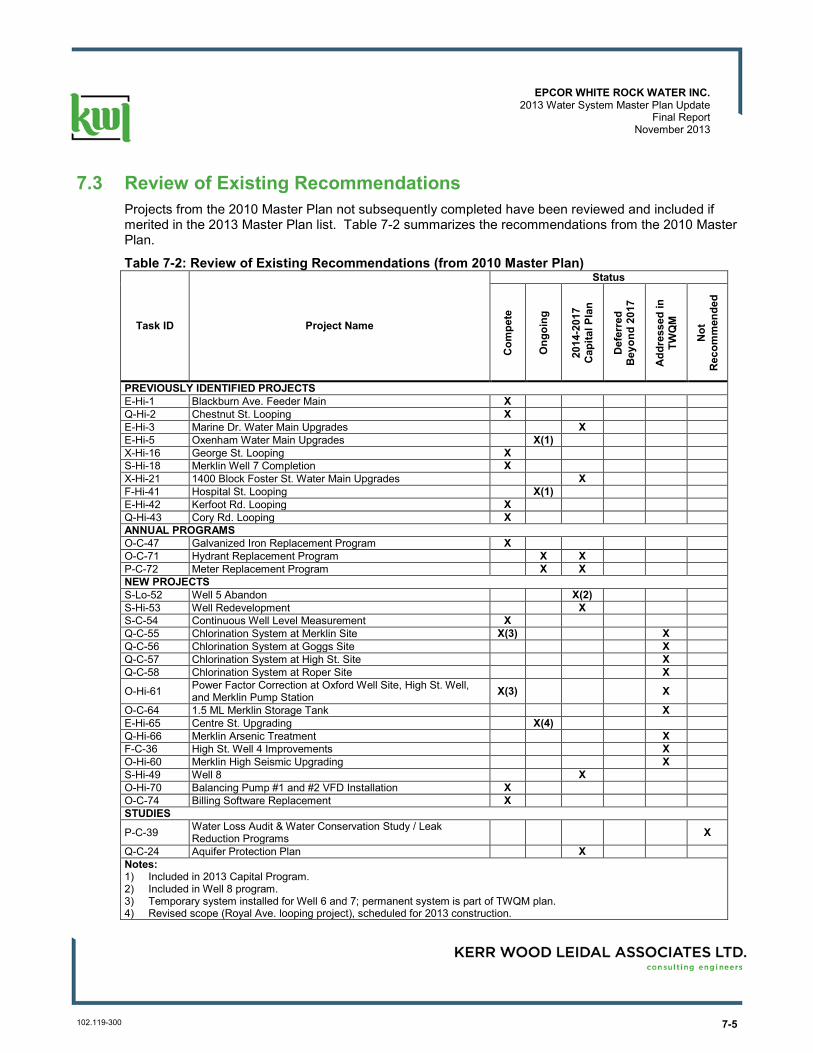
7-5
EPCOR WHITE ROCK WATER INC. 2013 Water System Master Plan Update
Final Report November 2013
102.119-300
7.3 Review of Existing Recommendations Projects from the 2010 Master Plan not subsequently completed have been reviewed and included if merited in the 2013 Master Plan list. Table 7-2 summarizes the recommendations from the 2010 Master Plan.
Table 7-2: Review of Existing Recommendations (from 2010 Master Plan)
Task ID Project Name
Status
Com
pete
Ong
oing
2014
-201
7 C
apita
l Pla
n
Def
erre
d B
eyon
d 20
17
Add
ress
ed in
TW
QM
Not
R
ecom
men
ded
PREVIOUSLY IDENTIFIED PROJECTS E-Hi-1 Blackburn Ave. Feeder Main X Q-Hi-2 Chestnut St. Looping X E-Hi-3 Marine Dr. Water Main Upgrades X E-Hi-5 Oxenham Water Main Upgrades X(1) X-Hi-16 George St. Looping X S-Hi-18 Merklin Well 7 Completion X X-Hi-21 1400 Block Foster St. Water Main Upgrades X F-Hi-41 Hospital St. Looping X(1) E-Hi-42 Kerfoot Rd. Looping X Q-Hi-43 Cory Rd. Looping X ANNUAL PROGRAMS O-C-47 Galvanized Iron Replacement Program X O-C-71 Hydrant Replacement Program X X P-C-72 Meter Replacement Program X X NEW PROJECTS S-Lo-52 Well 5 Abandon X(2) S-Hi-53 Well Redevelopment X S-C-54 Continuous Well Level Measurement X Q-C-55 Chlorination System at Merklin Site X(3) X Q-C-56 Chlorination System at Goggs Site X Q-C-57 Chlorination System at High St. Site X Q-C-58 Chlorination System at Roper Site X
O-Hi-61 Power Factor Correction at Oxford Well Site, High St. Well, and Merklin Pump Station X(3) X
O-C-64 1.5 ML Merklin Storage Tank X E-Hi-65 Centre St. Upgrading X(4) Q-Hi-66 Merklin Arsenic Treatment X F-C-36 High St. Well 4 Improvements X O-Hi-60 Merklin High Seismic Upgrading X S-Hi-49 Well 8 X O-Hi-70 Balancing Pump #1 and #2 VFD Installation X O-C-74 Billing Software Replacement X STUDIES
P-C-39 Water Loss Audit & Water Conservation Study / Leak Reduction Programs X
Q-C-24 Aquifer Protection Plan X Notes: 1) Included in 2013 Capital Program. 2) Included in Well 8 program. 3) Temporary system installed for Well 6 and 7; permanent system is part of TWQM plan. 4) Revised scope (Royal Ave. looping project), scheduled for 2013 construction.
7-6 102.119-300
EPCOR WHITE ROCK WATER INC. 2013 Water System Master Plan Update
Final Report November 2013
7.4 New Projects In addition to tasks from previous reports, the following projects have been added to address the following system deficiencies. Note that detailed descriptions are available in the justification sheets in Appendix A.
1. Improve system performance and reliability: The following water main upgrades are recommended to improve fire flows and reliability:
• 15500 Block Columbia Ln. Water Main Upgrades (E-Lo-76); • 15100 Block Beachview Ave. Pressure Improvements (E-Lo-77); • Saturna Dr. and Archibald Rd. Water Main Upgrades (E-Hi-82); and • 1400 Block Martin St. Water Main Upgrades (E-Hi-83).
2. Condition Assessment, Asset Management and Water Main Replacement: Given that water main breaks are occurring predominately in cast iron mains, a two faceted project is recommended to assess the condition of the water mains and to provide information for planning purposes with the goal of reducing system leaks and breaks.
• Cast Iron Condition Assessment Pilot Program & Water Main Asset Management Strategy (O-Hi-78);
• It is anticipated that this project will provide recommendations for water main replacement projects. Based on previous break history, four potential projects were identified by EWR staff. � 1300 Block Martin St. Water Main Replacement (O-Hi-85); � 13800 Block Coldicutt Ave. Water Main Replacement (O-Hi-86); � Marine Dr. from Vidal St. to Martin St. Water Main Replacement (O-Lo-87); and � Marine Dr. from Bishop Rd. to Magdalen Cres. Water Main Replacement (O-Hi-88).
3. Well Redevelopment: A regular program of well inspection and redevelopment to manage the existing wells and supply capacity.
• Well Redevelopment and Associated Work (O-C-80).
4. Supply capacity: A new well is recommended over the long term to meet supply capacity demands (existing and future).
• Oxford Well 8 (F-C-84).
7.5 Model Results with Upgrades Figure 7-2 shows the pressure at peak hour with the recommended upgrades. Figure 7-3 shows the available fire flow with the recommended upgrades.
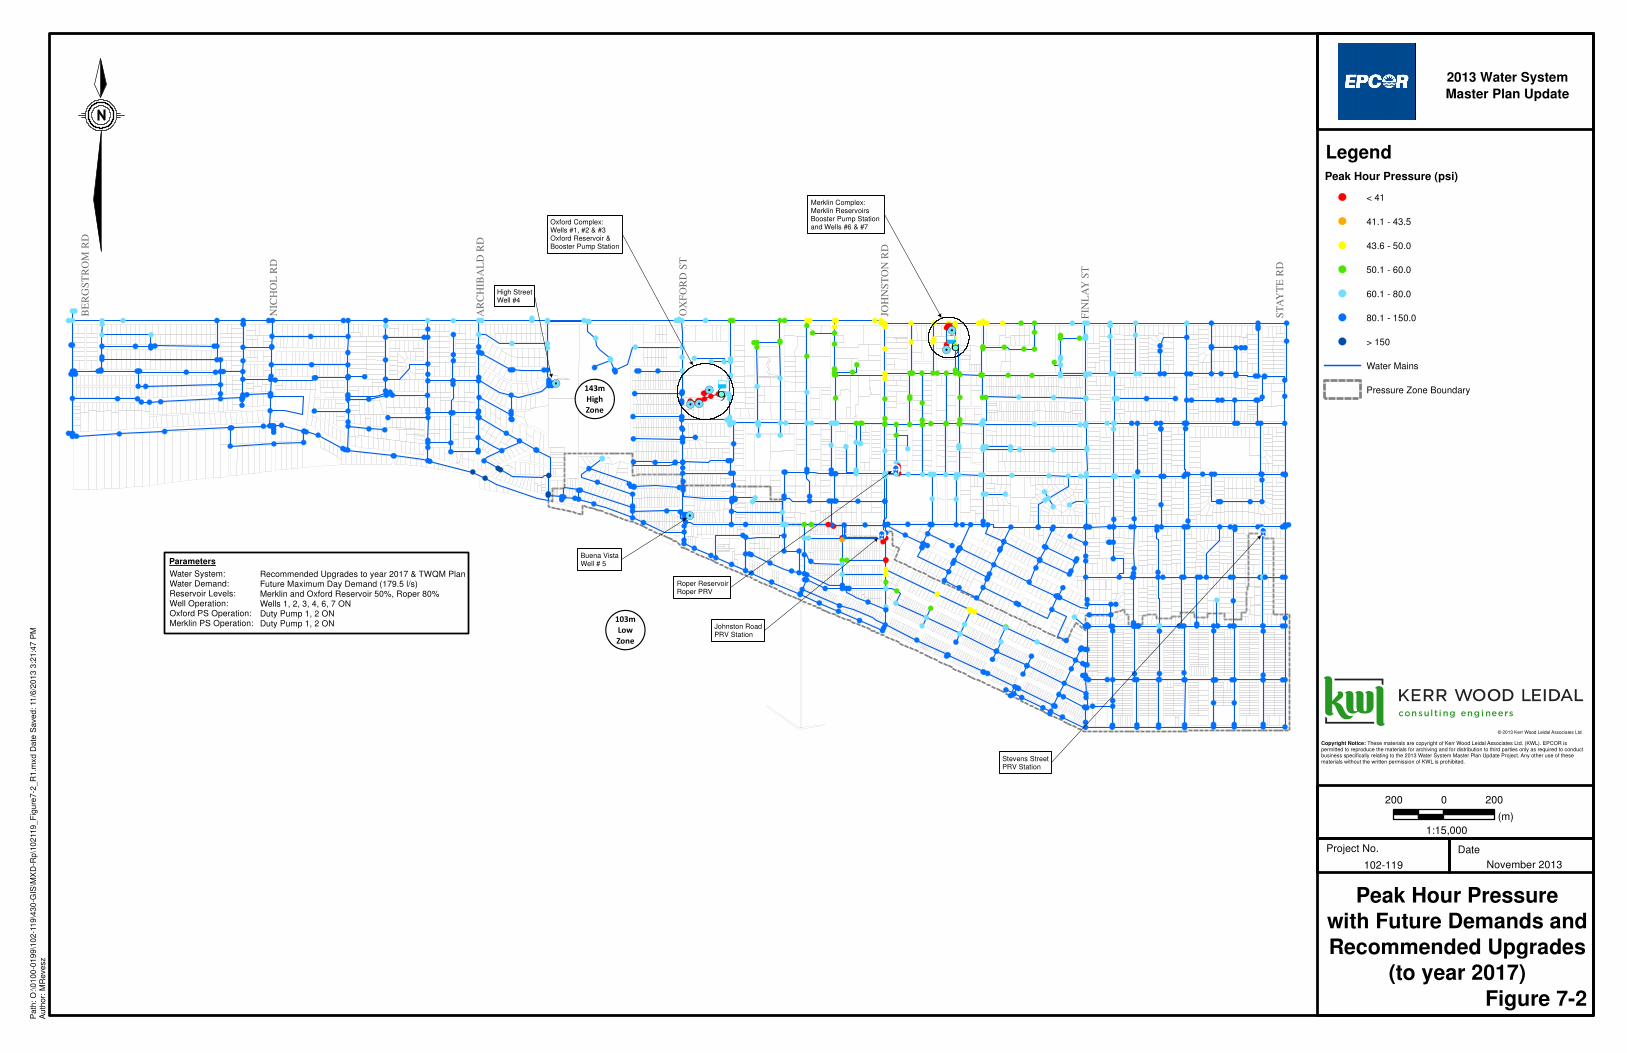
Project No. Date
"
e
&hJ
¨
&hJ
¨
&hJ¨
"
e
ÏÎ
ÏÎ
!.!.
!.!.
!.
!.
!.
!(143mHighZone
!(103mLowZone
Oxford Complex:Wells #1, #2 & #3Oxford Reservoir &Booster Pump Station
Merklin Complex:Merklin Reservoirs Booster Pump Station and Wells #6 & #7
Buena VistaWell # 5
Roper ReservoirRoper PRV
Johnston RoadPRV Station
Stevens StreetPRV Station
Water System:Water Demand:Reservoir Levels:Well Operation:Oxford PS Operation:Merklin PS Operation:
Recommended Upgrades to year 2017 & TWQM PlanFuture Maximum Day Demand (179.5 l/s)Merklin and Oxford Reservoir 50%, Roper 80%Wells 1, 2, 3, 4, 6, 7 ONDuty Pump 1, 2 ONDuty Pump 1, 2 ON
Parameters
NIC
HO
L R
D
AR
CH
IBA
LD
RD
OX
FO
RD
ST
JO
HN
ST
ON
RD
BE
RG
ST
RO
M R
D
ST
AY
TE
RD
FIN
LA
Y S
T
High StreetWell #4
Legend
Pa
th: O
:\0
10
0-0
19
9\1
02
-11
9\4
30
-GIS
\MX
D-R
p\1
02
119
_F
igu
re7
-2_R
1.m
xd
Da
te S
ave
d:
11/6
/20
13
3:2
1:4
7 P
MA
uth
or:
MR
eve
sz
Copyright Notice: These materials are copyright of Kerr Wood Leidal Associates Ltd. (KWL). EPCOR ispermitted to reproduce the materials for archiving and for distribution to third parties only as required to conductbusiness specifically relating to the 2013 Water System Master Plan Update Project. Any other use of thesematerials without the written permission of KWL is prohibited.
© 2013 Kerr Wood Leidal Associates Ltd.
102-119
Peak Hour Pressurewith Future Demands andRecommended Upgrades
(to year 2017)
200 2000
(m)
November 2013
Figure 7-2
1:15,000
Peak Hour Pressure (psi)
< 41
41.1 - 43.5
43.6 - 50.0
50.1 - 60.0
60.1 - 80.0
80.1 - 150.0
> 150
Water Mains
Pressure Zone Boundary
2013 Water System Master Plan Update
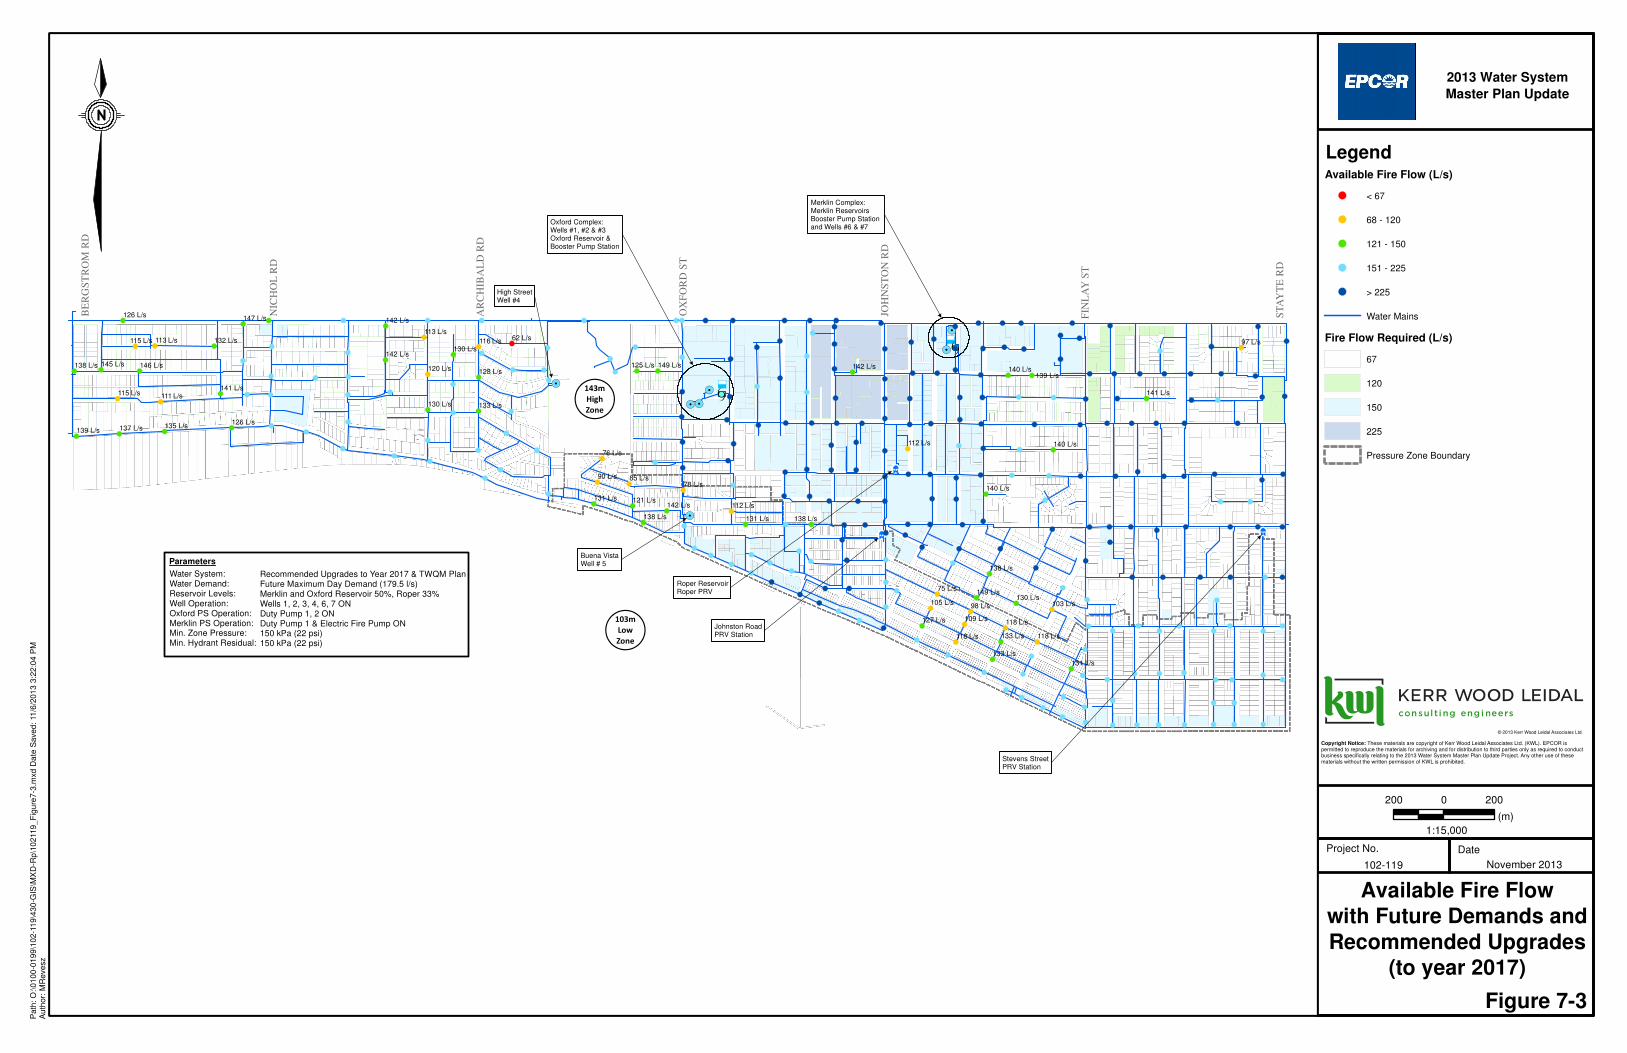
Project No. Date
"
e
&hJ
¨
&hJ
¨
&hJ¨
"
e
ÏÎ
ÏÎ
!.!.
!.!.
!.
!.
!.
!(143mHighZone
!(103mLowZone
Oxford Complex:Wells #1, #2 & #3Oxford Reservoir &Booster Pump Station
Merklin Complex:Merklin Reservoirs Booster Pump Station and Wells #6 & #7
Buena VistaWell # 5
Roper ReservoirRoper PRV
Johnston RoadPRV Station
Stevens StreetPRV Station
Water System:Water Demand:Reservoir Levels:Well Operation:Oxford PS Operation:Merklin PS Operation:Min. Zone Pressure:Min. Hydrant Residual:
Recommended Upgrades to Year 2017 & TWQM PlanFuture Maximum Day Demand (179.5 l/s)Merklin and Oxford Reservoir 50%, Roper 33%Wells 1, 2, 3, 4, 6, 7 ONDuty Pump 1, 2 ONDuty Pump 1 & Electric Fire Pump ON150 kPa (22 psi)150 kPa (22 psi)
Parameters
NIC
HO
L R
D
AR
CH
IBA
LD
RD
OX
FO
RD
ST
JO
HN
ST
ON
RD
BE
RG
ST
RO
M R
D
ST
AY
TE
RD
FIN
LA
Y S
T
High StreetWell #4
142 L/s 140 L/s139 L/s
112 L/s 140 L/s
140 L/s
126 L/s142 L/s
62 L/s
149 L/s125 L/s
113 L/s115 L/s 116 L/s
141 L/s
132 L/s130 L/s
113 L/s
146 L/s128 L/s
145 L/s138 L/s
142 L/s
111 L/s
120 L/s
141 L/s115 L/s
138 L/s
147 L/s
133 L/s
135 L/s
97 L/s
126 L/s
149 L/s130 L/s
137 L/s
75 L/s
139 L/s
130 L/s
98 L/s
138 L/s
105 L/s 103 L/s
118 L/s109 L/s
118 L/s
127 L/s
133 L/s
76 L/s
118 L/s
78 L/s
112 L/s
131 L/s
133 L/s
131 L/s
90 L/s 85 L/s
131 L/s 121 L/s142 L/s
138 L/s
Legend
Pa
th: O
:\0
10
0-0
19
9\1
02
-11
9\4
30
-GIS
\MX
D-R
p\1
02
119
_F
igu
re7
-3.m
xd D
ate
Sa
ved
: 11
/6/2
01
3 3
:22
:04
PM
Au
thor:
MR
eve
sz
Copyright Notice: These materials are copyright of Kerr Wood Leidal Associates Ltd. (KWL). EPCOR ispermitted to reproduce the materials for archiving and for distribution to third parties only as required to conductbusiness specifically relating to the 2013 Water System Master Plan Update Project. Any other use of thesematerials without the written permission of KWL is prohibited.
© 2013 Kerr Wood Leidal Associates Ltd.
102-119
Available Fire Flowwith Future Demands andRecommended Upgrades
(to year 2017)
200 2000
(m)
November 2013
Figure 7-3
1:15,000
Available Fire Flow (L/s)
< 67
68 - 120
121 - 150
151 - 225
> 225
Water Mains
Fire Flow Required (L/s)
67
120
150
225
Pressure Zone Boundary
2013 Water System Master Plan Update
Section 8
Conclusions
8-1
EPCOR WHITE ROCK WATER INC. 2013 Water System Master Plan Update
Final Report November 2013
102.119-300
8. Conclusions
8.1 Summary The master plan update reviewed the current system performance and developed a recommended upgrading program for 2014 to 2017.
Key observations from the update, compared to the 2010 Master Plan are summarized below:
• Since 2010 EPCOR has completed a Total Water Quality Management Plan (TWQM) that addresses supply, storage and treatment issues from the 2010 Master Plan. EPCOR is moving ahead separately with the TWQM plan and accordingly these items are not re-listed in this plan. However, the analysis completed assumes full implementation of the TWQM plan.
• System demands have decreased since 2010. The 2012 recorded ADD was 71 L/s compared to 85 L/s in 2009.
• Per capita base demands decreased from 233 L/ca/day in 2009 to 202 L/ca/day in 2012 (13% decrease). Reduction in base demands is attributed to increasing use of low-flow fixtures.
• Lower seasonal (irrigation) demands in 2012 (compared to 2009) may be coincidental (due to wet summer, etc.). The unit rate for seasonal demand was not adjusted.
• Demand forecast of 180 L/s was maintained. Due to lower base demand unit rates, the associated forecast population for the demand forecast has increased since the 2010 plan. Population of 26,649 ca are expected to be serviceable with the demand forecast of 180 L/s.
• Well supply capacity is currently adequate but with decommissioning of Well 5 and/or growth, a new well will be required (Oxford Well 8). A routine well redevelopment program is recommended to maintain existing wells.
• In general the White Rock system meets hydraulic design criteria. Isolated deficiencies in some areas result in recommended upgrades at:
- 13600 – 13800 Marine Dr.; - 15500 Block Columbia Ln.; and - 15100 Block Beachview Ave.
• As water mains age, the need for a water main asset management increases. A two faceted project is recommended, which includes:
- A cast-iron condition assessment pilot program; and - A water main asset management strategy.
• A review of the service meter assets indicates that an increase to the current replacement program is warranted. Replacement of all the remaining manual read meters (not touch read, all more than 20 years olds) is recommended within ten years.
8.2 Recommended 2014-2017 Program The recommended 2014-2017 program excluding TWQM plan projects total $4,039,000. The projects are listed in Table 7-1.
8-2 102.119-300
EPCOR WHITE ROCK WATER INC. 2013 Water System Master Plan Update
Final Report November 2013
8.3 Report Submission Prepared by:
KERR WOOD LEIDAL ASSOCIATES LTD.
Michelle Revesz, P.Eng. Project Engineer
Reviewed by:
Neal Whiteside, M.A.Sc., P.Eng. Project Manager
EPCOR WHITE ROCK WATER INC. 2013 Water System Master Plan Update
Final Report November 2013
102.119-300
Statement of Limitations This document has been prepared by Kerr Wood Leidal Associates Ltd. (KWL) for the exclusive use and benefit of EPCOR White Rock Water Inc. for the 2013 Water System Master Plan Update. No other party is entitled to rely on any of the conclusions, data, opinions, or any other information contained in this document.
This document represents KWL’s best professional judgement based on the information available at the time of its completion and as appropriate for the project scope of work. Services performed in developing the content of this document have been conducted in a manner consistent with that level and skill ordinarily exercised by members of the engineering profession currently practising under similar conditions. No warranty, express or implied, is made.
Copyright Notice These materials (text, tables, figures and drawings included herein) are copyright of EPCOR and/or KWL as per project agreement(s). Any other use of these materials without written permission is prohibited.
Appendix A
Capital Project Justification Sheets
1102.119-302
EPCOR WHITE ROCK WATER INC.2013 Water System Master Plan Update
Final ReportNovember 2013
APPENDIX A – CAPITAL PROJECT JUSTIFICATION SHEETS
Contents
Capital Projects ......................................................................................................................1
Task Labelling .........................................................................................................................1
Recommended Capital Projects (2014-2017) .......................................................................2 Marine Dr. Water Main Upgrades............................................................................................................................ 2 1400 Blk. Foster St. Water Main Upgrades ............................................................................................................. 3 Aquifer Protection Plan ............................................................................................................................................ 4 15500 Block Columbia Ln. Water Main Upgrades .................................................................................................. 5 15100 Block Beachview Ave. Pressure Improvements .......................................................................................... 6 Cast Iron Condition Assessment Pilot Program and Water Main Asset Management Strategy ............................. 7 Saturna Dr. and Archibald Rd. Water Main Upgrades ............................................................................................ 9 Oxford Well 8 ......................................................................................................................................................... 10 1300 Block Martin St. Water Main Replacement .................................................................................................. 11 13800 Block Coldicutt Ave. Water Main Replacement ......................................................................................... 12 Marine Dr. (Vidal St. to Martin St.) Water Main Replacement .............................................................................. 13 Marine Dr. (Bishop Rd. to Magdalen Cres.) Water Main Replacement ................................................................ 14
Annual Programs .................................................................................................................. 15 Hydrant Replacement Program ............................................................................................................................. 15 Meter Replacement Program ................................................................................................................................ 16 Well Redevelopment and Associated Work .......................................................................................................... 18 New Water Service Connections .......................................................................................................................... 19
Capital Projects Deferred (Beyond 2017) ........................................................................... 20 1400 Block Martin St. Water Main Upgrades ........................................................................................................ 20
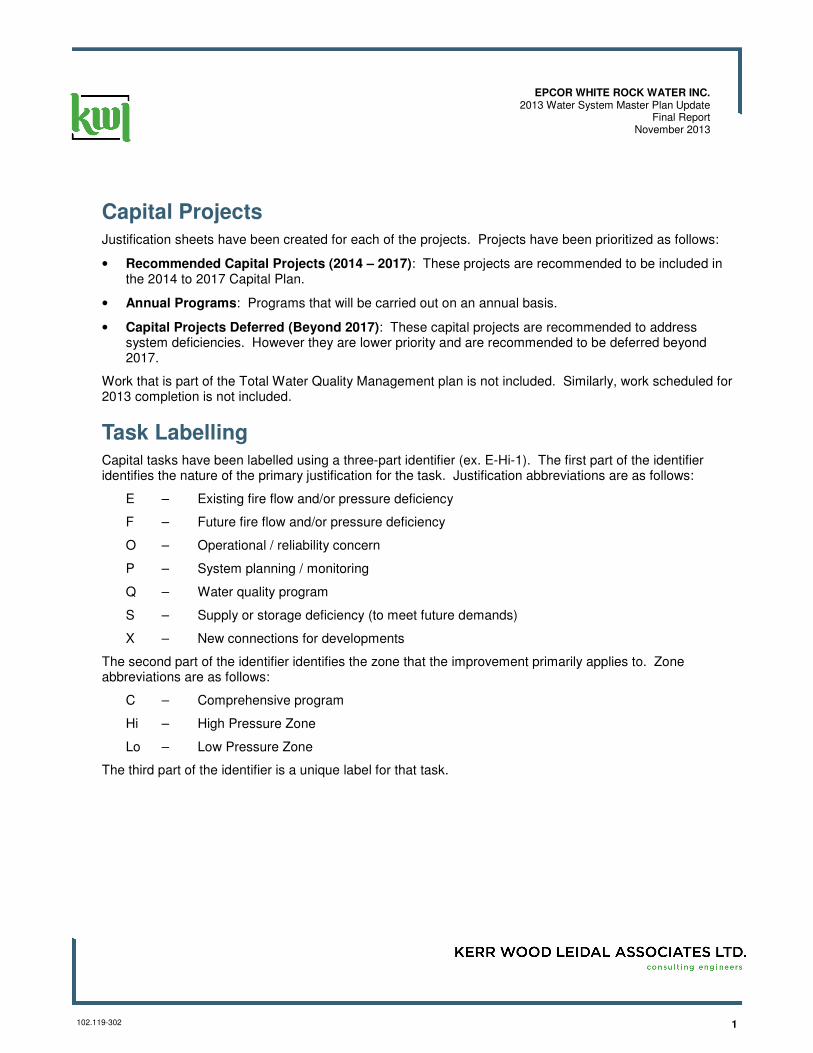
1102.119-302
EPCOR WHITE ROCK WATER INC.2013 Water System Master Plan Update
Final ReportNovember 2013
Capital Projects Justification sheets have been created for each of the projects. Projects have been prioritized as follows:
• Recommended Capital Projects (2014 – 2017): These projects are recommended to be included in the 2014 to 2017 Capital Plan.
• Annual Programs: Programs that will be carried out on an annual basis.
• Capital Projects Deferred (Beyond 2017): These capital projects are recommended to address system deficiencies. However they are lower priority and are recommended to be deferred beyond 2017.
Work that is part of the Total Water Quality Management plan is not included. Similarly, work scheduled for 2013 completion is not included.
Task Labelling Capital tasks have been labelled using a three-part identifier (ex. E-Hi-1). The first part of the identifier identifies the nature of the primary justification for the task. Justification abbreviations are as follows:
E – Existing fire flow and/or pressure deficiency
F – Future fire flow and/or pressure deficiency
O – Operational / reliability concern
P – System planning / monitoring
Q – Water quality program
S – Supply or storage deficiency (to meet future demands)
X – New connections for developments
The second part of the identifier identifies the zone that the improvement primarily applies to. Zone abbreviations are as follows:
C – Comprehensive program
Hi – High Pressure Zone
Lo – Low Pressure Zone
The third part of the identifier is a unique label for that task.
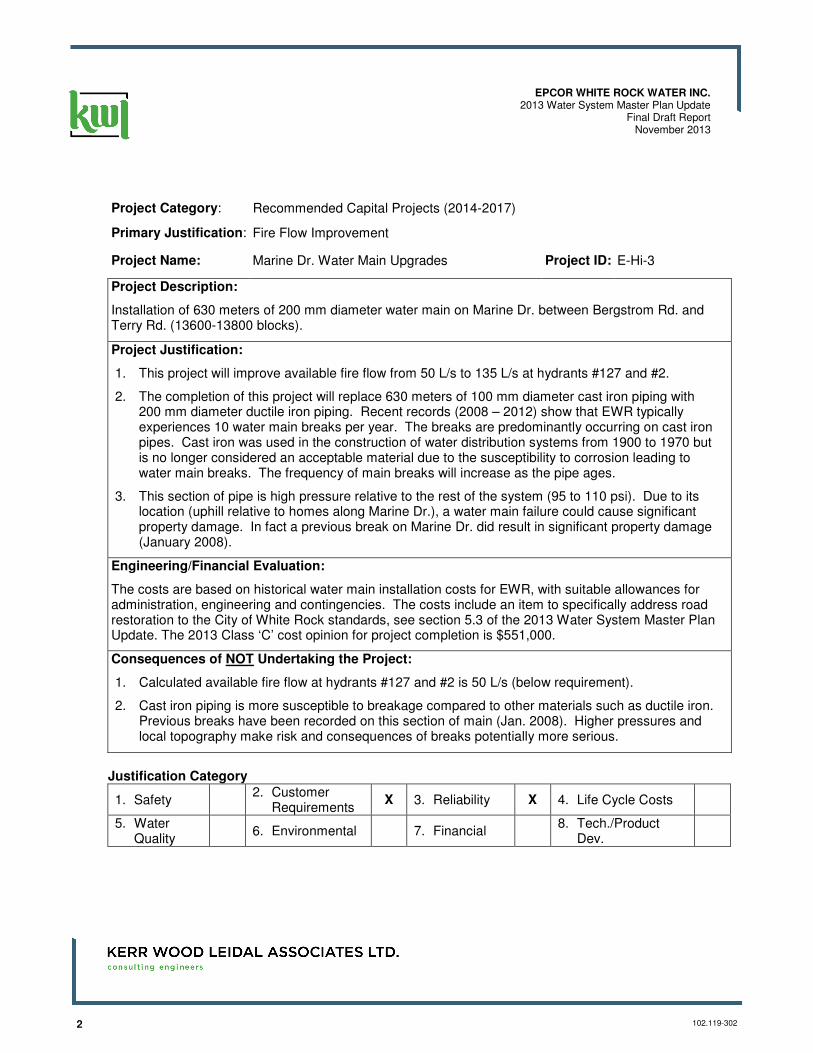
2 102.119-302
EPCOR WHITE ROCK WATER INC.2013 Water System Master Plan Update
Final Draft ReportNovember 2013
Project Category: Recommended Capital Projects (2014-2017)
Primary Justification: Fire Flow Improvement
Project Name: Marine Dr. Water Main Upgrades Project ID: E-Hi-3
Project Description:
Installation of 630 meters of 200 mm diameter water main on Marine Dr. between Bergstrom Rd. and Terry Rd. (13600-13800 blocks).
Project Justification:
1. This project will improve available fire flow from 50 L/s to 135 L/s at hydrants #127 and #2.
2. The completion of this project will replace 630 meters of 100 mm diameter cast iron piping with 200 mm diameter ductile iron piping. Recent records (2008 – 2012) show that EWR typically experiences 10 water main breaks per year. The breaks are predominantly occurring on cast iron pipes. Cast iron was used in the construction of water distribution systems from 1900 to 1970 but is no longer considered an acceptable material due to the susceptibility to corrosion leading to water main breaks. The frequency of main breaks will increase as the pipe ages.
3. This section of pipe is high pressure relative to the rest of the system (95 to 110 psi). Due to its location (uphill relative to homes along Marine Dr.), a water main failure could cause significant property damage. In fact a previous break on Marine Dr. did result in significant property damage (January 2008).
Engineering/Financial Evaluation:
The costs are based on historical water main installation costs for EWR, with suitable allowances for administration, engineering and contingencies. The costs include an item to specifically address road restoration to the City of White Rock standards, see section 5.3 of the 2013 Water System Master Plan Update. The 2013 Class ‘C’ cost opinion for project completion is $551,000.
Consequences of NOT Undertaking the Project:
1. Calculated available fire flow at hydrants #127 and #2 is 50 L/s (below requirement).
2. Cast iron piping is more susceptible to breakage compared to other materials such as ductile iron. Previous breaks have been recorded on this section of main (Jan. 2008). Higher pressures and local topography make risk and consequences of breaks potentially more serious.
Justification Category
1. Safety 2. Customer
Requirements X 3. Reliability X 4. Life Cycle Costs
5. Water Quality
6. Environmental 7. Financial 8. Tech./Product
Dev.
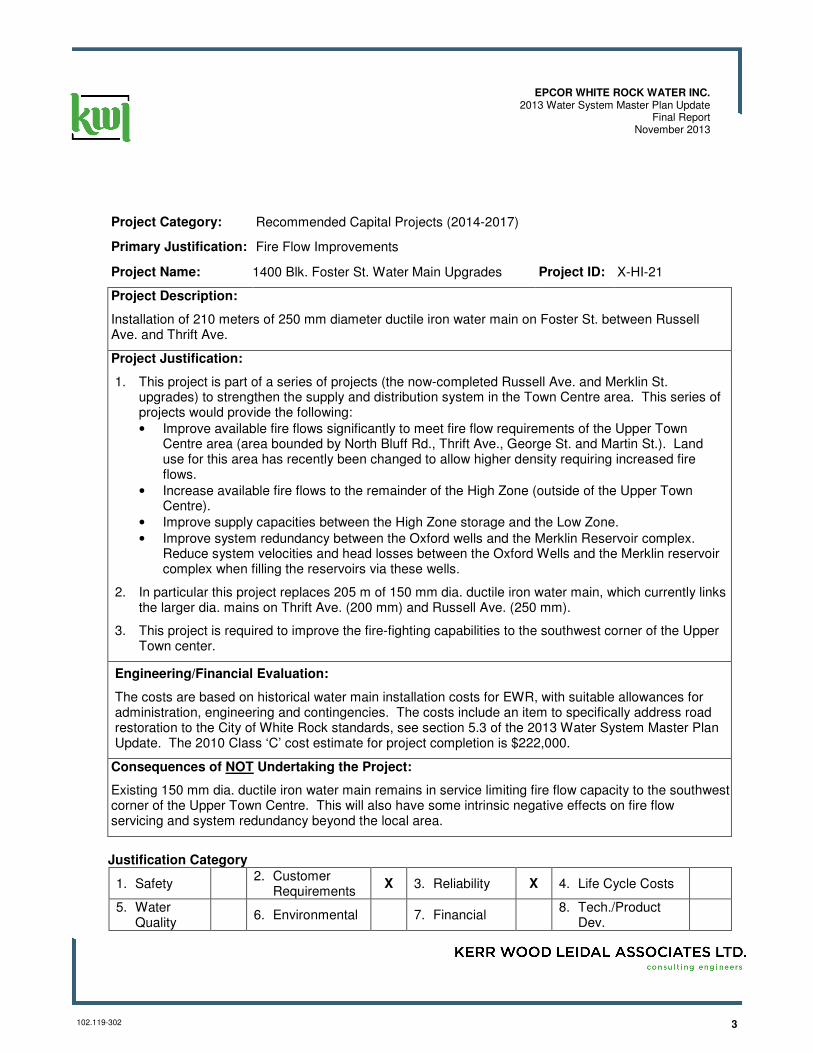
3102.119-302
EPCOR WHITE ROCK WATER INC.2013 Water System Master Plan Update
Final ReportNovember 2013
Project Category: Recommended Capital Projects (2014-2017)
Primary Justification: Fire Flow Improvements
Project Name: 1400 Blk. Foster St. Water Main Upgrades Project ID: X-HI-21
Project Description:
Installation of 210 meters of 250 mm diameter ductile iron water main on Foster St. between Russell Ave. and Thrift Ave.
Project Justification:
1. This project is part of a series of projects (the now-completed Russell Ave. and Merklin St. upgrades) to strengthen the supply and distribution system in the Town Centre area. This series of projects would provide the following: • Improve available fire flows significantly to meet fire flow requirements of the Upper Town
Centre area (area bounded by North Bluff Rd., Thrift Ave., George St. and Martin St.). Land use for this area has recently been changed to allow higher density requiring increased fire flows.
• Increase available fire flows to the remainder of the High Zone (outside of the Upper Town Centre).
• Improve supply capacities between the High Zone storage and the Low Zone. • Improve system redundancy between the Oxford wells and the Merklin Reservoir complex.
Reduce system velocities and head losses between the Oxford Wells and the Merklin reservoir complex when filling the reservoirs via these wells.
2. In particular this project replaces 205 m of 150 mm dia. ductile iron water main, which currently links the larger dia. mains on Thrift Ave. (200 mm) and Russell Ave. (250 mm).
3. This project is required to improve the fire-fighting capabilities to the southwest corner of the Upper Town center.
Engineering/Financial Evaluation:
The costs are based on historical water main installation costs for EWR, with suitable allowances for administration, engineering and contingencies. The costs include an item to specifically address road restoration to the City of White Rock standards, see section 5.3 of the 2013 Water System Master Plan Update. The 2010 Class ‘C’ cost estimate for project completion is $222,000.
Consequences of NOT Undertaking the Project:
Existing 150 mm dia. ductile iron water main remains in service limiting fire flow capacity to the southwest corner of the Upper Town Centre. This will also have some intrinsic negative effects on fire flow servicing and system redundancy beyond the local area.
Justification Category
1. Safety 2. Customer
Requirements X 3. Reliability X 4. Life Cycle Costs
5. Water Quality
6. Environmental 7. Financial 8. Tech./Product
Dev.
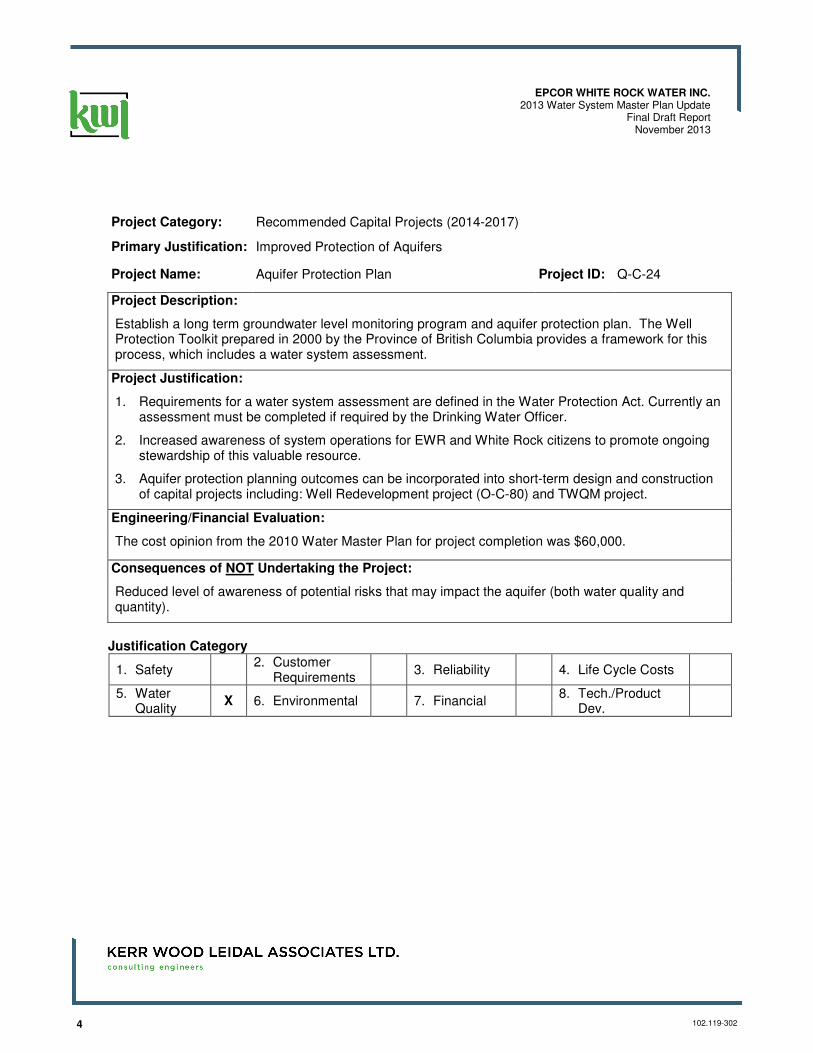
4 102.119-302
EPCOR WHITE ROCK WATER INC.2013 Water System Master Plan Update
Final Draft ReportNovember 2013
Project Category: Recommended Capital Projects (2014-2017)
Primary Justification: Improved Protection of Aquifers
Project Name: Aquifer Protection Plan Project ID: Q-C-24
Project Description:
Establish a long term groundwater level monitoring program and aquifer protection plan. The Well Protection Toolkit prepared in 2000 by the Province of British Columbia provides a framework for this process, which includes a water system assessment.
Project Justification:
1. Requirements for a water system assessment are defined in the Water Protection Act. Currently an assessment must be completed if required by the Drinking Water Officer.
2. Increased awareness of system operations for EWR and White Rock citizens to promote ongoing stewardship of this valuable resource.
3. Aquifer protection planning outcomes can be incorporated into short-term design and construction of capital projects including: Well Redevelopment project (O-C-80) and TWQM project.
Engineering/Financial Evaluation:
The cost opinion from the 2010 Water Master Plan for project completion was $60,000.
Consequences of NOT Undertaking the Project:
Reduced level of awareness of potential risks that may impact the aquifer (both water quality and quantity).
Justification Category
1. Safety 2. Customer
Requirements 3. Reliability 4. Life Cycle Costs
5. Water Quality
X 6. Environmental 7. Financial 8. Tech./Product
Dev.
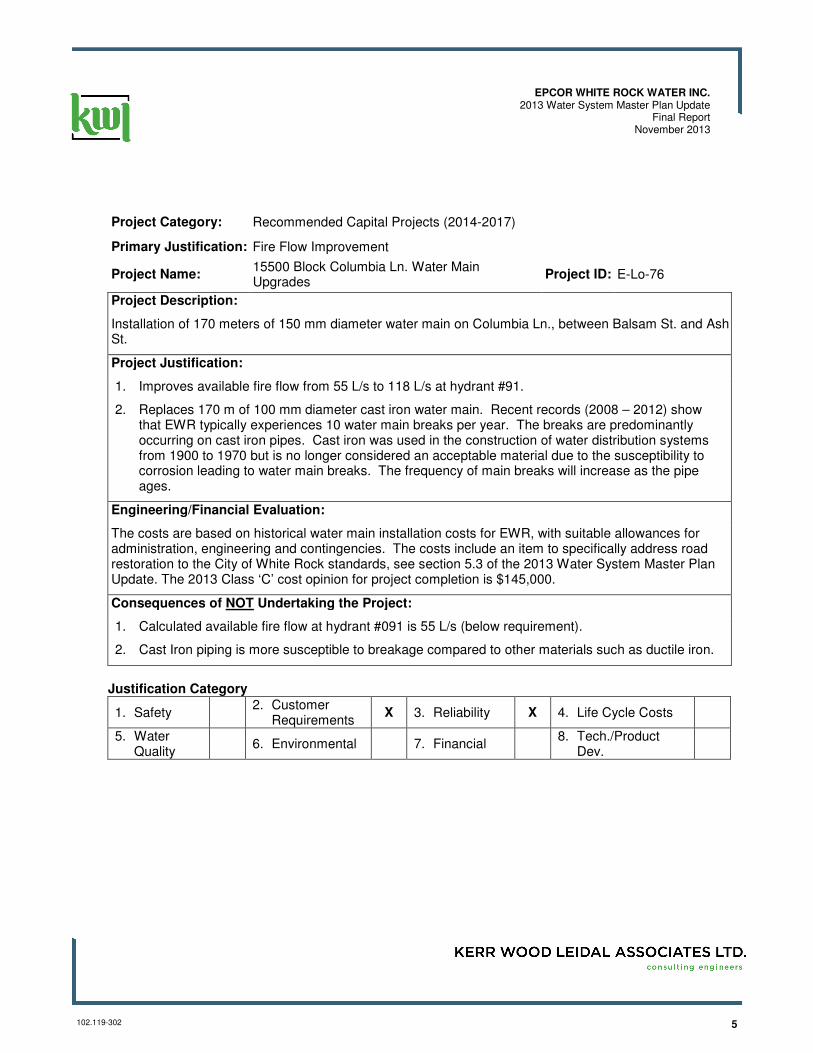
5102.119-302
EPCOR WHITE ROCK WATER INC.2013 Water System Master Plan Update
Final ReportNovember 2013
Project Category: Recommended Capital Projects (2014-2017)
Primary Justification: Fire Flow Improvement
Project Name: 15500 Block Columbia Ln. Water Main Upgrades
Project ID: E-Lo-76
Project Description:
Installation of 170 meters of 150 mm diameter water main on Columbia Ln., between Balsam St. and Ash St.
Project Justification:
1. Improves available fire flow from 55 L/s to 118 L/s at hydrant #91.
2. Replaces 170 m of 100 mm diameter cast iron water main. Recent records (2008 – 2012) show that EWR typically experiences 10 water main breaks per year. The breaks are predominantly occurring on cast iron pipes. Cast iron was used in the construction of water distribution systems from 1900 to 1970 but is no longer considered an acceptable material due to the susceptibility to corrosion leading to water main breaks. The frequency of main breaks will increase as the pipe ages.
Engineering/Financial Evaluation:
The costs are based on historical water main installation costs for EWR, with suitable allowances for administration, engineering and contingencies. The costs include an item to specifically address road restoration to the City of White Rock standards, see section 5.3 of the 2013 Water System Master Plan Update. The 2013 Class ‘C’ cost opinion for project completion is $145,000.
Consequences of NOT Undertaking the Project:
1. Calculated available fire flow at hydrant #091 is 55 L/s (below requirement).
2. Cast Iron piping is more susceptible to breakage compared to other materials such as ductile iron.
Justification Category
1. Safety 2. Customer
Requirements X 3. Reliability X 4. Life Cycle Costs
5. Water Quality
6. Environmental 7. Financial 8. Tech./Product
Dev.
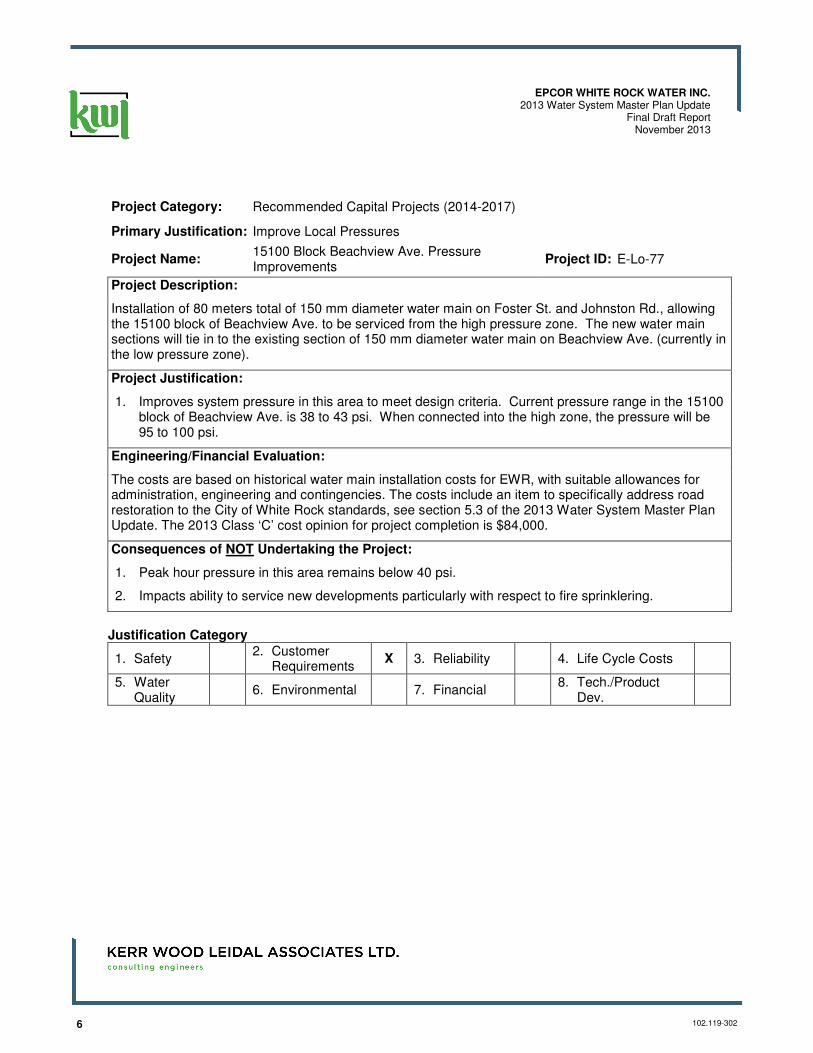
6 102.119-302
EPCOR WHITE ROCK WATER INC.2013 Water System Master Plan Update
Final Draft ReportNovember 2013
Project Category: Recommended Capital Projects (2014-2017)
Primary Justification: Improve Local Pressures
Project Name: 15100 Block Beachview Ave. Pressure Improvements
Project ID: E-Lo-77
Project Description:
Installation of 80 meters total of 150 mm diameter water main on Foster St. and Johnston Rd., allowing the 15100 block of Beachview Ave. to be serviced from the high pressure zone. The new water main sections will tie in to the existing section of 150 mm diameter water main on Beachview Ave. (currently in the low pressure zone).
Project Justification:
1. Improves system pressure in this area to meet design criteria. Current pressure range in the 15100 block of Beachview Ave. is 38 to 43 psi. When connected into the high zone, the pressure will be 95 to 100 psi.
Engineering/Financial Evaluation:
The costs are based on historical water main installation costs for EWR, with suitable allowances for administration, engineering and contingencies. The costs include an item to specifically address road restoration to the City of White Rock standards, see section 5.3 of the 2013 Water System Master Plan Update. The 2013 Class ‘C’ cost opinion for project completion is $84,000.
Consequences of NOT Undertaking the Project:
1. Peak hour pressure in this area remains below 40 psi.
2. Impacts ability to service new developments particularly with respect to fire sprinklering.
Justification Category
1. Safety 2. Customer
Requirements X 3. Reliability
4. Life Cycle Costs
5. Water Quality
6. Environmental 7. Financial 8. Tech./Product
Dev.
7102.119-302
EPCOR WHITE ROCK WATER INC.2013 Water System Master Plan Update
Final ReportNovember 2013
Project Category: Recommended Capital Projects (2014-2017)
Primary Justification: Reduce Leaks and Breaks
Project Name: Cast Iron Condition Assessment Pilot Program and Water Main Asset Management Strategy
Project ID: O-Hi-78
Project Description:
Condition assessment of 2 km of cast-iron water main in high break rate area (north east corner of utility including general area bound by Thrift to North Bluff Rd. east of Finlay St.).
Develop a system-wide asset management strategy for water mains based on the cast iron condition assessment pilot program, pipe material, year of install, break history, system pressures, and replacement costs.
Project Justification:
Cast iron piping failures constitute 92% of the recorded water main breaks in the system. Examination of a replacement program or condition assessment program for the cast iron piping is warranted.
Current break rates and repair costs do not indicate the need for a global replacement program for all of the cast iron water mains. Increasing break rates and/or higher damage lead to the need for a global replacement program. Increasing break rates may occur with CI piping as corrosion / pitting reduces wall thickness.
Replacement of specific water mains that are either high-risk (of causing property damage) and / or poor condition (extensive break history due to age, soils, etc.) may be warranted. Better information is required to positively identify these mains.
Certain clusters of break are noted in the break history but it is uncertain whether these are random or linked to the condition of the local main, or other factors (construction methods at the time of install, etc.). As an example in the north-east quadrant there has been 39 breaks over a 13 year period on 1.4 km of CI water main (2.2 breaks/year/km).
To better manage the cast iron water main asset class, a condition assessment program is recommended. A pilot condition assessment program that includes non-destructive inline inspection using a ‘smart pigging’ device such as PICA’s See Snake is recommended.
A condition assessment program would provide the following benefits:
• Identification of current pipe condition;
• Identification of leaks;
• Pre-emptive point repairs at areas identified with extensive localized wall loss;
• Enables informed decisions on pipe rehabilitation vs. continuing with point repairs for pipes inspected;
• Where pipe rehabilitation is indicated, inspection data provides additional information to determine method of rehabilitation, i.e. lining vs. replacement; and
• Enables extrapolation of results to a larger area.
8 102.119-302
EPCOR WHITE ROCK WATER INC.2013 Water System Master Plan Update
Final Draft ReportNovember 2013
The current water main replacement program was based primarily on replacing mains to provide adequate hydraulic characteristics (fire flows and pressures). Mains were also selected to provide additional redundancy (looping). As these level of service issues areas are addressed and the system ages, the need for an asset management strategy to justify a pipe rehabilitation rate and method (replacement vs. rehabilitation / lining) becomes more pressing.
The asset management study would review the cast iron condition assessment pilot program results and consider the need for expansion of this program, as well as using the results to extrapolate possible replacement / repair rates utility wide.
Engineering/Financial Evaluation:
Estimated cost $120,000 ($60/m) including costs for inspection, inspection report, engineering and project management. Cost estimate of $35-39/m obtained for inspection only. Additional $ 21-25/m included to allow for program development, engineering, cleaning of mains, internal costs and contingency. Note unit costs are based on reasonable (2 km or more) length of inspected main.
Additional $40,000 to complete an asset management strategy extending pilot to entire utility.
Consequences of NOT Undertaking the Project:
Additional future costs for water main breaks above economic threshold (for mains in poor condition) and/or premature replacement of mains with significant remaining economic service life (for mains in good condition). Replacement rates and methods not based on structured approach. Projects and replacement rates continue to be selected on an ad-hoc basis.
Justification Category
1. Safety 2. Customer
Requirements 3. Reliability X 4. Life Cycle Costs X
5. Water Quality
6. Environmental 7. Financial 8. Tech./Product
Dev. X
9102.119-302
EPCOR WHITE ROCK WATER INC.2013 Water System Master Plan Update
Final ReportNovember 2013
Project Category: Recommended Capital Projects (2014-2017)
Primary Justification: Fire Flow Improvement
Project Name: Saturna Dr. and Archibald Rd. Water Main Upgrades
Project ID: E-Hi-82
Project Description:
Installation of 290 meters of 150 mm diameter water main on Saturna Dr., between Archibald Rd. and High St. and 150 m of 150 mm diameter water main on Archibald Rd. between Mann Park Cres. and North Bluff Rd.
Project Justification:
1. Improves available fire flow from 60 L/s to 140 L/s at hydrant #21.
2. Replaces 440 m of 100 mm diameter cast iron water main. Recent records (2008 – 2012) show that EWR typically experiences 10 water main breaks per year. The breaks are predominantly occurring on cast iron pipes. Cast iron was used in the construction of water distribution systems from 1900 to 1970 but is no longer considered an acceptable material due to the susceptibility to corrosion leading to water main breaks. Industry best practice has shown that the frequency of main breaks will increase as the pipe ages.
3. There has been 2 breaks on this section of water main since 2008.
Engineering/Financial Evaluation:
The costs are based on historical water main installation costs for EWR, with suitable allowances for administration, engineering and contingencies. The costs include an item to specifically address road restoration to the City of White Rock standards, see section 5.3 of the 2013 Water System Master Plan Update. The 2013 Class ‘C’ cost opinion for project completion is $378,000.
Consequences of NOT Undertaking the Project:
1. Calculated available fire flow at Hydrant #21 is 60 L/s (below requirement).
2. Cast Iron piping is more susceptible to breakage compared to other materials such as ductile iron (one local break recorded on this section of water main).
Justification Category
1. Safety 2. Customer
Requirements X 3. Reliability X 4. Life Cycle Costs
5. Water Quality
6. Environmental 7. Financial 8. Tech./Product
Dev.
10 102.119-302
EPCOR WHITE ROCK WATER INC.2013 Water System Master Plan Update
Final Draft ReportNovember 2013
Project Category: Recommended Capital Projects (2014-2017)
Primary Justification: Additional Water Supply Capacity
Project Name: Oxford Well 8 Project ID: S-C-84
Project Description:
Install Well 8 at Utilities Oxford site to replace capacity loss as existing wells age and as wells are taken out of service, and to meet future water demands. To minimize the effect on the existing wells, the final siting of the new well will be based on a hydrogeological assessment and recommendations.
Project Justification:
1. Additional water supply capacity is required to meet increased demands and to replace capacity loss as existing wells age (reduction in productivity) and are taken out of service.
2. Decommissioning and abandoning Well 5 is also recommended (over long-term rather than re-development). Well 5 will be maintained over the short-term (until 2017). Decommissioning of Well 5 is recommended due to the inability to incorporate the well into TWQM plan, along with reduced capacity, condition and water quality concerns.
3. Decommissioning of Well 3 is subject to testing conducted beyond 2017.
4. Gross system supply capacity with existing wells (1 through 7 inclusive) is 199 L/s. Without Well 5 (31 L/s) gross capacity would be 168 L/s, compared to current maximum day demand of 156 L/s. Addition of Well 8 (at a nominal capacity of 40 L/s) would meet current and future demands. If Well 3 (29 L/s) is decommissioned, gross capacity will be reduced to 180 L/s (including Well 8), reducing redundancy.
Engineering/Financial Evaluation:
$740,000 excluding GST, including engineering, overhead/administration and contingency. Preliminary cost opinion is based on Well 7 costs (2012) but excluding costs specific to that project (chlorination equipment building, electrical kiosk, and other electrical modifications to the Merklin facility) and adding decommissioning of Well 5.
Consequences of NOT Undertaking the Project:
Unless demand-side measures are very effective or growth is less than anticipated, supply shortfalls on peak demand days are likely resulting in drawdown into fire storage at reservoirs.
Justification Category
1. Safety 2. Customer
Requirements X 3. Reliability 4. Life Cycle Costs
5. Water Quality
6. Environmental 7. Financial 8. Tech./Product
Dev.
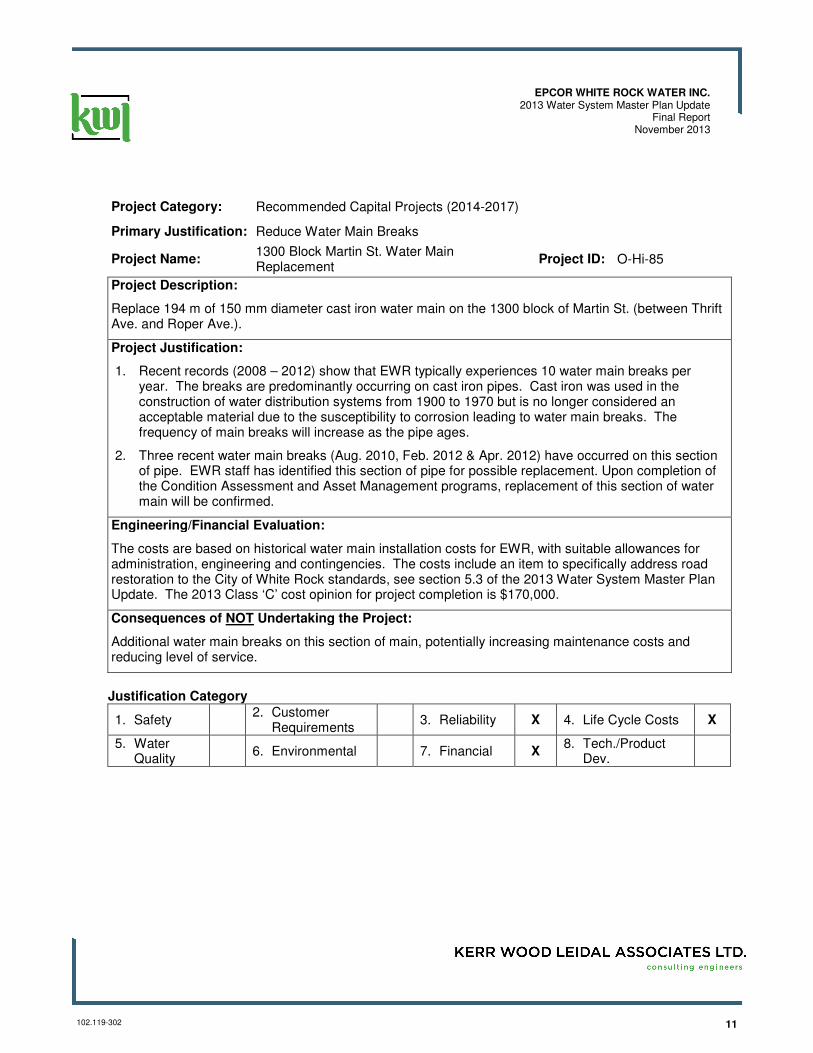
11102.119-302
EPCOR WHITE ROCK WATER INC.2013 Water System Master Plan Update
Final ReportNovember 2013
Project Category: Recommended Capital Projects (2014-2017)
Primary Justification: Reduce Water Main Breaks
Project Name: 1300 Block Martin St. Water Main Replacement
Project ID: O-Hi-85
Project Description:
Replace 194 m of 150 mm diameter cast iron water main on the 1300 block of Martin St. (between Thrift Ave. and Roper Ave.).
Project Justification:
1. Recent records (2008 – 2012) show that EWR typically experiences 10 water main breaks per year. The breaks are predominantly occurring on cast iron pipes. Cast iron was used in the construction of water distribution systems from 1900 to 1970 but is no longer considered an acceptable material due to the susceptibility to corrosion leading to water main breaks. The frequency of main breaks will increase as the pipe ages.
2. Three recent water main breaks (Aug. 2010, Feb. 2012 & Apr. 2012) have occurred on this section of pipe. EWR staff has identified this section of pipe for possible replacement. Upon completion of the Condition Assessment and Asset Management programs, replacement of this section of water main will be confirmed.
Engineering/Financial Evaluation:
The costs are based on historical water main installation costs for EWR, with suitable allowances for administration, engineering and contingencies. The costs include an item to specifically address road restoration to the City of White Rock standards, see section 5.3 of the 2013 Water System Master Plan Update. The 2013 Class ‘C’ cost opinion for project completion is $170,000.
Consequences of NOT Undertaking the Project:
Additional water main breaks on this section of main, potentially increasing maintenance costs and reducing level of service.
Justification Category
1. Safety 2. Customer
Requirements 3. Reliability X 4. Life Cycle Costs X
5. Water Quality
6. Environmental 7. Financial X 8. Tech./Product
Dev.
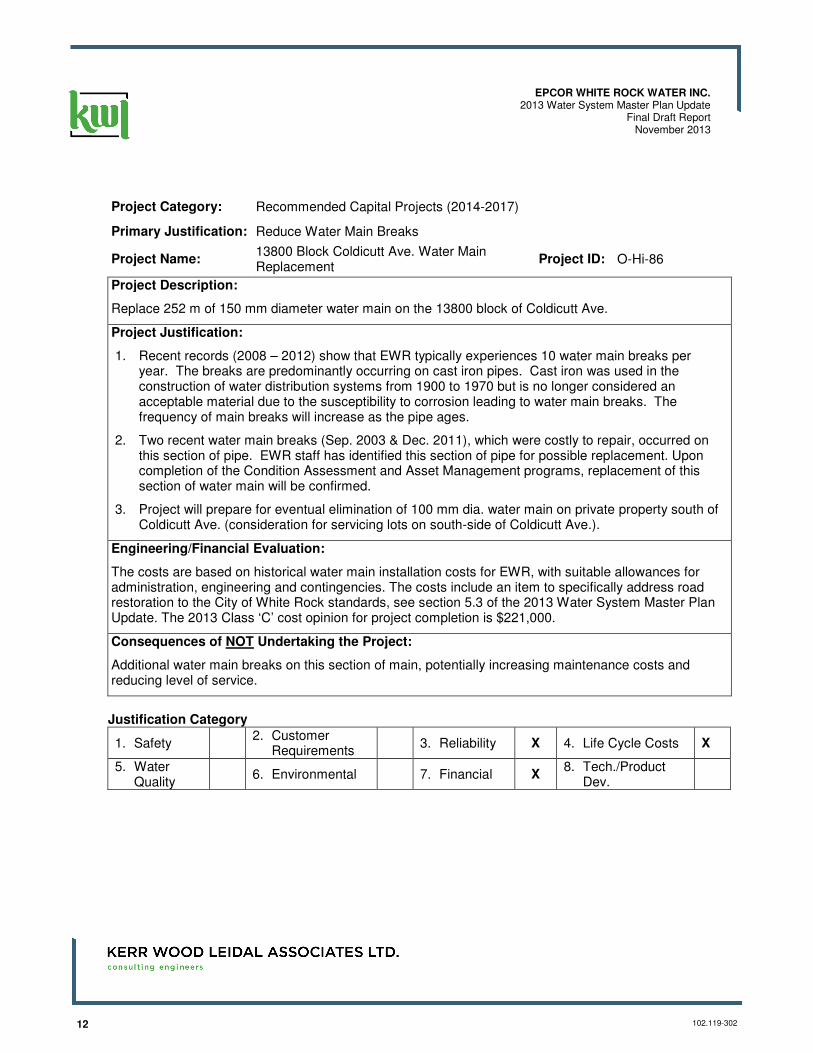
12 102.119-302
EPCOR WHITE ROCK WATER INC.2013 Water System Master Plan Update
Final Draft ReportNovember 2013
Project Category: Recommended Capital Projects (2014-2017)
Primary Justification: Reduce Water Main Breaks
Project Name: 13800 Block Coldicutt Ave. Water Main Replacement
Project ID: O-Hi-86
Project Description:
Replace 252 m of 150 mm diameter water main on the 13800 block of Coldicutt Ave.
Project Justification:
1. Recent records (2008 – 2012) show that EWR typically experiences 10 water main breaks per year. The breaks are predominantly occurring on cast iron pipes. Cast iron was used in the construction of water distribution systems from 1900 to 1970 but is no longer considered an acceptable material due to the susceptibility to corrosion leading to water main breaks. The frequency of main breaks will increase as the pipe ages.
2. Two recent water main breaks (Sep. 2003 & Dec. 2011), which were costly to repair, occurred on this section of pipe. EWR staff has identified this section of pipe for possible replacement. Upon completion of the Condition Assessment and Asset Management programs, replacement of this section of water main will be confirmed.
3. Project will prepare for eventual elimination of 100 mm dia. water main on private property south of Coldicutt Ave. (consideration for servicing lots on south-side of Coldicutt Ave.).
Engineering/Financial Evaluation:
The costs are based on historical water main installation costs for EWR, with suitable allowances for administration, engineering and contingencies. The costs include an item to specifically address road restoration to the City of White Rock standards, see section 5.3 of the 2013 Water System Master Plan Update. The 2013 Class ‘C’ cost opinion for project completion is $221,000.
Consequences of NOT Undertaking the Project:
Additional water main breaks on this section of main, potentially increasing maintenance costs and reducing level of service.
Justification Category
1. Safety 2. Customer
Requirements 3. Reliability X 4. Life Cycle Costs X
5. Water Quality
6. Environmental 7. Financial X 8. Tech./Product
Dev.
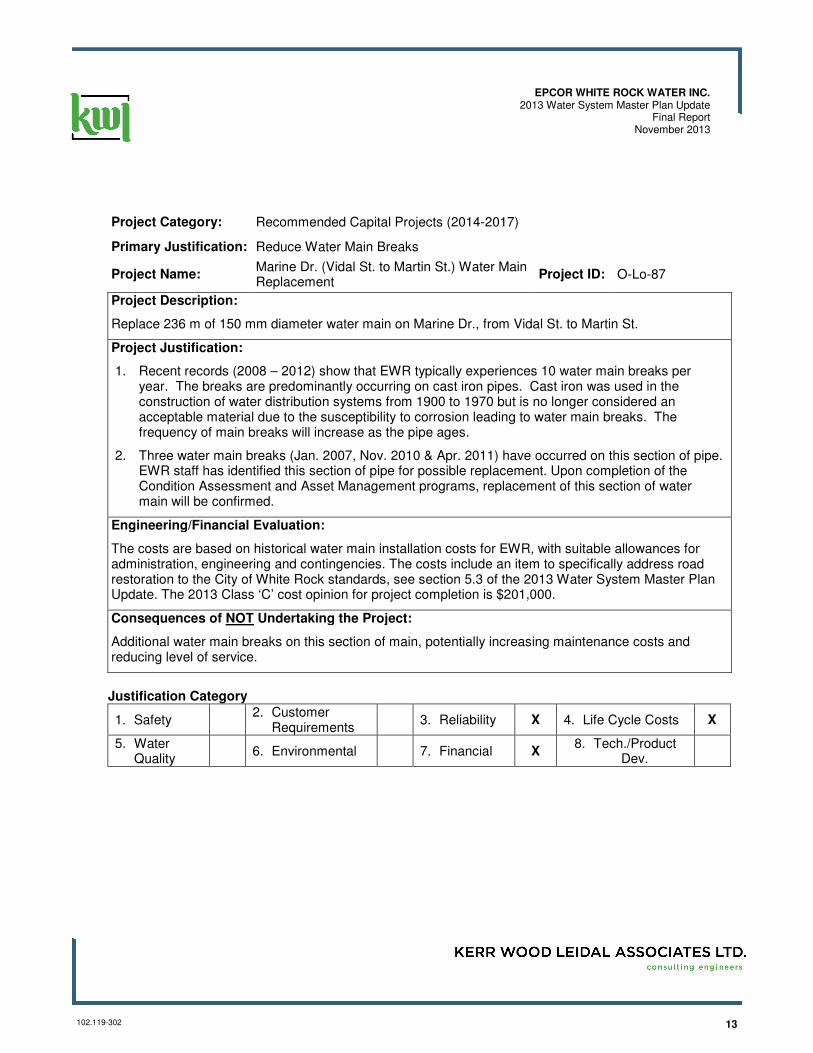
13102.119-302
EPCOR WHITE ROCK WATER INC.2013 Water System Master Plan Update
Final ReportNovember 2013
Project Category: Recommended Capital Projects (2014-2017)
Primary Justification: Reduce Water Main Breaks
Project Name: Marine Dr. (Vidal St. to Martin St.) Water Main Replacement
Project ID: O-Lo-87
Project Description:
Replace 236 m of 150 mm diameter water main on Marine Dr., from Vidal St. to Martin St.
Project Justification:
1. Recent records (2008 – 2012) show that EWR typically experiences 10 water main breaks per year. The breaks are predominantly occurring on cast iron pipes. Cast iron was used in the construction of water distribution systems from 1900 to 1970 but is no longer considered an acceptable material due to the susceptibility to corrosion leading to water main breaks. The frequency of main breaks will increase as the pipe ages.
2. Three water main breaks (Jan. 2007, Nov. 2010 & Apr. 2011) have occurred on this section of pipe. EWR staff has identified this section of pipe for possible replacement. Upon completion of the Condition Assessment and Asset Management programs, replacement of this section of water main will be confirmed.
Engineering/Financial Evaluation:
The costs are based on historical water main installation costs for EWR, with suitable allowances for administration, engineering and contingencies. The costs include an item to specifically address road restoration to the City of White Rock standards, see section 5.3 of the 2013 Water System Master Plan Update. The 2013 Class ‘C’ cost opinion for project completion is $201,000.
Consequences of NOT Undertaking the Project:
Additional water main breaks on this section of main, potentially increasing maintenance costs and reducing level of service.
Justification Category
1. Safety 2. Customer
Requirements 3. Reliability X 4. Life Cycle Costs X
5. Water Quality
6. Environmental 7. Financial X 8. Tech./Product
Dev.
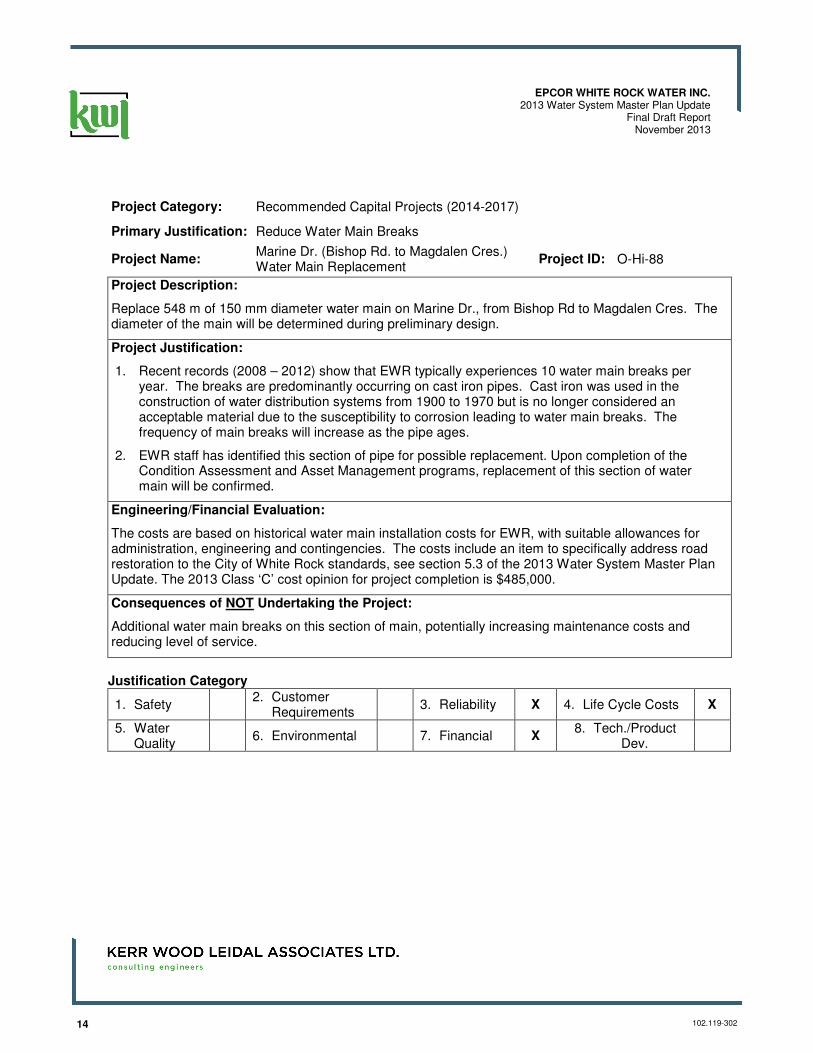
14 102.119-302
EPCOR WHITE ROCK WATER INC.2013 Water System Master Plan Update
Final Draft ReportNovember 2013
Project Category: Recommended Capital Projects (2014-2017)
Primary Justification: Reduce Water Main Breaks
Project Name: Marine Dr. (Bishop Rd. to Magdalen Cres.) Water Main Replacement
Project ID: O-Hi-88
Project Description:
Replace 548 m of 150 mm diameter water main on Marine Dr., from Bishop Rd to Magdalen Cres. The diameter of the main will be determined during preliminary design.
Project Justification:
1. Recent records (2008 – 2012) show that EWR typically experiences 10 water main breaks per year. The breaks are predominantly occurring on cast iron pipes. Cast iron was used in the construction of water distribution systems from 1900 to 1970 but is no longer considered an acceptable material due to the susceptibility to corrosion leading to water main breaks. The frequency of main breaks will increase as the pipe ages.
2. EWR staff has identified this section of pipe for possible replacement. Upon completion of the Condition Assessment and Asset Management programs, replacement of this section of water main will be confirmed.
Engineering/Financial Evaluation:
The costs are based on historical water main installation costs for EWR, with suitable allowances for administration, engineering and contingencies. The costs include an item to specifically address road restoration to the City of White Rock standards, see section 5.3 of the 2013 Water System Master Plan Update. The 2013 Class ‘C’ cost opinion for project completion is $485,000.
Consequences of NOT Undertaking the Project:
Additional water main breaks on this section of main, potentially increasing maintenance costs and reducing level of service.
Justification Category
1. Safety 2. Customer
Requirements 3. Reliability X 4. Life Cycle Costs X
5. Water Quality
6. Environmental 7. Financial X 8. Tech./Product
Dev.
15102.119-302
EPCOR WHITE ROCK WATER INC.2013 Water System Master Plan Update
Final ReportNovember 2013
Project Category: Annual Programs
Primary Justification: Fire Flow Protection
Project Name: Hydrant Replacement Program Project ID: O-C-71
Project Description:
Replacement and/or relocation of 5 hydrants per year.
Project Justification:
Hydrants have been provided by the water utility as required by the City of White Rock for fire protection. Hydrant maintenance is funded by the City via Schedule ‘F’ of the existing Water Tariff. The hydrant replacement program provides:
1. Improved fire hydrant coverage.
2. Improved flow capacity by replacing old hydrants with newer models.
Engineering/Financial Evaluation:
Cost estimate of $5,400 per hydrant, for a total of $27,000 annually (2013 dollars); based on previous experience.
Consequences of NOT Undertaking the Project:
Available fire protection may be compromised.
Notes: Project information provided by EWR.
Justification Category
1. Safety 2. Customer
Requirements X 3. Reliability 4. Life Cycle Costs
5. Water Quality
6. Environmental 7. Financial 8. Tech./Product
Dev.
16 102.119-302
EPCOR WHITE ROCK WATER INC.2013 Water System Master Plan Update
Final Draft ReportNovember 2013
Project Category: Annual Programs
Primary Justification: Service Meter Accuracy
Project Name: Meter Replacement Program Project ID: P-C-72
Project Description:
There are 4,466 meters in the EWR system according to the 2012 meter records provided by EWR. It is estimated that about 60% of these meters have been replaced since 1994. The remaining 40% are estimated to be between 20 and 50 years old.
Older meters may continue to function but wear will cause them to under record resulting in loss of revenue. Industry meter quality assurance programs indicate an optimum age to replace a water meter is 30 years.
The existing meters must be read manually, by physical access to the meter chamber. The readings are manually recorded and later transcribed into the billing system.
Replacement meters have electronic touch read capability. Readings can be taken quickly without physical access to the meter chamber. The readings can be then electronically uploaded into the billing software.
Identification of the meters to be replaced new each year rests with the EWR Operations staff in White Rock.
Based on completion of current cycle of meter replacement over a 10 year period will require 178 meters per year (1,780 meters total). Allowing 38 meters per year to be replaced through redevelopment leaves 140 per year to be replaced by the current program. Historic average cost per meter replacement is $650 per meter (including overhead and labour costs, and allowing for a nominal number of large / expensive meter installs).
Once meters have been identified for replacement or upgrading, the field work is planned. Meters are purchased locally and the models selected conform to the EWR standards.
Project Justification:
1. Reduce meter under reading and non-revenue water.
2. Increase staff efficiency by reducing manual meter reading, recording and transcribing.
3. Accuracy of service meters assists in water auditing.
Engineering/Financial Evaluation:
The recommended program cost is $91,000 annually (2013 dollars) to replace 140 meters per year.
17102.119-302
EPCOR WHITE ROCK WATER INC.2013 Water System Master Plan Update
Final ReportNovember 2013
Consequences of NOT Undertaking the Project:
1. Without accurate water meters, water usage cannot be accurately determined and billing is not equitable.
2. Possible loss of revenue due to under reading meters may occur.
3. Increased operating costs due to manual access, reading, recording and transcribing will occur.
4. Reduced level of service due to infrequent readings, and errors introduced by manual reading, recording and transcribing will affect customer service expectations.
Notes: Project information provided by EWR.
Justification Category
1. Safety 2. Customer
Requirements 3. Reliability 4. Life Cycle Costs X
5. Water Quality
6. Environmental 7. Financial X 8. Tech./Product
Dev.
18 102.119-302
EPCOR WHITE ROCK WATER INC.2013 Water System Master Plan Update
Final Draft ReportNovember 2013
Project Category: Annual Programs
Primary Justification: Maintain Supply Capacity
Project Name: Well Redevelopment and Associated Work Project ID: O-C-80
Project Description:
A regular program of well redevelopment to maintain the existing wells. Re-development of one well per year is recommended (five-year cycle). Program to start in yr-2015). Based on previous well redevelopments tentative redevelopment schedule: 2015 – Well 4, 2016 - Well 2, 2017 – Well 1.
Project Justification:
1. Re-development restores lost capacity.
2. Allows for inspection of down hole components such as well pump, motor, check valve, and instrumentation and replacement or rebuild on a structured basis.
3. Provides opportunity to improve well construction to current standards including well seal, re-grading around the well, and bringing well casing above-grade (if practical).
Engineering/Financial Evaluation:
The cost opinion, based on previous well redevelopments, is $50,000 per well (yearly). Total cost $150,000.
Consequences of NOT Undertaking the Project:
1. Well capacity will de-grade, lack of regular re-development schedule may result in permanent losses in capacity and the need for drilling new wells to compensate for lost capacity.
2. Down-hole components not maintained on a pro-active basis, increased potential for failures requiring emergency repair and associated reduced reliability of supply.
3. Based on the aquifer protection plan, improvements to surface seals, instrumentation, and other related measures are required for aquifer protection. Allowances for these items are included in this project.
Justification Category
1. Safety 2. Customer
Requirements 3. Reliability X 4. Life Cycle Costs X
5. Water Quality
6. Environmental 7. Financial 8. Tech./Product
Dev.
19102.119-302
EPCOR WHITE ROCK WATER INC.2013 Water System Master Plan Update
Final ReportNovember 2013
Project Category: Annual Programs
Primary Justification: New Connections for Developments
Project Name: New Water Service Connections Project ID: X-C-81
Project Description:
New water services connections for infill housing and redevelopment. Includes water meter and backflow protection. New water services are installed by EWR at developer's cost.
Project Justification:
1. Provides water service to infill housing and redevelopment.
2. Water meter is installed to EWR standards to ensure meter reading accuracy, efficiency and staff safety.
3. Backflow preventer is installed to EWR standards to protect the water system from potential cross connections.
Engineering/Financial Evaluation:
New water service connections are installed by EWR at the developers cost.
Consequences of NOT Undertaking the Project:
Services not installed to EWR standard may increase operations costs with maintenance of non-uniform services.
Justification Category
1. Safety 2. Customer
Requirements X 3. Reliability 4. Life Cycle Costs
5. Water Quality
6. Environmental 7. Financial 8. Tech./Product
Dev.
20 102.119-302
EPCOR WHITE ROCK WATER INC.2013 Water System Master Plan Update
Final Draft ReportNovember 2013
Project Category: Capital Projects Deferred (Beyond 2017)
Primary Justification: Fire Flow Improvement
Project Name: 1400 Block Martin St. Water Main Upgrades Project ID: E-Hi-83
Project Description:
Installation of 410 meters of 200 mm diameter water main on Martin St., between North Bluff Rd. and Thrift Ave.
Project Justification:
Improves available fire flow from 180 L/s and 200 L/s to 250 L/s at hydrants #129 and #293, by replacing 410 meters of 150 mm diameter ductile iron water main.
Engineering/Financial Evaluation:
The costs are based on historical water main installation costs for EWR, with suitable allowances for administration, engineering and contingencies. The costs include an item to specifically address road restoration to the City of White Rock standards, see section 5.3 of the 2013 Water System Master Plan Update. The 2013 Class ‘C’ cost opinion for project completion is $378,000.
Consequences of NOT Undertaking the Project:
The calculated available fire flow at hydrant #129 and #293 is 180 L/s and 200 L/s, respectively (below requirement for the Town Centre Area).
Justification Category
1. Safety 2. Customer
Requirements X 3. Reliability
4. Life Cycle Costs
5. Water Quality
6. Environmental 7. Financial 8. Tech./Product
Dev.


