Embed Size (px)
Citation preview
2018 Accountability Manual
for Texas Public School Districts and Campuses
Office of Academics Performance Reporting Department
Copies of the 2018 Accountability Manual can be purchased from: Publications Distribution Office Texas Education Agency P.O. Box 13817 Austin, TX 78711-3817 [email protected] Please use the order form on the last page of this publication. Remit $12.00 for each copy for a state agency, or $14.00 for all others. The cost includes mailing and handling charges. Inventory of this publication is not guaranteed. This publication can also be accessed and downloaded free of charge from the Texas Education Agency website at http://tea.texas.gov/2018accountabilitymanual.aspx. Copyright © Notice: The materials are copyrighted © and trademarked ™ as the property of the Texas Education Agency (TEA) and may not be reproduced without the express written permission of TEA, except under the following conditions: 1. Texas public school districts, charter schools, and Education Service Centers may reproduce
and use copies of the Materials and Related Materials for the districts’ and schools’ educational use without obtaining permission from TEA.
2. Residents of the state of Texas may reproduce and use copies of the Materials and Related Materials for individual personal use only without obtaining written permission of TEA.
3. Any portion reproduced must be reproduced in its entirety and remain unedited, unaltered and unchanged in any way.
4. No monetary charge can be made for the reproduced materials or any document containing them; however, a reasonable charge to cover only the cost of reproduction and distribution may be charged.
Private entities or persons located in Texas that are not Texas public school districts, Texas Education Service Centers, or Texas charter schools or any entity, whether public or private, educational or non-educational, located outside the state of Texas must obtain written approval from TEA and will be required to enter into a license agreement that may involve the payment of a licensing fee or a royalty. For information contact Office of Copyrights, Trademarks, License Agreements, and Royalties, Texas Education Agency, 1701 N. Congress Ave., Austin, TX 78701-1494; phone: (512) 463-9270 or (512) 463-7822; Email: [email protected].
TableofContentsChapter1—2018AccountabilityOverview.............................................................................................................3
AboutthisManual..............................................................................................................................................................3
AccountabilityAdvisoryGroups...................................................................................................................................3
Overviewofthe2018AccountabilitySystem.........................................................................................................3
WhoisRated?.......................................................................................................................................................................4
RatingLabels........................................................................................................................................................................4
2018AccountabilitySystemSchoolTypes..............................................................................................................5
AccountabilitySubsetRule.............................................................................................................................................7
STAARRetestPerformance............................................................................................................................................7
EnsuringDataIntegrity....................................................................................................................................................9
LocalAccountabilitySystems......................................................................................................................................10
Chapter2—StudentAchievementDomain...........................................................................................................11
STAARComponent...........................................................................................................................................................11
College,Career,andMilitaryReadinessComponent.........................................................................................12
GraduationRate(orAnnualDropoutRate)Component..................................................................................15
AlternativeEducationAccountabilityModifications.........................................................................................17
StudentAchievementDomainRatingCalculation..............................................................................................17
Chapter3—SchoolProgressDomain.......................................................................................................................21
SchoolProgress,PartA:AcademicGrowth............................................................................................................21
SchoolProgress,PartB:RelativePerformance....................................................................................................25
SchoolProgressDomainRatingCalculation.........................................................................................................26
Chapter4—ClosingtheGapsDomain......................................................................................................................27
AcademicAchievementComponent.........................................................................................................................29
AcademicGrowthComponents..................................................................................................................................30
FederalGraduationStatus............................................................................................................................................30
EnglishLanguageProficiencyComponent.............................................................................................................31
SchoolQualityorStudentSuccessComponent....................................................................................................32
ParticipationStatus..........................................................................................................................................................35
CalculatingaClosingtheGapsDomainScore.......................................................................................................37
IdentificationofSchoolsforImprovement............................................................................................................39
2018ClosingtheGapsPerformanceTargets........................................................................................................40
TableofContents iii
Chapter5—Calculating2018Ratings......................................................................................................................41
2018DistrictRatings.......................................................................................................................................................41
ScalingProcesses..............................................................................................................................................................41
2018CampusRatings.....................................................................................................................................................43
ScalingProcesses..............................................................................................................................................................43
2018DistrictCutScoresforScalingConversion.................................................................................................45
DistrictScalingTables....................................................................................................................................................45
2018CampusCutScoresforScalingConversion................................................................................................47
CampusScalingTables...................................................................................................................................................47
HowtoConverttoaScaledScore..............................................................................................................................49
Chapter6—DistinctionDesignations......................................................................................................................57
DistinctionDesignationLabels...................................................................................................................................57
CampusComparisonGroups........................................................................................................................................57
Chapter7—OtherAccountabilitySystemProcesses......................................................................................67
Pairing...................................................................................................................................................................................67
AEAProvisions..................................................................................................................................................................68
Chapter8—AppealingtheRatings............................................................................................................................73
AppealsProcessOverviewandCalendar................................................................................................................73
GeneralConsiderations..................................................................................................................................................74
HowtoSubmitanAppeal..............................................................................................................................................77
HowanAppealisProcessedbytheAgency...........................................................................................................81
RelationshiptotheFederalAccountabilityIndicators,PBMAS,andTAIS................................................82
Chapter9—ResponsibilitesandConsequences................................................................................................83
StateResponsibilities......................................................................................................................................................83
LocalResponsibilities.....................................................................................................................................................83
Chapter10—HurricaneHarvey..................................................................................................................................87
Chapter11—AccountabilityCalendar....................................................................................................................91
AppendixA—Acknowledgements.............................................................................................................................95
AppendixB—ESCContacts............................................................................................................................................99
AppendixC—StatutoryReferences........................................................................................................................101
AppendixD—AccountabilityGlossary.................................................................................................................103
AppendixE—CampusComparisionGroups......................................................................................................107
AppendixF—PublicandConfidentialReports................................................................................................111
AppendixG—InclusionorExclusionofData....................................................................................................115
AppendixH—DataSources........................................................................................................................................117
AppendixI—ScalingResources...............................................................................................................................171
iv TableofContents
2018 Accountability Manual Chapters 1–11

This page is intentionally blank.
2018 Accountability Manual
Chapter 1—2018 Accountability Overview 3
Chapter 1—2018 Accountability Overview
About this Manual The 2018 Accountability Manual is a technical guide that explains how the Texas Education Agency (TEA) uses the accountability system to evaluate the academic performance of Texas public schools. The manual describes the accountability system and explains how information from different sources is used to calculate and assign accountability ratings and award distinction designations.
The 2018 Accountability Manual attempts to address all possible scenarios; however, because of the number and diversity of districts and campuses in Texas, there could be unforeseen circumstances that are not anticipated in the manual. If a data source used to determine district or campus performance is unintentionally affected by unforeseen circumstances, including natural disasters or test administration issues, the commissioner of education will consider those circumstances and their impact in determining whether or how that data source will be used to assign accountability ratings and award distinction designations. In such instances, the commissioner will interpret the manual as needed to assign the appropriate ratings and/or award distinction designations that preserve both the intent and the integrity of the accountability system.
Accountability Advisory Groups Educators, school board members, business and community representatives, professional organizations, and legislative representatives from across the state have been instrumental in developing the current accountability system.
Accountability Technical Advisory Committee (ATAC) includes representatives from school districts, charter schools, and regional education service centers (ESCs). Members made recommendations to address technical issues for 2018 accountability.
Accountability Policy Advisory Committee (APAC) includes representatives from legislative offices, school districts, charter schools, and the business community. Members identified issues critical to the accountability system and reviewed the ATAC recommendations. The APAC either endorsed the ATAC recommendations or developed its own, which were forwarded to the commissioner. The commissioner considered all proposals and released the House Bill 22 2018 Accountability Decisions Framework on April 10, 2018, which is reflected in this manual.
The accountability development proposals and supporting materials that were reviewed and discussed at each advisory group meeting are available online at http://tea.texas.gov/2018AccountabilityDevelopment/.
Overview of the 2018 Accountability System The overall design of the accountability system evaluates performance according to three domains:
Student Achievement evaluates performance across all subjects for all students, on both general and alternate assessments, College, Career, and Military Readiness (CCMR) indicators, and graduation rates.
School Progress measures district and campus outcomes in two areas: the number of students that grew at least one year academically (or are on track) as measured by STAAR results and the achievement of all students relative to districts or campuses with similar economically disadvantaged percentages.
Closing the Gaps uses disaggregated data to demonstrate differentials among racial/ethnic groups, socioeconomic backgrounds and other factors. The indicators included in this domain, as well as the
2018 Accountability Manual
4 Chapter 1—2018 Accountability Overview
domain’s construction, align the state accountability system with the Every Student Succeeds Act (ESSA).
Who is Rated? Districts and campuses with students enrolled in the fall of the 2017–18 school year are assigned a state accountability rating.
Districts Beginning the first year they report fall enrollment, school districts and charter schools are rated based on the aggregate results of students in their campuses. Districts without any students enrolled in the grades for which STAAR assessments are administered (3–12) are assigned the rating label of Not Rated.
State-administered school districts, including Texas School for the Blind and Visually Impaired, Texas School for the Deaf, Texas Juvenile Justice Department, and Windham School District are not assigned a state accountability rating.
Campuses Beginning the first year they report fall enrollment, campuses and open-enrollment charter schools, including alternative education campuses (AECs), are rated based on the performance of their students. For the purposes of assigning accountability ratings, campuses that do not serve any grade level for which the STAAR assessments are administered are paired with campuses in their district that serve students who take STAAR. Please see “Chapter 7—Other Accountability System Processes” for information on pairing.
Rating Labels Districts and campuses receive an overall rating, as well as a rating for each domain. The 2018 rating labels for districts and campuses are as follows.
Districts • A, B, C, or D: Assigned for overall performance and for performance in each domain to districts
(including those evaluated under alternative education accountability [AEA]) that meet the performance target for the letter grade
• F: Assigned for overall performance and for performance in each domain to districts (including AEAs) that do not meet the performance target to earn at least a D
• Not Rated: Assigned to districts that—under certain, specific circumstances—do not receive a rating
Single-Campus Districts A school district or charter school comprised of only one campus that shares the same 2018 performance data with its only campus must meet the performance targets required for the campus in order to demonstrate acceptable performance. For these single-campus school districts and charter schools, the 2018 performance targets applied to the campus are also applied to the district, ensuring that both the district and campus receive identical ratings. Single-campus districts receive either a Met Standard or Improvement Required rating for 2018 to align with the campus rating. School districts or charter schools that meet the definition above are considered single-campus districts or charter schools in any criteria outlined in this manual.
2018 Accountability Manual
Chapter 1—2018 Accountability Overview 5
Campuses • Met Standard: Assigned for overall performance and for performance in each domain to
campuses that meet the performance targets
• Improvement Required: Assigned for overall performance and for performance in each domain to campuses (including AECs) that do not meet the performance targets
• Met Alternative Standard: Assigned for overall performance and for performance in each domain to alternative education campuses evaluated under AEA provisions that meet the performance targets
• Not Rated: Assigned to campuses that—under certain, specific circumstances—do not receive a rating
In a few specific circumstances, a district or campus does not receive a rating. When this occurs, a district or campus is given one of the following labels.
Not Rated indicates that a district or campus does not receive a rating for one or more of the following reasons:
• The district or campus has no data in the accountability subset. • The district or campus has insufficient data to assign a rating. • The district operates only residential facilities. • The campus is a Juvenile Justice Alternative Education Program (JJAEP). • The campus is a Disciplinary Alternative Education Program (DAEP). • The campus is a residential facility. • The commissioner otherwise determines that the district or campus will not be rated. Not Rated: Data Integrity Issues indicates data accuracy or integrity have compromised performance results, making it impossible to assign a rating. The assignment of a Not Rated: Data Integrity Issues label may be permanent or temporary pending investigation.
Not Rated: Annexation indicates that the campus is in its first school year after annexation by another district and, therefore, is not rated, as allowed by the annexation agreement with the agency.
Distinction Designations Campuses that receive an accountability rating of Met Standard are eligible to earn distinction designations. Distinction designations are awarded for achievement in several areas and are based on performance relative to a group of campuses of similar type, size, grade span, and student demographics. The distinction designation indicators are typically separate from those used to assign accountability ratings. Districts that receive a rating of A, B, C, or D are eligible for a distinction designation in postsecondary readiness. Please see “Chapter 6—Distinction Designations” for more information.
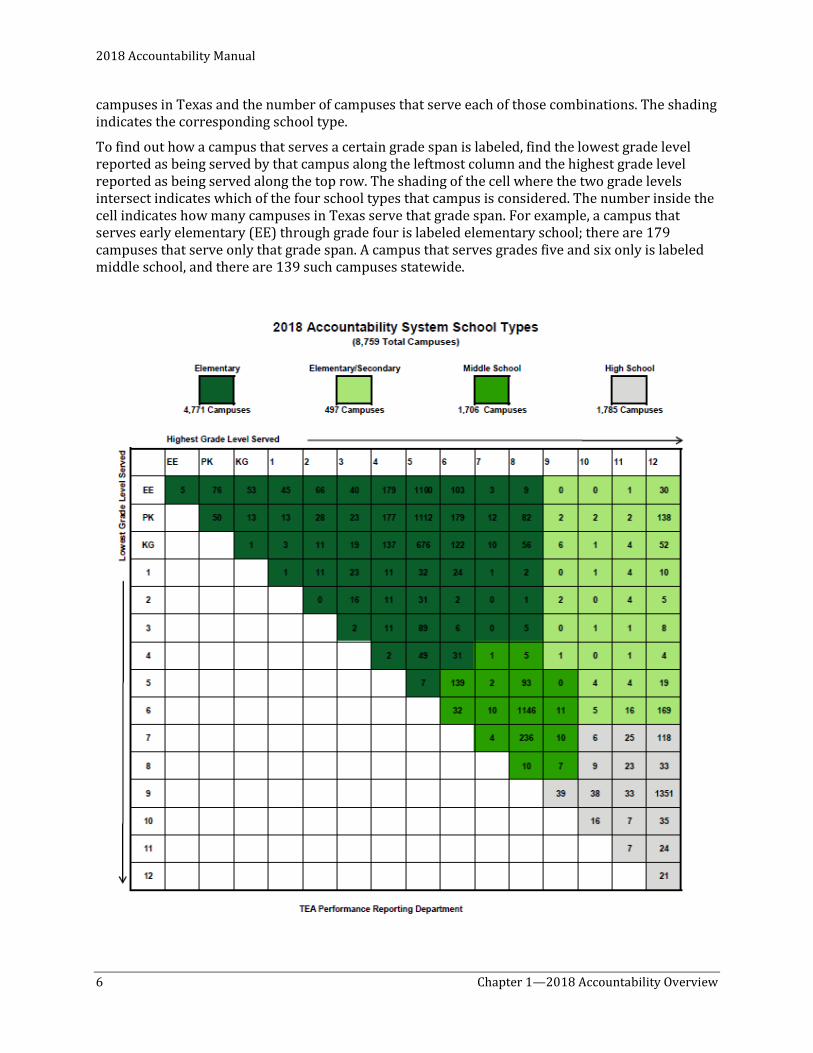
2018 Accountability System School Types Every campus is labeled as one of four school types according to its grade span based on 2017–18 enrollment data reported in the fall TSDS PEIMS submission. The four types—elementary school, middle school, elementary/secondary (also referred to as K–12), and high school—are illustrated by the table on the following page. The table shows every combination of grade levels served by
2018 Accountability Manual
6 Chapter 1—2018 Accountability Overview
campuses in Texas and the number of campuses that serve each of those combinations. The shading indicates the corresponding school type.
To find out how a campus that serves a certain grade span is labeled, find the lowest grade level reported as being served by that campus along the leftmost column and the highest grade level reported as being served along the top row. The shading of the cell where the two grade levels intersect indicates which of the four school types that campus is considered. The number inside the cell indicates how many campuses in Texas serve that grade span. For example, a campus that serves early elementary (EE) through grade four is labeled elementary school; there are 179 campuses that serve only that grade span. A campus that serves grades five and six only is labeled middle school, and there are 139 such campuses statewide.
2018 Accountability Manual
Chapter 1—2018 Accountability Overview 7
2018 STAAR-Based Indicators Accountability Subset Rule A subset of assessment results is used to calculate each domain. The calculation includes only assessment results for students enrolled in the district or campus in a previous fall, as reported on the TSDS PEIMS October snapshot. Three assessment administration periods are considered for accountability purposes:
STAAR results are included in the subset of district/campus accountability
if the student was enrolled in the district/campus on this date:
EOC summer 2017 administration Fall 2016 enrollment snapshot EOC fall 2017 administration
Fall 2017 enrollment snapshot EOC spring 2018 administration Grades 3–8 spring 2018 administration
The 2018 accountability subset rules apply to the STAAR performance results evaluated across all three domains.
• Grades 3–8: districts and campuses are responsible for students reported as enrolled in the fall (referred to as October snapshot) in the spring assessment results.
• End-of-Course (EOC): districts and campuses are responsible for o summer 2017 results for students reported as enrolled in fall 2016 snapshot; o fall 2017 results for students reported as enrolled in the fall 2017 snapshot; and o spring 2018 results for students reported as enrolled in the fall 2017 snapshot.
STAAR Retest Performance The opportunity to retest is available to students who have taken grades 5 and 8 STAAR reading, mathematics, or EOC assessments in any subject.
• Student Success Initiative (SSI) – For students in grades 5 and 8, performance calculations will include assessment results for reading and mathematics from the first administration and first retest administration of all STAAR versions. The second retest administration in June 2018 is not used.
• For students in grades 5 and 8, the STAAR reading and mathematics assessment results from the first and second administration (first retest opportunity) are processed in two steps. First, the best result from both administrations is found for each subject. If all results have the same level of performance, then the most recent result is selected for calculation. The best result is found for performance and progress, considered separately. Second, the accountability subset rules determine whether the result is included in accountability.
• EOC retesters are counted as passers based on the passing standard in place when they were first eligible to take any EOC assessment.
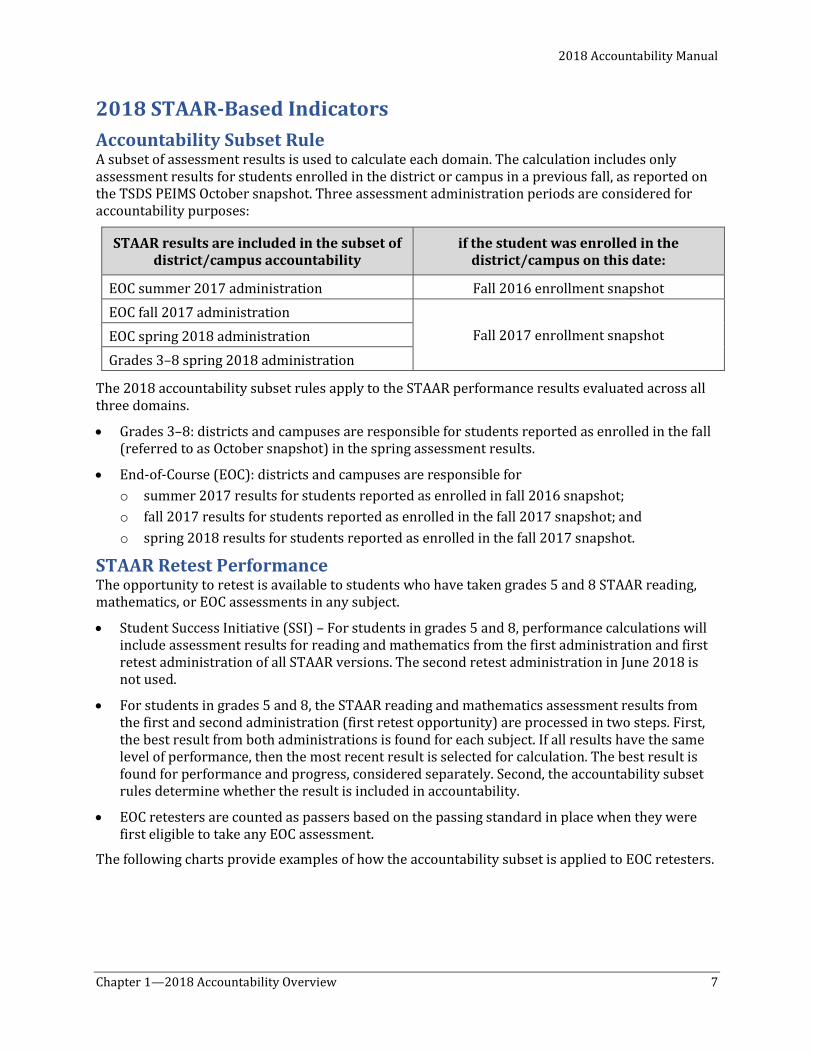
The following charts provide examples of how the accountability subset is applied to EOC retesters.
2018 Accountability Manual
8 Chapter 1—2018 Accountability Overview
Accountability Subset Examples for EOC Retesters
Enrolled Tested Enrolled Tested Tested
Fall 2016 Snapshot
Campus A
Summer 2017
Campus A
Fall 2017 Snapshot
Campus A
Fall 2017
Campus A
Spring 2018
Campus A
The best result is selected. Each result meets the accountability subset rule.
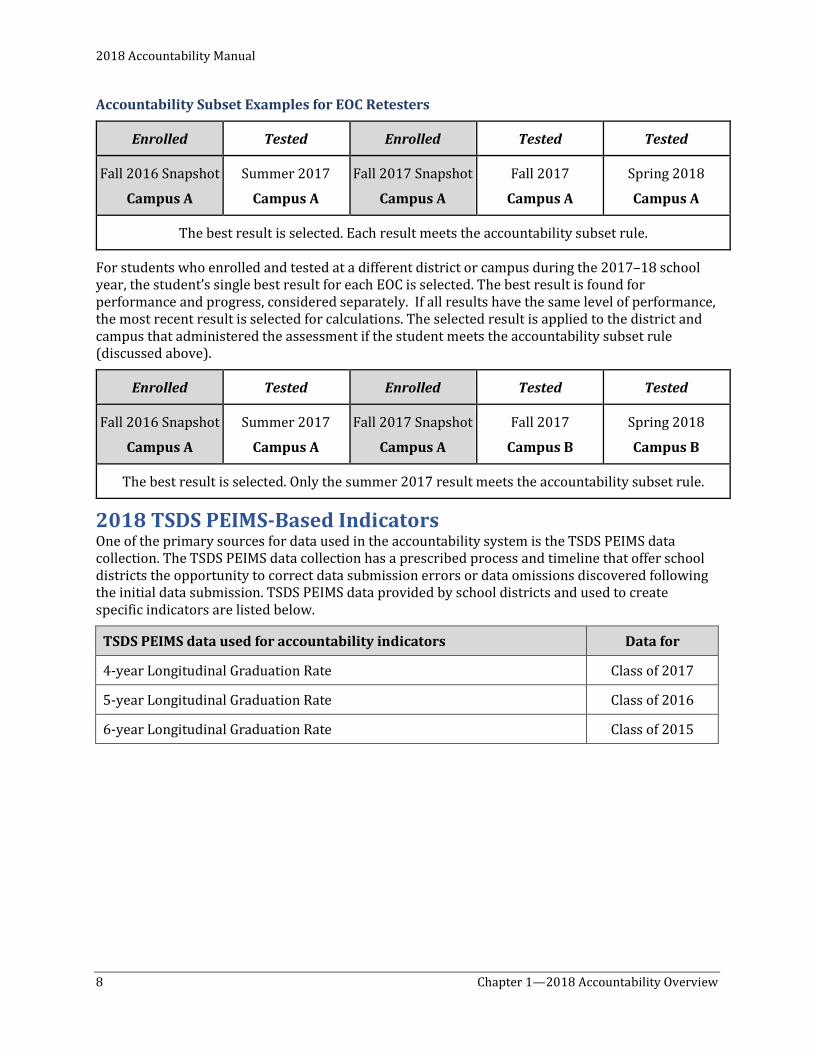
For students who enrolled and tested at a different district or campus during the 2017–18 school year, the student’s single best result for each EOC is selected. The best result is found for performance and progress, considered separately. If all results have the same level of performance, the most recent result is selected for calculations. The selected result is applied to the district and campus that administered the assessment if the student meets the accountability subset rule (discussed above).
Enrolled Tested Enrolled Tested Tested
Fall 2016 Snapshot
Campus A
Summer 2017
Campus A
Fall 2017 Snapshot
Campus A
Fall 2017
Campus B
Spring 2018
Campus B
The best result is selected. Only the summer 2017 result meets the accountability subset rule.
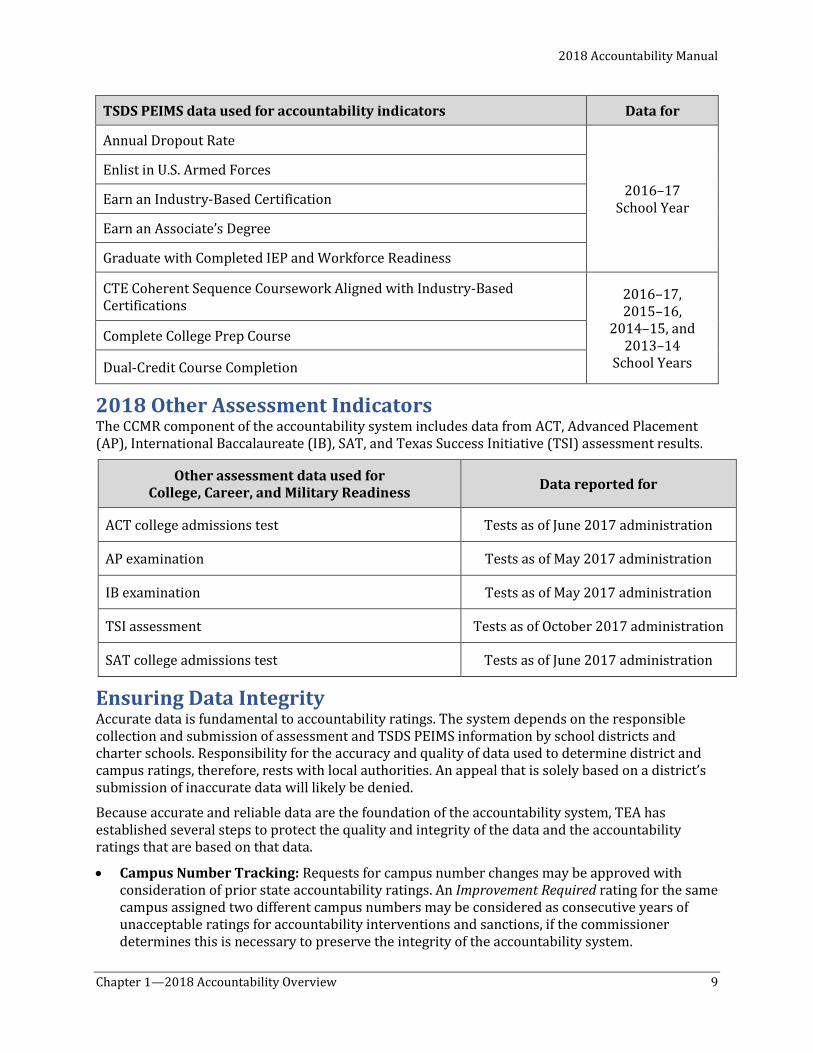
2018 TSDS PEIMS-Based Indicators One of the primary sources for data used in the accountability system is the TSDS PEIMS data collection. The TSDS PEIMS data collection has a prescribed process and timeline that offer school districts the opportunity to correct data submission errors or data omissions discovered following the initial data submission. TSDS PEIMS data provided by school districts and used to create specific indicators are listed below.
TSDS PEIMS data used for accountability indicators Data for
4-year Longitudinal Graduation Rate Class of 2017
5-year Longitudinal Graduation Rate Class of 2016
6-year Longitudinal Graduation Rate Class of 2015
2018 Accountability Manual
Chapter 1—2018 Accountability Overview 9
TSDS PEIMS data used for accountability indicators Data for
Annual Dropout Rate
2016–17 School Year
Enlist in U.S. Armed Forces
Earn an Industry-Based Certification
Earn an Associate’s Degree
Graduate with Completed IEP and Workforce Readiness
CTE Coherent Sequence Coursework Aligned with Industry-Based Certifications
2016–17, 2015–16,
2014–15, and 2013–14
School Years
Complete College Prep Course
Dual-Credit Course Completion
2018 Other Assessment Indicators The CCMR component of the accountability system includes data from ACT, Advanced Placement (AP), International Baccalaureate (IB), SAT, and Texas Success Initiative (TSI) assessment results.
Other assessment data used for College, Career, and Military Readiness Data reported for
ACT college admissions test Tests as of June 2017 administration
AP examination Tests as of May 2017 administration
IB examination Tests as of May 2017 administration
TSI assessment Tests as of October 2017 administration
SAT college admissions test Tests as of June 2017 administration
Ensuring Data Integrity Accurate data is fundamental to accountability ratings. The system depends on the responsible collection and submission of assessment and TSDS PEIMS information by school districts and charter schools. Responsibility for the accuracy and quality of data used to determine district and campus ratings, therefore, rests with local authorities. An appeal that is solely based on a district’s submission of inaccurate data will likely be denied.
Because accurate and reliable data are the foundation of the accountability system, TEA has established several steps to protect the quality and integrity of the data and the accountability ratings that are based on that data.
• Campus Number Tracking: Requests for campus number changes may be approved with consideration of prior state accountability ratings. An Improvement Required rating for the same campus assigned two different campus numbers may be considered as consecutive years of unacceptable ratings for accountability interventions and sanctions, if the commissioner determines this is necessary to preserve the integrity of the accountability system.
2018 Accountability Manual
10 Chapter 1—2018 Accountability Overview
• Data Validation Monitoring: The Performance-Based Monitoring Analysis System (PBMAS) is a comprehensive system designed to improve student performance and program effectiveness. The PBMAS, like the state accountability system, is a data-driven system based on data submitted by districts; therefore, the integrity of districts’ data is critical. The PBMAS includes annual data validation analyses that examine districts’ leaver and dropout data, student assessment data, and discipline data. Districts identified with potential data integrity concerns engage in a process to either validate the accuracy of their data or determine that erroneous data were submitted. This process is fundamental to the integrity of all the agency’s evaluation systems. For more information, see the Data Validation Manuals on the PBM website at http://tea.texas.gov/pbm/DVManuals.aspx.
• Test Security: As part of ongoing efforts to improve security measures surrounding the assessment program, TEA uses a comprehensive set of test security procedures designed to assure parents, students, and the public that assessment results are meaningful and valid. Among other measures, districts are required to implement seating charts during all administrations, conduct annual training for all testing personnel, and maintain certain test administration materials for five years. Detailed information about test security policies for the state assessment program is available online at http://tea.texas.gov/student.assessment/security/.
• Not Rated: Data Integrity Issues: This rating is used when the accuracy and/or integrity of performance results have been compromised, preventing the assignment of a rating. This label may be assigned temporarily pending an on-site investigation or may be the final rating for the year. It is not equivalent to an F or an Improvement Required rating, though the commissioner of education has the authority to lower a rating, assign an F or an Improvement Required rating due to data quality issues. A Not Rated rating does not break the chain of consecutive years of unacceptable accountability ratings for accountability sanctions and interventions purposes. All districts and campuses with a final rating label of Not Rated: Data Integrity Issues are automatically subject to desk audits the following year.
These steps can occur either before or after the ratings release, and sanctions can be imposed at any time. To the extent possible, ratings for the year are finalized when updated ratings are released following the resolution of appeals. A rating change resulting from an imposed sanction will stand as the final rating for the year.
Local Accountability Systems House Bill 22 (85th Texas Legislature, Regular Session, 2017) established Local Accountability Systems, which allow districts and charter schools to develop plans to locally evaluate their campuses. Once a plan receives approval from the agency, districts and charter schools may use locally developed domains and indicators with the three state-mandated domains to assign ratings for campuses that meet certain criteria.
The integration of Local Accountability Systems will come in stages. The agency is overseeing a small-scale pilot program for the 2017–18 academic year. This pilot program will inform the full roll out of the local accountability system option. Additional information will be released during the 2018–19 academic year.
2018 Accountability Manual
Chapter 2—Student Achievement Domain 11
Chapter 2—Student Achievement Domain
Overview The Student Achievement domain evaluates district and campus performance based on student achievement in three areas: performance on STAAR assessments, College, Career, and Military Readiness (CCMR) indicators, and graduation rates.
STAAR Component The STAAR component of the Student Achievement domain calculation uses a methodology in which scores are calculated based on students’ level of performance at Approaches Grade Level or above, Meets Grade Level or above, and Masters Grade Level standards.
STAAR Component—Assessments Evaluated The Student Achievement domain evaluates STAAR (with and without accommodations) and STAAR Alternate 2 assessment results for grades 3–8 and end-of-course in all subject areas.
Standard STAAR Assessments (with and without accommodations) STAAR Alternate 2 Assessments
Approaches Grade Level or above Approaches Grade Level or above Level II Satisfactory or above
Meets Grade Level or above Meets Grade Level or above Level II Satisfactory or above
Masters Grade Level Masters Grade Level Level III Accomplished
STAAR Component—Substitute Assessments Qualifying results on substitute assessments are included in the Student Achievement domain at the Meets Grade Level standard. The required equivalency standards for the eligible substitute assessment are found in 19 Texas Administrative Code (TAC), §101.4002, available online at https://www.sos.texas.gov/texreg/archive/July212017/Adopted%20Rules/19.EDUCATION.html.
STAAR Component—Students Evaluated All students, including English learners (ELs) as described below, are evaluated as one group.
STAAR Component—Inclusion of English Learners ELs who are year one in U.S. schools are excluded from accountability performance calculations. Due to changes to the Texas English Language Proficiency Assessment System (TELPAS), Texas requested a waiver from the U.S. Department of Education to exclude EL students who are year two in U.S. schools from 2018 performance calculations. If granted, ELs who are in their second year in U.S. schools will be included in accountability for 2019 and beyond. If denied, ELs who are in their second year in U.S. schools will be included in accountability for 2018. STAAR Alternate 2 assessment results will be included regardless of an EL’s years in U.S. schools.
Unschooled asylees, unschooled refugees, and students with interrupted formal education (SIFEs) are not included in state accountability until their sixth year of enrollment in U.S. schools.
2018 Accountability Manual
12 Chapter 2—Student Achievement Domain
STAAR Component—Minimum Size Criteria and Small Numbers Analysis • All students are evaluated in the STAAR component if there are 10 or more STAAR assessments,
combined across all subjects. • Small numbers analysis is not used in the STAAR component.
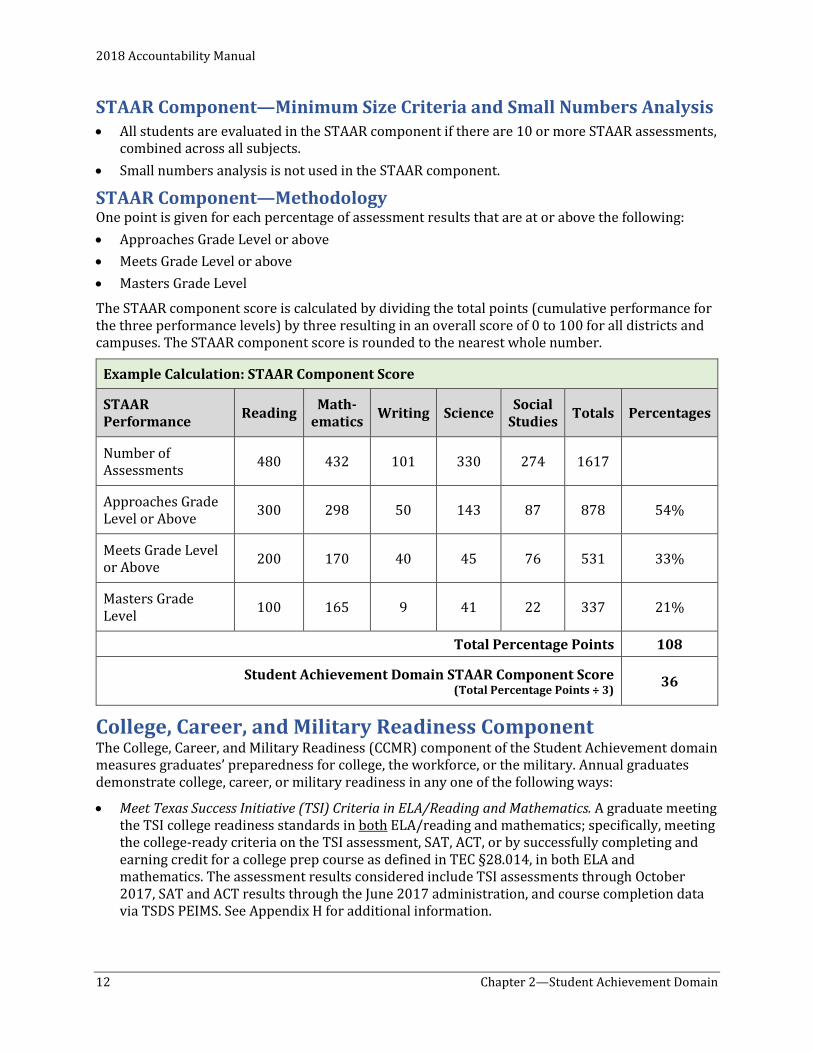
STAAR Component—Methodology One point is given for each percentage of assessment results that are at or above the following: • Approaches Grade Level or above • Meets Grade Level or above • Masters Grade Level
The STAAR component score is calculated by dividing the total points (cumulative performance for the three performance levels) by three resulting in an overall score of 0 to 100 for all districts and campuses. The STAAR component score is rounded to the nearest whole number.
Example Calculation: STAAR Component Score
STAAR Performance Reading Math-
ematics Writing Science Social Studies Totals Percentages
Number of Assessments 480 432 101 330 274 1617
Approaches Grade Level or Above 300 298 50 143 87 878 54%
Meets Grade Level or Above 200 170 40 45 76 531 33%
Masters Grade Level 100 165 9 41 22 337 21%
Total Percentage Points 108
Student Achievement Domain STAAR Component Score (Total Percentage Points ÷ 3) 36
College, Career, and Military Readiness Component The College, Career, and Military Readiness (CCMR) component of the Student Achievement domain measures graduates’ preparedness for college, the workforce, or the military. Annual graduates demonstrate college, career, or military readiness in any one of the following ways:
• Meet Texas Success Initiative (TSI) Criteria in ELA/Reading and Mathematics. A graduate meeting the TSI college readiness standards in both ELA/reading and mathematics; specifically, meeting the college-ready criteria on the TSI assessment, SAT, ACT, or by successfully completing and earning credit for a college prep course as defined in TEC §28.014, in both ELA and mathematics. The assessment results considered include TSI assessments through October 2017, SAT and ACT results through the June 2017 administration, and course completion data via TSDS PEIMS. See Appendix H for additional information.
2018 Accountability Manual
Chapter 2—Student Achievement Domain 13
A graduate must meet the TSI requirement for both reading and mathematics but does not necessarily need to meet them on the same assessment. For example, a graduate may meet the TSI criteria for college readiness in ELA/reading on the SAT and complete and earn credit for a college prep course in mathematics.
• Meet Criteria on Advanced Placement (AP)/International Baccalaureate (IB) Examination. Agraduate meeting the criterion score on an AP or IB examination in any subject area. Criterionscore is 3 or more for AP and 4 or more for IB.
• Earn Dual Course Credits. A graduate completing and earning credit for at least three credithours in ELA or mathematics or at least nine credit hours in any subject. See Appendix H foradditional information.
• Enlist in the Armed Forces. A graduate enlisting in the U.S. Army, Navy, Air Force, Coast Guard, orMarines.
• Earn an Industry-Based Certification. A graduate earning an industry-based certification under19 TAC §74.1003.
• Earn an Associate’s Degree. A graduate earning an associate’s degree while in high school.
• Graduate with Completed IEP and Workforce Readiness. A graduate receiving a graduation typecode of 04, 05, 54, or 55 which indicates the student has completed his/her IEP and has eitherdemonstrated self-employment with self-help skills to maintain employment or hasdemonstrated mastery of specific employability and self-help skills that do not require publicschool services.
• CTE Coherent Sequence Coursework Aligned with Industry-Based Certifications. A CTE coherentsequence graduate who has completed and received credit for at least one CTE course alignedwith an industry-based certification. This indicator will award one-half point only for graduateswho have met no other CCMR indicator. These graduates will receive one-half point credit forcoursework completed toward an industry-based certification. The list of CTE courses alignedwith industry-based certifications is provided at the end of this chapter.
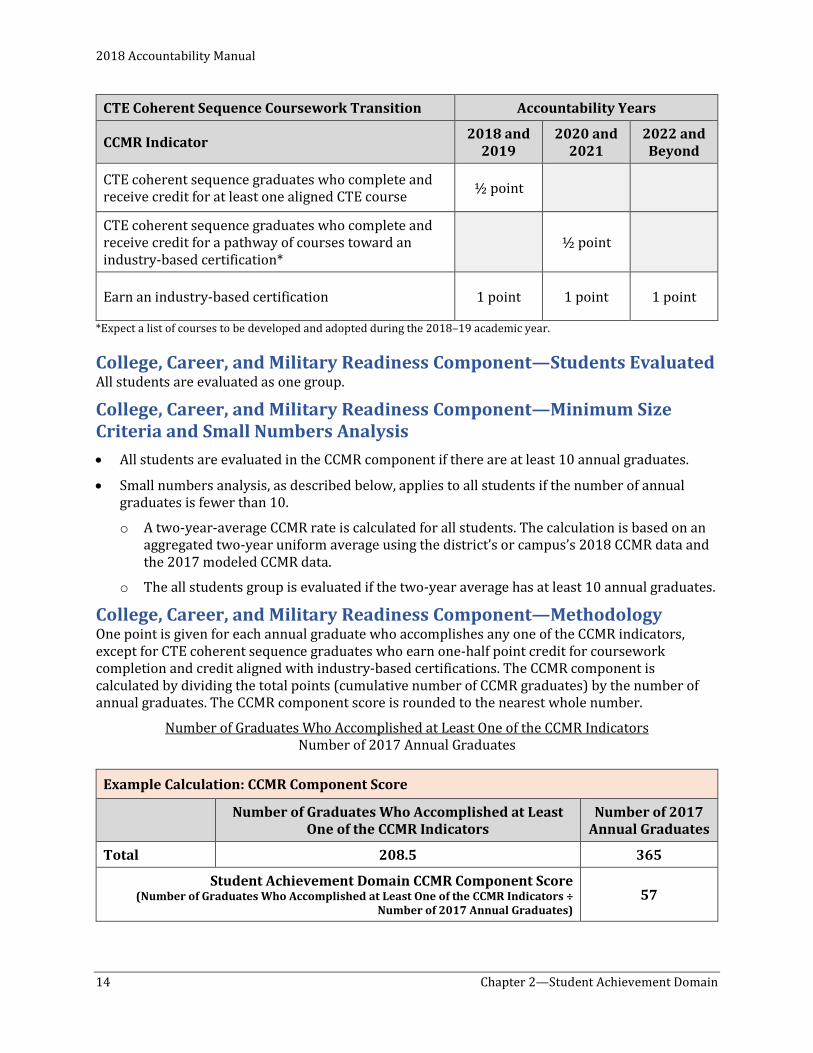
CTE Coherent Sequence Coursework Transition In 2018 accountability, CTE coherent sequence graduates who complete and receive credit for at least one CTE course aligned with an industry-based certification will receive one-half point in the CCMR component calculation. This indicator will award one-half point only for graduates who have met no other CCMR indicator. The following chart details a five-year transition from CTE coherent sequence coursework to industry-based certification. The list of 73 industry-based certifications is found in 19 TAC §74.1003, available online at https://tea.texas.gov/Industry_Based_Certifications.pdf.
2018 Accountability Manual
14 Chapter 2—Student Achievement Domain
*Expect a list of courses to be developed and adopted during the 2018–19 academic year.
College, Career, and Military Readiness Component—Students Evaluated All students are evaluated as one group.
College, Career, and Military Readiness Component—Minimum Size Criteria and Small Numbers Analysis • All students are evaluated in the CCMR component if there are at least 10 annual graduates.
• Small numbers analysis, as described below, applies to all students if the number of annual graduates is fewer than 10.
o A two-year-average CCMR rate is calculated for all students. The calculation is based on an aggregated two-year uniform average using the district’s or campus’s 2018 CCMR data and the 2017 modeled CCMR data.
o The all students group is evaluated if the two-year average has at least 10 annual graduates.
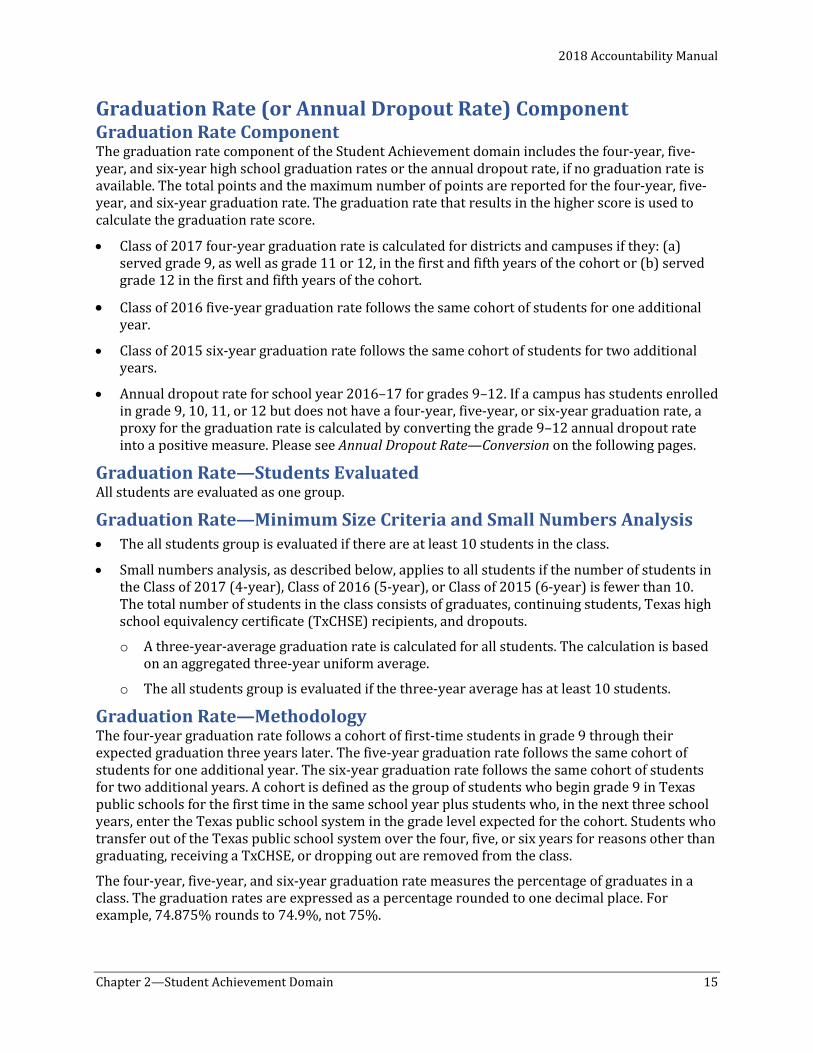
College, Career, and Military Readiness Component—Methodology One point is given for each annual graduate who accomplishes any one of the CCMR indicators, except for CTE coherent sequence graduates who earn one-half point credit for coursework completion and credit aligned with industry-based certifications. The CCMR component is calculated by dividing the total points (cumulative number of CCMR graduates) by the number of annual graduates. The CCMR component score is rounded to the nearest whole number.
Number of Graduates Who Accomplished at Least One of the CCMR Indicators Number of 2017 Annual Graduates
Example Calculation: CCMR Component Score
Number of Graduates Who Accomplished at Least One of the CCMR Indicators
Number of 2017 Annual Graduates
Total 208.5 365
Student Achievement Domain CCMR Component Score (Number of Graduates Who Accomplished at Least One of the CCMR Indicators ÷
Number of 2017 Annual Graduates) 57
CTE Coherent Sequence Coursework Transition Accountability Years
CCMR Indicator 2018 and 2019
2020 and 2021
2022 and Beyond
CTE coherent sequence graduates who complete and receive credit for at least one aligned CTE course ½ point
CTE coherent sequence graduates who complete and receive credit for a pathway of courses toward an industry-based certification*
½ point
Earn an industry-based certification 1 point 1 point 1 point
2018 Accountability Manual
Chapter 2—Student Achievement Domain 15
Graduation Rate (or Annual Dropout Rate) Component Graduation Rate Component The graduation rate component of the Student Achievement domain includes the four-year, five-year, and six-year high school graduation rates or the annual dropout rate, if no graduation rate is available. The total points and the maximum number of points are reported for the four-year, five-year, and six-year graduation rate. The graduation rate that results in the higher score is used to calculate the graduation rate score.
• Class of 2017 four-year graduation rate is calculated for districts and campuses if they: (a) served grade 9, as well as grade 11 or 12, in the first and fifth years of the cohort or (b) served grade 12 in the first and fifth years of the cohort.
• Class of 2016 five-year graduation rate follows the same cohort of students for one additional year.
• Class of 2015 six-year graduation rate follows the same cohort of students for two additional years.
• Annual dropout rate for school year 2016–17 for grades 9–12. If a campus has students enrolled in grade 9, 10, 11, or 12 but does not have a four-year, five-year, or six-year graduation rate, a proxy for the graduation rate is calculated by converting the grade 9–12 annual dropout rate into a positive measure. Please see Annual Dropout Rate—Conversion on the following pages.
Graduation Rate—Students Evaluated All students are evaluated as one group.
Graduation Rate—Minimum Size Criteria and Small Numbers Analysis • The all students group is evaluated if there are at least 10 students in the class.
• Small numbers analysis, as described below, applies to all students if the number of students in the Class of 2017 (4-year), Class of 2016 (5-year), or Class of 2015 (6-year) is fewer than 10. The total number of students in the class consists of graduates, continuing students, Texas high school equivalency certificate (TxCHSE) recipients, and dropouts.
o A three-year-average graduation rate is calculated for all students. The calculation is based on an aggregated three-year uniform average.
o The all students group is evaluated if the three-year average has at least 10 students.
Graduation Rate—Methodology The four-year graduation rate follows a cohort of first-time students in grade 9 through their expected graduation three years later. The five-year graduation rate follows the same cohort of students for one additional year. The six-year graduation rate follows the same cohort of students for two additional years. A cohort is defined as the group of students who begin grade 9 in Texas public schools for the first time in the same school year plus students who, in the next three school years, enter the Texas public school system in the grade level expected for the cohort. Students who transfer out of the Texas public school system over the four, five, or six years for reasons other than graduating, receiving a TxCHSE, or dropping out are removed from the class.
The four-year, five-year, and six-year graduation rate measures the percentage of graduates in a class. The graduation rates are expressed as a percentage rounded to one decimal place. For example, 74.875% rounds to 74.9%, not 75%.
2018 Accountability Manual
16 Chapter 2—Student Achievement Domain
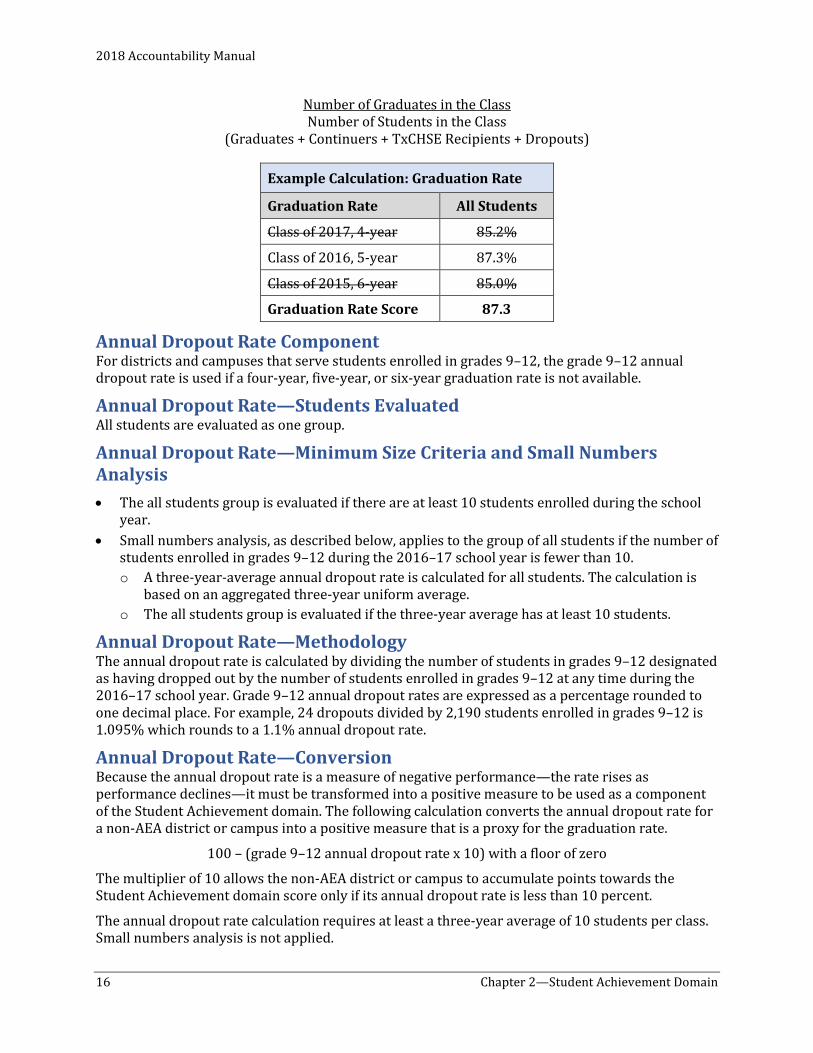
Number of Graduates in the Class Number of Students in the Class
(Graduates + Continuers + TxCHSE Recipients + Dropouts)
Example Calculation: Graduation Rate
Graduation Rate All Students
Class of 2017, 4-year 85.2%
Class of 2016, 5-year 87.3%
Class of 2015, 6-year 85.0%
Graduation Rate Score 87.3
Annual Dropout Rate Component For districts and campuses that serve students enrolled in grades 9–12, the grade 9–12 annual dropout rate is used if a four-year, five-year, or six-year graduation rate is not available.
Annual Dropout Rate—Students Evaluated All students are evaluated as one group.
Annual Dropout Rate—Minimum Size Criteria and Small Numbers Analysis • The all students group is evaluated if there are at least 10 students enrolled during the school
year. • Small numbers analysis, as described below, applies to the group of all students if the number of
students enrolled in grades 9–12 during the 2016–17 school year is fewer than 10. o A three-year-average annual dropout rate is calculated for all students. The calculation is
based on an aggregated three-year uniform average. o The all students group is evaluated if the three-year average has at least 10 students.
Annual Dropout Rate—Methodology The annual dropout rate is calculated by dividing the number of students in grades 9–12 designated as having dropped out by the number of students enrolled in grades 9–12 at any time during the 2016–17 school year. Grade 9–12 annual dropout rates are expressed as a percentage rounded to one decimal place. For example, 24 dropouts divided by 2,190 students enrolled in grades 9–12 is 1.095% which rounds to a 1.1% annual dropout rate.
Annual Dropout Rate—Conversion Because the annual dropout rate is a measure of negative performance—the rate rises as performance declines—it must be transformed into a positive measure to be used as a component of the Student Achievement domain. The following calculation converts the annual dropout rate for a non-AEA district or campus into a positive measure that is a proxy for the graduation rate.
100 – (grade 9–12 annual dropout rate x 10) with a floor of zero
The multiplier of 10 allows the non-AEA district or campus to accumulate points towards the Student Achievement domain score only if its annual dropout rate is less than 10 percent.
The annual dropout rate calculation requires at least a three-year average of 10 students per class. Small numbers analysis is not applied.
2018 Accountability Manual
Chapter 2—Student Achievement Domain 17
Alternative Education Accountability Modifications Alternative procedures applicable to the graduation rate and annual dropout rate calculations are provided for approved campuses and charter schools serving at-risk students in alternative education programs. For more information on the alternative education accountability (AEA) eligibility criteria, please see “Chapter 7—Other Accountability System Processes.”
AEA Graduation/Annual Dropout Rate—Methodology The graduation rate calculation is modified to credit AEA campuses and charter schools for graduates, continuing students (continuers), and TxCHSE recipients. The grade 9–12 annual dropout rate is used if no combined graduation, continuer, and TxCHSE rate is available.
Number of Graduates + Continuers + TxCHSE Recipients in the Class Number of Students in the Class
(Graduates + Continuers + TxCHSE Recipients + Dropouts)
• Class of 2017 four-year graduation, continuer, and TxCHSE rates are calculated for AEA campuses and charter schools if they: (a) served grade 9, as well as grade 11 or 12, in the first and fifth years of the cohort or (b) served grade 12 in the first and fifth years of the cohort.
• Class of 2016 five-year graduation, continuer, and TxCHSE rates follow the same cohort of students for one additional year; therefore, most AEA campuses and charter schools that have a four-year graduation, continuer, and TxCHSE rate in one year will have a five-year graduation, continuer, and TxCHSE rate for that cohort in the following year.
• Class of 2015 six-year graduation, continuer, and TxCHSE rates continue to follow the same cohort of students for one additional year; therefore, most AEA campuses and charter schools that have a five-year graduation, continuer, and TxCHSE rate in one year will have a six-year graduation, continuer, and TxCHSE rate for that cohort in the following year.
• Annual dropout rate for school year 2016–17 for grades 9–12. If an AEA charter school or campus has students enrolled in grade 9, 10, 11, or 12 but does not have a four-year, five-year, or six-year graduation, continuer, and TxCHSE rate, a proxy for the graduation rate is calculated by converting the grade 9–12 annual dropout rate into a positive measure.
AEA Annual Dropout Rate—Conversion The annual dropout rate conversion is also modified for AEA campuses and districts.
100 – (grade 9–12 annual dropout rate x 5) with a floor of zero
By using the multiplier of 5, an AEA charter or campus accumulates points towards the Student Achievement domain score if its annual dropout rate is less than 20 percent.
Student Achievement Domain Rating Calculation See “Chapter 5—Calculating 2018 Ratings” for the methodology to calculate the Student Achievement domain rating.
2018 Accountability Manual
18 Chapter 2—Student Achievement Domain
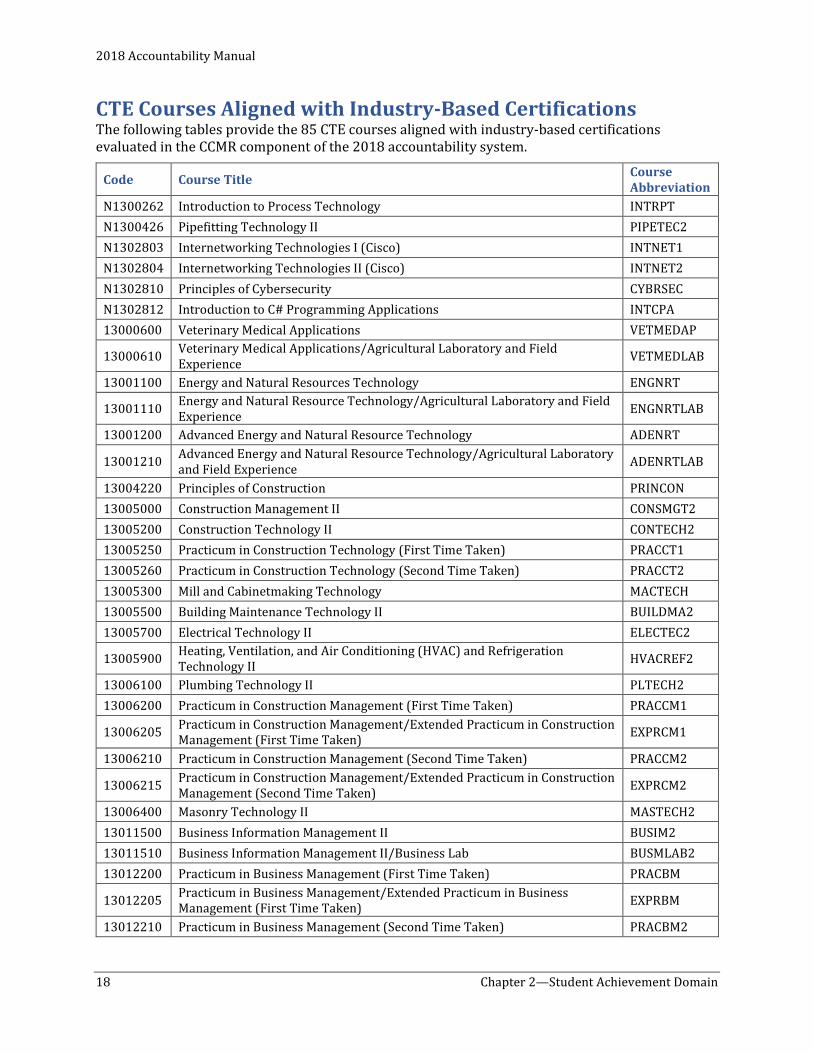
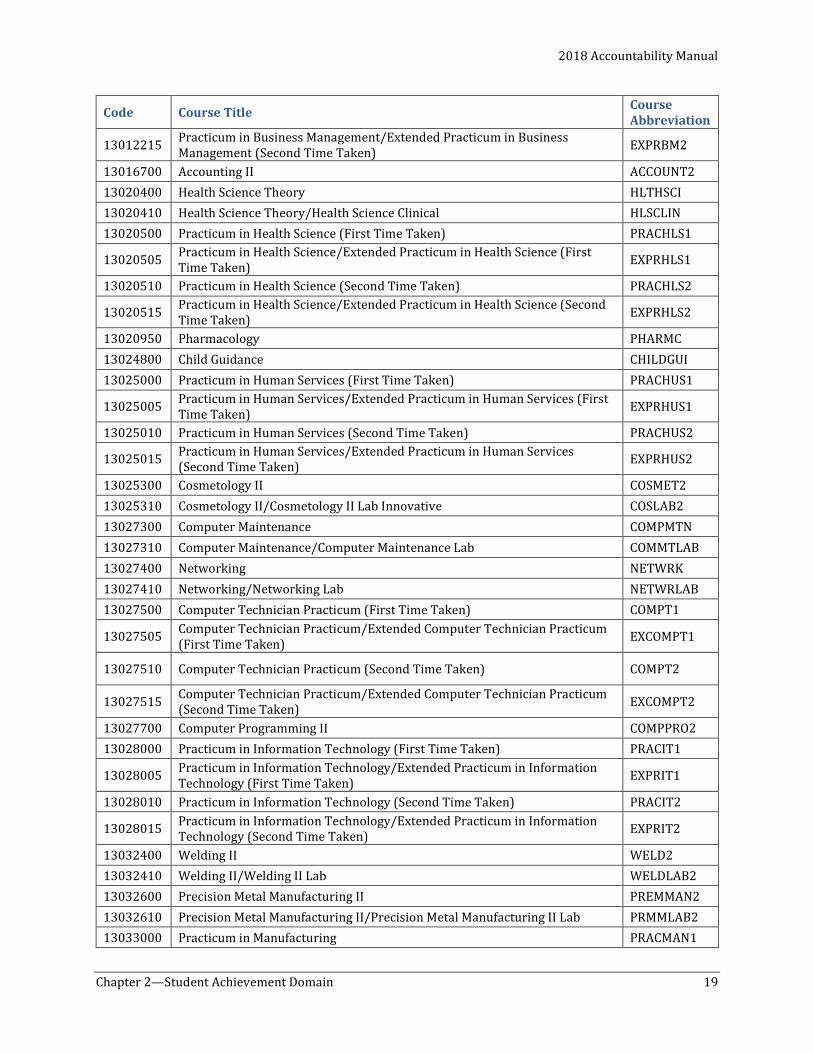
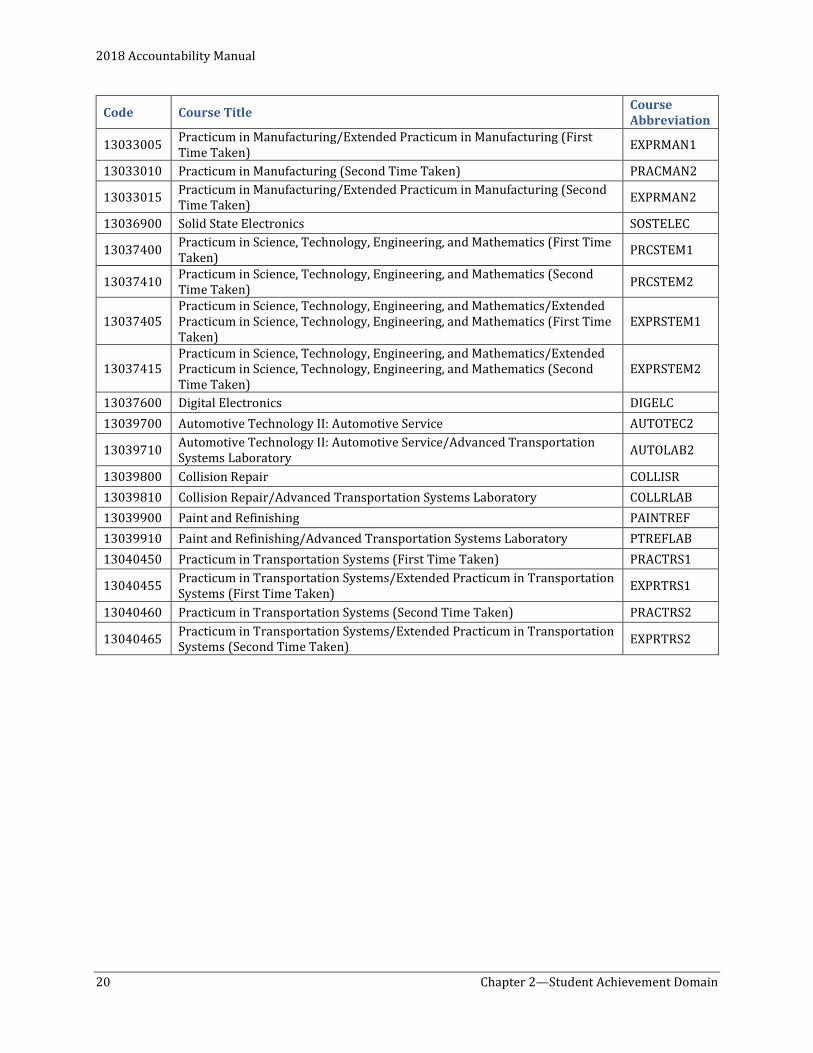
CTE Courses Aligned with Industry-Based Certifications The following tables provide the 85 CTE courses aligned with industry-based certifications evaluated in the CCMR component of the 2018 accountability system.
Code Course Title Course Abbreviation
N1300262 Introduction to Process Technology INTRPT N1300426 Pipefitting Technology II PIPETEC2 N1302803 Internetworking Technologies I (Cisco) INTNET1 N1302804 Internetworking Technologies II (Cisco) INTNET2 N1302810 Principles of Cybersecurity CYBRSEC N1302812 Introduction to C# Programming Applications INTCPA 13000600 Veterinary Medical Applications VETMEDAP
13000610 Veterinary Medical Applications/Agricultural Laboratory and Field Experience VETMEDLAB
13001100 Energy and Natural Resources Technology ENGNRT
13001110 Energy and Natural Resource Technology/Agricultural Laboratory and Field Experience ENGNRTLAB
13001200 Advanced Energy and Natural Resource Technology ADENRT
13001210 Advanced Energy and Natural Resource Technology/Agricultural Laboratory and Field Experience ADENRTLAB
13004220 Principles of Construction PRINCON 13005000 Construction Management II CONSMGT2 13005200 Construction Technology II CONTECH2 13005250 Practicum in Construction Technology (First Time Taken) PRACCT1 13005260 Practicum in Construction Technology (Second Time Taken) PRACCT2 13005300 Mill and Cabinetmaking Technology MACTECH 13005500 Building Maintenance Technology II BUILDMA2 13005700 Electrical Technology II ELECTEC2
13005900 Heating, Ventilation, and Air Conditioning (HVAC) and Refrigeration Technology II HVACREF2
13006100 Plumbing Technology II PLTECH2 13006200 Practicum in Construction Management (First Time Taken) PRACCM1
13006205 Practicum in Construction Management/Extended Practicum in Construction Management (First Time Taken) EXPRCM1
13006210 Practicum in Construction Management (Second Time Taken) PRACCM2
13006215 Practicum in Construction Management/Extended Practicum in Construction Management (Second Time Taken) EXPRCM2
13006400 Masonry Technology II MASTECH2 13011500 Business Information Management II BUSIM2 13011510 Business Information Management II/Business Lab BUSMLAB2 13012200 Practicum in Business Management (First Time Taken) PRACBM
13012205 Practicum in Business Management/Extended Practicum in Business Management (First Time Taken) EXPRBM
13012210 Practicum in Business Management (Second Time Taken) PRACBM2
2018 Accountability Manual
Chapter 2—Student Achievement Domain 19
Code Course Title Course Abbreviation
13012215 Practicum in Business Management/Extended Practicum in Business Management (Second Time Taken) EXPRBM2
13016700 Accounting II ACCOUNT2 13020400 Health Science Theory HLTHSCI 13020410 Health Science Theory/Health Science Clinical HLSCLIN 13020500 Practicum in Health Science (First Time Taken) PRACHLS1
13020505 Practicum in Health Science/Extended Practicum in Health Science (First Time Taken) EXPRHLS1
13020510 Practicum in Health Science (Second Time Taken) PRACHLS2
13020515 Practicum in Health Science/Extended Practicum in Health Science (Second Time Taken) EXPRHLS2
13020950 Pharmacology PHARMC 13024800 Child Guidance CHILDGUI 13025000 Practicum in Human Services (First Time Taken) PRACHUS1
13025005 Practicum in Human Services/Extended Practicum in Human Services (First Time Taken) EXPRHUS1
13025010 Practicum in Human Services (Second Time Taken) PRACHUS2
13025015 Practicum in Human Services/Extended Practicum in Human Services (Second Time Taken) EXPRHUS2
13025300 Cosmetology II COSMET2 13025310 Cosmetology II/Cosmetology II Lab Innovative COSLAB2 13027300 Computer Maintenance COMPMTN 13027310 Computer Maintenance/Computer Maintenance Lab COMMTLAB 13027400 Networking NETWRK 13027410 Networking/Networking Lab NETWRLAB 13027500 Computer Technician Practicum (First Time Taken) COMPT1
13027505 Computer Technician Practicum/Extended Computer Technician Practicum (First Time Taken) EXCOMPT1
13027510 Computer Technician Practicum (Second Time Taken) COMPT2
13027515 Computer Technician Practicum/Extended Computer Technician Practicum (Second Time Taken) EXCOMPT2
13027700 Computer Programming II COMPPRO2 13028000 Practicum in Information Technology (First Time Taken) PRACIT1
13028005 Practicum in Information Technology/Extended Practicum in Information Technology (First Time Taken) EXPRIT1
13028010 Practicum in Information Technology (Second Time Taken) PRACIT2
13028015 Practicum in Information Technology/Extended Practicum in Information Technology (Second Time Taken) EXPRIT2
13032400 Welding II WELD2 13032410 Welding II/Welding II Lab WELDLAB2 13032600 Precision Metal Manufacturing II PREMMAN2 13032610 Precision Metal Manufacturing II/Precision Metal Manufacturing II Lab PRMMLAB2 13033000 Practicum in Manufacturing PRACMAN1
2018 Accountability Manual
20 Chapter 2—Student Achievement Domain
Code Course Title Course Abbreviation
13033005 Practicum in Manufacturing/Extended Practicum in Manufacturing (First Time Taken) EXPRMAN1
13033010 Practicum in Manufacturing (Second Time Taken) PRACMAN2
13033015 Practicum in Manufacturing/Extended Practicum in Manufacturing (Second Time Taken) EXPRMAN2
13036900 Solid State Electronics SOSTELEC
13037400 Practicum in Science, Technology, Engineering, and Mathematics (First Time Taken) PRCSTEM1
13037410 Practicum in Science, Technology, Engineering, and Mathematics (Second Time Taken) PRCSTEM2
13037405 Practicum in Science, Technology, Engineering, and Mathematics/Extended Practicum in Science, Technology, Engineering, and Mathematics (First Time Taken)
EXPRSTEM1
13037415 Practicum in Science, Technology, Engineering, and Mathematics/Extended Practicum in Science, Technology, Engineering, and Mathematics (Second Time Taken)
EXPRSTEM2
13037600 Digital Electronics DIGELC 13039700 Automotive Technology II: Automotive Service AUTOTEC2
13039710 Automotive Technology II: Automotive Service/Advanced Transportation Systems Laboratory AUTOLAB2
13039800 Collision Repair COLLISR 13039810 Collision Repair/Advanced Transportation Systems Laboratory COLLRLAB 13039900 Paint and Refinishing PAINTREF 13039910 Paint and Refinishing/Advanced Transportation Systems Laboratory PTREFLAB 13040450 Practicum in Transportation Systems (First Time Taken) PRACTRS1
13040455 Practicum in Transportation Systems/Extended Practicum in Transportation Systems (First Time Taken) EXPRTRS1
13040460 Practicum in Transportation Systems (Second Time Taken) PRACTRS2
13040465 Practicum in Transportation Systems/Extended Practicum in Transportation Systems (Second Time Taken) EXPRTRS2
2018 Accountability Manual
Chapter 3—School Progress Domain 21
Chapter 3—School Progress Domain
Overview House Bill 22 (85th Texas Legislature) requires the accountability system measure the percentage of students who met the standard for improvement and the overall student performance at a district or campus compared to similar districts or campuses. The School Progress domain measures district and campus outcomes in two areas: the number of students that grew at least one year academically (or are on track) as measured by STAAR results and the achievement of students relative to districts or campuses with similar economically disadvantaged percentages.
School Progress, Part A: Academic Growth The School Progress, Part A: Academic Growth domain provides an opportunity for districts and campuses to receive credit for STAAR results in ELA/reading and mathematics that either meet the student-level criteria for the STAAR progress measure or maintain proficiency.
The STAAR progress measure indicates the amount of improvement or growth a student has made from year to year. For STAAR assessments (with or without accommodations), progress is measured as a student’s gain score, the difference between the scaled score a student achieved in the prior year and the scaled score a student achieved in the current year. Individual student progress is then categorized as Limited, Expected, or Accelerated. If a student’s progress measure is Expected, he or she met growth expectations. If the student’s progress measure is Accelerated, he or she exceeded growth expectations.
For STAAR Alternate 2 assessments, the progress measure is based on a student’s stage change from the prior year to the current year. A student’s stage for each year is determined by the student’s scaled score achieved on the assessment. The student’s stages of performance from the prior year and the current year are then compared to assign the student a progress indicator, which is a determination of whether the progress made is sufficient to designate the student as having Met or Exceeded growth expectations.
Part A: Academic Growth—Assessments Evaluated School Progress, Part A evaluates STAAR (with and without accommodations) and STAAR Alternate 2 assessment results for grades 4–8 and English II and Algebra I end-of-course (EOC) combined.
Substitute assessments are not included in School Progress, Part A.
Part A: Academic Growth—Students Evaluated All students, including English learners (ELs) as described below, are evaluated as one group.
Part A: Academic Growth—Inclusion of English Learners ELs who are year one in U.S. schools are excluded from accountability performance calculations. Due to changes to the Texas English Language Proficiency Assessment System (TELPAS), Texas has requested a waiver from the U.S. Department of Education to exclude EL students who are year two in U.S. schools from 2018 performance calculations. If granted, ELs who are in their second year in U.S. schools will be included in accountability for 2019 and beyond. If denied, ELs who are in their second year in U.S. schools will be included in accountability for 2018. The STAAR progress measure is used for ELs and non-ELs in the School Progress, Part A domain.
STAAR Alternate 2 assessment results are included regardless of an EL’s years in U.S. schools.
Unschooled asylees, unschooled refugees, and students with interrupted formal education (SIFEs) are not included in state accountability until their sixth year of enrollment in U.S. schools.
2018 Accountability Manual
22 Chapter 3—School Progress Domain
Part A: Academic Growth—Minimum Size Criteria and Small Numbers Analysis • All students are evaluated; results are used if there are 10 or more STAAR progress measures,
combined across ELA/reading and mathematics.
• Small numbers analysis is not used.
Part A: Academic Growth—Methodology School Progress, Part A includes all assessments with eligible growth measures (growth measure=STAAR progress measure). In order to receive a STAAR progress measure in 2018, a student must meet ALL of the following criteria within the same content area (ELA/reading or mathematics):
• Has a valid score from the previous year and the current year.
• Has tested in successive grade levels or EOC assessments in the previous year and the current year. Students who took the same grade-level or EOC assessment in the previous year and the current year will not receive a progress measure. Students who take STAAR assessments and have skipped a grade level between the previous year and the current year will receive a progress measure.
• Has taken a STAAR assessment in the previous year and a STAAR assessment in the current year.
• For STAAR reading assessments, has taken assessments in the same language in the previous year and the current year (i.e., English or Spanish).
• For STAAR Algebra I and English II, has taken the assessment for the first time.
• For students taking a STAAR Alternate 2 test in current year, must have taken a STAAR Alternate 2 in the previous year.
2018 Accountability Manual
Chapter 3—School Progress Domain 23
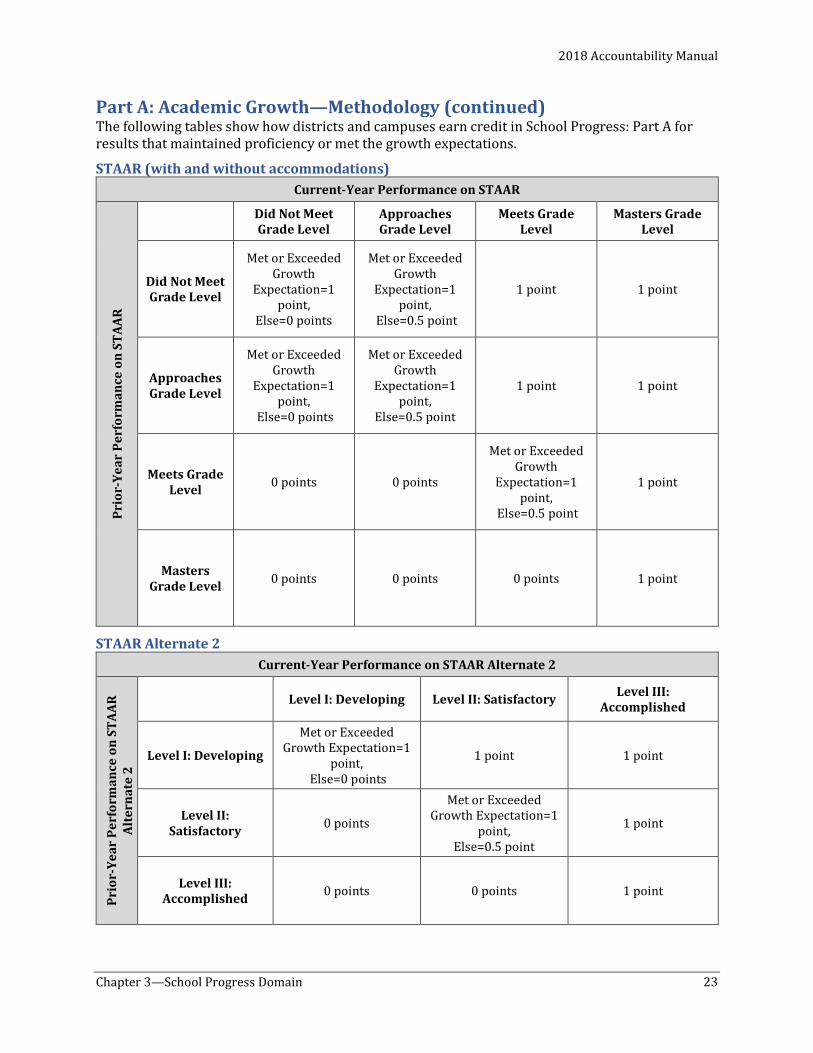
Part A: Academic Growth—Methodology (continued) The following tables show how districts and campuses earn credit in School Progress: Part A for results that maintained proficiency or met the growth expectations.
STAAR (with and without accommodations)
STAAR Alternate 2
Current-Year Performance on STAAR
Prio
r-Ye
ar P
erfo
rman
ce o
n ST
AAR
Did Not Meet Grade Level
Approaches Grade Level
Meets Grade Level
Masters Grade Level
Did Not Meet Grade Level
Met or Exceeded Growth
Expectation=1 point,
Else=0 points
Met or Exceeded Growth
Expectation=1 point,
Else=0.5 point
1 point 1 point
Approaches Grade Level
Met or Exceeded Growth
Expectation=1 point,
Else=0 points
Met or Exceeded Growth
Expectation=1 point,
Else=0.5 point
1 point 1 point
Meets Grade Level 0 points 0 points
Met or Exceeded Growth
Expectation=1 point,
Else=0.5 point
1 point
Masters Grade Level 0 points 0 points 0 points 1 point
Current-Year Performance on STAAR Alternate 2
Prio
r-Ye
ar P
erfo
rman
ce o
n ST
AAR
Al
tern
ate
2
Level I: Developing Level II: Satisfactory Level III: Accomplished
Level I: Developing
Met or Exceeded Growth Expectation=1
point, Else=0 points
1 point 1 point
Level II: Satisfactory 0 points
Met or Exceeded Growth Expectation=1
point, Else=0.5 point
1 point
Level III: Accomplished 0 points 0 points 1 point
2018 Accountability Manual
24 Chapter 3—School Progress Domain
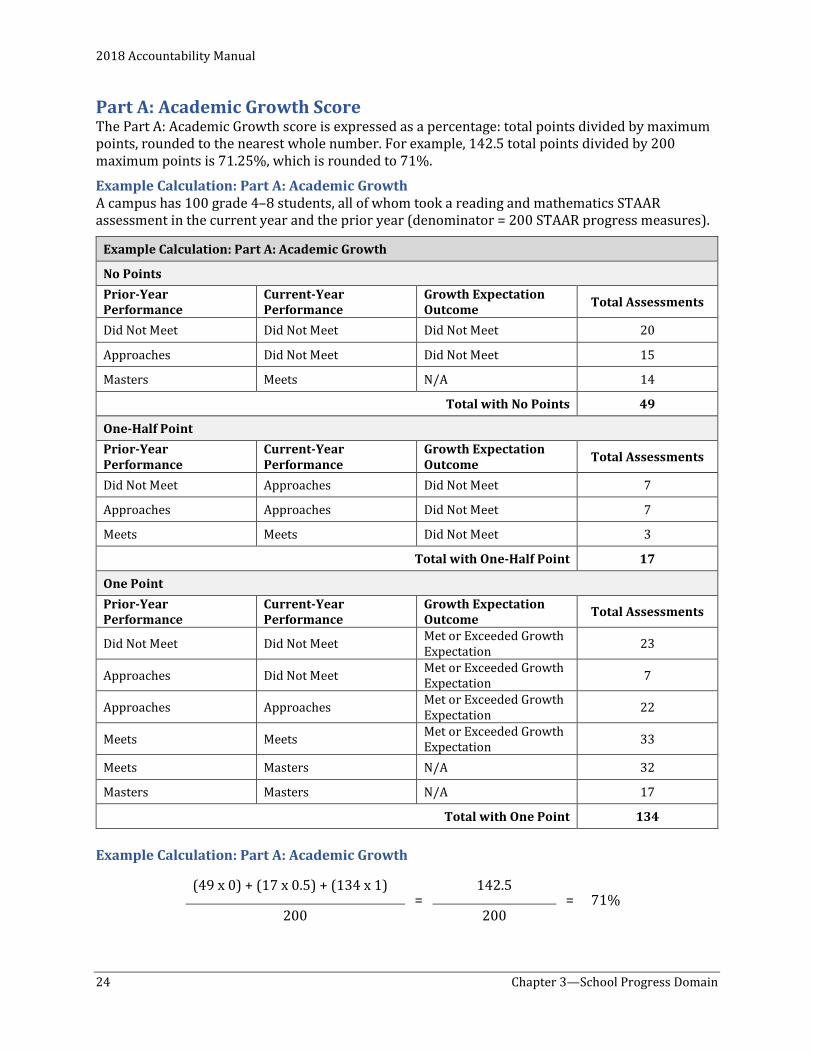
Part A: Academic Growth Score The Part A: Academic Growth score is expressed as a percentage: total points divided by maximum points, rounded to the nearest whole number. For example, 142.5 total points divided by 200 maximum points is 71.25%, which is rounded to 71%.
Example Calculation: Part A: Academic Growth A campus has 100 grade 4–8 students, all of whom took a reading and mathematics STAAR assessment in the current year and the prior year (denominator = 200 STAAR progress measures).
Example Calculation: Part A: Academic Growth
No Points Prior-Year Performance
Current-Year Performance
Growth Expectation Outcome Total Assessments
Did Not Meet Did Not Meet Did Not Meet 20
Approaches Did Not Meet Did Not Meet 15
Masters Meets N/A 14
Total with No Points 49
One-Half Point Prior-Year Performance
Current-Year Performance
Growth Expectation Outcome Total Assessments
Did Not Meet Approaches Did Not Meet 7
Approaches Approaches Did Not Meet 7
Meets Meets Did Not Meet 3
Total with One-Half Point 17
One Point Prior-Year Performance
Current-Year Performance
Growth Expectation Outcome Total Assessments
Did Not Meet Did Not Meet Met or Exceeded Growth Expectation 23
Approaches Did Not Meet Met or Exceeded Growth Expectation 7
Approaches Approaches Met or Exceeded Growth Expectation 22
Meets Meets Met or Exceeded Growth Expectation 33
Meets Masters N/A 32
Masters Masters N/A 17
Total with One Point 134 Example Calculation: Part A: Academic Growth
(49 x 0) + (17 x 0.5) + (134 x 1) =
142.5 = 71%
200 200
2018 Accountability Manual
Chapter 3—School Progress Domain 25
School Progress, Part B: Relative Performance School Progress, Part B: Relative Performance measures the achievement of all students relative to districts or campuses with similar economically disadvantaged percentages.
Part B: Relative Performance—Assessments Evaluated School Progress, Part B evaluates STAAR (with and without accommodations) and STAAR Alternate 2 assessment results for grades 3–8 and end-of-course in all subject areas.
Substitute assessments are included in School Progress, Part B at the Meets Grade Level or above standard.
Part B: Relative Performance—Students Evaluated All students, including ELs as described below, are evaluated as one group.
Part B: Relative Performance—Inclusion of English Learners ELs who are year one in U.S. schools are excluded from accountability performance calculations. Due to changes to the TELPAS, Texas requested a waiver from the U.S. Department of Education to exclude EL students who are year two in U.S. schools from 2018 performance calculations. If granted, ELs who are in their second year in U.S. schools will be included in accountability for 2019 and beyond. If denied, ELs who are in their second year in U.S. schools will be included in accountability for 2018. STAAR Alternate 2 assessment results will be included regardless of an EL’s years in U.S. schools.
Unschooled asylees, unschooled refugees, and SIFEs are not included in state accountability until their sixth year of enrollment in U.S. schools.
Part B: Relative Performance—Minimum Size Criteria and Small Numbers Analysis • The STAAR component is evaluated if there are 10 or more STAAR assessments, combined
across all subjects. Small numbers analysis is not used.
• The College, Career, and Military Readiness (CCMR) component is evaluated if there are 10 or more annual graduates. Small numbers analysis is not used.
Part B: Relative Performance—Methodology Elementary and Middle Schools For elementary and middle schools, School Progress, Part B evaluates the overall student performance on the Student Achievement STAAR component compared to campuses with similar percentages of economically disadvantaged students, as reported in the TSDS PEIMS fall snapshot.
High Schools, K–12 Campuses, and Districts with CCMR Component For high schools, K–12 campuses, and districts, School Progress, Part B evaluates the average of the Student Achievement STAAR component and the College, Career, and Military Readiness (CCMR) component compared to districts or campuses with similar percentages of economically disadvantaged students, as reported in the TSDS PEIMS fall snapshot.
High Schools, K–12 Campuses, and Districts without CCMR Component If CCMR outcomes are not available for a high school, K–12, and district, only the Student Achievement STAAR component is used.
2018 Accountability Manual
26 Chapter 3—School Progress Domain
Alternative Education Accountability Alternative education campuses and alternative education accountability charter schools are not evaluated on School Progress, Part B due to the small number of districts and campuses available for comparison.
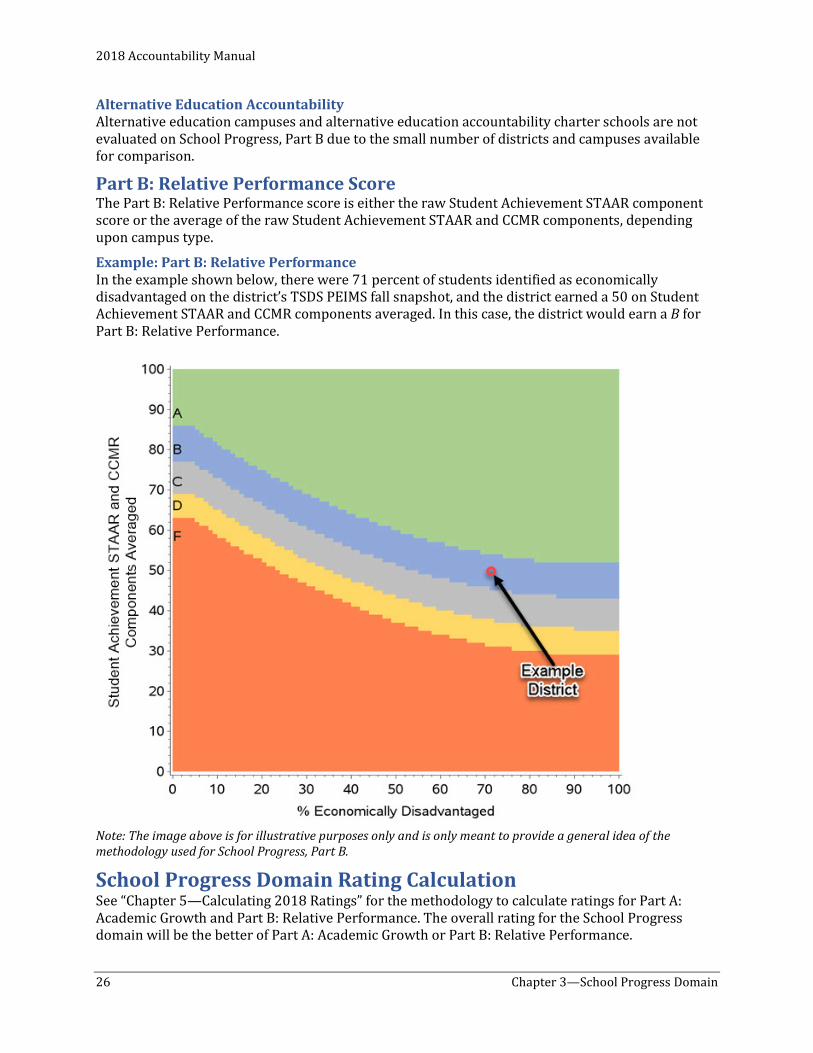
Part B: Relative Performance Score The Part B: Relative Performance score is either the raw Student Achievement STAAR component score or the average of the raw Student Achievement STAAR and CCMR components, depending upon campus type.
Example: Part B: Relative Performance In the example shown below, there were 71 percent of students identified as economically disadvantaged on the district’s TSDS PEIMS fall snapshot, and the district earned a 50 on Student Achievement STAAR and CCMR components averaged. In this case, the district would earn a B for Part B: Relative Performance.
Note: The image above is for illustrative purposes only and is only meant to provide a general idea of the methodology used for School Progress, Part B.
School Progress Domain Rating Calculation See “Chapter 5—Calculating 2018 Ratings” for the methodology to calculate ratings for Part A: Academic Growth and Part B: Relative Performance. The overall rating for the School Progress domain will be the better of Part A: Academic Growth or Part B: Relative Performance.
2018 Accountability Manual
Chapter 4—Closing the Gaps Domain 27
Chapter 4—Closing the Gaps Domain
Overview The Closing the Gaps domain uses disaggregated data to demonstrate differentials among racial/ethnic groups, socioeconomic backgrounds, and other factors. The indicators included in this domain, as well as the domain’s construction, align the state accountability system with the Every Student Succeeds Act (ESSA).
Components There are four components evaluated in the Closing the Gaps domain.
• Academic Achievement: STAAR Performance Status at the Meets Grade Level or above standard in English language arts (ELA)/reading and mathematics
• Growth or Graduation
o Academic Growth Status: The School Progress, Part A domain data in reading and mathematics for elementary and middle schools
o Federal Graduation Status: The four-year federal graduation rate (without exclusions) for high schools, K–12s, and districts with graduation rates. If a high school, K–12, or district does not have graduation data, Academic Growth Status is used, if available.
• English Language Proficiency
• School Quality or Student Success
o STAAR component of the Student Achievement domain for elementary and middle schools
o College, Career, and Military Readiness (CCMR) Performance Status component for high schools, K–12s, and districts If a high school, K–12, or district does not have CCMR data, STAAR component is used, if available.
Due to changes to the Texas English Language Proficiency Assessment System (TELPAS), Texas requested a waiver from the U.S. Department of Education to waive the English Language Proficiency component for 2018 accountability. If granted, the English Language Proficiency component will be evaluated for the first time in 2019. If denied, the English Language Proficiency component will be evaluated in 2018 as described in this chapter.
Minimum Size A district or campus must have 10 reading and 10 mathematics assessment results in the Academic Achievement component to be evaluated on the Closing the Gaps domain. If a district or campus does not meet minimum size, the Closing the Gaps domain is not evaluated.
Students Evaluated The Closing the Gaps domain evaluates performance of fourteen student groups. • All students • Seven racial/ethnic groups: African American, American Indian, Asian, Hispanic, Pacific
Islander, white, and two or more races • Economically disadvantaged • Students receiving special education services
2018 Accountability Manual
28 Chapter 4—Closing the Gaps Domain
• Students formerly receiving special education services • Current and monitored English learners (through year 4 of monitoring) • Continuously enrolled • Non-continuously enrolled
Current and Former Special Education Students A student is identified as a current special education student if the student receives special instruction and related developmental, corrective, supportive, or evaluative services for the current school year as reported in TSDS PEIMS and on STAAR answer documents.
Students are identified as formerly receiving special education services if in any of the preceding three years, they were reported in TSDS PEIMS as receiving special instruction and related developmental, corrective, supportive, or evaluative services, but in the current year, as reported through TSDS PEIMS and on STAAR answer documents, are no longer participating in a special education program.
Current and Monitored English Learners (ELs) A student is identified as current EL if the student is reported as Limited English Proficient (LEP) on either TELPAS or STAAR answer documents. A student is identified as monitored EL if the student is reported in TSDS PEIMS as having met the criteria for exiting a bilingual/ESL program and is being monitored as required by 19 Texas Administrative Code, §89.1220(l).
Both current and monitored ELs, through year 4, are included in performance rates for the Closing the Gaps domain. Exclusions for EL students are detailed in this chapter. For 2018 accountability, a proxy is used to determine which students are in year 3 and year 4 of monitored status based on whether they were reported as monitored year 1 or year 2 in the previous years. For 2019 accountability, TSDS PEIMS codes will be added to collect year 3 and year 4 of monitored status.
Continuously Enrolled and Non-Continuously Enrolled Students District For grades 4–12, a student is identified as continuously enrolled if the student was enrolled in the district on the fall snapshot during the current school year and each of the three preceding years. For grade 3, a student is identified as continuously enrolled if the student was enrolled in the same district on the current year fall snapshot and each of the preceding two years.
If the enrollment requirement is not met, then the student is considered non-continuously enrolled.
Campus For grades 4–12, a student is identified as continuously enrolled if the student was enrolled in the campus on the fall snapshot during the current school year and in the same district each of the three preceding years. For grade 3, a student is identified as continuously enrolled if the student was enrolled in the campus on the current year fall snapshot and in the same district each of the preceding two years.
2018 Accountability Manual
Chapter 4—Closing the Gaps Domain 29
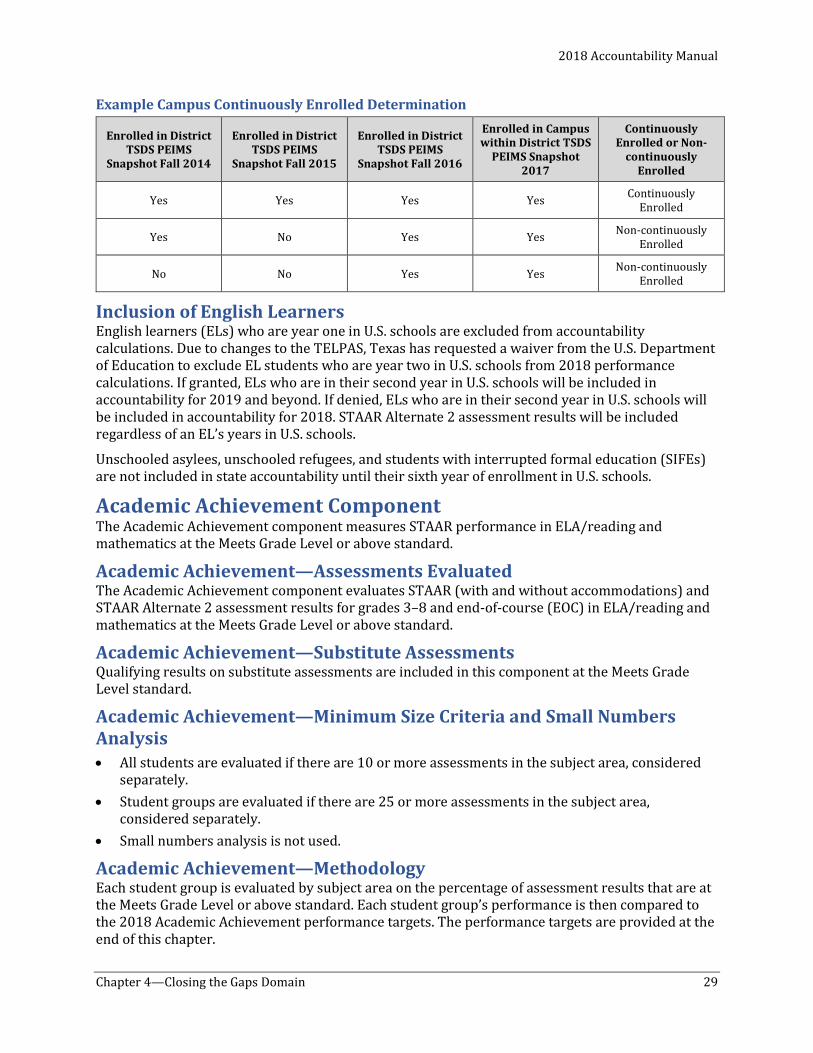
Example Campus Continuously Enrolled Determination
Enrolled in District TSDS PEIMS
Snapshot Fall 2014
Enrolled in District TSDS PEIMS
Snapshot Fall 2015
Enrolled in District TSDS PEIMS
Snapshot Fall 2016
Enrolled in Campus within District TSDS
PEIMS Snapshot 2017
Continuously Enrolled or Non-
continuously Enrolled
Yes Yes Yes Yes Continuously Enrolled
Yes No Yes Yes Non-continuously Enrolled
No No Yes Yes Non-continuously Enrolled
Inclusion of English Learners English learners (ELs) who are year one in U.S. schools are excluded from accountability calculations. Due to changes to the TELPAS, Texas has requested a waiver from the U.S. Department of Education to exclude EL students who are year two in U.S. schools from 2018 performance calculations. If granted, ELs who are in their second year in U.S. schools will be included in accountability for 2019 and beyond. If denied, ELs who are in their second year in U.S. schools will be included in accountability for 2018. STAAR Alternate 2 assessment results will be included regardless of an EL’s years in U.S. schools.
Unschooled asylees, unschooled refugees, and students with interrupted formal education (SIFEs) are not included in state accountability until their sixth year of enrollment in U.S. schools.
Academic Achievement Component The Academic Achievement component measures STAAR performance in ELA/reading and mathematics at the Meets Grade Level or above standard.
Academic Achievement—Assessments Evaluated The Academic Achievement component evaluates STAAR (with and without accommodations) and STAAR Alternate 2 assessment results for grades 3–8 and end-of-course (EOC) in ELA/reading and mathematics at the Meets Grade Level or above standard.
Academic Achievement—Substitute Assessments Qualifying results on substitute assessments are included in this component at the Meets Grade Level standard.
Academic Achievement—Minimum Size Criteria and Small Numbers Analysis • All students are evaluated if there are 10 or more assessments in the subject area, considered
separately. • Student groups are evaluated if there are 25 or more assessments in the subject area,
considered separately. • Small numbers analysis is not used.
Academic Achievement—Methodology Each student group is evaluated by subject area on the percentage of assessment results that are at the Meets Grade Level or above standard. Each student group’s performance is then compared to the 2018 Academic Achievement performance targets. The performance targets are provided at the end of this chapter.
2018 Accountability Manual
30 Chapter 4—Closing the Gaps Domain
The Academic Achievement calculation is expressed as a percentage, rounded to the nearest whole number. For example, 59.87% is rounded to 60%; 79.49% is rounded to 79%; and 89.5% is rounded to 90%.
Academic Growth Components For elementary and middle schools, the Academic Growth Status component provides an opportunity to receive credit for STAAR results in ELA/reading and mathematics that either meet the student-level criteria for the STAAR progress measure or maintain proficiency. For high schools, K–12s, and districts without a federal four-year graduation rate, the Academic Growth Status is used, if available.
Academic Growth Status—Assessments Evaluated The Academic Growth Status component evaluates STAAR (with and without accommodations) and STAAR Alternate 2 assessment results and progress measures for grades 4–8 and EOC in English II and Algebra I, disaggregated by student group.
Substitute assessments are not included in the Academic Growth Status component.
Academic Growth Status—Minimum Size Criteria and Small Numbers Analysis • All students are evaluated if there are 10 or more STAAR progress measures in ELA/reading
and mathematics, considered separately.• Student groups are evaluated if there are 25 or more STAAR progress measures in ELA/reading
and mathematics, considered separately.• Small numbers analysis is not used.
Academic Growth Status—Methodology Each student group is evaluated by subject area on the percentage of assessment results that maintained proficiency or met the growth expectations on STAAR. Each student group’s performance is then compared to the 2018 Academic Growth Status performance targets. Please see “Chapter 3—School Progress Domain” for details on how points are awarded for growth. The performance targets are provided at the end of this chapter.
The Academic Growth Status calculation is expressed as a percentage, rounded to the nearest whole number. For example, 59.87% is rounded to 60%; 79.49% is rounded to 79%; and 89.5% is rounded to 90%.
Federal Graduation Status The Federal Graduation Status component measures the federal four-year graduation rate of the Class of 2017 for high schools, K–12s, and districts. Texas uses the National Center for Education Statistics (NCES) dropout definition and the federal calculation for graduation rate. For high schools, K–12s, and districts without a federal four-year graduation rate, the Academic Growth Status is used, if available.
The long term statewide goal for the four-year graduation rate is 94 percent. High schools and districts that do not meet the long-term graduation rate goal must meet the interim target for the four-year graduation rate. Student groups that are at or above interim or long-term targets will be required to exceed that rate in the following year(s).
2018 Accountability Manual
Chapter 4—Closing the Gaps Domain 31
Four-Year Graduation Rate Interim Target For the Class of 2017, the four-year graduation target is 90 percent of students graduate with a regular high school diploma in four years. The targets are provided at the end of this chapter.
Federal Graduation Status—Minimum Size Criteria and Small Numbers Analysis All Students • The all students group is evaluated if there are at least 10 students in the class.
• Small numbers analysis, as described below, applies to all students if the number of students in the Class of 2017 (4-year) is fewer than 10. The total number of students in the class consists of graduates, continuing students, Texas certificate of high school equivalency (TxCHSE) recipients, and dropouts.
o A three-year-average graduation rate is calculated for all students. The calculation is based on an aggregated three-year uniform average.
o The all students group is evaluated if the three-year average has at least 10 students.
Student Groups • A student group is evaluated if there are at least 25 students from the group in the class. • Small numbers analysis is not applied to student groups.
Federal Graduation Status—Methodology The Federal Graduation Status component is calculated using the four-year federal graduation rate without state exclusions. The four-year federal graduation rate follows a cohort of first-time students in grade 9 through their expected graduation three years later. A cohort is defined as the group of students who begin grade 9 in Texas public schools for the first time in the same school year plus students who, in the next three school years, enter the Texas public school system in the grade level expected for the cohort. Students who transfer out of the Texas public school system over the four years for reasons other than graduating, receiving a TxCHSE, or dropping out are removed from the class.
The four-year federal graduation rate measures the percentage of graduates in a class. The graduation rates are expressed as a percentage rounded to one decimal place. For example, 74.875% rounds to 74.9%, not 75%.
Number of Graduates in the Class Number of Students in the Class
(Graduates + Continuers + TxCHSE Recipients + Dropouts)
Inclusions to the Four-Year Federal Dropout Rate Definition The definition of dropout that is used for the Student Achievement domain differs slightly from the NCES definition of dropout that is required for federal accountability. For Closing the Gaps domain calculations, the 2016–17 dropouts reported during the fall 2017 TSDS PEIMS data submission are processed using the NCES dropout definition so that certain students can be counted as dropouts. For additional information on dropout inclusions, please see Appendix G.
English Language Proficiency Component The English Language Proficiency component measures an EL’s progress towards achieving English language proficiency. Current ELs are the only students evaluated in this component.
2018 Accountability Manual
32 Chapter 4—Closing the Gaps Domain
2018 Waiver of English Language Proficiency Component Due to changes to the TELPAS, Texas requested a waiver from the U.S. Department of Education to waive the English Language Proficiency component for 2018 accountability. If granted, the English Language Proficiency component will be evaluated for the first time in 2019. If denied, the English Language Proficiency component will be evaluated in 2018 as described in this chapter.
English Language Proficiency—Assessments Evaluated The English Language Proficiency component evaluates the TELPAS results for grades K–12. If the request to the U.S. Department of Education to waive this component in 2018 is denied, the data evaluated in this indicator will lag a year. If evaluated in 2018 accountability, the English Language Proficiency component will evaluate TELPAS results from 2016–17 and 2015–16. If a 2015–16 composite rating is not available, the composite rating from 2014–15 will be used. If a 2014–15 composite rating is not available, the composite rating from 2013–14 will be used.
English Language Proficiency—Minimum Size Criteria and Small Numbers Analysis • The EL student group is evaluated if there are at least 25 current EL students. • Small numbers analysis is not used.
English Language Proficiency—Methodology A student is considered having made progress if • the student advances by at least one score of the composite rating from the prior year to the
current year, or • the student’s result is Advanced High. If the prior year composite rating is not available, the second or third year prior composite rating is used.
The current EL student group’s performance is compared to the 2018 English Language Proficiency target. The performance targets are provided at the end of this chapter.
The English Language Proficiency component calculation is expressed as a percentage, rounded to the nearest whole number. For example, 59.87% is rounded to 60%; 79.49% is rounded to 79%; and 89.5% is rounded to 90%.
School Quality or Student Success Component For elementary and middle schools, the Student Achievement Domain Score: STAAR Component Only evaluates disaggregated student performance on the STAAR. For high schools, K–12s, and districts with annual graduates, the College, Career, and Military Readiness Performance Status component measures disaggregated students’ preparedness for college, the workforce, or the military. If a high school, K–12, or district does not have CCMR data, the Student Achievement Domain Score: STAAR Component Only is used, if available.
Student Achievement Domain Score: STAAR Component Only—Assessments Evaluated The Student Achievement Domain Score: STAAR Component Only evaluates STAAR (with and without accommodations) and STAAR Alternate 2 assessment results for grades 3–8 and EOC in all subject areas at the Approaches Grade Level or above, Meets Grade Level or above, and Masters Grade Level standard. The performance rates calculated in this component are the disaggregated results used in the Student Achievement domain.
2018 Accountability Manual
Chapter 4—Closing the Gaps Domain 33
Student Achievement Domain Score: STAAR Component Only—Substitute Assessments Qualifying results on substitute assessments are included in this component at the Meets Grade Level standard.
Student Achievement Domain Score: STAAR Component Only—Minimum Size Criteria and Small Numbers Analysis • All students are evaluated if there are 10 or more assessments. • Student groups are evaluated if there are 25 or more assessments. • Small numbers analysis is not used.
Student Achievement Domain Score: STAAR Component Only—Methodology Each student group is evaluated on the average percentage of assessment results that are at the Approaches Grade Level or above, Meets Grade Level or above, and Masters Grade Level standard. Each student group’s performance is then compared to the 2018 Student Achievement Domain Score: STAAR Component Only performance targets. The performance targets are provided at the end of this chapter.
The Student Achievement Domain Score: STAAR Component Only calculation is expressed as a percentage, rounded to the nearest whole number. For example, 59.87% is rounded to 60%; 79.49% is rounded to 79%; and 89.5% is rounded to 90%. College, Career, and Military Readiness Performance Status The College, Career, and Military Readiness Performance Status component measures students’ preparedness for college, the workforce, or the military. This component differs from the CCMR component in the Student Achievement domain. The denominator used here is annual graduates plus students in grade 12 who did not graduate. These grade 12 students are those who were in attendance during the last six weeks of school year 2016–17 as reported in TSDS PEIMS attendance records.
Number of Graduates or Students in Grade 12 Who Accomplished at Least One of the CCMR Indicators Number of 2017 Annual Graduates plus Students in Grade 12 During School Year 2016–17
Students demonstrate college, career, or military readiness in any one of the following ways:
• Meet Texas Success Initiative (TSI) Criteria in ELA/Reading and Mathematics. A student meeting the TSI college readiness standards in both ELA/reading and mathematics; specifically, meeting the college-ready criteria on the TSI assessment, SAT, ACT, or by successfully completing and earning credit for a college prep course as defined in TEC §28.014, in both ELA and mathematics. The assessment results considered include TSI assessments through October 2017, SAT and ACT results through the June 2017 administration, and course completion data via TSDS PEIMS. See Appendix H for additional information.
A student must meet the TSI requirement for both ELA/reading and mathematics but does not necessarily need to meet them on the same assessment. For example, a student may meet the TSI criteria for college readiness in ELA/reading on the SAT and complete and earn credit for a college prep course in mathematics.
• Meet Criteria on Advanced Placement (AP)/International Baccalaureate (IB) Examination. A student meeting the criterion score on an AP or IB examination in any subject area. Criterion score is 3 or more for AP and 4 or more for IB.
2018 Accountability Manual
34 Chapter 4—Closing the Gaps Domain
• Earn Dual Course Credits. A student completing and earning credit for at least three credit hours in ELA or mathematics or at least nine credit hours in any subject. See Appendix H for additional information.
• Enlist in the Armed Forces. A graduate enlisting in the U.S. Army, Navy, Air Force, Coast Guard, or Marines.
• Earn an Industry-Based Certification. A graduate earning an industry-based certificate under 19 TAC, §74.1003.
• Earn an Associate’s Degree. A graduate earning an associate’s degree while in high school.
• Graduate with Completed IEP and Workforce Readiness. A graduate receiving a graduation type code of 04, 05, 54, or 55 which indicates the student has completed his/her IEP and has either demonstrated self-employment with self-help skills to maintain employment or has demonstrated mastery of specific employability and self-help skills that do not require public school services.
• CTE Coherent Sequence Coursework Aligned with Industry-Based Certifications. A CTE coherent sequence student who has completed and received credit for at least one CTE course aligned with an industry-based certification. This indicator will award one-half point only for students who have met no other CCMR indicator. These students will receive one-half point credit for coursework completed toward an industry-based certification. See Chapter 2 for additional information.
College, Career, and Military Readiness Performance Status—Minimum Size Criteria and Small Numbers Analysis • All students are evaluated in the CCMR component if there are 10 or more annual graduates
plus students in grade 12 who did not graduate.
• Student groups are evaluated if there are 25 or more annual graduates plus students in grade 12 who did not graduate.
• Small numbers analysis, as described below, applies to all students if the number of annual graduates plus students in grade 12 who did not graduate is fewer than 10.
o A two-year-average CCMR rate is calculated for all students. The calculation is based on an aggregated two-year uniform average using the district’s or campus’s 2018 CCMR data and the 2017 modeled CCMR data.
o The all students group is evaluated if the two-year average has at least 10 annual graduates plus students in grade 12 who did not graduate.
College, Career, and Military Readiness Performance Status—Methodology Each student group is evaluated on the percentage of students who meet the 2018 College, Career, and Military Readiness Performance Status targets. The performance targets are provided at the end of this chapter.
The College, Career, and Military Readiness Performance Status calculation is expressed as a percentage, rounded to the nearest whole number. For example, 59.87% is rounded to 60%; 79.49% is rounded to 79%; and 89.5% is rounded to 90%.
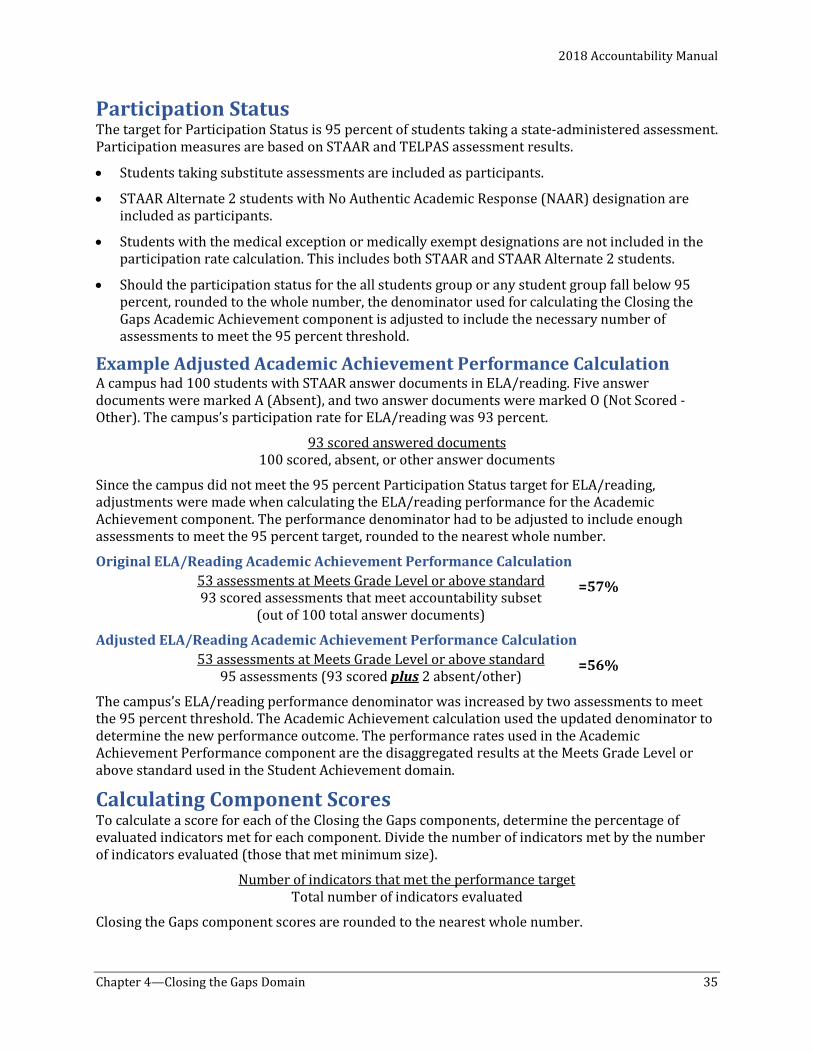
2018 Accountability Manual
Chapter 4—Closing the Gaps Domain 35
Participation Status The target for Participation Status is 95 percent of students taking a state-administered assessment. Participation measures are based on STAAR and TELPAS assessment results.
• Students taking substitute assessments are included as participants.
• STAAR Alternate 2 students with No Authentic Academic Response (NAAR) designation are included as participants.
• Students with the medical exception or medically exempt designations are not included in the participation rate calculation. This includes both STAAR and STAAR Alternate 2 students.
• Should the participation status for the all students group or any student group fall below 95 percent, rounded to the whole number, the denominator used for calculating the Closing the Gaps Academic Achievement component is adjusted to include the necessary number of assessments to meet the 95 percent threshold.
Example Adjusted Academic Achievement Performance Calculation A campus had 100 students with STAAR answer documents in ELA/reading. Five answer documents were marked A (Absent), and two answer documents were marked O (Not Scored -Other). The campus’s participation rate for ELA/reading was 93 percent.
93 scored answered documents 100 scored, absent, or other answer documents
Since the campus did not meet the 95 percent Participation Status target for ELA/reading, adjustments were made when calculating the ELA/reading performance for the Academic Achievement component. The performance denominator had to be adjusted to include enough assessments to meet the 95 percent target, rounded to the nearest whole number.
Original ELA/Reading Academic Achievement Performance Calculation 53 assessments at Meets Grade Level or above standard =57% 93 scored assessments that meet accountability subset
(out of 100 total answer documents)
Adjusted ELA/Reading Academic Achievement Performance Calculation 53 assessments at Meets Grade Level or above standard =56%
95 assessments (93 scored plus 2 absent/other)
The campus’s ELA/reading performance denominator was increased by two assessments to meet the 95 percent threshold. The Academic Achievement calculation used the updated denominator to determine the new performance outcome. The performance rates used in the Academic Achievement Performance component are the disaggregated results at the Meets Grade Level or above standard used in the Student Achievement domain.
Calculating Component Scores To calculate a score for each of the Closing the Gaps components, determine the percentage of evaluated indicators met for each component. Divide the number of indicators met by the number of indicators evaluated (those that met minimum size).
Number of indicators that met the performance target Total number of indicators evaluated
Closing the Gaps component scores are rounded to the nearest whole number.
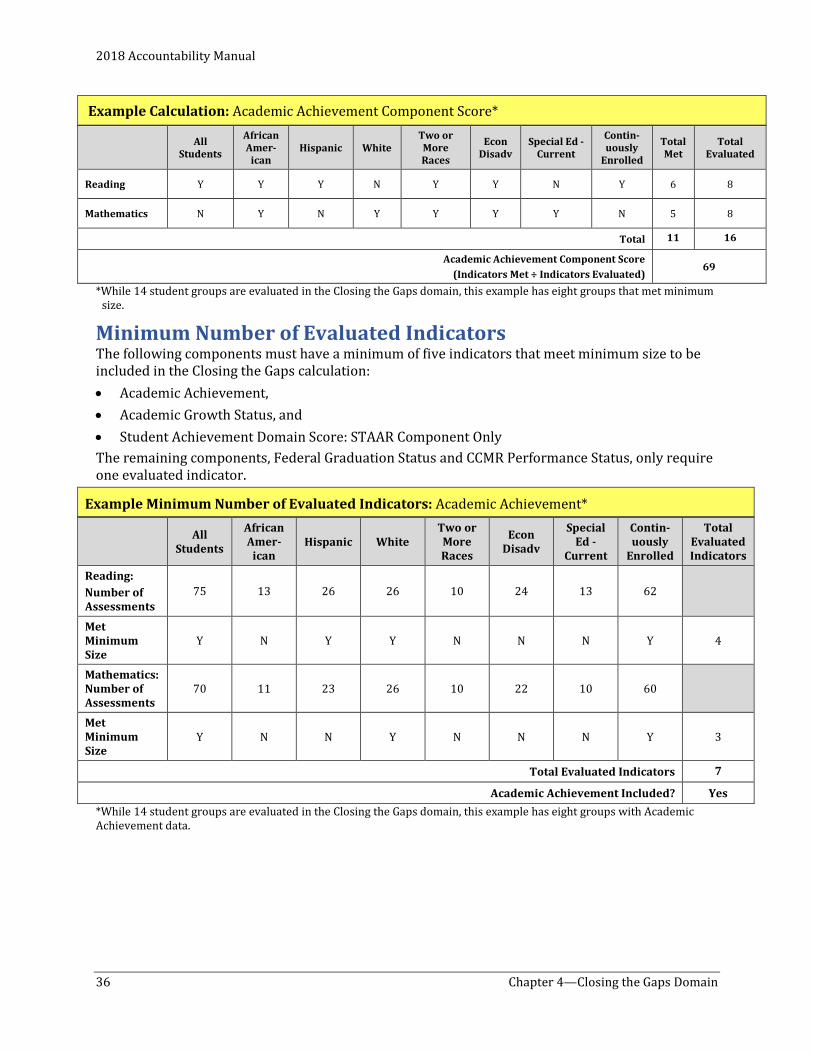
2018 Accountability Manual
36 Chapter 4—Closing the Gaps Domain
Example Calculation: Academic Achievement Component Score*
All Students
African Amer-
ican Hispanic White
Two or More Races
Econ Disadv
Special Ed -Current
Contin-uously
Enrolled
Total Met
Total Evaluated
Reading Y Y Y N Y Y N Y 6 8
Mathematics N Y N Y Y Y Y N 5 8
Total 11 16
Academic Achievement Component Score (Indicators Met ÷ Indicators Evaluated)
69
*While 14 student groups are evaluated in the Closing the Gaps domain, this example has eight groups that met minimum size.
Minimum Number of Evaluated Indicators The following components must have a minimum of five indicators that meet minimum size to be included in the Closing the Gaps calculation: • Academic Achievement, • Academic Growth Status, and • Student Achievement Domain Score: STAAR Component Only The remaining components, Federal Graduation Status and CCMR Performance Status, only require one evaluated indicator.
Example Minimum Number of Evaluated Indicators: Academic Achievement*
All Students
African Amer-
ican Hispanic White
Two or More Races
Econ Disadv
Special Ed -
Current
Contin-uously
Enrolled
Total Evaluated Indicators
Reading: Number of Assessments
75 13 26 26 10 24 13 62
Met Minimum Size
Y N Y Y N N N Y 4
Mathematics: Number of Assessments
70 11 23 26 10 22 10 60
Met Minimum Size
Y N N Y N N N Y 3
Total Evaluated Indicators 7
Academic Achievement Included? Yes *While 14 student groups are evaluated in the Closing the Gaps domain, this example has eight groups with Academic Achievement data.
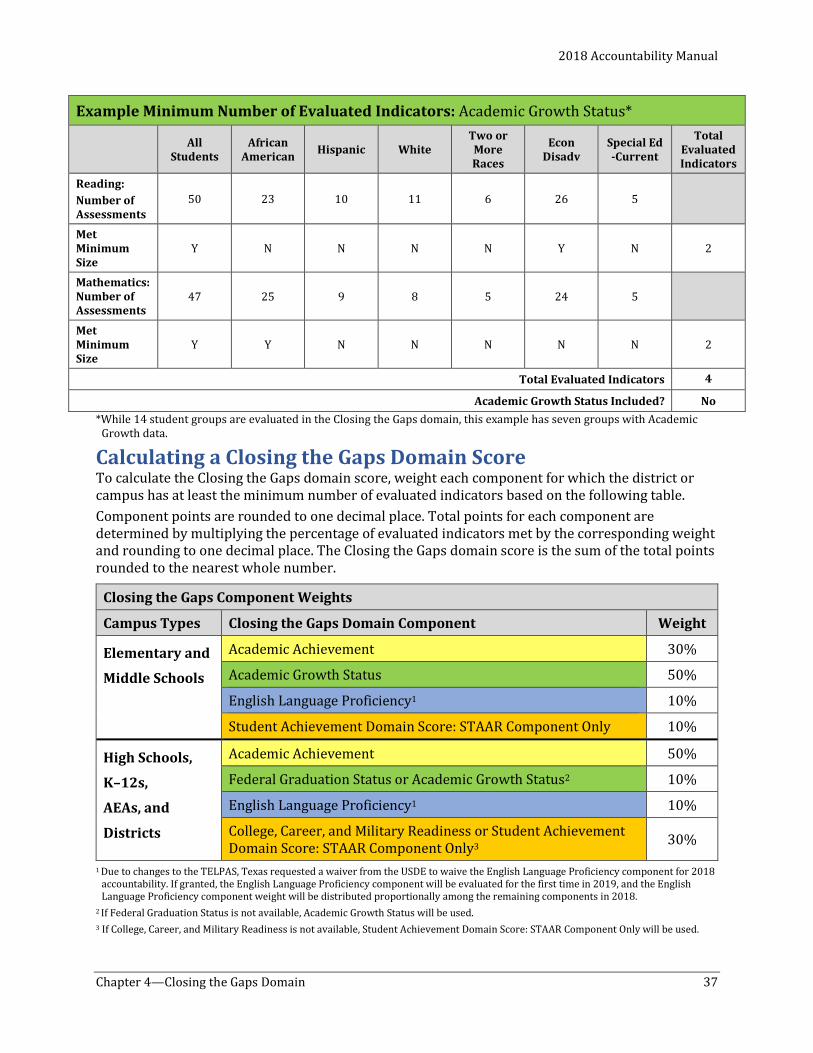
2018 Accountability Manual
Chapter 4—Closing the Gaps Domain 37
Example Minimum Number of Evaluated Indicators: Academic Growth Status*
All Students
African American Hispanic White
Two or More Races
Econ Disadv
Special Ed -Current
Total Evaluated Indicators
Reading: Number of Assessments
50 23 10 11 6 26 5
Met Minimum Size
Y N N N N Y N 2
Mathematics: Number of Assessments
47 25 9 8 5 24 5
Met Minimum Size
Y Y N N N N N 2
Total Evaluated Indicators 4
Academic Growth Status Included? No *While 14 student groups are evaluated in the Closing the Gaps domain, this example has seven groups with Academic
Growth data.
Calculating a Closing the Gaps Domain Score To calculate the Closing the Gaps domain score, weight each component for which the district or campus has at least the minimum number of evaluated indicators based on the following table. Component points are rounded to one decimal place. Total points for each component are determined by multiplying the percentage of evaluated indicators met by the corresponding weight and rounding to one decimal place. The Closing the Gaps domain score is the sum of the total points rounded to the nearest whole number.
Closing the Gaps Component Weights
Campus Types Closing the Gaps Domain Component Weight
Elementary and
Middle Schools
Academic Achievement 30%
Academic Growth Status 50%
English Language Proficiency1 10%
Student Achievement Domain Score: STAAR Component Only 10%
High Schools,
K–12s,
AEAs, and
Districts
Academic Achievement 50%
Federal Graduation Status or Academic Growth Status2 10%
English Language Proficiency1 10%
College, Career, and Military Readiness or Student Achievement Domain Score: STAAR Component Only3 30%
1 Due to changes to the TELPAS, Texas requested a waiver from the USDE to waive the English Language Proficiency component for 2018 accountability. If granted, the English Language Proficiency component will be evaluated for the first time in 2019, and the English Language Proficiency component weight will be distributed proportionally among the remaining components in 2018.
2 If Federal Graduation Status is not available, Academic Growth Status will be used. 3 If College, Career, and Military Readiness is not available, Student Achievement Domain Score: STAAR Component Only will be used.
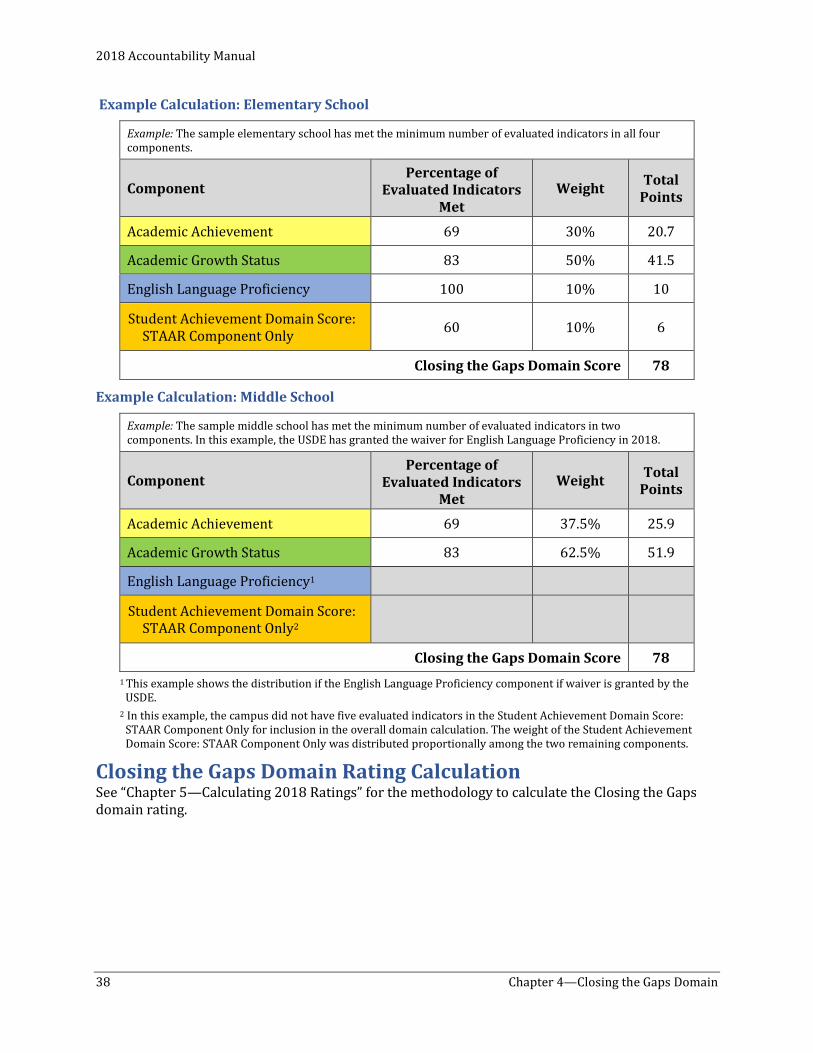
2018 Accountability Manual
38 Chapter 4—Closing the Gaps Domain
Example Calculation: Elementary School
Example: The sample elementary school has met the minimum number of evaluated indicators in all four components.
Component Percentage of
Evaluated Indicators Met
Weight Total Points
Academic Achievement 69 30% 20.7
Academic Growth Status 83 50% 41.5
English Language Proficiency 100 10% 10
Student Achievement Domain Score: STAAR Component Only 60 10% 6
Closing the Gaps Domain Score 78
Example Calculation: Middle School
Example: The sample middle school has met the minimum number of evaluated indicators in two components. In this example, the USDE has granted the waiver for English Language Proficiency in 2018.
Component Percentage of
Evaluated Indicators Met
Weight Total Points
Academic Achievement 69 37.5% 25.9
Academic Growth Status 83 62.5% 51.9
English Language Proficiency1
Student Achievement Domain Score: STAAR Component Only2
Closing the Gaps Domain Score 78 1 This example shows the distribution if the English Language Proficiency component if waiver is granted by the
USDE. 2 In this example, the campus did not have five evaluated indicators in the Student Achievement Domain Score:
STAAR Component Only for inclusion in the overall domain calculation. The weight of the Student Achievement Domain Score: STAAR Component Only was distributed proportionally among the two remaining components.
Closing the Gaps Domain Rating Calculation See “Chapter 5—Calculating 2018 Ratings” for the methodology to calculate the Closing the Gaps domain rating.
2018 Accountability Manual
Chapter 4—Closing the Gaps Domain 39
Identification of Schools for Improvement To align identification of schools for improvement with the state’s accountability system, TEA utilizes a rank-ordering method based on the Closing the Gaps domain performance to identify comprehensive, targeted, and additional targeted support and improvement schools.
Comprehensive Support and Improvement The Closing the Gaps domain scaled score is used to identify schools for comprehensive support and improvement. TEA rank orders the scaled domain score for all campuses. The lowest five percent of campuses that receive Title I, Part A funds are identified for comprehensive support and improvement. Also, if a campus does not attain a 67 percent four-year graduation rate for the all students group, the campus is also automatically identified for comprehensive support and improvement. Additionally, any Title I campus identified for targeted support and improvement for three consecutive years is identified for comprehensive support and improvement the following school year.
TEA will annually identify campuses for comprehensive support and improvement beginning with the August 2018 accountability release, which is based on school year 2017–18 performance data.
Targeted Support and Improvement TEA uses the Closing the Gaps domain to identify campuses that have consistently underperforming student groups. TEA defines “consistently underperforming” as a campus having one or more student groups that do not meet interim benchmark goals for three consecutive years. Any campus that has one or more achievement gap(s) between individual student groups and the performance targets will be identified for targeted support and improvement.
Campuses are evaluated annually, and identification will occur for the first time in August 2019 based on 2017, 2018, and 2019 data.
Additional Targeted Support Any campus that is not identified for comprehensive or targeted support and improvement will be identified for additional targeted support if an individual student group’s percentage of evaluated indicators met is at or below the percentage used to identify that campus type for comprehensive support and improvement.
For example, if 25 percent of evaluated indicators met is the cut point for elementary schools to be identified for comprehensive support and improvement, then any elementary campus with a student group that has met 25 percent or fewer of its evaluated indicators will be identified for additional targeted support.
Identification will begin with the August 2018 school ratings and will occur on an annual basis.
Exit Criteria for Comprehensive Support and Improvement Schools Campuses that do not rank in the bottom five percent of the Closing the Gaps domain for two consecutive years and have increased a letter grade (for example, from F to D or from D to C) on the Closing the Gaps domain will be considered as having successfully exited comprehensive support and improvement status. Exit Criteria for Additional Targeted Support and Improvement Schools To exit additional targeted support and improvement status, a student group must meet at least 50 percent of the indicators evaluated and meet the targets for the Academic Achievement component in both reading and mathematics.
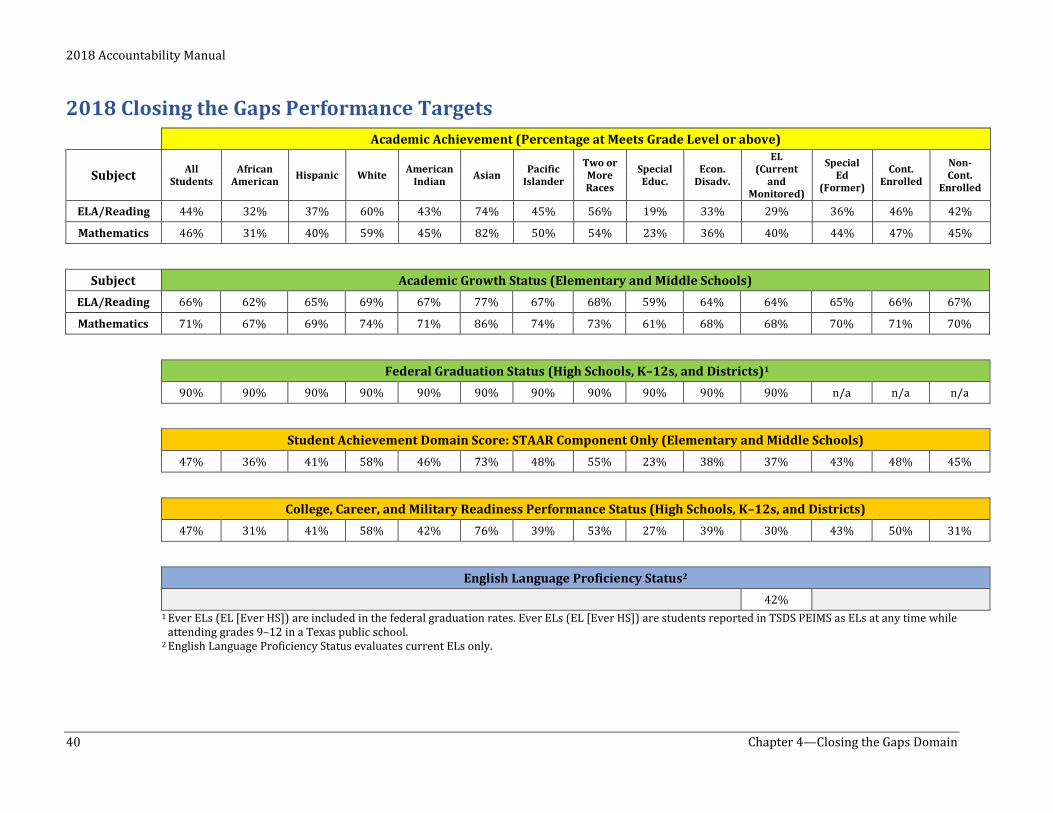
2018 Accountability Manual
40 Chapter 4—Closing the Gaps Domain
2018 Closing the Gaps Performance Targets Academic Achievement (Percentage at Meets Grade Level or above)
Subject All Students
African American Hispanic White American
Indian Asian Pacific Islander
Two or More Races
Special Educ.
Econ. Disadv.
EL (Current
and Monitored)
Special Ed
(Former)
Cont. Enrolled
Non-Cont.
Enrolled
ELA/Reading 44% 32% 37% 60% 43% 74% 45% 56% 19% 33% 29% 36% 46% 42%
Mathematics 46% 31% 40% 59% 45% 82% 50% 54% 23% 36% 40% 44% 47% 45%
Subject Academic Growth Status (Elementary and Middle Schools) ELA/Reading 66% 62% 65% 69% 67% 77% 67% 68% 59% 64% 64% 65% 66% 67%
Mathematics 71% 67% 69% 74% 71% 86% 74% 73% 61% 68% 68% 70% 71% 70%
Federal Graduation Status (High Schools, K–12s, and Districts)1
90% 90% 90% 90% 90% 90% 90% 90% 90% 90% 90% n/a n/a n/a
Student Achievement Domain Score: STAAR Component Only (Elementary and Middle Schools) 47% 36% 41% 58% 46% 73% 48% 55% 23% 38% 37% 43% 48% 45%
College, Career, and Military Readiness Performance Status (High Schools, K–12s, and Districts)
47% 31% 41% 58% 42% 76% 39% 53% 27% 39% 30% 43% 50% 31%
English Language Proficiency Status2
42% 1 Ever ELs (EL [Ever HS]) are included in the federal graduation rates. Ever ELs (EL [Ever HS]) are students reported in TSDS PEIMS as ELs at any time while
attending grades 9–12 in a Texas public school. 2 English Language Proficiency Status evaluates current ELs only.
2018 Accountability Manual
Chapter 5—Calculating 2018 Ratings 41
Chapter 5—Calculating 2018 Ratings
Overview In 2018, districts receive A–F ratings for overall performance and for performance in each domain. Campuses receive Met Standard, Met Alternative Standard, or Improvement Required ratings for overall performance and for performance in each domain. This chapter describes the process used to determine the ratings for districts and campuses.
2018 District Ratings Scaling Processes In order to align letter grades and scores used in the A–F academic accountability system to the common conception of letter grades, raw domain and component scores are adjusted to scaled scores. The methodology and formulas for scaling domains and components are provided in this chapter. For additional details on the scaling methodology, please see Appendix I.
Please note, the graduation rate component does not use the scaling process described above. This component is scaled using a conversion table provided in this chapter.
Methodology The following methodology is used to calculate domain and overall ratings for districts.
Student Achievement Domain Step 1: Determine a scaled score for the STAAR and College, Career, and Military Readiness (CCMR) components of the Student Achievement domain using the scaling methodology provided later in this chapter.
Determine a scaled score for the graduation rate component using the conversion table provided later in this chapter.
Step 2: Weight the STAAR component scaled score at 40 percent, the CCMR component scaled score at 40 percent, and the graduation rate converted score at 20 percent to determine the Student Achievement domain scaled score.
For districts lacking a graduation rate component, weight the STAAR component scaled score at 50 percent and the CCMR component scaled score at 50 percent to determine the Student Achievement domain scaled score.
For districts lacking both the CCMR and the graduation rate components, the STAAR component scaled score is the Student Achievement domain scaled score.
School Progress Domain Step 3: Determine a scaled score for both School Progress, Part A and Part B using the scaling methodology.
Step 4: Determine the better outcome of the School Progress, Part A and Part B scaled scores. Use the better as the School Progress domain scaled score. If either Part A or Part B’s scaled score results in an F rating, the highest scaled score that can be used is an 89.
Closing the Gaps Domain Step 5: Determine a scaled score for the Closing the Gaps domain using the scaling methodology.
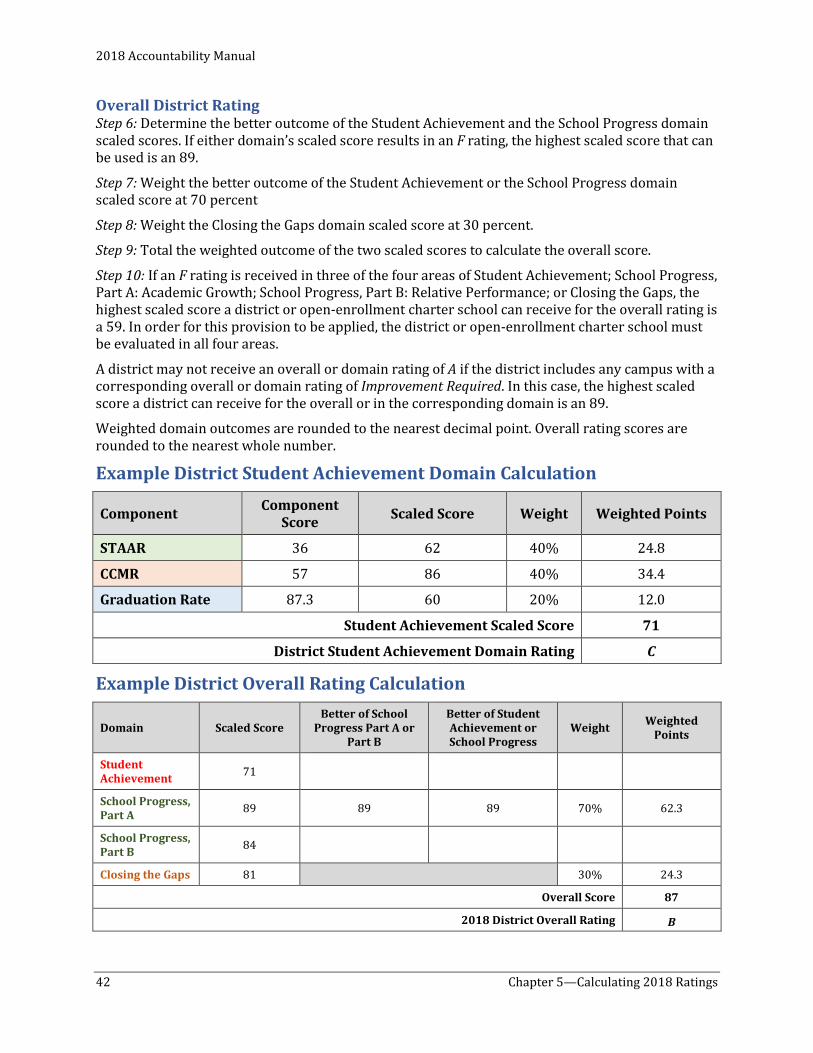
2018 Accountability Manual
42 Chapter 5—Calculating 2018 Ratings
Overall District Rating Step 6: Determine the better outcome of the Student Achievement and the School Progress domain scaled scores. If either domain’s scaled score results in an F rating, the highest scaled score that can be used is an 89.
Step 7: Weight the better outcome of the Student Achievement or the School Progress domain scaled score at 70 percent
Step 8: Weight the Closing the Gaps domain scaled score at 30 percent.
Step 9: Total the weighted outcome of the two scaled scores to calculate the overall score.
Step 10: If an F rating is received in three of the four areas of Student Achievement; School Progress, Part A: Academic Growth; School Progress, Part B: Relative Performance; or Closing the Gaps, the highest scaled score a district or open-enrollment charter school can receive for the overall rating is a 59. In order for this provision to be applied, the district or open-enrollment charter school must be evaluated in all four areas.
A district may not receive an overall or domain rating of A if the district includes any campus with a corresponding overall or domain rating of Improvement Required. In this case, the highest scaled score a district can receive for the overall or in the corresponding domain is an 89.
Weighted domain outcomes are rounded to the nearest decimal point. Overall rating scores are rounded to the nearest whole number.
Example District Student Achievement Domain Calculation
Component Component Score Scaled Score Weight Weighted Points
STAAR 36 62 40% 24.8
CCMR 57 86 40% 34.4
Graduation Rate 87.3 60 20% 12.0
Student Achievement Scaled Score 71
District Student Achievement Domain Rating C
Example District Overall Rating Calculation
Domain Scaled Score Better of School
Progress Part A or Part B
Better of Student Achievement or School Progress
Weight Weighted Points
Student Achievement 71
School Progress, Part A 89 89 89 70% 62.3
School Progress, Part B 84
Closing the Gaps 81 30% 24.3
Overall Score 87
2018 District Overall Rating B

2018 Accountability Manual
Chapter 5—Calculating 2018 Ratings 43
Single-Campus Districts A school district or charter school comprised of only one campus that shares the same 2018 performance data with its only campus must meet the performance targets for the campus to demonstrate acceptable performance. For these single-campus school districts and charter schools, the 2018 performance targets applied to the campus are applied to the district, ensuring that both the district and campus receive identical ratings. Single-campus districts receive either a Met Standard or Improvement Required rating for 2018 to align with the campus rating.
2018 Campus Ratings Scaling Processes The scaling processes that are used for districts are also used for campuses (by campus type).
Methodology The following methodology is used to calculate domain and overall ratings for campuses (by campus type).
Student Achievement Domain Step 1: Determine a scaled score for the STAAR and College, Career, and Military Readiness (CCMR) components of the Student Achievement domain using the scaling methodology provided in this chapter.
Determine a scaled score for the graduation rate component using the conversion table provided in this chapter.
Step 2: For elementary, middle, and high schools/K–12s without CCMR or graduation rate components, the STAAR component scaled score is the Student Achievement domain scaled score.
For high schools and K–12s with CCMR and graduation rate components, weight the STAAR component scaled score at 40 percent, the CCMR component scaled score at 40 percent, and the graduation rate converted score at 20 percent to determine the Student Achievement domain scaled score.
For campuses lacking the graduation rate component, weight the STAAR component scaled score at 50 percent and the CCMR component scaled score at 50 percent to determine the Student Achievement domain scaled score.
For campuses lacking both the CCMR and the graduation rate components, the STAAR component scaled score is the Student Achievement domain scaled score to determine the Student Achievement domain scaled score.
School Progress Domain Step 3: Determine a scaled score for both School Progress, Part A and Part B using the scaling methodology.
Step 4: Determine the better outcome of the School Progress, Part A and Part B scaled scores. Use the better as the School Progress domain scaled score. If either Part A or Part B’s scaled score results in an Improvement Required rating, the highest scaled score that can be used is an 89.
Closing the Gaps Domain Step 5: Determine a scaled score for the Closing the Gaps domain using the scaling methodology.
Overall Campus Rating Step 6: Determine the better outcome of the Student Achievement and the School Progress domain scaled scores. If either domain’s scaled score results in an Improvement Required rating, the highest scaled score that can be used is an 89.
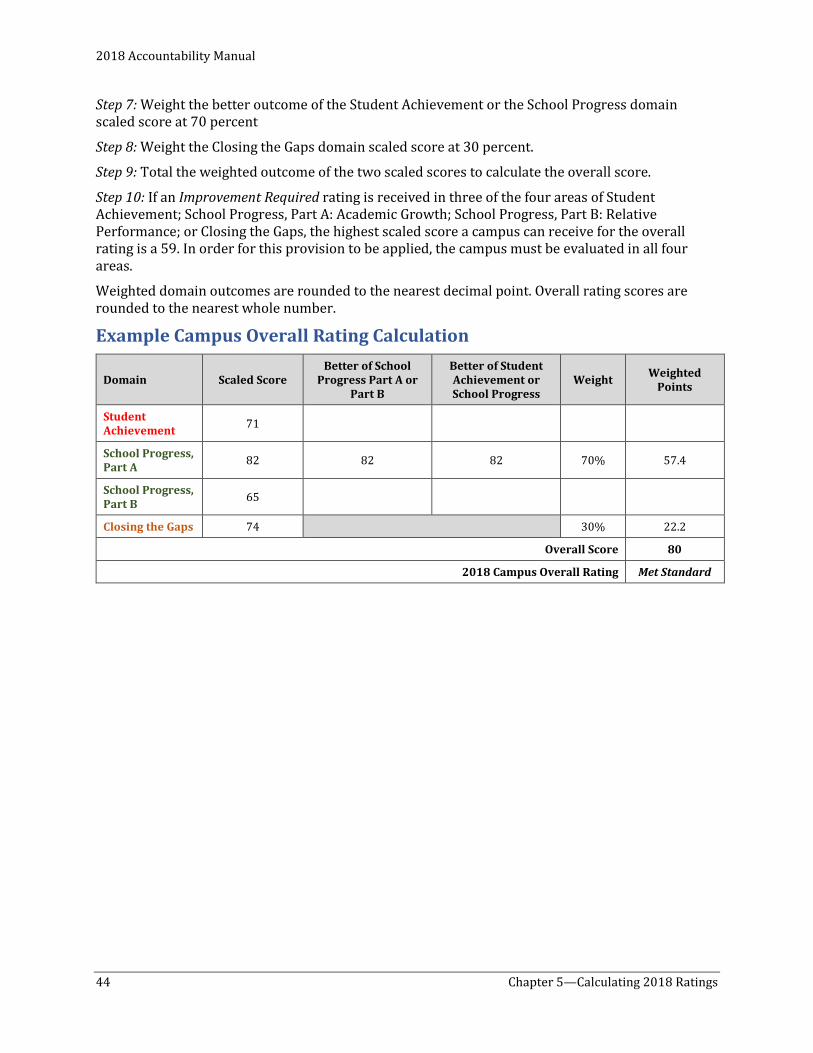
2018 Accountability Manual
44 Chapter 5—Calculating 2018 Ratings
Step 7: Weight the better outcome of the Student Achievement or the School Progress domain scaled score at 70 percent
Step 8: Weight the Closing the Gaps domain scaled score at 30 percent.
Step 9: Total the weighted outcome of the two scaled scores to calculate the overall score.
Step 10: If an Improvement Required rating is received in three of the four areas of Student Achievement; School Progress, Part A: Academic Growth; School Progress, Part B: Relative Performance; or Closing the Gaps, the highest scaled score a campus can receive for the overall rating is a 59. In order for this provision to be applied, the campus must be evaluated in all four areas.
Weighted domain outcomes are rounded to the nearest decimal point. Overall rating scores are rounded to the nearest whole number.
Example Campus Overall Rating Calculation
Domain Scaled Score Better of School
Progress Part A or Part B
Better of Student Achievement or School Progress
Weight Weighted Points
Student Achievement 71
School Progress, Part A 82 82 82 70% 57.4
School Part B
Progress, 65
Closing the Gaps 74 30% 22.2
Overall Score 80
2018 Campus Overall Rating Met Standard
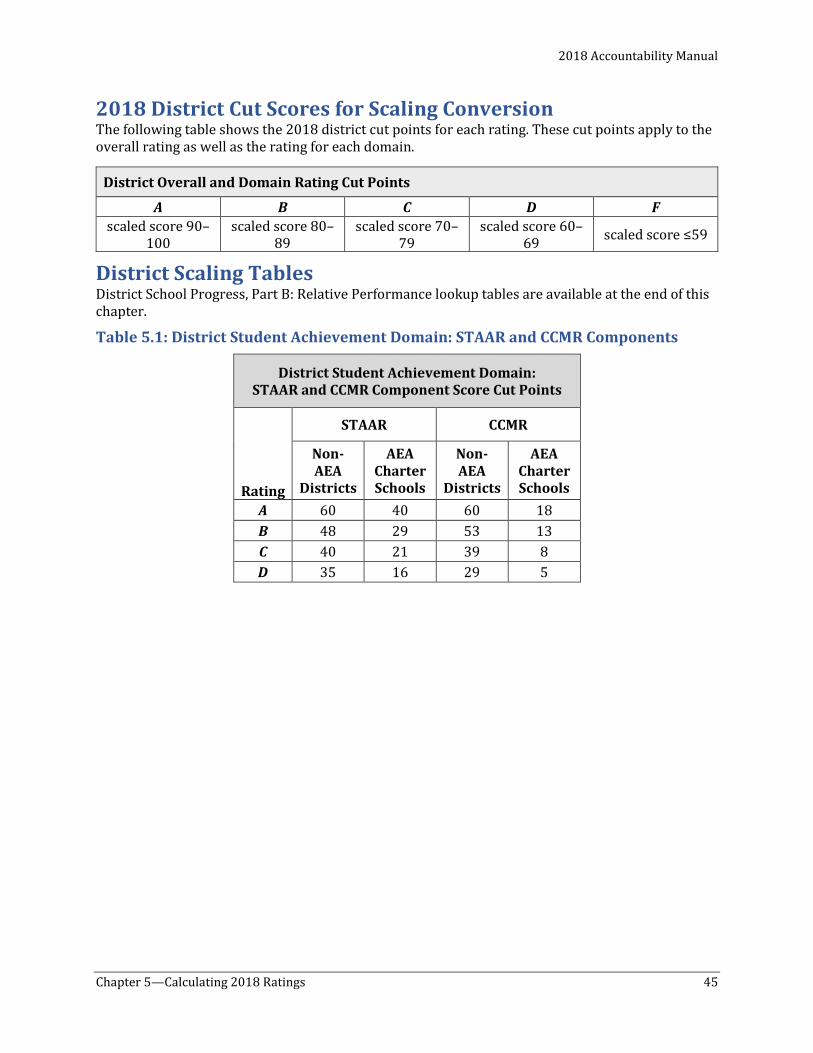
2018 Accountability Manual
Chapter 5—Calculating 2018 Ratings 45
2018 District Cut Scores for Scaling Conversion The following table shows the 2018 district cut points for each rating. These cut points apply to the overall rating as well as the rating for each domain.
District Scaling Tables District School Progress, Part B: Relative Performance lookup tables are available at the end of this chapter.
Table 5.1: District Student Achievement Domain: STAAR and CCMR Components
District Student Achievement Domain: STAAR and CCMR Component Score Cut Points
Rating
STAAR CCMR
Non-AEA
Districts
AEA Charter Schools
Non-AEA
Districts
AEA Charter Schools
A 60 40 60 18 B 48 29 53 13 C 40 21 39 8 D 35 16 29 5
District Overall and Domain Rating Cut Points
A B C D F scaled score 90–
100 scaled score 80–
89 scaled score 70–
79 scaled score 60–
69 scaled score ≤59
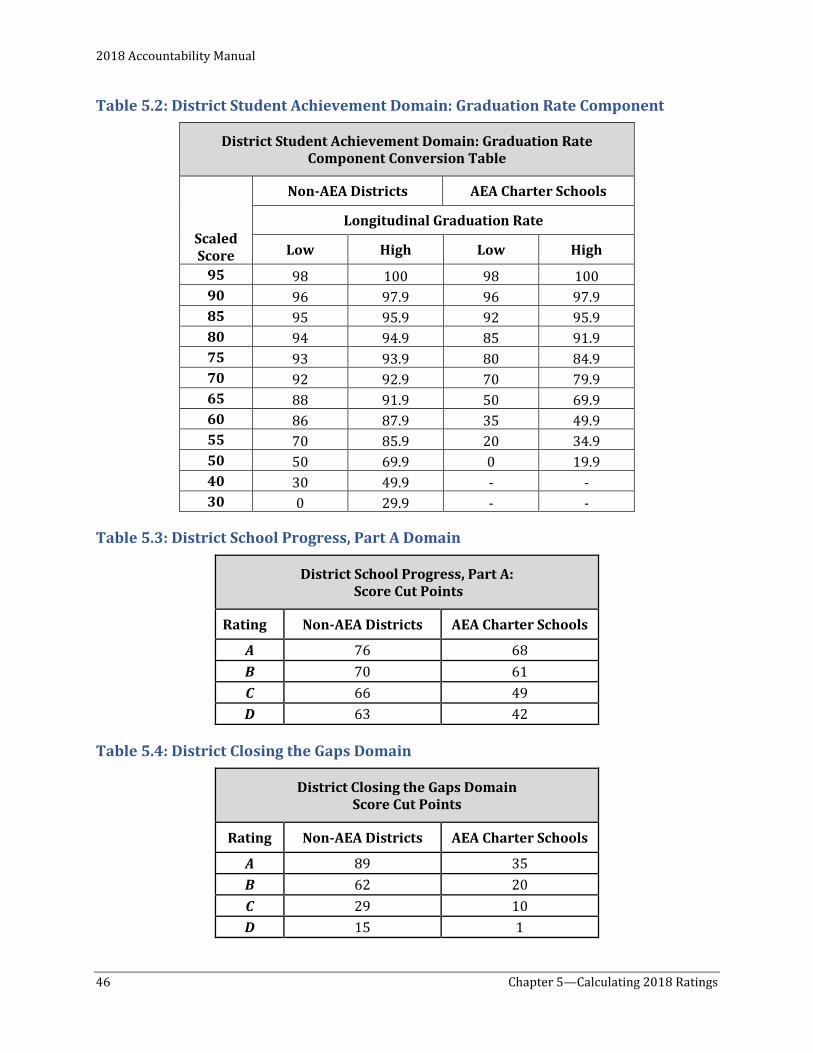
2018 Accountability Manual
46 Chapter 5—Calculating 2018 Ratings
Table 5.2: District Student Achievement Domain: Graduation Rate Component
District Student Achievement Domain: Graduation Rate Component Conversion Table
Scaled Score
Non-AEA Districts AEA Charter Schools
Longitudinal Graduation Rate
Low High Low High
95 98 100 98 100 90 96 97.9 96 97.9 85 95 95.9 92 95.9 80 94 94.9 85 91.9 75 93 93.9 80 84.9 70 92 92.9 70 79.9 65 88 91.9 50 69.9 60 86 87.9 35 49.9 55 70 85.9 20 34.9 50 50 69.9 0 19.9 40 30 49.9 - - 30 0 29.9 - -
Table 5.3: District School Progress, Part A Domain
District School Progress, Part A: Score Cut Points
Rating Non-AEA Districts AEA Charter Schools
A 76 68 B 70 61 C 66 49 D 63 42
Table 5.4: District Closing the Gaps Domain
District Closing the Gaps Domain Score Cut Points
Rating Non-AEA Districts AEA Charter Schools
A 89 35 B 62 20 C 29 10 D 15 1
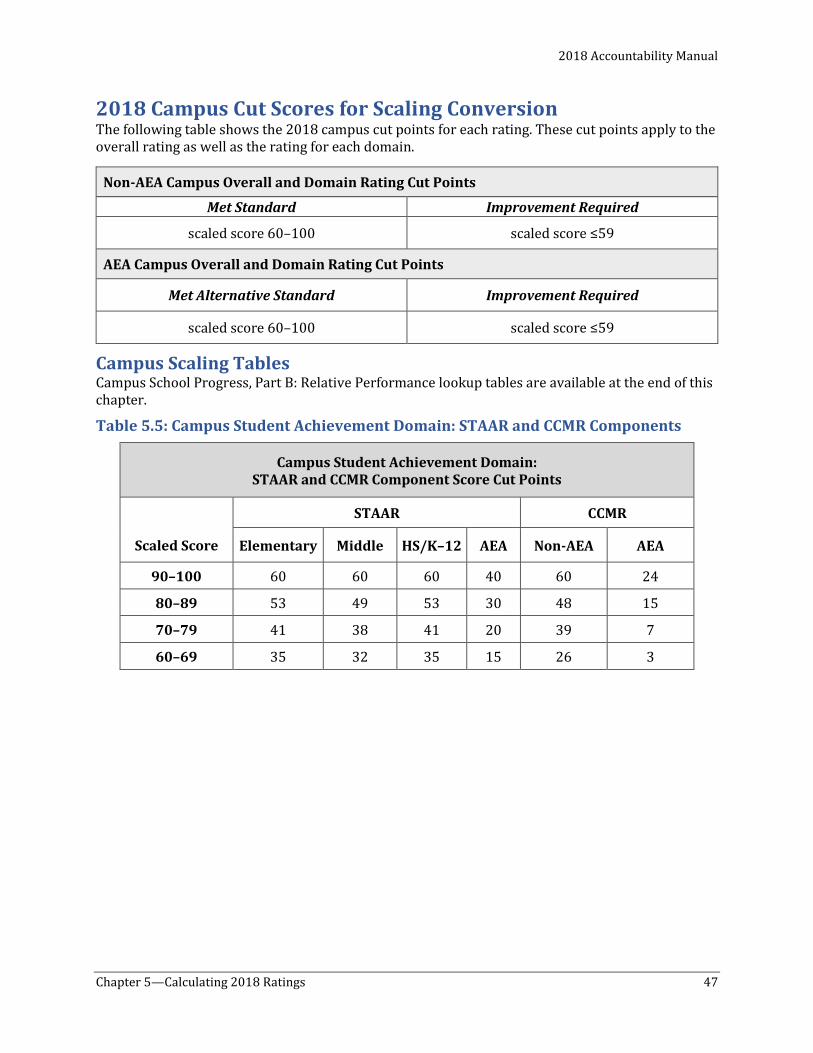
2018 Accountability Manual
Chapter 5—Calculating 2018 Ratings 47
2018 Campus Cut Scores for Scaling Conversion The following table shows the 2018 campus cut points for each rating. These cut points apply to the overall rating as well as the rating for each domain.
Campus Scaling Tables Campus School Progress, Part B: Relative Performance lookup tables are available at the end of this chapter.
Table 5.5: Campus Student Achievement Domain: STAAR and CCMR Components
Campus Student Achievement Domain: STAAR and CCMR Component Score Cut Points
Scaled Score
STAAR CCMR
Elementary Middle HS/K–12 AEA Non-AEA AEA
90–100 60 60 60 40 60 24
80–89 53 49 53 30 48 15
70–79 41 38 41 20 39 7
60–69 35 32 35 15 26 3
Non-AEA Campus Overall and Domain Rating Cut Points
Met Standard Improvement Required
scaled score 60–100 scaled score ≤59
AEA Campus Overall and Domain Rating Cut Points
Met Alternative Standard Improvement Required
scaled score 60–100 scaled score ≤59
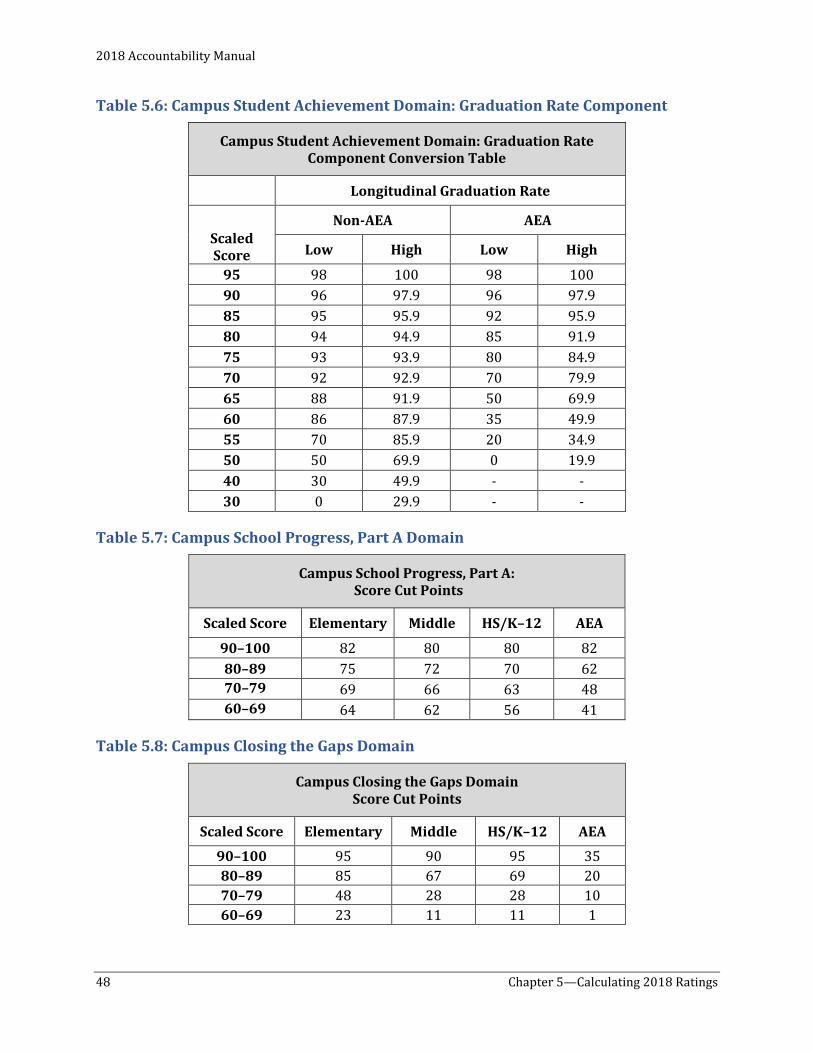
2018 Accountability Manual
48 Chapter 5—Calculating 2018 Ratings
Table 5.6: Campus Student Achievement Domain: Graduation Rate Component
Campus Student Achievement Domain: Graduation Rate Component Conversion Table
Longitudinal Graduation Rate
Scaled Score
Non-AEA AEA
Low High Low High
95 98 100 98 100 90 96 97.9 96 97.9 85 95 95.9 92 95.9 80 94 94.9 85 91.9 75 93 93.9 80 84.9 70 92 92.9 70 79.9 65 88 91.9 50 69.9 60 86 87.9 35 49.9 55 70 85.9 20 34.9 50 50 69.9 0 19.9 40 30 49.9 - - 30 0 29.9 - -
Table 5.7: Campus School Progress, Part A Domain
Campus School Progress, Part A: Score Cut Points
Scaled Score Elementary Middle HS/K–12 AEA
90–100 82 80 80 82 80–89 75 72 70 62 70–79 69 66 63 48 60–69 64 62 56 41
Table 5.8: Campus Closing the Gaps Domain
Campus Closing the Gaps Domain Score Cut Points
Scaled Score Elementary Middle HS/K–12 AEA
90–100 95 90 95 35 80–89 85 67 69 20 70–79 48 28 28 10 60–69 23 11 11 1
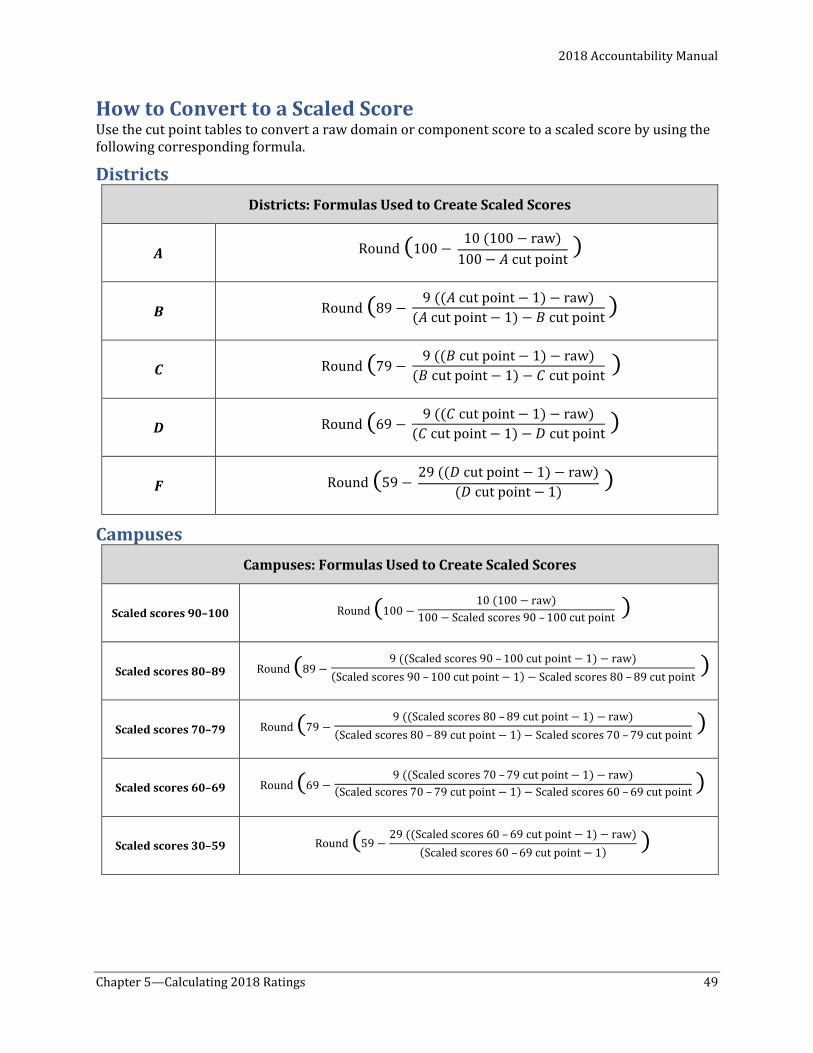
2018 Accountability Manual
How to Convert to a Scaled Score Use the cut point tables to convert a raw domain or component score to a scaled score by using the following corresponding formula.
Districts Districts: Formulas Used to Create Scaled Scores
A Round (100 − 10 (100 − raw)
100 − 𝐴𝐴 cut point )
B Round (89 − 9 ((𝐴𝐴 cut point − 1) − raw)
(𝐴𝐴 cut point − 1) − 𝐵𝐵 cut point )
C Round (79 − 9 ((𝐵𝐵 cut point − 1) − raw)
(𝐵𝐵 cut point − 1) − 𝐶𝐶 cut point )
D Round (69 − 9 ((𝐶𝐶 cut point − 1) − raw)
(𝐶𝐶 cut point − 1) − 𝐷𝐷 cut point )
F Round (59 − 29 ((𝐷𝐷 cut point − 1) − raw)
(𝐷𝐷 cut point − 1) )
Campuses
Campuses: Formulas Used to Create Scaled Scores
Scaled scores 90–100 Round (100 − 10 (100 − raw)
100 − Scaled scores 90 – 100 cut point )
Scaled scores 80–89 Round (89 − 9 ((Scaled scores 90 – 100 cut point − 1) − raw)
(Scaled scores 90 – 100 cut point − 1) − Scaled scores 80 – 89 cut point )
Scaled scores 70–79 Round (79 − 9 ((Scaled scores 80 – 89 cut point − 1) − raw)
(Scaled scores 80 – 89 cut point − 1) − Scaled scores 70 – 79 cut point )
Scaled scores 60–69 Round (69 − 9 ((Scaled scores 70 – 79 cut point − 1) − raw)
(Scaled scores 70 – 79 cut point − 1) − Scaled scores 60 – 69 cut point )
Scaled scores 30–59 Round (59 − 29 ((Scaled scores 60 – 69 cut point − 1) − raw)
(Scaled scores 60 – 69 cut point − 1) )
Chapter 5—Calculating 2018 Ratings 49
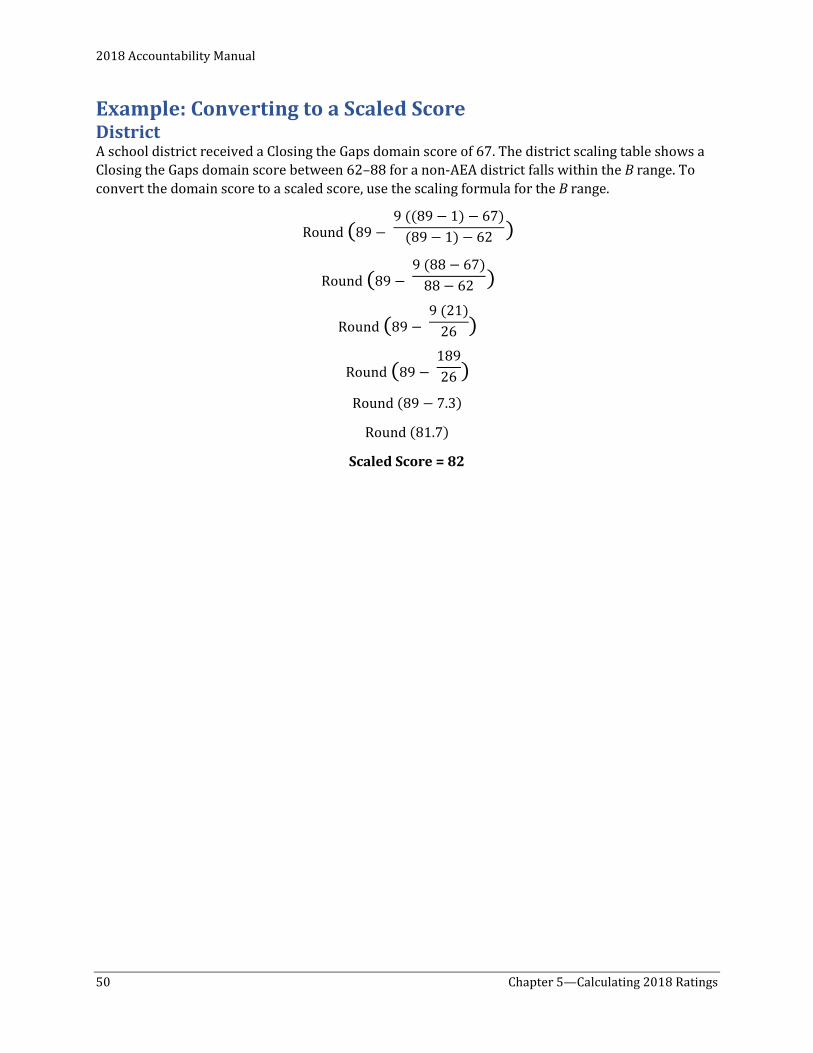
2018 Accountability Manual
50 Chapter 5—Calculating 2018 Ratings
Example: Converting to a Scaled Score District A school district received a Closing the Gaps domain score of 67. The district scaling table shows a Closing the Gaps domain score between 62–88 for a non-AEA district falls within the B range. To convert the domain score to a scaled score, use the scaling formula for the B range.
Round (89 − 9 ((89 − 1) − 67)
(89 − 1) − 62 )
Round (89 − 9 (88 − 67)
88 − 62 )
Round (89 − 9 (21)
26 )
Round (89 − 189
) 26
Round (89 − 7.3)
Round (81.7)
Scaled Score = 82
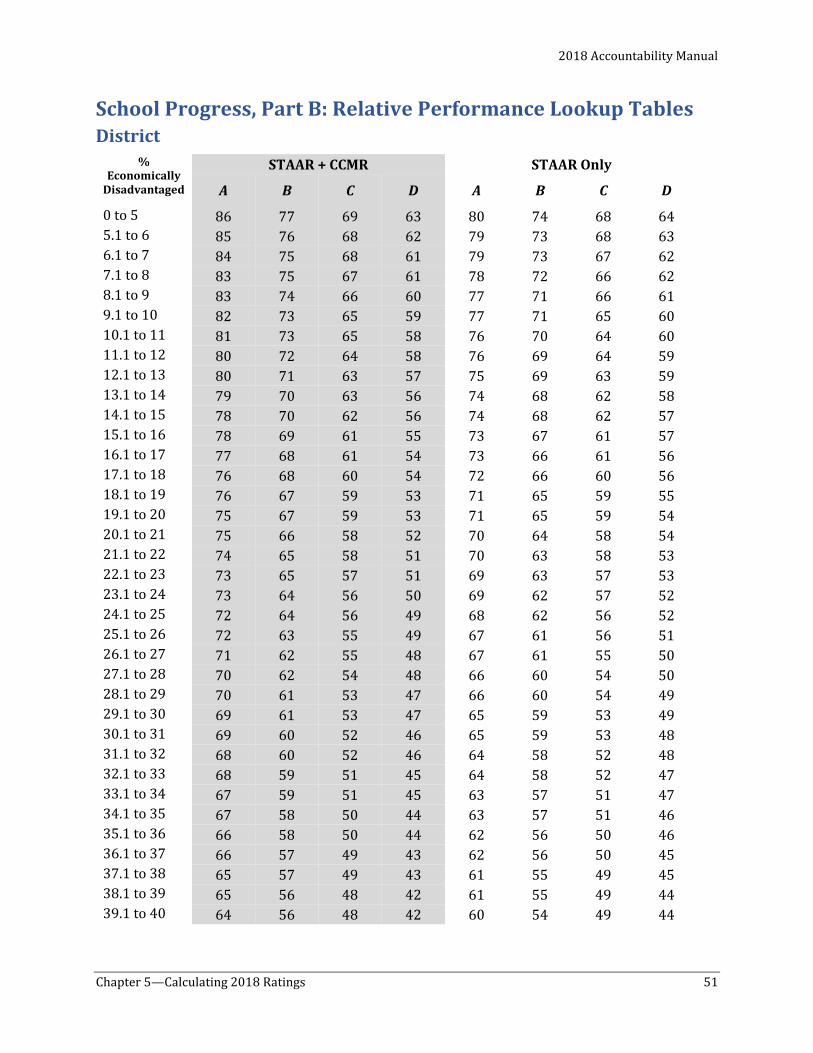
2018 Accountability Manual
Chapter 5—Calculating 2018 Ratings 51
School Progress, Part B: Relative Performance Lookup Tables District
% Economically
Disadvantaged
STAAR + CCMR STAAR Only
A B C D A B C D
0 to 5 86 77 69 63 80 74 68 64 5.1 to 6 85 76 68 62 79 73 68 63 6.1 to 7 84 75 68 61 79 73 67 62 7.1 to 8 83 75 67 61 78 72 66 62 8.1 to 9 83 74 66 60 77 71 66 61 9.1 to 10 82 73 65 59 77 71 65 60 10.1 to 11 81 73 65 58 76 70 64 60 11.1 to 12 80 72 64 58 76 69 64 59 12.1 to 13 80 71 63 57 75 69 63 59 13.1 to 14 79 70 63 56 74 68 62 58 14.1 to 15 78 70 62 56 74 68 62 57 15.1 to 16 78 69 61 55 73 67 61 57 16.1 to 17 77 68 61 54 73 66 61 56 17.1 to 18 76 68 60 54 72 66 60 56 18.1 to 19 76 67 59 53 71 65 59 55 19.1 to 20 75 67 59 53 71 65 59 54 20.1 to 21 75 66 58 52 70 64 58 54 21.1 to 22 74 65 58 51 70 63 58 53 22.1 to 23 73 65 57 51 69 63 57 53 23.1 to 24 73 64 56 50 69 62 57 52 24.1 to 25 72 64 56 49 68 62 56 52 25.1 to 26 72 63 55 49 67 61 56 51 26.1 to 27 71 62 55 48 67 61 55 50 27.1 to 28 70 62 54 48 66 60 54 50 28.1 to 29 70 61 53 47 66 60 54 49 29.1 to 30 69 61 53 47 65 59 53 49 30.1 to 31 69 60 52 46 65 59 53 48 31.1 to 32 68 60 52 46 64 58 52 48 32.1 to 33 68 59 51 45 64 58 52 47 33.1 to 34 67 59 51 45 63 57 51 47 34.1 to 35 67 58 50 44 63 57 51 46 35.1 to 36 66 58 50 44 62 56 50 46 36.1 to 37 66 57 49 43 62 56 50 45 37.1 to 38 65 57 49 43 61 55 49 45 38.1 to 39 65 56 48 42 61 55 49 44 39.1 to 40 64 56 48 42 60 54 49 44
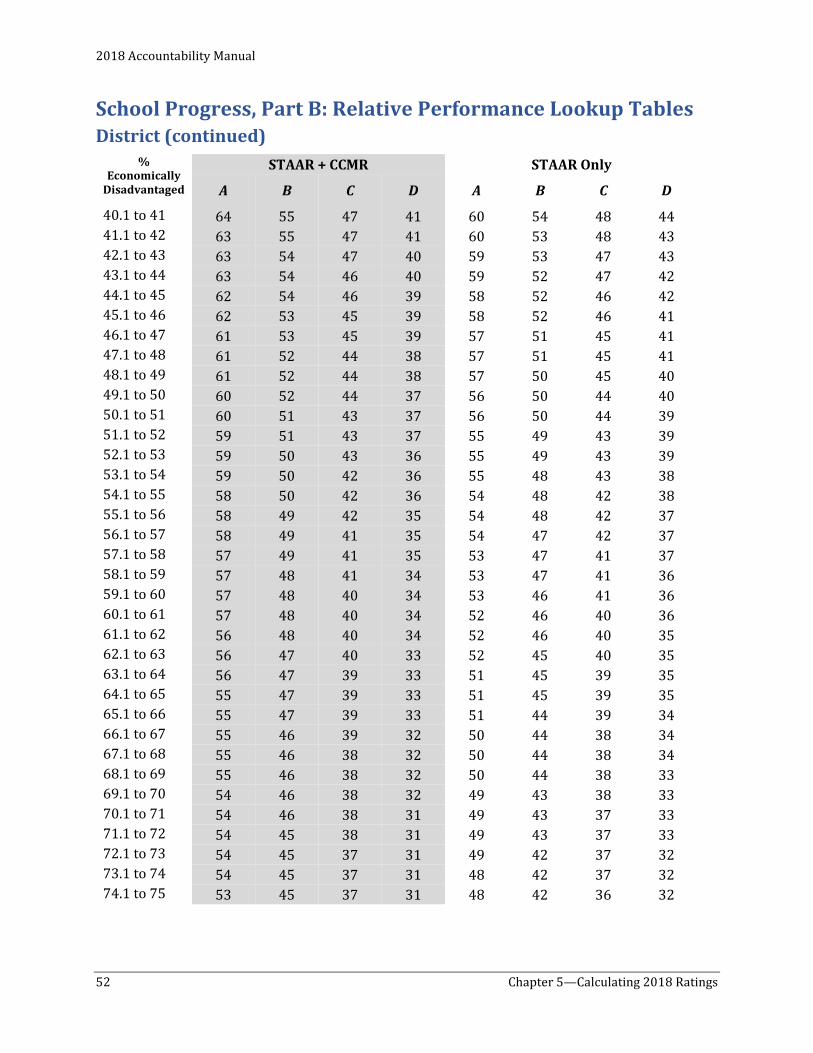
2018 Accountability Manual
52 Chapter 5—Calculating 2018 Ratings
School Progress, Part B: Relative Performance Lookup Tables District (continued)
% Economically
Disadvantaged
STAAR + CCMR STAAR Only
A B C D A B C D
40.1 to 41 64 55 47 41 60 54 48 44 41.1 to 42 63 55 47 41 60 53 48 43 42.1 to 43 63 54 47 40 59 53 47 43 43.1 to 44 63 54 46 40 59 52 47 42 44.1 to 45 62 54 46 39 58 52 46 42 45.1 to 46 62 53 45 39 58 52 46 41 46.1 to 47 61 53 45 39 57 51 45 41 47.1 to 48 61 52 44 38 57 51 45 41 48.1 to 49 61 52 44 38 57 50 45 40 49.1 to 50 60 52 44 37 56 50 44 40 50.1 to 51 60 51 43 37 56 50 44 39 51.1 to 52 59 51 43 37 55 49 43 39 52.1 to 53 59 50 43 36 55 49 43 39 53.1 to 54 59 50 42 36 55 48 43 38 54.1 to 55 58 50 42 36 54 48 42 38 55.1 to 56 58 49 42 35 54 48 42 37 56.1 to 57 58 49 41 35 54 47 42 37 57.1 to 58 57 49 41 35 53 47 41 37 58.1 to 59 57 48 41 34 53 47 41 36 59.1 to 60 57 48 40 34 53 46 41 36 60.1 to 61 57 48 40 34 52 46 40 36 61.1 to 62 56 48 40 34 52 46 40 35 62.1 to 63 56 47 40 33 52 45 40 35 63.1 to 64 56 47 39 33 51 45 39 35 64.1 to 65 55 47 39 33 51 45 39 35 65.1 to 66 55 47 39 33 51 44 39 34 66.1 to 67 55 46 39 32 50 44 38 34 67.1 to 68 55 46 38 32 50 44 38 34 68.1 to 69 55 46 38 32 50 44 38 33 69.1 to 70 54 46 38 32 49 43 38 33 70.1 to 71 54 46 38 31 49 43 37 33 71.1 to 72 54 45 38 31 49 43 37 33 72.1 to 73 54 45 37 31 49 42 37 32 73.1 to 74 54 45 37 31 48 42 37 32 74.1 to 75 53 45 37 31 48 42 36 32
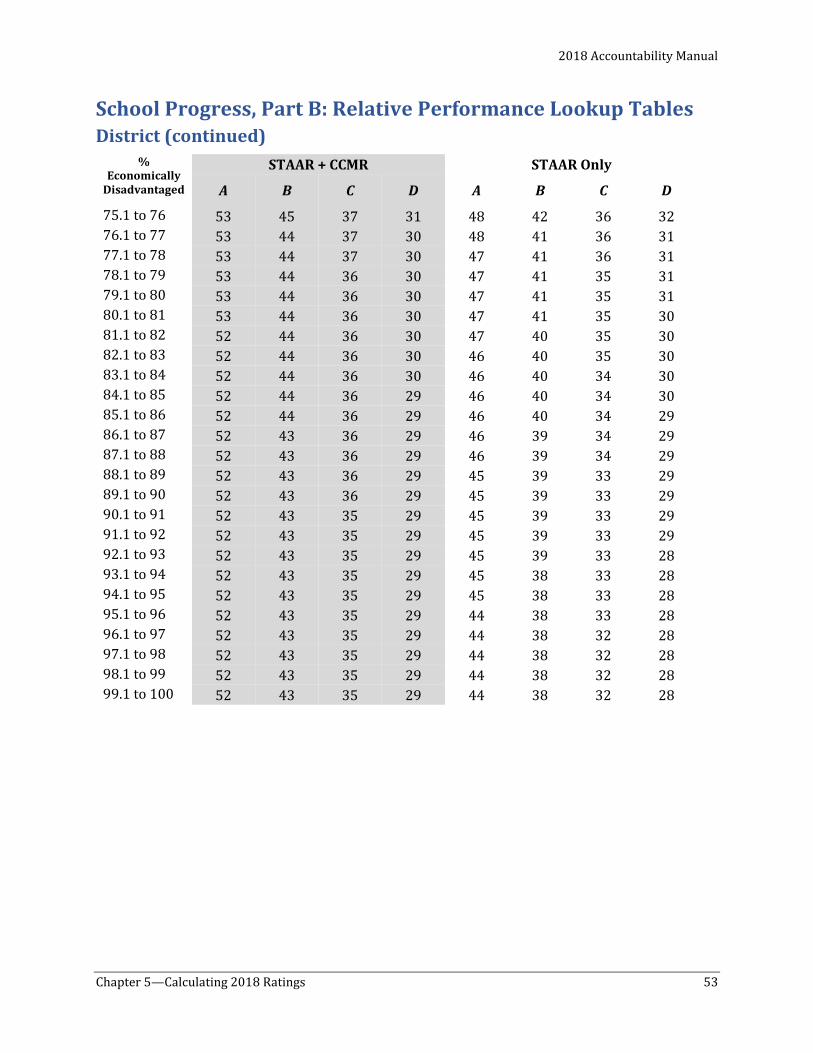
2018 Accountability Manual
Chapter 5—Calculating 2018 Ratings 53
School Progress, Part B: Relative Performance Lookup Tables District (continued)
% Economically
Disadvantaged
STAAR + CCMR STAAR Only
A B C D A B C D
75.1 to 76 53 45 37 31 48 42 36 32 76.1 to 77 53 44 37 30 48 41 36 31 77.1 to 78 53 44 37 30 47 41 36 31 78.1 to 79 53 44 36 30 47 41 35 31 79.1 to 80 53 44 36 30 47 41 35 31 80.1 to 81 53 44 36 30 47 41 35 30 81.1 to 82 52 44 36 30 47 40 35 30 82.1 to 83 52 44 36 30 46 40 35 30 83.1 to 84 52 44 36 30 46 40 34 30 84.1 to 85 52 44 36 29 46 40 34 30 85.1 to 86 52 44 36 29 46 40 34 29 86.1 to 87 52 43 36 29 46 39 34 29 87.1 to 88 52 43 36 29 46 39 34 29 88.1 to 89 52 43 36 29 45 39 33 29 89.1 to 90 52 43 36 29 45 39 33 29 90.1 to 91 52 43 35 29 45 39 33 29 91.1 to 92 52 43 35 29 45 39 33 29 92.1 to 93 52 43 35 29 45 39 33 28 93.1 to 94 52 43 35 29 45 38 33 28 94.1 to 95 52 43 35 29 45 38 33 28 95.1 to 96 52 43 35 29 44 38 33 28 96.1 to 97 52 43 35 29 44 38 32 28 97.1 to 98 52 43 35 29 44 38 32 28 98.1 to 99 52 43 35 29 44 38 32 28 99.1 to 100 52 43 35 29 44 38 32 28
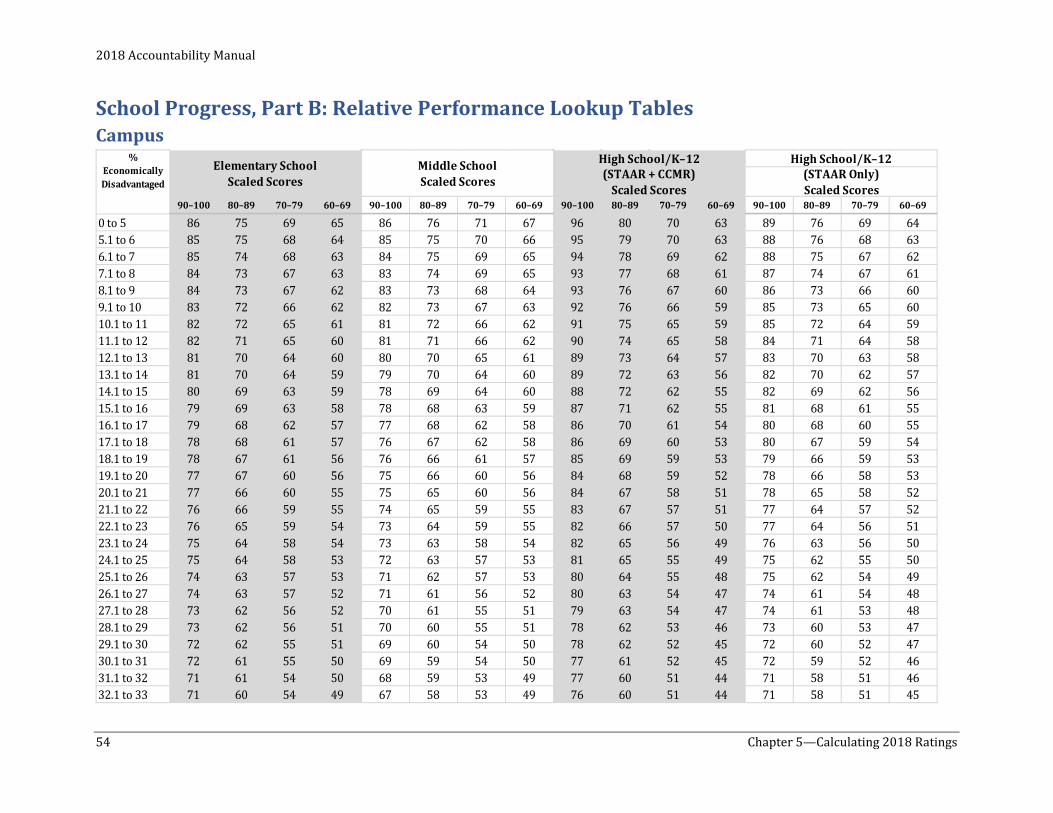
2018 Accountability Manual
54 Chapter 5—Calculating 2018 Ratings
School Progress, Part B: Relative Performance Lookup Tables Campus
% High School/K–12 High School/K–12Elementary School Middle School Economically (STAAR + CCMR) (STAAR Only)Disadvantaged Scaled Scores Scaled Scores Scaled Scores Scaled Scores
90–100 80–89 70–79 60–69 90–100 80–89 70–79 60–69 90–100 80–89 70–79 60–69 90–100 80–89 70–79 60–69
0 to 5 86 75 69 65 86 76 71 67 96 80 70 63 89 76 69 645.1 to 6 85 75 68 64 85 75 70 66 95 79 70 63 88 76 68 636.1 to 7 85 74 68 63 84 75 69 65 94 78 69 62 88 75 67 627.1 to 8 84 73 67 63 83 74 69 65 93 77 68 61 87 74 67 618.1 to 9 84 73 67 62 83 73 68 64 93 76 67 60 86 73 66 609.1 to 10 83 72 66 62 82 73 67 63 92 76 66 59 85 73 65 6010.1 to 11 82 72 65 61 81 72 66 62 91 75 65 59 85 72 64 5911.1 to 12 82 71 65 60 81 71 66 62 90 74 65 58 84 71 64 5812.1 to 13 81 70 64 60 80 70 65 61 89 73 64 57 83 70 63 5813.1 to 14 81 70 64 59 79 70 64 60 89 72 63 56 82 70 62 5714.1 to 15 80 69 63 59 78 69 64 60 88 72 62 55 82 69 62 5615.1 to 16 79 69 63 58 78 68 63 59 87 71 62 55 81 68 61 5516.1 to 17 79 68 62 57 77 68 62 58 86 70 61 54 80 68 60 5517.1 to 18 78 68 61 57 76 67 62 58 86 69 60 53 80 67 59 5418.1 to 19 78 67 61 56 76 66 61 57 85 69 59 53 79 66 59 5319.1 to 20 77 67 60 56 75 66 60 56 84 68 59 52 78 66 58 5320.1 to 21 77 66 60 55 75 65 60 56 84 67 58 51 78 65 58 5221.1 to 22 76 66 59 55 74 65 59 55 83 67 57 51 77 64 57 5222.1 to 23 76 65 59 54 73 64 59 55 82 66 57 50 77 64 56 5123.1 to 24 75 64 58 54 73 63 58 54 82 65 56 49 76 63 56 5024.1 to 25 75 64 58 53 72 63 57 53 81 65 55 49 75 62 55 5025.1 to 26 74 63 57 53 71 62 57 53 80 64 55 48 75 62 54 4926.1 to 27 74 63 57 52 71 61 56 52 80 63 54 47 74 61 54 4827.1 to 28 73 62 56 52 70 61 55 51 79 63 54 47 74 61 53 4828.1 to 29 73 62 56 51 70 60 55 51 78 62 53 46 73 60 53 4729.1 to 30 72 62 55 51 69 60 54 50 78 62 52 45 72 60 52 4730.1 to 31 72 61 55 50 69 59 54 50 77 61 52 45 72 59 52 4631.1 to 32 71 61 54 50 68 59 53 49 77 60 51 44 71 58 51 4632.1 to 33 71 60 54 49 67 58 53 49 76 60 51 44 71 58 51 45
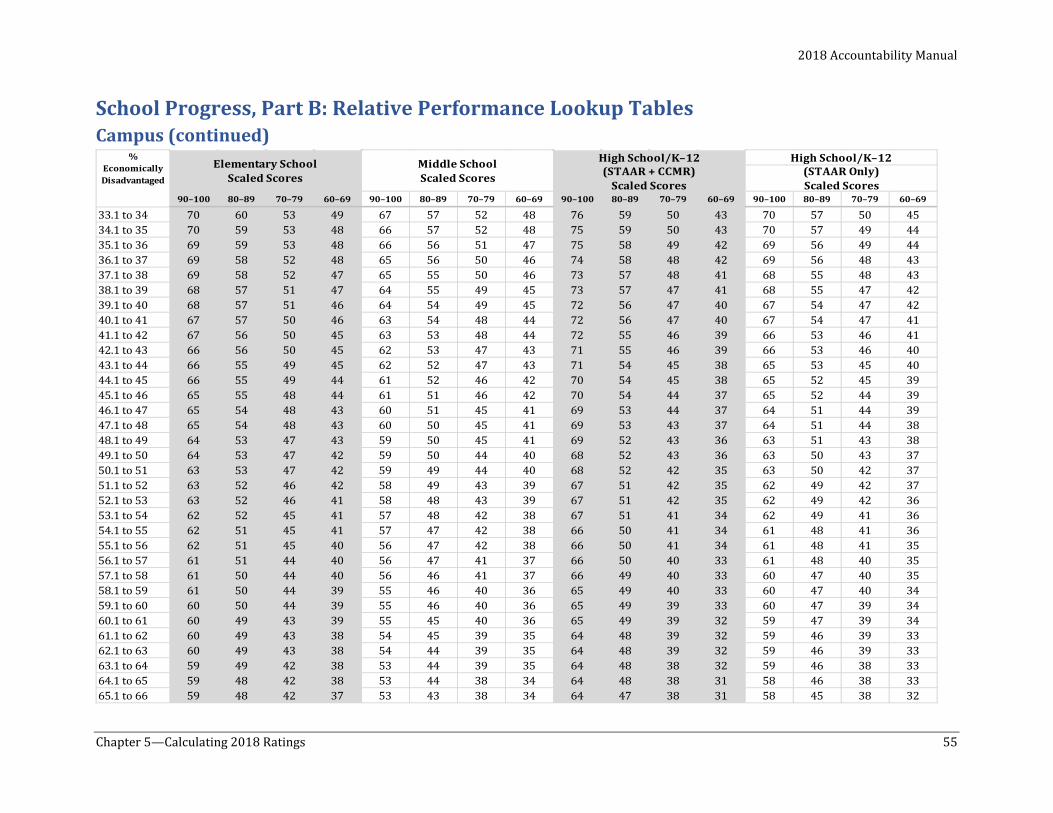
2018 Accountability Manual
Chapter 5—Calculating 2018 Ratings 55
School Progress, Part B: Relative Performance Lookup Tables Campus (continued)
% High School/K–12 High School/K–12Elementary School Middle School Economically (STAAR + CCMR) (STAAR Only)Disadvantaged Scaled Scores Scaled Scores Scaled Scores Scaled Scores
90–100 80–89 70–79 60–69 90–100 80–89 70–79 60–69 90–100 80–89 70–79 60–69 90–100 80–89 70–79 60–69
33.1 to 34 70 60 53 49 67 57 52 48 76 59 50 43 70 57 50 4534.1 to 35 70 59 53 48 66 57 52 48 75 59 50 43 70 57 49 4435.1 to 36 69 59 53 48 66 56 51 47 75 58 49 42 69 56 49 4436.1 to 37 69 58 52 48 65 56 50 46 74 58 48 42 69 56 48 4337.1 to 38 69 58 52 47 65 55 50 46 73 57 48 41 68 55 48 4338.1 to 39 68 57 51 47 64 55 49 45 73 57 47 41 68 55 47 4239.1 to 40 68 57 51 46 64 54 49 45 72 56 47 40 67 54 47 4240.1 to 41 67 57 50 46 63 54 48 44 72 56 47 40 67 54 47 4141.1 to 42 67 56 50 45 63 53 48 44 72 55 46 39 66 53 46 4142.1 to 43 66 56 50 45 62 53 47 43 71 55 46 39 66 53 46 4043.1 to 44 66 55 49 45 62 52 47 43 71 54 45 38 65 53 45 4044.1 to 45 66 55 49 44 61 52 46 42 70 54 45 38 65 52 45 3945.1 to 46 65 55 48 44 61 51 46 42 70 54 44 37 65 52 44 3946.1 to 47 65 54 48 43 60 51 45 41 69 53 44 37 64 51 44 3947.1 to 48 65 54 48 43 60 50 45 41 69 53 43 37 64 51 44 3848.1 to 49 64 53 47 43 59 50 45 41 69 52 43 36 63 51 43 3849.1 to 50 64 53 47 42 59 50 44 40 68 52 43 36 63 50 43 3750.1 to 51 63 53 47 42 59 49 44 40 68 52 42 35 63 50 42 3751.1 to 52 63 52 46 42 58 49 43 39 67 51 42 35 62 49 42 3752.1 to 53 63 52 46 41 58 48 43 39 67 51 42 35 62 49 42 3653.1 to 54 62 52 45 41 57 48 42 38 67 51 41 34 62 49 41 3654.1 to 55 62 51 45 41 57 47 42 38 66 50 41 34 61 48 41 3655.1 to 56 62 51 45 40 56 47 42 38 66 50 41 34 61 48 41 3556.1 to 57 61 51 44 40 56 47 41 37 66 50 40 33 61 48 40 3557.1 to 58 61 50 44 40 56 46 41 37 66 49 40 33 60 47 40 3558.1 to 59 61 50 44 39 55 46 40 36 65 49 40 33 60 47 40 3459.1 to 60 60 50 44 39 55 46 40 36 65 49 39 33 60 47 39 3460.1 to 61 60 49 43 39 55 45 40 36 65 49 39 32 59 47 39 3461.1 to 62 60 49 43 38 54 45 39 35 64 48 39 32 59 46 39 3362.1 to 63 60 49 43 38 54 44 39 35 64 48 39 32 59 46 39 3363.1 to 64 59 49 42 38 53 44 39 35 64 48 38 32 59 46 38 3364.1 to 65 59 48 42 38 53 44 38 34 64 48 38 31 58 46 38 3365.1 to 66 59 48 42 37 53 43 38 34 64 47 38 31 58 45 38 32
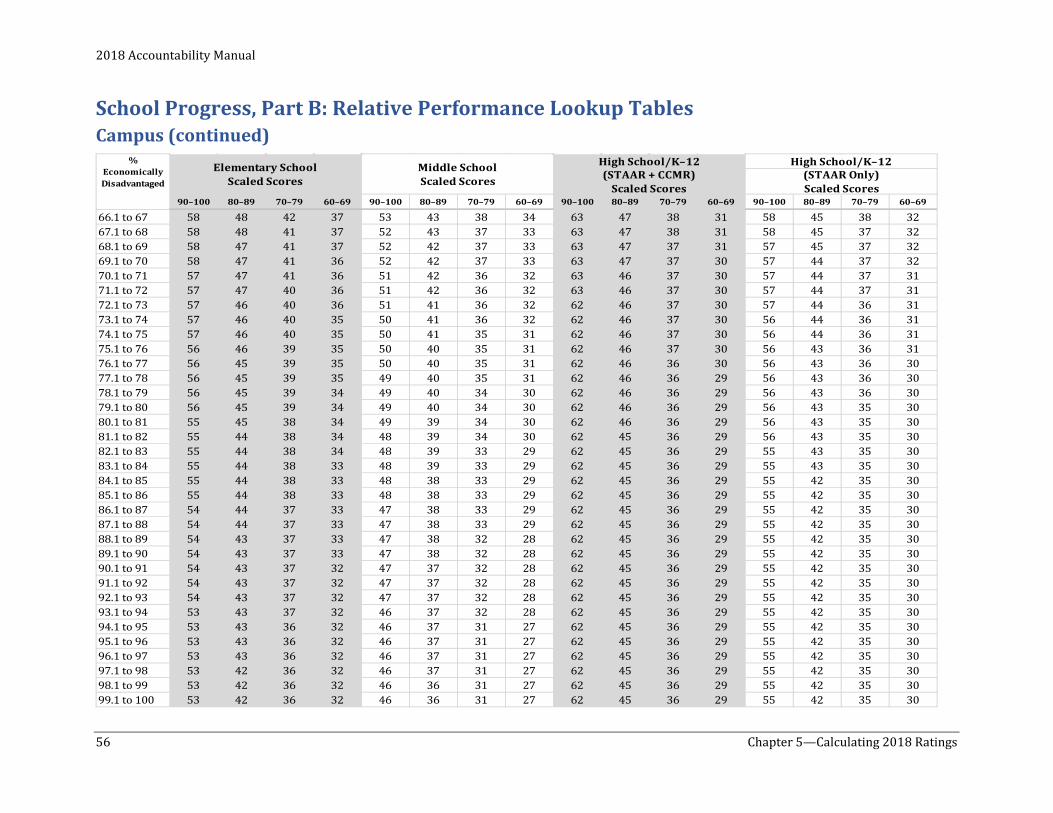
2018 Accountability Manual
56 Chapter 5—Calculating 2018 Ratings
School Progress, Part B: Relative Performance Lookup Tables Campus (continued)
% High School/K–12 High School/K–12Elementary School Middle School Economically (STAAR + CCMR) (STAAR Only)Disadvantaged Scaled Scores Scaled Scores Scaled Scores Scaled Scores
90–100 80–89 70–79 60–69 90–100 80–89 70–79 60–69 90–100 80–89 70–79 60–69 90–100 80–89 70–79 60–69
66.1 to 67 58 48 42 37 53 43 38 34 63 47 38 31 58 45 38 3267.1 to 68 58 48 41 37 52 43 37 33 63 47 38 31 58 45 37 3268.1 to 69 58 47 41 37 52 42 37 33 63 47 37 31 57 45 37 3269.1 to 70 58 47 41 36 52 42 37 33 63 47 37 30 57 44 37 3270.1 to 71 57 47 41 36 51 42 36 32 63 46 37 30 57 44 37 3171.1 to 72 57 47 40 36 51 42 36 32 63 46 37 30 57 44 37 3172.1 to 73 57 46 40 36 51 41 36 32 62 46 37 30 57 44 36 3173.1 to 74 57 46 40 35 50 41 36 32 62 46 37 30 56 44 36 3174.1 to 75 57 46 40 35 50 41 35 31 62 46 37 30 56 44 36 3175.1 to 76 56 46 39 35 50 40 35 31 62 46 37 30 56 43 36 3176.1 to 77 56 45 39 35 50 40 35 31 62 46 36 30 56 43 36 3077.1 to 78 56 45 39 35 49 40 35 31 62 46 36 29 56 43 36 3078.1 to 79 56 45 39 34 49 40 34 30 62 46 36 29 56 43 36 3079.1 to 80 56 45 39 34 49 40 34 30 62 46 36 29 56 43 35 3080.1 to 81 55 45 38 34 49 39 34 30 62 46 36 29 56 43 35 3081.1 to 82 55 44 38 34 48 39 34 30 62 45 36 29 56 43 35 3082.1 to 83 55 44 38 34 48 39 33 29 62 45 36 29 55 43 35 3083.1 to 84 55 44 38 33 48 39 33 29 62 45 36 29 55 43 35 3084.1 to 85 55 44 38 33 48 38 33 29 62 45 36 29 55 42 35 3085.1 to 86 55 44 38 33 48 38 33 29 62 45 36 29 55 42 35 3086.1 to 87 54 44 37 33 47 38 33 29 62 45 36 29 55 42 35 3087.1 to 88 54 44 37 33 47 38 33 29 62 45 36 29 55 42 35 3088.1 to 89 54 43 37 33 47 38 32 28 62 45 36 29 55 42 35 3089.1 to 90 54 43 37 33 47 38 32 28 62 45 36 29 55 42 35 3090.1 to 91 54 43 37 32 47 37 32 28 62 45 36 29 55 42 35 3091.1 to 92 54 43 37 32 47 37 32 28 62 45 36 29 55 42 35 3092.1 to 93 54 43 37 32 47 37 32 28 62 45 36 29 55 42 35 3093.1 to 94 53 43 37 32 46 37 32 28 62 45 36 29 55 42 35 3094.1 to 95 53 43 36 32 46 37 31 27 62 45 36 29 55 42 35 3095.1 to 96 53 43 36 32 46 37 31 27 62 45 36 29 55 42 35 3096.1 to 97 53 43 36 32 46 37 31 27 62 45 36 29 55 42 35 3097.1 to 98 53 42 36 32 46 37 31 27 62 45 36 29 55 42 35 3098.1 to 99 53 42 36 32 46 36 31 27 62 45 36 29 55 42 35 3099.1 to 100 53 42 36 32 46 36 31 27 62 45 36 29 55 42 35 30
2018 Accountability Manual
Chapter 6—Distinction Designations 57
Chapter 6—Distinction Designations Campuses that receive an accountability rating of Met Standard are eligible to earn distinction designations. Distinction designations are awarded for achievement in several areas and are based on performance relative to a group of campuses of similar type, size, grade span, and student demographics. The distinction designation indicators are typically separate from those used to assign accountability ratings. Districts that receive a rating of A, B, C, or D are eligible for a distinction designation in postsecondary readiness.
Distinction Designations For 2018, distinction designations are awarded in the following areas: • Academic Achievement in English Language Arts/Reading (campus only) • Academic Achievement in Mathematics (campus only) • Academic Achievement in Science (campus only) • Academic Achievement in Social Studies (campus only) • Top 25 Percent: Comparative Academic Growth (campus only) • Top 25 Percent: Comparative Closing the Gaps (campus only) • Postsecondary Readiness (district and campus)
Distinction Designation Labels The Distinction Designation Reports show one of the following labels for each distinction designation:
Distinction Earned. The district is rated A, B, C, or D and meets the criteria for the distinction designation. The campus is rated Met Standard and meets the criteria for the distinction designation.
No Distinction Earned. The district is rated F or does not meet the criteria for the distinction designation. The campus is rated Improvement Required or does not meet the criteria for the distinction designation.
Not Eligible. The district or campus does not have results to evaluate for the distinction designation, is not rated, is evaluated by alternative education accountability (AEA) provisions, or is a campus paired with a feeder campus for accountability evaluation.
Campus Comparison Groups Each campus is assigned to a unique comparison group comprised of Texas schools that are most similar to it. To determine the campus comparison group, each campus is identified by school type (See the school types chart in “Chapter 1—2018 Accountability Overview” for more information.) then grouped with 40 other campuses from anywhere in Texas that are most similar in grade levels served, size, percentage of students who are economically disadvantaged, mobility rate, percentage of English learners, percentage of students receiving special education services, and percentage of students enrolled in an Early College High School program. Each campus has only one unique campus comparison group. There is no limit on the number of comparison groups to which a campus may be a member. It is possible for a campus to be a member of no comparison group other than its own or a member of several comparison groups.
2018 Accountability Manual
58 Chapter 6—Distinction Designations
A campus earns a distinction designation if it is in the top quartile (Q1) of its comparison group for at least 33 percent (for high schools and K–12 campuses) or 50 percent (for elementary and middle schools) of the indicators used to award the distinction.
• For an indicator to be used to evaluate campuses for a distinction designation, at least 20 campuses in the comparison group must have data for that indicator. If fewer than 20 campuses have data for the indicator, it cannot be used to evaluate campuses for the distinction. This often affects campuses with non-traditional grade spans.
• Campuses will not have access to the performance data of other campuses and will not know where they rank in their comparison groups until the public release of all accountability data.
For details on how campus comparison groups are constructed, please see Appendix E.
Academic Achievement in English Language Arts/Reading An Academic Achievement Distinction Designation (AADD) is awarded to campuses for outstanding achievement in ELA/reading based on outcomes of several performance indicators.
Who is Eligible: Campuses assigned a Met Standard rating
Student Groups: Performance of only the all students group is used.
Minimum Size: Minimum size is determined separately for each indicator.
• Attendance Rate. Minimum size is based on total days in membership. If a campus has fewer than 1,800 total days in membership (e.g., 10 students x 180 school days) attendance cannot be used to evaluate the campus for this distinction.
• Assessments (STAAR, AP/IB, SAT, and/or ACT). Minimum size is 10 students for each assessment. If a campus has fewer than 10 test takers for an assessment, any indicator relying on that assessment cannot be used to evaluate the campus for this distinction.
• Participation. o AP/IB: ELA. Minimum size is 10 students enrolled in grades 11 and 12. o Advanced/Dual-Credit Course Completion: ELA/Reading. Minimum size is 10 students in
grades 9 through 12 who complete at least one course. o SAT/ACT Participation. Minimum size is 10 reported annual graduates.
AADD ELA/Reading Indicators: • Attendance Rate • Accelerated Student Growth in ELA/Reading • Grade 3 Reading Performance (Masters Grade Level) • Grade 4 Reading Performance (Masters Grade Level) • Grade 4 Writing Performance (Masters Grade Level) • Grade 5 Reading Performance (Masters Grade Level) • Grade 6 Reading Performance (Masters Grade Level) • Grade 7 Reading Performance (Masters Grade Level) • Grade 7 Writing Performance (Masters Grade Level) • Grade 8 Reading Performance (Masters Grade Level) • English I Performance (Masters Grade Level) • English II Performance (Masters Grade Level) • AP/IB Examination Participation: ELA • AP/IB Examination Results (Examinees >= Criterion): ELA
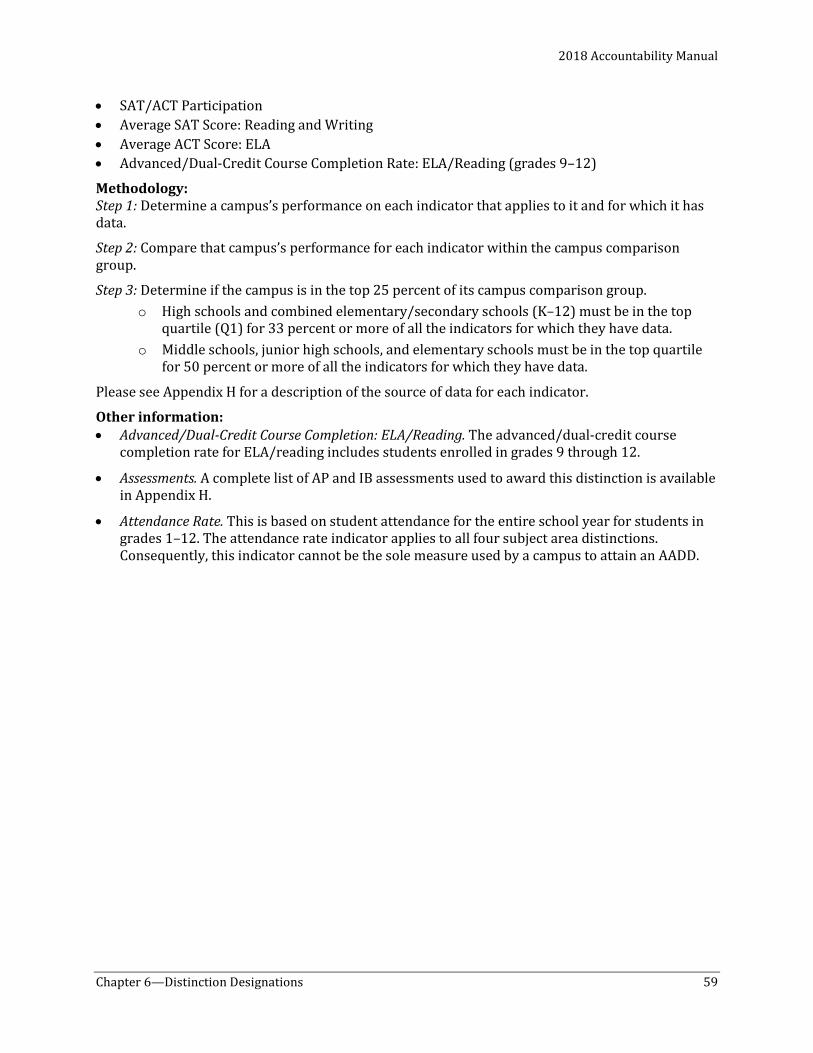
2018 Accountability Manual
Chapter 6—Distinction Designations 59
• SAT/ACT Participation • Average SAT Score: Reading and Writing • Average ACT Score: ELA • Advanced/Dual-Credit Course Completion Rate: ELA/Reading (grades 9–12)
Methodology: Step 1: Determine a campus’s performance on each indicator that applies to it and for which it has data.
Step 2: Compare that campus’s performance for each indicator within the campus comparison group.
Step 3: Determine if the campus is in the top 25 percent of its campus comparison group. o High schools and combined elementary/secondary schools (K–12) must be in the top
quartile (Q1) for 33 percent or more of all the indicators for which they have data. o Middle schools, junior high schools, and elementary schools must be in the top quartile
for 50 percent or more of all the indicators for which they have data.
Please see Appendix H for a description of the source of data for each indicator.
Other information: • Advanced/Dual-Credit Course Completion: ELA/Reading. The advanced/dual-credit course
completion rate for ELA/reading includes students enrolled in grades 9 through 12.
• Assessments. A complete list of AP and IB assessments used to award this distinction is available in Appendix H.
• Attendance Rate. This is based on student attendance for the entire school year for students in grades 1–12. The attendance rate indicator applies to all four subject area distinctions. Consequently, this indicator cannot be the sole measure used by a campus to attain an AADD.
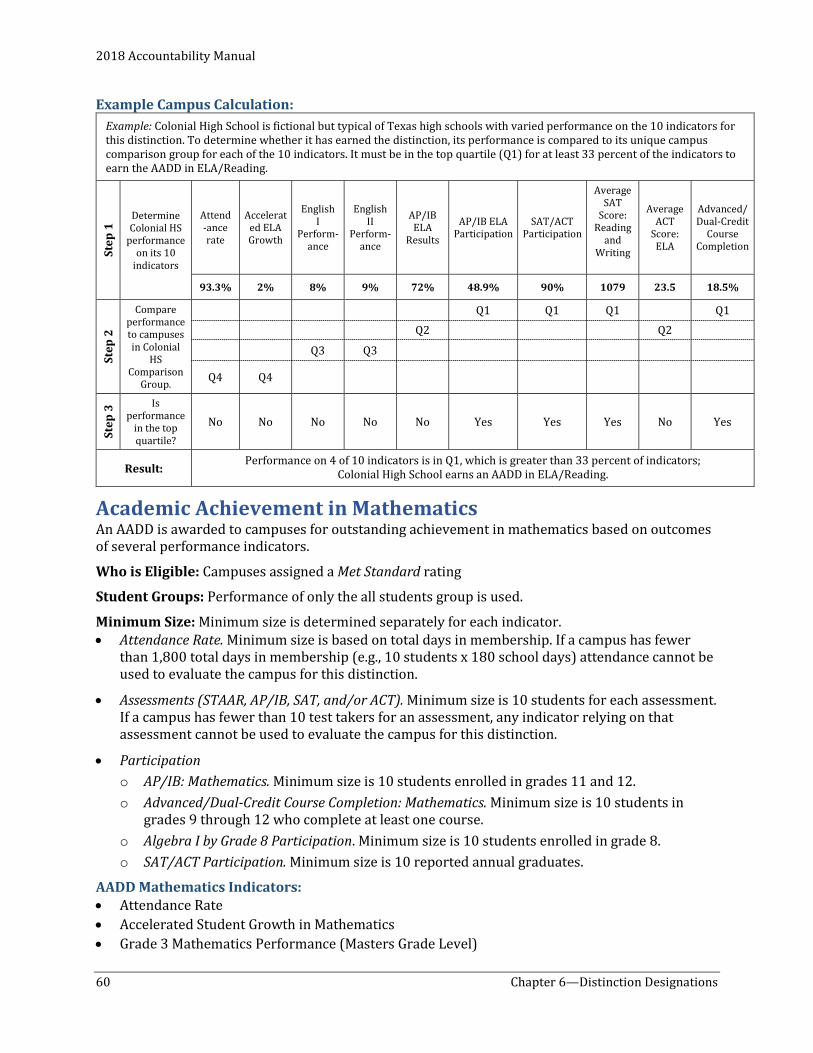
2018 Accountability Manual
60 Chapter 6—Distinction Designations
Example Campus Calculation:
Academic Achievement in Mathematics An AADD is awarded to campuses for outstanding achievement in mathematics based on outcomes of several performance indicators.
Who is Eligible: Campuses assigned a Met Standard rating
Student Groups: Performance of only the all students group is used.
Minimum Size: Minimum size is determined separately for each indicator. • Attendance Rate. Minimum size is based on total days in membership. If a campus has fewer
than 1,800 total days in membership (e.g., 10 students x 180 school days) attendance cannot be used to evaluate the campus for this distinction.
• Assessments (STAAR, AP/IB, SAT, and/or ACT). Minimum size is 10 students for each assessment. If a campus has fewer than 10 test takers for an assessment, any indicator relying on that assessment cannot be used to evaluate the campus for this distinction.
• Participation o AP/IB: Mathematics. Minimum size is 10 students enrolled in grades 11 and 12. o Advanced/Dual-Credit Course Completion: Mathematics. Minimum size is 10 students in
grades 9 through 12 who complete at least one course. o Algebra I by Grade 8 Participation. Minimum size is 10 students enrolled in grade 8. o SAT/ACT Participation. Minimum size is 10 reported annual graduates.
AADD Mathematics Indicators: • Attendance Rate • Accelerated Student Growth in Mathematics • Grade 3 Mathematics Performance (Masters Grade Level)
Example: Colonial High School is fictional but typical of Texas high schools with varied performance on the 10 indicators for this distinction. To determine whether it has earned the distinction, its performance is compared to its unique campus comparison group for each of the 10 indicators. It must be in the top quartile (Q1) for at least 33 percent of the indicators to earn the AADD in ELA/Reading.
Step
1 Determine
Colonial HS performance
on its 10 indicators
Attend-ance rate
Accelerated ELA Growth
English I
Perform-ance
English II
Perform-ance
AP/IB ELA
Results
AP/IB ELA Participation
SAT/ACT Participation
Average SAT
Score: Reading
and Writing
Average ACT
Score: ELA
Advanced/Dual-Credit
Course Completion
93.3% 2% 8% 9% 72% 48.9% 90% 1079 23.5 18.5%
Step
2
Compare performance to campuses in Colonial
HS Comparison
Group.
Q1 Q1 Q1 Q1 Q2 Q2
Q3 Q3
Q4 Q4
Step
3 Is
performance in the top quartile?
No No No No No Yes Yes Yes No Yes
Result: Performance on 4 of 10 indicators is in Q1, which is greater than 33 percent of indicators;
Colonial High School earns an AADD in ELA/Reading.
2018 Accountability Manual
Chapter 6—Distinction Designations 61
• Grade 4 Mathematics Performance (Masters Grade Level) • Grade 5 Mathematics Performance (Masters Grade Level) • Grade 6 Mathematics Performance (Masters Grade Level) • Grade 7 Mathematics Performance (Masters Grade Level) • Grade 8 Mathematics Performance (Masters Grade Level) • Algebra I by Grade 8 Participation • Algebra I Performance (Masters Grade Level) • AP/IB Examination Participation: Mathematics • AP/IB Examination Results (Examinees >= Criterion): Mathematics • SAT/ACT Participation • Average SAT Score: Mathematics • Average ACT Score: Mathematics • Advanced/Dual-Credit Course Completion Rate: Mathematics (grades 9–12)
Methodology: Step 1: Determine a campus’s performance on each indicator that applies to it and for which it has
data.
Step 2: Compare that campus’s performance for each indicator within the campus comparison group.
Step 3: Determine if the campus is in the top 25 percent of its campus comparison group. o High schools and combined elementary/secondary schools (K–12) must be in the top
quartile (Q1) for 33 percent or more of all the indicators for which they have data. o Middle schools, junior high schools, and elementary schools must be in the top quartile
for 50 percent or more of all the indicators for which they have data.
Please see Appendix H for a description of the source of data for each indicator.
Other information: • Algebra I by Grade 8 Participation: The Algebra I by Grade 8 Participation indicator limits the
denominator to grade 8 students based on 2017 TSDS PEIMS fall enrollment. The numerator is Algebra I assessments taken in either the current or any prior school year as reported in the consolidated accountability file (CAF) cumulative history section.
• Advanced/Dual-Credit Course Completion: Mathematics. The advanced/dual-credit course completion rate for mathematics includes students enrolled in grades 9 through 12.
• Assessments. A complete list of AP and IB assessments used to award this distinction is available in Appendix H.
• Attendance Rate. This is based on student attendance for the entire school year for students in grades 1–12. The attendance rate indicator applies to all four subject area distinctions. Consequently, this indicator cannot be the sole measure used by a campus to attain an AADD.
Academic Achievement in Science An AADD is awarded to campuses for outstanding achievement in science based on outcomes of several performance indicators.
Who is Eligible: Campuses assigned a Met Standard rating
Student Groups: Performance of only the all students group is used.
Minimum Size: Minimum size is determined separately for each indicator.
2018 Accountability Manual
62 Chapter 6—Distinction Designations
• Attendance Rate. Minimum size is based on total days in membership. If a campus has fewer than 1,800 total days in membership (e.g., 10 students x 180 school days) attendance cannot be used to evaluate the campus for this distinction.
• Assessments (STAAR, AP/IB, and/or ACT). Minimum size is 10 students for each assessment. If a campus has fewer than 10 test takers for an assessment, any indicator relying on that assessment cannot be used to evaluate the campus for this distinction.
• Participation. o AP/IB: Mathematics. Minimum size is 10 students enrolled in grades 11 and 12. o Advanced/Dual-Credit Course Completion: Science. Minimum size is 10 students in grades 9
through 12 who complete at least one course.
AADD Science Indicators: • Attendance Rate • Grade 5 Science Performance (Masters Grade Level) • Grade 8 Science Performance (Masters Grade Level) • EOC Biology Performance (Masters Grade Level) • AP/IB Examination Participation: Science • AP/IB Examination Results (Examinees >= Criterion): Science • Average ACT Score: Science • Advanced/Dual-Credit Course Completion Rate: Science (grades 9–12)
Methodology: Step 1: Determine a campus’s performance on each indicator that applies to it and for which it has
data.
Step 2: Compare that campus’s performance for each indicator within the campus comparison group.
Step 3: Determine if the campus is in the top 25 percent of its campus comparison group. o High schools and combined elementary/secondary schools (K–12) must be in the top
quartile (Q1) for 33 percent or more of all the indicators for which they have data. o Middle schools, junior high schools, and elementary schools must be in the top quartile
for 50 percent or more of all the indicators for which they have data.
Please see Appendix H for a description of the source of data for each indicator.
Other information: • Advanced/Dual-Credit Course Completion: Science. The advanced/dual-credit course completion
rate for science includes students enrolled in grades 9 through 12.
• Assessments. A complete list of AP and IB assessments used to award this distinction is available in Appendix H.
• Attendance Rate. This is based on student attendance for the entire school year for students in grades 1–12. The attendance rate indicator applies to all four subject area distinctions. Consequently, this indicator cannot be the sole measure used by a campus to attain a distinction.
Academic Achievement in Social Studies An AADD is awarded to campuses for outstanding achievement in social studies based on outcomes of several performance indicators.
2018 Accountability Manual
Chapter 6—Distinction Designations 63
Who is Eligible: Campuses assigned a Met Standard rating
Student Groups: Performance of only the all students group is used.
Minimum Size: Minimum size is determined separately for each indicator. • Attendance Rate. Minimum size is based on total days in membership. If a campus has fewer
than 1,800 total days in membership (e.g., 10 students x 180 school days) attendance cannot be used to evaluate the campus for this distinction.
• Assessments (STAAR, AP/IB). Minimum size is 10 students for each assessment. If a campus has fewer than 10 test takers for an assessment, any indicator relying on that assessment cannot be used to evaluate the campus for this distinction.
• Participation. o AP/IB: Social Studies. Minimum size is 10 students enrolled in grades 11 and 12. o Advanced/Dual-Credit Course Completion: Social Studies. Minimum size is 10 students in
grades 9 through 12 who complete at least one course.
AADD Social Studies Indicators: • Attendance Rate • Grade 8 Social Studies Performance (Masters Grade Level) • EOC U.S. History Performance (Masters Grade Level) • AP/IB Examination Participation: Social Studies • AP/IB Examination Results (Examinees >= Criterion): Social Studies • Advanced/Dual-Credit Course Completion Rate: Social Studies (grades 9–12)
Methodology: Step 1: Determine a campus’s performance on each indicator that applies to it and for which it has
data.
Step 2: Compare that campus’s performance for each indicator within the campus comparison group.
Step 3: Determine if the campus is in the top 25 percent of its campus comparison group. o High schools and combined elementary/secondary schools (K–12) must be in the top
quartile (Q1) for 33 percent or more of all the indicators for which they have data. o Middle schools, junior high schools, and elementary schools must be in the top quartile
for 50 percent or more of all the indicators for which they have data.
Please see Appendix H for a description of the source of data for each indicator.
Other information: • Advanced/Dual-Credit Course Completion: Social Studies. The advanced/dual-credit course
completion rate for social studies includes students enrolled in grades 9 through 12.
• Assessments. A complete list of AP and IB assessments used to award this distinction is available in Appendix H.
• Attendance Rate. This is based on student attendance for the entire school year for students in grades 1–12. The attendance rate indicator applies to all four subject area distinctions. Consequently, this indicator cannot be the sole measure used by a campus to attain a distinction.

2018 Accountability Manual
64 Chapter 6—Distinction Designations
Top 25 Percent: Comparative Academic Growth A distinction designation for outstanding academic growth is awarded to campuses whose School Progress, Part A domain scaled score is ranked in the top 25 percent (Q1) of campuses in its campus comparison group.
Who is Eligible: Campuses evaluated on School Progress, Part A and assigned a Met Standard rating
Methodology: Campuses are arranged in descending order per School Progress, Part A scaled scores. If the School Progress, Part A scaled score for a campus is within the top quartile of its comparison group, it earns a distinction for student progress.
For more information on the School Progress domain, please see “Chapter 3—School Progress Domain.”
Top 25 Percent: Comparative Closing the Gaps A distinction designation for outstanding performance in closing student achievement gaps is awarded to campuses whose Closing the Gaps domain scaled score is ranked in the top 25 percent (Q1) of campuses in its campus comparison group.
Who is Eligible: Campuses evaluated on Closing the Gaps domain and assigned a Met Standard rating
Methodology: Campuses are arranged in descending order per their Closing the Gaps domain scaled scores. If the Closing the Gaps scaled score for a campus is in the top quartile of its comparison group, it earns a distinction for closing student achievement gaps.
For more information on the Closing the Gaps domain, please see “Chapter 4—Closing the Gaps Domain.”
Postsecondary Readiness Both districts that receive an A, B, C, or D rating and campuses that receive a Met Standard rating are eligible for a distinction designation for outstanding academic performance in attainment of postsecondary readiness. To earn a distinction for postsecondary readiness, an elementary or middle school must be in the top quartile for at least one of the indicators for which they have data, high schools and K–12 campuses must have at least 33 percent of their indicators in the top quartile of their campus comparison groups, and districts must have at least 55 percent of all their campuses’ postsecondary indicators in the top quartile.
Who is Eligible: Multi-campus districts assigned an A, B, C, or D rating and campuses assigned a Met Standard rating
For single-campus districts and charter schools that share the same 2018 performance data as its only campus, the campus is eligible to earn a postsecondary readiness distinction designation, but the district or charter school is not eligible to earn the district postsecondary readiness distinction designation.
Student Groups: Performance of the all students group only
Minimum Size: The all students group must have a minimum size of 10.
Postsecondary Readiness Indicators for Campuses: • Percentage of STAAR Results at Meets Grade Level or Above Standard (All Subjects) • Percentage of Grade 3–8 Results at Meets Grade Level or Above in Both Reading and
Mathematics
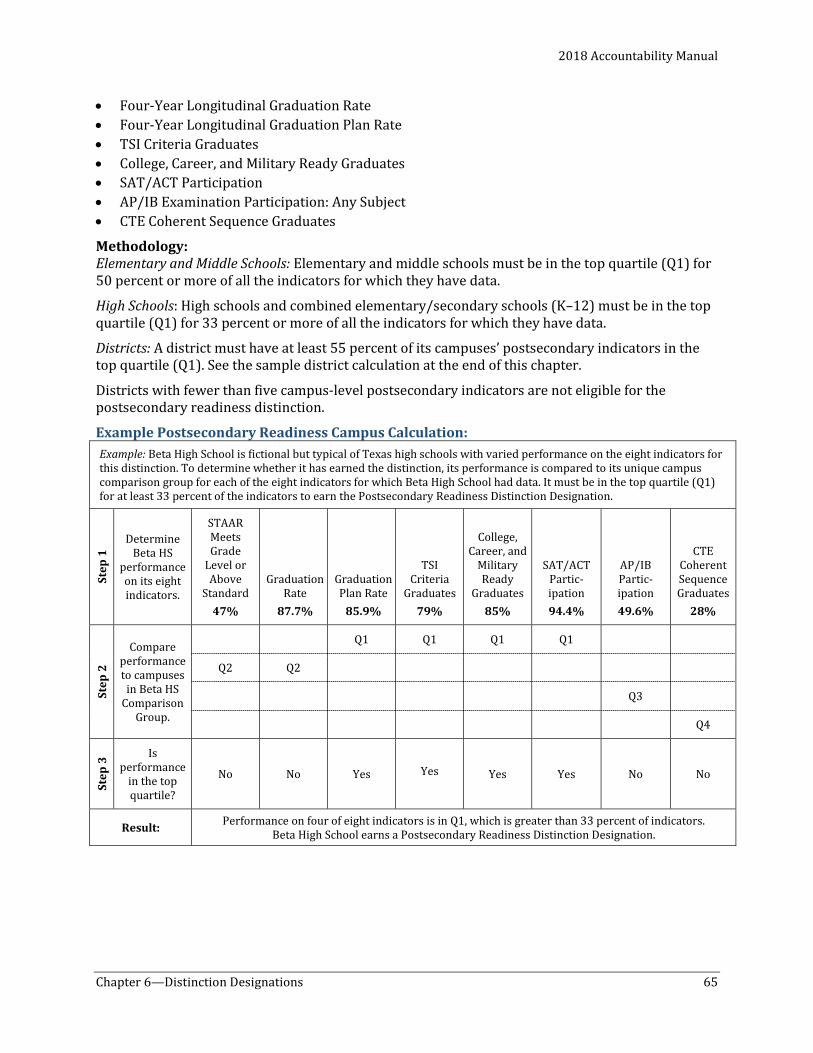
2018 Accountability Manual
Chapter 6—Distinction Designations 65
• Four-Year Longitudinal Graduation Rate • Four-Year Longitudinal Graduation Plan Rate • TSI Criteria Graduates • College, Career, and Military Ready Graduates • SAT/ACT Participation • AP/IB Examination Participation: Any Subject • CTE Coherent Sequence Graduates
Methodology: Elementary and Middle Schools: Elementary and middle schools must be in the top quartile (Q1) for 50 percent or more of all the indicators for which they have data.
High Schools: High schools and combined elementary/secondary schools (K–12) must be in the top quartile (Q1) for 33 percent or more of all the indicators for which they have data.
Districts: A district must have at least 55 percent of its campuses’ postsecondary indicators in the top quartile (Q1). See the sample district calculation at the end of this chapter.
Districts with fewer than five campus-level postsecondary indicators are not eligible for the postsecondary readiness distinction.
Example Postsecondary Readiness Campus Calculation: Example: Beta High School is fictional but typical of Texas high schools with varied performance on the eight indicators for this distinction. To determine whether it has earned the distinction, its performance is compared to its unique campus comparison group for each of the eight indicators for which Beta High School had data. It must be in the top quartile (Q1) for at least 33 percent of the indicators to earn the Postsecondary Readiness Distinction Designation.
Step
1 Determine
Beta HS performance on its eight indicators.
STAAR Meets Grade
Level or Above
Standard 47%
Graduation Rate
87.7%
Graduation Plan Rate
85.9%
TSI Criteria
Graduates 79%
College, Career, and
Military Ready
Graduates 85%
SAT/ACT Partic-ipation 94.4%
AP/IB Partic-ipation 49.6%
CTE Coherent Sequence Graduates
28%
Step
2
Compare performance to campuses
in Beta HS Comparison
Group.
Q1 Q1 Q1 Q1
Q2 Q2
Q3
Q4
Step
3 Is
performance in the top quartile?
No No Yes
Yes Yes Yes No No
Result: Performance on four of eight indicators is in Q1, which is greater than 33 percent of indicators. Beta High School earns a Postsecondary Readiness Distinction Designation.
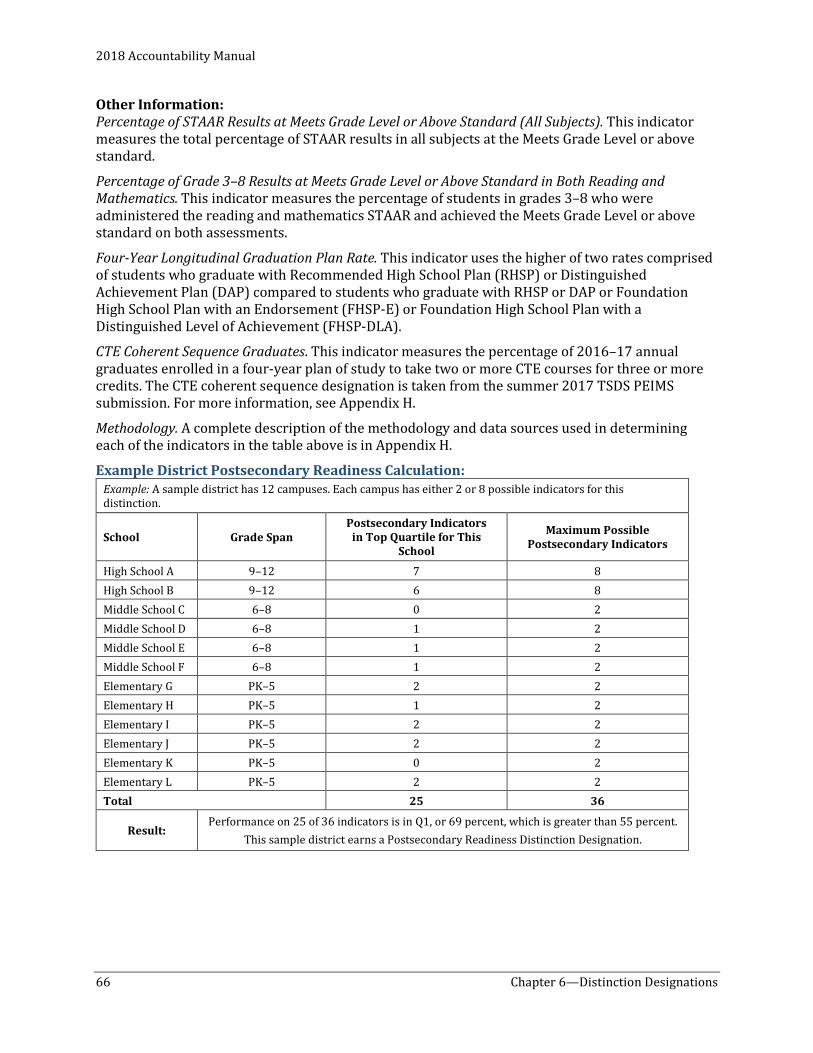
2018 Accountability Manual
66 Chapter 6—Distinction Designations
Other Information: Percentage of STAAR Results at Meets Grade Level or Above Standard (All Subjects). This indicator measures the total percentage of STAAR results in all subjects at the Meets Grade Level or above standard.
Percentage of Grade 3–8 Results at Meets Grade Level or Above Standard in Both Reading and Mathematics. This indicator measures the percentage of students in grades 3–8 who were administered the reading and mathematics STAAR and achieved the Meets Grade Level or above standard on both assessments.
Four-Year Longitudinal Graduation Plan Rate. This indicator uses the higher of two rates comprised of students who graduate with Recommended High School Plan (RHSP) or Distinguished Achievement Plan (DAP) compared to students who graduate with RHSP or DAP or Foundation High School Plan with an Endorsement (FHSP-E) or Foundation High School Plan with a Distinguished Level of Achievement (FHSP-DLA).
CTE Coherent Sequence Graduates. This indicator measures the percentage of 2016–17 annual graduates enrolled in a four-year plan of study to take two or more CTE courses for three or more credits. The CTE coherent sequence designation is taken from the summer 2017 TSDS PEIMS submission. For more information, see Appendix H.
Methodology. A complete description of the methodology and data sources used in determining each of the indicators in the table above is in Appendix H.
Example District Postsecondary Readiness Calculation: Example: A sample district has 12 campuses. Each campus has either 2 or 8 possible indicators for this distinction.
School Grade Span Postsecondary Indicators
in Top Quartile for This School
Maximum Possible Postsecondary Indicators
High School A 9–12 7 8 High School B 9–12 6 8 Middle School C 6–8 0 2 Middle School D 6–8 1 2 Middle School E 6–8 1 2 Middle School F 6–8 1 2 Elementary G PK–5 2 2 Elementary H PK–5 1 2 Elementary I PK–5 2 2 Elementary J PK–5 2 2 Elementary K PK–5 0 2 Elementary L PK–5 2 2 Total 25 36
Result: Performance on 25 of 36 indicators is in Q1, or 69 percent, which is greater than 55 percent.
This sample district earns a Postsecondary Readiness Distinction Designation.
2018 Accountability Manual
Chapter 7—Other Accountability System Processes 67
Chapter 7—Other Accountability System Processes Most accountability ratings are determined through the process detailed in Chapters 1–6. Accommodating all districts and campuses in Texas increases the complexity of the accountability system but also ensures the fairness of the ratings assigned. This chapter describes other processes necessary to implement the accountability system.
Pairing All campuses serving prekindergarten (PK) through grade 12 must receive an accountability rating. Campuses that do not serve any grade level for which STAAR assessments are administered are paired with another campus in the same district for accountability purposes. A campus may pair with its district and be evaluated on the district’s results.
The Texas Education Agency (TEA) analyzes TSDS PEIMS fall enrollment data to determine which campuses need to be paired. Campuses that serve only grades not tested on the STAAR (i.e., PK, K, grade 1, or grade 2) are paired with either another campus in the district or the district itself.
Charter school campuses and alternative education campuses (AECs) registered for evaluation by alternative education accountability (AEA) provisions are not paired with another campus.
Paired data are not used for distinction designation indicators; therefore, paired campuses cannot earn distinction designations.
Pairing Process Districts may use the prior-year pairing relationship or select a new relationship by completing the pairing form on the TEA Secure Environment (TEASE) Accountability application. Pairing decisions for 2018 were due May 11, 2018, at 5:00 p.m. CDT.
If a district fails to inform TEA of its pairing preference, pairing decisions are made by TEA. For campuses that have been paired in the past, staff assumes that prior-year pairing relationships still apply. For campuses in need of pairing for the first time, pairing selections are based on the guidelines given in this section in conjunction with analysis of attendance and enrollment patterns using TSDS PEIMS data.
Guidelines Campuses that are paired should have a “feeder” relationship and should serve students in contiguous grades. For example, a kindergarten (K) through grade 2 campus should be paired with the campus that serves grade 3 in which its students will be enrolled following grade 2.
When a campus being asked to pair is a PK or K campus with a “feeder” relationship to a campus that also requires pairing (e.g., a grade 1–2 campus) both campuses should pair with the same campus that serves grade 3 in which their students will be enrolled following grade 2.
A campus may be paired with its district instead of with another campus. This option is suggested for cases in which the campus has no clear relationship with another single campus in the district. A campus paired with its district is evaluated using the district’s assessment results (for all grades tested in the district). Note that pairing with a district is not required in these cases; districts may select another campus for pairing.
For 2018 accountability, a campus paired with its district receives a Met Standard rating if its district receives an A, B, C, or D. If its district receives an F, the campus is rated Improvement Required.
2018 Accountability Manual
68 Chapter 7—Other Accountability System Processes
Multiple pairings are possible. If several K–2 campuses feed the same 3–5 campus, all the K–2 campuses may pair with that 3–5 campus.
Districts may change pairings from year to year. Any changes should, however, be based on establishing the most appropriate pairing relationship. For example, a change in attendance zones that affects feeder patterns may cause a district to change pairing. A change in a pairing relationship does not change accountability ratings assigned in previous years to either campus.
Non-Traditional Education Settings Even though districts are responsible for the performance of all their students, statutory requirements affect the rating calculations for residential treatment facilities (RTF), Texas Juvenile Justice Department (TJJD), juvenile justice alternative education program (JJAEP), and disciplinary alternative education program (DAEP) campuses.
Inclusion or Exclusion of Performance Data The performance of students served in certain campuses cannot be used in evaluating the district where the campus is located. Texas Education Code (TEC) §39.055 requires that students ordered by a juvenile court into a residential program or facility operated by the TJJD, a juvenile board, or any other governmental entity or any student who is receiving treatment in a residential facility be excluded from the district and campus when determining the accountability ratings. Please see Appendix G.
Student Attribution Codes Districts with RTF or TJJD campuses are required to submit student attribution codes in TSDS PEIMS.
JJAEPs and DAEPs State statute and statutory intent prohibit the attribution of student performance results to JJAEPs and DAEPs. Each district that sends students to a JJAEP or DAEP is responsible for properly attributing all performance and attendance data to the home campuses according to the Texas Education Data Standards and testing guidelines.
Special Education Campuses Campuses where all students are served in special education programs and tested on STAAR are rated on the performance of their students.
AEA Provisions Alternative performance measures for campuses serving at-risk students were first implemented in the 1995–96 school year. Over time, these measures expanded to include charter schools that served large populations of at-risk students. Accountability advisory groups consistently recommend evaluating AECs by separate AEA provisions due to the large number of students served in alternative education programs on AECs and to ensure these unique campus settings are appropriately evaluated for accountability.
AEA provisions apply to and are appropriate for • campuses that offer nontraditional programs, rather than programs within a traditional
campus;• campuses that meet the at-risk enrollment criterion;• campuses that meet the grades 6–12 enrollment criterion;• charter schools that operate only AECs; and• charter schools that meet the AEC enrollment criterion.
2018 Accountability Manual
Chapter 7—Other Accountability System Processes 69
AEA Campus Identification AECs, including charter school AECs, must serve students at risk of dropping out of school as defined in TEC §29.081(d) and provide accelerated instructional services to these students. The performance results of students at registered AECs are included in the district’s performance and used in determining the district’s accountability rating.
The following types of campuses have the option to register for evaluation by AEA provisions:
• AEC of choice – At-risk students enroll at AECs of choice to expedite progress towardperforming at grade level and high school completion.
• Dropout recovery school (DRS) – Education services are targeted to dropout prevention andrecovery of students in grades 9–12, with enrollment consisting of at least 50 percent of thestudents 17 years of age or older as of September 1, 2017, as reported for the fall semesterTSDS PEIMS submission.
In this manual, the terms AEC and registered AEC refer collectively to AECs of choice, residential facilities, and dropout recovery schools that are registered for evaluation by AEA provisions and meet the at-risk and grades 6–12 enrollment criteria.
DAEPs, JJAEPs, and stand-alone Texas high school equivalency certificate (TxCHSE) programs are ineligible for evaluation by AEA provisions. Data for these campuses are attributed to the home campus.
AEA Campus Registration Process The AEA campus registration process is conducted online using the TEASE Accountability application. AECs rated by 2017 AEA provisions are re-registered automatically in 2018. Filing an AEA Campus Registration Form is required for each AEC not on the list of registered AECs that wishes to be evaluated by 2018 AEA provisions. The 2018 registration process occurred March 26–April 6, 2018.
AEA Campus Registration Criteria Campuses must meet thirteen criteria to register for AEA. However, the requirements in criteria 8–13 may not apply to charter school campuses (depending on the terms of the charter) or for community-based dropout recovery campuses established in accordance with TEC §29.081(e).
1) The AEC must have its own county-district-campus number for which TSDS PEIMS data aresubmitted and test answer documents are coded. A program operated within or supported byanother campus does not qualify.
2) The AEC must have its own county-district-campus number on TSDS PEIMS fall snapshot day(October 27, 2017).
3) The AEC must be identified in AskTED (Ask Texas Education Directory database) as analternative instructional campus. This is a self-designation that districts and charter schoolsrequest via AskTED.
4) The AEC must be dedicated to serving students at risk of dropping out of school as defined inTEC §29.081(d). Each AEC must have at least 75 percent at-risk student enrollment at the AECverified through current-year TSDS PEIMS fall enrollment data.
5) At least 50 percent of students at the AEC must be enrolled in grades 6–12 verified throughcurrent-year TSDS PEIMS fall enrollment data.
6) The AEC must operate on its own campus budget.
2018 Accountability Manual
70 Chapter 7—Other Accountability System Processes
7) The AEC must offer nontraditional settings and methods of instructional delivery designed tomeet the needs of the students served on the AEC.
8) The AEC cannot be the only middle school or high school listed for its district in AskTED.
9) The AEC must have an appropriately certified, full-time administrator whose primary duty isthe administration of the AEC.
10) The AEC must have appropriately certified teachers assigned in all areas including specialeducation, bilingual education, and/or English as a second language (ESL) to serve studentseligible for such services.
11) The AEC must provide each student the opportunity to attend a 75,600-minute school year asdefined in TEC §25.081(a), according to the needs of each student.
12) If the campus has students served by special education, the students must be placed at theAEC by their Admission, Review, and Dismissal (ARD) committee. If the campus is aresidential facility, the students must have been placed in the facility by the district.
13) Students served by special education must receive all services outlined in their currentindividualized education programs (IEPs). English learners (EL) must receive all servicesoutlined by the language proficiency assessment committee (LPAC). Students served byspecial education or language programs must be served by appropriately certified teachers.
At-Risk Enrollment Criterion Each registered AEC must have at least 75 percent at-risk student enrollment on the AEC verified through current-year TSDS PEIMS fall enrollment data in order to be evaluated by AEA provisions. TEC §29.081 defines thirteen criteria used to identify students as “at-risk of dropping out of school”. Districts and charter schools must identify students in TSDS PEIMS who meet one or more of the thirteen criteria. The at-risk enrollment criterion restricts use of AEA provisions to AECs that serve large populations of at-risk students and enhances at-risk data quality.
Prior-Year Safeguard. If a registered AEC does not meet the at-risk enrollment criterion in the current year, it remains registered for AEA if the AEC meets the at-risk enrollment criterion in the prior year. For example, an AEC with an at-risk enrollment below 75 percent in 2018 that had at least 75 percent in 2017 remains registered in 2018.
Grades 6–12 Enrollment Criterion In order to be evaluated by AEA provisions, each registered AEC must have at least 50 percent student enrollment in grades 6–12 based on total students enrolled (early education–grade 12) verified through current-year TSDS PEIMS fall enrollment data. The grades 6–12 enrollment criterion restricts use of AEA provisions to middle and high schools.
Final AEA Campus List The final list of AEA campuses is posted on the TEA website in April at which time an email notification is sent to all superintendents.
The 2018 Final AEA Campus List includes DRS designations. If at least 50 percent of the students enrolled at an AEA campus are 17 years of age or older as of September 1, 2017, then the AEC of choice is designated as a DRS (TEC §39.0548).
AEA Charter School Identification Charter school ratings are based on aggregate performance of the campuses operated by the charter school. Performance results of all students in the charter school are used in determining the charter school’s accountability rating and for distinction designations.
2018 Accountability Manual
Chapter 7—Other Accountability System Processes 71
• Charter schools that operate only registered AECs are evaluated by AEA provisions.
• Charter schools that operate both non-AEA campuses and registered AECs are evaluated byAEA provisions if the AEC enrollment criterion described below is met.
• Charter schools that operate both non-AEA campuses and registered AECs that do not meet theAEC enrollment criterion described below do not qualify for evaluation by AEA provisions.
• Charter schools that operate only non-AEA campuses do not qualify for evaluation by AEAprovisions because the campuses choose not to register for AEA evaluation, do not meet the at-risk criteria, or do not meet the grades 6–12 enrollment criteria.
AEC Enrollment Criterion for Charter Schools A charter school that operates both non-AEA campuses and registered AECs is eligible for evaluation by AEA provisions if at least 50 percent of the charter school’s students are enrolled at registered AECs. AEC enrollment is based on total students enrolled (early education–grade 12) verified through current-year TSDS PEIMS fall enrollment data.
Final AEA Charter School List After the AEA Campus List is finalized, AEA charter schools eligible for evaluation by AEA provisions are identified. The final list of AEA charter schools is posted on the TEA website in April, at which time an email is sent to all superintendents.
AEA Modifications “Chapter 2—Student Achievement Domain” and “Chapter 5—Calculating 2018 Ratings” describe the provisions and targets used to evaluate AEA campuses and AEA charter schools.

This page is intentionally blank.
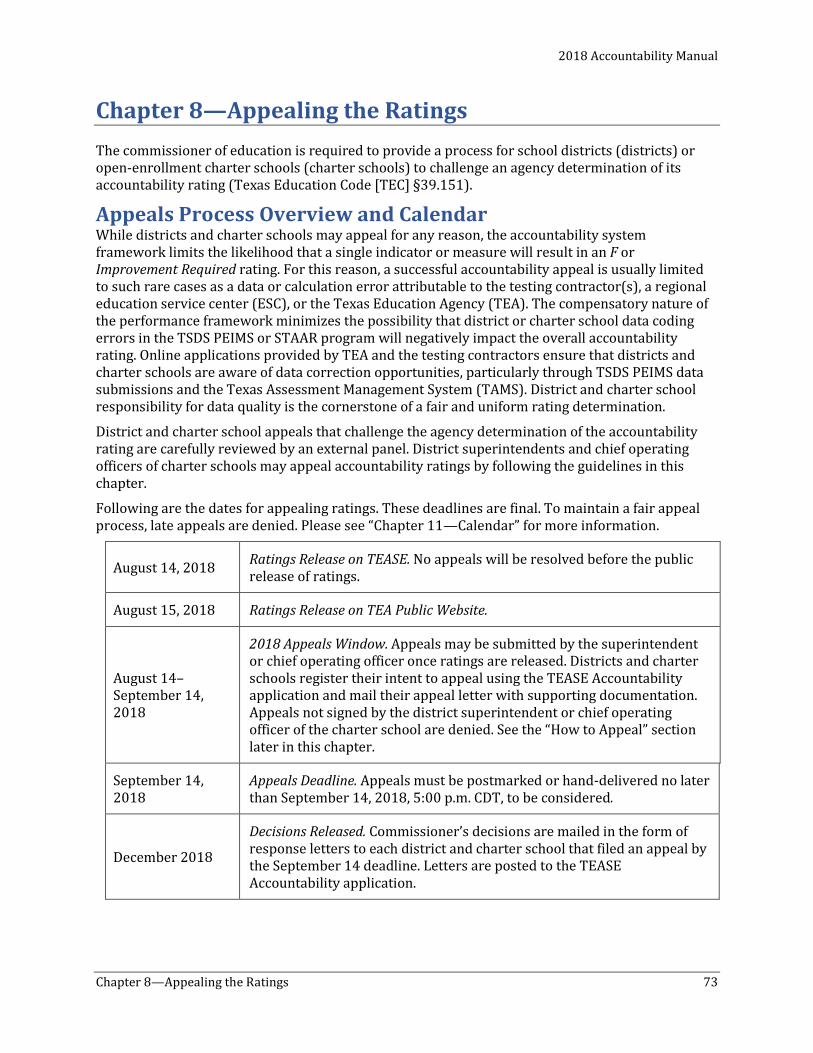
2018 Accountability Manual
Chapter 8—Appealing the Ratings 73
Chapter 8—Appealing the Ratings The commissioner of education is required to provide a process for school districts (districts) or open-enrollment charter schools (charter schools) to challenge an agency determination of its accountability rating (Texas Education Code [TEC] §39.151).
Appeals Process Overview and Calendar While districts and charter schools may appeal for any reason, the accountability system framework limits the likelihood that a single indicator or measure will result in an F or Improvement Required rating. For this reason, a successful accountability appeal is usually limited to such rare cases as a data or calculation error attributable to the testing contractor(s), a regional education service center (ESC), or the Texas Education Agency (TEA). The compensatory nature of the performance framework minimizes the possibility that district or charter school data coding errors in the TSDS PEIMS or STAAR program will negatively impact the overall accountability rating. Online applications provided by TEA and the testing contractors ensure that districts and charter schools are aware of data correction opportunities, particularly through TSDS PEIMS data submissions and the Texas Assessment Management System (TAMS). District and charter school responsibility for data quality is the cornerstone of a fair and uniform rating determination.
District and charter school appeals that challenge the agency determination of the accountability rating are carefully reviewed by an external panel. District superintendents and chief operating officers of charter schools may appeal accountability ratings by following the guidelines in this chapter.
Following are the dates for appealing ratings. These deadlines are final. To maintain a fair appeal process, late appeals are denied. Please see “Chapter 11—Calendar” for more information.
August 14, 2018 Ratings Release on TEASE. No appeals will be resolved before the public release of ratings.
August 15, 2018 Ratings Release on TEA Public Website.
August 14–September 14, 2018
2018 Appeals Window. Appeals may be submitted by the superintendent or chief operating officer once ratings are released. Districts and charter schools register their intent to appeal using the TEASE Accountability application and mail their appeal letter with supporting documentation. Appeals not signed by the district superintendent or chief operating officer of the charter school are denied. See the “How to Appeal” section later in this chapter.
September 14, 2018
Appeals Deadline. Appeals must be postmarked or hand-delivered no later than September 14, 2018, 5:00 p.m. CDT, to be considered.
December 2018
Decisions Released. Commissioner’s decisions are mailed in the form of response letters to each district and charter school that filed an appeal by the September 14 deadline. Letters are posted to the TEASE Accountability application.
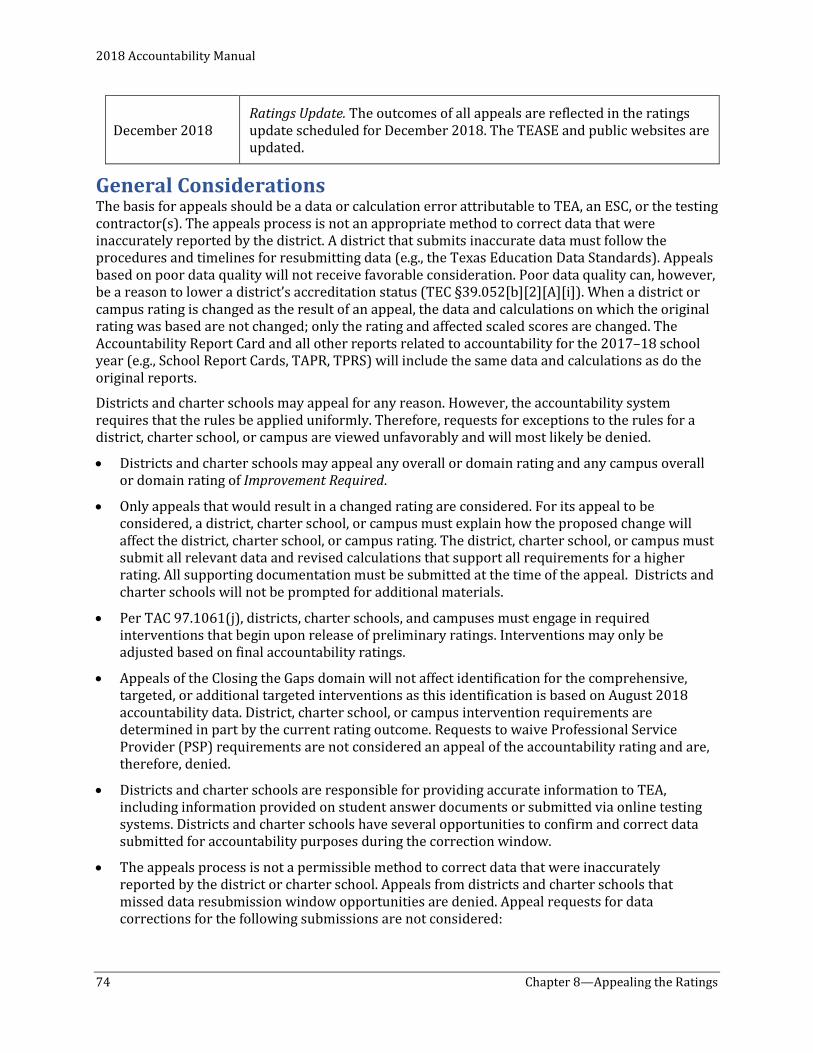
2018 Accountability Manual
74 Chapter 8—Appealing the Ratings
Ratings Update. The outcomes of all appeals are reflected in the ratings December 2018 update scheduled for December 2018. The TEASE and public websites are
updated.
General Considerations The basis for appeals should be a data or calculation error attributable to TEA, an ESC, or the testing contractor(s). The appeals process is not an appropriate method to correct data that were inaccurately reported by the district. A district that submits inaccurate data must follow the procedures and timelines for resubmitting data (e.g., the Texas Education Data Standards). Appeals based on poor data quality will not receive favorable consideration. Poor data quality can, however, be a reason to lower a district’s accreditation status (TEC §39.052[b][2][A][i]). When a district or campus rating is changed as the result of an appeal, the data and calculations on which the original rating was based are not changed; only the rating and affected scaled scores are changed. The Accountability Report Card and all other reports related to accountability for the 2017–18 school year (e.g., School Report Cards, TAPR, TPRS) will include the same data and calculations as do the original reports.
Districts and charter schools may appeal for any reason. However, the accountability system requires that the rules be applied uniformly. Therefore, requests for exceptions to the rules for a district, charter school, or campus are viewed unfavorably and will most likely be denied.
• Districts and charter schools may appeal any overall or domain rating and any campus overall or domain rating of Improvement Required.
• Only appeals that would result in a changed rating are considered. For its appeal to be considered, a district, charter school, or campus must explain how the proposed change will affect the district, charter school, or campus rating. The district, charter school, or campus must submit all relevant data and revised calculations that support all requirements for a higher rating. All supporting documentation must be submitted at the time of the appeal. Districts and charter schools will not be prompted for additional materials.
• Per TAC 97.1061(j), districts, charter schools, and campuses must engage in required interventions that begin upon release of preliminary ratings. Interventions may only be adjusted based on final accountability ratings.
• Appeals of the Closing the Gaps domain will not affect identification for the comprehensive, targeted, or additional targeted interventions as this identification is based on August 2018 accountability data. District, charter school, or campus intervention requirements are determined in part by the current rating outcome. Requests to waive Professional Service Provider (PSP) requirements are not considered an appeal of the accountability rating and are, therefore, denied.
• Districts and charter schools are responsible for providing accurate information to TEA, including information provided on student answer documents or submitted via online testing systems. Districts and charter schools have several opportunities to confirm and correct data submitted for accountability purposes during the correction window.
• The appeals process is not a permissible method to correct data that were inaccurately reported by the district or charter school. Appeals from districts and charter schools that missed data resubmission window opportunities are denied. Appeal requests for data corrections for the following submissions are not considered:
2018 Accountability Manual
Chapter 8—Appealing the Ratings 75
TSDS PEIMS data submissions for the following: o Student identification information or program participationo Student racial/ethnic categorieso Student economic statuso Student at-risk statuso Student attribution codeso Student leaver datao Student grade-level enrollment data
STAAR and TELPAS answer documents, specifically, the following:o Student identification information, demographic, or program participationo Student racial/ethnic categorieso Student economic statuso Score codes or test version codeso Student year in U.S. schools information reported on TELPASo Campus and group ID (header) sheets
• Requests to modify the 2018 state accountability calculations adopted by commissioner ruleare not considered. Commissioner rules are adopted under the Administrative Procedures Act(APA) in Texas Government Code Chapter 2001, and challenges to a commissioner rule shouldbe made under that chapter of the Government Code. Recommendations for changes to stateaccountability rules submitted to the agency outside of the appeals process may be consideredby accountability advisory groups for future accountability cycles.
• Requests to modify statutorily required implementation rules defined by the commissioner arenot considered. TSDS PEIMS requirements, campus identifications, and statutorily requiredexclusions are based on data submitted by districts. These data reporting requirements arereviewed by the appropriate advisory committee(s), such as the TEA Information Task Force(ITF) and Policy Committee on Public Education Information (PCPEI). Recommendations forchanges to agency rules submitted outside of the appeals process may be considered as theappropriate advisory groups reconvene annually.
• Examples of issues considered unfavorably by TEA on appeal are described below.
o Late Online Application Requests. Requests to submit or provide information after thedeadline of the online alternative education accountability (AEA) campus registration (5:00p.m. CDT on April 6, 2018) or the pairing application (5:00 p.m. CDT on May 11, 2018)
o Inclusion or exclusion of specific test results• Specific administration results used to meet grade 5 or 8 Student Success Initiative (SSI)
• Grade-level mathematics assessment for a middle school student who took the Algebra Iend-of-course (EOC)
o Inclusion or exclusion of specific students• English learners (ELs)
• Unschooled asylees, unschooled refugees, and students with interrupted formal education
• Students receiving special education services
o Requests to modify calculations or methodology applied to all districts and campuses
2018 Accountability Manual
76 Chapter 8—Appealing the Ratings
• STAAR progress measures; longitudinal graduation rates; annual dropout rates; college,career, and military readiness indicators
• District and campus mobility/accountability subsets
• Rounding
• Minimum size criteria
• Small-numbers analysis
o Requests to modify provisions or methodology applied to accountability• AEA Provisions. Requests for consideration of campus registration criteria, at-risk or
grades 6–12 enrollment criteria, prior-year safeguard methodology, dropout recoveryschool (DRS) designations, and to waive the alternative education campus (AEC)enrollment criterion for charter schools
• School Types. The four campus types categories used for 2018 accountability are identifiedbased on TSDS PEIMS enrollment data submitted in fall 2017. Requests to redefine thegrade spans that determine school types
• Campus Configuration Changes. Districts and charter schools have the opportunity todetermine changes in campus identification numbers and grade configurations. Requestsfor consideration of accountability rules based on changes in campus configurations are,therefore, viewed unfavorably
• New Campuses. Requests to assign a Not Rated label to campuses that are designatedImprovement Required in their first year of operation
Data Relevant to the Prior-Year Results Appeals are considered for the 2018 ratings status based on information relevant to the 2018 evaluation. Appeals are not considered for circumstances that may have affected the prior-year measures, regardless of whether the prior-year results impacted the current-year rating.
No Guaranteed Outcomes Each appeal is evaluated on the details of its unique situation. Well-written appeals that follow the guidelines are more easily processed but not automatically granted.
Special Circumstance Appeals • Rescoring. If a district or charter school requests its writing results be rescored and the
rescored results impact the rating, the district or charter school must provide a copy of thedated request to the testing contractor(s) and the outcome of the rescored tests with the appeal.These appeals are necessary because rescored results may not be processed in time to beincluded in the assessment data used to determine the accountability ratings released byAugust 15, 2018.
• Other Issues. If other serious issues are found, copies of correspondence with the testingcontractor(s), the regional ESC, or TEA should be provided with the appeal.
• Online Testing Errors. Appeals based on STAAR or TELPAS online test submission errors mustinclude documentation or validation of the administration of the assessment.
• TSI Data. A district rated B–F or campus rated Improvement Required because of mismatches inthe student-identifying information between the TSI data files (used in the College, Career, andMilitary Readiness component) and the TEA 2017 annual graduates file, may submit an appeal.
2018 Accountability Manual
Chapter 8—Appealing the Ratings 77
Sufficient documentation of student-identifying information and TSI assessment scores should be included.
• Years in U.S. Schools. Districts and charter schools should include documentation demonstratingthat using prior-spring TELPAS records for students taking EOCs in summer or fall would resultin a higher accountability rating.
Not Rated Appeals Districts, charter schools, and campuses assigned Not Rated labels are responsible for appealing this rating by the appeal deadline if the basis for this rating was due to special circumstance or error by the testing contractor(s). If TEA determines that the Not Rated label was indeed due to special circumstances, it may assign a revised rating.
Distinction Designations Decisions regarding distinction designations cannot be appealed. Indicators for distinctions are reported for most districts, charter schools, and campuses regardless of eligibility for a designation. Districts and charter schools receiving an F rating and campuses rated Improvement Required are not eligible for a distinction. However, districts, charter schools, and campuses that appeal an unfavorable rating will automatically receive any distinction designation earned if their appeal is granted and the district or charter school rating is revised to A–D or the campus rating is revised to Met Standard.
How to Submit an Appeal Districts and charter schools should file their intent to appeal district, charter school, or campus ratings using the TEA Secure Environment (TEASE) Accountability application. This confidential online system provides a mechanism for tracking all accountability rating appeals and allows districts and charter schools to monitor the status of their appeal(s).
After filing an intent to appeal, districts and charter schools must mail an appeal packet including all supporting documentation necessary for TEA to process the appeal. Filing an intent to appeal does not constitute an appeal. To file an intent to appeal:
1. Log on to TEASE at https://seguin.tea.state.tx.us/apps/logon.asp or TEAL athttps://tealprod.tea.state.tx.us/.
2. Click ACCT – Accountability.
3. From the Welcome page, click the Notification of Intent to Appeal link and follow theinstructions.
The Notification of Intent to Appeal link will be available during the appeals window from Tuesday, August 14 through 5:00 p.m. CDT on Friday, September 14. The status of the appeal (e.g., intent notification and receipt of documentation) will be available on the TEASE Accountability application.
District superintendents and charter school chief operating officers who do not have TEASE access must request access at the TEA Secure Applications Information page at https://tea.texas.gov/About_TEA/Other_Services/Secure_Applications/TEA__Secure_Applications_Information/.
• Districts and charter schools must submit their appeal in hard copy to TEA by 5:00 p.m. CDT onSeptember 14, 2018. The appeal must include the following:
o A statement that the letter is an appeal of a 2018 accountability rating
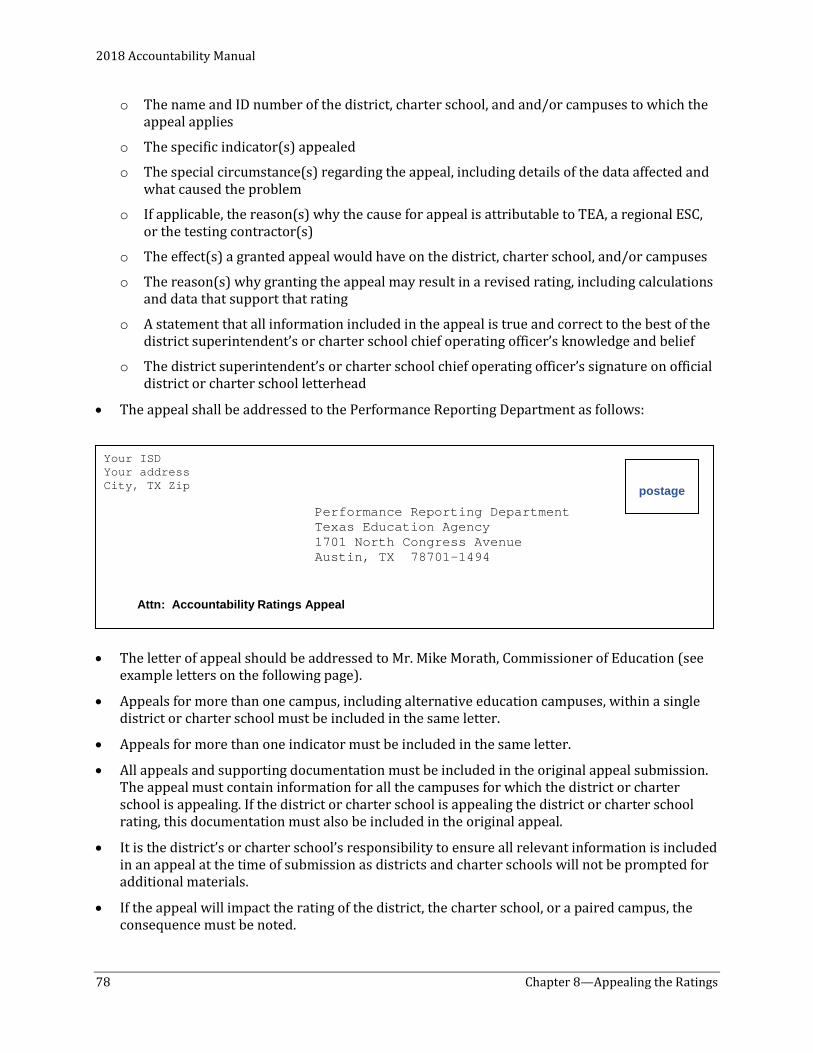
2018 Accountability Manual
78 Chapter 8—Appealing the Ratings
o The name and ID number of the district, charter school, and and/or campuses to which theappeal applies
o The specific indicator(s) appealed
o The special circumstance(s) regarding the appeal, including details of the data affected andwhat caused the problem
o If applicable, the reason(s) why the cause for appeal is attributable to TEA, a regional ESC,or the testing contractor(s)
o The effect(s) a granted appeal would have on the district, charter school, and/or campuses
o The reason(s) why granting the appeal may result in a revised rating, including calculationsand data that support that rating
o A statement that all information included in the appeal is true and correct to the best of thedistrict superintendent’s or charter school chief operating officer’s knowledge and belief
o The district superintendent’s or charter school chief operating officer’s signature on officialdistrict or charter school letterhead
• The appeal shall be addressed to the Performance Reporting Department as follows:
• The letter of appeal should be addressed to Mr. Mike Morath, Commissioner of Education (seeexample letters on the following page).
• Appeals for more than one campus, including alternative education campuses, within a singledistrict or charter school must be included in the same letter.
• Appeals for more than one indicator must be included in the same letter.
• All appeals and supporting documentation must be included in the original appeal submission.The appeal must contain information for all the campuses for which the district or charterschool is appealing. If the district or charter school is appealing the district or charter schoolrating, this documentation must also be included in the original appeal.
• It is the district’s or charter school’s responsibility to ensure all relevant information is includedin an appeal at the time of submission as districts and charter schools will not be prompted foradditional materials.
• If the appeal will impact the rating of the district, the charter school, or a paired campus, theconsequence must be noted.
Performance Reporting Department Texas Education Agency 1701 North Congress Avenue Austin, TX 78701-1494
Your ISD Your address City, TX Zip postage
Attn: Accountability Ratings Appeal
2018 Accountability Manual
Chapter 8—Appealing the Ratings 79
• When student-level information is in question, supporting documentation must be provided forreview (i.e., a list of the students by name and identification number). It is not sufficient toreference indicator data without providing documentation with which the appeal can beresearched and evaluated. Confidential student-level documentation included in the appealpacket will be processed and stored in a secure location and accessible only by TEA staffauthorized to view confidential student results. Please clearly mark any page that containsconfidential student data.
• Appeals postmarked after September 14, 2018, are not considered. Appeals delivered to TEA inperson must be time-stamped by the Performance Reporting Department before 5:00 p.m. CDTon September 14, 2018. Overnight courier tickets or tracking documentation must indicatepackage pickup on or before September 14.
• Only send one copy of the appeal letter and/or supporting documentation.
• Districts and charter schools are encouraged to obtain delivery confirmation services from theirmail courier.
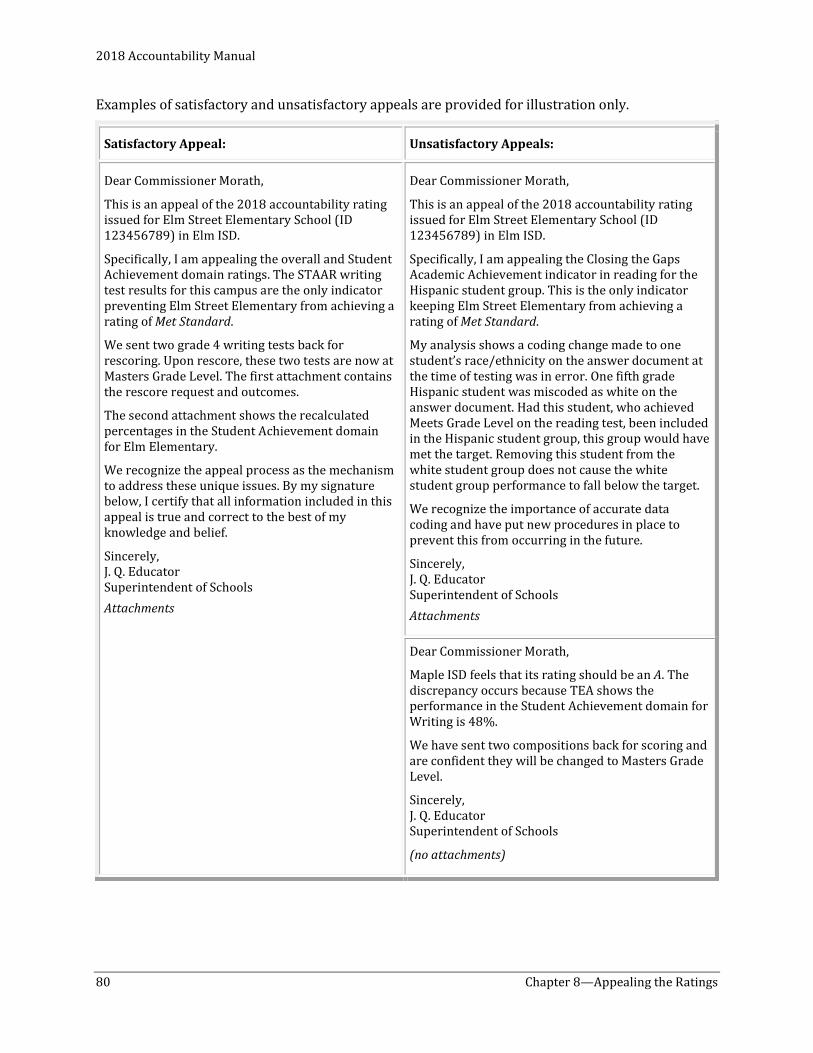
2018 Accountability Manual
80 Chapter 8—Appealing the Ratings
Examples of satisfactory and unsatisfactory appeals are provided for illustration only.
Satisfactory Appeal: Unsatisfactory Appeals:
Dear Commissioner Morath,
This is an appeal of the 2018 accountability rating issued for Elm Street Elementary School (ID 123456789) in Elm ISD.
Specifically, I am appealing the overall and Student Achievement domain ratings. The STAAR writing test results for this campus are the only indicator preventing Elm Street Elementary from achieving a rating of Met Standard.
We sent two grade 4 writing tests back for rescoring. Upon rescore, these two tests are now at Masters Grade Level. The first attachment contains the rescore request and outcomes.
The second attachment shows the recalculated percentages in the Student Achievement domain for Elm Elementary.
We recognize the appeal process as the mechanism to address these unique issues. By my signature below, I certify that all information included in this appeal is true and correct to the best of my knowledge and belief.
Sincerely, J. Q. Educator Superintendent of Schools Attachments
Dear Commissioner Morath,
This is an appeal of the 2018 accountability rating issued for Elm Street Elementary School (ID 123456789) in Elm ISD.
Specifically, I am appealing the Closing the Gaps Academic Achievement indicator in reading for the Hispanic student group. This is the only indicator keeping Elm Street Elementary from achieving a rating of Met Standard.
My analysis shows a coding change made to one student’s race/ethnicity on the answer document at the time of testing was in error. One fifth grade Hispanic student was miscoded as white on the answer document. Had this student, who achieved Meets Grade Level on the reading test, been included in the Hispanic student group, this group would have met the target. Removing this student from the white student group does not cause the white student group performance to fall below the target.
We recognize the importance of accurate data coding and have put new procedures in place to prevent this from occurring in the future.
Sincerely, J. Q. Educator Superintendent of Schools Attachments
Dear Commissioner Morath,
Maple ISD feels that its rating should be an A. The discrepancy occurs because TEA shows the performance in the Student Achievement domain for Writing is 48%.
We have sent two compositions back for scoring and are confident they will be changed to Masters Grade Level.
Sincerely, J. Q. Educator Superintendent of Schools
(no attachments)
2018 Accountability Manual
Chapter 8—Appealing the Ratings 81
How an Appeal is Processed by the Agency • The Performance Reporting Department receives an appeal packet.
• Once the appeal is received, TEA staff updates the TEASE Accountability application to reflectthe postmark date for each appeal and the date on which each appeal packet is received by theagency. Districts and charter schools may monitor the status of their appeal(s) using the TEASEAccountability application.
• Performance Reporting will process appeals in the following order:
o District appeals of D or F overall ratings and campus appeals of Improvement Requiredoverall ratings will be processed first. Priority will be given to districts and campuses facingsanctions and/or interventions.
o District appeals of D or F domain ratings and campus appeals of Improvement Requireddomain ratings will be processed second.
o District appeals of C overall or domain ratings will be processed third.
o District appeals of A or B overall or domain ratings will be processed last.
• Researchers evaluate the request using agency data sources to validate the statements made tothe extent possible. The agency examines all relevant data, not just the results for studentsspecifically named in the appeal.
• Researchers analyze the effect that granting a campus appeal may have on other campuses inthe district or charter school (such as paired campuses), even if they are not specifically namedin the appeal. Similarly, the effect that granting a campus appeal may have on the district orcharter school is evaluated, even if the district or charter school is not named in the appeal. Insingle-campus districts or charter schools, both the campus and district or charter school areevaluated, regardless of whether the district or charter school submits the appeal as a campusor district or charter school appeal.
• Staff prepares a recommendation and submits it to an external panel for review.
• The review panel examines all appeals, supporting documentation, staff research, and the staffrecommendation. The panel determines its recommendation.
• The panel’s recommendations are forwarded to the commissioner.
• The commissioner makes the final decision on all appeals.
• District superintendents and charter school chief operating officers receive written notificationof the commissioner's decision and the rationale upon which the decision is based. Thecommissioner’s response letters are posted to the TEASE Accountability application at the sametime the letters are mailed. District superintendents and charter school chief operating officersare also notified via email that appeal decisions are available on TEASE.
• If an appeal is granted, the data upon which the appeal is based are not modified. Accountabilityand performance reports, as well as all other publications reflecting accountability data, mustreport the data as submitted to the TEA. Accountability data are subject to scrutiny by the Officeof the State Auditor.
The commissioner’s decisions are final and not subject to further appeal or negotiation. The letter from the commissioner serves as notification of the final district or campus rating. Districts and charter schools may publicize the changed ratings at that time. The agency website and other accountability products are updated in December after the resolution of all appeals to reflect any
2018 Accountability Manual
82 Chapter 8—Appealing the Ratings
changed rating. When a district, charter school, or campus rating is changed as the result of an appeal, the data and calculations on which the original rating was based are not changed; only the rating itself is changed. The Accountability Report Card and all other reports related to accountability for the 2017–18 school year (e.g., School Report Cards, TAPR, TPRS) will include the same data and calculations as do the original reports.
Relationship to the Federal Accountability Indicators, PBMAS, and TAIS Federal accountability indicators, Performance-Based Monitoring Analysis System (PBMAS) indicators, and Texas Accountability Intervention System (TAIS) intervention requirements are considered when evaluating the appeal. District or charter school data submitted through TSDS PEIMS or to the state testing contractor(s) are also considered. Certain appeal requests may lead the Division of School Improvement to address potential issues related to data integrity.
2018 Accountability Manual
Chapter 9—Responsibilities and Consequences 83
Chapter 9—Responsibilities and Consequences
State Responsibilities The Texas Education Agency (TEA) is responsible for the state accountability system and other statutory requirements related to its implementation. As described in “Chapter 5—Closing the Gaps,” and this chapter, TEA applies a variety of safeguards to ensure the integrity of the system. TEA is also charged with taking actions to intervene when conditions warrant.
District Accreditation Status State statute requires the commissioner of education to determine an accreditation status for districts and charter schools. Accreditation statuses were first assigned under this statute in 2007.
Rules that define the procedures for determining a district’s or charter school’s accreditation status, as well as the prior accreditation statuses for all districts and charter schools in Texas are available at https://tea.texas.gov/accredstatus/.
Determination of Multiple-Year Unacceptable Status In determining consecutive years of unacceptable ratings for purposes of accountability interventions and sanctions, only years that a district, charter school, or campus is assigned an accountability rating shown below will be considered.
• 2018: A, B, C, D, F for districts and Met Standard, Met Alternative Standard, ImprovementRequired for campuses
• 2013–2017: Met Standard, Met Alternative Standard, Improvement Required
• 2012: (No state accountability ratings issued)
• 2004–2011: Exemplary, Recognized, Academically Acceptable, Academically Unacceptable, AEA:Academically Acceptable, AEA: Academically Unacceptable
While no ratings were issued in 2012, an Improvement Required rating assigned in 2013 and Academically Unacceptable/AEA: Academically Unacceptable ratings assigned in 2011 are considered consecutive years. In addition, although the consecutive years of F/Improvement Required ratings may be separated by one or more years of temporary closure or Not Rated ratings, such separations, whether for single or multiple years, do not break the chain of consecutive years of unacceptable ratings for purposes of accountability interventions and sanctions. This policy applies to districts and charter schools as well as campuses when Not Rated and Not Rated: Data Integrity Issues labels are assigned.
Public Education Grant (PEG) Program Campus List Each year, TEA produces a list of campuses identified under the Public Education Grant (PEG) criteria. House Bill 22 (85th Texas Legislature) changed the criteria for identifying PEG campuses: those that receive an Improvement Required rating in both the Student Achievement domain and the School Progress domain in August 2018 will be on the 2019–20 PEG List. The list of 2019–20 PEG campuses will be released on August 15, 2018. For more information about the PEG program, please see the PEG webpage on the TEA website at https://tea.texas.gov/PEG.aspx.
Local Responsibilities Districts and charter schools have responsibilities associated with the state accountability system. Primarily these involve following statutory requirements, collecting and submitting accurate data, and properly managing campus identification numbers.
2018 Accountability Manual
84 Chapter 9—Responsibilities and Consequences
Statutory Compliance Several state statutes direct local districts, charter schools, and/or campuses to perform certain tasks or duties in response to the annual release of the state accountability ratings. Key statutes are discussed below.
Public Discussion of Ratings (TEC §11.253(g)) Each campus site-based decision-making committee must hold at least one public meeting annually after the receipt of the annual campus accountability rating for discussing the performance of the campus and the campus performance objectives. The confidentiality of the performance results must be ensured before public release. The accountability data tables available on the TEA public website have been masked to protect confidentiality of individual student results.
Notice in Student Grade Report and on District Website (TEC §§39.361–39.362) Districts and charter schools are required to publish accountability ratings on their websites and include the rating in the student grade reports. These statutes require, in relevant part, districts and charter schools:
• to include, along with the first written notice of a student’s performance that a school district orcharter school gives during a school year, a statement of whether the campus has been awardeda distinction designation or has been rated Improvement Required, as well as an explanation ofthe distinction or unacceptable identification; and
• by the 10th day of the new school year to have posted on the district or charter school websitethe most current information available in the school report card and the information containedin the most recent performance report for the district or charter school.
For more information regarding these requirements, please see Requirement for Posting of Performance Frequently Asked Questions: Notice in Student Grade Report, available on the TEA website at https://rptsvr1.tea.texas.gov/perfreport/3297_faq.html.
Public Education Grant Program Parent Notification (TEC §§29.201–29.205) The PEG program permits parents with children attending campuses that are on the PEG List to request that their children be transferred to another campus. If a transfer is granted to another district, funding is provided to the receiving district. A list of campuses identified under the PEG criteria is released to districts annually. Districts must notify each parent of a student assigned to attend a campus on the PEG List by February 1. For more information on the PEG program, please see PEG Frequently Asked Questions, available at https://tea.texas.gov/perfreport/peg_faq.html.
Campus Intervention Requirements under Subchapters B and C of TEC Chapter 39A TEC §39A.101 prescribes specific interventions for any campus that was rated Improvement Required in the state’s accountability system for two or more years. For additional details on interventions, please see the Division of School Improvement’s Accountability Monitoring website at https://tea.texas.gov/si/accountabilitymonitoring/.
Actions Required Due to Low Ratings or Low Accreditation Status Districts and charter schools that earn an F rating or Accredited-Probation/Accredited-Warned accreditation status and campuses with an Improvement Required rating will be required to follow directives from the commissioner designed to remedy the identified concerns. Requirements will
2018 Accountability Manual
Chapter 9—Responsibilities and Consequences 85
vary depending on the circumstances for each individual district or charter school. Commissioner of education rules that define the implementation details of these statutes are available on the TEA School Improvement Division website at the Accountability link at https://tea.texas.gov/schoolimprovement/ and on the TEA Accreditation Status website at https://tea.texas.gov/accredstatus/.
Campus Identification Numbers In a given year, districts or charter schools may need to change, delete, or add one or more county-district-campus (CDC) numbers due to closing old schools, opening new schools, or changing the grades or populations served by an existing school. Unintended consequences can occur when districts or charter schools “recycle” CDC numbers.
As performance results of prior years are a component of the accountability system in small-numbers analysis and possible statutorily-required improvement calculations in future years, merging prior-year files with current-year files is driven by campus identification numbers. Comparisons may be inappropriate when a campus configuration has changed. The following example illustrates this situation.
Example: A campus served grades 7 and 8 in 2017, but in 2018 serves only grade 6. The district did not request a new CDC number for the new configuration. Instead, the same CDC number used in 2017 was maintained (recycled). Therefore, in 2018, grade 6 performance on the assessments may be combined for small-numbers analyses purposes with grade 7 and 8 outcomes from prior years.
Whether to change a campus number is a serious decision for local school districts and charter schools. Districts and charter schools should exercise caution when either requesting new numbers or continuing to use existing numbers when the student population changes significantly or the grades served change significantly. Districts and charter schools are strongly encouraged to request new CDC numbers when campus organizational configurations change dramatically.
TEA policy requires school districts and charter schools to request campus number changes of existing campuses for the current school year by October 1 to ensure time for processing before the TSDS PEIMS fall snapshot date in late October. Changes for a subsequent school year will not be processed before November 1. This policy does not apply to new active campuses opening mid-year or campuses under construction.
Districts and charter schools must consult with the Division of School Improvement to change the campus number of a campus rated Improvement Required. The consolidation, deletion, division, or addition of a campus identification number does not absolve the district or charter school of the state accountability rating history associated with campuses newly consolidated, divided or closed, nor preclude the requirement of participation in intervention activities for campuses that received a rating of Improvement Required rating. The Division of School Improvement will work with the district or charter school to determine specific intervention requirements.
Although the ratings history may be linked across campus numbers for purposes of determining consecutive years of Improvement Required ratings, data will not be linked across campus numbers. This includes TSDS PEIMS data, assessment data, and graduation/dropout data that are used to develop the accountability indicators. Therefore, changing a campus number under these circumstances may be to the disadvantage of an Improvement Required campus. This should be considered by districts and charter schools when requesting campus number changes for Improvement Required campuses. In the rare circumstance where a campus or charter school receives a new campus or district number, the ratings history is linked while the data are not linked across the district numbers.
2018 Accountability Manual
86 Chapter 9—Responsibilities and Consequences
If a district or charter school enters into a legal agreement with TEA that requires new district or campus numbers, the ratings history will be linked to the previous district or campus numbers. In this case, both the district/charter school and campuses will be rated the first year under the new numbers. Data for districts, charter schools, and campuses in these circumstances will not be linked. This includes the TSDS PEIMS data, assessment data, and graduation/dropout data that are used to develop the accountability indicators. Districts, charter schools, or campuses under a legal agreement with TEA cannot take advantage of small-numbers analysis the first year under a new district or campus number.
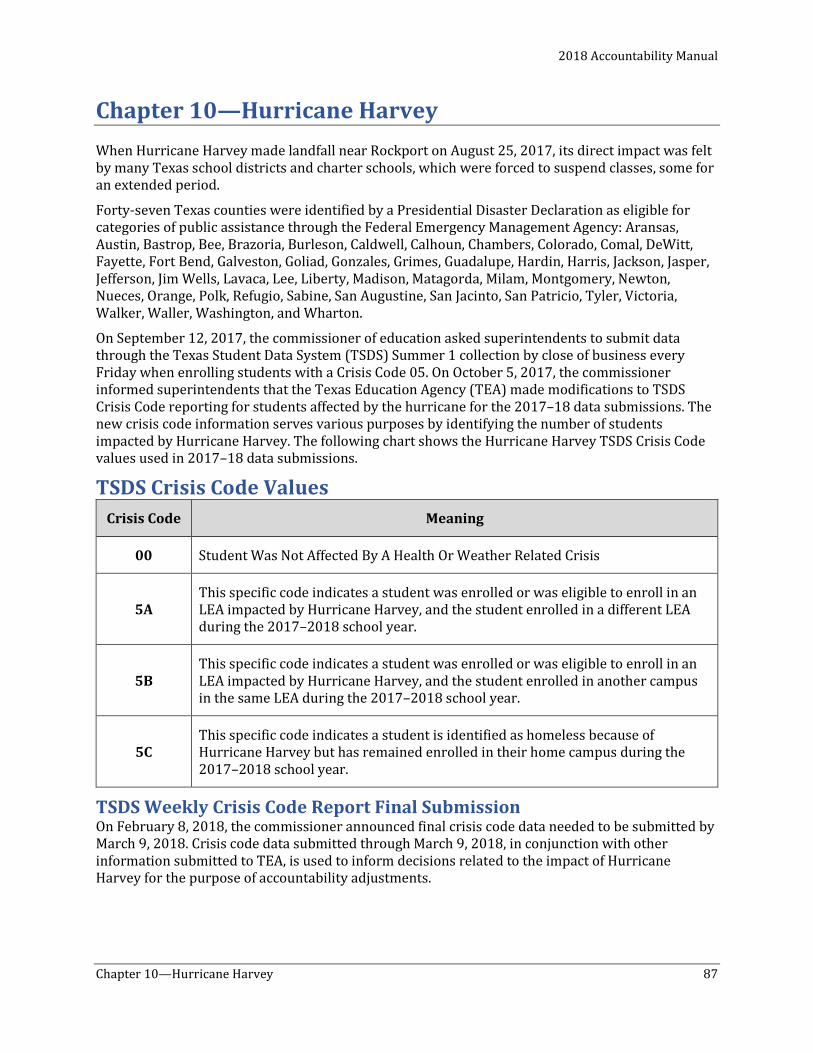
2018 Accountability Manual
Chapter 10—Hurricane Harvey 87
Chapter 10—Hurricane Harvey When Hurricane Harvey made landfall near Rockport on August 25, 2017, its direct impact was felt by many Texas school districts and charter schools, which were forced to suspend classes, some for an extended period.
Forty-seven Texas counties were identified by a Presidential Disaster Declaration as eligible for categories of public assistance through the Federal Emergency Management Agency: Aransas, Austin, Bastrop, Bee, Brazoria, Burleson, Caldwell, Calhoun, Chambers, Colorado, Comal, DeWitt, Fayette, Fort Bend, Galveston, Goliad, Gonzales, Grimes, Guadalupe, Hardin, Harris, Jackson, Jasper, Jefferson, Jim Wells, Lavaca, Lee, Liberty, Madison, Matagorda, Milam, Montgomery, Newton, Nueces, Orange, Polk, Refugio, Sabine, San Augustine, San Jacinto, San Patricio, Tyler, Victoria, Walker, Waller, Washington, and Wharton.
On September 12, 2017, the commissioner of education asked superintendents to submit data through the Texas Student Data System (TSDS) Summer 1 collection by close of business every Friday when enrolling students with a Crisis Code 05. On October 5, 2017, the commissioner informed superintendents that the Texas Education Agency (TEA) made modifications to TSDS Crisis Code reporting for students affected by the hurricane for the 2017–18 data submissions. The new crisis code information serves various purposes by identifying the number of students impacted by Hurricane Harvey. The following chart shows the Hurricane Harvey TSDS Crisis Code values used in 2017–18 data submissions.
TSDS Crisis Code Values Crisis Code Meaning
00 Student Was Not Affected By A Health Or Weather Related Crisis
5A This specific code indicates a student was enrolled or was eligible to enroll in an LEA impacted by Hurricane Harvey, and the student enrolled in a different LEA during the 2017–2018 school year.
5B This specific code indicates a student was enrolled or was eligible to enroll in an LEA impacted by Hurricane Harvey, and the student enrolled in another campus in the same LEA during the 2017–2018 school year.
5C This specific code indicates a student is identified as homeless because of Hurricane Harvey but has remained enrolled in their home campus during the 2017–2018 school year.
TSDS Weekly Crisis Code Report Final Submission On February 8, 2018, the commissioner announced final crisis code data needed to be submitted by March 9, 2018. Crisis code data submitted through March 9, 2018, in conjunction with other information submitted to TEA, is used to inform decisions related to the impact of Hurricane Harvey for the purpose of accountability adjustments.
2018 Accountability Manual
88 Chapter 10—Hurricane Harvey
Hurricane Harvey Provision School districts, open-enrollment charter schools, and campuses directly affected by Hurricane Harvey will be eligible for special evaluation if they meet the following criteria.
Campuses Campuses will be evaluated under the Hurricane Harvey Provision if they meet at least one of the following criteria:
a) The campus identified 10 percent or more of enrolled students in either the October snapshot data or in weekly crisis code reports finalized on March 9, 2018, with crisis codes 5A, 5B, or 5C. Campus enrollment is based on October snapshot data.
b) The campus reported 10 percent or more of its teachers experienced homelessness due to Hurricane Harvey, as reported in the Homeless Survey announced February 14, 2018.
c) The campus was reported to TEA as closed for ten or more instructional days due to Hurricane Harvey.
d) The campus was reported to TEA as displaced due to Hurricane Harvey either because the student population was relocated to another geographic location at least through winter break or the student population was required to share its own campus facility with the students of another campus closed as a direct result of Hurricane Harvey at least through winter break.
Under the Hurricane Harvey Provision, 2018 accountability data and ratings will be generated for eligible campuses using available data. If a campus meets at least one of the Hurricane Harvey criteria described above and receives an Improvement Required rating, the campus will be labeled Not Rated.
School Districts and Open-Enrollment Charter Schools School districts and open-enrollment charter schools are eligible to be labeled Not Rated under the Hurricane Harvey Provision if all campuses within the school district or open-enrollment charter school are eligible for the Hurricane Harvey Provision.
Additionally, if 10 percent or more of the school district or open-enrollment charter school’s students were reported on the October snapshot as enrolled in a campus eligible for the Hurricane Harvey Provision, the school district or open-enrollment charter school is eligible to be labeled Not Rated.
Under the Hurricane Harvey Provision, 2018 accountability data and ratings will be generated for eligible districts using available data. If a district or open-enrollment charter school meets at least one of the district and open-enrollment charter school Hurricane Harvey criteria described above and receives a B, C, D, or F rating, the district or open-enrollment charter school will be labeled Not Rated.
For purposes of counting consecutive years of ratings, 2017 and 2019 will be considered consecutive for school districts, open-enrollment charter schools, and campuses receiving a Not Rated label in 2018 due to hurricane-related issues.
Appeals Any hurricane-affected school district, open-enrollment charter school, or campus not identified as eligible for this provision may appeal under the accountability appeals process. The commissioner-adopted criteria detailed in this chapter are final. Therefore, requests for exceptions to the rules for a school district, open-enrollment charter school, or campus are viewed unfavorably and will most likely be denied. See “Chapter 8—Appealing the Ratings.”
2018 Accountability Manual
Chapter 10—Hurricane Harvey 89
Hurricane Harvey and the Public Education Grant (PEG) Program Campus List Campuses receiving a Not Rated label in 2018 due to Hurricane Harvey provisions will be excluded from the list of 2019–20 PEG campuses released on August 15, 2018. For more information about the PEG program, please see Chapter 9 and the PEG webpage on the TEA website at https://tea.texas.gov/PEG.aspx.

This page is intentionally blank.
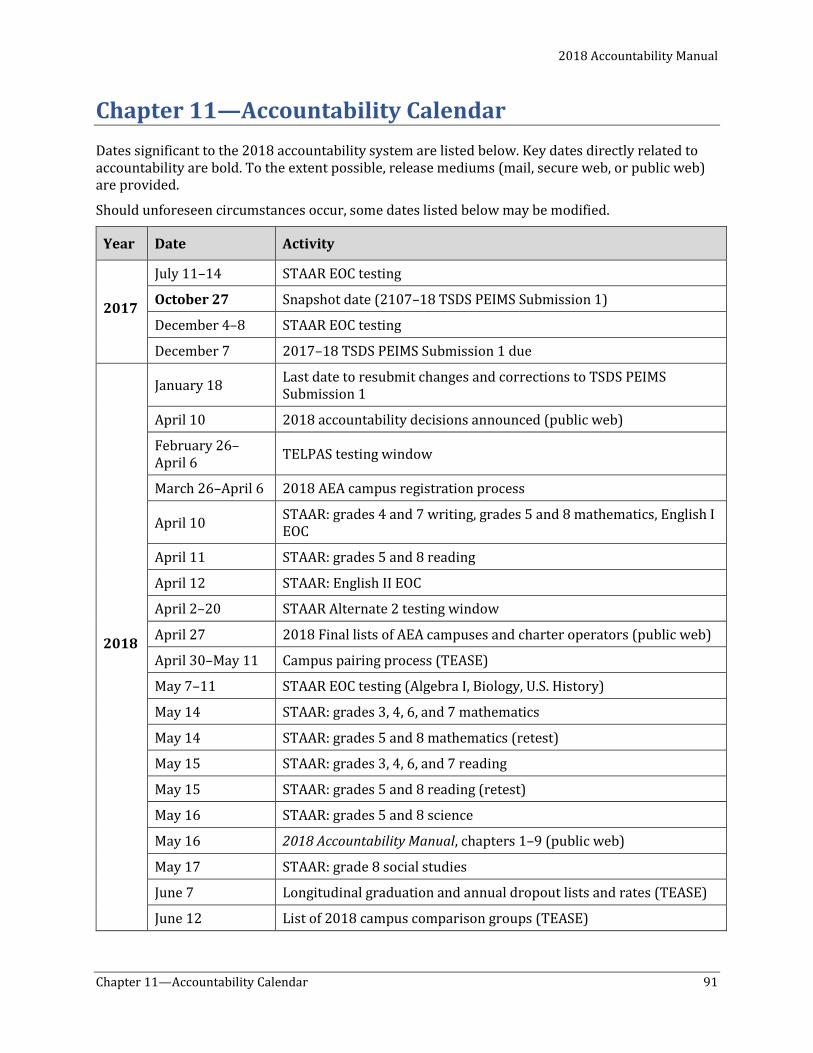
2018 Accountability Manual
Chapter 11—Accountability Calendar 91
Chapter 11—Accountability Calendar Dates significant to the 2018 accountability system are listed below. Key dates directly related to accountability are bold. To the extent possible, release mediums (mail, secure web, or public web) are provided.
Should unforeseen circumstances occur, some dates listed below may be modified.
Year Date Activity
2017
July 11–14 STAAR EOC testing
October 27 Snapshot date (2107–18 TSDS PEIMS Submission 1)
December 4–8 STAAR EOC testing
December 7 2017–18 TSDS PEIMS Submission 1 due
2018
January 18 Last date to resubmit changes and corrections to TSDS PEIMS Submission 1
April 10 2018 accountability decisions announced (public web)
February 26–April 6 TELPAS testing window
March 26–April 6 2018 AEA campus registration process
April 10 STAAR: grades 4 and 7 writing, grades 5 and 8 mathematics, English I EOC
April 11 STAAR: grades 5 and 8 reading
April 12 STAAR: English II EOC
April 2–20 STAAR Alternate 2 testing window
April 27 2018 Final lists of AEA campuses and charter operators (public web)
April 30–May 11 Campus pairing process (TEASE)
May 7–11 STAAR EOC testing (Algebra I, Biology, U.S. History)
May 14 STAAR: grades 3, 4, 6, and 7 mathematics
May 14 STAAR: grades 5 and 8 mathematics (retest)
May 15 STAAR: grades 3, 4, 6, and 7 reading
May 15 STAAR: grades 5 and 8 reading (retest)
May 16 STAAR: grades 5 and 8 science
May 16 2018 Accountability Manual, chapters 1–9 (public web)
May 17 STAAR: grade 8 social studies
June 7 Longitudinal graduation and annual dropout lists and rates (TEASE)
June 12 List of 2018 campus comparison groups (TEASE)
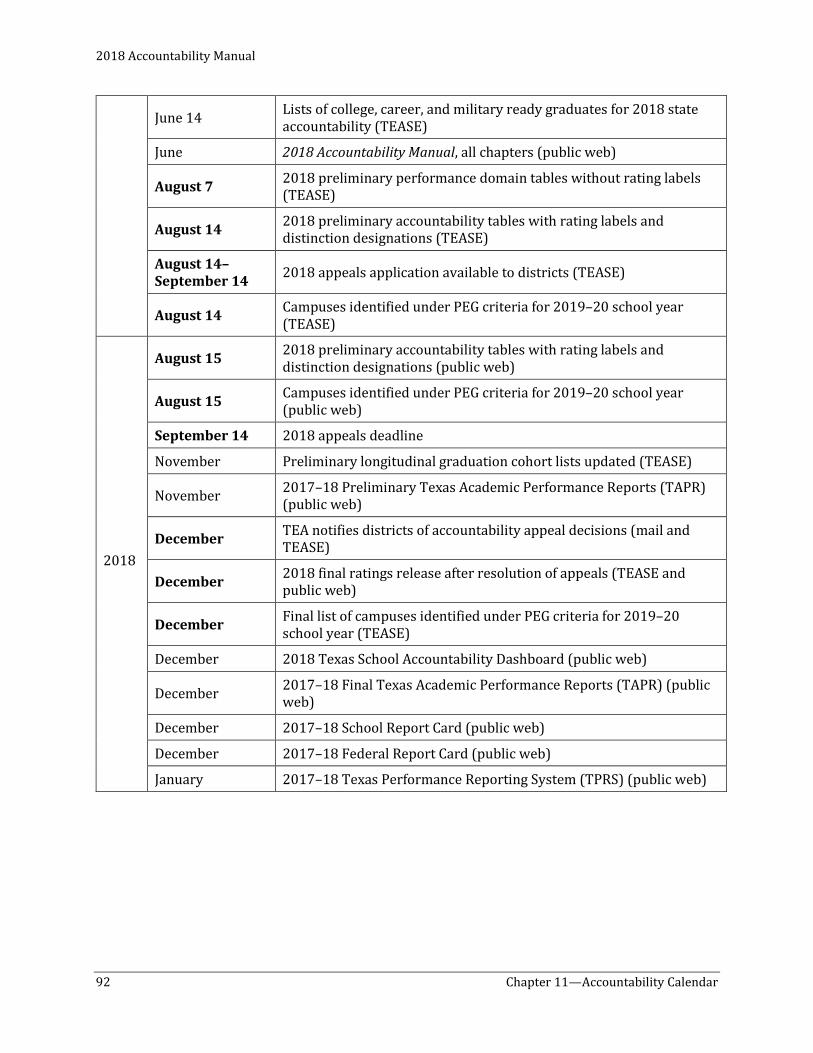
2018 Accountability Manual
92 Chapter 11—Accountability Calendar
June 14 Lists of college, career, and military ready graduates for 2018 state accountability (TEASE)
June 2018 Accountability Manual, all chapters (public web)
August 7 2018 preliminary performance domain tables without rating labels (TEASE)
August 14 2018 preliminary accountability tables with rating labels and distinction designations (TEASE)
August 14–September 14 2018 appeals application available to districts (TEASE)
August 14 Campuses identified under PEG criteria for 2019–20 school year (TEASE)
2018
August 15 2018 preliminary accountability tables with rating labels and distinction designations (public web)
August 15 Campuses identified under PEG criteria for 2019–20 school year (public web)
September 14 2018 appeals deadline
November Preliminary longitudinal graduation cohort lists updated (TEASE)
November 2017–18 Preliminary Texas Academic Performance Reports (TAPR) (public web)
December TEA notifies districts of accountability appeal decisions (mail and TEASE)
December 2018 final ratings release after resolution of appeals (TEASE and public web)
December Final list of campuses identified under PEG criteria for 2019–20 school year (TEASE)
December 2018 Texas School Accountability Dashboard (public web)
December 2017–18 Final Texas Academic Performance Reports (TAPR) (public web)
December 2017–18 School Report Card (public web)
December 2017–18 Federal Report Card (public web)
January 2017–18 Texas Performance Reporting System (TPRS) (public web)
2018 Accountability Manual Appendices A–I

This page is intentionally blank.
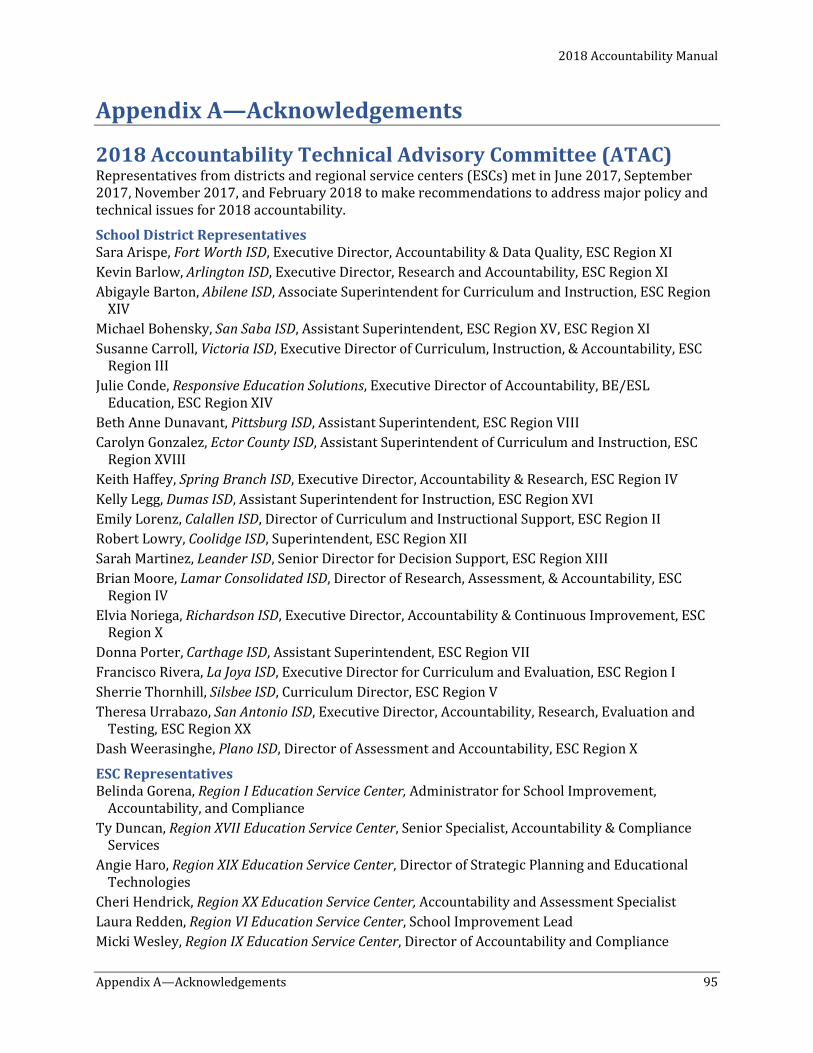
2018 Accountability Manual
Appendix A—Acknowledgements 95
Appendix A—Acknowledgements
2018 Accountability Technical Advisory Committee (ATAC) Representatives from districts and regional service centers (ESCs) met in June 2017, September 2017, November 2017, and February 2018 to make recommendations to address major policy and technical issues for 2018 accountability.
School District Representatives Sara Arispe, Fort Worth ISD, Executive Director, Accountability & Data Quality, ESC Region XI Kevin Barlow, Arlington ISD, Executive Director, Research and Accountability, ESC Region XI Abigayle Barton, Abilene ISD, Associate Superintendent for Curriculum and Instruction, ESC Region
XIV Michael Bohensky, San Saba ISD, Assistant Superintendent, ESC Region XV, ESC Region XI Susanne Carroll, Victoria ISD, Executive Director of Curriculum, Instruction, & Accountability, ESC
Region III Julie Conde, Responsive Education Solutions, Executive Director of Accountability, BE/ESL
Education, ESC Region XIV Beth Anne Dunavant, Pittsburg ISD, Assistant Superintendent, ESC Region VIII Carolyn Gonzalez, Ector County ISD, Assistant Superintendent of Curriculum and Instruction, ESC
Region XVIII Keith Haffey, Spring Branch ISD, Executive Director, Accountability & Research, ESC Region IV Kelly Legg, Dumas ISD, Assistant Superintendent for Instruction, ESC Region XVI Emily Lorenz, Calallen ISD, Director of Curriculum and Instructional Support, ESC Region II Robert Lowry, Coolidge ISD, Superintendent, ESC Region XII Sarah Martinez, Leander ISD, Senior Director for Decision Support, ESC Region XIII Brian Moore, Lamar Consolidated ISD, Director of Research, Assessment, & Accountability, ESC
Region IV Elvia Noriega, Richardson ISD, Executive Director, Accountability & Continuous Improvement, ESC
Region X Donna Porter, Carthage ISD, Assistant Superintendent, ESC Region VII Francisco Rivera, La Joya ISD, Executive Director for Curriculum and Evaluation, ESC Region I Sherrie Thornhill, Silsbee ISD, Curriculum Director, ESC Region V Theresa Urrabazo, San Antonio ISD, Executive Director, Accountability, Research, Evaluation and
Testing, ESC Region XX Dash Weerasinghe, Plano ISD, Director of Assessment and Accountability, ESC Region X
ESC Representatives Belinda Gorena, Region I Education Service Center, Administrator for School Improvement,
Accountability, and Compliance Ty Duncan, Region XVII Education Service Center, Senior Specialist, Accountability & Compliance
Services Angie Haro, Region XIX Education Service Center, Director of Strategic Planning and Educational
Technologies Cheri Hendrick, Region XX Education Service Center, Accountability and Assessment Specialist Laura Redden, Region VI Education Service Center, School Improvement Lead Micki Wesley, Region IX Education Service Center, Director of Accountability and Compliance
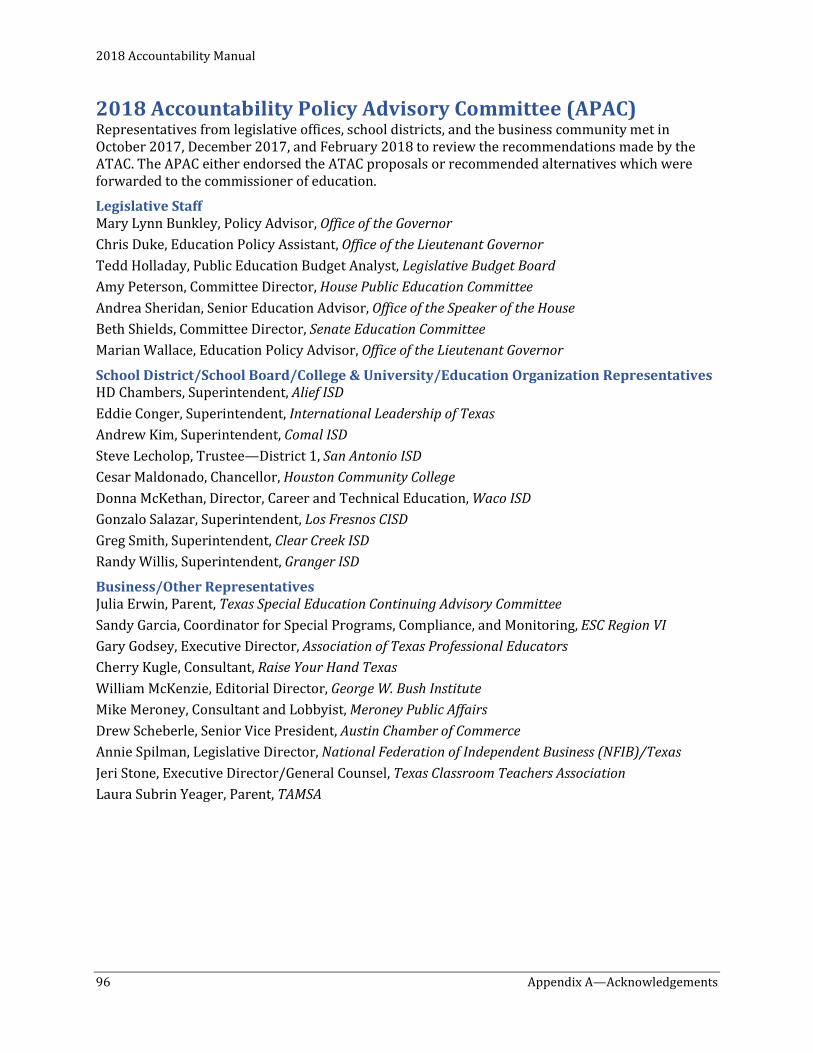
2018 Accountability Manual
96 Appendix A—Acknowledgements
2018 Accountability Policy Advisory Committee (APAC) Representatives from legislative offices, school districts, and the business community met in October 2017, December 2017, and February 2018 to review the recommendations made by the ATAC. The APAC either endorsed the ATAC proposals or recommended alternatives which were forwarded to the commissioner of education.
Legislative Staff Mary Lynn Bunkley, Policy Advisor, Office of the Governor Chris Duke, Education Policy Assistant, Office of the Lieutenant Governor Tedd Holladay, Public Education Budget Analyst, Legislative Budget Board Amy Peterson, Committee Director, House Public Education Committee Andrea Sheridan, Senior Education Advisor, Office of the Speaker of the House Beth Shields, Committee Director, Senate Education Committee Marian Wallace, Education Policy Advisor, Office of the Lieutenant Governor
School District/School Board/College & University/Education Organization Representatives HD Chambers, Superintendent, Alief ISD Eddie Conger, Superintendent, International Leadership of Texas Andrew Kim, Superintendent, Comal ISD Steve Lecholop, Trustee—District 1, San Antonio ISD Cesar Maldonado, Chancellor, Houston Community College Donna McKethan, Director, Career and Technical Education, Waco ISD Gonzalo Salazar, Superintendent, Los Fresnos CISD Greg Smith, Superintendent, Clear Creek ISD Randy Willis, Superintendent, Granger ISD
Business/Other Representatives Julia Erwin, Parent, Texas Special Education Continuing Advisory Committee Sandy Garcia, Coordinator for Special Programs, Compliance, and Monitoring, ESC Region VI Gary Godsey, Executive Director, Association of Texas Professional Educators Cherry Kugle, Consultant, Raise Your Hand Texas William McKenzie, Editorial Director, George W. Bush Institute Mike Meroney, Consultant and Lobbyist, Meroney Public Affairs Drew Scheberle, Senior Vice President, Austin Chamber of Commerce Annie Spilman, Legislative Director, National Federation of Independent Business (NFIB)/Texas Jeri Stone, Executive Director/General Counsel, Texas Classroom Teachers Association Laura Subrin Yeager, Parent, TAMSA
2018 Accountability Manual
Appendix A—Acknowledgements 97
TEA Staff Many people contributed to the development of the 2018 Accountability Manual. The project staff wish to thank these individuals for their expert advice and prompt review of our materials. Their comments greatly enhanced the accuracy and format of the document.
Executive Management Mike Morath, Commissioner of Education Penny Schwinn, Chief Deputy Commissioner of Academics
Project Leadership Jamie Crowe, Executive Director, Performance Reporting Department Christopher Lucas, Senior Director, Performance Reporting Department Heather Smalley, Director, Performance Reporting Department Keith Cranford, Senior Programmer, Performance Reporting Department
Contributors Leslie Brady, Policy Specialist, Performance Reporting Department Jonathan Delgado, Policy Coordinator, Performance Reporting Department Charles Hess, Communications Coordinator, Performance Reporting Department Von Byer, General Counsel, Legal Services Eric Marin, Attorney, Legal Services Susie Villalpando, Senior Director, Performance-Based Monitoring Linda Roska, Executive Director, Division of Research and Analysis Lizette Ridgeway, Division Director, Division of School Improvement

This page is intentionally blank.
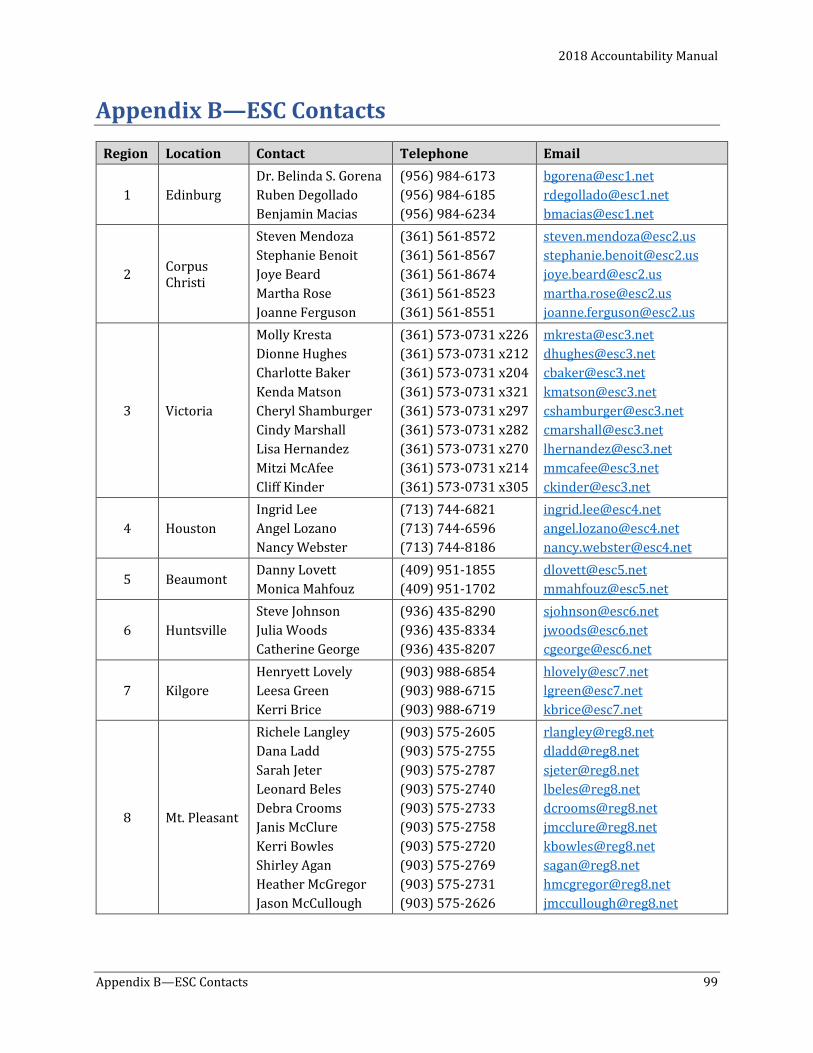
2018 Accountability Manual
Appendix B—ESC Contacts 99
Appendix B—ESC Contacts Region Location Contact Telephone Email
1 Edinburg Dr. Belinda S. Gorena Ruben Degollado Benjamin Macias
(956) 984-6173 (956) 984-6185 (956) 984-6234
[email protected] [email protected] [email protected]
2 Corpus Christi
Steven Mendoza Stephanie Benoit Joye Beard Martha Rose Joanne Ferguson
(361) 561-8572 (361) 561-8567 (361) 561-8674 (361) 561-8523 (361) 561-8551
[email protected] [email protected] [email protected] [email protected] [email protected]
3 Victoria
Molly Kresta Dionne Hughes Charlotte Baker Kenda Matson Cheryl Shamburger Cindy Marshall Lisa Hernandez Mitzi McAfee Cliff Kinder
(361) 573-0731 x226 (361) 573-0731 x212 (361) 573-0731 x204 (361) 573-0731 x321 (361) 573-0731 x297 (361) 573-0731 x282 (361) 573-0731 x270 (361) 573-0731 x214 (361) 573-0731 x305
[email protected] [email protected] [email protected] [email protected] [email protected] [email protected] [email protected] [email protected] [email protected]
4 Houston Ingrid Lee Angel Lozano Nancy Webster
(713) 744-6821 (713) 744-6596 (713) 744-8186
[email protected] [email protected] [email protected]
5 Beaumont Danny Lovett Monica Mahfouz
(409) 951-1855 (409) 951-1702
[email protected] [email protected]
6 Huntsville Steve Johnson Julia Woods Catherine George
(936) 435-8290 (936) 435-8334 (936) 435-8207
[email protected] [email protected] [email protected]
7 Kilgore Henryett Lovely Leesa Green Kerri Brice
(903) 988-6854 (903) 988-6715 (903) 988-6719
[email protected] [email protected] [email protected]
8 Mt. Pleasant
Richele Langley Dana Ladd Sarah Jeter Leonard Beles Debra Crooms Janis McClure Kerri Bowles Shirley Agan Heather McGregor Jason McCullough
(903) 575-2605 (903) 575-2755 (903) 575-2787 (903) 575-2740 (903) 575-2733 (903) 575-2758 (903) 575-2720 (903) 575-2769 (903) 575-2731 (903) 575-2626
[email protected] [email protected] [email protected] [email protected] [email protected] [email protected] [email protected] [email protected] [email protected] [email protected]
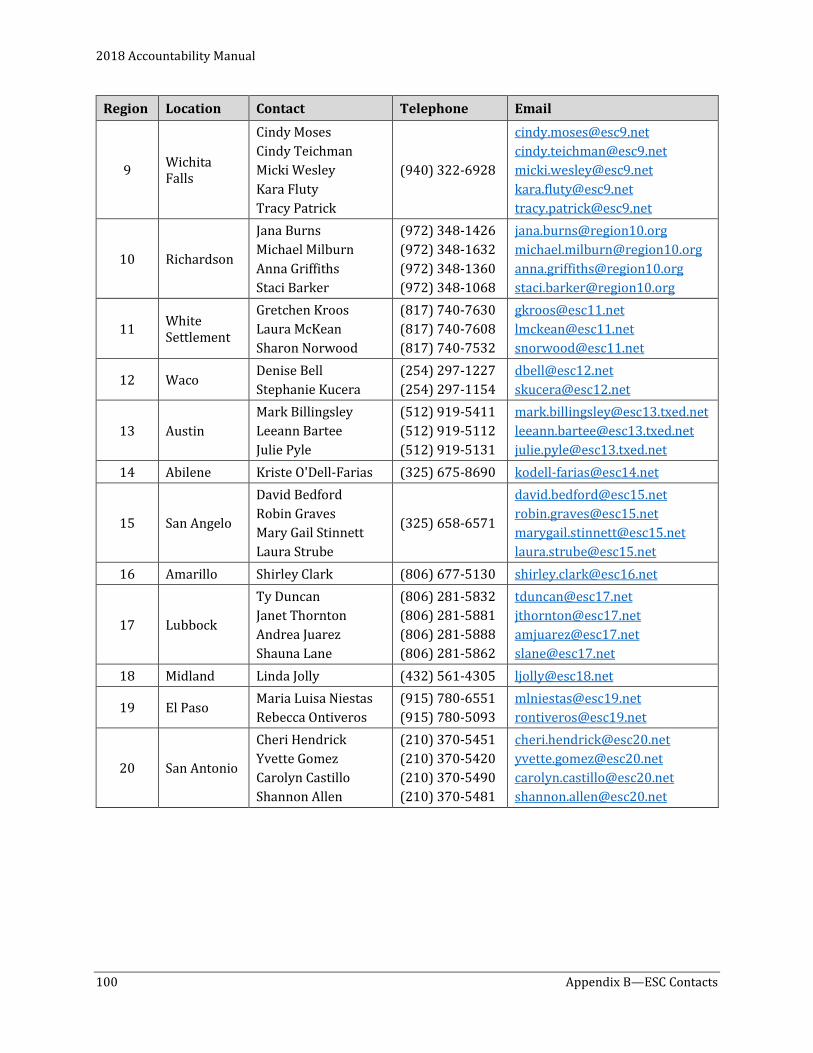
2018 Accountability Manual
100 Appendix B—ESC Contacts
Region Location Contact Telephone Email
9 Wichita Falls
Cindy Moses Cindy Teichman Micki Wesley Kara Fluty Tracy Patrick
(940) 322-6928
[email protected] [email protected] [email protected] [email protected] [email protected]
10 Richardson
Jana Burns Michael Milburn Anna Griffiths Staci Barker
(972) 348-1426 (972) 348-1632 (972) 348-1360 (972) 348-1068
[email protected] [email protected] [email protected] [email protected]
11 White Settlement
Gretchen Kroos Laura McKean Sharon Norwood
(817) 740-7630 (817) 740-7608 (817) 740-7532
[email protected] [email protected] [email protected]
12 Waco Denise Bell Stephanie Kucera
(254) 297-1227 (254) 297-1154
[email protected] [email protected]
13 Austin Mark Billingsley Leeann Bartee Julie Pyle
(512) 919-5411 (512) 919-5112 (512) 919-5131
[email protected] [email protected] [email protected]
14 Abilene Kriste O'Dell-Farias (325) 675-8690 [email protected]
15 San Angelo
David Bedford Robin Graves Mary Gail Stinnett Laura Strube
(325) 658-6571
[email protected] [email protected] [email protected] [email protected]
16 Amarillo Shirley Clark (806) 677-5130 [email protected]
17 Lubbock
Ty Duncan Janet Thornton Andrea Juarez Shauna Lane
(806) 281-5832 (806) 281-5881 (806) 281-5888 (806) 281-5862
[email protected] [email protected] [email protected] [email protected]
18 Midland Linda Jolly (432) 561-4305 [email protected]
19 El Paso Maria Luisa Niestas Rebecca Ontiveros
(915) 780-6551 (915) 780-5093
[email protected] [email protected]
20 San Antonio
Cheri Hendrick Yvette Gomez Carolyn Castillo Shannon Allen
(210) 370-5451 (210) 370-5420 (210) 370-5490 (210) 370-5481
[email protected] [email protected] [email protected] [email protected]
2018 Accountability Manual
Appendix C—Statutory References 101
Appendix C—Statutory References
Texas Administrative Code (TAC) Select chapters of the accountability manual are adopted as part of the Texas Administrative Code. With the publication of this manual, the Texas Education Agency (TEA) filed a Commissioner’s Rule amendment to 19 TAC §97.1001, Accountability Rating System, with the Office of the Secretary of State. For 2018, TEA also filed new 19 TAC §97.1002, Accountability Rating System Provisions Related to Hurricane Harvey, with the Office of the Secretary of State. These rules adopt Chapters 1–10 of the 2018 Accountability Manual giving legal standing to the state rating processes and procedures.
Following a 30-day public comment period, final adoption is scheduled to take effect in August 2018. Once effective, the rules are made available online at http://ritter.tea.state.tx.us/rules/tac/chapter097/ch097aa.html.
Texas Education Code (TEC) Statutory authority for the 2018 accountability system is Texas Education Code (TEC), Chapter 39. Public School System Accountability. The full text of Chapter 39 is available at http://www.statutes.legis.state.tx.us/Docs/ED/htm/ED.39.htm.

This page is intentionally blank.
2018 Accountability Manual
Appendix D—Accountability Glossary 103
Appendix D—Accountability Glossary Accountability Subset: The collection of assessment results that are used to determine district and campus accountability ratings. Only assessment results for those students enrolled in the same district/campus on both the snapshot date (the last Friday in October) and the testing date are used to determine district/campus performance.
AEC of Choice: An AEC that provides accelerated instruction to students at risk of dropping out of school. At-risk students enroll at these campuses specifically to expedite progress toward performing at grade level and completing high school.
Alternative Education Accountability (AEA): The specific provisions by which the performance of alternative education charter schools and campuses is determined and accountability ratings are assigned. AEA is comprised of a modified graduation rate component calculation in the Student Achievement domain and modified cut points across all domains. AEA charter schools and campuses are not evaluated on School Progress, Part B.
Alternative Education Campus (AEC): A campus at which at least 75 percent of students are considered at risk of dropping out of school and at least 50 percent of students are enrolled in grades 6–12. Campuses must register each year to be considered AECs evaluated under AEA provisions.
Asylee/Refugee Exclusions: Assessment results of students identified as unschooled refugees and/or unschooled asylees are not used in assigning ratings during their first five years in U.S. schools. To qualify as an unschooled asylee or refugee, both of the following criteria must be met:
• The student must be identified as limited English proficient (LEP) as defined by state law in Texas Education Code (TEC), Section 29.052 and must participate in a state-approved bilingual or English as a second language (ESL) program.
• The student’s permanent record must contain appropriate documentation of asylee/refugee status. The student must
o be an asylee as defined by 45 Code of Federal Regulations, Section 400.41 or a refugee as defined by 8 United States Code, Section 1101, and
o have a Form I-94 Arrival/Departure record, or a successor document, issued by the United States Citizenship and Immigration Services that is stamped with “Asylee,” “Refugee,” or “Asylum.”
For more information on qualifying as an unschooled asylee/refugee, visit http://tea.texas.gov/student.assessment/ell/lpac/.
At-risk: A student “at-risk of dropping out of school” includes each student who is under 26 years of age and who
• was not advanced from one grade level to the next for one or more school years; [excludes prekindergarten or kindergarten students who were not advanced as a result of a documented request by the student’s parent under TEC 29.081 (d-1).];
• is in grade 7, 8, 9, 10, 11, or 12 and did not maintain an average equivalent to 70 on a scale of 100 in two or more subjects in the foundation curriculum during a semester in the preceding or current school year or is not maintaining such an average in two or more subjects in the foundation curriculum in the current semester;
2018 Accountability Manual
104 Appendix D—Accountability Glossary
• did not perform satisfactorily on an assessment instrument administered to the student under TEC Subchapter B, Chapter 39, and who has not in the previous or current school year subsequently performed on that instrument or another appropriate instrument at a level equal to at least 110 percent of the level of satisfactory performance on that instrument;
• is in prekindergarten, kindergarten or grade 1, 2, or 3 and did not perform satisfactorily on a readiness test or assessment instrument administered during the current school year;
• is pregnant or is a parent; • has been placed in an alternative education program in accordance with TEC §37.006 during
the preceding or current school year; • has been expelled in accordance with TEC §37.007 during the preceding or current school year; • is currently on parole, probation, deferred prosecution, or other conditional release; • was previously reported through the Texas Student Data System/Public Education Information
Management System (TSDS PEIMS) to have dropped out of school; • is a student of limited English proficiency, as defined by TEC §29.052; • is in the custody or care of the Department of Protective and Regulatory Services or has, during
the current school year, been referred to the department by a school official, officer of the juvenile court, or law enforcement official;
• is homeless, as defined by 42 U.S.C. Section 11302, and its subsequent amendments; or • resided in the preceding school year or resides in the current school year in a residential
placement facility in the district, including a detention facility, substance abuse treatment facility, emergency shelter, psychiatric hospital, halfway house, or foster group home.
Campus: A school that is operated by a charter school or school district.
Campus Comparison Group: A set of 40 campuses that most closely match a campus in eight categories. Campus comparison groups are used to award distinction designations. Please see Appendix E for further details.
Charter School: An entity that controls and is responsible for a campus or campuses that has/have been granted a charter under TEC, Subchapter D, Chapter 12.
Continuously Enrolled (Campus): For grades 4–12, a student is identified as continuously enrolled if the student was enrolled in the campus on the TSDS PEIMS fall snapshot during the current school year and in the same district each of the three preceding years. For grade 3, a student is identified as continuously enrolled if the student was enrolled in the campus on the current year TSDS PEIMS fall snapshot and in the same district each of the preceding two years.
If the enrollment requirement is not met, then the student is considered non-continuously enrolled.
Continuously Enrolled (District): For grades 4–12, a student is identified as continuously enrolled if the student was enrolled in the district on the TSDS PEIMS fall snapshot during the current school year and each of the three preceding years. For grade 3, a student is identified as continuously enrolled if the student was enrolled in the same district on the current year TSDS PEIMS fall snapshot and each of the preceding two years.
If the enrollment requirement is not met, then the student is considered non-continuously enrolled.
Current Special Education: A student is identified as a current special education student if the student receives special instruction and related developmental, corrective, supportive, or evaluative services for the current school year as reported in TSDS PEIMS and on STAAR answer documents.
2018 Accountability Manual
Appendix D—Accountability Glossary 105
Data Integrity: Refers to the quality of the data used to determine an accountability rating. The integrity of data can be compromised either through intentional manipulation or through unintentional errors in data reporting. If data integrity is in question, it may not be possible to determine a reliable rating.
Disciplinary Alternative Education Program (DAEP): A system of instruction provided in a setting other than a regular classroom, that is located on or off a regular campus, that provides for the educational and behavioral needs of students, and that provides specialized supervision and counseling for its students. DAEPs are not assigned accountability ratings. The attendance and performance results of a student in a DAEP are attributed to his or her home campus.
Distinction Designations: Recognitions for campuses that are ranked in the top 25 percent of their campus comparison group in academic growth and closing the gaps and for academic achievement in English language arts/reading, mathematics, science, and social studies. Postsecondary Readiness Distinction Designations are awarded to both districts and campuses.
District: A campus or group of campuses that is operated by a board of trustees or other similar governing body. It includes both charter schools and traditional independent school districts.
Dropout Recovery School (DRS): An AEC of choice at which at least 50 percent of students are at least 17 years old as of September 1 of the current school year.
Economically Disadvantaged: The count and percentage of students eligible for free or reduced-price lunch or eligible for other public assistance as reported on the TSDS PEIMS fall snapshot. A student is reported as economically disadvantaged on the TSDS PEIMS fall snapshot using codes 01, 02, or 99:
01: Eligible For Free Meals Under The National School Lunch And Child Nutrition Program
02: Eligible For Reduced-price Meals Under The National School Lunch And Child Nutrition Program
99: Other Economic Disadvantage, Including: a) from a family with an annual income at or below the official federal poverty line, b) eligible for Temporary Assistance to Needy Families (TANF) or other public assistance, c) received a Pell Grant or comparable state program of need-based financial assistance, d) eligible for programs assisted under Title II of the Job Training Partnership Act (JTPA), or e) eligible for benefits under the Food Stamp Act of 1977
English Learner (EL): A student whose primary language is other than English and who is in the process of acquiring English.
English Learner Current and Monitored (EL [Current and Monitored]): Current ELs and former ELs in the first through fourth years of academic monitoring after exiting EL status.
Ever EL (EL [Ever HS]): Students reported in TSDS PEIMS as ELs at any time while attending grades 9–12 in a Texas public school.
Former Special Education: Students are identified as formerly receiving special education services if in any of the preceding three years, they were reported in TSDS PEIMS as receiving special instruction and related developmental, corrective, supportive, or evaluative services, but in the current year, as reported through TSDS PEIMS and on STAAR answer documents, are no longer participating in a special education program.
2018 Accountability Manual
106 Appendix D—Accountability Glossary
Juvenile Justice Alternative Education Program (JJAEP): A disciplinary alternative education program (DAEP) operated under the authority of a county juvenile justice board. JJAEPs are not assigned accountability ratings. The attendance and performance results of a student in a JJAEP are attributed to his or her home campus.
Minimum-Size Criteria: A benchmark that sets the fewest number of performance results that must be available in order for those results to be used to assign accountability ratings. The minimum-size criteria vary by indicator.
Public Education Grant (PEG): A state-wide program that permits parents with children attending campuses that do not meet specific performance criteria to request that their children be transferred to another campus within the same district or to another district. House Bill 22 (85th Texas Legislature) changed the criteria for identifying PEG campuses: those that receive an Improvement Required rating in both the Student Achievement domain and the School Progress domain in August 2018 will be on the 2019–20 PEG List. Please see TEC, §29.201–29.205 and “Chapter 9—Responsibilities and Consequences” for more information.
Registered AEC: A campus registered for evaluation by AEA provisions that meets the 11 registration requirements, 75 percent at-risk enrollment criterion, and 50 percent grades 6–12 enrollment criterion. This term includes AECs of Choice and DRSs.
Residential Treatment Facilities (RTF): Live-in private centers and programs or detention centers and correctional facilities operated by the TJJD that provide educational services. The performance results of students in a residential treatment facility are excluded from state accountability ratings if appropriate TSDS PEIMS student attribution codes are submitted. Please see “Appendix G—Inclusion or Exclusion of Data” for more information.
School Type: A specific label given to a campus for the purposes of determining its domain targets. The label a campus receives—elementary, middle school, elementary/secondary, or high school—is determined by the grades served by the campus as reported in the fall TSDS PEIMS enrollment snapshot.
Small Numbers Analysis: A process to determine if a rating is appropriate for small districts and campuses that do not meet minimum-size criteria using current year data. For more information about small numbers analysis, please visit the 2018 accountability webpage at http://tea.texas.gov/2018accountability.aspx.
Snapshot Date: The “as of” date that is used to determine TSDS PEIMS enrollment information. October 27, 2017, is the TSDS PEIMS snapshot date for the 2017–18 school year.
Superintendent: The educational leader and administrative manager of the district or charter school. It includes other titles that may apply to charter schools, such as chief operating officer, president, and chief administrative officer.
Texas Juvenile Justice Department (TJJD): Created in 2011 when the operations of both Texas Juvenile Probation Commission (TJPC) and Texas Youth Commission (TYC) were transferred to the TJJD and all references to TJPC and TYC were changed to the new name.
Texas Student Data System/Public Education Information Management System (TSDS PEIMS): TSDS PEIMS is the software application for the state's Public Education Information Management System. LEAs load, validate, and submit their data to TEA via TSDS PEIMS.
Uniform Average: The result of a calculation that aggregates current- and prior-year performance results for districts and campuses that do not meet minimum-size criteria. For more information, please see the small numbers analysis resource on the 2018 accountability webpage at http://tea.texas.gov/2018accountability.aspx.
2018 Accountability Manual
Appendix E—Campus Comparison Groups 107
Appendix E—Campus Comparison Groups Campus comparison groups are used to determine distinction designations in the following areas: • Academic Achievement in English Language Arts/Reading • Academic Achievement in Mathematics • Academic Achievement in Science • Academic Achievement in Social Studies • Top 25 Percent: Comparative Academic Growth • Top 25 Percent: Comparative Closing the Gaps • Postsecondary Readiness Campuses may also find campus comparison groups useful for comparing their own performance to peer campuses.
Each campus is assigned to a unique comparison group made up of Texas schools that are most similar to it. To determine the campus comparison group, each campus is identified by school type (See the School Types chart in Chapter 1 for more information.) then grouped with 40 other campuses from anywhere in Texas that are most similar in grade levels served, size, percentage of students who are economically disadvantaged, mobility rate, percentage of English learners, percentage of students served by special education, and percentage of students enrolled in an Early College High School program. Each campus has only one unique campus comparison group. There is no limit on the number of comparison groups to which a campus may be a member. It is possible for a campus to be a member of no comparison group other than its own or a member of several comparison groups.
Campus Comparison Groups: Demographic Characteristics Demographic characteristics used to construct campus comparison groups include those defined in state statute and others that are statistically relevant to performance:
• Campus type—elementary, middle, high school, or combined elementary/secondary (based on TSDS PEIMS fall enrollment)
• Grade levels served—lowest grade level and highest grade level enrollment (based on TSDS PEIMS fall enrollment)
• Campus size—total student enrollment (based on TSDS PEIMS fall enrollment)
• Percentage of students identified as economically disadvantaged (based on TSDS PEIMS fall enrollment)
• Percentage of students identified as English learners (ELs) (based on TSDS PEIMS fall enrollment counts of limited English proficiency [LEP] students)
• Percentage of students identified as mobile (based on TSDS PEIMS prior year attendance)
• Percentage of students served by special education (based on TSDS PEIMS fall enrollment)
• Percentage of students enrolled in an Early College High School program (based on TSDS PEIMS fall enrollment)
2018 Accountability Manual
108 Appendix E—Campus Comparison Groups
Methodology A unique comparison group is created for each campus by applying the following methodology:
Step 1: Group all eligible campuses (see below) by campus type: elementary, middle, high, or elementary/secondary.
Step 2: Determine the linear values for each of the demographic characteristics used to construct the campus comparison group.
Step 3: Compute the linear distance (the square root of the sum of the squared differences of the campus demographic characteristics) from the target campus.
Step 4: Select the 40 campuses with the smallest distance value from the target campus.
Eligible Campuses Campus comparison groups are created for all campuses with the following exceptions:
• Campuses evaluated under alternative education accountability provisions are not eligible fordistinction designations and, therefore, are not assigned a campus comparison group.
• Campuses that are not rated are ineligible for distinction designations and, therefore, are notassigned a campus comparison group. There are several reasons a campus is not rated, such asthe campus has insufficient data or it is a Juvenile Justice Alternative Education Program,Disciplinary Alternative Education Program, or a residential treatment facility.
Uniform Linear Values Campus comparison groups are determined by a distance formula that requires a consistent range of linear (or continuous) values for each demographic characteristic. The percentage of economically disadvantaged students, percentage of ELs, percentage of students who are mobile, percentage of students served by special education, and percentage of students enrolled in an Early College High School program are considered linear values within the consistent range of zero to 100. The remaining demographic values are transformed into linear values within the same rangein the following ways:
• Campus size—a value is created based on the “target” campus’s size as a percentage of themaximum statewide campus size by campus type.
• Lowest or highest grade span—a value is created based on the “target” campus’s grade span asa percentage of a constant value. This calculation creates uniform grade percentages for eachgrade level by shifting the range of grade levels from 3 to 12 to values of 0 to 9 and dividing thevalues into 9 increments:
o For grade levels 3 and above:
High value = 100 * (highest grade level – 3) / 9
Low value = 100 * (lowest grade level – 3) / 9
o For grade levels EE, PK, KG, 01, 02 (TSDS PEIMS-reported values), the high and lowpercentage values are set to 0.
In cases where the campus has a missing mobility value, the district’s average mobility is used as a proxy. This will happen for campuses in their first year of operation because mobility is based on prior-year data.
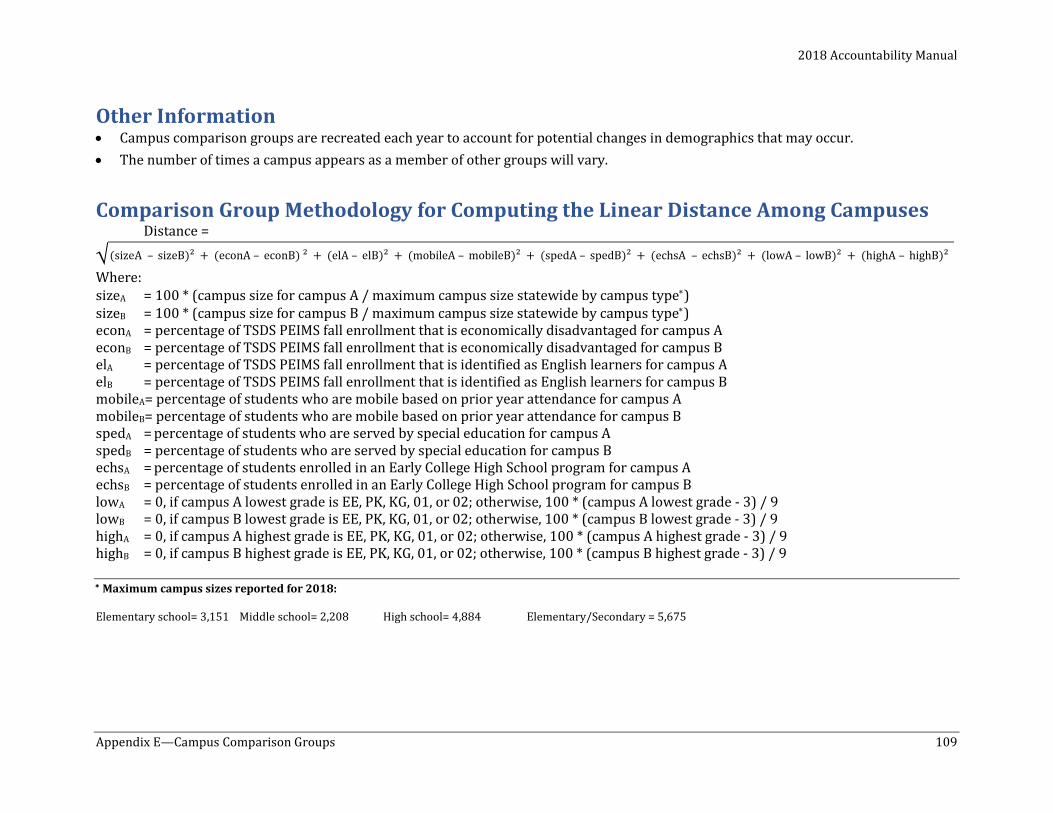
2018 Accountability Manual
Appendix E—Campus Comparison Groups 109
Other Information • Campus comparison groups are recreated each year to account for potential changes in demographics that may occur.• The number of times a campus appears as a member of other groups will vary.
Comparison Group Methodology for Computing the Linear Distance Among Campuses Distance =
A – sizeB)² + (econA – econB) ² + (elA – elB)² + (mobileA – mobileB)² + (spedA – spedB)² + (echsA – echsB)² + (lowA – lowB)² + (highA – highB)²
Where: sizeA = 100 * (campus size for campus A / maximum campus size statewide by campus type∗) sizeB = 100 * (campus size for campus B / maximum campus size statewide by campus type∗) econA = percentage of TSDS PEIMS fall enrollment that is economically disadvantaged for campus A econB = percentage of TSDS PEIMS fall enrollment that is economically disadvantaged for campus B elA = percentage of TSDS PEIMS fall enrollment that is identified as English learners for campus A elB = percentage of TSDS PEIMS fall enrollment that is identified as English learners for campus B mobileA= percentage of students who are mobile based on prior year attendance for campus A mobileB= percentage of students who are mobile based on prior year attendance for campus B spedA = percentage of students who are served by special education for campus A spedB = percentage of students who are served by special education for campus B echsA = percentage of students enrolled in an Early College High School program for campus A echsB = percentage of students enrolled in an Early College High School program for campus B lowA = 0, if campus A lowest grade is EE, PK, KG, 01, or 02; otherwise, 100 * (campus A lowest grade - 3) / 9 lowB = 0, if campus B lowest grade is EE, PK, KG, 01, or 02; otherwise, 100 * (campus B lowest grade - 3) / 9 highA = 0, if campus A highest grade is EE, PK, KG, 01, or 02; otherwise, 100 * (campus A highest grade - 3) / 9 highB = 0, if campus B highest grade is EE, PK, KG, 01, or 02; otherwise, 100 * (campus B highest grade - 3) / 9
∗ Maximum campus sizes reported for 2018:
Elementary school= 3,151 Middle school= 2,208 High school= 4,884 Elementary/Secondary = 5,675
√ (size
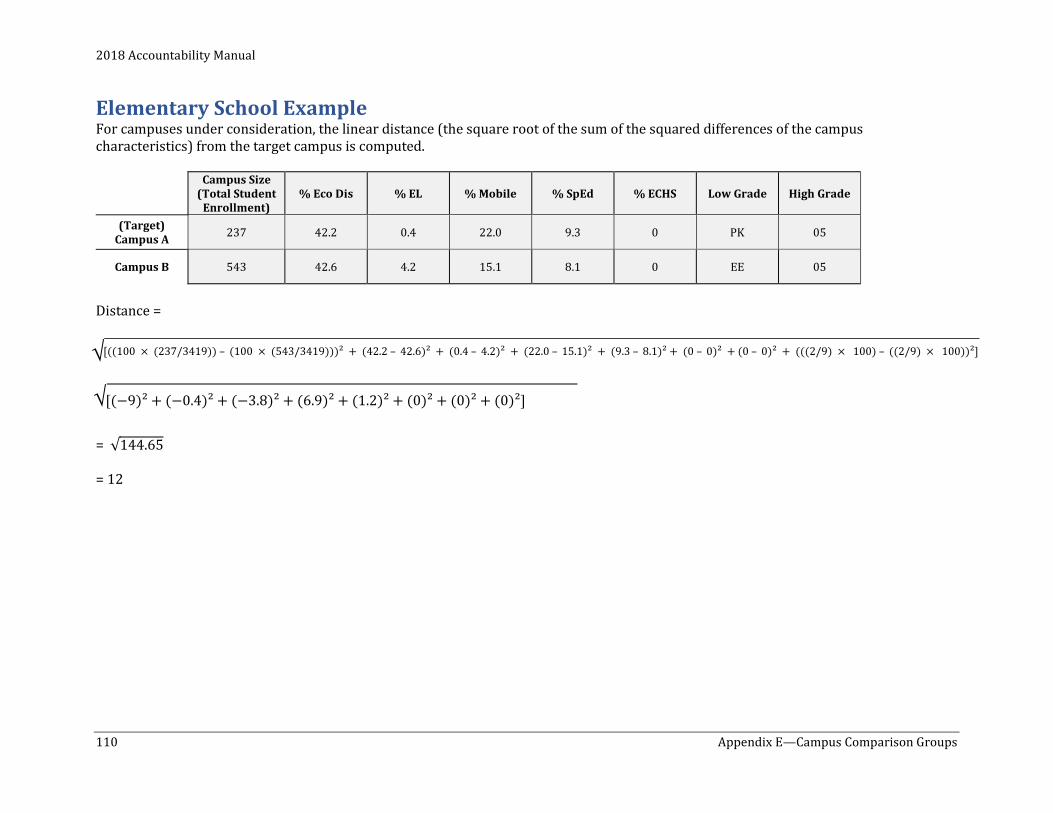
2018 Accountability Manual
110 Appendix E—Campus Comparison Groups
Elementary School Example For campuses under consideration, the linear distance (the square root of the sum of the squared differences of the campus characteristics) from the target campus is computed.
Campus Size (Total Student
Enrollment) % Eco Dis % EL % Mobile % SpEd % ECHS Low Grade High Grade
(Target) Campus A 237 42.2 0.4 22.0 9.3 0 PK 05
Campus B 543 42.6 4.2 15.1 8.1 0 EE 05
Distance =
7/3419)) – (100 × (543/3419)))² + (42.2 – 42.6)² + (0.4 – 4.2)² + (22.0 – 15.1)² + (9.3 – 8.1)² + (0 – 0)² + (0 – 0)² + (((2/9) × 100) – ((2/9) × 100))²]
)² + (−0.4)² + (−3.8)² + (6.9)² + (1.2)² + (0)² + (0)² + (0)²]
= √144.65
= 12
√ [((100 × (23
√ [(−9
2018 Accountability Manual
Appendix F—Public and Confidential Reports 111
Appendix F—Public and Confidential Reports District and campus accountability information is presented online in several different reports, each of which is described below.
Public Reports Accountability Report Card This web-based overview of performance presents the following information for districts and campuses:
• Demographics • Overall Accountability Rating and Score • Domain Ratings and Scores • Distinction Designations • Financial Information (Districts only)
Domain Data Tables For each domain, a district or campus must meet a specific target to demonstrate acceptable performance. These reports provide the disaggregated data used in the accountability system.
Distinction Designation Reports Distinction Designation Summary Report Campuses that receive an accountability rating of Met Standard and districts that receive a rating of A, B, C, or D are eligible for distinction designations. For each distinction designation, this report lists the indicators and shows the indicator score, campus quartile, the outcome (percentage of eligible indicators in the top quartile), and whether the distinction was earned.
Campus Comparison Group (available for campuses only) This report lists 40 campuses that comprise the campus comparison group used in determining distinction designations. For each of the campuses, the report gives data on the criteria used to form campus comparison groups.
Distinction Designation Data Overview Report (available for campuses only) This report gives further details about the performance of each campus in the comparison group on any specific indicator of the selected distinction designation. For more information on this report, see https://rptsvr1.tea.texas.gov/perfreport/account/2018/dddor_explanation.html.
See “Chapter 6—Distinction Designations” for further information.
Confidential Reports The Texas Education Agency Secure Environment (TEASE) is an authentication portal through which authorized users access sensitive or confidential information. The Performance Reporting Department releases unmasked products and reports containing confidential information through the TEASE Accountability application.
Products Available through TEASE Accountability The TEASE Accountability application contains products for districts produced by several divisions in the TEA Office of Academics. After logging into TEASE and selecting the Accountability application from the list of available applications, the main Accountability index screen appears, listing the products available from the site. This screen also contains recent announcements related to accountability.
2018 Accountability Manual
112 Appendix F—Public and Confidential Reports
The following accountability releases are planned for the 2018 cycle in chronological order. See “Chapter 11—Accountability Calendar” for specific dates.
• AEA campus registration process (data collection)• Pairing application (data collection)• Graduation and dropout data
o Lists of students who are considered dropoutso District and campus dropout rateso Lists of students in the 4-, 5-, and 6-year longitudinal cohortso District and campus 4-, 5-, and 6-year graduation rates
• Campus comparison groups• Lists of students included in the College, Career and Military Readiness (CCMR), STAAR
Performance, Academic Growth, and English Language Proficiency components• Preview accountability data tables without ratings• Accountability data tables with ratings and distinction designations• List of Public Education Grant (PEG) schools• Ratings appeal registration• Appeals response letters• Updated accountability data tables with ratings and distinction designations• Updated preliminary longitudinal cohorts• Texas Academic Performance Reports (TAPR)
• School Report Card (SRC)
The TEASE Accountability application is not an archive; it is intended to contain only the most recent products released. When a reporting cycle begins for a new year, the prior year’s final products are removed from the site. Districts are encouraged to save the products provided on this site to a secure, local location.
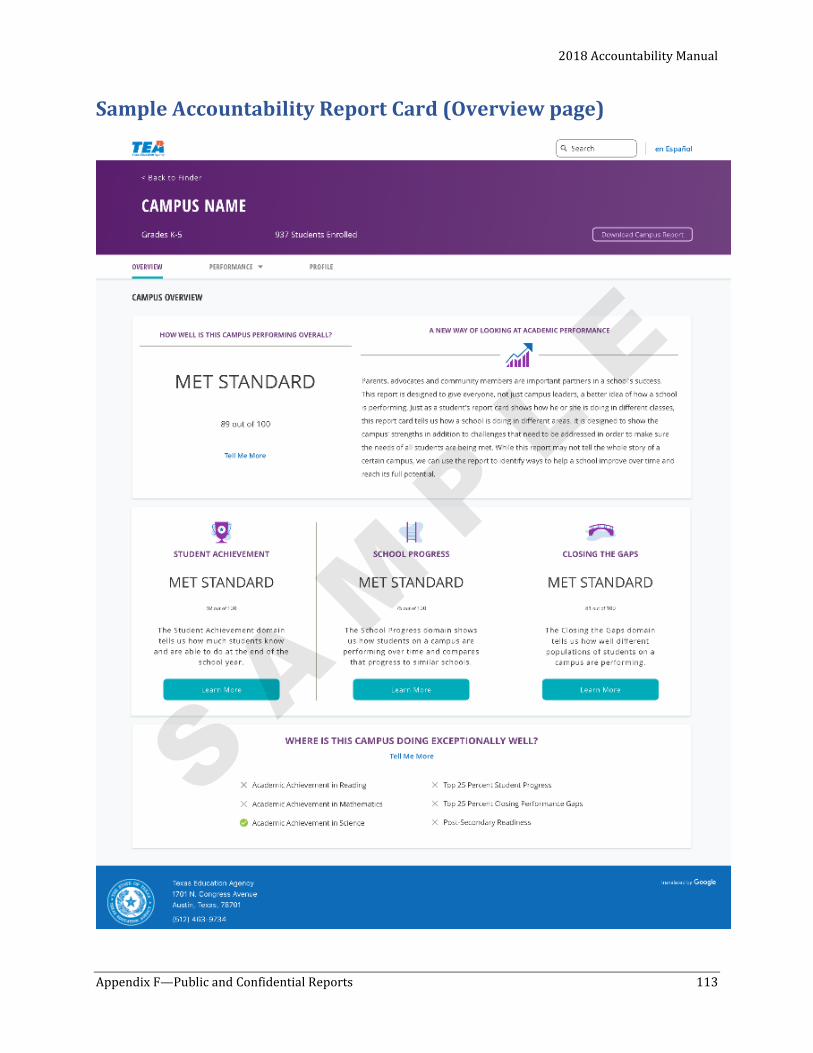
2018 Accountability Manual
Sample Accountability Report Card (Overview page)
Appendix F—Public and Confidential Reports 113
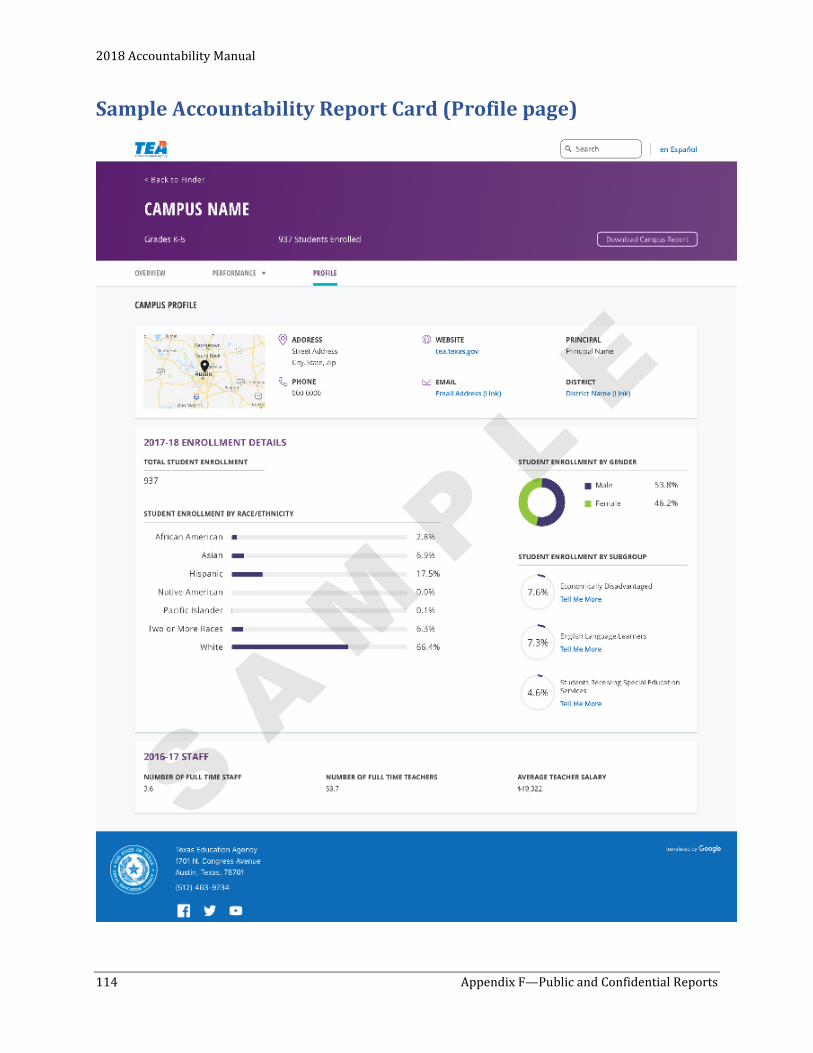
2018 Accountability Manual
Sample Accountability Report Card (Profile page)
114 Appendix F—Public and Confidential Reports
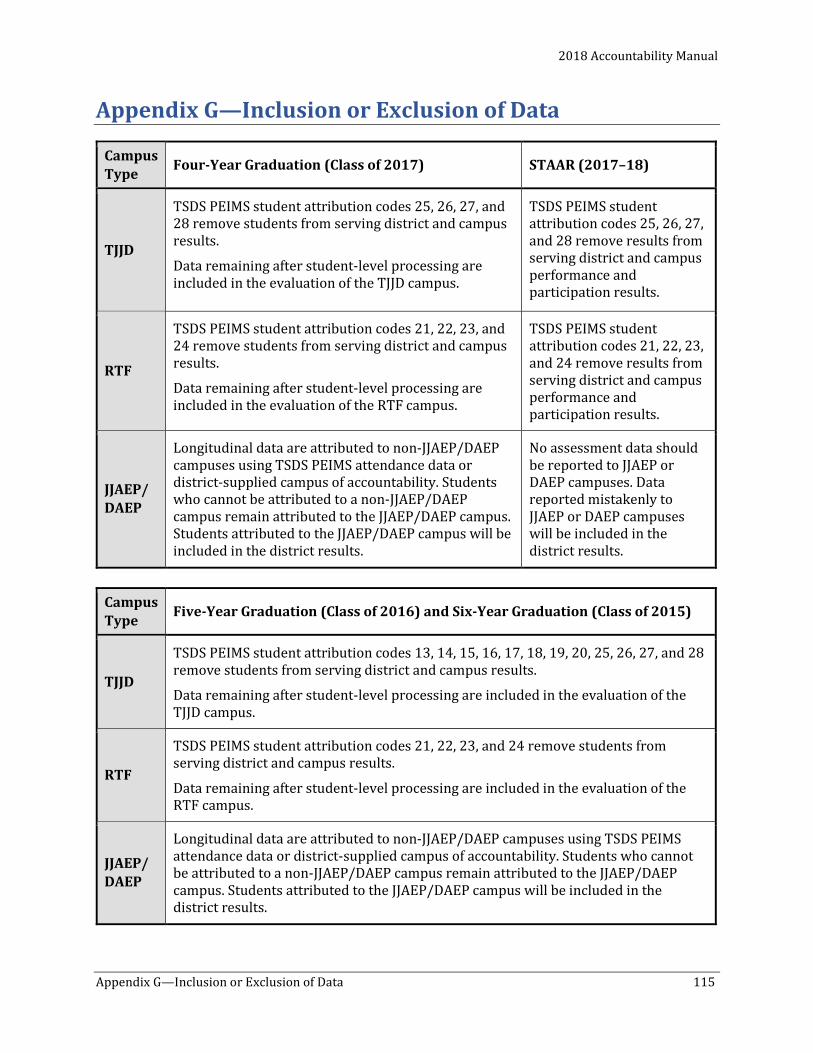
2018 Accountability Manual
Appendix G—Inclusion or Exclusion of Data 115
Appendix G—Inclusion or Exclusion of Data
Campus Type Four-Year Graduation (Class of 2017) STAAR (2017–18)
TJJD
TSDS PEIMS student attribution codes 25, 26, 27, and 28 remove students from serving district and campus results.
Data remaining after student-level processing are included in the evaluation of the TJJD campus.
TSDS PEIMS student attribution codes 25, 26, 27, and 28 remove results from serving district and campus performance and participation results.
RTF
TSDS PEIMS student attribution codes 21, 22, 23, and 24 remove students from serving district and campus results.
Data remaining after student-level processing are included in the evaluation of the RTF campus.
TSDS PEIMS student attribution codes 21, 22, 23, and 24 remove results from serving district and campus performance and participation results.
JJAEP/ DAEP
Longitudinal data are attributed to non-JJAEP/DAEP campuses using TSDS PEIMS attendance data or district-supplied campus of accountability. Students who cannot be attributed to a non-JJAEP/DAEP campus remain attributed to the JJAEP/DAEP campus. Students attributed to the JJAEP/DAEP campus will be included in the district results.
No assessment data should be reported to JJAEP or DAEP campuses. Data reported mistakenly to JJAEP or DAEP campuses will be included in the district results.
Campus Type Five-Year Graduation (Class of 2016) and Six-Year Graduation (Class of 2015)
TJJD
TSDS PEIMS student attribution codes 13, 14, 15, 16, 17, 18, 19, 20, 25, 26, 27, and 28 remove students from serving district and campus results.
Data remaining after student-level processing are included in the evaluation of the TJJD campus.
RTF
TSDS PEIMS student attribution codes 21, 22, 23, and 24 remove students from serving district and campus results.
Data remaining after student-level processing are included in the evaluation of the RTF campus.
JJAEP/ DAEP
Longitudinal data are attributed to non-JJAEP/DAEP campuses using TSDS PEIMS attendance data or district-supplied campus of accountability. Students who cannot be attributed to a non-JJAEP/DAEP campus remain attributed to the JJAEP/DAEP campus. Students attributed to the JJAEP/DAEP campus will be included in the district results.

This page is intentionally blank.
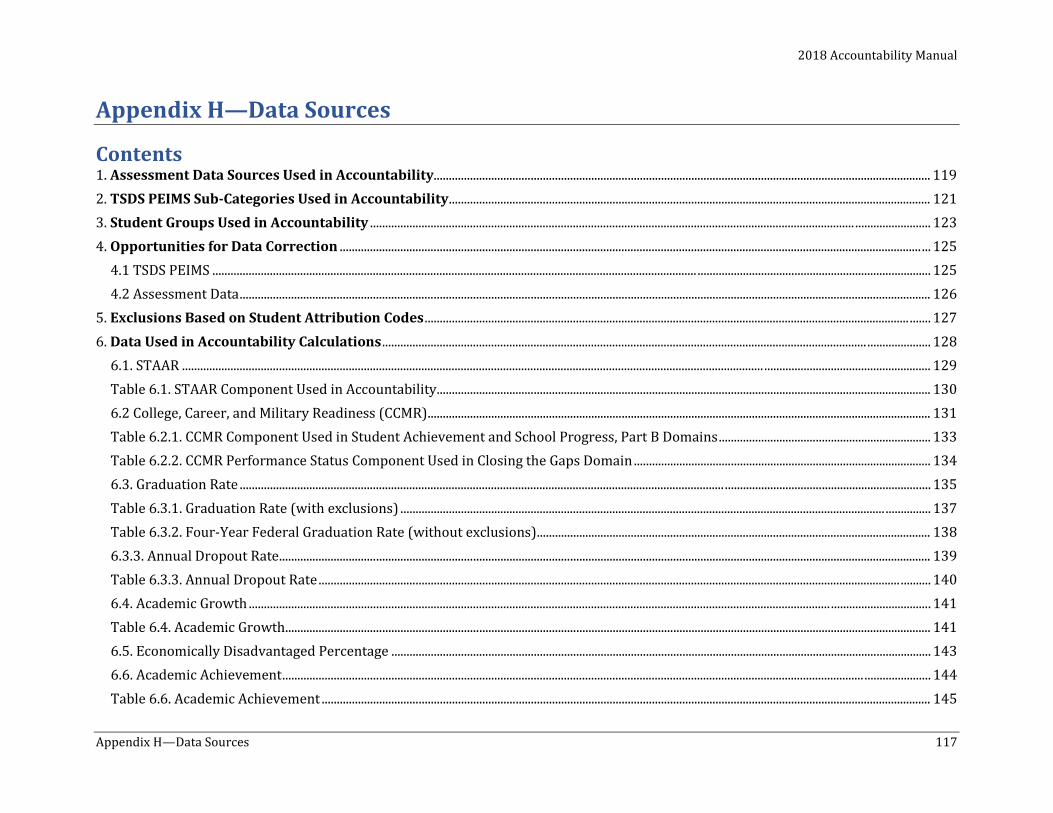
2018 Accountability Manual
Appendix H—Data Sources 117
Appendix H—Data Sources
Contents 1. Assessment Data Sources Used in Accountability.................................................................................................................................................................... 119 2. TSDS PEIMS Sub-Categories Used in Accountability ............................................................................................................................................................... 121 3. Student Groups Used in Accountability ................................................................................................................................................................ ......................... 123 4. Opportunities for Data Correction ................................................................................................................................................................................................ ... 125
4.1 TSDS PEIMS ................................................................................................................................................................ ............................................................................. 125 4.2 Assessment Data .................................................................................................................................................................................................................................... 126
5. Exclusions Based on Student Attribution Codes ................................................................................................................................................................ ....... 127 6. Data Used in Accountability Calculations ................................................................................................................................................................ ..................... 128
6.1. STAAR ................................................................................................................................................................................................ ....................................................... 129 Table 6.1. STAAR Component Used in Accountability ................................................................................................................................................................... 130 6.2 College, Career, and Military Readiness (CCMR) ...................................................................................................................................................................... 131 Table 6.2.1. CCMR Component Used in Student Achievement and School Progress, Part B Domains ...................................................................... 133 Table 6.2.2. CCMR Performance Status Component Used in Closing the Gaps Domain .................................................................................................. 134 6.3. Graduation Rate ................................................................................................................................................................ .................................................................... 135 Table 6.3.1. Graduation Rate (with exclusions) ................................................................................................................................................................ ............... 137 Table 6.3.2. Four-Year Federal Graduation Rate (without exclusions) .................................................................................................................................. 138 6.3.3. Annual Dropout Rate ....................................................................................................................................................................................................................... 139 Table 6.3.3. Annual Dropout Rate ................................................................................................................................................................................................ .......... 140 6.4. Academic Growth ................................................................................................................................................................................................ ................................. 141 Table 6.4. Academic Growth..................................................................................................................................................................................................................... 141 6.5. Economically Disadvantaged Percentage .................................................................................................................................................................................. 143 6.6. Academic Achievement ................................................................................................................................................................................................ ...................... 144 Table 6.6. Academic Achievement ......................................................................................................................................................................................................... 145
2018 Accountability Manual
118 Appendix H—Data Sources
6.7. English Language Proficiency ................................................................................................................................................................ ......................................... 146 Table 6.7. English Language Proficiency ............................................................................................................................................................................................. 146 6.8. Participation Status ................................................................................................................................................................ ............................................................. 147 Table 6.8. Participation Status................................................................................................................................................................ ................................................. 148
7. Data used in Distinction Designations ........................................................................................................................................................................................... 149 7.1. STAAR Data Used in Distinction Designations ......................................................................................................................................................................... 150 Table 7.1. STAAR Indicators ................................................................................................................................................................................................ ..................... 151 7.2. Graduation Plan Rate ................................................................................................................................................................................................ .......................... 154 Table 7.2. Graduation Plan Rate ............................................................................................................................................................................................................. 155 7.3. Texas Success Initiative (TSI) Criteria Graduates ................................................................................................................................................................ ... 156 Table 7.3. Texas Success Initiative (TSI) Criteria Graduates ...................................................................................................................................................... 157 7.4. College, Career, and Military Ready Graduates ................................................................................................................................................................ ........ 158 Table 7.4. College, Career, and Military Ready Graduates ........................................................................................................................................................... 159 7.5. AP/IB Participation and Performance ......................................................................................................................................................................................... 160 Table 7.5. AP/IB Participation and Performance ............................................................................................................................................................................ 162 7.6. SAT/ACT Results .................................................................................................................................................................................................................................. 165 7.7. Advanced/Dual-Credit Course Completion ................................................................................................................................................................ ............... 167 Table 7.7. Advanced/Dual-Credit Course Completion .................................................................................................................................................................. 167 7.8. CTE Coherent Sequence Graduates ............................................................................................................................................................................................... 169 7.9. Attendance Rate ................................................................................................................................................................ .................................................................... 170
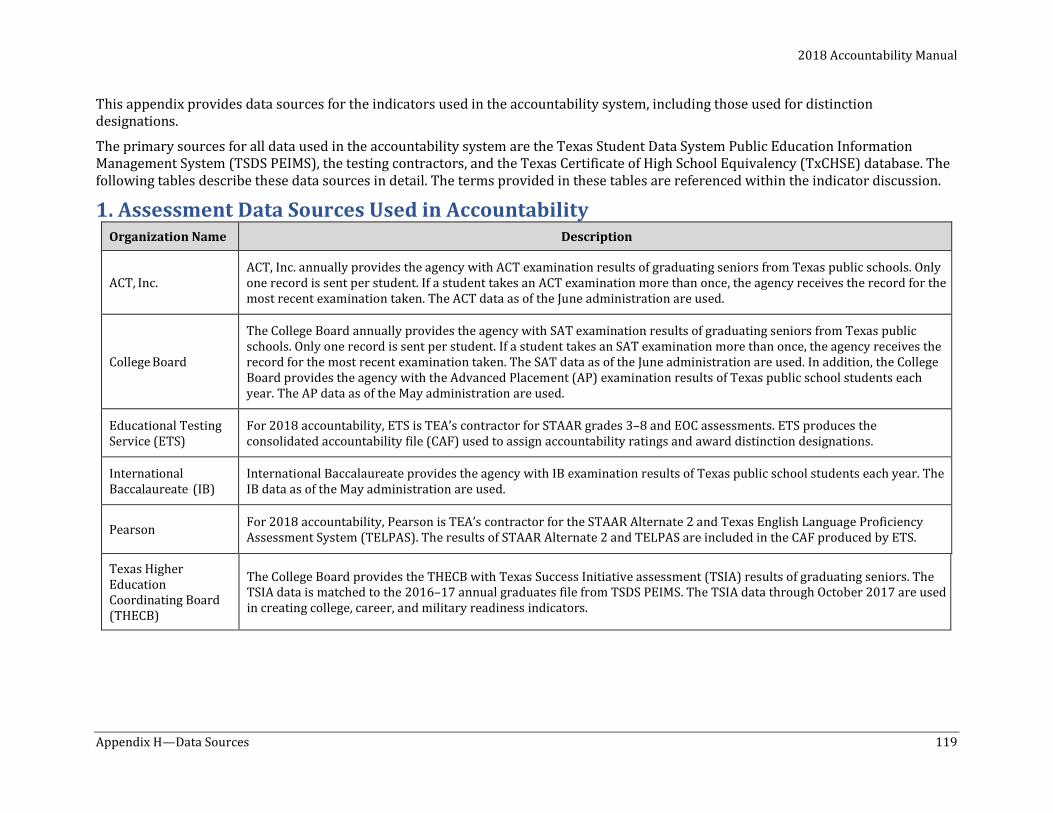
2018 Accountability Manual
Appendix H—Data Sources 119
This appendix provides data sources for the indicators used in the accountability system, including those used for distinction designations.
The primary sources for all data used in the accountability system are the Texas Student Data System Public Education Information Management System (TSDS PEIMS), the testing contractors, and the Texas Certificate of High School Equivalency (TxCHSE) database. The following tables describe these data sources in detail. The terms provided in these tables are referenced within the indicator discussion.
1. Assessment Data Sources Used in Accountability Organization Name Description
ACT, Inc. ACT, Inc. annually provides the agency with ACT examination results of graduating seniors from Texas public schools. Only one record is sent per student. If a student takes an ACT examination more than once, the agency receives the record for the most recent examination taken. The ACT data as of the June administration are used.
College Board
The College Board annually provides the agency with SAT examination results of graduating seniors from Texas public schools. Only one record is sent per student. If a student takes an SAT examination more than once, the agency receives the record for the most recent examination taken. The SAT data as of the June administration are used. In addition, the College Board provides the agency with the Advanced Placement (AP) examination results of Texas public school students each year. The AP data as of the May administration are used.
Educational Testing Service (ETS)
For 2018 accountability, ETS is TEA’s contractor for STAAR grades 3–8 and EOC assessments. ETS produces the consolidated accountability file (CAF) used to assign accountability ratings and award distinction designations.
International Baccalaureate (IB)
International Baccalaureate provides the agency with IB examination results of Texas public school students each year. The IB data as of the May administration are used.
Pearson For 2018 accountability, Pearson is TEA’s contractor for the STAAR Alternate 2 and Texas English Language Proficiency Assessment System (TELPAS). The results of STAAR Alternate 2 and TELPAS are included in the CAF produced by ETS.
Texas Higher Education Coordinating Board (THECB)
The College Board provides the THECB with Texas Success Initiative assessment (TSIA) results of graduating seniors. The TSIA data is matched to the 2016–17 annual graduates file from TSDS PEIMS. The TSIA data through October 2017 are used in creating college, career, and military readiness indicators.
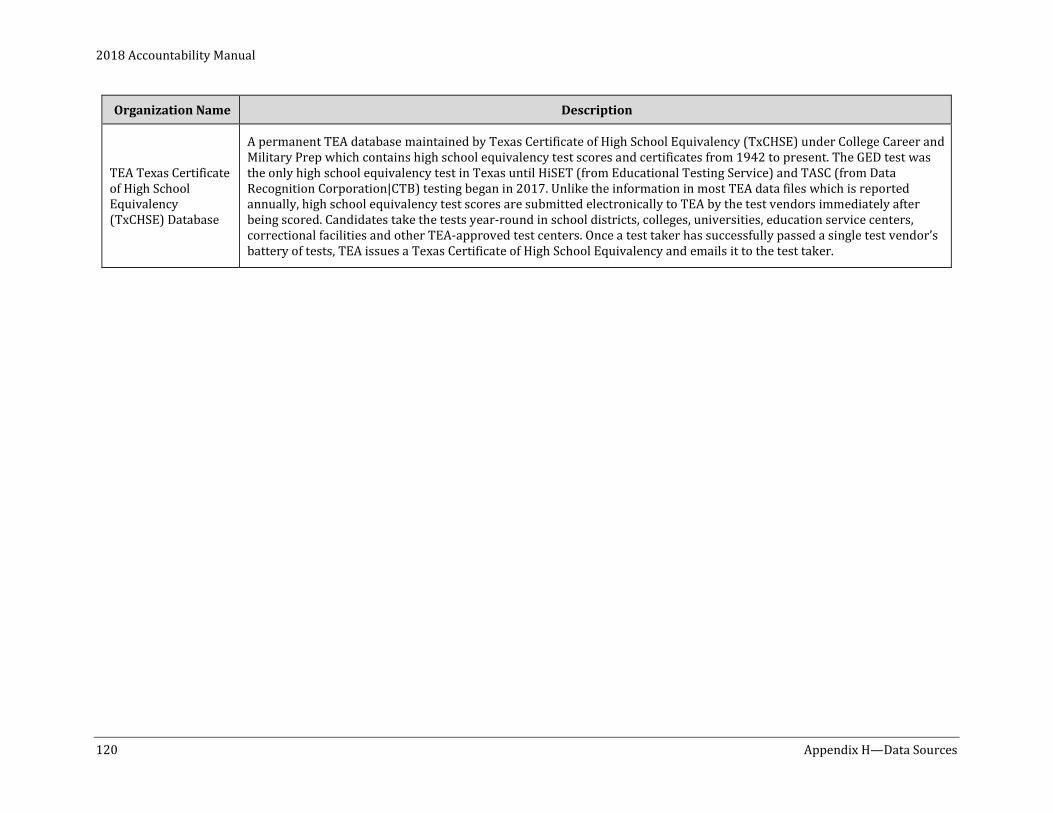
2018 Accountability Manual
120 Appendix H—Data Sources
Organization Name Description
TEA Texas Certificate of High School Equivalency (TxCHSE) Database
A permanent TEA database maintained by Texas Certificate of High School Equivalency (TxCHSE) under College Career and Military Prep which contains high school equivalency test scores and certificates from 1942 to present. The GED test was the only high school equivalency test in Texas until HiSET (from Educational Testing Service) and TASC (from Data Recognition Corporation|CTB) testing began in 2017. Unlike the information in most TEA data files which is reported annually, high school equivalency test scores are submitted electronically to TEA by the test vendors immediately after being scored. Candidates take the tests year-round in school districts, colleges, universities, education service centers, correctional facilities and other TEA-approved test centers. Once a test taker has successfully passed a single test vendor’s battery of tests, TEA issues a Texas Certificate of High School Equivalency and emails it to the test taker.
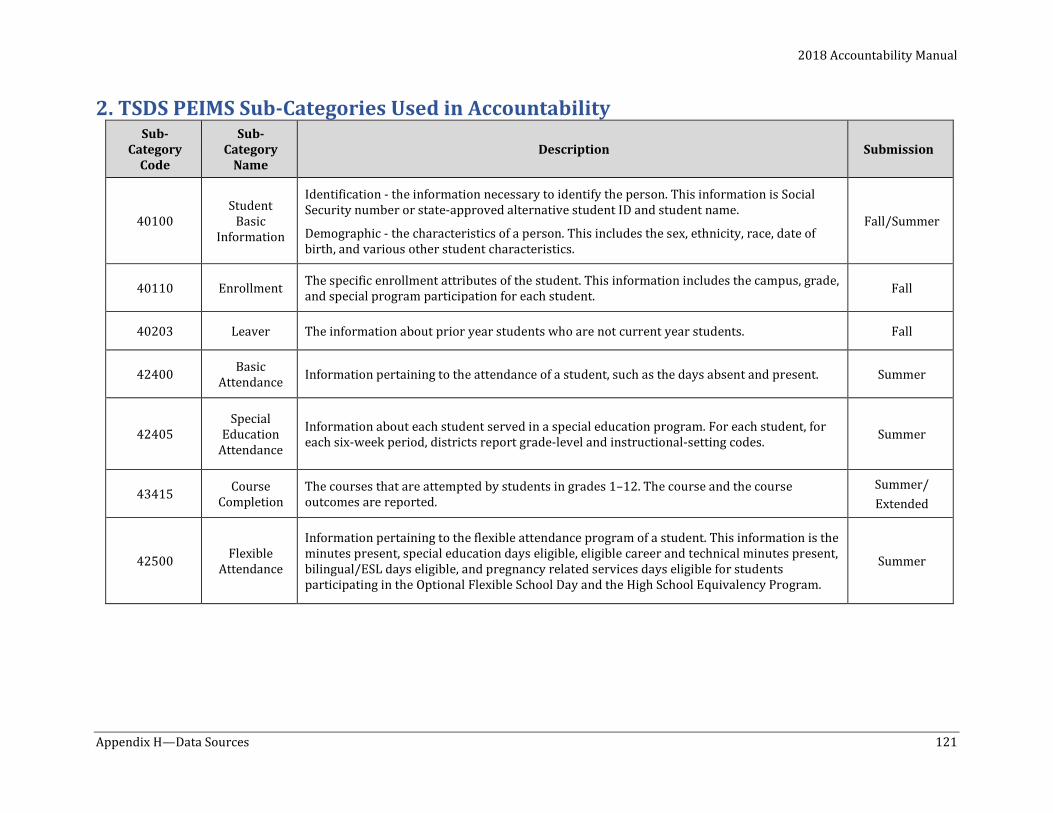
2018 Accountability Manual
Appendix H—Data Sources 121
2. TSDS PEIMS Sub-Categories Used in Accountability Sub-
Category Code
Sub-Category
Name Description Submission
40100 Student
Basic Information
Identification - the information necessary to identify the person. This information is Social Security number or state-approved alternative student ID and student name.
Demographic - the characteristics of a person. This includes the sex, ethnicity, race, date of birth, and various other student characteristics.
Fall/Summer
40110 Enrollment The specific enrollment attributes of the student. This information includes the campus, grade, and special program participation for each student. Fall
40203 Leaver The information about prior year students who are not current year students. Fall
42400 Basic Attendance Information pertaining to the attendance of a student, such as the days absent and present. Summer
42405 Special
Education Attendance
Information about each student served in a special education program. For each student, for each six-week period, districts report grade-level and instructional-setting codes. Summer
43415 Course Completion
The courses that are attempted by students in grades 1–12. The course and the course outcomes are reported.
Summer/ Extended
42500 Flexible Attendance
Information pertaining to the flexible attendance program of a student. This information is the minutes present, special education days eligible, eligible career and technical minutes present, bilingual/ESL days eligible, and pregnancy related services days eligible for students participating in the Optional Flexible School Day and the High School Equivalency Program.
Summer
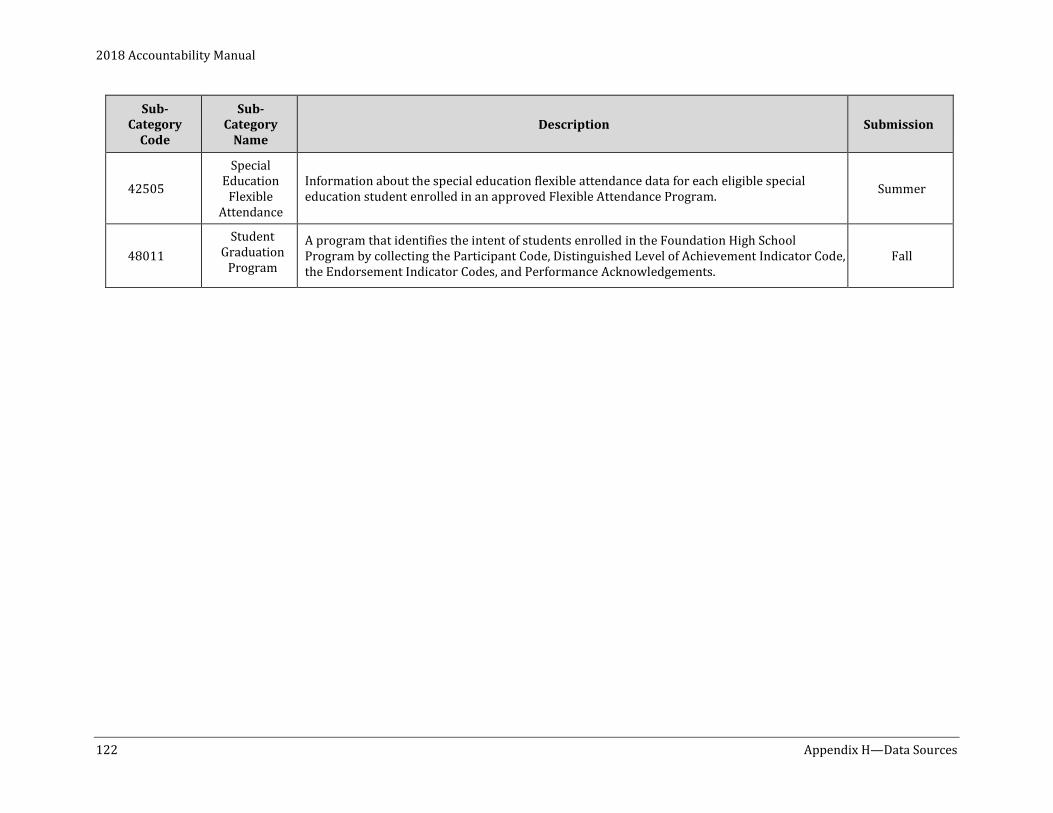
2018 Accountability Manual
122 Appendix H—Data Sources
Sub-Category
Code
Sub-Category
Name Description Submission
42505
Special Education
Flexible Attendance
Information about the special education flexible attendance data for each eligible special education student enrolled in an approved Flexible Attendance Program. Summer
48011 Student
Graduation Program
A program that identifies the intent of students enrolled in the Foundation High School Program by collecting the Participant Code, Distinguished Level of Achievement Indicator Code, the Endorsement Indicator Codes, and Performance Acknowledgements.
Fall
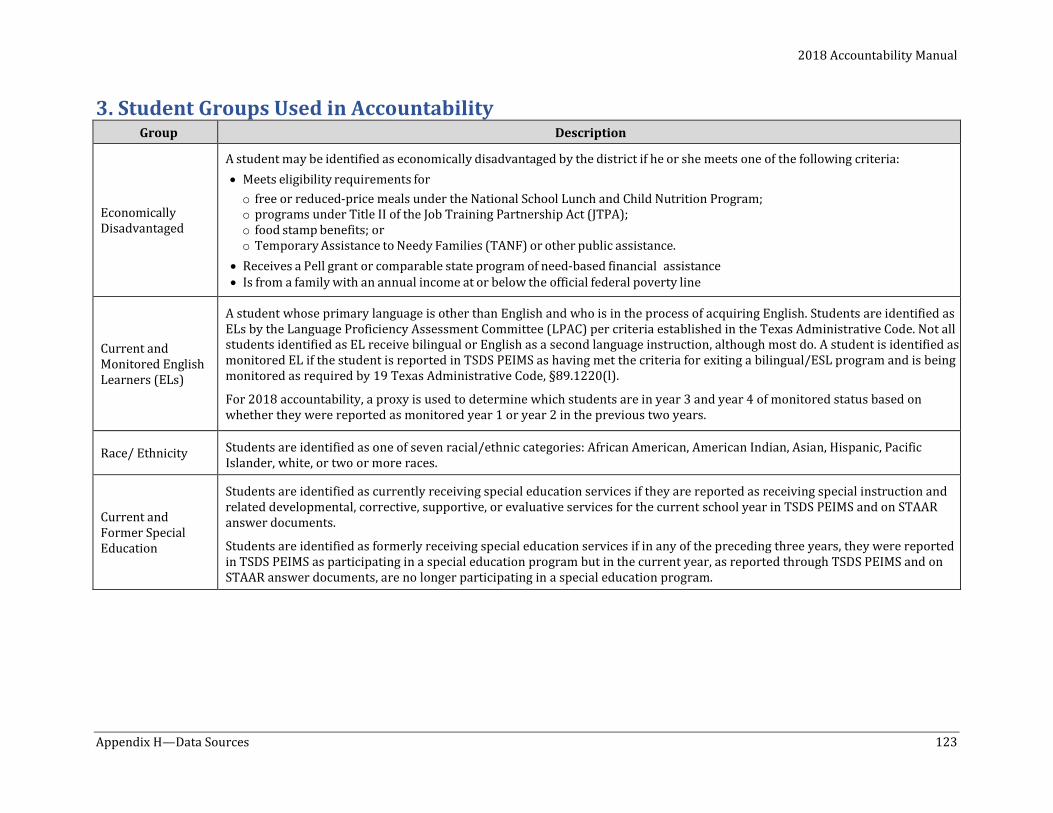
2018 Accountability Manual
Appendix H—Data Sources 123
3. Student Groups Used in Accountability Group Description
Economically Disadvantaged
A student may be identified as economically disadvantaged by the district if he or she meets one of the following criteria: • Meets eligibility requirements for o free or reduced-price meals under the National School Lunch and Child Nutrition Program; o programs under Title II of the Job Training Partnership Act (JTPA); o food stamp benefits; or o Temporary Assistance to Needy Families (TANF) or other public assistance.
• Receives a Pell grant or comparable state program of need-based financial assistance • Is from a family with an annual income at or below the official federal poverty line
Current and Monitored English Learners (ELs)
A student whose primary language is other than English and who is in the process of acquiring English. Students are identified as ELs by the Language Proficiency Assessment Committee (LPAC) per criteria established in the Texas Administrative Code. Not all students identified as EL receive bilingual or English as a second language instruction, although most do. A student is identified as monitored EL if the student is reported in TSDS PEIMS as having met the criteria for exiting a bilingual/ESL program and is being monitored as required by 19 Texas Administrative Code, §89.1220(l).
For 2018 accountability, a proxy is used to determine which students are in year 3 and year 4 of monitored status based on whether they were reported as monitored year 1 or year 2 in the previous two years.
Race/ Ethnicity Students are identified as one of seven racial/ethnic categories: African American, American Indian, Asian, Hispanic, Pacific Islander, white, or two or more races.
Current and Former Special Education
Students are identified as currently receiving special education services if they are reported as receiving special instruction and related developmental, corrective, supportive, or evaluative services for the current school year in TSDS PEIMS and on STAAR answer documents.
Students are identified as formerly receiving special education services if in any of the preceding three years, they were reported in TSDS PEIMS as participating in a special education program but in the current year, as reported through TSDS PEIMS and on STAAR answer documents, are no longer participating in a special education program.
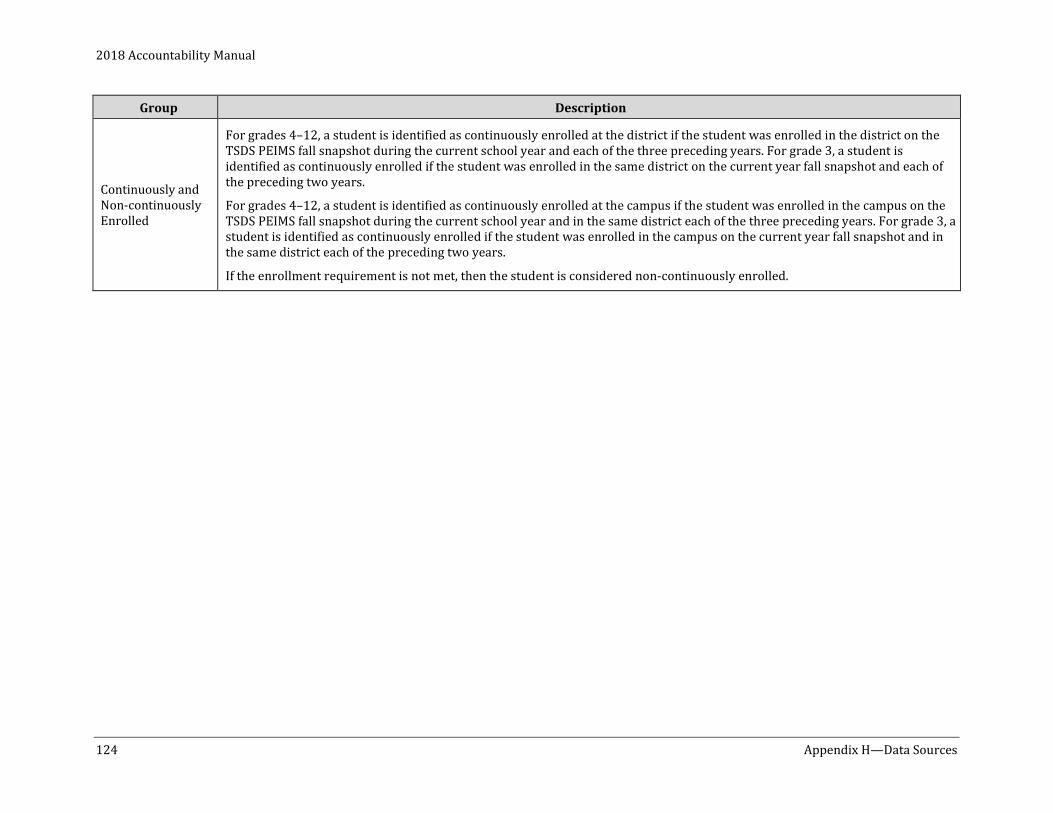
2018 Accountability Manual
124 Appendix H—Data Sources
Group Description
Continuously and Non-continuously Enrolled
For grades 4–12, a student is identified as continuously enrolled at the district if the student was enrolled in the district on the TSDS PEIMS fall snapshot during the current school year and each of the three preceding years. For grade 3, a student is identified as continuously enrolled if the student was enrolled in the same district on the current year fall snapshot and each of the preceding two years.
For grades 4–12, a student is identified as continuously enrolled at the campus if the student was enrolled in the campus on the TSDS PEIMS fall snapshot during the current school year and in the same district each of the three preceding years. For grade 3, a student is identified as continuously enrolled if the student was enrolled in the campus on the current year fall snapshot and in the same district each of the preceding two years.
If the enrollment requirement is not met, then the student is considered non-continuously enrolled.
2018 Accountability Manual
Appendix H—Data Sources 125
4. Opportunities for Data Correction 4.1 TSDS PEIMS General Data. The TSDS PEIMS data collection has a prescribed process and set calendar for correcting errors or omissions discovered after the original submission. The accuracy of all accountability reports, whether they show ratings or distinctions, is dependent on the accuracy of the information submitted by districts through TSDS PEIMS. Districts are responsible for the accuracy of all their TSDS PEIMS data. Several mechanisms are in place to facilitate the collection of accurate data. First, all submitted data must pass an editor program before being accepted. In addition, districts can access various summary reports through the TSDS PEIMS application to assist them in verifying the accuracy of their data prior to submission deadlines. For each submission, a resubmission window allows districts an opportunity to resubmit information if an error is detected. See the Texas Education Data Standards at http://www.texasstudentdatasystem.org/TSDS/TEDS/TEDS_Latest_Release/ for more details about the correction windows and submission deadlines.
Unique ID System Updates (UID). Student identification changes have profound ramifications throughout the Texas public education data system. Year-to-year and collection-to-collection matching are dependent upon stable identification records. Texas Education Data Standards should be followed to ensure that identification updates submitted by districts are processed properly. For more information, please see the edit process for student identification online at http://www.texasstudentdatasystem.org/TSDS/News_and_FAQs/FAQs/UID_PID_andPET/.
2018 Accountability Manual
126 Appendix H—Data Sources
4.2 Assessment Data State Assessments. Student identification, demographic data, and scoring status information as entered on the answer document at the time of testing are used to determine the accountability subset and student groups (School Progress, Part B percentage of economically disadvantaged students is based on fall TSDS PEIMS snapshot) for district and campus ratings. Districts have several opportunities to provide accurate information through TSDS PEIMS submissions, pre-coded data files provided to the testing contractor, and updates to the answer documents at the time of testing. After the testing dates, districts have a corrections window when they can provide corrections to the testing contractor and request corrected reports. However, only corrections submitted by districts in the Texas Assessment Management System during the correction window to the Test Taken Information field are reflected in the consolidated accountability file (CAF) used for determining accountability ratings and subsequent reports (e.g. TAPR, TPRS, School Report Cards, etc.).
SAT, ACT, AP, and IB. The student taking the SAT, ACT, AP, or IB assessment identifies the campus to which scores are attributed. Districts are responsible for verifying that the campus identified by the student is accurate as well as all other relevant information included on the campus summary for these assessments immediately upon receipt from the testing companies. This can include the students’ name and anticipated graduation year, if relevant. Discrepancies should be immediately reported to the testing companies, not to TEA. Once the testing companies have finalized results, and provided those results to TEA, subsequent corrections-corrections made outside a testing company’s correction window-will not be made by the testing companies, nor TEA, and will not be reflected in any national, state, district, or campus results released.
TSIA. The College Board provides the THECB with TSIA results of graduating seniors. The TSIA results received from THECB are matched to the 2016–17 annual graduates file from TSDS PEIMS. The results are matched to students using an algorithm which includes TSDS Unique ID, SSN, and a combination of first name, last name, and DOB. Then the results are attributed to the districts and campuses at which the students are identified as annual graduates in TSDS PEIMS.
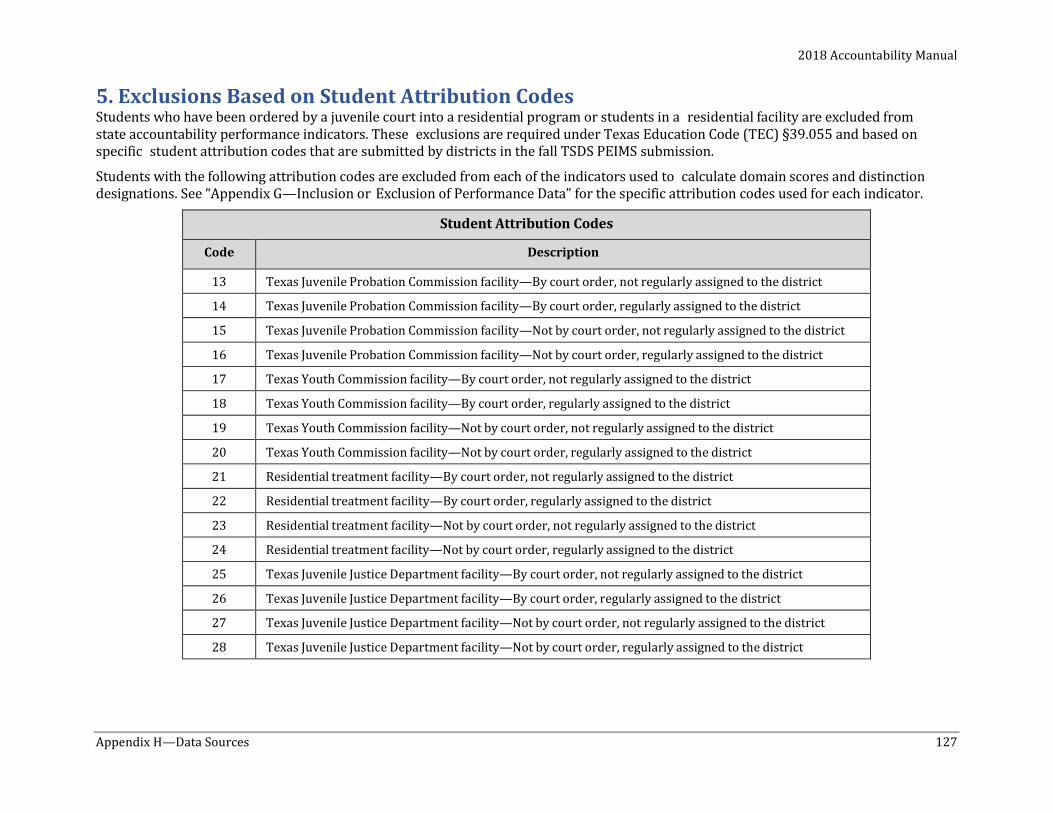
2018 Accountability Manual
Appendix H—Data Sources 127
5. Exclusions Based on Student Attribution CodesStudents who have been ordered by a juvenile court into a residential program or students in a residential facility are excluded from state accountability performance indicators. These exclusions are required under Texas Education Code (TEC) §39.055 and based on specific student attribution codes that are submitted by districts in the fall TSDS PEIMS submission.
Students with the following attribution codes are excluded from each of the indicators used to calculate domain scores and distinction designations. See “Appendix G—Inclusion or Exclusion of Performance Data” for the specific attribution codes used for each indicator.
Student Attribution Codes
Code Description
13 Texas Juvenile Probation Commission facility—By court order, not regularly assigned to the district
14 Texas Juvenile Probation Commission facility—By court order, regularly assigned to the district
15 Texas Juvenile Probation Commission facility—Not by court order, not regularly assigned to the district
16 Texas Juvenile Probation Commission facility—Not by court order, regularly assigned to the district
17 Texas Youth Commission facility—By court order, not regularly assigned to the district
18 Texas Youth Commission facility—By court order, regularly assigned to the district
19 Texas Youth Commission facility—Not by court order, not regularly assigned to the district
20 Texas Youth Commission facility—Not by court order, regularly assigned to the district
21 Residential treatment facility—By court order, not regularly assigned to the district
22 Residential treatment facility—By court order, regularly assigned to the district
23 Residential treatment facility—Not by court order, not regularly assigned to the district
24 Residential treatment facility—Not by court order, regularly assigned to the district
25 Texas Juvenile Justice Department facility—By court order, not regularly assigned to the district
26 Texas Juvenile Justice Department facility—By court order, regularly assigned to the district
27 Texas Juvenile Justice Department facility—Not by court order, not regularly assigned to the district
28 Texas Juvenile Justice Department facility—Not by court order, regularly assigned to the district
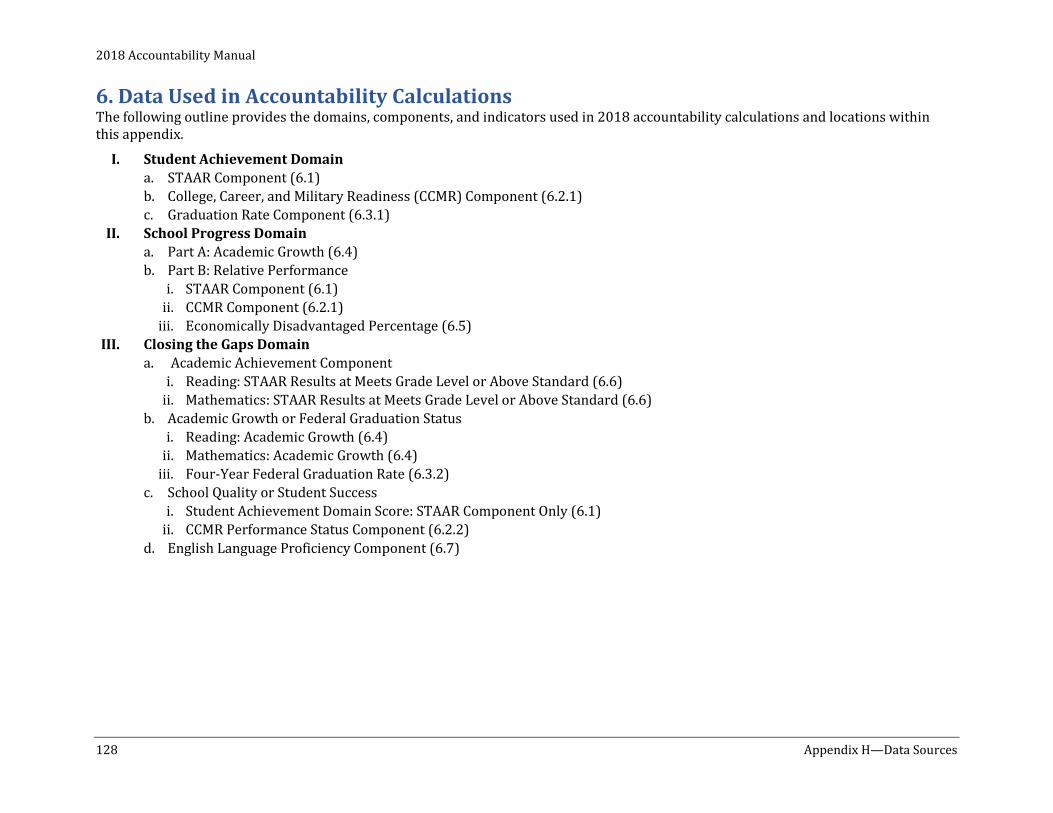
2018 Accountability Manual
128 Appendix H—Data Sources
6. Data Used in Accountability Calculations The following outline provides the domains, components, and indicators used in 2018 accountability calculations and locations within this appendix.
I. Student Achievement Domain a. STAAR Component (6.1) b. College, Career, and Military Readiness (CCMR) Component (6.2.1) c. Graduation Rate Component (6.3.1)
II. School Progress Domain a. Part A: Academic Growth (6.4) b. Part B: Relative Performance
i. STAAR Component (6.1) ii. CCMR Component (6.2.1)
iii. Economically Disadvantaged Percentage (6.5) III. Closing the Gaps Domain
a. Academic Achievement Component i. Reading: STAAR Results at Meets Grade Level or Above Standard (6.6)
ii. Mathematics: STAAR Results at Meets Grade Level or Above Standard (6.6) b. Academic Growth or Federal Graduation Status
i. Reading: Academic Growth (6.4) ii. Mathematics: Academic Growth (6.4)
iii. Four-Year Federal Graduation Rate (6.3.2) c. School Quality or Student Success
i. Student Achievement Domain Score: STAAR Component Only (6.1) ii. CCMR Performance Status Component (6.2.2)
d. English Language Proficiency Component (6.7)
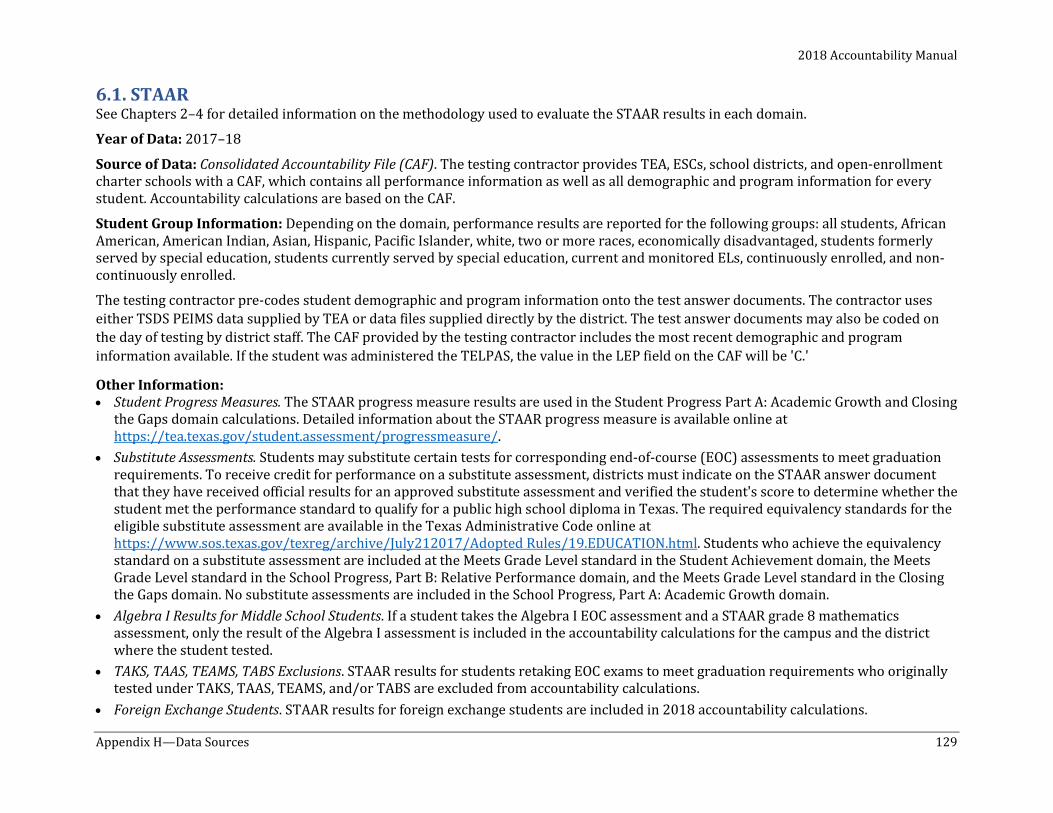
2018 Accountability Manual
Appendix H—Data Sources 129
6.1. STAAR See Chapters 2–4 for detailed information on the methodology used to evaluate the STAAR results in each domain.
Year of Data: 2017–18
Source of Data: Consolidated Accountability File (CAF). The testing contractor provides TEA, ESCs, school districts, and open-enrollment charter schools with a CAF, which contains all performance information as well as all demographic and program information for every student. Accountability calculations are based on the CAF.
Student Group Information: Depending on the domain, performance results are reported for the following groups: all students, African American, American Indian, Asian, Hispanic, Pacific Islander, white, two or more races, economically disadvantaged, students formerly served by special education, students currently served by special education, current and monitored ELs, continuously enrolled, and non-continuously enrolled.
The testing contractor pre-codes student demographic and program information onto the test answer documents. The contractor uses either TSDS PEIMS data supplied by TEA or data files supplied directly by the district. The test answer documents may also be coded on the day of testing by district staff. The CAF provided by the testing contractor includes the most recent demographic and program information available. If the student was administered the TELPAS, the value in the LEP field on the CAF will be 'C.'
Other Information: • Student Progress Measures. The STAAR progress measure results are used in the Student Progress Part A: Academic Growth and Closing
the Gaps domain calculations. Detailed information about the STAAR progress measure is available online at https://tea.texas.gov/student.assessment/progressmeasure/.
• Substitute Assessments. Students may substitute certain tests for corresponding end-of-course (EOC) assessments to meet graduation requirements. To receive credit for performance on a substitute assessment, districts must indicate on the STAAR answer document that they have received official results for an approved substitute assessment and verified the student's score to determine whether the student met the performance standard to qualify for a public high school diploma in Texas. The required equivalency standards for the eligible substitute assessment are available in the Texas Administrative Code online at https://www.sos.texas.gov/texreg/archive/July212017/Adopted Rules/19.EDUCATION.html. Students who achieve the equivalency standard on a substitute assessment are included at the Meets Grade Level standard in the Student Achievement domain, the Meets Grade Level standard in the School Progress, Part B: Relative Performance domain, and the Meets Grade Level standard in the Closing the Gaps domain. No substitute assessments are included in the School Progress, Part A: Academic Growth domain.
• Algebra I Results for Middle School Students. If a student takes the Algebra I EOC assessment and a STAAR grade 8 mathematics assessment, only the result of the Algebra I assessment is included in the accountability calculations for the campus and the district where the student tested.
• TAKS, TAAS, TEAMS, TABS Exclusions. STAAR results for students retaking EOC exams to meet graduation requirements who originally tested under TAKS, TAAS, TEAMS, and/or TABS are excluded from accountability calculations.
• Foreign Exchange Students. STAAR results for foreign exchange students are included in 2018 accountability calculations.
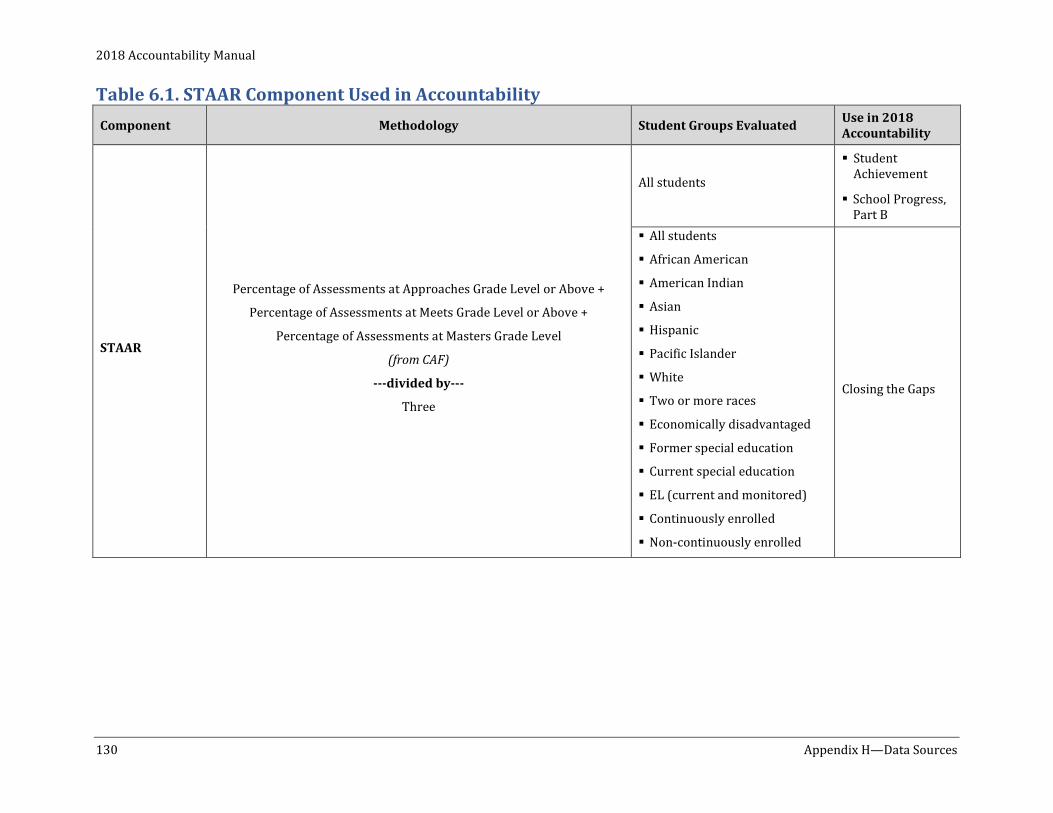
2018 Accountability Manual
130 Appendix H—Data Sources
Table 6.1. STAAR Component Used in Accountability Component Methodology Student Groups Evaluated Use in 2018
Accountability
STAAR
Percentage of Assessments at Approaches Grade Level or Above +
Percentage of Assessments at Meets Grade Level or Above +
Percentage of Assessments at Masters Grade Level
(from CAF)
---divided by---
Three
All students
Student Achievement
School Progress, Part B
All students
African American
American Indian
Asian
Hispanic
Pacific Islander
White
Two or more races
Economically disadvantaged
Former special education
Current special education
EL (current and monitored)
Continuously enrolled
Non-continuously enrolled
Closing the Gaps
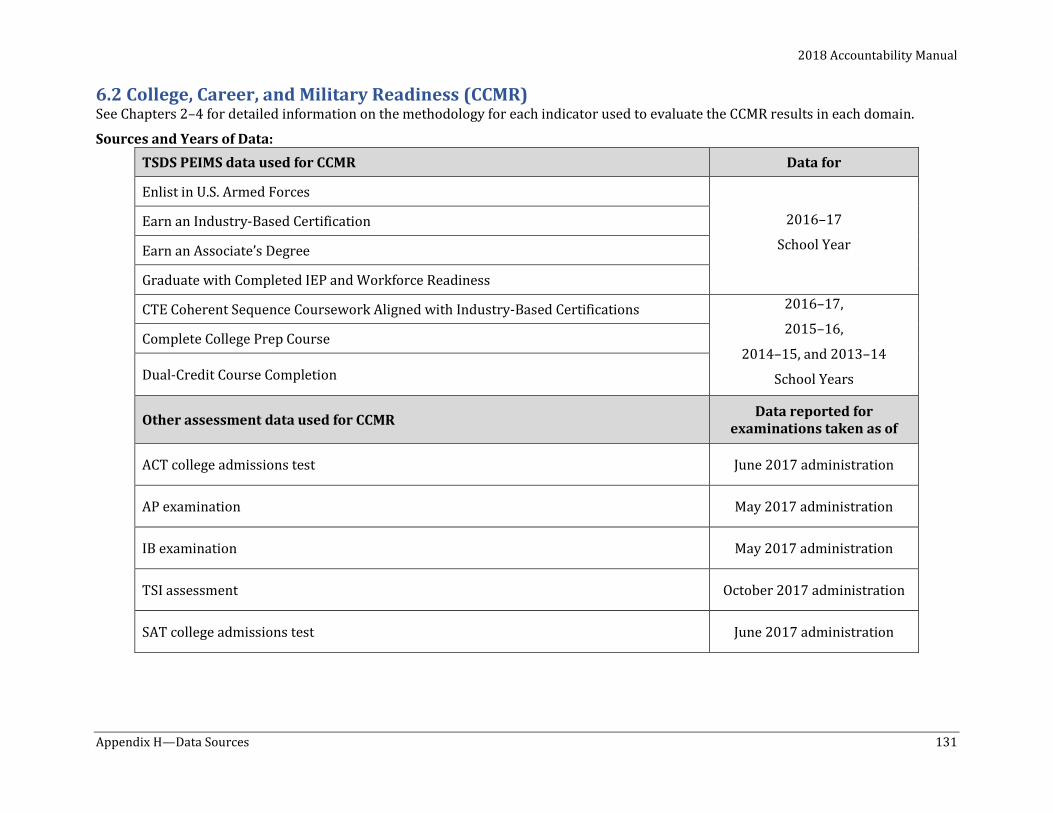
2018 Accountability Manual
Appendix H—Data Sources 131
6.2 College, Career, and Military Readiness (CCMR) See Chapters 2–4 for detailed information on the methodology for each indicator used to evaluate the CCMR results in each domain.
Sources and Years of Data: TSDS PEIMS data used for CCMR Data for
Enlist in U.S. Armed Forces
2016–17
School Year Earn an Industry-Based Certification
Earn an Associate’s Degree
Graduate with Completed IEP and Workforce Readiness
CTE Coherent Sequence Coursework Aligned with Industry-Based Certifications 2016–17,
2015–16,
2014–15, and 2013–14
School Years
Complete College Prep Course
Dual-Credit Course Completion
Other assessment data used for CCMR Data reported for examinations taken as of
ACT college admissions test June 2017 administration
AP examination May 2017 administration
IB examination May 2017 administration
TSI assessment October 2017 administration
SAT college admissions test June 2017 administration
2018 Accountability Manual
132 Appendix H—Data Sources
Student Group Information: Depending on the domain, performance results are reported for the following groups: all students, African American, American Indian, Asian, Hispanic, Pacific Islander, white, two or more races, economically disadvantaged, students formerly served by special education, students currently served by special education, current and monitored ELs, continuously enrolled, and non-continuously enrolled.
Use in 2018 Accountability: CCMR is used in determining the Student Achievement, School Progress, Part B: Relative Performance, and Closing the Gaps domain ratings for high schools, K–12s, and districts.
Other Information: The CCMR component used in the Student Achievement and School Progress, Part B domains measures graduates’ preparedness for college, the workforce, or the military. Annual graduates demonstrate college, career, or military readiness by meeting any one of the CCMR indicators. See Chapter 2 for specific criteria for each CCMR indicator.
The CTE Coherent Sequence Coursework Aligned with Industry-Based Certifications indicator awards one-half point only for students who met no other CCMR indicator. These students receive one-half point credit for coursework completed toward an industry-based certification. The list of CTE courses aligned with industry-based certifications is provided in Chapter 2. The list of 73 industry-based certifications is found in 19 TAC §74.1003, available online at http://tea.texas.gov/WorkArea/DownloadAsset.aspx?id=51539619413.
The College, Career, and Military Readiness Performance Status component evaluated in the Closing the Gaps domain differs from the CCMR component in the Student Achievement and School Progress, Part B domains. The denominator used in Closing the Gaps is annual graduates plus students in grade 12 who did not graduate. These grade 12 students are those who were in attendance during the last six weeks of school year 2016–17 as reported in TSDS PEIMS attendance records. See Chapter 4 for further information.
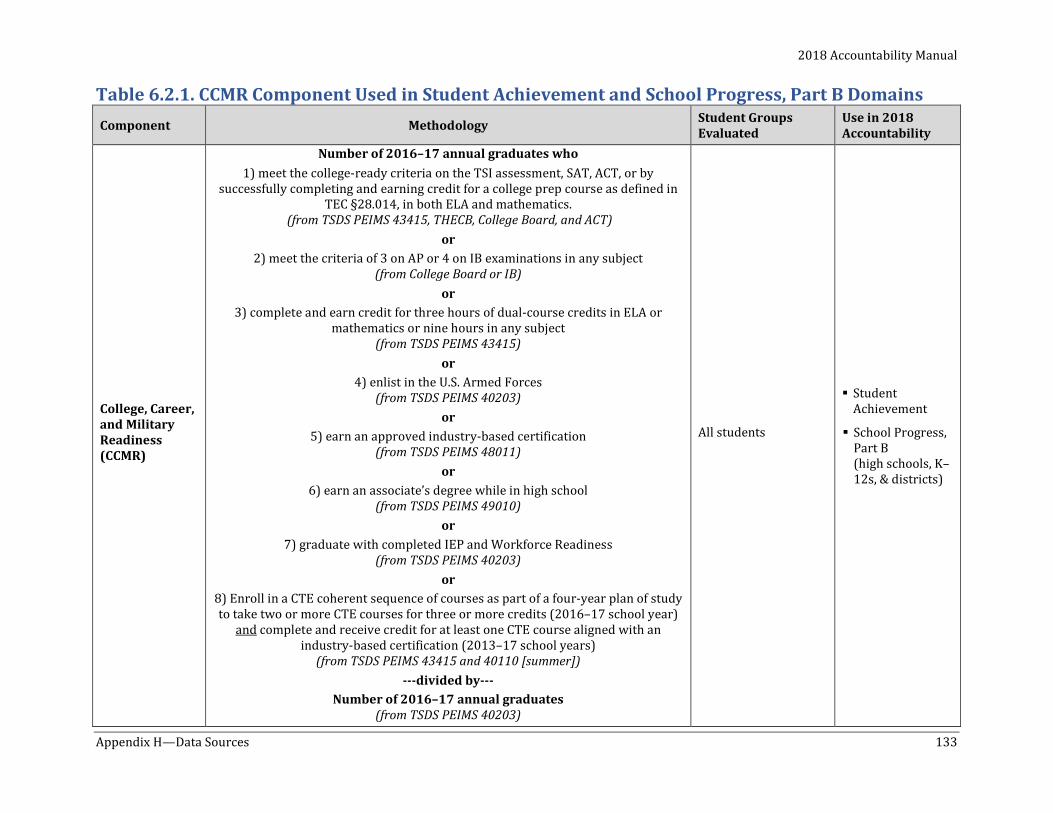
2018 Accountability Manual
Appendix H—Data Sources 133
Table 6.2.1. CCMR Component Used in Student Achievement and School Progress, Part B Domains Component Methodology Student Groups
Evaluated Use in 2018 Accountability
College, Career, and Military Readiness (CCMR)
Number of 2016–17 annual graduates who 1) meet the college-ready criteria on the TSI assessment, SAT, ACT, or by
successfully completing and earning credit for a college prep course as defined in TEC §28.014, in both ELA and mathematics.
(from TSDS PEIMS 43415, THECB, College Board, and ACT) or
2) meet the criteria of 3 on AP or 4 on IB examinations in any subject (from College Board or IB)
or 3) complete and earn credit for three hours of dual-course credits in ELA or
mathematics or nine hours in any subject (from TSDS PEIMS 43415)
or 4) enlist in the U.S. Armed Forces
(from TSDS PEIMS 40203) or
5) earn an approved industry-based certification (from TSDS PEIMS 48011)
or 6) earn an associate’s degree while in high school
(from TSDS PEIMS 49010) or
7) graduate with completed IEP and Workforce Readiness (from TSDS PEIMS 40203)
or 8) Enroll in a CTE coherent sequence of courses as part of a four-year plan of study to take two or more CTE courses for three or more credits (2016–17 school year)
and complete and receive credit for at least one CTE course aligned with an industry-based certification (2013–17 school years)
(from TSDS PEIMS 43415 and 40110 [summer]) ---divided by---
Number of 2016–17 annual graduates (from TSDS PEIMS 40203)
All students
Student Achievement
School Progress, Part B (high schools, K–12s, & districts)
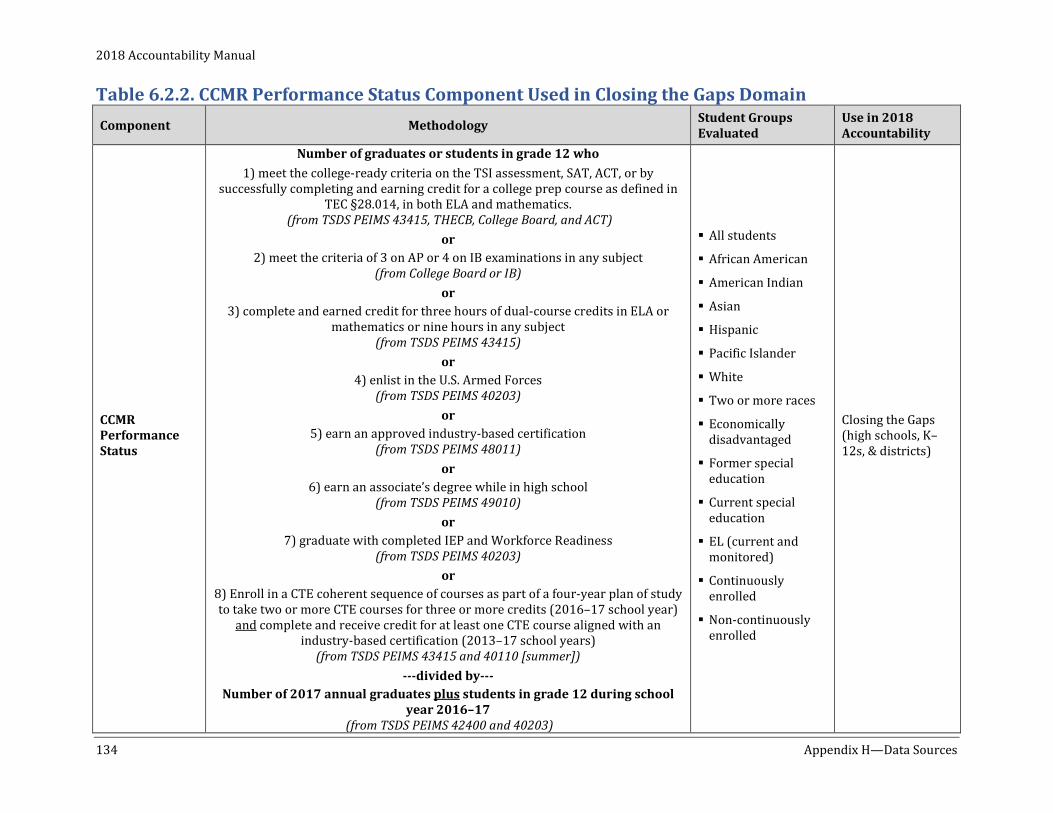
2018 Accountability Manual
134 Appendix H—Data Sources
Table 6.2.2. CCMR Performance Status Component Used in Closing the Gaps Domain Component Methodology Student Groups
Evaluated Use in 2018 Accountability
CCMR Performance Status
Number of graduates or students in grade 12 who 1) meet the college-ready criteria on the TSI assessment, SAT, ACT, or by
successfully completing and earning credit for a college prep course as defined in TEC §28.014, in both ELA and mathematics.
(from TSDS PEIMS 43415, THECB, College Board, and ACT) or
2) meet the criteria of 3 on AP or 4 on IB examinations in any subject (from College Board or IB)
or 3) complete and earned credit for three hours of dual-course credits in ELA or
mathematics or nine hours in any subject (from TSDS PEIMS 43415)
or 4) enlist in the U.S. Armed Forces
(from TSDS PEIMS 40203) or
5) earn an approved industry-based certification (from TSDS PEIMS 48011)
or 6) earn an associate’s degree while in high school
(from TSDS PEIMS 49010) or
7) graduate with completed IEP and Workforce Readiness (from TSDS PEIMS 40203)
or 8) Enroll in a CTE coherent sequence of courses as part of a four-year plan of study to take two or more CTE courses for three or more credits (2016–17 school year)
and complete and receive credit for at least one CTE course aligned with an industry-based certification (2013–17 school years)
(from TSDS PEIMS 43415 and 40110 [summer]) ---divided by---
Number of 2017 annual graduates plus students in grade 12 during school year 2016–17
(from TSDS PEIMS 42400 and 40203)
All students
African American
American Indian
Asian
Hispanic
Pacific Islander
White
Two or more races
Economically disadvantaged
Former special education
Current special education
EL (current and monitored)
Continuously enrolled
Non-continuously enrolled
Closing the Gaps (high schools, K–12s, & districts)
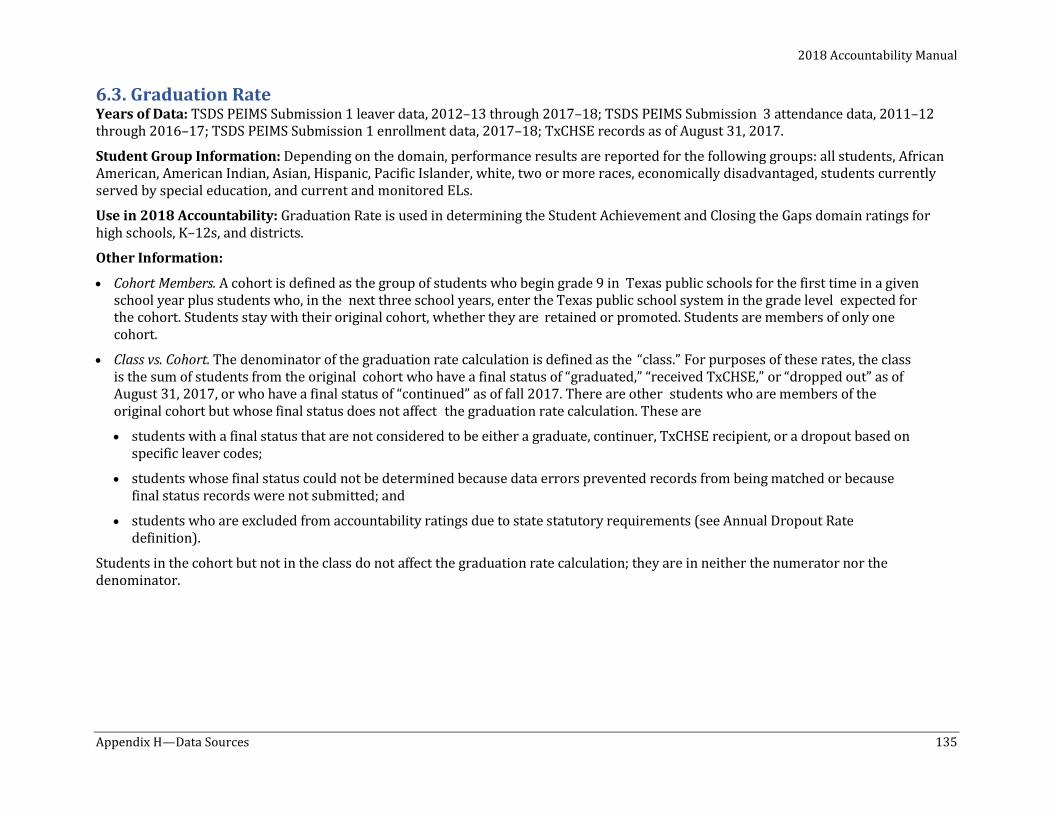
2018 Accountability Manual
Appendix H—Data Sources 135
6.3. Graduation Rate Years of Data: TSDS PEIMS Submission 1 leaver data, 2012–13 through 2017–18; TSDS PEIMS Submission 3 attendance data, 2011–12 through 2016–17; TSDS PEIMS Submission 1 enrollment data, 2017–18; TxCHSE records as of August 31, 2017.
Student Group Information: Depending on the domain, performance results are reported for the following groups: all students, African American, American Indian, Asian, Hispanic, Pacific Islander, white, two or more races, economically disadvantaged, students currently served by special education, and current and monitored ELs.
Use in 2018 Accountability: Graduation Rate is used in determining the Student Achievement and Closing the Gaps domain ratings for high schools, K–12s, and districts.
Other Information:
• Cohort Members. A cohort is defined as the group of students who begin grade 9 in Texas public schools for the first time in a given school year plus students who, in the next three school years, enter the Texas public school system in the grade level expected for the cohort. Students stay with their original cohort, whether they are retained or promoted. Students are members of only one cohort.
• Class vs. Cohort. The denominator of the graduation rate calculation is defined as the “class.” For purposes of these rates, the class is the sum of students from the original cohort who have a final status of “graduated,” “received TxCHSE,” or “dropped out” as of August 31, 2017, or who have a final status of “continued” as of fall 2017. There are other students who are members of the original cohort but whose final status does not affect the graduation rate calculation. These are
• students with a final status that are not considered to be either a graduate, continuer, TxCHSE recipient, or a dropout based on specific leaver codes;
• students whose final status could not be determined because data errors prevented records from being matched or because final status records were not submitted; and
• students who are excluded from accountability ratings due to state statutory requirements (see Annual Dropout Rate definition).
Students in the cohort but not in the class do not affect the graduation rate calculation; they are in neither the numerator nor the denominator.
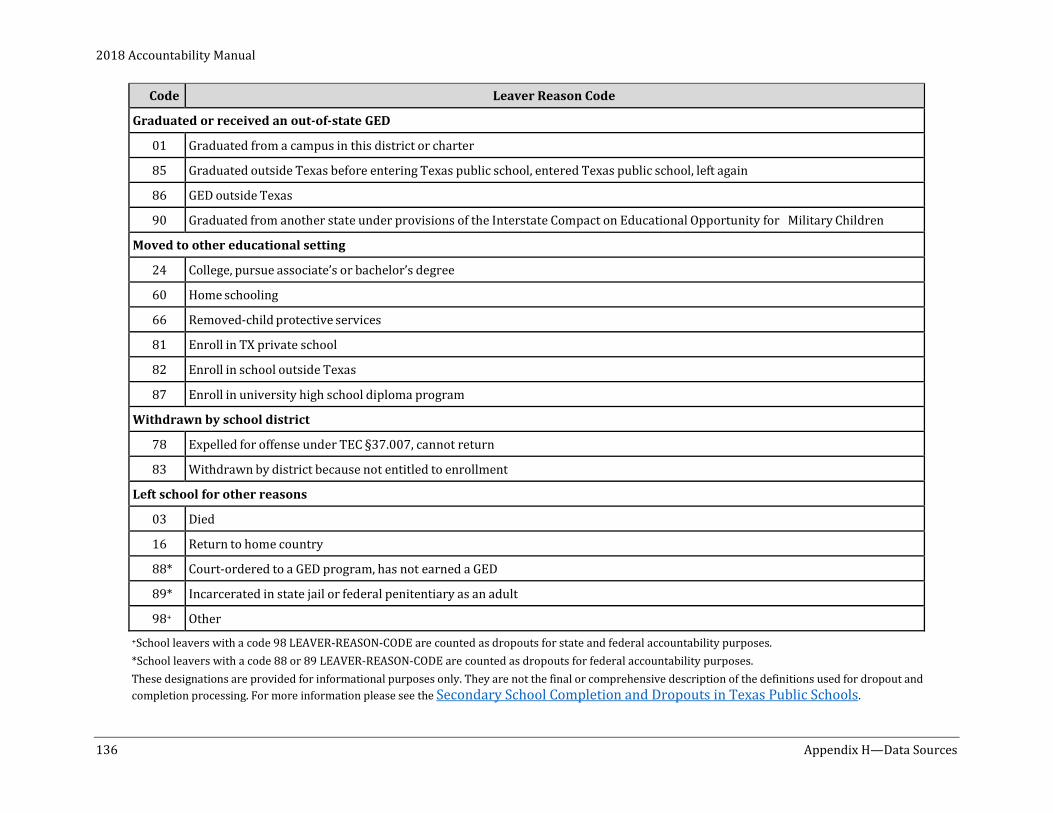
2018 Accountability Manual
136 Appendix H—Data Sources
Code Leaver Reason Code
Graduated or received an out-of-state GED
01 Graduated from a campus in this district or charter
85 Graduated outside Texas before entering Texas public school, entered Texas public school, left again
86 GED outside Texas
90 Graduated from another state under provisions of the Interstate Compact on Educational Opportunity for Military Children
Moved to other educational setting
24 College, pursue associate’s or bachelor’s degree
60 Home schooling
66 Removed-child protective services
81 Enroll in TX private school
82 Enroll in school outside Texas
87 Enroll in university high school diploma program
Withdrawn by school district
78 Expelled for offense under TEC §37.007, cannot return
83 Withdrawn by district because not entitled to enrollment
Left school for other reasons
03 Died
16 Return to home country
88* Court-ordered to a GED program, has not earned a GED
89* Incarcerated in state jail or federal penitentiary as an adult
98+ Other +School leavers with a code 98 LEAVER-REASON-CODE are counted as dropouts for state and federal accountability purposes. *School leavers with a code 88 or 89 LEAVER-REASON-CODE are counted as dropouts for federal accountability purposes. These designations are provided for informational purposes only. They are not the final or comprehensive description of the definitions used for dropout and completion processing. For more information please see the Secondary School Completion and Dropouts in Texas Public Schools.
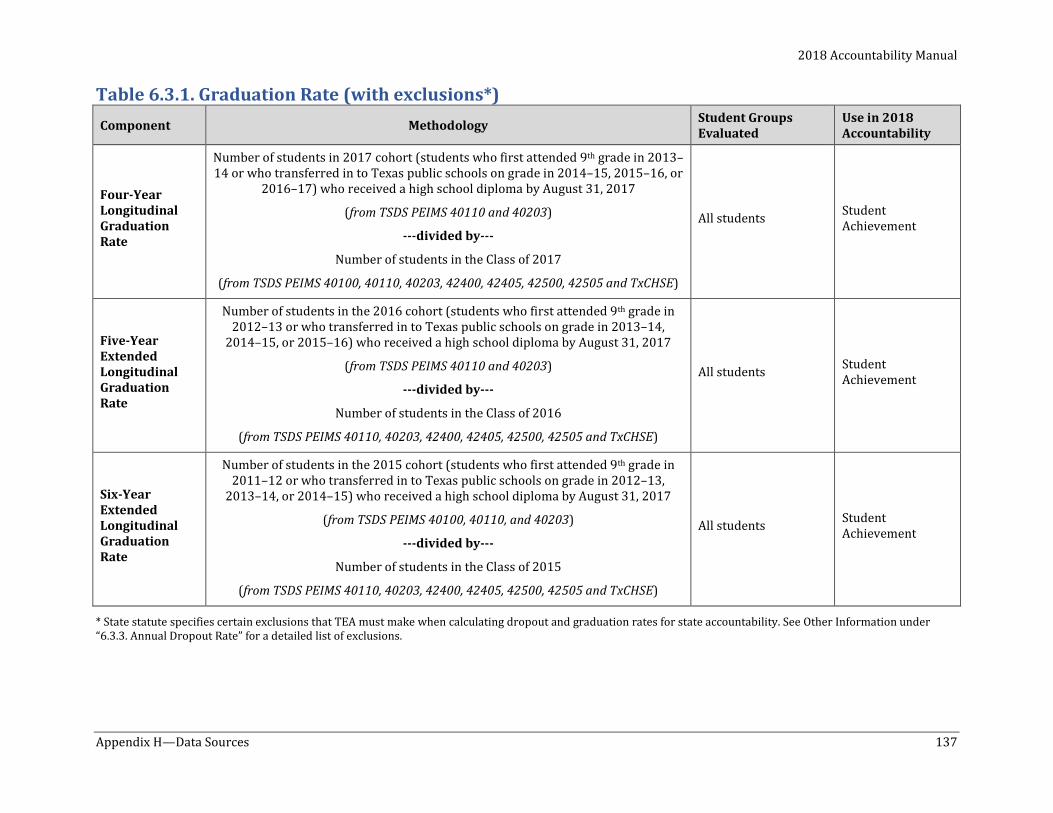
2018 Accountability Manual
Appendix H—Data Sources 137
Table 6.3.1. Graduation Rate (with exclusions*) Component Methodology Student Groups
Evaluated Use in 2018 Accountability
Four-Year Longitudinal Graduation Rate
Number of students in 2017 cohort (students who first attended 9th grade in 2013–14 or who transferred in to Texas public schools on grade in 2014–15, 2015–16, or
2016–17) who received a high school diploma by August 31, 2017
(from TSDS PEIMS 40110 and 40203)
---divided by---
Number of students in the Class of 2017
(from TSDS PEIMS 40100, 40110, 40203, 42400, 42405, 42500, 42505 and TxCHSE)
All students Student Achievement
Five-Year Extended Longitudinal Graduation Rate
Number of students in the 2016 cohort (students who first attended 9th grade in 2012–13 or who transferred in to Texas public schools on grade in 2013–14,
2014–15, or 2015–16) who received a high school diploma by August 31, 2017
(from TSDS PEIMS 40110 and 40203)
---divided by---
Number of students in the Class of 2016
(from TSDS PEIMS 40110, 40203, 42400, 42405, 42500, 42505 and TxCHSE)
All students Student Achievement
Six-Year Extended Longitudinal Graduation Rate
Number of students in the 2015 cohort (students who first attended 9th grade in 2011–12 or who transferred in to Texas public schools on grade in 2012–13,
2013–14, or 2014–15) who received a high school diploma by August 31, 2017
(from TSDS PEIMS 40100, 40110, and 40203)
---divided by---
Number of students in the Class of 2015
(from TSDS PEIMS 40110, 40203, 42400, 42405, 42500, 42505 and TxCHSE)
All students Student Achievement
* State statute specifies certain exclusions that TEA must make when calculating dropout and graduation rates for state accountability. See Other Information under “6.3.3. Annual Dropout Rate” for a detailed list of exclusions.
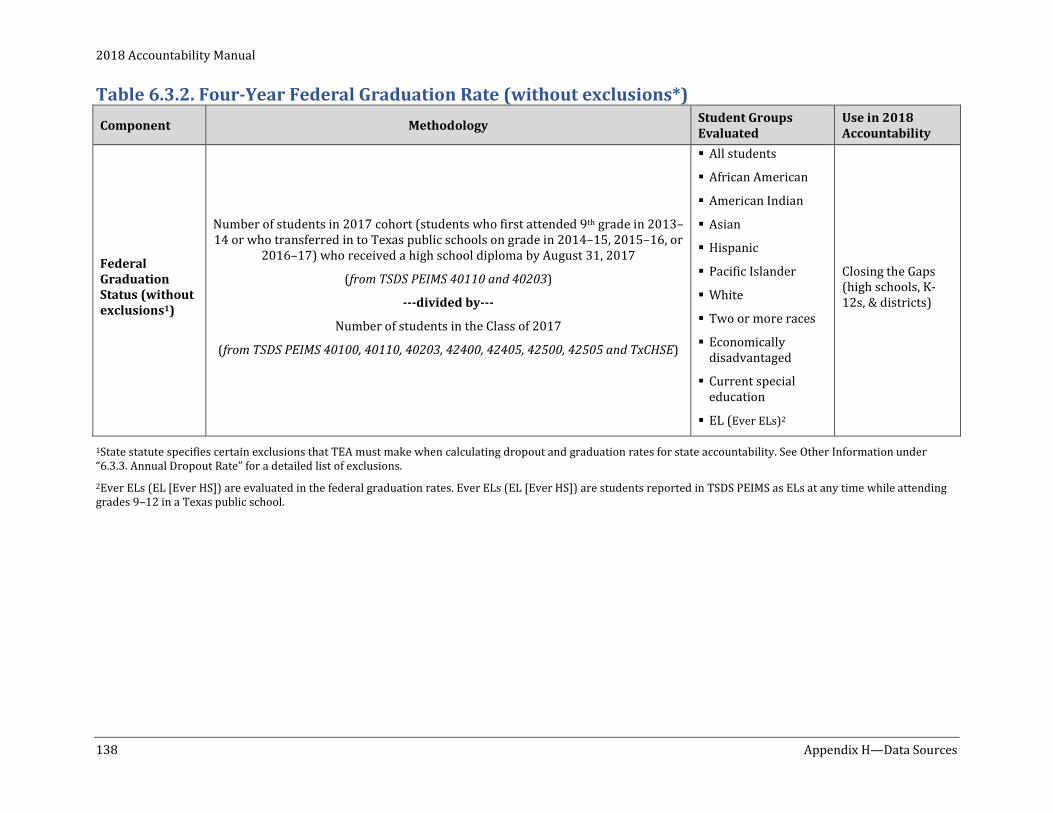
2018 Accountability Manual
138 Appendix H—Data Sources
Table 6.3.2. Four-Year Federal Graduation Rate (without exclusions*) Component Methodology Student Groups
Evaluated Use in 2018 Accountability
Federal Graduation Status (without exclusions1)
Number of students in 2017 cohort (students who first attended 9th grade in 2013–14 or who transferred in to Texas public schools on grade in 2014–15, 2015–16, or
2016–17) who received a high school diploma by August 31, 2017
(from TSDS PEIMS 40110 and 40203)
---divided by---
Number of students in the Class of 2017
(from TSDS PEIMS 40100, 40110, 40203, 42400, 42405, 42500, 42505 and TxCHSE)
All students
African American
American Indian
Asian
Hispanic
Pacific Islander
White
Two or more races
Economicallydisadvantaged
Current specialeducation
EL (Ever ELs)2
Closing the Gaps (high schools, K-12s, & districts)
1State statute specifies certain exclusions that TEA must make when calculating dropout and graduation rates for state accountability. See Other Information under “6.3.3. Annual Dropout Rate” for a detailed list of exclusions. 2Ever ELs (EL [Ever HS]) are evaluated in the federal graduation rates. Ever ELs (EL [Ever HS]) are students reported in TSDS PEIMS as ELs at any time while attending grades 9–12 in a Texas public school.
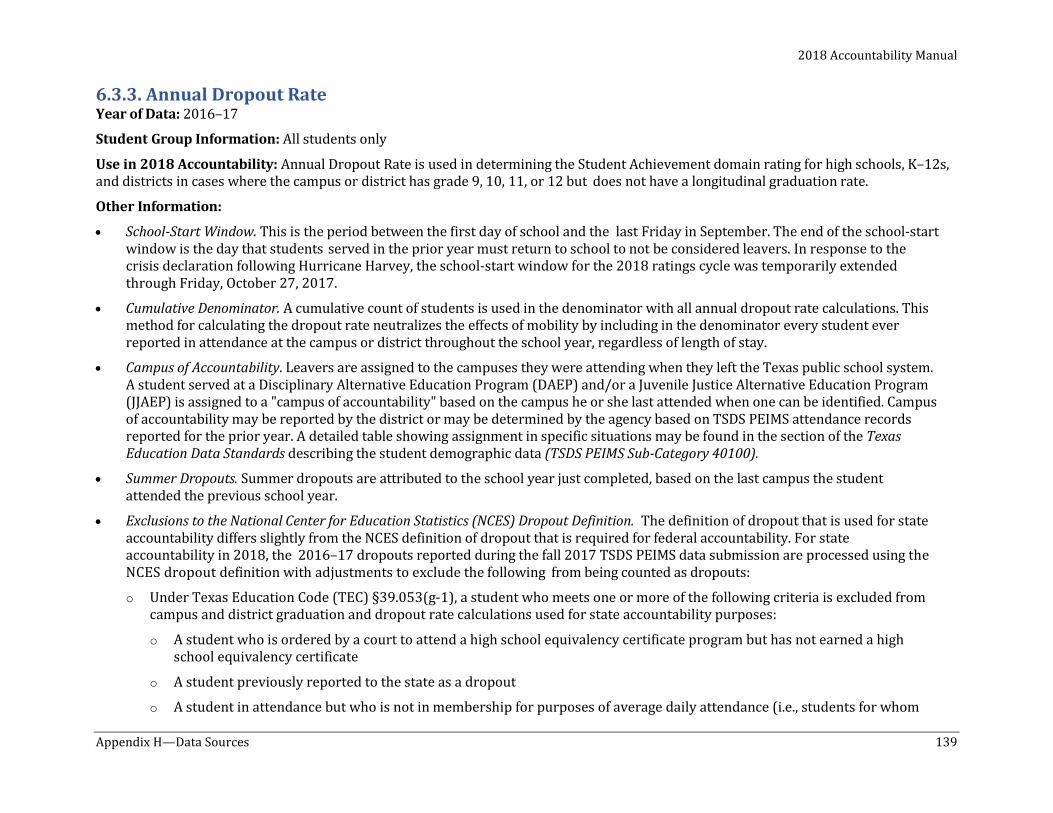
2018 Accountability Manual
Appendix H—Data Sources 139
6.3.3. Annual Dropout Rate Year of Data: 2016–17
Student Group Information: All students only
Use in 2018 Accountability: Annual Dropout Rate is used in determining the Student Achievement domain rating for high schools, K–12s, and districts in cases where the campus or district has grade 9, 10, 11, or 12 but does not have a longitudinal graduation rate.
Other Information:
• School-Start Window. This is the period between the first day of school and the last Friday in September. The end of the school-start window is the day that students served in the prior year must return to school to not be considered leavers. In response to the crisis declaration following Hurricane Harvey, the school-start window for the 2018 ratings cycle was temporarily extended through Friday, October 27, 2017.
• Cumulative Denominator. A cumulative count of students is used in the denominator with all annual dropout rate calculations. This method for calculating the dropout rate neutralizes the effects of mobility by including in the denominator every student ever reported in attendance at the campus or district throughout the school year, regardless of length of stay.
• Campus of Accountability. Leavers are assigned to the campuses they were attending when they left the Texas public school system. A student served at a Disciplinary Alternative Education Program (DAEP) and/or a Juvenile Justice Alternative Education Program (JJAEP) is assigned to a "campus of accountability" based on the campus he or she last attended when one can be identified. Campus of accountability may be reported by the district or may be determined by the agency based on TSDS PEIMS attendance records reported for the prior year. A detailed table showing assignment in specific situations may be found in the section of the Texas Education Data Standards describing the student demographic data (TSDS PEIMS Sub-Category 40100).
• Summer Dropouts. Summer dropouts are attributed to the school year just completed, based on the last campus the student attended the previous school year.
• Exclusions to the National Center for Education Statistics (NCES) Dropout Definition. The definition of dropout that is used for state accountability differs slightly from the NCES definition of dropout that is required for federal accountability. For state accountability in 2018, the 2016–17 dropouts reported during the fall 2017 TSDS PEIMS data submission are processed using the NCES dropout definition with adjustments to exclude the following from being counted as dropouts:
o Under Texas Education Code (TEC) §39.053(g-1), a student who meets one or more of the following criteria is excluded from campus and district graduation and dropout rate calculations used for state accountability purposes:
o A student who is ordered by a court to attend a high school equivalency certificate program but has not earned a high school equivalency certificate
o A student previously reported to the state as a dropout
o A student in attendance but who is not in membership for purposes of average daily attendance (i.e., students for whom
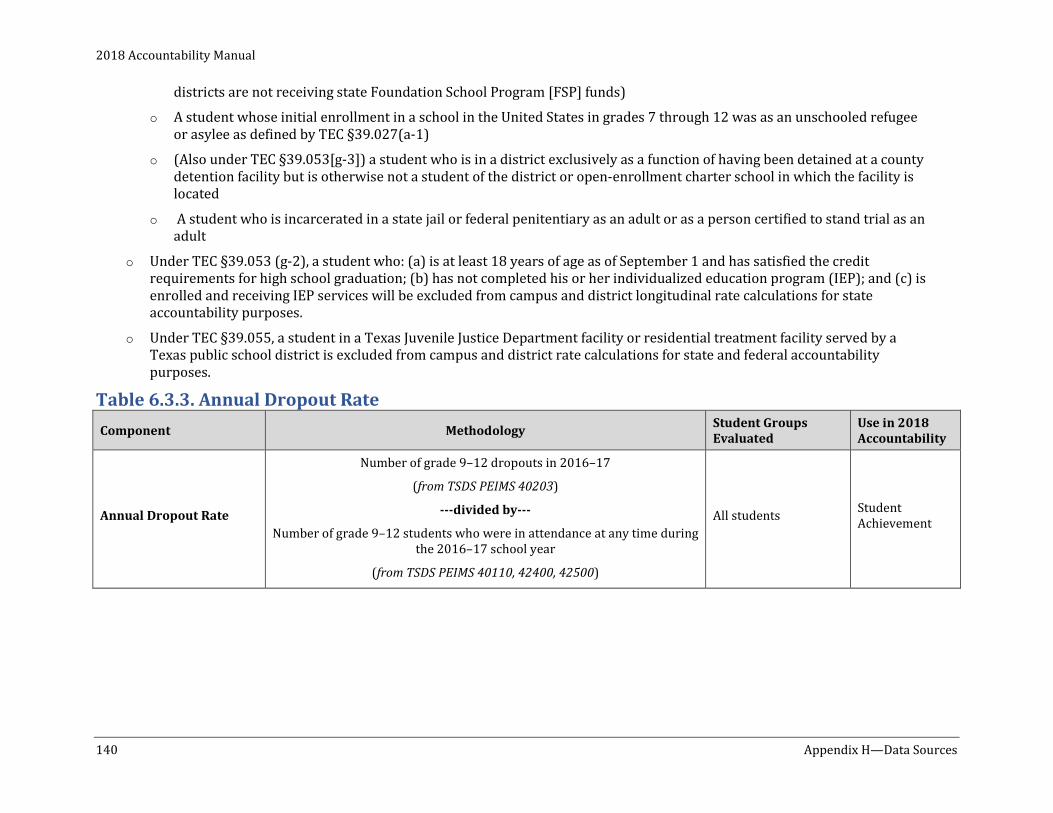
2018 Accountability Manual
140 Appendix H—Data Sources
districts are not receiving state Foundation School Program [FSP] funds)
o A student whose initial enrollment in a school in the United States in grades 7 through 12 was as an unschooled refugee or asylee as defined by TEC §39.027(a-1)
o (Also under TEC §39.053[g-3]) a student who is in a district exclusively as a function of having been detained at a county detention facility but is otherwise not a student of the district or open-enrollment charter school in which the facility is located
o A student who is incarcerated in a state jail or federal penitentiary as an adult or as a person certified to stand trial as an adult
o Under TEC §39.053 (g-2), a student who: (a) is at least 18 years of age as of September 1 and has satisfied the credit requirements for high school graduation; (b) has not completed his or her individualized education program (IEP); and (c) is enrolled and receiving IEP services will be excluded from campus and district longitudinal rate calculations for state accountability purposes.
o Under TEC §39.055, a student in a Texas Juvenile Justice Department facility or residential treatment facility served by a Texas public school district is excluded from campus and district rate calculations for state and federal accountability purposes.
Table 6.3.3. Annual Dropout Rate Component Methodology Student Groups
Evaluated Use in 2018 Accountability
Annual Dropout Rate
Number of grade 9–12 dropouts in 2016–17
(from TSDS PEIMS 40203)
---divided by---
Number of grade 9–12 students who were in attendance at any time during the 2016–17 school year
(from TSDS PEIMS 40110, 42400, 42500)
All students Student Achievement
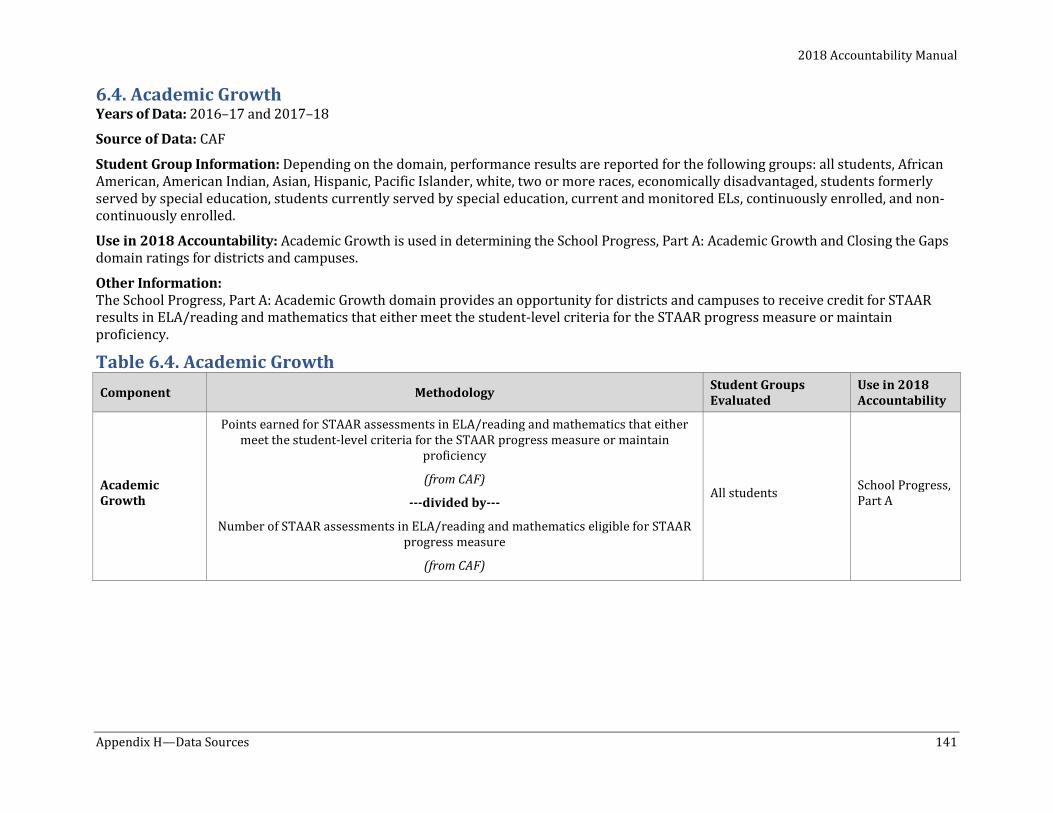
2018 Accountability Manual
Appendix H—Data Sources 141
6.4. Academic Growth Years of Data: 2016–17 and 2017–18
Source of Data: CAF
Student Group Information: Depending on the domain, performance results are reported for the following groups: all students, African American, American Indian, Asian, Hispanic, Pacific Islander, white, two or more races, economically disadvantaged, students formerly served by special education, students currently served by special education, current and monitored ELs, continuously enrolled, and non-continuously enrolled.
Use in 2018 Accountability: Academic Growth is used in determining the School Progress, Part A: Academic Growth and Closing the Gaps domain ratings for districts and campuses.
Other Information: The School Progress, Part A: Academic Growth domain provides an opportunity for districts and campuses to receive credit for STAAR results in ELA/reading and mathematics that either meet the student-level criteria for the STAAR progress measure or maintain proficiency.
Table 6.4. Academic Growth Component Methodology Student Groups
Evaluated Use in 2018 Accountability
Academic Growth
Points earned for STAAR assessments in ELA/reading and mathematics that either meet the student-level criteria for the STAAR progress measure or maintain
proficiency
(from CAF)
---divided by---
Number of STAAR assessments in ELA/reading and mathematics eligible for STAAR progress measure
(from CAF)
All students School Progress, Part A
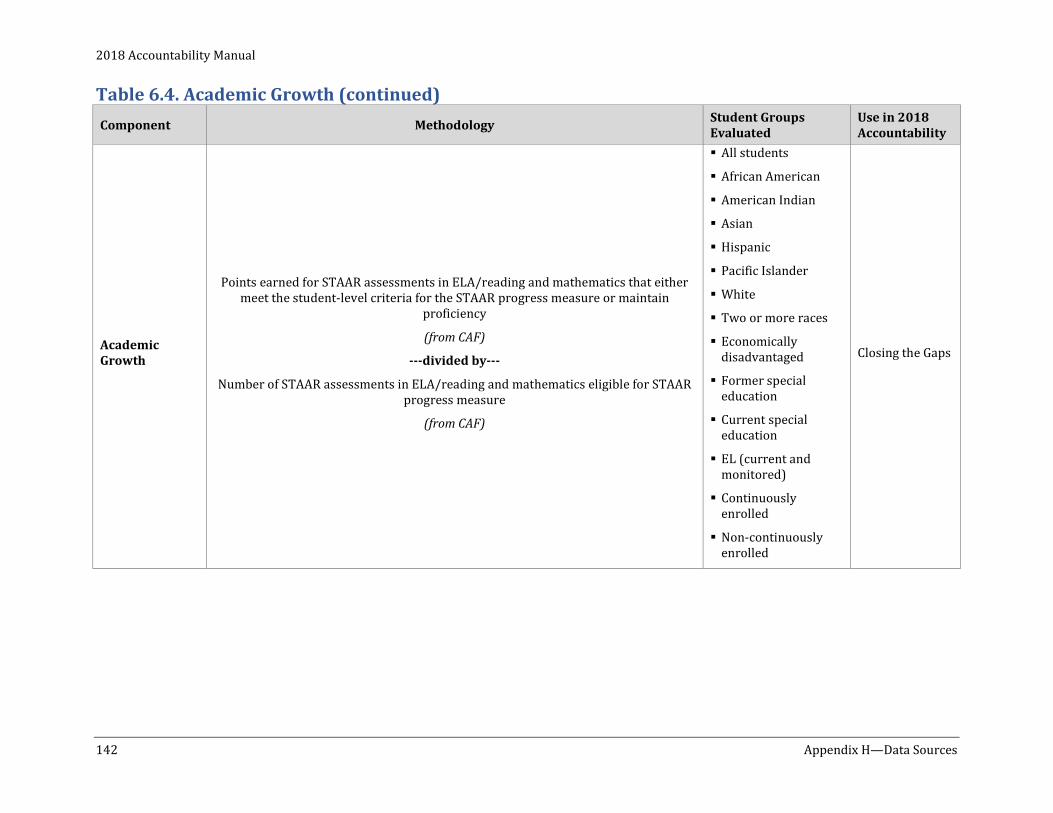
2018 Accountability Manual
142 Appendix H—Data Sources
Table 6.4. Academic Growth (continued) Component Methodology Student Groups
Evaluated Use in 2018 Accountability
Academic Growth
Points earned for STAAR assessments in ELA/reading and mathematics that either meet the student-level criteria for the STAAR progress measure or maintain
proficiency
(from CAF)
---divided by---
Number of STAAR assessments in ELA/reading and mathematics eligible for STAAR progress measure
(from CAF)
All students
African American
American Indian
Asian
Hispanic
Pacific Islander
White
Two or more races
Economically disadvantaged
Former special education
Current special education
EL (current and monitored)
Continuously enrolled
Non-continuously enrolled
Closing the Gaps
2018 Accountability Manual
Appendix H—Data Sources 143
6.5. Economically Disadvantaged Percentage Years of Data: 2017–18
Use in 2018 Accountability: The percentage of students identified as economically disadvantaged is used in determining the School Progress, Part B: Relative Performance domain rating. School Progress, Part B: Relative Performance measures the achievement of all students relative to districts or campuses with similar economically disadvantaged percentages.
Other Information: This percentage is based on the count and percentage of students eligible for free or reduced-price lunch or eligible for other public assistance as reported on the TSDS PEIMS fall snapshot. A student is reported as economically disadvantaged on the TSDS PEIMS fall snapshot using codes 01, 02, or 99:
01: Eligible For Free Meals Under The National School Lunch And Child Nutrition Program
02: Eligible For Reduced-price Meals Under The National School Lunch And Child Nutrition Program
99: Other Economic Disadvantage, Including: a) from a family with an annual income at or below the official federal poverty line, b) eligible for Temporary Assistance to Needy Families (TANF) or other public assistance, c) received a Pell Grant or comparable state program of need-based financial assistance, d) eligible for programs assisted under Title II of the Job Training Partnership Act (JTPA), or e) eligible for benefits under the Food Stamp Act of 1977
2018 Accountability Manual
144 Appendix H—Data Sources
6.6. Academic Achievement Years of Data: 2017–18
Source of Data: CAF
Student Group Information: Results are reported for the following groups: all students, African American, American Indian, Asian, Hispanic, Pacific Islander, white, two or more races, economically disadvantaged, students formerly served by special education, students currently served by special education, current and monitored ELs, continuously enrolled, and non-continuously enrolled.
Use in 2018 Accountability: Academic Achievement is used in determining the Closing the Gaps domain rating for districts and campuses.
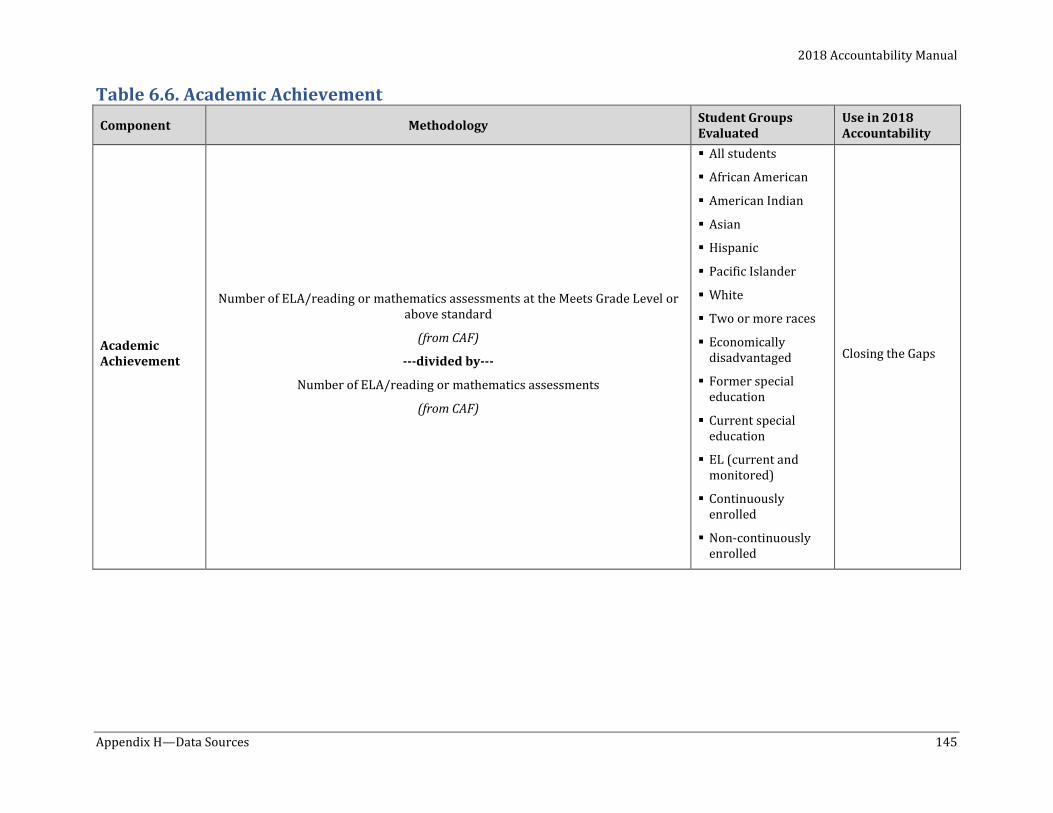
2018 Accountability Manual
Appendix H—Data Sources 145
Table 6.6. Academic Achievement Component Methodology Student Groups
Evaluated Use in 2018 Accountability
Academic Achievement
Number of ELA/reading or mathematics assessments at the Meets Grade Level or above standard
(from CAF)
---divided by---
Number of ELA/reading or mathematics assessments
(from CAF)
All students
African American
American Indian
Asian
Hispanic
Pacific Islander
White
Two or more races
Economically disadvantaged
Former special education
Current special education
EL (current and monitored)
Continuously enrolled
Non-continuously enrolled
Closing the Gaps
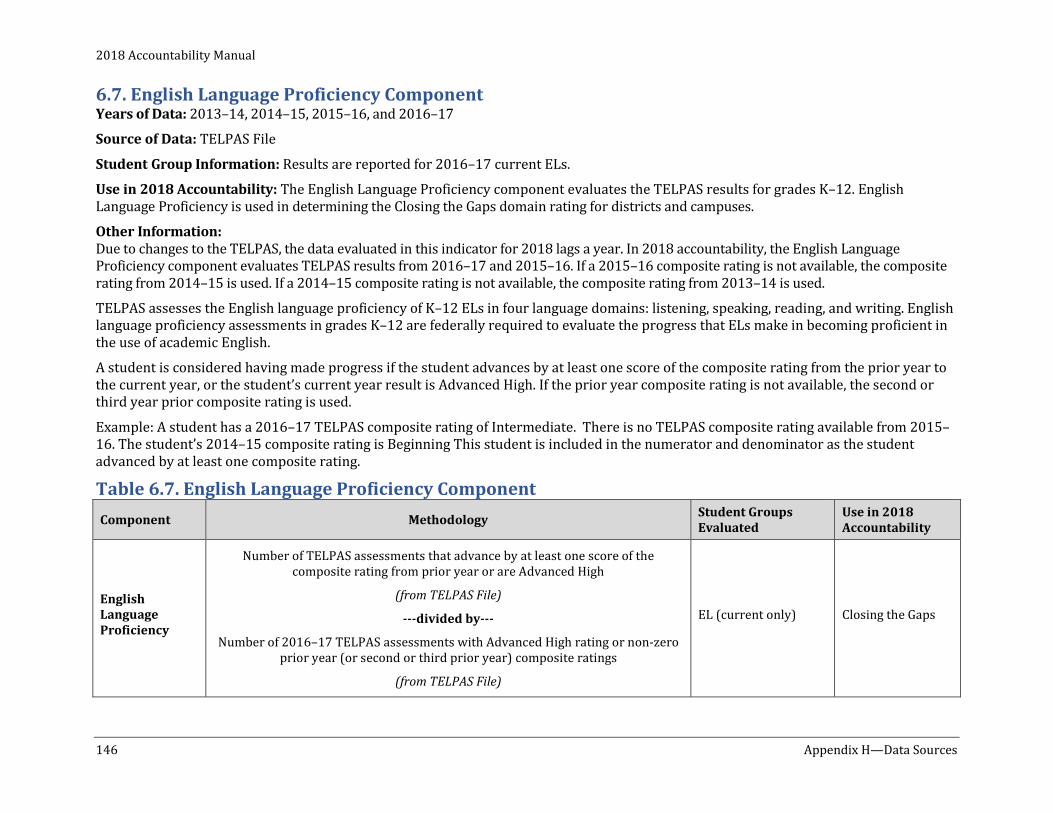
2018 Accountability Manual
146 Appendix H—Data Sources
6.7. English Language Proficiency Component Years of Data: 2013–14, 2014–15, 2015–16, and 2016–17
Source of Data: TELPAS File
Student Group Information: Results are reported for 2016–17 current ELs.
Use in 2018 Accountability: The English Language Proficiency component evaluates the TELPAS results for grades K–12. English Language Proficiency is used in determining the Closing the Gaps domain rating for districts and campuses.
Other Information: Due to changes to the TELPAS, the data evaluated in this indicator for 2018 lags a year. In 2018 accountability, the English Language Proficiency component evaluates TELPAS results from 2016–17 and 2015–16. If a 2015–16 composite rating is not available, the composite rating from 2014–15 is used. If a 2014–15 composite rating is not available, the composite rating from 2013–14 is used.
TELPAS assesses the English language proficiency of K–12 ELs in four language domains: listening, speaking, reading, and writing. English language proficiency assessments in grades K–12 are federally required to evaluate the progress that ELs make in becoming proficient in the use of academic English.
A student is considered having made progress if the student advances by at least one score of the composite rating from the prior year to the current year, or the student’s current year result is Advanced High. If the prior year composite rating is not available, the second or third year prior composite rating is used.
Example: A student has a 2016–17 TELPAS composite rating of Intermediate. There is no TELPAS composite rating available from 2015–16. The student’s 2014–15 composite rating is Beginning This student is included in the numerator and denominator as the student advanced by at least one composite rating.
Table 6.7. English Language Proficiency Component Component Methodology Student Groups
Evaluated Use in 2018 Accountability
English Language Proficiency
Number of TELPAS assessments that advance by at least one score of the composite rating from prior year or are Advanced High
(from TELPAS File)
---divided by---
Number of 2016–17 TELPAS assessments with Advanced High rating or non-zero prior year (or second or third prior year) composite ratings
(from TELPAS File)
EL (current only) Closing the Gaps
2018 Accountability Manual
Appendix H—Data Sources 147
6.8. Participation Status Years of Data: 2017–18
Student Group Information: Results are reported for the following groups: all students, African American, American Indian, Asian, Hispanic, Pacific Islander, white, two or more races, economically disadvantaged, students formerly served by special education, students currently served by special education, current and monitored ELs, continuously enrolled, and non-continuously enrolled.
Use in 2018 Accountability: Participation status is used in determining the Closing the Gaps domain rating for districts and campuses.
Other Information: The target for Participation Status is 95 percent of students taking a state-administered assessment. Participation measures are based on STAAR and TELPAS assessment results. See Chapter 4 for additional information.
• Students taking substitute assessments are included as participants.
• STAAR Alternate 2 students with No Authentic Academic Response (NAAR) designation are included as participants.
• Students with the medical exception or medically exempt designations are not included in the participation rate calculation. This includes both STAAR and STAAR Alternate 2 students.
• Should the participation status for the all students group or any student group fall below 95 percent, rounded to the nearest whole number, the denominator used for calculating the Closing the Gaps Academic Achievement component is adjusted to include the necessary number of assessments to meet the 95 percent threshold.
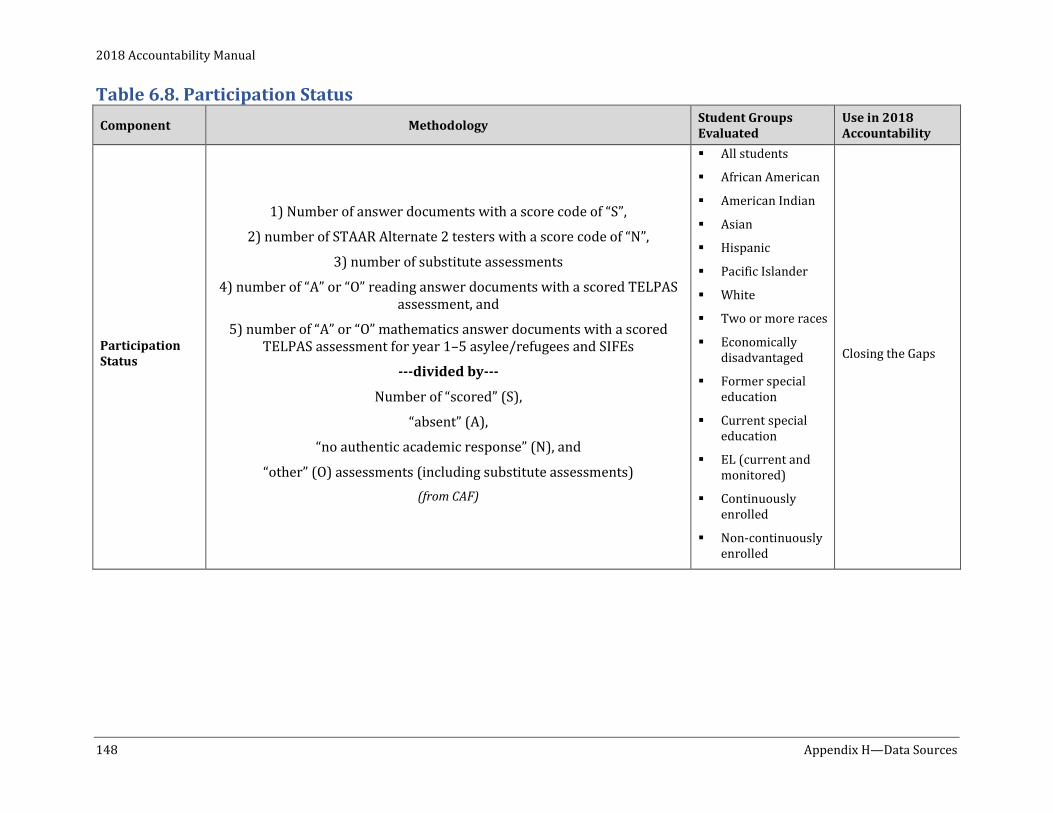
2018 Accountability Manual
148 Appendix H—Data Sources
Table 6.8. Participation Status Component Methodology Student Groups
Evaluated Use in 2018 Accountability
Participation Status
1) Number of answer documents with a score code of “S”,
2) number of STAAR Alternate 2 testers with a score code of “N”,
3) number of substitute assessments
4) number of “A” or “O” reading answer documents with a scored TELPAS assessment, and
5) number of “A” or “O” mathematics answer documents with a scored TELPAS assessment for year 1–5 asylee/refugees and SIFEs
---divided by---
Number of “scored” (S),
“absent” (A),
“no authentic academic response” (N), and
“other” (O) assessments (including substitute assessments) (from CAF)
All students
African American
American Indian
Asian
Hispanic
Pacific Islander
White
Two or more races
Economically disadvantaged
Former special education
Current special education
EL (current and monitored)
Continuously enrolled
Non-continuously enrolled
Closing the Gaps
2018 Accountability Manual
Appendix H—Data Sources 149
7. Data used in Distinction Designations Campuses that receive an accountability rating of Met Standard are eligible to earn distinction designations. Distinction designations are awarded for achievement in several areas and are based on performance relative to a group of campuses of similar type, size, grade span, and student demographics. The distinction designation indicators are typically separate from those used to assign accountability ratings. Districts that receive a rating of A, B, C, or D are eligible for a distinction designation in postsecondary readiness.
See “Chapter 6—Distinction Designations” for detailed information on the methodology used to evaluate each distinction designation.
2018 Accountability Manual
150 Appendix H—Data Sources
7.1. STAAR Data Used in Distinction Designations Year of Data: 2017–18
Source of Data: CAF
Student Group Information: All students only
Other Information: • Student Progress Measures. The STAAR progress measure results are used in the Academic Achievement in English Language
Arts/Reading, Academic Achievement in Mathematics, Top 25 Percent: Comparative Academic Growth, and Top 25 Percent: Comparative Closing the Gaps distinction designation calculations. Detailed information about the STAAR progress measure is available online at https://tea.texas.gov/student.assessment/progressmeasure/.
• Substitute Assessments. Students may substitute certain tests for corresponding end-of-course (EOC) assessments to meet graduation requirements. To receive credit for performance on a substitute assessment, districts must indicate on the STAAR answer document that they have received official results for an approved substitute assessment and verified the student's score to determine whether the student met the performance standard to qualify for a public high school diploma in Texas. The required equivalency standards for the eligible substitute assessment are available in the Texas Administrative Code online at https://www.sos.texas.gov/texreg/archive/July212017/Adopted Rules/19.EDUCATION.html. Students who achieve the equivalency standard on a substitute assessment are included at the Meets Grade Level standard. No substitute assessments are included in the student growth indicators.
• TAKS, TAAS, TEAMS, TABS Exclusions. STAAR results for students retaking EOC exams to meet graduation requirements who originally tested under TAKS, TAAS, TEAMS, and/or TABS are excluded from distinction designation calculations.
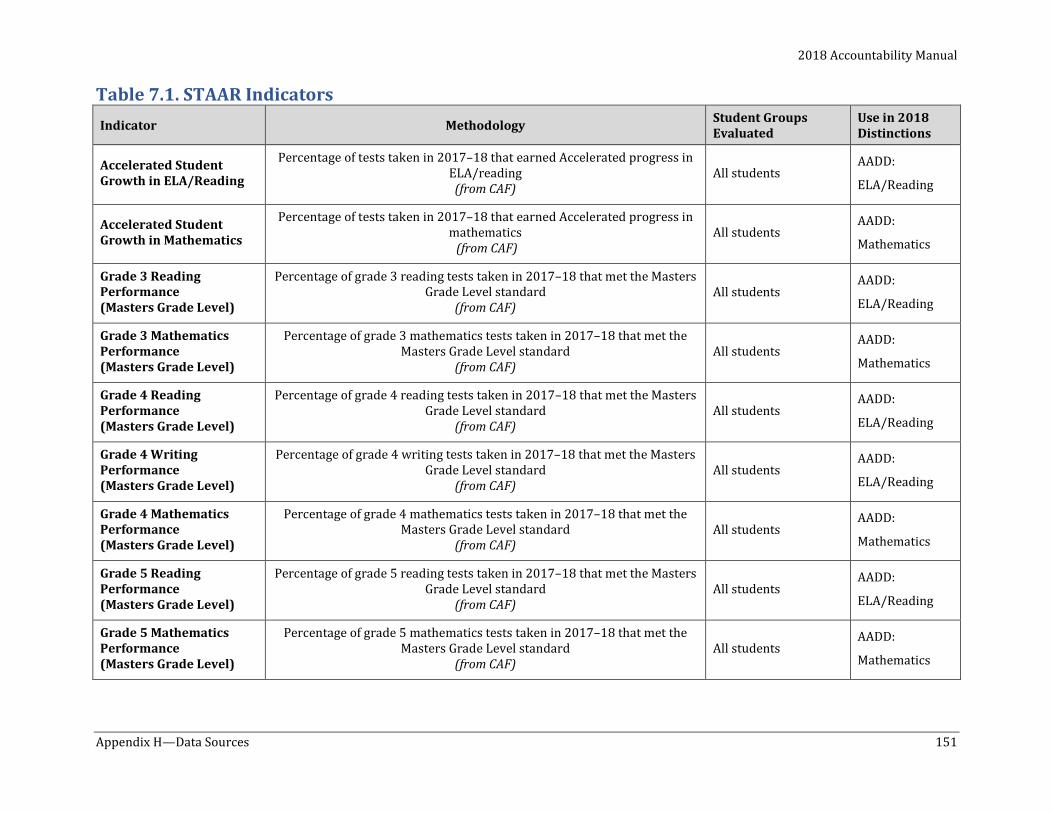
2018 Accountability Manual
Appendix H—Data Sources 151
Table 7.1. STAAR Indicators Indicator Methodology Student Groups
Evaluated Use in 2018 Distinctions
Accelerated Student Growth in ELA/Reading
Percentage of tests taken in 2017–18 that earned Accelerated progress in ELA/reading (from CAF)
All students AADD:
ELA/Reading
Accelerated Student Growth in Mathematics
Percentage of tests taken in 2017–18 that earned Accelerated progress in mathematics (from CAF)
All students AADD:
Mathematics
Grade 3 Reading Performance (Masters Grade Level)
Percentage of grade 3 reading tests taken in 2017–18 that met the Masters Grade Level standard
(from CAF) All students
AADD:
ELA/Reading
Grade 3 Mathematics Performance (Masters Grade Level)
Percentage of grade 3 mathematics tests taken in 2017–18 that met the Masters Grade Level standard
(from CAF) All students
AADD:
Mathematics
Grade 4 Reading Performance (Masters Grade Level)
Percentage of grade 4 reading tests taken in 2017–18 that met the Masters Grade Level standard
(from CAF) All students
AADD:
ELA/Reading
Grade 4 Writing Performance (Masters Grade Level)
Percentage of grade 4 writing tests taken in 2017–18 that met the Masters Grade Level standard
(from CAF) All students
AADD:
ELA/Reading
Grade 4 Mathematics Performance (Masters Grade Level)
Percentage of grade 4 mathematics tests taken in 2017–18 that met the Masters Grade Level standard
(from CAF) All students
AADD:
Mathematics
Grade 5 Reading Performance (Masters Grade Level)
Percentage of grade 5 reading tests taken in 2017–18 that met the Masters Grade Level standard
(from CAF) All students
AADD:
ELA/Reading
Grade 5 Mathematics Performance (Masters Grade Level)
Percentage of grade 5 mathematics tests taken in 2017–18 that met the Masters Grade Level standard
(from CAF) All students
AADD:
Mathematics
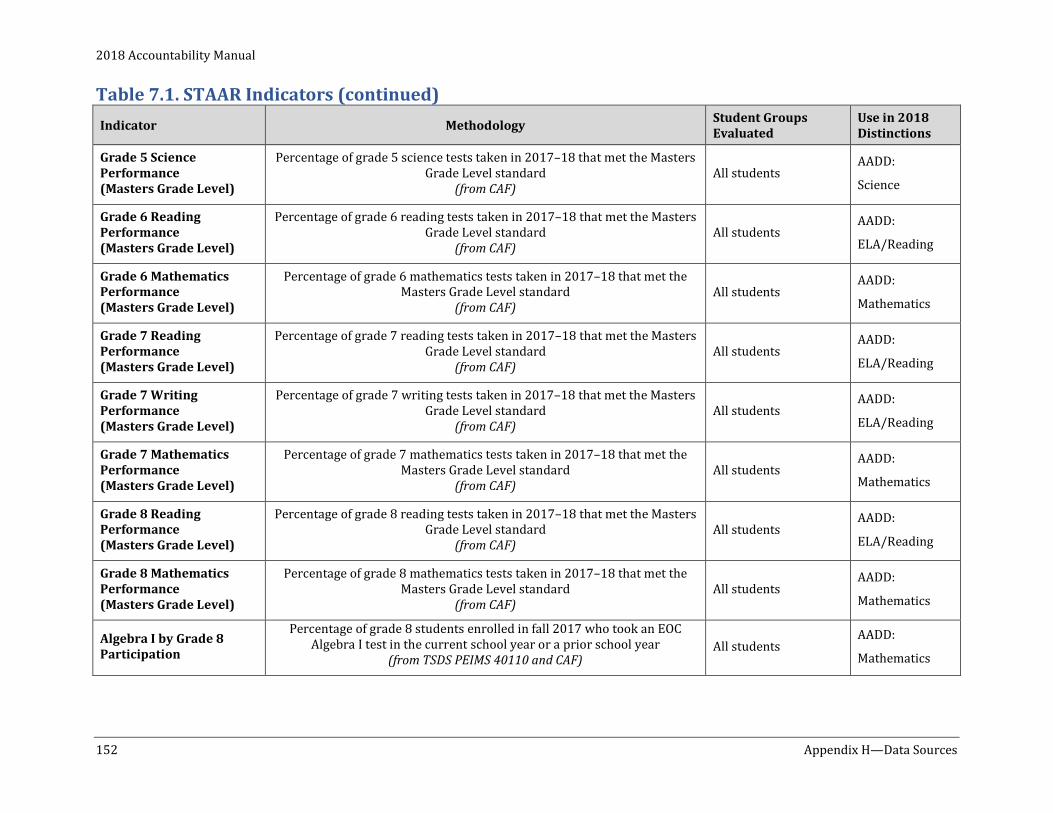
2018 Accountability Manual
152 Appendix H—Data Sources
Table 7.1. STAAR Indicators (continued) Indicator Methodology Student Groups
Evaluated Use in 2018 Distinctions
Grade 5 Science Performance (Masters Grade Level)
Percentage of grade 5 science tests taken in 2017–18 that met the Masters Grade Level standard
(from CAF) All students
AADD:
Science
Grade 6 Reading Performance (Masters Grade Level)
Percentage of grade 6 reading tests taken in 2017–18 that met the Masters Grade Level standard
(from CAF) All students
AADD:
ELA/Reading
Grade 6 Mathematics Performance (Masters Grade Level)
Percentage of grade 6 mathematics tests taken in 2017–18 that met the Masters Grade Level standard
(from CAF) All students
AADD:
Mathematics
Grade 7 Reading Performance (Masters Grade Level)
Percentage of grade 7 reading tests taken in 2017–18 that met the Masters Grade Level standard
(from CAF) All students
AADD:
ELA/Reading
Grade 7 Writing Performance (Masters Grade Level)
Percentage of grade 7 writing tests taken in 2017–18 that met the Masters Grade Level standard
(from CAF) All students
AADD:
ELA/Reading
Grade 7 Mathematics Performance (Masters Grade Level)
Percentage of grade 7 mathematics tests taken in 2017–18 that met the Masters Grade Level standard
(from CAF) All students
AADD:
Mathematics
Grade 8 Reading Performance (Masters Grade Level)
Percentage of grade 8 reading tests taken in 2017–18 that met the Masters Grade Level standard
(from CAF) All students
AADD:
ELA/Reading
Grade 8 Mathematics Performance (Masters Grade Level)
Percentage of grade 8 mathematics tests taken in 2017–18 that met the Masters Grade Level standard
(from CAF) All students
AADD:
Mathematics
Algebra I by Grade 8 Participation
Percentage of grade 8 students enrolled in fall 2017 who took an EOC Algebra I test in the current school year or a prior school year
(from TSDS PEIMS 40110 and CAF) All students
AADD:
Mathematics
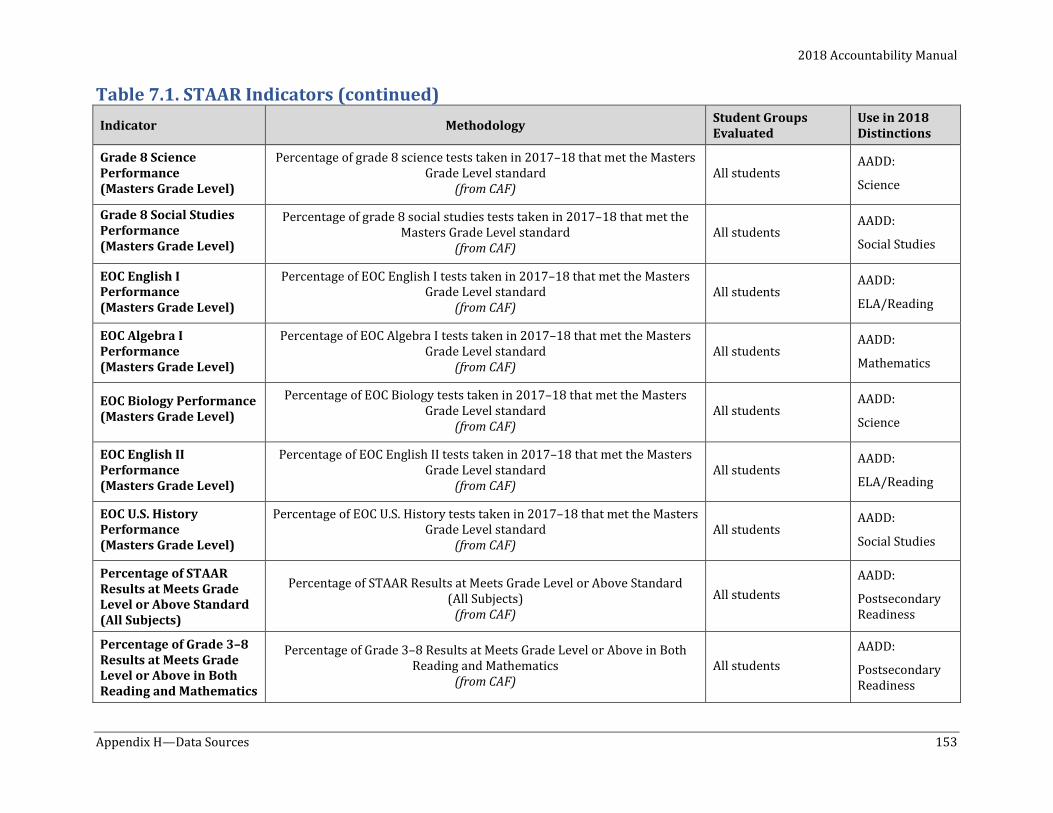
2018 Accountability Manual
Appendix H—Data Sources 153
Table 7.1. STAAR Indicators (continued) Indicator Methodology Student Groups
Evaluated Use in 2018 Distinctions
Grade 8 Science Performance (Masters Grade Level)
Percentage of grade 8 science tests taken in 2017–18 that met the Masters Grade Level standard
(from CAF) All students
AADD:
Science
Grade 8 Social Studies Performance (Masters Grade Level)
Percentage of grade 8 social studies tests taken in 2017–18 that met the Masters Grade Level standard
(from CAF) All students
AADD:
Social Studies
EOC English I Performance (Masters Grade Level)
Percentage of EOC English I tests taken in 2017–18 that met the Masters Grade Level standard
(from CAF) All students
AADD:
ELA/Reading
EOC Algebra I Performance (Masters Grade Level)
Percentage of EOC Algebra I tests taken in 2017–18 that met the Masters Grade Level standard
(from CAF) All students
AADD:
Mathematics
EOC Biology Performance (Masters Grade Level)
Percentage of EOC Biology tests taken in 2017–18 that met the Masters Grade Level standard
(from CAF) All students
AADD:
Science
EOC English II Performance (Masters Grade Level)
Percentage of EOC English II tests taken in 2017–18 that met the Masters Grade Level standard
(from CAF) All students
AADD:
ELA/Reading
EOC U.S. History Performance (Masters Grade Level)
Percentage of EOC U.S. History tests taken in 2017–18 that met the Masters Grade Level standard
(from CAF) All students
AADD:
Social Studies
Percentage of STAAR Results at Meets Grade Level or Above Standard (All Subjects)
Percentage of STAAR Results at Meets Grade Level or Above Standard (All Subjects)
(from CAF) All students
AADD:
Postsecondary Readiness
Percentage of Grade 3–8 Results at Meets Grade Level or Above in Both Reading and Mathematics
Percentage of Grade 3–8 Results at Meets Grade Level or Above in Both Reading and Mathematics
(from CAF) All students
AADD:
Postsecondary Readiness
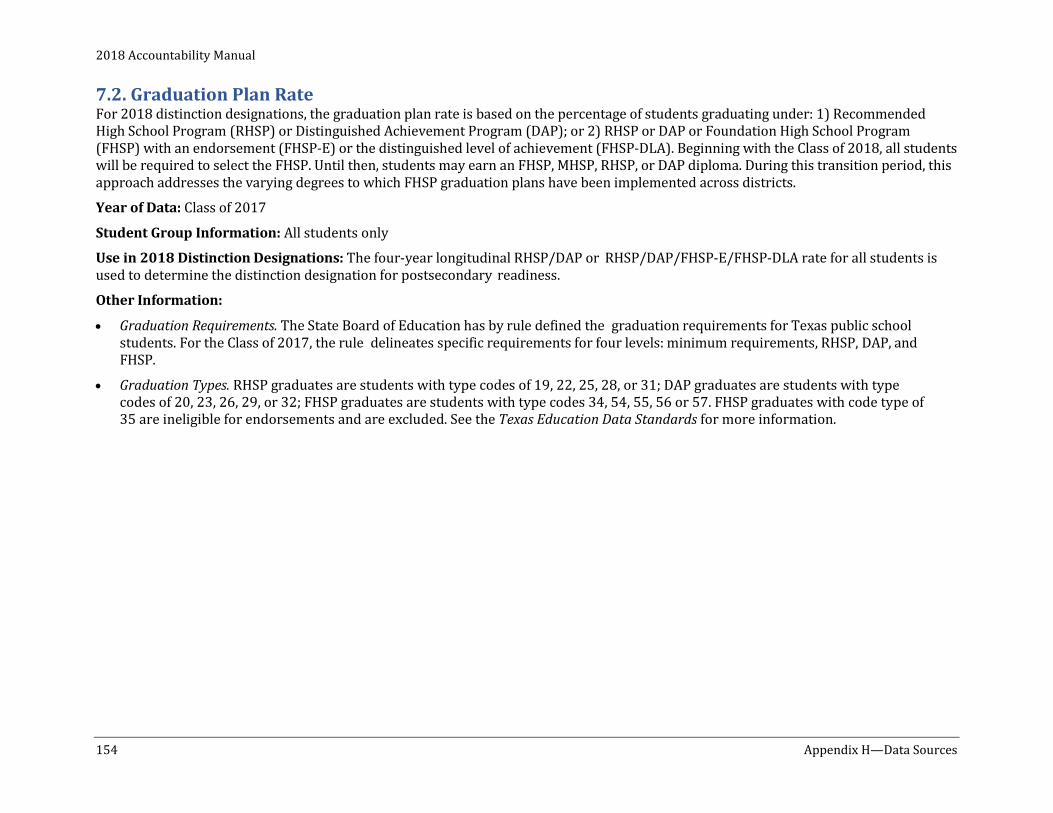
2018 Accountability Manual
154 Appendix H—Data Sources
7.2. Graduation Plan Rate For 2018 distinction designations, the graduation plan rate is based on the percentage of students graduating under: 1) Recommended High School Program (RHSP) or Distinguished Achievement Program (DAP); or 2) RHSP or DAP or Foundation High School Program (FHSP) with an endorsement (FHSP-E) or the distinguished level of achievement (FHSP-DLA). Beginning with the Class of 2018, all students will be required to select the FHSP. Until then, students may earn an FHSP, MHSP, RHSP, or DAP diploma. During this transition period, this approach addresses the varying degrees to which FHSP graduation plans have been implemented across districts.
Year of Data: Class of 2017
Student Group Information: All students only
Use in 2018 Distinction Designations: The four-year longitudinal RHSP/DAP or RHSP/DAP/FHSP-E/FHSP-DLA rate for all students is used to determine the distinction designation for postsecondary readiness.
Other Information:
• Graduation Requirements. The State Board of Education has by rule defined the graduation requirements for Texas public school students. For the Class of 2017, the rule delineates specific requirements for four levels: minimum requirements, RHSP, DAP, and FHSP.
• Graduation Types. RHSP graduates are students with type codes of 19, 22, 25, 28, or 31; DAP graduates are students with type codes of 20, 23, 26, 29, or 32; FHSP graduates are students with type codes 34, 54, 55, 56 or 57. FHSP graduates with code type of 35 are ineligible for endorsements and are excluded. See the Texas Education Data Standards for more information.
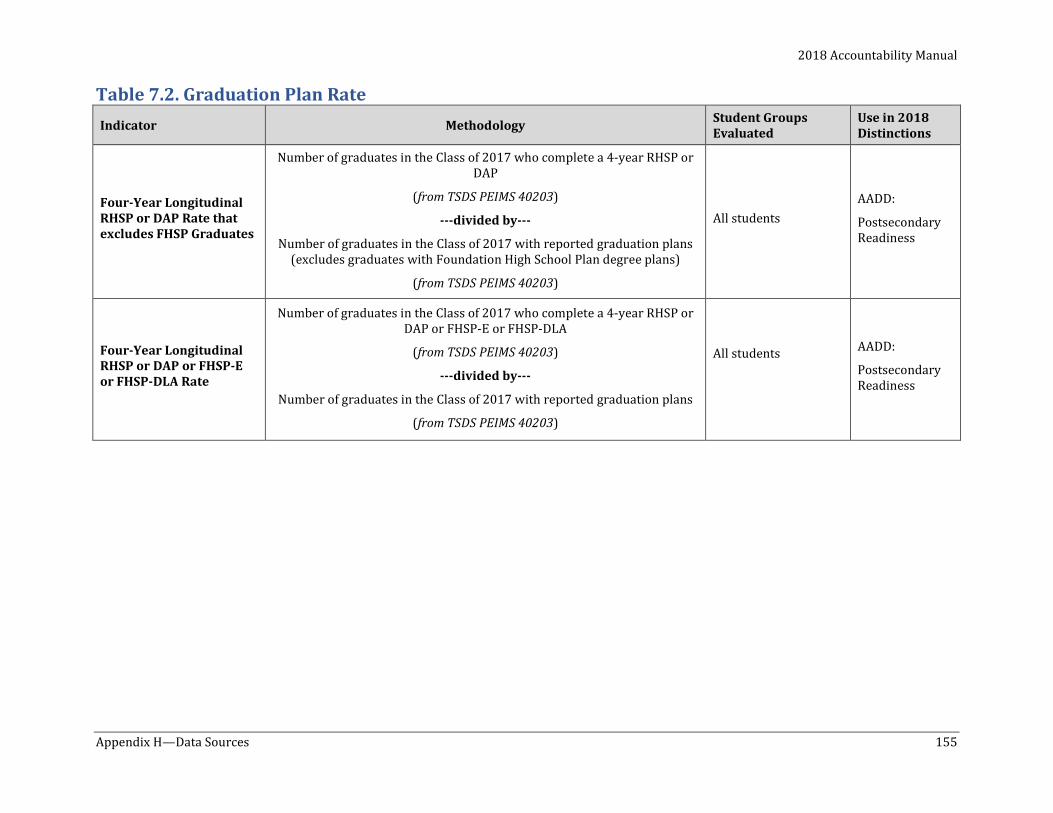
2018 Accountability Manual
Appendix H—Data Sources 155
Table 7.2. Graduation Plan Rate Indicator Methodology Student Groups
Evaluated Use in 2018 Distinctions
Four-Year Longitudinal RHSP or DAP Rate that excludes FHSP Graduates
Number of graduates in the Class of 2017 who complete a 4-year RHSP or DAP
(from TSDS PEIMS 40203)
---divided by---
Number of graduates in the Class of 2017 with reported graduation plans (excludes graduates with Foundation High School Plan degree plans)
(from TSDS PEIMS 40203)
All students AADD:
Postsecondary Readiness
Four-Year Longitudinal RHSP or DAP or FHSP-E or FHSP-DLA Rate
Number of graduates in the Class of 2017 who complete a 4-year RHSP or DAP or FHSP-E or FHSP-DLA
(from TSDS PEIMS 40203)
---divided by---
Number of graduates in the Class of 2017 with reported graduation plans
(from TSDS PEIMS 40203)
All students
AADD:
Postsecondary Readiness
2018 Accountability Manual
156 Appendix H—Data Sources
7.3. Texas Success Initiative (TSI) Criteria Graduates Year of Data: 2016–17
Student Group Information: All students only
Other Information:
• TSIA. This measure includes the performance for the Class of 2017. The results include TSI assessments through October 2017.
• SAT and ACT. This measure includes the performance for the Class of 2017. If a student takes an ACT or SAT test more than once, the performance used is for the most recent examination taken.
• College Prep Course. This measure includes performance for the Class of 2017. Graduates must have completed and received credit for a college prep course, as defined in TEC §28.014, in ELA and/or mathematics.
• Matching ID. Students are included only once. The numerator consists of students matched across the multiple assessments using their unique IDs.
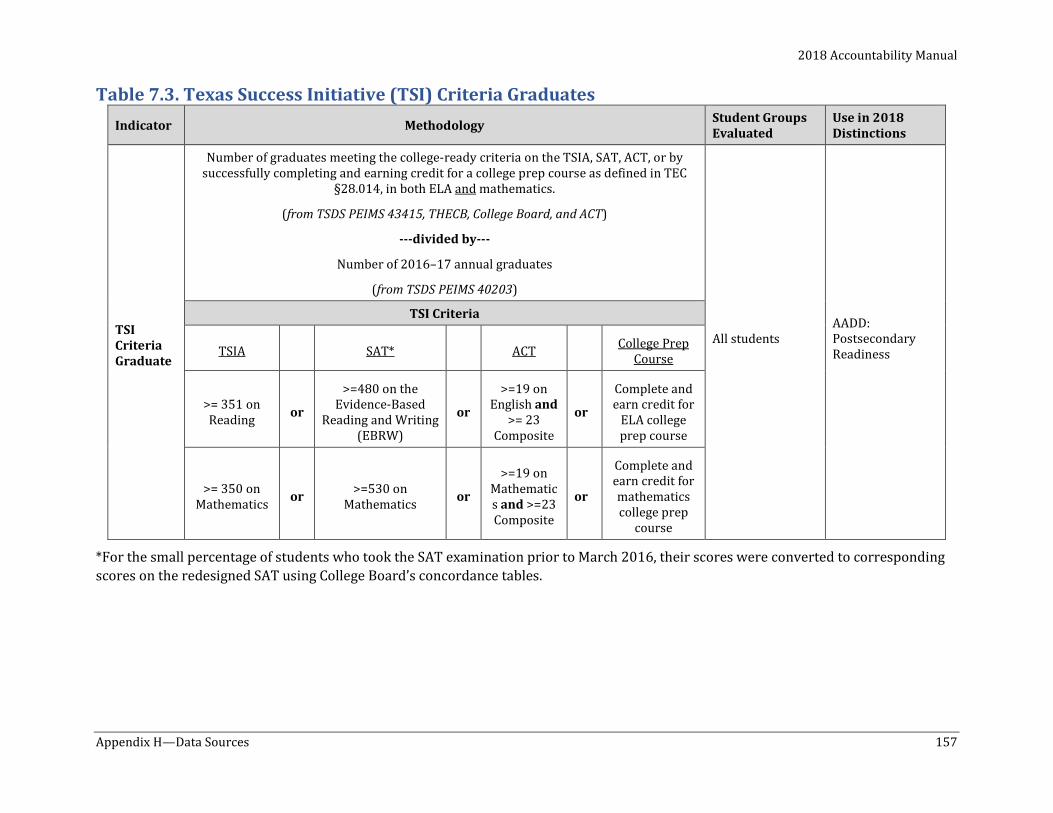
2018 Accountability Manual
Appendix H—Data Sources 157
Table 7.3. Texas Success Initiative (TSI) Criteria Graduates Indicator Methodology Student Groups
Evaluated Use in 2018 Distinctions
TSI Criteria Graduate
Number of graduates meeting the college-ready criteria on the TSIA, SAT, ACT, or by successfully completing and earning credit for a college prep course as defined in TEC
§28.014, in both ELA and mathematics.
(from TSDS PEIMS 43415, THECB, College Board, and ACT)
---divided by---
Number of 2016–17 annual graduates
(from TSDS PEIMS 40203)
All students AADD: Postsecondary Readiness
TSI Criteria
TSIA SAT* ACT College Prep Course
>= 351 on Reading or
>=480 on the Evidence-Based
Reading and Writing (EBRW)
or
>=19 on English and
>= 23 Composite
or
Complete and earn credit for
ELA college prep course
>= 350 on Mathematics or >=530 on
Mathematics or
>=19 on Mathematics and >=23 Composite
or
Complete and earn credit for mathematics college prep
course
*For the small percentage of students who took the SAT examination prior to March 2016, their scores were converted to corresponding scores on the redesigned SAT using College Board’s concordance tables.
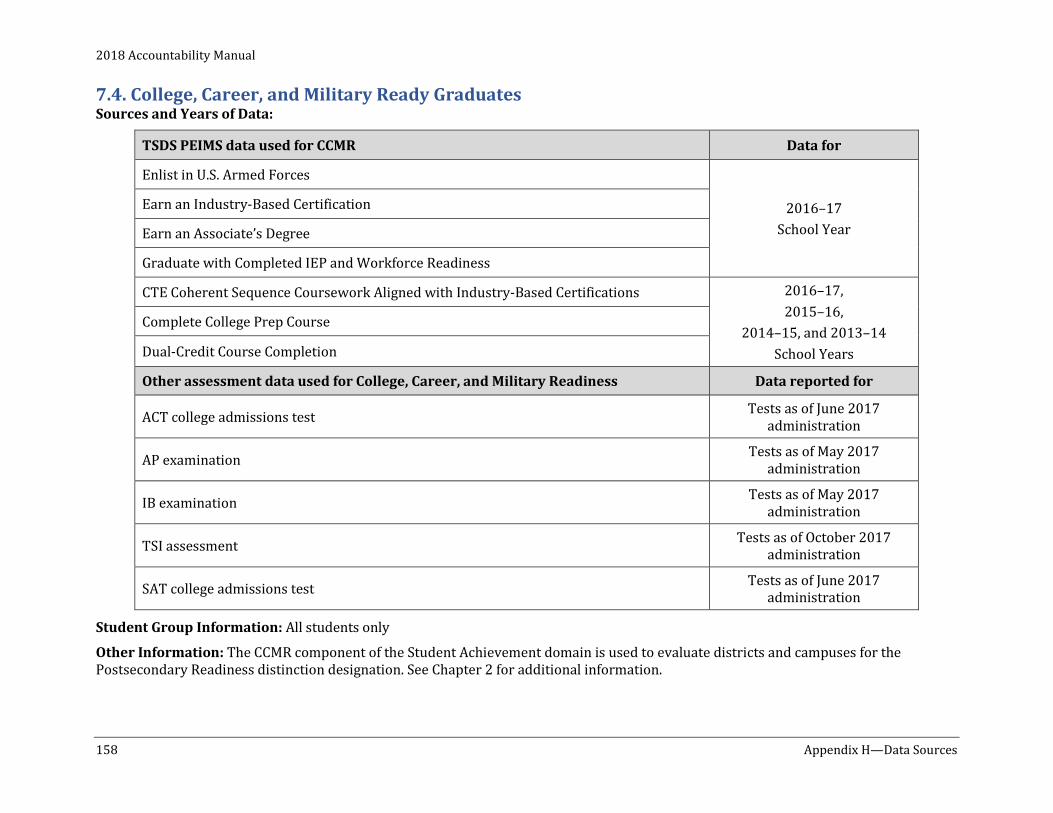
2018 Accountability Manual
158 Appendix H—Data Sources
7.4. College, Career, and Military Ready Graduates Sources and Years of Data:
TSDS PEIMS data used for CCMR Data for
Enlist in U.S. Armed Forces
2016–17 School Year
Earn an Industry-Based Certification
Earn an Associate’s Degree
Graduate with Completed IEP and Workforce Readiness
CTE Coherent Sequence Coursework Aligned with Industry-Based Certifications 2016–17, 2015–16,
2014–15, and 2013–14 School Years
Complete College Prep Course
Dual-Credit Course Completion
Other assessment data used for College, Career, and Military Readiness Data reported for
ACT college admissions test Tests as of June 2017 administration
AP examination Tests as of May 2017 administration
IB examination Tests as of May 2017 administration
TSI assessment Tests as of October 2017 administration
SAT college admissions test Tests as of June 2017 administration
Student Group Information: All students only
Other Information: The CCMR component of the Student Achievement domain is used to evaluate districts and campuses for the Postsecondary Readiness distinction designation. See Chapter 2 for additional information.
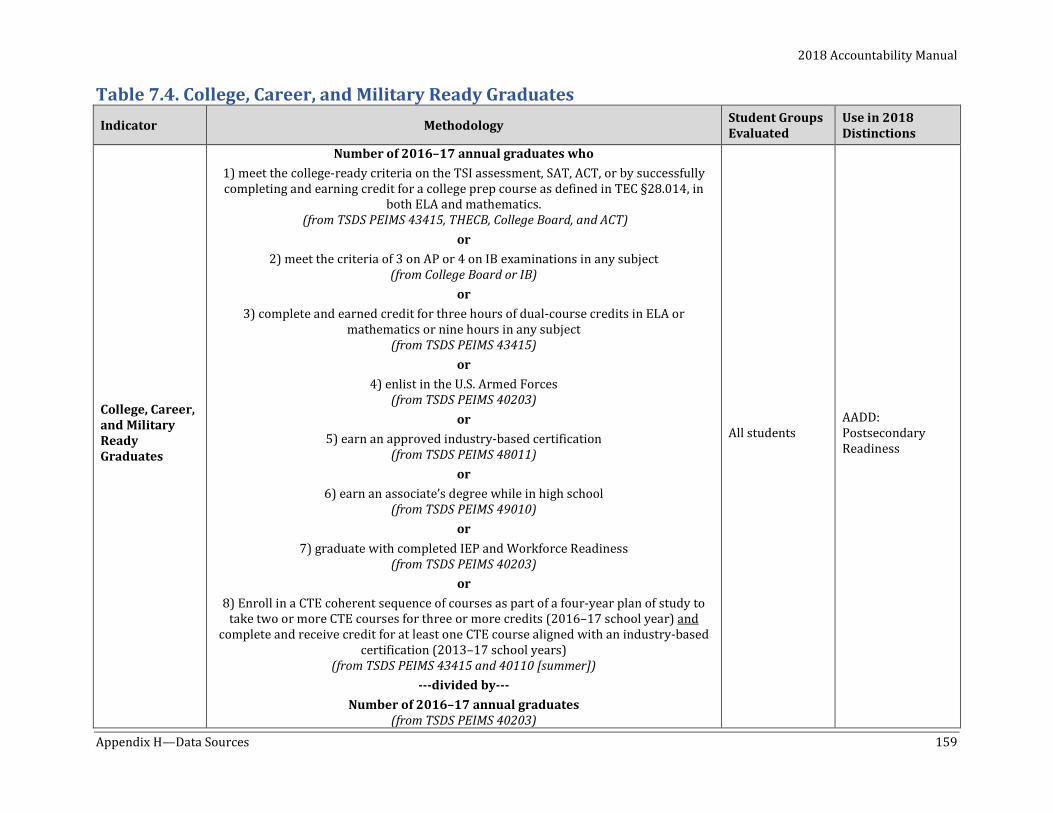
2018 Accountability Manual
Appendix H—Data Sources 159
Table 7.4. College, Career, and Military Ready Graduates Indicator Methodology Student Groups
Evaluated Use in 2018 Distinctions
College, Career, and Military Ready Graduates
Number of 2016–17 annual graduates who 1) meet the college-ready criteria on the TSI assessment, SAT, ACT, or by successfully completing and earning credit for a college prep course as defined in TEC §28.014, in
both ELA and mathematics. (from TSDS PEIMS 43415, THECB, College Board, and ACT)
or 2) meet the criteria of 3 on AP or 4 on IB examinations in any subject
(from College Board or IB) or
3) complete and earned credit for three hours of dual-course credits in ELA or mathematics or nine hours in any subject
(from TSDS PEIMS 43415) or
4) enlist in the U.S. Armed Forces (from TSDS PEIMS 40203)
or 5) earn an approved industry-based certification
(from TSDS PEIMS 48011) or
6) earn an associate’s degree while in high school (from TSDS PEIMS 49010)
or 7) graduate with completed IEP and Workforce Readiness
(from TSDS PEIMS 40203) or
8) Enroll in a CTE coherent sequence of courses as part of a four-year plan of study to take two or more CTE courses for three or more credits (2016–17 school year) and
complete and receive credit for at least one CTE course aligned with an industry-based certification (2013–17 school years)
(from TSDS PEIMS 43415 and 40110 [summer]) ---divided by---
Number of 2016–17 annual graduates (from TSDS PEIMS 40203)
All students AADD: Postsecondary Readiness
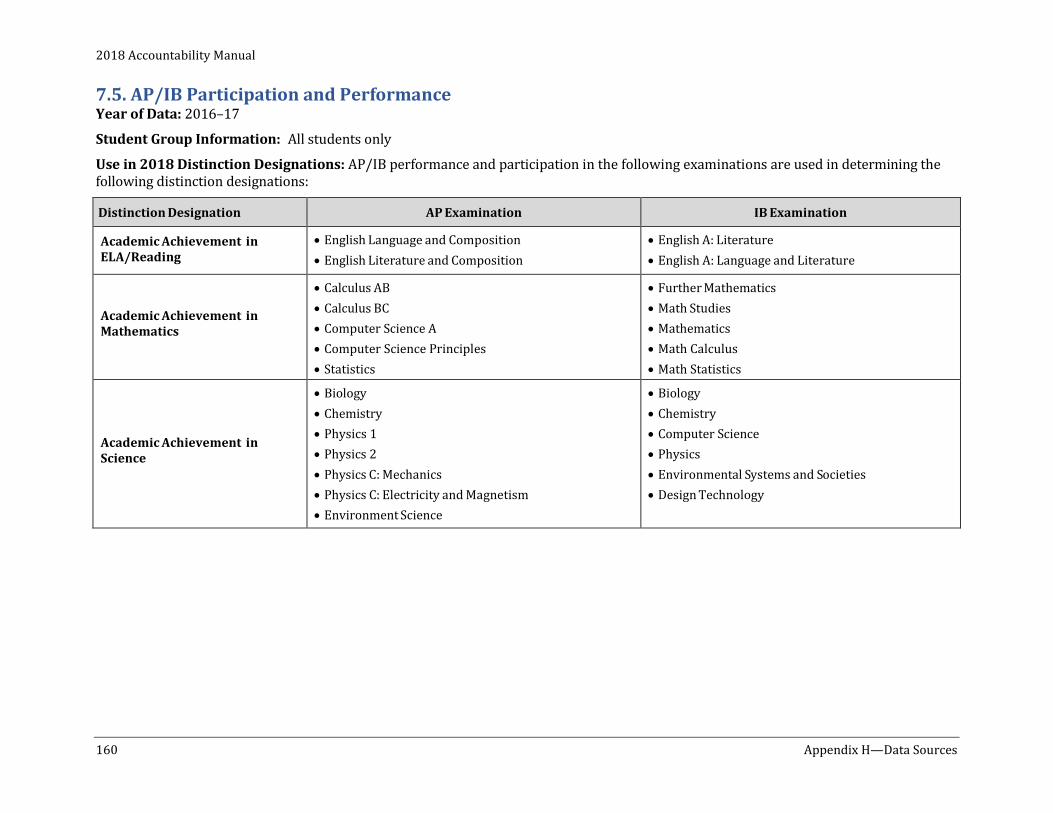
2018 Accountability Manual
160 Appendix H—Data Sources
7.5. AP/IB Participation and Performance Year of Data: 2016–17
Student Group Information: All students only
Use in 2018 Distinction Designations: AP/IB performance and participation in the following examinations are used in determining the following distinction designations:
Distinction Designation AP Examination IB Examination
Academic Achievement in ELA/Reading
• English Language and Composition • English Literature and Composition
• English A: Literature • English A: Language and Literature
Academic Achievement in Mathematics
• Calculus AB • Calculus BC • Computer Science A • Computer Science Principles • Statistics
• Further Mathematics • Math Studies • Mathematics • Math Calculus • Math Statistics
Academic Achievement in Science
• Biology • Chemistry • Physics 1 • Physics 2 • Physics C: Mechanics • Physics C: Electricity and Magnetism • Environment Science
• Biology • Chemistry • Computer Science • Physics • Environmental Systems and Societies • Design Technology
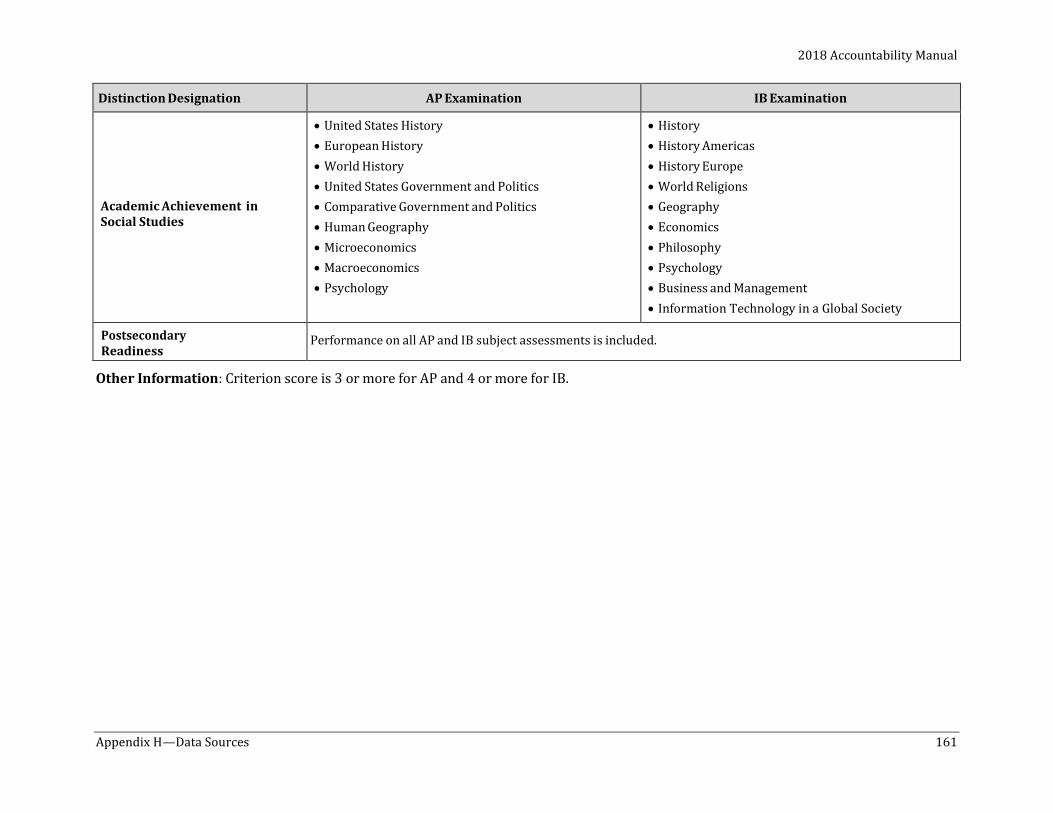
2018 Accountability Manual
Appendix H—Data Sources 161
Distinction Designation AP Examination IB Examination
Academic Achievement in Social Studies
• United States History • European History • World History • United States Government and Politics • Comparative Government and Politics • Human Geography • Microeconomics • Macroeconomics • Psychology
• History • History Americas • History Europe • World Religions • Geography • Economics • Philosophy • Psychology • Business and Management • Information Technology in a Global Society
Postsecondary Readiness
Performance on all AP and IB subject assessments is included.
Other Information: Criterion score is 3 or more for AP and 4 or more for IB.
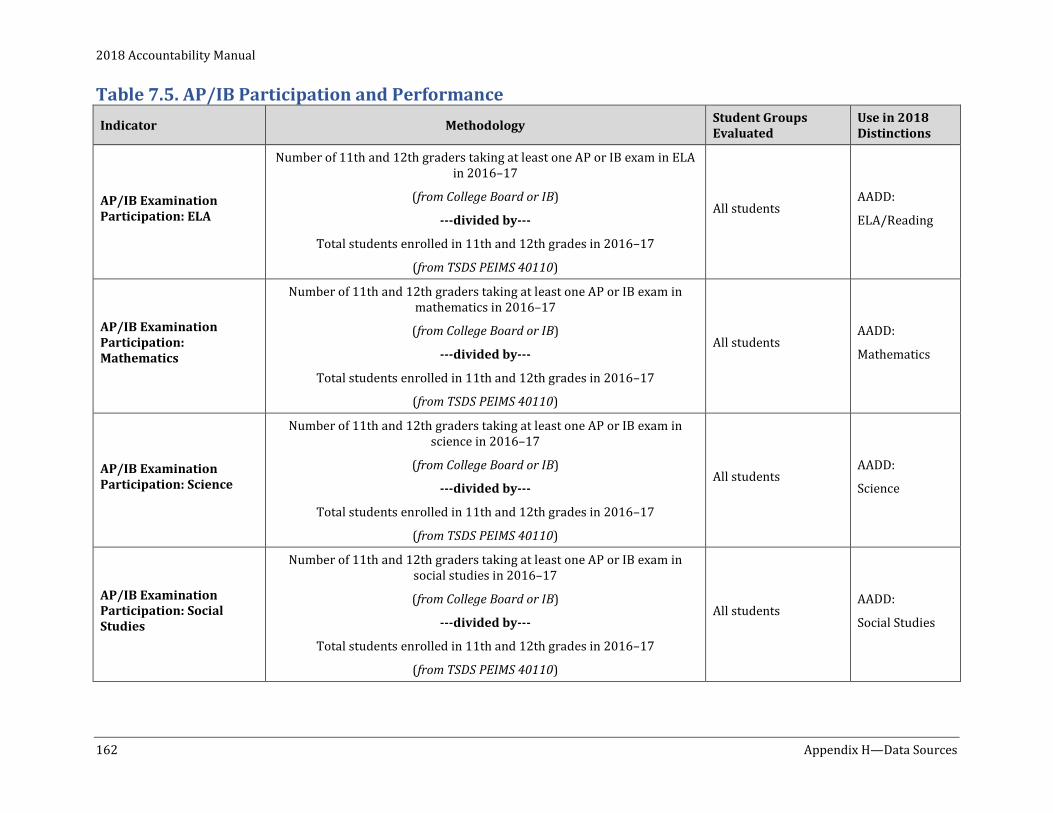
2018 Accountability Manual
162 Appendix H—Data Sources
Table 7.5. AP/IB Participation and Performance Indicator Methodology
Student Groups Evaluated
Use in 2018 Distinctions
AP/IB Examination Participation: ELA
Number of 11th and 12th graders taking at least one AP or IB exam in ELA in 2016–17
(from College Board or IB)
---divided by---
Total students enrolled in 11th and 12th grades in 2016–17
(from TSDS PEIMS 40110)
All students AADD:
ELA/Reading
AP/IB Examination Participation: Mathematics
Number of 11th and 12th graders taking at least one AP or IB exam in mathematics in 2016–17
(from College Board or IB)
---divided by---
Total students enrolled in 11th and 12th grades in 2016–17
(from TSDS PEIMS 40110)
All students AADD:
Mathematics
AP/IB Examination Participation: Science
Number of 11th and 12th graders taking at least one AP or IB exam in science in 2016–17
(from College Board or IB)
---divided by---
Total students enrolled in 11th and 12th grades in 2016–17
(from TSDS PEIMS 40110)
All students AADD:
Science
AP/IB Examination Participation: Social Studies
Number of 11th and 12th graders taking at least one AP or IB exam in social studies in 2016–17
(from College Board or IB)
---divided by---
Total students enrolled in 11th and 12th grades in 2016–17
(from TSDS PEIMS 40110)
All students AADD:
Social Studies
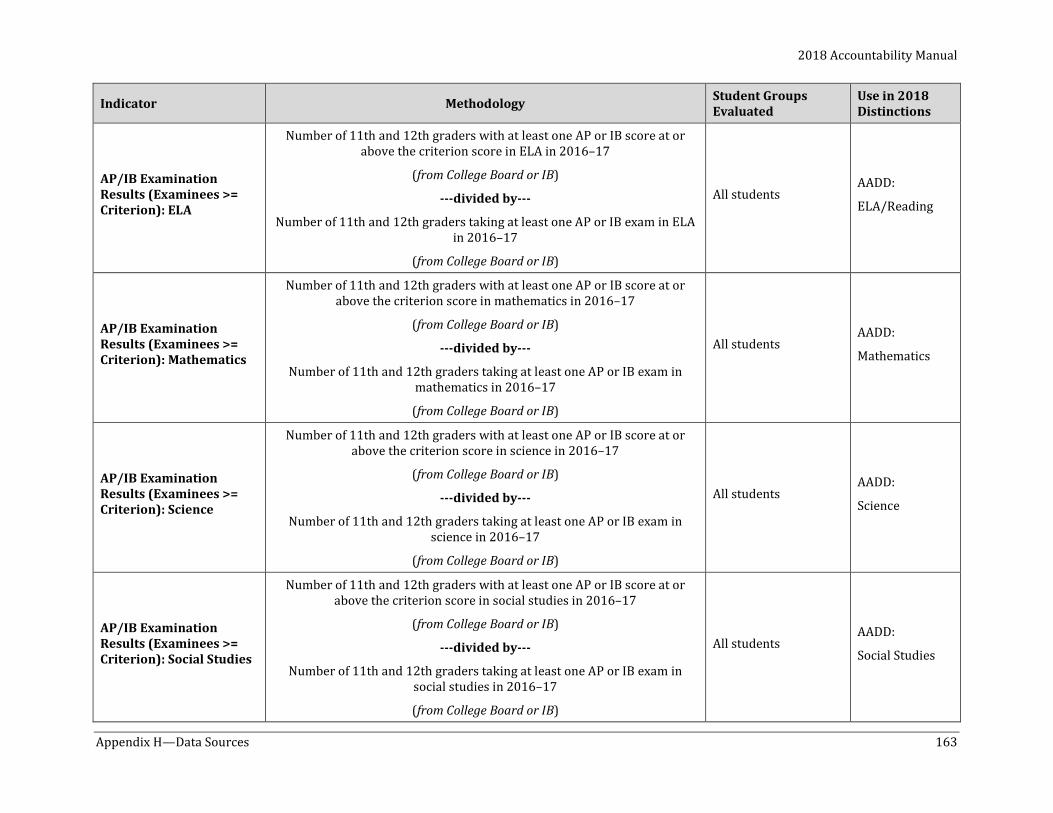
2018 Accountability Manual
Appendix H—Data Sources 163
Indicator Methodology Student Groups Evaluated
Use in 2018 Distinctions
AP/IB Examination Results (Examinees >= Criterion): ELA
Number of 11th and 12th graders with at least one AP or IB score at or above the criterion score in ELA in 2016–17
(from College Board or IB)
---divided by---
Number of 11th and 12th graders taking at least one AP or IB exam in ELA in 2016–17
(from College Board or IB)
All students AADD:
ELA/Reading
AP/IB Examination Results (Examinees >= Criterion): Mathematics
Number of 11th and 12th graders with at least one AP or IB score at or above the criterion score in mathematics in 2016–17
(from College Board or IB)
---divided by---
Number of 11th and 12th graders taking at least one AP or IB exam in mathematics in 2016–17
(from College Board or IB)
All students AADD:
Mathematics
AP/IB Examination Results (Examinees >= Criterion): Science
Number of 11th and 12th graders with at least one AP or IB score at or above the criterion score in science in 2016–17
(from College Board or IB)
---divided by---
Number of 11th and 12th graders taking at least one AP or IB exam in science in 2016–17
(from College Board or IB)
All students AADD:
Science
AP/IB Examination Results (Examinees >= Criterion): Social Studies
Number of 11th and 12th graders with at least one AP or IB score at or above the criterion score in social studies in 2016–17
(from College Board or IB)
---divided by---
Number of 11th and 12th graders taking at least one AP or IB exam in social studies in 2016–17
(from College Board or IB)
All students AADD:
Social Studies
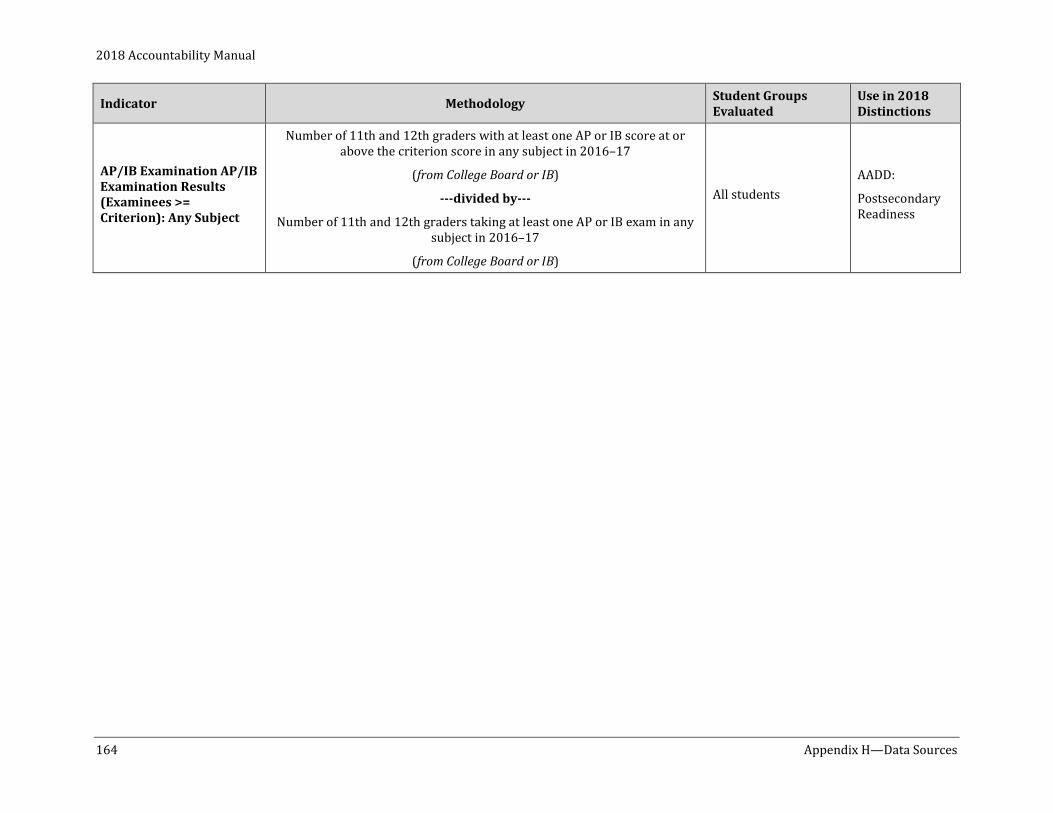
2018 Accountability Manual
164 Appendix H—Data Sources
Indicator Methodology Student Groups Evaluated
Use in 2018 Distinctions
AP/IB Examination AP/IB Examination Results (Examinees >= Criterion): Any Subject
Number of 11th and 12th graders with at least one AP or IB score at or above the criterion score in any subject in 2016–17
(from College Board or IB)
---divided by---
Number of 11th and 12th graders taking at least one AP or IB exam in any subject in 2016–17
(from College Board or IB)
All students AADD:
Postsecondary Readiness
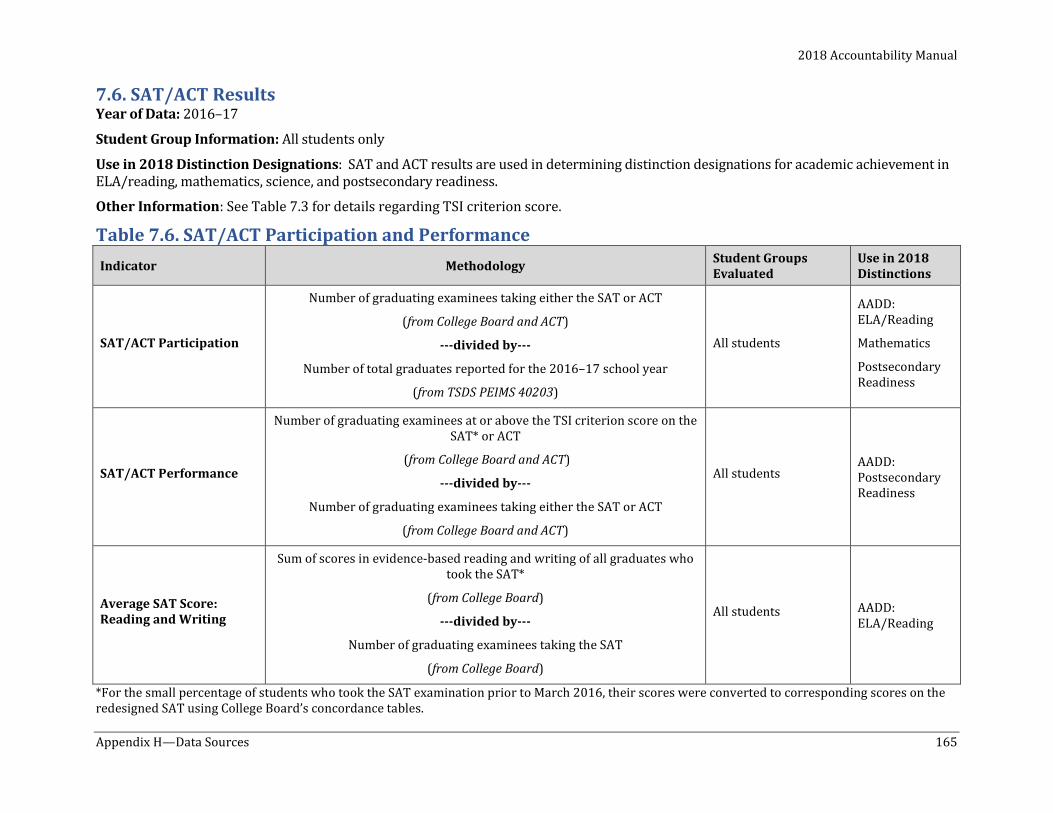
2018 Accountability Manual
Appendix H—Data Sources 165
7.6. SAT/ACT Results Year of Data: 2016–17
Student Group Information: All students only
Use in 2018 Distinction Designations: SAT and ACT results are used in determining distinction designations for academic achievement in ELA/reading, mathematics, science, and postsecondary readiness.
Other Information: See Table 7.3 for details regarding TSI criterion score.
Table 7.6. SAT/ACT Participation and Performance Indicator Methodology
Student Groups Evaluated
Use in 2018 Distinctions
SAT/ACT Participation
Number of graduating examinees taking either the SAT or ACT
(from College Board and ACT)
---divided by---
Number of total graduates reported for the 2016–17 school year
(from TSDS PEIMS 40203)
All students
AADD: ELA/Reading
Mathematics
Postsecondary Readiness
SAT/ACT Performance
Number of graduating examinees at or above the TSI criterion score on the SAT* or ACT
(from College Board and ACT)
---divided by---
Number of graduating examinees taking either the SAT or ACT
(from College Board and ACT)
All students AADD: Postsecondary Readiness
Average SAT Score: Reading and Writing
Sum of scores in evidence-based reading and writing of all graduates who took the SAT*
(from College Board)
---divided by---
Number of graduating examinees taking the SAT
(from College Board)
All students AADD: ELA/Reading
*For the small percentage of students who took the SAT examination prior to March 2016, their scores were converted to corresponding scores on the redesigned SAT using College Board’s concordance tables.
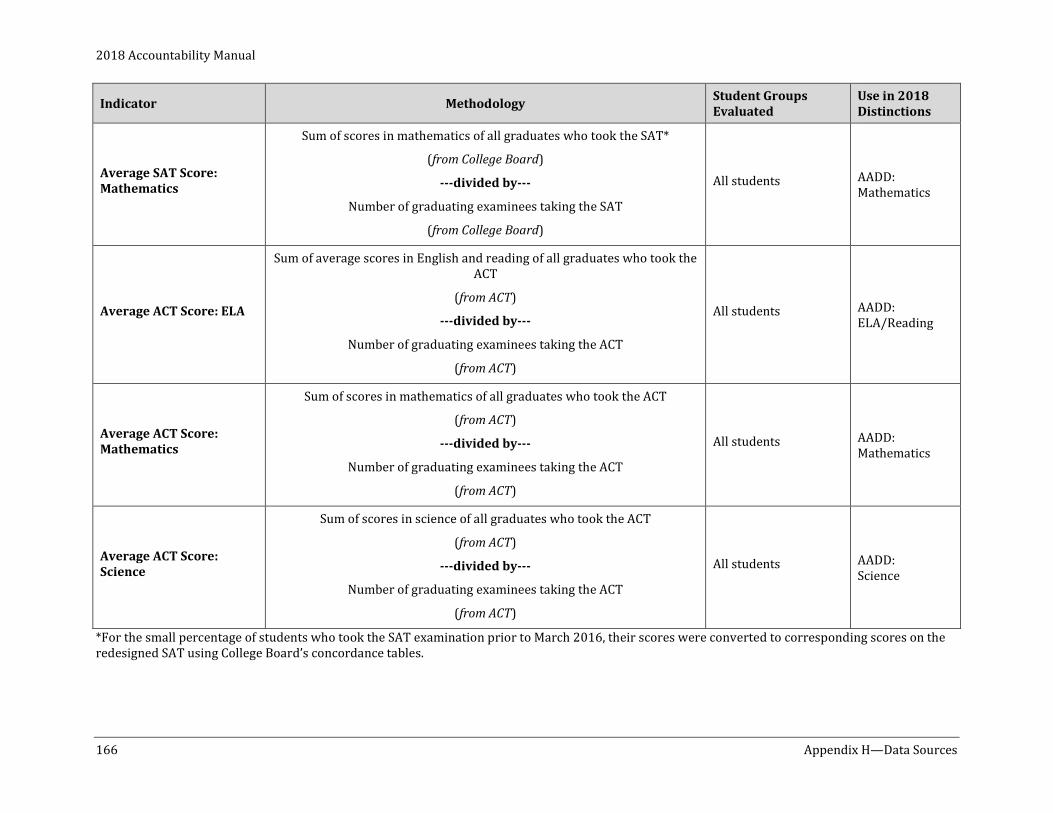
2018 Accountability Manual
166 Appendix H—Data Sources
Indicator Methodology Student Groups Evaluated
Use in 2018 Distinctions
Average SAT Score: Mathematics
Sum of scores in mathematics of all graduates who took the SAT*
(from College Board)
---divided by---
Number of graduating examinees taking the SAT
(from College Board)
All students AADD: Mathematics
Average ACT Score: ELA
Sum of average scores in English and reading of all graduates who took the ACT
(from ACT)
---divided by---
Number of graduating examinees taking the ACT
(from ACT)
All students AADD: ELA/Reading
Average ACT Score: Mathematics
Sum of scores in mathematics of all graduates who took the ACT
(from ACT)
---divided by---
Number of graduating examinees taking the ACT
(from ACT)
All students AADD: Mathematics
Average ACT Score: Science
Sum of scores in science of all graduates who took the ACT
(from ACT)
---divided by---
Number of graduating examinees taking the ACT
(from ACT)
All students AADD: Science
*For the small percentage of students who took the SAT examination prior to March 2016, their scores were converted to corresponding scores on the redesigned SAT using College Board’s concordance tables.
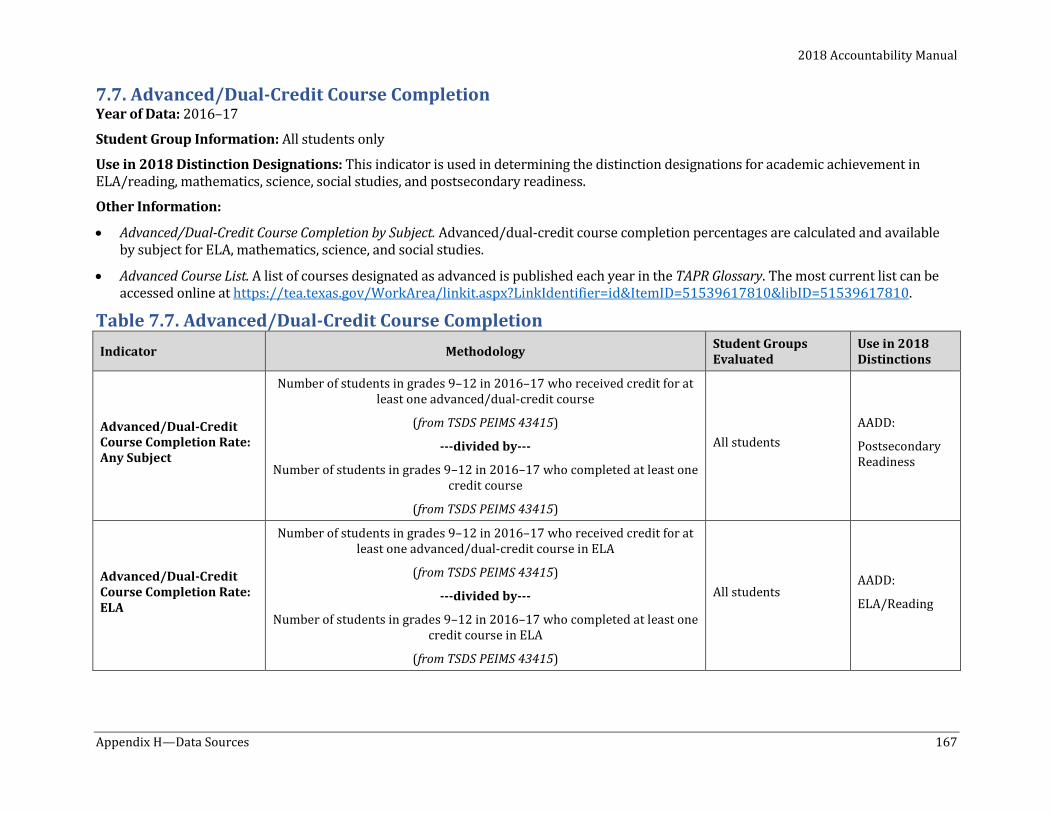
2018 Accountability Manual
Appendix H—Data Sources 167
7.7. Advanced/Dual-Credit Course Completion Year of Data: 2016–17
Student Group Information: All students only
Use in 2018 Distinction Designations: This indicator is used in determining the distinction designations for academic achievement in ELA/reading, mathematics, science, social studies, and postsecondary readiness.
Other Information:
• Advanced/Dual-Credit Course Completion by Subject. Advanced/dual-credit course completion percentages are calculated and available by subject for ELA, mathematics, science, and social studies.
• Advanced Course List. A list of courses designated as advanced is published each year in the TAPR Glossary. The most current list can be accessed online at https://tea.texas.gov/WorkArea/linkit.aspx?LinkIdentifier=id&ItemID=51539617810&libID=51539617810.
Table 7.7. Advanced/Dual-Credit Course Completion Indicator Methodology
Student Groups Evaluated
Use in 2018 Distinctions
Advanced/Dual-Credit Course Completion Rate: Any Subject
Number of students in grades 9–12 in 2016–17 who received credit for at least one advanced/dual-credit course
(from TSDS PEIMS 43415)
---divided by---
Number of students in grades 9–12 in 2016–17 who completed at least one credit course
(from TSDS PEIMS 43415)
All students AADD:
Postsecondary Readiness
Advanced/Dual-Credit Course Completion Rate: ELA
Number of students in grades 9–12 in 2016–17 who received credit for at least one advanced/dual-credit course in ELA
(from TSDS PEIMS 43415)
---divided by---
Number of students in grades 9–12 in 2016–17 who completed at least one credit course in ELA
(from TSDS PEIMS 43415)
All students AADD:
ELA/Reading
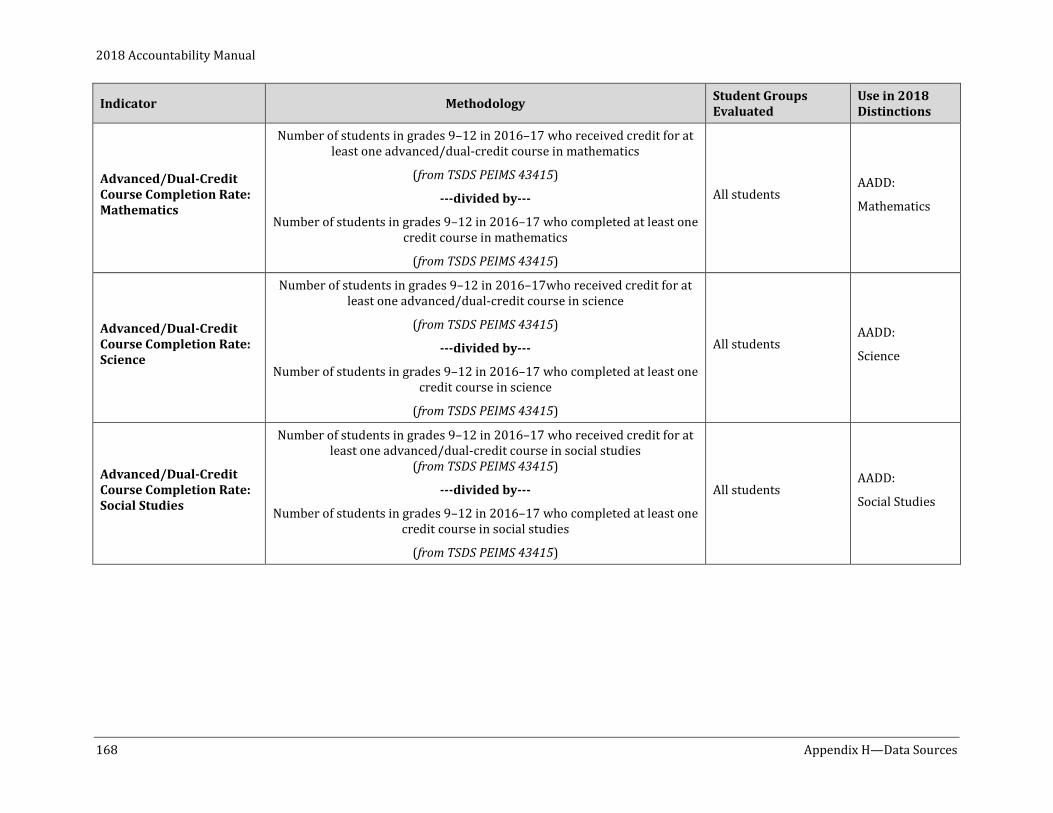
2018 Accountability Manual
168 Appendix H—Data Sources
Indicator Methodology Student Groups Evaluated
Use in 2018 Distinctions
Advanced/Dual-Credit Course Completion Rate: Mathematics
Number of students in grades 9–12 in 2016–17 who received credit for at least one advanced/dual-credit course in mathematics
(from TSDS PEIMS 43415)
---divided by---
Number of students in grades 9–12 in 2016–17 who completed at least one credit course in mathematics
(from TSDS PEIMS 43415)
All students AADD:
Mathematics
Advanced/Dual-Credit Course Completion Rate: Science
Number of students in grades 9–12 in 2016–17who received credit for at least one advanced/dual-credit course in science
(from TSDS PEIMS 43415)
---divided by---
Number of students in grades 9–12 in 2016–17 who completed at least one credit course in science
(from TSDS PEIMS 43415)
All students AADD:
Science
Advanced/Dual-Credit Course Completion Rate: Social Studies
Number of students in grades 9–12 in 2016–17 who received credit for at least one advanced/dual-credit course in social studies
(from TSDS PEIMS 43415)
---divided by---
Number of students in grades 9–12 in 2016–17 who completed at least one credit course in social studies
(from TSDS PEIMS 43415)
All students AADD:
Social Studies
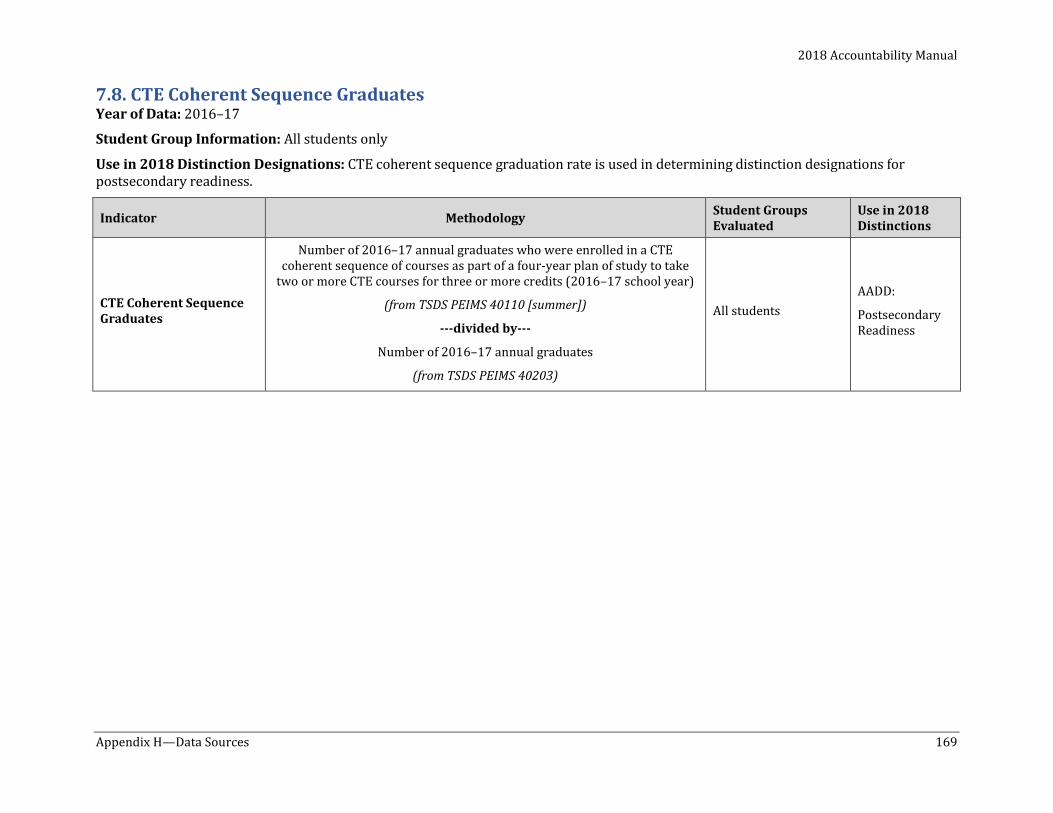
2018 Accountability Manual
Appendix H—Data Sources 169
7.8. CTE Coherent Sequence Graduates Year of Data: 2016–17
Student Group Information: All students only
Use in 2018 Distinction Designations: CTE coherent sequence graduation rate is used in determining distinction designations for postsecondary readiness.
Indicator Methodology Student Groups Evaluated
Use in 2018 Distinctions
CTE Coherent Sequence Graduates
Number of 2016–17 annual graduates who were enrolled in a CTE coherent sequence of courses as part of a four-year plan of study to take
two or more CTE courses for three or more credits (2016–17 school year)
(from TSDS PEIMS 40110 [summer])
---divided by---
Number of 2016–17 annual graduates
(from TSDS PEIMS 40203)
All students AADD:
Postsecondary Readiness
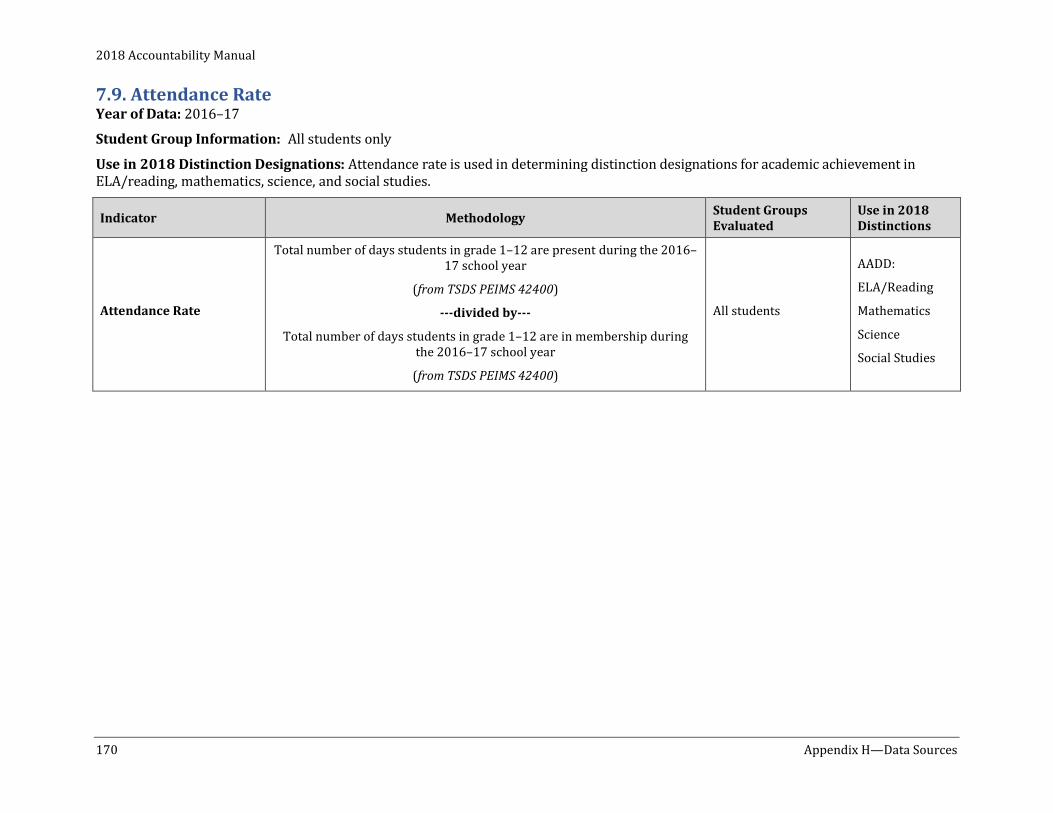
2018 Accountability Manual
170 Appendix H—Data Sources
7.9. Attendance Rate Year of Data: 2016–17
Student Group Information: All students only
Use in 2018 Distinction Designations: Attendance rate is used in determining distinction designations for academic achievement in ELA/reading, mathematics, science, and social studies.
Indicator Methodology Student Groups Evaluated
Use in 2018 Distinctions
Attendance Rate
Total number of days students in grade 1–12 are present during the 2016–17 school year
(from TSDS PEIMS 42400)
---divided by---
Total number of days students in grade 1–12 are in membership during the 2016–17 school year
(from TSDS PEIMS 42400)
All students
AADD:
ELA/Reading
Mathematics
Science
Social Studies
2018 Accountability Manual
Appendix I—Scaling Resources 171
Appendix I—Scaling Resources In order to align letter grades and scores used in the A–F academic accountability system to the common conception of letter grades, raw domain and component scores are adjusted or “scaled.” The scaling processes that are used for districts are also used for campuses by campus type. This appendix provides scaled score lookup tables for domain and domain component scores.
To use the charts, locate the component or domain you would like to scale. The far-left column provides the raw component or domain score. Determine your scaled score by using your campus type. Campus types are shown on page 6 of Chapter 1.
Please note, the graduation rate component does not use the scaling process. This component is scaled using a conversion table provided in “Chapter 5—Calculating 2018 Ratings.”
School Progress, Part B: Relative Performance must be scaled using the scaling formulas provided in Chapter 5 or by using the scaling tool available on the TEA website at https://tea.texas.gov/2018scalingresources.aspx.
More information about scaling and the formulas used to create the following tables, including the graduation rate scaled score table, can be found in Chapter 5.
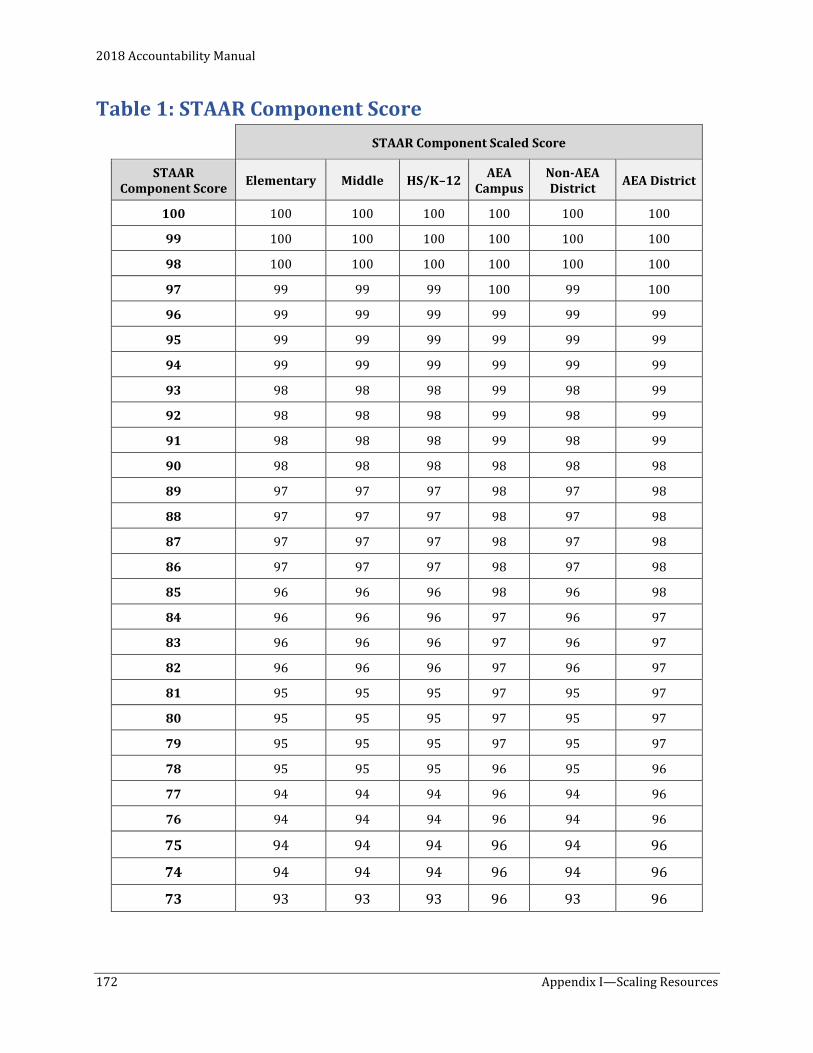
2018 Accountability Manual
172 Appendix I—Scaling Resources
Table 1: STAAR Component Score STAAR Component Scaled Score
STAAR Component Score Elementary Middle HS/K–12 AEA
Campus Non-AEA District AEA District
100 100 100 100 100 100 100
99 100 100 100 100 100 100
98 100 100 100 100 100 100
97 99 99 99 100 99 100
96 99 99 99 99 99 99
95 99 99 99 99 99 99
94 99 99 99 99 99 99
93 98 98 98 99 98 99
92 98 98 98 99 98 99
91 98 98 98 99 98 99
90 98 98 98 98 98 98
89 97 97 97 98 97 98
88 97 97 97 98 97 98
87 97 97 97 98 97 98
86 97 97 97 98 97 98
85 96 96 96 98 96 98
84 96 96 96 97 96 97
83 96 96 96 97 96 97
82 96 96 96 97 96 97
81 95 95 95 97 95 97
80 95 95 95 97 95 97
79 95 95 95 97 95 97
78 95 95 95 96 95 96
77 94 94 94 96 94 96
76 94 94 94 96 94 96
75 94 94 94 96 94 96
74 94 94 94 96 94 96
73 93 93 93 96 93 96
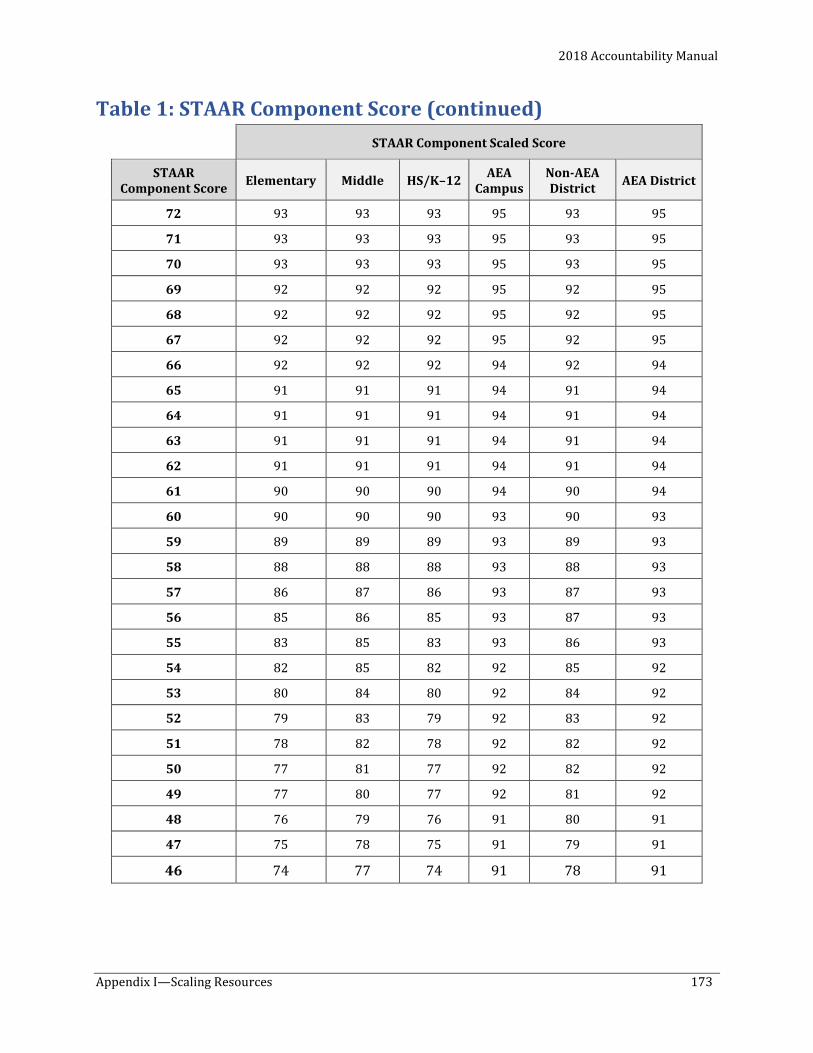
2018 Accountability Manual
Appendix I—Scaling Resources 173
Table 1: STAAR Component Score (continued) STAAR Component Scaled Score
STAAR Component Score Elementary Middle HS/K–12 AEA
Campus Non-AEA District AEA District
72 93 93 93 95 93 95
71 93 93 93 95 93 95
70 93 93 93 95 93 95
69 92 92 92 95 92 95
68 92 92 92 95 92 95
67 92 92 92 95 92 95
66 92 92 92 94 92 94
65 91 91 91 94 91 94
64 91 91 91 94 91 94
63 91 91 91 94 91 94
62 91 91 91 94 91 94
61 90 90 90 94 90 94
60 90 90 90 93 90 93
59 89 89 89 93 89 93
58 88 88 88 93 88 93
57 86 87 86 93 87 93
56 85 86 85 93 87 93
55 83 85 83 93 86 93
54 82 85 82 92 85 92
53 80 84 80 92 84 92
52 79 83 79 92 83 92
51 78 82 78 92 82 92
50 77 81 77 92 82 92
49 77 80 77 92 81 92
48 76 79 76 91 80 91
47 75 78 75 91 79 91
46 74 77 74 91 78 91
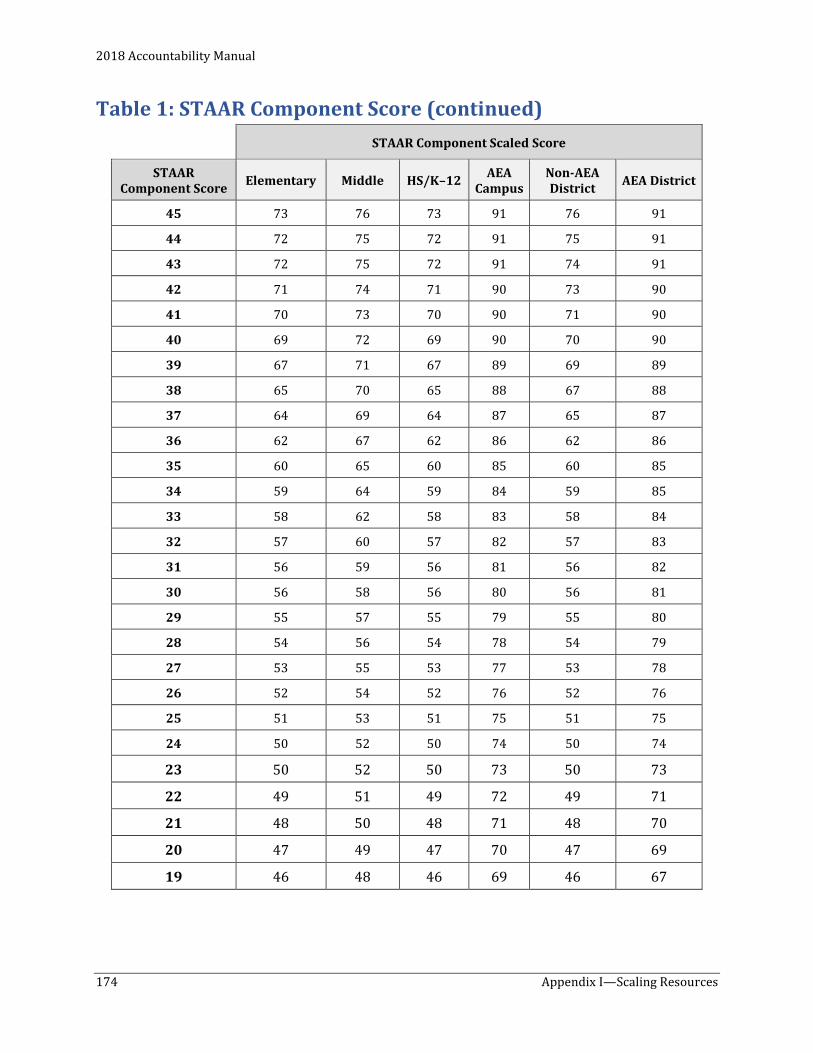
2018 Accountability Manual
174 Appendix I—Scaling Resources
Table 1: STAAR Component Score (continued) STAAR Component Scaled Score
STAAR Component Score Elementary Middle HS/K–12 AEA
Campus Non-AEA District AEA District
45 73 76 73 91 76 91
44 72 75 72 91 75 91
43 72 75 72 91 74 91
42 71 74 71 90 73 90
41 70 73 70 90 71 90
40 69 72 69 90 70 90
39 67 71 67 89 69 89
38 65 70 65 88 67 88
37 64 69 64 87 65 87
36 62 67 62 86 62 86
35 60 65 60 85 60 85
34 59 64 59 84 59 85
33 58 62 58 83 58 84
32 57 60 57 82 57 83
31 56 59 56 81 56 82
30 56 58 56 80 56 81
29 55 57 55 79 55 80
28 54 56 54 78 54 79
27 53 55 53 77 53 78
26 52 54 52 76 52 76
25 51 53 51 75 51 75
24 50 52 50 74 50 74
23 50 52 50 73 50 73
22 49 51 49 72 49 71
21 48 50 48 71 48 70
20 47 49 47 70 47 69
19 46 48 46 69 46 67
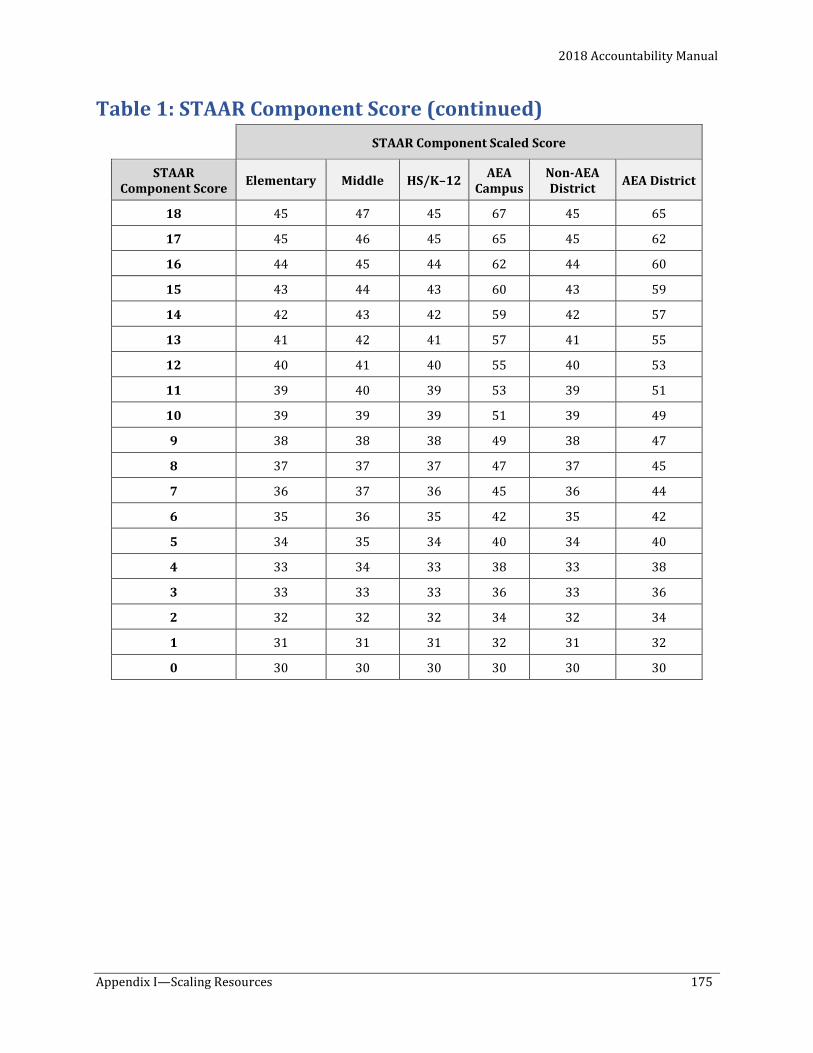
2018 Accountability Manual
Appendix I—Scaling Resources 175
Table 1: STAAR Component Score (continued) STAAR Component Scaled Score
STAAR Component Score Elementary Middle HS/K–12 AEA
Campus Non-AEA District AEA District
18 45 47 45 67 45 65
17 45 46 45 65 45 62
16 44 45 44 62 44 60
15 43 44 43 60 43 59
14 42 43 42 59 42 57
13 41 42 41 57 41 55
12 40 41 40 55 40 53
11 39 40 39 53 39 51
10 39 39 39 51 39 49
9 38 38 38 49 38 47
8 37 37 37 47 37 45
7 36 37 36 45 36 44
6 35 36 35 42 35 42
5 34 35 34 40 34 40
4 33 34 33 38 33 38
3 33 33 33 36 33 36
2 32 32 32 34 32 34
1 31 31 31 32 31 32
0 30 30 30 30 30 30
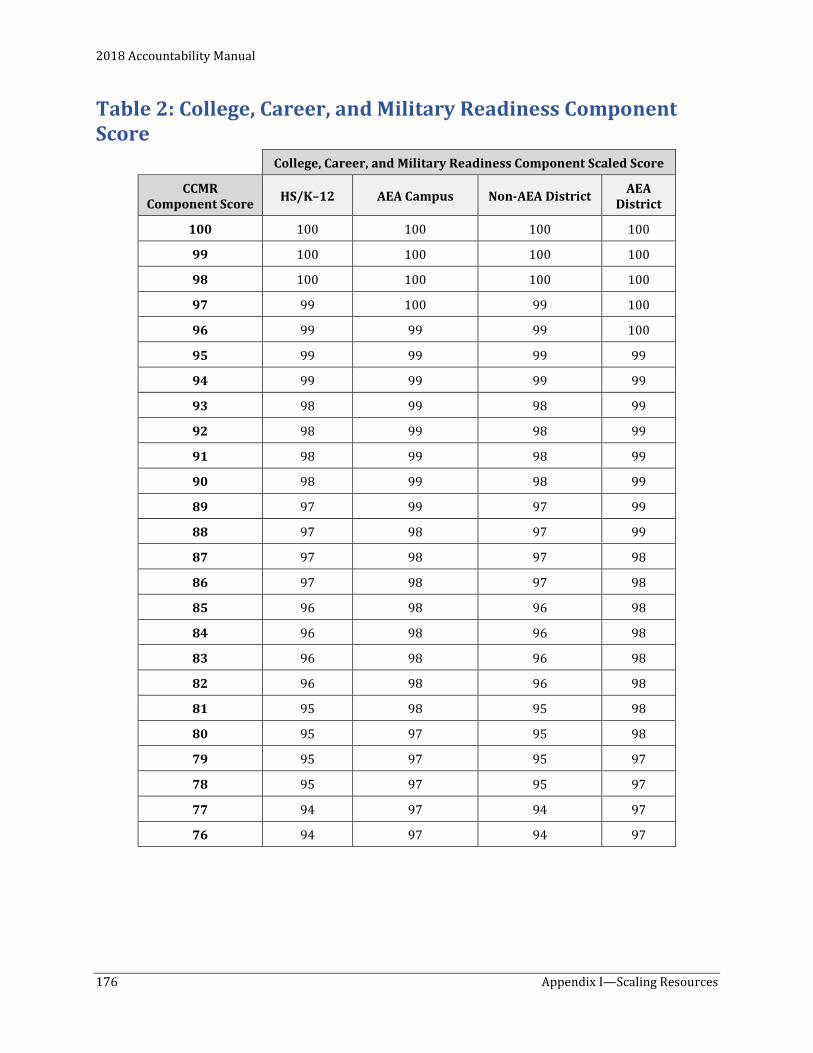
2018 Accountability Manual
176 Appendix I—Scaling Resources
Table 2: College, Career, and Military Readiness Component Score
College, Career, and Military Readiness Component Scaled Score
CCMR Component Score HS/K–12 AEA Campus Non-AEA District AEA
District
100 100 100 100 100
99 100 100 100 100
98 100 100 100 100
97 99 100 99 100
96 99 99 99 100
95 99 99 99 99
94 99 99 99 99
93 98 99 98 99
92 98 99 98 99
91 98 99 98 99
90 98 99 98 99
89 97 99 97 99
88 97 98 97 99
87 97 98 97 98
86 97 98 97 98
85 96 98 96 98
84 96 98 96 98
83 96 98 96 98
82 96 98 96 98
81 95 98 95 98
80 95 97 95 98
79 95 97 95 97
78 95 97 95 97
77 94 97 94 97
76 94 97 94 97
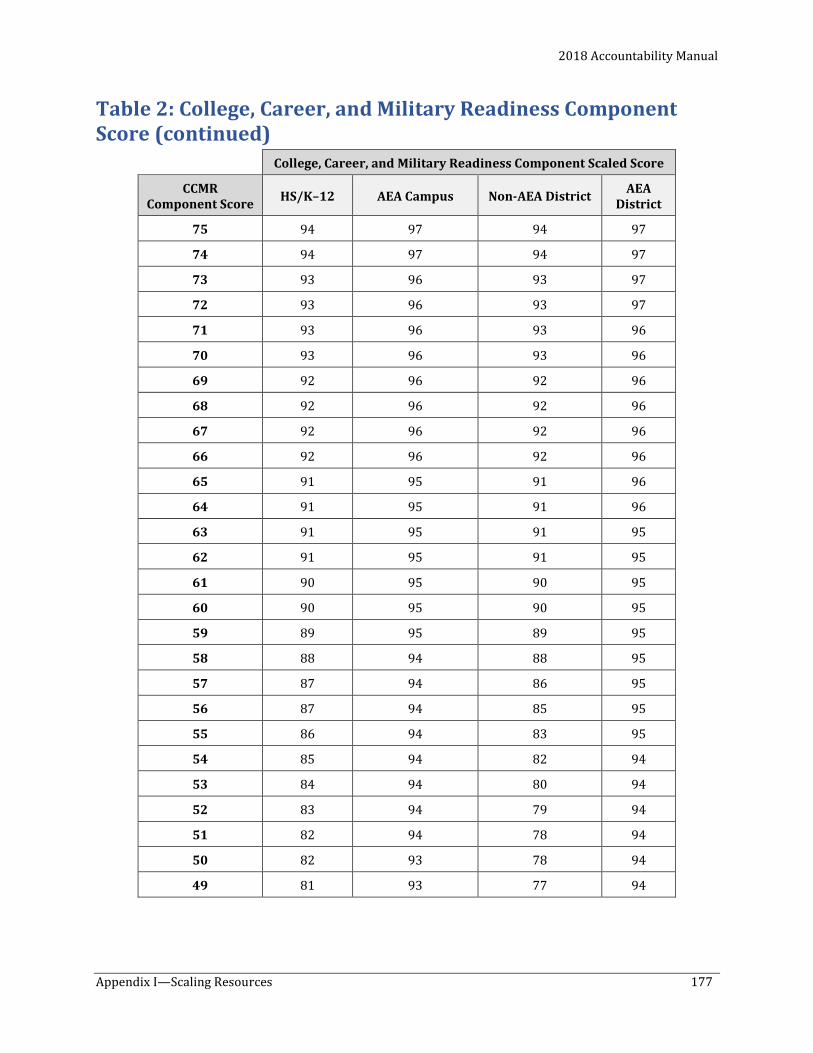
2018 Accountability Manual
Appendix I—Scaling Resources 177
Table 2: College, Career, and Military Readiness Component Score (continued)
College, Career, and Military Readiness Component Scaled Score
CCMR Component Score HS/K–12 AEA Campus Non-AEA District AEA
District
75 94 97 94 97
74 94 97 94 97
73 93 96 93 97
72 93 96 93 97
71 93 96 93 96
70 93 96 93 96
69 92 96 92 96
68 92 96 92 96
67 92 96 92 96
66 92 96 92 96
65 91 95 91 96
64 91 95 91 96
63 91 95 91 95
62 91 95 91 95
61 90 95 90 95
60 90 95 90 95
59 89 95 89 95
58 88 94 88 95
57 87 94 86 95
56 87 94 85 95
55 86 94 83 95
54 85 94 82 94
53 84 94 80 94
52 83 94 79 94
51 82 94 78 94
50 82 93 78 94
49 81 93 77 94
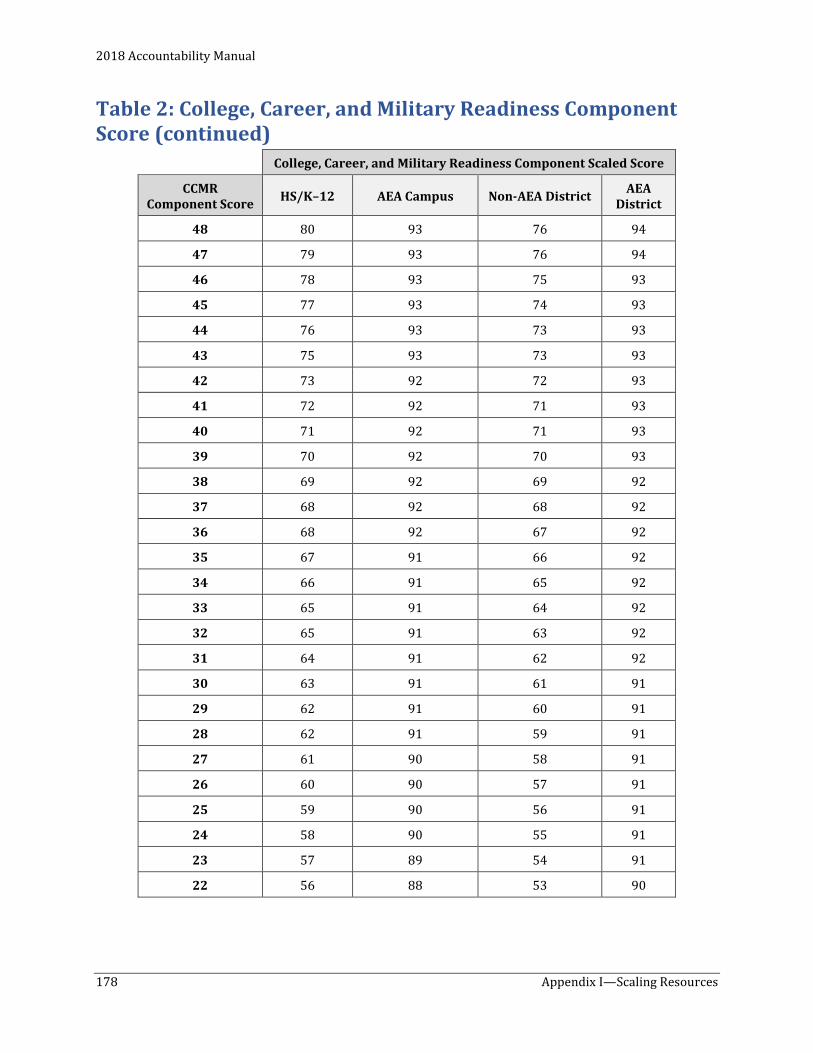
2018 Accountability Manual
178 Appendix I—Scaling Resources
Table 2: College, Career, and Military Readiness Component Score (continued)
College, Career, and Military Readiness Component Scaled Score
CCMR Component Score HS/K–12 AEA Campus Non-AEA District AEA
District
48 80 93 76 94
47 79 93 76 94
46 78 93 75 93
45 77 93 74 93
44 76 93 73 93
43 75 93 73 93
42 73 92 72 93
41 72 92 71 93
40 71 92 71 93
39 70 92 70 93
38 69 92 69 92
37 68 92 68 92
36 68 92 67 92
35 67 91 66 92
34 66 91 65 92
33 65 91 64 92
32 65 91 63 92
31 64 91 62 92
30 63 91 61 91
29 62 91 60 91
28 62 91 59 91
27 61 90 58 91
26 60 90 57 91
25 59 90 56 91
24 58 90 55 91
23 57 89 54 91
22 56 88 53 90
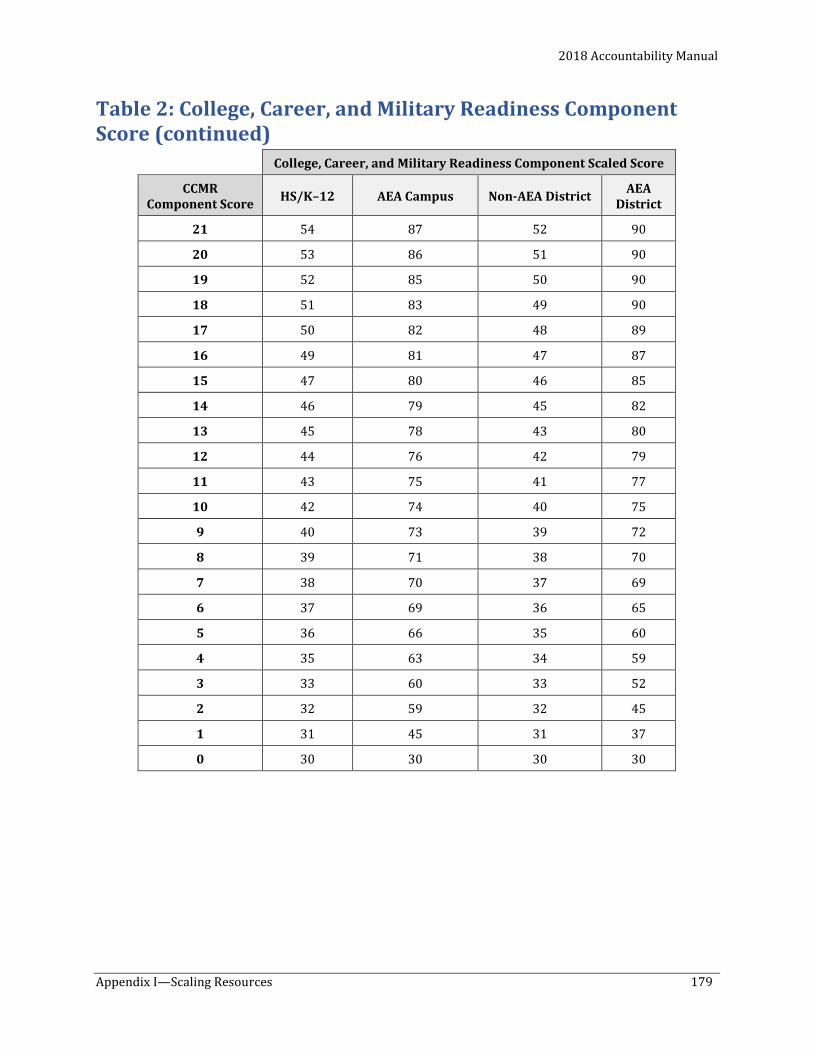
2018 Accountability Manual
Appendix I—Scaling Resources 179
Table 2: College, Career, and Military Readiness Component Score (continued)
College, Career, and Military Readiness Component Scaled Score
CCMR Component Score HS/K–12 AEA Campus Non-AEA District AEA
District
21 54 87 52 90
20 53 86 51 90
19 52 85 50 90
18 51 83 49 90
17 50 82 48 89
16 49 81 47 87
15 47 80 46 85
14 46 79 45 82
13 45 78 43 80
12 44 76 42 79
11 43 75 41 77
10 42 74 40 75
9 40 73 39 72
8 39 71 38 70
7 38 70 37 69
6 37 69 36 65
5 36 66 35 60
4 35 63 34 59
3 33 60 33 52
2 32 59 32 45
1 31 45 31 37
0 30 30 30 30
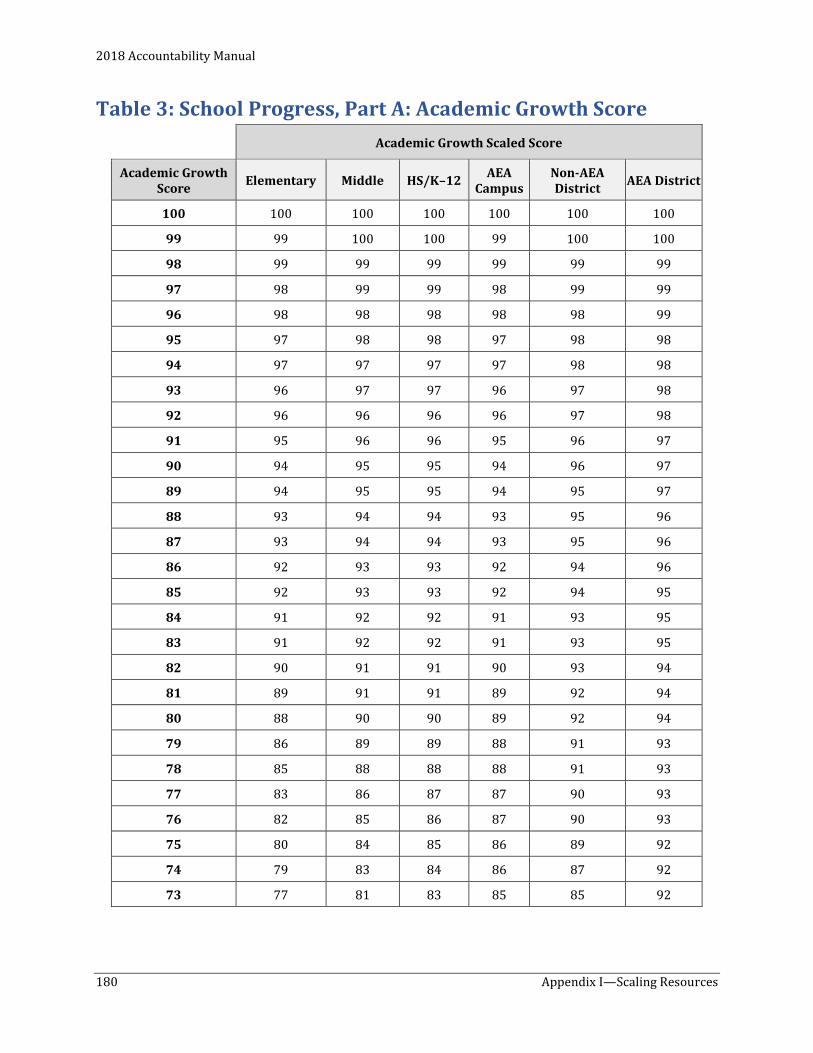
2018 Accountability Manual
180 Appendix I—Scaling Resources
Table 3: School Progress, Part A: Academic Growth Score Academic Growth Scaled Score
Academic Growth Score Elementary Middle HS/K–12 AEA
Campus Non-AEA District AEA District
100 100 100 100 100 100 100
99 99 100 100 99 100 100
98 99 99 99 99 99 99
97 98 99 99 98 99 99
96 98 98 98 98 98 99
95 97 98 98 97 98 98
94 97 97 97 97 98 98
93 96 97 97 96 97 98
92 96 96 96 96 97 98
91 95 96 96 95 96 97
90 94 95 95 94 96 97
89 94 95 95 94 95 97
88 93 94 94 93 95 96
87 93 94 94 93 95 96
86 92 93 93 92 94 96
85 92 93 93 92 94 95
84 91 92 92 91 93 95
83 91 92 92 91 93 95
82 90 91 91 90 93 94
81 89 91 91 89 92 94
80 88 90 90 89 92 94
79 86 89 89 88 91 93
78 85 88 88 88 91 93
77 83 86 87 87 90 93
76 82 85 86 87 90 93
75 80 84 85 86 89 92
74 79 83 84 86 87 92
73 77 81 83 85 85 92
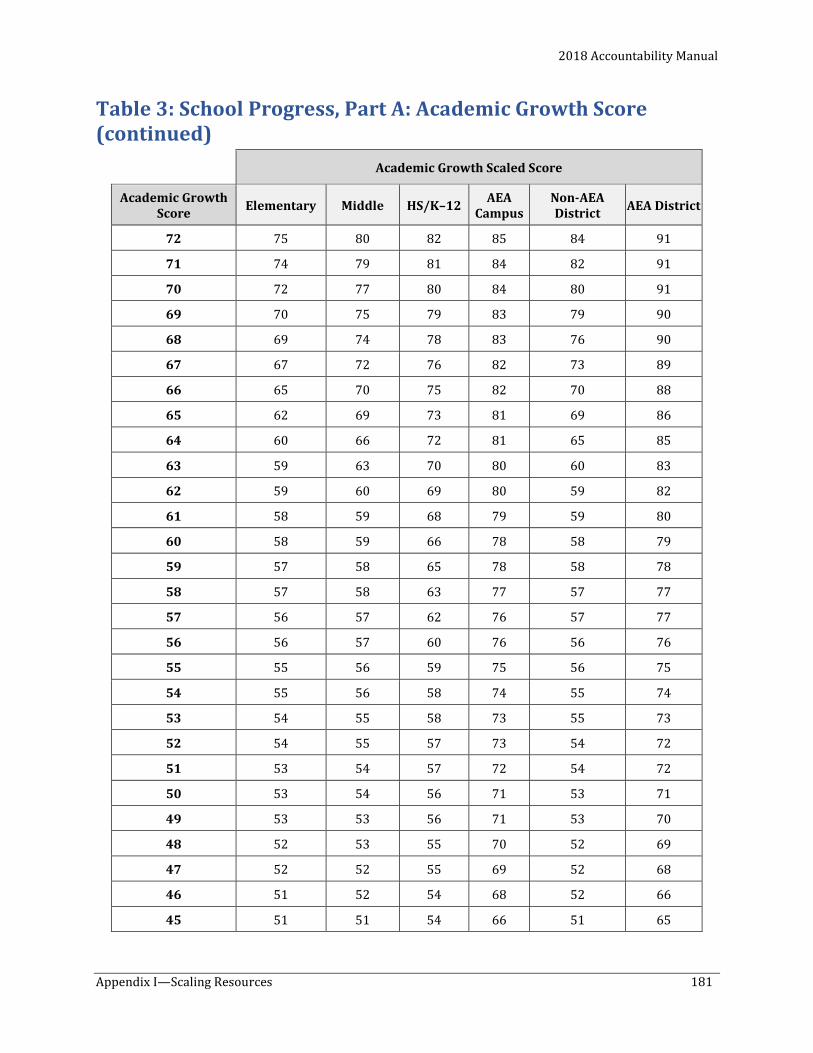
2018 Accountability Manual
Appendix I—Scaling Resources 181
Table 3: School Progress, Part A: Academic Growth Score (continued)
Academic Growth Scaled Score
Academic Growth Score Elementary Middle HS/K–12 AEA
Campus Non-AEA District AEA District
72 75 80 82 85 84 91
71 74 79 81 84 82 91
70 72 77 80 84 80 91
69 70 75 79 83 79 90
68 69 74 78 83 76 90
67 67 72 76 82 73 89
66 65 70 75 82 70 88
65 62 69 73 81 69 86
64 60 66 72 81 65 85
63 59 63 70 80 60 83
62 59 60 69 80 59 82
61 58 59 68 79 59 80
60 58 59 66 78 58 79
59 57 58 65 78 58 78
58 57 58 63 77 57 77
57 56 57 62 76 57 77
56 56 57 60 76 56 76
55 55 56 59 75 56 75
54 55 56 58 74 55 74
53 54 55 58 73 55 73
52 54 55 57 73 54 72
51 53 54 57 72 54 72
50 53 54 56 71 53 71
49 53 53 56 71 53 70
48 52 53 55 70 52 69
47 52 52 55 69 52 68
46 51 52 54 68 52 66
45 51 51 54 66 51 65
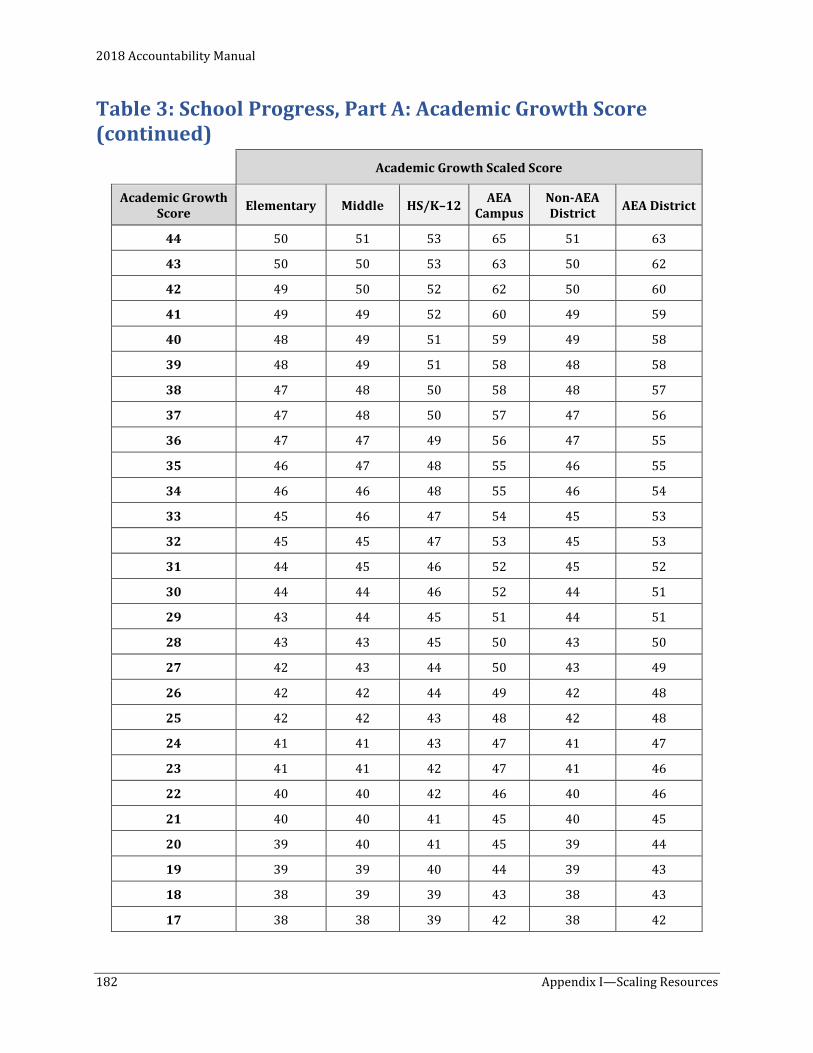
2018 Accountability Manual
182 Appendix I—Scaling Resources
Table 3: School Progress, Part A: Academic Growth Score (continued)
Academic Growth Scaled Score
Academic Growth Score Elementary Middle HS/K–12 AEA
Campus Non-AEA District AEA District
44 50 51 53 65 51 63
43 50 50 53 63 50 62
42 49 50 52 62 50 60
41 49 49 52 60 49 59
40 48 49 51 59 49 58
39 48 49 51 58 48 58
38 47 48 50 58 48 57
37 47 48 50 57 47 56
36 47 47 49 56 47 55
35 46 47 48 55 46 55
34 46 46 48 55 46 54
33 45 46 47 54 45 53
32 45 45 47 53 45 53
31 44 45 46 52 45 52
30 44 44 46 52 44 51
29 43 44 45 51 44 51
28 43 43 45 50 43 50
27 42 43 44 50 43 49
26 42 42 44 49 42 48
25 42 42 43 48 42 48
24 41 41 43 47 41 47
23 41 41 42 47 41 46
22 40 40 42 46 40 46
21 40 40 41 45 40 45
20 39 40 41 45 39 44
19 39 39 40 44 39 43
18 38 39 39 43 38 43
17 38 38 39 42 38 42
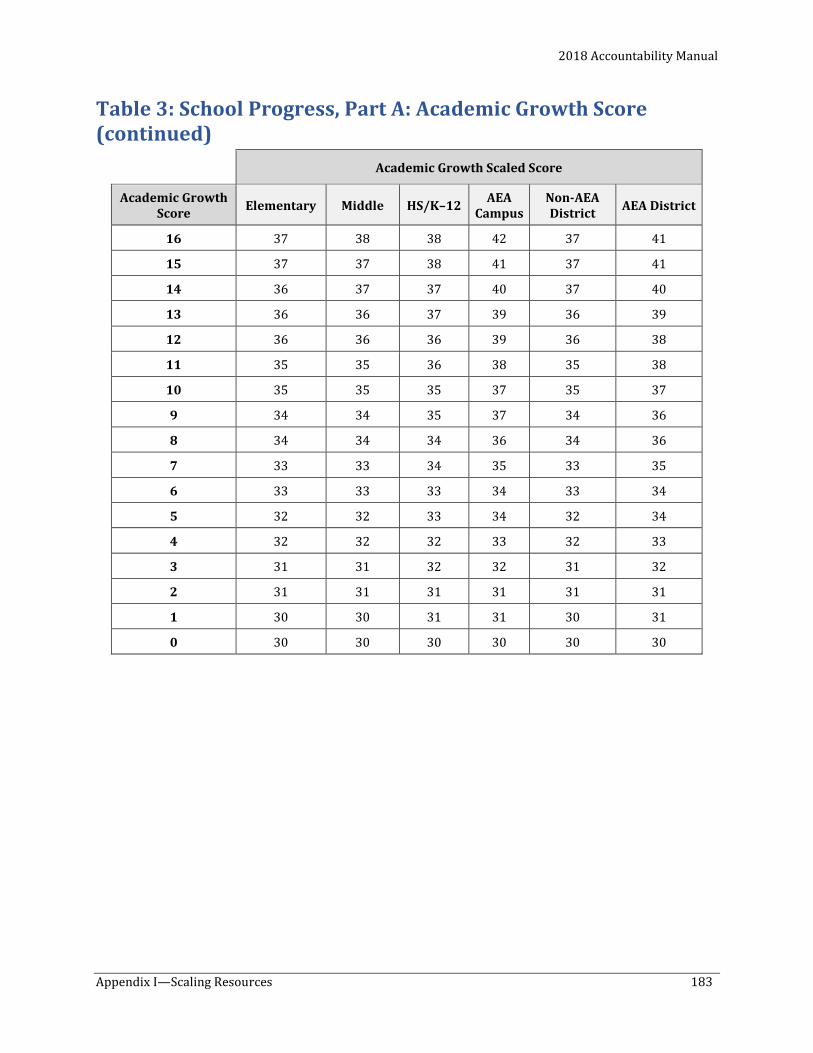
2018 Accountability Manual
Appendix I—Scaling Resources 183
Table 3: School Progress, Part A: Academic Growth Score (continued)
Academic Growth Scaled Score
Academic Growth Score Elementary Middle HS/K–12 AEA
Campus Non-AEA District AEA District
16 37 38 38 42 37 41
15 37 37 38 41 37 41
14 36 37 37 40 37 40
13 36 36 37 39 36 39
12 36 36 36 39 36 38
11 35 35 36 38 35 38
10 35 35 35 37 35 37
9 34 34 35 37 34 36
8 34 34 34 36 34 36
7 33 33 34 35 33 35
6 33 33 33 34 33 34
5 32 32 33 34 32 34
4 32 32 32 33 32 33
3 31 31 32 32 31 32
2 31 31 31 31 31 31
1 30 30 31 31 30 31
0 30 30 30 30 30 30
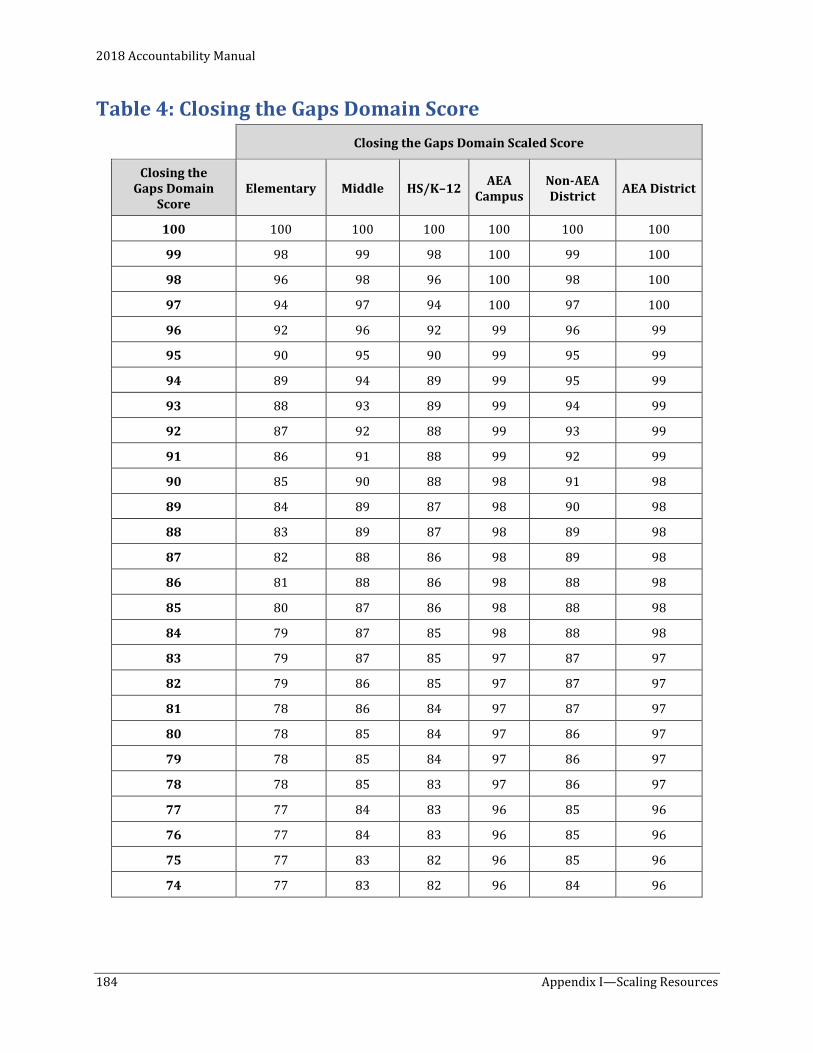
2018 Accountability Manual
184 Appendix I—Scaling Resources
Table 4: Closing the Gaps Domain Score Closing the Gaps Domain Scaled Score
Closing the Gaps Domain
Score Elementary Middle HS/K–12 AEA
Campus Non-AEA District AEA District
100 100 100 100 100 100 100
99 98 99 98 100 99 100
98 96 98 96 100 98 100
97 94 97 94 100 97 100
96 92 96 92 99 96 99
95 90 95 90 99 95 99
94 89 94 89 99 95 99
93 88 93 89 99 94 99
92 87 92 88 99 93 99
91 86 91 88 99 92 99
90 85 90 88 98 91 98
89 84 89 87 98 90 98
88 83 89 87 98 89 98
87 82 88 86 98 89 98
86 81 88 86 98 88 98
85 80 87 86 98 88 98
84 79 87 85 98 88 98
83 79 87 85 97 87 97
82 79 86 85 97 87 97
81 78 86 84 97 87 97
80 78 85 84 97 86 97
79 78 85 84 97 86 97
78 78 85 83 97 86 97
77 77 84 83 96 85 96
76 77 84 83 96 85 96
75 77 83 82 96 85 96
74 77 83 82 96 84 96
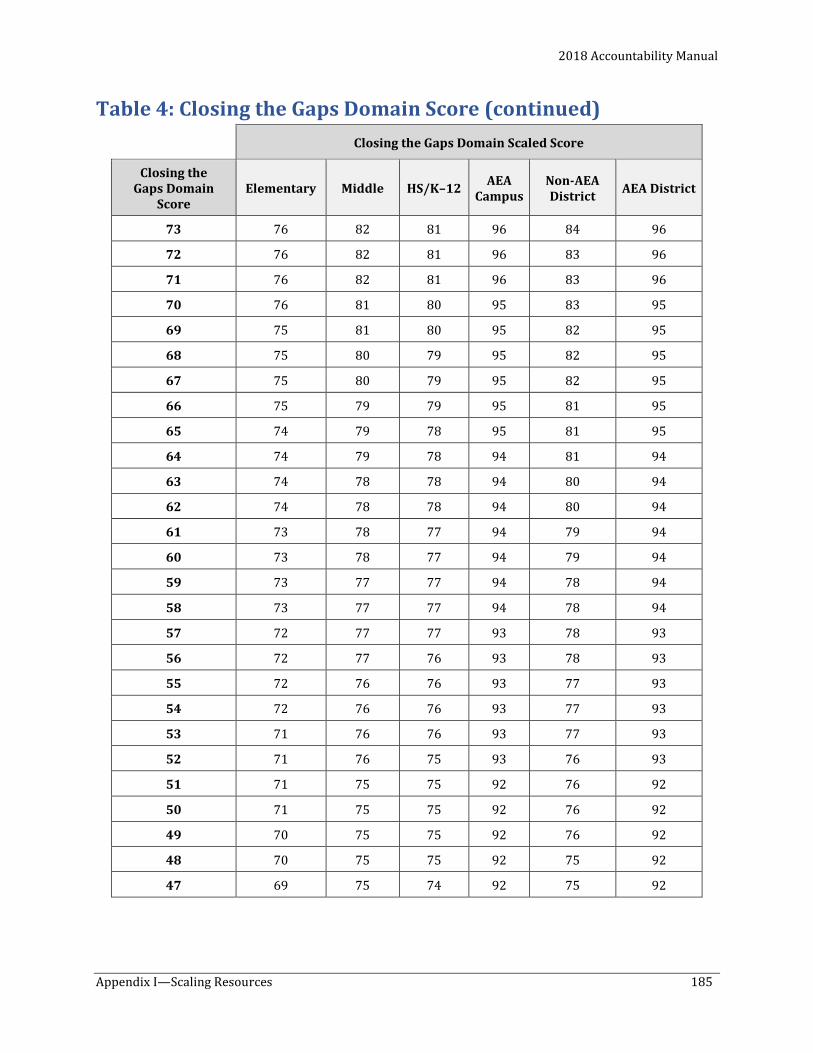
2018 Accountability Manual
Appendix I—Scaling Resources 185
Table 4: Closing the Gaps Domain Score (continued) Closing the Gaps Domain Scaled Score
Closing the Gaps Domain
Score Elementary Middle HS/K–12 AEA
Campus Non-AEA District AEA District
73 76 82 81 96 84 96
72 76 82 81 96 83 96
71 76 82 81 96 83 96
70 76 81 80 95 83 95
69 75 81 80 95 82 95
68 75 80 79 95 82 95
67 75 80 79 95 82 95
66 75 79 79 95 81 95
65 74 79 78 95 81 95
64 74 79 78 94 81 94
63 74 78 78 94 80 94
62 74 78 78 94 80 94
61 73 78 77 94 79 94
60 73 78 77 94 79 94
59 73 77 77 94 78 94
58 73 77 77 94 78 94
57 72 77 77 93 78 93
56 72 77 76 93 78 93
55 72 76 76 93 77 93
54 72 76 76 93 77 93
53 71 76 76 93 77 93
52 71 76 75 93 76 93
51 71 75 75 92 76 92
50 71 75 75 92 76 92
49 70 75 75 92 76 92
48 70 75 75 92 75 92
47 69 75 74 92 75 92
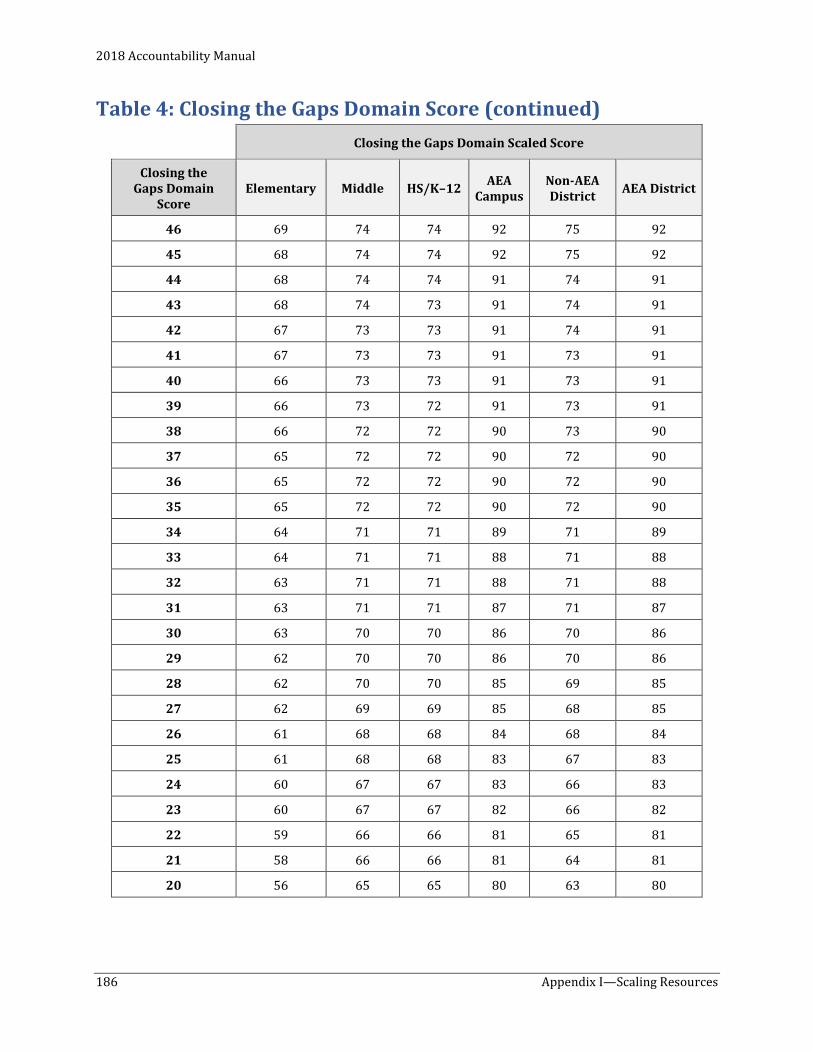
2018 Accountability Manual
186 Appendix I—Scaling Resources
Table 4: Closing the Gaps Domain Score (continued) Closing the Gaps Domain Scaled Score
Closing the Gaps Domain
Score Elementary Middle HS/K–12 AEA
Campus Non-AEA District AEA District
46 69 74 74 92 75 92
45 68 74 74 92 75 92
44 68 74 74 91 74 91
43 68 74 73 91 74 91
42 67 73 73 91 74 91
41 67 73 73 91 73 91
40 66 73 73 91 73 91
39 66 73 72 91 73 91
38 66 72 72 90 73 90
37 65 72 72 90 72 90
36 65 72 72 90 72 90
35 65 72 72 90 72 90
34 64 71 71 89 71 89
33 64 71 71 88 71 88
32 63 71 71 88 71 88
31 63 71 71 87 71 87
30 63 70 70 86 70 86
29 62 70 70 86 70 86
28 62 70 70 85 69 85
27 62 69 69 85 68 85
26 61 68 68 84 68 84
25 61 68 68 83 67 83
24 60 67 67 83 66 83
23 60 67 67 82 66 82
22 59 66 66 81 65 81
21 58 66 66 81 64 81
20 56 65 65 80 63 80
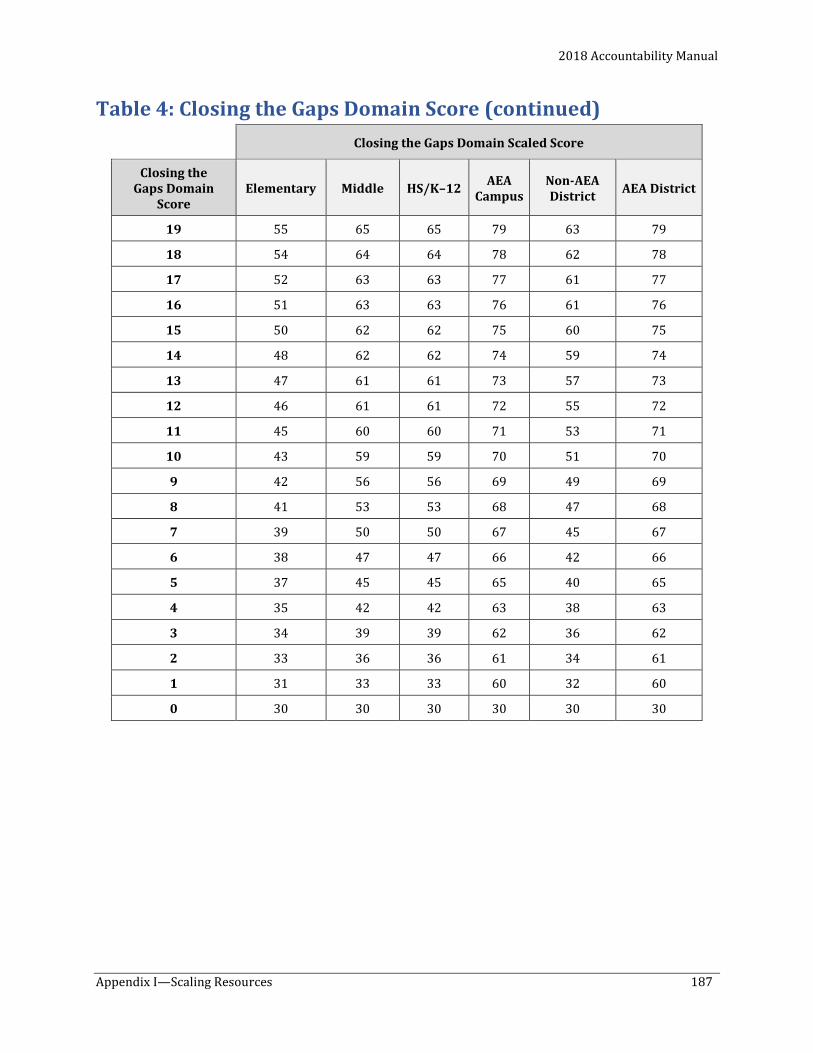
2018 Accountability Manual
Appendix I—Scaling Resources 187
Table 4: Closing the Gaps Domain Score (continued) Closing the Gaps Domain Scaled Score
Closing the Gaps Domain
Score Elementary Middle HS/K–12 AEA
Campus Non-AEA District AEA District
19 55 65 65 79 63 79
18 54 64 64 78 62 78
17 52 63 63 77 61 77
16 51 63 63 76 61 76
15 50 62 62 75 60 75
14 48 62 62 74 59 74
13 47 61 61 73 57 73
12 46 61 61 72 55 72
11 45 60 60 71 53 71
10 43 59 59 70 51 70
9 42 56 56 69 49 69
8 41 53 53 68 47 68
7 39 50 50 67 45 67
6 38 47 47 66 42 66
5 37 45 45 65 40 65
4 35 42 42 63 38 63
3 34 39 39 62 36 62
2 33 36 36 61 34 61
1 31 33 33 60 32 60
0 30 30 30 30 30 30

This page is intentionally blank.
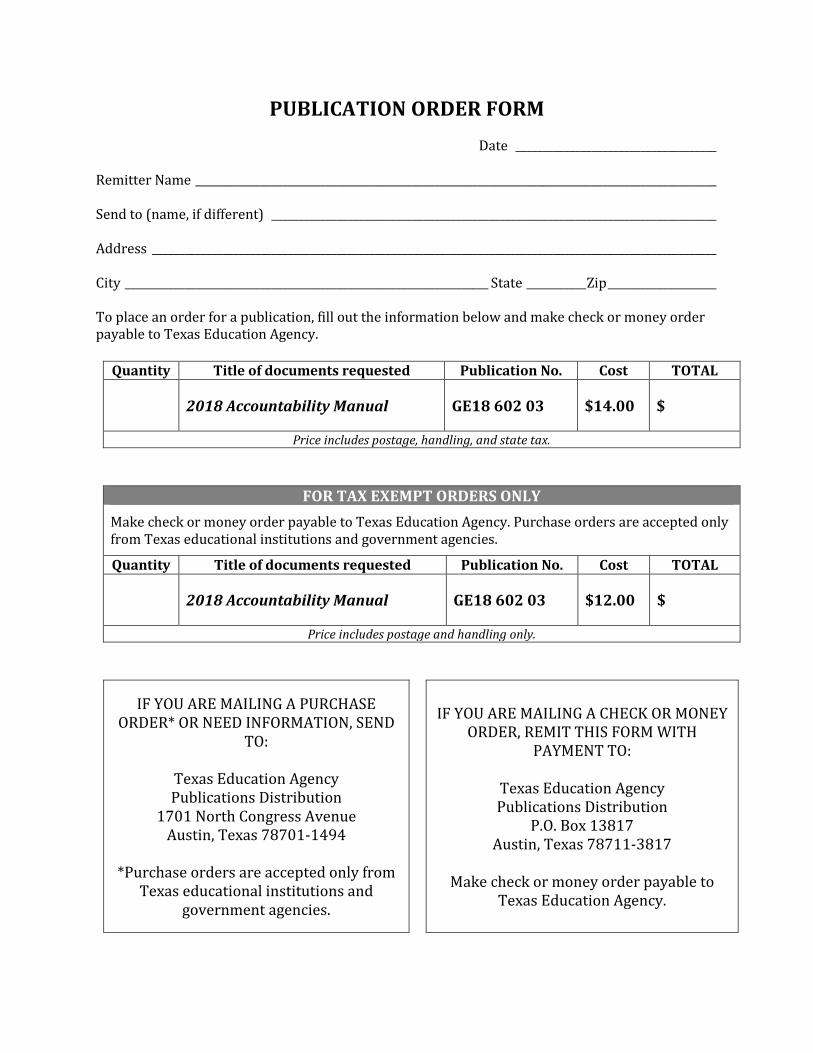
PUBLICATION ORDER FORM Date _____________________________________
Remitter Name ________________________________________________________________________________________________
Send to (name, if different) __________________________________________________________________________________
Address ________________________________________________________________________________________________________
City ___________________________________________________________________ State ___________ Zip ____________________
To place an order for a publication, fill out the information below and make check or money order payable to Texas Education Agency.
Quantity Title of documents requested Publication No. Cost TOTAL
2018 Accountability Manual GE18 602 03 $14.00 $
Price includes postage, handling, and state tax.
FOR TAX EXEMPT ORDERS ONLY Make check or money order payable to Texas Education Agency. Purchase orders are accepted only from Texas educational institutions and government agencies.
Quantity Title of documents requested Publication No. Cost TOTAL
2018 Accountability Manual GE18 602 03 $12.00 $
Price includes postage and handling only.
IF YOU ARE MAILING A PURCHASE ORDER* OR NEED INFORMATION, SEND
TO:
Texas Education Agency Publications Distribution
1701 North Congress Avenue Austin, Texas 78701-1494
*Purchase orders are accepted only fromTexas educational institutions and
government agencies.
IF YOU ARE MAILING A CHECK OR MONEY ORDER, REMIT THIS FORM WITH
PAYMENT TO:
Texas Education Agency Publications Distribution
P.O. Box 13817 Austin, Texas 78711-3817
Make check or money order payable to Texas Education Agency.
Texas Education Agency 1701 North Congress Avenue
Austin, Texas 78701-1494
GE18 602 03 August 2018