Embed Size (px)
Citation preview
Infratil Limited 5 Market Lane, PO Box 320, Wellington, New Zealand Tel +64-4-473 3663 www.infratil.com
17 May 2018 Infratil Limited Results for the Year Ended 31 March 2018 Infratil’s consolidated Underlying EBITDAF1 was $552.4 million, up 6.3% from the $519.5 million reported in 2017. Underlying EBITDAF1 was above the guidance level as a result of associate investment valuations. Net parent surplus was $60.5 million compared to $66.1 million in the prior period. While the higher Underlying EBITDAF1 resulted in higher operating cash flow (up 21% to $295.8 million from $245.0 million), the net surplus was impacted by higher depreciation, tax and minorities, partially offset by lower interest costs. Infratil had a positive year of operating performance and capital allocation and is well placed to provide good returns going forward. For the year ended 31 March 2018, Infratil invested $325.9 million through its businesses and platforms. These investments provide the source of future income and value growth. Each of last year’s new investments, Canberra Data Centres, Longroad Energy and ANU Student Accommodation, performed above expectations. Wellington Airport and Trustpower delivered record results. Additional capital was provided to RetireAustralia to enable a doubling of its rate of development, and Tilt Renewables commenced construction of a wind farm in Victoria and contracted the electricity output. As at 31 March 2018, Infratil net debt was $780 million and represented 31% of capital. Infratil has undrawn bank facilities of $269 million. Infratil has declared a final ordinary dividend of 10.75 cps, fully imputed, payable on 18 June 2018 to shareholders recorded as owners by the registry as at 5 June 2018, bringing the full year dividend to 16.75 cps. Infratil’s capital structure and confidence in outlook are positive for continued growth in dividends per share, with potential for a higher dividend as Longroad development gains are realised. Based on current portfolio composition, the imputation credit forecast supports ~9 to 10 cps fully imputed annually. Infratil has provided normalised Underlying EBITDAF1 guidance of $500 – $540 million for the 2019 financial year, compared to $478 million normalised Underlying EBITDAF for the 2018 financial year.
Contact: Mark Flesher, Investor Relations, Infratil Limited [email protected]
1 Underlying EBITDAF is a non-GAAP measure of financial performance, presented to show management’s view of the underlying business
performance. Underlying EBITDAF represents consolidated net earnings before interest, tax, depreciation, amortisation, financial derivative movements, revaluations, gains or losses on the sales of investments, and includes Infratil’s share of its associates’ underlying profits (Canberra Data Centres, Longroad Energy, RetireAustralia and ANU Student Accommodation). Underlying profit for RetireAustralia removes the impact of unrealised fair value movements on investment properties and impairment of property, plant and equipment. A reconciliation from Net Parent Surplus to Underlying EBITDAF is provided in Infratil’s Annual Report 2018.
For
per
sona
l use
onl
y

Infratil2018 Full Year Result
17 May 2018For
per
sona
l use
onl
y
Full Year Overview New platforms gathering momentum while core businesses deliver strong results
Infratil Full Year results presentation 20182
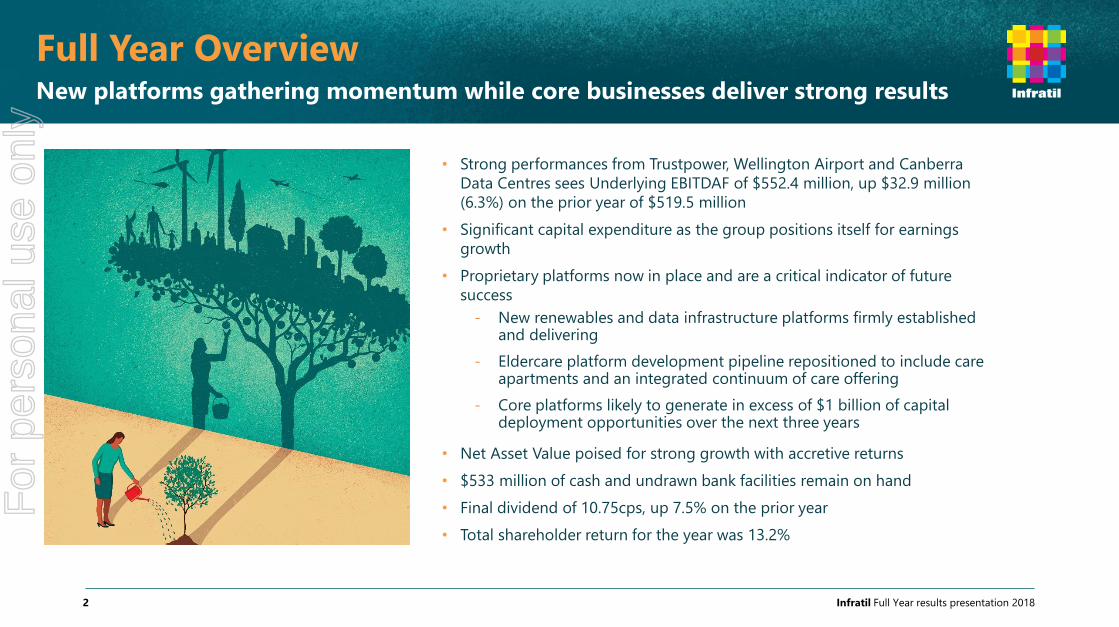
• Strong performances from Trustpower, Wellington Airport and Canberra
Data Centres sees Underlying EBITDAF of $552.4 million, up $32.9 million
(6.3%) on the prior year of $519.5 million
• Significant capital expenditure as the group positions itself for earnings
growth
• Proprietary platforms now in place and are a critical indicator of future
success
- New renewables and data infrastructure platforms firmly established and delivering
- Eldercare platform development pipeline repositioned to include care apartments and an integrated continuum of care offering
- Core platforms likely to generate in excess of $1 billion of capital deployment opportunities over the next three years
• Net Asset Value poised for strong growth with accretive returns
• $533 million of cash and undrawn bank facilities remain on hand
• Final dividend of 10.75cps, up 7.5% on the prior year
• Total shareholder return for the year was 13.2%
For
per
sona
l use
onl
y
Financial Highlights6.3% growth in Underlying EBITDAF drives a strong full year result
Infratil Full Year results presentation 20183
1Underlying EBITDAF is a non-GAAP measure of financial performance, presented to show management’s view of the underlying business performance. Underlying EBITDAF represents consolidated net
earnings before interest, tax, depreciation, amortisation, financial derivative movements, revaluations, gains or losses on the sales of investments, and includes Infratil’s share of RetireAustralia’s
underlying profits (and Metlifecare in the prior year). Underlying profit is a common performance measure used by retirement companies and removes the impact of unrealised fair value movements on
investment properties, impairment of property, plant and equipment, one-off gains and deferred taxation, and includes realised resale gains and realised development margins. A reconciliation of
Underlying EBITDAF is provided in Appendix I
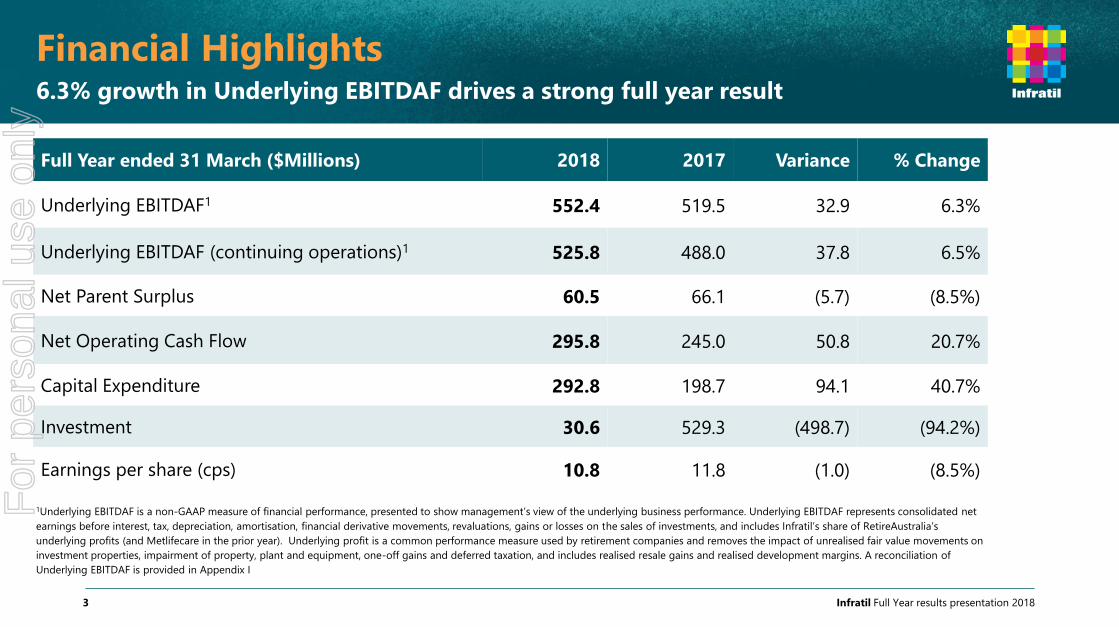
Full Year ended 31 March ($Millions) 2018 2017 Variance % Change
Underlying EBITDAF1 552.4 519.5 32.9 6.3%
Underlying EBITDAF (continuing operations)1 525.8 488.0 37.8 6.5%
Net Parent Surplus 60.5 66.1 (5.7) (8.5%)
Net Operating Cash Flow 295.8 245.0 50.8 20.7%
Capital Expenditure 292.8 198.7 94.1 40.7%
Investment 30.6 529.3 (498.7) (94.2%)
Earnings per share (cps) 10.8 11.8 (1.0) (8.5%)
For
per
sona
l use
onl
y
Results SummaryHigher NPAT but lower net parent surplus from slightly lower consolidated revenues
Infratil Full Year results presentation 20184
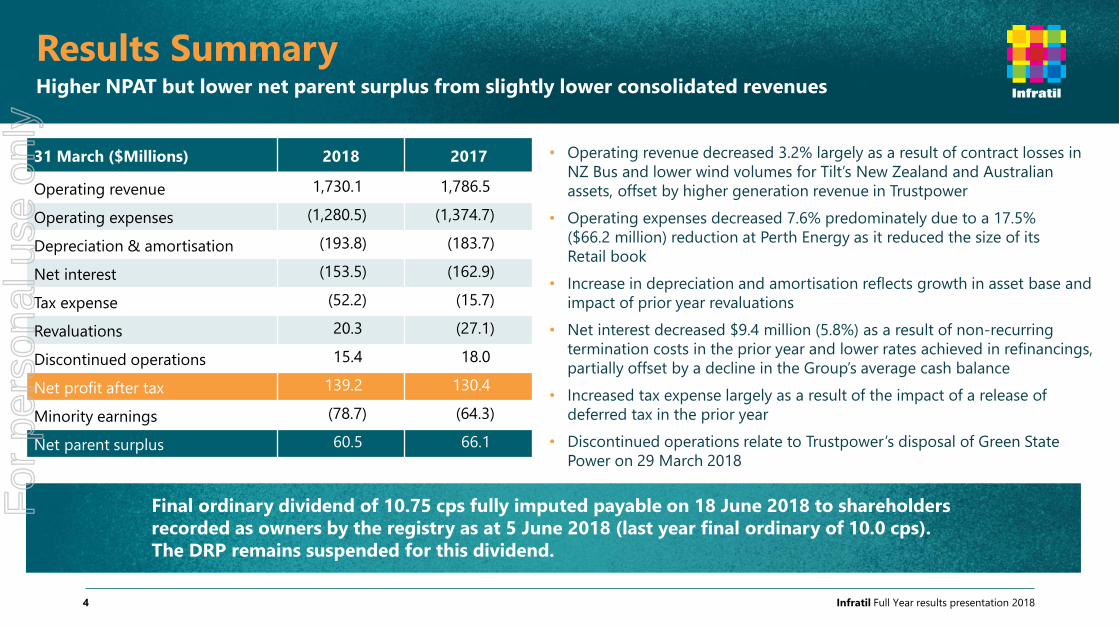
• Operating revenue decreased 3.2% largely as a result of contract losses in
NZ Bus and lower wind volumes for Tilt’s New Zealand and Australian
assets, offset by higher generation revenue in Trustpower
• Operating expenses decreased 7.6% predominately due to a 17.5%
($66.2 million) reduction at Perth Energy as it reduced the size of its
Retail book
• Increase in depreciation and amortisation reflects growth in asset base and
impact of prior year revaluations
• Net interest decreased $9.4 million (5.8%) as a result of non-recurring
termination costs in the prior year and lower rates achieved in refinancings,
partially offset by a decline in the Group’s average cash balance
• Increased tax expense largely as a result of the impact of a release of
deferred tax in the prior year
• Discontinued operations relate to Trustpower’s disposal of Green State
Power on 29 March 2018
Final ordinary dividend of 10.75 cps fully imputed payable on 18 June 2018 to shareholders
recorded as owners by the registry as at 5 June 2018 (last year final ordinary of 10.0 cps).
The DRP remains suspended for this dividend.
31 March ($Millions) 2018 2017
Operating revenue 1,730.1 1,786.5
Operating expenses (1,280.5) (1,374.7)
Depreciation & amortisation (193.8) (183.7)
Net interest (153.5) (162.9)
Tax expense (52.2) (15.7)
Revaluations 20.3 (27.1)
Discontinued operations 15.4 18.0
Net profit after tax 139.2 130.4
Minority earnings (78.7) (64.3)
Net parent surplus 60.5 66.1
For
per
sona
l use
onl
y
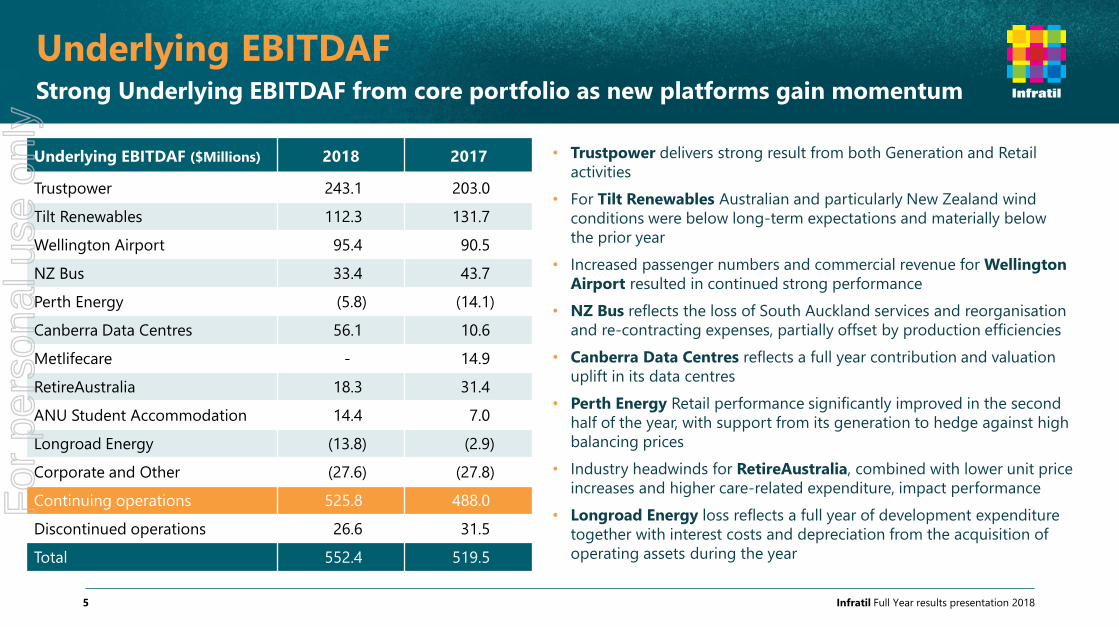
Underlying EBITDAF Strong Underlying EBITDAF from core portfolio as new platforms gain momentum
Infratil Full Year results presentation 20185
• Trustpower delivers strong result from both Generation and Retail
activities
• For Tilt Renewables Australian and particularly New Zealand wind
conditions were below long-term expectations and materially below
the prior year
• Increased passenger numbers and commercial revenue for Wellington
Airport resulted in continued strong performance
• NZ Bus reflects the loss of South Auckland services and reorganisation
and re-contracting expenses, partially offset by production efficiencies
• Canberra Data Centres reflects a full year contribution and valuation
uplift in its data centres
• Perth Energy Retail performance significantly improved in the second
half of the year, with support from its generation to hedge against high
balancing prices
• Industry headwinds for RetireAustralia, combined with lower unit price
increases and higher care-related expenditure, impact performance
• Longroad Energy loss reflects a full year of development expenditure
together with interest costs and depreciation from the acquisition of
operating assets during the year
Underlying EBITDAF ($Millions) 2018 2017
Trustpower 243.1 203.0
Tilt Renewables 112.3 131.7
Wellington Airport 95.4 90.5
NZ Bus 33.4 43.7
Perth Energy (5.8) (14.1)
Canberra Data Centres 56.1 10.6
Metlifecare - 14.9
RetireAustralia 18.3 31.4
ANU Student Accommodation 14.4 7.0
Longroad Energy (13.8) (2.9)
Corporate and Other (27.6) (27.8)
Continuing operations 525.8 488.0
Discontinued operations 26.6 31.5
Total 552.4 519.5
For
per
sona
l use
onl
y
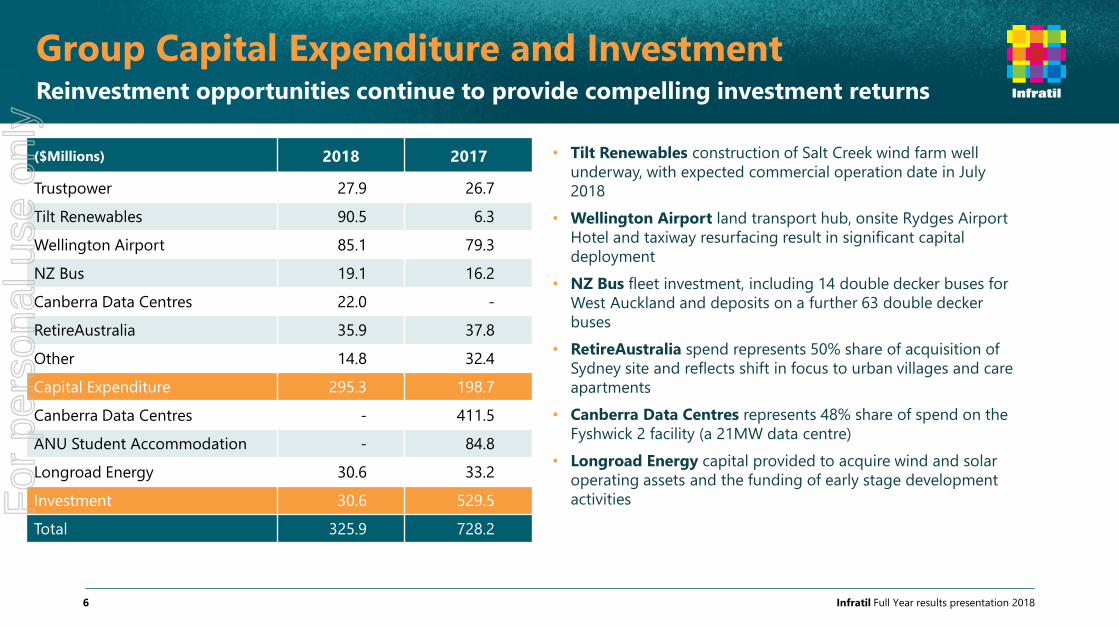
Group Capital Expenditure and Investment Reinvestment opportunities continue to provide compelling investment returns
Infratil Full Year results presentation 20186
• Tilt Renewables construction of Salt Creek wind farm well
underway, with expected commercial operation date in July
2018
• Wellington Airport land transport hub, onsite Rydges Airport
Hotel and taxiway resurfacing result in significant capital
deployment
• NZ Bus fleet investment, including 14 double decker buses for
West Auckland and deposits on a further 63 double decker
buses
• RetireAustralia spend represents 50% share of acquisition of
Sydney site and reflects shift in focus to urban villages and care
apartments
• Canberra Data Centres represents 48% share of spend on the
Fyshwick 2 facility (a 21MW data centre)
• Longroad Energy capital provided to acquire wind and solar
operating assets and the funding of early stage development
activities
($Millions) 2018 2017
Trustpower 27.9 26.7
Tilt Renewables 90.5 6.3
Wellington Airport 85.1 79.3
NZ Bus 19.1 16.2
Canberra Data Centres 22.0 -
RetireAustralia 35.9 37.8
Other 14.8 32.4
Capital Expenditure 295.3 198.7
Canberra Data Centres - 411.5
ANU Student Accommodation - 84.8
Longroad Energy 30.6 33.2
Investment 30.6 529.5
Total 325.9 728.2
For
per
sona
l use
onl
y
Infratil Full Year results presentation 20187
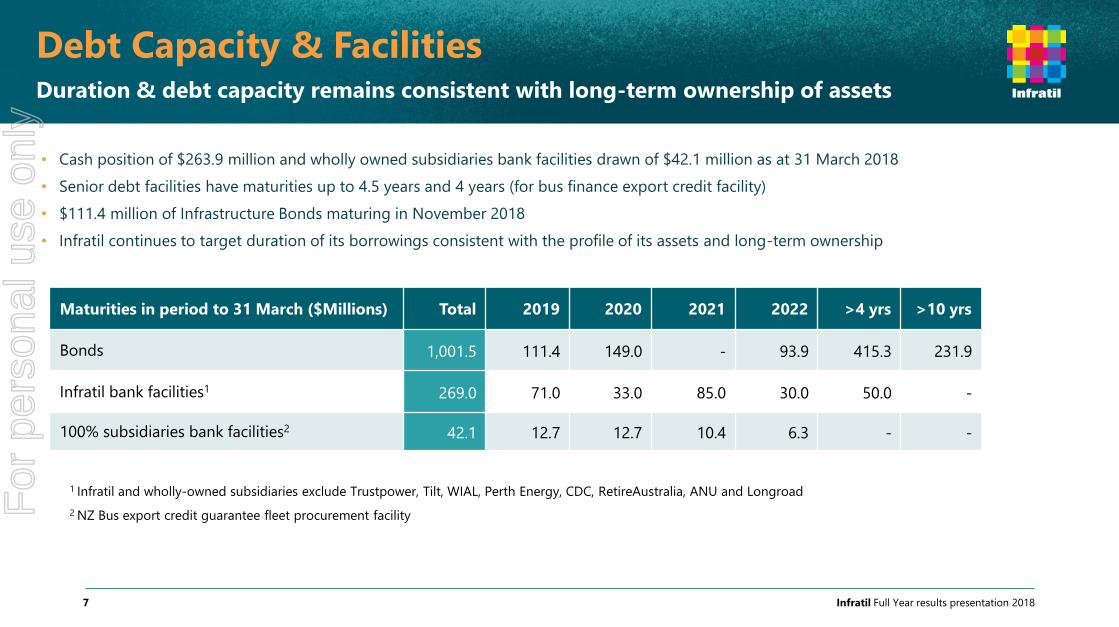
• Cash position of $263.9 million and wholly owned subsidiaries bank facilities drawn of $42.1 million as at 31 March 2018
• Senior debt facilities have maturities up to 4.5 years and 4 years (for bus finance export credit facility)
• $111.4 million of Infrastructure Bonds maturing in November 2018
• Infratil continues to target duration of its borrowings consistent with the profile of its assets and long-term ownership
Maturities in period to 31 March ($Millions) Total 2019 2020 2021 2022 >4 yrs >10 yrs
Bonds 1,001.5 111.4 149.0 - 93.9 415.3 231.9
Infratil bank facilities1 269.0 71.0 33.0 85.0 30.0 50.0 -
100% subsidiaries bank facilities2 42.1 12.7 12.7 10.4 6.3 - -
1 Infratil and wholly-owned subsidiaries exclude Trustpower, Tilt, WIAL, Perth Energy, CDC, RetireAustralia, ANU and Longroad
2 NZ Bus export credit guarantee fleet procurement facility
Debt Capacity & Facilities Duration & debt capacity remains consistent with long-term ownership of assets
For
per
sona
l use
onl
y
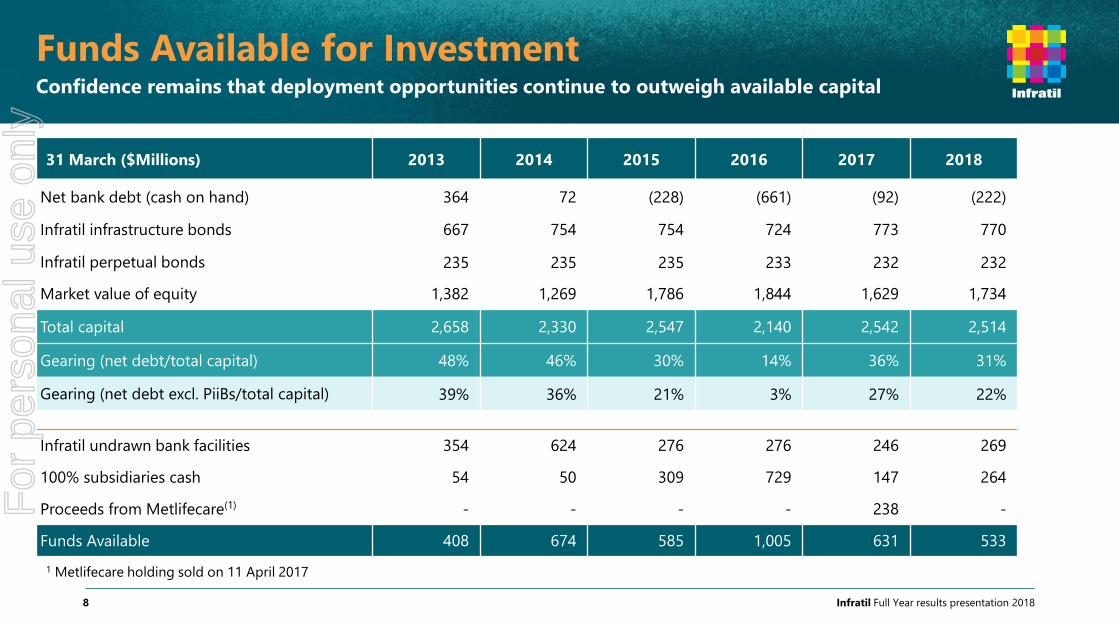
Funds Available for Investment Confidence remains that deployment opportunities continue to outweigh available capital
Infratil Full Year results presentation 20188
31 March ($Millions) 2013 2014 2015 2016 2017 2018
Net bank debt (cash on hand) 364 72 (228) (661) (92) (222)
Infratil infrastructure bonds 667 754 754 724 773 770
Infratil perpetual bonds 235 235 235 233 232 232
Market value of equity 1,382 1,269 1,786 1,844 1,629 1,734
Total capital 2,658 2,330 2,547 2,140 2,542 2,514
Gearing (net debt/total capital) 48% 46% 30% 14% 36% 31%
Gearing (net debt excl. PiiBs/total capital) 39% 36% 21% 3% 27% 22%
Infratil undrawn bank facilities 354 624 276 276 246 269
100% subsidiaries cash 54 50 309 729 147 264
Proceeds from Metlifecare(1) - - - - 238 -
Funds Available 408 674 585 1,005 631 533
1 Metlifecare holding sold on 11 April 2017
For
per
sona
l use
onl
y
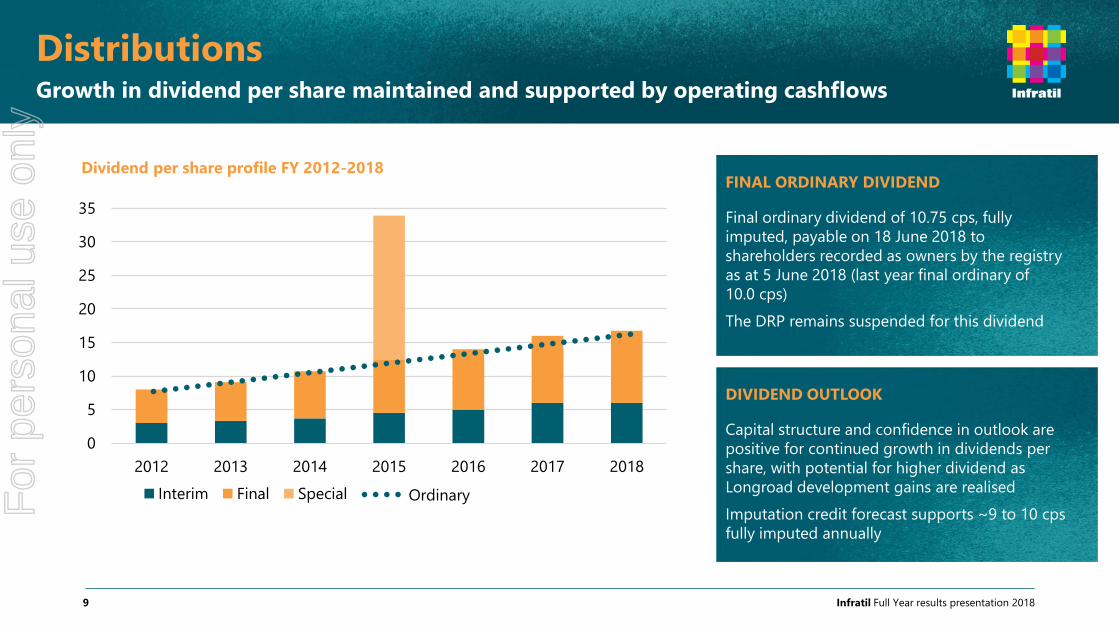
DistributionsGrowth in dividend per share maintained and supported by operating cashflows
Infratil Full Year results presentation 20189
FINAL ORDINARY DIVIDEND
Final ordinary dividend of 10.75 cps, fully
imputed, payable on 18 June 2018 to
shareholders recorded as owners by the registry
as at 5 June 2018 (last year final ordinary of
10.0 cps)
The DRP remains suspended for this dividend
0
5
10
15
20
25
30
35
2012 2013 2014 2015 2016 2017 2018
Dividend per share profile FY 2012-2018
Interim Final Special Ordinary
DIVIDEND OUTLOOK
Capital structure and confidence in outlook are
positive for continued growth in dividends per
share, with potential for higher dividend as
Longroad development gains are realised
Imputation credit forecast supports ~9 to 10 cps
fully imputed annually
For
per
sona
l use
onl
y
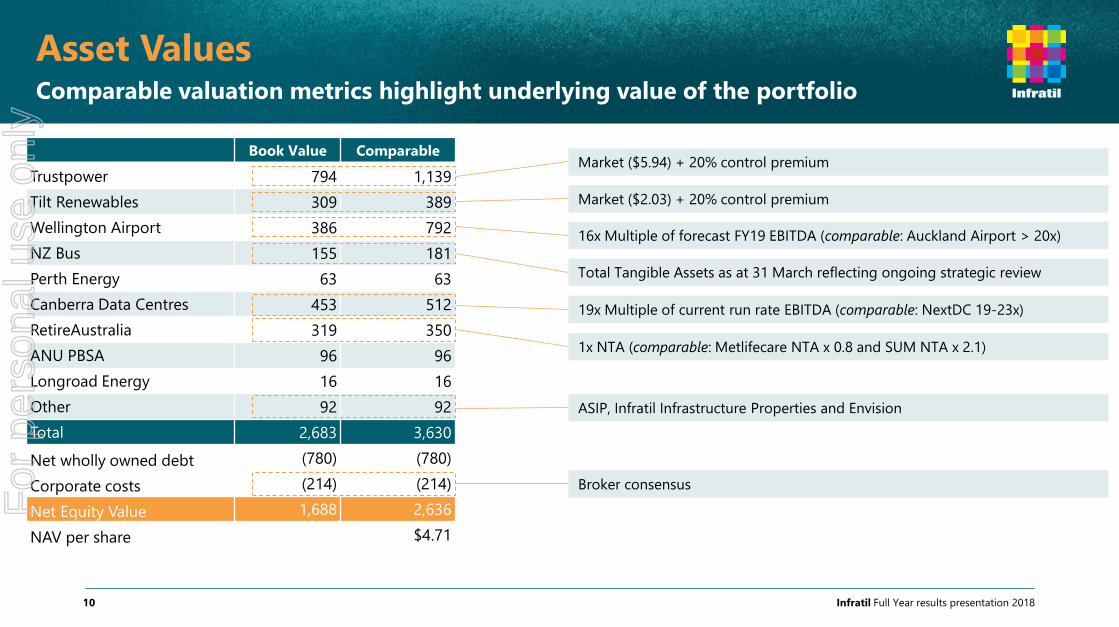
Book Value Comparable
Trustpower 794 1,139
Tilt Renewables 309 389
Wellington Airport 386 792
NZ Bus 155 181
Perth Energy 63 63
Canberra Data Centres 453 512
RetireAustralia 319 350
ANU PBSA 96 96
Longroad Energy 16 16
Other 92 92
Total 2,683 3,630
Net wholly owned debt (780) (780)
Corporate costs (214) (214)
Net Equity Value 1,688 2,636
NAV per share $4.71
Asset Values Comparable valuation metrics highlight underlying value of the portfolio
Infratil Full Year results presentation 201810
1x NTA (comparable: Metlifecare NTA x 0.8 and SUM NTA x 2.1)
19x Multiple of current run rate EBITDA (comparable: NextDC 19-23x)
Total Tangible Assets as at 31 March reflecting ongoing strategic review
16x Multiple of forecast FY19 EBITDA (comparable: Auckland Airport > 20x)
Market ($2.03) + 20% control premium
Market ($5.94) + 20% control premium
ASIP, Infratil Infrastructure Properties and Envision
Broker consensus
For
per
sona
l use
onl
y
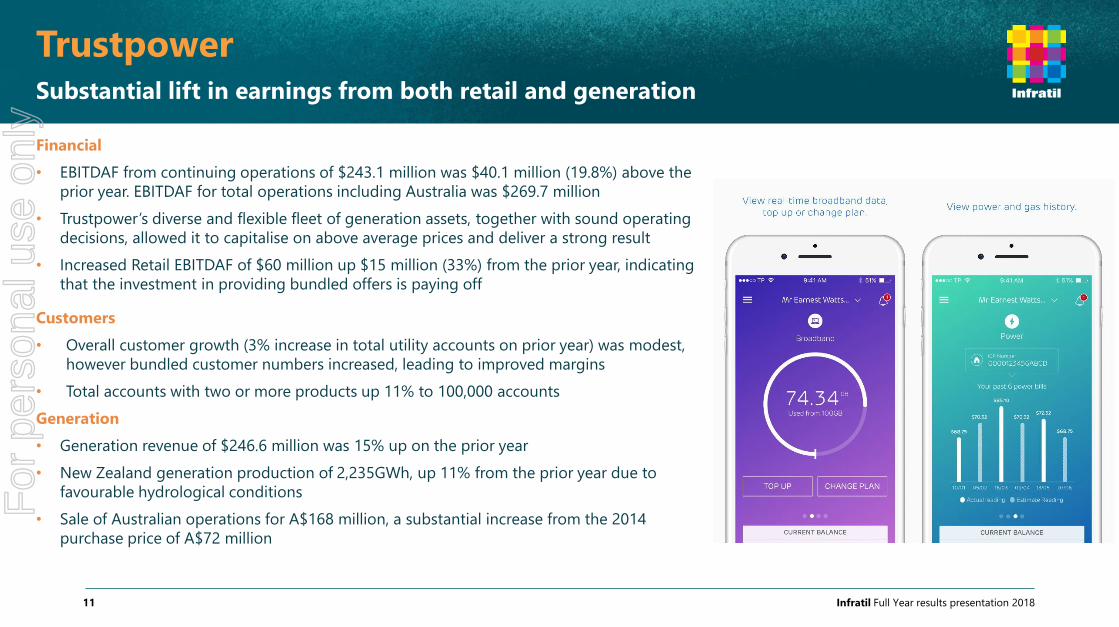
Trustpower Substantial lift in earnings from both retail and generation
Infratil Full Year results presentation 201811
Financial
• EBITDAF from continuing operations of $243.1 million was $40.1 million (19.8%) above the
prior year. EBITDAF for total operations including Australia was $269.7 million
• Trustpower’s diverse and flexible fleet of generation assets, together with sound operating
decisions, allowed it to capitalise on above average prices and deliver a strong result
• Increased Retail EBITDAF of $60 million up $15 million (33%) from the prior year, indicating
that the investment in providing bundled offers is paying off
Customers
• Overall customer growth (3% increase in total utility accounts on prior year) was modest,
however bundled customer numbers increased, leading to improved margins
• Total accounts with two or more products up 11% to 100,000 accounts
Generation
• Generation revenue of $246.6 million was 15% up on the prior year
• New Zealand generation production of 2,235GWh, up 11% from the prior year due to
favourable hydrological conditions
• Sale of Australian operations for A$168 million, a substantial increase from the 2014
purchase price of A$72 million
For
per
sona
l use
onl
y
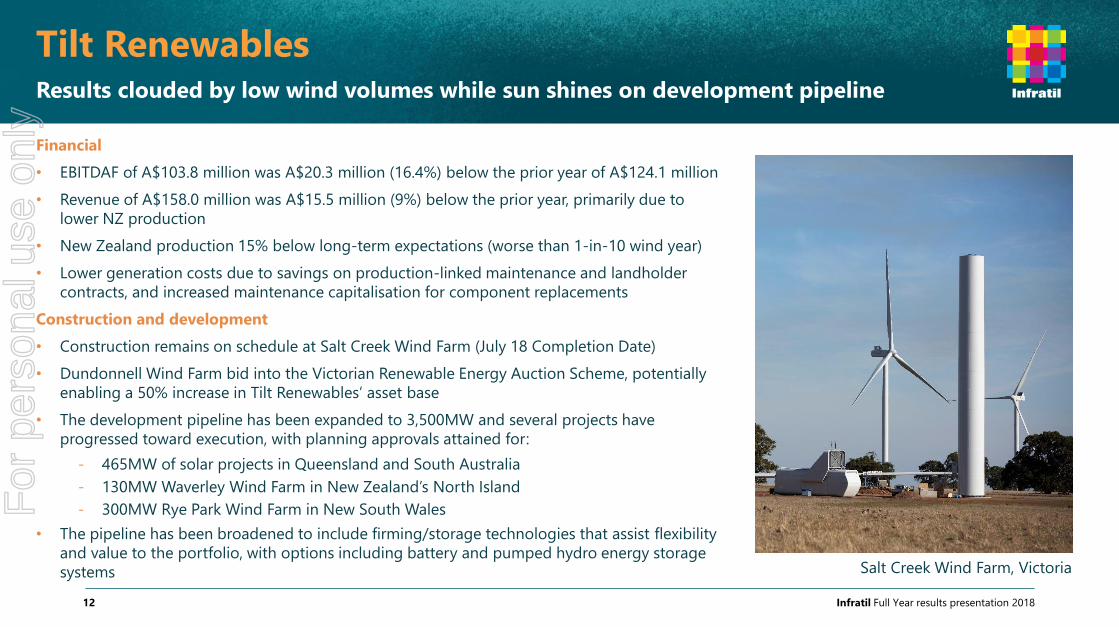
Tilt Renewables Results clouded by low wind volumes while sun shines on development pipeline
Infratil Full Year results presentation 201812
Financial
• EBITDAF of A$103.8 million was A$20.3 million (16.4%) below the prior year of A$124.1 million
• Revenue of A$158.0 million was A$15.5 million (9%) below the prior year, primarily due to
lower NZ production
• New Zealand production 15% below long-term expectations (worse than 1-in-10 wind year)
• Lower generation costs due to savings on production-linked maintenance and landholder
contracts, and increased maintenance capitalisation for component replacements
Construction and development
• Construction remains on schedule at Salt Creek Wind Farm (July 18 Completion Date)
• Dundonnell Wind Farm bid into the Victorian Renewable Energy Auction Scheme, potentially
enabling a 50% increase in Tilt Renewables’ asset base
• The development pipeline has been expanded to 3,500MW and several projects have
progressed toward execution, with planning approvals attained for:
- 465MW of solar projects in Queensland and South Australia
- 130MW Waverley Wind Farm in New Zealand’s North Island
- 300MW Rye Park Wind Farm in New South Wales
• The pipeline has been broadened to include firming/storage technologies that assist flexibility
and value to the portfolio, with options including battery and pumped hydro energy storage
systems Salt Creek Wind Farm, Victoria
For
per
sona
l use
onl
y
Infratil Full Year results presentation 201813
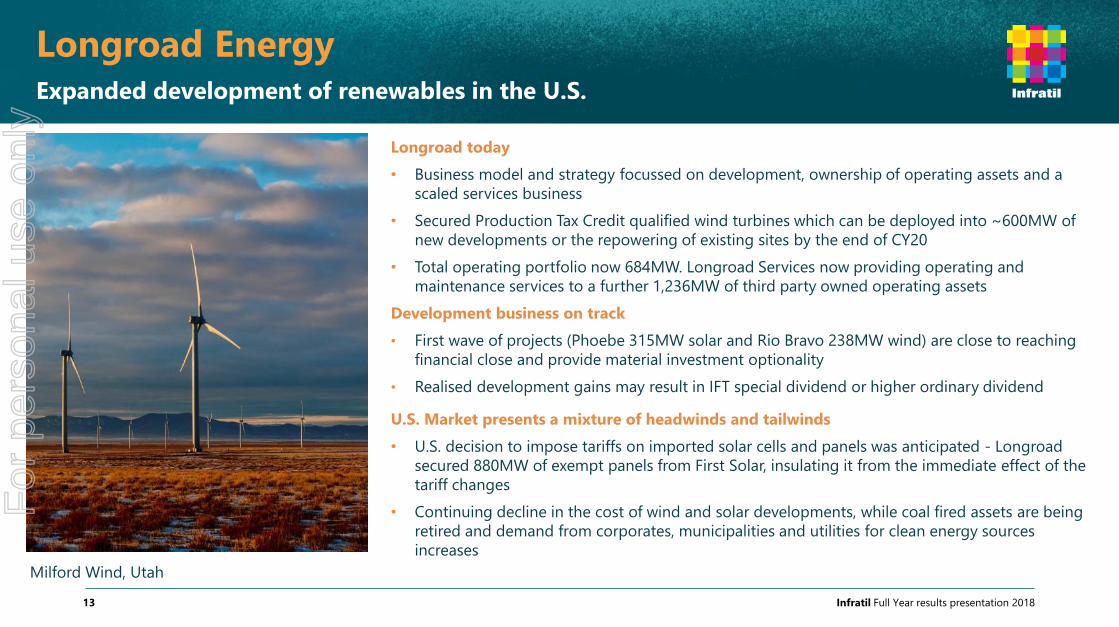
Longroad EnergyExpanded development of renewables in the U.S.
Longroad today
• Business model and strategy focussed on development, ownership of operating assets and a
scaled services business
• Secured Production Tax Credit qualified wind turbines which can be deployed into ~600MW of
new developments or the repowering of existing sites by the end of CY20
• Total operating portfolio now 684MW. Longroad Services now providing operating and
maintenance services to a further 1,236MW of third party owned operating assets
Development business on track
• First wave of projects (Phoebe 315MW solar and Rio Bravo 238MW wind) are close to reaching
financial close and provide material investment optionality
• Realised development gains may result in IFT special dividend or higher ordinary dividend
U.S. Market presents a mixture of headwinds and tailwinds
• U.S. decision to impose tariffs on imported solar cells and panels was anticipated - Longroad
secured 880MW of exempt panels from First Solar, insulating it from the immediate effect of the
tariff changes
• Continuing decline in the cost of wind and solar developments, while coal fired assets are being
retired and demand from corporates, municipalities and utilities for clean energy sources
increases
Milford Wind, Utah
For
per
sona
l use
onl
y
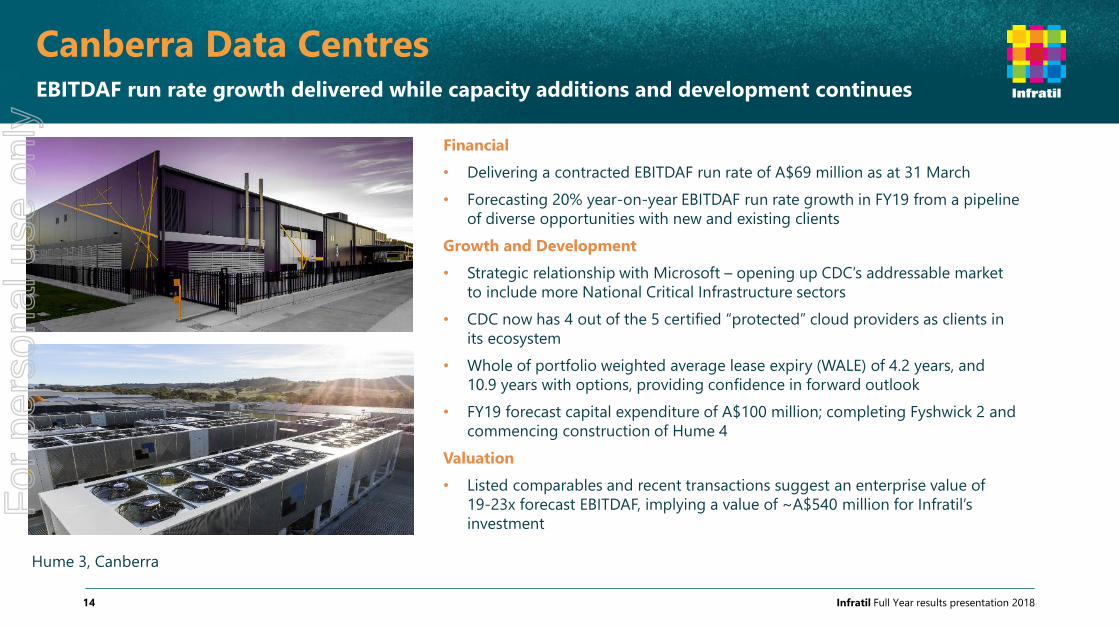
Infratil Full Year results presentation 201814
Financial
• Delivering a contracted EBITDAF run rate of A$69 million as at 31 March
• Forecasting 20% year-on-year EBITDAF run rate growth in FY19 from a pipeline
of diverse opportunities with new and existing clients
Growth and Development
• Strategic relationship with Microsoft – opening up CDC’s addressable market
to include more National Critical Infrastructure sectors
• CDC now has 4 out of the 5 certified “protected” cloud providers as clients in
its ecosystem
• Whole of portfolio weighted average lease expiry (WALE) of 4.2 years, and
10.9 years with options, providing confidence in forward outlook
• FY19 forecast capital expenditure of A$100 million; completing Fyshwick 2 and
commencing construction of Hume 4
Valuation
• Listed comparables and recent transactions suggest an enterprise value of
19-23x forecast EBITDAF, implying a value of ~A$540 million for Infratil’s
investment
Canberra Data CentresEBITDAF run rate growth delivered while capacity additions and development continues
Hume 3, Canberra
For
per
sona
l use
onl
y
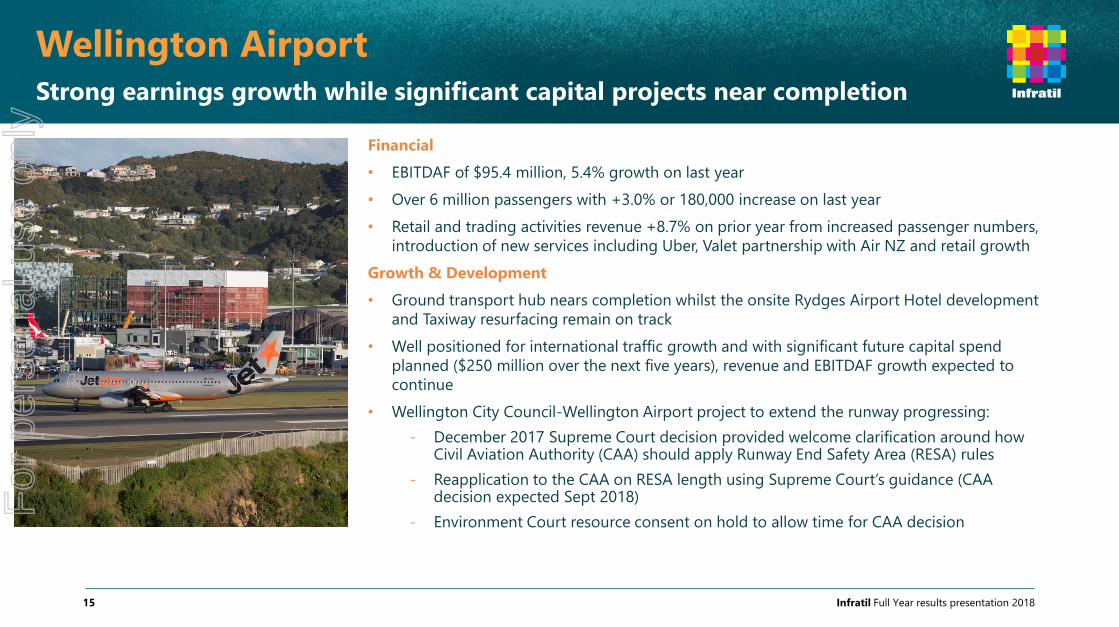
Infratil Full Year results presentation 201815
Financial
• EBITDAF of $95.4 million, 5.4% growth on last year
• Over 6 million passengers with +3.0% or 180,000 increase on last year
• Retail and trading activities revenue +8.7% on prior year from increased passenger numbers,
introduction of new services including Uber, Valet partnership with Air NZ and retail growth
Growth & Development
• Ground transport hub nears completion whilst the onsite Rydges Airport Hotel development
and Taxiway resurfacing remain on track
• Well positioned for international traffic growth and with significant future capital spend
planned ($250 million over the next five years), revenue and EBITDAF growth expected to
continue
• Wellington City Council-Wellington Airport project to extend the runway progressing:
- December 2017 Supreme Court decision provided welcome clarification around how Civil Aviation Authority (CAA) should apply Runway End Safety Area (RESA) rules
- Reapplication to the CAA on RESA length using Supreme Court’s guidance (CAA decision expected Sept 2018)
- Environment Court resource consent on hold to allow time for CAA decision
Wellington Airport Strong earnings growth while significant capital projects near completion
For
per
sona
l use
onl
y
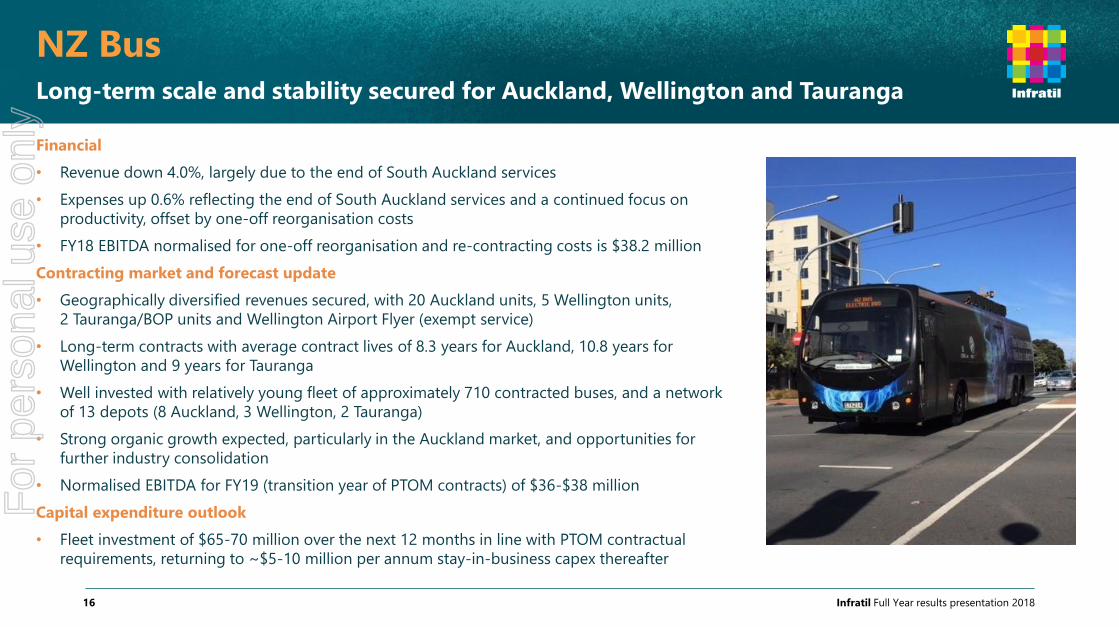
Infratil Full Year results presentation 201816
Financial
• Revenue down 4.0%, largely due to the end of South Auckland services
• Expenses up 0.6% reflecting the end of South Auckland services and a continued focus on
productivity, offset by one-off reorganisation costs
• FY18 EBITDA normalised for one-off reorganisation and re-contracting costs is $38.2 million
Contracting market and forecast update
• Geographically diversified revenues secured, with 20 Auckland units, 5 Wellington units,
2 Tauranga/BOP units and Wellington Airport Flyer (exempt service)
• Long-term contracts with average contract lives of 8.3 years for Auckland, 10.8 years for
Wellington and 9 years for Tauranga
• Well invested with relatively young fleet of approximately 710 contracted buses, and a network
of 13 depots (8 Auckland, 3 Wellington, 2 Tauranga)
• Strong organic growth expected, particularly in the Auckland market, and opportunities for
further industry consolidation
• Normalised EBITDA for FY19 (transition year of PTOM contracts) of $36-$38 million
Capital expenditure outlook
• Fleet investment of $65-70 million over the next 12 months in line with PTOM contractual
requirements, returning to ~$5-10 million per annum stay-in-business capex thereafter
NZ BusLong-term scale and stability secured for Auckland, Wellington and Tauranga
For
per
sona
l use
onl
y
Infratil Full Year results presentation 201817
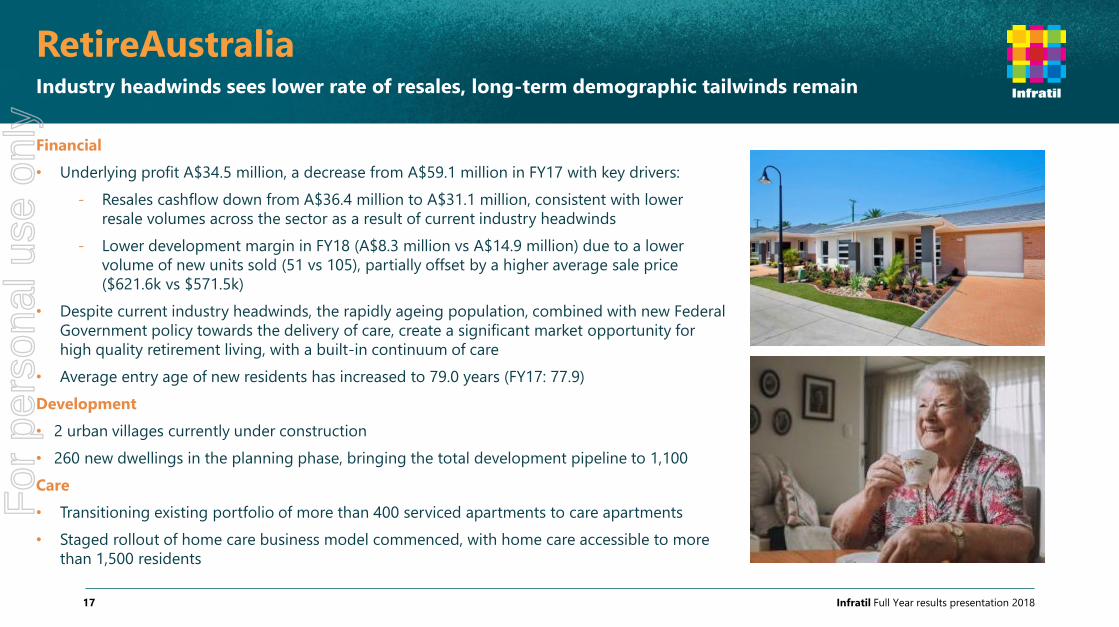
RetireAustraliaIndustry headwinds sees lower rate of resales, long-term demographic tailwinds remain
Financial
• Underlying profit A$34.5 million, a decrease from A$59.1 million in FY17 with key drivers:
- Resales cashflow down from A$36.4 million to A$31.1 million, consistent with lower
resale volumes across the sector as a result of current industry headwinds
- Lower development margin in FY18 (A$8.3 million vs A$14.9 million) due to a lower
volume of new units sold (51 vs 105), partially offset by a higher average sale price
($621.6k vs $571.5k)
• Despite current industry headwinds, the rapidly ageing population, combined with new Federal
Government policy towards the delivery of care, create a significant market opportunity for
high quality retirement living, with a built-in continuum of care
• Average entry age of new residents has increased to 79.0 years (FY17: 77.9)
Development
• 2 urban villages currently under construction
• 260 new dwellings in the planning phase, bringing the total development pipeline to 1,100
Care
• Transitioning existing portfolio of more than 400 serviced apartments to care apartments
• Staged rollout of home care business model commenced, with home care accessible to more
than 1,500 residents
For
per
sona
l use
onl
y
Infratil Full Year results presentation 201818
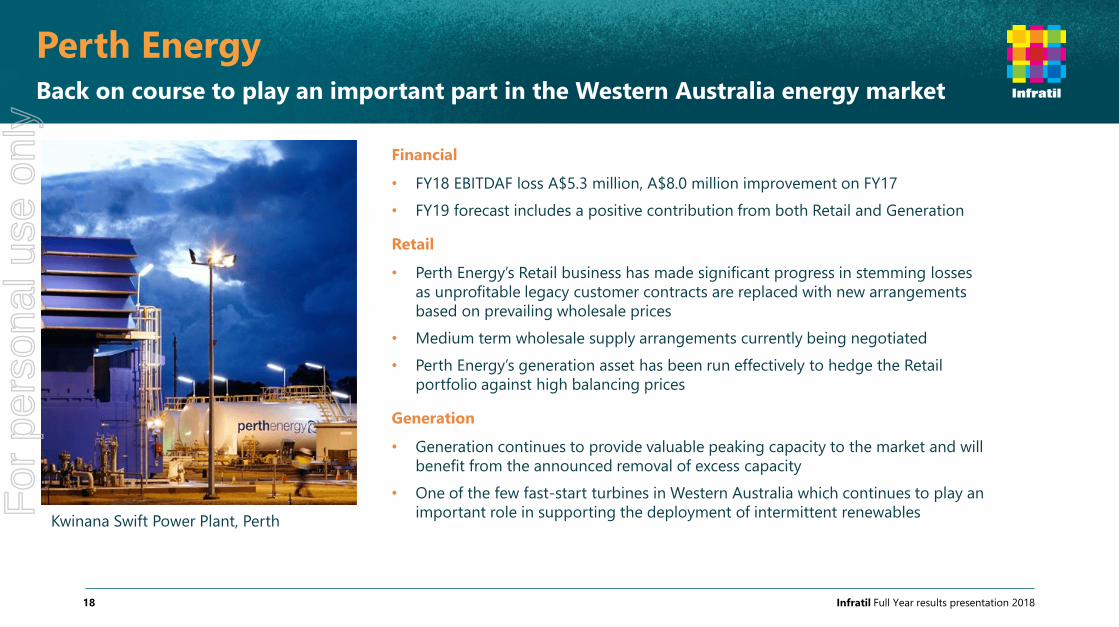
Financial
• FY18 EBITDAF loss A$5.3 million, A$8.0 million improvement on FY17
• FY19 forecast includes a positive contribution from both Retail and Generation
Retail
• Perth Energy’s Retail business has made significant progress in stemming losses
as unprofitable legacy customer contracts are replaced with new arrangements
based on prevailing wholesale prices
• Medium term wholesale supply arrangements currently being negotiated
• Perth Energy’s generation asset has been run effectively to hedge the Retail
portfolio against high balancing prices
Generation
• Generation continues to provide valuable peaking capacity to the market and will
benefit from the announced removal of excess capacity
• One of the few fast-start turbines in Western Australia which continues to play an
important role in supporting the deployment of intermittent renewables
Perth EnergyBack on course to play an important part in the Western Australia energy market
Kwinana Swift Power Plant, Perth
For
per
sona
l use
onl
y
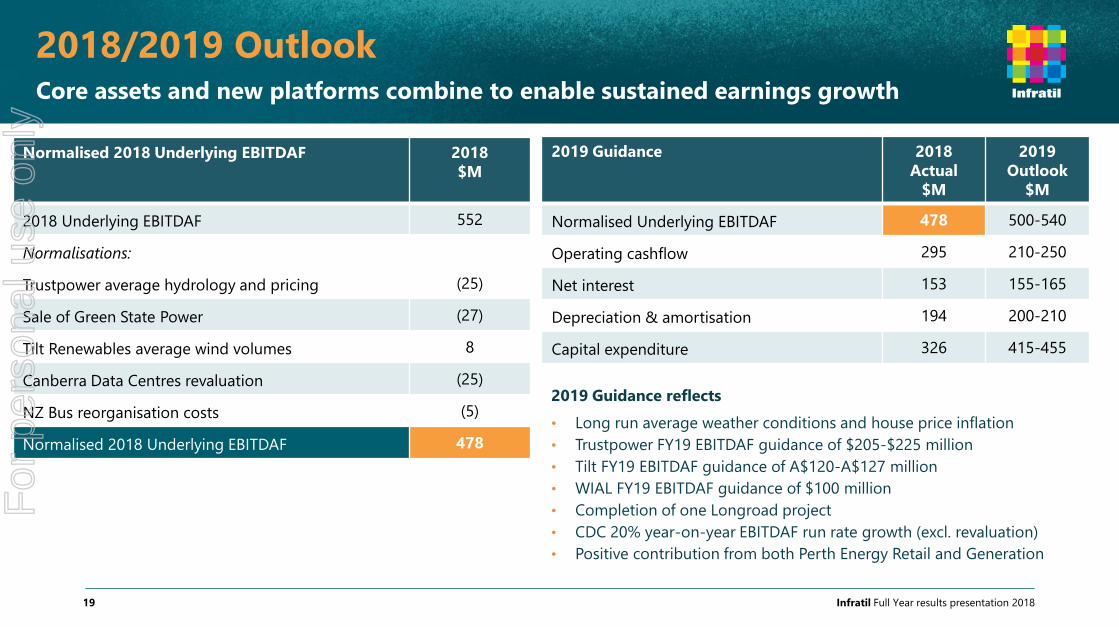
Core assets and new platforms combine to enable sustained earnings growth
Infratil Full Year results presentation 201819
Normalised 2018 Underlying EBITDAF 2018
$M
2018 Underlying EBITDAF 552
Normalisations:
Trustpower average hydrology and pricing (25)
Sale of Green State Power (27)
Tilt Renewables average wind volumes 8
Canberra Data Centres revaluation (25)
NZ Bus reorganisation costs (5)
Normalised 2018 Underlying EBITDAF 478
2018/2019 Outlook
2019 Guidance 2018
Actual
$M
2019
Outlook
$M
Normalised Underlying EBITDAF 478 500-540
Operating cashflow 295 210-250
Net interest 153 155-165
Depreciation & amortisation 194 200-210
Capital expenditure 326 415-455
2019 Guidance reflects
• Long run average weather conditions and house price inflation
• Trustpower FY19 EBITDAF guidance of $205-$225 million
• Tilt FY19 EBITDAF guidance of A$120-A$127 million
• WIAL FY19 EBITDAF guidance of $100 million
• Completion of one Longroad project
• CDC 20% year-on-year EBITDAF run rate growth (excl. revaluation)
• Positive contribution from both Perth Energy Retail and Generation
For
per
sona
l use
onl
y
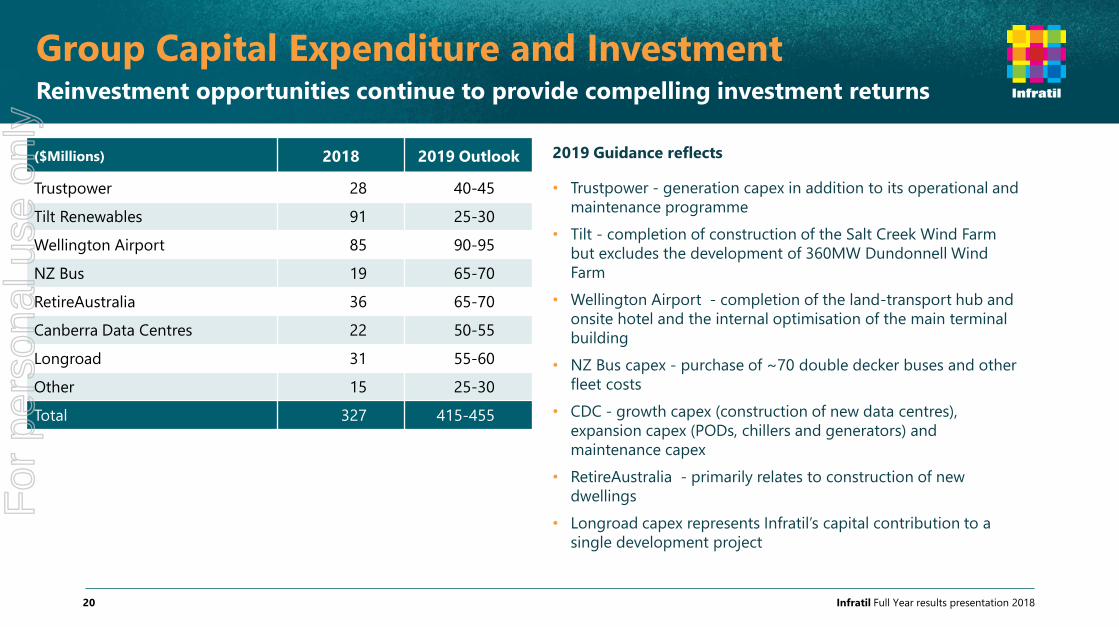
Group Capital Expenditure and Investment Reinvestment opportunities continue to provide compelling investment returns
Infratil Full Year results presentation 201820
2019 Guidance reflects
• Trustpower - generation capex in addition to its operational and
maintenance programme
• Tilt - completion of construction of the Salt Creek Wind Farm
but excludes the development of 360MW Dundonnell Wind
Farm
• Wellington Airport - completion of the land-transport hub and
onsite hotel and the internal optimisation of the main terminal
building
• NZ Bus capex - purchase of ~70 double decker buses and other
fleet costs
• CDC - growth capex (construction of new data centres),
expansion capex (PODs, chillers and generators) and
maintenance capex
• RetireAustralia - primarily relates to construction of new
dwellings
• Longroad capex represents Infratil’s capital contribution to a
single development project
($Millions) 2018 2019 Outlook
Trustpower 28 40-45
Tilt Renewables 91 25-30
Wellington Airport 85 90-95
NZ Bus 19 65-70
RetireAustralia 36 65-70
Canberra Data Centres 22 50-55
Longroad 31 55-60
Other 15 25-30
Total 327 415-455
For
per
sona
l use
onl
y
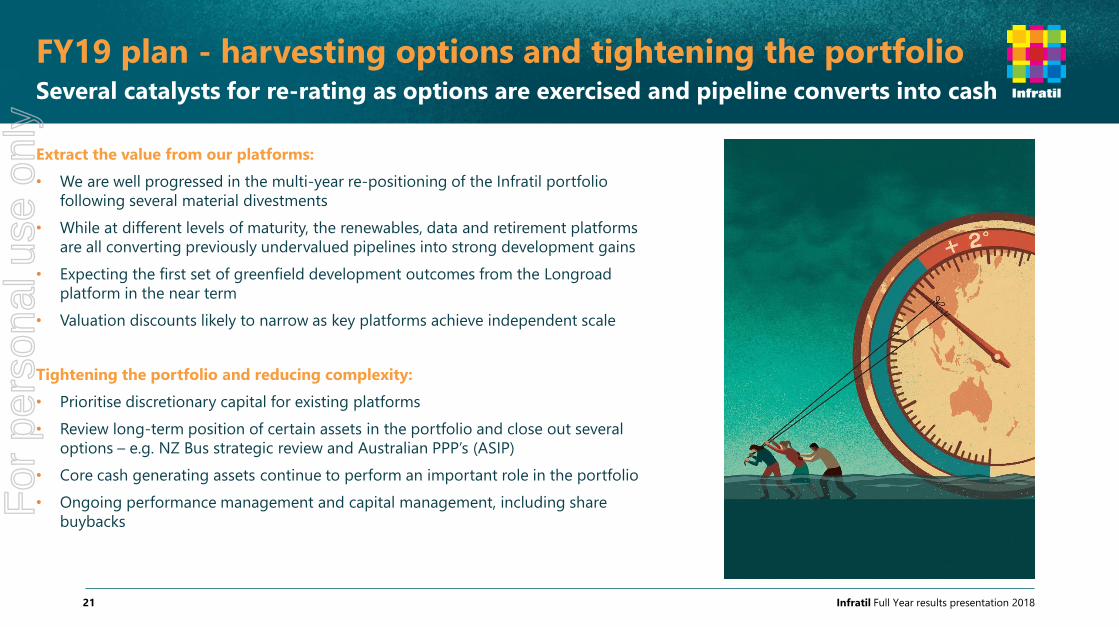
FY19 plan - harvesting options and tightening the portfolio Several catalysts for re-rating as options are exercised and pipeline converts into cash
Infratil Full Year results presentation 201821
Extract the value from our platforms:
• We are well progressed in the multi-year re-positioning of the Infratil portfolio
following several material divestments
• While at different levels of maturity, the renewables, data and retirement platforms
are all converting previously undervalued pipelines into strong development gains
• Expecting the first set of greenfield development outcomes from the Longroad
platform in the near term
• Valuation discounts likely to narrow as key platforms achieve independent scale
Tightening the portfolio and reducing complexity:
• Prioritise discretionary capital for existing platforms
• Review long-term position of certain assets in the portfolio and close out several
options – e.g. NZ Bus strategic review and Australian PPP’s (ASIP)
• Core cash generating assets continue to perform an important role in the portfolio
• Ongoing performance management and capital management, including share
buybacks
For
per
sona
l use
onl
y
For more information www.Infratil.com
Infratil Full Year results presentation 201822
For
per
sona
l use
onl
y
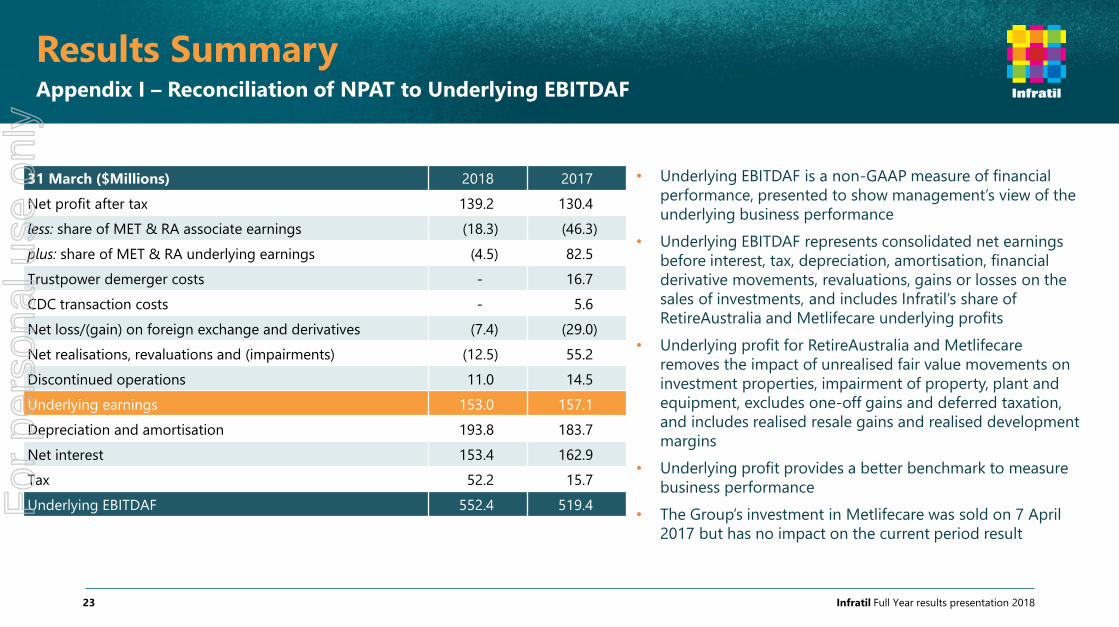
Results Summary Appendix I – Reconciliation of NPAT to Underlying EBITDAF
Infratil Full Year results presentation 201823
• Underlying EBITDAF is a non-GAAP measure of financial
performance, presented to show management’s view of the
underlying business performance
• Underlying EBITDAF represents consolidated net earnings
before interest, tax, depreciation, amortisation, financial
derivative movements, revaluations, gains or losses on the
sales of investments, and includes Infratil’s share of
RetireAustralia and Metlifecare underlying profits
• Underlying profit for RetireAustralia and Metlifecare
removes the impact of unrealised fair value movements on
investment properties, impairment of property, plant and
equipment, excludes one-off gains and deferred taxation,
and includes realised resale gains and realised development
margins
• Underlying profit provides a better benchmark to measure
business performance
• The Group’s investment in Metlifecare was sold on 7 April
2017 but has no impact on the current period result
31 March ($Millions) 2018 2017
Net profit after tax 139.2 130.4
less: share of MET & RA associate earnings (18.3) (46.3)
plus: share of MET & RA underlying earnings (4.5) 82.5
Trustpower demerger costs - 16.7
CDC transaction costs - 5.6
Net loss/(gain) on foreign exchange and derivatives (7.4) (29.0)
Net realisations, revaluations and (impairments) (12.5) 55.2
Discontinued operations 11.0 14.5
Underlying earnings 153.0 157.1
Depreciation and amortisation 193.8 183.7
Net interest 153.4 162.9
Tax 52.2 15.7
Underlying EBITDAF 552.4 519.4 For
per
sona
l use
onl
y
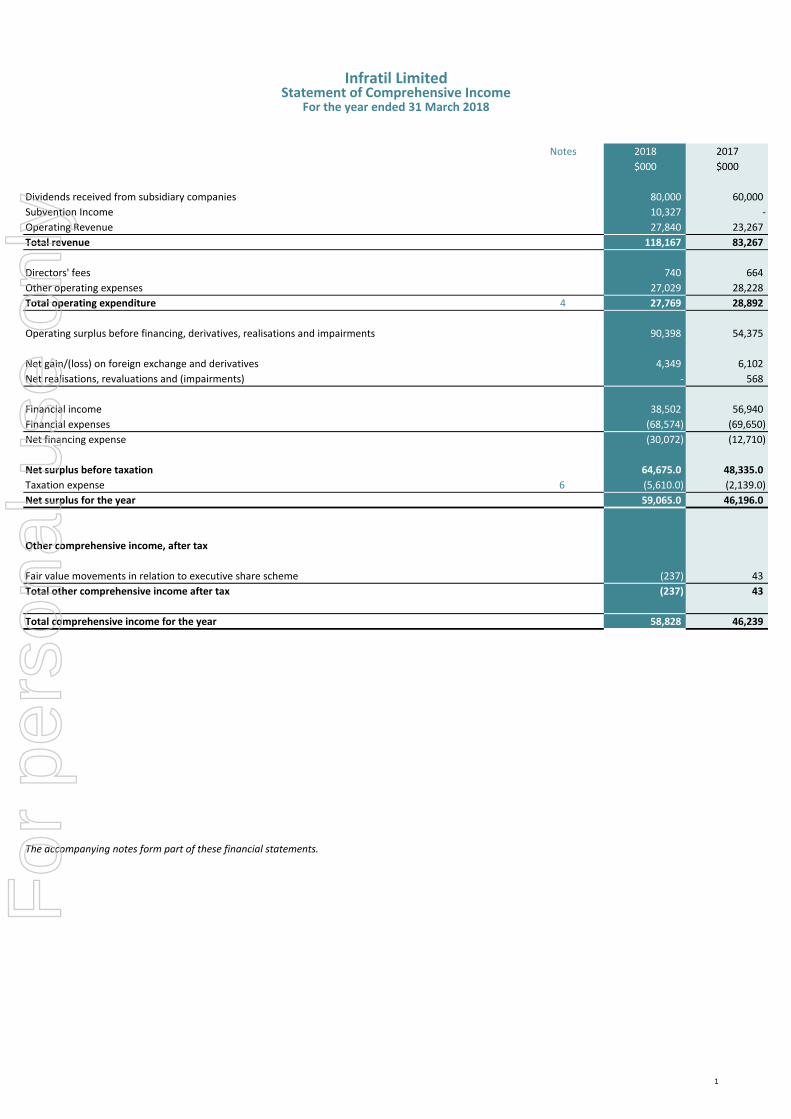
Notes 2018 2017
$000 $000
Dividends received from subsidiary companies 80,000 60,000
Subvention Income 10,327 -
Operating Revenue 27,840 23,267
Total revenue 118,167 83,267
Directors' fees 740 664
Other operating expenses 27,029 28,228
Total operating expenditure 4 27,769 28,892
Operating surplus before financing, derivatives, realisations and impairments 90,398 54,375
Net gain/(loss) on foreign exchange and derivatives 4,349 6,102
Net realisations, revaluations and (impairments) - 568
Financial income 38,502 56,940
Financial expenses (68,574) (69,650)
Net financing expense (30,072) (12,710)
Net surplus before taxation 64,675.0 48,335.0
Taxation expense 6 (5,610.0) (2,139.0)
Net surplus for the year 59,065.0 46,196.0
Other comprehensive income, after tax
Fair value movements in relation to executive share scheme (237) 43
Total other comprehensive income after tax (237) 43
Total comprehensive income for the year 58,828 46,239
The accompanying notes form part of these financial statements.
Infratil LimitedStatement of Comprehensive Income
For the year ended 31 March 2018
1
For
per
sona
l use
onl
y
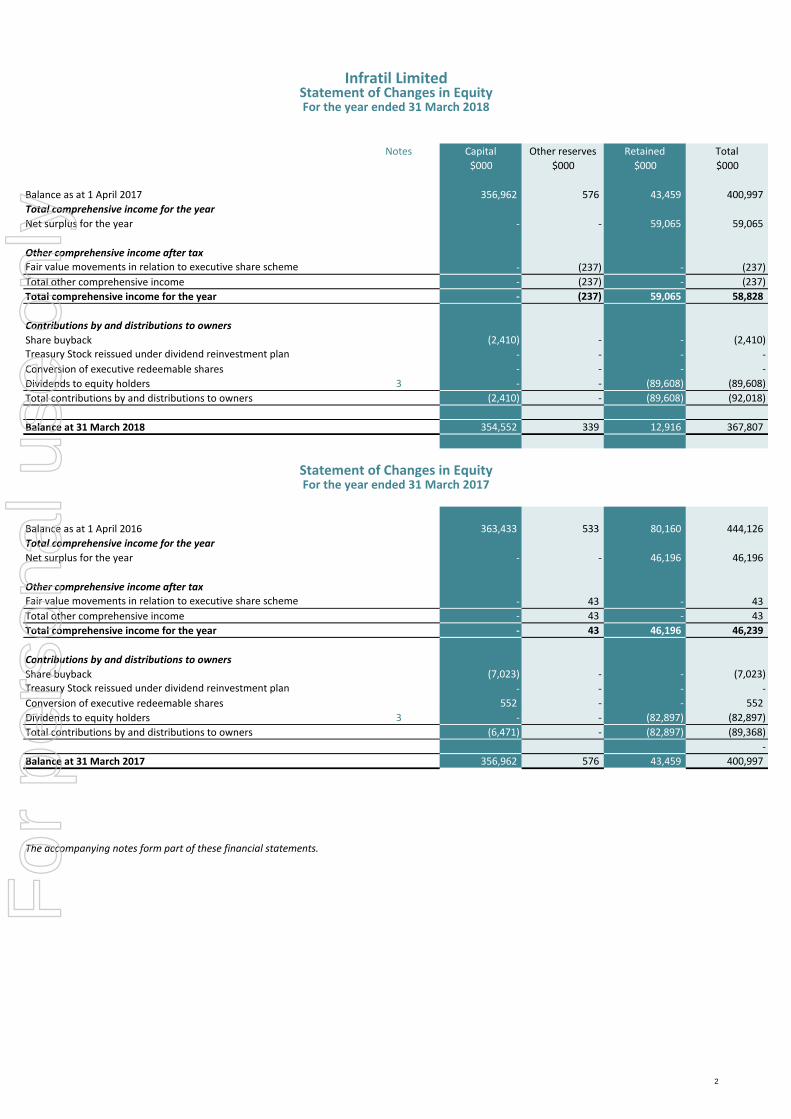
Notes Capital Other reserves Retained Total
$000 $000 $000 $000
Balance as at 1 April 2017 356,962 576 43,459 400,997
Total comprehensive income for the year
Net surplus for the year - - 59,065 59,065
Other comprehensive income after tax
- (237) - (237)
Total other comprehensive income - (237) - (237)
Total comprehensive income for the year - (237) 59,065 58,828
Contributions by and distributions to owners
Share buyback (2,410) - - (2,410)
- - - -
Conversion of executive redeemable shares - - - -
Dividends to equity holders 3 - - (89,608) (89,608)
Total contributions by and distributions to owners (2,410) - (89,608) (92,018)
Balance at 31 March 2018 354,552 339 12,916 367,807
Balance as at 1 April 2016 363,433 533 80,160 444,126
Total comprehensive income for the year
Net surplus for the year - - 46,196 46,196
Other comprehensive income after tax
- 43 - 43
Total other comprehensive income - 43 - 43
Total comprehensive income for the year - 43 46,196 46,239
Contributions by and distributions to owners
Share buyback (7,023) - - (7,023)
- - - -
Conversion of executive redeemable shares 552 - - 552
Dividends to equity holders 3 - - (82,897) (82,897)
Total contributions by and distributions to owners (6,471) - (82,897) (89,368)
-
Balance at 31 March 2017 356,962 576 43,459 400,997
The accompanying notes form part of these financial statements.
Infratil Limited
Fair value movements in relation to executive share scheme
Treasury Stock reissued under dividend reinvestment plan
Fair value movements in relation to executive share scheme
Treasury Stock reissued under dividend reinvestment plan
Statement of Changes in EquityFor the year ended 31 March 2018
Statement of Changes in EquityFor the year ended 31 March 2017
2
For
per
sona
l use
onl
y
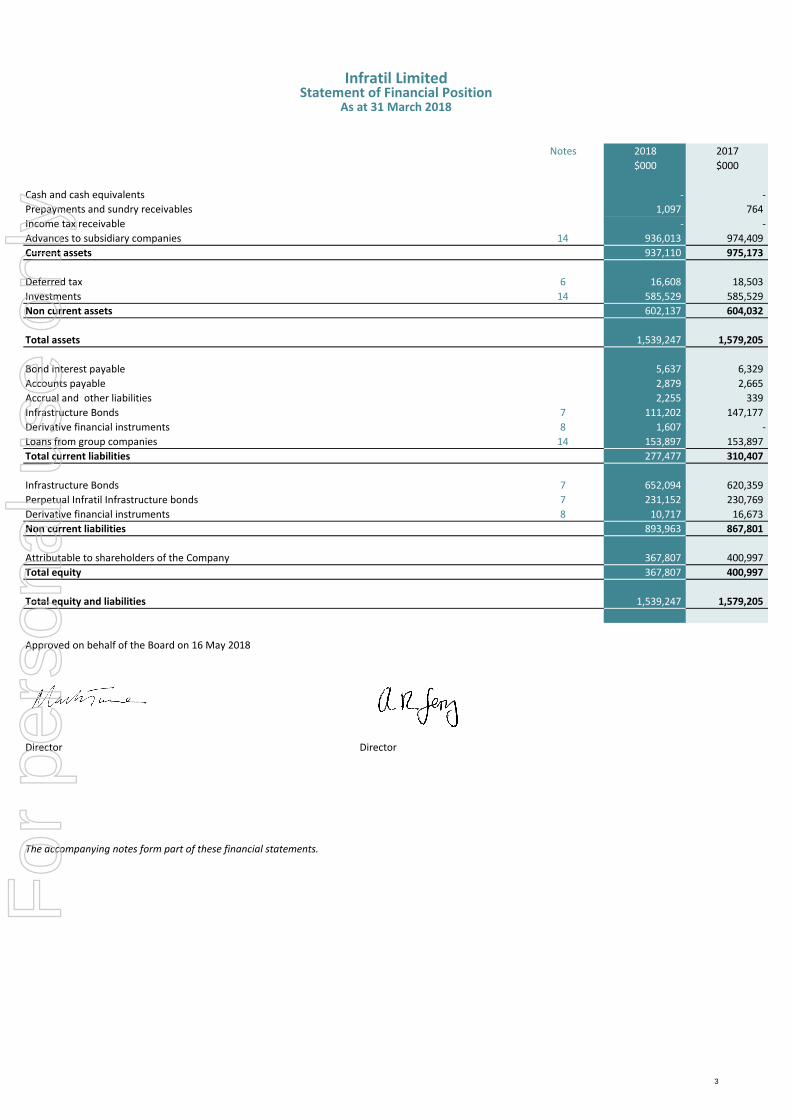
Notes 2018 2017
$000 $000
Cash and cash equivalents - -
Prepayments and sundry receivables 1,097 764
Income tax receivable - -
Advances to subsidiary companies 14 936,013 974,409
Current assets 937,110 975,173
Deferred tax 6 16,608 18,503
Investments 14 585,529 585,529
Non current assets 602,137 604,032
Total assets 1,539,247 1,579,205
Bond interest payable 5,637 6,329
Accounts payable 2,879 2,665
Accrual and other liabilities 2,255 339
Infrastructure Bonds 7 111,202 147,177
Derivative financial instruments 8 1,607 -
Loans from group companies 14 153,897 153,897
Total current liabilities 277,477 310,407
Infrastructure Bonds 7 652,094 620,359
Perpetual Infratil Infrastructure bonds 7 231,152 230,769
Derivative financial instruments 8 10,717 16,673
Non current liabilities 893,963 867,801
Attributable to shareholders of the Company 367,807 400,997
Total equity 367,807 400,997
Total equity and liabilities 1,539,247 1,579,205
Approved on behalf of the Board on 16 May 2018
Director Director
The accompanying notes form part of these financial statements.
As at 31 March 2018Statement of Financial Position
Infratil Limited
3
For
per
sona
l use
onl
y
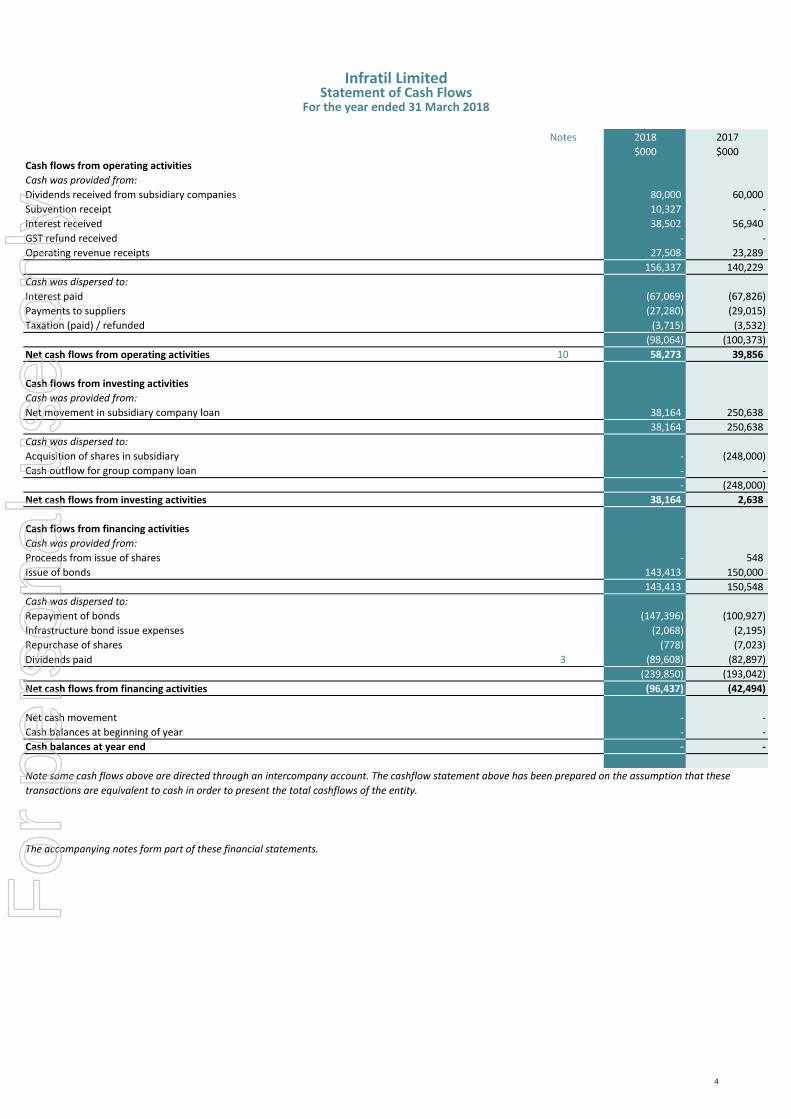
Notes 2018 2017
$000 $000Cash flows from operating activities
Cash was provided from:
Dividends received from subsidiary companies 80,000 60,000
Subvention receipt 10,327 -
Interest received 38,502 56,940
GST refund received - -
Operating revenue receipts 27,508 23,289
156,337 140,229
Cash was dispersed to:
Interest paid (67,069) (67,826)
Payments to suppliers (27,280) (29,015)
Taxation (paid) / refunded (3,715) (3,532)
(98,064) (100,373)
Net cash flows from operating activities 10 58,273 39,856
Cash flows from investing activities
Cash was provided from:
Net movement in subsidiary company loan 38,164 250,638
38,164 250,638
Cash was dispersed to:
Acquisition of shares in subsidiary - (248,000)
Cash outflow for group company loan - -
- (248,000)
Net cash flows from investing activities 38,164 2,638
Cash flows from financing activities
Cash was provided from:
Proceeds from issue of shares - 548
Issue of bonds 143,413 150,000
143,413 150,548
Cash was dispersed to:
Repayment of bonds (147,396) (100,927)
Infrastructure bond issue expenses (2,068) (2,195)
Repurchase of shares (778) (7,023)
Dividends paid 3 (89,608) (82,897)
(239,850) (193,042)
Net cash flows from financing activities (96,437) (42,494)
Net cash movement - -
Cash balances at beginning of year - -
Cash balances at year end - -
The accompanying notes form part of these financial statements.
For the year ended 31 March 2018
Note some cash flows above are directed through an intercompany account. The cashflow statement above has been prepared on the assumption that these
transactions are equivalent to cash in order to present the total cashflows of the entity.
Infratil LimitedStatement of Cash Flows
4
For
per
sona
l use
onl
y
(1) Accounting policies
(A) Reporting Entity
(B) Basis of preparation
Accounting estimates and judgements
Valuation of investments
Accounting for income taxes
(C) Taxation
(D) Derivative financial instruments
Preparation of the financial statements requires management to make estimates as to, amongst other things, the amount of tax that will ultimately be payable,
the availability of losses to be carried forward and the amount of foreign tax credits that it will receive. Actual results may differ from these estimates as a result
of reassessment by management and/or taxation authorities.
Income tax comprises both current and deferred tax. Current tax is the expected tax payable on the taxable income for the year, using tax rates enacted or
substantively enacted at the balance date, and any adjustment to tax payable in respect of previous years. Deferred tax is recognised in respect of the differences
between the carrying amounts of assets and liabilities for financial reporting purposes and the carrying amounts used for taxation purposes.
The amount of deferred tax provided is based on the expected manner of realisation or settlement of the carrying amount of assets and liabilities, using tax rates
enacted or substantively enacted at the balance sheet date. A deferred tax asset is recognised only to the extent that it is probable that future taxable profits or
deferred tax liabilities will be available within the Company against which the asset can be utilised.
When appropriate, the Company enters into agreements to manage its interest rate, foreign exchange, operating and investment risks. In accordance with the
Company's risk management policies, the Company does not hold or issue derivative financial instruments for speculative purposes. However, certain derivatives
do not qualify for hedge accounting and are required to be accounted for at fair value through profit or loss. Derivative financial instruments are recognised
initially at fair value at the date they are entered into. Subsequent to initial recognition, derivative financial instruments are stated at fair value at each balance
sheet date. The resulting gain or loss is recognised in the profit or loss immediately unless the derivative is designated effective as a hedging instrument, in which
event, recognition of any resultant gain or loss depends on the nature of the hedging relationship.
Notes to the Financial StatementsFor the year ended 31 March 2018
Infratil Limited ('the Company') is a company domiciled in New Zealand and registered under the Companies Act 1993. The Company is listed on the NZX and ASX,
and is an issuer in terms of the Financial Market Conducts Act 2013.
The financial statements have been prepared in accordance with New Zealand Generally Accepted Accounting Practice (‘NZ GAAP’) and comply with New Zealand
equivalents to International Financial Reporting Standards ('NZ IFRS') and other applicable financial reporting standards as appropriate for profit-oriented
entities. The presentation currency used in the preparation of these financial statements is New Zealand dollars, which is also the Company's functional currency,
and is presented in $ thousands unless otherwise stated. The principal accounting policies adopted in the preparation of these financial statements are set out
below. These policies have been consistently applied to all the periods presented, unless otherwise stated. Comparative figures have been restated where
appropriate to ensure consistency with the current period.
The financial statements comprise statements of the following: comprehensive income; financial position; changes in equity; cash flows; significant accounting
policies; and the notes to those statements are contained on pages 5 to 15 of this report. The financial statements are prepared on the basis of historical cost,
except financial derivatives valued in accordance with accounting policy (D).
The preparation of financial statements in conformity with NZ IFRS requires management to make estimates and assumptions that affect the reported amounts of
assets and liabilities at the date of the financial statements and the reported amounts of revenues and expenses during the reporting period. Future outcomes
could differ from those estimates. The principal areas of judgement in preparing these financial statements are set out below.
Infratil completes an assessment of the carrying value of investments at least annually and considers objective evidence for impairment on each investment taking
into account observable data on the investment, the fair value, the status or context of capital markets, its own view of investment value, and its long term
intentions. Infratil notes the following matters which are specifically considered in terms of objective evidence of impairment of its investments, and whether
there is a significant or prolonged decline from cost, which should be recorded as an impairment, and taken to profit and loss: any known loss events that have
occurred since the initial recognition date of the investments, including its long term investment horizon, specific initiatives which reflect the strategic or
influential nature of its existing investment position and internal valuations; and the state of financial markets. The assessment also requires judgements about
the expected future performance and cash flows of the investment.
5
For
per
sona
l use
onl
y
Notes to the Financial StatementsFor the year ended 31 March 2018
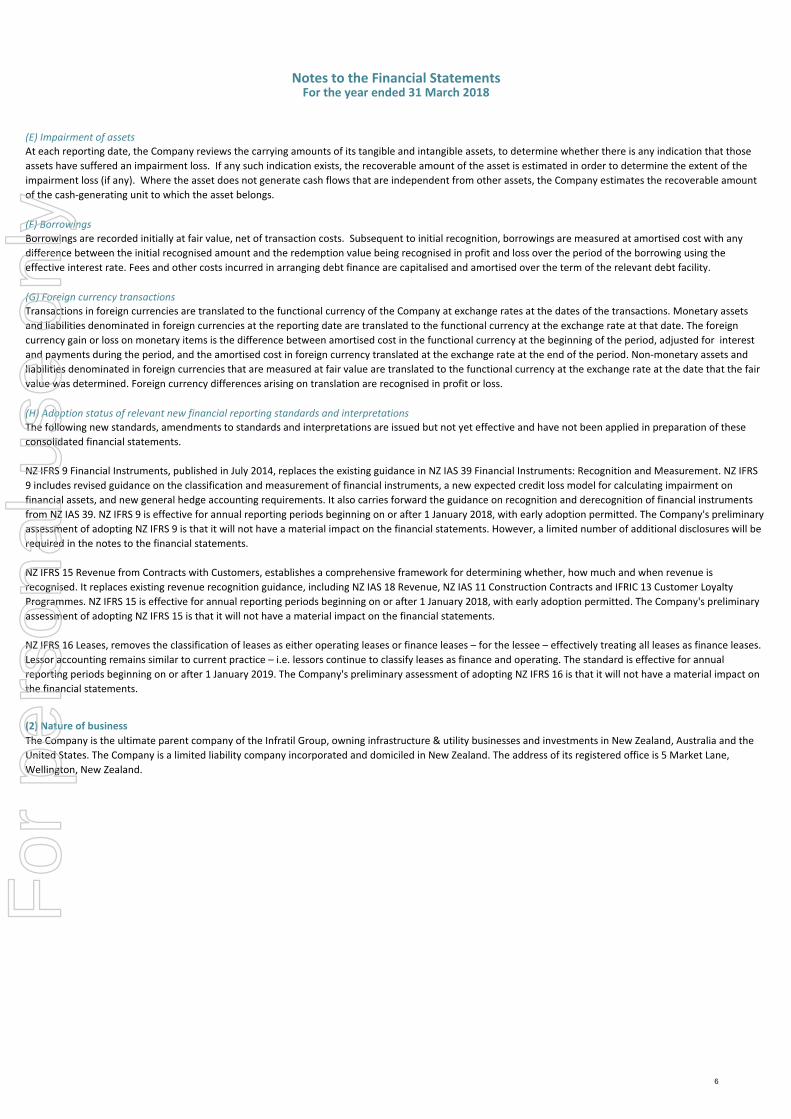
(E) Impairment of assets
(F) Borrowings
(G) Foreign currency transactions
(H) Adoption status of relevant new financial reporting standards and interpretations
(2) Nature of business
At each reporting date, the Company reviews the carrying amounts of its tangible and intangible assets, to determine whether there is any indication that those
assets have suffered an impairment loss. If any such indication exists, the recoverable amount of the asset is estimated in order to determine the extent of the
impairment loss (if any). Where the asset does not generate cash flows that are independent from other assets, the Company estimates the recoverable amount
of the cash-generating unit to which the asset belongs.
Borrowings are recorded initially at fair value, net of transaction costs. Subsequent to initial recognition, borrowings are measured at amortised cost with any
difference between the initial recognised amount and the redemption value being recognised in profit and loss over the period of the borrowing using the
effective interest rate. Fees and other costs incurred in arranging debt finance are capitalised and amortised over the term of the relevant debt facility.
Transactions in foreign currencies are translated to the functional currency of the Company at exchange rates at the dates of the transactions. Monetary assets
and liabilities denominated in foreign currencies at the reporting date are translated to the functional currency at the exchange rate at that date. The foreign
currency gain or loss on monetary items is the difference between amortised cost in the functional currency at the beginning of the period, adjusted for interest
and payments during the period, and the amortised cost in foreign currency translated at the exchange rate at the end of the period. Non-monetary assets and
liabilities denominated in foreign currencies that are measured at fair value are translated to the functional currency at the exchange rate at the date that the fair
value was determined. Foreign currency differences arising on translation are recognised in profit or loss.
The Company is the ultimate parent company of the Infratil Group, owning infrastructure & utility businesses and investments in New Zealand, Australia and the
United States. The Company is a limited liability company incorporated and domiciled in New Zealand. The address of its registered office is 5 Market Lane,
Wellington, New Zealand.
The following new standards, amendments to standards and interpretations are issued but not yet effective and have not been applied in preparation of these
consolidated financial statements.
NZ IFRS 9 Financial Instruments, published in July 2014, replaces the existing guidance in NZ IAS 39 Financial Instruments: Recognition and Measurement. NZ IFRS
9 includes revised guidance on the classification and measurement of financial instruments, a new expected credit loss model for calculating impairment on
financial assets, and new general hedge accounting requirements. It also carries forward the guidance on recognition and derecognition of financial instruments
from NZ IAS 39. NZ IFRS 9 is effective for annual reporting periods beginning on or after 1 January 2018, with early adoption permitted. The Company's preliminary
assessment of adopting NZ IFRS 9 is that it will not have a material impact on the financial statements. However, a limited number of additional disclosures will be
required in the notes to the financial statements.
NZ IFRS 15 Revenue from Contracts with Customers, establishes a comprehensive framework for determining whether, how much and when revenue is
recognised. It replaces existing revenue recognition guidance, including NZ IAS 18 Revenue, NZ IAS 11 Construction Contracts and IFRIC 13 Customer Loyalty
Programmes. NZ IFRS 15 is effective for annual reporting periods beginning on or after 1 January 2018, with early adoption permitted. The Company's preliminary
assessment of adopting NZ IFRS 15 is that it will not have a material impact on the financial statements.
NZ IFRS 16 Leases, removes the classification of leases as either operating leases or finance leases – for the lessee – effectively treating all leases as finance leases.
Lessor accounting remains similar to current practice – i.e. lessors continue to classify leases as finance and operating. The standard is effective for annual
reporting periods beginning on or after 1 January 2019. The Company's preliminary assessment of adopting NZ IFRS 16 is that it will not have a material impact on
the financial statements.
6
For
per
sona
l use
onl
y
Notes to the Financial StatementsFor the year ended 31 March 2018
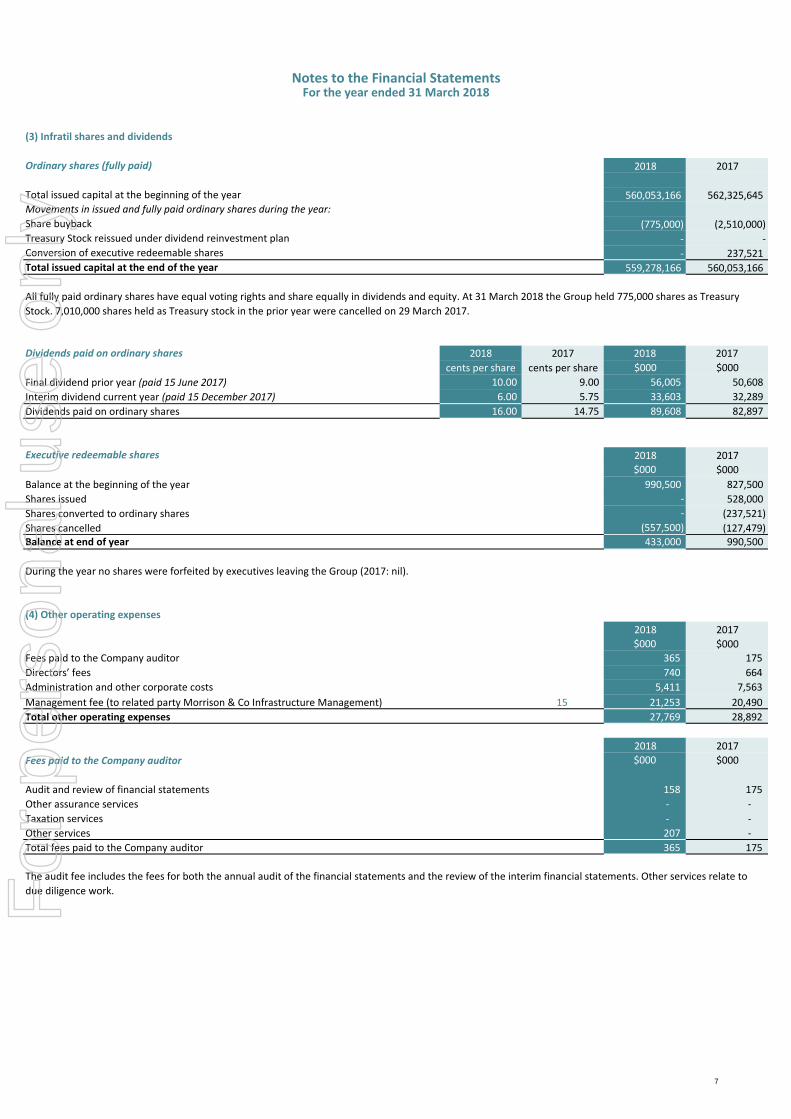
(3) Infratil shares and dividends
Ordinary shares (fully paid) 2018 2017
Total issued capital at the beginning of the year 560,053,166 562,325,645Movements in issued and fully paid ordinary shares during the year:
Share buyback (775,000) (2,510,000)Treasury Stock reissued under dividend reinvestment plan - -Conversion of executive redeemable shares - 237,521
Total issued capital at the end of the year 559,278,166 560,053,166
Dividends paid on ordinary shares 2018 2017 2018 2017
cents per share cents per share $000 $000
Final dividend prior year (paid 15 June 2017) 10.00 9.00 56,005 50,608
Interim dividend current year (paid 15 December 2017) 6.00 5.75 33,603 32,289
Dividends paid on ordinary shares 16.00 14.75 89,608 82,897
Executive redeemable shares 2018 2017
$000 $000
Balance at the beginning of the year 990,500 827,500
Shares issued - 528,000
Shares converted to ordinary shares - (237,521)
Shares cancelled (557,500) (127,479)Balance at end of year 433,000 990,500
(4) Other operating expenses
2018 2017
$000 $000
Fees paid to the Company auditor 365 175
Directors’ fees 740 664
Administration and other corporate costs 5,411 7,563
Management fee (to related party Morrison & Co Infrastructure Management) 15 21,253 20,490
Total other operating expenses 27,769 28,892
2018 2017
Fees paid to the Company auditor $000 $000
Audit and review of financial statements 158 175
Other assurance services - -
Taxation services - -
Other services 207 -
Total fees paid to the Company auditor 365 175
During the year no shares were forfeited by executives leaving the Group (2017: nil).
All fully paid ordinary shares have equal voting rights and share equally in dividends and equity. At 31 March 2018 the Group held 775,000 shares as Treasury
Stock. 7,010,000 shares held as Treasury stock in the prior year were cancelled on 29 March 2017.
The audit fee includes the fees for both the annual audit of the financial statements and the review of the interim financial statements. Other services relate to
due diligence work.
7
For
per
sona
l use
onl
y
Notes to the Financial StatementsFor the year ended 31 March 2018
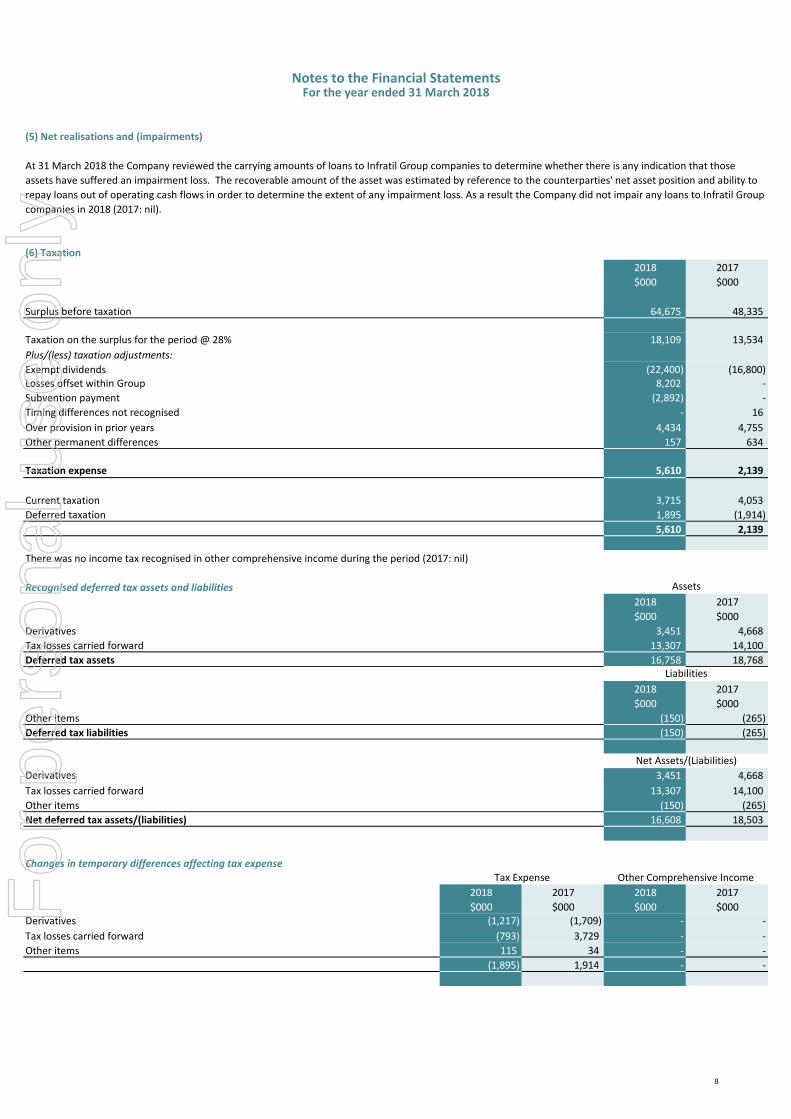
(5) Net realisations and (impairments)
(6) Taxation
2018 2017
$000 $000
Surplus before taxation 64,675 48,335
Taxation on the surplus for the period @ 28% 18,109 13,534
Plus/(less) taxation adjustments:
Exempt dividends (22,400) (16,800)Losses offset within Group 8,202 -
Subvention payment (2,892) -
Timing differences not recognised - 16
Over provision in prior years 4,434 4,755
Other permanent differences 157 634
Taxation expense 5,610 2,139
Current taxation 3,715 4,053
Deferred taxation 1,895 (1,914)
5,610 2,139
There was no income tax recognised in other comprehensive income during the period (2017: nil)
Recognised deferred tax assets and liabilities
2018 2017
$000 $000
Derivatives 3,451 4,668
Tax losses carried forward 13,307 14,100
Deferred tax assets 16,758 18,768
2018 2017
$000 $000
Other items (150) (265)
Deferred tax liabilities (150) (265)
Derivatives 3,451 4,668
Tax losses carried forward 13,307 14,100
Other items (150) (265)
Net deferred tax assets/(liabilities) 16,608 18,503
Changes in temporary differences affecting tax expense
2018 2017 2018 2017
$000 $000 $000 $000Derivatives (1,217) (1,709) - -
Tax losses carried forward (793) 3,729 - -
Other items 115 34 - -
(1,895) 1,914 - -
Tax Expense
Liabilities
Net Assets/(Liabilities)
Other Comprehensive Income
At 31 March 2018 the Company reviewed the carrying amounts of loans to Infratil Group companies to determine whether there is any indication that those
assets have suffered an impairment loss. The recoverable amount of the asset was estimated by reference to the counterparties' net asset position and ability to
repay loans out of operating cash flows in order to determine the extent of any impairment loss. As a result the Company did not impair any loans to Infratil Group
companies in 2018 (2017: nil).
Assets
8
For
per
sona
l use
onl
y
Notes to the Financial StatementsFor the year ended 31 March 2018
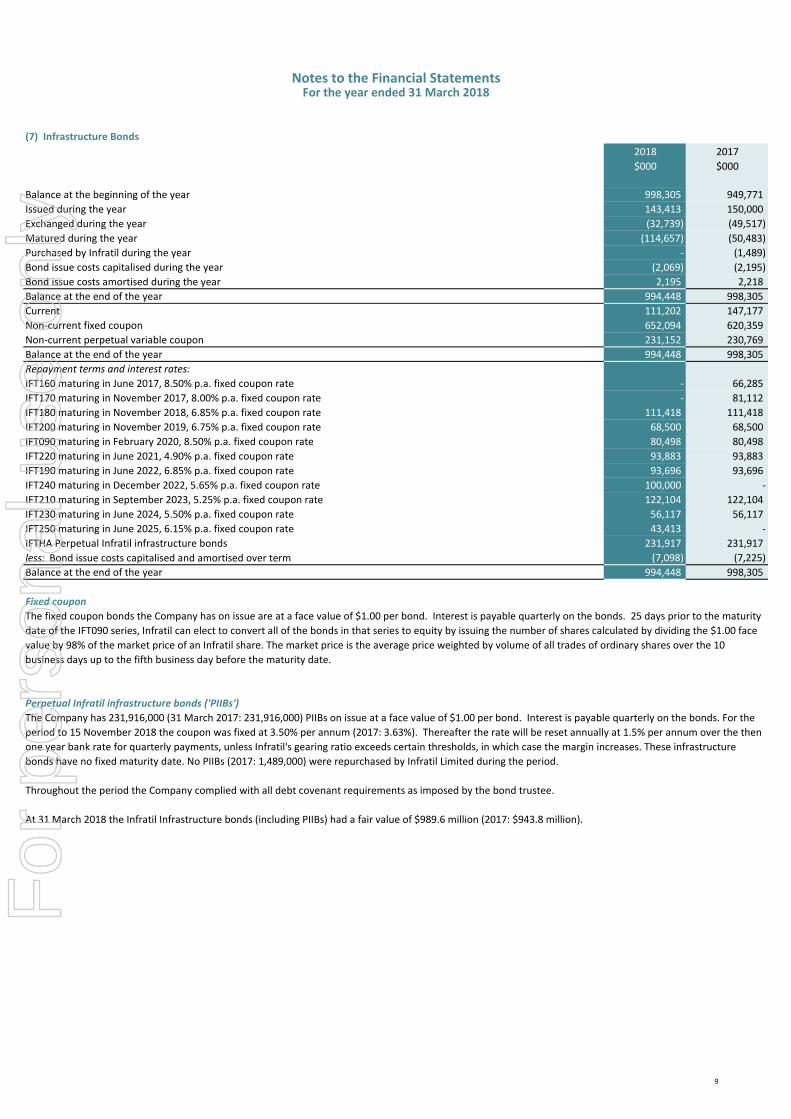
(7) Infrastructure Bonds
2018 2017
$000 $000
Balance at the beginning of the year 998,305 949,771
Issued during the year 143,413 150,000
Exchanged during the year (32,739) (49,517)
Matured during the year (114,657) (50,483)
Purchased by Infratil during the year - (1,489)
Bond issue costs capitalised during the year (2,069) (2,195)
Bond issue costs amortised during the year 2,195 2,218
Balance at the end of the year 994,448 998,305
Current 111,202 147,177
Non-current fixed coupon 652,094 620,359
Non-current perpetual variable coupon 231,152 230,769
Balance at the end of the year 994,448 998,305
Repayment terms and interest rates:
IFT160 maturing in June 2017, 8.50% p.a. fixed coupon rate - 66,285
IFT170 maturing in November 2017, 8.00% p.a. fixed coupon rate - 81,112
IFT180 maturing in November 2018, 6.85% p.a. fixed coupon rate 111,418 111,418
IFT200 maturing in November 2019, 6.75% p.a. fixed coupon rate 68,500 68,500
IFT090 maturing in February 2020, 8.50% p.a. fixed coupon rate 80,498 80,498
IFT220 maturing in June 2021, 4.90% p.a. fixed coupon rate 93,883 93,883
IFT190 maturing in June 2022, 6.85% p.a. fixed coupon rate 93,696 93,696
IFT240 maturing in December 2022, 5.65% p.a. fixed coupon rate 100,000 -
IFT210 maturing in September 2023, 5.25% p.a. fixed coupon rate 122,104 122,104
IFT230 maturing in June 2024, 5.50% p.a. fixed coupon rate 56,117 56,117
IFT250 maturing in June 2025, 6.15% p.a. fixed coupon rate 43,413 -
IFTHA Perpetual Infratil infrastructure bonds 231,917 231,917
less: Bond issue costs capitalised and amortised over term (7,098) (7,225)
Balance at the end of the year 994,448 998,305
Throughout the period the Company complied with all debt covenant requirements as imposed by the bond trustee.
The fixed coupon bonds the Company has on issue are at a face value of $1.00 per bond. Interest is payable quarterly on the bonds. 25 days prior to the maturity
date of the IFT090 series, Infratil can elect to convert all of the bonds in that series to equity by issuing the number of shares calculated by dividing the $1.00 face
value by 98% of the market price of an Infratil share. The market price is the average price weighted by volume of all trades of ordinary shares over the 10
business days up to the fifth business day before the maturity date.
The Company has 231,916,000 (31 March 2017: 231,916,000) PIIBs on issue at a face value of $1.00 per bond. Interest is payable quarterly on the bonds. For the
period to 15 November 2018 the coupon was fixed at 3.50% per annum (2017: 3.63%). Thereafter the rate will be reset annually at 1.5% per annum over the then
one year bank rate for quarterly payments, unless Infratil's gearing ratio exceeds certain thresholds, in which case the margin increases. These infrastructure
bonds have no fixed maturity date. No PIIBs (2017: 1,489,000) were repurchased by Infratil Limited during the period.
At 31 March 2018 the Infratil Infrastructure bonds (including PIIBs) had a fair value of $989.6 million (2017: $943.8 million).
Fixed coupon
Perpetual Infratil infrastructure bonds ('PIIBs')
9
For
per
sona
l use
onl
y
Notes to the Financial StatementsFor the year ended 31 March 2018
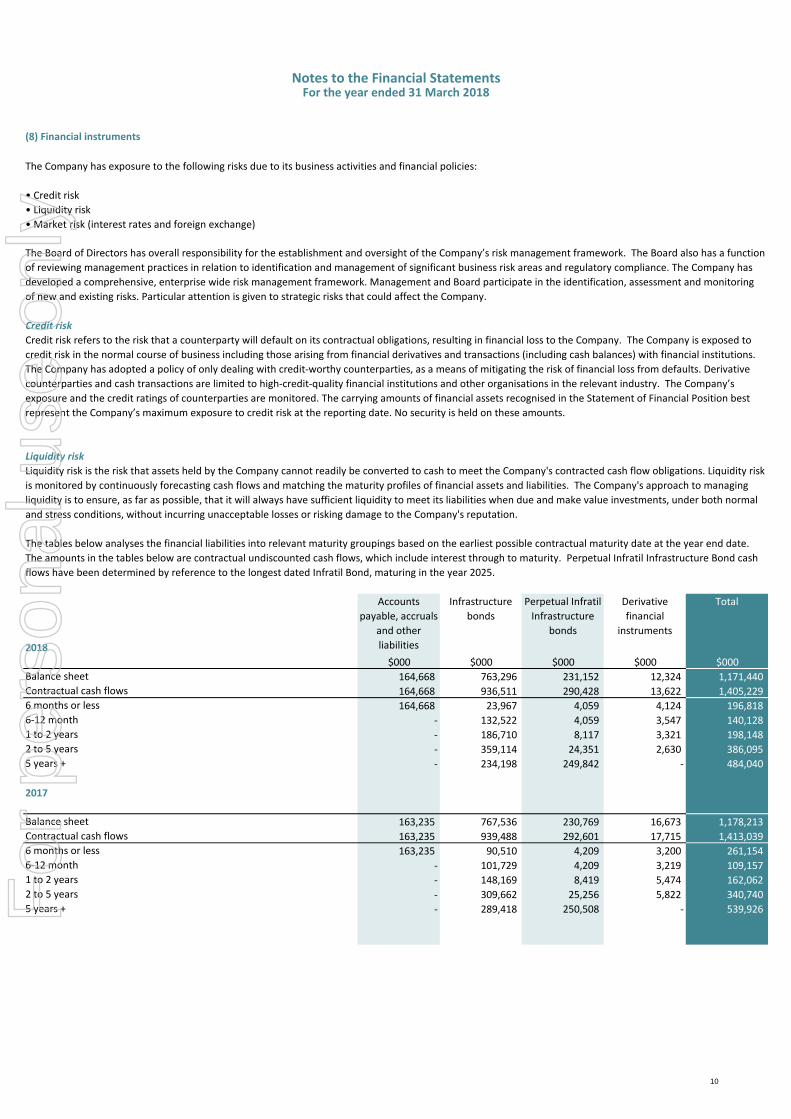
(8) Financial instruments
The Company has exposure to the following risks due to its business activities and financial policies:
• Credit risk
• Liquidity risk
• Market risk (interest rates and foreign exchange)
2018
Accounts
payable, accruals
and other
liabilities
Infrastructure
bonds
Perpetual Infratil
Infrastructure
bonds
Derivative
financial
instruments
Total
$000 $000 $000 $000 $000
Balance sheet 164,668 763,296 231,152 12,324 1,171,440
Contractual cash flows 164,668 936,511 290,428 13,622 1,405,229
6 months or less 164,668 23,967 4,059 4,124 196,818
6-12 month - 132,522 4,059 3,547 140,128
1 to 2 years - 186,710 8,117 3,321 198,148
2 to 5 years - 359,114 24,351 2,630 386,095
5 years + - 234,198 249,842 - 484,040
2017
Balance sheet 163,235 767,536 230,769 16,673 1,178,213
Contractual cash flows 163,235 939,488 292,601 17,715 1,413,039
6 months or less 163,235 90,510 4,209 3,200 261,154
6-12 month - 101,729 4,209 3,219 109,157
1 to 2 years - 148,169 8,419 5,474 162,062
2 to 5 years - 309,662 25,256 5,822 340,740
5 years + - 289,418 250,508 - 539,926
The Board of Directors has overall responsibility for the establishment and oversight of the Company’s risk management framework. The Board also has a function
of reviewing management practices in relation to identification and management of significant business risk areas and regulatory compliance. The Company has
developed a comprehensive, enterprise wide risk management framework. Management and Board participate in the identification, assessment and monitoring
of new and existing risks. Particular attention is given to strategic risks that could affect the Company.
Credit risk
Liquidity risk
Credit risk refers to the risk that a counterparty will default on its contractual obligations, resulting in financial loss to the Company. The Company is exposed to
credit risk in the normal course of business including those arising from financial derivatives and transactions (including cash balances) with financial institutions.
The Company has adopted a policy of only dealing with credit-worthy counterparties, as a means of mitigating the risk of financial loss from defaults. Derivative
counterparties and cash transactions are limited to high-credit-quality financial institutions and other organisations in the relevant industry. The Company’s
exposure and the credit ratings of counterparties are monitored. The carrying amounts of financial assets recognised in the Statement of Financial Position best
represent the Company’s maximum exposure to credit risk at the reporting date. No security is held on these amounts.
Liquidity risk is the risk that assets held by the Company cannot readily be converted to cash to meet the Company's contracted cash flow obligations. Liquidity risk
is monitored by continuously forecasting cash flows and matching the maturity profiles of financial assets and liabilities. The Company's approach to managing
liquidity is to ensure, as far as possible, that it will always have sufficient liquidity to meet its liabilities when due and make value investments, under both normal
and stress conditions, without incurring unacceptable losses or risking damage to the Company's reputation.
The tables below analyses the financial liabilities into relevant maturity groupings based on the earliest possible contractual maturity date at the year end date.
The amounts in the tables below are contractual undiscounted cash flows, which include interest through to maturity. Perpetual Infratil Infrastructure Bond cash
flows have been determined by reference to the longest dated Infratil Bond, maturing in the year 2025.
10
For
per
sona
l use
onl
y
Notes to the Financial StatementsFor the year ended 31 March 2018
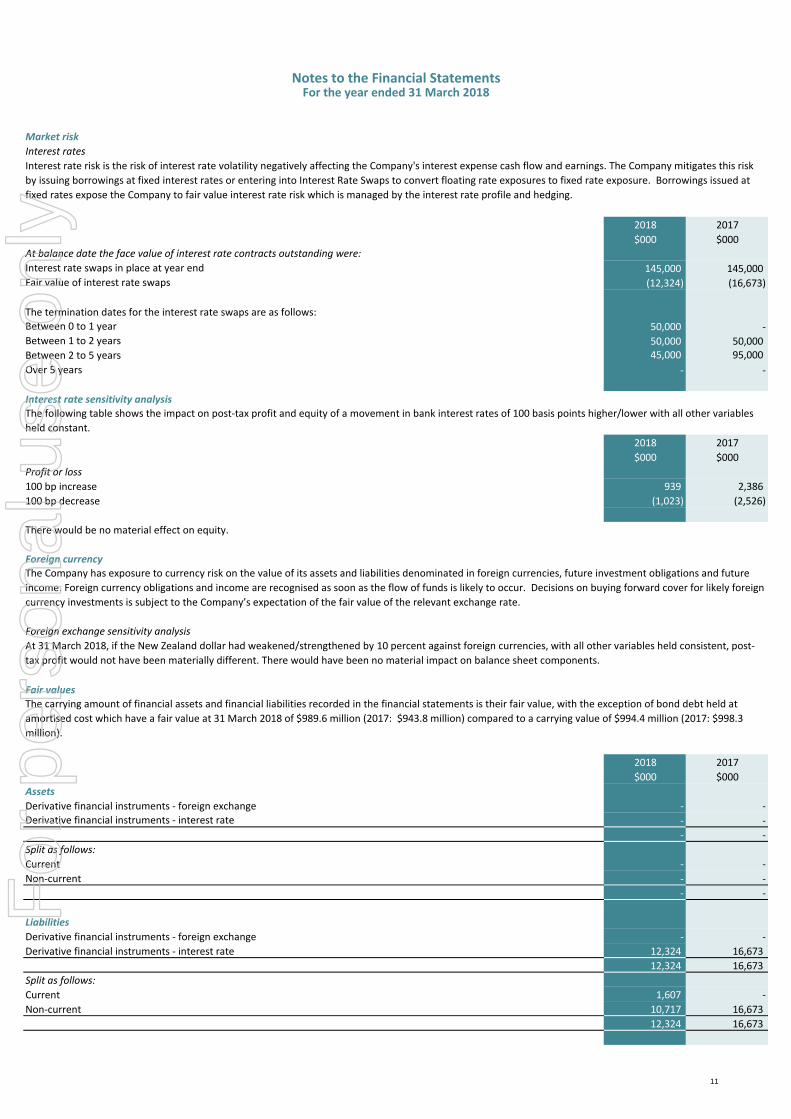
Interest rates
2018 2017
$000 $000At balance date the face value of interest rate contracts outstanding were:
Interest rate swaps in place at year end 145,000 145,000Fair value of interest rate swaps (12,324) (16,673)
The termination dates for the interest rate swaps are as follows:
Between 0 to 1 year 50,000 -
Between 1 to 2 years 50,000 50,000
Between 2 to 5 years 45,000 95,000
Over 5 years - -
Interest rate sensitivity analysis
2018 2017
$000 $000
Profit or loss
100 bp increase 939 2,386
100 bp decrease (1,023) (2,526)
There would be no material effect on equity.
Foreign currency
Fair values
2018 2017
$000 $000
Assets
Derivative financial instruments - foreign exchange - -
- -
- -
Split as follows:
Current - -
Non-current - -
- -
Liabilities
Derivative financial instruments - foreign exchange - -
Derivative financial instruments - interest rate 12,324 16,673
12,324 16,673
Split as follows:
Current 1,607 -
Non-current 10,717 16,673
12,324 16,673
Market risk
Interest rate risk is the risk of interest rate volatility negatively affecting the Company's interest expense cash flow and earnings. The Company mitigates this risk
by issuing borrowings at fixed interest rates or entering into Interest Rate Swaps to convert floating rate exposures to fixed rate exposure. Borrowings issued at
fixed rates expose the Company to fair value interest rate risk which is managed by the interest rate profile and hedging.
The following table shows the impact on post-tax profit and equity of a movement in bank interest rates of 100 basis points higher/lower with all other variables
held constant.
The Company has exposure to currency risk on the value of its assets and liabilities denominated in foreign currencies, future investment obligations and future
income. Foreign currency obligations and income are recognised as soon as the flow of funds is likely to occur. Decisions on buying forward cover for likely foreign
currency investments is subject to the Company’s expectation of the fair value of the relevant exchange rate.
Foreign exchange sensitivity analysis
At 31 March 2018, if the New Zealand dollar had weakened/strengthened by 10 percent against foreign currencies, with all other variables held consistent, post-
tax profit would not have been materially different. There would have been no material impact on balance sheet components.
The carrying amount of financial assets and financial liabilities recorded in the financial statements is their fair value, with the exception of bond debt held at
amortised cost which have a fair value at 31 March 2018 of $989.6 million (2017: $943.8 million) compared to a carrying value of $994.4 million (2017: $998.3
million).
Derivative financial instruments - interest rate
11
For
per
sona
l use
onl
y
Notes to the Financial StatementsFor the year ended 31 March 2018
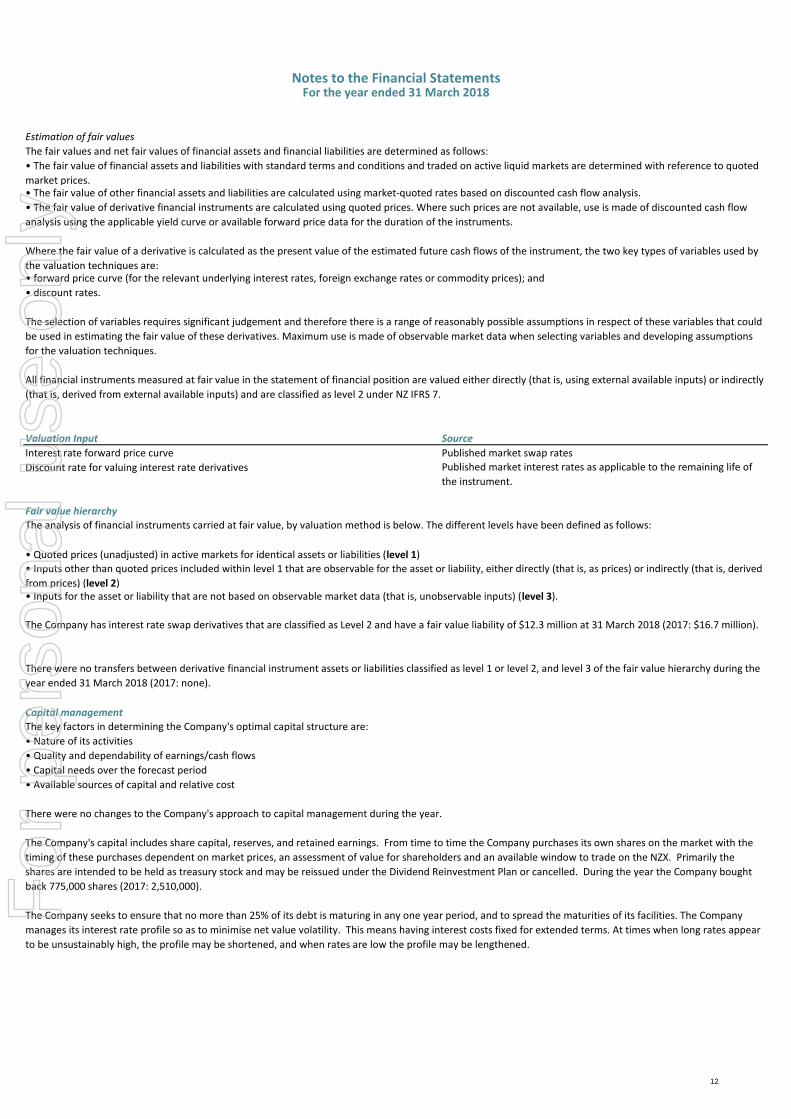
Estimation of fair values
Valuation Input Source
Interest rate forward price curve Published market swap rates
Discount rate for valuing interest rate derivatives
Fair value hierarchy
• Quoted prices (unadjusted) in active markets for identical assets or liabilities (level 1)
• Inputs for the asset or liability that are not based on observable market data (that is, unobservable inputs) (level 3).
Capital management
The Company's capital includes share capital, reserves, and retained earnings. From time to time the Company purchases its own shares on the market with the
timing of these purchases dependent on market prices, an assessment of value for shareholders and an available window to trade on the NZX. Primarily the
shares are intended to be held as treasury stock and may be reissued under the Dividend Reinvestment Plan or cancelled. During the year the Company bought
back 775,000 shares (2017: 2,510,000).
There were no changes to the Company's approach to capital management during the year.
The Company seeks to ensure that no more than 25% of its debt is maturing in any one year period, and to spread the maturities of its facilities. The Company
manages its interest rate profile so as to minimise net value volatility. This means having interest costs fixed for extended terms. At times when long rates appear
to be unsustainably high, the profile may be shortened, and when rates are low the profile may be lengthened.
The selection of variables requires significant judgement and therefore there is a range of reasonably possible assumptions in respect of these variables that could
be used in estimating the fair value of these derivatives. Maximum use is made of observable market data when selecting variables and developing assumptions
for the valuation techniques.
All financial instruments measured at fair value in the statement of financial position are valued either directly (that is, using external available inputs) or indirectly
(that is, derived from external available inputs) and are classified as level 2 under NZ IFRS 7.
The Company has interest rate swap derivatives that are classified as Level 2 and have a fair value liability of $12.3 million at 31 March 2018 (2017: $16.7 million).
There were no transfers between derivative financial instrument assets or liabilities classified as level 1 or level 2, and level 3 of the fair value hierarchy during the
year ended 31 March 2018 (2017: none).
• discount rates.
Published market interest rates as applicable to the remaining life of
the instrument.
The key factors in determining the Company's optimal capital structure are:
• Inputs other than quoted prices included within level 1 that are observable for the asset or liability, either directly (that is, as prices) or indirectly (that is, derived
from prices) (level 2)
The analysis of financial instruments carried at fair value, by valuation method is below. The different levels have been defined as follows:
• Capital needs over the forecast period
The fair values and net fair values of financial assets and financial liabilities are determined as follows:
• The fair value of financial assets and liabilities with standard terms and conditions and traded on active liquid markets are determined with reference to quoted
market prices.• The fair value of other financial assets and liabilities are calculated using market-quoted rates based on discounted cash flow analysis.
Where the fair value of a derivative is calculated as the present value of the estimated future cash flows of the instrument, the two key types of variables used by
the valuation techniques are:• forward price curve (for the relevant underlying interest rates, foreign exchange rates or commodity prices); and
• Available sources of capital and relative cost
• Nature of its activities
• Quality and dependability of earnings/cash flows
• The fair value of derivative financial instruments are calculated using quoted prices. Where such prices are not available, use is made of discounted cash flow
analysis using the applicable yield curve or available forward price data for the duration of the instruments.
12
For
per
sona
l use
onl
y
Notes to the Financial StatementsFor the year ended 31 March 2018
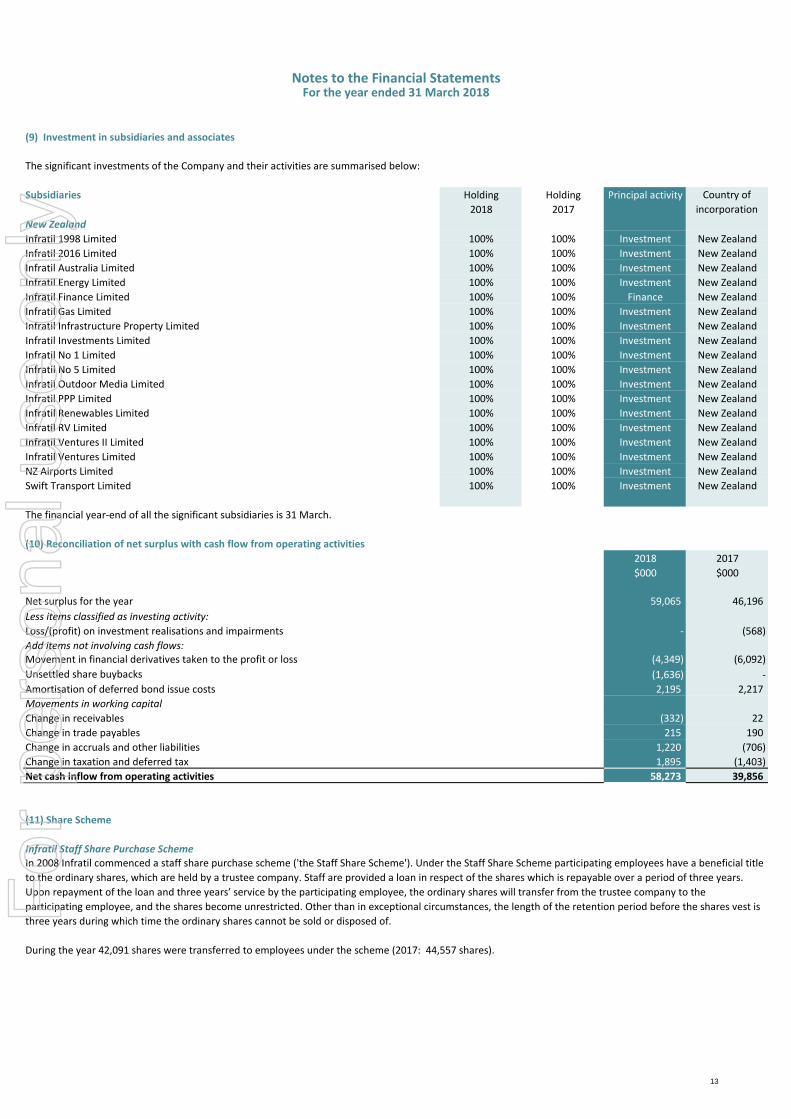
(9) Investment in subsidiaries and associates
The significant investments of the Company and their activities are summarised below:
Subsidiaries Holding Holding
2018 2017
New Zealand
Infratil 1998 Limited 100% 100% Investment New Zealand
Infratil 2016 Limited 100% 100% Investment New Zealand
Infratil Australia Limited 100% 100% Investment New Zealand
Infratil Energy Limited 100% 100% Investment New Zealand
Infratil Finance Limited 100% 100% Finance New Zealand
Infratil Gas Limited 100% 100% Investment New Zealand
Infratil Infrastructure Property Limited 100% 100% Investment New Zealand
Infratil Investments Limited 100% 100% Investment New Zealand
Infratil No 1 Limited 100% 100% Investment New Zealand
Infratil No 5 Limited 100% 100% Investment New Zealand
Infratil Outdoor Media Limited 100% 100% Investment New Zealand
Infratil PPP Limited 100% 100% Investment New Zealand
Infratil Renewables Limited 100% 100% Investment New Zealand
Infratil RV Limited 100% 100% Investment New Zealand
Infratil Ventures II Limited 100% 100% Investment New Zealand
Infratil Ventures Limited 100% 100% Investment New Zealand
NZ Airports Limited 100% 100% Investment New Zealand
Swift Transport Limited 100% 100% Investment New Zealand
The financial year-end of all the significant subsidiaries is 31 March.
(10) Reconciliation of net surplus with cash flow from operating activities
2018 2017
$000 $000
Net surplus for the year 59,065 46,196
Less items classified as investing activity:
Loss/(profit) on investment realisations and impairments - (568)
Add items not involving cash flows:(4,349) (6,092)
(1,636) -
Amortisation of deferred bond issue costs 2,195 2,217
Movements in working capital
Change in receivables (332) 22
Change in trade payables 215 190
Change in accruals and other liabilities 1,220 (706)
Change in taxation and deferred tax 1,895 (1,403)
Net cash inflow from operating activities 58,273 39,856
(11) Share Scheme
Infratil Staff Share Purchase Scheme
Principal activity Country of
incorporation
Movement in financial derivatives taken to the profit or loss
Unsettled share buybacks
In 2008 Infratil commenced a staff share purchase scheme ('the Staff Share Scheme'). Under the Staff Share Scheme participating employees have a beneficial title
to the ordinary shares, which are held by a trustee company. Staff are provided a loan in respect of the shares which is repayable over a period of three years.
Upon repayment of the loan and three years’ service by the participating employee, the ordinary shares will transfer from the trustee company to the
participating employee, and the shares become unrestricted. Other than in exceptional circumstances, the length of the retention period before the shares vest is
three years during which time the ordinary shares cannot be sold or disposed of.
During the year 42,091 shares were transferred to employees under the scheme (2017: 44,557 shares).
13
For
per
sona
l use
onl
y
Notes to the Financial StatementsFor the year ended 31 March 2018
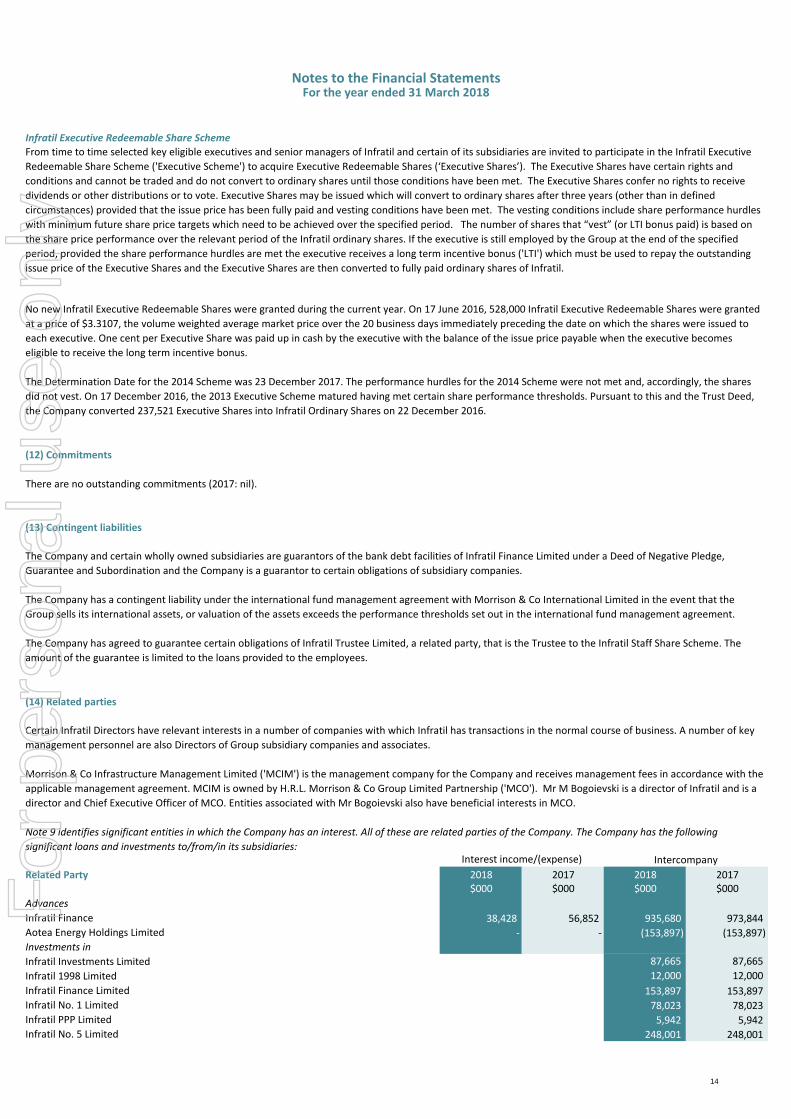
Infratil Executive Redeemable Share Scheme
(12) Commitments
There are no outstanding commitments (2017: nil).
(13) Contingent liabilities
(14) Related parties
Related Party 2018 2017 2018 2017$000 $000 $000 $000
Advances
Infratil Finance 38,428 56,852 935,680 973,844
Aotea Energy Holdings Limited - - (153,897) (153,897)
Investments in
Infratil Investments Limited 87,665 87,665
Infratil 1998 Limited 12,000 12,000
Infratil Finance Limited 153,897 153,897
Infratil No. 1 Limited 78,023 78,023
Infratil PPP Limited 5,942 5,942
Infratil No. 5 Limited 248,001 248,001
Interest income/(expense) Intercompany
Certain Infratil Directors have relevant interests in a number of companies with which Infratil has transactions in the normal course of business. A number of key
management personnel are also Directors of Group subsidiary companies and associates.
Morrison & Co Infrastructure Management Limited ('MCIM') is the management company for the Company and receives management fees in accordance with the
applicable management agreement. MCIM is owned by H.R.L. Morrison & Co Group Limited Partnership ('MCO'). Mr M Bogoievski is a director of Infratil and is a
director and Chief Executive Officer of MCO. Entities associated with Mr Bogoievski also have beneficial interests in MCO.
No new Infratil Executive Redeemable Shares were granted during the current year. On 17 June 2016, 528,000 Infratil Executive Redeemable Shares were granted
at a price of $3.3107, the volume weighted average market price over the 20 business days immediately preceding the date on which the shares were issued to
each executive. One cent per Executive Share was paid up in cash by the executive with the balance of the issue price payable when the executive becomes
eligible to receive the long term incentive bonus.
Note 9 identifies significant entities in which the Company has an interest. All of these are related parties of the Company. The Company has the following
significant loans and investments to/from/in its subsidiaries:
The Determination Date for the 2014 Scheme was 23 December 2017. The performance hurdles for the 2014 Scheme were not met and, accordingly, the shares
did not vest. On 17 December 2016, the 2013 Executive Scheme matured having met certain share performance thresholds. Pursuant to this and the Trust Deed,
the Company converted 237,521 Executive Shares into Infratil Ordinary Shares on 22 December 2016.
The Company and certain wholly owned subsidiaries are guarantors of the bank debt facilities of Infratil Finance Limited under a Deed of Negative Pledge,
Guarantee and Subordination and the Company is a guarantor to certain obligations of subsidiary companies.
The Company has a contingent liability under the international fund management agreement with Morrison & Co International Limited in the event that the
Group sells its international assets, or valuation of the assets exceeds the performance thresholds set out in the international fund management agreement.
The Company has agreed to guarantee certain obligations of Infratil Trustee Limited, a related party, that is the Trustee to the Infratil Staff Share Scheme. The
amount of the guarantee is limited to the loans provided to the employees.
From time to time selected key eligible executives and senior managers of Infratil and certain of its subsidiaries are invited to participate in the Infratil Executive
Redeemable Share Scheme ('Executive Scheme') to acquire Executive Redeemable Shares (‘Executive Shares’). The Executive Shares have certain rights and
conditions and cannot be traded and do not convert to ordinary shares until those conditions have been met. The Executive Shares confer no rights to receive
dividends or other distributions or to vote. Executive Shares may be issued which will convert to ordinary shares after three years (other than in defined
circumstances) provided that the issue price has been fully paid and vesting conditions have been met. The vesting conditions include share performance hurdles
with minimum future share price targets which need to be achieved over the specified period. The number of shares that “vest” (or LTI bonus paid) is based on
the share price performance over the relevant period of the Infratil ordinary shares. If the executive is still employed by the Group at the end of the specified
period, provided the share performance hurdles are met the executive receives a long term incentive bonus ('LTI') which must be used to repay the outstanding
issue price of the Executive Shares and the Executive Shares are then converted to fully paid ordinary shares of Infratil.
14
For
per
sona
l use
onl
y
Notes to the Financial StatementsFor the year ended 31 March 2018
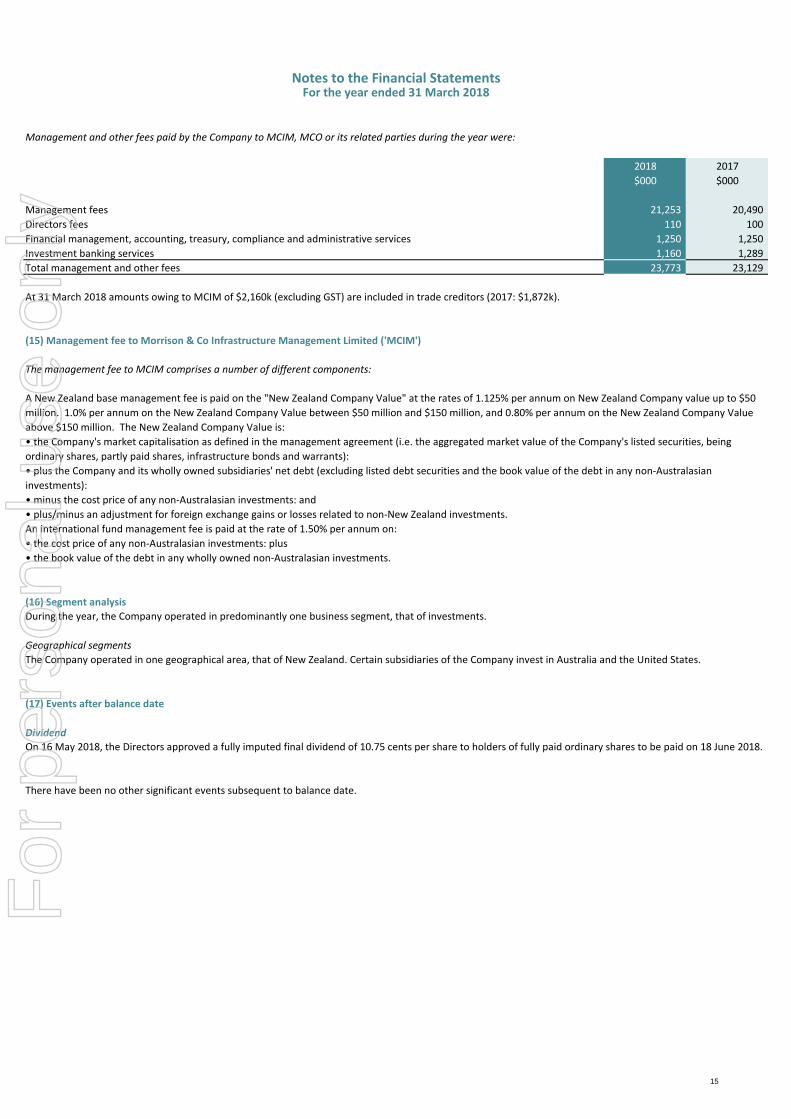
Management and other fees paid by the Company to MCIM, MCO or its related parties during the year were:
2018 2017
$000 $000
Management fees 21,253 20,490
Directors fees 110 100
Financial management, accounting, treasury, compliance and administrative services 1,250 1,250
Investment banking services 1,160 1,289
Total management and other fees 23,773 23,129
At 31 March 2018 amounts owing to MCIM of $2,160k (excluding GST) are included in trade creditors (2017: $1,872k).
(15) Management fee to Morrison & Co Infrastructure Management Limited ('MCIM')
The management fee to MCIM comprises a number of different components:
(16) Segment analysis
During the year, the Company operated in predominantly one business segment, that of investments.
Geographical segments
(17) Events after balance date
Dividend
There have been no other significant events subsequent to balance date.
A New Zealand base management fee is paid on the "New Zealand Company Value" at the rates of 1.125% per annum on New Zealand Company value up to $50
million. 1.0% per annum on the New Zealand Company Value between $50 million and $150 million, and 0.80% per annum on the New Zealand Company Value
above $150 million. The New Zealand Company Value is:
• the Company's market capitalisation as defined in the management agreement (i.e. the aggregated market value of the Company's listed securities, being
ordinary shares, partly paid shares, infrastructure bonds and warrants):
• plus the Company and its wholly owned subsidiaries' net debt (excluding listed debt securities and the book value of the debt in any non-Australasian
investments):
• minus the cost price of any non-Australasian investments: and
• plus/minus an adjustment for foreign exchange gains or losses related to non-New Zealand investments.
An international fund management fee is paid at the rate of 1.50% per annum on:
• the cost price of any non-Australasian investments: plus
• the book value of the debt in any wholly owned non-Australasian investments.
The Company operated in one geographical area, that of New Zealand. Certain subsidiaries of the Company invest in Australia and the United States.
On 16 May 2018, the Directors approved a fully imputed final dividend of 10.75 cents per share to holders of fully paid ordinary shares to be paid on 18 June 2018.
15
For
per
sona
l use
onl
y
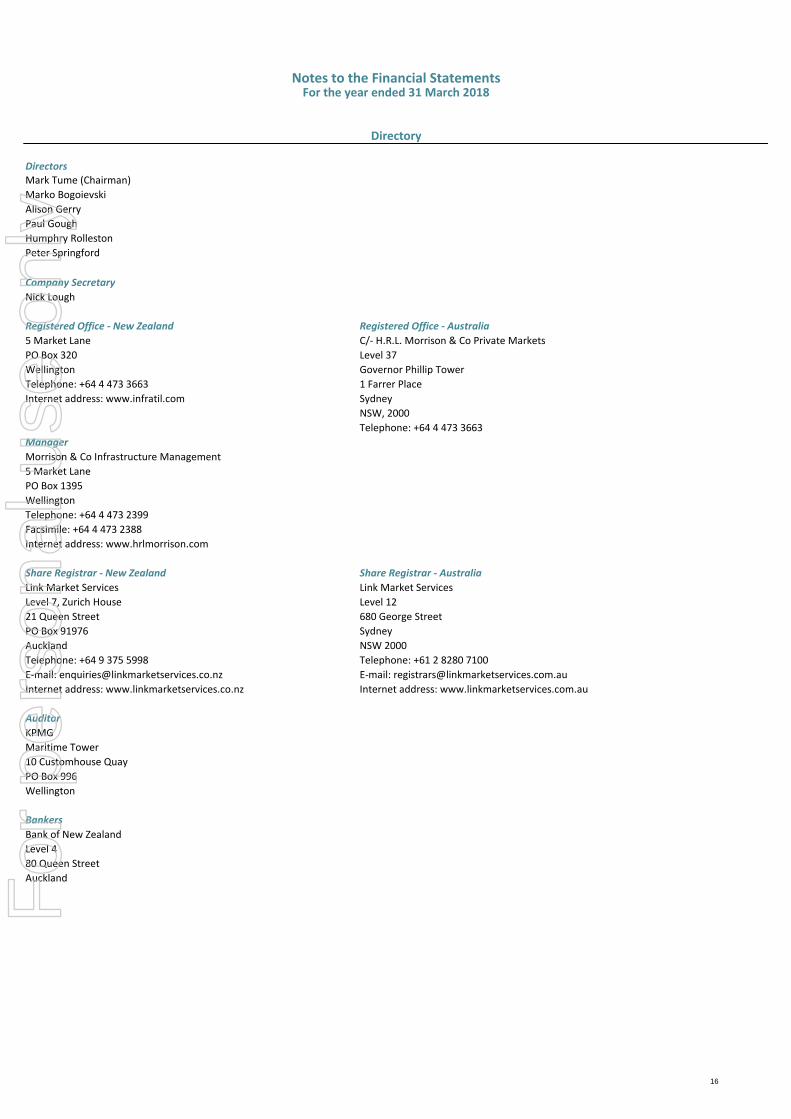
Notes to the Financial StatementsFor the year ended 31 March 2018
DirectorsMark Tume (Chairman)
Marko Bogoievski
Alison Gerry
Paul Gough
Humphry Rolleston
Peter Springford
Company Secretary
Nick Lough
Registered Office - New Zealand Registered Office - Australia
5 Market Lane C/- H.R.L. Morrison & Co Private Markets
PO Box 320 Level 37
Wellington Governor Phillip Tower
Telephone: +64 4 473 3663 1 Farrer Place
Internet address: www.infratil.com Sydney
NSW, 2000
Telephone: +64 4 473 3663
Manager
Morrison & Co Infrastructure Management
5 Market Lane
PO Box 1395
Wellington
Telephone: +64 4 473 2399
Facsimile: +64 4 473 2388
Internet address: www.hrlmorrison.com
Share Registrar - New Zealand Share Registrar - Australia
Link Market Services Link Market Services
Level 7, Zurich House Level 12
21 Queen Street 680 George Street
PO Box 91976 Sydney
Auckland NSW 2000
Telephone: +64 9 375 5998 Telephone: +61 2 8280 7100
E-mail: [email protected] E-mail: [email protected]
Internet address: www.linkmarketservices.co.nz Internet address: www.linkmarketservices.com.au
Auditor
KPMG
Maritime Tower
10 Customhouse Quay
PO Box 996
Wellington
Bankers
Bank of New Zealand
Level 4
80 Queen Street
Auckland
Directory
16
For
per
sona
l use
onl
y
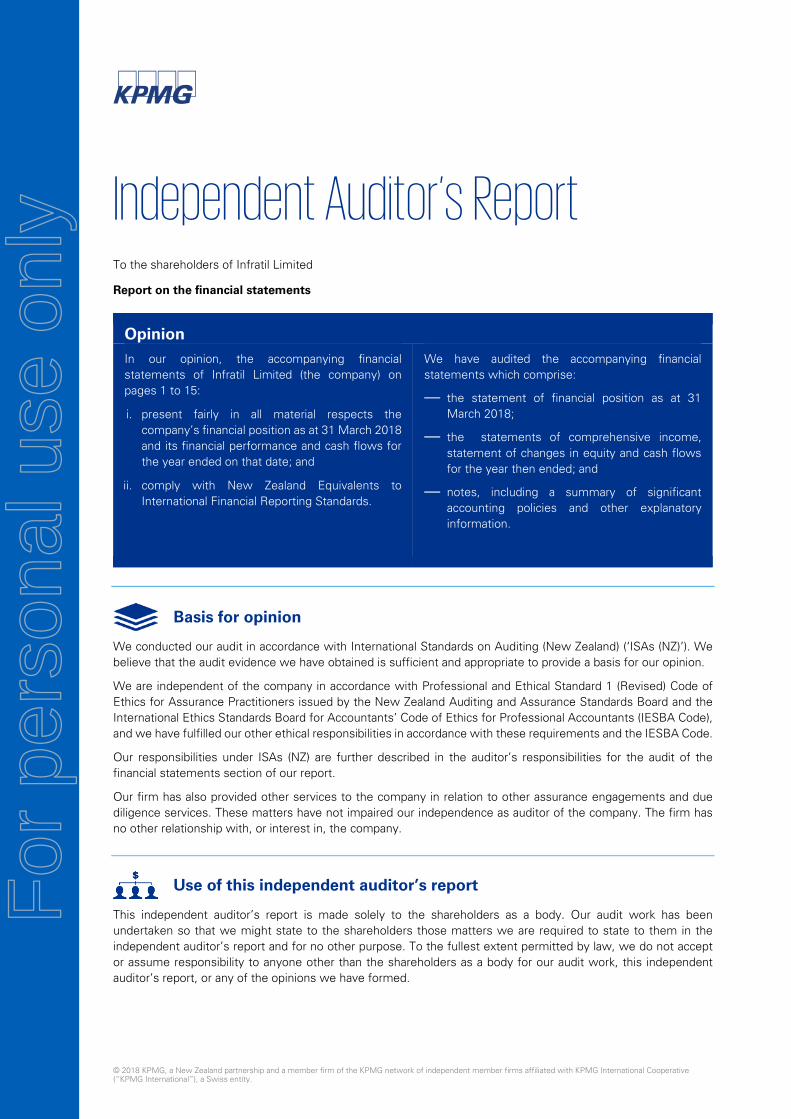
© 2018 KPMG, a New Zealand partnership and a member firm of the KPMG network of independent member firms affiliated with KPMG International Cooperative (“KPMG International”), a Swiss entity.
Independent Auditor’s Report To the shareholders of Infratil Limited
Report on the financial statements
Opinion In our opinion, the accompanying financial statements of Infratil Limited (the company) on pages 1 to 15:
i. present fairly in all material respects thecompany’s financial position as at 31 March 2018and its financial performance and cash flows forthe year ended on that date; and
ii. comply with New Zealand Equivalents toInternational Financial Reporting Standards.
We have audited the accompanying financial statements which comprise:
— the statement of financial position as at 31March 2018;
— the statements of comprehensive income,statement of changes in equity and cash flows for the year then ended; and
— notes, including a summary of significantaccounting policies and other explanatory information.
Basis for opinion
We conducted our audit in accordance with International Standards on Auditing (New Zealand) (‘ISAs (NZ)’). We believe that the audit evidence we have obtained is sufficient and appropriate to provide a basis for our opinion.
We are independent of the company in accordance with Professional and Ethical Standard 1 (Revised) Code of Ethics for Assurance Practitioners issued by the New Zealand Auditing and Assurance Standards Board and the International Ethics Standards Board for Accountants’ Code of Ethics for Professional Accountants (IESBA Code), and we have fulfilled our other ethical responsibilities in accordance with these requirements and the IESBA Code.
Our responsibilities under ISAs (NZ) are further described in the auditor’s responsibilities for the audit of the financial statements section of our report.
Our firm has also provided other services to the company in relation to other assurance engagements and due diligence services. These matters have not impaired our independence as auditor of the company. The firm has no other relationship with, or interest in, the company.
Use of this independent auditor’s report
This independent auditor’s report is made solely to the shareholders as a body. Our audit work has been undertaken so that we might state to the shareholders those matters we are required to state to them in the independent auditor’s report and for no other purpose. To the fullest extent permitted by law, we do not accept or assume responsibility to anyone other than the shareholders as a body for our audit work, this independent auditor’s report, or any of the opinions we have formed.
For
per
sona
l use
onl
y
2
Responsibilities of the Directors for the financial statements
The Directors, on behalf of the company, are responsible for:
— the preparation and fair presentation of the financial statements in accordance with generally acceptedaccounting practice in New Zealand (being New Zealand Equivalents to International Financial Reporting Standards);
— implementing necessary internal control to enable the preparation of a set of financial statements that is fairlypresented and free from material misstatement, whether due to fraud or error; and
— assessing the ability to continue as a going concern. This includes disclosing, as applicable, matters related togoing concern and using the going concern basis of accounting unless they either intend to liquidate or to cease operations, or have no realistic alternative but to do so.
Auditor’s responsibilities for the audit of the financial statements
Our objective is:
— to obtain reasonable assurance about whether the financial statements as a whole are free from materialmisstatement, whether due to fraud or error; and
— to issue an independent auditor’s report that includes our opinion.
Reasonable assurance is a high level of assurance, but is not a guarantee that an audit conducted in accordance with ISAs NZ will always detect a material misstatement when it exists.
Misstatements can arise from fraud or error. They are considered material if, individually or in the aggregate, they could reasonably be expected to influence the economic decisions of users taken on the basis of these financial statements.
A further description of our responsibilities for the audit of these financial statements is located at the External Reporting Board (XRB) website at:
http://www.xrb.govt.nz/standards-for-assurance-practitioners/auditors-responsibilities/audit-report-2/
This description forms part of our independent auditor’s report.
The engagement partner on the audit resulting in this independent auditor's report is Ross Buckley
For and on behalf of
KPMG Wellington
16 May 2018 For
per
sona
l use
onl
y
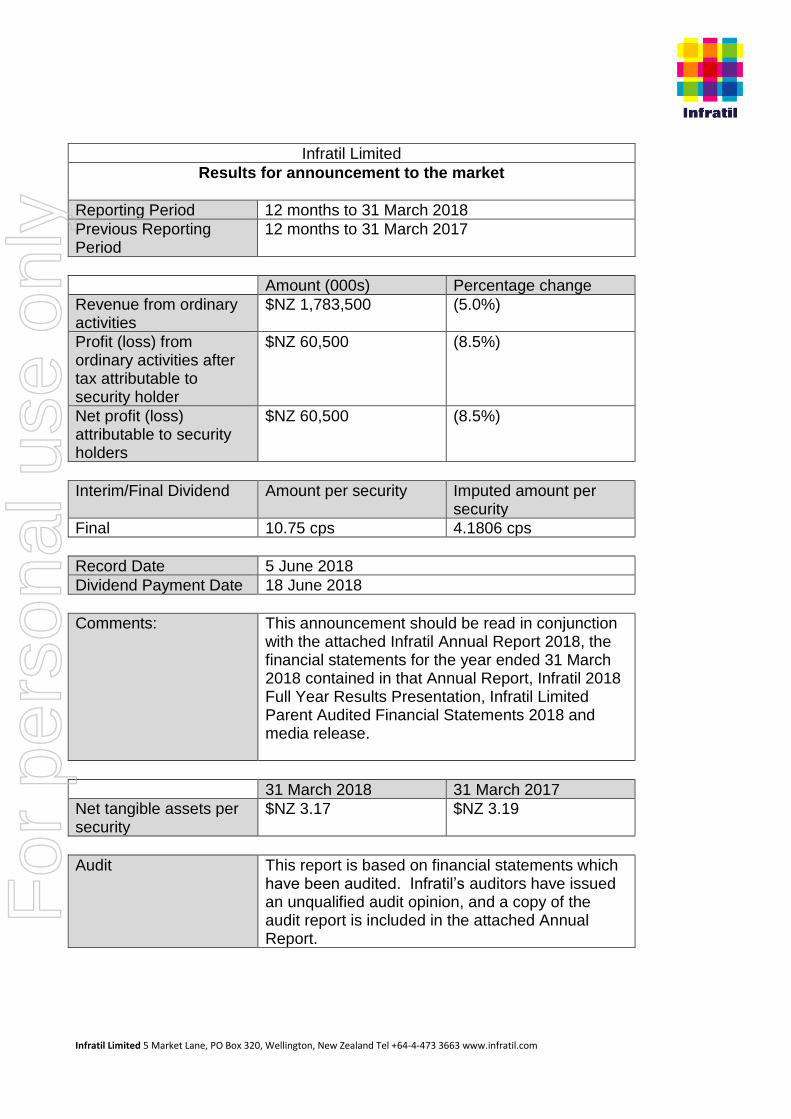
Infratil Limited 5 Market Lane, PO Box 320, Wellington, New Zealand Tel +64-4-473 3663 www.infratil.com
Infratil Limited
Results for announcement to the market
Reporting Period 12 months to 31 March 2018
Previous Reporting Period
12 months to 31 March 2017
Amount (000s) Percentage change
Revenue from ordinary activities
$NZ 1,783,500 (5.0%)
Profit (loss) from ordinary activities after tax attributable to security holder
$NZ 60,500 (8.5%)
Net profit (loss) attributable to security holders
$NZ 60,500 (8.5%)
Interim/Final Dividend Amount per security Imputed amount per security
Final 10.75 cps 4.1806 cps
Record Date 5 June 2018
Dividend Payment Date 18 June 2018
Comments: This announcement should be read in conjunction with the attached Infratil Annual Report 2018, the financial statements for the year ended 31 March 2018 contained in that Annual Report, Infratil 2018 Full Year Results Presentation, Infratil Limited Parent Audited Financial Statements 2018 and media release.
31 March 2018 31 March 2017
Net tangible assets per security
$NZ 3.17 $NZ 3.19
Audit This report is based on financial statements which have been audited. Infratil’s auditors have issued an unqualified audit opinion, and a copy of the audit report is included in the attached Annual Report.
For
per
sona
l use
onl
y
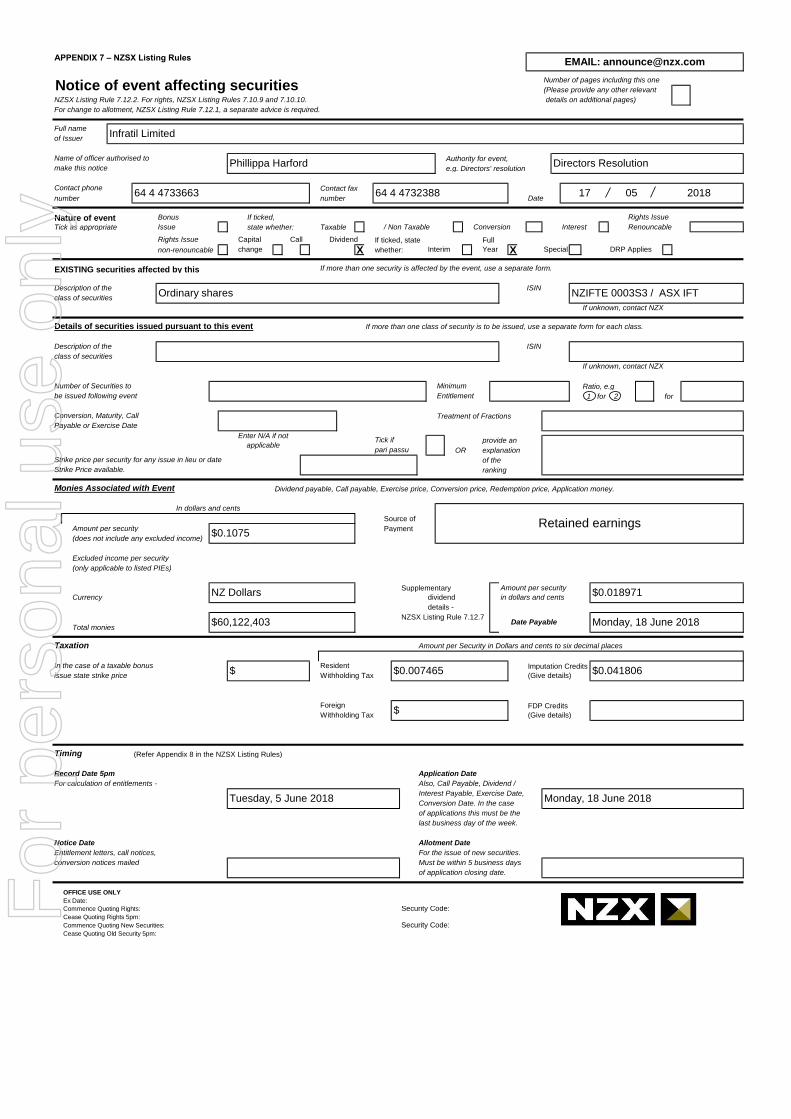
APPENDIX 7 – NZSX Listing Rules
Number of pages including this one
(Please provide any other relevant
NZSX Listing Rule 7.12.2. For rights, NZSX Listing Rules 7.10.9 and 7.10.10. details on additional pages)
For change to allotment, NZSX Listing Rule 7.12.1, a separate advice is required.
Full name
of Issuer
Name of officer authorised to Authority for event,
make this notice e.g. Directors' resolution
Contact phone Contact fax
number number Date
Nature of event Bonus If ticked, Rights Issue
Tick as appropriate Issue state whether: Taxable / Non Taxable Conversion Interest Renouncable
Rights Issue Capital Call Dividend If ticked, state Full
non-renouncable change X whether: Interim Year X Special DRP Applies
EXISTING securities affected by this If more than one security is affected by the event, use a separate form.
Description of the ISIN
class of securities
If unknown, contact NZX
Details of securities issued pursuant to this event If more than one class of security is to be issued, use a separate form for each class.
Description of the ISIN
class of securities
If unknown, contact NZX
Number of Securities to Minimum Ratio, e.g
be issued following event Entitlement 1 for 2 for
Conversion, Maturity, Call Treatment of Fractions
Payable or Exercise Date
Tick if provide an
pari passu OR explanation
Strike price per security for any issue in lieu or date of the
Strike Price available. ranking
Monies Associated with Event Dividend payable, Call payable, Exercise price, Conversion price, Redemption price, Application money.
Source of
Amount per security Payment
(does not include any excluded income)
Excluded income per security
(only applicable to listed PIEs)
Supplementary Amount per security
Currency dividend in dollars and cents
details -
NZSX Listing Rule 7.12.7
Total monies
Taxation Amount per Security in Dollars and cents to six decimal places
In the case of a taxable bonus Resident Imputation Credits
issue state strike price Withholding Tax (Give details)
Foreign FDP Credits
Withholding Tax (Give details)
Timing (Refer Appendix 8 in the NZSX Listing Rules)
Record Date 5pm Application Date
For calculation of entitlements - Also, Call Payable, Dividend /
Interest Payable, Exercise Date,
Conversion Date. In the case
of applications this must be the
last business day of the week.
Notice Date Allotment Date
Entitlement letters, call notices, For the issue of new securities.
conversion notices mailed Must be within 5 business days
of application closing date.
OFFICE USE ONLY
Ex Date:
Commence Quoting Rights: Security Code:Cease Quoting Rights 5pm:
Commence Quoting New Securities: Security Code:Cease Quoting Old Security 5pm:
EMAIL: [email protected]
Notice of event affecting securities
Infratil Limited
Phillippa Harford Directors Resolution
64 4 4733663 64 4 4732388 17 05 2018
Ordinary shares NZIFTE 0003S3 / ASX IFT
In dollars and cents
Retained earnings$0.1075
Enter N/A if not
applicable
$ $0.007465 $0.041806
$
NZ Dollars $0.018971
Date Payable Monday, 18 June 2018$60,122,403
Tuesday, 5 June 2018 Monday, 18 June 2018
For
per
sona
l use
onl
y
1
CAPITAL GROWTH
Infratil Annual Report 2018
For
per
sona
l use
onl
y

2
ANNUAL REPORT 2018
For
per
sona
l use
onl
y

1
Infratil owns infrastructure businesses that provide essential facilities and services to individuals and communities. Shareholders receive good risk-adjusted returns if the businesses provide satisfactory services, are efficient, and risks are well managed.Infrastructure comprises the basic physical and organisational structures and facilities needed for the operation of a society or enterprise. In the 24 years since Infratil was established, what constitutes infrastructure has evolved. In 1994, ports, power plants, wires and airports were infrastructure; today the scope has widened in response to changes in society, technology, and consumer preferences. Data storage and transmission is increasingly sourced from specialist infrastructure providers. Social infrastructure includes accommodation and care for those for whom society has recognised responsibility. Airports have become regional gateways with a much wider mandate than offering passengers shelter and airlines a safe airfield.
Energy providers were vertically integrated entities which offered “take it or leave it” service. They are now segmented, specialist and closely focussed on consumer preferences.Along with changes to what constitutes infrastructure has been the evolution of business models and sources of capital. Throughout, Infratil has maintained a consistent approach to its goal of providing its risk-adjusted returns by seeking to invest:• Where demographic or core societal
factors are driving long-term demand. • Where Infratil has expertise and
influence.• Where Infratil has a competitive
advantage as an operator and a capital provider, and where demand growth, market structures and regulation supports further investment in capacity and capability.
Although the core features of Infratil’s approach have not changed, some aspects have. In part because of the changes to the investment environment and in part because of changes in the priorities of Infratil’s shareholders. Infratil invests in a portfolio of businesses. Some
are mature and strongly cash generative (e.g. Trustpower, Wellington Airport), some are early stage (e.g. Longroad Energy). The portfolio approach reduces risk through diversification, creates stability of cash flows, and enables Infratil to take a long-term approach to early-stage developments. A consistent feature of infrastructure is its reliance on capital. Energy, airports, data storage/transmission, accommodation/care; all require assets, buildings, structures, equipment, and land. Reflecting this, Infratil and its businesses have invested $3,993 million over the last decade. This creates a distinct pattern of earnings and capital growth. Capital is deployed, structures are erected, utilisation rises, earnings increase, capital grows. This annual report covers Infratil’s operations, capital deployment, and how the goal of capital growth is being realised.
CAPITAL GROWTH
ANNUAL REPORT 2018
For
per
sona
l use
onl
y

2
ANNUAL REPORT 2018
For
per
sona
l use
onl
y

3
For
per
sona
l use
onl
y
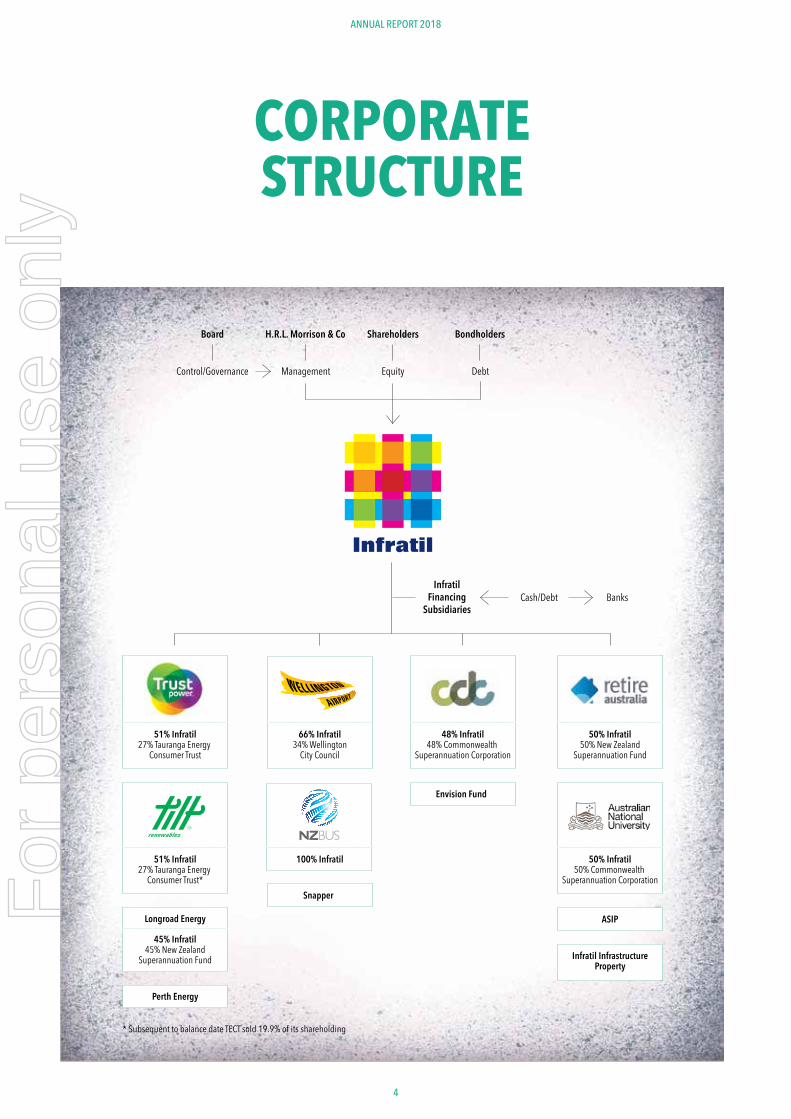
ANNUAL REPORT 2018
4
Equity
Shareholders
Debt
BondholdersBoard
Control/Governance Management
H.R.L. Morrison & Co
Cash/Debt BanksInfratil
FinancingSubsidiaries
Envision Fund
Longroad Energy
51% Infratil27% Tauranga Energy
Consumer Trust
Perth Energy
Snapper
ASIP
Infratil InfrastructureProperty
66% Infratil34% Wellington
City Council
48% Infratil48% Commonwealth
Superannuation Corporation
50% Infratil50% New Zealand
Superannuation Fund
45% Infratil45% New Zealand
Superannuation Fund
51% Infratil27% Tauranga Energy
Consumer Trust*
100% Infratil 50% Infratil50% Commonwealth
Superannuation Corporation
CORPORATE STRUCTURE
* Subsequent to balance date TECT sold 19.9% of its shareholding
For
per
sona
l use
onl
y
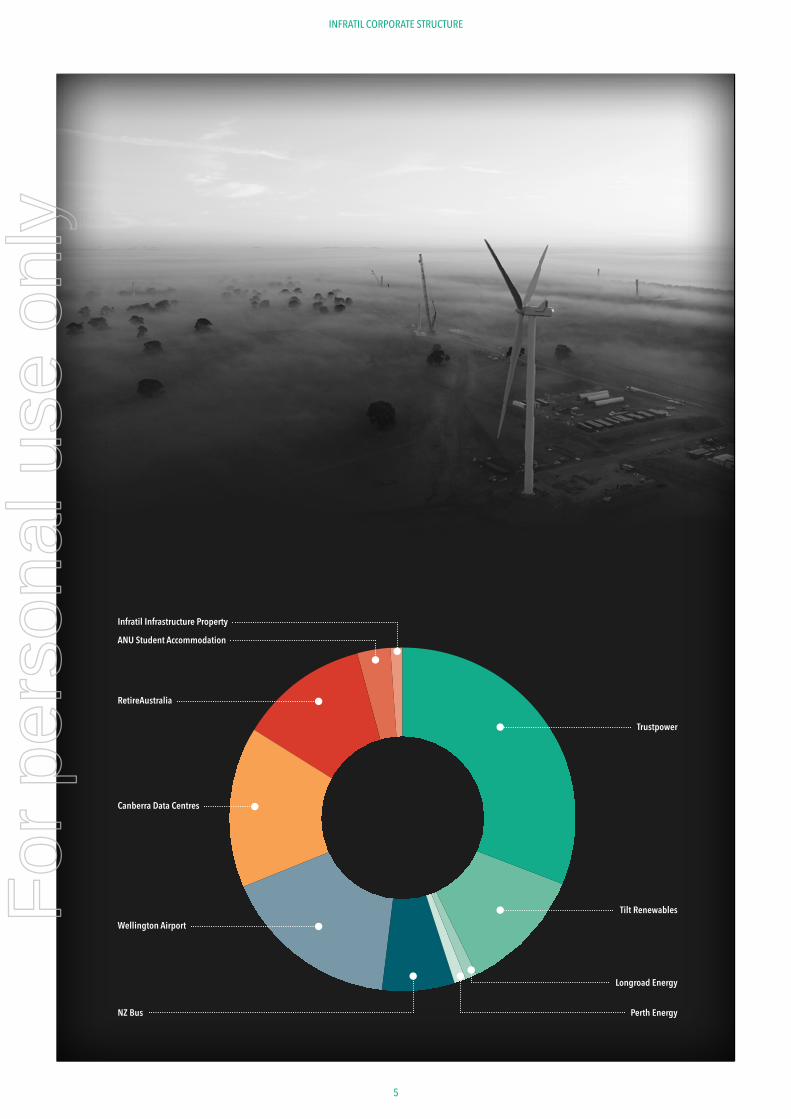
5
INFRATIL CORPORATE STRUCTUREANNUAL REPORT 2018
Tilt Renewables
Infratil Infrastructure Property
ANU Student Accommodation
RetireAustralia
Wellington Airport
Canberra Data Centres
Trustpower
Longroad Energy
Perth EnergyNZ Bus
For
per
sona
l use
onl
y

6
ANNUAL REPORT 2018
GOVERNANCE & DIRECTION
Left to right: Humphry Rolleston, Alison Gerry, Mark Tume, Marko Bogoievski, Peter Springford and Paul Gough.For
per
sona
l use
onl
y

7
Infratil’s shareholders elect directors for three year terms to represent them and to look after their interests. Directors:• maintain a dialogue with shareholders;• participate in the formulation and
articulation of the Company’s strategy for long-term value creation;
• monitor strategy implementation, the pathway to financial performance, risks and legal compliance, and the evolution of the strategy as circumstances change;
• ensure effective articulation to external stakeholders of strategy, goals, risks and performance;
• maintain awareness of societal and market developments relevant to the Company’s performance; and
• offer diversity of perspective and knowledge relevant to the Company.
Infratil has six directors of whom five are independent of management. They have been on the board for between two and 12 years.Infratil’s directors also have an area of particular responsibility monitoring the performance of Infratil’s manager H.R.L. Morrison & Co (“Morrison & Co.”).Morrison & Co is a specialist manager of infrastructure investments and performs this role for Infratil under an investment management agreement. Infratil benefits from having a management team with great breadth and depth of skills, however the board must be vigilant about potential conflicts of interest and satisfied that the cost is reasonable relative to alternatives.During the last year the board’s monitoring of Morrison & Co included commissioning an external review of the management agreement, which concluded that the current arrangements remain fair to Infratil shareholders. In addition, when the board undertook its annual externally-facilitated review of its own capabilities and performance it prioritised the issues of independence and governance over potential
conflicts of interest. This review raised no material concerns.Further commentary on the role of the board, the credentials of directors and their remuneration are set out on pages 101-104 of this annual report.
MARK TUMEChair. Independent. Appointed 2007. Due for re-election in 2018My obligation is to maintain ties with Infratil’s diverse range of stakeholders and to ensure that the board is delivering on the responsibilities set out above.My experience in finance and on the boards of infrastructure companies (Transpower, Kiwi Rail, NZ Refining) has given me an appreciation of the sectors in which Infratil operates and the operational, regulatory and financial risks it faces.
PETER SPRINGFORD Director. Independent. Appointed 2016. Last elected 2017I have been the leader of a major industrial company based in New Zealand and Australia and of industrial businesses in Asia, as well as the chair or director of companies which operate in New Zealand and in international markets. People are important; their safety; the need to act with integrity in offshore markets just as we would in New Zealand; and that top operational performance and strong customer relationships are key to long-term returns for shareholders.
PAUL GOUGHDirector. Independent. Appointed 2012. Due for re-election in 2018As a Kiwi who works in London I’m very aware of how global events impact in New Zealand and Australia. In London I manage investments in similar fields to Infratil’s, but with more development risk. Achieving the best outcome requires the best from people. The focus on performance and people is consistent with what I see at Infratil.
ALISON GERRYDirector, Chair of the Audit & Risk Committee. Independent. Appointed 2014. Last elected 2016 My experience in finance and risk management helps me appreciate Infratil’s strategic opportunities and threats; from financial markets, technology, regulation and the natural environment. Executing strategy is in part about allocating capital and in part about developing a culture which reflects the value we place on our own people, our customers, and our communities.
MARKO BOGOIEVSKIDirector. Chief Executive. Appointed 2009. Last elected 2017 Managing Infratil requires awareness of external markets, a thorough understanding of each of our businesses, an ability to develop and articulate strategy, and discipline around risk.In so many of our businesses I see change accelerating and it’s not possible to anticipate all the outcomes. But this is a backdrop that creates opportunities.
HUMPHRY ROLLESTONDirector. Independent. Appointed 2006. Last elected 2017 I have business experience in start-ups, property, and a diversity of geographies and sectors. I have been a director of large and small listed New Zealand companies, and involvement in charitable organisations.I have a good appreciation of practicalities and howto get the best from the people you work with.
GOVERNANCE & DIRECTION
For
per
sona
l use
onl
y

8
ANNUAL REPORT 2018
MANAGEMENT
Left To Right
Infratil’s management comprises people employed by Infratil’s manager, Morrison & Co, and those employed by Infratil’s subsidiaries and investee companies. Morrison & Co is an investment manager with a specialist focus on the infrastructure sector. In addition to managing Infratil it also manages investments on behalf of a number of superannuation funds; including the New Zealand Superannuation Fund and the Commonwealth Superannuation Corporation which have both made investments in partnership with Infratil. Infratil benefits from its management having the expertise of a larger and more experienced group of individuals than a company of Infratil’s scale could normally retain and from the manager’s contacts and relationships.
MARKO BOGOIEVSKIChief Executive. Director of Infratil and Longroad Energy
PHILLIPPA HARFORDChief Financial Officer. Director of Snapper
KEVIN BAKERChair of NZ Bus and Director of Canberra Data Centres and Infratil Infrastructure Property
GREG BOORERCEO Canberra Data Centres
JASON BOYESLegal and commercial oversight. Director of Wellington Airport and NZ Bus
TIM BROWNCapital markets, and economic regulation Chair of Wellington Airport
FIONA CAMERONGroup Treasurer and Risk Manager
DEION CAMPBELLCEO Tilt Renewables
KELLEE CLARKLegal, compliance, transaction structuring and execution
PETER COMANProperty and social infrastructure Director of Infratil Infrastructure Property
HARRY COMINOS Investment strategy
ROGER CRAWFORDAustralian energy sector activities Director of Perth Energy
For
per
sona
l use
onl
y

9
Left To Right
STEVEN FITZGERALDChair of Perth Energy, Director of RetireAustralia, Trustpower and ANU Student Accommodation
MARK FLESHERCapital markets and investor relations
ZANE FULLJAMESCEO NZ Bus
PAUL GAYNORCEO Longroad Energy
BRUCE HARKEREnergy team. Chair of Tilt Renewables
VINCE HAWKSWORTHCEO Trustpower
MICHAEL HRUBYAcquisition management and investment performance
ANDREW LAMBDevelopment Director Infratil Infrastructure Property
NICK LOUGHCompany Secretary and legal, compliance, transaction structuring and execution
DAVID MCKINNONSocial infrastructure. Director ANU Student Accommodation
MARK MUDIESocial infrastructure. Director ANU Student Accommodation
ANTHONY MUHAsian operations and investment activities
PAUL NEWFIELDStrategy, sector analysis and transaction execution. Director Tilt Renewables
ALISON QUINNCEO RetireAustralia. President of the Australian Retirement Living Council
PAUL RIDLEY-SMITHChair of Trustpower
MATTHEW ROSSInfratil Financial Controller
STEVE SANDERSONCEO Wellington Airport
WILLIAM SMALESPrivate markets investment activity. Director of RetireAustralia and Canberra Data Centres
MIKI SZIKSZAICEO Snapper
VIMAL VALLABHEnergy team. Director Tilt Renewables and Longroad Energy
MANAGEMENT
For
per
sona
l use
onl
y

10
ANNUAL REPORT 2018
Each of Infratil’s businesses provides services that are critical to its community and customers. In addition to these responsibilities, each also recognises its
obligations to its own people and to the physical environment. A business is not an end in itself. It represents a coming together of people and resources with the intention of
delivering benefits to all stakeholders. Set out below are four short case studies of how Infratil’s businesses have recognised and are delivering on their responsibilities.
EMPLOYEES, CUSTOMERS,
ENVIRONMENT, COMMUNITY
WELLINGTON AIRPORT & THE ENVIRONMENT
“Lyall Bay is an escape as much as a playground. We would come for sunrise surfs before a school day and for the evening swims and burgers by the sea. Sometimes, even if the surf wasn’t pumping we would just mess around in the water, but either way, we always have a fun time. The beach is a great part of our lives.“ Geena Belle Lloyd Sanders and Isabelle Cushman.
Wellington Airport operates on a site created by flattening hills and reclaiming sea. The extension of the runway into Cook Strait now under consenting involves the creation of 10 hectares of land using two million cubic metres of fill. In addition to its physical impact on the environment, the Airport hosts approximately 100,000 aircraft movements a year and the associated ancillary services of refuelling, passenger embarkation, and so on.
An environmental impact is inevitable, so there is a high level of commitment to reduce adverse effects and to provide offsets. For instance, by working with the local community to reduce the effects of noise, including through an active programme of home insulation, and by working with local surfers to ensure they are fully informed about the impact of extending the runway seawall and about possible benefits as well as costs, and through sponsorship of the Lyall Bay Surf Club.
For
per
sona
l use
onl
y

11
TILT RENEWABLES & ITS COMMUNITY
”What I love about the wind farm is that we can go on farming, producing 500 bales of fine merino wool a year and meanwhile producing enough electricity to power a town the size of Warrnambool. Its also been a boon for the area, its brought people here and lifted incomes, including mine.” Peter Coy, farmer and landowner.
Tilt Renewables worked to ensure that local people benefitted from the construction and operation of the Salt Creek wind farm. Construction contractors have been encouraged to maximize their use of local people and services and the project has actively supported volunteer groups such as the local fire service. In addition, the operational project will provide annual funding for an educational scholarship programme and a community sponsorship initiative, which elsewhere has contributed to projects ranging from native vegetation restoration, to local sports facilities and to mental health improvement.
TRUSTPOWER & ITS STAFF
“I love working for a company whose values align so closely with my own, especially our community involvement. Coming to work every day with the aim of engaging with, and making a difference in, the lives of the people in our communities is pretty special. The Trustpower Community Awards are definitely a highlight too – being able to celebrate and say thank you to New Zealand’s volunteering community is very humbling and rewarding”. Alice Boyd, Trustpower Community and Communications Advisor.
Trustpower invests in both its local communities and its employees. Annually it works in
EMPLOYEES, CUSTOMERS, ENVIRONMENT, COMMUNITY
24 communities across New Zealand to celebrate their volunteers in a national award programme. Its employees value the connection to the community this programme provides. Trustpower also prioritises investment in its Trustpower employee community, increasing internal capability via tailored training opportunities and creating development opportunities for cross functional work to share ideas and create impact across traditional hierarchical lines for its customers. Its people are proud to be part of the Trustpower team of 780 people nationwide and with 530 in its head office, Trustpower is one of Tauranga’s largest employers.
CANBERRA DATA CENTRES & ITS CUSTOMERS
Canberra Data Centres was established with the primary objective of meeting the data storage and transmission requirements of government agencies.
Its data halls are secured to government standards along with 24 hours a day, 7 days a week on-site security guards and CCTV monitoring.
To compliment Canberra Data Centres’ Top Secret building classification, it operates the SecureNetLINK service to supplement customers’ internal network security and governance mechanisms.
For
per
sona
l use
onl
y

12
ANNUAL REPORT 2018
For
per
sona
l use
onl
y
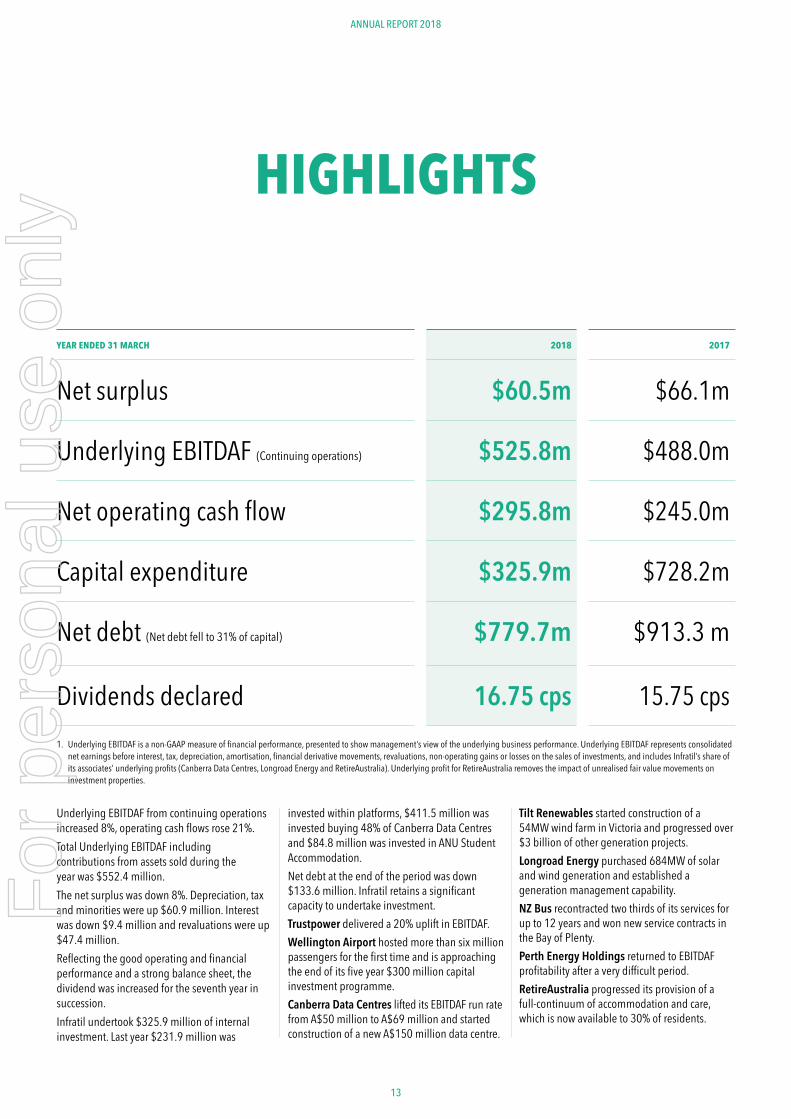
13
Underlying EBITDAF from continuing operations increased 8%, operating cash flows rose 21%.Total Underlying EBITDAF including contributions from assets sold during the year was $552.4 million.The net surplus was down 8%. Depreciation, tax and minorities were up $60.9 million. Interest was down $9.4 million and revaluations were up $47.4 million.Reflecting the good operating and financial performance and a strong balance sheet, the dividend was increased for the seventh year in succession. Infratil undertook $325.9 million of internal investment. Last year $231.9 million was
invested within platforms, $411.5 million was invested buying 48% of Canberra Data Centres and $84.8 million was invested in ANU Student Accommodation.Net debt at the end of the period was down $133.6 million. Infratil retains a significant capacity to undertake investment.Trustpower delivered a 20% uplift in EBITDAF.Wellington Airport hosted more than six million passengers for the first time and is approaching the end of its five year $300 million capital investment programme.Canberra Data Centres lifted its EBITDAF run rate from A$50 million to A$69 million and started construction of a new A$150 million data centre.
Tilt Renewables started construction of a 54MW wind farm in Victoria and progressed over $3 billion of other generation projects.Longroad Energy purchased 684MW of solar and wind generation and established a generation management capability. NZ Bus recontracted two thirds of its services for up to 12 years and won new service contracts in the Bay of Plenty.Perth Energy Holdings returned to EBITDAF profitability after a very difficult period.RetireAustralia progressed its provision of a full-continuum of accommodation and care, which is now available to 30% of residents.
HIGHLIGHTS
ANNUAL REPORT 2018
YEAR ENDED 31 MARCH 2018 2017
Net surplus $60.5m $66.1m
Underlying EBITDAF (Continuing operations) $525.8m $488.0m
Net operating cash flow $295.8m $245.0m
Capital expenditure $325.9m $728.2m
Net debt (Net debt fell to 31% of capital) $779.7m $913.3 m
Dividends declared 16.75 cps 15.75 cps1. Underlying EBITDAF is a non-GAAP measure of financial performance, presented to show management’s view of the underlying business performance. Underlying EBITDAF represents consolidated
net earnings before interest, tax, depreciation, amortisation, financial derivative movements, revaluations, non-operating gains or losses on the sales of investments, and includes Infratil’s share of its associates’ underlying profits (Canberra Data Centres, Longroad Energy and RetireAustralia). Underlying profit for RetireAustralia removes the impact of unrealised fair value movements on investment properties.
For
per
sona
l use
onl
y
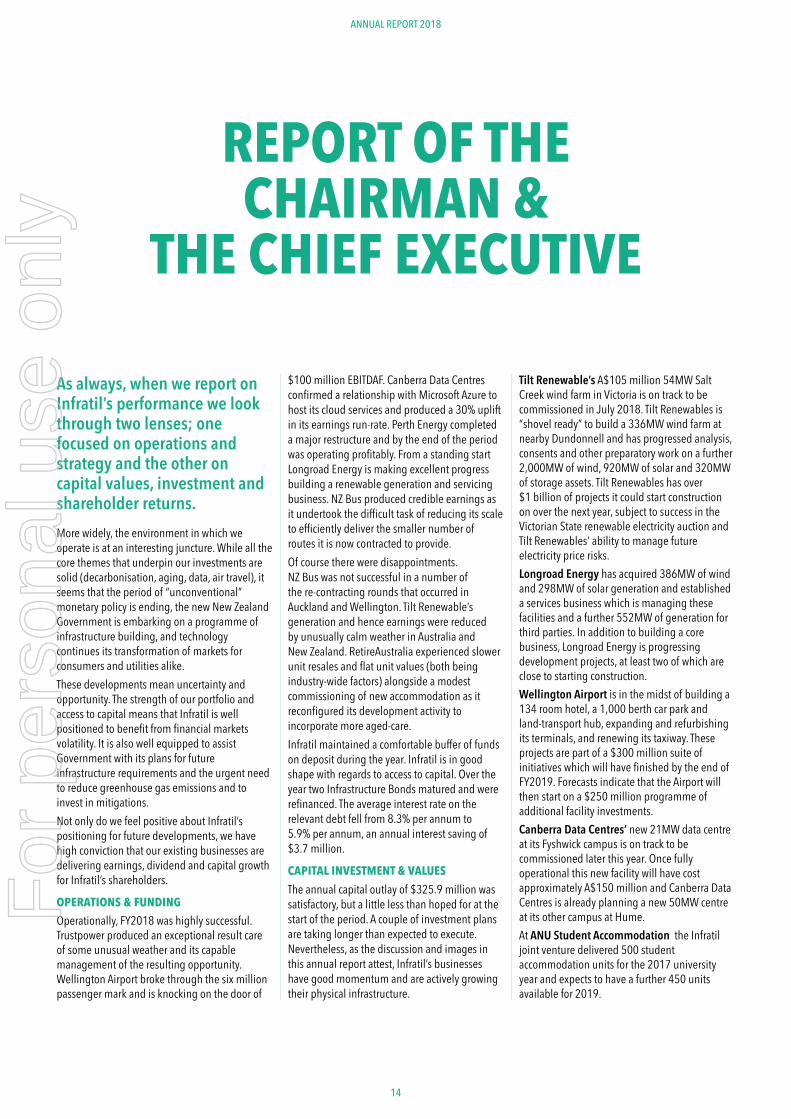
14
ANNUAL REPORT 2018
As always, when we report on Infratil’s performance we look through two lenses; one focused on operations and strategy and the other on capital values, investment and shareholder returns.More widely, the environment in which we operate is at an interesting juncture. While all the core themes that underpin our investments are solid (decarbonisation, aging, data, air travel), it seems that the period of “unconventional” monetary policy is ending, the new New Zealand Government is embarking on a programme of infrastructure building, and technology continues its transformation of markets for consumers and utilities alike.These developments mean uncertainty and opportunity. The strength of our portfolio and access to capital means that Infratil is well positioned to benefit from financial markets volatility. It is also well equipped to assist Government with its plans for future infrastructure requirements and the urgent need to reduce greenhouse gas emissions and to invest in mitigations. Not only do we feel positive about Infratil’s positioning for future developments, we have high conviction that our existing businesses are delivering earnings, dividend and capital growth for Infratil’s shareholders.
OPERATIONS & FUNDING
Operationally, FY2018 was highly successful. Trustpower produced an exceptional result care of some unusual weather and its capable management of the resulting opportunity. Wellington Airport broke through the six million passenger mark and is knocking on the door of
$100 million EBITDAF. Canberra Data Centres confirmed a relationship with Microsoft Azure to host its cloud services and produced a 30% uplift in its earnings run-rate. Perth Energy completed a major restructure and by the end of the period was operating profitably. From a standing start Longroad Energy is making excellent progress building a renewable generation and servicing business. NZ Bus produced credible earnings as it undertook the difficult task of reducing its scale to efficiently deliver the smaller number of routes it is now contracted to provide. Of course there were disappointments. NZ Bus was not successful in a number of the re-contracting rounds that occurred in Auckland and Wellington. Tilt Renewable’s generation and hence earnings were reduced by unusually calm weather in Australia and New Zealand. RetireAustralia experienced slower unit resales and flat unit values (both being industry-wide factors) alongside a modest commissioning of new accommodation as it reconfigured its development activity to incorporate more aged-care.Infratil maintained a comfortable buffer of funds on deposit during the year. Infratil is in good shape with regards to access to capital. Over the year two Infrastructure Bonds matured and were refinanced. The average interest rate on the relevant debt fell from 8.3% per annum to 5.9% per annum, an annual interest saving of $3.7 million.
CAPITAL INVESTMENT & VALUES
The annual capital outlay of $325.9 million was satisfactory, but a little less than hoped for at the start of the period. A couple of investment plans are taking longer than expected to execute. Nevertheless, as the discussion and images in this annual report attest, Infratil’s businesses have good momentum and are actively growing their physical infrastructure.
Tilt Renewable’s A$105 million 54MW Salt Creek wind farm in Victoria is on track to be commissioned in July 2018. Tilt Renewables is “shovel ready” to build a 336MW wind farm at nearby Dundonnell and has progressed analysis, consents and other preparatory work on a further 2,000MW of wind, 920MW of solar and 320MW of storage assets. Tilt Renewables has over $1 billion of projects it could start construction on over the next year, subject to success in the Victorian State renewable electricity auction and Tilt Renewables’ ability to manage future electricity price risks.Longroad Energy has acquired 386MW of wind and 298MW of solar generation and established a services business which is managing these facilities and a further 552MW of generation for third parties. In addition to building a core business, Longroad Energy is progressing development projects, at least two of which are close to starting construction. Wellington Airport is in the midst of building a 134 room hotel, a 1,000 berth car park and land-transport hub, expanding and refurbishing its terminals, and renewing its taxiway. These projects are part of a $300 million suite of initiatives which will have finished by the end of FY2019. Forecasts indicate that the Airport will then start on a $250 million programme of additional facility investments.Canberra Data Centres’ new 21MW data centre at its Fyshwick campus is on track to be commissioned later this year. Once fully operational this new facility will have cost approximately A$150 million and Canberra Data Centres is already planning a new 50MW centre at its other campus at Hume.At ANU Student Accommodation the Infratil joint venture delivered 500 student accommodation units for the 2017 university year and expects to have a further 450 units available for 2019.
REPORT OF THE CHAIRMAN &
THE CHIEF EXECUTIVE
For
per
sona
l use
onl
y
15
CHAIRMAN & CHIEF EXECUTIVE REPORT
RetireAustralia drew A$100 million of capital from its shareholders to enable it to increase its rate of development. While only a small number of new units were delivered in FY2018 and the target for FY2019 is also modest, from that point on a substantial increase in available accommodation is anticipated.NZ Bus having concluded the arduous process of re-contracting its routes, NZ Bus is now investing in the necessary fleet.Trustpower’s $27.9 million of investment was allocated across various generation upgrades and other core systems.The values of our businesses have also mainly experienced a positive period. It’s worth making specific note of Canberra Data Centres. Infratil purchased 48% of Canberra Data Centres in mid 2016 for A$386 million. At that time Canberra Data Centres’ EBITDAF run-rate was A$50 million per annum and its enterprise value was A$1,075 million. Canberra Data Centres now has an EBITDAF run-rate of A$69 million which is forecast to be A$82 million within a year. Market comparables suggest that multiples have further strengthened, however just using the acquisition valuation multiple gives a current value for Infratil’s holding of A$540 million.
SHAREHOLDER RETURNSOur objective is to provide Infratil’s shareholders with good risk-adjusted returns. Primarily we seek to achieve this by making good investments which fit within our scope, and by ensuring that our businesses and risks are well managed. We also have to ensure that the market recognises the value that has been created. This is more than just providing lots of information. We acknowledge that our portfolio is relatively complex given the number of sectors and jurisdictions within which we operate. Strategically we are proposing the following actions to improve the visibility of returns and valuation of our portfolio:
• We are to simplify our portfolio of businesses. By reducing the number, we hope that shareholders will be able to focus on the more material platforms.
• We will continue to provide useful asset-level information on our businesses and our objectives.
• To the extent possible we will provide guidance as to future returns and goals at both the asset and portfolio levels.
These may sound obvious, but each reflects trade-offs, for instance owning fewer businesses means owning fewer growth options. But we believe the sharemarket is not fully, or even reasonably, valuing Infratil and we intend to be more proactive to improve this situation.
DIVIDENDS & GUIDANCE
Dividends for FY2018 amounted to 16.75 cents per share. Since FY2011 full-year dividends have risen from 6.25 cps. It is anticipated that the dividend will continue to increase.The final dividend of 10.75 cps fully imputed will be paid on 18 June. With a growing share of Infratil’s earnings coming from outside of New Zealand the availability of imputation credits is constrained which means that it is unlikely that the dividend will continue to be fully imputed. Our three year ahead forecast indicates that over that period imputation credits may not cover annual dividends above 10 cps.Guidance for underlying EBITDAF in the year to 31 March 2019 is for between $500 million and $540 million ($525.8 million this year). The guidance range is based on no material acquisitions or divestments, and on normal wind and hydro generation. In mitigation of a flat guidance relative to FY2018, it should be noted that FY2019’s range includes an assumption that the value of hydro electricity generation is
forecast to be $25 million lower in FY2019. In part this is because of the recent sale of Australian generation assets and in part because New Zealand’s generation levels were unusually elevated in the year just concluded. Across the remainder of the business earnings growth is anticipated.Our goals for our shareholders are to preserve their capital, to provide a good income, and to deliver capital growth. We are confident that we can deliver. This is not an era of certainties, but Infratil has good access to capital and a portfolio of strong and resilient businesses.
MARK TUME
Chairman
MARKO BOGOIEVSKI
Chief Executive
For
per
sona
l use
onl
y

16
ANNUAL REPORT 2018
Infratil seeks to invest in sectors where something big is underway. The key themes which now underpin where it is allocating capital are population aging, decarbonisation,
air travel, and data.
In 2017 the New Zealand and Australian population of people aged 85 or over rose 2.5% to 85,100 and 494,500 respectively.
Boeing and Airbus are both projecting Asia-Pacific air travel to double within 12 to 13 years.
197 countries have signed the Paris Accord to cap global manmade greenhouse gas emissions. In 2017 global emissions of CO2 are estimated to have amounted to 14 billion tonnes with
New Zealand contributing an estimated 76 million tonnes (59 million tonnes after deducting offsets).
Its estimated that 2,500,000,000,000,000,000 bytes of data are now generated a day (about 25 billion times as much
data as is used by an average connected New Zealand household).
IDEAS THAT MATTER
For
per
sona
l use
onl
y
17
CHAIRMAN & CHIEF EXECUTIVE REPORT
For
per
sona
l use
onl
y
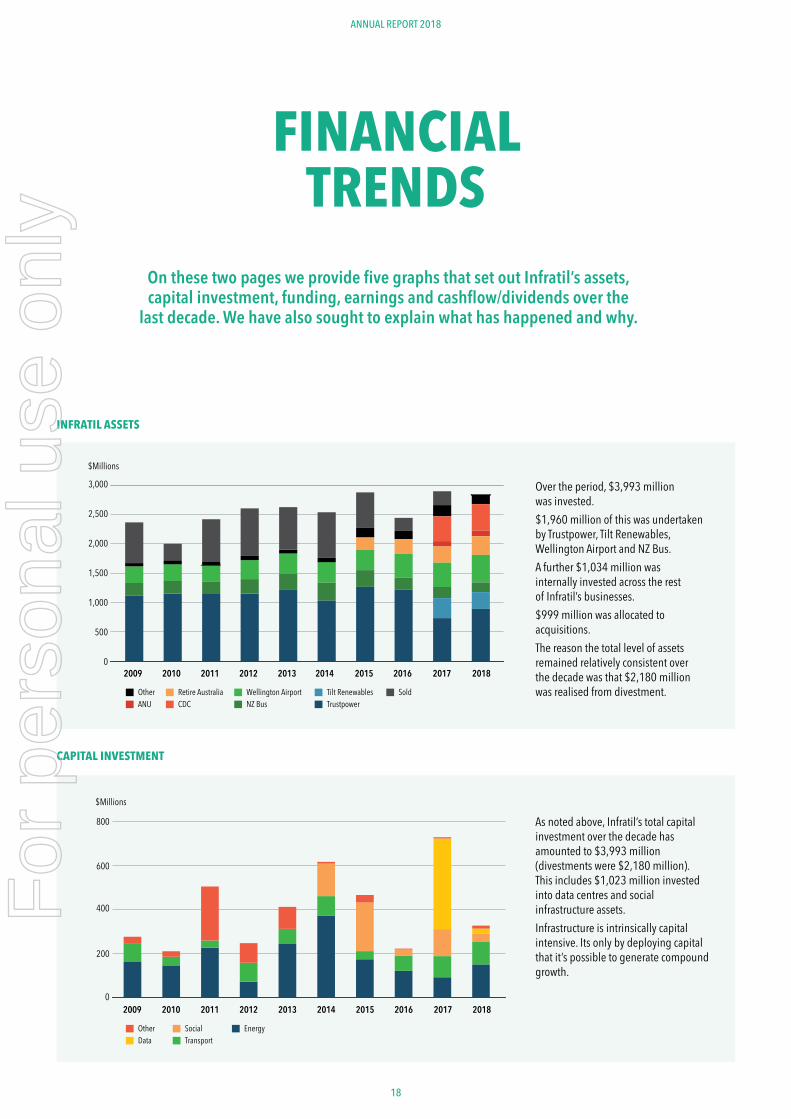
18
ANNUAL REPORT 2018
FINANCIAL TRENDS
On these two pages we provide five graphs that set out Infratil’s assets, capital investment, funding, earnings and cashflow/dividends over the
last decade. We have also sought to explain what has happened and why.
Infratil's Assets
0
10
20
30
40
50
60
70
80
90
100
%
Infratil's Capital Structure
0
5
10
15
0
100
200
300
400
500
600
2018
2018
Dividend, cents per share$Millions
$Millions
EBITDAF, Free Cash Flows, Dividends
Sources of Consolidated EBITDAF
0
Wellington Airport Other NZ Bus
Tilt Renewables
Trustpower
2018
$Millions
Data Other Social
Transport
Energy
2009 2010 2011 2012 2013 2014 201720162015
0
200
400
600
800
1000
100
200
300
400
500
600
2018
Perpetual bonds Equity (market value) Net bank debt and dated bonds
Operating cash flow Interest, tax, working capital Dividend (rhs)
2009 2010 2011 2012 2013 2014 20172016 2015
2009 2010 2011 2012 2013 2014 2017 2016 2015
200
400
600
0
800
2009 2010 2011 2012 2013 2014 2017 2016 2015
0
500
1,000
1,500
2,000
2,500
3,000
2018
$Millions
ANU Sold Retire Australia
CDC NZ Bus
Wellington Airport Trustpower Tilt Renewables Other
2009 2010 2011 2012 2013 2014 20172016 2015
0
500
1,000
1,500
2,000
2,500
3,000
2018
$Millions
Infratil's Assets
0
10
20
30
40
50
60
70
80
90
100
%
Infratil's Capital Structure
0
5
10
15
0
100
200
300
400
500
600
2018
2018
Dividend, cents per share$Millions
$Millions
EBITDAF, Free Cash Flows, Dividends
Sources of Consolidated EBITDAF
0
ANU Other Retire Australia
CDC NZ Bus
Wellington Airport
Wellington Airport Other NZ Bus
Tilt Renewables
Trustpower
2018
$Millions
Data Other Social
Transport
Energy
Trustpower Tilt Renewables Sold
2009 2010 2011 2012 2013 2014 201720162015
2009 2010 2011 2012 2013 2014 20172016 2015
100
200
300
400
500
600
2018
Perpetual bonds Equity (market value) Net bank debt and dated bonds
Operating cash flow Interest, tax, working capital Dividend (rhs)
2009 2010 2011 2012 2013 2014 20172016 2015
2009 2010 2011 2012 2013 2014 2017 2016 2015
200
400
600
0
800
2009 2010 2011 2012 2013 2014 2017 2016 2015
Over the period, $3,993 million was invested. $1,960 million of this was undertaken by Trustpower, Tilt Renewables, Wellington Airport and NZ Bus.A further $1,034 million was internally invested across the rest of Infratil’s businesses.$999 million was allocated to acquisitions.The reason the total level of assets remained relatively consistent over the decade was that $2,180 million was realised from divestment.
As noted above, Infratil’s total capital investment over the decade has amounted to $3,993 million (divestments were $2,180 million). This includes $1,023 million invested into data centres and social infrastructure assets.Infrastructure is intrinsically capital intensive. Its only by deploying capital that it’s possible to generate compound growth.
INFRATIL ASSETS
CAPITAL INVESTMENT
For
per
sona
l use
onl
y
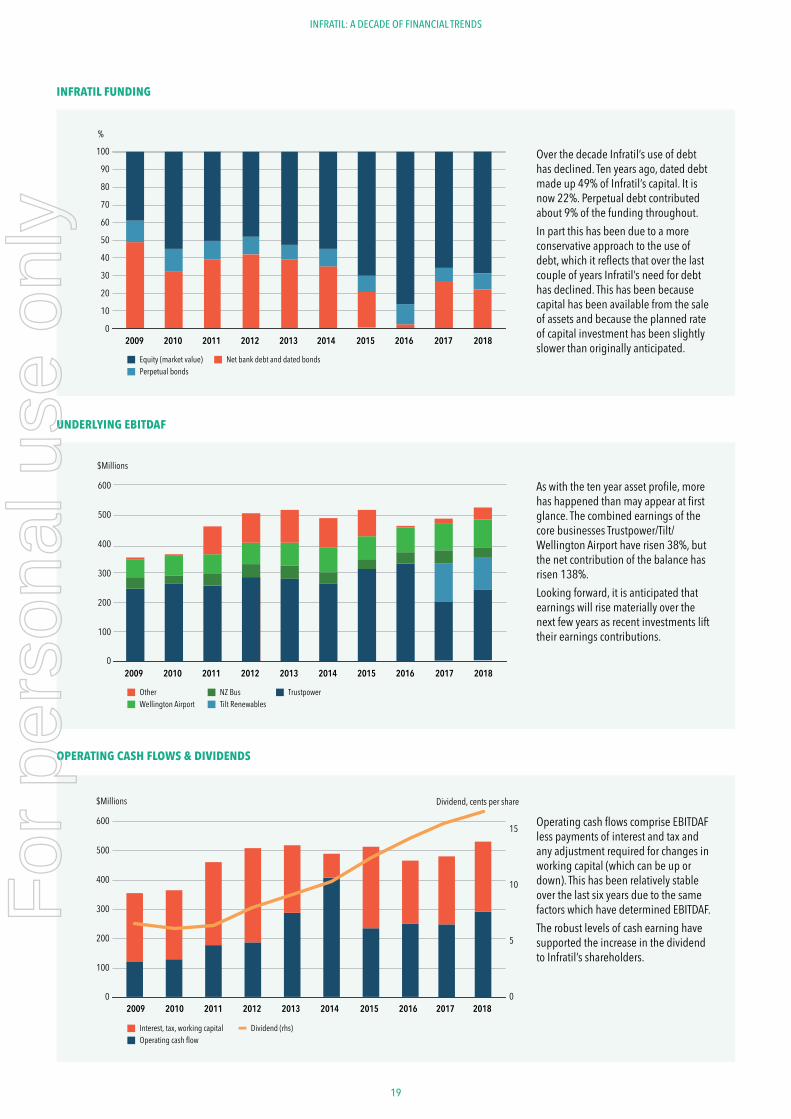
19
OPERATING CASH FLOWS & DIVIDENDS
Operating cash flows comprise EBITDAF less payments of interest and tax and any adjustment required for changes in working capital (which can be up or down). This has been relatively stable over the last six years due to the same factors which have determined EBITDAF. The robust levels of cash earning have supported the increase in the dividend to Infratil’s shareholders.
UNDERLYING EBITDAF
INFRATIL FUNDING
INFRATIL: A DECADE OF FINANCIAL TRENDS
0
500
1,000
1,500
2,000
2,500
3,000
2018
$Millions
Infratil's Assets
0
10
20
30
40
50
60
70
80
90
100
%
Infratil's Capital Structure
0
5
10
15
0
100
200
300
400
500
600
2018
2018
Dividend, cents per share$Millions
$Millions
EBITDAF, Free Cash Flows, Dividends
Sources of Consolidated EBITDAF
0
ANU Other Retire Australia
CDC NZ Bus
Wellington Airport
Wellington Airport Other NZ Bus
Tilt Renewables
Trustpower
2018
$Millions
Data Other Social
Transport
Energy
Trustpower Tilt Renewables Sold
2009 2010 2011 2012 2013 2014 201720162015
2009 2010 2011 2012 2013 2014 20172016 2015
100
200
300
400
500
600
2018
Perpetual bonds Equity (market value) Net bank debt and dated bonds
Operating cash flow Interest, tax, working capital Dividend (rhs)
2009 2010 2011 2012 2013 2014 20172016 2015
2009 2010 2011 2012 2013 2014 2017 2016 2015
200
400
600
0
800
2009 2010 2011 2012 2013 2014 2017 2016 2015
0
500
1,000
1,500
2,000
2,500
3,000
2018
$Millions
Infratil's Assets
0
10
20
30
40
50
60
70
80
90
100
%
Infratil's Capital Structure
0
5
10
15
0
100
200
300
400
500
600
2018
2018
Dividend, cents per share$Millions
$Millions
EBITDAF, Free Cash Flows, Dividends
Sources of Consolidated EBITDAF
0
ANU Other Retire Australia
CDC NZ Bus
Wellington Airport
Wellington Airport Other NZ Bus
Tilt Renewables
Trustpower
2018
$Millions
Data Other Social
Transport
Energy
Trustpower Tilt Renewables Sold
2009 2010 2011 2012 2013 2014 201720162015
2009 2010 2011 2012 2013 2014 20172016 2015
100
200
300
400
500
600
2018
Perpetual bonds Equity (market value) Net bank debt and dated bonds
Operating cash flow Interest, tax, working capital Dividend (rhs)
2009 2010 2011 2012 2013 2014 20172016 2015
2009 2010 2011 2012 2013 2014 2017 2016 2015
200
400
600
0
800
2009 2010 2011 2012 2013 2014 2017 2016 2015
As with the ten year asset profile, more has happened than may appear at first glance. The combined earnings of the core businesses Trustpower/Tilt/Wellington Airport have risen 38%, but the net contribution of the balance has risen 138%.Looking forward, it is anticipated that earnings will rise materially over the next few years as recent investments lift their earnings contributions.
Over the decade Infratil’s use of debt has declined. Ten years ago, dated debt made up 49% of Infratil’s capital. It is now 22%. Perpetual debt contributed about 9% of the funding throughout.In part this has been due to a more conservative approach to the use of debt, which it reflects that over the last couple of years Infratil’s need for debt has declined. This has been because capital has been available from the sale of assets and because the planned rate of capital investment has been slightly slower than originally anticipated.
For
per
sona
l use
onl
y
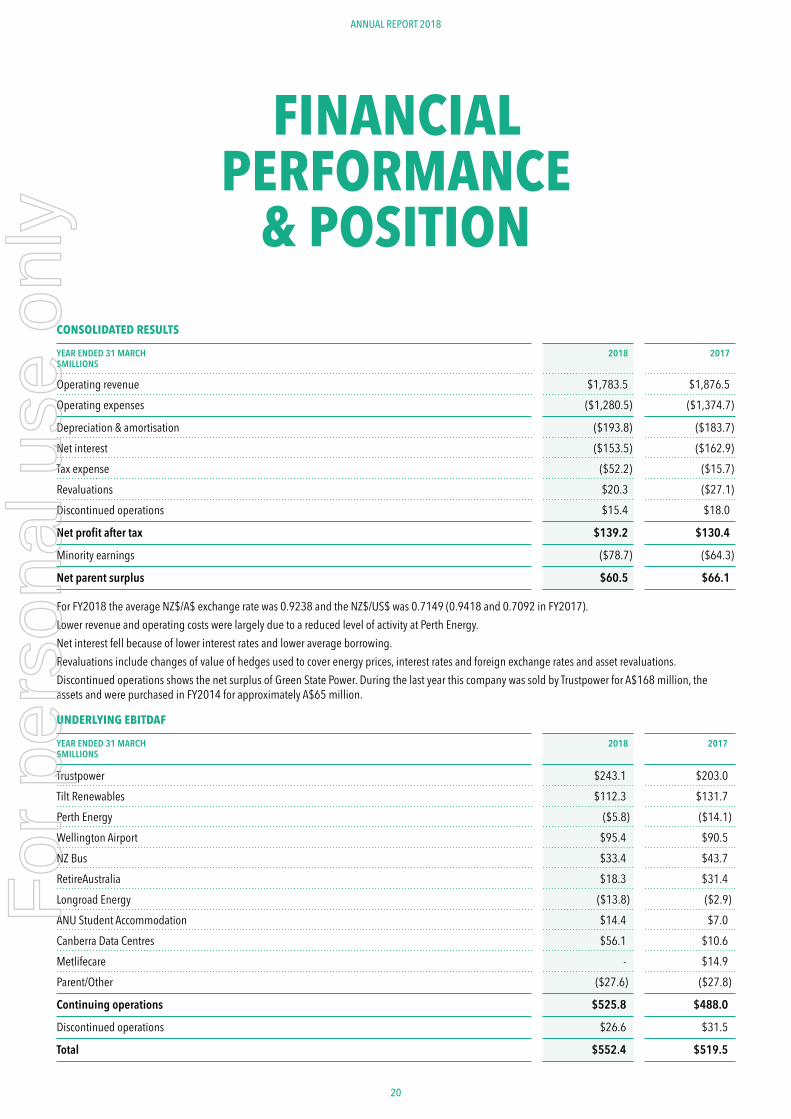
20
ANNUAL REPORT 2018
FINANCIAL PERFORMANCE
& POSITION
CONSOLIDATED RESULTS
YEAR ENDED 31 MARCH $MILLIONS
2018 2017
Operating revenue $1,783.5 $1,876.5Operating expenses ($1,280.5) ($1,374.7)
Depreciation & amortisation ($193.8) ($183.7)Net interest ($153.5) ($162.9)Tax expense ($52.2) ($15.7)Revaluations $20.3 ($27.1)Discontinued operations $15.4 $18.0
Net profit after tax $139.2 $130.4
Minority earnings ($78.7) ($64.3)
Net parent surplus $60.5 $66.1
For FY2018 the average NZ$/A$ exchange rate was 0.9238 and the NZ$/US$ was 0.7149 (0.9418 and 0.7092 in FY2017).Lower revenue and operating costs were largely due to a reduced level of activity at Perth Energy.Net interest fell because of lower interest rates and lower average borrowing. Revaluations include changes of value of hedges used to cover energy prices, interest rates and foreign exchange rates and asset revaluations.Discontinued operations shows the net surplus of Green State Power. During the last year this company was sold by Trustpower for A$168 million, the assets and were purchased in FY2014 for approximately A$65 million.
UNDERLYING EBITDAF
YEAR ENDED 31 MARCH $MILLIONS
2018 2017
Trustpower $243.1 $203.0Tilt Renewables $112.3 $131.7Perth Energy ($5.8) ($14.1)Wellington Airport $95.4 $90.5NZ Bus $33.4 $43.7RetireAustralia $18.3 $31.4Longroad Energy ($13.8) ($2.9)ANU Student Accommodation $14.4 $7.0Canberra Data Centres $56.1 $10.6Metlifecare - $14.9Parent/Other ($27.6) ($27.8)
Continuing operations $525.8 $488.0
Discontinued operations $26.6 $31.5
Total $552.4 $519.5
For
per
sona
l use
onl
y
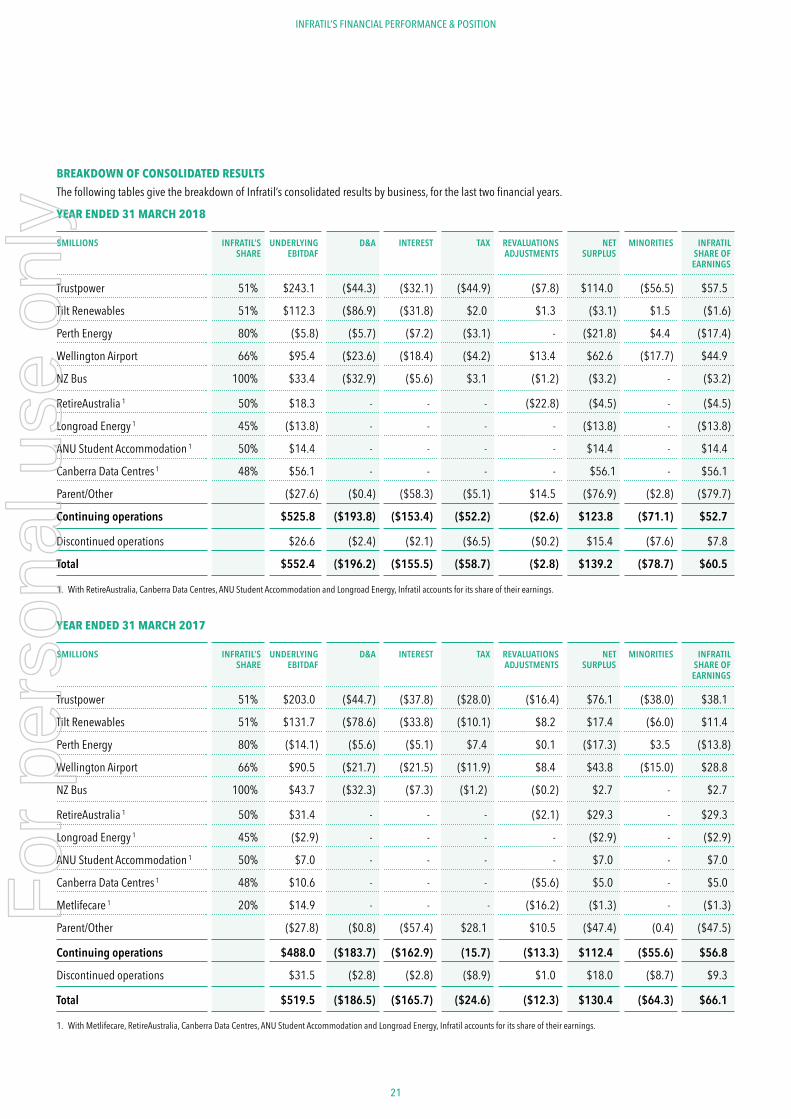
21
BREAKDOWN OF CONSOLIDATED RESULTS
The following tables give the breakdown of Infratil’s consolidated results by business, for the last two financial years.
YEAR ENDED 31 MARCH 2018
$MILLIONS INFRATIL’S SHARE
UNDERLYING EBITDAF
D&A INTEREST TAX REVALUATIONS ADJUSTMENTS
NET SURPLUS
MINORITIES INFRATIL SHARE OF EARNINGS
Trustpower 51% $243.1 ($44.3) ($32.1) ($44.9) ($7.8) $114.0 ($56.5) $57.5
Tilt Renewables 51% $112.3 ($86.9) ($31.8) $2.0 $1.3 ($3.1) $1.5 ($1.6)
Perth Energy 80% ($5.8) ($5.7) ($7.2) ($3.1) - ($21.8) $4.4 ($17.4)
Wellington Airport 66% $95.4 ($23.6) ($18.4) ($4.2) $13.4 $62.6 ($17.7) $44.9
NZ Bus 100% $33.4 ($32.9) ($5.6) $3.1 ($1.2) ($3.2) - ($3.2)
RetireAustralia 1 50% $18.3 - - - ($22.8) ($4.5) - ($4.5)
Longroad Energy 1 45% ($13.8) - - - - ($13.8) - ($13.8)
ANU Student Accommodation 1 50% $14.4 - - - - $14.4 - $14.4
Canberra Data Centres 1 48% $56.1 - - - - $56.1 - $56.1
Parent/Other ($27.6) ($0.4) ($58.3) ($5.1) $14.5 ($76.9) ($2.8) ($79.7)
Continuing operations $525.8 ($193.8) ($153.4) ($52.2) ($2.6) $123.8 ($71.1) $52.7
Discontinued operations $26.6 ($2.4) ($2.1) ($6.5) ($0.2) $15.4 ($7.6) $7.8
Total $552.4 ($196.2) ($155.5) ($58.7) ($2.8) $139.2 ($78.7) $60.5
1. With RetireAustralia, Canberra Data Centres, ANU Student Accommodation and Longroad Energy, Infratil accounts for its share of their earnings.
YEAR ENDED 31 MARCH 2017
$MILLIONS INFRATIL’S SHARE
UNDERLYING EBITDAF
D&A INTEREST TAX REVALUATIONS ADJUSTMENTS
NET SURPLUS
MINORITIES INFRATIL SHARE OF EARNINGS
Trustpower 51% $203.0 ($44.7) ($37.8) ($28.0) ($16.4) $76.1 ($38.0) $38.1
Tilt Renewables 51% $131.7 ($78.6) ($33.8) ($10.1) $8.2 $17.4 ($6.0) $11.4
Perth Energy 80% ($14.1) ($5.6) ($5.1) $7.4 $0.1 ($17.3) $3.5 ($13.8)
Wellington Airport 66% $90.5 ($21.7) ($21.5) ($11.9) $8.4 $43.8 ($15.0) $28.8
NZ Bus 100% $43.7 ($32.3) ($7.3) ($1.2) ($0.2) $2.7 - $2.7
RetireAustralia 1 50% $31.4 - - - ($2.1) $29.3 - $29.3
Longroad Energy 1 45% ($2.9) - - - - ($2.9) - ($2.9)
ANU Student Accommodation 1 50% $7.0 - - - - $7.0 - $7.0
Canberra Data Centres 1 48% $10.6 - - - ($5.6) $5.0 - $5.0
Metlifecare 1 20% $14.9 - - - ($16.2) ($1.3) - ($1.3)
Parent/Other ($27.8) ($0.8) ($57.4) $28.1 $10.5 ($47.4) (0.4) ($47.5)
Continuing operations $488.0 ($183.7) ($162.9) (15.7) ($13.3) $112.4 ($55.6) $56.8
Discontinued operations $31.5 ($2.8) ($2.8) ($8.9) $1.0 $18.0 ($8.7) $9.3
Total $519.5 ($186.5) ($165.7) ($24.6) ($12.3) $130.4 ($64.3) $66.1
1. With Metlifecare, RetireAustralia, Canberra Data Centres, ANU Student Accommodation and Longroad Energy, Infratil accounts for its share of their earnings.
INFRATIL’S FINANCIAL PERFORMANCE & POSITION
For
per
sona
l use
onl
y
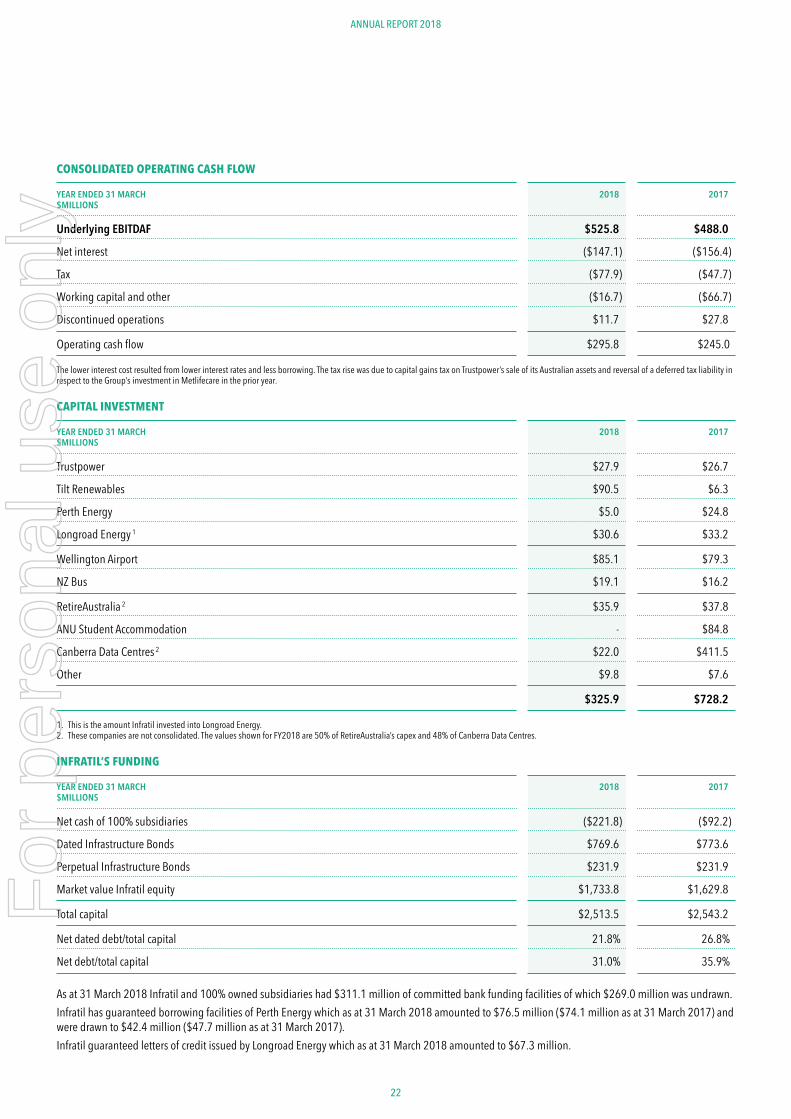
22
ANNUAL REPORT 2018
CONSOLIDATED OPERATING CASH FLOW
YEAR ENDED 31 MARCH $MILLIONS
2018 2017
Underlying EBITDAF $525.8 $488.0
Net interest ($147.1) ($156.4)
Tax ($77.9) ($47.7)
Working capital and other ($16.7) ($66.7)
Discontinued operations $11.7 $27.8
Operating cash flow $295.8 $245.0
The lower interest cost resulted from lower interest rates and less borrowing. The tax rise was due to capital gains tax on Trustpower’s sale of its Australian assets and reversal of a deferred tax liability in respect to the Group’s investment in Metlifecare in the prior year.
CAPITAL INVESTMENT
YEAR ENDED 31 MARCH $MILLIONS
2018 2017
Trustpower $27.9 $26.7
Tilt Renewables $90.5 $6.3
Perth Energy $5.0 $24.8
Longroad Energy 1 $30.6 $33.2
Wellington Airport $85.1 $79.3
NZ Bus $19.1 $16.2
RetireAustralia 2 $35.9 $37.8
ANU Student Accommodation - $84.8
Canberra Data Centres 2 $22.0 $411.5
Other $9.8 $7.6
$325.9 $728.2
1. This is the amount Infratil invested into Longroad Energy.2. These companies are not consolidated. The values shown for FY2018 are 50% of RetireAustralia’s capex and 48% of Canberra Data Centres.
INFRATIL’S FUNDING
YEAR ENDED 31 MARCH $MILLIONS
2018 2017
Net cash of 100% subsidiaries ($221.8) ($92.2)
Dated Infrastructure Bonds $769.6 $773.6
Perpetual Infrastructure Bonds $231.9 $231.9
Market value Infratil equity $1,733.8 $1,629.8
Total capital $2,513.5 $2,543.2
Net dated debt/total capital 21.8% 26.8%
Net debt/total capital 31.0% 35.9%
As at 31 March 2018 Infratil and 100% owned subsidiaries had $311.1 million of committed bank funding facilities of which $269.0 million was undrawn. Infratil has guaranteed borrowing facilities of Perth Energy which as at 31 March 2018 amounted to $76.5 million ($74.1 million as at 31 March 2017) and were drawn to $42.4 million ($47.7 million as at 31 March 2017).Infratil guaranteed letters of credit issued by Longroad Energy which as at 31 March 2018 amounted to $67.3 million.
For
per
sona
l use
onl
y
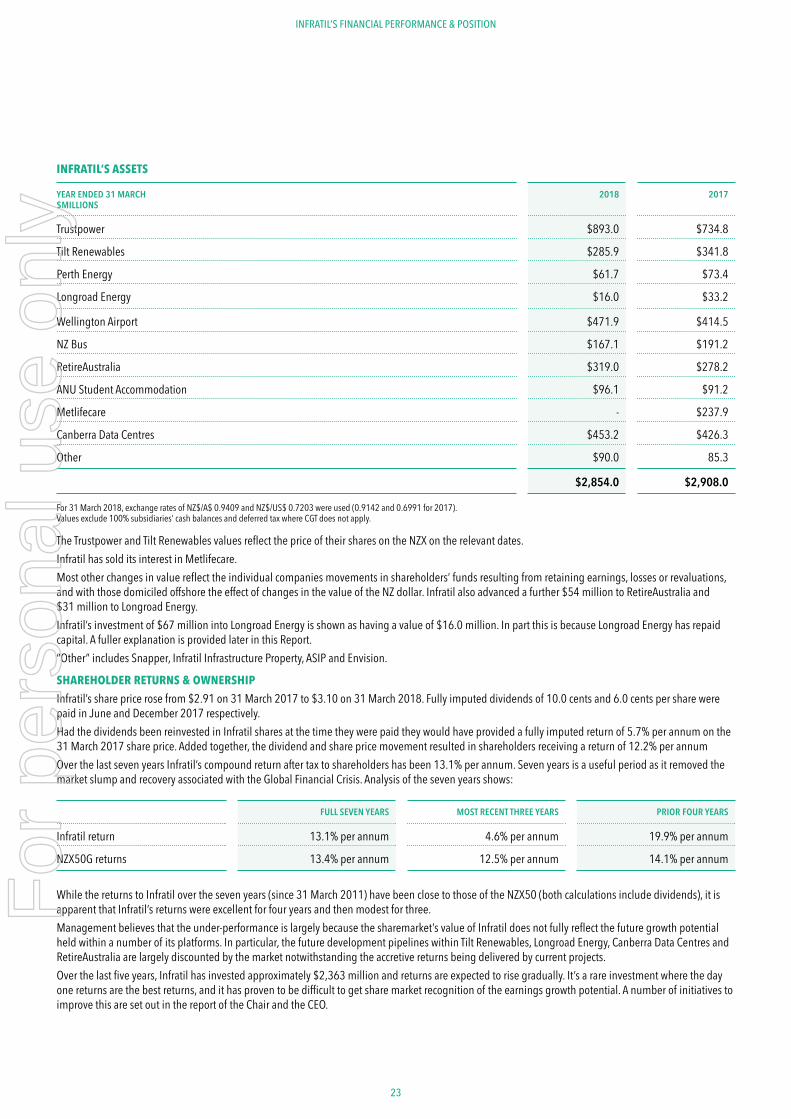
23
INFRATIL’S FINANCIAL PERFORMANCE & POSITION
INFRATIL’S ASSETS
YEAR ENDED 31 MARCH $MILLIONS
2018 2017
Trustpower $893.0 $734.8
Tilt Renewables $285.9 $341.8
Perth Energy $61.7 $73.4
Longroad Energy $16.0 $33.2
Wellington Airport $471.9 $414.5
NZ Bus $167.1 $191.2
RetireAustralia $319.0 $278.2
ANU Student Accommodation $96.1 $91.2
Metlifecare - $237.9
Canberra Data Centres $453.2 $426.3
Other $90.0 85.3
$2,854.0 $2,908.0
For 31 March 2018, exchange rates of NZ$/A$ 0.9409 and NZ$/US$ 0.7203 were used (0.9142 and 0.6991 for 2017).Values exclude 100% subsidiaries’ cash balances and deferred tax where CGT does not apply.
The Trustpower and Tilt Renewables values reflect the price of their shares on the NZX on the relevant dates.Infratil has sold its interest in Metlifecare.Most other changes in value reflect the individual companies movements in shareholders’ funds resulting from retaining earnings, losses or revaluations, and with those domiciled offshore the effect of changes in the value of the NZ dollar. Infratil also advanced a further $54 million to RetireAustralia and $31 million to Longroad Energy. Infratil’s investment of $67 million into Longroad Energy is shown as having a value of $16.0 million. In part this is because Longroad Energy has repaid capital. A fuller explanation is provided later in this Report.“Other” includes Snapper, Infratil Infrastructure Property, ASIP and Envision.
SHAREHOLDER RETURNS & OWNERSHIP
Infratil’s share price rose from $2.91 on 31 March 2017 to $3.10 on 31 March 2018. Fully imputed dividends of 10.0 cents and 6.0 cents per share were paid in June and December 2017 respectively.Had the dividends been reinvested in Infratil shares at the time they were paid they would have provided a fully imputed return of 5.7% per annum on the 31 March 2017 share price. Added together, the dividend and share price movement resulted in shareholders receiving a return of 12.2% per annumOver the last seven years Infratil’s compound return after tax to shareholders has been 13.1% per annum. Seven years is a useful period as it removed the market slump and recovery associated with the Global Financial Crisis. Analysis of the seven years shows:
FULL SEVEN YEARS MOST RECENT THREE YEARS PRIOR FOUR YEARS
Infratil return 13.1% per annum 4.6% per annum 19.9% per annum
NZX50G returns 13.4% per annum 12.5% per annum 14.1% per annum
While the returns to Infratil over the seven years (since 31 March 2011) have been close to those of the NZX50 (both calculations include dividends), it is apparent that Infratil’s returns were excellent for four years and then modest for three. Management believes that the under-performance is largely because the sharemarket’s value of Infratil does not fully reflect the future growth potential held within a number of its platforms. In particular, the future development pipelines within Tilt Renewables, Longroad Energy, Canberra Data Centres and RetireAustralia are largely discounted by the market notwithstanding the accretive returns being delivered by current projects.Over the last five years, Infratil has invested approximately $2,363 million and returns are expected to rise gradually. It’s a rare investment where the day one returns are the best returns, and it has proven to be difficult to get share market recognition of the earnings growth potential. A number of initiatives to improve this are set out in the report of the Chair and the CEO.
For
per
sona
l use
onl
y
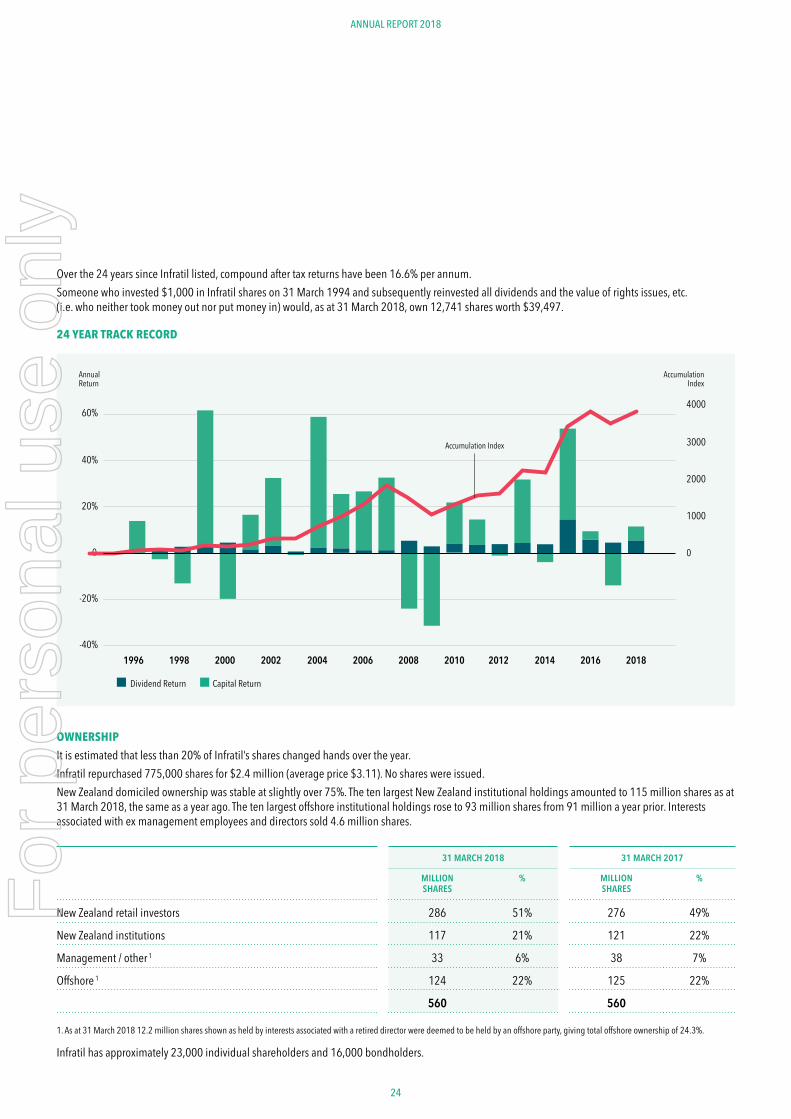
24
ANNUAL REPORT 2018
OWNERSHIP
It is estimated that less than 20% of Infratil’s shares changed hands over the year. Infratil repurchased 775,000 shares for $2.4 million (average price $3.11). No shares were issued.New Zealand domiciled ownership was stable at slightly over 75%. The ten largest New Zealand institutional holdings amounted to 115 million shares as at 31 March 2018, the same as a year ago. The ten largest offshore institutional holdings rose to 93 million shares from 91 million a year prior. Interests associated with ex management employees and directors sold 4.6 million shares.
31 MARCH 2018 31 MARCH 2017
MILLION SHARES
% MILLION SHARES
%
New Zealand retail investors 286 51% 276 49%
New Zealand institutions 117 21% 121 22%
Management / other 1 33 6% 38 7%
Offshore 1 124 22% 125 22%
560 560
1. As at 31 March 2018 12.2 million shares shown as held by interests associated with a retired director were deemed to be held by an offshore party, giving total offshore ownership of 24.3%.
Infratil has approximately 23,000 individual shareholders and 16,000 bondholders.
24 YEAR TRACK RECORD
0
1000
2000
4000
3000
60%
40%
20%
0
-20%
-40%201820162014201220102008200620042002200019981996
Accumulation Index
AccumulationIndex
AnnualReturn
Dividend Return Capital Return
Over the 24 years since Infratil listed, compound after tax returns have been 16.6% per annum. Someone who invested $1,000 in Infratil shares on 31 March 1994 and subsequently reinvested all dividends and the value of rights issues, etc. (i.e. who neither took money out nor put money in) would, as at 31 March 2018, own 12,741 shares worth $39,497.
For
per
sona
l use
onl
y
25
BONDHOLDERS
MATURITY YIELD 31 MARCH 2018 RELATIVE TO GOVT BONDS YIELD 31 MARCH 2017 RELATIVE TO GOVT BONDS
November 2020 3.90% per annum +2.00% per annum 4.80% per annum +2.40% per annum
February 2022 4.10% per annum +1.80% per annum 5.00% per annum +2.45% per annum
June 2024 4.75% per annum +2.25% per annum 5.70% per annum +2.95% per annum
BONDHOLDERS
BONDHOLDERS
Information that is likely to be of interest to holders of Infratil’s Infrastructure Bonds, which is not included elsewhere in the annual report, is set out below.
THE INFRASTRUCTURE BOND YEAR IN REVIEW
Over the year, Infratil repaid two maturing bonds and issued two new bonds:
• Repayment of $66.3 million of bonds paying an 8.5% per annum coupon that were issued in January 2011.
• Repayment of $81.1 million of bonds paying an 8.0% per annum coupon that were issued in November 2011.
• Issuing $100.0 million of 5.65% per annum coupon bonds maturing in December 2022.
• Issuing $43.4 million of 6.15% per annum coupon bonds maturing June 2025.
Infratil has previously established an explicit $30 million bond buy back capability, but over the year the market operated effectively and no bond buy backs occurred. The main purpose of buying back bonds would be to remedy market illiquidity and unfair prices.The start and end of year yields of three of Infratil’s bonds is set out in the table, along with their yield-spread relative to government bonds.
The decline in New Zealand Government Bond rates over the year (the benchmark 5 and 10 year bonds fell in yield from 2.56% per annum to 2.38% per annum and from 3.28% per annum to 2.89% per annum respectively) saw all creditworthy bonds follow suit.The most intriguing (and positive) development for holders of Infratil’s bonds fell to those with the Perpetual Infratil Infrastructure Bonds (PiiBs). In November 2017 the annual coupon rate for these bonds was reset at 3.50% per annum which is an all-time low. However, from 31 March 2017 to 31 March 2018 the price of the PiiBs in the market rose from $65 per $100 to $79 per $100. Someone who bought them at the start of the year and sold at the end earned a return of 27% per annum. If the rise in price is logical, it can be explained by two factors. One is that as the yields on other bonds fell, even a coupon of 3.5% per annum becomes more attractive. The second is that investors anticipating higher interest rates in the future prefer a security which resets its rate annually. Further explanation of the PiiB can be found on Infratil’s website.
CONTINUOUS DISCLOSURE OF INFORMATION
As Infratil has shares and bonds listed on the NZX it is required to continuously disclose information which could be relevant to investors.
This includes:• Annual and interim reports which are released
each May and November. They provide financial statements, a summary of key developments and activities, and guidance as to expectations of short term earnings and investments.
• Update newsletters which give in-depth coverage of topics relevant to Infratil’s businesses. Market reports which give periodic coverage to the operating activities of Infratil’s businesses and interesting market influences.
• Occasional announcements on matters which could be material to the value of Infratil’s shares and bonds, such as changes in personnel, transactions, financial results, payments to share and bond holders, and so on.
• Infratil hosts an annual investor day where management present on investment market conditions, strategies and specific business plans. The presentations are available on Infratil’s website.
INFRATIL’S CAPITAL STRUCTURE
Infratil’s capital structure means lender rights are tiered. A lender to, say, Trustpower will have direct recourse to the assets of Trustpower and no recourse to the assets of Infratil. A lender to Infratil will have recourse to Infratil’s assets including its shareholding in Trustpower, but no direct recourse to the assets of Trustpower.
There is also a distinction between the rights of the banks that lend to the Infratil 100% group and the rights of Infratil’s bondholders. The banks have preferred recourse to Infratil’s shareholdings (in companies such as Trustpower) and other assets of members of the Infratil 100% group that provide a guarantee to the banks.The upshot is that Infratil’s bondholders have rights to all of Infratil’s assets and are not limited to the assets of just one subsidiary, but their recourse to assets of Infratil’s subsidiaries is only after the direct recourse of other lenders and creditors.As at 31 March 2018, the Infratil group debt comprised:• $1,526.9 million of net debt of subsidiaries in
which Infratil had less than a 100% interest. (This included $42.4 million of Perth Energy’s borrowing which was guaranteed by Infratil. None of the other debt was guaranteed by Infratil.)
• $1,002 million of Infratil Infrastructure Bonds.• The wholly-owned group also had
$222 million of net bank deposits.These amounts do not include the borrowings of the companies in which Infratil owns less than 50%. Infratil does not guarantee any of the debt or other liabilities of these companies which include Canberra Data Centres, RetireAustralia, ANU Student Accommodation and Longroad Energy.
For
per
sona
l use
onl
y
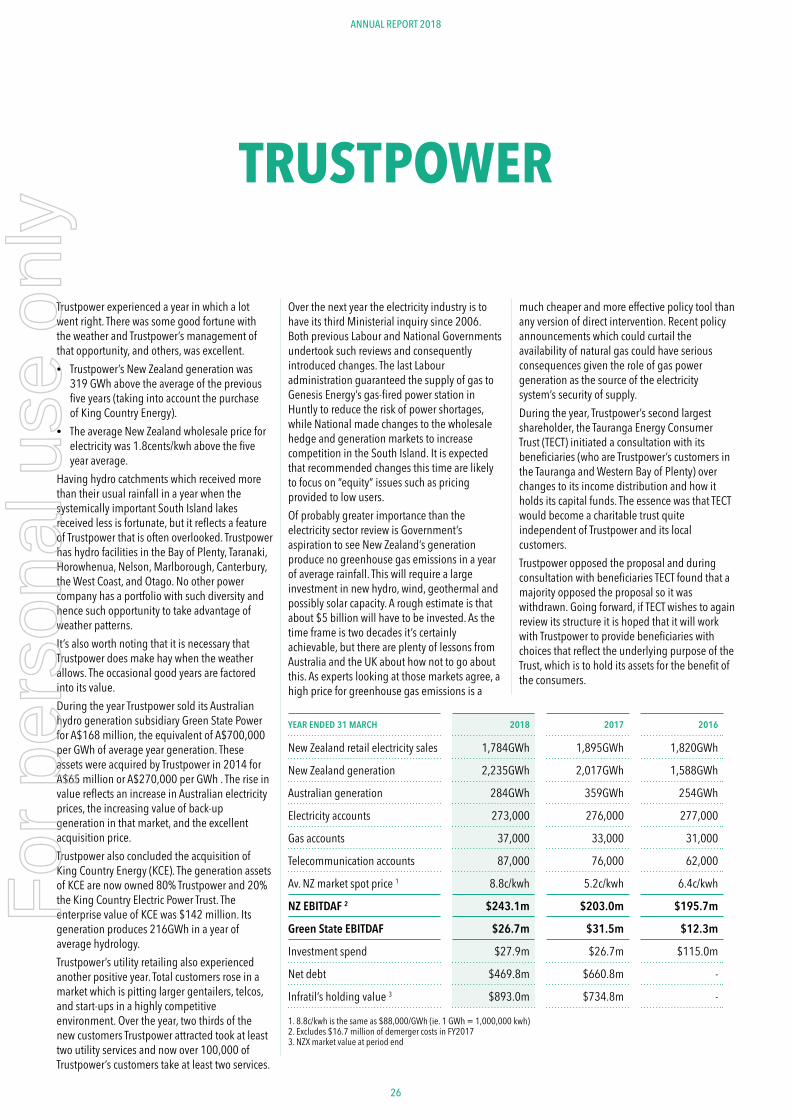
26
ANNUAL REPORT 2018
TRUSTPOWER
Trustpower experienced a year in which a lot went right. There was some good fortune with the weather and Trustpower’s management of that opportunity, and others, was excellent.• Trustpower’s New Zealand generation was
319 GWh above the average of the previous five years (taking into account the purchase of King Country Energy).
• The average New Zealand wholesale price for electricity was 1.8cents/kwh above the five year average.
Having hydro catchments which received more than their usual rainfall in a year when the systemically important South Island lakes received less is fortunate, but it reflects a feature of Trustpower that is often overlooked. Trustpower has hydro facilities in the Bay of Plenty, Taranaki, Horowhenua, Nelson, Marlborough, Canterbury, the West Coast, and Otago. No other power company has a portfolio with such diversity and hence such opportunity to take advantage of weather patterns.It’s also worth noting that it is necessary that Trustpower does make hay when the weather allows. The occasional good years are factored into its value.During the year Trustpower sold its Australian hydro generation subsidiary Green State Power for A$168 million, the equivalent of A$700,000 per GWh of average year generation. These assets were acquired by Trustpower in 2014 for A$65 million or A$270,000 per GWh . The rise in value reflects an increase in Australian electricity prices, the increasing value of back-up generation in that market, and the excellent acquisition price.Trustpower also concluded the acquisition of King Country Energy (KCE). The generation assets of KCE are now owned 80% Trustpower and 20% the King Country Electric Power Trust. The enterprise value of KCE was $142 million. Its generation produces 216GWh in a year of average hydrology.Trustpower’s utility retailing also experienced another positive year. Total customers rose in a market which is pitting larger gentailers, telcos, and start-ups in a highly competitive environment. Over the year, two thirds of the new customers Trustpower attracted took at least two utility services and now over 100,000 of Trustpower’s customers take at least two services.
Over the next year the electricity industry is to have its third Ministerial inquiry since 2006. Both previous Labour and National Governments undertook such reviews and consequently introduced changes. The last Labour administration guaranteed the supply of gas to Genesis Energy’s gas-fired power station in Huntly to reduce the risk of power shortages, while National made changes to the wholesale hedge and generation markets to increase competition in the South Island. It is expected that recommended changes this time are likely to focus on “equity” issues such as pricing provided to low users.Of probably greater importance than the electricity sector review is Government’s aspiration to see New Zealand’s generation produce no greenhouse gas emissions in a year of average rainfall. This will require a large investment in new hydro, wind, geothermal and possibly solar capacity. A rough estimate is that about $5 billion will have to be invested. As the time frame is two decades it’s certainly achievable, but there are plenty of lessons from Australia and the UK about how not to go about this. As experts looking at those markets agree, a high price for greenhouse gas emissions is a
much cheaper and more effective policy tool than any version of direct intervention. Recent policy announcements which could curtail the availability of natural gas could have serious consequences given the role of gas power generation as the source of the electricity system’s security of supply. During the year, Trustpower’s second largest shareholder, the Tauranga Energy Consumer Trust (TECT) initiated a consultation with its beneficiaries (who are Trustpower’s customers in the Tauranga and Western Bay of Plenty) over changes to its income distribution and how it holds its capital funds. The essence was that TECT would become a charitable trust quite independent of Trustpower and its local customers. Trustpower opposed the proposal and during consultation with beneficiaries TECT found that a majority opposed the proposal so it was withdrawn. Going forward, if TECT wishes to again review its structure it is hoped that it will work with Trustpower to provide beneficiaries with choices that reflect the underlying purpose of the Trust, which is to hold its assets for the benefit of the consumers.
YEAR ENDED 31 MARCH 2018 2017 2016
New Zealand retail electricity sales 1,784GWh 1,895GWh 1,820GWh
New Zealand generation 2,235GWh 2,017GWh 1,588GWh
Australian generation 284GWh 359GWh 254GWh
Electricity accounts 273,000 276,000 277,000
Gas accounts 37,000 33,000 31,000
Telecommunication accounts 87,000 76,000 62,000
Av. NZ market spot price 1 8.8c/kwh 5.2c/kwh 6.4c/kwh
NZ EBITDAF 2 $243.1m $203.0m $195.7m
Green State EBITDAF $26.7m $31.5m $12.3m
Investment spend $27.9m $26.7m $115.0m
Net debt $469.8m $660.8m -
Infratil’s holding value 3 $893.0m $734.8m -
1. 8.8c/kwh is the same as $88,000/GWh (ie. 1 GWh = 1,000,000 kwh)2. Excludes $16.7 million of demerger costs in FY20173. NZX market value at period end
For
per
sona
l use
onl
y

27
TRUSTPOWER
51% INFRATIL 27% TAURANGA ENERGY CONSUMER TRUST 22% PUBLIC
INFRATIL’S INVESTMENT OBJECTIVES
Over the last decade the New Zealand electricity market has experienced an excess of generation capacity/supply and correspondingly depressed electricity prices. Looking forward the supply/demand balance will change as older coal/gas power stations are retired and as transport shifts from being powered by oil to using electricity.
Trustpower has been the most dynamic of the New Zealand gentailers showing leadership in developing generation in Australia, using its hydro storage for irrigation, and through the development of multi-utility retailing. It has now demerged its wind farms into Tilt Renewables. Opportunities are expected in New Zealand as wholesale electricity prices firm and additional generation capacity is required.
For
per
sona
l use
onl
y
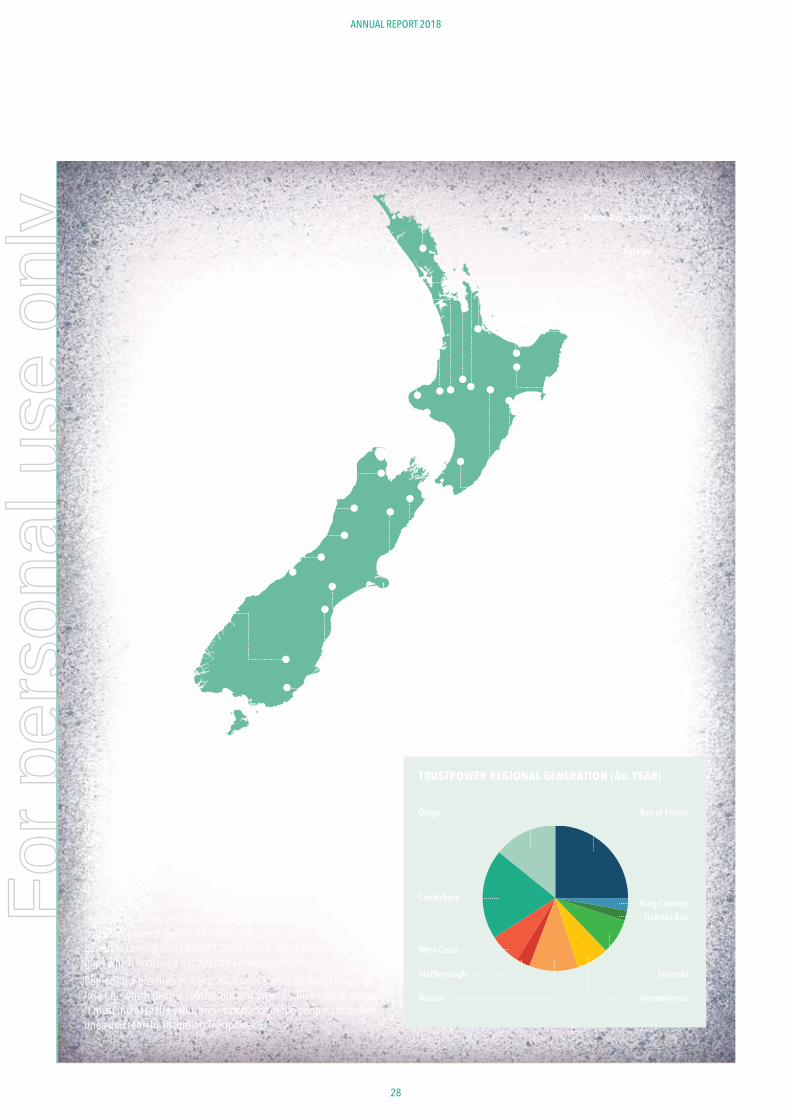
28
ANNUAL REPORT 2018
Waipori
Highbank
Coleridge
Waihopai
Branch River
Hinemaiaia
Mangahao
Esk
Wheao and Flaxy
Matahina
Kaimai
Kuratau
Bream Bay (diesel)
Motukawa
Wairere & Mokauiti
Mangorei
Piriaka
Patea
Cobb
Arnold
Dillmans
Kaniere Forks
Paerau/Patearoa
Wahapo
As the map and the graph show, Trustpower’s generation is geographically diversified which provides a hedge against dry years as usually a drought in one region is matched by wet weather somewhere else. It also means that if one region has high prices (there can be substantial regional price variability) Trustpower can generate in that region. Protection against adverse regional electricity prices can be important for a company with customers spread around the country.It is almost certain that over the next two decades some of the country’s existing coal and gas fired stations will be retired and replaced by wind, geothermal and possibly solar and hydro. Wind and solar generate when its windy and sunny. Geothermal tends to generate continuously. None fits the bill of being able to fill supply gaps which occur in a normal day as well as seasonally. Replacing a gas-fired power station with a wind powered one is to lose one which people control and to gain one which nature controls. It must increase the value and importance of the people controlled ones that remain, including Trustpower’s.
TRUSTPOWER REGIONAL GENERATION (Av. YEAR)
Otago Bay of Plenty
Canterbury King Country
West Coast
Hawkes Bay
Marlborough Taranaki
Nelson Horowhenua
For
per
sona
l use
onl
y
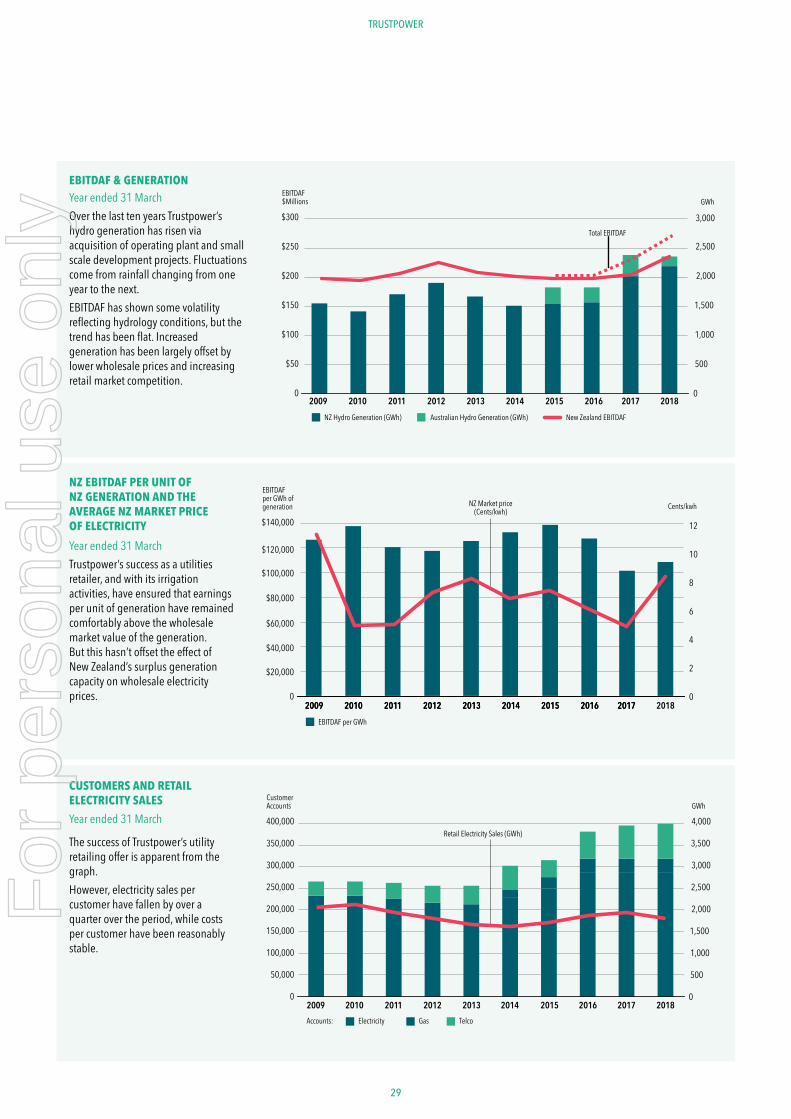
29
EBITDAF & GENERATIONYear ended 31 MarchOver the last ten years Trustpower’s hydro generation has risen via acquisition of operating plant and small scale development projects. Fluctuations come from rainfall changing from one year to the next.EBITDAF has shown some volatility reflecting hydrology conditions, but the trend has been flat. Increased generation has been largely offset by lower wholesale prices and increasing retail market competition.
NZ EBITDAF PER UNIT OF NZ GENERATION AND THE AVERAGE NZ MARKET PRICE OF ELECTRICITY
Year ended 31 MarchTrustpower’s success as a utilities retailer, and with its irrigation activities, have ensured that earnings per unit of generation have remained comfortably above the wholesale market value of the generation. But this hasn’t offset the effect of New Zealand’s surplus generation capacity on wholesale electricity prices.
CUSTOMERS AND RETAIL ELECTRICITY SALES
Year ended 31 March
The success of Trustpower’s utility retailing offer is apparent from the graph. However, electricity sales per customer have fallen by over a quarter over the period, while costs per customer have been reasonably stable.
0
500
1,500
1,000
2,000
2,500
3,000
2018
GWh
$50
02009 2010 2011 2012 2013 2016 2017 2015 2014
$100
$150
$200
$250
EBITDAF$Millions
$300
NZ Hydro Generation (GWh) Australian Hydro Generation (GWh) New Zealand EBITDAF
Total EBITDAF
0
12
10
8
6
4
2
2018 2009 2010 2011 2012 2013 2016 2017 2015 2014 2009 2010 2011 2012 2013 2016 2017 2015 2014
Cents/kwh
$80,000
$60,000
$40,000
$20,000
0
$100,000
$120,000
$140,000
EBITDAFper GWh of generation
EBITDAF per GWh
NZ Market price(Cents/kwh)
Customer Accounts
0
4,000
3,500
3,000
2,500
2,000
1,500
1,000
500
GWh
200,000
150,000
100,000
50,000
0
250,000
300,000
350,000
400,000
2018 2009 2010 2011 2012 2013 2016 2017 2015 2014 Electricity Accounts: TelcoGas
Retail Electricity Sales (GWh)
TRUSTPOWER
For
per
sona
l use
onl
y
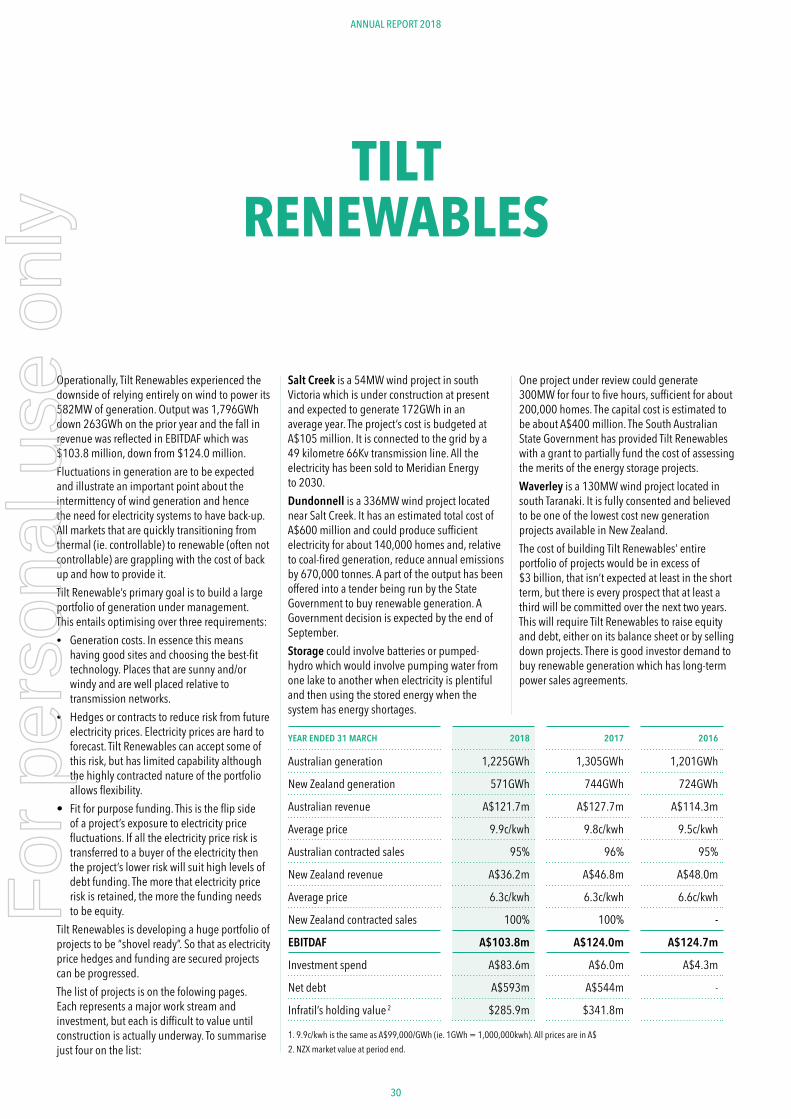
30
ANNUAL REPORT 2018
Operationally, Tilt Renewables experienced the downside of relying entirely on wind to power its 582MW of generation. Output was 1,796GWh down 263GWh on the prior year and the fall in revenue was reflected in EBITDAF which was $103.8 million, down from $124.0 million.Fluctuations in generation are to be expected and illustrate an important point about the intermittency of wind generation and hence the need for electricity systems to have back-up. All markets that are quickly transitioning from thermal (ie. controllable) to renewable (often not controllable) are grappling with the cost of back up and how to provide it. Tilt Renewable’s primary goal is to build a large portfolio of generation under management. This entails optimising over three requirements:• Generation costs. In essence this means
having good sites and choosing the best-fit technology. Places that are sunny and/or windy and are well placed relative to transmission networks.
• Hedges or contracts to reduce risk from future electricity prices. Electricity prices are hard to forecast. Tilt Renewables can accept some of this risk, but has limited capability although the highly contracted nature of the portfolio allows flexibility.
• Fit for purpose funding. This is the flip side of a project’s exposure to electricity price fluctuations. If all the electricity price risk is transferred to a buyer of the electricity then the project’s lower risk will suit high levels of debt funding. The more that electricity price risk is retained, the more the funding needs to be equity.
Tilt Renewables is developing a huge portfolio of projects to be “shovel ready”. So that as electricity price hedges and funding are secured projects can be progressed.The list of projects is on the folowing pages. Each represents a major work stream and investment, but each is difficult to value until construction is actually underway. To summarise just four on the list:
Salt Creek is a 54MW wind project in south Victoria which is under construction at present and expected to generate 172GWh in an average year. The project’s cost is budgeted at A$105 million. It is connected to the grid by a 49 kilometre 66Kv transmission line. All the electricity has been sold to Meridian Energy to 2030.Dundonnell is a 336MW wind project located near Salt Creek. It has an estimated total cost of A$600 million and could produce sufficient electricity for about 140,000 homes and, relative to coal-fired generation, reduce annual emissions by 670,000 tonnes. A part of the output has been offered into a tender being run by the State Government to buy renewable generation. A Government decision is expected by the end of September. Storage could involve batteries or pumped-hydro which would involve pumping water from one lake to another when electricity is plentiful and then using the stored energy when the system has energy shortages.
One project under review could generate 300MW for four to five hours, sufficient for about 200,000 homes. The capital cost is estimated to be about A$400 million. The South Australian State Government has provided Tilt Renewables with a grant to partially fund the cost of assessing the merits of the energy storage projects.Waverley is a 130MW wind project located in south Taranaki. It is fully consented and believed to be one of the lowest cost new generation projects available in New Zealand.The cost of building Tilt Renewables’ entire portfolio of projects would be in excess of $3 billion, that isn’t expected at least in the short term, but there is every prospect that at least a third will be committed over the next two years. This will require Tilt Renewables to raise equity and debt, either on its balance sheet or by selling down projects. There is good investor demand to buy renewable generation which has long-term power sales agreements.
YEAR ENDED 31 MARCH 2018 2017 2016
Australian generation 1,225GWh 1,305GWh 1,201GWh
New Zealand generation 571GWh 744GWh 724GWh
Australian revenue A$121.7m A$127.7m A$114.3m
Average price 9.9c/kwh 9.8c/kwh 9.5c/kwh
Australian contracted sales 95% 96% 95%
New Zealand revenue A$36.2m A$46.8m A$48.0m
Average price 6.3c/kwh 6.3c/kwh 6.6c/kwh
New Zealand contracted sales 100% 100% -
EBITDAF A$103.8m A$124.0m A$124.7m
Investment spend A$83.6m A$6.0m A$4.3m
Net debt A$593m A$544m -
Infratil’s holding value 2 $285.9m $341.8m
1. 9.9c/kwh is the same as A$99,000/GWh (ie. 1GWh = 1,000,000kwh). All prices are in A$2. NZX market value at period end.
TILT RENEWABLES
For
per
sona
l use
onl
y
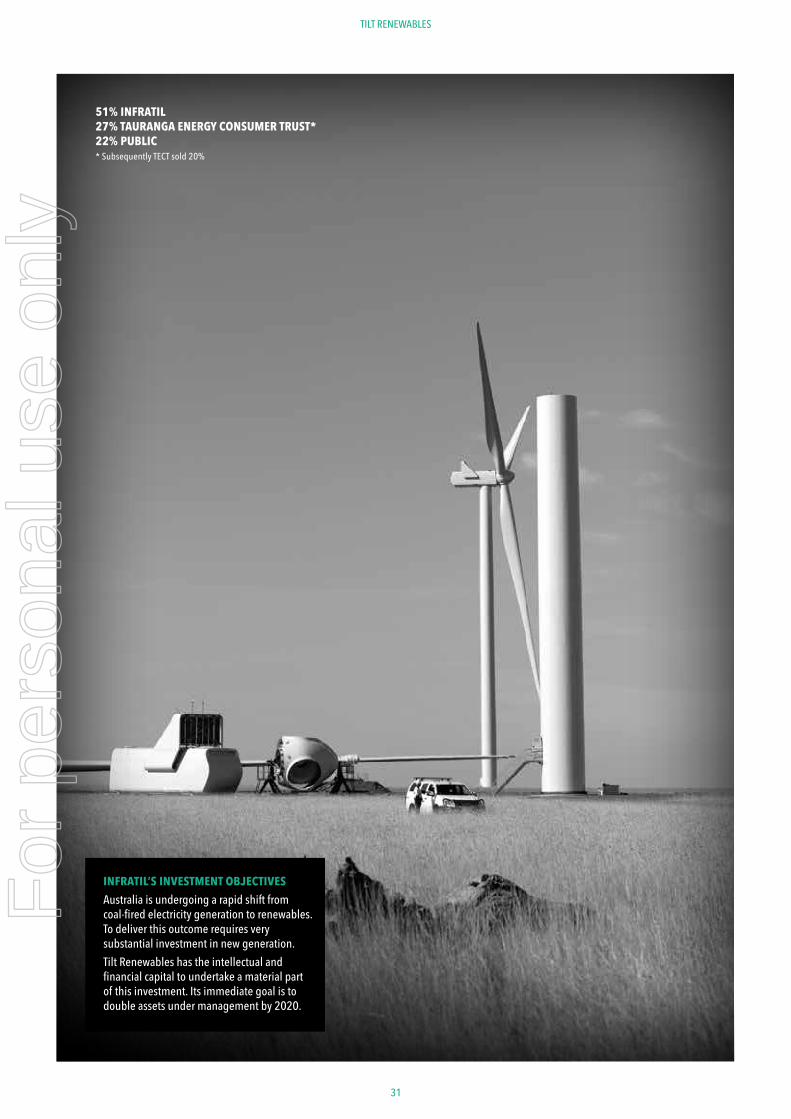
31
TILT RENEWABLES
51% INFRATIL 27% TAURANGA ENERGY CONSUMER TRUST* 22% PUBLIC* Subsequently TECT sold 20%
INFRATIL’S INVESTMENT OBJECTIVES
Australia is undergoing a rapid shift from coal-fired electricity generation to renewables. To deliver this outcome requires very substantial investment in new generation.
Tilt Renewables has the intellectual and financial capital to undertake a material part of this investment. Its immediate goal is to double assets under management by 2020.
For
per
sona
l use
onl
y
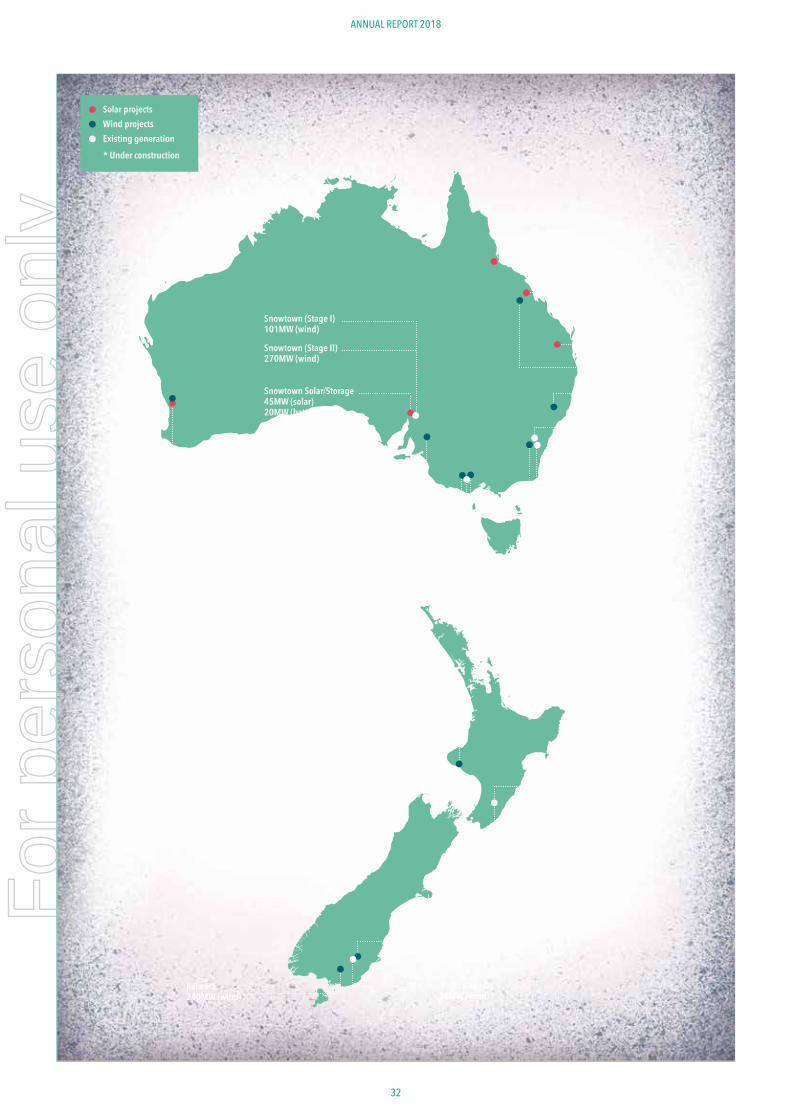
32
ANNUAL REPORT 2018
QLD Wind 70MW (wind)
NSW Wind Project 400MW (wind)
Blayney 10MW (wind)
Crookwell 5MW (wind)
Rye Park 300MW (wind)
Dundonnell 336MW (wind)
Salt Creek* 54MW (wind)
Waverley 130MW (wind)
Kaiwera 240MW (wind)
VIC Wind Project 300MW (wind)
Palmer 300MW (wind)
Waddi 105MW (wind) 40MW (solar)
Snowtown (Stage I) 101MW (wind)
Snowtown (Stage II) 270MW (wind)
Snowtown Solar/Storage 45MW (solar) 20MW (battery)
QLD Solar Projects 770MW (solar)
Mahinerangi (Stage I) 36MW (wind)
Mahinerangi (Stage II) 160MW (wind)
Tararua (Stage I & II) 68MW (wind)
Tararua (Stage III) 93MW (wind)
Solar projectsWind projectsExisting generation
* Under construction
For
per
sona
l use
onl
y
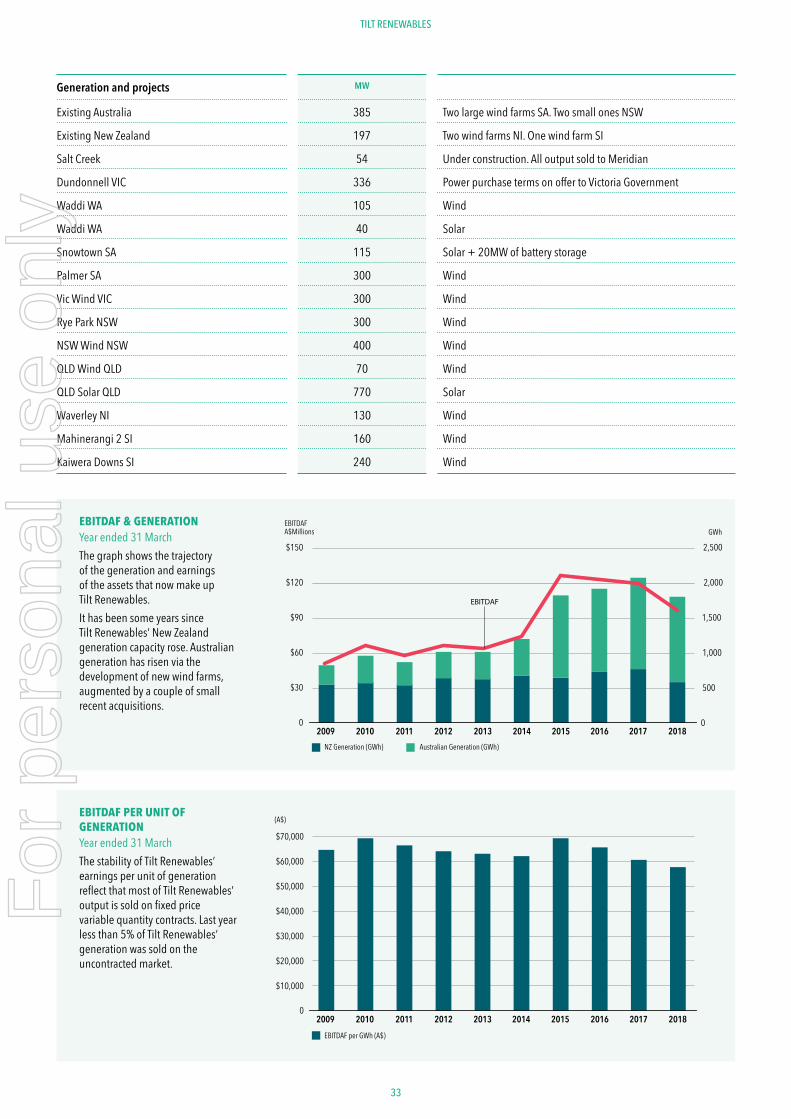
33
EBITDAF & GENERATIONYear ended 31 MarchThe graph shows the trajectory of the generation and earnings of the assets that now make up Tilt Renewables.It has been some years since Tilt Renewables’ New Zealand generation capacity rose. Australian generation has risen via the development of new wind farms, augmented by a couple of small recent acquisitions.
EBITDAF PER UNIT OF GENERATIONYear ended 31 MarchThe stability of Tilt Renewables’ earnings per unit of generation reflect that most of Tilt Renewables’ output is sold on fixed price variable quantity contracts. Last year less than 5% of Tilt Renewables’ generation was sold on the uncontracted market.
0
500
1,500
1,000
2,000
2,500
2018 2009 2010 2011 2012 2013 2015 2016 2017 2014
GWh
$30
0
$60
$90
$120
$150
EBITDAFA$Millions
NZ Generation (GWh) Australian Generation (GWh)
EBITDAF
2018 2009 2010 2011 2012 2013 2016 2017 2015 2014
$10,000
$20,000
$30,000
$40,000
$50,000
$60,000
$70,000
0
(A$)
EBITDAF per GWh (A$)
TILT RENEWABLES
Generation and projects MW
Existing Australia 385 Two large wind farms SA. Two small ones NSW
Existing New Zealand 197 Two wind farms NI. One wind farm SI
Salt Creek 54 Under construction. All output sold to Meridian
Dundonnell VIC 336 Power purchase terms on offer to Victoria Government
Waddi WA 105 Wind
Waddi WA 40 Solar
Snowtown SA 115 Solar + 20MW of battery storage
Palmer SA 300 Wind
Vic Wind VIC 300 Wind
Rye Park NSW 300 Wind
NSW Wind NSW 400 Wind
QLD Wind QLD 70 Wind
QLD Solar QLD 770 Solar
Waverley NI 130 Wind
Mahinerangi 2 SI 160 Wind
Kaiwera Downs SI 240 Wind
For
per
sona
l use
onl
y
34
ANNUAL REPORT 2018
LONGROAD ENERGY
In the less than two years since being established, Longroad Energy has delivered an impressive set of milestones. Their variety illustrates the heterogenous and dynamic character of the US electricity generation market.Owning & Managing Generation: Longroad Energy has employed a team to manage generation assets and it has purchased three going-concern vehicles which were established in the past to own and fund generation. With each there are opportunities to release capital, to enhance their value by upgrading or expanding the generation capacity, and to provide recurring income from plant management and energy sales. • Federal Street Solar owns 297MW of solar
generation spread over more than a dozen states with all output sold on fixed price contracts.
• Minnesota Wind owns 80MW of wind generation with all output sold on contract. Work is under way to determine whether the turbines and blades warrant renewal to increase their output.
• Milford Wind in Utah owns 306MW of wind generation with the potential to increase output. Electricity is sold to the Southern California Public Power Authority.
Development Projects: The Longroad Energy team are working on over 6,000MW of wind and solar generation projects in over 20 states.The three most advanced of these are coincidentally in Texas and involve 626MW of solar generation and 238MW of wind and in aggregate will cost approximately US$1,500 million if progressed to commissioning. With these projects Longroad Energy has arranged consents and agreements for use of the land, construction, and grid connection. It has firm pricing for the generation plant and the cost of its installation, the required debt funding and tax credits, and for the sale of the output for 15-20 years.
Whether the projects are retained (which would involve Infratil providing equity capital) or sold prior to commissioning will depend on the value placed on them by institutional investors. Longroad Energy and Infratil are reviewing the options at present.Financial Flexibility: The three shareholders have provided an initial commitment of US$100 million. In addition there has been conditional support provided to letters of credit issued by Longroad Energy as a part of the projects that have been acquired. Over the last year, Longroad Energy has drawn on the US$100 million commitment as the acquisitions and projects outlined above have progressed, and repaid capital as other sources of funding have become available.As at 31 March 2018, Infratil had invested, over the two years, $66.8 million into Longroad Energy by way off equity ($63.8 million) and shareholder loans ($3.0 million) and received back distributions of $28.9 million. Because of
Longroad Energy’s book losses, Infratil’s holding had a book value of $16.0 million as at 31 March 2018.For the twelve months to 31 December 2017 (Longroad Energy’s financial year) Longroad Energy reported a net loss of US$22.6 million. This included depreciation, amortisations, and interest expenses related to the generation ownership vehicles which have been acquired as well as development costs actually incurred by Longroad Energy. Non-development activities actually delivered a profit of $1.1 million.Over time as Longroad Energy grows its portfolio of generation it will provide more recurring income and transparency. However, in the short term, for Infratil’s shareholders Longroad Energy is likely to represent an interesting, but hard to value, portfolio of activities. In recognition of this, Infratil is to consider linking Longroad Energy’s delivery of cash development earnings with dividend payments to Infratil shareholders.
YEAR ENDED 31 MARCH 2018
Infratil investment amount $66.8 million
Infratil capital received back $28.9 million
Infratil book value $16.0 million
Infratil’s share of Longroad Energy’s net income ($13.8 million)
EBITDAF 1 (US$5.6 million)
Depreciation/Amortisation 1 (US$8.4 million)
Interest 1 (US$8.6 million)
Net surplus before tax 1 (US$22.6 million)
Operating cash flow inc. development costs 1 (US$5.3 million)
Owned generation 684MW
Managed generation 1,236MW
Employees 74 people
1. Longroad Energy has a 31 December financial year. These figures are for the year ended 31 December 2017.
For
per
sona
l use
onl
y

35
LONGROAD ENERGY
45% INFRATIL 45% NZ SUPERANNUATION FUND 10% MANAGEMENT
INFRATIL’S INVESTMENT OBJECTIVES
Longroad Energy was established as a development vehicle focused on building the next generation of utility-scale renewable assets in the United States. The thesis is that an experienced development team with deep operating capability and a flexible remit will create opportunities to invest in a broad array of renewable assets as the U.S. migrates away from subsidised investment in renewables. Longroad is expected to produce a series of development and work-out profits, as well as a core portfolio of operating assets and recurring services revenues. The investment is also expected to provide insights into the economics and trends at the cutting edge of renewable generation which will be applied across Infratil’s overall portfolio. Longroad’s immediate priority is to deliver the first set of realised development gains from the extensive pipeline of opportunities that has been established across a range of wind and solar opportunities.
For
per
sona
l use
onl
y
36
ANNUAL REPORT 2018
WELLINGTON AIRPORT
Wellington Airport hosted 173,000 more domestic and 7,000 more international passengers than the prior year. The growth was above budget.Fluctuations in growth annually and over longer periods reflect the dynamics of the airline market. Last year’s domestic increase was mainly due to Air New Zealand’s incremental additions of capacity and strong competition by Jetstar on Dunedin and Nelson routes. Air New Zealand’s move to larger aircraft has created opportunities on services with lower passenger demand, and in central New Zealand Sounds Air has done a good job expanding its network.Internationally, the flat net outcome included reduced airline capacity on the Tasman balanced by growth on Fiji Airways and Singapore Airlines services. The year ahead is more positive; following the decision by Air New Zealand to cease collaborating with Virgin Australia both airlines have announced new services, and Singapore Airlines is upgrading its service by routing it via Melbourne rather than Canberra. The new route offers more convenience, more interconnection options and a quicker travel time. It is hoped that the airline’s next step will be to introduce new aircraft and to increase the service to daily, from its current four times a week.In the domestic market, the most positive development may be Jetstar’s reintroduction of jet services with Queenstown. This is popular with locals and Queenstown is “must see” for many international visitors. In FY2019 the route will have 260,000 seats available, up 600% from the 37,000 seats of a decade ago.In FY2019, Wellington Airport will conclude the $300 million development programme started four years ago. The final deliveries are the hotel, the domestic terminal refurbishment, the renewal of the airfield taxiway, and the multi-level car park and transport hub. Airport management are now scoping out the capital investment programme for the following five years. Initial estimates are for $250 million of capital outlays over this period.
At the end of FY2018 Infratil had owned 66% of Wellington Airport for almost two decades and had overseen $570 million of development investment. The result is that Wellington Airport is extremely efficient, it has the lowest per-passenger operating cost of any jet airport in Australasia, and is very popular with users with the second highest user rating in Australasia.Next year Wellington Airport will again consult with its major airline customers to set aeronautical charges. Indicative of the good working relationship with airlines, they have agreed to a postponement of this while Wellington clarifies its likely investment programme.The Airport is involved with two controversial initiatives reflecting its extremely small site and its growth. Consultation is underway with the adjacent golf club to purchase land to enable the accommodation of larger and more aircraft. The Airport’s construction of the car parking building at $72,000 per park was part of its initiatives to stay within its land footprint, but vertical parking of aircraft is not possible.
The other initiative is the extension of the runway 355 metres to the south. This was delayed by 18 months due to a succession of court cases which sought to clarify how the Civil Aviation Authority should interpret its regulations. The final court decision was close to an affirmation of CAA’s historic approach and the Airport has resubmitted its application to have CAA indicate what runway safety features will be required once the runway is extended. Knowing this means that the safety features can be incorporated in the construction.The delay means that its likely to be mid 2019 before construction consents could be available and perhaps a minimum of three years after that before the first long-haul service could take advantage of a longer runway to link central New Zealand directly with Asia or North America. While progressing construction is taking longer than hoped, the merits of the initiative are unchanged. It was recently calculated that 83% of the world can reach 100 of the world’s top tourist locations with a single flight. A two stop itinerary is a material impediment when competing for tourists.
YEAR ENDED 31 MARCH 2018 2017
Passengers Domestic 5,249,358 5,076,479
Passengers International 895,605 888,427
Aeronautical income $76.2m $70.3m
Passenger services income $40.3m $37.0m
Property/other $12.2m $12.2m
Operating costs ($33.3m) ($29.0m)
EBITDAF $95.4m $90.5m
Investment spending $85.1m $79.3m
Net debt $400.1m $349.6m
Infratil cash income $37.9m $38.9m
Infratil’s holding value 1 $471.9m $414.5m 1. Infratil’s share of net assets excluding deferred tax at period end
For
per
sona
l use
onl
y

37
WELLINGTON AIRPORT
INFRATIL’S INVESTMENT OBJECTIVES
It is now almost two decades since Infratil acquired its 66% shareholding in Wellington Airport. Over that period, annual passenger numbers have risen from 3.5 million to 6.1 million. This has required the investment of $570 million into facilities which has driven annual earnings from $15.5 million to $95.4 million.
The Airport has benefitted from people’s increasing propensity to fly and the dynamic airline market. Both factors are expected to continue and as long as the regulatory environment allows, it is anticipated that the Airport will continue to invest in its own activities and to grow its returns and value.
Incidentally; in 1998 Wellington Airport had 127,000 aircraft movements and employed 104 people, last year that was 95,000 movements and 107 people.
66% INFRATIL 34% WELLINGTON CITY COUNCIL
For
per
sona
l use
onl
y

38
ANNUAL REPORT 2018
FIJI
Since Fiji Airways initiated Wellington-Nadi services• Wellington-Fiji traffic (direct and via Auckland) +47%• Competitor capacity +67%• Wellington-Fiji direct +242%
SINGAPORE
Since Singapore Airlines initiated Wellington-Singapore services• 86% increase in the number of Singaporeans flying
to Wellington• 83% in the number of visitors from India• 20% increase in the total Asian traffic• International visitors to New Zealand spent
$11.7 billion last year. 14% of this was spent in central New Zealand
• Asian visitors spent $3.5 billion in New Zealand but only 7% in central New Zealand
Improving international connectivity is critical if tourism is to be spread around New Zealand
Wellington
Auckland
78% now fly direct
52% used to fly via Auckland
Fiji
For
per
sona
l use
onl
y
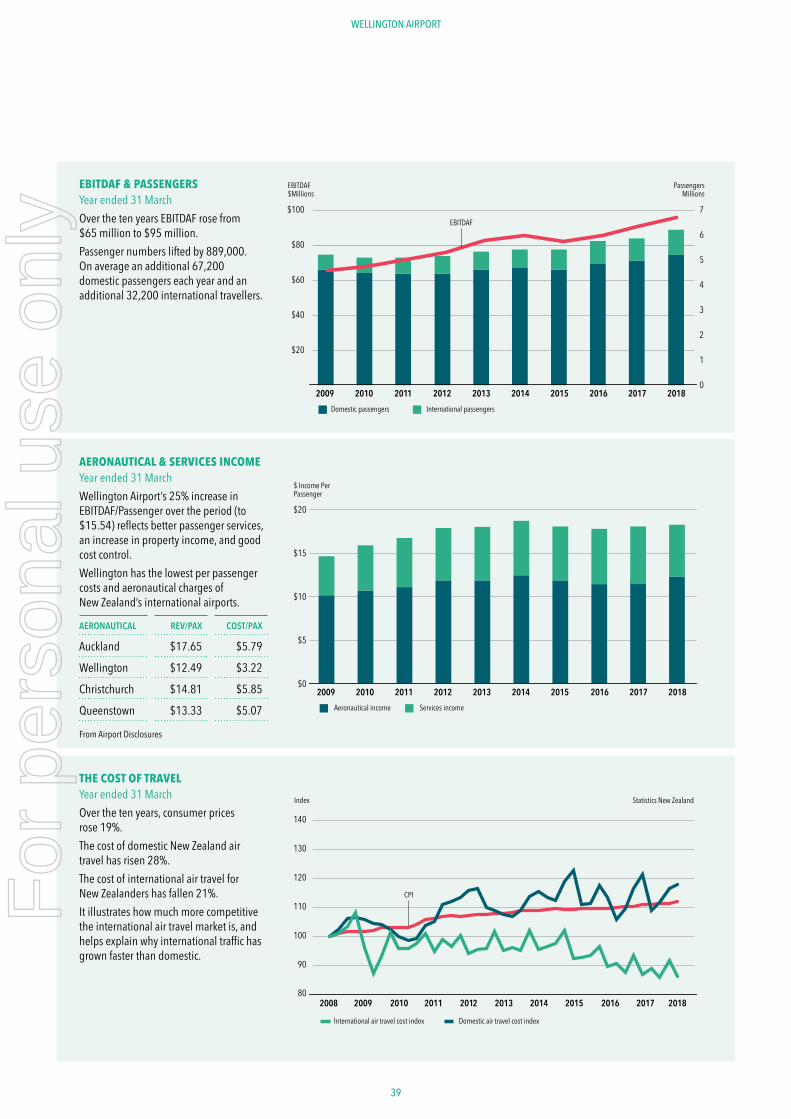
39
EBITDAF & PASSENGERSYear ended 31 MarchOver the ten years EBITDAF rose from $65 million to $95 million.Passenger numbers lifted by 889,000. On average an additional 67,200 domestic passengers each year and an additional 32,200 international travellers.
THE COST OF TRAVELYear ended 31 MarchOver the ten years, consumer prices rose 19%. The cost of domestic New Zealand air travel has risen 28%.The cost of international air travel for New Zealanders has fallen 21%.It illustrates how much more competitive the international air travel market is, and helps explain why international traffic has grown faster than domestic.
$20
$60
$40
$80
$100
0
1
2
3
4
5
6
7
2018 2009 2010 2011 2012 2013 2016 2017 2015 2014
PassengersMillions
EBITDAF$Millions
Domestic passengers International passengers
EBITDAF
$0
$5
$10
$15
$20
20182009 2010 2011 2012 2013 2016 20172015 2014
$ Income Per Passenger
Aeronautical income Services income
International air travel cost index Domestic air travel cost index
Statistics New Zealand
80
90
100
110
120
130
140
Index
2008 2009 2010 2011 2012 2013 2014 2017 201820162015
CPI
WELLINGTON AIRPORT
AERONAUTICAL & SERVICES INCOMEYear ended 31 MarchWellington Airport’s 25% increase in EBITDAF/Passenger over the period (to $15.54) reflects better passenger services, an increase in property income, and good cost control. Wellington has the lowest per passenger costs and aeronautical charges of New Zealand’s international airports.
AERONAUTICAL REV/PAX COST/PAX
Auckland $17.65 $5.79
Wellington $12.49 $3.22
Christchurch $14.81 $5.85
Queenstown $13.33 $5.07
From Airport Disclosures
For
per
sona
l use
onl
y
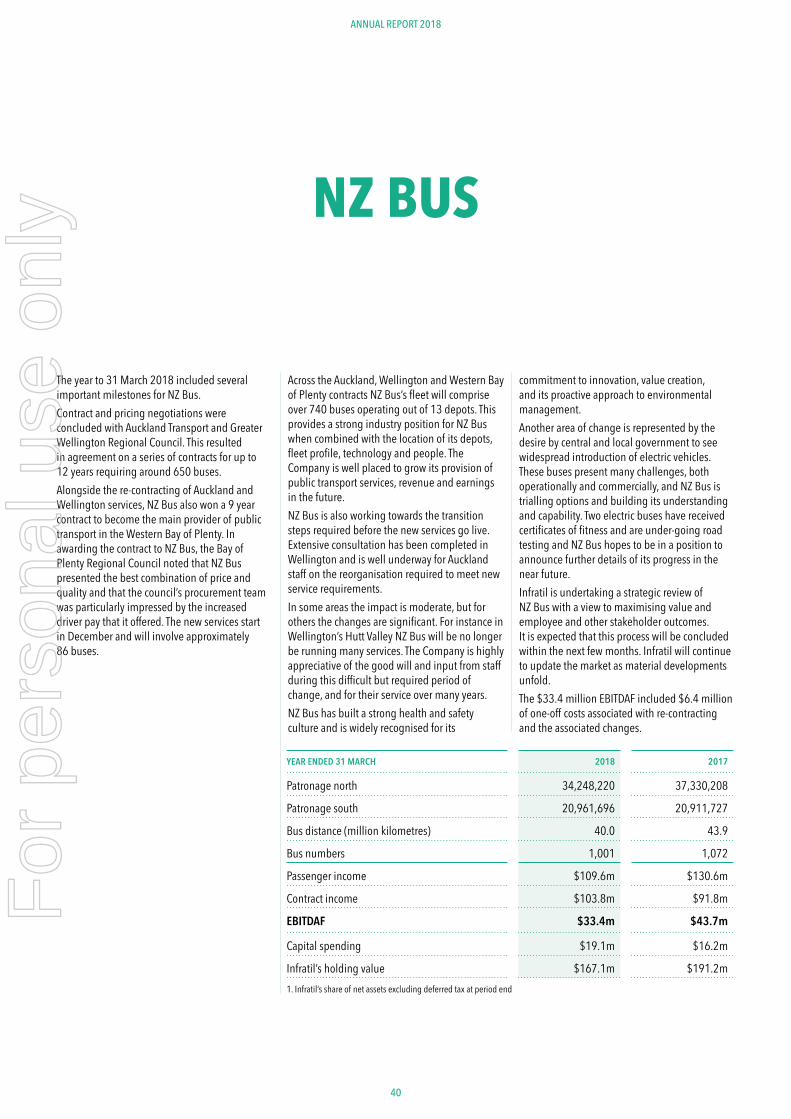
40
ANNUAL REPORT 2018
NZ BUS
The year to 31 March 2018 included several important milestones for NZ Bus. Contract and pricing negotiations were concluded with Auckland Transport and Greater Wellington Regional Council. This resulted in agreement on a series of contracts for up to 12 years requiring around 650 buses. Alongside the re-contracting of Auckland and Wellington services, NZ Bus also won a 9 year contract to become the main provider of public transport in the Western Bay of Plenty. In awarding the contract to NZ Bus, the Bay of Plenty Regional Council noted that NZ Bus presented the best combination of price and quality and that the council’s procurement team was particularly impressed by the increased driver pay that it offered. The new services start in December and will involve approximately 86 buses.
Across the Auckland, Wellington and Western Bay of Plenty contracts NZ Bus’s fleet will comprise over 740 buses operating out of 13 depots. This provides a strong industry position for NZ Bus when combined with the location of its depots, fleet profile, technology and people. The Company is well placed to grow its provision of public transport services, revenue and earnings in the future. NZ Bus is also working towards the transition steps required before the new services go live. Extensive consultation has been completed in Wellington and is well underway for Auckland staff on the reorganisation required to meet new service requirements. In some areas the impact is moderate, but for others the changes are significant. For instance in Wellington’s Hutt Valley NZ Bus will be no longer be running many services. The Company is highly appreciative of the good will and input from staff during this difficult but required period of change, and for their service over many years. NZ Bus has built a strong health and safety culture and is widely recognised for its
commitment to innovation, value creation, and its proactive approach to environmental management.Another area of change is represented by the desire by central and local government to see widespread introduction of electric vehicles. These buses present many challenges, both operationally and commercially, and NZ Bus is trialling options and building its understanding and capability. Two electric buses have received certificates of fitness and are under-going road testing and NZ Bus hopes to be in a position to announce further details of its progress in the near future.Infratil is undertaking a strategic review of NZ Bus with a view to maximising value and employee and other stakeholder outcomes. It is expected that this process will be concluded within the next few months. Infratil will continue to update the market as material developments unfold.The $33.4 million EBITDAF included $6.4 million of one-off costs associated with re-contracting and the associated changes.
YEAR ENDED 31 MARCH 2018 2017
Patronage north 34,248,220 37,330,208
Patronage south 20,961,696 20,911,727
Bus distance (million kilometres) 40.0 43.9
Bus numbers 1,001 1,072
Passenger income $109.6m $130.6m
Contract income $103.8m $91.8m
EBITDAF $33.4m $43.7m
Capital spending $19.1m $16.2m
Infratil’s holding value $167.1m $191.2m 1. Infratil’s share of net assets excluding deferred tax at period end
For
per
sona
l use
onl
y
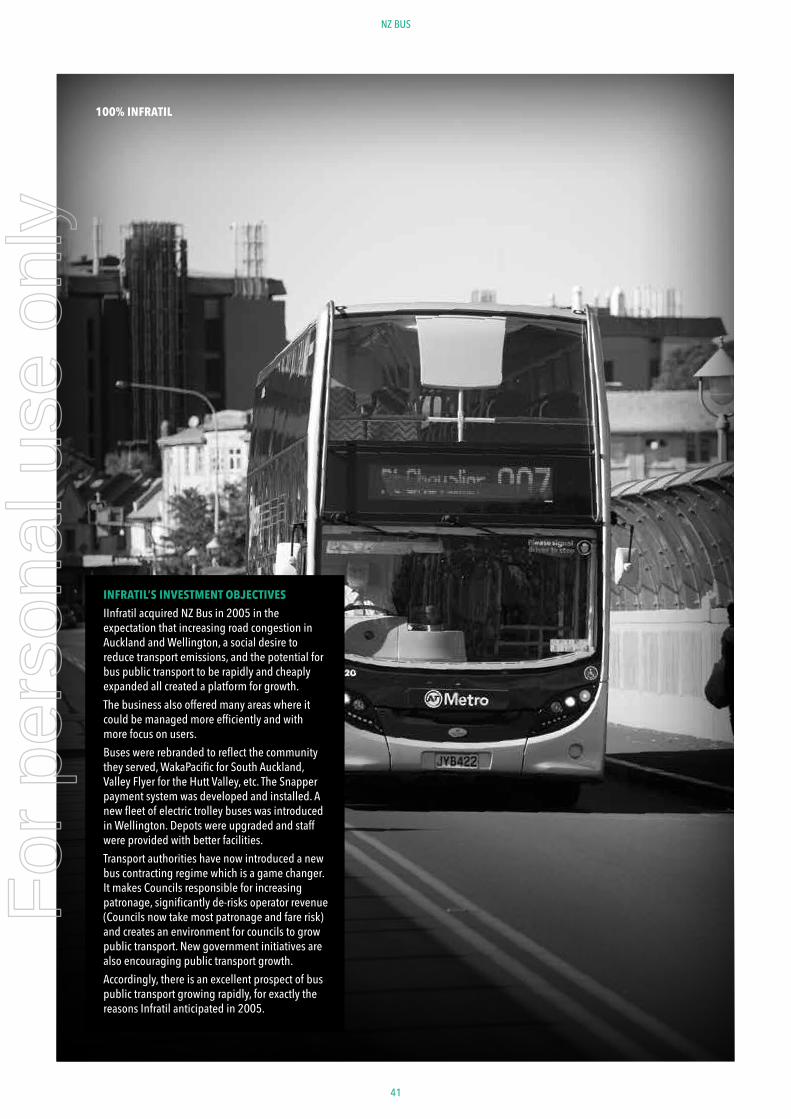
41
NZ BUS
100% INFRATIL
INFRATIL’S INVESTMENT OBJECTIVES
IInfratil acquired NZ Bus in 2005 in the expectation that increasing road congestion in Auckland and Wellington, a social desire to reduce transport emissions, and the potential for bus public transport to be rapidly and cheaply expanded all created a platform for growth.
The business also offered many areas where it could be managed more efficiently and with more focus on users.
Buses were rebranded to reflect the community they served, WakaPacific for South Auckland, Valley Flyer for the Hutt Valley, etc. The Snapper payment system was developed and installed. A new fleet of electric trolley buses was introduced in Wellington. Depots were upgraded and staff were provided with better facilities.
Transport authorities have now introduced a new bus contracting regime which is a game changer. It makes Councils responsible for increasing patronage, significantly de-risks operator revenue (Councils now take most patronage and fare risk) and creates an environment for councils to grow public transport. New government initiatives are also encouraging public transport growth.
Accordingly, there is an excellent prospect of bus public transport growing rapidly, for exactly the reasons Infratil anticipated in 2005.
For
per
sona
l use
onl
y
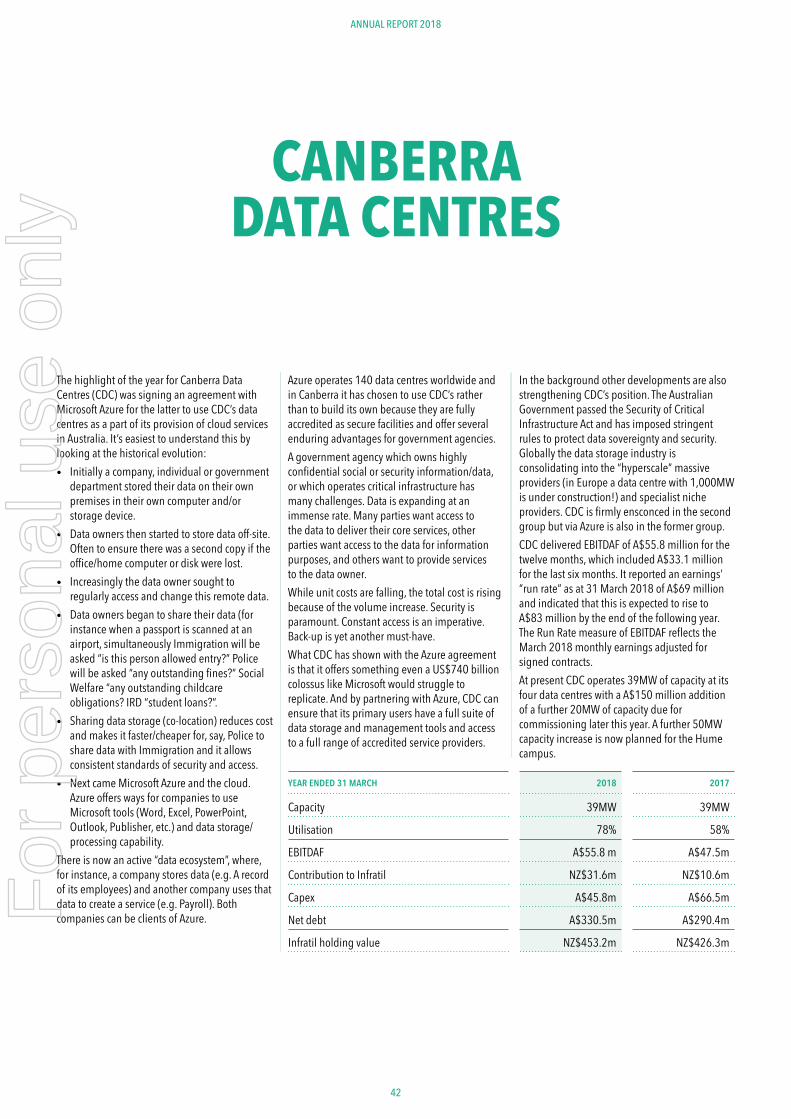
42
ANNUAL REPORT 2018
CANBERRA DATA CENTRES
The highlight of the year for Canberra Data Centres (CDC) was signing an agreement with Microsoft Azure for the latter to use CDC’s data centres as a part of its provision of cloud services in Australia. It’s easiest to understand this by looking at the historical evolution:• Initially a company, individual or government
department stored their data on their own premises in their own computer and/or storage device.
• Data owners then started to store data off-site. Often to ensure there was a second copy if the office/home computer or disk were lost.
• Increasingly the data owner sought to regularly access and change this remote data.
• Data owners began to share their data (for instance when a passport is scanned at an airport, simultaneously Immigration will be asked “is this person allowed entry?” Police will be asked “any outstanding fines?” Social Welfare “any outstanding childcare obligations? IRD “student loans?”.
• Sharing data storage (co-location) reduces cost and makes it faster/cheaper for, say, Police to share data with Immigration and it allows consistent standards of security and access.
• Next came Microsoft Azure and the cloud. Azure offers ways for companies to use Microsoft tools (Word, Excel, PowerPoint, Outlook, Publisher, etc.) and data storage/processing capability.
There is now an active “data ecosystem”, where, for instance, a company stores data (e.g. A record of its employees) and another company uses that data to create a service (e.g. Payroll). Both companies can be clients of Azure.
Azure operates 140 data centres worldwide and in Canberra it has chosen to use CDC’s rather than to build its own because they are fully accredited as secure facilities and offer several enduring advantages for government agencies.A government agency which owns highly confidential social or security information/data, or which operates critical infrastructure has many challenges. Data is expanding at an immense rate. Many parties want access to the data to deliver their core services, other parties want access to the data for information purposes, and others want to provide services to the data owner. While unit costs are falling, the total cost is rising because of the volume increase. Security is paramount. Constant access is an imperative. Back-up is yet another must-have.What CDC has shown with the Azure agreement is that it offers something even a US$740 billion colossus like Microsoft would struggle to replicate. And by partnering with Azure, CDC can ensure that its primary users have a full suite of data storage and management tools and access to a full range of accredited service providers.
In the background other developments are also strengthening CDC’s position. The Australian Government passed the Security of Critical Infrastructure Act and has imposed stringent rules to protect data sovereignty and security. Globally the data storage industry is consolidating into the “hyperscale” massive providers (in Europe a data centre with 1,000MW is under construction!) and specialist niche providers. CDC is firmly ensconced in the second group but via Azure is also in the former group.CDC delivered EBITDAF of A$55.8 million for the twelve months, which included A$33.1 million for the last six months. It reported an earnings’ “run rate” as at 31 March 2018 of A$69 million and indicated that this is expected to rise to A$83 million by the end of the following year. The Run Rate measure of EBITDAF reflects the March 2018 monthly earnings adjusted for signed contracts. At present CDC operates 39MW of capacity at its four data centres with a A$150 million addition of a further 20MW of capacity due for commissioning later this year. A further 50MW capacity increase is now planned for the Hume campus.
YEAR ENDED 31 MARCH 2018 2017
Capacity 39MW 39MW
Utilisation 78% 58%
EBITDAF A$55.8 m A$47.5m
Contribution to Infratil NZ$31.6m NZ$10.6m
Capex A$45.8m A$66.5m
Net debt A$330.5m A$290.4m
Infratil holding value NZ$453.2m NZ$426.3m
For
per
sona
l use
onl
y
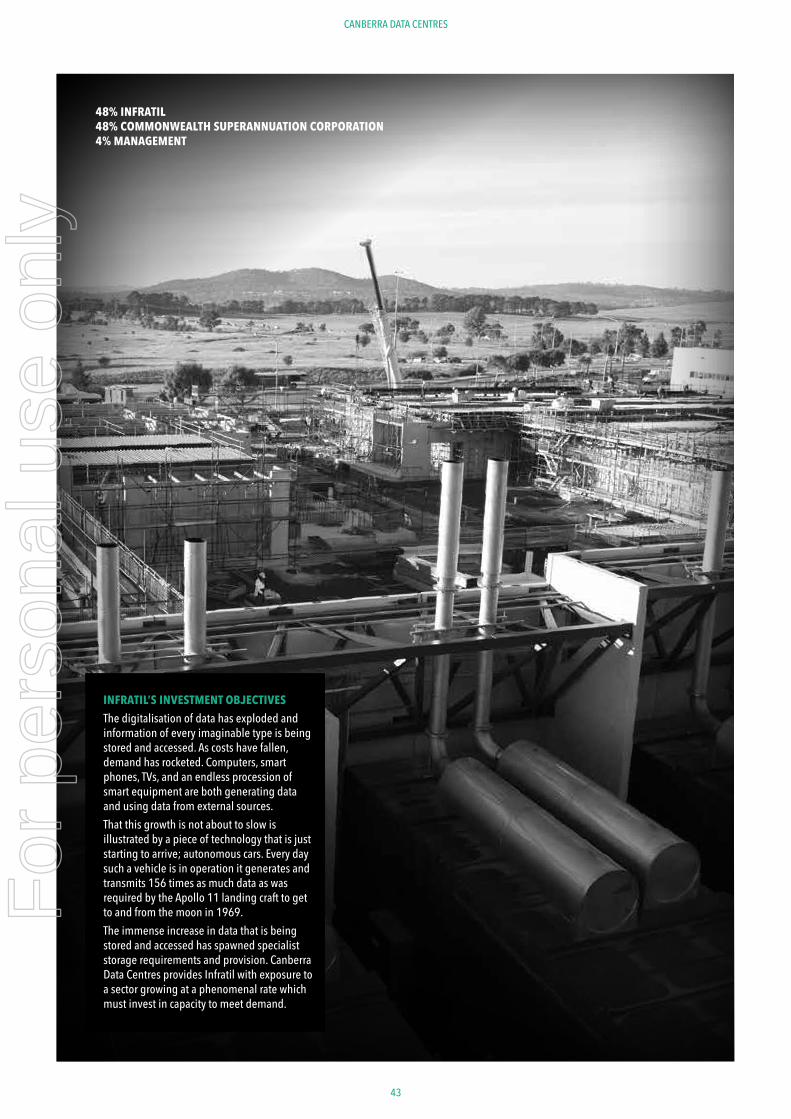
43
CANBERRA DATA CENTRES
INFRATIL’S INVESTMENT OBJECTIVES
The digitalisation of data has exploded and information of every imaginable type is being stored and accessed. As costs have fallen, demand has rocketed. Computers, smart phones, TVs, and an endless procession of smart equipment are both generating data and using data from external sources.
That this growth is not about to slow is illustrated by a piece of technology that is just starting to arrive; autonomous cars. Every day such a vehicle is in operation it generates and transmits 156 times as much data as was required by the Apollo 11 landing craft to get to and from the moon in 1969.
The immense increase in data that is being stored and accessed has spawned specialist storage requirements and provision. Canberra Data Centres provides Infratil with exposure to a sector growing at a phenomenal rate which must invest in capacity to meet demand.
48% INFRATIL48% COMMONWEALTH SUPERANNUATION CORPORATION4% MANAGEMENT
For
per
sona
l use
onl
y
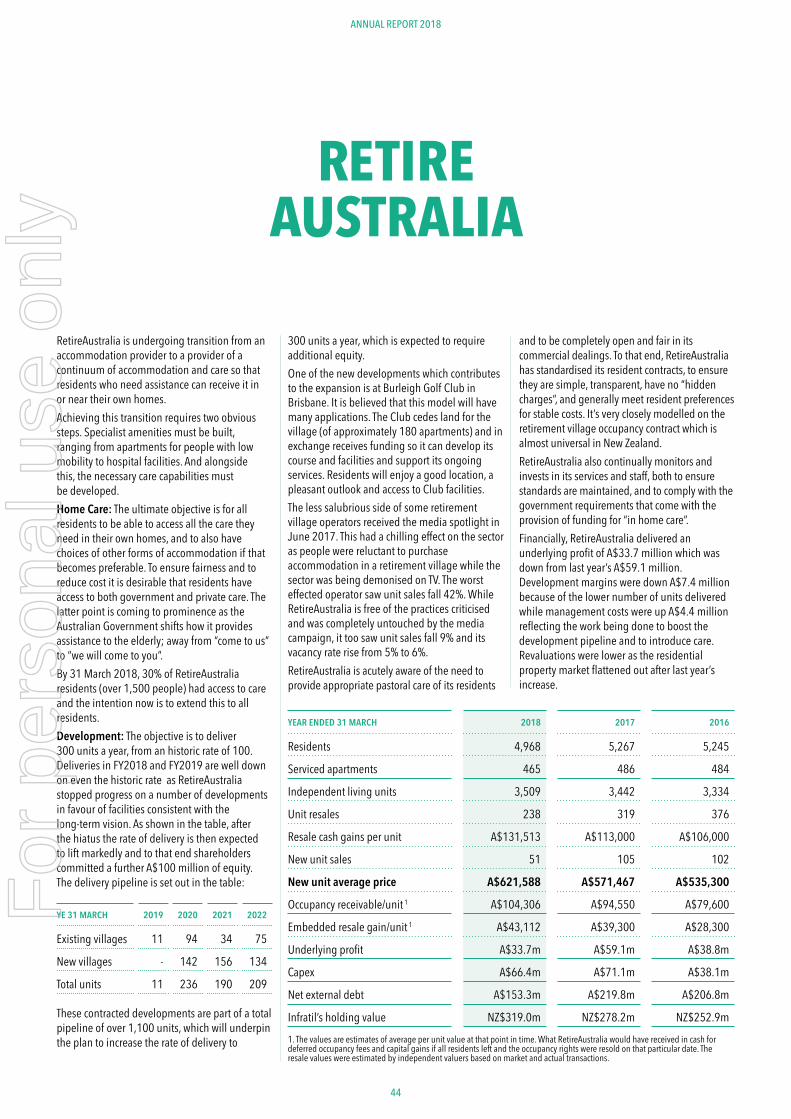
44
ANNUAL REPORT 2018
RETIRE AUSTRALIA
YEAR ENDED 31 MARCH 2018 2017 2016
Residents 4,968 5,267 5,245
Serviced apartments 465 486 484
Independent living units 3,509 3,442 3,334
Unit resales 238 319 376
Resale cash gains per unit A$131,513 A$113,000 A$106,000
New unit sales 51 105 102
New unit average price A$621,588 A$571,467 A$535,300
Occupancy receivable/unit 1 A$104,306 A$94,550 A$79,600
Embedded resale gain/unit 1 A$43,112 A$39,300 A$28,300
Underlying profit A$33.7m A$59.1m A$38.8m
Capex A$66.4m A$71.1m A$38.1m
Net external debt A$153.3m A$219.8m A$206.8m
Infratil’s holding value NZ$319.0m NZ$278.2m NZ$252.9m1. The values are estimates of average per unit value at that point in time. What RetireAustralia would have received in cash for deferred occupancy fees and capital gains if all residents left and the occupancy rights were resold on that particular date. The resale values were estimated by independent valuers based on market and actual transactions.
RetireAustralia is undergoing transition from an accommodation provider to a provider of a continuum of accommodation and care so that residents who need assistance can receive it in or near their own homes.Achieving this transition requires two obvious steps. Specialist amenities must be built, ranging from apartments for people with low mobility to hospital facilities. And alongside this, the necessary care capabilities must be developed.Home Care: The ultimate objective is for all residents to be able to access all the care they need in their own homes, and to also have choices of other forms of accommodation if that becomes preferable. To ensure fairness and to reduce cost it is desirable that residents have access to both government and private care. The latter point is coming to prominence as the Australian Government shifts how it provides assistance to the elderly; away from “come to us” to “we will come to you”.By 31 March 2018, 30% of RetireAustralia residents (over 1,500 people) had access to care and the intention now is to extend this to all residents.Development: The objective is to deliver 300 units a year, from an historic rate of 100. Deliveries in FY2018 and FY2019 are well down on even the historic rate as RetireAustralia stopped progress on a number of developments in favour of facilities consistent with the long-term vision. As shown in the table, after the hiatus the rate of delivery is then expected to lift markedly and to that end shareholders committed a further A$100 million of equity. The delivery pipeline is set out in the table:
YE 31 MARCH 2019 2020 2021 2022
Existing villages 11 94 34 75
New villages - 142 156 134
Total units 11 236 190 209
These contracted developments are part of a total pipeline of over 1,100 units, which will underpin the plan to increase the rate of delivery to
300 units a year, which is expected to require additional equity.One of the new developments which contributes to the expansion is at Burleigh Golf Club in Brisbane. It is believed that this model will have many applications. The Club cedes land for the village (of approximately 180 apartments) and in exchange receives funding so it can develop its course and facilities and support its ongoing services. Residents will enjoy a good location, a pleasant outlook and access to Club facilities.The less salubrious side of some retirement village operators received the media spotlight in June 2017. This had a chilling effect on the sector as people were reluctant to purchase accommodation in a retirement village while the sector was being demonised on TV. The worst effected operator saw unit sales fall 42%. While RetireAustralia is free of the practices criticised and was completely untouched by the media campaign, it too saw unit sales fall 9% and its vacancy rate rise from 5% to 6%.RetireAustralia is acutely aware of the need to provide appropriate pastoral care of its residents
and to be completely open and fair in its commercial dealings. To that end, RetireAustralia has standardised its resident contracts, to ensure they are simple, transparent, have no “hidden charges”, and generally meet resident preferences for stable costs. It’s very closely modelled on the retirement village occupancy contract which is almost universal in New Zealand.RetireAustralia also continually monitors and invests in its services and staff, both to ensure standards are maintained, and to comply with the government requirements that come with the provision of funding for “in home care”.Financially, RetireAustralia delivered an underlying profit of A$33.7 million which was down from last year’s A$59.1 million. Development margins were down A$7.4 million because of the lower number of units delivered while management costs were up A$4.4 million reflecting the work being done to boost the development pipeline and to introduce care. Revaluations were lower as the residential property market flattened out after last year’s increase.
For
per
sona
l use
onl
y

45
RETIRE AUSTRALIA
50% INFRATIL50% NEW ZEALAND SUPERANNUATION FUND
INFRATIL’S INVESTMENT OBJECTIVES
There are roughly 500,000 people in Australia over 85 years old. When the youngest of these individuals was 50 years old, only slightly more than 100,000 Australians was over 85.
Many elderly people seek accommodation and care to suit their reduced mobility and personal and social needs, and they have the capital to support this. However, society has also accepted a welfare obligation, especially when medical treatment or intensive care is required.
RetireAustralia was conceived, by its previous owners/managers, to provide accommodation with features which suited retired people. The objective now is to develop RetireAustralia to offer a “full continuum” of accommodation and care. So that an elderly resident knows that a full range of facilities and services will be available in their own homes for as long as they wish. For governments which both recognise an obligation to the elderly and worry about the cost, the objective is to ensure that there is as much private care and funding as possible and as much public support as is required.
For Infratil, RetireAustralia provides investment exposure to a high growth sector and a restructuring opportunity.
For
per
sona
l use
onl
y
46
ANNUAL REPORT 2018
AUSTRALIAN NATIONAL UNIVERSITY STUDENT
ACCOMMODATION
When Infratil and the Commonwealth Superannuation Corporation acquired the economic interest in the ANU Student Accommodation in August 2016 it comprised 3,250 fully occupied units (either apartments or rooms in halls of residence).
Later that year the JV received another 500 units so that 3,750 were available for students attending ANU for the 2017 academic year. They too were fully occupied in 2017 and 2018.The University is now building a further 450 units and it is anticipated that the JV will acquire these so they can be available for the 2019 academic year. When this occurs Infratil and its partner will provide equity and further bank funding will be drawn. These additional units are part of the Kambri Union Court development being undertaken by ANU. Once open in 2019, Kambri will be the largest and most profound change to the ANU campus since its establishment. It combines the best elements of existing campus life, adding educational, cultural, physical and social facilities for the benefit of the university community. It will certainly make it even more attractive for students to reside on campus.
Infratil’s original thesis when making this investment was that it would deliver solid inflation-protected cash earnings and provide opportunities to put additional capital to work, to reduce risk and to increase returns. This is occurring. It is also a showcase for a university partnering with long-term capital providers. ANU has been able to free up its balance sheet and progress developments such as Kambri. Students have benefited from having both the University and the private partners working to invest in better facilities. And the JV partners have been able to manage the facilities so as to reduce risk and capture the benefits of 100% occupancy.For the year to 31 March 2018 Infratil received income of NZ$14.4 million (NZ$7.0 million the previous year for an eight month holding period).The holding was revalued up to A$90.4 million from A$83.4 million. The independent valuer recognised the improved cash flows and market discount rates.
For
per
sona
l use
onl
y

47
ANU STUDENT ACCOMMODATION
INFRATIL’S INVESTMENT OBJECTIVES
Universities attract students on the basis of their academic faculties and their holistic impact. This can take the form of sporting or cultural activities which build bonds amongst the students, support programmes to help students transition into university life, and living conditions which build personal bonds and life skills.
The Australian National University is taking a proactive approach to make sure that its students are offered affordable, safe, and communal accommodation in halls or apartments. ANU is not alone.
However, while the University’s rationale is apparent, it requires a lot of capital. Infratil in partnership with the Commonwealth Superannuation Corporation acquired an economic interest in the student accommodation owned by ANU. It is a material investment in a sector where demand and the need for capital is growing.
50% INFRATIL50% COMMONWEALTH SUPERANNUATION CORPORATION
For
per
sona
l use
onl
y
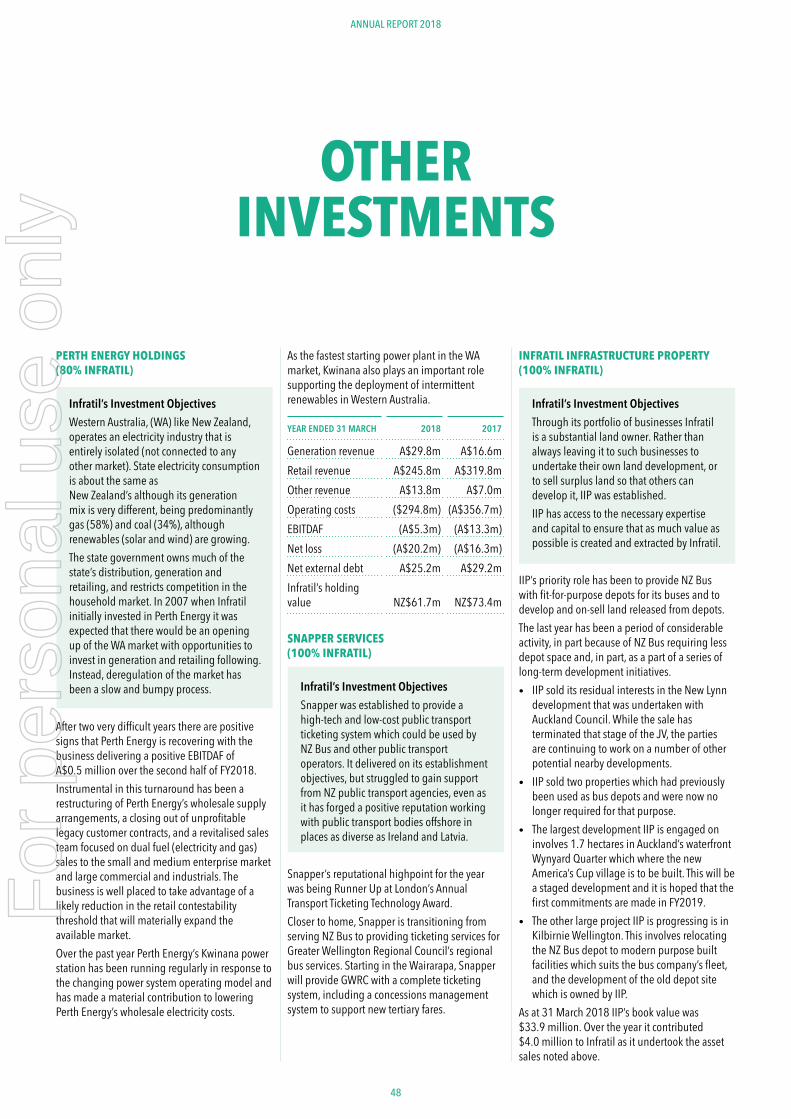
48
ANNUAL REPORT 2018
OTHER INVESTMENTS
PERTH ENERGY HOLDINGS(80% INFRATIL)
Infratil’s Investment ObjectivesWestern Australia, (WA) like New Zealand, operates an electricity industry that is entirely isolated (not connected to any other market). State electricity consumption is about the same as New Zealand’s although its generation mix is very different, being predominantly gas (58%) and coal (34%), although renewables (solar and wind) are growing.The state government owns much of the state’s distribution, generation and retailing, and restricts competition in the household market. In 2007 when Infratil initially invested in Perth Energy it was expected that there would be an opening up of the WA market with opportunities to invest in generation and retailing following. Instead, deregulation of the market has been a slow and bumpy process.
After two very difficult years there are positive signs that Perth Energy is recovering with the business delivering a positive EBITDAF of A$0.5 million over the second half of FY2018. Instrumental in this turnaround has been a restructuring of Perth Energy’s wholesale supply arrangements, a closing out of unprofitable legacy customer contracts, and a revitalised sales team focused on dual fuel (electricity and gas) sales to the small and medium enterprise market and large commercial and industrials. The business is well placed to take advantage of a likely reduction in the retail contestability threshold that will materially expand the available market.Over the past year Perth Energy’s Kwinana power station has been running regularly in response to the changing power system operating model and has made a material contribution to lowering Perth Energy’s wholesale electricity costs.
As the fastest starting power plant in the WA market, Kwinana also plays an important role supporting the deployment of intermittent renewables in Western Australia.
YEAR ENDED 31 MARCH 2018 2017
Generation revenue A$29.8m A$16.6mRetail revenue A$245.8m A$319.8mOther revenue A$13.8m A$7.0mOperating costs ($294.8m) (A$356.7m)EBITDAF (A$5.3m) (A$13.3m)Net loss (A$20.2m) (A$16.3m)Net external debt A$25.2m A$29.2m Infratil’s holding value NZ$61.7m NZ$73.4m
SNAPPER SERVICES (100% INFRATIL)
Infratil’s Investment ObjectivesSnapper was established to provide a high-tech and low-cost public transport ticketing system which could be used by NZ Bus and other public transport operators. It delivered on its establishment objectives, but struggled to gain support from NZ public transport agencies, even as it has forged a positive reputation working with public transport bodies offshore in places as diverse as Ireland and Latvia.
Snapper’s reputational highpoint for the year was being Runner Up at London’s Annual Transport Ticketing Technology Award.Closer to home, Snapper is transitioning from serving NZ Bus to providing ticketing services for Greater Wellington Regional Council’s regional bus services. Starting in the Wairarapa, Snapper will provide GWRC with a complete ticketing system, including a concessions management system to support new tertiary fares.
INFRATIL INFRASTRUCTURE PROPERTY (100% INFRATIL)
Infratil’s Investment ObjectivesThrough its portfolio of businesses Infratil is a substantial land owner. Rather than always leaving it to such businesses to undertake their own land development, or to sell surplus land so that others can develop it, IIP was established. IIP has access to the necessary expertise and capital to ensure that as much value as possible is created and extracted by Infratil.
IIP’s priority role has been to provide NZ Bus with fit-for-purpose depots for its buses and to develop and on-sell land released from depots.The last year has been a period of considerable activity, in part because of NZ Bus requiring less depot space and, in part, as a part of a series of long-term development initiatives.• IIP sold its residual interests in the New Lynn
development that was undertaken with Auckland Council. While the sale has terminated that stage of the JV, the parties are continuing to work on a number of other potential nearby developments.
• IIP sold two properties which had previously been used as bus depots and were now no longer required for that purpose.
• The largest development IIP is engaged on involves 1.7 hectares in Auckland’s waterfront Wynyard Quarter which where the new America’s Cup village is to be built. This will be a staged development and it is hoped that the first commitments are made in FY2019.
• The other large project IIP is progressing is in Kilbirnie Wellington. This involves relocating the NZ Bus depot to modern purpose built facilities which suits the bus company’s fleet, and the development of the old depot site which is owned by IIP.
As at 31 March 2018 IIP’s book value was $33.9 million. Over the year it contributed $4.0 million to Infratil as it undertook the asset sales noted above.
For
per
sona
l use
onl
y

49
OTHER INVESTMENTS
Perth EnergySnapper ServicesInfratil Infrastructure Property
For
per
sona
l use
onl
y
50
ANNUAL REPORT 2018
ENVISION VENTURES FUND (INFRATIL HAS COMMITTED US$25 MILLION WITH US$9.8 MILLION NOW DRAWN)
Infratil’s Investment ObjectivesTechnology changes the fortunes of businesses by reducing the cost of desirable but previously expensive services or products.Apple’s iPhone provided ubiquitous mobile access to the net and its extraordinary level of take up resulted in widespread disruption as it fundamentally changed the way many businesses communicate and interact with customers.Infratil is aware of potential technology changes which could impact its businesses. More electric vehicles will mean cheaper batteries, which will impact the economics of the electricity industry. Autonomous vehicles will change how people get around town and the demand for public transport and even car parks. Cheap sensors and data processing capability will change energy demand patterns.Historically Infratil sought to engage directly with technology with toe-in-the-water initiatives. But this gave more insights about how difficult it is for start-up businesses than about which technologies were about to succeed at delivering a low-cost solution to a previously expensive problem.To improve direct awareness of technology developments in a cost and time efficient way, Infratil has committed capital to a fund managed by California based Envision Ventures.
Infratil committed US$25 million to Envision Ventures to investment in technology activities with relevance to Infratil’s businesses. So far US$9.8 million has been committed to 10 companies. Investment sectors include transportation (electric vehicle charging), security (the “internet of things (IoT)”, cyber, real time data encryption), management of devices which connect via the IoT, and satellite communication and imaging.An example of the investments made by the Fund is ChargePoint; which provides electric vehicle charging stations. They have over 49,000 stations in North America and are seeking to expand in other hemispheres. ChargePoint has achieved this scale by being able to work with a wide range of partners. In New York and San Francisco they are working with the cities. In other locations they work with companies such as Apple and Google to provide charging stations for employee vehicles. They are also working with Uber on that company’s initiative to introduce flying electric taxis! There are a great many lessons available to Infratil from how ChargePoint has succeeded in this field. To date the valuation of the Fund’s portfolio is also positive. While the priority is to gain insights about technology changes relevant to Infratil and its businesses, it is naturally hoped that the investment also provides a good return.Infratil management actively engages with both Envision Ventures Fund management and people in the investee companies and Infratil’s businesses are also encouraged to develop relationships with the technology companies relevant to their own activities; both to raise awareness and to identify commercial opportunities.F
or p
erso
nal u
se o
nly

FINANCIAL STATEMENTS
For
per
sona
l use
onl
y
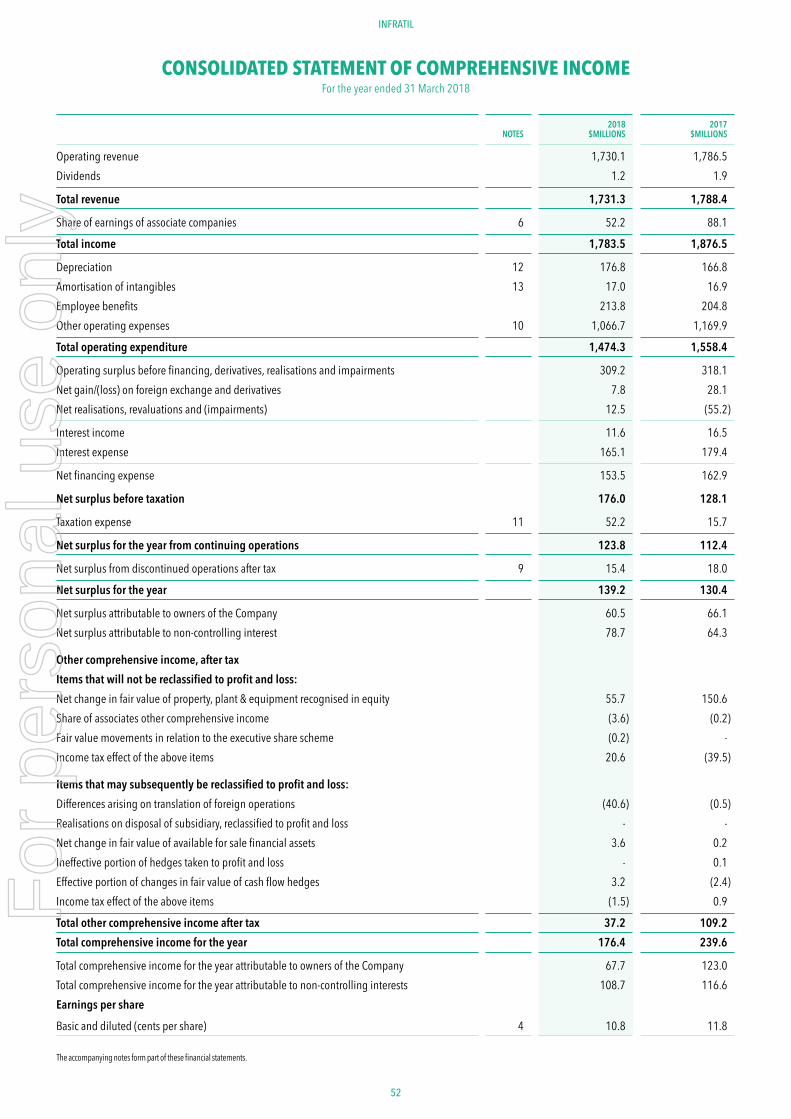
52 53
ANNUAL REPORT 2018INFRATIL
CONSOLIDATED STATEMENT OF COMPREHENSIVE INCOMEFor the year ended 31 March 2018
NOTES2018
$MILLIONS2017
$MILLIONS
Operating revenue 1,730.1 1,786.5 Dividends 1.2 1.9
Total revenue 1,731.3 1,788.4
Share of earnings of associate companies 6 52.2 88.1
Total income 1,783.5 1,876.5
Depreciation 12 176.8 166.8 Amortisation of intangibles 13 17.0 16.9 Employee benefits 213.8 204.8 Other operating expenses 10 1,066.7 1,169.9
Total operating expenditure 1,474.3 1,558.4
Operating surplus before financing, derivatives, realisations and impairments 309.2 318.1 Net gain/(loss) on foreign exchange and derivatives 7.8 28.1 Net realisations, revaluations and (impairments) 12.5 (55.2)
Interest income 11.6 16.5 Interest expense 165.1 179.4
Net financing expense 153.5 162.9
Net surplus before taxation 176.0 128.1
Taxation expense 11 52.2 15.7
Net surplus for the year from continuing operations 123.8 112.4
Net surplus from discontinued operations after tax 9 15.4 18.0
Net surplus for the year 139.2 130.4
Net surplus attributable to owners of the Company 60.5 66.1 Net surplus attributable to non-controlling interest 78.7 64.3
Other comprehensive income, after taxItems that will not be reclassified to profit and loss:Net change in fair value of property, plant & equipment recognised in equity 55.7 150.6 Share of associates other comprehensive income (3.6) (0.2)Fair value movements in relation to the executive share scheme (0.2) - Income tax effect of the above items 20.6 (39.5)
Items that may subsequently be reclassified to profit and loss:Differences arising on translation of foreign operations (40.6) (0.5)Realisations on disposal of subsidiary, reclassified to profit and loss - - Net change in fair value of available for sale financial assets 3.6 0.2 Ineffective portion of hedges taken to profit and loss - 0.1 Effective portion of changes in fair value of cash flow hedges 3.2 (2.4)Income tax effect of the above items (1.5) 0.9
Total other comprehensive income after tax 37.2 109.2 Total comprehensive income for the year 176.4 239.6
Total comprehensive income for the year attributable to owners of the Company 67.7 123.0 Total comprehensive income for the year attributable to non-controlling interests 108.7 116.6 Earnings per share
Basic and diluted (cents per share) 4 10.8 11.8
The accompanying notes form part of these financial statements.
For
per
sona
l use
onl
y
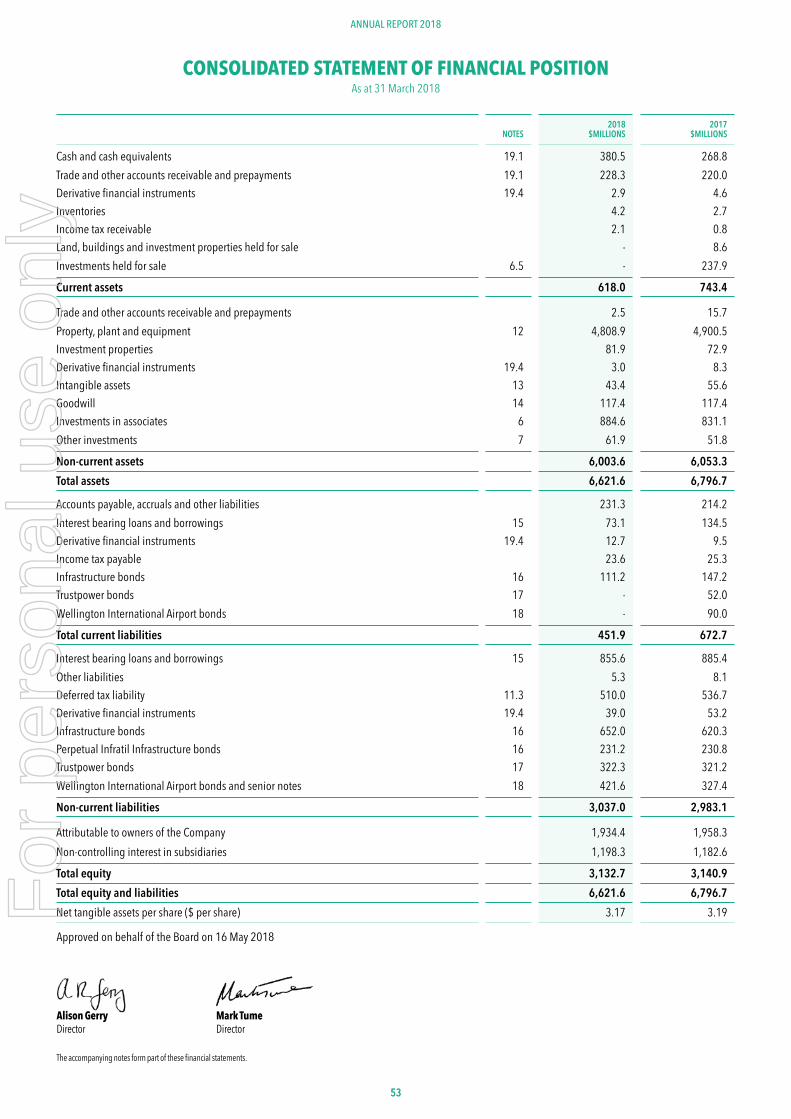
5353
ANNUAL REPORT 2018
CONSOLIDATED STATEMENT OF FINANCIAL POSITIONAs at 31 March 2018
NOTES2018
$MILLIONS2017
$MILLIONS
Cash and cash equivalents 19.1 380.5 268.8 Trade and other accounts receivable and prepayments 19.1 228.3 220.0 Derivative financial instruments 19.4 2.9 4.6 Inventories 4.2 2.7 Income tax receivable 2.1 0.8 Land, buildings and investment properties held for sale - 8.6 Investments held for sale 6.5 - 237.9
Current assets 618.0 743.4
Trade and other accounts receivable and prepayments 2.5 15.7 Property, plant and equipment 12 4,808.9 4,900.5 Investment properties 81.9 72.9 Derivative financial instruments 19.4 3.0 8.3 Intangible assets 13 43.4 55.6 Goodwill 14 117.4 117.4 Investments in associates 6 884.6 831.1 Other investments 7 61.9 51.8
Non-current assets 6,003.6 6,053.3 Total assets 6,621.6 6,796.7
Accounts payable, accruals and other liabilities 231.3 214.2 Interest bearing loans and borrowings 15 73.1 134.5 Derivative financial instruments 19.4 12.7 9.5 Income tax payable 23.6 25.3 Infrastructure bonds 16 111.2 147.2 Trustpower bonds 17 - 52.0 Wellington International Airport bonds 18 - 90.0
Total current liabilities 451.9 672.7
Interest bearing loans and borrowings 15 855.6 885.4 Other liabilities 5.3 8.1 Deferred tax liability 11.3 510.0 536.7 Derivative financial instruments 19.4 39.0 53.2 Infrastructure bonds 16 652.0 620.3 Perpetual Infratil Infrastructure bonds 16 231.2 230.8 Trustpower bonds 17 322.3 321.2 Wellington International Airport bonds and senior notes 18 421.6 327.4
Non-current liabilities 3,037.0 2,983.1
Attributable to owners of the Company 1,934.4 1,958.3 Non-controlling interest in subsidiaries 1,198.3 1,182.6
Total equity 3,132.7 3,140.9 Total equity and liabilities 6,621.6 6,796.7 Net tangible assets per share ($ per share) 3.17 3.19
Approved on behalf of the Board on 16 May 2018
Alison Gerry Mark Tume Director Director
The accompanying notes form part of these financial statements.
For
per
sona
l use
onl
y
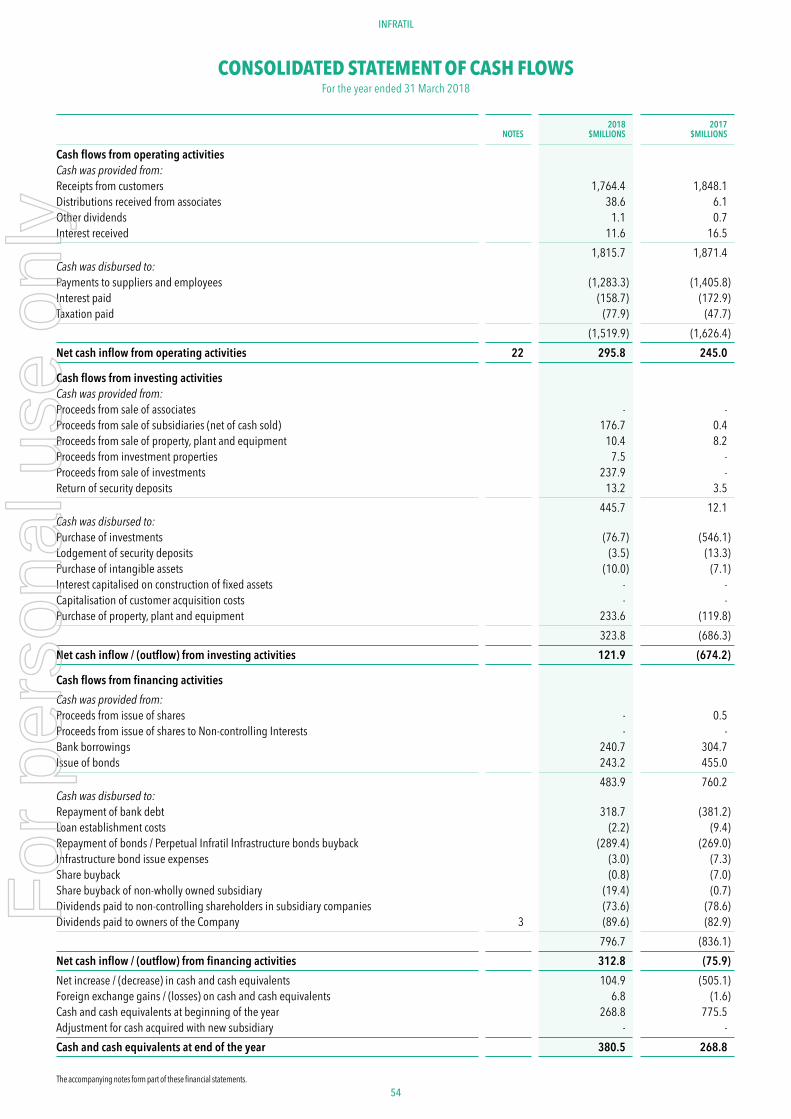
54 55
ANNUAL REPORT 2018INFRATIL
CONSOLIDATED STATEMENT OF CASH FLOWSFor the year ended 31 March 2018
NOTES2018
$MILLIONS2017
$MILLIONS
Cash flows from operating activitiesCash was provided from:Receipts from customers 1,764.4 1,848.1 Distributions received from associates 38.6 6.1 Other dividends 1.1 0.7 Interest received 11.6 16.5
1,815.7 1,871.4 Cash was disbursed to:Payments to suppliers and employees (1,283.3) (1,405.8)Interest paid (158.7) (172.9)Taxation paid (77.9) (47.7)
(1,519.9) (1,626.4)Net cash inflow from operating activities 22 295.8 245.0
Cash flows from investing activitiesCash was provided from:Proceeds from sale of associates - - Proceeds from sale of subsidiaries (net of cash sold) 176.7 0.4 Proceeds from sale of property, plant and equipment 10.4 8.2 Proceeds from investment properties 7.5 - Proceeds from sale of investments 237.9 - Return of security deposits 13.2 3.5
445.7 12.1 Cash was disbursed to:Purchase of investments (76.7) (546.1)Lodgement of security deposits (3.5) (13.3)Purchase of intangible assets (10.0) (7.1)Interest capitalised on construction of fixed assets - - Capitalisation of customer acquisition costs - - Purchase of property, plant and equipment 233.6 (119.8)
323.8 (686.3)Net cash inflow / (outflow) from investing activities 121.9 (674.2)
Cash flows from financing activitiesCash was provided from:Proceeds from issue of shares - 0.5 Proceeds from issue of shares to Non-controlling Interests - - Bank borrowings 240.7 304.7 Issue of bonds 243.2 455.0
483.9 760.2 Cash was disbursed to:Repayment of bank debt 318.7 (381.2)Loan establishment costs (2.2) (9.4)Repayment of bonds / Perpetual Infratil Infrastructure bonds buyback (289.4) (269.0)Infrastructure bond issue expenses (3.0) (7.3)Share buyback (0.8) (7.0)Share buyback of non-wholly owned subsidiary (19.4) (0.7)Dividends paid to non-controlling shareholders in subsidiary companies (73.6) (78.6)Dividends paid to owners of the Company 3 (89.6) (82.9)
796.7 (836.1)Net cash inflow / (outflow) from financing activities 312.8 (75.9)Net increase / (decrease) in cash and cash equivalents 104.9 (505.1)Foreign exchange gains / (losses) on cash and cash equivalents 6.8 (1.6)Cash and cash equivalents at beginning of the year 268.8 775.5 Adjustment for cash acquired with new subsidiary - - Cash and cash equivalents at end of the year 380.5 268.8
The accompanying notes form part of these financial statements.
For
per
sona
l use
onl
y
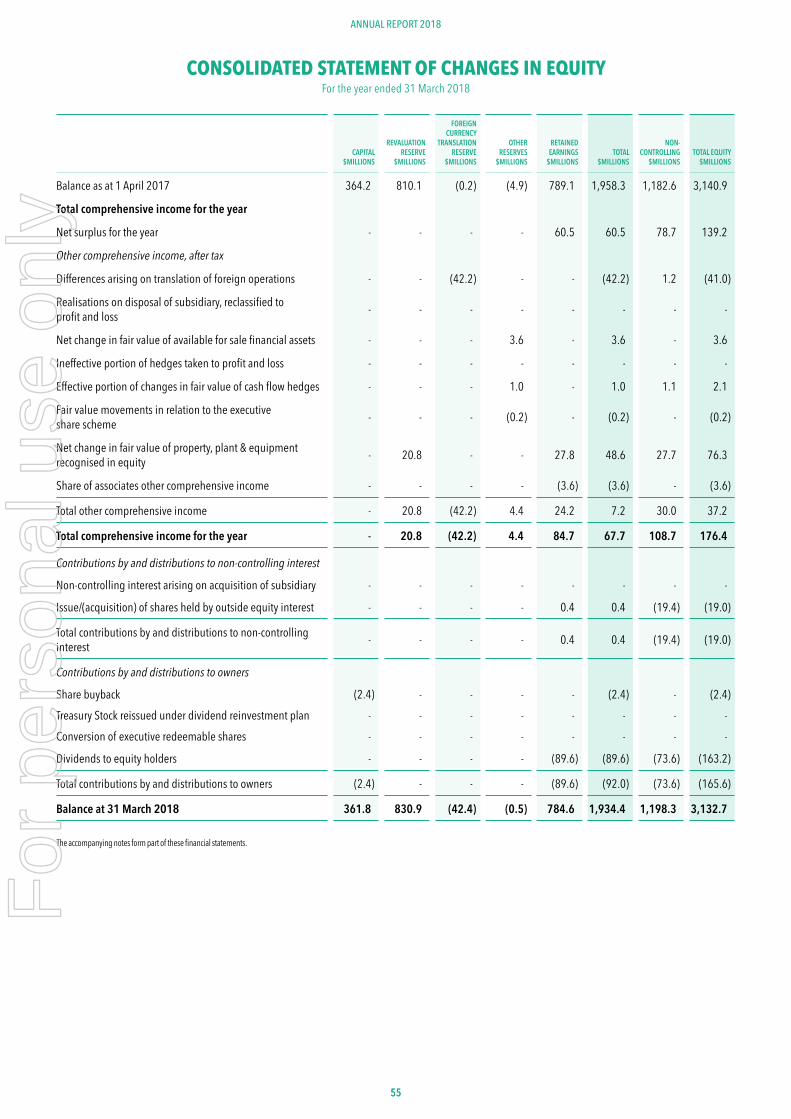
5555
ANNUAL REPORT 2018
CONSOLIDATED STATEMENT OF CHANGES IN EQUITYFor the year ended 31 March 2018
CAPITAL$MILLIONS
REVALUATION RESERVE
$MILLIONS
FOREIGN CURRENCY
TRANSLATION RESERVE
$MILLIONS
OTHER RESERVES
$MILLIONS
RETAINED EARNINGS
$MILLIONSTOTAL
$MILLIONS
NON-CONTROLLING
$MILLIONSTOTAL EQUITY
$MILLIONS
Balance as at 1 April 2017 364.2 810.1 (0.2) (4.9) 789.1 1,958.3 1,182.6 3,140.9
Total comprehensive income for the year
Net surplus for the year - - - - 60.5 60.5 78.7 139.2
Other comprehensive income, after tax
Differences arising on translation of foreign operations - - (42.2) - - (42.2) 1.2 (41.0)
Realisations on disposal of subsidiary, reclassified to profit and loss - - - - - - - -
Net change in fair value of available for sale financial assets - - - 3.6 - 3.6 - 3.6
Ineffective portion of hedges taken to profit and loss - - - - - - - -
Effective portion of changes in fair value of cash flow hedges - - - 1.0 - 1.0 1.1 2.1
Fair value movements in relation to the executive share scheme - - - (0.2) - (0.2) - (0.2)
Net change in fair value of property, plant & equipment recognised in equity - 20.8 - - 27.8 48.6 27.7 76.3
Share of associates other comprehensive income - - - - (3.6) (3.6) - (3.6)
Total other comprehensive income - 20.8 (42.2) 4.4 24.2 7.2 30.0 37.2
Total comprehensive income for the year - 20.8 (42.2) 4.4 84.7 67.7 108.7 176.4
Contributions by and distributions to non-controlling interest
Non-controlling interest arising on acquisition of subsidiary - - - - - - - -
Issue/(acquisition) of shares held by outside equity interest - - - - 0.4 0.4 (19.4) (19.0)
Total contributions by and distributions to non-controlling interest - - - - 0.4 0.4 (19.4) (19.0)
Contributions by and distributions to owners
Share buyback (2.4) - - - - (2.4) - (2.4)Treasury Stock reissued under dividend reinvestment plan - - - - - - - - Conversion of executive redeemable shares - - - - - - - -
Dividends to equity holders - - - - (89.6) (89.6) (73.6) (163.2)
Total contributions by and distributions to owners (2.4) - - - (89.6) (92.0) (73.6) (165.6)
Balance at 31 March 2018 361.8 830.9 (42.4) (0.5) 784.6 1,934.4 1,198.3 3,132.7
The accompanying notes form part of these financial statements.
For
per
sona
l use
onl
y
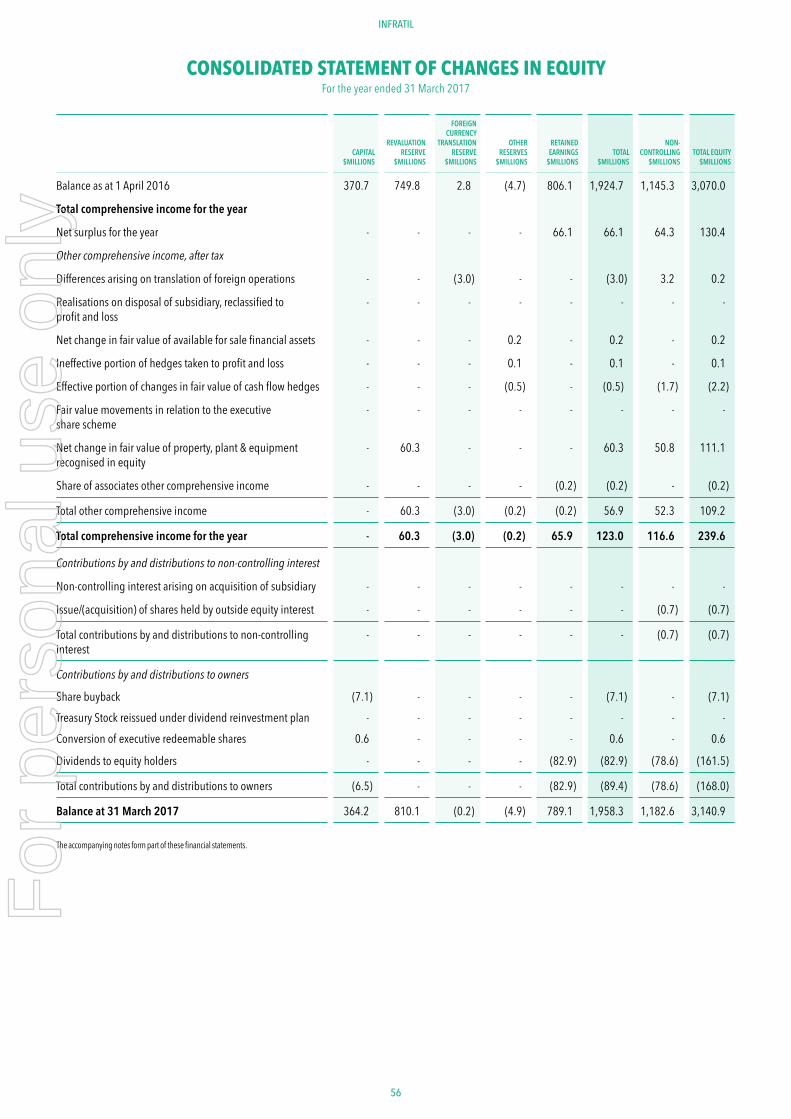
56 57
ANNUAL REPORT 2018INFRATIL
CONSOLIDATED STATEMENT OF CHANGES IN EQUITYFor the year ended 31 March 2017
CAPITAL$MILLIONS
REVALUATION RESERVE
$MILLIONS
FOREIGN CURRENCY
TRANSLATION RESERVE
$MILLIONS
OTHER RESERVES
$MILLIONS
RETAINED EARNINGS
$MILLIONSTOTAL
$MILLIONS
NON-CONTROLLING
$MILLIONSTOTAL EQUITY
$MILLIONS
Balance as at 1 April 2016 370.7 749.8 2.8 (4.7) 806.1 1,924.7 1,145.3 3,070.0
Total comprehensive income for the year
Net surplus for the year - - - - 66.1 66.1 64.3 130.4
Other comprehensive income, after tax
Differences arising on translation of foreign operations - - (3.0) - - (3.0) 3.2 0.2
Realisations on disposal of subsidiary, reclassified to profit and loss
- - - - - - - -
Net change in fair value of available for sale financial assets - - - 0.2 - 0.2 - 0.2
Ineffective portion of hedges taken to profit and loss - - - 0.1 - 0.1 - 0.1
Effective portion of changes in fair value of cash flow hedges - - - (0.5) - (0.5) (1.7) (2.2)
Fair value movements in relation to the executive share scheme
- - - - - - - -
Net change in fair value of property, plant & equipment recognised in equity
- 60.3 - - - 60.3 50.8 111.1
Share of associates other comprehensive income - - - - (0.2) (0.2) - (0.2)
Total other comprehensive income - 60.3 (3.0) (0.2) (0.2) 56.9 52.3 109.2
Total comprehensive income for the year - 60.3 (3.0) (0.2) 65.9 123.0 116.6 239.6
Contributions by and distributions to non-controlling interest
Non-controlling interest arising on acquisition of subsidiary - - - - - - - -
Issue/(acquisition) of shares held by outside equity interest - - - - - - (0.7) (0.7)
Total contributions by and distributions to non-controlling interest
- - - - - - (0.7) (0.7)
Contributions by and distributions to owners
Share buyback (7.1) - - - - (7.1) - (7.1)Treasury Stock reissued under dividend reinvestment plan - - - - - - - - Conversion of executive redeemable shares 0.6 - - - - 0.6 - 0.6
Dividends to equity holders - - - - (82.9) (82.9) (78.6) (161.5)
Total contributions by and distributions to owners (6.5) - - - (82.9) (89.4) (78.6) (168.0)
Balance at 31 March 2017 364.2 810.1 (0.2) (4.9) 789.1 1,958.3 1,182.6 3,140.9
The accompanying notes form part of these financial statements.
For
per
sona
l use
onl
y
5757
ANNUAL REPORT 2018
1. ACCOUNTING POLICIES(A) Reporting EntityInfratil Limited (‘the Company’) is a company domiciled in New Zealand and registered under the Companies Act 1993. The Company is listed on the NZX Main Board (‘NZX’) and Australian Securities Exchange (‘ASX’), and is an FMC Reporting Entity in terms of Part 7 of the Financial Markets Conduct Act 2013.
(B) Basis of preparationThe financial statements have been prepared in accordance with New Zealand Generally Accepted Accounting Practice (‘NZ GAAP’) and comply with New Zealand equivalents to International Financial Reporting Standards (‘NZ IFRS’) and other applicable financial reporting standards as appropriate for profit-oriented entities. The consolidated financial statements comprise the Company, its subsidiaries and associates (‘the Group’). The presentation currency used in the preparation of these financial statements is New Zealand dollars, which is also the Group’s functional currency, and is presented in $Millions unless otherwise stated. The principal accounting policies adopted in the preparation of these financial statements are set out below. These policies have been consistently applied to all the periods presented, unless otherwise stated. Comparative figures have been restated where appropriate to ensure consistency with the current period.
The financial statements comprise statements of the following: comprehensive income; financial position; changes in equity; cash flows; significant accounting policies; and the notes to those statements. The financial statements are prepared on the basis of historical cost, except certain property, plant and equipment which is valued in accordance with accounting policy (D), investment property valued in accordance with accounting policy (E), investments valued in accordance with accounting policy (G), and financial derivatives valued in accordance with accounting policy (K).
Accounting estimates and judgementsThe preparation of financial statements in conformity with NZ IFRS requires management to make estimates and assumptions that affect the reported amounts of assets and liabilities at the date of the financial statements and the reported amounts of revenues and expenses during the reporting period. Future outcomes could differ from those estimates. The principal areas of judgement in preparing these financial statements are set out below.
Valuation of property, plant and equipment and investment propertiesThe basis of valuation for the Group’s property, plant and equipment and investment properties is fair value by independent valuers, or cost. The basis of the valuations include assessment of the net present value of the future earnings of the assets, the depreciated replacement cost, and other market based information, in accordance with asset valuation standards. The major inputs and assumptions that are used in the valuations that require judgement include projections of future revenues, sales volumes, operational and capital expenditure profiles, capacity, life assumptions, terminal values for each asset, the application of discount rates and replacement values. The key inputs and assumptions are reassessed at each balance date between valuations to ensure there has been no significant change that may impact the valuation.
With respect to assets held at cost, judgements must be made about whether costs incurred relate to bringing an asset to its working condition for its intended use, and therefore are appropriate for capitalisation as part of the cost of the asset. The determination of the appropriate life for a particular asset requires judgements about, among other factors, the expected future economic benefits of the asset and the likelihood of
obsolescence. Assessing whether an asset is impaired involves estimating the future cash flows that the asset is expected to generate. This will, in turn, involve a number of assumptions, including rates of expected revenue growth or decline, expected future margins, terminal values and the selection of an appropriate discount rate for valuing future cash flows.
Valuation of investments including AssociatesInfratil completes an assessment of the carrying value of investments at least annually and considers objective evidence for impairment on each investment, taking into account observable data on the investment, the status or context of markets, its own view of fair value, and its long term investment intentions. Infratil notes the following matters which are specifically considered in terms of objective evidence of impairment of its investments, and whether there is a significant or prolonged decline from cost, which should be recorded as an impairment, and taken to profit and loss: any known loss events that have occurred since the initial recognition date of the investments, including its investment performance, its long term investment horizon, specific initiatives which reflect the strategic or influential nature of its existing investment position and internal valuations; and the state of markets. The assessment also requires judgements about the expected future performance and cash flows of the investment.
Accounting for income taxesPreparation of the financial statements requires estimates of the amount of tax that will ultimately be payable, the availability and recognition of losses to be carried forward and the amount of foreign tax credits that will be received.
GoodwillThe carrying value of goodwill is subject to an annual impairment test to ensure the carrying value does not exceed the recoverable amount at balance date. For the purpose of impairment testing, goodwill is allocated to the individual cash-generating units to which it relates. Any impairment losses are recognised in the statement of comprehensive income. In determining the recoverable amount of goodwill, fair value is assessed, including the use of valuation models to calculate the present value of expected future cash flows of the cash-generating units, and where available with reference to Listed prices. The major inputs and assumptions requiring judgement that are used in the models, include forecasts of sales volumes and revenues, future prices and costs, terminal values and discount rates.
DerivativesCertain derivatives are classified as financial assets or financial liabilities at fair value through profit or loss. The key assumptions and risk factors for these derivatives relate to energy price hedges and their valuation. Energy price hedges are valued with reference to financial models of future energy prices or market values for the relevant derivative. Accounting judgements have been made in determining hedge designation for the different types of derivatives employed by the Group to hedge risk exposures. Other derivatives including interest rate instruments and foreign exchange contracts are valued based on market information and prices.
RevenueJudgement is required to be exercised when determining estimated sales for unbilled revenues at balance date. Specifically, this involves estimates of consumption or sales to customers, turnover for turnover based rents and customer/passenger volumes.
Provision for doubtful debtsProvisions are maintained for estimated losses incurred from customers being unable to make required payments. These provisions take into account known commercial factors impacting specific customer accounts,
NOTES TO THE FINANCIAL STATEMENTSFor the year ended 31 March 2018
For
per
sona
l use
onl
y
58 59
ANNUAL REPORT 2018INFRATIL
as well as the overall profile of the debtor portfolio. In assessing the provision, factors such as past collection history, the age of receivable balances, the level of activity in customer accounts, as well as general macro-economic trends, are also taken into account.
(C) Basis of preparing consolidated financial statementsPrinciples of consolidationThe consolidated financial statements are prepared by combining the financial statements of all the entities that comprise the consolidated entity. A list of significant subsidiaries and associates is shown in Note 8. Consistent accounting policies are employed in the preparation and presentation of the Group financial statements.
(D) Property, plant and equipmentProperty, plant and equipment (‘PPE’) is recorded at cost less accumulated depreciation and accumulated impairment losses (or fair value on acquisition), or at valuation, with valuations undertaken on a systematic basis. No individual asset is included at a valuation undertaken more than five years previously. PPE that is revalued, is revalued to its fair value determined by an independent valuer or by the Directors with reference to independent experts, in accordance with NZ IAS 16 Property, Plant and Equipment. Where the assets are of a specialised nature and do not have observable market values in their existing use, depreciated replacement cost is used as the basis of the valuation. Depreciated replacement cost measures net current value as the most efficient, lowest cost which would replace existing assets and offer the same amount of utility in their present use. For non-specialised assets where there is no observable market an income based approach is used.
Land, buildings, leasehold improvements and civil works are measured at fair value or cost.
Renewable and Non-renewable Generation assets are shown at fair value, based on periodic valuations by independent external valuers or by Directors with reference to independent experts, less subsequent depreciation.
Depreciation is provided on a straight line basis and the major depreciation periods (in years) are:
Buildings and civil works 5-80
Vehicles, plant and equipment 3-20
Renewable generation 12-200
Non-renewable generation assets 30-40
Metering equipment 6-20
Land not depreciated
Capital work in progress not depreciated until asset in use
(E) Investment propertyInvestment property is property held to earn rental income. Investment property is measured at fair value with any change therein recognised in profit or loss. Property that is being constructed for future use as investment property is measured at fair value and classified as investment property.
(F) ReceivablesReceivables, classified as loans and receivables, are initially recognised at fair value and subsequently measured at amortised cost, less any provision for impairment. A provision for impairment is established when there is objective evidence that the Group will not be able to collect the amount due.
(G) InvestmentsShare investments held by the Group and classified as available-for-sale are stated at fair value, with any resulting gain or loss recognised directly in equity, except for impairment losses. When these investments are derecognised, the cumulative gain or loss previously recognised directly in equity is recognised in profit or loss. The fair value of shares are quoted bid price where there is a quoted market bid price, or cost if fair value cannot be reliably measured. Investments classified as available-for-sale are recognised/derecognised by the Group on the trade date. Equity instruments are deemed to be impaired when there is a significant or prolonged decline in fair value below the original purchase price or there is other objective evidence that the investment is impaired. Investments classified as Financial Assets at Fair Value Through Profit or Loss, are stated at fair value, with any resulting gain or loss recognised in profit or loss.
(H) Other intangible assetsIntangible customer base assetsCosts incurred in acquiring customers are recorded based on the directly attributable costs of obtaining the customer contract and are amortised on a straight line basis over the period of the expected benefit. This period has been assessed as between 12 years and 20 years depending on the nature of the customer and term of the contract. The carrying value is reviewed for any indication of impairment on an annual basis and adjusted where it is considered necessary.
Computer softwareAcquired computer software licenses are capitalised on the basis of the costs incurred to acquire and bring to use the specific software. These costs are amortised over three years on a straight line basis except for major pieces of billing system software which are amortised over no more than seven years on a straight line basis.
(I) Non-current assets and disposal groups held for saleNon-current assets and disposal groups classified as held for sale are measured at the lower of carrying amount or fair value less costs to sell. Non-current assets and disposal groups are classified as held for sale if their carrying amount will be recovered through a sale transaction rather than through continuing use. This condition is regarded as met only when the sale is highly probable and the asset (or disposal group) is available for immediate sale in its present condition and the sale of the asset (or disposal group) is expected to be completed within one year from the date of classification.
(J) TaxationIncome tax comprises both current and deferred tax. Current tax is the expected tax payable on the taxable income for the year, using tax rates enacted or substantively enacted at the balance date, and any adjustment to tax payable in respect of previous years. Deferred tax is recognised in respect of the differences between the carrying amounts of assets and liabilities for financial reporting purposes and the carrying amounts used for taxation purposes.
The amount of deferred tax provided is based on the expected manner of realisation or settlement of the carrying amount of assets and liabilities, using tax rates enacted or substantively enacted at the balance sheet date. A deferred tax asset is recognised only to the extent that it is probable that future taxable profits will be available against which the asset can be utilised, or there are deferred tax liabilities to offset it.
(K) Derivative financial instrumentsWhen appropriate, the Group enters into agreements to manage its interest rate, foreign exchange, operating and investment risks.
In accordance with the Group’s risk management policies, the Group does not hold or issue derivative financial instruments for speculative purposes.
For
per
sona
l use
onl
y
5959
ANNUAL REPORT 2018
However, certain derivatives do not qualify for hedge accounting and are required to be accounted for at fair value through profit or loss. Derivative financial instruments are recognised initially at fair value at the date they are entered into. Subsequent to initial recognition, derivative financial instruments are stated at fair value at each balance sheet date. The resulting gain or loss is recognised in the profit or loss immediately unless the derivative is designated effective as a hedging instrument, in which event, recognition of any resultant gain or loss depends on the nature of the hedging relationship. The Group identifies certain derivatives as hedges of highly probable forecast transactions to the extent the hedge meets the hedge designation tests.
Hedge accountingThe Group designates certain hedging instruments as either cash flow hedges or hedges of net investments in equity. At the inception of the hedge relationship the Group documents the relationship between the hedging instrument and hedged item, along with its risk management objectives and its strategy for undertaking various hedge transactions. Furthermore, at the inception of the hedge and on an on-going basis, the Group documents whether the hedging instrument that is used in the hedging relationship is highly effective in offsetting changes in fair values or cash flows of the hedged item.
The effective portion of changes in the fair value of derivatives that are designated and qualify as cash flow hedges are recognised in other comprehensive income and presented in equity. The gain or loss relating to the ineffective portion is recognised in profit or loss. Amounts presented in equity are recognised in profit or loss in the periods when the hedged item is recognised in profit or loss.
Hedge accounting is discontinued when the Group revokes the hedging relationship, the hedging instrument expires or is sold, terminated, or exercised, or no longer qualifies for hedge accounting. Any cumulative gain or loss recognised in equity at that time remains in equity and is recognised when the forecast transaction is ultimately recognised in profit or loss. When a forecast transaction is no longer expected to occur, the cumulative gain or loss that was recognised in equity is recognised in profit or loss.
Foreign currency differences arising on the retranslation of a financial liability designated as a hedge of a net investment in a foreign operation are recognised directly in equity, in the foreign currency translation reserve, to the extent that the hedge is effective. To the extent that the hedge is ineffective, such differences are recognised in profit or loss. When the hedged net investment is disposed of, the cumulative amount in equity is transferred to profit or loss as an adjustment to the profit or loss on disposal.
(L) Foreign currency transactionsTransactions in foreign currencies are translated to the respective functional currencies of Group entities at exchange rates at the dates of the transactions. Monetary assets and liabilities denominated in foreign currencies at the reporting date are translated to the functional currency at the exchange rate at that date. The foreign currency gain or loss on monetary items is the difference between amortised cost in the functional currency at the beginning of the period, adjusted for interest and payments during the period, and the amortised cost in foreign currency translated at the exchange rate at the end of the period. Non-monetary assets and liabilities denominated in foreign currencies that are measured at fair value are translated to the functional currency at the exchange rate at the date that the fair value was determined. Foreign currency differences arising on translation are recognised in profit or loss, except for differences arising on the translation of the net investment in a foreign operation.
Foreign operations The assets and liabilities of foreign operations including goodwill and fair value adjustments arising on acquisition, are translated to New Zealand dollars at exchange rates at the reporting date. The income and expenses of foreign operations are translated to New Zealand dollars at the average rate for the reporting period.
(M) Impairment of assetsAt each reporting date, the Group reviews the carrying amounts of its assets to determine whether there is any indication that those assets have suffered an impairment loss. If any such indication exists, the recoverable amount of the asset is estimated in order to determine the extent of the impairment loss (if any). Where the asset does not generate cash flows that are independent from other assets, the Group estimates the recoverable amount of the cash-generating unit to which the asset belongs. Goodwill, intangible assets with indefinite useful lives and intangible assets not yet available for use are tested for impairment annually and whenever there is an indication that the asset may be impaired.
(N) Revenue recognitionRevenue comprises the fair value of consideration received or receivable for the sale of goods or services in the ordinary course of the Group’s activities.
Interest revenues are recognised as accrued, taking into account the effective yield of the financial asset. Revenue from services is recognised in the profit or loss over the period of service. Dividend income is recognised when the right to receive the payment is established.
(O) BorrowingsBorrowings are recorded initially at fair value, net of transaction costs. Subsequent to initial recognition, borrowings are measured at amortised cost with any difference between the initial recognised amount and the redemption value being recognised in profit or loss over the period of the borrowing using the effective interest rate. Bond and bank debt issue expenses, fees and other costs incurred in arranging finance are capitalised and amortised over the term of the relevant debt instrument or debt facility.
(P) Discontinued operationsClassification as a discontinued operation occurs on disposal, or when the operation meets the criteria to be classified as a non-current asset or disposal group held for sale (see note (I)), if earlier. When an operation is classified as a discontinued operation, the comparative statement of comprehensive income is re-presented as if the operation had been discontinued from the start of the comparative year.
(Q) Segment reportingAn operating segment is a component of the Group that engages in business activities from which it may earn revenues and incur expenses, including revenues and expenses that relate to transactions with any of the Group’s other components. All operating segments’ operating results are reviewed regularly by the Group’s Board of Directors to make decisions about resources to be allocated to the segment and assess its performance, and for which discrete financial information is available.
The Group is organised into seven main business segments, Trustpower, Tilt Renewables, Wellington International Airport, NZ Bus, Perth Energy, Associate Companies and Other. Other comprises investment activity not included in the specific categories.
(R) Adoption status of relevant new financial reporting standards and interpretations
The following new standards, amendments to standards and interpretations are issued but not yet effective and have not been applied in preparation of these consolidated financial statements.
For
per
sona
l use
onl
y
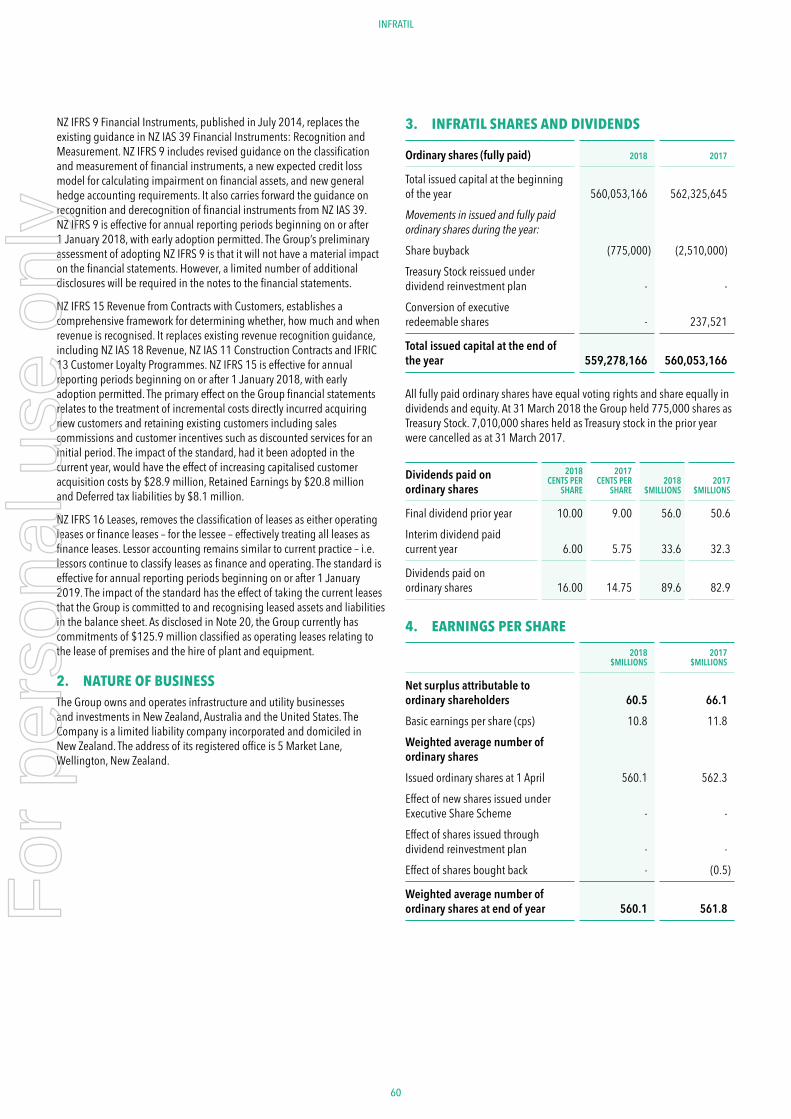
60 61
ANNUAL REPORT 2018INFRATIL
NZ IFRS 9 Financial Instruments, published in July 2014, replaces the existing guidance in NZ IAS 39 Financial Instruments: Recognition and Measurement. NZ IFRS 9 includes revised guidance on the classification and measurement of financial instruments, a new expected credit loss model for calculating impairment on financial assets, and new general hedge accounting requirements. It also carries forward the guidance on recognition and derecognition of financial instruments from NZ IAS 39. NZ IFRS 9 is effective for annual reporting periods beginning on or after 1 January 2018, with early adoption permitted. The Group’s preliminary assessment of adopting NZ IFRS 9 is that it will not have a material impact on the financial statements. However, a limited number of additional disclosures will be required in the notes to the financial statements.
NZ IFRS 15 Revenue from Contracts with Customers, establishes a comprehensive framework for determining whether, how much and when revenue is recognised. It replaces existing revenue recognition guidance, including NZ IAS 18 Revenue, NZ IAS 11 Construction Contracts and IFRIC 13 Customer Loyalty Programmes. NZ IFRS 15 is effective for annual reporting periods beginning on or after 1 January 2018, with early adoption permitted. The primary effect on the Group financial statements relates to the treatment of incremental costs directly incurred acquiring new customers and retaining existing customers including sales commissions and customer incentives such as discounted services for an initial period. The impact of the standard, had it been adopted in the current year, would have the effect of increasing capitalised customer acquisition costs by $28.9 million, Retained Earnings by $20.8 million and Deferred tax liabilities by $8.1 million.
NZ IFRS 16 Leases, removes the classification of leases as either operating leases or finance leases – for the lessee – effectively treating all leases as finance leases. Lessor accounting remains similar to current practice – i.e. lessors continue to classify leases as finance and operating. The standard is effective for annual reporting periods beginning on or after 1 January 2019. The impact of the standard has the effect of taking the current leases that the Group is committed to and recognising leased assets and liabilities in the balance sheet. As disclosed in Note 20, the Group currently has commitments of $125.9 million classified as operating leases relating to the lease of premises and the hire of plant and equipment.
2. NATURE OF BUSINESSThe Group owns and operates infrastructure and utility businesses and investments in New Zealand, Australia and the United States. The Company is a limited liability company incorporated and domiciled in New Zealand. The address of its registered office is 5 Market Lane, Wellington, New Zealand.
3. INFRATIL SHARES AND DIVIDENDS
Ordinary shares (fully paid) 2018 2017
Total issued capital at the beginning of the year 560,053,166 562,325,645Movements in issued and fully paid ordinary shares during the year:
Share buyback (775,000) (2,510,000) Treasury Stock reissued under dividend reinvestment plan - - Conversion of executive redeemable shares - 237,521
Total issued capital at the end of the year 559,278,166 560,053,166
All fully paid ordinary shares have equal voting rights and share equally in dividends and equity. At 31 March 2018 the Group held 775,000 shares as Treasury Stock. 7,010,000 shares held as Treasury stock in the prior year were cancelled as at 31 March 2017.
Dividends paid on ordinary shares
2018CENTS PER
SHARE
2017CENTS PER
SHARE2018
$MILLIONS2017
$MILLIONS
Final dividend prior year 10.00 9.00 56.0 50.6 Interim dividend paid current year 6.00 5.75 33.6 32.3
Dividends paid on ordinary shares 16.00 14.75 89.6 82.9
4. EARNINGS PER SHARE
2018$MILLIONS
2017$MILLIONS
Net surplus attributable to ordinary shareholders 60.5 66.1 Basic earnings per share (cps) 10.8 11.8 Weighted average number of ordinary sharesIssued ordinary shares at 1 April 560.1 562.3 Effect of new shares issued under Executive Share Scheme - - Effect of shares issued through dividend reinvestment plan - - Effect of shares bought back - (0.5)
Weighted average number of ordinary shares at end of year 560.1 561.8 F
or p
erso
nal u
se o
nly
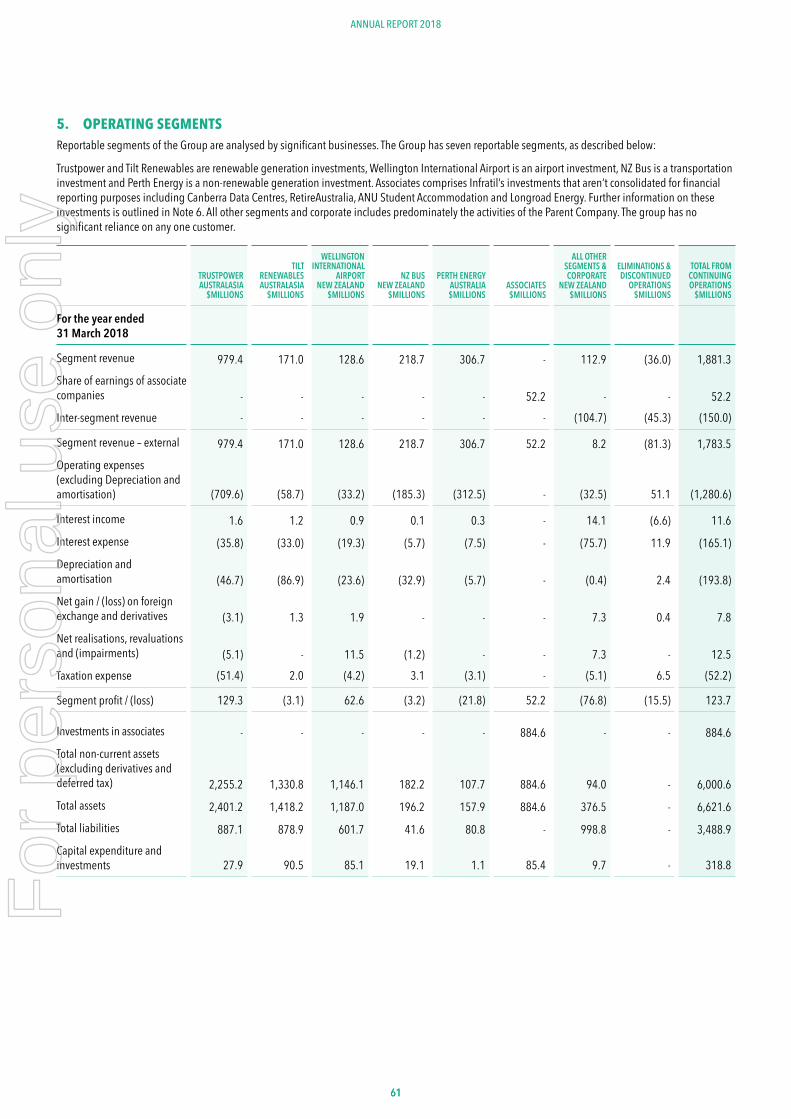
6161
ANNUAL REPORT 2018
5. OPERATING SEGMENTSReportable segments of the Group are analysed by significant businesses. The Group has seven reportable segments, as described below:
Trustpower and Tilt Renewables are renewable generation investments, Wellington International Airport is an airport investment, NZ Bus is a transportation investment and Perth Energy is a non-renewable generation investment. Associates comprises Infratil’s investments that aren’t consolidated for financial reporting purposes including Canberra Data Centres, RetireAustralia, ANU Student Accommodation and Longroad Energy. Further information on these investments is outlined in Note 6. All other segments and corporate includes predominately the activities of the Parent Company. The group has no significant reliance on any one customer.
TRUSTPOWER AUSTRALASIA
$MILLIONS
TILT RENEWABLES AUSTRALASIA
$MILLIONS
WELLINGTON INTERNATIONAL
AIRPORTNEW ZEALAND
$MILLIONS
NZ BUS NEW ZEALAND
$MILLIONS
PERTH ENERGYAUSTRALIA$MILLIONS
ASSOCIATES$MILLIONS
ALL OTHER SEGMENTS & CORPORATE
NEW ZEALAND$MILLIONS
ELIMINATIONS & DISCONTINUED
OPERATIONS$MILLIONS
TOTAL FROM CONTINUING OPERATIONS
$MILLIONS
For the year ended 31 March 2018
Segment revenue 979.4 171.0 128.6 218.7 306.7 - 112.9 (36.0) 1,881.3 Share of earnings of associate companies - - - - - 52.2 - - 52.2 Inter-segment revenue - - - - - - (104.7) (45.3) (150.0)
Segment revenue – external 979.4 171.0 128.6 218.7 306.7 52.2 8.2 (81.3) 1,783.5 Operating expenses (excluding Depreciation and amortisation) (709.6) (58.7) (33.2) (185.3) (312.5) - (32.5) 51.1 (1,280.6)
Interest income 1.6 1.2 0.9 0.1 0.3 - 14.1 (6.6) 11.6 Interest expense (35.8) (33.0) (19.3) (5.7) (7.5) - (75.7) 11.9 (165.1)Depreciation and amortisation (46.7) (86.9) (23.6) (32.9) (5.7) - (0.4) 2.4 (193.8)Net gain / (loss) on foreign exchange and derivatives (3.1) 1.3 1.9 - - - 7.3 0.4 7.8 Net realisations, revaluations and (impairments) (5.1) - 11.5 (1.2) - - 7.3 - 12.5 Taxation expense (51.4) 2.0 (4.2) 3.1 (3.1) - (5.1) 6.5 (52.2)
Segment profit / (loss) 129.3 (3.1) 62.6 (3.2) (21.8) 52.2 (76.8) (15.5) 123.7
Investments in associates - - - - - 884.6 - - 884.6 Total non-current assets (excluding derivatives and deferred tax) 2,255.2 1,330.8 1,146.1 182.2 107.7 884.6 94.0 - 6,000.6 Total assets 2,401.2 1,418.2 1,187.0 196.2 157.9 884.6 376.5 - 6,621.6 Total liabilities 887.1 878.9 601.7 41.6 80.8 - 998.8 - 3,488.9 Capital expenditure and investments 27.9 90.5 85.1 19.1 1.1 85.4 9.7 - 318.8
For
per
sona
l use
onl
y
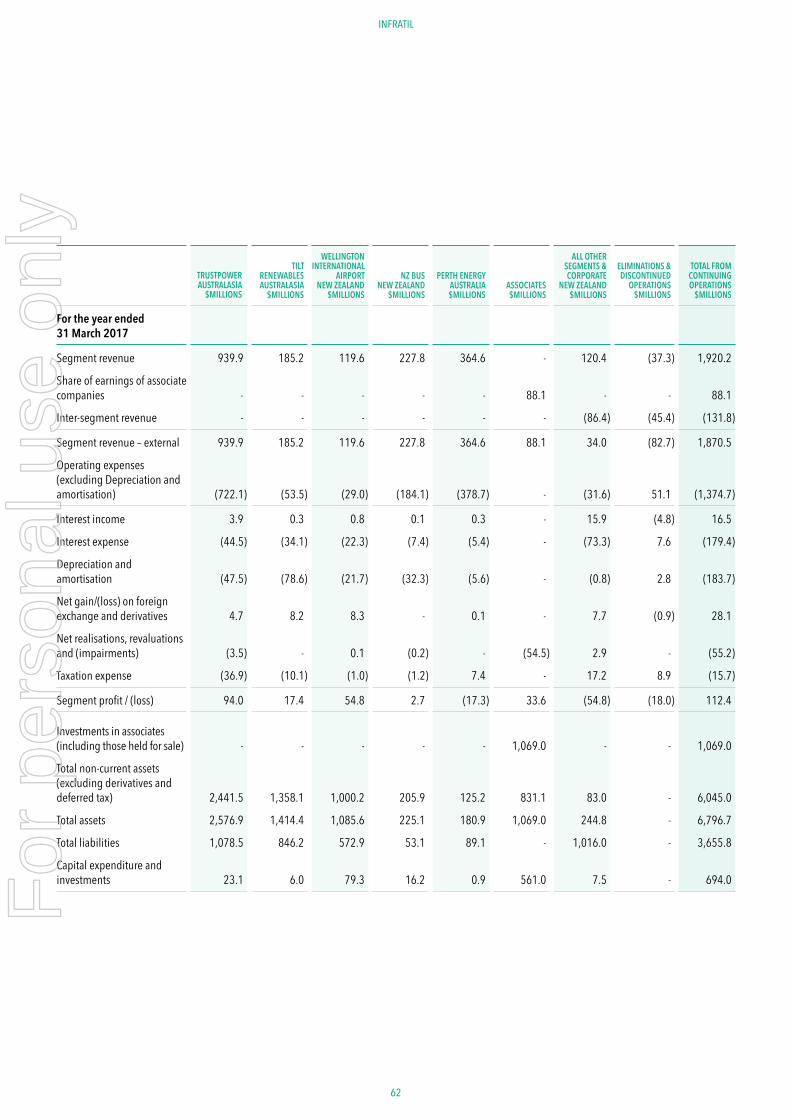
62 63
ANNUAL REPORT 2018INFRATIL
TILT RENEWABLES AUSTRALASIA
$MILLIONS
WELLINGTON INTERNATIONAL
AIRPORTNEW ZEALAND
$MILLIONS
NZ BUS NEW ZEALAND
$MILLIONS
PERTH ENERGYAUSTRALIA$MILLIONS
ASSOCIATES$MILLIONS
ALL OTHER SEGMENTS & CORPORATE
NEW ZEALAND$MILLIONS
ELIMINATIONS & DISCONTINUED
OPERATIONS$MILLIONS
TOTAL FROM CONTINUING OPERATIONS
$MILLIONS
For the year ended 31 March 2017
Segment revenue 939.9 185.2 119.6 227.8 364.6 - 120.4 (37.3) 1,920.2
Share of earnings of associate companies - - - - - 88.1 - - 88.1
Inter-segment revenue - - - - - - (86.4) (45.4) (131.8)
Segment revenue – external 939.9 185.2 119.6 227.8 364.6 88.1 34.0 (82.7) 1,870.5
Operating expenses (excluding Depreciation and amortisation) (722.1) (53.5) (29.0) (184.1) (378.7) - (31.6) 51.1 (1,374.7)
Interest income 3.9 0.3 0.8 0.1 0.3 - 15.9 (4.8) 16.5
Interest expense (44.5) (34.1) (22.3) (7.4) (5.4) - (73.3) 7.6 (179.4)
Depreciation and amortisation (47.5) (78.6) (21.7) (32.3) (5.6) - (0.8) 2.8 (183.7)
Net gain/(loss) on foreign exchange and derivatives 4.7 8.2 8.3 - 0.1 - 7.7 (0.9) 28.1
Net realisations, revaluations and (impairments) (3.5) - 0.1 (0.2) - (54.5) 2.9 - (55.2)
Taxation expense (36.9) (10.1) (1.0) (1.2) 7.4 - 17.2 8.9 (15.7)
Segment profit / (loss) 94.0 17.4 54.8 2.7 (17.3) 33.6 (54.8) (18.0) 112.4
Investments in associates (including those held for sale) - - - - - 1,069.0 - - 1,069.0
Total non-current assets (excluding derivatives and deferred tax) 2,441.5 1,358.1 1,000.2 205.9 125.2 831.1 83.0 - 6,045.0
Total assets 2,576.9 1,414.4 1,085.6 225.1 180.9 1,069.0 244.8 - 6,796.7
Total liabilities 1,078.5 846.2 572.9 53.1 89.1 - 1,016.0 - 3,655.8
Capital expenditure and investments 23.1 6.0 79.3 16.2 0.9 561.0 7.5 - 694.0
TRUSTPOWER AUSTRALASIA
$MILLIONS
For
per
sona
l use
onl
y

6363
ANNUAL REPORT 2018
Entity wide disclosure – geographicalThe Group operates in two principal areas, New Zealand and Australia, as well as having certain investments in the United States. The Group’s geographical segments are based on the location of both customers and assets.
NEW ZEALAND$MILLIONS
AUSTRALIA$MILLIONS
UNITED STATES$MILLIONS
ELIMINATIONS & DISCONTINUED
OPERATIONS$MILLIONS
TOTAL FROM CONTINUING OPERATIONS
$MILLIONS
For the year ended 31 March 2018
Segment revenue 1,446.3 471.0 - (36.0) 1,881.3 Share of earnings of associate companies - 66.0 (13.8) - 52.2 Inter-segment revenue (104.7) - - (45.3) (150.0)
Segment revenue – external 1,341.6 537.0 (13.8) (81.3) 1,783.5 Operating expenses (excluding Depreciation and amortisation) (1,015.7) (316.0) - 51.1 (1,280.6)
Interest income 16.5 1.7 - (6.6) 11.6 Interest expense (139.2) (37.8) - 11.9 (165.1)Depreciation and amortisation (125.6) (70.6) - 2.4 (193.8)Net gain/(loss) on foreign exchange and derivatives 5.1 2.3 - 0.4 7.8 Net realisations, revaluations and (impairments) 12.2 0.3 - - 12.5 Taxation expense (47.9) (10.8) - 6.5 (52.2)
Segment profit/(loss) 47.0 106.1 (13.8) (15.5) 123.8
Investments in associates 0.3 868.3 16.0 - 884.6 Total non-current assets (excluding derivatives and deferred tax) 3,721.2 2,251.0 28.4 - 6,000.6 Total assets 4,267.8 2,325.4 28.4 - 6,621.6 Total liabilities 2,654.5 834.4 - - 3,488.9 Capital expenditure and investments 143.8 144.4 30.6 - 318.8
For the year ended 31 March 2017
Segment revenue 1,417.4 540.1 - (37.3) 1,920.2 Share of earnings of associate companies 53.2 37.8 (2.9) - 88.1 Inter-segment revenue (86.4) - - (45.4) (131.8)
Segment revenue – external 1,384.2 577.9 (2.9) (82.7) 1,876.5 Operating expenses (excluding Depreciation and amortisation) (1,025.1) (400.7) - 51.1 (1,374.7)
Interest income 20.6 0.7 - (4.8) 16.5 Interest expense (148.1) (38.9) - 7.6 (179.4)Depreciation and amortisation (123.4) (63.1) - 2.8 (183.7)Net gain/(loss) on foreign exchange and derivatives 21.8 7.2 - (0.9) 28.1 Net realisations, revaluations and (impairments) (55.2) - - - (55.2)Taxation expense (13.9) (10.7) - 8.9 (15.7)
Segment profit/(loss) 79.5 53.8 (2.9) (18.0) 112.4
Investments in associates (including those held for sale) 240.1 795.7 33.2 - 1,069.0 Total non-current assets (excluding derivatives and deferred tax) 3,848.3 2,153.8 42.9 - 6,045.0 Total assets 4,496.9 2,256.9 42.9 - 6,796.7 Total liabilities 2,780.0 875.8 - - 3,655.8 Capital expenditure and investments 128.0 529.8 36.2 - 694.0
For
per
sona
l use
onl
y
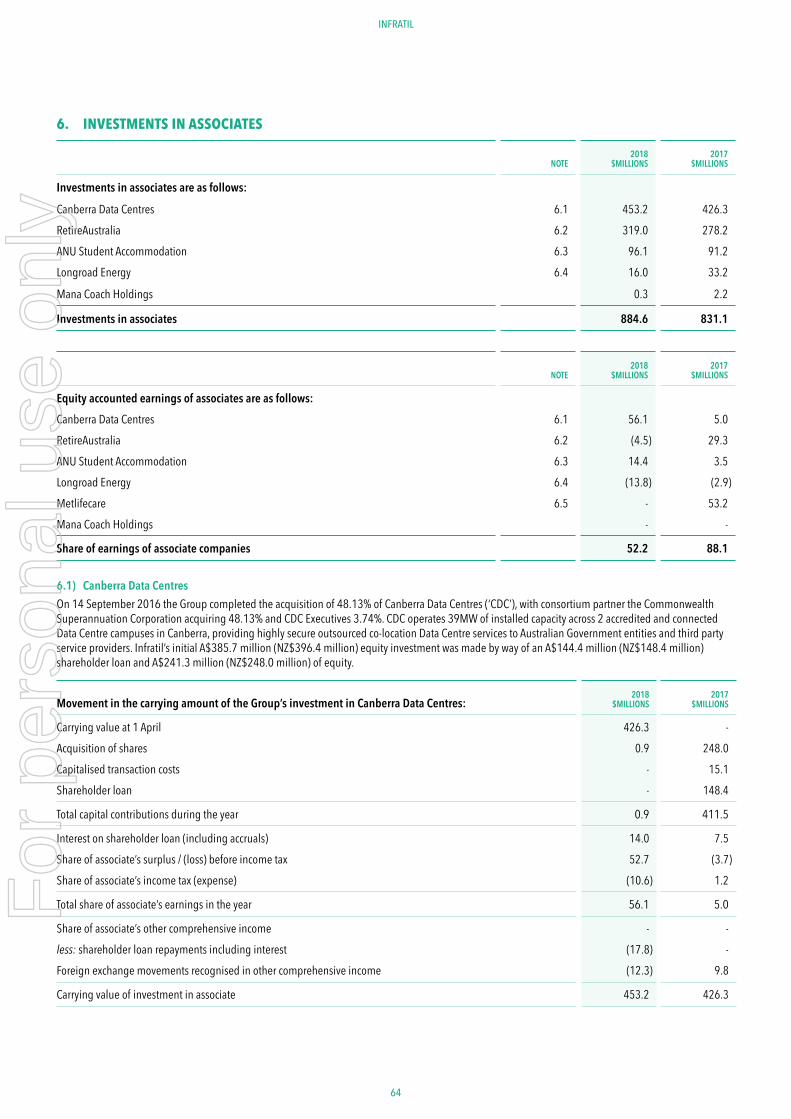
64 65
ANNUAL REPORT 2018INFRATIL
6. INVESTMENTS IN ASSOCIATES
NOTE2018
$MILLIONS2017
$MILLIONS
Investments in associates are as follows:
Canberra Data Centres 6.1 453.2 426.3RetireAustralia 6.2 319.0 278.2ANU Student Accommodation 6.3 96.1 91.2Longroad Energy 6.4 16.0 33.2
Mana Coach Holdings 0.3 2.2
Investments in associates 884.6 831.1
NOTE2018
$MILLIONS2017
$MILLIONS
Equity accounted earnings of associates are as follows:Canberra Data Centres 6.1 56.1 5.0RetireAustralia 6.2 (4.5) 29.3ANU Student Accommodation 6.3 14.4 3.5Longroad Energy 6.4 (13.8) (2.9)Metlifecare 6.5 - 53.2Mana Coach Holdings - -
Share of earnings of associate companies 52.2 88.1
6.1) Canberra Data CentresOn 14 September 2016 the Group completed the acquisition of 48.13% of Canberra Data Centres (‘CDC’), with consortium partner the Commonwealth Superannuation Corporation acquiring 48.13% and CDC Executives 3.74%. CDC operates 39MW of installed capacity across 2 accredited and connected Data Centre campuses in Canberra, providing highly secure outsourced co-location Data Centre services to Australian Government entities and third party service providers. Infratil’s initial A$385.7 million (NZ$396.4 million) equity investment was made by way of an A$144.4 million (NZ$148.4 million) shareholder loan and A$241.3 million (NZ$248.0 million) of equity.
Movement in the carrying amount of the Group’s investment in Canberra Data Centres:2018
$MILLIONS2017
$MILLIONS
Carrying value at 1 April 426.3 -Acquisition of shares 0.9 248.0 Capitalised transaction costs - 15.1 Shareholder loan - 148.4
Total capital contributions during the year 0.9 411.5
Interest on shareholder loan (including accruals) 14.0 7.5 Share of associate’s surplus / (loss) before income tax 52.7 (3.7)Share of associate’s income tax (expense) (10.6) 1.2
Total share of associate’s earnings in the year 56.1 5.0
Share of associate’s other comprehensive income - -less: shareholder loan repayments including interest (17.8) -Foreign exchange movements recognised in other comprehensive income (12.3) 9.8
Carrying value of investment in associate 453.2 426.3
For
per
sona
l use
onl
y
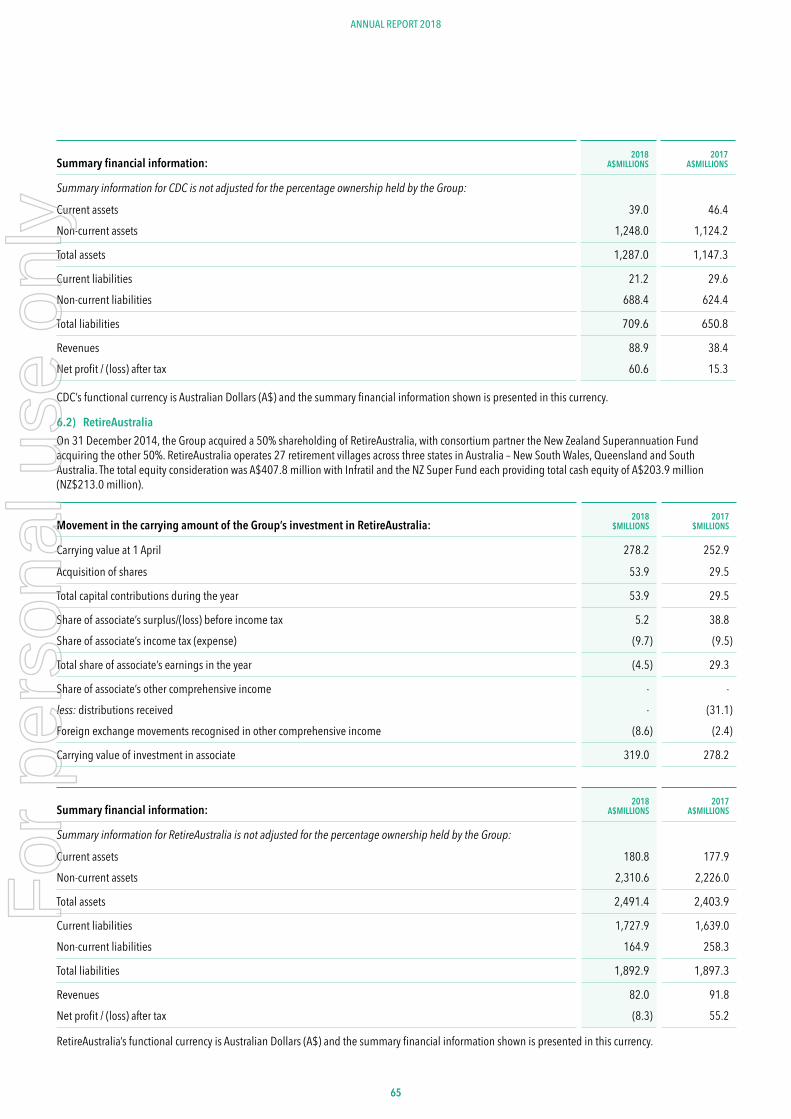
6565
ANNUAL REPORT 2018
Summary financial information:2018
A$MILLIONS2017
A$MILLIONS
Summary information for CDC is not adjusted for the percentage ownership held by the Group:
Current assets 39.0 46.4 Non-current assets 1,248.0 1,124.2
Total assets 1,287.0 1,147.3
Current liabilities 21.2 29.6 Non-current liabilities 688.4 624.4
Total liabilities 709.6 650.8
Revenues 88.9 38.4 Net profit / (loss) after tax 60.6 15.3
CDC’s functional currency is Australian Dollars (A$) and the summary financial information shown is presented in this currency.
6.2) RetireAustraliaOn 31 December 2014, the Group acquired a 50% shareholding of RetireAustralia, with consortium partner the New Zealand Superannuation Fund acquiring the other 50%. RetireAustralia operates 27 retirement villages across three states in Australia – New South Wales, Queensland and South Australia. The total equity consideration was A$407.8 million with Infratil and the NZ Super Fund each providing total cash equity of A$203.9 million (NZ$213.0 million).
Movement in the carrying amount of the Group’s investment in RetireAustralia:2018
$MILLIONS2017
$MILLIONS
Carrying value at 1 April 278.2 252.9
Acquisition of shares 53.9 29.5
Total capital contributions during the year 53.9 29.5
Share of associate’s surplus/(loss) before income tax 5.2 38.8 Share of associate’s income tax (expense) (9.7) (9.5)
Total share of associate’s earnings in the year (4.5) 29.3
Share of associate’s other comprehensive income - - less: distributions received - (31.1)Foreign exchange movements recognised in other comprehensive income (8.6) (2.4)
Carrying value of investment in associate 319.0 278.2
Summary financial information:2018
A$MILLIONS2017
A$MILLIONS
Summary information for RetireAustralia is not adjusted for the percentage ownership held by the Group:
Current assets 180.8 177.9 Non-current assets 2,310.6 2,226.0
Total assets 2,491.4 2,403.9
Current liabilities 1,727.9 1,639.0 Non-current liabilities 164.9 258.3
Total liabilities 1,892.9 1,897.3
Revenues 82.0 91.8 Net profit / (loss) after tax (8.3) 55.2
RetireAustralia’s functional currency is Australian Dollars (A$) and the summary financial information shown is presented in this currency.
For
per
sona
l use
onl
y
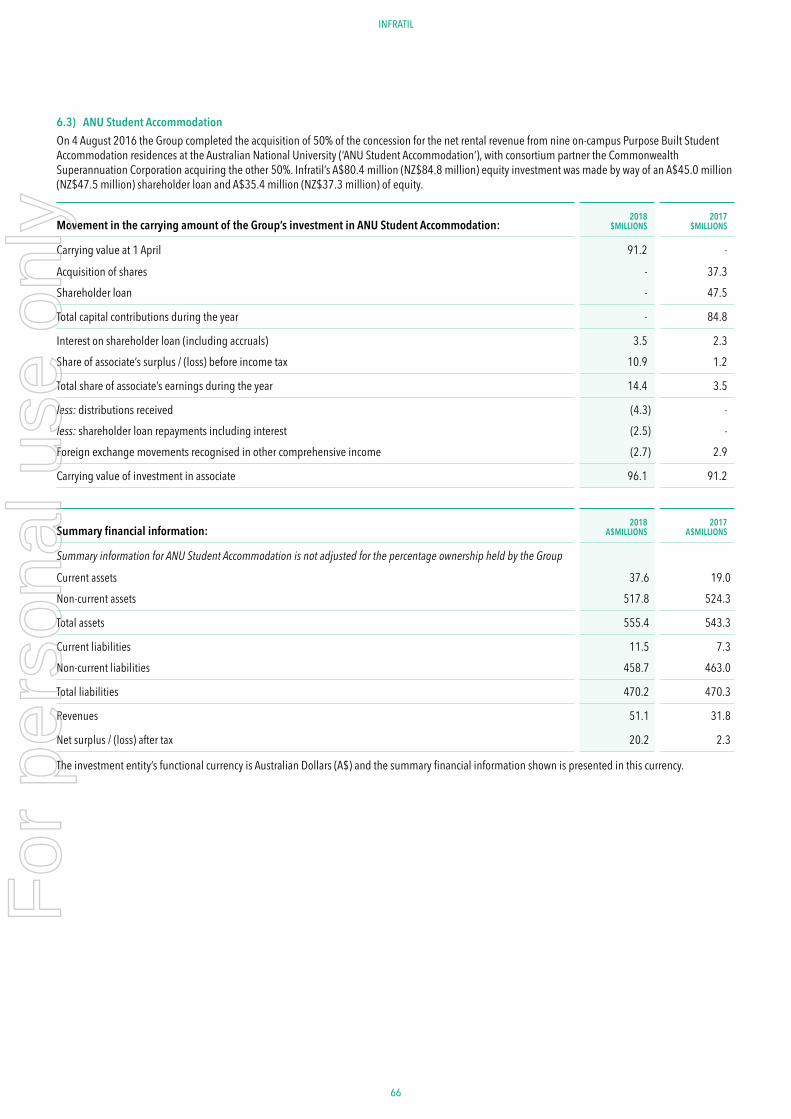
66 67
ANNUAL REPORT 2018INFRATIL
6.3) ANU Student AccommodationOn 4 August 2016 the Group completed the acquisition of 50% of the concession for the net rental revenue from nine on-campus Purpose Built Student Accommodation residences at the Australian National University (‘ANU Student Accommodation’), with consortium partner the Commonwealth Superannuation Corporation acquiring the other 50%. Infratil’s A$80.4 million (NZ$84.8 million) equity investment was made by way of an A$45.0 million (NZ$47.5 million) shareholder loan and A$35.4 million (NZ$37.3 million) of equity.
Movement in the carrying amount of the Group’s investment in ANU Student Accommodation:2018
$MILLIONS2017
$MILLIONS
Carrying value at 1 April 91.2 -
Acquisition of shares - 37.3 Shareholder loan - 47.5
Total capital contributions during the year - 84.8
Interest on shareholder loan (including accruals) 3.5 2.3 Share of associate’s surplus / (loss) before income tax 10.9 1.2
Total share of associate’s earnings during the year 14.4 3.5
less: distributions received (4.3) -less: shareholder loan repayments including interest (2.5) -Foreign exchange movements recognised in other comprehensive income (2.7) 2.9
Carrying value of investment in associate 96.1 91.2
Summary financial information:2018
A$MILLIONS2017
A$MILLIONS
Summary information for ANU Student Accommodation is not adjusted for the percentage ownership held by the Group
Current assets 37.6 19.0Non-current assets 517.8 524.3
Total assets 555.4 543.3
Current liabilities 11.5 7.3Non-current liabilities 458.7 463.0
Total liabilities 470.2 470.3
Revenues 51.1 31.8
Net surplus / (loss) after tax 20.2 2.3
The investment entity’s functional currency is Australian Dollars (A$) and the summary financial information shown is presented in this currency.
For
per
sona
l use
onl
y
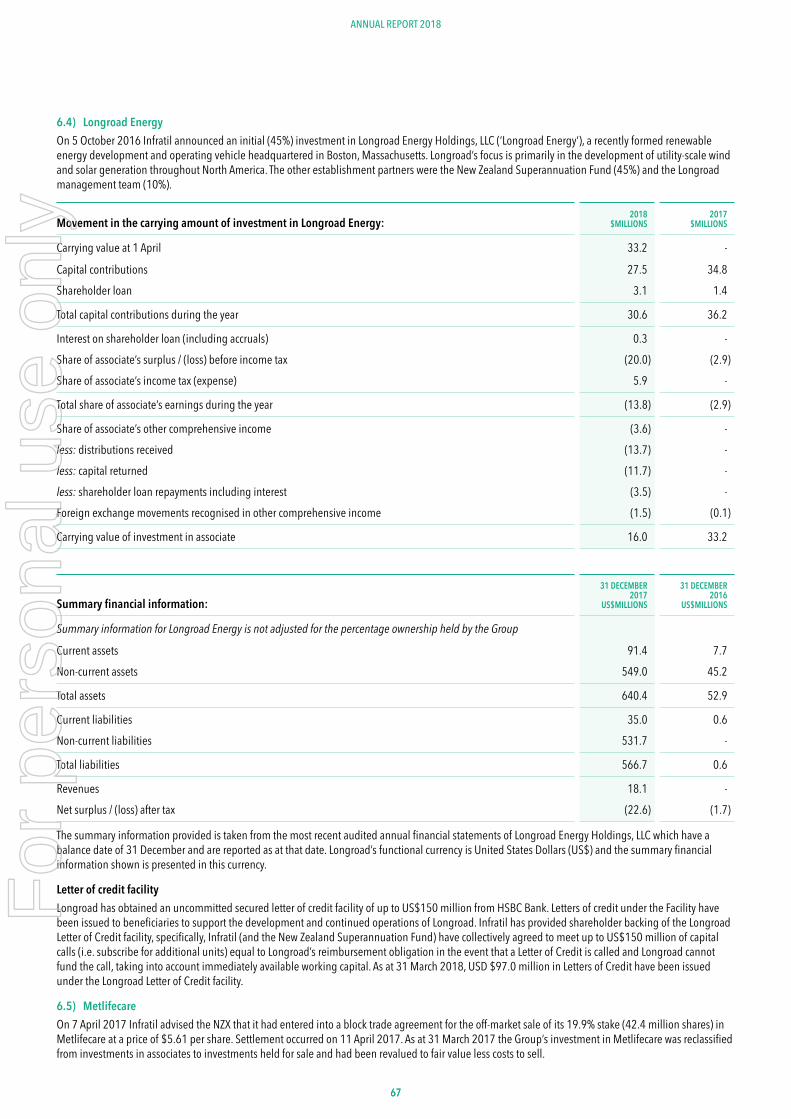
6767
ANNUAL REPORT 2018
6.4) Longroad EnergyOn 5 October 2016 Infratil announced an initial (45%) investment in Longroad Energy Holdings, LLC (‘Longroad Energy’), a recently formed renewable energy development and operating vehicle headquartered in Boston, Massachusetts. Longroad’s focus is primarily in the development of utility-scale wind and solar generation throughout North America. The other establishment partners were the New Zealand Superannuation Fund (45%) and the Longroad management team (10%).
Movement in the carrying amount of investment in Longroad Energy:2018
$MILLIONS2017
$MILLIONS
Carrying value at 1 April 33.2 -
Capital contributions 27.5 34.8 Shareholder loan 3.1 1.4
Total capital contributions during the year 30.6 36.2
Interest on shareholder loan (including accruals) 0.3 - Share of associate’s surplus / (loss) before income tax (20.0) (2.9)Share of associate’s income tax (expense) 5.9 -
Total share of associate’s earnings during the year (13.8) (2.9)
Share of associate’s other comprehensive income (3.6) - less: distributions received (13.7) - less: capital returned (11.7) - less: shareholder loan repayments including interest (3.5) - Foreign exchange movements recognised in other comprehensive income (1.5) (0.1)
Carrying value of investment in associate 16.0 33.2
Summary financial information:31 DECEMBER
2017US$MILLIONS
31 DECEMBER 2016
US$MILLIONS
Summary information for Longroad Energy is not adjusted for the percentage ownership held by the Group
Current assets 91.4 7.7 Non-current assets 549.0 45.2
Total assets 640.4 52.9
Current liabilities 35.0 0.6 Non-current liabilities 531.7 -
Total liabilities 566.7 0.6
Revenues 18.1 - Net surplus / (loss) after tax (22.6) (1.7)
The summary information provided is taken from the most recent audited annual financial statements of Longroad Energy Holdings, LLC which have a balance date of 31 December and are reported as at that date. Longroad’s functional currency is United States Dollars (US$) and the summary financial information shown is presented in this currency.
Letter of credit facilityLongroad has obtained an uncommitted secured letter of credit facility of up to US$150 million from HSBC Bank. Letters of credit under the Facility have been issued to beneficiaries to support the development and continued operations of Longroad. Infratil has provided shareholder backing of the Longroad Letter of Credit facility, specifically, Infratil (and the New Zealand Superannuation Fund) have collectively agreed to meet up to US$150 million of capital calls (i.e. subscribe for additional units) equal to Longroad’s reimbursement obligation in the event that a Letter of Credit is called and Longroad cannot fund the call, taking into account immediately available working capital. As at 31 March 2018, USD $97.0 million in Letters of Credit have been issued under the Longroad Letter of Credit facility.
6.5) MetlifecareOn 7 April 2017 Infratil advised the NZX that it had entered into a block trade agreement for the off-market sale of its 19.9% stake (42.4 million shares) in Metlifecare at a price of $5.61 per share. Settlement occurred on 11 April 2017. As at 31 March 2017 the Group’s investment in Metlifecare was reclassified from investments in associates to investments held for sale and had been revalued to fair value less costs to sell.
For
per
sona
l use
onl
y
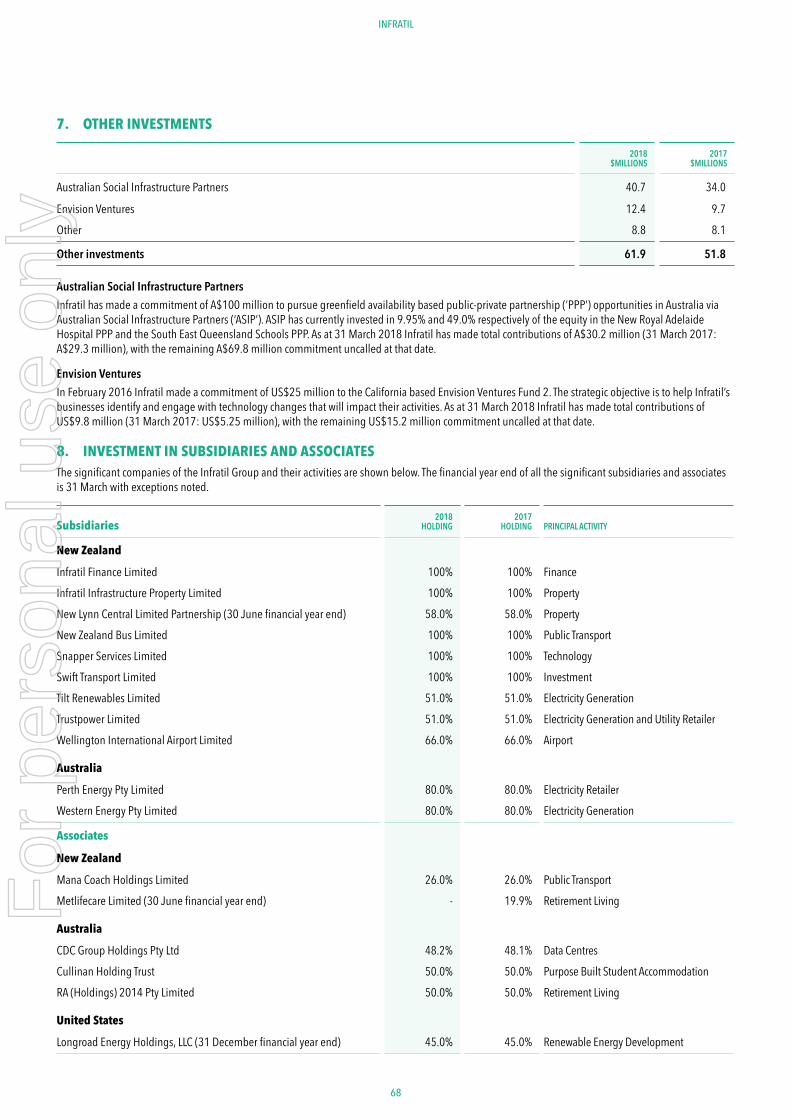
68 69
ANNUAL REPORT 2018INFRATIL
7. OTHER INVESTMENTS
2018$MILLIONS
2017$MILLIONS
Australian Social Infrastructure Partners 40.7 34.0
Envision Ventures 12.4 9.7 Other 8.8 8.1
Other investments 61.9 51.8
Australian Social Infrastructure PartnersInfratil has made a commitment of A$100 million to pursue greenfield availability based public-private partnership (‘PPP’) opportunities in Australia via Australian Social Infrastructure Partners (‘ASIP’). ASIP has currently invested in 9.95% and 49.0% respectively of the equity in the New Royal Adelaide Hospital PPP and the South East Queensland Schools PPP. As at 31 March 2018 Infratil has made total contributions of A$30.2 million (31 March 2017: A$29.3 million), with the remaining A$69.8 million commitment uncalled at that date.
Envision VenturesIn February 2016 Infratil made a commitment of US$25 million to the California based Envision Ventures Fund 2. The strategic objective is to help Infratil’s businesses identify and engage with technology changes that will impact their activities. As at 31 March 2018 Infratil has made total contributions of US$9.8 million (31 March 2017: US$5.25 million), with the remaining US$15.2 million commitment uncalled at that date.
8. INVESTMENT IN SUBSIDIARIES AND ASSOCIATES The significant companies of the Infratil Group and their activities are shown below. The financial year end of all the significant subsidiaries and associates is 31 March with exceptions noted.
Subsidiaries2018
HOLDING2017
HOLDING PRINCIPAL ACTIVITY
New Zealand
Infratil Finance Limited 100% 100% FinanceInfratil Infrastructure Property Limited 100% 100% PropertyNew Lynn Central Limited Partnership (30 June financial year end) 58.0% 58.0% PropertyNew Zealand Bus Limited 100% 100% Public TransportSnapper Services Limited 100% 100% TechnologySwift Transport Limited 100% 100% InvestmentTilt Renewables Limited 51.0% 51.0% Electricity GenerationTrustpower Limited 51.0% 51.0% Electricity Generation and Utility RetailerWellington International Airport Limited 66.0% 66.0% Airport
Australia
Perth Energy Pty Limited 80.0% 80.0% Electricity RetailerWestern Energy Pty Limited 80.0% 80.0% Electricity Generation
Associates
New Zealand
Mana Coach Holdings Limited 26.0% 26.0% Public TransportMetlifecare Limited (30 June financial year end) - 19.9% Retirement Living
Australia
CDC Group Holdings Pty Ltd 48.2% 48.1% Data CentresCullinan Holding Trust 50.0% 50.0% Purpose Built Student AccommodationRA (Holdings) 2014 Pty Limited 50.0% 50.0% Retirement Living
United States
Longroad Energy Holdings, LLC (31 December financial year end) 45.0% 45.0% Renewable Energy Development
For
per
sona
l use
onl
y
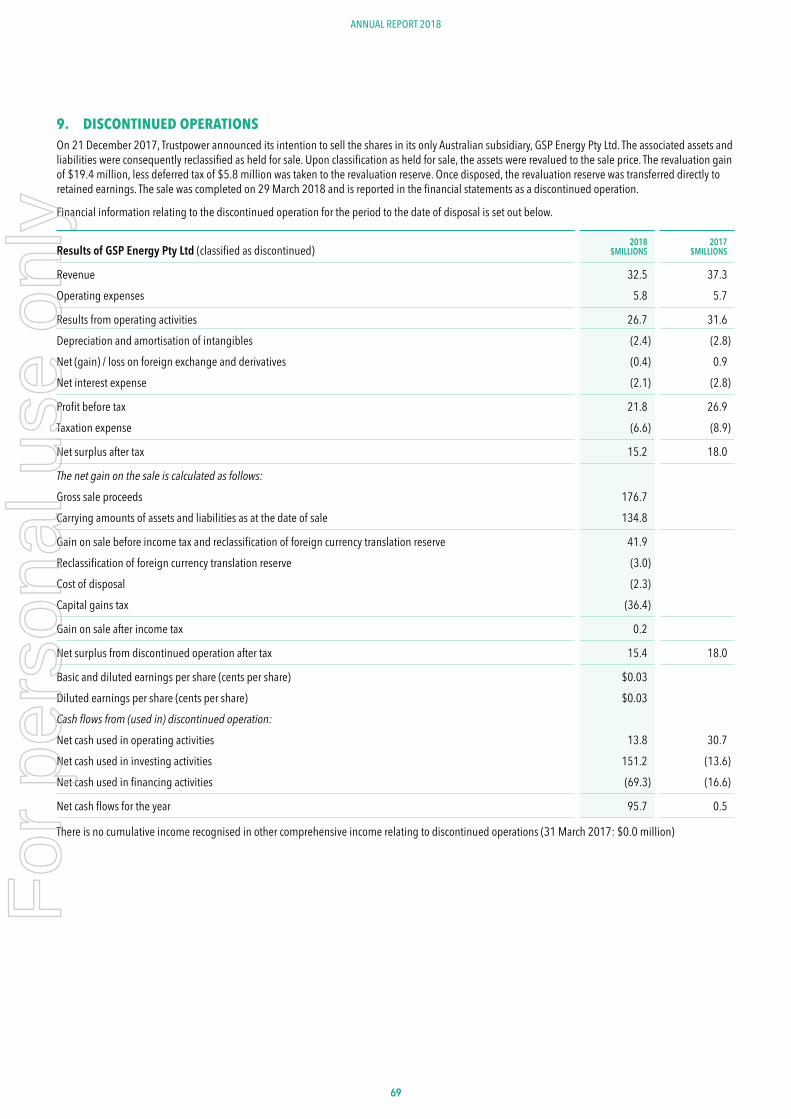
6969
ANNUAL REPORT 2018
9. DISCONTINUED OPERATIONSOn 21 December 2017, Trustpower announced its intention to sell the shares in its only Australian subsidiary, GSP Energy Pty Ltd. The associated assets and liabilities were consequently reclassified as held for sale. Upon classification as held for sale, the assets were revalued to the sale price. The revaluation gain of $19.4 million, less deferred tax of $5.8 million was taken to the revaluation reserve. Once disposed, the revaluation reserve was transferred directly to retained earnings. The sale was completed on 29 March 2018 and is reported in the financial statements as a discontinued operation.
Financial information relating to the discontinued operation for the period to the date of disposal is set out below.
Results of GSP Energy Pty Ltd (classified as discontinued)2018
$MILLIONS2017
$MILLIONS
Revenue 32.5 37.3 Operating expenses 5.8 5.7
Results from operating activities 26.7 31.6 Depreciation and amortisation of intangibles (2.4) (2.8)Net (gain) / loss on foreign exchange and derivatives (0.4) 0.9 Net interest expense (2.1) (2.8)
Profit before tax 21.8 26.9 Taxation expense (6.6) (8.9)
Net surplus after tax 15.2 18.0
The net gain on the sale is calculated as follows:
Gross sale proceeds 176.7 Carrying amounts of assets and liabilities as at the date of sale 134.8
Gain on sale before income tax and reclassification of foreign currency translation reserve 41.9 Reclassification of foreign currency translation reserve (3.0)Cost of disposal (2.3)Capital gains tax (36.4)
Gain on sale after income tax 0.2
Net surplus from discontinued operation after tax 15.4 18.0
Basic and diluted earnings per share (cents per share) $0.03 Diluted earnings per share (cents per share) $0.03 Cash flows from (used in) discontinued operation:
Net cash used in operating activities 13.8 30.7 Net cash used in investing activities 151.2 (13.6)Net cash used in financing activities (69.3) (16.6)
Net cash flows for the year 95.7 0.5
There is no cumulative income recognised in other comprehensive income relating to discontinued operations (31 March 2017: $0.0 million)
For
per
sona
l use
onl
y
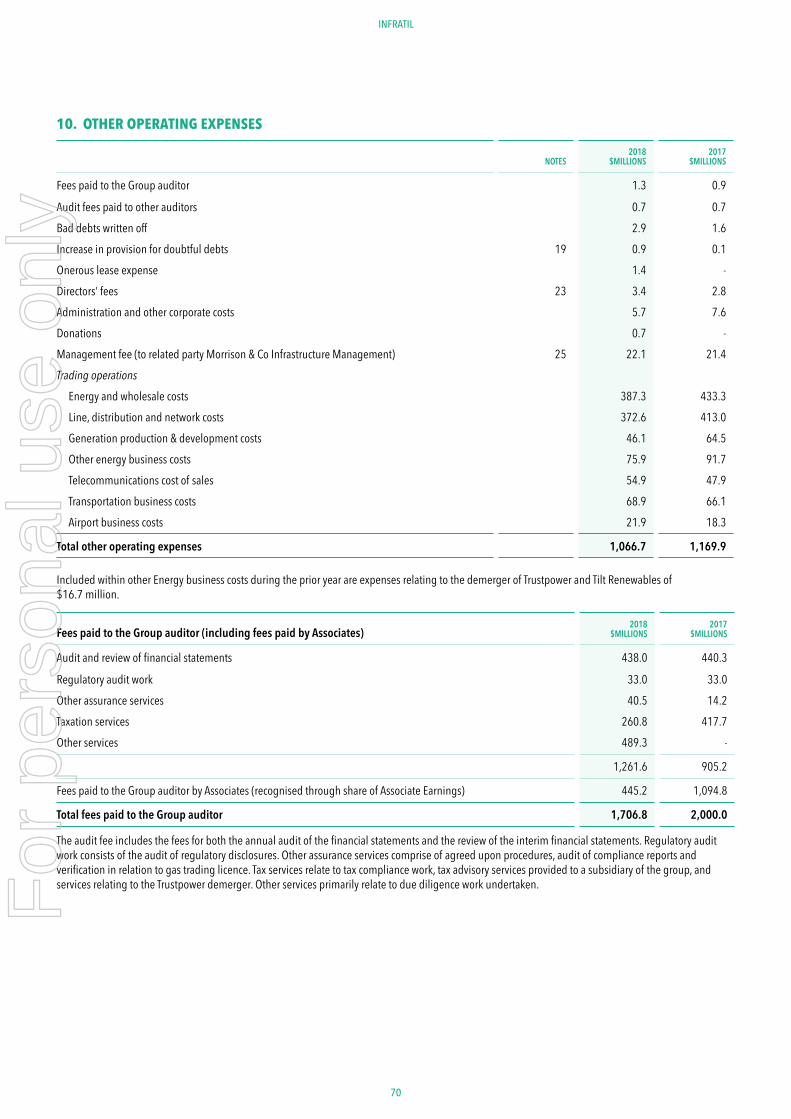
70 71
ANNUAL REPORT 2018INFRATIL
10. OTHER OPERATING EXPENSES
NOTES 2018
$MILLIONS 2017
$MILLIONS
Fees paid to the Group auditor 1.3 0.9
Audit fees paid to other auditors 0.7 0.7 Bad debts written off 2.9 1.6 Increase in provision for doubtful debts 19 0.9 0.1 Onerous lease expense 1.4 - Directors’ fees 23 3.4 2.8 Administration and other corporate costs 5.7 7.6 Donations 0.7 - Management fee (to related party Morrison & Co Infrastructure Management) 25 22.1 21.4 Trading operations
Energy and wholesale costs 387.3 433.3 Line, distribution and network costs 372.6 413.0 Generation production & development costs 46.1 64.5 Other energy business costs 75.9 91.7 Telecommunications cost of sales 54.9 47.9 Transportation business costs 68.9 66.1 Airport business costs 21.9 18.3
Total other operating expenses 1,066.7 1,169.9
Included within other Energy business costs during the prior year are expenses relating to the demerger of Trustpower and Tilt Renewables of $16.7 million.
Fees paid to the Group auditor (including fees paid by Associates) 2018
$MILLIONS 2017
$MILLIONS
Audit and review of financial statements 438.0 440.3
Regulatory audit work 33.0 33.0 Other assurance services 40.5 14.2 Taxation services 260.8 417.7 Other services 489.3 -
1,261.6 905.2
Fees paid to the Group auditor by Associates (recognised through share of Associate Earnings) 445.2 1,094.8
Total fees paid to the Group auditor 1,706.8 2,000.0
The audit fee includes the fees for both the annual audit of the financial statements and the review of the interim financial statements. Regulatory audit work consists of the audit of regulatory disclosures. Other assurance services comprise of agreed upon procedures, audit of compliance reports and verification in relation to gas trading licence. Tax services relate to tax compliance work, tax advisory services provided to a subsidiary of the group, and services relating to the Trustpower demerger. Other services primarily relate to due diligence work undertaken.F
or p
erso
nal u
se o
nly
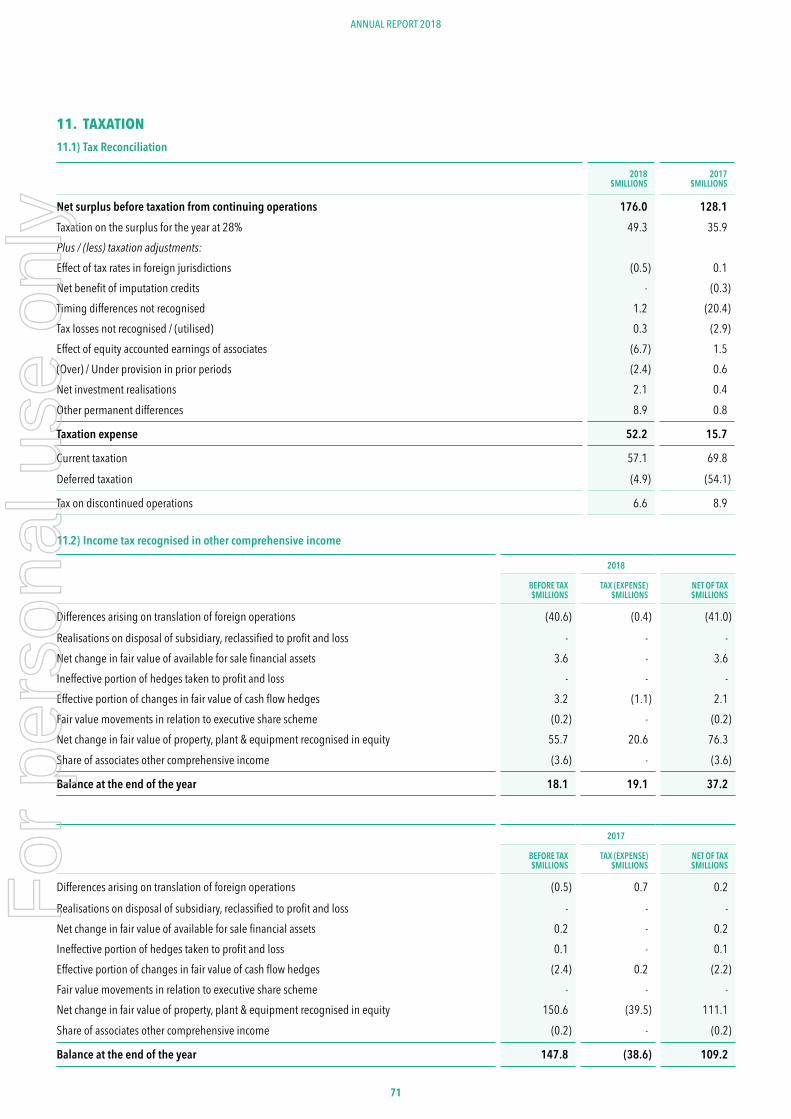
7171
ANNUAL REPORT 2018
11. TAXATION11.1) Tax Reconciliation
2018 $MILLIONS
2017 $MILLIONS
Net surplus before taxation from continuing operations 176.0 128.1 Taxation on the surplus for the year at 28% 49.3 35.9 Plus / (less) taxation adjustments:
Effect of tax rates in foreign jurisdictions (0.5) 0.1 Net benefit of imputation credits - (0.3)Timing differences not recognised 1.2 (20.4)Tax losses not recognised / (utilised) 0.3 (2.9)Effect of equity accounted earnings of associates (6.7) 1.5 (Over) / Under provision in prior periods (2.4) 0.6 Net investment realisations 2.1 0.4 Other permanent differences 8.9 0.8
Taxation expense 52.2 15.7
Current taxation 57.1 69.8 Deferred taxation (4.9) (54.1)
Tax on discontinued operations 6.6 8.9 11.2) Income tax recognised in other comprehensive income
2018
BEFORE TAX$MILLIONS
TAX (EXPENSE)$MILLIONS
NET OF TAX$MILLIONS
Differences arising on translation of foreign operations (40.6) (0.4) (41.0)
Realisations on disposal of subsidiary, reclassified to profit and loss - - -Net change in fair value of available for sale financial assets 3.6 - 3.6 Ineffective portion of hedges taken to profit and loss - - - Effective portion of changes in fair value of cash flow hedges 3.2 (1.1) 2.1 Fair value movements in relation to executive share scheme (0.2) - (0.2)Net change in fair value of property, plant & equipment recognised in equity 55.7 20.6 76.3 Share of associates other comprehensive income (3.6) - (3.6)
Balance at the end of the year 18.1 19.1 37.2
2017
BEFORE TAX$MILLIONS
TAX (EXPENSE)$MILLIONS
NET OF TAX$MILLIONS
Differences arising on translation of foreign operations (0.5) 0.7 0.2
Realisations on disposal of subsidiary, reclassified to profit and loss - - -Net change in fair value of available for sale financial assets 0.2 - 0.2Ineffective portion of hedges taken to profit and loss 0.1 - 0.1Effective portion of changes in fair value of cash flow hedges (2.4) 0.2 (2.2)Fair value movements in relation to executive share scheme - - -Net change in fair value of property, plant & equipment recognised in equity 150.6 (39.5) 111.1 Share of associates other comprehensive income (0.2) - (0.2)
Balance at the end of the year 147.8 (38.6) 109.2
For
per
sona
l use
onl
y
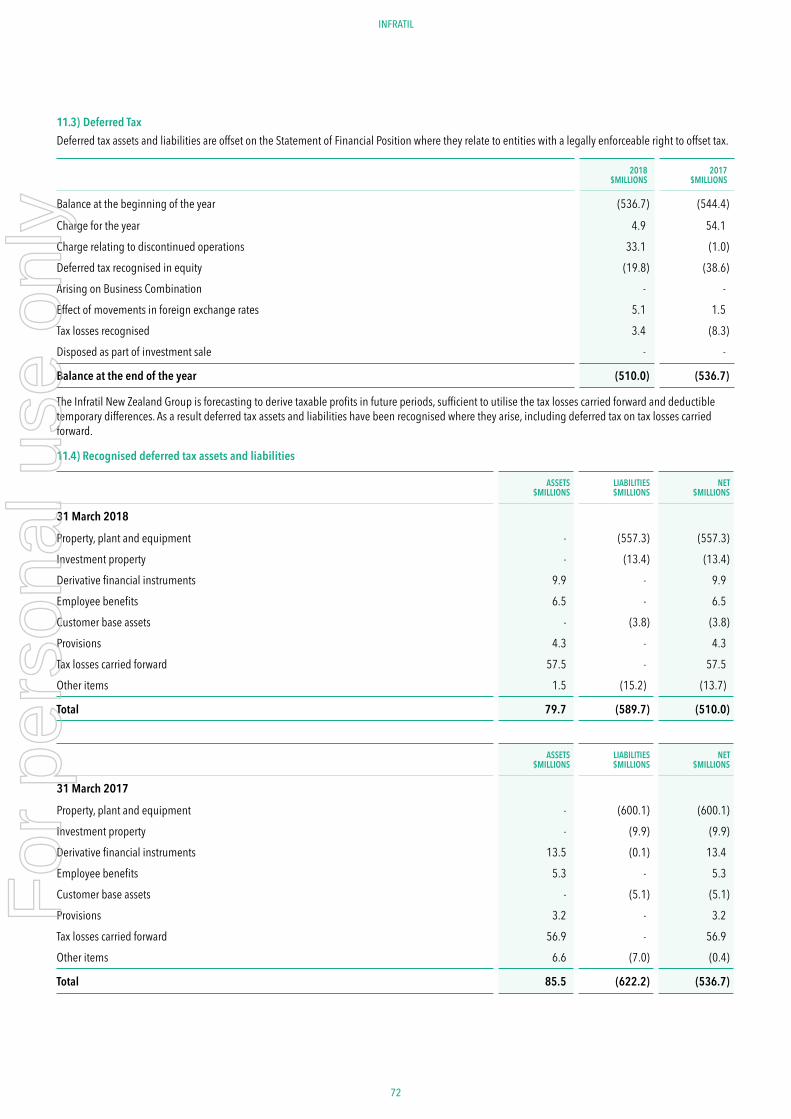
72 73
ANNUAL REPORT 2018INFRATIL
11.3) Deferred TaxDeferred tax assets and liabilities are offset on the Statement of Financial Position where they relate to entities with a legally enforceable right to offset tax.
2018 $MILLIONS
2017 $MILLIONS
Balance at the beginning of the year (536.7) (544.4)
Charge for the year 4.9 54.1 Charge relating to discontinued operations 33.1 (1.0)Deferred tax recognised in equity (19.8) (38.6)Arising on Business Combination - - Effect of movements in foreign exchange rates 5.1 1.5 Tax losses recognised 3.4 (8.3)Disposed as part of investment sale - -
Balance at the end of the year (510.0) (536.7)
The Infratil New Zealand Group is forecasting to derive taxable profits in future periods, sufficient to utilise the tax losses carried forward and deductible temporary differences. As a result deferred tax assets and liabilities have been recognised where they arise, including deferred tax on tax losses carried forward.
11.4) Recognised deferred tax assets and liabilities
ASSETS$MILLIONS
LIABILITIES$MILLIONS
NET$MILLIONS
31 March 2018
Property, plant and equipment - (557.3) (557.3)Investment property - (13.4) (13.4)Derivative financial instruments 9.9 - 9.9 Employee benefits 6.5 - 6.5 Customer base assets - (3.8) (3.8)Provisions 4.3 - 4.3 Tax losses carried forward 57.5 - 57.5 Other items 1.5 (15.2) (13.7)
Total 79.7 (589.7) (510.0)
ASSETS$MILLIONS
LIABILITIES$MILLIONS
NET$MILLIONS
31 March 2017
Property, plant and equipment - (600.1) (600.1)Investment property - (9.9) (9.9)Derivative financial instruments 13.5 (0.1) 13.4 Employee benefits 5.3 - 5.3 Customer base assets - (5.1) (5.1)Provisions 3.2 - 3.2 Tax losses carried forward 56.9 - 56.9 Other items 6.6 (7.0) (0.4)
Total 85.5 (622.2) (536.7)
For
per
sona
l use
onl
y
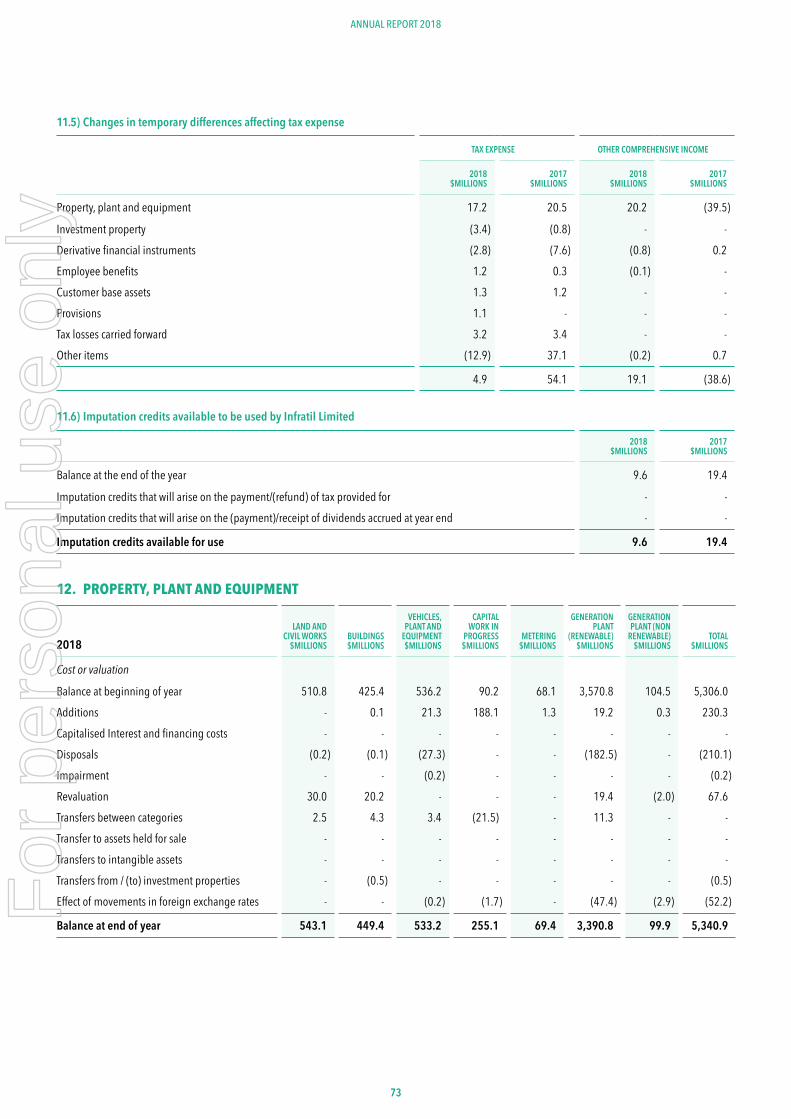
7373
ANNUAL REPORT 2018
11.5) Changes in temporary differences affecting tax expense
TAX EXPENSE OTHER COMPREHENSIVE INCOME
2018$MILLIONS
2017$MILLIONS
2018$MILLIONS
2017$MILLIONS
Property, plant and equipment 17.2 20.5 20.2 (39.5)
Investment property (3.4) (0.8) - - Derivative financial instruments (2.8) (7.6) (0.8) 0.2 Employee benefits 1.2 0.3 (0.1) - Customer base assets 1.3 1.2 - - Provisions 1.1 - - - Tax losses carried forward 3.2 3.4 - - Other items (12.9) 37.1 (0.2) 0.7
4.9 54.1 19.1 (38.6)
11.6) Imputation credits available to be used by Infratil Limited
2018 $MILLIONS
2017 $MILLIONS
Balance at the end of the year 9.6 19.4
Imputation credits that will arise on the payment/(refund) of tax provided for - - Imputation credits that will arise on the (payment)/receipt of dividends accrued at year end - -
Imputation credits available for use 9.6 19.4
12. PROPERTY, PLANT AND EQUIPMENT
2018LAND AND
CIVIL WORKS$MILLIONS
BUILDINGS$MILLIONS
VEHICLES, PLANT AND
EQUIPMENT$MILLIONS
CAPITAL WORK IN
PROGRESS$MILLIONS
METERING$MILLIONS
GENERATION PLANT
(RENEWABLE)$MILLIONS
GENERATION PLANT (NON
RENEWABLE)$MILLIONS
TOTAL$MILLIONS
Cost or valuation
Balance at beginning of year 510.8 425.4 536.2 90.2 68.1 3,570.8 104.5 5,306.0 Additions - 0.1 21.3 188.1 1.3 19.2 0.3 230.3 Capitalised Interest and financing costs - - - - - - - -Disposals (0.2) (0.1) (27.3) - - (182.5) - (210.1)Impairment - - (0.2) - - - - (0.2)Revaluation 30.0 20.2 - - - 19.4 (2.0) 67.6 Transfers between categories 2.5 4.3 3.4 (21.5) - 11.3 - - Transfer to assets held for sale - - - - - - - - Transfers to intangible assets - - - - - - - - Transfers from / (to) investment properties - (0.5) - - - - - (0.5)Effect of movements in foreign exchange rates - - (0.2) (1.7) - (47.4) (2.9) (52.2)
Balance at end of year 543.1 449.4 533.2 255.1 69.4 3,390.8 99.9 5,340.9 For
per
sona
l use
onl
y
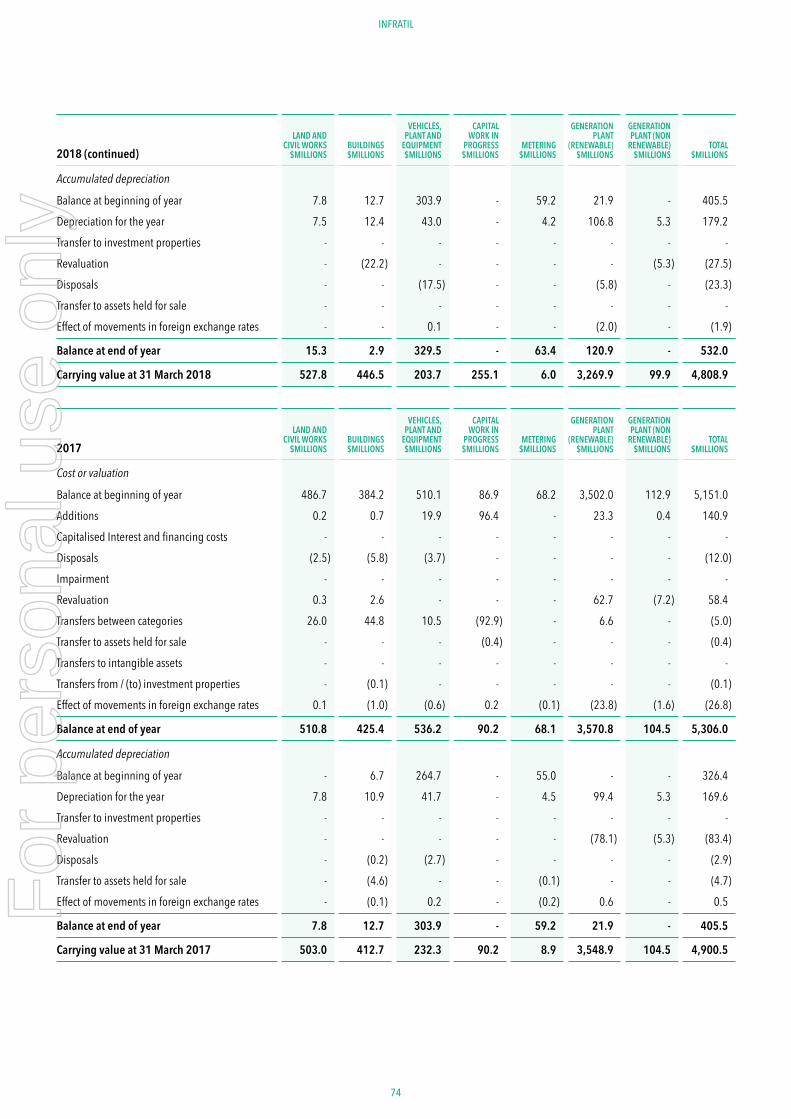
74 75
ANNUAL REPORT 2018INFRATIL
2018 (continued)LAND AND
CIVIL WORKS$MILLIONS
BUILDINGS$MILLIONS
VEHICLES, PLANT AND
EQUIPMENT$MILLIONS
CAPITAL WORK IN
PROGRESS$MILLIONS
METERING$MILLIONS
GENERATION PLANT
(RENEWABLE)$MILLIONS
GENERATION PLANT (NON
RENEWABLE)$MILLIONS
TOTAL$MILLIONS
Accumulated depreciation
Balance at beginning of year 7.8 12.7 303.9 - 59.2 21.9 - 405.5 Depreciation for the year 7.5 12.4 43.0 - 4.2 106.8 5.3 179.2 Transfer to investment properties - - - - - - - - Revaluation - (22.2) - - - - (5.3) (27.5)Disposals - - (17.5) - - (5.8) - (23.3)Transfer to assets held for sale - - - - - - - - Effect of movements in foreign exchange rates - - 0.1 - - (2.0) - (1.9)
Balance at end of year 15.3 2.9 329.5 - 63.4 120.9 - 532.0
Carrying value at 31 March 2018 527.8 446.5 203.7 255.1 6.0 3,269.9 99.9 4,808.9
2017LAND AND
CIVIL WORKS$MILLIONS
BUILDINGS$MILLIONS
VEHICLES, PLANT AND
EQUIPMENT$MILLIONS
CAPITAL WORK IN
PROGRESS$MILLIONS
METERING$MILLIONS
GENERATION PLANT
(RENEWABLE)$MILLIONS
GENERATION PLANT (NON
RENEWABLE)$MILLIONS
TOTAL$MILLIONS
Cost or valuation
Balance at beginning of year 486.7 384.2 510.1 86.9 68.2 3,502.0 112.9 5,151.0 Additions 0.2 0.7 19.9 96.4 - 23.3 0.4 140.9 Capitalised Interest and financing costs - - - - - - - -Disposals (2.5) (5.8) (3.7) - - - - (12.0)Impairment - - - - - - - - Revaluation 0.3 2.6 - - - 62.7 (7.2) 58.4 Transfers between categories 26.0 44.8 10.5 (92.9) - 6.6 - (5.0)Transfer to assets held for sale - - - (0.4) - - - (0.4)Transfers to intangible assets - - - - - - - - Transfers from / (to) investment properties - (0.1) - - - - - (0.1)Effect of movements in foreign exchange rates 0.1 (1.0) (0.6) 0.2 (0.1) (23.8) (1.6) (26.8)
Balance at end of year 510.8 425.4 536.2 90.2 68.1 3,570.8 104.5 5,306.0
Accumulated depreciation
Balance at beginning of year - 6.7 264.7 - 55.0 - - 326.4 Depreciation for the year 7.8 10.9 41.7 - 4.5 99.4 5.3 169.6 Transfer to investment properties - - - - - - - - Revaluation - - - - - (78.1) (5.3) (83.4)Disposals - (0.2) (2.7) - - - - (2.9)Transfer to assets held for sale - (4.6) - - (0.1) - - (4.7)Effect of movements in foreign exchange rates - (0.1) 0.2 - (0.2) 0.6 - 0.5
Balance at end of year 7.8 12.7 303.9 - 59.2 21.9 - 405.5
Carrying value at 31 March 2017 503.0 412.7 232.3 90.2 8.9 3,548.9 104.5 4,900.5
For
per
sona
l use
onl
y
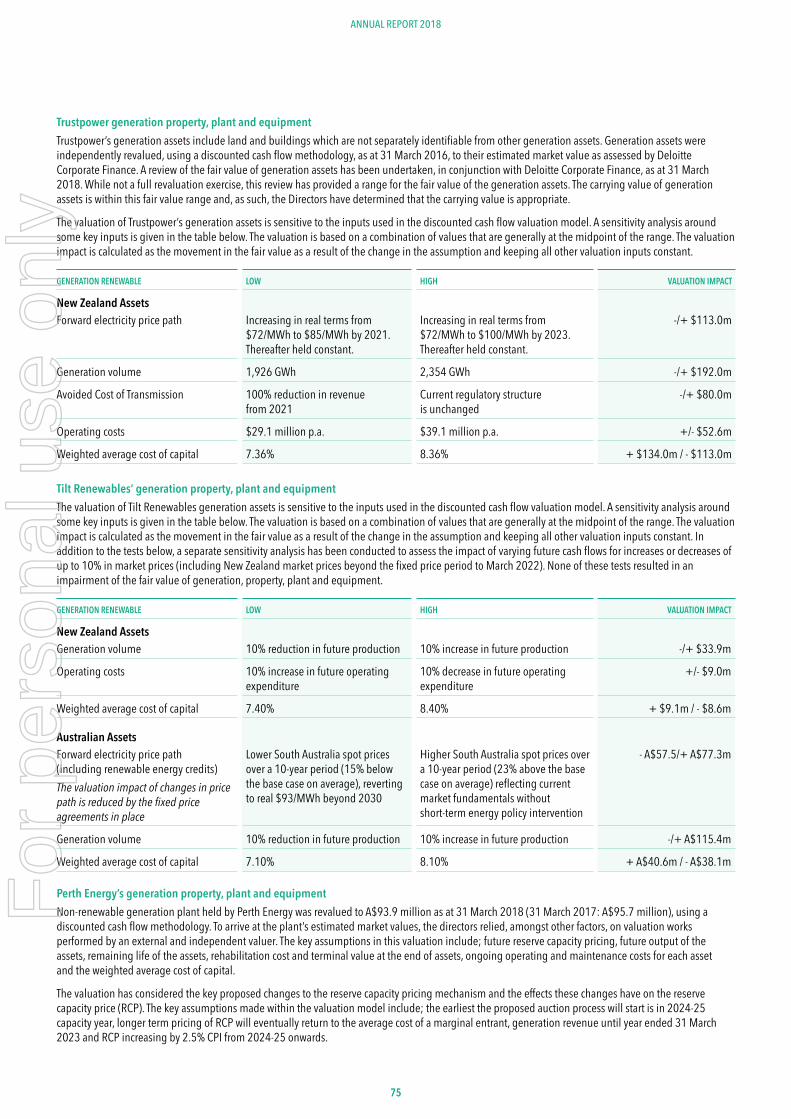
7575
ANNUAL REPORT 2018
Trustpower generation property, plant and equipmentTrustpower’s generation assets include land and buildings which are not separately identifiable from other generation assets. Generation assets were independently revalued, using a discounted cash flow methodology, as at 31 March 2016, to their estimated market value as assessed by Deloitte Corporate Finance. A review of the fair value of generation assets has been undertaken, in conjunction with Deloitte Corporate Finance, as at 31 March 2018. While not a full revaluation exercise, this review has provided a range for the fair value of the generation assets. The carrying value of generation assets is within this fair value range and, as such, the Directors have determined that the carrying value is appropriate.
The valuation of Trustpower’s generation assets is sensitive to the inputs used in the discounted cash flow valuation model. A sensitivity analysis around some key inputs is given in the table below. The valuation is based on a combination of values that are generally at the midpoint of the range. The valuation impact is calculated as the movement in the fair value as a result of the change in the assumption and keeping all other valuation inputs constant.
GENERATION RENEWABLE LOW HIGH VALUATION IMPACT
New Zealand AssetsForward electricity price path Increasing in real terms from
$72/MWh to $85/MWh by 2021. Thereafter held constant.
Increasing in real terms from $72/MWh to $100/MWh by 2023. Thereafter held constant.
-/+ $113.0m
Generation volume 1,926 GWh 2,354 GWh -/+ $192.0m
Avoided Cost of Transmission 100% reduction in revenue from 2021
Current regulatory structure is unchanged
-/+ $80.0m
Operating costs $29.1 million p.a. $39.1 million p.a. +/- $52.6m
Weighted average cost of capital 7.36% 8.36% + $134.0m / - $113.0m
Tilt Renewables’ generation property, plant and equipmentThe valuation of Tilt Renewables generation assets is sensitive to the inputs used in the discounted cash flow valuation model. A sensitivity analysis around some key inputs is given in the table below. The valuation is based on a combination of values that are generally at the midpoint of the range. The valuation impact is calculated as the movement in the fair value as a result of the change in the assumption and keeping all other valuation inputs constant. In addition to the tests below, a separate sensitivity analysis has been conducted to assess the impact of varying future cash flows for increases or decreases of up to 10% in market prices (including New Zealand market prices beyond the fixed price period to March 2022). None of these tests resulted in an impairment of the fair value of generation, property, plant and equipment.
GENERATION RENEWABLE LOW HIGH VALUATION IMPACT
New Zealand AssetsGeneration volume 10% reduction in future production 10% increase in future production -/+ $33.9m
Operating costs 10% increase in future operating expenditure
10% decrease in future operating expenditure
+/- $9.0m
Weighted average cost of capital 7.40% 8.40% + $9.1m / - $8.6m
Australian AssetsForward electricity price path (including renewable energy credits)The valuation impact of changes in price path is reduced by the fixed price agreements in place
Lower South Australia spot prices over a 10-year period (15% below the base case on average), reverting to real $93/MWh beyond 2030
Higher South Australia spot prices over a 10-year period (23% above the base case on average) reflecting current market fundamentals without short-term energy policy intervention
- A$57.5/+ A$77.3m
Generation volume 10% reduction in future production 10% increase in future production -/+ A$115.4m
Weighted average cost of capital 7.10% 8.10% + A$40.6m / - A$38.1m
Perth Energy’s generation property, plant and equipmentNon-renewable generation plant held by Perth Energy was revalued to A$93.9 million as at 31 March 2018 (31 March 2017: A$95.7 million), using a discounted cash flow methodology. To arrive at the plant’s estimated market values, the directors relied, amongst other factors, on valuation works performed by an external and independent valuer. The key assumptions in this valuation include; future reserve capacity pricing, future output of the assets, remaining life of the assets, rehabilitation cost and terminal value at the end of assets, ongoing operating and maintenance costs for each asset and the weighted average cost of capital.
The valuation has considered the key proposed changes to the reserve capacity pricing mechanism and the effects these changes have on the reserve capacity price (RCP). The key assumptions made within the valuation model include; the earliest the proposed auction process will start is in 2024-25 capacity year, longer term pricing of RCP will eventually return to the average cost of a marginal entrant, generation revenue until year ended 31 March 2023 and RCP increasing by 2.5% CPI from 2024-25 onwards.
For
per
sona
l use
onl
y
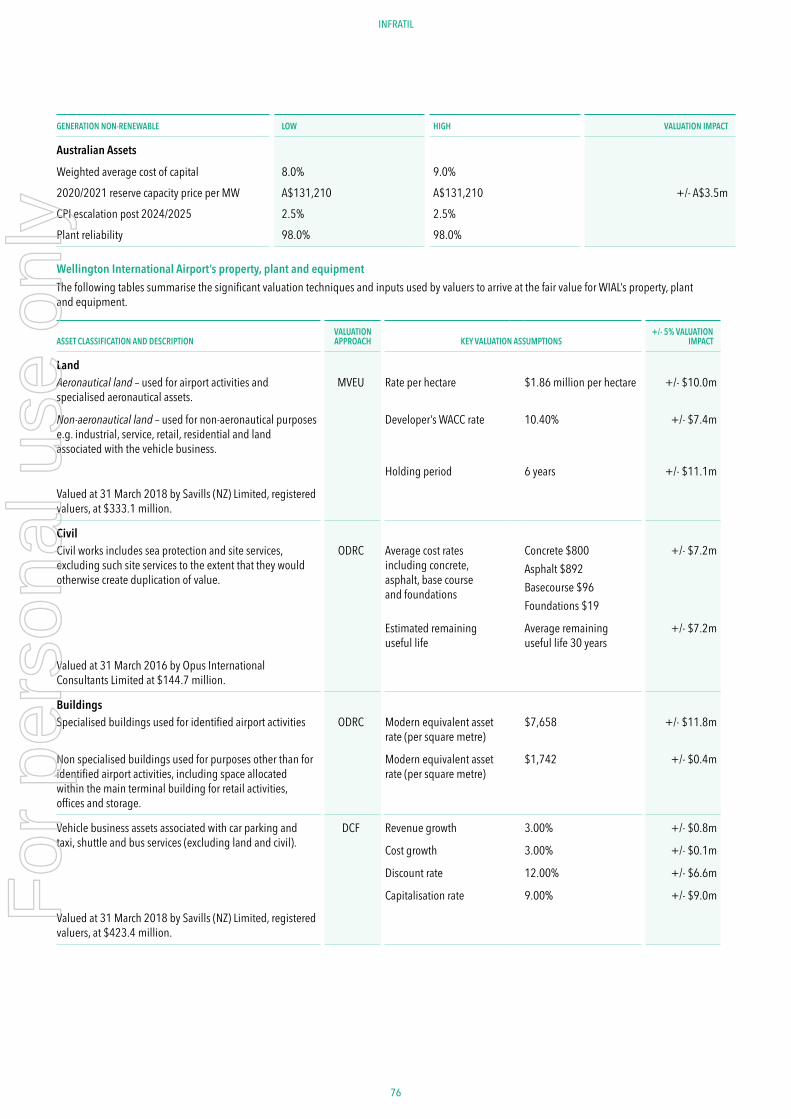
76 77
ANNUAL REPORT 2018INFRATIL
GENERATION NON-RENEWABLE LOW HIGH VALUATION IMPACT
Australian Assets
Weighted average cost of capital 8.0% 9.0%2020/2021 reserve capacity price per MW A$131,210 A$131,210 +/- A$3.5mCPI escalation post 2024/2025 2.5% 2.5% Plant reliability 98.0% 98.0%
Wellington International Airport’s property, plant and equipmentThe following tables summarise the significant valuation techniques and inputs used by valuers to arrive at the fair value for WIAL’s property, plant and equipment.
ASSET CLASSIFICATION AND DESCRIPTIONVALUATION APPROACH KEY VALUATION ASSUMPTIONS
+/- 5% VALUATION IMPACT
LandAeronautical land – used for airport activities and specialised aeronautical assets.
MVEU Rate per hectare $1.86 million per hectare +/- $10.0m
Non-aeronautical land – used for non-aeronautical purposes e.g. industrial, service, retail, residential and land associated with the vehicle business.
Developer’s WACC rate 10.40% +/- $7.4m
Holding period 6 years +/- $11.1m
Valued at 31 March 2018 by Savills (NZ) Limited, registered valuers, at $333.1 million.
CivilCivil works includes sea protection and site services, excluding such site services to the extent that they would otherwise create duplication of value.
ODRC Average cost rates including concrete, asphalt, base course and foundations
Concrete $800Asphalt $892Basecourse $96Foundations $19
+/- $7.2m
Estimated remaining useful life
Average remaining useful life 30 years
+/- $7.2m
Valued at 31 March 2016 by Opus International Consultants Limited at $144.7 million.
BuildingsSpecialised buildings used for identified airport activities ODRC Modern equivalent asset
rate (per square metre)$7,658 +/- $11.8m
Non specialised buildings used for purposes other than for identified airport activities, including space allocated within the main terminal building for retail activities, offices and storage.
Modern equivalent asset rate (per square metre)
$1,742 +/- $0.4m
Vehicle business assets associated with car parking and taxi, shuttle and bus services (excluding land and civil).
DCF Revenue growth 3.00% +/- $0.8m
Cost growth 3.00% +/- $0.1m
Discount rate 12.00% +/- $6.6m
Capitalisation rate 9.00% +/- $9.0m
Valued at 31 March 2018 by Savills (NZ) Limited, registered valuers, at $423.4 million.
For
per
sona
l use
onl
y
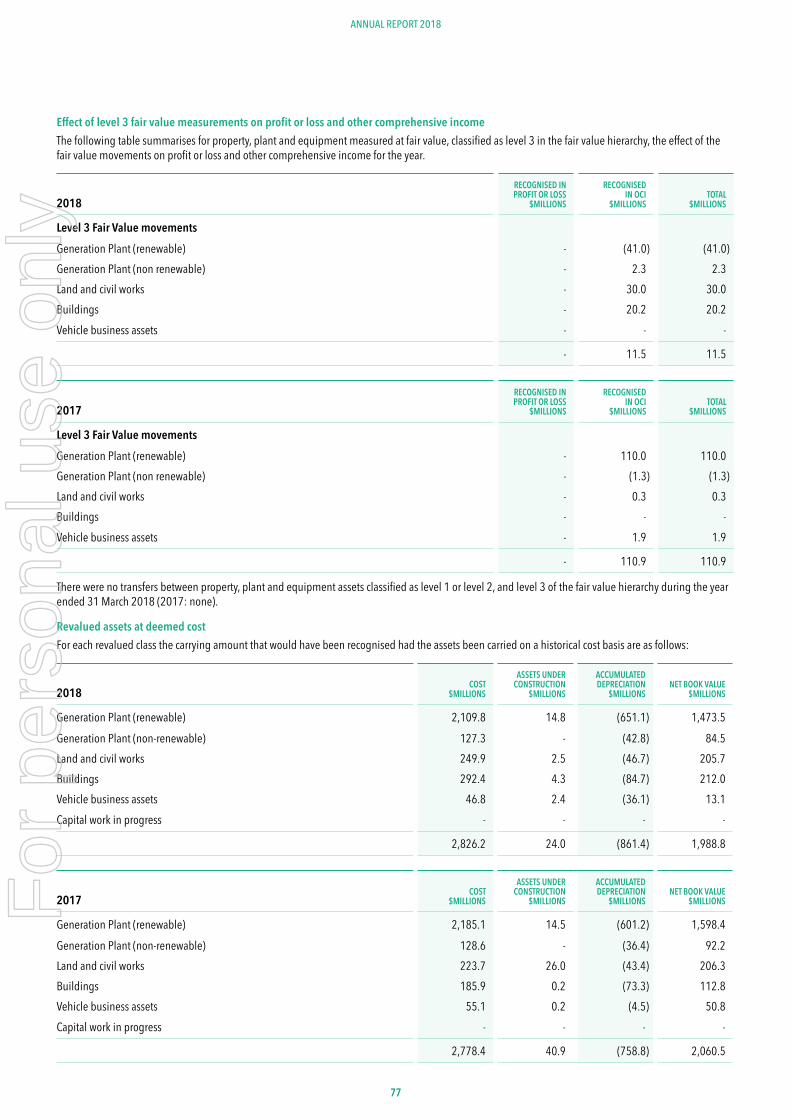
7777
ANNUAL REPORT 2018
Effect of level 3 fair value measurements on profit or loss and other comprehensive incomeThe following table summarises for property, plant and equipment measured at fair value, classified as level 3 in the fair value hierarchy, the effect of the fair value movements on profit or loss and other comprehensive income for the year.
2018RECOGNISED IN PROFIT OR LOSS
$MILLIONS
RECOGNISED IN OCI
$MILLIONSTOTAL
$MILLIONS
Level 3 Fair Value movementsGeneration Plant (renewable) - (41.0) (41.0)Generation Plant (non renewable) - 2.3 2.3 Land and civil works - 30.0 30.0 Buildings - 20.2 20.2 Vehicle business assets - - -
- 11.5 11.5
2017RECOGNISED IN PROFIT OR LOSS
$MILLIONS
RECOGNISED IN OCI
$MILLIONSTOTAL
$MILLIONS
Level 3 Fair Value movementsGeneration Plant (renewable) - 110.0 110.0 Generation Plant (non renewable) - (1.3) (1.3)Land and civil works - 0.3 0.3 Buildings - - - Vehicle business assets - 1.9 1.9
- 110.9 110.9
There were no transfers between property, plant and equipment assets classified as level 1 or level 2, and level 3 of the fair value hierarchy during the year ended 31 March 2018 (2017: none).
Revalued assets at deemed costFor each revalued class the carrying amount that would have been recognised had the assets been carried on a historical cost basis are as follows:
2018COST
$MILLIONS
ASSETS UNDER CONSTRUCTION
$MILLIONS
ACCUMULATED DEPRECIATION
$MILLIONSNET BOOK VALUE
$MILLIONS
Generation Plant (renewable) 2,109.8 14.8 (651.1) 1,473.5 Generation Plant (non-renewable) 127.3 - (42.8) 84.5 Land and civil works 249.9 2.5 (46.7) 205.7 Buildings 292.4 4.3 (84.7) 212.0 Vehicle business assets 46.8 2.4 (36.1) 13.1 Capital work in progress - - - -
2,826.2 24.0 (861.4) 1,988.8
2017COST
$MILLIONS
ASSETS UNDER CONSTRUCTION
$MILLIONS
ACCUMULATED DEPRECIATION
$MILLIONSNET BOOK VALUE
$MILLIONS
Generation Plant (renewable) 2,185.1 14.5 (601.2) 1,598.4 Generation Plant (non-renewable) 128.6 - (36.4) 92.2 Land and civil works 223.7 26.0 (43.4) 206.3 Buildings 185.9 0.2 (73.3) 112.8 Vehicle business assets 55.1 0.2 (4.5) 50.8 Capital work in progress - - - -
2,778.4 40.9 (758.8) 2,060.5
For
per
sona
l use
onl
y
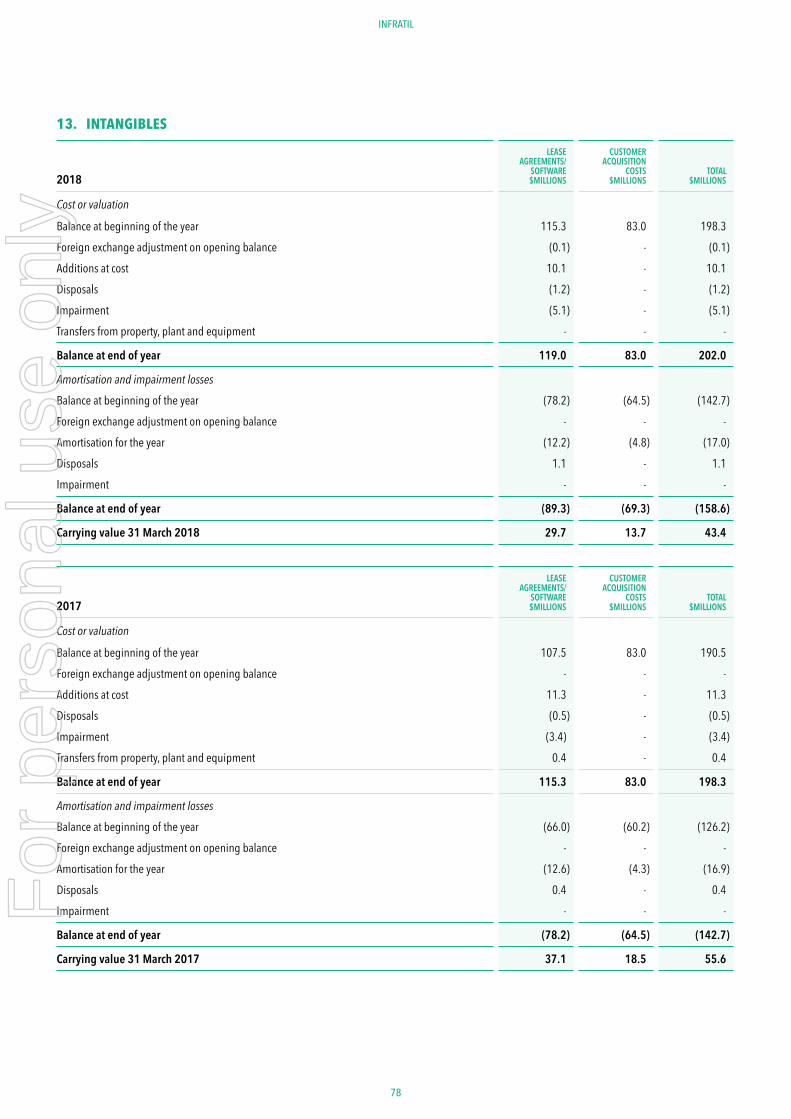
78 79
ANNUAL REPORT 2018INFRATIL
13. INTANGIBLES
2018
LEASE AGREEMENTS/
SOFTWARE$MILLIONS
CUSTOMER ACQUISITION
COSTS$MILLIONS
TOTAL$MILLIONS
Cost or valuation
Balance at beginning of the year 115.3 83.0 198.3 Foreign exchange adjustment on opening balance (0.1) - (0.1)Additions at cost 10.1 - 10.1 Disposals (1.2) - (1.2)Impairment (5.1) - (5.1)Transfers from property, plant and equipment - - -
Balance at end of year 119.0 83.0 202.0
Amortisation and impairment losses
Balance at beginning of the year (78.2) (64.5) (142.7)Foreign exchange adjustment on opening balance - - - Amortisation for the year (12.2) (4.8) (17.0)Disposals 1.1 - 1.1 Impairment - - -
Balance at end of year (89.3) (69.3) (158.6)
Carrying value 31 March 2018 29.7 13.7 43.4
2017
LEASE AGREEMENTS/
SOFTWARE$MILLIONS
CUSTOMER ACQUISITION
COSTS$MILLIONS
TOTAL$MILLIONS
Cost or valuation
Balance at beginning of the year 107.5 83.0 190.5 Foreign exchange adjustment on opening balance - - - Additions at cost 11.3 - 11.3 Disposals (0.5) - (0.5)Impairment (3.4) - (3.4)Transfers from property, plant and equipment 0.4 - 0.4
Balance at end of year 115.3 83.0 198.3
Amortisation and impairment losses
Balance at beginning of the year (66.0) (60.2) (126.2)Foreign exchange adjustment on opening balance - - - Amortisation for the year (12.6) (4.3) (16.9)Disposals 0.4 - 0.4 Impairment - - -
Balance at end of year (78.2) (64.5) (142.7)
Carrying value 31 March 2017 37.1 18.5 55.6
For
per
sona
l use
onl
y
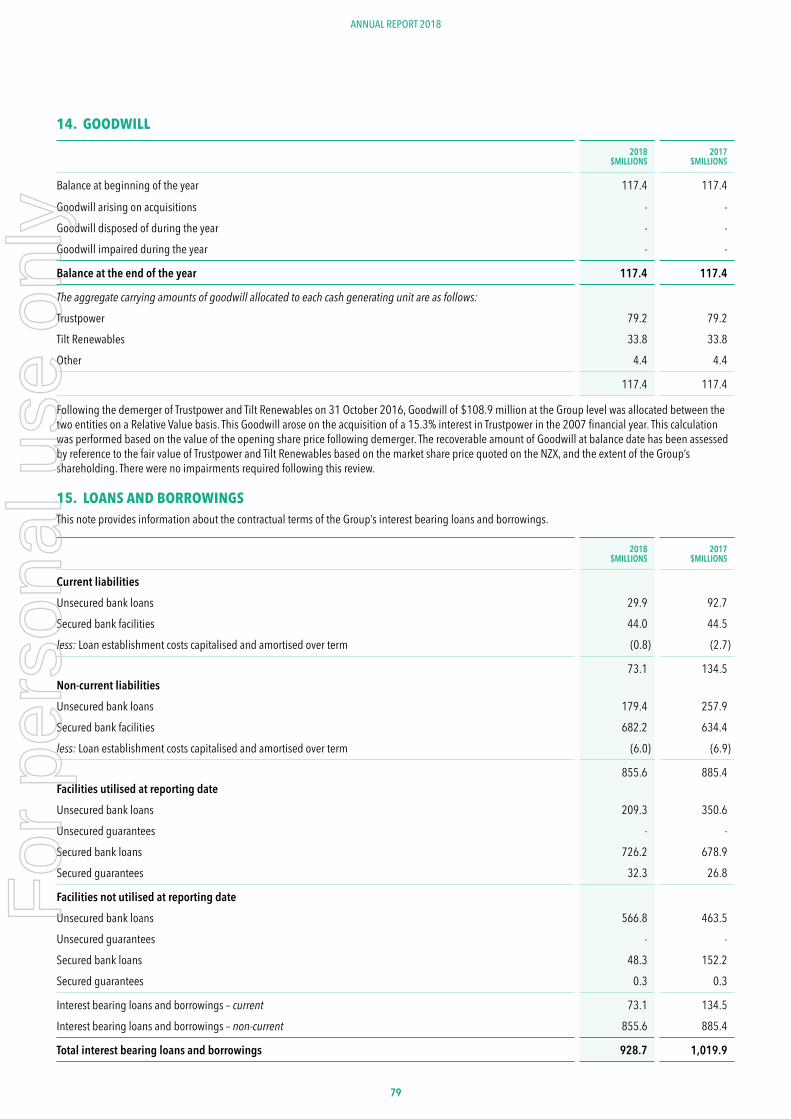
7979
ANNUAL REPORT 2018
14. GOODWILL
2018$MILLIONS
2017$MILLIONS
Balance at beginning of the year 117.4 117.4
Goodwill arising on acquisitions - - Goodwill disposed of during the year - - Goodwill impaired during the year - -
Balance at the end of the year 117.4 117.4
The aggregate carrying amounts of goodwill allocated to each cash generating unit are as follows:
Trustpower 79.2 79.2 Tilt Renewables 33.8 33.8 Other 4.4 4.4
117.4 117.4
Following the demerger of Trustpower and Tilt Renewables on 31 October 2016, Goodwill of $108.9 million at the Group level was allocated between the two entities on a Relative Value basis. This Goodwill arose on the acquisition of a 15.3% interest in Trustpower in the 2007 financial year. This calculation was performed based on the value of the opening share price following demerger. The recoverable amount of Goodwill at balance date has been assessed by reference to the fair value of Trustpower and Tilt Renewables based on the market share price quoted on the NZX, and the extent of the Group’s shareholding. There were no impairments required following this review.
15. LOANS AND BORROWINGSThis note provides information about the contractual terms of the Group’s interest bearing loans and borrowings.
2018$MILLIONS
2017$MILLIONS
Current liabilitiesUnsecured bank loans 29.9 92.7 Secured bank facilities 44.0 44.5 less: Loan establishment costs capitalised and amortised over term (0.8) (2.7)
73.1 134.5 Non-current liabilitiesUnsecured bank loans 179.4 257.9 Secured bank facilities 682.2 634.4 less: Loan establishment costs capitalised and amortised over term (6.0) (6.9)
855.6 885.4 Facilities utilised at reporting dateUnsecured bank loans 209.3 350.6 Unsecured guarantees - - Secured bank loans 726.2 678.9 Secured guarantees 32.3 26.8
Facilities not utilised at reporting dateUnsecured bank loans 566.8 463.5 Unsecured guarantees - - Secured bank loans 48.3 152.2 Secured guarantees 0.3 0.3
Interest bearing loans and borrowings – current 73.1 134.5 Interest bearing loans and borrowings – non-current 855.6 885.4
Total interest bearing loans and borrowings 928.7 1,019.9
For
per
sona
l use
onl
y
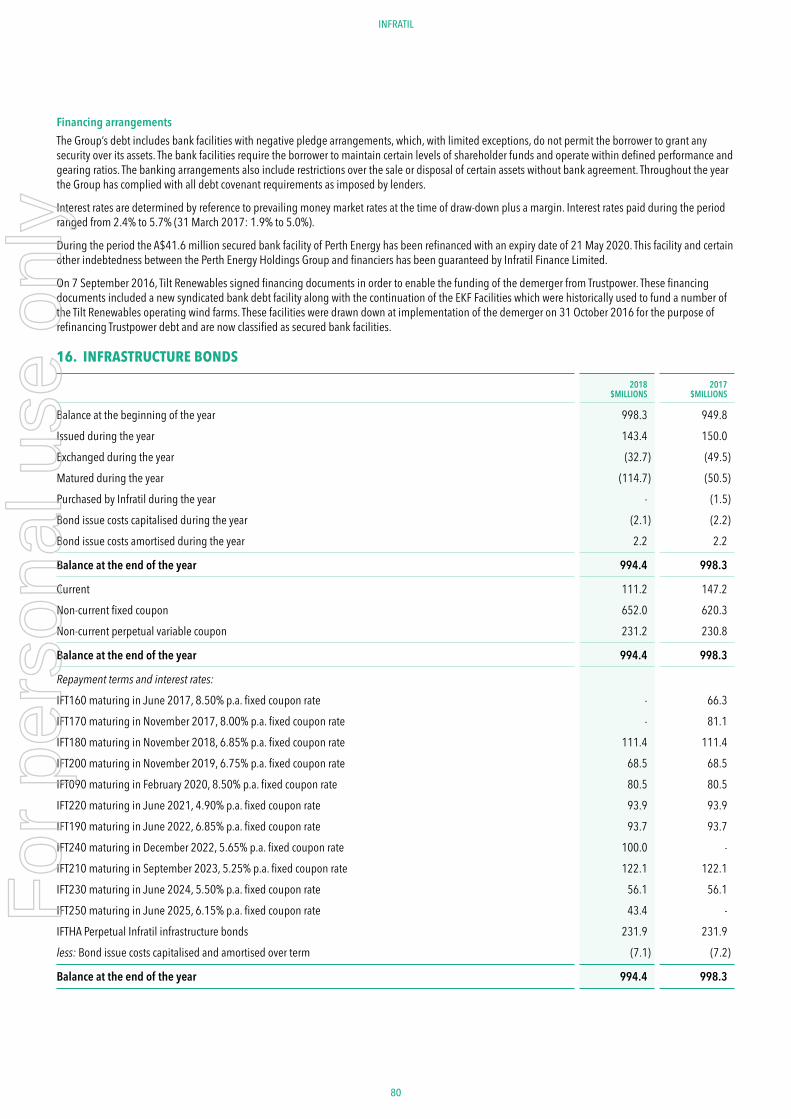
80 81
ANNUAL REPORT 2018INFRATIL
Financing arrangementsThe Group’s debt includes bank facilities with negative pledge arrangements, which, with limited exceptions, do not permit the borrower to grant any security over its assets. The bank facilities require the borrower to maintain certain levels of shareholder funds and operate within defined performance and gearing ratios. The banking arrangements also include restrictions over the sale or disposal of certain assets without bank agreement. Throughout the year the Group has complied with all debt covenant requirements as imposed by lenders.
Interest rates are determined by reference to prevailing money market rates at the time of draw-down plus a margin. Interest rates paid during the period ranged from 2.4% to 5.7% (31 March 2017: 1.9% to 5.0%).
During the period the A$41.6 million secured bank facility of Perth Energy has been refinanced with an expiry date of 21 May 2020. This facility and certain other indebtedness between the Perth Energy Holdings Group and financiers has been guaranteed by Infratil Finance Limited.
On 7 September 2016, Tilt Renewables signed financing documents in order to enable the funding of the demerger from Trustpower. These financing documents included a new syndicated bank debt facility along with the continuation of the EKF Facilities which were historically used to fund a number of the Tilt Renewables operating wind farms. These facilities were drawn down at implementation of the demerger on 31 October 2016 for the purpose of refinancing Trustpower debt and are now classified as secured bank facilities.
16. INFRASTRUCTURE BONDS
2018$MILLIONS
2017$MILLIONS
Balance at the beginning of the year 998.3 949.8 Issued during the year 143.4 150.0 Exchanged during the year (32.7) (49.5)Matured during the year (114.7) (50.5)Purchased by Infratil during the year - (1.5)Bond issue costs capitalised during the year (2.1) (2.2)Bond issue costs amortised during the year 2.2 2.2
Balance at the end of the year 994.4 998.3
Current 111.2 147.2 Non-current fixed coupon 652.0 620.3 Non-current perpetual variable coupon 231.2 230.8
Balance at the end of the year 994.4 998.3
Repayment terms and interest rates:
IFT160 maturing in June 2017, 8.50% p.a. fixed coupon rate - 66.3 IFT170 maturing in November 2017, 8.00% p.a. fixed coupon rate - 81.1 IFT180 maturing in November 2018, 6.85% p.a. fixed coupon rate 111.4 111.4 IFT200 maturing in November 2019, 6.75% p.a. fixed coupon rate 68.5 68.5 IFT090 maturing in February 2020, 8.50% p.a. fixed coupon rate 80.5 80.5 IFT220 maturing in June 2021, 4.90% p.a. fixed coupon rate 93.9 93.9 IFT190 maturing in June 2022, 6.85% p.a. fixed coupon rate 93.7 93.7 IFT240 maturing in December 2022, 5.65% p.a. fixed coupon rate 100.0 - IFT210 maturing in September 2023, 5.25% p.a. fixed coupon rate 122.1 122.1 IFT230 maturing in June 2024, 5.50% p.a. fixed coupon rate 56.1 56.1 IFT250 maturing in June 2025, 6.15% p.a. fixed coupon rate 43.4 - IFTHA Perpetual Infratil infrastructure bonds 231.9 231.9 less: Bond issue costs capitalised and amortised over term (7.1) (7.2)
Balance at the end of the year 994.4 998.3
For
per
sona
l use
onl
y
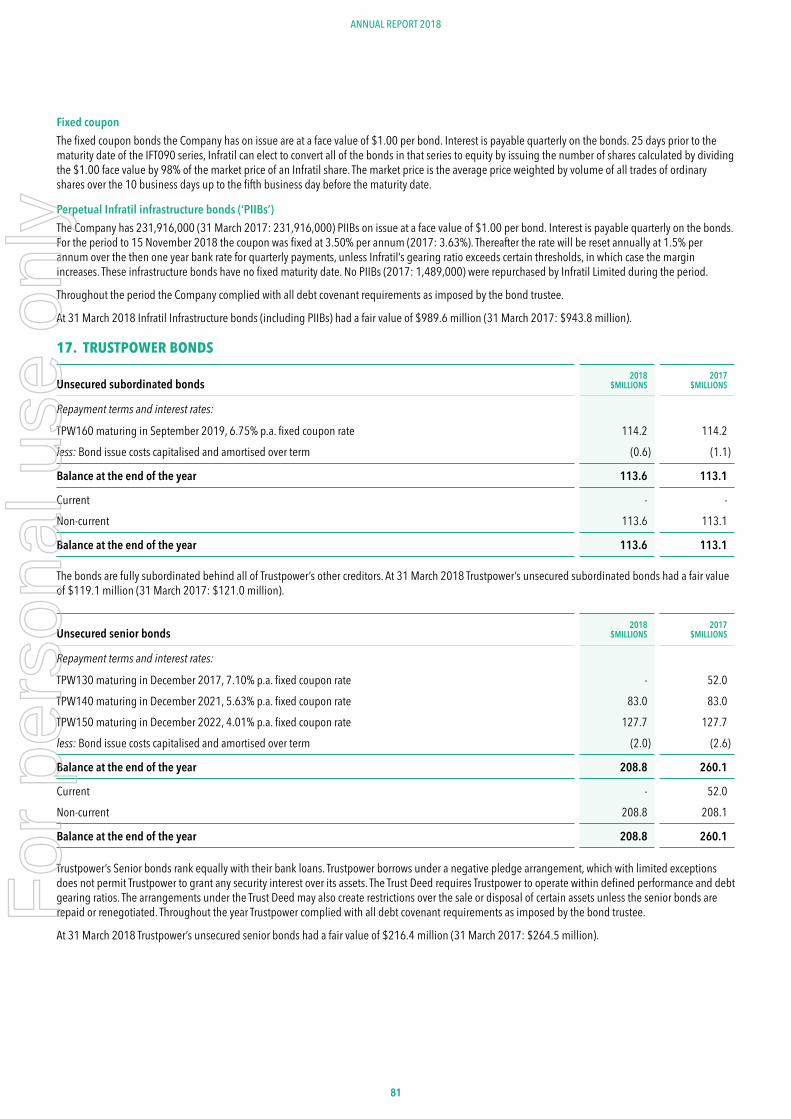
8181
ANNUAL REPORT 2018
Fixed couponThe fixed coupon bonds the Company has on issue are at a face value of $1.00 per bond. Interest is payable quarterly on the bonds. 25 days prior to the maturity date of the IFT090 series, Infratil can elect to convert all of the bonds in that series to equity by issuing the number of shares calculated by dividing the $1.00 face value by 98% of the market price of an Infratil share. The market price is the average price weighted by volume of all trades of ordinary shares over the 10 business days up to the fifth business day before the maturity date.
Perpetual Infratil infrastructure bonds (‘PIIBs’)The Company has 231,916,000 (31 March 2017: 231,916,000) PIIBs on issue at a face value of $1.00 per bond. Interest is payable quarterly on the bonds. For the period to 15 November 2018 the coupon was fixed at 3.50% per annum (2017: 3.63%). Thereafter the rate will be reset annually at 1.5% per annum over the then one year bank rate for quarterly payments, unless Infratil’s gearing ratio exceeds certain thresholds, in which case the margin increases. These infrastructure bonds have no fixed maturity date. No PIIBs (2017: 1,489,000) were repurchased by Infratil Limited during the period.
Throughout the period the Company complied with all debt covenant requirements as imposed by the bond trustee.
At 31 March 2018 Infratil Infrastructure bonds (including PIIBs) had a fair value of $989.6 million (31 March 2017: $943.8 million).
17. TRUSTPOWER BONDS
Unsecured subordinated bonds2018
$MILLIONS2017
$MILLIONS
Repayment terms and interest rates:
TPW160 maturing in September 2019, 6.75% p.a. fixed coupon rate 114.2 114.2 less: Bond issue costs capitalised and amortised over term (0.6) (1.1)
Balance at the end of the year 113.6 113.1
Current - - Non-current 113.6 113.1
Balance at the end of the year 113.6 113.1
The bonds are fully subordinated behind all of Trustpower’s other creditors. At 31 March 2018 Trustpower’s unsecured subordinated bonds had a fair value of $119.1 million (31 March 2017: $121.0 million).
Unsecured senior bonds2018
$MILLIONS2017
$MILLIONS
Repayment terms and interest rates:
TPW130 maturing in December 2017, 7.10% p.a. fixed coupon rate - 52.0 TPW140 maturing in December 2021, 5.63% p.a. fixed coupon rate 83.0 83.0 TPW150 maturing in December 2022, 4.01% p.a. fixed coupon rate 127.7 127.7 less: Bond issue costs capitalised and amortised over term (2.0) (2.6)
Balance at the end of the year 208.8 260.1
Current - 52.0 Non-current 208.8 208.1
Balance at the end of the year 208.8 260.1 Trustpower’s Senior bonds rank equally with their bank loans. Trustpower borrows under a negative pledge arrangement, which with limited exceptions does not permit Trustpower to grant any security interest over its assets. The Trust Deed requires Trustpower to operate within defined performance and debt gearing ratios. The arrangements under the Trust Deed may also create restrictions over the sale or disposal of certain assets unless the senior bonds are repaid or renegotiated. Throughout the year Trustpower complied with all debt covenant requirements as imposed by the bond trustee.
At 31 March 2018 Trustpower’s unsecured senior bonds had a fair value of $216.4 million (31 March 2017: $264.5 million).
For
per
sona
l use
onl
y
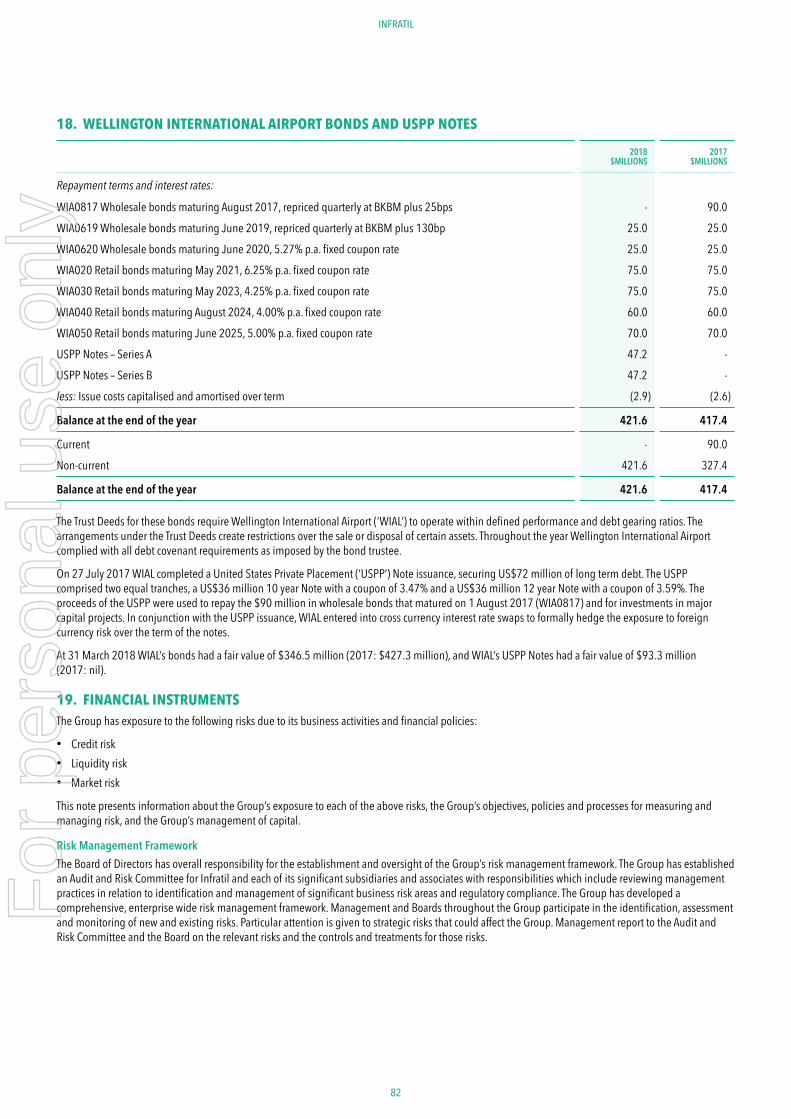
82 83
ANNUAL REPORT 2018INFRATIL
18. WELLINGTON INTERNATIONAL AIRPORT BONDS AND USPP NOTES
2018$MILLIONS
2017$MILLIONS
Repayment terms and interest rates:
WIA0817 Wholesale bonds maturing August 2017, repriced quarterly at BKBM plus 25bps - 90.0 WIA0619 Wholesale bonds maturing June 2019, repriced quarterly at BKBM plus 130bp 25.0 25.0 WIA0620 Wholesale bonds maturing June 2020, 5.27% p.a. fixed coupon rate 25.0 25.0 WIA020 Retail bonds maturing May 2021, 6.25% p.a. fixed coupon rate 75.0 75.0 WIA030 Retail bonds maturing May 2023, 4.25% p.a. fixed coupon rate 75.0 75.0 WIA040 Retail bonds maturing August 2024, 4.00% p.a. fixed coupon rate 60.0 60.0 WIA050 Retail bonds maturing June 2025, 5.00% p.a. fixed coupon rate 70.0 70.0 USPP Notes – Series A 47.2 - USPP Notes – Series B 47.2 - less: Issue costs capitalised and amortised over term (2.9) (2.6)
Balance at the end of the year 421.6 417.4
Current - 90.0 Non-current 421.6 327.4
Balance at the end of the year 421.6 417.4 The Trust Deeds for these bonds require Wellington International Airport (‘WIAL’) to operate within defined performance and debt gearing ratios. The arrangements under the Trust Deeds create restrictions over the sale or disposal of certain assets. Throughout the year Wellington International Airport complied with all debt covenant requirements as imposed by the bond trustee.
On 27 July 2017 WIAL completed a United States Private Placement (‘USPP’) Note issuance, securing US$72 million of long term debt. The USPP comprised two equal tranches, a US$36 million 10 year Note with a coupon of 3.47% and a US$36 million 12 year Note with a coupon of 3.59%. The proceeds of the USPP were used to repay the $90 million in wholesale bonds that matured on 1 August 2017 (WIA0817) and for investments in major capital projects. In conjunction with the USPP issuance, WIAL entered into cross currency interest rate swaps to formally hedge the exposure to foreign currency risk over the term of the notes.
At 31 March 2018 WIAL’s bonds had a fair value of $346.5 million (2017: $427.3 million), and WIAL’s USPP Notes had a fair value of $93.3 million (2017: nil).
19. FINANCIAL INSTRUMENTSThe Group has exposure to the following risks due to its business activities and financial policies:
• Credit risk• Liquidity risk• Market risk
This note presents information about the Group’s exposure to each of the above risks, the Group’s objectives, policies and processes for measuring and managing risk, and the Group’s management of capital.
Risk Management FrameworkThe Board of Directors has overall responsibility for the establishment and oversight of the Group’s risk management framework. The Group has established an Audit and Risk Committee for Infratil and each of its significant subsidiaries and associates with responsibilities which include reviewing management practices in relation to identification and management of significant business risk areas and regulatory compliance. The Group has developed a comprehensive, enterprise wide risk management framework. Management and Boards throughout the Group participate in the identification, assessment and monitoring of new and existing risks. Particular attention is given to strategic risks that could affect the Group. Management report to the Audit and Risk Committee and the Board on the relevant risks and the controls and treatments for those risks.
For
per
sona
l use
onl
y
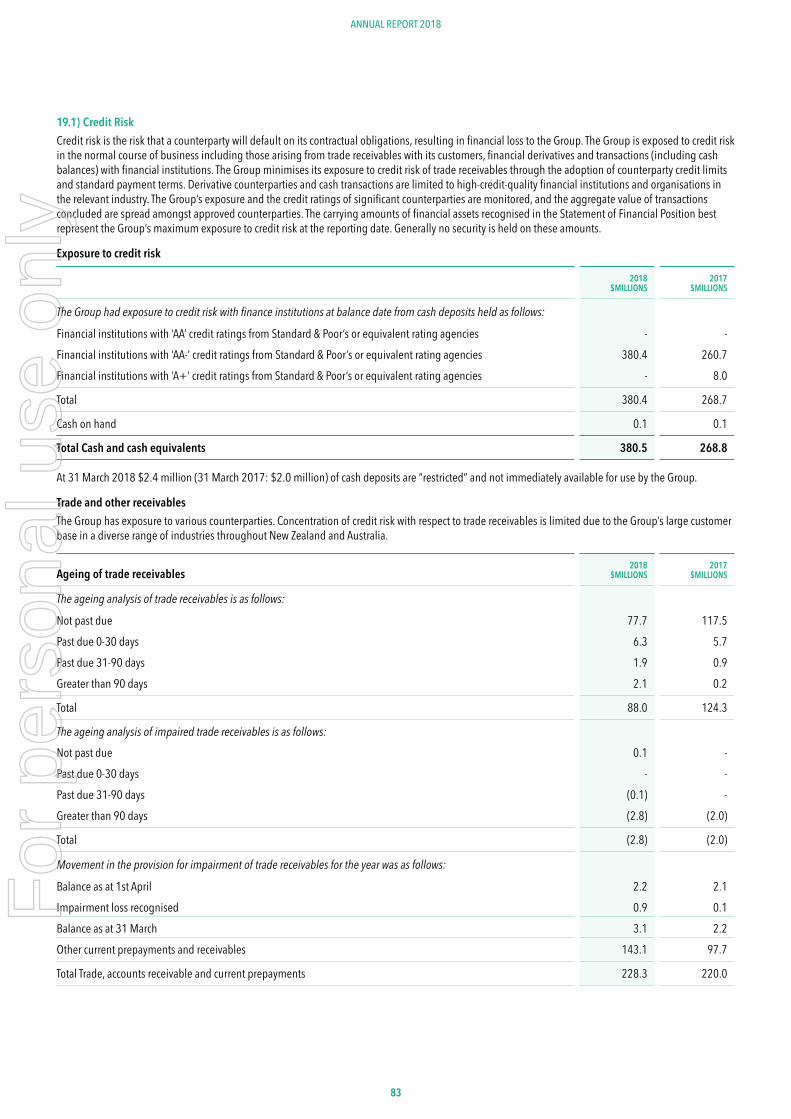
8383
ANNUAL REPORT 2018
19.1) Credit RiskCredit risk is the risk that a counterparty will default on its contractual obligations, resulting in financial loss to the Group. The Group is exposed to credit risk in the normal course of business including those arising from trade receivables with its customers, financial derivatives and transactions (including cash balances) with financial institutions. The Group minimises its exposure to credit risk of trade receivables through the adoption of counterparty credit limits and standard payment terms. Derivative counterparties and cash transactions are limited to high-credit-quality financial institutions and organisations in the relevant industry. The Group’s exposure and the credit ratings of significant counterparties are monitored, and the aggregate value of transactions concluded are spread amongst approved counterparties. The carrying amounts of financial assets recognised in the Statement of Financial Position best represent the Group’s maximum exposure to credit risk at the reporting date. Generally no security is held on these amounts.
Exposure to credit risk
2018$MILLIONS
2017$MILLIONS
The Group had exposure to credit risk with finance institutions at balance date from cash deposits held as follows:
Financial institutions with ‘AA’ credit ratings from Standard & Poor’s or equivalent rating agencies - - Financial institutions with ‘AA-’ credit ratings from Standard & Poor’s or equivalent rating agencies 380.4 260.7 Financial institutions with ‘A+’ credit ratings from Standard & Poor’s or equivalent rating agencies - 8.0
Total 380.4 268.7
Cash on hand 0.1 0.1
Total Cash and cash equivalents 380.5 268.8
At 31 March 2018 $2.4 million (31 March 2017: $2.0 million) of cash deposits are “restricted” and not immediately available for use by the Group.
Trade and other receivablesThe Group has exposure to various counterparties. Concentration of credit risk with respect to trade receivables is limited due to the Group’s large customer base in a diverse range of industries throughout New Zealand and Australia.
Ageing of trade receivables2018
$MILLIONS2017
$MILLIONS
The ageing analysis of trade receivables is as follows:
Not past due 77.7 117.5 Past due 0-30 days 6.3 5.7 Past due 31-90 days 1.9 0.9 Greater than 90 days 2.1 0.2
Total 88.0 124.3
The ageing analysis of impaired trade receivables is as follows:
Not past due 0.1 - Past due 0-30 days - - Past due 31-90 days (0.1) - Greater than 90 days (2.8) (2.0)
Total (2.8) (2.0)
Movement in the provision for impairment of trade receivables for the year was as follows:
Balance as at 1st April 2.2 2.1 Impairment loss recognised 0.9 0.1 Balance as at 31 March 3.1 2.2 Other current prepayments and receivables 143.1 97.7
Total Trade, accounts receivable and current prepayments 228.3 220.0
For
per
sona
l use
onl
y
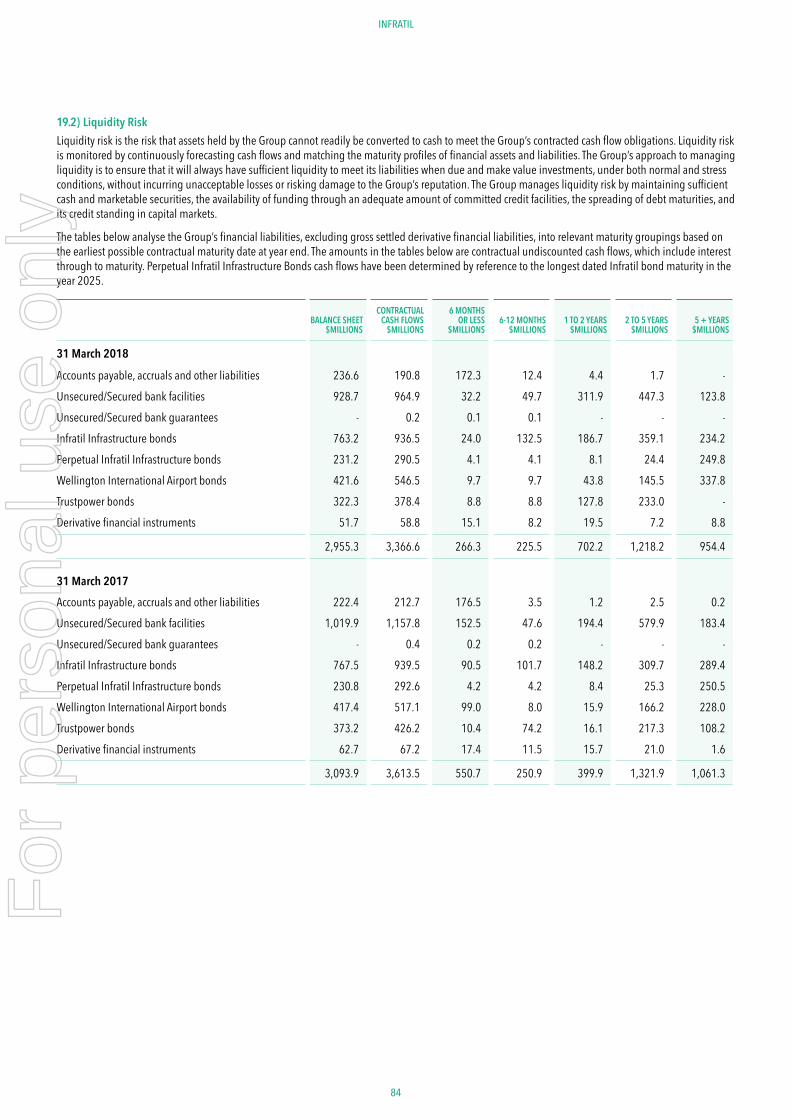
84 85
ANNUAL REPORT 2018INFRATIL
19.2) Liquidity RiskLiquidity risk is the risk that assets held by the Group cannot readily be converted to cash to meet the Group’s contracted cash flow obligations. Liquidity risk is monitored by continuously forecasting cash flows and matching the maturity profiles of financial assets and liabilities. The Group’s approach to managing liquidity is to ensure that it will always have sufficient liquidity to meet its liabilities when due and make value investments, under both normal and stress conditions, without incurring unacceptable losses or risking damage to the Group’s reputation. The Group manages liquidity risk by maintaining sufficient cash and marketable securities, the availability of funding through an adequate amount of committed credit facilities, the spreading of debt maturities, and its credit standing in capital markets.
The tables below analyse the Group’s financial liabilities, excluding gross settled derivative financial liabilities, into relevant maturity groupings based on the earliest possible contractual maturity date at year end. The amounts in the tables below are contractual undiscounted cash flows, which include interest through to maturity. Perpetual Infratil Infrastructure Bonds cash flows have been determined by reference to the longest dated Infratil bond maturity in the year 2025.
BALANCE SHEET$MILLIONS
CONTRACTUAL CASH FLOWS
$MILLIONS
6 MONTHS OR LESS
$MILLIONS6-12 MONTHS
$MILLIONS1 TO 2 YEARS
$MILLIONS2 TO 5 YEARS
$MILLIONS5 + YEARS
$MILLIONS
31 March 2018
Accounts payable, accruals and other liabilities 236.6 190.8 172.3 12.4 4.4 1.7 - Unsecured/Secured bank facilities 928.7 964.9 32.2 49.7 311.9 447.3 123.8 Unsecured/Secured bank guarantees - 0.2 0.1 0.1 - - - Infratil Infrastructure bonds 763.2 936.5 24.0 132.5 186.7 359.1 234.2 Perpetual Infratil Infrastructure bonds 231.2 290.5 4.1 4.1 8.1 24.4 249.8 Wellington International Airport bonds 421.6 546.5 9.7 9.7 43.8 145.5 337.8 Trustpower bonds 322.3 378.4 8.8 8.8 127.8 233.0 - Derivative financial instruments 51.7 58.8 15.1 8.2 19.5 7.2 8.8
2,955.3 3,366.6 266.3 225.5 702.2 1,218.2 954.4
31 March 2017Accounts payable, accruals and other liabilities 222.4 212.7 176.5 3.5 1.2 2.5 0.2 Unsecured/Secured bank facilities 1,019.9 1,157.8 152.5 47.6 194.4 579.9 183.4 Unsecured/Secured bank guarantees - 0.4 0.2 0.2 - - - Infratil Infrastructure bonds 767.5 939.5 90.5 101.7 148.2 309.7 289.4 Perpetual Infratil Infrastructure bonds 230.8 292.6 4.2 4.2 8.4 25.3 250.5 Wellington International Airport bonds 417.4 517.1 99.0 8.0 15.9 166.2 228.0 Trustpower bonds 373.2 426.2 10.4 74.2 16.1 217.3 108.2 Derivative financial instruments 62.7 67.2 17.4 11.5 15.7 21.0 1.6
3,093.9 3,613.5 550.7 250.9 399.9 1,321.9 1,061.3
For
per
sona
l use
onl
y
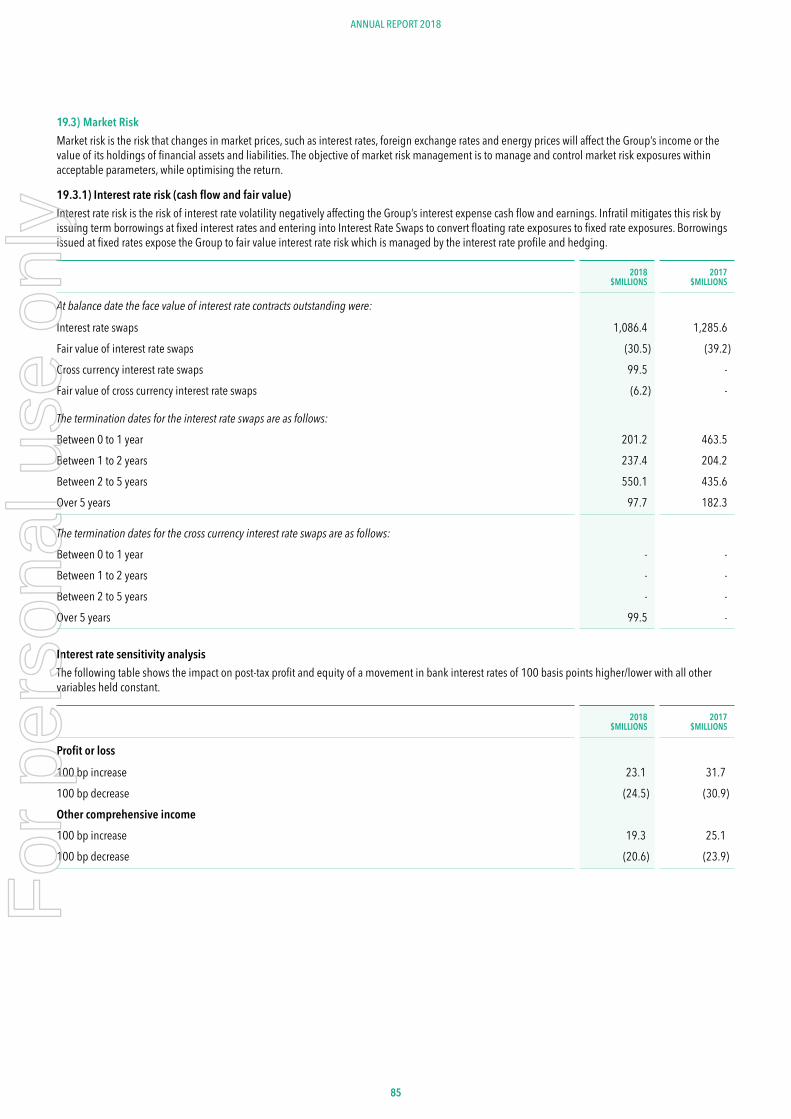
8585
ANNUAL REPORT 2018
19.3) Market RiskMarket risk is the risk that changes in market prices, such as interest rates, foreign exchange rates and energy prices will affect the Group’s income or the value of its holdings of financial assets and liabilities. The objective of market risk management is to manage and control market risk exposures within acceptable parameters, while optimising the return.
19.3.1) Interest rate risk (cash flow and fair value)Interest rate risk is the risk of interest rate volatility negatively affecting the Group’s interest expense cash flow and earnings. Infratil mitigates this risk by issuing term borrowings at fixed interest rates and entering into Interest Rate Swaps to convert floating rate exposures to fixed rate exposures. Borrowings issued at fixed rates expose the Group to fair value interest rate risk which is managed by the interest rate profile and hedging.
2018$MILLIONS
2017$MILLIONS
At balance date the face value of interest rate contracts outstanding were:
Interest rate swaps 1,086.4 1,285.6 Fair value of interest rate swaps (30.5) (39.2)Cross currency interest rate swaps 99.5 - Fair value of cross currency interest rate swaps (6.2) -
The termination dates for the interest rate swaps are as follows:
Between 0 to 1 year 201.2 463.5 Between 1 to 2 years 237.4 204.2 Between 2 to 5 years 550.1 435.6 Over 5 years 97.7 182.3
The termination dates for the cross currency interest rate swaps are as follows:
Between 0 to 1 year - - Between 1 to 2 years - - Between 2 to 5 years - -Over 5 years 99.5 -
Interest rate sensitivity analysisThe following table shows the impact on post-tax profit and equity of a movement in bank interest rates of 100 basis points higher/lower with all other variables held constant.
2018$MILLIONS
2017$MILLIONS
Profit or loss
100 bp increase 23.1 31.7 100 bp decrease (24.5) (30.9)Other comprehensive income100 bp increase 19.3 25.1 100 bp decrease (20.6) (23.9)
For
per
sona
l use
onl
y
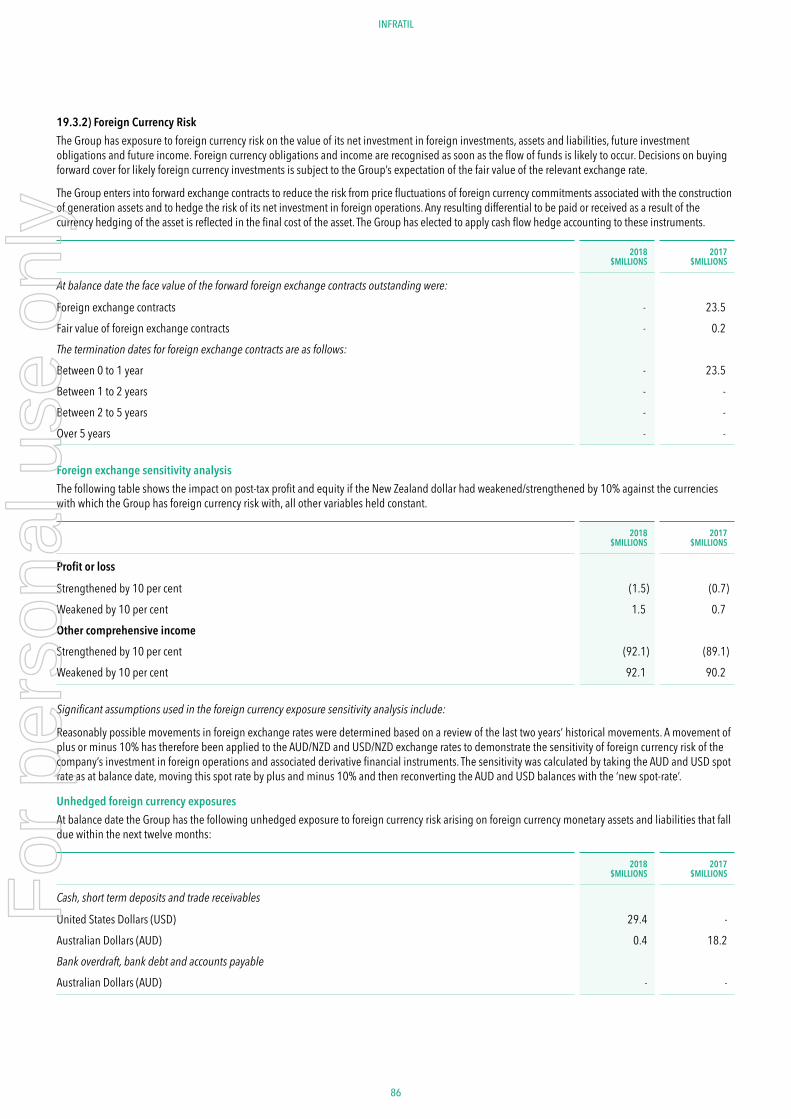
86 87
ANNUAL REPORT 2018INFRATIL
19.3.2) Foreign Currency RiskThe Group has exposure to foreign currency risk on the value of its net investment in foreign investments, assets and liabilities, future investment obligations and future income. Foreign currency obligations and income are recognised as soon as the flow of funds is likely to occur. Decisions on buying forward cover for likely foreign currency investments is subject to the Group’s expectation of the fair value of the relevant exchange rate.
The Group enters into forward exchange contracts to reduce the risk from price fluctuations of foreign currency commitments associated with the construction of generation assets and to hedge the risk of its net investment in foreign operations. Any resulting differential to be paid or received as a result of the currency hedging of the asset is reflected in the final cost of the asset. The Group has elected to apply cash flow hedge accounting to these instruments.
2018$MILLIONS
2017$MILLIONS
At balance date the face value of the forward foreign exchange contracts outstanding were:
Foreign exchange contracts - 23.5 Fair value of foreign exchange contracts - 0.2 The termination dates for foreign exchange contracts are as follows:
Between 0 to 1 year - 23.5 Between 1 to 2 years - - Between 2 to 5 years - - Over 5 years - -
Foreign exchange sensitivity analysisThe following table shows the impact on post-tax profit and equity if the New Zealand dollar had weakened/strengthened by 10% against the currencies with which the Group has foreign currency risk with, all other variables held constant.
2018$MILLIONS
2017$MILLIONS
Profit or loss
Strengthened by 10 per cent (1.5) (0.7)Weakened by 10 per cent 1.5 0.7 Other comprehensive incomeStrengthened by 10 per cent (92.1) (89.1)Weakened by 10 per cent 92.1 90.2
Significant assumptions used in the foreign currency exposure sensitivity analysis include:
Reasonably possible movements in foreign exchange rates were determined based on a review of the last two years’ historical movements. A movement of plus or minus 10% has therefore been applied to the AUD/NZD and USD/NZD exchange rates to demonstrate the sensitivity of foreign currency risk of the company’s investment in foreign operations and associated derivative financial instruments. The sensitivity was calculated by taking the AUD and USD spot rate as at balance date, moving this spot rate by plus and minus 10% and then reconverting the AUD and USD balances with the ‘new spot-rate’.
Unhedged foreign currency exposuresAt balance date the Group has the following unhedged exposure to foreign currency risk arising on foreign currency monetary assets and liabilities that fall due within the next twelve months:
2018$MILLIONS
2017$MILLIONS
Cash, short term deposits and trade receivables
United States Dollars (USD) 29.4 - Australian Dollars (AUD) 0.4 18.2 Bank overdraft, bank debt and accounts payable
Australian Dollars (AUD) - -
For
per
sona
l use
onl
y
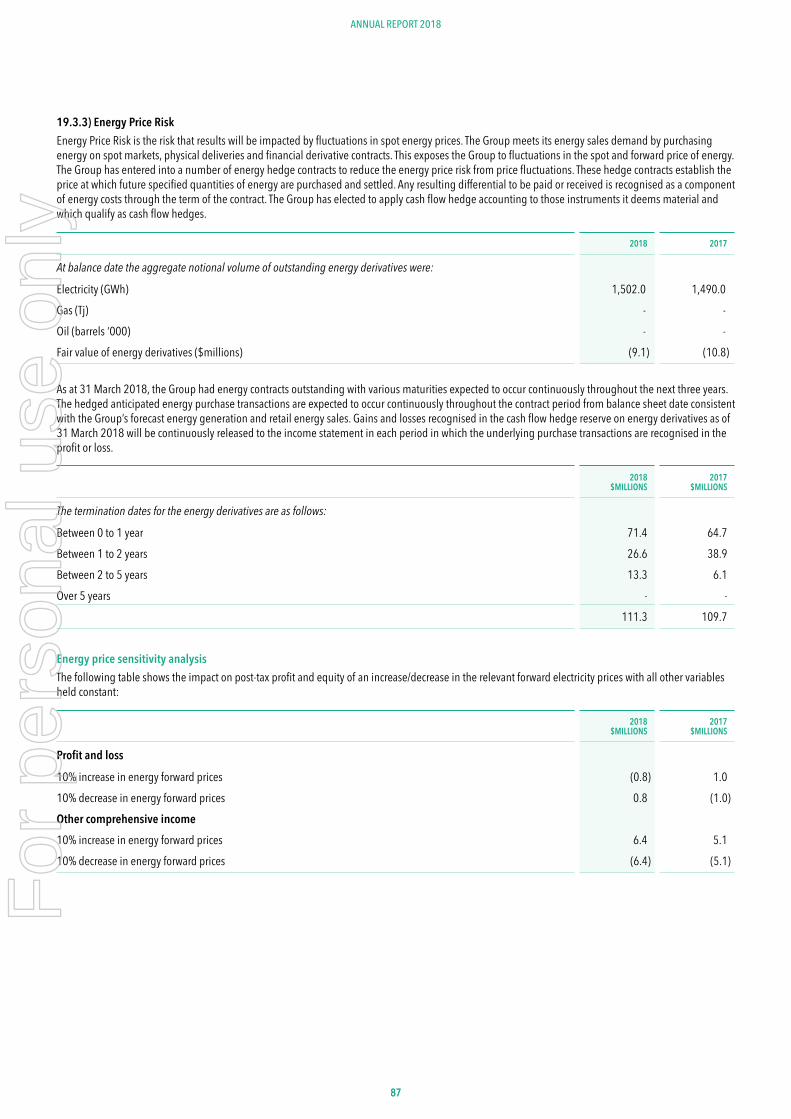
8787
ANNUAL REPORT 2018
19.3.3) Energy Price RiskEnergy Price Risk is the risk that results will be impacted by fluctuations in spot energy prices. The Group meets its energy sales demand by purchasing energy on spot markets, physical deliveries and financial derivative contracts. This exposes the Group to fluctuations in the spot and forward price of energy. The Group has entered into a number of energy hedge contracts to reduce the energy price risk from price fluctuations. These hedge contracts establish the price at which future specified quantities of energy are purchased and settled. Any resulting differential to be paid or received is recognised as a component of energy costs through the term of the contract. The Group has elected to apply cash flow hedge accounting to those instruments it deems material and which qualify as cash flow hedges.
2018 2017
At balance date the aggregate notional volume of outstanding energy derivatives were:
Electricity (GWh) 1,502.0 1,490.0 Gas (Tj) - - Oil (barrels ‘000) - - Fair value of energy derivatives ($millions) (9.1) (10.8)
As at 31 March 2018, the Group had energy contracts outstanding with various maturities expected to occur continuously throughout the next three years. The hedged anticipated energy purchase transactions are expected to occur continuously throughout the contract period from balance sheet date consistent with the Group’s forecast energy generation and retail energy sales. Gains and losses recognised in the cash flow hedge reserve on energy derivatives as of 31 March 2018 will be continuously released to the income statement in each period in which the underlying purchase transactions are recognised in the profit or loss.
2018$MILLIONS
2017$MILLIONS
The termination dates for the energy derivatives are as follows:
Between 0 to 1 year 71.4 64.7 Between 1 to 2 years 26.6 38.9 Between 2 to 5 years 13.3 6.1 Over 5 years - -
111.3 109.7
Energy price sensitivity analysisThe following table shows the impact on post-tax profit and equity of an increase/decrease in the relevant forward electricity prices with all other variables held constant:
2018$MILLIONS
2017$MILLIONS
Profit and loss
10% increase in energy forward prices (0.8) 1.010% decrease in energy forward prices 0.8 (1.0) Other comprehensive income10% increase in energy forward prices 6.4 5.110% decrease in energy forward prices (6.4) (5.1)
For
per
sona
l use
onl
y
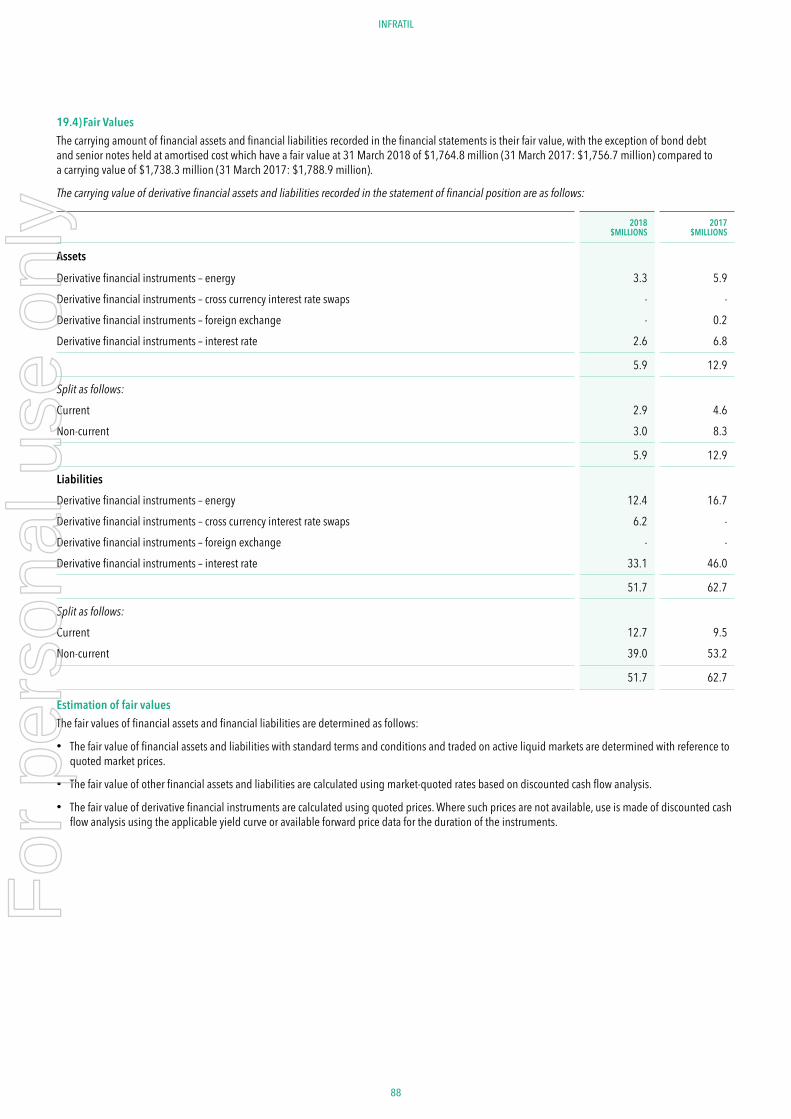
88 89
ANNUAL REPORT 2018INFRATIL
19.4) Fair ValuesThe carrying amount of financial assets and financial liabilities recorded in the financial statements is their fair value, with the exception of bond debt and senior notes held at amortised cost which have a fair value at 31 March 2018 of $1,764.8 million (31 March 2017: $1,756.7 million) compared to a carrying value of $1,738.3 million (31 March 2017: $1,788.9 million).
The carrying value of derivative financial assets and liabilities recorded in the statement of financial position are as follows:
2018$MILLIONS
2017$MILLIONS
Assets
Derivative financial instruments – energy 3.3 5.9 Derivative financial instruments – cross currency interest rate swaps - - Derivative financial instruments – foreign exchange - 0.2 Derivative financial instruments – interest rate 2.6 6.8
5.9 12.9
Split as follows:
Current 2.9 4.6 Non-current 3.0 8.3
5.9 12.9
LiabilitiesDerivative financial instruments – energy 12.4 16.7 Derivative financial instruments – cross currency interest rate swaps 6.2 - Derivative financial instruments – foreign exchange - - Derivative financial instruments – interest rate 33.1 46.0
51.7 62.7
Split as follows:
Current 12.7 9.5 Non-current 39.0 53.2
51.7 62.7
Estimation of fair valuesThe fair values of financial assets and financial liabilities are determined as follows:
• The fair value of financial assets and liabilities with standard terms and conditions and traded on active liquid markets are determined with reference to quoted market prices.
• The fair value of other financial assets and liabilities are calculated using market-quoted rates based on discounted cash flow analysis.
• The fair value of derivative financial instruments are calculated using quoted prices. Where such prices are not available, use is made of discounted cash flow analysis using the applicable yield curve or available forward price data for the duration of the instruments.
For
per
sona
l use
onl
y
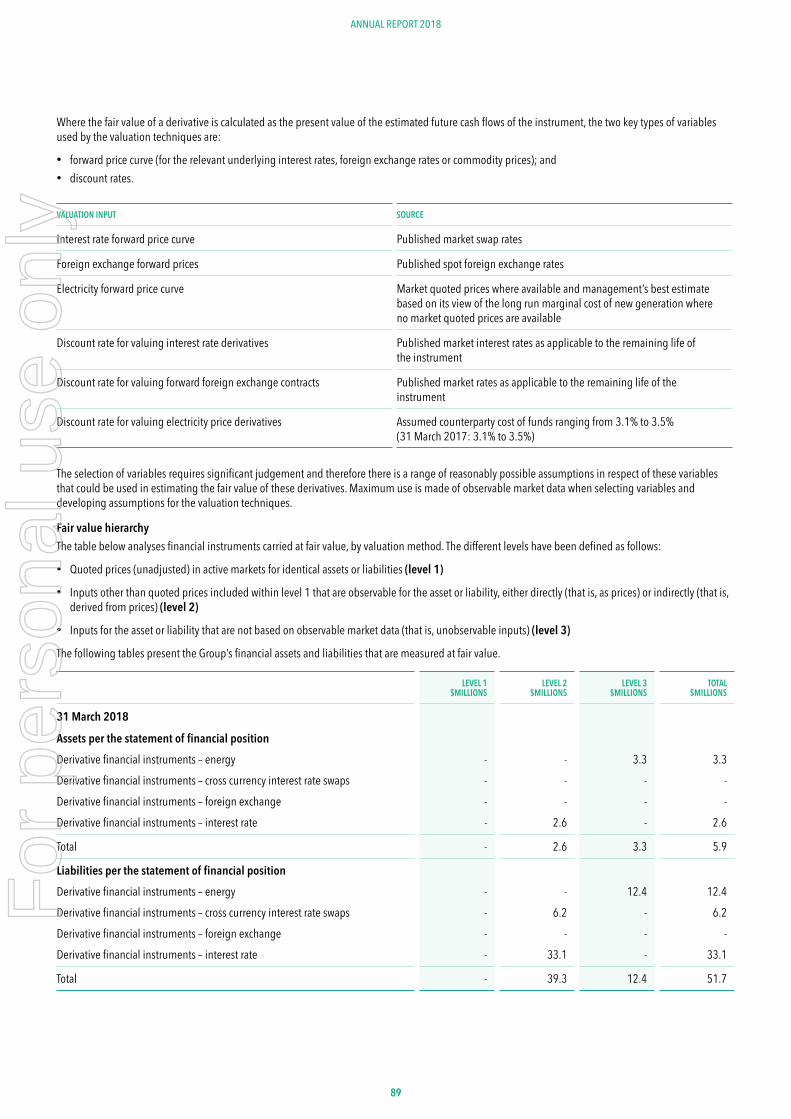
8989
ANNUAL REPORT 2018
Where the fair value of a derivative is calculated as the present value of the estimated future cash flows of the instrument, the two key types of variables used by the valuation techniques are:
• forward price curve (for the relevant underlying interest rates, foreign exchange rates or commodity prices); and • discount rates.
VALUATION INPUT SOURCE
Interest rate forward price curve Published market swap rates
Foreign exchange forward prices Published spot foreign exchange rates
Electricity forward price curve Market quoted prices where available and management’s best estimate based on its view of the long run marginal cost of new generation where no market quoted prices are available
Discount rate for valuing interest rate derivatives Published market interest rates as applicable to the remaining life of the instrument
Discount rate for valuing forward foreign exchange contracts Published market rates as applicable to the remaining life of the instrument
Discount rate for valuing electricity price derivatives Assumed counterparty cost of funds ranging from 3.1% to 3.5% (31 March 2017: 3.1% to 3.5%)
The selection of variables requires significant judgement and therefore there is a range of reasonably possible assumptions in respect of these variables that could be used in estimating the fair value of these derivatives. Maximum use is made of observable market data when selecting variables and developing assumptions for the valuation techniques.
Fair value hierarchyThe table below analyses financial instruments carried at fair value, by valuation method. The different levels have been defined as follows:
• Quoted prices (unadjusted) in active markets for identical assets or liabilities (level 1)
• Inputs other than quoted prices included within level 1 that are observable for the asset or liability, either directly (that is, as prices) or indirectly (that is, derived from prices) (level 2)
• Inputs for the asset or liability that are not based on observable market data (that is, unobservable inputs) (level 3)
The following tables present the Group’s financial assets and liabilities that are measured at fair value.
LEVEL 1 $MILLIONS
LEVEL 2 $MILLIONS
LEVEL 3 $MILLIONS
TOTAL $MILLIONS
31 March 2018
Assets per the statement of financial positionDerivative financial instruments – energy - - 3.3 3.3 Derivative financial instruments – cross currency interest rate swaps - - - - Derivative financial instruments – foreign exchange - - - - Derivative financial instruments – interest rate - 2.6 - 2.6
Total - 2.6 3.3 5.9
Liabilities per the statement of financial positionDerivative financial instruments – energy - - 12.4 12.4 Derivative financial instruments – cross currency interest rate swaps - 6.2 - 6.2 Derivative financial instruments – foreign exchange - - - - Derivative financial instruments – interest rate - 33.1 - 33.1
Total - 39.3 12.4 51.7
For
per
sona
l use
onl
y
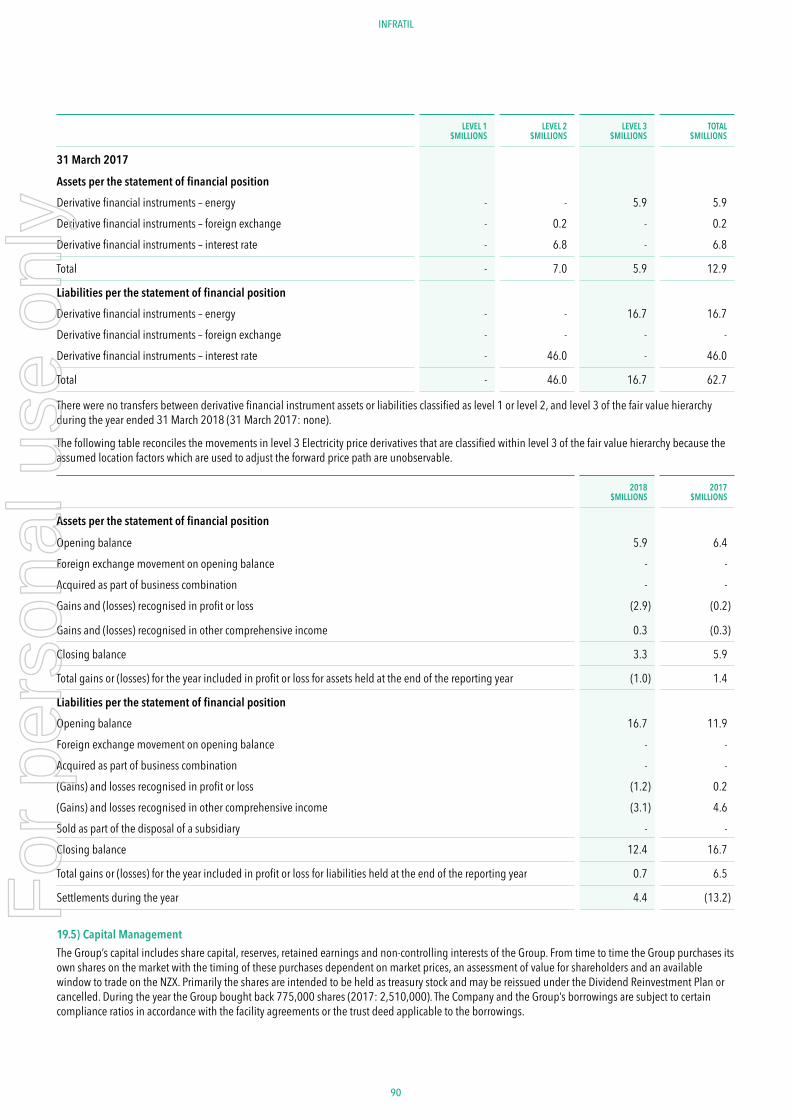
90 91
ANNUAL REPORT 2018INFRATIL
LEVEL 1 $MILLIONS
LEVEL 2 $MILLIONS
LEVEL 3 $MILLIONS
TOTAL $MILLIONS
31 March 2017
Assets per the statement of financial positionDerivative financial instruments – energy - - 5.9 5.9 Derivative financial instruments – foreign exchange - 0.2 - 0.2 Derivative financial instruments – interest rate - 6.8 - 6.8
Total - 7.0 5.9 12.9
Liabilities per the statement of financial positionDerivative financial instruments – energy - - 16.7 16.7 Derivative financial instruments – foreign exchange - - - - Derivative financial instruments – interest rate - 46.0 - 46.0
Total - 46.0 16.7 62.7
There were no transfers between derivative financial instrument assets or liabilities classified as level 1 or level 2, and level 3 of the fair value hierarchy during the year ended 31 March 2018 (31 March 2017: none).
The following table reconciles the movements in level 3 Electricity price derivatives that are classified within level 3 of the fair value hierarchy because the assumed location factors which are used to adjust the forward price path are unobservable.
2018$MILLIONS
2017$MILLIONS
Assets per the statement of financial position
Opening balance 5.9 6.4 Foreign exchange movement on opening balance - - Acquired as part of business combination - - Gains and (losses) recognised in profit or loss (2.9) (0.2)
Gains and (losses) recognised in other comprehensive income 0.3 (0.3)
Closing balance 3.3 5.9
Total gains or (losses) for the year included in profit or loss for assets held at the end of the reporting year (1.0) 1.4
Liabilities per the statement of financial positionOpening balance 16.7 11.9 Foreign exchange movement on opening balance - - Acquired as part of business combination - - (Gains) and losses recognised in profit or loss (1.2) 0.2 (Gains) and losses recognised in other comprehensive income (3.1) 4.6 Sold as part of the disposal of a subsidiary - - Closing balance 12.4 16.7
Total gains or (losses) for the year included in profit or loss for liabilities held at the end of the reporting year 0.7 6.5
Settlements during the year 4.4 (13.2)
19.5) Capital ManagementThe Group’s capital includes share capital, reserves, retained earnings and non-controlling interests of the Group. From time to time the Group purchases its own shares on the market with the timing of these purchases dependent on market prices, an assessment of value for shareholders and an available window to trade on the NZX. Primarily the shares are intended to be held as treasury stock and may be reissued under the Dividend Reinvestment Plan or cancelled. During the year the Group bought back 775,000 shares (2017: 2,510,000). The Company and the Group’s borrowings are subject to certain compliance ratios in accordance with the facility agreements or the trust deed applicable to the borrowings.
For
per
sona
l use
onl
y
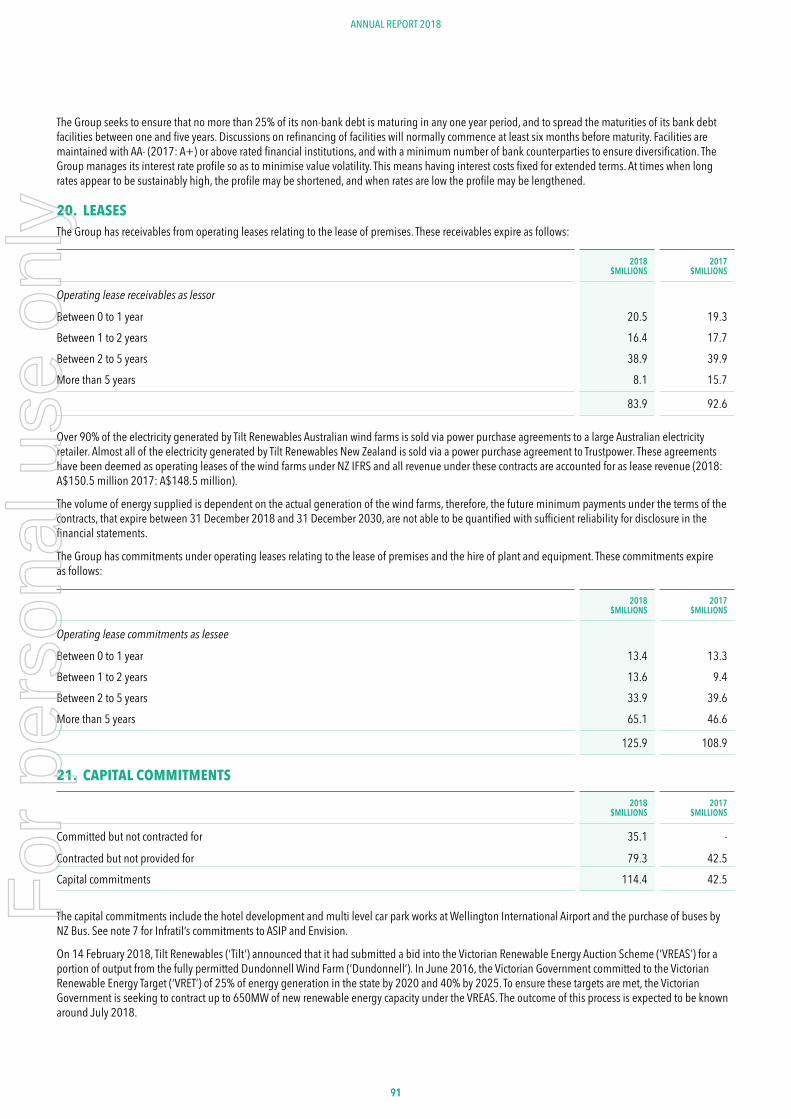
9191
ANNUAL REPORT 2018
The Group seeks to ensure that no more than 25% of its non-bank debt is maturing in any one year period, and to spread the maturities of its bank debt facilities between one and five years. Discussions on refinancing of facilities will normally commence at least six months before maturity. Facilities are maintained with AA- (2017: A+) or above rated financial institutions, and with a minimum number of bank counterparties to ensure diversification. The Group manages its interest rate profile so as to minimise value volatility. This means having interest costs fixed for extended terms. At times when long rates appear to be sustainably high, the profile may be shortened, and when rates are low the profile may be lengthened.
20. LEASESThe Group has receivables from operating leases relating to the lease of premises. These receivables expire as follows:
2018$MILLIONS
2017$MILLIONS
Operating lease receivables as lessor
Between 0 to 1 year 20.5 19.3 Between 1 to 2 years 16.4 17.7 Between 2 to 5 years 38.9 39.9 More than 5 years 8.1 15.7
83.9 92.6
Over 90% of the electricity generated by Tilt Renewables Australian wind farms is sold via power purchase agreements to a large Australian electricity retailer. Almost all of the electricity generated by Tilt Renewables New Zealand is sold via a power purchase agreement to Trustpower. These agreements have been deemed as operating leases of the wind farms under NZ IFRS and all revenue under these contracts are accounted for as lease revenue (2018: A$150.5 million 2017: A$148.5 million).
The volume of energy supplied is dependent on the actual generation of the wind farms, therefore, the future minimum payments under the terms of the contracts, that expire between 31 December 2018 and 31 December 2030, are not able to be quantified with sufficient reliability for disclosure in the financial statements.
The Group has commitments under operating leases relating to the lease of premises and the hire of plant and equipment. These commitments expire as follows:
2018$MILLIONS
2017$MILLIONS
Operating lease commitments as lessee
Between 0 to 1 year 13.4 13.3 Between 1 to 2 years 13.6 9.4 Between 2 to 5 years 33.9 39.6 More than 5 years 65.1 46.6
125.9 108.9
21. CAPITAL COMMITMENTS
2018$MILLIONS
2017$MILLIONS
Committed but not contracted for 35.1 -
Contracted but not provided for 79.3 42.5 Capital commitments 114.4 42.5
The capital commitments include the hotel development and multi level car park works at Wellington International Airport and the purchase of buses by NZ Bus. See note 7 for Infratil’s commitments to ASIP and Envision.
On 14 February 2018, Tilt Renewables (‘Tilt’) announced that it had submitted a bid into the Victorian Renewable Energy Auction Scheme (‘VREAS’) for a portion of output from the fully permitted Dundonnell Wind Farm (‘Dundonnell’). In June 2016, the Victorian Government committed to the Victorian Renewable Energy Target (‘VRET’) of 25% of energy generation in the state by 2020 and 40% by 2025. To ensure these targets are met, the Victorian Government is seeking to contract up to 650MW of new renewable energy capacity under the VREAS. The outcome of this process is expected to be known around July 2018.
For
per
sona
l use
onl
y
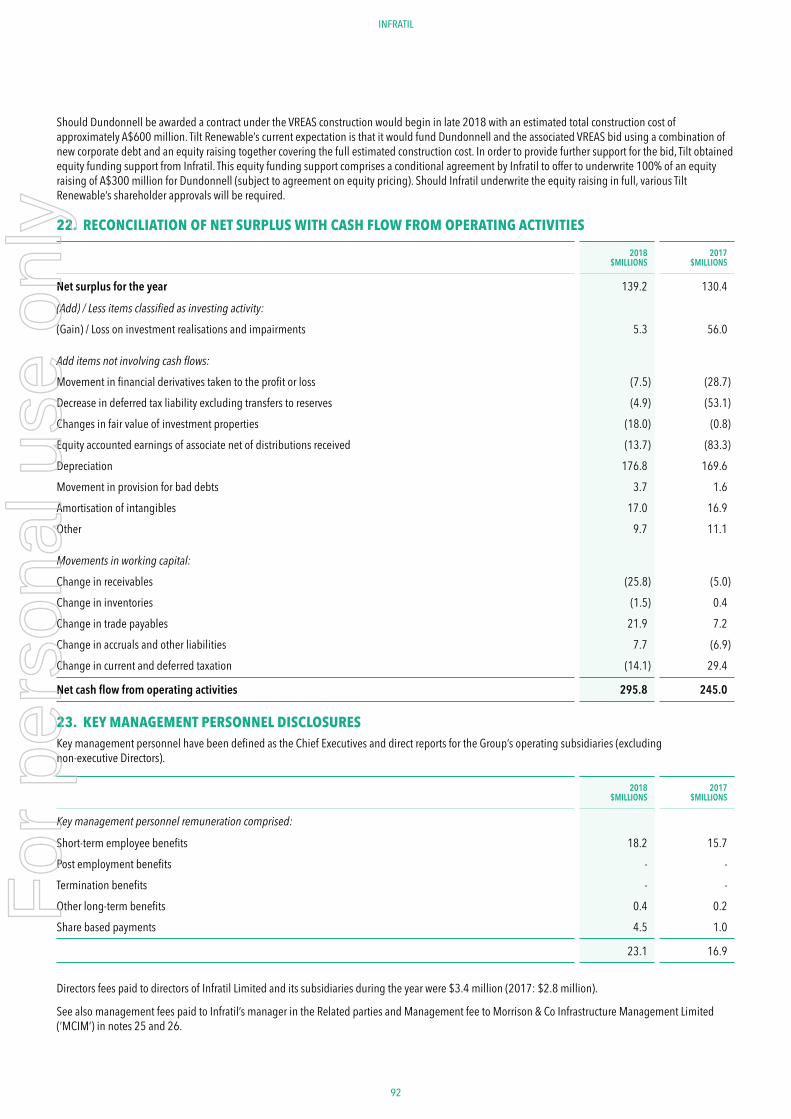
92 93
ANNUAL REPORT 2018INFRATIL
Should Dundonnell be awarded a contract under the VREAS construction would begin in late 2018 with an estimated total construction cost of approximately A$600 million. Tilt Renewable’s current expectation is that it would fund Dundonnell and the associated VREAS bid using a combination of new corporate debt and an equity raising together covering the full estimated construction cost. In order to provide further support for the bid, Tilt obtained equity funding support from Infratil. This equity funding support comprises a conditional agreement by Infratil to offer to underwrite 100% of an equity raising of A$300 million for Dundonnell (subject to agreement on equity pricing). Should Infratil underwrite the equity raising in full, various Tilt Renewable’s shareholder approvals will be required.
22. RECONCILIATION OF NET SURPLUS WITH CASH FLOW FROM OPERATING ACTIVITIES
2018$MILLIONS
2017$MILLIONS
Net surplus for the year 139.2 130.4
(Add) / Less items classified as investing activity:
(Gain) / Loss on investment realisations and impairments 5.3 56.0
Add items not involving cash flows:
Movement in financial derivatives taken to the profit or loss (7.5) (28.7)Decrease in deferred tax liability excluding transfers to reserves (4.9) (53.1)Changes in fair value of investment properties (18.0) (0.8)Equity accounted earnings of associate net of distributions received (13.7) (83.3)Depreciation 176.8 169.6 Movement in provision for bad debts 3.7 1.6 Amortisation of intangibles 17.0 16.9 Other 9.7 11.1
Movements in working capital:
Change in receivables (25.8) (5.0)Change in inventories (1.5) 0.4 Change in trade payables 21.9 7.2 Change in accruals and other liabilities 7.7 (6.9)Change in current and deferred taxation (14.1) 29.4
Net cash flow from operating activities 295.8 245.0
23. KEY MANAGEMENT PERSONNEL DISCLOSURES Key management personnel have been defined as the Chief Executives and direct reports for the Group’s operating subsidiaries (excluding non-executive Directors).
2018$MILLIONS
2017$MILLIONS
Key management personnel remuneration comprised:
Short-term employee benefits 18.2 15.7 Post employment benefits - - Termination benefits - - Other long-term benefits 0.4 0.2 Share based payments 4.5 1.0
23.1 16.9
Directors fees paid to directors of Infratil Limited and its subsidiaries during the year were $3.4 million (2017: $2.8 million).
See also management fees paid to Infratil’s manager in the Related parties and Management fee to Morrison & Co Infrastructure Management Limited (‘MCIM’) in notes 25 and 26.
For
per
sona
l use
onl
y
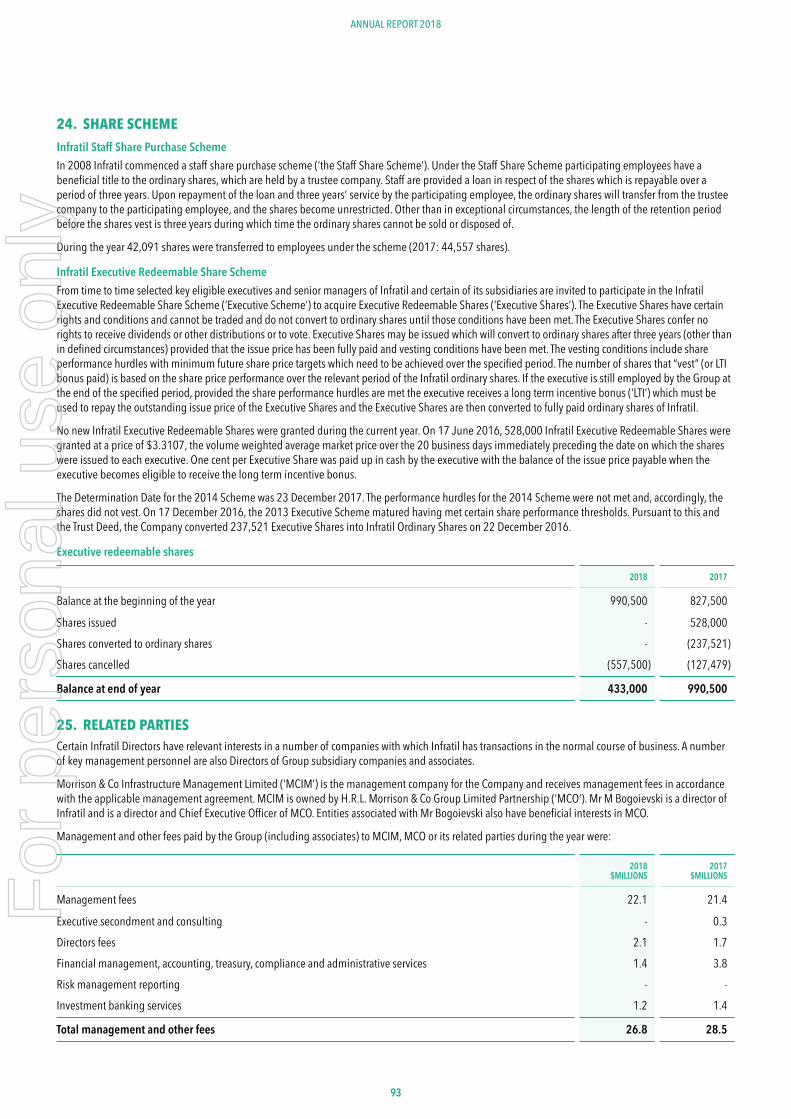
9393
ANNUAL REPORT 2018
24. SHARE SCHEMEInfratil Staff Share Purchase SchemeIn 2008 Infratil commenced a staff share purchase scheme (‘the Staff Share Scheme’). Under the Staff Share Scheme participating employees have a beneficial title to the ordinary shares, which are held by a trustee company. Staff are provided a loan in respect of the shares which is repayable over a period of three years. Upon repayment of the loan and three years’ service by the participating employee, the ordinary shares will transfer from the trustee company to the participating employee, and the shares become unrestricted. Other than in exceptional circumstances, the length of the retention period before the shares vest is three years during which time the ordinary shares cannot be sold or disposed of.
During the year 42,091 shares were transferred to employees under the scheme (2017: 44,557 shares).
Infratil Executive Redeemable Share SchemeFrom time to time selected key eligible executives and senior managers of Infratil and certain of its subsidiaries are invited to participate in the Infratil Executive Redeemable Share Scheme (‘Executive Scheme’) to acquire Executive Redeemable Shares (‘Executive Shares’). The Executive Shares have certain rights and conditions and cannot be traded and do not convert to ordinary shares until those conditions have been met. The Executive Shares confer no rights to receive dividends or other distributions or to vote. Executive Shares may be issued which will convert to ordinary shares after three years (other than in defined circumstances) provided that the issue price has been fully paid and vesting conditions have been met. The vesting conditions include share performance hurdles with minimum future share price targets which need to be achieved over the specified period. The number of shares that “vest” (or LTI bonus paid) is based on the share price performance over the relevant period of the Infratil ordinary shares. If the executive is still employed by the Group at the end of the specified period, provided the share performance hurdles are met the executive receives a long term incentive bonus (‘LTI’) which must be used to repay the outstanding issue price of the Executive Shares and the Executive Shares are then converted to fully paid ordinary shares of Infratil.
No new Infratil Executive Redeemable Shares were granted during the current year. On 17 June 2016, 528,000 Infratil Executive Redeemable Shares were granted at a price of $3.3107, the volume weighted average market price over the 20 business days immediately preceding the date on which the shares were issued to each executive. One cent per Executive Share was paid up in cash by the executive with the balance of the issue price payable when the executive becomes eligible to receive the long term incentive bonus.
The Determination Date for the 2014 Scheme was 23 December 2017. The performance hurdles for the 2014 Scheme were not met and, accordingly, the shares did not vest. On 17 December 2016, the 2013 Executive Scheme matured having met certain share performance thresholds. Pursuant to this and the Trust Deed, the Company converted 237,521 Executive Shares into Infratil Ordinary Shares on 22 December 2016.
Executive redeemable shares
2018 2017
Balance at the beginning of the year 990,500 827,500
Shares issued - 528,000 Shares converted to ordinary shares - (237,521)Shares cancelled (557,500) (127,479)
Balance at end of year 433,000 990,500
25. RELATED PARTIESCertain Infratil Directors have relevant interests in a number of companies with which Infratil has transactions in the normal course of business. A number of key management personnel are also Directors of Group subsidiary companies and associates.
Morrison & Co Infrastructure Management Limited (‘MCIM’) is the management company for the Company and receives management fees in accordance with the applicable management agreement. MCIM is owned by H.R.L. Morrison & Co Group Limited Partnership (‘MCO’). Mr M Bogoievski is a director of Infratil and is a director and Chief Executive Officer of MCO. Entities associated with Mr Bogoievski also have beneficial interests in MCO.
Management and other fees paid by the Group (including associates) to MCIM, MCO or its related parties during the year were:
2018$MILLIONS
2017$MILLIONS
Management fees 22.1 21.4
Executive secondment and consulting - 0.3 Directors fees 2.1 1.7 Financial management, accounting, treasury, compliance and administrative services 1.4 3.8 Risk management reporting - - Investment banking services 1.2 1.4
Total management and other fees 26.8 28.5
For
per
sona
l use
onl
y
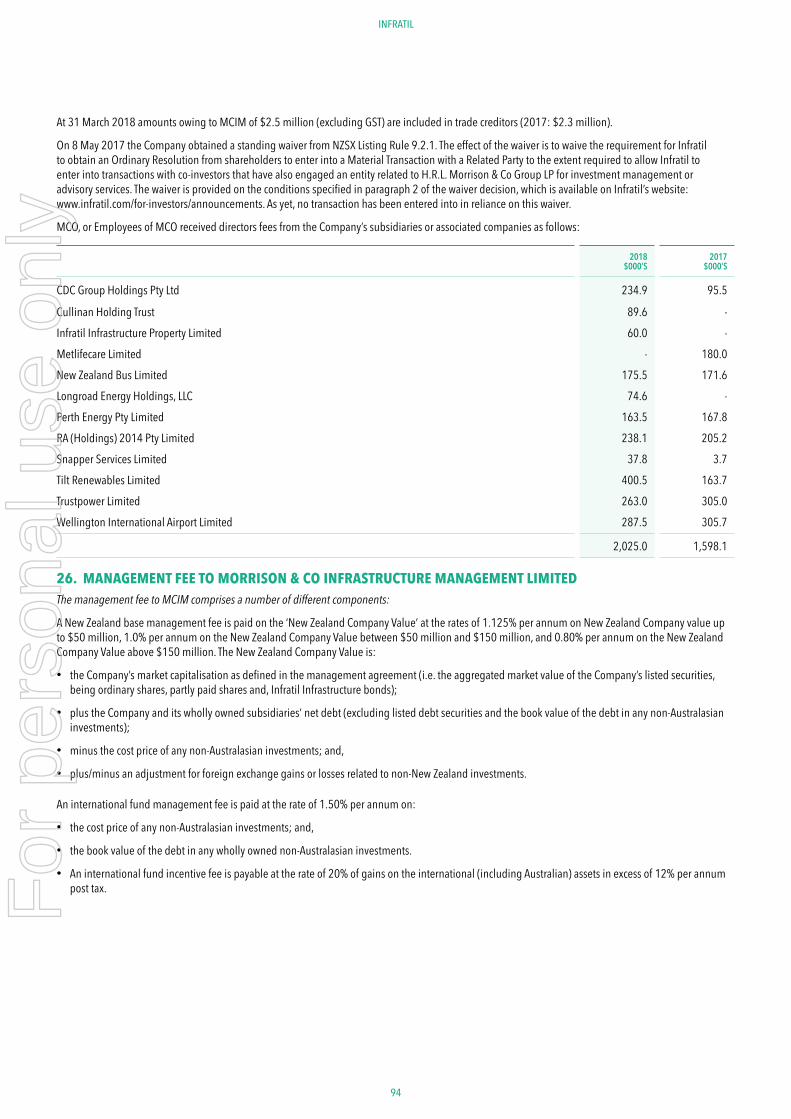
94 95
ANNUAL REPORT 2018INFRATIL
At 31 March 2018 amounts owing to MCIM of $2.5 million (excluding GST) are included in trade creditors (2017: $2.3 million).
On 8 May 2017 the Company obtained a standing waiver from NZSX Listing Rule 9.2.1. The effect of the waiver is to waive the requirement for Infratil to obtain an Ordinary Resolution from shareholders to enter into a Material Transaction with a Related Party to the extent required to allow Infratil to enter into transactions with co-investors that have also engaged an entity related to H.R.L. Morrison & Co Group LP for investment management or advisory services. The waiver is provided on the conditions specified in paragraph 2 of the waiver decision, which is available on Infratil’s website: www.infratil.com/for-investors/announcements. As yet, no transaction has been entered into in reliance on this waiver.
MCO, or Employees of MCO received directors fees from the Company’s subsidiaries or associated companies as follows:
2018$000’S
2017$000’S
CDC Group Holdings Pty Ltd 234.9 95.5
Cullinan Holding Trust 89.6 - Infratil Infrastructure Property Limited 60.0 - Metlifecare Limited - 180.0 New Zealand Bus Limited 175.5 171.6 Longroad Energy Holdings, LLC 74.6 - Perth Energy Pty Limited 163.5 167.8 RA (Holdings) 2014 Pty Limited 238.1 205.2 Snapper Services Limited 37.8 3.7 Tilt Renewables Limited 400.5 163.7 Trustpower Limited 263.0 305.0 Wellington International Airport Limited 287.5 305.7
2,025.0 1,598.1
26. MANAGEMENT FEE TO MORRISON & CO INFRASTRUCTURE MANAGEMENT LIMITEDThe management fee to MCIM comprises a number of different components:
A New Zealand base management fee is paid on the ‘New Zealand Company Value’ at the rates of 1.125% per annum on New Zealand Company value up to $50 million, 1.0% per annum on the New Zealand Company Value between $50 million and $150 million, and 0.80% per annum on the New Zealand Company Value above $150 million. The New Zealand Company Value is:
• the Company’s market capitalisation as defined in the management agreement (i.e. the aggregated market value of the Company’s listed securities, being ordinary shares, partly paid shares and, Infratil Infrastructure bonds);
• plus the Company and its wholly owned subsidiaries’ net debt (excluding listed debt securities and the book value of the debt in any non-Australasian investments);
• minus the cost price of any non-Australasian investments; and,
• plus/minus an adjustment for foreign exchange gains or losses related to non-New Zealand investments.
An international fund management fee is paid at the rate of 1.50% per annum on:
• the cost price of any non-Australasian investments; and,
• the book value of the debt in any wholly owned non-Australasian investments.
• An international fund incentive fee is payable at the rate of 20% of gains on the international (including Australian) assets in excess of 12% per annum post tax.F
or p
erso
nal u
se o
nly

9595
ANNUAL REPORT 2018
27. CONTINGENT LIABILITIES AND LEGAL MATTERSThe Company and certain wholly owned subsidiaries are guarantors of the bank debt facilities of Infratil Finance Limited under a Deed of Negative Pledge, Guarantee and Subordination and the Company is a guarantor to certain obligations of subsidiary companies.
The Perth Energy group has issued bank guarantees of $32.3 million to satisfy the prudential requirements from suppliers and the Australian Energy Market Operator.
The Company has a contingent liability under the international fund management agreement with Morrison & Co International Limited in the event that the Group sells its international assets, or valuation of the assets exceeds the performance thresholds set out in the international fund management agreement.
During 2007 the European Commission opened formal investigations into alleged state aid in relation to Lübeck airport (owned and operated by Flughafen Lübeck GmbH, one of the Group’s subsidiaries at that time). One of the matters being investigated with regard to Lübeck airport related to Infratil Airports Europe Limited (‘IAEL’), specifically the price IAEL paid when it purchased 90% of Flughafen Lübeck GmbH. In February 2012, the investigation was formally extended to include the put option arrangements (including the 2009 exercise of a put option by Infratil, by which it sold its interest in Lübeck airport back to the City of Lübeck) and the postponement of the put option period. On 7 February 2017, the European Commission released a decision that there was no state aid in respect of any of the Lübeck airport transactions involving Infratil. This decision became final and non-appealable on 1 March 2018, following the expiry of the deadline for challenges to be brought. Consequently, this has ceased to be a contingent liability for Infratil.
28. EVENTS AFTER BALANCE DATEDividendOn 16 May 2018, the Directors approved a fully imputed final dividend of 10.75 cents per share to holders of fully paid ordinary shares to be paid on 18 June 2018.
For
per
sona
l use
onl
y
96 97
ANNUAL REPORT 2018INFRATIL
© 2017 KPMG, a New Zealand partnership and a member firm of the KPMG network of independent member firms affiliated with KPMG International Cooperative (“KPMG International”), a Swiss entity.
Independent Auditor’s Report To the shareholders of Infratil Limited
Report on the consolidated financial statements
Opinion In our opinion, the accompanying consolidated financial statements of Infratil Limited (the company) and its subsidiaries (the Group) on pages 1 to 38:
i. present fairly in all material respects the Group’s financial position as at 31 March 2017 and its financial performance and cash flows for the year ended on that date; and
ii. comply with New Zealand Equivalents to International Financial Reporting Standards and International Financial Reporting Standards.
We have audited the accompanying consolidated financial statements which comprise:
— the consolidated statement of financial position as at 31 March 2017;
— the consolidated statement of comprehensive income, statement of changes in equity and statement of cash flows for the year then ended; and
— notes, including a summary of significant accounting policies and other explanatory information.
Basis for opinion
We conducted our audit in accordance with International Standards on Auditing (New Zealand) (“ISAs (NZ)”). We believe that the audit evidence we have obtained is sufficient and appropriate to provide a basis for our opinion.
We are independent of the Group in accordance with Professional and Ethical Standard 1 (Revised) Code of Ethics for Assurance Practitioners issued by the New Zealand Auditing and Assurance Standards Board and the International Ethics Standards Board for Accountants’ Code of Ethics for Professional Accountants (IESBA Code), and we have fulfilled our other ethical responsibilities in accordance with these requirements and the IESBA Code.
Our responsibilities under ISAs (NZ) are further described in the Auditor’s Responsibilities for the Audit of the consolidated financial statements section of our report.
Our firm has also provided other services to the Group in relation to taxation, regulatory disclosures and other assurance engagements. Subject to certain restrictions, partners and employees of our firm may also deal with the Group on normal terms within the ordinary course of trading activities of the business of the Group. These matters have not impaired our independence as auditor of the Group. The firm has no other relationship with, or interest in, the Group.
Scoping
The scope of our audit is designed to ensure that we perform adequate work to be able to give an opinion on the consolidated financial statements as a whole, taking into account the structure of the Group, the significance and risk profile of each investment it owns, the Group’s accounting processes and controls, and the industry in which the investments operate.
© 2018 KPMG, a New Zealand partnership and a member firm of the KPMG network of independent member firms affiliated with KPMG International Cooperative (“KPMG International”), a Swiss entity.
Independent Auditor’s Report To the shareholders of Infratil Limited
Report on the consolidated financial statements
Opinion In our opinion, the accompanying consolidated financial statements of Infratil Limited (the company) and its subsidiaries (the group) on pages 52 to 95:
i. present fairly in all material respects the group’s financial position as at 31 March 2018 and its financial performance and cash flows for the year ended on that date; and
ii. comply with New Zealand Equivalents to International Financial Reporting Standards.
We have audited the accompanying consolidated financial statements which comprise:
— the consolidated statement of financial position as at 31 March 2018;
— the consolidated statements of comprehensive income, changes in equity and cash flows for the year then ended; and
— notes, including a summary of significant accounting policies and other explanatory information.
Basis for opinion
We conducted our audit in accordance with International Standards on Auditing (New Zealand) (‘ISAs (NZ)’). We believe that the audit evidence we have obtained is sufficient and appropriate to provide a basis for our opinion.
We are independent of the group in accordance with Professional and Ethical Standard 1 (Revised) Code of Ethics for Assurance Practitioners issued by the New Zealand Auditing and Assurance Standards Board and the International Ethics Standards Board for Accountants’ Code of Ethics for Professional Accountants (IESBA Code), and we have fulfilled our other ethical responsibilities in accordance with these requirements and the IESBA Code.
Our responsibilities under ISAs (NZ) are further described in the auditor’s responsibilities for the audit of the consolidated financial statements section of our report.
Our firm has also provided other services to the group in relation to taxation, regulatory disclosures and other assurance engagements. Subject to certain restrictions, partners and employees of our firm may also deal with the group on normal terms within the ordinary course of trading activities of the business of the group. These matters have not impaired our independence as auditor of the group. The firm has no other relationship with, or interest in, the group.
Scoping
The scope of our audit is designed to ensure that we perform adequate work to be able to give an opinion on the consolidated financial statements as a whole, taking into account the structure of the group, the significance and risk profile of each investment it owns, the group’s accounting processes and controls, and the industry in which the investments operate.
For
per
sona
l use
onl
y
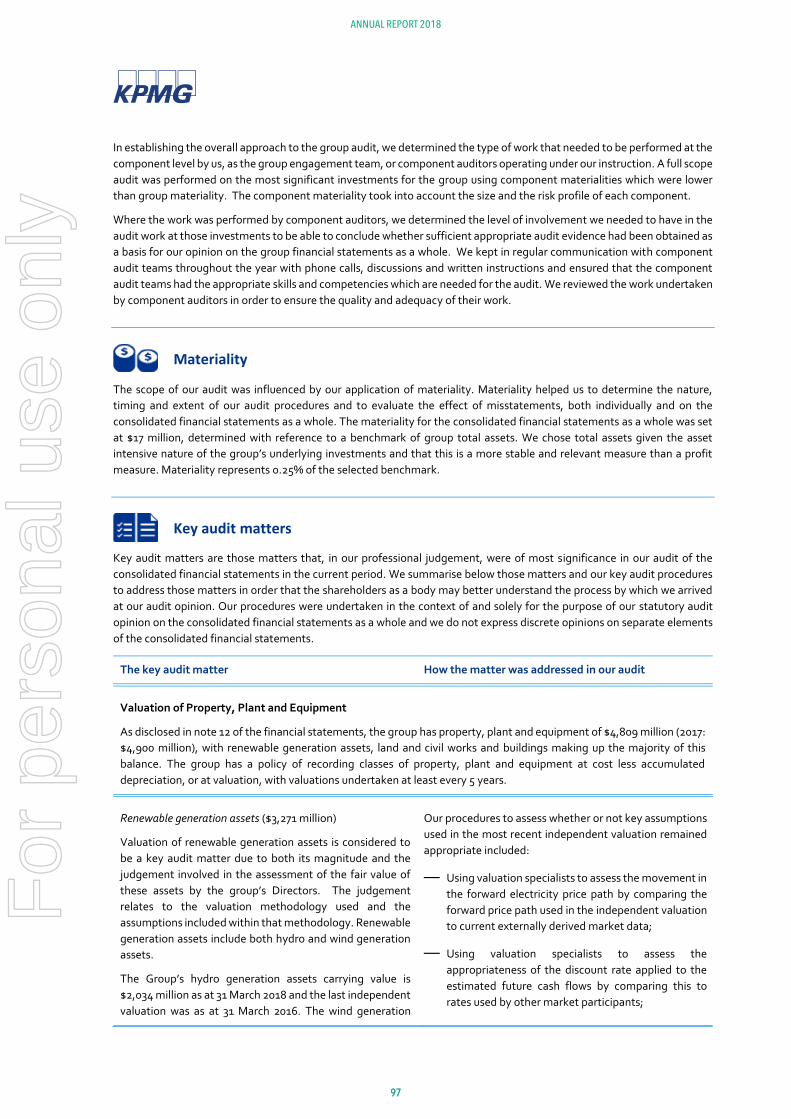
9797
ANNUAL REPORT 2018
IFT Audit report final 2
In establishing the overall approach to the group audit, we determined the type of work that needed to be performed at the component level by us, as the group engagement team, or component auditors operating under our instruction. A full scope audit was performed on the most significant investments for the group using component materialities which were lower than group materiality. The component materiality took into account the size and the risk profile of each component.
Where the work was performed by component auditors, we determined the level of involvement we needed to have in the audit work at those investments to be able to conclude whether sufficient appropriate audit evidence had been obtained as a basis for our opinion on the group financial statements as a whole. We kept in regular communication with component audit teams throughout the year with phone calls, discussions and written instructions and ensured that the component audit teams had the appropriate skills and competencies which are needed for the audit. We reviewed the work undertaken by component auditors in order to ensure the quality and adequacy of their work.
Materiality
The scope of our audit was influenced by our application of materiality. Materiality helped us to determine the nature, timing and extent of our audit procedures and to evaluate the effect of misstatements, both individually and on the consolidated financial statements as a whole. The materiality for the consolidated financial statements as a whole was set at $17 million, determined with reference to a benchmark of group total assets. We chose total assets given the asset intensive nature of the group’s underlying investments and that this is a more stable and relevant measure than a profit measure. Materiality represents 0.25% of the selected benchmark.
Key audit matters
Key audit matters are those matters that, in our professional judgement, were of most significance in our audit of the consolidated financial statements in the current period. We summarise below those matters and our key audit procedures to address those matters in order that the shareholders as a body may better understand the process by which we arrived at our audit opinion. Our procedures were undertaken in the context of and solely for the purpose of our statutory audit opinion on the consolidated financial statements as a whole and we do not express discrete opinions on separate elements of the consolidated financial statements.
The key audit matter How the matter was addressed in our audit
Valuation of Property, Plant and Equipment
As disclosed in note 12 of the financial statements, the group has property, plant and equipment of $4,809 million (2017: $4,900 million), with renewable generation assets, land and civil works and buildings making up the majority of this balance. The group has a policy of recording classes of property, plant and equipment at cost less accumulated depreciation, or at valuation, with valuations undertaken at least every 5 years.
Renewable generation assets ($3,271 million)
Valuation of renewable generation assets is considered to be a key audit matter due to both its magnitude and the judgement involved in the assessment of the fair value of these assets by the group’s Directors. The judgement relates to the valuation methodology used and the assumptions included within that methodology. Renewable generation assets include both hydro and wind generation assets.
The Group’s hydro generation assets carrying value is $2,034 million as at 31 March 2018 and the last independent valuation was as at 31 March 2016. The wind generation
Our procedures to assess whether or not key assumptions used in the most recent independent valuation remained appropriate included:
— Using valuation specialists to assess the movement in the forward electricity price path by comparing the forward price path used in the independent valuation to current externally derived market data;
— Using valuation specialists to assess the appropriateness of the discount rate applied to the estimated future cash flows by comparing this to rates used by other market participants;
For
per
sona
l use
onl
y
98 99
ANNUAL REPORT 2018INFRATIL
IFT Audit report final 3
The key audit matter How the matter was addressed in our audit
assets carrying value as at 31 March 2018 is $1,237 million, and the last independent valuation was as at 31 March 2017.
The assumptions included in the valuations that have the largest impact on fair value are:
— New Zealand and Australian electricity forward price path forecasts;
— Future generation volumes in New Zealand and Australia;
— Discount rates applied to the estimated future cash flows to determine a present day value; and
— Forecast costs of operating the generation schemes.
Management have applied judgement in determining that there were no significant changes to those assumptions which would warrant performing a full revaluation at 31 March 2018.
— Comparing forecast generation volumes and operating costs assumed in the independent valuation against actual realised volumes and operating costs incurred in the year to 31 March 2018; and
— Giving specific consideration to the Electricity Authority proposal on Avoided Cost of Transmission and its impact on the fair value of hydro generation assets.
Land and civil works ($528 million) and Buildings ($446 million).
Valuation of land and civil works and buildings, specifically in relation to airport assets, is considered to be a key audit matter due to the magnitude and judgement involved in the assessment of the fair value of these assets by the group’s Directors. The judgement relates to the valuation methodologies used and the assumptions included in each of those methodologies.
A revaluation of land and buildings was carried out as at 31 March 2018 due to identified changes in market derived valuation inputs. The previous independent valuation of civil works was carried out as at 31 March 2016. The assumptions that have the largest impact on the valuations are:
— The potential value of the airport land if there was no airport on the site primarily driven by weighted average cost of capital;
— The replacement cost of buildings including the main terminal building;
— The replacement cost of civil assets including the runway, taxiways and roads;
— The estimated future cash flows and expected rate of return from the vehicle assets.
Our procedures to assess the fair value of land and civil works and buildings included, amongst others:
— Utilising valuation specialists to assess the changes in key judgemental assumptions which have the largest impact on the valuation. This included assessing:
— the future cash flows against approved budgets and historical financial performance;
— the weighted average cost of capital against observable market data; and
— changes in the cost of buildings and civil assets;
— Comparing the valuation methodologies used by the valuer for the group, to the valuation methodologies used by other airports within New Zealand for comparability.
For
per
sona
l use
onl
y
9999
ANNUAL REPORT 2018
IFT Audit report final 3
The key audit matter How the matter was addressed in our audit
assets carrying value as at 31 March 2018 is $1,237 million, and the last independent valuation was as at 31 March 2017.
The assumptions included in the valuations that have the largest impact on fair value are:
— New Zealand and Australian electricity forward price path forecasts;
— Future generation volumes in New Zealand and Australia;
— Discount rates applied to the estimated future cash flows to determine a present day value; and
— Forecast costs of operating the generation schemes.
Management have applied judgement in determining that there were no significant changes to those assumptions which would warrant performing a full revaluation at 31 March 2018.
— Comparing forecast generation volumes and operating costs assumed in the independent valuation against actual realised volumes and operating costs incurred in the year to 31 March 2018; and
— Giving specific consideration to the Electricity Authority proposal on Avoided Cost of Transmission and its impact on the fair value of hydro generation assets.
Land and civil works ($528 million) and Buildings ($446 million).
Valuation of land and civil works and buildings, specifically in relation to airport assets, is considered to be a key audit matter due to the magnitude and judgement involved in the assessment of the fair value of these assets by the group’s Directors. The judgement relates to the valuation methodologies used and the assumptions included in each of those methodologies.
A revaluation of land and buildings was carried out as at 31 March 2018 due to identified changes in market derived valuation inputs. The previous independent valuation of civil works was carried out as at 31 March 2016. The assumptions that have the largest impact on the valuations are:
— The potential value of the airport land if there was no airport on the site primarily driven by weighted average cost of capital;
— The replacement cost of buildings including the main terminal building;
— The replacement cost of civil assets including the runway, taxiways and roads;
— The estimated future cash flows and expected rate of return from the vehicle assets.
Our procedures to assess the fair value of land and civil works and buildings included, amongst others:
— Utilising valuation specialists to assess the changes in key judgemental assumptions which have the largest impact on the valuation. This included assessing:
— the future cash flows against approved budgets and historical financial performance;
— the weighted average cost of capital against observable market data; and
— changes in the cost of buildings and civil assets;
— Comparing the valuation methodologies used by the valuer for the group, to the valuation methodologies used by other airports within New Zealand for comparability.
IFT Audit report final 4
The key audit matter How the matter was addressed in our audit
Valuation of investment in Canberra Data Centres
The carrying value of the group’s investment in associates as at 31 March 2018 was $883 million. The recoverability of the Canberra Data Centres (CDC) investment is considered a key audit matter due to the magnitude of the investment, comprising over 50% of the group’s total investment in associates, and the significant judgement involved in the assessment of the recoverable amount of the CDC investment including its forecast future cash flows and the discount rate applied to the estimated future cash flows to determine a present day value.
Our procedures performed to assess the recoverability of our investment into CDC included, amongst others:
— Challenging the reasonableness of the revenue and cost forecasts by comparing these forecasts to historic cash flows, and growth rates achieved;
— Utilising our valuation specialists to assess the reasonableness of the discount rates applied to future cash flows and the perpetuity growth rate applied; and
— Performing sensitivity analysis considering a range of likely outcomes for various scenarios.
Carrying value of goodwill
As disclosed in Note 14 of the financial statements, the group’s assets include $117 million of goodwill in relation to acquisition of a controlling interest in Trustpower Limited (“Trustpower”) during the 2007 financial year. Following the demerger in October 2016, the goodwill was split between Trustpower and Tilt Renewables Limited (“TILT”).
The recoverable amount of TILT is considered to be a key audit matter due to TILT’s market capitalisation at year end being below the group’s share of TILT net assets plus goodwill, which is an indication of impairment.
Our procedures performed to assess the carrying value of goodwill included:
— Determining the recoverable amount of Infratil’s investment in TILT taking into account the group’s shareholding and observed relevant market values applied to such a shareholding within the Australian context; and
— Comparing our valuation against those assessed by other market observers and recent market transactions.
Other information
The Directors, on behalf of the group, are responsible for the other information included in the entity’s Annual Report. Other information includes the report of the Chairman and the Chief Executive, investment performance, disclosures relating to corporate governance and statutory information. Our opinion on the consolidated financial statements does not cover any other information and we do not express any form of assurance conclusion thereon.
In connection with our audit of the consolidated financial statements our responsibility is to read the other information and, in doing so, consider whether the other information is materially inconsistent with the consolidated financial statements or our knowledge obtained in the audit or otherwise appears materially misstated. If, based on the work we have performed, we conclude that there is a material misstatement of this other information, we are required to report that fact. We have nothing to report in this regard.
Use of this independent auditor’s report
This independent auditor’s report is made solely to the shareholders as a body. Our audit work has been undertaken so that we might state to the shareholders those matters we are required to state to them in the independent auditor’s report and for no other purpose. To the fullest extent permitted by law, we do not accept or assume responsibility to anyone other
For
per
sona
l use
onl
y
100 101
ANNUAL REPORT 2018INFRATIL
IFT Audit report final 5
than the shareholders as a body for our audit work, this independent auditor’s report, or any of the opinions we have formed.
Responsibilities of the Directors for the consolidated financial statements
The Directors, on behalf of the company, are responsible for:
— the preparation and fair presentation of the consolidated financial statements in accordance with generally accepted accounting practice in New Zealand (being New Zealand Equivalents to International Financial Reporting Standards);
— implementing necessary internal control to enable the preparation of a consolidated set of financial statements that is fairly presented and free from material misstatement, whether due to fraud or error; and
— assessing the ability to continue as a going concern. This includes disclosing, as applicable, matters related to going concern and using the going concern basis of accounting unless they either intend to liquidate or to cease operations, or have no realistic alternative but to do so.
Auditor’s responsibilities for the audit of the consolidated financial statements
Our objective is:
— to obtain reasonable assurance about whether the consolidated financial statements as a whole are free from material misstatement, whether due to fraud or error; and
— to issue an independent auditor’s report that includes our opinion.
Reasonable assurance is a high level of assurance, but is not a guarantee that an audit conducted in accordance with ISAs NZ will always detect a material misstatement when it exists.
Misstatements can arise from fraud or error. They are considered material if, individually or in the aggregate, they could reasonably be expected to influence the economic decisions of users taken on the basis of these consolidated financial statements. A further description of our responsibilities for the audit of these consolidated financial statements is located at the External Reporting Board (XRB) website at:
http://www.xrb.govt.nz/standards-for-assurance-practitioners/auditors-responsibilities/audit-report-1/
This description forms part of our independent auditor’s report.
The engagement partner on the audit resulting in this independent auditor's report is Ross Buckley.
For and on behalf of
KPMG Wellington
16 May 2018
For
per
sona
l use
onl
y
101101
ANNUAL REPORT 2018
IFT Audit report final 5
than the shareholders as a body for our audit work, this independent auditor’s report, or any of the opinions we have formed.
Responsibilities of the Directors for the consolidated financial statements
The Directors, on behalf of the company, are responsible for:
— the preparation and fair presentation of the consolidated financial statements in accordance with generally accepted accounting practice in New Zealand (being New Zealand Equivalents to International Financial Reporting Standards);
— implementing necessary internal control to enable the preparation of a consolidated set of financial statements that is fairly presented and free from material misstatement, whether due to fraud or error; and
— assessing the ability to continue as a going concern. This includes disclosing, as applicable, matters related to going concern and using the going concern basis of accounting unless they either intend to liquidate or to cease operations, or have no realistic alternative but to do so.
Auditor’s responsibilities for the audit of the consolidated financial statements
Our objective is:
— to obtain reasonable assurance about whether the consolidated financial statements as a whole are free from material misstatement, whether due to fraud or error; and
— to issue an independent auditor’s report that includes our opinion.
Reasonable assurance is a high level of assurance, but is not a guarantee that an audit conducted in accordance with ISAs NZ will always detect a material misstatement when it exists.
Misstatements can arise from fraud or error. They are considered material if, individually or in the aggregate, they could reasonably be expected to influence the economic decisions of users taken on the basis of these consolidated financial statements. A further description of our responsibilities for the audit of these consolidated financial statements is located at the External Reporting Board (XRB) website at:
http://www.xrb.govt.nz/standards-for-assurance-practitioners/auditors-responsibilities/audit-report-1/
This description forms part of our independent auditor’s report.
The engagement partner on the audit resulting in this independent auditor's report is Ross Buckley.
For and on behalf of
KPMG Wellington
16 May 2018
The Board is committed to undertaking its role in accordance with internationally accepted best practice, within the context of Infratil’s business. Infratil’s corporate governance practices have been prepared with reference to the Financial Markets Authority’s Corporate Governance Handbook, the requirements of the NZX Main Board Rules and the recommendations in the NZX Corporate Governance Code 2017 (‘NZX Code’).
Copies of Infratil’s key corporate governance documents are available on the corporate governance section of Infratil’s website: www.infratil.com/about-us/corporate-governance/. These include Infratil’s Constitution, the Management Agreement, the Board and Committee Charters and key corporate governance policies.
CORPORATE GOVERNANCE STRUCTURE The Board is elected by the shareholders with overall responsibility for the governance of Infratil, while the day to day management of Infratil has been delegated to Morrison & Co. The respective roles of the Board and Morrison & Co within this corporate governance structure are summarised below.
THE BOARDRole of the BoardThe primary role of the Board is to approve and monitor the strategic direction of Infratil recommended by Morrison & Co and add long-term value to Infratil’s shares, having appropriate regard to the interests of all material stakeholders. In addition:
• The Board establishes Infratil’s objectives, overall policy framework within which the business is conducted and confirms strategies for achieving these objectives.
• The Board monitors performance and ensures that procedures are in place to provide effective internal financial control.
• Although the day to day management of Infratil has been delegated to Morrison & Co, Board approval is required for:
- all investments and divestments;
- Infratil’s capital management, capital structure and risk management/appetite;
- Infratil’s portfolio management.
The Board’s role and responsibilities are set out in the Board Charter.
Board CommitteesThe Board has established four standing committees, and other committees may be formed when it is efficient or necessary to facilitate efficient decision-making or when required by law:
• Audit and Risk Committee The Board has established this Committee to oversee financial reporting,
accounting policies, financial management, internal control systems, risk management systems, systems for protecting assets and compliance. The Committee also:
− keeps under review the scope and results of audit work, its cost effectiveness and performance and the independence and objectivity of the auditors;
− reviews the financial statements and the release to the NZX and ASX of financial results; and
− receives regular reports from Morrison & Co, including reports on financial and business performance, risk management, financial derivative exposures and accounting and internal control matters.
During Financial Year 2018, the Committee comprised two independent Directors (A Gerry (Chair) and M Tume) and one non-independent Director (M Bogoievski). However, the Board has, following the end of the Financial Year 2018, resolved to change the composition of the Committee so it comprises solely of independent Directors and, as a result of this, M Bogoievski has resigned from, and P Springford has been appointed a member of, the Committee. Manager representatives will attend meetings of the Committee as appropriate, at the invitation of the Committee Chair.
The Committee will meet at least quarterly to fulfil its obligations. The Committee Chair may convene a meeting if he or she considers one is required, and will also convene a meeting upon request of any Committee member who considers it necessary.
The Committee’s role and responsibilities, and membership requirements, are set out in the Audit and Risk Committee Charter.
• Nomination and Remuneration Committee The Board has established this Committee (which was formerly called
the Board Nomination Committee) to manage the identification, consideration and recommendation of director appointments to the Board, succession planning for Directors, ensuring written agreements are in place for all Directors and the induction programme for new Directors. The Board has, following the end of the Financial Year 2018, resolved to expand the mandate of this Committee to include recommending remuneration for directors for consideration by shareholders.
Nominations will be put to the annual meeting in accordance with Infratil’s constitution and the relevant legislation and listing rules. The filling of casual vacancies must be approved by the Board, and then approved by shareholders at the next general meeting.
The Committee comprises three independent Directors (M Tume (Chair), A Gerry and P Gough), with attendances by appropriate Manager representatives.
The Committee will meet at least annually to fulfil its obligations. The Committee Chair may convene a meeting if he or she considers one is required, and will also convene a meeting upon request of any Committee member who considers it necessary.
The Committee’s role and responsibilities, and membership requirements, are set out in the Nomination and Remuneration Committee Charter.
• Manager Engagement Committee The Board recognises that the interests of Infratil shareholders and
Morrison & Co have the potential to conflict, and that an important role of the Board is to be aware of and assess potential conflicts in relation to Infratil’s capital structure and strategies adopted, and the resulting potential Morrison & Co revenues. Accordingly, the Board has, following the end of the Financial Year 2018, resolved to establish a Manager Engagement Committee to monitor Morrison & Co’s performance and compliance with the Management Agreement (previously, the Board dealt with these matters by a meeting of the independent Directors, without representatives of Morrison & Co present, as a standing item for regularly scheduled Board meetings). This Committee is also responsible for managing any potential conflicts between the interests of Infratil shareholders and Morrison & Co (for instance, in agreeing the terms of governance arrangements for investment joint ventures with other Morrison & Co clients).
CORPORATE GOVERNANCEF
or p
erso
nal u
se o
nly
102 103
ANNUAL REPORT 2018INFRATIL
The Committee must comprise solely of independent Directors (with a minimum of three members). The Committee currently comprises all five independent Directors. Manager representatives do not attend meetings of the Committee.
The Committee will meet at least biannually to fulfil its obligations. The Committee Chair may convene a meeting if he or she considers one is required, and will also convene a meeting upon request of any Committee member who considers it necessary.
The Committee’s role and responsibilities, and membership requirements, are set out in the Manager Engagement Committee Charter.
Board MembershipThe number of Directors is determined by the Board, in accordance with Infratil’s constitution, to ensure it is large enough to provide a range of knowledge, views and experience relevant to Infratil’s business. The composition of the Board will reflect the duties and responsibilities it is to discharge and perform in setting Infratil’s strategy and seeing that it is implemented.
The Board currently comprises six Directors: five independent Directors and one non-independent Director. The Board Charter requires both a majority of the Board, and the Chairman, to be independent Directors. The composition of the Board, experience and Board tenure are set out below:
Mark Tume (BBS, Dip Bkg Stud) – Chairman and Independent DirectorMark Tume has been Chairman since 2013 and a director since 2007. He is Chair of RetireAustralia and Te Atiawa Iwi Holdings and a director of the New Zealand Refining Company. His professional experience has been in banking and funds management.
Marko Bogoievski (BCA, MBA, FCA) – Non-Independent Director Marko Bogoievski is Chief Executive of Infratil and its Manager, Morrison & Co. He joined the Infratil board in 2009. He is Chairman of Longroad Energy and a director of Morrison & Co. He was previously Chief Financial Officer of Telecom New Zealand and has held board roles with Trustpower and Auckland Airport. Mr Bogoievski has an interest in Morrison & Co, which has a Management Agreement with Infratil.
Alison Gerry (BMS(Hons), MAppFin) – Independent DirectorAlison Gerry joined the Infratil board in 2014 and is Chair of the Audit and Risk Committee. She is a director of Wellington International Airport, Spark New Zealand and Vero Insurance New Zealand. She has been a professional director from 2007. Previously, Alison worked for both corporates and financial institutions in Australia, Asia and London in trading, finance and risk roles.
Paul Gough (BCom(Hons)) – Independent DirectorPaul Gough joined the Infratil board in 2012. He is managing partner of the UK private equity fund STAR Capital. He is a director of several international companies and previously worked for Credit Suisse First Boston in New Zealand and London.
Humphry Rolleston – Independent DirectorHumphry Rolleston joined the Infratil board in 2006. He is a director of NZX listed Property for Industry and owns private companies involved in tourism, security, disruptive technology, manufacturing and finance. He is a Fellow of the New Zealand Institute of Directors and the Institute of Management.
Peter Springford (MBA) – Independent DirectorPeter Springford joined the Infratil board in 2016. He has extensive experience in managing companies in Australia, New Zealand and Asia, including five years based in Hong Kong as President of International Paper (Asia) and four years as Chief Executive Officer and Managing Director of Carter Holt Harvey. He is a chartered member of the New Zealand Institute of Directors.
IndependenceThe Board Charter sets out the standards for determining whether a Director is independent for the purposes of service on the Board and committees. These standards reflect the requirements of the NZX Main Board Rules.
A Director is independent if the Board affirmatively determines that the Director satisfies these standards. The Board has determined that:
• All the non-executive Directors (namely, M Tume, A Gerry, P Gough, P Springford and H Rolleston) are independent Directors.
• The Chief Executive (M Bogoievski), as an employee of Morrison & Co (and occupying a position analogous to an executive Director), is not an independent Director.
TenureDirectors are not appointed for fixed terms. However, the Constitution and the NZX Main Board Rules require that:
• One third (or the number nearest to one third) of the Directors (excluding any Director appointed since the previous annual meeting) must retire by rotation at each annual meeting. The Directors to retire are those who have been longest in office since their last election. Directors retiring by rotation may, if eligible, stand for re-election.
• A Director appointed by the Board to fill a casual vacancy must stand for election at the following annual meeting.
M Bogoievski, the Chief Executive, is subject to the same rotation requirements as the other Directors (as he is not an employee of Infratil).
Board and Committee MeetingsThe Board will normally hold at least six meetings in each year, and additional Board meetings are held where necessary in order to prioritise and respond to issues as they arise.
The Board and Committee meetings and attendance in Financial Year 2018 are set out below:
FULL AGENDA BOARD
MEETINGS
LIMITED AGENDA BOARD
MEETINGS
AUDIT AND RISK
COMMITTEE
NOMINATION AND
REMUNERATION COMMITTEE †
M Tume 7 / 7 1 / 1 5 / 5 0 / 0
M Bogoievski 7 / 7 1 / 1 5 / 5 -
A Gerry 7 / 7 1 / 1 5 / 5 0 / 0
P Gough 7 / 7 1 / 1 - 0 / 0
P M Springford 7 / 7 1 / 1 - -
H J D Rolleston 7 / 7 1 / 1 - -
† The Nomination Committee did not meet in Financial Year 2018 as neither the Chair nor a member considered a meeting necessary.
For
per
sona
l use
onl
y
103103
ANNUAL REPORT 2018
Independent Professional Advice and TrainingWith the approval of the Chairman, Directors are entitled to seek independent professional advice on any aspect of the Directors’ duties, at Infratil’s expense. Directors are also encouraged to identify and undertake training and development opportunities.
Board Performance and SkillsThe Board, the Audit and Risk Committee and individual Directors are subject to a performance appraisal from time to time (the Chairman initiates a review of Board performance annually, and an external review of the Board was conducted in Financial Year 2018). Appropriate strategies for improvement are agreed and actioned.
The skills and capabilities of the Board are continually assessed through the Chairman and the Board, including potential gaps in skills and experience. Infratil has developed a Board skills matrix of the skills and experience currently regarded as being important to Infratil (and which is set out in the table below). The Board considers that this mix of skills and experience is currently represented on the Board (and this conclusion was supported by the external review of the Board conducted in Financial Year 2018).
Skill/Experience
Governance and stakeholder management
Infrastructure asset management and private markets
Financial/accounting
Capital markets and funds management
People and performance
Technology and innovation
Regulation
Marketing and consumer intelligence
Directors’ and Officers’ InsuranceInfratil has arranged Directors’ and Officers’ liability insurance covering Directors acting on behalf of Infratil. Cover is for damages, judgements, fines, penalties, legal costs awarded and defence costs arising from wrongful acts committed while acting for Infratil. The types of acts that are not covered are dishonest, fraudulent, malicious acts or omissions, wilful breach of statute or regulations or duty to Infratil, improper use of information to the detriment of Infratil, or breach of professional duty.
Takeover ProtocolsThe Board has approved protocols that set out the procedure to be followed if there is a takeover for Infratil, which reflect the requirements of the Takeovers Code, market practice and recommendations by the Takeovers Panel.
MORRISON & CORole of Morrison & CoThe day to day management responsibilities have been delegated to Morrison & Co under the Management Agreement. The Management Agreement specifies the duties and powers of Morrison & Co, and the management fee payable to Morrison & Co (which is summarised in note 26 to the Financial Statements on page 94 of this annual report).
The Board determines and agrees with Morrison & Co specific goals and objectives, with a view to achieving the strategic goals of Infratil. Between Board meetings, the Chairman maintains an informal link between the Board and Morrison & Co, and is kept informed by Morrison & Co on all
important matters. The Chairman is available to Morrison & Co to provide counsel and advice where appropriate. Decisions of the Board are binding on Morrison & Co. Morrison & Co is accountable to the Board for the achievement of the strategic goals of Infratil. At each of its Board meetings, the Board receives reports from or through Morrison & Co including financial, operational and other reports and proposals.
Infratil’s management comprises people employed by Morrison & Co (including the Chief Executive and Chief Financial Officer), and people employed by Infratil’s subsidiaries and investee companies.
Manager PerformanceA key responsibility of the Board is monitoring Morrison & Co’s performance and compliance with the Management Agreement (including potential conflicts between the interests of Morrison & Co and the interests of Infratil shareholders):
• This responsibility is set out expressly in the Board Charter, and was previously dealt with by meetings of the independent Directors (without representatives of Morrison & Co present). However, given the importance of this responsibility in the context of Infratil’s business, the Board has now established the Management Engagement Committee to deal with these matters, to allow the Board to continue to discharge this responsibility through a dedicated Board committee.
• The Board also recognises the potential for conflicts to arise in the allocation of investment opportunities among clients of Morrison & Co (including Infratil). Infratil has used investment joint ventures for many years and expects to continue to do so, and the Board encourages Morrison & Co to identify aligned parties with which Infratil can co-invest. Accordingly, the Board and Morrison & Co has a deal allocation process so Infratil has visibility of all investment opportunities that fit with Infratil’s investment strategy and clear investment rights in respect of those opportunities.
The Board initiates a review of the Management Agreement from time to time. An external review of the management fee payable to Morrison & Co under the Management Agreement was conducted in Financial Year 2018. Having assessed the terms of the Management Agreement in relation to the terms in samples of management contracts for similar funds, the consultant concluded that:
• The fees in the Management Agreement are more favourable to Infratil that those which would be negotiated in the current market between unrelated parties on an arm’s length basis for the management and administration of an unlisted private infrastructure fund.
• Morrison and Co arguably bears a greater compliance burden because Infratil is a listed entity and, therefore, the terms and conditions of the fees are fair to Infratil shareholders.
HEALTH AND SAFETYHealth and safety is managed by Infratil’s operational businesses and Morrison & Co (rather than in aggregate at a group level), and the Board is provided with regular health and safety reports for those operating businesses and Morrison & Co.
DIVERSITYInfratil has a Diversity Policy, which applies to Infratil and its wholly-owned subsidiaries (currently, NZ Bus and Snapper). This policy does not apply to portfolio businesses which are not wholly-owned subsidiaries of Infratil:
• Trustpower and Tilt Renewables (which, in aggregate, comprise approximately 57.7% of Infratil’s assets and employees approximately 25.6% of the people employed in Infratil’s operational businesses) have their own diversity policies for their business, which are available on
For
per
sona
l use
onl
y
104 105
ANNUAL REPORT 2018INFRATIL
their websites: https://www.trustpower.co.nz/Company-And-Investor-Information/Governance-Documents and https://www.tiltrenewables.com/investors-landowners/governance-documents/.
• Infratil encourages its other portfolio businesses to adopt diversity policies which are appropriate for their businesses.
The Infratil Diversity Policy recognises that diversity of thought at all levels of the business, in an inclusive environment, is beneficial to decision making, improving and increasing corporate and shareholder value, enhancing talent recruitment and retention, increasing employee satisfaction and enhancing the probability of achieving Infratil’s objectives (‘Principle’). Infratil ensures that it has (and encourages other wholly-owned subsidiaries to have) strategies, initiatives and practices to promote behaviours and processes that are consistent with the Principle. Infratil recognises that these strategies, initiative and practices will be different for each wholly-owned subsidiary depending on its specific business requirements and accordingly it believes that it is better to engage with each wholly-owned subsidiary on diversity rather than impose specific objectives on each company. For the same reason, the Infratil Diversity Policy does not include measurable objectives, as the appropriate measurable objectives will be different for each portfolio business (and Trustpower and Tilt Renewables have set, and report in their Annual Reports on, gender diversity objectives as part of their diversity policies).
Management monitors, reviews and reports to the Board on Infratil’s progress under this Policy.
At 31 March 2018, the Infratil Board comprised five male Directors and one female Director (31 March 2017: five male Directors and one female Director).
The following tables provide the proportion of women employees in the organisation, women in senior executive positions and women on the Board (senior executives are defined as a CEO or CEO direct report, or a position that effectively carries executive responsibilities):
2018POSITION
NUMBER PROPORTION
FEMALE MALE FEMALE MALE
Board 1 5 17% 83%
Senior Executive Positions1,2
19 61 24% 76%
Organisation 1,091 2,391 31% 69%
2017POSITION
NUMBER PROPORTION
FEMALE MALE FEMALE MALE
Board 1 5 17% 83%
Senior Executive Positions1,2
20 63 24% 76%
Organisation 1,852 2,584 42% 58%
1 Senior Executive Positions include Morrison & Co2 The gender proportions of Senior Executive Positions (Infratil Group excluding associates) was
10 female executives 24% and 31 male executives 76% in 2018 and 11 female executives (19%) and 47 male executives (81%) in 2016
RISK MANAGEMENTRisk Management and ComplianceThe Audit and Risk Committee is responsible for ensuring that Infratil has an effective risk management framework to identify, treat and monitor key business risks and regulatory compliance, and also reviews management practices in these areas. Formal systems have been introduced for regular reporting to the Board on business risk, including impacts and mitigation strategies and compliance matters.
Morrison & Co (via the Chief Executive and Chief Financial Officer) is required to, and has confirmed to the Audit and Risk Committee and the Board in writing that, in its opinion:
• Financial records have been properly maintained and Infratil’s financial statements present a true and fair view, in all material respects, of Infratil’s financial condition, and operating results are in accordance with relevant accounting standards;
• The financial statements have been prepared in accordance with New Zealand Generally Accepted Accounting Practice and comply with International Financial Reporting Standards and other applicable financial reporting standards for profit-oriented entities;
• This opinion has been formed on the basis of a sound system of risk management and internal control which is operating effectively; and
• That system of risk management and internal control is appropriate and effective internal controls and risk management practices are in place to safeguard and protect Infratil’s assets, to identify, assess, monitor and manage risk, and identify material changes to Infratil’s risk profile.
Internal Financial ControlThe Board has overall responsibility for Infratil’s system of internal financial control. Infratil does not have a separate internal audit function, however the Board has established procedures and policies that are designed to provide effective internal financial control:
• Annual budgets, forecasts and reports on the strategic direction of Infratil are prepared regularly and reviewed and agreed by the Board.
• Financial and business performance reports are prepared monthly and reviewed by the Board throughout the year to monitor performance against financial and non-financial targets and strategic objectives.
External AuditorThe Audit and Risk Committee is also responsible for the selection and appointment of the external auditor (which is included within the External Audit Relationship section of the Audit and Risk Committee Charter), and ensuring that the external auditor or lead audit partner is changed at least every five years.
Going ConcernAfter reviewing the current results and detailed forecasts, taking into account available credit facilities and making further enquiries as considered appropriate, the Directors are satisfied that Infratil has adequate resources to enable it to continue in business for the foreseeable future. For this reason, the Directors believe it is appropriate to adopt the going concern basis in preparing the financial statements.
REPORTING AND DISCLOSUREDisclosure Infratil is committed to promoting investor confidence by providing forthright, timely, accurate, complete and equal access to information, and to providing comprehensive continuous disclosure to shareholders and other stakeholders, in compliance with the NZX Main Board Rules. This commitment is reflected in Infratil’s Disclosure and Communications Policy.
For
per
sona
l use
onl
y
105105
ANNUAL REPORT 2018
Under this policy:
• All shareholder communications and market releases are subject to review by Morrison & Co (including Chief Executive, Chief Financial Officer and legal counsel), and information is only released after proper review and reasonable inquiry.
• Full year and half year results releases are approved by the Audit and Risk Committee and by the Board.
Shareholder and other stakeholder communicationsInfratil aims to communicate effectively, give ready access to balanced and understandable information about Infratil group and corporate proposals and make it easy to participate in general meetings. Infratil seeks to ensure its shareholders are appropriately informed on its operations and results, with the delivery of timely and focused communication, and the holding of shareholder meetings in a manner conducive to achieving shareholder participation. To ensure shareholders and other stakeholders have access to relevant information Infratil:
• holds regular investor road shows and an annual investor day, and sends interested parties the dates and invitations to attend;
• sends security holders its annual and half year review, which is a summary of Infratil’s operating and financial performance for the relevant period, and periodic operational updates;
• ensures its website contains media releases, full year and half year financial information and presentations, current and past annual reports, Infratil bond documents, dividend histories, notices of meeting, details of Directors and Morrison & Co, a list of shareholders’ frequently asked questions and other information about Infratil;
• makes available printed half year and annual reports and encourages shareholders to access these documents on the website and to receive advice of their availability by email;
• publishes press releases on issues/events that may have material information content that could impact on the price of its traded securities and sends email updates to interested stakeholders;
• webcasts its half year and full year results so that a wide group of interested parties can review and participate in discussions on performance, and advises interested parties of the dates and how to participate in the webcast; and
• provides additional explanatory information where circumstances require.
Shareholder meetings are generally held in a location and at a time which is intended to maximise participation by shareholders. Meetings are typically alternated between Wellington, Auckland and Christchurch. Full participation of shareholders at the annual meeting is encouraged to ensure a high level of accountability and identification with Infratil’s strategies and goals. Shareholders have the opportunity to submit questions prior to each meeting and Morrison & Co, senior management of subsidiary companies and auditors are present to assist in and provide answers to questions raised by shareholders. There is also an opportunity for informal discussion with Directors, Morrison & Co and senior management for a period after the meeting concludes.
Infratil supports the efforts of the New Zealand Shareholders’ Association (“NZSA”) to raise the quality of relations between public companies and their shareholders. Shareholders wishing to learn more about the NZSA can find information on its website (http://www.nzshareholders.co.nz). While Infratil supports the general aims and objectives of the NZSA, its specific actions and views are not necessarily endorsed by Infratil, or representative of Infratil’s view.
ETHICAL BEHAVIOURCode of Conduct and Ethics PolicyInfratil has always required the highest standards of honesty and integrity from its Directors, Manager and employees, and this commitment is reflected in Infratil’s Ethics and Code of Conduct Policy. The policy recognises Infratil’s commitment to maintaining the highest standards of integrity and its legal and other obligations to all legitimate stakeholders, and applies to Directors, Morrison & Co and all employees.
The policy sets the ethical and behavioural standards and professional conduct for which Directors, Morrison & Co and employees of Infratil and its subsidiaries are expected to conduct their work life. Infratil has communicated the policy to employees and provided training on it, and failure to follow the standards provided in this Code will result in the appropriate staff or other performance management practices being invoked and may lead to disciplinary action (including dismissal).
Financial Products Trading PolicyInfratil has a financial products trading policy applicable to Directors, Morrison & Co and all employees of Infratil and its subsidiaries who intend to trade in Infratil Financial Products (which includes quoted financial products issued by Trustpower, Tilt Renewables and WIAL, in addition to those issued by Infratil).
All trading in Infratil Financial Products by Directors, Morrison & Co and employees of Infratil and its subsidiaries must comply with this policy. The policy includes a fundamental prohibition on insider trading and obligations of confidentiality when dealing with material information. The policy also requires Directors, Morrison & Co and other employees who have, or may have, access to market sensitive information to obtain consent prior to trading (although these obligations do not apply to employees of Trustpower or Tilt Renewables, which as separate listed companies have their own procedures for dealing with trading).
INVESTMENT STRATEGYInfratil’s investments are long-term, and its objective is to deliver above average returns to shareholders over the its-term. The first part of this goal is to position Infratil in sectors where there will be opportunities to invest capital to meet customer and community needs. The second part is to make sure that Infratil’s businesses meet those needs with value-for-money services and facilities.
Infratil will invest where it has expertise, or can partner with expertise, and where it can influence the strategic and operational directions of the companies it invests in.
Further information is available on Infratil’s website: www.infratil.com/about-us/strategy/.
RESPONSIBLE INVESTMENTAs an infrastructure investor, Infratil has a special opportunity to contribute to society’s greatest long-term challenges. Infratil recognises that environmental, social and governance (‘ESG’) issues can be value accretive and, accordingly, ESG issues are central to Infratil’s investment strategy and asset management processes.
The Board recognises that investors are increasingly interested to understand how these risks are viewed at the Infratil group level. Infratil’s current approach to policies for, and reporting on, ESG issues is summarised below. However, the Board is considering ways to provide better visibility of ESG themes for Infratil, including:
• considering the appropriateness for Infratil of internationally recognised ESG reporting frameworks (e.g. the Sustainable Stock Exchange Initiative);
For
per
sona
l use
onl
y
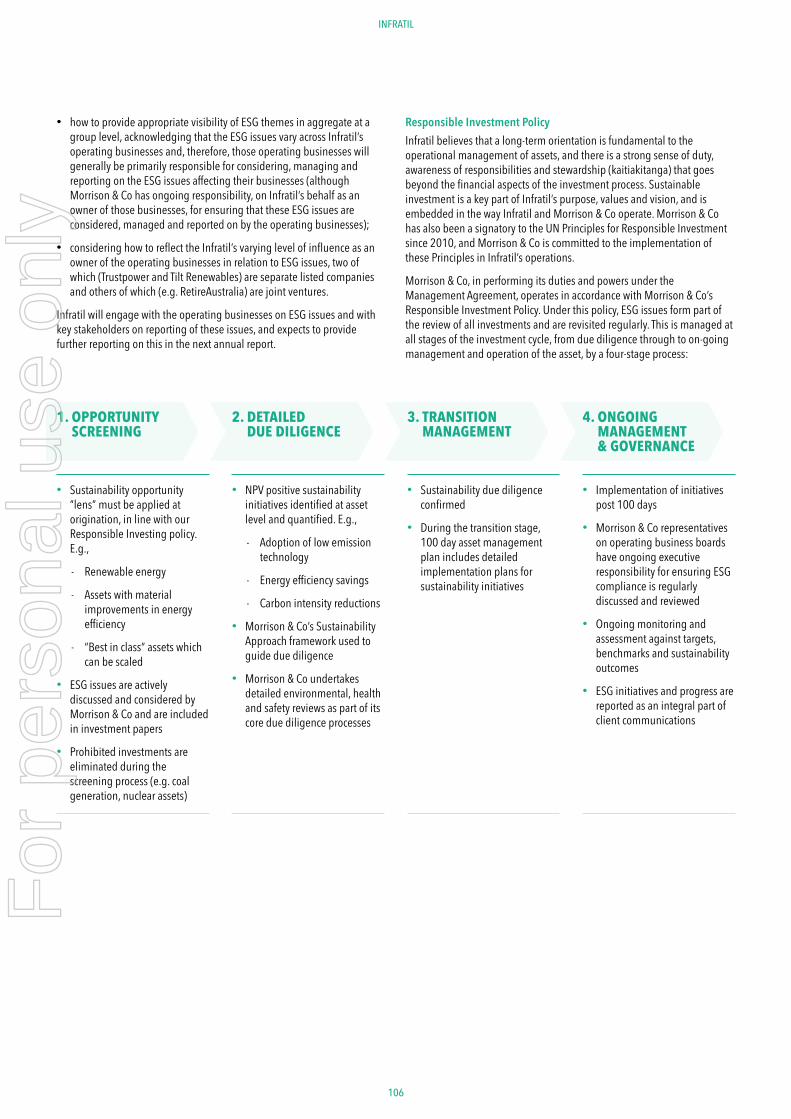
106 107
ANNUAL REPORT 2018INFRATIL
• how to provide appropriate visibility of ESG themes in aggregate at a group level, acknowledging that the ESG issues vary across Infratil’s operating businesses and, therefore, those operating businesses will generally be primarily responsible for considering, managing and reporting on the ESG issues affecting their businesses (although Morrison & Co has ongoing responsibility, on Infratil’s behalf as an owner of those businesses, for ensuring that these ESG issues are considered, managed and reported on by the operating businesses);
• considering how to reflect the Infratil’s varying level of influence as an owner of the operating businesses in relation to ESG issues, two of which (Trustpower and Tilt Renewables) are separate listed companies and others of which (e.g. RetireAustralia) are joint ventures.
Infratil will engage with the operating businesses on ESG issues and with key stakeholders on reporting of these issues, and expects to provide further reporting on this in the next annual report.
Responsible Investment PolicyInfratil believes that a long-term orientation is fundamental to the operational management of assets, and there is a strong sense of duty, awareness of responsibilities and stewardship (kaitiakitanga) that goes beyond the financial aspects of the investment process. Sustainable investment is a key part of Infratil’s purpose, values and vision, and is embedded in the way Infratil and Morrison & Co operate. Morrison & Co has also been a signatory to the UN Principles for Responsible Investment since 2010, and Morrison & Co is committed to the implementation of these Principles in Infratil’s operations.
Morrison & Co, in performing its duties and powers under the Management Agreement, operates in accordance with Morrison & Co’s Responsible Investment Policy. Under this policy, ESG issues form part of the review of all investments and are revisited regularly. This is managed at all stages of the investment cycle, from due diligence through to on-going management and operation of the asset, by a four-stage process:
1. OPPORTUNITY SCREENING
• Sustainability opportunity “lens” must be applied at origination, in line with our Responsible Investing policy. E.g.,
- Renewable energy
- Assets with material improvements in energy efficiency
- “Best in class” assets which can be scaled
• ESG issues are actively discussed and considered by Morrison & Co and are included in investment papers
• Prohibited investments are eliminated during the screening process (e.g. coal generation, nuclear assets)
2. DETAILED DUE DILIGENCE
• NPV positive sustainability initiatives identified at asset level and quantified. E.g.,
- Adoption of low emission technology
- Energy efficiency savings
- Carbon intensity reductions
• Morrison & Co’s Sustainability Approach framework used to guide due diligence
• Morrison & Co undertakes detailed environmental, health and safety reviews as part of its core due diligence processes
3. TRANSITION MANAGEMENT
• Sustainability due diligence confirmed
• During the transition stage, 100 day asset management plan includes detailed implementation plans for sustainability initiatives
4. ONGOING MANAGEMENT & GOVERNANCE
• Implementation of initiatives post 100 days
• Morrison & Co representatives on operating business boards have ongoing executive responsibility for ensuring ESG compliance is regularly discussed and reviewed
• Ongoing monitoring and assessment against targets, benchmarks and sustainability outcomes
• ESG initiatives and progress are reported as an integral part of client communications
For
per
sona
l use
onl
y
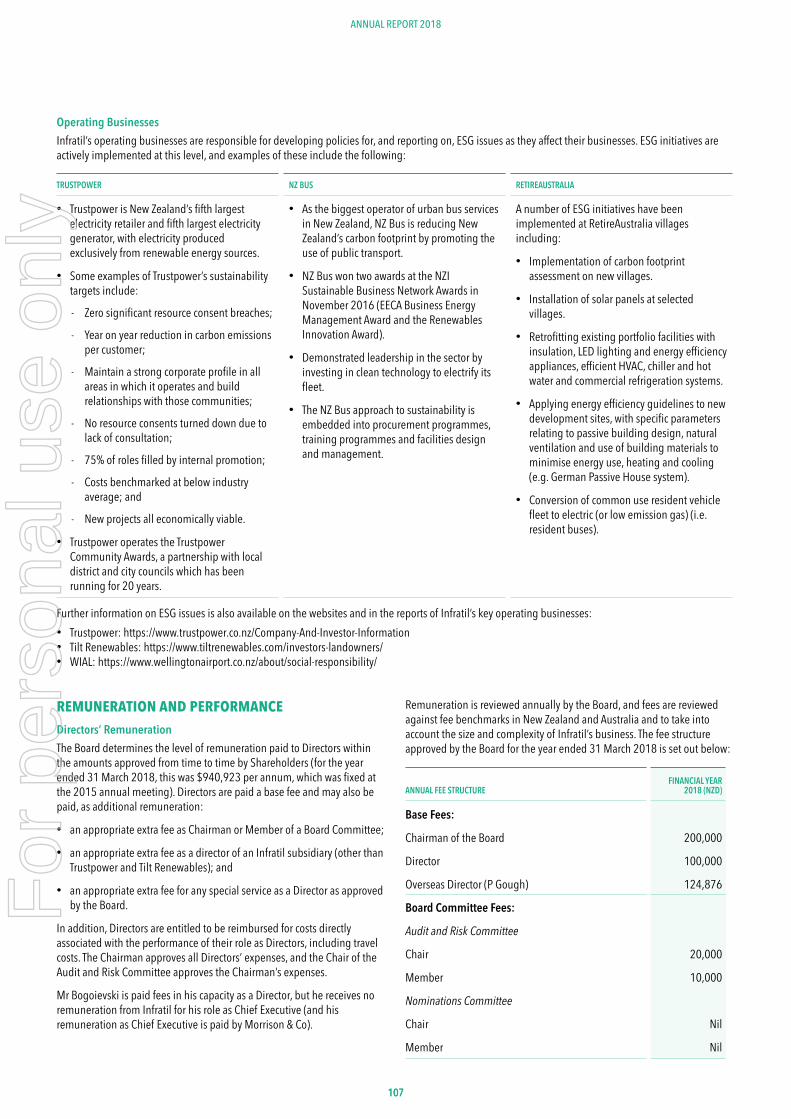
107107
ANNUAL REPORT 2018
Operating BusinessesInfratil’s operating businesses are responsible for developing policies for, and reporting on, ESG issues as they affect their businesses. ESG initiatives are actively implemented at this level, and examples of these include the following:
TRUSTPOWER NZ BUS RETIREAUSTRALIA
• Trustpower is New Zealand’s fifth largest electricity retailer and fifth largest electricity generator, with electricity produced exclusively from renewable energy sources.
• Some examples of Trustpower’s sustainability targets include:
- Zero significant resource consent breaches;
- Year on year reduction in carbon emissions per customer;
- Maintain a strong corporate profile in all areas in which it operates and build relationships with those communities;
- No resource consents turned down due to lack of consultation;
- 75% of roles filled by internal promotion;
- Costs benchmarked at below industry average; and
- New projects all economically viable.
• Trustpower operates the Trustpower Community Awards, a partnership with local district and city councils which has been running for 20 years.
• As the biggest operator of urban bus services in New Zealand, NZ Bus is reducing New Zealand’s carbon footprint by promoting the use of public transport.
• NZ Bus won two awards at the NZI Sustainable Business Network Awards in November 2016 (EECA Business Energy Management Award and the Renewables Innovation Award).
• Demonstrated leadership in the sector by investing in clean technology to electrify its fleet.
• The NZ Bus approach to sustainability is embedded into procurement programmes, training programmes and facilities design and management.
A number of ESG initiatives have been implemented at RetireAustralia villages including:
• Implementation of carbon footprint assessment on new villages.
• Installation of solar panels at selected villages.
• Retrofitting existing portfolio facilities with insulation, LED lighting and energy efficiency appliances, efficient HVAC, chiller and hot water and commercial refrigeration systems.
• Applying energy efficiency guidelines to new development sites, with specific parameters relating to passive building design, natural ventilation and use of building materials to minimise energy use, heating and cooling (e.g. German Passive House system).
• Conversion of common use resident vehicle fleet to electric (or low emission gas) (i.e. resident buses).
Further information on ESG issues is also available on the websites and in the reports of Infratil’s key operating businesses:• Trustpower: https://www.trustpower.co.nz/Company-And-Investor-Information• Tilt Renewables: https://www.tiltrenewables.com/investors-landowners/• WIAL: https://www.wellingtonairport.co.nz/about/social-responsibility/
REMUNERATION AND PERFORMANCEDirectors’ RemunerationThe Board determines the level of remuneration paid to Directors within the amounts approved from time to time by Shareholders (for the year ended 31 March 2018, this was $940,923 per annum, which was fixed at the 2015 annual meeting). Directors are paid a base fee and may also be paid, as additional remuneration:
• an appropriate extra fee as Chairman or Member of a Board Committee;
• an appropriate extra fee as a director of an Infratil subsidiary (other than Trustpower and Tilt Renewables); and
• an appropriate extra fee for any special service as a Director as approved by the Board.
In addition, Directors are entitled to be reimbursed for costs directly associated with the performance of their role as Directors, including travel costs. The Chairman approves all Directors’ expenses, and the Chair of the Audit and Risk Committee approves the Chairman’s expenses.
Mr Bogoievski is paid fees in his capacity as a Director, but he receives no remuneration from Infratil for his role as Chief Executive (and his remuneration as Chief Executive is paid by Morrison & Co).
Remuneration is reviewed annually by the Board, and fees are reviewed against fee benchmarks in New Zealand and Australia and to take into account the size and complexity of Infratil’s business. The fee structure approved by the Board for the year ended 31 March 2018 is set out below:
ANNUAL FEE STRUCTUREFINANCIAL YEAR
2018 (NZD)
Base Fees:
Chairman of the Board 200,000
Director 100,000
Overseas Director (P Gough) 124,876
Board Committee Fees:
Audit and Risk Committee
Chair 20,000
Member 10,000
Nominations Committee
Chair Nil
Member Nil
For
per
sona
l use
onl
y
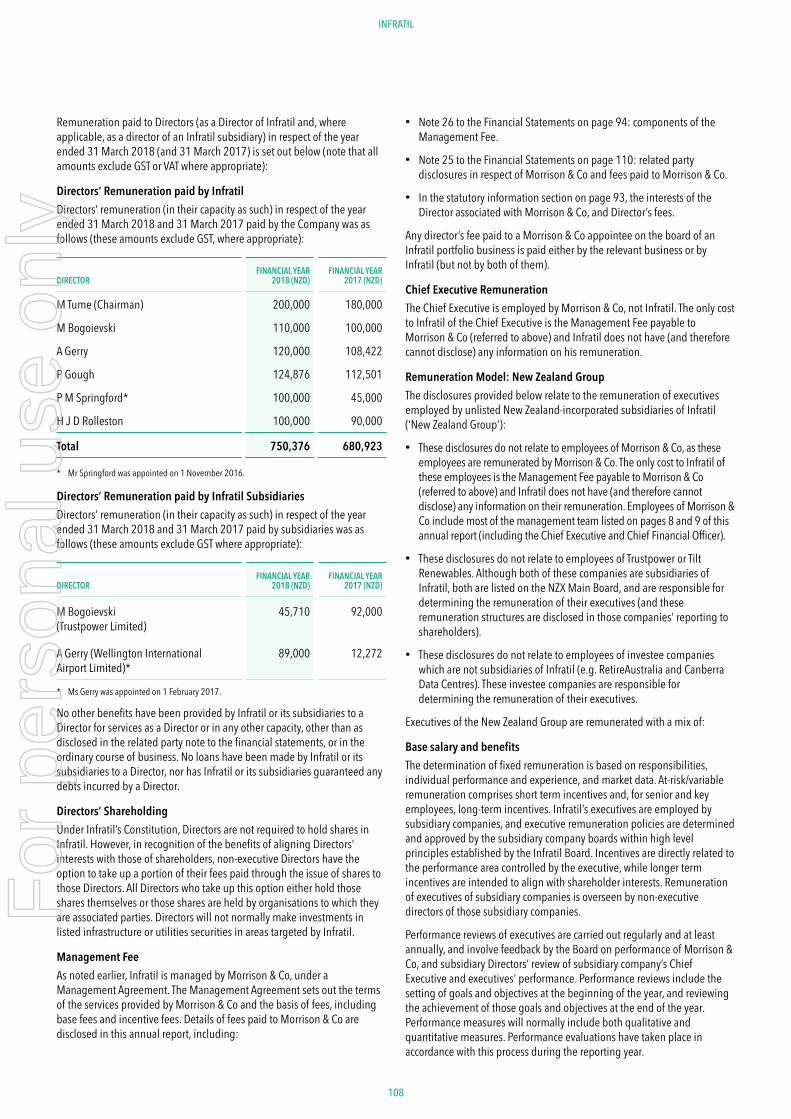
108 109
ANNUAL REPORT 2018INFRATIL
Remuneration paid to Directors (as a Director of Infratil and, where applicable, as a director of an Infratil subsidiary) in respect of the year ended 31 March 2018 (and 31 March 2017) is set out below (note that all amounts exclude GST or VAT where appropriate):
Directors’ Remuneration paid by InfratilDirectors’ remuneration (in their capacity as such) in respect of the year ended 31 March 2018 and 31 March 2017 paid by the Company was as follows (these amounts exclude GST, where appropriate):
DIRECTORFINANCIAL YEAR
2018 (NZD)FINANCIAL YEAR
2017 (NZD)
M Tume (Chairman) 200,000 180,000
M Bogoievski 110,000 100,000
A Gerry 120,000 108,422
P Gough 124,876 112,501
P M Springford* 100,000 45,000
H J D Rolleston 100,000 90,000
Total 750,376 680,923
* Mr Springford was appointed on 1 November 2016.
Directors’ Remuneration paid by Infratil SubsidiariesDirectors’ remuneration (in their capacity as such) in respect of the year ended 31 March 2018 and 31 March 2017 paid by subsidiaries was as follows (these amounts exclude GST where appropriate):
DIRECTORFINANCIAL YEAR
2018 (NZD)FINANCIAL YEAR
2017 (NZD)
M Bogoievski (Trustpower Limited)
45,710 92,000
A Gerry (Wellington International Airport Limited)*
89,000 12,272
* Ms Gerry was appointed on 1 February 2017.
No other benefits have been provided by Infratil or its subsidiaries to a Director for services as a Director or in any other capacity, other than as disclosed in the related party note to the financial statements, or in the ordinary course of business. No loans have been made by Infratil or its subsidiaries to a Director, nor has Infratil or its subsidiaries guaranteed any debts incurred by a Director.
Directors’ ShareholdingUnder Infratil’s Constitution, Directors are not required to hold shares in Infratil. However, in recognition of the benefits of aligning Directors’ interests with those of shareholders, non-executive Directors have the option to take up a portion of their fees paid through the issue of shares to those Directors. All Directors who take up this option either hold those shares themselves or those shares are held by organisations to which they are associated parties. Directors will not normally make investments in listed infrastructure or utilities securities in areas targeted by Infratil.
Management FeeAs noted earlier, Infratil is managed by Morrison & Co, under a Management Agreement. The Management Agreement sets out the terms of the services provided by Morrison & Co and the basis of fees, including base fees and incentive fees. Details of fees paid to Morrison & Co are disclosed in this annual report, including:
• Note 26 to the Financial Statements on page 94: components of the Management Fee.
• Note 25 to the Financial Statements on page 110: related party disclosures in respect of Morrison & Co and fees paid to Morrison & Co.
• In the statutory information section on page 93, the interests of the Director associated with Morrison & Co, and Director’s fees.
Any director’s fee paid to a Morrison & Co appointee on the board of an Infratil portfolio business is paid either by the relevant business or by Infratil (but not by both of them).
Chief Executive RemunerationThe Chief Executive is employed by Morrison & Co, not Infratil. The only cost to Infratil of the Chief Executive is the Management Fee payable to Morrison & Co (referred to above) and Infratil does not have (and therefore cannot disclose) any information on his remuneration.
Remuneration Model: New Zealand GroupThe disclosures provided below relate to the remuneration of executives employed by unlisted New Zealand-incorporated subsidiaries of Infratil (‘New Zealand Group’):
• These disclosures do not relate to employees of Morrison & Co, as these employees are remunerated by Morrison & Co. The only cost to Infratil of these employees is the Management Fee payable to Morrison & Co (referred to above) and Infratil does not have (and therefore cannot disclose) any information on their remuneration. Employees of Morrison & Co include most of the management team listed on pages 8 and 9 of this annual report (including the Chief Executive and Chief Financial Officer).
• These disclosures do not relate to employees of Trustpower or Tilt Renewables. Although both of these companies are subsidiaries of Infratil, both are listed on the NZX Main Board, and are responsible for determining the remuneration of their executives (and these remuneration structures are disclosed in those companies’ reporting to shareholders).
• These disclosures do not relate to employees of investee companies which are not subsidiaries of Infratil (e.g. RetireAustralia and Canberra Data Centres). These investee companies are responsible for determining the remuneration of their executives.
Executives of the New Zealand Group are remunerated with a mix of:
Base salary and benefitsThe determination of fixed remuneration is based on responsibilities, individual performance and experience, and market data. At-risk/variable remuneration comprises short term incentives and, for senior and key employees, long-term incentives. Infratil’s executives are employed by subsidiary companies, and executive remuneration policies are determined and approved by the subsidiary company boards within high level principles established by the Infratil Board. Incentives are directly related to the performance area controlled by the executive, while longer term incentives are intended to align with shareholder interests. Remuneration of executives of subsidiary companies is overseen by non-executive directors of those subsidiary companies.
Performance reviews of executives are carried out regularly and at least annually, and involve feedback by the Board on performance of Morrison & Co, and subsidiary Directors’ review of subsidiary company’s Chief Executive and executives’ performance. Performance reviews include the setting of goals and objectives at the beginning of the year, and reviewing the achievement of those goals and objectives at the end of the year. Performance measures will normally include both qualitative and quantitative measures. Performance evaluations have taken place in accordance with this process during the reporting year.
For
per
sona
l use
onl
y
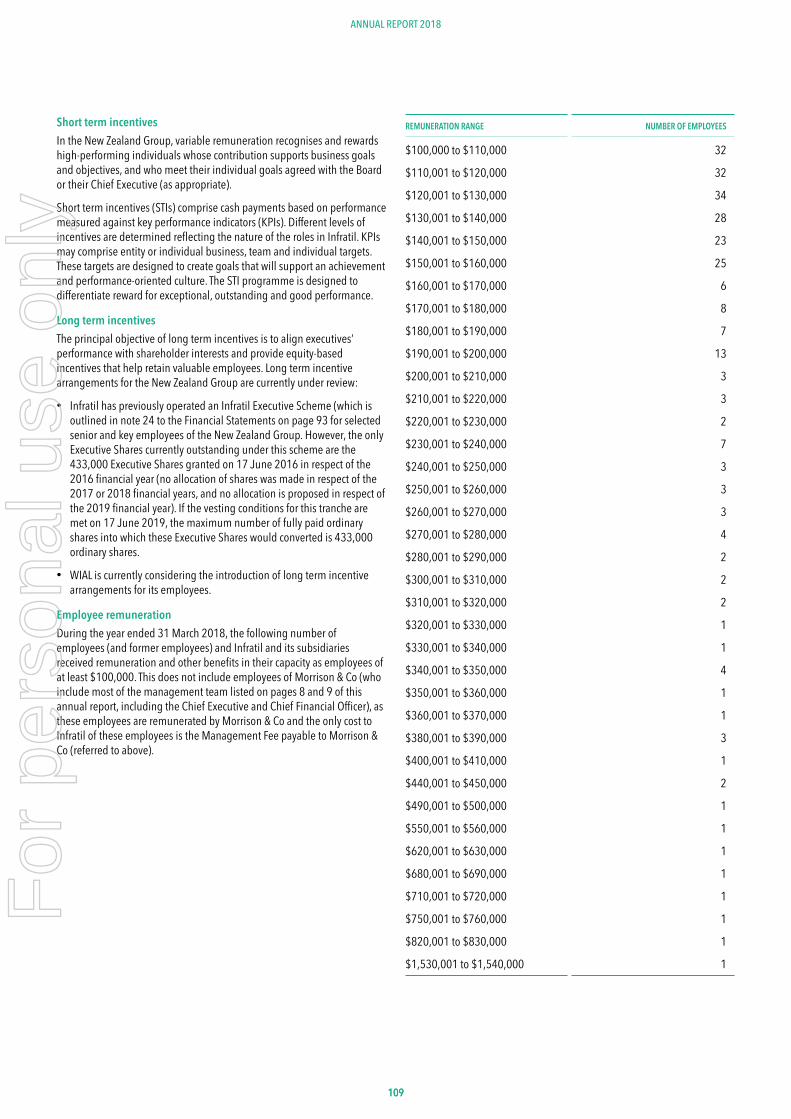
109109
ANNUAL REPORT 2018
Short term incentivesIn the New Zealand Group, variable remuneration recognises and rewards high-performing individuals whose contribution supports business goals and objectives, and who meet their individual goals agreed with the Board or their Chief Executive (as appropriate).
Short term incentives (STIs) comprise cash payments based on performance measured against key performance indicators (KPIs). Different levels of incentives are determined reflecting the nature of the roles in Infratil. KPIs may comprise entity or individual business, team and individual targets. These targets are designed to create goals that will support an achievement and performance-oriented culture. The STI programme is designed to differentiate reward for exceptional, outstanding and good performance.
Long term incentivesThe principal objective of long term incentives is to align executives’ performance with shareholder interests and provide equity-based incentives that help retain valuable employees. Long term incentive arrangements for the New Zealand Group are currently under review:
• Infratil has previously operated an Infratil Executive Scheme (which is outlined in note 24 to the Financial Statements on page 93 for selected senior and key employees of the New Zealand Group. However, the only Executive Shares currently outstanding under this scheme are the 433,000 Executive Shares granted on 17 June 2016 in respect of the 2016 financial year (no allocation of shares was made in respect of the 2017 or 2018 financial years, and no allocation is proposed in respect of the 2019 financial year). If the vesting conditions for this tranche are met on 17 June 2019, the maximum number of fully paid ordinary shares into which these Executive Shares would converted is 433,000 ordinary shares.
• WIAL is currently considering the introduction of long term incentive arrangements for its employees.
Employee remunerationDuring the year ended 31 March 2018, the following number of employees (and former employees) and Infratil and its subsidiaries received remuneration and other benefits in their capacity as employees of at least $100,000. This does not include employees of Morrison & Co (who include most of the management team listed on pages 8 and 9 of this annual report, including the Chief Executive and Chief Financial Officer), as these employees are remunerated by Morrison & Co and the only cost to Infratil of these employees is the Management Fee payable to Morrison & Co (referred to above).
REMUNERATION RANGE NUMBER OF EMPLOYEES
$100,000 to $110,000 32
$110,001 to $120,000 32
$120,001 to $130,000 34
$130,001 to $140,000 28
$140,001 to $150,000 23
$150,001 to $160,000 25
$160,001 to $170,000 6
$170,001 to $180,000 8
$180,001 to $190,000 7
$190,001 to $200,000 13
$200,001 to $210,000 3
$210,001 to $220,000 3
$220,001 to $230,000 2
$230,001 to $240,000 7
$240,001 to $250,000 3
$250,001 to $260,000 3
$260,001 to $270,000 3
$270,001 to $280,000 4
$280,001 to $290,000 2
$300,001 to $310,000 2
$310,001 to $320,000 2
$320,001 to $330,000 1
$330,001 to $340,000 1
$340,001 to $350,000 4
$350,001 to $360,000 1
$360,001 to $370,000 1
$380,001 to $390,000 3
$400,001 to $410,000 1
$440,001 to $450,000 2
$490,001 to $500,000 1
$550,001 to $560,000 1
$620,001 to $630,000 1
$680,001 to $690,000 1
$710,001 to $720,000 1
$750,001 to $760,000 1
$820,001 to $830,000 1
$1,530,001 to $1,540,000 1
For
per
sona
l use
onl
y
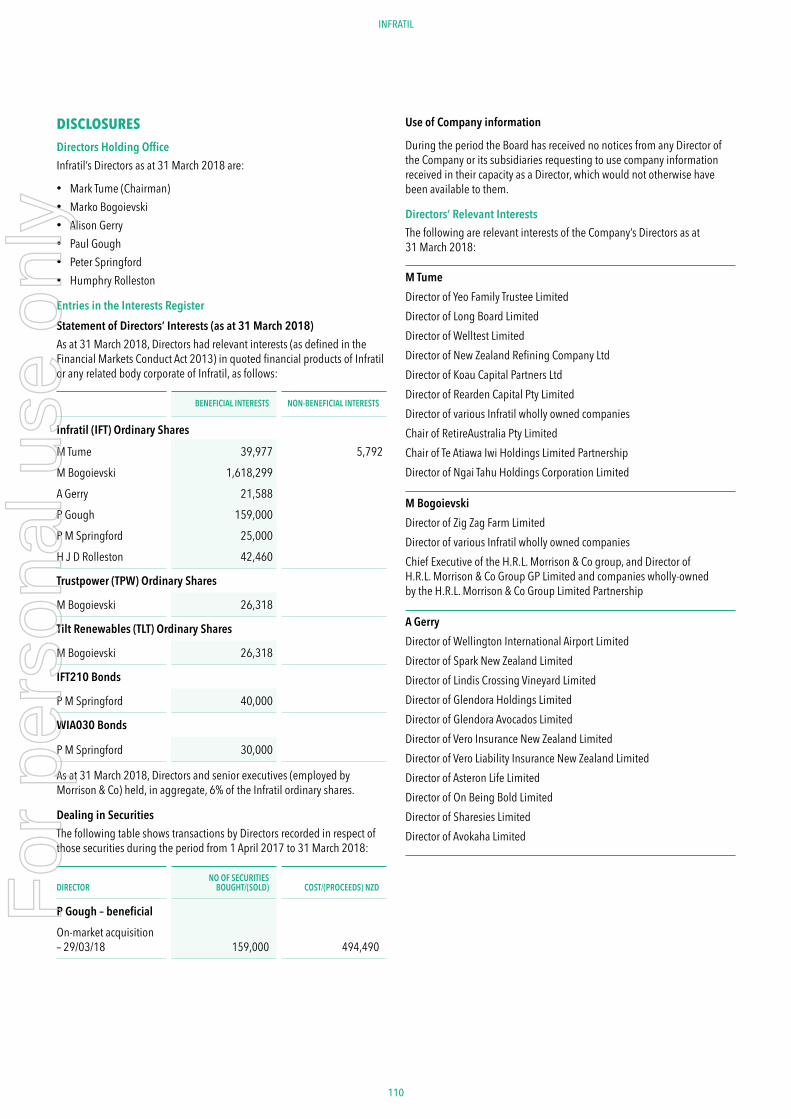
110 111
ANNUAL REPORT 2018INFRATIL
DISCLOSURESDirectors Holding OfficeInfratil’s Directors as at 31 March 2018 are:
• Mark Tume (Chairman)• Marko Bogoievski• Alison Gerry• Paul Gough• Peter Springford• Humphry Rolleston
Entries in the Interests RegisterStatement of Directors’ Interests (as at 31 March 2018)As at 31 March 2018, Directors had relevant interests (as defined in the Financial Markets Conduct Act 2013) in quoted financial products of Infratil or any related body corporate of Infratil, as follows:
BENEFICIAL INTERESTS NON-BENEFICIAL INTERESTS
Infratil (IFT) Ordinary Shares
M Tume 39,977 5,792M Bogoievski 1,618,299A Gerry 21,588P Gough 159,000P M Springford 25,000H J D Rolleston 42,460
Trustpower (TPW) Ordinary Shares
M Bogoievski 26,318
Tilt Renewables (TLT) Ordinary Shares
M Bogoievski 26,318
IFT210 Bonds
P M Springford 40,000
WIA030 Bonds
P M Springford 30,000
As at 31 March 2018, Directors and senior executives (employed by Morrison & Co) held, in aggregate, 6% of the Infratil ordinary shares.
Dealing in SecuritiesThe following table shows transactions by Directors recorded in respect of those securities during the period from 1 April 2017 to 31 March 2018:
DIRECTORNO OF SECURITIES
BOUGHT/(SOLD) COST/(PROCEEDS) NZD
P Gough – beneficialOn-market acquisition – 29/03/18 159,000 494,490
Use of Company information
During the period the Board has received no notices from any Director of the Company or its subsidiaries requesting to use company information received in their capacity as a Director, which would not otherwise have been available to them.
Directors’ Relevant InterestsThe following are relevant interests of the Company’s Directors as at 31 March 2018:
M TumeDirector of Yeo Family Trustee LimitedDirector of Long Board LimitedDirector of Welltest Limited Director of New Zealand Refining Company LtdDirector of Koau Capital Partners LtdDirector of Rearden Capital Pty LimitedDirector of various Infratil wholly owned companiesChair of RetireAustralia Pty LimitedChair of Te Atiawa Iwi Holdings Limited PartnershipDirector of Ngai Tahu Holdings Corporation Limited
M BogoievskiDirector of Zig Zag Farm LimitedDirector of various Infratil wholly owned companiesChief Executive of the H.R.L. Morrison & Co group, and Director of H.R.L. Morrison & Co Group GP Limited and companies wholly-owned by the H.R.L. Morrison & Co Group Limited Partnership
A GerryDirector of Wellington International Airport LimitedDirector of Spark New Zealand LimitedDirector of Lindis Crossing Vineyard LimitedDirector of Glendora Holdings LimitedDirector of Glendora Avocados LimitedDirector of Vero Insurance New Zealand LimitedDirector of Vero Liability Insurance New Zealand LimitedDirector of Asteron Life LimitedDirector of On Being Bold Limited Director of Sharesies LimitedDirector of Avokaha Limited
For
per
sona
l use
onl
y
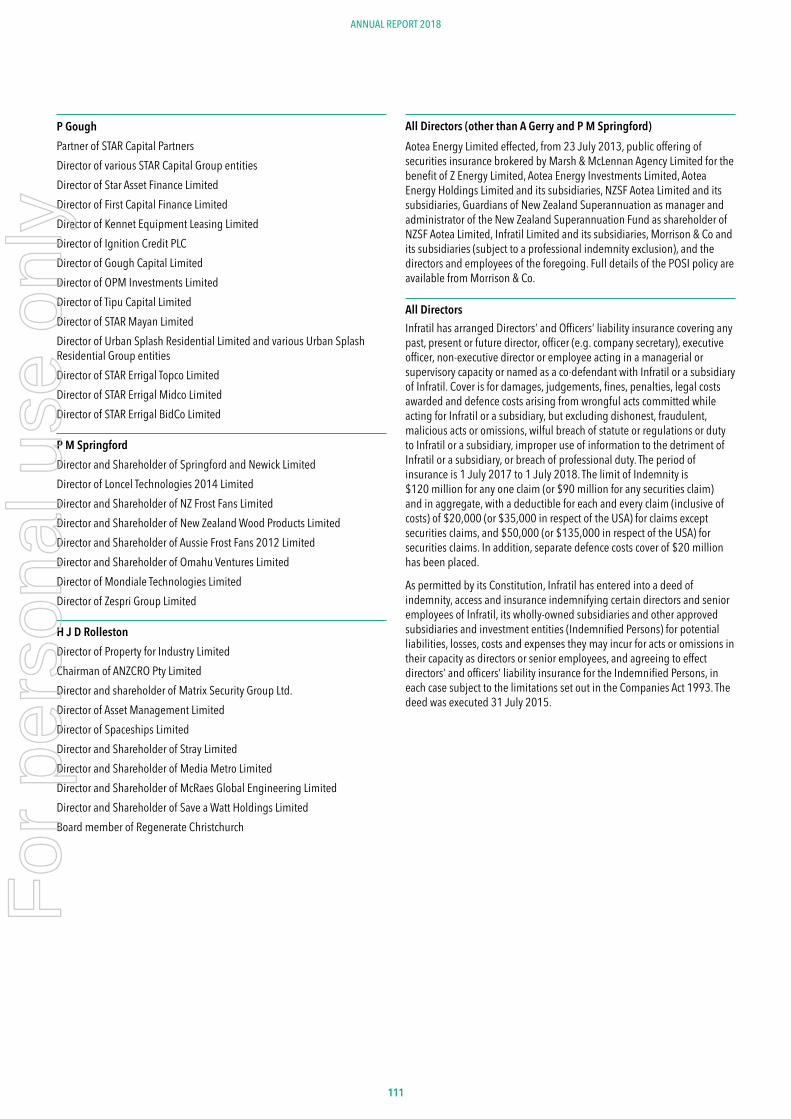
111111
ANNUAL REPORT 2018
P GoughPartner of STAR Capital PartnersDirector of various STAR Capital Group entitiesDirector of Star Asset Finance LimitedDirector of First Capital Finance LimitedDirector of Kennet Equipment Leasing LimitedDirector of Ignition Credit PLCDirector of Gough Capital LimitedDirector of OPM Investments LimitedDirector of Tipu Capital LimitedDirector of STAR Mayan LimitedDirector of Urban Splash Residential Limited and various Urban Splash Residential Group entitiesDirector of STAR Errigal Topco LimitedDirector of STAR Errigal Midco LimitedDirector of STAR Errigal BidCo Limited
P M SpringfordDirector and Shareholder of Springford and Newick LimitedDirector of Loncel Technologies 2014 LimitedDirector and Shareholder of NZ Frost Fans LimitedDirector and Shareholder of New Zealand Wood Products LimitedDirector and Shareholder of Aussie Frost Fans 2012 LimitedDirector and Shareholder of Omahu Ventures LimitedDirector of Mondiale Technologies LimitedDirector of Zespri Group Limited
H J D RollestonDirector of Property for Industry LimitedChairman of ANZCRO Pty LimitedDirector and shareholder of Matrix Security Group Ltd.Director of Asset Management LimitedDirector of Spaceships LimitedDirector and Shareholder of Stray LimitedDirector and Shareholder of Media Metro LimitedDirector and Shareholder of McRaes Global Engineering Limited Director and Shareholder of Save a Watt Holdings LimitedBoard member of Regenerate Christchurch
All Directors (other than A Gerry and P M Springford) Aotea Energy Limited effected, from 23 July 2013, public offering of securities insurance brokered by Marsh & McLennan Agency Limited for the benefit of Z Energy Limited, Aotea Energy Investments Limited, Aotea Energy Holdings Limited and its subsidiaries, NZSF Aotea Limited and its subsidiaries, Guardians of New Zealand Superannuation as manager and administrator of the New Zealand Superannuation Fund as shareholder of NZSF Aotea Limited, Infratil Limited and its subsidiaries, Morrison & Co and its subsidiaries (subject to a professional indemnity exclusion), and the directors and employees of the foregoing. Full details of the POSI policy are available from Morrison & Co.
All DirectorsInfratil has arranged Directors’ and Officers’ liability insurance covering any past, present or future director, officer (e.g. company secretary), executive officer, non-executive director or employee acting in a managerial or supervisory capacity or named as a co-defendant with Infratil or a subsidiary of Infratil. Cover is for damages, judgements, fines, penalties, legal costs awarded and defence costs arising from wrongful acts committed while acting for Infratil or a subsidiary, but excluding dishonest, fraudulent, malicious acts or omissions, wilful breach of statute or regulations or duty to Infratil or a subsidiary, improper use of information to the detriment of Infratil or a subsidiary, or breach of professional duty. The period of insurance is 1 July 2017 to 1 July 2018. The limit of Indemnity is $120 million for any one claim (or $90 million for any securities claim) and in aggregate, with a deductible for each and every claim (inclusive of costs) of $20,000 (or $35,000 in respect of the USA) for claims except securities claims, and $50,000 (or $135,000 in respect of the USA) for securities claims. In addition, separate defence costs cover of $20 million has been placed.
As permitted by its Constitution, Infratil has entered into a deed of indemnity, access and insurance indemnifying certain directors and senior employees of Infratil, its wholly-owned subsidiaries and other approved subsidiaries and investment entities (Indemnified Persons) for potential liabilities, losses, costs and expenses they may incur for acts or omissions in their capacity as directors or senior employees, and agreeing to effect directors’ and officers’ liability insurance for the Indemnified Persons, in each case subject to the limitations set out in the Companies Act 1993. The deed was executed 31 July 2015.
For
per
sona
l use
onl
y
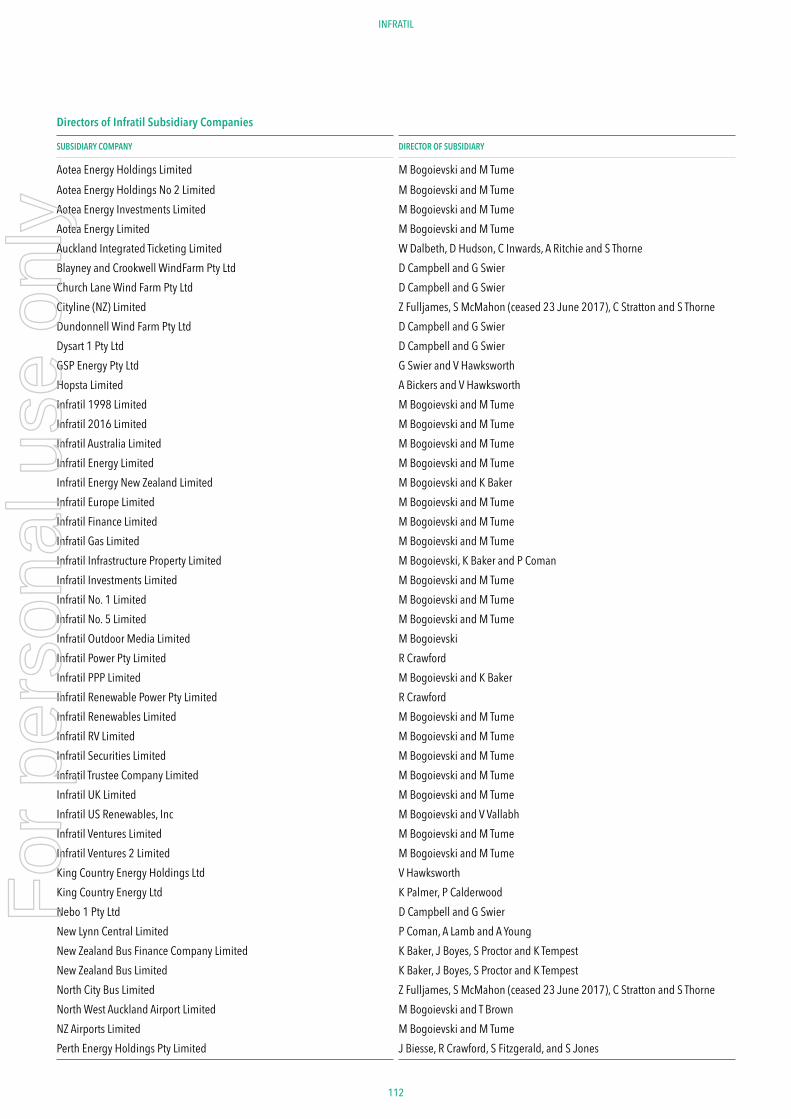
112 113
ANNUAL REPORT 2018INFRATIL
Directors of Infratil Subsidiary Companies
SUBSIDIARY COMPANY DIRECTOR OF SUBSIDIARY
Aotea Energy Holdings Limited M Bogoievski and M TumeAotea Energy Holdings No 2 Limited M Bogoievski and M Tume Aotea Energy Investments Limited M Bogoievski and M Tume Aotea Energy Limited M Bogoievski and M TumeAuckland Integrated Ticketing Limited W Dalbeth, D Hudson, C Inwards, A Ritchie and S Thorne Blayney and Crookwell WindFarm Pty Ltd D Campbell and G SwierChurch Lane Wind Farm Pty Ltd D Campbell and G SwierCityline (NZ) Limited Z Fulljames, S McMahon (ceased 23 June 2017), C Stratton and S ThorneDundonnell Wind Farm Pty Ltd D Campbell and G SwierDysart 1 Pty Ltd D Campbell and G SwierGSP Energy Pty Ltd G Swier and V HawksworthHopsta Limited A Bickers and V HawksworthInfratil 1998 Limited M Bogoievski and M Tume Infratil 2016 Limited M Bogoievski and M Tume Infratil Australia Limited M Bogoievski and M Tume Infratil Energy Limited M Bogoievski and M Tume Infratil Energy New Zealand Limited M Bogoievski and K Baker Infratil Europe Limited M Bogoievski and M TumeInfratil Finance Limited M Bogoievski and M Tume Infratil Gas Limited M Bogoievski and M Tume Infratil Infrastructure Property Limited M Bogoievski, K Baker and P ComanInfratil Investments Limited M Bogoievski and M Tume Infratil No. 1 Limited M Bogoievski and M TumeInfratil No. 5 Limited M Bogoievski and M TumeInfratil Outdoor Media Limited M BogoievskiInfratil Power Pty Limited R CrawfordInfratil PPP Limited M Bogoievski and K Baker Infratil Renewable Power Pty Limited R CrawfordInfratil Renewables Limited M Bogoievski and M TumeInfratil RV Limited M Bogoievski and M Tume Infratil Securities Limited M Bogoievski and M TumeInfratil Trustee Company Limited M Bogoievski and M TumeInfratil UK Limited M Bogoievski and M Tume Infratil US Renewables, Inc M Bogoievski and V Vallabh Infratil Ventures Limited M Bogoievski and M Tume Infratil Ventures 2 Limited M Bogoievski and M Tume King Country Energy Holdings Ltd V HawksworthKing Country Energy Ltd K Palmer, P CalderwoodNebo 1 Pty Ltd D Campbell and G SwierNew Lynn Central Limited P Coman, A Lamb and A YoungNew Zealand Bus Finance Company Limited K Baker, J Boyes, S Proctor and K TempestNew Zealand Bus Limited K Baker, J Boyes, S Proctor and K TempestNorth City Bus Limited Z Fulljames, S McMahon (ceased 23 June 2017), C Stratton and S ThorneNorth West Auckland Airport Limited M Bogoievski and T BrownNZ Airports Limited M Bogoievski and M Tume Perth Energy Holdings Pty Limited J Biesse, R Crawford, S Fitzgerald, and S Jones
For
per
sona
l use
onl
y
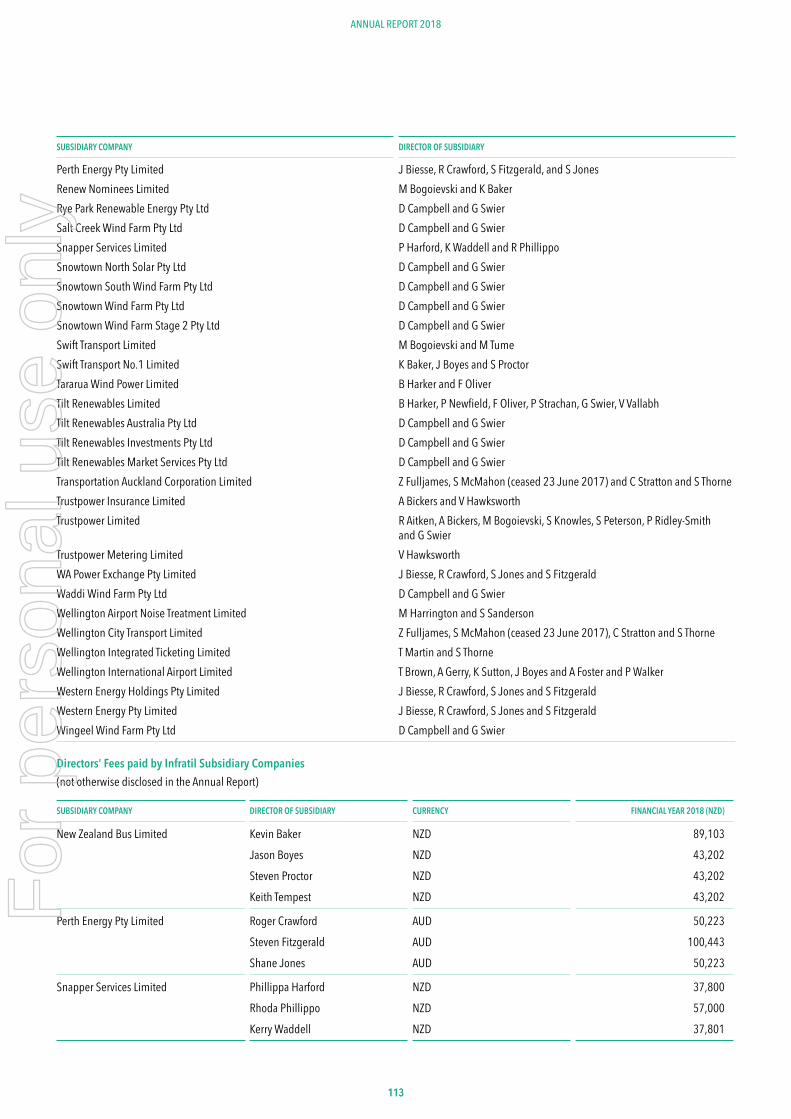
113113
ANNUAL REPORT 2018
SUBSIDIARY COMPANY DIRECTOR OF SUBSIDIARY
Perth Energy Pty Limited J Biesse, R Crawford, S Fitzgerald, and S JonesRenew Nominees Limited M Bogoievski and K Baker Rye Park Renewable Energy Pty Ltd D Campbell and G SwierSalt Creek Wind Farm Pty Ltd D Campbell and G SwierSnapper Services Limited P Harford, K Waddell and R Phillippo Snowtown North Solar Pty Ltd D Campbell and G SwierSnowtown South Wind Farm Pty Ltd D Campbell and G SwierSnowtown Wind Farm Pty Ltd D Campbell and G SwierSnowtown Wind Farm Stage 2 Pty Ltd D Campbell and G SwierSwift Transport Limited M Bogoievski and M TumeSwift Transport No.1 Limited K Baker, J Boyes and S ProctorTararua Wind Power Limited B Harker and F OliverTilt Renewables Limited B Harker, P Newfield, F Oliver, P Strachan, G Swier, V VallabhTilt Renewables Australia Pty Ltd D Campbell and G SwierTilt Renewables Investments Pty Ltd D Campbell and G SwierTilt Renewables Market Services Pty Ltd D Campbell and G SwierTransportation Auckland Corporation Limited Z Fulljames, S McMahon (ceased 23 June 2017) and C Stratton and S ThorneTrustpower Insurance Limited A Bickers and V HawksworthTrustpower Limited R Aitken, A Bickers, M Bogoievski, S Knowles, S Peterson, P Ridley-Smith
and G SwierTrustpower Metering Limited V HawksworthWA Power Exchange Pty Limited J Biesse, R Crawford, S Jones and S Fitzgerald Waddi Wind Farm Pty Ltd D Campbell and G SwierWellington Airport Noise Treatment Limited M Harrington and S SandersonWellington City Transport Limited Z Fulljames, S McMahon (ceased 23 June 2017), C Stratton and S ThorneWellington Integrated Ticketing Limited T Martin and S ThorneWellington International Airport Limited T Brown, A Gerry, K Sutton, J Boyes and A Foster and P WalkerWestern Energy Holdings Pty Limited J Biesse, R Crawford, S Jones and S FitzgeraldWestern Energy Pty Limited J Biesse, R Crawford, S Jones and S Fitzgerald Wingeel Wind Farm Pty Ltd D Campbell and G Swier
Directors’ Fees paid by Infratil Subsidiary Companies (not otherwise disclosed in the Annual Report)
SUBSIDIARY COMPANY DIRECTOR OF SUBSIDIARY CURRENCY FINANCIAL YEAR 2018 (NZD)
New Zealand Bus Limited Kevin Baker NZD 89,103Jason Boyes NZD 43,202Steven Proctor NZD 43,202Keith Tempest NZD 43,202
Perth Energy Pty Limited Roger Crawford AUD 50,223Steven Fitzgerald AUD 100,443Shane Jones AUD 50,223
Snapper Services Limited Phillippa Harford NZD 37,800Rhoda Phillippo NZD 57,000Kerry Waddell NZD 37,801
For
per
sona
l use
onl
y
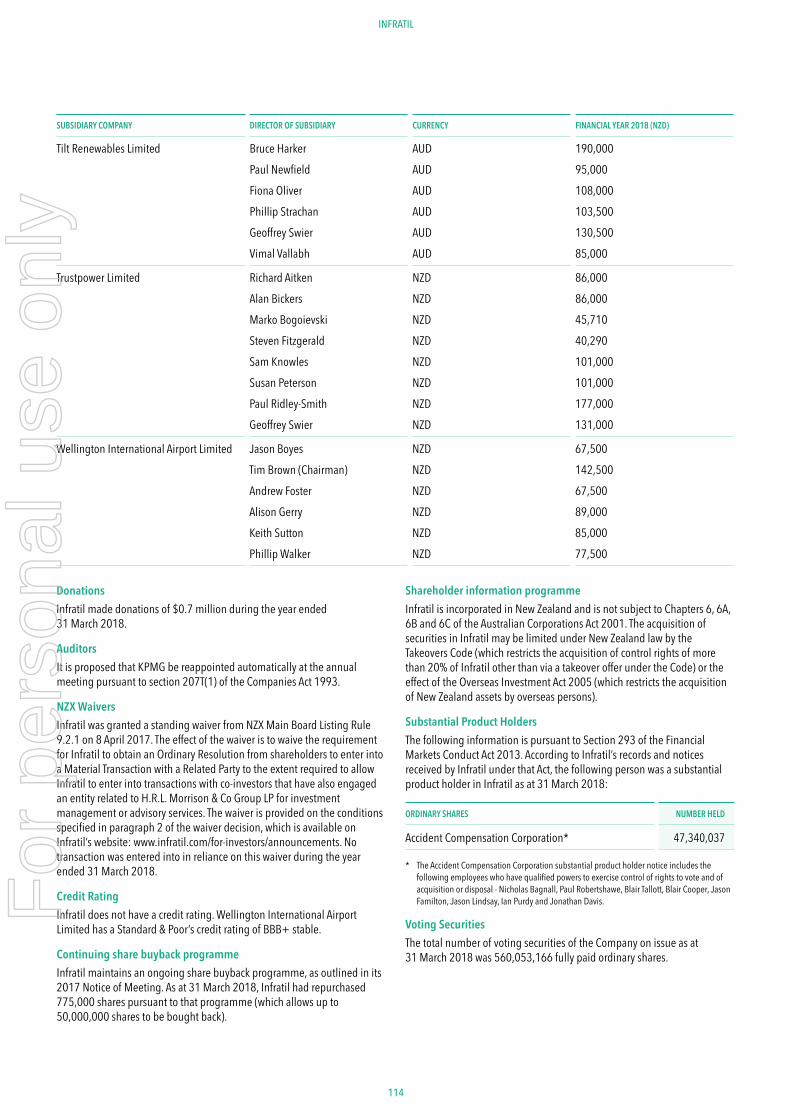
114 115
ANNUAL REPORT 2018INFRATIL
SUBSIDIARY COMPANY DIRECTOR OF SUBSIDIARY CURRENCY FINANCIAL YEAR 2018 (NZD)
Tilt Renewables Limited Bruce Harker AUD 190,000Paul Newfield AUD 95,000Fiona Oliver AUD 108,000Phillip Strachan AUD 103,500Geoffrey Swier AUD 130,500Vimal Vallabh AUD 85,000
Trustpower Limited Richard Aitken NZD 86,000Alan Bickers NZD 86,000Marko Bogoievski NZD 45,710Steven Fitzgerald NZD 40,290Sam Knowles NZD 101,000Susan Peterson NZD 101,000Paul Ridley-Smith NZD 177,000Geoffrey Swier NZD 131,000
Wellington International Airport Limited Jason Boyes NZD 67,500Tim Brown (Chairman) NZD 142,500Andrew Foster NZD 67,500Alison Gerry NZD 89,000Keith Sutton NZD 85,000Phillip Walker NZD 77,500
DonationsInfratil made donations of $0.7 million during the year ended 31 March 2018.
AuditorsIt is proposed that KPMG be reappointed automatically at the annual meeting pursuant to section 207T(1) of the Companies Act 1993.
NZX WaiversInfratil was granted a standing waiver from NZX Main Board Listing Rule 9.2.1 on 8 April 2017. The effect of the waiver is to waive the requirement for Infratil to obtain an Ordinary Resolution from shareholders to enter into a Material Transaction with a Related Party to the extent required to allow Infratil to enter into transactions with co-investors that have also engaged an entity related to H.R.L. Morrison & Co Group LP for investment management or advisory services. The waiver is provided on the conditions specified in paragraph 2 of the waiver decision, which is available on Infratil’s website: www.infratil.com/for-investors/announcements. No transaction was entered into in reliance on this waiver during the year ended 31 March 2018.
Credit RatingInfratil does not have a credit rating. Wellington International Airport Limited has a Standard & Poor’s credit rating of BBB+ stable.
Continuing share buyback programmeInfratil maintains an ongoing share buyback programme, as outlined in its 2017 Notice of Meeting. As at 31 March 2018, Infratil had repurchased 775,000 shares pursuant to that programme (which allows up to 50,000,000 shares to be bought back).
Shareholder information programmeInfratil is incorporated in New Zealand and is not subject to Chapters 6, 6A, 6B and 6C of the Australian Corporations Act 2001. The acquisition of securities in Infratil may be limited under New Zealand law by the Takeovers Code (which restricts the acquisition of control rights of more than 20% of Infratil other than via a takeover offer under the Code) or the effect of the Overseas Investment Act 2005 (which restricts the acquisition of New Zealand assets by overseas persons).
Substantial Product HoldersThe following information is pursuant to Section 293 of the Financial Markets Conduct Act 2013. According to Infratil’s records and notices received by Infratil under that Act, the following person was a substantial product holder in Infratil as at 31 March 2018:
ORDINARY SHARES NUMBER HELD
Accident Compensation Corporation* 47,340,037
* The Accident Compensation Corporation substantial product holder notice includes the following employees who have qualified powers to exercise control of rights to vote and of acquisition or disposal - Nicholas Bagnall, Paul Robertshawe, Blair Tallott, Blair Cooper, Jason Familton, Jason Lindsay, Ian Purdy and Jonathan Davis.
Voting SecuritiesThe total number of voting securities of the Company on issue as at 31 March 2018 was 560,053,166 fully paid ordinary shares.
For
per
sona
l use
onl
y
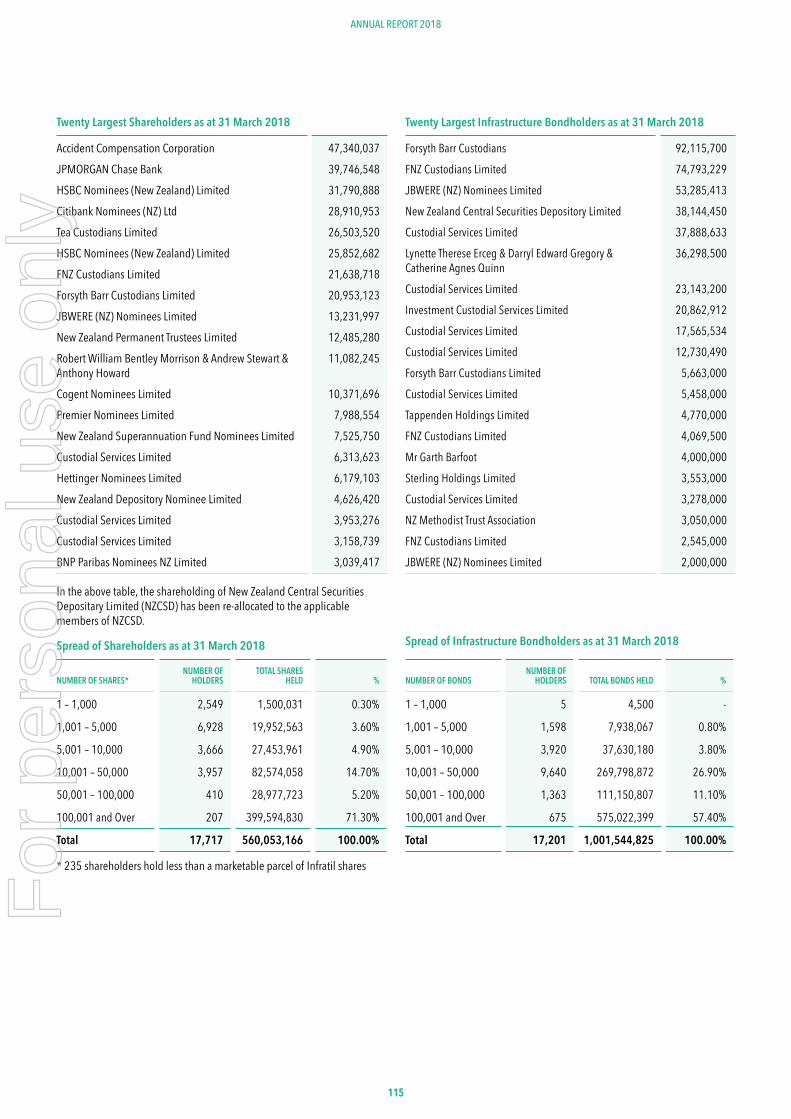
115115
ANNUAL REPORT 2018
Twenty Largest Shareholders as at 31 March 2018
Accident Compensation Corporation 47,340,037 JPMORGAN Chase Bank 39,746,548 HSBC Nominees (New Zealand) Limited 31,790,888 Citibank Nominees (NZ) Ltd 28,910,953 Tea Custodians Limited 26,503,520 HSBC Nominees (New Zealand) Limited 25,852,682 FNZ Custodians Limited 21,638,718 Forsyth Barr Custodians Limited 20,953,123 JBWERE (NZ) Nominees Limited 13,231,997 New Zealand Permanent Trustees Limited 12,485,280 Robert William Bentley Morrison & Andrew Stewart & Anthony Howard
11,082,245
Cogent Nominees Limited 10,371,696 Premier Nominees Limited 7,988,554 New Zealand Superannuation Fund Nominees Limited 7,525,750 Custodial Services Limited 6,313,623 Hettinger Nominees Limited 6,179,103 New Zealand Depository Nominee Limited 4,626,420 Custodial Services Limited 3,953,276 Custodial Services Limited 3,158,739 BNP Paribas Nominees NZ Limited 3,039,417
In the above table, the shareholding of New Zealand Central Securities Depositary Limited (NZCSD) has been re-allocated to the applicable members of NZCSD.
Spread of Shareholders as at 31 March 2018
NUMBER OF SHARES*NUMBER OF
HOLDERSTOTAL SHARES
HELD %
1 – 1,000 2,549 1,500,031 0.30%
1,001 – 5,000 6,928 19,952,563 3.60%
5,001 – 10,000 3,666 27,453,961 4.90%
10,001 – 50,000 3,957 82,574,058 14.70%
50,001 – 100,000 410 28,977,723 5.20%
100,001 and Over 207 399,594,830 71.30%
Total 17,717 560,053,166 100.00%
* 235 shareholders hold less than a marketable parcel of Infratil shares
Twenty Largest Infrastructure Bondholders as at 31 March 2018
Forsyth Barr Custodians 92,115,700 FNZ Custodians Limited 74,793,229 JBWERE (NZ) Nominees Limited 53,285,413 New Zealand Central Securities Depository Limited 38,144,450 Custodial Services Limited 37,888,633 Lynette Therese Erceg & Darryl Edward Gregory & Catherine Agnes Quinn
36,298,500
Custodial Services Limited 23,143,200 Investment Custodial Services Limited 20,862,912 Custodial Services Limited 17,565,534 Custodial Services Limited 12,730,490 Forsyth Barr Custodians Limited 5,663,000 Custodial Services Limited 5,458,000 Tappenden Holdings Limited 4,770,000 FNZ Custodians Limited 4,069,500 Mr Garth Barfoot 4,000,000 Sterling Holdings Limited 3,553,000 Custodial Services Limited 3,278,000 NZ Methodist Trust Association 3,050,000 FNZ Custodians Limited 2,545,000 JBWERE (NZ) Nominees Limited 2,000,000
Spread of Infrastructure Bondholders as at 31 March 2018
NUMBER OF BONDSNUMBER OF
HOLDERS TOTAL BONDS HELD %
1 – 1,000 5 4,500 -
1,001 – 5,000 1,598 7,938,067 0.80%
5,001 – 10,000 3,920 37,630,180 3.80%
10,001 – 50,000 9,640 269,798,872 26.90%
50,001 – 100,000 1,363 111,150,807 11.10%
100,001 and Over 675 575,022,399 57.40%
Total 17,201 1,001,544,825 100.00%
For
per
sona
l use
onl
y
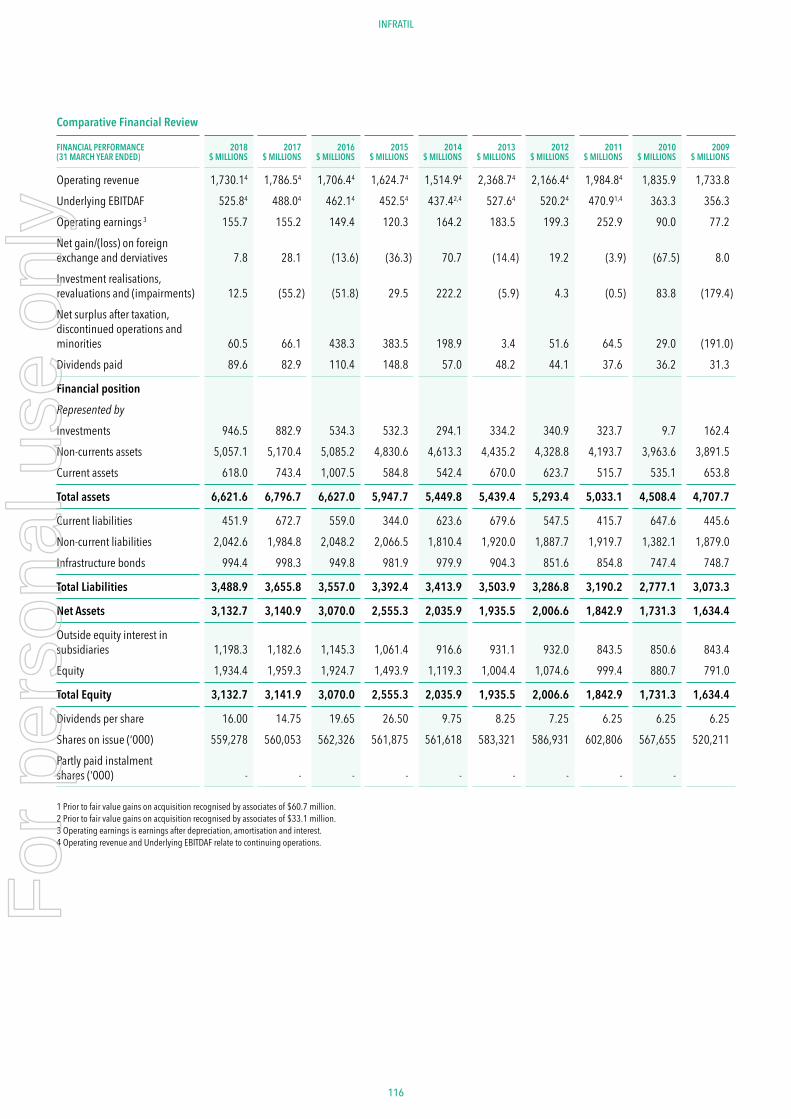
Comparative Financial Review
FINANCIAL PERFORMANCE (31 MARCH YEAR ENDED)
2018 $ MILLIONS
2017 $ MILLIONS
2016 $ MILLIONS
2015 $ MILLIONS
2014 $ MILLIONS
2013 $ MILLIONS
2012 $ MILLIONS
2011 $ MILLIONS
2010 $ MILLIONS
2009 $ MILLIONS
Operating revenue 1,730.14 1,786.54 1,706.44 1,624.74 1,514.94 2,368.74 2,166.44 1,984.84 1,835.9 1,733.8 Underlying EBITDAF 525.84 488.04 462.14 452.54 437.42,4 527.64 520.24 470.91,4 363.3 356.3 Operating earnings 3 155.7 155.2 149.4 120.3 164.2 183.5 199.3 252.9 90.0 77.2 Net gain/(loss) on foreign exchange and derviatives 7.8 28.1 (13.6) (36.3) 70.7 (14.4) 19.2 (3.9) (67.5) 8.0 Investment realisations, revaluations and (impairments) 12.5 (55.2) (51.8) 29.5 222.2 (5.9) 4.3 (0.5) 83.8 (179.4) Net surplus after taxation, discontinued operations and minorities 60.5 66.1 438.3 383.5 198.9 3.4 51.6 64.5 29.0 (191.0) Dividends paid 89.6 82.9 110.4 148.8 57.0 48.2 44.1 37.6 36.2 31.3
Financial positionRepresented by
Investments 946.5 882.9 534.3 532.3 294.1 334.2 340.9 323.7 9.7 162.4 Non-currents assets 5,057.1 5,170.4 5,085.2 4,830.6 4,613.3 4,435.2 4,328.8 4,193.7 3,963.6 3,891.5 Current assets 618.0 743.4 1,007.5 584.8 542.4 670.0 623.7 515.7 535.1 653.8
Total assets 6,621.6 6,796.7 6,627.0 5,947.7 5,449.8 5,439.4 5,293.4 5,033.1 4,508.4 4,707.7
Current liabilities 451.9 672.7 559.0 344.0 623.6 679.6 547.5 415.7 647.6 445.6 Non-current liabilities 2,042.6 1,984.8 2,048.2 2,066.5 1,810.4 1,920.0 1,887.7 1,919.7 1,382.1 1,879.0 Infrastructure bonds 994.4 998.3 949.8 981.9 979.9 904.3 851.6 854.8 747.4 748.7
Total Liabilities 3,488.9 3,655.8 3,557.0 3,392.4 3,413.9 3,503.9 3,286.8 3,190.2 2,777.1 3,073.3
Net Assets 3,132.7 3,140.9 3,070.0 2,555.3 2,035.9 1,935.5 2,006.6 1,842.9 1,731.3 1,634.4
Outside equity interest in subsidiaries 1,198.3 1,182.6 1,145.3 1,061.4 916.6 931.1 932.0 843.5 850.6 843.4 Equity 1,934.4 1,959.3 1,924.7 1,493.9 1,119.3 1,004.4 1,074.6 999.4 880.7 791.0
Total Equity 3,132.7 3,141.9 3,070.0 2,555.3 2,035.9 1,935.5 2,006.6 1,842.9 1,731.3 1,634.4
Dividends per share 16.00 14.75 19.65 26.50 9.75 8.25 7.25 6.25 6.25 6.25Shares on issue (‘000) 559,278 560,053 562,326 561,875 561,618 583,321 586,931 602,806 567,655 520,211Partly paid instalment shares (‘000) - - - - - - - - -
1 Prior to fair value gains on acquisition recognised by associates of $60.7 million.2 Prior to fair value gains on acquisition recognised by associates of $33.1 million.3 Operating earnings is earnings after depreciation, amortisation and interest.4 Operating revenue and Underlying EBITDAF relate to continuing operations.
INFRATIL
116
For
per
sona
l use
onl
y
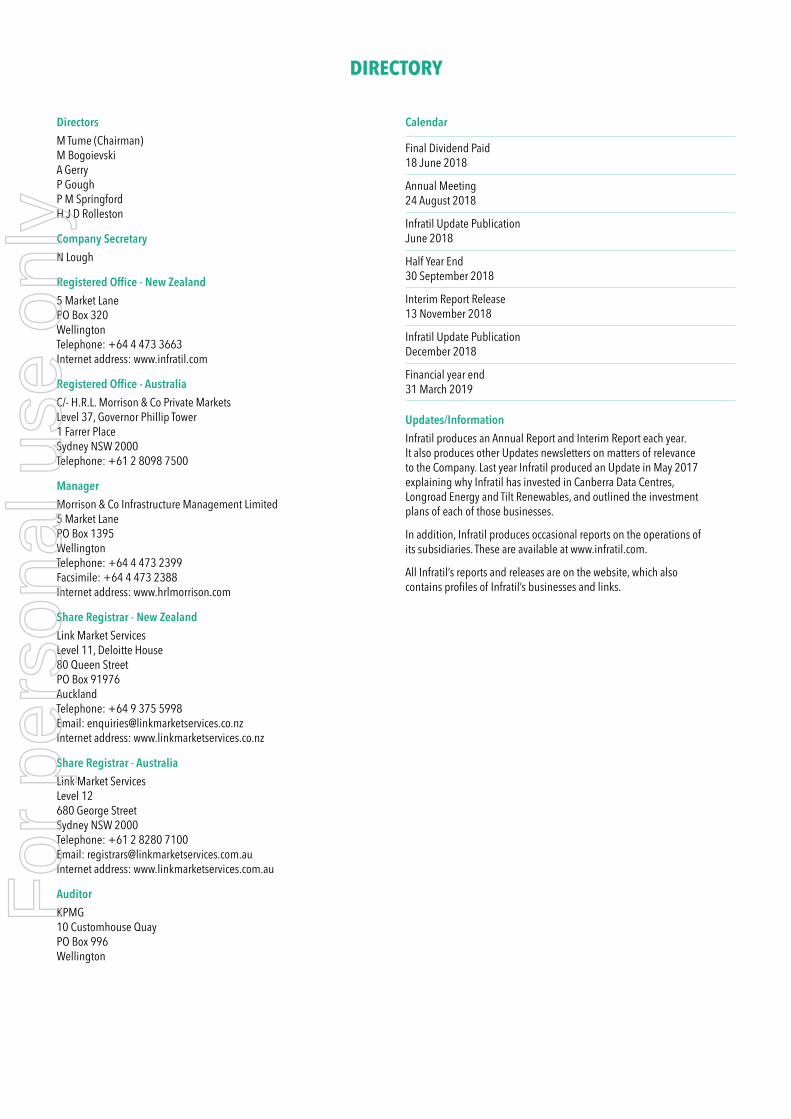
Directors M Tume (Chairman)M BogoievskiA GerryP GoughP M SpringfordH J D Rolleston
Company Secretary N Lough
Registered Office - New Zealand5 Market LanePO Box 320 WellingtonTelephone: +64 4 473 3663Internet address: www.infratil.com
Registered Office - AustraliaC/- H.R.L. Morrison & Co Private MarketsLevel 37, Governor Phillip Tower1 Farrer PlaceSydney NSW 2000Telephone: +61 2 8098 7500
ManagerMorrison & Co Infrastructure Management Limited5 Market LanePO Box 1395WellingtonTelephone: +64 4 473 2399Facsimile: +64 4 473 2388Internet address: www.hrlmorrison.com
Share Registrar - New ZealandLink Market ServicesLevel 11, Deloitte House80 Queen StreetPO Box 91976AucklandTelephone: +64 9 375 5998Email: [email protected] address: www.linkmarketservices.co.nz
Share Registrar - AustraliaLink Market ServicesLevel 12680 George StreetSydney NSW 2000Telephone: +61 2 8280 7100Email: [email protected] address: www.linkmarketservices.com.au
AuditorKPMG10 Customhouse Quay PO Box 996Wellington
Calendar
Final Dividend Paid 18 June 2018
Annual Meeting 24 August 2018
Infratil Update Publication June 2018
Half Year End 30 September 2018
Interim Report Release 13 November 2018
Infratil Update Publication December 2018
Financial year end 31 March 2019
Updates/InformationInfratil produces an Annual Report and Interim Report each year. It also produces other Updates newsletters on matters of relevance to the Company. Last year Infratil produced an Update in May 2017 explaining why Infratil has invested in Canberra Data Centres, Longroad Energy and Tilt Renewables, and outlined the investment plans of each of those businesses.
In addition, Infratil produces occasional reports on the operations of its subsidiaries. These are available at www.infratil.com.
All Infratil’s reports and releases are on the website, which also contains profiles of Infratil’s businesses and links.
DIRECTORYF
or p
erso
nal u
se o
nly

For
per
sona
l use
onl
y


