Embed Size (px)
Citation preview
2020 Market Outlook
January 2020
Caesar Maasry Goldman Sachs and Co. LLC +1 (212) 902 8763 [email protected]
Head of EM Cross-Asset Strategy
Goldman Sachs does and seeks to do business with companies covered in its research reports. As a result, investors should be aware that the firm may have a conflict of interest
that could affect the objectivity of this report. Investors should consider this report as only a single factor in making their investment decision.
For Reg AC certification and other important disclosures, see the Disclosure Appendix, or go to www.gs.com/research/hedge.html.
Analysts employed by non-US affiliates are not registered/qualified as research analysts with FINRA in the U.S.
The Goldman Sachs Group, Inc.
2Global Investment Research
Source: FactSet. Datastream, Haver, Goldman Sachs Global Investment Research
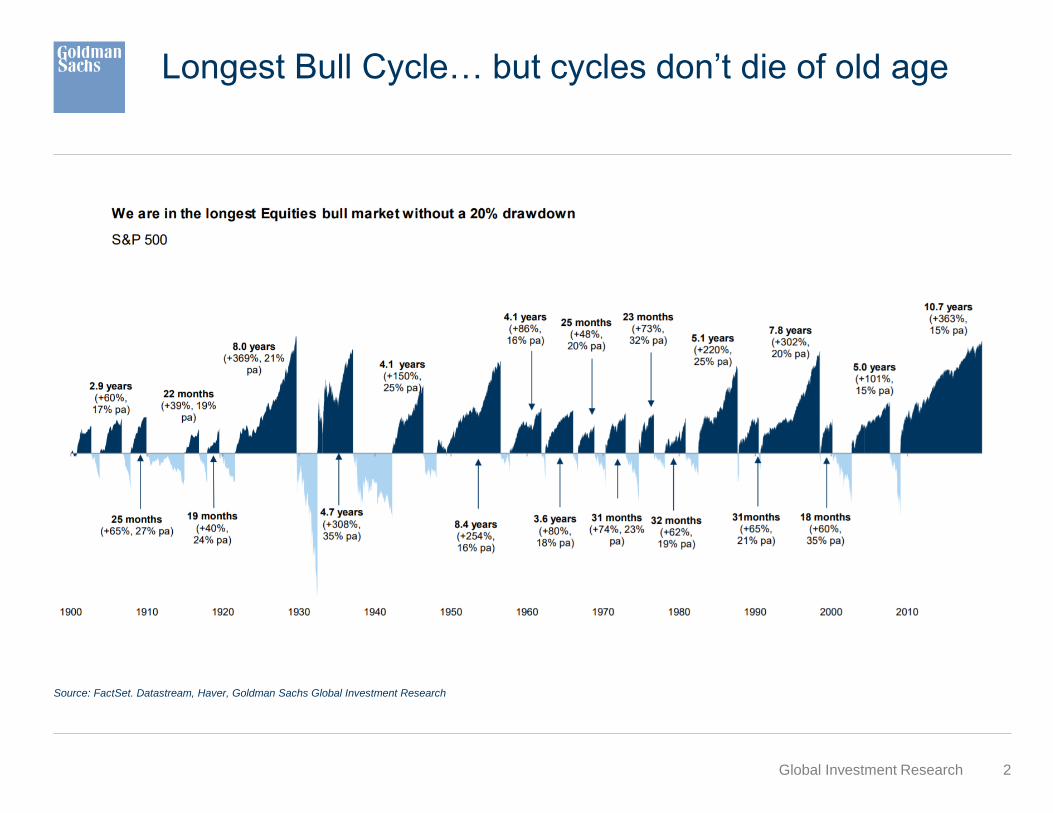
Longest Bull Cycle… but cycles don’t die of old age
3Global Investment ResearchSource: FactSet. Datastream, Haver, Goldman Sachs Global Investment Research
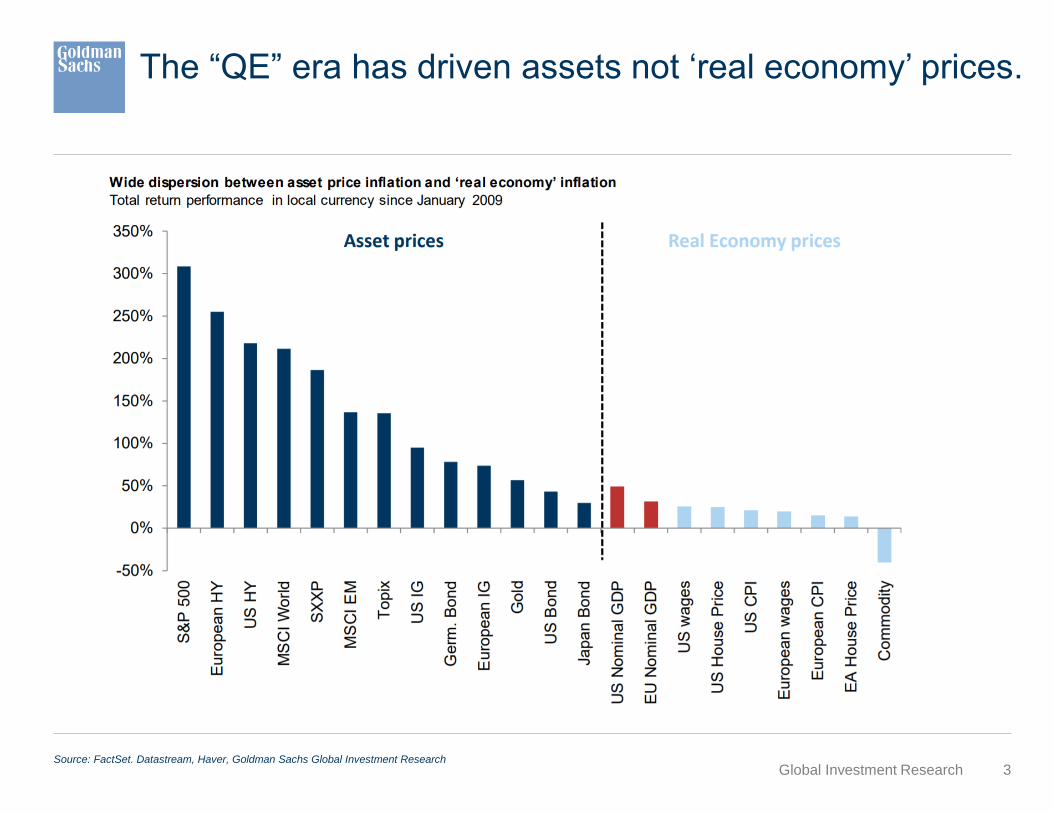
The “QE” era has driven assets not ‘real economy’ prices.
4Global Investment ResearchSource: FactSet. Datastream, Haver, Goldman Sachs Global Investment Research
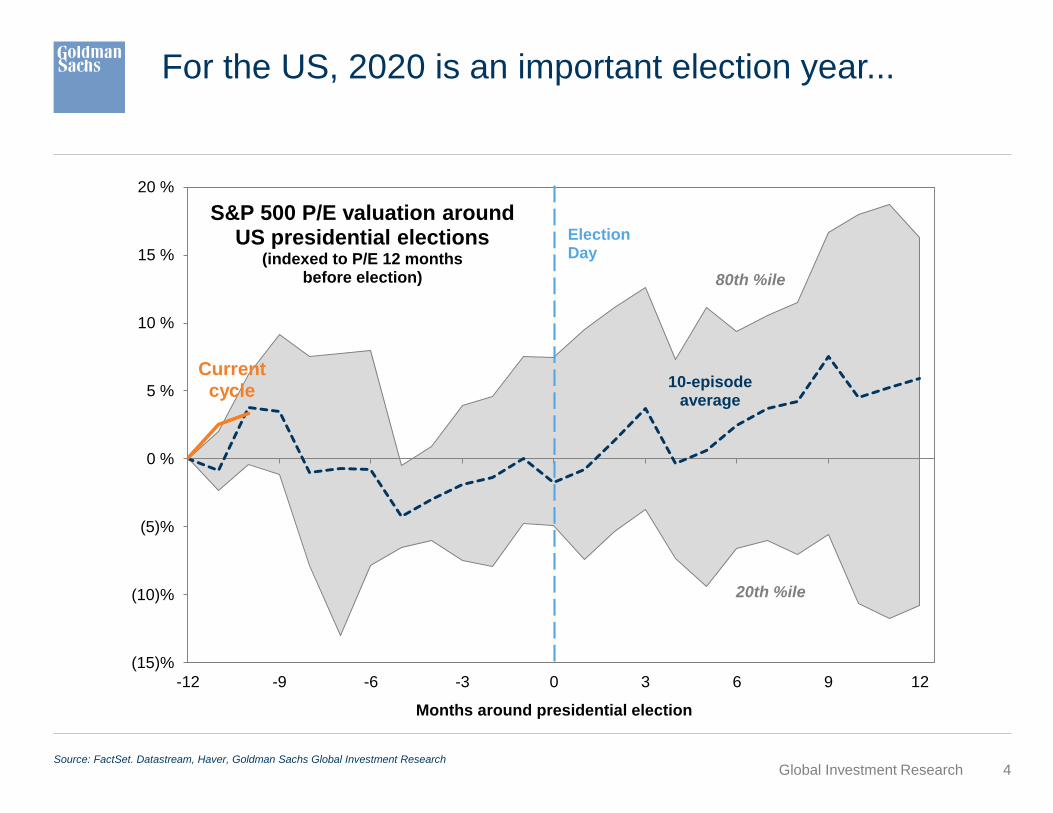
For the US, 2020 is an important election year...
(15)%
(10)%
(5)%
0 %
5 %
10 %
15 %
20 %
-12 -9 -6 -3 0 3 6 9 12
Months around presidential election
S&P 500 P/E valuation aroundUS presidential elections
(indexed to P/E 12 months before election) 80th %ile
20th %ile
10-episodeaverage
Current cycle
Election Day
5Global Investment ResearchSource: FactSet. Datastream, Haver, Goldman Sachs Global Investment Research
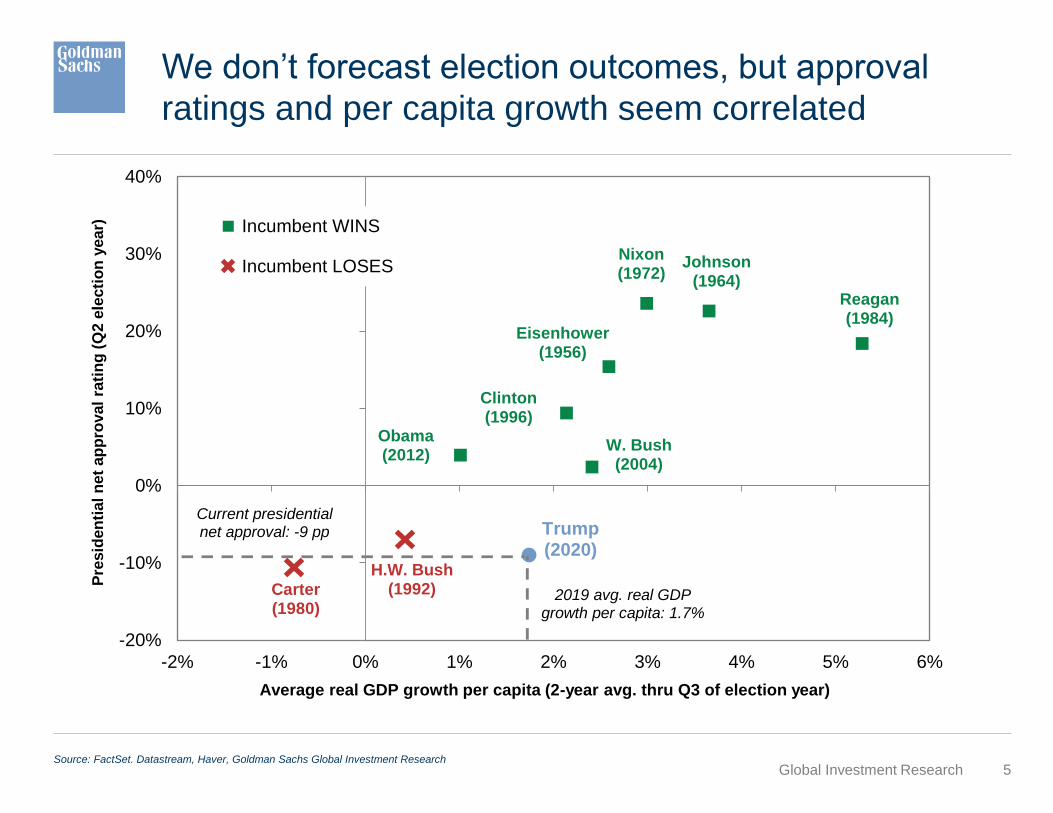
We don’t forecast election outcomes, but approval
ratings and per capita growth seem correlated
-20%
-10%
0%
10%
20%
30%
40%
-2% -1% 0% 1% 2% 3% 4% 5% 6%
Pre
sid
en
tial
net
ap
pro
val
rati
ng
(Q
2 e
lecti
on
year)
Average real GDP growth per capita (2-year avg. thru Q3 of election year)
Incumbent WINS
Incumbent LOSES
Carter(1980)
H.W. Bush(1992)
W. Bush(2004)
Obama(2012)
Clinton(1996)
Eisenhower(1956)
Nixon(1972)
Johnson(1964)
Reagan(1984)
Trump(2020)
Current presidentialnet approval: -9 pp
2019 avg. real GDPgrowth per capita: 1.7%
6Global Investment ResearchSource: FactSet. Datastream, Haver, Goldman Sachs Global Investment Research
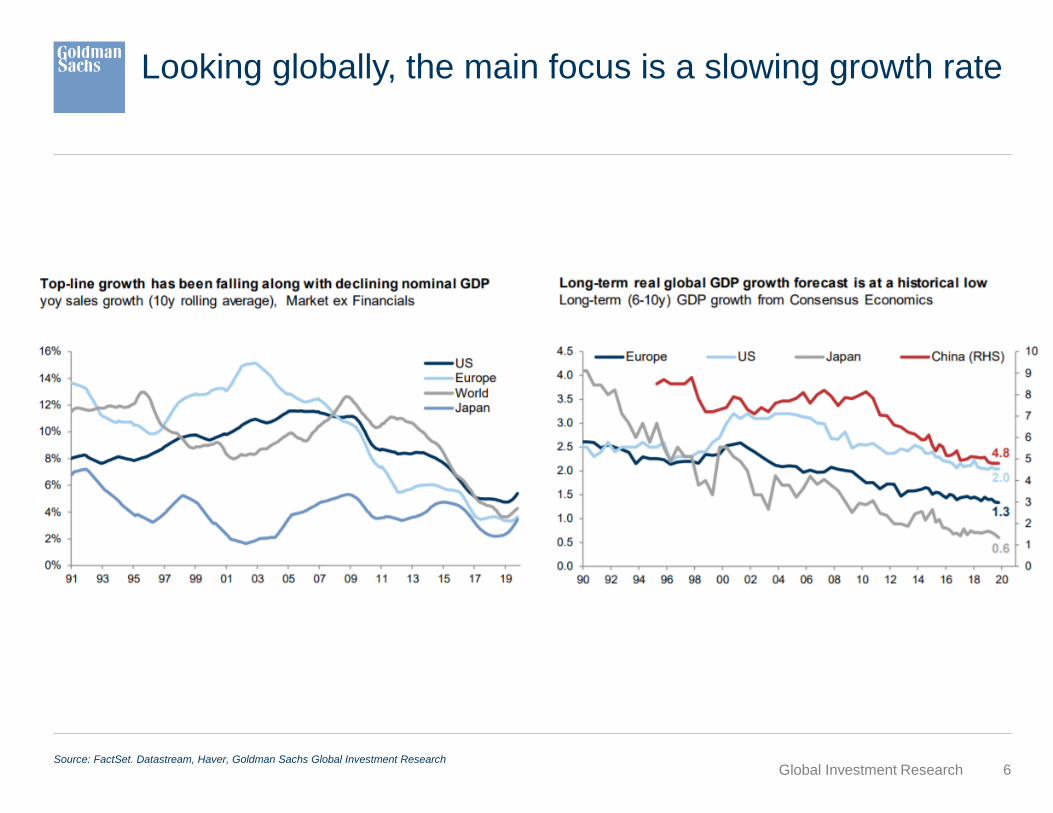
Looking globally, the main focus is a slowing growth rate
7Global Investment ResearchSource: FactSet. Datastream, Haver, Goldman Sachs Global Investment Research
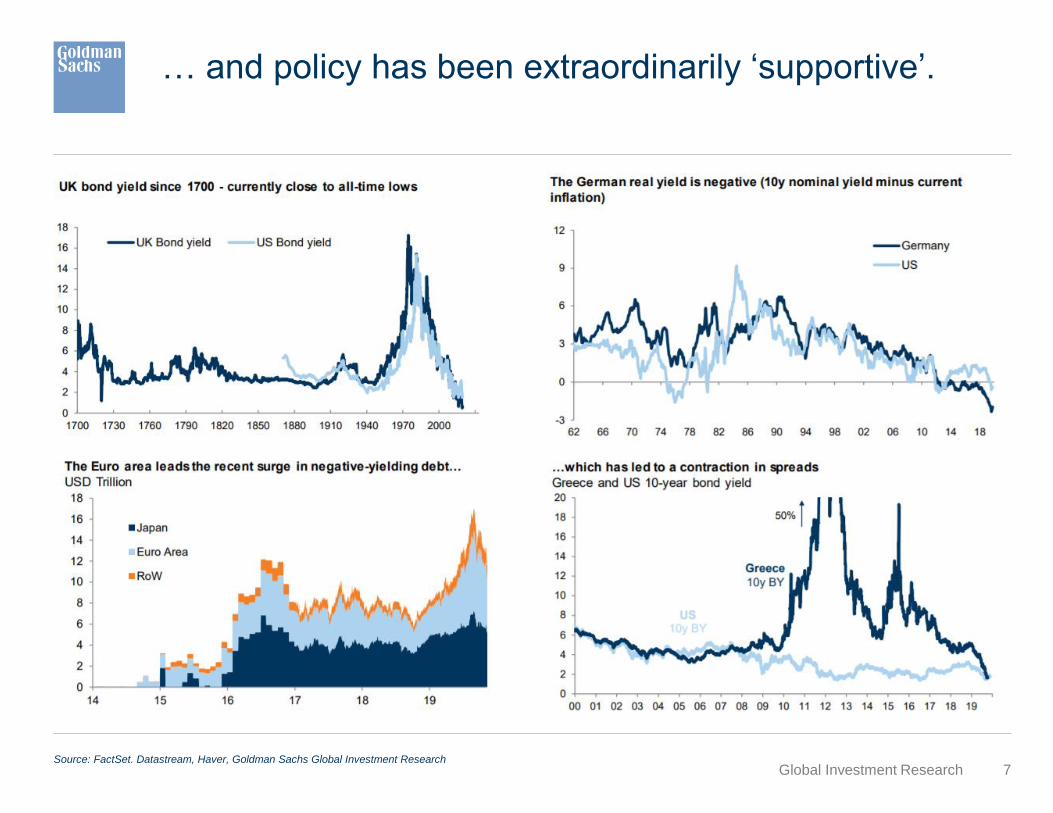
… and policy has been extraordinarily ‘supportive’.
8Global Investment Research
Source: FactSet. Datastream, Haver, Goldman Sachs Global Investment Research
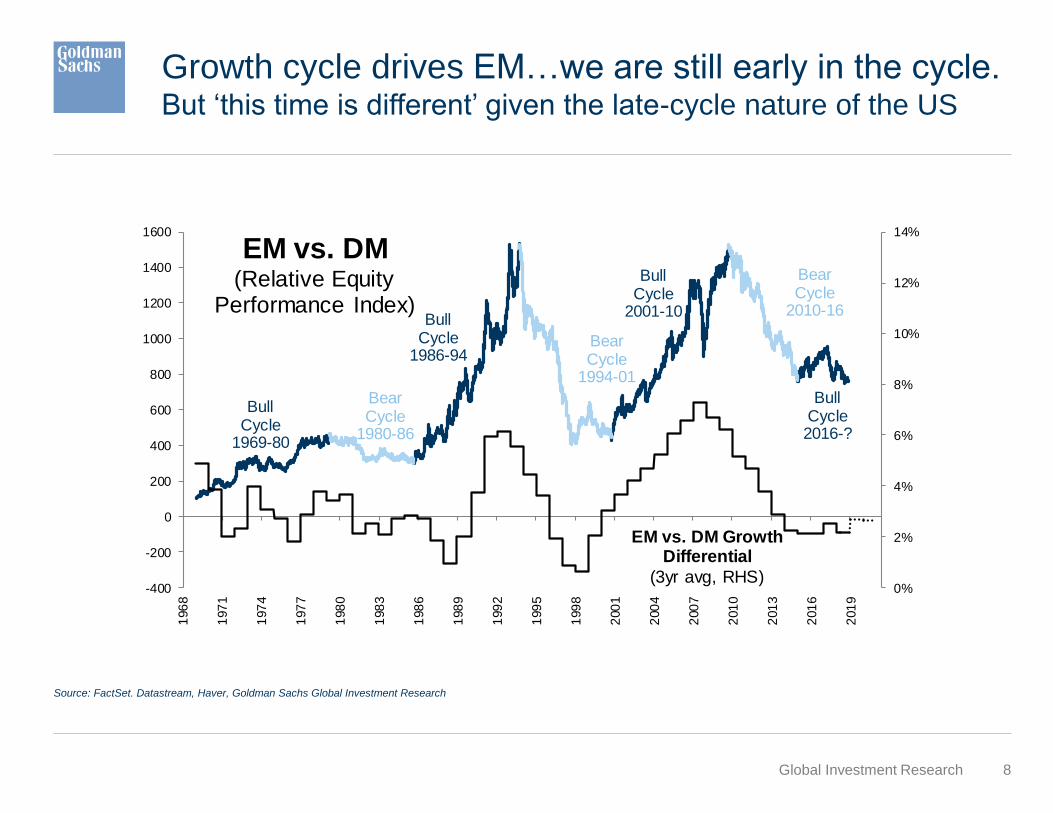
Growth cycle drives EM…we are still early in the cycle.But ‘this time is different’ given the late-cycle nature of the US
0%
2%
4%
6%
8%
10%
12%
14%
-400
-200
0
200
400
600
800
1000
1200
1400
1600
196
8
197
1
197
4
197
7
198
0
198
3
198
6
198
9
199
2
199
5
199
8
200
1
200
4
200
7
201
0
201
3
201
6
201
9
EM vs. DM(Relative Equity
Performance Index)
BullCycle
1969-80
BearCycle
1980-86
BullCycle
1986-94BearCycle
1994-01
BullCycle
2001-10
BearCycle
2010-16
EM vs. DM Growth Differential
(3yr avg, RHS)
BullCycle2016-?
9Global Investment Research
Source: FactSet, Datastream, Goldman Sachs Global Investment Research
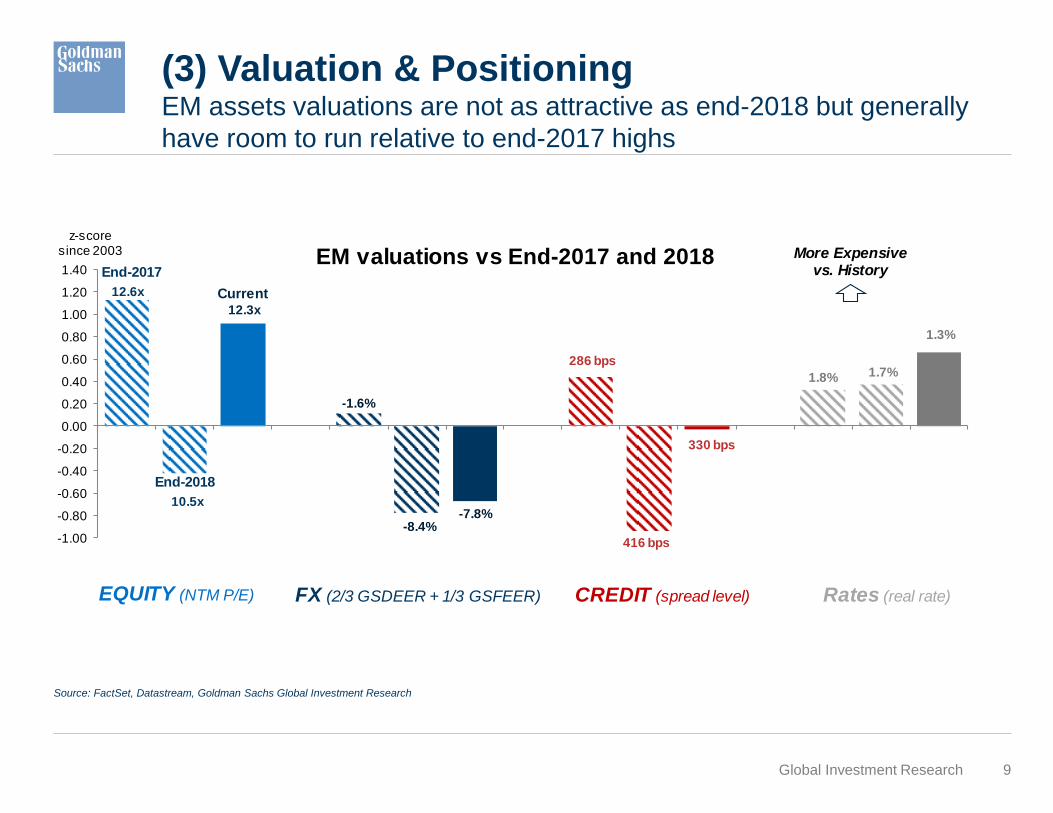
(3) Valuation & PositioningEM assets valuations are not as attractive as end-2018 but generally
have room to run relative to end-2017 highs
-1.00
-0.80
-0.60
-0.40
-0.20
0.00
0.20
0.40
0.60
0.80
1.00
1.20
1.40EM valuations vs End-2017 and 2018
z-scoresince 2003
EQUITY (NTM P/E) CREDIT (spread level)FX (2/3 GSDEER + 1/3 GSFEER) Rates (real rate)
More Expensivevs. History
End-2018
Current12.3x
10.5x-7.8%
-8.4%
330 bps
416 bps
1.7%
1.3%
End-2017
12.6x
-1.6%
286 bps
1.8%
10Global Investment Research
Source: FactSet. Datastream, Haver, Goldman Sachs Global Investment Research
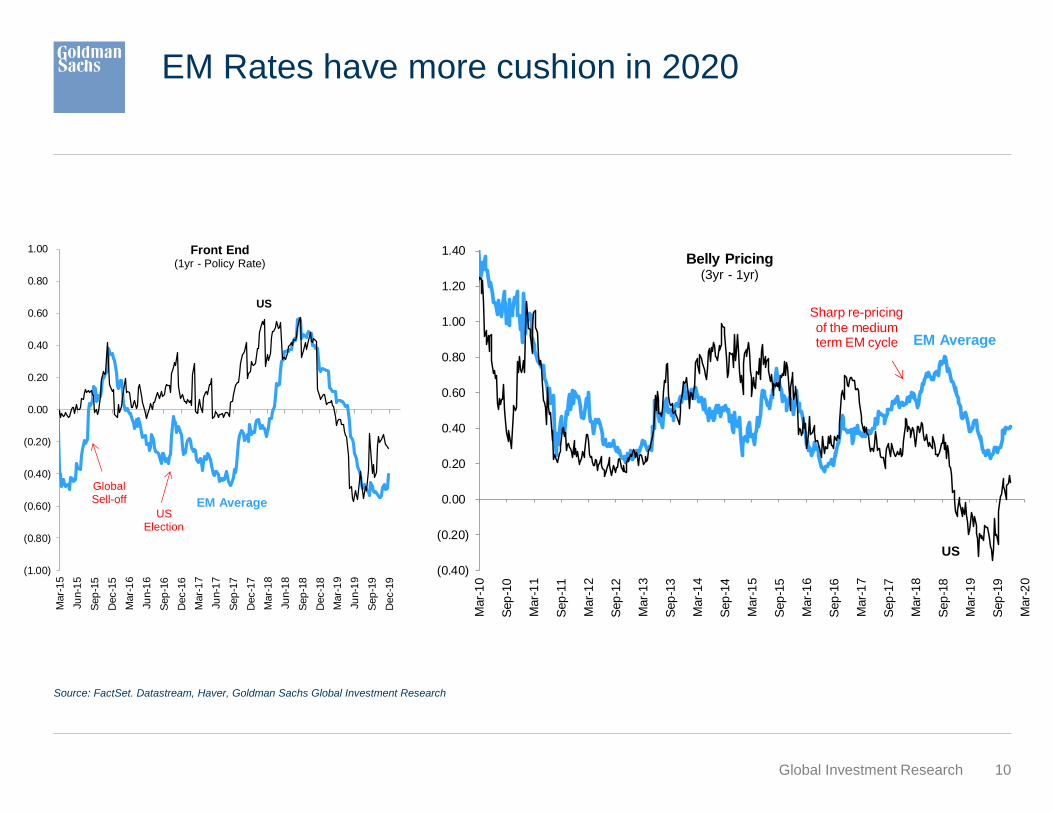
EM Rates have more cushion in 2020
(1.00)
(0.80)
(0.60)
(0.40)
(0.20)
0.00
0.20
0.40
0.60
0.80
1.00
Mar-
15
Ju
n-1
5
Sep
-15
Dec-1
5
Mar-
16
Ju
n-1
6
Sep
-16
Dec-1
6
Mar-
17
Ju
n-1
7
Sep
-17
Dec-1
7
Mar-
18
Ju
n-1
8
Sep
-18
Dec-1
8
Mar-
19
Ju
n-1
9
Sep
-19
Dec-1
9
Front End(1yr - Policy Rate)
US
EM Average
GlobalSell-off
USElection
(0.40)
(0.20)
0.00
0.20
0.40
0.60
0.80
1.00
1.20
1.40
Mar-
10
Sep
-10
Mar-
11
Sep
-11
Mar-
12
Sep
-12
Mar-
13
Sep
-13
Mar-
14
Sep
-14
Mar-
15
Sep
-15
Mar-
16
Sep
-16
Mar-
17
Sep
-17
Mar-
18
Sep
-18
Mar-
19
Sep
-19
Mar-
20
Belly Pricing(3yr - 1yr)
US
EM Average
Sharp re-pricingof the mediumterm EM cycle
11Global Investment Research
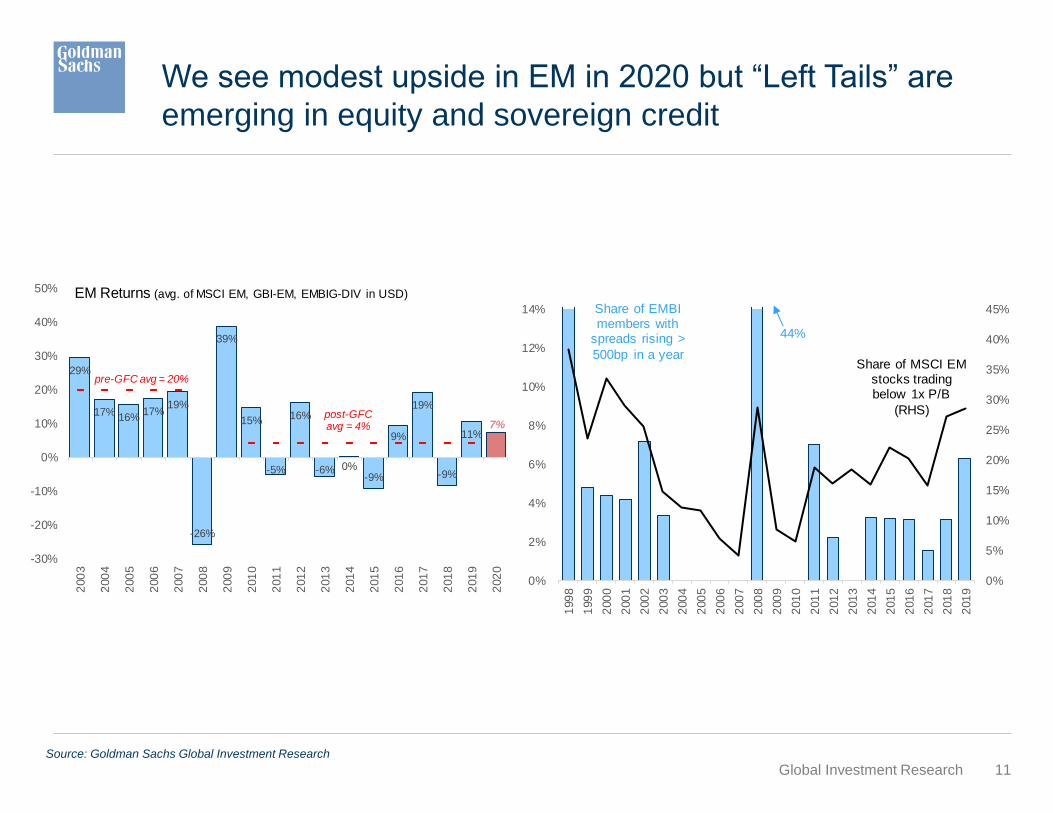
We see modest upside in EM in 2020 but “Left Tails” are
emerging in equity and sovereign credit
Source: Goldman Sachs Global Investment Research
0%
5%
10%
15%
20%
25%
30%
35%
40%
45%
0%
2%
4%
6%
8%
10%
12%
14%
199
8
199
9
200
0
200
1
200
2
200
3
200
4
200
5
200
6
200
7
200
8
200
9
201
0
201
1
201
2
201
3
201
4
201
5
201
6
201
7
201
8
201
9
Share of MSCI EMstocks tradingbelow 1x P/B
(RHS)
Share of EMBImembers with
spreads rising >
500bp in a year
44%
29%
17%16%
17%19%
-26%
39%
15%
-5%
16%
-6% 0%-9%
9%
19%
-9%
11%7%
-30%
-20%
-10%
0%
10%
20%
30%
40%
50%
200
3
200
4
200
5
200
6
200
7
200
8
200
9
201
0
201
1
201
2
201
3
201
4
201
5
201
6
201
7
201
8
201
9
202
0
EM Returns (avg. of MSCI EM, GBI-EM, EMBIG-DIV in USD)
pre-GFC avg = 20%
post-GFCavg = 4%
12Global Investment ResearchSource: Goldman Sachs, Goldman Sachs Global Investment Research
Appendix for Q&A
13Global Investment ResearchSource: Goldman Sachs, Goldman Sachs Global Investment Research
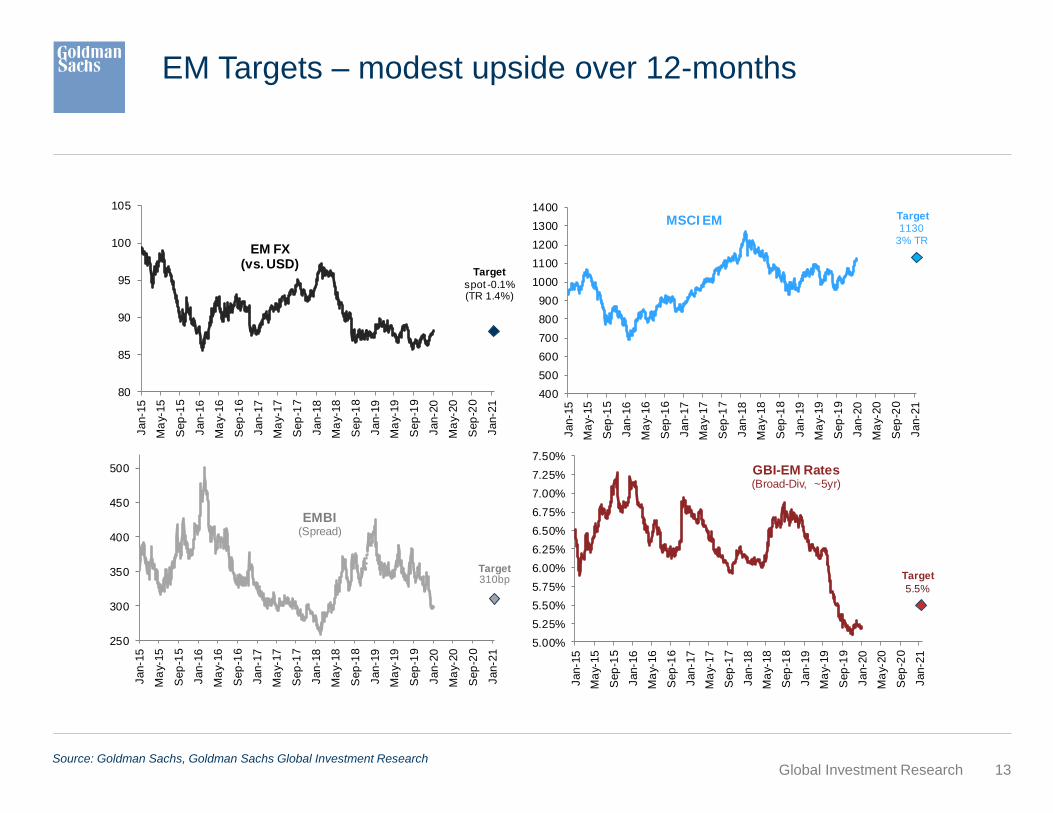
EM Targets – modest upside over 12-months
80
85
90
95
100
105
Jan-1
5
Ma
y-15
Sep
-15
Jan-1
6
Ma
y-16
Sep
-16
Jan-1
7
Ma
y-17
Sep
-17
Jan-1
8
Ma
y-18
Sep
-18
Jan-1
9
Ma
y-19
Sep
-19
Jan-2
0
Ma
y-20
Sep
-20
Jan-2
1
EM FX(vs. USD)
Target
spot -0.1%(TR 1.4%)
400
500
600
700
800
900
1000
1100
1200
1300
1400
Jan-1
5
Ma
y-15
Sep
-15
Jan-1
6
Ma
y-16
Sep
-16
Jan-1
7
Ma
y-17
Sep
-17
Jan-1
8
Ma
y-18
Sep
-18
Jan-1
9
Ma
y-19
Sep
-19
Jan-2
0
Ma
y-20
Sep
-20
Jan-2
1
MSCI EM Target1130
3% TR
250
300
350
400
450
500
Jan-1
5
Ma
y-15
Sep
-15
Jan-1
6
Ma
y-16
Sep
-16
Jan-1
7
Ma
y-17
Sep
-17
Jan-1
8
Ma
y-18
Sep
-18
Jan-1
9
Ma
y-19
Sep
-19
Jan-2
0
Ma
y-20
Sep
-20
Jan-2
1
EMBI(Spread)
Target310bp
5.00%
5.25%
5.50%
5.75%
6.00%
6.25%
6.50%
6.75%
7.00%
7.25%
7.50%
Jan-1
5
Ma
y-15
Sep
-15
Jan-1
6
Ma
y-16
Sep
-16
Jan-1
7
Ma
y-17
Sep
-17
Jan-1
8
Ma
y-18
Sep
-18
Jan-1
9
Ma
y-19
Sep
-19
Jan-2
0
Ma
y-20
Sep
-20
Jan-2
1
GBI-EM Rates(Broad-Div, ~5yr)
Target
5.5%
14Global Investment Research
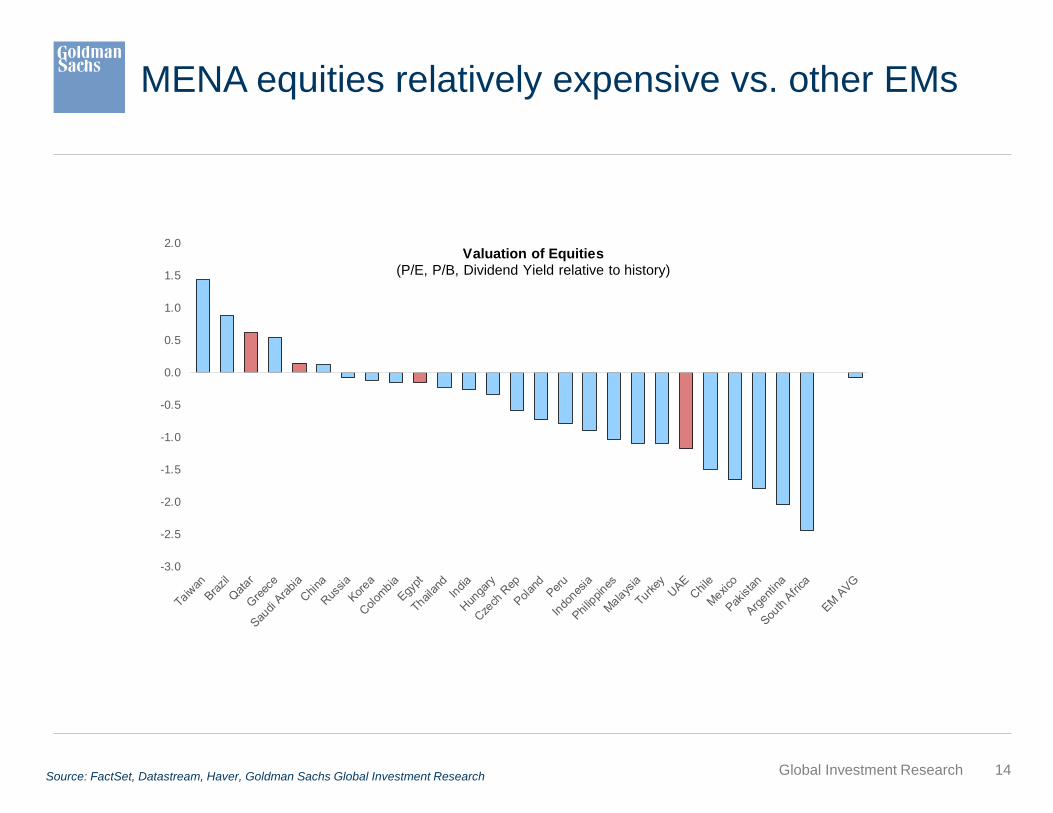
MENA equities relatively expensive vs. other EMs
Source: FactSet, Datastream, Haver, Goldman Sachs Global Investment Research
-3.0
-2.5
-2.0
-1.5
-1.0
-0.5
0.0
0.5
1.0
1.5
2.0Valuation of Equities
(P/E, P/B, Dividend Yield relative to history)
15Global Investment Research
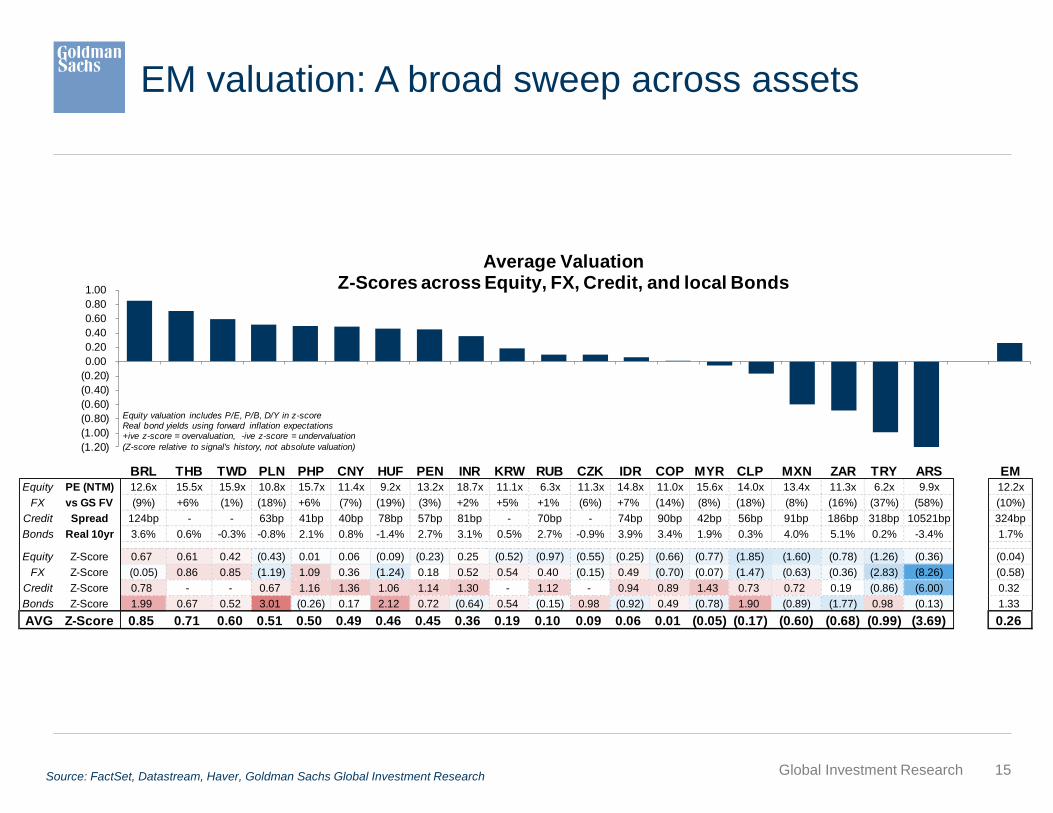
EM valuation: A broad sweep across assets
Source: FactSet, Datastream, Haver, Goldman Sachs Global Investment Research
BRL THB TWD PLN PHP CNY HUF PEN INR KRW RUB CZK IDR COP MYR CLP MXN ZAR TRY ARS EMEquity PE (NTM) 12.6x 15.5x 15.9x 10.8x 15.7x 11.4x 9.2x 13.2x 18.7x 11.1x 6.3x 11.3x 14.8x 11.0x 15.6x 14.0x 13.4x 11.3x 6.2x 9.9x 12.2x
FX vs GS FV (9%) +6% (1%) (18%) +6% (7%) (19%) (3%) +2% +5% +1% (6%) +7% (14%) (8%) (18%) (8%) (16%) (37%) (58%) (10%)
Credit Spread 124bp - - 63bp 41bp 40bp 78bp 57bp 81bp - 70bp - 74bp 90bp 42bp 56bp 91bp 186bp 318bp 10521bp 324bp
Bonds Real 10yr 3.6% 0.6% -0.3% -0.8% 2.1% 0.8% -1.4% 2.7% 3.1% 0.5% 2.7% -0.9% 3.9% 3.4% 1.9% 0.3% 4.0% 5.1% 0.2% -3.4% 1.7%
Equity Z-Score 0.67 0.61 0.42 (0.43) 0.01 0.06 (0.09) (0.23) 0.25 (0.52) (0.97) (0.55) (0.25) (0.66) (0.77) (1.85) (1.60) (0.78) (1.26) (0.36) (0.04)
FX Z-Score (0.05) 0.86 0.85 (1.19) 1.09 0.36 (1.24) 0.18 0.52 0.54 0.40 (0.15) 0.49 (0.70) (0.07) (1.47) (0.63) (0.36) (2.83) (8.26) (0.58)
Credit Z-Score 0.78 - - 0.67 1.16 1.36 1.06 1.14 1.30 - 1.12 - 0.94 0.89 1.43 0.73 0.72 0.19 (0.86) (6.00) 0.32
Bonds Z-Score 1.99 0.67 0.52 3.01 (0.26) 0.17 2.12 0.72 (0.64) 0.54 (0.15) 0.98 (0.92) 0.49 (0.78) 1.90 (0.89) (1.77) 0.98 (0.13) 1.33
AVG Z-Score 0.85 0.71 0.60 0.51 0.50 0.49 0.46 0.45 0.36 0.19 0.10 0.09 0.06 0.01 (0.05) (0.17) (0.60) (0.68) (0.99) (3.69) 0.26
(1.20)
(1.00)
(0.80)
(0.60)
(0.40)
(0.20)
0.00
0.20
0.40
0.60
0.80
1.00
Average ValuationZ-Scores across Equity, FX, Credit, and local Bonds
Equity valuation includes P/E, P/B, D/Y in z-scoreReal bond yields using forward inflation expectations+ive z-score = overvaluation, -ive z-score = undervaluation
(Z-score relative to signal's history, not absolute valuation)
16Global Investment Research
Source: Haver, Goldman Sachs Global Investment Research
Source: Haver, Datastream, Goldman Sachs Global Investment Research
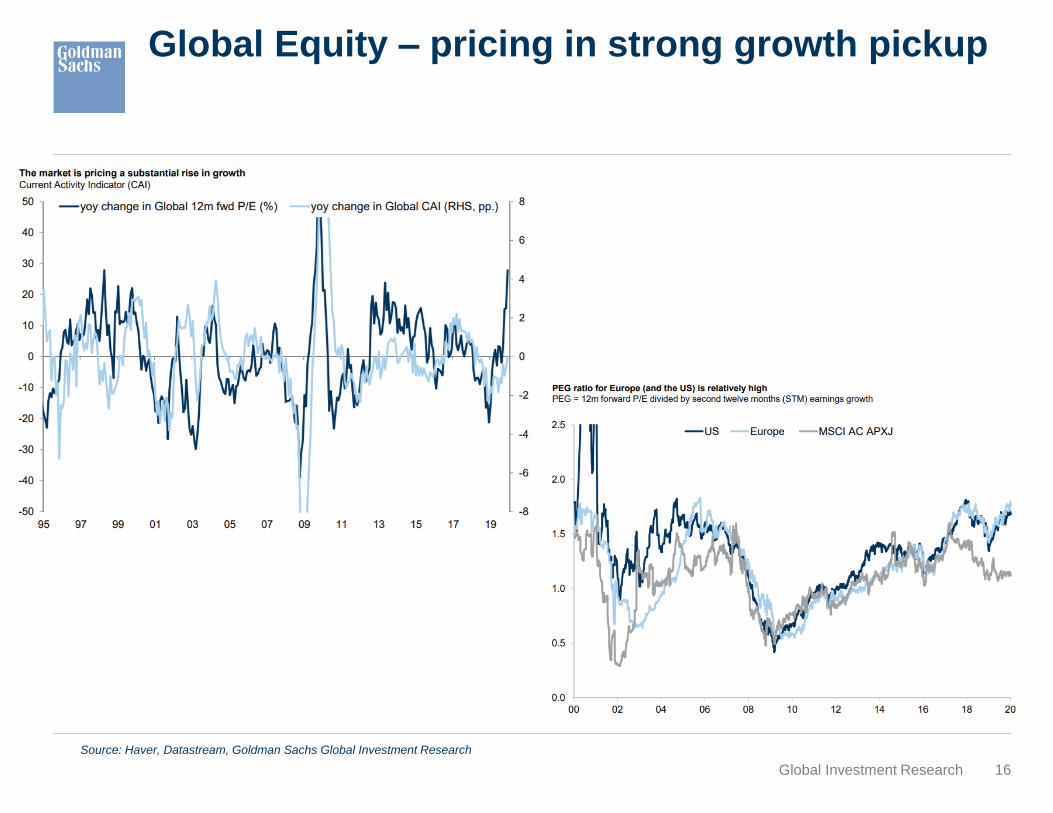
Global Equity – pricing in strong growth pickup
17Global Investment Research
Source: Haver, Goldman Sachs Global Investment Research
Source: Haver, Datastream, Goldman Sachs Global Investment Research
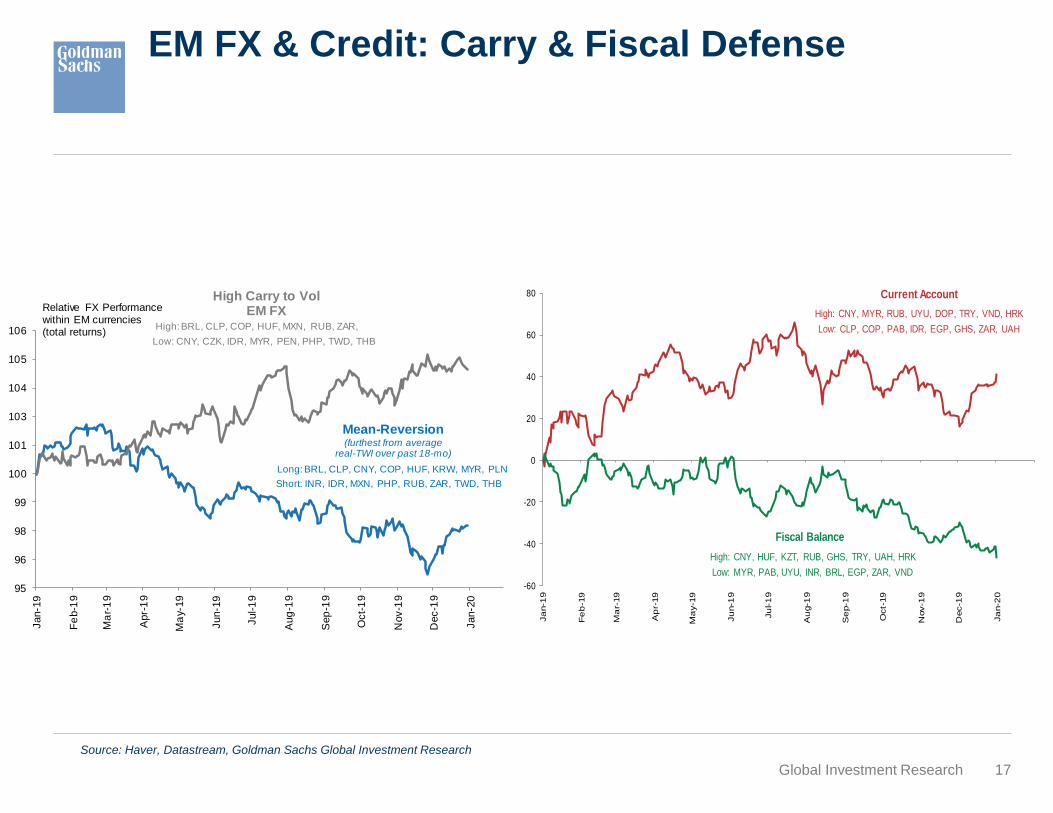
-60
-40
-20
0
20
40
60
80
Ja
n-1
9
Fe
b-1
9
Ma
r-19
Ap
r-19
Ma
y-1
9
Ju
n-1
9
Ju
l-1
9
Au
g-1
9
Se
p-1
9
Oct-
19
Nov-1
9
Dec-1
9
Ja
n-2
0
Fiscal Balance
High: CNY, HUF, KZT, RUB, GHS, TRY, UAH, HRK
Low: MYR, PAB, UYU, INR, BRL, EGP, ZAR, VND
Current Account
High: CNY, MYR, RUB, UYU, DOP, TRY, VND, HRK
Low: CLP, COP, PAB, IDR, EGP, GHS, ZAR, UAH
EM FX & Credit: Carry & Fiscal Defense
95
96
98
99
100
101
103
104
105
106
Jan-1
9
Fe
b-1
9
Ma
r-1
9
Apr-
19
Ma
y-19
Jun-1
9
Jul-1
9
Aug
-19
Sep
-19
Oct-
19
Nov-1
9
Dec-1
9
Jan-2
0
Relative FX Performancewithin EM currencies(total returns)
Mean-Reversion(furthest from average
real-TWI over past 18-mo)
Short: INR, IDR, MXN, PHP, RUB, ZAR, TWD, THB
Long: BRL, CLP, CNY, COP, HUF, KRW, MYR, PLN
High Carry to VolEM FX
High: BRL, CLP, COP, HUF, MXN, RUB, ZAR,
Low: CNY, CZK, IDR, MYR, PEN, PHP, TWD, THB
18Global Investment ResearchSource: FactSet. Datastream, Haver, Goldman Sachs Global Investment Research
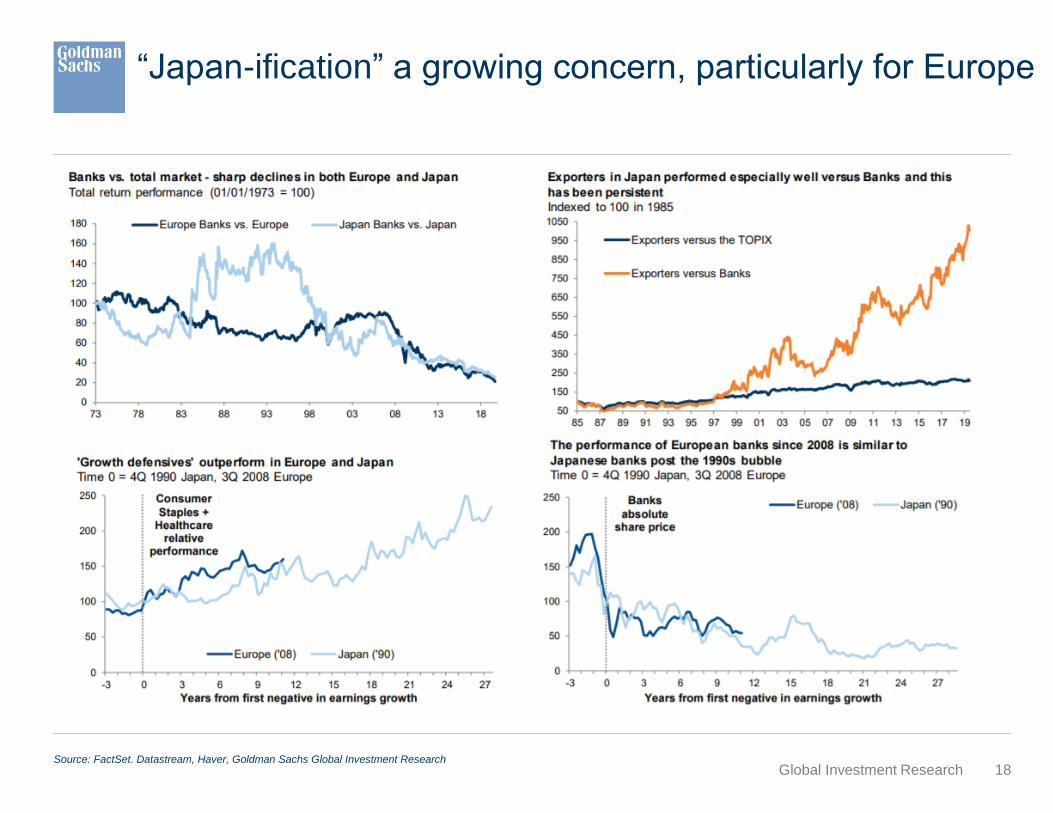
“Japan-ification” a growing concern, particularly for Europe
19Global Investment Research
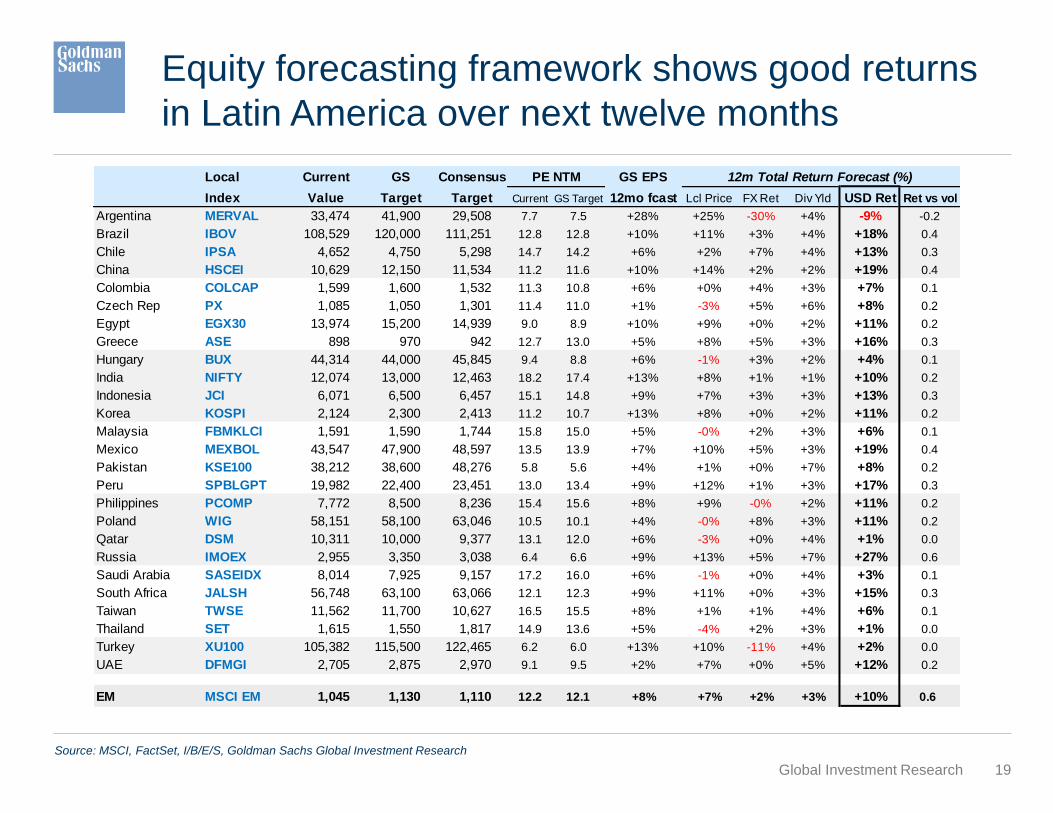
Equity forecasting framework shows good returns
in Latin America over next twelve months
Source: MSCI, FactSet, I/B/E/S, Goldman Sachs Global Investment Research
Local Current GS Consensus PE NTM GS EPS 12m Total Return Forecast (%)
Index Value Target Target Current GS Target 12mo fcast Lcl Price FX Ret Div Yld USD Ret Ret vs vol
Argentina MERVAL 33,474 41,900 29,508 7.7 7.5 +28% +25% -30% +4% -9% -0.2
Brazil IBOV 108,529 120,000 111,251 12.8 12.8 +10% +11% +3% +4% +18% 0.4
Chile IPSA 4,652 4,750 5,298 14.7 14.2 +6% +2% +7% +4% +13% 0.3
China HSCEI 10,629 12,150 11,534 11.2 11.6 +10% +14% +2% +2% +19% 0.4
Colombia COLCAP 1,599 1,600 1,532 11.3 10.8 +6% +0% +4% +3% +7% 0.1
Czech Rep PX 1,085 1,050 1,301 11.4 11.0 +1% -3% +5% +6% +8% 0.2
Egypt EGX30 13,974 15,200 14,939 9.0 8.9 +10% +9% +0% +2% +11% 0.2
Greece ASE 898 970 942 12.7 13.0 +5% +8% +5% +3% +16% 0.3
Hungary BUX 44,314 44,000 45,845 9.4 8.8 +6% -1% +3% +2% +4% 0.1
India NIFTY 12,074 13,000 12,463 18.2 17.4 +13% +8% +1% +1% +10% 0.2
Indonesia JCI 6,071 6,500 6,457 15.1 14.8 +9% +7% +3% +3% +13% 0.3
Korea KOSPI 2,124 2,300 2,413 11.2 10.7 +13% +8% +0% +2% +11% 0.2
Malaysia FBMKLCI 1,591 1,590 1,744 15.8 15.0 +5% -0% +2% +3% +6% 0.1
Mexico MEXBOL 43,547 47,900 48,597 13.5 13.9 +7% +10% +5% +3% +19% 0.4
Pakistan KSE100 38,212 38,600 48,276 5.8 5.6 +4% +1% +0% +7% +8% 0.2
Peru SPBLGPT 19,982 22,400 23,451 13.0 13.4 +9% +12% +1% +3% +17% 0.3
Philippines PCOMP 7,772 8,500 8,236 15.4 15.6 +8% +9% -0% +2% +11% 0.2
Poland WIG 58,151 58,100 63,046 10.5 10.1 +4% -0% +8% +3% +11% 0.2
Qatar DSM 10,311 10,000 9,377 13.1 12.0 +6% -3% +0% +4% +1% 0.0
Russia IMOEX 2,955 3,350 3,038 6.4 6.6 +9% +13% +5% +7% +27% 0.6
Saudi Arabia SASEIDX 8,014 7,925 9,157 17.2 16.0 +6% -1% +0% +4% +3% 0.1
South Africa JALSH 56,748 63,100 63,066 12.1 12.3 +9% +11% +0% +3% +15% 0.3
Taiwan TWSE 11,562 11,700 10,627 16.5 15.5 +8% +1% +1% +4% +6% 0.1
Thailand SET 1,615 1,550 1,817 14.9 13.6 +5% -4% +2% +3% +1% 0.0
Turkey XU100 105,382 115,500 122,465 6.2 6.0 +13% +10% -11% +4% +2% 0.0
UAE DFMGI 2,705 2,875 2,970 9.1 9.5 +2% +7% +0% +5% +12% 0.2
EM MSCI EM 1,045 1,130 1,110 12.2 12.1 +8% +7% +2% +3% +10% 0.6
20Global Investment Research
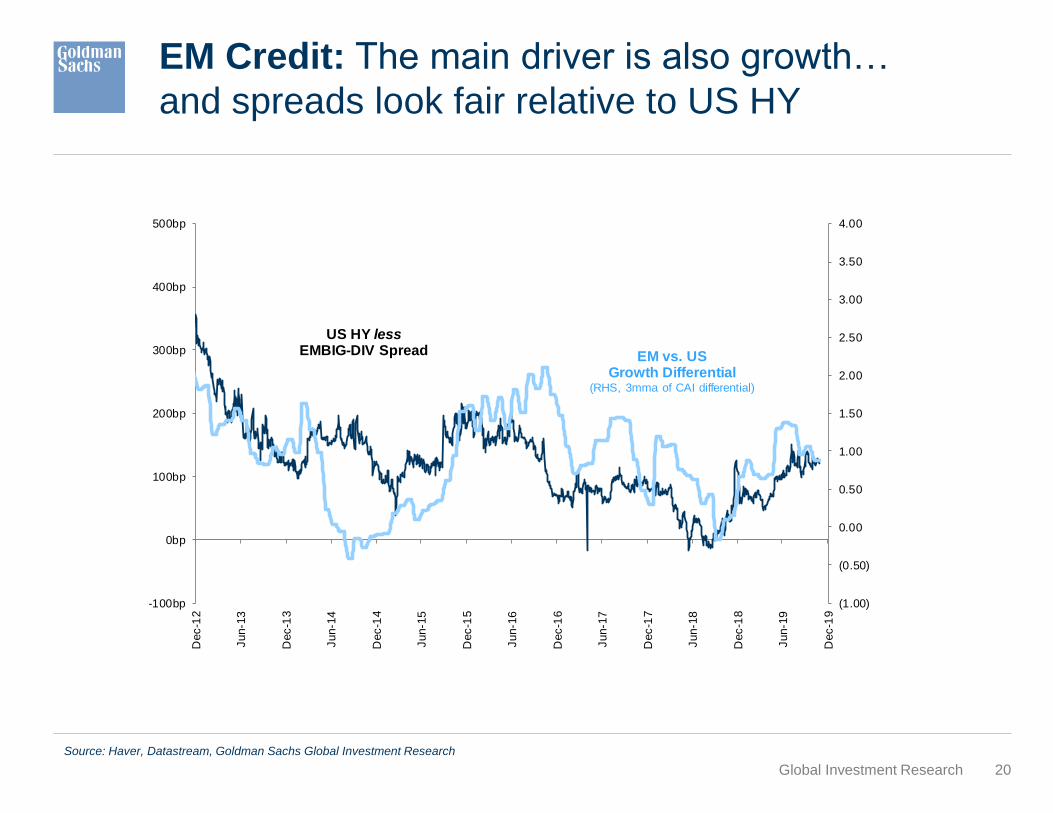
EM Credit: The main driver is also growth…
and spreads look fair relative to US HY
Source: Haver, Goldman Sachs Global Investment Research
Source: Haver, Datastream, Goldman Sachs Global Investment Research
(1.00)
(0.50)
0.00
0.50
1.00
1.50
2.00
2.50
3.00
3.50
4.00
-100bp
0bp
100bp
200bp
300bp
400bp
500bp
Dec-1
2
Jun-1
3
Dec-1
3
Jun-1
4
Dec-1
4
Jun-1
5
Dec-1
5
Jun-1
6
Dec-1
6
Jun-1
7
Dec-1
7
Jun-1
8
Dec-1
8
Jun-1
9
Dec-1
9
EM vs. USGrowth Differential
(RHS, 3mma of CAI differential)
US HY lessEMBIG-DIV Spread
21Global Investment Research
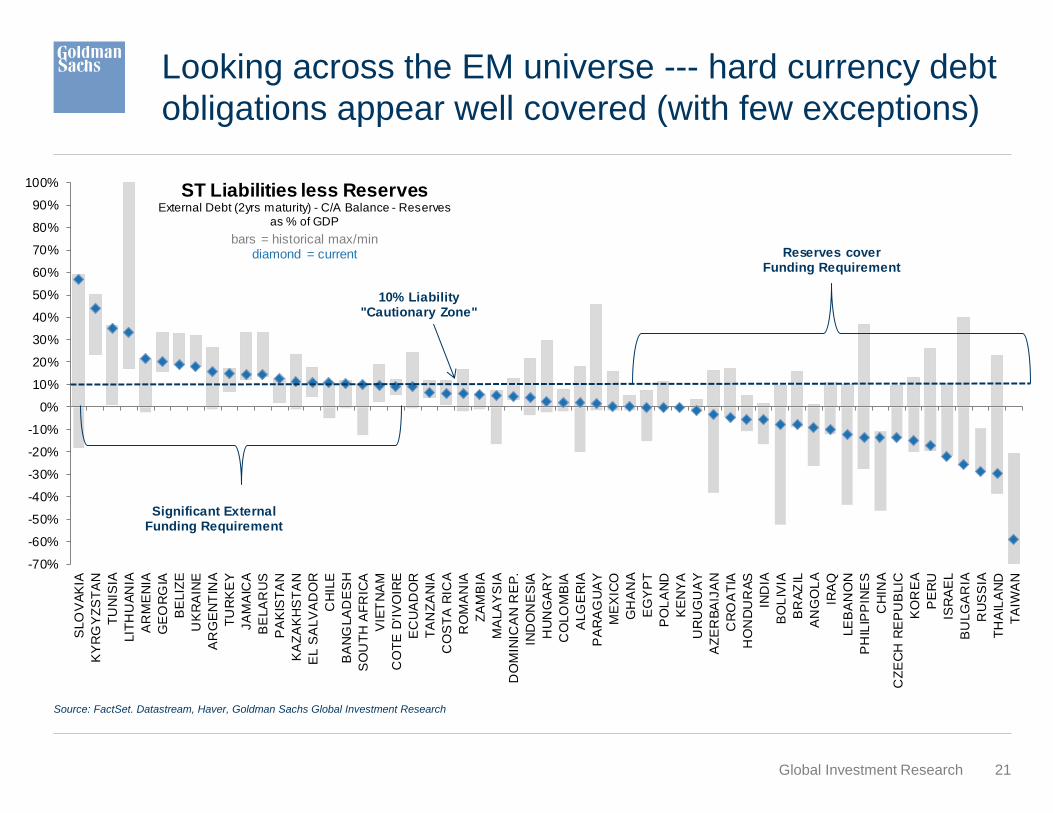
Source: FactSet. Datastream, Haver, Goldman Sachs Global Investment Research
Looking across the EM universe --- hard currency debt
obligations appear well covered (with few exceptions)
-70%
-60%
-50%
-40%
-30%
-20%
-10%
0%
10%
20%
30%
40%
50%
60%
70%
80%
90%
100%
SLO
VA
KIA
KY
RG
YZ
ST
AN
TU
NIS
IA
LIT
HU
AN
IA
AR
ME
NIA
GE
OR
GIA
BE
LIZ
E
UK
RA
INE
AR
GE
NT
INA
TU
RK
EY
JA
MA
ICA
BE
LA
RU
S
PA
KIS
TA
N
KA
ZA
KH
ST
AN
EL S
ALV
AD
OR
CH
ILE
BA
NG
LA
DE
SH
SO
UT
H A
FR
ICA
VIE
TN
AM
CO
TE
D'IV
OIR
E
EC
UA
DO
R
TA
NZ
AN
IA
CO
ST
A R
ICA
RO
MA
NIA
ZA
MB
IA
MA
LA
YS
IA
DO
MIN
ICA
N R
EP
.
IND
ON
ES
IA
HU
NG
AR
Y
CO
LO
MB
IA
ALG
ER
IA
PA
RA
GU
AY
ME
XIC
O
GH
AN
A
EG
YP
T
PO
LA
ND
KE
NY
A
UR
UG
UA
Y
AZ
ER
BA
IJA
N
CR
OA
TIA
HO
ND
UR
AS
IND
IA
BO
LIV
IA
BR
AZ
IL
AN
GO
LA
IRA
Q
LE
BA
NO
N
PH
ILIP
PIN
ES
CH
INA
CZ
EC
H R
EP
UB
LIC
KO
RE
A
PE
RU
ISR
AE
L
BU
LG
AR
IA
RU
SS
IA
TH
AIL
AN
D
TA
IWA
N
ST Liabilities less ReservesExternal Debt (2yrs maturity) - C/A Balance - Reserves
as % of GDP
bars = historical max/mindiamond = current
10% Liability"Cautionary Zone"
Significant External Funding Requirement
Reserves coverFunding Requirement
22Global Investment Research
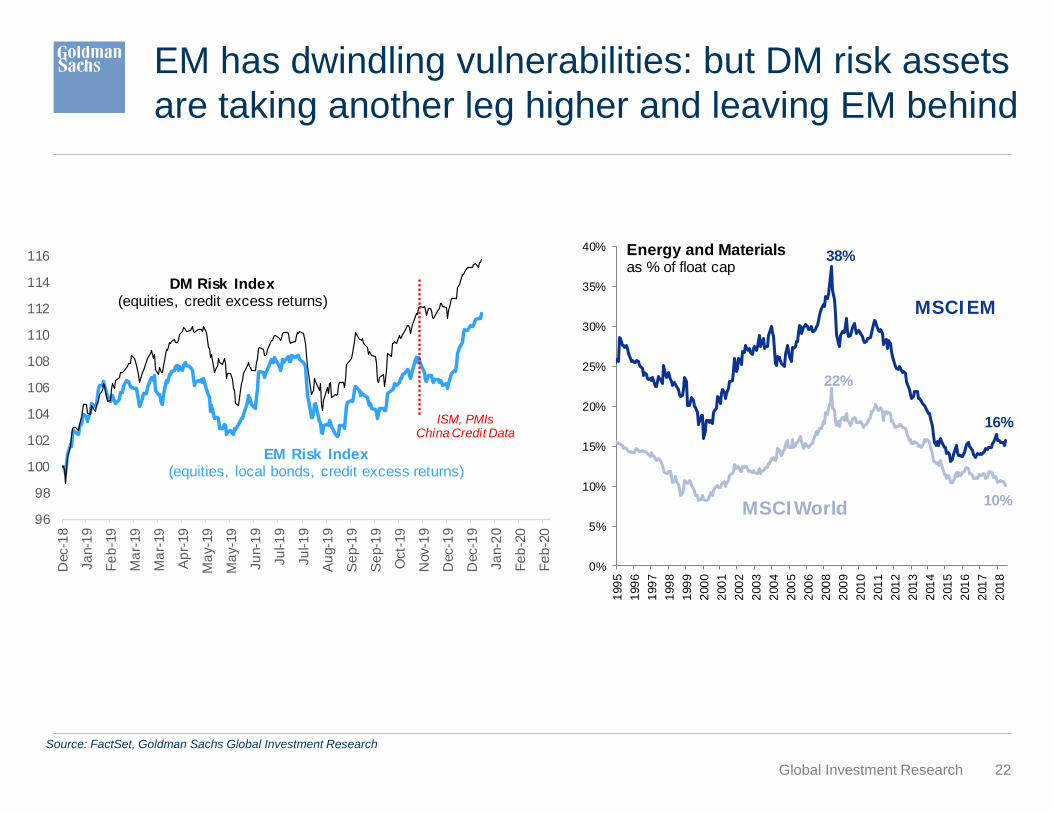
EM has dwindling vulnerabilities: but DM risk assets
are taking another leg higher and leaving EM behind
Source: FactSet, Goldman Sachs Global Investment Research
0%
5%
10%
15%
20%
25%
30%
35%
40%
199
5
199
6
199
7
199
8
199
9
200
0
200
1
200
2
200
3
200
4
200
5
200
6
200
8
200
9
201
0
201
1
201
2
201
3
201
4
201
5
201
6
201
7
201
8
Energy and Materialsas % of float cap
MSCI EM
MSCI World
38%
16%
22%
10%
96
98
100
102
104
106
108
110
112
114
116
Dec-1
8
Ja
n-1
9
Fe
b-1
9
Ma
r-19
Ma
r-19
Ap
r-19
Ma
y-1
9
Ma
y-1
9
Ju
n-1
9
Ju
l-1
9
Ju
l-1
9
Au
g-1
9
Se
p-1
9
Se
p-1
9
Oct-
19
Nov-1
9
Dec-1
9
Dec-1
9
Ja
n-2
0
Fe
b-2
0
Fe
b-2
0
DM Risk Index(equities, credit excess returns)
EM Risk Index(equities, local bonds, credit excess returns)
ISM, PMIsChina Credit Data
23
Disclosure Appendix
October 4, 2019
Investors should consider this report as only a single factor in making their investment decision. For Reg AC certification and other important disclosures, see the Disclosure
Appendix, or go to www.gs.com/research/hedge.html.
24Global Investment Research
Disclosure Appendix
Reg AC
I, Caesar Maasry, hereby certify that all of the views expressed in this report accurately reflect my personal views, which have not been influenced by considerations of the firm’s business or client relationships.
Unless otherwise stated, the individuals listed on the cover page of this report are analysts in Goldman Sachs’ Global Investment Research division.
Disclosures
Regulatory disclosures
Disclosures required by United States laws and regulationsSee company-specific regulatory disclosures above for any of the following disclosures required as to companies referred to in this report: manager or co-manager in a pending transaction; 1% or other ownership; compensation for certain services; types of client relationships; managed/co-managed public offerings in prior periods; directorships; for equity securities, market making and/or specialist role. Goldman Sachs trades or may trade as a principal in debt securities (or in related derivatives) of issuers discussed in this report.
The following are additional required disclosures: Ownership and material conflicts of interest: Goldman Sachs policy prohibits its analysts, professionals reporting to analysts and members of their households from owning securities of any company in the analyst’s area of coverage. Analyst compensation: Analysts are paid in part based on the profitability of Goldman Sachs, which includes investment banking revenues. Analyst as officer or director: Goldman Sachs policy generally prohibits its analysts, persons reporting to analysts or members of their households from serving as an officer, director or advisor of any company in the analyst’s area of coverage. Non-U.S. Analysts: Non-U.S. analysts may not be associated persons of Goldman Sachs & Co. LLC and therefore may not be subject to FINRA Rule 2241 or FINRA Rule 2242 restrictions on communications with subject company, public appearances and trading securities held by the analysts.
Additional disclosures required under the laws and regulations of jurisdictions other than the United StatesThe following disclosures are those required by the jurisdiction indicated, except to the extent already made above pursuant to United States laws and regulations. Australia: Goldman Sachs Australia Pty Ltd and its affiliates are not authorised deposit-taking institutions (as that term is defined in the Banking Act 1959 (Cth)) in Australia and do not provide banking services, nor carry on a banking business, in Australia. This research, and any access to it, is intended only for “wholesale clients” within the meaning of the Australian Corporations Act, unless otherwise agreed by Goldman Sachs. In producing research reports, members of the Global Investment Research Division of Goldman Sachs Australia may attend site visits and other meetings hosted by the companies and other entities which are the subject of its research reports. In some instances the costs of such site visits or meetings may be met in part or in whole by the issuers concerned if Goldman Sachs Australia considers it is appropriate and reasonable in the specific circumstances relating to the site visit or meeting. To the extent that the contents of this document contains any financial product advice, it is general advice only and has been prepared by Goldman Sachs without taking into account a client’s objectives,financial situation or needs. A client should, before acting on any such advice, consider the appropriateness of the advice having regard to the client’s own objectives, financial situation and needs. A copy of certainGoldman Sachs Australia and New Zealand disclosure of interests and a copy of Goldman Sachs’ Australian Sell-Side Research Independence Policy Statement are available at: https://www.goldmansachs.com/disclosures/australia-new-zealand/index.html. Brazil: Disclosure information in relation to CVM Instruction 598 is available at https://www.gs.com/worldwide/brazil/area/gir/index.html. Where applicable, the Brazil-registered analyst primarily responsible for the content of this research report, as defined in Article 20 of CVM Instruction 598, is the first author named at the beginning of this report, unless indicated otherwise at the end of the text. Canada: Goldman Sachs Canada Inc. is an affiliate of The Goldman Sachs Group Inc. and therefore is included in the company specific disclosures relating to Goldman Sachs (as defined above). Goldman Sachs Canada Inc. has approved of, and agreed to take responsibility for, this research report in Canada if and to the extent that Goldman Sachs Canada Inc. disseminates this research report to its clients. Hong Kong: Further information on the securities of covered companies referred to in this research may be obtained on request from Goldman Sachs (Asia) L.L.C. India: Further information on the subject company or companies referred to in this research may be obtained from Goldman Sachs (India) Securities Private Limited, Research Analyst - SEBI Registration Number INH000001493, 951-A, Rational House, Appasaheb Marathe Marg, Prabhadevi, Mumbai 400 025, India, Corporate Identity Number U74140MH2006FTC160634, Phone +91 22 6616 9000, Fax +91 22 6616 9001. Goldman Sachs may beneficially own 1% or more of the securities (as such term is defined in clause 2 (h) the Indian Securities Contracts (Regulation) Act, 1956) of the subject company or companies referred to in this research report. Japan: See below. Korea: This research, and any access to it, is intended only for “professional investors” within the meaning of the Financial Services and Capital Markets Act, unless otherwise agreed by Goldman Sachs. Further information on the subject company or companies referred to in this research may be obtained from Goldman Sachs (Asia) L.L.C., Seoul Branch. New Zealand: Goldman Sachs New Zealand Limited and its affiliates are neither “registered banks” nor “deposit takers” (as defined in the Reserve Bank of New Zealand Act 1989) in New Zealand. This research, and any access to it, is intended for “wholesale clients” (as defined in the Financial
25Global Investment Research
Disclosure Appendix
Advisers Act 2008) unless otherwise agreed by Goldman Sachs. A copy of certain Goldman Sachs Australia and New Zealand disclosure of interests is available at: https://www.goldmansachs.com/disclosures/australia-new-
zealand/index.html. Russia: Research reports distributed in the Russian Federation are not advertising as defined in the Russian legislation, but are information and analysis not having product promotion as their main purpose and do not provide appraisal within the meaning of the Russian legislation on appraisal activity. Research reports do not constitute a personalized investment recommendation as defined in Russian laws and regulations, are not addressed to a specific client, and are prepared without analyzing the financial circumstances, investment profiles or risk profiles of clients. Goldman Sachs assumes no responsibility for any investment decisions that may be taken by a client or any other person based on this research report. Singapore: Further information on the covered companies referred to in this research may be obtained from Goldman Sachs (Singapore) Pte. (Company Number: 198602165W). Taiwan: This material is for reference only and must not be reprinted without permission. Investors should carefully consider their own investment risk. Investment results are the responsibility of the individual investor. United Kingdom: Persons who would be categorized as retail clients in the United Kingdom, as such term is defined in the rules of the Financial Conduct Authority, should read this research in conjunction with prior Goldman Sachs research on the covered companies referred to herein and should refer to the risk warnings that have been sent to them by Goldman Sachs International. A copy of these risks warnings, and a glossary of certain financial terms used in this report, are available from Goldman Sachs International on request.
European Union: Disclosure information in relation to Article 6 (2) of the European Commission Delegated Regulation (EU) (2016/958) supplementing Regulation (EU) No 596/2014 of the European Parliament and of the Council with regard to regulatory technical standards for the technical arrangements for objective presentation of investment recommendations or other information recommending or suggesting an investment strategy and for disclosure of particular interests or indications of conflicts of interest is available at https://www.gs.com/disclosures/europeanpolicy.html which states the European Policy for Managing Conflicts of Interest in Connection with Investment Research.
Japan: Goldman Sachs Japan Co., Ltd. is a Financial Instrument Dealer registered with the Kanto Financial Bureau under registration number Kinsho 69, and a member of Japan Securities Dealers Association,Financial Futures Association of Japan and Type II Financial Instruments Firms Association. Sales and purchase of equities are subject to commission pre-determined with clients plus consumption tax. See company-specific disclosures as to any applicable disclosures required by Japanese stock exchanges, the Japanese Securities Dealers Association or the Japanese Securities Finance Company.
Global product; distributing entitiesThe Global Investment Research Division of Goldman Sachs produces and distributes research products for clients of Goldman Sachs on a global basis. Analysts based in Goldman Sachs offices around the worldproduce research on industries and companies, and research on macroeconomics, currencies, commodities and portfolio strategy. This research is disseminated in Australia by Goldman Sachs Australia Pty Ltd (ABN 21 006 797 897); in Brazil by Goldman Sachs do Brasil Corretora de Títulos e Valores Mobiliários S.A.; Ombudsman Goldman Sachs Brazil: 0800 727 5764 and / or [email protected]. Available Weekdays (except holidays), from 9am to 6pm. Ouvidoria Goldman Sachs Brasil: 0800 727 5764 e/ou [email protected]. Horário de funcionamento: segunda-feira à sexta-feira (exceto feriados), das 9h às 18h; in Canada by either Goldman Sachs Canada Inc. or Goldman Sachs & Co. LLC; in Hong Kong by Goldman Sachs (Asia) L.L.C.; in India by Goldman Sachs (India) Securities Private Ltd.; in Japan by Goldman Sachs Japan Co., Ltd.; in the Republic of Korea by Goldman Sachs (Asia) L.L.C., Seoul Branch; in New Zealand by Goldman Sachs New Zealand Limited; in Russia by OOO Goldman Sachs; in Singapore by Goldman Sachs(Singapore) Pte. (Company Number: 198602165W); and in the United States of America by Goldman Sachs & Co. LLC. Goldman Sachs International has approved this research in connection with its distribution in the United Kingdom and European Union.
European Union: Goldman Sachs International authorised by the Prudential Regulation Authority and regulated by the Financial Conduct Authority and the Prudential Regulation Authority, has approved thisresearch in connection with its distribution in the European Union and United Kingdom.
General disclosuresThis research is for our clients only. Other than disclosures relating to Goldman Sachs, this research is based on current public information that we consider reliable, but we do not represent it is accurate or complete,
and it should not be relied on as such. The information, opinions, estimates and forecasts contained herein are as of the date hereof and are subject to change without prior notification. We seek to update our research
as appropriate, but various regulations may prevent us from doing so. Other than certain industry reports published on a periodic basis, the large majority of reports are published at irregular intervals as appropriate in
the analyst’s judgment.
Goldman Sachs conducts a global full-service, integrated investment banking, investment management, and brokerage business. We have investment banking and other business relationships with a substantialpercentage of the companies covered by our Global Investment Research Division. Goldman Sachs & Co. LLC, the United States broker dealer, is a member of SIPC (https://www.sipc.org).
Our salespeople, traders, and other professionals may provide oral or written market commentary or trading strategies to our clients and principal trading desks that reflect opinions that are contrary to the opinions expressed in this research. Our asset management area, principal trading desks and investing businesses may make investment decisions that are inconsistent with the recommendations or views expressed in thisresearch.
We and our affiliates, officers, directors, and employees, will from time to time have long or short positions in, act as principal in, and buy or sell, the securities or derivatives, if any, referred to in this research, unless
otherwise prohibited by regulation or Goldman Sachs policy.
26Global Investment Research
Disclosure Appendix
The views attributed to third party presenters at Goldman Sachs arranged conferences, including individuals from other parts of Goldman Sachs, do not necessarily reflect those of Global Investment Research and are
not an official view of Goldman Sachs.
Any third party referenced herein, including any salespeople, traders and other professionals or members of their household, may have positions in the products mentioned that are inconsistent with the views expressed by analysts named in this report.
This research is focused on investment themes across markets, industries and sectors. It does not attempt to distinguish between the prospects or performance of, or provide analysis of, individual companies within any industry or sector we describe.
Any trading recommendation in this research relating to an equity or credit security or securities within an industry or sector is reflective of the investment theme being discussed and is not a recommendation of any such
security in isolation.
This research is not an offer to sell or the solicitation of an offer to buy any security in any jurisdiction where such an offer or solicitation would be illegal. It does not constitute a personal recommendation or take into account the particular investment objectives, financial situations, or needs of individual clients. Clients should consider whether any advice or recommendation in this research is suitable for their particular circumstances and, if appropriate, seek professional advice, including tax advice. The price and value of investments referred to in this research and the income from them may fluctuate. Past performance is not a guide to future performance, future returns are not guaranteed, and a loss of original capital may occur. Fluctuations in exchange rates could have adverse effects on the value or price of, or income derived from, certain investments.
Certain transactions, including those involving futures, options, and other derivatives, give rise to substantial risk and are not suitable for all investors. Investors should review current options and futures disclosure documents which are available from Goldman Sachs sales representatives or at https://www.theocc.com/about/publications/character-risks.jsp and https://www.fiadocumentation.org/fia/regulatory-disclosures_1/fia-uniform-futures-and-options-on-futures-risk-disclosures-booklet-pdf-version-2018. Transaction costs may be significant in option strategies calling for multiple purchase and sales of options such as spreads. Supporting documentation will be supplied upon request.
Differing Levels of Service provided by Global Investment Research: The level and types of services provided to you by the Global Investment Research division of GS may vary as compared to that provided to internal and other external clients of GS, depending on various factors including your individual preferences as to the frequency and manner of receiving communication, your risk profile and investment focus and perspective (e.g., marketwide, sector specific, long term, short term), the size and scope of your overall client relationship with GS, and legal and regulatory constraints. As an example, certain clients may request to receive notifications when research on specific securities is published, and certain clients may request that specific data underlying analysts’ fundamental analysis available on our internal client websites be delivered to them electronically through data feeds or otherwise. No change to an analyst’s fundamental research views (e.g., ratings, price targets, or material changes to earnings estimates for equity securities), will be communicated to any client prior to inclusion of such information in a research report broadly disseminated through electronic publication to our internal client websites or through other means, as necessary, to all clients who are entitled to receive such reports.
All research reports are disseminated and available to all clients simultaneously through electronic publication to our internal client websites. Not all research content is redistributed to our clients or available to third-partyaggregators, nor is Goldman Sachs responsible for the redistribution of our research by third party aggregators. For research, models or other data related to one or more securities, markets or asset classes (includingrelated services) that may be available to you, please contact your GS representative or go to https://research.gs.com.
Disclosure information is also available at https://www.gs.com/research/hedge.html or from Research Compliance, 200 West Street, New York, NY 10282.
© 2019 Goldman Sachs.
No part of this material may be (i) copied, photocopied or duplicated in any form by any means or (ii) redistributed without the prior written consent of The Goldman Sachs Group, Inc.


