Embed Size (px)
Citation preview
2020 PREQIN GLOBALPRIVATE EQUITY &VENTURE CAPITALREPORTSAMPLE PAGES
ISBN: 978-1-912116-22-5
2
2020 PREQIN GLOBAL PRIVATE EQUITY & VENTURE CAPITAL REPORT
Contents3 CEO's Foreword – Mark O'Hare, Preqin
5 Three Mega Trends Driving China’s New Economy – Bao Fan, China RenaissanceGroup
7 How Technology Is Changing Manager Operations – Dr. Dimitris Matalliotakis, AssetMetrix
1. Overview of the Industry10 Executive Summary
11 Private Equity Megatrends
12 Private Equity in 2019: Key Facts
2. Assets under Management14 AUM Exceeds $4tn
3. Fundraising18 Fundraising: Strength in Uncertainty
21 Traffic on the Road
23 In Focus: When the Big Get Bigger
4. Fund Managers26 The Rising Tide of Fund Managers
29 The First Billion Is Always the Hardest
31 Fund Terms and Conditions
5. Investors34 Private Equity Is a Force for Good – Alex Brooks,
Capstone Partners
36 How Access to Private Equity Is Changing – Dr. Steffen Pauls, Moonfare
37 ILPA Principles 3.0 and the GP-LP Balance – Jennifer Choi, ILPA
38 An Evolving Investor Universe
42 A More Diverse Investor Base
45 Alternative Structures on the Rise
6. Deals & Exits48 Caution on the Buyout Front
51 Buyout Exits
52 Uncertainty Takes its Toll on VC Deals & Exits
55 Venture Capital Exits
56 In Focus: The Healthtech Boom
58 In Focus: Fintech's Unicorns Are Becoming Decacorns
60 Cryptocurrency’s Growing Appeal for Venture Capital Funds – George Salapa, bardicredit
62 In Focus: The Rising Star of AI
7. Performance66 Top Performing Funds Are Delivering Even
Higher Returns
69 PrEQIn Private Equity Index
70 Horizon IRRs
71 Public Pension Fund Returns
72 Performance Benchmarks and PMEs
8. League Tables76 Largest Funds
78 Largest Fund Managers
80 Largest Investors
82 Consistent Top Performing Fund Managers
85 Largest Buyout Deals & Exits
89 Largest Venture Capital Deals & Exits
9. Regions94 North America
96 Europe
98 Asia
101 The South African Private Equity Opportunity – John Seymour, Sanlam Investments
102 Rest of World
10. Strategies106 Buyout
108 Venture Capital
110 Growth
112 Private Equity Fund of Funds
114 Private Equity Secondaries
11. Outlook118 2020 Outlook for Private Equity
122 In Focus: ESG on the Rise
125 Preqin Predictions
10
2020 PREQIN GLOBAL PRIVATE EQUITY & VENTURE CAPITAL REPORT 1. OVERVIEW OF THE INDUSTRY
Executive Summary
Capital flows into global private equity1 were robust in 2019. As the world economy faltered – GDP growth slid to 2.3%, the lowest since the Global Financial Crisis (GFC)2 – and interest rates remained low, investors on the hunt for yield continued to flock to private equity funds, committing more than $0.5tn and boosting fund managers’ stockpile of dry powder. This growth in available capital, along with an 11% increase in unrealized value, boosted assets under management (AUM) to a record $4.11tn as of June 2019.
However, market conditions are becoming more difficult. For a start, the influx of investable capital and intensifying competition have helped to drive up asset prices. Just over half (51%) of fund managers and over two-thirds of investors (69%) feel that private equity portfolio company prices are higher compared with 12 months ago. And 44% of fund managers experienced more competition for private equity transactions. All this has had a dampening effect on deal flow. Between 2018 and 2019, the value of all private equity-backed buyout deals fell 21% to $389bn, while venture capital deal value declined by 18%, from $271bn to $223bn.
A tougher environment for the industry does not appear to be deterring investors, however. Indeed, 86% of LPs told us that they intend to allocate as much or more capital to the asset class in 2020 as they did in 2019. Why is that? One reason is that most investors are satisfied with how their private equity portfolios are performing. In fact, 87% of LPs surveyed by Preqin said that returns in 2019 had either met or exceeded their expectations. And LPs with access to the best private equity funds are benefiting from higher and higher returns. For example, top performing funds of vintages 2015 and 2016 are delivering net IRRs of 23.0% and 25.9% respectively.
1 Unless otherwise stated, in this report ‘Private Equity’ includes Venture Capital.2 https://www.un.org/development/desa/dpad/publication/world-economic-situation-and-prospects-2020/
The outperformance of top-quartile funds has helped to attract more investors into the industry. Over 8,400 institutions across the globe now invest in private equity, up from 6,170 in 2015, ranging from small private wealth managers to massive sovereign wealth funds. As the investor universe has expanded, so has the number of fund managers: there are more than 18,000 currently offering a private equity product, up from 16,400 in 2018.
The number of private equity vehicles is also increasing. As of January 2020, there are 3,524 funds in market, a new record. For GPs raising their first fund, the market is especially challenging. Established players with a strong track record and global scale are securing the lion’s share. In 2019, the 20 largest funds captured almost half (45%) of all committed capital. That is quite a change from five years ago, when 29% of committed capital went to the 20 largest funds.
We conclude this year’s report with five predictions. They reflect not just the exciting opportunities ahead, but also the challenges for the industry. Fund managers have record amounts of capital to put to work – 58% expect to invest more in 2020 than they did in 2019. But investing is especially challenging when prices are high and competition stiff. Market conditions could get tougher still: 62% of fund managers (as well as 61% of investors) believe that we are currently at the peak of the cycle. If the cycle turns and managers are faced with a recession, the task of maintaining the kinds of returns that investors have come to expect from the asset class becomes even more difficult. This will test the mettle of the best performers. Investors will be watching closely to determine which firms are able to flourish in bad times as well as good.
Private equity AUM hits a record $4.11tn, but market conditions are challenging
2020 PREQIN GLOBAL PRIVATE EQUITY & VENTURE CAPITAL REPORT 1. OVERVIEW OF THE INDUSTRY
© Preqin Ltd. www.preqin.com 11
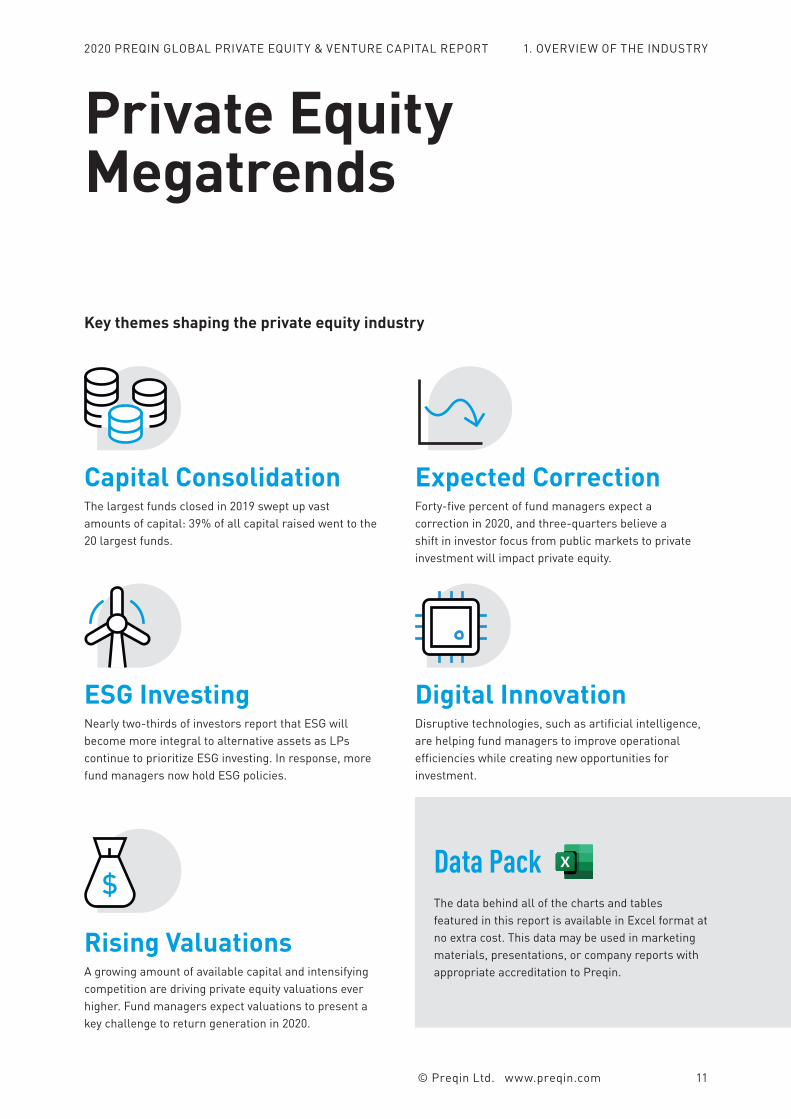
Capital ConsolidationThe largest funds closed in 2019 swept up vast amounts of capital: 39% of all capital raised went to the 20 largest funds.
Expected CorrectionForty-five percent of fund managers expect a correction in 2020, and three-quarters believe a shift in investor focus from public markets to private investment will impact private equity.
ESG InvestingNearly two-thirds of investors report that ESG will become more integral to alternative assets as LPs continue to prioritize ESG investing. In response, more fund managers now hold ESG policies.
Rising ValuationsA growing amount of available capital and intensifying competition are driving private equity valuations ever higher. Fund managers expect valuations to present a key challenge to return generation in 2020.
Private EquityMegatrends
Key themes shaping the private equity industry
$Data PackThe data behind all of the charts and tables featured in this report is available in Excel format at no extra cost. This data may be used in marketing materials, presentations, or company reports with appropriate accreditation to Preqin.
Digital InnovationDisruptive technologies, such as artificial intelligence, are helping fund managers to improve operational efficiencies while creating new opportunities for investment.
5
2020 PREQIN GLOBAL PRIVATE EQUITY & VENTURE CAPITAL REPORT
Three Mega Trends Driving China’s New Economy
How has the slowdown in technology investment and softer GDP growth affected China’s ‘New Economy’ of fast-growing technology industries?China's economy has entered a ‘new normal.’ As of June 2019, the number of mobile internet users in China hit 847 million, an increase of only 0.5% compared to the end of 2018. But private equity investors continue to invest in innovation-driven enterprises, with a focus on productivity improvement and synergy. Despite the slowdown of overall GDP in China, the revenue of internet giants such as Tencent and Alibaba continues to grow at a rate of more than 20%. The New Economy now accounts for about 16% of China's GDP, with 2018 output growth of 12.2% year on year, outpacing GDP growth in current prices by 2.5 percentage points.
What key trends do you see driving attractive risk/return opportunities?The first trend is the change in consumption patterns, which can be summarized as the Five New.
1. New Consumers: Generation Z cares about attitude, not just basic functionality; they are looking for high-quality, stylish goods at fair prices. Meanwhile, the ‘silver economy’ is creating investment opportunities in health, leisure, and tourism that caters to older generations.
2. New Media: China has 430 million daily active viewers of short videos. Each viewer spends 60-70 minutes per day on platforms such as Douyin, known outside China as TikTok. Integrating Douyin with online shopping site Taobao creates a powerful e-commerce ecosystem that’s reinforced via influencers, whose video posts generate buzz and drive even more traffic.
3. New Channels: The cost of user acquisition through online channels has increased significantly in the past two years. But new channels, such as offline shopping malls in lower-tier markets, offer a more competitive user acquisition cost.
4. New Brands: China has many export-oriented original equipment manufacturer (OEM) companies. As a result of the US-China trade war, many OEMs are actively looking to establish their own brands. And on the demand side, as Chinese GDP per capita approaches $10,000, consumption upgrades are more accessible to the general population. An example of a New Brand is NOME, whose products span lifestyle goods, products for the home, and food.
5. New Infrastructure: The on-demand food delivery industry has created a very well-developed delivery network across Chinese cities – even better than that of traditional courier services. Same-city delivery now only takes 30 minutes. This is creating opportunities for other types of delivery
Bao FanFounder, Chairman, and CEO, China Renaissance Group
Changes in consumption, technological innovation, and advanced manufacturing are creating exciting opportunities for private equity
SPONSORED
© Preqin Ltd. www.preqin.com 5
6
2020 PREQIN GLOBAL PRIVATE EQUITY & VENTURE CAPITAL REPORT
About China Renaissance GroupChina Renaissance Group (CR Group) is a leading financial institution that combines private placement advisory, M&A advisory, direct investment, equity underwriting, sales, trading and brokerage, research, structured products, asset management, wealth management, and other financial services. Providing one-stop financial services across mainland China, Hong Kong, and the US, CR Group operates a competitive and unique international network that connects China’s capital markets with the rest of the world, serving new economy entrepreneurs and investors globally.
Bao Fan is the Founder, Chairman, and CEO of China Renaissance Group, China’s leading financial institution serving the New Economy, which he founded in 2005. Bao was Chief Strategy Officer of AsiaInfo after spending seven years in investment banking, at Morgan Stanley and Credit Suisse. Bao is a guest lecturer at PBC School of Finance at Tsinghua University, and a postdoctoral supervisor at the Shenzhen Stock Exchange.
businesses – not just food, but medicine, for example. As long as these networks are located in the same city as the inventory, any type of good can be delivered locally, and fast.
The second trend to mention is the industrial internet. As labor becomes more expensive, non-digital companies are beginning to conduct more business online and are embarking on digital transformation journeys. And new technologies – like artificial intelligence (AI), big data, and cloud services – are helping businesses to improve efficiencies in the flow of information, production, and transaction, thereby lowering their costs. This process is still at an early stage, but it has lots of potential as consumer internet companies, such as Tencent, invest heavily in the sector.
The third trend is technological innovation & advanced manufacturing. The ongoing trade war is forcing Chinese companies to develop in-house technology, which creates investment opportunities in high-end manufacturing, 5G, AI, and chips. 5G, for instance, enables capabilities like wireless control and communication for equipment, advanced logistics tracking, low latency industrial AI, and sensitive augmented reality (AR) and mixed reality (MR) cloud applications.
The number of players in China’s private equity industry is growing. What advice do you have for LPs looking to select the best GPs?We believe that to be successful in this industry, you need three key strengths:
1. Visibility and insight into the most promising deals This requires a strong pipeline of advisory services, an extensive network within the entrepreneur and investor community, dedicated and full coverage of new economy sectors, first-hand market intelligence, and an in-depth understanding of the latest industry trends.
2. Ability to invest in exclusive opportunities Entrepreneurs and start-ups must see you as a valuable investor and strategic advisor, capable of bringing long-term value and advice. That’s how you generate transactions that are exclusive or offered to only a very limited number of private equity firms.
3. Ability to provide comprehensive solutions Having a platform of financial services is attractive to both limited partners and portfolio companies. Whether their business needs involve financings, industry consolidation, strategic investment, divestitures, or going public, they want seamless support.
Huaxing Growth Capital started in 2013 as the investment management arm of an established financial institution, China Renaissance. How did Huaxing come about?Huaxing primarily focuses on the formation, management, and investment of private equity funds, and is a natural extension of our advisory services. It allows us to participate in our clients’ value creation, by leveraging our platform and network strengths to bring significant value to both portfolio companies and limited partners.
SPONSORED
58
2020 PREQIN GLOBAL PRIVATE EQUITY & VENTURE CAPITAL REPORT2020 PREQIN GLOBAL PRIVATE EQUITY & VENTURE CAPITAL REPORT
In Focus: Fintech's Unicorns Are Becoming Decacorns
Powered by digital innovations like mobile internet, blockchain, and big data, financial technology (fintech) is transforming financial services. Digital technologies are helping financial service providers to introduce more efficient, personalized services, while enabling technology companies to offer financial services such as mobile payments. This is generating new investment opportunities for both venture capital and private equity players.
From Unicorns to DecacornsAcross the globe, venture capital-backed fintech firms are reaching – and surpassing – unicorn status (a company valued at $1bn or more). US fintech has nurtured unicorns such as Menlo Park-based Robinhood Markets, Inc., a digital platform that enables users to invest in stocks, exchange-traded 1 CNBC, https://www.cnbc.com/2019/07/22/robinhood-lands-a-7point6-billion-valuation-after-recent-funding-round.html2 Forbes, https://www.forbes.com/sites/donnafuscaldo/2019/09/19/stripe-now-has-a-pre-money-valuation-of-35-billion/#1cf6a4a362e63 Sky News, https://news.sky.com/story/revolut-targets-1-5bn-to-join-fintech-elite-11833527
funds (ETFs), cryptocurrencies, and options without paying commission fees. Founded in 2013, Robinhood is now worth about $7.6bn, according to CNBC1. The US already boasts a fintech decacorn (a company valued at $10bn or more): San Francisco-based Stripe, a software provider that companies use to accept payments and manage their businesses online. Stripe launched in 2011 and is now valued at $35bn2.
European fintech has fostered high-profile unicorns such as London-based Revolut Limited, the developer of a mobile app that allows users to exchange currencies at interbank rates. Founded in 2015, Revolut is targeting a valuation of between $5bn and $10bn, a figure that would make the company Europe's most highly valued fintech firm, Sky News reports3.
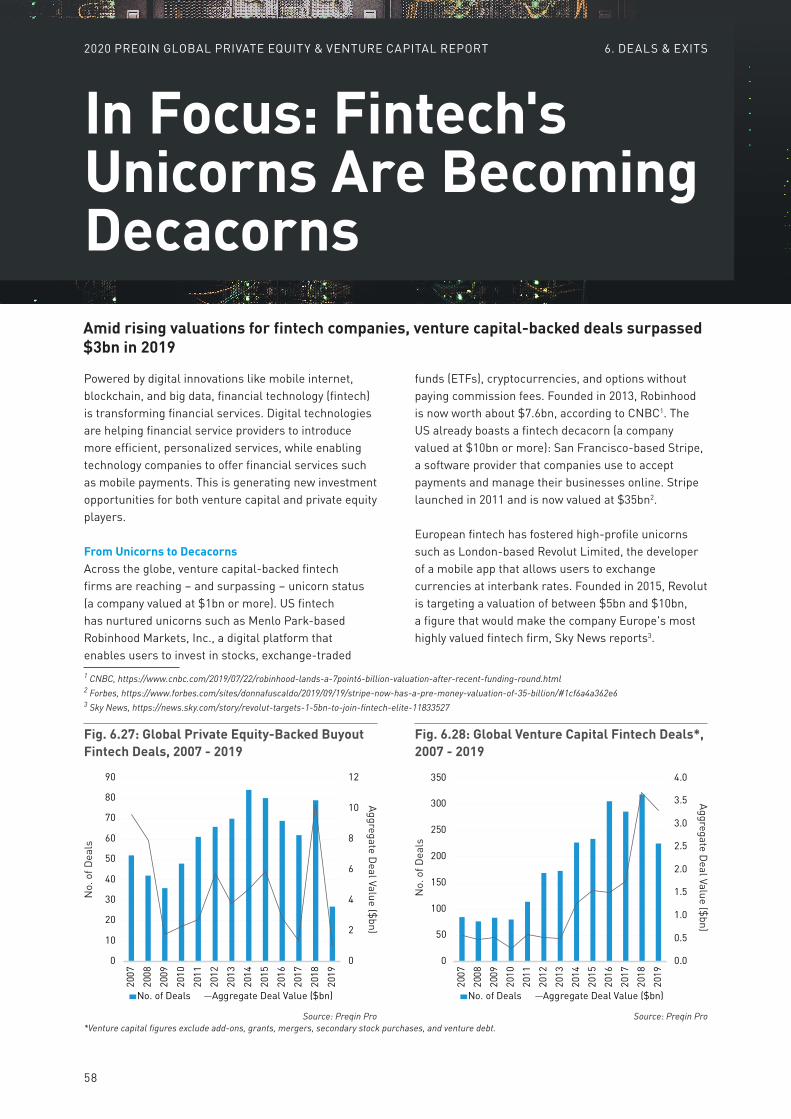
Amid rising valuations for fintech companies, venture capital-backed deals surpassed $3bn in 2019
0
2
4
6
8
10
12
0
10
20
30
40
50
60
70
80
90
2007
2008
2009
2010
2011
2012
2013
2014
2015
2016
2017
2018
2019
No. of Deals Aggregate Deal Value ($bn)
Fig. 6.27: Global Private Equity-Backed Buyout Fintech Deals, 2007 - 2019
Source: Preqin Pro
No.
of D
eals
Aggregate Deal Value ($bn)
0.0
0.5
1.0
1.5
2.0
2.5
3.0
3.5
4.0
0
50
100
150
200
250
300
350
2007
2008
2009
2010
2011
2012
2013
2014
2015
2016
2017
2018
2019
No. of Deals Aggregate Deal Value ($bn)
Fig. 6.28: Global Venture Capital Fintech Deals*, 2007 - 2019
Source: Preqin Pro
No.
of D
eals
Aggregate Deal Value ($bn)
*Venture capital figures exclude add-ons, grants, mergers, secondary stock purchases, and venture debt.
6. DEALS & EXITS
38
2020 PREQIN GLOBAL PRIVATE EQUITY & VENTURE CAPITAL REPORT 5. INVESTORS
More investors look to private equity as returns keep coming
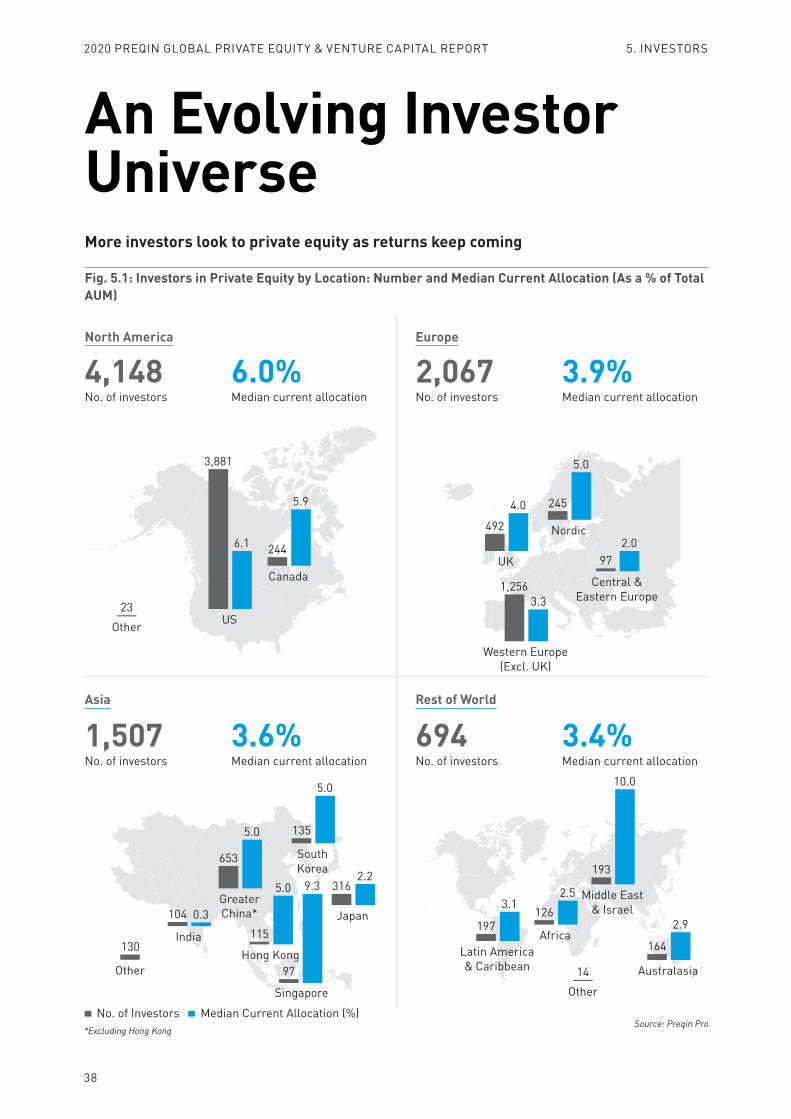
An Evolving Investor UniverseFig. 5.1: Investors in Private Equity by Location: Number and Median Current Allocation (As a % of Total AUM)
4,148No. of investors
6.0%Median current allocation
North America Europe
Asia Rest of World
2,067No. of investors
3.9%Median current allocation
1,507No. of investors
3.6%Median current allocation
694No. of investors
3.4%Median current allocation
No. of Investors Median Current Allocation (%)
GreaterChina*
653
5.0
Japan
3162.2
SouthKorea
135
5.0
Singapore
97
9.3
India
104 0.3
Australasia
164
2.9
Middle East& Israel
193
10.0
Latin America& Caribbean
197
3.1
Africa
1262.5
US
3,881
6.1
Canada
244
5.9
UK
492
4.0
Nordic
245
5.0
Western Europe(Excl. UK)
1,2563.3
Central &Eastern Europe
972.0
Source: Preqin Pro
Other23
Other14
Hong Kong
115
5.0
*Excluding Hong Kong
Other
130

2020 PREQIN GLOBALREAL ESTATEREPORTSAMPLE PAGES
ISBN: 978-1-912116-24-9
2
2020 PREQIN GLOBAL REAL ESTATE REPORT – SAMPLE PAGES
Contents
3 CEO's Foreword – Mark O'Hare, Preqin
4 Investing in Tomorrow’s World Real Estate – Mike Sales, Nuveen
6 Real Estate Living Sectors Move into the Mainstream – Jose Pellicer, M&G Real Estate
1. Overview of the Industry10 Executive Summary
11 Real Estate Megatrends
12 Real Estate in 2019: Key Facts
2. Assets under Management14 The Changing Shape of US Real Estate –
Laura Dietzel, RSM US LLP
15 Assets under Management Approach $1tn
18 Capital Calls and Distributions
3. Fundraising20 The Case for Real Estate Debt – Andrew Fentress
& Mark Fogel, ACRES Capital
22 Fundraising Hits a New Record
26 Record Level of Funds in Market
28 In Focus: Opportunities in PropTech
4. Fund Managers30 Number of Managers Rises to Meet Investor
Demand
32 First-Time Fund Managers Secure More Capital in 2019
34 Fund Terms
5. Investors36 Investor Pool Continues to Grow
38 Investor Mandates Reflect a Cautious Approach
40 Large Investors Seek Alternative Structures
6. Deals44 Deal-Making Gradually Adapts to Change
46 In Focus: The E-Commerce Effect
7. Performance50 Real Estate Exhibits Consistent Performance
52 PrEQIn Real Estate Index
53 Horizon IRRs
54 Public Pension Funds Enjoy Stable Returns
55 Performance Benchmarks Highlight Consistency
8. League Tables58 Largest Funds
62 Largest Fund Managers
65 Largest Investors
67 Top Performers
69 Largest Deals
9. Regions72 North America
74 Europe
76 Asia
78 Rest of World
10. Strategies82 Debt
84 Core
86 Core-Plus
88 Opportunistic
90 Value Added
11. Outlook94 In Focus: Real Estate Adapts to ESG
96 2020 Outlook for Real Estate
99 Preqin Predictions
10
2020 PREQIN GLOBAL REAL ESTATE REPORT – SAMPLE PAGES
Executive Summary
Even as the global economy weakened in 2019, private real estate continued to grow. Investors seeking real estate’s steady cash flows poured more capital into the sector, driving the total amount of funds raised to $151bn, an all-time high. The increase in dry powder – along with a 5.3% rise in unrealized value – boosted assets under management (AUM) to a record $992bn as of June 2019, marking the fourth consecutive year of AUM growth for the industry.
However, there are some cautionary indicators. First, fewer vehicles reached a final close in 2019. The number that did close fell to 295, the lowest total in a decade; in 2009, during the Global Financial Crisis (GFC), just 229 funds closed.
Second, capital consolidation in the industry deepened. Forty-four percent of the total capital raised was amassed by the 10 largest funds. Just two of those funds dominated the entire fundraising landscape: Blackstone Real Estate Partners IX, which secured $20.5bn to become the largest private real estate fund ever closed, and Brookfield Strategic Real Estate Partners III, which hoovered up $15bn to become the third largest such fund.
Third, deal volume and value fell amid concerns over rising valuations. Three-quarters of real estate fund managers we surveyed in November 2019 said that asset prices were higher than they were 12 months ago, and rather than pay too much for targets they perceived to be overvalued, some GPs stayed on the sidelines. As a result, the total number of private equity real estate (PERE) deals slid by 4.7% compared with the year before, while aggregate deal value slumped by more than 10%. Even as market conditions became more challenging, fund managers with massive amounts of financial firepower continued to put capital to work. In September 2019, the same month in which Blackstone Group set a record for raising private real estate’s largest-ever fund, the firm set another one
when it acquired Singapore-based GLP’s US logistics portfolio for $18.7bn. This is the largest-ever PERE deal.
Fund Managers Turn to Higher-Risk Strategies and New NichesMarket participants adapted to tougher times in different ways. Some investors sought safety, helping core funds to secure more than 3x as much capital as the year before. Others opted for higher-risk strategies. The result was that aggregate capital raised by opportunistic funds surged by 38% to almost $70bn in 2019, while the amount raised by distressed funds rose by more than 8x to $8.4bn.
As competition intensified, fund managers went on the prowl for promising new niches. One such niche is PropTech, a sector comprising a broad range of businesses that are using technology in innovative ways (see page 28). These days, more real estate companies are looking to improve operational efficiencies with the help of new technologies. This has bolstered demand for the products and services offered by businesses operating in the PropTech space. Fund managers are well aware of the potential. In 2019, there were 209 real estate technology-focused buyout and venture capital deals, amounting to $13bn in total value; that is almost double the value recorded in 2018.
What’s in Store in 2020As 2020 kicks off, there are 918 funds on the road targeting an aggregate $281bn, an all-time high for both figures. The good news for fund managers is that investor appetite remains healthy. Ninety-three percent of the investors we surveyed plan to either maintain or increase their allocation to real estate beyond 2020. This is not a surprise, given that 87% of investors expressed satisfaction with the performance of their real estate portfolios over the past 12 months. For fund managers, the challenge will be maintaining that performance even if market conditions worsen.
Private real estate enjoys another year of growth, but deal numbers decline as asset prices rise
1. OVERVIEW OF THE INDUSTRY
2020 PREQIN GLOBAL REAL ESTATE REPORT – SAMPLE PAGES
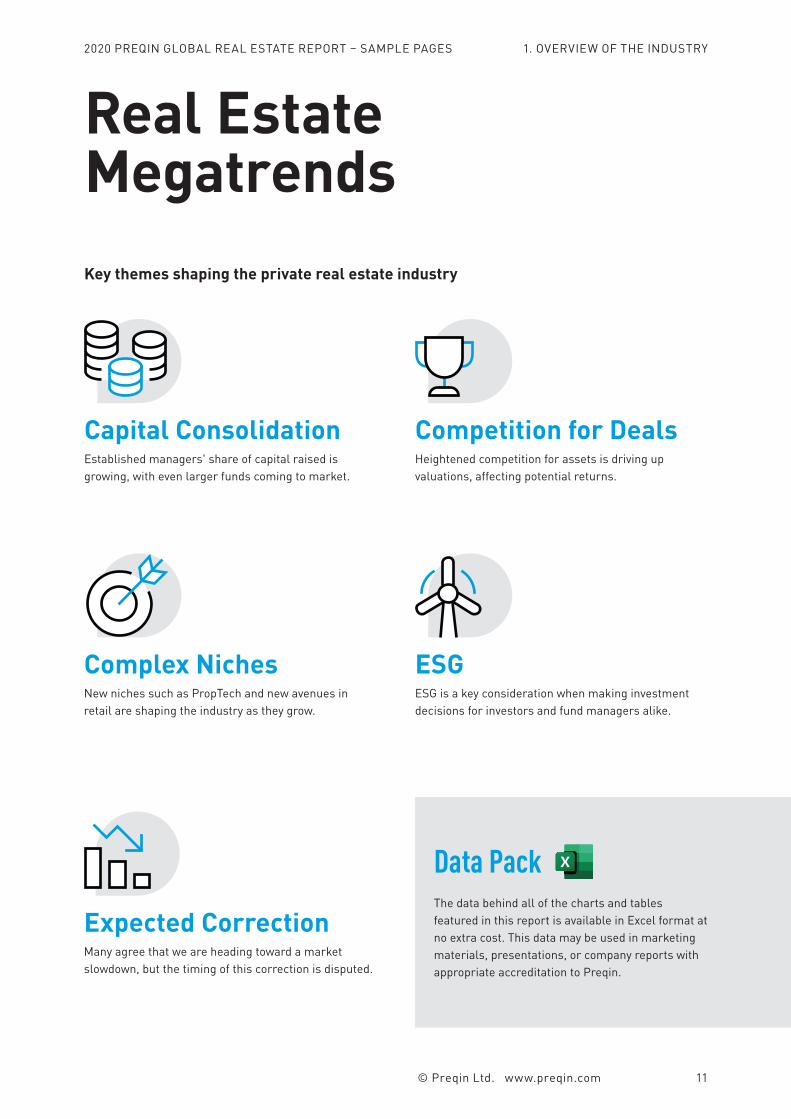
Capital ConsolidationEstablished managers' share of capital raised is growing, with even larger funds coming to market.
Competition for DealsHeightened competition for assets is driving up valuations, affecting potential returns.
Complex NichesNew niches such as PropTech and new avenues in retail are shaping the industry as they grow.
ESGESG is a key consideration when making investment decisions for investors and fund managers alike.
Expected CorrectionMany agree that we are heading toward a market slowdown, but the timing of this correction is disputed.
Real EstateMegatrendsKey themes shaping the private real estate industry
Data PackThe data behind all of the charts and tables featured in this report is available in Excel format at no extra cost. This data may be used in marketing materials, presentations, or company reports with appropriate accreditation to Preqin.
1. OVERVIEW OF THE INDUSTRY
© Preqin Ltd. www.preqin.com 11
4
2020 PREQIN GLOBAL REAL ESTATE REPORT – SAMPLE PAGES SPONSORED
Investing in Tomorrow’s World Real Estate
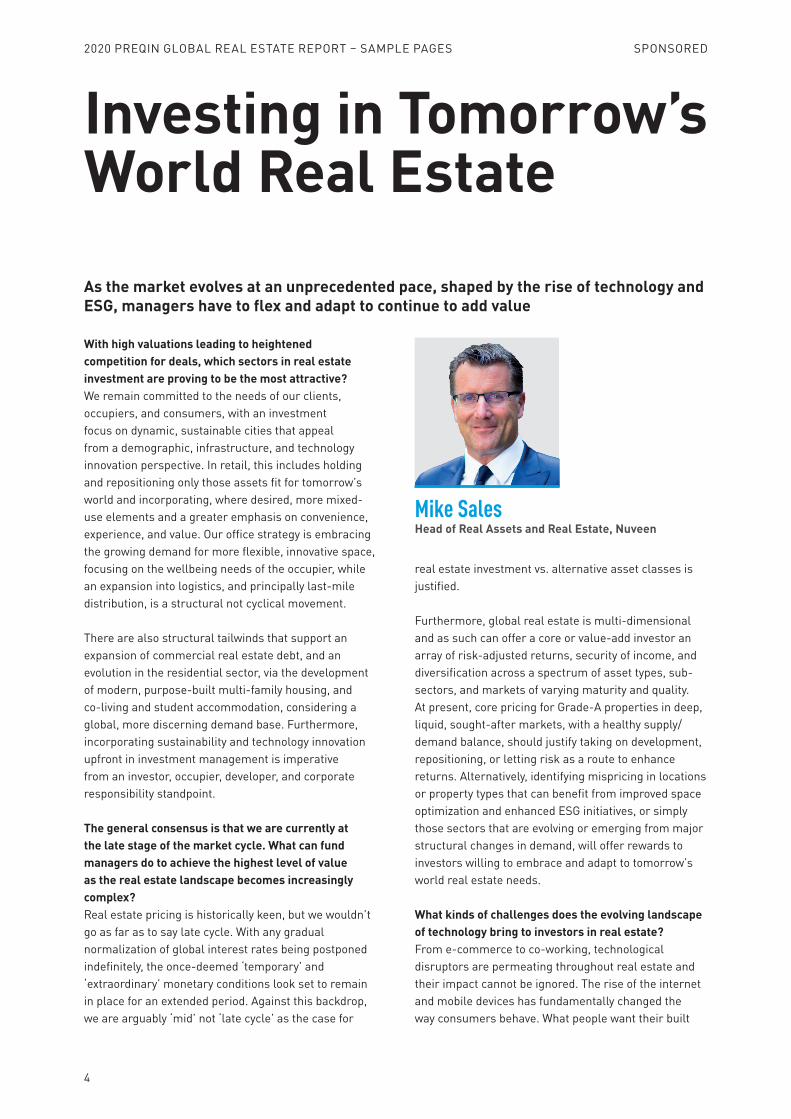
With high valuations leading to heightened competition for deals, which sectors in real estate investment are proving to be the most attractive? We remain committed to the needs of our clients, occupiers, and consumers, with an investment focus on dynamic, sustainable cities that appeal from a demographic, infrastructure, and technology innovation perspective. In retail, this includes holding and repositioning only those assets fit for tomorrow’s world and incorporating, where desired, more mixed-use elements and a greater emphasis on convenience, experience, and value. Our office strategy is embracing the growing demand for more flexible, innovative space, focusing on the wellbeing needs of the occupier, while an expansion into logistics, and principally last-mile distribution, is a structural not cyclical movement.
There are also structural tailwinds that support an expansion of commercial real estate debt, and an evolution in the residential sector, via the development of modern, purpose-built multi-family housing, and co-living and student accommodation, considering a global, more discerning demand base. Furthermore, incorporating sustainability and technology innovation upfront in investment management is imperative from an investor, occupier, developer, and corporate responsibility standpoint.
The general consensus is that we are currently at the late stage of the market cycle. What can fund managers do to achieve the highest level of value as the real estate landscape becomes increasingly complex? Real estate pricing is historically keen, but we wouldn’t go as far as to say late cycle. With any gradual normalization of global interest rates being postponed indefinitely, the once-deemed ‘temporary’ and ‘extraordinary’ monetary conditions look set to remain in place for an extended period. Against this backdrop, we are arguably ‘mid’ not ‘late cycle’ as the case for
real estate investment vs. alternative asset classes is justified.
Furthermore, global real estate is multi-dimensional and as such can offer a core or value-add investor an array of risk-adjusted returns, security of income, and diversification across a spectrum of asset types, sub-sectors, and markets of varying maturity and quality. At present, core pricing for Grade-A properties in deep, liquid, sought-after markets, with a healthy supply/demand balance, should justify taking on development, repositioning, or letting risk as a route to enhance returns. Alternatively, identifying mispricing in locations or property types that can benefit from improved space optimization and enhanced ESG initiatives, or simply those sectors that are evolving or emerging from major structural changes in demand, will offer rewards to investors willing to embrace and adapt to tomorrow’s world real estate needs.
What kinds of challenges does the evolving landscape of technology bring to investors in real estate?From e-commerce to co-working, technological disruptors are permeating throughout real estate and their impact cannot be ignored. The rise of the internet and mobile devices has fundamentally changed the way consumers behave. What people want their built
Mike SalesHead of Real Assets and Real Estate, Nuveen
As the market evolves at an unprecedented pace, shaped by the rise of technology and ESG, managers have to flex and adapt to continue to add value
2020 PREQIN GLOBAL REAL ESTATE REPORT – SAMPLE PAGES
© Preqin Ltd. www.preqin.com 5
SPONSORED
Nuveen Real EstateNuveen Real Estate is one of the largest investment managers in the world with $130bn of assets under management. Managing a suite of funds and mandates, across both public and private investments, and spanning both debt and equity across diverse geographies and investment styles, we provide access to every aspect of real estate investing.
With over 80 years of real estate investing experience and more than 600 employees* located across over 25 cities throughout the US, Europe, and Asia-Pacific, the platform offers unparalleled geographic reach, which is married with deep sector expertise.
For further information, please visit us at nuveen.com/realestate
R-1018414G-O1119X
environment to provide has fundamentally evolved. We are therefore closely monitoring technological trends to position our assets defensively against them while also identifying the opportunities that can be gained to create value.
For example, digital commerce is driving many changes to how consumers behave and we believe it is an opportunity for retail real estate to evolve into a more exciting and dynamic product. This means creating new experiences by blurring the lines between online and offline retail, capturing more data about how retail is used by brands and consumers, and embracing a new generation of digitally native brands.
At Xanadú, a super-prime shopping center we manage in Madrid, the asset’s value proposition goes well beyond traditional retail, with an indoor ski slope, aquarium, and theme park. It also contains non-traditional retail tenants, such as Alibaba, the global retail online marketplace, which opened its first store in Europe at Xanadú in Autumn 2019.
With the advent of 5G and the increasing affordability of sensors, the Internet of Things will accelerate and further increase the potential of Smart Buildings, helping them to become more operationally efficient as well as enhancing the user experience.
As well as trialing and rolling out solutions across our portfolio – from tenant engagement apps to energy efficiency technologies – we have partnered with Edge Technologies in Europe to create the “office of the future.” EDGE Olympic is one of the healthiest buildings in the world – being one of the first buildings to receive WELL Platinum – is highly energy efficient, and is a Smart Building, with data from all aspects of the
building’s operation and user experience centralized into one digital platform.
With environmental and social governance remaining at the top of the real estate agenda, what do you believe to be the most important of these factors when considering new real estate investments?Sustainability continues to be at the forefront for us when considering potential investments as we transition to the low-carbon economy. We strive to be leaders in responsible investing in the real estate market, not only to ensure that we are contributing toward a more sustainable future, but also because it makes business sense as in many cases investing in the most sustainable, forward-thinking, and advanced assets will have a positive return on investment for our clients too.
However, the changes our industry is now facing no longer just sit within the confines of environmental factors. We are seeing a structural shift with issues of sustainability, demographics, and technology all playing a part. All three overlap and have the potential to massively disrupt the industry, but they also present opportunities to create value. Demographic factors, for example, such as urbanization and generational shifts in consumer preferences, will change the needs of real estate in certain locations, offering savvy investors the opportunity to invest in real estate assets that will become more prevalent and necessary in those geographic areas.
Taking a strategic approach to these structural disruptors is part of our tomorrow’s world philosophy, sitting at the core of our investment process and informing our long-term view of real estate investments for the enduring benefit of both clients and society.
46
2020 PREQIN GLOBAL REAL ESTATE REPORT – SAMPLE PAGES
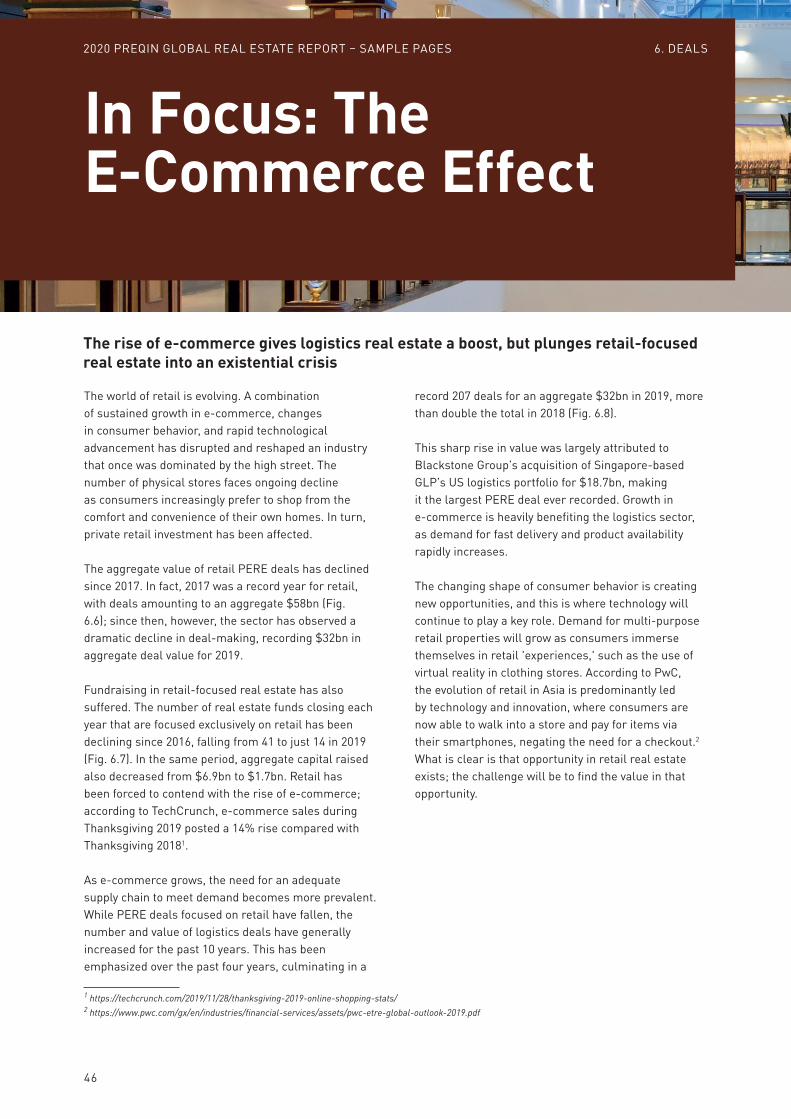
In Focus: The E-Commerce Effect
The world of retail is evolving. A combination of sustained growth in e-commerce, changes in consumer behavior, and rapid technological advancement has disrupted and reshaped an industry that once was dominated by the high street. The number of physical stores faces ongoing decline as consumers increasingly prefer to shop from the comfort and convenience of their own homes. In turn, private retail investment has been affected.
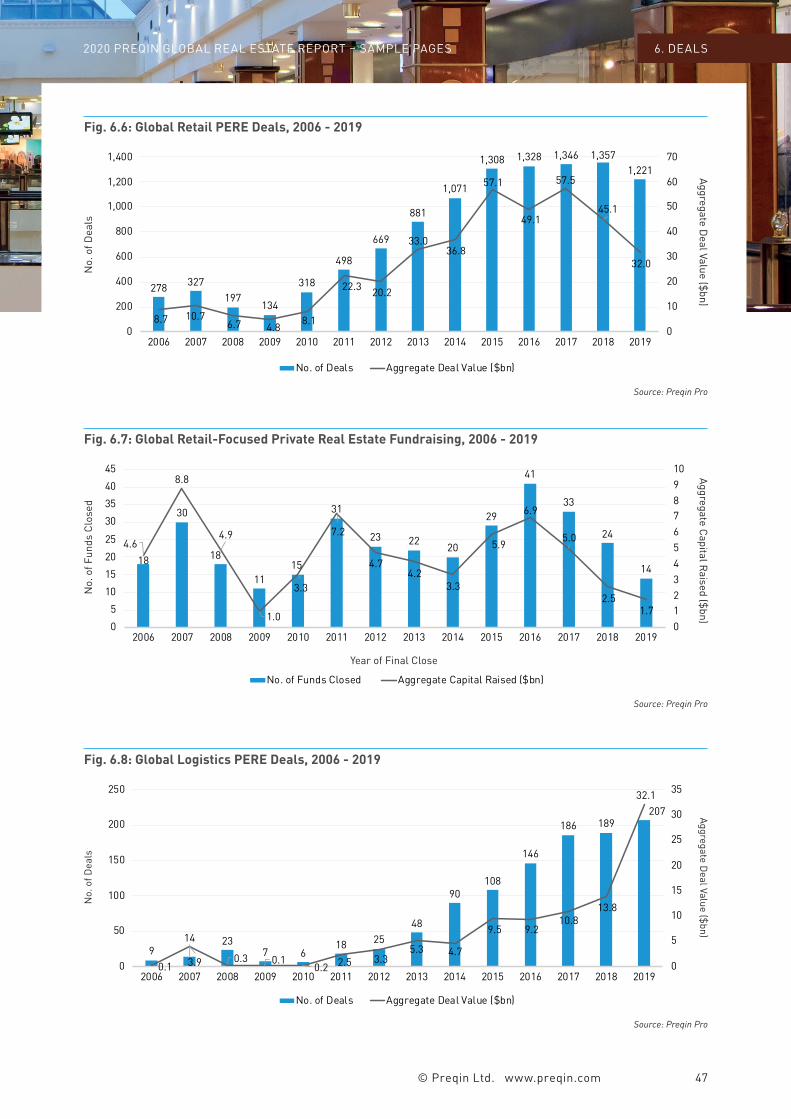
The aggregate value of retail PERE deals has declined since 2017. In fact, 2017 was a record year for retail, with deals amounting to an aggregate $58bn (Fig. 6.6); since then, however, the sector has observed a dramatic decline in deal-making, recording $32bn in aggregate deal value for 2019.
Fundraising in retail-focused real estate has also suffered. The number of real estate funds closing each year that are focused exclusively on retail has been declining since 2016, falling from 41 to just 14 in 2019 (Fig. 6.7). In the same period, aggregate capital raised also decreased from $6.9bn to $1.7bn. Retail has been forced to contend with the rise of e-commerce; according to TechCrunch, e-commerce sales during Thanksgiving 2019 posted a 14% rise compared with Thanksgiving 20181.
As e-commerce grows, the need for an adequate supply chain to meet demand becomes more prevalent. While PERE deals focused on retail have fallen, the number and value of logistics deals have generally increased for the past 10 years. This has been emphasized over the past four years, culminating in a
1 https://techcrunch.com/2019/11/28/thanksgiving-2019-online-shopping-stats/ 2 https://www.pwc.com/gx/en/industries/financial-services/assets/pwc-etre-global-outlook-2019.pdf
record 207 deals for an aggregate $32bn in 2019, more than double the total in 2018 (Fig. 6.8).
This sharp rise in value was largely attributed to Blackstone Group’s acquisition of Singapore-based GLP’s US logistics portfolio for $18.7bn, making it the largest PERE deal ever recorded. Growth in e-commerce is heavily benefiting the logistics sector, as demand for fast delivery and product availability rapidly increases.
The changing shape of consumer behavior is creating new opportunities, and this is where technology will continue to play a key role. Demand for multi-purpose retail properties will grow as consumers immerse themselves in retail 'experiences,' such as the use of virtual reality in clothing stores. According to PwC, the evolution of retail in Asia is predominantly led by technology and innovation, where consumers are now able to walk into a store and pay for items via their smartphones, negating the need for a checkout.2 What is clear is that opportunity in retail real estate exists; the challenge will be to find the value in that opportunity.
The rise of e-commerce gives logistics real estate a boost, but plunges retail-focused real estate into an existential crisis
2020 PREQIN GLOBAL REAL ESTATE REPORT – SAMPLE PAGES 6. DEALS
2020 PREQIN GLOBAL REAL ESTATE REPORT – SAMPLE PAGES
Fig. 6.8: Global Logistics PERE Deals, 2006 - 2019
Source: Preqin Pro
914 23
7 618 25
48
90108
146
186 189207
0.1 3.9 0.3 0.10.2 2.5 3.3
5.3 4.7
9.5 9.210.8
13.8
32.1
0
5
10
15
20
25
30
35
0
50
100
150
200
250
2006 2007 2008 2009 2010 2011 2012 2013 2014 2015 2016 2017 2018 2019
No. of Deals Aggregate Deal Value ($bn)
No.
of D
eals
Aggregate Deal Value ($bn)
6. DEALS
Fig. 6.6: Global Retail PERE Deals, 2006 - 2019
Source: Preqin Pro
278 327197
134
318
498
669
881
1,071
1,308 1,328 1,346 1,3571,221
8.7 10.76.7 4.8 8.1
22.3 20.2
33.036.8
57.1
49.1
57.5
45.1
32.0
0
10
20
30
40
50
60
70
0
200
400
600
800
1,000
1,200
1,400
2006 2007 2008 2009 2010 2011 2012 2013 2014 2015 2016 2017 2018 2019
No. of Deals Aggregate Deal Value ($bn)
No.
of D
eals
Fig. 6.7: Global Retail-Focused Private Real Estate Fundraising, 2006 - 2019
Source: Preqin Pro
18
30
18
1115
31
23 22 20
29
41
33
24
14
4.6
8.8
4.9
1.0
3.3
7.2
4.74.2
3.3
5.9
6.9
5.0
2.51.7
012345678910
05
10152025
30354045
2006 2007 2008 2009 2010 2011 2012 2013 2014 2015 2016 2017 2018 2019
No. of Funds Closed Aggregate Capital Raised ($bn)
No.
of F
unds
Clo
sed
Aggregate Deal Value ($bn)
Year of Final Close
Aggregate Capital Raised ($bn)
© Preqin Ltd. www.preqin.com 47
2020 PREQIN GLOBAL REAL ESTATE REPORT – SAMPLE PAGES
2020 PREQIN GLOBAL REAL ESTATE REPORT – SAMPLE PAGES
HorizonIRRs
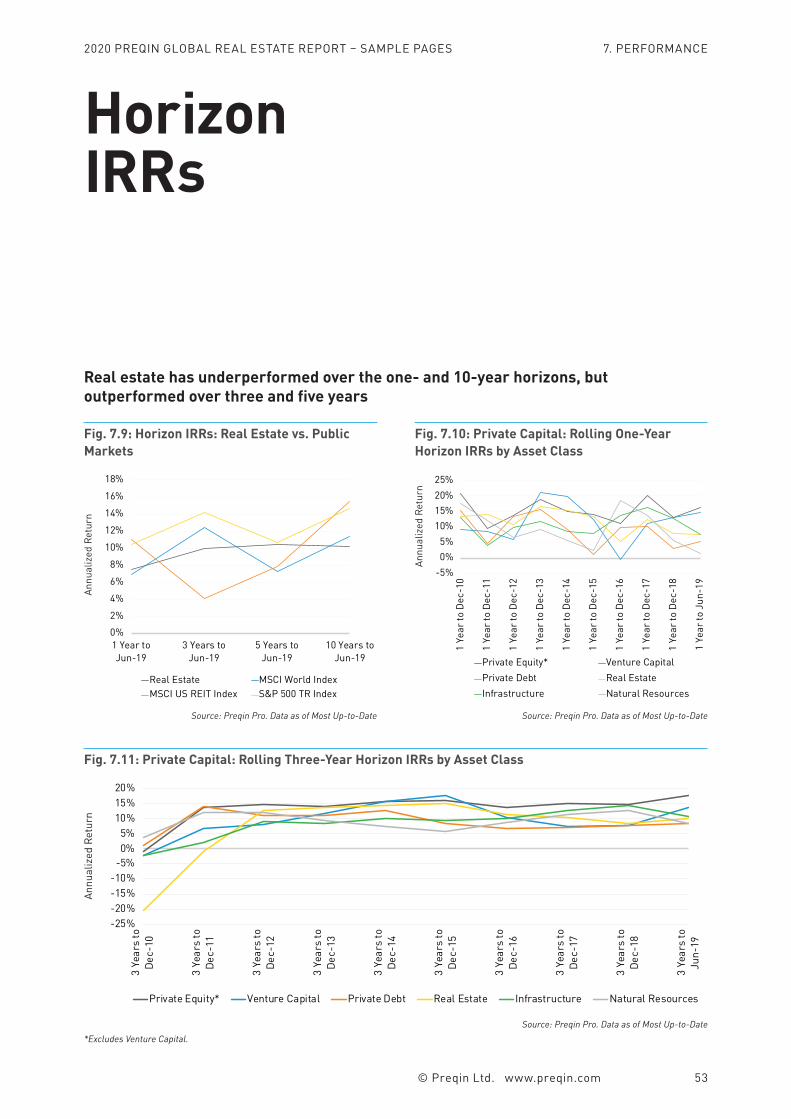
Fig. 7.11: Private Capital: Rolling Three-Year Horizon IRRs by Asset Class
Source: Preqin Pro. Data as of Most Up-to-Date
-25%-20%-15%-10%
-5%0%5%
10%15%20%
3 Ye
ars
toDe
c-10
3 Ye
ars
toDe
c-11
3 Ye
ars
toDe
c-12
3 Ye
ars
toDe
c-13
3 Ye
ars
toDe
c-14
3 Ye
ars
toDe
c-15
3 Ye
ars
toDe
c-16
3 Ye
ars
toDe
c-17
3 Ye
ars
toDe
c-18
3 Ye
ars
toJu
n-19
Private Equity* Venture Capital Private Debt Real Estate Infrastructure Natural Resources
Annu
aliz
ed R
etur
n
0%2%
4%
6%
8%
10%
12%
14%
16%
18%
1 Year toJun-19
3 Years toJun-19
5 Years toJun-19
10 Years toJun-19
Real Estate MSCI World IndexMSCI US REIT Index S&P 500 TR Index
Fig. 7.9: Horizon IRRs: Real Estate vs. Public Markets
Source: Preqin Pro. Data as of Most Up-to-Date
-5%0%5%
10%15%20%25%
1 Ye
ar to
Dec
-10
1 Ye
ar to
Dec
-11
1 Ye
ar to
Dec
-12
1 Ye
ar to
Dec
-13
1 Ye
ar to
Dec
-14
1 Ye
ar to
Dec
-15
1 Ye
ar to
Dec
-16
1 Ye
ar to
Dec
-17
1 Ye
ar to
Dec
-18
1 Ye
ar to
Jun
-19
Private Equity* Venture CapitalPrivate Debt Real EstateInfrastructure Natural Resources
Fig. 7.10: Private Capital: Rolling One-Year Horizon IRRs by Asset Class
Source: Preqin Pro. Data as of Most Up-to-Date
Annu
aliz
ed R
etur
n
Annu
aliz
ed R
etur
n
*Excludes Venture Capital.
Real estate has underperformed over the one- and 10-year horizons, but outperformed over three and five years
© Preqin Ltd. www.preqin.com 53
7. PERFORMANCE

2020 PREQIN GLOBALPRIVATE DEBTREPORTSAMPLE PAGES
ISBN: 978-1-912116-26-3
2
2020 PREQIN GLOBAL PRIVATE DEBT REPORT – SAMPLE PAGES
Contents
3 CEO's Foreword – Mark O'Hare, Preqin
4 Selectivity Is Key in Private Debt – Ken Kencel, Churchill Asset Management, a Nuveen company
6 Why Investors Should Focus on Outcomes, Not Definitions – Jo Waldron, M&G Investments
1. Overview of the Industry10 Executive Summary
11 Private Debt Megatrends
12 Private Debt in 2019: Key Facts
2. Assets under Management14 Five Forces Shaping the Future of Private Credit
– Jirí Król, Alternative Investment Management Association
15 Managers Find Opportunity as AUM Rises
18 Capital Calls and Distributions
3. Fundraising20 Fundraising: Established Managers Flourish in
Private Debt
23 Funds in Market Reach All-Time High
25 China's Real Estate Market Offers Promising Distressed Debt Opportunities – Xiaolin Zhang & Zheng Zhang, Lakeshore Capital
27 In Focus: The Rise of Asian Private Debt
4. Fund Managers30 When the Check Alone Isn’t Enough – Alex
Schmid, ESO Capital
31 The Expanding Fund Manager Universe
33 In Focus: First-Time Funds Struggle to Raise
35 Fund Terms
5. Investors38 Investor Universe
39 Future Searches and Mandates
40 Large Investors Seek Alternative Structures
42 In Focus: Rise of Covenant-Lite Loans
6. Deals44 The Mainstreaming of Private Credit in
India – Hemant Daga, Edelweiss Global Asset Management
46 Deals Drop off but Managers Break New Ground
7. Performance50 Rising Competition Weighs on Performance
52 Horizon IRRs
54 Performance Benchmarks and PMEs
8. League Tables58 Largest Fund Managers
63 Largest Funds Closed
65 Top Performers
67 Largest Investors
9. Regions70 North America
72 Europe
74 Asia
76 Rest of World
10. Outlook80 Six Principles for Successful Alternative Credit
Investments in Emerging Markets – Nabil Marc Abdul-Massih, INOKS Capital
82 In Focus: ESG, Slow and Steady
84 Outlook for Private Debt in 2020
87 Preqin Predictions
^
10
2020 PREQIN GLOBAL PRIVATE DEBT REPORT – SAMPLE PAGES
Executive Summary
Arguably the youngest asset class in the private capital universe, private debt has soared to incredible heights since the Global Financial Crisis (GFC). Assets under management (AUM) have grown consistently each year and, as of June 2019, reached a record $812bn. Private debt is now the third-largest asset class in private capital, ahead of infrastructure and natural resources.
The market has continuously expanded ever since the GFC, when banks retrenched from serving the middle market as they derisked their balance sheets. Private debt firms swooped in to capitalize on the void in the middle market. Over 4,100 investors now make allocations to the asset class. Demand has given rise to a record 1,764 fund managers now active in the space – up from 1,604 at the beginning of 2019 and over twice as many as five years ago – and a significant pool of capital available for them to put to use.
And put it to use they have. In tandem with growth in AUM, dry powder had been rising for the past five years; but in 2019, dry powder levels flattened somewhat, rising by only $4bn, from $292bn at the end of 2018 to $296bn as of December 2019, despite an 8% increase in overall AUM.
A total of 151 private debt funds closed to raise a combined $104bn, down from $110bn in 2018 through 210 fund closures, which in turn was down from the record $132bn secured through 220 fund closures in 2017. The 10 largest funds closed in 2019 raised 36% of total capital, an increase of seven percentage points in comparison to the previous year, highlighting the existence of capital consolidation as investors are increasingly drawn to larger, more established fund managers.
The uncertainty surrounding the current economic and credit cycle is undoubtedly a key consideration for many players in the private debt industry. In a low-yield environment, investors require fund managers with the capability and resources to adequately deal with distressed loans, and therefore may be drawn to more experienced managers with stronger track records in the event of a market downturn. Newer managers can still offer opportunity in these times, however; indeed, first-time fundraising made up 9% of total capital raised in private debt in 2019, up from 7% at the end of 2018.
Looking ahead, investors are upbeat about their private debt portfolios. A significant 91% of investors we spoke to will either maintain or increase their allocation to private debt over the longer term. That said, challenges lie in wait. While investors may be seeking downside protection, private debt has not been tested through a full market cycle. This is where managers will want to provide more transparency around investment decisions, to convince stakeholders of the value the asset class can deliver even if there are difficult times ahead.
Assets under management in private debt have once again hit a record, but the asset class has become more nuanced
1. OVERVIEW OF THE INDUSTRY
2020 PREQIN GLOBAL PRIVATE DEBT REPORT – SAMPLE PAGES
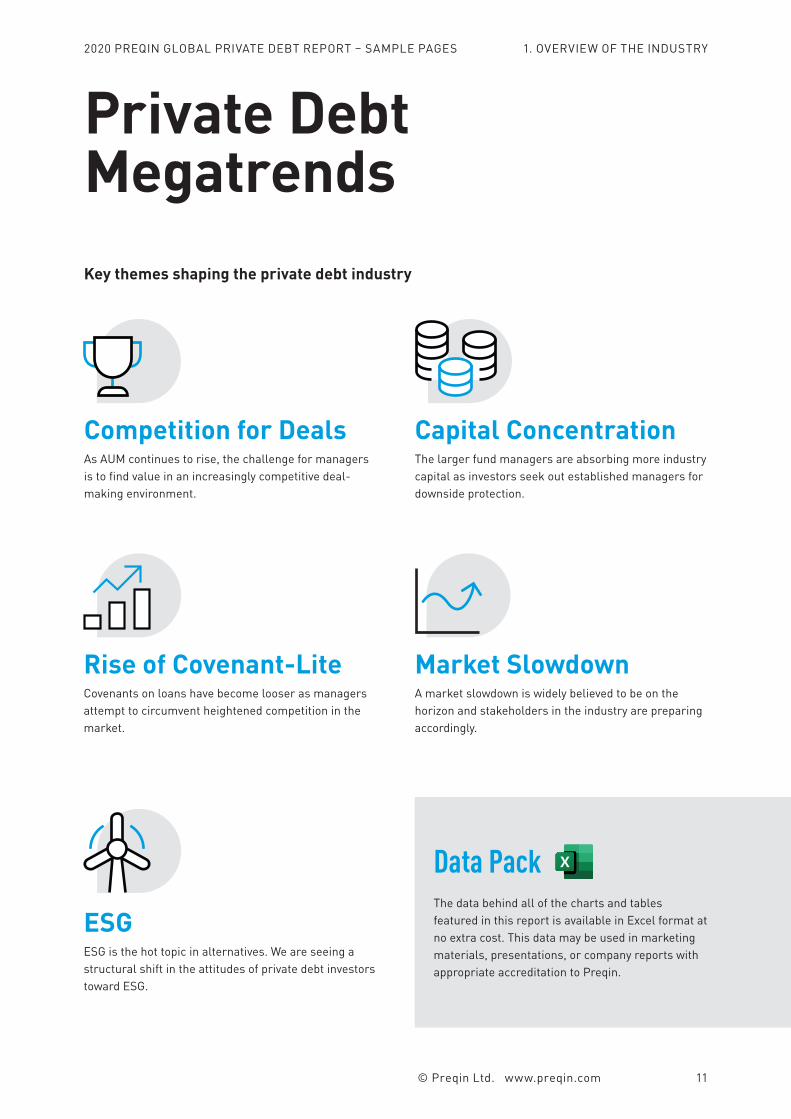
Competition for DealsAs AUM continues to rise, the challenge for managers is to find value in an increasingly competitive deal-making environment.
Capital ConcentrationThe larger fund managers are absorbing more industry capital as investors seek out established managers for downside protection.
Rise of Covenant-LiteCovenants on loans have become looser as managers attempt to circumvent heightened competition in the market.
Market SlowdownA market slowdown is widely believed to be on the horizon and stakeholders in the industry are preparing accordingly.
ESGESG is the hot topic in alternatives. We are seeing a structural shift in the attitudes of private debt investors toward ESG.
Private DebtMegatrendsKey themes shaping the private debt industry
Data PackThe data behind all of the charts and tables featured in this report is available in Excel format at no extra cost. This data may be used in marketing materials, presentations, or company reports with appropriate accreditation to Preqin.
1. OVERVIEW OF THE INDUSTRY
© Preqin Ltd. www.preqin.com 11

4
2020 PREQIN GLOBAL PRIVATE DEBT REPORT – SAMPLE PAGES
Selectivity Is Key in Private Debt
In which areas are you seeing the most attractive opportunities in the private debt market?We are focused on investing in directly originated senior secured loans to private equity-backed, traditional middle-market companies ($10-50mn of EBITDA), which we believe provide an attractive risk/return opportunity for investors. These assets can offer yields in the 7-8% range, along with reasonable leverage, solid loan-to-value, and financial covenants.
With record private equity capital fundraising and over $600bn in expected refinancing activity over the next several years, the opportunities for directly originated, middle-market senior secured loans are expected to remain attractive for larger investment platforms that can access the highest-quality investment opportunities. We also believe private equity is increasingly reliant on direct lending, as direct lending dry powder in North America is currently $70bn – just 16% of buyout dry powder.
Additionally, many investors believe a market correction is imminent, and the downside protection that senior middle-market loans can provide is often a key draw. Notably, historical performance data suggests that middle-market loans exhibit less risk, as measured by default and loss rates, than the closest comparable investment option, which are non-investment-grade, broadly syndicated loans.
In situations where business models are extremely resilient and cycle tested, we also believe middle-market junior capital can be an interesting risk-adjusted return opportunity, whereby we are able to access tranches of junior debt securities yielding 10-12%, but positioned under 50% of loan-to-value. These opportunities have been increasingly prevalent, as middle-market sponsors are driving up enterprise valuations for safer assets and accepting a lower base-case return on equity.
How have you positioned yourselves in the event of a market downturn?While we don’t know exactly when, there will be an economic downturn at some point, and we believe senior middle-market loans provide investors access to attractive yields from relatively conservative assets with inherent downside protection.
We believe that Churchill is particularly well positioned for a downturn. In the current environment, it is essential to remain highly selective (closing 5-10% of deals reviewed) and focused on building diversified portfolios of loans with 1-2% position sizes, conservative leverage multiples, significant sponsor equity contributions, and at least one financial covenant per transaction. We have also developed a strong position in the middle market as a trusted partner to lead traditional senior and unitranche credit facilities, which gives us an important seat at the table in case a credit issue arises throughout the life of an investment.
Lastly, we remain focused on defensive sectors, such as healthcare and technology, while avoiding lending to borrowers in industries reliant on commodities and heavy cyclicals. And, ultimately, it is essential to align ourselves with top-tier private equity sponsors with decades of successful experience investing in the same industries.
Ken KencelCEO and President, Churchill Asset Management, a Nuveen company
Churchill, the private capital affiliate of Nuveen, on the key opportunities in the private debt market and the importance of selectivity and diversification in portfolio development
SPONSORED
2020 PREQIN GLOBAL PRIVATE DEBT REPORT – SAMPLE PAGES
© Preqin Ltd. www.preqin.com 5
NuveenNuveen, the investment management arm of TIAA, is one of the largest investment managers in the world with $1tn in assets under management. Managing a broad array of assets across diverse asset classes, geographies, and investment styles, we provide investors access to a wide range of liquid and illiquid alternative strategies.
Churchill Asset Management, our private capital investment affiliate, is a leading capital provider for private equity sponsor-owned middle-market companies. With $19bn of committed capital under management, Churchill has broad experience in all aspects of the middle-market financing business, including origination, structuring, credit analysis, syndication, and deal monitoring and oversight.
www.nuveen.com
Is the increasing presence of covenant-lite loans creating more risk for investors? In the current market, we have seen more aggressive structures typically found in the larger broadly syndicated loan market continue to creep into the upper middle market, such as covenant-lite loans. We believe this trend will continue, until there is some sort of credit event that gives lenders pause.
We view financial covenants as being critical structural elements of credit documentation in the middle market. Covenants are intended to act as guard rails that provide an impetus for all parties to sit around the table and review financial performance, allowing for thoughtful, constructive solutions early on, often before more serious issues arise.
In general, Churchill targets loans with at least one financial covenant and has also significantly reduced exposure to the upper middle market (companies with over $50mn in EBITDA) in response to the market dynamics described above. Our core focus remains on the traditional middle market, particularly in companies with $10-50mn in EBITDA, as we believe that protection from covenants (such as an ongoing debt-to-EBITDA maintenance test) will serve our portfolios well in every phase of the credit cycle.
What are the main differences between European private debt opportunities and those in the US? From which regions are you receiving the most investor interest?The European direct lending market is less mature when compared to the US, as alternative lenders began to emerge in reaction to the Global Financial Crisis. The European direct lending market is essentially where the US was about 10 years ago.
1 The National Center for the Middle Market
Banks in Europe have been aggressive about defending their market share, particularly with relationship sponsors, so direct lenders are driven to offer more unitranche financings, as well as more lower-in-the-capital-stack solutions, which are fundamentally riskier.
The markets in the US and Europe are also very different in size – over the past 15 years the volume of institutional leveraged loans in the US has, on average, been more than 6x greater than that in Europe. The pool of direct lending opportunities is substantially smaller in Europe, particularly as managers focus on the deals the banks are not doing. As a result, given the amount of capital raised, the pace of deployment is much slower compared to that of US funds.
On the other hand, if the US middle market were a country, its GDP would rank it as the third-largest economy in the world – ahead of Japan, Germany, and the UK.1 US direct lending managers with scaled origination platforms and strong track records can really enjoy the benefits of this much larger market, which allows them to be highly selective and hand pick the very best deals for their portfolios. In our view, this gives investors access to better market dynamics and more conservative assets. Churchill’s investment portfolio, for instance, consists of 100% senior loans to a diversified pool of middle-market companies backed by top sponsors – all with at least one financial covenant. At this point in the cycle, the risk/return for our credit profile is very compelling.
In terms of investor interest, we are seeing that Asian investors, in particular from Japan, have increasingly begun to adopt private debt strategies.
SPONSORED
2020 PREQIN GLOBAL PRIVATE DEBT REPORT – SAMPLE PAGES
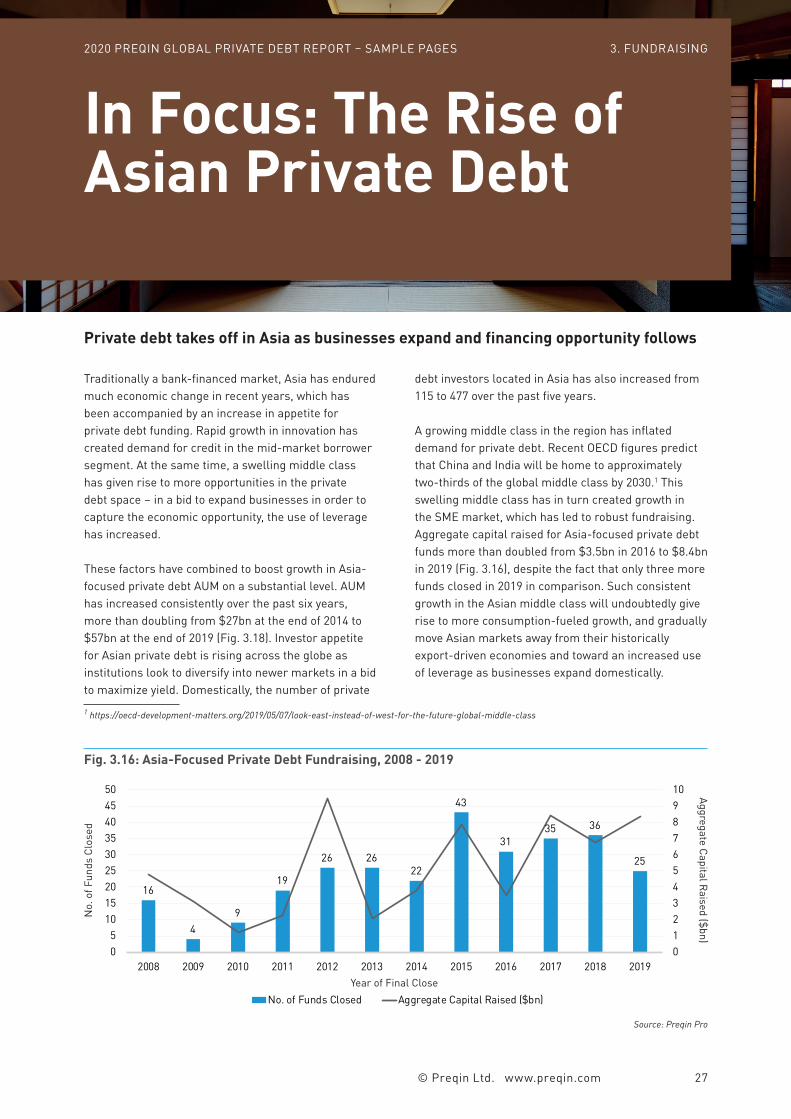
Traditionally a bank-financed market, Asia has endured much economic change in recent years, which has been accompanied by an increase in appetite for private debt funding. Rapid growth in innovation has created demand for credit in the mid-market borrower segment. At the same time, a swelling middle class has given rise to more opportunities in the private debt space – in a bid to expand businesses in order to capture the economic opportunity, the use of leverage has increased.
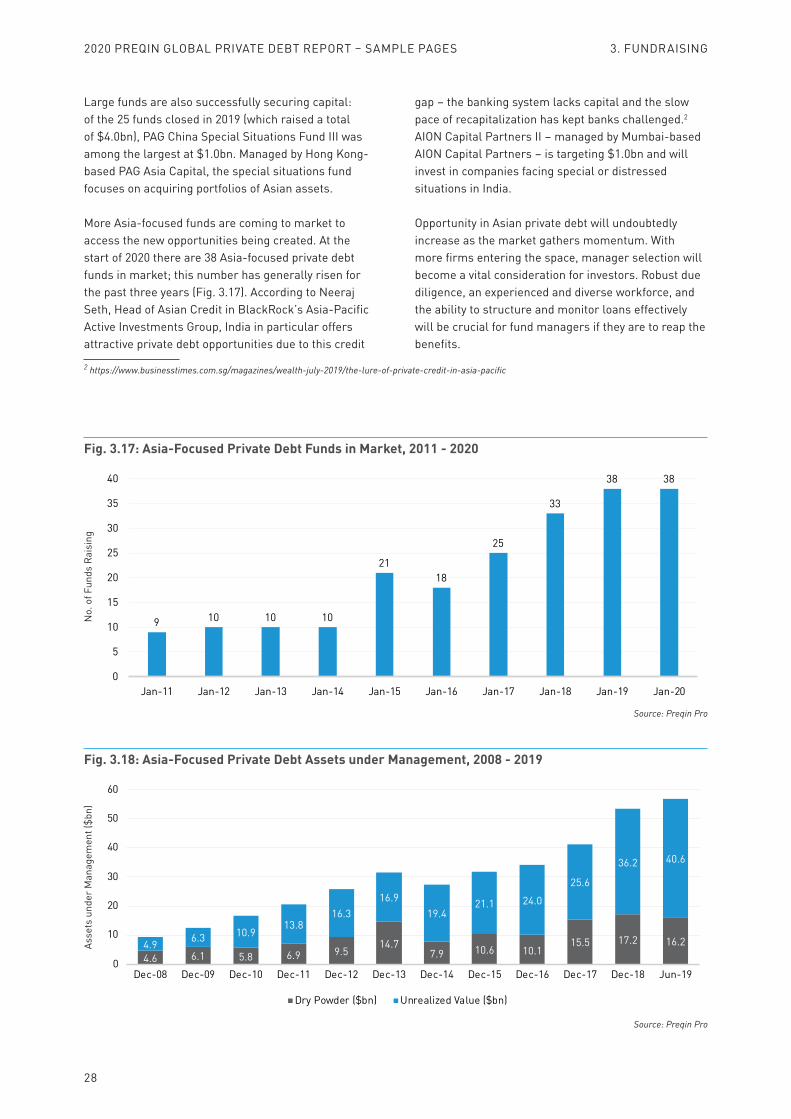
These factors have combined to boost growth in Asia-focused private debt AUM on a substantial level. AUM has increased consistently over the past six years, more than doubling from $27bn at the end of 2014 to $57bn at the end of 2019 (Fig. 3.18). Investor appetite for Asian private debt is rising across the globe as institutions look to diversify into newer markets in a bid to maximize yield. Domestically, the number of private
1 https://oecd-development-matters.org/2019/05/07/look-east-instead-of-west-for-the-future-global-middle-class
debt investors located in Asia has also increased from 115 to 477 over the past five years.
A growing middle class in the region has inflated demand for private debt. Recent OECD figures predict that China and India will be home to approximately two-thirds of the global middle class by 2030.1 This swelling middle class has in turn created growth in the SME market, which has led to robust fundraising. Aggregate capital raised for Asia-focused private debt funds more than doubled from $3.5bn in 2016 to $8.4bn in 2019 (Fig. 3.16), despite the fact that only three more funds closed in 2019 in comparison. Such consistent growth in the Asian middle class will undoubtedly give rise to more consumption-fueled growth, and gradually move Asian markets away from their historically export-driven economies and toward an increased use of leverage as businesses expand domestically.
In Focus: The Rise of Asian Private Debt
Private debt takes off in Asia as businesses expand and financing opportunity follows
Fig. 3.16: Asia-Focused Private Debt Fundraising, 2008 - 2019
Source: Preqin Pro
16
49
19
26 2622
43
3135 36
25
012345678910
05
101520253035404550
2008 2009 2010 2011 2012 2013 2014 2015 2016 2017 2018 2019
No. of Funds Closed Aggregate Capital Raised ($bn)
No.
of F
unds
Clo
sed
Aggregate Capital Raised ($bn)
Year of Final Close
3. FUNDRAISING2020 PREQIN GLOBAL PRIVATE DEBT REPORT – SAMPLE PAGES
© Preqin Ltd. www.preqin.com 27
28
2020 PREQIN GLOBAL PRIVATE DEBT REPORT – SAMPLE PAGES
Large funds are also successfully securing capital: of the 25 funds closed in 2019 (which raised a total of $4.0bn), PAG China Special Situations Fund III was among the largest at $1.0bn. Managed by Hong Kong-based PAG Asia Capital, the special situations fund focuses on acquiring portfolios of Asian assets.
More Asia-focused funds are coming to market to access the new opportunities being created. At the start of 2020 there are 38 Asia-focused private debt funds in market; this number has generally risen for the past three years (Fig. 3.17). According to Neeraj Seth, Head of Asian Credit in BlackRock’s Asia-Pacific Active Investments Group, India in particular offers attractive private debt opportunities due to this credit
2 https://www.businesstimes.com.sg/magazines/wealth-july-2019/the-lure-of-private-credit-in-asia-pacific
gap – the banking system lacks capital and the slow pace of recapitalization has kept banks challenged.2 AION Capital Partners II – managed by Mumbai-based AION Capital Partners – is targeting $1.0bn and will invest in companies facing special or distressed situations in India.
Opportunity in Asian private debt will undoubtedly increase as the market gathers momentum. With more firms entering the space, manager selection will become a vital consideration for investors. Robust due diligence, an experienced and diverse workforce, and the ability to structure and monitor loans effectively will be crucial for fund managers if they are to reap the benefits.
Fig. 3.18: Asia-Focused Private Debt Assets under Management, 2008 - 2019
Source: Preqin Pro
4.6 6.1 5.8 6.9 9.514.7
7.9 10.6 10.115.5 17.2 16.24.9 6.3 10.9
13.816.3
16.919.4
21.1 24.0
25.6
36.2 40.6
0
10
20
30
40
50
60
Dec-08 Dec-09 Dec-10 Dec-11 Dec-12 Dec-13 Dec-14 Dec-15 Dec-16 Dec-17 Dec-18 Jun-19
Dry Powder ($bn) Unrealized Value ($bn)
Asse
ts u
nder
Man
agem
ent (
$bn)
Fig. 3.17: Asia-Focused Private Debt Funds in Market, 2011 - 2020
Source: Preqin Pro
9 10 10 10
2118
25
33
38 38
0
5
10
15
20
25
30
35
40
Jan-11 Jan-12 Jan-13 Jan-14 Jan-15 Jan-16 Jan-17 Jan-18 Jan-19 Jan-20
No.
of F
unds
Rai
sing
3. FUNDRAISING
2020 PREQIN GLOBAL PRIVATE DEBT REPORT – SAMPLE PAGES
Future Searchesand Mandates
59%14%
18%
4% 5%Less than $50mn
$50-99mn
$100-349mn
$350-499mn
$500mn or More
Fig. 5.6: Private Debt Mandates Issued in 2019 by Commitment Size
Source: Preqin Pro
48%41% 40%
30%
16%11% 7% 4% 3% 1%
0%10%20%30%40%50%60%
Dire
ct L
endi
ng
Mez
zani
ne
Dist
ress
ed D
ebt
Spec
ial S
ituat
ions
Real
Est
ate
Debt
Infr
astr
uctu
re D
ebt
Priv
ate
Debt
Fun
d of
Fun
ds
Vent
ure
Debt
CLO
Cred
it-Fo
cuse
d H
edge
Fun
d
Fig. 5.7: Private Debt Mandates Issued in 2019 by Fund Type
Source: Preqin Pro
Prop
ortio
n of
Fun
d Se
arch
es
14%13%12%11%
10%8% 8%
6% 6%
4% 4%1% 1% 2%
0%
5%
10%
15%
Publ
ic P
ensi
on F
und
Priv
ate
Sect
or P
ensi
on F
und
Fam
ily O
ffice
Fund
of F
unds
Man
ager
Insu
ranc
e Co
mpa
ny
Wea
lth M
anag
er
Asse
t Man
ager
Bank
/Inve
stm
ent B
ank
Foun
datio
n
Endo
wm
ent P
lan
Inve
stm
ent C
ompa
ny
Gove
rnm
ent A
genc
y
Sove
reig
n W
ealth
Fun
d
Othe
r
Fig. 5.4: Private Debt Mandates Issued in 2019 by Investor Type
Source: Preqin Pro
39%
40%
15%
6%
North America
Europe
Asia
Rest of World
Fig. 5.5: Private Debt Mandates Issued in 2019 by Investor Location
Source: Preqin Pro
Prop
ortio
n of
Fun
d Se
arch
es
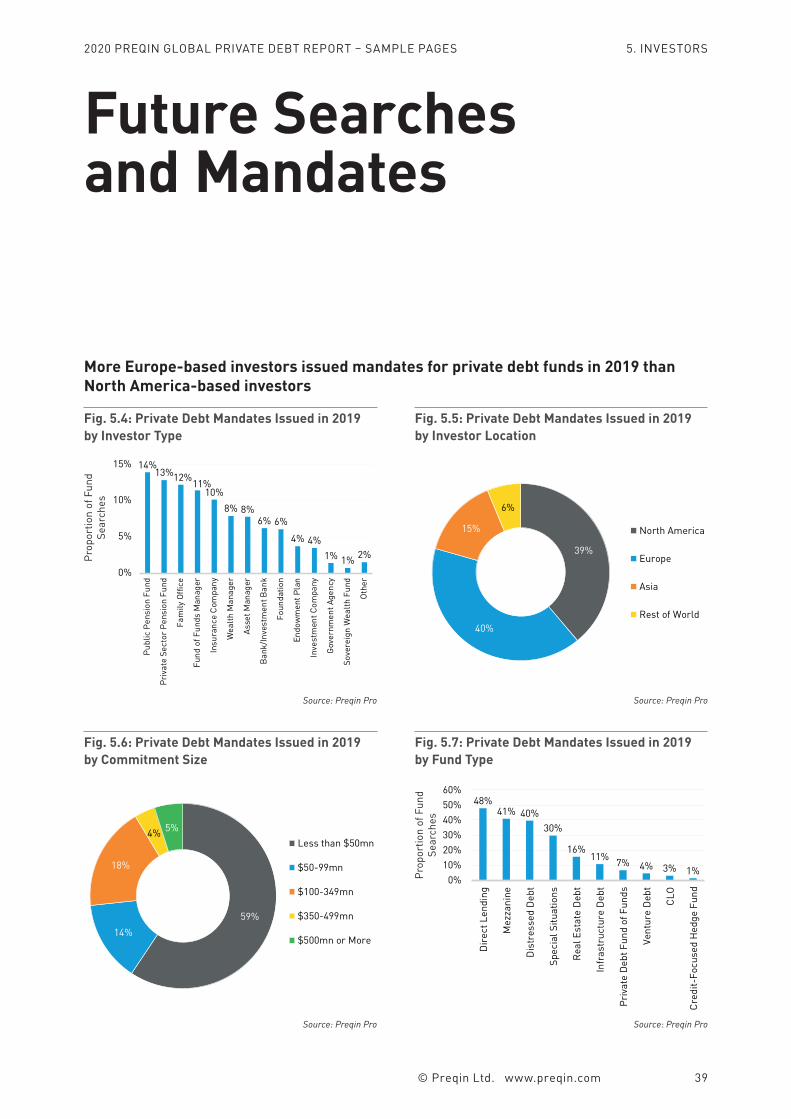
More Europe-based investors issued mandates for private debt funds in 2019 than North America-based investors
© Preqin Ltd. www.preqin.com 39
5. INVESTORS
1
2020 PREQIN GLOBAL HEDGE FUND REPORT – SAMPLE PAGES
3
2020 PREQIN GLOBAL PRIVATE EQUITY & VENTURE CAPITAL REPORT
2020 PREQIN GLOBALHEDGE FUNDREPORTSAMPLE PAGES
ISBN: 978-1-912116-23-2
2
2020 PREQIN GLOBAL HEDGE FUND REPORT – SAMPLE PAGES
Contents
4 CEO's Foreword – Mark O'Hare, Preqin
6 Our Evolving Industry – Jon Hitchon, Managed Funds Association
1. Overview of the Industry8 Executive Summary
9 Hedge Fund Megatrends
10 Hedge Funds in 2019: Key Facts
2. Hedge Fund Management12 Investors Issue Redemptions Across the Globe
15 Managers Faced Challenging Conditions
18 In Focus: Early Lifecycle Demand
20 What Makes a Successful Prime Broker? – Frank Magnani & Andrew Wilkinson, InteractiveBrokers
22 In Focus: Evolving Fee Structures
24 Fund Terms and Conditions
3. Performance28 Performance Benchmarks
31 Performance in 2019
34 In Focus: Artificial Intelligence, Real Returns
36 Performance over the Longer Term
4. Investors40 Investor Caution and Rebalancing
43 Capital Looks to Defense
45 Aligning Hedge Fund Interests for a Better Industry Outcome – Tom Kehoe, AIMA
5. Hedge Fund Strategies48 Equity Strategies
49 Macro Strategies
50 Event Driven Strategies
51 Credit Strategies
52 Relative Value Strategies
53 Multi-Strategy
54 Niche Strategies
55 Volatility Trading
56 Activist Funds
57 Discretionary vs. Systematic Traders
58 Emerging Markets
59 Alternative Risk Premia
60 Cryptocurrency Strategies
6. League Tables62 Largest Funds
64 Largest Fund Managers
66 Largest Investors
68 Largest Funds of Hedge Funds
7. Regions72 North America
74 Europe
76 Asia-Pacific
78 Rest of World
8. Funds of Hedge Funds82 Finding the Value in Funds of Hedge Funds
9. CTAs88 CTAs
10. Liquid Alternatives94 Liquid Alternatives
11. Outlook98 2020 Outlook for Hedge Funds
102 Preqin Predictions
8
2020 PREQIN GLOBAL HEDGE FUND REPORT – SAMPLE PAGES
Executive Summary
For hedge fund managers, 2019 marked the start of a much-needed recovery following 2018’s weak performance. Capitalizing on strong equity market tailwinds, the asset class returned +11.45% over the year, bouncing back from the -3.06% return recorded the year before. As performance improved, assets under management (AUM) rose, increasing by 4.6% compared with the year before to hit $3.61tn as of November 2019. That is the highest point since Q3 2018 ($3.62tn).
Still, 40% of hedge fund investors we surveyed in November 2019 said that performance did not live up to expectations. 2019’s improved performance is only the second time that industry returns have exceeded double digits in the past six years. For hedge fund managers, the pressure is on.
The Worst Year for Redemptions since 2016 There are some clear warning signs for the industry. For a start, investors withdrew a net $82bn from hedge funds in the year to November 2019, which marks the worst year for redemptions since $110bn was withdrawn in 2016. What’s more, net outflows occurred in every major region.
Shifting investor sentiment also made the market more challenging for new launches. Just 529 hedge funds launched in 2019 – roughly half the number seen in 2018 (1,169) – marking the seventh consecutive year of decline. Liquidations outpaced new funds entering the market, shrinking the number of active funds in the industry to 16,256.
Fund Managers Evolve and Innovate The silver lining? Today’s market challenges are creating opportunities for fund managers to do what they do best: adapt, evolve, and innovate. Take fees, which have long been a bugbear for investors. Several funds that launched recently have eschewed the industry standard of a 2% management fee and a 20% performance fee in favor of more investor-friendly fee
structures. For example, when Arizona-based Camkay Capital Management launched its Crisis Alpha Intraday CTA fund in 2019, the firm offered a 0% & 30% fee model with a high-water mark.
Fund managers are also increasingly applying artificial intelligence & machine learning (AIML) techniques to improve operational efficiencies and boost returns. After all, AIML funds have outperformed the wider hedge fund market and other systematically traded hedge funds on a three- and five-year annualized basis. Nearly a quarter (23%) of systematic hedge funds launched in 2019 use AIML, which is more than double the proportion that did so in 2016 (see page 35).
Investors Seek Defensive Strategies Although market conditions have become more difficult, the hedge fund industry keeps growing. Investors are continuing to look to the asset class to diversify their portfolios and generate high, uncorrelated returns. Delivering risk-adjusted returns with low volatility is a key benefit of a hedge fund allocation that extends beyond headline returns, and using a risk-free rate of 2%, the Sharpe ratio of hedge funds has been steady around the 2.5 mark for four years.
Amid slowing global economic growth, and jitters that the market cycle could be at its peak, investors are looking to the industry in search of defensive strategies. Demand for relative value strategies, which are designed to produce returns regardless of market direction, spiked over 2019. And relative value strategies funds made up 14% of all launches last year, the largest share achieved in over five years.
Over the next 12 months, more than three-quarters (79%) of surveyed investors say that they plan to allocate the same amount of capital or more to hedge funds. If the market cycle does turn and conditions get even tougher, star managers will have a golden opportunity to demonstrate their value.
Market challenges spur greater innovation in the hedge fund industry
1. OVERVIEW OF THE INDUSTRY
9
2020 PREQIN GLOBAL HEDGE FUND REPORT – SAMPLE PAGES
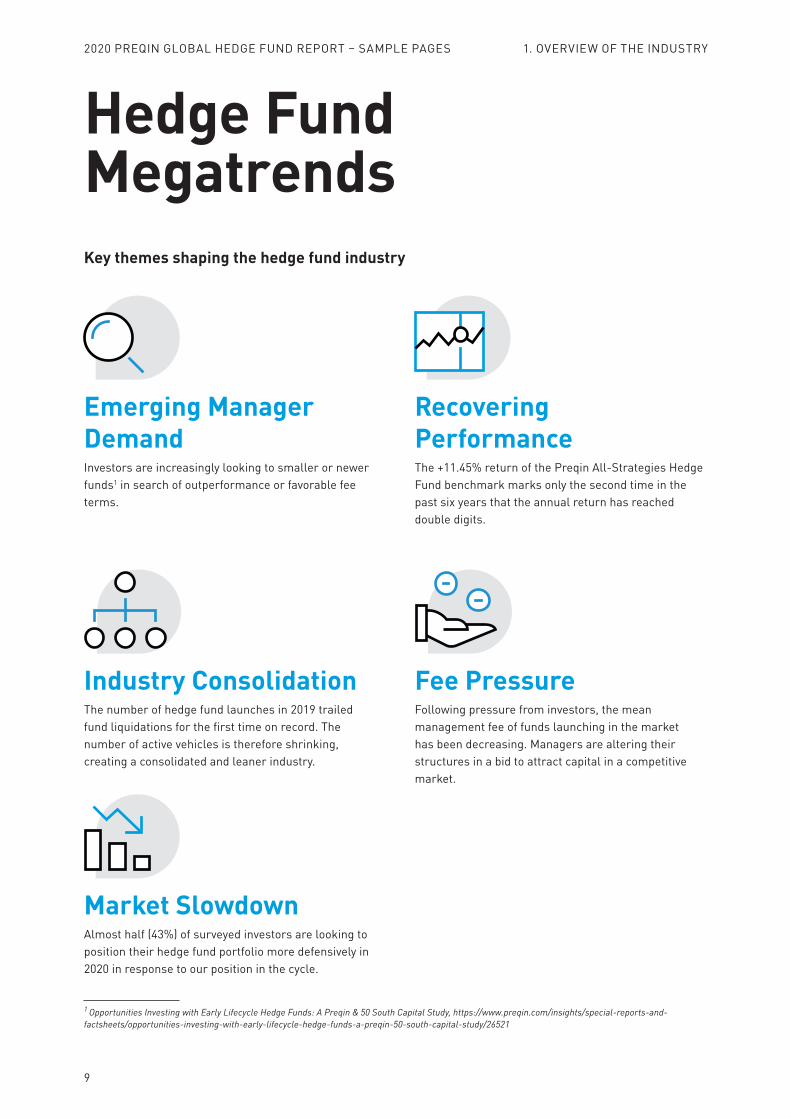
Hedge Fund MegatrendsKey themes shaping the hedge fund industry
Market SlowdownAlmost half (43%) of surveyed investors are looking to position their hedge fund portfolio more defensively in 2020 in response to our position in the cycle.
Recovering PerformanceThe +11.45% return of the Preqin All-Strategies Hedge Fund benchmark marks only the second time in the past six years that the annual return has reached double digits.
Emerging Manager DemandInvestors are increasingly looking to smaller or newer funds1 in search of outperformance or favorable fee terms.
Fee PressureFollowing pressure from investors, the mean management fee of funds launching in the market has been decreasing. Managers are altering their structures in a bid to attract capital in a competitive market.
Industry ConsolidationThe number of hedge fund launches in 2019 trailed fund liquidations for the first time on record. The number of active vehicles is therefore shrinking, creating a consolidated and leaner industry.
1 Opportunities Investing with Early Lifecycle Hedge Funds: A Preqin & 50 South Capital Study, https://www.preqin.com/insights/special-reports-and-factsheets/opportunities-investing-with-early-lifecycle-hedge-funds-a-preqin-50-south-capital-study/26521
1. OVERVIEW OF THE INDUSTRY
6
2020 PREQIN GLOBAL HEDGE FUND REPORT – SAMPLE PAGES
Our Evolving Industry
For years, Preqin’s Global Hedge Fund Report has provided interesting and useful insight into our industry and its investors and this year’s is no different. Over the past year, our industry has continued to grow. Assets under management are near an all-time high and 80% of institutional investors surveyed by Preqin reported that they plan to maintain or increase their allocations to hedge funds over the longer term. And MFA has grown alongside our industry – both staff and revenue have doubled in size. Part of this growth is to help members meet the demands we feel from our client base. Institutional investors are becoming more and more sophisticated.
That is why each year MFA brings together thousands of fund managers, service providers, prime brokers, and institutional investors in the industry’s leading network – a network that is one of the most valuable aspects of our engagement with MFA. The peer-to-peer networking and legal, operational, and compliance training helps us reduce risk, manage costs, and attract assets.
MFA has also taken steps to keep pace with the changing regulatory and market environments by creating three new annual conferences in the past three years alone. At MFA’s inaugural DATA conference in September 2019, speakers from Amazon, Apple, and Microsoft, as well as policymakers and fund managers, discussed the compliance challenges that accompany obtaining, securely storing, and utilizing data.
At that conference, MFA released a report, authored by McKinsey on our behalf, titled ‘The Lifecycle of Data in Context: How Data Proliferation is Shaping Alternatives.’ That paper found that more than 60% of MFA members surveyed believe alternative data will create the potential for additional alpha as data quality and the analytical techniques applied to it improve.
On the advocacy front, MFA worked to encourage regulators to simplify systemic risk reporting mandated by Dodd-Frank. We heard from our members that they
were concerned about disclosing sensitive information and worked directly with lawmakers, the SEC, and the CFTC to change this approach.
That work is part of MFA’s far-reaching, on-the-ground advocacy, which is driven by the issues we, as MFA members, identify as priorities. 2020 will be a busy year on Capitol Hill and at the regulatory agencies. We will be active participants in the process – whether it is working to improve the CFTC’s swaps trading framework or contributing to the SEC’s efforts to modernize the Advisers Act advertising rules.
MFA has also worked closely with regulators and policymakers in Europe in support of their goal of deepening capital markets by advocating for regulation that considers the unique nature of investment firms. Our primary concern is that the post-Brexit regulatory framework ensures our members have continued access to investors – and investors have access to our members’ expertise. We have also made clear that any changes to longstanding portfolio delegation rules would threaten that access.
As MFA moves into the future, we are confident our reach and impact will continue to grow in partnership with and in service to our members.
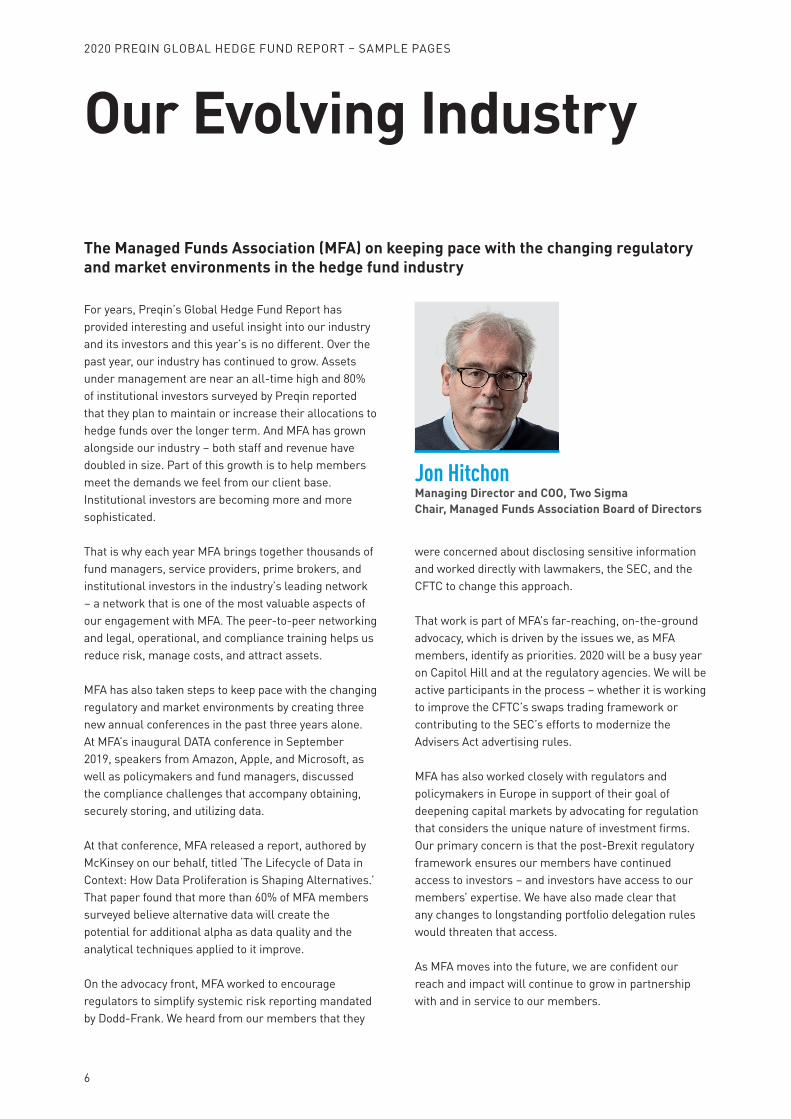
The Managed Funds Association (MFA) on keeping pace with the changing regulatory and market environments in the hedge fund industry
Jon HitchonManaging Director and COO, Two SigmaChair, Managed Funds Association Board of Directors
34
2020 PREQIN GLOBAL HEDGE FUND REPORT – SAMPLE PAGES
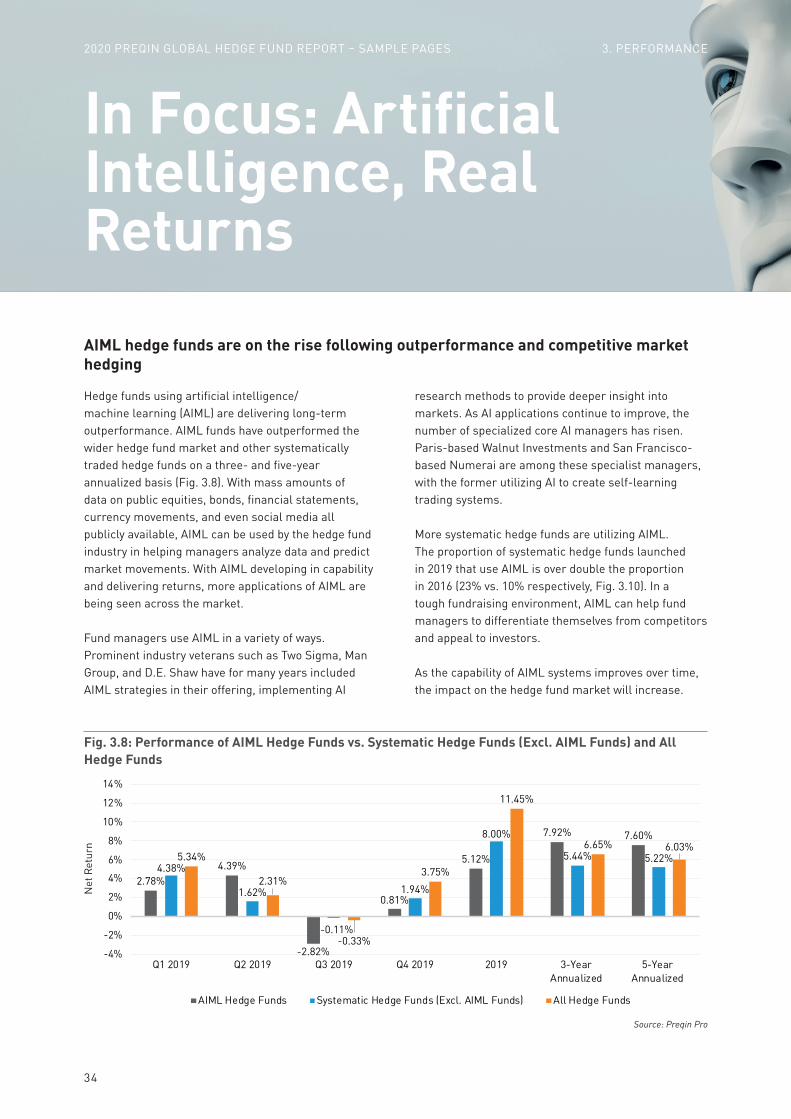
Hedge funds using artificial intelligence/machine learning (AIML) are delivering long-term outperformance. AIML funds have outperformed the wider hedge fund market and other systematically traded hedge funds on a three- and five-year annualized basis (Fig. 3.8). With mass amounts of data on public equities, bonds, financial statements, currency movements, and even social media all publicly available, AIML can be used by the hedge fund industry in helping managers analyze data and predict market movements. With AIML developing in capability and delivering returns, more applications of AIML are being seen across the market.
Fund managers use AIML in a variety of ways. Prominent industry veterans such as Two Sigma, Man Group, and D.E. Shaw have for many years included AIML strategies in their offering, implementing AI
research methods to provide deeper insight into markets. As AI applications continue to improve, the number of specialized core AI managers has risen. Paris-based Walnut Investments and San Francisco-based Numerai are among these specialist managers, with the former utilizing AI to create self-learning trading systems.
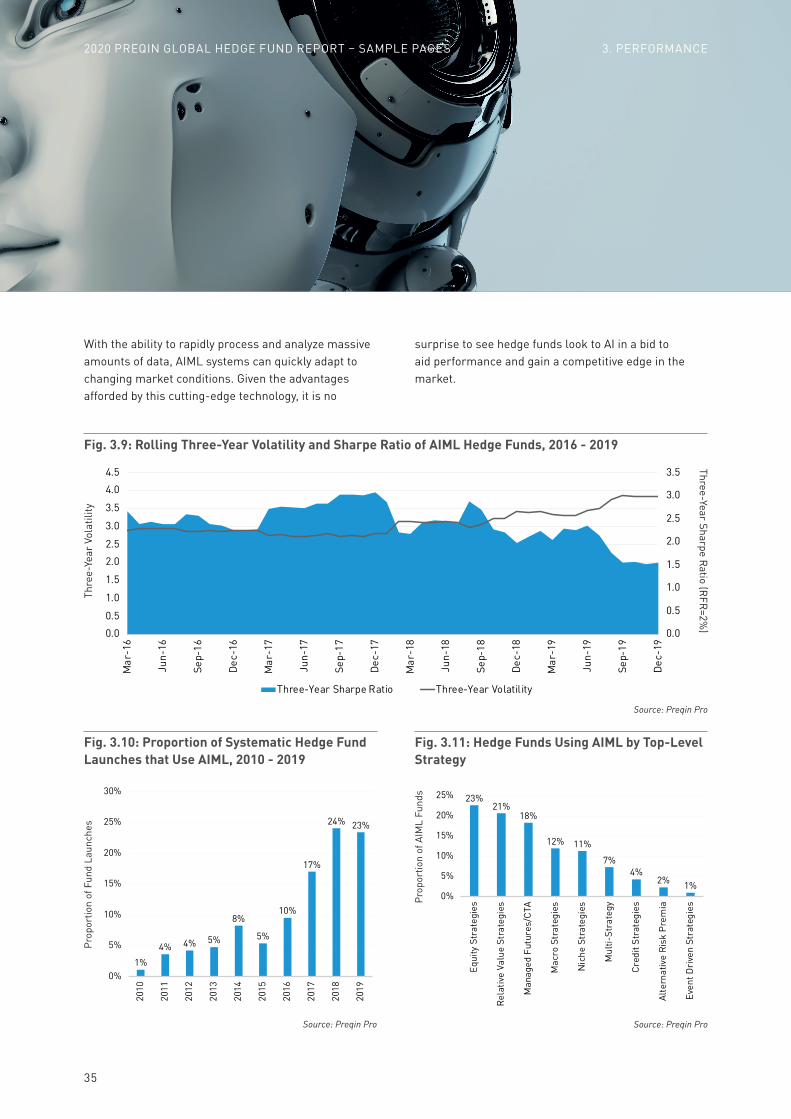
More systematic hedge funds are utilizing AIML. The proportion of systematic hedge funds launched in 2019 that use AIML is over double the proportion in 2016 (23% vs. 10% respectively, Fig. 3.10). In a tough fundraising environment, AIML can help fund managers to differentiate themselves from competitors and appeal to investors.
As the capability of AIML systems improves over time, the impact on the hedge fund market will increase.
In Focus: Artificial Intelligence, Real ReturnsAIML hedge funds are on the rise following outperformance and competitive market hedging
Fig. 3.8: Performance of AIML Hedge Funds vs. Systematic Hedge Funds (Excl. AIML Funds) and All Hedge Funds
Source: Preqin Pro
2.78%4.39%
-2.82%
0.81%
5.12%
7.92% 7.60%
4.38%
1.62%
-0.11%
1.94%
8.00%
5.44% 5.22%5.34%
2.31%
-0.33%
3.75%
11.45%
6.65% 6.03%
-4%
-2%
0%
2%
4%
6%
8%
10%
12%
14%
Q1 2019 Q2 2019 Q3 2019 Q4 2019 2019 3-YearAnnualized
5-YearAnnualized
AIML Hedge Funds Systematic Hedge Funds (Excl. AIML Funds) All Hedge Funds
Net
Ret
urn
2020 PREQIN GLOBAL HEDGE FUND REPORT – SAMPLE PAGES 3. PERFORMANCE
35
2020 PREQIN GLOBAL HEDGE FUND REPORT – SAMPLE PAGES
23%21%
18%
12% 11%
7%4%
2% 1%0%
5%
10%
15%
20%
25%
Equi
ty S
trat
egie
s
Rela
tive
Valu
e St
rate
gies
Man
aged
Fut
ures
/CTA
Mac
ro S
trat
egie
s
Nic
he S
trat
egie
s
Mul
ti-St
rate
gy
Cred
it St
rate
gies
Alte
rnat
ive
Risk
Pre
mia
Even
t Dri
ven
Stra
tegi
es
Fig. 3.11: Hedge Funds Using AIML by Top-Level Strategy
Source: Preqin Pro
1%4% 4% 5%
8%
5%
10%
17%
24% 23%
0%
5%
10%
15%
20%
25%
30%
2010
2011
2012
2013
2014
2015
2016
2017
2018
2019
Fig. 3.10: Proportion of Systematic Hedge Fund Launches that Use AIML, 2010 - 2019
Source: Preqin Pro
Prop
ortio
n of
Fun
d La
unch
es
Fig. 3.9: Rolling Three-Year Volatility and Sharpe Ratio of AIML Hedge Funds, 2016 - 2019
Source: Preqin Pro
0.0
0.5
1.0
1.5
2.0
2.5
3.0
3.5
0.00.5
1.0
1.5
2.02.5
3.0
3.5
4.04.5
Mar
-16
Jun-
16
Sep-
16
Dec-
16
Mar
-17
Jun-
17
Sep-
17
Dec-
17
Mar
-18
Jun-
18
Sep-
18
Dec-
18
Mar
-19
Jun-
19
Sep-
19
Dec-
19
Three-Year Sharpe Ratio Three-Year Volatility
Thre
e-Ye
ar V
olat
ility
Three-Year Sharpe Ratio (RFR=2%
)
Prop
ortio
n of
AIM
L Fu
nds
With the ability to rapidly process and analyze massive amounts of data, AIML systems can quickly adapt to changing market conditions. Given the advantages afforded by this cutting-edge technology, it is no
surprise to see hedge funds look to AI in a bid to aid performance and gain a competitive edge in the market.
2020 PREQIN GLOBAL HEDGE FUND REPORT – SAMPLE PAGES 3. PERFORMANCE
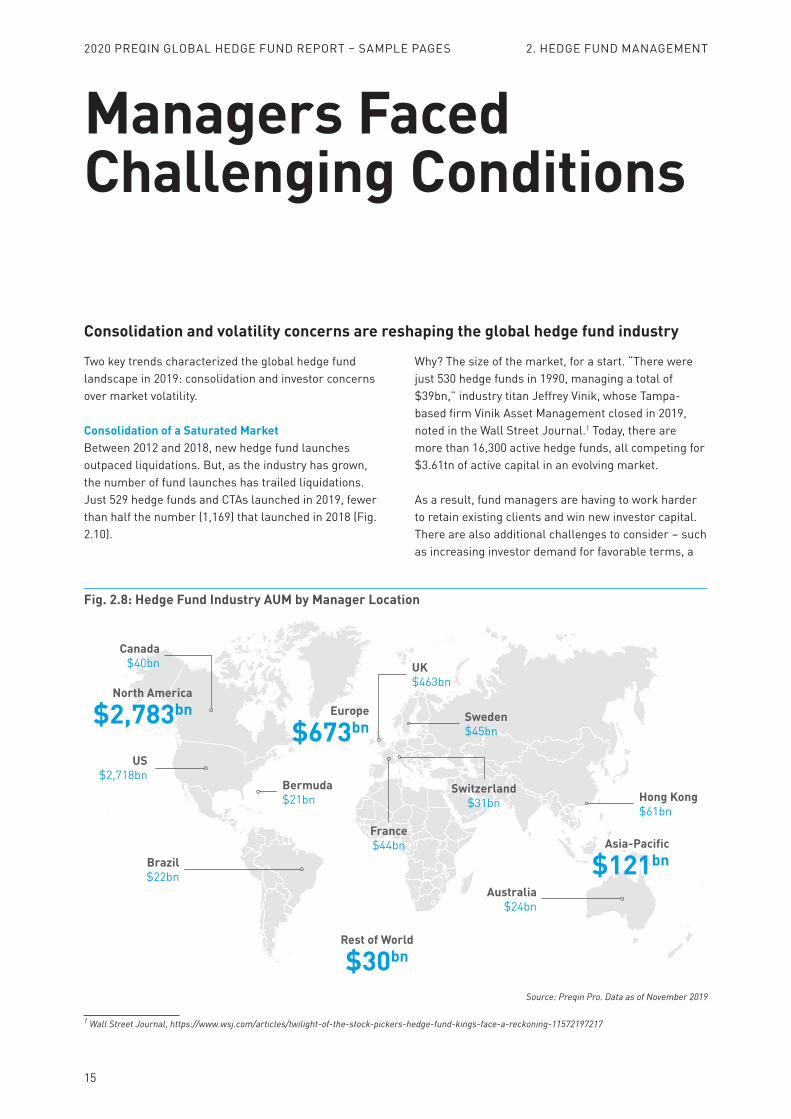
15
2020 PREQIN GLOBAL HEDGE FUND REPORT – SAMPLE PAGES
Managers Faced Challenging Conditions
Two key trends characterized the global hedge fund landscape in 2019: consolidation and investor concerns over market volatility.
Consolidation of a Saturated MarketBetween 2012 and 2018, new hedge fund launches outpaced liquidations. But, as the industry has grown, the number of fund launches has trailed liquidations. Just 529 hedge funds and CTAs launched in 2019, fewer than half the number (1,169) that launched in 2018 (Fig. 2.10).
1 Wall Street Journal, https://www.wsj.com/articles/twilight-of-the-stock-pickers-hedge-fund-kings-face-a-reckoning-11572197217
Why? The size of the market, for a start. “There were just 530 hedge funds in 1990, managing a total of $39bn,” industry titan Jeffrey Vinik, whose Tampa-based firm Vinik Asset Management closed in 2019, noted in the Wall Street Journal.1 Today, there are more than 16,300 active hedge funds, all competing for $3.61tn of active capital in an evolving market.
As a result, fund managers are having to work harder to retain existing clients and win new investor capital. There are also additional challenges to consider – such as increasing investor demand for favorable terms, a
Consolidation and volatility concerns are reshaping the global hedge fund industry
Source: Preqin Pro. Data as of November 2019
Fig. 2.8: Hedge Fund Industry AUM by Manager Location
UK $463bn
Sweden $45bn
Switzerland $31bn
France $44bn
Australia $24bn
Brazil $22bn
Bermuda $21bn
US$2,718bn
Canada$40bn
Hong Kong $61bn
Europe
$673bn
North America
$2,783bn
Asia-Pacific
$121bn
Rest of World
$30bn
2. HEDGE FUND MANAGEMENT
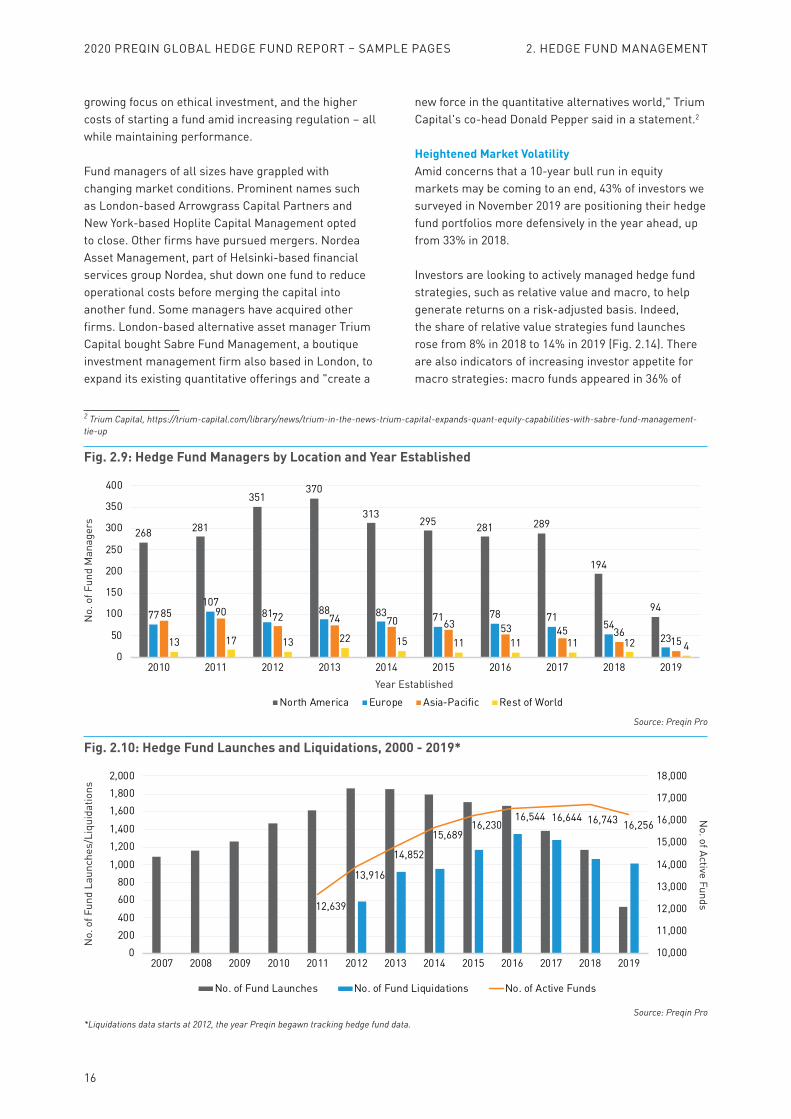
16
2020 PREQIN GLOBAL HEDGE FUND REPORT – SAMPLE PAGES
growing focus on ethical investment, and the higher costs of starting a fund amid increasing regulation – all while maintaining performance.
Fund managers of all sizes have grappled with changing market conditions. Prominent names such as London-based Arrowgrass Capital Partners and New York-based Hoplite Capital Management opted to close. Other firms have pursued mergers. Nordea Asset Management, part of Helsinki-based financial services group Nordea, shut down one fund to reduce operational costs before merging the capital into another fund. Some managers have acquired other firms. London-based alternative asset manager Trium Capital bought Sabre Fund Management, a boutique investment management firm also based in London, to expand its existing quantitative offerings and "create a
2 Trium Capital, https://trium-capital.com/library/news/trium-in-the-news-trium-capital-expands-quant-equity-capabilities-with-sabre-fund-management-tie-up
new force in the quantitative alternatives world," Trium Capital's co-head Donald Pepper said in a statement.2
Heightened Market VolatilityAmid concerns that a 10-year bull run in equity markets may be coming to an end, 43% of investors we surveyed in November 2019 are positioning their hedge fund portfolios more defensively in the year ahead, up from 33% in 2018.
Investors are looking to actively managed hedge fund strategies, such as relative value and macro, to help generate returns on a risk-adjusted basis. Indeed, the share of relative value strategies fund launches rose from 8% in 2018 to 14% in 2019 (Fig. 2.14). There are also indicators of increasing investor appetite for macro strategies: macro funds appeared in 36% of
Fig. 2.10: Hedge Fund Launches and Liquidations, 2000 - 2019*
Source: Preqin Pro
12,639
13,916
14,852
15,68916,230
16,544 16,644 16,743 16,256
10,000
11,000
12,000
13,000
14,000
15,000
16,000
17,000
18,000
0200400
600800
1,000
1,2001,400
1,6001,8002,000
2007 2008 2009 2010 2011 2012 2013 2014 2015 2016 2017 2018 2019
No. of Fund Launches No. of Fund Liquidations No. of Active Funds
No.
of F
und
Laun
ches
/Liq
uida
tions
No. of Active Funds
Fig. 2.9: Hedge Fund Managers by Location and Year Established
Source: Preqin Pro
268 281
351370
313295 281 289
194
9477
10781 88 83 71 78 71
5423
85 90 72 74 70 63 53 45 361513 17 13 22 15 11 11 11 12 4
0
50
100
150
200
250
300
350
400
2010 2011 2012 2013 2014 2015 2016 2017 2018 2019
North America Europe Asia-Pacific Rest of World
No.
of F
und
Man
ager
s
Year Established
*Liquidations data starts at 2012, the year Preqin begawn tracking hedge fund data.
2. HEDGE FUND MANAGEMENT
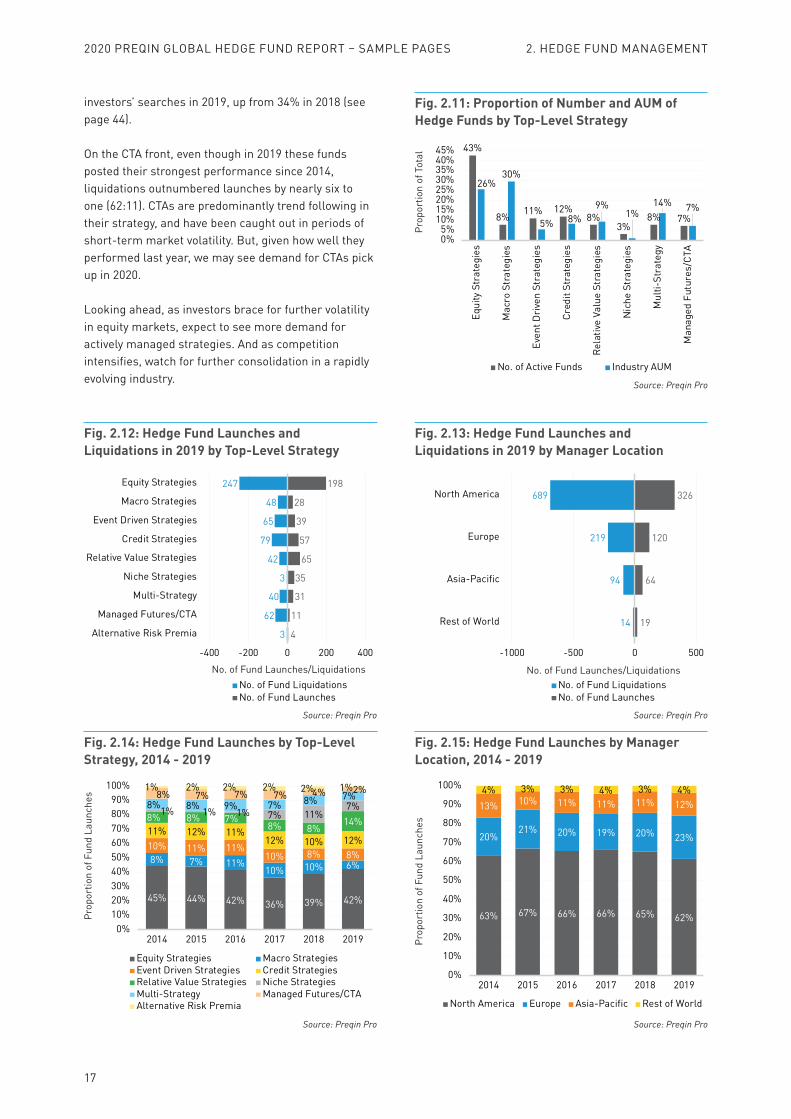
17
2020 PREQIN GLOBAL HEDGE FUND REPORT – SAMPLE PAGES
investors’ searches in 2019, up from 34% in 2018 (see page 44).
On the CTA front, even though in 2019 these funds posted their strongest performance since 2014, liquidations outnumbered launches by nearly six to one (62:11). CTAs are predominantly trend following in their strategy, and have been caught out in periods of short-term market volatility. But, given how well they performed last year, we may see demand for CTAs pick up in 2020.
Looking ahead, as investors brace for further volatility in equity markets, expect to see more demand for actively managed strategies. And as competition intensifies, watch for further consolidation in a rapidly evolving industry.
45% 44% 42% 36% 39% 42%
8% 7% 11%10% 10% 6%
10% 11% 11%10% 8% 8%
11% 12% 11%12% 10% 12%
8% 8% 7%8% 8%
14%1% 1% 1% 7% 11%
7%8% 8% 9% 7% 8% 7%8% 7% 7% 7% 4% 2%1% 2% 2% 2% 2% 1%
0%10%20%30%40%50%60%70%80%90%
100%
2014 2015 2016 2017 2018 2019
Equity Strategies Macro StrategiesEvent Driven Strategies Credit StrategiesRelative Value Strategies Niche StrategiesMulti-Strategy Managed Futures/CTAAlternative Risk Premia
Fig. 2.14: Hedge Fund Launches by Top-Level Strategy, 2014 - 2019
Source: Preqin Pro
Prop
ortio
n of
Fun
d La
unch
es
63% 67% 66% 66% 65% 62%
20%21% 20% 19% 20% 23%
13% 10% 11% 11% 11% 12%4% 3% 3% 4% 3% 4%
0%
10%
20%
30%
40%
50%
60%
70%
80%
90%
100%
2014 2015 2016 2017 2018 2019
North America Europe Asia-Pacific Rest of World
Fig. 2.15: Hedge Fund Launches by Manager Location, 2014 - 2019
Source: Preqin Pro
Prop
ortio
n of
Fun
d La
unch
es
43%
8% 11% 12%8%
3%8% 7%
26%30%
5% 8%9%
1%14% 7%
0%5%
10%15%20%25%30%35%40%45%
Equi
ty S
trat
egie
s
Mac
ro S
trat
egie
s
Even
t Dri
ven
Stra
tegi
es
Cred
it St
rate
gies
Rela
tive
Valu
e St
rate
gies
Nic
he S
trat
egie
s
Mul
ti-St
rate
gy
Man
aged
Fut
ures
/CTA
No. of Active Funds Industry AUM
Fig. 2.11: Proportion of Number and AUM of Hedge Funds by Top-Level Strategy
Source: Preqin Pro
Prop
ortio
n of
Tot
al
3
62
40
3
42
79
65
48
247
4
11
31
35
65
57
39
28
198
-400 -200 0 200 400
Alternative Risk Premia
Managed Futures/CTA
Multi-Strategy
Niche Strategies
Relative Value Strategies
Credit Strategies
Event Driven Strategies
Macro Strategies
Equity Strategies
No. of Fund LiquidationsNo. of Fund Launches
Fig. 2.12: Hedge Fund Launches and Liquidations in 2019 by Top-Level Strategy
Source: Preqin Pro
No. of Fund Launches/Liquidations
14
94
219
689
19
64
120
326
-1000 -500 0 500
Rest of World
Asia-Pacific
Europe
North America
No. of Fund LiquidationsNo. of Fund Launches
Fig. 2.13: Hedge Fund Launches and Liquidations in 2019 by Manager Location
Source: Preqin Pro
No. of Fund Launches/Liquidations
2. HEDGE FUND MANAGEMENT
1
2020 PREQIN GLOBAL INFRASTRUCTURE REPORT – SAMPLE PAGES
5
2020 PREQIN GLOBAL PRIVATE EQUITY & VENTURE CAPITAL REPORT
2020 PREQIN GLOBALINFRASTRUCTUREREPORTSAMPLE PAGES
ISBN: 978-1-912116-25-6
2
2020 PREQIN GLOBAL INFRASTRUCTURE REPORT – SAMPLE PAGES
Contents
4 CEO's Foreword – Mark O'Hare, Preqin
6 Creating Value in Infrastructure – Martin Lennon, Infracapital
1. Overview of the Industry10 Executive Summary
12 Infrastructure Megatrends
13 Infrastructure in 2019: Key Facts
2. Assets under Management16 Infrastructure Assets Surge Past $500bn
18 In Focus: How Big Will Infrastructure Get?
20 US Investors Move to “Higher Alpha Infra” – Brian DeFee, Capstone Partners
22 The Flowing Capital Tap: Calls and Distributions
3. Fundraising24 Echoes of the Infrastructure Fundraising Boom
26 Fundraising Breakdowns
28 Funds in Market: Infrastructure Fundraising Supply Line Stays Full
29 In Focus: Investors Look for Direct Access
4. Fund Managers32 The Expanding Fund Manager Universe
34 In Focus: The First Fund Is the Hardest
36 Funds Keep Terms Short and Sweet
5. Investors38 Investors Go Slow and Steady
40 Future Searches and Mandates
42 In Focus: What Do Investors Need from Infrastructure?
6. Deals & Exits46 Deal-Making Trends
48 Infrastructure Exits Tick up in Value
49 Most Active Buyers
7. ESG52 In Focus: Investor Shift to ESG May Be
Overstated
56 In Focus: Fund Managers Embrace ESG
8. Performance60 Performance of a Lifetime
62 Public Pension Fund Returns
63 Horizon IRRs
64 PrEQIn Infrastructure Index
65 Public Performance: Benchmarks and PMEs
9. Regions68 North America
70 Europe
72 Asia
74 Rest of World
10. League Tables78 Largest Fund Managers
79 Largest Investors
80 Largest Funds
81 Notable Deals
82 Top Performing Funds
83 Consistent Top Performing Fund Managers
11. Outlook86 Managers Adapt to Stiff Competition
88 Investors Stick with Infrastructure
90 Preqin Predictions
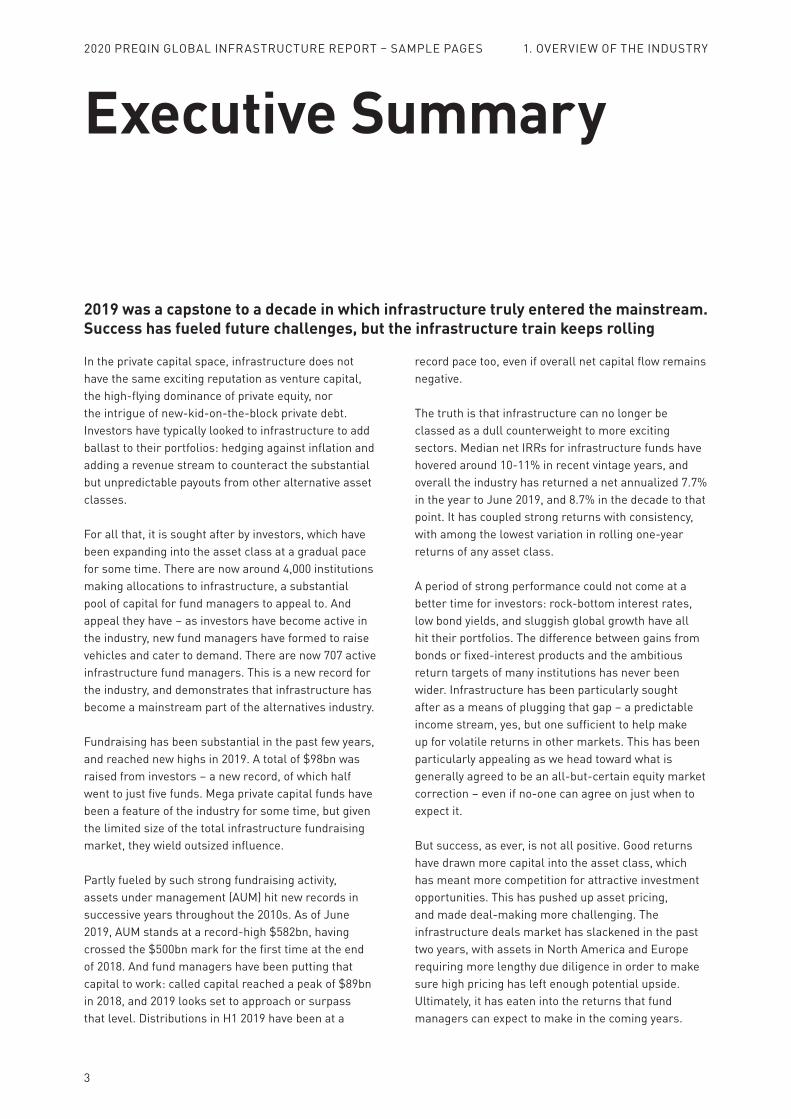
3
Executive Summary
In the private capital space, infrastructure does not have the same exciting reputation as venture capital, the high-flying dominance of private equity, nor the intrigue of new-kid-on-the-block private debt. Investors have typically looked to infrastructure to add ballast to their portfolios: hedging against inflation and adding a revenue stream to counteract the substantial but unpredictable payouts from other alternative asset classes.
For all that, it is sought after by investors, which have been expanding into the asset class at a gradual pace for some time. There are now around 4,000 institutions making allocations to infrastructure, a substantial pool of capital for fund managers to appeal to. And appeal they have – as investors have become active in the industry, new fund managers have formed to raise vehicles and cater to demand. There are now 707 active infrastructure fund managers. This is a new record for the industry, and demonstrates that infrastructure has become a mainstream part of the alternatives industry.
Fundraising has been substantial in the past few years, and reached new highs in 2019. A total of $98bn was raised from investors – a new record, of which half went to just five funds. Mega private capital funds have been a feature of the industry for some time, but given the limited size of the total infrastructure fundraising market, they wield outsized influence.
Partly fueled by such strong fundraising activity, assets under management (AUM) hit new records in successive years throughout the 2010s. As of June 2019, AUM stands at a record-high $582bn, having crossed the $500bn mark for the first time at the end of 2018. And fund managers have been putting that capital to work: called capital reached a peak of $89bn in 2018, and 2019 looks set to approach or surpass that level. Distributions in H1 2019 have been at a
record pace too, even if overall net capital flow remains negative.
The truth is that infrastructure can no longer be classed as a dull counterweight to more exciting sectors. Median net IRRs for infrastructure funds have hovered around 10-11% in recent vintage years, and overall the industry has returned a net annualized 7.7% in the year to June 2019, and 8.7% in the decade to that point. It has coupled strong returns with consistency, with among the lowest variation in rolling one-year returns of any asset class.
A period of strong performance could not come at a better time for investors: rock-bottom interest rates, low bond yields, and sluggish global growth have all hit their portfolios. The difference between gains from bonds or fixed-interest products and the ambitious return targets of many institutions has never been wider. Infrastructure has been particularly sought after as a means of plugging that gap – a predictable income stream, yes, but one sufficient to help make up for volatile returns in other markets. This has been particularly appealing as we head toward what is generally agreed to be an all-but-certain equity market correction – even if no-one can agree on just when to expect it.
But success, as ever, is not all positive. Good returns have drawn more capital into the asset class, which has meant more competition for attractive investment opportunities. This has pushed up asset pricing, and made deal-making more challenging. The infrastructure deals market has slackened in the past two years, with assets in North America and Europe requiring more lengthy due diligence in order to make sure high pricing has left enough potential upside. Ultimately, it has eaten into the returns that fund managers can expect to make in the coming years.
2019 was a capstone to a decade in which infrastructure truly entered the mainstream. Success has fueled future challenges, but the infrastructure train keeps rolling
2020 PREQIN GLOBAL INFRASTRUCTURE REPORT – SAMPLE PAGES 1. OVERVIEW OF THE INDUSTRY

4 © Preqin Ltd. www.preqin.com 4
Operators are adapting in two main ways: first, they are reducing the targeted returns of the funds they have in market, recalibrating their ambitions in light of the current environment. Second, they are looking to move into higher-risk strategies and new markets. As such, we have seen a shift toward value-added funds and a renewed focus on emerging markets.
The overall mood in the industry is upbeat, though. Infrastructure has enjoyed a considerable run of success in recent years, and is still in the midst of a fundraising boom. Unlike other asset classes, where a flood of capital has proved challenging for fund managers to absorb, infrastructure has plenty of release valves left to pull. Activity is highly concentrated on developed markets and on certain sectors like renewables. There is a huge amount of scope for managers to explore new sectors and markets that are as yet untapped. And investors certainly have faith in their ability to do so: in the long term more than nine out of 10 intend to invest as much or more capital in the industry compared to today. It will be up to fund managers to innovate ways to keep meeting those expectations.
Data PackThe data behind all of the charts and tables featured in this report is available in Excel format at no extra cost. This data may be used in marketing materials, presentations, or company reports with appropriate accreditation to Preqin.
2020 PREQIN GLOBAL INFRASTRUCTURE REPORT – SAMPLE PAGES 1. OVERVIEW OF THE INDUSTRY
14
Capital ConcentrationThe majority of capital flowing into the industry has been swallowed by a small group of the largest fund managers, creating a two-tiered fundraising and deals market.
ESGArguably the hottest topic in the investment world, ESG is a key consideration behind investment decisions for investors and fund managers alike. Is it just a phase, or is ESG here to stay?
Competition for DealsWith new firms being founded and bringing funds to market, existing managers raising larger-than-ever vehicles, and investors developing a taste for direct investment, there is more competition for prime assets than ever before.
LP SophisticationAs much as fund managers are in a constant race for the best opportunities, so too are investors always looking for the next big thing in allocating. We look at how LPs are increasingly evaluating, contacting, and competing with fund managers themselves.
InfrastructureMegatrendsKey themes shaping the unlisted infrastructure industry
Market SlowdownIf there is one thing almost everyone can agree on, it is that there is a market slowdown coming. But when exactly to expect it, what sectors will be most exposed, and whether investors should be adjusting their approach in anticipation are all hotly contested.
Performance PressureInfrastructure has performed well in recent years, but maintaining those returns is a challenging prospect. Fierce competition, large dry powder stores, and sluggish global growth have all made it more difficult to return tomorrow what you returned yesterday.
2020 PREQIN GLOBAL INFRASTRUCTURE REPORT – SAMPLE PAGES 1. OVERVIEW OF THE INDUSTRY
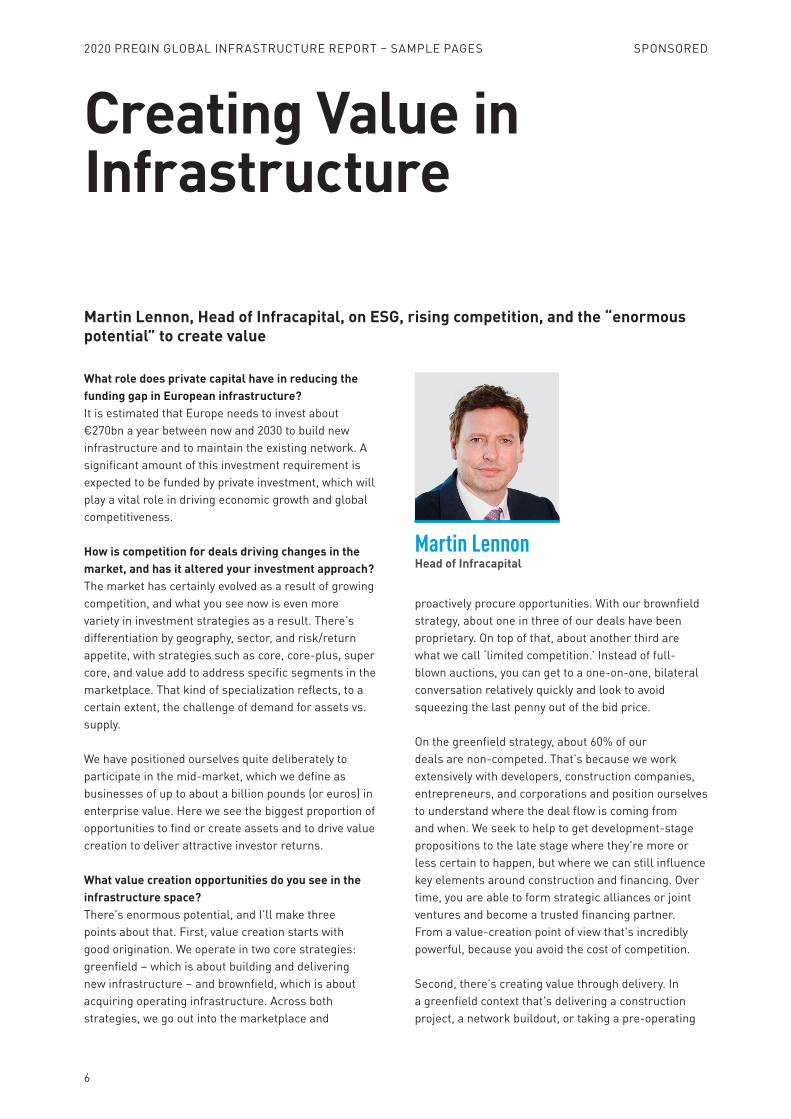
6
2020 PREQIN GLOBAL INFRASTRUCTURE REPORT – SAMPLE PAGES
Creating Value in Infrastructure
What role does private capital have in reducing the funding gap in European infrastructure?It is estimated that Europe needs to invest about €270bn a year between now and 2030 to build new infrastructure and to maintain the existing network. A significant amount of this investment requirement is expected to be funded by private investment, which will play a vital role in driving economic growth and global competitiveness.
How is competition for deals driving changes in the market, and has it altered your investment approach?The market has certainly evolved as a result of growing competition, and what you see now is even more variety in investment strategies as a result. There’s differentiation by geography, sector, and risk/return appetite, with strategies such as core, core-plus, super core, and value add to address specific segments in the marketplace. That kind of specialization reflects, to a certain extent, the challenge of demand for assets vs. supply.
We have positioned ourselves quite deliberately to participate in the mid-market, which we define as businesses of up to about a billion pounds (or euros) in enterprise value. Here we see the biggest proportion of opportunities to find or create assets and to drive value creation to deliver attractive investor returns.
What value creation opportunities do you see in the infrastructure space?There’s enormous potential, and I’ll make three points about that. First, value creation starts with good origination. We operate in two core strategies: greenfield – which is about building and delivering new infrastructure – and brownfield, which is about acquiring operating infrastructure. Across both strategies, we go out into the marketplace and
proactively procure opportunities. With our brownfield strategy, about one in three of our deals have been proprietary. On top of that, about another third are what we call ‘limited competition.’ Instead of full-blown auctions, you can get to a one-on-one, bilateral conversation relatively quickly and look to avoid squeezing the last penny out of the bid price.
On the greenfield strategy, about 60% of our deals are non-competed. That’s because we work extensively with developers, construction companies, entrepreneurs, and corporations and position ourselves to understand where the deal flow is coming from and when. We seek to help to get development-stage propositions to the late stage where they're more or less certain to happen, but where we can still influence key elements around construction and financing. Over time, you are able to form strategic alliances or joint ventures and become a trusted financing partner. From a value-creation point of view that's incredibly powerful, because you avoid the cost of competition.
Second, there’s creating value through delivery. In a greenfield context that’s delivering a construction project, a network buildout, or taking a pre-operating
Martin Lennon, Head of Infracapital, on ESG, rising competition, and the “enormous potential” to create value
Martin LennonHead of Infracapital
SPONSORED
7
2020 PREQIN GLOBAL INFRASTRUCTURE REPORT – SAMPLE PAGES
opportunity and making it operational, so if delivered successfully, you should benefit from a reduction in the risk premium when you sell. In a brownfield context this refers to situations where delivery is 'complex,' but where there’s the potential to improve the asset, de-risk, and drive value. That could mean carving out a division from a corporation, putting in place a new management team, implementing a new billing system, and creating a standalone company.
The third example is the platform approach, which involves growing a small- to mid-cap company and transforming it into a real leader in its sector. If you can show that the growth that you've delivered is expected to continue you can drive some very exciting returns. We see this a lot in our greenfield strategy – we start with constructing assets, but with a view that these become multi-asset platforms where you can put in place quality management teams and drive synergies and efficiencies.
Let’s talk about ESG. How do you see its role in the industry – is it seen as an optional extra, or is it more critical than that?I think we need to take the ESG opportunity as far as we can, because infrastructure provides us with a
relatively unique opportunity to make a positive impact on the environment and society. At Infracapital, we issued our first comprehensive ESG report to our investors last year, and we've identified a set of KPIs that we want to manage and measure transparently across our portfolios and within our team. These KPIs include, for example, climate impact, diversity, employee wellness, data, cybersecurity.
For those measures, we will be looking at equivalent businesses and industries to see where there are differences, so that we can use best practice. It’s a huge advantage having a large portfolio of companies; while one might be a broadband business and another might be a waste-to-energy business, some KPIs share common features. And if one business has an effective solution, we can share learnings and help others come up to that standard. What we want to drive is ongoing improvement across those KPIs, so that every asset is proactively looking to deliver best practice across the board.
InfracapitalInfracapital invests in, builds, and manages a diverse range of essential infrastructure to meet the changing needs of society and support long-term economic growth. We take an active role in all of our investments, whether nascent or large, to fulfill their potential and ensure they are adaptable and resilient. Our approach creates value for our investors, as we target investments with the scope for stable and sustainable growth. Our portfolio companies work closely with the communities where they are based, to the benefit of all stakeholders. Infracapital is well positioned to deliver the significant investment required to help build the future. The founder-led team of experienced specialists has worked with more than 45 companies around Europe and has raised and managed over £5bn across five funds.
Infracapital is part of M&G, a leading European savings and investments business. M&G manages the long-term savings of more than seven million people and is a major investor in the UK and in the global economy. Total assets under management are £341bn (as at 30 June 2019).
www.infracapital.co.uk
Disclaimer:For Investment Professionals only.This guide reflects M&G’s present opinions reflecting current market conditions. They are subject to change without notice and involve a number of assumptions which may not prove valid. Past performance is not a guide to future performance. The distribution of this guide does not constitute an offer or solicitation. It has been written for informational and educational purposes only and should not be considered as investment advice or as a recommendation of any security, strategy or investment product. Reference in this document to individual companies is included solely for the purpose of illustration and should not be construed as a recommendation to buy or sell the same. Information given in this document has been obtained from, or based upon, sources believed by us to be reliable and accurate although M&G does not accept liability for the accuracy of the contents.The services and products provided by M&G Investment Management Limited are available only to investors who come within the category of the Professional Client as defined in the Financial Conduct Authority’s Handbook.Issued by M&G Investment Management Limited (unless stated otherwise), registered in England and Wales under number 936683 with its registered office at 10 Fenchurch Avenue, London EC3M 5AG. M&G Investment Management Limited is authorised and regulated by the Financial Conduct Authority.
SPONSORED
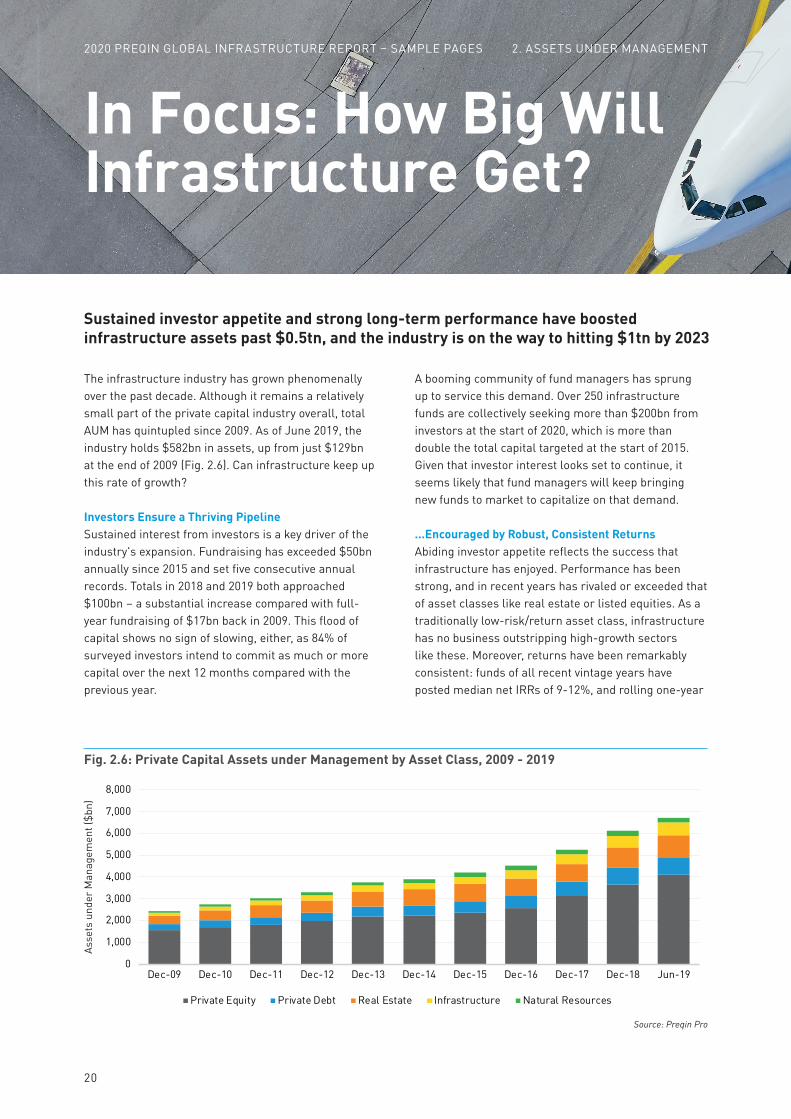
20
2020 PREQIN GLOBAL INFRASTRUCTURE REPORT2020 PREQIN GLOBAL INFRASTRUCTURE REPORT – SAMPLE PAGES
The infrastructure industry has grown phenomenally over the past decade. Although it remains a relatively small part of the private capital industry overall, total AUM has quintupled since 2009. As of June 2019, the industry holds $582bn in assets, up from just $129bn at the end of 2009 (Fig. 2.6). Can infrastructure keep up this rate of growth?
Investors Ensure a Thriving PipelineSustained interest from investors is a key driver of the industry's expansion. Fundraising has exceeded $50bn annually since 2015 and set five consecutive annual records. Totals in 2018 and 2019 both approached $100bn – a substantial increase compared with full-year fundraising of $17bn back in 2009. This flood of capital shows no sign of slowing, either, as 84% of surveyed investors intend to commit as much or more capital over the next 12 months compared with the previous year.
A booming community of fund managers has sprung up to service this demand. Over 250 infrastructure funds are collectively seeking more than $200bn from investors at the start of 2020, which is more than double the total capital targeted at the start of 2015. Given that investor interest looks set to continue, it seems likely that fund managers will keep bringing new funds to market to capitalize on that demand.
...Encouraged by Robust, Consistent ReturnsAbiding investor appetite reflects the success that infrastructure has enjoyed. Performance has been strong, and in recent years has rivaled or exceeded that of asset classes like real estate or listed equities. As a traditionally low-risk/return asset class, infrastructure has no business outstripping high-growth sectors like these. Moreover, returns have been remarkably consistent: funds of all recent vintage years have posted median net IRRs of 9-12%, and rolling one-year
In Focus: How Big Will Infrastructure Get?
Sustained investor appetite and strong long-term performance have boosted infrastructure assets past $0.5tn, and the industry is on the way to hitting $1tn by 2023
Fig. 2.6: Private Capital Assets under Management by Asset Class, 2009 - 2019
Source: Preqin Pro
0
1,000
2,000
3,000
4,000
5,000
6,000
7,000
8,000
Dec-09 Dec-10 Dec-11 Dec-12 Dec-13 Dec-14 Dec-15 Dec-16 Dec-17 Dec-18 Jun-19
Private Equity Private Debt Real Estate Infrastructure Natural Resources
Asse
ts u
nder
Man
agem
ent (
$bn)
2. ASSETS UNDER MANAGEMENT

9
2020 PREQIN GLOBAL INFRASTRUCTURE REPORT – SAMPLE PAGES
© Preqin Ltd. www.preqin.com 21
2. ASSETS UNDER MANAGEMENT
horizon returns have hovered around 10% annually since 2016.
It is no surprise, then, that investors are so happy with their infrastructure investments. Eighty-seven percent report that their infrastructure portfolios have met or exceeded expectations over the past 12 months, and 86% are generally positive about the asset class.
...And a Market-Resilient RecordThis consistency is thrown into even sharper contrast by two macro factors: recent market volatility, and the seemingly certain prospect of a market slowdown in the near future. Sixty percent of infrastructure investors now say we are at a peak in the equity market cycle, and 28% are increasing allocations to private capital accordingly. Infrastructure’s main advantages are that it offers a reliable income stream and has low correlation to other asset classes – vital factors for investors looking to mitigate possible swings in other parts of their portfolios.
History bears this out: while infrastructure has not been completely immune to previous market movements, it has proved resilient to recent swings in equity markets, which have played havoc with investments in listed equities and hedge funds. Where one-year returns for listed equities fell from 22.8% as of December 2017 to -9.6% a year later, and hedge fund returns sank from 12.20% to -3.05% in the same period, infrastructure returns swung from 11.4% to 9.6% respectively.
On the Way to One TrillionGiven all of this, there is no reason to suspect that the growth in infrastructure AUM will slow any time soon. There are concerns about competition and pricing in core developed markets, but thus far these concerns have not been reflected in a fall in returns. Infrastructure funds also have more room to expand 1 Preqin: The Future of Alternatives, 2018, go.preqin.com/future
into new sectors and regions. Asia in particular enjoys huge demand for infrastructure, but very few specialists currently focus on the region. And even so-called 'played-out' markets like European utilities can still offer significant value to fund managers if they can secure attractive opportunities.
Preqin predicted back in 20181 that the infrastructure market would hold $1tn in AUM by the end of 2023, doubling its size from December 2017. The industry grew by 17% over 2018, and expanded by a further 11% in the first half of 2019. If this rate of expansion continues, then infrastructure assets will breach $1tn by the end of 2022 – a full year sooner than we predicted.
2020 PREQIN GLOBAL INFRASTRUCTURE REPORT – SAMPLE PAGES
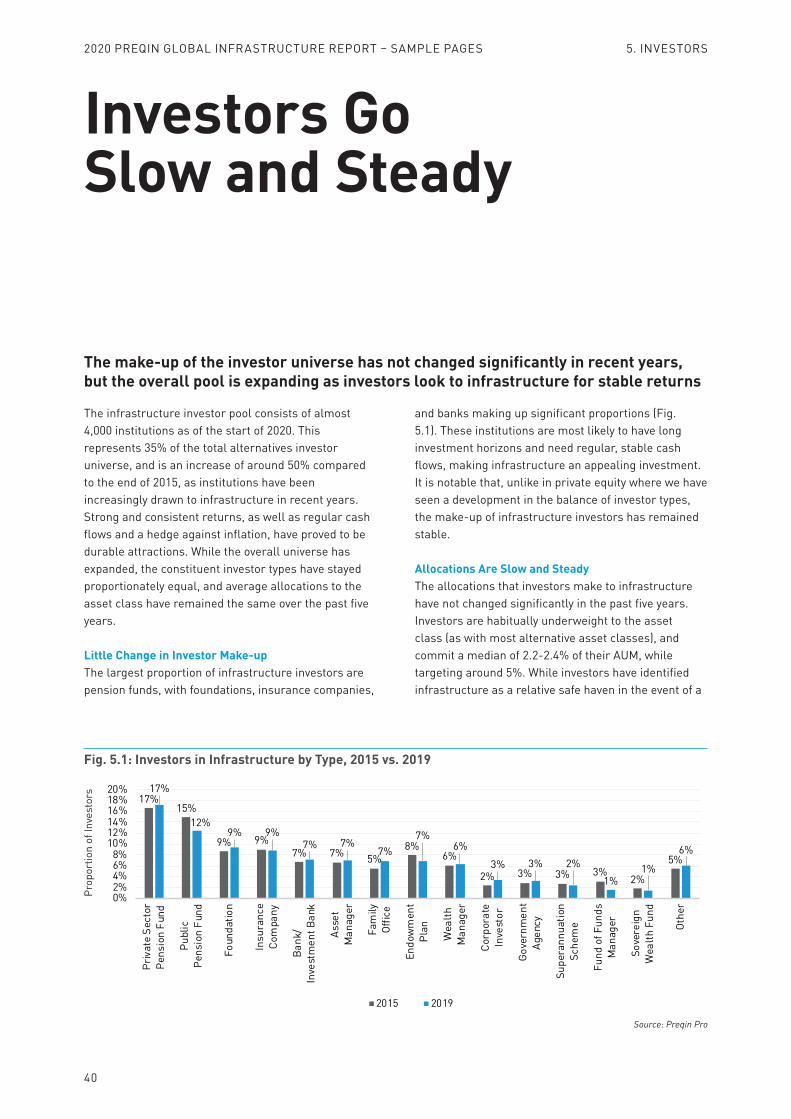
40
The infrastructure investor pool consists of almost 4,000 institutions as of the start of 2020. This represents 35% of the total alternatives investor universe, and is an increase of around 50% compared to the end of 2015, as institutions have been increasingly drawn to infrastructure in recent years. Strong and consistent returns, as well as regular cash flows and a hedge against inflation, have proved to be durable attractions. While the overall universe has expanded, the constituent investor types have stayed proportionately equal, and average allocations to the asset class have remained the same over the past five years.
Little Change in Investor Make-upThe largest proportion of infrastructure investors are pension funds, with foundations, insurance companies,
and banks making up significant proportions (Fig. 5.1). These institutions are most likely to have long investment horizons and need regular, stable cash flows, making infrastructure an appealing investment. It is notable that, unlike in private equity where we have seen a development in the balance of investor types, the make-up of infrastructure investors has remained stable.
Allocations Are Slow and SteadyThe allocations that investors make to infrastructure have not changed significantly in the past five years. Investors are habitually underweight to the asset class (as with most alternative asset classes), and commit a median of 2.2-2.4% of their AUM, while targeting around 5%. While investors have identified infrastructure as a relative safe haven in the event of a
Investors Go Slow and Steady
Fig. 5.1: Investors in Infrastructure by Type, 2015 vs. 2019
Source: Preqin Pro
17%15%
9% 9%7% 7% 5%
8%6%
2% 3% 3% 3%2%
5%
17%
12%9% 9%
7% 7%7%
7%6%
3% 3% 2%1%
1%
6%
0%2%4%6%8%
10%12%14%16%18%20%
Priv
ate
Sect
orPe
nsio
n Fu
nd
Publ
icPe
nsio
n Fu
nd
Foun
datio
n
Insu
ranc
eCo
mpa
ny
Bank
/In
vest
men
t Ban
k
Asse
tM
anag
er
Fam
ilyOf
fice
Endo
wm
ent
Plan
Wea
lthM
anag
er
Corp
orat
eIn
vest
or
Gove
rnm
ent
Agen
cy
Supe
rann
uatio
nSc
hem
e
Fund
of F
unds
Man
ager
Sove
reig
nW
ealth
Fun
d
Othe
r
2015 2019
The make-up of the investor universe has not changed significantly in recent years, but the overall pool is expanding as investors look to infrastructure for stable returns
Prop
ortio
n of
Inve
stor
s
2020 PREQIN GLOBAL INFRASTRUCTURE REPORT – SAMPLE PAGES 5. INVESTORS
11
2020 PREQIN GLOBAL INFRASTRUCTURE REPORT – SAMPLE PAGES
© Preqin Ltd. www.preqin.com 41
market downturn, we have not seen a wholesale shift toward larger allocations. For investors, infrastructure is still a risk-mitigator and downside-protector rather than an alpha-generator.
The average allocation to infrastructure is therefore quite small as a proportion of total assets, even where the absolute dollar allocation may be large. Investors such as pension funds and insurance companies typically commit around 2-3% of their total assets to infrastructure (Fig. 5.3). Most of these investors have relatively high liquidity needs, and the illiquidity of infrastructure investments means they cannot commit too much to the asset class.
Larger Investors Reduce AllocationsSovereign wealth funds (which generally do not have high liquidity needs) and superannuation schemes are among the largest allocators to the asset class, with median allocations of 4.9% and 6.0% of AUM respectively. Interestingly, though, in both cases this figure is lower than it was in 2015. Both investor types traditionally emphasize investments in real assets. Over the past five years, however, they have become more active in asset classes like public and private equities, and so have reduced allocations to 'slow and steady' asset classes like infrastructure in favor of these.
Most investor types will make larger individual commitments to infrastructure funds than to other alternative assets. This is partly because infrastructure is a smaller fund universe: there are currently only around 250 infrastructure funds seeking capital, compared with around 4,000 private equity vehicles. It
is also likely a reflection of the relative prevalence of large investors in the asset class – asset managers will make larger commitments than family offices in order to disburse their allocations across a similar number of vehicles (Fig. 5.2).
With fewer funds seeking capital for infrastructure compared to other asset classes, and investors looking to make larger commitments than in other asset classes, it is no wonder that some fund managers have been able to raise ever-larger funds in recent years to service demand.
Fig. 5.3: Investors' Median Current Allocations to Infrastructure by Investor Type, 2015 vs. 2019
Source: Preqin Pro
6.3%
4.5%
6.0%5.0%
3.3%
2.0%
4.0%
2.1% 1.9%1.0%
1.6%
6.0%
5.0% 4.9%4.8%
3.6%3.0% 2.7% 2.3% 2.0%
1.5%1.3%
0%1%2%3%4%5%6%7%
Supe
rann
uatio
nSc
hem
e
Corp
orat
eIn
vest
or
Sove
reig
nW
ealth
Fun
d
Wea
lthM
anag
er
Asse
tM
anag
er
Fam
ilyOf
fice
Endo
wm
ent
Plan
Publ
icPe
nsio
n Fu
nd
Priv
ate
Sect
orPe
nsio
n Fu
nd
Insu
ranc
eCo
mpa
ny
Foun
datio
n
2015 2019
153
7960
43 38 33 31 24 16 11 8 60
20406080
100120140160180
Sove
reig
n W
ealth
Fun
d
Asse
t Man
ager
Publ
ic P
ensi
on F
und
Insu
ranc
e Co
mpa
ny
Supe
rann
uatio
n Sc
hem
e
Gove
rnm
ent A
genc
yPr
ivat
e Se
ctor
Pen
sion
Fund
Wea
lth M
anag
er
Endo
wm
ent P
lan
Foun
datio
n
Fam
ily O
ffice
Corp
orat
e In
vest
or
Fig. 5.2: Infrastructure Investors' Mean Commitment Size by Investor Type
Source: Preqin Pro
Mea
n Co
mm
itmen
t Siz
e ($
mn)
Med
ian
Curr
ent
Allo
catio
n to
In
fras
truc
ture
(As
a %
of
AU
M)
5. INVESTORS
16
2020 PREQIN GLOBAL PRIVATE EQUITY & VENTURE CAPITAL REPORT
2020 PREQIN GLOBALNATURAL RESOURCESREPORTSAMPLE PAGES
ISBN: 978-1-912116-27-0
2
Contents
4 CEO's Foreword – Mark O'Hare, Preqin
6 The Global Push for Sustainability – Justin "Biff" Ourso, Nuveen
1. Overview of the Industry10 Executive Summary
11 Natural Resources Megatrends
12 Natural Resources in 2019: Key Facts
2. Assets under Management14 Assets under Management: AUM Hits Record
High
3. Fundraising18 Mega Funds Dominate Fundraising
21 North America
22 Europe
23 Asia
24 Rest of World
26 Don’t Ignore the Energy Sector – Steve Standbridge, Capstone Partners
4. Fund Managers30 First-Time Fundraising: First-Time Fund
Managers Face Strong Competition
5. Investors34 Two Key Trends Shaping the Investor Universe
37 League Tables: Largest Investors
6. Performance40 Performance: All Risk, Low Returns?
7. Sector Focus46 Energy in Focus: Appetite for Renewables Grows
52 Agriculture in Focus: In the Mood for Food
54 Timberland in Focus: Money Grows on Trees
56 Metals & Mining in Focus: Digging for Returns
8. Outlook58 The Future Is ESG
61 2020 Outlook for Natural Resources
65 Preqin Predictions
MethodologyIn this report, unless otherwise stated, 'Natural Resources' includes Infrastructure and other Private Capital funds with a significant focus on natural resources.
2020 PREQIN GLOBAL NATURAL RESOURCES REPORT – SAMPLE PAGES
10
Executive Summary
At first glance, the headline numbers for 2019 are strong: natural resources assets under management (AUM) surpassed $760bn, a new record. And fundraising hit a high of $109bn, exceeding $100bn for the second year in a row. But these figures were bolstered by the closing of mega infrastructure funds that also invest in energy assets. For natural resources and timberland fund types only1, 2019 proved to be a challenging year.
Indeed, the number of natural resources funds closed slid for the second straight year, dropping from 149 vehicles in 2018 to 128 in 2019, reflecting a tougher environment for fundraising in this asset class. Performance also disappointed investors: the rolling one-year median net IRR to H1 2019 plummeted to a 10-year low of 1.5%. Amid volatility in commodity prices and rising geopolitical tensions, the industry struggled to gain momentum.
Still, in a quiet year for fundraising, there were some bright spots. Africa-focused natural resources funds, for instance, had a successful year. They raised 10x more capital than in 2017, and made up close to a third (30%) of fund closures in the Rest of World region.
Looking beyond fundraising to the investor universe, we see several emerging trends. The investor pool is expanding, with increased participation from institutions such as endowment plans and private wealth investors. The investor base is also becoming more geographically diverse. While North America and Europe are still the largest investors in natural resources, comprising 52% and 22% of the total respectively, Asia is becoming a significant player on the global scene: it now makes up 16% of the investor universe.
1 Excludes Private Equity and Infrastructure fund types with a focus on natural resources.
The Rise of ESG, Transitioning toward a Low-Carbon EconomyEnergy assets make up the lion’s share of natural resources AUM. As the global economy increasingly moves away from fossil fuels toward renewable sources of energy, investments in natural resources are shifting in this direction (see page 46).
At the same time, the rise of ESG is driving growing investor interest in sustainable farming, as well as in the agricultural technologies that make greener methods of food production possible (see page 52). This increasing focus on environmental sustainability is generating new opportunities for investment in the agriculture/farming sector, boosting aggregate capital raised by agriculture funds by 100%, from $1.8bn in 2018 to $3.6bn in 2019.
A Challenging Outlook for FundraisingAs 2020 kicks off, there are 318 vehicles in market seeking a total of $205bn. Just over half (56%) of funds in market have held at least one interim close with only about a quarter (28%, $58bn) secured so far, which is indicative of a crowded fundraising environment.
That’s not all. Fund managers are having to grapple with a tough exit environment, rising asset valuations, commodity market volatility, and geopolitical uncertainty. Amid these challenges, investors are likely to put ever-greater emphasis on strong track records when selecting managers. Those that make the cut will have to show that they can deliver results even as market conditions become less favorable.
Strong fundraising and AUM numbers, boosted by mega infrastructure funds investing in energy, masked a challenging landscape for natural resources funds
2020 PREQIN GLOBAL NATURAL RESOURCES REPORT – SAMPLE PAGES 1. OVERVIEW OF THE INDUSTRY
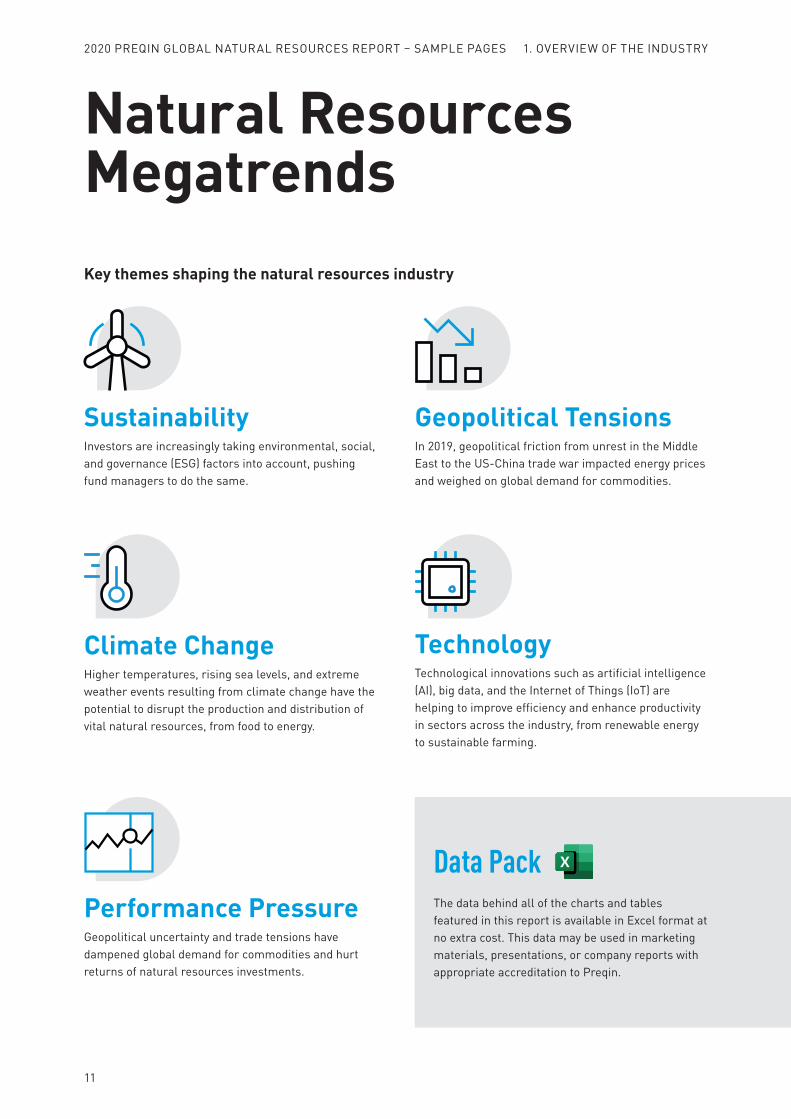
11
Natural ResourcesMegatrendsKey themes shaping the natural resources industry
Geopolitical TensionsIn 2019, geopolitical friction from unrest in the Middle East to the US-China trade war impacted energy prices and weighed on global demand for commodities.
SustainabilityInvestors are increasingly taking environmental, social, and governance (ESG) factors into account, pushing fund managers to do the same.
Performance PressureGeopolitical uncertainty and trade tensions have dampened global demand for commodities and hurt returns of natural resources investments.
TechnologyTechnological innovations such as artificial intelligence (AI), big data, and the Internet of Things (IoT) are helping to improve efficiency and enhance productivity in sectors across the industry, from renewable energy to sustainable farming.
Climate ChangeHigher temperatures, rising sea levels, and extreme weather events resulting from climate change have the potential to disrupt the production and distribution of vital natural resources, from food to energy.
Data PackThe data behind all of the charts and tables featured in this report is available in Excel format at no extra cost. This data may be used in marketing materials, presentations, or company reports with appropriate accreditation to Preqin.
2020 PREQIN GLOBAL NATURAL RESOURCES REPORT – SAMPLE PAGES 1. OVERVIEW OF THE INDUSTRY
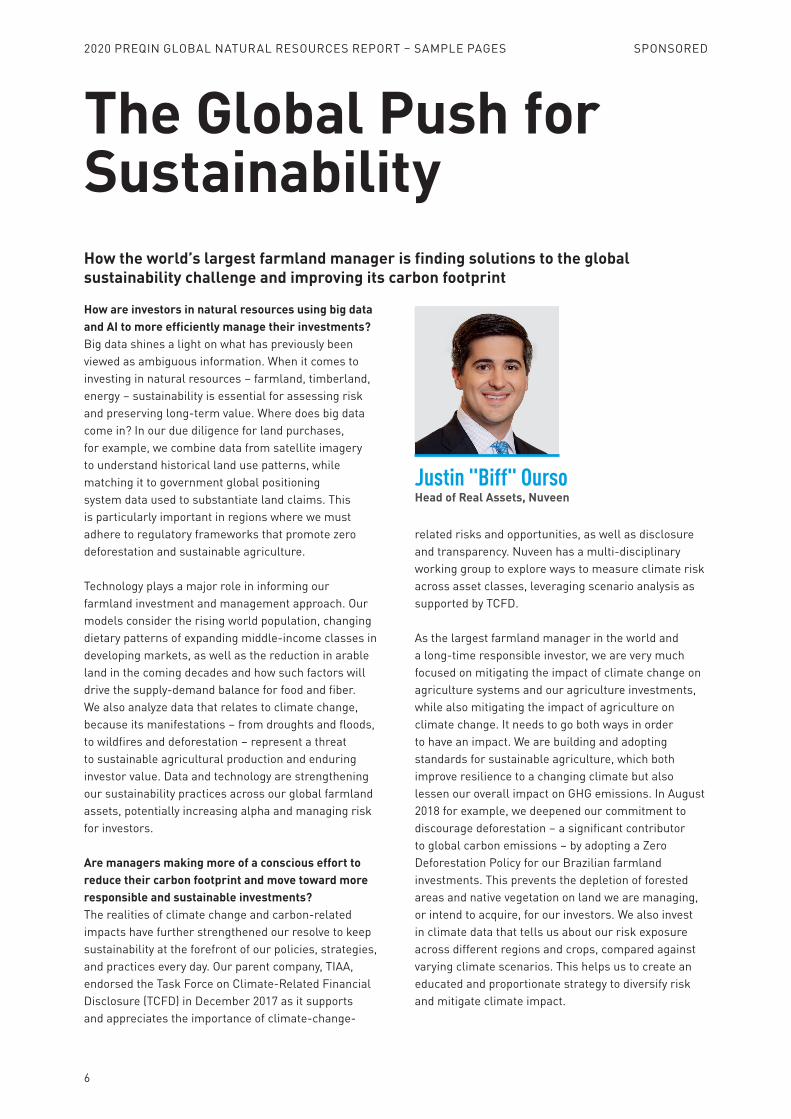
6
The Global Push for Sustainability
How are investors in natural resources using big data and AI to more efficiently manage their investments?Big data shines a light on what has previously been viewed as ambiguous information. When it comes to investing in natural resources – farmland, timberland, energy – sustainability is essential for assessing risk and preserving long-term value. Where does big data come in? In our due diligence for land purchases, for example, we combine data from satellite imagery to understand historical land use patterns, while matching it to government global positioning system data used to substantiate land claims. This is particularly important in regions where we must adhere to regulatory frameworks that promote zero deforestation and sustainable agriculture.
Technology plays a major role in informing our farmland investment and management approach. Our models consider the rising world population, changing dietary patterns of expanding middle-income classes in developing markets, as well as the reduction in arable land in the coming decades and how such factors will drive the supply-demand balance for food and fiber. We also analyze data that relates to climate change, because its manifestations – from droughts and floods, to wildfires and deforestation – represent a threat to sustainable agricultural production and enduring investor value. Data and technology are strengthening our sustainability practices across our global farmland assets, potentially increasing alpha and managing risk for investors.
Are managers making more of a conscious effort to reduce their carbon footprint and move toward more responsible and sustainable investments?The realities of climate change and carbon-related impacts have further strengthened our resolve to keep sustainability at the forefront of our policies, strategies, and practices every day. Our parent company, TIAA, endorsed the Task Force on Climate-Related Financial Disclosure (TCFD) in December 2017 as it supports and appreciates the importance of climate-change-
related risks and opportunities, as well as disclosure and transparency. Nuveen has a multi-disciplinary working group to explore ways to measure climate risk across asset classes, leveraging scenario analysis as supported by TCFD.
As the largest farmland manager in the world and a long-time responsible investor, we are very much focused on mitigating the impact of climate change on agriculture systems and our agriculture investments, while also mitigating the impact of agriculture on climate change. It needs to go both ways in order to have an impact. We are building and adopting standards for sustainable agriculture, which both improve resilience to a changing climate but also lessen our overall impact on GHG emissions. In August 2018 for example, we deepened our commitment to discourage deforestation – a significant contributor to global carbon emissions – by adopting a Zero Deforestation Policy for our Brazilian farmland investments. This prevents the depletion of forested areas and native vegetation on land we are managing, or intend to acquire, for our investors. We also invest in climate data that tells us about our risk exposure across different regions and crops, compared against varying climate scenarios. This helps us to create an educated and proportionate strategy to diversify risk and mitigate climate impact.
Justin "Biff" OursoHead of Real Assets, Nuveen
How the world’s largest farmland manager is finding solutions to the global sustainability challenge and improving its carbon footprint
SPONSORED2020 PREQIN GLOBAL NATURAL RESOURCES REPORT – SAMPLE PAGES
7
This mindset informs how we invest in other areas as well. Through our private equity impact strategy, we seek out companies with innovative technologies that improve resource efficiency and reduce carbon intensity in production processes and supply chains. In 2018 alone, these investments saved 1.8 million tons of CO2e.
Are you seeing more demand for ancillary services/infrastructure to overcome water scarcity and remedy infrastructure shortcomings? If so, what challenges will this bring?Global water crises and shortages demand new solutions and better metrics to track performance and ensure responsible management. These extreme conditions can fallow acreage, depress crop yields, reduce annual returns, and endanger the long-term productivity of natural resource assets. Severe droughts in California, Australia, and Brazil in recent years have also affected crop yields.
Across our permanent crop properties (tree fruits, nuts, citrus, grapes), we implement efficient drip-line and micro-sprinkler irrigation systems. On farmland using flood or furrow irrigation, we aim to use recyclable polyethylene piping. When combined with other water-management techniques, these pipes can improve water-use efficiency by 25%. On Nuveen properties in the Southern US and Australia, techniques like precision land leveling are being introduced to improve drainage, control erosion, and reduce overall water use. The techniques we employ are designed to improve sustainability and
efficiency. When used, they can cut overall water usage dramatically.
Invariably, an investment in natural resources – farmland and timberland in particular – leaves an investor exposed to the vagaries of Mother Nature. In a warming, more variable climate, ensuring the quality and quantity of water resources is perhaps the most important challenge. Implementing mitigation strategies requires investors and managers to have the requisite knowledge, and also financial capital to invest in the improvements and programs. There are also potential opportunities for governments, policymakers, and private investors to come together to address large-scale infrastructure solutions at a more elevated, regional, state, or even federal level.
A weaker-than-expected global growth outlook has created lower commodity prices. Where are you seeing the most attractive opportunities as a result? As global growth has slowed, commodity prices have reflected lower current and forecast demand. The US-China trade war has been and is projected to be a drag on global GDP. However, it does present upside potential in the event of early-relaxation trade barriers for many commodities. With weaker global growth already incorporated into suppliers’ plans (lower rigs, reduced fracking production growth, etc.), the slowdown in supply will create dislocations in time and geography throughout supply chains, producing opportunities. If the slowdown in growth is harsher than expected, price action may support trend-following strategies.
NuveenNuveen, the investment management arm of TIAA, is one of the largest investment managers in the world with $1tn in assets under management.1 Managing a broad array of assets across diverse asset classes, geographies, and investment styles, we provide investors access to a wide range of liquid and illiquid alternative strategies.
We offer real asset strategies through our investment specialists. AGR Partners provides growth capital to leading mid-market agribusinesses and food companies. Westchester has more than 30 years of experience in acquiring, managing, and marketing agricultural real estate assets around the world, and is the largest manager of farmland assets globally.2 GreenWood Resources specializes in the acquisition and stewardship of forestry assets. Gresham Investment Management is recognized as one of the world’s leading investment managers focused exclusively on portfolios providing investors access to a diversified array of commodities.
www.nuveen.com
1 As of 30 September 20192 Source: Pensions & Investments, 30 Sept 2019. Rankings based on institutional tax-exempt assets under management as of 30 Jun 2019 reported by each responding asset manager
2020 PREQIN GLOBAL NATURAL RESOURCES REPORT – SAMPLE PAGES SPONSORED
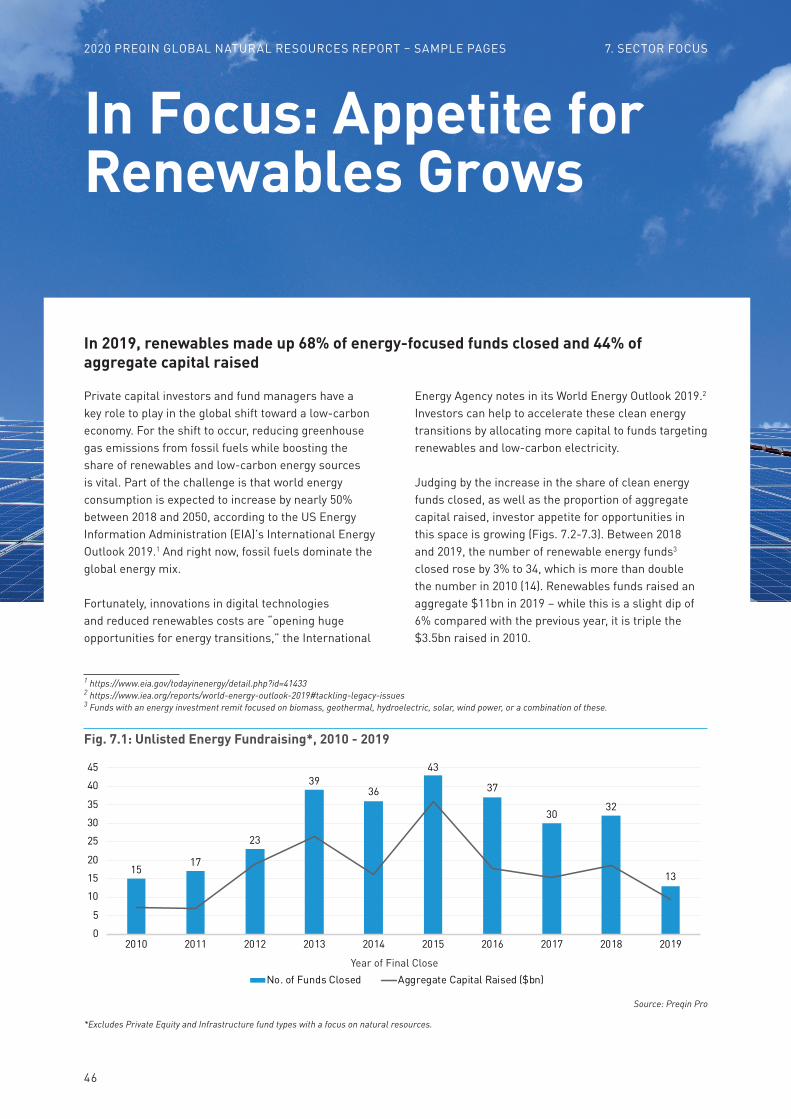
46
Private capital investors and fund managers have a key role to play in the global shift toward a low-carbon economy. For the shift to occur, reducing greenhouse gas emissions from fossil fuels while boosting the share of renewables and low-carbon energy sources is vital. Part of the challenge is that world energy consumption is expected to increase by nearly 50% between 2018 and 2050, according to the US Energy Information Administration (EIA)’s International Energy Outlook 2019.1 And right now, fossil fuels dominate the global energy mix.
Fortunately, innovations in digital technologies and reduced renewables costs are “opening huge opportunities for energy transitions,” the International
1 https://www.eia.gov/todayinenergy/detail.php?id=414332 https://www.iea.org/reports/world-energy-outlook-2019#tackling-legacy-issues3 Funds with an energy investment remit focused on biomass, geothermal, hydroelectric, solar, wind power, or a combination of these.
Energy Agency notes in its World Energy Outlook 2019.2 Investors can help to accelerate these clean energy transitions by allocating more capital to funds targeting renewables and low-carbon electricity.
Judging by the increase in the share of clean energy funds closed, as well as the proportion of aggregate capital raised, investor appetite for opportunities in this space is growing (Figs. 7.2-7.3). Between 2018 and 2019, the number of renewable energy funds3 closed rose by 3% to 34, which is more than double the number in 2010 (14). Renewables funds raised an aggregate $11bn in 2019 – while this is a slight dip of 6% compared with the previous year, it is triple the $3.5bn raised in 2010.
In 2019, renewables made up 68% of energy-focused funds closed and 44% of aggregate capital raised
In Focus: Appetite for Renewables Grows
Fig. 7.1: Unlisted Energy Fundraising*, 2010 - 2019
Source: Preqin Pro
1517
23
3936
43
37
3032
13
0
5
10
15
20
25
30
35
40
45
2010 2011 2012 2013 2014 2015 2016 2017 2018 2019
No. of Funds Closed Aggregate Capital Raised ($bn)Year of Final Close
*Excludes Private Equity and Infrastructure fund types with a focus on natural resources.
2020 PREQIN GLOBAL NATURAL RESOURCES REPORT – SAMPLE PAGES 7. SECTOR FOCUS
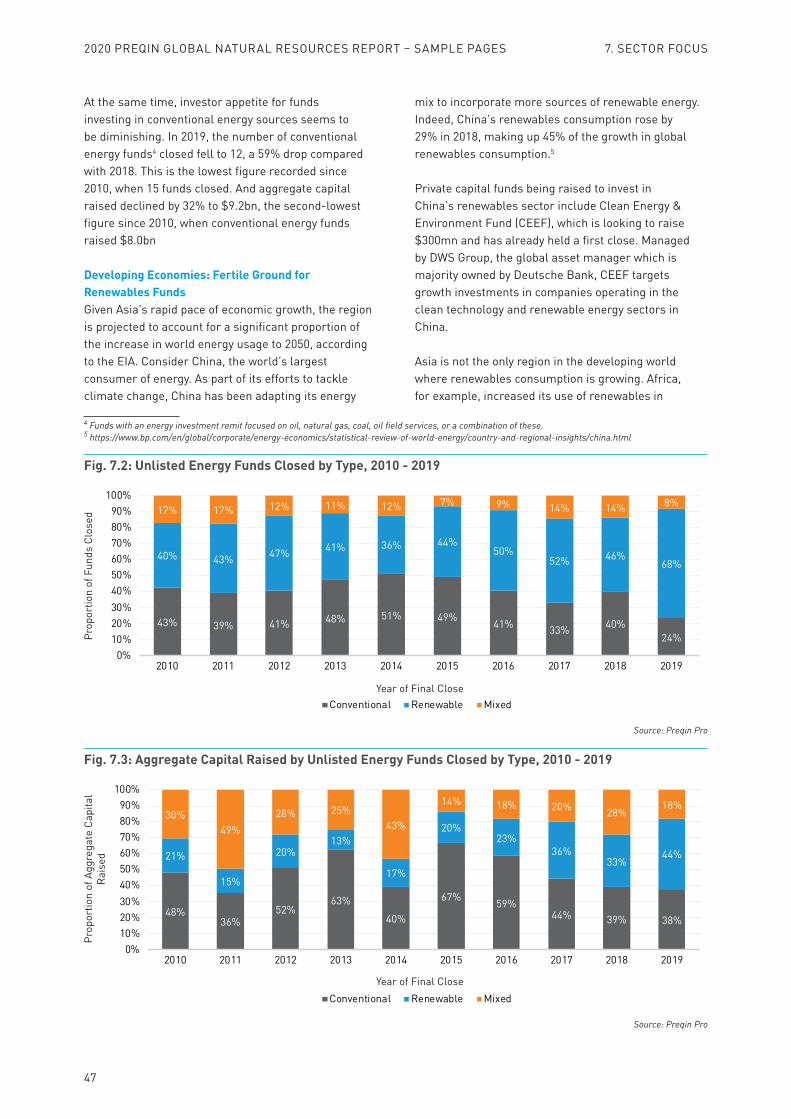
47
At the same time, investor appetite for funds investing in conventional energy sources seems to be diminishing. In 2019, the number of conventional energy funds4 closed fell to 12, a 59% drop compared with 2018. This is the lowest figure recorded since 2010, when 15 funds closed. And aggregate capital raised declined by 32% to $9.2bn, the second-lowest figure since 2010, when conventional energy funds raised $8.0bn
Developing Economies: Fertile Ground for Renewables FundsGiven Asia’s rapid pace of economic growth, the region is projected to account for a significant proportion of the increase in world energy usage to 2050, according to the EIA. Consider China, the world’s largest consumer of energy. As part of its efforts to tackle climate change, China has been adapting its energy
4 Funds with an energy investment remit focused on oil, natural gas, coal, oil field services, or a combination of these.5 https://www.bp.com/en/global/corporate/energy-economics/statistical-review-of-world-energy/country-and-regional-insights/china.html
mix to incorporate more sources of renewable energy. Indeed, China’s renewables consumption rose by 29% in 2018, making up 45% of the growth in global renewables consumption.5
Private capital funds being raised to invest in China’s renewables sector include Clean Energy & Environment Fund (CEEF), which is looking to raise $300mn and has already held a first close. Managed by DWS Group, the global asset manager which is majority owned by Deutsche Bank, CEEF targets growth investments in companies operating in the clean technology and renewable energy sectors in China.
Asia is not the only region in the developing world where renewables consumption is growing. Africa, for example, increased its use of renewables in
Fig. 7.2: Unlisted Energy Funds Closed by Type, 2010 - 2019
Source: Preqin Pro
43% 39% 41% 48% 51% 49% 41% 33% 40%24%
40% 43% 47% 41% 36% 44%50%
52% 46%68%
17% 17% 12% 11% 12% 7% 9% 14% 14% 8%
0%10%20%30%40%50%60%70%80%90%
100%
2010 2011 2012 2013 2014 2015 2016 2017 2018 2019
Conventional Renewable Mixed
Prop
ortio
n of
Fun
ds C
lose
d
Year of Final Close
Fig. 7.3: Aggregate Capital Raised by Unlisted Energy Funds Closed by Type, 2010 - 2019
Source: Preqin Pro
48%36%
52%63%
40%
67% 59%44% 39% 38%
21%
15%
20%13%
17%
20%23%
36%33%
44%
30%49%
28% 25%43%
14% 18% 20% 28%18%
0%10%20%30%40%50%60%70%80%90%
100%
2010 2011 2012 2013 2014 2015 2016 2017 2018 2019
Conventional Renewable Mixed
Prop
ortio
n of
Agg
rega
te C
apita
l Ra
ised
Year of Final Close
7. SECTOR FOCUS2020 PREQIN GLOBAL NATURAL RESOURCES REPORT – SAMPLE PAGES
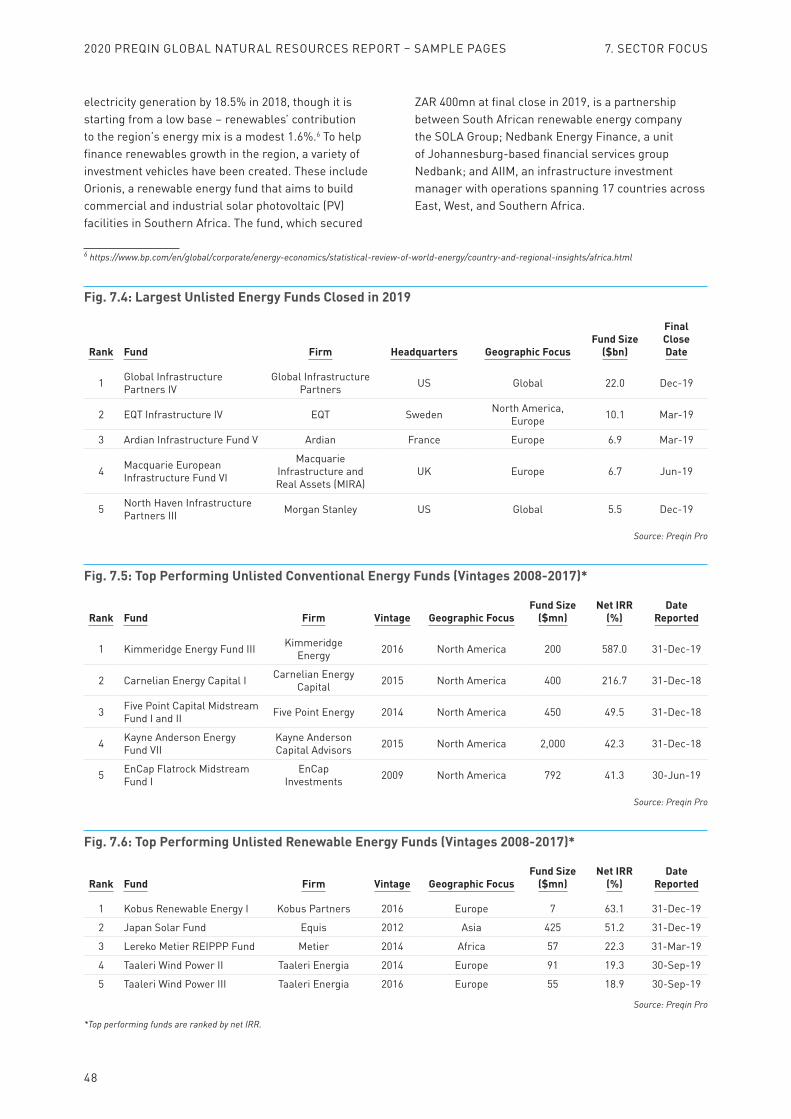
48
electricity generation by 18.5% in 2018, though it is starting from a low base – renewables’ contribution to the region’s energy mix is a modest 1.6%.6 To help finance renewables growth in the region, a variety of investment vehicles have been created. These include Orionis, a renewable energy fund that aims to build commercial and industrial solar photovoltaic (PV) facilities in Southern Africa. The fund, which secured
6 https://www.bp.com/en/global/corporate/energy-economics/statistical-review-of-world-energy/country-and-regional-insights/africa.html
ZAR 400mn at final close in 2019, is a partnership between South African renewable energy company the SOLA Group; Nedbank Energy Finance, a unit of Johannesburg-based financial services group Nedbank; and AIIM, an infrastructure investment manager with operations spanning 17 countries across East, West, and Southern Africa.
Rank Fund Firm Headquarters Geographic FocusFund Size
($bn)
Final Close Date
1 Global Infrastructure Partners IV
Global Infrastructure Partners US Global 22.0 Dec-19
2 EQT Infrastructure IV EQT Sweden North America, Europe 10.1 Mar-19
3 Ardian Infrastructure Fund V Ardian France Europe 6.9 Mar-19
4 Macquarie European Infrastructure Fund VI
Macquarie Infrastructure and Real Assets (MIRA)
UK Europe 6.7 Jun-19
5 North Haven Infrastructure Partners III Morgan Stanley US Global 5.5 Dec-19
Source: Preqin Pro
Fig. 7.4: Largest Unlisted Energy Funds Closed in 2019
Rank Fund Firm Vintage Geographic FocusFund Size
($mn)Net IRR
(%)Date
Reported
1 Kimmeridge Energy Fund III Kimmeridge Energy 2016 North America 200 587.0 31-Dec-19
2 Carnelian Energy Capital I Carnelian Energy Capital 2015 North America 400 216.7 31-Dec-18
3 Five Point Capital Midstream Fund I and II Five Point Energy 2014 North America 450 49.5 31-Dec-18
4 Kayne Anderson Energy Fund VII
Kayne Anderson Capital Advisors 2015 North America 2,000 42.3 31-Dec-18
5 EnCap Flatrock Midstream Fund I
EnCap Investments 2009 North America 792 41.3 30-Jun-19
Source: Preqin Pro
Fig. 7.5: Top Performing Unlisted Conventional Energy Funds (Vintages 2008-2017)*
Rank Fund Firm Vintage Geographic FocusFund Size
($mn)Net IRR
(%)Date
Reported
1 Kobus Renewable Energy I Kobus Partners 2016 Europe 7 63.1 31-Dec-19
2 Japan Solar Fund Equis 2012 Asia 425 51.2 31-Dec-19
3 Lereko Metier REIPPP Fund Metier 2014 Africa 57 22.3 31-Mar-19
4 Taaleri Wind Power II Taaleri Energia 2014 Europe 91 19.3 30-Sep-19
5 Taaleri Wind Power III Taaleri Energia 2016 Europe 55 18.9 30-Sep-19
Source: Preqin Pro
Fig. 7.6: Top Performing Unlisted Renewable Energy Funds (Vintages 2008-2017)*
*Top performing funds are ranked by net IRR.
7. SECTOR FOCUS2020 PREQIN GLOBAL NATURAL RESOURCES REPORT – SAMPLE PAGES
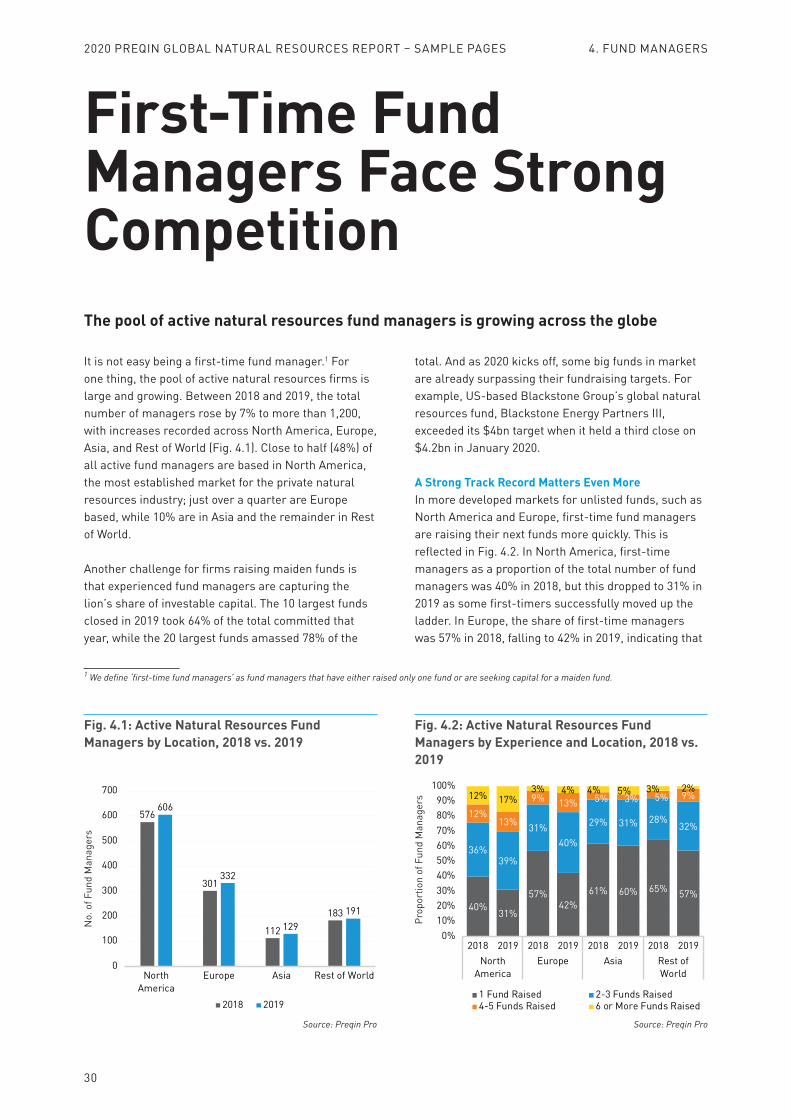
30
First-Time Fund Managers Face Strong Competition
It is not easy being a first-time fund manager.1 For one thing, the pool of active natural resources firms is large and growing. Between 2018 and 2019, the total number of managers rose by 7% to more than 1,200, with increases recorded across North America, Europe, Asia, and Rest of World (Fig. 4.1). Close to half (48%) of all active fund managers are based in North America, the most established market for the private natural resources industry; just over a quarter are Europe based, while 10% are in Asia and the remainder in Rest of World.
Another challenge for firms raising maiden funds is that experienced fund managers are capturing the lion’s share of investable capital. The 10 largest funds closed in 2019 took 64% of the total committed that year, while the 20 largest funds amassed 78% of the
1 We define ‘first-time fund managers’ as fund managers that have either raised only one fund or are seeking capital for a maiden fund.
total. And as 2020 kicks off, some big funds in market are already surpassing their fundraising targets. For example, US-based Blackstone Group’s global natural resources fund, Blackstone Energy Partners III, exceeded its $4bn target when it held a third close on $4.2bn in January 2020.
A Strong Track Record Matters Even MoreIn more developed markets for unlisted funds, such as North America and Europe, first-time fund managers are raising their next funds more quickly. This is reflected in Fig. 4.2. In North America, first-time managers as a proportion of the total number of fund managers was 40% in 2018, but this dropped to 31% in 2019 as some first-timers successfully moved up the ladder. In Europe, the share of first-time managers was 57% in 2018, falling to 42% in 2019, indicating that
The pool of active natural resources fund managers is growing across the globe
576
301
112
183
606
332
129191
0
100
200
300
400
500
600
700
NorthAmerica
Europe Asia Rest of World
2018 2019
Fig. 4.1: Active Natural Resources Fund Managers by Location, 2018 vs. 2019
Source: Preqin Pro
40%31%
57%42%
61% 60% 65% 57%
36%39%
31%40%
29% 31% 28%32%
12%13%
9% 13% 5% 3% 5% 9%12% 17%3% 4% 4% 5% 3% 2%
0%10%20%30%40%50%60%70%80%90%
100%
2018 2019 2018 2019 2018 2019 2018 2019North
AmericaEurope Asia Rest of
World
1 Fund Raised 2-3 Funds Raised4-5 Funds Raised 6 or More Funds Raised
Fig. 4.2: Active Natural Resources Fund Managers by Experience and Location, 2018 vs. 2019
Source: Preqin Pro
Prop
ortio
n of
Fun
d M
anag
ers
No.
of F
und
Man
ager
s
2020 PREQIN GLOBAL NATURAL RESOURCES REPORT – SAMPLE PAGES 4. FUND MANAGERS
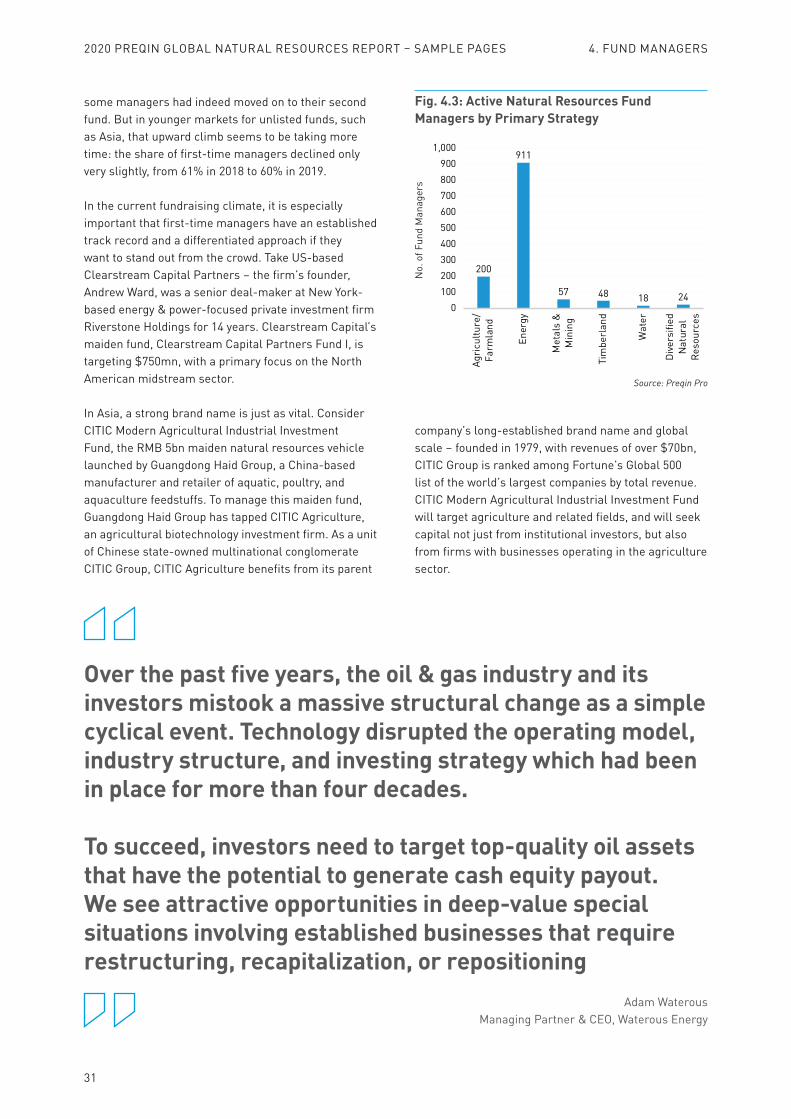
31
Over the past five years, the oil & gas industry and its investors mistook a massive structural change as a simple cyclical event. Technology disrupted the operating model, industry structure, and investing strategy which had been in place for more than four decades.
To succeed, investors need to target top-quality oil assets that have the potential to generate cash equity payout. We see attractive opportunities in deep-value special situations involving established businesses that require restructuring, recapitalization, or repositioning
Adam WaterousManaging Partner & CEO, Waterous Energy
some managers had indeed moved on to their second fund. But in younger markets for unlisted funds, such as Asia, that upward climb seems to be taking more time: the share of first-time managers declined only very slightly, from 61% in 2018 to 60% in 2019.
In the current fundraising climate, it is especially important that first-time managers have an established track record and a differentiated approach if they want to stand out from the crowd. Take US-based Clearstream Capital Partners – the firm’s founder, Andrew Ward, was a senior deal-maker at New York-based energy & power-focused private investment firm Riverstone Holdings for 14 years. Clearstream Capital’s maiden fund, Clearstream Capital Partners Fund I, is targeting $750mn, with a primary focus on the North American midstream sector.
In Asia, a strong brand name is just as vital. Consider CITIC Modern Agricultural Industrial Investment Fund, the RMB 5bn maiden natural resources vehicle launched by Guangdong Haid Group, a China-based manufacturer and retailer of aquatic, poultry, and aquaculture feedstuffs. To manage this maiden fund, Guangdong Haid Group has tapped CITIC Agriculture, an agricultural biotechnology investment firm. As a unit of Chinese state-owned multinational conglomerate CITIC Group, CITIC Agriculture benefits from its parent
company’s long-established brand name and global scale – founded in 1979, with revenues of over $70bn, CITIC Group is ranked among Fortune’s Global 500 list of the world’s largest companies by total revenue. CITIC Modern Agricultural Industrial Investment Fund will target agriculture and related fields, and will seek capital not just from institutional investors, but also from firms with businesses operating in the agriculture sector.
200
911
57 48 18 240
100200300400500600700800900
1,000
Agri
cultu
re/
Farm
land
Ener
gy
Met
als
&M
inin
g
Tim
berl
and
Wat
er
Div
ersi
fied
Nat
ural
Reso
urce
s
Fig. 4.3: Active Natural Resources Fund Managers by Primary Strategy
Source: Preqin Pro
No.
of F
und
Man
ager
s
2020 PREQIN GLOBAL NATURAL RESOURCES REPORT – SAMPLE PAGES 4. FUND MANAGERS

2020 Preqin Global Alternatives ReportsThe 2020 Preqin Global Alternatives Reports are the most detailed and comprehensive reviews of the alternative assets industry available, offering exclusive insight into the latest developments in the private equity, hedge fund, real estate, infrastructure, private debt and natural resources asset classes.
If you would like to build a custom enterprise package, or purchase individual hard copies, please contact your account manager or email [email protected]
Where applicable, VAT/sales tax is charged at the standard rate.*Shipping costs: $40/£10/€25, $20/£5/€12 for additional copies. Shipping costs will not exceed a maximum of $60/£15/€37 per order when all shipped to same address. If shipped to multiple addresses then full postage rates apply for additional copies.
Payment Details Cheque enclosed (cheque payable to 'Preqin') Charge my: Visa Mastercard Amex InvoiceCurrency: USD ($) GBP (£) EUR (€)
Card Number: __________________________Name on Card: __________________________Expiration Date: __________________________Security Code: __________________________
Shipping Details
Name: _____________________________
Firm: _____________________________
Job Title: _____________________________
Address: _____________________________
_____________________________
City: _____________________________
State: _____________________________
Postcode/Zip: _____________________________
Country: _____________________________
Telephone: _____________________________
Email: _____________________________
Product Price No. of Copies
Digital
2020 Preqin Global Private Equity & Venture Capital Report
$295/£225/€260
____2020 Preqin Global Private Debt Report ____2020 Preqin Global Hedge Fund Report ____2020 Preqin Global Real Estate Report ____2020 Preqin Global Infrastructure Report ____2020 Preqin Global Natural Resources Report ____2020 Preqin Global Alternatives Reports - All Six Titles (25% Discount) $1,327.50/£1,012.50/€1,170 ____
Digital + Print
2020 Preqin Global Private Equity & Venture Capital Report
$440/£335/€390*
____2020 Preqin Global Private Debt Report ____2020 Preqin Global Hedge Fund Report ____2020 Preqin Global Real Estate Report ____2020 Preqin Global Infrastructure Report ____2020 Preqin Global Natural Resources Report ____2020 Preqin Global Alternatives Reports - All Six Titles (25% Discount) $1,980/£1,507.50/€1,755 ____
Team
2020 Preqin Global Private Equity & Venture Capital Report
$1,500/£1,200/€1,400
____2020 Preqin Global Private Debt Report ____2020 Preqin Global Hedge Fund Report ____2020 Preqin Global Real Estate Report ____2020 Preqin Global Infrastructure Report ____2020 Preqin Global Natural Resources Report ____2020 Preqin Global Alternatives Reports - All Six Titles (25% Discount) $6,750/£5,400/€6,300 ____
Postage addresses can be found on our website: www.preqin.com/contact
For more information, or to purchase copies online, please visit: www.preqin.com/reports


