Embed Size (px)
Citation preview
Materials Today Communications 26 (2021) 101983
Available online 26 December 20202352-4928/© 2020 Elsevier Ltd. All rights reserved.
The effect of high energy milling and high thermal treatment on the structure and thermal decomposition of minerals from natural CaO-SiO2-P2O5 ceramic system
Bilyana Kostova a, Vilma Petkova b,*, Ventseslav Stoyanov c, Zh. Uzunov d
a Department of Natural Sciences, New Bulgarian University, Sofia, Bulgaria b Institute of Mineralogy and Crystallography “Acad. Iv. Kostov”, Bulgarian Academy of Sciences, Bulgaria c University of Structural Engineering and Architecture (VSU) „Lyuben Karavelov“, Bulgaria d Department of Archeology, New Bulgarian University, Sofia, Bulgaria
A R T I C L E I N F O
Keywords: CaO-SiO2-P2O5 system High energy milling Thermal activation Thermal analysis Reaction mechanisms
A B S T R A C T
The major issue studied in this paper is a natural mineral aggregate of quartz, calcite, and fluorapatite (the raw material originated from Bulgaria) before and after high energy milling and thermal treatment, in the order to investigate the properties of natural CaO-SiO2-P2O5 ceramic system. The activation effects are monitored by chemical analysis, X-ray powder diffraction, Fourier transformed infrared spectroscopy, and Thermal analysis (TG/DTG).
The activation effect study shows: (i) change of chemical bond strength; (ii) deformation of structural poly-hedrons with the formation of new isomorphic phases; (iii) the prolonged time of HEM activation leads to lower raw mineral stability and to the formation of new phases; iv) increased SiO2 reactivity resulting in solid-phase crystallization.
The obtained results can be used in the study of ceramic and cement materials (ancient and modern), soil conditioners, etc.
1. Introduction
The natural mixture of apatite, quartz, and calcite is a well-known system (CaO-SiO2-P2O5) investigated by many authors as a source of bone bioactive ceramic [1,2], ancient and modern cement [3–7], ceramic composites [8–12], phosphorus fertilizers, and soil improvers, [13–16].
Apatite is the name of a mineral group consisting of several isomorphic minerals with end members hydroxyl-apatite (HAp), fluor- apatite (FAp), and chlorite-apatite [17]. The object of interest is inter-mediate members of this series, characterized by the partially isomor-phic substitution of PO4, OH and F, forming hydroxyl-flour-apatite (HFAp), carbonate-hydroxyl-flour-apatite (CHFAp), etc., after high
energy milling (HEM) treatment [18]. HEM treatment of solids causes the appearance of strain field, i. e. the solids accumulated energy in strain field. The accumulated energy relaxed into heat. The other way to energy relaxation is solid plastic deformation, which can lead to the destruction of the crystal (crushing). During high-energy milling, the size of crystals decreases to some critical values. Further energy supply to these crystals of limiting size causes further deformation of crystals, energy accumulation in the volume or at the surface of crystals, and subsequently amorphization/or transition into a metastable poly-morphous state/or rupture of chemical bonds [19–21]. Suitable methods for studying such a system are powder diffraction X-Ray analysis, FTIR spectroscopy and thermal analysis [22–30].
The studied raw material (natural CaO-SiO2-P2O5 system) is from
Abbreviations: A-type isomorphism, the isomorphic substitution of OH− by CO3 in the apatite structure; A-B-type isomorphism, the isomorphic substitution of PO4 by CO3
2- and occupancy of the vacancy; B-type isomorphism, the isomorphic substitution of PO4 by CO32- in the apatite structure; B0, raw sample; B10, B30, B60, B120,
and B240, samples milled for different milling times: 10, 30, 60, 120 and 240 min, respectively; CHFAp, carbonate-hydroxyl-flour-apatite; FAp, fluor-apatite; FTIR, Fourier Transform Infra-Red; HAp, hydroxyl-apatite; HEM, high energy milling; HFAp, hydroxyl-flour-apatite; HPP, hydroxyl-pyrophosphate; ML, mass losses; PP, pyrophosphate; PXRD, powder X-ray diffraction; RT, room temperature; SSA, specific surface area; TCP, tricalcium phosphate; TG-DTG, Thermal analyses.
* Corresponding author at: Institute of Mineralogy and Crystallography, Bulgarian Academy of Sciences, Acad. G. Bonchev Str., build.107, 1113 Sofia, Bulgaria. E-mail addresses: [email protected] (B. Kostova), [email protected], [email protected] (V. Petkova), [email protected], vensy.stoyanov@
vsu.bg (V. Stoyanov), [email protected] (Zh. Uzunov).
Contents lists available at ScienceDirect
Materials Today Communications
journal homepage: www.elsevier.com/locate/mtcomm
https://doi.org/10.1016/j.mtcomm.2020.101983 Received 1 September 2020; Received in revised form 28 November 2020; Accepted 18 December 2020
Materials Today Communications 26 (2021) 101983
2
Sanadinovo, Bulgaria, where the quartz is in higher quantity, followed by calcite and apatite. It was studied in the past and defined as low- phosphate and unpromising ore for agriculture because of the high quantity of SiO2 and CaCO3, as well as the low quantity of P2O5 [15,31]. This mixture was not studied for the properties of the system after HEM and thermal treatment of milled samples. The CaO-SiO2-P2O5 is part of ancient and modern cement and ceramic composites whose behavior at milling, rising temperature and atmospheric conditions (CO2 and H2O) is of practical importance for the clinker and ceramic minerals obtained as a result. The study of ancient building composite manufacturing technologies, as well as, used local raw materials for their production with practical application in archaeomineralogy and archaeological chemistry which contributes to knowledge of ancient environment. In the future, the low-phosphate ores could become an essential resource for agriculture due to the depletion of rich phosphor ores. The mentioned above the features of the CaO-SiO2-P2O5 system justified studying its properties after HEM and thermal treatment.
2. Experimental
Natural sedimentary mineral aggregate from Bulgaria has been investigated (sample B0) with chemical composition (mass%): 38.97 % SiO2, 26.34 % CаO, 14.61 % P2O5
tot, 7.91 % R2O3 (R2O3 = Fe2O3+Al2O3) 2.63 % F2, 2.10 % K2O, 1.13 % Na2O, 0.95 % SOх, 0.84 % MgO.
The B0 sample was activated via high energy milling (HEM) for different milling times: 10, 30, 60, 120, and 240 min, where the milled samples were named B10, B30, B60, B120, and B240 respectively. The HEM activation was carried out in a planetary mill Pulverisette-5, Fritsch Co (Germany), using both Cr-Ni plain steel for the milling container of 250 mL volume and for the milling balls with a diameter of 20 mm and mass of 510 g. The treatment was implemented at a milling velocity of 320 rpm and the balls-to-powder mass ratio was 25.5:1 and sample mass of 20 g.
All samples (B0, B10, B30, B60, B120, and B240) were thermally activated at a temperature of 1050 ◦C.
The specific surface area (SSA) measurements were performed by the BET-method (adsorptive gas N2, carrier gas He, heating temperature 150 ◦C) using an EMS-53 sorptometer and KELVIN 1040/1042 software (Costech International).
The powder X-ray diffraction (PXRD) measurements were made by D2 Phaser BrukerAXS, CuKα radiation (λ =0.15418 nm) (operating at 30 kV, 10 mA) from 5 to 80◦2θ with a step of 0.05◦ (ground sample weight – 1.0 ± 0.1 mg and particle size below 0.075 mm. The PDF (Powder Diffraction File, ICDD, 2001) database was used for deter-mining the phases and minerals in the samples [32].
The Fourier Transform Infra Red (FTIR) spectra were registered on Bruker Tensor 37 spectrometer in the range 400–4000 cm− 1, using KBr pellet technique. A resolution of 2 cm− 1 was used collecting 60 scans for each sample.
Thermal analyses (TG-DTG) were performed on a LABSYS evo ther-mal analyzer (SETARAM, France) in the temperature range: room tem-perature (RT) – 1050 ◦C in air medium, with heating rate of 10 ◦C.min− 1.
3. Results
3.1. SSA measurements
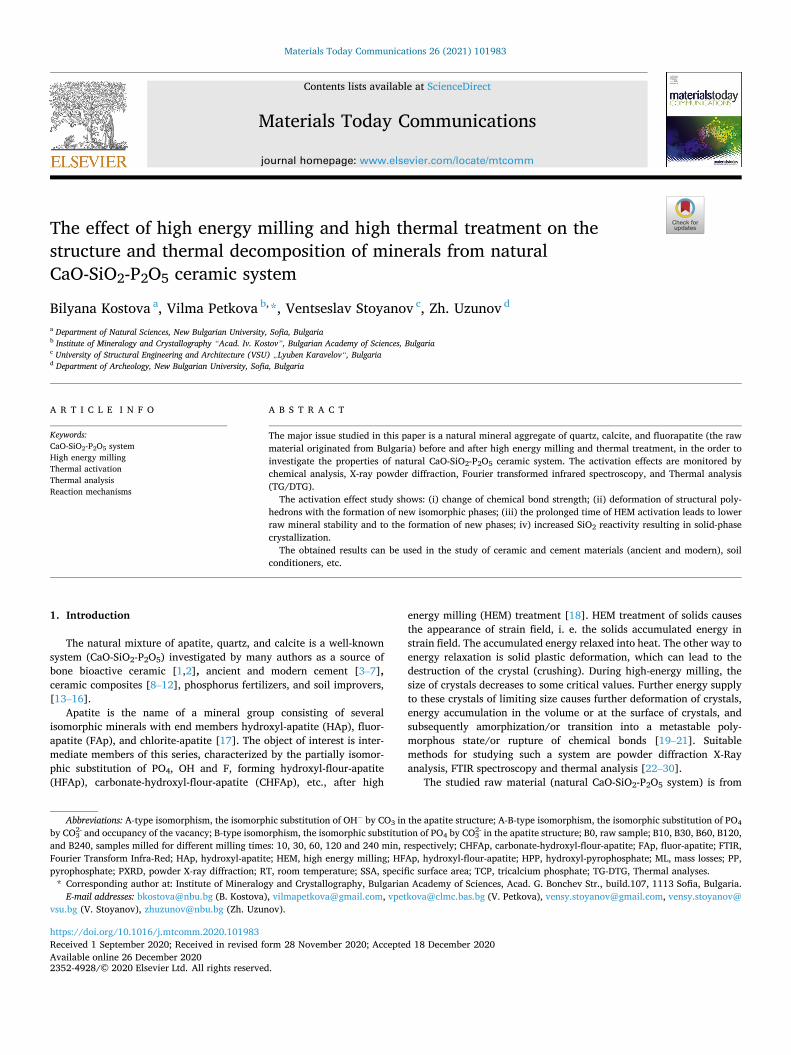
Fig. 1 shows the results from the SSA measurements proving the dependence on SSA changes of HEM activation time. The HEM activated sample at 10 min displays the intensive increase of the SSA. After 10 min of HEM activation, the SSA decreases exponentially, while the solid line is the best fit: y = 9.56 exp(-x/90.92) + 2.82 (R2 = 0.99).
3.2. PXRD analysis
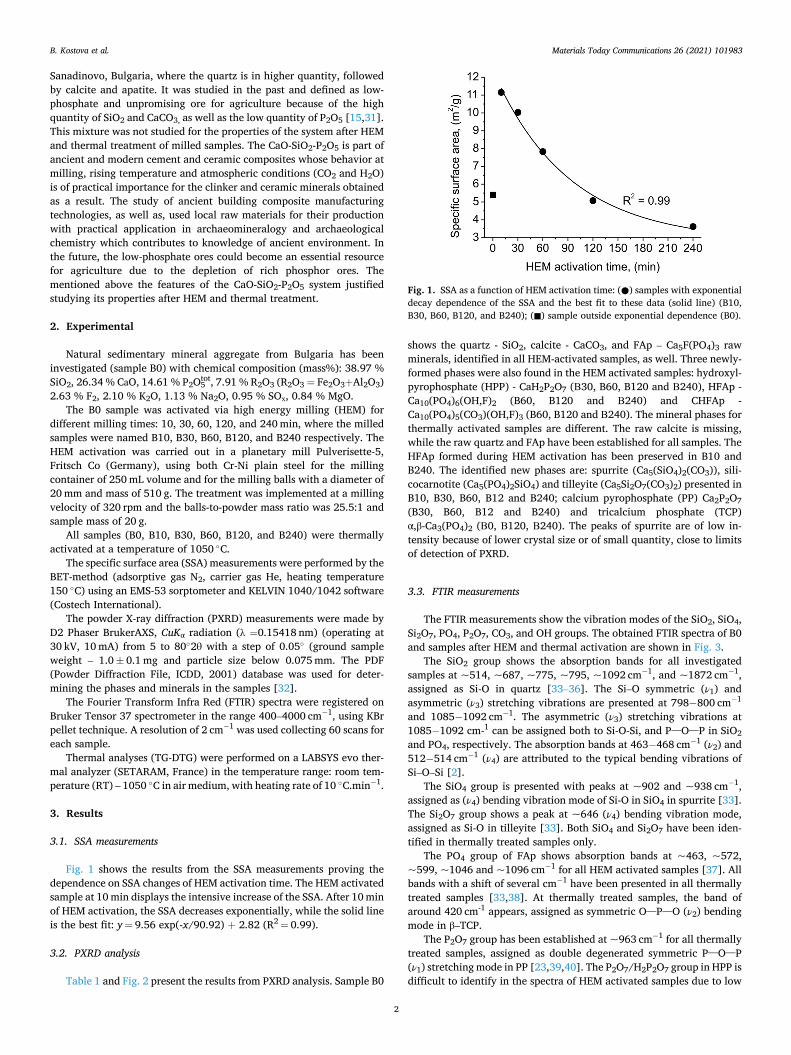
Table 1 and Fig. 2 present the results from PXRD analysis. Sample B0
shows the quartz - SiO2, calcite - CaCO3, and FAp – Ca5F(PO4)3 raw minerals, identified in all HEM-activated samples, as well. Three newly- formed phases were also found in the HEM activated samples: hydroxyl- pyrophosphate (HPP) - CaH2P2O7 (В30, B60, B120 and В240), HFAp - Ca10(PO4)6(OH,F)2 (B60, B120 and В240) and CHFAp - Ca10(PO4)5(CO3)(OH,F)3 (B60, B120 and В240). The mineral phases for thermally activated samples are different. The raw calcite is missing, while the raw quartz and FAp have been established for all samples. The HFAp formed during HEM activation has been preserved in B10 and B240. The identified new phases are: spurrite (Ca5(SiO4)2(CO3)), sili-cocarnotite (Ca5(PO4)2SiO4) and tilleyite (Ca5Si2O7(CO3)2) presented in B10, B30, B60, B12 and B240; calcium pyrophosphate (PP) Ca2P2O7 (B30, B60, B12 and B240) and tricalcium phosphate (TCP) α,β-Ca3(PO4)2 (В0, В120, В240). The peaks of spurrite are of low in-tensity because of lower crystal size or of small quantity, close to limits of detection of PXRD.
3.3. FTIR measurements
The FTIR measurements show the vibration modes of the SiO2, SiO4, Si2O7, PO4, P2O7, CO3, and OH groups. The obtained FTIR spectra of B0 and samples after HEM and thermal activation are shown in Fig. 3.
The SiO2 group shows the absorption bands for all investigated samples at ~514, ~687, ~775, ~795, ~1092 cm− 1, and ~1872 cm− 1, assigned as Si-O in quartz [33–36]. The Si–O symmetric (ν1) and asymmetric (ν3) stretching vibrations are presented at 798− 800 cm− 1
and 1085− 1092 cm− 1. The asymmetric (ν3) stretching vibrations at 1085− 1092 cm-1 can be assigned both to Si-O-Si, and P–O–P in SiO2 and PO4, respectively. The absorption bands at 463− 468 cm− 1 (ν2) and 512− 514 cm− 1 (ν4) are attributed to the typical bending vibrations of Si–O–Si [2].
The SiO4 group is presented with peaks at ~902 and ~938 cm− 1, assigned as (ν4) bending vibration mode of Si-O in SiO4 in spurrite [33]. The Si2O7 group shows a peak at ~646 (ν4) bending vibration mode, assigned as Si-O in tilleyite [33]. Both SiO4 and Si2O7 have been iden-tified in thermally treated samples only.
The PO4 group of FAp shows absorption bands at ~463, ~572, ~599, ~1046 and ~1096 cm− 1 for all HEM activated samples [37]. All bands with a shift of several cm− 1 have been presented in all thermally treated samples [33,38]. At thermally treated samples, the band of around 420 cm-1 appears, assigned as symmetric O–P–O (ν2) bending mode in β–TCP.
The P2O7 group has been established at ~963 cm− 1 for all thermally treated samples, assigned as double degenerated symmetric P–O–P (ν1) stretching mode in PP [23,39,40]. The P2O7/H2P2O7 group in HPP is difficult to identify in the spectra of HEM activated samples due to low
Fig. 1. SSA as a function of HEM activation time: (●) samples with exponential decay dependence of the SSA and the best fit to these data (solid line) (B10, B30, B60, B120, and B240); (◼) sample outside exponential dependence (B0).
B. Kostova et al.
Materials Today Communications 26 (2021) 101983
3
peak intensities and their overlapping with other peaks. The peaks at ~414 cm− 1 (ν2) (inserted in peak at ~463 cm− 1); ~568 cm− 1 (ν4) (inserted in peak at ~ 572 cm− 1); ~732 cm− 1 (ν1) and ~915 cm− 1 (ν1) (inserted in peak at ~1048 cm− 1); and ~1114 cm− 1 (ν3)) have been taken with a high probability of HPP crystallization in these samples [41].
In all studied samples peaks appear at 2360 and 2344 cm− 1 due to CO2 absorption from the air [38]. The doublet stayed unchanged after
HEM- and thermal treatment of the samples. Absorption bands at ~875 cm− 1 and in the range of
1400− 1600 cm− 1 are attributed to (ν3) CO3 symmetric and asymmetric stretching modes and as (ν2) CO3 stretching modes in apatite structure [33,38]. They are typical of all HEM-activated samples. The band at the 1400− 1600 cm− 1 range dramatically decreases in intensity, while the peak at ~875 cm− 1 is absent for all thermally treated samples. The peak positions of HEM activated samples are obtained by multiple peak deconvolution applying Gauss function (Table 2).
Absorption bands at ~2500 and ~2874 are assigned to CO3 in calcite [33]. They are typical of B0 and all HEM activated samples and stay in practically unchanged positions, and are missing in the thermally acti-vated samples.
Absorption bands at 3200 - 3800 cm− 1 and ~1797 cm-1 are assigned to structural OH-groups in apatite structure (stretching modes) [33]. The broad band at 3200 - 3800 cm− 1 is composed of three peaks and their position is obtained by peak deconvolution by Gauss function of experimental FTIR measurements (Table 2). The OH-bands are pre-sented in all HEM activated samples and the B0 sample. The exact peak positions of all samples are shown in Table 2. The thermally activated samples show a significant intensity decrease of the band at 3500 - 3800 cm− 1 and no peak at ~1790 cm− 1.
The peak at ~1630 cm− 1, found in HEM activated samples, is assigned as crystal bonded (ν2) OH-group in HPP [40,41]. For thermally activated samples this peak vanishes.
3.4. Thermal analysis
Table 3 and Fig. 4 show the results from the thermal analysis of B0 and HEM activated samples. The results prove thermal decomposition of carbonate phases and new solid-phase formation after HEM activation. The thermal reactions complete with a total of 11–12 % mass losses (ML). For sample B0, the temperature stages are: RT-200 ◦C (0.40 % ML), 200− 510 ◦C (2.34 % ML), 590− 750 ◦C (5.74 % ML) and 800− 910 ◦C (1.44 % ML).
The decomposition of HEM activated samples is characterized by parallel thermal reactions in which low values of ML are measured. The ML of HEM activated samples are distributed in the following three temperature intervals: 50− 370 ◦C (0.53–2.70 % ML); 430− 530 ◦C (0.72–1.67 % ML) and 530− 920 ◦C (decrease from 6.40 % to 4.56 % ML). ML decreases in the third temperature range, while an increase is measured in the first two. The four stages of decomposition have been distinguished in the third temperature range marked in Table 3 with No 3, 4, 5, and 6, respectively.
4. Discussion
The obtained experimental results of BET method, PXRD analysis, FTIR spectroscopy, and Thermal analysis for all studied samples agree.
4.1. The B0 raw sample
The PXRD measurement shows the following mineral composition: quartz, calcite, and FAp. The FTIR spectroscopy confirms the presence of quartz and calcite and gives new data on the chemical composition of FAp. The peaks position of (ν3) CO3
2− (Table 2) evidence the isomorphic substitution of PO4 by CO3
2− , while the OH- band at ~3550 cm-1 shows the isomorphic substitution of F- by OH- in FAp. The defect substitution of PO4 by CO3
2− is quite known both in literature [17,18,25,28–30,43] and our previous investigations [24,27], known as B-type substitution. The 200− 500 ◦C temperature interval shows a weak step in the TG curve (Fig. 4a, Table 3) with 1.23 % ML caused by burning a small amount of organic matter. The presence of organic matter is related to the sedi-mentary origin of B0. After HEM activation, this effect overlaps with the dehydroxylation process without a significant influence on the reaction mechanism of thermal decomposition of HEM activated samples.
Table 1 Results from the PXRD phase analyses.
After HEM activation Sample After HEM and Thermal activation
Quartz, SiO2 (46− 1045) – 3.34* B0 Quartz, SiO2 (46− 1045) – 3.34* FAp, Ca5F(PO4)3 (15− 0876) – 2.79
* FAp, Ca5F(PO4)3 (15− 0876) –2.79 *
Calcite, CaCO3, (47− 1743) – 3.04* β-TCP, β-Cа3(PO4)2, (09− 0169) – 2.88*
Quartz, SiO2 (46− 1045) – 3.34* B10 Quartz, SiO2 (46− 1045) – 3.34* FAp, Ca5F(PO4)3 (15− 0876) – 2.79
* FAp, Ca5F(PO4)3 (15− 0876) – 2.79*
Calcite, CaCO3, (47− 1743) – 3.04*
HFAp, Ca10(PO4)6(OH,F)2 [9] – 2.80* Spurrite, Ca5(SiO4)2(CO3) (13− 0496) – 2.69* Tilleyite, Ca5Si2O7(CO3)2, (24− 0184) – 3.00* Silicocarnotite, Ca5(PO4)2SiO4
(40− 0393) – 2.81* Quartz, SiO2 (46− 1045) – 3.34* B30 Quartz, SiO2 (46− 1045) – 3.34* FAp, Ca5F(PO4)3 (15− 0876) – 2.79
* FAp, Ca5F(PO4)3 (15− 0876) – 2.79*
Calcite, CaCO3, (47− 1743) – 3.04* Spurrite, Ca5(SiO4)2(CO3), (13− 0496) – 2.69*
HPP, CaH2P2O7 (51− 0200) – 3.35* Tilleyite, Ca5Si2O7(CO3)2, (24− 0184) – 3.00* Silicocarnotite, Ca5(PO4)2SiO4, (40− 0393) – 2.81* PP, Ca2P2O7, (20− 0024) – 3.02*
Quartz, SiO2 (46− 1045) – 3.34* B60 Quartz, SiO2 (46− 1045) – 3.34* FAp, Ca5F(PO4)3 (15− 0876) – 2.79
* FAp, Ca5F(PO4)3 (15− 0876) – 2.79*
Calcite, CaCO3 (47− 1743) – 3.04* Spurrite, Ca5(SiO4)2(CO3) (13− 0496) – 2.69*
HPP, CaH2P2O7 (51− 0200) – 3.35* Tilleyite, Ca5Si2O7(CO3)2
(24− 0184) – 3.00* CHFAp, Ca10(PO4)5(CO3)(OH,F)3
(21− 0145) – 2.71* Silicocarnotite, Ca5(PO4)2SiO4
(40− 0393) – 2.81* HFAp, Ca10(PO4)6(OH,F)2 [9] –
2.80* PP, Ca2P2O7 (20− 0024) – 3.02*
Quartz, SiO2 (46− 1045) – 3.34* B120 Quartz, SiO2 (46− 1045) – 3.34* FAp, Ca5F(PO4)3 (15− 0876) – 2.79
* FAp, Ca5F(PO4)3 (15− 0876) – 2.79*
Calcite, CaCO3, (47− 1743) – 3.04* Spurrite, Ca5(SiO4)2(CO3), (13− 0496) – 2.69*
HPP, CaH2P2O7 (51− 0200) – 3.35* Tilleyite, Ca5Si2O7(CO3)2, (24− 0184) – 3.00*
CHFAp, Ca10(PO4)5(CO3)(OH,F)3
(21− 0145), – 2.71* Silicocarnotite, Ca5(PO4)2SiO4, (40− 0393) – 2.81*
HFAp Ca10(PO4)6(OH,F)2 [9] – 2.80 *
PP, Ca2P2O7, (20− 0024) – 3.02* α-TCP, α-Cа3(PO4)2, (09− 0348) – 2.90*
Quartz, SiO2 (46− 1045) – 3.34* B240 Quartz, SiO2 (46− 1045) – 3.34* FAp, Ca5F(PO4)3 (15− 0876) – 2.79
* FAp, Ca5F(PO4)3 (15− 0876) – 2.79*
Calcite, CaCO3, (47− 1743) – 3.04* HFAp, Ca10(PO4)6(OH,F)2 [9] – 2.80*
HPP, CaH2P2O7, (51− 0200) – 3.35 *
Spurrite, Ca5(SiO4)2(CO3), (13− 0496) – 2.69*
CHFAp, Ca10(PO4)5(CO3)(OH,F)3
(21− 0145), – 2.71* Tilleyite, Ca5Si2O7(CO3)2, (24− 0184) – 3.00*
HFAp Ca10(PO4)6(OH,F)2 [9] – 2.80 *
Silicocarnotite, Ca5(PO4)2SiO4, (40− 0393) – 2.81* PP, Ca2P2O7, (20− 0024) – 3.02* α-TCP, α-Cа3(PO4)2, (09− 0348) – 2.90*
* strongest line.
B. Kostova et al.
Materials Today Communications 26 (2021) 101983
4
The general formula of such apatite is Ca(10-x+u)(PO4)6-x(CO3)xF(2-x+2u), where 0≤x<2 and 0≤u<1 [17,18,22]. According to our results, the chemical formula of B0 is Ca10(PO4)5(CO3) (OH)F2, where x = 1 and u = 1. The low degree of isomorphic sub-stitutions is probably a reason for PXRD identification of raw material as FAp.
4.2. HEM activated samples
The raw minerals: quartz, FAp, and calcite have been identified in all samples by PXRD and FTIR. For B10 sample they remain the only mineral phases. This has been confirmed by BET analysis results (Fig. 1) – the maximum of SSA is measured for B10 because of mechanical fragmentation of the sample, without the formation of new mineral phases because of quartz and FAp low chemical activity [17,18]. The prolonged time of HEM activation leads to exponential decrease of SSA due to crystal aggregates formation [19,21]. For the B30 – B240, the new mineral (HPP) and new isomorphic members of the apatite group (HFAp and CHFAp) arise, proven by PXRD and FTIR.
The quartz, having strong covalent bonds, high hardness (7 by Mohs), and high melting point, remains chemically inactive during HEM activation: (i) PRXD patterns show decreasing peaks intensity without any broadening for B10 – B240 (Fig. 2), in accordance with decreasing SSA after HEM activation (Fig. 1) and (ii) FTIR measurements show practically unchanged Si-O vibration modes of quartz (Fig. 3).
FAp and calcite are with lower hardness - 5 and 3 by Mohs, respec-tively, and with lower melting points. Therefore, the effect of HEM activation is greater – the intensity decrease of PXRD is obvious, as well as the formation of new minerals (Figs. 2, 3 and Table 1).
The crystallization of HPP is a result of P-ions direct pairing (cate-nation) with pyrophosphates [H2P2O7]2− formation (Table 2), skipping ortophosphates - [H2PO4]- and/or [HPO4]2− [47–49].
The formation of HFAp and CHFAp is proven by both PXRD and FTIR. The presence of peaks close to 1418, 1458, and 875 cm− 1 evidence the B-type isomorphic substitution structure [17,18]. The ~1515 cm− 1
peak shows the isomorphic substitution of OH- by CO3 in the apatite structure, known as A-type substitution [46]. Theoretically, the charge compensation at heterovalent substitution is most frequently realized by the occurrence of cationic vacancy [18,50]. The ~875 cm− 1 peak pre-sents the A-type substitution in all samples, while due to B-type substi-tution, the band splitting for B120 and B240 and the presence of two additional peaks at 862 and 868 cm− 1 have been observed [18,51]. The cationic vacancy at the Ca positions, formed during the HEM activation, is very likely to be occupied by CO2 adopted from the air or by migrating CO3-ions which leads to the third type of isomorphic substitution, namely A-B-type. The appearance of A-B-type isomorphism is proved by shifting of the peak close to ~1515 cm− 1 to a higher wavenumber (Table 2) [18]. Additional evidence for isomorphism in the CaO-P2O5 system has been obtained from the thermal analysis.
The maximum at ~3570 cm− 1 shows substitution of OH- by CO3 [18, 38]. As a result, the isomorphic transformation from raw FAp to HCFAp occurs. The probable mechanism of such type of substitution is deter-mined by: (i) adsorption of CO2 from the air [52] and (ii) partial decomposition of calcite and relocation and migration of CO3 in the tetragonal positions of the phosphate ions in the course of HEM-activation. It is known that peak intensity close to 3550 cm− 1 de-creases with the increase of CO3 content in the apatite structure and the area of ν1, ν2, and ν3 CO3 peaks increases with the rise of CO3 [46]. On
Fig. 2. PXRD patterns of B0 and HEM activated samples: (a) measurements at RT; (b) measurements after thermal activation at 1050 ◦C.
B. Kostova et al.
Materials Today Communications 26 (2021) 101983
5
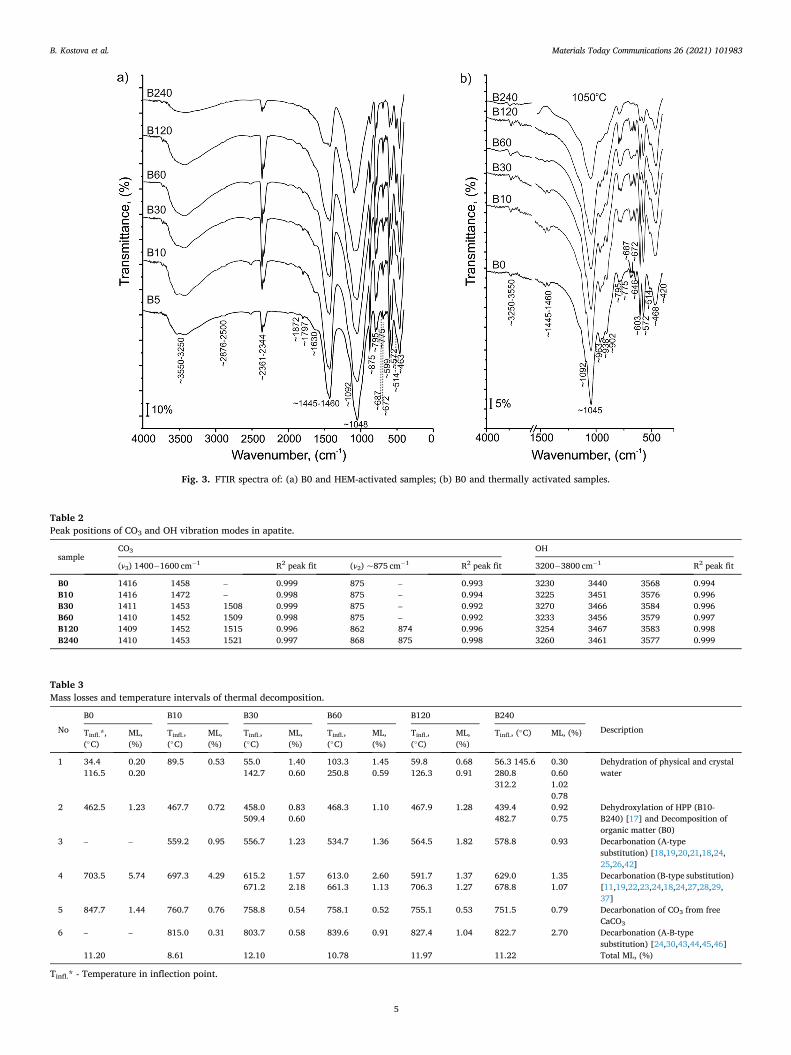
Fig. 3. FTIR spectra of: (a) B0 and HEM-activated samples; (b) B0 and thermally activated samples.
Table 2 Peak positions of CO3 and OH vibration modes in apatite.
sample CO3 OH
(ν3) 1400− 1600 cm− 1 R2 peak fit (ν2) ~875 cm− 1 R2 peak fit 3200− 3800 cm− 1 R2 peak fit
B0 1416 1458 – 0.999 875 – 0.993 3230 3440 3568 0.994 B10 1416 1472 – 0.998 875 – 0.994 3225 3451 3576 0.996 B30 1411 1453 1508 0.999 875 – 0.992 3270 3466 3584 0.996 B60 1410 1452 1509 0.998 875 – 0.992 3233 3456 3579 0.997 B120 1409 1452 1515 0.996 862 874 0.996 3254 3467 3583 0.998 B240 1410 1453 1521 0.997 868 875 0.998 3260 3461 3577 0.999
Table 3 Mass losses and temperature intervals of thermal decomposition.
No
B0 B10 B30 B60 B120 B240
Description Tinfl.*, (◦C)
ML, (%)
Tinfl., (◦C)
ML, (%)
Tinfl., (◦C)
ML, (%)
Tinfl., (◦C)
ML, (%)
Tinfl., (◦C)
ML, (%)
Tinfl., (◦C) ML, (%)
1 34.4 116.5
0.20 0.20
89.5 0.53 55.0 142.7
1.40 0.60
103.3 250.8
1.45 0.59
59.8 126.3
0.68 0.91
56.3 145.6 280.8 312.2
0.30 0.60 1.02 0.78
Dehydration of physical and crystal water
2 462.5 1.23 467.7 0.72 458.0 509.4
0.83 0.60
468.3 1.10 467.9 1.28 439.4 482.7
0.92 0.75
Dehydroxylation of HPP (B10- B240) [17] and Decomposition of organic matter (B0)
3 – – 559.2 0.95 556.7 1.23 534.7 1.36 564.5 1.82 578.8 0.93 Decarbonation (A-type substitution) [18,19,20,21,18,24, 25,26,42]
4 703.5 5.74 697.3 4.29 615.2 671.2
1.57 2.18
613.0 661.3
2.60 1.13
591.7 706.3
1.37 1.27
629.0 678.8
1.35 1.07
Decarbonation (B-type substitution) [11,19,22,23,24,18,24,27,28,29, 37]
5 847.7 1.44 760.7 0.76 758.8 0.54 758.1 0.52 755.1 0.53 751.5 0.79 Decarbonation of CO3 from free CaCO3
6 – – 815.0 0.31 803.7 0.58 839.6 0.91 827.4 1.04 822.7 2.70 Decarbonation (A-B-type substitution) [24,30,43,44,45,46]
11.20 8.61 12.10 10.78 11.97 11.22 Total ML, (%)
Tinfl.* - Temperature in inflection point.
B. Kostova et al.
Materials Today Communications 26 (2021) 101983
6
the other hand, the decrease of peak intensity close to 3550 cm− 1 could be due to: (i) decrease of samples crystallinity [46] because of increased CO3 content or (ii) HEM-activation (Fig. 1) [53]. The results show decreasing intensities of both peaks due to the reduction of crystallinity of HEM-activation, proven by SSA measurements (Fig. 1).
The three peaks in the broad band at 3200 – 3800 cm− 1 (Table 2) assumes the OH–F substitution in the apatite structure [54,55].
The position of the peak close to 3550 cm− 1 defined the quantity of OH in the F position, whereas the peak shift to 3580 cm− 1 displays an increase of OH (Table 2). The increase of OH-content in the apatite structure appears as a result of the sample HEM-activation and supposes isomorphic transformation from raw FAp to HFAp.
The chemical mechanism of the isomorphic substitutions and the formation of the new phases could be presented by the following possible reactions:
Ca10(PO4)6F2 → 3Ca3(PO4)2 + CaF2 (1)
Ca10(PO4)6F2 + H2O → Ca10(PO4)6(OH)F + HF (2)
2Ca10(PO4)6F2 + 2H2O + CaCO3 + CO2 → 2Ca10(PO4)5(CO3)(OH)F2 +
CaH2P2O7 (3)
Ca10(PO4)6F2 + H2O + 2CaCO3 → Ca9(PO4)4(CO3)2(OH)F + Ca3(PO4)2 +
HF (4)
Ca10(PO4)6F2 + H2O → CaH2P2O7 + 2Ca3(PO4)2 + CaF2 + 2CaO (5)
and/or
Ca10(PO4)6(OH)F + H2O → CaH2P2O7 + 2Ca3(PO4)2 + 3CaO + HF (5a)
Taking into account the obtained formula of B0 - Ca10(PO4)5(CO3) (OH)F2, the reactions (3) and (4) could be transformed in accordance with a possible increase of CO2 and H2O adsorbtion from the air as following:
2Ca10(PO4)5(CO3)(OH)F2+H2O+2CO2→2Ca9(PO4)4(CO3)2(OH)F + CaH2-
P2O7+CaF2+2HF (6)
2Ca10(PO4)5(CO3)(OH)F2 + H2O → Ca9(PO4)4(CO3)2(OH)F + 3Ca3(PO4)2 +
2CaO +3HF (7)
Ca10(PO4)5(CO3)(OH)F2 + H2O → Ca10(PO4)5(CO3)(OH)2F + 2HF (8)
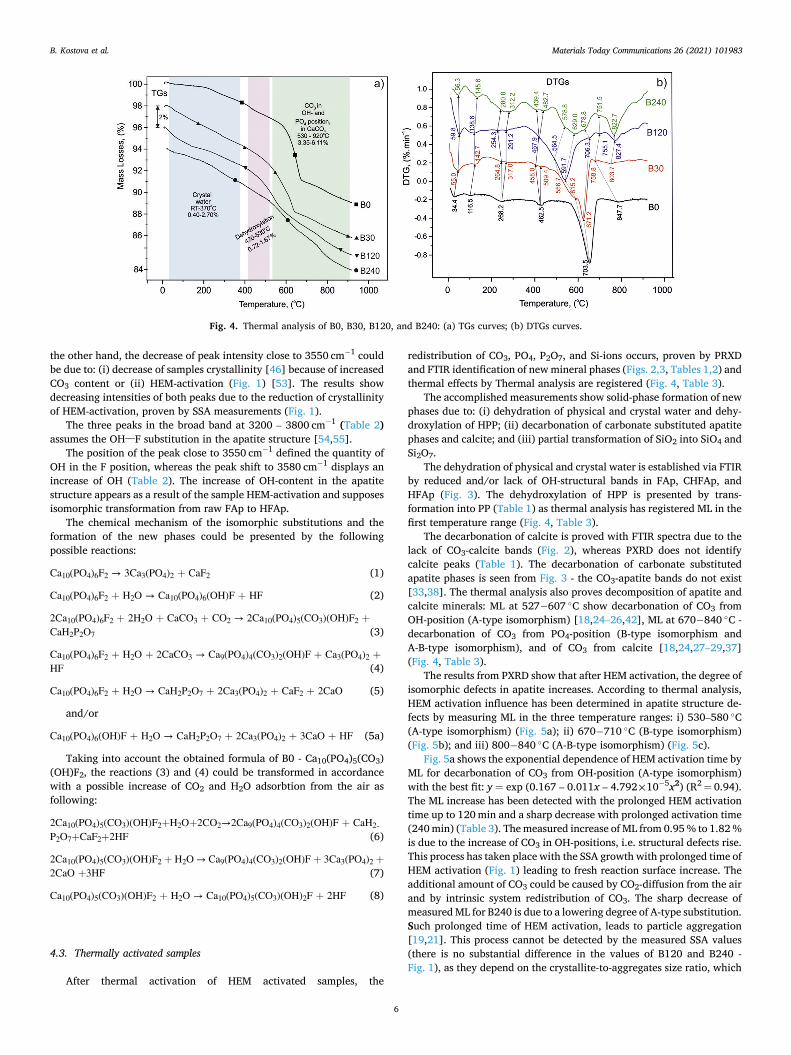
4.3. Thermally activated samples
After thermal activation of HEM activated samples, the
redistribution of CO3, PO4, P2O7, and Si-ions occurs, proven by PRXD and FTIR identification of new mineral phases (Figs. 2,3, Tables 1,2) and thermal effects by Thermal analysis are registered (Fig. 4, Table 3).
The accomplished measurements show solid-phase formation of new phases due to: (i) dehydration of physical and crystal water and dehy-droxylation of HPP; (ii) decarbonation of carbonate substituted apatite phases and calcite; and (iii) partial transformation of SiO2 into SiO4 and Si2O7.
The dehydration of physical and crystal water is established via FTIR by reduced and/or lack of OH-structural bands in FAp, CHFAp, and HFAp (Fig. 3). The dehydroxylation of HPP is presented by trans-formation into PP (Table 1) as thermal analysis has registered ML in the first temperature range (Fig. 4, Table 3).
The decarbonation of calcite is proved with FTIR spectra due to the lack of CO3-calcite bands (Fig. 2), whereas PXRD does not identify calcite peaks (Table 1). The decarbonation of carbonate substituted apatite phases is seen from Fig. 3 - the CO3-apatite bands do not exist [33,38]. The thermal analysis also proves decomposition of apatite and calcite minerals: ML at 527− 607 ◦C show decarbonation of CO3 from OH-position (A-type isomorphism) [18,24–26,42], ML at 670− 840 ◦C - decarbonation of CO3 from PO4-position (B-type isomorphism and A-B-type isomorphism), and of CO3 from calcite [18,24,27–29,37] (Fig. 4, Table 3).
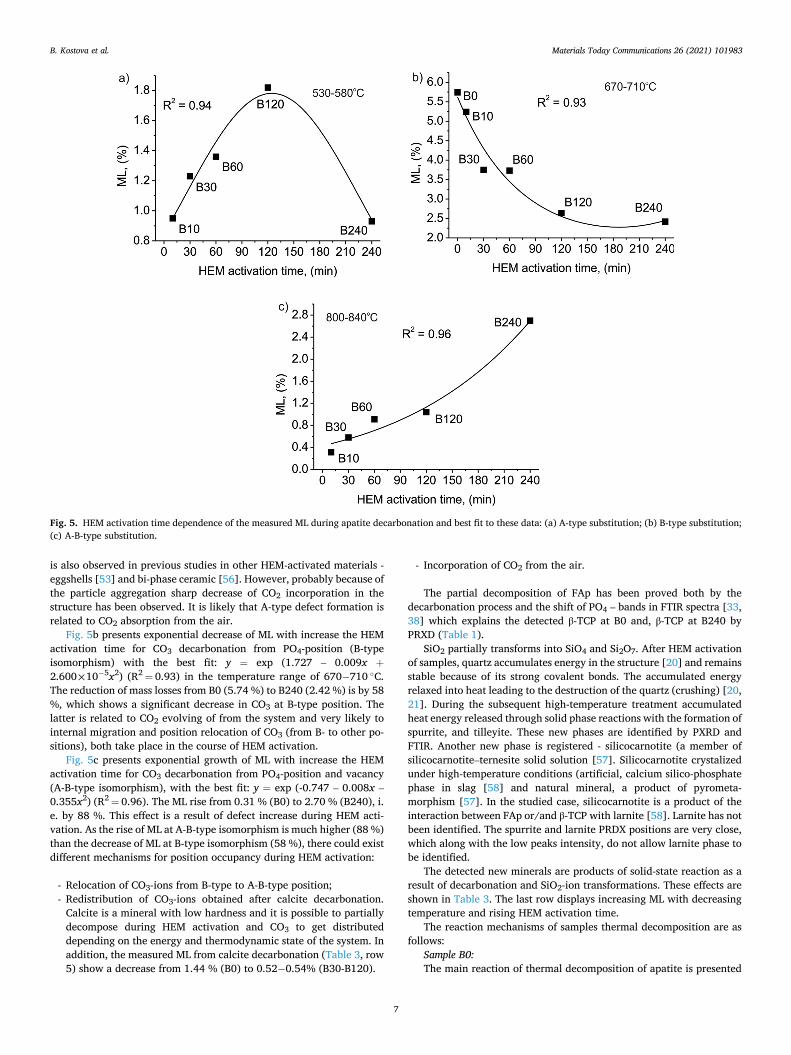
The results from PXRD show that after HEM activation, the degree of isomorphic defects in apatite increases. According to thermal analysis, HEM activation influence has been determined in apatite structure de-fects by measuring ML in the three temperature ranges: i) 530–580 ◦C (A-type isomorphism) (Fig. 5a); ii) 670− 710 ◦C (B-type isomorphism) (Fig. 5b); and iii) 800− 840 ◦C (A-B-type isomorphism) (Fig. 5c).
Fig. 5a shows the exponential dependence of HEM activation time by ML for decarbonation of CO3 from OH-position (A-type isomorphism) with the best fit: y = exp (0.167 – 0.011x – 4.792£10− 5x2) (R2 = 0.94). The ML increase has been detected with the prolonged HEM activation time up to 120 min and a sharp decrease with prolonged activation time (240 min) (Table 3). The measured increase of ML from 0.95 % to 1.82 % is due to the increase of CO3 in OH-positions, i.e. structural defects rise. This process has taken place with the SSA growth with prolonged time of HEM activation (Fig. 1) leading to fresh reaction surface increase. The additional amount of CO3 could be caused by CO2-diffusion from the air and by intrinsic system redistribution of CO3. The sharp decrease of measured ML for B240 is due to a lowering degree of A-type substitution. Such prolonged time of HEM activation, leads to particle aggregation [19,21]. This process cannot be detected by the measured SSA values (there is no substantial difference in the values of B120 and B240 - Fig. 1), as they depend on the crystallite-to-aggregates size ratio, which
Fig. 4. Thermal analysis of B0, B30, B120, and B240: (a) TGs curves; (b) DTGs curves.
B. Kostova et al.
Materials Today Communications 26 (2021) 101983
7
is also observed in previous studies in other HEM-activated materials - eggshells [53] and bi-phase ceramic [56]. However, probably because of the particle aggregation sharp decrease of CO2 incorporation in the structure has been observed. It is likely that A-type defect formation is related to CO2 absorption from the air.
Fig. 5b presents exponential decrease of ML with increase the HEM activation time for CO3 decarbonation from PO4-position (B-type isomorphism) with the best fit: y = exp (1.727 – 0.009x +
2.600£10− 5x2) (R2 = 0.93) in the temperature range of 670− 710 ◦C. The reduction of mass losses from B0 (5.74 %) to B240 (2.42 %) is by 58 %, which shows a significant decrease in CO3 at B-type position. The latter is related to CO2 evolving of from the system and very likely to internal migration and position relocation of CO3 (from B- to other po-sitions), both take place in the course of HEM activation.
Fig. 5c presents exponential growth of ML with increase the HEM activation time for CO3 decarbonation from PO4-position and vacancy (A-B-type isomorphism), with the best fit: y = exp (-0.747 – 0.008x – 0.355x2) (R2 = 0.96). The ML rise from 0.31 % (B0) to 2.70 % (B240), i. e. by 88 %. This effect is a result of defect increase during HEM acti-vation. As the rise of ML at A-B-type isomorphism is much higher (88 %) than the decrease of ML at B-type isomorphism (58 %), there could exist different mechanisms for position occupancy during HEM activation:
- Relocation of CO3-ions from B-type to A-B-type position; - Redistribution of CO3-ions obtained after calcite decarbonation.
Calcite is a mineral with low hardness and it is possible to partially decompose during HEM activation and CO3 to get distributed depending on the energy and thermodynamic state of the system. In addition, the measured ML from calcite decarbonation (Table 3, row 5) show a decrease from 1.44 % (B0) to 0.52− 0.54% (B30-B120).
- Incorporation of CO2 from the air.
The partial decomposition of FAp has been proved both by the decarbonation process and the shift of PO4 – bands in FTIR spectra [33, 38] which explains the detected β-TCP at B0 and, β-TCP at B240 by PRXD (Table 1).
SiO2 partially transforms into SiO4 and Si2O7. After HEM activation of samples, quartz accumulates energy in the structure [20] and remains stable because of its strong covalent bonds. The accumulated energy relaxed into heat leading to the destruction of the quartz (crushing) [20, 21]. During the subsequent high-temperature treatment accumulated heat energy released through solid phase reactions with the formation of spurrite, and tilleyite. These new phases are identified by PXRD and FTIR. Another new phase is registered - silicocarnotite (a member of silicocarnotite–ternesite solid solution [57]. Silicocarnotite crystalized under high-temperature conditions (artificial, calcium silico-phosphate phase in slag [58] and natural mineral, a product of pyrometa-morphism [57]. In the studied case, silicocarnotite is a product of the interaction between FAp or/and β-TCP with larnite [58]. Larnite has not been identified. The spurrite and larnite PRDX positions are very close, which along with the low peaks intensity, do not allow larnite phase to be identified.
The detected new minerals are products of solid-state reaction as a result of decarbonation and SiO2-ion transformations. These effects are shown in Table 3. The last row displays increasing ML with decreasing temperature and rising HEM activation time.
The reaction mechanisms of samples thermal decomposition are as follows:
Sample B0: The main reaction of thermal decomposition of apatite is presented
Fig. 5. HEM activation time dependence of the measured ML during apatite decarbonation and best fit to these data: (a) A-type substitution; (b) B-type substitution; (c) A-B-type substitution.
B. Kostova et al.
Materials Today Communications 26 (2021) 101983
8
by (1). Taking into account the identification of sample B0 as CHFAp, the reaction (1) is modified into decarbonation of CHFAp via CO3 from PO4-position:
660− 720 ◦C, Decarbonation of CHFAp (CO3 from PO4-position)
2Ca10(PO4)5(CO3)(OH)F2 → 2Ca5(PO4)3F + 2Ca3(PO4)2 + CaF2 + 3CaO +H2O + 2CO2 (9)
800− 910 ◦C, Decarbonation of calcite
CaCO3 = CaO + CO2 (10)
HEM activated samples (B10-B240) Up to 370 ◦C, Dehydration of free physical and crystal water 430− 530 ◦C, Dehydroxylation of HPP
CaH2P2O7 + 2CaCO3 → Ca3(PO4)2 + 2CO2 + H2O (11)
CaH2P2O7 + CaCO3 → Ca2P2O7 + H2O + CO2 (12)
530− 920 ◦C, Decarbonation of CO3 from different types of isomor-phic substitutions and CO3 from calcite:
2Ca10(PO4)5(CO3)(OH)F2 → 2Ca5(PO4)3F + 2Ca3(PO4)2 + CaF2 + 3CaO +H2O + 2CO2 (9)
CaCO3 → CaO + CO2 (10)
Solid-phase crystallization of spurrite and tilleyite from calcite and quartz:
CaCO3 + 2SiO2 → Ca5(SiO4)2(CO3) + 4CO2 (13)
CaCO3 + 2SiO2 → Ca5Si2O7(CO3)2 + 3CO2 (14)
Solid-phase crystallization of spurrite and tilleyite from apatite, quartz and CaO:
Ca9(PO4)4(CO3)2(OH)F + 2SiO2 + 2CaO → Ca5(SiO4)2(CO3) + 2Ca3(PO4)2 + CO2 + HF (15)
Ca9(PO4)4(CO3)2(OH)F + 2SiO2 + 2CaO → Ca5Si2O7(CO3)2 + 2Ca3(PO4)2 +
HF (16)
Ca9(PO4)4(CO3)2(OH)F + 2SiO2 + 2CaO → Ca5(SiO4)2(CO3) + 2Ca2P2O7 +
CO2 + HF (17)
Ca9(PO4)4(CO3)2(OH)F + 2SiO2 + 2CaO → Ca5Si2O7(CO3)2 + 2Ca2P2O7 +
HF (18)
2CaO + SiO2 → Ca2SiO4 (20)
Solid-phase synthesis of silicocarnotite:
Ca3(PO4)2 + 2Ca2SiO2 → Ca5(PO4)2(SiO4) (21)
5. Conclusions
After HEM- and thermal treatment, the redistribution of CaO, SiO2, and P2O5 occurs as follows:
- Strength change of chemical bonds: SiO2 partially passes into SiO4 with the formation of new phases during thermal activation. The increased reactivity of SiO2 is a result of HEM treatment of the samples and after their thermal treatment, the solid-phase reactions of Ca-Si-carbonates crystallization occur;
- deformation of structural polyhedrons and formation of new isomorphic apatite phases after HEM activation: (i) CO3 both partially substitutes P2O5 and OH in two different positions and oc-cupies the vacancy in apatite structure, as the degree of defects de-pends on HEM-activation time by functional dependencies; (ii) OH partially substitutes F in the apatite structure;
- the prolonged time of HEM activation leads to decreasing raw min-eral stability leads to the formation of new phases: (i) P2O5 partially passes into P2O7 with the formation of new phases during both types of treatment; (ii) CaO after thermal treatment is transformed from Ca-carbonate into Ca-silicate, Ca-phosphate, and Ca-silicate- carbonate phases.
The obtained results can be used as a reference in the study of ceramic and cement materials (ancient and modern), soil conditioners, etc.
6. Projects contributions
The KP-06-PN-40/6 grant has sponsored the following activities: sample collection, sample preparation, and chemical analysis; the KP- 06-N39/9 grant - experiments and measurements of HEM activation, and results interpretation. The contribution of both projects is 50:50.
Funding
This work has been supported by the National Science Fund, Re-public of Bulgaria [grant number KP-06-N39/9 (B.K., V.S., Zh.U) and grant number KP-06-PN-40/6 (Zh.U., B.K)].
Declaration of Competing Interest
The authors declare that they have no known competing financial interests or personal relationships that could have appeared to influence the work reported in this paper
Acknowledgments
The authors acknowledge the technical support from the Department of Natural Sciences, Laboratory of Geology - BF at NBU (B.K.) and of Institute of Mineralogy and Crystallography "Acad. Iv. Kostov", Bulgarian Academy of Sciences (V.P. of K2-2020). Special thanks to Mrs. Ina Maneva for the technical assistance.
References
[1] Z. Gou, J. Chang, W. Zhai, Preparation and characterization of novel bioactive dicalcium silicate ceramics, J. Eur. Ceram. Soc. 25 (2005) 1507–1514, https://doi. org/10.1016/j.jeurceramsoc.2004.05.029.
[2] L. Radev, V. Hristov, I. Michailova, M.H.V. Fernandes, I.M.M. Salvado, Collagen/ silicocarnotite composites, cross-linked with chondroitin sulphate: in vitro bioactivity, Process. Appl. Ceram. 5 (3) (2011) 161–170, https://doi.org/10.2298/ PAC1103161R.
[3] S.V. Maruti, R. Krishna, M. Mounesh, Properties of geopolymer cement mortar and blocks with calcium carbonate, Mater. Today Proc. 24 (2) (2020) 1518–1524, https://doi.org/10.1016/j.matpr.2020.04.471.
[4] R.A. Steinke, M.R. Silsbee, D.K. Agrawal, R. Roy, D.M. Roy, Development of chemically bonded ceramics in the CaO-SiO2-P2O5-H2O system, Cem. Concr. Res. 21 (1) (1991) 66–72, https://doi.org/10.1016/0008-8846(91)90032-d.
[5] M. Catauro, A. Dell’Era, S. Vecchio Ciprioti, Synthesis, structural, spectroscopic and thermoanalytical study of sol–gel derived SiO2–CaO–P2O5 gel and ceramic materials, Thermochim. Acta 625 (2016) 20–27, https://doi.org/10.1016/j. tca.2015.12.004.
[6] J. Hu, D.K. Agrawal, R. Roy, Investigation of hydration phases in the system CaO–SiO2-P2O5-H2O, J. Mater. Res. 3 (1988) 772–780, https://doi.org/10.1557/ JMR.1988.0772.
[7] I. Odler, Special Inorganic Cements (Modern Concrete Technology), Taylor & Francis Ltd, United Kingdom, 2000.
[8] L. Maritan, I. Angelini, G. Artioli, C. Mazzoli, M. Saracino, Secondary phosphates in the ceramic materials from Frattesina (Rovigo, North-Eastern Italy), J. Cult. Herit. 10 (1) (2009) 144–151, https://doi.org/10.1016/j.culher.2008.01.008.
[9] L. Maritan, C. Mazzoli, Phosphates in archaeological finds: implications forenvironmental conditions of burial, Archaeometry 46 (4) (2004) 673–683, https://doi.org/10.1111/j.1475-4754.2004.00182.x.
[10] L. Maritan, Ceramic Materials, Archaeological Soil and Sediment Micromorphology, Wiley, Hoboken, NJ, 2017.
[11] S.F.S.R. Rodrigues, M. Lima da Costa, Phosphorus in archeological ceramics as evidence of the use of pots for cooking food, Appl. Clay Sci. 123 (2016) 224–231, https://doi.org/10.1016/j.clay.2015.10.038.
B. Kostova et al.
Materials Today Communications 26 (2021) 101983
9
[12] C.L. Giannossa, I.M. Muntoni, R. Laviano, A. Mangone, Building a step by step result in archaeometry. Raw materials, provenance and production technology of Apulian Red Figure pottery, J. Cult. Herit. 43 (2020) 242–248, https://doi.org/ 10.1016/j.culher.2019.11.002.
[13] P.J. Cook, J.H. Shergold (Eds.), Phosphate Deposits of the World: Volume 1: Proterozoic and Cambrian Phosphorites, Cambridge University Press, Cambridge, 2005.
[14] W.L. Pohl, Economic Geology: Principles and Practice. Metals, Minerals, Coal and Hydrocarbons – Introduction to Formation and Sustainable Exploitation of Mineral Deposits, Wiley-Blackwell, Oxford, 2011.
[15] V. Kovatchev, S. Strashimirov, P. Petrov, Non-metallic Ores, University of Minning and Geology, Sofia, 1991.
[16] S.K. Kawatra, J.T. Carlson, Benefication of phosphate. Society for Mining, Metallurgy & Exploration, Englewood, Colorado, USA, 2014.
[17] J.C. Elliott, Structure and Chemistry of the Apatite and Other Calcium Orthophosphate, Studies in Inorganic Chemistry, Elsevier, Amsterdam, 1994. Hardcover ISBN: 9780444815828; eBook ISBN: 9781483290317.
[18] M.V. Chaikina, Mechanochemistry of Natural and Synthetic Apatites, Publishing house of SB RAS, Branch "GEO", Novosibirsk, 2002. ISBN 5-7692-0528-8.
[19] G. Hainike, Tribochemistry, Akademie-Verlag, Berlin, Münich, 1984. [20] V.V. Boldyrev, K. Tkacova, Mechanochemistry of Solids: Past, Present, and
Prospects, J. Mater. Synth. Process. 8 (2000) 121–132, https://doi.org/10.1023/A: 1011347706721.
[21] P. Balaz, Mechanochemistry in Nanoscience and Minerals Engineering, Springer, Berlin Heidelberg, 2008. Print ISBN 978-3-540-74854-0. Online ISBN 978-3-540- 74855-74857.
[22] K. Tonsuaadu, K. Rimm, M. Veiderma, Composition and properties of thermophosphates from apatite and aluminosilicates, Phosphorus Sulfur 84 (1993), https://doi.org/10.1080/10426509308034317, 1-4-73.
[23] L. Daasch, D. Smith, Infrared spectra of phosphorus compounds, Anal. Chem. 23 (1951) 6–853, https://doi.org/10.1021/ac60054a008.
[24] V. Petkova, V. Koleva, B. Kostova, S. Sarov, Structural and thermal transformations on high energy milling of natural apatite, J. Therm. Anal. Calorim. 121 (2015) 1–217, https://doi.org/10.1007/s10973-014-4205-5.
[25] S. Jebri, H. Boughzala, A. Bechrifa, M. Jemal, Structural analysis and thermochemistry of "A" type phosphostrontium carbonate hydroxyapatites, J. Therm. Anal. Calorim. 107 (2012) 3–963, https://doi.org/10.1007/s10973-011- 1598-2.
[26] M.E. Fleet, X. Liu, Local structure of channel ions in carbonate apatite, Biomaterials 26 (2005) 36–7548, https://doi.org/10.1016/j.biomaterials.2005.05.025.
[27] V. Petkova, V. Yaneva, Thermal behavior and phase transformations of nanosized apatite (Syria), J. Therm. Anal. Calorim. 99 (2010) 1–179, https://doi.org/ 10.1007/s10973-009-0149-6.
[28] J.P. Lafon, E. Champion, D. Bernache-Assollant, R. Gibert, A.M. Danna, Thermal decomposition of carbonated calcium phosphate apatites, J. Therm. Anal. Calorim. (2003) 73–1127, https://doi.org/10.1023/A:1025036214044.
[29] F. Bel, H. Yahia, M. Jemal, Synthesis, structural analysis and thermochemistry of B- type carbonate apatites, Thermochim. Acta 505 (2010), https://doi.org/10.1016/j. tca.2010.03.017, 1-2- 22.
[30] K. Tonsuaadu, K.A. Gross, L. Pluduma, M. Veiderma, A review on the thermal stability of calcium apatites, J. Therm. Anal. Calorim. 110 (2012) 2–647, https:// doi.org/10.1007/s10973-011-1877-y.
[31] S. Pironkov, S. Marinova, Phosphorites. Non-metallic Ores. Technological and Economical Review, Tehnika, Sofia, 1991.
[32] Powder Diffraction File (PDF), ICDD, Newtown Square, PA. [33] N.V. Chukanov, Infrared Spectra of Mineral Species: Extended Library, Volume 1,
Springer Science+Business Media, Dordrecht, 2014, https://doi.org/10.1007/978- 94-007-7128-4.
[34] M. Catauro, S.V. Ciprioti, E. Tranquillo, R. Risoluti, Sol-Gel Synthesis, Spectroscopic and thermal behavior study of SiO2/PEG composites containing different amount of chlorogenic acid, Polymers 10 (2018) 682, https://doi.org/ 10.3390/polym10060682.
[35] M. Catauro, F. Barrino, G. Dal Poggetto, G. Crescente, Pacifico. New SiO2/caffeic acid hybrid materials: synthesis, spectroscopic characterization, and bioactivity, Materials 13 (2020) 394, https://doi.org/10.3390/ma13020394.
[36] M. Catauro, S. Piccolella, C. Leonelli, FT-IR characterization of antimicrobial hybrid materials through sol-gel synthesis, Appl. Sci. 10 (2020) 1180, https://doi. org/10.3390/app10031180.
[37] J.C. Elliott, The interpretation of the infra-red absorption spectra of some carbonate-containing apatites, in: M.V. Stack, R.W. Fearnhead (Eds.), Tooth Enamel: Its Composition, Properties, and Fundamental Structure, John Wright and Sons, Bristol, 1965, pp. 20–22, and p. 50-57.
[38] Th Theophile (Ed.), Infrared Spectroscopy, Materials Science, Engineering and Technology Croatia: Intech, 2012.
[39] T.V. Safronova, E.A. Mukhin, V.I. Putlyaev, A.V. Knotko, P.V. Evdokimov, Yu Filippov Ya, Amorphous calcium phosphate powder synthesized from calcium acetate and polyphosphoric acid for bioceramics application, Ceram. Int. 43 (2017) 1B–1310, https://doi.org/10.1016/j.ceramint.2016.10.085.
[40] J.R. Lehr, Crystallographic Properties of Fertilizer Compounds, Muscle Shoals, National Fertilizer Development Center, Alabama, 1967.
[41] R. Khaoulaf, A. Ennaciri, M. Ezzaafrani, F. Capitelli, Structure and vibrational spectra of a new acidic diphosphate K2Cu(H2P2O7)2.2H2O, Phosphorus Sulfur 188 (2013) 8–1038, https://doi.org/10.1080/10426507.2012.736096.
[42] D.U. Schramm, J. Terra, A.M. Rossi, D.E. Ellis, Configuration of CO2 radicals in g- irradiated A-type carbonated apatites: theory and experimental EPR and ENDOR studies, Phys. Rev. B (2000), https://doi.org/10.1103/PhysRevB.63.024107, 63-1.
[43] I.R. Gibson, W. Bonfield, Novel synthesis and characterization of an AB-type carbonate-substituted hydroxyapatite, J. Biomed. Mater. Res. 59 (2020) 4–97, https://doi.org/10.1002/jbm.10044.
[44] L. Muller, E. Conforto, D. Caillard, F.A. Muller, Biomimetic apatite coatings—carbonate substitution and preferred growth orientation, Biomol. Eng. (2007) 24–462, https://doi.org/10.1016/j.bioeng.2007.07.011.
[45] J.P. Lafon, E. Championa, D. Bernache-Assollant, Processing of AB-type carbonated hydroxyapatite Ca10− x(PO4)6− x(CO3)x(OH)2− x− 2y(CO3)y ceramics with controlled composition, J. Eur. Ceram. Soc. 28 (2008) 1–139, https://doi.org/10.1016/j. jeurceramsoc.2007.06.009.
[46] M.E. Fleet, X. Liu, Coupled substitution of type A and B carbonate in sodium- bearing apatite, Biomaterials 28 (2007) 6–916, https://doi.org/10.1016/j. biomaterials.2006.11.003.
[47] S. Seesanong, C. Laosinwattana, B. Boonchom, A simple rapid route to synthesize monocalcium phosphate monohydrate using calcium carbonate with different phases derived from green mussel shells, J Mater Environ Sci 10 (2019) 2–113.
[48] A. Durif, Crystal Chemistry of Condensed Phosphates, Springer Science+Buisness Media, New York, 1995.
[49] P. Gras, S. Teychene, Rey Ch, C. Charvillat, B. Biscans, S. Sarda, et al., Crystallisation of a highly metastable hydrated calcium pyrophosphate phase, Cryst Eng Comm 15 (2013) 12–2294, https://doi.org/10.1039/C2CE26499D.
[50] N. Leroy, E. Bres, Structure and substitutions in fluorapatite, Eur. Cell. Mater. 2 (2001) 36–48, https://doi.org/10.22203/eCM.v002a05.
[51] M.E. Fleet, L. Xiaoyang, X. Liu, Orientation of channel carbonate ions in apatite: effect of pressure and composition, Am. Mineral. 96 (2011) 7–1148, https://doi. org/10.2138/am.2011.3683.
[52] V. Koleva, V. Petkova, IR spectroscopic study of high energy activated Tunisian phosphorite, Vib. Spectrosc. (2012) 58–125., https://doi.org/10.1016/j. vibspec.2011.09.010.
[53] B.V. Kostova, V. Petkova, M. Shopska, G. Kadinov, M. Balaz, P. Balaz, M. Kadiyski, Influence of high energy milling activation on nano-to-micro-sized CaCO3 crystallite formation, Fresenius Environ Bull 26 (2017) 1–426.
[54] L. Rintou, E. Wentrup-Byrne, Sh Suzuki, L. Grøndahl, FT-IR spectroscopy of fluoro- substituted hydroxyapatite: strengths and limitations, J. Mater. Sci. Mater. Med. (2007) 18–1701, https://doi.org/10.1007/s10856-007-3052-3.
[55] F. Freund, Ordering of F− along the OH− -chains in apatite, Inorg Nucl Chem Lett (1977) 13–57.
[56] V.V. Kostov-Kytin, E. Dyulgerova, R. Ilieva, V. Petkova, Powder X-ray difraction studies of hydroxyapatite and β-TCP mixtures processed by high energy dry milling, Ceram. Int. 44 (2018) 8664–8671, https://doi.org/10.1016/j. ceramint.2018.02.094.
[57] E.V. Galuskin, I.O. Galuskina, F. Gfeller, B. Krüger, J. Kusz, Y. Vapnik, et al., Silicocarnotite, Ca5[(SiO4)(PO4)](PO4), a new ‘old’ mineral from the Negev Desert, Israel, and the ternesite-silicocarnotite solid solution: indicators of high- temperature alteration of pyrometamorphic rocks of the Hatrurim Complex, Southern Levant, Eur J Mineral 28 (2016) 1–105, https://doi.org/10.1127/ejm/ 2015/0027-2494.
[58] P. Ros-Tarraga, P. Mazon, L. Meseguer-Olmo, P.N. De Aza, Revising the subsystem nurse’s A-Phase-Silicocarnotite within the system Ca₃(PO₄)₂-Ca₂SiO4, Materials 9 (2016) 5–322, https://doi.org/10.3390/ma9050322.
B. Kostova et al.


