Embed Size (px)
Citation preview

A501 N DIXON STREET, PORTLAND, OREGON 97227
FISCAL YEAR JULY 1, 2022- JUNE 30, 2023
Portland Public Schools
School District No . 1J,
Multnomah County, Oregon
www.pps.net
PORTLAND PUBLIC SCHOOLS
2022-23PROPOSEDBUDGETVOLUME #1
Cover artwork created by: Jenny, 8th Grade - Access Academy

ii
This Meritorious Budget Award is presented to
PORTLAND PUBLIC SCHOOLS
for excellence in the preparation and issuance of its budget for the Fiscal Year 2021–2022.
The budget adheres to the principles and standards
of ASBO International’s Meritorious Budget Award criteria.
W. Edward Chabal David J. Lewis President Executive Director

iii
Portland Public Schools Nondiscrimination / Anti-Harassment Statement
Portland Public Schools recognizes the diversity and worth of all individuals and groups and their roles in society. It is the policy of the Portland Public Schools Board of Education that there will be no discrimination or harassment of individuals or groups on the grounds of age, color, creed, disability, marital status, national origin, race, religion, sex or sexual orientation in any educational programs, activities or employment.
Board of Education Policy 1.80.020-P

iv
PORTLAND PUBLIC SCHOOLS TABLE OF CONTENTS
Executive Summary .....................................................................................................1Executive Summary ............................................................................................................................2Superintendent’s Budget Message ..................................................................................................3Budget Document Format ..............................................................................................................13Budget Calendar .............................................................................................................................14District Goals and Objectives .........................................................................................................15District Strategic Plan Summary .....................................................................................................18Budget Overview .............................................................................................................................22State School Fund Grants and Property Tax Revenues ................................................................40School Staffing Changes .................................................................................................................41Capital Projects Summary for 2022-23 ..........................................................................................42School Board ....................................................................................................................................43Community Budget Review Committee (CBRC) ..........................................................................43Administrative Personnel .................................................................................................................44
Organizational Section ............................................................................................ 45Organizational Section ....................................................................................................................46The District and the Community.....................................................................................................47Organizational Chart ........................................................................................................................48The Board of Education ...................................................................................................................49District Strategic Plan .......................................................................................................................51Policies & Regulations ................................................................................................................... 101Budget Calendar .......................................................................................................................... 106Portland Public Schools Fund Structure ..................................................................................... 107Classification of Revenues and Expenditures ............................................................................ 109Financial Board Policies ................................................................................................................ 110
Financial Section .....................................................................................................117Financial Section............................................................................................................................ 118Financial Overview ........................................................................................................................ 119All Funds Resources ...................................................................................................................... 131All Funds Requirements by Major Function ............................................................................... 132All Funds Requirements by Object ............................................................................................. 133

v
3-Year Forecast All Funds ............................................................................................................. 134Interfund Transfer Schedule ........................................................................................................ 135Variance by Major Function ........................................................................................................ 136Variance by Major Object ............................................................................................................ 137General Fund Summary (100) ...................................................................................................... 138Budgeted Positions and Students Served by Minor Function (General Fund) ...................... 150Accrued Obligation for Post Employment Benefits .................................................................. 151Special Revenue Funds Summary (200) ..................................................................................... 153Student Body Activity Fund (201) ................................................................................................ 157Cafeteria Fund (202) ..................................................................................................................... 160Grants Fund (205) .......................................................................................................................... 165ESSER Budget ................................................................................................................................ 176PERS Rate Stabilization Reserve Fund (225) ............................................................................... 179Student Investment Account Fund (251) .................................................................................... 182Dedicated Resource Fund (299) .................................................................................................. 186Debt Service Funds Summary (300)............................................................................................ 196Debt Service Overview ................................................................................................................. 200IT Projects Debt Service Fund (307) ............................................................................................ 203PERS UAL Debt Service Fund (308) ............................................................................................. 206Full Faith and Credit Debt Service Fund (320) ........................................................................... 209GO Bonds Debt Service Fund (350) .......................................................................................... 212Capital Projects Funds Summary (400) ....................................................................................... 215Construction Excise Fund (404) ................................................................................................... 219IT System Project Fund (407) ........................................................................................................ 223Full Faith and Credit Fund (420) .................................................................................................. 226Energy Efficient Schools Fund (435) ........................................................................................... 230Facilities Capital Fund (438) ......................................................................................................... 233Capital Asset Renewal Fund (445) ............................................................................................... 236GO Bonds Fund (450) ................................................................................................................... 240Partnership Funds (470) ................................................................................................................ 245Bond Program Summary .............................................................................................................. 248Other Capital Projects ................................................................................................................... 253Internal Service Funds Summary (600) ....................................................................................... 254Self Insurance Fund (601) ............................................................................................................. 258Multnomah Education Service District Allocation ..................................................................... 262

vi
Informational Section ............................................................................................265Informational Section .................................................................................................................... 266Portland Public Schools Assessed Value of Taxable Property .................................................. 267Property Tax Levies and Collections ............................................................................................ 268Budget’s Effect on Average Homeowner ................................................................................... 269Principal Property Taxpayers in District Boundaries .................................................................. 270Demographic Data ........................................................................................................................ 271Debt Service Overview ................................................................................................................. 272Legal Debt Limit ............................................................................................................................ 274Bonded and Other Debt .............................................................................................................. 275Long Term Debt ............................................................................................................................. 276Personnel Resource Allocations .................................................................................................. 277FTE by Major Function and Employee Type ............................................................................. 278School Staffing ............................................................................................................................... 280Student Enrollment History and Projected Enrollment ............................................................ 291Student Performance Measures .................................................................................................. 292Student Demographics ................................................................................................................ 295Charter Schools ............................................................................................................................. 298Community Based Organizations (CBO) .................................................................................... 299Glossary of Terms and Acronyms ................................................................................................ 300
Appendices .............................................................................................................317Expenditures Overview ................................................................................................................ 319Description of Function Codes .................................................................................................... 336
Note: In addition to the Proposed Budget, the district has compiled Individual School Reports to accompany this document relaying specific budget, staffing, student demographics, and student achievement information for each school in Portland Public Schools. The supplemental document is available on the district website Budget Office page.

vii

1
EXECUTIVE SUMMARY

The executive summary includes the Budget Message and a comprehensive narrative overview for the 2022-23 budget. The narrative presents the budget in the context of the District’s emerging vision. In addition, summary budget information is presented in tabular and graphic format including student enrollment history and projections and budget forecasts.
The School Board, acting as the Budget Committee, is responsible for oversight and approval of the budget. The School Board adopts the budget, makes appropriations and imposes taxes.
The Budget Overview highlights major budget changes year-over-year.
EXECUTIVE SUMMARY

3
SUPERINTENDENT’S BUDGET MESSAGE
Dear PPS Board of Education and Portland Community, I submit to you our proposed 2022-2023 budget totaling $1.87 billion dollars. This proposal reflects the ways our schools will emerge from this pandemic with a commitment to the success of every student. This budget is fiscally responsible, ensures operation of our core functions, and most importantly, uses one-time and targeted resources to meet the learning, social and emotional needs of our students. We have all felt the consequences of the global pandemic. This budget represents the investments we are making directly to our classrooms and schools. Our budget focuses on making the learning experience better for every student next year. It commits dollars to narrowing learning gaps for students of color, especially Black and Native American students. In fact, our budget continues to allocate resources and put more dollars and staffing in schools with higher needs. Next year, we propose using more than $118 million of targeted state and one-time federal funds to prioritize five important areas:
1. Address unfinished learning as a result of the pandemic ○ Provide the largest academic and enrichment summer program in PPS history ○ Hire more specialists to support small groups of students to become proficient in reading and
math ○ Create more opportunities for students to access tutoring and make up high school credits
2. Increase learning opportunities for every student
○ Reduce class sizes ○ Expand middle school electives ○ Expand access to visual and performing arts and career technical education ○ Continue PPS Online Learning Academy
3. Provide high-quality emotional, mental health, and wraparound supports
○ Invest in social workers, school counselors and other mental-health professionals to provide direct support to students
○ Partner with culturally specific community based organizations to support the success of students of color
○ Establish a new team that will partner with families to support their student’s education ○ Expand access to fresh and nutritious food
4. Create more time for professional educators to plan, collaborate and prepare
○ Create more time for teachers to engage in professional learning opportunities ○ Increase opportunities for educators to plan, collaborate and prepare to implement the school
district’s updated curriculum
5. Make meaningful progress on our community’s top priorities ○ Support school communities to promote Black and Native American student success ○ Develop a diverse, high-quality, and thriving workforce ○ Reduce the district’s impact on the environment ○ Continue to update curriculum and technology ○ Build, renovate, and make safety improvements ○ Resource community-based and charter schools
With these priorities in mind, and with an understanding that the infusion of pandemic-response dollars is finite, we have been thoughtful and strategic as we have crafted next year’s budget. We believe the choices we have made are the best ones to serve our students.

4
Overview of our 2022-2023 Budget The 2022-23 proposed budget is $1.87 billion. It represents a decrease of about $190 million from this year’s budget due to expected spend down in our Bond Program to modernize schools. As a result of escalating costs, declining enrollment and increased student needs, our general fund budget gap grew to approximately $40 million. Similar to districts across Oregon, we expect enrollment to decrease. At PPS we expect to see 3,400 fewer students (8 percent) from the start of the pandemic. The impact of fewer students enrolled in public schools across the state means we will see a slight increase in per-student funding. Although we are able to keep pace with expenditures because of our one-time revenue, this is not a sustainable strategy and will need to be addressed as one-time monies go away. Despite this reality, this budget delivers on fiscal responsibility and uses one-time and targeted resources to meet the learning and whole-child needs of our students. Revenue Our operating budget, known as the General Fund, is estimated to receive $704 million. This is the largest part of our overall revenue and is largely funded by the Oregon State School Fund (SSF). The General Fund supports the daily cost of operating schools, like paying salaries and purchasing school supplies. We are expecting $17 million more dollars from this year (2.5 percent). The general fund includes two notable resources: the local option levy and Portland City Arts Tax. We expect to receive $110 million dollars from the local option levy. This is projected to be $6 million more than last year and will help fund close to 900 teaching positions. We also expect to receive $4 million dollars from the Portland City Arts Tax. As a result of declining enrollment, we will receive about $1 million less than this year. Thanks to your advocacy, PPS expects to receive $38 million dollars in special revenue from the Student Investment Account (SIA). These dollars provide high-quality mental health supports, reduce class size, and provide more than 190 school-based positions. We also thank the Oregon State Legislature for supporting summer programming. We expect to receive $8 million, which we will combine with one-time federal dollars, to make available the largest summer academic, enrichment, child care and safety programming in PPS history at no cost to families. Lastly, our School Improvement Bond program continues to impact school communities. Thanks to your support, the district continues to update curriculum; upgrade technology; and build, renovate, improve accessibility, and make safety improvements to school buildings. Expenditures We expect that our costs to operate schools from the general fund will be $744 million dollars. It represents $24 million (3%) more costs than this year’s budget. In the current year, central office departments identified $6.5M in savings and efficiencies from their budgets, and in preparing budgets for next year, central office teams identified an additional $7M in savings. The resulting rise in expenses are driven by an increased investment in school-based team members. We are proposing that the Board of Education use $40 million dollars from our reserves to close the shortfall from the general fund. We also expect to use all of our allocated funds from the Student Investment Account to provide more mental health support, reduce class size, and other key supports. Of the district’s allocation of one-time federal dollars, known as ESSER, we expect to use $65 million of the remaining $75 million dollars during the 2022-2023 school year. Any remaining balance of ESSER funds would be dedicated to maintaining a more limited number of priority areas during the 2023-2024 school year.

5
General Fund $ SIA $ ESSER $ Total Address unfinished learning as a result of the pandemic $5,570,305 $24,063,519 $29,633,824
Increase learning opportunities for every student $1,316,066 $14,668,650 $13,707,692 $29,692,408
Create more time for professional educators to plan, collaborate and prepare $2,725,791 $14,010,000 $16,735,791
Provide high-quality emotional, mental health, and wraparound supports $100,000 $12,957,336 $1,296,196 $14,353,532
Make meaningful progress on our community’s top district priorities $5,270,000 $1,780,811 $4,899,000 $11,949,811
FEMA and Safe Operations1 $16,642,367 $16,642,367
Grand Total $6,686,066 $37,702,893 $74,618,7732 $118,007,732 While we will use general fund dollars to fund our school’s daily functions, we plan, in total, to use more than $118 million dollars to make next year a more positive experience for our students, educators and school communities: Address unfinished learning as a result of the pandemic We know the pandemic has interrupted teaching and learning. We are excited to provide a robust summer academic and enrichment program that will serve more than 12,500 students. We are pleased to bring dozens of new instructional specialists who will be responsible for supporting students to meet grade-level expectations. At our high schools we are increasing supports and the number of educators to ensure our students are successful and prepared upon graduation. Provide the Largest Summer Programming in PPS History This summer, PPS will create opportunities to create, learn and play. Visit PPS.net/summer2022 to learn more. Here are just a few highlights:
Early Kindergarten Transition Our Early Kindergarten Transition program is a three–week summer school aimed at welcoming and preparing our newest students. More than 19 schools, including every Title I school, will participate.
Summer Acceleration Academy More than 5,000 1st- through 8th-grade students at 25 PPS schools are invited to participate in a four-week learning academy. We will focus on accelerating towards grade-level expectations, with a focus on reading, math, social emotional learning and hands-on STEM and Arts experiences. Leap into 9th Grade Every comprehensive high school will provide a three-week summer program that will serve more than 400 incoming 9th-grade students. This program will build a strong foundation for success upon entering high school.
1 This category represents funding for cleaning supplies & materials. It also covers other COVID operating expenses such as pending reimbursement claims from FEMA. If FEMA reimburses eligible COVID expenses, it would release about $10.5M in ESSER funds for the next school year. There is currently no timetable for a reimbursement decision from FEMA on these claims. 2 This represents the plan for how PPS plans to spend its remaining $75 M of ESSER through September 2024.

6
Summer Scholars High School Credit Completion More than half of high schools will open summer school so students can keep on track towards graduation. Students will have an opportunity to receive up to 24 credits towards graduation. Summer Arts Academy More than 170 students will be invited to experience life-changing activities as they continue to develop their identity, collaborate with peers, perform and exhibit their love for visual and performing arts. This program will prioritize incoming 6th to 9th-grade students attending schools in the Jefferson, McDaniel, and Roosevelt clusters, as well as Title I schools in SE Portland.
PIL Summer Math Program About 160 students will participate in a six-week summer program focused on learning math and playing sports. This extended summer program, which will be run largely by educators of color, will serve rising middle school students at McDaniel and Roosevelt High Schools.
Special Education Summer Programming Students who are receiving special education services and are determined eligible for Extended School Year (ESY) by their Individualized Educational Plan (IEP) team will be invited to attend our ESY. During ESY, students will receive instruction related to their IEP goals.
RESJ Summer Enrichment and Safety Programming with Community-Based Partners In partnership with culturally specific and multiracial community organizations, we will offer enrichment and learning opportunities to more than 7,500 Portland youth, including hands-on learning experiences, field trips and academic tutoring. Our partners plan to provide more than 500 summer jobs to youth this summer.
Provide More Learning Supports During the School Year We know the pandemic has interrupted teaching and learning. We are pleased that dozens of new educators will be hired to support students to meet grade-level expectations and advance course-credit towards high school graduation. We also plan on providing more tutoring services for students needing extra support.
More Learning Specialists Across Dozens of PPS Schools This budget maintains more than two dozen instructional specialists. These specialized educators provide targeted learning support to small groups of students.
Additionally, we plan on hiring 20 more learning acceleration specialists next year. These educators will focus on students who need additional learning support in reading and math across elementary, middle and high schools. High School Credit Recovery Towards Graduation For students who need to recover high school credit or improve a grade, we continue to provide multiple pathways to graduation. This budget proposal adds:
● Seven teachers to the PPS Virtual Scholars Program: This will increase the number of high
school students who access self-paced blended/online learning to get back on track or accelerate towards graduation.
● Six credit recovery teachers: These educators will work with high school students who need additional time to complete coursework.
● More dollars towards Evening Scholars: Five schools will provide evening sessions so that students can earn high school credit outside the school day.
Expanded Student Tutoring Services We expect to grow our “high dosage tutoring” effort, providing small groups of students intense tutoring support in foundational literacy and math, three times a week.

7
Continue to serve students identified for special education services Special education teachers, related service providers, and paraeducators continue to be assigned to school buildings to provide supplemental and specially designed instructional services to students with disabilities. These staff work in partnership with classroom teachers and families to ensure students with disabilities are accessing and progressing in core learning. We continue to fund additional staff, including a school psychologist, a speech language pathologist, and a special education teacher assigned to address the backlog of assessments resulting from interruptions during the pandemic and remote instruction.
Increase learning opportunities for every student Beyond demonstrating mastery of core academic knowledge and skills, we intend for students to have a deep and well-rounded experience. As a result, we continue to make significant investments in improving class sizes across PPS, redesigning the middle school experience, and expanding course offerings in the arts and career and technical education. Reduce Class Size We know that our community values smaller class sizes. Next year, we will continue to use special revenues to lower class sizes, with averages at:
● 22 students in first-, second- and third-grade classrooms; ● 23 students in fourth grade; ● 24 students in fifth grade; ● and 28 students at the middle school level.
Moreover, we are committed to making staffing allocations more equitable, ensuring lower class sizes at our most underserved schools. Average class sizes will be fewer than 18 students across kindergarten, first and second grades across these targeted schools. Redesign the Middle School Experience We know our middle school students need a variety of support unique to this stage in development. As they transition out of elementary school, they undergo physical, intellectual, social, and emotional changes. Our “Middle School Redesign” efforts aim to create an experience and environment in which students can explore their various interests and begin to find a path to future success. At the same time, we continue to:
Make 7-Period Day More Available Across PPS Middle Schools Making a 7-period day more available allows students in Special Education, English Language Learners and Dual Language Immersion students access to more elective classes. Add Additional Supports and Interventions to Enhance Middle School Success Dedicating staff to develop school-level strategies to improve social-emotional learning and school climate. This dedicated staff will provide professional development to educators.
Expand Visual and Performing Arts We believe arts education to be a foundational building block of public education. To make progress towards every student participating in both visual and performing arts, we are increasing resources so that approximately three in four of our schools can offer both. Next year, every student will have access to at least one art form, including students attending alternative high school programs. Expand Career and Technical Education We know that Career and Technical Education (CTE) is an integral part of the learning experience. At PPS, more than 95% of students who participate in at least a year-long CTE program graduate from high school. With more than 100 credentialed teachers and 70+ state approved programs, we continue to expand CTE course offerings at high schools. We also are working to provide career learning experiences across elementary and middle schools.

8
High School New Career Technical Education Program in 2022-2023
Jefferson Health Sciences Digital Media
Roosevelt Health Sciences Media Studies and Mass Communication
McDaniel Media Studies and Mass Communication
Ida B. Wells Media Studies and Mass Communication
Lincoln Education Preparation Construction
Mt. Scott Learning Center Hospitality and Culinary Arts
Benson Tech Skills Academy
Continue PPS Online Learning Academy and Access to the Internet At the beginning of this school year, we met the demand for online learning and opened the Online Learning Academy. We expect to see more than 450 students enroll, a drop of 26% from this year’s enrollment. We also plan on making more than 8,000 hotspots available to students who need access to the internet next year. Provide high-quality emotional, mental health, and wraparound supports We know that the pandemic has had a toll on student well being. Our data show a significant increase in the number of young people who report symptoms of stress, anxiety, depression, suicidal ideation and substance use. We plan on using dollars to address social, emotional and behavioral needs of our students. Ensure Every School’s Access to a Social Worker and/or Mental Health Professional Next year, every school will be supported by a social worker and/or mental health professional. These professionals help students gain access to basic needs, refer them to mental health services and help identify resources that will support their learning. Staffing will be as follows:
● Elementary or K-8 School: At least a half-time social worker or mental health professional ● Middle School: In addition to standard staffing, we fund at least a half-time counselor or social worker ● High School: At least one full-time social worker
Maintain School Counseling Staff Across Elementary and Middle Schools Despite enrollment declines, we will continue the same level of school counseling staff. Our school counselors are critical to improving the student learning experience. Maintain our Certified Alcohol and Drug Specialists We will continue funding three full-time certified alcohol and drug specialists. These multilingual and culturally informed professionals provide students mental health and substance use disorder support. Increased Partnership with Mental Health Providers and Experts We continue to expand partnerships with culturally responsive mental health partners, including Horizon Counseling, NARA, and the Asian Health and Service Center, offering services to students free of charge. We are also excited to launch our partnership with the University of Oregon’s Ballmer Institute. This summer, we expect to provide staff new learning opportunities focused on student behavioral health.
9
Continue Longstanding Partnerships with Culturally Specific Community Organizations We continue our steady partnership with 20 culturally specific organizations to implement six Racial Equity and Social Justice (RESJ) Partnership Strategies across 45 schools:
● Culturally Specific Family Engagement ● Wraparound Services ● Mentoring and Leadership Development ● Enrichment and Extended Learning ● Positive Cultural Identity Development ● Youth Gun Violence Prevention
Continue Access to the SUN Service System across 45 PPS schools In partnership with Multnomah County, the City of Portland and community partners, PPS continues to host the Schools Uniting Neighborhoods (SUN) Service System, a community school approach where 45 schools operate as full service neighborhood hubs, providing after school academic and enrichment support. Establish the Family Supports Services Department Families are critical partners to the success of their student’s learning. We are establishing the Family and Community Supports department focused on collaborating with families to support their children’s education. Expand Access to Fresh and Nutritious Food Thanks to federal funds, PPS provides close to 30,000 meals to Portland students each day. We plan on using one-time ESSER dollars to augment these federal funds:
● Grow our Fresh Fruit and Vegetable Program, giving students more access to this food group ● Maintain and expand after school snacks and supper programs in schools with SUN programs ● Add new meal services and/or food options during the school day for students experiencing
homelessness, food insecurity, or special needs and accommodations ● Replace and reduce the district’s use of plastic forks and spoons by purchasing reusable silverware
Create more time for professional educators to plan, collaborate and prepare Our educators, building leaders and classified staff are essential to creating a thriving learning experience for every student. We continue to align teaching and learning tools, practices, and expectations across every classroom, and are committed to providing opportunities for educators to learn professionally. Our adult learning offerings will focus on curriculum adoptions and our emerging instructional framework:
● A three-day summer teacher institute ● Three professional learning days built into the school calendar ● Professional cadres during staff meeting time for educators to collaboratively plan lessons for new
curriculum and to evaluate student learning ● New opportunities to receive coaching and feedback in the classroom
Expanded Training on the Science of Reading / LETRS Approximately 250 elementary school educators will continue our Science of Reading / LETRS training, a foundational tool for improving reading proficiency. Multi-Tiered Systems of Support (MTSS) and Social Emotional Learning (SEL) We value the importance of data to help match academic and social-emotional behavior resources to meet every student’s needs. As we continue rolling out our MTSS and SEL supports to schools, we are continuing adult learning efforts for educators and school leaders across more than 45 schools. We plan to launch training on our new student conduct discipline policy and administrative directives that seek to eliminate disproportionate discipline for students of color and students with disabilities.

10
Support the capacity of school principals We will continue to support school administrators in having the knowledge and tools to effectively coach and support their teachers. They will continue to receive professional development in standards-aligned core curriculum, multi-tiered systems of support, as well as leadership development centered on racial equity, instructional coaching for teachers, and other standards-based leadership skills. Provide learning opportunities for classified staff Para-educators and educational assistants are essential partners in classrooms. We are excited to increase access to multiple professional learning opportunities that build on their skills to support teaching and learning of new curriculum adoptions. Continue providing racial equity professional development training We are committed to increasing opportunities for adults to explore, learn, reflect and grow in support of our racial equity and social justice goals. We continue to partner with the Center for Equity and Inclusion and Luna Jimenez Institute for Social Transformation, providing staff powerful learning opportunities aimed at cultivating a culture of racial equity and care. Make progress on our community’s top priorities In addition to becoming a world-class school district for learning, we continue to make significant progress to advance our community’s priorities. These include: Collaborating with Black community leaders and educators to make progress on the Center for Black Student Excellence Led by Black community leaders, education and youth development experts and educators, we will launch a racial equity centered design and planning process that informs both the academic programming and the physical design and implementation of the Center for Black Student Excellence in schools and facilities in the heart of the historic Albina neighborhood. Prioritizing the Success of Every Native American Student Led by Native American parents and educators, we will focus on elevating the Native American student experience:
● We continue to supplement dollars received from Federal Title VI - Indian Education Program to ensure students have access to direct support from Native American educators.
● We continue to invest in the expansion of the Native Montessori classroom at Faubion K-8 School, including additional seats, transportation, and cultural support.
● We expect to offer a robust Native-led and Native-centered summer programming developed with parents and PPS Native American staff.
● In alignment with SB13, we continue to embed Native American history across core subject areas in elementary, middle and high school.
Developing a Diverse, High-Quality, and Thriving Workforce We are committed to ensuring every PPS school is led by a school principal equipped to lead with equity and excellence. To do so, we must ensure we allocate resources and create a supportive culture that inspires them to do their jobs at the highest possible level. Leveraging a 5-year, $8.2 million dollar grant from the Wallace Foundation, we are committed to supporting and accelerating our work towards that vision of a strong racial-equity-centered leadership pipeline. This includes:
● Developing our ability to design and provide appropriate, rigorous training for leaders, such as providing support for our Principal Supervisors and Principal Coaches
● Collaborating with our university partners to redesign principal preparation programs ● Transforming processes like hiring and leadership evaluation to support growth ● Ensuring our system is set up to sustain and elevate the role of our school principals

11
Continuing to update curriculum to reflect the importance of climate justice; making progress to reduce greenhouse gas emissions In response to the human-caused climate crisis and the direct harm being done by climate change, we continue to take climate action. We will begin auditing and assessing the district’s footprint and making actionable plans in the key areas of green buildings, energy efficiency, waste reduction, sustainable transportation, student learning and leadership, and future career opportunities, in alignment with the newly adopted Board policy. Making Meaningful Progress on our Strategic Plan, “Forward Together” While all of the strategic outcomes in Forward Together are critical to reaching our vision, we have identified nine foundational outcomes to focus on over the next year that are ambitious, yet feasible. Much of this focus and effort is already underway and is captured throughout this narrative. We are excited to create an organizational culture of racial equity that is characterized by respect, care, affirmation, and interconnectedness. We also recognize that our district has an ambitious agenda. In order to effectively manage multiple projects of varying scope and size, we will establish a project management office to support consistent, repeatable, standard methods for project planning, change management, and communication across the organization. Building, renovating, and making safety improvements; Updating curriculum and technology We continue the work of improving the health and safety of our aging school buildings with new roofs and heating and air-conditioning systems, seismic retrofits, accessibility upgrades, and security upgrades. We continue investing in educational improvements by adopting new curriculum materials, improving Special Education learning environments, and updating school sites to accommodate changes in capacity. This year, we finally became a fully digitally enabled learning school district. Thanks to you, every PPS student grades three to twelve has a tech device to use at home. We continue the construction of a modernized Benson High School, a new Multiple Pathways to Graduation building on the Benson campus, and master planning and design for the full modernization of Jefferson High School. We are also excited that the newly built Lincoln High School will open this Fall. Resourcing Community Based and Charter Schools We continue our standing funding commitments to supporting our charter schools and community based organizations (CBOs) and ensuring our families have options that best meet their children’s needs. Closing Thoughts In 2019, our community established the vision of who we aspire to be. We outlined a portrait of the ways in which our graduates will enter the world confident, optimistic, and prepared for their future, and how we as educators, and the system as a whole, must support and nurture them. This budget represents tangible steps we are taking toward this longer-term vision. We truly believe that every day, our classrooms should be places of wonder, concentration, “aha” moments, friendship and laughter, and so much more. We want students to have a sense of true community, and an excitement in creating their own future. Though we as educators are aware of the many challenges to transforming this large system, and of the fiscal constraints faced by public education systems, we also approach our work with optimism, creativity and the deeply held notion that we must–and we can–do our very best to meet these challenges. The students of Portland Public Schools deserve nothing less. Lastly, I would again say that I have been awed by the many ways all of you–families, educators, community partners, and first and foremost our students–have weathered these last two years. You have continually met new obstacles with a willingness to embrace change and make the very best of difficult circumstances. Thank you for all you have done and know that I am excited to continue this journey with you. Forward Together. Respectfully submitted, Guadalupe Guerrero Superintendent
12

13
BUDGET DOCUMENT FORMATWelcome to Portland Public School District (PPS or the District). If you are a new reader of our budget document or just need a review, the following section will guide you through the budget document’s format and organization as well as the budget preparation process.
Budget FormatThe Table of Contents leads the budget document and each of the four main sections has a separate and more detailed Table of Contents. The following is a brief overview of what to expect from each of the four sections:
y Executive Summary – This section includes the Budget Message and comprehensive narrative overview of the 2022-23 budget. The narrative presents the budget in the context of the District’s vision and emerging strategic plan. In addition, summary budget information, student enrollment history and projections, budget forecasts, and benchmark data are presented in tabular and graphic format. The School Board, acting as the Budget Committee, is responsible for oversight, budget approval and adoption, appropriations, and imposing taxes for the District. The Budget Overview highlights major budget changes from 2021-22 with an emphasis on the General Fund, Capital Projects Fund, Student Investment Fund, and Federal funds including the Elementary and Secondary School Relief (ESSER) funds.
y Organizational Section – This section contains general information about the District and its budget, including the level of education provided, geographic area served, and the number of schools and students. Also included in this section are significant budget changes, financial policies, procedures and regulations, and a detailed description of the budget process.
y Financial Section – This section contains required information for the District’s funds and descriptions of significant revenue sources and expenditure categories.
y Informational Section – This section includes detailed historical and projected personnel resource allocations, property tax information and other performance measures used by the District.

14
BUDGET CALENDAR
Portland Public Schools Budget Calendar to Prepare the 2022-23 Budget
Adopted October 12, 2021 Amended April 19, 2022
Board Inform / Review
Board Acon
September 28, 2021 School Board Meeng 6:00 PM Board reviews dra� 2022-23 Budget Calendar ✔
BESC
October 12, 2021 School Board Meeng 6:00 PM Board approves 2022-23 Budget Calendar ✔
BESC
October 26, 2021 School Board Meeng 6:00 PM Board appoints Community Budget Review Commiee (CBRC) members ✔
BESC
November- 2021 Community Engagement Events School Finance 101 & Strategic Plan ✔ ✔
BESC
March 15, 2022 School Board Meeng 6:00 PM Work session with CBRC Board reviews Strategic Plan and Mul-Year Business Plan
✔ BESC
April 3, 2022 Publish 1 st Noce of Budget Commiee Meeng (5 to 30 days before the meeng)
The Oregonian Web Site
April 10, 2022 Publish 2 nd Noce of Budget Commiee Meeng (5 to 30 days before the meeng)
The Oregonian Web Site
April 26, 2022* School Board Budget Meeng 6:00 PM *Not a Regularly Scheduled Board Meeng CBRC in aendance Proposed Budget : Superintendent delivers 2022-23 Proposed Budget message and presentaon
✔
BESC
May 4, 2022* School Board Budget Work Session 6:00 PM *Not a Regularly Scheduled Board Meeng Board conducts public engagement session on Proposed Budget
✔ BESC
May 17, 2022* School Board Budget Work Session 6:00 PM CBRC presents 2022-23 Proposed Budget Report to the Board *Not a Regularly Scheduled Board Meeng
✔ BESC
May 24, 2022 School Board Meeng 6:00 PM Approved Budget : Board as Budget Commiee approves 2022-23 Proposed Budget ✔
BESC
June 5, 2022 Publish Noce of Budget Hearing and Budget Summary The Oregonian Web Site
June 14, 2022 TSCC Hearing 4:30 PM TSCC cerfies 2022-23 Approved Budget
School Board Meeng 6:00 PM Adopted Budget : Board conducts a public hearing, adopts budget, makes appropriaons and imposes taxes
✔
✔
BESC
July 15, 2022 Submit Tax Cerficaon documentaons File budget informaon with County Recorder and Designated Agencies
15
DISTRICT GOALS AND OBJECTIVESOverviewPortland Public Schools, founded in 1851, is a pre-kindergarten through twelfth grade urban school district in Portland, Oregon. Serving approximately 45,000 students in 81 schools and numerous programs, PPS is one of the largest school districts in the Pacific Northwest.
VisioningIn 2018-19, the District engaged in a process to define a new vision. The Board wanted to tap into the wisdom of our students, our educators, and our community to help re-imagine Portland Public Schools. The Vision for PPS focuses on what we want to be true for our graduates. The vision is a journey of ongoing creativity, learning, and improvement, and its boldness can speed progress by inspiring action and collaboration. This vision will serve as our “North Star” guiding and aligning all of the District’s plans and innovations toward the same clear and ambitious goals.
Core Values are an organization’s enduring beliefs that remain constant over time. By making these values explicit through value statements and tethering them to a vision, an organization can articulate the ethical principles that guide action toward its vision:
Students at the Center Racial Equity and Social Justice
Honesty and Integrity Excellence
Respect Relationships
Creativity and Innovation Partnerships and Collaboration
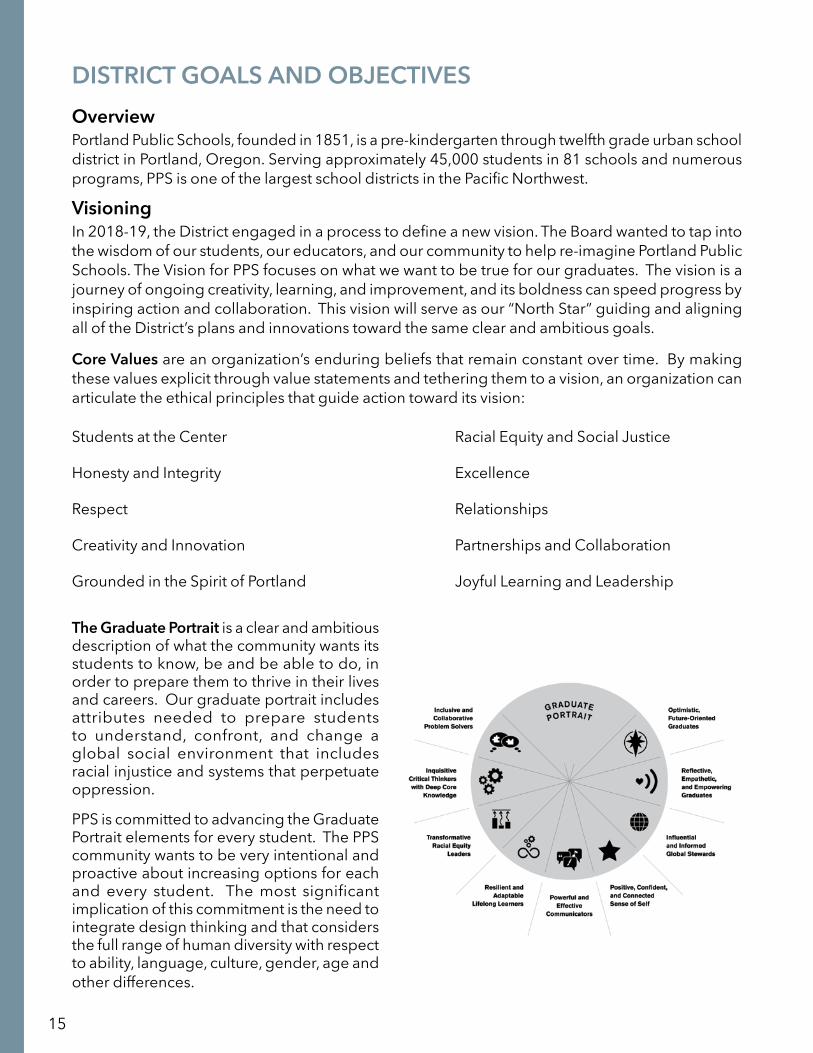
Grounded in the Spirit of Portland Joyful Learning and Leadership The Graduate Portrait is a clear and ambitious description of what the community wants its students to know, be and be able to do, in order to prepare them to thrive in their lives and careers. Our graduate portrait includes attributes needed to prepare students to understand, confront, and change a global social environment that includes racial injustice and systems that perpetuate oppression.
PPS is committed to advancing the Graduate Portrait elements for every student. The PPS community wants to be very intentional and proactive about increasing options for each and every student. The most significant implication of this commitment is the need to integrate design thinking and that considers the full range of human diversity with respect to ability, language, culture, gender, age and other differences.
16
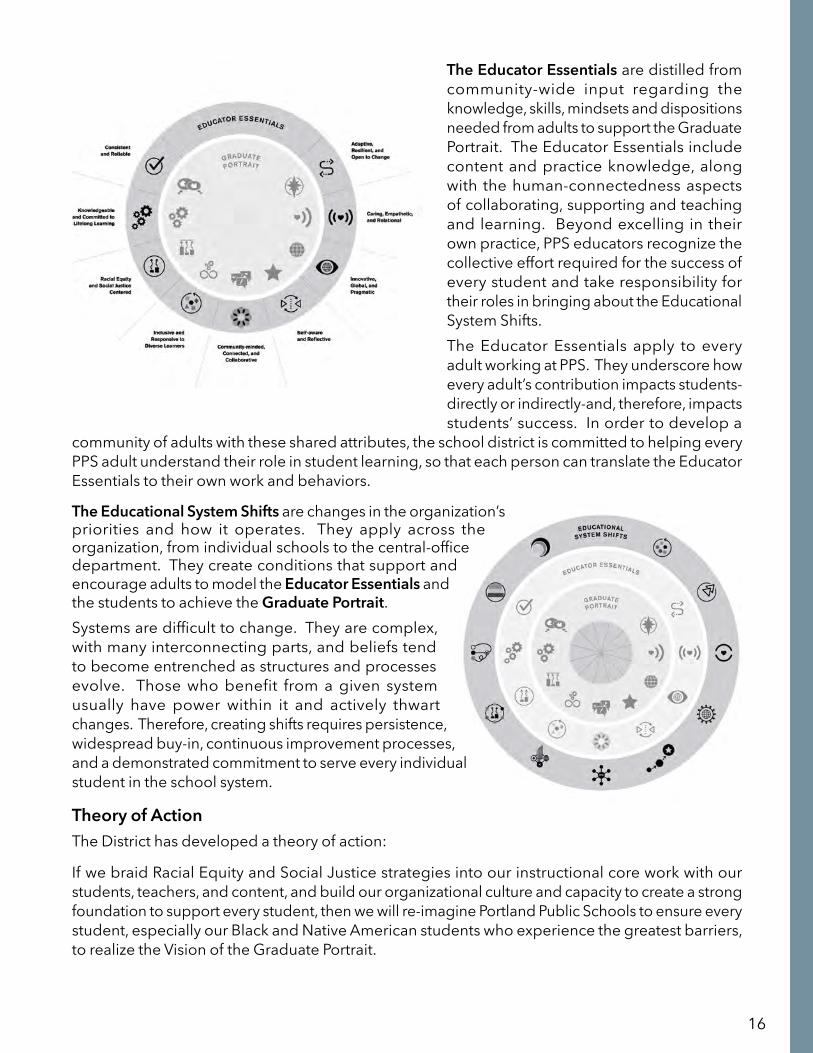
The Educator Essentials are distilled from community-wide input regarding the knowledge, skills, mindsets and dispositions needed from adults to support the Graduate Portrait. The Educator Essentials include content and practice knowledge, along with the human-connectedness aspects of collaborating, supporting and teaching and learning. Beyond excelling in their own practice, PPS educators recognize the collective effort required for the success of every student and take responsibility for their roles in bringing about the Educational System Shifts.The Educator Essentials apply to every adult working at PPS. They underscore how every adult’s contribution impacts students-directly or indirectly-and, therefore, impacts students’ success. In order to develop a
community of adults with these shared attributes, the school district is committed to helping every PPS adult understand their role in student learning, so that each person can translate the Educator Essentials to their own work and behaviors.
The Educational System Shifts are changes in the organization’s priorities and how it operates. They apply across the organization, from individual schools to the central-office department. They create conditions that support and encourage adults to model the Educator Essentials and the students to achieve the Graduate Portrait.Systems are difficult to change. They are complex, with many interconnecting parts, and beliefs tend to become entrenched as structures and processes evolve. Those who benefit from a given system usually have power within it and actively thwart changes. Therefore, creating shifts requires persistence, widespread buy-in, continuous improvement processes, and a demonstrated commitment to serve every individual student in the school system.
Theory of ActionThe District has developed a theory of action:
If we braid Racial Equity and Social Justice strategies into our instructional core work with our students, teachers, and content, and build our organizational culture and capacity to create a strong foundation to support every student, then we will re-imagine Portland Public Schools to ensure every student, especially our Black and Native American students who experience the greatest barriers, to realize the Vision of the Graduate Portrait.

17
Strategic PlanWhile the vision identifies the what and the why, the strategy that follows from the vision defines the how. Four Strategic Themes have been prioritized into a multi-year strategic plan that will lead to the District Goals and Strategies. The complete Strategic Plan is included in this budget document.
Finance MissionSupport equitable outcomes for students through transparent stewardship of resources and effective financial processes and services, emphasizing collaboration, responsive customer service and continuous improvement.
Budget GoalIn 2019, the PPS Board of Education revised the District’s policy on Reserve Funds (Board Policy 8.10.025) to establish a reserve in the General Fund ranging from 5% to 10% of annual General Fund revenues. The goals for the reserve will be set as part of the District’s long-range financial plan, with an expectation that the District will achieve and sustain a 10% reserve.

18
DISTRICT STRATEGIC PLAN SUMMARY
Forward Together2021–2025 Strategic Plan for Racial Equity, Inclusion, and Excellence
As a community, we have an urgency to intentionally disrupt systems of oppression, because they are closely tied to disparities of access and educational outcomes, especially among our Black and Native American students. We have to attack racism and longstanding, structural inequities in our system. We have to remove barriers to teaching and learning. We have to create a sense of belonging for everyone. And we will establish a Center for Black Student Excellence, a constellation of built environments and a designated set of culturally responsive strategies that celebrate and advance Black student achievement at PPS. The issues of race, racism and racial equity are important to the strategic plan as a whole—and they suffuse other themes and action areas throughout. It is important that all stakeholders see opportunities to confront racism and promote equity in every element of our plan.
Strategic Outcomes
We celebrate the diversity of our students, and are working to provide differentiated learning experiences and supports that meet every child where they are, work with their interests, and enable them to thrive at PPS. We have a significant population who have varying abilities that require special attention and programs. Many students with disabilities, and those with complex learning needs, were not well-served by COVID-19 virtual learning. We need to strengthen educational offerings for every student, including those with disabilities, and expand resources for their physical and emotional safety. And we must make learning relatable and relevant for real-world contexts—for jobs, technology, and challenges of the future—for every student.
Strategic Outcomes
To become a world-class school district, we must hire talented people from diverse backgrounds and experiences. We also know that our world-class staff needs ongoing professional support and resources. This will require action across many forms, including better communication and coordination; career pathways for educators, building our educators’ capacity in social and emotional support to students; and a culture of adult learning to accelerate student achievement.
Strategic Outcomes
We need to create and support a culture open to positive change—as a system. The way we solve problems systematically, the way we build a culture and approach to successfully manage our work, the way we build trust and promote empathy, the way we communicate within our system and to our stakeholders—all of these are actions that require constant refinement and improvement.
Strategic Outcomes
• Transform Structures for Racial Equity
• Cultivate a Culture of Racial Equity and Care
• Reimagine Relationships and a Sense of Belonging
• Plan the Center for Black Student Excellence
• Ensure Equitable Access to Facility Resources
• Develop an Integrated Instructional Framework
• Design Learning Experiences that Promote Self-Directed, Future-Ready Learning
• Implement Multi-Tiered System of Supports
• Establish Systems and Structures for Inclusion
• Promote an Inclusive Mindset
• Build the Advocacy Power of Students and Families of Students with Disabilities
• Develop a Diverse, High- Quality, and Thriving Workforce
• Advance Our Organizational Learning Culture and Practice
• Socialize Our Vision and Strategic Plan
• Build a Collective Sense of Trust and Belonging
• Establish a System-Wide Project Management Culture and Practice
• Embed System-Wide Data-Driven Continuous Improvement Practices
• Establish Exceptional Service Culture and Standards
• Implement a Proactive, Effective, and Creative Communication Practice
• Launch an Innovation Practice that Reimagines System Problem Solving
• Cultivate and Promote Aligned Community Partnerships
• Develop a Coherent System-Wide Community Engagement Approach
1
2
3
4
Racial Equity and Social Justice
Inclusive and Differentiated Learning for Every Child
Professional Excellence and Support
Embracing Change
Portland Public Schools reImagined—our vision—serves as our compass toward a shared “north star,” knitting together our community’s long-term aspirations for our graduates, educators, and the overall school system. Forward Together: PPS’s 2021–2025 Strategic Plan for Racial Equity, Inclusion, and Excellence is the first in a series of multi-year strategic plans for the district, outlining the important steps we’ll take on the road toward realizing our vision.
Thank you for your support and engagement as we roll up our sleeves to make our audacious strategic plan widely understood, relevant, and real, in order to ensure the success of everyone at Portland Public Schools.
The focus areas of the plan are organized under four main themes:
To learn more about our Strategic Plan, visit pps.net/forwardtogether

19
As a community, we have an urgency to intentionally disrupt systems of oppression, because they are closely tied to disparities of access and educational outcomes, especially among our Black and Native American students. We have to attack racism and longstanding, structural inequities in our system. We have to remove barriers to teaching and learning. We have to create a sense of belonging for everyone. And we will establish a Center for Black Student Excellence, a constellation of built environments and a designated set of culturally responsive strategies that celebrate and advance Black student achievement at PPS. The issues of race, racism and racial equity are important to the strategic plan as a whole—and they suffuse other themes and action areas throughout. It is important that all stakeholders see opportunities to confront racism and promote equity in every element of our plan.
Strategic Outcomes
We celebrate the diversity of our students, and are working to provide differentiated learning experiences and supports that meet every child where they are, work with their interests, and enable them to thrive at PPS. We have a significant population who have varying abilities that require special attention and programs. Many students with disabilities, and those with complex learning needs, were not well-served by COVID-19 virtual learning. We need to strengthen educational offerings for every student, including those with disabilities, and expand resources for their physical and emotional safety. And we must make learning relatable and relevant for real-world contexts—for jobs, technology, and challenges of the future—for every student.
Strategic Outcomes
To become a world-class school district, we must hire talented people from diverse backgrounds and experiences. We also know that our world-class staff needs ongoing professional support and resources. This will require action across many forms, including better communication and coordination; career pathways for educators, building our educators’ capacity in social and emotional support to students; and a culture of adult learning to accelerate student achievement.
Strategic Outcomes
We need to create and support a culture open to positive change—as a system. The way we solve problems systematically, the way we build a culture and approach to successfully manage our work, the way we build trust and promote empathy, the way we communicate within our system and to our stakeholders—all of these are actions that require constant refinement and improvement.
Strategic Outcomes
• Transform Structures for Racial Equity
• Cultivate a Culture of Racial Equity and Care
• Reimagine Relationships and a Sense of Belonging
• Plan the Center for Black Student Excellence
• Ensure Equitable Access to Facility Resources
• Develop an Integrated Instructional Framework
• Design Learning Experiences that Promote Self-Directed, Future-Ready Learning
• Implement Multi-Tiered System of Supports
• Establish Systems and Structures for Inclusion
• Promote an Inclusive Mindset
• Build the Advocacy Power of Students and Families of Students with Disabilities
• Develop a Diverse, High- Quality, and Thriving Workforce
• Advance Our Organizational Learning Culture and Practice
• Socialize Our Vision and Strategic Plan
• Build a Collective Sense of Trust and Belonging
• Establish a System-Wide Project Management Culture and Practice
• Embed System-Wide Data-Driven Continuous Improvement Practices
• Establish Exceptional Service Culture and Standards
• Implement a Proactive, Effective, and Creative Communication Practice
• Launch an Innovation Practice that Reimagines System Problem Solving
• Cultivate and Promote Aligned Community Partnerships
• Develop a Coherent System-Wide Community Engagement Approach
1
2
3
4
Racial Equity and Social Justice
Inclusive and Differentiated Learning for Every Child
Professional Excellence and Support
Embracing Change
Portland Public Schools reImagined—our vision—serves as our compass toward a shared “north star,” knitting together our community’s long-term aspirations for our graduates, educators, and the overall school system. Forward Together: PPS’s 2021–2025 Strategic Plan for Racial Equity, Inclusion, and Excellence is the first in a series of multi-year strategic plans for the district, outlining the important steps we’ll take on the road toward realizing our vision.
Thank you for your support and engagement as we roll up our sleeves to make our audacious strategic plan widely understood, relevant, and real, in order to ensure the success of everyone at Portland Public Schools.
The focus areas of the plan are organized under four main themes:
To learn more about our Strategic Plan, visit pps.net/forwardtogether

20

21
Student-centered Indicators
We will increase
> Students who report increasing sense of belonging as measured by the Successful Schools Survey
> Number of students on track for the Graduate Portrait milestones as expressed by the Graduate Portrait continuum
We will reduce
> Opportunity gaps for Black and Native students by increasing numbers of students prepared for 1st grade as measured by an appropriate set of early learning indicators, and by our progress on our Board Goals
> Disproportionate identification of students in Special Education, especially our Black, Native, and English Learner students
> Disproportionality in exclusionary discipline measures for our Black and Native students
Students will
> Report learning is more engaging and relevant for their future
> Report their learning experiences support their understanding and attainment of the Graduate Portrait
> Be able to self-assess growth on the Graduate Portrait, including an adapted Graduate Portrait for students with disabilities, using a developmentally appropriate continuum
Other Success Indicators Related to Educator Essentials and Implementation of Key Strategies
> Increases in number of educators of color who are hired and retained, and in educators of color reporting feeling a sense of belonging
> The regular use of Educator Essentials to self-assess professional growth
> Data driven, continuous improvement practices evident at grade level, schools, departments, and district as a whole
> Evidence that educators are aligning their work and professional learning to the Vision
Our VisionA graduate of Portland Public Schools will be a compassionate critical thinker, able to collaborate and solve problems, and be prepared to lead a more socially just world.
Our MissionWe provide rigorous, high-quality academic learning experiences that are inclusive and joyful. We disrupt racial inequities to create vibrant environments for every student to demonstrate excellence.
Our Theory of ActionIf … We braid Racial Equity and Social Justice strategies into our instructional core, work with our students, teachers, and content, and build our organizational culture and capacity to create a strong foundation to support every student…
Then … We will reImagine Portland Public Schools to ensure every student, especially our Black and Native American students who experience the greatest barriers, realizes the Vision of the Graduate Portrait.

22
BUDGET OVERVIEWBackgroundPortland Public Schools is the largest school district in the state of Oregon. PPS serves approximately 45,000 students in pre-kindergarten through twelfth grade in 81 schools and numerous programs, including Online Learning Academy, Odyssey and ACCESS. PPS serves a population of students and families from economically, ethnically and racially diverse backgrounds. Educational services and programs provided include general and special education, career and technical education and a variety of alternative programs.
PPS is governed by a Board of Education comprised of seven elected members serving four-year terms. Board members serve as community volunteers and do not receive compensation for their work. The Board is the policy-making body of the District and is responsible for determining the long-range direction of the District, calling for elections on bond proposals and approving the annual budget. The District’s superintendent reports directly to the Board of Education.
Financial resources for the District are allocated between several individual funds, the largest of which is the General Fund. The General Fund is unrestricted and provides the majority of the District’s operational budget for personnel, instruction and operating expenses.
General Fund resources largely come from state sources, which include both the permanent rate property taxes and the State School Fund (SSF) grant. Local sources of revenue primarily include property taxes, the Local Option Levy and Gap Tax. Revenues from the Local Option Leavy and Gap Tax go directly to PPS and are excluded from the State School Fund formula.
The District imposes a total permanent tax rate of $5.2781 that is made up of the original permanent rate of $4.7743 and the gap portion of $0.5038. The 2009 Oregon Legislature re-authorized the gap portion of the District’s permanent tax rate limit and it is the difference between the 1990 Measure 5 limit and the 1997 Measure 50 limit on local property taxes.
The Local Option Levy funds teaching positions and classroom support. PPS first passed a five-year local option levy in 2011 and it was renewed in 2014 for another five years. The Local Option Levy will continue for a third five-year term thanks to our voters who approved a renewal in November 2019 with a rate of $1.9900 per $1,000 of assessed value.
Voter-approved bond measures are the primary source of funding for the District’s major capital improvement projects, such as school modernization work. In November 2020, voters approved a $1.20 billion school bond measure that allows PPS to continue the vital work of improving the health and safety of our aging school buildings with new roofs and mechanical systems, seismic retrofits, accessibility and security upgrades. The bond also includes modernization work at Jefferson and Benson as well as investments in curriculum and technology.
In 2019, the PPS Board of Education revised the District’s policy on Reserve Funds (Board Policy 8.10.025) to establish a reserve in the General Fund ranging from 5% to 10% of annual General Fund revenues. The goals for the reserve will be set as part of the District’s long-range financial plan, with an expectation that the District will achieve and sustain a 10% reserve.
Projected Outstanding Debt as of 6-30-2022: $1.70 billion
Projected Outstanding Debt as of 6-30-2023: $1.55 billion
Permanent Property Tax Rate: $5.2781 per $1,000 assessed property value

23
Budget Preparation The District develops an annual budget focused on using available resources to address PPS core values, organizational priorities and obligations.In 2022-23, the budget process incorporated targeted community input, braiding the four overarching themes from our strategic plan, Forward Together, and best practices to lay the foundation for emerging from the pandemic stronger.The District Staffing Team (DST), along with the Strategic Budget Team (SBT), which includes central office district leaders and principals from elementary, K-8, middle and high schools, reflected and advised in making budget decisions that best reflect our 1) Racial Equity and Social Justice (RESJ) lens, 2) strategic plan, and 3) long term sustainability in making budget recommendations. Through a year-long process, the PPS community articulated a vision to re-Imagine PPS. It describes the Graduate Portrait for PPS students and Educator Essentials (skills and dispositions that will enable our organization to bring these to life). This year’s budget represents the work of the DST and SBT which convened to prepare recommendations on the budget. The teams underscored the pandemic’s effect on our student community and guided investments that reinforce District strategies and fiscally sustainable decisions that are aligned with achieving our vision and the Board’s goals.
Budgeting Highlights
The Board Goals
The PPS School Board sets the following budget goals to guide the 2022-23 program delivery planning work completed by the SBT.
y Third Grade Reading y Fifth Grade Mathematics y Eighth Grade Student Snapshot of Graduate Portrait y Post-secondary Readiness for College & Career
The Strategic Framework’s Four ThemesThe District focus is described in our strategic plan, Forward Together. Our strategic plan outlines the first stage of our journey toward our vision. It describes a set of collective and coherent actions and goals that, taken together, will set in motion the changes needed to bring our vision to fruition. Our strategic plan is organized under four main themes:
y Racial Equity and Social Justice y Inclusive and Differentiated Learning for Every Child y Professional Excellence and Support y Embracing Change
The Student Success Act (SSA) - HB 3427In 2020-21 the state of the economy in Oregon allowed the work of the legislature’s Student Success Committee to offer a historic opportunity to improve educational opportunities. The act will help put all Oregon students on a path to graduate from high school with a plan for the future, while focusing on achieving equitable student outcomes and eliminating opportunity gaps. PPS expects to receive about $38 million from Student Investment Account funding for the 2022-23 school year. This investment will allow PPS the opportunity to accelerate our ability to actualize PPS re-Imagined.

24
These investments are aligned with the Student Success Act guidelines and stakeholder input:
y Increased academic supports and targeted interventions for our most vulnerable and historically underserved students
y Increased social emotional, mental and behavioral health supports across the District y More optimal student-teacher ratios and class sizes across many grade levels y Expansion of elective courses at comprehensive middle schools and K-8’s y More equitable access to arts education, especially in historically under-served school
communities y Culturally-specific student and family supports and expanded community partnerships y Curriculum materials and Professional Development for educators
Each school and central department established a plan for service delivery:
y Careful consideration was given to the needs of the individual schools, including their demographics, family income and mobility levels
y Teacher-student ratios were reviewed during this process y The budget process was conducted with a fresh perspective and adherence to established
best practices and district goals and priorities y Used objective and measurable student characteristics as weights (income status, English
learners, students with disabilities, low/high academic performance, etc.) to improve equity
General Obligation Bonds SaleThe District sold $365.47 million in General Obligation Bonds, Series 2020B, in December of 2020 to support the first phase of the Technology and Curriculum work outlined in the 2020 bond authorization. The District plans to sell bonds in the 2022-23 fiscal year.
The School Staffing BalancingThe PPS staffing model uses enrollment projections to determine the school staffing allocation, and ensures:
y Each school, especially small schools and those with underserved student populations, have an adequate number of teachers
y Instruction for core programming and state PE and Health requirements; equity funds are put to best and highest use
y Principals have significant control over school budgets, transforming how the central district business office collaborates with administrators at each school site
y Compliance with Oregon Local Budget Law (ORS 294) y Budget account codes have been restructured to align with the state’s required chart of
accounts for expense functions, objects, areas and locations y All direct and indirect costs by subject, grade level, organization and school are accounted for
The Meritorious Budget AwardPPS received a Meritorious Budget Award from the Association of School Business Officials International for the 2021-22 budget for providing:
y A comprehensive and quality document, including a wealth of graphic and narrative information
25
y Material relevant to the community while serving as a helpful reference resource for all stakeholders
Budget OverviewThis year’s budget will be the final year of the Oregon Legislature’s biennial budget cycle for 2021-23. PPS has based the budget on state funding of $9.3 billion State School Fund, $893 million SIA and $314.5 million High School Success. PPS is proposing a budget of almost $1.87 billion for 2022-23 and is using all available resources to meet the board goals and priorities set forth by PPS leadership. The 2022-23 budget is focused on two areas:
y Addressing the needs of students and staff returning from the pandemic:
` Meet students’ mental and behavioral health needs ` Learning Acceleration ` Wraparound supports
y Increase academic achievements and reduce academic disparities for:
` Students of color ` Students with disabilities ` Emerging bilingual students ` Students navigating poverty, homelessness, foster care, and students that have
historically experienced disparities in our schools
Budget Assumptions
RevenuesThe District’s estimate of available resources in 2022-23 is based on the following assumptions:
y The District Average Daily Membership Weighted (ADMw) is projected to be 53,244. y The estimated SSF distribution is based upon a $9.3 billion state budget for K-12 education
funding to be distributed at 49/51% split over two years with PPS' share of the second year being $243 million.
y The estimated overall property tax and local option revenue to be collected by the District during 2022-23 is $573.83 million and is based upon a 4.5% growth factor for property taxes, a 4.5% for local option and a 97% collection rate based on historical receipts.
y The District’s General Fund beginning fund balance, considered a resource in the budget process, is estimated to be $90.5 million on July 1, 2022.
y The Multnomah Education Service District (MESD) pass through or “Transit” dollars anticipated for 2022-23 is $7.5 million. It is based upon changes to the service plan selection and will be refined not only though the budget process, but throughout the year, dependent on student needs and available funding.
y Funding from the passage of the three rounds of Federal COVID stimulus funding, including the American Rescue Plan Act, will provide PPS and its partners an estimated $115 million in funding via the Elementary and Secondary School Emergency Relief (commonly known as ESSER I, II and III). The District is projecting approximately $75 million in remaining funds to deploy in July 2022 through September 2024 from ESSER II and ESSER III (having spent down ESSER I). Initial expenditures supported by ESSER funding may be eligible for

26
Federal Emergency Management Agency (FEMA) reimbursement. There are outstanding reimbursements claims of approximately $10 million with FEMA. There is currently no timetable for a reimbursement decision and therefore the approximately $10 million are not included as part of the available resources for 2022-23.
ExpensesThe District’s 2022-23 plans are based on a number of projected expenditures with labor costs being the largest expense. It is important to note that the committed contingency amounts identified in the budget are to cover a variety of items, such as:
y Staffing for enrollment in excess of projections y Unforeseen expenses, inclusive of needs related to the COVID-19 pandemic
The proposed expenditures for 2022-23 are based upon the following assumptions:
y The salary schedules for each labor group are established by existing agreements. y The Public Employees Retirement System (PERS) Board released the contribution rates for the
biennium beginning July 1, 2021: ` Portland Public Schools is using a blended PERS rate of 0.01%, weighting Tier 1/2
and OPSRP employees, down from 4.04% in 2021-22. This significantly lower rate is due to the PERS side account.
` The PERS Unfunded Actuarial Liability (UAL) requires a fringe rate of 15.56% applied to PERS eligible payroll, up from 12.14% in 2021-22.
y Other employer labor costs are based on the assumption of the group health insurance negotiated amount and the following: 7.65% FICA, 0.29% Workers’ Compensation, 0.18% Other Employer Benefits, 0.71% Retiree Health Insurance, 0.18% Early Retirement, a self-funded unemployment rate of 0.07%, and a Paid Family Medical Leave (PFML) rate of 0.20%.
Revenue FactorsPortland Public Schools 2018-19 2019-20 2020-21 2021-22 2022-23
Real Market Value (in Billions) $131.74 $134.59 $140.25 $147.26 $152.42
Total Net Assessed Value (in Billions) $51.11 $53.70 $56.04 $57.28 $61.70
Property Tax Rate Extended (per $1000 Assessed Value):
Operations $5.28 $5.28 $5.28 $5.28 $5.28
Local Option for Operations $1.99 $1.99 $1.99 $1.99 $1.99
Debt Service $2.49 $2.41 $2.44 $2.33 $2.50
Total Property Tax Rate $9.76 $9.67 $9.67 $9.60 $9.77
Less Measure 5 Adjustments $18,829,623 $20,910,923 $22,989,685 $24,819,0070* $23,000,000*
Average Daily Enrollment - ADMr 48,439 48,338 46,649 45,354 44,582**
Weighted Enrollment - ADMw 57,616 57,825 55,904 54,241 53,244**
Weighted Enrollment - ADMw Extended 57,616 57,825 57,825 55,904 54,241**
* Projected**Latest estimates from ODE website and from 21/22 Tax Supervising and Conservation Commission information

27
DEBT DETAIL SCHEDULES
Issue Date Series Original Issue
Outstanding at June 30,2022
2022-23 Principal Payments
2022-23 Interest
Payments
General Obligation Bonds
May 1, 2013 2013B 68,575 3,160 3,160 158 April 30, 2015 2015B 244,700 110,410 6,340 4,496
August 10, 2017 2017B 241,890 175,380 2,650 5,977 April 14, 2020 2020 441,320 344,765 36,945 15,800 Dec 30,2020 2020B 365,465 325,225 57,970 9,816 Dec 30,2020 2020C 53,965 52,520 905 836
1,011,460 107,970 37,083
Limited Tax Pension Obligation Bonds
October 31, 2002 2002B 156,580 126,680 17,945 7,020 April 30, 2003 2003A 124,800 7,536 7,536 18,679 April 30, 2003 2003B 156,370 156,370 - 8,862 July 15, 2021 2021 399,390 388,600 12,815 7,588
679,186 38,296 42,149
Full Faith & Credit Ogligations
Jul-10 2010 Recovery Zone 11,000 608 608 15 4-Aug-16 2016 Qualified Zone 4,000 3,000 200 - 9-Nov-16 2016 FF&C Taxable 5,048 3,613 315 103
7,221 1,123 118
Total 1,697,867 147,389 79,350
Bonded and Other Debt (In Thousands)

28
Fiscal Year
LTD Tax Pension & Refunding
2010 Recovery Bonds
2016 Qualified Zone Bonds
FF&C Taxable Debt 2016
2013 GO Bonds
2015 GO Bonds
2017 GO Bonds
2020 GO Bonds
2020B GO Bonds
2020C GO Bonds TOTAL
Principal:2023 38,296 608 200 315 3,160 6,340 2,650 36,945 57,970 905 147,389 2024 62,240 - 200 325 - 6,980 2,985 40,430 - 4,070 117,230 2025 68,320 - 200 335 - 7,665 3,345 44,140 - 4,295 128,300 2026 76,755 - 200 345 - 8,390 3,305 26,630 - 4,535 120,160 2027 83,940 - 200 355 - 9,165 3,780 29,010 - 4,780 131,230 2028-2032 131,900 - 1,000 1,938 - 57,735 26,705 95,675 28,530 27,645 371,128 2033-2037 134,220 - 1,000 - - 14,135 42,235 71,935 63,355 6,290 333,170 2038-2042 83,515 - - - - - 60,230 - 86,855 - 230,600 2043-2047 - - - - - - 30,145 - 88,515 - 118,660 Principal Total 679,186$ 608$ 3,000$ 3,613$ 3,160$ 110,410$ 175,380$ 344,765$ 325,225$ 52,520$ 1,697,867$ Interest:2023 42,148 15 - 103 158 4,496 5,977 15,800 9,816 836 79,349 2024 22,440 - - 94 - 4,179 5,845 13,952 6,918 818 54,246 2025 19,626 - - 84 - 3,830 5,695 11,931 6,918 737 48,821 2026 16,447 - - 74 - 3,446 5,528 9,724 6,918 651 42,788 2027 12,818 - - 63 - 3,027 5,363 8,392 6,917 560 37,140 2028-2032 33,577 - - 148 - 8,951 24,218 21,858 33,170 1,553 123,475 2033-2037 19,878 - - - - 424 19,003 6,808 24,569 91 70,773 2038-2042 3,750 - - - - - 11,394 - 15,137 - 30,281 2043-2047 - - - - - - 1,600 - 4,657 - 6,257 Interest Total 170,684$ 15$ -$ 566$ 158$ 28,353$ 84,623$ 88,465$ 115,020$ 5,246$ 493,130$
Total Debt Service 849,870$ 623$ 3,000$ 4,179$ 3,318$ 138,763$ 260,003$ 433,230$ 440,245$ 57,766$ 2,190,997$
LTD Tax Pension & Refinding
2010 Recovery Bonds
2016 Qualified Zone Bonds
FF&C Taxable Debt 2016
2013 GO Bonds
2015 GO Bonds
2017 GO Bonds
2020 GO Bonds
2020B GO Bonds
2020C GO Bonds TOTAL
Fund 308 80,444 80,444 Fund 321 623 623 Fund 322 200 200 Fund 323 418 418 Fund 350 3,318 10,836 8,627 52,745 67,786 1,741 145,053 Total 80,444$ 623$ 200$ 418$ 3,318$ 10,836$ 8,627$ 52,745$ 67,786$ 1,741$ 226,738$
Long Term Debt (In Thousands)
Payments by Debt Service Fund, FY 2022/23

29
2022-23 BUDGETThe budget presented in this document represents the financial plan for PPS. It is balanced and contains estimates of the revenues and expenditures needed to support the program offerings of the District for a single year. In total it demonstrates the District’s strategies and operational requirements to serve PPS students during the 2022-23 school year. Due to the time restriction between developing the 2022-23 Budget and the recent approval by the Board of Education of an amendment for the 2021-22 budget, all comparisons are between the 2022-23 Budget and the 2021-22 Adopted Budget. For informational purposes, the 2021-22 amended budget, approved via Board Resolution No. 6437, included the below major components which resulted in an increase of $457.1 million to the 2021-22 Adopted Budget which are not reflected in other parts of the 2022-23 Budget Book:
y $404.7 million General Fund - Beginning Fund balance and Appropriation adjustments
` Recognize resources to true up the audited beginning fund balance and recognize PERS Bond refunding.
` Adjust appropriation levels to more accurately reflect updated spending, including PERS issuance that took place in August 2021, an increase in the Community Based Organizations’ (CBOs) Net Operating Expense allocation from 80% to 90%, allocation of funding to support the non-bond compensable work, as well as supporting the work to rebrand two high schools.
y $11.4 million Special Revenue Fund - Beginning Fund balance and Appropriation adjustments
` Recognize reduction in the beginning fund balance to align with audited financials, additional resources include but are not limited to Student Investment Account (SIA), Elementary and Secondary School Emergency Relief Funds (ESSER), and other additional grants received.
` Adjust appropriations from additional State and Federal sources to align with the current spending plan.
y $18.6 million Debt Service Fund - Beginning Fund balance and Appropriation adjustments
` Recognize resources and appropriation levels to include the PERS Bond refunding that took place in August 2021.
y $21.8 million Capital Projects Fund - Beginning Fund balance and Appropriation adjustments
` Recognize resources to true up the audited beginning fund balances. ` Adjust appropriation levels to more accurately reflect the updated spending plan
for the current year.
y $0.7 million Internal Service Contingency Fund - Beginning Fund balance and Appropriation adjustments from risk management
` Adjust resources and appropriation levels to align with audited beginning fund balance.
The total combined budget, including all funds, decreased 9.2% or about $190million, from $2.06 billion in 2021-22 to $1.87 billion in 2022-23, including a contingency of $61.2 million and an ending fund balance of $50.6 million.

30
Combined Budget (All Funds)in billions
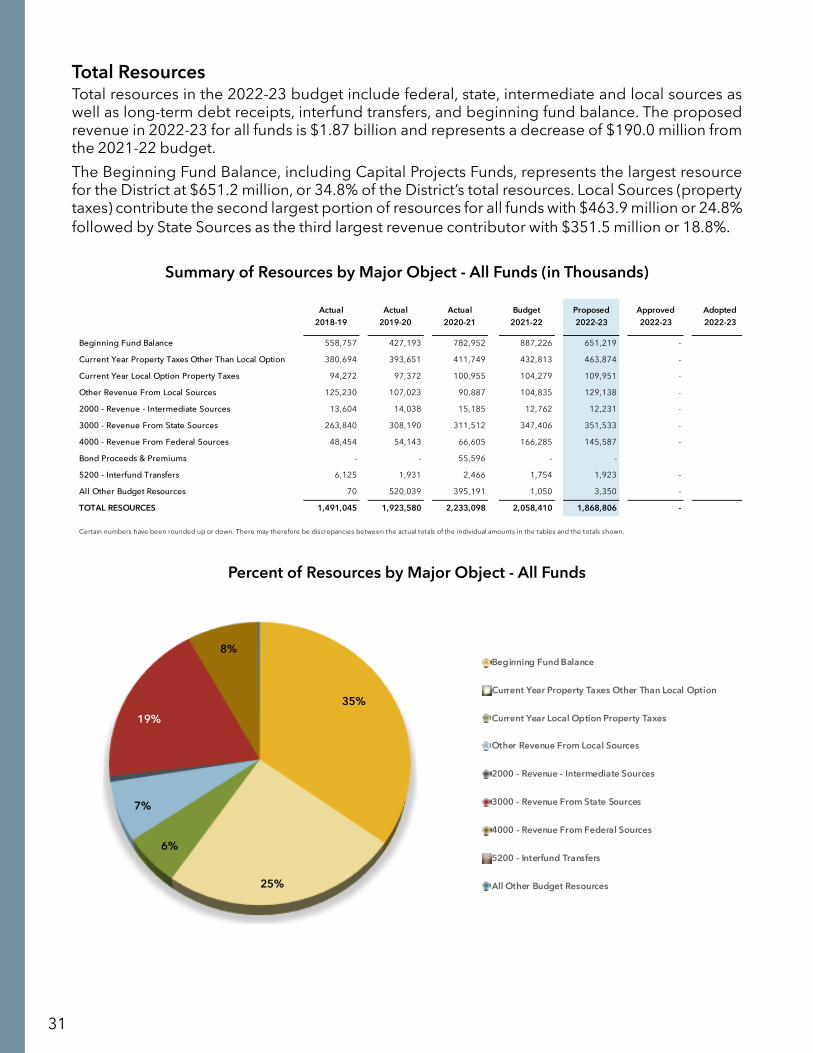
31
Total ResourcesTotal resources in the 2022-23 budget include federal, state, intermediate and local sources as well as long-term debt receipts, interfund transfers, and beginning fund balance. The proposed revenue in 2022-23 for all funds is $1.87 billion and represents a decrease of $190.0 million from the 2021-22 budget. The Beginning Fund Balance, including Capital Projects Funds, represents the largest resource for the District at $651.2 million, or 34.8% of the District’s total resources. Local Sources (property taxes) contribute the second largest portion of resources for all funds with $463.9 million or 24.8% followed by State Sources as the third largest revenue contributor with $351.5 million or 18.8%. Beginning Fund Balance 558,757 427,193 782,952 887,226 651,219 - -
Current Year Property Taxes Other Than Local Option 380,694 393,651 411,749 432,813 463,874 - -
Current Year Local Option Property Taxes 94,272 97,372 100,955 104,279 109,951 - -
Other Revenue From Local Sources 125,230 107,023 90,887 104,835 129,138 - -
2000 - Revenue - Intermediate Sources 13,604 14,038 15,185 12,762 12,231 - -
3000 - Revenue From State Sources 263,840 308,190 311,512 347,406 351,533 - -
4000 - Revenue From Federal Sources 48,454 54,143 66,605 166,285 145,587 - -
Bond Proceeds & Premiums - - 55,596 - -
5200 - Interfund Transfers 6,125 1,931 2,466 1,754 1,923 - -
All Other Budget Resources 70 520,039 395,191 1,050 3,350 - -
TOTAL RESOURCES 1,491,045 1,923,580 2,233,098 2,058,410 1,868,806 - -
Summary of Resources by Major Object - All Funds (In Thousands)
Actual2018-19
Proposed 2022-23
Certain numbers have been rounded up or down. There may therefore be discrepancies between the actual totals of the individual amounts in the tables and the totals shown.
Actual2019-20
Actual2020-21
Budget2021-22
Approved2022-23
Adopted2022-23
35%
25%
6%
7%
19%
8%
Percent of Total Resources - All Funds
Beginning Fund Balance
Current Year Property Taxes Other Than Local Option
Current Year Local Option Property Taxes
Other Revenue From Local Sources
2000 - Revenue - Intermediate Sources
3000 - Revenue From State Sources
4000 - Revenue From Federal Sources
5200 - Interfund Transfers
All Other Budget Resources
Beginning Fund Balance 558,757 427,193 782,952 887,226 651,219 - -
Current Year Property Taxes Other Than Local Option 380,694 393,651 411,749 432,813 463,874 - -
Current Year Local Option Property Taxes 94,272 97,372 100,955 104,279 109,951 - -
Other Revenue From Local Sources 125,230 107,023 90,887 104,835 129,138 - -
2000 - Revenue - Intermediate Sources 13,604 14,038 15,185 12,762 12,231 - -
3000 - Revenue From State Sources 263,840 308,190 311,512 347,406 351,533 - -
4000 - Revenue From Federal Sources 48,454 54,143 66,605 166,285 145,587 - -
Bond Proceeds & Premiums - - 55,596 - -
5200 - Interfund Transfers 6,125 1,931 2,466 1,754 1,923 - -
All Other Budget Resources 70 520,039 395,191 1,050 3,350 - -
TOTAL RESOURCES 1,491,045 1,923,580 2,233,098 2,058,410 1,868,806 - -
Summary of Resources by Major Object - All Funds (In Thousands)
Actual2018-19
Proposed 2022-23
Certain numbers have been rounded up or down. There may therefore be discrepancies between the actual totals of the individual amounts in the tables and the totals shown.
Actual2019-20
Actual2020-21
Budget2021-22
Approved2022-23
Adopted2022-23
35%
25%
6%
7%
19%
8%
Percent of Total Resources - All Funds
Beginning Fund Balance
Current Year Property Taxes Other Than Local Option
Current Year Local Option Property Taxes
Other Revenue From Local Sources
2000 - Revenue - Intermediate Sources
3000 - Revenue From State Sources
4000 - Revenue From Federal Sources
5200 - Interfund Transfers
All Other Budget Resources
Summary of Resources by Major Object - All Funds (in Thousands)
Percent of Resources by Major Object - All Funds

32
Total RequirementsThe 2022-23 proposed budget expenditures for all funds represent a $189.6 million decrease as compared to the 2021-22 adopted budget. In accordance with Oregon Budget Law and District policy, future bond sales will be appropriately recorded.Expenditures are categorized by major function and major object.
y Major function includes instruction, support services, enterprise and community services, facility acquisition and construction, debts, transfers out, contingency and ending fund balance. Instruction is the largest budget category at $523.9 million or 28.0% of all funds. Facilities Acquisition and Construction is the second largest budget category at $513.2 million or 27.5%. Support Services is the third largest budget category at $454.8 million or 24.3% of all funds.
1000 - Instruction 394,078 408,759 417,111 507,966 3,479.27 523,921 3,654.63
2000 - Support Services 302,212 322,815 348,539 425,257 2,488.88 456,149 2,520.85
3000 - Enterprise And Community Svcs 22,831 21,937 23,914 57,046 204.00 36,048 240.83
4000 - Facilities Acquisition And Con 164,764 207,451 287,539 438,086 39.55 513,203 48.80
5100 - Debt Service & 5400 - PERS UAL Programs 173,842 177,734 246,806 201,532 - 227,723 -
5200 - Transfers Of Funds 6,125 1,931 2,466 1,754 - 1,923 -
6000 - Contingencies - - - 61,586 - 59,248 -
7000 - Unappropriated Fund Balance 427,192 782,952 906,725 365,183 - 50,591 -
TOTAL REQUIREMENTS 1,491,045 1,923,580 2,233,099 2,058,410 6,211.70 1,868,806 - - 6,465.11
Certain numbers have been rounded up or down. There may therefore be discrepancies between the actual totals of the individual amounts in the tables and the totals shown.
Budget FTE2022-23
Summary of Requirements by Major Function - All Funds (Financial Data in Thousands)
Actual2018-19
Proposed 2022-23
Adopted2022-23
Approved2022-23
Budget FTE2021-22
Budget2021-22
Actual2020-21
Actual2019-20
28%
24%
2%
28%
12%
3% 3%
Requirements by Major Function - All Funds
1000 - Instruction
2000 - Support Services
3000 - Enterprise And Community Svcs
4000 - Facilities Acquisition And Con
5100 - Debt Service & 5400 - PERS UAL Programs
5200 - Transfers Of Funds
6000 - Contingencies
7000 - Unappropriated Fund Balance
Percent of Requirements by Major Function - All Funds
Summary of Requirements by Major Function - All Funds (in Thousands)

33
y Major object includes salaries, payroll benefits, purchased services, supplies and materials, capital outlay, other objects, transfers and reserves. Salaries and associated payroll costs represent the largest budget category at $770.2 million or 41.2% of all funds.
111 - Licensed Salaries 243,932 247,318 271,439 285,529 3,549.58 311,518 - - 3,724.52
1121 - Classified - Represented 58,707 64,235 65,467 76,182 1,894.87 81,784 - - 1,947.59
1122 - Non - Represented Staff 30,172 33,652 36,375 43,930 490.75 48,494 - - 519.26
113 - Administrators 28,152 31,316 33,539 37,363 276.50 39,323 - - 273.75
Other Salaries 27,845 26,811 22,434 34,824 - 36,453 - - -
200 - Associated Payroll Costs 180,305 200,639 219,461 231,687 - 254,006 - - -
300 - Purchased Services 131,026 127,945 122,468 267,857 - 225,295 - - -
400 - Supplies And Materials 42,640 39,284 48,953 55,976 - 120,237 - - -
500 - Capital Outlay 127,641 169,339 234,584 368,169 - 391,657 - - -
600 - Other Objects 187,234 198,159 269,188 228,370 - 248,278 - - -
700 - Transfers 6,199 1,931 2,466 1,754 - 1,923 - - -
581000 - Operating Contingency - - - 61,586 - 59,247 - - -
376520 - Budgeted Ending Fund Balance 427,192 782,952 906,725 365,183 - 50,591 - - -
TOTAL REQUIREMENTS 1,491,045 1,923,580 2,233,099 2,058,410 6,211.70 1,868,806 - - 6,465.11
Actual2019-20
Actual2020-21
Budget2021-22
Budget FTE2021-22
Approved2022-23
Adopted2022-23
Certain numbers have been rounded up or down. There may therefore be discrepancies between the actual totals of the individual amounts in the tables and the totals shown.
Budget FTE2022-23
Summary of Requirements by Major Object - All Funds (Financial Data in Thousands)
Actual2018-19
Proposed 2022-23
17%
4%
3%
2%
2%
14%
12%6%
21%
13%
3% 3%
Requirements by Major Object - All Funds
111 - Licensed Salaries
1121 - Classified - Represented
1122 - Non - Represented Staff
113 - Administrators
Other Salaries
200 - Associated Payroll Costs
300 - Purchased Services
400 - Supplies And Materials
500 - Capital Outlay
600 - Other Objects
700 - Transfers
581000 - Operating Contingency
376520 - Budgeted Ending Fund Balance
Summary of Requirements by Major Object - All Funds (in Thousands)
Percent of Requirements by Major Object - All Funds

34
3-YEAR FORECAST - ALL FUNDS
Resources Proposed 2022-23
Projected 2023-24
Projected 2024-25
Projected 2025-26
BEGINNING FUND BALANCE 651,219 176,515 385,364 270,714
CURRENT YEAR PROPERTY TAXES OTHER THAN LOCAL OPTION 463,874 480,110 496,913 514,305
CURRENT YEAR LOCAL OPTION PROPERTY TAXES 109,952 113,800 117,783 121,906
OTHER REVENUE FROM LOCAL SOURCES 129,136 136,550 141,330 146,276
2000 - REVENUE - INTERMEDIATE SOURCES 12,231 12,525 12,963 13,417
3000 - REVENUE FROM STATE SOURCES 351,533 363,820 376,535 389,696
4000 - REVENUE FROM FEDERAL SOURCES 145,588 150,677 155,951 161,410
5200 - INTERFUND TRANSFERS 1,923 1,344 1,368 1,395
ALL OTHER BUDGET RESOURCES 3,350 444,467 3,589 3,714
Total Resources 1,868,806 1,879,808 1,691,797 1,622,834
Requirements Proposed 2022-23
Projected 2023-24
Projected 2024-25
Projected 2025-26
111 - LICENSED SALARIES 311,518 322,421 333,706 345,386
1121 - CLASSIFIED - REPRESENTED 81,784 84,646 87,609 90,675
1122 - NON-REPRESENTED STAFF 48,172 49,858 51,603 53,409
113 - ADMINISTRATORS 39,323 40,699 42,124 43,598
OTHER SALARIES 35,403 36,384 37,658 38,976
200 - ASSOCIATED PAYROLL COSTS 255,380 264,319 273,571 283,145
300 - PURCHASED SERVICES 225,294 200,834 191,701 190,460
400 - SUPPLIES AND MATERIALS 120,236 93,726 81,648 76,826
500 - CAPITAL OUTLAY 391,656 217,055 130,548 89,885
600 - OTHER OBJECTS 248,279 256,929 265,881 275,149
700 - TRANSFERS 1,923 1,344 1,368 1,395
581000 - OPERATING CONTINGENCY 59,248 61,968 64,159 66,427
376520 - BUDGETED ENDING FUND BALANCE 50,590 249,623 130,222 67,503
Total Requirements 1,868,806 1,879,808 1,691,797 1,622,834
Budget Forecast by Major Object - All Funds (In Thousands)
Certain numbers have been rounded up or down. There may therefore be discrepancies between the actual totals of the individual amounts in the tables and the totals shown.

35
Contingencies and Unappropriated Ending Fund BalanceContingencies are reserved for expenditures that cannot be foreseen and planned in the budget process because of the occurrence of an unusual or extraordinary event. From 2021-22 to 2022-23, total budgeted contingency will decrease by 0.6% from $61.6 million to $61.2 million. The federal grant funds that the District will receive include a fee that is assessed as the money is drawn. The contingency is the portion of the allocation that the District may not draw down next year.Ending Fund Balance is an estimate of funds needed to maintain operations of the District from July 1 of the ensuing fiscal year to the time when sufficient new revenues become available to meet cash flow needs of the fund. No expenditure shall be made from the unappropriated ending fund balance in the year in which it is budgeted. Total budgeted ending fund balance will decrease from $365.2 million in 2021-22 to $50.6 million in 2022-23 mainly due to the spending down of capital bonds.
The General Fund BudgetGeneral Fund The General Fund Budget increased by 2.9%, or $22.6 million from almost $773.0 million in 2021-22 to $794.6 million in 2022-23, including a contingency of almost $51.0 million.
General Fund Budgetin millions

36
General Fund ResourcesIn 2022-23, the proposed resources for the General Fund total $794.6 million, an increase of $22.6 million, compared to the 2021-22 budget.
The 2022-23 resources budget includes property taxes, local option property taxes, local, intermediate, state, interfund transfers and other sources. The primary sources of revenue for the General Fund are Local Sources (property taxes) totaling $314.4 million or 39.6%, State Sources totaling more than $247.4 million or 31.1%, and Local Option Property Taxes totaling almost $110.0 million, or 13.8% of all sources.
General Fund RequirementsThe 2022-23 proposed requirements for General Fund increased by $22.6 million, or 2.9%, compared to the 2021-22 budget.Expenditures are categorized by major function and major object.
y Major function includes classroom instruction, support services, enterprise and community services, facility acquisition and construction, debts, transfers out, contingency and ending fund balance. Classroom instruction is the largest budget category at $399.2 million or 50.2% of the General Fund. Support Services is the second largest budget category at almost $337.9 million or 42.5% of the General Fund.
Beginning Fund Balance 38,282 39,887 64,474 84,845 90,500 - -
Current Year Property Taxes Other Than Local Option 257,076 268,840 281,443 293,823 314,424 - -
Current Year Local Option Property Taxes 94,272 97,372 100,955 104,279 109,951 - -
Other Revenue From Local Sources 26,692 17,505 13,925 13,724 17,736 - -
2000 - Revenue - Intermediate Sources 13,494 13,768 14,374 12,762 12,101 - -
3000 - Revenue From State Sources 230,628 271,620 269,250 261,465 247,407 - -
4000 - Revenue From Federal Sources 80 84 18 15 15 - -
5200 - Interfund Transfers 14 - - - - - -
All Other Budget Resources 55 17 152 1,050 2,450 - -
TOTAL RESOURCES 660,592 709,092 744,589 771,963 794,585 - -
Summary of Resources by Major Object - General Funds (Financial Data in Thousands)
Actual2018-19
Proposed 2022-23
Certain numbers have been rounded up or down. There may therefore be discrepancies between the actual totals of the individual amounts in the tables and the totals shown.
Actual2019-20
Actual2020-21
Budget2021-22
Approved2022-23
Adopted2022-23
11%
40%
14%2%
2%
31%
Resources by Major Object - General Funds
Beginning Fund Balance
Current Year Property Taxes Other Than Local Option
Current Year Local Option Property Taxes
Other Revenue From Local Sources
2000 - Revenue - Intermediate Sources
3000 - Revenue From State Sources
4000 - Revenue From Federal Sources
5200 - Interfund Transfers
All Other Budget Resources
Percent of Resources by Major Object - General Funds
Beginning Fund Balance 38,282 39,887 64,474 84,845 90,500 - -
Current Year Property Taxes Other Than Local Option 257,076 268,840 281,443 293,823 314,424 - -
Current Year Local Option Property Taxes 94,272 97,372 100,955 104,279 109,951 - -
Other Revenue From Local Sources 26,692 17,505 13,925 13,724 17,736 - -
2000 - Revenue - Intermediate Sources 13,494 13,768 14,374 12,762 12,101 - -
3000 - Revenue From State Sources 230,628 271,620 269,250 261,465 247,407 - -
4000 - Revenue From Federal Sources 80 84 18 15 15 - -
5200 - Interfund Transfers 14 - - - - - -
All Other Budget Resources 55 17 152 1,050 2,450 - -
TOTAL RESOURCES 660,592 709,092 744,589 771,963 794,585 - -
Summary of Resources by Major Object - General Funds (Financial Data in Thousands)
Actual2018-19
Proposed 2022-23
Certain numbers have been rounded up or down. There may therefore be discrepancies between the actual totals of the individual amounts in the tables and the totals shown.
Actual2019-20
Actual2020-21
Budget2021-22
Approved2022-23
Adopted2022-23
11%
40%
14%2%
2%
31%
Resources by Major Object - General Funds
Beginning Fund Balance
Current Year Property Taxes Other Than Local Option
Current Year Local Option Property Taxes
Other Revenue From Local Sources
2000 - Revenue - Intermediate Sources
3000 - Revenue From State Sources
4000 - Revenue From Federal Sources
5200 - Interfund Transfers
All Other Budget Resources1000 - Instruction 347,734 359,882 363,865 386,622 2,966.62 399,183 - - 2,987.31
2000 - Support Services 265,988 281,918 285,720 328,092 2,157.26 339,250 - - 2,153.42
3000 - Enterprise And Community Svcs 1,491 1,507 5,115 2,993 11.88 3,100 - - 12.88
5100 - Debt Service - - - 1,223 - 783 - - -
5200 - Transfers Of Funds 5,492 1,311 1,198 1,136 - 1,302 - - -
6000 - Contingencies - - - 51,896 - 50,967 - - -
7000 - Unappropriated Fund Balance 39,887 64,474 88,691 - - - - - -
TOTAL REQUIREMENTS 660,592 709,092 744,589 771,963 5,135.75 794,585 - - 5,153.61
BBuuddggeett FFTTEE22002222--2233
SSuummmmaarryy ooff RReeqquuiirreemmeennttss bbyy MMaajjoorr FFuunnccttiioonn -- GGeenneerraall FFuunnddss ((FFiinnaanncciiaall DDaattaa iinn TThhoouussaannddss))
AAccttuuaall22001188--1199
PPrrooppoosseedd 22002222--2233
AAccttuuaall22001199--2200
AAccttuuaall22002200--2211
BBuuddggeett22002211--2222
BBuuddggeett FFTTEE22002211--2222
AApppprroovveedd22002222--2233
AAddoopptteedd22002222--2233
Certain numbers have been rounded up or down. There may therefore be discrepancies between the actual totals of the individual amounts in the tables and the totals shown.
50%43%
7%
Requirements by Major Function - General Funds
1000 - Instruction
2000 - Support Services
3000 - Enterprise And Community Svcs
5100 - Debt Service
5200 - Transfers Of Funds
6000 - Contingencies
7000 - Unappropriated Fund Balance
Percent of Requirements by Major Function - General Funds
1000 - Instruction 347,734 359,882 363,865 386,622 2,966.62 399,183 - - 2,987.31
2000 - Support Services 265,988 281,918 285,720 328,092 2,157.26 339,250 - - 2,153.42
3000 - Enterprise And Community Svcs 1,491 1,507 5,115 2,993 11.88 3,100 - - 12.88
5100 - Debt Service - - - 1,223 - 783 - - -
5200 - Transfers Of Funds 5,492 1,311 1,198 1,136 - 1,302 - - -
6000 - Contingencies - - - 51,896 - 50,967 - - -
7000 - Unappropriated Fund Balance 39,887 64,474 88,691 - - - - - -
TOTAL REQUIREMENTS 660,592 709,092 744,589 771,963 5,135.75 794,585 - - 5,153.61
BBuuddggeett FFTTEE22002222--2233
SSuummmmaarryy ooff RReeqquuiirreemmeennttss bbyy MMaajjoorr FFuunnccttiioonn -- GGeenneerraall FFuunnddss ((FFiinnaanncciiaall DDaattaa iinn TThhoouussaannddss))
AAccttuuaall22001188--1199
PPrrooppoosseedd 22002222--2233
AAccttuuaall22001199--2200
AAccttuuaall22002200--2211
BBuuddggeett22002211--2222
BBuuddggeett FFTTEE22002211--2222
AApppprroovveedd22002222--2233
AAddoopptteedd22002222--2233
Certain numbers have been rounded up or down. There may therefore be discrepancies between the actual totals of the individual amounts in the tables and the totals shown.
50%43%
7%
Requirements by Major Function - General Funds
1000 - Instruction
2000 - Support Services
3000 - Enterprise And Community Svcs
5100 - Debt Service
5200 - Transfers Of Funds
6000 - Contingencies
7000 - Unappropriated Fund Balance

37
y Major object includes salaries, payroll benefits, purchased services, supplies and materials, capital outlay, other objects, transfers and reserves. Salaries and associated payrolls costs are the largest budget category at almost $618.6 million, or 77.9% of the General Fund.
Special Revenue FundThe budget reflects projected 2022-23 grant revenues and expenses as well as projected carry-forward to be used from July 1 to September 30 due to the grants operating on a federal fiscal year of October 1 through September 30. The Special Revenue Fund is expected to increase by $2.3 million or 0.8% in 2022-23 from 2021-22. This includes remaining resources from the spend down of one-time federal grants such as Elementary and Secondary School Emergency Relief Funds (ESSER), which represents a $20.7 million decrease in ESSER funds.
111 - Licensed Salaries 224,724 225,339 245,595 247,667 3,074.55 260,343 - - 3,096.16
1121 - Classified - Represented 46,871 51,293 51,048 59,367 1,432.85 63,156 - - 1,426.16
1122 - Non - Represented Staff 23,853 26,814 28,736 34,698 380.61 37,762 - - 396.29
113 - Administrators 26,199 29,247 30,738 33,682 247.75 33,944 - - 234.99
Other Salaries 23,236 23,482 15,208 21,101 - 19,448 - - -
200 - Associated Payroll Costs 159,479 176,456 189,914 193,128 - 205,360 - - -
300 - Purchased Services 87,227 84,559 79,002 99,694 - 96,956 - - -
400 - Supplies And Materials 16,788 18,945 6,908 17,204 - 12,641 - - -
500 - Capital Outlay 2,539 1,936 1,092 3,011 - 3,710 - - -
600 - Other Objects 4,297 5,235 6,458 9,378 - 8,996 - - -
700 - Transfers 5,492 1,311 1,198 1,136 - 1,302 - - -
581000 - Operating Contingency - - - 51,896 - 50,967 - - -
376520 - Budgeted Ending Fund Balance 39,887 64,474 88,691 - - - - - -
TOTAL REQUIREMENTS 660,592 709,092 744,589 771,963 5,135.75 794,585 - - 5,153.61
Adopted2022-23
Certain numbers have been rounded up or down. There may therefore be discrepancies between the actual totals of the individual amounts in the tables and the totals shown.
Budget FTE2022-23
Summary of Requirements by Major Object - General Funds (Financial Data in Thousands)
Actual2018-19
Proposed 2022-23
Actual2019-20
Actual2020-21
Budget2021-22
Budget FTE2021-22
Approved2022-23
33%
8%
5%4%2%
26%
12%
2%1%
6%
Requirements by Major Object - General Funds
111 - Licensed Salaries
1121 - Classified - Represented
1122 - Non - Represented Staff
113 - Administrators
Other Salaries
200 - Associated Payroll Costs
300 - Purchased Services
400 - Supplies And Materials
500 - Capital Outlay
600 - Other Objects
700 - Transfers
581000 - Operating Contingency
376520 - Budgeted Ending Fund Balance
Percent of Requirements by Major Object - General Funds
111 - Licensed Salaries 224,724 225,339 245,595 247,667 3,074.55 260,343 - - 3,096.16
1121 - Classified - Represented 46,871 51,293 51,048 59,367 1,432.85 63,156 - - 1,426.16
1122 - Non - Represented Staff 23,853 26,814 28,736 34,698 380.61 37,762 - - 396.29
113 - Administrators 26,199 29,247 30,738 33,682 247.75 33,944 - - 234.99
Other Salaries 23,236 23,482 15,208 21,101 - 19,448 - - -
200 - Associated Payroll Costs 159,479 176,456 189,914 193,128 - 205,360 - - -
300 - Purchased Services 87,227 84,559 79,002 99,694 - 96,956 - - -
400 - Supplies And Materials 16,788 18,945 6,908 17,204 - 12,641 - - -
500 - Capital Outlay 2,539 1,936 1,092 3,011 - 3,710 - - -
600 - Other Objects 4,297 5,235 6,458 9,378 - 8,996 - - -
700 - Transfers 5,492 1,311 1,198 1,136 - 1,302 - - -
581000 - Operating Contingency - - - 51,896 - 50,967 - - -
376520 - Budgeted Ending Fund Balance 39,887 64,474 88,691 - - - - - -
TOTAL REQUIREMENTS 660,592 709,092 744,589 771,963 5,135.75 794,585 - - 5,153.61
Adopted2022-23
Certain numbers have been rounded up or down. There may therefore be discrepancies between the actual totals of the individual amounts in the tables and the totals shown.
Budget FTE2022-23
Summary of Requirements by Major Object - General Funds (Financial Data in Thousands)
Actual2018-19
Proposed 2022-23
Actual2019-20
Actual2020-21
Budget2021-22
Budget FTE2021-22
Approved2022-23
33%
8%
5%4%2%
26%
12%
2%1%
6%
Requirements by Major Object - General Funds
111 - Licensed Salaries
1121 - Classified - Represented
1122 - Non - Represented Staff
113 - Administrators
Other Salaries
200 - Associated Payroll Costs
300 - Purchased Services
400 - Supplies And Materials
500 - Capital Outlay
600 - Other Objects
700 - Transfers
581000 - Operating Contingency
376520 - Budgeted Ending Fund Balance
Beginning Fund Balance 36,207 37,428 35,790 36,505 43,351 - -
Current Year Property Taxes Other Than Local Option 283 296 309 323 342 - -
Other Revenue From Local Sources 23,416 20,451 11,795 20,795 17,929 - -
2000 - Revenue - Intermediate Sources 104 43 28 - 130 - -
3000 - Revenue From State Sources 28,529 24,982 40,775 79,297 97,185 - -
4000 - Revenue From Federal Sources 48,277 53,984 66,518 166,240 145,566 - -
5200 - Interfund Transfers 114 69 716 - 75 - -
All Other Budget Resources 15 0 - - 900 - -
TOTAL RESOURCES 136,944 137,252 155,931 303,161 305,478 - -
Summary of Resources by Major Object - 200 - Special Revenue Funds (In Thousands)
Actual2018-19
Proposed 2022-23
Certain numbers have been rounded up or down. There may therefore be discrepancies between the actual totals of the individual amounts in the tables and the totals shown.
Actual2019-20
Actual2020-21
Budget2021-22
Approved2022-23
Adopted2022-23
14%
6%
32%
48%
Resources by Major Object - 200 - Special Revenue Funds
Beginning Fund Balance
Current Year Property Taxes Other Than Local Option
Other Revenue From Local Sources
2000 - Revenue - Intermediate Sources
3000 - Revenue From State Sources
4000 - Revenue From Federal Sources
5200 - Interfund Transfers
All Other Budget Resources
Percent of Resources by Major Object - 200 - Special Revenue Funds
Beginning Fund Balance 36,207 37,428 35,790 36,505 43,351 - -
Current Year Property Taxes Other Than Local Option 283 296 309 323 342 - -
Other Revenue From Local Sources 23,416 20,451 11,795 20,795 17,929 - -
2000 - Revenue - Intermediate Sources 104 43 28 - 130 - -
3000 - Revenue From State Sources 28,529 24,982 40,775 79,297 97,185 - -
4000 - Revenue From Federal Sources 48,277 53,984 66,518 166,240 145,566 - -
5200 - Interfund Transfers 114 69 716 - 75 - -
All Other Budget Resources 15 0 - - 900 - -
TOTAL RESOURCES 136,944 137,252 155,931 303,161 305,478 - -
Summary of Resources by Major Object - 200 - Special Revenue Funds (In Thousands)
Actual2018-19
Proposed 2022-23
Certain numbers have been rounded up or down. There may therefore be discrepancies between the actual totals of the individual amounts in the tables and the totals shown.
Actual2019-20
Actual2020-21
Budget2021-22
Approved2022-23
Adopted2022-23
14%
6%
32%
48%
Resources by Major Object - 200 - Special Revenue Funds
Beginning Fund Balance
Current Year Property Taxes Other Than Local Option
Other Revenue From Local Sources
2000 - Revenue - Intermediate Sources
3000 - Revenue From State Sources
4000 - Revenue From Federal Sources
5200 - Interfund Transfers
All Other Budget Resources

38
Debt Service FundThe growth of the Debt Service Fund by 16.6% is partly attributable to increased property taxes. Debt repayment schedules have been structured to grow with assessed property values in an effort to keep millage rates stable over the life of the debt. Total resources in this fund are expected to grow from almost $211.0 million in 2021-22 to $245.9 million in 2022-23. These resources will be used to pay down principal and interest on current debt.
Capital Projects FundThe Capital Projects Fund is expected to decrease by 32.7%, or $249.5 million from 2021-22 to 2022-23. This decrease is due to the spending down of funds to support projects. As construction projects develop, future bond sales will be appropriately recorded in accordance with Oregon Budget Law and District policy.
Beginning Fund Balance 6,137 10,783 13,823 10,228 13,061 - -
Current Year Property Taxes Other Than Local Option 123,335 124,515 129,997 138,667 149,108 - -
Other Revenue From Local Sources 50,598 54,432 57,259 60,284 82,477 - -
4000 - Revenue From Federal Sources 97 76 53 30 6 - -
Bond Proceeds & Premiums 4,458 1,752 1,750 1,754 1,238 - -
5200 - Interfund Transfers - - 55,596 - - - -
TOTAL RESOURCES 184,625 191,557 258,478 210,963 245,890 - -
Summary of Resources by Major Object - 300 - Debt Service Funds (In Thousands)
Actual2018-19
Proposed 2022-23
Certain numbers have been rounded up or down. There may therefore be discrepancies between the actual totals of the individual amounts in the tables and the totals shown.
Actual2019-20
Actual2020-21
Budget2021-22
Approved2022-23
Adopted2022-23
5%
61%
34%
Resources by Major Object - 300 - Debt Service Funds
Beginning Fund Balance
Current Year Property Taxes Other Than Local Option
Other Revenue From Local Sources
Bond Proceeds & Premiums
Percent of Resources by Major Object - 300 - Debt Service Funds
Beginning Fund Balance 6,137 10,783 13,823 10,228 13,061 - -
Current Year Property Taxes Other Than Local Option 123,335 124,515 129,997 138,667 149,108 - -
Other Revenue From Local Sources 50,598 54,432 57,259 60,284 82,477 - -
4000 - Revenue From Federal Sources 97 76 53 30 6 - -
Bond Proceeds & Premiums 4,458 1,752 1,750 1,754 1,238 - -
5200 - Interfund Transfers - - 55,596 - - - -
TOTAL RESOURCES 184,625 191,557 258,478 210,963 245,890 - -
Summary of Resources by Major Object - 300 - Debt Service Funds (In Thousands)
Actual2018-19
Proposed 2022-23
Certain numbers have been rounded up or down. There may therefore be discrepancies between the actual totals of the individual amounts in the tables and the totals shown.
Actual2019-20
Actual2020-21
Budget2021-22
Approved2022-23
Adopted2022-23
5%
61%
34%
Resources by Major Object - 300 - Debt Service Funds
Beginning Fund Balance
Current Year Property Taxes Other Than Local Option
Other Revenue From Local Sources
Bond Proceeds & PremiumsBeginning Fund Balance 472,196 330,978 663,007 749,789 499,241 - -
Other Revenue From Local Sources 20,736 13,908 6,281 7,425 7,441 - -
2000 - Revenue - Intermediate Sources 6 227 783 - - - -
3000 - Revenue From State Sources 4,500 11,368 1,319 6,544 6,941 - -
5200 - Interfund Transfers 1,539 110 - - 610 - -
All Other Budget Resources - 520,022 395,039 - - - -
TOTAL RESOURCES 498,977 876,613 1,066,429 763,758 514,233 - -
Summary of Resources by Major Object - 400 - Capital Project Funds (In Thousands)
Actual2018-19
Proposed 2022-23
Certain numbers have been rounded up or down. There may therefore be discrepancies between the actual totals of the individual amounts in the tables and the totals shown.
Actual2019-20
Actual2020-21
Budget2021-22
Approved2022-23
Adopted2022-23
97%
2% 1%
Resources by Major Object - 400 - Capital Project Funds
Beginning Fund Balance
Other Revenue From Local Sources
3000 - Revenue From State Sources
5200 - Interfund Transfers
Percent of Resources by Major Object - 400 - Capital Projects Funds
Beginning Fund Balance 472,196 330,978 663,007 749,789 499,241 - -
Other Revenue From Local Sources 20,736 13,908 6,281 7,425 7,441 - -
2000 - Revenue - Intermediate Sources 6 227 783 - - - -
3000 - Revenue From State Sources 4,500 11,368 1,319 6,544 6,941 - -
5200 - Interfund Transfers 1,539 110 - - 610 - -
All Other Budget Resources - 520,022 395,039 - - - -
TOTAL RESOURCES 498,977 876,613 1,066,429 763,758 514,233 - -
Summary of Resources by Major Object - 400 - Capital Project Funds (In Thousands)
Actual2018-19
Proposed 2022-23
Certain numbers have been rounded up or down. There may therefore be discrepancies between the actual totals of the individual amounts in the tables and the totals shown.
Actual2019-20
Actual2020-21
Budget2021-22
Approved2022-23
Adopted2022-23
97%
2% 1%
Resources by Major Object - 400 - Capital Project Funds
Beginning Fund Balance
Other Revenue From Local Sources
3000 - Revenue From State Sources
5200 - Interfund Transfers

39
Internal Service FundResources in the Internal Service Fund increased slightly by 0.6% to $8.6 million in 2022-23 from 2021-22. Fund 601 is the only sub-fund currently budgeted to the Internal Service Fund and it serves as a Self-Insurance Fund for Workers’ Compensation, Unemployment Compensation, Risk Management, and some group health services.
Beginning Fund Balance 5,937 8,117 5,858 5,858 5,066 - -
Other Revenue From Local Sources 3,788 729 1,627 2,607 3,554 - -
3000 - Revenue From State Sources 184 221 188 100 - - -
TOTAL RESOURCES 9,908 9,066 7,673 8,565 8,620 - -
Summary of Resources by Major Object - 600 - Internal Service Funds (In Thousands)
Actual2018-19
Proposed 2022-23
Certain numbers have been rounded up or down. There may therefore be discrepancies between the actual totals of the individual amounts in the tables and the totals shown.
Actual2019-20
Actual2020-21
Budget2021-22
Approved2022-23
Adopted2022-23
59%
41%
Resources by Major Object - 600 - Internal Service Funds
Beginning Fund Balance
Other Revenue From Local Sources
Percent of Resources by Major Object - 600 - Internal Service Funds
Beginning Fund Balance 5,937 8,117 5,858 5,858 5,066 - -
Other Revenue From Local Sources 3,788 729 1,627 2,607 3,554 - -
3000 - Revenue From State Sources 184 221 188 100 - - -
TOTAL RESOURCES 9,908 9,066 7,673 8,565 8,620 - -
Summary of Resources by Major Object - 600 - Internal Service Funds (In Thousands)
Actual2018-19
Proposed 2022-23
Certain numbers have been rounded up or down. There may therefore be discrepancies between the actual totals of the individual amounts in the tables and the totals shown.
Actual2019-20
Actual2020-21
Budget2021-22
Approved2022-23
Adopted2022-23
59%
41%
Resources by Major Object - 600 - Internal Service Funds
Beginning Fund Balance
Other Revenue From Local Sources

40
STATE SCHOOL FUND GRANTS AND PROPERTY TAX REVENUESSTATE SCHOOL FUND GRANTS AND PROPERTY TAX REVENUESState School Fund and property taxes are primary sources of Portland Public Schools’ Operating Fund, General Fund. The Legislature determines how much money is available from State sources such as income taxes, and local sources primarily property taxes.
State School Fund (SSF)The State School Fund was created in response to the requirement that the state replace school tax revenue lost under Measure 5. The legislature created the State School Fund (SSF) and established an equalization formula to allocate revenue to schools on a weighted per-student basis. State School Fund is calculated based on enrollment. A per-student amount consists of two different enrollment numbers: average daily membership, resident (ADMr) and average daily membership, weighted (ADMw). The ADMr number represents the average number of students enrolled in Portland Public Schools on a daily basis. The ADMw is an adjusted number to compensate for the high costs of educating certain groups of students, such as English Language Learners, special education, pregnant or parenting, income at or below poverty and students in foster care.
The chart shows the actual October Enrollment by year, along with the middle projection provided by Portland State University’s Population and Research Center (PRC). Since the COVID-19 pandemic had a significant impact on the October 2020 enrollment, it is important to note that those large enrollment losses were not carried forward in the School and District projections for 2021-22 (not shown in the chart), in an effort to lessen impacts to K-8 staffing for 2021-22. Any loss in General Fund revenue would be offset by ESSER funding. Enrollment losses have
been corrected in the 2022-23 and future projections, since students did not return in the fall of 2021 as predicted and we saw additional losses in enrollment. Property TaxesProperty taxes from each school district’s permanent rate are deducted from the General Purpose Grant to determine the amount the school district will receive from the State School Fund Grant. However, the property taxes from the 2009 Legislature gap bond and local option levy are excluded from the per student state school funding calculations. Property owners are taxed on the combined rates of education and debt service to repay bond expenses from Measure 5. The permanent Property Tax Rate for Portland Public Schools is $5.2781 per $1,000 of assessed value.Assessed values are limited to 3% increases a year unless there is new construction. Even if the market value is reduced, the assessed value can still go up by 3%. Once the assessed value “catches up” to market value, it can only increase if the market value increases. The permanent tax rates are determined by the State of Oregon Constitution and State Statutes. Existing districts cannot increase their permanent rate authority. Rates for debt services are set based on each year’s requirements. For more information on the Gap Tax please see https://www.oregonlegislature.gov/lro/Documents/report%205-99.pdf
The taxes levied are based upon the tax collection year July 1 to June 30.
*Enrollment impacted by COVID-19 pandemic.

41
SCHOOL STAFFING CHANGESBeginning in 2019-20, in an effort to transform school and student achievement, differentiated levels of supports and resources were allocated to the schools with the greatest needs. Schools with a Title I, Comprehensive School Improvement (CSI), and Targeted School Improvement (TSI) designation are considered those with the highest needs. CSI and TSI are federally required designations under the Every Student Succeeds Act (ESSA).
School staffing for 2021-22 was based on projected October 2021 enrollment, which typically uses the actual October 2020 enrollment as the base. Since the COVID-19 pandemic had a significant impact on the October 2020 enrollment, the large enrollment losses were ignored in the School and District projections, in an effort to lessen impacts to K-8 staffing.
For 2022-23, the large enrollment losses in grades K-8, particularly K-5, have been incorporated into the October 2022 projections, which is the main basis for school staffing allocations. The main priorities for the 2022-23 school staffing are to continue previous targeted investments, improve class sizes in K-8 and reduce the impact on schools seeing large K-5 enrollment losses by utilizing all funds available, including the General Fund and the Student Investment Account (SIA) and Elementary and Secondary School Emergency Relief Fund (ESSER) grant funds.
English Language Development (ELD) StaffingBeginning with the 2022-23 staffing, PPS has increased investments in English Language Development (ELD) services. ELD licensed and classified FTE is allocated based on weighting students based on proficiency levels. This change was made to allocate FTE to students based on need for ELD services. For example, PISA students are high school newcomers to the United States; Emerging students have lower levels of proficiency and require more support in comparison to a student who is identified as progressing. In the past, calculations were based on the number of students and kindergarten students at Immersion schools were not included in those counts. All ELD students are now included in the weighting and calculations. Over 10 additional FTE have been allocated to ELD staff as compared to the 2021-22 school year.
School FTE allocations are based on the most current English Language Proficiency Assessment (ELPA) or the ELPA Screener scores, if no ELPA test has been taken, for each student slated to attend the school in the next year. Due to a statewide change in the ELPA Screener in 2019-20, more students were identified as English Language Learners across the state. Additionally, due to the COVID pandemic, students did not take the ELPA test in 2020-21 and 2021-22. School FTE allocations will be reviewed and adjusted, as needed, after the ELPA scores are received in late spring of 2022.
The weighting provides FTE for ELD staff as well as additional FTE to support ELD students across the day.
Special Education (SPED) StaffingThere were no formula changes to the Special Education staffing for 2022-23.

42
CAPITAL PROJECTS SUMMARY FOR 2022-23In November 2012 and May 2017, Portland voters overwhelmingly supported capital improvement bonds totaling nearly $1.30 billion to upgrade PPS schools. In November of 2020, Portland voters supported a third capital improvement bond totaling $1.20 billion.
The 2012 School Building Improvement Bond, totaling $482 million, enabled the district to make improvements in more than 51 schools, including seismic, accessibility and science classroom upgrades. In addition, Franklin, Roosevelt and Grant High Schools were modernized and Faubion PK-8 was completely rebuilt. All work is complete except final efforts on a project that is adding a softball field at Grant High School.
The $790 million May 2017 Health, Safety and Modernization Bond is currently underway. McDaniel High School (formerly known as Madison High School) has been completely modernized and a new Kellogg Middle School has been built, with both opening to students in Fall 2021. Construction of a new Lincoln High School, a modernized Benson Polytechnic High School, and a new Multiple Pathways to Graduation building (on the Benson campus) will continue in 2022-23. Bond funding set aside for health and safety projects across the District has been half spent, but projects addressing water quality, lead paint, asbestos, and roof replacements will continue in 2022-23. For additional information on our bond projects please visit: https://www.pps.net/domain/62.
The 2020 bond is allowing PPS to continue the work of improving the health and safety of our aging school buildings with new roofs and mechanical systems, seismic retrofits, accessibility upgrades, improved SPED learning environments, and security upgrades. Large capital projects include the modernization of Jefferson High School, the Center for Black Student Excellence, and the modernization planning and design of Cleveland High School, Ida B Wells High School, and additional capacity at Roosevelt High School. New investments in curriculum and technology round out the bond. Over the course of 2022-23, all of the above projects will be in progress, except for the modernization planning efforts of Cleveland, Ida B Wells and Roosevelt, which will commence in 2023-24.

43
School Board
Zone Board Member Board Term Expires
1 Andrew Scott (Vice Chair) 6/30/2023
2 Michelle DePass (Board Chair) 6/30/2023
3 Amy Kohnstamm 6/30/2023
4 Herman Greene 6/30/2025
5 Gary Hollands 6/30/2025
6 Julia Brim-Edwards 6/30/2025
7 Eilidh Lowery 6/30/2023
Student Representative Jackson Weinberg 6/30/2022
Community Budget Review Committee (CBRC)
Committee Member Board Term Expires
Roger Kirchner 6/30/2024
Huyhn Pool 6/30/2024
Hoang Samuelson 6/30/2023Lisa Selman 6/30/2023Renee Anderson 6/30/2023Elona Wilson 6/30/2023
Parker Myrus, Student Representative 6/30/2022
Hobbs Waters, Student Representative 6/30/2022

44
Administrative Personnel
Name Title
Guadalupe Guerrero Superintendent
Dr. Cheryl Proctor Deputy Superintendent, Instruction & School Communities
Claire Hertz Deputy Superintendent, Business & Operations
Liz Large Contracted General Counsel
Jonathan Garcia Chief of Staff
Brenda Martinek Chief of Student Support Services
Dan Jung Chief Operating Officer
Dani Ledezma Senior Advisor, Racial Equity & Social Justice
Don Wolff Chief Technology Officer
Dr. Esther Omogbehin Regional Superintendent, Elementary Schools
Freddie Mack Senior Director of Communications
Margaret Calvert Regional Superintendent, Secondary Schools and Multiple Pathways
Nolberto Delgadillo Chief Financial Officer
Dr. Renard Adams Chief of Research, Assessment & Accountability
Rosanne Powell Senior Manager, Board of Education
Sharon Reese Chief Human Resources Officer

45
ORGANIZATIONAL SECTION

ORGANIZATIONAL SECTION
The organizational section is comprised of general information about the District and its budget, including the level of education provided, geographic area served, and number of schools and students. Also included in this section are significant budget and financial policies, procedures and regulations as well as a detailed description of the budget process.

47
THE DISTRICT AND THE COMMUNITYGeneral InformationEstablished in 1851, Portland Public Schools is the largest and oldest school district in the State of Oregon. Located in Northwestern Oregon at the confluence of the Columbia and Willamette Rivers, the District covers an area over 152 square miles. The district boundaries include portions of the cities of Portland (pop. 652,503), Lake Oswego (pop. 40,731), and Milwaukie (pop. 21,119), based on the April 2020 census by the U.S. Census Bureau, Population Estimates Program (PEP). The District owns and maintains over 100 campuses (schools and other uses) with more than 300 buildings and a total floor area of more than 9 million square feet. Please see Volume 2 for building location, age, and grade level information. The Portland Public School District Board, elected by a majority of the voting electorate, is the governing body responsible for the District’s public decisions. The seven member Board has oversight responsibility and control over all activities related to the District. The Board is accountable for all fiscal matters that significantly influence operations.

48
ORGANIZATIONAL CHART

49
THE BOARD OF EDUCATIONThe Board of Education (also referred to as School Board or Board) is the chief governing body of the District and is accountable for all fiscal matters that significantly affect operations. Its seven elected members establish and oversee the District’s policies, and appoint the Superintendent of the District. The School Board establishes guidelines and regulations concerning organization, general policies, and major plans and procedures for the District. They are legally responsible for the education of all children residing within the 152-square-mile school district. The Board requires the Superintendent to manage the budget, direct over 8,000 employees, supervise approximately 45,000 students, and make recommendations on the operation of the District. The School Board holds twice monthly regular meetings to consider, discuss, and determine District direction on a wide range of issues. Special meetings or work sessions are held as needed to discuss specific topics. Due to COVID-19, all meetings are live streamed under the provision ORS 192.670. Meeting dates may be obtained at http://www.pps.net/Page/1679 under the Board Calendar and Public Notices links.Voters living within District boundaries (including most of the City of Portland and portions of unincorporated Multnomah, Clackamas, and Washington Counties) elect Board members by zones. School Board members serve four-year terms without compensation and may be reelected. School Board Student Representatives, selected by the Superintendent’s Student Advisory Committee, serve as unofficial voting members for one year to represent the students and to report on various activities.
Zone 1Andrew Scott (Board Vice-Chair)[email protected] Term: 7/2019-6/2023
Zone 5Gary [email protected] Term: 7/2021-6/2025
Zone 2Michelle DePass (Board Chair)[email protected] Term: 7/2019-6/2023
Zone 6Julia Brim-Edwards [email protected] Term: 7/2021-6/2025
Zone 3Amy Kohnstamm [email protected] Term: 7/2019-6/2023
Zone 7Eilidh [email protected] Term: 7/2019-6/2023
Zone 4Herman Greene [email protected] Current Term: 7/2021-6/2025
Student RepresentativeJackson [email protected] Term: 7/2021-6/2022

50
PORTLAND PUBLIC SCHOOLS2021-22 Attendance Areas and Schools
Portland Public Schools is the largest of six school districts within the city of Portland, educating more than 49,000 students. Every K-12 student has a neighborhood school based on home address.
General information: www.pps.net, 503-916-2000Detailed School Boundaries: www.pps.net/mapSchool Boundaries Do Not Reflect City or County Lines
Map Notes:Beverly Cleary K-8 resides at two sites:
• Hollyrood: Kindergarten• Fernwood: Grades 1-8
Benson HS is temporarily located at the Marshall site and will reopen in 2024 The Willamette River is a functional boundary for all attendance areas.
̄bb
±°±°̄
±°±°̄
±°±°̄
±°±°̄
±°±°̄
±°±°̄
±°±°̄
̄bb
̄bb
̄bb
̄bb
̄bb
̄bb
̄bb
̄bb
̄bb
̄bb
̄bb
¯¯
¯
¯
¯
¯
¯
¯
¯
¯
¯
¯
¯
¯
¯
¯
¯
¯
¯
¯
¯
¯
¯
¯
¯
¯
b
b
b
b
b
b
b
b
b
b
b
b
b
b
b
b
b
b
b
b
b
b
b
b
b
b¯
¯¯
¯
¯
¯
¯
¯
¯
¯
¯
¯
¯
¯
¯
¯
¯¯¯
¯
¯
¯
¯
¯
¯
¯
¯
¯
¯¯
¯
¯
¯
¯
¯
¯
¯
¯
¯
¯
¯
¯
¯
¯
¯¯
¯
¯¯
¯
¯
¯
¯
¯
¯
¯
¯
¯
¯
¯
¯
¯
¯
¯
¯
¯
¯
¯
¯
¯¯
¯
¯
¯
¯
¯
¯
¯
¯
¯
¯
¯
¯
¯
¯
¯
¯
¯
¯
¯
¯
¯
¯
¯
¯
¯
¯
¯¯
¯
¯¯
¯
¯
¯
¯
b
b
b
b
b
b
b
b
b
b
b
b
b
b
b
b
bb
b
b
b
b
b
b
b
b
b
b
b
b
b
b
b
b
b
b
b
b
b
b
b
b
b
b
bb
b
b
b
b
b
b
b
b
b
b
b
b
b
b
b
b
b
b
b
b
b
b
b
bb
b
b
b
b
b
b
b
b
b
b
b
b
b
b
b
b
b
b
b
b
b
b
b
b
b
b
bb
b
b
b
b
b
b
b
¯¯
¯
¯
¯
¯
¯
¯
¯
¯
¯
¯
¯
¯
¯
¯
¯
¯
b
b
b
b
b
b
b
b
b
b
b
b
b
b
b
b
b
bVERMONT ST
82
ND
A
VE
CE
SA
RE
CH
AV
EZ
BLV
D
CAPITO L
HW
Y
57
TH
A
VE
CORNELL RD
BARBURBLV
D
TAYLORS
FE
RR
YR
D
ROSA PARKS WAY
MILW
AU
KIE
AV
E
PORTLAND HWY
GREELEY
AVE
82
ND
A
VE
CLAY ST
BOO
NE
SFE
RRY
RD
BURNSIDE ST
DIVISION ST
92
ND
A
VE
BELMONT ST
LOMBARD ST
MORRISON ST
KILLINGSWORTH ST
DIVISION ST
VIS
TAA
VE
SANDY BLVD
42
ND
A
VE
SKYLIN E
BLVDLOVEJOY ST
TACOMA ST
TAYLORS FERRY RD
HARNEY DR
MC
LOU
GH
LINBLVD
BURNSIDE ST
STARK ST
28
TH
A
VE
SH
ATTU
CKRD
45
TH
A
VE
THORBURN
ST
18
TH
A
VE
BRO
ADW
AY
HO
OD
AV
E
COUCH ST
HAR
BOR
DR
CU
LLY
BLV
D
LOMBARD ST
19
TH
A
VE
HALSEY ST
NA
ITO
PKW
Y
SUNSETH
WY
BROADWAY
52N
DA
VE
21
ST
A
VE
MULTNOMAH BLVD
MA
CA
DA
MA
VE
POWELL BLVD
STARK ST
COLUMBIA BLVD
35TH
DR
MARTIN
LUTHERK
ING
JRB
LVD
STH
ELENS
RD
SC
HO
LLS
FERRY
R
D
33
RD
A
VE
HALSEY ST
23
RD
A
VE
45TH
DR
WOODSTOCK BLVD
50TH
AV
E
62
ND
A
VE
BEAVERTON HILLSDALEHWY
POWELL BLVD
33
RD
A
VE
72
ND
A
VE
HOLGATE BLVD
KILLINGSWORTH ST
92
ND
AVE
FREMONT ST
FLAVEL ST
20
TH
A
VE
11
TH
A
VE
GOING ST
82
ND
AV
E
HAWTHORNE BLVD
COLUMBIA BLVD
MARINE DR
NAITO PKWY
FOSTERRD
BU
RGAR
DRD
CAP ITOL
HW
Y
FLAVEL
DR
NICOLAI ST
DO
SC
HR
D
FRONT AVE
WILLAMETTE BLVD
SK
YL I NE BLVD
BER
TH
A BLVD
PATTON RD
13
TH
A
VE
STEELE ST
BA
RB
UR
BLV
D
CAN
YON
RD
KE
R R PKWY
SUNSET HWY
21
ST
A
VE
82
ND
A
VE
WEIDLER ST
DE
NV
ER
AV
E
60
TH
A
VE
TERW
ILLIG
ERBL
VD
35
TH
A
VE
GLISAN ST
LESS
ER
RD
76
TH
A
VE
TERWILLIG
ER
BLVD
MARINEDR
SUNSET BLVD
THOMPSONR
D
STEPHENSON ST
BR O ADW A YD
R
LOM
BA
RDST
33
RD
DR
COLUMBIA BLVD
BURNSIDE RD
PRESCOTT ST
PORT
LAND R
D
G ERMANTOWN
RD
LOM
BA
RD
S
T
YEONAVE
COLUMBIABLVD
Mt. TaborPark
PierPark
LentsPark
CouncilCrestPark
SellwoodPark
CrestonPark
GabrielPark
Forest Park
JeffersonRoosevelt
JeffersonGrant
JeffersonMcDaniel
BensonReopening
2024
BESCAdmin
ColumbiaTransportationAdmin
RiceAdmin
WilcoxAdmin
SacajaweaEarlyLearning
ApplegateEarly
Learning
ClarendonEarly
Learning
RichmondK-5
HolladayAnnexK-6Youngson5-12
MLCK-12
Alternative
WinterhavenK-8
Creative ScienceSchool K-8
OdysseyK-8
KentonHS
Alliance
DaVinciArts MS
Green ThumbSpec Ed
GroutK-5
WoodmereK-5
KelloggMS
Harrison ParkK-8Bridger 6-8
Leodis VMcDaniel HS
JeffersonHS
RooseveltHS
CésarChávezK-8
MLK JrK-5
HollyroodK
BeverlyCleary
Fernwood 1-8
Rose CityParkK-5
AbernethyK-5
AinsworthK-5
AlamedaK-5
AtkinsonK-5
BridlemileK-5
BuckmanK-5
CapitolHillK-5
ChapmanK-5
DuniwayK-5
ForestParkK-5
GlencoeK-5
HayhurstK-5
JamesJohnK-5
KellyK-5
LewisK-5
LlewellynK-5
MaplewoodK-5
MarkhamK-5
RiekeK-5
RiglerK-5
Rosa ParksK-5
SittonK-5
StephensonK-5
WhitmanK-5
WoodstockK-5
ArletaK-5
AstorK-8
BeachK-5
Boise-EliotK-5
BridgerK-5
ChiefJoseph
K-5
CrestonK-5
FaubionK-8
IrvingtonK-5
LaurelhurstK-8
LeeK-5
LentK-5
MarysvilleK-5
PeninsulaK-5
SabinK-5
ScottK-5
SunnysideK-8
VernonK-8
VestalAccess
K-5
WoodlawnK-5
RosewayHeightsMSBeaumont
MS
GeorgeMS
GrayMS
HosfordMS
JacksonMS
LaneAccessMS
Mt. TaborMS
OckleyGreenMS
SellwoodMS
WestSylvan
MS
Harriet TubmanMS
ClevelandHS
FranklinHS
GrantHS
LincolnHS
Benson atMarshall
HS
Ida BWells HS
MeekHS
Alliance
̄bb
CO
RN
ELIU
SP A
SS
RD
S K YLI NE
BL
V
D
SK
YLIN
EBLVD
ST
HELENSRD
ST
HELE
NS
RD
SkylineK-8
Path
: M:\
PRO
JEC
TS\D
istr
ict M
aps\
PPS_
Dis
tric
t_M
ap_
Smal
l_La
yout
.apr
xD
ate:
8/2
3/20
21
2021-22 Attendance Areas and SchoolsPORTLAND PUBLIC SCHOOLS
Portland Public Schools is the largest of six school districts within the city of Portland, educating more than 49,000 students.Every K-12 student has a neighborhood school based on home address.
The Willamette River is a functional boundary
for all attendance areas. School boundaries
do not reflect city or county lines.
Detailed School Boundaries:
www.pps.net/map
PPS School Sites
̄ggHigh School
̄gg Middle School
̄gg K-5/K-8
̄gg Special Programs
±°±°̄ Early Learning
±°±°̄ AdministrationK5/K8 BoundariesMS BoundariesParks
0 1Miles
High School Clusters Coded by Color
See Inset MapNorthwest Portland
Beverly Cleary K-8 resides at two sites: •Hollyrood: Kindergarten •Fernwood: Grades 1-8
Benson HS is temporarily located at the Marshall siteand will reopen in 2024.
George MSAttendanceArea
Faubion K-8AttendanceArea
Bridlemile K-5Attendance
Area
PPS Special Programs
ACCESS Lane 6-8ACCESS Vestal 1-5Alliance Kenton 10-12Alliance Meek 10-12DART Kenton 6-12PISA Roosevelt HSPISA McDaniel HSPioneer Youngson 5-12Pioneer Holladay Center K-6Reconnection Kenton 10-12
Program Site Grade
Rigler K-5 is a dual language immersion
school in conjunction with Scott K-5,
Beaumont and Roseway Heights middle schools.
For detailed information contact Enrollment at (503) 916-3205
or email: [email protected]
Map Notes
§̈¦5
§̈¦84
§̈¦405£¤26
§̈¦5
£¤26
£¤30
£¤26
£¤26
§̈¦5
§̈¦5
§̈¦5
§̈¦405
§̈¦205
§̈¦205
£¤30
§̈¦84
§̈¦205
§̈¦5
o

51
DISTRICT STRATEGIC PLAN
Forw
ard
Toge
ther
2021
–202
5 S
trat
egic
Pla
n fo
r R
acia
l Equ
ity, I
nclu
sion
, and
Exc
elle
nce
52
In M
ay 2
019
, PP
S a
dopt
ed o
ur c
omm
unity
-info
rmed
vi
sion
, Por
tland
Pub
lic S
choo
ls re
Imag
ined
. Thi
s vi
sion
, w
hich
ser
ves
as a
map
tow
ard
a sh
ared
“nor
th s
tar,”
kni
ts
toge
ther
our
com
mun
ity’s
long
-ter
m a
spira
tions
for
our
gr
adua
tes,
edu
cato
rs*,
and
the
over
all s
choo
l sys
tem
. It i
s al
so o
ur p
rom
ise
to s
tude
nts,
thei
r fa
mili
es, a
nd o
ur
com
mun
ity a
bout
the
futu
re o
f pu
blic
edu
catio
n in
our
city
.
Forw
ard
Toge
ther
: PP
S’s
202
1–20
25 S
trat
egic
Pla
n
for R
acia
l Equ
ity, I
nclu
sion
and
Exc
elle
nce
is th
e fir
st o
f
a se
ries
of m
ulti-
year
str
ateg
ic p
lans
for
the
dist
rict,
outli
ning
this
impo
rtan
t ste
p to
war
d re
aliz
ing
our
visi
on.
In th
e fo
llow
ing
page
s, y
ou w
ill s
ee a
set
of
colle
ctiv
e an
d co
here
nt a
ctio
ns a
nd g
oals
that
toge
ther
rep
rese
nt th
e ch
ange
s w
e be
lieve
will
get
us
clos
er to
brin
ging
our
vi
sion
to li
fe. T
his
stra
tegi
c pl
an is
a h
igh-
leve
l des
crip
tion;
fu
rthe
r im
plem
enta
tion
step
s w
ill b
e ar
ticul
ated
in d
etai
led
actio
n pl
ans.
PP
S re
Imag
ined
(ou
r vi
sion
) se
rves
as
our
com
pass
; Fo
rwar
d To
geth
er (
our
stra
tegi
c pl
an)
is o
ur ro
adm
ap.
Forw
ard
Toge
ther
mar
ks th
e st
art o
f an
acc
eler
ated
jo
urne
y of
sig
nific
ant i
mpr
ovem
ent a
nd g
row
th f
or o
ur
scho
ol s
yste
m, o
ne th
at le
aves
us
with
a f
ar s
tron
ger
cultu
re to
ser
ve a
nd s
uppo
rt o
ur s
choo
ls, s
tude
nts,
fa
mili
es, a
nd e
duca
tors
to th
rive
and
achi
eve
exce
llenc
e.
In F
orw
ard
Toge
ther
, you
will
see
fou
r m
ajor
them
es
that
we
have
iden
tified
as
area
s of
foc
us, a
imed
at
prod
ucin
g m
eani
ngfu
l out
com
es. W
e be
lieve
that
the
mos
t inn
ovat
ive
idea
s an
d pr
oduc
tive
actio
ns to
hel
p
us a
chie
ve o
ur s
trat
egic
goa
ls a
re n
ot y
et id
entifi
ed a
nd
will
be
deve
lope
d in
dee
p co
llabo
ratio
n w
ith e
duca
tors
, st
uden
ts, c
ultu
rally
spe
cific
par
tner
s, a
nd s
uppo
rt te
ams
that
mak
e up
the
PP
S e
cosy
stem
. For
war
d To
geth
er
will
dire
ct o
ur e
nerg
y an
d re
sour
ces
whe
re th
ey a
re m
ost
need
ed. O
ur p
lan
is a
lso
inte
nded
to b
e ite
rativ
e, a
nd
thus
leav
es r
oom
for
adj
ustm
ent a
nd r
ecal
ibra
tion
base
d on
fut
ure
insi
ghts
and
new
lear
ning
, fre
sh e
vide
nce,
co
ntin
uing
com
mun
ity in
put,
and
furt
her
expl
orat
ion
of
the
issu
es w
e ar
e co
mm
itted
to a
ddre
ssin
g.
Ed
uca
tors
A s
choo
l dis
tric
t is
a
com
mun
ity o
f ad
ults
that
supp
orts
stu
dent
lear
ning
in v
ario
us w
ays.
For
this
reas
on, e
very
one
wor
king
at P
PS
is a
n ed
ucat
or
in th
e co
ntex
t of
our
Visi
on
and
Str
ateg
ic P
lan.
The
dist
rict p
ledg
es to
cre
ate
the
cond
ition
s to
sup
port
and
culti
vate
the
nece
ssar
y
attr
ibut
es, w
hich
we
refe
r to
as th
e E
duca
tor
Ess
entia
ls,
in e
very
sup
port
ive
adul
t
in th
e sy
stem
who
wor
ks to
ensu
re s
tude
nt s
ucce
ss.
*
Real
izin
g Ou
r Vi
sion
, Tog
ethe
r

53
Our
str
ateg
ic p
lan,
now
mer
ely
wor
ds, w
ill b
ecom
e re
ality
in
PP
S, w
hen:
• E
very
stu
dent
, reg
ardl
ess
of b
ackg
roun
d, h
as a
cces
s
to th
e es
sent
ial s
uppo
rts
and
reso
urce
s ne
cess
ary
to
enga
ge s
ucce
ssfu
lly in
a m
ore
pers
onal
ized
lear
ning
ex
perie
nce.
Thi
s w
ill b
e es
peci
ally
true
whe
n ou
r stu
dent
s,
with
thei
r br
oad
rang
e of
tale
nts
and
abili
ties,
incl
udin
g th
ose
from
div
erse
cul
tura
l and
ling
uist
ic b
ackg
roun
ds,
are
prov
ided
mor
e op
port
uniti
es to
dev
elop
, and
ulti
mat
ely
exhi
bit,
the
elem
ents
of
our
Gra
duat
e P
ortr
ait.
Our
vi
sion
’s G
radu
ate
Por
trai
t rep
rese
nts
a cl
ear
desc
riptio
n of
wha
t sk
ills
and
disp
ositi
ons
our
com
mun
ity w
ants
ou
r st
uden
ts to
kno
w, b
e, a
nd b
e ab
le to
do,
in o
rder
to
prep
are
them
to th
rive
in th
eir
lives
and
car
eers
and
“b
e pr
epar
ed to
lead
cha
nge
in a
mor
e so
cial
ly ju
st w
orld
.”
• O
ur c
omm
unity
of
scho
ol-b
ased
edu
cato
rs, a
nd th
e ce
ntra
l offi
ce e
duca
tors
who
sup
port
them
, all
fully
em
brac
e ch
ange
and
act
ivel
y pa
rtic
ipat
e in
a c
ultu
re o
f co
ntin
uous
impr
ovem
ent.
The
shar
ing
of id
eas,
insp
iratio
ns
and
best
pra
ctic
es is
ingr
aine
d in
the
PP
S c
ultu
re s
o
w
e gr
ow o
ur k
now
ledg
e an
d bu
ild m
eani
ngfu
l con
nect
ions
ac
ross
hal
lway
s, s
choo
ls a
nd n
eigh
borh
oods
—al
l in
a sh
ared
eff
ort t
o ef
fect
ivel
y se
rve
ever
y st
uden
t in
the
scho
ol s
yste
m.
This
pla
n is
a r
eflec
tion
of th
e co
llect
ive
time,
ene
rgy,
an
d in
sigh
ts o
f th
e ta
lent
ed le
gion
of
dedi
cate
d
peop
le o
n Te
am P
PS
. I a
m g
rate
ful f
or th
eir
and
your
co
ntin
ued
part
ners
hip.
Than
k yo
u, in
adv
ance
, for
you
r sup
port
and
eng
agem
ent
as w
e ro
ll up
our
sle
eves
to m
ake
our
auda
ciou
s
stra
tegi
c pl
an w
idel
y un
ders
tood
, rel
evan
t, an
d re
al, i
n or
der
to e
nsur
e th
e su
cces
s of
eve
ryon
e at
Por
tland
P
ublic
Sch
ools
.
Forw
ard
Toge
ther
,
Gua
dalu
pe G
uerr
ero,
Sup
erin
tend
ent
Tab
le o
f C
on
ten
ts
Ove
rvie
w
2 Sum
mar
y of
Str
ateg
ic
Pla
n Th
emes
and
Out
com
es
10 Str
ateg
ic P
lan
Obj
ectiv
es
16 Them
e 1:
Rac
ial E
quity
an
d S
ocia
l Jus
tice
18 Them
e 2:
Incl
usiv
e an
d D
iffer
entia
ted
Lear
ning
for
Eve
ry C
hild
26 Th
eme
3: P
rofe
ssio
nal
Exc
elle
nce
and
Sup
port
3
4
Them
e 4:
Em
brac
ing
Cha
nge
38

54
2 P
ortla
nd P
ublic
Sch
ools
For
war
d To
geth
er
Ove
rvie
w

55

56
4 P
ortla
nd P
ublic
Sch
ools
For
war
d To
geth
er
Wha
t is
a St
rate
gic
Plan
?
A v
isio
n de
scrib
es o
ur d
estin
atio
n: w
hat w
e w
ant t
o be
true
for
our
sch
ool d
istr
ict b
y 2
03
0. A
str
ateg
ic
plan
des
crib
es h
ow w
e w
ill r
each
our
des
tinat
ion.
Th
is p
lan
cove
rs th
e ye
ars
2021
to 2
025
and
outli
nes
the
first
sta
ge o
f ou
r jo
urne
y to
war
d ou
r vi
sion
. It
desc
ribes
a s
et o
f co
llect
ive
and
cohe
rent
act
ions
an
d go
als
that
, tak
en to
geth
er, w
ill s
et in
mot
ion
the
chan
ges
need
ed to
brin
g ou
r vi
sion
to f
ruiti
on. T
his
is s
till a
hig
h-le
vel d
escr
iptio
n; th
e im
plem
enta
tion
deta
ils a
re in
the
site
leve
l and
dep
artm
ent p
lans
. As
the
visi
on is
long
-ter
m, w
e w
ill n
eed
seve
ral s
trat
egic
pl
ans
to c
hart
our
cou
rse.
Visi
on
The
visi
on d
escr
ibes
the
chan
ge w
e w
ant t
o se
e in
th
e w
orld
. Our
vis
ion
docu
men
t des
crib
es o
ur h
opes
fo
r st
uden
ts (
the
Gra
duat
e P
ortr
ait)
and
for
all
of
the
educ
ator
s w
ho w
ork
at P
ortla
nd P
ublic
Sch
ools
(t
he E
duca
tor
Ess
entia
ls),
and
artic
ulat
es h
ow th
e sy
stem
nee
ds to
cha
nge
to s
uppo
rt th
e ed
ucat
ors
to s
uppo
rt th
e st
uden
ts (
the
Sys
tem
Shi
fts)
.
Ulti
mat
ely,
ever
ythi
ng in
the
visi
on d
ocum
ent
supp
orts
the
follo
win
g:
A g
radu
ate
of P
ortla
nd P
ublic
Sch
ools
will
be
a co
mpa
ssio
nate
crit
ical
thin
ker,
able
to c
olla
bora
te
and
solv
e pr
oble
ms,
and
be
prep
ared
to le
ad
a m
ore
soci
ally
just
wor
ld.
Mis
sion
Our
mis
sion
des
crib
es w
hat w
e as
an
orga
niza
tion
will
do
to r
ealiz
e th
e vi
sion
:
We
prov
ide
rigor
ous,
hig
h-qu
ality
aca
dem
ic
lear
ning
exp
erie
nces
that
are
incl
usiv
e an
d
joyf
ul. W
e di
srup
t rac
ial i
nequ
ities
to c
reat
e
vibr
ant e
nviro
nmen
ts f
or e
very
stu
dent
to
dem
onst
rate
exc
elle
nce.

57
Por
tland
Pub
lic S
choo
ls F
orw
ard
Toge
ther
5
Inte
gra
ted
Dia
gra
m
This
dia
gram
inte
grat
es th
e G
radu
ate
Por
trai
t ele
men
ts
with
the
Edu
cato
r E
ssen
tials
an
d E
duca
tiona
l Sys
tem
Shi
fts.
It
show
s th
e G
radu
ate
Por
trai
t el
emen
ts a
t the
cen
ter,
at th
e he
art o
f ev
eryt
hing
the
scho
ol
dist
rict
does
. Sup
port
ing
th
e G
radu
ate
Por
trai
t are
the
Edu
cato
r E
ssen
tials
. Som
e
of t
hese
ele
men
ts a
lign
dire
ctly
with
tho
se in
the
G
radu
ate
Por
trai
t, fo
r ex
ampl
e,
arou
nd E
mpa
thy
with
Car
ing,
E
mpa
thet
ic, a
nd R
elat
iona
l ed
ucat
ors
supp
ortin
g R
eflec
tive,
Em
path
etic
, and
E
mpo
wer
ing
Gra
duat
es.
Oth
ers
cove
r th
e le
ss d
irect
, bu
t equ
ally
pow
erfu
l way
s E
duca
tors
cre
ate
an e
cosy
stem
in
whi
ch s
tude
nts
can
thriv
e.
Aro
und
the
oute
r la
yer
are
the
Edu
catio
nal S
yste
m S
hift
s,
whi
ch f
urth
er d
evel
op th
is
ecos
yste
m a
nd p
rovi
de th
e su
ppor
ts f
or b
oth
educ
ator
s an
d st
uden
ts a
s th
ey d
evel
op
the
know
ledg
e, s
kills
, and
di
spos
ition
s th
at w
ill ta
ke th
em
into
the
futu
re.
PO
RT
RA
ITG
RA
DU
AT
E
ED
UC
ATO
R E
SS
EN
TIA
LS
SY
ST
EM
SH
IFT
SE
DU
CA
TIO
NA
L
PP
S

58
PPS
Profi
leP
ortla
nd P
ublic
Sch
ools
, fou
nded
in
18
51, i
s O
rego
n’s
larg
est
PK
–12
sch
ool d
istr
ict,
prep
arin
g st
uden
ts to
“lea
d ch
ange
, and
im
prov
e th
e w
orld
.” W
ith m
ore
than
47
,00
0 s
tude
nts
in 8
1 s
choo
ls,
PP
S s
triv
es to
ens
ure
acad
emic
ex
celle
nce
and
pers
onal
suc
cess
fo
r ev
ery
stud
ent,
espe
cial
ly o
ur
Bla
ck, N
ativ
e A
mer
ican
, stu
dent
s
of c
olor
and
/or
with
dis
abili
ties.
C
entr
al to
this
goa
l is
affir
min
g an
d op
erat
iona
lizin
g ou
r de
eply
hel
d co
mm
unity
val
ue o
f ra
cial
equ
ity,
soci
al ju
stic
e an
d in
clus
ion.
Tota
l Stu
den
t E
nro
llmen
t47
,314
Em
plo
yees
Stu
den
t D
emo
gra
ph
ics
Ad
dit
ion
al S
tud
ent
Ser
vice
s
Dat
a fr
om th
e 2
02
0–
20
21 s
choo
l yea
r. O
ur s
choo
ls in
clud
e th
e H
ead
Sta
rt E
arly
Chi
ldho
od E
duca
tion
prog
ram
, se
ven
com
mun
ity-b
ased
pro
gram
s, s
ix c
hart
er s
choo
ls, t
wo
alte
rnat
ive
prog
ram
s, a
nd s
even
spe
cial
ser
vice
s pr
ogra
ms
13
Mid
dle
Sch
ools
18K–
8 S
choo
ls
39
Ele
men
tary
S
choo
ls
10 Hig
h S
choo
ls
K–12
S
choo
ls
1R
ecei
ve E
nglis
h
as a
Sec
ond
La
ngua
ge S
ervi
ces
Elig
ible
for
Fr
ee M
eals
via
D
irect
Cer
tifica
tion
Rec
eive
Spe
cial
E
duca
tion
Ser
vice
s
22.5
%
15.4
%
8.3%
Spe
cial
Ser
vice
s P
rogr
ams
Latin
x
Nat
ive
Am
eric
an/
Ala
skan
Nat
ive
0.5%
Pac
ific
Isla
nder
0.
8%
Mul
ti-R
acia
l:
Asi
an/W
hite
Mul
ti-R
acia
l:
Oth
er A
nces
trie
s
Asi
an
Whi
te
55.9
%
16.6
%
8.6%
6.2%
6.4% 4.
9%
Bla
ck
Com
mun
ity B
ased
Pro
gram
s
Pub
lic C
hart
er S
choo
ls
Dis
tric
t Sch
ools
44,5
91
408
1,44
3872
Tota
l Sch
oo
ls
81
7,92
5
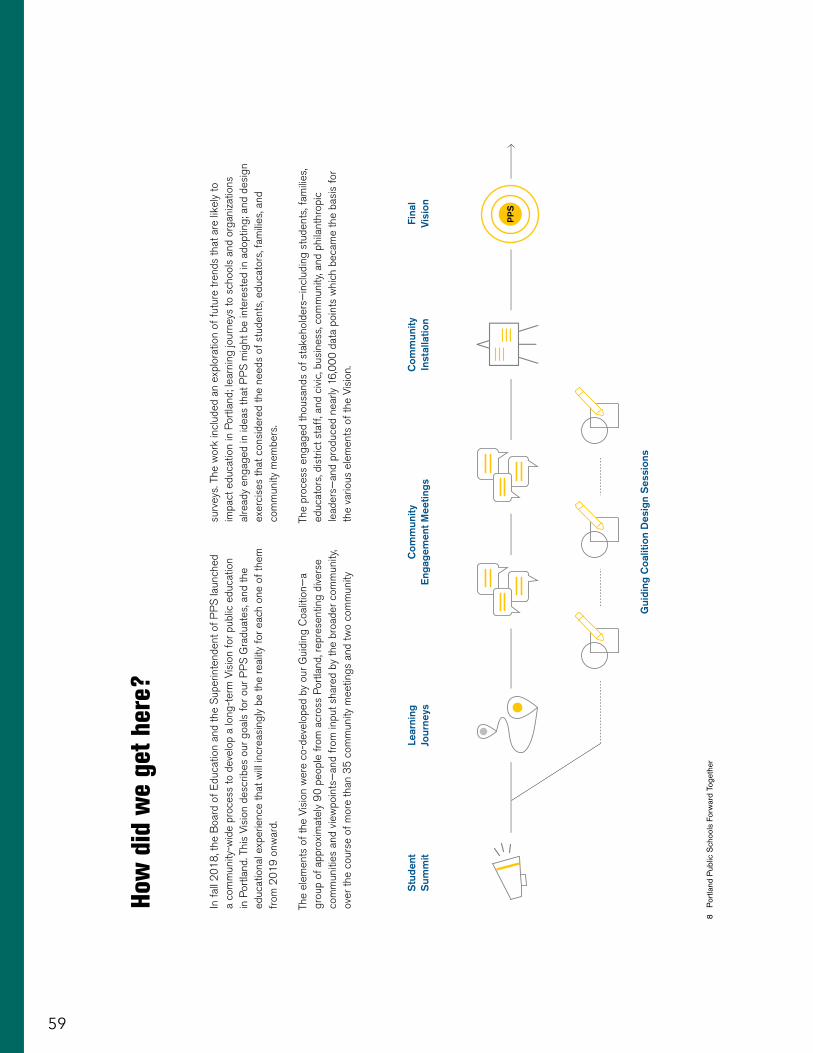
59
8 P
ortla
nd P
ublic
Sch
ools
For
war
d To
geth
er
How
did
we
get h
ere?
In f
all 2
01
8, t
he B
oard
of
Edu
catio
n an
d th
e S
uper
inte
nden
t of
PP
S la
unch
ed
a co
mm
unity
-wid
e pr
oces
s to
dev
elop
a lo
ng-t
erm
Vis
ion
for
publ
ic e
duca
tion
in P
ortla
nd. T
his
Visi
on d
escr
ibes
our
goa
ls f
or o
ur P
PS
Gra
duat
es, a
nd th
e ed
ucat
iona
l exp
erie
nce
that
will
incr
easi
ngly
be
the
real
ity f
or e
ach
one
of th
em
from
20
19
onw
ard.
The
elem
ents
of
the
Visi
on w
ere
co-d
evel
oped
by
our
Gui
ding
Coa
litio
n—a
grou
p of
app
roxi
mat
ely
90
peo
ple
from
acr
oss
Por
tland
, rep
rese
ntin
g di
vers
e co
mm
uniti
es a
nd v
iew
poin
ts—
and
from
inpu
t sha
red
by th
e br
oade
r co
mm
unity
, ov
er th
e co
urse
of
mor
e th
an 3
5 c
omm
unity
mee
tings
and
two
com
mun
ity
surv
eys.
The
wor
k in
clud
ed a
n ex
plor
atio
n of
fut
ure
tren
ds th
at a
re li
kely
to
impa
ct e
duca
tion
in P
ortla
nd; l
earn
ing
jour
neys
to s
choo
ls a
nd o
rgan
izat
ions
al
read
y en
gage
d in
idea
s th
at P
PS
mig
ht b
e in
tere
sted
in a
dopt
ing;
and
des
ign
exer
cise
s th
at c
onsi
dere
d th
e ne
eds
of s
tude
nts,
edu
cato
rs, f
amili
es, a
nd
com
mun
ity m
embe
rs.
The
proc
ess
enga
ged
thou
sand
s of
sta
keho
lder
s—in
clud
ing
stud
ents
, fam
ilies
, ed
ucat
ors,
dis
tric
t sta
ff, a
nd c
ivic
, bus
ines
s, c
omm
unity
, and
phi
lant
hrop
ic
lead
ers—
and
prod
uced
nea
rly 1
6,0
00
dat
a po
ints
whi
ch b
ecam
e th
e ba
sis
for
the
vario
us e
lem
ents
of
the
Visi
on. Com
mun
ity
Inst
alla
tion
Com
mun
ity
Eng
agem
ent M
eetin
gsFi
nal
Visi
onS
tude
nt
Sum
mit
2030
Lear
ning
Jo
urne
ys
Gui
ding
Coa
litio
n D
esig
n S
essi
ons
PP
S

60
Por
tland
Pub
lic S
choo
ls F
orw
ard
Toge
ther
7
Stu
den
ts a
t th
e C
ente
rW
e be
lieve
that
all
stud
ents
hav
e th
e ab
ility
to
succ
eed
and
that
pos
itive
impa
cts
on s
tude
nts
ar
e at
the
cent
er o
f ea
ch d
ecis
ion
and
actio
n.
We
belie
ve th
at s
tude
nt v
oice
is e
ssen
tial t
o un
ders
tand
ing
and
solv
ing
the
core
issu
es o
f ed
ucat
ion
and
that
incl
udin
g st
uden
t voi
ce is
a
prio
rity.
Rac
ial E
qu
ity
and
So
cial
Ju
stic
eW
e be
lieve
in th
e fu
ndam
enta
l rig
ht to
hum
an
dign
ity a
nd th
at g
ener
atin
g an
equ
itabl
e w
orld
re
quire
s an
edu
catio
nal s
yste
m th
at in
tent
iona
lly
disr
upts
—an
d bu
ilds
lead
ers
to d
isru
pt—
syst
ems
of
opp
ress
ion.
Ho
nes
ty a
nd
Inte
gri
tyW
e be
lieve
in d
emon
stra
ting
hone
sty
and
inte
grity
in
eve
ry a
ctio
n w
e ta
ke, w
ith s
ince
re, e
thic
al,
tran
spar
ent,
and
acco
unta
ble
com
mun
icat
ion
and
deci
sion
-mak
ing
in s
ervi
ce o
f ou
r st
uden
ts, f
amili
es,
staf
f, an
d co
mm
unity
.
Exc
elle
nce
We
belie
ve in
rig
or a
nd h
igh
stan
dard
s fo
r al
l st
uden
ts a
nd s
taff
, and
that
ach
ievi
ng e
xcel
lenc
e an
d hi
gh p
erfo
rman
ce is
the
resu
lt of
the
scho
ol
syst
em a
ctin
g as
a c
ontin
uous
lear
ning
org
aniz
atio
n.
Res
pec
tW
e be
lieve
in r
espe
ct f
or a
ll. E
very
per
son
br
ings
val
ue a
nd d
eser
ves
to b
e tr
eate
d w
ith
care
, cou
rtes
y, an
d co
mpa
ssio
n.
Rel
atio
nsh
ips
We
belie
ve th
at r
elat
ions
hips
are
vita
l to
our
succ
ess.
Aut
hent
ic h
uman
con
nect
ion,
est
ablis
hed
thro
ugh
kind
, car
ing
rela
tions
hips
, bui
lds
trus
t, fo
ster
s un
ders
tand
ing,
and
str
engt
hens
our
abi
lity
to w
ork
toge
ther
tow
ard
shar
ed a
spira
tions
.
Cre
ativ
ity
and
Inn
ova
tio
nW
e be
lieve
in th
e po
wer
of
effe
ctiv
e pr
oble
m
solv
ing,
sup
port
ed b
y a
cultu
re o
f cr
eativ
ity a
nd
inno
vatio
n. C
halle
ngin
g as
sum
ptio
ns, n
urtu
ring
curio
sity
, wel
com
ing
new
idea
s, a
nd d
evel
opin
g la
tera
l thi
nkin
g sk
ills
are
esse
ntia
l to
deve
lopi
ng
effe
ctiv
e st
rate
gies
for
con
stru
ctiv
e ch
ange
.
Par
tner
ship
s an
d C
olla
bo
rati
on
We
belie
ve th
at to
geth
er, w
e kn
ow a
nd c
an a
chie
ve
a gr
eat d
eal,
and
that
by
leve
ragi
ng th
e co
llect
ive
actio
ns o
f a
grou
p of
com
mitt
ed s
take
hold
ers,
we
can
achi
eve
our
Visi
on.
Gro
un
ded
in t
he
Sp
irit
of
Po
rtla
nd
We
belie
ve th
at o
ur u
niqu
e P
ortla
nd id
entit
y gi
ves
us th
e co
llect
ive
wis
dom
to a
ckno
wle
dge
and
le
arn
from
our
com
mun
ity’s
div
erse
his
tory
and
fue
l ou
r pr
ogre
ss to
war
d a
new
era
of
cour
ageo
us
and
inno
vativ
e co
llect
ive
actio
n to
cre
ate
a be
tter
P
ortla
nd f
or a
ll.
Joyf
ul L
earn
ing
an
d L
ead
ersh
ipW
e be
lieve
in le
arni
ng a
nd le
adin
g in
way
s
that
fos
ter
hum
an c
onne
ctio
n, d
eep
appr
ecia
tion
fo
r ea
ch o
ther
, sat
isfa
ctio
n in
our
wor
k, a
nd
appr
ecia
tion
of th
e le
arni
ng p
roce
ss.
Core
Val
ues

61
Por
tland
Pub
lic S
choo
ls F
orw
ard
Toge
ther
9
Stra
tegi
c Pl
an P
roce
ss
Follo
win
g th
e co
mm
unity
-for
med
vis
ion
proc
ess,
we
iden
tified
five
of
the
Sys
tem
Shi
fts
to c
reat
e an
initi
al S
trat
egic
Pla
n fo
r th
e sc
hool
yea
r 2
02
0–
21.
Bui
ldin
g on
that
pla
n, w
e ha
ve n
ow c
reat
ed a
fou
r-ye
ar p
lan,
whi
ch c
ontin
ues
the
wor
k of
the
initi
al p
lan
and
adds
sev
eral
key
are
as o
f w
ork.
Des
pite
the
cons
trai
nts
brou
ght b
y th
e C
OV
ID-1
9 pa
ndem
ic, i
nteg
ratin
g di
vers
e pe
rspe
ctiv
es
from
stu
dent
s an
d ed
ucat
ors
repr
esen
ting
diff
eren
t par
ts o
f th
e or
gani
zatio
n w
as c
entr
al to
the
deve
lopm
ent o
f th
is p
lan.
We
cond
ucte
d a
stud
ent s
urve
y an
d he
ld s
tude
nt f
ocus
gro
ups
and
we
cond
ucte
d a
serie
s of
edu
cato
r
focu
s gr
oups
, inc
ludi
ng th
ree
in w
hich
mor
e th
an tw
o do
zen
scho
ol-b
ased
ed
ucat
ors
of c
olor
fro
m a
cros
s P
PS
cam
e to
geth
er f
or s
essi
ons
with
sen
ior
staf
f. Th
ree
stud
ent i
nter
ns jo
ined
a 1
48
per
son
Adv
isor
y C
omm
ittee
to p
rovi
de
inpu
t on
prio
ritie
s fo
r th
e pl
an. A
dvis
ory
Com
mitt
ee m
embe
rs a
lso
took
par
t in
Sys
tem
-Shi
ft-s
peci
fic w
ork
grou
ps to
dev
elop
the
deta
ils o
f st
rate
gic
outc
omes
an
d go
als.
Eac
h w
ork
area
fol
low
s th
e gu
idan
ce p
rovi
ded
by th
e co
mm
unity
du
ring
the
visi
on p
roce
ss, a
nd w
e w
ill c
ontin
ue to
hav
e si
gnifi
cant
com
mun
ity
enga
gem
ent t
hrou
ghou
t the
impl
emen
tatio
n of
the
stra
tegi
c pl
an.
Initi
al S
trat
egic
P
lann
ing
Str
ateg
ic P
lan
Wor
k G
roup
sFi
nal S
trat
egic
P
lan
Com
mun
ity a
nd E
duca
tor:
Eng
agem
ent a
nd Im
plem
enta
tion
Fo
rwar
d
Tog
eth
er

62
10
Por
tland
Pub
lic S
choo
ls F
orw
ard
Toge
ther

63
Por
tland
Pub
lic S
choo
ls F
orw
ard
Toge
ther
11
Them
e 1:
Rac
ial E
quity
an
d S
ocia
l Jus
tice
As
a co
mm
unity
, we
have
an
urge
ncy
to in
tent
iona
lly
disr
upt s
yste
ms
of o
ppre
ssio
n, b
ecau
se th
ey a
re
clos
ely
tied
to d
ispa
ritie
s of
acc
ess
and
educ
atio
nal
outc
omes
, esp
ecia
lly a
mon
g ou
r B
lack
and
Nat
ive
Am
eric
an s
tude
nts.
We
have
to a
ttac
k ra
cism
and
lo
ngst
andi
ng, s
truc
tura
l ine
quiti
es in
our
sys
tem
. W
e ha
ve to
rem
ove
barr
iers
to te
achi
ng a
nd le
arni
ng.
We
have
to c
reat
e a
sens
e of
bel
ongi
ng fo
r eve
ryon
e.
And
we
will
est
ablis
h a
Cen
ter
for
Bla
ck S
tude
nt
Exc
elle
nce,
a c
onst
ella
tion
of b
uilt
envi
ronm
ents
an
d a
desi
gnat
ed s
et o
f cu
ltura
lly r
espo
nsiv
e st
rate
gies
that
cel
ebra
te a
nd a
dvan
ce B
lack
stu
dent
ac
hiev
emen
t at P
PS
. The
issu
es o
f ra
ce, r
acis
m a
nd
raci
al e
quity
are
impo
rtan
t to
the
stra
tegi
c pl
an a
s
a w
hole
—an
d th
ey s
uffu
se o
ther
them
es a
nd a
ctio
n ar
eas
thro
ugho
ut. I
t is
impo
rtan
t tha
t all
stak
ehol
ders
se
e op
port
uniti
es to
con
fron
t rac
ism
and
pro
mot
e eq
uity
in e
very
ele
men
t of
our
plan
.
Sum
mar
y of
Str
ateg
ic P
lan
Th
emes
and
Out
com
es
The
focu
s ar
eas
of th
e pl
an, d
escr
ibed
as
stra
tegi
c ou
tcom
es
(i.e.
, wha
t will
be
true
onc
e th
ey a
re a
chie
ved)
are
org
aniz
ed
unde
r fo
ur m
ain
them
es:
Str
ateg
ic O
utco
mes
Tran
sfo
rm S
tru
ctu
res
for
Rac
ial E
qu
ity
We
are
gain
ing
the
know
ledg
e an
d de
mon
stra
ting
the
prac
tices
that
mod
el c
hara
cter
istic
s of
an
an
ti-ra
cist
org
aniz
atio
n, o
ne th
at e
limin
ates
dis
parit
ies
in e
quita
ble
acce
ss to
opp
ortu
nitie
s an
d ou
tcom
es
for
stud
ents
of
colo
r.
Cu
ltiv
ate
a C
ult
ure
of
R
acia
l Eq
uit
y an
d C
are
We
are
culti
vatin
g th
e co
nditi
ons
for a
n or
gani
zatio
nal
cultu
re o
f ra
cial
equ
ity a
nd a
ffirm
atio
n to
col
lect
ivel
y br
ing
abou
t mea
ning
ful c
hang
e.
Rei
mag
ine
Rel
atio
nsh
ips
an
d a
Sen
se o
f B
elo
ng
ing
Stu
dent
s de
velo
p a
stro
ng s
ense
of
belo
ngin
g,
and
we
fost
er s
afe,
hea
lthy,
and
posi
tive
lear
ning
an
d w
orki
ng e
nviro
nmen
ts.
Pla
n t
he
Cen
ter
for
B
lack
Stu
den
t E
xcel
len
ceA
com
preh
ensi
ve, c
o-co
nstr
ucte
d, c
omm
unity
pl
an f
or th
e C
ente
r fo
r B
lack
Stu
dent
Exc
elle
nce.
En
sure
Eq
uit
able
Acc
ess
to
Fac
ility
Res
ou
rces
We
reim
agin
e th
e us
e of
spa
ce to
pro
vide
mor
e eq
uita
ble
acce
ss to
faci
litie
s an
d su
ppor
ting
reso
urce
s,
enab
ling
grea
ter
optio
ns f
or s
tude
nt s
ucce
ss.

64
12
Por
tland
Pub
lic S
choo
ls F
orw
ard
Toge
ther
Them
e 2:
Incl
usiv
e an
d D
iffer
entia
ted
Lear
ning
fo
r E
very
Chi
ld
We
cele
brat
e th
e di
vers
ity o
f ou
r st
uden
ts, a
nd
are
wor
king
to p
rovi
de d
iffer
entia
ted
lear
ning
ex
perie
nces
and
sup
port
s th
at m
eet e
very
chi
ld
whe
re th
ey a
re, w
ork
with
thei
r in
tere
sts,
and
en
able
them
to th
rive
at P
PS
. We
have
a s
igni
fican
t po
pula
tion
who
hav
e va
ryin
g ab
ilitie
s th
at r
equi
re
spec
ial a
tten
tion
and
prog
ram
s. M
any
stud
ents
w
ith d
isab
ilitie
s, a
nd th
ose
with
com
plex
lear
ning
ne
eds,
wer
e no
t wel
l-ser
ved
by C
OV
ID-1
9 v
irtua
l le
arni
ng. W
e ne
ed to
str
engt
hen
educ
atio
nal
offe
rings
for
eve
ry s
tude
nt, i
nclu
ding
thos
e w
ith
disa
bilit
ies,
and
exp
and
reso
urce
s fo
r th
eir
phys
ical
an
d em
otio
nal s
afet
y. A
nd w
e m
ust m
ake
lear
ning
re
lata
ble
and
rele
vant
for
rea
l-wor
ld c
onte
xts—
fo
r jo
bs, t
echn
olog
y, an
d ch
alle
nges
of
the
futu
re—
for
ever
y st
uden
t.
Str
ateg
ic O
utco
mes
Dev
elo
p a
n In
teg
rate
d
Inst
ruct
ion
al F
ram
ewo
rk
Our
Inte
grat
ed In
stru
ctio
nal F
ram
ewor
k gu
ides
te
achi
ng a
nd le
arni
ng a
nd in
tegr
ates
res
pect
ful
cons
ider
atio
n of
cul
ture
, dis
abili
ty, r
ace,
gen
der,
and
lang
uage
. It s
uppo
rts
inqu
iry-b
ased
, fou
ndat
iona
l, an
d in
terd
isci
plin
ary
lear
ning
for
stu
dent
s to
de
velo
p an
d de
mon
stra
te m
aste
ry o
f th
e G
radu
ate
Por
trai
t and
lear
ning
sta
ndar
ds.
Des
ign
Lea
rnin
g E
xper
ien
ces
that
Pro
mo
te
Sel
f-D
irec
ted
, Fu
ture
-Rea
dy
Lear
nin
g
Eve
ry s
tude
nt h
as a
cces
s to
flex
ible
, per
sona
lized
, an
d di
ffer
entia
ted
lear
ning
exp
erie
nces
thro
ugho
ut
thei
r P
K–1
2 jo
urne
y th
at a
re c
ente
red
on th
eir
inte
rest
s an
d ne
eds,
sup
port
sel
f-di
rect
ed le
arni
ng,
are
real
-wor
ld r
elev
ant,
and
prov
ide
mul
tiple
pa
thw
ays
to g
radu
atio
n or
a c
ertifi
cate
of c
ompl
etio
n.
Imp
lem
ent
Mu
lti-
Tier
ed S
yste
m o
f S
up
po
rts
Our
str
ongl
y al
igne
d sy
stem
of
tiere
d su
ppor
ts
prov
ides
pro
gres
sive
ly ta
rget
ed a
nd in
divi
dual
ized
su
ppor
ts f
or s
tude
nts,
bas
ed o
n st
uden
t dat
a,
deci
sion
crit
eria
, edu
cato
r co
llabo
ratio
n, a
nd u
sing
ev
iden
ced-
base
d ac
adem
ic, s
ocia
l-em
otio
nal,
and
beha
vior
al in
terv
entio
ns th
at a
re c
ultu
rally
re
spon
sive
and
elim
inat
e ba
rrie
rs to
lear
ning
.
Est
ablis
h S
yste
ms
and
S
tru
ctu
res
for
Incl
usi
on
All
of o
ur s
yste
ms
and
stru
ctur
es s
uppo
rt th
e un
ders
tand
ing
and
impl
emen
tatio
n of
incl
usio
nary
pr
actic
es f
or s
tude
nts
with
dis
abili
ties.
Pro
mo
te a
n In
clu
sive
Min
dse
tW
e al
l sha
re th
e m
inds
et th
at s
tude
nts
with
di
sabi
litie
s ar
e ev
eryo
ne’s
stu
dent
s.
Bu
ild t
he
Ad
voca
cy P
ow
er o
f S
tud
ents
an
d F
amili
es o
f S
tud
ents
wit
h D
isab
iliti
esW
e en
sure
that
all
fam
ilies
and
stu
dent
s, e
spec
ially
th
ose
hist
oric
ally
und
erse
rved
, hav
e th
e kn
owle
dge,
in
form
atio
n an
d su
ppor
t the
y ne
ed to
ful
ly e
ngag
e in
, and
con
trib
ute
to, t
he s
peci
al e
duca
tion
proc
ess.

65
Por
tland
Pub
lic S
choo
ls F
orw
ard
Toge
ther
13
Them
e 3:
Pro
fess
iona
l E
xcel
lenc
e an
d S
uppo
rt
To b
ecom
e a
wor
ld-c
lass
sch
ool d
istr
ict,
we
mus
t hi
re ta
lent
ed p
eopl
e fr
om d
iver
se b
ackg
roun
ds
and
expe
rienc
es. W
e al
so k
now
that
our
wor
ld-
clas
s st
aff
need
s on
goin
g pr
ofes
sion
al s
uppo
rt
and
reso
urce
s. T
his
will
req
uire
act
ion
acro
ss
man
y fo
rms,
incl
udin
g be
tter c
omm
unic
atio
n an
d co
ordi
natio
n; c
aree
r pa
thw
ays
for
educ
ator
s,
build
ing
our
educ
ator
s’ c
apac
ity in
soc
ial a
nd
emot
iona
l sup
port
to s
tude
nts;
and
a c
ultu
re o
f ad
ult l
earn
ing
to a
ccel
erat
e st
uden
t ach
ieve
men
t.
Str
ateg
ic O
utco
mes
Dev
elo
p a
Div
erse
, Hig
h-Q
ual
ity,
an
d T
hri
vin
g W
ork
forc
eW
e ha
ve a
div
erse
, hig
h-qu
ality
, and
thriv
ing
wor
kfor
ce th
at is
sup
port
ed in
per
sona
l and
pr
ofes
sion
al w
ell-b
eing
and
suc
cess
.
Ad
van
ce O
ur
Org
aniz
atio
nal
Le
arn
ing
Cu
ltu
re a
nd
Pra
ctic
eO
ur c
oher
ent,
syst
em-w
ide,
cul
ture
of
adul
t lea
rnin
g pr
ovid
es s
yste
ms
and
supp
orts
that
spu
r gr
owth
, in
nova
tion,
and
col
labo
ratio
n.

66
14
Por
tland
Pub
lic S
choo
ls F
orw
ard
Toge
ther
Them
e 4:
Em
brac
ing
Cha
nge
We
need
to c
reat
e an
d su
ppor
t a c
ultu
re o
pen
to
posi
tive
chan
ge—
as a
sys
tem
. The
way
we
solv
e pr
oble
ms
syst
emat
ical
ly, t
he w
ay w
e bu
ild a
cul
ture
an
d ap
proa
ch to
suc
cess
fully
man
age
our
wor
k,
the
way
we
build
trus
t and
pro
mot
e em
path
y, th
e w
ay w
e co
mm
unic
ate
with
in o
ur s
yste
m a
nd to
our
st
akeh
olde
rs—
all o
f th
ese
are
actio
ns th
at r
equi
re
cons
tant
refi
nem
ent a
nd im
prov
emen
t.
Str
ateg
ic O
utco
mes
So
cial
ize
Ou
r V
isio
n a
nd
Str
ateg
ic P
lan
We
soci
aliz
e ou
r vi
sion
, PP
S r
eIm
agin
ed,
and
our
stra
tegi
c pl
an b
y pr
ovid
ing
ongo
ing
oppo
rtun
ities
for
edu
cato
rs, s
tude
nts,
and
co
mm
unity
sta
keho
lder
s to
eng
age,
und
erst
and,
an
d m
ake
mea
ning
toge
ther
.
Bu
ild a
Co
llect
ive
Sen
se o
f
Tru
st a
nd
Bel
on
gin
gO
ur e
duca
tors
and
com
mun
ity c
olle
ctiv
ely
fo
ster
an
envi
ronm
ent o
f be
long
ing,
trus
t,
and
shar
ed o
wne
rshi
p fo
r th
e su
cces
s of
our
st
uden
ts, e
duca
tors
, and
sch
ool d
istr
ict.
Est
ablis
h a
Sys
tem
-Wid
e P
roje
ct
Man
agem
ent
Cu
ltu
re a
nd
Pra
ctic
eO
ur p
roje
ct m
anag
emen
t pra
ctic
e en
sure
s co
nsis
tent
, sus
tain
able
, and
syn
chro
nize
d im
plem
enta
tion
and
orga
niza
tiona
l coh
eren
ce
of a
ll st
rate
gic
plan
eff
orts
.
Em
bed
Sys
tem
-Wid
e D
ata-
Dri
ven
C
on
tin
uo
us
Imp
rove
men
t P
ract
ices
We
effe
ctiv
ely
and
cons
iste
ntly
use
dat
a to
dr
ive
cycl
es o
f co
ntin
uous
impr
ovem
ent t
hat
lead
to d
ecis
ions
and
act
ions
that
impr
ove
st
uden
t out
com
es.
Est
ablis
h E
xcep
tio
nal
Ser
vice
C
ult
ure
an
d S
tan
dar
ds
We
deliv
er e
xcep
tiona
l cen
tral
ser
vice
s to
our
sc
hool
s, s
tude
nts,
and
fam
ilies
.
Imp
lem
ent
a P
roac
tive
, Eff
ecti
ve,
and
Cre
ativ
e C
om
mu
nic
atio
n P
ract
ice
Our
com
mun
icat
ions
pra
ctic
e pr
oact
ivel
y in
form
s in
tern
al a
nd e
xter
nal s
take
hold
ers
in w
ays
that
ar
e re
spec
tful
, tra
nspa
rent
, and
incl
usiv
e of
our
lin
guis
tical
ly a
nd c
ultu
rally
div
erse
com
mun
ities
.
Lau
nch
an
Inn
ova
tio
n P
ract
ice
that
R
eim
agin
es S
yste
m P
rob
lem
So
lvin
gO
ur s
yste
m-w
ide
inno
vatio
n pr
actic
e ad
dres
ses
chal
leng
es in
the
syst
em b
y ge
nera
ting
crea
tive
solu
tions
and
mov
ing
prom
isin
g pr
actic
es to
im
plem
enta
tion
at s
cale
.
Cu
ltiv
ate
and
Pro
mo
te A
lign
ed
Co
mm
un
ity
Par
tner
ship
sO
ur p
artn
ersh
ips
equi
tabl
y su
ppor
t our
stu
dent
s
to a
chie
ve th
e G
radu
ate
Por
trai
t.
Dev
elo
p a
Co
her
ent
Sys
tem
-Wid
e
Co
mm
un
ity
En
gag
emen
t A
pp
roac
hS
take
hold
er e
ngag
emen
t is
a co
re c
ompe
tenc
y th
roug
h w
hich
the
pers
pect
ives
and
voi
ce o
f ed
ucat
ors,
stu
dent
s, f
amili
es, a
nd c
omm
unity
are
au
then
tical
ly in
tegr
ated
.

67
For
a la
rger
ver
sion
of
this
dia
gram
se
e th
e di
agra
m a
t the
cen
ter
of
the
Str
ateg
ic P
lan
quic
kgui
de.

68
16
Por
tland
Pub
lic S
choo
ls F
orw
ard
Toge
ther
Stu
dent
-Cen
tere
d In
dica
tors
> B
lack
and
Nat
ive
stud
ents
will
nar
row
opp
ortu
nity
gap
s in
lear
ning
show
n by
incr
easi
ng n
umbe
rs o
f st
uden
ts p
repa
red
for 1
st g
rade
as
m
easu
red
by a
n ap
prop
riate
set
of
early
lear
ning
indi
cato
rs.
> N
arro
win
g th
e op
port
unity
gap
s fo
r ou
r B
lack
and
Nat
ive
stud
ents
: (T
hese
are
alig
ned
to B
oard
Goa
ls)
•
By
3rd
Gra
de, o
ur B
lack
and
Nat
ive
stud
ents
will
nar
row
opp
ortu
nity
gap
s in
re
adin
g sh
own
by m
ore
grow
th th
an o
ther
sub
grou
ps a
s m
easu
red
by th
e
NW
EA
Mea
sure
s of
Aca
dem
ic P
rogr
ess
(MA
P)
asse
ssm
ents
•
By
5th
Gra
de, o
ur B
lack
and
Nat
ive
stud
ents
will
nar
row
opp
ortu
nity
gap
s in
m
ath
by s
how
ing
mor
e gr
owth
than
oth
er s
ubgr
oups
as
mea
sure
d by
the
N
WE
A M
easu
res
of A
cade
mic
Pro
gres
s (M
AP
) as
sess
men
ts
•
By
8th
Gra
de, o
ur B
lack
and
Nat
ive
stud
ents
will
nar
row
opp
ortu
nity
ga
ps in
bot
h re
adin
g an
d m
ath
show
n by
incr
easi
ng n
umbe
rs o
f st
uden
ts
who
mee
t or
exce
ed p
rofic
ienc
y in
bot
h E
nglis
h La
ngua
ge A
rts
and
Mat
hem
atic
s as
mea
sure
d by
Sm
arte
r B
alan
ced
Ass
essm
ent C
onso
rtiu
m
(SB
AC
) as
sess
men
ts
•
By
grad
uatio
n, o
ur B
lack
and
Nat
ive
stud
ents
will
nar
row
pos
tsec
onda
ry
op
port
unity
gap
s sh
own
by g
reat
er in
crea
ses
of s
tude
nts,
as
com
pare
d to
ot
her
subg
roup
s, w
ho m
eet a
t lea
st o
ne o
f th
e fo
llow
ing
post
seco
ndar
y
re
adin
ess
indi
cato
rs a
s st
ated
in th
e cu
rren
t boa
rd g
oals
:
Suc
cess
ful c
ompl
etio
n (C
or
bett
er)
of 3
or
mor
e A
dvan
ced
P
lace
men
t cou
rses
,
S
ucce
ssfu
l com
plet
ion
(C o
r be
tter
) of
3 o
r m
ore
Inte
rnat
iona
l
B
acca
laur
eate
cou
rses
,
S
ucce
ssfu
l com
plet
ion
(C o
r be
tter
) of
3 o
r m
ore
Dua
l Cre
dit c
ours
es,
S
ucce
ssfu
l com
plet
ion
of C
aree
r an
d Te
chno
logy
Pat
hway
(2
or
mor
e
co
urse
s in
the
sam
e pa
th),
S
ucce
ssfu
l ach
ieve
men
t of
the
seal
of
bilit
erac
y
(AP
for
eign
lang
uage
: 3 o
r ab
ove)
.
Stra
tegi
c Pl
an
Obje
ctiv
esTh
ese
Str
ateg
ic P
lan
Obj
ectiv
es d
escr
ibe
the
hi
gh-le
vel i
ndic
ator
s of
suc
cess
for
our
str
ateg
ic
plan
. Wha
t doe
s su
cces
s lo
ok li
ke a
t the
end
of
the
stra
tegi
c pl
anni
ng p
erio
d?

69
> S
tude
nts
repo
rt in
crea
sing
sen
se o
f be
long
ing
as m
easu
red
by th
e
Suc
cess
ful S
choo
ls S
urve
y
> S
tude
nts
repo
rt le
arni
ng is
mor
e en
gagi
ng a
nd r
elev
ant f
or th
eir
futu
re
> R
educ
e di
spro
port
iona
te id
entifi
catio
n of
stu
dent
s in
Spe
cial
Edu
catio
n,
espe
cial
ly o
ur B
lack
, Nat
ive,
and
Eng
lish
Lear
ner
stud
ents
> R
educ
e di
spro
port
iona
lity
in e
xclu
sion
ary
disc
iplin
e m
easu
res
for
our
B
lack
and
Nat
ive
stud
ents
> S
tude
nts
are
able
to s
elf-
asse
ss g
row
th o
n th
e G
radu
ate
Por
trai
t, in
clud
ing
an
ada
pted
Gra
duat
e P
ortr
ait f
or s
tude
nts
with
dis
abili
ties,
usi
ng a
de
velo
pmen
tally
app
ropr
iate
con
tinuu
m
> G
row
th in
num
ber
of s
tude
nts
on tr
ack
for
the
Gra
duat
e P
ortr
ait m
ilest
ones
as
exp
ress
ed b
y th
e G
radu
ate
Por
trai
t con
tinuu
m
> S
tude
nts
repo
rt th
eir
lear
ning
exp
erie
nces
sup
port
thei
r un
ders
tand
ing
an
d at
tain
men
t of
the
Gra
duat
e P
ortr
ait
Oth
er S
ucce
ss In
dica
tors
R
elat
ed to
Edu
cato
r E
ssen
tials
and
Im
plem
enta
tion
of K
ey S
trat
egie
s
> In
crea
se in
num
ber
of e
duca
tors
of
colo
r w
ho a
re h
ired
and
reta
ined
> In
crea
se in
edu
cato
rs o
f co
lor
repo
rtin
g fe
elin
g a
sens
e of
bel
ongi
ng
> E
duca
tors
use
the
Edu
cato
r E
ssen
tials
to s
elf-
asse
ss p
rofe
ssio
nal g
row
th
> D
ata
driv
en, c
ontin
uous
impr
ovem
ent p
ract
ices
evi
dent
at g
rade
leve
l,
scho
ols,
dep
artm
ents
, and
dis
tric
t as
a w
hole
> E
vide
nce
that
edu
cato
rs a
re a
ligni
ng th
eir
wor
k an
d pr
ofes
sion
al le
arni
ng
to th
e Vi
sion

70
18
Por
tland
Pub
lic S
choo
ls F
orw
ard
Toge
ther
Them
e 1
Rac
ial E
quity
an
d S
ocia
l Jus
tice

71
1 Racial Equity and Social Justice

72
20
Por
tland
Pub
lic S
choo
ls F
orw
ard
Toge
ther
Raci
al E
quity
an
d So
cial
Jus
tice
Tran
sfor
m S
truc
ture
s fo
r R
acia
l Equ
ity
Str
ateg
ic O
utc
om
eW
e ar
e ga
inin
g th
e kn
owle
dge
and
dem
onst
ratin
g th
e pr
actic
es
that
mod
el c
hara
cter
istic
s of
an
anti-
raci
st o
rgan
izat
ion,
one
that
el
imin
ates
dis
parit
ies
in e
quita
ble
acce
ss to
opp
ortu
nitie
s an
d ou
tcom
es f
or s
tude
nts
of c
olor
.
Des
crip
tio
nW
e ar
e di
srup
ting
entr
ench
ed in
stitu
tiona
l and
cul
tura
l rac
ism
by
inte
grat
ing
the
PP
S R
ES
J Le
ns in
to c
ritic
al d
istr
ict s
truc
ture
s an
d pr
oces
ses
and
cont
inuo
usly
exa
min
ing
and
chan
ging
bel
iefs
, min
dset
s,
polic
ies,
act
ions
, and
dec
isio
n-m
akin
g to
elim
inat
e di
spar
ities
in
acce
ss to
opp
ortu
nitie
s an
d ou
tcom
es f
or s
tude
nts
of c
olor
.
Go
al #
1D
isru
pt r
acia
l ine
quiti
es b
y ap
plyi
ng th
e P
PS
RE
SJ
Lens
to
anal
yze
and
inte
rrog
ate
high
-leve
rage
sys
tem
cha
nge
oppo
rtun
ities
, in
clud
ing
polic
ies,
pro
cess
es, a
nd r
esou
rce
allo
catio
n.
Go
al #
2E
very
edu
cato
r ca
n ar
ticul
ate
thei
r ro
le a
nd r
espo
nsib
ility
with
in
the
RE
SJ
Fram
ewor
k an
d P
lan
and
unde
rsta
nd h
ow it
fits
with
in
thei
r w
ork
as r
eflec
ted
in th
eir
prof
essi
onal
goa
ls, p
ublis
hed
team
wor
k pl
ans,
and
qua
rter
ly r
evie
ws.
Go
al #
3In
ser
vice
of
boar
d go
als,
the
RE
SJ
Adv
isor
y C
ounc
il su
ppor
ts
the
impl
emen
tatio
n of
the
RE
SJ
Fram
ewor
k an
d P
lan
to e
nsur
e th
at th
e di
stric
t mea
sure
s, m
onito
rs, e
valu
ates
, and
act
s to
trac
k pr
ogre
ss to
war
d eq
uita
ble
stud
ent o
utco
mes
.
The
vign
ette
s in
the
bubb
les
show
som
e of
the
prog
ress
alre
ady
mad
e, e
ither
th
roug
h di
stric
t wor
k or
the
resu
lts o
f st
uden
t adv
ocac
y, th
at s
uppo
rt th
e di
rect
ion
of th
is p
lan,
and
sho
w th
at w
hile
our
pla
n is
bol
d, it
is a
lso
achi
evab
le.
NO
VE
MB
ER
3, 2
020
Por
tland
vot
ers
appr
ove
hist
oric
$1
.2 b
illio
n P
PS
Bon
d, in
clud
ing
$6
0 m
illio
n to
laun
ch th
e C
ente
r
for
Bla
ck S
tude
nt E
xcel
lenc
e.

73
Por
tland
Pub
lic S
choo
ls F
orw
ard
Toge
ther
21
Cul
tivat
e a
Cul
ture
of R
acia
l Equ
ity a
nd C
are
Str
ateg
ic O
utc
om
eW
e ar
e cu
ltiva
ting
the
cond
ition
s fo
r an
org
aniz
atio
nal c
ultu
re o
f ra
cial
equ
ity a
nd c
are
to c
olle
ctiv
ely
brin
g ab
out m
eani
ngfu
l cha
nge.
Des
crip
tio
nW
e ar
e cr
eatin
g an
org
aniz
atio
nal c
ultu
re o
f ra
cial
equ
ity th
at is
ch
arac
teriz
ed b
y re
spec
t, ca
re, a
ffirm
atio
n, a
nd in
terc
onne
cted
ness
. Th
is c
ultu
re re
sults
from
wid
espr
ead
use
of th
e P
PS
RE
SJ
Lens
an
d fr
om e
duca
tors
dev
elop
ing
our i
ndiv
idua
l cap
acity
to u
nder
stan
d op
pres
sion
in e
duca
tion.
Thi
s en
able
s us
to s
ucce
ssfu
lly c
olla
bora
te
with
oth
ers
to b
ring
abou
t mea
ning
ful c
hang
e th
at in
crea
ses
stud
ent s
ucce
ss, r
esili
ence
, and
em
pow
erm
ent.
Go
al #
1D
evel
op a
nd im
plem
ent R
ES
J pr
ofes
sion
al le
arni
ng a
nd s
choo
l site
su
ppor
ts a
ligne
d to
the
RE
SJ
PD
Fra
mew
ork
and
the
Pro
fess
iona
l Le
arni
ng M
aste
r P
lan.
Thi
s is
don
e in
col
labo
ratio
n w
ith s
choo
l te
ams,
dep
artm
ents
, and
ext
erna
l par
tner
s so
the
entir
e sy
stem
is
enga
ged
in c
ontin
uous
RE
SJ
lear
ning
and
impr
ovem
ent.
Go
al #
2E
ngag
e m
eani
ngfu
lly w
ith s
tude
nts,
fam
ilies
, and
com
mun
ity
lead
ers
thro
ugh
inte
ntio
nal a
nd in
clus
ive
part
ners
hip
and
colla
bora
tion
with
cul
tura
lly s
peci
fic, m
ultir
acia
l par
tner
s an
d co
mm
unity
, and
in c
oord
inat
ion
with
our
Com
mun
ity E
ngag
emen
t te
am. I
mpl
emen
t RE
SJ
stra
tegi
es in
eve
ry s
choo
l and
dep
artm
ent
to m
eet t
he n
eeds
of
stud
ents
and
fam
ilies
.

74
22
Por
tland
Pub
lic S
choo
ls F
orw
ard
Toge
ther
Rei
mag
ine
Rel
atio
nshi
ps
and
a S
ense
of B
elon
ging
Str
ateg
ic O
utc
om
eS
tude
nts
deve
lop
a st
rong
sen
se o
f be
long
ing,
and
we
fost
er s
afe,
he
alth
y, an
d po
sitiv
e le
arni
ng a
nd w
orki
ng e
nviro
nmen
ts.
Des
crip
tio
nO
ur “d
esig
n pr
inci
ples
for
bel
ongi
ng,”
base
d on
col
labo
rativ
e w
ork
with
stu
dent
s, s
tude
nt g
roup
s, f
amili
es a
nd c
omm
uniti
es, a
nd
exte
rnal
res
earc
h, b
uild
cap
acity
thro
ugho
ut th
e sy
stem
to r
eim
agin
e re
latio
nshi
ps, f
oste
r co
mm
unity
and
bel
ongi
ng, a
nd r
eim
agin
e di
scip
line.
The
des
ign
proc
ess
iden
tifies
nee
ded
reso
urce
s an
d cr
eate
s th
e co
nditi
ons
for
grea
ter
phys
ical
and
em
otio
nal s
afet
y fo
r st
uden
ts a
nd e
duca
tors
.
Go
al #
1C
ompl
ete
a pr
oces
s of
exp
lora
tory
lear
ning
and
gat
herin
g
inpu
t on
wha
t is
nee
ded
to b
uild
a s
ense
of
belo
ngin
g an
d su
ppor
tive
rela
tions
hips
.
Go
al #
2B
ased
on
the
resu
lts o
f go
al #
1, p
roto
type
a s
et o
f “d
esig
n pr
inci
ples
fo
r be
long
ing”
that
cre
ate
the
cond
ition
s fo
r ed
ucat
ors
to f
oste
r em
otio
nal r
egul
atio
n an
d he
alth
y en
viro
nmen
ts f
or e
very
stu
dent
.
Go
al #
3D
evel
op a
nd im
plem
ent a
com
preh
ensi
ve p
lan,
bui
ldin
g on
goa
ls #
1
and
#2
, tha
t inc
reas
es a
cces
s to
, and
rep
rese
ntat
ion
of, s
tude
nt-le
d ac
tiviti
es th
at s
uppo
rt c
ultu
ral a
nd s
ocia
l ide
ntity
, enh
anci
ng a
sen
se
of s
afet
y an
d be
long
ing
at e
very
sch
ool s
ite.

75
Por
tland
Pub
lic S
choo
ls F
orw
ard
Toge
ther
23
Pla
n th
e C
ente
r fo
r
Bla
ck S
tude
nt E
xcel
lenc
e
Str
ateg
ic O
utc
om
eA
com
preh
ensi
ve, c
o-co
nstr
ucte
d, c
omm
unity
pla
n fo
r th
e C
ente
r fo
r B
lack
Stu
dent
Exc
elle
nce.
Des
crip
tio
nIn
par
tner
ship
with
Bla
ck c
omm
unity
lead
ers,
edu
catio
n an
d yo
uth
deve
lopm
ent e
xper
ts, a
nd e
duca
tors
, our
com
mun
ity la
unch
es a
ra
cial
equ
ity c
ente
red
desi
gn a
nd p
lann
ing
proc
ess
that
info
rms
both
the
educ
atio
nal p
rogr
amm
ing
and
the
phys
ical
des
ign
and
impl
emen
tatio
n of
the
Cen
ter
for
Bla
ck S
tude
nt E
xcel
lenc
e in
sc
hool
s an
d fa
cilit
ies
in th
e he
art o
f the
his
toric
Alb
ina
neig
hbor
hood
ar
ound
Jef
fers
on H
igh
Sch
ool.
Dra
win
g fr
om lo
cal,
natio
nal,
and
inte
rnat
iona
l exp
ertis
e as
wel
l as
stud
ent,
fam
ily, a
nd c
omm
unity
en
gage
men
t, th
e co
llect
ive
sets
the
fram
ewor
k an
d de
sign
for
im
plem
enta
tion
of th
e C
ente
r.
Go
al #
1A
rob
ust a
nd d
etai
led
com
mun
ity, s
tude
nt, a
nd s
take
hold
er
enga
gem
ent p
lan,
dev
elop
ed in
coo
rdin
atio
n w
ith o
ur C
omm
unity
E
ngag
emen
t tea
m, i
s re
view
ed, v
ette
d, a
nd a
ppro
ved.
Go
al #
2O
ur c
omm
unity
- an
d st
uden
t-fo
cuse
d en
gage
men
t pro
cess
pr
oduc
es a
vis
ion
and
mis
sion
, and
a c
ompr
ehen
sive
pla
n th
at
outli
nes
educ
atio
nal o
utco
mes
, par
tner
ship
nee
ds/d
evel
opm
ent,
phys
ical
spa
ce n
eeds
, ove
rsig
ht, a
nd r
espo
nsib
ility
.
Go
al #
3C
reat
e an
d im
plem
ent a
pla
n to
hire
, tra
in, a
nd p
rom
ote
educ
ator
s,
and
othe
rs, w
ho r
eflec
t the
cul
tura
l and
rac
ial d
iver
sity
of
our
stud
ent d
emog
raph
ics.

76

77
Por
tland
Pub
lic S
choo
ls F
orw
ard
Toge
ther
25
Ens
ure
Equ
itabl
e A
cces
s to
Fac
ility
Res
ourc
es
JAN
UA
RY
26,
202
1
The
PP
S B
oard
of
Edu
catio
n un
anim
ousl
y
appr
oves
cha
ngin
g th
e na
me
of W
oodr
ow
Wils
on H
igh
Sch
ool t
o Id
a B
. Wel
ls-B
arne
tt
Hig
h S
choo
l, m
akin
g it
the
first
tim
e in
170
-yea
r hi
stor
y th
at a
PP
S H
igh
Sch
ool
will
be
nam
ed a
fter
a B
lack
per
son.
Str
ateg
ic O
utc
om
eW
e re
imag
ine
the
use
of s
pace
to p
rovi
de m
ore
equi
tabl
e ac
cess
to
fac
ilitie
s an
d su
ppor
ting
reso
urce
s, th
ereb
y en
ablin
g gr
eate
r op
tions
for
stu
dent
suc
cess
.
Des
crip
tio
nO
ur r
espo
nse
to th
e qu
estio
n, “H
ow m
ight
we
chan
ge e
nrol
lmen
t, bu
dget
ing,
and
par
tner
ship
pol
icie
s an
d pr
actic
es to
cre
ate
an
equi
tabl
e al
loca
tion
of r
esou
rces
and
mor
e fle
xibl
e an
d fu
ture
-fo
cuse
d sc
hool
s, in
clud
ing
non-
com
preh
ensi
ves,
suc
h as
CB
O
alte
rnat
ive
scho
ols?
” res
ults
in a
rei
mag
ined
use
of
spac
e. S
tude
nt
need
s ar
e th
e dr
iver
, and
the
Gra
duat
e P
ortr
ait i
s th
e fr
ame
that
gu
ides
acc
ess
to s
pace
s an
d al
loca
tion
of r
esou
rces
, sup
port
ing
mul
tiple
pat
hway
s to
gra
duat
ion.
Go
al #
1D
evel
op a
nd im
plem
ent g
uide
lines
and
pla
ns f
or in
tent
iona
l and
eq
uita
ble
upgr
adin
g of
eve
ry in
acce
ssib
le a
nd a
ging
fac
ility
in th
e sc
hool
dis
tric
t.
Go
al #
2R
egul
ar, t
wo-
way
, eng
agem
ent i
nfor
ms
faci
litie
s pl
anni
ng a
nd
reso
urce
allo
catio
n de
velo
ped
in c
oord
inat
ion
with
our
Com
mun
ity
Eng
agem
ent t
eam
.
Go
al #
3D
evel
op a
nd im
plem
ent a
dmin
istr
ativ
e po
licie
s an
d pr
oces
ses
that
al
low
stu
dent
s to
flex
ibly
acc
ess
mul
tiple
edu
catio
nal p
rogr
ams
and
offe
rings
, virt
ually
or
phys
ical
ly, a
nd in
con
junc
tion
with
ong
oing
ca
reer
lear
ning
aca
dem
y de
velo
pmen
t wor
k.

78
26
Por
tland
Pub
lic S
choo
ls F
orw
ard
Toge
ther
Them
e 2
Incl
usiv
e an
d D
iffer
entia
ted
Lear
ning
fo
r E
very
Chi
ld

79
2 Inclusive and Differentiated Learning for Every Child

80
28
Por
tland
Pub
lic S
choo
ls F
orw
ard
Toge
ther
Dev
elop
an
Inte
grat
ed In
stru
ctio
nal F
ram
ewor
k
Str
ateg
ic O
utc
om
eO
ur In
tegr
ated
Inst
ruct
iona
l Fra
mew
ork
guid
es
teac
hing
and
lear
ning
and
inte
grat
es
resp
ectf
ul c
onsi
dera
tion
of c
ultu
re, d
isab
ility
, ra
ce, g
ende
r, an
d la
ngua
ge. I
t su
ppor
ts
inqu
iry-b
ased
, fou
ndat
iona
l, an
d in
terd
isci
plin
ary
lear
ning
for
stu
dent
s to
dev
elop
and
de
mon
stra
te m
aste
ry o
f th
e G
radu
ate
Por
trai
t an
d le
arni
ng s
tand
ards
.
Des
crip
tio
nTh
e fr
amew
ork
desc
ribes
an
inte
rrel
ated
set
of
tool
s, p
ract
ices
, and
exp
ecta
tions
that
gui
de
how
we
supp
ort i
nqui
ry-b
ased
, dis
cipl
inar
y, an
d in
terd
isci
plin
ary
lear
ning
. It a
lso
desc
ribes
te
achi
ng th
at is
incl
usiv
e, c
ultu
rally
res
pons
ive,
le
arne
r-ce
nter
ed, i
nter
activ
e, e
ngag
ing,
and
in
telle
ctua
lly r
igor
ous.
Go
al #
1D
evel
op th
e fir
st v
ersi
on o
f a c
ultu
rally
re
spon
sive
and
cul
tura
lly s
usta
inin
g In
stru
ctio
nal F
ram
ewor
k th
at id
entifi
es
lear
ning
and
teac
hing
pra
ctic
es th
at s
uppo
rt
all s
tude
nts
in a
ttain
ing
the
Gra
duat
e Po
rtra
it.
Go
al #
2B
ackw
ard
map
and
bui
ld o
ut th
e de
velo
pmen
tal
cont
inuu
m (
PK
–12
) of
the
Gra
duat
e
Port
rait.
Fol
low
ing
this
, dev
elop
cor
resp
ondi
ng
perf
orm
ance
-bas
ed a
sses
smen
ts to
de
mon
stra
te m
aste
ry, i
n al
ignm
ent w
ith th
e In
stru
ctio
nal F
ram
ewor
k, f
or a
ll le
vels
.
Go
al #
3D
evel
op a
nd im
plem
ent a
com
preh
ensi
ve
prof
essi
onal
lear
ning
pla
n, in
alig
nmen
t with
th
e P
rofe
ssio
nal L
earn
ing
Mas
ter
Pla
n, to
su
ppor
t adu
lt le
arni
ng r
elat
ed to
eff
ectiv
e im
plem
enta
tion
of th
e In
stru
ctio
nal F
ram
ewor
k.
Go
al #
4 P
roto
type
inte
rdis
cipl
inar
y te
achi
ng a
nd
lear
ning
pra
ctic
es a
t a s
mal
l sca
le in
ord
er
to le
arn
abou
t the
sys
tem
s an
d st
ruct
ures
th
at c
an b
e sc
aled
eff
ectiv
ely
in th
e ne
xt
stra
tegi
c pl
an.
Incl
usiv
e an
d Di
ffer
entia
ted
Lear
ning
for
Ev
ery
Child
MAY
21,
202
1
Gov
erno
r K
ate
Bro
wn
sign
s in
to la
w
Hou
se B
ill 2
05
2, r
equi
ring
all O
rego
n
scho
ol d
istr
icts
to a
llow
stu
dent
s to
wea
r N
ativ
e A
mer
ican
reg
alia
dur
ing
grad
uatio
ns a
nd o
ther
cer
emon
ies.

81
Por
tland
Pub
lic S
choo
ls F
orw
ard
Toge
ther
29
Des
ign
Lear
ning
Exp
erie
nces
that
Pro
mot
e
Sel
f-D
irect
ed, F
utur
e-R
eady
Lea
rnin
g
Str
ateg
ic O
utc
om
eE
very
stu
dent
has
acc
ess
to fl
exib
le, p
erso
naliz
ed,
diff
eren
tiate
d le
arni
ng e
xper
ienc
es th
roug
hout
thei
r P
K–1
2 jo
urne
y. Th
ese
expe
rienc
es a
re c
ente
red
on
thei
r in
tere
sts
and
need
s, s
uppo
rt s
elf-
dire
cted
le
arni
ng, a
re r
eal-w
orld
rel
evan
t, an
d pr
ovid
e m
ultip
le
path
way
s to
gra
duat
ion
or a
cer
tifica
te o
f co
mpl
etio
n.
Des
crip
tio
nE
duca
tors
and
div
erse
gro
ups
of s
tude
nts
colla
bora
te,
in c
oord
inat
ion
with
our
Com
mun
ity E
ngag
emen
t tea
m,
to d
esig
n an
d im
plem
ent fl
exib
le, p
erso
naliz
ed le
arni
ng
expe
rienc
es a
nd e
nviro
nmen
ts. T
hese
exp
erie
nces
an
d en
viro
nmen
ts b
uild
upo
n st
uden
t in
tere
sts
and
need
s; u
se s
pace
and
tim
e cr
eativ
ely,
in w
ays
that
ex
pand
the
lear
ning
env
ironm
ent b
eyon
d th
e tr
aditi
onal
“b
ell”
stru
ctur
e; a
nd a
re a
ligne
d to
the
Gra
duat
e P
ortr
ait.
This
col
labo
rativ
e de
sign
pro
cess
inte
ntio
nally
de
velo
ps s
elf-
dire
cted
lear
ning
ski
lls f
or s
tude
nts.
Our
initi
al w
ork
iden
tifies
key
prin
cipl
es f
or d
esig
ning
fle
xibl
e, in
tere
st-b
ased
lear
ning
exp
erie
nces
that
ca
n be
app
lied
acro
ss th
e sy
stem
. The
prin
cipl
es c
an
be a
dopt
ed b
y ot
her
stud
ents
and
edu
cato
rs to
mak
e le
arni
ng m
ore
enga
ging
, rel
evan
t, an
d se
lf-di
rect
ed
for
all s
tude
nts.
The
des
ign
prin
cipl
es a
lso
info
rm a
nd
influ
ence
the
rede
sign
of
mul
tiple
inte
rest
-bas
ed
lear
ning
exp
erie
nces
PK
–12
. Exa
mpl
es in
clud
e th
e P
K–
3 a
lignm
ent a
nd d
esig
n w
ork,
Mid
dle
Sch
ool
rede
sign
eff
orts
, col
lege
and
car
eer
path
way
s to
gr
adua
tion
or a
cer
tifica
te o
f com
plet
ion,
and
alte
rnat
ive
path
way
s fo
r st
uden
ts P
K–1
2. T
he d
esig
n pr
inci
ples
ar
e in
tegr
ated
into
the
dist
rict’s
inst
ruct
iona
l fra
mew
ork.
Go
al #
1D
evel
op in
itial
des
ign
prin
cipl
es t
o in
corp
orat
e
stud
ent i
nter
ests
and
nee
ds in
to le
arni
ng e
xper
ienc
es.
Col
labo
rativ
ely
deve
lop
the
desi
gn p
rinci
ples
with
a
dive
rse
grou
p of
stu
dent
s an
d ed
ucat
ors
in c
oord
inat
ion
with
our
Com
mun
ity E
ngag
emen
t tea
m. I
nclu
de th
e pr
inci
ples
in a
“des
ign
guid
e” th
at is
inco
rpor
ated
into
th
e In
tegr
ated
Inst
ruct
iona
l Fra
mew
ork.
Go
al #
2S
uppo
rt s
choo
ls a
t all
leve
ls to
red
esig
n m
aste
r sc
hedu
les
cent
ered
on
lear
ner
need
s an
d st
uden
t ac
cess
to
equi
tabl
e le
arni
ng e
xper
ienc
es, a
nd
supp
ort
the
impl
emen
tatio
n of
flex
ible
lear
ning
ex
perie
nces
PK
–12
.
Go
al #
3 P
rovi
de s
tude
nts
oppo
rtun
ities
for
per
sona
lized
le
arni
ng th
at c
ente
rs a
roun
d di
ffer
entia
ted
and
flexi
ble
lear
ning
exp
erie
nces
tha
t ar
e de
velo
pmen
tally
ap
prop
riate
and
focu
sed
on th
e pe
rson
aliz
ed in
tere
sts
and
need
s of
eac
h st
uden
t.
Go
al #
4 D
evel
op a
com
preh
ensi
ve p
lan,
and
pro
toty
pe
exte
rnal
and
inte
rnal
car
eer-
rela
ted
lear
ning
with
st
uden
ts th
at e
mph
asiz
es r
eal-w
orld
, han
ds-o
n ex
perie
nces
, suc
h as
inte
rnsh
ips
and
exte
rnsh
ips,
jo
b sh
adow
s, a
nd s
imul
atio
ns.

82
30
Por
tland
Pub
lic S
choo
ls F
orw
ard
Toge
ther
Impl
emen
t Mul
ti-Ti
ered
Sys
tem
of S
uppo
rts
(MTS
S)
Str
ateg
ic O
utc
om
eO
ur s
tron
gly
alig
ned
syst
em o
f tie
red
su
ppor
ts p
rovi
des
prog
ress
ivel
y ta
rget
ed a
nd
indi
vidu
aliz
ed r
esou
rces
for
stu
dent
s. T
he
supp
orts
are
bas
ed o
n st
uden
t dat
a, d
ecis
ion
crite
ria, a
nd e
duca
tor
colla
bora
tion,
and
us
e cu
ltura
lly r
espo
nsiv
e, e
vide
nce-
base
d ac
adem
ic, s
ocia
l-em
otio
nal,
and
beha
vior
al
inte
rven
tions
to e
limin
ate
barr
iers
to le
arni
ng.
Des
crip
tio
nM
ulti-
tiere
d S
yste
m o
f S
uppo
rt (
MTS
S)
is
a fr
amew
ork
focu
sed
on p
reve
ntio
n an
d pr
oble
m s
olvi
ng f
or a
ll st
uden
ts, u
sing
dat
a-
base
d de
cisi
on m
akin
g. T
his
fram
ewor
k pr
omot
es e
duca
tiona
l sys
tem
s th
at p
rovi
de
equi
tabl
e ou
tcom
es f
or a
ll st
uden
ts. M
TSS
us
es e
vide
nce-
base
d in
stru
ctio
n, in
terv
entio
n,
and
asse
ssm
ent p
ract
ices
to e
nsur
e th
at
ever
y st
uden
t rec
eive
s th
e ap
prop
riate
le
vel o
f su
ppor
t bas
ed o
n th
eir
leve
l of
need
. A
tten
tion
is f
ocus
ed o
n cr
eatin
g an
d su
stai
ning
Tie
r I s
uppo
rt (
univ
ersa
l), T
ier
II in
terv
entio
n (t
arge
ted
grou
p), a
nd T
ier
III
inte
rven
tion
(indi
vidu
al)
syst
ems
to h
elp
elim
inat
e ba
rrie
rs to
lear
ning
and
ens
ure
equi
tabl
e ou
tcom
es. M
TSS
inte
grat
es R
acia
l E
quity
, Soc
ial E
mot
iona
l Lea
rnin
g, a
nd
Res
tora
tive
Just
ice
prac
tices
to p
rom
ote
a cu
lture
of
emot
iona
l saf
ety
and
resp
ect f
or
stud
ents
and
edu
cato
rs.
Go
al #
1Fu
lly im
plem
ent M
TSS
sch
ool-l
evel
sys
tem
s an
d st
ruct
ures
, suc
h as
Pro
fess
iona
l Lea
rnin
g C
omm
uniti
es, S
tude
nt In
terv
entio
n Te
ams,
S
choo
l Clim
ate
Team
s, a
nd In
stru
ctio
nal
Lead
ersh
ip T
eam
s th
at m
onito
r st
uden
t su
cces
s an
d de
velo
pmen
t and
pro
vide
tier
ed
leve
l sup
port
and
inte
rven
tions
con
sist
ently
.
Go
al #
2A
ll ou
r PK
–12
scho
ols
impl
emen
t sch
ool-w
ide
Tran
sfor
mat
ive
Soc
ial E
mot
iona
l Lea
rnin
g (T
SE
L) a
s de
fined
thro
ugh
our
part
ners
hip
with
CA
SE
L an
d ex
pres
sed
in o
ur s
choo
l gu
ide.
Dis
tric
t-w
ide
prof
essi
onal
lear
ning
, al
igne
d w
ith th
e P
rofe
ssio
nal L
earn
ing
Mas
ter
Pla
n an
d gu
ided
by
the
PP
S R
ES
J le
ns,
is a
vaila
ble
and
requ
ired
for
the
entir
e w
orkf
orce
. TS
EL
is in
tegr
ated
in th
e st
ruct
ures
an
d sy
stem
s ac
ross
our
dep
artm
ents
and
un
its, a
nd a
rob
ust c
ontin
uous
impr
ovem
ent
proc
ess
is in
pla
ce to
gui
de it
s im
plem
enta
tion.
Go
al #
3A
ll of
our
PK
–12
site
s ha
ve a
cces
s to
R
esto
rativ
e Ju
stic
e re
sour
ces,
foc
used
on
build
ing
com
mun
ity, s
treng
then
ing
rela
tions
hips
, an
d re
pairi
ng h
arm
, as
part
of
our
wor
k to
re
imag
ine
disc
iplin
e. T
hese
res
ourc
es in
clud
e su
ppor
t for
cla
ssro
oms,
trai
ning
for
edu
cato
rs,
faci
litat
ion
of in
terv
entio
ns, a
nd s
uppo
rt f
or
com
mun
ity e
ngag
emen
t.

83
Por
tland
Pub
lic S
choo
ls F
orw
ard
Toge
ther
31
Str
ateg
ic O
utc
om
eA
ll of
our
sys
tem
s an
d st
ruct
ures
sup
port
th
e un
ders
tand
ing
and
impl
emen
tatio
n
of in
clus
iona
ry p
ract
ices
for
stu
dent
s
with
dis
abili
ties.
Des
crip
tio
nO
ur s
yste
m-w
ide
capa
city
for
incl
usio
n of
st
uden
ts is
sup
port
ed b
y th
e co
nsid
erat
ion
of
spe
cial
edu
catio
n ne
eds
in p
lann
ing
fo
r pr
ofes
sion
al d
evel
opm
ent,
curr
icul
um
adop
tion,
bud
get,
MTS
S, C
aree
r an
d Te
chni
cal
Edu
catio
n (C
TE),
and
staf
fing.
Thi
s en
sure
s th
at e
very
stu
dent
can
att
ain
the
Gra
duat
e P
ortr
ait,
and
ever
y ed
ucat
or c
an d
evel
op
thei
r ca
paci
ty to
be
incl
usiv
e an
d re
spon
sive
to
all
dive
rse
lear
ners
, as
refle
cted
in th
e E
duca
tor
Ess
entia
ls.
Go
al #
1D
istr
ict-
wid
e pl
anni
ng f
or p
rofe
ssio
nal
deve
lopm
ent,
curr
icul
um a
dopt
ion,
bud
get,
MTS
S, C
TE, a
nd s
taffi
ng is
incl
usiv
e of
sp
ecia
l edu
catio
n.
Go
al #
2D
evel
op a
nd f
und
an in
clus
ion
team
that
fo
cuse
s on
coa
chin
g su
ppor
t and
men
torin
g fo
r ge
nera
l edu
catio
n te
ache
rs a
roun
d th
e in
clus
ion
of s
tude
nts
with
com
plex
nee
ds.
Est
ablis
h S
yste
ms
and
S
truc
ture
s fo
r In
clus
ion

84
32
Por
tland
Pub
lic S
choo
ls F
orw
ard
Toge
ther
Pro
mot
e an
Incl
usiv
e M
inds
et
Str
ateg
ic O
utc
om
eW
e al
l sha
re th
e m
inds
et th
at s
tude
nts
with
dis
abili
ties
are
ev
eryo
ne’s
stu
dent
s.
Des
crip
tio
nW
e un
ders
tand
and
impl
emen
t inc
lusi
onar
y pr
actic
es f
or s
tude
nts
w
ith d
isab
ilitie
s, in
clud
ing
full
impl
emen
tatio
n of
MTS
S, U
nive
rsal
D
esig
n fo
r Le
arni
ng (
UD
L), c
ompr
ehen
sive
pro
fess
iona
l dev
elop
men
t, an
d tie
red
acad
emic
sup
port
s, a
ligne
d to
the
Gra
duat
e P
ortr
ait a
nd
Edu
cato
r E
ssen
tials
.
Go
al #
1E
very
edu
cato
r re
ceiv
es p
rofe
ssio
nal t
rain
ing
and
reso
urce
s to
opt
imiz
e op
port
uniti
es f
or s
tude
nts
with
dis
abili
ties
to s
ucce
ed. T
he p
rofe
ssio
nal
deve
lopm
ent i
s al
igne
d w
ith th
e P
rofe
ssio
nal L
earn
ing
Mas
ter
Pla
n
and
incl
udes
a fu
ll im
plem
enta
tion
of U
DL
prac
tices
in s
peci
al e
duca
tion
and
gene
ral e
duca
tion,
and
tier
ed a
cade
mic
sup
port
s, in
clud
ing
cultu
rally
res
pons
ive
peda
gogy
. Thi
s su
ppor
ts o
ur b
elie
f th
at s
tude
nts
with
dis
abili
ties
are
ever
yone
’s s
tude
nts
and
expa
nds
our u
nder
stan
ding
of
the
impo
rtan
ce o
f in
clus
ion.
Go
al #
2W
e ar
e re
duci
ng e
xclu
sion
s fr
om g
ener
al e
duca
tion
by in
crea
sing
aw
aren
ess,
red
ucin
g bi
as a
nd d
iscr
imin
ator
y pr
actic
es, a
nd in
crea
sing
in
clus
iona
ry p
ract
ices
by
educ
ator
s in
the
gene
ral e
duca
tion
sett
ing.
Go
al #
3W
e ha
ve in
crea
sed
trai
ning
, edu
catio
n, a
nd s
uppo
rt f
or e
duca
tors
, al
igne
d w
ith th
e P
rofe
ssio
nal L
earn
ing
Mas
ter
Pla
n, in
the
use
of th
e M
ultil
ingu
al S
pEd
Fam
ily T
oolk
it.

85
Por
tland
Pub
lic S
choo
ls F
orw
ard
Toge
ther
33
Bui
ld th
e A
dvoc
acy
Pow
er o
f Stu
dent
s
and
Fam
ilies
of S
tude
nts
with
Dis
abili
ties
Str
ateg
ic O
utc
om
eW
e en
sure
that
all
fam
ilies
and
stu
dent
s, e
spec
ially
thos
e w
ho h
ave
been
und
erse
rved
his
toric
ally
, ha
ve th
e kn
owle
dge,
info
rmat
ion,
and
sup
port
they
nee
d to
ful
ly e
ngag
e in
, and
con
trib
ute
to, t
he
spec
ial e
duca
tion
proc
ess.
Des
crip
tio
nW
e w
ork
with
fam
ilies
and
stu
dent
s to
iden
tify
info
rmat
ion
need
s an
d ex
pand
res
ourc
es a
bout
al
l asp
ects
of
the
spec
ial e
duca
tion
proc
ess,
incl
udin
g ev
alua
tion,
elig
ibili
ty, a
nd In
divi
dual
E
duca
tion
Pla
n (I
EP
) pr
oces
ses.
We
empo
wer
stu
dent
s to
lead
thei
r ow
n IE
Ps.
Edu
cato
rs h
ave
the
trai
ning
and
sup
port
to b
e fu
lly in
clus
ive
of a
ll fa
mili
es a
nd s
tude
nts
and
help
cre
ate
conn
ectio
ns b
etw
een
spec
ial e
duca
tion
supp
orts
and
the
Gra
duat
e P
ortr
ait.
Go
al #
1W
e en
sure
that
stu
dent
s w
ith d
isab
ilitie
s an
d th
eir f
amili
es u
nder
stan
d th
e G
radu
ate
Port
rait
elem
ents
to h
elp
stud
ents
rea
lize
them
. We
also
exp
lore
thos
e el
emen
ts in
an
adap
ted
Gra
duat
e P
ortr
ait f
or s
tude
nts
with
com
plex
ne
eds,
in c
olla
bora
tion
with
stu
dent
s an
d fa
mili
es, t
o en
sure
that
eve
ry s
tude
nt s
ees
them
selv
es in
our
Gra
duat
e P
ortr
ait.
Go
al #
2E
xpan
d ou
r Mul
tilin
gual
SpE
d Fa
mily
Too
lkit
to
incr
ease
edu
catio
n an
d aw
aren
ess
fo
r fa
mili
es a
nd g
uard
ians
, esp
ecia
lly o
ur
hist
oric
ally
und
erse
rved
fam
ilies
, reg
ardi
ng
spec
ial e
duca
tion
proc
esse
s an
d pr
actic
es.
Go
al #
3U
se o
ur e
xpan
ded
Mul
tilin
gual
SpE
d Fa
mily
To
olki
t to
incr
ease
stu
dent
aw
aren
ess
and
enga
gem
ent i
n sp
ecia
l edu
catio
n pr
oces
ses
so
that
stu
dent
s ca
n le
arn
to le
ad th
eir
own
IEP
s an
d un
ders
tand
how
spe
cial
sup
port
s co
nnec
t to
mee
ting
Gra
duat
e P
ortr
ait g
oals
, esp
ecia
lly
for
our
hist
oric
ally
und
erse
rved
stu
dent
s.

86
34
Por
tland
Pub
lic S
choo
ls F
orw
ard
Toge
ther
Them
e 3
P
rofe
ssio
nal
Exc
elle
nce
and
S
uppo
rt

87
3 Professional Excellence and Support

88
36
Por
tland
Pub
lic S
choo
ls F
orw
ard
Toge
ther
Dev
elop
a D
iver
se,
Hig
h-Q
ualit
y, T
hriv
ing
Wor
kfor
ce
Str
ateg
ic O
utc
om
eW
e ha
ve a
div
erse
, hig
h-qu
ality
, thr
ivin
g w
orkf
orce
that
is s
uppo
rted
in
pers
onal
and
pro
fess
iona
l wel
l-bei
ng a
nd s
ucce
ss.
Des
crip
tio
nW
e ha
ve a
div
erse
wor
kfor
ce th
at r
eflec
ts s
tude
nt d
emog
raph
ics
thro
ugh
inte
ntio
nal r
ecru
itmen
t, hi
ring,
ret
entio
n, a
nd d
evel
opm
ent o
f ed
ucat
ors
of
col
or. W
e ha
ve a
hig
h-qu
ality
, thr
ivin
g w
orkf
orce
that
is s
uppo
rted
by
prof
essi
onal
exp
erie
nces
thro
ugho
ut th
e en
tire
empl
oyee
life
cycl
e, to
en
sure
eac
h ed
ucat
or’s
per
sona
l and
pro
fess
iona
l wel
l-bei
ng, g
row
th,
and
succ
ess.
Go
al #
1Im
plem
ent i
nclu
sive
and
equ
itabl
e pr
oces
ses,
pra
ctic
es, a
nd a
ccou
ntab
ility
sy
stem
s to
dec
reas
e ra
cial
dis
prop
ortio
nalit
y of
rec
ruitm
ent,
hirin
g, r
eten
tion,
an
d pr
omot
ion,
prio
ritiz
ing
the
grow
th a
nd d
evel
opm
ent o
f ed
ucat
ors
of
colo
r in
thei
r ca
reer
s.
Go
al #
2In
crea
se th
e he
alth
and
wel
l-bei
ng o
f ev
ery
educ
ator
by
impl
emen
ting
soci
al,
emot
iona
l, an
d w
elln
ess
best
pra
ctic
es a
nd s
uppo
rts,
incl
udin
g id
entif
ying
cu
ltura
lly a
ffirm
ing
supp
orts
for
edu
cato
rs o
f co
lor.
Prof
essi
onal
Exc
elle
nce
an
d Su
ppor
t

89
Por
tland
Pub
lic S
choo
ls F
orw
ard
Toge
ther
37
Adv
ance
Our
Org
aniz
atio
nal
Lear
ning
Cul
ture
and
Pra
ctic
e
Str
ateg
ic O
utc
om
eO
ur c
oher
ent,
syst
em-w
ide
cultu
re o
f ad
ult l
earn
ing
prov
ides
sys
tem
s an
d su
ppor
ts th
at s
pur
gr
owth
, inn
ovat
ion,
and
col
labo
ratio
n.
Des
crip
tio
nW
e ar
e a
lear
ning
org
aniz
atio
n th
at f
acili
tate
s in
divi
dual
gro
wth
for
edu
cato
rs a
t all
leve
ls, t
hrou
gh
path
way
s th
at a
re a
ligne
d to
the
Edu
cato
r E
ssen
tials
, diff
eren
tiate
d su
ppor
ts, a
nd p
rofe
ssio
nal l
earn
ing
choi
ces.
Our
sup
port
ive
adul
t lea
rnin
g cu
lture
and
pro
fess
iona
l lea
rnin
g sy
stem
enc
oura
ges
inno
vatio
n an
d in
crea
ses
colla
bora
tion
and
know
ledg
e sh
arin
g sy
stem
-wid
e, r
esul
ting
in s
tron
ger
prof
essi
onal
pr
actic
e ac
ross
the
dist
rict.
JUN
E 4
, 202
0
With
new
inve
stm
ents
in d
irect
stu
dent
supp
orts
(so
cial
wor
kers
, cou
nsel
ors,
cultu
rally
-spe
cific
par
tner
ship
s an
d m
ore)
,
PP
S S
uper
inte
nden
t Gua
dalu
pe G
uerr
ero
anno
unce
s th
e di
scon
tinue
d re
gula
r
pres
ence
of
Sch
ool R
esou
rce
Offi
cers
in P
PS
Sch
ools
.
Go
al #
1C
reat
e a
Pro
fess
iona
l Lea
rnin
g M
aste
r P
lan
that
id
entifi
es s
yste
m-w
ide
lear
ning
req
uire
men
ts,
optio
ns, a
nd g
uida
nce
on d
evel
opin
g in
divi
dual
an
d si
te-s
peci
fic le
arni
ng p
lans
that
inte
grat
e sy
stem
-wid
e le
arni
ng n
eeds
, ind
ivid
ual n
eeds
, an
d in
tere
sts.
Go
al #
2Id
entif
y an
d im
plem
ent c
ultu
rally
affi
rmin
g an
d di
ffer
entia
ted
supp
orts
and
res
ourc
es to
sup
port
em
ploy
ee g
row
th, i
nclu
ding
indi
vidu
aliz
ed
prof
essi
onal
gro
wth
pla
ns.
Go
al #
3D
evel
op a
nd im
plem
ent p
rofe
ssio
nal l
earn
ing
that
is a
ligne
d ac
ross
site
s an
d de
part
men
ts a
nd
inte
grat
es a
con
tinuu
m to
war
d m
aste
ry f
or a
pr
iorit
ized
set
of
Edu
cato
r E
ssen
tials
alig
ned
to
the
Gra
duat
e P
ortr
ait.
Go
al #
4D
esig
n an
d de
velo
p a
Kno
wle
dge
and
Lear
ning
M
anag
emen
t Sys
tem
that
sup
port
s kn
owle
dge
build
ing,
sha
ring,
and
lear
ning
for
all
educ
ator
s.

90
38
Por
tland
Pub
lic S
choo
ls F
orw
ard
Toge
ther
Them
e 4
E
mbr
acin
g C
hang
e

91
4 Embracing Change

92
Soc
ializ
e O
ur V
isio
n an
d S
trat
egic
Pla
n
Str
ateg
ic O
utc
om
eW
e so
cial
ize
our
visi
on, P
PS
reIm
agin
ed, a
nd o
ur s
trat
egic
pla
n by
pro
vidi
ng o
ngoi
ng
oppo
rtun
ities
for
edu
cato
rs, s
tude
nts,
and
com
mun
ity s
take
hold
ers
to e
ngag
e, u
nder
stan
d,
and
crea
te m
eani
ng to
geth
er.
Des
crip
tio
nO
ur s
ocia
lizat
ion
proc
ess
invi
tes
our
educ
ator
s, s
tude
nts,
and
com
mun
ity s
take
hold
ers
to
expl
ore
the
idea
s, a
sk q
uest
ions
, and
thin
k th
roug
h th
e im
plic
atio
ns o
f bo
th o
ur v
isio
n an
d ou
r st
rate
gic
plan
. Thr
ough
a v
arie
ty o
f on
goin
g op
port
uniti
es, o
ur c
omm
unity
dev
elop
s a
shar
ed
unde
rsta
ndin
g an
d co
mm
itmen
t to
our
visi
on a
nd o
ur s
trat
egic
pla
n, a
nd e
ach
stak
ehol
der
can
see
that
they
pla
y an
impo
rtan
t rol
e in
rea
chin
g ou
r sh
ared
asp
iratio
ns.
Go
al #
1D
evel
op a
nd im
plem
ent a
pla
n to
cre
ate
oppo
rtun
ities
for
inte
rnal
and
ext
erna
l sta
keho
lder
s,
espe
cial
ly o
ur s
tude
nts,
to m
ake
mea
ning
of
the
visi
on a
nd th
e st
rate
gic
plan
, and
to
unde
rsta
nd h
ow th
ey c
an p
roac
tivel
y su
ppor
t, le
ad, a
nd h
elp
us c
olle
ctiv
ely
achi
eve
our
goal
s.
Embr
acin
g
Chan
ge
FE
BR
UA
RY
23,
202
1
The
Boa
rd a
ppro
ved
the
rena
min
g of
Mad
ison
Hig
h S
choo
l to
Leod
is V
. McD
anie
l
Hig
h S
choo
l, ho
norin
g a
Bla
ck P
ortla
nder
and
educ
ator
who
led
the
form
er M
adis
on
scho
ol th
roug
h cu
ltura
l shi
fts
in h
is
com
mun
ity w
ith h
is o
wn
raci
al e
quity
and
soci
al ju
stic
e le
ns.

93
Por
tland
Pub
lic S
choo
ls F
orw
ard
Toge
ther
41
Bui
ld a
Col
lect
ive
Sen
se
of T
rust
and
Bel
ongi
ng
Str
ateg
ic O
utc
om
eO
ur e
duca
tors
and
com
mun
ity c
olle
ctiv
ely
fost
er a
n en
viro
nmen
t of
belo
ngin
g,
trus
t, an
d sh
ared
ow
ners
hip
for
the
succ
ess
of o
ur s
tude
nts,
edu
cato
rs, a
nd
scho
ol d
istr
ict.
Des
crip
tio
nIn
col
labo
ratio
n w
ith o
ur c
omm
unity
, we
have
iden
tified
the
actio
ns th
at b
uild
re
latio
nal t
rust
and
thos
e th
at d
ism
antle
it. W
ith th
is u
nder
stan
ding
, we
nurt
ure
trus
ting
rela
tions
hips
thro
ugh
mea
ning
ful c
olla
bora
tion
and
inve
stm
ent i
n un
ders
tand
ing
each
oth
er’s
bac
kgro
unds
, per
spec
tives
, and
mot
ivat
ions
(ou
r w
hy).
We
cont
inua
lly r
ealig
n to
our
sha
red
purp
ose,
bui
ldin
g a
colle
ctiv
e se
nse
of
belo
ngin
g, to
cre
ate
a sy
stem
that
pow
ers
our
stud
ents
’ suc
cess
.
Est
ablis
h a
Sys
tem
-Wid
e
Pro
ject
Man
agem
ent C
ultu
re a
nd P
ract
ice
Str
ateg
ic O
utc
om
eO
ur p
roje
ct m
anag
emen
t pra
ctic
e en
sure
s co
nsis
tent
, sus
tain
able
, and
sy
nchr
oniz
ed im
plem
enta
tion
and
orga
niza
tiona
l coh
eren
ce o
f al
l str
ateg
ic
plan
eff
orts
.
Des
crip
tio
nTh
e su
cces
sful
exe
cutio
n of
the
stra
tegi
c pl
an is
bro
ught
abo
ut th
roug
h th
e es
tabl
ishm
ent o
f a
syst
em-w
ide
Pro
ject
Man
agem
ent O
ffice
. Thi
s en
sure
s co
nsis
tent
, sus
tain
able
, and
syn
chro
nize
d im
plem
enta
tion
of p
lans
, inc
ludi
ng s
ite
and
depa
rtm
ent a
ctio
n pl
ans,
thro
ugh
com
mon
pro
ject
man
agem
ent s
tand
ards
pr
actic
ed th
roug
hout
the
orga
niza
tion.
Sys
tem
-wid
e co
ordi
natio
n of
thes
e ef
fort
s in
crea
ses
visi
bilit
y, ef
fect
ive
com
mun
icat
ion,
and
org
aniz
atio
nal a
lignm
ent.
Go
al #
1C
reat
e an
d im
plem
ent a
sha
red
proj
ect m
anag
emen
t fra
mew
ork
with
co
mm
on s
tand
ards
, pro
cess
es, a
nd
tool
s to
mon
itor
and
exec
ute
the
stra
tegi
c pl
an.
Go
al #
2E
stab
lish
an E
nter
pris
e P
roje
ct
Man
agem
ent O
ffice
, bas
ed o
n pr
ofes
sion
al in
dust
ry p
ract
ice
and
the
uniq
ue n
eeds
of
our
envi
ronm
ent.
The
offic
e pr
ovid
es o
ngoi
ng
orga
niza
tiona
l lea
ders
hip
and
staf
fing
tow
ard
a co
nsis
tent
, eff
ectiv
e
proj
ect m
anag
emen
t exp
erie
nce
for
all e
duca
tors
.
Go
al #
3S
uppo
rt s
ites
and
depa
rtm
ents
to
crea
te a
ctio
n pl
ans
alig
ned
with
the
stra
tegi
c pl
an, a
nd d
evel
op p
roce
sses
fo
r on
goin
g co
ordi
natio
n of
im
plem
enta
tion
effo
rts.
Go
al #
1E
stab
lish
shar
ed d
efini
tions
of
rela
tiona
l tru
st a
nd b
elon
ging
, bas
ed
on a
n un
ders
tand
ing
of th
e ac
tions
th
at b
uild
or
dism
antle
them
.
Go
al #
2U
se th
e un
ders
tand
ing
and
defin
ition
s de
velo
ped
thro
ugh
goal
#1
to d
evel
op
and
impl
emen
t a p
lan
to s
tren
gthe
n ou
r ca
paci
ty to
bui
ld r
elat
iona
l tru
st
and
a co
llect
ive
sens
e of
bel
ongi
ng.

94
42
Por
tland
Pub
lic S
choo
ls F
orw
ard
Toge
ther
Em
bed
Sys
tem
-Wid
e D
ata-
Driv
en
Con
tinuo
us Im
prov
emen
t Pra
ctic
es
Str
ateg
ic O
utc
om
eW
e us
e da
ta e
ffec
tivel
y an
d co
nsis
tent
ly to
driv
e cy
cles
of
cont
inuo
us
impr
ovem
ent t
hat l
eads
to d
ecis
ions
and
act
ions
that
impr
ove
stud
ent o
utco
mes
.
Des
crip
tio
nE
ffec
tive
data
-driv
en c
ontin
uous
impr
ovem
ent p
ract
ices
are
evi
dent
thro
ugho
ut
the
dist
rict,
espe
cial
ly a
t the
cla
ssro
om, g
rade
-leve
l, sc
hool
, and
cen
tral
offi
ce
depa
rtm
ent l
evel
s. E
duca
tors
hav
e th
e ca
paci
ty to
set
mea
sura
ble
goal
s, c
olle
ct
outc
ome
and
impl
emen
tatio
n da
ta f
rom
mul
tiple
sou
rces
, ana
lyze
dat
a, a
djus
t ac
tions
, and
mon
itor
prog
ress
tow
ard
goal
s. D
iver
se s
take
hold
ers
are
invo
lved
in
data
ana
lysi
s to
str
engt
hen
inte
rpre
tatio
n, a
nd th
is in
form
s de
cisi
ons
and
actio
ns,
espe
cial
ly r
esou
rce
allo
catio
ns, t
hat l
ead
to im
prov
ed o
utco
mes
.
Est
ablis
h E
xcep
tiona
l Ser
vice
C
ultu
re a
nd S
tand
ards
Str
ateg
ic O
utc
om
eW
e de
liver
exc
eptio
nal c
entr
al s
ervi
ces
to o
ur s
choo
ls, s
tude
nts,
and
fam
ilies
.
Des
crip
tio
nO
ur c
entr
al o
ffice
is tr
ansf
orm
ing
to b
ette
r se
rve
our
scho
ols
for
the
bene
fit o
f st
uden
ts a
nd f
amili
es. W
e ha
ve a
per
form
ance
man
agem
ent s
yste
m th
at
supp
orts
edu
cato
rs to
impr
ove
serv
ices
con
tinuo
usly
, usi
ng a
mea
ning
ful s
et o
f m
ultip
le m
easu
res,
gro
unde
d in
a c
usto
mer
ser
vice
cul
ture
and
a r
esea
rch-
base
d fr
amew
ork.
Thi
s re
flect
s ou
r be
lief
that
stu
dent
ach
ieve
men
t can
be
acce
lera
ted
whe
n sc
hool
s ar
e su
ppor
ted
by c
entr
al s
ervi
ces
that
are
per
form
ed
relia
bly
and
accu
rate
ly, c
onve
y tr
ust a
nd c
onfid
ence
thro
ugh
know
ledg
e of
pr
oduc
ts a
nd s
ervi
ces,
com
mun
icat
e ca
ring
and
indi
vidu
aliz
ed a
tten
tion,
and
pr
ovid
e he
lp w
illin
gly
and
prom
ptly
.
Go
al #
1S
trat
egic
pla
n pr
iorit
ies
are
bein
g m
onito
red
quar
terly
and
pub
licly
re
port
ed a
nnua
lly to
ens
ure
prog
ress
to
war
d ou
r eq
uita
ble
met
rics
an
d in
dica
tors
.
Go
al #
2A
sha
red
mod
el o
f da
ta-d
riven
co
ntin
uous
impr
ovem
ent c
ycle
s ha
s be
en a
dopt
ed b
y sc
hool
s an
d de
part
men
ts, a
nd s
uppo
rts
for
effe
ctiv
e im
plem
enta
tion
are
in p
lace
.
Go
al #
3Th
e B
oard
of
Edu
catio
n, th
e di
stric
t, ce
ntra
l offi
ce d
epar
tmen
ts, s
choo
ls,
and
grad
e-le
vel t
eam
s w
ill e
stab
lish
regu
lar c
ycle
s of
revi
ew a
s pa
rt o
f the
ir co
ntin
uous
impr
ovem
ent p
roce
ss.
Go
al #
4S
tren
gthe
n ca
paci
ty to
pro
vide
ef
fect
ive
inst
ruct
ion
that
lead
s to
cl
osur
e of
our
sig
nific
ant g
aps
in
stud
ent o
utco
mes
thro
ugh
acce
ss to
re
al-t
ime
stud
ent p
rogr
ess
mon
itorin
g da
ta, s
uch
as f
orm
ativ
e as
sess
men
ts
and
othe
r m
easu
res.
Go
al #
5D
evel
op a
n in
tegr
ated
dat
a-m
anag
emen
t inf
rast
ruct
ure
that
is
resp
onsi
ve a
nd a
ccur
ate
so th
at
effe
ctiv
e da
ta-d
riven
con
tinuo
us
impr
ovem
ent p
ract
ice
is s
uppo
rted
th
roug
hout
the
dist
rict.
Go
al #
1D
evel
op a
nd im
plem
ent a
dis
tric
t-w
ide
perf
orm
ance
man
agem
ent
syst
em th
at is
gro
unde
d in
a
rese
arch
-bas
ed C
usto
mer
Ser
vice
E
xcel
lenc
e m
odel
.
Go
al #
2E
stab
lish
Pro
fess
iona
l Lea
rnin
g C
omm
uniti
es, a
ligne
d w
ith o
ur
Pro
fess
iona
l Lea
rnin
g M
aste
r
Pla
n, a
cros
s se
rvic
e de
part
men
ts
to s
uppo
rt c
ross
-dep
artm
enta
l co
llabo
ratio
n on
cha
lleng
ing
pr
oble
ms
of p
ract
ice.
Iden
tify
actio
ns
to im
prov
e se
rvic
e pe
rfor
man
ce.

95
Por
tland
Pub
lic S
choo
ls F
orw
ard
Toge
ther
43
Impl
emen
t a P
roac
tive,
Eff
ectiv
e,
and
Cre
ativ
e C
omm
unic
atio
n P
ract
ice
Str
ateg
ic O
utc
om
eO
ur c
omm
unic
atio
n pr
actic
e pr
oact
ivel
y in
form
s in
tern
al a
nd e
xter
nal
stak
ehol
ders
in w
ays
that
are
res
pect
ful,
tran
spar
ent,
and
incl
usiv
e of
our
lin
guis
tical
ly a
nd c
ultu
rally
div
erse
com
mun
ities
.
Des
crip
tio
nIn
tern
al a
nd e
xter
nal c
omm
unic
atio
n is
con
sist
ent a
nd a
ccur
ate,
and
it in
form
s st
akeh
olde
rs in
a ti
mel
y fa
shio
n. A
tten
tion
to a
cces
sibi
lity
has
mad
e m
etho
ds
and
cont
ent r
espo
nsiv
e to
aud
ienc
e ne
eds.
By
usin
g a
varie
ty o
f da
ta a
nd m
edia
, w
e “s
how
the
syst
em to
itse
lf” th
roug
h st
orie
s of
gro
wth
and
acc
ompl
ishm
ent,
keep
ing
our
com
mun
ity p
roac
tivel
y in
form
ed a
s to
pro
gres
s ac
ross
the
dist
rict.
Go
al #
1D
evel
op a
nd im
plem
ent o
ur g
uide
lines
for
cle
ar, a
cces
sibl
e, in
clus
ive,
and
m
eani
ngfu
l com
mun
icat
ions
cre
ated
in c
olla
bora
tion
with
stu
dent
s, f
amili
es,
site
edu
cato
rs a
nd th
e ce
ntra
l offi
ce s
o th
at w
e ca
n ta
rget
our
mes
sage
s to
di
vers
e st
akeh
olde
rs.
Go
al #
2Id
entif
y an
d im
plem
ent c
reat
ive
met
hods
to p
roac
tivel
y de
velo
p an
d sh
are,
bo
th in
tern
ally
and
ext
erna
lly, s
torie
s th
at c
eleb
rate
and
sha
re th
e pr
ogre
ss
we
are
colle
ctiv
ely
mak
ing
tow
ard
real
izin
g ou
r vi
sion
.

96
44
Por
tland
Pub
lic S
choo
ls F
orw
ard
Toge
ther
Laun
ch a
n In
nova
tion
Pra
ctic
e th
at R
eim
agin
es S
yste
m P
robl
em S
olvi
ng
Str
ateg
ic O
utc
om
eO
ur s
yste
m-w
ide
inno
vatio
n pr
actic
e ad
dres
ses
chal
leng
es in
the
syst
em b
y ge
nera
ting
crea
tive
solu
tions
and
mov
ing
prom
isin
g pr
actic
es to
impl
emen
tatio
n
at s
cale
.
Des
crip
tio
n
Our
inno
vatio
n pr
actic
e en
able
s al
l ed
ucat
ors
and
stud
ents
to a
ddre
ss
chal
leng
es in
the
syst
em a
nd p
uts
a su
ppor
tive
stru
ctur
e in
pla
ce to
ena
ble
them
to d
o so
. Thi
s st
ruct
ure
is th
e In
nova
tion
Stu
dio,
whi
ch in
clud
es tr
aini
ng,
reso
urce
s, a
nd in
cent
ives
that
pro
mot
e a
cultu
re o
f cr
eativ
ity, i
tera
tive
desi
gn
impr
ovem
ents
, and
man
aged
ris
k-ta
king
.
Inno
vatio
n ap
proa
ches
are
des
crib
ed in
a
PP
S In
nova
tion
Fram
ewor
k, a
nd r
egul
arly
ap
plie
d to
ens
ure
that
sol
utio
ns m
eet
the
need
s of
inte
nded
sta
keho
lder
s an
d ar
e re
silie
nt to
pot
entia
l fut
ure
forc
es.
Inno
vatio
n is
non
-line
ar a
nd o
ften
incl
udes
id
eatin
g br
oadl
y to
tack
le p
robl
ems
that
ar
e ill
-defi
ned
and
for
whi
ch e
ffec
tive
solu
tions
are
unk
now
n. A
n in
nova
tion
prac
tice
invo
lves
des
ign
rese
arch
and
hu
man
-cen
tere
d de
sign
to le
arn
insi
ghts
fr
om th
ose
for
who
m th
e so
lutio
n is
de
sign
ed. T
hen,
thro
ugh
exer
cise
s th
at
harn
ess
crea
tivity
, thr
ough
des
ign
thin
king
an
d pr
otot
ypin
g, n
ew a
nd in
nova
tive
solu
tions
to c
halle
nges
are
dev
elop
ed.
Go
al #
1E
stab
lish
the
PP
S In
nova
tion
Stu
dio
and
trai
n th
e in
itial
div
erse
team
of
inno
vatio
n pr
oces
s fa
cilit
ator
s fo
r pro
ject
s, in
alig
nmen
t w
ith th
e P
rofe
ssio
nal L
earn
ing
Mas
ter P
lan.
Go
al #
2C
ompl
ete
the
deve
lopm
ent o
f a
PP
S
Inno
vatio
n Fr
amew
ork
to p
rovi
de a
cle
ar
defin
ition
of
inno
vatio
n in
PP
S w
ith
writ
ten
guid
elin
es a
nd e
xpec
tatio
ns o
n
the
inno
vatio
n pr
actic
e in
the
dist
rict.
Go
al 3
E
stab
lish
a ro
bust
pla
n to
con
tinue
bu
ildin
g ou
r in
nova
tion
prac
tice,
incl
udin
g on
goin
g su
ppor
t sys
tem
s an
d ad
ditio
nal
trai
ned
faci
litat
ors,
incl
udin
g st
uden
ts.

97
Por
tland
Pub
lic S
choo
ls F
orw
ard
Toge
ther
45
Cul
tivat
e an
d P
rom
ote
Alig
ned
Com
mun
ity
Par
tner
ship
s
Str
ateg
ic O
utc
om
eO
ur p
artn
ersh
ips
equi
tabl
y su
ppor
t our
stu
dent
s
to a
chie
ve th
e G
radu
ate
Por
trai
t.
Des
crip
tio
nIn
tern
al a
nd e
xter
nal s
take
hold
ers
are
activ
e pa
rtne
rs s
uppo
rtin
g ou
r vi
sion
, PP
S re
Imag
ined
, an
d ha
ve c
lear
opt
ions
and
opp
ortu
nitie
s to
alig
n th
eir
effo
rts
with
our
vis
ion.
We
culti
vate
, fos
ter,
and
sust
ain
part
ners
hips
so
that
our
col
lect
ive
effo
rts
to s
uppo
rt o
ur s
tude
nts
to a
chie
ve th
e G
radu
ate
Por
trai
t are
max
imiz
ed.
Go
al #
1C
olla
bora
tivel
y de
velo
p a
part
ners
hip
fram
ewor
k,
in c
oord
inat
ion
with
our
Com
mun
ity E
ngag
emen
t te
am, t
hat d
efine
s ty
pes
and
elem
ents
of
effe
ctiv
e pa
rtne
rshi
ps, o
utlin
es R
ES
J-fo
cuse
d cr
iteria
for
pa
rtne
rshi
ps, a
nd p
rovi
des
guid
elin
es o
n fo
ster
ing
and
sust
aini
ng e
ffec
tive
part
ners
hips
.
Go
al #
2R
edefi
ne a
nd d
evel
op o
ur c
ultu
re o
f gi
ving
that
gr
ows
sust
aina
ble
part
ners
hips
with
sta
keho
lder
s,
and
build
mul
tiple
mea
ning
ful a
nd a
ligne
d op
port
uniti
es f
or a
ll co
mm
unity
mem
bers
to ta
ke
actio
n in
sup
port
of
our
visi
on.
Go
al #
3E
stab
lish
a ci
tyw
ide
cam
paig
n of
par
tner
s th
at
colle
ctiv
ely
alig
ns a
sha
red
set o
f pr
iorit
ies
to
achi
eve
the
Gra
duat
e P
ortr
ait.

98
46
Por
tland
Pub
lic S
choo
ls F
orw
ard
Toge
ther
Dev
elop
a C
oher
ent S
yste
m-W
ide
C
omm
unity
Eng
agem
ent A
ppro
ach
Str
ateg
ic O
utc
om
eS
take
hold
er e
ngag
emen
t is
a co
re c
ompe
tenc
y th
roug
h w
hich
the
pers
pect
ives
an
d vo
ice
of e
duca
tors
, stu
dent
s, a
nd f
amili
es a
re a
uthe
ntic
ally
inte
grat
ed.
Des
crip
tio
nO
ur c
oher
ent,
syst
em-w
ide
appr
oach
to in
tern
al a
nd e
xter
nal c
omm
unity
en
gage
men
t use
s co
nsis
tent
gui
delin
es f
or d
epar
tmen
ts a
nd s
ites
on th
e
desi
gn o
f en
gage
men
t act
iviti
es to
ens
ure
that
they
are
mea
ning
ful a
nd
tran
spar
ent.
Gui
delin
es c
larif
y ex
pect
atio
ns a
s to
the
purp
ose
and
outc
omes
of
eng
agem
ent,
incl
udin
g ex
pect
atio
ns fo
r col
labo
ratio
n an
d fe
edba
ck lo
ops,
an
d he
lp s
take
hold
ers
feel
that
thei
r pa
rtic
ipat
ion
is v
alue
d by
und
erst
andi
ng
how
thei
r in
put,
feed
back
, and
col
labo
rativ
e de
sign
eff
orts
will
be
used
.
Go
al #
1D
evel
op a
nd it
erat
ivel
y im
prov
e en
gage
men
t gui
delin
es a
nd to
ols
to
supp
ort s
ites
and
depa
rtm
ents
to
auth
entic
ally
eng
age
stak
ehol
ders
. Th
is in
clud
es p
roto
cols
and
ex
pect
atio
ns fo
r par
ticip
atio
n an
d co
mm
unic
atio
n, a
nd fe
edba
ck lo
ops
so th
at p
artic
ipan
ts u
nder
stan
d
the
purp
ose,
met
hods
, and
out
com
es
to e
ngag
emen
t ini
tiativ
es in
whi
ch
they
hav
e pa
rtic
ipat
ed.
Go
al #
2M
ap e
ngag
emen
t eff
orts
of
all
stra
tegi
c pl
an e
ffor
ts, a
nd c
olla
bora
te
proa
ctiv
ely
with
str
ateg
ic p
lan
proj
ect
lead
s to
ens
ure
that
all
enga
gem
ent
effo
rts
follo
w th
e gu
idel
ines
.
Go
al #
3E
stab
lish
dist
rict-
wid
e pr
inci
ples
fo
r cr
eatin
g m
eani
ngfu
l and
ac
tiona
ble
feed
back
loop
s w
ith c
lear
ex
pect
atio
ns s
o th
at e
duca
tors
, fa
mili
es, a
nd s
tude
nts
feel
hea
rd a
nd
appr
ecia
ted,
and
und
erst
and
how
th
eir
feed
back
will
be
used
.
99
Alli
son
Ada
ms
Loun
a A
goro
Ari
Alb
erg
Aim
ee A
lexa
nder
-She
a
Laur
aine
Alle
n
Jenn
ifer
And
erso
n
Nic
ole
Bas
sen
Mic
helle
Bat
ten
Lore
tta
Ben
jam
in-
Sam
uels
Sha
wn
Bird
Ang
ela
Bon
illa
Kris
ten
Bra
yson
Bra
ndon
Bre
eden
Judy
Bre
nnan
Rus
sell
Bro
wn
Jill
Bry
ant
Ale
xis
Bur
nett
Chr
is B
urns
Mar
gare
t Cal
vert
Osc
ar C
ampo
s
Isaa
c C
ardo
na
Junh
o C
hang
Sha
nice
Cla
rke
Dan
iel C
ogan
Kev
in C
rotc
hett
Kre
gg C
uella
r
Tric
ia C
urle
y
Rob
bie
Dav
is
Sar
ah D
avis
Nol
bert
o D
elga
dillo
Yeng
Dha
bolt
Kat
hlee
n E
llwoo
d
Mol
ly E
mm
ons
Nic
ole
Eny
eart
Gua
dalu
pe G
uerr
ero
Rob
yn F
arao
ne
Lorn
a Fa
st B
uffa
lo H
orse
Will
iam
Fer
nand
ez
Sar
ah F
itch
Chr
isto
pher
Fra
zier
Jona
than
Gar
cia
Deb
ra G
iles
Em
ily G
lasg
ow
Mat
t Gol
dste
in
Nat
asha
Gra
nnis
Ant
onye
Har
ris
Mar
shal
l Has
kins
Sha
wn
Hel
m
Jenn
ifer
Her
nand
ez
Cla
ire H
ertz
Cas
ey H
offm
an
Ais
ha H
olla
nds
Sar
ah H
olm
Filip
Hris
tic
Kat
herin
e H
u
Cha
rnet
ta H
utso
n
Aur
ora
Hym
el
Cam
ille
Ided
evbo
Eliz
abet
h Is
rael
-Dav
is
Tiel
Jac
kson
Ste
tson
Jam
es
Dan
Jun
g
Sta
cey
Jung
Pau
lina
Lare
nas
Liz
Larg
e
Fran
k Le
avitt
Dan
i Led
ezm
a
Mel
issa
Lim
Jere
my
Lo
Deo
n Lo
gan
Kar
l Log
an
Lidi
a Lo
pez
Gam
boa
John
Lyo
ns
Dav
id M
arie
nbur
g
Lori
Mar
tin
Bre
nda
Mar
tinek
Dav
id M
artin
ez
Kim
berly
Mat
ier
Meg
an M
cCar
ter
Lisa
McC
onac
hie
Tani
a M
cKey
Nao
mi M
onte
long
o
Sag
e M
orgi
llo
Ang
ela
Mor
rill
Zul
ema
Nae
gele
Gis
elle
Nar
anjo
-Nel
son
Dan
a N
eren
berg
Mea
nrot
h N
y
Lesl
ie O
’Del
l
Am
bar
Oliv
as
Est
her
Om
ogbe
hin
Juni
per
Pai
nton
Mar
gare
tt P
eopl
es
Lana
Per
ice
Chr
istie
Pet
erse
n
Chr
istin
e P
itts
Mei
sha
Plo
tzke
Lydi
a P
oole
Ros
anne
Pow
ell
Aar
on P
resb
erg
Lori
Pre
ston
Bel
inda
Rea
gan
Sha
ron
Ree
se
Dan
a R
iem
er
Nai
lah
Roq
ue
Gen
evie
ve R
ough
Dav
id R
oy
Am
y R
uona
Yia
n S
aech
ao
Mar
ifer
Sag
er
Meg
an S
alva
dor
Car
los
San
chez
Hui
zar
Key
la S
antia
go
De
Vasq
uez
Elis
a S
chor
r
Cla
ire S
kelly
Kee
ley
Sim
pson
Noe
lle S
isk
Tulla
n S
pitz
Ste
ven
Sta
plet
on
Eric
a S
tavi
s
Nat
han
Sw
over
land
Eliz
abet
h Th
iel
Car
mel
la T
hom
as
Lind
say
Trap
p
Rob
ert U
nzue
ta
Luis
Val
entin
o
Alm
a Ve
lazq
uez
Jill
Vogt
Em
ily W
alsh
Kar
en W
erst
ein
Cou
rtne
y W
estli
ng
Kris
tyn
Wes
tpha
l
Dan
a W
hite
Chr
is W
illia
ms
Kar
min
Will
iam
s
Rei
ko W
illia
ms
Cur
tis W
ilson
III
Cur
tis W
ilson
Cha
ndra
Wils
on-C
oope
r
Han
nah
Witt
Kor
inna
Wol
fe
Don
Wol
ff
Pat
rice
Woo
ds
Str
ateg
ic P
lan
supp
ort b
y P
rosp
ect S
tudi
o | w
ww
.pro
spec
tstu
dios
f.com
Than
k yo
u t
o t
he
staf
f an
d s
tud
ents
wh
o w
ork
ed o
n o
ur
stra
teg
ic p
lan
.

100
Forw
ard
Toge
ther

101
POLICIES & REGULATIONSThe Budget Process The budget is developed by incorporating input from the Board of Education, the Superintendent and staff, the public, and information from the State Legislature regarding the funding level of the State School Fund (SSF).
Board Discussion and Community EngagementDuring the course of the year the Board held work sessions, committee presentations, and discussions on a number of program topics which included information about budget implications and possibilities.
Local Budget LawBudgeting in Oregon is governed by Local Budget Law, Chapter 294 of the Oregon Revised Statutes. The law has two major objectives:
y To provide standard procedures for preparing, presenting, and administering local budgets
y To ensure citizen involvement in the preparation of the budget
Local Budget Law provides a method of estimating revenues, expenditures and proposed taxes for all major funds and offers an approach for outlining the programs and services to be provided by the schools to implement fiscal policies and financial decisions. The structure of school budgets in the State of Oregon is further defined by the Oregon Department of Education (ODE). ODE, through the administrative rule process, defines the structure of the budget and the classification system to be used; guidance is published in the Program Budgeting and Accounting Manual (see below). The budget forms defined by ODE present the planned Resources and Requirements the District budgets to carry out its educational mission. Further information on specific requirements for the budget process and budget document may be found at the Tax Supervising Conservation Commission (TSCC) website - http://www.tsccmultco.com/. Detail on ODE requirements can be found in the Oregon Administrative Rules (OAR), at: http://arcweb.sos.state.or.us/pages/rules/access/numerically.html
Budgeting is a Continuous ProcessBudgeting is a continuous process taking almost 24 months to complete a cycle. The budgeting process has various phases with three distinct products:
y Proposed Budget - Staff works to assist the Superintendent and to prepare a proposed budget for the upcoming fiscal year. In addition to staff work, the Superintendent provides regular updates and leads discussions with the Board, as well as listening sessions at public meetings to gather citizen input. The Proposed Budget is the product of an extensive, collaborative process of budget development, analysis, and revision, which builds upon work done in reviewing programs and developing new plans for delivering services to students and families. The outcome is the Superintendent’s Proposed Budget document, also called the Budget Book.
y Approved Budget - The Board, sitting as the Budget Committee, reviews and discusses the Proposed Budget. The Budget Committee refines the Proposed Budget and votes to approve a budget and impose property taxes. This stage also involves budget review and input from the

102
Community Budget Review Committee. This committee performs separate review and analysis of the Proposed Budget and provides recommendations to the Board acting as the Budget Committee. This phase of budget development requires public participation and at least one public hearing. The Approved Budget is passed to the TSCC for its review and certification.
y Adopted Budget - The District’s Approved Budget is reviewed and certified by the TSCC. Unique to Multnomah County, the TSCC is a five-member citizen board appointed by the Governor that reviews the budgets of all governmental jurisdictions in Multnomah County. The Commission, following standard procedures established by the State Department of Revenue, is responsible for ensuring the District budget complies with local budget law. The TSCC certifies the Approved Budget after review. Successful completion of that action includes a public hearing held by TSCC. The Board further refines the budget prior to final adoption in late June, but no later than June 30. The Board, as a governing body, votes to adopt the Budget, levy taxes and appropriate funds. The outcome is a legally adopted budget published as the Budget Book.
y Amending the Budget - Local Budget Law defines procedures and controls on allowed changes to the budget during the fiscal year, commonly referred to as supplemental budgets. In supplemental budgets, the District may increase appropriations within the guidelines defined in Local Budget Law. The size of the increase determines whether a minor or major supplemental budget process is required.
` A minor supplemental budget process (increase in any fund must be less than ten percent of expenditures) provides the Board the opportunity to change the budget during the year. Minor supplemental budgets are scheduled as needed, usually in the fall or winter, after school begins and staff movement has been finalized, and again in the spring.
` A major supplemental budget process (any fund increase of ten percent or more of expenditures) occurs as needed. Major supplemental budgets are infrequent and normally timed to coincide with the minor supplemental budget actions. Major supplemental budget actions require a public notice and public hearing.

103
Budget MethodologyThe District seeks to align resources to programs and strategies with proven student outcomes. Additionally, since the PPS Strategic Plan adoption in June 2021, the District has focused on allocating resources to target goals and outcomes in the plan.
Budget Officer and Budget CommitteeTo ensure participation in the budget process, Local Budget Law requires that a budget officer be appointed and a budget committee consisting of Board members and members of the public be formed. At PPS the budget officer is currently the Chief Financial Officer. For local jurisdictions with greater than 200,000 in population such as PPS, the elected body is the Budget Committee, with no community members. The District’s budget officer prepares the Proposed Budget under the direction of the Superintendent. The Budget Committee then reviews, revises, and approves the budget before it is formally adopted by the governing body.Public notices are published, budgets are made available for public review, and opportunities for public comment are also provided. This structure encourages public participation in the budget decision-making process and gives public exposure to budgeted programs and fiscal policies prior to adoption.
Community Budget Review Committee (CBRC)The District is not required to have a budget committee composed of citizen members. However, the Board has established a Community Budget Review Committee (CBRC) composed of several community stakeholders to advise the Board on the budget. The CBRC reviews, evaluates, and makes recommendations to the Board regarding the Superintendent’s Proposed Budget and any other budgetary issues the CBRC or the Board identify. The CBRC also monitors and advises the Board on the allocation and expenditure of Local Option Levy funds.
Capital ProjectsThe District reviews capital projects on a monthly basis both for cash flow and arbitrage consideration within the context of achieving the stated outcomes in the bond’s ballot. The PPS Finance Team, Office of School Modernization, Technology and Curriculum teams meet with financial planners for planning future capital needs and subsequent strategy for issuing debt. The School Board votes on all debt issuance resolutions. The Board is also presented with a Capital Improvement Plan and Long-Range Facility Plans. The information includes which schools are included in the bond projects. Citizens Bond Accountability Committee (BAC) meets quarterly to review bond funded projects and offer advice to the School Board.
The Long Range Facility Planning ProcessPortland Public Schools’ Board of Education accepted the Long-Range Facility Plan in December 2021 after a year of development and engagement with the broader District community. The Long-Range Facility Plan outlines a sequence of planning processes intended to guide future capital measures. The plan synthesizes three primary considerations:
y Educational program requirements
y Enrollment and capacity
y Facility condition

104
These considerations are guided by a strategic vision established by the District and informed by input from the broader district community. This work is an opportunity to institute lasting change by re-envisioning teaching and learning environments. The District garnered ideas from diverse communities and developed a representative vision for the future of our schools.All large school districts in Oregon are required to complete a Long-Range Facility Plan every ten years. The purpose of the document is to plan for future capital improvements within the context of current educational vision and student enrollment trends over the next 10 to 15 years. The plan provides a strategic framework to be tested against community voice and vision prior to future bond campaigns. A Long-Range Facility Plan is intended to provide clear sightlines for the management of Portland Public Schools facilities over time, such that they continually support the ongoing success of district students, staff, and community. The plan also addresses the requirements of OAR 581-027-0040, Long-Range Facility Plan Requirements, and Section 5 of ORS 195.110, School Facility Plan for Large School Districts. In doing so, this plan creates a framework for future bond-planning efforts, reflects community values, and targets alignment with community capital support.The Long-Range Facility Plan document falls within a sequence of steps recommended by the state before capital Bond planning. Preceding this document is a multi-year facility condition assessment and enrollment forecasts outlining student population trends for the next fifteen years. Building on these efforts, this plan documents capital forecasts in the context of educational vision, building condition, and building capacity. Many steps remain before a capital measure can be referred to the voters. It is essential to recognize that the Long-Range Facility Plan document does not make commitments that will require future Board action or make specific recommendations for future bonds. Instead, the Long-Range Facility Plan is intended to provide a framework to be tested against community voice and vision before future capital measures. Access this PPS website for more information: https://www.pps.net/Page/954
Bond Accountability CommitteeThe Citizens Bond Accountability Committee (BAC) is made up of seven to ten members reflective, to the extent possible, of the diversity of Portland. The members shall have a reputation for fairness and transparency and experience in building design, construction, public contracting, budgeting, and/or auditing. The Board will appoint committee members and a chairperson or co-chairpersons. The committee meets quarterly to review bond funded projects and offer advice to the School Board, on:
A. Whether bond revenues are expended only for the purpose for which the bond was approved
B. Alignment with the goals and principles of the district’s Long Range Facilities Plan
C. Alignment with the goals of the Business Equity Policy
D. Lowering maintenance and construction costs while improving operating efficiency
E. Historic preservation and school renovation
F. Potential capital partnerships for joint and shared use of PPS facilities
G. Implementation of appropriate ways to address seismic issues
H. Compliance with ADA requirements

105
Access this PPS website for more information: https://www.pps.net/Page/464
Board PoliciesBoard policy 2.10.010-P establishes the Board’s requirements for Racial Educational Equity.Board policy 8.10.025-P establishes the Board’s requirements for contingencies and reserves. Most notably, the Board has established a goal of maintaining an operating contingency of 5-10%. The goals for the reserve will be set as part of the District’s long-range financial plan, with an expectation that the District will achieve and sustain a 10% reserve. Administrative Directive 8.10.030-AD establishes the guidelines for budget reallocations post adopted budget. .
Budgetary Basis of AccountingThe District reports financial position, results of operations, and changes in fund balance/net position on the basis of Generally Accepted Accounting Principles (GAAP). The government-wide financial statements are reported using the economic resources measurement focus and the accrual basis of accounting, as are the proprietary fund financial statements. The budgetary statements provided as part of required or other supplementary information are presented on the budgetary basis to provide a meaningful comparison of actual results with the budget.

106
BUDGET CALENDAR
Portland Public Schools Budget Calendar to Prepare the 2022-23 Budget
Adopted October 12, 2021 Amended April 19, 2022
Board Inform / Review
Board Acon
September 28, 2021 School Board Meeng 6:00 PM Board reviews dra� 2022-23 Budget Calendar ✔
BESC
October 12, 2021 School Board Meeng 6:00 PM Board approves 2022-23 Budget Calendar ✔
BESC
October 26, 2021 School Board Meeng 6:00 PM Board appoints Community Budget Review Commiee (CBRC) members ✔
BESC
November- 2021 Community Engagement Events School Finance 101 & Strategic Plan ✔ ✔
BESC
March 15, 2022 School Board Meeng 6:00 PM Work session with CBRC Board reviews Strategic Plan and Mul-Year Business Plan
✔ BESC
April 3, 2022 Publish 1 st Noce of Budget Commiee Meeng (5 to 30 days before the meeng)
The Oregonian Web Site
April 10, 2022 Publish 2 nd Noce of Budget Commiee Meeng (5 to 30 days before the meeng)
The Oregonian Web Site
April 26, 2022* School Board Budget Meeng 6:00 PM *Not a Regularly Scheduled Board Meeng CBRC in aendance Proposed Budget : Superintendent delivers 2022-23 Proposed Budget message and presentaon
✔
BESC
May 4, 2022* School Board Budget Work Session 6:00 PM *Not a Regularly Scheduled Board Meeng Board conducts public engagement session on Proposed Budget
✔ BESC
May 17, 2022* School Board Budget Work Session 6:00 PM CBRC presents 2022-23 Proposed Budget Report to the Board *Not a Regularly Scheduled Board Meeng
✔ BESC
May 24, 2022 School Board Meeng 6:00 PM Approved Budget : Board as Budget Commiee approves 2022-23 Proposed Budget ✔
BESC
June 5, 2022 Publish Noce of Budget Hearing and Budget Summary The Oregonian Web Site
June 14, 2022 TSCC Hearing 4:30 PM TSCC cerfies 2022-23 Approved Budget
School Board Meeng 6:00 PM Adopted Budget : Board conducts a public hearing, adopts budget, makes appropriaons and imposes taxes
✔
✔
BESC
July 15, 2022 Submit Tax Cerficaon documentaons File budget informaon with County Recorder and Designated Agencies
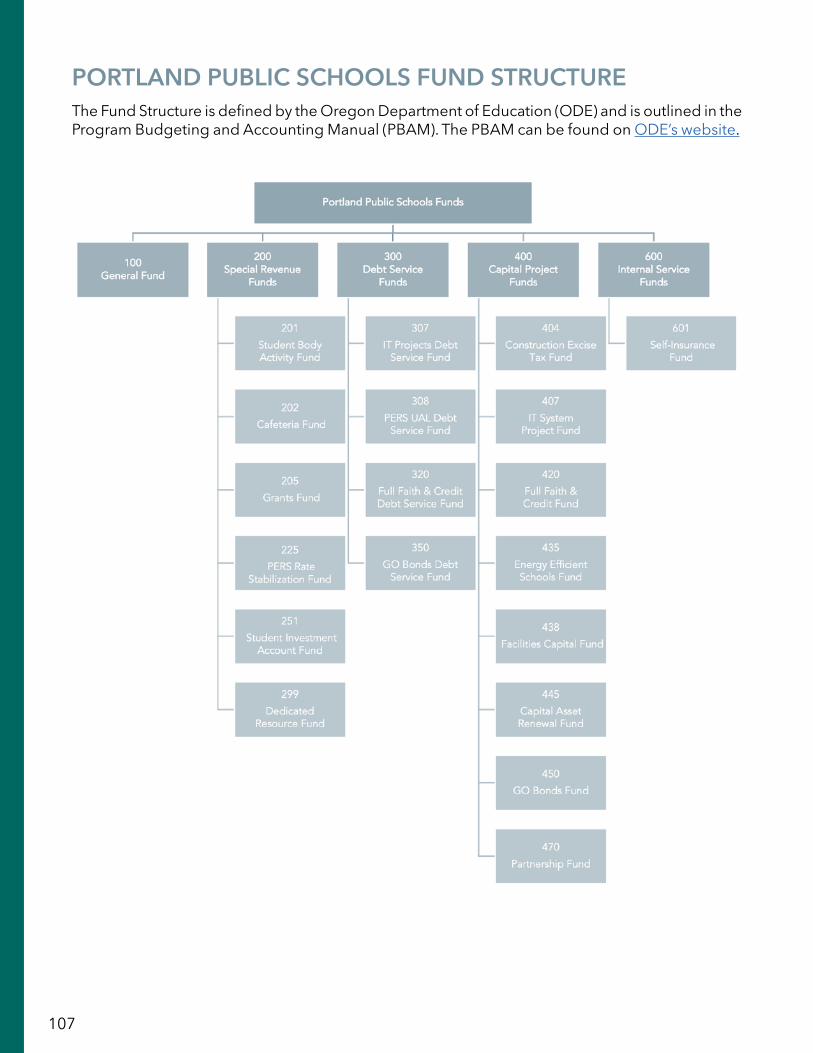
107
PORTLAND PUBLIC SCHOOLS FUND STRUCTUREThe Fund Structure is defined by the Oregon Department of Education (ODE) and is outlined in the Program Budgeting and Accounting Manual (PBAM). The PBAM can be found on ODE’s website.

108
Fund Descriptions and DefinitionsFund Type Fund Purpose Budgeted Funds
100 General Fund The primary day-to-day operating fund of the District. 100 - General Fund
200 Special Revenue Funds
Dedicated revenues such as: Federal, State and Local Grants and Private Donations.
201 - Student Body Activity Fund
202 - Cafeteria Fund
205 - Grants Fund
225 - PERS Rate Stabilization Fund
251 - Student Investment Account Fund
299 - Dedicated resource Fund
300 Debt Service Funds
Accounts for the payment of principal and interest on certain long-term debt.
307 - IT Projects Debt Service Fund
308 - PERS UAL Debt Service Fund
320 - Full Faith & Credit Debt Service Fund
350 - GO Bonds Debt Service Fund
400 Capital Project Funds
Resources and expenditures used to finance acquisition of technology or construction or renovation of capital facilities.
404 - Construction Excise Tax Fund
407 - IT System Project Fund
420 - Full Faith & Credit Funds
435 - Energy Efficient Schools Fund
438 - Facilities Capital Fund
445 - Capital Asset Renewal Fund
450 - GO Bonds Fund
470 - Partnership Funds
600 Internal Service Fund
Accounts for services furnished by one department or agency to another department or agency on a cost-reimbursement basis.
601 - Self Insurance Fund

109
CLASSIFICATION OF REVENUES AND EXPENDITURESOregon Program Budgeting & Accounting ManualPursuant to the Program Budgeting and Accounting Manual (PBAM), PPS classifies revenues by five major sources:
Major Sources1000 Local Sources2000 Intermediate Sources3000 State Sources4000 Federal Sources5000 Other Sources
Expenditures are classified by function and object.
Major Functions1000 Instruction2000 Support Services3000 Enterprise and Community Services4000 Facilities Acquisition and Construction5000 Other Uses (Interagency/Fund Transactions and Debt Service)6000 Contingency7000 Unappropriated Ending Fund Balance
Major Objects100 Salaries200 Associated Payroll Costs300 Purchased Services400 Supplies and Materials500 Capital Outlay600 Other Objects700 Transfers800 Other Uses of Funds

BOARD POLICYPortland Public Schools Racial Educational Equity Policy
2.10.010-P
110
FINANCIAL BOARD POLICIES
BOARD POLICY
Portland Public Schools Racial Educational Equity Policy
2.10.010-P
Portland Public Schools Page 1 of 3
The Board of Education for Portland Public Schools is committed to the success of every student in each of our schools. The mission of Portland Public Schools is that by the end of elementary, middle, and high school, every student by name will meet or exceed academic standards and will be fully prepared to make productive life decisions. We believe that every student has the potential to achieve, and it is the responsibility of our school district to give each student the opportunity and support to meet his or her highest potential.
In light of this mission and our beliefs, Portland Public Schools’ historic, persistent achievement gap between White students and students of color is unacceptable. While efforts have been made to address the inequities between White students and students of color, these efforts have been largely unsuccessful. Recognizing that there are other student groups that have not reached their achievement potential, this policy focuses on the most historically persistent achievement gap, which is that between White students and students of color. Closing this achievement gap while raising achievement for all students is the top priority of the Board of Education, the Superintendent and all district staff. Race must cease to be a predictor of student achievement and success.1
In Portland Public Schools, for every year that we have data, White students have clearly outperformed Black, Hispanic and Native American students on state assessments in every subject at every grade level. White students consistently graduate at higher percentages than students of color, while students of color are disciplined far more frequently than White students. These disparities are unacceptable and are directly at odds with our belief that all students can achieve.
The responsibility for the disparities among our young people rests with adults, not the children. We are aware that student achievement data from school districts across the country reveal similar patterns, and that complex societal and historical factors contribute to the inequities our students face. Nonetheless, rather than perpetuating disparities, Portland Public Schools must address and overcome this inequity and institutional racism, providing all students with the support and opportunity to succeed.
1 For the purposes of this policy, “race” is defined as “A social construct that artificially divides people into distinct groups based on characteristics such as physical appearance (particularly color), ancestral heritage, cultural affiliation, cultural history, ethnic classification, and the social, economic, and political needs of a society at a given period of time. Racial categories subsume ethnic groups.” Maurianne Adams, Lee Anne Bell, and Pat Griffin, editors. Teaching for Diversity and Social Justice: A Sourcebook. (2007).

BOARD POLICYPortland Public Schools Racial Educational Equity Policy
2.10.010-P
111
FINANCIAL BOARD POLICIES
BOARD POLICY
Portland Public Schools Racial Educational Equity Policy
2.10.010-P
Portland Public Schools Page 2 of 3
Portland Public Schools will significantly change its practices in order to achieve and maintain racial equity in education. Educational equity means raising the achievement of all students while (1) narrowing the gaps between the lowest and highest performing students and (2) eliminating the racial predictability and disproportionality of which student groups occupy the highest and lowest achievement categories.2 The concept of educational equity goes beyond formal equality -- where all students are treated the same -- to fostering a barrier-free environment where all students, regardless of their race, have the opportunity to benefit equally. Educational equity benefits all students, and our entire community. Students of all races shall graduate from PPS ready to succeed in a racially and culturally diverse local, national and global community. To achieve educational equity, PPS will provide additional and differentiated resources to support the success of all students, including students of color.
In order to achieve racial equity for our students, the Board establishes the following goals:
A. The District shall provide every student with equitable access to high quality and culturally relevant instruction, curriculum, support, facilities and other educational resources, even when this means differentiating resources to accomplish this goal.
B. The District shall create multiple pathways to success in order to meet the needs of our diverse students, and shall actively encourage, support and expect high academic achievement for students from all racial groups.
C. The District shall recruit, employ, support and retain racially and linguistically diverse and culturally competent administrative, instructional and support personnel, and shall provide professional development to strengthen employees’ knowledge and skills for eliminating racial and ethnic disparities in achievement. Additionally, in alignment with the Oregon Minority Teacher Act, the District shall actively strive to have our teacher and administrator workforce reflect the diversity of our student body.
D. The District shall remedy the practices, including assessment, that lead to the over-representation of students of color in areas such as special education and discipline, and the under-representation in programs such as talented and gifted and Advanced Placement.
E. All staff and students shall be given the opportunity to understand racial identity, and the impact of their own racial identity on themselves and others.
2 Glenn Singleton and Curtis Linton Courageous Conversations About Race, p. 46 (2006)

BOARD POLICYPortland Public Schools Racial Educational Equity Policy
2.10.010-P
112
FINANCIAL BOARD POLICIES
BOARD POLICY
Portland Public Schools Racial Educational Equity Policy
2.10.010-P
Portland Public Schools Page 3 of 3
F. The District shall welcome and empower students and families, including underrepresented families of color (including those whose first language may not be English) as essential partners in their student’s education, school planning and District decision-making. The District shall create welcoming environments that reflect and support the racial and ethnic diversity of the student population and community. In addition, the District will include other partners who have demonstrated culturally-specific expertise -- including government agencies, non-profit organizations, businesses, and the community in general -- in meeting our educational outcomes.
The Board will hold the Superintendent and central and school leadership staff accountable for making measurable progress in meeting the goals. Every Portland Public Schools employee is responsible for the success and achievement of all students. The Board recognizes that these are long term goals that require significant work and resources to implement across all schools. As such, the Board directs the Superintendent to develop action plans with clear accountability and metrics, and including prioritizing staffing and budget allocations, which will result in measurable results on a yearly basis towards achieving the above goals. Such action plans shall identify specific staff leads on all key work, and include clear procedures for district schools and staff. The Superintendent will present the Board with a plan to implement goals A through F within three months of adoption of this policy. Thereafter, the Superintendent will report on progress towards these goals at least twice a year, and will provide the Board with updated action plans each year.
References: “The State of Black Oregon” (The Urban League of Portland 2009); “Communities of Color in Multnomah County: An Unsettling Report” (Coalition of Communities of Color/Portland State University 2010); “The Economic Cost of the Achievement Gap” (Chalkboard Project 2010); “The Hispanic/White Achievement Gap in Oregon” (Chalkboard Project 2009); “A Deeper Look at the Black-White Achievement Gap in Multnomah County” (Chalkboard Project 2009); ORS 342.433.
History: Adopted by Resolution No. 4459, 6-13-11

BOARD POLICYContingencies and Reserves
8.10.025-P
113
FINANCIAL BOARD POLICIES
Board Policy Reserve Funds
8.10.025-P
1. The Board understands that to avoid financial instability, continuing expenditure requirements should be insulated from typical fluctuations in revenues and expenditures.
2. It is the goal of the Board to fund and maintain a reserve in the general fund that shall range from 5% to 10% of annual general fund revenues. The goals for the reserve will be set as part of the District’s long-range financial plan, with an expectation that the District will achieve and sustain a 10% reserve. The Board shall establish an annual operating contingency each fiscal year during the budget process.
3. Contingencies and reserves will be established pursuant to ORS 294.388. Interfund transfers from contingency will be made in accordance with ORS 294.463. The Board may authorize by resolution transfers of contingency funds of up to 15%. Transfers that exceed 15% may be made only after Board approval and adoption of a supplemental budget for that purpose.
4. Reserves generally should not be used for new or increased operating costs or investments. Reserves may be used at the discretion of the Board to address one-time emergencies and unanticipated expenditure requirements or to offset unanticipated revenue fluctuations occurring within a fiscal year. In the event that reserves are expended, there will be a plan to replenish the expended funds within three fiscal years.
5. Reserves are the fund balances carried over from year to year and contingency funds are annually budgeted and reflected in current year fund balances.
Legal References: ORS 294.388, ORS 294.463. History: Adpt. 4/8/02; Rev. 4/19/17; Rev. 6/2019

BOARD POLICYAdministrative Directive
8.10.030-AD
114
FINANCIAL BOARD POLICIES
Administrative Directive 8.10.030-AD
Portland Public Schools Page 1 of 3 Portland, Oregon
8.10.030-AD Budget Reallocations – Post Budget Adoption
I. Purpose
This administrative directive establishes the guidelines to assure consistent and detailed communication between the Superintendent and the Board regarding fiscal issues. Communication is essential under circumstances that could result in significant reductions or reallocations of funding after the Board has adopted the budget.
II. General Provisions
The Finance, Audit and Operations Committee will be apprised in a timely manner of significant changes in revenue expectations and cost/expenditure patterns. In particular, the Finance, Audit and Operations Committee will be informed when fiscal circumstances may result in the need for transfers from the contingency fund.
III. Provision of Information to the Board
(1) Budget to Actual Financial Reports and Revenue Reports will be provided to and discussed with the Board Finance, Audit and Operations Committee on a monthly basis.
(2) Specific information regarding budget reductions will be provided to the committee when expenditure adjustments are considered significant. Criteria for judging the significance of a change can include:
(a) Expenditure items or programs that are of priority to or of special interest to Board members as reflected in history of Board and committee meetings;
(b) Expenditure items or program adjustments that exceed $250,000;
(c) Program changes expected to have direct and noticeable student or staff impact;
(d) Any proposed reallocations from the contingency fund.
(3) Upon request or as deemed appropriate, information will be provided to all Board members.

BOARD POLICYAdministrative Directive
8.10.030-AD
115
FINANCIAL BOARD POLICIES
8.10.030-AD
(4) At the option of the Finance, Audit and Operations chair, particular expenditure reductions could be considered ‘major’ as defined below, triggering a more extensive review and submittal of information to the Board.
IV. Process for Determining Major Expenditure Reductions
Major budget reallocations are defined here as those that exceed .5% of the General Fund Operating Budget.
(1) In the event that major expenditure reductions must be undertaken, the Superintendent will consult with the Finance, Audit and Operations Committee in preparation of recommendations for such reductions.
(2) Subsequent to consultation with the Finance, Audit and Operations Committee, the Superintendent will report to the full Board regarding plans and recommendations for expenditure reductions. The following types of background information will be provided:
(a) Superintendent’s recommendations for reductions;
(b) Criteria and policy assumptions that underlie the prioritization of the reductions;
(c) Explanation of the procedure/process used in developing the recommendations for reductions;
(d) Expected consequences/impact of the reduction on services.
(3) The Superintendent will submit the reduction recommendations to the Board for approval by resolution.
V. Contingency Fund Transfers
(1) If the Superintendent recommends a transfer from the Contingency Fund, justification for this transfer will first be presented to the Finance, Audit and Operations Committee for discussion.
(2) After consultation with the Finance, Audit and Operations Committee, the Superintendent will submit the recommendation to the Board for approval by resolution.
Policy Implemented:

116

117
FINANCIAL SECTION

FINANCIAL SECTION
The financial section contains required information for the District’s funds and descriptions of significant revenue sources and expenditure categories.

119
FINANCIAL OVERVIEWThe Financial Section details the financial resources and requirements of the school district. Resources include revenues from local, state, and federal sources, as well as beginning fund balances. Requirements are the expenditures necessary for operating the district, along with contingencies and ending fund balances. This section contains summaries of assumptions and major shifts; descriptions of funds, programs, and accounts used for budgeting; a high-level overview of all the district’s Resources and Requirements; and summaries for each of the funds: General (100), Special Revenue (200), Debt Service (300), Capital Projects (400), and Internal Service (600). The section ends with detailed reports for each of the funds. Throughout the Proposed Budget, the budget information in the 2021-22 year is from the 2021-22 Adopted Budget.The budget for 2022-23 reflects the continued and additional investments in the following areas using available resources:Academic Supports and Interventions for Our Most Vulnerable Students
y Continue targeted learning supports (i.e. learning acceleration specialists, high dosage tutoring) across PPS schools, focused on supporting students at CSI, TSI, and Title I schools
y Culturally specific support for Native American students y Continue Credit Recovery FTE for the high schools and CBOs y Access to technology to continue to support community technology needs y Support Charter schools and CBOs y Learning acceleration and Summer Enrichment
Steady Increase of Mental and Behavioral Health Supports for Students y Continuing social workers for Title middle schools and K-8s while continuing the investments
made in 2021-22 for the high schools and K-5/K-8 and Multiple Pathways to Graduation schools (e.g. Alliance, DART)
y Further Social Emotional Learning and trauma-informed care initiative. Improve coaching and partnerships by expanding our outreach and professional learning (e.g. Ballmer Institute)
y Increase mental and behavioral health supports; this includes contracts with culturally-specific organizations to provide mental and behavioral health support and additional school psychologists to support case management
More Optimal Student-Teacher Ratios and Class Sizes y Continued commitment to ensuring class size goals in Grades KG-2 in CSI schools y Continued investment in full-time Educational Assistants in Title 1 Kindergarten classrooms y Improve class sizes in grades KG-5 and reduce the impact on schools seeing large enrollment
lossesContinue Elective Courses at Comprehensive Middle Schools and K-8s
y Continue investment in staffing allocated to schools to support added elective offerings y Continue FTE for middle schools to provide a seven-period day schedule, which expands
elective offerings y Improve class sizes in grades 6-8
Greater Access to Arts Education Opportunities y Additional investments in staffing to ensure complete arts discipline pathways exist at
elementary-middle-high school levels

120
y Continued investments supporting a visual and performing arts Teacher on Special Assignment (TOSA) position to support Master Arts Education Plan development and implementation, and to support Visual and Performing Arts (VAPA) teacher network
y Identified budget to support arts materials, sheet music, and instrument purchase/repair
Culturally-Specific Student and Family Supports and Expanded Community Partnerships y Develop the Center for Black Student Excellence and our emerging Native American Student
Success Plan, initiatives aimed at targeting resources and supports in schools with historic and large numbers of Black and Native students
y Launch a PPS Family University, aimed at elevating the skills, knowledge, and support of families to better advocate for their student’s success
y Grow extended learning and enrichment programming (i.e. summer school) with a specific focus on strengthening collaboration with our community’s culturally-specific organizations
y Support and provide opportunities for youth leadership activities, such as student-led conferences, community-building with affinity groups, and networking
y Support and resources for Community Engagement, such as translation services, supplies, food, and childcare
y Increase funding for Racial Equity and Social Justice (RESJ) partnership contracts for culturally specific services:
` Family Engagement ` Wraparound Services ` Mentoring and Leadership Development ` Extended Day and Enrichment Activities ` Identity Development
Curriculum Materials and Professional Development for Educators y Build the professional knowledge and skills of our educators and staff by increasing access
to more paid or released professional learning and collaborative planning time
y Plan and implement the K-12 math redesign and curriculum adoption
y Support the development and implementation of curricular resources for K-12 Social Studies/Ethnic Studies, K-12 Multilingual Literacy System which include Reading, Writing and Speaking, and K-3 Foundational Skills
y Additional professional development and support for principals (e.g. Wallace Foundation Grant)
Make Significant Progress on Strategic Plan Priorities y Cultivate a strong culture of racial equity and care
y Develop a diverse, high-quality, and thriving workforce
y Progress towards establishing data-driven continuous improvement practices

121
Accounts OverviewResources include revenues from local, state, and federal sources, as well as beginning fund balances, sometimes referred to as reserves. Throughout the details in this document, the words fund, program, and account are referenced to mean the following:
y Funds describe the respective purposes of the resources and are the same for resources and requirements.
y Programs or Functions describe how the resources are used and will only be present in the requirements details.
y Accounts or Objects describe the source of the resources and the district’s intended disposition of those resources.
The following section details the various codes used throughout this document. More information can be found in the Oregon Department of Revenue Local Budgeting Manual and the Oregon Department of Education Program Budgeting and Accounting Manual (PBAM).
Account Code OverviewPPS uses an account code structure that is composed of several main elements. While this is very similar to the Oregon Department of Education’s (ODE) PBAM, PPS’s account codes contain additional digits to capture information not required by the state. The two elements that are presented in different formats are the Object and the Function. These different formats also act as roll-ups aggregating District level spend into single categories for state reporting.
ObjectFor PPS, the Object code is a six-digit number for both revenues and expenditures, while the State Object code, which is the corresponding element, is a three-digit number for expenditures and a four-digit number for revenues. In addition, PPS’ initial digit clarifies whether it is a revenue or expenditure (revenues begin with 4, expenditures begin with 5).
PPS Object PPS Description State Object State Description
411111 Current-Multnomah Co 1111 Current Year’s Property Taxes
411112 Current-Clackamas Co 1111 Current Year’s Property Taxes
411113 Current-Washington Co 1111 Current Year’s Property Taxes
511210 Classified - Represented 112 Classified Salaries
511220 Non-Represented Staff 112 Classified Salaries
522000 Social Security - FICA 220 Social Security Administration
541000 Consumable Supplies 410 Consumable Supplies and Materials

122
FunctionFor PPS, the Function code is a five-digit number, while the state Function code, which is the corresponding element, is a four-digit number. Generally, only the first 3 digits match as PPS’ Function code provides additional details.
PPS Function PPS Description State Function State Description
11111 Elementary K-5 Program 1111 Elementary, K-5 or K-6
11119 Kindergarten Homeroom 1111 Elementary, K-5 or K-6
12211 Functional Living Skills 1220 Restrictive Programs for Students with Disabilities
12261 Home Instruction 1220 Restrictive Programs for Students with Disabilities
22402 Instructional Specialists 2240 Instructional Staff Development
22410 Instructional Staff Training Services 2240 Instructional Staff Development
Fund ClassificationsMost school districts are financed through governmental and proprietary funds. PPS’s governmental funds include 100, 200, 300, and 400. PPS has one proprietary fund – 600.
100 General FundThe purpose of the General Fund is to record financial transactions relating to all activities for which specific types of funds are not required. It is the general operating fund for the District.
200 Special Revenue Funds Special Revenue Funds are set up for specific purpose grants and other revenues when required by statute, charter provision, or the terms of a grant.
300 Debt Service FundsDebt Service Funds are used to budget for the payment of principal and interest on all long-term debt.
400 Capital Projects FundsCapital Project Funds are a type of fund that is used to record the resources and expenditures needed to finance the building or acquisition of capital facilities that are non-recurring major expenditure items. Resources can include the proceeds from the sale of general obligation bonds, construction excise tax, grants, transfers from other funds, or other revenues authorized for financing capital projects. A capital project fund is normally established when a capital project or series of projects is authorized. It is dissolved when the project is completed. Several related projects financed from one bond issue may be accounted for in one fund if there are no provisions to the contrary in the establishment of the bond issuance.
600 Internal Service FundsInternal Service Funds finance and account for services furnished by one department or agency to another department or agency of the same local government. Internal Service Fund resources usually come from operating earnings or transfers from other funds.

123
Resource Accounts (Revenue Sources)
1000 Revenue from Local Sources1110 Ad Valorem Taxes Levied by District Taxes levied by a district on the assessed valuation of real and personal property located within the district which, within legal limits, is the final authority in determining the amount to be raised for school purposes.
1120 Local Option Ad Valorem Taxes Levied by District Local option taxes levied by a district on the “Tax Gap” valuation of real and personal property located within the district which, within legal limits, is the final authority in determining the amount to be raised for school purposes.
1130 Construction Excise Tax Amounts collected as a result of Senate Bill 1036 from the 2007 legislative session which allows for a construction excise tax.
1190 Penalties and Interest on Taxes Amounts collected as penalties for the payment of taxes after the due date, and the interest charged on delinquent taxes from the due date to the date of actual payment.
1200 Revenue from Local Governmental Units Other Than DistrictsRevenue from the appropriations of another local governmental unit. The district is not the final authority in determining the amount of money to be received, and the money is raised by taxes or other means which are not earmarked for school purposes.
1310 Regular Day School Tuition Money received as tuition for students attending the regular day schools in the district, including alternative programs entitled to State School Fund support. 1310 is used when instruction and related services are tied directly to the student.
1500 Earnings on Investments Money received as interest earnings from holdings for savings.
1600 Food Service Revenue for dispensing food to students and adults.
1700 Extracurricular Activities Revenue from school-sponsored activities.
1800 Community Services Activities Revenue from community services activities operated by a district. For example, revenue received from operation of a swimming pool as a community service would be recorded here.
1910 Rentals Revenue from the rental of either real or personal property owned by the district.
1920 Contributions and Donations from Private Sources Money received from a philanthropic foundation, private individuals, or private organizations for which no repayment or special service to the contributor is expected. Separate accounts may be maintained for unrestricted revenue and revenue which has restricted use.

124
1960 Recovery of Prior Years’ ExpenditureRefund of expenditure made in a prior fiscal year.
1970 Services Provided Other Funds Services provided other funds, such as printing or data processing. Generally, this account is only used in Internal Service Funds.
1980 Fees Charged to Grants Indirect administrative charges assessed to grants.
1990 MiscellaneousRevenue from local sources not provided for elsewhere.
2000 Revenue from Intermediate Sources2100 Unrestricted Revenue Revenue received as grants by the district which can be used for any legal purpose desired by the district without restriction.
2199 Other Intermediate SourcesAll other unrestricted intermediate revenue sources not listed in 2100.
2200 Restricted RevenueRevenue received as grants by the district which must be used for a categorical or specific purpose.
3000 Revenue from State Sources3101 State School Fund—General SupportState school funding for general operations based on the number and types of students.
3103 Common School FundA local revenue generated from state surplus funds, and a component of the State School Funding.
3199 Other Unrestricted Grants-in-aid
3299 Other Restricted Grants-in-aidThis is used for restricted grants in aid from the state.
4000 Revenue from Federal Sources4100 Unrestricted Revenue Direct from the Federal GovernmentRevenue direct from the Federal government are grants awarded directly to the district which can be used for any legal purpose desired by the district without restriction.
4200 Unrestricted Revenue from the Federal Government Through the StateRevenues from the federal government passed through the state as grants which can be used for any legal purpose desired by the district without restriction.
4300 Restricted Revenue Direct from the Federal GovernmentRevenues direct from the federal government as grants awarded directly to the district which must be used for a categorical or specific purpose.

125
4500 Restricted Revenue from the Federal Government Through the StateRevenues from the federal government passed through the state as grants to the district which must be used for a categorical or specific purpose.
4700 Grants-In-Aid from the Federal Government Through Other Intermediate AgenciesRevenues from the federal government through an intermediate agency.
4801 Federal Forest FeesRevenue collected in lieu of property taxes for federal lands in the district’s county.
5000 Other Sources5200 Interfund TransfersRevenue transferred from another fund which will not be repaid.
5300 Sale of or Compensation for Loss of Fixed AssetsRevenue from the sale of school property or compensation for the sale or loss of fixed assets.
5400 Resources—Beginning Fund BalanceBeginning fund balance is the fund balance carryover from the prior year.
Required Programs (Expenditure Functions)
1000 Instruction1100 Regular ProgramsClassroom Instructional activities designed primarily to prepare students for activities as citizens, family members, and workers. Regular programs include Pre-kindergarten, Elementary, Middle, and High School.
1200 Special ProgramsInstructional activities designed primarily to serve students having special needs. The Special Program Service Area includes Talented and Gifted, Children with Disabilities, Disadvantaged Children, English Language Learners, and special programs for other student populations.
1300 Adult/Continuing Education ProgramsLearning experiences designed to develop knowledge and skills to meet immediate and long-range educational objectives of adults who, having completed or interrupted formal schooling, have accepted adult roles and responsibilities.
1400 Summer School ProgramsInstructional activities as defined under 1100 Regular Programs carried on during the period between the end of the regular school term and the beginning of the next regular school term; this does not include the summer term of a 12-month school year.
2000 Support Services2100 Support Services—StudentsActivities which are designed to assess and improve the well-being of students and/or supplement the teaching process.

126
2200 Support Services—Instructional StaffActivities associated with assisting the instructional staff with the content and process of providing learning experiences for students.
2300 Support Services—General AdministrationActivities concerned with establishing and administering policy in connection with operating the district.
2400 School Administration Activities concerned with area wide supervisory responsibility. This function could include directors of district-wide instructional programs that have administrative responsibilities.
2500 Support Services—BusinessActivities concerned with purchasing, paying, transporting, exchanging, and maintaining goods and services for the district. Included are the fiscal, operation and maintenance, transportation and internal services for operating all schools.
2600 Support Services—Central ActivitiesActivities, other than general administration, which support each of the other instructional and supporting services programs. These activities include planning, research, development, evaluation, information, staff, statistical, and data processing services.
2700 Supplemental Retirement ProgramCosts associated with a supplemental retirement program provided to both current and prior employees by the district.
3000 Enterprise and Community Services3100 Food ServicesActivities concerned with providing food to students and staff in a school or district.
3300 Community ServicesActivities which are not directly related to the provision of education for pupils in a district. These include services such as community recreation programs, civic activities, public libraries, programs of custody and care of children, and community welfare activities provided by the district for the community as a whole or in part.
4000 Facilities Acquisition and Construction4110 Service Area DirectionActivities pertaining to directing and managing facilities acquisition and construction services.
4120 Site Acquisition and Development Services Activities pertaining to the initial acquisition of sites and improvements thereon.
4150 Building Acquisition, Construction, and Improvement ServicesActivities concerned with building acquisition through purchase or construction and building improvements. Initial installation or extension of service systems, other built-in equipment and building additions.

127
4180 Other Capital ItemsActivities concerned with major capital expenditures that are eligible for general obligation bonding such as textbooks and technology.
4190 Other Facilities Construction ServicesFacilities construction activities which cannot be classified above.
5000 Other Uses5100 Debt ServiceThe servicing of the debt of a district. Categories of debt service are listed under objects.
5200 Transfers of FundsThese are transactions which withdraw money from one fund and place it in another without recourse.
5300 Apportionment of Funds by ESD or LEAApportionment of equalization funds and distribution of other funds by the educational service districts (flow-through dollars from ESDs to districts or other ESDs) or from a Local Education Agency (LEA) acting as the fiscal agent for a grant distributed to other districts.
5400 PERS UAL Bond Lump Sum Payment to PERSThe one-time lump sum payment made to PERS following the issuance of a PERS UAL Bond.
6000 Contingencies (for budget only)Reserves for expenditures which cannot be foreseen and planned in the budget process because of an occurrence of an unusual or extraordinary event. Use with Object 810 only.
7000 Unappropriated Ending Fund BalanceAn estimate of funds needed to maintain operations of the school district from July 1 of the ensuing fiscal year and the time when sufficient new revenues become available to meet cash flow needs of the fund. No expenditure shall be made from the unappropriated ending fund balance in the year in which it is budgeted. Use with Object 820 only.
Requirement Accounts (Expenditure Objects)100 Salaries110 Regular SalariesFull-time, part-time, and prorated portions of the costs for work performed by employees of the district who are considered to be in positions of a permanent nature.
120 Non-permanent SalariesFull-time, part-time and prorated portions of the costs for work performed by employees of the district who are hired on a temporary or substitute basis to perform work in positions in either temporary or permanent nature.
130 Additional SalaryMoney paid to employees of the district in positions of either a temporary or permanent nature for work performed in addition to the normal work period for which the employee is compensated under Regular Salaries and Temporary Salaries above.

128
200 Associated Payroll Costs210 Public Employees Retirement SystemDistrict payments to the Public Employees Retirement System.
220 Social Security AdministrationEmployer’s contribution to the Social Security/ Medicare (FICA) for employee retirement.
230 Other Required Payroll CostsWorkers’ compensation and unemployment compensation.
240 Contractual Employee BenefitsAmounts paid by the district which are a result of a negotiated agreement between the Board of Directors and the employee groups. Examples of expenditures would be health insurance, long-term disability, and tuition reimbursement.
270 Post Retirement Health Benefits (PRHB)Post-retirement Health Benefits are costs of health insurance or health services not included in a pension plan for retirees and their spouses, dependents, and survivors.
300 Purchased Services 310 Instructional, Professional and Technical ServicesServices which by their nature can be performed only by persons with specialized skills and knowledge. Included are the services of medical doctors, lawyers, consultants, and teachers for the instructional area.
320 Property ServicesServices purchased to operate, repair, maintain, insure, and rent property owned and/or used by the district. These services are performed by persons other than district employees.
330 Student Transportation ServicesExpenditures to persons (not on the district payroll) or agencies for the purpose of transporting children.
340 TravelCosts for transportation for all district personnel (including students), conference registration, meals, hotel, and other expenses associated with traveling on business for the district.
350 CommunicationServices provided by persons or businesses to assist in transmitting and receiving data or information.
360 Charter School PaymentsExpenditures to reimburse Charter Schools for services rendered to students.
370 TuitionExpenditures to reimburse other educational agencies for services rendered to students.
380 Non-instructional Professional and Technical ServicesServices which by their nature can be performed only by persons with specialized skills and knowledge.

129
390 Other General Professional and Technological Services
400 Supplies and Materials410 Consumable Supplies and MaterialsExpenditures for all supplies for the operation of a district, including freight and cartage.
420 TextbooksExpenditures for prescribed books which are purchased for students or groups of students, and resold or furnished free to them.
430 Library BooksExpenditures for regular or incidental purchases of library books available for general use by students, including any reference books, even though such reference books may be used solely in the classroom. Also recorded here are costs of binding or other repairs to school library books and e-library books.
440 PeriodicalsExpenditures for periodicals and newspapers. A periodical is any publication appearing at regular intervals of less than a year and continuing for an indefinite period.
450 FoodExpenditures for food purchases related to 3100 Food Service only. Other food purchases are recorded in object code 410.
460 Non-consumable ItemsExpenditures for equipment with a current value of less than $5,000 or for items which are “equipment-like,” but which fail one or more of the tests for classification as Object 540 (see 540 definition).
470 Computer SoftwareExpenditures for published computer software including licensure and usage fees for software.
480 Computer HardwareExpenditures for non-capital computer hardware, generally of value not meeting the capital expenditure criterion. An iPad or e-reader needed to access e-textbooks is considered hardware and would be coded here.
500 Capital Outlay510 Land AcquisitionExpenditures for the purchase of land.
520 Buildings AcquisitionExpenditures for acquiring buildings and additions, either existing or to be constructed, except for bus garages.
530 Improvements Other Than BuildingsExpenditures for the initial and additional improvement of sites and adjacent ways after acquisition by the district.
540 Depreciable EquipmentExpenditures for the initial, additional, and replacement items of equipment, except for buses and capital bus improvements.

130
550 Depreciable TechnologyExpenditures for computer hardware, related equipment, and other capital outlay for technology.
560 Depreciable TransportationExpenditures for bus garages, buses and capital bus improvements for student transportation.
590 Other Capital OutlayExpenditures for all other Capital Outlay not classified above.
600 Other Objects610 Redemption of PrincipalExpenditures which are from current funds to retire bonds, and principal portion of contractual payments for capital acquisitions.
620 InterestExpenditures from current funds for interest on serial bonds, short-term loans and interest included in contractual payments for capital acquisitions.
640 Dues and FeesExpenditures or assessments for membership in professional or other organizations or associations or payments to a paying agent for services rendered.
650 Insurance and JudgmentsInsurance to protect school board members and their employees against loss due to accident or neglect.
670 Taxes, Licenses and AssessmentsThis includes taxes, licenses and assessments paid to a government body and penalties assessed for lack of health benefits for eligible employees (Affordable Care Act).
680 PERS UAL Lump Sum Payment to PERSThe one-time lump sum payment made to PERS following the issuance of a PERS UAL Bond.
690 Grant Indirect ChargesCharges made to a grant to recover charges made to administration.
700 Transfers710 Fund ModificationsThis category represents transactions of transferring money from one fund to another.
720 TransitsThis category represents transactions which are transit or flow-through means to convey money to the recipient (person or agency).
790 Other TransfersThis category is used for those transfer transactions which cannot be identified in the above classifications.
800 Other Uses of Funds810 Planned ReserveAmounts set aside for operating contingencies for expenditures which cannot be foreseen and planned in the budget because of the occurrence of some unusual or extraordinary event.
820 Reserved for Next Year

131
ALL FUNDS RESOURCESFor the fiscal year ending June 30, 2023, the budgeted resources for all funds are almost $1.87 billion. Major sources of revenue are grants, general obligation bonds, SSF, and property taxes. Grants are accounted for in the Special Revenue Fund, and sources include federal Title and Individuals with Disabilities Education Act (IDEA) grants, Elementary and Secondary School Emergency Relief Fund (ESSER), as well as local and state grants such as Student Success Act (HB 3427), and High School Success (M98). Resources for paying general obligation bonds come from local property taxes, which are accounted for in the Debt Service Fund. Resources from the sale of general obligation bonds are accounted for in the Capital Projects Fund. School district budgeting is governed by Oregon’s Local Budget Law.
Beginning Fund Balance 558,757 427,193 782,952 887,226 651,219 - -
Current Year Property Taxes Other Than Local Option 380,694 393,651 411,749 432,813 463,874 - -
Current Year Local Option Property Taxes 94,272 97,372 100,955 104,279 109,951 - -
Other Revenue From Local Sources 125,230 107,023 90,887 104,835 129,138 - -
2000 - Revenue - Intermediate Sources 13,604 14,038 15,185 12,762 12,231 - -
3000 - Revenue From State Sources 263,840 308,190 311,512 347,406 351,533 - -
4000 - Revenue From Federal Sources 48,454 54,143 66,605 166,285 145,587 - -
Bond Proceeds & Premiums - - 55,596 - -
5200 - Interfund Transfers 6,125 1,931 2,466 1,754 1,923 - -
All Other Budget Resources 70 520,039 395,191 1,050 3,350 - -
TOTAL RESOURCES 1,491,045 1,923,580 2,233,098 2,058,410 1,868,806 - -
Summary of Resources by Major Object - All Funds (In Thousands)
Actual2018-19
Proposed 2022-23
Certain numbers have been rounded up or down. There may therefore be discrepancies between the actual totals of the individual amounts in the tables and the totals shown.
Actual2019-20
Actual2020-21
Budget2021-22
Approved2022-23
Adopted2022-23
35%
25%
6%
7%
19%
8%
Percent of Total Resources - All Funds
Beginning Fund Balance
Current Year Property Taxes Other Than Local Option
Current Year Local Option Property Taxes
Other Revenue From Local Sources
2000 - Revenue - Intermediate Sources
3000 - Revenue From State Sources
4000 - Revenue From Federal Sources
5200 - Interfund Transfers
All Other Budget Resources
Summary of Resources by Major Object - All Funds (in Thousands)Beginning Fund Balance 558,757 427,193 782,952 887,226 651,219 - -
Current Year Property Taxes Other Than Local Option 380,694 393,651 411,749 432,813 463,874 - -
Current Year Local Option Property Taxes 94,272 97,372 100,955 104,279 109,951 - -
Other Revenue From Local Sources 125,230 107,023 90,887 104,835 129,138 - -
2000 - Revenue - Intermediate Sources 13,604 14,038 15,185 12,762 12,231 - -
3000 - Revenue From State Sources 263,840 308,190 311,512 347,406 351,533 - -
4000 - Revenue From Federal Sources 48,454 54,143 66,605 166,285 145,587 - -
Bond Proceeds & Premiums - - 55,596 - -
5200 - Interfund Transfers 6,125 1,931 2,466 1,754 1,923 - -
All Other Budget Resources 70 520,039 395,191 1,050 3,350 - -
TOTAL RESOURCES 1,491,045 1,923,580 2,233,098 2,058,410 1,868,806 - -
Summary of Resources by Major Object - All Funds (In Thousands)
Actual2018-19
Proposed 2022-23
Certain numbers have been rounded up or down. There may therefore be discrepancies between the actual totals of the individual amounts in the tables and the totals shown.
Actual2019-20
Actual2020-21
Budget2021-22
Approved2022-23
Adopted2022-23
35%
25%
6%
7%
19%
8%
Percent of Total Resources - All Funds
Beginning Fund Balance
Current Year Property Taxes Other Than Local Option
Current Year Local Option Property Taxes
Other Revenue From Local Sources
2000 - Revenue - Intermediate Sources
3000 - Revenue From State Sources
4000 - Revenue From Federal Sources
5200 - Interfund Transfers
All Other Budget Resources
Percent of Resources by Major Object - All Funds

132
ALL FUNDS REQUIREMENTS BY MAJOR FUNCTIONFor the fiscal year ending June 30, 2023, the requirement for all funds is almost $1.87 billion. Major program requirements include instruction, support services, community services, facilities acquisition, debt service, transfers, contingency, and unappropriated fund balance. The largest increase is in facilities acquisition and construction. The increase is due to progress on bond projects. The proposed budget includes a decreased contingency for 2022-23. Reserves are for expenditures that cannot be foreseen and planned in the budget process because of an occurrence of an unusual or extraordinary event. From 2021-22 to 2022-23 the budgeted contingency will decrease by 3.8% from $61.6 million to $59.2 million. The federal grant funds that the District will receive include indirect that is assessed as the money is drawn. The contingency is the portion of the allocation that the District may not draw down in future years.Prior years include an unappropriated ending fund balance which is an estimate of funds needed to maintain operations of the school district from July 1 of the ensuing fiscal year to the time when sufficient new revenues become available to meet cash flow needs. No expenditure shall be made from the unappropriated ending fund balance in the year in which it is budgeted. Unappropriated ending fund balance will decrease from $365.2 million in 2021-22 to $50.6 million in 2022-23 due to the spending-down of capital bonds.
1000 - Instruction 394,078 408,759 417,111 507,966 3,479.27 523,921 3,654.63
2000 - Support Services 302,212 322,815 348,539 425,257 2,488.88 456,149 2,520.85
3000 - Enterprise And Community Svcs 22,831 21,937 23,914 57,046 204.00 36,048 240.83
4000 - Facilities Acquisition And Con 164,764 207,451 287,539 438,086 39.55 513,203 48.80
5100 - Debt Service & 5400 - PERS UAL Programs 173,842 177,734 246,806 201,532 - 227,723 -
5200 - Transfers Of Funds 6,125 1,931 2,466 1,754 - 1,923 -
6000 - Contingencies - - - 61,586 - 59,248 -
7000 - Unappropriated Fund Balance 427,192 782,952 906,725 365,183 - 50,591 -
TOTAL REQUIREMENTS 1,491,045 1,923,580 2,233,099 2,058,410 6,211.70 1,868,806 - - 6,465.11
Certain numbers have been rounded up or down. There may therefore be discrepancies between the actual totals of the individual amounts in the tables and the totals shown.
Budget FTE2022-23
Summary of Requirements by Major Function - All Funds (Financial Data in Thousands)
Actual2018-19
Proposed 2022-23
Adopted2022-23
Approved2022-23
Budget FTE2021-22
Budget2021-22
Actual2020-21
Actual2019-20
28%
24%
2%
28%
12%
3% 3%
Requirements by Major Function - All Funds
1000 - Instruction
2000 - Support Services
3000 - Enterprise And Community Svcs
4000 - Facilities Acquisition And Con
5100 - Debt Service & 5400 - PERS UAL Programs
5200 - Transfers Of Funds
6000 - Contingencies
7000 - Unappropriated Fund Balance
Summary of Requirements by Major Function - All Funds (in Thousands)
Percent of Requirements by Major Function - All Funds

133
ALL FUNDS REQUIREMENTS BY OBJECTAcross all funds, staffing costs account for 41.2% of Total Requirements. Capital Outlay is responsible for 21.0% while Supplies is 6.4%. Other Objects - most notably debt service payments - account for another 13.3%. Purchased Services are expected to require 12.1%. Contingency and Budgeted Ending Fund Balance make up 6.0% of the overall budget.
111 - Licensed Salaries 243,932 247,318 271,439 285,529 3,549.58 311,518 - - 3,724.52
1121 - Classified - Represented 58,707 64,235 65,467 76,182 1,894.87 81,784 - - 1,947.59
1122 - Non - Represented Staff 30,172 33,652 36,375 43,930 490.75 48,494 - - 519.26
113 - Administrators 28,152 31,316 33,539 37,363 276.50 39,323 - - 273.75
Other Salaries 27,845 26,811 22,434 34,824 - 36,453 - - -
200 - Associated Payroll Costs 180,305 200,639 219,461 231,687 - 254,006 - - -
300 - Purchased Services 131,026 127,945 122,468 267,857 - 225,295 - - -
400 - Supplies And Materials 42,640 39,284 48,953 55,976 - 120,237 - - -
500 - Capital Outlay 127,641 169,339 234,584 368,169 - 391,657 - - -
600 - Other Objects 187,234 198,159 269,188 228,370 - 248,278 - - -
700 - Transfers 6,199 1,931 2,466 1,754 - 1,923 - - -
581000 - Operating Contingency - - - 61,586 - 59,247 - - -
376520 - Budgeted Ending Fund Balance 427,192 782,952 906,725 365,183 - 50,591 - - -
TOTAL REQUIREMENTS 1,491,045 1,923,580 2,233,099 2,058,410 6,211.70 1,868,806 - - 6,465.11
Actual2019-20
Actual2020-21
Budget2021-22
Budget FTE2021-22
Approved2022-23
Adopted2022-23
Certain numbers have been rounded up or down. There may therefore be discrepancies between the actual totals of the individual amounts in the tables and the totals shown.
Budget FTE2022-23
Summary of Requirements by Major Object - All Funds (Financial Data in Thousands)
Actual2018-19
Proposed 2022-23
17%
4%
3%
2%
2%
14%
12%6%
21%
13%
3% 3%
Requirements by Major Object - All Funds
111 - Licensed Salaries
1121 - Classified - Represented
1122 - Non - Represented Staff
113 - Administrators
Other Salaries
200 - Associated Payroll Costs
300 - Purchased Services
400 - Supplies And Materials
500 - Capital Outlay
600 - Other Objects
700 - Transfers
581000 - Operating Contingency
376520 - Budgeted Ending Fund Balance
Summary of Requirements by Major Object - All Funds (in Thousands)
Percent of Requirements by Major Object - All Funds

134
3-YEAR FORECAST ALL FUNDS
Resources Proposed 2022-23
Projected 2023-24
Projected 2024-25
Projected 2025-26
BEGINNING FUND BALANCE 651,219 176,515 385,364 270,714
CURRENT YEAR PROPERTY TAXES OTHER THAN LOCAL OPTION 463,874 480,110 496,913 514,305
CURRENT YEAR LOCAL OPTION PROPERTY TAXES 109,952 113,800 117,783 121,906
OTHER REVENUE FROM LOCAL SOURCES 129,136 136,550 141,330 146,276
2000 - REVENUE - INTERMEDIATE SOURCES 12,231 12,525 12,963 13,417
3000 - REVENUE FROM STATE SOURCES 351,533 363,820 376,535 389,696
4000 - REVENUE FROM FEDERAL SOURCES 145,588 150,677 155,951 161,410
5200 - INTERFUND TRANSFERS 1,923 1,344 1,368 1,395
ALL OTHER BUDGET RESOURCES 3,350 444,467 3,589 3,714
Total Resources 1,868,806 1,879,808 1,691,797 1,622,834
Requirements Proposed 2022-23
Projected 2023-24
Projected 2024-25
Projected 2025-26
111 - LICENSED SALARIES 311,518 322,421 333,706 345,386
1121 - CLASSIFIED - REPRESENTED 81,784 84,646 87,609 90,675
1122 - NON-REPRESENTED STAFF 48,172 49,858 51,603 53,409
113 - ADMINISTRATORS 39,323 40,699 42,124 43,598
OTHER SALARIES 35,403 36,384 37,658 38,976
200 - ASSOCIATED PAYROLL COSTS 255,380 264,319 273,571 283,145
300 - PURCHASED SERVICES 225,294 200,834 191,701 190,460
400 - SUPPLIES AND MATERIALS 120,236 93,726 81,648 76,826
500 - CAPITAL OUTLAY 391,656 217,055 130,548 89,885
600 - OTHER OBJECTS 248,279 256,929 265,881 275,149
700 - TRANSFERS 1,923 1,344 1,368 1,395
581000 - OPERATING CONTINGENCY 59,248 61,968 64,159 66,427
376520 - BUDGETED ENDING FUND BALANCE 50,590 249,623 130,222 67,503
Total Requirements 1,868,806 1,879,808 1,691,797 1,622,834
Budget Forecast by Major Object - All Funds (In Thousands)
Certain numbers have been rounded up or down. There may therefore be discrepancies between the actual totals of the individual amounts in the tables and the totals shown.

135
INTERFUND TRANSFER SCHEDULE Interfund transfers represent the movement of monies from one fund to another within PPS. The fund transfers may pay for specific services such as transfers to debt service funds for payment of principal and interest; or to fund other operational requirements of the District.
Source Fund Transfer Out Destination Fund Transfer In Purpose
101 General Fund (617,000) 320 Full Faith and Credit Debt Service Fund 617,000 Debt Service Principal & Interest
Payments
101 General Fund (75,000) 202 Nutrition Fund 75,000 Fund Student Meals Bad Debt
101 General Fund (610,000) 445 Capital Asset Renewal 610,000 Fund Capital Projects
404 Construction Excise (621,000) 320 Full Faith and Credit Debt Service Fund 621,000 Debt Service Principal & Interest
PaymentsTotal Transfers (1,923,000)$ 1,923,000$
Fund Transfers - FY 2022/23

136
VARIANCE BY MAJOR FUNCTION The following chart summarizes the variances from the 2021-22 adopted budget to the 2022-23 proposed budget. The parameters for General Fund variance were 10% or $1 million variance. All other funds list variances for each major program.
Fund Description Fund Program Function Description Variance Explanation General 100 1111 Elementary K-5 10,778,340$ Overall increase in pesronnel and associated payroll costs due to COLA and Step increases
General 100 1121 Middle School Programs (2,822,800)$ Overall decrease in personnel and associated costs, purchased services, and supplies and materials
General 100 1122 Middle School Extra Curricular (81,470)$ Overall decrease in personnel and associated costs, purchased services, and supplies and materials
General 100 1131 High School Programs 4,024,045$ Overall increase in personnel and associated payroll costs due to COLA and Step increases
General 100 1132 High School Extra Curricular (2,068,915)$ Overall decrease in personnel and associated costs, purchased services, and supplies and materials
General 100 1210 Programs for Talented and Gifted (202,245)$ Reduction of additional salary (extended responsibility) and associated costsGeneral 100 1260 Treatment and Habilitation 219,510$ Increase in personnel and associated payroll costs to match SPED programmatic need
General 100 1280 Alternative Education 1,217,737$ Overall increase due to reduction in salaries and associated costs to increased budget for purchased services
General 100 1292 Teen Parent Programs (61,394)$ Decrease in personnel and associated payroll costs to match projected programmatic needs
General 100 1299 Other Special Programs (83,917)$ Decrease in personnel and associated payroll costs to match projected programmatic needs
General 100 2110 Attendance/Social Work Svcs 1,838,221$ Increase personnel and associated payroll costs due to projected need for social workers/counselors support for students
General 100 2210 Improvement of Instruction 3,238,438$ Increase for FTE set-a-side for school needs and balancing enrollment that will occur for Fall FY23
General 100 2230 Assessment and Testing (269,713)$ Decrease in personnel, associated payroll costs, supplies and materials to better match programmatic needs
General 100 2240 Instructional Staff Development (3,861,221)$ Decrease in personnel, associated payroll costs, supplies and materials to better match programmatic needs
General 100 2310 Board of Education Services 146,546$ Increase personnel and associated payroll costs for Security ServiceGeneral 100 2490 Other School Support Admin 67,000$ Increase supplies and materials to match High School admin support needGeneral 100 2510 Support Services - Business 47,914$ Overall increase in pesronnel and associated payroll costs due to COLA increasesGeneral 100 2550 Student Transportation Services 1,290,312$ Increase personnel and associated payroll costs for TransportationGeneral 100 2630 Information Services 819,221$ Increase in personnel and associated payroll costs
General 100 2660 Technology Services 3,218,052$ Increase in personnel and associated payroll costs, purchased services, supplies and materials to match Technology needs to support district
General 100 5110 Long-Term Debt Service (440,237)$ Reduction of Debt Service principal and interest payment dueGeneral 100 5210 Fund Transfers 165,917$ Increase transfer of funds to facilitate activities in Fund 200, 300, and 400
Fund Description Fund Program Function Description Variance Explanation
Special Revenue 200 1000 Instruction 3,393,680$ Increase in personnel and associated payroll costs; reduce purchased services, supplies and materials to shift on student in person needs from primarily ESSER and SIA funds
Special Revenue 200 2000 Support Services 25,888,283$ Increased due to match appropriation spending from primarily ESSER and SIA fundsSpecial Revenue 200 3000 Enterprise & Community Services (15,009,977)$ Reduced due to match appropriation spending from primarily ESSER and SIA fundsSpecial Revenue 200 4000 Facilities Acquisition & Construction 19,429$ Increased for construction improvements at schoolsSpecial Revenue 200 5000 Other Uses 198,898$ Increase Principal and Interest for long debt service
Special Revenue 200 6000 Contingencies (4,902,701)$ Reduced to re-appropriate spending levels elsewhere to focus on the health, safety and learning needs of students primarily from ESSER and SIA funds
Special Revenue 200 7000 Unappropriated Fund Balance 1,507,148$ Increase Unappropriated Fund Balance
Fund Description Fund Program Function Description Variance Explanation Debt Service 300 5000 Other Uses 26,425,905$ Increase in principal and interest payments on long term debt serviceDebt Service 300 7000 Unappropriated Fund Balance 8,494,590$ Increase Unappropriated Fund Balance
Fund Description Fund Program Function Description Variance Explanation Capital Projects 400 2000 Support Services (1,815,393)$ Reduction in insurance and judgments costs, and costs of maintenance and repairs
Capital Projects 400 4000 Facilities Acquisition & Construction 75,097,830$ Increase in personnel and associated payroll costs; increase in purchased services, and supplies and materials
Capital Projects 400 7000 Unappropriated Fund Balance (322,810,423)$ Reduce Unappropriated Fund Balance
Fund Description Fund Program Function Description Variance Explanation Internal Service 600 2000 Support Services (3,438,803)$ Reduction in Bad Debt write-offs and Insurance and Judgements to increase contingencyInternal Service 600 6000 Contingencies 3,493,542$ Increase due to reappropriation of support services spending levels
*Offsetting variances due to reorganizations may not be displayed on program-by-program basis
Major Variance by Function

137
VARIANCE BY MAJOR OBJECT Major Variance by ObjectFund Description Fund Major Object Description Variance Explanation
General 100 510000 Salaries $ 18,137,174 Increases in overall staffing costs due to COLA, Step, and associated payroll
General 100 520000 Associated Payroll Costs $ 12,232,222 Increases in associated costs, including fringe, due to projected salaries being higher due to COLA & Step
General 100 530000 Purchased Services $ (2,738,045) Repurpose & reduce purchased services at central officeGeneral 100 540000 Supplies & Materials $ (4,562,389) Repurpose & reduce supplies and materials at central officeGeneral 100 550000 Capital Outlay $ 698,600 Increase due to district wide targeted technology improvements
General 100 570000 Transfers $ 165,917 Increase transfer of funds to facilitate activities in Fund 200, 300, and 400

138
GENERAL FUND SUMMARY (100)The General Fund is unrestricted and includes all District activities that are supported by the State School Fund including property taxes as well as other non-dedicated revenues. The General Fund’s resources are available to the District for any purpose provided they are expended or transferred according to resolution or policy. This fund is considered a Major Governmental Fund and accounted for using the modified accrual method of accounting. The major revenue sources are discussed within the Budget Detail section of this document. The detail sections present resources by object code. Fund requirements are presented in two separate tables affording different views of the budget. The first view is by Function and the second is by Object, both as defined in the State Program Budgeting and Accounting Manual for School Districts and Education Service Districts in Oregon.
Fund 100-General Fund Resources SummaryThe State School Fund and local property taxes provide 70.7% of the General Fund Resources available to PPS for delivering services to our students. Our community’s generous support provides another 13.8% through the Local Option Levy. The final 15.5% is provided by our Beginning Fund Balance, the City of Portland Arts Tax, Multnomah Education Service District transit, and others.
Fund 100-General Fund Requirements SummaryPayroll and Associated Payroll Costs (such as PERS, taxes, and healthcare) account for 77.9% of our General Fund Budget. Purchased Services, which include non-staff instructional support, non-staff maintenance activities, and staff development services, account for 12.2%. Supplies and Materials, Capital Outlay, and Operating Contingency account for 9.9%. The work of strengthening the core functions and best practices at PPS is funded primarily out of the General Fund. Building towards a three-year strategic plan, PPS will continue to commit to consistent use of the Racial Equity Social Justice Lens. This commitment ensures that the District’s General Fund will contain strategic investments in Academic and Behavioral programming and Operational improvements that will encourage personal success and academic excellence for every student.
Academic and Behavioral Programming y Through the staffing process, PPS continues to allocate differentiated supports to Targeted
and Comprehensive Support and Improvement Schools, providing additional school climate and leadership support to schools with the highest concentration of our historically under-served communities. In addition, an increase in Summer School offerings will provide those identified schools with additional instruction time.
y The Implementation of the Guaranteed Viable Curriculum is supported through increased investments in textbook adoption and curricular material from the bond, as well as the General Fund funded professional development and instructional staff training that supports our educators. In addition, the Offices of Teaching & Learning and Information Technology are partnering to create standards for a technology-enabled learning environment.
y Expansions in Attendance, Social and Psychological Services to promote students’ social, emotional and behavioral well-being as a critical component of improving school climate, safety, and learning, and to provide school leaders with best practices for dealing with school crises related to mental health.
y Investments to address class size and credit recovery as schools begin to re-open and students return.

139
Operational Investments y The Health and Safety of PPS Students is a critical goal, and General Fund resources are being
committed towards needed custodial positions as well as investments in security.
y Other operational investments will include system updates to support data driven information for reporting and tracking.
y Investments to support the management of additional federal dollars per the Elementary and Secondary School Emergency Relief guidelines.

140
Beginning Fund Balance 38,282 39,887 64,474 84,845 90,500 - -
Current Year Property Taxes Other Than Local Option 257,076 268,840 281,443 293,823 314,424 - -
Current Year Local Option Property Taxes 94,272 97,372 100,955 104,279 109,951 - -
Other Revenue From Local Sources 26,692 17,505 13,925 13,724 17,736 - -
2000 - Revenue - Intermediate Sources 13,494 13,768 14,374 12,762 12,101 - -
3000 - Revenue From State Sources 230,628 271,620 269,250 261,465 247,407 - -
4000 - Revenue From Federal Sources 80 84 18 15 15 - -
5200 - Interfund Transfers 14 - - - - - -
All Other Budget Resources 55 17 152 1,050 2,450 - -
TOTAL RESOURCES 660,592 709,092 744,589 771,963 794,585 - -
Summary of Resources by Major Object - General Funds (Financial Data in Thousands)
Actual2018-19
Proposed 2022-23
Certain numbers have been rounded up or down. There may therefore be discrepancies between the actual totals of the individual amounts in the tables and the totals shown.
Actual2019-20
Actual2020-21
Budget2021-22
Approved2022-23
Adopted2022-23
11%
40%
14%2%
2%
31%
Resources by Major Object - General Funds
Beginning Fund Balance
Current Year Property Taxes Other Than Local Option
Current Year Local Option Property Taxes
Other Revenue From Local Sources
2000 - Revenue - Intermediate Sources
3000 - Revenue From State Sources
4000 - Revenue From Federal Sources
5200 - Interfund Transfers
All Other Budget Resources
Summary of Resources by Major Object - General Funds (in Thousands)
Percent of Resources by Major Object - General Funds
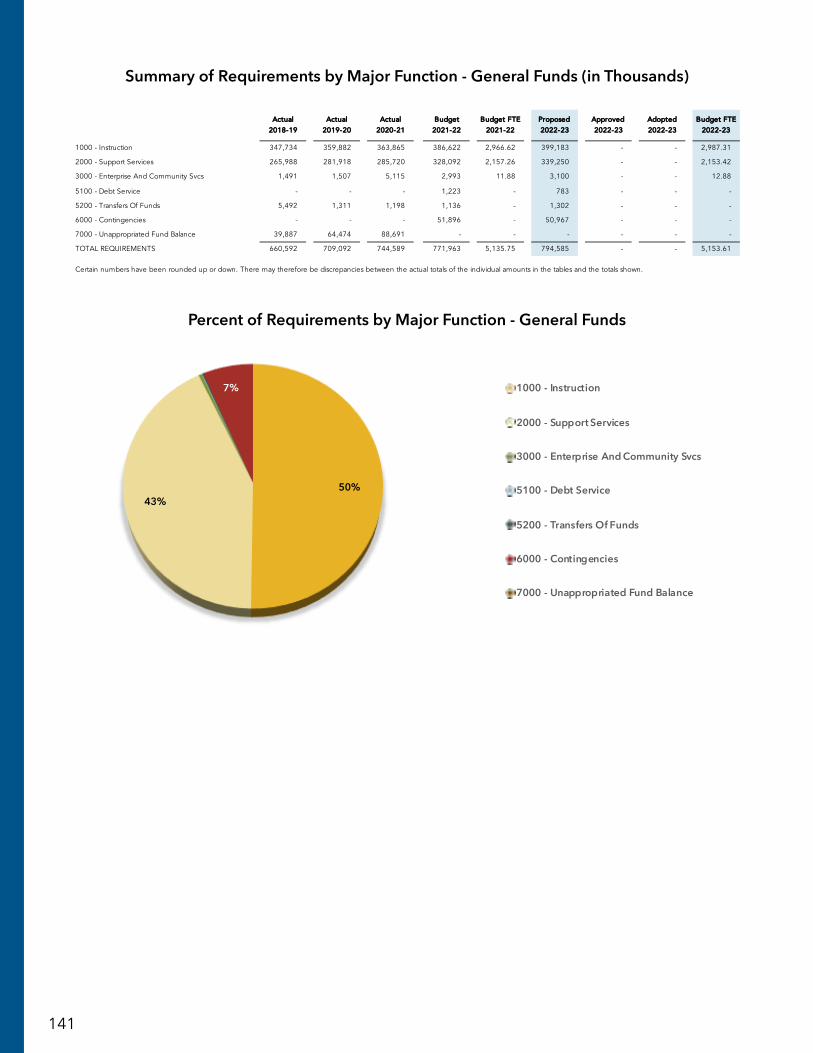
141
1000 - Instruction 347,734 359,882 363,865 386,622 2,966.62 399,183 - - 2,987.31
2000 - Support Services 265,988 281,918 285,720 328,092 2,157.26 339,250 - - 2,153.42
3000 - Enterprise And Community Svcs 1,491 1,507 5,115 2,993 11.88 3,100 - - 12.88
5100 - Debt Service - - - 1,223 - 783 - - -
5200 - Transfers Of Funds 5,492 1,311 1,198 1,136 - 1,302 - - -
6000 - Contingencies - - - 51,896 - 50,967 - - -
7000 - Unappropriated Fund Balance 39,887 64,474 88,691 - - - - - -
TOTAL REQUIREMENTS 660,592 709,092 744,589 771,963 5,135.75 794,585 - - 5,153.61
BBuuddggeett FFTTEE22002222--2233
SSuummmmaarryy ooff RReeqquuiirreemmeennttss bbyy MMaajjoorr FFuunnccttiioonn -- GGeenneerraall FFuunnddss ((FFiinnaanncciiaall DDaattaa iinn TThhoouussaannddss))
AAccttuuaall22001188--1199
PPrrooppoosseedd 22002222--2233
AAccttuuaall22001199--2200
AAccttuuaall22002200--2211
BBuuddggeett22002211--2222
BBuuddggeett FFTTEE22002211--2222
AApppprroovveedd22002222--2233
AAddoopptteedd22002222--2233
Certain numbers have been rounded up or down. There may therefore be discrepancies between the actual totals of the individual amounts in the tables and the totals shown.
50%43%
7%
Requirements by Major Function - General Funds
1000 - Instruction
2000 - Support Services
3000 - Enterprise And Community Svcs
5100 - Debt Service
5200 - Transfers Of Funds
6000 - Contingencies
7000 - Unappropriated Fund Balance
Summary of Requirements by Major Function - General Funds (in Thousands)
Percent of Requirements by Major Function - General Funds
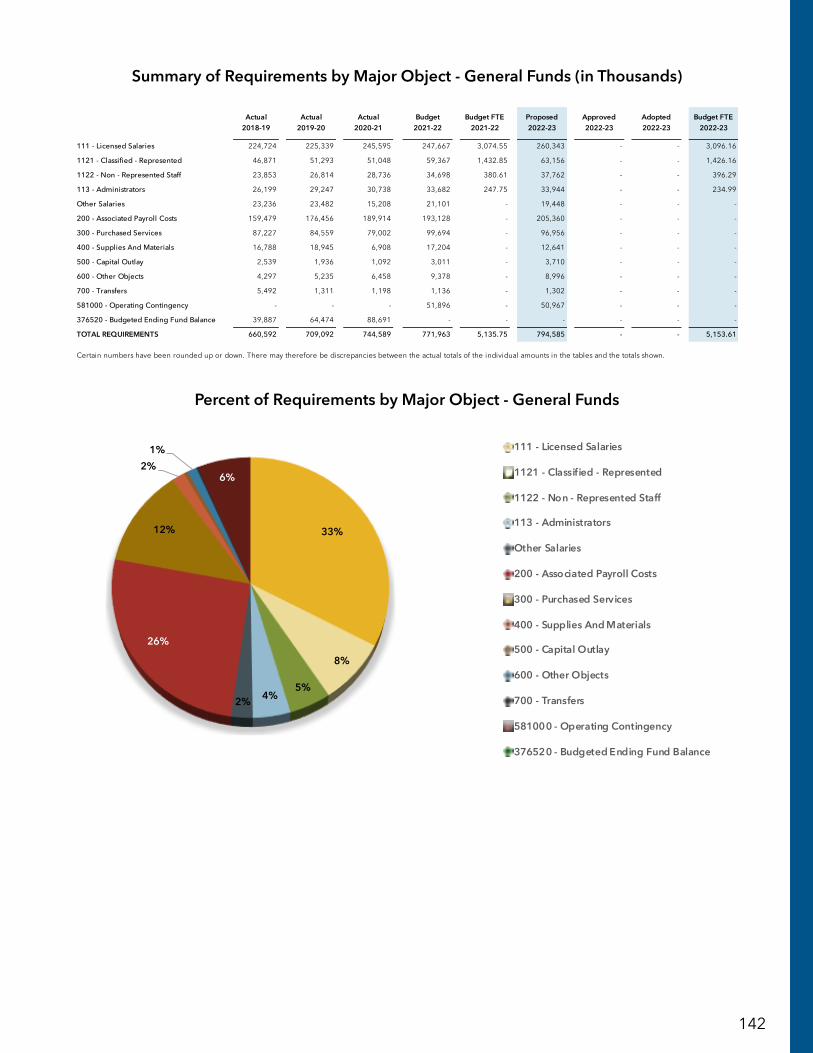
142
111 - Licensed Salaries 224,724 225,339 245,595 247,667 3,074.55 260,343 - - 3,096.16
1121 - Classified - Represented 46,871 51,293 51,048 59,367 1,432.85 63,156 - - 1,426.16
1122 - Non - Represented Staff 23,853 26,814 28,736 34,698 380.61 37,762 - - 396.29
113 - Administrators 26,199 29,247 30,738 33,682 247.75 33,944 - - 234.99
Other Salaries 23,236 23,482 15,208 21,101 - 19,448 - - -
200 - Associated Payroll Costs 159,479 176,456 189,914 193,128 - 205,360 - - -
300 - Purchased Services 87,227 84,559 79,002 99,694 - 96,956 - - -
400 - Supplies And Materials 16,788 18,945 6,908 17,204 - 12,641 - - -
500 - Capital Outlay 2,539 1,936 1,092 3,011 - 3,710 - - -
600 - Other Objects 4,297 5,235 6,458 9,378 - 8,996 - - -
700 - Transfers 5,492 1,311 1,198 1,136 - 1,302 - - -
581000 - Operating Contingency - - - 51,896 - 50,967 - - -
376520 - Budgeted Ending Fund Balance 39,887 64,474 88,691 - - - - - -
TOTAL REQUIREMENTS 660,592 709,092 744,589 771,963 5,135.75 794,585 - - 5,153.61
Adopted2022-23
Certain numbers have been rounded up or down. There may therefore be discrepancies between the actual totals of the individual amounts in the tables and the totals shown.
Budget FTE2022-23
Summary of Requirements by Major Object - General Funds (Financial Data in Thousands)
Actual2018-19
Proposed 2022-23
Actual2019-20
Actual2020-21
Budget2021-22
Budget FTE2021-22
Approved2022-23
33%
8%
5%4%2%
26%
12%
2%1%
6%
Requirements by Major Object - General Funds
111 - Licensed Salaries
1121 - Classified - Represented
1122 - Non - Represented Staff
113 - Administrators
Other Salaries
200 - Associated Payroll Costs
300 - Purchased Services
400 - Supplies And Materials
500 - Capital Outlay
600 - Other Objects
700 - Transfers
581000 - Operating Contingency
376520 - Budgeted Ending Fund Balance
Summary of Requirements by Major Object - General Funds (in Thousands)
Percent of Requirements by Major Object - General Funds

143
Description by Object Code Actual Actual Actual Budget Proposed Approved Adopted2018-19 2019-20 2020-21 2021-22 2022-23 2022-23 2022-23
Resources by Object376510 - Budgeted Beginning Fund Balance - - - 84,845 90,500 - -377000 - Fund Balance-Unres/Undes 38,282 39,887 64,474 - - - -
Subtotal - Beginning Fund Balance 38,282 39,887 64,474 84,845 90,500 - -411111 - Current-Multnomah Co 230,600 241,066 252,167 263,275 281,816 - -411112 - Current-Clackamas Co 185 194 200 208 217 - -411113 - Current-Washington Co 1,567 1,608 1,670 1,734 1,873 - -411114 - Current-Mult Co Cancel/Omit 206 345 599 620 559 - -411311 - CY Gap Rate Taxes - Mult Co 24,333 25,438 26,609 27,781 29,738 - -411312 - CY Gap Rate Taxes - Clack Co 19 20 21 22 23 - -411313 - CY Gap Rate Taxes - Wash Co 165 170 176 183 198 - -
Subtotal - Current Year Property Taxes other than Local Option 257,076 268,840 281,443 293,823 314,424 - -
411211 - CY Local Option Taxes-Mult Co 93,541 96,621 100,174 103,478 109,080 - -411212 - CY Local Option Taxes-Clack Co 77 81 83 86 91 - -411213 - CY Local Option Taxes-Wash Co. 654 671 697 716 781 - -
Subtotal - Current Year Local Option Property Taxes 94,272 97,372 100,955 104,279 109,951 - -
411121 - Prior-Multnomah Co 8,730 3,261 3,543 3,536 3,525 - -411122 - Prior-Clackamas Co 6 2 3 3 2 - -411123 - Prior-Washington Co 46 14 15 17 17 - -411124 - Prior-Mult Co Cancel/Omit 26 8 8 - 9 - -411130 - Foreclosures - - - - - - -411140 - Pymts In Lieu Of Prop Taxes 352 349 497 363 400 - -411170 - Other Property Taxes - - 15 - 15 - -411221 - PY Local Option Taxes-Mult Co. 2,798 1,288 1,409 1,388 1,401 - -411222 - PY Local Option Taxes-Clack Co 2 1 1 1 1 - -411223 - PY Local Option Taxes-Wash Co 18 6 6 7 7 - -411231 - Pen/Int-Local Opt Tax-MultCo 98 121 46 54 47 - -411232 - Pen/Int-Local Opt Tax-ClackCo - - - 1 - - -411233 - Pen/Int-Local Opt Tax-WashCo 1 1 - - - - -411321 - PY Gap Rate Taxes - Mult Co 921 344 374 373 372 - -411322 - PY Gap Rate Taxes - Clack Co 1 - - - - - -411323 - PY Gap Rate Taxes - Wash Co 5 1 2 2 2 - -411521 - PY GO Bond - Multnomah County 2 1 - - - - -411522 - PY GO Bond - Clackamas County - - - - - - -411523 - PY GO Bond - Washington County - - - - - - -411901 - Pen/Int-Multnomah Co 268 335 128 150 131 - -411902 - Pen/Int-Clackamas Co 1 1 1 - - - -411903 - Pen/Int-Washington Co 2 2 1 - - - -412000 - Rev-Local Gov't Not Districts 40 8 8 - - - -413110 - Regular Day Tuition 10 8 3 - - - -413111 - Reg Tuition-Evening HS 29 36 - - - - -415100 - Interest on Investments 4,527 3,162 544 417 371 - -416201 - A la Carte Sales 122 91 - - - - -416300 - Special Functions 10 5 - - - - -416310 - Contracts and Other Sales (1) - - - - - -417110 - Football Admissions 45 40 - - - - -417120 - Basketball Admissions 36 42 - - - - -417130 - Wrestling Admissions 3 1 - - - - -417140 - Other Admissions 19 6 - - - - -417410 - Pay to Play Fees 484 920 182 - - - -417420 - Other Activity Fees 64 65 - - - - -419110 - Civic Use of Bldgs 948 647 10 200 200 - -419112 - CUB-Day Care 426 281 5 100 100 - -419120 - Community Parking Fees 24 5 - - - - -419130 - Rent-Lease of Facilities 1,657 1,689 1,442 1,600 1,600 - -419200 - Contrib-Donation - Priv Source 5 26 15 - - - -419410 - Svc Provided-Oth Dist in State (4) - - - - - -419600 - Recovery PY Expenditure 11 19 4 50 100 - -419800 - Fees Charged to Grants 3,786 3,918 4,629 4,791 8,764 - -419910 - Miscellaneous 678 319 580 320 320 - -419920 - Jury Duty 2 1 1 1 1 - -419930 - Fingerprinting 81 (2) 89 - - - -419940 - Restitution 1 3 3 - - - -419941 - Financial Rebates 333 404 249 350 350 - -419950 - Sales, Royalties and Events 1 2 2 - - - -419965 - Administrative Claiming 72 71 109 - - - -419970 - Public Records Request 9 1 3 - - - -
Subtotal - Other Revenue from Local Sources 26,692 17,505 13,925 13,724 17,736 - -
General Fund Detail
General Fund - Resources by Object (In Thousands)

144
Description by Object Code Actual Actual Actual Budget Proposed Approved Adopted2018-19 2019-20 2020-21 2021-22 2022-23 2022-23 2022-23
Resources by Object421010 - County School Funds 7 21 18 15 15 - -421020 - Ed Service Dist Apportionment 8,500 8,500 8,500 7,500 7,500 - -421990 - Other Intermediate Sources - - 1,017 - - - -421991 - City of Portland 4,987 5,247 4,839 5,247 4,586 - -
Subtotal - 2000 - REVENUE - INTERMEDIATE SOURCES 13,494 13,768 14,374 12,762 12,101 - -
431010 - SSF--General Support 225,135 266,607 263,622 256,417 242,531 - -431030 - Common School Fund 5,493 5,012 5,628 5,048 4,875 - -
Subtotal - 3000 - REVENUE FROM STATE SOURCES 230,628 271,620 269,250 261,465 247,407 - -
442000 - Unrestr Rev-Fed Govt Thru St 79 45 1 - - - -448010 - Federal Forest Fees 1 39 16 15 15 - -
Subtotal - 4000 - REVENUE FROM FEDERAL SOURCES 80 84 18 15 15 - -
452100 - Interfund Transfers 14 - - - - - -Subtotal - 5200 - INTERFUND TRANSFERS 14 - - - - - -
451300 - Accrued Interest - - - 1,000 1,000 - -451600 - Lease Proceeds - - - - 1,400 - -453000 - Sale of Fixed Assets 55 17 152 50 50 - -
Subtotal - All Other Budget Resources 55 17 152 1,050 2,450 - -Total Resources by Object 660,592 709,092 744,589 771,963 794,585 - -
Description by Function Code Actual Actual Actual BudgetBudget
FTE Proposed Approved AdoptedBudget
FTE2018-19 2019-20 2020-21 2021-22 2021-22 2022-23 2022-23 2022-23 2022-23
Requirements by Function1111 - ELEMENTARY K-5 125,334 124,957 125,731 131,789 1,025.00 142,567 - - 1,089.33 1113 - ELEMENTARY EXTRA CURRICULAR 702 385 346 24 - 24 - - -1121 - MIDDLE SCHOOL PROGRAMS 51,431 54,748 56,375 60,535 470.29 57,713 - - 432.99 1122 - MIDDLE SCHOOL EXTR CURRICULAR 57 208 352 404 3.38 322 - - 2.56 1131 - HIGH SCHOOL PROGRAMS 65,837 68,785 71,342 80,148 615.59 84,172 - - 631.18 1132 - HIGH SCHOOL EXTRA CURRICULAR 7,239 7,915 7,220 7,075 18.29 5,006 - - 17.85 1140 - PRE KINDERGARTEN PROGRAMS 300 263 298 331 1.50 324 - - 2.72 1100 - INSTRUCTIONAL SUB ROLLUP 7,527 9,599 2,873 - - - - - -1210 - PROGRAMS FOR TALENTED AND GIFTED 248 236 248 223 - 21 - - -1220 - RESTRICTIVE PROGRAMS 21,974 25,277 26,002 28,624 366.38 29,062 - - 354.88 1250 - LESS RESTRICTIVE PROGRAMS 24,887 25,444 29,771 31,932 326.82 32,484 - - 319.76 1260 - TREATMENT AND HABILITATION 1,689 1,800 2,062 2,147 16.00 2,366 - - 17.00 1272 - TITLE I A/D - - - - - - - - -1280 - ALTERNATIVE EDUCATION 27,623 27,811 28,836 29,347 10.00 30,565 - - 5.17 1291 - ENGLISH LANGUAGE LEARNER 11,535 11,197 11,339 11,381 101.89 12,080 - - 105.50 1292 - TEEN PARENT PROGRAMS 115 61 114 101 1.00 39 - - -1293 - MIGRANT EDUCATION - - 3 - - - - - -1299 - OTHER SPECIAL PROGRAMS 416 535 542 601 10.48 517 - - 8.38 1400 - SUMMER SCHOOL PROGRAMS 819 663 414 1,959 - 1,921 - - -
Subtotal - 1000 - INSTRUCTION 347,734 359,882 363,865 386,622 2,966.62 399,183 - - 2,987.31
General Fund - Requirements by Function (Financial Data In Thousands)
General Fund Detail
General Fund - Resources by Object (In Thousands)

145
Description by Function Code Actual Actual Actual BudgetBudget
FTE Proposed Approved AdoptedBudget
FTE2018-19 2019-20 2020-21 2021-22 2021-22 2022-23 2022-23 2022-23 2022-23
Requirements by Function2110 - ATTENDANCE/SOCIAL WORK SVCS 9,509 12,085 12,633 13,542 135.34 15,380 - - 153.62 2120 - GUIDANCE SERVICES 23,380 23,731 24,015 25,344 189.98 25,552 - - 184.10 2130 - HEALTH SERVICES PROGRAMS - - 46 - - - - - -2140 - PSYCHOLOGICAL SERVICES 6,073 5,925 6,468 6,446 50.22 6,227 - - 45.44 2150 - SPEECH PATHOLOGY/AUDIOLOGY SVC 9,640 10,460 11,632 11,816 90.60 11,750 - - 85.60 2160 - OTHER STUDENT TREATMENT SVCS 3,128 3,773 3,795 3,683 27.30 3,996 - - 27.30 2190 - SVC DIRECTION-STUDENT SUPPORT 13,414 15,108 13,891 13,618 56.81 14,513 - - 57.79 2210 - IMPROVEMENT OF INSTRUCTION 2,699 3,391 4,366 5,929 15.50 9,168 - - 31.05 2220 - EDUCATIONAL MEDIA SERVICES 11,296 11,360 12,689 12,700 116.51 13,421 - - 115.87 2230 - ASSESSMENT AND TESTING 585 569 497 1,279 5.00 1,009 - - 3.00 2240 - INSTRUC STAFF DEVELOPMENT 18,000 19,007 21,716 21,276 122.46 17,414 - - 108.66 2310 - BOARD OF EDUCATION SERVICES 843 665 704 835 3.00 981 - - 4.00 2320 - EXECUTIVE ADMINISTRATION SVCS 12,003 11,487 11,449 14,120 42.50 14,393 - - 49.00 2410 - OFFICE OF THE PRINCIPAL SVCS 42,011 44,623 48,133 51,522 413.88 51,960 - - 394.16 2490 - OTHER SCHOOL SUPPORT ADMIN 522 446 463 447 - 514 - - -2510 - SUPPORT SERVICES-BUSINESS 258 372 386 426 2.00 474 - - 2.00 2520 - FISCAL SERVICES 10,335 11,584 12,590 17,801 57.22 17,784 - - 53.42 2540 - OPER/MAINTENANCE OF PLANT SVCS 51,069 54,880 49,144 59,773 510.45 60,422 - - 507.85 2550 - STUDENT TRANSPORTATION SERVICE 26,901 25,818 20,675 29,391 112.50 30,681 - - 117.75 2570 - INTERNAL SERVICES 3,078 3,174 3,241 3,464 25.00 3,752 - - 26.00 2610 - DIRECTION OF CENTRAL SUPPORT 265 793 1,110 1,305 10.00 1,253 - - 9.00 2620 - RESEARCH,DEVELOP,EVAL SVCS 977 1,138 1,532 2,208 12.50 2,556 - - 14.50 2630 - INFORMATION SERVICES 2,513 2,576 2,559 3,376 26.00 4,195 - - 29.63 2640 - STAFF SERVICES 5,839 6,200 6,471 8,780 53.00 8,217 - - 51.00 2660 - TECHNOLOGY SERVICES 11,007 12,469 15,197 18,585 75.50 21,803 - - 78.70 2670 - RECORDS MANAGEMENT SVCS 644 285 320 426 4.00 461 - - 4.00
Subtotal - 2000 - SUPPORT SERVICES 265,988 281,918 285,720 328,092 2,157.26 337,875 - - 2,153.42 3100 - FOOD SERVICES 195 165 19 192 1.88 196 - - 1.88 3300 - COMMUNITY SVCS 1,296 1,342 5,095 2,801 10.00 2,904 - - 11.00
Subtotal - 3000 - ENTERPRISE AND COMMUNITY SVCS 1,491 1,507 5,115 2,993 11.88 3,100 - - 12.88
5100 - DEBT SERVICE - - - - - 783 - - -Subtotal - 5100 - DEBT SERVICE & 5400 - PERS UAL PROGRAMS - - - - - 783 - - -
52100 - Fund Transfers 5,492 1,311 1,198 1,136 - 1,302 - - -Subtotal - 5200 - TRANSFERS OF FUNDS 5,492 1,311 1,198 1,136 - 1,302 - - -
61100 - Operating Contingency - - - 51,896 - 50,967 - - -Subtotal - 6000 - CONTINGENCIES - - - 51,896 - 50,967 - - -
71100 - Ending Fund Balance 39,887 64,474 88,691 - - - - - - Subtotal - 7000 - UNAPPROPRIATED FUND BALANCE 39,887 64,474 88,691 - - - - - -
Total Requirements by Function 660,592 709,092 744,589 771,963 5,135.75 793,210 - - 5,153.61
General Fund - Requirements by Function (Financial Data In Thousands)
General Fund Detail

146
Description by Object Code Actual Actual Actual BudgetBudget
FTE Proposed Approved AdoptedBudget
FTE2018-19 2019-20 2020-21 2021-22 2021-22 2022-23 2022-23 2022-23 2022-23
Requirements by Object511100 - Licensed Staff 224,724 225,339 245,595 247,667 3,074.55 260,343 - - 3,096.16 511210 - Classified - Represented 46,871 51,293 51,048 59,367 1,432.85 63,156 - - 1,426.16 511220 - Non-Represented Staff 19,634 22,220 24,127 29,210 341.61 31,983 - - 355.29 511310 - Administrators - Licensed 25,336 27,760 29,381 31,942 238.75 32,381 - - 226.99 511320 - Administrators - NonLicensed 863 1,487 1,357 1,740 9.00 1,562 - - 8.00 511420 - Directors/Program Admins 4,218 4,595 4,608 5,489 39.00 5,779 - - 41.00 512100 - Substitutes - Licensed 8,312 8,786 1,696 9,244 - 7,723 - - -512200 - Substitutes - Classified 637 656 128 1,436 - 1,435 - - -512300 - Temporary Misc - Licensed 1,719 1,591 1,413 630 - 630 - - -512400 - Temporary Misc - Classified 1,142 901 560 26 - 26 - - -513100 - Extended Responsibility - LIC 2,230 2,454 2,545 1,817 - 1,051 - - -513200 - Extended Responsibility - CLS 1,820 2,363 1,868 527 - 41 - - -513300 - Extended Hours 3,871 3,028 4,893 4,080 - 5,210 - - -513350 - PAT Overload Pay Stipend 1,820 2,298 1,308 2,571 - 2,571 - - -513400 - Overtime Pay 1,420 1,116 500 740 - 736 - - -513510 - Group Hlth Opt Out Lic 216 252 262 31 - 25 - - -513520 - Group Hlth Opt Out Non Lic 49 35 40 - - - - - -
Subtotal - 100 - SALARIES 344,883 356,176 371,326 396,516 5,135.75 414,653 - - 5,153.61 521000 - PERS 9,798 16,404 16,483 16,124 - 828 - - -521310 - PERS UAL 41,342 45,261 47,700 48,039 - 63,526 - - -522000 - Social Security - FICA 26,019 26,791 27,920 30,333 - 31,573 - - -523100 - Workers' Compensation 3,227 281 1,630 2,283 - 2,855 - - -523200 - Unemployment Compensation 75 519 972 507 - 292 - - -523300 - PFMLA - - - - - 825 - - -524100 - Group Health Insurance 73,060 82,585 89,153 90,018 - 99,424 - - -524200 - Other Employer Paid Benefits 723 734 831 813 - 794 - - -524300 - Retiree Health Insurance 2,562 1,895 3,558 2,874 - 3,115 - - -524530 - Early Retirement Benefits 1,268 890 903 761 - 751 - - -524400 - DCU Union Contract Items 7 4 - - - - - - -524510 - PAT Union Tuition Reimbursemnt 841 754 658 875 - 875 - - -524520 - PAT Union Prof Improvement Fds 559 338 106 500 - 500 - - -
Subtotal - 200 - ASSOCIATED PAYROLL COSTS 159,479 176,456 189,914 193,128 - 205,360 - - -
General Fund - Requirements by Object (Financial Data in Thousands)
General Fund Detail

147
Description by Object Code Actual Actual Actual BudgetBudget
FTE Proposed Approved AdoptedBudget
FTE2018-19 2019-20 2020-21 2021-22 2021-22 2022-23 2022-23 2022-23 2022-23
Requirements by Object531100 - Instructional Services 2,238 1,809 2,032 4,062 - 3,908 - - -531200 - Instr Program Improvement Svcs 284 305 180 3,138 - 1,149 - - -531300 - Student Services - 10 1 - - - - - -531800 - Local Mtgs/Non-Instr Staff Dev 1,060 786 370 1,137 - 928 - - -531810 - Non-Instr Dev Profess Dev Fds 202 161 112 110 - 110 - - -531900 - Other Instr Prof/Tech Svcs 5,124 6,114 5,189 4,217 - 4,018 - - -532100 - Cleaning Services 1 6 1 1 - 1 - - -532200 - Repairs and Maintenance Svcs 757 1,462 771 2,188 - 2,096 - - -532400 - Rentals 763 337 262 203 - 153 - - -532410 - Leased Copy Machines 651 - - - - - - - -532500 - Electricity 3,875 3,464 2,860 3,618 - 3,464 - - -532600 - Fuel 2,711 2,734 2,512 3,446 - 3,935 - - -532700 - Water and Sewage 3,008 3,036 2,514 3,559 - 3,019 - - -532800 - Garbage 1,036 813 551 1,011 - 1,011 - - -532900 - Other Property Services 3,369 4,871 5,019 2,947 - 2,667 - - -533110 - Reimb - School Bus 14,090 13,161 11,670 15,474 - 15,474 - - -533120 - Reimb - Taxi Cab 2,306 1,545 98 1,631 - 1,631 - - -533130 - Reimb - In-Lieu 30 40 1 15 - 15 - - -533140 - Reimb - Tri-Met 2,031 1,992 996 2,113 - 2,115 - - -533150 - Reimb - Field Trips 628 314 6 356 - 356 - - -533200 - Non-Reimb Student Transport 547 449 323 20 - 20 - - -534100 - Travel, Local in District 243 152 41 223 - 225 - - -534200 - Travel, Out of District 843 464 133 853 - 729 - - -534210 - Trav Out Dist Profess Dev Fds 47 37 1 - - - - - -534300 - Travel, Student Activities 221 110 40 188 - 186 - - -534901 - Student Academic Transport - 1 - - - - - - -535100 - Telephone 771 1,006 530 678 - 677 - - -535300 - Postage 266 298 278 305 - 342 - - -535400 - Advertising 84 68 110 70 - 70 - - -535500 - Printing and Binding 906 1,602 725 1,939 - 2,023 - - -535920 - Internet Fees 1 1 43 2 - 2 - - -535990 - Wide Area Network/Misc 1,013 742 1,474 1,250 - 1,250 - - -536000 - Charter Schools 13,796 14,066 15,846 15,507 - 15,187 - - -537100 - Tuition to Other Dist InState - - - - - - - - -537300 - Tuition to Private Schools 8,182 8,399 7,726 8,369 - 10,632 - - -537410 - Tuition - Fees College Credit 8 - - 3 - 3 - - -538100 - Audit Services 230 231 244 227 - 227 - - -538200 - Legal Services 2,857 2,087 2,217 2089 - 2,089 - - -538300 - Architect and Engineering Svcs 36 241 302 - - - - - -538400 - Negotiation Services 9 98 222 - - - - - -538500 - Management Services 394 85 118 78 - 78 - - -538600 - Data Processing Services 66 126 37 - - - - - -538800 - Election Services 258 127 259 250 - 250 - - -538910 - Security Services 317 233 458 361 - 149 - - -538930 - Secretarial/Clerical Services 99 45 18 16 - 16 - - -538940 - Professional Moving Services 104 93 129 407 - 303 - - -538950 - Professional Health Care Svcs 12 47 11 11 - 11 - - -538960 - Professional Child Care Svcs 94 118 110 298 - 298 - - -538970 - Graphic Arts Services - - 9 - - - - - -538980 - Laundering Services 6 5 4 5 - 5 - - -538990 - Non-Instr Pers/Professional Sv 11,548 10,601 12,357 17,244 - 16,087 - - -539100 - Pass Through 106 68 89 47 - 47 - - -
Subtotal - 300 - PURCHASED SERVICES 87,227 84,559 79,002 99,694 - 96,956 - - -
General Fund - Requirements by Object (Financial Data in Thousands)
General Fund Detail

148
Description by Object Code Actual Actual Actual BudgetBudget
FTE Proposed Approved AdoptedBudget
FTE2018-19 2019-20 2020-21 2021-22 2021-22 2022-23 2022-23 2022-23 2022-23
Requirements by Object541000 - Consumable Supplies 6,728 5,052 3,264 7,199 - 5,753 - - -541100 - Loss Prevention - 11 22 - - - - - -541270 - Food Inventory Adjustm-NS Only (1) - 3 - - - - - -541310 - Auto Parts, Batteries 76 58 50 88 - 88 - - -541315 - Tires 22 14 10 20 - 20 - - -541320 - Oil & Lubricants 10 5 15 8 - 8 - - -541325 - Gas 173 124 53 215 - 215 - - -541330 - Propane 81 195 55 150 - 150 - - -541400 - Maintenance Materials 1,660 1,323 1,371 760 - 610 - - -541500 - Inventory Adjustments (14) (4) (14) 20 - 20 - - -541600 - Interdepartmental Charges (400) (317) (149) 71 - 35 - - -541700 - Discounts Taken - - (1) - - - - - -542100 - Textbook Expansion 496 403 390 943 - 671 - - -542200 - Textbook Adoption 2,282 1,348 237 2,595 - - - - -542300 - Textbook Replacement - - 10 - - - - - -543000 - Library Books 467 266 361 385 - 378 - - -544000 - Periodicals 7 61 1 11 - 10 - - -544100 - Online Periodical Subscription 154 296 96 245 - 125 - - -545100 - Purchased Food-NS Only 74 51 - 68 - 64 - - -546000 - Non-Consumable Supplies 686 277 358 369 - 593 - - -546100 - Minor Equipment - Tagged 178 58 37 253 - 222 - - -547000 - Computer Software 2,674 3,176 3,113 3,034 - 2,891 - - -548000 - Computer Equipment 1,435 6,548 (2,373) 772 - 789 - - -
Subtotal - 400 - SUPPLIES AND MATERIALS 16,788 18,945 6,908 17,204 - 12,641 - - -552000 - Building Acquisition/Improvmnt 509 381 121 - - - - - -553000 - Improvements - Not Buildings 39 22 47 - - - - - -554100 - Initial and Addl Equipment 1,061 598 449 1,770 - 1,339 - - -554110 - Vehicles 181 322 162 75 - 75 - - -555010 - Computers 2 7 28 143 - 39 - - -555020 - Printers - - - 1 - - - - -555030 - Software Capital Expense 129 26 113 - - - - - -555090 - Misc Other Technology 241 185 173 592 - 427 - - -556410 - Buses/Capital Bus Improvements 377 393 (2) 430 - 430 - - -559000 - Other Capital Outlay - - - - - 1,400 - - -
Subtotal - 500 - CAPITAL OUTLAY 2,539 1,936 1,092 3,011 - 3,710 - - -561000 - Redemption of Principal - - - 1177 - 706 - - -562100 - Interest (Except Bus/Garage) - - - 47 - 77 - - -563000 - Fiscal Charges 41 91 88 110 - 110 - - -563500 - Administrative Write-Off 23 1 44 - - - - - -564000 - Dues and Fees 669 973 1,030 748 - 806 - - -564010 - Dues & Fees Profess Dev Fds 4 1 1 103 - 103 - - -564100 - Bond Issuance Cost - - 1 - - - - - -565100 - Liability Insurance 2,300 522 745 616 - 616 - - -565300 - Property Insurance Premiums 1 2,109 2,417 2056 - 2,056 - - -565500 - Judgmnts&Settlemnts Against 829 122 176 2,703 - 2,703 - - -565930 - Deductible Insurance Loss 382 1,371 1,913 1786 - 1,786 - - -567100 - Permits 41 37 38 26 - 26 - - -567200 - Public Assessments 7 7 7 7 - 7 - - -569000 - Grant Indirect Charges - - - - - - - - -
Subtotal - Other Objects 4,297 5,235 6,458 9,378 - 8,996 - - -571000 - Transfers to Other Funds 5,492 1,311 1,198 1,136 - 1,302 - - -
Subtotal - 700 - TRANSFERS 5,492 1,311 1,198 1,136 - 1,302 - - -581000 - Operating Contingency - - - 51,896 - 50,967 - - -
Subtotal - 581000 - Operating Contingency - - - 51,896 - 50,967 - - -376520 - Budgeted Ending Fund Balance 39,887 64,474 88,691 - - - - - -
Subtotal - 376520 - Budgeted Ending Fund Balance 39,887 64,474 88,691 - - - - - - Total Requirements by Object 660,592 709,092 744,589 771,963 5,135.75 794,585 - - 5,153.61
General Fund - Requirements by Object (Financial Data in Thousands)
Certain numbers have been rounded up or down. There may therefore be discrepancies between the actual totals of the individual amounts in the tables and the totals shown.
General Fund Detail

149
Resources Proposed 2022-23
Projected 2023-24
Projected 2024-25
Projected 2025-26
BEGINNING FUND BALANCE 90,500 93,668 96,946 100,339
CURRENT YEAR PROPERTY TAXES OTHER THAN LOCAL OPTION 314,424 325,429 336,819 348,608
CURRENT YEAR LOCAL OPTION PROPERTY TAXES 109,952 113,800 117,783 121,906
OTHER REVENUE FROM LOCAL SOURCES 17,736 18,357 18,999 19,664
2000 - REVENUE - INTERMEDIATE SOURCES 12,101 12,525 12,963 13,417
3000 - REVENUE FROM STATE SOURCES 247,407 256,066 265,029 274,305
4000 - REVENUE FROM FEDERAL SOURCES 15 16 16 17
5200 - INTERFUND TRANSFERS - - - -
ALL OTHER BUDGET RESOURCES 2,450 2,536 2,625 2,716
Total Resources 794,585 822,395 851,179 880,971
Requirements Proposed 2022-23
Projected 2023-24
Projected 2024-25
Projected 2025-26
111 - LICENSED SALARIES 260,343 269,455 278,886 288,647
1121 - CLASSIFIED - REPRESENTED 63,156 65,366 67,654 70,022
1122 - NON-REPRESENTED STAFF 37,762 39,084 40,452 41,867
113 - ADMINISTRATORS 33,944 35,132 36,362 37,634
OTHER SALARIES 19,448 20,129 20,833 21,562
200 - ASSOCIATED PAYROLL COSTS 205,360 212,548 219,987 227,686
300 - PURCHASED SERVICES 96,956 100,349 103,862 107,497
400 - SUPPLIES AND MATERIALS 12,641 13,083 13,541 14,015
500 - CAPITAL OUTLAY 3,710 3,840 3,974 4,113
600 - OTHER OBJECTS 8,996 9,311 9,637 9,974
700 - TRANSFERS 1,302 701 703 706
581000 - OPERATING CONTINGENCY 50,967 53,397 55,289 57,246
376520 - BUDGETED ENDING FUND BALANCE - - - -
Total Requirements 794,585 822,395 851,179 880,971
Certain numbers have been rounded up or down. There may therefore be discrepancies between the actual totals of the individual amounts in the tables and the totals shown.
Budget Forecast by Major Object - General Fund (In Thousands)

150
BUDGETED POSITIONS AND STUDENTS SERVED BY MINOR FUNCTION (GENERAL FUND)
Proposed % Of Cost Per
Function - 2021-22 2022-23 - 2021-22 2022-23 - 2021-22
2022-23 - 2021-
222022-
23 - 2021-22
2022-23 - Student
s - Budget Budget Student
1111 - ELEMENTARY K-5 1,001.1 1,072.7 22.9 15.6 1.0 1.0 142,567,104 17.94
1113 - ELEMENTARY EXTRA CURRICULAR 23,700 0.00
1121 - MIDDLE SCHOOL PROGRAMS 469.8 432.4 0.5 0.6 57,712,611 7.26
1122 - MIDDLE SCHOOL EXTR CURRICULAR 3.4 2.6 322,329 0.04
1131 - HIGH SCHOOL PROGRAMS 612.9 628.7 2.5 2.5 0.2 84,171,752 10.59
1132 - HIGH SCHOOL EXTRA CURRICULAR 12.3 11.9 2.5 2.5 2.5 2.5 1.0 1.0 5,005,873 0.63
1140 - PRE KINDERGARTEN PROGRAMS 1.5 2.7 323,522 0.04
1210 - PROGRAMS FOR TALENTED AND GIFTED 21,168 0.00 1220 - RESTRICTIVE PROGRAMS 98.1 94.1 268.3 260.8 29,062,470 3.66
1250 - LESS RESTRICTIVE PROGRAMS 192.3 183.8 134.6 136.0 32,483,751 4.09
1260 - TREATMENT AND HABILITATION 16.0 17.0 2,366,460 0.30
1280 - ALTERNATIVE EDUCATION 7.0 3.2 2.0 1.0 1.0 1.0 30,564,708 3.85
1291 - ENGLISH LANGUAGE LEARNER 81.6 82.9 20.3 22.6 12,079,920 1.52
1292 - TEEN PARENT PROGRAMS 1.0 39,368 0.00
1299 - OTHER SPECIAL PROGRAMS 10.5 8.4 517,162 0.07
1400 - SUMMER SCHOOL PROGRAMS 1,920,861 0.24
1000 - INSTRUCTION 2,495.8 2,531.7 465.1 450.1 3.5 3.5 2.2 2.0 399,182,759 50.24
2110 - ATTENDANCE/SOCIAL WORK SVCS 66.0 68.2 67.4 85.5 2.0 15,380,134 1.94
2120 - GUIDANCE SERVICES 150.2 144.9 15.8 18.8 5.0 3.0 19.0 17.5 25,551,647 3.22 2140 - PSYCHOLOGICAL SERVICES 50.2 45.4 6,227,000 0.78 2150 - SPEECH PATHOLOGY/AUDIOLOGY SVC 90.6 85.6 11,750,063 1.48
2160 - OTHER STUDENT TREATMENT SVCS 27.3 27.3 3,996,112 0.50
2190 - SVC DIRECTION-STUDENT SUPPORT 16.3 14.5 25.5 29.5 15.0 13.8 14,513,153 1.83
2210 - IMPROVEMENT OF INSTRUCTION 12.3 2.0 0.8 8.0 8.0 5.5 10.0 9,167,652 1.15
2220 - EDUCATIONAL MEDIA SERVICES 64.2 62.7 45.6 45.0 6.8 8.1 13,421,485 1.69
2230 - ASSESSMENT AND TESTING 5.0 3.0 1,009,251 0.13
2240 - INSTRUC STAFF DEVELOPMENT 120.0 107.2 1.5 0.5 1.0 1.0 17,414,451 2.19
2310 - BOARD OF EDUCATION SERVICES 3.0 4.0 981,073 0.12
2320 - EXECUTIVE ADMINISTRATION SVCS 18.0 16.0 24.5 33.0 14,392,779 1.81
2410 - OFFICE OF THE PRINCIPAL SVCS 6.0 3.0 196.2 190.6 178.3 166.5 33.5 34.0 51,959,774 6.54
2490 - OTHER SCHOOL SUPPORT ADMIN 513,652 0.06
2510 - SUPPORT SERVICES-BUSINESS 1.0 1.0 1.0 1.0 474,189 0.06
2520 - FISCAL SERVICES 3.5 3.5 1.0 1.0 52.7 48.9 17,783,912 2.24 2540 - OPER/MAINTENANCE OF PLANT SVCS 468.3 459.3 42.2 48.6 60,421,578 7.60
2550 - STUDENT TRANSPORTATION SERVICE 103.5 108.8 9.0 9.0 30,681,473 3.86 2570 - INTERNAL SERVICES 12.0 12.0 13.0 14.0 3,752,364 0.47
2610 - DIRECTION OF CENTRAL SUPPORT 2.0 2.0 8.0 7.0 1,252,504 0.16
2620 - RESEARCH,DEVELOP,EVAL SVCS 3.0 3.0 9.5 11.5 2,555,822 0.32
2630 - INFORMATION SERVICES 6.5 6.5 1.0 1.0 18.5 22.1 4,194,788 0.53 2640 - STAFF SERVICES 1.0 1.0 1.0 1.0 51.0 49.0 8,217,210 1.03 2660 - TECHNOLOGY SERVICES 4.3 8.0 13.0 12.0 1.0 1.0 57.2 57.7 21,802,590 2.74
2670 - RECORDS MANAGEMENT SVCS 3.0 3.0 1.0 1.0 460,830 0.06
2000 - SUPPORT SERVICES 578.7 564.5 955.9 963.2 244.3 231.5 378.4 394.3 337,875,486 42.52 3100 - FOOD SERVICES 1.9 1.9 195,681 0.02 3300 - COMMUNITY SVCS 10.0 11.0 2,904,154 0.37
3000 - ENTERPRISE AND COMMUNITY SVCS 11.9 12.9 3,099,835 0.39
5100 - DEBT SERVICE & 5400 - PERS UAL PROGRAMS 782,963 0.10 5200 - TRANSFERS OF FUNDS 697,917 0.09 6000 - CONTINGENCIES 52,945,749 6.66
FUND TOTAL 3,074.5 3,096.2 1,432.8 1,426.2 247.8 235.0 380.6 396.3 794,584,709 100.00
PORTLAND PUBLIC SCHOOLSBUDGETED POSITIONS & STUDENTS SERVED BY FUNCTION (100 - General Funds)
For the 2022-23 Proposed Budget
Licensed Classified - Represented Administrators Non -
Represented Other Number of

151
ACCRUED OBLIGATION FOR POST EMPLOYMENT BENEFITSEarly Retirement The District has a single-employer defined benefit early retirement supplement program.Retirement Health Insurance Subsidy (RHIS) Plan Description – The District provides a single-employer defined benefit plan that provides post-employment health, dental, vision and life insurance benefits to eligible employees and their spouses for employees who have retired from the District with a minimum of fifteen accumulated years of service and are eligible to retire from the Oregon retirement system. Covered employees under the plan are eligible to receive full or part time District-paid medical and pharmacy benefits for up to 60 months, or until reaching age 65, whichever comes first. The program was established under separate collective bargaining agreements with certified and classified employees and by precedent for all other certified District employees. The Portland Association of Teachers (PAT) group terminated this benefit after September 30, 2019. All other bargaining units and employee groups, except the District Council Unions (DCU), agreed to terminate this benefit after June 30, 2014. The DCU agreed to terminate this benefit after December 31, 2014.Summary of Significant Accounting Policies - The Retirement Health Insurance Subsidy (RHIS) is a health and welfare program the District provides for retirees. The plan is actuarially determined, is reflected as a long term liability in the government-wide financial statements and reflects the present value of expected future payments. The net other post employment benefits liability and expenditure in the governmental fund financial statements are limited to amounts that become due and payable as of the end of the fiscal year, and are reported on a pay-as-you-go basis.Funding policy - The benefits from this program are fully paid by the District; therefore, no contributions by employees are required. The District’s total actuarially determined liability on June 30, 2021 was $78.6 million. Contributions - Contributions are financed on a pay-as-you-go basis. During fiscal year 2021 the District recognized, on a budgetary basis, expenditures of approximately $4.1 million for the post-employment healthcare benefits. Program membership for RHIS consisted of 484 retirees receiving benefits on June 30, 2021.
Stipend Stipend Plan Description – The District provides a single-employer defined benefit early retirement program for members of the PAT, physical therapists, occupational therapists and licensed administrators. Certificated employees with 15 consecutive years of at least half time service with the District, and who are eligible to retire under OPERS, and who retired before age 62 are eligible for the early retirement benefits. Eligible employees are entitled to a monthly benefit of $425 dollars commencing on the first month after their retirement. Benefits are payable up to the earlier of attaining age 62 or receiving 60 monthly payments. The General Fund and the Special Revenue Fund are the primary funds from which the stipend liability is liquidated. The District does not issue a separate stand-alone financial report for this plan. The District pays for the benefits without any cost to employees. The contributions are financed on a pay-as-you-go basis, and there are no assets accumulated in a trust. The program was established under separate bargaining agreements and may be amended by the District under new collective bargaining agreements.Summary of Significant Accounting Policies - The District provides a single-employer defined benefit early retirement program. The stipend benefit is actuarially determined, is reflected as a long-term liability in the government-wide financial statements, and reflects the present value of expected future payments. This plan is accounted for under the provisions of GASB Statement No. 73.

152
Funding policy - The benefits from this program are fully paid by the District; therefore, no contributions by employees are required. The District’s total actuarially determined liability on June 30, 2021 was $6.1 million. Contributions - Contributions are financed on a pay-as-you-go basis. During fiscal year 2021 the District recognized, on a budgetary basis, expenditures of approximately $1.0 million for the stipend benefits.

153
SPECIAL REVENUE FUNDS SUMMARY (200)Fund 200 - Special Revenue Funds Resources SummaryTotal resources for Fund 200 are expected to grow by $9 million or 3% from 2021-22 to 2022-23. It is expected that resources are to remain consistent to 2021-22 as we near the end of the ESSER funding.
Fund 200 - Special Revenue Funds Requirements SummaryPayroll and its associated costs along with purchased services are responsible for most of the anticipated expenditure growth in Fund 200. The various Special Revenue Funds support the District’s vision of strengthening the core functions and best practices by providing additional support in the form of grants and foundation funding to core curriculum areas and bringing more equity to historically underserved students through the Racial Equity Social Justice Lens. This is accomplished by providing Educational Assistants and additional Teachers as needed, as well as providing continued support of High School Success, funding engagement coaches and Community Engagement opportunities, strengthening Multi-tiered Systems of Support, increasing Social Emotional Learning, promoting family focused training and education, funding improving technological infrastructure to support Technology Aligned to Instruction, and continuing support of high-needs students through Enhanced Special Education Services. Also prevalent is the PERS Rate Stabilization Reserve Fund which continues support of the finance plan of aligned strategic investments and the Cafeteria Fund which provides equity for historically underserved students and students in need.

154
Beginning Fund Balance 36,207 37,428 35,790 36,505 43,351 - -
Current Year Property Taxes Other Than Local Option 283 296 309 323 342 - -
Other Revenue From Local Sources 23,416 20,451 11,795 20,795 17,929 - -
2000 - Revenue - Intermediate Sources 104 43 28 - 130 - -
3000 - Revenue From State Sources 28,529 24,982 40,775 79,297 97,185 - -
4000 - Revenue From Federal Sources 48,277 53,984 66,518 166,240 145,566 - -
5200 - Interfund Transfers 114 69 716 - 75 - -
All Other Budget Resources 15 0 - - 900 - -
TOTAL RESOURCES 136,944 137,252 155,931 303,161 305,478 - -
Summary of Resources by Major Object - 200 - Special Revenue Funds (In Thousands)
Actual2018-19
Proposed 2022-23
Certain numbers have been rounded up or down. There may therefore be discrepancies between the actual totals of the individual amounts in the tables and the totals shown.
Actual2019-20
Actual2020-21
Budget2021-22
Approved2022-23
Adopted2022-23
14%
6%
32%
48%
Resources by Major Object - 200 - Special Revenue Funds
Beginning Fund Balance
Current Year Property Taxes Other Than Local Option
Other Revenue From Local Sources
2000 - Revenue - Intermediate Sources
3000 - Revenue From State Sources
4000 - Revenue From Federal Sources
5200 - Interfund Transfers
All Other Budget Resources
Summary of Resources by Major Object - 200 - Special Revenue Funds (in Thousands)
Percent of Resources by Major Object - 200 - Special Revenue Funds

155
1000 - Instruction 46,344 48,877 53,245 121,344 512.65 124,738 - - 667.32
2000 - Support Services 31,769 32,104 54,985 91,074 328.34 116,062 - - 364.15
3000 - Enterprise And Community Svcs 21,341 20,430 18,799 54,053 192.12 32,948 - - 227.96
4000 - Facilities Acquisition And Con 49 52 - - - 89 - - - 5100 - Debt Service & 5400 - PERS UAL Programs
- - - - - 199
5200 - Transfers Of Funds 14 - 651 - - - - - -
6000 - Contingencies - - - 4,903 - - - - -
7000 - Unappropriated Fund Balance 37,428 35,790 28,222 31,718 - 31,442 - - -
TOTAL REQUIREMENTS 136,944 137,252 155,931 303,161 1,033.12 305,478 - - 1,259.43
Budget FTE2022-23
Summary of Requirements by Major Function - Special Revenue Funds (Financial Data in Thousands)
Actual2018-19
Proposed 2022-23
Certain numbers have been rounded up or down. There may therefore be discrepancies between the actual totals of the individual amounts in the tables and the totals shown.
Actual2019-20
Actual2020-21
Budget2021-22
Budget FTE2021-22
Approved2022-23
Adopted2022-23
41%
38%
11%
10%
Requirements by Major Function - Special Revenue Funds
1000 - Instruction
2000 - Support Services
3000 - Enterprise And Community Svcs
4000 - Facilities Acquisition And Con
5100 - Debt Service & 5400 - PERS UAL Programs
5200 - Transfers Of Funds
6000 - Contingencies
7000 - Unappropriated Fund Balance
Summary of Requirements by Major Function - Special Revenue Funds (in Thousands)
Percent of Requirements by Major Function - Special Revenue Funds

156
111 - Licensed Salaries 19,208 21,979 25,844 37,862 475.03 51,176 - - 628.35
1121 - Classified - Represented 11,651 12,698 14,121 16,473 456.02 18,180 - - 514.43
1122 - Non - Represented Staff 4,305 4,385 4,592 5,394 73.56 5,928 - - 77.89
113 - Administrators 1,953 2,069 2,791 3,650 28.50 5,379 - - 38.76
Other Salaries 4,461 3,122 7,127 13,639 - 15,630 - - -
200 - Associated Payroll Costs 19,994 23,075 28,214 36,734 - 47,727 - - -
300 - Purchased Services 9,938 9,213 14,537 108,292 - 68,541 - - -
400 - Supplies And Materials 22,500 18,906 24,743 37,895 - 50,179 - - -
500 - Capital Outlay 1,143 1,678 175 957 - 1,889 - - -
600 - Other Objects 4,277 4,337 4,914 5,644 - 9,408 - - -
700 - Transfers 88 - 651 - - - - - -
581000 - Operating Contingency - - - 4,903 - - - - -
376520 - Budgeted Ending Fund Balance 37,428 35,790 28,222 31,718 - 31,442 - - -
TOTAL REQUIREMENTS 136,944 137,252 155,931 303,161 1,033.12 305,478 - - 1,259.43
Budget FTE2022-23
Summary of Requirements by Major Object - Special Revenue Funds (in Thousands)
Actual2018-19
Proposed 2022-23
Certain numbers have been rounded up or down. There may therefore be discrepancies between the actual totals of the individual amounts in the tables and the totals shown.
Actual2019-20
Actual2020-21
Budget2021-22
Budget FTE2021-22
Approved2022-23
Adopted2022-23
17%
6%
2%
2%5%
16%22%
16%
1%3%
10%
Requirements by Major Object - Special Revenue Funds
111 - Licensed Salaries
1121 - Classified - Represented
1122 - Non - Represented Staff
113 - Administrators
Other Salaries
200 - Associated Payroll Costs
300 - Purchased Services
400 - Supplies And Materials
500 - Capital Outlay
600 - Other Objects
700 - Transfers
581000 - Operating Contingency
376520 - Budgeted Ending Fund Balance
Summary of Requirements by Major Object- Special Revenue Funds (in Thousands)
Percent of Requirements by Major Object- Special Revenue Funds

157
STUDENT BODY ACTIVITY FUND (201)The Student Body Activity Fund accounts for the receipts, disbursements and cash balances of the various schools’ Student Body Funds. The resources are primarily generated by students, student groups, Parent Teacher Associations (PTAs), booster clubs, fundraising activities and donations. The individual schools are responsible for managing their school’s fund. Each school’s Student Body Fund is reviewed on a recurring schedule.

158
Description by Object Code Actual Actual Actual Budget Proposed Approved Adopted2018-19 2019-20 2020-21 2021-22 2022-23 2022-23 2022-23
Resources by Object376510 - Budgeted Beginning Fund Balance - - - 5,000 5,000 - -377000 - Fund Balance-Unres/Undes 4,369 4,968 4,930 - - - -
Subtotal - Beginning Fund Balance 4,369 4,968 4,930 5,000 5,000 - -417900 - Other Curricular Activities 7,191 4,914 1,237 8,000 7,500 - -
Subtotal - Other Revenue from Local Sources 7,191 4,914 1,237 8,000 7,500 - -
Total Resources by Object 11,560 9,882 6,167 13,000 12,500 - -
Description by Function Code Actual Actual Actual BudgetBudget
FTE Proposed Approved AdoptedBudget
FTE2018-19 2019-20 2020-21 2021-22 2021-22 2022-23 2022-23 2022-23 2022-23
Requirements by Function1132 - HIGH SCHOOL EXTRA CURRICULAR 6,592 4,952 1,093 8,000 - 7,500 - - -
Subtotal - 1000 - INSTRUCTION 6,592 4,952 1,093 8,000 - 7,500 - - -71100 - Ending Fund Balance 4,968 4,930 5,074 5,000 - 5,000 - - -
Subtotal - 7000 - UNAPPROPRIATED FUND BALANCE 4,968 4,930 5,074 5,000 - 5,000 - - -
Total Requirements by Function 11,560 9,882 6,167 13,000 - 12,500 - - -
YearTotal YearTotal YearTotal YearTotal Jul YearTotal YearTotal YearTotal Jul
Description by Object Code Actual Actual Actual BudgetBudget
FTE Proposed Approved AdoptedBudget
FTE2018-19 2019-20 2020-21 2021-22 2021-22 2022-23 2022-23 2022-23 2022-23
Requirements by Object541000 - Consumable Supplies 6,592 4,952 1,093 8,000 - 7,500 - - -
Subtotal - 400 - SUPPLIES AND MATERIALS 6,592 4,952 1,093 8,000 - 7,500 - - -
376520 - Budgeted Ending Fund Balance 4,968 4,930 5,074 5,000 - 5,000 - - -Subtotal - 376520 - Budgeted Ending Fund Balance 4,968 4,930 5,074 5,000 - 5,000 - - -
Total Requirements by Object 11,560 9,882 6,167 13,000 - 12,500 - - -
Student Body Activity Fund - Requirements by Function (Financial Data In Thousands)
Student Body Activity Fund - Requirements by Object (Financial Data in Thousands)
Certain numbers have been rounded up or down. There may therefore be discrepancies between the actual totals of the individual amounts in the tables and the totals shown.
Fund 201 - Student Body Activity Fund Detail
Student Body Activity Fund - Resources by Object (In Thousands)

159
Resources Proposed 2022-23
Projected 2023-24
Projected 2024-25
Projected 2025-26
BEGINNING FUND BALANCE 5,000 5,175 5,356 5,544
CURRENT YEAR PROPERTY TAXES OTHER THAN LOCAL OPTION - - - -
CURRENT YEAR LOCAL OPTION PROPERTY TAXES - - - -
OTHER REVENUE FROM LOCAL SOURCES 7,500 7,763 8,034 8,315
2000 - REVENUE - INTERMEDIATE SOURCES - - - -
3000 - REVENUE FROM STATE SOURCES - - - -
4000 - REVENUE FROM FEDERAL SOURCES - - - -
5200 - INTERFUND TRANSFERS - - - -
ALL OTHER BUDGET RESOURCES - - - -
Total Resources 12,500 12,938 13,390 13,859
Requirements Proposed 2022-23
Projected 2023-24
Projected 2024-25
Projected 2025-26
111 - LICENSED SALARIES - - - -
1121 - CLASSIFIED - REPRESENTED - - - -
1122 - NON-REPRESENTED STAFF - - - -
113 - ADMINISTRATORS - - - -
OTHER SALARIES - - - -
200 - ASSOCIATED PAYROLL COSTS - - - -
300 - PURCHASED SERVICES - - - -
400 - SUPPLIES AND MATERIALS 7,500 7,763 8,034 8,315
500 - CAPITAL OUTLAY - - - -
600 - OTHER OBJECTS - - - -
700 - TRANSFERS - - - -
581000 - OPERATING CONTINGENCY - - - -
376520 - BUDGETED ENDING FUND BALANCE 5,000 5,175 5,356 5,544
Total Requirements 12,500 12,938 13,390 13,859Certain numbers have been rounded up or down. There may therefore be discrepancies between the actual totals of the individual amounts in the tables and the totals shown.
Budget Forecast by Major Object - 201 -Student Body Activity Fund (In Thousands)
160
CAFETERIA FUND (202)This fund provides for all costs associated with operating federally-funded child nutrition programs in Portland schools.
The department has served on average 6,000 breakfasts, 18,000 lunches, and 1,500 after-school suppers and was awarded a fresh fruit and vegetable program grant at 26 schools during FY22. Additionally, for 10 weeks in the summer, breakfasts and/or lunches are served for free to children ages 1-18 years at 55 schools, community or park locations. Operating costs include menu planning (recipe testing, product/food testing, nutritional analysis and food crediting, participation tracking), supply chain management (bid specification, purchasing, inventory control, warehousing and delivery), meal production and service (HACCP food safety procedures and inspections, food preparation and cooking, equipment maintenance), management of information services (>46,000 student meal accounts, collection and processing eligibility from family meal benefit applications, regular download and analysis of direct certification information, ensuring sibling matches for extension of benefits, determining district socio-economic data, technical support of a web-based department enterprise system), human resource management (recruiting, hiring, training, professional development, performance reviews, progressive discipline, union negotiations), marketing and communication (printing, communication to families about eligibility and meal accounts, information about programs and services, webpage and social media accounts), financial management (budget and grant management), and contract meal service to outside agencies.
Operating funds are generated through sales of meals to students (in a traditional meal service year) and reimbursement for meals served to students under United States Department of Agriculture (USDA) Child Nutrition Program reimbursement guidelines. USDA establishes a fixed reimbursement rate for each documented meal served and sets the household income guidelines that determine a family’s eligibility for free or reduced priced meals. USDA requires that paid meal price covers expenses, and federal reimbursements for free or reduced priced meals should not subsidize the cost for paid eligible meals. Portland Public School’s Board of Directors approves the price for full price meals (3.60.010-AD). The state of Oregon provides reimbursement to cover the family portions (copays) of the reduced price eligible meals for both breakfast and lunch.

161
Description by Object Code Actual Actual Actual Budget Proposed Approved Adopted2018-19 2019-20 2020-21 2021-22 2022-23 2022-23 2022-23
Resources by Object376510 - Budgeted Beginning Fund Balance - - - - 4,269 - -377000 - Fund Balance-Unres/Undes 5,458 3,974 1,707 - - - -
Subtotal - Beginning Fund Balance 5,458 3,974 1,707 - 4,269 - -416120 - Lunch 3,453 2,751 (34) 2,359 2,889 - -416201 - A la Carte Sales - - - - - - -419200 - Contrib-Donation - Priv Source 41 55 59 12 5 - -419700 - Services Provided Other Funds 916 656 - - - - -419910 - Miscellaneous 1 1 2 - - - -419940 - Restitution 1 1 1 - - - -419950 - Sales, Royalties and Events 3 1 4 - - - -
Subtotal - Other Revenue from Local Sources 4,415 3,464 32 2,371 2,894 - -
431020 - SSF--School Lunch Match 139 142 142 - 150 - -432990 - Restricted State Grants 209 443 322 2,369 2,804 - -
Subtotal - 3000 - REVENUE FROM STATE SOURCES 348 585 465 2,369 2,954 - -
445010 - Fed Reimburse-Breakfast 2,655 2,822 4,499 2,522 2,589 - -445020 - Fed Reimburse-Lunch 6,909 6,620 7,900 6,743 7,240 - -445030 - Fed Reimburse-Fresh Fruit & Ve 529 419 132 465 395 - -445060 - Fed Reimburse - Supper 724 614 2,448 852 868 - -445080 - Fed Grants- State Pass Thru 1,129 1,197 1,185 1,047 1,178 - -
Subtotal - 4000 - REVENUE FROM FEDERAL SOURCES 11,946 11,672 16,165 11,629 12,271 - -
452100 - Interfund Transfers 76 69 65 - 75 - -Subtotal - 5200 - INTERFUND TRANSFERS 76 69 65 - 75 - -
451600 - Lease Proceeds - - - - 900 - -Subtotal - All Other Budget Resources - - - - 900 - -
Total Resources by Object 22,244 19,764 18,433 16,368 23,363 - -
Description by Function Code Actual Actual Actual BudgetBudget
FTE Proposed Approved AdoptedBudget
FTE2018-19 2019-20 2020-21 2021-22 2021-22 2022-23 2022-23 2022-23 2022-23
Requirements by Function2520 - FISCAL SERVICES - 526 421 321 - 1,548 - - -
Subtotal - 2000 - SUPPORT SERVICES - 526 421 321 - 1,548 - - -3100 - FOOD SERVICES 18,269 17,531 14,031 16,047 153.99 21,616 - - 187.92
Subtotal - 3000 - ENTERPRISE AND COMMUNITY SVCS 18,269 17,531 14,031 16,047 153.99 21,616 - - 187.92
5100 - DEBT SERVICE - - - - - 199 - - -Subtotal - 5100 - DEBT SERVICE & 5400 - PERS UAL PROGRAMS - - - - - 199 - - -
71100 - Ending Fund Balance 3,974 1,707 3,982 - - - - -Subtotal - 7000 - UNAPPROPRIATED FUND BALANCE 3,974 1,707 3,982 - - - - -
Total Requirements by Function 22,244 19,764 18,433 16,368 153.99 23,363 - - 187.92
Cafeteria Fund - Requirements by Function (Financial Data in Thousands)
Fund 202 - Cafeteria Fund Detail
Cafeteria Fund - Resources by Object (In Thousands)

162
YearTotal YearTotal YearTotal YearTotal Jul YearTotal YearTotal YearTotal Jul
Description by Object Code Actual Actual Actual BudgetBudget
FTE Proposed Approved AdoptedBudget
FTE2018-19 2019-20 2020-21 2021-22 2021-22 2022-23 2022-23 2022-23 2022-23
Requirements by Object511210 - Classified - Represented 3,774 4,142 2,577 4,999 137.59 5,048 - - 171.52 511220 - Non-Represented Staff 1,016 1,081 1,045 1,211 14.40 1,292 - - 14.40 511420 - Directors/Program Admins 229 242 254 269 2.00 277 - - 2.00 512400 - Temporary Misc - Classified 126 156 13 234 - 234 - - -513300 - Extended Hours 1 - - 1 - - - - -513400 - Overtime Pay 66 60 8 35 - 18 - - -513510 - Group Hlth Opt Out Lic 11 8 4 11 - - - - -513520 - Group Hlth Opt Out Non Lic 38 42 41 22 - - - - -
Subtotal - 100 - SALARIES 5,261 5,731 3,942 6,780 153.99 6,868 - - 187.92 521000 - PERS 120 231 161 265 - (87) - - -521310 - PERS UAL 615 727 533 795 - 1,098 - - -522000 - Social Security - FICA 394 434 298 519 - 525 - - -523100 - Workers' Compensation 51 7 13 39 - 52 - - -523200 - Unemployment Compensation 2 10 16 9 - 4 - - -524100 - Group Health Insurance 1,708 1,669 1,995 1,704 - 2,627 - - -524200 - Other Employer Paid Benefits 21 20 21 13 - 6 - - -524300 - Retiree Health Insurance 36 35 36 49 - 55 - - -524530 - Early Retirement Benefits - 1 - - - (4) - - -
Subtotal - 200 - ASSOCIATED PAYROLL COSTS 2,947 3,134 3,072 3,392 - 4,290 - - -
531800 - Local Mtgs/Non-Instr Staff Dev 11 9 - 10 - 10 - - -532200 - Repairs and Maintenance Svcs 69 79 - 80 - 100 - - -532400 - Rentals - - - - - 58 - - -532410 - Leased Copy Machines 6 - - - - - - - -532900 - Other Property Services 46 83 92 75 - 128 - - -534100 - Travel, Local in District 10 8 4 10 - 9 - - -534200 - Travel, Out of District 29 10 - 7 - 20 - - -535100 - Telephone 9 14 14 14 - 13 - - -535300 - Postage 13 11 4 15 - 12 - - -535400 - Advertising 8 - - 5 - 10 - - -535500 - Printing and Binding 41 48 9 30 - 13 - - -538940 - Professional Moving Services - - - - - 1 - - -538950 - Professional Health Care Svcs - - - 1 - 1 - - -538980 - Laundering Services 42 26 1 43 - 50 - - -538990 - Non-Instr Pers/Professional Sv 113 84 76 110 - 10 - - -
Subtotal - 300 - PURCHASED SERVICES 397 371 199 399 - 434 - - -541000 - Consumable Supplies 419 582 557 513 - 620 - - -541270 - Food Inventory Adjustm-NS Only (55) (701) (202) - - - - - -541600 - Interdepartmental Charges 79 69 23 100 - 50 - - -545100 - Purchased Food-NS Only 6,919 6,541 4,989 7,030 - 7,425 - - -545300 - Donated Commodity -NS Only 1,206 1,309 1,251 1,122 - 1,245 - - -546000 - Non-Consumable Supplies 34 32 - (3,942) - 25 - - -547000 - Computer Software 147 131 124 127 - 123 - - -548000 - Computer Equipment 1 8 4 5 - - - - -
Subtotal - 400 - SUPPLIES AND MATERIALS 8,750 7,973 6,746 4,956 - 9,488 - - -
552000 - Building Acquisition/Improvmnt 26 46 - - - - - - -554100 - Initial and Addl Equipment 290 214 61 55 - 430 - - -554110 - Vehicles - - - 390 - - - - -555090 - Misc Other Technology - 7 - 1 - - - - -559000 - Other Capital Outlay - - - - - 900 - - -
Subtotal - 500 - CAPITAL OUTLAY 316 267 61 446 - 1,330 - - -
Cafeteria Fund - Requirements by Object (Financial Data in Thousands)
Fund 202 - Cafeteria Fund Detail

163
YearTotal YearTotal YearTotal YearTotal Jul YearTotal YearTotal YearTotal Jul
Description by Object Code Actual Actual Actual BudgetBudget
FTE Proposed Approved AdoptedBudget
FTE2018-19 2019-20 2020-21 2021-22 2021-22 2022-23 2022-23 2022-23 2022-23
Requirements by Object561000 - Redemption of Principal - - - - - 166 - - -562100 - Interest (Except Bus/Garage) - - - - - 33 - - -564000 - Dues and Fees 67 55 10 74 - 106 - - -569000 - Grant Indirect Charges 532 526 421 321 - 648 - - -
Subtotal - Other Objects 599 581 431 395 - 954 - - -376520 - Budgeted Ending Fund Balance 3,974 1,707 3,982 - - - - - -
Subtotal - 376520 - Budgeted Ending Fund Balance 3,974 1,707 3,982 - - - - - -
Total Requirements by Object 22,244 19,764 18,433 16,368 153.99 23,363 - - 187.92
Cafeteria Fund - Requirements by Object (Financial Data in Thousands)
Certain numbers have been rounded up or down. There may therefore be discrepancies between the actual totals of the individual amounts in the tables and the totals shown.
Fund 202 - Cafeteria Fund Detail
* Note that object code 523300 (pertaining to Portland Family Medical Leave) is not itemized in the table, however the amounts are included in the totals. This is due to a software error and will be updated in the approved budget.

164
Resources Proposed 2022-23
Projected 2023-24
Projected 2024-25
Projected 2025-26
BEGINNING FUND BALANCE 4,269 4,420 4,575 4,735
CURRENT YEAR PROPERTY TAXES OTHER THAN LOCAL OPTION - - - -
CURRENT YEAR LOCAL OPTION PROPERTY TAXES - - - -
OTHER REVENUE FROM LOCAL SOURCES 2,894 2,995 3,100 3,209
2000 - REVENUE - INTERMEDIATE SOURCES - - - -
3000 - REVENUE FROM STATE SOURCES 2,954 3,057 3,164 3,275
4000 - REVENUE FROM FEDERAL SOURCES 12,271 12,700 13,145 13,605
5200 - INTERFUND TRANSFERS 75 78 80 83
ALL OTHER BUDGET RESOURCES 900 932 964 998
Total Resources 23,363 24,182 25,028 25,905
Requirements Proposed 2022-23
Projected 2023-24
Projected 2024-25
Projected 2025-26
111 - LICENSED SALARIES - - - -
1121 - CLASSIFIED - REPRESENTED 5,048 5,225 5,408 5,597
1122 - NON-REPRESENTED STAFF 1,569 1,624 1,681 1,740
113 - ADMINISTRATORS - - - -
OTHER SALARIES 252 261 270 279
200 - ASSOCIATED PAYROLL COSTS 4,290 4,440 4,596 4,756
300 - PURCHASED SERVICES 434 449 465 481
400 - SUPPLIES AND MATERIALS 9,489 9,821 10,165 10,521
500 - CAPITAL OUTLAY 1,330 1,377 1,425 1,475
600 - OTHER OBJECTS 953 985 1,020 1,056
700 - TRANSFERS - - - -
581000 - OPERATING CONTINGENCY - - - -
376520 - BUDGETED ENDING FUND BALANCE - - - -
Total Requirements 23,363 24,182 25,028 25,905Certain numbers have been rounded up or down. There may therefore be discrepancies between the actual totals of the individual amounts in the tables and the totals shown.
Budget Forecast by Major Object - 202 - Cafeteria Fund (In Thousands)

165
GRANTS FUND (205)This fund captures the resources and requirements for grants received by the District. The District actively pursues federal, state, local, and private grants to support projects in a variety of instruction and service areas. Most grant funded programs are operated to enable the District to achieve goals in situations that require supplementary or compensatory effort beyond what can be provided using General Fund support. Other grants supplement basic offerings of the District. All grants complement the primary mission of the District, which is to provide quality education to all students.

166
Description by Object Code Actual Actual Actual Budget Proposed Approved Adopted2018-19 2019-20 2020-21 2021-22 2022-23 2022-23 2022-23
Resources by Object376510 - Budgeted Beginning Fund Balance - - - - 538 - -377000 - Fund Balance-Unres/Undes - - - - - - -
Subtotal - Beginning Fund Balance - - - - 538 - -412000 - Rev-Local Gov't Not Districts 1,883 3,683 1,367 1,067 629 - -419200 - Contrib-Donation - Priv Source 18 6 - - - - -419400 - Svc Provided-Oth Local Ed Agcy 146 110 58 - - - -419600 - Recovery PY Expenditure 37 3 (1) - - - -
Subtotal - Other Revenue from Local Sources 2,084 3,801 1,424 1,067 629 - -
422000 - Restricted Revenue 104 43 28 - 130 - -Subtotal - 2000 - REVENUE - INTERMEDIATE SOURCES 104 43 28 - 130 - -
432990 - Restricted State Grants 28,179 24,396 28,738 45,402 56,231 - -Subtotal - 3000 - REVENUE FROM STATE SOURCES 28,179 24,396 28,738 45,402 56,231 - -
442000 - Unrestr Rev-Fed Govt Thru St - - 77 535 43 - -443000 - Restr Rev-Fed Govt Direct 8,549 4,861 8,625 11,360 13,578 - -445080 - Fed Grants- State Pass Thru 27,170 36,961 41,585 142,701 119,659 - -447000 - Fed Grants-Other Interm Agency 563 432 67 15 15 - -
Subtotal - 4000 - REVENUE FROM FEDERAL SOURCES 36,282 42,254 50,353 154,612 133,296 - -
452100 - Interfund Transfers - - 651 - - - -Subtotal - 5200 - INTERFUND TRANSFERS - - 651 - - - -
Total Resources by Object 66,649 70,494 81,194 201,081 190,824 - -
Fund 205 - Grants Fund Detail
Grants Fund - Resources by Object (In Thousands)

167
Description by Function Code Actual Actual Actual BudgetBudget
FTE Proposed Approved AdoptedBudget
FTE2018-19 2019-20 2020-21 2021-22 2021-22 2022-23 2022-23 2022-23 2022-23
Requirements by Function1111 - ELEMENTARY K-5 2,122 2,645 6,064 20,765 81.85 10,872 - - 121.69 1113 - ELEMENTARY EXTRA CURRICULAR 157 7 5 - - - - - -1121 - MIDDLE SCHOOL PROGRAMS 300 566 1,193 9,267 12.00 2,013 - - 17.98
1122 - MIDDLE SCHOOL EXTR CURRICULAR 5 - - - - - - - -
1131 - HIGH SCHOOL PROGRAMS 1,631 2,117 2,947 14,991 21.20 5,785 - - 38.34 1132 - HIGH SCHOOL EXTRA CURRICULAR 28 - 31 3 0.03 132 - - 1.17 1140 - PRE KINDERGARTEN PROGRAMS 8,368 8,913 9,945 11,101 119.61 13,604 - - 140.57 1100 - INSTRUCTIONAL SUB ROLLUP - - 4,020 - - 2,913 - - 27.00 1220 - RESTRICTIVE PROGRAMS 2,157 2,352 2,765 3,191 38.15 19,319 - - 35.34 1250 - LESS RESTRICTIVE PROGRAMS 10,258 12,546 10,289 9,760 60.93 11,690 - - 70.06 1260 - TREATMENT AND HABILITATION 505 490 446 534 4.00 412 - - 3.00 1272 - TITLE I A/D 2,190 3,309 1,912 4,465 - 3,682 - - 0.50 1280 - ALTERNATIVE EDUCATION 3,994 4,072 4,987 7,949 36.89 11,852 - - 56.27 1291 - ENGLISH LANGUAGE LEARNER 308 257 435 1,075 2.37 1,661 - - 3.17 1292 - TEEN PARENT PROGRAMS 154 174 140 260 - 254 - - -1293 - MIGRANT EDUCATION 244 256 262 354 1.00 259 - - 1.00 1299 - OTHER SPECIAL PROGRAMS 870 436 841 1,401 - 969 - - -1400 - SUMMER SCHOOL PROGRAMS 194 87 651 7,347 - 10,021 - - -
Subtotal - 1000 - INSTRUCTION 33,485 38,227 46,931 92,463 378.03 95,437 - - 516.07 2110 - ATTENDANCE/SOCIAL WORK SVCS 2,505 2,980 2,085 6,478 26.00 2,650 - - 24.39 2120 - GUIDANCE SERVICES 5,791 4,005 4,616 8,956 29.25 7,007 - - 33.54 2130 - HEALTH SERVICES PROGRAMS 281 191 264 528 0.50 67 - - -2140 - PSYCHOLOGICAL SERVICES 1,034 1,302 1,195 1,194 8.98 1,412 - - 10.36 2150 - SPEECH PATHOLOGY/AUDIOLOGY SVC 1,296 1,187 1,449 1,454 11.20 1,511 - - 11.20
2160 - OTHER STUDENT TREATMENT SVCS 723 596 278 1,005 8.20 931 - - 7.20
2190 - SVC DIRECTION-STUDENT SUPPORT 4,786 4,857 6,294 6,639 37.62 31,443 - - 36.04
2210 - IMPROVEMENT OF INSTRUCTION 903 1,036 2,046 20,551 2.50 1,935 - - 3.50 2220 - EDUCATIONAL MEDIA SERVICES 284 478 713 189 2.35 213 - - 2.30 2230 - ASSESSMENT AND TESTING 4 - 70 - - 19 - - -2240 - INSTRUC STAFF DEVELOPMENT 6,916 5,913 8,630 8,885 41.61 6,747 - - 29.30 2320 - EXECUTIVE ADMINISTRATION SVCS 448 410 78 - - - - - -2410 - OFFICE OF THE PRINCIPAL SVCS 1,270 1,154 1,700 6,551 24.59 5,003 - - 42.03 2520 - FISCAL SERVICES 3,157 3,266 3,621 4,379 - 7,670 - - -
2540 - OPER/MAINTENANCE OF PLANT SVCS 50 50 6,438 1,784 - 5,050 - - -
2550 - STUDENT TRANSPORTATION SERVICE 101 134 - 158 - 101 - - -
2570 - INTERNAL SERVICES - - 2,317 42 - - - - -2620 - RESEARCH,DEVELOP,EVAL SVCS 65 - 92 - - 114 - - 1.00 2630 - INFORMATION SERVICES 25 - 43 160 1.00 253 - - 2.00 2640 - STAFF SERVICES 2 - 943 - - - - - -2660 - TECHNOLOGY SERVICES 538 1,945 181 127 - 14,307 - - 2.00 2690 - OTHER SUPPORT SERVICES-CENTRAL 18 - - - - - - - -
Subtotal - 2000 - SUPPORT SERVICES 30,196 29,504 43,054 69,078 193.79 86,434 - - 204.86 3100 - FOOD SERVICES 946 679 1,526 3,310 - - - - -3300 - COMMUNITY SVCS 2,023 2,083 2,450 31,302 38.13 8,700 - - 40.01
Subtotal - 3000 - ENTERPRISE AND COMMUNITY SVCS 2,969 2,762 3,975 34,612 38.13 8,700 - - 40.01
Grants Fund - Requirements by Function (Financial Data In Thousands)
Fund 205 - Grants Fund Detail

168
Description by Function Code Actual Actual Actual BudgetBudget
FTE Proposed Approved AdoptedBudget
FTE2018-19 2019-20 2020-21 2021-22 2021-22 2022-23 2022-23 2022-23 2022-23
Requirements by Function4110 - Service Area Direction - - - 25 - - - - -
Subtotal - 4000 - FACILITIES ACQUISITION AND CON - - - 25 - - - - -
61100 - Operating Contingency - - - 4,903 - - - - -Subtotal - 6000 - CONTINGENCIES - - - 4,903 - - - - -
71100 - Ending Fund Balance - - (12,768) - - 253 - - -Subtotal - 7000 - UNAPPROPRIATED FUND BALANCE - - (12,768) - - 253 - - -
Total Requirements by Function 66,649 70,494 81,194 201,081 609.95 190,824 - - 760.94
YearTotal YearTotal YearTotal YearTotal Jul YearTotal YearTotal YearTotal Jul
Description by Object Code Actual Actual Actual BudgetBudget
FTE Proposed Approved AdoptedBudget
FTE2018-19 2019-20 2020-21 2021-22 2021-22 2022-23 2022-23 2022-23 2022-23
Requirements by Object511100 - Licensed Staff 17,473 19,867 18,605 22,422 275.54 31,323 - - 381.24 511210 - Classified - Represented 6,722 6,993 10,445 9,308 258.87 10,996 - - 289.26 511220 - Non-Represented Staff 2,602 2,550 2,871 3,384 50.04 3,701 - - 53.18 511310 - Administrators - Licensed 1,849 1,906 2,550 3,132 24.50 5,024 - - 36.26 511420 - Directors/Program Admins 449 470 174 116 1.00 124 - - 1.00 512100 - Substitutes - Licensed 531 423 3,442 469 - 5,969 - - -512200 - Substitutes - Classified 63 14 172 40 - 57 - - -512300 - Temporary Misc - Licensed 436 262 153 1,881 - 1,881 - - -512400 - Temporary Misc - Classified 369 310 218 116 - 116 - - -513100 - Extended Responsibility - LIC 186 232 282 300 - 70 - - -513200 - Extended Responsibility - CLS 3 4 - - - - - - -513300 - Extended Hours 1,394 1,227 2,319 7,071 - 6,332 - - -513350 - PAT Overload Pay Stipend 14 - - - - - - - -513400 - Overtime Pay 71 44 72 40 - 105 - - -513510 - Group Hlth Opt Out Lic 16 28 24 - - - - - -
Subtotal - 100 - SALARIES 32,178 34,330 41,327 48,278 609.95 65,697 - - 760.94 521000 - PERS 921 1,646 1,910 1,920 - 575 - - -521310 - PERS UAL 3,818 4,385 5,368 5,612 - 9,431 - - -522000 - Social Security - FICA 2,405 2,574 3,116 3,693 - 5,000 - - -523100 - Workers' Compensation 302 32 205 274 - 433 - - -523200 - Unemployment Compensation 8 52 113 60 - 48 - - -524100 - Group Health Insurance 7,492 8,785 9,303 10,794 - 14,864 - - -524200 - Other Employer Paid Benefits 67 69 94 112 - 152 - - -524300 - Retiree Health Insurance 236 181 408 345 - 481 - - -524530 - Early Retirement Benefits 118 87 102 95 - 124 - - -524510 - PAT Union Tuition Reimbursemnt 1 - - - - - - - -524600 - PFSP District Inservices - - 5 - - - - - -
Subtotal - 200 - ASSOCIATED PAYROLL COSTS 15,367 17,811 20,624 22,904 - 31,238 - - -
Grants Fund - Requirements by Function (Financial Data In Thousands)
Grants Fund - Requirements by Object (Financial Data in Thousands)
Fund 205 - Grants Fund Detail

169
YearTotal YearTotal YearTotal YearTotal Jul YearTotal YearTotal YearTotal Jul
Description by Object Code Actual Actual Actual BudgetBudget
FTE Proposed Approved AdoptedBudget
FTE2018-19 2019-20 2020-21 2021-22 2021-22 2022-23 2022-23 2022-23 2022-23
Requirements by Object531100 - Instructional Services 1,472 996 1,173 45,021 - 4,252 - - -531200 - Instr Program Improvement Svcs 488 198 709 2,366 - 3,264 - - -531300 - Student Services 78 95 46 682 - 375 - - -531800 - Local Mtgs/Non-Instr Staff Dev 357 282 258 1,241 - 652 - - -531810 - Non-Instr Dev Profess Dev Fds - - - 3 - 3 - - -531900 - Other Instr Prof/Tech Svcs 3,080 3,650 3,127 47,730 - 34,288 - - -532100 - Cleaning Services - 13 25 42 - - - - -532200 - Repairs and Maintenance Svcs 82 78 666 77 - 331 - - -532400 - Rentals 12 6 1 10 - - - - -532410 - Leased Copy Machines 27 - - - - 10 - - -532500 - Electricity - - - 1,580 - - - - -532600 - Fuel - - 8 - - - - - -532900 - Other Property Services 52 26 57 82 - 58 - - -533110 - Reimb - School Bus 13 - - 145 - - - - -533120 - Reimb - Taxi Cab 101 105 - 103 - 101 - - -533140 - Reimb - Tri-Met - - - - - - - - -533150 - Reimb - Field Trips 3 35 - 114 - 94 - - -533200 - Non-Reimb Student Transport 42 64 - 860 - 55 - - -534100 - Travel, Local in District 206 118 24 161 - 235 - - -534200 - Travel, Out of District 899 424 29 212 - 162 - - -534300 - Travel, Student Activities 63 36 5 29 - 14 - - -534901 - Student Academic Transport 16 1 - 5 - 5 - - -535100 - Telephone 42 58 993 58 - 17 - - -535300 - Postage 6 5 18 3 - 2 - - -535400 - Advertising - 2 5 6 - 3 - - -535500 - Printing and Binding 23 50 23 16 - 36 - - -535920 - Internet Fees - - 570 - - - - - -535990 - Wide Area Network/Misc 1 - - - - - - - -536000 - Charter Schools - - 1,321 797 - - - - -537410 - Tuition - Fees College Credit - - 43 - - - - - -538100 - Audit Services - - 3 267 - - - - -538300 - Architect and Engineering Svcs 3 - 32 - - 300 - - -538500 - Management Services - - 45 - - - - - -538600 - Data Processing Services 13 48 83 119 - 19 - - -538910 - Security Services - - 176 - - 85 - - -538940 - Professional Moving Services 1 27 280 - - 225 - - -538950 - Professional Health Care Svcs 214 191 232 377 - 1 - - -538960 - Professional Child Care Svcs 159 176 216 610 - 254 - - -538970 - Graphic Arts Services 6 15 26 7 - 6 - - -538980 - Laundering Services 23 23 - 70 - 69 - - -538990 - Non-Instr Pers/Professional Sv 407 881 1,890 1,228 - 11,336 - - -538995 - Meal Services 907 651 - - - - - - -539100 - Pass Through - - 162 - - 8 - - -
Subtotal - 300 - PURCHASED SERVICES 8,796 8,253 12,247 104,020 - 56,260 - - -
Grants Fund - Requirements by Object (Financial Data in Thousands)
Fund 205 - Grants Fund Detail

170
YearTotal YearTotal YearTotal YearTotal Jul YearTotal YearTotal YearTotal Jul
Description by Object Code Actual Actual Actual BudgetBudget
FTE Proposed Approved AdoptedBudget
FTE2018-19 2019-20 2020-21 2021-22 2021-22 2022-23 2022-23 2022-23 2022-23
Requirements by Object541000 - Consumable Supplies 1,191 797 5,092 14,641 - 11,226 - - -541325 - Gas - 11 10 - - - - - -541600 - Interdepartmental Charges 7 1 - - - 225 - - -542100 - Textbook Expansion 464 442 192 3 - 14 - - -542200 - Textbook Adoption - 8 585 - - - - - -542300 - Textbook Replacement 2 - - - - - - - -543000 - Library Books 200 323 298 8 - 126 - - -544000 - Periodicals 8 - 16 6 - - - - -544100 - Online Periodical Subscription 1 17 33 2 - 1 - - -546000 - Non-Consumable Supplies 1,047 404 5,168 1,046 - 2,884 - - -546100 - Minor Equipment - Tagged 264 164 771 61 - 1,003 - - -547000 - Computer Software 862 1,154 3,299 596 - 103 - - -548000 - Computer Equipment 2,155 2,005 709 53 - 14,114 - - -
Subtotal - 400 - SUPPLIES AND MATERIALS 6,203 5,325 16,172 16,416 - 29,697 - - -
551200 - Infrastructure - - - 2 - - - - -552000 - Building Acquisition/Improvmnt 413 579 69 102 - - - - -553000 - Improvements - Not Buildings 103 - - 30 - - - - -554100 - Initial and Addl Equipment 192 53 135 5 - - - - -555010 - Computers 5 - 193 38 - 63 - - -555090 - Misc Other Technology 25 766 (495) 15 - 2 - - -
Subtotal - 500 - CAPITAL OUTLAY 737 1,399 (99) 193 - 65 - - -561000 - Redemption of Principal - - - 2 - - - - -564000 - Dues and Fees 210 109 73 91 - 44 - - -564100 - Bond Issuance Cost 2 - - - - - - - -569000 - Grant Indirect Charges 3,157 3,266 3,618 4,274 - 7,570 - - -
Subtotal - Other Objects 3,368 3,375 3,691 4,367 - 7,613 - - -581000 - Operating Contingency - - - 4,903 - - - - -
Subtotal - 581000 - Operating Contingency - - - 4,903 - - - - -376520 - Budgeted Ending Fund Balance - - (12,768) - - 253 - - -
Subtotal - 376520 - Budgeted Ending Fund Balance - - (12,768) - - 253 - - -
Total Requirements by Object 66,649 70,494 81,194 201,081 609.95 190,824 - - 760.94
Grants Fund - Requirements by Object (Financial Data in Thousands)
Certain numbers have been rounded up or down. There may therefore be discrepancies between the actual totals of the individual amounts in the tables and the totals shown.
Fund 205 - Grants Fund Detail
* Note that object code 523300 (pertaining to Portland Family Medical Leave) is not itemized in the table, however the amounts are included in the totals. This is due to a software error and will be updated in the approved budget.

171
Resources Proposed 2022-23
Projected 2023-24
Projected 2024-25
Projected 2025-26
BEGINNING FUND BALANCE 538 253 - -
CURRENT YEAR PROPERTY TAXES OTHER THAN LOCAL OPTION - - - -
CURRENT YEAR LOCAL OPTION PROPERTY TAXES - - - -
OTHER REVENUE FROM LOCAL SOURCES 629 651 674 697
2000 - REVENUE - INTERMEDIATE SOURCES 130 - - -
3000 - REVENUE FROM STATE SOURCES 56,231 58,199 60,236 62,344
4000 - REVENUE FROM FEDERAL SOURCES 133,295 137,960 142,789 147,788
5200 - INTERFUND TRANSFERS - - - -
ALL OTHER BUDGET RESOURCES - - - -
Total Resources 190,823 197,063 203,699 210,829
Requirements Proposed 2022-23
Projected 2023-24
Projected 2024-25
Projected 2025-26
111 - LICENSED SALARIES 31,323 32,419 33,554 34,728
1121 - CLASSIFIED - REPRESENTED 10,996 11,381 11,779 12,191
1122 - NON-REPRESENTED STAFF 3,825 3,959 4,097 4,241
113 - ADMINISTRATORS 5,024 5,200 5,382 5,570
OTHER SALARIES 14,530 15,039 15,565 16,110
200 - ASSOCIATED PAYROLL COSTS 31,238 32,331 33,463 34,634
300 - PURCHASED SERVICES 56,260 58,052 59,823 61,917
400 - SUPPLIES AND MATERIALS 29,696 30,735 31,811 32,924
500 - CAPITAL OUTLAY 65 67 70 72
600 - OTHER OBJECTS 7,613 7,879 8,155 8,441
700 - TRANSFERS - - - -
581000 - OPERATING CONTINGENCY - - - -
376520 - BUDGETED ENDING FUND BALANCE 253 - - -
Total Requirements 190,823 197,063 203,699 210,829Certain numbers have been rounded up or down. There may therefore be discrepancies between the actual totals of the individual amounts in the tables and the totals shown.
Budget Forecast by Major Object - 205 - Grants Fund (In Thousands)

172
OObbjjeecctt bbyy PPrroojjeecctt AAmmoouunntt
337766551100 -- BBuuddggeetteedd BBeeggiinnnniinngg FFuunndd BBaallaannccee
G2023 - FED- Medicaid - CRP Audiology 63,426
G2024 - FED- Medicaid - DART Program 334,950
G2025 - FED- Medicaid - Special Education 139,792
337766551100 -- BBuuddggeetteedd BBeeggiinnnniinngg FFuunndd BBaallaannccee 553388,,116688
337766552200 -- BBuuddggeetteedd EEnnddiinngg FFuunndd BBaallaannccee
G2023 - FED- Medicaid - CRP Audiology 20,584
G2024 - FED- Medicaid - DART Program 167,475
G2025 - FED- Medicaid - Special Education 65,134
337766552200 -- BBuuddggeetteedd EEnnddiinngg FFuunndd BBaallaannccee 225533,,119933
441122000000 -- RReevv--LLooccaall GGoovv''tt NNoott DDiissttrriiccttss
G1973 - Benson Const Workforce Training 8,018
G2113 - Metro Reading Results - Chapman 22,000
G2222 - Metro Regional Refresh-Faubion 5,000
G2249 - City of Portland Water Bureau Lead Grant 50,000
G9999 - Budget Revisions 544,000
441122000000 -- RReevv--LLooccaall GGoovv''tt NNoott DDiissttrriiccttss 662299,,001188
442222000000 -- RReessttrriicctteedd RReevveennuuee
G2076 - BVIS 129,512
442222000000 -- RReessttrriicctteedd RReevveennuuee 112299,,551122
443322999900 -- RReessttrriicctteedd SSttaattee GGrraannttss
G1789 - YTP Summer Work Program 96,981
G1830 - Aspire - Alliance 3,701
G1927 - Outdoor School 375,445
G1970 - Aspire - Franklin HS 3,000
G1971 - Aspire - Wilson HS 6,500
G1988 - SSA Summer School 465,000
G2017 - Teen Parent Services 254,000
G2047 - SSA Summer Academic High Sch 1,793,779
G2048 - SSA Summer Enrichment K-8 2,468,704
G2070 - Columbia Regional State 6,362,305
G2078 - Providence Nursing State 1,056,200
G2080 - DART LTCT State 4,773,044
G2098 - Aspire - McDaniel 3,300
G2099 - Aspire - Benson 3,300
G2101 - Aspire - Roosevelt 3,300
G2105 - YDD-Workforce Readiness 210,217
G2106 - YDD-Violence & Gang Prevention 100,000
G2119 - USGS - Mt Tabor 7,800
G2220 - Early Indicator and Intervention System 20,000
G2221 - FED- ECF - Emergency Connectivity Fund 14,060,525
GGrraannttss FFuunndd -- PPrroojjeecctteedd GGrraanntt AAwwaarrddss

173
OObbjjeecctt bbyy PPrroojjeecctt AAmmoouunntt
G2223 - Preschool For All 1,260,000
G2246 - Head Start State 6,089,802
G2247 - Head Start PCL 595,054
G2248 - Preschool Promise 1,730,400
G2254 - M98 CTE 3,524,486
G2255 - M98 Dropout Prevention 7,053,034
G2256 - M98 Post Secondary Success 2,617,300
G2257 - CTE - Support 293,919
G9999 - Budget Revisions 1,000,000
443322999900 -- RReessttrriicctteedd SSttaattee GGrraannttss 5566,,223311,,009966
444422000000 -- UUnnrreessttrr RReevv--FFeedd GGoovvtt TThhrruu SStt
G2023 - FED- Medicaid - CRP Audiology 18,664
G2025 - FED- Medicaid - Special Education 24,346
444422000000 -- UUnnrreessttrr RReevv--FFeedd GGoovvtt TThhrruu SStt 4433,,001100
444433000000 -- RReessttrr RReevv--FFeedd GGoovvtt DDiirreecctt
G1716 - FED-PREP Education Innovation 646,710
G1770 - FED - SAY Wellness 438,367
G1827 - FED-E3 Engage Empower Elevate 2,049,398
G1923 - FED - Developing Leaders 704,128
G1928 - FED-Perkins Innovation 314,333
G2030 - FED- SAY Wellness COVID 353,838
G2062 - FED- Indian Education (Title VI-Part A) 122,678
G2065 - FED- Head Start 1,480,562
G2095 - FED-HS COVID-19 26,526
G2097 - FED-HS American Rescue Plan 350,933
G2242 - FED- Indian Education (Title VI-Part A) 120,000
G2245 - FED- Head Start 5,970,785
G9999 - Budget Revisions 1,000,000
444433000000 -- RReessttrr RReevv--FFeedd GGoovvtt DDiirreecctt 1133,,557788,,225588
GGrraannttss FFuunndd -- PPrroojjeecctteedd GGrraanntt AAwwaarrddss

174
OObbjjeecctt bbyy PPrroojjeecctt AAmmoouunntt
444455008800 -- FFeedd GGrraannttss-- SSttaattee PPaassss TThhrruu
G0972 - FED-Int. Bacc (IB) Payment Prg 10,000
G1790 - YTP (Youth Transition Program) FY 19/21 319,498
G1879 - FED- Title IIA Private School Allocation 24,624
G1899 - FED Title IV-A Student Support and Academic Enrichment (Private) 21,347
G1984 - FED-ESSER 254,032
G1985 - FED-MultCo Teen Pregnancy 145,293
G1996 - FED- Title ID 8,977
G1998 - FED- Title IIA- Private School 133,300
G1999 - FED- Title III- English Language Acquisition 168,326
G2027 - FEMA - Covid-19 Reimbursement 5,000,000
G2041 - FED- ESSER II 15,000,000
G2051 - FED- Title IA- Central 2,600,079
G2053 - FED- Title IC- Migrant Education 574,891
G2054 - FED- Title IC- Migrant Ed Preschool 13,118
G2056 - FED- Title ID 161,568
G2057 - FED- Title IIA- Teacher Quality 1,316,587
G2058 - FED- Title IIA- Private School 195,821
G2059 - FED- Title III- English Language Acquisition 602,443
G2061 - FED- Title IV-A Student Support and Academic Enrichment (Private) 81,405
G2064 - FED- ESSA Partnerships TB 794,000
G2071 - FED - Columbia Regional 7,250,486
G2072 - FED- CRP - Audiology 572,276
G2073 - FED- CRP - TBI 31,030
G2074 - FED- CRP - Addition 235,160
G2075 - FED- OR Commission for the Blind 149,103
G2077 - FED- Providence Nursing 20,264
G2079 - FED- DART Title IND 150,239
G2081 - FED- DART IDEA 49,890
G2082 - FED- IDEA Sec 611 8,829,011
G2083 - FED- IDEA Sec 619 108,013
G2094 - FED- ESSER III 60,000,161
G2107 - FED- ESSA Partnerships 21-22 794,000
G2114 - ARP-HCY II 254,510
G2118 - FED- GEER- Education Stabilization Fund (CRRSA Act) 500,000
G2230 - FED- Title IA- School Budgets 6,225,662
G2231 - FED- Title IA- Central 426,306
G2232 - FED- Title IA- Focus/Priority Set Aside 165,402
G2233 - FED- Title IC- Migrant Education 28,918
G2234 - FED- Title IC- Migrant Ed Preschool 254,510
G2235 - FED- Title IC- Migrant Ed Summer 254,510
G2236 - FED- Title ID 110,195
G2237 - FED- Title IIA- Teacher Quality 605,426
G2238 - FED- Title IIA- Private School 195,821
G2239 - FED- Title III- English Language Acquisition 602,443
GGrraannttss FFuunndd -- PPrroojjeecctteedd GGrraanntt AAwwaarrddss

175
OObbjjeecctt bbyy PPrroojjeecctt AAmmoouunntt
444455008800 -- FFeedd GGrraannttss-- SSttaattee PPaassss TThhrruu
G2240 - FED- Title IV-A Student Support and Academic Enrichment 675,089
G2241 - FED- Title IV-A Student Support and Academic Enrichment (Private) 108,034
G2243 - FED- McKinney Homeless 50,000
G2252 - FED-Foster Care Transportation 100,500
G2253 - FED- Carl Perkins 487,222
G9999 - Budget Revisions 3,000,000
444455008800 -- FFeedd GGrraannttss-- SSttaattee PPaassss TThhrruu 111199,,665599,,449900
444477000000 -- FFeedd GGrraannttss--OOtthheerr IInntteerrmm AAggeennccyy
G1589 - FED-Paths 2 the Future 14,886
444477000000 -- FFeedd GGrraannttss--OOtthheerr IInntteerrmm AAggeennccyy 1144,,888866
GGrraanndd TToottaall 119900,,228855,,227700
GGrraannttss FFuunndd -- PPrroojjeecctteedd GGrraanntt AAwwaarrddss

176
ESSER BUDGETOVERVIEW OF ELEMENTARY & SECONDARY SCHOOL EMERGENCY RELIEF (ESSER) FEDERAL FUNDSThe COVID-19 pandemic solicited a multi-billion dollar response from the federal government to support public education across the country during the health crisis. The stimulus funding for schools to contend with the impact of the pandemic was termed Elementary and Secondary School Emergency Relief (ESSER) and there were three rounds of funding between March 2020 and March 2021.
Overview of Elementary & Secondary School Emergency Relief Federal Funds ESSER I, II, III
US CongressionalAction
K-12 PublicSchoolFundingAcross theNation
How Much for Oregon Public Schools?
About How Much for Portland Public Schools?*
Must Be Invested By
Balance at the Start of the FY2022-23 School Year (July 1, 2022)
CARES Act (Coronavirus Aid, Relief, and Economic Security Act, ESSER I, March 2020)
$13.2 billion $121 million $7.5 million September2022 $0
CRRS Act (Coronavirus Response and Relief Supplemental Appropriations Act, ESSER II, December 2020)
$54.3 billion $499 million $30 million September2023 $15 million
American Rescue Plan Act (ESSER III, March 2021)
$122.8 billion $1.1 billion $70 million September2024 $60 million
*Totals are projected balance after pass through and other allocation requirements per federal and state relief guidelines as of April 2022.
The projected overall ESSER funding awarded to the District and its partners is almost $115 million. There is approximately $75 million in remaining funds to invest as a response to the impact and subsequent recovery from the COVID-19 pandemic.When CARES Act (ESSER I) funding became available to support and maintain operations, the District’s initial investment focus was to address immediate and urgent needs. ESSER I funded preparations for hybrid learning, health-related materials and supplies such as masks, contracts with agencies to sanitize buildings, funding at the emergency operations center and planning/materials for home learning.

177
CRRSA (ESSER II) funding was used to get schools ready for in-person learning; funds were utilized for facility upgrades like Heating, Ventilation and Air Conditioning (HVAC) upgrades, building modifications and classroom modifications. The funding was also used to ensure there was enough personal protective equipment for in-person learning. As the pandemic continued, additional needs surfaced and therefore, additional federal relief was appropriated through the American Rescue Plan Act (ARPA or ESSER III). To further enhance our approach to prioritizing this third round of ESSER funding, under guidance from the Oregon Department of Education, we leveraged the feedback from our Student Investment Account community engagement. In 2019, PPS engaged many diverse groups of community stakeholders to design our Student Investment Account (SIA) plan and garnered tremendous community feedback. We leveraged the SIA feedback and additionally, engaged in targeted community outreach (e.g. incarcerated youth, migrant community, RESJ community partners) to inform and reaffirm our investment priorities. As a result, Portland Public Schools has braided SIA and ESSER funds for pandemic needs that manifested across five general areas:
1. Facility Projects
2. Technology Initiatives
3. Social Emotional & Mental Health Services
4. Safe Operation of Schools and Covid Costs
5. Addressing Student Learning Needs
As the District learns more about the impact of COVID-19, and balances sustainable investments with these one-time funds, PPS will continuously engage with our communities to learn more about pandemic needs in order to further align our ongoing resources with our Strategic Plan and Student Investment Account (SIA) commitments so that we may emerge stronger from the pandemic.
Elementary & Secondary School Emergency Relief (ESSER) Funds Projected Investment Plan through September 2024
*Estimates as of April 2022 and are subject to change.

178
Initiatives with ESSER Full Time Equivalents (FTEs)* Total FTE FTE ESSER Investment*Virtual Programs (including OLA) 58 $6,268,336Maintain Class Sizes 56 $7,051,834Title I Kindergarten Educational Assistants 26 $1,585,035Targeted Instructional Supports / Summer & Wraparound 12 $1,612,419Credit Recovery Support (Including Evening Scholars) 11 $1,314,871Total ESSER FTE Support in FY 2022-23 163 $17,832,495
For more information on ESSER, please see:State of Oregon’s Proposed American Rescue Plan (ARP) ESSER PlanU.S. Department of Education ESSER Frequently Asked QuestionsPortland Public Schools ESSER website
PPS ESSER III Integrated Planning Tool (English)PPS ESSER III 综合规划工具 (中文 | Chinese)Интегрированный инструмент планирования для инициативы PPS ESSER III (Русский | Russian)Qalabka Qorsheynta Isku-dhafan ee PPS ESSER III (Soomaali | Somali)Herramienta de planificación integrada ESSER III de PPS (Español | Spanish)Công Cụ Lập Kế Hoạch Tích Hợp PPS ESSER III (Tiếng Việt | Vietnamese)
*Estimates as of April 2022

179
PERS RATE STABILIZATION RESERVE FUND (225)The Public Employees Retirement System (PERS) Rate Stabilization Reserve Fund accounts for the reserve funds needed to mitigate the budgetary impact of significant employer personnel benefit rate fluctuations when they occur in PERS UAL or OPERS charges.
The resources of the fund are Beginning Balance from the previous year’s unspent fund balance and interfund transfers from the General Fund based upon estimated needs as determined by calculations provided by staff and financial consultants. Beginning in fiscal year 2010-11, 0.11% of current year permanent rate property taxes are dedicated to this fund (Board Resolution 4471, June 27, 2011).
Requirements of the fund are recorded as interfund transfers to the General Fund in an amount determined adequate to manage rate increases. To date, no transfers have been made to the General Fund. Disbursements from this fund are made in accordance with Board Resolution No. 2679.

180
Description by Object Code Actual Actual Actual Budget Proposed Approved Adopted2018-19 2019-20 2020-21 2021-22 2022-23 2022-23 2022-23
Resources by Object376510 - Budgeted Beginning Fund Balance - - - 18,937 19,411 - -377000 - Fund Balance-Unres/Undes 17,209 17,954 18,666 - - - -
Subtotal - Beginning Fund Balance 17,209 17,954 18,666 18,937 19,411 - -411111 - Current-Multnomah Co 254 265 278 290 307 - -411112 - Current-Clackamas Co - - - - - - -411113 - Current-Washington Co 2 2 2 2 2 - -411311 - CY Gap Rate Taxes - Mult Co 27 28 29 31 32 - -411312 - CY Gap Rate Taxes - Clack Co - - - - - - -411313 - CY Gap Rate Taxes - Wash Co - - - - - - -
Subtotal - Current Year Property Taxes other than Local Option 283 296 309 323 342 - -
415100 - Interest on Investments 462 416 81 95 40 - -415300 - Gain/Loss Sale of Investment - 1 - - - - -
Subtotal - Other Revenue from Local Sources 462 416 81 95 40 - -
Total Resources by Object 17,954 18,666 19,056 19,355 19,793 - -
Description by Function Code Actual Actual Actual BudgetBudget
FTE Proposed Approved AdoptedBudget
FTE2018-19 2019-20 2020-21 2021-22 2021-22 2022-23 2022-23 2022-23 2022-23
Requirements by Function71100 - Ending Fund Balance 17,954 18,666 19,056 19,355 - 19,793 - - -
Subtotal - 7000 - UNAPPROPRIATED FUND BALANCE 17,954 18,666 19,056 19,355 - 19,793 - - -
Total Requirements by Function 17,954 18,666 19,056 19,355 - 19,793 - - -
YearTotal YearTotal YearTotal YearTotal Jul YearTotal YearTotal YearTotal Jul
Description by Object Code Actual Actual Actual BudgetBudget
FTE Proposed Approved AdoptedBudget
FTE2018-19 2019-20 2020-21 2021-22 2021-22 2022-23 2022-23 2022-23 2022-23
Requirements by Object376520 - Budgeted Ending Fund Balance 17,954 18,666 19,056 19,355 - 19,793 - - -
Subtotal - 376520 - Budgeted Ending Fund Balance 17,954 18,666 19,056 19,355 - 19,793 - - -
Total Requirements by Object 17,954 18,666 19,056 19,355 - 19,793 - - -
PERS Rate Stabilization Reserve Fund - Requirements by Function (Financial Data in Thousands)
PERS Rate Stabilization Reserve Fund - Requirements by Object (Financial Data in Thousands)
Certain numbers have been rounded up or down. There may therefore be discrepancies between the actual totals of the individual amounts in the tables and the totals shown.
Fund 225 - PERS Rate Stabilization Reserve Fund
PERS Rate Stabilization Reserve Fund - Resources by Object (In Thousands)

181
Resources Proposed 2022-23
Projected 2023-24
Projected 2024-25
Projected 2025-26
BEGINNING FUND BALANCE 19,411 20,090 20,794 21,521
CURRENT YEAR PROPERTY TAXES OTHER THAN LOCAL OPTION 342 354 366 379
CURRENT YEAR LOCAL OPTION PROPERTY TAXES - - - -
OTHER REVENUE FROM LOCAL SOURCES 40 41 43 44
2000 - REVENUE - INTERMEDIATE SOURCES - - - -
3000 - REVENUE FROM STATE SOURCES - - - -
4000 - REVENUE FROM FEDERAL SOURCES - - - -
5200 - INTERFUND TRANSFERS - - - -
ALL OTHER BUDGET RESOURCES - - - -
Total Resources 19,793 20,486 21,203 21,945
Requirements Proposed 2022-23
Projected 2023-24
Projected 2024-25
Projected 2025-26
111 - LICENSED SALARIES - - - -
1121 - CLASSIFIED - REPRESENTED - - - -
1122 - NON-REPRESENTED STAFF - - - -
113 - ADMINISTRATORS - - - -
OTHER SALARIES - - - -
200 - ASSOCIATED PAYROLL COSTS - - - -
300 - PURCHASED SERVICES - - - -
400 - SUPPLIES AND MATERIALS - - - -
500 - CAPITAL OUTLAY - - - -
600 - OTHER OBJECTS - - - -
700 - TRANSFERS - - - -
581000 - OPERATING CONTINGENCY - - - -
376520 - BUDGETED ENDING FUND BALANCE 19,793 20,486 21,203 21,945
Total Requirements 19,793 20,486 21,203 21,945Certain numbers have been rounded up or down. There may therefore be discrepancies between the actual totals of the individual amounts in the tables and the totals shown.
Budget Forecast by Major Object - 225 - PERS Rate Stabilization Reserve Fund (In Thousands)

182
STUDENT INVESTMENT ACCOUNT FUND (251)The State of Oregon adopted a historic investment of funds (HB 3427) to Oregon schools last fiscal year, the Student Success Act (SSA). This act marks a turning point for education in Oregon. When fully implemented, the State will see an additional $1 Billion investment in schools each year, providing new opportunities for every student in Oregon.
The Student Success Act invests in our students in three ways:
y 50% - Student Investment Account (dedicated for K-12)
y 20% - Early Learning Account
y 30% - Statewide Education Initiatives
The Student Investment Account is non-competitive grant money for all Oregon school districts and eligible charter schools. Portland Public Schools is estimated to receive approximately $38 million in the 2022-23 school year.This funding has two purposes:
1. Meet students’ mental and behavioral health needs
2. Increase academic achievements and reduce academic disparities for:
` Students of color ` Students with disabilities ` Emerging bilingual students ` Students navigating poverty, homelessness, foster care, and other students that
have historically experienced disparities in our schools

183
Description by Object Code Actual Actual Actual Budget Proposed Approved Adopted2018-19 2019-20 2020-21 2021-22 2022-23 2022-23 2022-23
Resources by Object432990 - Restricted State Grants - - 11,572 31,526 38,000 - -
Subtotal - 3000 - REVENUE FROM STATE SOURCES - - 11,572 31,526 38,000 - -
Total Resources by Object - - 11,572 31,526 38,000 - -
Description by Function Code Actual Actual Actual BudgetBudget
FTE Proposed Approved AdoptedBudget
FTE2018-19 2019-20 2020-21 2021-22 2021-22 2022-23 2022-23 2022-23 2022-23
Requirements by Function1111 - ELEMENTARY K-5 - - 208 4,762 42.07 4,955 - - 43.14 1121 - MIDDLE SCHOOL PROGRAMS - - 52 2,437 20.30 4,344 - - 36.39
1122 - MIDDLE SCHOOL EXTR CURRICULAR - - - 74 0.73 17 - - 0.15
1131 - HIGH SCHOOL PROGRAMS - - - 459 4.23 375 - - 3.30 1220 - RESTRICTIVE PROGRAMS - - 2 - - - - - -1260 - TREATMENT AND HABILITATION - - 119 227 2.00 239 - - 2.00 1280 - ALTERNATIVE EDUCATION - - 950 4,913 3.30 3,879 - - 3.30 1291 - ENGLISH LANGUAGE LEARNER - - - 86 0.75 - - - -1299 - OTHER SPECIAL PROGRAMS - - 63 168 2.75 172 - - 2.75
Subtotal - 1000 - INSTRUCTION - - 1,394 13,126 76.13 13,979 - - 91.03 2110 - ATTENDANCE/SOCIAL WORK SVCS - - 3,056 3,754 36.19 4,938 - - 44.28 2120 - GUIDANCE SERVICES - - 2,971 3,630 30.30 4,230 - - 34.80 2130 - HEALTH SERVICES PROGRAMS - - - - - 71 - - 0.50 2140 - PSYCHOLOGICAL SERVICES - - 369 495 3.80 498 - - 3.80
2160 - OTHER STUDENT TREATMENT SVCS - - 239 339 3.00 361 - - 3.00
2190 - SVC DIRECTION-STUDENT SUPPORT - - - - - 3,215 - - 1.00
2210 - IMPROVEMENT OF INSTRUCTION - - 246 292 1.00 326 - - 2.00 2220 - EDUCATIONAL MEDIA SERVICES - - - 145 0.25 - - - -2240 - INSTRUC STAFF DEVELOPMENT - - 1,996 5,139 40.50 6,377 - - 48.50 2410 - OFFICE OF THE PRINCIPAL SVCS - - 194 407 3.00 441 - - 3.00 2520 - FISCAL SERVICES - - 500 500 - 500 - - -
2540 - OPER/MAINTENANCE OF PLANT SVCS - - 53 - - - - - -
2660 - TECHNOLOGY SERVICES - - - 516 4.17 588 - - 4.55 Subtotal - 2000 - SUPPORT SERVICES - - 9,623 15,217 122.21 21,545 - - 145.43
3300 - COMMUNITY SVCS - - 555 3,183 - 2,476 - - -Subtotal - 3000 - ENTERPRISE AND COMMUNITY SVCS - - 555 3,183 - 2,476 - - -
Total Requirements by Function - - 11,572 31,526 198.34 38,000 - - 236.45
251 - Student Investment Account - Requirements by Function (Financial Data In Thousands)
Fund 251 - Student Investment Account Detail
251 - Student Investment Account - Resources by Object (In Thousands)

184
YearTotal YearTotal YearTotal YearTotal Jul YearTotal YearTotal YearTotal Jul
Description by Object Code Actual Actual Actual BudgetBudget
FTE Proposed Approved AdoptedBudget
FTE2018-19 2019-20 2020-21 2021-22 2021-22 2022-23 2022-23 2022-23 2022-23
Requirements by Object511100 - Licensed Staff - - 5,635 14,063 181.60 17,718 - - 219.65 511210 - Classified - Represented - - 211 402 9.69 366 - - 8.75 511220 - Non-Represented Staff - - 159 367 5.05 478 - - 6.05 511310 - Administrators - Licensed - - 128 265 2.00 290 - - 2.00 512100 - Substitutes - Licensed - - - - - 80 - - -512300 - Temporary Misc - Licensed - - 17 - - - - - -513100 - Extended Responsibility - LIC - - 1 - - - - - -513300 - Extended Hours - - 147 2,536 - 557 - - -513400 - Overtime Pay - - - - - - - - -513510 - Group Hlth Opt Out Lic - - 3 - - - - - -
Subtotal - 100 - SALARIES - - 6,302 17,633 198.34 19,489 - - 236.45 521000 - PERS - - 196 729 - 31 - - -521310 - PERS UAL - - 703 2,138 - 3,010 - - -522000 - Social Security - FICA - - 480 1,349 - 1,491 - - -523100 - Workers' Compensation - - 29 100 - 135 - - -523200 - Unemployment Compensation - - 21 22 - 14 - - -524100 - Group Health Insurance - - 1,451 3,650 - 4,795 - - -524200 - Other Employer Paid Benefits - - 13 41 - 37 - - -524300 - Retiree Health Insurance - - 64 126 - 147 - - -524530 - Early Retirement Benefits - - 16 34 - 35 - - -
Subtotal - 200 - ASSOCIATED PAYROLL COSTS - - 2,973 8,190 - 9,734 - - -
531100 - Instructional Services - - 467 - - - - - -531200 - Instr Program Improvement Svcs - - 116 - - - - - -531300 - Student Services - - 2 120 - - - - -531800 - Local Mtgs/Non-Instr Staff Dev - - 1 - - - - - -531900 - Other Instr Prof/Tech Svcs - - 230 - - 8,277 - - -536000 - Charter Schools - - 361 - - - - - -538990 - Non-Instr Pers/Professional Sv - - 604 236 - - - - -
Subtotal - 300 - PURCHASED SERVICES - - 1,782 356 - 8,277 - - -541000 - Consumable Supplies - - 3 4,847 - - - - -542100 - Textbook Expansion - - 12 - - - - - -
Subtotal - 400 - SUPPLIES AND MATERIALS - - 15 4,847 - - - - -
569000 - Grant Indirect Charges - - 500 500 - 500 - - -Subtotal - Other Objects - - 500 500 - 500 - - -
Total Requirements by Object - - 11,572 31,526 198.34 38,000 - - 236.45
251 - Student Investment Account - Requirements by Object (Financial Data in Thousands)
Certain numbers have been rounded up or down. There may therefore be discrepancies between the actual totals of the individual amounts in the tables and the totals shown.
Fund 251 - Student Investment Account Detail
* Note that object code 523300 (pertaining to Portland Family Medical Leave) is not itemized in the table, however the amounts are included in the totals. This is due to a software error and will be updated in the approved budget.

185
Resources Proposed 2022-23
Projected 2023-24
Projected 2024-25
Projected 2025-26
BEGINNING FUND BALANCE - - - -
CURRENT YEAR PROPERTY TAXES OTHER THAN LOCAL OPTION - - - -
CURRENT YEAR LOCAL OPTION PROPERTY TAXES - - - -
OTHER REVENUE FROM LOCAL SOURCES - - - -
2000 - REVENUE - INTERMEDIATE SOURCES - - - -
3000 - REVENUE FROM STATE SOURCES 38,000 39,313 40,671 42,076
4000 - REVENUE FROM FEDERAL SOURCES - - - -
5200 - INTERFUND TRANSFERS - - - -
ALL OTHER BUDGET RESOURCES - - - -
Total Resources 38,000 39,313 40,671 42,076
Requirements Proposed 2022-23
Projected 2023-24
Projected 2024-25
Projected 2025-26
111 - LICENSED SALARIES 17,718 18,338 18,980 19,644
1121 - CLASSIFIED - REPRESENTED 366 379 392 406
1122 - NON-REPRESENTED STAFF 478 495 512 530
113 - ADMINISTRATORS 290 300 311 322
OTHER SALARIES 637 659 682 706
200 - ASSOCIATED PAYROLL COSTS 9,734 10,075 10,427 10,791
300 - PURCHASED SERVICES 8,277 8,567 8,867 9,177
400 - SUPPLIES AND MATERIALS - - - -
500 - CAPITAL OUTLAY - - - -
600 - OTHER OBJECTS 500 500 500 500
700 - TRANSFERS - - - -
581000 - OPERATING CONTINGENCY - - - -
376520 - BUDGETED ENDING FUND BALANCE - - - -
Total Requirements 38,000 39,313 40,671 42,076Certain numbers have been rounded up or down. There may therefore be discrepancies between the actual totals of the individual amounts in the tables and the totals shown.
Budget Forecast by Major Object - 251 - Student Investment Account Detail (In Thousands)

186
DEDICATED RESOURCE FUND (299)The Dedicated Resource Fund accounts for revenues from specific sources that are legally restricted to specific purposes or are designated for specific uses.
Resources are generated by a variety of sources such as tuition, donations, sales and royalties and Third Party Medical Reimbursement. These resources fund multiple programs and initiatives across the District.

187
Description by Object Code Actual Actual Actual Budget Proposed Approved Adopted2018-19 2019-20 2020-21 2021-22 2022-23 2022-23 2022-23
Resources by Object376510 - Budgeted Beginning Fund Balance - - - 12,568 14,133 - -377000 - Fund Balance-Unres/Undes 9,171 10,531 10,486 - - - -
Subtotal - Beginning Fund Balance 9,171 10,531 10,486 12,568 14,133 - -413110 - Regular Day Tuition 215 140 235 160 300 - -413310 - Summer School Tuition 60 21 1 - - - -416201 - A la Carte Sales - - - - - - -417420 - Other Activity Fees 1 - - - - - -417700 - Outdoor School Fees 361 - - - - - -419200 - Contrib-Donation - Priv Source 5,724 5,948 5,161 6,074 3,631 - -419400 - Svc Provided-Oth Local Ed Agcy 113 72 90 - 91 - -419410 - Svc Provided-Oth Dist in State 1,687 1,432 1,289 2,969 2,493 - -419500 - Textbook Sales and Rentals - - - - - - -419600 - Recovery PY Expenditure 1 - - - - - -419910 - Miscellaneous 15 4 4 - - - -419940 - Restitution 1 - - - - - -419945 - E-RATE PRIORITY 1 1,012 100 1,098 - 258 - -419946 - E-RATE PRIORITY 2 - 91 1,094 - 73 - -419950 - Sales, Royalties and Events 72 46 50 60 19 - -
Subtotal - Other Revenue from Local Sources 9,263 7,855 9,022 9,263 6,866 - -
422000 - Restricted Revenue - 1 - - - - -Subtotal - 2000 - REVENUE - INTERMEDIATE SOURCES - 1 - - - - -
432990 - Restricted State Grants 1 1 - - - - -Subtotal - 3000 - REVENUE FROM STATE SOURCES 1 1 - - - - -
442000 - Unrestr Rev-Fed Govt Thru St 49 58 - - - - -Subtotal - 4000 - REVENUE FROM FEDERAL SOURCES 49 58 - - - - -
452100 - Interfund Transfers 38 - - - - - -Subtotal - 5200 - INTERFUND TRANSFERS 38 - - - - - -
453000 - Sale of Fixed Assets 15 - - - - - -Subtotal - All Other Budget Resources 15 - - - - - -
Total Resources by Object 18,537 18,445 19,508 21,831 20,999 - -
Fund 299 - Dedicated Resource Fund Detail
Dedicated Resource Fund - Resources by Object (In Thousands)

188
Description by Function Code Actual Actual Actual BudgetBudget
FTE Proposed Approved AdoptedBudget
FTE2018-19 2019-20 2020-21 2021-22 2021-22 2022-23 2022-23 2022-23 2022-23
Requirements by Function1111 - ELEMENTARY K-5 2,141 2,318 1,288 1,683 19.52 2,122 - - 18.68 1113 - ELEMENTARY EXTRA CURRICULAR 18 35 35 71 - 23 - - -1121 - MIDDLE SCHOOL PROGRAMS 758 503 389 573 4.38 698 - - 3.32
1122 - MIDDLE SCHOOL EXTR CURRICULAR 27 - 4 9 - 4 - - -
1131 - HIGH SCHOOL PROGRAMS 721 761 541 1,064 6.72 969 - - 3.06 1132 - HIGH SCHOOL EXTRA CURRICULAR 686 7 4 897 - 323 - - -1140 - PRE KINDERGARTEN PROGRAMS 12 9 6 139 - 26 - - -1100 - INSTRUCTIONAL SUB ROLLUP - - - - - 15 - - -1220 - RESTRICTIVE PROGRAMS 137 88 70 112 - 129 - - -1250 - LESS RESTRICTIVE PROGRAMS 1,654 1,850 1,459 2,410 27.82 3,115 - - 34.63 1272 - TITLE I A/D 4 3 1 2 - 14 - - -1280 - ALTERNATIVE EDUCATION 66 76 15 566 - 133 - - -1291 - ENGLISH LANGUAGE LEARNER - - - 4 0.05 37 - - 0.53 1292 - TEEN PARENT PROGRAMS - - - 46 - 46 - - -1293 - MIGRANT EDUCATION - - - 13 - - - - -1400 - SUMMER SCHOOL PROGRAMS 43 48 16 166 - 168 - - -
Subtotal - 1000 - INSTRUCTION 6,267 5,698 3,827 7,755 58.49 7,822 - - 60.22 2110 - ATTENDANCE/SOCIAL WORK SVCS 8 152 82 87 0.50 39 - - 0.34 2120 - GUIDANCE SERVICES 395 312 354 378 1.00 380 - - 0.33 2130 - HEALTH SERVICES PROGRAMS 20 - - 51 - 91 - - -2140 - PSYCHOLOGICAL SERVICES 9 - - - - - - - -2150 - SPEECH PATHOLOGY/AUDIOLOGY SVC 82 173 134 147 1.00 150 - - 1.00
2190 - SVC DIRECTION-STUDENT SUPPORT 107 326 87 582 2.03 318 - - 0.53
2210 - IMPROVEMENT OF INSTRUCTION 1 48 38 88 - 173 - - -2220 - EDUCATIONAL MEDIA SERVICES 206 195 119 214 1.15 287 - - 2.31 2240 - INSTRUC STAFF DEVELOPMENT 69 167 229 246 1.00 301 - - 1.78 2320 - EXECUTIVE ADMINISTRATION SVCS 65 13 4 262 - 257 - - -2410 - OFFICE OF THE PRINCIPAL SVCS 289 325 380 327 4.14 411 - - 5.13 2520 - FISCAL SERVICES 97 126 90 169 - 46 - - -
2540 - OPER/MAINTENANCE OF PLANT SVCS 24 133 4 17 - - - - -
2550 - STUDENT TRANSPORTATION SERVICE 74 - 2 296 - 355 - - -
2630 - INFORMATION SERVICES 8 10 - 8 - 8 - - -2640 - STAFF SERVICES - - - 1 - 1 - - -2660 - TECHNOLOGY SERVICES 119 93 364 3,586 1.53 3,717 - - 2.45
Subtotal - 2000 - SUPPORT SERVICES 1,573 2,073 1,886 6,459 12.34 6,535 - - 13.87 3100 - FOOD SERVICES 22 21 131 75 - 42 - - -3300 - COMMUNITY SVCS 80 116 107 136 - 115 - - 0.02
Subtotal - 3000 - ENTERPRISE AND COMMUNITY SVCS 102 136 238 211 - 157 - - 0.02
4150 - Bldg Acquis/Constr/Improv Svcs 49 52 27 44 - 89 - - -Subtotal - 4000 - FACILITIES ACQUISITION AND CON 49 52 27 44 - 89 - - -
52100 - Fund Transfers 14 - 651 - - - - - -Subtotal - 5200 - TRANSFERS OF FUNDS 14 - 651 - - - - - -
71100 - Ending Fund Balance 10,531 10,486 12,878 7,363 - 6,396 - - -Subtotal - 7000 - UNAPPROPRIATED FUND BALANCE 10,531 10,486 12,878 7,363 - 6,396 - - -
Total Requirements by Function 18,537 18,445 19,508 21,831 70.83 20,999 - - 74.11
Dedicated Resource Fund - Requirements by Function (Financial Data In Thousands)
Fund 299 - Dedicated Resource Fund Detail

189
YearTotal YearTotal YearTotal YearTotal Jul YearTotal YearTotal YearTotal Jul
Description by Object Code Actual Actual Actual BudgetBudget
FTE Proposed Approved AdoptedBudget
FTE2018-19 2019-20 2020-21 2021-22 2021-22 2022-23 2022-23 2022-23 2022-23
Requirements by Object511100 - Licensed Staff 1,735 2,111 1,604 1,377 17.89 2,134 - - 27.46 511210 - Classified - Represented 1,155 1,563 887 1,765 49.87 1,770 - - 44.89 511220 - Non-Represented Staff 8 15 84 48 1.07 56 - - 1.26 511310 - Administrators - Licensed 104 163 114 253 2.00 65 - - 0.50 511420 - Directors/Program Admins - 28 5 - - - - - -512100 - Substitutes - Licensed 107 43 3 22 - 10 - - -512200 - Substitutes - Classified 1 1 - - - - - - -512300 - Temporary Misc - Licensed 38 5 - - - - - - -512400 - Temporary Misc - Classified 33 30 11 - - - - - -513100 - Extended Responsibility - LIC 102 52 53 586 - - - - -513200 - Extended Responsibility - CLS 540 2 1 69 - - - - -513300 - Extended Hours 301 172 136 208 - 204 - - -513400 - Overtime Pay 14 7 4 - - - - - -513510 - Group Hlth Opt Out Lic - - 2 - - - - - -
Subtotal - 100 - SALARIES 4,138 4,192 2,903 4,328 70.83 4,240 - - 74.11 521000 - PERS 75 162 125 179 - 10 - - -521310 - PERS UAL 393 492 365 520 - 651 - - -522000 - Social Security - FICA 276 316 219 328 - 323 - - -523100 - Workers' Compensation 35 3 14 24 - 29 - - -523200 - Unemployment Compensation 1 7 10 5 - 3 - - -524100 - Group Health Insurance 856 1,109 772 1,140 - 1,392 - - -524200 - Other Employer Paid Benefits 5 6 6 11 - 8 - - -524300 - Retiree Health Insurance 26 24 29 30 - 32 - - -524530 - Early Retirement Benefits 13 11 7 8 - 8 - - -
Subtotal - 200 - ASSOCIATED PAYROLL COSTS 1,680 2,130 1,545 2,245 - 2,465 - - -
531100 - Instructional Services 59 64 82 138 - 136 - - -531200 - Instr Program Improvement Svcs 3 8 16 67 - 43 - - -531300 - Student Services 20 49 5 73 - 84 - - -531800 - Local Mtgs/Non-Instr Staff Dev 119 31 24 227 - 262 - - -531900 - Other Instr Prof/Tech Svcs 146 79 68 235 - 220 - - -532200 - Repairs and Maintenance Svcs 25 178 22 7 - 15 - - -532400 - Rentals 11 2 - 76 - 328 - - -532410 - Leased Copy Machines - - - 3 - 3 - - -532600 - Fuel - - 1 - - - - - -532900 - Other Property Services 10 3 - 4 - 4 - - -533120 - Reimb - Taxi Cab - - - - - - - - -533140 - Reimb - Tri-Met - - - - - - - - -533150 - Reimb - Field Trips 118 - - 1 - - - - -533200 - Non-Reimb Student Transport 15 13 - 19 - 39 - - -534100 - Travel, Local in District 5 2 3 9 - 31 - - -534200 - Travel, Out of District 85 26 (2) 50 - 52 - - -534300 - Travel, Student Activities 60 5 6 17 - 15 - - -534901 - Student Academic Transport - - - - - 1 - - -535100 - Telephone 1 1 1 1 - 1 - - -535300 - Postage 1 3 1 2 - 20 - - -535400 - Advertising - - - - - 3 - - -535500 - Printing and Binding 1 2 5 3 - 6 - - -535990 - Wide Area Network/Misc - - - 2,446 - 2,200 - - -537410 - Tuition - Fees College Credit - - - 57 - 50 - - -538300 - Architect and Engineering Svcs - - - 1 - - - - -538940 - Professional Moving Services 2 - - - - - - - -538960 - Professional Child Care Svcs - - 19 - - - - - -538990 - Non-Instr Pers/Professional Sv 64 91 60 76 - 56 - - -539100 - Pass Through - 32 - 5 - - - - -
Subtotal - 300 - PURCHASED SERVICES 745 589 309 3,517 - 3,570 - - -
Dedicated Resource Fund - Requirements by Object (Financial Data in Thousands)
Fund 299 - Dedicated Resource Fund Detail
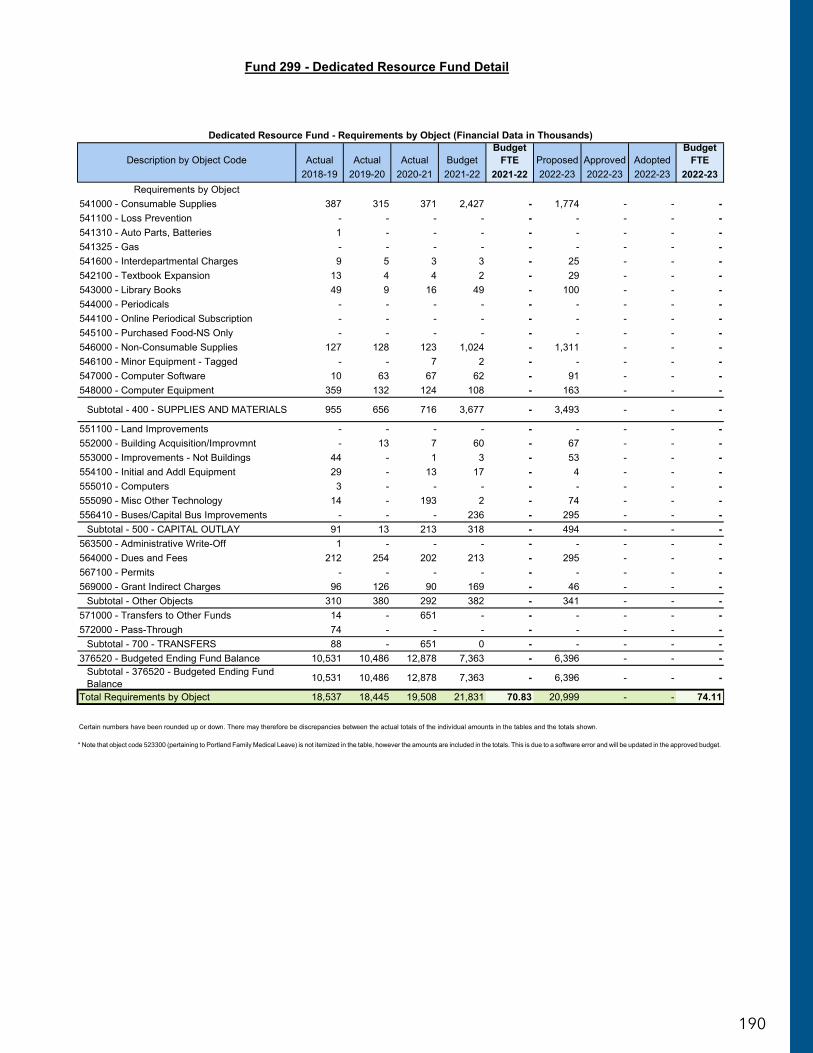
190
YearTotal YearTotal YearTotal YearTotal Jul YearTotal YearTotal YearTotal Jul
Description by Object Code Actual Actual Actual BudgetBudget
FTE Proposed Approved AdoptedBudget
FTE2018-19 2019-20 2020-21 2021-22 2021-22 2022-23 2022-23 2022-23 2022-23
Requirements by Object541000 - Consumable Supplies 387 315 371 2,427 - 1,774 - - -541100 - Loss Prevention - - - - - - - - -541310 - Auto Parts, Batteries 1 - - - - - - - -541325 - Gas - - - - - - - - -541600 - Interdepartmental Charges 9 5 3 3 - 25 - - -542100 - Textbook Expansion 13 4 4 2 - 29 - - -543000 - Library Books 49 9 16 49 - 100 - - -544000 - Periodicals - - - - - - - - -544100 - Online Periodical Subscription - - - - - - - - -545100 - Purchased Food-NS Only - - - - - - - - -546000 - Non-Consumable Supplies 127 128 123 1,024 - 1,311 - - -546100 - Minor Equipment - Tagged - - 7 2 - - - - -547000 - Computer Software 10 63 67 62 - 91 - - -548000 - Computer Equipment 359 132 124 108 - 163 - - -
Subtotal - 400 - SUPPLIES AND MATERIALS 955 656 716 3,677 - 3,493 - - -
551100 - Land Improvements - - - - - - - - -552000 - Building Acquisition/Improvmnt - 13 7 60 - 67 - - -553000 - Improvements - Not Buildings 44 - 1 3 - 53 - - -554100 - Initial and Addl Equipment 29 - 13 17 - 4 - - -555010 - Computers 3 - - - - - - - -555090 - Misc Other Technology 14 - 193 2 - 74 - - -556410 - Buses/Capital Bus Improvements - - - 236 - 295 - - -
Subtotal - 500 - CAPITAL OUTLAY 91 13 213 318 - 494 - - -563500 - Administrative Write-Off 1 - - - - - - - -564000 - Dues and Fees 212 254 202 213 - 295 - - -567100 - Permits - - - - - - - - -569000 - Grant Indirect Charges 96 126 90 169 - 46 - - -
Subtotal - Other Objects 310 380 292 382 - 341 - - -571000 - Transfers to Other Funds 14 - 651 - - - - - -572000 - Pass-Through 74 - - - - - - - -
Subtotal - 700 - TRANSFERS 88 - 651 0 - - - - -376520 - Budgeted Ending Fund Balance 10,531 10,486 12,878 7,363 - 6,396 - - -
Subtotal - 376520 - Budgeted Ending Fund Balance 10,531 10,486 12,878 7,363 - 6,396 - - -
Total Requirements by Object 18,537 18,445 19,508 21,831 70.83 20,999 - - 74.11
Dedicated Resource Fund - Requirements by Object (Financial Data in Thousands)
Certain numbers have been rounded up or down. There may therefore be discrepancies between the actual totals of the individual amounts in the tables and the totals shown.
Fund 299 - Dedicated Resource Fund Detail
* Note that object code 523300 (pertaining to Portland Family Medical Leave) is not itemized in the table, however the amounts are included in the totals. This is due to a software error and will be updated in the approved budget.

191
Resources Proposed 2022-23
Projected 2023-24
Projected 2024-25
Projected 2025-26
BEGINNING FUND BALANCE 14,133 6,324 6,545 6,774
CURRENT YEAR PROPERTY TAXES OTHER THAN LOCAL OPTION - - - -
CURRENT YEAR LOCAL OPTION PROPERTY TAXES - - - -
OTHER REVENUE FROM LOCAL SOURCES 6,866 10,000 10,350 10,712
2000 - REVENUE - INTERMEDIATE SOURCES - - - -
3000 - REVENUE FROM STATE SOURCES - - - -
4000 - REVENUE FROM FEDERAL SOURCES - - - -
5200 - INTERFUND TRANSFERS - - - -
ALL OTHER BUDGET RESOURCES - - - -
Total Resources 20,999 16,324 16,895 17,486
Requirements Proposed 2022-23
Projected 2023-24
Projected 2024-25
Projected 2025-26
111 - LICENSED SALARIES 2,134 2,209 2,286 2,366
1121 - CLASSIFIED - REPRESENTED 1,770 1,832 1,896 1,962
1122 - NON-REPRESENTED STAFF 56 58 60 62
113 - ADMINISTRATORS 65 67 70 72
OTHER SALARIES 215 223 230 238
200 - ASSOCIATED PAYROLL COSTS 2,465 2,551 2,641 2,733
300 - PURCHASED SERVICES 3,570 3,695 3,824 3,958
400 - SUPPLIES AND MATERIALS 3,493 3,615 3,742 3,873
500 - CAPITAL OUTLAY 494 511 529 548
600 - OTHER OBJECTS 341 352 364 377
700 - TRANSFERS - - - -
581000 - OPERATING CONTINGENCY - - - -
376520 - BUDGETED ENDING FUND BALANCE 6,396 1,211 1,253 1,297
Total Requirements 20,999 16,324 16,895 17,486Certain numbers have been rounded up or down. There may therefore be discrepancies between the actual totals of the individual amounts in the tables and the totals shown.
Budget Forecast by Major Object - 299 - Dedicated Resource Fund (In Thousands)

192
Object by Project Amount
376510 - Budgeted Beginning Fund BalanceS0031 - L.E.A. Billings - Deaf / Hard 500,000
S0081 - Regional Inservice 33,992
S0082 - Cash Contributions 690,680
S0083 - Foundation Funds 1,234,967
S0115 - Summer Scholars Program 674,000
S0117 - Teen Parent / Child Developmen 45,858
S0118 - TLC / TNT Donations 3,000
S0128 - Improving Achievement in Scien 2,529
S0133 - Donald Chapman Memorial Fund 62,511
S0142 - Benson House 414,047
S0163 - Deaf/HOH EI-ECSE Classrm 318,342
S0166 - Special Projects 249,000
S0167 - Project: Community Care 905
S0170 - DART - Student Activities 4,149
S0204 - Wilcox Partners Coffee Cart 7,275
S0206 - Audiology Equipment - Non Medi 11,000
S0215 - Districtwide Music Program 1,514
S0220 - SLIP Testing for Non-ESL Stude 5,016
S0226 - Transition Center 13,018
S0229 - Credit-by-Exam: Ed Options (N 450
S0230 - Spec Proj/Early Entry:TAG(NF) 38,664
S0234 - Green Thumb Green House 24,000
S0240 - Walmart Foundation Grant 46,157
S0245 - Adv Place. (AP) Fee Payment Pr 400,000
S0247 - Kaiser Permanente Oral Health 40,175
S0251 - Head Start-BeverlyOliver Trust 84,957
S0256 - Nutrition Donations Misc Rev 41,750
S0266 - iPad Fee for Service 25,947
S0272 - Athletic donations 1,640,084
S0280 - Vol Supp St award Learn Garden 1,529
S0281 - Audiology Services 2,500
S0285 - Assistive Tech & Ed Materials 3,600
S0290 - LTCT Fee for Service 66,369
S0296 - Wellness Works 1,046
S0299 - KPBS Radio Donation 92,834
S0300 - Verizon Innovative Learning 3,622
S0301 - Pauline Bryan Annuity 3,394
S0302 - Pioneer Coffee Cart 16,045
S0303 - Community Transition Coffee Ca 16,921
S0319 - Unique Inks - Roosevelt 21,908
S0320 - Freshman Transitioning - Nike 6,122
S0324 - PEMCO Partnership 7,037
S0325 - Independent Foundations 778,251
S0327 - SPED Classrooms-Fee for Svc 27,246
S0334 - Star Autism/OrPats Reimb 3,000
S0339 - Band Instrument Replacement 14,070
Dedicated Resource Fund - Projected Dedicated Resource ObjectsDedicated Resource Fund - Projected Dedicated Resource Objects

193
S0340 - ODE Alternative Ed Summit 3,876
S0346 - Roosevelt Tennis Camp 10,220
S0349 - Kaiser Perm. School Health Ctr 4,383
S0350 - PPS Parent Fund 1,787,939
S0351 - E-Rate Priority 1 1,942,395
S0353 - Safety Exercises 315
S0354 - Driver In-Service 609
S0363 - Moda Assist Project 15,248
S0367 - Environmental Sustainability 8,383
S0370 - Benson HS Engineering Program 36,822
S0371 - James John K2 Bsktbll Ct Rnvtn 3,242
S0375 - Attendence Monitoring 3,650
S0376 - CRP-DDH Fund Raising 2,316
S0379 - School-Family Partnerships 50,150
S0380 - Nike NSIF College Career Readiness Program 128,580
S0383 - Greg Houser Business Center 180,000
S0385 - Four Cs 3,471
S0390 - REAHL Tookit Development 31,948
S0391 - Nike Community Impact Fund OCF 5,000
S0392 - Benson Microbial Genetics 1,616
S0393 - Roosevelt RESPECT 3,895
S0394 - All Star Awards 1,304
S0396 - Improving Arts Education 10,000
S0399 - Wilson HS Marquee 125
S0400 - LaBonte-Linehan TAG PD 20,395
S0402 - E-rate Priority 2 1,126,610
S0405 - Lincoln Suicide Prevention 34,031
S0408 - ABLE 42,008
S0411 - Climate Justice 130,025
S0414 - Vestal Playground 1,000
S0415 - LETRS PD Research 6,330
S0416 - Electric Bus Project 354,247
S0417 - Mike Walsh Field 197,500
S0423 - Vollum STEM Indian Ed 5,000
S0426 - Home Classroom Kits 238
S0427 - Fund for PPS Classroom Kits 22,799
S0428 - Homeless Student Support Services 11,229
S0431 - Beaumont Band 11,432
S0432 - LETRS 22,564
S0433 - Peninsula Playground 15,500
S0434 - OCF Weston Covid-19 Emergency Relief 7,690
S0436 - Invention Education 11,959
S0439 - On Point 4,293
S0441 - Project the Lead the Way 3,000
S0442 - Royal Rosarian 10,000
S0444 - Gro More Good 3,000
S0447 - Richmond Student Supports 8,541
S0449 - Sustainable Agriculture Program 50,000
S0451 - Youth Against Violence 1,000
S0457 - GHS Class of 47 Benefit 9,005
S0461 - Thriving Schools Playbook 24,999
Dedicated Resource Fund - Projected Dedicated Resource Objects
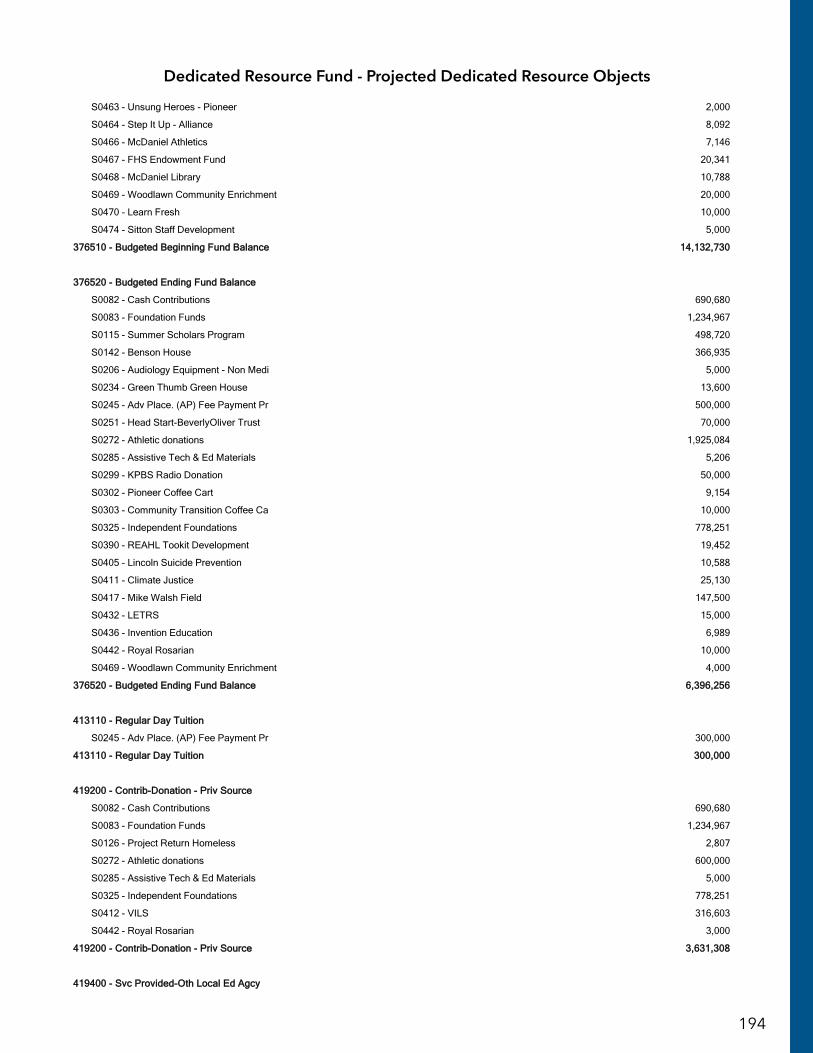
194
S0463 - Unsung Heroes - Pioneer 2,000
S0464 - Step It Up - Alliance 8,092
S0466 - McDaniel Athletics 7,146
S0467 - FHS Endowment Fund 20,341
S0468 - McDaniel Library 10,788
S0469 - Woodlawn Community Enrichment 20,000
S0470 - Learn Fresh 10,000
S0474 - Sitton Staff Development 5,000
337766551100 -- BBuuddggeetteedd BBeeggiinnnniinngg FFuunndd BBaallaannccee 1144,,113322,,773300
337766552200 -- BBuuddggeetteedd EEnnddiinngg FFuunndd BBaallaannccee
S0082 - Cash Contributions 690,680
S0083 - Foundation Funds 1,234,967
S0115 - Summer Scholars Program 498,720
S0142 - Benson House 366,935
S0206 - Audiology Equipment - Non Medi 5,000
S0234 - Green Thumb Green House 13,600
S0245 - Adv Place. (AP) Fee Payment Pr 500,000
S0251 - Head Start-BeverlyOliver Trust 70,000
S0272 - Athletic donations 1,925,084
S0285 - Assistive Tech & Ed Materials 5,206
S0299 - KPBS Radio Donation 50,000
S0302 - Pioneer Coffee Cart 9,154
S0303 - Community Transition Coffee Ca 10,000
S0325 - Independent Foundations 778,251
S0390 - REAHL Tookit Development 19,452
S0405 - Lincoln Suicide Prevention 10,588
S0411 - Climate Justice 25,130
S0417 - Mike Walsh Field 147,500
S0432 - LETRS 15,000
S0436 - Invention Education 6,989
S0442 - Royal Rosarian 10,000
S0469 - Woodlawn Community Enrichment 4,000
337766552200 -- BBuuddggeetteedd EEnnddiinngg FFuunndd BBaallaannccee 66,,339966,,225566
441133111100 -- RReegguullaarr DDaayy TTuuiittiioonn
S0245 - Adv Place. (AP) Fee Payment Pr 300,000
441133111100 -- RReegguullaarr DDaayy TTuuiittiioonn 330000,,000000
441199220000 -- CCoonnttrriibb--DDoonnaattiioonn -- PPrriivv SSoouurrccee
S0082 - Cash Contributions 690,680
S0083 - Foundation Funds 1,234,967
S0126 - Project Return Homeless 2,807
S0272 - Athletic donations 600,000
S0285 - Assistive Tech & Ed Materials 5,000
S0325 - Independent Foundations 778,251
S0412 - VILS 316,603
S0442 - Royal Rosarian 3,000
441199220000 -- CCoonnttrriibb--DDoonnaattiioonn -- PPrriivv SSoouurrccee 33,,663311,,330088
441199440000 -- SSvvcc PPrroovviiddeedd--OOtthh LLooccaall EEdd AAggccyy
Dedicated Resource Fund - Projected Dedicated Resource Objects

195
S0249 - PCC-Jefferson Middle College 90,803
441199440000 -- SSvvcc PPrroovviiddeedd--OOtthh LLooccaall EEdd AAggccyy 9900,,880033
441199441100 -- SSvvcc PPrroovviiddeedd--OOtthh DDiisstt iinn SSttaattee
S0031 - L.E.A. Billings - Deaf / Hard 2,278,847
S0281 - Audiology Services 4,985
S0368 - LEA Billings-BVI Para Educator 209,560
441199441100 -- SSvvcc PPrroovviiddeedd--OOtthh DDiisstt iinn SSttaattee 22,,449933,,339922
441199994455 -- EE--RRAATTEE PPRRIIOORRIITTYY 11
S0351 - E-Rate Priority 1 257,605
441199994455 -- EE--RRAATTEE PPRRIIOORRIITTYY 11 225577,,660055
441199994466 -- EE--RRAATTEE PPRRIIOORRIITTYY 22
S0402 - E-rate Priority 2 73,390
441199994466 -- EE--RRAATTEE PPRRIIOORRIITTYY 22 7733,,339900
441199995500 -- SSaalleess,, RRooyyaallttiieess aanndd EEvveennttss
S0206 - Audiology Equipment - Non Medi 13,400
S0302 - Pioneer Coffee Cart 3,000
S0303 - Community Transition Coffee Ca 3,000
441199995500 -- SSaalleess,, RRooyyaallttiieess aanndd EEvveennttss 1199,,440000
GGrraanndd TToottaall 2277,,339944,,888844
Dedicated Resource Fund - Projected Dedicated Resource Objects

196
DEBT SERVICE FUNDS SUMMARY (300)Fund 300 - Debt Service Fund Resources Summary Growth in fund 300 resources is related to growth in assessed value of properties within the District’s service boundaries, and increased internal service charges to fund payment of pension debt. Resources are expected to grow $8.3 million from 2021-22 to 2022-23, due to increases in Pension and GO bond debt service. When GO bonds are sold, repayment is structured with the intent of keeping property taxes consistent until maturity. Ideally, millage rates do not grow, but revenues grow with assessed value increases.
Fund 300 - Debt Service Fund Requirements Summary This fund accounts for the District’s payment of principal and interest on long term obligations, including General Obligation (GO) bonds from 2012, 2017 and 2020 authorizations, Limited Tax Pension Obligations and Full Faith and Credit Obligations (FFCO). When GO bonds are sold, repayment is structured with the intent of keeping property taxes consistent until maturity. Requirements are expected to increase by $8.3 million from 2021-22 to 2022-23, due to increases in Pension and GO bond debt service. Additional tax revenues will be used to pay the principal and interest on the 2012, 2017 and 2020 bond authorizations. The total outstanding debt as of June 30, 2021 was $1.43 billion.
A major portion of the District’s debt service relates to GO bonds approved in the November 2012, the May 2017, and the November 2020 elections. Portland voters overwhelmingly supported GO bonds for capital improvement totaling nearly $2.50 billion to upgrade PPS schools. The $482 million School Building Improvement Bond authorized in 2012 enabled the district to make improvements in more than 51 schools, and the $790 million Health, Safety and Modernization Bond authorized in May 2017 is underway with the goal of reaching every school in the district. Bonds were issued in December 2020 under the May 2020 authorization for two purposes: 1) $54.0 million to redeem a portion of the outstanding debt on the 2012 authorization; and 2) $365.5 million to continue the work of modernizing PPS schools.
Limited Tax Pension Obligation Bonds were issued to finance the District’s Unfunded Actuarial Liability (UAL). The District participated in an Oregon School Boards Association (OSBA) sponsored pooled limited tax pension bond program in October 2002 and April 2003. The District also issued Full Faith and Credit Pension Bonds in 2021. Through these bond strategic investments, PPS has been able to contain its PERS costs. Under the terms of the borrowing agreements for the Pension Bonds, the District is bound by intercept agreements whereby Wells Fargo Bank Northwest NA and U.S. Bank National Association, as the trustees, directly receive specific amounts that have been withheld from the District’s State School Fund support payments that are deposited in trust with Local Government Investment Pool (LGIP). The trustees then make the scheduled semi-annual debt service payments from the LGIP trust account. Our combined PERS rate is now 17.16% of wages, while some school districts experience rates of 24% to 26%. This translates to General Fund resources remaining available for investment in programs aligned to our vision such as investments in Academic and Behavioral Programming, Technology Aligned with Instruction and Social Emotional Learning.

197
Beginning Fund Balance 6,137 10,783 13,823 10,228 13,061 - -
Current Year Property Taxes Other Than Local Option 123,335 124,515 129,997 138,667 149,108 - -
Other Revenue From Local Sources 50,598 54,432 57,259 60,284 82,477 - -
4000 - Revenue From Federal Sources 97 76 53 30 6 - -
Bond Proceeds & Premiums 4,458 1,752 1,750 1,754 1,238 - -
5200 - Interfund Transfers - - 55,596 - - - -
TOTAL RESOURCES 184,625 191,557 258,478 210,963 245,890 - -
Summary of Resources by Major Object - 300 - Debt Service Funds (In Thousands)
Actual2018-19
Proposed 2022-23
Certain numbers have been rounded up or down. There may therefore be discrepancies between the actual totals of the individual amounts in the tables and the totals shown.
Actual2019-20
Actual2020-21
Budget2021-22
Approved2022-23
Adopted2022-23
5%
61%
34%
Resources by Major Object - 300 - Debt Service Funds
Beginning Fund Balance
Current Year Property Taxes Other Than Local Option
Other Revenue From Local Sources
Bond Proceeds & Premiums
Summary of Resources by Major Object - 300 - Debt Service Funds (in Thousands)
Percent of Resources by Major Object - 300 - Debt Service Funds

198
Summary of Requirements by Major Function - 300 - Debt Service Funds (in Thousands)
Percent of Requirements by Major Function - 300 - Debt Service Funds
5100 - Debt Service & 5400 - Pers Ual Programs 173,842 177,734 246,806 200,309 - 226,741 - - -
7000 - Unappropriated Fund Balance 10,783 13,823 11,672 10,654 - 19,149 - - -
TOTAL REQUIREMENTS 184,625 191,557 258,478 210,963 - 245,890 - - -
Budget FTE
2022-23
Summary of Requirements by Major Function - 300 - Debt Service Funds (Financial Data in Thousands)
Actual2018-19
Proposed 2022-23
Certain numbers have been rounded up or down. There may therefore be discrepancies between the actual totals of the individual amounts in the tables and the totals shown.
Actual2019-20
Actual2020-21
Budget2021-22
Budget FTE
2021-22
Approved2022-23
Adopted2022-23
92%
8%
Requirements by Major Function - 300 - Debt Service Funds
5100 - Debt Service & 5400 - Pers Ual Programs
7000 - Unappropriated Fund Balance

199
Summary of Requirements by Major Object - 300 - Debt Service Funds (in Thousands)
Percent of Requirements by Major Object - 300 - Debt Service Funds
600 - Other Objects 173,842 177,734 246,806 200,309 - 226,741 - - -
376520 - Budgeted Ending Fund Balance 10,783 13,823 11,672 10,654 - 19,149 - - -
TOTAL REQUIREMENTS 184,625 191,557 258,478 210,963 - 245,890 - - -
Certain numbers have been rounded up or down. There may therefore be discrepancies between the actual totals of the individual amounts in the tables and the totals shown.
Actual2019-20
Actual2020-21
Budget2021-22
Budget FTE
2021-22
Approved2022-23
Adopted2022-23
Budget FTE
2022-23
Summary of Requirements by Major Object - Fund 300 - Debt Service Funds (Financial Data in Thousands)
Actual2018-19
Proposed 2022-23
92%
8%
Requirements by Major Object - Fund 300 - Debt Service Funds
600 - Other Objects
376520 - Budgeted Ending Fund Balance

200
DEBT SERVICE OVERVIEWLimited Tax Pension BondsIn October 2002 Portland Public Schools participated as one of forty-one Oregon school districts and education service districts in issuing limited tax pension bonds. The proceeds were used to finance a portion of the estimated unfunded actuarial liability of each participating school district with the Oregon Public Employees Retirement System (“OPERS”). The Oregon School Boards Association (“OSBA”) sponsored this pooled limited tax pension bond program. The OSBA does not have a financial obligation in connection with the bonds issued under the program. Except for the payment of its pension bond payments and additional charges when due, each participating school district has no obligation or liability to any other participating school district’s pension bonds or liabilities to OPERS. In April 2003, OSBA sponsored another pooled limited tax pension bond program with thirty school districts and education service districts. Payments of yearly principal and interest are recorded as financial statement expenditures in instruction and in support services. On October 31, 2002, the District issued $210.1 million Limited Tax Pension Bonds, Series 2002 (Federally Taxable), of which $53.5 million are Series 2002A (deferred interest bonds) and $156.6 million are Series 2002B (current interest bonds). The Series 2002A Bonds were paid off June 30, 2020. The 2002B Bonds are payable annually through June 2028. During 2012, $14.2 million of Series 2002 Pension Bonds were refinanced. The Series 2012 Refunding was paid off June 30, 2021.On April 30, 2003, the District issued $281.2 million Limited Tax Pension Bonds, Series 2003 (Federally Taxable), of which $124.8 million are Series 2003A (deferred interest bonds) and $156.4 million are Series 2003B (current interest bonds). The Series 2003 series Limited Tax Pension Bonds are payable annually through June 2028.
Full Faith and Credit Pension BondsOn July 15, 2021 the District issued $399.4 million Full Faith and Credit Bonds, Series 2021 (Federally Taxable). The bonds were issued to finance the District’s unfunded actuarial liability (UAL) with the OPERS and are payable annually through June 2040.The District anticipates the total costs of financing the District’s UAL with Limited Tax and Full Faith and Credit Pension Bonds will result in a significant savings to the District when compared to paying for such costs as additional contribution rates to OPERS.
General Obligation Bonds As part of a $482 million capital bond measure passed by District voters in 2012, the District issued the following General Obligation debt to finance school renovation and replacement:On May 1, 2013, the District issued $68.6 million in General Obligation Bonds, Series 2013B. The bonds mature on June 15, 2033 with principal payments due annually on June 15. On December 30, 2020 $50.4 million of Series 2013B General Obligation Bonds were refinanced through an advance refunding. On April 30, 2015, the District issued $244.7 million in General Obligation Bonds, Series 2015B. The bonds mature on June 15, 2033 with principal payments due annually on June 15. On August 10, 2017, the District issued $62.2 million in General Obligation Bonds, Series 2017B. The bonds mature on June 15, 2030, with principal payments due annually on June 15. As part of a $790 million capital bond measure passed by District voters in 2017, the District has issued the following General Obligation debt to finance school renovation and replacement:

201
On August 10, 2017, the District issued $179.7 million in General Obligation Bonds, Series 2017B. The bonds mature on June 15, 2044 with principal payments due annually on June 15. On April 14, 2020, the District issued $441.3 million in General Obligation Bonds, Series 2020. The bonds mature on June 15, 2037, with principal payments due annually on June 15. As part of a $1.2 billion capital bond measure passed by District voters in November 2020, the District issued the following General Obligation debt to finance school renovation and replacement and to redeem bonds issued in 2013:On December 30, 2020, the District Issued $365.5 million in General Obligation Bonds, Series 2020B. The bonds mature on June 15, 2046, with principal payments due annually on June 15. On December 30, 2020, the District Issued $54.0 million in General Obligation Advance Refunding Bonds, Series 2020C. The bond proceeds were used to redeem Series 2013B bonds. The bonds mature on June 15, 2033, with principal payments due annually on June 15. The Series 2020C Bonds maturing on or after June 15, 2031 are subject to optional early redemption. The total amount of interest savings (economic gain) as a result of the refinancing is $6.2 million. The present value of future cash savings as a result of the refinancing is $5.5 million. Article XI-K of the Oregon Constitution allows the state to guarantee the general obligation bonded indebtedness of school districts. For the Series 2013B, 2015B, 2017B, 2020, 2020B, and 2020C General Obligation Bonds mentioned immediately above, the District participated in the Oregon School Bond Guaranty program (ORS 328.321 to 328.356), whereby the State of Oregon (State) guarantees all principal and interest payments until maturity will be made to bondholders when due. Should the District fail to make a payment of debt service on these bonds when due, the State will make the payment on behalf of the District, and then will seek recovery from the District. The State may recover funds by means of intercepting any source of operating monies normally remitted from the State to the District. Since the inception of the bonds, the District has not used the guarantee.Other DebtPursuant to the American Recovery and Reinvestment Act of 2009 (ARRA), the City of Portland was awarded $13.5 million in Recovery Zone Economic Development (RZED) Bonds. In July 2010, the City sub-awarded $11.0 million of the RZED bonds to Portland Public Schools, which are being used to complete energy and water conservation projects that will financially benefit the District in reduced energy and water costs and will yield on-going financial benefit once the bonds are paid off. The District makes semi-annual interest payments and annual principal payments, and the bonds will mature in December 2022. The bond’s interest payments are 42 percent federally subsidized.On November 9, 2016, the District issued $5.0 million in Full Faith and Credit Obligations, Series 2016. The obligations mature on December 1, 2031. The obligations carry a prepayment option such that any or all outstanding maturities may be redeemed on or after December 1, 2018.On August 4, 2016 the District issued $4.0 million in Qualified Zone Academy (QZAB) Bonds, Series 2016. The District pays no interest over the 20 year term of the bonds. The bonds carry a 4.39 percent interest rate for structuring purposes, but the purchaser of the bonds receives a Federal tax credit in lieu of interest earnings. The bonds mature on August 4, 2036.Legal Debt LimitORS 328.245 establishes a parameter of bonded indebtedness for school districts. Aggregates are governed by real market values within the District based on the following:For each grade from kindergarten to eighth for which the District operates schools, fifty-five one-hundredths of one percent (.0055) of the real market value. For each grade from ninth to twelfth for which the District operates schools, seventy-five one-hundredths of one percent (.0075) of the real market value. 10 years of Legal Debt Margin information from the District’s 2021 Annual Comprehensive Financial Report is excerpted below.

202
Legal Debt Margin Calculation for Fiscal Year 2021Real Market Value 140,249,375$
Debt Limit (7.95% of Real Market Value) 1 11,149,825$ Amount of Debt Applicable to Debt Limit:
General Obligation Bonded Debt 1,230,887 Less: Amount Available in Debt Service Funds (10,482)
Amount of Debt Applicable to Debt Limit 1,220,405
Legal Debt Margin 9,929,420$
Debt LimitTotal net debt
applicable to limit Legal debt margin
Total net debt applicable to the
limit as a percentage of
debt limit, , , ,, , , ,2012 5,680,406$ -$ 5,680,406$ 0.00%2013 5,604,461 158,187 5,446,274 2.822014 5,917,214 118,738 5,798,476 2.012015 6,517,491 382,186 6,135,305 5.862016 7,228,979 346,748 6,882,231 4.802017 8,501,342 309,076 8,192,266 3.642018 9,670,978 633,588 9,037,390 6.552019 10,472,898 526,062 9,946,836 5.022020 10,698,745 924,888 9,773,857 8.642021 11,149,825 1,220,405 9,929,420 10.95
Allowable Percentage of Real Market Value:A Kindergarten through eighth grade, 9 x .0055 4.95%B Ninth through twelfth, 4 x .0075 3.00%Allowable Percentage 7.95% 1
Notes1
A
B
SourcesTax Supervising and Conservation Commission Annual Reports for the relevant fiscal year
Schedule 12SCHOOL DISTRICT NO.1J, MULTNOMAH COUNTY, OREGON
Legal Debt Margin InformationLast Ten Fiscal Years(dollars in thousands)
ORS 328.245 establishes a parameter of bonded indebtedness for school districts. Aggregates are governed by realmarket values within the District based on the following:
For each grade from kindergarten to eighth for which the District operates schools, fifty-five one-hundredths of one percent(.0055) of the real market value.
For each grade from ninth to twelfth for which the District operates schools, seventy-five one-hundredths of one percent(.0075) of the real market value.
120

203
IT PROJECTS DEBT SERVICE FUND (307)The IT Projects Debt Service Fund was created for the purpose of capturing the General Fund debt repayment (principal and interest), the proceeds from which are spent in Fund 407.The Board of Education issued debt in the amount of $15 million in October 2009. The proceeds funded District Information Technology projects within these major areas: Teacher/Classroom, Information Systems, and Technical Infrastructure. This fund was created on June 29, 2009 in accordance with Board Resolution No. 4106 and completed on June 30, 2019.

204
Description by Object Code Actual Actual Actual Budget Proposed Approved Adopted
2018-19 2019-20 2020-21 2021-22 2022-23 2022-23 2022-23
Resources by Object
452100 - Interfund Transfers 2,708 - - - - - -
Subtotal - 5200 - INTERFUND TRANSFERS 2,708 - - - - - -
Total Resources by Object 2,708 - - - - - -
Description by Function Code Actual Actual Actual Budget Budget FTE Proposed Approved Adopted Budget FTE
2018-19 2019-20 2020-21 2021-22 2021-22 2022-23 2022-23 2022-23 2022-23
Requirements by Function
5100 - DEBT SERVICE 2,708 - - - - - - - -
Subtotal - 5100 - DEBT SERVICE & 5400 - PERS UAL PROGRAMS 2,708 - - - - - - - -
Total Requirements by Function 2,708 - - - - - - - -
YearTotal YearTotal YearTotal YearTotal Jul YearTotal YearTotal YearTotal Jul
Description by Object Code Actual Actual Actual Budget Budget FTE Proposed Approved Adopted Budget FTE
2018-19 2019-20 2020-21 2021-22 2021-22 2022-23 2022-23 2022-23 2022-23
Requirements by Object
561000 - Redemption of Principal 2,619 - - - - - - - -
562100 - Interest (Except Bus/Garage) 89 - - - - - - - -
Subtotal - Other Objects 2,708 - - - - - - - -
Total Requirements by Object 2,708 - - - - - - - -
IT Projects Debt Service Fund - Requirements by Function (Financial Data In Thousands)
IT Projects Debt Service Fund - Requirements by Object (Financial Data in Thousands)
Certain numbers have been rounded up or down. There may therefore be discrepancies between the actual totals of the individual amounts in the tables and the totals shown.
Fund 307 - IT Projects Debt Service Fund Detail
IT Projects Debt Service Fund - Resources by Object (In Thousands)

205
Resources Proposed 2022-23
Projected 2023-24
Projected 2024-25
Projected 2025-26
BEGINNING FUND BALANCE - - - -
CURRENT YEAR PROPERTY TAXES OTHER THAN LOCAL OPTION - - - -
CURRENT YEAR LOCAL OPTION PROPERTY TAXES - - - -
OTHER REVENUE FROM LOCAL SOURCES - - - -
2000 - REVENUE - INTERMEDIATE SOURCES - - - -
3000 - REVENUE FROM STATE SOURCES - - - -
4000 - REVENUE FROM FEDERAL SOURCES - - - -
5200 - INTERFUND TRANSFERS - - - -
ALL OTHER BUDGET RESOURCES - - - -
Total Resources - - - -
Requirements Proposed 2022-23
Projected 2023-24
Projected 2024-25
Projected 2025-26
111 - LICENSED SALARIES - - - -
1121 - CLASSIFIED - REPRESENTED - - - -
1122 - NON-REPRESENTED STAFF - - - -
113 - ADMINISTRATORS - - - -
OTHER SALARIES - - - -
200 - ASSOCIATED PAYROLL COSTS - - - -
300 - PURCHASED SERVICES - - - -
400 - SUPPLIES AND MATERIALS - - - -
500 - CAPITAL OUTLAY - - - -
600 - OTHER OBJECTS - - - -
700 - TRANSFERS - - - -
581000 - OPERATING CONTINGENCY - - - -
376520 - BUDGETED ENDING FUND BALANCE - - - -
Total Requirements - - - -Certain numbers have been rounded up or down. There may therefore be discrepancies between the actual totals of the individual amounts in the tables and the totals shown.
Budget Forecast by Major Object - 307 - IT Projects Debt Service Fund (In Thousands)

206
PERS UAL DEBT SERVICE FUND (308)The fund was established to improve the transparency of debt service related to the Public Employees Retirement System (PERS) unfunded actuarial liability (UAL) debt. The District, in cooperation with a number of districts across the state and in cooperation with the Oregon School Boards Association, issued two series of limited tax Pension Obligation Bonds (POB). These were series 2002 and series 2003. On July 15, 2021, the District issued a series of Federally Taxable Full Faith and Credit Bonds to finance all or a portion of the District’s share of the estimated PERS UAL. Resources include revenues generated from payroll charges dedicated solely to payment of PERS UAL debt service, and interest earnings on funds collected monthly and held in trust in an LGIP account reserved for debt service payments.Fund 308 was established as part of the Adopted Budget process in accordance with Board Resolution No. 4473 on June 27, 2011. The fund was effective as of July 1, 2011.

207
Description by Object Code Actual Actual Actual Budget Proposed Approved Adopted2018-19 2019-20 2020-21 2021-22 2022-23 2022-23 2022-23
Resources by Object376510 - Budgeted Beginning Fund Balance - - - 228 783 - -377000 - Fund Balance-Unres/Undes 1,907 231 255 - - - -
Subtotal - Beginning Fund Balance 1,907 231 255 228 783 - -415100 - Interest on Investments 673 556 205 152 156 - -419700 - Services Provided Other Funds 46,505 51,328 55,144 53,781 78,531 - -419910 - Miscellaneous - - - 3,918 1,758 - -
Subtotal - Other Revenue from Local Sources 47,178 51,883 55,349 57,851 80,445 - -
Total Resources by Object 49,085 52,114 55,604 58,079 81,228 - -
Description by Function Code Actual Actual Actual BudgetBudget
FTE Proposed Approved AdoptedBudget
FTE2018-19 2019-20 2020-21 2021-22 2021-22 2022-23 2022-23 2022-23 2022-23
Requirements by Function5100 - DEBT SERVICE 48,854 51,859 54,414 57,699 - 80,445 - - -
Subtotal - 5100 - DEBT SERVICE & 5400 - PERS UAL PROGRAMS 48,854 51,859 54,414 57,699 - 80,445 - - -
71100 - Ending Fund Balance 231 255 1190 380 - 783 - - -Subtotal - 7000 - UNAPPROPRIATED FUND BALANCE 231 255 1190 380 - 783 - - -
Total Requirements by Function 49,085 52,114 55,604 58,079 - 81,228 - - -
YearTotal YearTotal YearTotal YearTotal Jul YearTotal YearTotal YearTotal Jul
Description by Object Code Actual Actual Actual BudgetBudget
FTE Proposed Approved AdoptedBudget
FTE2018-19 2019-20 2020-21 2021-22 2021-22 2022-23 2022-23 2022-23 2022-23
Requirements by Object561000 - Redemption of Principal 11,949 12,160 21,903 23,573 - 38,296 - - -562100 - Interest (Except Bus/Garage) 36,905 39,699 32,511 34,126 - 42,149 - - -
Subtotal - Other Objects 48,854 51,859 54,414 57,699 - 80,445 - - -376520 - Budgeted Ending Fund Balance 231 255 1190 380 - 783 - - -
Subtotal - 376520 - Budgeted Ending Fund Balance 231 255 1190 380 - 783 - - -
Total Requirements by Object 49,085 52,114 55,604 58,079 - 81,228 - - -
PERS UAL Debt Service Fund - Requirements by Function (Financial Data in Thousands)
PERS UAL Debt Service Fund - Requirements by Object (Financial Data in Thousands)
Certain numbers have been rounded up or down. There may therefore be discrepancies between the actual totals of the individual amounts in the tables and the totals shown.
Fund 308 - PERS UAL Debt Service Fund
PERS UAL Debt Service Fund - Resources by Object (In Thousands)

208
Resources Proposed 2022-23
Projected 2023-24
Projected 2024-25
Projected 2025-26
BEGINNING FUND BALANCE 783 783 783 783
CURRENT YEAR PROPERTY TAXES OTHER THAN LOCAL OPTION - - - -
CURRENT YEAR LOCAL OPTION PROPERTY TAXES - - - -
OTHER REVENUE FROM LOCAL SOURCES 80,445 84,680 87,945 93,202
2000 - REVENUE - INTERMEDIATE SOURCES - - - -
3000 - REVENUE FROM STATE SOURCES - - - -
4000 - REVENUE FROM FEDERAL SOURCES - - - -
5200 - INTERFUND TRANSFERS - - - -
ALL OTHER BUDGET RESOURCES - - - -
Total Resources 81,228 85,463 88,728 93,985
Requirements Proposed 2022-23
Projected 2023-24
Projected 2024-25
Projected 2025-26
111 - LICENSED SALARIES - - - -
1121 - CLASSIFIED - REPRESENTED - - - -
1122 - NON-REPRESENTED STAFF - - - -
113 - ADMINISTRATORS - - - -
OTHER SALARIES - - - -
200 - ASSOCIATED PAYROLL COSTS - - - -
300 - PURCHASED SERVICES - - - -
400 - SUPPLIES AND MATERIALS - - - -
500 - CAPITAL OUTLAY - - - -
600 - OTHER OBJECTS 80,445 84,680 87,945 93,202
700 - TRANSFERS - - - -
581000 - OPERATING CONTINGENCY - - - -
376520 - BUDGETED ENDING FUND BALANCE 783 783 783 783
Total Requirements 81,228 85,463 88,728 93,985Certain numbers have been rounded up or down. There may therefore be discrepancies between the actual totals of the individual amounts in the tables and the totals shown.
Budget Forecast by Major Object - 308 - PERS UAL Debt Service Fund (In Thousands)

209
FULL FAITH AND CREDIT DEBT SERVICE FUND (320)This fund is used to manage the repayment of principal and interest for debt incurred using funds borrowed under the full faith and credit facility of the District. The fund captures the principal and interest for multiple borrowings, each of which fund a specific venture or capital expenditure.
The fund includes the payment of debt for the Recovery Zone Bond-Energy and Water Conservation Program. The interest payments are federally subsidized by this bond program. The balance of the interest payments and the principal are funded through transfers from the General Fund.On July 25, 2016 by way of Board Resolution No. 5314, the Board authorized entering into a purchase agreement sale of the Board’s Qualified Zone Academy Bonds (QZAB) for $4.0 million. This fund also accounts for the principal and interest payments resulting from the issuance of QZAB bonds.
On September 6, 2016 by way of Board Resolution No. 5330, the Board voted to authorize the issuance of a principal amount of revenue bonds sufficient to provide net proceeds of up to $5 million for immediate environmental health and safety issues and assessments. The District is utilizing these funds for projects that remediate health and safety concerns, including repairs to the water system, lead paint encapsulation and abatement, and environmental health and safety assessment and other health and safety related projects.

210
Description by Object Code Actual Actual Actual Budget Proposed Approved Adopted2018-19 2019-20 2020-21 2021-22 2022-23 2022-23 2022-23
Resources by Object449100 - Federal Subsidy 97 76 53 30 6 - -
Subtotal - 4000 - REVENUE FROM FEDERAL SOURCES 97 76 53 30 - - -
452100 - Interfund Transfers 1,750 1,752 1,750 1,754 1,238 - -Subtotal - 5200 - INTERFUND TRANSFERS 1,750 1,752 1,750 1,754 1,244 - -
Total Resources by Object 1,847 1,828 1,803 1,784 1,244 - -
Description by Function Code Actual Actual Actual BudgetBudget
FTE Proposed Approved AdoptedBudget
FTE2018-19 2019-20 2020-21 2021-22 2021-22 2022-23 2022-23 2022-23 2022-23
Requirements by Function5100 - DEBT SERVICE 1,847 1,828 1,803 1,784 - 1,244 - - -
Subtotal - 5100 - DEBT SERVICE & 5400 - PERS UAL PROGRAMS 1,847 1,828 1,803 1,784 - 1,244 - - -
Total Requirements by Function 1,847 1,828 1,803 1,784 - 1,244 - - -
YearTotal YearTotal YearTotal YearTotal Jul YearTotal YearTotal YearTotal Jul
Description by Object Code Actual Actual Actual BudgetBudget
FTE Proposed Approved AdoptedBudget
FTE2018-19 2019-20 2020-21 2021-22 2021-22 2022-23 2022-23 2022-23 2022-23
Requirements by Object561000 - Redemption of Principal 1,479 1,519 1,556 1,598 - 1,123 - - -562100 - Interest (Except Bus/Garage) 368 309 248 186 - 121 - - -
Subtotal - Other Objects 1,847 1,828 1,803 1,784 - 1,244 - - -Total Requirements by Object 1,847 1,828 1,803 1,784 - 1,244 - - -
Full Faith and Credit Debt Service Fund - Requirements by Function (Financial Data In Thousands
Full Faith and Credit Debt Service Fund - Requirements by Object (Financial Data In Thousands)
Certain numbers have been rounded up or down. There may therefore be discrepancies between the actual totals of the individual amounts in the tables and the totals shown.
Full Faith and Credit Debt Service Fund Detail
Full Faith and Credit Debt Service Fund - Resources by Object (In Thousands)

211
Resources Proposed 2022-23
Projected 2023-24
Projected 2024-25
Projected 2025-26
BEGINNING FUND BALANCE - - - -
CURRENT YEAR PROPERTY TAXES OTHER THAN LOCAL OPTION - - - -
CURRENT YEAR LOCAL OPTION PROPERTY TAXES - - - -
OTHER REVENUE FROM LOCAL SOURCES - - - -
2000 - REVENUE - INTERMEDIATE SOURCES - - - -
3000 - REVENUE FROM STATE SOURCES - - - -
4000 - REVENUE FROM FEDERAL SOURCES 6 - - -
5200 - INTERFUND TRANSFERS 1,238 1,266 1,288 1,312
ALL OTHER BUDGET RESOURCES - - - -
Total Resources 1,244 1,266 1,288 1,312
Requirements Proposed 2022-23
Projected 2023-24
Projected 2024-25
Projected 2025-26
111 - LICENSED SALARIES - - - -
1121 - CLASSIFIED - REPRESENTED - - - -
1122 - NON-REPRESENTED STAFF - - - -
113 - ADMINISTRATORS - - - -
OTHER SALARIES - - - -
200 - ASSOCIATED PAYROLL COSTS - - - -
300 - PURCHASED SERVICES - - - -
400 - SUPPLIES AND MATERIALS - - - -
500 - CAPITAL OUTLAY - - - -
600 - OTHER OBJECTS 1,244 1,266 1,288 1,312
700 - TRANSFERS - - - -
581000 - OPERATING CONTINGENCY - - - -
376520 - BUDGETED ENDING FUND BALANCE - - - -
Total Requirements 1,244 1,266 1,288 1,312 Certain numbers have been rounded up or down. There may therefore be discrepancies between the actual totals of the individual amounts in the tables and the totals shown.
Budget Forecast by Major Object - 320 - Full Faith and Credit Debt Service Fund (In Thousands)

212
GO BONDS DEBT SERVICE FUND (350) This fund is used to manage the repayment of principal and interest for debt incurred using funds borrowed through the issuance of General Obligation bonds. The fund captures the principal and interest for multiple borrowings, each of which funds a specific capital expenditure.
Activity in this fund includes the issuance of General Obligation bonds in 2013, 2015 and 2017, issued under the $482.0 million bond authorized by voters in November 2012.
In addition, this fund includes the issuance of General Obligation bonds in 2017, issued under the $790.0 million bond authorized by voters in May 2017.
This fund also includes the issuance of General Obligation bonds in 2020, issued under the $1.20 billion bond authorized by voters in November 2020.
The creation of this fund was authorized in accordance with Board Resolution No. 4416 on February 28, 2011.

213
Description by Object Code Actual Actual Actual Budget Proposed Approved Adopted2018-19 2019-20 2020-21 2021-22 2022-23 2022-23 2022-23
Resources by Object376510 - Budgeted Beginning Fund Balance - - - 10,000 12,278 - -377000 - Fund Balance-Unres/Undes 4,229 10,552 13568 - - - -
Subtotal - Beginning Fund Balance 4,229 10,552 13,568 10,000 12,278 - -411111 - Current-Multnomah Co 122,421 123,606 129,055 137,664 148,069 - -411112 - Current-Clackamas Co 96 98 101 107 110 - -411113 - Current-Washington Co 818 811 841 896 929 - -
Subtotal - Current Year Property Taxes other than Local Option 123,335 124,515 129,997 138,667 149,108 - -
411521 - PY GO Bond - Multnomah County 1,747 1,441 1,753 2,215 1,837 - -411522 - PY GO Bond - Clackamas County 1 1 1 1 1 - -411523 - PY GO Bond - Washington County 10 5 8 8 9 - -411901 - Pen/Int-Multnomah Co 128 155 59 108 43 - -411902 - Pen/Int-Clackamas Co - - - - - - -411903 - Pen/Int-Washington Co 1 1 - 1 - - -415100 - Interest on Investments 1,533 945 88 100 140 - -
Subtotal - Other Revenue from Local Sources 3,420 2,548 1,909 2,433 2,032 - -
451100 - Bond Proceeds - - 53,965 - - - -451200 - Bond Premium - - 1,631 - - - -
Subtotal - All Other Budget Resources - - 55,596 - - - -Total Resources by Object 130,984 137,615 201,070 151,100 163,418 - -
Description by Function Code Actual Actual Actual BudgetBudget
FTE Proposed Approved AdoptedBudget
FTE2018-19 2019-20 2020-21 2021-22 2021-22 2022-23 2022-23 2022-23 2022-23
Requirements by Function5100 - DEBT SERVICE 120,432 124,047 190,588 140,826 - 145,053 - - -
Subtotal - 5100 - DEBT SERVICE & 5400 - PERS UAL PROGRAMS 120,432 124,047 190,588 140,826 - 145,053 - - -
71100 - Ending Fund Balance 10,552 13,568 10,482 10,274 - 18,365 - - -Subtotal - 7000 - UNAPPROPRIATED FUND BALANCE 10,552 13,568 10,482 10,274 - 18,365 - - -
Total Requirements by Function 130,984 137,615 201,070 151,100 - 163,418 - - -
YearTotal YearTotal YearTotal YearTotal Jul YearTotal YearTotal YearTotal Jul
Description by Object Code Actual Actual Actual BudgetBudget
FTE Proposed Approved AdoptedBudget
FTE2018-19 2019-20 2020-21 2021-22 2021-22 2022-23 2022-23 2022-23 2022-23
Requirements by Object561000 - Redemption of Principal 98,490 104,305 146,710 93,665 - 107,970 - - -562100 - Interest (Except Bus/Garage) 21,942 19,742 43,317 47,161 - 37,083 - - -564100 - Bond Issuance Cost - - 561 - - - - - -
Subtotal - Other Objects 120,432 124,047 190,588 140,826 - 145,053 - - -376520 - Budgeted Ending Fund Balance 10552 13568 10482 10,274 - 18,365 - - -
Subtotal - 376520 - Budgeted Ending Fund Balance 10552 13568 10482 10,274 - 18,365 - - -
Total Requirements by Object 130,984 137,615 201,070 151,100 - 163,418 - - -
GO Bonds Debt Service Fund - Requirements by Function (Financial Data In Thousands)
GO Bonds Debt Service Fund - Requirements by Object (Financial Data In Thousands)
Certain numbers have been rounded up or down. There may therefore be discrepancies between the actual totals of the individual amounts in the tables and the totals shown.
GO Bonds Debt Service Fund Detail
GO Bonds Debt Service Fund - Resources by Object (In Thousands)

214
Resources Proposed 2022-23
Projected 2023-24
Projected 2024-25
Projected 2025-26
BEGINNING FUND BALANCE 12,278 18,365 24,665 31,186
CURRENT YEAR PROPERTY TAXES OTHER THAN LOCAL OPTION 149,108 154,327 159,728 165,319
CURRENT YEAR LOCAL OPTION PROPERTY TAXES - - - -
OTHER REVENUE FROM LOCAL SOURCES 2,032 2,103 2,177 2,253
2000 - REVENUE - INTERMEDIATE SOURCES - - - -
3000 - REVENUE FROM STATE SOURCES - - - -
4000 - REVENUE FROM FEDERAL SOURCES - - - -
5200 - INTERFUND TRANSFERS - - - -
ALL OTHER BUDGET RESOURCES - - - -
Total Resources 163,418 174,795 186,570 198,757
Requirements Proposed 2022-23
Projected 2023-24
Projected 2024-25
Projected 2025-26
111 - LICENSED SALARIES - - - -
1121 - CLASSIFIED - REPRESENTED - - - -
1122 - NON-REPRESENTED STAFF - - - -
113 - ADMINISTRATORS - - - -
OTHER SALARIES - - - -
200 - ASSOCIATED PAYROLL COSTS - - - -
300 - PURCHASED SERVICES - - - -
400 - SUPPLIES AND MATERIALS - - - -
500 - CAPITAL OUTLAY - - - -
600 - OTHER OBJECTS 145,053 150,130 155,384 160,823
700 - TRANSFERS - - - -
581000 - OPERATING CONTINGENCY - - - -
376520 - BUDGETED ENDING FUND BALANCE 18,365 24,665 31,186 37,934
Total Requirements 163,418 174,795 186,570 198,757Certain numbers have been rounded up or down. There may therefore be discrepancies between the actual totals of the individual amounts in the tables and the totals shown.
Budget Forecast by Major Object - 350 - GO Bond Debt Service Fund (In Thousands)

215
CAPITAL PROJECTS FUNDS SUMMARY (400)Fund 400 - Capital Projects Fund Resources SummaryFund 400 budgeted resources will be $249.52 million less than 2021-22. This is due to the spend down of our current bond. The District has been awarded $14.5 million in state grant resources for seismic rehabilitation, and has applied for an additional $2.5 million. Seismic Rehabilitation Grant Program (SRGP) work will continue on Creative Sciences in 2022-23. If the additional $2.5 million is awarded, SRGP-related work on Benson will commence in 2022-23 or 2023-24.
Fund 400 - Capital Projects Fund Requirements SummaryThe District is advancing various capital improvement initiatives. Projects include asbestos abatement, seismic improvements, radon mitigation, access controls, cameras, card readers, code compliance requirements, instruction delivery improvements, playgrounds, classroom changes, and energy improvement projects. Work on 2017 and 2020 bond projects will also continue.
On average, Portland Public Schools’ buildings are 77 years old, and some are more than 100 years old. Many schools are in need of upgrades to provide students with modern learning environments and to address unsafe conditions. The District’s capital needs far exceed the available resources to meet those needs and is challenged to find new and innovative ways to support the operational and instructional improvements needed district wide.
In 2022-23 the District will see an overall decrease in capital resources of $249.52 million, this decrease is due to the spend down of the bond with various capital projects. With the limited annual resources and aging buildings and systems, there has been a focus to bring in additional funds in support of establishing equitable student outcomes, stability and improved student experiences. Some additional sources of funding to date include Recovery Zone Bonds (RZB), Qualified Zone Academy Bonds (QZAB), Seismic Rehab Grant Program (SRGP), loans, and Oregon School Capital Improvement Matching Program (OSCIM).
In both November of 2012 and in May 2017, Portland voters overwhelmingly supported capital improvement bonds totaling nearly $1.3 billion to upgrade PPS schools. The focus of those projects has been school modernizations, rebuilds, seismic improvements, roof replacements, and a variety of health & safety work across the district. The District’s other capital resources have also been allocated to support the health & safety work including radon mitigation, lead paint, water quality, ADA upgrades, fire safety as well as support capacity expansions and emergency improvements. In November of 2020, Portland voters again passed a bond, this time for $1.21 billion, to support continued investments in health and safety of our aging school buildings with new roofs and mechanical systems, seismic retrofits, accessibility upgrades, improved SPED learning environments, and security upgrades. Large capital projects and new investments in curriculum and technology round out the bond.In 2022-23 the District is expecting $5 million of SRGP grant funding. The seismic work will continue on Creative Sciences and if the additional grant is awarded, SRGP-related work on Benson will begin. There will be focused work on energy conservation, health & safety, security, legal and code related upgrades and supported improvements around delivery of instruction.
Over the long term, Portland Public Schools plans to modernize every school through a series of capital construction bonds, bringing them all up to modern facility and educational standards.

216
Beginning Fund Balance 472,196 330,978 663,007 749,789 499,241 - -
Other Revenue From Local Sources 20,736 13,908 6,281 7,425 7,441 - -
2000 - Revenue - Intermediate Sources 6 227 783 - - - -
3000 - Revenue From State Sources 4,500 11,368 1,319 6,544 6,941 - -
5200 - Interfund Transfers 1,539 110 - - 610 - -
All Other Budget Resources - 520,022 395,039 - - - -
TOTAL RESOURCES 498,977 876,613 1,066,429 763,758 514,233 - -
Summary of Resources by Major Object - 400 - Capital Project Funds (In Thousands)
Actual2018-19
Proposed 2022-23
Certain numbers have been rounded up or down. There may therefore be discrepancies between the actual totals of the individual amounts in the tables and the totals shown.
Actual2019-20
Actual2020-21
Budget2021-22
Approved2022-23
Adopted2022-23
97%
2% 1%
Resources by Major Object - 400 - Capital Project Funds
Beginning Fund Balance
Other Revenue From Local Sources
3000 - Revenue From State Sources
5200 - Interfund Transfers
Summary of Resources by Major Object - 400 - Capital Projects Funds (in Thousands)
Percent of Resources by Major Object - 400 - Capital Projects Funds

217
1000 - Instruction - - - - - - - - -
2000 - Support Services 2,664 5,586 6,711 1,813 1.00 498 - - 1.00
4000 - Facilities Acquisition And Con 164,715 207,400 287,511 438,406 39.55 513,114 - - 48.80
5200 - Transfers Of Funds 619 620 617 618 - 621 - - -
7000 - Unappropriated Fund Balance 330,978 663,007 771,590 322,810 - - - - -
TOTAL REQUIREMENTS 498,976 876,613 1,066,429 763,648 40.55 514,233 - - 49.80
Certain numbers have been rounded up or down. There may therefore be discrepancies between the actual totals of the individual amounts in the tables and the totals shown.
Actual2019-20
Actual2020-21
Budget2021-22
Budget FTE2021-22
Approved2022-23
Adopted2022-23
Budget FTE2022-23
Summary of Requirements by Major Function - 400 - Capital Project Funds (Financial Data in Thousands)
Actual2018-19
Proposed 2022-23
100%
Requirements by Major Function - 400 - Capital Project Funds
2000 - Support Services
4000 - Facilities Acquisition And Con
5200 - Transfers Of Funds
Summary of Requirements by Major Function - 400 - Capital Projects Funds (in Thousands)
Percent of Requirements by Major Function - 400 - Capital Projects Funds

218
1121 - Classified - Represented 186 244 299 342 6.00 448 - - 7.00
1122 - Non - Represented Staff 1,827 2,258 2,840 3,614 34.30 4,566 - - 42.80
113 - Administrators - - 9.00 31.00 0.25 - - - -
Other Salaries 92 180 98 - - - - - -
200 - Associated Payroll Costs 753 1,026 1,251 1,709 - 2,192 - - -
300 - Purchased Services 33,609 33,863 28,679 59,428 - 59,798 - - -
400 - Supplies And Materials 3,350 1,415 17,277 806 - 57,417 - - -
500 - Capital Outlay 123,959 165,725 233,318 364,200 - 386,058 - - -
600 - Other Objects 3,604 8,273 10,451 10,200 - 3,134 - - -
700 - Transfers 619 620 617 618 - 621 - - -
581000 - Operating Contingency - - - 0 - - - - -
376520 - Budgeted Ending Fund Balance 330,978 663,009 771,590 322,810 - - - - -
TOTAL REQUIREMENTS 498,977 876,613 1,066,429 763,758 40.55 514,233 - - 49.80
Budget FTE
2022-23
Summary of Requirements by Major Object - Fund 400 - Capital Project Funds (Financial Data in Thousands)
Actual2018-19
Proposed 2022-23
Certain numbers have been rounded up or down. There may therefore be discrepancies between the actual totals of the individual amounts in the tables and the totals shown.
Actual2019-20
Actual2020-21
Budget2021-22
Budget FTE
2021-22
Approved2022-23
Adopted2022-23
1%
12%
11%
75%
1%
Requirements by Major Object - Fund 400 - Capital Project Funds
1121 - Classified - Represented
1122 - Non - Represented Staff
200 - Associated Payroll Costs
300 - Purchased Services
400 - Supplies And Materials
500 - Capital Outlay
600 - Other Objects
700 - Transfers
Summary of Requirements by Major Object - 400 - Capital Projects Funds (in Thousands)
Percent of Requirements by Major Object - 400 - Capital Projects Funds

219
CONSTRUCTION EXCISE FUND (404)This Capital Projects Fund accounts for the resources and requirements for school facility projects funded through the Construction Excise Tax as allowed under Senate Bill 1036.The Construction Excise Tax was approved by the Board of Directors per Resolution No. 3833 on January 14, 2008. The tax is imposed on improvements to real property within the District’s boundaries that result in new construction or additional square footage in an existing structure, with exemptions outlined in SB 1036. The use of funds is limited to capital improvements to school facilities.The tax is collected on behalf of the District by the responsible local government jurisdiction issuing building permits.

220
Description by Object Code Actual Actual Actual Budget Proposed Approved Adopted2018-19 2019-20 2020-21 2021-22 2022-23 2022-23 2022-23
Resources by Object376510 - Budgeted Beginning Fund Balance - - - 9,744 11,497 - -377000 - Fund Balance-Unres/Undes 15,743 13,050 11,213 - - - -
Subtotal - Beginning Fund Balance 15,743 13,050 11,213 9,744 11,497 - -411301 - Construct Excise Tax - Cty Ptd 5,990 4,291 3,440 5,000 5,500 - -411303 - Construct Excise Tax - Wash Ct 1 - 7 1 5 - -415100 - Interest on Investments 168 82 19 100 13 - -
Subtotal - Other Revenue from Local Sources 6,159 4,373 3,465 5,101 5,518 - -
Total Resources by Object 21,902 17,423 14,678 14,845 17,015 - -
Description by Function Code Actual Actual Actual BudgetBudget
FTE Proposed Approved AdoptedBudget
FTE2018-19 2019-20 2020-21 2021-22 2021-22 2022-23 2022-23 2022-23 2022-23
Requirements by Function4150 - Bldg Acquis/Constr/Improv Svcs 8,233 5,590 3,954 14,227 3.00 16,394 - - 3.00
Subtotal - 4000 - FACILITIES ACQUISITION AND CON 8,233 5,590 3,954 14,227 3.00 16,394 - - 3.00
52100 - Fund Transfers 619 620 617 618 - 621 - - -Subtotal - 5200 - TRANSFERS OF FUNDS 619 620 617 618 - 621 - - -
71100 - Ending Fund Balance 13,050 11,213 10,107 - - - - - -Subtotal - 7000 - UNAPPROPRIATED FUND BALANCE 13,050 11,213 10,107 - - - - - -
Total Requirements by Function 21,902 17,423 14,678 14,845 3.00 17,015 - - 3.00
Construction Excise Fund - Requirements by Function (Financial Data In Thousands)
Fund 404 - Construction Excise Fund Detail
Construction Excise Fund - Resources by Object (In Thousands)

221
YearTotal YearTotal YearTotal YearTotal Jul YearTotal YearTotal YearTotal Jul
Description by Object Code Actual Actual Actual BudgetBudget
FTE Proposed Approved AdoptedBudget
FTE2018-19 2019-20 2020-21 2021-22 2021-22 2022-23 2022-23 2022-23 2022-23
Requirements by Object511220 - Non-Represented Staff - 110 337 360 3.00 382 - - 3.00512400 - Temporary Misc - Classified - - - - - - - - -513300 - Extended Hours 32 23 - - - - - - -513510 - Group Hlth Opt Out Lic - - 3 - - - - - -
Subtotal - 100 - SALARIES 32 133 340 360 3.00 382 - - 3.00521000 - PERS 1 4 10 15 - - - - -521310 - PERS UAL 4 14 43 44 - 59 - - -522000 - Social Security - FICA 2 10 26 28 - 29 - - -523100 - Workers' Compensation - - 1 2 - 3 - - -523200 - Unemployment Compensation - - 1 - - - - - -524100 - Group Health Insurance - 11 32 50 - 55 - - -524200 - Other Employer Paid Benefits - 1 2 1 - 1 - - -524300 - Retiree Health Insurance - 1 3 3 - 3 - - -524530 - Early Retirement Benefits - - 1 1 - 1 - - -
Subtotal - 200 - ASSOCIATED PAYROLL COSTS 8 40 118 142 - 152 - - -
531800 - Local Mtgs/Non-Instr Staff Dev - - - - - - - - -532200 - Repairs and Maintenance Svcs 832 524 304 - - - - - -532400 - Rentals 2 - - - - - - - -532500 - Electricity 3 - - - - - - - -532900 - Other Property Services 185 137 233 - - - - - -535500 - Printing and Binding - - 1 - - - - - -538300 - Architect and Engineering Svcs 1,781 304 151 - - - - - -538500 - Management Services 65 - - - - - - - -538940 - Professional Moving Services 249 32 26 - - - - - -538990 - Non-Instr Pers/Professional Sv 191 101 97 - - - - - -
Subtotal - 300 - PURCHASED SERVICES 3,309 1,099 813 - - - - - -541000 - Consumable Supplies 6 1 - - - - - - -541600 - Interdepartmental Charges 6 2 1 - - - - - -546000 - Non-Consumable Supplies 25 11 - - - - - - -548000 - Computer Equipment 527 24 16 - - - - - -
Subtotal - 400 - SUPPLIES AND MATERIALS 564 37 17 - - - - - -
552000 - Building Acquisition/Improvmnt 4,045 3,995 2,389 13,725 - 15,861 - - -553000 - Improvements - Not Buildings 92 142 - - - - - - -554100 - Initial and Addl Equipment 3 109 250 - - - - - -555090 - Misc Other Technology 3 - - - - - - - -
Subtotal - 500 - CAPITAL OUTLAY 4,144 4,246 2,639 13,725 - 15,861 - - -564000 - Dues and Fees 54 6 5 - - - - - -567100 - Permits 123 29 21 - - - - - -
Subtotal - Other Objects 176 34 27 - - - - - -571000 - Transfers to Other Funds 619 620 617 618 - 621 - - -
Subtotal - 700 - TRANSFERS 619 620 617 618 - 621 - - -376520 - Budgeted Ending Fund Balance 13,050 11,213 10,107 - - - - - -
Subtotal - 376520 - Budgeted Ending Fund Balance 13,050 11,213 10,107 - - - - - -
Total Requirements by Object 21,902 17,423 14,678 14,845 3.00 17,015 - - 3.00
Construction Excise Fund - Requirements by Object (Financial Data In Thousands)
Certain numbers have been rounded up or down. There may therefore be discrepancies between the actual totals of the individual amounts in the tables and the totals shown.
Fund 404 - Construction Excise Fund Detail

222
Resources Proposed 2022-23
Projected 2023-24
Projected 2024-25
Projected 2025-26
BEGINNING FUND BALANCE 11,497 11,900 12,317 12,748
CURRENT YEAR PROPERTY TAXES OTHER THAN LOCAL OPTION - - - -
CURRENT YEAR LOCAL OPTION PROPERTY TAXES - - - -
OTHER REVENUE FROM LOCAL SOURCES 5,518 5,711 5,911 6,118
2000 - REVENUE - INTERMEDIATE SOURCES - - - -
3000 - REVENUE FROM STATE SOURCES - - - -
4000 - REVENUE FROM FEDERAL SOURCES - - - -
5200 - INTERFUND TRANSFERS - - - -
ALL OTHER BUDGET RESOURCES - - - -
Total Resources 17,015 17,612 18,228 18,866
Requirements Proposed 2022-23
Projected 2023-24
Projected 2024-25
Projected 2025-26
111 - LICENSED SALARIES - - - -
1121 - CLASSIFIED - REPRESENTED - - - -
1122 - NON-REPRESENTED STAFF 382 395 409 424
113 - ADMINISTRATORS - - - -
OTHER SALARIES - - - -
200 - ASSOCIATED PAYROLL COSTS 151 156 162 167
300 - PURCHASED SERVICES - - - -
400 - SUPPLIES AND MATERIALS - - - -
500 - CAPITAL OUTLAY 15,861 16,417 16,992 17,586
600 - OTHER OBJECTS - - - -
700 - TRANSFERS 621 643 665 689
581000 - OPERATING CONTINGENCY - - - -
376520 - BUDGETED ENDING FUND BALANCE - - - -
Total Requirements 17,015 17,612 18,228 18,866Certain numbers have been rounded up or down. There may therefore be discrepancies between the actual totals of the individual amounts in the tables and the totals shown.
Budget Forecast by Major Object - 404 - Construction Excise Fund (In Thousands)

223
IT SYSTEM PROJECT FUND (407)This fund accounts for the Resources & Requirements supporting District Information Technology projects, primarily in these major areas: Teacher/Classroom Technology (laptops, projectors, document cameras), Information Systems (software applications, new systems), and Technical Infrastructure (core hardware and network services) as they relate to the District’s school modernization efforts. There are many pressing needs for IT capital funding including student computing resources, teacher technology, process automation, and business systems.
To fund these projects, the Board issued debt in the amount of $15 million. This borrowing was authorized per Board Resolution No. 4155 on October 5, 2009.
This fund was created on June 29, 2009 per Board Resolution No. 4106.

224
Description by Object Code Actual Actual Actual Budget Proposed Approved Adopted2018-19 2019-20 2020-21 2021-22 2022-23 2022-23 2022-23
Resources by Object377000 - Fund Balance-Unres/Undes 385 50 - - - - -
Subtotal - Beginning Fund Balance 385 50 - - - - -415100 - Interest on Investments 8 4 - - - - -419946 - E-RATE PRIORITY 2 84 - - - - - -
Subtotal - Other Revenue from Local Sources 92 4 - - - - -
452100 - Interfund Transfers 311 - - - - - -Subtotal - 5200 - INTERFUND TRANSFERS 311 - - - - - -
Total Resources by Object 788 54 - - - - -
Description by Function Code Actual Actual Actual BudgetBudget
FTE Proposed Approved AdoptedBudget
FTE2018-19 2019-20 2020-21 2021-22 2021-22 2022-23 2022-23 2022-23 2022-23
Requirements by Function2660 - TECHNOLOGY SERVICES 738 54 - - - - - - -
Subtotal - 2000 - SUPPORT SERVICES 738 54 - - - - - - -71100 - Ending Fund Balance 50 - - - - - - -
Subtotal - 7000 - UNAPPROPRIATED FUND BALANCE 50 - - - - - - -
Total Requirements by Function 788 54 - - - - - - -
YearTotal YearTotal YearTotal YearTotal Jul YearTotal YearTotal YearTotal Jul
Description by Object Code Actual Actual Actual BudgetBudget
FTE Proposed Approved AdoptedBudget
FTE2018-19 2019-20 2020-21 2021-22 2021-22 2022-23 2022-23 2022-23 2022-23
Requirements by Object535100 - Telephone 11 1 - - - - - - -535990 - Wide Area Network/Misc 65 - - - - - - - -538990 - Non-Instr Pers/Professional Sv 17 - - - - - - - -
Subtotal - 300 - PURCHASED SERVICES 92 1 - - - - - - -547000 - Computer Software 164 53 - - - - - - -548000 - Computer Equipment 441 - - - - - - - -
Subtotal - 400 - SUPPLIES AND MATERIALS 605 53 - - - - - - -
555090 - Misc Other Technology 40 - - - - - - - -Subtotal - 500 - CAPITAL OUTLAY 40 - - - - - - - -
376520 - Budgeted Ending Fund Balance 50 - - - - - - -Subtotal - 376520 - Budgeted Ending Fund Balance 50 - - - - - - -
Total Requirements by Object 788 54 - - - - - - -
IT System Project Fund - Requirements by Function (Financial Data In Thousands)
IT System Project Fund - Requirements by Object (Financial Data In Thousands)
Certain numbers have been rounded up or down. There may therefore be discrepancies between the actual totals of the individual amounts in the tables and the totals shown.
Fund 407 - IT System Project Fund Detail
IT System Project Fund - Resources by Object (In Thousands)

225
Resources Proposed 2022-23
Projected 2023-24
Projected 2024-25
Projected 2025-26
BEGINNING FUND BALANCE - - - -
CURRENT YEAR PROPERTY TAXES OTHER THAN LOCAL OPTION - - - -
CURRENT YEAR LOCAL OPTION PROPERTY TAXES - - - -
OTHER REVENUE FROM LOCAL SOURCES - - - -
2000 - REVENUE - INTERMEDIATE SOURCES - - - -
3000 - REVENUE FROM STATE SOURCES - - - -
4000 - REVENUE FROM FEDERAL SOURCES - - - -
5200 - INTERFUND TRANSFERS - - - -
ALL OTHER BUDGET RESOURCES - - - -
Total Resources - - - -
Requirements Proposed 2022-23
Projected 2023-24
Projected 2024-25
Projected 2025-26
111 - LICENSED SALARIES - - - -
1121 - CLASSIFIED - REPRESENTED - - - -
1122 - NON-REPRESENTED STAFF - - - -
113 - ADMINISTRATORS - - - -
OTHER SALARIES - - - -
200 - ASSOCIATED PAYROLL COSTS - - - -
300 - PURCHASED SERVICES - - - -
400 - SUPPLIES AND MATERIALS - - - -
500 - CAPITAL OUTLAY - - - -
600 - OTHER OBJECTS - - - -
700 - TRANSFERS - - - -
581000 - OPERATING CONTINGENCY - - - -
376520 - BUDGETED ENDING FUND BALANCE - - - -
Total Requirements - - - -Certain numbers have been rounded up or down. There may therefore be discrepancies between the actual totals of the individual amounts in the tables and the totals shown.
Budget Forecast by Major Object - 407 - IT System Project Fund (In Thousands)

226
FULL FAITH AND CREDIT FUND (420)This fund is used to manage capital expenditures for specifically authorized projects, including those projects funded through proceeds from the Recovery Zone Bond- Energy and Water Conservation Program and other loan proceeds.
This creation of the fund was authorized by the Board of Education per Board Resolution No. 4416 on February 28, 2011.

227
Description by Object Code Actual Actual Actual Budget Proposed Approved Adopted2018-19 2019-20 2020-21 2021-22 2022-23 2022-23 2022-23
Resources by Object376510 - Budgeted Beginning Fund Balance - - - 644 453 - -377000 - Fund Balance-Unres/Undes 5,822 4,173 1,629 - - - -
Subtotal - Beginning Fund Balance 5,822 4,173 1,629 644 453 - -415100 - Interest on Investments - - - - - - -
Subtotal - Other Revenue from Local Sources - - - - - - -
Total Resources by Object 5,822 4,173 1,629 644 453 - -
Description by Function Code Actual Actual Actual BudgetBudget
FTE Proposed Approved AdoptedBudget
FTE2018-19 2019-20 2020-21 2021-22 2021-22 2022-23 2022-23 2022-23 2022-23
Requirements by Function
2540 - OPER/MAINTENANCE OF PLANT SVCS 1,421 1,827 276 508 - 354 - - -
Subtotal - 2000 - SUPPORT SERVICES 1,421 1,827 276 508 - 354 - - -4150 - Bldg Acquis/Constr/Improv Svcs 227 717 634 136 - 99 - - -
Subtotal - 4000 - FACILITIES ACQUISITION AND CON 227 717 634 136 - 99 - - -
71100 - Ending Fund Balance 4,173 1,629 719 - - - - - -Subtotal - 7000 - UNAPPROPRIATED FUND BALANCE 4,173 1,629 719 - - - - - -
Total Requirements by Function 5,822 4,173 1,629 644 - 453 - - -
Full Faith and Credit Fund - Requirements by Function (Financial Data In Thousands
Full Faith and Credit Fund
Full Faith and Credit Fund - Resources by Object (In Thousands)

228
YearTotal YearTotal YearTotal YearTotal Jul YearTotal YearTotal YearTotal Jul
Description by Object Code Actual Actual Actual BudgetBudget
FTE Proposed Approved AdoptedBudget
FTE2018-19 2019-20 2020-21 2021-22 2021-22 2022-23 2022-23 2022-23 2022-23
Requirements by Object513300 - Extended Hours 1 1 - - - - - - -
Subtotal - 100 - SALARIES 1 1 - - - - - - -521000 - PERS - - - - - - - - -521310 - PERS UAL - - - - - - - - -522000 - Social Security - FICA - - - - - - - - -523100 - Workers' Compensation - - - - - - - - -523200 - Unemployment Compensation - - - - - - - - -524100 - Group Health Insurance - - - - - - - - -524200 - Other Employer Paid Benefits - - - - - - - - -524300 - Retiree Health Insurance - - - - - - - - -524530 - Early Retirement Benefits - - - - - - - - -
Subtotal - 200 - ASSOCIATED PAYROLL COSTS - - - - - - - - -
532200 - Repairs and Maintenance Svcs 10 198 108 508 - 354 - - -532900 - Other Property Services 489 1,655 242 - - - - - -535500 - Printing and Binding - - - - - - - - -538300 - Architect and Engineering Svcs 171 38 41 - - - - - -538500 - Management Services 7 - - - - - - - -538940 - Professional Moving Services - 12 6 - - - - - -538990 - Non-Instr Pers/Professional Sv 149 35 (3) - - - - - -
Subtotal - 300 - PURCHASED SERVICES 826 1,937 394 508 - 354 - - -541000 - Consumable Supplies 413 148 14 - - - - - -541600 - Interdepartmental Charges - - - - - - - - -547000 - Computer Software 253 43 - - - - - - -548000 - Computer Equipment 2 3 - - - - - - -
Subtotal - 400 - SUPPLIES AND MATERIALS 668 194 14 - - - - - -
552000 - Building Acquisition/Improvmnt 149 234 493 136 - 99 - - -553000 - Improvements - Not Buildings - 7 - - - - - - -554100 - Initial and Addl Equipment - 165 - - - - - - -
Subtotal - 500 - CAPITAL OUTLAY 149 406 493 136 - 99 - - -564000 - Dues and Fees - 2 2 - - - - - -567100 - Permits 4 3 7 - - - - - -
Subtotal - Other Objects 4 6 9 - - - - - -376520 - Budgeted Ending Fund Balance 4,173 1,629 719 - - - - - -
Subtotal - 376520 - Budgeted Ending Fund Balance 4,173 1,629 719 - - - - - -
Total Requirements by Object 5,822 4,173 1,629 644 - 453 - - -
Full Faith and Credit Fund - Requirements by Object (Financial Data In Thousands
Certain numbers have been rounded up or down. There may therefore be discrepancies between the actual totals of the individual amounts in the tables and the totals shown.
Full Faith and Credit Fund

229
Resources Proposed 2022-23
Projected 2023-24
Projected 2024-25
Projected 2025-26
BEGINNING FUND BALANCE 453 - - -
CURRENT YEAR PROPERTY TAXES OTHER THAN LOCAL OPTION - - - -
CURRENT YEAR LOCAL OPTION PROPERTY TAXES - - - -
OTHER REVENUE FROM LOCAL SOURCES - - - -
2000 - REVENUE - INTERMEDIATE SOURCES - - - -
3000 - REVENUE FROM STATE SOURCES - - - -
4000 - REVENUE FROM FEDERAL SOURCES - - - -
5200 - INTERFUND TRANSFERS - - - -
ALL OTHER BUDGET RESOURCES - - - -
Total Resources 453 - - -
Requirements Proposed 2022-23
Projected 2023-24
Projected 2024-25
Projected 2025-26
111 - LICENSED SALARIES - - - -
1121 - CLASSIFIED - REPRESENTED - - - -
1122 - NON-REPRESENTED STAFF - - - -
113 - ADMINISTRATORS - - - -
OTHER SALARIES - - - -
200 - ASSOCIATED PAYROLL COSTS - - - -
300 - PURCHASED SERVICES 354 - - -
400 - SUPPLIES AND MATERIALS - - - -
500 - CAPITAL OUTLAY 99 - - -
600 - OTHER OBJECTS - - - -
700 - TRANSFERS - - - -
581000 - OPERATING CONTINGENCY - - - -
376520 - BUDGETED ENDING FUND BALANCE - - - -
Total Requirements 453 - - -Certain numbers have been rounded up or down. There may therefore be discrepancies between the actual totals of the individual amounts in the tables and the totals shown.
Budget Forecast by Major Object - 420 - Full Faith and Credit Fund (In Thousands)

230
ENERGY EFFICIENT SCHOOLS FUND (435)The Energy Efficient Schools Fund is used to manage capital expenditures for specifically designated capital projects, including those projects funded, in part, through proceeds authorized by State Bill 1149.This fund was formally created as part of the District’s FY 2012-13 Budget Adoption process.

231
Description by Object Code Actual Actual Actual Budget Proposed Approved Adopted2018-19 2019-20 2020-21 2021-22 2022-23 2022-23 2022-23
Resources by Object376510 - Budgeted Beginning Fund Balance - - - 1,789 2,993 - -377000 - Fund Balance-Unres/Undes 2,144 1,943 1,537 - - - -
Subtotal - Beginning Fund Balance 2,144 1,943 1,537 1,789 2,993 - -415100 - Interest on Investments - - - 3 3 - -419910 - Miscellaneous 90 364 22 200 200 - -419948 - Utility Refund - PGE 675 614 718 625 860 - -419949 - Utility Refund - Pacific Power 258 223 242 250 250 - -
Subtotal - Other Revenue from Local Sources 1,023 1,201 981 1,078 1,313 - -
422000 - Restricted Revenue 6 228 783 - - - -Subtotal - 2000 - REVENUE - INTERMEDIATE SOURCES 6 228 783 - - - -
Total Resources by Object 3,173 3,372 3,301 2,867 4,306 - -
Description by Function Code Actual Actual Actual BudgetBudget
FTE Proposed Approved AdoptedBudget
FTE2018-19 2019-20 2020-21 2021-22 2021-22 2022-23 2022-23 2022-23 2022-23
Requirements by Function4150 - Bldg Acquis/Constr/Improv Svcs 1,230 1,835 1,315 2,867 - 4,306 - - -
Subtotal - 4000 - FACILITIES ACQUISITION AND CON 1,230 1,835 1,315 2,867 - 4,306 - - -
71100 - Ending Fund Balance 1,943 1,537 1,986 - - - - - -Subtotal - 7000 - UNAPPROPRIATED FUND BALANCE 1,943 1,537 1,986 - - - - - -
Total Requirements by Function 3,173 3,372 3,301 2,867 - 4,306 - - -
YearTotal YearTotal YearTotal YearTotal Jul YearTotal YearTotal YearTotal Jul
Description by Object Code Actual Actual Actual BudgetBudget
FTE Proposed Approved AdoptedBudget
FTE2018-19 2019-20 2020-21 2021-22 2021-22 2022-23 2022-23 2022-23 2022-23
Requirements by Object532200 - Repairs and Maintenance Svcs - 1 - - - - - - -538300 - Architect and Engineering Svcs 1,191 29 - - - - - - -
Subtotal - 300 - PURCHASED SERVICES 1,191 30 - - - - - - -541000 - Consumable Supplies - - (2) - - - - - -
Subtotal - 400 - SUPPLIES AND MATERIALS - - (2) - - - - - -
552000 - Building Acquisition/Improvmnt 40 1,805 1,317 2,867 - 4,306 - - -Subtotal - 500 - CAPITAL OUTLAY 40 1,805 1,317 2,867 - 4,306 - - -
376520 - Budgeted Ending Fund Balance 1,943 1,537 1,986 - - - - - -Subtotal - 376520 - Budgeted Ending Fund Balance 1,943 1,537 1,986 - - - - - -
Total Requirements by Object 3,173 3,372 3,301 2,867 - 4,306 - - -
Energy Efficient Schools Fund - Requirements by Function (Financial Data In Thousands)
Energy Efficient Schools Fund - Requirements by Object (Financial Data In Thousands)
Certain numbers have been rounded up or down. There may therefore be discrepancies between the actual totals of the individual amounts in the tables and the totals shown.
Fund 435 - Energy Efficient Schools Fund Detail
Energy Efficient Schools Fund - Resources by Object (In Thousands)

232
Resources Proposed 2022-23
Projected 2023-24
Projected 2024-25
Projected 2025-26
BEGINNING FUND BALANCE 2,993 3,098 3,206 3,319
CURRENT YEAR PROPERTY TAXES OTHER THAN LOCAL OPTION - - - -
CURRENT YEAR LOCAL OPTION PROPERTY TAXES - - - -
OTHER REVENUE FROM LOCAL SOURCES 1,313 1,359 1,407 1,456
2000 - REVENUE - INTERMEDIATE SOURCES - - - -
3000 - REVENUE FROM STATE SOURCES - - - -
4000 - REVENUE FROM FEDERAL SOURCES - - - -
5200 - INTERFUND TRANSFERS - - - -
ALL OTHER BUDGET RESOURCES - - - -
Total Resources 4,306 4,457 4,613 4,774
Requirements Proposed 2022-23
Projected 2023-24
Projected 2024-25
Projected 2025-26
111 - LICENSED SALARIES - - - -
1121 - CLASSIFIED - REPRESENTED - - - -
1122 - NON-REPRESENTED STAFF - - - -
113 - ADMINISTRATORS - - - -
OTHER SALARIES - - - -
200 - ASSOCIATED PAYROLL COSTS - - - -
300 - PURCHASED SERVICES - - - -
400 - SUPPLIES AND MATERIALS - - - -
500 - CAPITAL OUTLAY 4,306 4,457 4,613 4,774
600 - OTHER OBJECTS - - - -
700 - TRANSFERS - - - -
581000 - OPERATING CONTINGENCY - - - -
376520 - BUDGETED ENDING FUND BALANCE - - - -
Total Requirements 4,306 4,457 4,613 4,774Certain numbers have been rounded up or down. There may therefore be discrepancies between the actual totals of the individual amounts in the tables and the totals shown.
Budget Forecast by Major Object - 435 - Energy Efficient Schools Fund (In Thousands)

233
FACILITIES CAPITAL FUND (438)The Facilities Capital Fund is used to manage capital expenditures for specifically designated capital projects, as part of the District’s continuing facilities capital project efforts.
This creation of the fund was authorized by the Board of Directors per Board Resolution No. 4600 on May 14, 2012.

234
Description by Object Code Actual Actual Actual Budget Proposed Approved Adopted
2018-19 2019-20 2020-21 2021-22 2022-23 2022-23 2022-23
Resources by Object
376510 - Budgeted Beginning Fund Balance - - - 231 1,403 - -
377000 - Fund Balance-Unres/Undes 1,728 1,311 (112) - - - -
Subtotal - Beginning Fund Balance 1,728 1,311 (112) 231 1,403 - -
415100 - Interest on Investments 7 - - 8 - - -
419600 - Recovery PY Expenditure - 263 (263) - - - -
419910 - Miscellaneous - 14 - - - - -
Subtotal - Other Revenue from Local Sources 7 277 (263) 8 - - -
432990 - Restricted State Grants 4,500 11,368 1,319 6,544 6,941 - -
Subtotal - 3000 - REVENUE FROM STATE SOURCES 4,500 11,368 1,319 6,544 6,941 - -
452100 - Interfund Transfers 1,228 - - - - - -
Subtotal - 5200 - INTERFUND TRANSFERS 1,228 - - - - - -
Total Resources by Object 7,462 12,956 944 6,783 8,344 - -
Description by Function Code Actual Actual Actual Budget Budget FTE Proposed Approved Adopted Budget FTE
2018-19 2019-20 2020-21 2021-22 2021-22 2022-23 2022-23 2022-23 2022-23
Requirements by Function
2520 - FISCAL SERVICES 3 6 6 6 - 6 - - -
Subtotal - 2000 - SUPPORT SERVICES 3 6 6 6 - 6 - - -
4150 - Bldg Acquis/Constr/Improv Svcs 6,148 13,062 193 6,777 - 8,338 - - -
Subtotal - 4000 - FACILITIES ACQUISITION AND CON 6,148 13,062 193 6,777 - 8,338 - - -
71100 - Ending Fund Balance 1,311 (112) 745 - - - - - -
Subtotal - 7000 - UNAPPROPRIATED FUND BALANCE 1,311 (112) 745 - - - - - -
Total Requirements by Function 7,462 12,956 944 6,783 - 8,344 - - -
YearTotal YearTotal YearTotal YearTotal Jul YearTotal YearTotal YearTotal Jul
Description by Object Code Actual Actual Actual Budget Budget FTE Proposed Approved Adopted Budget FTE
2018-19 2019-20 2020-21 2021-22 2021-22 2022-23 2022-23 2022-23 2022-23
Requirements by Object
532200 - Repairs and Maintenance Svcs 280 119 2 - - - - - -
532900 - Other Property Services 68 21 - - - - - - -
538300 - Architect and Engineering Svcs 426 371 (228) - - - - - -
538940 - Professional Moving Services 2 - - - - - - - -
538990 - Non-Instr Pers/Professional Sv 84 20 - - - - - - -
Subtotal - 300 - PURCHASED SERVICES 860 531 (226) - - - - - -
541000 - Consumable Supplies - - - - - - - - -
541600 - Interdepartmental Charges - - - - - - - - -
546000 - Non-Consumable Supplies - 4 - - - - - - -
Subtotal - 400 - SUPPLIES AND MATERIALS - 4 - - - - - - -
552000 - Building Acquisition/Improvmnt 5,207 12,520 454 6,777 - 8,338 - - -
553000 - Improvements - Not Buildings 32 - - - - - - - -
Subtotal - 500 - CAPITAL OUTLAY 5,239 12,520 454 6,777 - 8,338 - - -
564000 - Dues and Fees 5 2 - - - - - - -
565100 - Liability Insurance 3 - - 6 - 6 - - -
565300 - Property Insurance Premiums - 6 6 - - - - - -
567100 - Permits 43 4 (35) - - - - - -
Subtotal - Other Objects 52 12 (29) 6 - 6 - - -
376520 - Budgeted Ending Fund Balance 1,311 (112) 745 - - - - - -
Subtotal - 376520 - Budgeted Ending Fund Balance 1,311 (112) 745 - - - - - -
Total Requirements by Object 7,462 12,956 944 6,783 - 8,344 - - -
Facilities Capital Fund - Requirements by Function (Financial Data In Thousands)
Facilities Capital Fund - Requirements by Object (Financial Data In Thousands)
Certain numbers have been rounded up or down. There may therefore be discrepancies between the actual totals of the individual amounts in the tables and the totals shown.
Fund 438 - Facilities Capital Fund Detail
Facilities Capital Fund - Resources by Object (In Thousands)

235
Resources Proposed 2022-23
Projected 2023-24
Projected 2024-25
Projected 2025-26
BEGINNING FUND BALANCE 1,403 1,452 1,503 1,555
CURRENT YEAR PROPERTY TAXES OTHER THAN LOCAL OPTION - - - -
CURRENT YEAR LOCAL OPTION PROPERTY TAXES - - - -
OTHER REVENUE FROM LOCAL SOURCES - - - -
2000 - REVENUE - INTERMEDIATE SOURCES - - - -
3000 - REVENUE FROM STATE SOURCES 6,941 7,184 7,435 7,696
4000 - REVENUE FROM FEDERAL SOURCES - - - -
5200 - INTERFUND TRANSFERS - - - -
ALL OTHER BUDGET RESOURCES - - - -
Total Resources 8,344 8,636 8,938 9,251
Requirements Proposed 2022-23
Projected 2023-24
Projected 2024-25
Projected 2025-26
111 - LICENSED SALARIES - - - -
1121 - CLASSIFIED - REPRESENTED - - - -
1122 - NON-REPRESENTED STAFF - - - -
113 - ADMINISTRATORS - - - -
OTHER SALARIES - - - -
200 - ASSOCIATED PAYROLL COSTS - - - -
300 - PURCHASED SERVICES - - - -
400 - SUPPLIES AND MATERIALS - - - -
500 - CAPITAL OUTLAY 8,338 8,630 8,932 9,244
600 - OTHER OBJECTS 6 6 6 7
700 - TRANSFERS - - - -
581000 - OPERATING CONTINGENCY - - - -
376520 - BUDGETED ENDING FUND BALANCE - - - -
Total Requirements 8,344 8,636 8,938 9,251Certain numbers have been rounded up or down. There may therefore be discrepancies between the actual totals of the individual amounts in the tables and the totals shown.
Budget Forecast by Major Object - 438 - Facilities Capital Fund (In Thousands)

236
CAPITAL ASSET RENEWAL FUND (445)This Capital Asset Renewal Fund is used to manage capital expenditures for specifically designated capital projects, as part of the District’s continuing Capital Asset Renewal Program. Refer to the District’s Policy 8.70.044-P. The Capital Asset Renewal Funds and Plans adopted January 23, 2012.
This fund was formally created as part of the District’s 2012-13 Budget Adoption process.

237
Description by Object Code Actual Actual Actual Budget Proposed Approved Adopted2018-19 2019-20 2020-21 2021-22 2022-23 2022-23 2022-23
Resources by Object376510 - Budgeted Beginning Fund Balance - - - 8,874 4,941 - -377000 - Fund Balance-Unres/Undes 4,916 5,763 14,673 - - - -
Subtotal - Beginning Fund Balance 4,916 5,763 14,673 8,874 4,941 - -415100 - Interest on Investments - 31 30 1 12 - -419114 - CUB HS Athletic Field Use Fees 256 88 15 100 100 - -419130 - Rent-Lease of Facilities 591 729 - 500 - - -
Subtotal - Other Revenue from Local Sources 847 848 45 601 112 - -
452100 - Interfund Transfers - - - - 610 - -Subtotal - 5200 - INTERFUND TRANSFERS - - - - 610 - -
453000 - Sale of Fixed Assets - 10,500 - - - - -Subtotal - All Other Budget Resources - 10,500 - - - - -
Total Resources by Object 5,763 17,111 14,718 9,475 5,663 - -
Description by Function Code Actual Actual Actual BudgetBudget
FTE Proposed Approved AdoptedBudget
FTE2018-19 2019-20 2020-21 2021-22 2021-22 2022-23 2022-23 2022-23 2022-23
Requirements by Function2520 - FISCAL SERVICES - 73 - - - - - - -
2540 - OPER/MAINTENANCE OF PLANT SVCS - - 264 - - - - - -
Subtotal - 2000 - SUPPORT SERVICES - 73 264 - - - - - -4150 - Bldg Acquis/Constr/Improv Svcs - 2,365 4,932 9,475 - 5,663 - - -
Subtotal - 4000 - FACILITIES ACQUISITION AND CON - 2,365 4,932 9,475 - 5,663 - - -
71100 - Ending Fund Balance 5,763 14,673 9,522 - - - - - -Subtotal - 7000 - UNAPPROPRIATED FUND BALANCE 5,763 14,673 9,522 - - - - - -
Total Requirements by Function 5,763 17,110 14,718 9,475 - 5,663 - - -
Capital Asset Renewal Fund - Requirements by Function (Financial Data In Thousands)
Fund 445 - Capital Asset Renewal Fund Detail
Capital Asset Renewal Fund - Resources by Object (In Thousands)

238
YearTotal YearTotal YearTotal YearTotal Jul YearTotal YearTotal YearTotal Jul
Description by Object Code Actual Actual Actual BudgetBudget
FTE Proposed Approved AdoptedBudget
FTE2018-19 2019-20 2020-21 2021-22 2021-22 2022-23 2022-23 2022-23 2022-23
Requirements by Object513300 - Extended Hours - - 1 - - - - - -
Subtotal - 100 - SALARIES - - 1 - - - - - -521000 - PERS - - - - - - - - -521310 - PERS UAL - - - - - - - - -522000 - Social Security - FICA - - - - - - - - -523100 - Workers' Compensation - - - - - - - - -523200 - Unemployment Compensation - - - - - - - - -524100 - Group Health Insurance - - - - - - - - -524200 - Other Employer Paid Benefits - - - - - - - - -524300 - Retiree Health Insurance - - - - - - - - -524530 - Early Retirement Benefits - - - - - - - - -
Subtotal - 200 - ASSOCIATED PAYROLL COSTS - - - - - - - - -
532200 - Repairs and Maintenance Svcs - 354 1,178 - - - - - -532900 - Other Property Services - 160 518 - - - - - -538200 - Legal Services - 13 - - - - - - -538300 - Architect and Engineering Svcs - 114 149 - - - - - -538940 - Professional Moving Services - 10 10 - - - - - -538990 - Non-Instr Pers/Professional Sv - 239 523 - - - - - -
Subtotal - 300 - PURCHASED SERVICES - 890 2,378 - - - - - -541000 - Consumable Supplies - 15 - - - - - - -541400 - Maintenance Materials - - 1 - - - - - -541600 - Interdepartmental Charges - - 2 - - - - - -546000 - Non-Consumable Supplies - - 17 - - - - - -548000 - Computer Equipment - - 23 - - - - - -
Subtotal - 400 - SUPPLIES AND MATERIALS - 15 43 - - - - - -
552000 - Building Acquisition/Improvmnt - 1,179 2,373 9,475 - 5,663 - - -553000 - Improvements - Not Buildings - 119 119 - - - - - -554100 - Initial and Addl Equipment - 155 180 - - - - - -
Subtotal - 500 - CAPITAL OUTLAY - 1,452 2,673 9,475 - 5,663 - - -564000 - Dues and Fees - 71 70 - - - - - -567100 - Permits - 8 31 - - - - - -
Subtotal - Other Objects - 80 102 - - - - - -376520 - Budgeted Ending Fund Balance 5,763 14,673 9,522 - - - - - -
Subtotal - 376520 - Budgeted Ending Fund Balance 5,763 14,673 9,522 - - - - - -
Total Requirements by Object 5,763 17,110 14,718 9,475 - 5,663 - - -
Capital Asset Renewal Fund - Requirements by Object (Financial Data In Thousands)
Certain numbers have been rounded up or down. There may therefore be discrepancies between the actual totals of the individual amounts in the tables and the totals shown.
Fund 445 - Capital Asset Renewal Fund Detail

239
Resources Proposed 2022-23
Projected 2023-24
Projected 2024-25
Projected 2025-26
BEGINNING FUND BALANCE 4,941 5,745 5,946 6,154
CURRENT YEAR PROPERTY TAXES OTHER THAN LOCAL OPTION - - - -
CURRENT YEAR LOCAL OPTION PROPERTY TAXES - - - -
OTHER REVENUE FROM LOCAL SOURCES 112 116 120 124
2000 - REVENUE - INTERMEDIATE SOURCES - - - -
3000 - REVENUE FROM STATE SOURCES - - - -
4000 - REVENUE FROM FEDERAL SOURCES - - - -
5200 - INTERFUND TRANSFERS 610 - - -
ALL OTHER BUDGET RESOURCES - - - -
Total Resources 5,663 5,861 6,066 6,278
Requirements Proposed 2022-23
Projected 2023-24
Projected 2024-25
Projected 2025-26
111 - LICENSED SALARIES - - - -
1121 - CLASSIFIED - REPRESENTED - - - -
1122 - NON-REPRESENTED STAFF - - - -
113 - ADMINISTRATORS - - - -
OTHER SALARIES - - - -
200 - ASSOCIATED PAYROLL COSTS - - - -
300 - PURCHASED SERVICES - - - -
400 - SUPPLIES AND MATERIALS - - - -
500 - CAPITAL OUTLAY 5,663 5,861 6,066 6,278
600 - OTHER OBJECTS - - - -
700 - TRANSFERS - - - -
581000 - OPERATING CONTINGENCY - - - -
376520 - BUDGETED ENDING FUND BALANCE - - - -
Total Requirements 5,663 5,861 6,066 6,278Certain numbers have been rounded up or down. There may therefore be discrepancies between the actual totals of the individual amounts in the tables and the totals shown.
Budget Forecast by Major Object - 445 - Capital Asset Renewal Fund (In Thousands)

240
GO BONDS FUND (450)This fund is used to manage capital expenditures for specifically authorized projects funded by General Obligation bonds. This fund will capture the expenditures for multiple borrowings, each of which funds a specific capital expenditure.
Current activity in this fund is related to the 2012, 2017 and 2020 bonds that were passed by voters in November 2012, May 2017 and November 2020.
The creation of this fund was authorized in accordance with Board Resolution No. 4416 on February 28, 2011. Detailed information on bond projects is available at https://www.pps.net/Domain/62.

241
Description by Object Code Actual Actual Actual Budget Proposed Approved Adopted2018-19 2019-20 2020-21 2021-22 2022-23 2022-23 2022-23
Resources by Object376510 - Budgeted Beginning Fund Balance - - - 728,507 477,954 - -377000 - Fund Balance-Unres/Undes 441,140 304,370 634,067 - - - -
Subtotal - Beginning Fund Balance 441,140 304,370 634,067 728,507 477,954 - -415100 - Interest on Investments 12,591 7,195 2,057 637 498 - -415300 - Gain/Loss Sale of Investment (13) 9 (5) - - - -419600 - Recovery PY Expenditure 31 - - - - - -
Subtotal - Other Revenue from Local Sources 12,609 7,205 2,052 637 498 - -
422000 - Restricted Revenue - - - - - - -Subtotal - 2000 - REVENUE - INTERMEDIATE SOURCES - - - - - - -
451100 - Bond Proceeds - 441,320 365,465 - - - -451200 - Bond Premium - 68,202 29,574 - - - -
Subtotal - All Other Budget Resources - 509,522 395,039 - - - -Total Resources by Object 453,748 821,097 1,031,158 729,144 478,452 - -
Description by Function Code Actual Actual Actual BudgetBudget
FTE Proposed Approved AdoptedBudget
FTE2018-19 2019-20 2020-21 2021-22 2021-22 2022-23 2022-23 2022-23 2022-23
Requirements by Function2520 - FISCAL SERVICES 478 3,035 6,036 1,153 - - - - -
2540 - OPER/MAINTENANCE OF PLANT SVCS 11 48 - - - - - - -
2570 - INTERNAL SERVICES 13 119 128 146 1.00 138 - - 1.00 Subtotal - 2000 - SUPPORT SERVICES 502 3,203 6,164 1,299 1.00 138 - - 1.00
4110 - Service Area Direction 2,541 2,954 3,500 4,505 30.55 5,960 - - 39.80 4150 - Bldg Acquis/Constr/Improv Svcs 146,335 180,874 255,225 325,121 6.00 414,937 - - 6.00 4180 - OTHER CAPITAL ITEMS - - 17,759 75,408 - 57,417 - - -
Subtotal - 4000 - FACILITIES ACQUISITION AND CON 148,876 183,827 276,484 405,034 36.55 478,314 - - 45.80
71100 - Ending Fund Balance 304,370 634,067 748,510 322,810 - - - - -Subtotal - 7000 - UNAPPROPRIATED FUND BALANCE 304,370 634,067 748,510 322,810 - - - - -
Total Requirements by Function 453,748 821,097 1,031,158 729,144 37.55 478,452 - - 46.80
GO Bonds Fund - Requirements by Function (Financial Data in Thousands)
GO Bonds Fund
GO Bonds Fund - Resources by Object (In Thousands)

242
YearTotal YearTotal YearTotal YearTotal Jul YearTotal YearTotal YearTotal Jul
Description by Object Code Actual Actual Actual BudgetBudget
FTE Proposed Approved AdoptedBudget
FTE2018-19 2019-20 2020-21 2021-22 2021-22 2022-23 2022-23 2022-23 2022-23
Requirements by Object511210 - Classified - Represented 186 244 299 342 6.00 448 - - 7.00 511220 - Non-Represented Staff 1,751 2,011 2,337 3,078 30.30 3,935 - - 38.30 511310 - Administrators - Licensed - - 9 31 0.25 - - - -511420 - Directors/Program Admins 76 137 165 175 1.00 249 - - 1.50 512100 - Substitutes - Licensed 1 - - - - - - - -512200 - Substitutes - Classified (7) - - - - - - - -512400 - Temporary Misc - Classified 6 2 8 - - - - - -513300 - Extended Hours 56 151 81 - - - - - -513400 - Overtime Pay - 1 - - - - - - -513510 - Group Hlth Opt Out Lic 4 3 6 - - - - - -
Subtotal - 100 - SALARIES 2,073 2,548 2,905 3,626 37.55 4,631 - - 46.80 521000 - PERS 31 88 92 147 - - - - -521310 - PERS UAL 231 321 361 440 - 721 - - -522000 - Social Security - FICA 154 186 219 277 - 354 - - -523100 - Workers' Compensation 20 4 11 21 - 32 - - -523200 - Unemployment Compensation 1 3 6 5 - 3 - - -524100 - Group Health Insurance 280 350 393 636 - 868 - - -524200 - Other Employer Paid Benefits 10 12 14 7 - 8 - - -524300 - Retiree Health Insurance 12 15 29 26 - 35 - - -524530 - Early Retirement Benefits 7 7 7 7 - 8 - - -
Subtotal - 200 - ASSOCIATED PAYROLL COSTS 745 985 1,132 1,566 - 2,041 - - -
531200 - Instr Program Improvement Svcs - - 6 16,604 - - - - -531800 - Local Mtgs/Non-Instr Staff Dev 1 - 7 47 - - - - -531810 - Non-Instr Dev Profess Dev Fds - - - 31 - - - - -532200 - Repairs and Maintenance Svcs 193 117 189 - - - - - -532400 - Rentals 4 14 290 - - - - - -532410 - Leased Copy Machines 5 - - 45 - - - - -532500 - Electricity 196 192 347 - - - - - -532900 - Other Property Services 618 312 795 - - - - - -533200 - Non-Reimb Student Transport 2 - - - - - - - -534100 - Travel, Local in District 8 8 2 16 - - - - -534200 - Travel, Out of District 17 11 - 74 - - - - -535100 - Telephone 6 8 23 16 - - - - -535300 - Postage - - - - - - - - -535400 - Advertising - - 2 - - - - - -535500 - Printing and Binding 15 13 6 - - - - - -537100 - Tuition to Other Dist InState 2 - - - - - - - -538100 - Audit Services 369 271 205 678 - - - - -538200 - Legal Services - 647 23 70 - - - - -538300 - Architect and Engineering Svcs 19,529 20,353 16,644 23,299 - 42,597 - - -538500 - Management Services 3,736 5,103 4,664 10,215 - 16,847 - - -538940 - Professional Moving Services 623 356 403 849 - - - - -538990 - Non-Instr Pers/Professional Sv 2,007 1,969 1,713 6,475 - - - - -539100 - Pass Through - - - - - - - - -
Subtotal - 300 - PURCHASED SERVICES 27,330 29,375 25,320 58,420 - 59,444 - - -541000 - Consumable Supplies 76 109 70 574 - - - - -541310 - Auto Parts, Batteries - - - - - - - - -541600 - Interdepartmental Charges 12 8 4 - - - - - -541700 - Discounts Taken - (3) - - - - - - -542200 - Textbook Adoption - - 680 - - 17,255 - - -546000 - Non-Consumable Supplies 167 27 215 39 - - - - -546100 - Minor Equipment - Tagged - - 1 - - - - - -547000 - Computer Software 124 186 475 194 - - - - -548000 - Computer Equipment 1,133 784 15,761 - - 40,162 - - -
Subtotal - 400 - SUPPLIES AND MATERIALS 1,513 1,111 17,205 806 - 57,417 - - -
GO Bonds Fund - Requirement by Object (Financials Data in Thousands)
GO Bonds Fund

243
YearTotal YearTotal YearTotal YearTotal Jul YearTotal YearTotal YearTotal Jul
Description by Object Code Actual Actual Actual BudgetBudget
FTE Proposed Approved AdoptedBudget
FTE2018-19 2019-20 2020-21 2021-22 2021-22 2022-23 2022-23 2022-23 2022-23
Requirements by Object
Subtotal - 400 - SUPPLIES AND MATERIALS 1,513 1,111 17,205 806 - 57,417 - - -
551000 - Land Acquisition - - 32 - - - - - -552000 - Building Acquisition/Improvmnt 110,865 144,998 216,685 261,891 - 351,791 - - -553000 - Improvements - Not Buildings 114 22 4,803 - - - - - -554100 - Initial and Addl Equipment 3,335 241 1,577 8,216 - - - - -554110 - Vehicles 27 - 1 - - - - - -555010 - Computers (3) - 1,513 15,572 - - - - -555030 - Software Capital Expense - 15 - 19,105 - - - - -555090 - Misc Other Technology 9 14 1,131 26,937 - - - - -
Subtotal - 500 - CAPITAL OUTLAY 114,347 145,291 225,742 331,721 - 351,791 - - -563000 - Fiscal Charges 2 2 2 - - - - - -564000 - Dues and Fees 92 166 95 497 - - - - -564100 - Bond Issuance Cost - 1,820 4,438 - - - - - -565100 - Liability Insurance 335 - (1) 2,741 - 3,128 - - -565300 - Property Insurance Premiums 1,052 2,141 1,197 2,008 - - - - -567100 - Permits 1,891 3,590 4,612 4,948 - - - - -
Subtotal - Other Objects 3,371 7,719 10,343 10,194 - 3,128 - - -376520 - Budgeted Ending Fund Balance 304,370 634,067 748,510 322,810 - - - - -
Subtotal - 376520 - Budgeted Ending Fund Balance 304,370 634,067 748,510 322,810 - - - - -
Total Requirements by Object 453,748 821,097 1,031,158 729,144 37.55 478,452 - - 46.80
GO Bonds Fund - Requirement by Object (Financials Data in Thousands)
Certain numbers have been rounded up or down. There may therefore be discrepancies between the actual totals of the individual amounts in the tables and the totals shown.
GO Bonds Fund
* Note that object code 523300 (pertaining to Portland Family Medical Leave) is not itemized in the table, however the amounts are included in the totals. This is due to a software error and will be updated in the approved budget.
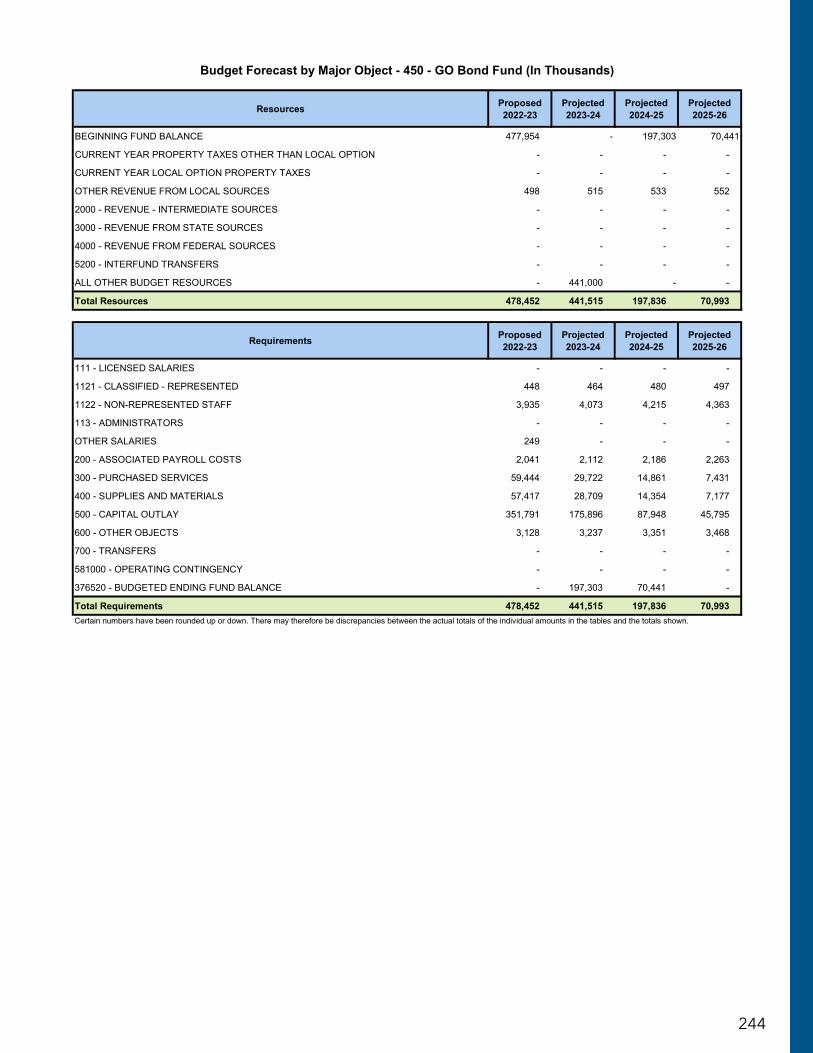
244
Resources Proposed 2022-23
Projected 2023-24
Projected 2024-25
Projected 2025-26
BEGINNING FUND BALANCE 477,954 - 197,303 70,441
CURRENT YEAR PROPERTY TAXES OTHER THAN LOCAL OPTION - - - -
CURRENT YEAR LOCAL OPTION PROPERTY TAXES - - - -
OTHER REVENUE FROM LOCAL SOURCES 498 515 533 552
2000 - REVENUE - INTERMEDIATE SOURCES - - - -
3000 - REVENUE FROM STATE SOURCES - - - -
4000 - REVENUE FROM FEDERAL SOURCES - - - -
5200 - INTERFUND TRANSFERS - - - -
ALL OTHER BUDGET RESOURCES - 441,000 - -
Total Resources 478,452 441,515 197,836 70,993
Requirements Proposed 2022-23
Projected 2023-24
Projected 2024-25
Projected 2025-26
111 - LICENSED SALARIES - - - -
1121 - CLASSIFIED - REPRESENTED 448 464 480 497
1122 - NON-REPRESENTED STAFF 3,935 4,073 4,215 4,363
113 - ADMINISTRATORS - - - -
OTHER SALARIES 249 - - -
200 - ASSOCIATED PAYROLL COSTS 2,041 2,112 2,186 2,263
300 - PURCHASED SERVICES 59,444 29,722 14,861 7,431
400 - SUPPLIES AND MATERIALS 57,417 28,709 14,354 7,177
500 - CAPITAL OUTLAY 351,791 175,896 87,948 45,795
600 - OTHER OBJECTS 3,128 3,237 3,351 3,468
700 - TRANSFERS - - - -
581000 - OPERATING CONTINGENCY - - - -
376520 - BUDGETED ENDING FUND BALANCE - 197,303 70,441 -
Total Requirements 478,452 441,515 197,836 70,993Certain numbers have been rounded up or down. There may therefore be discrepancies between the actual totals of the individual amounts in the tables and the totals shown.
Budget Forecast by Major Object - 450 - GO Bond Fund (In Thousands)

245
PARTNERSHIP FUNDS (470)This fund is used to manage non-bond-funded capital improvement work conducted by Portland Public Schools in conjunction with external partners; for example, with Concordia University at Faubion.
The creation of this fund was authorized in accordance with Board Resolution No. 5088 on May 12, 2015.

246
Description by Object Code Actual Actual Actual Budget Proposed Approved Adopted2018-19 2019-20 2020-21 2021-22 2022-23 2022-23 2022-23
Resources by Object377000 - Fund Balance-Unres/Undes 318 318 - - - - -
Subtotal - Beginning Fund Balance 318 318 - - - - -452100 - Interfund Transfers - 110 - - - - -
Subtotal - 5200 - INTERFUND TRANSFERS - 110 - - - - -Total Resources by Object 318 428 - - - - -
Description by Function Code Actual Actual Actual BudgetBudget
FTE Proposed Approved AdoptedBudget
FTE2018-19 2019-20 2020-21 2021-22 2021-22 2022-23 2022-23 2022-23 2022-23
Requirements by Function2520 - FISCAL SERVICES - 423 - - - - - - -
Subtotal - 2000 - SUPPORT SERVICES - 423 - - - - - - -4150 - Bldg Acquis/Constr/Improv Svcs - 5 - - - - - - -
Subtotal - 4000 - FACILITIES ACQUISITION AND CON - 5 - - - - - - -
71100 - Ending Fund Balance 318 - - - - - - - -Subtotal - 7000 - UNAPPROPRIATED FUND BALANCE 318 - - - - - - - -
Total Requirements by Function 318 428 - - - - - - -
YearTotal YearTotal YearTotal YearTotal Jul YearTotal YearTotal YearTotal Jul
Description by Object Code Actual Actual Actual BudgetBudget
FTE Proposed Approved AdoptedBudget
FTE2018-19 2019-20 2020-21 2021-22 2021-22 2022-23 2022-23 2022-23 2022-23
Requirements by Object552000 - Building Acquisition/Improvmnt - 5 - - - - - - -
Subtotal - 500 - CAPITAL OUTLAY - 5 - - - - - - -563500 - Administrative Write-Off - 423 - - - - - - -
Subtotal - Other Objects - 423 - - - - - - -376520 - Budgeted Ending Fund Balance 318 - - - - - - - -
Subtotal - 376520 - Budgeted Ending Fund Balance 318 - - - - - - - -
Total Requirements by Object 318 428 - - - - - - -
470 - Partnership Funds - Requirements by Function (Financial Data In Thousands)
470 - Partnership Funds - Requirements by Object (Financial Data in Thousands)
Certain numbers have been rounded up or down. There may therefore be discrepancies between the actual totals of the individual amounts in the tables and the totals shown.
Partnership Funds Detail
470 - Partnership Funds - Resources by Object (In Thousands)

247
Resources Proposed 2022-23
Projected 2023-24
Projected 2024-25
Projected 2025-26
BEGINNING FUND BALANCE - - - -
CURRENT YEAR PROPERTY TAXES OTHER THAN LOCAL OPTION - - - -
CURRENT YEAR LOCAL OPTION PROPERTY TAXES - - - -
OTHER REVENUE FROM LOCAL SOURCES - - - -
2000 - REVENUE - INTERMEDIATE SOURCES - - - -
3000 - REVENUE FROM STATE SOURCES - - - -
4000 - REVENUE FROM FEDERAL SOURCES - - - -
5200 - INTERFUND TRANSFERS - - - -
ALL OTHER BUDGET RESOURCES - - - -
Total Resources - - - -
Requirements Proposed 2022-23
Projected 2023-24
Projected 2024-25
Projected 2025-26
111 - LICENSED SALARIES - - - -
1121 - CLASSIFIED - REPRESENTED - - - -
1122 - NON-REPRESENTED STAFF - - - -
113 - ADMINISTRATORS - - - -
OTHER SALARIES - - - -
200 - ASSOCIATED PAYROLL COSTS - - - -
300 - PURCHASED SERVICES - - - -
400 - SUPPLIES AND MATERIALS - - - -
500 - CAPITAL OUTLAY - - - -
600 - OTHER OBJECTS - - - -
700 - TRANSFERS - - - -
581000 - OPERATING CONTINGENCY - - - -
376520 - BUDGETED ENDING FUND BALANCE - - - -
Total Requirements - - - -Certain numbers have been rounded up or down. There may therefore be discrepancies between the actual totals of the individual amounts in the tables and the totals shown.
Budget Forecast by Major Object - 470 - Partnership Fund (In Thousands)

248
BOND PROGRAM SUMMARYIn November 2012, May 2017 and November 2020, Portland voters overwhelmingly supported capital improvement bonds totaling nearly $2.5 billion to upgrade PPS schools. The majority of PPS schools were built before World War II, and are in need of significant remodeling and modernization.
The $482 million 2012 School Building Improvement Bond enabled the district to make improvements to 51 schools. In addition, Franklin, Grant and Roosevelt High Schools were completely modernized and Faubion PK-8 was completely rebuilt. In addition to the modernization projects, the focus of the 2012 improvement bond work was:
y Seismic improvements
y New seismically strengthened roofs
y Accessibility improvements, including new elevators
y Science classroom upgrades
The work of the 2012 Bond is now almost complete, with only one small project remaining. The $790 million May 2017 Health, Safety and Modernization Bond is currently underway and reaching every school in the district. That work includes:
y Water quality improvements
y Roof replacements, including roof-level seismic improvements
y Security upgrades at all District schools
y Lead paint remediation
y Asbestos remediation
y Radon remediation
y Improving fire safety with the installation of new alarm and sprinkler systems
y ADA upgrades and improvements including new elevators
Modernization work funded by the 2017 bond is also proceeding. McDaniel High School (formerly known as Madison High School) has been completely modernized and a new Kellogg Middle School has been built. Both schools opened to students in fall of 2021. Construction of a new Lincoln High School began in January of 2020. Students will occupy the new building in fall of 2022 and the new athletic fields in 2023. Construction for the modernization of Benson Polytechnic High School and a new Multiple Pathways to Graduation building on the Benson campus began in summer of 2021 and is scheduled to be completed in fall of 2024.
The $1.2 billion November 2020 Bond work includes:
y Replacing textbooks and curriculum materials
y Providing students with tablets and laptops and laptops and updating classroom and district technology
y Updating special education learning spaces

249
y Providing every school in the District with ground floor accessibility that meets requirements of the Americans with Disabilities Act (ADA)
y Replacing school roofs
y Partnering with grant funds to seismically retrofit select schools
y Replacing whole, or components of, heating, cooling and ventilation systems
y Addressing building modifications needed to support school enrollment or capacity changes
y Updating security cameras, intrusion alarm systems and classroom door locks
The measure provides funding to modernize Jefferson High School and complete master planning and design for Cleveland High School, Ida B Wells (formerly Wilson) High School, and additional capacity at Roosevelt High School. Over the long term, Portland Public Schools plans to modernize every school through a series of capital construction bonds, bringing them all up to modern facility and educational standards.For more information on bond-funded projects, including financial information, access the School Building Improvement Bond website. Access the following website for a map and dashboard of bond-funded projects.
Benson Polytechnic HS Groundbreaking Celebration, August 7, 2021

250
Roosevelt HS Phase 4 Construction, July 13, 2021
Roosevelt HS Phase 4 Construction, October 6, 2021

251
McDaniel HS Construction, August 19, 2021
McDaniel HS Construction, August 19, 2021

252
McDaniel HS Complete, September 14, 2021
Kellogg MS Complete, August 31, 2021

253
OTHER CAPITAL PROJECTSThe Facilities and Projects and Construction Group manages planned, volunteer, and emergency repair/replacement work across the District. Projects range in scope and size from the very small repair projects, to large capital replacement projects such as mechanical system replacements. The work is categorized into seven categories: Health & Safety, Warm & Dry, Security, Legal/Regulatory, Delivery of Instruction, Delivery of Support Services, and Energy. Examples of the type of projects included in each category can be seen at the bottom of the document.
Category/Fund 438 191 445 404 435 423 424 Grand TotalHealth & Safety -$ 695,381$ 12,153,256$ 12,848,637$ Warm & Dry -$ 723,648$ 1,084,510$ 1,808,158$ Security -$ 400,257$ 359,893$ 760,150$ Legal/Regulatory -$ 463,282$ 126,581$ 64,903$ 654,766$ Delivery of Instruction -$ 1,193,910$ 319,600$ 1,513,510$ Delivery of Support Services -$ 1,316,513$ 356,308$ 303,765$ 1,976,586$ Energy -$ -$ Maintenance -$ -$ Restricted Grants/Funds 3,930,000$ 617,000$ 4,547,000$ Projects in Process -$ -$ Budget to be Programmed 4,414,000$ 1,186,606$ 870,009$ 1,997,852$ 4,306,000$ 34,097$ 50,235$ 12,858,799$ Fund Totals 8,344,000$ 1,186,606$ 5,663,000$ 17,015,000$ 4,306,000$ 99,000$ 354,000$ 36,967,606$
Category/Fund 438 191 445 404 435 423 424 Grand TotalHealth & Safety -$ 200,000$ 3,019,147$ 863,296$ -$ -$ -$ 4,082,443$ Warm & Dry -$ 200,000$ 3,236,721$ 418,837$ -$ -$ -$ 3,855,558$ Security -$ 200,000$ 512,200$ 141,825$ -$ -$ -$ 854,025$ Legal/Regulatory -$ 250,000$ 250,000$ 69,193$ -$ -$ -$ 569,193$ Delivery of Instruction 150,000$ 125,000$ 1,185,648$ 11,957,036$ -$ -$ -$ 13,417,684$ Delivery of Support Services -$ 150,000$ 110,333$ 250,000$ -$ -$ 308,000$ 818,333$ Energy -$ -$ 160,000$ 123,945$ -$ -$ -$ 283,945$ Maintenance -$ -$ -$ -$ -$ -$ -$ -$ Restricted Grants/Funds 6,543,285$ -$ -$ 618,000$ -$ -$ -$ 7,161,285$ Projects in Process -$ -$ -$ -$ -$ -$ -$ -$ Budget to be Programmed 88,838$ 120,606$ 1,000,000$ 402,700$ 2,866,498$ 136,000$ 200,000$ 4,814,642$ Fund Totals 6,782,123$ 1,245,606$ 9,474,049$ 14,844,831$ 2,866,498$ 136,000$ 508,000$ 35,857,107$
Category/Fund 438 191 445 404 435 423 424 Grand TotalHealth & Safety 455,014$ 173,976$ 391,204$ 507,402$ -$ 396,197$ 21,839$ 1,945,632$ Warm & Dry 316,708$ 114,850$ 772,732$ 577,270$ -$ 18,000$ 49,480$ 1,849,040$ Security -$ 228,958$ 4,795$ 250$ -$ -$ -$ 234,003$ Legal/Regulatory -$ 208,234$ 201,043$ 21,576$ -$ 87,740$ -$ 518,593$ Delivery of Instruction 70,664$ 217,557$ 223,737$ 3,333,375$ -$ 215,190$ -$ 4,060,523$ Delivery of Support Services -$ 643,996$ 843,670$ 187,467$ -$ -$ 1,692$ 1,676,825$ Energy -$ -$ 30$ 962,222$ 1,834,581$ -$ -$ 2,796,832$ Maintenance -$ -$ -$ -$ -$ -$ -$ -$ Restricted Grants/Funds 12,225,116$ -$ -$ 620,304$ -$ -$ 1,754,231$ 14,599,651$ Budget to be Programmed -$ Fund Totals 13,067,501$ 1,587,571$ 2,437,211$ 6,209,866$ 1,834,581$ 717,127$ 1,827,243$ 27,681,099$
CategoryHealth & Safety Projects include Abatement, Structural, Radon mitigation
Security Projects include Access controls, cameras, card readers
Delivery of Instruction
Delivery of Support Services
Energy
Restricted Grants/Funds
Budget to be Programmed
Proposed 2022-23 Project Management Budget
Adopted 2021-22 Project Management Budget
Actual 2020-21 Project Management Budget
Funding not currently assigned to a project
Examples
Legal/Regulatory Projects include fire marshall citations, code compliance requirements, backflows etc Kilns, Modulars, playgrounds, classroom changes and other projects that impact students and the learning environments Dishwashers, water heaters, asphalt repairs and other projects that are overall district supports Energy improvement projects to include control upgrads, LED lighting etc Funds received for projects and can only be spent on those projects ie SRGP and OSCIM grants
Warm & Dry Projects include Heating or cooling improvements, roof repairs, water or sewer lines

254
INTERNAL SERVICE FUNDS SUMMARY (600)Fund 600 - Internal Service Fund Resources SummaryFund 601 is the only sub-fund currently budgeted to the Internal Service Fund and it serves as a Self-Insurance Fund for Workers’ Compensation. Growth in this fund is based on district estimates for these costs.
Fund 600 - Internal Service Fund Requirements SummaryPortland Public Schools is authorized by the State of Oregon as a workers’ compensation self-insured employer. This fund accounts for costs in the program. An excess insurance policy is purchased to cover any claim that may exceed the self-insured retention of $1 million.
Managed by the Risk Management department, self-insurance saves taxpayer money. Greater ability exists to develop workforce injury prevention initiatives (e.g., fall protection improvements, respiratory protection, ergonomics, kiln safety improvements, stage operations safety learning for theater teachers) and engage in return to work efforts that promote keeping injured staff meaningfully engaged in their schools and offices during recovery (e.g., light duty work stations, substitute funding).
Costs include employee injury claim expenses, Third Party Administrator (TPA) contract, staff injury prevention, risk control initiatives, return to work efforts, premiums for excess insurance, and the statutory reserve funds.
Resources include earnings on investments, insurance recoveries, reimbursements from the Oregon EAIP (Employer at Injury Program), and revenues generated from payroll funds solely for the workers’ compensation self-insurance program.

255
Beginning Fund Balance 5,937 8,117 5,858 5,858 5,066 - -
Other Revenue From Local Sources 3,788 729 1,627 2,607 3,554 - -
3000 - Revenue From State Sources 184 221 188 100 - - -
TOTAL RESOURCES 9,908 9,066 7,673 8,565 8,620 - -
Summary of Resources by Major Object - 600 - Internal Service Funds (In Thousands)
Actual2018-19
Proposed 2022-23
Certain numbers have been rounded up or down. There may therefore be discrepancies between the actual totals of the individual amounts in the tables and the totals shown.
Actual2019-20
Actual2020-21
Budget2021-22
Approved2022-23
Adopted2022-23
59%
41%
Resources by Major Object - 600 - Internal Service Funds
Beginning Fund Balance
Other Revenue From Local Sources
Summary of Resources by Major Object - 600 - Internal Service Funds (in Thousands)
Percent of Resources by Major Object - 600 - Internal Service Funds

256
2000 - Support Services 1,791 3,208 1,124 3,778 2.28 339 - - 2.28
6000 - Contingencies - - - 4,787 - 8,281 - - -
7000 - Unappropriated Fund Balance 8,117 5,858 6,549 - - - - - -
TOTAL REQUIREMENTS 9,908 9,066 7,673 8,565 2.28 8,620 - - 2.28
Certain numbers have been rounded up or down. There may therefore be discrepancies between the actual totals of the individual amounts in the tables and the totals shown.
Actual2019-20
Actual2020-21
Budget2021-22
Budget FTE2021-22
Approved2022-23
Adopted2022-23
Budget FTE2022-23
Summary of Requirements by Major Function - 600 - Internal Service Funds (Financial Data in Thousands)
Actual2018-19
Proposed 2022-23
4%
96%
Requirements by Major Function - 600 - Internal Service Funds
2000 - Support Services
6000 - Contingencies
Summary of Requirements by Major Function - 600 - Internal Service Funds (in Thousands)
Percent of Requirements by Major Function - 600 - Internal Service Funds

257
1122 - Non - Represented Staff 187 193 207 224 2.28 237 - - 2.28
Other Salaries 56 26 - 84 - - - - -
200 - Associated Payroll Costs 78 82 82 117 - 102 - - -
300 - Purchased Services 252 309 250 443 - - - - -
400 - Supplies And Materials 3 18 25 71 - - - - -
500 - Capital Outlay - - 559 - - - - - -
600 - Other Objects 1,215 2,580 - 2,839 - - - - -
581000 - Operating Contingency - - - 4,787 - 8,281 - - -
376520 - Budgeted Ending Fund Balance 8,117 5,858 6,549 - - - - - -
TOTAL REQUIREMENTS 9,908 9,066 7,673 8,565 2.28 8,620 - - 2.28
Budget FTE2022-23
Summary of Requirements by Major Object - Fund 600 - Internal Service Funds (Financial Data in Thousands)
Actual2018-19
Proposed 2022-23
Certain numbers have been rounded up or down. There may therefore be discrepancies between the actual totals of the individual amounts in the tables and the totals shown.
Actual2019-20
Actual2020-21
Budget2021-22
Budget FTE2021-22
Approved2022-23
Adopted2022-23
3% 1%
96%
Requirements by Major Object - Fund 600 - Internal Service Funds
1122 - Non - Represented Staff
200 - Associated Payroll Costs
581000 - Operating Contingency
Summary of Requirements by Major Object - 600 - Internal Service Funds (in Thousands)
Percent of Requirements by Major Object - 600 - Internal Service Funds

258
SELF INSURANCE FUND (601)Portland Public Schools is an Oregon authorized workers’ compensation self-insured carrier. The Risk Management department runs the District’s Workers’ Compensation Program. Fund 601 is the only sub-fund currently budgeted to the Internal Service Fund, and it accounts for claim expenses, Third Party Administrator (TPA) contracts, injury prevention risk control initiatives, and the statutory reserve funds.
Resources in Fund 601 include earnings on investments, insurance recoveries, reimbursements from the Oregon Employer at Injury Program (EAIP), and revenues generated from payrolls from other funds solely for the District’s Workers’ Compensation Program.

259
Description by Object Code Actual Actual Actual Budget Proposed Approved Adopted2018-19 2019-20 2020-21 2021-22 2022-23 2022-23 2022-23
Resources by Object376510 - Budgeted Beginning Fund Balance - - - 5,858 5,066 - -377000 - Fund Balance-Unres/Undes 5,937 8,117 5,858 - - - -
Subtotal - Beginning Fund Balance 5,937 8,117 5,858 5,858 5,066 - -415100 - Interest on Investments 275 134 89 16 13 - -419600 - Recovery PY Expenditure 3 - 4 5 - - -419700 - Services Provided Other Funds 3,510 595 1,534 2,586 3,541 - -419910 - Miscellaneous - - - - - - -
Subtotal - Other Revenue from Local Sources 3,788 729 1,627 2,607 3,554 - -
431992 - Return To Work 184 221 188 100 - - -Subtotal - 3000 - REVENUE FROM STATE SOURCES 184 221 188 100 - - -
Total Resources by Object 9,908 9,066 7,673 8,565 8,620 - -
Description by Function Code Actual Actual Actual BudgetBudget
FTE Proposed Approved AdoptedBudget
FTE2018-19 2019-20 2020-21 2021-22 2021-22 2022-23 2022-23 2022-23 2022-23
Requirements by Function2520 - FISCAL SERVICES 1,791 3,208 1,124 3,778 2.28 339 - - 2.28
Subtotal - 2000 - SUPPORT SERVICES 1,791 3,208 1,124 3,778 2.28 339 - - 2.28 61100 - Operating Contingency - - - 4,787 - 8,281 - - -
Subtotal - 6000 - CONTINGENCIES - - - 4,787 - 8,281 - - -71100 - Ending Fund Balance 8,117 5,858 6,549 - - - - - -
Subtotal - 7000 - UNAPPROPRIATED FUND BALANCE 8,117 5,858 6,549 - - - - - -
Total Requirements by Function 9,908 9,066 7,673 8,565 2.28 8,620 - - 2.28
Self Insurance Fund - Requirements by Function (Financial Data In Thousands)
Fund 601 - Self Insurance Fund Detail
Self Insurance Fund - Resources by Object (In Thousands)

260
YearTotal YearTotal YearTotal YearTotal Jul YearTotal YearTotal YearTotal Jul
Description by Object Code Actual Actual Actual BudgetBudget
FTE Proposed Approved AdoptedBudget
FTE2018-19 2019-20 2020-21 2021-22 2021-22 2022-23 2022-23 2022-23 2022-23
Requirements by Object511220 - Non-Represented Staff 128 192 207 224 2.28 165 - - 1.78 511420 - Directors/Program Admins 59 1 - - - 72 - - 0.50 512100 - Substitutes - Licensed 56 19 - 66 - - - - -512200 - Substitutes - Classified - 6 - 18 - - - - -513300 - Extended Hours 1 1 - - - - - - -513400 - Overtime Pay - - - - - - - - -
Subtotal - 100 - SALARIES 243 219 207 307 2.28 237 - - 2.28 521000 - PERS 3 7 7 13 - - - - -521310 - PERS UAL 25 28 28 37 - 37 - - -522000 - Social Security - FICA 18 16 16 24 - 18 - - -523100 - Workers' Compensation 2 - 1 2 - 2 - - -523200 - Unemployment Compensation - - - - - - - - -524100 - Group Health Insurance 26 27 26 38 - 42 - - -524200 - Other Employer Paid Benefits 1 1 1 1 - - - - -524300 - Retiree Health Insurance 2 1 2 2 - 2 - - -524530 - Early Retirement Benefits 1 1 1 1 - - - - -
Subtotal - 200 - ASSOCIATED PAYROLL COSTS 78 82 82 117 - 102 - - -
532200 - Repairs and Maintenance Svcs - 9 6 13 - - - - -532900 - Other Property Services - 29 19 200 - - - - -534100 - Travel, Local in District 1 - - 3 - - - - -534200 - Travel, Out of District - 1 1 2 - - - - -535100 - Telephone - - 1 - - - - - -535300 - Postage - - - - - - - - -535500 - Printing and Binding - - - - - - - - -538200 - Legal Services 2 - - - - - - - -538940 - Professional Moving Services - - - - - - - - -538990 - Non-Instr Pers/Professional Sv 249 271 224 220 - - - - -
Subtotal - 300 - PURCHASED SERVICES 252 309 250 443 - - - - -541000 - Consumable Supplies - - - 11 - - - - -541600 - Interdepartmental Charges - - - 2 - - - - -544000 - Periodicals - - - 1 - - - - -546000 - Non-Consumable Supplies 3 - - 34 - - - - -547000 - Computer Software - 16 24 20 - - - - -548000 - Computer Equipment - 1 1 3 - - - - -
Subtotal - 400 - SUPPLIES AND MATERIALS 3 18 25 71 - - - - -
564000 - Dues and Fees - - 1 3 - - - - -565350 - Work Comp Insurance Premiums 109 135 131 110 - - - - -565910 - Worker's Comp Claim Expense 989 2,324 283 2,600 - - - - -565920 - Worker's Comp Assessment 117 121 145 126 - - - - -
Subtotal - Other Objects 1,215 2,580 559 2,839 - - - - -581000 - Operating Contingency - - - 4,787 - 8,281 - - -
Subtotal - 581000 - Operating Contingency - - - 4,787 - 8,281 - - -376520 - Budgeted Ending Fund Balance 8,117 5,858 6,549 - - - - - -
Subtotal - 376520 - Budgeted Ending Fund Balance 8,117 5,858 6,549 - - - - - -
Total Requirements by Object 9,908 9,066 7,673 8,565 2.28 8,620 - - 2.28
Self Insurance Fund - Requirements by Object (Financial Data In Thousands)
Certain numbers have been rounded up or down. There may therefore be discrepancies between the actual totals of the individual amounts in the tables and the totals shown.
Fund 601 - Self Insurance Fund Detail

261
Resources Proposed 2022-23
Projected 2023-24
Projected 2024-25
Projected 2025-26
BEGINNING FUND BALANCE 5,066 5,243 5,427 5,617
CURRENT YEAR PROPERTY TAXES OTHER THAN LOCAL OPTION - - - -
CURRENT YEAR LOCAL OPTION PROPERTY TAXES - - - -
OTHER REVENUE FROM LOCAL SOURCES 3,554 3,678 3,807 3,940
2000 - REVENUE - INTERMEDIATE SOURCES - - - -
3000 - REVENUE FROM STATE SOURCES - - - -
4000 - REVENUE FROM FEDERAL SOURCES - - - -
5200 - INTERFUND TRANSFERS - - - -
ALL OTHER BUDGET RESOURCES - - - -
Total Resources 8,620 8,922 9,234 9,557
Requirements Proposed 2022-23
Projected 2023-24
Projected 2024-25
Projected 2025-26
111 - LICENSED SALARIES - - - -
1121 - CLASSIFIED - REPRESENTED - - - -
1122 - NON-REPRESENTED STAFF 165 171 177 183
113 - ADMINISTRATORS - - - -
OTHER SALARIES 72 75 77 80
200 - ASSOCIATED PAYROLL COSTS 102 106 109 113
300 - PURCHASED SERVICES - - - -
400 - SUPPLIES AND MATERIALS - - - -
500 - CAPITAL OUTLAY - - - -
600 - OTHER OBJECTS - - - -
700 - TRANSFERS - - - -
581000 - OPERATING CONTINGENCY 8,281 8,571 8,871 9,181
376520 - BUDGETED ENDING FUND BALANCE - - - -
Total Requirements 8,620 8,922 9,234 9,557
Certain numbers have been rounded up or down. There may therefore be discrepancies between the actual totals of the individual amounts in the tables and the totals shown.
Budget Forecast by Major Object - 601 - Self Insurance Fund (In Thousands)

262
MULTNOMAH EDUCATION SERVICE DISTRICT ALLOCATIONThe Multnomah Education Service District (MESD) is a public agency responsible for a variety of direct and indirect educational services to eight Multnomah County school districts as well as other public and private agencies and schools in the region. MESD’s services are those best managed on a regional basis either because they are too costly for an individual district to support, or because demand for the service within a single district is limited.
MESD’s core services are funded by the State School Fund, local property taxes, contracts and grants. The state allocates support to all Education Service Districts (ESD) in the state by granting each ESD a fixed share of the total ESD funding formula revenue. The ESD then allocates these funds to the participating local school districts.
The broad categories of services are Instructional Services, Special Education Services, School Health Services, Technology Services, and Administrative Support Services. There are more than 60 separate “resolution” services and programs from which component districts choose to spend their annual allocation. In addition, numerous programs are operated on a contracted or fee-for service basis. Some programs may be funded through both resolution and contract dollars.
The ESD determines the mix of services to be provided through discussions with advisory committees comprised of local school district representatives. The unit cost or actual cost for each of the services is determined by MESD.
Each participating local school district selects from a menu of services, the total cost of which shall not exceed the district’s dollar allocation. Transit dollars are received from MESD as General Fund revenues in support of services that the District provides for itself. Transit dollars may be used to contract for additional services from MESD.
Transit Dollars: Funds allocated to the ESD through the State School Fund allocation model are then passed from the ESD to the District. Funds may be used by the District to purchase services from the ESD, to fund services provided directly by the District, or services may be purchased.
Resolution Dollars: Funds allocated to the ESD through the State School Fund allocation model. These funds stay at the ESD and are available to the District to purchase services. The services are selected from a menu detailed in MESD Local Service Plan.

263
FY2021-22 MESD DSP Update 032322 as of 3/23/2022 11:20 AM
Multnomah Education Service District2021-2022 LOCAL SERVICE PLAN SELECTIONS
Unit CostUnit 7/1/2021
INSTRUCTIONAL SERVICES1 Curriculum Services2 Classroom Law Project (CLP) All/None 26,072$ 3 School Improvement4 Current Program (w/ 1.05 Math, 1.0 Lit) All/None 611,042$ 5 add 1.0 English Language Learner TOSA All/None 122,251$ 6 add 1.0 Teacher PreK-3 All/None 111,460$ 7 add 0.5 Science Facilitator All/None 66,632$ 8 add 1.0 Student Assessment Specialist All/None 122,251$ 9 Helensview School
10 General Ed (1.0x) slot 1 Student 13,405$ 11 Y SPED slot (1.0x plus Special Ed Teachers) 1 Student 16,319$ 12 ELL Slot (1.5x slot) 1 Student 20,108$ 13 Helensview Phoenix (2.0x slot) 1 Student 26,810$ 14 Home School Notification15 Service ALL 52,385$ 1617 Service All/None 404,702$ 18 Outdoor Schools19 6th Grade Offering Level 1: Full Week 1 Student 613$ 20 6th Grade Offering 4-Day Program 1 Student 415$ 21 6th Grade Outdoor School Credits22 Measure 99 Reimbursement Estimate 1 Student (613)$ 23 Outdoor School credit (METRO) 1 Student -$ 24 4th Grade Overnight 1 Student 146$
STUDENT SERVICESSpecial Education Services
25 Y The Creeks: Social Emotional Skills (SESP) 1 Student 57,992$ 26 Y The Creeks: Behavioral Health (BH) 1 Student 57,992$ 27 Y The Creeks: Therapeutic Classroom (TC) 1 Student 57,992$ 28 Y Helensview Therapeutic Classroom (TC) 1 Student 42,386$ 29 Y Functional Living Skills (FLS)30 Y FLS: K-12 and Transition 1 Student 75,613$ 31 Y FLS: Alternative Behavior Prog (Wheatley) 1 Student 120,512$ 32 Y Related Services33 Y Individually Purchased Option34 Y Speech Pathologist 1 FTE 133,936$ 35 Y Occupational Therapist 1 FTE 129,009$ 36 Y Physical Therapist 1 FTE 138,302$ 37 Y Psychological Services 1 FTE 125,334$ 38 Y Educational Assistants 0.875 FTE 52,246$ 39 Y Assistive Technology (AT) 1 FTE 129,458$ 40 Y Speech Pathology Assistant (SLPA) 1 FTE 94,454$ 41 Y Certified Occup. Therapy Asst (COTA) 1 FTE 98,533$ 42 Y Licensed Physical Therapy Asst (LPTA) 1 FTE 108,245$ 43 Y Behavior Interventionist 1 FTE 129,171$
School Health Services44 Hearing and Vision Screening All/None 233,262$ 45 Immunization All/None 161,860$ 46 School Nurse Services47 Registered Nurses 1 FTE 136,461$ 48 School Health Assistants Hour 41.40$ 49 Complex Needs Nursing All/None 551,056$ 50 1:1 Nurses 1 FTE 136,461$
row
MO
E
Educ. Prog. in Adult Correction Facilities (Incarcerated Youth)
as of: 2/28/2022 ODE Extended ADMw 57,311.39 CTA ADMw Ext. 57,311.39
CTA ADMr 48,056.00
Units Amount Units Amount Units Amount
A 25,756$ N -$ A 25,756$
A 317,235$ N -$ A 317,235$ N -$ N -$ N -$ N -$ N -$ N -$ N -$ N -$ N -$ N -$ N -$ N -$
52.75 707,120$ 0 -$ 52.75 707,120$ 42 685,416$ 0 -$ 42 685,416$ 6.5 130,700$ 0 -$ 6.5 130,700$
17.75 475,882$ 0 -$ 17.75 475,882$
A 27,197$ N -$ A 27,197$
A 379,540$ N -$ A 379,540$
1710 1,048,863$ 1710 1,048,863$ 3420 2,097,725$ 0 -$ 0 -$ 0 -$
1710 (1,048,863)$ 1710 (1,048,863)$ 3420 (2,097,725)$ 0 -$ 0 -$ 0 -$ 0 -$ 0 -$ 0 -$
5 289,960$ 19.28 1,118,086$ 24.28 1,408,046$ 4 231,968$ 2.44 141,500$ 6.44 373,468$ 3 173,976$ 0 -$ 3 173,976$
12 508,632$ 2.31 97,912$ 14.31 606,544$
0 -$ 1 75,613$ 1 75,613$ 15 1,807,680$ 0 -$ 15 1,807,680$
0 -$ 0 -$ 0 -$ 0 -$ 0 -$ 0 -$ 0 -$ 0 -$ 0 -$ 0 -$ 0 -$ 0 -$ 0 -$ 7.8751 470,214$ 1 470,214$ 0 -$ 0 -$ 0 -$ 0 -$ 0 -$ 0 -$ 0 -$ 0 -$ 0 -$ 0 -$ 0 -$ 0 -$ 0 -$ 0 -$ 0 -$
A 121,102$ N -$ A 121,102$ A 84,033$ N -$ A 84,033$
25.3 3,452,462$ 10.61 1,447,851$ 35.91 4,900,313$ 83355 3,450,897$ 15647 647,786$ 99002 4,098,683$
A 286,092$ N -$ A 286,092$ 0 -$ 1.44 196,504$ 1.44 196,504$
PORTLAND SCHOOL DISTRICT
Resolution Contract Total

264
FY2021-22 MESD DSP Update 032322 as of 3/23/2022 11:20 AM
Multnomah Education Service District2021-2022 LOCAL SERVICE PLAN SELECTIONS
Unit CostUnit 7/1/2021ro
w
MO
E
51 Application and Development Services52 Business Systems ("IFAS") - Corbett SD only per memo 23,524$ 53 Data Warehouse Services - Level 1 (Database) A/N (ADMw) 2.92$ 54 Data Warehouse Services - Level 2 (add'l cost) A/N (ADMw) 2.37$ 55 Student Info Sys - Level 1B (SIS Admin) A/N (ADMw) 5.53$ 56 Student Info Sys - Level 1A (SIS Admin + add'l cos A/N (ADMw) 2.91$ 57 Student Info Sys - Level 2 (includes 1B + 1A) A/N (ADMw) 14.88$ 58 Forecast5 Analytics A/N (ADMw) 1.03$ 59 District Office Services60 School Messenger A/N (ADMr) 1.30$ 61 add Messenger App w/ InfoCenter A/N (ADMr) 1.00$ 62 Substitute Services ("Absence Mgmt") A/N (ADMw) SOW63 add Substitute Calling Service A/N (ADMw) SOW64 Infrastructure Services65 Network/Internet Services66 One-time Equipment -$ 67 One-time Equipment - Portland SD only 365,000$ 68 One-time Implementation Services All/None 2.00$ 69 Internet Connectivity - Portland SD All/None 134,146$ 70 Last Mile Connect & Network Monitoring All/None 1,429,487$ 71 Network services - Portland SD only All/None 1,253,016$ 72 Engineering Support Hour 94$ 73 On-Site Help Desk Technician Day 536$ 74 Database Administration Month 3,400$ 75 Instructional Services76 Follett Destiny Library and Textbook Mgmt. A/N (ADMr) 4.81$ 77
78 Inter-District Delivery System (PONY) All/None 41,709$ 79 School Announce Closure Network ALL (div by 8) 2,480$ 80 Government Affairs A/N (ADMw) 162,160$ 81 Multnomah County MOU Coordinator All/None 8,000$ 82 Other Business Administrative Services per memo memo
SUBTOTAL MESD SERVICES
TRANSIT REQUESTED BY DISTRICT
GRAND TOTAL MESD SERVICES AND TRANSITS
RESOURCES AVAILABLE FOR RESOLUTION SERVICESBalance Forward from Prior Year District Service PlanApportionment of Current Year SSF RevenueApportionment of Prior Year SSF Revenue Adjustment (May 2022 Warrant)TOTAL RESOURCES FOR RESOLUTION SERVICES
ENDING CONTINGENCY BALANCE
Maintenance of Effort (MOE) Total ----- sum of services with "Y" in MOE column
Instructional ServicesStudent Services - Special EducationStudent Services - School Health ServicesTechnology Services (CTA)Administrative Support Servicessubtotal MESD ServicesTransits direct to districtTotal MESD Services & Transits
ADMINISTRATIVE SUPPORT SERVICES
TECHNOLOGY SERVICES (via the "CTA")**
** CTA offers many services not listed on the MESD DSP
as of: 2/28/2022 ODE Extended ADMw 57,311.39 CTA ADMw Ext. 57,311.39
CTA ADMr 48,056.00
Units Amount Units Amount Units Amount
PORTLAND SCHOOL DISTRICT
Resolution Contract Total
N -$ N -$ N -$ N -$ N -$ N -$ N -$ N -$ N -$ A 316,932$ N -$ A 316,932$ A 181,169$ N -$ A 181,169$ N -$ N -$ N -$ A 40,300$ N -$ A 40,300$
A 65,767$ N -$ A 65,767$ N -$ N -$ N -$ N -$ N -$ N -$ N -$ N -$ N -$
N -$ N -$ N -$ N -$ N -$ N -$ N -$ N -$ N -$ A 134,146$ N -$ A 134,146$ N -$ N -$ N -$ A 1,253,016$ N -$ A 1,253,016$ 0 -$ 0 -$ 0 -$ 0 -$ 0 -$ 0 -$
12 40,800$ 0 -$ 12 40,800$
A 219,836$ N -$ A 219,836$
A 22,426$ N -$ A 22,426$ A 310$ N -$ A 310$ N -$ N -$ N -$ A 8,000$ N -$ A 8,000$ N -$ N -$ N -$
15,438,350$ 4,195,465$ 19,633,816$
7,500,000$
22,938,350$
2,635,805$ 21,464,963$
-$ 24,100,768$
1,162,418$
3,697,632$
2,748,845$ -$ 2,748,845$ 3,012,216$ 1,903,325$ 4,915,541$ 7,394,586$ 2,292,140$ 9,686,726$ 2,251,967$ -$ 2,251,967$
30,736$ -$ 30,736$ 15,438,350$ 4,195,465$ 19,633,816$
7,500,000$ -$ -$ 22,938,350$ 4,195,465$ 19,633,816$

265
INFORMATIONAL SECTION

INFORMATIONAL SECTION
The Informational Section includes detailed historical and projected personnel resource allocations, property tax information and other performance measures used by the District.

267
PORTLAND PUBLIC SCHOOLS ASSESSED VALUE OF TAXABLE PROPERTY
Fiscal Year Residential
Property Personal Property Total Assessed
Value
Total Direct Rate a
Levy Amount Before
Adjustments
2026 b 65,624,543 2,784,538 68,409,081 9.7681 668,226 2025 b 63,405,356 2,690,375 66,095,730 9.7681 645,630 2024 b 61,261,213 2,599,396 63,860,609 9.7681 623,798 2023 b 59,189,578 2,511,493 61,701,072 9.7681 602,702 2022 57,187,998 2,426,564 59,614,562 9.6016 572,396 2021 53,701,040 2,344,506 56,045,546 9.6698 541,950 2020 51,230,970 2,472,239 53,703,209 9.6734 519,492 2019 48,899,771 2,212,720 51,112,491 9.7571 498,709
a Per $1,000 of Assessed Valueb Estimated
Assessed Value
244,026
256,395
267,578
284,618
294,579
304,890
315,561
326,605
101,714
106,869
111,531
118,633
122,785
127,083
131,531
136,134
25,750
27,056
28,236
30,034
31,085
32,173
33,299
34,464
127,219
129,172
134,605
139,111
154,253
159,652
165,239
171,023
- 100,000 200,000 300,000 400,000 500,000 600,000 700,000
2018-19
2019-20
2020-21
2021-22 est.
2022-23 est.
2023-24 est.
2024-25 est.
2025-26 est.
Total Taxes Levied (in thousands)Permanent Rate Taxes Levied Local Option Taxes Levied Gap Taxes Levied Total Bond Taxes Levied (in thousands)
Note: All Amounts listed in thousands

268
PROPERTY TAX LEVIES AND COLLECTIONS
Fiscal Year
Taxes Levied Before
Adjustments
Taxes Levied for the Fiscal Year
* Adjustment
Factor Current & Prior Year Collection Collection Rate
2023 580,549 574,744 99.00% 551,754 96.00%2022 560,917 555,308 99.00% 533,096 96.00%2021 541,949 536,371 98.97% 512,270 95.51%2020 519,493 514,918 99.12% 495,182 96.17%2019 498,710 495,645 99.39% 480,501 96.94%2018 481,463 476,797 99.03% 458,103 96.08%
* Estimated** Amounts are based upon the tax collection year July 1 to June 30
Note: All Amounts listed in thousands

269
BUDGET’S EFFECT ON AVERAGE HOMEOWNER2018-19 2019-20 2020-21 2021-22 2022-23Actual Actual Actual Actual Projecteda
Tax RatesPermanent Tax Rate per $1,000 of AV 4.7743$ 4.7743$ 4.7743$ 4.7743$ 4.7743$ Local Option Tax 1.9900 1.9900 1.9900 1.9900 1.9900 Gap Tax Rate per $1,000 of AV 0.5038 0.5038 0.5038 0.5038 0.5038 Bond Tax Rate per $1,000 of AV 2.4890 2.4053 2.4017 2.4890 2.5000 Total Tax Rate 9.7571$ 9.6734$ 9.6698$ 9.7571$ 9.7681$
Average Assessed Value 300,000$ 300,000$ 300,000$ 300,000$ 300,000$ Tax Burden 2,927 2,902 2,901 2,927 2,930 a Actual levy rate determined by county assessors' offices
Measure 5 Limits$5 per $1,000 of Real Market Value (RMV)$10 per $1,000 of RMV for general government taxesApplied only to operating taxes, not bondsFor each property, school taxes and general government taxes compared to their limits respectively
Measure 50 Limits
For existing property, annual growth of AV limited to 3%For new property, AV = RMV multiplied by AV/RMV of similar property
Budget's Effect on Average Homeowner
Measure 5, which introduced property tax rate limits, was passed in 1990 and became effective starting in the 1991-92 tax year. When fully implemented in 1995-96, Measure 5 cut property tax rates an average of 51 percent from their 1990-91 levels.
Measure 50 was passed in 1997 and cut property taxes, introduced assessed value growth limits and replaced most tax levies with permanent tax rates. Permanent tax rate equals the maximum rate without voter approval. Measure 50 cut effective tax rates an average of 11 percent from their 1996-97 levels.
Assessed Value (AV) for 1997-98 was set at 90% of 1995-96 AV for each property and permanent rates were established for taxing districts
2,885
2,890
2,895
2,900
2,905
2,910
2,915
2,920
2,925
2,930
2018-19 Actual 2019-20 Actual 2020-21 Actual 2021-22 Budget 2022-23 Projected
Taxes Paid by Average Homeowner

270
PRINCIPAL PROPERTY TAXPAYERS IN DISTRICT BOUNDARIES
Taxpayer Taxable Assessed
Value Rank
Percentage of Total Taxable
Assessed ValueTaxable Assessed
Value Rank
Percentage of Total Taxable
Assessed Value
Pacificorp (PP&L) 483,934$ 1 0.90% 282,606$ 1 0.74%Portland General Electric Co 454,209 2 0.85% 241,239 2 0.63%CenturyLink 299,726 3 0.56%Weston Investment Co LLC 252,134 4 0.47% 219,480 3 0.58%Port of Portland 235,786 5 0.44% 210,833 4 0.55%Comcast Corporation 190,456 6 0.35% 194,788 5 0.51%AT&T Inc 181,621 7 0.34%111 SW 5th Avenue Investors LLC 172,979 8 0.32%Capref Lloyd Center LLC 162,999 9 0.30%AAT Lloyd District LLC 157,225 10 0.29%Qwest Corporation 184,976 6 0.49%LC Portland LLC 173,396 7 0.45%Evraz Inc LLC 166,299 8 0.44%555 SW Oak LLC 130,945 9 0.34%Fred Meyer Stores 126,979 10 0.33%
Subtotal of Ten Largest Taxpayers 2,591,069 4.82% 1,931,541 5.06%
All Other Taxpayers 51,112,140 95.18% 36,189,366 94.94%
Total All Taxpayers 53,703,209$ 100.00% 38,120,907$ 100.00%
a 2020 information most current at time of distribution
2020a 2011
Principal Property Taxpayers in District BoundariesSCHOOL DISTRICT NO.1J, MULTNOMAH COUNTY, OREGON
Principal Property Tax Payers for Multnomah CountyPrior Year and Nine Years Ago
Taxing District - 311 Portland Public School District(dollars in thousands)
SourcesMultnomah County, Division of Assessment and TaxationTax Supervising and Conservation Commission Annual Reports for the relevant fiscal year

271
DEMOGRAPHIC DATA
Demographic DataSCHOOL DISTRICT NO.1J, MULTNOMAH COUNTY, OREGON
Demographic and Economic StatisticsLast Ten Calendar Years
Multnomah County
Year Population
Personal Income (thousands of
dollars)
Per Capita Personal Income
(dollars)Unemployment
Rateb2009 726,855 29,430,654$ 40,490$ 9.5%
2012 759,256 32,715,802$ 43,089$ 8.9%2013 766,135 33,376,029 43,564 7.92014 776,712 36,588,018 47,106 6.82015 790,294 38,906,295 49,230 5.72016 801,539 41,735,341 52,069 4.92017 807,555 43,873,915 54,329 4.12018 811,880 46,966,887 57,850 4.02019 812,855 49,399,774 60,773 4.02020 - a - a - a 11.62021 - a - a - a 5.6
a Data for 2020 and 2021 not available at time of publication.b Oregon rates as of June 30 each year. Sources:
US Department of Labor, Bureau of Labor Statistics: unemployment rate information
US Department of Commerce, Bureau of Economic Analysis: Population, personal income and per capita information

272
DEBT SERVICE OVERVIEWLimited Tax Pension BondsIn October 2002 Portland Public Schools participated as one of forty-one Oregon school districts and education service districts in issuing limited tax pension bonds. The proceeds were used to finance a portion of the estimated unfunded actuarial liability of each participating school district with the Oregon Public Employees Retirement System (“OPERS”). The Oregon School Boards Association (“OSBA”) sponsored this pooled limited tax pension bond program. The OSBA does not have a financial obligation in connection with the bonds issued under the program. Except for the payment of its pension bond payments and additional charges when due, each participating school district has no obligation or liability to any other participating school district’s pension bonds or liabilities to OPERS. In April 2003, OSBA sponsored another pooled limited tax pension bond program with thirty school districts and education service districts. Payments of yearly principal and interest are recorded as financial statement expenditures in instruction and in support services. On October 31, 2002, the District issued $210.1 million Limited Tax Pension Bonds, Series 2002 (Federally Taxable), of which $53.5 million are Series 2002A (deferred interest bonds) and $156.6 million are Series 2002B (current interest bonds). The Series 2002A Bonds were paid off June 30, 2020. The 2002B Bonds are payable annually through June 2028. During 2012, $14.2 million of Series 2002 Pension Bonds were refinanced. The Series 2012 Refunding was paid off June 30, 2021.On April 30, 2003, the District issued $281.2 million Limited Tax Pension Bonds, Series 2003 (Federally Taxable), of which $124.8 million are Series 2003A (deferred interest bonds) and $156.4 million are Series 2003B (current interest bonds). The Series 2003 series Limited Tax Pension Bonds are payable annually through June 2028.
Full Faith and Credit Pension BondsOn July 15, 2021 the District issued $399.4 million Full Faith and Credit Bonds, Series 2021 (Federally Taxable). The bonds were issued to finance the District’s unfunded actuarial liability (UAL) with the OPERS and are payable annually through June 2040.The District anticipates the total costs of financing the District’s UAL with Limited Tax and Full Faith and Credit Pension Bonds will result in a significant savings to the District when compared to paying for such costs as additional contribution rates to OPERS.
General Obligation Bonds As part of a $482 million capital bond measure passed by District voters in 2012, the District issued the following General Obligation debt to finance school renovation and replacement:On May 1, 2013, the District issued $68.6 million in General Obligation Bonds, Series 2013B. The bonds mature on June 15, 2033 with principal payments due annually on June 15. On December 30, 2020 $50.4 million of Series 2013B General Obligation Bonds were refinanced through an advance refunding. On April 30, 2015, the District issued $244.7 million in General Obligation Bonds, Series 2015B. The bonds mature on June 15, 2033 with principal payments due annually on June 15. On August 10, 2017, the District issued $62.2 million in General Obligation Bonds, Series 2017B. The bonds mature on June 15, 2030, with principal payments due annually on June 15. As part of a $790 million capital bond measure passed by District voters in 2017, the District has issued the following General Obligation debt to finance school renovation and replacement:

273
On August 10, 2017, the District issued $179.7 million in General Obligation Bonds, Series 2017B. The bonds mature on June 15, 2044 with principal payments due annually on June 15. On April 14, 2020, the District issued $441.3 million in General Obligation Bonds, Series 2020. The bonds mature on June 15, 2037, with principal payments due annually on June 15. As part of a $1.2 billion capital bond measure passed by District voters in November 2020, the District issued the following General Obligation debt to finance school renovation and replacement and to redeem bonds issued in 2013:On December 30, 2020, the District Issued $365.5 million in General Obligation Bonds, Series 2020B. The bonds mature on June 15, 2046, with principal payments due annually on June 15. On December 30, 2020, the District Issued $54.0 million in General Obligation Advance Refunding Bonds, Series 2020C. The bond proceeds were used to redeem Series 2013B bonds. The bonds mature on June 15, 2033, with principal payments due annually on June 15. The Series 2020C Bonds maturing on or after June 15, 2031 are subject to optional early redemption. The total amount of interest savings (economic gain) as a result of the refinancing is $6.2 million. The present value of future cash savings as a result of the refinancing is $5.5 million. Article XI-K of the Oregon Constitution allows the state to guarantee the general obligation bonded indebtedness of school districts. For the Series 2013B, 2015B, 2017B, 2020, 2020B, and 2020C General Obligation Bonds mentioned immediately above, the District participated in the Oregon School Bond Guaranty program (ORS 328.321 to 328.356), whereby the State of Oregon (State) guarantees all principal and interest payments until maturity will be made to bondholders when due. Should the District fail to make a payment of debt service on these bonds when due, the State will make the payment on behalf of the District, and then will seek recovery from the District. The State may recover funds by means of intercepting any source of operating monies normally remitted from the State to the District. Since the inception of the bonds, the District has not used the guarantee.Other DebtPursuant to the American Recovery and Reinvestment Act of 2009 (ARRA), the City of Portland was awarded $13.5 million in Recovery Zone Economic Development (RZED) Bonds. In July 2010, the City sub-awarded $11.0 million of the RZED bonds to Portland Public Schools, which are being used to complete energy and water conservation projects that will financially benefit the District in reduced energy and water costs and will yield on-going financial benefit once the bonds are paid off. The District makes semi-annual interest payments and annual principal payments, and the bonds will mature in December 2022. The bond’s interest payments are 42 percent federally subsidized.On November 9, 2016, the District issued $5.0 million in Full Faith and Credit Obligations, Series 2016. The obligations mature on December 1, 2031. The obligations carry a prepayment option such that any or all outstanding maturities may be redeemed on or after December 1, 2018.On August 4, 2016 the District issued $4.0 million in Qualified Zone Academy (QZAB) Bonds, Series 2016. The District pays no interest over the 20 year term of the bonds. The bonds carry a 4.39 percent interest rate for structuring purposes, but the purchaser of the bonds receives a Federal tax credit in lieu of interest earnings. The bonds mature on August 4, 2036.Legal Debt LimitORS 328.245 establishes a parameter of bonded indebtedness for school districts. Aggregates are governed by real market values within the District based on the following:For each grade from kindergarten to eighth for which the District operates schools, fifty-five one-hundredths of one percent (.0055) of the real market value. For each grade from ninth to twelfth for which the District operates schools, seventy-five one-hundredths of one percent (.0075) of the real market value. 10 years of Legal Debt Margin information from the District’s 2021 Annual Comprehensive Financial Report is excerpted below.

274
LEGAL DEBT LIMIT
Legal Debt Margin Calculation for Fiscal Year 2021Real Market Value 140,249,375$
Debt Limit (7.95% of Real Market Value) 1 11,149,825$ Amount of Debt Applicable to Debt Limit:
General Obligation Bonded Debt 1,230,887 Less: Amount Available in Debt Service Funds (10,482)
Amount of Debt Applicable to Debt Limit 1,220,405
Legal Debt Margin 9,929,420$
Debt LimitTotal net debt
applicable to limit Legal debt margin
Total net debt applicable to the
limit as a percentage of
debt limit, , , ,, , , ,2012 5,680,406$ -$ 5,680,406$ 0.00%2013 5,604,461 158,187 5,446,274 2.822014 5,917,214 118,738 5,798,476 2.012015 6,517,491 382,186 6,135,305 5.862016 7,228,979 346,748 6,882,231 4.802017 8,501,342 309,076 8,192,266 3.642018 9,670,978 633,588 9,037,390 6.552019 10,472,898 526,062 9,946,836 5.022020 10,698,745 924,888 9,773,857 8.642021 11,149,825 1,220,405 9,929,420 10.95
Allowable Percentage of Real Market Value:A Kindergarten through eighth grade, 9 x .0055 4.95%B Ninth through twelfth, 4 x .0075 3.00%Allowable Percentage 7.95% 1
Notes1
A
B
SourcesTax Supervising and Conservation Commission Annual Reports for the relevant fiscal year
Schedule 12SCHOOL DISTRICT NO.1J, MULTNOMAH COUNTY, OREGON
Legal Debt Margin InformationLast Ten Fiscal Years(dollars in thousands)
ORS 328.245 establishes a parameter of bonded indebtedness for school districts. Aggregates are governed by realmarket values within the District based on the following:
For each grade from kindergarten to eighth for which the District operates schools, fifty-five one-hundredths of one percent(.0055) of the real market value.
For each grade from ninth to twelfth for which the District operates schools, seventy-five one-hundredths of one percent(.0075) of the real market value.
120

275
BONDED AND OTHER DEBT
Issue Date Series Original Issue
Outstanding at June 30,2022
2022-23 Principal Payments
2022-23 Interest
Payments
General Obligation Bonds
May 1, 2013 2013B 68,575 3,160 3,160 158 April 30, 2015 2015B 244,700 110,410 6,340 4,496
August 10, 2017 2017B 241,890 175,380 2,650 5,977 April 14, 2020 2020 441,320 344,765 36,945 15,800 Dec 30,2020 2020B 365,465 325,225 57,970 9,816 Dec 30,2020 2020C 53,965 52,520 905 836
1,011,460 107,970 37,083
Limited Tax Pension Obligation Bonds
October 31, 2002 2002B 156,580 126,680 17,945 7,020 April 30, 2003 2003A 124,800 7,536 7,536 18,679 April 30, 2003 2003B 156,370 156,370 - 8,862 July 15, 2021 2021 399,390 388,600 12,815 7,588
679,186 38,296 42,149
Full Faith & Credit Ogligations
Jul-10 2010 Recovery Zone 11,000 608 608 15 4-Aug-16 2016 Qualified Zone 4,000 3,000 200 - 9-Nov-16 2016 FF&C Taxable 5,048 3,613 315 103
7,221 1,123 118
Total 1,697,867 147,389 79,350
Bonded and Other Debt (In Thousands)

276
LONG TERM DEBT
Fiscal Year
LTD Tax Pension & Refunding
2010 Recovery Bonds
2016 Qualified Zone Bonds
FF&C Taxable Debt 2016
2013 GO Bonds
2015 GO Bonds
2017 GO Bonds
2020 GO Bonds
2020B GO Bonds
2020C GO Bonds TOTAL
Principal:2023 38,296 608 200 315 3,160 6,340 2,650 36,945 57,970 905 147,389 2024 62,240 - 200 325 - 6,980 2,985 40,430 - 4,070 117,230 2025 68,320 - 200 335 - 7,665 3,345 44,140 - 4,295 128,300 2026 76,755 - 200 345 - 8,390 3,305 26,630 - 4,535 120,160 2027 83,940 - 200 355 - 9,165 3,780 29,010 - 4,780 131,230 2028-2032 131,900 - 1,000 1,938 - 57,735 26,705 95,675 28,530 27,645 371,128 2033-2037 134,220 - 1,000 - - 14,135 42,235 71,935 63,355 6,290 333,170 2038-2042 83,515 - - - - - 60,230 - 86,855 - 230,600 2043-2047 - - - - - - 30,145 - 88,515 - 118,660 Principal Total 679,186$ 608$ 3,000$ 3,613$ 3,160$ 110,410$ 175,380$ 344,765$ 325,225$ 52,520$ 1,697,867$ Interest:2023 42,148 15 - 103 158 4,496 5,977 15,800 9,816 836 79,349 2024 22,440 - - 94 - 4,179 5,845 13,952 6,918 818 54,246 2025 19,626 - - 84 - 3,830 5,695 11,931 6,918 737 48,821 2026 16,447 - - 74 - 3,446 5,528 9,724 6,918 651 42,788 2027 12,818 - - 63 - 3,027 5,363 8,392 6,917 560 37,140 2028-2032 33,577 - - 148 - 8,951 24,218 21,858 33,170 1,553 123,475 2033-2037 19,878 - - - - 424 19,003 6,808 24,569 91 70,773 2038-2042 3,750 - - - - - 11,394 - 15,137 - 30,281 2043-2047 - - - - - - 1,600 - 4,657 - 6,257 Interest Total 170,684$ 15$ -$ 566$ 158$ 28,353$ 84,623$ 88,465$ 115,020$ 5,246$ 493,130$
Total Debt Service 849,870$ 623$ 3,000$ 4,179$ 3,318$ 138,763$ 260,003$ 433,230$ 440,245$ 57,766$ 2,190,997$
LTD Tax Pension & Refinding
2010 Recovery Bonds
2016 Qualified Zone Bonds
FF&C Taxable Debt 2016
2013 GO Bonds
2015 GO Bonds
2017 GO Bonds
2020 GO Bonds
2020B GO Bonds
2020C GO Bonds TOTAL
Fund 308 80,444 80,444 Fund 321 623 623 Fund 322 200 200 Fund 323 418 418 Fund 350 3,318 10,836 8,627 52,745 67,786 1,741 145,053 Total 80,444$ 623$ 200$ 418$ 3,318$ 10,836$ 8,627$ 52,745$ 67,786$ 1,741$ 226,738$
Long Term Debt (In Thousands)
Payments by Debt Service Fund, FY 2022/23

277
PERSONNEL RESOURCE ALLOCATIONSThe charts on the following pages depict Staffing allocations from four previous years, as well as this year’s Budget. These allocations are broken out by their program type. Descriptions of the type of activity being carried out can be found below. Staff are further broken down by employee type. Direct Instruction refers to any activity dealing directly with the teaching of students. Teaching may be provided for students in a school classroom, in another location such as a home or hospital, or in other learning situations such as those involving co-curricular activities. All Others refers to support services - services which provide administrative, technical, personal (such as guidance and health), and logistical support to facilitate and enhance instruction; community services, such as nutrition services; and all other areas in which the district provides direct personnel resources, such as construction management.For the 2022-23 Budget year, the Staffing allocations are preliminary and should not be considered final. Assignments to the various programs can and will change as the District progresses through the various phases of Budget Development, Spring Staffing and Fall Balancing. Final staffing allocations are not completed until after the beginning of the school year. For previous budget years, these allocations are drawn from the Final Budgets.
Personnel Resource Allocations The charts on the following pages depict Staffing allocations from four previous years, as well as this year’s Budget. These allocations are broken out by their program type. Descriptions of the type of activity being carried out can be found below. Staff are further broken down by employee type. Direct Instruction refers to any activity dealing directly with the teaching of students. Teaching may be provided for students in a school classroom, in another location such as a home or hospital, or in other learning situations such as those involving co-curricular activities. All Others refers to support services - services which provide administrative, technical, personal (such as guidance and health), and logistical support to facilitate and enhance instruction; community services, such as nutrition services; and all other areas in which the district provides direct personnel resources, such as construction management.
For the 2022-23 Budget year, the Staffing allocations are preliminary and should not be considered final. Assignments to the various programs can and will change as the District progresses through the various phases of Budget Development, Spring Staffing and Fall Balancing. Final staffing allocations are not completed until after the beginning of the school year. For previous budget years, these allocations are drawn from the Final Budgets.

278
FTE BY MAJOR FUNCTION AND EMPLOYEE TYPE
Licensed Staff
Classified ‐ Represented
Non‐Represented Staff
Administrators ‐ Licensed
Administrators ‐ NonLicensed
Directors/Program Admins
Teachers, Licensed Support Personnel, Counselors, TOSAs, POSAs
Educational Assistants, Secretarial, Clerical, Maintenance, Transportation
Professional Central Office Staff
Superintendent, Academic Administrators and Directors, Principals
Operational and Business Administrators
Operational and Business Directors and Supervisors
PBAM Function 2019 Actual 2020 Actual 2021 Actual 2022 Adopted 2023 Proposed 10 ‐ Instructional Support
Licensed Staff ‐ ‐ ‐ ‐ 27.00 11 ‐ Regular Programs: Primary Instructional Activities Licensed Staff 2,267.25 2,258.52 2,402.24 2,262.32 2,398.88 Classified ‐ Represented 188.08 194.26 185.84 195.15 195.23 Non‐Represented Staff 1.78 4.26 1.60 2.80 3.80 Administrators ‐ Licensed 1.50 4.50 6.50 6.50 6.50 12 ‐ Special Programs: Instructional activities for students with special needs Licensed Staff 459.63 492.09 593.48 496.69 510.25 Classified ‐ Represented 487.86 515.94 642.00 512.10 509.17 Non‐Represented Staff 0.80 0.75 2.80 2.80 3.80 Administrators ‐ Licensed 3.00 1.00 1.00 ‐ ‐ Directors/Program Admins 1.00 1.00 1.00 1.00 ‐ 14 ‐ Summer School Programs Licensed Staff ‐ ‐ 1.50 ‐ ‐ Classified ‐ Represented ‐ ‐ 1.00 ‐ ‐ 21 ‐ Support Services—Students: Activities to assess and improve the well‐being of students Licensed Staff 440.06 421.68 529.68 504.96 505.49 Classified ‐ Represented 110.16 127.08 133.04 131.62 154.24 Non‐Represented Staff 52.25 51.75 71.21 57.23 48.43 Administrators ‐ Licensed 39.70 34.50 59.40 50.00 53.00 Directors/Program Admins 9.90 17.00 12.50 6.00 5.00 22 ‐ Support Services—Instructional Staff: Activities associated with assisting the instructional staff Licensed Staff 189.19 230.58 276.23 268.97 264.33 Classified ‐ Represented 57.98 51.37 55.64 49.80 Non‐Represented Staff 10.00 15.50 21.00
51.10 19.25 23.63
Administrators ‐ Licensed 3.70 9.01 10.01 9.50 9.50 Administrators ‐ Non‐Licensed ‐ ‐ ‐ ‐ ‐ Directors/Program Admins ‐ ‐ ‐ 1.00 1.00 23 ‐ Support Services—General Administration: Activities associated with administering policy and operating the district Licensed Staff 0.75 1.00 ‐ ‐ ‐ Classified ‐ Represented 2.00 2.00 ‐ ‐ Non‐Represented Staff 40.50 30.25 24.50 30.00 Administrators ‐ Licensed 11.00 14.00 14.00
- 21.50 14.00 13.00
Administrators ‐ NonLicensed 1.00 4.00 4.00 4.00 3.00 Directors/Program Admins 7.00 6.00 5.00 6.00 7.00 24 ‐ School Administration: Activities of School Direction and Supervision Licensed Staff 9.40 9.87 39.53 6.73 3.57 Classified ‐ Represented 206.61 205.41 208.83 205.04 204.22 Non‐Represented Staff 16.45 24.92 32.33 48.58 55.78 Administrators ‐ Licensed 163.55 167.20 166.00 184.25 180.75 Directors/Program Admins ‐ 1.00 1.00 1.00 ‐

279
PBAM Function 2019 Actual 2020 Actual 2021 Actual 2022 Adopted 2023 Proposed 25 ‐ Support Services—Business: Activities including fiscal, operation and maintenance, and internal services Classified ‐ Represented 538.25 549.75 550.25 587.25 583.50 Non‐Represented Staff 104.60 109.60 108.20 109.20 111.80 Administrators ‐ NonLicensed 1.00 2.00 2.00 2.00 2.00 Directors/Program Admins 18.00 14.00 13.00 12.00 13.00 26 ‐ Support Services—Central: Activities other than general admin, which support instructional and supporting programs Licensed Staff ‐ ‐ 2.50 10.00 15.00 Classified ‐ Represented 10.00 10.50 12.50 25.50 26.50 Non‐Represented Staff 106.90 123.10 140.95 133.20 134.83 Administrators ‐ Licensed 0.30 3.00 3.00 3.00 3.00 Administrators ‐ NonLicensed 3.00 3.00 3.00 3.00 3.00 Directors/Program Admins 12.95 12.00 11.00 13.00 16.50 31 ‐ Food Services: Activities concerned with providing food to students and staff Classified ‐ Represented 175.67 177.04 176.40 139.47 173.40 Non‐Represented Staff 16.40 15.40 15.40 14.40 14.40 Directors/Program Admins 2.00 2.00 2.00 2.00 2.00 33 ‐ Community Services: Activities which are not directly related to educating students Licensed Staff 1.00 ‐ ‐ ‐ ‐ Classified ‐ Represented 29.24 42.34 38.42 41.63 44.53 Non‐Represented Staff 2.78 5.00 5.00 6.50 6.50 41 ‐ Facilities Acquisition and Construction: Activities concerned with the acquisition of land and buildings Classified ‐ Represented ‐ 5.50 11.00 6.00 7.00 Non‐Represented Staff 32.00 20.50 27.80 32.30 40.30 Administrators ‐ Licensed ‐ ‐ ‐ 0.25 ‐ Directors/Program Admins ‐ 1.00 2.00 1.00 1.50
Grand Total 5,836.49 5,990.77 6,627.38 6,211.70 6,465.11
2022‐23 Budgeted Personnel Resource Allocations
Licensed
Classified Represented & Non‐Rep
Administrators
Directors/Program Admins
0.8%
4.2%
37.4%
57.6%

280
SCHOOL STAFFINGBeginning in 2019-20, in an effort to transform school and student achievement, differentiated levels of supports and resources were allocated to the schools with the greatest needs. Schools with a Title I, Comprehensive School Improvement (CSI), and Targeted School Improvement (TSI) designation are considered those with the highest needs. CSI and TSI are federally required designations under the Every Student Succeeds Act (ESSA).School staffing for 2021-22 was based on projected October 2021 enrollment, which typically uses the actual October 2020 enrollment as the base. Since the COVID-19 pandemic had a significant impact on the October 2020 enrollment, the large enrollment losses were not included in the School and District projections, in an effort to lessen impacts to K-8 staffing. Any loss in General Fund revenue would be offset by ESSER funding. For 2022-23, the large enrollment losses in grades K-8, particularly K-5, have been incorporated into the October 2022 projections, which is the main basis for school staffing allocations. The main priorities for the 2022-23 school staffing are to continue previous targeted investments, improve class sizes in K-8 and reduce the impact on schools seeing large K-5 enrollment losses. The information below provides the details associated with staffing assignments to the schools in the district, including the General Fund and the Student Investment Account (SIA) and Elementary and Secondary School Emergency Relief Fund (ESSER) grant funds.
Teacher StaffingGrades K-5As one of the priorities for 2022-23, many maximum K-5 class sizes were improved (in bold font below). Teacher needs are identified for grades K-5 by sections of students. A section is a group of students that are participating in a specific program. For instance, a section could be a group enrolled in a traditional neighborhood program or a group enrolled in a language immersion program. When assigning teachers based on sections, schools are able to ensure that there are enough teachers to teach at each grade for each section. If sections aren’t considered, it is possible for a school to receive an inadequate number of teachers for a particular grade level for both the neighborhood class and the immersion class.Once school starts, additional teachers may be added to address unexpected enrollment or to improve class sizes in the largest classes. Exceptions to the maximum class size may occur where a school facility does not have space for an additional section, or if there are programmatic reasons for a slightly larger class size (as in an immersion program).Very few classes are expected to be at the maximum class size. As part of the targeted investments for 2022-23, additional homeroom teachers were allocated for schools staffed at the maximum class size, where enrollment has grown since October, and at schools seeing large reductions in staffing due to enrollment loss over the past two years.The table displays the maximum class sizes used for staffing, along with expected class size ranges:
CSI Schools Title I Schools Other Schools
Grade Maximum Class Size
Class Size Ranges
Maximum Class Size
Class Size Ranges
Maximum Class Size Class Size Ranges
KG 24 13-24 28 15-28 29 15-29
1 26 14-26 28 15-28 31 16-31
2 28 15-28 28 15-28 32 17-32
3 28 15-28 28 15-28 33 17-33
4 32 17-32 32 17-32 33 17-33
5 32 17-32 32 17-32 33 17-33

281
K-5 Special Education (SPED) Focus Students and K-5 Homeroom participationIn past years, students in SPED focused classrooms were counted in their homeroom class size and counted in their SPED focus classroom class size, resulting in double counting. Students in SPED focused Classrooms will now be counted as half time participants in homerooms when they spend 1 to 3 hours in the classroom. If the student does not attend a general homeroom during the day, they will now be counted in the classroom size.
Kindergarten Educational Assistants at Title I SchoolsTitle I will continue to fund part of the Kindergarten Education Assistants (EAs) for 15 hours per week and the ESSER grant will fund 20 hours per week to ensure EAs continue to be 35 hours per week for schools where the total school population is 60% or greater historically underserved students. The KG EAs are only allocated where the KG class sizes are 17 or higher.
General Fund K-5 ArtsThe City of Portland, through the Arts Education and Access tax, provides funding for art teachers for students in Kindergarten to 5th grades. This funding must be used to hire licensed teachers for the arts (music, art, dance, drama) for students. The table below shows the allotment of arts teachers based on student enrollment in schools.
K-5 Enrollment City of Portland Arts FTE
<334 0.50 arts teacher
334 to 556 1.00 arts teacher
>557 1.50 arts teacher
With the expansion of the K-5 Arts Pathway targeted investment, many schools receive additional Art allocations to ensure they can offer both visual arts and music to students. Additional Art allocations were also provided to schools to reduce the impact of enrollment losses over the past two years.
Elementary PE AllocationEach K-5 and K-8 school is allocated PE teachers to ensure each K-5 Homeroom and SPED Focus Classrooms can have PE three times per week.
Grade 6-8 Teacher StaffingAs one of the priorities for 2022-23, the maximum sizes were reduced for grades 6-8. In middle grades, the number of teachers allocated is based on the estimated number of sections needed per grade level using a maximum size of 33 for Title I Schools and 34 for the other schools now. Additional FTE is added to cover instructional periods and teacher planning periods for each teacher. Each section requires 1.2 FTE because there are 6 periods for students and teachers only teach 5 periods. The overall 6-8 FTE is rounded up to the nearest 0.5 FTE. For example, 200 6th graders require 7 sections, since it is rounded up. In a 6 period schedule, these 7 sections produce 8.5 FTE to account for the planning periods and to ensure adequate teaching staff. Additional targeted investments for the middle grades include additional teacher allocations for the 7 period day at some middle schools and additional electives at many K-8 and middle schools.
Grade 9-12 Teacher StaffingTeacher allocation for high schools is based on the total projected enrollment with a base allocation in both large and small schools. Schools identified as needing additional support (TSI and CSI) will continue to be allocated based on the 2019-20 ratios. This approach assures parity of course offerings amongst high schools, the ability to keep student-teacher load between a range of 160-190, and provides the necessary resources to meet the state Instructional Time Requirements.

282
Additional targeted investments for high schools in response to the COVID-19 pandemic include credit recovery teacher FTE for all schools.
TSI / CSISchools Other Schools
Small Schools<1,000
Ratio 23.4:1 24.2:1
Base 5 FTE 5 FTE
Large Schools>1,000
Ratio 25.8:1 26.8:1
Base 9 FTE 9 FTE Equity FundingIn an effort to align with our RESJ lens across the District, additional resources are allocated to schools in need through Equity Funding. The equity allocation is eight percent of the total funding allocated for instructional staff, with half of the Equity FTE allocated to schools based on students’ Socio-Economic Status, and the other half of the Equity FTE provided to schools based on the number and percentage of Historically Underserved students. Each school receives a two-part allocation: (i) resources based on Socio- Economic Status (4%) and (ii) resources based on Combined Historically Underserved population (4%). As mentioned earlier, Kindergarten EAs are allocated to schools with more than 60% Combined Historically Underserved population.
The graphic represents the percentage of resources used for instructors in K-5, K-8, and 6-8 schools, and helps illustrate the percentage of resources reserved for equity funding. Note that K-5 Art is funded mainly from the City of Portland and is not included here.
i. Socio-Economic Status FTE is determined based on each school’s number of students who are eligible for free meals by Direct Certification. Direct Certification is a proxy measure to determine economic disadvantage. Direct Certification is based on income level or a categorical reason such as participation in the Supplemental Nutrition Assistance Program, Temporary Assistance for Needy Families, or Foster Care. All schools where more than 15% of students are identified as eligible will receive Equity funding. This 15% minimum requirement (floor) was designed to concentrate the allocation of the Equity resources to higher poverty schools.
ii. Combined Historically Underserved funding is determined based on each school’s number of students who are identified as at least one of the groups considered Historically Underserved (HU). Combined Historically Underserved students include:

283
y Special Education Eligibility
y English Language Learner (receive English Language Development services)
y Free meal eligibility by Direct Certification (see above for definition)
y Identification as any the following races:
` African-American ` Latino ` Native American ` Pacific Islander ` Multiracial, which includes any of the races listed above
Schools with more than 40% of students meeting this criterion will receive a Combined Historically Underserved allocation. This 40% minimum requirement was designed to focus the allocation of the Equity resources to schools with higher concentrations of historically underserved students.
School-Wide SupportThe School-Wide Support Tables (shown below) indicate the number and types of positions allocated to each school for administrative and other basic supports. The allocations are based on the school size and configuration (K-5, K-8, middle, or high schools). FTE on all tables is shown in Licensed Equivalents, with Secretary positions represented as half a certified FTE. Counselor allocations are shown in a separate table below the school configuration tables.
K-5s
FTE Allocated by School Enrollment <300 300-349 350-399 400-499 500-549 550-599 600-699 700-799
Principal 1.00 1.00 1.00 1.00 1.00 1.00 1.00 1.00
Assistant Principal (1, 2) 1.00 1.00 1.00
Secretary 0.75 0.75 0.75 0.75 0.75 0.75 1.00 1.00
Media Specialist (3) 0.50 0.50 0.50 0.50 0.50 0.50 0.50 0.50
Library Assistant or Media Specialist (4) 0.25 0.25 0.25 0.25 0.25 0.25 0.25 0.25
Social Worker, Counselor, or QMHP 0.50 0.50 0.50 0.50 0.50 0.50 0.50 0.50
K-5 School Total (5) 3.00 3.00 3.00 3.50 3.00 4.00 4.25 4.25
1. Targeted Investment – All single administer schools identified as in need of support (Title I, CSI, TSI) receive 0.5 Assistant Principal FT which can be combined with 0.7 Equity FTE to fund a 1.0 Assistant Principal or combined with 0.3 Equity FTE to fund a 1.0 School Climate Specialist.
2. Schools that are between 500 and 549 and are above 50% Historically Underserved receive an Assistant Principal.
3. Schools above 80% Historically Underserved receive an additional 0.5 FTE in Media Specialist.
4. Schools below 80% Historically Underserved can use the 0.25 FTE toward maintaining the Library Assistant or it can be used toward a Media Specialist.

284
5. Targeted investment – additional allocation of instructional specialists to schools in need of support (not shown in the table), with 1.5 Instructional Specialists for CSI schools and 1.0 Instructional Specialists for all Title or TSI schools serving grades K-8.
K-8s
FTE Allocated by School Enrollment <250 250-299 300-399 400-499 500-599 600-699 700-799
Principal 1.00 1.00 1.00 1.00 1.00 1.00 1.00
Assistant Principal (1) 1.00 1.00 1.00 1.00
Secretary 0.75 0.75 0.75 0.75 0.75 1.00 1.00
Media Specialist (2) 0.50 0.50 0.50 0.50 0.50 0.50 0.50
Library Assistant or Media Specialist (3) 0.25 0.25 0.25 0.25 0.25 0.25 0.25
Social Worker, Counselor, or QMHP (4) 0.50 0.50 0.50 0.50 0.50 0.50 0.50
K-8 School Total (5) 3.00 3.00 3.00 4.00 4.00 4.25 4.25
1. Targeted Investment – All single administer schools identified as in need of support (Title I, CSI, TSI) receive 0.5 Assistant Principal FT which can be combined with 0.7 Equity FTE to fund a 1.0 Assistant Principal or combined with 0.3 Equity FTE to fund a 1.0 School Climate Specialist.
2. Schools above 80% Historically Underserved receive an additional 0.5 FTE in Media Specialist.
3. Schools below 80% Historically Underserved can use the 0.25 FTE toward maintaining the Library Assistant or it can be used toward a Media Specialist.
4. Targeted Investment – 0.5 Social Worker, Counselor, or QMHP to Title K-8 Schools.
5. Targeted investment – additional allocation of instructional specialists to schools in need of support (not shown in the table), with 1.5 Instructional Specialists for CSI schools and 1.0 Instructional Specialists for all Title or TSI schools serving grades K-8. Middle Schools
Middle Schools
FTE Allocated by School Enrollment <400 400-499 500-599 600-699 700-799 800-899
Principal 1.00 1.00 1.00 1.00 1.00 1.00
Assistant Principal 1.00 1.00 1.00 1.00 1.00 2.00
Secretary 0.75 0.75 0.75 0.75 0.75 0.75
Media Specialist (1) 0.50 0.50 0.50 0.50 0.50 0.50
Library Assistant or Media Specialist (2) 0.25 0.25 0.25 0.25 0.25 0.25
Discretionary Support 0.25 0.25 1.00 1.25 1.25 1.25
Middle School Total (3, 4) 3.75 3.75 4.50 4.75 4.75 5.75
1. Schools above 80% Historically Underserved receive an additional 0.5 FTE in Media Specialist.
2. Schools below 80% Historically Underserved can use the 0.25 FTE toward maintaining the Library Assistant or it can be used toward a Media Specialist.

285
3. Targeted Investment – 0.5 Social Worker to Title or TSI Middle Schools.
4. Targeted investment – additional allocation of instructional specialists to schools in need of support (not shown in the table), with 1.5 Instructional Specialists for CSI schools and 1.0 Instructional Specialists for all Title or TSI schools serving grades K-8.
High Schools
FTE Allocated by School Enrollment <500 500-
599600-699
700-799
800-899
900-999
1000-1099
1100-1199
1200-1299
1300-1399
1400-1499
1500-1599 1600+
Principal 1.00 1.00 1.00 1.00 1.00 1.00 1.00 1.00 1.00 1.00 1.00 1.00 1.00
Vice Principal 1.00 1.00 1.00 2.00 2.00 2.00 2.00 2.00 2.00 2.00 2.00 2.00 3.00
Secretary 1.00 1.00 1.50 1.50 1.50 1.50 1.50 1.50 1.75 1.75 2.00 2.00 2.00
College/Career Coordination 1.50 1.50 1.50 1.50 1.50 1.50 1.50 1.50 1.50 1.50 1.50 1.50 1.50
Media Specialist 1.00 1.00 1.00 1.00 1.00 1.00 1.00 1.00 1.00 1.00 1.00 1.00 1.00
Discretionary Support (1) 0.25 0.50 1.00 1.00 1.00 1.25 1.50 1.50 1.75 2.00*
Social Worker 1.00 1.00 1.00 1.00 1.00 1.00 1.00 1.00 1.00 1.00 1.00 1.00 1.00
Bookkeeper 0.50 0.50 0.50 0.50 0.50 0.50 0.50 0.50 0.50 0.50 0.50 0.50 0.50
High School Total (2, 3) 7.00 7.00 7.50 8.75 9.00 9.50 9.50 9.50 10.00 10.25 10.50 10.75 12.00
1. Discretionary Support increases by 0.25 every 100 students starting at 1700 students and caps out at a total increase of 1.0. Schools with enrollment above 2,000 students would receive 3.0 in Discretionary (not shown in the table).
2. Targeted investment – additional allocation of instructional specialists to schools in need of support (not shown in the table), with 1.5 Instructional Specialists for CSI schools and 1.0 Instructional Specialists for all Title or TSI schools serving grades K-8.
3. There are additional support staff provided centrally, such as Campus Monitors and Athletic Directors (not shown in the table).
Counselor FTE Allocated by School EnrollmentThe allocation of Counselors is based on the total School Enrollment. All K-5 and K-8 schools receive a minimum of 1.0 Counselor, using a ratio of 400:1. All Middle Schools receive a minimum of 2.0 Counselors, using a ratio of 250:1. High Schools have a ratio of 300:1. All FTE is rounded to the nearest 0.5 FTE. The table below shows the FTE allocated based on the enrollment thresholds and school types using the different ratios.
FTE Allocated by School Enrollment
1.00 1.50 2.00 2.50 3.00 3.50 4.00 4.50 5.00 5.50 6.00 6.50
K-5 & K-8 <499500-699
700+
Middle School <562563-687
688-812
813+
High School <374375-524
525-674
675-824
825-974
975-1124
1125-1274
1275-1424
1425-1574
1575-1724
1725-1874
1875-2024

286
Additional Need Based FTEA formula cannot always reflect the special circumstances of a particular school. As a result, it is sometimes necessary to make additional allocations to account for unusual school requirements or schools in transitioning situations.These special situations include:
y Schools operating on more than one site
y Schools faced with significant transition, such as those undergoing a move due to capital improvement/bond planning, reconfiguring or newly opening
y Adjustments made for programs that require additional investment. Some of these include:
` IB Program ` Makerspace
Grant Funds and Special Revenue FundsMany schools have grant and/or special revenue funds that provide for additional staff in the schools.
Title IA AllocationsTitle IA is a Federal grant that is intended to support students in poverty. These grant funds are allocated in dollars and may be used for certified and classified staff, but cannot be used for core content teachers. Dollars are allocated per qualifying student. A significant amount of the Title IA funds received by the District are allocated directly to elementary, middle and K-8 schools where at least 33% of the students would qualify for free meals through Direct Certification. High schools only receive Title I funding if they are identified as “High Poverty” by a Direct Certification percentage of 46.8%, which is equivalent to 75% Free or Reduced-Price Meals under the prior calculation method of collecting meal applications.
High School Success FundHigh School Success is a fund initiated by ballot Measure 98 in November 2016. Funding is provided to establish or expand programs in three specific areas: Dropout Prevention, Career & Technical Education, and College Level Education Opportunities.High Schools receive additional FTE for high school success teams through Measure 98 funding. The allocation includes FTE for the following types of positions which may vary by school: instructional coaches, release time for 9th grade teachers to collaborate, student engagement coaches, CTE teachers, Pathways Pilot, and College Coordinators.
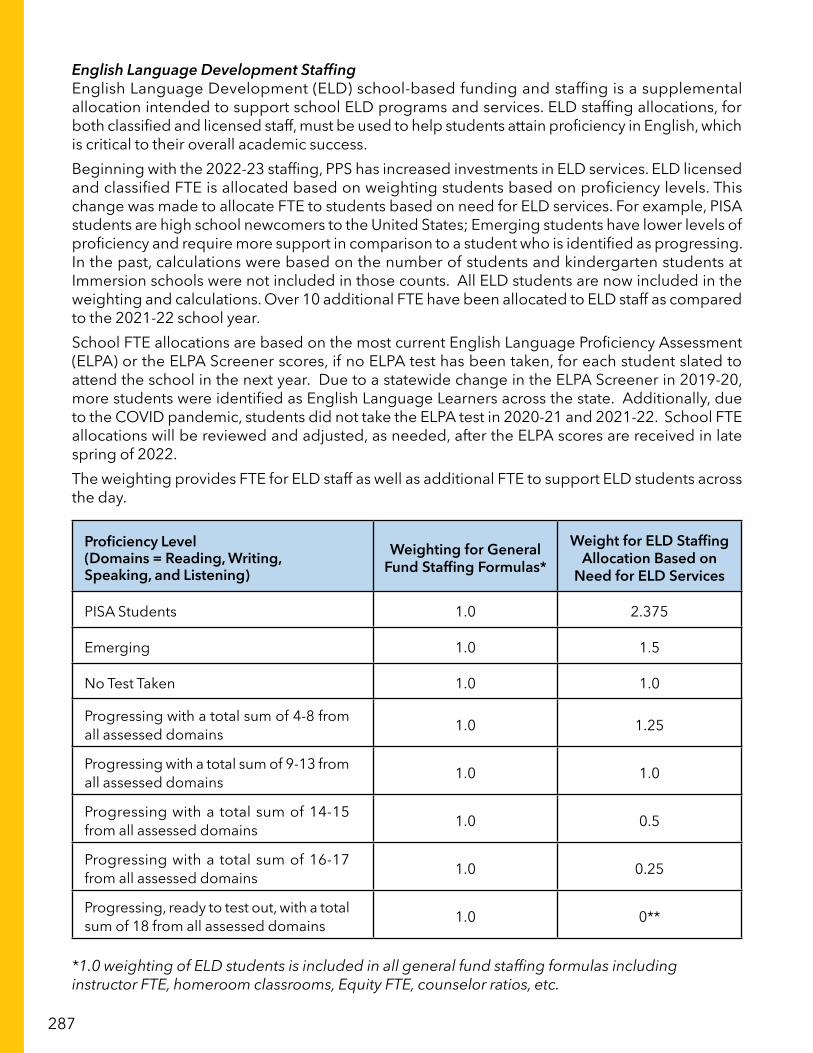
287
English Language Development StaffingEnglish Language Development (ELD) school-based funding and staffing is a supplemental allocation intended to support school ELD programs and services. ELD staffing allocations, for both classified and licensed staff, must be used to help students attain proficiency in English, which is critical to their overall academic success.Beginning with the 2022-23 staffing, PPS has increased investments in ELD services. ELD licensed and classified FTE is allocated based on weighting students based on proficiency levels. This change was made to allocate FTE to students based on need for ELD services. For example, PISA students are high school newcomers to the United States; Emerging students have lower levels of proficiency and require more support in comparison to a student who is identified as progressing. In the past, calculations were based on the number of students and kindergarten students at Immersion schools were not included in those counts. All ELD students are now included in the weighting and calculations. Over 10 additional FTE have been allocated to ELD staff as compared to the 2021-22 school year.School FTE allocations are based on the most current English Language Proficiency Assessment (ELPA) or the ELPA Screener scores, if no ELPA test has been taken, for each student slated to attend the school in the next year. Due to a statewide change in the ELPA Screener in 2019-20, more students were identified as English Language Learners across the state. Additionally, due to the COVID pandemic, students did not take the ELPA test in 2020-21 and 2021-22. School FTE allocations will be reviewed and adjusted, as needed, after the ELPA scores are received in late spring of 2022.The weighting provides FTE for ELD staff as well as additional FTE to support ELD students across the day.
Proficiency Level (Domains = Reading, Writing, Speaking, and Listening)
Weighting for General Fund Staffing Formulas*
Weight for ELD Staffing Allocation Based on
Need for ELD Services
PISA Students 1.0 2.375
Emerging 1.0 1.5
No Test Taken 1.0 1.0
Progressing with a total sum of 4-8 from all assessed domains 1.0 1.25
Progressing with a total sum of 9-13 from all assessed domains 1.0 1.0
Progressing with a total sum of 14-15 from all assessed domains 1.0 0.5
Progressing with a total sum of 16-17 from all assessed domains 1.0 0.25
Progressing, ready to test out, with a total sum of 18 from all assessed domains 1.0 0**
*1.0 weighting of ELD students is included in all general fund staffing formulas including instructor FTE, homeroom classrooms, Equity FTE, counselor ratios, etc.

288
**A weight of 0 is only used for the initial staffing allocations as students are assumed to test out. A weight of 0.25 will be used after Spring ELPA scores are received, for any students who did not exit.
Licensed ELD staffing formula: ELD Teacher staffing is based on the sum of the weighting of students and allocated as described in the table below.
EB Students (weighted) Teacher Allocation
1-14 Allocated Itinerant ELD Teacher or Language Support Teacher (0.25)
15-35 0.50
36-56 1.00
57-81 1.50
82-106 2.00
107-136 2.50
137-166 3.00
167-197 3.50
198-228 4.00
229> 4.50
Bilingual Educational AssistantsBilingual Educational Assistant (EA) staffing is based on the sum of the weighting of students. EAs provide students support during core classes and provide invaluable support for linguistically diverse families.This allocation model is described in the table below:
EB Students (weighted) EA Allocation (0.875 FTE (35 hours) considered full-time)
Fewer than 50 No EA Allocation
50-99 0.438 FTE (half-time EA)
100-149 0.875 FTE (1 EA)
150-199 1.313 FTE (1.5 EAs)
200-249 1.75 FTE (2 EAs)

289
Special Education (SPED) StaffingSpecial Education staff includes Learning Center teachers, Speech Pathologists, School Psychologists, Paraeducators, Motor Team staff (Adaptive PE, Physical Therapists, and Occupational Therapists), and other specialists.Special Education services also include classrooms located in various schools, designated for the support of special student populations. The methods for allocating teachers and paraeducators for these various settings are described below.Allocations of teachers and assistants are made on the basis of the best information available at the time staffing is completed in the spring. Depending upon the resources available, these allocations may be adjusted based on updated information at the beginning of the school year.The staffing listed below outlines the current staffing levels for 2022-23, which remain unchanged from 2021-22.
School Psychologists (K-12)School Psychologists are allocated based on the table below. Schedules will continue to be divided into full days at each school they serve. These FTEs are centrally managed.
Grade-Level Students to School Psychologist Ratio
K-5 110:1
K-8 115:1
6-8 125:1
K-12 125:1
HS 135:1
Speech and Language Pathologists (K-12)Speech and Language Pathologists are allocated based on the number of students receiving speech services. Allocations are rounded to the nearest 0.2 FTE to provide for full days at each school, reducing lost service due to time spent traveling between buildings. These FTEs are managed centrally.
Grade-Level Students to Speech and Language Pathologist Ratio
K-8 50:1
HS 55:1

290
Designated Special Education ClassroomsStaffing allocations for Specialized Focused classrooms at high-need school sites is as follows, with a student maximum of 13, per classroom:
Classroom Type Grade-Level Teacher Para-educators
Therapeutic Intervention Coach (TIC)
Qualified Mental Health
Professional (QMHP)
Social Emotional Skills Classrooms (SES)
K-5 1 3 0.5 per class 0.5
6-8 1 3 0.5
HS 1 2 1 1
Communication Behavior Classrooms (CB) K-8 1 3
Intensive Skills Centers (ISC) K-12 1 3
Communication Behavior - CB Team
6-8 1 3
HS* 1 1
*HS CB Team FTE is allocated for every 15 eligible students
One-to-One ParaeducatorsDesignated paraeducators will be assigned to schools to meet the needs of students as indicated by services on an Individual Education Plan (IEP). All designated support paraeducators for adult assistance in all grades K-12 will be allocated from an FTE pool managed by the central Special Education department. Designated supports are assigned to a student based on the need outlined within the IEP. These supports are removed when the support is no longer required for that student or the student no longer attends the school.
Learning Center Teachers (K-12)All Learning Center teachers are allocated in 0.5 FTE increments. The learning center ratio for K-5, K-8, 6-8 and K-12 are as follows:
K-8 Learning Center Formula y Every 14 eligible students = 0.5 FTE
High School Learning Center Formula
y Every 15 eligible students = 0.5 FTE
Students included for forecasted allocation: ` Students currently eligible and currently receiving Learning Center Supports ` 80% of students in process of establishing initial eligibility for Special Education (K-8 only) ` 100% of all incoming kindergarten students who are on an IEP (K-5 and K-8 only)

291
STUDENT ENROLLMENT HISTORY AND PROJECTED ENROLLMENTSchool staffing for 2022-23 is based on projected October 2022 Enrollment, which uses the actual October 2021 enrollment as the base. Since the COVID-19 pandemic had a significant impact on the October 2020 enrollment, it is important to note that those large enrollment losses were not carried forward in the School and District projections for 2021-22 (not shown in the chart below), in an effort to lessen impacts to K-8 staffing for 2021-22. However, those enrollment losses have been corrected in the 2022-23 and future projections, since students did not return in the fall of 2021 as predicted and we saw additional losses in enrollment. The graph below shows the impact of the pandemic and future projections.The process of projecting enrollment figures is also called “forecasting”; these figures have been computed by Portland State University’s Population and Research Center (PRC). PRC has calculated district enrollment projections for PPS since 1999. Projections account for changes in school configuration (e.g., adding a grade, a new school or program, a program expansion, changes in transfer policy or boundaries, or changing demographic factors) and neighborhood changes (e.g., known future housing developments). PRC provides three different levels of district enrollment forecasts. The Middle Forecast is used, but low and high forecasts show the potential variance.
PPS’ enrollment projections by PRC are done at the district, cluster and school level. They use a “grade progression model,” also referred to as a “cohort survival method” to forecast enrollment at individual schools. Projected enrollment in any given school and grade is based on the previous year’s grade at that school with adjustments for how students have progressed from grade to grade in the recent past. For example, next year’s third grade enrollment at School A is based on the current number of second graders in School A and the percent of students matriculating from second grade to third grade at School A in the previous three years.
Beginning in 2018-19, PRC generated enrollment projections separately for the Neighborhood and co-located program for each grade in grades K-8. For example, School B has both a Neighborhood and Immersion program. The projections for each grade will be broken out between the Neighborhood and Immersion program.
For the beginning grade level at a school (i.e., Kindergarten, 6th, and 9th grades), projections are based on the historic share of residents that attend the schools and on transfer trends. Kindergarten forecasts are informed by birth data collected by health agencies.All school level forecasts are reconciled with the overall cluster and district projections. PRC projections are completed in December, and adjustments to the PRC forecast may be made later in the year when there are school consolidations, program changes or expansions, configuration changes, changes in the numbers of students to be accepted for transfers and other factors associated with the transfer process, and any other changes that would not be known by PRC at the time of their forecast.

292
STUDENT PERFORMANCE MEASURESFour Year Cohort Graduation RatesThe four-year cohort graduation rate is the percentage of students in the cohort who earn a high school diploma or modified high school diploma within four years of entering high school. Students earning General Education Development (GEDs), or adult high school diplomas, or extended diplomas are not counted as graduates.Oregon Department of Education (ODE) calculates graduation rates for accountable schools throughout the state. The graduation cohort for a school is made up of all students in the cohort whose last accountable enrollment was at that school.Students leave a school’s cohort if they transfer:
y To another accountable school, including a charter school
y Out of the district, state or country
y To home or private school
Students remain in a school’s cohort if they:
y Transfer to a community-based alternative program
y Transfer to a non-accountable district program
y Drop out
The following data are the four-year cohort graduation rates for 2016-17 through 2020-21. PPS continues to have a higher four-year cohort graduation rate than the state.
Source: ODE Cohort Graduation Rates

293
Dropout RatesDropout rates are one year rates and are unrelated to the four year cohort graduation rates. ODE calculates one year dropout rates for accountable schools throughout the state. As defined in ORS 339.505, a dropout is an individual who has enrolled for the current school year, or was enrolled in a previous school year and did not attend during the current school year:
y Is not a high school graduate
y Has not received a GED certificate
y Has withdrawn from school
Dropouts do NOT include students who:
y Are deceased
y Are being home schooled
y Are enrolled in an alternative school or hospital education program
y Are enrolled in a juvenile detention facility
y Are enrolled in a foreign exchange program
y Are temporarily absent because of suspension, a family emergency, or severe health problems that prevent attendance at school
y Received a GED certificate
y Received an adult high school diploma from a community college
The following data are the one year dropout rates for 2016-17 through 2020-21. The dropout rate at PPS has continued to decrease since 2016-17. In 2019-20 and continuing in 2020-21 the dropout rate at PPS has been lower than the state dropout rate.
Source: ODE Dropout Rates

294
ODE Statewide Assessments Oregon public schools test students in English Language Arts (ELA) and math in grades 3 through 8 and 11. Oregon’s ELA and math summative assessments go beyond multiple-choice questions to include extended response and technology enhanced items, as well as performance tasks that allow students to demonstrate critical-thinking and problem-solving skills. Performance tasks challenge students to apply their knowledge and skills to respond to complex real-world problems. They can best be described as collections of questions and activities that are coherently connected to a single theme or scenario. These activities are meant to measure capacities such as depth of understanding, writing and research skills, and complex analysis, which cannot be adequately assessed with traditional assessment questions. Overall results for all schools and grades for PPS and the state for Math and ELA are shown below. PPS scored approximately 5% higher than the state in ELA and 6% higher than the state for Math in 2018-19. Due to the COVID pandemic, the statewide assessments were halted so there are not any more recent data available to report beyond 2018-19.
Source: ODE Statewide Assessments

295
STUDENT DEMOGRAPHICSStudent Equity DemographicsThe District has two demographics that are used as measures of equity, which are used as part of School Staffing allocations: Direct Certification and Combined Historically Underserved. Direct Certification is a subset of Combined Historically Underserved. The overall percentages for PPS are displayed below. The percentage of students eligible to receive free meals by Direct Certification was on the decline until the COVID pandemic hit, which also impacts the percentage of students considered Combined Underserved.
Source: PPS October 1 Enrollment
The Combined Underserved category was originally established by the Oregon Department of Education as part of the requirements of the ESEA Waiver. PPS’ current definition of Combined Underserved includes students eligible to receive:
y Free meals by Direct Certification
y Special Education Services
y English Language Development (ELD) services Or:
y Students with any of the following races, ethnicities, or ancestry:
` Black ` Latino/Hispanic ` Native American ` Pacific Islander
Students eligible to receive free meals by Direct Certification are students who are eligible for free meals, as identified by the state. Direct Certification status is determined by state agencies and shared electronically with school districts. Students or families qualify for Direct Certification through a number of avenues such as eligibility for Supplemental Nutrition Assistance Program (SNAP) or Temporary Assistance for Needy Families (TANF), Migrant Ed, or foster care. Direct Certification does not include students eligible for:

296
y Free or reduced meals by paper application y Free meals because they are enrolled in a CEP school but are not Direct Certified by the state.
Free Meal by Direct Certification is the only comparable measure of economic hardship across all schools. High poverty schools are labeled Community Eligibility Provisioning (CEP) schools. Through CEP, the federal government provides free meals to all students, including students who would not normally qualify for free meals. At CEP schools all students eat for free and therefore paper applications are not collected. Head Start Pre-K is only available to students from low-income families, and all students are meal eligible. For more information about CEP please see this website: http://www.pps.net/Page/2088 At non-CEP schools, a combination of paper applications and Direct Certification are used to identify who qualifies for free or reduced price meals. The federal government provides free meals to families whose income is at or below 130% of the federal poverty level, according to information supplied voluntarily by families in paper applications. Paper applications are also used to identify families whose income is at or below 185% of the poverty level to whom the federal government provides reduced price meals. Starting in 2015-16, the state of Oregon provides additional funding so all students living at 185% of poverty can eat for free. Federal income guidelines for 130% and 185% poverty for each school year can be found here: https://www.fns.usda.gov/cacfp/income-eligibility-guidelines.
Special Education and English Language Learners SubgroupsStudents eligible for Special Education are students with an Individual Education Plan (IEP) receiving special education services. Students identified as English Language Learners are students who are eligible to receive English Language Development (ELD) services. There had been a slow but steady increase in the percentage of Special Education Students at PPS since 2017-18, but there was a slight decline in 2021-22. Due to a statewide change in the Assessment in 2019-20, more students were identified as English Language Learners across the state, which is what the PPS data reflects as well. Additionally, due to the COVID pandemic, students were not tested which has impacted the 2020-21 and 2021-22 percentages.
Source: PPS October 1 Enrollment

297
Student Race/Ethnicity PercentagesThe overall percentages of PPS students by race/ethnicity have been relatively unchanged over the past three years. The percentages of students by race/ethnicity vary by school, which can be seen on each of the individual school summaries in Volume II.Per the Federal race/ethnicity reporting requirements, Latino ethnicity includes students identified as Hispanic/Latino regardless of race. PPS separates the Multiple Races category into two categories, Multiple-Asian/White, which includes non-Latino students identifying only as Asian and White; and Multiple-Other Ancestries, which includes non-Latino students identifying with multiple races.
Source: PPS October 1 Enrollment

298
CHARTER SCHOOLSCharter schools are public schools that are intended to provide innovative programs with specific educational philosophies and/or delivery models that offer additional options for students and families within the public school system. District sponsored charter schools have entered into a contract with Portland Public Schools for sponsorship and they maintain a high level of autonomy in exchange for increased accountability. PPS passes through the charter schools’ share of the State School Fund based on the funding formula outlined in Oregon’s Charter School Law (ORS 338.155). The PPS Charter Schools Office is part of the Multiple Pathways to Graduation Department which supports all contracted schools. A key component of the Charter Schools Office is to provide oversight and support to ensure that terms under the sponsorship agreement are met.
PPS-Sponsored Charter Schools: y KairosPDX Learning Academy – Grades K-5, focused on culturally responsive practices to
cultivate student engagement and achievement.
y Le Monde French Immersion Charter School – Grades K-8, French immersion instruction.
y Portland Arthur Academy – Grades K-5, using a Direct Instruction model.
y Portland Village School – Grades K-8, Waldorf-inspired education.
y The Emerson School – Grades K-5, curriculum grounded in project-based learning.
State-Sponsored Charter Schools in PPS: y Cottonwood School of Civics and Science – Grades K-8, offering place-based education.
y Ivy School – Grades K-8, a Montessori charter school.
299
COMMUNITY BASED ORGANIZATIONS (CBO)Contracted Private Alternative Schools or more commonly known as Community Based Organizations (CBO schools) complement Portland Public Schools educational re-engagement efforts. Each school provides a unique range of supports for students working toward their PPS diploma or GED.The funding formula for CBO schools is outlined in state statute (ORS 336.635) and is based on the district's Net Operating Expenditure (NOE). The NOE is a per student rate. This, in conjunction with the number of students to be served and student demographics, are the primary factors PPS uses to determine CBO funding. Funding is detailed in each school's annual contract. This contract also codifies the contractual relationship between PPS and each school. Funding to CBO’s is made up from funding streams from both the General Fund and the Special Revenue fund. Funding amounts in the budget book are projections and will be dependent on external factors (e.g. state school fund, corporate excise taxes, etc.). Specific funding details are outlined in each CBO’s annual contract.
CBO Schools Contracted with PPS y Helensview* (*funded via state resolution dollars)
y Rosemary Anderson Middle and High School
y Mt Scott Learning Center
y NAYA Many Nations Academy
y Open School East
y Portland Community College: Gateway to College & YES to College
y Portland Youth Builders
y Youth Progress Association

300
GLOSSARY OF TERMS AND ACRONYMSAAccount Codes - The account codes identify the nature of the expenditure, and is based on the Oregon Department of Education’s Program Budgeting and Accounting Manual. An example of a complete chart of accounts consist of the following elements:
Object (Account) Fund Dept ID Function
(Program)Area (Class) Proj/Grant*
# of Digits 6 3 4 5 5 5
Account Code 511100 205 2156 11211 18000 G1800
Description of Fund or Use
Licensed Teacher Grant Fund George MS MS Programs Math Title I - School
*Project/Grant field is only used if funding is from a project or a grant, such as Title I or SIA.
A complete list of the chart of accounts, with descriptions of products or services, is shown in the Introductory Information section of this book.
Accrual Basis - The basis of accounting under which revenues are recorded when earned or when levies are made, and expenditures are recorded as soon as they result in liabilities, regardless of when the revenue is received or the payment is actually made.
Accrue - To record revenues when earned or when levies are made and to record expenditures as soon as they result in liabilities, regardless of when the revenue is actually received or the payment is actually made.
Accrued Liabilities - Amounts owed but not yet due; for example, accrued interest on bonds or notes.
Accrued Revenues - Levies made or other revenue earned and not collected regardless of whether due or not.
ACT (American College Test)
ADA (Americans with Disabilities Act)
ADM (Average Daily Membership) - Average student enrollment is the measure that indicates the average number of students in membership (enrolled) on any given day over a school year. It is calculated based on the total days students are enrolled (present or absent) divided by the number of days in a school year.
Administrative Support Tables - Besides using a student teacher ratio to staff schools, schools are allocated FTEs based on Administrative Support tables (shown in the Staffing Overview section of this document). Administrative Support provides FTEs for Principals and other administrative staff, such as assistant principals, vice principals, and secretarial/data staff.
Administrators, Licensed - Persons assigned to administrative or supervisory positions who meet standards of eligibility established and who have training or licensure relevant to specific positions within the District. This includes positions such as the Superintendent, Assistant Superintendents, Senior Directors, School Principals, etc.

301
Administrators, Non-Licensed - Administrative or supervisory positions not requiring any type of licensure but who meet eligibility and or needs set forth by the District. This category is primarily made up of cabinet level managers that support the business operations of the District.
ADMr (Average Daily Membership Resident) - Students that the district claims as residents for State School Funding. Some residents may attend school in another district.
ADMw (Average Daily Membership Weighted) - The major component of the State School Fund is ADMw which is ADMr with weightings added for the following factors:
Factor Weight Data Source
Special Education 1.00 times December Special Education Census
English Second Language 0.50 times ELL, ADM student data submissions
Pregnant & Parenting (P&P) 1.00 times P&P, ADM Student data submissions
Poverty Factor 0.25 times Census data – proportionally adjusted
Foster Care/Neglected and Delinquent 0.25 times Dept. of Human Resources counts
Adopted Budget - The final version of the budget that has been adopted by the Board of Education after a hearing with the Tax Supervising and Conservation Commission (TSCC) and meeting all requirements under local budget law.
Ad Valorem Taxes - Taxes levied on the assessed valuation of real and personal property which, within legal limits, is the final authority in determining the amount to be raised for school purposes.
Ad Valorem Taxes Levied by School System - Taxes levied by a school system on the assessed valuation of real and personal property located within the school system which, within legal limits, is the final authority in determining the amount to be raised for school purposes. Separate accounts may be maintained for real property and for personal property.
Allocations - An appropriation divided into amounts used for certain periods or for specific purposes.
Alternative Education - See Multiple Pathways to Graduation (MPG).
Amortize - The gradual payment of an amount owed according to a specified schedule of times and amounts.
AP (Advanced Placement)
Appropriation - A legal authorization granted by the school board to make expenditures and to incur obligations for specific purposes. An appropriation is usually limited in amount and the time when it may be expended.
Approved Budget - The version of the budget that has been approved by the Board of Education acting in their capacity as the Budget Committee for PPS.
A-ROI (Academic Return on Investment)
ARP or ARPA (The American Rescue Plan Act, 2021) - See ESSER III
ARRA (American Recovery and Reinvestment Act of 2009)

302
Arts Education and Access Income Tax (Arts Tax) - This local tax funds art and music teachers for elementary school students for grades KG-5.
Assessed Valuation - A valuation set upon real and personal property by a government as a basis for levying taxes.
Assets - Resources owned or held by PPS, which have monetary value.
ATU (Amalgamated Transit Union) - Bargaining representative for Student Transportation bus drivers.
Audit - The examination of records and documents, and the securing of other evidence for one or more of the following purposes: (a) determining the propriety of proposed or completed transactions, (b) ascertaining whether all transactions have been recorded, and (c) determining whether transactions are accurately recorded in the accounts and in the statements drawn from the accounts.
AYP (Adequate Yearly Progress) - Adequate Yearly Progress is the measure of the extent to which students in a school, taken as a whole, and certain groups within a school, demonstrate proficiency in at least reading/language arts and mathematics. It also measures the progress of schools under other academic indicators, such as the graduation or school attendance rate. This was established as part of the No Child Left Behind (NCLB) Act.
BBESC (Blanchard Education Service Center) - Headquarters of Portland Public Schools, located at 501 North Dixon Street, across from the Rose Quarter in North Portland.
Board of Education (also School Board or Board) - Consists of the elected or appointed body, which has been created according to State law, vested with responsibilities for educational activities in a given geographical area. (See the District Overview section of this document for a list of the Directors and the zones to which they were elected.)
Bond - A written promise, generally under seal, to pay for a specified sum of money (face value) at a fixed time in the future (date of maturity) and carrying interest at a fixed rate, usually payable periodically. The difference between a note and a bond is that the latter usually runs for a longer period of time and requires greater legal formality.
Bond Discount - The excess of the face value of a bond over the price for which it is acquired or sold. The price does not include accrued interest at the date of acquisition or sale.
Bond Premium - The excess of the price at which a bond is acquired or sold, over its face value. The price does not include accrued interest at the date of acquisition or sale.
Bonded Debt - The part of the school system debt, which is covered by outstanding bonds of the system.
Bridge Year - A transition period during which a program or department might receive some form of interim funding. In regards to Title I, a bridge year refers to a period during which a school may not meet the eligibility criteria to receive funding, but may continue to receive funding if they were eligible to receive Title I funding the previous year and is expected to be eligible to receive Title I funding in the following year.

303
Budget - Written report showing the local government’s comprehensive financial plan for one fiscal year or for a 24-month budget period. It must include a balanced statement of actual revenues and expenditures for each of the last two budgets and estimated revenues and expenditures for the current and upcoming budget. A proposed budget is presented to the budget committee for approval. An approved budget is subsequently adopted as approved or modified by the school board.
Budget Calendar - The District’s fiscal year spans from July 1 through June 30. Within this time period, the budget is developed incorporating input from the Board of Education, the Superintendent and staff, the public, and information from the State Legislature regarding the level of School Support Funding (SSF). Budgeting is not simply something done once a year. It is a continuous process taking 12 months to complete a cycle. The budgeting process has five parts. The budget is (1) prepared, (2) approved, (3) adopted, (4) executed, and (5) reviewed by audit. The budget must be prepared far enough in advance so that it can be adopted before June 30. After adopting the budget the District makes the necessary appropriations and certifies the tax levy to the county assessor.
Budget Document - The instrument used by the budget-making authority to present a comprehensive financial program to the school board, which is the appropriating body. The budget document contains a message from the Superintendent, together with a summary of the proposed expenditures, the means of financing them, and the schedules supporting the summary. These schedules show in detail the information as to past years’ actual revenues, expenditures, and other data used in making the estimates.
Budget Officer - The budget officer, or the person or position designated by charter and acting as budget officer, prepares or supervises the preparation of the budget document. The budget officer, unless the charter specifies otherwise, acts under the direction of the executive officer of the municipal corporation or under the direction of the governing body.
Budget Period - A 12 or 24-month period from July 1 through June 30 to which the operating budget applies.
Budgetary Control - The management of the District in accordance with an approved budget for the purpose of keeping expenditures within the limitations of available appropriations and available revenues.
Budgetary Expenditures - Decreases in net current assets. In contrast to conventional expenditures, budgetary expenditures are limited in amount to exclude amounts represented by non-current liabilities. Due to their spending measurement focus, governmental fund types are concerned with the measurement of budgetary expenditures.
BVIS (Blind Vision Impaired Services)
C Comprehensive Annual Financial Report - An annual report that is required by ORS 297.405-297.555, which represents the District’s financial position and activity. This report is audited by an independent firm of Certified Public Accountants.
Capital - Purchases relating to or being an asset of PPS that add to the long-term net worth of the District.
Capital Bond - See Bond
304
Capital Outlay - Expenditures which result in the acquisition of or addition to fixed assets.
Capital Projects Fund - Dedicated to major capital improvements, construction and acquisition of school district facilities and often funded with general obligation bonds.
CARES Act (The Coronavirus Aid, Relief, and Economic Security Act, 2020) - See ESSER
CBRC (Community Budget Review Committee) - A panel appointed by the Board of Education; generally comprised of up to twelve community members and one student representative, which serves to provide a community voice in the budgeting process.
CEIS (Coordinated Early Intervention Services)
CEP (Community Eligibility Provisioning)
Class/Area Code - This is the portion of the account code that identifies a certain group within a program. For example, program 11211 represents Middle School programs and the class code indicates whether the expenditure or budget is for art, social studies, technology, science, language arts, etc.
Classified Employees - There are two categories of classified employees: 1. Non-licensed employees who are represented by a union (ATU, DCU, PFSP, or SEIU), which
includes teacher support personnel, paraeducators, educational assistants, library assistants, community agents, campus monitors, secretaries, data clerks, clerical staff, cafeteria staff, maintenance workers, warehouse workers, truck drivers, and bus drivers.
2. Non-licensed employees who are not represented, which includes specialists and analysts who primarily work to support the business operations of the District.
Combined Underserved – Please note that the District uses the following three terminologies interchangeably: Combined Underserved, Combined Historically Underserved, and Historically Underserved. A new subgroup of students originally established by the ODE as part of the requirements of the Elementary and Secondary Education Act (ESEA) Waiver. PPS’s current definition of Combined Underserved includes the following:
y Students eligible to receive free meals by Direct Certification y Students eligible for Special Education y Students eligible to receive English as a Second Language (ESL) services y Students with any of the following races, ethnicities, or ancestry:
` Black ` Latino/Hispanic ` Native American ` Pacific Islander
Consolidated Budgets - The discretionary portion of schools’ General Fund budget that supports non-FTE resources, including, but not limited to supplies, printing, copy machines, toners, limited-term personnel, extended responsibility, and substitute costs not covered centrally. Schools are allocated a consolidated operating budget each fiscal year (July 1 - June 30), and that information is available for tracking in PeopleSoft Financials starting July 1st. Schools are allocated this budget based on projected enrollment with the following formula:
y K-8 Schools: $10,000 + ($82 x Projected Students)
y High Schools: $50,000 + ($86 x Projected Students)

305
Construction Excise Tax - In 2007, the Oregon State Legislature passed a law (SB1036) that allows school boards, in cooperation with cities and counties, to tax new residential and non-residential development in order to help school districts pay for a portion of the cost of new or expanded school facilities.
Contingency - A special amount budgeted each year for unforeseen expenditures. Transfer of general operating contingency funds to cover unanticipated expenditures requires board approval.
Contracted Personnel Services - Services rendered by outside personnel when a particular undertaking requires skills and resources not otherwise available within the school system, including all related expenses covered by the contract.
CRRSA Act (The Coronavirus Response and Relief Supplemental Appropriations Act, 2021) - See ESSER II
CSI (Comprehensive Support and Improvement) - CSI is one of two federally required designations under ESSA. CSI designation indicates the school as a whole needs additional support.
CTC (Community Transition Centers)
CTE (Career and Technical Education)
Current Resources - Resources to which recourse can be had to meet current obligations and expenditures. Examples are current assets, estimated revenues of a particular period not yet realized, transfers from other funds authorized but not received, and in the case of certain funds, bonds authorized and unissued.
DD&SI (District & School Improvement)
DART (Day and Residential Treatment)
DCU (District Council of Unions) - Bargaining representative for selected workers of the school district including warehouse workers, truck drivers, bus mechanics, maintenance workers, and television services employees.
Debt Service - This is the cash required in a given period, usually one year, for payments of interest and current maturities of principal on outstanding debt. Debt service in mortgage loans includes interest and principal; in corporate bond issues, the annual interest plus annual sinking fund payments; in government bonds, the annual payments from the debt service fund.
Deficit - The excess of a fund’s liabilities over its assets. Oregon school districts may not carry deficits in any fund.
Dept ID (Department ID) - The portion of the account code that identifies a specific school or department that is part of a given program.
Designated Programs - Designated programs include English as Second Language, Teen Parent Programs, Migrant Education, and Summer School.
Direct Certification - Students eligible to receive free meals by Direct Certification are students who are eligible for free meals, as identified by the State. Direct Certification status is determined by state agencies and shared electronically with school districts. Students or families qualify for Direct Certification through a number of avenues such as eligibility for Supplemental Nutrition Assistance Program (SNAP) or Temporary Assistance to Needy Families (TANF), migrant education, homeless or runaway education, Head Start, or foster care. Direct Certification does not include:

306
y Students eligible for free or reduced meals by paper application (per federal income guidelines for 130% and 185% poverty).
y Students eligible for free meals because they are enrolled in a Community Eligibility Provision (CEP) school but are not Direct Certified by the state.
Direct Services – Direct services are activities identifiable with a specific program. Activities involving teaching learners are considered to be direct services for instruction.
District-wide Boundary Review Advisory Committee (DBRAC) - A collaborative committee tasked with providing recommendations to the Superintendent on grade configuration, size, and boundaries of neighborhood schools.
EEA (Educational Assistant) - Educational Assistants are classified employees who work alongside or under the direction of a certified staff member. In some cases they work in a classroom or with groups of children, while in other cases they are assigned to work one-on-one with students who require this level of staffing. EAs are primarily employed to serve in Title I and ESL/Bilingual classrooms.
EAIP (Employer-at-Injury Program)
Early Retirement Benefit - This provides for the direct payments to early retirees in accordance with the collective bargaining agreements for certified staff.
EB (Emergent Bilinguals)
ECEC (Early Childhood Education Centers)
ECSE (Early Childhood Special Education)
Education Options - See Multiple Pathways to Graduation (MPG).
EI (Early Intervention)
ELA (English Language Arts)
ELPA 21 (English Language Proficiency Assessment for the 21st Century)
Employee Benefits - Amounts paid by the District on behalf of employees; these amounts are not included in the base salary, but are over and above. While not paid directly to employees, nevertheless, they are part of the cost of salaries and benefits.
Encumbrance - An obligation chargeable to an appropriation and for which part of the appropriation is reserved.
Enterprise Funds - These account for operations that are financed and operated where the stated intent is that the costs (expenses, including depreciation and indirect costs) of providing goods or services to students are recovered primarily through user charges.
ER (Extended Responsibility) - Additional pay to District employees for activities and responsibilities performed, primarily, outside the standard workday. The varied amounts of pay are contractual under the PAT contract for employees.
ESD (Education Service Districts)

307
ESEA (Elementary and Secondary Education Act)
ELD (English Learners with Disabilities)
ESL / ELL - English as a Second Language / English Language Learners programs for identified students.
ESSA (Every Student Succeeds Act of 2015) - ESSA was signed into law in 2015, effectively ending heavy federal involvement in public schools and sending that authority back to states and local school districts. The law replaces No Child Left Behind (NCLB) which gave considerable control to the federal government to set expectations around student achievement and enforce consequences when achievement lagged, including school districts paying to bus students to other schools if families wished to leave failing schools as measured by state test scores. ESSA maintains the goals of NCLB (high standards, accountability, and closing the achievement gap), but no longer focuses on standardized solutions. Students are still required to take yearly tests in math and reading in 3rd through 8th grades and 11th grade, and to publicly report the scores by subgroups such as race, English-language proficiency, poverty, and Special Education. States are required to intervene in schools that are not meeting their goals. The most significant change is that states and local school districts, not the federal government, will now be responsible for developing methods for judging school quality. The new law went into effect in the 2017/18 school year, giving states time to develop the new school quality standards.
ESSER (Elementary and Secondary School Emergency Relief Fund) - Part of The Coronavirus Aid, Relief, and Economic Security Act, 2020 (CARES Act) provided $13.2 billion for the Elementary and Secondary School Emergency Relief Fund (ESSER Fund). Oregon was awarded $121.1 million. For more information, go to the following website:https://www.oregon.gov/ode/schools-and-districts/grants/Pages/ESSER-Fund.aspx
ESSER II (Elementary and Secondary School Emergency Relief Fund II) - Part of The Coronavirus Response and Relief Supplemental Appropriations Act, 2021 (CRRSA Act) provides an additional $54.3 billion for ESSER funding (ESSER II). In January 2021, Oregon was awarded $499.1 million. For more information, go to the following website:https://www.oregon.gov/ode/schools-and-districts/grants/Pages/ESSER-Fund-II.aspx
ESSER III or ARP ESSER (Elementary and Secondary School Emergency Relief Fund III) - Part of The American Rescue Plan Act, 2021 (ARP Act or ARPA) provides an additional $122 billion ESSER funding (ESSER III or ARP ESSER). Oregon was awarded $1.1 billion. For more information, go to the following website:https://www.oregon.gov/ode/schools-and-districts/grants/Pages/ESSER-Fund-III.aspx
Expenditures - Decreases in net financial resources. Expenditures include current operating expenses, which require the current or future use of net current assets, debt service, and capital outlays.
FFall Enrollment - Number of students enrolled in school on October 1st.
FFCO (Full Faith and Credit Obligations)
FICA (Federal Insurance Contributions Act)
Fiscal Year - A 12-month period from July 1 through June 30 to which the annual operating budget applies.

308
Fixed Assets - Assets purchased and intended for long-term use such as land, building, improvements, machinery, and equipment.
FTE (Full Time Equivalent) - One FTE is defined as a regular staff position scheduled to work eight hours per day. FTE does not count people, but positions. Two individuals who each work half time (4 hours per day) equal 1.0 FTE.
Fund - A fiscal and accounting entity with a self-balancing set of accounts in which cash or other financial resources; all related liabilities, residual equities, or balances; and changes therein, are recorded and segregated to carry on specific activities or attain certain objectives in accordance with special regulations, restrictions or limitations.
The State chart of accounts is as follows: y Governmental Funds
` General funds (numbered in the 100 series) ` Special Revenue funds (numbered in the 200 series) ` Debt Service funds (numbered in the 300 series) ` Capital Projects funds (numbered in the 400 series)
y Proprietary Funds
` Enterprise funds (numbered in the 500 series) ` Internal Service funds (numbered in the 600 series)
y Fiduciary Fund
` Trust and Agency Funds (numbered in the 700 series)
GGAAP (Generally Accepted Accounting Principles) - A widely accepted set of rules, conventions, standards, and procedures for recording and reporting financial information, as established by GASB.
Gap Bonds - Any portion of a local government’s property tax levy that is used to repay qualified taxing district obligations. Qualified taxing district obligations include principal and interest on any bond or formal, written borrowing of moneys issued before December 5, 1996, for which ad valorem property tax revenues have been pledged or explicitly committed or that are secured by a covenant to levy. Also included are pension and disability plan obligations that commit property taxes and impose property taxes to fulfill those obligations.
GASB (Government Accounting Standards Board) - The mission of GASB is to establish and improve standards of state and local governmental accounting and financial reporting that will result in useful information for users, and guide and educate the public.
GED (General Education Development) or (General Equivalency Diploma)
General Fund - The fund used to account for all financial resources except those required to be accounted for in another fund. It covers the operations of schools, including expenditures for salaries and benefits, supplies, textbooks, utilities, and other general expenses.

309
GFOA (Government Finance Officers Association)
GO (General Obligation) Bonds
Grant - A donation or contribution in cash which may be made to support a specific or general purpose or function.
HHACCP (Hazard Analysis and Critical Control Point)
Head Start - Head Start is a child development program that serves low-income three and four year old children and their families. Section 645 of the Head Start Act (42 U.S.C. 9840) establishes income eligibility for participation in Head Start programs by reference to the official poverty line, adjusted annually in accordance with changes in the Consumer Price Index.
HOH (Hard of Hearing)
HSSD (High School System Design) - The District’s large-scale effort to strengthen the High School System.
HU (Historically Underserved) - Refer to Combined Underserved
IIDEA (Individuals with Disabilities Education Act)
IEP (Individualized Education Plan/Program) - By law, each student with a special education placement must have an IEP. The IEP must include certain information about the child and the educational program designed to meet their unique needs.
Indirect Costs - A cost necessary for the functioning of the organization as a whole, but which cannot be directly assigned to one service.
Interfund Loans - Loans made by one fund to another and authorized by resolution or ordinance.
Interfund Transfers - Amounts moved from one fund to finance activities in another fund. They are shown as expenditures in the originating fund and revenues in the receiving fund.
Internal Service Fund - A fund used to account for the financing of goods or services provided by one department or agency to other departments or government agencies on a cost-reimbursement basis.
IT (Information Technology)
KK or KG (Kindergarten)
LLEA (Local Education Agency)
Levy - Amount or rate of ad valorem tax certified by a local government for the support of governmental activities.

310
LGIP (Local Government Investment Pool)
Liabilities - Debt or other legal obligations arising out of transactions in the past which must be liquidated, renewed, or refunded at some future date. This term does not include encumbrances.
Licensed Employees - Includes teachers, counselors, media specialists, psychologists, social workers, nurses, athletic trainers, occupational speech, and physical therapists.
Licensed Equivalent - See Weighted FTE.
Limited Term Employee - Limited Term employees are those hired for short-duration or sporadic work during the school or fiscal year. No benefits are associated with these positions. They may work any number of hours per week, for a total of up to 780 hours per year in the same assignment.
Local Option Tax - Voters may be asked to approve temporary taxing authority that is in addition to the taxes generated by the permanent tax rate. Local option taxes can be for general operations, a specific purpose or capital projects. They are limited to five years unless they are for a capital project, then they are limited to the useful life of the project for 10 years, whichever is less.
LTCT (Long Term Care or Treatment)
LTHT (Less-Than-Half-time) Employees - LTHT employees are those hired for 19 or fewer hours per week for one or more school or fiscal years. Benefits are generally not associated with these positions. Note however, that a LTHT employee with multiple jobs may easily surpass 20 hours per week and thus earn full benefits.
MMAP (Measures of Academic Progress)
Measure 5 - Property tax limitation passed by Oregon’s voters in November 1990, limiting local property taxes for schools to $5 per $1,000 of assessed value.
Measure 47 - Property tax limit passed by Oregon voters in November 1996, rolling taxes back to 1995-96 levels less 10% and capping future increases by 3% annually.
Measure 50 - Initiative referred by legislature and approved by voters to clarify and implement Measure 47.
MESD (Multnomah Education Service District) - State-established Education Service District (ESD) to provide regional services to school districts within Multnomah County.
MPG (Multiple Pathways to Graduation) - Formerly Alternative Education and Education Options are programs and services available for students whose academic and social needs are not being met effectively in traditional school settings. Options include school-within-school programs in high schools, night schools, or programs located at separate locations.
MTSS (Multi-Tiered Systems of Support)
NNCLB (No Child Left Behind) Act
NS (Nutrition Services)

311
OOAR (Oregon Administrative Rules) - Rules written to clarify and implement Oregon law, and has the authority of law.
ODE (Oregon Department of Education)
OEBB (Oregon Educators Benefit Board)
Operating Budget - Plans of current expenditures and the proposed means of financing them. The annual operating budget is the primary means by which most of the financing acquisition, spending, and service delivery activities of a government are controlled. The use of annual operating budgets is required by law.
OPERS (Oregon Public Employees Retirement System)
ORS (Oregon Revised Statute) - Oregon laws established by the legislature.
OSBA (Oregon School Boards Association)
OSCIM (Oregon School Capital Improvement Matching Program)
PP&P (Pregnant & Parenting)
PAPSA (Portland Association of Public School Administrators) - PAPSA is the professional association which represents licensed school administrators employed in PPS.
Paraeducator (Paraprofessional Educator) - As Part of the No Child Left Behind Act (NCLB), there were new requirements for paraeducators working in Title I schools or programs funded by Title I. These requirements applied only to paraeducators who provide instructional support under the direction of teachers and must be met at the time of hire. The following job titles at PPS provide instructional aid and are thus required to meet the NCLB requirements:
y ESL Bilingual Assistants y Certified Nursing Assistants y Community Agents y Educational Assistants y Instructional Technology Assistants y Library or Media Center Assistants y Special Education Paraeducators - Levels I, II and III
However, paraeducators who have one of the above job titles, but do NOT provide any instructional assistance may not be required to meet the NCLB requirements if they work in the following areas:
y Playground supervision y Personal care services y Non-instructional computer assistance y Serve solely as translators
y Work only with parental involvement activities
PAT (Portland Association of Teachers) – PAT represents professional educators employed in PPS, including teachers, counselors, media specialists, student management specialists, and others.
312
PAT Contract, General Education IEPs - Professional educators who are required to conference regarding IEPs shall have a substitute provided to allow for such meetings to occur within the workday. If a unit member volunteers to attend such a conference outside of the workday, such member shall be compensated at his/her per diem hourly rate.
PAT Contract, Special Education IEPs - In addition to contractually provided planning days, special education professional educators assigned to conference with parents and write IEPs shall be provided release time for that purpose. A special education unit member may elect to use these hours before or after the school year or outside his/her workday at this/her per diem hourly rate of pay.
PAT Contract, TAG/504 Plans - Professional educators who are required to write student plans other than IEPs, including Gifted Student plans or 504 plans, shall be provided at the member’s option either release time or compensation at his/her per diem hourly rate. One hour will be allotted for each student plan.
PBAM (Program Budgeting and Accounting Manual) - This ODE manual guides PPS’ budgeting and accounting codes and structures.
PCC (Portland Community College)
PCL (Portland Children’s Levy)
PE (Physical Education)
PEIP (Portland Early Intervention Program)
PEP (Population Estimates Program) - A program of the U.S. Census Bureau.
PERS (Public Employees Retirement System)
PFSP (Portland Federation of School Professionals) - PFSP represents classroom educational assistants, paraeducators, secretaries, clerks, certified occupational therapy assistants, licensed physical therapy assistants, campus monitors, and community agents employed by PPS.
PLC (Professional Learning Community)
POB (Pension Obligation Bonds)
Post Retirement Benefit - The program provides health and welfare medical benefits to qualified retired District employees. Qualifications require the employee to have 15 years of employment with the District and must qualify for PERS retirement benefits. Benefits are afforded for 5 years upon qualifying, but not beyond age 65.
PPS (Portland Public Schools or District)
PRC (Population Research Center)
Prior Year Taxes - Taxes levied for fiscal years preceding the current one. Revenues from these taxes are treated as non-tax resources in the current budget.
Program Budget - A budget based on the programs of district offices.
Program/Function Code - The portion of the account code that identifies an area within the organization for personnel, goods and services.
Project/Grant ID - The portion of the account code that identifies a specific project account, grant account, or dedicated resource account within a given fund.

313
Property Taxes - Ad valorem tax certified to the county assessor by a local government unit.
Proposed Budget - Financial and operating plan prepared by the budget officer and submitted by the Superintendent to the Budget Committee and public for review.
PSAT (Preliminary Scholastic Aptitude Test)
PTA (Parent Teacher Associations)
Publication - Public notice given by publication in a newspaper of general circulation within the boundaries of the local government; mailing through the U.S. Postal Service by first class mail to each street address within the boundaries of the local government; and hand delivery to each street address within the boundaries of the local government.
QQMHP (Qualified Mental Health Professional)
QZAB (Qualified Zone Academy Bonds)
RREAHL (Recovery, Education, and Action for Healthy Living)
Requirement - The sum of all appropriated and unappropriated items in a given fund. Total requirements must always equal total resources in a fund.
Reserve Fund - Established to accumulate money over time for a specific purpose, such as purchase of new equipment.
RESJ (Racial Equity & Social Justice) - In 2011, PPS adopted a Racial Educational Equity Policy that called out harmful disparities in its schools and identified the district’s role in eliminating them. Since then, several achievements have been made, but there is collective acknowledgement that there is still much work remaining to ensure all students experience equitable outcomes. Current leadership has embarked on an inclusive planning process to identify the most urgent areas of opportunity to continue this work and to incorporate efforts into its five-year road map for RESJ. The goal is to elevate RESJ practices into a comprehensive, defined framework with clear system-wide equity and social justice actions, and measurable results. The current primary focus of the RESJ lens is on race and ethnicity as that will allow direct improvements in other dimensions of diversity.
Resolution - A formal order of a governing body (the Board); it has lower legal status than an ordinance.
Resources - Estimated beginning fund balances on hand at the beginning of the fiscal year, plus all anticipated revenues.
Restructuring - A school identified for restructuring is a school that has not made AYP for five years. The first year of restructuring may be used for planning, and the plan must be implemented no later than the second year. This was established as part of the NCLB Act.
Revenues - Monies received or anticipated by a local government from either tax or non-tax sources.

314
RHIS (Retirement Health Insurance Subsidy)
RMV (Real Market Value)
RTI (Response to Intervention) - The RTI system strengthens core delivery to all students, focusing on prevention of student academic and behavior challenges. In addition, it provides for systematic identification of students in need of greater support. Through monitoring student progress, staff are able to remove or add student interventions as needed throughout the school year.
RZED (Recovery Zone Economic Development) Bonds
SSAT (Scholastic Aptitude Test)
SBAC (Smarter Balanced Assessment Consortium) - Oregon is part of a team of states working together voluntarily to develop K-12 assessments in English language arts/literacy and mathematics aligned to Oregon’s Common Core State Standards. These tests, called Smarter Balanced Assessments, are delivered online and include questions that adapt to each individual’s performance. The Performance Task feature mimics real world application of a student’s knowledge and skills.
SBT (Strategic Budget Team) - A group of PPS central office leaders and school principals who makes budget decisions using an RESJ Lens.
School Board - See Board of Education
SEA (State Educational Agencies)
SEIU (Service Employees International Union) - This group represents Nutrition Services and Custodial employees in PPS.
SEL (Social Emotional Learning)
Service Area Direction - Activities associated with managing and directing a given program within a department.
SIA (Student Investment Account)
SIP (School Improvement Plan)
SKIP (Screening Kids for Intervention & Prevention) - Early intervention screening for kids from birth to age 5.
SLC (Structured Learning Centers)
SNAP (Supplemental Nutrition Assistance Program)
Special Revenue Fund - This fund tracks money school districts receive from federal, state, and private grants. Some examples are funds for disabled students, funds for educationally disadvantaged students, funds for drug and alcohol prevention, and funds for professional development. Money that schools receive from students and parent groups for purposes such as special school projects, field trips, and various student activities may be recorded here.
SPED (Special Education) - Educational programs and services provided to students designated as SPED as required by law.

315
SRGP (Seismic Rehab Grant Program)
SSA (Student Success Act)
SSF (State School Fund) - This is the major appropriation of state support for public schools. The State School Fund is distributed to school districts on a weighted student basis (see ADM-w). The formula makes weighting adjustments to consider the additional cost of operating remote small schools, and includes reimbursement of student transportation costs. The State School Fund is also adjusted based on local property taxes. For more information, go to the following website:
https://www.oregon.gov/ode/schools-and-districts/grants/Pages/School-District-and-ESD-payment-Statements.aspx
Staffing Ratio - The staffing ratio is the ratio of students to staff (e.g., 24.5:1) and is the primary measure used to allocate staff to schools. Class size may be higher than the staffing ratio because counselors and specialists in areas such as Music, Media and PE are also included in the staffing ratio; or a principal can decide to lower class size by not having as many specialists teaching in the school. Information about how schools are staffed is shown in the School Staffing section of this document.
State of Oregon (State)
Supplemental Budget - A supplemental budget is prepared to meet unexpected needs or to spend revenues not anticipated at the time the regular budget was adopted. A supplemental budget cannot be used to increase a tax levy.
Supplemental Educational Services - Supplemental educational services are additional academic services designed to increase the academic achievement of low-income students in low-performing schools. These services may include tutoring, remediation, or other educational interventions that are consistent with the content and instruction used by ODE. Supplemental education services must be provided outside of the regular school day; and must be high quality, research-based, and specifically designed to increase student academic achievement.
TTAG (Talented and Gifted) - Programs and services provided to students identified as TAG as required by State law.
TANF (Temporary Assistance for Needy Families)
Tax Rate - The amount of tax stated in terms of a unit of tax for each $1,000 of assessed value of taxable property.
Title I - Title I, Part A provides federal dollars to help supplement educational opportunities for children who live in high poverty areas who are most at risk of failing to meet the state’s challenging content and performance standards. There are two types of programs: Targeted Assistance and Schoolwide. Most of the schools that qualify for Title I in PPS have Schoolwide programs. A Targeted Assistance program is one in which individual students are targeted to receive Title I services. Students are identified based upon multiple, objective, educationally related criteria. Services may be delivered in a number of ways such as in-class instruction, pull out instruction, extended day, and/or week or year programming. Title I teachers are responsible for providing extra services to the identified children, coordinating with other school personnel involved with the children, and involving parents in the planning, implementation and evaluation of the Title I program.
A Title I school is eligible to become a Schoolwide program when the poverty level (determined by free and reduced lunch counts, AFDC, census or Medicaid) is at or above 33%. A Schoolwide program is designed with the knowledge that there is a link between poverty and low achievement;
316
therefore, when there are large numbers of disadvantaged students, interventions will be more successful when they are implemented “schoolwide.” A Schoolwide program has more flexibility in the use of Title I funds and in the delivery of services. Staff paid with Title I funds are free to work with all students in the building, for there are no students identified as “Title I.” The school works together to develop its curriculum and instruction to raise the achievement of all students.
TLC/TNT (Tender Loving Care/Think-n-Try)
TOSA (Teachers on Special Assignment)
TPA (Third Party Administrator)
Transfers - Amounts distributed from one fund to finance activities in another fund. These are shown as an expenditure in the originating fund and revenue in the receiving fund.
TSCC (Tax Supervising and Conservation Commission) - TSCC is an independent, impartial panel of citizen volunteers established to monitor the financial affairs of local governments. The Oregon Legislature created TSCC in 1919 (Chapter 375), with the first TSCC being organized in 1921. TSCC has jurisdiction over all local governments that are required to follow local budget law and which have more real market value within Multnomah County than in any other county. TSCC presently oversees the budgeting and taxing activities of thirty-nine municipal corporations, including Oregon’s largest: city (Portland), county (Multnomah), school district (Portland), community college (PCC), education service district (Multnomah), port (Portland), mass transit district (Tri-Met), regional government (Metro), and urban renewal agency (Portland Development Commission). In total, these 42 entities employ more than 32,000 full time equivalent positions (FTE) and have budgets totaling over $17 billion.
TSI (Targeted Support and Improvement) - TSI is one of two federally required designations under ESSA. TSI designated schools indicate one or more subgroups that need additional support.
UUAL (Unfunded Actuarial Liability)
UEFB (Unappropriated Ending Fund Balance) - Amount budgeted to carry over to the next year’s budget to provide the District with needed cash flow until other money is received and to provide financial stability. This amount cannot be transferred by resolution or used through a supplemental budget during the fiscal year.
USDA (United States Department of Agriculture)
VVAPA (Visual and Performing Arts)
WWeighted FTE (also referred to as Licensed Equivalent FTE) - Staff allocations for schools primarily consist of licensed staff (i.e., certified teachers). The allocation also includes administrative staff such as principals (licensed administrators) and secretaries (classified staff). For staffing purposes only, school administrators can convert FTEs allocated for licensed staff to classified staff at a 1:2 ratio. For example, 1.0 licensed FTE could be used to hire 2 full-time classified employees who are represented by a union. Therefore, classified employees are valued as “half-weighted,” though a full-time equivalent classified employee would still show as a 1.0 position FTE.
YYTP (Youth Transition Program)

317
APPENDICES


319
EXPENDITURES OVERVIEWThe following pages show the object codes (formerly known as account codes) which correspond to the State’s chart of accounts and which correspond to the detail in both the General Fund Requirements by Object and the Other Funds in the Fund Detail section of this document. These object codes describe the type of expenditures for which funds have been budgeted and expensed.
510000 - Salaries Amounts paid to employees of the District who are considered to be in a position of a permanent nature or hired temporarily, including personnel substituting for those in permanent positions. This includes gross salary for personal services rendered while on the payroll of the District.
Regular Salaries - Full-time, part time, and prorated portions of the costs for work performed by employees of the District who are considered to be in positions of a permanent nature.
511100 Licensed Staff y CLASSROOM TEACHERS. Teachers of general education, ESL/bilingual teachers, teachers
of special education, and media specialists (librarians). y TEACHER SUPPORT PERSONNEL – LICENSED. Behavior management specialists, child
development specialists, educational audiologists, home/hospital teachers, speech/language pathologists, occupational therapists, physical therapists, school psychologists, social workers, and student management specialists.
y COUNSELORS and work experience coordinators. y OTHER SALARIED – LICENSED. Teachers on special assignment (TOSA), achievement
coordinators, instructional support specialists, and curriculum guide leaders.
511210 Classified - Represented y TEACHER SUPPORT PERSONNEL – NON-LICENSED. Includes positions such as campus
security agents, community agents, study hall monitors, and student management assistants. y EDUCATIONAL ASSISTANTS. Includes special education paraeducators, certified occupational
therapy assistants, interpreters, library assistants, licensed physical therapy assistants, licensed practical nurses.
y SECRETARIAL. Secretaries, principals’ secretaries, school secretaries, administrative secretaries, and director secretaries. Temporary classified help (limited term employees) is charged to object 512400, and contracted secretarial services are charged to object 538900.
y CLERICAL. Clerks, computer operators, data processing couriers, dispatchers, high school bookkeepers, receptionists, switchboard operators, warehouse persons, and word processors.
y CAFETERIA STAFF. Cafeteria substitutes, central kitchen lead person, cooks, dessert makers, food service assistants, and snack bar manager.
y MAINTENANCE WORKERS (except apprentices) charged to work orders.
y DRIVERS - BUS AND TRUCK (also includes food service delivery drivers).
511220 Non-Represented Staff y PROFESSIONAL – NON-LICENSED. Includes analysts, associates, functional leads,
representatives, technical support staff, confidential assistants, etc.

320
y OTHER SALARIES – NON-LICENSED. Includes assistant supervisors, coordinators, print press operators, radio and television staff and videographers, hourly performing arts staff, and positions not specified elsewhere.
511310 Administrators - Licensed y SUPERINTENDENT
y ASSISTANT / DEPUTY SUPERINTENDENTS
y SENIOR DIRECTORS / AREA DIRECTORS
y ADMINISTRATORS – LICENSED. Includes licensed administrators and departmental directors.
y ASSISTANT DIRECTORS / SUPERVISORS / MANAGERS – LICENSED. Includes licensed assistant directors, project/program administrators, directors, managers, and supervisors.
y PRINCIPALS and administrative or supervisory substitutes defined in the PAT (Portland Association of Teachers) agreement.
y VICE PRINCIPALS / ASSISTANT VICE PRINCIPALS / ASSISTANT PRINCIPALS
511320 Administrators - Non Licensed y ADMINISTRATORS – NON-LICENSED. Includes Cabinet level administrators who oversee
multiple departments and other district operations. (Other managers and supervisors coded to 511420 below.)
511410 Managerial - Represented y CAFETERIA MANAGERS (This object is used only by food service programs in Fund 202 and
in Grants.)
511420 Directors / Program Administrators y NON-LICENSED DIRECTORS / ASSISTANT DIRECTORS / SUPERVISORS / MANAGERS
Non-Permanent Salaries - Full-time, part time, and prorated portions of the costs for work performed by employees of the District who are hired on a temporary or substitute basis to perform work in positions in either temporary or permanent nature.
512100 Substitutes - Licensed y TEACHER SUBSTITUTES – LICENSED. Substitutes for professional educators absent due to
illness, emergency, family illness, and other types of absences.
y PAT – PROFESSIONAL/CONFERENCE LEAVES. Substitutes for professional educators attending seminars, meetings, or conferences that fall within the guidelines of the PAT Agreement.
y PAT – SABBATICAL LEAVES. Compensation paid to professional educators on approved sabbatical leaves (time document not required; changes made directly by Human Resources Department).
512200 Substitute - Classified y EDUCATIONAL ASSISTANTS. Substitutes for positions listed in object 511210.

321
y SPECIAL ED PARAEDUCATORS. Substitutes for positions listed in object 511210.
y SECRETARIAL. Substitutes for positions listed in object 511210.
y CLERICAL. Substitutes for positions listed in object 511210.
512300 Temporary Misc - Licensed y TEMPORARY WORKERS – LICENSED. Personnel required for specific jobs or to help in peak-
load periods. Personnel are NOT permanent or regular part-time and are paid on an hourly basis.
512400 Temporary Misc - Classified y TEMPORARY WORKERS – NON-LICENSED. Personnel required for specific jobs or to help in
peak-load periods. Personnel are NOT permanent or regular part-time and are paid on an hourly basis. (Object 538900 used for contracted secretarial/clerical services.)
y STUDENT WORKERS.
Additional Salary - Compensation paid to District employees in temporary or permanent positions for work performed in addition to normal earnings. This includes additional pay for classified overtime, extended hours for licensed staff, and activities such as coaching, supervision of extracurricular activities, etc.
513100 Extended Responsibility (ER) - Licensed y Compensation to licensed staff for positions listed in the PAT Union Agreement, Appendix C.
513200 Extended Responsibility (ER) - Classified y Compensation to classified staff performing ER responsibilities when no certificated employee
is willing to accept assignment listed in Appendix B of the PAT Union Agreement.
513300 Extended Hours y Compensation to District personnel at their hourly rate for services performed on curriculum
development committees, workshops for instructional staff, teaching in-service classes, after-hour meetings, etc.
513350 PAT Class Overload Stipend y Stipends paid to teachers who have class sizes that exceed the established thresholds of
student numbers.
513400 Overtime Pay y Compensation to non-certificated District personnel for authorized time in excess of regular
hours.
y SPORTING EVENT SUPPORT PERSONNEL. Compensation for District staff that perform jobs such as gatekeepers, game officials, ticket takers, and security officers. (Object 531900 used for Game Expenses for non-district personnel.)
322
513510 Group Health Opt Out - Licensed Employees y Monthly incentive for full-time employees opting out of Group Health Insurance.
513520 Group Health Opt Out - Non Licensed Employees y Monthly incentive for full-time employees opting out of Group Health Insurance.
520000 - Associated Payroll CostsAmounts paid by the District on behalf of employees. These amounts are not included in the gross salary but are in addition to that amount and, while not paid directly to employees, are part of the cost of personnel services.
521000 PERS y RETIREMENT CONTRIBUTIONS. Employer’s share of the Public Employees Retirement System
(PERS) contributions paid by the District.
521310 PERS UAL y Unfunded Actuarial Liability amount of PERS.
522000 Social Security - FICA y Employer’s share of social security taxes paid by the District as required by the Federal
Insurance Contributions Act (FICA).
523100 Workers’ Compensation y Amounts paid by the District to provide workers’ compensation insurance for employees.
523200 Unemployment Compensation y Amounts paid by the District to provide unemployment compensation for employees.
Contractual Employee Benefits - Amounts paid by the District resulting from negotiated agreement between the Board and the employee groups. Examples of expenditures would be health insurance, long-term disability, and tuition reimbursement.
524100 Group Health Insurance y Employees’ and employer’s share of health insurance plan contributions paid by the District.
524200 Other Employer Paid Benefits y Amounts paid by the District to provide life insurance coverage for eligible employees.
524300 Retiree Health Insurance y Amounts paid by the District to retired employees eligible under the plan.
524400 DCU Union Contract Items y PROFESSIONAL CONFERENCES – District Council of Unions (DCU) UNION ARTICLE. Travel
costs such as lodging, meals, registration, and travel incurred by employees while attending

323
approved conferences, seminars, and workshops related to the employee’s work assignment. Membership dues should NOT be charged to this object; refer to object 564000.
524500 PAT Union Contract Items y PERSONAL (OWNED) AUTO DAMAGE. Compensation paid to professional educators who
sustain personal (owned) automobile damage caused by an accident while the employee is in the course and scope of District employment.
y PERSONAL PROPERTY LOSS. Compensation made to professional educators when clothing or other personal property, excluding automobile, is damaged or destroyed as the result of any unwarranted assault on the teacher’s person suffered during the course of employment.
524510 PAT Union Tuition Reimbursement y Payments made to employees for tuition reimbursement.
524520 PAT Union Professional Improvement Funds y PROFESSIONAL CONFERENCE - PAT UNION AGREEMENT. Payments for costs such as lodging,
meals, registration, and transportation incurred by a professional educator while attending approved professional conferences offered by PAT Union Agreement. The conferences, meetings, workshops, etc., can be either in or out of District. (Object 564000 used for dues or membership fees.)
524530 Early Retirement Benefits y Amounts paid by the District to retired certificated employees eligible under the plan.
524600 PFSP District Inservices y Inservice events for Portland Federation of School Professionals (PFSP) professional
development and staff training.
530000 - Purchased ServicesServices which, by their nature, can be performed only by persons or firms with specialized skills and knowledge who are not employees of the District. Instructional, Professional, and Technical Services - Services in support of the instructional program and its administration. Included would be curriculum improvement services, counseling and guidance services, library and media support, and contracted instructional services.
531100 Instructional Services y Non-payroll services performed by qualified persons or organizations providing one or more
of the following: learning experiences for students, assistance to teachers and supervisors in enhancing the quality of the teaching process, student and parent solving problems to supplement the teaching process.
531200 Instructional Program Improvement Services y Non-payroll services performed by persons qualified to assist teachers and supervisors in
enhancing the quality of the teaching process. Includes curriculum consultants, in-service training specialists, etc.

324
531300 Student Services y Non-payroll services of qualified personnel to assist students and their parents in solving
mental and physical problems to supplement the teaching process.
531800 Local Meetings / Non-Instructional Staff Development y Training fees for workshops, conferences, seminars and other staff development activities
attended by non-instructional personnel excluding travel related costs. This includes meals or refreshments for working business meetings.
531810 Non-Instructional Development - Professional Development Funds y Fees for training workshops, conferences, seminars and other staff development activities
using allocated Professional Development funding by licensed employees.
531900 Other Instructional, Professional, and Technical Services y PERSONAL/PROFESSIONAL SERVICES. Personal/professional service contracts for
instructional related services such as educational studies and consultant service contracts for instructional programs.
y GAME EXPENSES. Non-payroll services provided by non-District personnel for security, game officials, ticket takers, labor to line fields, facilities rental, etc.
y SERVICES PURCHASED FROM ANOTHER SCHOOL DISTRICT WITHIN THE STATE. Payments to another school district within the state for services rendered, other than tuition and transportation fees. Examples of services are data processing, purchasing, nursing, and guidance.
532100 Cleaning Services y Services purchased to clean buildings or equipment other than those provided by District
employees.
532200 Repairs and Maintenance Services y CONTRACTED RENOVATION/REMODELING. Contractor costs for the renovation and
remodeling of existing structures.
532400 Rentals y RENTAL OF LAND AND BUILDINGS. Rentals for both temporary and long-range use. Some
examples are administrative offices, garages, warehouse space, auditorium facilities, parking lots, classroom space, and playground space.
y RENTAL OF EQUIPMENT AND VEHICLES. Rentals for both temporary and long-range use. This includes bus and other vehicle rentals when operated by the District, and similar rental agreements such as for cable systems. Under such arrangements, ownership of the asset (i.e. equipment or vehicle) DOES NOT revert to the District at the end of the agreement.
y LEASE-PURCHASE OF EQUIPMENT AND VEHICLES. Lease-purchase of equipment and vehicles where the ownership of the asset (i.e. equipment or vehicle) DOES revert to the District at the end of the lease-purchase agreement.

325
532410 Leased Copy Machines y Leasing or renting copy machines and the supplies to operate copy machines.
Energy/Utility Services - Expenditures for energy, such as natural gas, oil, gasoline, and expenditures for utility services supplied by public or private organizations.
532500 Electricity
532600 Fuel y NATURAL GAS. y OIL FOR HEATING.
532700 Water and Sewage
532800 Garbage y DISPOSAL SERVICES. Pickup and handling of garbage by non-District employees.
532900 Other Property Services y CONTRACTED BUILDING UPKEEP. Non-payroll services provided by outside vendors for
repairs and maintenance of buildings. y CONTRACTED EQUIPMENT SERVICES. Non-payroll services provided by outside vendors
for repairs and maintenance of instructional and non-instructional equipment. y TRANSPORTATION EQUIPMENT UPKEEP. Non-payroll services provided by outside vendors
for repairs and maintenance of District buses.
Student Transportation Services - Contracted costs incurred in transporting students to and from instructional programs during the school term including District expenditures associated with: (a) Home-to-school transportation of students as scheduled by the local school board; (b) Student transportation between educational facilities either within or across district boundaries, if the facilities are used as part of the regularly scheduled instructional program approved by the board; (c) Student transportation for in-state field trips when such represents an extension of classroom activities for instructional purposes, and shall include out-of-state destinations within 50 miles of the Oregon border.
533110 Reimbursable - School Bus
533120 Reimbursable - Taxi Cab
533130 Reimbursable - In-Lieu
533140 Reimbursable - Tri-Met
533150 Reimbursable - Field Trips
533160 Reimbursable - Athletic Trips
533200 Non-Reimbursable Student Transportation y STUDENT ACTIVITY EXPENSES. Includes only transportation cost for field trips for non-
educational purposes not allowed for reimbursement by the state. Includes contract payments for transporting students on student activity trips, interscholastic athletic events, out-of-state field trips, or non-instructional field trips.

326
Travel - Expenditures for transportation, meals, hotels, and other travel related expenses for District related business.
534100 Travel, Local in District y LOCAL TRAVEL AND MILEAGE. Reimbursement for mileage incurred within the 25-mile
limitation by a District employee when conducting District business. Includes parking fees and taxi fares within the confines of the District.
534200 Travel, Out of District y OUT-OF-TOWN TRAVEL. Payments for employee travel costs such as lodging, meals, and
transportation incurred outside the 25-mile limitation when conducting District business, such as attending conferences and meetings. (Object 531800 used for costs of workshops and seminars for training purposes. Object 524500 used for conferences covered by PAT Union Agreement. Object 564000 used for dues and membership fees).
534210 Travel, Out of District - Professional Development Funds y Employee travel costs such as lodging, meals, and transportation incurred outside the 25-mile
limitation when attending training or workshops using allocated Professional Development funding by licensed employees.
534300 Travel, Student Activities y STUDENT ACTIVITY EXPENSES. Student activities such as conferences, workshops, registration
fees, entry fees, performance tickets, lodging and meals. (Object 533200 used for Non-Instructional transportation expenses related to these activities.)
534900 Other Travel y INTERVIEW EXPENSE. Travel costs such as lodging, meals, and transportation incurred by a
prospective employee for the District. Advance permission to use this object must be obtained from the Human Resources Department.
534901 Non-Reimbursable Student Academic Transportation y Student bus passes / tickets provided for travel to and from school.
Communication - Services provided by persons or businesses to assist in transmitting and receiving messages or information. This category includes internet, telephone and fax services, as well as postage and postage machine rental.
535100 Telephone y Telephone services, cellular phones, toll charges, etc.
535300 Postage y Postage stamps, postage machine rentals, etc.
535400 Advertising y Printed announcements in professional periodicals and newspapers or announcements
broadcast by way of radio and television networks. These expenditures include advertising for such purposes as personnel recruitment, legal requirements, and the sale of property.

327
535500 Printing and Binding y Printing/copying/binding of forms, posters, publications, etc.
535910 Fax y Facsimile machine rental/use charges.
535920 Internet Fees y 535990 Wide Area Network / Misc.
Charter School Payments - Expenditures to reimburse Charter Schools for instructional services rendered to students residing in the legal boundaries of the District.
536000 Charter Schools
Tuition - Expenditures to reimburse other educational agencies for instructional services rendered to students residing in the legal boundaries of the District.
537100 Tuition Payments to Other Districts In State
537300 Tuition Payments to Private Schools
537410 Tuition Fees for College Credit
Non-Instructional Professional and Technical Services - Services which by their nature can be performed only by persons with specialized skills and knowledge.
538100 Audit Services y Fees paid to independent auditors, fees paid to actuaries, audit filing fees paid to the Secretary
of State, and related costs.
538200 Legal Services y Services of outside legal counsel.
538300 Architect and Engineering Services y Expenditures for professional services of licensed professionals for consultation regarding
the District’s facilities.
538400 Negotiation Services y Expenditures for services performed in negotiating contracts with any labor group.
538500 Management Services y Services performed by persons qualified to assist management in policy matters or the general
operation of the District. Includes consultant services, accounting and financial advisors, individually or as a team, to assist management in performing systematic studies and other services to enhance District effectiveness.

328
538600 Data Processing Services y Non-payroll services performed by persons, organizations, or other agencies qualified to
process data. This includes data processing organizations contracted to perform a specific task on a short-term basis.
538800 Election Services y Ballots, poll books, and publications of official notices.
Other Non-Instructional Professional and Technological Services - Includes other professional and technical services that require specialized knowledge and skills.
538910 Security Services ` Non-payroll security services such as armored car services and school registration
security.
538920 Staff Services y Non-payroll services performed by qualified persons to assist in employing and assigning
staff, including specialists in personnel counseling and guidance. (Used only in Funds 202 and in Grants.)
538930 Secretarial/Clerical Services y Non-payroll services performed by qualified persons or from temporary service organizations.
538940 Professional Moving Services y Non-payroll services performed by qualified persons or organizations to move materials,
furniture, etc.
538950 Professional Health Care Services y Non-payroll dental, vision, and/or medical services, etc.
538960 Professional Child Care Services y Non-payroll services performed by qualified persons, organizations, or other agencies to
provide child care services.
538970 Graphic Arts Services y Non-payroll services performed by persons, organizations, or other agencies qualified in any
form of visual artistic representation including painting, drawing, photography, etc.
538980 Laundering Services y Non-payroll services relating to cleaning and/or laundering.
538990 Non-Instructional Personal/Professional Services y Non-payroll personal/professional service contracts, outside consultant service contracts,
appraisal services, etc., not listed elsewhere.

329
538992 Custodial Services Contract
538995 Meal Services y NUTRITION SERVICES MEALS FOR HEAD START. (Used by Grants only.)
540000 - Supplies & Materials Material and freight costs for items of an expendable nature that are consumed, wear out, deteriorate from use, or are used in fabrication or as components of more complex products.
541000 Consumable Supplies y SUPPLIES. Supplies such as chalk, home economics food, gas/ oil for shop equipment,
paintbrushes, test tubes, pencils, pens, pre-printed forms, and computer cables. Cafeteria supplies such as small utensils, aprons, straws, napkins. Custodial supplies such as brooms, mops, soap, and garden hoses. Maintenance Shop supplies such as flashlights, batteries, sandpaper, drill bits, and adhesive. Printing supplies such as paper, and ink. Miscellaneous items such as uniforms and costumes.
y CUSTODIAL NON-CLEANING SUPPLIES. Non-cleaning supplies such as floor finish, gum seal, hand soap, paint, paper towels, rock salt, toilet tissue, etc.
y AUDIOVISUAL SUPPLIES. Audiovisual, graphic, and photographic supplies, blank audio and visual tapes, overhead transparency film, mounting tissue, laminating supplies, film processing, etc.
541100 Loss Prevention
Cafeteria Needs - Expenditures that support the various needs of the department of Nutrition Services (NS).
541210 Bakery Products - NS only
541220 Dairy Products - NS only
541230 Donated Commodities - NS only
541240 Fruits and Vegetables - NS only
541250 Meat - NS only
541260 Staples - NS only
541270 Food Inventory Adjustment - NS onlyOther Consumable Supplies - Expenditures that support the various needs of the District.
541310 Auto Parts and Batteries
541315 Tires
541320 Oil and Lubricants y Bulk purchases for the maintenance garage or from a service station on an emergency basis
only.

330
541325 Gas y Bulk purchases for the maintenance garage or from a service station on an emergency basis
only.
541330 Propane y Bulk purchases for student transportation vehicles.
541400 Maintenance Materials y Materials and supplies for the repair and maintenance of District buildings and equipment.
(This object is only used by Facilities & Asset Management and Fund 601 Self-Insurance.)
541500 Inventory Adjustments y Adjustments for overages (shortages) of warehouse supplies resulting from periodic inventory
counts.
541600 Interdepartmental Charges y Work order costs that are initiated and funded by departments and schools for minor
improvement requests. Items such as installation of white boards, fixtures, internal material moves, etc.
541700 Discounts Taken y Discounts received by the District for early payment of invoices.
Books and Periodicals - Expenditures for books, textbooks, and periodicals available for general use, including any reference books.
542100 Textbook Expansion y Textbook purchases that are unique and outside the basic curriculum. Special one-time
purchases to support expansion of classrooms, reconfiguration to K-8 schools, additional classrooms, individual school-based requirements, etc. Textbooks purchased against grants should be charged to this object.
542200 Textbook Adoption y New curriculum adoption purchases at the District level.
542300 Textbook Replacement y Purchase of textbooks damaged or lost to maintain the standard curriculum.
543000 Library Books y LIBRARY AND REFERENCE BOOKS. Books for a new library or for materially expanding a
present library, reference books for staff, repair of library books, etc.
y AUDIOVISUAL MEDIA. Motion pictures, recorded video and audio programs, filmstrips, charts, maps, rental of audiovisual materials, etc.

331
544000 Periodicals y Subscriptions for any publications that appear at regular intervals, pamphlets, or newspapers.
544100 Online Periodical Subscriptions y Subscriptions for any web-based or electronic publications used for instructional purposes.
Food (for Nutrition Services only) - Expenditures for food used in the school food service program. These objects are only used by Nutrition Services in Fund 202.
545100 Purchased Food - NS only
545200 Food Inventory Adjustments - NS only y Adjustments for overages (shortages) of food inventory resulting from periodic inventory
counts.
545210 Bakery Products - NS only
545220 Dairy Products - NS only
545240 Fruits and Vegetables - NS only
545250 Meat - NS only
545260 Nutritional Staples - NS only
545300 Donated Commodities - NS only y Market value of food products received through the State from USDA (US Department of
Agriculture).
Non-Consumable Supplies - Expenditures for items that are equipment, or are “equipment like,” but which fail one or more of the tests for classification as Object 554100.
546000 Non-Consumable Supplies y MINOR EQUIPMENT. Equipment items costing up to $4,999 not requiring asset tagging.
546100 Minor Equipment - Tagged y MINOR EQUIPMENT. Equipment items costing up to $4,999 such as furniture, fixtures, VCRs,
DVD players, projectors, televisions, camcorders, modems, cabling, etc., requiring tagging for asset control purposes.
547000 Computer Software y Software program packages and site licenses, blank floppy disks, emulator boards, multi-
protocol adapter boards, interface boards, font cartridges, etc.
548000 Computer Hardware y Non-capital computer hardware, such as iPads or Chromebooks, generally of value not
meeting the capital expenditure criterion.

332
550000 - Capital OutlayExpenditures for the acquisition of fixed assets, including land or existing buildings and improvements of grounds, construction of buildings, additions to buildings, initial equipment, additional equipment, and replacement of equipment.
551000 Land Acquisitions y Land purchases; purchases of air rights, mineral rights, etc.
551100 Land Improvements
551200 Infrastructure
552000 Building Acquisitions and Improvements y CONTRACTED BUILDING CONSTRUCTION. Contractor costs for new building construction
and construction of additions to existing buildings.
y PURCHASE OF BUILDINGS.
553000 Improvements - Not Buildings y Initial and additional improvement of sites, and adjacent ways after acquisition by the District.
Consists of work as grading, landscaping, seeding, planting; new sidewalks, roadways, retaining walls, sewers and storm drains; installing hydrants; initial surfacing and soil treatment of athletic fields; furnishing and installing fixed playground apparatus, flagpoles, gateways, fences, demolition work and underground storage tanks which are not part of building service systems. Use objects 559000 or 567200 as appropriate for special assessments against the District for capital improvement such as streets, curbs, and drains.
553100 Leasehold Improvements
Depreciable Equipment - Expenditures for the initial, additional, and replacement items of equipment. An equipment item is a movable or fixed unit of furniture or furnishings, an instrument, a machine, an apparatus, or a set of articles that meets all of the following conditions:
1. It has an anticipated useful life of more than 1 year.
2. It is of significant value, measured as original cost or estimated market value of $5,000 or more.
3. It retains its original shape and appearance with use.
4. It is nonexpendable; that is, if the article is damaged or some of its parts are lost or worn out, it is usually more feasible to repair it than to replace it with an entirely new unit.
5. It does not lose its identity through incorporation into a different or more complex unit or substance.
554100 Initial & Additional Equipment y Any equipment purchase costing $5,000 or more such as machinery, furniture and fixtures,
and vehicles (Object series 555000 used for technology related items.)

333
554110 Vehicles y Automobiles, trucks, vans, etc.
Technology - Expenditures related to technology needs.
555010 Computers y Computer equipment and expenditures for computer hardware, related equipment, and
other capital outlay for technology.
555020 Printers
555030 Software Capital Expense y Purchase and upgrades of individual software programs in excess of $5,000.
555090 Miscellaneous Other Technology y Technology equipment such as monitors, additional memory, speakers, keyboards, etc.
Transportation – Expenditures for bus garages, buses, and capital bus improvements for student transportation.
556410 Buses/Capital Bus ImprovementsOther Capital Outlay – Expenditures for all other Capital Outlay not classified above.
559000 Other Capital Outlay y CAPITAL ASSESSMENTS. Assessments for capital improvements such as streets, curbs, and
drains on District properties. This object is not to be used for any other purpose. (Object 567200 used for assessments charged by other governmental agencies to properties NOT adjacent to District properties.)
560000 - Other Objects (formerly known as Accounts)Amounts paid for goods and services not otherwise classified. This includes expenditures for the retirement of debt, the payment of interest on debt, and payment of dues and fees.
561000 Redemption of Principal y Expenditures that are from current funds to retire bonds, and principal portion of contractual
payments for capital acquisitions.
562000 Interest y Interest expense on indebtedness. Expenditures from current funds for interest on serial
bonds, short-term loans and interest included in contractual payments for capital acquisitions.
562100 Interest (Except Bus/Garage)
562200 Interest - Bus/Garage
563000 Fiscal Charges y BOND TRUSTEE FEES including bank service fees, check printing, deposit slips, deposit bags, etc.
334
563400 Bad Debt Expense
563500 Administrative Write-Off y Used only by the Accounting Department.
564000 Dues and Fees y Expenditures or assessments for membership in professional or other organizations or
associations or payments to a paying agent for services rendered such as professional certifications, fingerprinting, miscellaneous fees, etc. (Do NOT include Internet fees, which should be charged to object 535920)
564010 Dues and Fees - Professional Development Funds y Expenditures for membership in professional or other organizations or associations when
using allocated Professional Development funding by Licensed Employees.
564100 Bond Issuance Cost
Insurance and Judgments
565100 Liability Insurance y Premiums for insurance coverage against losses. (This object is only used by Fund 601 Self-
Insurance.)
565200 Fidelity Bond Premiums y Expenditures for bonds guaranteeing the District against losses resulting from the actions of
the CFO, employees, or other persons of the District. Also recorded here are expenditures (not judgments) made in lieu of liability bonds.
565300 Property Insurance Premiums y Premiums for insurance coverage on property against loss and damage. Charge to Program
25410 for buildings and Program 25510 for school buses. (This object is only used by Fund 601 Self-Insurance and Grant Funds.)
565350 Workers’ Compensation Insurance Premiums y Premiums for insurance coverage against Workers’ Compensation claims.
565400 Student Insurance Premiums y Expenditures for premiums on student accident insurance for students playing sports who
are not covered by any other insurance program.
565500 Judgments and Settlements Against the District y Expenditures from current funds for all judgments against the District that are not covered by
liability insurance, but are of a type that might have been covered by insurance.
Other Insurance and Judgments
565910 Workers’ Comp Claim Expense y Compensation made on behalf of employees due to a work-related accident. (This object is
only used by Fund 601 Self-Insurance.)

335
565915 Workers’ Comp Recovery
565920 Workers’ Comp Assessment y Assessment fees as established by the Workers’ Compensation Board. (This object is used
only by Fund 601 Self-Insurance.)
565930 Deductible Insurance Loss y Costs resulting from automobile accidents, fire loss, building damage, etc., which are not
reimbursable by insurance. Also recorded here are any expenditures made in lieu of liability insurance, and accident coverage. (This object is only used by Fund 601 Self-Insurance.)
565945 Property Damage Recovery
565946 Fire Loss Recovery
565947 Auto Loss Recovery
565948 Liability Loss Recovery
Taxes and Licenses
567100 Permits y Permit costs for buildings, elevators, OSHA, FCC, etc.
567200 Public Assessments y Property taxes and assessments charged by other governmental agencies for improvements
to District properties or adjacent properties. (Use object 559000 for capital improvement assessments to District properties.)
568000 PERS UAL Lump Payment
569000 Grant Indirect Charges y Covers administrative overhead expenses. (This object is only used by Grants.)
570000 - Transfers571000 Transfers to Other Funds
y Transactions conveying money from one fund to another, generally in the form of payments from the General Fund to some other fund (used only with Budget Office approval). They are not recorded as expenditures.
572000 Pass-Through y Used by Grants only to record pass-through of federal monies to other entities.
Other Uses of Funds
581000 Operating Contingency
581100 Payments of Refunded Debt
581200 Discounts on Issuance of Long-Term Debt

336
DESCRIPTION OF FUNCTION CODES
10000 - InstructionActivities dealing directly with the teaching of students, or the interaction between teacher and students. Included here are the activities of instructional assistants of any type that assist in the instructional process. Expenditures for teachers’ travel within the District in connection with teaching assignments are considered costs of instruction.10000 - Regular Programs - Instructional activities designed primarily to fully prepare students to make productive life decisions as citizens, family members, and workers.
y 1000A - Instructional Substitutes
y 1000B - Unassigned Teachers
11100 Elementary and K-8 School Instruction y 11111 - Elementary Programs; Grades K-5
y 11112 - Elementary 1-5 Homeroom
y 11113 - Elementary Consolidated Budget; supplies, textbooks, extended hours, etc., in K-5 and K-8 schools
y 11119 - Kindergarten Homeroom
y 11131 - Elementary Extracurricular Activities; K-5 and K-8 schools
11200 Middle School Instruction y 11211 - Middle School Program; Grades 6-8
y 11212 - Middle School Homeroom
y 11213 - Middle School Consolidated Budget; supplies, textbooks, extended hours, etc., in middle schools
y 11221 - Middle School Extracurricular Activities
11300 High School Instruction y 11311 - High School Program; Grades 9-12
y 11312 - High School Homeroom
y 11313 - High School Consolidated Budget; supplies, textbooks, extended hours, etc., in high schools
y 11321 - High School Extracurricular Activities
y 11322 - Athletic Activities
11400 Pre-Kindergarten Programs y 11401 - Early Childhood Education Centers (ECEC); programs for pre-kindergarten pupils in
select schools
y 11402 - Head Start; Federal program that provides services to low-income pre-kindergarten pupils and their families

337
12000 - Special Programs - Instructional activities designed primarily to provide support for students with special needs.
12100 Programs for the Talented and Gifted y 12100 - Talented and Gifted (TAG)
12200 Restrictive Programs for Students with Disabilities - Special learning experiences for students with disabilities who spend half or more of their time in a restricted setting. These learning experiences include, but are not limited to, such areas as Structured Learning Centers (SLC), Intensive Learning Centers (ILC), Developmental Kindergarten, Community Transition Centers (CTC), Life Skills with Nursing Services, Out-of-District programs, Home Instruction, Extended School Year programs, Diagnostic Classrooms, and Functional Living Skills.
y 12210 - Restrictive Programs
y 12211 - Functional Living Skills
y 12212 - Communication Behavior - Academic
y 12213 - Intensive Skills - Academic
y 12214 - Communication Behavior - Functional
y 12215 - SLC/ILC - Intensive Learning Center
y 12216 - Deaf/Hard of Hearing Classroom
y 12217 - Social Emotional - Behavior
y 12218 - Social Emotional - Intensive
y 12219 - Social Emotional - Fragile
y 12221 - SLC - Developmental Kindergarten
y 12230 - Life Skills/CTP
y 12241 - Intensive Skills - Functional
y 12251 - Direction Services
y 12253 - Out-of-District Programs
y 12261 - Home Instruction
y 12271 - Extended School Year
y 12282 - Behavior Intervention Classroom Diagnosis
y 12291 - Skilled Nursing Care Facilities
y 12292 - Assistive Technology Services
y 12293 - Other Individualized Instruction
12500 Less Restrictive Programs for Students with Disabilities - Special learning experiences for students with disabilities outside the regular classroom such as Resource Rooms where students with disabilities go during certain periods of the school day to receive remedial instruction in specific subject areas.

338
y 12501 - Resource Center Classrooms
y 12502 - Instructional Specialists
y 12503 - Individual Educational Assistants - General Ed Classroom
y 12504 - Deaf/Hard of Hearing
y 12505 - Vision Services
y 12506 - Interpreter Services
y 12507 - Behavior Program - Less Restrictive
y 12508 - Deaf/Blind Program
y 12509 - Orthopedic Services
y 12510 - Less Restrictive Programs
y 12511 - Deaf/Hard of Hearing Itinerant Services
y 12512 - Autism Services
y 12520 - Team-Communication Behavior
12600 Early Intervention - Services of treatment and habilitation designed to address a child’s developmental deficits in sensory, motor, communication, self-help, and socialization areas.
y 12601 - SKIP Screening (Screening Kids for Intervention & Prevention) - Birth to Age 5
y 12602 - MESD Early Intervention Evaluations
y 12603 - Early Childhood Special Education (ECSE) Evaluations
y 12604 - Early Intervention/Early Childhood Special Ed (EI/ECSE)
y 12606 - Subcontractor Contracts
y 12607 - Portland Early Intervention Program (PEIP)
y 12609 - Albina Head Start
y 12613 - PEIP Peer Tuition
12700 Educationally Disadvantaged - Instructional activities designed for students who are disadvantaged due to socioeconomic status or other circumstances that can affect their educational opportunities.
y 12710 - Remediation
y 12720 - Title I: Federal program that provides additional support for schools that serve low-income students
y 12721 - Title I: Supplemental Educational Services; programs for students attending schools failing to meet Adequate Yearly Progress (AYP) as defined by the No Child Left Behind Act of 2001 (NCLB)
y 12722 - Title I: Teacher Professional Development
y 12723 - Title I: Human Resources Training on NCLB

339
y 12724 - Title I: Project Return Homeless; program designed to remove barriers to school enrollment and provide stability in school for students in homeless living situations
y 12725 - Title I: Summer School
y 12726 - Title I: School Choice Transportation
y 12727 - Title I: Performance Assistance
y 12728 - Title I: Accelerated Learning
12800 Alternative Education - Learning experiences for students who are at risk of dropping out of school, are not succeeding in a regular classroom setting, or may be more successful in a non-traditional setting.
y 12811 - Public Alternative Programs; programs provided by other public agencies
y 12821 - Community-Based Programs; programs provided by private agencies
y 12831 - Delayed Expulsion School Counseling Center (DESCC)
y 12832 - Classroom Alternative Education
y 12833 - Evening Programs
y 12835 - Indian Education
y 12870 - Targeted Transition
y 12872 - Transition Center
y 12880 - Charter Schools
y 12891 - Contract Programs
y 12892 - Alternative Education Instructional Support
y 12893 - CEIS (Coordinated Early Intervention Services)
12900 Designated Programs - Special learning experiences for other students with special needs, including English as a Second Language (ESL) and English Language Learner (ELL) students, teen parents and migrant education.
y 12910 - English as a Second Language Programs
y 12911 - ESL/Bilingual in K-5 and K-8 schools
y 12912 - ESL/Bilingual in middle schools
y 12913 - ESL/Bilingual in high schools
y 12914 - Bilingual Assessment Services
y 12921 - Parent Education/Pregnancy Prevention
y 12922 - Teen Parenting Services
y 12930 - Migrant Education
y 12991 - Private School Instruction; provided by District staff in area private schools
y 12992 - Section 504/Americans with Disabilities Act (ADA) Accommodation

340
14000 - Summer School Programs - Instructional activities as defined under 11000 Regular Programs carried on during the period between the end of the regular school term and the beginning of the next regular school term; this does not include the summer term of a 12-month school year.
y 14100 - Summer School, Elementary (grades K-5)
y 14200 - Summer School, Middle (grades 6-8)
y 14300 - Summer School, High (grades 9-12)
20000 - Support ServicesServices which provide administrative, technical, personal (such as guidance and health), and logistical support to facilitate and enhance instruction.
21000 - Student Support Services - Activities designed to assess or improve the success and wellbeing of students and supplement instruction.
21100 Attendance and Social Work Services y 21110 - Attendance/Social Work Services Area Direction
y 21120 - Attendance Services; assessment of attendance patterns and response to attendance problems
y 21130 - Social Work Services
y 21131 - Behavior Intervention
y 21141 - Special Education (SPED) Data Services
y 21150 - Student Safety (campus security agents, campus monitors, crossing guards, etc.)
y 21170 - Migrant Identification and Recruitment
y 21191 - Child Development Services
y 21192 - Student Discipline Services
y 21193 - Drug and Alcohol Services
21200 Guidance Services y 21210 - Guidance Services Area Direction
y 21220 - Counseling Services
y 21221 - Counseling College Preparation
y 21240 - Student Guidance Information Services
y 21262 - Vocational Education Placement Services
21300 Health Services y 21320 - Medical Services
y 21330 - Dental Services
y 21390 - Other Health Services

341
21400 Psychological Services y 21400 - Psychological Services y 21420 - Psychological Testing Services
21500 Speech Pathology and Audiology Services y 21520 - Speech Pathology; identification and guidance of students with speech and language
disorders y 21530 - Audiology; identification and guidance of students with hearing loss y 21580 - Access Services - Special Education (SPED) Technology y 21590 - Other Speech Pathology and Audiology Services
21600 Other Student Treatment Services y 21601 - Occupational Therapy y 21602 - Physical Therapy y 21603 - Adaptive Physical Education y 21604 - Feeding Team - Training
21900 Student Support - Service Direction y 21901 - Program Administration/Supervision y 21902 - Administration y 21903 - Collaborative Supports Team y 21905 - Third Party Medical Reimbursement
y 21906 - IEP Writing/Meetings for Special Education Staff
y 21907 - IEP Writing/Meetings for General Education Staff y 21908 - TAG Plan Writing
22000 - Instructional Staff Support Services - Activities associated with assisting instructional staff with the content and process of providing learning experiences for students.
22100 Improvement of Instruction Services y 22110 - Improvement of Instruction Services Area Direction y 22130 - Curriculum Development y 22131 - Curriculum Development - K-5 y 22132 - Curriculum Development - 6-8 y 22133 - Curriculum Development - HS y 22191 - Multicultural/Multiethnic Services y 22192 - School Improvement Funds y 22193 - School Improvement Plan (SIP) Development y 22194 - Immersion Support & Administrative Services
y 22195 - Teaching Innovation Support

342
22200 Educational Media Services y 22210 - Educational Media Services Area Direction
y 22220 - Library/Media Services
y 22230 - Multimedia Services
y 22240 - Educational Television Service
y 22251 - KBPS Programming and Production (KBPS is Benson High School’s on-campus radio station)
y 22252 - KBPS Broadcasting
y 22253 - KBPS Program Information
y 22254 - KBPS Fundraising
y 22255 - KBPS Underwriting Grant Canvassing
y 22256 - KBPS Management and General Support
y 22257 - KBPS National Program Acquisition
y 22291 - Textbook Services
y 22292 - Classroom Technology Services
y 22293 - Curriculum Distribution
22300 Assessment and Testing y 22301 - Assessment System Design
y 22302 - Measurement & Assessment
y 22304 - General Equivalency Diploma (GED) Assessment & Testing
y 22305 - Assessment Reporting
22400 Instructional Staff Development y 22401 - Instructional Consultants
y 22402 - Instructional Specialists
y 22403 - Autistic Services
y 22410 - Instructional Staff Training Services
y 22411 - Instructional Staff Training - K-5
y 22412 - Instructional Staff Training - 6-8
y 22413 - Instructional Staff Training - HS
y 22420 - Portland Teacher Program; recruits/supports teacher candidates of color in their professional training
y 22430 - New Teacher Orientation
y 22440 - Occupational Therapists/Physical Therapists

343
23000 - General Administration Support Services - Activities associated with the overall general administrative or executive responsibility for the entire District.
23100 Board of Education Services
23200 Executive Administration Services y 23210 - Office of Superintendent
y 23211 - Executive Administration
y 23212 - Assistant Superintendent
y 23240 - State and Federal Relations
y 23291 - General Administration/Contracts
y 23292 - Legal Services
y 23293 - Operational Support Services
y 23294 - School Standards/Accreditation
y 23295 - Strategic Planning
24000 - School Administration - Activities associated with school direction and supervisory responsibility.
24100 Office of the Principal Services y 24101 - School Administrative Services
y 24102 - School Curriculum Services
y 24103 - School Business Services
24900 Other School Administration Support y 24901 - Graduation Services
y 24910 - Licensed Administrator Professional Development
y 24920 - School Closure
25000 - Business Support Services - Activities associated with the purchasing, paying for, transporting, exchanging, and maintaining goods and services for the District.
25100 Direction of Business Support Services25100 - Direction of Business Support
25200 Fiscal Services y 25210 - Direction of Fiscal Services
y 25220 - Budgeting Services
y 25231 - Funding Management Activities
y 25240 - Payroll Services
y 25250 - Financial Accounting Services

344
y 25260 - Internal Auditing Services y 25270 - Property Accounting Services y 25281 - Risk Management Service Area Direction y 25282 - Employer-at-Injury Program (EAIP) Worksite Modifications y 25283 - Liability Claims y 25284 - Property/Fire Loss y 25285 - Workers’ Compensation y 25286 - Worksite Safety y 25287 - Mandated Health Services y 25288 - Risk Control Initiatives y 25291 - Enrollment Services y 25292 - Family Support Centers
25400 Operation and Maintenance of Plant Services y 25410 - Operation and Maintenance Services Area Direction y 25411 - Project Management y 25421 - Custodial Services y 25422 - Environmental Health and Safety y 25423 - Utilities Services y 25424 - Property Management y 25430 - Care and Upkeep of Grounds y 25441 - Maintenance Workforce y 25442 - Other Funded work y 25443 - Vehicle Operation/Maintenance y 25444 - Multicraft Services y 25445 - Electrical Services y 25446 - Mechanical Services y 25460 - Security Services y 25490 - Other Operations and Maintenance
25500 Student Transportation Services y 25510 - Transportation Administration y 25520 - Transportation Operations y 25530 - Transportation Fleet Maintenance
y 25540 - Transportation Routing Services
y 25550 - Transportation Safety and Training
y 25580 - Special Education Transportation Services

345
25700 Internal Services y 25710 - Internal Services Area Direction
y 25720 - Purchasing Services
y 25730 - Warehousing/Distribution Services
y 25740 - Printing, Publishing and Duplicating Services
y 25790 - Other Internal Services
26000 - Central Support Services - Activities that support each of the other instructional and supporting service programs.
26200 Planning, Research, Development, Evaluation, Grant Writing and Statistical Services y 26210 - Service Area Direction
y 26211 - Evaluation Services Direction
y 26212 - Grant Writing Direction
y 26220 - Development Services
y 26230 - Evaluation Services
y 26240 - Planning Services
y 26250 - Research Services
y 26260 - Grant Writing Services
y 26270 - Statistical Services
y 26271 - Accountability & Reporting
26300 Communication Services y 26320 - Internal Information Services
y 26330 - Public Information Services
y 26331 - Volunteer Activities and Recognition
y 26340 - Management Information Services
y 26350 - Translation Services
26400 Staff Services y 26410 - Staff Services Area Direction
y 26420 - Recruitment and Placement Services
y 26430 - Staff Accounting Services
y 26440 - Health Reimbursement Arrangement (HRA) Benefits Program
y 26491 - Staff Services
y 26492 - Non-Instructional Staff Development
y 26493 - Staff Relations and Negotiations

346
26600 Technology Services y 26610 - IT Service Area Direction y 26611 - IT Project Management y 26620 - Systems Analysis Services y 26631 - Student Information Systems y 26632 - Business Information Systems y 26634 - Web Information Systems y 26635 - Systems Development and Integration y 26641 - Technical Operations y 26642 - Information Security y 26643 - Client Services and Collaboration y 26691 - Central Telecommunication Services y 26696 - School Hardware Modernization y 26697 - Technical Training Services y 26698 - Infrastructure Development
y 26699 - Systems Development
26700 Records Management Services y 26700 - Records Management Services
26900 Other Support Services - Central y 26901 - District Equity
y 26902 - Partnership Development
30000 - Enterprise and Community ServicesEnterprise services are activities financed and operated similarly to private business enterprises, providing goods and services to students or the general public and financed primarily through user fees or community programs. Community services are activities which are not directly related to the provision of education for pupils in the District. These include services such as community recreation programs, civic activities, public libraries, programs of custody and care of children, and community welfare activities provided by the District for the community as a whole or in part.
31000 Food Services - Activities concerned with providing food to students and staff in the District.
y 31100 - Food Services Administration y 31200 - Food Preparation and Service y 31220 - BESC Deli y 31230 - Fresh Fruit & Vegetable Program y 31300 - Food Delivery Services y 31900 - Nutrition Education/Other
y 31910 - Summer Nutrition

347
33000 Community Services - Activities which are not directly related to the provision of education to pupils.
40000 - Facilities Acquisition and ConstructionActivities associated with the acquisition of land and buildings, major remodeling and construction of buildings and major additions to buildings, initial installation or extension of service systems and other built-in equipment, and major improvements to sites.
y 41100 - Service Area Direction
y 41200 - Site Acquisition and Development
y 41500 - Building Acquisition, Construction, and Improvement Services
y 41905 - Capital Bond Planning
y 41910 - Relocation Projects
50000 - Other UsesActivities included in this category are servicing the debt of the District, conduit-type transfers from one fund to another fund, and apportionment of funds by the Educational Service District (ESD).
y 51100 - Long-Term Debt Service
y 51200 - Short-Term Debt Retirement
y 52100 - Fund Transfers
y 54100 - PERS Unfunded Actuarial Liability (UAL)
60000 - ContingenciesExpenditures which cannot be foreseen and planned in the budget process.
y 61100 - Operating Contingency
70000 - Unappropriated Ending Fund BalanceAn estimate of funds needed to maintain operations of the District from July 1 of the ensuing fiscal year and the time when sufficient new revenues become available to meet cash flow needs of the fund.
y 71100 - Ending Fund Balance

348