Embed Size (px)
Citation preview

Cairo University Institute of Statistical Studies and Research
The 50th Annual Conference on Statistics, Computer
Sciences and Operations Research
Computer Sciences
27-30 Dec. 2015
Cairo University Institute of Statistical Studies and Research
Index Computer Sciences
1 Fully Automatic Adaptive Contrast Enhancement Algorithm
Based on Double-Plateaus Histogram Aly Meligy, Hani M. Ibrahem, Sahar Shoman
1-17
2 AntGME: Ant Algorithm in Green Cloud Computing to
Minimize Energy Abeer H.El Bakely, Hesham A.Hefny
18-34
3 On Emotion Recognition using EEG Mohammed A. AbdelAal, Assem A. Alsawy, Hesham A. Hefny 35-49
4 Evaluation of an Aspect Oriented Approach for SaaS
Customization Areeg Samir, Abdelaziz Khamis, and Ashraf A. Shahin
50-60
5 Challenges and Research Questions of SaaS Applications
Customization Areeg Samir and Akram Salah
61-79
6 A Proposed Approach for Enhancing Usability of Web-Based
Applications Abeer Mosaad Ghareeb, Nagy Ramadan Darwish
80-95
7 Towards Applying Agile Practices to Bioinformatics Software
Development Islam Ibrahim Amin, Amr Ebada,Nagy Ramadan Darwish
96-105
8 Petri net model for multi-threaded multi-core processing of
satellite telemetry data Abdelfattah El-Sharkawi, El-Said Soliman, Ahmed Abdellatif
106-122
9 Enhancing the Intelligent Transport System for Dynamic Traffic
Routing by Using Swarm Intelligence Ayman M. Ghazy , Hesham A. Hefny
123-142
10 Towards Enhanced Differentiation for Web-Based Applications
Abeer Mosaad Ghareeb, Nagy Rarnadan Darwish, Hesham A. Hefney
143-158
11 An Overview On Twitter Data Analysis Hana Anber, Akram Salah, A.A. Abd El-Aziz 159-169
The 50th
Annual Conference on Statistics, Computer Sciences and Operation Research 27-30 Dec,2015
Cairo University-Institute of Statistical Studies and Research
1
Fully Automatic Adaptive Contrast Enhancement Algorithm Based on Double-
Plateaus Histogram
Aly Meligy1 Hani M. Ibrahem
2 Sahar Shoman
3
Abstract
In this paper, we propose a fully automatic and adaptive contrast enhancement
algorithm based on double-Plateaus histogram enhancement. This algorithm is
composed of three stages. The first stage is clipping the image histogram by self-
adaptive double-plateaus histogram enhancement algorithm, the second stage is
dividing the clipped image into overexposed and underexposed sub images by using
an automatic classification algorithm based on contrast factor parameter and finally
the third stage is applying contrast enhancement algorithm based on statistical
operations and neighborhood processing to each separate sub image. The proposed
algorithm enhances the contrast without losing the original histogram characteristics
and eliminates the drawbacks of the conventional histogram equalization effectively.
Experimental results show that the proposed algorithm outperforms many of state-of-
the-art algorithms in terms of visual quality and quantitative measures. Unlike the
other algorithms, the proposed algorithm is free of parameter setting for a given
dynamic range of the enhanced image and can be applied to a wide range of image
types.
Key Words: contrast enhancement,histogram equalization,plateau histogram,contrast
factor.
1. INTRODUCTION
Image enhancement is still the main challenge in the field of image processing
area. It can be defined as the processing of images to improve the appearance to
human viewers or to enhance other image processing systems performance. In one
important class of enhancement problems, an image is enhanced by modifying its
contrast and/or dynamic range .In other class of enhancement problems, a degraded
image may be enhanced by reducing the degradation.
1 Proffessor, Dept. of Mathematics ,Faculty of Science ,Menufia University
2 Lecturer, Dept. of Mathematics ,Faculty of Science ,Menufia University
3 Master Student , Dept. of Mathematics ,Faculty of Science ,Menufia University

The 50th
Annual Conference on Statistics, Computer Sciences and Operation Research 27-30 Dec,2015
Cairo University-Institute of Statistical Studies and Research
2
Researchers have developed and proposed methods to increase the image contrast
[1-20]. Histogram Equalization (HE) [1] is one of the well-known methods for
enhancing contrast of an image. HE makes a uniform distribution of the gray level for
an image. Although it is capable to increase the contrast of an image, two main
drawbacks can be found in the HE. First, an equalized image by the HE is often with
annoying visual artifacts, loss of details and intensity saturation artifacts due to the
error in brightness mean-shifting. Therefore, an unnatural image with unpleasing
visual quality is obtained. Second, the HE provides no way to control the equalized
histogram distribution.
In this paper, we propose an automatic and adaptive algorithm based on double-
Plateaus histogram enhancement. First, the histogram is clipped by Self-adaptive
double-plateaus histogram enhancement algorithm. Then, the modified image is
divided into overexposed and underexposed sub images by automatic contrast factor
parameter. Finally, contrast enhancement algorithm is applied to each sub image
separately. The proposed algorithm prevents the significant change in brightness and
details of the image, prevents the washed-out appearance and preserves the
naturalness of the enhanced image. It also can be applied without any parameter
tuning and executed in short computational time.
The rest of this paper is organized as follows, in section 2 a related work is
introduced .The proposed algorithm is presented in section 3 .The implementation
result and comparison are provided in section 4. Finally, conclusion is presented in
section 5.
2. RELATED WORK
Some researchers have focused on the improvement of HE by partitioning the
histogram into several parts and equalizing them separately [2]. Some of these are
mean preserving bi-histogram equalization (BBHE)[3],equal area dualistic sub-image
histogram equalization (DSIHE)[4] and minimum mean brightness error bi-histogram
equalization (MMBEBHE) [5] .BBHE separates the input image histogram into two
parts based on the mean then each part is equalized independently. This method tries
to overcome the brightness preservation problem. DSIHE uses the median intensity
value as the separating point. MMBEBHE is the extension of BBHE method that
provides maximal brightness preservation. Though these methods can perform good
The 50th
Annual Conference on Statistics, Computer Sciences and Operation Research 27-30 Dec,2015
Cairo University-Institute of Statistical Studies and Research
3
contrast enhancement, they also cause more annoying side effects depending on the
variation of gray level distribution in the histogram [6].
Recursive Mean-Separate Histogram Equalization for scalable brightness
preservation (RMSHE) was proposed [7]. RMSHE is an extended version of the
BBHE method. The design of BBHE indicates that performing mean-separation
before the equalization process does preserve an image‟s original brightness. In
RMSHE instead of decomposing the image only once, it perform image
decomposition recursively to further preserve the original brightness up to scale r. HE
is equivalent to RMSHE level 0 (r = 0). BBHE is equivalent to RMSHE with r = 1.
The brightness of the output image is better preserved as r increases.
Sim et al. [8] shares similar concepts with DSIHE and RMSHE. The proposed
technique, known as Recursive Sub-Image HE (RSIHE), iteratively divides the
histogram based on median rather than mean values. Since the median value is used,
each partition shares the same number of pixels. Therefore, both RMSHE and RSIHE
divide the histogram into 2r number of partitions, where r is the recursive level, and
they preserve the brightness to better extend than previous partitioning method to
enhance the visual outlook. However, finding the optimal value of r is difficult, and
with a large value of r there will be no enhancement, despite the fact that the
brightness preservation property is fulfilled adequately [9].
However, the global histogram equalization will cause an effect on brightness
saturation in some almost homogeneous area. To overcome this problem, Multi-peak
histogram equalization with brightness preserving (MPHEBP) has been proposed
[10]. In this method, the histogram of an image will be considered of many peaks.
Brightness preserving dynamic histogram equalization (BPDHE) which
is an extension to HE, is proposed to produce the output image with the mean
intensity almost equal to the mean intensity of input, thus fulfill the requirement of
maintaining the mean brightness of the image [9].
One type of histogram equalization based methods that is the clipped or plateau
histogram equalization. By altering the input histogram before the equalization is
taking place, clipped histogram equalization methods are able to preserve brightness
and control the enhancement rate. As a consequence, these methods can avoid over
amplification of noise in the image. Example of clipped histogram equalization
methods are Histogram Equalization with Bin Underflow and Bin Overflow
(BUBOHE) [11], Weighted and Thresholded Histogram Equalization (WTHE) [12],
Gain-Controllable Clipped Histogram qualization (GC-CHE) [13], Self-Adaptive
Plateau Histogram Equalization (SAPHE) [14] , and Modified SAPHE (MSAPHE)
[15] .
The 50th
Annual Conference on Statistics, Computer Sciences and Operation Research 27-30 Dec,2015
Cairo University-Institute of Statistical Studies and Research
4
Double-plateau histogram equalization [16] is then proposed so that the detailed
information can be further protected by adding a proper lower threshold value. As the
upper threshold is used to constrain background noise and the lower threshold is used
to protect and enhance the details, a critical issue of double-plateau histogram
equalization is how to properly choose the upper and lower threshold values.
Empirically, the value of upper threshold is set to be 20–30% of the total pixels
number, while the lower threshold value is set to be 5–10% of it [17].
Nonparametric modified histogram equalization[18] (NMHE) first removes any
spikes from the input histogram, clips and normalizes the result, computes the
summed deviation of this intermediate modified histogram from the uniform
histogram and uses this as a weighting factor to construct a final modified histogram
that is a weighted mean of the modified histogram and the uniform histogram.
Contrast enhancement is then achieved by using the CDF of this modified histogram
as the transformation function. Extensive experiments have shown that this method
produces results that are comparable or even superior to several state-of-the-art
contrast enhancement algorithms [18].
Contrast enhancement using various statistical operations and neighborhood
processing was proposed [19] .in this method statistics play an important role in
image processing, where statistical operations is applied to the image to get the
desired result such as manipulation of brightness and contrast. Singh and Kapoor
proposed exposure based sub-image histogram equalization (ESIHE) [20], which
uses an exposure-related threshold to bisect the input histogram and mean brightness
as a threshold to clip the histogram.
3. PROPOSED ALGORITHM
The proposed algorithm contains three algorithms. These are: Self-adaptive
double-plateaus histogram enhancement algorithm, automatic image separation
algorithm based on contrast factor parameter and contrast enhancement algorithm
using statistical operations and neighborhood processing [19].
A. Self-adaptive double-plateaus histogram enhancement algorithm :
Self-adaptive double-plateaus histogram enhancement algorithm is presented to
enhance low contrast images. It can overcome the disadvantages of traditional
The 50th
Annual Conference on Statistics, Computer Sciences and Operation Research 27-30 Dec,2015
Cairo University-Institute of Statistical Studies and Research
5
histogram equalization. Double-plateaus threshold values can be self-adaptively
adjusted to different kinds of images. By setting a higher threshold value, the
algorithm can constrain the background and noise. At the same time, the algorithm
can magnify small targets and image details by setting a lower threshold value.
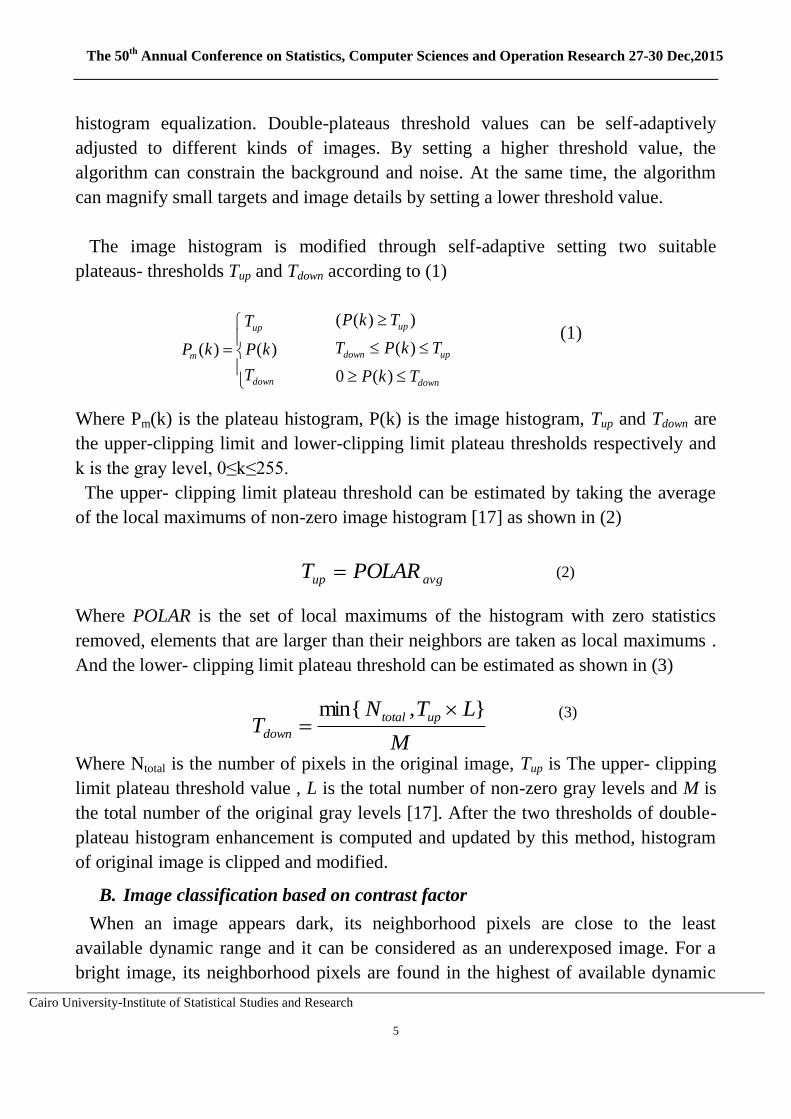
The image histogram is modified through self-adaptive setting two suitable
plateaus- thresholds Tup and Tdown according to (1)
Where Pm(k) is the plateau histogram, P(k) is the image histogram, Tup and Tdown are
the upper-clipping limit and lower-clipping limit plateau thresholds respectively and
k is the gray level, 0≤k≤255.
The upper- clipping limit plateau threshold can be estimated by taking the average
of the local maximums of non-zero image histogram [17] as shown in (2)
Where POLAR is the set of local maximums of the histogram with zero statistics
removed, elements that are larger than their neighbors are taken as local maximums .
And the lower- clipping limit plateau threshold can be estimated as shown in (3)
Where Ntotal is the number of pixels in the original image, Tup is The upper- clipping
limit plateau threshold value , L is the total number of non-zero gray levels and M is
the total number of the original gray levels [17]. After the two thresholds of double-
plateau histogram enhancement is computed and updated by this method, histogram
of original image is clipped and modified.
B. Image classification based on contrast factor
When an image appears dark, its neighborhood pixels are close to the least
available dynamic range and it can be considered as an underexposed image. For a
bright image, its neighborhood pixels are found in the highest of available dynamic
avgup POLART
M
LTNT
uptotal
down
},min{
(2)
(3)
down
updown
up
TkP
TkPT
TkP
)(0
)(
))((
down
up
m
T
kP
T
kP )()((1)
The 50th
Annual Conference on Statistics, Computer Sciences and Operation Research 27-30 Dec,2015
Cairo University-Institute of Statistical Studies and Research
6
range and the image is known as an overexposed image. However, we seldom
encounter a solely overexposed (bright) image or a solely underexposed (dark)
image. Most of the recorded images are mixed wherein underexposed, overexposed
or combinations of both regions are found in one image.
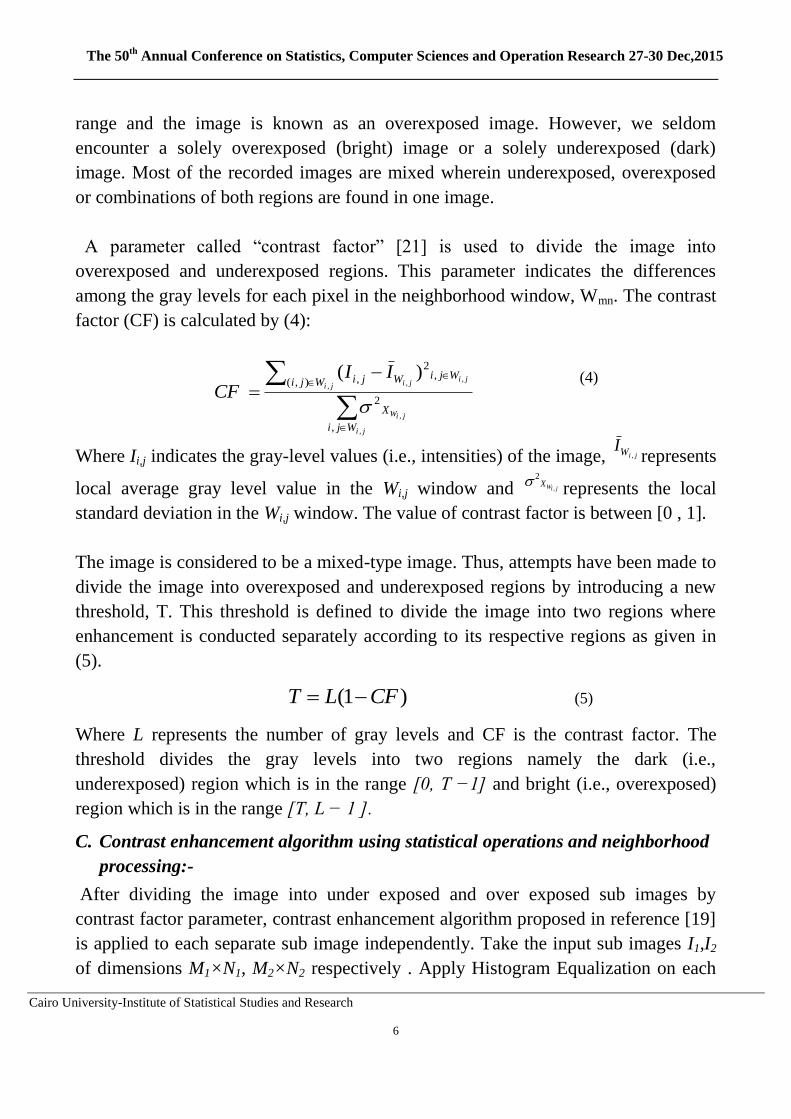
A parameter called “contrast factor” [21] is used to divide the image into
overexposed and underexposed regions. This parameter indicates the differences
among the gray levels for each pixel in the neighborhood window, Wmn. The contrast
factor (CF) is calculated by (4):
Where Ii,j indicates the gray-level values (i.e., intensities) of the image, jiWI , represents
local average gray level value in the Wi,j window and jiWX,
2 represents the local
standard deviation in the Wi,j window. The value of contrast factor is between [0 , 1].
The image is considered to be a mixed-type image. Thus, attempts have been made to
divide the image into overexposed and underexposed regions by introducing a new
threshold, T. This threshold is defined to divide the image into two regions where
enhancement is conducted separately according to its respective regions as given in
(5).
Where L represents the number of gray levels and CF is the contrast factor. The
threshold divides the gray levels into two regions namely the dark (i.e.,
underexposed) region which is in the range [0, T −1] and bright (i.e., overexposed)
region which is in the range [T, L − 1 ].
C. Contrast enhancement algorithm using statistical operations and neighborhood
processing:-
After dividing the image into under exposed and over exposed sub images by
contrast factor parameter, contrast enhancement algorithm proposed in reference [19]
is applied to each separate sub image independently. Take the input sub images I1,I2
of dimensions M1×N1, M2×N2 respectively . Apply Histogram Equalization on each
ji
jiW
jiji
ji
Wji
X
WjiWjiWji II
CF
,
,
,,
,
,
2
),(,
2
, )(
(4)
(5) )1( CFLT

The 50th
Annual Conference on Statistics, Computer Sciences and Operation Research 27-30 Dec,2015
Cairo University-Institute of Statistical Studies and Research
7
2
)()(
2
)()(
222
111
IMINIMAXX
IMINIMAXX
sub image I1,I2 to get the equalized images IEqualized1,IEqualized2.The algorithm steps can
be summarized as follows:
1. Pad each of the input sub images I1,I2 by two rows and columns
2. Calculate the maximum and the minimum intensity of each sub images using
the following formula
3. Calculate the mean value of every sub image I1,I2 .
4. Calculate the threshold by using the following formula
5. For each separate sub image I1,I2 select the first processed pixel I1(i,j),I2(i,j) by
using a window of size 3×3, and using its eight neighborhood to calculate the
Local Standard Deviation ),(1 jiI, ),(2 jiI then calculate the difference
Check whether the difference is less or greater than the threshold using the
following criteria:
a. In under exposed sub image, if ),(1 jiIdiff is greater than Threshold1 then replace
the processed pixel I1(i,j) by the equalized one IEqualized1(i,j) .
b. In over exposed sub image, if ),(2 jiIdiff is greater than Threshold2 then replace
the processed pixel I2(i,j)by the equalized sub image I Equalized2(i,j) .
c. Else, the processed pixel in every sub image is left as it is.
2
1
2
1
22
1
1
1
1
11
22
),(
11
),(
M
i
N
j
M
i
N
j
NM
jiImean
NM
jiImean
)(
)(
222
111
meanXabsThreshold
meanXabsThreshold
)),((
)),((
),(2),(
),(1),(
22
11
jiIjiI
jiIjiI
jiIdiff
jiIdiff
(6)
(8)
(9)
(7)
The 50th
Annual Conference on Statistics, Computer Sciences and Operation Research 27-30 Dec,2015
Cairo University-Institute of Statistical Studies and Research
8
6. The window slides to the next pixel for each sub image and the steps 6 to 8 are
repeated until the last pixel of each one is mapped.
7. Check whether all the pixels in each sub image have been remapped with the
equalized value.
8. Combine the sub images into one image to obtain the output image.
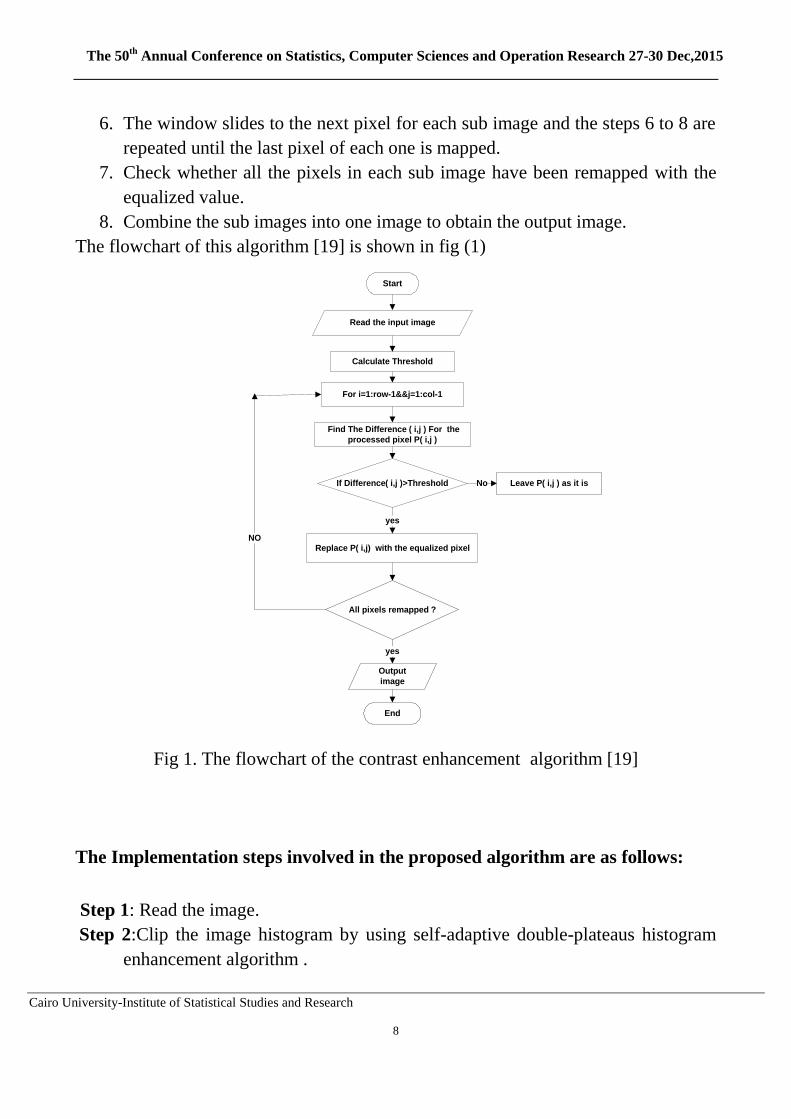
The flowchart of this algorithm [19] is shown in fig (1)
Fig 1. The flowchart of the contrast enhancement algorithm [19]
The Implementation steps involved in the proposed algorithm are as follows:
Step 1: Read the image.
Step 2:Clip the image histogram by using self-adaptive double-plateaus histogram
enhancement algorithm .
Read the input image
Calculate Threshold
Start
Find The Difference ( i,j ) For the
processed pixel P( i,j )
For i=1:row-1&&j=1:col-1
If Difference( i,j )>Threshold
Replace P( i,j) with the equalized pixel
yes
Leave P( i,j ) as it is No
All pixels remapped ?
NO
Output
image
yes
End
The 50th
Annual Conference on Statistics, Computer Sciences and Operation Research 27-30 Dec,2015
Cairo University-Institute of Statistical Studies and Research
9
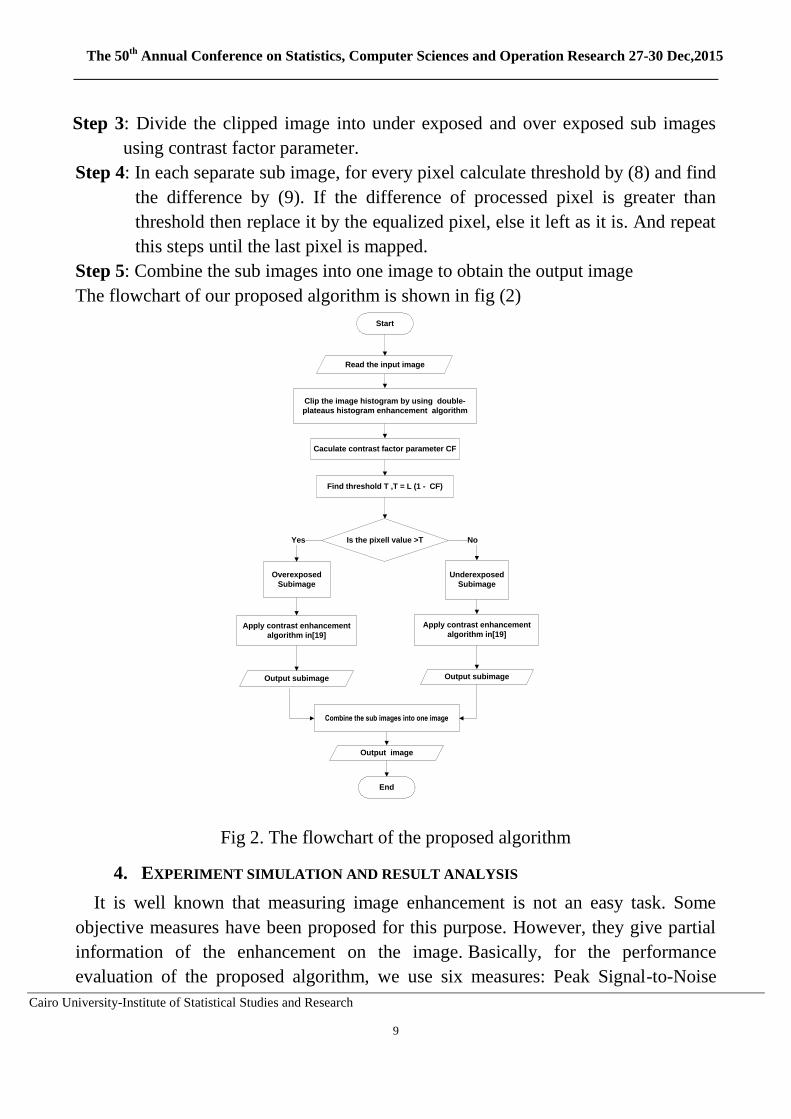
Step 3: Divide the clipped image into under exposed and over exposed sub images
using contrast factor parameter.
Step 4: In each separate sub image, for every pixel calculate threshold by (8) and find
the difference by (9). If the difference of processed pixel is greater than
threshold then replace it by the equalized pixel, else it left as it is. And repeat
this steps until the last pixel is mapped.
Step 5: Combine the sub images into one image to obtain the output image
The flowchart of our proposed algorithm is shown in fig (2)
Fig 2. The flowchart of the proposed algorithm
4. EXPERIMENT SIMULATION AND RESULT ANALYSIS
It is well known that measuring image enhancement is not an easy task. Some
objective measures have been proposed for this purpose. However, they give partial
information of the enhancement on the image. Basically, for the performance
evaluation of the proposed algorithm, we use six measures: Peak Signal-to-Noise
Start
Read the input image
Caculate contrast factor parameter CF
Find threshold T ,T = L (1 - CF)
Is the pixell value >T
Overexposed
Subimage
Underexposed
Subimage
Yes No
Apply contrast enhancement
algorithm in[19]
Apply contrast enhancement
algorithm in[19]
Output subimage Output subimage
Combine the sub images into one image
Output image
End
Clip the image histogram by using double-
plateaus histogram enhancement algorithm

The 50th
Annual Conference on Statistics, Computer Sciences and Operation Research 27-30 Dec,2015
Cairo University-Institute of Statistical Studies and Research
10
Ratio (PSNR), Entropy [22], the Absolute Mean Brightness Error AMBE [23],
Universal Image Quality Index (UIQI) [24], Structural Similarity Index
(SSIM)[25]and Luminance Distortion (LD) [26] .
These metrics complement each other, since they measure different aspects of the
image, especially UIQI and SSIM which break the comparison between original and
distorted image into three comparisons: luminance, contrast, and structural
comparisons. It is desirable to complement the objective assessment with a subjective
one, in order to accurately evaluate the algorithms.
The proposed algorithm was tested using standard images from the widely used
USC-SIPI database for the objective and subjective performance evaluation. It is also
important to note that the tests were performed on gray-scale images with dimension
256×256. All computations were performed in MATLAB® 2008a running on a PC
with an Intel I5-3340M processor and 4 GB RAM memory. HE [1] was performed
with the standard MATLAB histeq function.
A. Objective Assessment
The metrics used to quantify an image is mentioned below:
1. Peak Signal-to-Noise Ratio (PSNR).
2. Entropy.
3. Absolute Mean Brightness Error (AMBE)
4. Universal Image Quality Index (UIQI)
5. Structural Similarity Index (SSIM).
6. Luminance Distortion (LD).
In order to demonstrate the performance of the proposed algorithm, we have
simulated various images with HE [1], contrast enhancement algorithm in [19],
ESIHE [20], NMHE[18].The experimental results of the PSNR, Entropy, AMBE
,UIQI,SSIM and LD measures are shown in Table 1 .
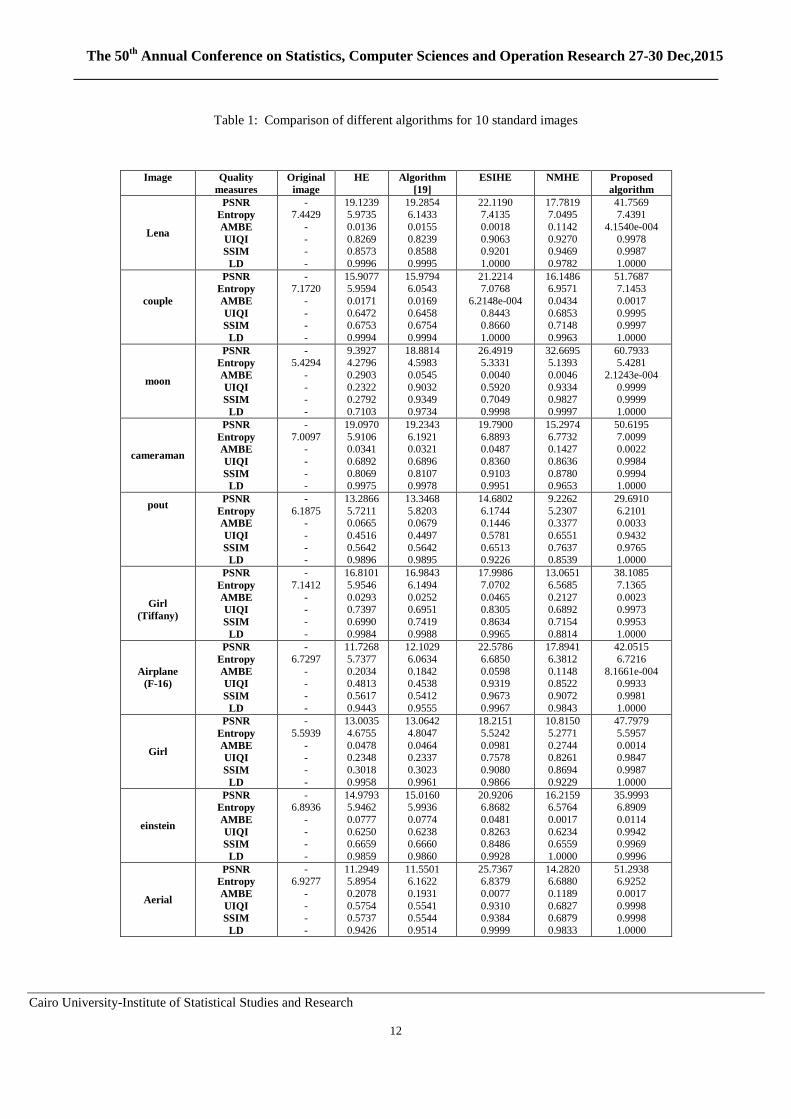
Table 1 show the result for 10 standard gray-scale images with dimension
256×256. The proposed algorithm preserves image details, as indicated by the high
entropy. Higher entropy indicates the higher ability of the proposed algorithm to
The 50th
Annual Conference on Statistics, Computer Sciences and Operation Research 27-30 Dec,2015
Cairo University-Institute of Statistical Studies and Research
11
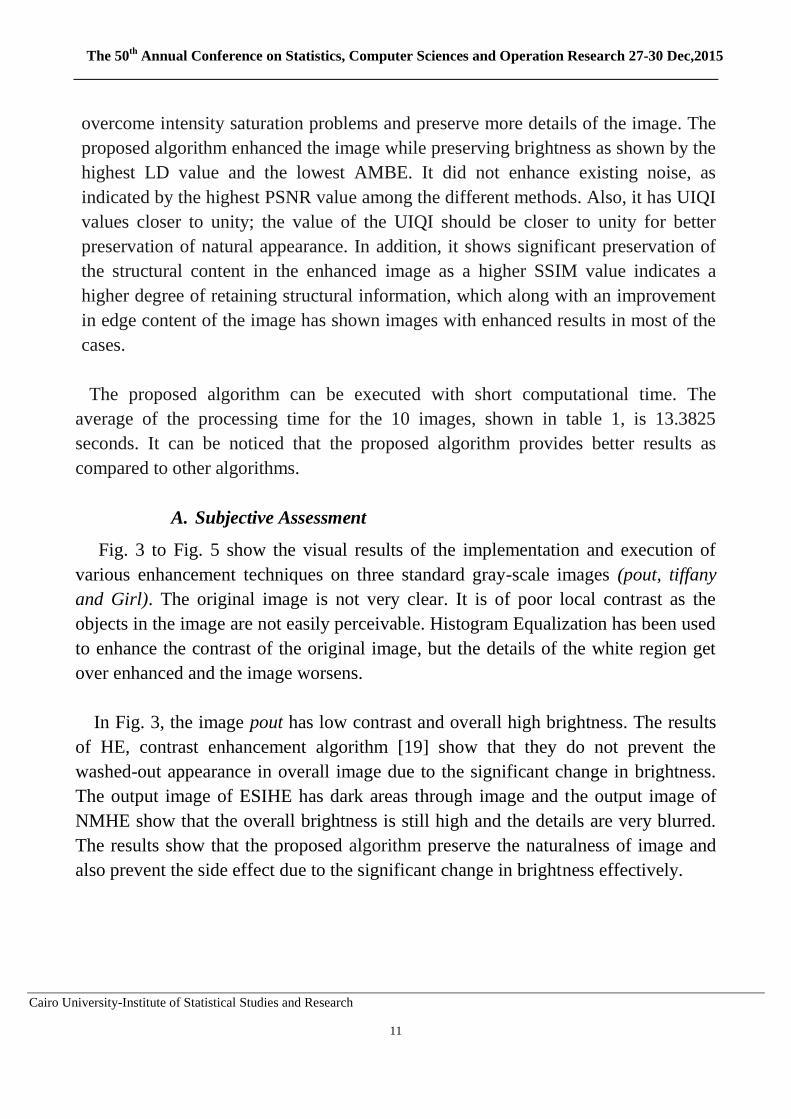
overcome intensity saturation problems and preserve more details of the image. The
proposed algorithm enhanced the image while preserving brightness as shown by the
highest LD value and the lowest AMBE. It did not enhance existing noise, as
indicated by the highest PSNR value among the different methods. Also, it has UIQI
values closer to unity; the value of the UIQI should be closer to unity for better
preservation of natural appearance. In addition, it shows significant preservation of
the structural content in the enhanced image as a higher SSIM value indicates a
higher degree of retaining structural information, which along with an improvement
in edge content of the image has shown images with enhanced results in most of the
cases.
The proposed algorithm can be executed with short computational time. The
average of the processing time for the 10 images, shown in table 1, is 13.3825
seconds. It can be noticed that the proposed algorithm provides better results as
compared to other algorithms.
A. Subjective Assessment
Fig. 3 to Fig. 5 show the visual results of the implementation and execution of
various enhancement techniques on three standard gray-scale images (pout, tiffany
and Girl). The original image is not very clear. It is of poor local contrast as the
objects in the image are not easily perceivable. Histogram Equalization has been used
to enhance the contrast of the original image, but the details of the white region get
over enhanced and the image worsens.
In Fig. 3, the image pout has low contrast and overall high brightness. The results
of HE, contrast enhancement algorithm [19] show that they do not prevent the
washed-out appearance in overall image due to the significant change in brightness.
The output image of ESIHE has dark areas through image and the output image of
NMHE show that the overall brightness is still high and the details are very blurred.
The results show that the proposed algorithm preserve the naturalness of image and
also prevent the side effect due to the significant change in brightness effectively.
The 50th
Annual Conference on Statistics, Computer Sciences and Operation Research 27-30 Dec,2015
Cairo University-Institute of Statistical Studies and Research
12
Table 1: Comparison of different algorithms for 10 standard images
Image Quality
measures
Original
image
HE Algorithm
[19]
ESIHE
NMHE Proposed
algorithm
Lena
PSNR
Entropy
AMBE
UIQI
SSIM
LD
- 7.4429
-
- -
-
19.1239 5.9735
0.0136
0.8269 0.8573
0.9996
19.2854 6.1433
0.0155
0.8239 0.8588
0.9995
22.1190 7.4135
0.0018
0.9063 0.9201
1.0000
17.7819 7.0495
0.1142
0.9270 0.9469
0.9782
41.7569 7.4391
4.1540e-004
0.9978 0.9987
1.0000
couple
PSNR
Entropy
AMBE
UIQI
SSIM
LD
- 7.1720
-
- -
-
15.9077 5.9594
0.0171
0.6472 0.6753
0.9994
15.9794 6.0543
0.0169
0.6458 0.6754
0.9994
21.2214 7.0768
6.2148e-004
0.8443 0.8660
1.0000
16.1486 6.9571
0.0434
0.6853 0.7148
0.9963
51.7687 7.1453
0.0017
0.9995 0.9997
1.0000
moon
PSNR
Entropy
AMBE
UIQI
SSIM
LD
- 5.4294
-
- -
-
9.3927 4.2796
0.2903
0.2322 0.2792
0.7103
18.8814 4.5983
0.0545
0.9032 0.9349
0.9734
26.4919 5.3331
0.0040
0.5920 0.7049
0.9998
32.6695 5.1393
0.0046
0.9334 0.9827
0.9997
60.7933 5.4281
2.1243e-004
0.9999 0.9999
1.0000
cameraman
PSNR
Entropy
AMBE
UIQI
SSIM
LD
-
7.0097 -
-
- -
19.0970
5.9106 0.0341
0.6892
0.8069 0.9975
19.2343
6.1921 0.0321
0.6896
0.8107 0.9978
19.7900
6.8893 0.0487
0.8360
0.9103 0.9951
15.2974
6.7732 0.1427
0.8636
0.8780 0.9653
50.6195
7.0099 0.0022
0.9984
0.9994 1.0000
pout
PSNR
Entropy
AMBE
UIQI
SSIM
LD
-
6.1875 -
-
- -
13.2866
5.7211 0.0665
0.4516
0.5642 0.9896
13.3468
5.8203 0.0679
0.4497
0.5642 0.9895
14.6802
6.1744 0.1446
0.5781
0.6513 0.9226
9.2262
5.2307 0.3377
0.6551
0.7637 0.8539
29.6910
6.2101 0.0033
0.9432
0.9765 1.0000
Girl
(Tiffany)
PSNR
Entropy
AMBE
UIQI
SSIM
LD
-
7.1412
- -
-
-
16.8101
5.9546
0.0293 0.7397
0.6990
0.9984
16.9843
6.1494
0.0252 0.6951
0.7419
0.9988
17.9986
7.0702
0.0465 0.8305
0.8634
0.9965
13.0651
6.5685
0.2127 0.6892
0.7154
0.8814
38.1085
7.1365
0.0023 0.9973
0.9953
1.0000
Airplane
(F-16)
PSNR
Entropy
AMBE
UIQI
SSIM
LD
-
6.7297
- -
-
-
11.7268
5.7377
0.2034 0.4813
0.5617
0.9443
12.1029
6.0634
0.1842 0.4538
0.5412
0.9555
22.5786
6.6850
0.0598 0.9319
0.9673
0.9967
17.8941
6.3812
0.1148 0.8522
0.9072
0.9843
42.0515
6.7216
8.1661e-004 0.9933
0.9981
1.0000
Girl
PSNR
Entropy
AMBE
UIQI
SSIM
LD
-
5.5939
- -
-
-
13.0035
4.6755
0.0478 0.2348
0.3018
0.9958
13.0642
4.8047
0.0464 0.2337
0.3023
0.9961
18.2151
5.5242
0.0981 0.7578
0.9080
0.9866
10.8150
5.2771
0.2744 0.8261
0.8694
0.9229
47.7979
5.5957
0.0014 0.9847
0.9987
1.0000
einstein
PSNR
Entropy
AMBE
UIQI
SSIM
LD
- 6.8936
-
- -
-
14.9793 5.9462
0.0777
0.6250 0.6659
0.9859
15.0160 5.9936
0.0774
0.6238 0.6660
0.9860
20.9206 6.8682
0.0481
0.8263 0.8486
0.9928
16.2159 6.5764
0.0017
0.6234 0.6559
1.0000
35.9993 6.8909
0.0114
0.9942 0.9969
0.9996
Aerial
PSNR
Entropy
AMBE
UIQI
SSIM
LD
- 6.9277
-
- -
-
11.2949 5.8954
0.2078
0.5754 0.5737
0.9426
11.5501 6.1622
0.1931
0.5541 0.5544
0.9514
25.7367 6.8379
0.0077
0.9310 0.9384
0.9999
14.2820 6.6880
0.1189
0.6827 0.6879
0.9833
51.2938 6.9252
0.0017
0.9998 0.9998
1.0000
The 50th
Annual Conference on Statistics, Computer Sciences and Operation Research 27-30 Dec,2015
Cairo University-Institute of Statistical Studies and Research
13
Fig 3. (a) Original „Pout‟ image ,(b) HE , (c) algorithm [19],(d) ESIHE , (e) NMHE, (f) the
proposed algorithm
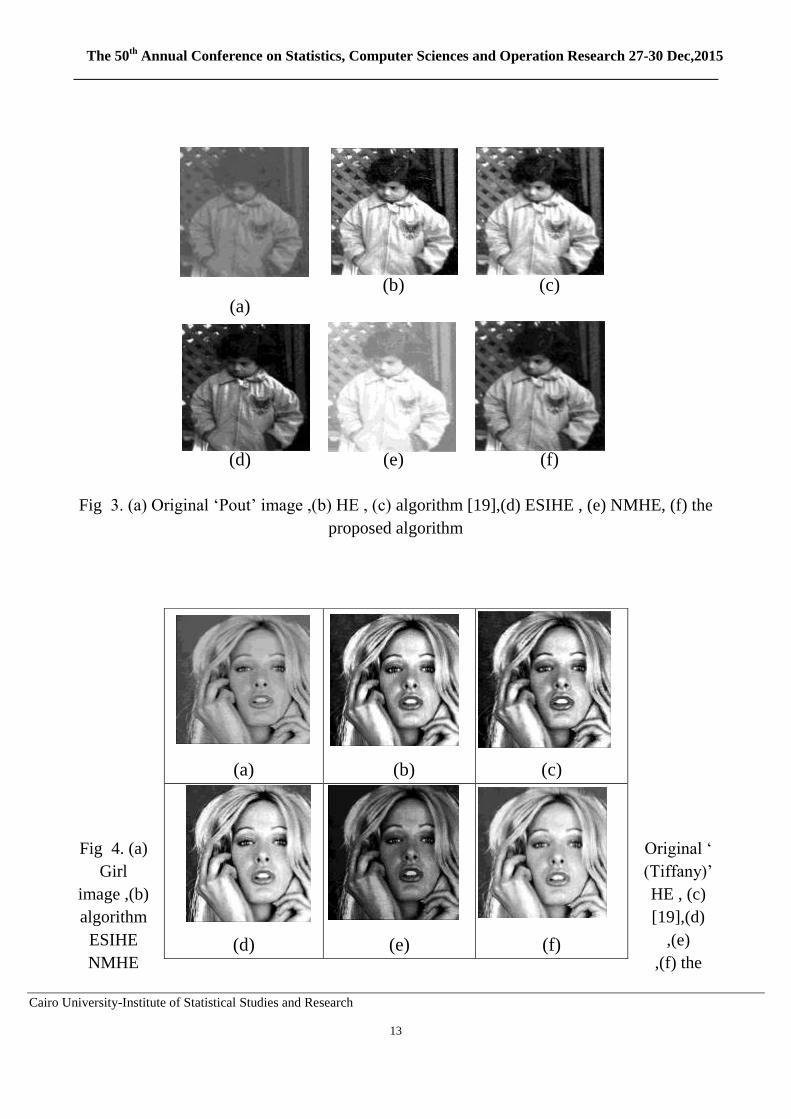
Fig 4. (a) Original „
Girl (Tiffany)‟
image ,(b) HE , (c)
algorithm [19],(d)
ESIHE ,(e)
NMHE ,(f) the
(a)
(b) (c)
(d) (e) (f)
(a) (b) (c)
(d) (e) (f)
The 50th
Annual Conference on Statistics, Computer Sciences and Operation Research 27-30 Dec,2015
Cairo University-Institute of Statistical Studies and Research
14
proposed algorithm
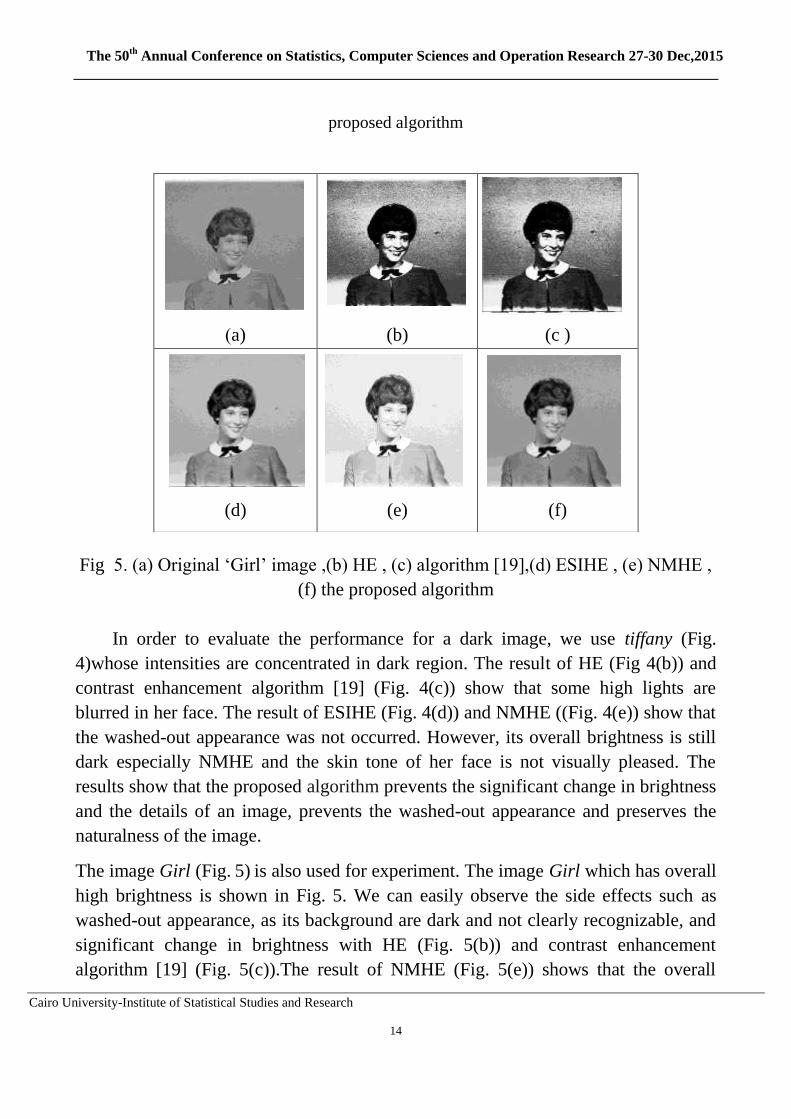
Fig 5. (a) Original „Girl‟ image ,(b) HE , (c) algorithm [19],(d) ESIHE , (e) NMHE ,
(f) the proposed algorithm
In order to evaluate the performance for a dark image, we use tiffany (Fig.
4)whose intensities are concentrated in dark region. The result of HE (Fig 4(b)) and
contrast enhancement algorithm [19] (Fig. 4(c)) show that some high lights are
blurred in her face. The result of ESIHE (Fig. 4(d)) and NMHE ((Fig. 4(e)) show that
the washed-out appearance was not occurred. However, its overall brightness is still
dark especially NMHE and the skin tone of her face is not visually pleased. The
results show that the proposed algorithm prevents the significant change in brightness
and the details of an image, prevents the washed-out appearance and preserves the
naturalness of the image.
The image Girl (Fig. 5) is also used for experiment. The image Girl which has overall
high brightness is shown in Fig. 5. We can easily observe the side effects such as
washed-out appearance, as its background are dark and not clearly recognizable, and
significant change in brightness with HE (Fig. 5(b)) and contrast enhancement
algorithm [19] (Fig. 5(c)).The result of NMHE (Fig. 5(e)) shows that the overall
)a) (b) (c )
(d) (e) (f)
The 50th
Annual Conference on Statistics, Computer Sciences and Operation Research 27-30 Dec,2015
Cairo University-Institute of Statistical Studies and Research
15
brightness is still high and the details in face and background are blurred. The result
of the proposed algorithm (Fig. 5(f)) shows that it preserves the details of image,
effectively suppresses the over enhancement and prevents the significant change in
brightness more than ESIHE (Fig. 5(d)) and other methods.
5. Conclusion:
This paper proposed an automatic and adaptive algorithm for contrast enhancement
of low contrast images based on double-plateaus histogram enhancement. The
proposed algorithm can be applied without any parameter tuning and executed in
short computational time .The experimental results showed that the proposed
algorithm generates the enhanced images with good quality as it prevents excessive
enhancement in contrast, prevents the significant change in brightness and details of
the image, prevents the washed-out appearance and preserves the naturalness of the
enhanced image. It can be applied to a wide range of image types and adapted the
local information of the image .The experimental results have been demonstrated by
qualitative and quantitative evaluations compared to other state-of-the-art methods.
REFERENCES
[1] Gonzalez C. and Woods E., Digital Image Processing, Addison-Wesley, 1992.
[2] Manpreet K., Jasdeep K., Jappreet K., “Survey of Contrast Enhancement
Techniques based on Histogram Equalization”, (IJACSA) International Journal of
Advanced Computer Science and Applications, Vol. 2, No. 7, 2011.
[3] Yeong-Taeg Kim, “Contrast enhancement using brightness preserving Bi-
Histogram equalization”, IEEE Trans. Consumer Electronics, vol. 43,no. 1, pp. 1-
8, Feb. 1997.
[4] Y. Wang, Q. Chen, and B. Zhang, “Image enhancement based on equal area
dualistic sub-image histogram equalization method,” IEEE Trans.on Consumer
Electronics, vol. 45, no. 1, pp. 68-75, Feb. 1999.
[5] S.-D. Chen and A. Ramli, “Minimum mean brightness error Bi-Histogram
equalization in contrast enhancement,” IEEE Trans. on Consumer Electronics,
vol. 49, no. 4, pp. 1310-1319, Nov. 2003.
[6] Nymlkhagva Sengee, and Heung Kook Choi, “Brightness preserving weight
clustering histogram equalization”, IEEE Trans. ConsumerElectronics, vol. 54,
no. 3, pp. 1329 - 1337, August 2008.
The 50th
Annual Conference on Statistics, Computer Sciences and Operation Research 27-30 Dec,2015
Cairo University-Institute of Statistical Studies and Research
16
[7] Chen D. and Ramli R., “Contrast Enhancement Using Recursive Mean-Separate
Histogram Equalization for Scalable Brightness Preservation,” Computer Journal
of IEEE Transactions Consumer Electronics, vol. 49, no. 4, pp. 1301-1309, 2003.
[8] Sim S., Tso P., and Tan Y., “Recursive Sub: Image Histogram Equalization
Applied to Gray Scale Images,” Computer Journal of Pattern Recognition Letters,
vol. 28, no. 10, pp. 1209- 1221, 2007.
[9] Ibrahim H. and Kong P., “Brightness Preserving Dynamic Histogram
Equalization for Image Contrast Enhancement,” Computer Journal of IEEE
Transactions on Consumer Electronics, vol. 53, no. 4, pp. 1752-1758, 2007.
[10] K. Wongsritong, K. Kittayaruasiriwat, F. Cheevasuvit, K. Dejhan and A.
Somboonkaew, “Contrast Enhancement using Multipeak Histogram Equalization
with Brightness Preserving”, IEEE Asia-Pacific Conference on Circuit and
System, pp. 455-458, November 1998.
[11] Seungjoon Yang, Jae Hwan Oh, and Yungfun Park, “Contrast enhancement using
histogram equalization with bin underflow and bin overflow”, In Image
Processing, 2003. ICIP 2003. Proceedings.2003 International Conference on, vol.
1, pp. 881-884, September 2003.
[12] Qing Wang, and Rabab K. Ward, “Fast image/video contrast enhancement based
on weighted thresholded histogram equalization”,IEEE Trans. Consumer
Electronics, vol. 53, no. 2, pp. 757-764, May 2007.
[13] Taekyung Kim and Joonki Paik, “Adaptive contrast enhancement using gain-
controllable clipped histogram equalization”, IEEE Trans.on Consumer
Electronics, vol. 54, no. 4, pp. 1803-1810, November 2008.
[14] Bing-Jian Wang, Shang-Qian Liu, Qing Li, and Hui-Xin Zhou, “A real-time
contrast enhancement algorithm for infrared images based on plateau
histogram”, Infrared Physics & Technology, vol. 48, no. 1, pp. 77-82, April 2006.
[15] Nicholas Sia Pik Kong, Haidi Ibrahim, Chen Hee Ooi, and Derek Chan Juinn
Chieh, “Enhancement of microscopic images using modified self-adaptive
plateau histogram equalization”, submitted for publication in Proceedings of
2009 International Conference on Graphic and Image Processing (ICGIP 2009),
Kota Kinabalu,Malaysia, November 2009.
[16] Yang Shubin, He Xi, Cao Heng and Cui Wanlong “Double-plateaus Histogram
Enhancement Algorithm for Low-light-level Night Vision Image “ Journal of
Convergence Information Technology, Volume 6, Number 1. January 2011.
The 50th
Annual Conference on Statistics, Computer Sciences and Operation Research 27-30 Dec,2015
Cairo University-Institute of Statistical Studies and Research
17
[17] K. Liang, Y. Ma, Y. Xie, B. Zhou and R. Wang, “A new adaptive contrast
enhancement algorithm for infrared images based on double plateaus histogram
equalization”, Infrared Physics & Technology, vol. 55, (2012), pp. 309-315.
[18] S. Poddar et al., “ Non-parametric modified histogram equalisation for contrast
enhancement,” IET Image Process. vol. 7, no. 7, pp. 641–652, (2013).
[19] Nungsanginla Longkumer, Mukesh Kumar, A.K. Jaiswal and Rohini Saxena,”
CONTRAST ENHANCEMENT USING VARIOUS STATISTICAL OPERATIONS
AND NEIGHBORHOOD PROCESSING” , Signal & Image Processing : An
International Journal (SIPIJ) Vol.5, No.2, April 2014
[20] K. Singh and R. Kapoor, “Image enhancement using exposure based sub image
histogram equalization,” Pattern Recogn. Lett., vol. 36, pp. 10-14, 2014.
[21] Khairunnisa Hasikin, & Nor Ashidi Mat Isa, 2012, „Adaptive fuzzy contrast
factor enhancement technique for low contrast and nonuniform illumination
images’, Signal, Image and Video Processing, vol.6, No.4, pp1-12.
[22] Zhengmao Ye, Objective Assessment of Nonlinear Segmentation Approaches to
Gray Level Underwater Images, ICGST-GVIP Journal, ISSN 1687-398X,
Volume (9), Issue (II), April 2009.
[23] Iyad Jafar Hao Ying, “A New Method for Image Contrast Enhancement Based on
AutomaticSpecification of Local Histograms”, IJCSNS International Journal of
Computer Science and Network Security, VOL.7 No.7, July 2007.
[24] a. A. C. B. Zhou Wang, "A Universal Image Quality Index," IEEE SIGNAL
PROCESSING LETTERS, vol. 9, pp. 81-84, 2002.
[25] Z. Wang, A. C. Bovik, H. R. Sheikh and E. P. Simoncelli, "Image quality
assessment: From error visibility to structural similarity," IEEE Transactions on
Image Processing, vol. 13, no. 4, pp. 600-612, Apr. 2004.
[26] S. C. Huang and C. H. Yeh, “Image contrast enhancement for preserving mean
brightness without losing image features,” Eng. Appl. Artif. Intell. 26(5–6),
1487–1492 (2013).
The 50th
Annual Conference on Statistics, Computer Sciences and Operation Research 27-30 Dec,2015
Cairo University-Institute of Statistical Studies and Research
18
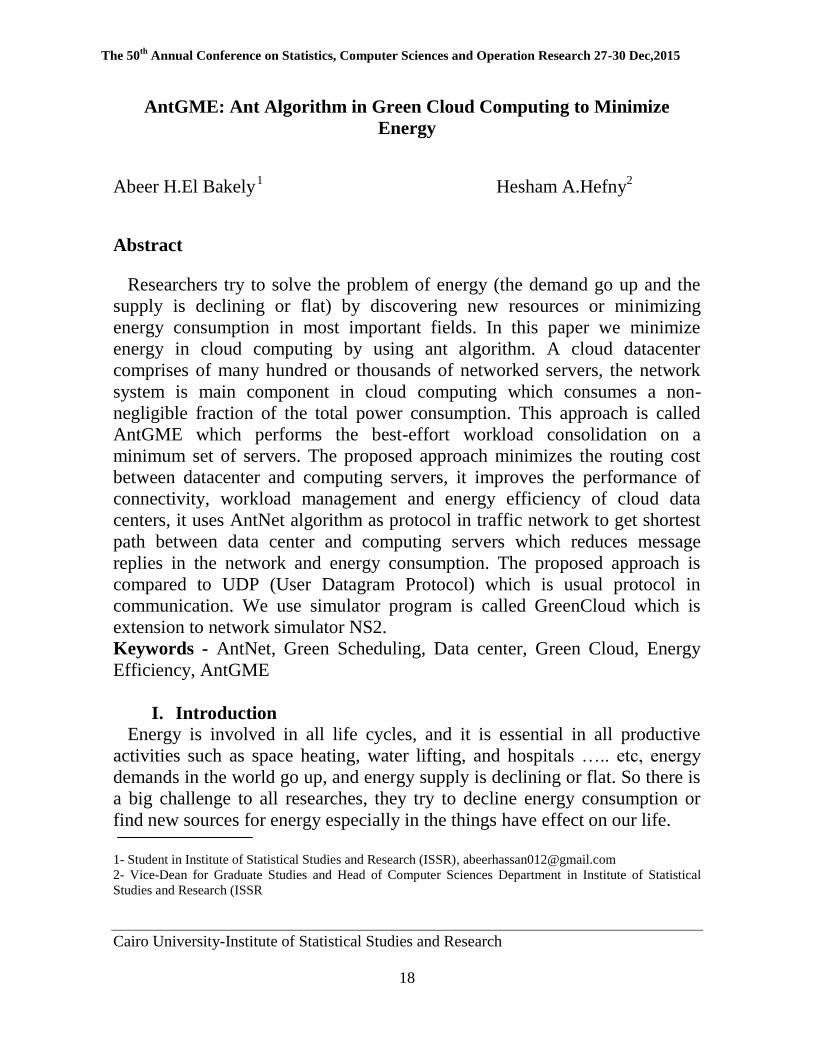
AntGME: Ant Algorithm in Green Cloud Computing to Minimize
Energy
Abeer H.El Bakely 1 Hesham A.Hefny
2
Abstract
Researchers try to solve the problem of energy (the demand go up and the
supply is declining or flat) by discovering new resources or minimizing
energy consumption in most important fields. In this paper we minimize
energy in cloud computing by using ant algorithm. A cloud datacenter
comprises of many hundred or thousands of networked servers, the network
system is main component in cloud computing which consumes a non-
negligible fraction of the total power consumption. This approach is called
AntGME which performs the best-effort workload consolidation on a
minimum set of servers. The proposed approach minimizes the routing cost
between datacenter and computing servers, it improves the performance of
connectivity, workload management and energy efficiency of cloud data
centers, it uses AntNet algorithm as protocol in traffic network to get shortest
path between data center and computing servers which reduces message
replies in the network and energy consumption. The proposed approach is
compared to UDP (User Datagram Protocol) which is usual protocol in
communication. We use simulator program is called GreenCloud which is
extension to network simulator NS2.
Keywords - AntNet, Green Scheduling, Data center, Green Cloud, Energy
Efficiency, AntGME
I. Introduction
Energy is involved in all life cycles, and it is essential in all productive
activities such as space heating, water lifting, and hospitals ….. etc, energy
demands in the world go up, and energy supply is declining or flat. So there is
a big challenge to all researches, they try to decline energy consumption or
find new sources for energy especially in the things have effect on our life.
1- Student in Institute of Statistical Studies and Research (ISSR), [email protected]
2- Vice-Dean for Graduate Studies and Head of Computer Sciences Department in Institute of Statistical
Studies and Research (ISSR
The 50th
Annual Conference on Statistics, Computer Sciences and Operation Research 27-30 Dec,2015
Cairo University-Institute of Statistical Studies and Research
19
Cloud computing is a technology maintains data and applications within remote
servers and allows consumers and businesses to use applications without installation
and access their personal files at any computer with internet access by centralizing
storage, memory, processing and bandwidth. This technology does not require end-
user knowledge of the physical location and configuration of the system that delivers
the services. Cloud enhances collaboration, agility, scaling, and availability, and
provides the potential for cost reduction through optimized and efficient computing.
[13, 14]
Cloud computing presents all services through a simple Internet connection using
a standard browser or other connection because it is TCP/IP based high development
and integrations of computer technologies such as fast micro processor, huge
memory, high-speed network and reliable system architecture. Without the standard
inter-connect protocols and mature of assembling data center technologies, cloud
computing would not become reality. [5, 6]
Using cloud computing becomes necessary to individuals and organization, so
minimizing energy consumption in it is most important and big challenge.
A cloud datacenter comprises of many hundreds or thousands of networked
servers with their corresponding storage and networking subsystems, power
distribution and conditioning equipment, and cooling infrastructure. Due to large
number of equipment, datacenters can consume massive energy consumption. The
network system is another main component in cloud computing which consumes a
non-negligible fraction of the total power consumption. In cloud computing, since
resources are accessed through Internet, both applications and data are needed to be
transferred to the compute node. It requires much more data communication
bandwidth between user’s PC to the cloud resources than require the application
execution requirements. In the network infrastructure, the energy consumption
depends especially on the power efficiency and awareness of wired network, namely
the network equipment or system design, topology design, and network protocol
design. Most of the energy in network devices is wasted because they are designed
to handle worst case scenario. The energy consumption of these devices remains
almost the same during both peak time and idle state. Many improvements are
required to get high energy efficiency in these devices. For example during low
utilization periods, Ethernet links can be turned off and packets can be routed around
them. Further energy savings are possible at the hardware level of the routers
through appropriate selection and optimization of the layout of various internal
router components (i.e. buffers, links, etc.). [1]

The 50th
Annual Conference on Statistics, Computer Sciences and Operation Research 27-30 Dec,2015
Cairo University-Institute of Statistical Studies and Research
20
In fact, about one-third of the total IT energy is consumed by communication
links, switching, and aggregation elements, while the remaining two-thirds are
allocated to computing servers. Other systems contributing to the data center energy
extends the host-to-host delivery of packets of the underlying network into a
process-to-process communication consumption are cooling and power distribution
systems that account for 45% and 15% of total energy consumption. [4]
There are many solutions that are implemented for making data center hardware
energy efficient. There are two common techniques for reducing power consumption
in computing systems. The Dynamic Voltage and Frequency Scaling (DVFS)
enables processors to run at different combinations of frequencies with voltages to
reduce the power consumption of the processor. [10]
Dynamic Power Management (DPM) achieves most of energy savings by
coordinating and distributing the work between all available nodes. To make DPM
scheme efficient, a scheduler must consolidate data center jobs on a minimum set of
computing resources to maximize the amount of unloaded servers that can be
powered down (or put to sleep). Because the average data center workload often
stays around 30%, the portion of unloaded servers can be as high as 70%. [4, 9]
GreenCloud simulator is an extension of NS2 which represents the cloud data
center’s energy efficiency by using two techniques which are DVFS and DPM.
Most of the existing approaches for energy-efficient focus on other targets such as
balance between energy efficient and performance by job scheduling in data centers,
reduce traffic and congestion in networks of cloud computing but in this paper we
study the effects of ANTGME on reducing energy.
This paper presents routing protocol approach which increases an improvement in
energy consumption. The proposed approach uses the ant algorithm especially
AntNet algorithm to reduce communication energy by reduction message replies and
shortest path to each part in cloud computing, improve performance of connectivity
and workload management. The compared protocol is UDP (User Datagram
Protocol) which is a simple transport protocol that the proposed approach reduces
computational and memory overhead compared to previous approaches, such as
flow differentiation, also it reduces complexity time of processing compared to
previous approaches.
The main contributions of this paper are summarized below.
This paper proposes a routing protocol approach which increases an improvement
in energy consumption. The proposed approach reduces
The 50th
Annual Conference on Statistics, Computer Sciences and Operation Research 27-30 Dec,2015
Cairo University-Institute of Statistical Studies and Research
21
communication energy by reduction message replies and shortest path to each
part in cloud computing, improve performance of connectivity and workload
management.
Experimental work presents comparison between UDP (User Datagram
Protocol) and proposed approach; also it shows that the proposed approach is
better to apply in cloud computing, because it improves reduction of energy
consumption through increasing number of servers.
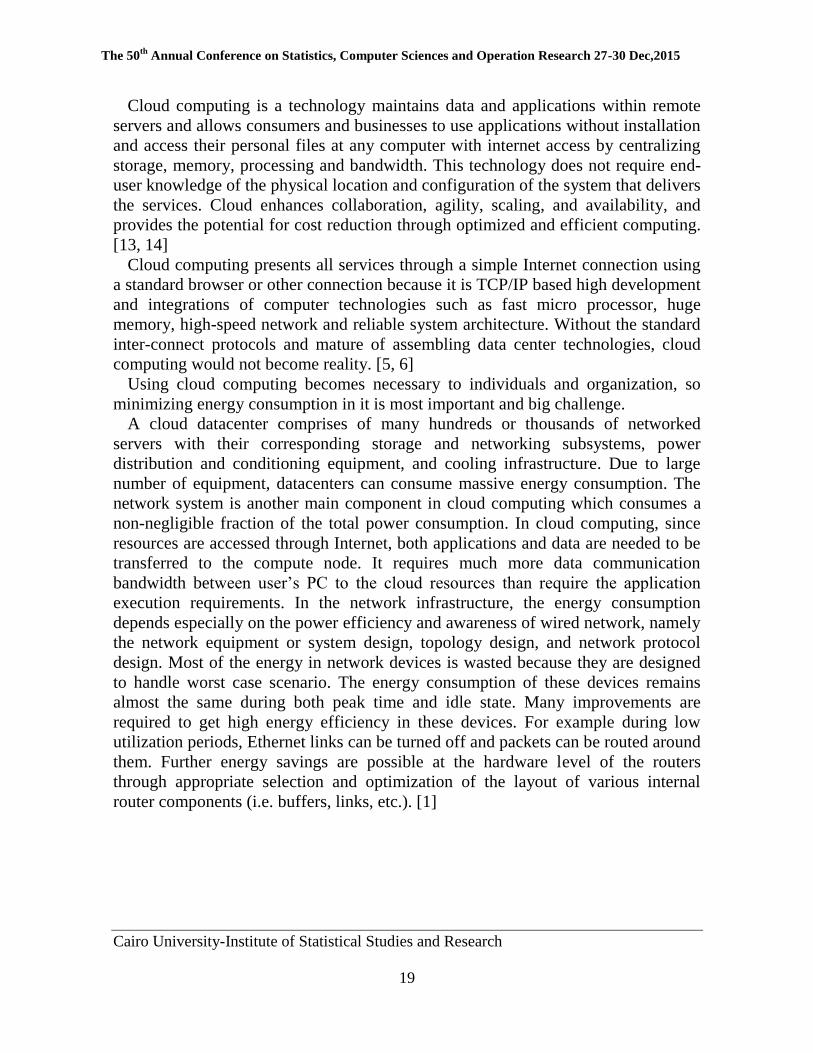
Fig.1GreenCloud simulator architecture (three tiers) [3]
The rest of the paper is organized as follows: Section 2 presents the related
works; Section 3 explains problem statement Section 4 focuses on environment of simulation; Section 5 presents AntGME as a proposed approach; Section 6 simulation scenario of proposed approach; Section 7 Results of proposed approach and Section 8 conclusion
II. Related Works
Through reviewing the literature to stand on what other researchers have reached
in this research area, a number of subjects of interest were found and can be
summarized as follows;
[Anusuya, Krishnapriya, 2014] introduce the Ad-Hoc On-Demand or Reactive
protocol to improve the performance of connectivity, workload management and
energy efficiency of cloud data centers. Hence, the protocol with aggregation
method in order to reduce message replies in the network and energy consumption
while transaction to increase the quick connection establishment. The results show
that the discovery success rate and the message reduction to minimizing the energy consumption and boost the overall performance of cloud data centers. [7]
The 50th
Annual Conference on Statistics, Computer Sciences and Operation Research 27-30 Dec,2015
Cairo University-Institute of Statistical Studies and Research
22
[Giuseppe Portaluri et al, 2014] propose a power efficient resource allocation
algorithm for cloud computing data centers which is based on genetic heuristics. The
proposed approach finds a set of non-dominated solutions in this multi-objective
computation minimizing makespan and power consumption of the system. When the
execution of the algorithm is completed and optimal Pareto solutions are obtained, it
becomes possible to fine tune the trade-off between power consumption and
execution time. An algorithm shows quadratic complexity dependency on with the
respect to the number of tasks to be allocated. [8]
[Gianni, Marco, 1998] proposed AntNet algorithm which is based on the concept
of Ant Colony Optimization Algorithm (ACO) which is a metaheuristic approach
for solving computational problems based on probability techniques. It can perform
better than many shortest path algorithms given varying traffic loads and topology.
In the AntNet algorithm, each node maintains a routing table and another table
which holds network statistics about the traffic distribution over the network. The
routing table contains the goodness value normalized to one for each destination and
each next hop node. [2]
III. Problem statement
Energy is most important for the world, so all countries try to find new resources
for energy or minimize consumption, cloud computing plays a very important role in
Information Technology sector, because it is very important to individual users in
common using such as E-mail, drives and so on, also it is a technological revolution
for companies because they don’t need to purchase and maintain expensive
instances of physical computer hardware and at the long-run companies won’t need
planning and provisioning of physical hardware resources required for potential
computing needs which is very expensive. Many researchers try to minimize energy
in each component in cloud computing such as servers in data center, network and
so on by using many techniques and models.
IV. Environment of Simulation We use GreenCloud simulator which is an extension to the network simulator NS2
which is developed for the study of cloud computing environments. The GreenCloud offers users a detailed fine-grained modeling of the energy consumed by the elements of the data center, such as servers, switches, and links. Moreover, GreenCloud offers a thorough investigation of workload distributions. Furthermore, a specific focus is devoted on the packet-level simulations of communications in the data center infrastructure, which
The 50th
Annual Conference on Statistics, Computer Sciences and Operation Research 27-30 Dec,2015
Cairo University-Institute of Statistical Studies and Research
23
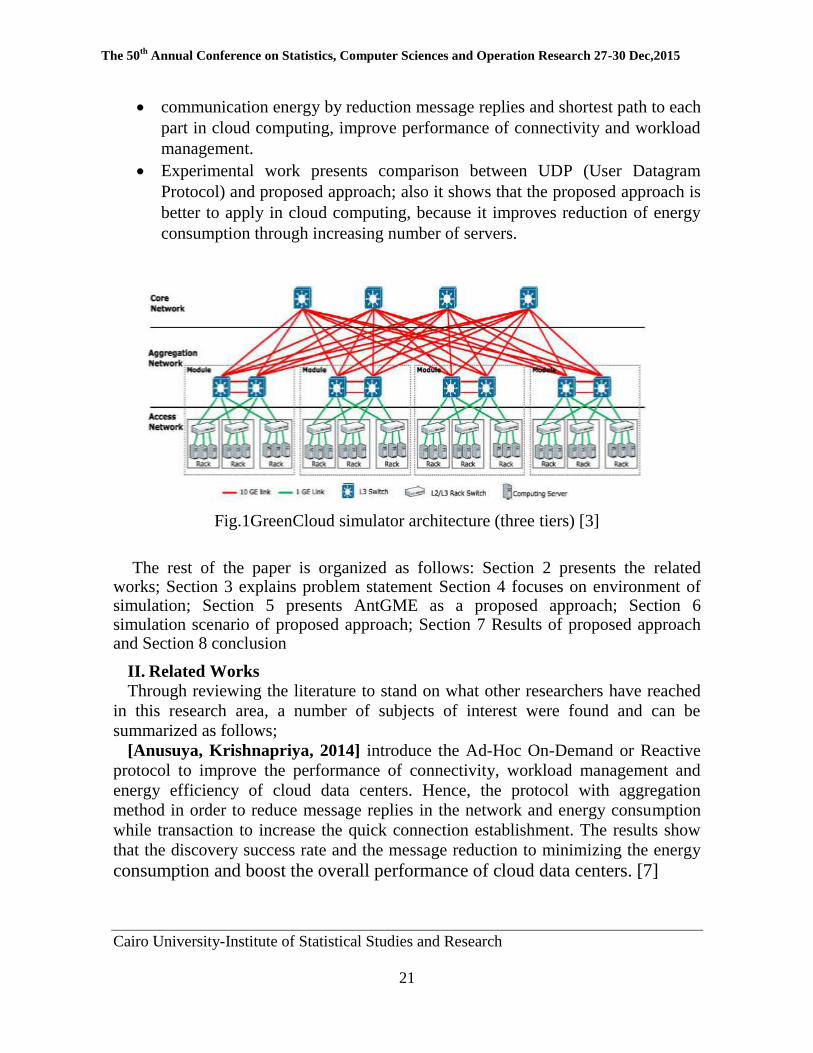
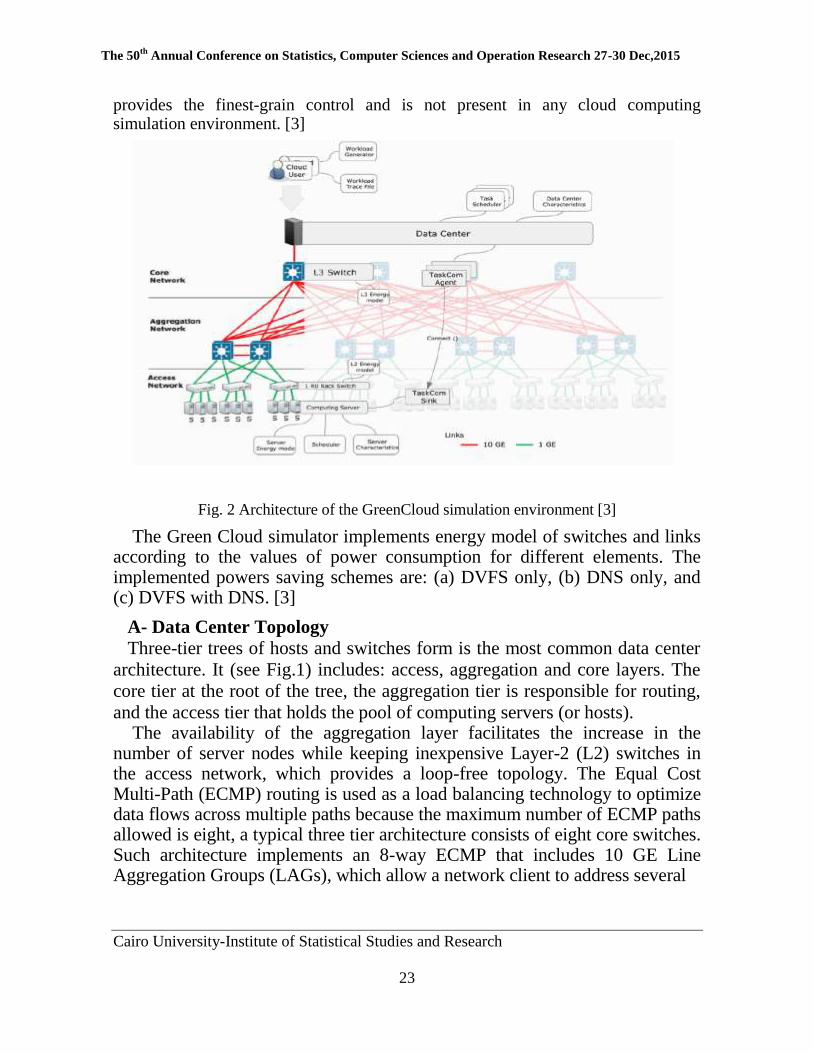
provides the finest-grain control and is not present in any cloud computing simulation environment. [3]
Fig. 2 Architecture of the GreenCloud simulation environment [3]
The Green Cloud simulator implements energy model of switches and links according to the values of power consumption for different elements. The implemented powers saving schemes are: (a) DVFS only, (b) DNS only, and (c) DVFS with DNS. [3]
A- Data Center Topology
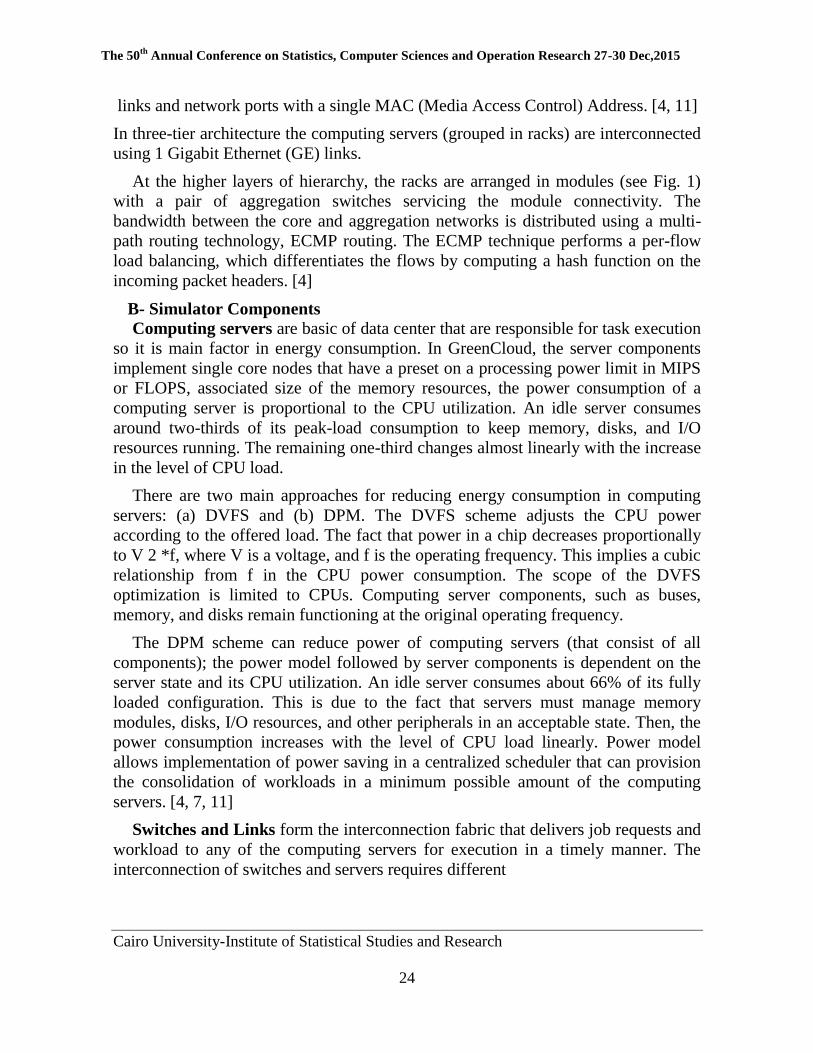
Three-tier trees of hosts and switches form is the most common data center
architecture. It (see Fig.1) includes: access, aggregation and core layers. The
core tier at the root of the tree, the aggregation tier is responsible for routing,
and the access tier that holds the pool of computing servers (or hosts). The availability of the aggregation layer facilitates the increase in the
number of server nodes while keeping inexpensive Layer-2 (L2) switches in the access network, which provides a loop-free topology. The Equal Cost Multi-Path (ECMP) routing is used as a load balancing technology to optimize data flows across multiple paths because the maximum number of ECMP paths allowed is eight, a typical three tier architecture consists of eight core switches. Such architecture implements an 8-way ECMP that includes 10 GE Line Aggregation Groups (LAGs), which allow a network client to address several
The 50th
Annual Conference on Statistics, Computer Sciences and Operation Research 27-30 Dec,2015
Cairo University-Institute of Statistical Studies and Research
24
links and network ports with a single MAC (Media Access Control) Address. [4, 11]
In three-tier architecture the computing servers (grouped in racks) are interconnected
using 1 Gigabit Ethernet (GE) links.
At the higher layers of hierarchy, the racks are arranged in modules (see Fig. 1)
with a pair of aggregation switches servicing the module connectivity. The
bandwidth between the core and aggregation networks is distributed using a multi-
path routing technology, ECMP routing. The ECMP technique performs a per-flow
load balancing, which differentiates the flows by computing a hash function on the
incoming packet headers. [4]
B- Simulator Components
Computing servers are basic of data center that are responsible for task execution
so it is main factor in energy consumption. In GreenCloud, the server components
implement single core nodes that have a preset on a processing power limit in MIPS
or FLOPS, associated size of the memory resources, the power consumption of a
computing server is proportional to the CPU utilization. An idle server consumes
around two-thirds of its peak-load consumption to keep memory, disks, and I/O
resources running. The remaining one-third changes almost linearly with the increase
in the level of CPU load.
There are two main approaches for reducing energy consumption in computing
servers: (a) DVFS and (b) DPM. The DVFS scheme adjusts the CPU power
according to the offered load. The fact that power in a chip decreases proportionally
to V 2 *f, where V is a voltage, and f is the operating frequency. This implies a cubic
relationship from f in the CPU power consumption. The scope of the DVFS
optimization is limited to CPUs. Computing server components, such as buses,
memory, and disks remain functioning at the original operating frequency.
The DPM scheme can reduce power of computing servers (that consist of all
components); the power model followed by server components is dependent on the
server state and its CPU utilization. An idle server consumes about 66% of its fully
loaded configuration. This is due to the fact that servers must manage memory
modules, disks, I/O resources, and other peripherals in an acceptable state. Then, the
power consumption increases with the level of CPU load linearly. Power model
allows implementation of power saving in a centralized scheduler that can provision
the consolidation of workloads in a minimum possible amount of the computing
servers. [4, 7, 11]
Switches and Links form the interconnection fabric that delivers job requests and
workload to any of the computing servers for execution in a timely manner. The
interconnection of switches and servers requires different
The 50th
Annual Conference on Statistics, Computer Sciences and Operation Research 27-30 Dec,2015
Cairo University-Institute of Statistical Studies and Research
25
cabling solutions depending on the supported bandwidth, physical and quality
characteristics of the link. The quality of signal transmission in a given cable
determines a tradeoff between the transmission rate and the link distance, which are
the factors defining the cost and energy consumption of the transceivers. Energy
consumption of a switch depends on the:
(a) Type of switch, (b) Number of ports, (c) Port transmission rates and (d) Employed cabling solutions.
The energy is consumed by a switch can be generalized by the following:
Where Pchassis is related to the power consumed by the switch hardware, Plinecard is the power consumed by any active network line card, Pr corresponds to the power consumed by a port (transceiver) running at the rate r. In (1), only the last component appears to be dependent on the link rate while other components, such as Pchassis and Plinecard remain fixed for all the duration of switch operation. Therefore, Pchassis and Plinecard can be avoided by turning the switch hardware off or putting it into sleep mode. [3]
Not all of the switches can dynamically be put to sleep. Each core switch consumes a certain amount of energy to service large switching capacity. Because of their location within the communication fabric and proper ECMP forwarding functionality, it is advisable to keep the core network switches running continuously at their maximum transmission rates. On the contrary, the aggregation switches service modules, which can be reduced energy consumption when the module racks are inactive. The fact that on average most of the data centers are utilized around 30% of their compute capacity, it shows power down of unused aggregation switches. However, such an operation must be performed carefully by considering possible fluctuations in job arrival rates. Typically, it is enough to keep a few computing servers running idle on top of the necessary computing servers as a buffer to account for possible data center load fluctuation. [11]
V. ANTGME Approach The proposed approach uses AntNet protocol which is proposed by Gianni Di
Caro and Marco Dorigo for data communication networks. In this algorithm two types of ants are generated which are Forward ant and Backward ants. The Forward ant stores information about traveling from a source to a destination in their memory, this information is paths and the traffic conditions they encounter. After reaching the destination the forward ant transfers its memory to the backward ant and dies. The
backward ant retraces the path traversed by the forward ant and updates the routing tables in the path. AntNet is designed
(1)[4]
The 50th
Annual Conference on Statistics, Computer Sciences and Operation Research 27-30 Dec,2015
Cairo University-Institute of Statistical Studies and Research
26
in such way that the forward ants carry the information about the status of the links it traverses. This status information can be captured and can be used to find the best path. AntNet is one of the dynamic routing algorithms for learning new routes. Each node in the network consists of mainly two data structures routing table and neighbor list. [2]
AntNet is a swarm-based routing algorithm for packet switched networks using multi-agent philosophy to improve the routing performance factors such as network throughput and packet delay. In this algorithm network nodes generate forward ants towards random destinations in regular time intervals. At destination nodes, forward ants are killed and backward ants are generated with the forward ant knowledge. The backward ants then return to source nodes updating the intermediate routing tables. [12]
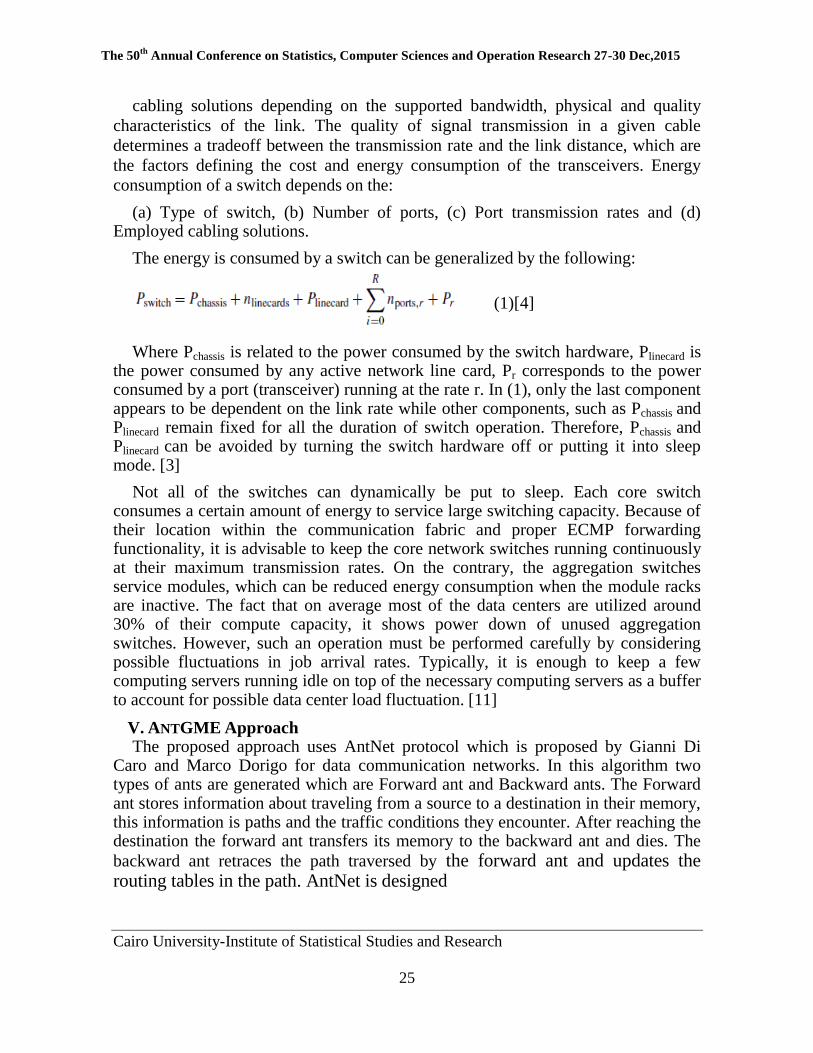
Fig.3 Internal state of ants in AntNet[12]
In Fig. 3 service queue state is awaiting state for ants to be serviced. It is evident
that, host node failure condition kills the generated ant (die state). Transfer queue state is a waiting state for ants to be transferred through the selected outgoing links. In the execution state, forward ants randomly select the outgoing link at the current node, while backward ants update the routing tables. It should be noted that the backward ant generation state in fig. 3 only defines for forward ants.
An ant in a Transfer state is being transferred through a link. Generate backward ant state, is a state in which a backward ant is generated with the related forward ant knowledge. The forward ant is then switched to a die state. [12]
The 50th
Annual Conference on Statistics, Computer Sciences and Operation Research 27-30 Dec,2015
Cairo University-Institute of Statistical Studies and Research
27
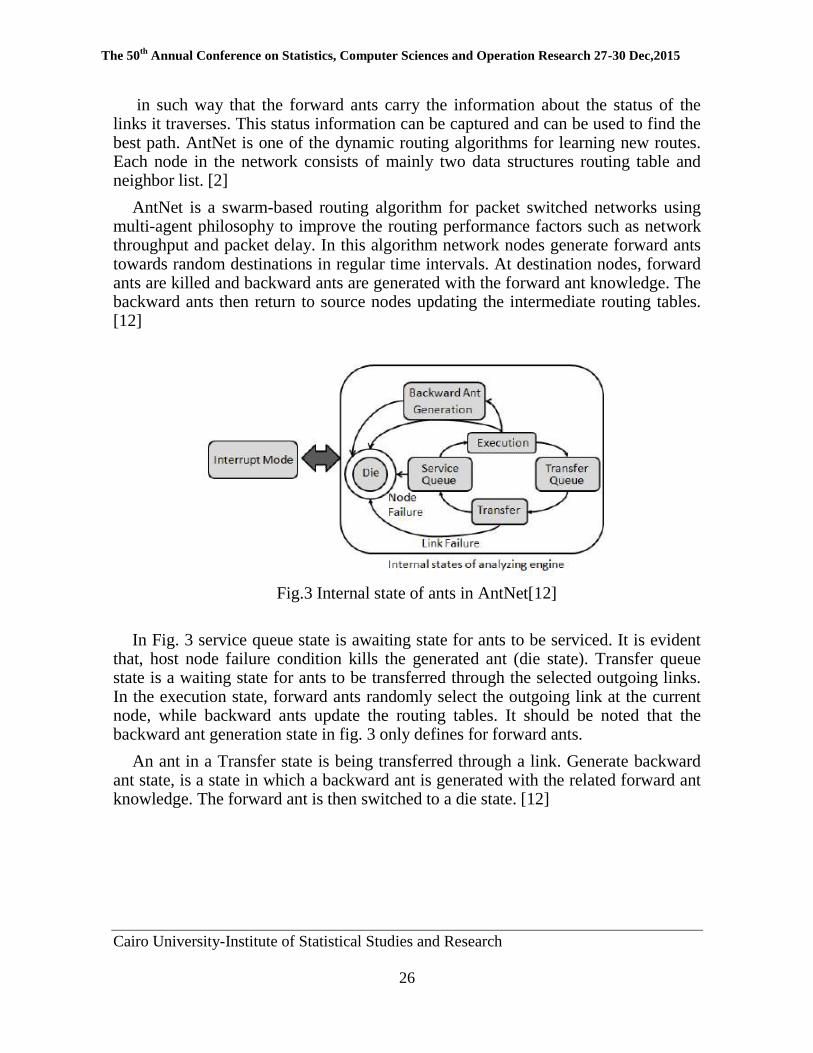
Fig.4 Greencloud Architecture with using AntGME approach
V. Simulation Scenario A three-tier tree data center topology comprised of 1536 servers arranged
into 32 racks each holding 48 servers, served by 4 core and 8 aggregation switches (see Fig. 4), was used in simulation experiment. We used 1 GE links for interconnecting servers in the inside racks while 10 GE links were used to form a fat-tree topology interconnecting access, aggregation and core switches. The size of the workload is equal to 15 KB. Being fragmented, it occupies 10 Ethernet packets. During execution, the workloads produce a constant bit rate stream of 1 Mb/s directed out of the data center. Such a stream is designed to mimic the behavior of the most common video sharing applications. To add uncertainties, , the chosen of server inside the data center at the moment of task completion is randomly, the amount of internal message which is send from data center to server is a 75 KB. The message of the same size is also sent out of the data center at the moment of task completion as an external communication. [3, 4]
The 50th
Annual Conference on Statistics, Computer Sciences and Operation Research 27-30 Dec,2015
Cairo University-Institute of Statistical Studies and Research
28
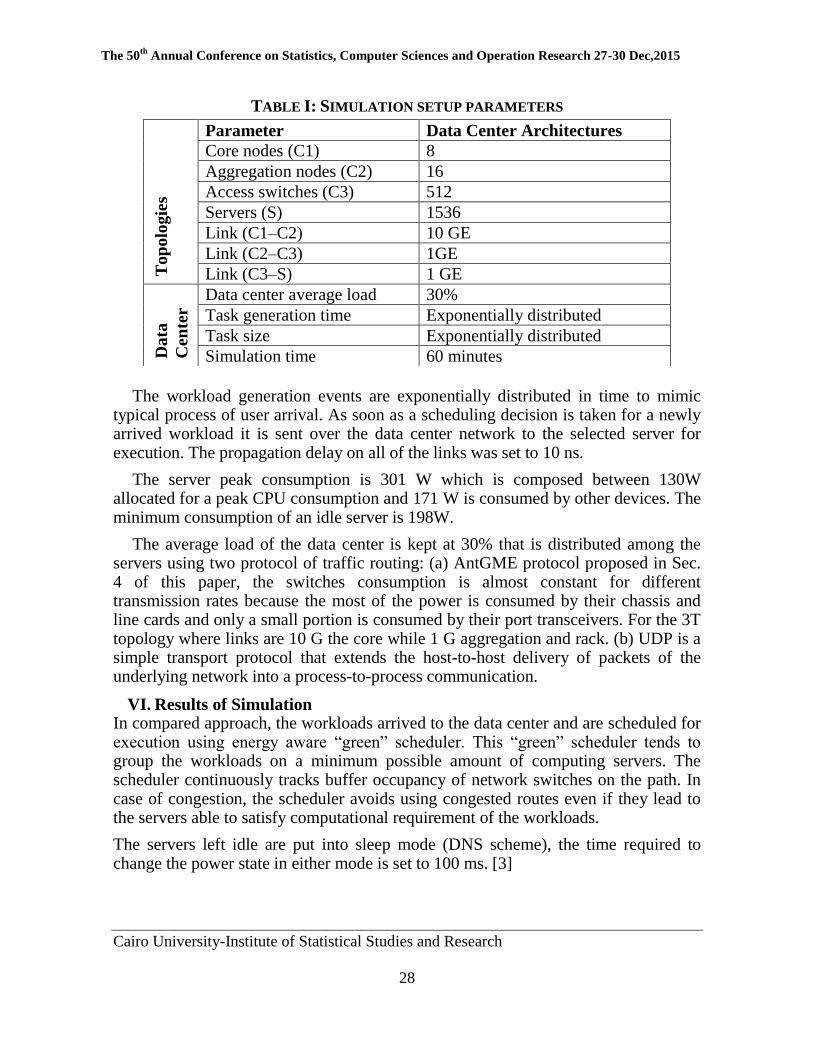
TABLE I: SIMULATION SETUP PARAMETERS
The workload generation events are exponentially distributed in time to mimic
typical process of user arrival. As soon as a scheduling decision is taken for a newly arrived workload it is sent over the data center network to the selected server for execution. The propagation delay on all of the links was set to 10 ns.
The server peak consumption is 301 W which is composed between 130W allocated for a peak CPU consumption and 171 W is consumed by other devices. The minimum consumption of an idle server is 198W.
The average load of the data center is kept at 30% that is distributed among the servers using two protocol of traffic routing: (a) AntGME protocol proposed in Sec. 4 of this paper, the switches consumption is almost constant for different transmission rates because the most of the power is consumed by their chassis and line cards and only a small portion is consumed by their port transceivers. For the 3T topology where links are 10 G the core while 1 G aggregation and rack. (b) UDP is a simple transport protocol that extends the host-to-host delivery of packets of the underlying network into a process-to-process communication.
VI. Results of Simulation In compared approach, the workloads arrived to the data center and are scheduled for execution using energy aware “green” scheduler. This “green” scheduler tends to group the workloads on a minimum possible amount of computing servers. The scheduler continuously tracks buffer occupancy of network switches on the path. In case of congestion, the scheduler avoids using congested routes even if they lead to the servers able to satisfy computational requirement of the workloads.
The servers left idle are put into sleep mode (DNS scheme), the time required to change the power state in either mode is set to 100 ms. [3]
Top
olo
gie
s
Parameter Data Center Architectures
Core nodes (C1) 8
Aggregation nodes (C2) 16
Access switches (C3) 512
Servers (S) 1536
Link (C1–C2) 10 GE
Link (C2–C3) 1GE
Link (C3–S) 1 GE
Da
ta
Cen
ter Data center average load 30%
Task generation time Exponentially distributed
Task size Exponentially distributed
Simulation time 60 minutes
The 50th
Annual Conference on Statistics, Computer Sciences and Operation Research 27-30 Dec,2015
Cairo University-Institute of Statistical Studies and Research
29
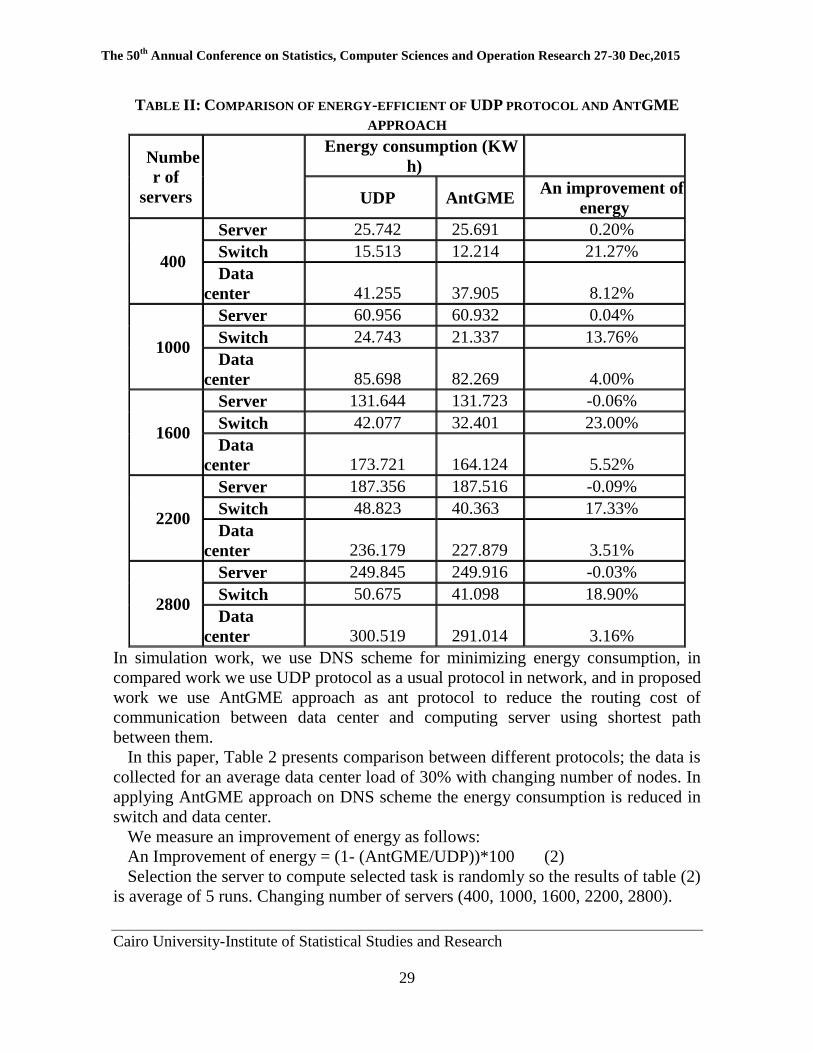
TABLE II: COMPARISON OF ENERGY-EFFICIENT OF UDP PROTOCOL AND ANTGME
APPROACH
Numbe
r of
servers
Energy consumption (KW
h)
UDP AntGME An improvement of
energy
400
Server 25.742 25.691 0.20%
Switch 15.513 12.214 21.27%
Data
center 41.255 37.905 8.12%
1000
Server 60.956 60.932 0.04%
Switch 24.743 21.337 13.76%
Data
center 85.698 82.269 4.00%
1600
Server 131.644 131.723 -0.06%
Switch 42.077 32.401 23.00%
Data
center 173.721 164.124 5.52%
2200
Server 187.356 187.516 -0.09%
Switch 48.823 40.363 17.33%
Data
center 236.179 227.879 3.51%
2800
Server 249.845 249.916 -0.03%
Switch 50.675 41.098 18.90%
Data
center 300.519 291.014 3.16%
In simulation work, we use DNS scheme for minimizing energy consumption, in
compared work we use UDP protocol as a usual protocol in network, and in proposed
work we use AntGME approach as ant protocol to reduce the routing cost of
communication between data center and computing server using shortest path
between them.
In this paper, Table 2 presents comparison between different protocols; the data is
collected for an average data center load of 30% with changing number of nodes. In
applying AntGME approach on DNS scheme the energy consumption is reduced in
switch and data center.
We measure an improvement of energy as follows:
An Improvement of energy = (1- (AntGME/UDP))*100 (2)
Selection the server to compute selected task is randomly so the results of table (2)
is average of 5 runs. Changing number of servers (400, 1000, 1600, 2200, 2800).
The 50th
Annual Conference on Statistics, Computer Sciences and Operation Research 27-30 Dec,2015
Cairo University-Institute of Statistical Studies and Research
30
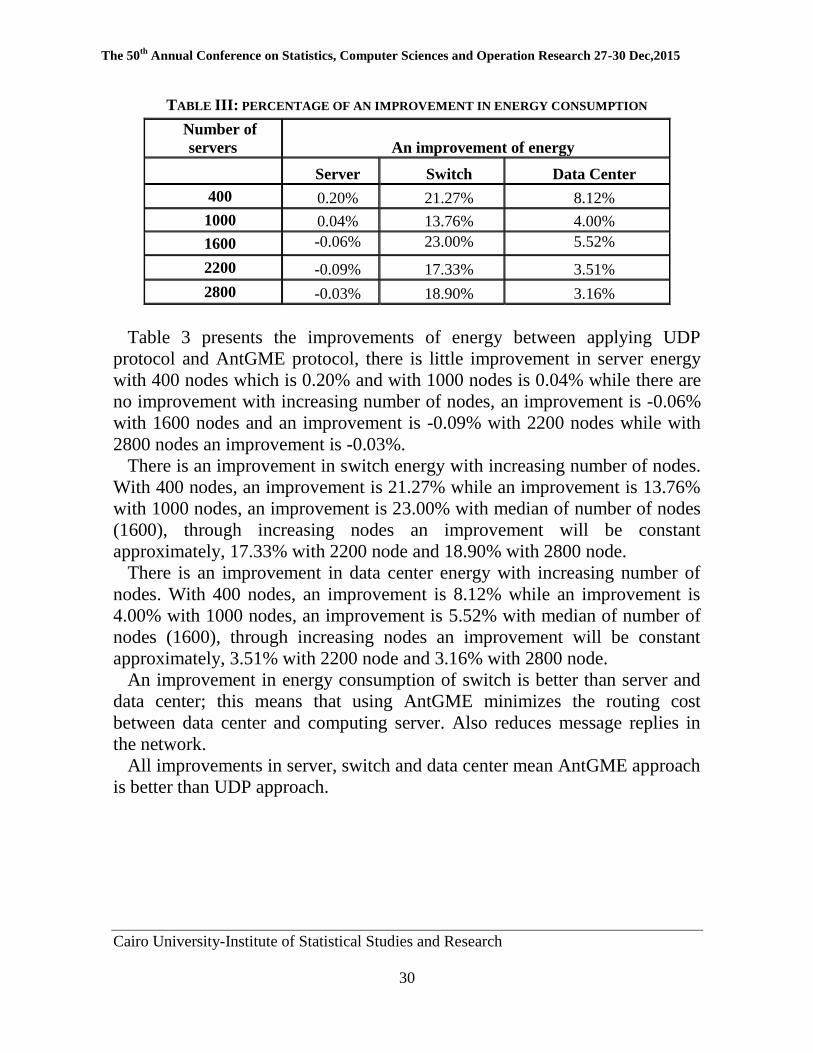
TABLE III: PERCENTAGE OF AN IMPROVEMENT IN ENERGY CONSUMPTION
Number of
servers An improvement of energy
Server Switch Data Center
400 0.20% 21.27% 8.12%
1000 0.04% 13.76% 4.00%
1600 -0.06% 23.00% 5.52%
2200 -0.09% 17.33% 3.51%
2800 -0.03% 18.90% 3.16%
Table 3 presents the improvements of energy between applying UDP
protocol and AntGME protocol, there is little improvement in server energy
with 400 nodes which is 0.20% and with 1000 nodes is 0.04% while there are
no improvement with increasing number of nodes, an improvement is -0.06%
with 1600 nodes and an improvement is -0.09% with 2200 nodes while with
2800 nodes an improvement is -0.03%.
There is an improvement in switch energy with increasing number of nodes.
With 400 nodes, an improvement is 21.27% while an improvement is 13.76%
with 1000 nodes, an improvement is 23.00% with median of number of nodes
(1600), through increasing nodes an improvement will be constant
approximately, 17.33% with 2200 node and 18.90% with 2800 node.
There is an improvement in data center energy with increasing number of
nodes. With 400 nodes, an improvement is 8.12% while an improvement is
4.00% with 1000 nodes, an improvement is 5.52% with median of number of
nodes (1600), through increasing nodes an improvement will be constant
approximately, 3.51% with 2200 node and 3.16% with 2800 node.
An improvement in energy consumption of switch is better than server and
data center; this means that using AntGME minimizes the routing cost
between data center and computing server. Also reduces message replies in
the network.
All improvements in server, switch and data center mean AntGME approach
is better than UDP approach.
The 50th
Annual Conference on Statistics, Computer Sciences and Operation Research 27-30 Dec,2015
Cairo University-Institute of Statistical Studies and Research
31
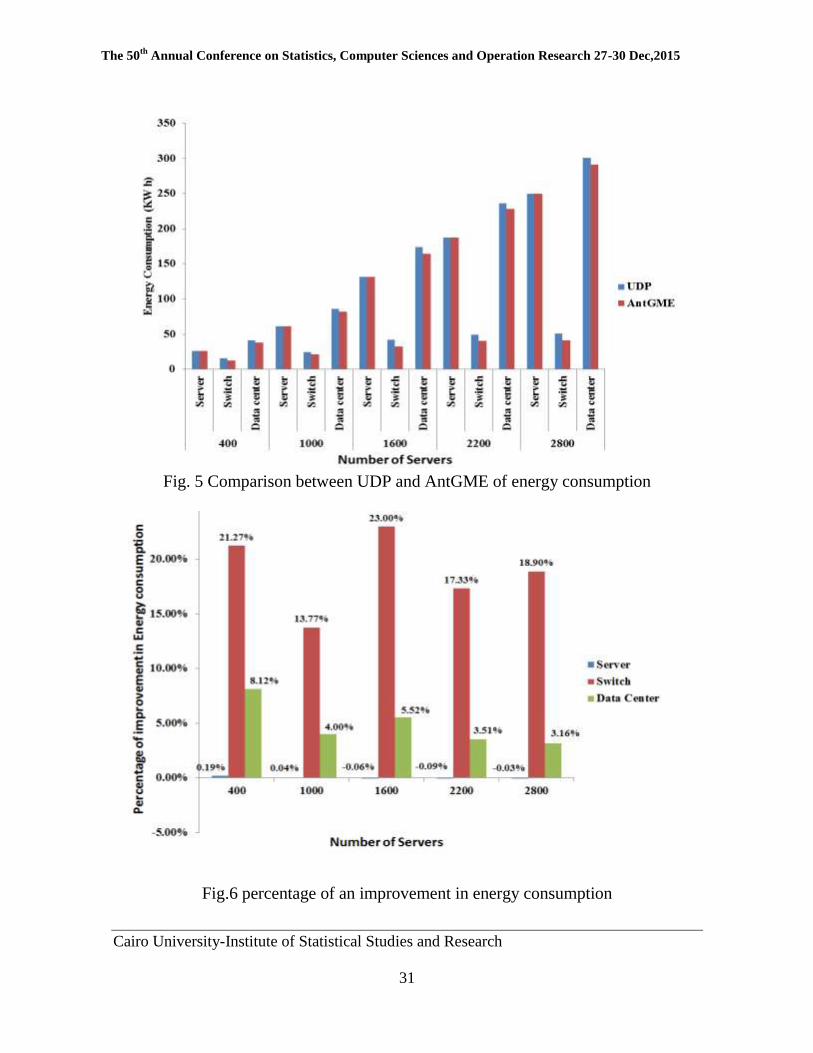
Fig. 5 Comparison between UDP and AntGME of energy consumption
Fig.6 percentage of an improvement in energy consumption

The 50th
Annual Conference on Statistics, Computer Sciences and Operation Research 27-30 Dec,2015
Cairo University-Institute of Statistical Studies and Research
32
VII. CONCLUSION AND FUTURE WORK In this paper, we present a proposed approach to minimize energy in cloud computing, which is based on AntNet algorithm. It stores routes in forward and backward paths which reduces cost of routing between data center and computing servers.
The AntGME approach reduces energy consumption especially in switch; this fact is very clear from results of simulation. Also there is general improvement of energy in switch and data center with changing in number of servers but improvement energy consumption in server is bad because the approach try to find shortest path to computing servers which are the destination to the proposed approach, there are not effect of proposed approach on energy server.
From Comparison between AntGME and UDP, we conclude the proposed approach is better than the compared approach especially in energy consumption in switch because the percentage of improvement is better than server and data center.
At result, the proposed approach is better than compared approach in minimizing energy consumption of cloud computing.
Future work focus on measuring packet delivery ratio, Packet Received, Throughput
and End-to-end Delay which describe the reasons of reduction energy consumption.
The 50th
Annual Conference on Statistics, Computer Sciences and Operation Research 27-30 Dec,2015
Cairo University-Institute of Statistical Studies and Research
33
REFERENCES
1. S.K.Garg , R.Buyya, “Green Cloud computing and Environmental
Sustainability”, Dept. of Computer Science and Software Engineering The
University of Melbourne, Australia,2011
2. Polepalli B.R., “ANTSENS – AN ANT BASED ROUTING PROTOCOL
FOR LARGE SCALE WIRELESS SENSOR NETWORKS”, M.Thesis,
Wisconsin Milwaukee University, U.S.A, Aug. 2009.
3. D.Kliazovich, P.Bouvry, S.U.Khan, “GreenCloud: a packet-level simulator of
energy-aware cloud computing data centers”, Springer Science+Business
Media, LLC, pp. 1263-1283, Nov. 2010.
4. D.Kliazovich, P.Bouvry, S.U.Khan,” DENS: data center energy-efficient
network-aware scheduling”, Springer Science+Business Media, LLC, Sep.
2011
5. C.Gong, J. Liu, Q. Zhang, H. Chen, Z.Gong, “The Characteristics of Cloud
Computing”, 39th International Conference on Parallel Processing
Workshops, 2010
6. J.Yang, Z.Chen, “Cloud Computing Research and Security Issues”, 978-1-
4244-5392-4/10, IEEE, 2010
7. Anusuya, Krishnapriya, “Green Cloud: A Pocket-Level Simulator with On-
Demand Protocol for Energy-Aware Cloud Data Centers”, International
Journal of Science and Research (IJSR), Vol 3 Issue 2, Feb.2014
8. G.Portaluri, S.Giordano, D.Kliazovich, B. Dorronsoro, “A Power Efficient
Genetic Algorithm for Resource Allocation in Cloud Computing Data
Centers”, IEEE 3rd International Conference, 2014
9. Wissam.C, Chansu.Y, “Survey on Power Management Techniques for
Energy Efficient Computer Systems”, Cleveland State University, 2003.
The 50th
Annual Conference on Statistics, Computer Sciences and Operation Research 27-30 Dec,2015
Cairo University-Institute of Statistical Studies and Research
34
10. Chia.-M.W, Ruay.-S.C, Hsin.-Y.C, “A green energy-efficient scheduling
algorithm using DVFS technique for cloud datacenters”, Future Generation
Computer Systems, 2013, http://dx.doi.org/10.1016/j.future.2013.06.009
11. B.S.Gill, S.k.Gill, P.Jain, “Analysis of Energy Aware Data Center using
Green Cloud Simulator in Cloud Computing”, International Journal of
Computer Trends and Technology (IJCTT) –Vol. 5 number 3 – Nov. 2013
12. P.Lalbakhsh, B.Zaeri, Mehdi.N.Fesharaki, N.Sohrabi, “Swarm Simulation
and Performance Evaluation”, 10th WSEAS Int. Conf. on Automatic Control,
Modelling & Simulation (ACMOS'08), Istanbul, Turkey, May. 2008
13. A.Goel, S.Goel, “Security Issues in Cloud Computing”, IJAIEM, Volume 1,
Issue 4, Dec.2012
14. A.Asma , M.A.Chaurasia and H.Mokhtar, “Cloud Computing Security
Issues”, IJAIEM, Vol. 1, Issue 4, Oct. 2012
The 50th
Annual Conference on Statistics, Computer Sciences and Operation Research 27-30 Dec,2015
Cairo University-Institute of Statistical Studies and Research
35
On Emotion Recognition using EEG
Mohammed A. AbdelAal, Assem A. Alsawy, Hesham A. Hefny
Abstract
Emotion recognition got a lot of interests from many researchers recently. Emotion
recognition is the process of detecting, analyzing and recognizing a user's emotional
state. EEG is a method to measure the electrical activity of the brain, which can be
recorded through a set of electrodes placed on the scalp. This paper gives an overview
of emotion recognition using EEG, and also it compares the most recent approaches
that used the same dataset. Finally, it recommends the most important features and the
best classifiers that brought the highest accuracy.
Keywords: Emotion Recognition, Electroencephalography (EEG), Machine
Learning, Affective Computing, Human-Computer Interaction (HCI), DEAP dataset.
1. Introduction
Emotions are important part in the communication process between people. Facial
expression and the way of speech have a huge impact on the meaning of what the
others will understand. The word “OK” with an emotion of anger or discontent will
give an impression that, it is just a compelled acceptance, but on the other hand, the
same word with an emotion of happiness will give an impression of satisfaction.
Despite the importance of emotions in people communications, most of currently
human-computer interaction (HCI) systems lack the ability to recognize and
understand emotions of the user that interact with them. Effective computing is a new
research field that has an increasing interest in the last period. Affective computing is
interested in study and design systems that can recognize, interpret and simulate the
affective state of humans [1].
2. Emotions
The following subsections discuss some issues related to emotions, such as
emotion definition, emotion representation and emotion observation.
2.1. Emotion definition
Emotion refers to the changes in the psychological and physical state as a response
to internal or external stimulus event, but there is no widespread consensus on the
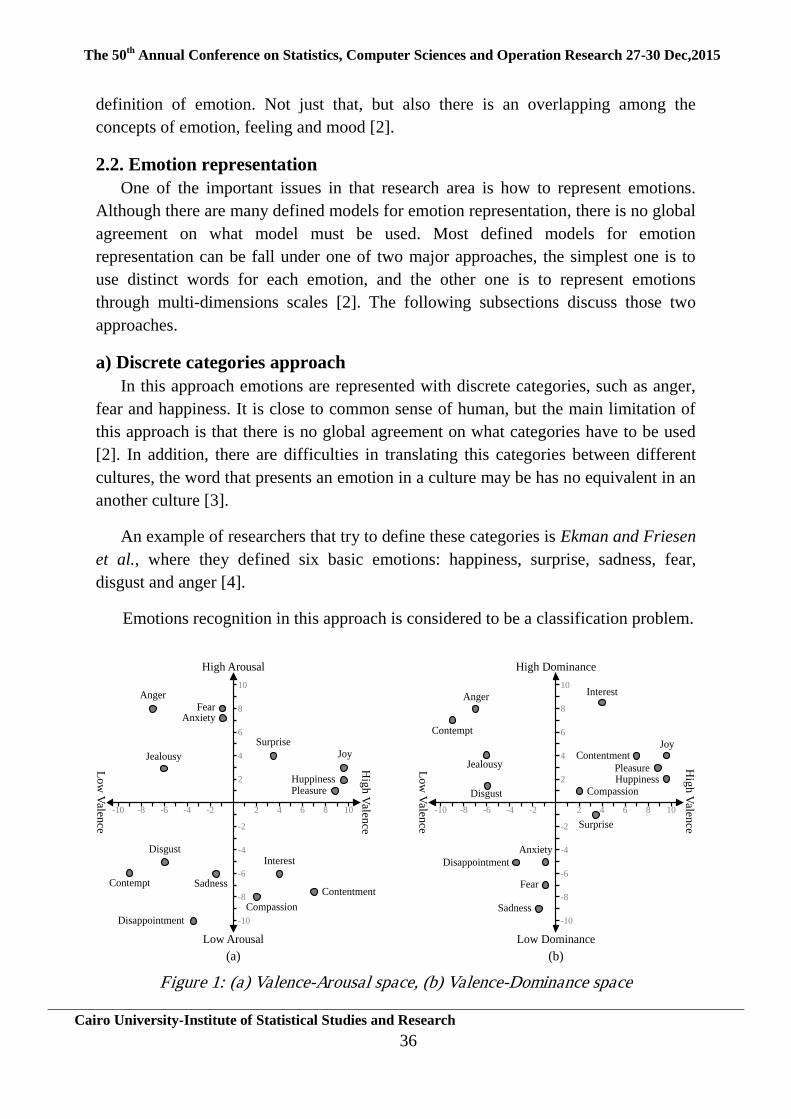
The 50th
Annual Conference on Statistics, Computer Sciences and Operation Research 27-30 Dec,2015
Cairo University-Institute of Statistical Studies and Research
36
definition of emotion. Not just that, but also there is an overlapping among the
concepts of emotion, feeling and mood [2].
2.2. Emotion representation
One of the important issues in that research area is how to represent emotions.
Although there are many defined models for emotion representation, there is no global
agreement on what model must be used. Most defined models for emotion
representation can be fall under one of two major approaches, the simplest one is to
use distinct words for each emotion, and the other one is to represent emotions
through multi-dimensions scales [2]. The following subsections discuss those two
approaches.
a) Discrete categories approach
In this approach emotions are represented with discrete categories, such as anger,
fear and happiness. It is close to common sense of human, but the main limitation of
this approach is that there is no global agreement on what categories have to be used
[2]. In addition, there are difficulties in translating this categories between different
cultures, the word that presents an emotion in a culture may be has no equivalent in an
another culture [3].
An example of researchers that try to define these categories is Ekman and Friesen
et al., where they defined six basic emotions: happiness, surprise, sadness, fear,
disgust and anger [4].
Emotions recognition in this approach is considered to be a classification problem.
High Dominance
Low Dominance
Disgust
Sadness
PleasureHuppiness
Jealousy
Contempt
Compassion
(b)
Disappointment
Fear
Surprise
Anxiety
AngerInterest
JoyContentment
2 4 6 8 10-2-4-6-8-10
2
4
6
8
10
-2
-4
-6
-8
-10
High Arousal
Low Arousal
(a)
Surprise
Anger
Jealousy
FearAnxiety
Contentment
Compassion
Interest
Sadness
Disappointment
Contempt
Disgust
Joy
HuppinessPleasure
2 4 6 8 10-2-4-6-8-10
2
4
6
8
10
-2
-4
-6
-8
-10
Hig
h V
alence
Low
Valen
ce
Hig
h V
alence
Low
Valen
ce
Figure 1: (a) Valence-Arousal space, (b) Valence-Dominance space
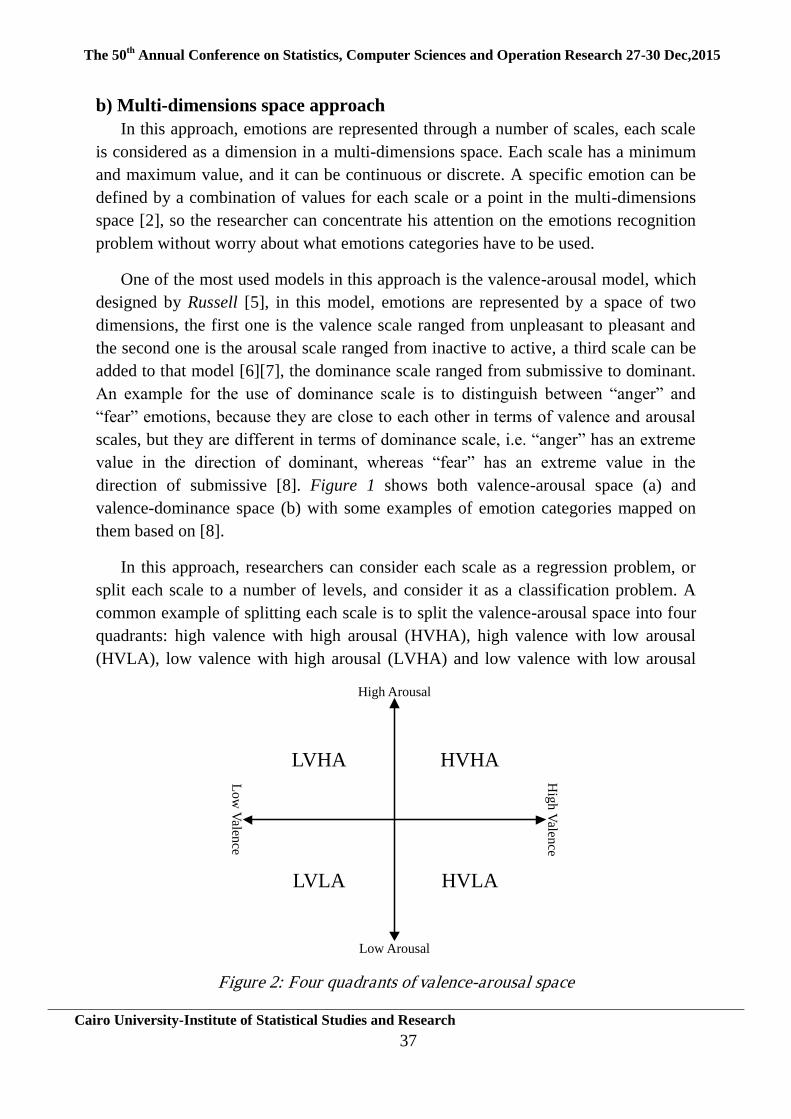
The 50th
Annual Conference on Statistics, Computer Sciences and Operation Research 27-30 Dec,2015
Cairo University-Institute of Statistical Studies and Research
37
b) Multi-dimensions space approach
In this approach, emotions are represented through a number of scales, each scale
is considered as a dimension in a multi-dimensions space. Each scale has a minimum
and maximum value, and it can be continuous or discrete. A specific emotion can be
defined by a combination of values for each scale or a point in the multi-dimensions
space [2], so the researcher can concentrate his attention on the emotions recognition
problem without worry about what emotions categories have to be used.
One of the most used models in this approach is the valence-arousal model, which
designed by Russell [5], in this model, emotions are represented by a space of two
dimensions, the first one is the valence scale ranged from unpleasant to pleasant and
the second one is the arousal scale ranged from inactive to active, a third scale can be
added to that model [6][7], the dominance scale ranged from submissive to dominant.
An example for the use of dominance scale is to distinguish between “anger” and
“fear” emotions, because they are close to each other in terms of valence and arousal
scales, but they are different in terms of dominance scale, i.e. “anger” has an extreme
value in the direction of dominant, whereas “fear” has an extreme value in the
direction of submissive [8]. Figure 1 shows both valence-arousal space (a) and
valence-dominance space (b) with some examples of emotion categories mapped on
them based on [8].
In this approach, researchers can consider each scale as a regression problem, or
split each scale to a number of levels, and consider it as a classification problem. A
common example of splitting each scale is to split the valence-arousal space into four
quadrants: high valence with high arousal (HVHA), high valence with low arousal
(HVLA), low valence with high arousal (LVHA) and low valence with low arousal
High Arousal
LVHA HVHA
LVLA HVLA
Low Arousal
Hig
h V
alence
Low
Valen
ce
Figure 2: Four quadrants of valence-arousal space

The 50th
Annual Conference on Statistics, Computer Sciences and Operation Research 27-30 Dec,2015
Cairo University-Institute of Statistical Studies and Research
38
(LVLA) [9]. Figure 2 shows these four quadrants, which resulting from splitting the
valence-arousal space.
2.3. Emotion observation
Emotions can be observed through many non-verbal ways, such as facial
expressions, voice intonation and body movement. Emotion can also be observed
through internal physiological signals, such as heart rate, skin conductance,
respiration, galvanic skin response (GSR), electroencephalography (EEG),
magnetoencephalography (MEG), position emission tomography (PET) and functional
magnetic resonance imaging (fMRI). The ways that based on physiological signals are
considered more reliable than other ways specially signals from central nerves system
(CNS), such as EEG, MEG, PET and fMRI [10]. EEG is now the most used modality
in the field of brain-computer interface (BCI) and has a great attention recently [11],
so the rest of this paper focus on the use of EEG for emotion recognition.
3. Electroencephalography (EEG)
EEG is a method to measure the electrical activity of the brain and it can be
recorded through a set of electrodes placed on the scalp [12], EEG first appearance
was in 1924 [12], it is usually used in medical fields like study epilepsy or sleep
disorders, it is non-invasive method with a high temporal resolution [11].
The electrodes, channels, are placed on the scalp according to a standard system
called the international 10-20 system, which introduced by the American
Fp2Fp1
F7
T7
P7
CP5
C3 Cz C4 T8
P8
OzO1 O2
PO3 PO4
P4
CP6
PzP3
F8
AF4
Fz
AF3
F3
FC1 FC2 FC6
F4
FC5
CP2CP1
Figure 3: International 10-20 system with 32 channels
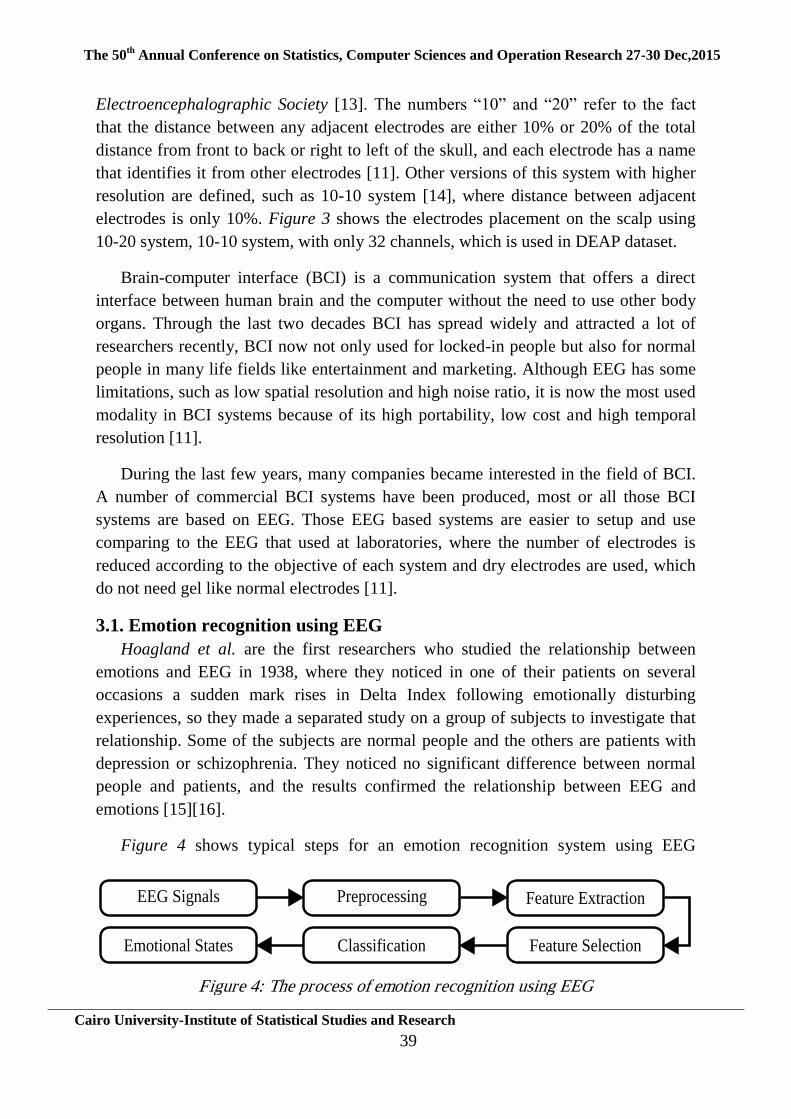
The 50th
Annual Conference on Statistics, Computer Sciences and Operation Research 27-30 Dec,2015
Cairo University-Institute of Statistical Studies and Research
39
Electroencephalographic Society [13]. The numbers “10” and “20” refer to the fact
that the distance between any adjacent electrodes are either 10% or 20% of the total
distance from front to back or right to left of the skull, and each electrode has a name
that identifies it from other electrodes [11]. Other versions of this system with higher
resolution are defined, such as 10-10 system [14], where distance between adjacent
electrodes is only 10%. Figure 3 shows the electrodes placement on the scalp using
10-20 system, 10-10 system, with only 32 channels, which is used in DEAP dataset.
Brain-computer interface (BCI) is a communication system that offers a direct
interface between human brain and the computer without the need to use other body
organs. Through the last two decades BCI has spread widely and attracted a lot of
researchers recently, BCI now not only used for locked-in people but also for normal
people in many life fields like entertainment and marketing. Although EEG has some
limitations, such as low spatial resolution and high noise ratio, it is now the most used
modality in BCI systems because of its high portability, low cost and high temporal
resolution [11].
During the last few years, many companies became interested in the field of BCI.
A number of commercial BCI systems have been produced, most or all those BCI
systems are based on EEG. Those EEG based systems are easier to setup and use
comparing to the EEG that used at laboratories, where the number of electrodes is
reduced according to the objective of each system and dry electrodes are used, which
do not need gel like normal electrodes [11].
3.1. Emotion recognition using EEG
Hoagland et al. are the first researchers who studied the relationship between
emotions and EEG in 1938, where they noticed in one of their patients on several
occasions a sudden mark rises in Delta Index following emotionally disturbing
experiences, so they made a separated study on a group of subjects to investigate that
relationship. Some of the subjects are normal people and the others are patients with
depression or schizophrenia. They noticed no significant difference between normal
people and patients, and the results confirmed the relationship between EEG and
emotions [15][16].
Figure 4 shows typical steps for an emotion recognition system using EEG
EEG Signals Preprocessing Feature Extraction
Feature SelectionClassificationEmotional States
Figure 4: The process of emotion recognition using EEG
The 50th
Annual Conference on Statistics, Computer Sciences and Operation Research 27-30 Dec,2015
Cairo University-Institute of Statistical Studies and Research
40
signals. The first step after signal acquisition is signal preprocessing, where EEG
signals are prepared for farther processing steps, this preparation can include noise
reduction, artifact removing and signal down-sampling [11]. The second step is
feature extraction, where EEG signals are mapped into feature vectors, which are
more suitable for applying machine learning techniques. To reduce the computational
costs in the classification step, the dimensions of the feature vectors are reduced
through applying a selection method that select the most important and discriminant
features. Finally a classification method is applied to recognize the emotional state.
3.2. Extracted Features from EEG signals
Scientists found that EEG signal comprises a set of signals. Each signal exists in a
specific frequency band and related to some biological phenomena, so they gave a
label to each signal. Five major frequency bands have been defined: delta (below 4
Hz), theta (4-7 Hz), alpha (8-12 Hz), beta (12-30 Hz), and gamma (30-100 Hz). A
frequency domain method, such as Fourier transform, is used to extract different
frequency bands from EEG signal for each channel [11].
After decomposing EEG signal into previously mentioned frequency bands, many
features can be calculated, such as spectral power [9], statistical measurements (e.g.
mean, variance and standard division) [17][18], energy [19], entropy features [18] and
Hjorth parameters [18].
Harman and Ray [20] were the first to compare the left and right hemisphere in
context of emotional state on normal subjects. A significant difference between both
hemispheres was found, so most studies on emotion recognition compare features of
electrodes on the left hemisphere with features of the identical opposite electrodes on
the right hemisphere. These electrodes are called symmetrical pairs of electrodes.
3.3. DEAP, a dataset for emotion analysis using physiological signals
Many researchers collected the data they need by themselves. Most of those data
are small and from few participants. Koelstra et al. [9] attempted to fill this gap by
collecting a relatively large dataset called DEAP dataset.
In this dataset, 32 participants have watched 40 one-minute long excerpts of music
videos. EEG and peripheral physiological signals, such as GSR, blood volume,
respiration amplitude and skin temperature, were recorded for each participant. In
addition, for 22 participants, a camera was used to record participant face video. The
combination of a specific participant watching a specific music video is called a
“trial”. After each trial, the participant gives a rate for valence, arousal and dominance
scales, in addition to liking and familiarity scales. The objective of researchers who

The 50th
Annual Conference on Statistics, Computer Sciences and Operation Research 27-30 Dec,2015
Cairo University-Institute of Statistical Studies and Research
41
will work on that datasets is to predict the participant rating of different scales for
each trial.
4. Literature review
In this subsection we will present a number of studies for EEG-based emotion
recognition using DEAP dataset, followed by a summary for those studies in Table 1.
Koelstra et al. [9], the authors of DEAP dataset, investigated the correlation
between EEG signal frequencies and participants' ratings. They perform a single-trial
classification for the scales of valence, arousal and liking using features extracted
from the EEG, peripheral physiological signals and multimedia content analysis
modalities. For EEG modality, the spectral power of theta, slow alpha, alpha, beta and
gamma bands for each electrode was extracted. In addition the spectral power
asymmetry between all symmetrical pairs of electrodes in the four bands of alpha,
beta, theta and gamma was also extracted. The total number of extracted features of
EEG signals was 216. Fisher’s linear discriminant analysis (Fisher’s LDA) was used
for feature selection with a threshold at 0.3. The three scales of valence, arousal and
liking were split into two classes (low and high), and a Gaussian naïve Bayes
classifier was used to deal with those three different binary classification problems.
Due to the existence of unbalanced classes in some scales, F1-scores in addition to
accuracy were used to evaluate the classification performance in a leave-one-out
cross-validation scheme. The average accuracies were 57.6%, 62.0% and 55.4% for
valence, arousal and liking respectively, and the F1-scores were 56.3%, 58.3% and
50.2%. The results of EEG-based classification were slightly better than random
classification.
Matiko et al. [17] presented a fuzzy based classification algorithm of positive and
negative emotions. In this work, fuzzy rules are defined based on previous studies
showing that there is a correlation of negative and positive emotions with activation of
right and left hemispheres of the human brain [21][22]. Alpha band was filtered for all
symmetrical pairs of electrodes, and for each electrode four statistical features were
computed, they are mean, standard deviation and mean of the absolute values of the
first and second differences. In addition to statistical features, the signal power of the
alpha band was also computed. The authors also proposed a new feature that referred
as the oscillation feature, which obtained by finding all local maxima and local
minima of the signal. After feature extraction step, Fisher’s LDA was used to reduce
the high dimension feature space into low dimension space. The results of feature
reduction step show that the signal power and oscillation features have a higher
discrimination ratio than other features. Each fuzzy rule has two inputs: the value of a
specific feature for an electrode and the same value of the other corresponding pair
The 50th
Annual Conference on Statistics, Computer Sciences and Operation Research 27-30 Dec,2015
Cairo University-Institute of Statistical Studies and Research
42
electrode, and one output, which is the valence. Three linguistic variables: low,
medium and high were used for the input features and five linguistic variables: very
low, low, medium, high and very high were used for the output valence. The average
accuracy was 62.62% in a 10-fold cross-validation scheme. The used fuzzy based
classifier was compared to Gaussian naïve Bayes and SVM classifiers. The results
show that the fuzzy based algorithm was better than the Gaussian naïve Bayes and
SVM classifiers.
Jirayucharoensak et al. [23] investigated the usage of deep learning network
(DLN) for emotion recognition. The input features of the network are the power
spectral densities of all electrodes in five frequencies (theta, lower alpha, upper alpha,
beta and gamma), and also the difference between the power spectral of all
symmetrical pairs of electrodes in the same five frequencies. The total number of
extracted features was 230. Principle component analysis (PCA) is used to handle the
over-fitting problem of the DLN by selecting the most important features. The 50
most important features were extracted by PCA and were fed into the DLN with 50
hidden nodes in each layer. Covariate shift adaptation (CSA) concept is applied to
solve the non-stationarity problem in EEG signals. The DLN is implemented with a
stacked auto-encoder using hierarchical feature learning approach. The outputs of the
network are valence and arousal scales, and each one has been split into three levels.
The classification accuracy was measured with a leave-one-out cross-validation
scheme. The average accuracy for valence and arousal was 53.42% and 52.03%
respectively. The used DLN classifier outperformed a SVM classifier, which has been
compared to it.
Daimi and Saha [19] presented a novel approach for emotion classification using
Dual-Tree Complex Wavelet Packet Transform (DT-CWPT) based energy features
from EEG. First, energy features are extracted by decomposing each channel of EEG
using DT-CWPT, and also difference between energy features of all symmetrical pairs
of electrodes on right and left cortical hemisphere are extracted. Then, feature
selection is performed to eliminate weak and redundant features through singular
value decomposition (SVD), QR factorization with column pivoting (QRcp) and F-
Ratio based feature selection method. Then, the selected features are used to classify
emotion using SVM. Finally, F1-score and accuracy are used to evaluate classification
performance in a leave-one-out cross-validation scheme. The average accuracies were
65.3%, 66.9%, 69.1% and 71.2% for valence, arousal, dominance and like
respectively, and the F1-scores were 55.0%, 57.0%, 55.2% and 50.9%.
Chen et al. [18] proposed an EEG-based emotion assessment system. They
combined ontologies for the management of EEG- and emotion-related information,
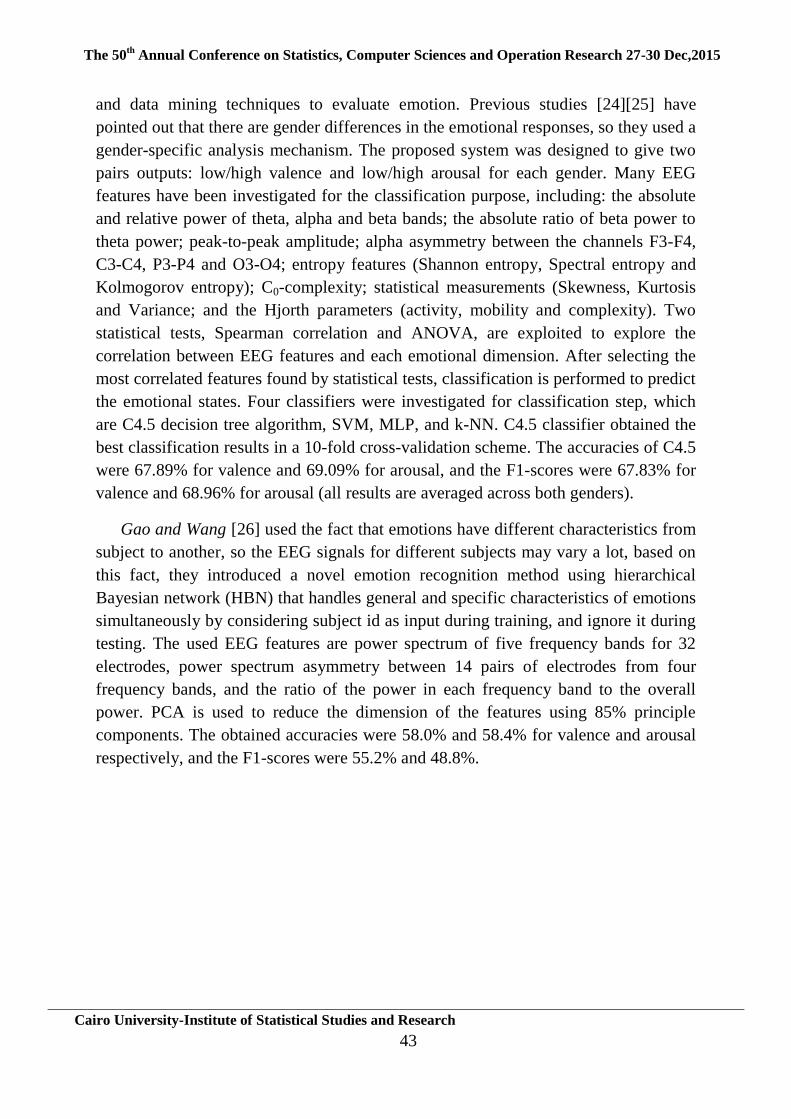
The 50th
Annual Conference on Statistics, Computer Sciences and Operation Research 27-30 Dec,2015
Cairo University-Institute of Statistical Studies and Research
43
and data mining techniques to evaluate emotion. Previous studies [24][25] have
pointed out that there are gender differences in the emotional responses, so they used a
gender-specific analysis mechanism. The proposed system was designed to give two
pairs outputs: low/high valence and low/high arousal for each gender. Many EEG
features have been investigated for the classification purpose, including: the absolute
and relative power of theta, alpha and beta bands; the absolute ratio of beta power to
theta power; peak-to-peak amplitude; alpha asymmetry between the channels F3-F4,
C3-C4, P3-P4 and O3-O4; entropy features (Shannon entropy, Spectral entropy and
Kolmogorov entropy); C0-complexity; statistical measurements (Skewness, Kurtosis
and Variance; and the Hjorth parameters (activity, mobility and complexity). Two
statistical tests, Spearman correlation and ANOVA, are exploited to explore the
correlation between EEG features and each emotional dimension. After selecting the
most correlated features found by statistical tests, classification is performed to predict
the emotional states. Four classifiers were investigated for classification step, which
are C4.5 decision tree algorithm, SVM, MLP, and k-NN. C4.5 classifier obtained the
best classification results in a 10-fold cross-validation scheme. The accuracies of C4.5
were 67.89% for valence and 69.09% for arousal, and the F1-scores were 67.83% for
valence and 68.96% for arousal (all results are averaged across both genders).
Gao and Wang [26] used the fact that emotions have different characteristics from
subject to another, so the EEG signals for different subjects may vary a lot, based on
this fact, they introduced a novel emotion recognition method using hierarchical
Bayesian network (HBN) that handles general and specific characteristics of emotions
simultaneously by considering subject id as input during training, and ignore it during
testing. The used EEG features are power spectrum of five frequency bands for 32
electrodes, power spectrum asymmetry between 14 pairs of electrodes from four
frequency bands, and the ratio of the power in each frequency band to the overall
power. PCA is used to reduce the dimension of the features using 85% principle
components. The obtained accuracies were 58.0% and 58.4% for valence and arousal
respectively, and the F1-scores were 55.2% and 48.8%.
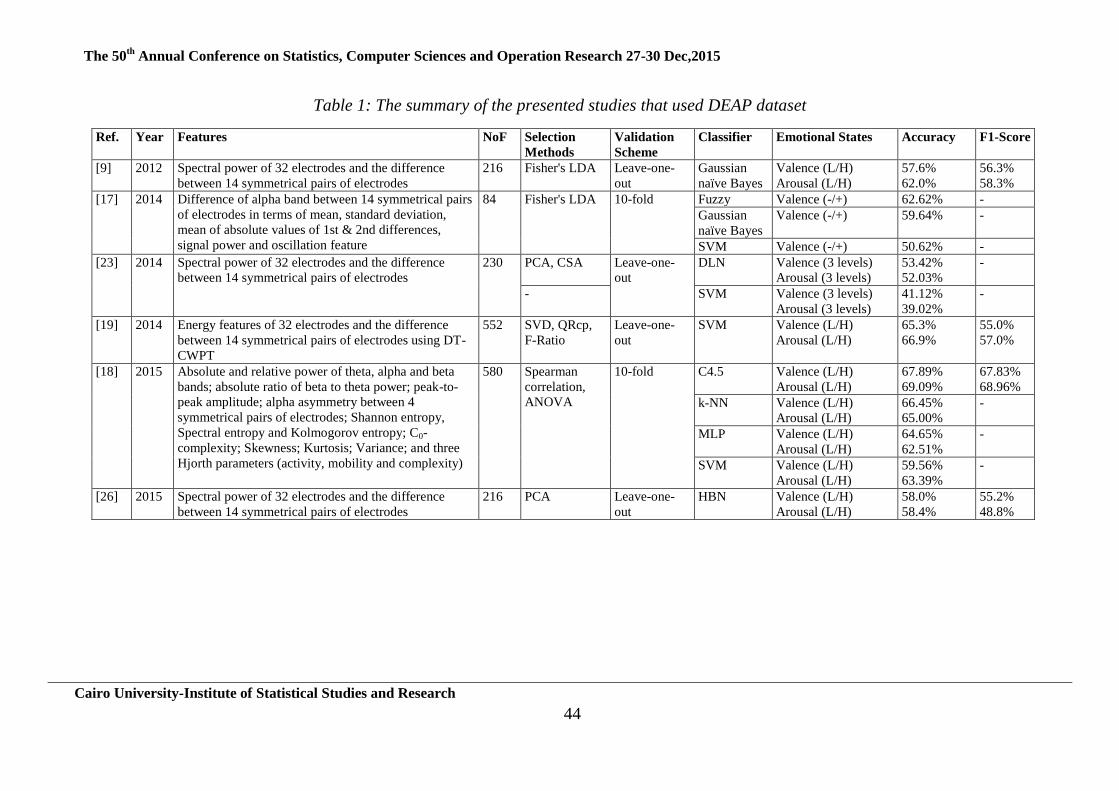
The 50th
Annual Conference on Statistics, Computer Sciences and Operation Research 27-30 Dec,2015
Cairo University-Institute of Statistical Studies and Research
44
Table 1: The summary of the presented studies that used DEAP dataset
Ref. Year Features NoF Selection
Methods
Validation
Scheme
Classifier Emotional States Accuracy F1-Score
[9] 2012 Spectral power of 32 electrodes and the difference
between 14 symmetrical pairs of electrodes
216 Fisher's LDA Leave-one-
out
Gaussian
naïve Bayes
Valence (L/H)
Arousal (L/H)
57.6%
62.0%
56.3%
58.3%
[17] 2014 Difference of alpha band between 14 symmetrical pairs
of electrodes in terms of mean, standard deviation,
mean of absolute values of 1st & 2nd differences,
signal power and oscillation feature
84 Fisher's LDA 10-fold Fuzzy Valence (-/+) 62.62% -
Gaussian
naïve Bayes
Valence (-/+) 59.64% -
SVM Valence (-/+) 50.62% -
[23] 2014 Spectral power of 32 electrodes and the difference
between 14 symmetrical pairs of electrodes
230 PCA, CSA Leave-one-
out
DLN Valence (3 levels)
Arousal (3 levels)
53.42%
52.03%
-
- SVM Valence (3 levels)
Arousal (3 levels)
41.12%
39.02%
-
[19] 2014 Energy features of 32 electrodes and the difference
between 14 symmetrical pairs of electrodes using DT-
CWPT
552 SVD, QRcp,
F-Ratio
Leave-one-
out
SVM Valence (L/H)
Arousal (L/H)
65.3%
66.9%
55.0%
57.0%
[18] 2015 Absolute and relative power of theta, alpha and beta
bands; absolute ratio of beta to theta power; peak-to-
peak amplitude; alpha asymmetry between 4
symmetrical pairs of electrodes; Shannon entropy,
Spectral entropy and Kolmogorov entropy; C0-
complexity; Skewness; Kurtosis; Variance; and three
Hjorth parameters (activity, mobility and complexity)
580 Spearman
correlation,
ANOVA
10-fold C4.5 Valence (L/H)
Arousal (L/H)
67.89%
69.09%
67.83%
68.96%
k-NN Valence (L/H)
Arousal (L/H)
66.45%
65.00%
-
MLP Valence (L/H)
Arousal (L/H)
64.65%
62.51%
-
SVM Valence (L/H)
Arousal (L/H)
59.56%
63.39%
-
[26] 2015 Spectral power of 32 electrodes and the difference
between 14 symmetrical pairs of electrodes
216 PCA Leave-one-
out
HBN Valence (L/H)
Arousal (L/H)
58.0%
58.4%
55.2%
48.8%
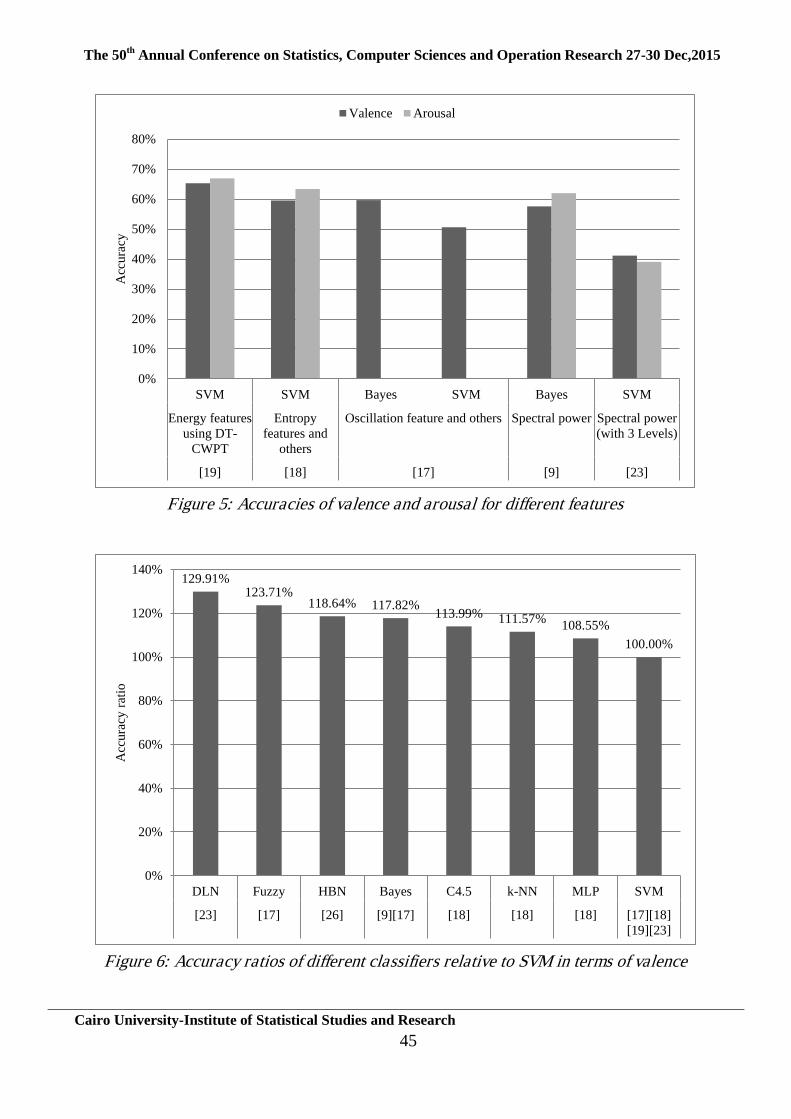
The 50th
Annual Conference on Statistics, Computer Sciences and Operation Research 27-30 Dec,2015
Cairo University-Institute of Statistical Studies and Research
45
0%
10%
20%
30%
40%
50%
60%
70%
80%
SVM SVM Bayes SVM Bayes SVM
Energy features
using DT-
CWPT
Entropy
features and
others
Oscillation feature and others Spectral power Spectral power
(with 3 Levels)
[19] [18] [17] [9] [23]
Acc
ura
cy
Valence Arousal
129.91% 123.71%
118.64% 117.82% 113.99% 111.57%
108.55%
100.00%
0%
20%
40%
60%
80%
100%
120%
140%
DLN Fuzzy HBN Bayes C4.5 k-NN MLP SVM
[23] [17] [26] [9][17] [18] [18] [18] [17][18]
[19][23]
Acc
ura
cy r
atio
Figure 5: Accuracies of valence and arousal for different features
Figure 6: Accuracy ratios of different classifiers relative to SVM in terms of valence
The 50th
Annual Conference on Statistics, Computer Sciences and Operation Research 27-30 Dec,2015
Cairo University-Institute of Statistical Studies and Research
46
5. Discussion
Based on the literature review, the following results can be elicited:
All the presented studies split emotional scales into 2 levels except
Jirayucharoensak et al. [23] split them into 3 levels, which is mostly the reason
why they has the worst accuracy among other studies, so it is unfair to judge DLN
method without taking into account the number of levels.
The method that used by Matiko et al. [17] to test different classifiers is somehow
strange. The common method is to use the most important features from all pairs
of electrodes as inputs to the classifier, but they used the features of each pair of
electrodes separately and after calculating the accuracy of each pair, the mean of
accuracies is calculated and used.
Both Koelstra et al. [9] and Matiko et al. [17] have tested the Gaussian naïve
Bayes classifier with the same feature selection method, but each of them used
different extracted features. [17] achieved a slightly better accuracy than [9]. It is
not enough to differentiate between these two methods because they used a
different validation scheme.
Both Koelstra et al. [9] and Gao and Wang [26] used the spectral power features,
but [9] used Gaussian naïve Bayes classifier with Fisher's LDA for feature
selection, while [26] used HBN classifier with PCA for feature selection. No
significant difference between both studies in terms of valence, but [9]
outperformed [26] in terms of arousal.
Both Matiko et al. [17] and Daimi and Saha [19] have tested SVM, but with
different extracted features. [19] outperformed [17] with 15% difference in
accuracy. Although they used a different validation scheme, the difference in
accuracy is bigger to be affected only by the validation scheme. The main reason
for that difference is features that have been used by [19].
Both Matiko et al. [17] and Chen et al. [18] have tested SVM with 10-fold
validation scheme, but each one used different features. [18] outperformed [17]
with 9% difference in accuracy. This difference is due to the features that have
been used in [18].
The reason for the good results that achieved by Daimi and Saha [19] is the
method that has been used for feature extraction, DT-CWPT, comparing to the use
of predefined frequency bands of theta, alpha, beta and gamma.
Chen et al. [18] have achieved the best results among other presented studies. The
reasons for that are the used features and the gender-specific mechanism.
The used features can be ordered by its effect on the accuracy as the following (see
Figure 5):
1. Energy features using DT-CWPT.
The 50th
Annual Conference on Statistics, Computer Sciences and Operation Research 27-30 Dec,2015
Cairo University-Institute of Statistical Studies and Research
47
2. Entropy features, C0-complexity, Hjorth parameters, Statistical features,
Peak-to-peak amplitude, absolute and relative power of theta, alpha and beta
bands, absolute ratio of beta power to theta power and alpha asymmetry.
3. Oscillation feature, signal power, mean and standard deviation.
4. Spectral power.
For the sake of ordering classifiers, the effects of the used features need to be
removed. SVM is the most used classifier in the literature, so other classifiers were
compared to it. The accuracies of all classifiers are computed as a relative ratio to
the accuracy of SVM in terms of valence (see Figure 6). The used classifiers can
be ordered by its effect on the accuracy as the following:
1. DLN.
2. Fuzzy based classification algorithm.
3. HBN.
4. Gaussian naïve Bayes.
5. C4.5 decision tree algorithm.
6. k-NN.
7. MLP.
8. SVM.
Conclusion
EEG is a useful method for recognizing emotion of human being, by comparing
the most recent approaches for emotion recognition using EEG, the one can conclude
that: the most significant features are energy using DT-CWPT, entropy, C0-
complexity, Hjorth parameters, statistical measures and peak-to-peak amplitude, and
the most accurate classifier is DLN then fuzzy based classification algorithm. In the
future work, a new approach will be designed based on combination techniques by
merging the most accurate classifiers with the most significant features.
References
[1] Rosalind W. Picard. "Affective Computing." MIT Media Laboratory Perceptual
Computing Section Technical Report No. 321 (1995).
[2] Klaus R. Scherer. "What are emotions? And how can they be measured?." Social
Science Information 44, no. 4 (2005): 695-729.
[3] Mohammad Soleymani, Sander Koelstra, Ioannis Patras, and Thierry Pun.
"Continuous Emotion Detection in Response to Music Videos." In IEEE
International Conference on Automatic Face & Gesture Recognition and
Workshops (FG 2011), pp. 803-808. IEEE, 2011.
[4] Paul Ekman, Wallace V. Friesen, Maureen O'Sullivan, Anthony Chan, Irene
Diacoyanni-Tarlatzis, Karl Heider, Rainer Krause, William Ayhan LeCompte,
Tom Pitcairn, Pio E. Ricci-Bitti, Klaus Scherer, Masatoshi Tomita, and Athanase
The 50th
Annual Conference on Statistics, Computer Sciences and Operation Research 27-30 Dec,2015
Cairo University-Institute of Statistical Studies and Research
48
Tzavaras. "Universals and Cultural Differences in the Judgments of Facial
Expressions of Emotion." Journal of personality and social psychology 53, no. 4
(1987): 712-717.
[5] James A. Russell. "A circumplex model of affect." Journal of Personality and
Social Psychology 39, no. 6 (1980): 1161-1178.
[6] James A. Russell, and Albert Mehrabian. "Evidence for a three-factor theory of
emotions." Journal of Research in Personality 11, no. 3 (1977): 273-294.
[7] Albert Mehrabian. "Pleasure-arousal-dominance: A general framework for
describing and measuring individual differences in Temperament." Current
Psychology 14, no. 4 (1996): 261-292.
[8] Johnny R.J. Fontaine, Klaus R. Scherer, Etienne B. Roesch, and Phoebe C.
Ellsworth. "The World of Emotions is not Two-Dimensional." Psychological
Science 18, no. 12 (2007): 1050-1057.
[9] Sander Koelstra, Christian Mühl, Mohammad Soleymani, Jong-Seok Lee,
Ashkan Yazdani, Touradj Ebrahimi, Thierry Pun, Anton Nijholt, and Ioannis
Patras. "DEAP: A Database for Emotion Analysis using Physiological Signals."
IEEE Transactions on Affective Computing 3, no. 1 (2012): 18-31.
[10] Panagiotis C. Petrantonakis, and Leontios J. Hadjileontiadis. "Emotion
Recognition from Brain Signals Using Hybrid Adaptive Filtering and Higher
Order Crossings Analysis." IEEE Transactions on Affective Computing 1, no. 2
(2010): 81-97.
[11] Luis Fernando Nicolas-Alonso, and Jaime Gomez-Gil. "Brain Computer
Interfaces, a Review." Sensors 12, no. 2 (2012): 1211-1279.
[12] Sylvain Baillet, John C. Mosher, and Richard M. Leahy. "Electromagnetic brain
mapping." IEEE Signal Processing Magazine 18, no. 6 (2001): 14-30.
[13] Herbert H. Jasper. "The ten-twenty electrode system of the International
Federation." Electroencephalography and Clinical Neurophysiology 10 (1958):
371-375.
[14] American Clinical Neurophysiology Society. "Guideline 5: Guidelines for
Standard Electrode Position Nomenclature." Journal of Clinical
Neurophysiology 32, no. 2 (2006): 107-110.
[15] Hudson Hoagland, D. Ewen Cameron, and Morton A. Rubin. "Emotion in man
as Tested by the Delta Index of the Electroencephalogram: I." The Journal of
General Psychology 19, no. 2 (1938): 227-245.
[16] Hudson Hoagland, D. Ewen Cameron, and Morton A. Rubin. "The
electroencephalogram of schizophrenics during insulin treatments." The
American Journal of Psychiatry 94, no. 1 (1937): 183-208.
[17] Joseph W. Matiko, Stephen P. Beeby, and John Tudor. "Fuzzy logic based
emotion classification." In IEEE International Conference on Acoustics, Speech
and Signal Processing (ICASSP), pp. 4389-4393. IEEE, 2014.
[18] Jing Chen, Bin Hu, Philip Moore, Xiaowei Zhang, and Xu Ma.
"Electroencephalogram-based emotion assessment system using ontology and
data mining techniques." Applied Soft Computing 29 (2015): 663-674.
[19] Syed Naser Daimi, and Goutam Saha. "Classification of emotions induced by
The 50th
Annual Conference on Statistics, Computer Sciences and Operation Research 27-30 Dec,2015
Cairo University-Institute of Statistical Studies and Research
49
music videos and correlation with participants’ rating." Expert Systems with
Applications 41, no. 13 (2014): 6057-6065.
[20] David W. Harman, and William J. Ray. "Hemispheric activity during affective
verbal stimuli: An EEG study." Neuropsychologia 15, no. 3 (1977): 457-460.
[21] Louis A. Schmidt, and Laurel J. Trainor. "Frontal brain electrical activity (EEG)
distinguishes valence and intensity of musical emotions." Cognition and Emotion
15, no. 4 (2001): 487-500.
[22] Robert E. Wheeler, Richard J. Davidson, and Andrew J. Tomarken. "Frontal
brain asymmetry and emotional reactivity: A biological substrate of affective
style." Psychophysiology 30, no. 1 (1993): 82-89.
[23] Suwicha Jirayucharoensak, Setha Pan-Ngum, and Pasin Israsena. "EEG-Based
Emotion Recognition Using Deep Learning Network with Principal Component
Based Covariate Shift Adaptation." The Scientific World Journal 2014 (2014):
Article ID 627892, 10 pages.
[24] Margaret M. Bradley, Maurizio Codispoti, Dean Sabatinelli, and Peter J. Lang.
"Emotion and motivation II: Sex differences in picture processing." Emotion 1,
no. 3 (2001): 300-319.
[25] Batja Mesquita. "Emotions as dynamic cultural phenomena." In Handbook of
affective sciences, pp. 871-890. Oxford University Press, 2003.
[26] Zhen Gao, and Shangfei Wang. "Emotion Recognition from EEG Signals using
Hierarchical Bayesian Network with Privileged Information." In Proceedings of
the 5th ACM on International Conference on Multimedia Retrieval, pp. 579-582.
ACM, 2015.
The 50th
Annual Conference on Statistics, Computer Sciences and Operation Research 27-30 Dec,2015
Cairo University-Institute of Statistical Studies and Research
50
Evaluation of an Aspect Oriented Approach for SaaS Customization
Areeg Samir*, Abdelaziz Khamis**, and Ashraf A. Shahin*
Abstract
Software as a Service (SaaS) applications provide resources that need to be customized in order
to satisfy various tenants‘ requirements. In a previous paper, we proposed a SaaS application
customization approach to provide a tenant administrator with a suitable way for customizing
SaaS applications and validating each customization during run time. In this paper, we provide
an evaluation of a previous approach by giving a detailed comparison with other approaches, and
by showing the performance of our approach with and without applying aspects. The evaluation
shows the ability of our approach to deal with all variability and constraint dependencies.
Moreover, the comparison with other researches demonstrates that the more SaaS applications
have the ability to be customized, validated, and adapted to the changes during run time, the
more they become upgradable, maintainable, adaptable, understandable, and secure.
Keywords: Cloud computing, Software as a Service, SaaS Application Customization, Aspect-
Oriented Programming, Orthogonal Variability Model, Metagraph, AO4BPEL.
1. Introduction
Cloud computing is a model for enabling convenient, on-demand network access to a shared
pool of configurable computing resources that can be rapidly delivered with a minimal
management effort or service provider interaction [1].
Software as a Service is a software delivery model in which software resources are accessed
remotely by clients [2]. The SaaS delivery model is focused on bringing down the cost by
offering the same instance of an application to as many customers, i.e. supporting multi-tenants.
Multi-tenancy is one of the most important concepts for any SaaS application.
SaaS applications need to be customizable to fulfill the varying functional and quality
requirements of individual tenants [3]. The elements of an application that need to be customized
include Graphical User Interface (GUI), Workflow (business process logic), Service selection
and configuration, and Data [4]. Several researches have attempted to support customization of
these elements [2, 5, 6, 7, and 8]. In this paper, we propose an evaluation approach for SaaS
applications customization [9].
The remainder of the paper is organized as follows. In section 2, a brief background information
about a previous work has been given. Section 3, provides a detailed evaluation of the previous
approach. At the end, section 4 provides a conclusion and future work.
Department of Computer and Information Sciences, Institute of Statistical Studies & Research, Cairo University, Egypt ** Department of Computer and Information Sciences, Arab East College for Graduate Studies, Riyadh, Kingdom of Saudi Arabia
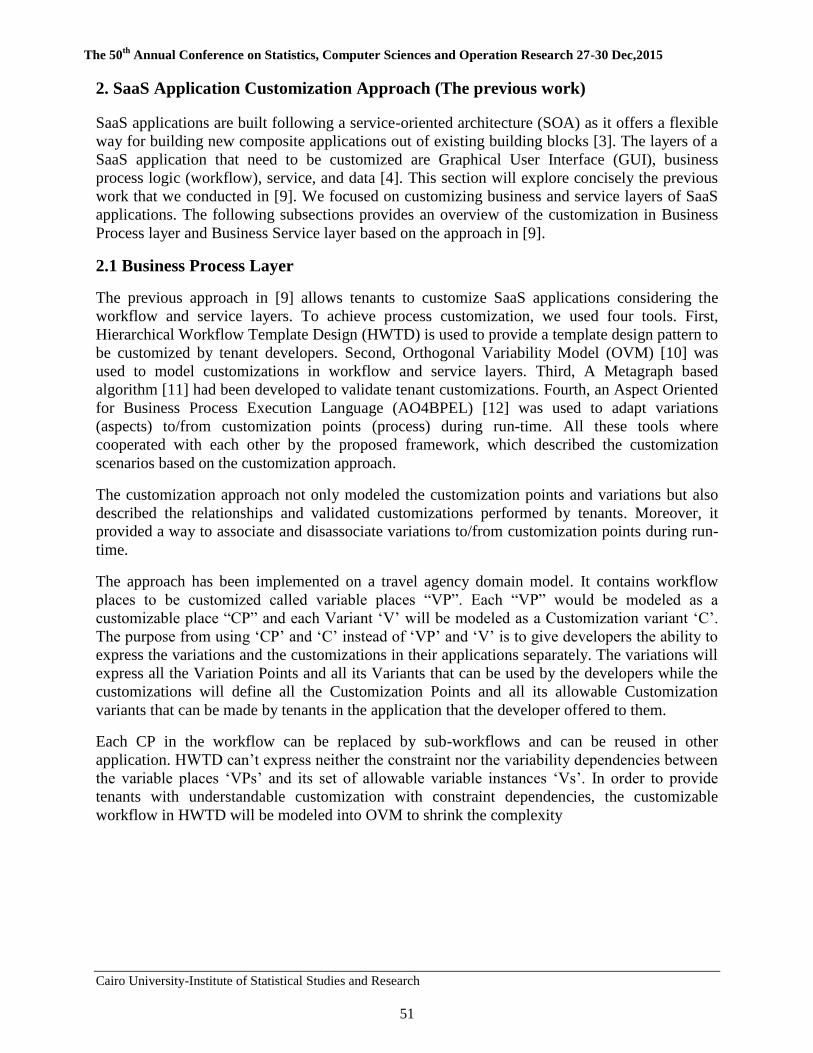
The 50th
Annual Conference on Statistics, Computer Sciences and Operation Research 27-30 Dec,2015
Cairo University-Institute of Statistical Studies and Research
51
2. SaaS Application Customization Approach (The previous work)
SaaS applications are built following a service-oriented architecture (SOA) as it offers a flexible
way for building new composite applications out of existing building blocks [3]. The layers of a
SaaS application that need to be customized are Graphical User Interface (GUI), business
process logic (workflow), service, and data [4]. This section will explore concisely the previous
work that we conducted in [9]. We focused on customizing business and service layers of SaaS
applications. The following subsections provides an overview of the customization in Business
Process layer and Business Service layer based on the approach in [9].
2.1 Business Process Layer
The previous approach in [9] allows tenants to customize SaaS applications considering the
workflow and service layers. To achieve process customization, we used four tools. First,
Hierarchical Workflow Template Design (HWTD) is used to provide a template design pattern to
be customized by tenant developers. Second, Orthogonal Variability Model (OVM) [10] was
used to model customizations in workflow and service layers. Third, A Metagraph based
algorithm [11] had been developed to validate tenant customizations. Fourth, an Aspect Oriented
for Business Process Execution Language (AO4BPEL) [12] was used to adapt variations
(aspects) to/from customization points (process) during run-time. All these tools where
cooperated with each other by the proposed framework, which described the customization
scenarios based on the customization approach.
The customization approach not only modeled the customization points and variations but also
described the relationships and validated customizations performed by tenants. Moreover, it
provided a way to associate and disassociate variations to/from customization points during run-
time.
The approach has been implemented on a travel agency domain model. It contains workflow
places to be customized called variable places ―VP‖. Each ―VP‖ would be modeled as a
customizable place ―CP‖ and each Variant ‗V‘ will be modeled as a Customization variant ‗C‘.
The purpose from using ‗CP‘ and ‗C‘ instead of ‗VP‘ and ‗V‘ is to give developers the ability to
express the variations and the customizations in their applications separately. The variations will
express all the Variation Points and all its Variants that can be used by the developers while the
customizations will define all the Customization Points and all its allowable Customization
variants that can be made by tenants in the application that the developer offered to them.
Each CP in the workflow can be replaced by sub-workflows and can be reused in other
application. HWTD can‘t express neither the constraint nor the variability dependencies between
the variable places ‗VPs‘ and its set of allowable variable instances ‗Vs‘. In order to provide
tenants with understandable customization with constraint dependencies, the customizable
workflow in HWTD will be modeled into OVM to shrink the complexity

The 50th
Annual Conference on Statistics, Computer Sciences and Operation Research 27-30 Dec,2015
Cairo University-Institute of Statistical Studies and Research
52
and the size of the variability models by documenting the variability and not the commonalities
in a separate model.
However, OVM does not provide tools to validate tenant‘s customizations therefore the
Metagraph has been used to mapped OVM CP and CV into vertices and convert the variability
and constraint dependencies to edges labeled with qualitative attributes, defined on the
generating set. After that, to manipulate the Metagraph, an adjacency matrix representation of the
Metagraph will be constructed to store all the valid customizations, and to keep the possible
simple paths of different customizations. Finally, the previous approach has used the incidence
matrix to store all the validated customizations by the developer in the database.
A Metagraph-based validation algorithm has been developed to validate tenants‘ customizations
across SaaS applications through achieving four key concerns. First, how to model the
customization points and variations. Second, how to describe the relationships among variations.
Third, how to validate customizations performed by tenants. Fourth, how to associate and
disassociate variations to/from customization points during run-time.
The algorithm takes four inputs such as Metagraph (M), Initial Customizable Points (ICP),
cardinality matrix (R), and set of customizations performed by the tenant. It produces four
outputs, which are the validated Metagraph of Tenant (MT), tenant Invalid Customization (IC),
tenant customization Validation Flag (VF), and the Completeness Flag (CF) that works as
indicator to check the completeness of the tenant customization.
To put all the preceding mentioned steps together, a SaaS framework had been proposed. The
framework consisted of several components. The Customization Validation unit, which
implements the validation algorithm. SaaS-Customization-Data that stores the developer SaaS
customization data. The Validated-Customization-Data, a storage contains only the validated
customization. Process Store unit that stores all valid customizable points as processes. Service
Store unit contains the web services. Validation UI unit allows administrators to define their
customization sets and send a request to the Customization-Validation unit to validate these sets.
Application UI unit accepts requests from tenant end users. The AO4BPEL engine retrieves the
relevant validation customization data for tenant from the Validated-Customization-Data, and
then waves the corresponding process (CP) and aspects (CV) to perform the user request.
2.2 Service Layer
To customize a web service, providers need to identify commonalities and variations across the
scope of their SaaS application. Identified commonalities are realized as core services that exist
in all customized applications. Identified variations are realized as variant services. Tenants
customize web services by selecting one or more of these variation web services. Each
customizable service will be modeled into OVM with a Customization Point ‗CP‘ and one or
more Customization variants. ‗C‘. A customizable

The 50th
Annual Conference on Statistics, Computer Sciences and Operation Research 27-30 Dec,2015
Cairo University-Institute of Statistical Studies and Research
53
service contained one mandatory core service and at least one optional customization variant
services.
3. Evaluation of the SaaS Application Customization Approach
In this section, we provide an evaluation of the SaaS customization approach. The following
subsections provide a comparison with some related works, and then evaluate the performance of
the previous approach [9] that has been discussed briefly in the previous section.
3.1 Comparison with Related Work
The previous SaaS customization approach followed the composition-based customization
approach, which provided tenants with the ability to customize SaaS applications by selecting
variant components from a provided set of components. In addition to the previous proposed
approach, there are examples of other research papers that follow the composition-based
customization approach include [3], [8], and [13-16].
The proposed approach dealt with all the previous mentioned concerns in section 2 by providing
the tenants with simple and understandable customization model, developing a customization
validation algorithm, and making use of the aspect-oriented approach to handle the runtime
customization. On the other hand, many of the other related work partially addressed these
concerns such as [3], [4], and [13-14]. Achieving the four concerns allow SaaS applications to
be:
More secure, through validating tenants‘ customization to ensure its correctness and
prohibiting the threats that may happen by tenants during customization procedure.
More upgradable, the SaaS application providers can upgrade their applications by
adding new customizations at any time without having to reengineering existing ones. In
addition, providers can expect the effects of their upgrades on the tenants‘
customizations.
More understandable, this can be achieved by splitting the variability of the SaaS
applications from the commonalities in a separate model. Describing the relationships
between customization points and its related customization variants in a proper way.
Giving the SaaS application provider the ability to relate the customizations defined in
the customization model to other software development models. Furthermore, instead of
developing all the application, providers can develop specific components. Moreover,
providing a simple representation allows tenants to choose and understand their
customizations and its related dependencies easily.
More adaptable, this can occur by associating and disassociating tenants‘ customization
choices to/from customization points during run-time.
More maintainable, this can be addressed through modeling variability in a separate
model and reducing customization duplication that can be made by defining a new
component and this component existed before.
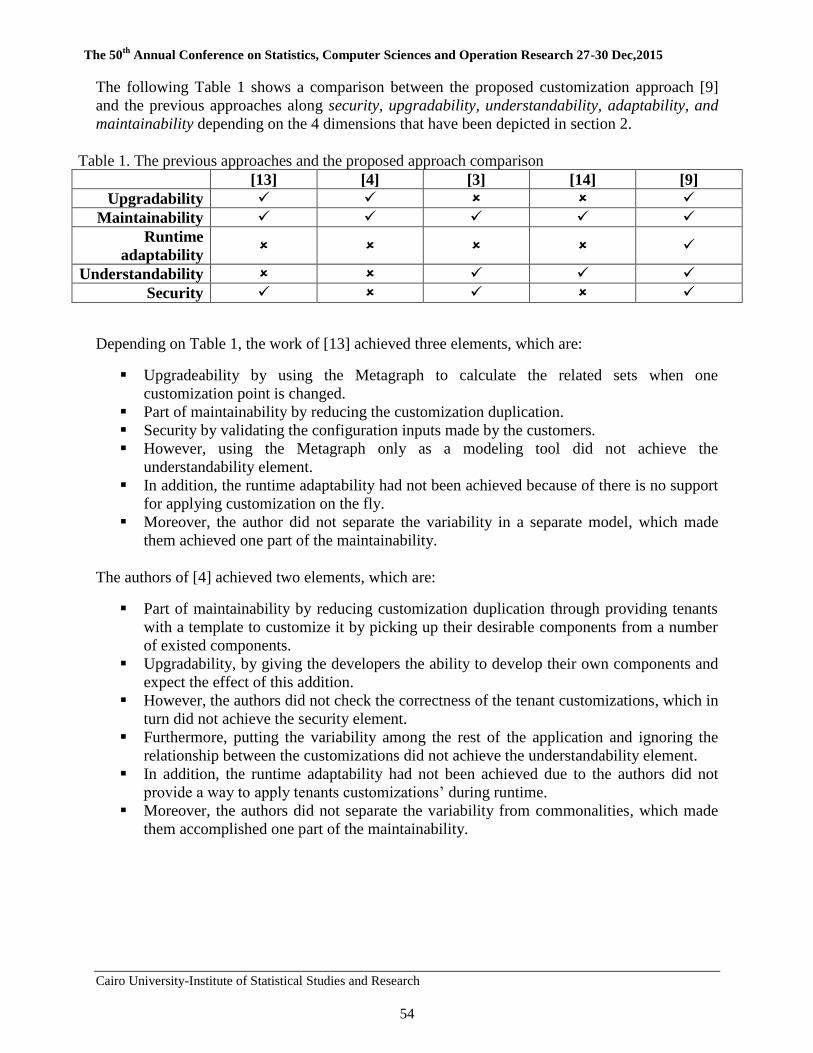
The 50th
Annual Conference on Statistics, Computer Sciences and Operation Research 27-30 Dec,2015
Cairo University-Institute of Statistical Studies and Research
54
The following Table 1 shows a comparison between the proposed customization approach [9]
and the previous approaches along security, upgradability, understandability, adaptability, and
maintainability depending on the 4 dimensions that have been depicted in section 2.
[13] [4] [3] [14] [9]
Upgradability
Maintainability
Runtime
adaptability
Understandability
Security
Depending on Table 1, the work of [13] achieved three elements, which are:
Upgradeability by using the Metagraph to calculate the related sets when one
customization point is changed.
Part of maintainability by reducing the customization duplication.
Security by validating the configuration inputs made by the customers.
However, using the Metagraph only as a modeling tool did not achieve the
understandability element.
In addition, the runtime adaptability had not been achieved because of there is no support
for applying customization on the fly.
Moreover, the author did not separate the variability in a separate model, which made
them achieved one part of the maintainability.
The authors of [4] achieved two elements, which are:
Part of maintainability by reducing customization duplication through providing tenants
with a template to customize it by picking up their desirable components from a number
of existed components.
Upgradability, by giving the developers the ability to develop their own components and
expect the effect of this addition.
However, the authors did not check the correctness of the tenant customizations, which in
turn did not achieve the security element.
Furthermore, putting the variability among the rest of the application and ignoring the
relationship between the customizations did not achieve the understandability element.
In addition, the runtime adaptability had not been achieved due to the authors did not
provide a way to apply tenants customizations‘ during runtime.
Moreover, the authors did not separate the variability from commonalities, which made
them accomplished one part of the maintainability.
Table 1. The previous approaches and the proposed approach comparison

The 50th
Annual Conference on Statistics, Computer Sciences and Operation Research 27-30 Dec,2015
Cairo University-Institute of Statistical Studies and Research
55
In [3] three elements have been achieved which are:
Understandability by splitting the variability in a separate model and modeling the
relationships between customizations.
Security (in small application) by guiding tenants through the customization.
Maintainability by reducing the customization duplication through choosing from existed
items and separating the variability from the commonalities using OVM.
However, the runtime adaptability had not been achieved because the author did not
apply tenants‘ customizations in runtime.
In addition, the security will not achieve its functionality properly, as in large SaaS
applications with many variants; the guiding process cannot help tenants in deciding
which variants should become part of their SaaS application.
Furthermore, the author did not provide a way to achieve upgradeability.
The work of [14] only achieved:
Part of understandability by separating the variability in a separate model without
modeling the relationships among customizations.
In addition, it achieved the Maintainability by reducing the customization duplication
through store all the customizable items and separating the variability from the
commonalities using OVM.
However, the work did not achieve three elements, which are the security, runtime
adaptability, and upgradeability elements.
The previous approach in [9] achieved the following:
Handled the security, by providing an algorithm that validates the correctness of the
customizations made by the tenants through using the Metagraph tool.
Achieved the upgradeability, through the Metagraph by allowing the developer to add new
components at any time without having to reengineering existing ones, and by giving them
the ability to upgrade each component independently.
Addressed the runtime adaptability through using AO4BPEL in order to apply tenant
customizations during runtime without stopping, rebinding, recompiling, or even
restarting the applications.
Solved understandability, by using OVM to: separate the variability from the
commonalities in the SaaS applications, model the relationships among customizations
(customization points and its customization variants), and relate the customizations
defined in the customization model to other software development models.
Increased maintainability, by having a separated model and by reducing customization
duplication, through allowing developers to provide a wide range of components and
enabling tenants to handle these components easily.

The 50th
Annual Conference on Statistics, Computer Sciences and Operation Research 27-30 Dec,2015
Cairo University-Institute of Statistical Studies and Research
56
However, the proposed approach in [9] illustrated some drawbacks, which are:
It requires more runtime; this problem happens due to the runtime customizations process
such as (storing, checking, composing and retrieving) and due to the database transactions.
In addition, if the SaaS application developers update the OVM model, they have to
update the corresponding Metagraph, which in turn increases the manual work especially
in large SaaS applications.
3.2 A Performance Evaluation of the Proposed Aspect Oriented Approach
To evaluate the performance of SaaS applications developed using the proposed aspect oriented
approach that have been mentioned in section 2 [9], different applications with different numbers
of customization points and customization variants have been developed. These applications are
developed with and without the approach in [9] to show the effect of the aspect on the process by
providing two test cases one without aspect and the other with the aspect.
The two test cases were run using the SoapUI Pro load test, which is a performance and
functionality test utility. It ―provides the ability to create advanced performance tests quickly,
modify them easily and validate a web service performance under different load scenarios‖ [17].
Table 2 shows the parameters used for the load tests. The Simple Strategy has been used to run a
specified number of requests using a randomized delay between requests. The Test Delay
measures delays in milliseconds (ms) between each response and next requests. The Total Run
indicates the number of concurrent requests, which is start from one request and increased until
ten requests. Finally, the Random that is the random factor of the test with a Test Delay of 1000
ms and a Random factor of 0.5, which is the actual delay that will be distributed uniformly
between 500 ms and 1000 ms.
The following test cases have been run on a virtual machine that has windows server 2008 R2,
Core2 Duo-2.80GHz processor, 40 GB HD, and 1 GB RAM. The two test cases will measure the
proposed approach performance by comparing the maximum, average, and minimum response
times of the application, while increasing the number of concurrent requests. The test case
without aspect is used to estimate the performance and overhead for the Payment application
without aspect under Apache ODE (Orchestration Director Engine).
Parameters Values Strategy Simple
Test Delay 1000 ms = 1 second Total Run Time 1:10
Random 0.5
Table 2. Load test parameter
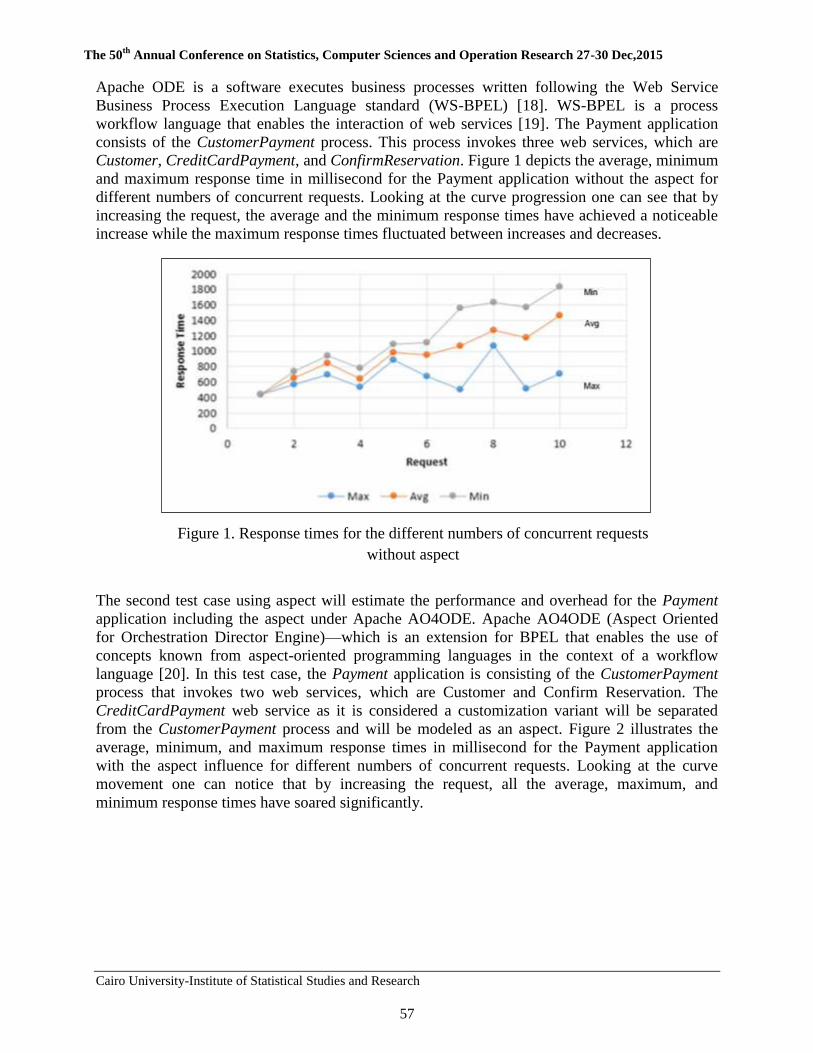
The 50th
Annual Conference on Statistics, Computer Sciences and Operation Research 27-30 Dec,2015
Cairo University-Institute of Statistical Studies and Research
57
Apache ODE is a software executes business processes written following the Web Service
Business Process Execution Language standard (WS-BPEL) [18]. WS-BPEL is a process
workflow language that enables the interaction of web services [19]. The Payment application
consists of the CustomerPayment process. This process invokes three web services, which are
Customer, CreditCardPayment, and ConfirmReservation. Figure 1 depicts the average, minimum
and maximum response time in millisecond for the Payment application without the aspect for
different numbers of concurrent requests. Looking at the curve progression one can see that by
increasing the request, the average and the minimum response times have achieved a noticeable
increase while the maximum response times fluctuated between increases and decreases.
The second test case using aspect will estimate the performance and overhead for the Payment
application including the aspect under Apache AO4ODE. Apache AO4ODE (Aspect Oriented
for Orchestration Director Engine)—which is an extension for BPEL that enables the use of
concepts known from aspect-oriented programming languages in the context of a workflow
language [20]. In this test case, the Payment application is consisting of the CustomerPayment
process that invokes two web services, which are Customer and Confirm Reservation. The
CreditCardPayment web service as it is considered a customization variant will be separated
from the CustomerPayment process and will be modeled as an aspect. Figure 2 illustrates the
average, minimum, and maximum response times in millisecond for the Payment application
with the aspect influence for different numbers of concurrent requests. Looking at the curve
movement one can notice that by increasing the request, all the average, maximum, and
minimum response times have soared significantly.
Figure 1. Response times for the different numbers of concurrent requests
without aspect
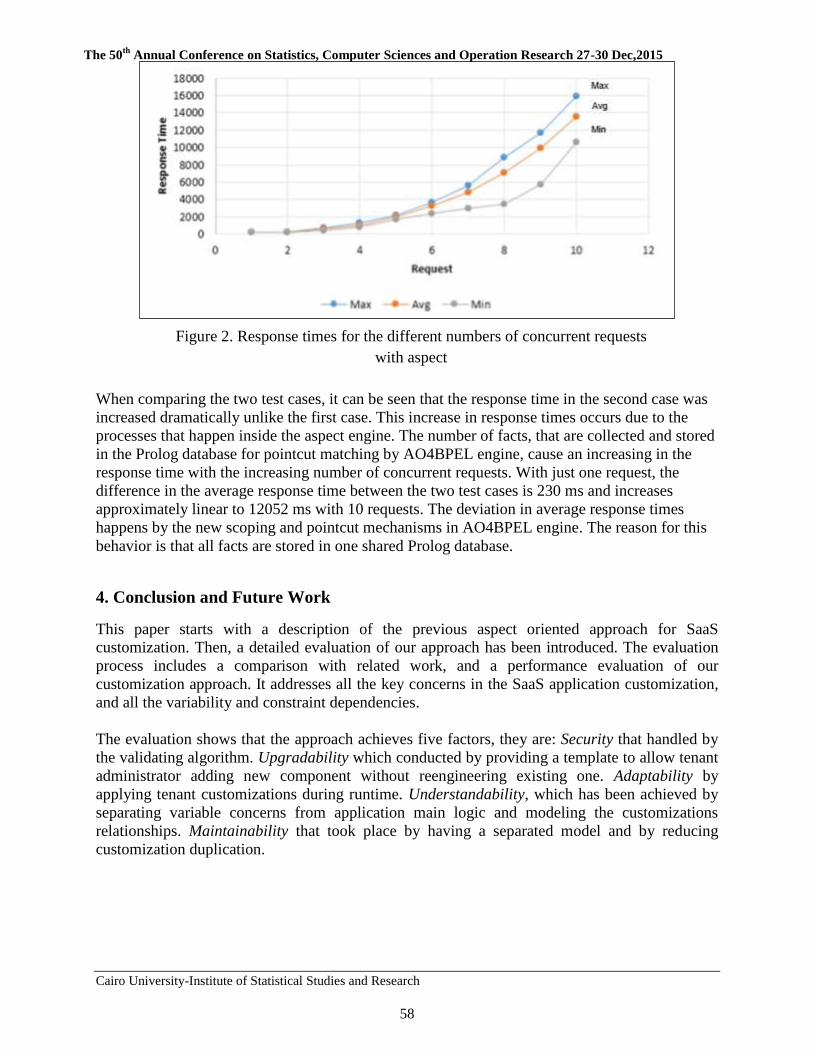
The 50th
Annual Conference on Statistics, Computer Sciences and Operation Research 27-30 Dec,2015
Cairo University-Institute of Statistical Studies and Research
58
When comparing the two test cases, it can be seen that the response time in the second case was
increased dramatically unlike the first case. This increase in response times occurs due to the
processes that happen inside the aspect engine. The number of facts, that are collected and stored
in the Prolog database for pointcut matching by AO4BPEL engine, cause an increasing in the
response time with the increasing number of concurrent requests. With just one request, the
difference in the average response time between the two test cases is 230 ms and increases
approximately linear to 12052 ms with 10 requests. The deviation in average response times
happens by the new scoping and pointcut mechanisms in AO4BPEL engine. The reason for this
behavior is that all facts are stored in one shared Prolog database.
4. Conclusion and Future Work
This paper starts with a description of the previous aspect oriented approach for SaaS
customization. Then, a detailed evaluation of our approach has been introduced. The evaluation
process includes a comparison with related work, and a performance evaluation of our
customization approach. It addresses all the key concerns in the SaaS application customization,
and all the variability and constraint dependencies.
The evaluation shows that the approach achieves five factors, they are: Security that handled by
the validating algorithm. Upgradability which conducted by providing a template to allow tenant
administrator adding new component without reengineering existing one. Adaptability by
applying tenant customizations during runtime. Understandability, which has been achieved by
separating variable concerns from application main logic and modeling the customizations
relationships. Maintainability that took place by having a separated model and by reducing
customization duplication.
Figure 2. Response times for the different numbers of concurrent requests
with aspect
The 50th
Annual Conference on Statistics, Computer Sciences and Operation Research 27-30 Dec,2015
Cairo University-Institute of Statistical Studies and Research
59
The proposed aspect oriented approach for SaaS customization has a slight drawback, which is
the runtime overhead. This problem happens due to runtime customizations and because of the
database transactions. Nevertheless, the advantages of the proposed approach outweigh the
disadvantages. Using AO4BPEL engine, tenant customizations can be applied during runtime
without stopping or even restarting the applications. The scoping mechanism in AO4BPEL
allows tenant customizations to be either global level, process level, or instance level. The
proposed approach provides a way to secure tenant‘s customizations, it prevents the
customization repetition across the SaaS application, and it uses fewer resources to achieve
tenant's customizations.
As a future work, we will improve the proposed aspect oriented approach to solve its drawback
and to provide a proper mechanism for guiding tenants through the customization process during
runtime.
References
[1] P. Mell and T. Grance, ―The NIST definition of cloud computing,‖ National Institute of
Standards and Technology, pp. 1-7, Jan. 2011.
[2] W. Lee and M. Choi, ―A multi-tenant web application framework for SaaS,‖ in 2012 IEEE
5th International Conference on Cloud Computing (CLOUD), 2012, pp. 970–971.
[3] R. Mietzner, A. Metzger, F. Leymann, and K. Pohl, ―Variability modeling to support
customization and deployment of multi-tenant-aware software as a service applications,‖ in
2009. PESOS 2009. ICSE Workshop on Principles of Engineering Service Oriented
Systems, 2009, pp. 18–25.
[4] W. Tsai, Q. Shao, and W. Li, ―OIC: Ontology-based intelligent customization framework
for SaaS,‖ in 2010 IEEE International Conference on Service-Oriented Computing and
Applications (SOCA), 2010, pp. 1–8.
[5] P. Aghera, S. Chaudhary, and V. Kumar, ―An approach to build multi-tenant SaaS
application with monitoring and SLA,‖ in 2012 International Conference on
Communication Systems and Network Technologies (CSNT), 2012, pp. 658–661.
[6] M. Pathirage, S. Perera, I. Kumara, and S. Weerawarana, ―A multi-tenant architecture for
business process executions,‖ in 2011 IEEE International Conference on Web Services
(ICWS), 2011, pp. 121–128.
[7] J. Lee, S. Kang, and S. J. Hur, ―Web-based development framework for customizing java-
based business logic of SaaS application,‖ in 2012 14th International Conference on
Advanced Communication Technology (ICACT), 2012, pp. 1310–1313.
[8] H. Moens, E. Truyen, S. Walraven, W. Joosen, B. Dhoedt, and F. De Turck, ―Developing
and managing customizable software as a service using feature model conversion,‖ in 2012
IEEE Network Operations and Management Symposium (NOMS), 2012, pp. 1295–1302.

The 50th
Annual Conference on Statistics, Computer Sciences and Operation Research 27-30 Dec,2015
Cairo University-Institute of Statistical Studies and Research
60
[9] S. Areeg, K. Abdelaziz, and S. Ashraf, "An Aspect-Oriented Approach for SaaS
Application Customization", in 2013 the 48 Annual Conference on Statistics, Computer
Sciences & Operation Research, 2013, pp. 16–30.
[10] K. Pohl, G. Böckle, and F. J. v. d. Linden, Software Product Line Engineering:
Foundations, Principles and Techniques. Secaucus, NJ, USA: Springer-Verlag New York,
Inc., 2005.
[11] A. Look, ―Expressive scoping and pointcut mechanisms for aspect-oriented web service
composition,‖ Master‘s thesis, Technische Universität Darmstadt, Germany, 2011.
[12] A. Basu and R. W. Blanning, Metagraphs and Their Applications. Springer
Science+Business Media, LLC, 233 Spring Street, New York, NY 10013, USA, 2006.
[13] C. Lizhen, W. Haiyang, J. Lin, and H. Pu, ―Customization modeling based on Metagraph
for multi-tenant applications,‖ in 2010 5th International Conference on Pervasive
Computing and Applications (ICPCA), 2010, pp. 255–260.
[14] W.-T. Tsai and X. Sun, ―SaaS multi-tenant application customization,‖ in 2013 IEEE 7th
International Symposium on Service Oriented System Engineering (SOSE), 2013, pp. 1–12
[15] J. Park, M. Moon, and K. Yeom, ―Variability modeling to develop flexible service-oriented
applications,‖ Journal of Systems Science and Systems Engineering, vol. 20, no. 2, pp.
193–216, 2011.
[16] Q. Li, S. Liu, and Y. Pan, ―A cooperative construction approach for SaaS applications,‖ in
2012 IEEE 16th International Conference on Computer Supported Cooperative Work in
Design (CSCWD), 2012, pp. 398–403.
[17] ―SoapUI‖ (2012). Available at: http://www.soapui.org/Getting-Started/load-testing.html
[Accessed: 2015].
[18] A. Shinichiro and A. Erik (2013). "Apache ODE". apache.org, Available at:
http://ode.apache.org/ [Accessed: 2015].
[19] ―WSBPEL‖ (2015). Available at: https://www/oasis-
open.org/committees/tc_home.php?wg_abbrev=wsbpel [Accessed: 2015].
[20] C. Anis C. and S. Benjamin (2011). "AO4BPEL". stg.tu-darmstadt.de, Available at:
http://www.stg.tu-darmstadt.de/research/ao4bpel/index.en.jsp [Accessed: 2015]
The 50th
Annual Conference on Statistics, Computer Sciences and Operation Research 27-30 Dec,2015
Cairo University-Institute of Statistical Studies and Research
61
Challenges and Research Questions of SaaS Applications Customization
Areeg Samir* and Akram Salah**
Abstract
SaaS (Software as a Service) is becoming a popular research field for its feature of novel schema
in software development. The promise of SaaS model is to exploit economies of scale on the
Service provider side by hosting multiple customers (or tenants) on the same hardware and
software infrastructure. Providers are in charge of constructing, managing and maintaining the
necessary IT supporting infrastructure and platform for operating services, while tenants take use
of the customization functions to formalize their own individual applications. Thus,
Multitenancy architecture that enables tenants share system software is one of the key features of
SaaS. To attract a considerable number of tenants, SaaS applications have to be customizable to
fulfill the varying functional and quality requirements of individual tenants. However, current
studies on customization mechanisms are difficult in modifying, managing, and validating the
complex relationships of SaaS application. This paper focuses on the challenges of SaaS
application customization. These include aspects of customizability, configurability, and
guidance. In addition, this work will highlight the important research questions about SaaS
application customization, explore the approaches that tackle the customization challenges,
provide a comparison between different customization approaches, and a suggestion about how
to build a customizable application that satisfies the tenant requirements and guides them during
customization process will be discussed.
Keywords: Software as a Service, Multitenancy, Customization, Machine Learning, Guiding,
Variability, Cloud Computing, Quality attributes.
Introduction
Software as a Service (SaaS) is considered a layer of Cloud Computing layers. SaaS has emerged as a promising new delivery model for software applications. Instead of installing
software applications on the premises of a customer, software applications are maintained and
run by SaaS provider to support multiple tenants in Cloud environment. Consequently, SaaS
applications must be multitenant aware [1].
Multitenancy architecture allows multiple tenants to share a software service with customization
so that each tenant may have its own Graphical User Interface (GUI), Service, Data, and
Workflow. Consequently, the SaaS software may appear to each tenant as if it is a sole tenant
[2].
** Department of Computer Science, Faculty of Computers and Information (FCI), Cairo
University, Giza, Egypt
* Department of Information System, Institute of Statistical Studies and Research (ISSR),
Cairo University, Giza, Egypt

The 50th
Annual Conference on Statistics, Computer Sciences and Operation Research 27-30 Dec,2015
Cairo University-Institute of Statistical Studies and Research
62
Multitenant SaaS applications can be domain-independent, such as Enterprise Resource Planning
(ERP), Customer Relationship Management (CRM), Human Resource Management (HRM), or
domain specific, such as Inventory Management for retailers, Practice Management for medical
practices. Moreover, requirements of organizations for software differ from one software to
another and overlapping between software requirements may occur. Therefore, customizing SaaS
applications is needed to differentiate requirements of tenants [2].
In order to customize SaaS applications multiple goals are required to be achieved. First, SaaS
providers need to support tenants’ different requirements so that it is possible for each tenant to
have a unique software configuration. Second, providers need to supply the tenants with a simple
configuration to satisfy their different requirements without extra development or operation
costs. Third, the SaaS customization is related to functionality and Quality-of-Services (QoS),
e.g., some tenants care about software availability, while other tenants are interested in the price
of software or the security robustness that the provider offered to the tenants [3].
SaaS application layers such as GUI, workflows, services and data can be configured and
customized at a specific places defined by SaaS providers to meet tenants’ different requirements
[3]. In addition, a guided mechanism is needed to study similar tenants’ customization choices,
and to provide a planned customization process at each layer of SaaS for the future tenants. A
guided customization process will not only enable tenants to quickly implement the
customization that best suits their business needs but it also decreases the manual work that
tenants have to make at each customization point in each SaaS layers.
However, there are several challenges that are needed to be enhanced for providing a
customizable SaaS application. For example, customizing complex SaaS application considered
a costly approach because it requires expert people to work on customization. In addition, not all
tenants know the proper customization that satisfies their needs. Moreover, existing SaaS
customization solutions do not propose a simple mechanism to provide recommendations to
tenants as a guide to help them during the customization process. Thus, the task of customization
still needs more enhancement.
This paper will give an overview on the state of the art of SaaS customization, demonstrate the
critical research questions about it, outline approaches to tackle the presented challenges, present
the advantages and the drawbacks of each work, compare the current approaches, and provide a
suggestion to make a complete customization.
The remainder of the paper is organized as follows. In section 2, a value proposition on SaaS
customization will be presented. Section 3 explains the customization and configuration in multi-
tenancy Software as a Service. Section 4 demonstrates the layers and the customization of SaaS.
In section 5, the challenges and the research questions of customization will be illustrated.
Section 6 evaluates the current research works by outlining their approaches and providing a
comparison between them.
The 50th
Annual Conference on Statistics, Computer Sciences and Operation Research 27-30 Dec,2015
Cairo University-Institute of Statistical Studies and Research
63
In section 7, we will suggest ways for tackling the gaps in research works and for achieving the
challenges to satisfy tenants’ requirements. Finally, we conclude and suggest a future work in
section 8.
1. Value Proposition
SaaS can help to realize or improve scalability, availability, and other (non)functional properties
of application. The main value proposition of SaaS is to provide the tenants with a cost-effective
and convenient means to consume software applications [4]. SaaS has many benefits. For the
service provider perspective, better resource utilization is achieved through a multi-tenant
architecture [4]. It provides long-term customer relationship, which increases the provider
profits, as the more customers are happy with the service, the longer they will stay with the
provider [5]. Systems Integration, most SaaS providers offer customization capabilities to meet
specific needs. They provide template with customizable parts or configuration file with
variability points that can be customized by tenants according to their needs. In addition, SaaS
providers create Application Program Interfaces (APIs) to enable connections between internal
applications and other cloud vendors [6].
From a business perspective, SaaS is about improving organizational efficiency, reducing cost
and time often coupled with the objective of achieving a faster time to market [4]. It offers an
alternative to buying, building, configuring and maintaining hardware and software on-premises.
Instead of installing an application on an expensive server, organizations can subscribe to
services and applications built on shared infrastructure via the cloud [7]. Moreover, SaaS not
only simplifies the deployment process but it also provides tenants with the latest and greatest
features of business applications. For example, Oracle’s SaaS business applications are updated
continuously, not only to improve functionality, but also to enhance security, usability, patches
and bug fixes that it is all done in the background, transparent to the users in organization. SaaS
business applications make it easier to increase and maintain flexibility by requiring new features
for business applications, new functionality, adding new users to an application or adopting a
new application entirely [8]. Reusable components provide a way to exchange working IT
solutions. Capabilities to allocate and deallocate shared resources on demand can significantly
decrease the overall IT spending. Low-cost access to SaaS applications in different geographical
regions may further reduce market entry barriers and enable new business models [4].
From IT perspective, SaaS is considered a way to offload management of non-mission-critical
applications such as HR and CRM. Moreover, the subscription-based SaaS pricing model can
keep IT budget costs consistent or lower than packaged or homegrown software [9].

The 50th
Annual Conference on Statistics, Computer Sciences and Operation Research 27-30 Dec,2015
Cairo University-Institute of Statistical Studies and Research
64
2. Customization and Configuration in Multi-Tenancy Environment
Customization and Configuration are two terms that used interchangeably. They are critical
components in the strategies of successful SaaS architectures. Therefore, before moving to a
SaaS model, organizations must obtain answers to some questions about the objectives and
benefits that need to be achieved in the application customization.
In SaaS applications, each particular tenant requires different features and quality from a
software solution. As a result, SaaS providers need to answer the specific needs of tenants by
enabling a configurable and customizable application that best suites each tenant [10].
Customization is usually described as the process of implementing a new feature to the
application that doesn’t even exist, which requires changes in the source code with deep
understanding of the exciting program functionality and the domain the program should support
[11]. On the other hand, configuration allows the tenant to adjust the application through
predefined parameters to change the application functions within predefined scope and it doesn’t
require a source code changes as the work in [12], [13], and [14].
However, some researches point at the customization as a general term for adjusting a system
and the configuration is just one of the customization methods [11].
Customization defined in [11] as “Adapting standard software to the requirements of an
individual organization” and point to the ability of configuring the software in alternative name
(parameterization) which means the settings of parameters or selecting from list of options.
Some SaaS applications providers tend to configure their application instead of customizing it in
order to save cost and provide simple configurable application. For example, the customization
of SaaS Enterprise Resource Planning (ERP) is one of the main problems that organizations have
been complaining about due to its cost and complexity, thus the configuration process is
considered as one of the key success of any SaaS ERP [15]. According to [16] in order to
provide a well-designed SaaS application and reach high level of maturity configurability quality
should be achieved.
Customizing SaaS applications is not only related to functionality but also related Quality of
Services (QoS), e.g., some tenants require an application to be highly available and are willing to
pay for it, while other tenants are not interested in high availability but care more about the price.
The work in [17] poses several characteristics of software that is easy to customize.
These characteristics are: Software has well documented APIs, Software is written in standard or
common programming language and platform, Software has SDK (Software Development Kit),
Customizations are managed separately from core logic, Customizations occur at any time. The
author stated that systems, which fall short in any of these areas, are not easy to customize.
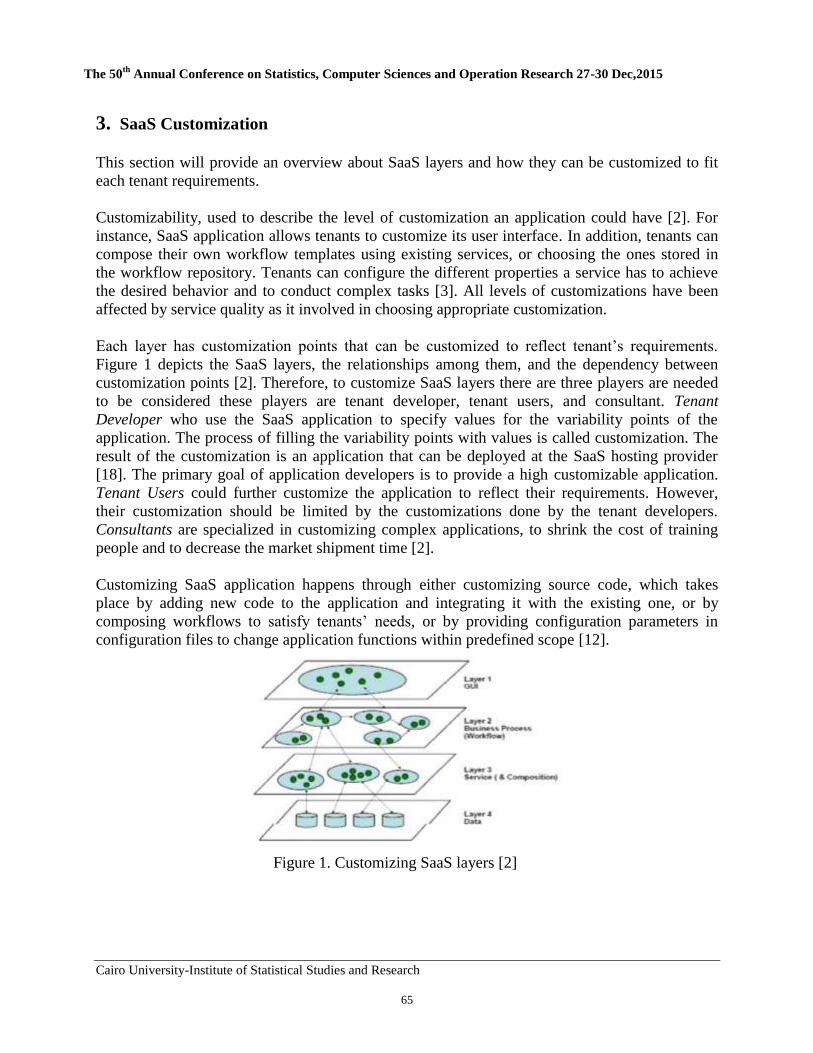
The 50th
Annual Conference on Statistics, Computer Sciences and Operation Research 27-30 Dec,2015
Cairo University-Institute of Statistical Studies and Research
65
Figure 1. Customizing SaaS layers [2]
3. SaaS Customization
This section will provide an overview about SaaS layers and how they can be customized to fit
each tenant requirements.
Customizability, used to describe the level of customization an application could have [2]. For
instance, SaaS application allows tenants to customize its user interface. In addition, tenants can
compose their own workflow templates using existing services, or choosing the ones stored in
the workflow repository. Tenants can configure the different properties a service has to achieve
the desired behavior and to conduct complex tasks [3]. All levels of customizations have been
affected by service quality as it involved in choosing appropriate customization.
Each layer has customization points that can be customized to reflect tenant’s requirements.
Figure 1 depicts the SaaS layers, the relationships among them, and the dependency between
customization points [2]. Therefore, to customize SaaS layers there are three players are needed
to be considered these players are tenant developer, tenant users, and consultant. Tenant
Developer who use the SaaS application to specify values for the variability points of the
application. The process of filling the variability points with values is called customization. The
result of the customization is an application that can be deployed at the SaaS hosting provider
[18]. The primary goal of application developers is to provide a high customizable application.
Tenant Users could further customize the application to reflect their requirements. However,
their customization should be limited by the customizations done by the tenant developers.
Consultants are specialized in customizing complex applications, to shrink the cost of training
people and to decrease the market shipment time [2].
Customizing SaaS application happens through either customizing source code, which takes
place by adding new code to the application and integrating it with the existing one, or by
composing workflows to satisfy tenants’ needs, or by providing configuration parameters in
configuration files to change application functions within predefined scope [12].

The 50th
Annual Conference on Statistics, Computer Sciences and Operation Research 27-30 Dec,2015
Cairo University-Institute of Statistical Studies and Research
66
As depicted in [2] customization could be done Manually by allowing tenants to manually make
decisions at each customization point and choose a value from set of alternatives for each
customized point as presented in [18] and [19]. Automatically, through automating all the
customization choices based on tenants’ requirements inputs. The work in [2] provided a semi-
automated approach to customize SaaS applications. However, in automatic customization, the
final customization results might not meet all tenants’ requirements. The guided customization
stated that for each customization point, an automated customization will return a few top
matching customization choices, and the tenant will manually recheck these choices and make a
decision based on their judgment. This approach shrinks the manual work and reduces errors that
may be occur by the automated customization.
4. Challenges and Research Questions
Most SaaS vendors have tried to figure out ways to enable complete customization. Software as a
Service introduces a number of goals that need to be enriched for facilitating customization
process a cross SaaS layers. These goals are:
A) Flexible Customization and Configuration.
B) Efficient guidance mechanism through the customization process.
C) Ensuring and validating the correctness of tenants’ customizations.
D) Managing constrains and variability dependencies in customization.
Moreover, several challenges and research questions need to be addresses for customizing SaaS
applications such as:
Which metrics are useful to describe and analyze SaaS customization? Based on specific
software architecture styles and solutions, how these goals are correlated? How can trade-offs be
accounted during application design, how can they be adapted during run-time? Building a
software application to be deployed in the cloud requires new architectural decisions and
decision-making processes.
Which services can be customized and adapted as components of a new software/service? How
do we measure the effectiveness of SaaS application customization? Which is the right
customization to be performed in the SaaS application? How much or how little customization
will be possible with the SaaS services? What are the measures that can be taken to assure the
customization security? What are the ability to add user defined fields to master data (e.g. adding
attributes to accounts, vendor or customer master records) and what types of fields are they?
What are the ability to modify predelivered reports and queries to suit tenants reporting
requirements? How to integrate the customized component and shared it with other solutions?
How to min existing tenant customizations to be used as reusable solutions for upcoming
tenants? How do we manage the relation among customization places in each SaaS layer and
between all layers? How to describe the relationships among variations and what is the best way
to achieve it?
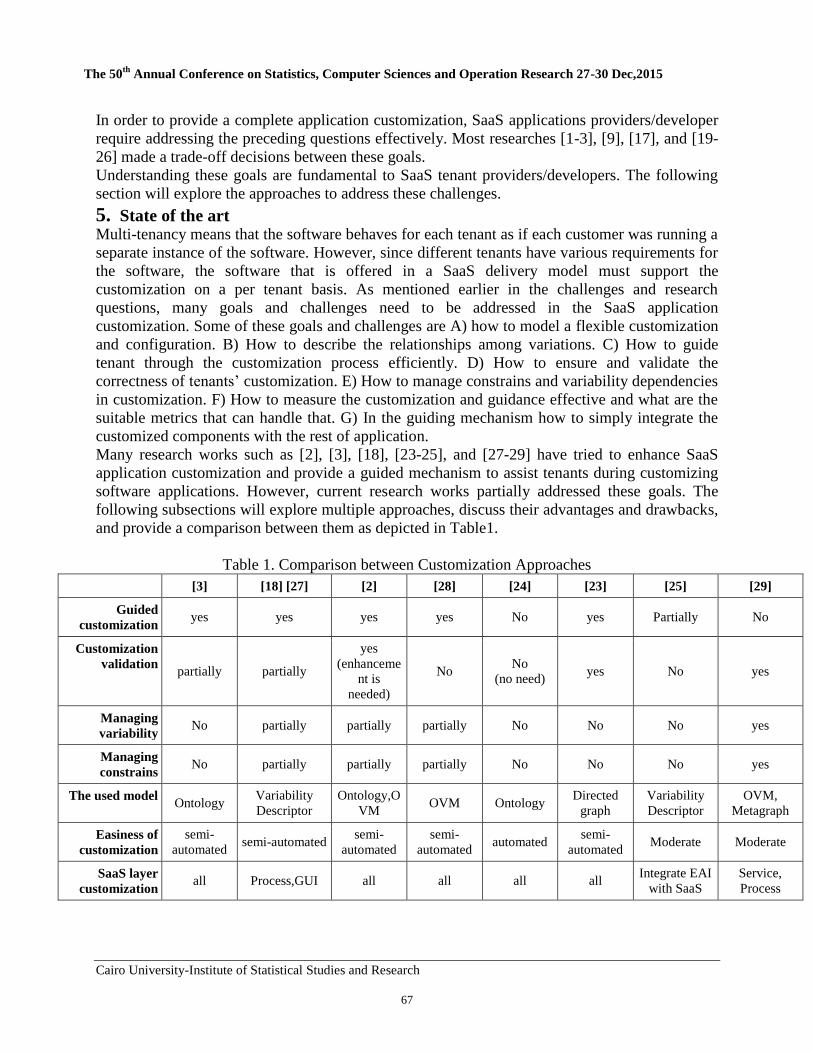
The 50th
Annual Conference on Statistics, Computer Sciences and Operation Research 27-30 Dec,2015
Cairo University-Institute of Statistical Studies and Research
67
In order to provide a complete application customization, SaaS applications providers/developer
require addressing the preceding questions effectively. Most researches [1-3], [9], [17], and [19-
26] made a trade-off decisions between these goals.
Understanding these goals are fundamental to SaaS tenant providers/developers. The following
section will explore the approaches to address these challenges.
5. State of the art Multi-tenancy means that the software behaves for each tenant as if each customer was running a
separate instance of the software. However, since different tenants have various requirements for
the software, the software that is offered in a SaaS delivery model must support the
customization on a per tenant basis. As mentioned earlier in the challenges and research
questions, many goals and challenges need to be addressed in the SaaS application
customization. Some of these goals and challenges are A) how to model a flexible customization
and configuration. B) How to describe the relationships among variations. C) How to guide
tenant through the customization process efficiently. D) How to ensure and validate the
correctness of tenants’ customization. E) How to manage constrains and variability dependencies
in customization. F) How to measure the customization and guidance effective and what are the
suitable metrics that can handle that. G) In the guiding mechanism how to simply integrate the
customized components with the rest of application.
Many research works such as [2], [3], [18], [23-25], and [27-29] have tried to enhance SaaS
application customization and provide a guided mechanism to assist tenants during customizing
software applications. However, current research works partially addressed these goals. The
following subsections will explore multiple approaches, discuss their advantages and drawbacks,
and provide a comparison between them as depicted in Table1.
Table 1. Comparison between Customization Approaches
[3] [18] [27] [2] [28] [24] [23] [25] [29]
Guided
customization yes yes yes yes No yes Partially No
Customization
validation partially partially
yes
(enhanceme
nt is
needed)
No No
(no need) yes No yes
Managing
variability No partially partially partially No No No yes
Managing
constrains No partially partially partially No No No yes
The used model Ontology
Variability
Descriptor
Ontology,O
VM OVM Ontology
Directed
graph
Variability
Descriptor
OVM,
Metagraph
Easiness of
customization
semi-
automated semi-automated
semi-
automated
semi-
automated automated
semi-
automated Moderate Moderate
SaaS layer
customization all Process,GUI all all all all
Integrate EAI
with SaaS
Service,
Process
The 50th
Annual Conference on Statistics, Computer Sciences and Operation Research 27-30 Dec,2015
Cairo University-Institute of Statistical Studies and Research
68
6.1 Ontology based Customization Framework Work The work in [3] presented a multilayer customization framework to support and manage SaaS
application variability, guide tenant through customization, and derive tenant deployment
information cross SaaS layers through the using of ontology. They use Domain ontology to assist
the customization process by specifying domain vocabulary and their relationships through each
SaaS layer. The work provided a template objects to allow users search for the objects in
repositories to reuse, include, and modify them easily. They specified two types of variants for
customization. These two variants are used to classify the customization into four categories
(levels) for helping the SaaS providers understanding the essences for SaaS customization and
making their choices before starting their own SaaS design. Their framework supported two
mining algorithms that filters tenants’ similarities and use profiling to provide recommendations.
Moreover, the authors defined some elements in SaaS applications to handle unmatching in
results, facilitate tenant customization, specify customization parts, retrieve the more suitable
components from component databases, and validate each new updated component.
6.1.1 The main Advantages of the work The work has several advantages such as Derive customization through all SaaS layers. Analyze
relationships inside and cross SaaS layers using Ontology. Guided tenants through
customization. Providing template objects and candidate components at different SaaS layers to
enable customization through using filtering technique and content recommendation and to allow
and provide customization guidance in cost effective way. Handle unmatching in the retrieved
templates. Mine knowledge in repository to be reused as a recommendation in the future.
Individual community help in identifying the content of interest from large choices. Predict
tenants’ actions by capturing their preferences history.
6.1.2 The drawback of the framework
The authors’ work has several drawbacks such as using ontology to derive customization across
SaaS layers is considered a difficult task because tenant has to specify concepts of a specific
domain and relationships which is differ from one organization to another even in the same
domain. They did not separate variability from commonality during customizing SaaS layers
(they included them in one model). The work did not address the variability and dependency
constrains. They only supported and classified customization into four categories and they did
not mention the non-customization. Because of the sequential execution of their framework, they
did not address what will happen if the tenant wants to use the solution as it is. They did not
mention a way or steps in how they could validate tenant’s customization. As the authors
claimed, they only validated the replaced customized components. They did not mention what
will happen if the tenant wants to delete or update a component.
The 50th
Annual Conference on Statistics, Computer Sciences and Operation Research 27-30 Dec,2015
Cairo University-Institute of Statistical Studies and Research
69
6.2 Customization based on BPEL Processes and Variability Descriptor
The authors of [18] and [27] allowed tenants to customize the process layer and the related
artifacts of SaaS application according to their needs. This happened by defining and providing
some concepts such as application template, variability points, filling values, application
solution, variability descriptor. They used constraint to ensure that the customization performed
by customizer is valid. After modeling the variability descriptor file, it is exported as an XML
file to serve as input to a transformation tool that generates customizable process, which can be
executed by a process engine. In order to perform the transformation steps from variability
descriptor until process execution, the tenant is prompted for input to bind the variability
point by dependencies and only the enabled alternatives will be presented to tenants.
Moreover, the work gave tenants the possibility to stop and continue the customization at
any point. In addition, human can be involved in the binding procedure of a variability
point.
6.2.1 The Benefits of the work
The major advantages of these works are automatically generated process-based customization
out of variability points in SaaS application. Their approach not only supported process but it
also provided documents that make up the process (configuration files, interface descriptions,
and deployment descriptors) in service-oriented manner. They reused existing services and
integrated them in the application. They guided tenants through SaaS process customization by
giving them alternative points, evaluating each alternative, and converting the file descriptor to
process file. The variability mechanism is independent from the type of document in which the
variability points should be specified for. Different customers groups can introduce different
variability descriptors (certain alternatives might be allowed only for premium customers).
6.2.2 The Obstacles of the work
The shortage points within these works are they did not guide tenants nor customize the other
SaaS layers such as data layer and service layer. They said that their approach can
guide tenants through customization by converting file descriptor to process but they did not
mention how we could mine user preferences. They allowed the tenant to do customization in the
file descriptor however, they did not specify what will be done if invalid customization generated
out of customization and how it can be avoided. A simple tool is needed to allow tenants do the
customization through it. They only focused on filling the variability points and validate
constrains but they did not handle the duplication or mismatch that may happen during the
customization made by tenant. If an error happens in the customization in which that
customization will be converted to process, the final output will hold wrong results in the
generated flow. Moreover, business process language is a static orchestration language which
means that the tenant should return back to fix the error in the descriptor file to obtain a
workflow free of errors. Customizing using descriptor file means tenant will use the code based
customization type, which suffers from errors that may occur during writing.

The 50th
Annual Conference on Statistics, Computer Sciences and Operation Research 27-30 Dec,2015
Cairo University-Institute of Statistical Studies and Research
70
In addition, their approach is Business Process Execution Language (BPEL) engine dependent.
They just mentioned the customization validation. They did not provide a practical mechanism or
algorithm steps to achieve it. Their approach did not generate a template out of the validated
customization. They allowed only one value to be used for filling out the variability point. As a
result, what will happen if there is a customizable SaaS application that requires more than one
value as alternatives? In case of choosing between different alternatives (human branch), their
work only returns one value. Therefore, there is an urgent question, which is what tenants can do
if the application nature requires more than one value to be entered as filling values for the
variability points.
6.3 The Innovative Customization Approach
The work in [2] presented a framework to model customization process by using Orthogonal
Variability Model (OVM). OVM used to model variability points and variants in a customizable
workflow. The work specifies the parent/child relationships of variability points. The authors
defined and organized variants by using ontology. In addition, they specified classifier to find all
variants for a given variation point. Their customization algorithms help in mining existing
tenants’ results and make a decision at each variation point. They used feature selection, which
works by calculating a score for each attribute, then select the attributes with the best scores to
solve the problem of the irrelevant tenant characteristics to the decision making. Their work
checked the tenant customization consistency through defining rules. Moreover, existing tenant
choices at each variability point will be stored as a workflow. A customized workflow that
confirms all mandatory rules will be returned to the tenants. The workflow is modified again in
case there is a hard rule violation and the final workflow will be stored in the repository.
6.3.1 The major advantages of the work
The positive points in the work are providing a framework that mines relationships between
tenant customization decisions, tenants’ characteristics, and their application specific
requirements.
They used the knowledge of this framework to automate the customization for future tenants.
They used ontology to define variability points and assist discovery and matching of variability.
Handled customization in all SaaS layers. Helped tenants to customize the application according
to their needs. Specified an algorithm to check and handle the effects that happen during
decision-making. Guided tenants through customization using the guidance customization
algorithm. Use Orthogonal Variability Model to separate the variability from commonalities.
6.3.2 The major disadvantages of the work
However, this work has several drawbacks such as the provided framework did not handle the
rest of the constraint and variability dependencies in all SaaS layers. The validation
customization of tenant need to be enhanced. They did not specify the
The 50th
Annual Conference on Statistics, Computer Sciences and Operation Research 27-30 Dec,2015
Cairo University-Institute of Statistical Studies and Research
71
relationships if there are more than one characteristics ontologies. They did not handle the
deleting case in which tenants wanted to delete a customization. What are the effects on other
variation points? In big SaaS applications, OVM model is not sufficient to express the variability
point, variants, and their relationships. It will be so hard to express them clearly.
6.4 Customization Using Meta-model
The authors of [28] designed two meta-models. The application meta-model contains a set of
components such as hardware, user interface, web service, workflow, and database components.
The variability model specifies variability across different components. Their variability model
consists of set of variability points, locator, alternatives, and dependencies. In addition, they
constructed a runtime architecture, which allows customer selects, subscribes, starts, stops,
configures, and manages applications. They guided customers through the customization process
by directing them to the user interface which is a graphical front-end for the customization flows.
The authors’ architecture consisted of application vendor portal, which enables to upload the
application template package. Once customers had bound all variability, they applied their
choices to the template and store results in repository. Moreover, they specified an algorithm to
transform the variability model to an executable workflow. As a result, there will be one
customizable workflow for each phase of the variability point.
6.4.1 The Work Advantages
This work has several advantages. They guided customer through complex customization
without knowing the implementation details. They allowed customers to start, configure and stop
applications in a self-service portal, without having any knowledge about the implementation of
applications. Provisioned, customized and configured components automatically in the right
order which allows the whole application to run later while respecting the functional and
nonfunctional selection by customer. The ability to provision their application portal from
another application portal. Specified alternatives to variability points. They customized and
automatically deployed the cloud applications from an application portal.
6.4.2 The Work Drawbacks
The disadvantages of the work are the authors did not mention most of the variability and
constrains dependencies neither provided a customization validation. Moreover, they did not
provision their approach dynamically nor monitoring it to scale application dynamically. In
addition, their provisioning infrastructure selects suitable components after customizing them,
which makes the selection of suitable components, is essentially an optimization problem.
However, they did not prove how the customer could find the cheapest combination of already
provisioned components that fulfills requirements.
6.5 Easy SaaS Customization Framework Work
The authors of [24] proposed a framework (EasySaaS) that stored component description and
specified domain information in ontologies to enable classification, search, and

The 50th
Annual Conference on Statistics, Computer Sciences and Operation Research 27-30 Dec,2015
Cairo University-Institute of Statistical Studies and Research
72
reasoning. Their work linked components together, and published them as a template to facilitate
customization. In addition, they used a subscription model to enable tenant developer and
provider collaboration. The authors provided a recommendation and customization engine to
publish and modify the customizable template. In addition, tenants can publish their
requirements and SaaS provider can subscribe to the requirements they are interested in. For
every new published requirement, the EasySaaS notifies the provider to subscribe to it.
6.5.1 The Work Benefits
This work has several advantages such as alleviated the workload of tenant developer and
provided a simple approach for doing the customization according to tenants’ requirements. In
addition, tenants tasks became simplified and now they can focus on defining their data model
and business logic. They stored domain knowledge in ontology to support the cross-domain
development. The customization responsibility is on SaaS provider shoulders. Allow tenants to
search for components that satisfy their requirements. Their framework provided
recommendations based on the published requirements by tenants. The providers could share
platform to search for reusable components. No customization validation is needed since all
customization take place at the provider side. Tenants have two alternatives to build their SaaS
application either by publishing their application specifications with their requirements and let
SaaS providers customize their SaaS solutions to meet their requirements, or allowing tenants to
compose the application using templates provided in EasySaaS.
6.5.2 The Work Shortages
However, this work has several drawbacks such as they did not separate the functional and
nonfunctional requirements neither handled the relationships of the customization. They stored a
redundant information in ontology to recover failure, which may lead to concepts duplication. In
addition, their classification search takes much time to do its job. Their framework did not
mention constrains and variability dependencies. Moreover, the framework did not provide a
guiding mechanism but provided recommendations to assist tenants finding suitable components.
6.6 The Multi-Granularity Customization
The authors in [23] defined four-granularity level to help the provider understanding the SaaS
customization and compared them from four perspectives. Their approach allowed tenants to add
and retrieve objects from library to be customized by selecting objects through defining the
aggregate of parameters, relations, and creation tags. The approach used the directed graph to
describe the process, edges, and users. The authors proposed two engines for supporting
parameters and object granularity and for interpreting workflow process and managing the
cooperation granularity. Moreover, they guided tenants through customization by introducing
recursion methods to customize the correct applications and to guarantee that the relationships
between objects are modified according to the customization steps.

The 50th
Annual Conference on Statistics, Computer Sciences and Operation Research 27-30 Dec,2015
Cairo University-Institute of Statistical Studies and Research
73
6.6.1 The Interested Points of the Work
There are many significant elements of this work such as proposed and handled the relations in
the customization process. Defined multi-granularity model to assist the providers in
understanding the customization of SaaS applications clearly. Moreover, they created a
validation algorithm to ensure the correctness of SaaS application customization. Guided tenant
during customization. In addition, the work explored the relationships in each SaaS layer and in
between them to clarify the customization relationship of SaaS application.
6.6.2 The Pitfalls of the Work
This work has several drawbacks. For example, they did not specify the variability and
dependency constrains neither separate the variability from commonality. In addition, the
mismatch and duplication that occur during the customization process had not been handled. The
authors had not specify how tenants could choose components in case there are alternatives.
6.7 SaaS and EAI Integration Approach
The work in [25] integrated SaaS with the on premise IT system and other SaaS applications.
The authors used the power of Enterprise Application Integration (EAI) patterns, which split an
integration architecture into several recurring units. They enabled users to select a set of patterns
from the pattern catalogue and parameterize patterns. They guided user through the selecting and
the parameterizing tasks by using workflow. The authors used the variability descriptor to
specify which parts of EAI pattern have to be parameterized. They pointed out that different
settings of the same pattern could be developed depending on the requirements. These settings
lead to different outcomes in the method that guides user through the customization. The authors
allowed the inclusion of human task to select the suitable pattern to be modified and
parameterized.
6.7.1 The Benefits of the Work
The main advantages of the work are parameterizing EAI pattern to be customized by tenant,
partially guiding tenant through customization, integrating SaaS with IT systems, and using
multitenancy pattern to describe how a reusable component can be deployed in the provided
patterns.
6.7.2 The Work limitations
The work suffers from several drawback such as they mentioned constrains, relationships, and
alternatives between the variability points but they did not mention how to manage or specify
them. In addition, their work did not provide a customization validation neither support user
guidance in the validated customization part. They did not mention how the tenant can handle the
errors that may appear during the parameterization process and descriptor file.
The 50th
Annual Conference on Statistics, Computer Sciences and Operation Research 27-30 Dec,2015
Cairo University-Institute of Statistical Studies and Research
74
6.8 The Aspect Oriented Approach
The work in [29] provided a customizing approach for SaaS applications based on Orthogonal
Variability Model (OVM) and Metagraph. The approach used OVM to model customizations
and customizations’ dependencies. The OVM model has been converted to a Metagraph, which
mapped customization points and dependencies to vertices and edges with qualitative attributes.
A Metagraph based algorithm has been written to validate the customizations made by tenants.
The approach supported a dynamic workflow language, which is Aspect Oriented 4 Business
Process Execution Language (AO4BPEL), to adapt dynamically customizations during run-time.
In addition, the aspect approach handled the four key concerns that are needed to customize SaaS
applications, which are first, model customization points and variations. Second, describe the
relationships among variations. Third, validate customizations performed by tenants. Fourth,
associate and disassociate variations to/from customization points during run-time.
6.8.1 The Work Benefits
The work has several advantages first, it provided simple approach by using Orthogonal
Variability Model to separate the variability in another model, and address the relationships
among customizations. Separating variability reduced the customization duplication and
complexity. The approach provided an algorithm that validates tenants’ customization through
using a Metagraph tool, which considered graphical structures represent relationships between
sets of elements. Moreover, the approach enabled the developer to add new components at any
time without having to reengineering existing ones, and by giving them the ability to upgrade
each component independently. Tenants can customize SaaS applications during runtime through
using AO4BPEL without stopping, rebinding, recompiling, or even restarting the applications. In
addition, the work.
6.8.2 The Work Obstacles
The approach has a few shortages. It requires more runtime because of first, the processes that
happened on customizations such as storing, checking, composing, and retrieving
customizations. Second, the database transactions. Moreover, the required manual effort to
update the Orthogonal Variability Model and its correlated Metagraph increases dramatically by
growing the SaaS application. In addition, the approach did not provide tenants with
recommendations during the customizations process.
6. The Steps of Building a Customizable SaaS
This section will suggest a way to handle the research questions and challenges that have been
mentioned in section 5 and to fill the gaps that exist in the literature studies.
To provide a complete customization, SaaS providers need to answer the challenges questions.
As has been showed, most research work partially addressed these challenges. Therefore, we will
specify steps to fill the gaps in these researches and to achieve the

The 50th
Annual Conference on Statistics, Computer Sciences and Operation Research 27-30 Dec,2015
Cairo University-Institute of Statistical Studies and Research
75
challenges in order to satisfy tenants’ requirements.
The following subsections will explore each step in order to be adapted for building highly
customizable SaaS applications.
7.1 Providing Simple and Understandable Customization
To provide the tenants with a simple and understandable customizable SaaS application the
following two steps should be achieved.
A) Identifying commonalities and variations across the scope of providers of SaaS application
and handling the variability and constrains dependency.
B) Allowing the tenants to customize application by selecting one or more of variations.
These two challenges can be achieved by using Orthogonal Variability (OVM) Model that
allows the provider decreasing the complexity and the size of variability models by documenting
the variability and not the commonalities in a separate model. OVM helps the developer to relate
customizations defined in the customization model to another software development models. It
simplifies the communicating variability to the stakeholders. Only the tenants must understand
the variability model and not design models. Moreover, it expresses the constraint and the
variability dependencies between the variable places and its set of allowable variable instances.
7.2 Ensuring the Correctness of Customization
Validating the tenants’ customization, and ensuring it does not violate the relationships among
customization places, customization values and the rest of the application are important tasks that
need to be stated.
A) Validating tenant customization during the selection of components and after generating
the customizable solution.
B) Creating and designing a suitable validation method that ensures the correctness of tenant
customization by validating: the customization relationships, constrains, adding new
components, deleting existing components, and updating components.
The previous tasks can be satisfied by using Metagraph. It provides a suitable way to store each
tenant validated customizations in the database. It introduces that ability to map all customization
points and customization variants in OVM to vertices in the Metagraph. The variability and
constraint dependencies in OVM can be mapped to edges labeled with qualitative attributes and
defined on the generating set. It keeps the possible simple paths of different customizations.
Using Metagraph allows the addition, updating, and deleting customization seamlessly. An
automatic mapping is needed to up to date customization from OVM to Metagraph.

The 50th
Annual Conference on Statistics, Computer Sciences and Operation Research 27-30 Dec,2015
Cairo University-Institute of Statistical Studies and Research
76
Moreover, a suitable algorithm can be created to check the validation of tenants’ customization
and to ensure they did not violate customization constrains, customization relationships. In
addition, the algorithm should allow the processing on customization from adding to deleting and
updating components.
7.3 Integration Management
Ensuring a seamless integration between the customized component and the rest of the
application are considered a mandatory step. This can be approached by using a runtime
workflow language that allows tenant to modify, deploy, and integrate customization with the
rest of the application without affecting the core mechanism of the application. The workflow
can be obtained from converting (mapping) customization that exist in Metagraph or even in
Variability Descriptors. After that, the generated workflow can be deployed on an execution
environment so the integration will be done easily.
7.4 Measure the Customization Quality
Measure the effectiveness of the customization and analyze it is a recommended task. To handle
this task, a suitable methodology is needed to address the quality attributes for making a proper
customization. Moreover, a customization metrics is required to measure and test each
customization quality attribute.
7.5 Guiding Through Customization
To provide tenants with a simple customization, a guiding mechanism is required for supplying
tenants with recommendation during the customization process. The recommendation can be
achieved through collecting the previous tenants’ customizations and provide them as choices
that suitable each tenant requirements.
Most papers used ontology to classify, derive, and store tenants’ customizations in repository to
be used as a recommendation for the new tenants. However, using ontology in large and complex
SaaS application will lead to misunderstanding in the concepts and will delay the performance of
the classification process.
To achieve this challenge, machine-learning techniques can be used to guide tenants’ through
customization. For example, the on-line algorithm, which considers an efficient and scalable
machine learning algorithms for large-scale applications [30], can be used to make decisions
about the present customization based on the past knowledge. The main feature of the on-line
algorithm resides in its ability to receive sequence of requests and performs an immediate action
in response to each request.
Moreover, a supervised learning algorithm can be employed as it discovers the relationship
between input data and target Data. For instance, a regression algorithm, which considered a
category of the supervised learning, can be utilized to model the relationships between
customization places and its relevant values that are continuously improved using an error
measurement in the predictions made by the model [31].
The 50th
Annual Conference on Statistics, Computer Sciences and Operation Research 27-30 Dec,2015
Cairo University-Institute of Statistical Studies and Research
77
Addressing the previous challenges will enhance the customization of the SaaS application and
will simplify the guiding process as well. The previous aspect-oriented work in [29], which has
been mentioned in subsection 6.8 achieved three steps, which are 7.1, 7.2, and 7.3 through using
OVM to separate variability in a separate model. Metagraph-based algorithm had been
developed to validate tenants’ customizations. In addition, the aspect-oriented had been used to
offer a high level of runtime adaptability. Currently, we are working on enhancing the aspect-
oriented approach to customize SaaS applications, which has been explained in subsection 6.8, to
provide tenants with recommendations during customizing the SaaS applications.
7. Conclusion and Future Work This paper discussed the benefits of SaaS and explored its advantages from different
perspectives. The layers and the levels of SaaS customization have been explained. The purpose
from this paper is to explore the challenges and outline the research questions about
customization. Thus, the current approaches that support SaaS customization have been proposed
and compared. At the end, a suggestion about how to provide a good customizable SaaS
application has been provided.
As a future work, we are still working on providing a developed aspect-oriented approach that
tackles the last two challenges, which are measuring the customization quality and guiding
tenants through customization. The customization quality effectiveness can be measured through
proposing quality model and metrics that measure the quality of customization. The guiding
mechanism will be achieved by building an online-supervised machine-learning algorithm that
aims to provide tenants with recommendations during the customization process.
References [1] R. Mietzner, A. Metzger, F. Leymann, and K. Pohl, “Variability modeling to support
customization and deployment of multi-tenant-aware Software as Service applications,”
ICSE Workshop, 2009, pp. 18-25.
[2] W. Tsai, and X. Sun, “SaaS Multi-Tenant Application Customization,” in IEEE 7th
International Symposium on Service Oriented System Engineering, 2013, pp. 25-28
[3] W. Tsai, Q. Shao, and W. Li, “OIC: Ontology-based intelligent customization framework
for SaaS,” in 2010 IEEE International Conference on Service-Oriented Computing and
Applications (SOCA), 2010, pp. 1–8.
[4] M. Hauck, M. Huber, M. Klems, S. Kounev, J. Quade, A. Pretschner, R. Reussner, and S.
Tai, “Challenges and Opportunities of Cloud Computing Trade-off Decisions in Cloud
Computing Architecture,” Karlsruhe Institute of Technology, vol. 19, pp. 1-31, 2010.
[5] K. Haines. (2015). Software as a Service - Top 10 Benefits of SaaS. Retrieved December
1, 2015, from http://www.workbooks.com/resources/10-benefits-of-software-as-a-
service-saas
[6] J. Lowry. (2015). SaaS Benefits and Considerations. Retrieved December 1, 2015, from
http://joshlowryblog.com/2015/03/25/saas-benefits-and-considerations/
[7] R. Millman. (2013). The Advantages of SaaS What are They. Retrieved December 1,
2015, from http://www.techradar.com/news/software/business-software/the-advantages-
of-saas-what-are-they--1184572
[8] QuinStreet. (2013). 5 Reasons to Consider SaaS for Your Business Applications.
Retrieved December 1, 2015, from http://www.oracle.com/us/solutions/cloud/saas-
business-applications-1945540.pdf
The 50th
Annual Conference on Statistics, Computer Sciences and Operation Research 27-30 Dec,2015
Cairo University-Institute of Statistical Studies and Research
78
[9] Salesforce. (2000). Benefits of SaaS. Retrieved December 1, 2015, from
http://www.salesforce.com/saas/benefits-ofsaas/
[10] V. Araujo, J. Vazquez, and M. Cota, “A Framework for the Evaluation of SaaS Impact,”
International Journal in Foundations of Computer Science & Technology (IJFCST), vol. 4, no. 3,
pp. 1-16, 2014.
[11] M. Al-shardan, and D. Ziani, “Configuration as a Service in Multi-Tenant Enterprise Resource
Planning System,” Lecture Notes on Software Engineering 3, vol. 3, no. 2, pp. 1-6, 2015.
[12] W. Sun, X. Zhang, C. Guo, and P. Sun, “Software as a service: Configuration and customization
perspectives,” Congress on Services Part II, 2008. SERVICES-2. IEEE, 2008, pp. 18-25.
[13] G. Purohit, M. Jaiswal, and S. Pandey, “Challenges Involved in implementation of ERP on
Demand Solution: Cloud Computing,” SOURCE International Journal of Computer Science
Issues (IJCSI), vol. 9, no. 4, pp. 481-489, 2012.
[14] G. Makkar, and M. Bist, “EaaS-ERP as a Service,” Journal of Information and Operations
Management3.1, vol. 3, no. 1, pp. 141-145, 2012.
[15] Nitun, “Configurability in SaaS (software as a service) applications,” In the ISEC '09
Proceedings of the 2nd
India software engineering conference, 2009, pp. 19-26.
[16] S. Liu, Y. Zhang, and X. Meng, “Towards High Maturity in SaaS Applications Based on
Virtualization: Methods and Case Study,” International Journal of Information Systems in the
Service Sector (IJISSS), vol. 3, no. 4, pp. 1-15, 2012.
[17] D. Johnson. (2015). Customizing ERP on SaaS and Cloud Platforms. Retrieved December 1,
2015, from http://erpcloudnews.com/2009/10/customizingerp-on-saas-and-cloud-platforms/
[18] R. Mietzner, A. Metzger, F. Leymann, and K. Pohl, “Generation of BPEL Customization
Processes for SaaS Applications from Variability Descriptors,” In the IEEE International
Conference on Services Computing (SCC), 2008 , pp. 359-366.
[19] P. Arya, V. Venkatesakumar, and S. Palaniswami, “Configurability in SaaS for an electronic
contract Management application,” In the ICNVS'10 Proceedings of the 12th international
conference on Networking, VLSI and signal processing, 2010, pp. 210-216.
[20] X. Jiang, Y. Zhang, and S. Liu, “A well-designed SaaS application platform based on model-
driven approach,” In the 9th International Conference on Grid and Cooperative Computing
(GCC), 2010, pp. 276-281.
[21] H. Yosuke, and Y. Yasuda, “Discovering configuration templates of virtualized tenant networks
in multi-tenancy datacenters via graph-mining,” ACM SIGCOMM Computer
[22] C. Lizhen, W. Haiyang, J. Lin, and P. Haitao, “Customization modeling based on Metagraph for
multi-tenant applications,” In the 5th International Conference on Pervasive Computing and
Applications (ICPCA), 2010, pp. 255-260.
[23] H. Li, Y. Shi, and Q. Li, “A Multi-granularity Customization Relationship Model for SaaS,” In
the International Conference on Web Information Systems and Mining, 2009, pp. 611-615.
[24] W. Tsai, Y. Huang, and Q. Shao, “EasySaaS: A SaaS development framework,” In the IEEE
International Conference on Service-Oriented Computing and Applications (SOCA), 2011, pp. 1-
4.
[25] T. Scheibler, R. Mietzner, and F. Leymann, “EAI as a Service-Combining the Power of
Executable EAI Patterns and SaaS,” In the 12th International IEEE Enterprise Distributed Object
Computing Conference, 2008, pp. 107-116.
The 50th
Annual Conference on Statistics, Computer Sciences and Operation Research 27-30 Dec,2015
Cairo University-Institute of Statistical Studies and Research
79
[26] Q. Shao, “Towards Effective and Intelligent Multi-tenancy SaaS,” Ph.D. dissertation,
Arizona State Univ., Arizona, 2011.
[27] R. Mietzner, “Using Variability Descriptors to Describe Customizable SaaS Application
Templates,” IAAS, Stuttgart Univ, Germany, Rep. 2008/01, Jan. 2008
[28] R. Mietzner, and F. Leymann, “A self-service portal for service-based applications,” In
the IEEE International Conference on Service-Oriented Computing and Applications
(SOCA), 2010, pp. 1-8.
[29] S. Areeg, K. Abdelaziz, and S. Ashraf, “An Aspect-Oriented Approach for SaaS
Application Customization,” In the Proceedings of the 48 Annual Conference on
Statistics, Computer Sciences & Operation Research, 2013, pp. 16 – 30.
[30] S. Hoi, J. Wang, and P. Zhao, “LIBOL: A Library for Online Learning Algorithms,”
Journal of Machine Learning Research, vol. 15, no. 1, pp. 495-499, 2014.
[31] M. Oded, and R. Lior, “Introduction To Supervised Methods,” Data Mining and
Knowledge Discovery Handbook. Springer US, 2005, pp. 149-64. Print
The sn" Annual Conference on Statistics, Computer Sciences and Operation Research 27-30 Dec ,2015
A Proposed Approach for Enhancing Usability of Web-BasedApplications
IAbeer Mosaad Ghareeb, 2Nagy Ramadan Darwish
Abstract
Web-Based Applications (WBA) play an important and critical role in our life. They become closelyingrained with our personal life and work style, and they have already become crucial to the success ofthe business. Web development process is often ad-hoc and chaotic manner, lacking systematic anddisciplined approaches and lacking quality assurance and control procedures. To attain the desiredquality of WBA, a lot of quality factors should be considered. Web quality factors can be organizedaround three perspectives: visitor, owner, and developer. Each perspective is mainly interested in somequality factors than others. Visitor is mainly concerned with seven quality factors: usability,accessibility, content quality, credibility, functionality, security, and internationalization. This paperfocuses on the usability as an example of quality considerations that is more important from thevisitor's perspective. Therefore, this paper aims to propose an approach for enhancing the usability ofWBAs. The proposed approach depends of a set of quality guidelines for three quality sub-factors ofusability, which are: navigability, searching, and legibility. Finally, a case study is used to evaluate andillustrate the validity of the proposed approach. The outcomes are explained and interpreted.
Keywords- Web-Based Application, Quality Guidelines, Usability, Navigability, Searching, Legibility,Quality Factors, Evaluation, Measurement.
I. INTRODUCTIONWBA is an application that accessed via a web browser over a network to accomplish a certain
business need. WBAs possess their own peculiar features that are very different from traditionalapplications. Examples of such features are: variety of content, ever evolving, multiplicity of userprofiles, more vulnerable systems, required run uninterruptedly, and ramification of failure ordissatisfaction. WBAs play an important and critical role in our life. They become closely ingrainedwith our personal life and work style, and they have already become crucial to the success of thebusiness. Number of internet users has evolved from 16 million, in December 1995, to 3345 million, inNovember 2015 [10].
I Computer and Information Sciences Department, Institute of Statistical Studies and Research, Cairo University, Egypt.abeer [email protected] Computer and Information Sciences Department, Institute of Statistical Studies and Research, Cairo University, [email protected]
Cairo University-Institute of Statistical Studies and Research 80

The sn"Annual Conference on Statistics, Computer Sciences and Operation Research 27-30 Dec ,2015
Although the importance and critical role of WBAs, many of them don't achieve the return oninvestment and they tend to be failed. Web development process is often ad-hoc and chaotic manner,lacking systematic and disciplined approaches and lacking quality assurance and control procedures.Web quality is a crucial issue in a society that vitally depends on the internet. Its importance andbenefits are not fully recognized and understood in spite of its critical role. Organizations that developpoor quality applications are always spending a lot of money and time on correcting defects. It isvitally important to devote greater care and attention to WBA quality. The proposed approach providesquality guidelines that can be considered by WBAs developers for enhancing the usability. In addition,the evaluation process can provide them with weaknesses and strengths that can be analyzed toincrease the usability in later development activities.
11. LITERATURE REVIEWThe previously introduced quality models for traditional software are not adequate because WBA
possess their own peculiar characteristics that are different from traditional ones. Some proposed webquality models either directed towards a specific WBA perspective or dealing with a limited number ofquality factors. Other studies introduced a number of quality factors, but they didn't suggest means forachievement or they introduced limited guidelines for each quality factors or sub-factors. Therefore,these models don't provide the developer with the required assistance for how to fulfill the presentedfactors.
ISO/lEe 9126, describes a two-part model for software product quality. The first part of the modeldefines six characteristics for internal and external quality: functionality, usability, efficiency,maintainability and portability [11]. The second part of the model defines four quality in use:effectiveness, productivity, safety and satisfaction. Quality in use is the combined effect for the user ofthe six software product quality characteristics [12].
In [13], one layer web quality model is presented. It is based on eight quality factors. They areinteractivity/functionality, usability, correctness, real time information, information linkage, integrity,customer care, and socio-cultural aspects. Some of these quality factors require more decomposition.For example, usability can be divided into sub factors like navigability, legibility, consistency,simplicity, and audibility. At the same time, socio-cultural aspects should be considered sub factor forinternationalization factor. In addition, definition of the presented factors is not clear. For instances, itis consider that security is part of integrity while it is known in the literature that integrity is part ofsecurity [2]. The authors defined customer care factor as dealing with features like appealing andvisual appearance, and these are more related to presentation. Also it contains uniformly placedhypertext links and this is more related to navigation. Information linkage shouldn't be considered aquality factor, it is a necessity for the web. Finally, this model is directed towards the visitorperspective.
In late 1990s, Luis Olsina proposed a quantitative, expert-driven, and model-based methodology,for the evaluation and comparison of web site quality, called Web Site Quality Evaluation Method(WebQEM). It helps the evaluators to understand and enhance the quality of WBAs. The main stepsand activities of WebQEM can be grouped into four major phases, namely: quality requirementsdefinition and specification, elementary evaluation, partial and global evaluation, and analysis,conclusion and recommendations [6, 20, 21, 22, 24
81 Cairo University-Institute of Statistical Studies and Research
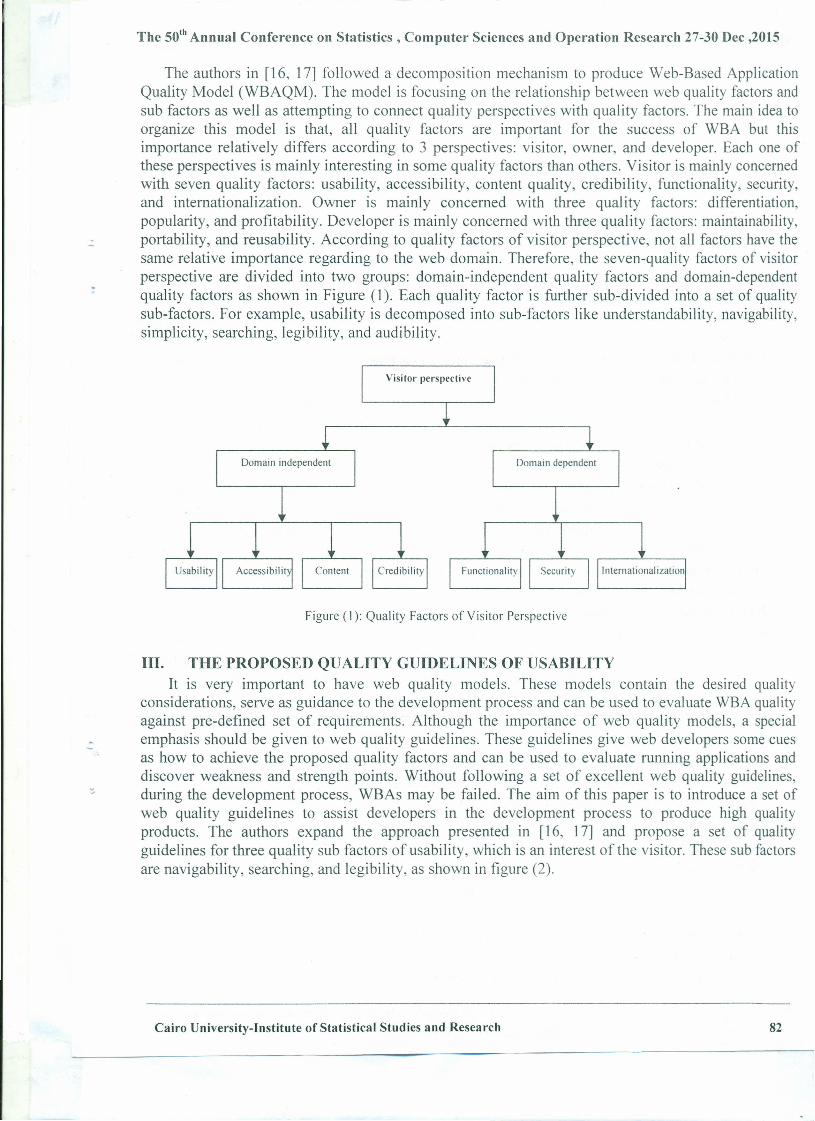
The so"Annual Conference on Statistics, Computer Sciences and Operation Research 27-30 Dec ,2015
The authors in [16, 17] followed a decomposition mechanism to produce Web-Based ApplicationQuality Model (WBAQM). The model is focusing on the relationship between web quality factors andsub factors as well as attempting to connect quality perspectives with quality factors. The main idea toorganize this model is that, all quality factors are important for the success of WBA but thisimportance relatively differs according to 3 perspectives: visitor, owner, and developer. Each one ofthese perspectives is mainly interesting in some quality factors than others. Visitor is mainly concernedwith seven quality factors: usability, accessibility, content quality, credibility, functionality, security,and internationalization. Owner is mainly concerned with three quality factors: differentiation,popularity, and profitability. Developer is mainly concerned with three quality factors: maintainability,
. portability, and reusability. According to quality factors of visitor perspective, not all factors have thesame relative importance regarding to the web domain. Therefore, the seven-quality factors of visitorperspective are divided into two groups: domain-independent quality factors and domain-dependentquality factors as shown in Figure (1). Each quality factor is further sub-divided into a set of qualitysub-factors. For example, usability is decomposed into sub-factors like understandability, navigability,simplicity, searching, legibility, and audibility.
Visitor perspective
Figure (l): Quality Factors of Visitor Perspective
Ill. THE PROPOSED QUALITY GUIDELINES OF USABILITYIt is very important to have web quality models. These models contain the desired quality
considerations, serve as guidance to the development process and can be used to evaluate WBA qualityagainst pre-defined set of requirements. Although the importance of web quality models, a specialemphasis should be given to web quality guidelines. These guidelines give web developers some cuesas how to achieve the proposed quality factors and can be used to evaluate running applications anddiscover weakness and strength points. Without following a set of excellent web quality guidelines,during the development process, WBAs may be failed. The aim of this paper is to introduce a set ofweb quality guidelines to assist developers in the development process to produce high qualityproducts. The authors expand the approach presented in [16, 17] and propose a set of qualityguidelines for three quality sub factors of usability, which is an interest of the visitor. These sub factorsare navigability, searching, and legibility, as shown in figure (2).
Cairo University-Institute of Statistical Studies and Research 82

The so"Annual Conference on Statistics, Computer Sciences and Operation Research 27-30 Dec ,2015
Navigability
Legibility} Usability Cl ======~> VisitorSearching
Figure (2): Sub factors of usabi lity
A. Navigability GuidelinesNavigability is the extent to which WBA is ease to browse. WBA should guide the visitors through
browsing process and support a complete set of navigational aids to allow the visitors to link to anypart of the application, and acquire more of the information they are seeking for [4]. The following setof guidelines can be considered to make WBA easier to navigate:1. Having a main navigation menu. Guiding visitors through WBA and providing access to the
main sections/pages by using a main navigation menu [5, 14].2. Location of main navigation menu. Placing the main navigation menu horizontally or vertically
or both. Horizontally, near the top, just below the logo, or standing right beside it. Vertical menushould be placed on the left side of the page. Don't place it on the right of the page, or in themiddle of it.
3. Horizontal menu and displaying images area. If there is an area dedicated for displaying images,don't put it before the horizontal menu.
4. Number of horizontal navigational items. Limiting the number of navigational items to about 7.Otherwise, using a vertical menu which able to accommodate a long list of navigational items.
5. One line horizontal navigation menu. Horizontal navigation menu should be with one line/row. 2or more lineslrows horizontal menu seems to be strange.
6. Short sub-menus. Submenus should be short so that there are no invisible items and visitors cansee and access the end of these sub-menus.
7. Having footer as a secondary navigation tool. Using footer on every web page as a secondarynavigation tool. It is often formatted as text links for copyright statement, privacy policy, terms ofuse. It can be used to repeat some main navigational items or for pages that don't fit within themain menu. Footer can hold a lot of links because it may be multiple lines with a smaller font size.
8. Including a c1ickable hierarchical bar. Letting the visitors to know where they are in WBA bydisplaying a clickable hierarchical bar at the top of each web page content (except home page).This bar reflected the full path from the home page.
9. Normal location of hierarchical bar. Hierarchical bar should be placed on the left corner of thecontent area for languages that read from left to right. And on the right corner of the content areafor languages that read from right to left.
10. First item on the hierarchical bar. Starting the hierarchical bar with Home, Home Page, MainPage, <WBA_name> Home, or Home Icon. Don't start it with Top, Position, URL,<WBA _name>, "H" or other.
11. Having a "Home" link. Letting visitors to return back to the home page from any internal page byhaving a 'home" link [3].
12. The most appropriate locations for "Home" link. Incorporating a "Home" link in any of3 ,ydifferent locations. The first choice is to incorporate this link as a first link in the horizontal
83 Cairo University-Institute of Statistical Studies and Research
The so" Annual Conference on Statistics, Computer Sciences and Operation Research 27-30 Dec ,2015
or vertical navigation menu. The second is to incorporate "Home" link in the footer. Thisoption is preferable when the main menu is horizontal and has a lot of links and we want to save thespace to link to the main sections of WBA. The third is that when WBA has a c1ickable hierarchicalbar at the top of every web page. In this case, the bar already has a c1ickable "Home" link and visitorscan use it to return back to home page.
13. "Home" link on home page. "Home" link shouldn't be put on the home page, or may be put butmake it inactive. By this technique, we save a click to the visitors and provide a guidance that theyare in the home page.
14. Having a "Site map" or an "A-Z Index" link. Including a 'Site map" link [4] or an "Index" linkon the home page and every web page. There is an approach to have both hierarchical map and analphabetical index. So that, the site map provides a meaningful frame work and helps novice usersto understand the overall structure of the WBA. The index provides a means for expert users tolocate specific topics without going through a fixed sequence of information. But one of them (asite map or an index) may be sufficient. When index is presented, it should be presented on thehome page as a text link, not as a horizontal list of letters from A to Z.
15. Locations of the 'Site map" or the "A-Z Index" link. Placing the "site map" link or the "A-ZIndex" link on the footer (more common) or on the right top, near the search bar.
16. Clickable elements in the site map page or in the index page. The elements in the site map pageand/or in the index page should be clickable, to enable the visitors to go to the wanted pages.
17. Descriptive title for vague image link. Helping the visitors to predict where they might go byusing title attribute for some text and image links. For instance, a link within content and doesn'tsay too much about where it is going, an image which doesn't give any guidance about itsdestination. Using title attribute to provide additional information, not to duplicate content. If it isobvious where the link lead, don't use title attribute.
18. Identification of c1ickability. Styling clickable elements so that, web visitors don't confusedwhich elements are clickable and which are not. For example, when visitors hover over a text link,mouse's pointer changes to the hand Icon, link turns to a different color, turns to uppercase, orincrease font size, or underlining. Changing mouse's pointer to the hand Icon may be notsufficient. Combining this with another effect.
19. Don't incorporate inactive links or links to blank pages. If a web page is not ready forlaunching yet, then don't link to it. Some links take the visitors to blank pages or pages containing"under construction", "coming soon", not yet available", "in development", or similar notice.Other links reload the same page, and sometimes, nothing happens. These cases increase the workfor the visitors and provide no benefit.
20. Avoid text link duplication. Limiting the number of link appearance on the page to one. Twolinks with the same link text always point to the same address. There is no need to duplication [18].Instead of putting a link on different places on the page, just put it on its standard or more commonplace. Some designers use the footer to only repeat the main navigational items. The footer shouldbe linked to additional information.
21. Minimizing horizontal scrolling. Most web visitors don't like to scroll horizontally. They canscan the pages faster from top to bottom rather than from left to right [3, 18].
Cairo University-Institute of Statistical Studies and Research 84

The so"Annual Conference on Statistics, Computer Sciences and Operation Research 27-30 Dec ,2015
B. Searching GuidelinesSearching is another mechanism that can be used to effectively retrieve the desired information and
avoid browsing [5]. It has a great importance especially in the case of large applications. Thefollowing is a suggested set of quality guidelines that can be considered to add searching facility onthe web pages:
1. Adding searching facility whether WBA has a good navigation system or not. Internalsearching is helpful and nice if WBA has simple, clear, and logical navigation. It is crucial in thecase of heavy content WBA with many pages that can't all be listed easily together and likely togrow in the future.
2. Searching shape on home page. Designing searching as a bar which consists of an input field anda submit button [18]. This shape is more understandable and easily recognizable than a linked text,a magnifying glass icon, an input field without a submit button, or even an input field with text linkinstead of the button.
3. Placement of the search bar. Placing the search bar on the upper right corner for languages thatread from left to right [1J and on the upper left corner for languages that right from right to left.
4. Position of the submit button with regard to the input field. Positioning the submit buttonimmediately to the right of the input field for languages that read from left to right [18J. Andpositioning the submit button immediately to the left of the input field for languages that readfrom right to left.
5. Small space between input field and submit button. Leaving a small space between the inputfield and the submit button. Don't stick them.
6. Input field and submit button should be adjusted.7. Label of submit button. Labeling the submit button something meaningful and intuitive such as
"Search", "Go", or "Find". Phrases like "OK", "Take Me There", "Start" or "Submit" tend tomislead web visitors.
8. Color of input field. Input field color should be white. White input field seems to be the standard.If the background behind the search bar is white or light, putting a border for the input field to berecognizable or setting a background to the search area.
9. Color of submit button. Giving the submit button a vivid calor to be spotted. Vivid calor likeorange, red, blue, turquoise, or any calor which fits with the used color schema.
10. Size of submit button. Submit button shouldn't be very small. Designing it in a suitable size.11. Default words on input field. If the input field has default words, they should be disappear when
the visitors put the mouse inside it.12. Clickability of submit button. Identifying the c1ickability of the button by changing the mouse's
pointer to the hand icon, or changing the border calor, or both.13. Font size inside the input field. Font size inside the input field should be readable [18]. When the
researchers visited Morgridge Center for Public Service's web site (www.morgridge.wisc.edu)they found that, the font size inside the input field was very small, and they couldn't read what Ityped.
14. Magnifying glass. Using a magnifying glass to communicate the function of the search element.Determination of the suitable location of it is left to the designer. It can be put to the left or right inthe input field, on the right edge of the input field, or near the submit button. It can be also used asa submit button. In this case, it should be placed in the appropriate location as a submit button.
85 Cairo University-Institute of Statistical Studies and Research
The so"Annual Conference on Statistics , Compute~ Sciences and Operation Research 27-30 Dec ,2015
15. Searching execution. Making the search executable from either pressing the enter key withinthe input field, or clicking the submit button.
16. Searching available from all web pages. Putting the search bar on all pages, or at least putting itonly on the home page and include a text link to the search page from the interior pages.
C. Legibility GuidelinesLegibility is the ease of reading. Reading on screen is difficult in nature. Web developers should be
aware of some features that affect the ease of reading. Examples of these features are: contrastbetween foreground text and background calor, font type and size, and length of text lines. Thefollowing guidelines can be followed to increase the legibility of WBA:I. Running text and dancing images. Letting the visitors to read the text in peace and quiet by
keeping the text static. Some web designers use running text as a way to highlight news and otherimportant events. Running text is presented, on the home page, in text fields or list boxes. By thisway, a lot of text can be displayed in a little space. Designers also believe that, running text,dancing images, or dancing text make the page fanny and cool. In fact, running text is a negativedesign element. It is difficult to read. It is also a cheap effect, old fashion, and makes WBA lookunprofessional. Running text gives the visitors a headache, especially, when it is running indifferent directions. The worst is that, when running text doesn't pause when the mouse over hoverit. In this case, the visitors have to wait until the end to re-read a part that they missed.
2. Font type. Selecting font type carefully. Font type should be simple, easy on eyes and morereadable on screen. Complicated and stylish fonts perhaps make WBA visually attractive but offerpoor legibility. The studies indicate that serif fonts are more readable in print while Sans-Seriffonts are more readable on screen.
3. Short text lines as possible. Keeping the length of lines as short as possible. Long lines, whichtake the vast majority of screen width, are hard to read. One or two long lines are still readable onscreen. The problem with big paragraphs which may be reach to 30 long lines and sometimesmore. The worst is that, when scrolling (horizontally and may be also vertically) is needed to readthese lines.
4. Font size. Specifying font size that the vast majority of WBA 's visitors, without disabilities, canread it on arrival without requiring to enlarge or reduce the size. Larger size is more readable but,in the same time, it makes page appearance is not good and consumes the space which must besaved for content offering. 12 point is the most commonly used font size for text body. This sizecan be little reduced for heavy content page. It is also can be little enlarged for pages that don'tcontain a lot of content.
5. Using upper case text sparingly. Uniformally of size and shape of capitals make them harder toread than lower case letters. So, don't use capital letters for long text and for entire headings/titles.Capitals can be used for first letter in headings/menu items [18].
6. Italic Avoid using italic for long text or for entire paragraph. Italic fonts look bad, particularly at asmall size.
Sufficient contrast. Ensuring that there is sufficient contrast between foreground text and backgroundcalor (1, 3, 5, 9, 18]. Best legibility results can be obtained from combination of dark calor with lightcalor. Examples of combinations that have good contrast are black and white, black and light blue, andyellow and dark blue. Examples of combinations that don't have good contrast are grey and white, red
and orange, red and purple, green and yellow, and
Cairo University-Institute of Statistical Studies and Research 86

The su" Annual Conference on Statistics, Computer Sciences and Operation Research 27-30 Dec ,20157. white and light blue. However, designers could use tools like "Color Contrast Check" to test
different colors and contrast. There are two approaches for choosing the color of text andbackground. The former is to employ dark text on a light background. The second is to employlight text on a dark background. I personally prefer the former especially black text on a whitebackground because white background is simple, clean and elegant. It makes the content standoutand gives the visitors comfort in exploring. Without proper contrast, visitors can't read the text andthey will leave.
8. Text scannability. Online people don't read, they scan. Arrange the content for scannability byseveral ways: breaking up long blocks of text into smaller paragraphs, beginning each paragraphwith the most important idea, having lots of headings, using short phrases that read quickly,removing unnecessary words or sentences, and using bulleted or numbered lists rather than densepassages of text when appropriate [4,5,9,19].
9. Text aligning and ragging. Aligning text on the left, ragging it on the right, Increase readingspeed because the straight left edge helps to anchor the eye when starting a new line.
] O. Line height. Paying attention to the line-height of the elements within the page [5]. The choice ofa suitable line-height depends on the font type used, font size, word spacing, and length of line. Forinstance, the longer the line, the bigger we need to make the line-height.
IV. THE EVALUA TION PROCESSThe proposed approach depends of a set of quality guidelines for three quality sub-factors of
usability. These sub-factors are: navigability, searching, and legibility. The evaluation process aims toevaluate the usability of WBA according to the proposed quality guidelines. The evaluation processstarts with selecting a set of WBAs and ended by analyzing and comparing the outcomes. Asillustrated in figure (3), the evaluation process contains the following steps:
1. Selecting a set of WBAs for evaluation purpose.2. Collecting data and applying elementary evaluation.3. Aggregating elementary values to yield satisfaction level for each guideline, then, for each sub-
factor.4. Aggregating satisfaction values of each sub-factor to yield total satisfaction level for usability.5. Analyzing and comparing outcomes.
A. Selecting a Set of WBAs for evaluation purposeWebometrics ranking of world universities is an initiative of the Cybermetrics Lab, a research group
belonging to SCIC (Consejo Superior de Investigaciones Cientificas), the largest public research bodyin Spain. Cybermetrics Lab is devoted to quantitative analysis of the internet. Webometrics ranking ispublished twice a year (at the end of January and July months), covering about 20.000 highereducation institutions worldwide [23]. The evaluation process is performed by selecting a sample ofthirty WBAs that appeared in the final list of July 2012 edition. The selected sample is shown inAppendix (A). This sample contains three groups namely: top group (ten WBAs of the highest rank),middle group (ten WBAs of the middle rank, and last group (ten WBAs of the least rank). Whatexpected is that, top group will take higher rank in all examined sub-factors, then middle group willtake moderate rank, and then, last group
87 Cairo University-Institute of Statistical Studies and Research
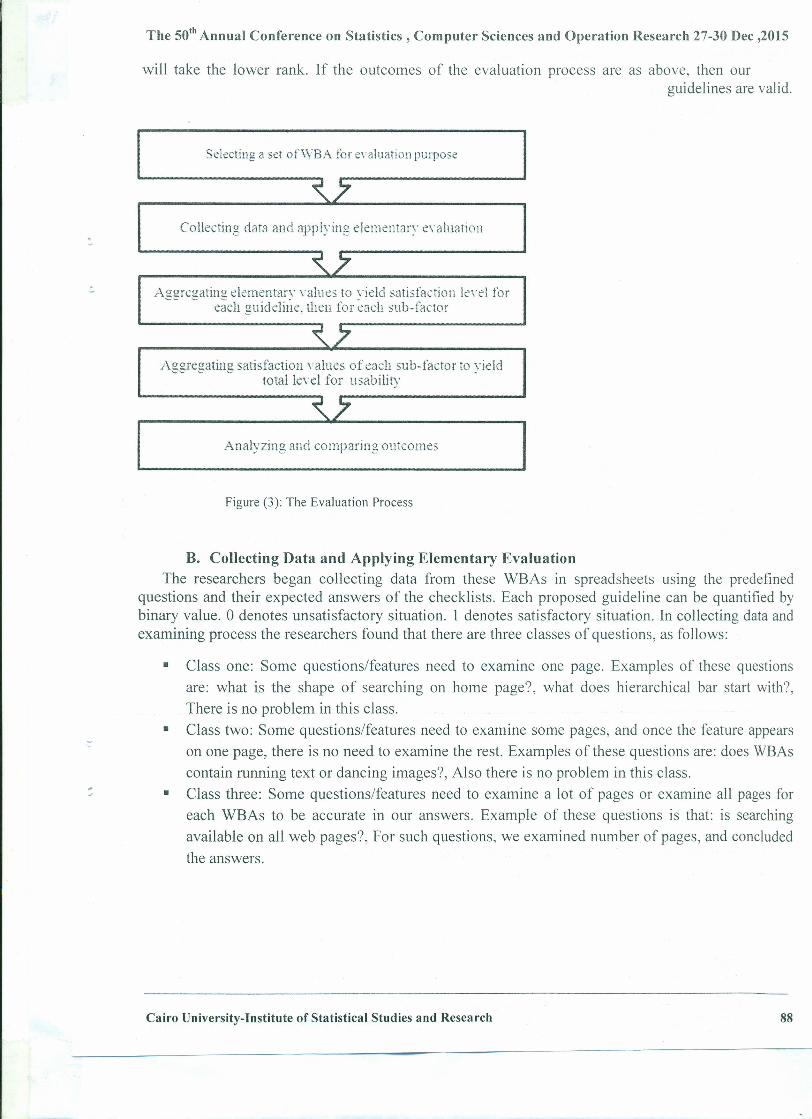
The 50th Annual Conference on Statistics, Computer Sciences and Operation Research 27-30 Dec ,2015
will take the lower rank. If the outcomes of the evaluation process are as above, then ourguidelines are valid.
...,
Selecting a set ofWBA for evaluation purpose
~7Collecting data and applying elementary evaluation
~7Aggregating elementary values to yield satisfaction kwl for
each guideline, then for each sub-factor
~7Aggregating satisfaction values of each sub-factor to yield
total level for usability
~7Analyzing and comparing outcomes
Figure (3): The Evaluation Process
B. Collecting Data and Applying Elementary EvaluationThe researchers began collecting data from these WBAs in spreadsheets using the predefined
questions and their expected answers of the checklists, Each proposed guideline can be quantified bybinary value, 0 denotes unsatisfactory situation. 1 denotes satisfactory situation. In collecting data andexamining process the researchers found that there are three classes of questions, as follows:
• Class one: Some questions/features need to examine one page. Examples of these questionsare: what is the shape of searching on home page?, what does hierarchical bar start with?,There is no problem in this class.
• Class two: Some questions/features need to examine some pages, and once the feature appearson one page, there is no need to examine the rest. Examples of these questions are: does WBAscontain running text or dancing images?, Also there is no problem in this class.
• Class three: Some questions/features need to examine a lot of pages or examine all pages foreach WBAs to be accurate in our answers. Example of these questions is that: is searchingavailable on all web pages?, For such questions, we examined number of pages, and concludedthe answers.
Cairo University-Institute of Statistical Studies and Research 88

The 50th Annual Conference on Statistics, Computer Sciences and Operation Research 27-30 Dec ,2015
C. Aggregating Elementary Values to Yield Satisfaction Level for each Guideline, then,for each Sub-Factor
After examining WBAs and collecting data in spread sheets, a stepwise aggregation mechanismhave been performed to yield the quality satisfaction level for each guideline, and then yield qualitysatisfaction level for each sub-factor using a scale from 0 to 100%. This can be done by calculatingpercentage of the cells which contain 1 to the total number of cells. 0% denotes a totally unsatisfactorysituation. 100% denotes a fully satisfactory situation. The values between 0% and 100% denote apartial satisfaction. In the following sub-sections, the researchers show some mentioned guidelines andthe outcomes of the examining process for each sub factor.
1. Evaluation of Navigability Guidelines• Having a main navigation menu: All examined WBAs, in the three groups, have a mam
navigation menu except BPK in last group. So, percentages of satisfaction are 100%, 100%,and 90% for top, middle, and last groups respectively.
• Location of main navigation menu: U of I in top group and XNU in middle group have rightvertical ones. TCC in middle group has a navigation menu with two columns. SPCE in lastgroup put the horizontal menu above the institute name. So, percentages of satisfaction are90%,80%, and 80% for top, middle, and last ten groups, respectively.
• Short sub-menus: HU in top group has long drop down sub menu and visibility of its enddepends on the display size and screen resolution. TCC in middle group has very long dropdown sub menus. About TCC item contains more than sixteen sub items (see figure 6). Webusers can't reach to its end even in higher resolution (1366 by 768). Dellarte and FSCC, in lastgroup, have also long drop down sub menus. So, percentages of satisfaction are 90%, 90%, and80% for top, middle, and last ten groups, respectively.
• Having a "site map" or an "A-Z index" link: Six WBAs in top group either have a site map oran index or both. Five WBAs in middle group (CIA, Hult, AC, TCC, VCC) have a site map.Two in last group (Dellarte and NTCB) have a site map. No one in middle and last groups havean index. AIMS (middle) and LUC (last) have a XML site map which is supposed to beprocessed by search engines. So, percentages of satisfaction are 60%, 50%, and 20% for top,middle, and last groups, respectively.
After examining each navigability guideline, in each group, we found that, our proposedguidelines are satisfied in the three groups. Top group has reached 80%, middle group has reached65.24%, and last group has reached 60.48%.
2. Evaluation of Searching Guidelines• Adding a search facility: This guide is fully satisfied in top group. All WBAs in this group have
a search facility. Two WBAs (XNU and Sonoda) in middle group and five WBAs (BPK, DCT,Dellarte, NTCB, and SJUT) in last group don't have this facility. So percentages of satisfactionare 100%,80%, and 50% for top, middle, and last groups, respectively.
• Searching shape on home page: This guide is fully satisfied in top group. All WBAs in thisgroup have a search bar consists of an input field and submit button. AIMS, and Huit, in middlegroup, have an icon. WCCC, in last group, has an input field only without a button or even atext link. So percentages of satisfaction for this edition are 100%, 60%, and 40% for top,middle, and last groups, respectively.
89 Cairo University-Institute of Statistical Studies and Research

The 50th Annual Conference on Statistics, Computer Sciences and Operation Research 27-30 Dec ,2015
• Position of submit button with regard to the input field: All WBAs, in top group, have submitbutton on the right of input field. TCC, in middle group, puts submit button to the left of inputfield. All WBAs, in last group, which have submit button, put it on the right of input field. So,Satisfaction percentages are 100%, 50%, and 40% for top, middle, and last groups,respectively.
• Magnifying glass: Four WBAs (HU, SU, Penn, and MSU) in top group, and four WBAs(AIMS, Hult, AC, and ISDM) in middle group, and SPCE in last group, use a magnifyingglass. So, Satisfaction percentages are 40%, 40%, and 10% for top, middle, and last groups,
..• respectively.After examining each searching guidelines, in each group, we found that, our proposed
guidelines are satisfied in the three groups. Top group has reached 85%, middle group has reached55.63%, and last group has reached 37.5%.
=
3. Evaluation of Legibility GuidelinesRunning text and dancing images: All examined WBAs, in top group, don't have running textor dancing images. XNU, in middle group, and SlUT, in last group, are WBAs which violatethis guide. So, satisfaction percentages are 100%, 90%, and 90% for top, middle, and lastgroups, respectively.Text scannability: All pages, in all top WBAs, are scannable. A lot of pages, in middle group,have no headings, no numbered or bulleted lists, or even no colors, just big paragraphs, as infigure (4). Three WBAs (MAL, AIMS, and XNU) in middle group, and two WBAs (BPK andNTCB) in last group have unscannable pages. So, satisfaction percentages are 100%, 70%, and80% for top, middle, and last groups, respectively.Text aligning and ragging: All WBAs, in top group, have text aligning on the left and raggingon the right. Two WBAs (AIMS and XNU) in middle group, and three in last group (BPK,DCT, and SPCE) violate this guideline. So, satisfaction percentages are 100%, 80%, and 70%for top, middle, and last groups, respectively.
•
•
•
-:'.. "'," '~""'''. ;.),.- " ' •. ' .<: :." ..••"-< " ),>,;-,f','. ,'., "'''~. ", • ."..;, .-,"' "", "'.
:'••. ·~·••,'~t,-: L".·":., ..• ..- ",,_,",,: ",,", "'~""'"'''' --,~••" ""-.".- _,,', :~" ..• ' ..
Figure (4): Unscannable page
Cairo University-Institute of Statistical Studies and Research 90
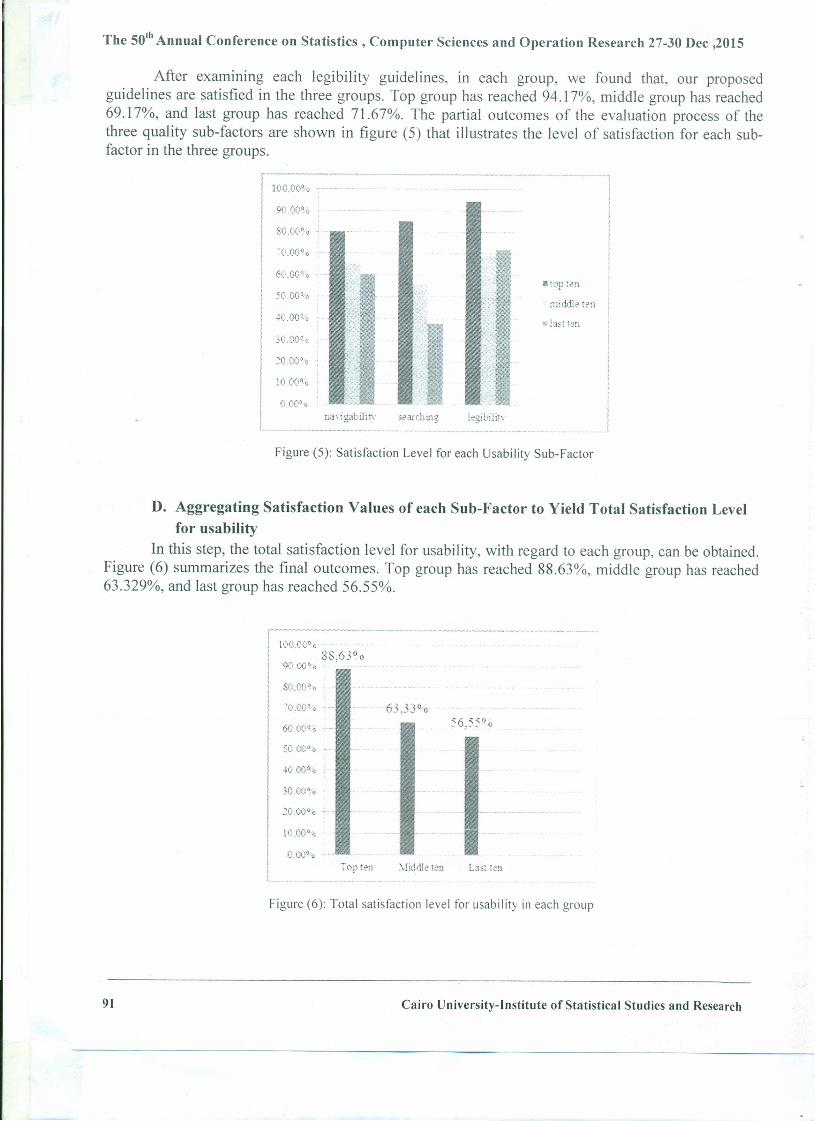
The so" Annual Conference on Statistics, Computer Sciences and Operation Research 27-30 Dec ,2015
After examining each legibility guidelines, in each group, we found that, our proposedguidelines are satisfied in the three groups. Top group has reached 94.17%, middle group has reached69.17%, and last group has reached 71.67%. The partial outcomes of the evaluation process of thethree quality sub-factors are shown in figure (5) that illustrates the level of satisfaction for each sub-factor in the three groups.
100.00"'0
90.00"'0
SO.OO·.
-0.00' o
I 60.00"·"
I
IIL
searchmg
atop ten
middle ten
~ last ten
Figure (5): Satisfaction Level for each Usability Sub-Factor
D. Aggregating Satisfaction Values of each Sub-Factor to Yield Total Satisfaction Levelfor usability
In this step, the total satisfaction level for usability, with regard to each group, can be obtained.Figure (6) summarizes the final outcomes. Top group has reached 88.63%, middle group has reached63.329%, and last group has reached 56.55%.
10G.00°,:;8S.63°0
9().OO··c ..
50.CO·o
30.00·e
20.(,'0·.' ..
, 10.00·,t
I G.OO·.
I Top ten "fiddle tell Last t-en
Figure (6): Total satisfaction level for usability in each group
91 Cairo University-Institute of Statistical Studies and Research
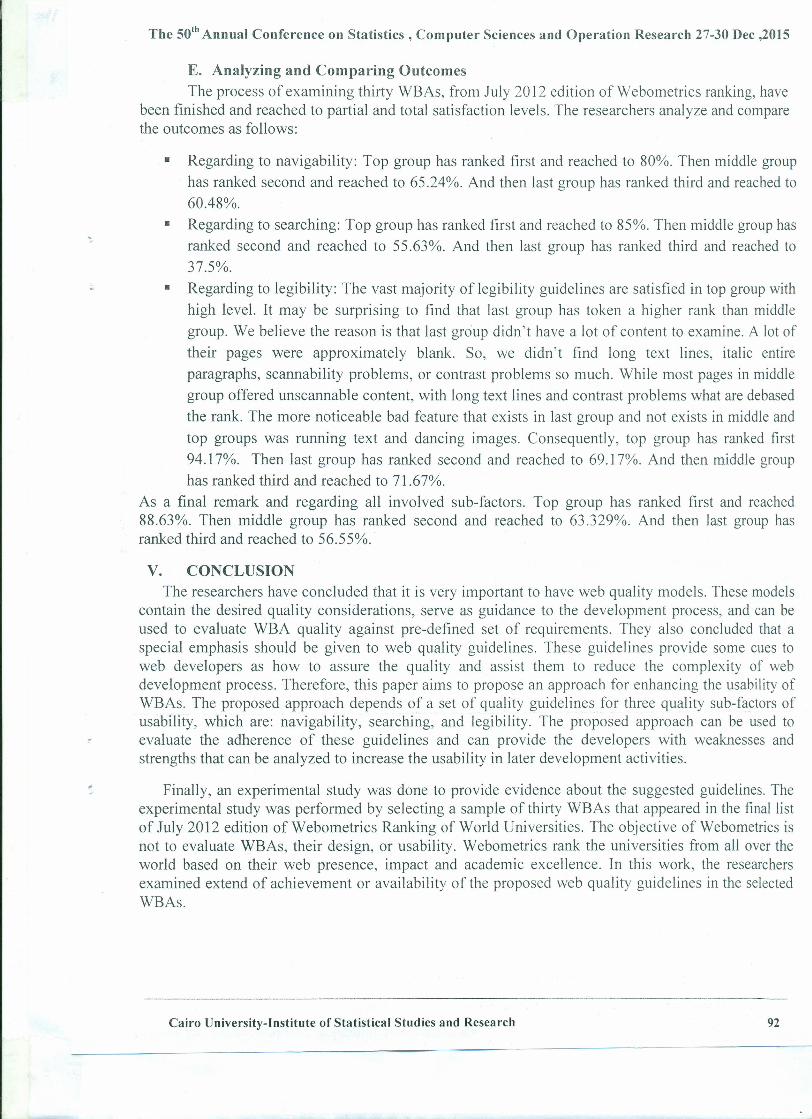
The so" Annual Conference on Statistics, Computer Sciences and Operation Research 27-30 Dec ,2015
E. Analyzing and Comparing OutcomesThe process of examining thirty WBAs, from July 2012 edition of Webometrics ranking, have
been finished and reached to partial and total satisfaction levels. The researchers analyze and comparethe outcomes as follows:
• Regarding to navigability: Top group has ranked first and reached to 80%. Then middle grouphas ranked second and reached to 65.24%. And then last group has ranked third and reached to60.48%.
• Regarding to searching: Top group has ranked first and reached to 85%. Then middle group hasranked second and reached to 55.63%. And then last group has ranked third and reached to37.5%.
• Regarding to legibility: The vast majority of legibility guidelines are satisfied in top group withhigh level. It may be surprising to find that last group has token a higher rank than middlegroup. We believe the reason is that last group didn't have a lot of content to examine. A lot oftheir pages were approximately blank. So, we didn't find long text lines, italic entireparagraphs, scannability problems, or contrast problems so much. While most pages in middlegroup offered unscannable content, with long text lines and contrast problems what are debasedthe rank. The more noticeable bad feature that exists in last group and not exists in middle andtop groups was running text and dancing images. Consequently, top group has ranked first94.17%. Then last group has ranked second and reached to 69.17%. And then middle grouphas ranked third and reached to 71.67%.
As a final remark and regarding all involved sub-factors. Top group has ranked first and reached88.63%. Then middle group has ranked second and reached to 63.329%. And then last group hasranked third and reached to 56.55%.
v. CONCLUSIONThe researchers have concluded that it is very important to have web quality models. These models
contain the desired quality considerations, serve as guidance to the development process, and can beused to evaluate WBA quality against pre-defined set of requirements. They also concluded that aspecial emphasis should be given to web quality guidelines. These guidelines provide some cues toweb developers as how to assure the quality and assist them to reduce the complexity of webdevelopment process. Therefore, this paper aims to propose an approach for enhancing the usability ofWBAs. The proposed approach depends of a set of quality guidelines for three quality sub-factors ofusability, which are: navigability, searching, and legibility. The proposed approach can be used toevaluate the adherence of these guidelines and can provide the developers with weaknesses andstrengths that can be analyzed to increase the usability in later development activities.
Finally, an experimental study was done to provide evidence about the suggested guidelines. Theexperimental study was performed by selecting a sample of thirty WBAs that appeared in the final listof July 2012 edition of Webometrics Ranking of World Universities. The objective of Webometrics isnot to evaluate WBAs, their design, or usability. Webometrics rank the universities from all over theworld based on their web presence, impact and academic excellence. In this work, the researchersexamined extend of achievement or availability of the proposed web quality guidelines in the selectedWBAs.
Cairo University-Institute of Statistical Studies and Research 92
The so" Annual Conference on Statistics, Computer Sciences and Operation Research 27-30 Dec ,2015
REFERENCES[1] 25-Point Web Site Usability Checklist.. Retrieved from
www.usereffect.com/topic/25-point-website-usability-checklist, 2009.User Effect:
[2] M. Barbacci, T. H.Longstaff, M. H.Klein & e. B.Weinstock, "Quality Attributes. TechnicalReport", CMU/SEI-95- TR-021, ESC- TR-95-021, 1995.
[3] N. Bevan, "Guidelines and Standards for Web Usability", Proceedings of HCI International,Lawrence Erlbaum. 2005.
[4] T. Chiew & S. Salim, "Webuse: Web Site Usability Evaluation tool", Malaysian journal ofcomputer science, 16 (1),47-57,2003.
[5] M. Cronin, "10 Principles for Readable Web Typography", Retrieved fromwww.smashingmagazine.com/2009/03/18/10-principles-for-readable-web-typography/, 2009.
[6] A. I. Eldesouky, H. Arafat & H. Rarnzey, "Toward Complex Academic Websites QualityEvaluation Method (QEM) Framework: Quality Requirements Phase Definition andSpecification", Mansoura University, Faculty of Engineering, Computer and SystemsEngineering Department, Cairo, Egypt, 2008.
[7] Ronan Fitzpatrick, "Additional Quality Factorsfor the World Wide Web", Retrieved 02 27, 2008,from www.comp.dit.ie/rfitzpatrick/papers/2RF_AQF_WWW.pdf, 2000.
[8] Hall, R. H., & Hanna, P. (2004). The Impact of Web Page Text Background ColourCombinations on Readability, Retention, Aesthetics and Behavioural Intention. Behaviour &Information Technology, 23 (3),183-195.
[9] Hussain, W., Sohaib, 0., Ahmed, A., & Khan, M. Q. (2011). Web Readability Factors AffectingUsers of all Ages. Australian Journal of Basic and Applied Sciences, 5 (11), 972-977.
[10] Internet World Stats. Retrieved 2015, from www.internetworldstats.com. 2015.
[11] ISO/IEe. "9126-1- Software engineering - Product quality - part1: Quality model",International Organization for Standardization, 2001.
[12] ISO/IEC, "TR 9126-4- Software Engineering - Product Quality - Part2: Quality in use Metrics",International Organization for Standardization, 2004
[13] S. Khaddaj & B. john, "Quality Model for Semantic Web Applications", InternationalConference on Advanced Computing and Communication (1CACC), Kerala, India, 2010.
93 Cairo University-Institute of Statistical Studies and Research
The so" Annual Conference on Statistics, Computer Sciences and Operation Research 27-30 Dec ,2015
[14] F. Miranda, R. Cortes & c. Barriuso, "Quantitative Evaluation of e-banking Web Sites: AnEmpirical Study of Spanish Banks", Electronic Journal Information Systems Evaluation, 9 (2),73-82, 2006.
[15] S. e. Murugesan, "Web Engineering: A new Discipline for Development of Web-BasedSystems", In Proceeding of First ICSE Workshop on Web Engineering, (pp. 1-9). Los Angeles,1999.
[16] Doaa Nabil, Abeer Mosaad, and Hesham A. Hefny, "A Proposed Conceptual Model forAssessing Web-Based Applications Quality Factors", Proceeding of IEEE InternationalConference on Intelligent Computing and Intelligent Systems (ICIS 2011). Guangzhou, China,2011.
[17] Doaa Nabil, Abeer Mosaad, and Hesham A. Hefny, "Web-Based Applications QualityFactors: A Survey and a Proposed Conceptual Model", Egyptian Informatics Journal, 211-217,2011.
[18] Jakob Nielsen, "113 Design Guidelines for Home Page Usability" Retrieved fromwww.nngroup.com/articles. 2001.
[19] Jakob Nielsen, "Top 10 Mistakes in Web Design",www.nngroup.com/articles/top-1 O-mistakes-web-designl, 2011.
Retrieved from
[20] Luis Olsina & G. Rossi, "Towards Website Quantitative Evaluation: Defining QualityCharacteristics and Attributes", Proceedings of IV Int, I WebNet Conference, WorldConference on the WWW and Internet, (pp. 834-839). Hawaii, USA, 1999.
[21] Luis Olsina, G. Lafuente & G. Rossi, "E-commerce Site Evaluation: A case study", 1stInternational Conference on Electronic Commerce and Web Technology. London - Greenwich,2000.
[22] Luis Olsina, G. Rossi, D. Godoy & G. 1. Lafuente, "Specifying Quality Characteristics andAttributes for Web Sites" Proceeding of First ICSE workshop on web engineering, ACM LosAngeles, 1999.
[23] Ranking Web of Universities. (2012, July). Retrieved Sep. 2012, from Webomterics Rankingof World Universities: www.webomterics.infol
[24] L. O. Santos, "Website Quality Evaluation Method: A Case Study on Museums", IC5E 99Software Engineering over the internet. Los Angeles, US, 1999.
Cairo University-Institute of Statistical Studies and Research 94

The so"Annual Conference on Statistics, Computer Sciences and Operation Research 27-30 Dec ,2015
APPENDIX A
List of Selected WBAs for Webometrics (July 2012 edition)
Name Abbreviation URl Rank
Top groupHarvard University HU www.harvard.com 1
Massachusetts Institute of Technology MIT www.mit.edu 2Stanford University SU www.stanford.edu 3University of California Berkeley UCB www.berkeley.edu 4
Cornell University CU www.comell.edu 5University of Minnesota U of M http://wwwl.umn.edu/twincities/index.html 6University of Pennsylvania Penn http://www.upenn.edu/ 7
University of Wisconsin Madison UWM www.wisc.edu 8
University of Illinois Urbana Champaign U of I http://i1linois.edu/ 9
Michigan State University MSU www.msn.edu 10
Middle group
Medical Academy Ludwik Rydygier in Bydgoszcz MAL http://www.cm.umk.pl/en/ 5983
Amrita Institute of Medical Sciences AIMS http://www.aimshospital.org/ 5986
Culinary Institute of America CIA http://www.ciachef.edu/ 5987
Hult International Business School Hult http://www.hult.edu/ 5987
Xiangnan University XNU http://www.xnu.edu.cn/ 5987
Sonoda Women's University Sonoda http://www.sonoda-u.ac.jp/ 5992
American College AC http://www.theamericancollege.edu/ 5992Tulsa Community College TCC http://www.tulsacc.edu/ 5992
Institute Superieur des Materiaux et de la ISDM http://www.supmeca.fr/ 5996Construction MecaniqueVancouver Community College VCC http://www.vcc.ca/ 5996
last group
BP Koirala Institute of Health Sciences BPK http://www.bpkihs.edu/ 11977
Darlington College of Technology DCT http://www.darlington.ac.uk/ 11984
Dell' Arte International School of Physical Theatre Dellarte http://www.dellarte.com/default.aspx 11984
National Taipei College of Business NTCB http://eng.ntcb.edu.tw/front/bin/home.phtml 11984
Saint John's University of Tanzania 5JUT http://www.sjut.ac.tz/ 11984
Washington County Community College WCCC http://www.wccc.me.edu/ 11993
Faulkner State Community College FSCC http://www.faulknerstate.edu/ 11993Brokenshire College BC http://www.brokenshire.edu.ph/ 11998Linton University College LUC http://www.linton.edu.my/en/ 11998
Sardar Pate I College of Engineering SPCE http://www.spce.ac.in/ 11998
95 Cairo University-Institute of Statistical Studies and Research
The so" Annual Conference on Statistics, Computer Sciences and Operation Research 27-30 Dec ,2015
Towards Applying Agile Practices to Bioinformatics Software Development
Islam Ibrahim Amin 1 Amr Ebada2
[email protected] [email protected] Ramadan Darwish3
ABSTRACT
The bioinformatics software developments industry represents one of the fastest growingfields. As a result of the lack of software engineering practices in the developments and thecomplex nature of bioinformatics software developments, there is a strong need for more agilitydealing with these challenges. Agile method represents a good developments approach relies onstrong collaboration and automation to develop high quality software within time and budgetconstraints through several iterations. This paper adopts agile principles especially extremeprogramming (XP) practices to solve the common challenges that face the developers ofbioinformatics software. The proposed agile practices can be used to facilitate and enhance thedevelopments processes that may increase the possibility of its successes.
Keywords: Bioinformatics, Software Engineering, Software Developments, Agile,Requirement Engineering.
Introduction
Bioinformatics is an interdisciplinary field of molecular biology, computer sciencetheories, statistics and mathematics that developing efficient algorithms to analysis, model,visualize and solve complex biological problems in plant, animal and human including DNA,RNA sequences, protein sequences and structures, microarray data and next generationsequencing data. In April 2003, the Human Genome Project had completed by sequencing the 3billion DNA letters in the human genome also it was planned for 15 year and cost $1 billion, nowUS company lIIumina has announced it will begin shipping a system capable of sequencing thehuman genome for under $1,000 by producing around 600 giga bases of sequencing data perday. There are three major international bioinformatics centers, NCBI, EBI and ExPASy thatcollect, develop and maintain hundreds of bioinformatics data and tools. Bioinformatics fieldproduces a large amount of complex data such as DNA, RNA, proteins, and other cellularmolecules. A bioinformatician works to provide services to the scientific commurrity in the formof data bases and analytical tools. One of the challenges that will face the bioinformatics fieldover the next decade is integration and presentation of the enormous and ever expanding sizedata also it is necessary to integrate and present data from different views of the same system [1].
Cairo University-Institute of Statistical Studies and Research 96

The so" Annual Conference on Statistics, Computer Sciences and Operation Research 27-30 Dec ,2015
Since the completion of the human genome project, computer sciences tools have becomeindispensable in supporting model, analysis, integration, and visualization of large amounts ofmolecular data and advancing a major core of biological research. Bioinformatics has become one ofthe fastest growing interdisciplinary scientific fields, combing together Molecular Biology andComputer Science, among other disciplines. Many of commercial and open source tools ofbioinforrnatics are emerged, but they often lack transparency in that researchers end up dealing morewith the complexity of the tools, rather than the scientific problems at hand [2].
The remainder of this paper is organized as follows. Section 2 gives a brief of bioinforrnatics softwaredevelopments agile methods. Section 3 represents the proposed agile practices. Finally in section 4conclusionsand future work inspiration.
2. Bioinformatics Software Developments and Agile Methods
In bioinforrnatics software developments, the primary stakeholders are biologists rather thancomputer scientists therefore it presents a unique situation for the field of software engineering, as itresults in challenges and opportunities that are not typically find during the normal engineeringprocess. Software engineering practices are still not of major importance in bioinformatics filed asemphasis is on how to apply mathematics, computer sciences to solve complex biological thereforethere is still a large gap in understanding problems in bioinformatics software developments [1].
2.1 Bioinformatics Software Developments Challenges
Due to the complex and critical nature of bioinformatics software and it's rapidgrowing volume, thereis a strong need to support bioinformatics professionals to develop a maintainable and a reliablesoftware systems by applying software engineering practices. In addition, the bioinforrnatics domain isactually different in some aspects to the general software engineering community. First, inbioinformatics software developments project, the main driver of software requirements is toinvestigate sophisticated research questions rather than a more generic business function, therefore therequirements will be complex, vague, and volatile, which presents an important risk for bioinformaticssoftware efforts. Secondly, the strict budgets and schedule constraints of typical research projectsproposed additional constraints for developments; for example, the resources for appropriate testing,validation and verification can be limited. Finally, bioinformatics developers, who may lack a formalsoftware engineering background, are usually in a position to develop and maintain their ownprograms, i.e. there is a high proportion of end-user programmers in bioinformatics [4]. The lists of themain challenges in bioinforrnatics software developments are [1]:
• Cross-disciplinary: Bioinformatics is a cross-disciplinary field, it is one in which the twodisciplines do not even speak remotely the same language.
• Stakeholder heterogeneity: Stakeholders are biologists rather than computer scientists.Stakeholders may be more inclined to sacrifice program structure to get something that works.
• Lack of reusability: Most bioinformaticians and computational biologists believing that goodbioinforrnaticians building up their own toolbox, but the software developments practicesmostly surround the notion of "Don't reinvent the wheel
97 Cairo University-Institute of Statistical Studies and Research

The so" Annual Conference on Statistics, Computer Sciences and Operation Research 27-30 Dec ,2015
which essentially refers to the use of existing frameworks and to take advantage of large existingprojects like BioPython.• Project constraints: Tighter restraints on budget and timetables, as well as less time allotted
for verifying and testing Many bioiformatician who are doing the programming themselves,and have been left to their own devices in terms of software developments and documentation.
• Documentation: Documentation is very limited, if it exists.• Lack of Teamwork: Most of bioinformatician said that self-teaching was one of their main
modes of software developments process learning.
2.2 Bioinformatics Software Development Requirements
According to the nature of the bioinformatics fields, there are some requirements that should take intoconsiderations to target the common challenges of this domain.
2.2.1 Approaches to Software Development
Rapid application developments or prototyping is the best way to develop a tangible solution to thecustomer, but the drawback is that the prototype ends up being used as the actual system, which laterresults in problems. Future bioinformatics software developers should have complete knowledge ofsoftware engineering practices such as XP and related paradigms such as Test-Driven Developments(TDD), and how to use the right mix for a successful project. Object-oriented concepts should betaught with rich examples and plenty of exercises [4]. In the experience reports on developingbioinformatics software by Kane [5] and by Kendall [6], these reports emphasized that extremeprogramming and the agile practices were indeed well suited to bioinformatics software developments.
2.2.2 Importance of Documentation
In terms of software maintenance, wntmg an increased number of perceive comments anddocumentation is very helpful for maintenance phase. Bioinformatics software is the most complexand constantly evolving one therefore, documentation is very important to developing software forbioinformatics software. The importance of documentation was stressed by the researchers ofBioconductor project therefore documentation considered as a key practice to be strengthened inscientific software developments [7].
2.2.3 Quality Assurance Practices
Bioinformatics research practice has critical implications for life sciences, and it is very important tohave strong quality assurance (QA) practices such as code reviews and testing to ensure softwarequality. It would be very helpful have a step-by-step tutorial about how to write a test case, as well ashow to perform a code review. [4].
Cairo University-Institute of Statistical Studies and Research 98

The 50th Annual Conference on Statistics, Computer Sciences and Operation Research 27-30 Dec ,2015
2.2.4 Software Evolution and Maintenance
Bioinformatics field is still a very young domain, and software developed in this domain has not yetmatured enough to be studied from an evolutionary perspective. As their applications move into legacystatus, bioinformatics programmers need to understand more about the complex relationships amongsoftware size, complexity and age, so that they can take preventive measures in advance [4].
2.2.5 Requirements Engineering
Managing requirements in the bioinformatics field is a challenging task. In bioinformatics,requirements cannot simply be "handed off' from the domain experts to the degree that is possible inother disciplines. Close interaction and cooperation between domain scientists and professionaldevelopers is necessary in order to keep up with changing hypotheses, new algorithms and newmethods for handling vast quantities of data [8].
2.3 Agile Methods
H. Frank Cervone, et al., 2010 [9] study is display the outgrowth of the agile software developmentsmovement. It is state four core principles manifesto for agile software developments as follows:
(1) Individuals and interactions over processes and tools.(2) Working software over comprehensive documentation.(3) Customer collaboration over contract negotiation.(4) Responding to change over following a plan.
Several different takes how to best apply agile methods. Some of the most important include: Scrum,extreme project management, adaptive project management, and dynamic project managementmethod. H. Frank Cervone, et al., 2010 [9] says "the goal is to deliver a more suitable product morequickly than with traditional methods".
2.3.1 Extreme Programming Practices (XP)
XP, originally explained by Kent Beck [16], XP is considered as one pf the first agile methodology.Figure 1 represents XP practices which consist of three cycles. Each cycle has methods.
99 Cairo University-Institute of Statistical Studies and Research
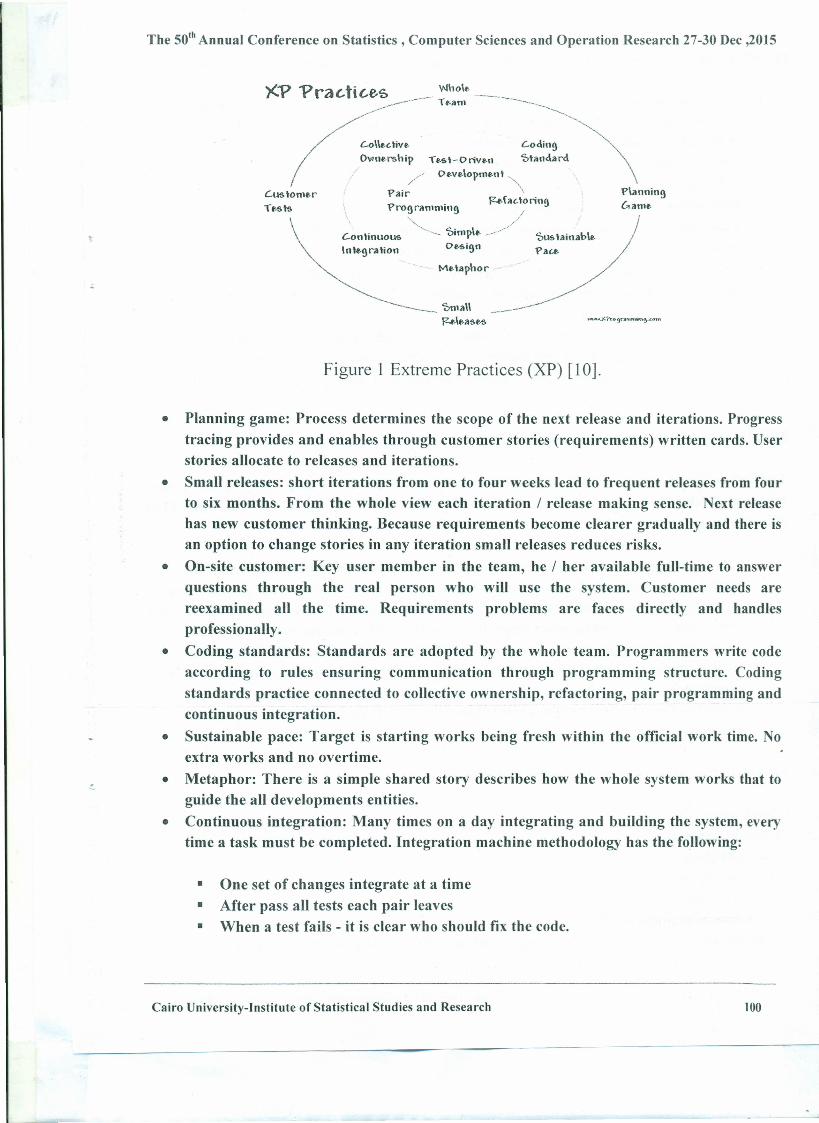
The 50th Annual Conference on Statistics, Computer Sciences and Operation Research 27-30 Dec ,2015
)("P "Pra cti{,e,S _' Wl1ol~,./' ~-.--. -r~.anl ~----.~- <,
/~/--- "'---.
~
C.ol\u.tive. C.oding '\Owne.rsl1ip Ie.st-Drive.n '5tandard
, // De.ve.lopme.nt"<,
C.ustonle.r Yair \ V\anning~fac.tOrin9 r .
Ie.stS ,Vrogran1ming I ""ame."'-. /
C.ontinuous ,~- '5impIt. ,,J"'/ '5ustainable.Inte.gration De.sign Vau
Me.tapl1or
-- '5nla\\ _--~Ie.ase.s
Figure 1 Extreme Practices (XP) [10].
• Planning game: Process determines the scope of the next release and iterations. Progresstracing provides and enables through customer stories (requirements) written cards. Userstories allocate to releases and iterations.
• Small releases: short iterations from one to four weeks lead to frequent releases from fourto six months. From the whole view each iteration / release making sense. Next releasehas new customer thinking. Because requirements become clearer gradually and there isan option to change stories in any iteration small releases reduces risks.
• On-site customer: Key user member in the team, he / her available full-time to answerquestions through the real person who will use the system. Customer needs arereexamined all the time. Requirements problems are faces directly and handlesprofessionally.
• Coding standards: Standards are adopted by the whole team. Programmers write codeaccording to rules ensuring communication through programming structure. Codingstandards practice connected to collective ownership, refactoring, pair programming andcontinuous integration.
• Sustainable pace: Target is starting works being fresh within the official work time. Noextra works and no overtime.
• Metaphor: There is a simple shared story describes how the whole system works that toguide the all developments entities.
• Continuous integration: Many times on a day integrating and building the system, everytime a task must be completed. Integration machine methodology has the following:
• One set of changes integrate at a time• After pass all tests each pair leaves• When a test fails - it is clear who should fix the code.
Cairo University-Institute of Statistical Studies and Research 100

The 50th Annual Conference on Statistics, Computer Sciences and Operation Research 27-30 Dec ,2015
• Collective ownership: If Programmers see the needs to improve, they can manipulate anycode anywhere at any time in the system. Collective ownership concept is to reduce thetechnical risk that In case of programmer leaves the organization.
• Testing: Test cases are written before the code is written. Testing is an essential part ofcoding process.
• Refactoring: Programmers tuning the system restructure without changing its behavior.They remove duplication, improve communication, and simplicity. Code improvement ismust. An overcome benefit meets the challenge between short and long-term.
• Simple design: Simplicity of system designs implements as possible. Collective ownershipand refactoring are strongly support simplification. Simple design is Improves programstructure understanding.
• Pair programming (PP): all code is written within pairs and changes according to tasks,and team work expertise. Programmers prefer PP because discover bugs earlier, help theteam on accepts decisions of pairs, increase productivity and quality.
2.3.2 Test Driven Developments (TDD)
Test-Driven Developments (TDD) is an advanced technique for developing software that guidessoftware development by writing tests. Antti Hanhineva [14] illustrate the following TDDdefinitions:
TDD is an agile practice where the tests are written before the actual program code.TDD is a technical enabler for increasing agility at the developer and product projectlevels. Existing empirical literature on TDD has demonstrated increased productivity andmore robust code, among other important benefits. TDD is an incremental process. Firsta test is added and the code of test is written. If the test is passed then code is refactored.Refactoring is a process of making changes (tuning) to existing and working code withoutchanging its external behavior, i.e., the code is altered for the purposes of comments,simplification, or other quality aspect. This cycle is repeated until all of the functionalityis implemented.
TDD identifies several potential benefits as follows:
• Developer confidence• Efficient refactoring• Fast debugging• Software improving• Safety changes• Up-to-date code documentation• Help developers avoid over-engineering by setting a limit on what needs to be implemented.
101 Cairo University-Institute of Statistical Studies and Research

The so" Annual Conference on Statistics, Computer Sciences and Operation Research 27-30 Dec ,2015
2.3.3 Scrum
Scrum is a part of the Agile umbrella that was introduced in 1995 by Ken Schwaber and Jeff Sutherland.Scrum is an agile software development framework that is widely used to achieve the agility, incrementaland iterative development in the software development cycle as shown in the figure 2. Scrum is focusedon project management that can manage and control software development while XP focused on softwaredevelopment of rapidly changing req uirements. The Scrum activities are [17):
• Preparing product backlog• Sprint planning meeting and preparing sprint backlog• Sprint• Daily Scrum• Sprint review and presenting an increment.• Spring retrospective
, TC;lIn Sclcc« \
,\/\ Huw Much To \
Commit To I)" ,:{ lly Spnnt'> l:nd/
Sprrm I'lal1lllng Spnnt\kelinu nn('kln:~
(l'url> I ;,,1<1 ~ I
tScrumvlasrer
Input from l.nd-L'sers.Customers, I cam findOther Stakcholdcrx
!!!t ttttttt
I)ad, "calli 1\.1..:~iln~and
.\rtif:,cl.' l pdutc
Product O\\.IICT T l·'1I11 t t'tttReview
1\,)('hmlg~,III IJurauon or (It):'!
ProductlIacklpg
tttttttFigure (2): The Scrum Framework [17].
3. The Proposed Agile Practices for Bioinformatics Software Developments
The goal of the paper is to propose agile practices for enhancing the developing of thebioinformatics software and overcome the bioinformatics software developments challenges in spite of,excluding the agile methodology in others [1). M. M. Muller and W. F. Tichy, et aI., 2001 [11) th
z: lightweight nature of agile methods affords a lot of flexibility to the developments process, but makesagile methods difficult to implement in a disciplined manner without coaching. An undisciplinedapplication of agile methods leads to a "patch and go" attitude. Agile methods are commonly used in thedevelopments of scientific software (e.g, [12), [13J).
The proposed agile practices will be enhanced to use and utilize the following agile methods to overcomethe bioinformatics software developments challenges as shown in Figure 3:
Cairo University-Institute of Statistical Studies and Research 102
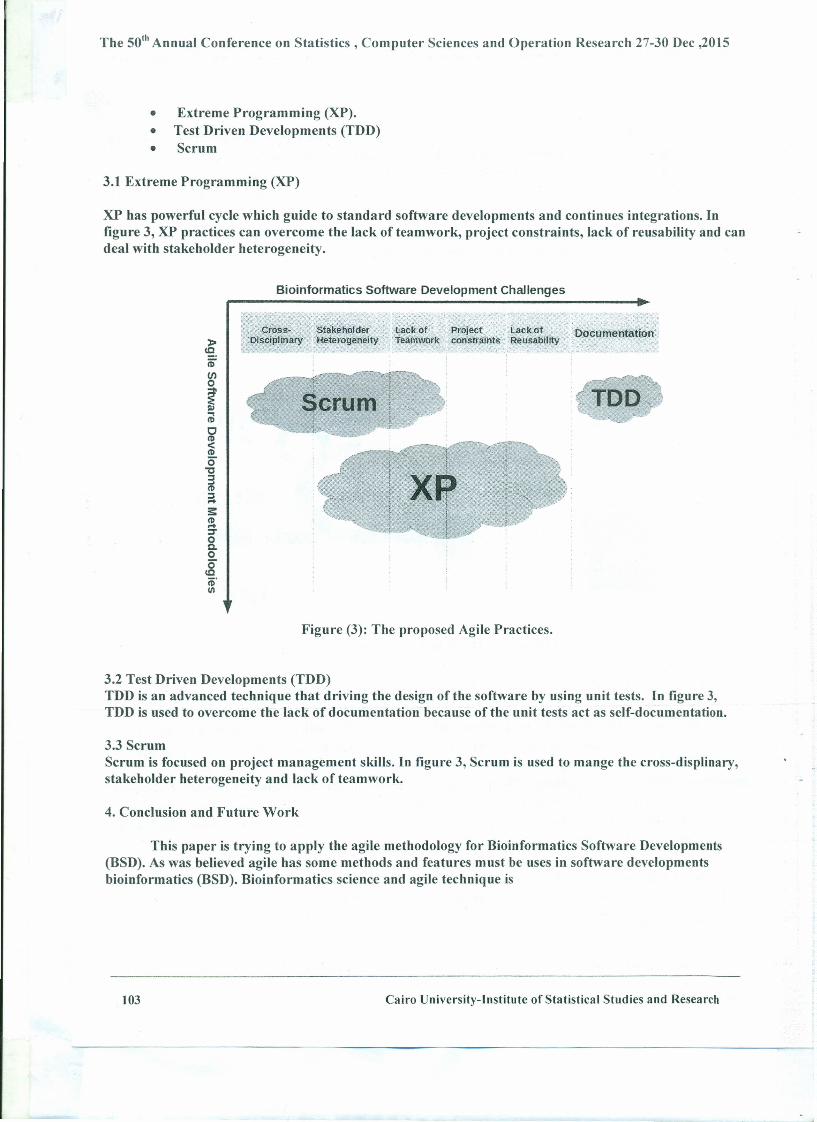
The so" Annual Conference on Statistics, Computer Sciences and Operation Research 27-30 Dec ,2015
• Extreme Programming (XP).• Test Driven Developments (TDD)• Scrum
3.1 Extreme Programming (XP)
XP has powerful cycle which guide to standard software developments and continues integrations. Infigure 3, XP practices can overcome the lack of teamwork, project constraints, lack of reusability and candeal with stakeholder heterogeneity.
Bioinformatics Software Development Challenges
,:i' Cross- Stakeholder Lack,of Project Lackof .DocumentationDisciplinary Heterogeneity Teamwork constraints Reusability
Scrum
Figure (3): The proposed Agile Practices.
3.2 Test Driven Developments (TDD)TDD is an advanced technique that driving the design of the software by using unit tests. In figure 3,TDD is used to overcome the lack of documentation because of the unit tests act as self-documentation.
3.3 ScrumScrum is focused on project management skills. In figure 3, Scrum is used to mange the cross-displinary,stakeholder heterogeneity and lack of teamwork.
4. Conclusion and Future Work
This paper is trying to apply the agile methodology for Bioinformatics Software Developments(BSD). As was believed agile has some methods and features must be uses in software developmentsbioinformatics (BSD). Bioinformatics science and agile technique is
103 Cairo University-Institute of Statistical Studies and Research
The so" Annual Conference on Statistics, Computer Sciences and Operation Research 27-30 Dec ,2015
discussed to be synchronized especially with extreme programming practices, Test drivendevelopments (TDD) appears as a centralize core face. TTD discover the implicit hiddenknowledge of bioinformatics developers. TDD interpreted this knowledge on a specific test codecases. Scrum can enhancement the management skills of bioinformatics project in spite offinding a cross-displinary with different background. The contribution of this paper isdemonstrates and gives some of the software engineering logic that agile has flexibility to beadopted with specific science like bionfonnatics. There is a need to be improved in terms ofquality assurance, also proposed framework need to be experimented, and finally real softwaredevelopments bioinformatics projects should be included in future works.
References
111 Dhawal Verma, Jon Gesell, Harvey Siy, and Mansou r Zand." Lack of Software EngineeringPractices in the Developments of Bioinformatics Software. "In ICCGI 2013, The EighthInternational Multi-Conference on Computing in the Global Information Technology, pp. 57-62.2013.
[2] Chilana, Parmit K., Carole L. Palmer, and Andrew J. Ko. "Comparing bioinformaticssoftware developments by computer scientists and biologists: An exploratory study."ln SoftwareEngineering for Computational Science and Engineering, 2009.SECSE'09. ICSE Workshop on,pp. 72-79. IEEE, 2009.
[3] Chen, Hsinchun, Sherrilynne S. Fuller, Carol Friedman, and WilIiam Hersh. Medicalinformatics: knowledge management and data mining in biomedicine. Vol. 8.Springer, 2006.
[4] Umarji, Medha, Carolyn Seaman, AkifGiines Koru, and Hongfang Liu. "Softwareengineering education for bioinformatics." In Software Engineering Education and Training,2009.CSEET'09. 22nd Conference on, pp. 216-223. IEEE, 2009.
[5] Kane, David. "Introducing agile developments into bioinformatics: an experience report. "InAgile Developments Conference, 2003.ADC 2003. Proceedings of the, pp. 132-139. IEEE, 2003.
[6] Kendall, Richard, Jeffrey C. Carver, David Fisher, Dale Henderson, Andrew Mark, DouglassPost, Clifford E. Rhoades, and Susan Squires. "Developments of a weather forecasting code: Acase study." Software, IEEE 25, no. 4 (2008): 59-65.
[7] Gentleman, Robert c., Vincent J. Carey, Douglas M. Bates, Ben Bolstad, Marcel Dettling,Sandrine Dudoit, Byron Ellis et aI. "Bioconductor: open software developments forcomputational biology and bioinformatics." Genome biology 5, no. 10 (2004): R80.
[8] Letondal, Catherine, and Wendy E. Mackay, "Participatory programming and the scope ofmutual responsibility: balancing scientific, design and software commitment." In Proceedings ofthe eighth conference on Participatory design: Artful integration: interweaving media, materialsand practices-Volume 1, pp. 31-41. ACM, 2004.
[9] H. Frank Cervone, Understanding agile project management methods using Scrum
Cairo University-Institute of Statistical Studies and Research 104
The 50th Annual Conference on Statistics, Computer Sciences and Operation Research 27-30 Dec ,2015
MANAGING DIGITAL LIBRARIES: THE VIEW FROM 30,000 FEET. Purdue UniversityCalumet, Hammond, Indiana, USA, Accepted October 2010.http://www.gbd.dkffiles/649 Understanding agile.pdf. Downloaded on: 30.10.2014 06:47 P.M.Purdue University Calumet, Harnmond, Indiana, USA, Accepted October 2010.
[10] Cory Foy, Figure of Extreme Practices (XP). [email protected]. http://www.cometdesign.com. Downloaded on: .r .. ,. ~., t.PM v: ..
[11] M. M. Muller and W. F. Tichy, "Case study: Extreme programming in a universityenvironment," in Proceedings of the International Conference on Software Engineering, pp.537-544. (ICSE 01), 2001
[12] O. Chirouze, D. Cleary, and G. G. Mitchell, "A software methodology for applied research:extreme researching," Software: Practice and Experiences, vol. 35, no. 15, pp. 1441-1454,2005.
[13] W. A. Wood and W. L. Kleb, "Exploring XP for scientific research," IEEE Software, vol.20, no. 3,pp. 30-36,2003.
[14] Antti Hanhineva ElbitOy. Juho.Iaalinoja. Nokia Technology Platforms. Oulu, Finland. XIMPROVING BUSINESS AGILITY THROUGH TECHNICAL SOLUTIONS: A Case Study onTest-Driven Developments in Mobile Software Developments. Pekka Abrahamsson, VTTTechnical Research Centre of Finland. Downloaded on: 06.12.2014 09:08 P.M.http://agile.vtt.fi/docs/publications/2005/2005_business_quality_ifip.pdf.Agile.vtt.fi, 2005
[15] David W Kane, Moses M Hohman, Ethan G Cerami, Michael W McCormick, Karl FKuhlmman and Jeff A Byrd. Agile methods in biomedical software developments: a multi-siteexperience report. http://www.biomedcentral.comI1471-2105171273/.Doi:l0.1186/1471-2105-7-273. Downloaded on: 29.11.201408:25 P.M. BMC Bioinformatics 2006.[16] Beck, Kent. Extreme programming explained: embrace change. Addison-WesleyProfessional, 2000.
[17] Nagy Ramadan Darwish, "Enhancements in Scrum Framework using ExtremeProgramming Practices", International Journal of Intelligent Computing and InformationSciences (IJICIS), Ain Shams University, Vol. 14 No. 2, Page: 53-67, April 2014.
105 Cairo University-Institute of Statistical Studies and Research
The 50th
Annual Conference on Statistics, Computer Sciences and Operation Research 27-30 Dec,2015
Cairo University-Institute of Statistical Studies and Research
106
Petri net model for multi-threaded multi-core processing of satellite telemetry data
1 Abdelfattah El-Sharkawi,
2 El-Said Soliman,
3 Ahmed Abdellatif
Abstract
This paper introduces Petri Net (PN) model as a design and performance analysis tool for high
performance PC clusters. The model is supposed to estimate the optimum number of threads to be used for
splitting the given tasks on the non-identical nodes of the cluster while keeping an accepted load balance. The
suggested model is helpful in solving the telemetry processing data collected problem from remote sensing
satellite in the real time. Open MPI was used for real implementation of the cluster.
Key words
High Performance Clusters (HPC), load balance in parallel processing, MPI, multi-threaded multi-core
applications, remote sensing, PN.
1. Introduction
Microprocessors performance is almost linearly increasing, with rate of about 50% a year specially in
the 1986 to 2002 [1]. However, after 2002, the improvement of single processor performance has slowed to
about 20% a year. This difference is dramatic: at 50% per year, performance will increase by almost a factor of
60 in 10 years, while at 20%, it will only increase by about a factor of 6. By the end of 2005 manufacturers
tend to increase its performance by duplicating the CPU cores on a single integrated circuit [2]. All these
improvements in manufacturing led to very important consequence for software developers: simply adding
more processors will not magically improve the performance of the vast majority of serial programs. Such
programs are unaware of the existence of multiple processors, and then the performance of such a program on a
system of multiple processors will be effectively the same as its performance on a single processor of the
multiprocessor system. Multiple processors can also operate independently but share the same memory
resources[2].
On the other hand, ordinary serial programs, which are written for a conventional single core processor,
usually cannot exploit the presence of multiple processors within the same node. So converting these programs
into parallel ones will be recommended. Indeed, the multiple processors are either a single computer node with
multi-processor or multi-computer nodes connected together through network (cluster) [3,4]. HPC are hybrid
systems that often using both of shared and distributed memory as well as multi-core platforms [5]. It is also
important to focus that parallel programs design is more complicated than sequential ones. This is due to their
uncertainty as many parameters such as parallel communication overhead, hardware architecture, programming
paradigms and load balance[6], may give negative effect in making its execution time larger than serial version
[7]. So, it is necessarily to model and analyze the expected performance of the program before implementation
to maintain the high speed performance.
Petri nets are good candidates to model the process synchronization, asynchronous events, concurrent
operations, and conflicts of resource sharing [8]. In addition, Petri nets have an appealing graphical
representation with a powerful algebraic formulation for supervisory control design [9]. Many attempts have been made for task scheduling on parallel hardware using Colored Petri net models. The research in this field focuses one of two areas. The first is to use CPN directly for modeling the parallel environment aiming at measuring the behavior as well as improving the performance of these systems. The other is to
The 50th
Annual Conference on Statistics, Computer Sciences and Operation Research 27-30 Dec,2015
Cairo University-Institute of Statistical Studies and Research
107
develop simulation tool specially tailored for CPN simulation. The work of MIRONESCU et. al. [10] is an example of the first approach. They introduced a colored Petri Net model for Task Scheduling on a Heterogeneous Computational Nodes that allows the expression of the application as a DAG (Directed Acyclic Graph) of tasks and the partition of the heterogeneous hardware in worker units. In their model, the CPN allows the rapid evaluation of the suitability of the implemented scheduling algorithms. An example of the second approach is the work done by BOHM et el.[11]. They developed a CPN called Kaira which was intended for modeling, simulation and generation of parallel applications. A developer is able to model parallel programs and different aspects of communication using Kaira. Models are based on the variant of Colored Petri nets. The important feature of their tool is automatic generation of standalone parallel applications from models. The final application can be generated with different parallel back-ends. Nowadays, many Petri nets simulation tools were developed such as the CPN Tools [12-13], developed
by the CPN Group at Aarhus University. The model of this work is simulated by using CPN Tools.
To implement multi-threaded applications on multi-core mesh platforms, Message Passing Interface
(MPI) is highly recommended. MPI is a specification for a standard library for message passing that was
defined by the MPI Forum [14]. It can be employed not only within a single processing node but also across
several connected ones [15,16]. In general, all data exchange among nodes can be accomplished using MPI
send and receive routines. Moreover, a set of standard collective communication routines [17]. Several
implementations such as LAM-MPI [18], MVAPICH [19], MPICH2 [20], MPJ Express [21-22] and Open MPI
[23] are nowadays available. The Open MPI is used in this paper to implement our model.
2. Problem definition
A remote sensing satellite is composed of a space and a ground segments. The space segment is the
satellite itself which is composed of many subsystems. To do its mission, the satellite receives its plans i.e.
sequence of Tele-commands from the ground segment and sends back data packets to tell the ground segment
many sensory readings about everything on the satellite. The data downloaded from satellite during
communication session in which the satellite is being in the ground station radio visibility zone, that is called
telemetry data. These telemetry data are transmitted in standard data frames, and each these data frame contains
one or more standard data packets with different sizes. Data packets describe the status, and health of the
satellite subsystems using the readings of the sensors mounted on the space segment. These data are interpreted,
displayed, analyzed, and archived in the real time of the communication session that is normally less than or
equal to 10 minutes [24]. Summary for telemetry data processing steps are:
1. Receive telemetry data from satellite during communication session.
2. Checking frame correction through error detection mechanism.
3. Extract packet(s) from telemetry frame using the control fields in telemetry frame header [25].
4. Identify which telemetry packet concern.
5. Analyze received telemetry packet as follow:
List all sensors included in received telemetry packet.
Determine sensors location.
Determine sensors data format.
Identify sensors type.
6. For each sensor perform unpacking process.
7. Discard sensor abnormal readings.

The 50th
Annual Conference on Statistics, Computer Sciences and Operation Research 27-30 Dec,2015
Cairo University-Institute of Statistical Studies and Research
108
8. Check if sensor(s) codes either exceeds its limit, or match specific condition such as fault detection to take
action. for instance send Tele-command automatically to satellite or doing an operator action request.
9. Calibration of the sensors status, for example the device status may take only two codes (0 or 1), 0 the
device is OFF and 1 it will be ON
10. Archive and analyze all the received data.
Taking into consideration the huge amount of data received per communication session, the required
analysis to be done on telemetry packets due to its receiving time sequence means to complete unpacking,
calibration and fault detection for some packet before receiving the next packet. This will produce the required
reports for the operator at the ground station to make his/her decision within the short time of the
communication session. Problem is typically realized according to Egypt-Sat1 satellite , see Appendix (A).
To guarantee synchronization and then to implement the whole process on parallel processors to gain
the maximum speed of processing, telemetry frames split into jobs, each job is needed to be split into tasks.
The game will be how to schedule jobs between nodes and find the optimum number of threads [26] to be
created on each slave node given that those nodes may be non-identical. Implementation on HPC composed of a
master Linux node while its slave nodes are a collection of different platforms (i.e. multi-core). This paper
introduces Petri net model as a tool for designing as well as studying the performance of the required parallel
algorithm. For the implementation, Open MPI was used to realize the algorithm on a Linux PC cluster. Section
(3) discusses the solution of HPC multi-core on the non-identical nodes. Section (4) discusses the details of that
part of the solution of multi-threading on HPC’s, task to thread decomposition, task execution time. Section (5)
discusses how to calculate execution time in HPC. Section (6) introduces a brief summary of PN. Section (7)
discusses the new Petri net model to solve our problem. Section (8) presents the results of the simulation of the
solution.
3. HPC multi-core
In an HPC organization, the aim is to keep all nodes busy most of the time. For accomplishing this, the
master-slave architecture is used. In this architecture, there is a single node called master (head node), and the
other multiple nodes are called slaves.
Concerning the application of remote sensing telemetry processing, the master node will hold the jobs
to be serviced. The master node then assigns these jobs to the slave nodes. When a slave node completes a job
service, it sends back the result (sensors calibration data) back to the master node. This of course requests a new
packet from the master node. Each slave node has two states: either busy state when slave node services a
certain job or idle state when slave node has nothing to do and hence requests a new packet from the master
node. An ascending priority is given to each slave node according nodes speeds. The master node also increases
the assigned packets to the highest priority level node. The distribution algorithm of jobs among the nodes is
illustrated in the following flowchart:
start
end
Receive data from master node
Check for
signal statusDo no thingInitial signal
Exit signal
else
Process Data
(unpacking,
calibrations)
Send node ID
and result to
master node
(a) slave node
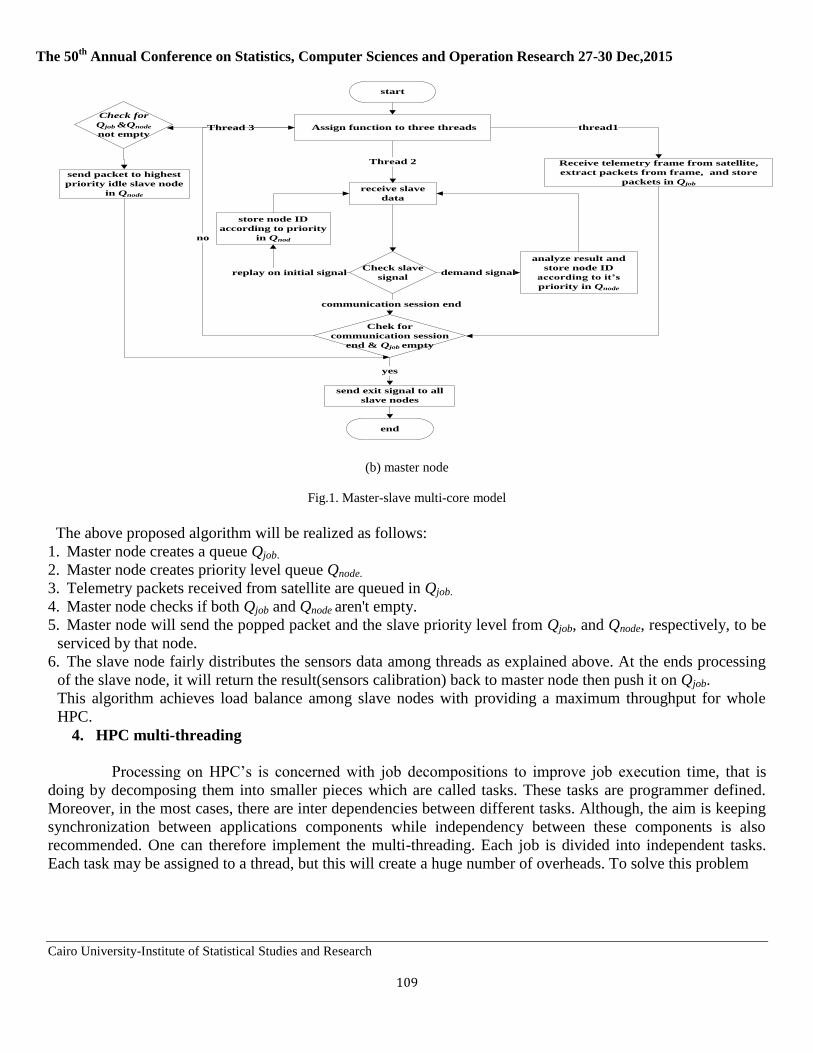
The 50th
Annual Conference on Statistics, Computer Sciences and Operation Research 27-30 Dec,2015
Cairo University-Institute of Statistical Studies and Research
109
receive slave
data
Check slave
signaldemand signal
analyze result and
store node ID
according to it’s
priority in Qnode
Receive telemetry frame from satellite,
extract packets from frame, and store
packets in Qjob
thread1
Check for
Qjob &Qnode
not emptyThread 3
send packet to highest
priority idle slave node
in Qnode
communication session end
store node ID
according to priority
in Qnod
replay on initial signal
Chek for
communication session
end & Qjob empty
send exit signal to all
slave nodes
yes
start
end
no
Thread 2
Assign function to three threads
(b) master node
Fig.1. Master-slave multi-core model
The above proposed algorithm will be realized as follows:
1. Master node creates a queue Qjob.
2. Master node creates priority level queue Qnode.
3. Telemetry packets received from satellite are queued in Qjob.
4. Master node checks if both Qjob and Qnode aren't empty.
5. Master node will send the popped packet and the slave priority level from Qjob, and Qnode, respectively, to be
serviced by that node.
6. The slave node fairly distributes the sensors data among threads as explained above. At the ends processing
of the slave node, it will return the result(sensors calibration) back to master node then push it on Qjob.
This algorithm achieves load balance among slave nodes with providing a maximum throughput for whole
HPC.
4. HPC multi-threading
Processing on HPC’s is concerned with job decompositions to improve job execution time, that is
doing by decomposing them into smaller pieces which are called tasks. These tasks are programmer defined.
Moreover, in the most cases, there are inter dependencies between different tasks. Although, the aim is keeping
synchronization between applications components while independency between these components is also
recommended. One can therefore implement the multi-threading. Each job is divided into independent tasks.
Each task may be assigned to a thread, but this will create a huge number of overheads. To solve this problem
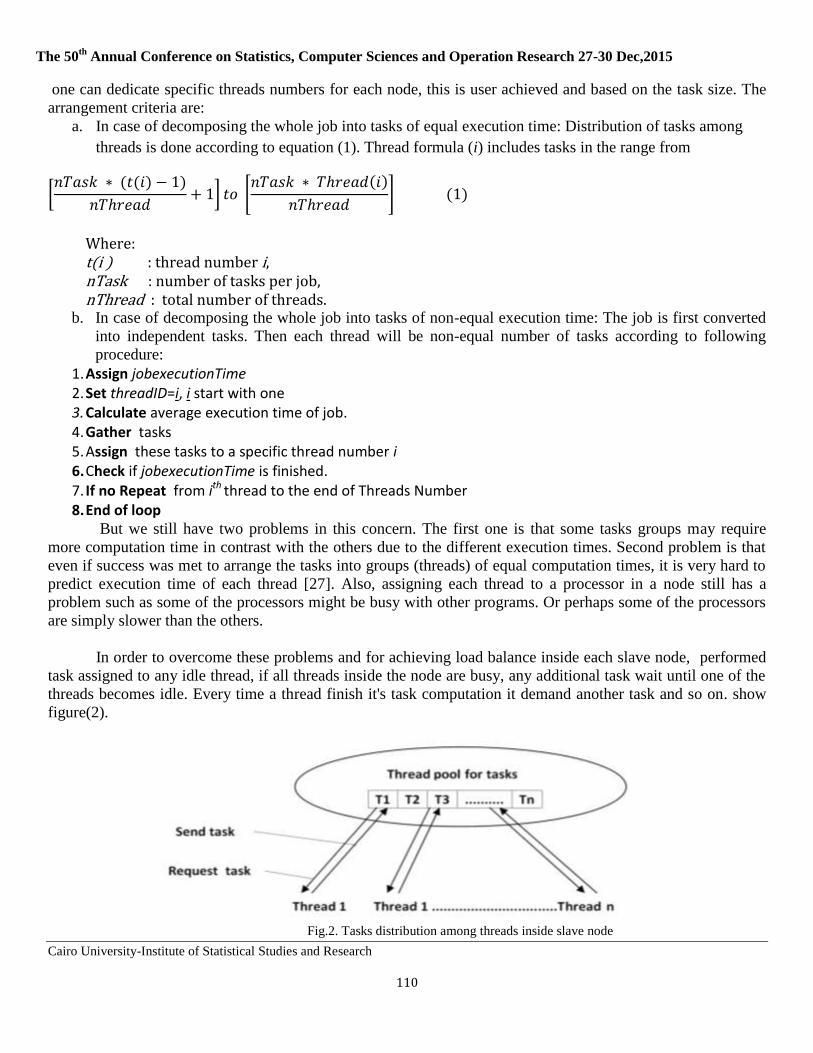
The 50th
Annual Conference on Statistics, Computer Sciences and Operation Research 27-30 Dec,2015
Cairo University-Institute of Statistical Studies and Research
110
one can dedicate specific threads numbers for each node, this is user achieved and based on the task size. The
arrangement criteria are:
a. In case of decomposing the whole job into tasks of equal execution time: Distribution of tasks among
threads is done according to equation (1). Thread formula (i) includes tasks in the range from
[
] [
]
Where: t(i ) : thread number i, nTask : number of tasks per job, nThread : total number of threads.
b. In case of decomposing the whole job into tasks of non-equal execution time: The job is first converted
into independent tasks. Then each thread will be non-equal number of tasks according to following
procedure:
1. Assign jobexecutionTime 2. Set threadID=i, i start with one 3. Calculate average execution time of job. 4. Gather tasks 5. Assign these tasks to a specific thread number i 6. Check if jobexecutionTime is finished. 7. If no Repeat from ith thread to the end of Threads Number 8. End of loop
But we still have two problems in this concern. The first one is that some tasks groups may require
more computation time in contrast with the others due to the different execution times. Second problem is that
even if success was met to arrange the tasks into groups (threads) of equal computation times, it is very hard to
predict execution time of each thread [27]. Also, assigning each thread to a processor in a node still has a
problem such as some of the processors might be busy with other programs. Or perhaps some of the processors
are simply slower than the others.
In order to overcome these problems and for achieving load balance inside each slave node, performed
task assigned to any idle thread, if all threads inside the node are busy, any additional task wait until one of the
threads becomes idle. Every time a thread finish it's task computation it demand another task and so on. show
figure(2).
Fig.2. Tasks distribution among threads inside slave node
The 50th
Annual Conference on Statistics, Computer Sciences and Operation Research 27-30 Dec,2015
Cairo University-Institute of Statistical Studies and Research
111
The following algorithm is applied to achieve previous approach:
1. Determine number of threads.
2. Tasks are stored on a queue form before running the threads.
3. The idle thread will automatically popped the task.
4. Implementing the algorithm will be terminated whenever the queue becomes empty.
So by applying this algorithm, all threads will be kept busy most of the time which will enable achieving load
balance inside each slave node.
5. HPC execution time
To measure the performance of parallel computation we need to calculate job execution time which
measures the time required for running the job (i.e. the duration taken since the inputs are ready until the output
is calculated). In serial computation which have no parallel computation this time can be easily calculated as the
time elapsed between the beginning and the end of job execution. It's only a function of input data as all jobs
use the same node for computation. But in HPC this time depends on four variables; namely communication
time between master and slave node, latency time, the job size and job processing time inside the proper slave
node. This time can be calculated according to HPC configuration using the following equation[28]:
Where:
Tjob : Total execution time for one job in a single node,
Tcomm : Communications (transferring) time, where synchronous processing must be fulfilled,
Tlat : Latency time in which a minimal (0 byte) job from point to point should be sent,
N: The job size in bytes,
TnodeExe : Running time required, that includes the times of CPU, disk accesses, memory accesses, and the I/O
activity, etc [29]. This time estimation is very important in the distributed systems. This is due to the need of
ascending computers prioritization according their speeds [29]. Petri net model is realized using this running
time to determine the approximate execution time for each slave nodes. The running time, TnodeExe could be
obtained from the task profiling and node benchmarking [30-31].
6. Petri net
Petri nets are essentially weighted labeled directed graphs which consist of four basic elements; namely
places, transitions, tokens, and arcs. Places represent conditions or local system states. Transitions represent the
activities or event occurrences. Tokens reside in a place where corresponding condition or local state holds and
can move between places according to the firing rules (event occurrence). Arcs specify relations between places
and transitions. But graphical representation of ordinary Petri nets becomes complex if we try to model real life
problems. The main reason is that only one type of tokens can be used. In addition ordinary Petri nets involve
no notion of time, since it is not defined at what point of time a transition will fire. Analysis of the performance
of a system with a Petri net is thus not possible. So, two concepts color and time were added to Petri nets in
order to solve these problems [32].
In the colored Petri nets, it is possible to use data types and complex data manipulation: each token has
attached data value called token color which can be investigated and modified by firing transitions. Each place
has a data type and can only hold tokens which have the same data type. Each transition has Guard which is a
Boolean expression containing some of the variables. Each arc has inscriptions containing expression and when
these expressions are evaluated, it yields a multi-set of token colors [33].
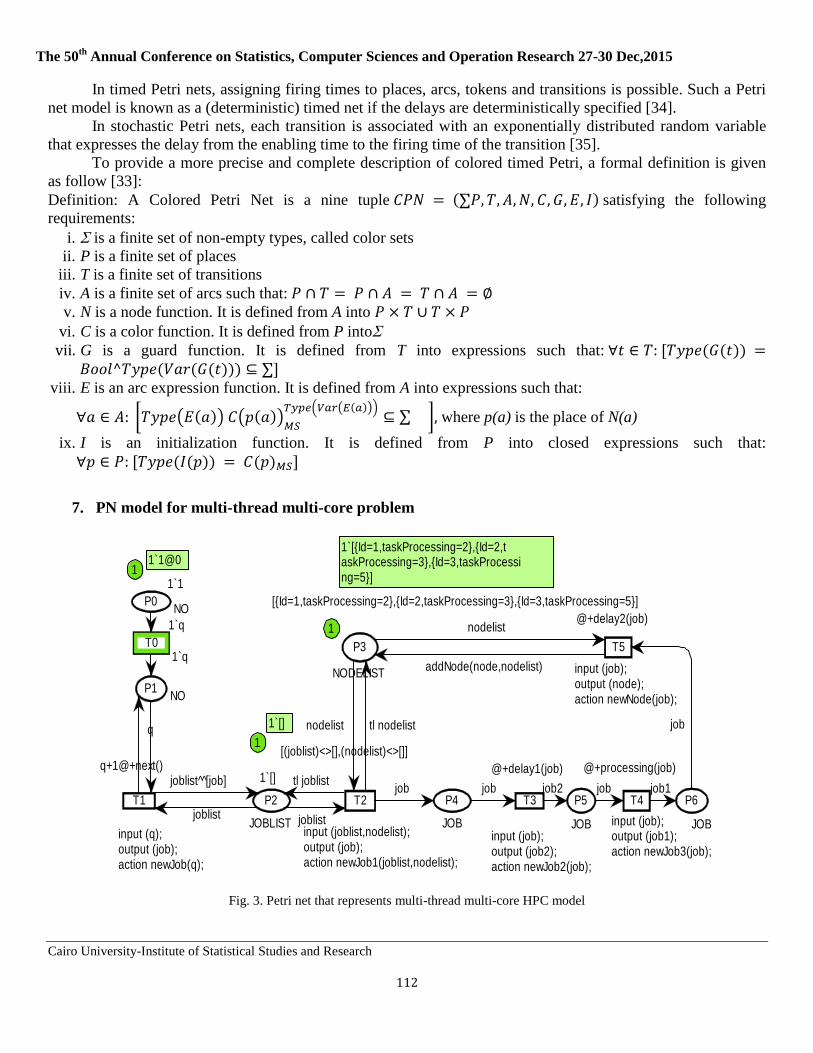
The 50th
Annual Conference on Statistics, Computer Sciences and Operation Research 27-30 Dec,2015
Cairo University-Institute of Statistical Studies and Research
112
In timed Petri nets, assigning firing times to places, arcs, tokens and transitions is possible. Such a Petri
net model is known as a (deterministic) timed net if the delays are deterministically specified [34].
In stochastic Petri nets, each transition is associated with an exponentially distributed random variable
that expresses the delay from the enabling time to the firing time of the transition [35].
To provide a more precise and complete description of colored timed Petri, a formal definition is given
as follow [33]:
Definition: A Colored Petri Net is a nine tuple satisfying the following
requirements:
i. is a finite set of non-empty types, called color sets
ii. P is a finite set of places
iii. T is a finite set of transitions
iv. A is a finite set of arcs such that:
v. N is a node function. It is defined from A into
vi. C is a color function. It is defined from P into
vii. G is a guard function. It is defined from T into expressions such that:
viii. E is an arc expression function. It is defined from A into expressions such that:
[ ( ) ( )
( ( )) ] where p(a) is the place of N(a)
ix. I is an initialization function. It is defined from P into closed expressions such that:
7. PN model for multi-thread multi-core problem
Fig. 3. Petri net that represents multi-thread multi-core HPC model
P1NO
P0NO
P2
JOBLIST
1`[]
P3
NODELIST
P4
JOB
P6
JOB
P5
JOB
T1
input (q);output (job);action newJob(q);
T0
T2
[(joblist)<>[],(nodelist)<>[]]
input (joblist,nodelist);output (job);action newJob1(joblist,nodelist);
T4
@+processing(job)
input (job);output (job1);action newJob3(job);
T5
@+delay2(job)
input (job);output (node);action newNode(job);
T3
@+delay1(job)
input (job);output (job2);action newJob2(job);
1`q
q
q+1@+next()joblist^̂ [job]
job job1
nodelist jobtl nodelist
addNode(node,nodelist)
nodelist
joblist
tl joblist
joblist
1`q
job job2 job
[{Id=1,taskProcessing=2},{Id=2,taskProcessing=3},{Id=3,taskProcessing=5}]
1`11
1`1@0
1
1`[]
1
1`[{Id=1,taskProcessing=2},{Id=2,taskProcessing=3},{Id=3,taskProcessing=5}]

The 50th
Annual Conference on Statistics, Computer Sciences and Operation Research 27-30 Dec,2015
Cairo University-Institute of Statistical Studies and Research
113
The above figure show a Petri net model for multi-thread multi-core that consists of a one master node and three
slave nodes. Telemetry data packets processing (jobs) will be distributed on cluster nodes. The model is
supposing to determine the best number of the threads. The HPC is supposed to be composed of non-identical.
The number of running threads is assuming that they are the same in all nodes.
7.1. Terms of the model data types Color set NO: INT timed data type used to model sequence number of packets (jobs) arrival;
Color set JOB: record used to collect all packet information, contains the following attributes:
jobNumber: represents packet sequence,
subsystemID: represent subsystem identification,
node: detects which slave node handles this packet,
jobLength: is the packet length in bytes,
jobTasks: is the sensors number per packet,
tMaster: is the receiving time of the packet on the master node,
tNodeStart: represents time when packet starts to service by slave node,
tNodeEnd: represents time when slave node finishes packet computation,
threadId_i: represents thread number i,
noTaskStart_i, noTaskEnd_i: represents range of sensors thread i serviced,
taskProcessing_i: represents processing time for thread number i,
tThreadEnd_i : represents time when thread i finish sensors computation
Color set JOBLIST: a list used to store all packets received from packets source(satellite),
Color set NODE: record used to list information about slave nodes, contains the following attributes:
Id: represents slave node ID, lowest permissible value means highest priority,
taskProcessing: sensor process per unit time,
Color set NODELIST: a list used to store idle slave nodes.
7.2. Model structure 1. Place, P0: represents initial state.
2. Transition, T0: represents the time when that satellite begins connection with ground station (start of
processing).
3. Place, P1: represents satellite packets arrival, each next() time delay ground station receive new packet
from satellite.
4. Transition, T1: represents time when master node stores a received packet in Qjob.
5. Place, P2: represents a master node job buffer Qjob that contains all non-serviced jobs which need to be
distributed to slave nodes.
6. Place, P3: represents slave node buffer Qnode that contains all idle slave nodes.
7. Transition, T2: represents the time of master node that assigns a job from Qjob of place P2 to idle node in
Qnode of place P3.
8. Place, P4: represents beginning of packet transmission between master and slave nodes.
9. Transition, T3: represents time when a packet is received by certain slave node;
10. Place, P5:represents beginning of packet computation in a certain slave node; a packet is composed of a
certain number of sensors’ data that are distributed among threads according to procedure explained in
section (4) of this paper
11. Transition, T4: represents time when a packet service is completed (longest thread computation time
completed e.g. processing(job);
12. Place, P6: represents end of packet computation and start to sending results (sensors calibration data)
back to master node, also notify master node that a slave node ended a packet processing and needs a
new one;
The 50th
Annual Conference on Statistics, Computer Sciences and Operation Research 27-30 Dec,2015
Cairo University-Institute of Statistical Studies and Research
114
13. Transition, T5: represents time when master node receives a result from slave node e.g. transmission
time between master node and certain slave node.
7.3. Model functions 1. next() function: represents packet arrival data rate, i.e. it represents the time delay by which the ground
station will receive new packets.
2. newJob() function: checks the subsystem ID and find out the associated packet sequence numbers
according to the interpretation of table(3) of Appendix (A). Hence it forms a record of packets named
job which is considered as an object of class JOB as described in subsection (7.1)
3. newjob1() function: checks if both places P2 and P3 are not empty, this function then assigns the first
job in JOBLIST to the first node from NODELIST. Also divides the job into tasks among threads, and
assigns a processing time for tasks according to selected node (modify the attributes of job record)
4. delay1() function: represents transmission delay time between master and slave nodes. This delay is
determined according to the job length.
5. processing() function: represents time required for job computation. This time equals the longest thread
computation time
6. delay2() function: represents transmission delay time between slave nodes and master node. This delay
is determined according to result length.
7. addNode() function: push a proper slave node according to its priority level.
7.4. Model dynamics Transition, T0:
Once simulation started,T0 transition is fired. Token q takes the value1 which represents job (packet) start
sequence number 1, and the token is moved from place P0 to place P1.
Transition, T1:
T1, transition will be recursively fired by the effect of function next().Once transition T1is fired, q is
incremented by one due to the arrival of a new packet. Function newJob() will check the packet sequence and
form job record. Having T1 changed the token color from NO to JOB, according to sequence number of q, the
job stores the job length in bytes of jobLength, the number of tasks per job, jobTasks and all the other
attributes of job. When T1 transition is fired a token (packet) is moved from place P1 and stored in place P2.
The moved token will be popped the joblist to the queue.
Transition, T2:
The transition T2 is fired only if there's a packet that required to be serviced (joblist is not empty) and there is
an idle slave node (nodelist is not empty). T2 takes first packet from joblist queue and assigns it to the first
slave node in nodelist. A token will appear in place P4 due to firing T2.
Transition, T3:
Transition T3 is fired after a slave node has received a new packet from master node after a delay of
transmission between master and slave node. The function delay1() calculates the delay according to
equation(2). Firing T3 will move a token to P5.
Transition, T4:
Transition T4 is fired when last thread in a slave node finish its computation after processing time as calculated
function processing(). Firing T4 will move a token place P6.
Transition, T5:
Transition, T5 is fired after the master node has received the results back i.e. sensors calibration data from a
slave node after time delay2() unit time (transmission delay between slave node and master node as described in
equation(2)). Once T5 is fired, then a token is moved to place P3 which means that a slave node became free
and can be stored in NODELIST queue according to its priory using the function addNode()).
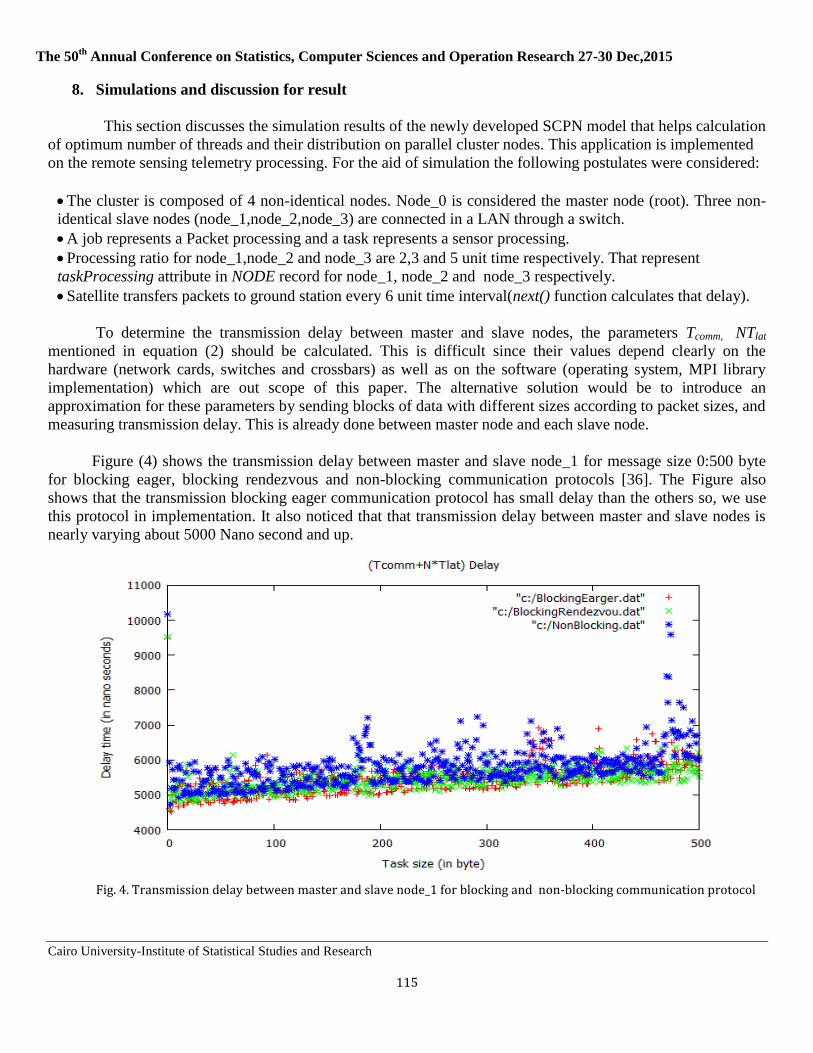
The 50th
Annual Conference on Statistics, Computer Sciences and Operation Research 27-30 Dec,2015
Cairo University-Institute of Statistical Studies and Research
115
8. Simulations and discussion for result
This section discusses the simulation results of the newly developed SCPN model that helps calculation
of optimum number of threads and their distribution on parallel cluster nodes. This application is implemented
on the remote sensing telemetry processing. For the aid of simulation the following postulates were considered:
The cluster is composed of 4 non-identical nodes. Node_0 is considered the master node (root). Three non-
identical slave nodes (node_1,node_2,node_3) are connected in a LAN through a switch.
A job represents a Packet processing and a task represents a sensor processing.
Processing ratio for node_1,node_2 and node_3 are 2,3 and 5 unit time respectively. That represent
taskProcessing attribute in NODE record for node_1, node_2 and node_3 respectively.
Satellite transfers packets to ground station every 6 unit time interval(next() function calculates that delay).
To determine the transmission delay between master and slave nodes, the parameters Tcomm, NTlat
mentioned in equation (2) should be calculated. This is difficult since their values depend clearly on the
hardware (network cards, switches and crossbars) as well as on the software (operating system, MPI library
implementation) which are out scope of this paper. The alternative solution would be to introduce an
approximation for these parameters by sending blocks of data with different sizes according to packet sizes, and
measuring transmission delay. This is already done between master node and each slave node.
Figure (4) shows the transmission delay between master and slave node_1 for message size 0:500 byte
for blocking eager, blocking rendezvous and non-blocking communication protocols [36]. The Figure also
shows that the transmission blocking eager communication protocol has small delay than the others so, we use
this protocol in implementation. It also noticed that that transmission delay between master and slave nodes is
nearly varying about 5000 Nano second and up.
Fig. 4. Transmission delay between master and slave node_1 for blocking and non-blocking communication protocol
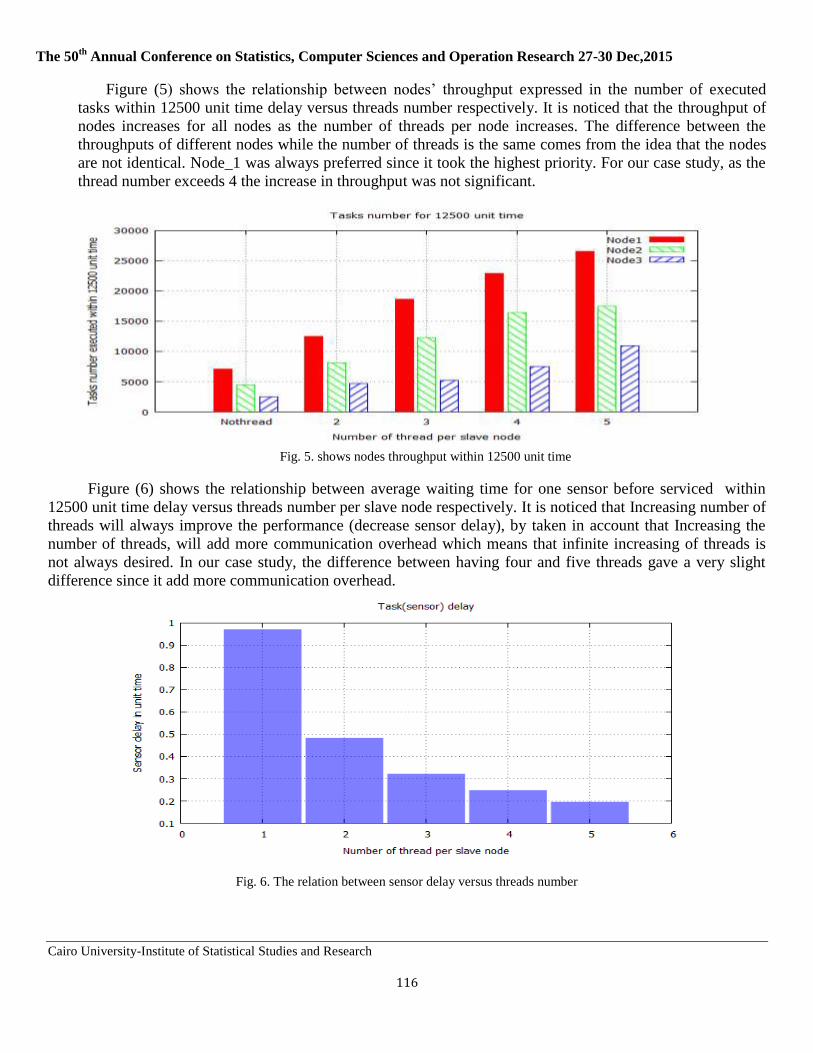
The 50th
Annual Conference on Statistics, Computer Sciences and Operation Research 27-30 Dec,2015
Cairo University-Institute of Statistical Studies and Research
116
Figure (5) shows the relationship between nodes’ throughput expressed in the number of executed
tasks within 12500 unit time delay versus threads number respectively. It is noticed that the throughput of
nodes increases for all nodes as the number of threads per node increases. The difference between the
throughputs of different nodes while the number of threads is the same comes from the idea that the nodes
are not identical. Node_1 was always preferred since it took the highest priority. For our case study, as the
thread number exceeds 4 the increase in throughput was not significant.
Fig. 5. shows nodes throughput within 12500 unit time
Figure (6) shows the relationship between average waiting time for one sensor before serviced within
12500 unit time delay versus threads number per slave node respectively. It is noticed that Increasing number of
threads will always improve the performance (decrease sensor delay), by taken in account that Increasing the
number of threads, will add more communication overhead which means that infinite increasing of threads is
not always desired. In our case study, the difference between having four and five threads gave a very slight
difference since it add more communication overhead.
Fig. 6. The relation between sensor delay versus threads number
The 50th
Annual Conference on Statistics, Computer Sciences and Operation Research 27-30 Dec,2015
Cairo University-Institute of Statistical Studies and Research
117
9. Conclusion
This paper introduced a Petri net model for multi-thread/multi-core clusters. The model classifies the
slave nodes into categories according to its speed; i.e. nodes having short execution time will have high priority.
Simulation results show that the new modeling technique succeeded to keep the highest priority slave nodes
busy all the time according to the condition of keeping load balance most of the time. It also succeeded in
finding the optimized number of threads to divide jobs between them and hence to increase performance
without increasing overhead. This work has also suggested an HPC of non-identical nodes to solve the problem
of remote sensing telemetry processing. The simulation results showed that the blocking eager protocol was the
best to be used with open MPI library to realize the message passing problem between the cluster nodes.
APPENDIX A
EGYPT-SAT1 TELEMETRY DATA
Our model is typically realized according to the following tabulated data collection of numbers drawn
from the Egypt-Sat.
The satellite transfers packets in order according to certain measurement program stored in its
memory. For EgySat-1 telemetry packets are transferred in due to the following sequence : packet containing
communication subsystem status, , then packet containing Stabilization and Attitude Control subsystem status,
then packet containing Telemetry subsystem status, , then packet containing On board computer subsystem
status, then packet containing Payload subsystem status and packet containing Power subsystem status. Table
(3) shows an example of packet arrival sequence e.g. communication subsystem packets will take the sequence
numbers 1,3 and 7; while ADCS packets will take the sequence numbers 2, 8 and 14 etc
TABLE 1
Egypt-Sat-1 Specification
Egypt-Sat1 data Value
Number of subsystems on the space segment 7
Number of sensors on the satellite 1092
Number of satellite modes 5
Average telemetry packets received per communication
session 52000
Maximum Duration of communication session(minutes) 10
Telemetry frames received from satellite with rate 32kb/sec
Table (1) Shows specification parameters for Egypt-Sat-1 satellite
TABLE 2
Satellite subsystem packets and sensors
Satellite subsystem packets Packet size(byte) Sensors/packet
communication subsystem 20 23
Stabilization and Attitude Control subsystem 302 320
Telemetry subsystem 183 149
On board computer subsystem 280 471
Payload subsystem 22 60
Power subsystem 42 69
Sum 1092
Table (2) Telemetry packet sizes relative to the number of sensors per packet
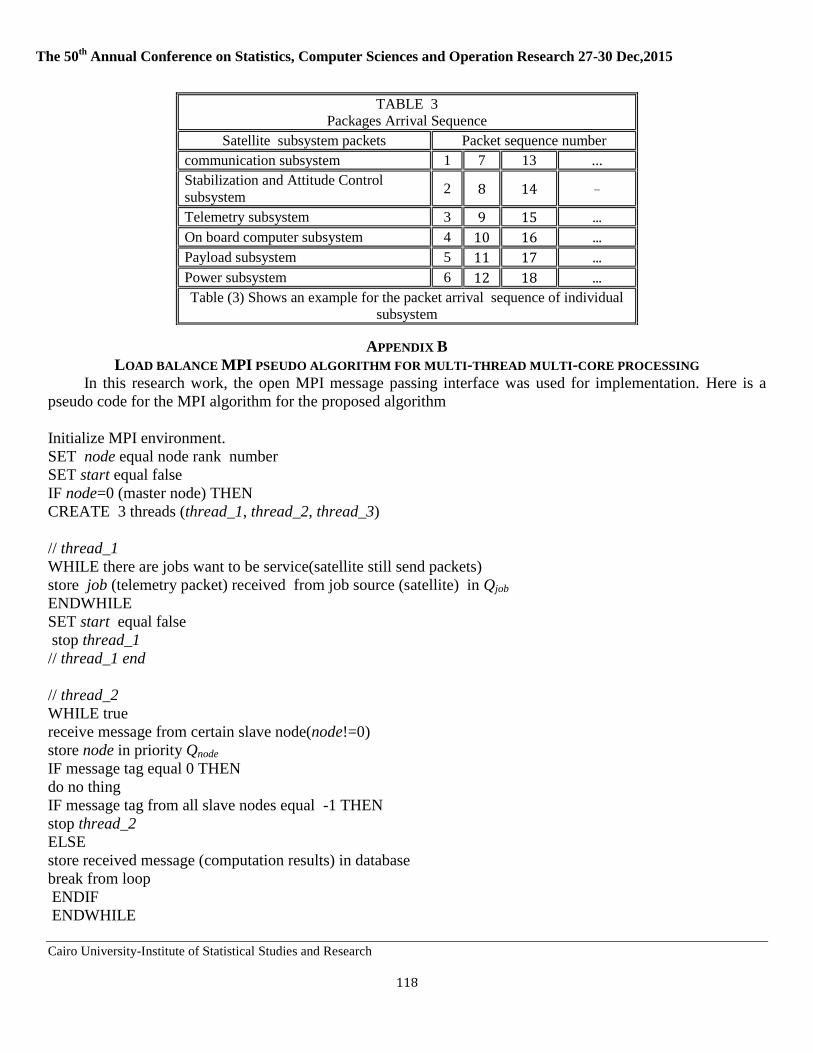
The 50th
Annual Conference on Statistics, Computer Sciences and Operation Research 27-30 Dec,2015
Cairo University-Institute of Statistical Studies and Research
118
APPENDIX B
LOAD BALANCE MPI PSEUDO ALGORITHM FOR MULTI-THREAD MULTI-CORE PROCESSING
In this research work, the open MPI message passing interface was used for implementation. Here is a
pseudo code for the MPI algorithm for the proposed algorithm
Initialize MPI environment.
SET node equal node rank number
SET start equal false
IF node=0 (master node) THEN
CREATE 3 threads (thread_1, thread_2, thread_3)
// thread_1
WHILE there are jobs want to be service(satellite still send packets)
store job (telemetry packet) received from job source (satellite) in Qjob
ENDWHILE
SET start equal false
stop thread_1
// thread_1 end
// thread_2
WHILE true
receive message from certain slave node(node!=0)
store node in priority Qnode
IF message tag equal 0 THEN
do no thing
IF message tag from all slave nodes equal -1 THEN
stop thread_2
ELSE
store received message (computation results) in database
break from loop
ENDIF
ENDWHILE
TABLE 3
Packages Arrival Sequence
Satellite subsystem packets Packet sequence number
communication subsystem 1 7 13 ...
Stabilization and Attitude Control
subsystem 2 8 14 ...
Telemetry subsystem 3 9 15 ...
On board computer subsystem 4 10 16 ...
Payload subsystem 5 11 17 ...
Power subsystem 6 12 18 ...
Table (3) Shows an example for the packet arrival sequence of individual
subsystem

The 50th
Annual Conference on Statistics, Computer Sciences and Operation Research 27-30 Dec,2015
Cairo University-Institute of Statistical Studies and Research
119
// thread_2 end
// thread_3
initially send start message to all slaves nodes(node!=0)with tag=0
WHILE start equal true
WHILE Qjob and Qnode aren't empty THEN
SET job equal pop job( packet) from Qjob
SET node equal pop slave node number from Qnode
send job to slave node number node
ENDWHILE
ENDWHILE
send termination message to all slave nodes with tag=-1
// thread_3 end
WHILE job source not start(satellite doesn't enter ground station zone )
do no thing
ENDWHILE
SET start equal true
run thread_1
run thread_2
run thread_3
ELSE
SET WorkerThread inner class in slave node
// class WorkerThread
WHILE Main function is running
IF there's tasks in Main.Qtask THEN
pop task from Main.Qtask
execute task
ELSE
break from the loop which mean all tasks are serviced
ENDIF
ENDWHILE
// class WorkerThread end
SET threadCount equal number of used thread
WHILE true
receive message from master node
IF message tag equal 0 THEN
send message with tag=0 to master node and continue in loop
ELSEIF message tag equal -1
break from loop
ELSE
store incoming message(packet) in Qtask
SET workers to WorkerThread[threadCount]
FOR i = 0 to threadCount
SET workers[i] to new object of WorkerThread
run thread workers[i]
ENDFOR
send result to master node
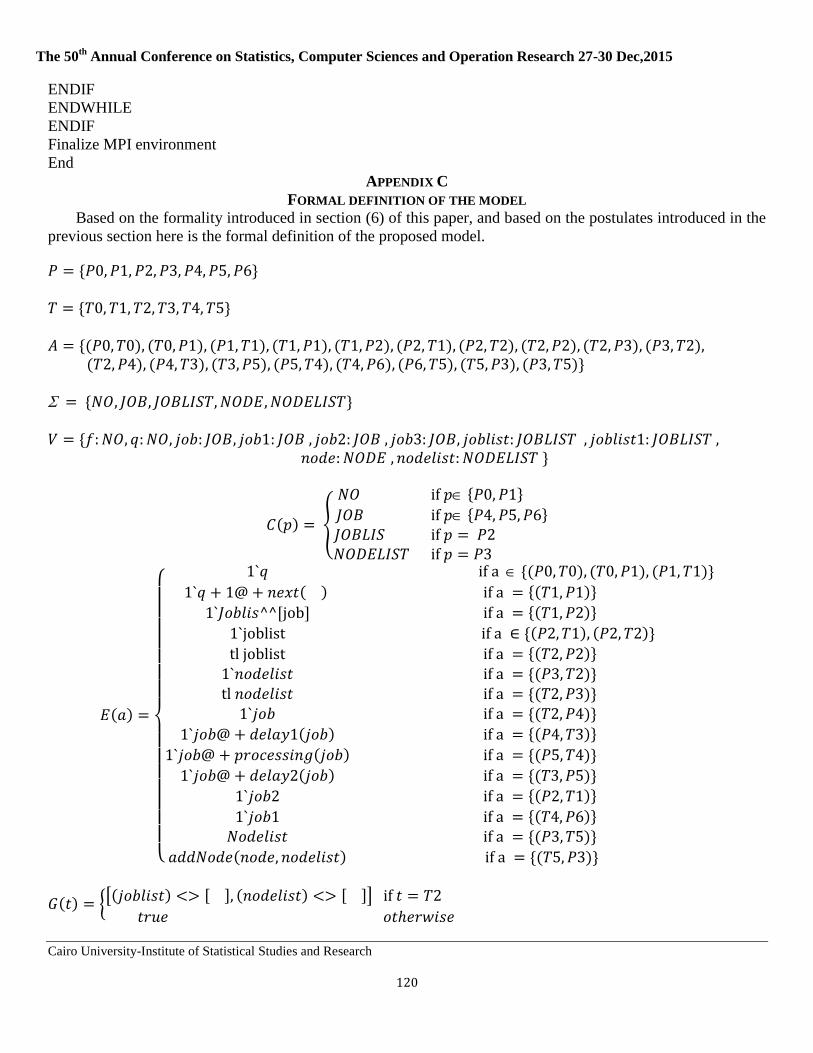
The 50th
Annual Conference on Statistics, Computer Sciences and Operation Research 27-30 Dec,2015
Cairo University-Institute of Statistical Studies and Research
120
ENDIF
ENDWHILE
ENDIF
Finalize MPI environment
End
APPENDIX C
FORMAL DEFINITION OF THE MODEL
Based on the formality introduced in section (6) of this paper, and based on the postulates introduced in the
previous section here is the formal definition of the proposed model.
{
{
{[ ]
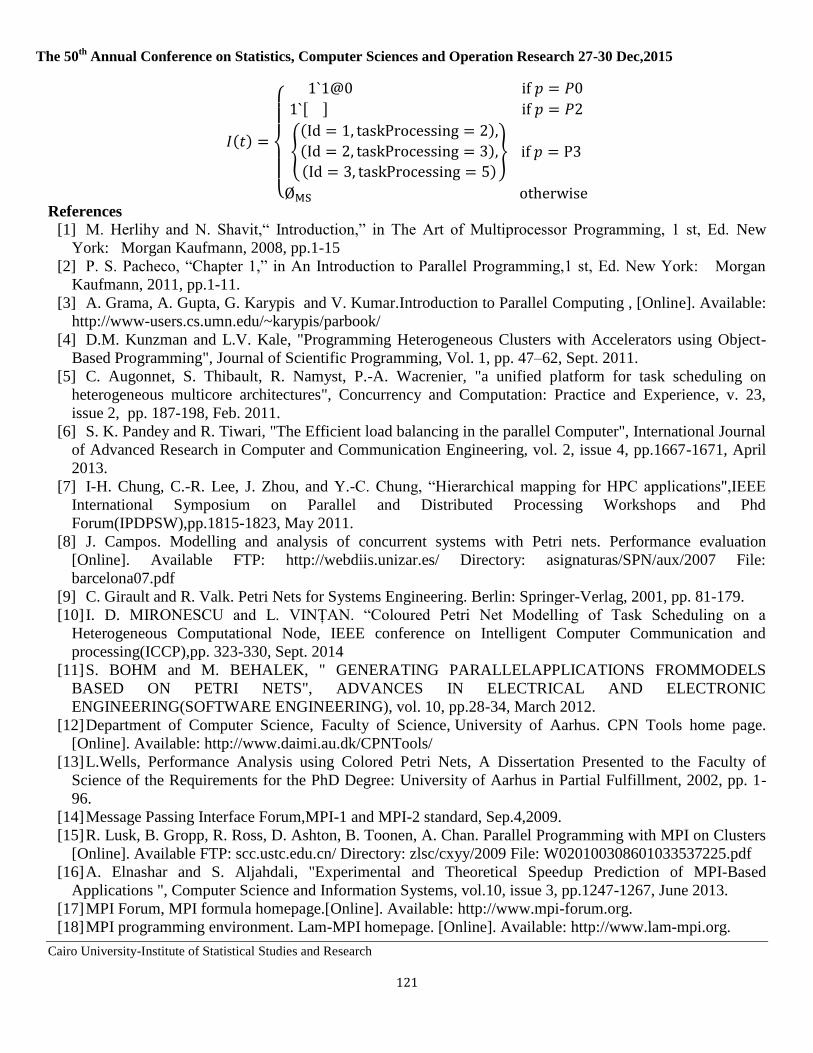
The 50th
Annual Conference on Statistics, Computer Sciences and Operation Research 27-30 Dec,2015
Cairo University-Institute of Statistical Studies and Research
121
{
{
}
References
[1] M. Herlihy and N. Shavit,“ Introduction,” in The Art of Multiprocessor Programming, 1 st, Ed. New
York: Morgan Kaufmann, 2008, pp.1-15
[2] P. S. Pacheco, “Chapter 1,” in An Introduction to Parallel Programming,1 st, Ed. New York: Morgan
Kaufmann, 2011, pp.1-11.
[3] A. Grama, A. Gupta, G. Karypis and V. Kumar.Introduction to Parallel Computing , [Online]. Available:
http://www-users.cs.umn.edu/~karypis/parbook/
[4] D.M. Kunzman and L.V. Kale, "Programming Heterogeneous Clusters with Accelerators using Object-
Based Programming", Journal of Scientific Programming, Vol. 1, pp. 47–62, Sept. 2011.
[5] C. Augonnet, S. Thibault, R. Namyst, P.-A. Wacrenier, "a unified platform for task scheduling on
heterogeneous multicore architectures", Concurrency and Computation: Practice and Experience, v. 23,
issue 2, pp. 187-198, Feb. 2011.
[6] S. K. Pandey and R. Tiwari, "The Efficient load balancing in the parallel Computer", International Journal
of Advanced Research in Computer and Communication Engineering, vol. 2, issue 4, pp.1667-1671, April
2013.
[7] I-H. Chung, C.-R. Lee, J. Zhou, and Y.-C. Chung, “Hierarchical mapping for HPC applications",IEEE
International Symposium on Parallel and Distributed Processing Workshops and Phd
Forum(IPDPSW),pp.1815-1823, May 2011.
[8] J. Campos. Modelling and analysis of concurrent systems with Petri nets. Performance evaluation
[Online]. Available FTP: http://webdiis.unizar.es/ Directory: asignaturas/SPN/aux/2007 File:
barcelona07.pdf
[9] C. Girault and R. Valk. Petri Nets for Systems Engineering. Berlin: Springer-Verlag, 2001, pp. 81-179.
[10] I. D. MIRONESCU and L. VINȚAN. “Coloured Petri Net Modelling of Task Scheduling on a
Heterogeneous Computational Node, IEEE conference on Intelligent Computer Communication and
processing(ICCP),pp. 323-330, Sept. 2014
[11] S. BOHM and M. BEHALEK, " GENERATING PARALLELAPPLICATIONS FROMMODELS
BASED ON PETRI NETS", ADVANCES IN ELECTRICAL AND ELECTRONIC
ENGINEERING(SOFTWARE ENGINEERING), vol. 10, pp.28-34, March 2012.
[12] Department of Computer Science, Faculty of Science, University of Aarhus. CPN Tools home page.
[Online]. Available: http://www.daimi.au.dk/CPNTools/
[13] L.Wells, Performance Analysis using Colored Petri Nets, A Dissertation Presented to the Faculty of
Science of the Requirements for the PhD Degree: University of Aarhus in Partial Fulfillment, 2002, pp. 1-
96.
[14] Message Passing Interface Forum,MPI-1 and MPI-2 standard, Sep.4,2009.
[15] R. Lusk, B. Gropp, R. Ross, D. Ashton, B. Toonen, A. Chan. Parallel Programming with MPI on Clusters
[Online]. Available FTP: scc.ustc.edu.cn/ Directory: zlsc/cxyy/2009 File: W020100308601033537225.pdf
[16] A. Elnashar and S. Aljahdali, "Experimental and Theoretical Speedup Prediction of MPI-Based
Applications ", Computer Science and Information Systems, vol.10, issue 3, pp.1247-1267, June 2013.
[17] MPI Forum, MPI formula homepage.[Online]. Available: http://www.mpi-forum.org.
[18] MPI programming environment. Lam-MPI homepage. [Online]. Available: http://www.lam-mpi.org.
The 50th
Annual Conference on Statistics, Computer Sciences and Operation Research 27-30 Dec,2015
Cairo University-Institute of Statistical Studies and Research
122
[19] MPI programming environment. Mvapich homepage. [Online]. Available: http://mvapich.cse.ohio-
state.edu.
[20] High-Performance Portable MPI. Mpich homepage. [Online]. Available: http://www.mpich.org .
[21] A. Shafi, B. Carpenter, and M. Baker. “Nested parallelism for multi-core HPC systems using java,”J.
Parallel Distrib.Comput.,Vol.69, pp.532–545, Jun. 2009.
[22] Open source Java message passing library. MPJ Express homepage. [Online]. Available: http://www.mpj-
express.org.
[23] Open Source High Performance Computing. Open-MPI homepage. [Online]. Available:
http://www.open-mpi.org/.
[24] Wiley J. Larson and James R. Wertz,”Spacecraft Subsystem,” in Space Mission Analysis and Design,3rd,
CA. :Microcosm Press, 1999, pp.353-518.
[25] Consultative Committee for Space Data System, CCSDS standard, Nov.,1995.
[26] Thread (computing). [Online]. Available: https://en.wikipedia.org/wiki/Thread_(computing).
[27] David J. Eck, et al. Introduction to Programming Using Java. [Online]. Available
http://math.hws.edu/javanotes/index/html, chapter 12:thread and multiprocessing.
[28] MPI Training Course, Part 2 Advanced, KISTI Supercomputing Center, Aug. 2014. [Online]. Available:
https://www.cacds.uh.edu/education/courses/fall-2015/introduction-mpi-2/
[29] University of Nebraska at Omaha. ADVANCED COMPUTER ARCHITECTURE Course Number CSCI
8150. [Online]. Available http://www.chegg.com/courses/unomaha/CSCI/8150.
[30] S. Ali, H. J. Siegel, M. Maheswaran, D. Hensgen and S. Ali, "Task Execution Time Modeling for
Heterogeneous Computing Systems," in 9th Heterogeneous Computing Workshop, May 2000, pp. 185-199.
[31] E.Albert, et al. “Experiments in Cost Analysis of Java Bytecode.”, Electronic Notes in Theoretical
Computer Science, Vol. 190, pp. 67–83 , July 2007.
[32] J. Wang, Handbook of Dynamic System Modeling (Petri nets for dynamic event-driven system
modeling). Ed: Paul Fishwick, CRC Press, 2007.
[33] K. Jensen, L. M. Kristensen, Colored Petri Nets Modeling and Validation of Concurrent Systems,
Springer-Verlag Berlin Heidelberg, 2009, pp.1-150
[34] J. Wang, Timed Petri nets Theory and Application, Klumer Academic, 1998, p.p.37-69P.
[35] P. J. Haas, Stochastic Petri Nets Modeling, Stability, Simulation, Springer-Verlag New York,
2002,pp.385-446.
[36] Optimization of MPI Applications. The High Performance Computing Center Stuttgart (HLRS) of the
University of Stuttgart. [Online]. Available:http://fs.hlrs.de/projects/par/par_prog_ws/pdf/
mpi_optimize_3.pdf
The 50th
Annual Conference on Statistics, Computer Sciences and Operation Research 27-30 Dec,2015
Cairo University-Institute of Statistical Studies and Research
123
Enhancing the Intelligent Transport System for Dynamic Traffic Routing
by Using Swarm Intelligence
Ayman M. Ghazy , Hesham A. Hefny
Abstract. One of the most popular intelligent transport systems is the dynamic traffic routing system. Dynamic
routing algorithms play an important role in road traffic routing to avoid congestion and to direct vehicles to better
routes. TAntNet-2 algorithm presented a modified version of AntNet algorithm to dynamic traffic routing of road net-
work. TAntNet-2 uses a threshold of pre-known information about the expected good travel time between sources and
destinations. The threshold value is used to fast direct the algorithm to good route, conserve on the discovered good
route and remove unneeded computations. TAntNet-3 presented a modified version of the TAntNet-2 routing algo-
rithm, the modified algorithm used double threshold, the first is the threshold used in TAntNet-2 and the second is
anew defined threshold which used to detect the discovered bad route. TAntNet-3 employs a behavior inspired from
bee behavior when foraging for nectar. The algorithm tries to avoid the effects of ants that take long route during
searching for a good route. The algorithm introduces a new technique for launching forward agents according the
quality of the discovered solution. The algorithm uses forward scout instead of forward ant and uses two forward
scouts for each backward ant, in case of failing the first scout in finding accepted good route. The experimental results
on small network of 16 nodes show high performance for TAntNet-3 compared with AntNet and TAntNet-2. This
paper introduces further discussion and testing for the TAntNet-3, on a new medium size network of 36 nodes. Also
this paper present a statistical analysis to the experimental results to ensure the significant of the enhancement of
TAntNet-3 comparing with the previous versions of TAntNet and the standard AntNet algorithm. The experiments
result insures better performance for TAntNet-3 compared with AntNet and TAntNet-2, and represents a significant
decreasing in average travel time.
Keywords: Swarm Intelligence, Road networks, Dynamic traffic routing, AntNet, TAntNet-2, TAntNet-3, Forward
ant, Forward scout, Backward ant, Check ant, bee behavior, bad route.
The 50th
Annual Conference on Statistics, Computer Sciences and Operation Research 27-30 Dec,2015
Cairo University-Institute of Statistical Studies and Research
124
1 Introduction
Ant routing algorithms is one of the most promising swarm intelligence (SI) methodologies that are capable
of finding near optimal solutions at low computational cost. Ant routing algorithms have been studied in
many researches [1-7]. AntNet is a distributed agent based routing algorithm inspired by the behavior of
natural ants [8]. Since its first appearance in 1998, AntNet algorithm has attracted many researchers to adopt
it in both of data communication networks and road traffic networks.
On data networks, it has been shown that under varying traffic loads, AntNet algorithm is amenable to the
associated changes and it shows better performance than that of Dijkstra’s shortest path algorithm [9]. Sev-
eral enhancements have been made to the AntNet algorithm. Baran and Sosa [10] proposed to initialize the
routing table at each node in the network. The proposed initialization reflects previous knowledge about
network topology rather than the presumption of uniform probabilities distribution given in original AntNet
algorithm. Tekiner et al. [11] produced a version of the AntNet algorithm that improved the throughput and
the average delay. In addition, their algorithm utilized the ant/packet ratio to limit the number of used ants.
A new type of helping ants has been introduced in [12] to increase cooperation among neighboring nodes,
thereby reducing AntNet algorithm’s convergence time. A study for a computation of the pheromone values
in AntNet has been given in [13]. Radwan et al. [14] proposed an adapted AntNet protocol with blocking–
expanding ring search and local retransmission technique for routing of Mobile ad hoc network (MANET).
Sharma et al. [15] showed that load balancing is successfully fulfilled for ant based techniques [15].
On road traffic networks, An Ant Based Control (ABC) algorithm has been applied in [2] for routing of
road traffic through a city. In [3] a modification of Ant Based Control (ABC) and AntNet has been presented
for routing vehicle drivers using historically-based traffic information. Claes and Holvoet [4] proposed a
cooperative ACO algorithm for finding routes based on a cooperative pheromone among ants. Yousefi and
Zamani in [6] proposed an optimal routing method for car navigation system based on a combination be-
tween Divide and Conquer method and Ant Colony algorithm. According to their proposed method, road
network is divided into small areas. Then the learning operation is done in these small areas. Then different
learnt paths are combined together to make the complete paths. This method causes traffic load balance over
the road network. A version of the AntNet algorithm has been applied in [16] to improve traveling time over
a road traffic network with the ability to divert traffic from congested routes. In [17] a city based parking

The 50th
Annual Conference on Statistics, Computer Sciences and Operation Research 27-30 Dec,2015
Cairo University-Institute of Statistical Studies and Research
125
routing system (CBPRS) that used Ant based routing has been proposed. Kammoun et al. in [18] introduced
an adaptive vehicle guidance system instigated from the ant behavior. Their system allows adjusting the
route choice according to the real-time changes in the road network, such as new congestions and jams. In
[19] an Ant Colony Optimization combined with link travel time prediction has been applied to find routes.
The proposed algorithm takes into account link travel time prediction, which can reduce the travel time.
Ghazy et al. [20] proposed a threshold based AntNet algorithm (called TAntNet) for dynamic traffic routing
of road networks, which used the pre-known information about good travel times among different nodes as a
threshold value.
In the last decade, many researches were directed their efforts to produce hybrid algorithms that combine
features from ants and bees behavior [21, 22]. Rahmatizadeh et al. [23] proposed an Ant-Bee Routing algo-
rithm, which inspired from the behavior of both ant and bee to solve the routing problem. The algorithm is
based on the AntNet algorithm and enhanced via using bee agents, it use forward agent inspired from ant
and backward agent inspired from bee [23]. Pankajavalli et al. [24] presented and implemented an algorithm
based on ant and bee behavior called BADSR for Routing in mobile ad-hoc network. The algorithm aimed
to integrate the best of ant colony optimization (ACO) and bee colony optimization (BCO), the algorithm
uses forward ant agents to collect data and backward bee agents to update the links state, the bee agent up-
date data based on checking a threshold. Simulation results represented better result for the BADSR algo-
rithm in terms of reliability and energy consumption [24]. Kanimozhi Suguna et al. [25] showed an algo-
rithm for on demand ad-hoc routing algorithm, which is based on the foraging behavior of Ant colony opti-
mization and bee colony optimization. The proposed algorithm uses bee agents to collect data about the
neighborhood of the node, and uses forward ant agents to update the pheromone state of the links. The re-
sults showed that the proposed algorithm has the potential to become an appropriate routing strategy for mo-
bile ad-hoc networks [25].
TAntNet-2 algorithm is presented for using to dynamic traffic routing on road network in ([26], [27]),
where a performance of the algorithm is enhanced by avoiding the bad effect of forward ants that take a bad
route. The new modified version of the algorithm “TAntNet-3 “ that uses a new threshold to measure the
quality of the solution that found by forward agent is presented in [28].
In this paper, the TAntNet-3 algorithm, will be further investigate on a medium size network of 36 nodes
against the TAntNet-2 and the standard AntNet algorithm, also the experimental results will be analyzed to
The 50th
Annual Conference on Statistics, Computer Sciences and Operation Research 27-30 Dec,2015
Cairo University-Institute of Statistical Studies and Research
126
ensure the performance of the algorithms, this paper aims to show that the performance of the enhancements
in TAntNet-3 is not related to a small size of the network, however in case of larger size network, hierar-
chical routing is applied in cooperate with the used routing algorithm to divide the large size network into
smaller ones.
For the purpose of this paper, the TAntnet-2 algorithm is presented in Section 2.While, the TAntNet-3 al-
gorithm is introduced in Section 3. The simulation experiment is given in section 4. Section 5 concludes the
paper.
2 Threshold based AntNet-2 algorithm
TAntNet-2 algorithm was proposed by Ghazy et.al. [20]. TAntNet-2 is a modified version of AntNet algo-
rithm for traffic routing of road network. The main idea of TAntNet-2 algorithm is to get benefit of the pre
known information about the good travel time between a source and a destination. And use this good travel
times as threshold values. TAntNet-2 used a new type of ants called “check ants”. Check ants are responsi-
ble of periodically checking the discovered good route whether it is still good or not.
When running TAntNet-2, it was noticed that the good route between a source and a destination may dis-
appear after some amount of time of running ants over the network. The reason was the bad effect of the sub
path update on the discovered good route. To overcome this problem, TAntNet-2 was suggested in ([26],
[27]) to prevent the sub path updates for the already discovered good routes.
The pseudo code of The TAntNet-2 algorithm ([26], [27]) can be described as follow:
Algorithm: Threshold-based AntNet (TAntNet-2)
/* Main loop */
FOR each (Node s) /*Concurrent activity*/
t=current time
WHILE /* T is the total experiment time */ Set d := Select destination node;
Set Tsd = 0 /* Tsd travel time from s to d */
IF (Gd = yes)
Launch Check Ant (s, d); /* From s to d*/
ELSE
Launch Forward Ant (s, d); /* From s to d*/
IF (Tsd<=T_GoodSd)
Set Gd = yes
The 50th
Annual Conference on Statistics, Computer Sciences and Operation Research 27-30 Dec,2015
Cairo University-Institute of Statistical Studies and Research
127
END IF
END IF
END WHILE
END FOR
CHECK ANT ( source node: s , destination node: d)
Tsd = 0
WHILE (current_node ≠ destination_node)
Select next node using routing table
(node with highest probability)
Set travel_time= travel time from current node to
next_node
Set Tsd = Tsd + travel_time;
Set current_node = next_node;
END WHILE
IF (Tsd>T_GoodSd)
Set Gd = No
END IF END CHECK ANT
Forward Ant ( source node: s , destination node: d)
WHILE (current_node ≠ destination_node)
Select next node using routing table
Push on stack(next_node, travel_time);
Set current_node = next_node;
END WHILE
Launch backward ant
Die
END Forward Ant
Backward Ant ( source node: s , destination node: d)
WHILE (current node source node) do Choose next node by popping the stack
Update the traffic model
Update the routing table as follows:
IF (Tsd<=T_GoodSd)
/* where: h is the node “come from”, k is the
current node, NK is the set of neighbors nodes,
is the destination or sub path destination */
ELSE if (Gsd'= No)
/* where r is the reinforcement value*/
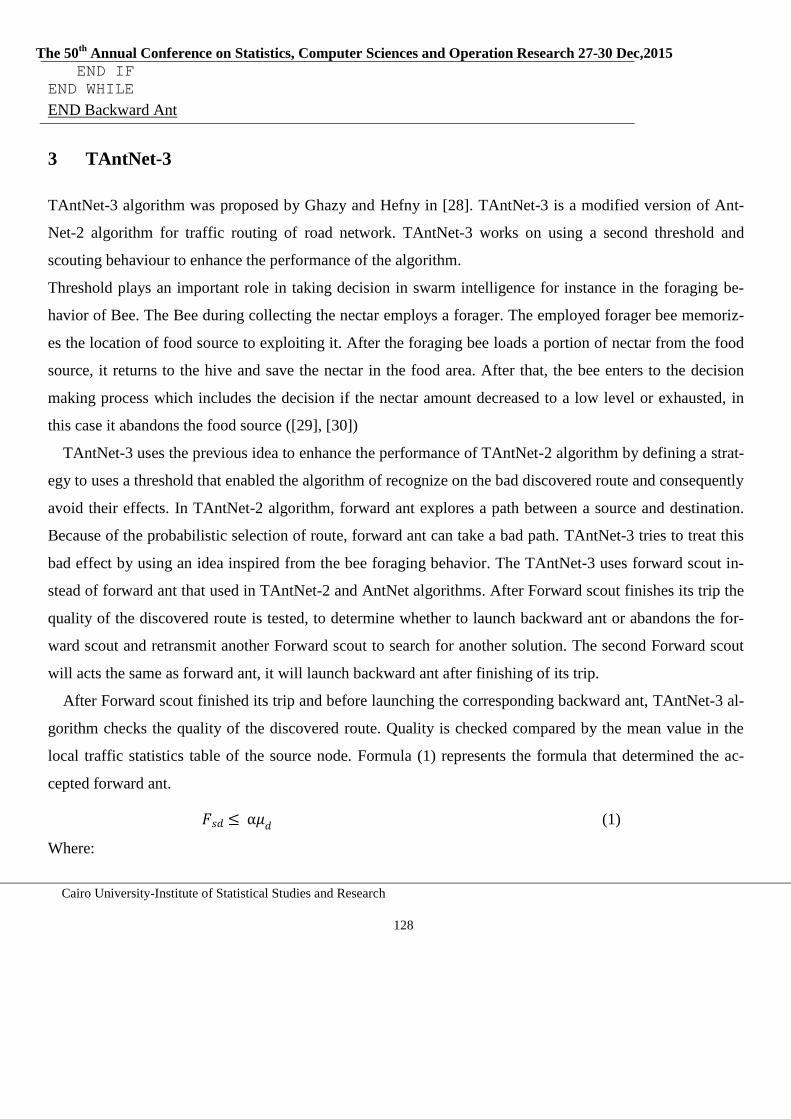
The 50th
Annual Conference on Statistics, Computer Sciences and Operation Research 27-30 Dec,2015
Cairo University-Institute of Statistical Studies and Research
128
END IF
END WHILE
END Backward Ant
3 TAntNet-3
TAntNet-3 algorithm was proposed by Ghazy and Hefny in [28]. TAntNet-3 is a modified version of Ant-
Net-2 algorithm for traffic routing of road network. TAntNet-3 works on using a second threshold and
scouting behaviour to enhance the performance of the algorithm.
Threshold plays an important role in taking decision in swarm intelligence for instance in the foraging be-
havior of Bee. The Bee during collecting the nectar employs a forager. The employed forager bee memoriz-
es the location of food source to exploiting it. After the foraging bee loads a portion of nectar from the food
source, it returns to the hive and save the nectar in the food area. After that, the bee enters to the decision
making process which includes the decision if the nectar amount decreased to a low level or exhausted, in
this case it abandons the food source ([29], [30])
TAntNet-3 uses the previous idea to enhance the performance of TAntNet-2 algorithm by defining a strat-
egy to uses a threshold that enabled the algorithm of recognize on the bad discovered route and consequently
avoid their effects. In TAntNet-2 algorithm, forward ant explores a path between a source and destination.
Because of the probabilistic selection of route, forward ant can take a bad path. TAntNet-3 tries to treat this
bad effect by using an idea inspired from the bee foraging behavior. The TAntNet-3 uses forward scout in-
stead of forward ant that used in TAntNet-2 and AntNet algorithms. After Forward scout finishes its trip the
quality of the discovered route is tested, to determine whether to launch backward ant or abandons the for-
ward scout and retransmit another Forward scout to search for another solution. The second Forward scout
will acts the same as forward ant, it will launch backward ant after finishing of its trip.
After Forward scout finished its trip and before launching the corresponding backward ant, TAntNet-3 al-
gorithm checks the quality of the discovered route. Quality is checked compared by the mean value in the
local traffic statistics table of the source node. Formula (1) represents the formula that determined the ac-
cepted forward ant.
(1)
Where:
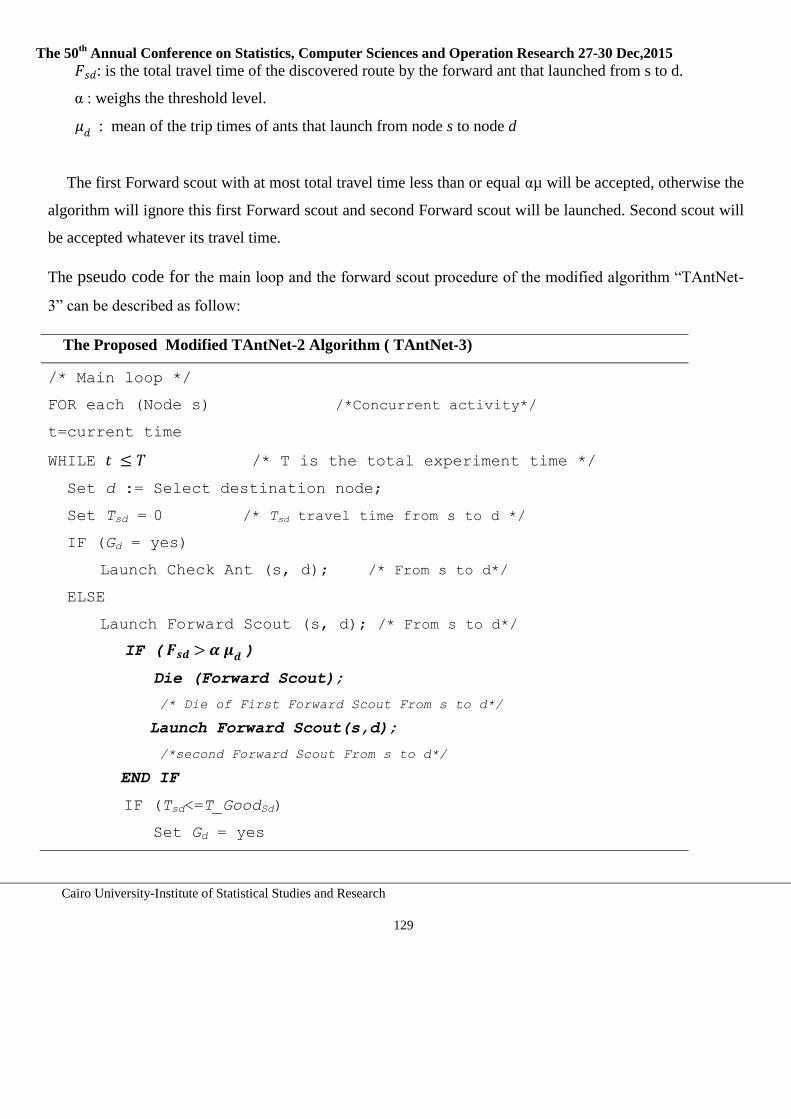
The 50th
Annual Conference on Statistics, Computer Sciences and Operation Research 27-30 Dec,2015
Cairo University-Institute of Statistical Studies and Research
129
: is the total travel time of the discovered route by the forward ant that launched from s to d.
α : weighs the threshold level.
: mean of the trip times of ants that launch from node s to node d
The first Forward scout with at most total travel time less than or equal αµ will be accepted, otherwise the
algorithm will ignore this first Forward scout and second Forward scout will be launched. Second scout will
be accepted whatever its travel time.
The pseudo code for the main loop and the forward scout procedure of the modified algorithm “TAntNet-
3” can be described as follow:
The Proposed Modified TAntNet-2 Algorithm ( TAntNet-3)
/* Main loop */
FOR each (Node s) /*Concurrent activity*/
t=current time
WHILE /* T is the total experiment time */
Set d := Select destination node;
Set Tsd = 0 /* Tsd travel time from s to d */
IF (Gd = yes)
Launch Check Ant (s, d); /* From s to d*/
ELSE
Launch Forward Scout (s, d); /* From s to d*/
IF ( )
Die (Forward Scout);
/* Die of First Forward Scout From s to d*/
Launch Forward Scout(s,d);
/*second Forward Scout From s to d*/
END IF
IF (Tsd<=T_GoodSd)
Set Gd = yes

The 50th
Annual Conference on Statistics, Computer Sciences and Operation Research 27-30 Dec,2015
Cairo University-Institute of Statistical Studies and Research
130
END IF
Launch Backward Ant (d, s)
Die (Forward Scout); /* Die of Second Forward Scout*/
END IF
END WHILE
END FOR
Forward Scout (source node: s, destination node: d)
WHILE (current_node ≠ destination_node)
Select next node using routing table
Push on stack(next_node, travel_time);
Set current_node = next_node;
END WHILE
END Forward Scout
Note that, the lines of codes appear in bold font represent the new modifications compared with the
TAntNet-2 algorithm. Also note that the procedures of Check Ant and Backward Ant will be the same as
that of the TAntNet-2 algorithm.
Figure 1 shows the flowchart that described the mechanism of launching agents in the TAntNet-3 algo-
rithm.
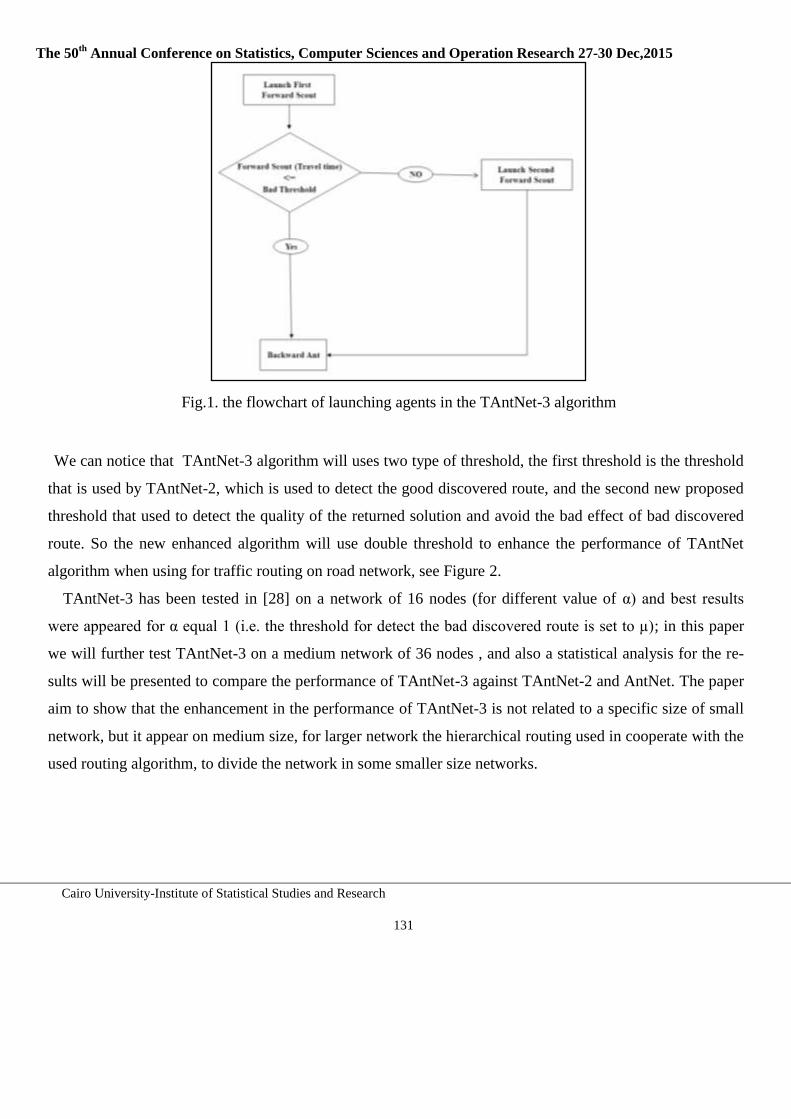
The 50th
Annual Conference on Statistics, Computer Sciences and Operation Research 27-30 Dec,2015
Cairo University-Institute of Statistical Studies and Research
131
Fig.1. the flowchart of launching agents in the TAntNet-3 algorithm
We can notice that TAntNet-3 algorithm will uses two type of threshold, the first threshold is the threshold
that is used by TAntNet-2, which is used to detect the good discovered route, and the second new proposed
threshold that used to detect the quality of the returned solution and avoid the bad effect of bad discovered
route. So the new enhanced algorithm will use double threshold to enhance the performance of TAntNet
algorithm when using for traffic routing on road network, see Figure 2.
TAntNet-3 has been tested in [28] on a network of 16 nodes (for different value of α) and best results
were appeared for α equal 1 (i.e. the threshold for detect the bad discovered route is set to µ); in this paper
we will further test TAntNet-3 on a medium network of 36 nodes , and also a statistical analysis for the re-
sults will be presented to compare the performance of TAntNet-3 against TAntNet-2 and AntNet. The paper
aim to show that the enhancement in the performance of TAntNet-3 is not related to a specific size of small
network, but it appear on medium size, for larger network the hierarchical routing used in cooperate with the
used routing algorithm, to divide the network in some smaller size networks.
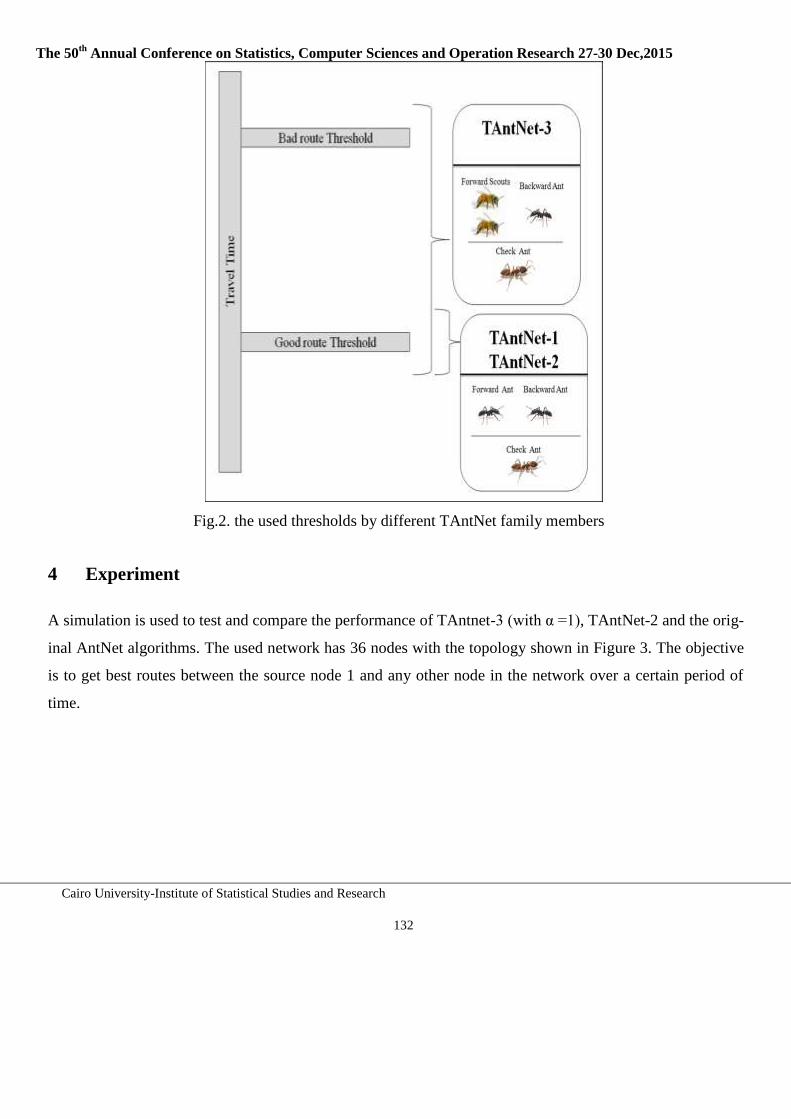
The 50th
Annual Conference on Statistics, Computer Sciences and Operation Research 27-30 Dec,2015
Cairo University-Institute of Statistical Studies and Research
132
Fig.2. the used thresholds by different TAntNet family members
4 Experiment
A simulation is used to test and compare the performance of TAntnet-3 (with α =1), TAntNet-2 and the orig-
inal AntNet algorithms. The used network has 36 nodes with the topology shown in Figure 3. The objective
is to get best routes between the source node 1 and any other node in the network over a certain period of
time.
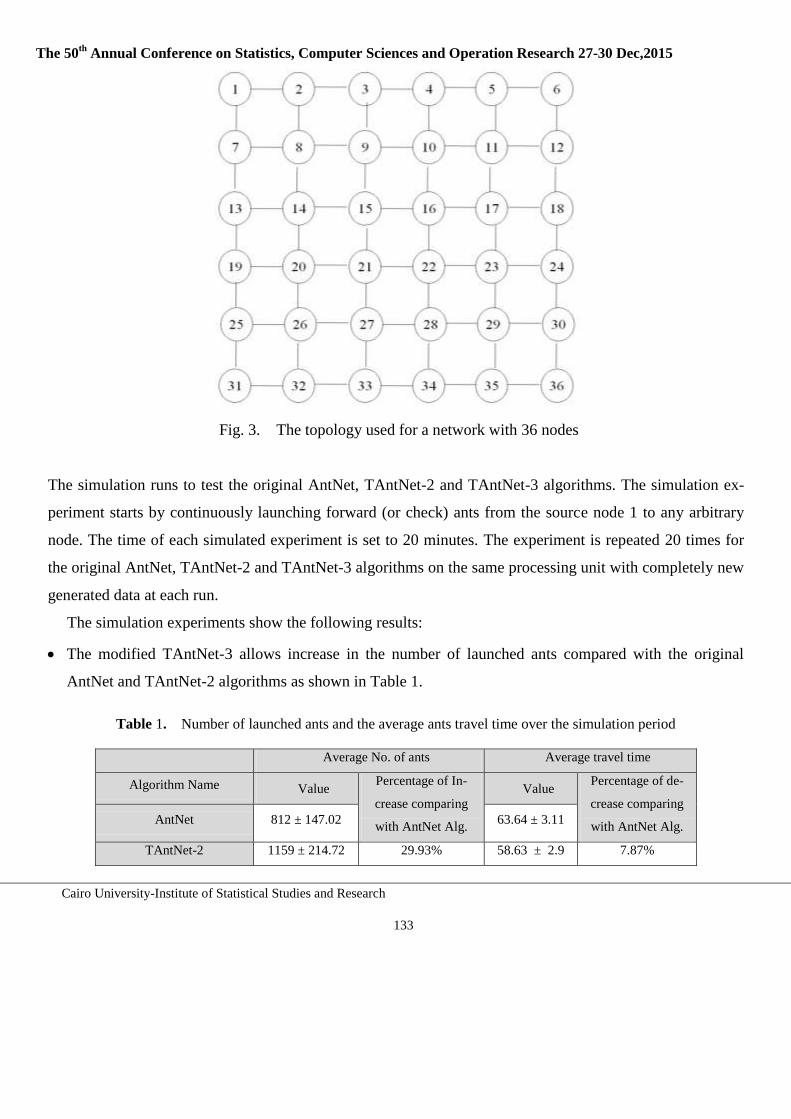
The 50th
Annual Conference on Statistics, Computer Sciences and Operation Research 27-30 Dec,2015
Cairo University-Institute of Statistical Studies and Research
133
Fig. 3. The topology used for a network with 36 nodes
The simulation runs to test the original AntNet, TAntNet-2 and TAntNet-3 algorithms. The simulation ex-
periment starts by continuously launching forward (or check) ants from the source node 1 to any arbitrary
node. The time of each simulated experiment is set to 20 minutes. The experiment is repeated 20 times for
the original AntNet, TAntNet-2 and TAntNet-3 algorithms on the same processing unit with completely new
generated data at each run.
The simulation experiments show the following results:
The modified TAntNet-3 allows increase in the number of launched ants compared with the original
AntNet and TAntNet-2 algorithms as shown in Table 1.
Table 1. Number of launched ants and the average ants travel time over the simulation period
Average No. of ants Average travel time
Algorithm Name Value Percentage of In-
crease comparing
with AntNet Alg.
Value Percentage of de-
crease comparing
with AntNet Alg. AntNet 812 ± 147.02 63.64 ± 3.11
TAntNet-2 1159 ± 214.72 29.93% 58.63 ± 2.9 7.87%
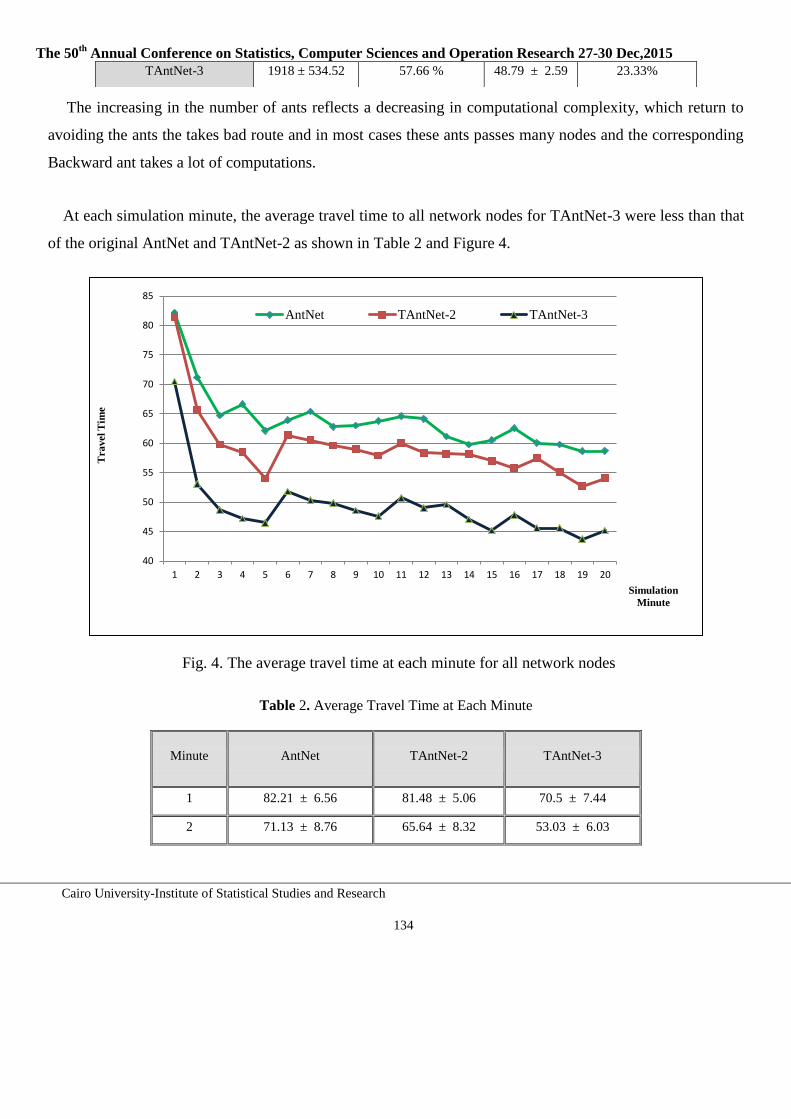
The 50th
Annual Conference on Statistics, Computer Sciences and Operation Research 27-30 Dec,2015
Cairo University-Institute of Statistical Studies and Research
134
The increasing in the number of ants reflects a decreasing in computational complexity, which return to
avoiding the ants the takes bad route and in most cases these ants passes many nodes and the corresponding
Backward ant takes a lot of computations.
At each simulation minute, the average travel time to all network nodes for TAntNet-3 were less than that
of the original AntNet and TAntNet-2 as shown in Table 2 and Figure 4.
Fig. 4. The average travel time at each minute for all network nodes
Table 2. Average Travel Time at Each Minute
Minute AntNet TAntNet-2 TAntNet-3
1 82.21 ± 6.56 81.48 ± 5.06 70.5 ± 7.44
2 71.13 ± 8.76 65.64 ± 8.32 53.03 ± 6.03
40
45
50
55
60
65
70
75
80
85
1 2 3 4 5 6 7 8 9 10 11 12 13 14 15 16 17 18 19 20
AntNet TAntNet-2 TAntNet-3
Tra
vel T
ime
Simulation
Minute
TAntNet-3 1918 ± 534.52 57.66 % 48.79 ± 2.59 23.33%
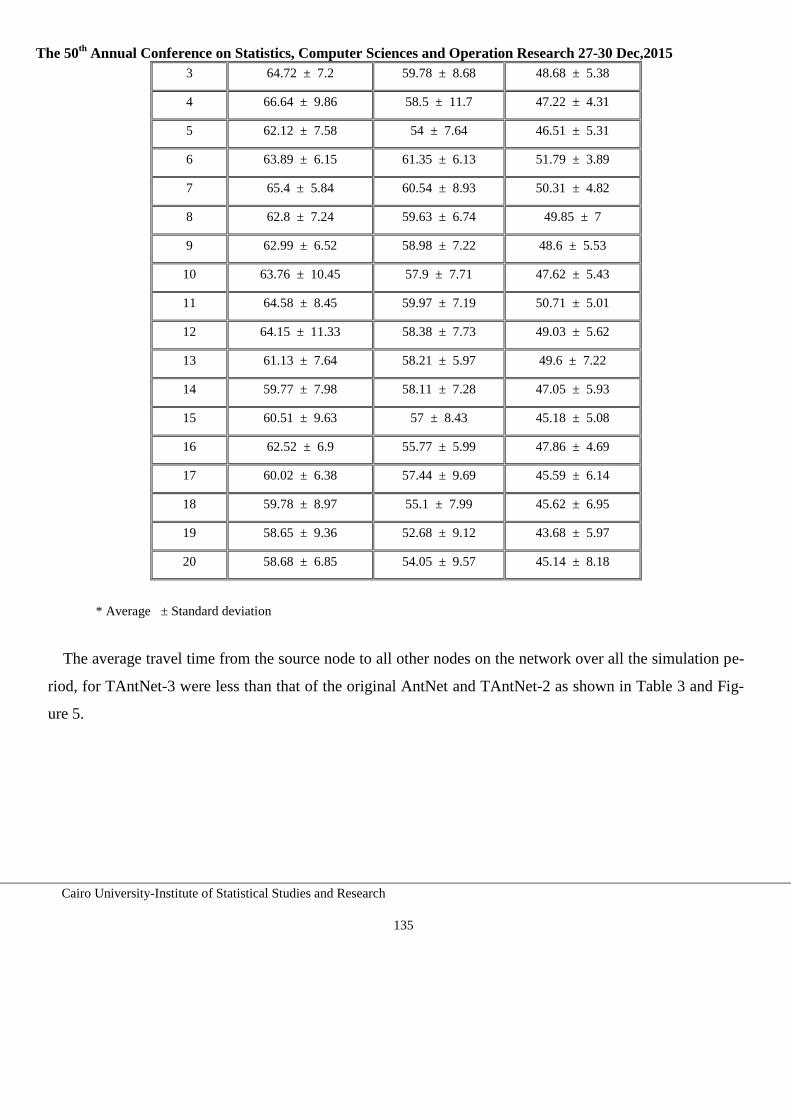
The 50th
Annual Conference on Statistics, Computer Sciences and Operation Research 27-30 Dec,2015
Cairo University-Institute of Statistical Studies and Research
135
3 64.72 ± 7.2 59.78 ± 8.68 48.68 ± 5.38
4 66.64 ± 9.86 58.5 ± 11.7 47.22 ± 4.31
5 62.12 ± 7.58 54 ± 7.64 46.51 ± 5.31
6 63.89 ± 6.15 61.35 ± 6.13 51.79 ± 3.89
7 65.4 ± 5.84 60.54 ± 8.93 50.31 ± 4.82
8 62.8 ± 7.24 59.63 ± 6.74 49.85 ± 7
9 62.99 ± 6.52 58.98 ± 7.22 48.6 ± 5.53
10 63.76 ± 10.45 57.9 ± 7.71 47.62 ± 5.43
11 64.58 ± 8.45 59.97 ± 7.19 50.71 ± 5.01
12 64.15 ± 11.33 58.38 ± 7.73 49.03 ± 5.62
13 61.13 ± 7.64 58.21 ± 5.97 49.6 ± 7.22
14 59.77 ± 7.98 58.11 ± 7.28 47.05 ± 5.93
15 60.51 ± 9.63 57 ± 8.43 45.18 ± 5.08
16 62.52 ± 6.9 55.77 ± 5.99 47.86 ± 4.69
17 60.02 ± 6.38 57.44 ± 9.69 45.59 ± 6.14
18 59.78 ± 8.97 55.1 ± 7.99 45.62 ± 6.95
19 58.65 ± 9.36 52.68 ± 9.12 43.68 ± 5.97
20 58.68 ± 6.85 54.05 ± 9.57 45.14 ± 8.18
* Average ± Standard deviation
The average travel time from the source node to all other nodes on the network over all the simulation pe-
riod, for TAntNet-3 were less than that of the original AntNet and TAntNet-2 as shown in Table 3 and Fig-
ure 5.
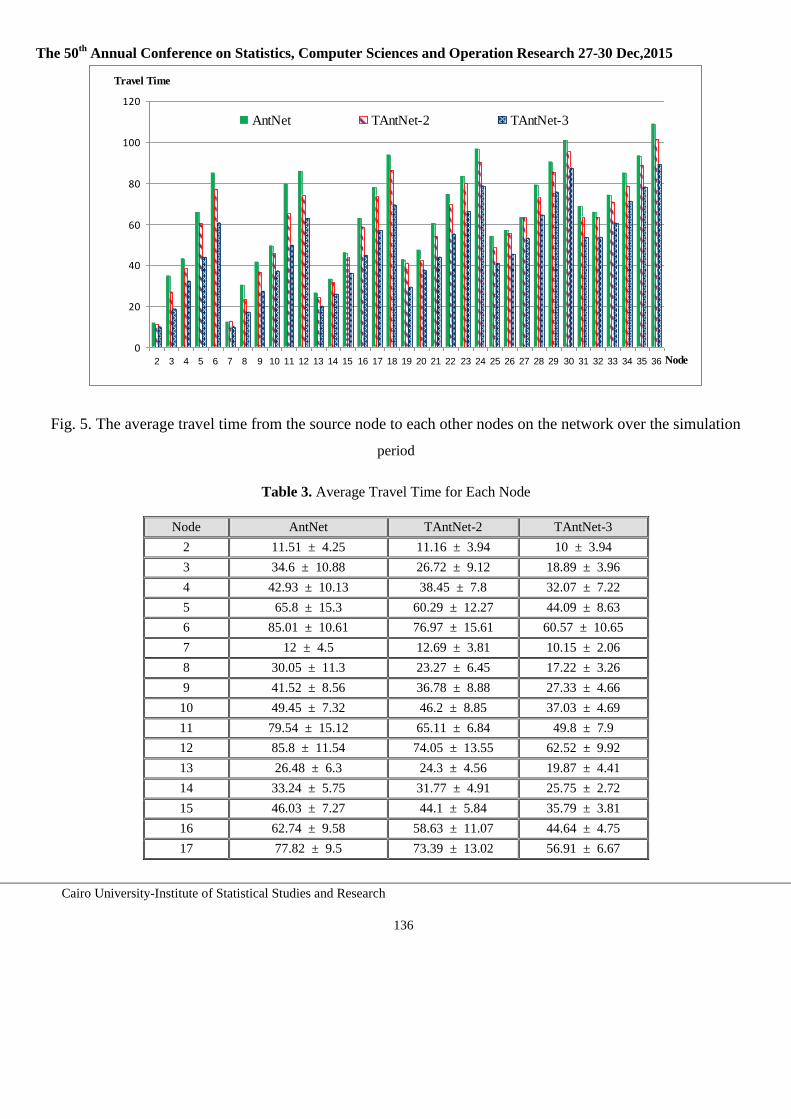
The 50th
Annual Conference on Statistics, Computer Sciences and Operation Research 27-30 Dec,2015
Cairo University-Institute of Statistical Studies and Research
136
Fig. 5. The average travel time from the source node to each other nodes on the network over the simulation
period
Table 3. Average Travel Time for Each Node
Node AntNet TAntNet-2 TAntNet-3
2
11.51 ± 4.25 11.16 ± 3.94 10 ± 3.94
3 34.6 ± 10.88 26.72 ± 9.12 18.89 ± 3.96
4 42.93 ± 10.13 38.45 ± 7.8 32.07 ± 7.22
5 65.8 ± 15.3 60.29 ± 12.27 44.09 ± 8.63
6 85.01 ± 10.61 76.97 ± 15.61 60.57 ± 10.65
7 12 ± 4.5 12.69 ± 3.81 10.15 ± 2.06
8 30.05 ± 11.3 23.27 ± 6.45 17.22 ± 3.26
9 41.52 ± 8.56 36.78 ± 8.88 27.33 ± 4.66
10 49.45 ± 7.32 46.2 ± 8.85 37.03 ± 4.69
11 79.54 ± 15.12 65.11 ± 6.84 49.8 ± 7.9
12 85.8 ± 11.54 74.05 ± 13.55 62.52 ± 9.92
13 26.48 ± 6.3 24.3 ± 4.56 19.87 ± 4.41
14 33.24 ± 5.75 31.77 ± 4.91 25.75 ± 2.72
15 46.03 ± 7.27 44.1 ± 5.84 35.79 ± 3.81
16 62.74 ± 9.58 58.63 ± 11.07 44.64 ± 4.75
17 77.82 ± 9.5 73.39 ± 13.02 56.91 ± 6.67
0
20
40
60
80
100
120
2 3 4 5 6 7 8 9 10 11 12 13 14 15 16 17 18 19 20 21 22 23 24 25 26 27 28 29 30 31 32 33 34 35 36
AntNet TAntNet-2 TAntNet-3
Travel Time
Node
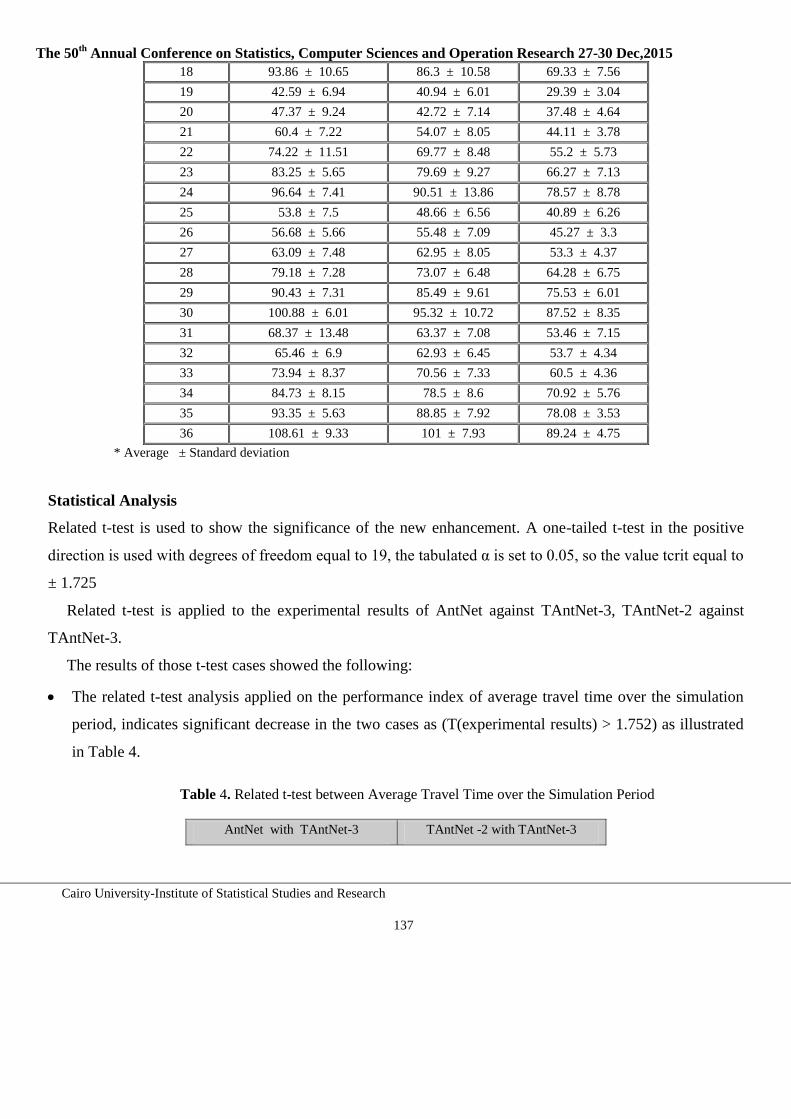
The 50th
Annual Conference on Statistics, Computer Sciences and Operation Research 27-30 Dec,2015
Cairo University-Institute of Statistical Studies and Research
137
18 93.86 ± 10.65 86.3 ± 10.58 69.33 ± 7.56
19 42.59 ± 6.94 40.94 ± 6.01 29.39 ± 3.04
20 47.37 ± 9.24 42.72 ± 7.14 37.48 ± 4.64
21 60.4 ± 7.22 54.07 ± 8.05 44.11 ± 3.78
22 74.22 ± 11.51 69.77 ± 8.48 55.2 ± 5.73
23 83.25 ± 5.65 79.69 ± 9.27 66.27 ± 7.13
24 96.64 ± 7.41 90.51 ± 13.86 78.57 ± 8.78
25 53.8 ± 7.5 48.66 ± 6.56 40.89 ± 6.26
26 56.68 ± 5.66 55.48 ± 7.09 45.27 ± 3.3
27 63.09 ± 7.48 62.95 ± 8.05 53.3 ± 4.37
28 79.18 ± 7.28 73.07 ± 6.48 64.28 ± 6.75
29 90.43 ± 7.31 85.49 ± 9.61 75.53 ± 6.01
30 100.88 ± 6.01 95.32 ± 10.72 87.52 ± 8.35
31 68.37 ± 13.48 63.37 ± 7.08 53.46 ± 7.15
32 65.46 ± 6.9 62.93 ± 6.45 53.7 ± 4.34
33 73.94 ± 8.37 70.56 ± 7.33 60.5 ± 4.36
34 84.73 ± 8.15 78.5 ± 8.6 70.92 ± 5.76
35 93.35 ± 5.63 88.85 ± 7.92 78.08 ± 3.53
36 108.61 ± 9.33 101 ± 7.93 89.24 ± 4.75
* Average ± Standard deviation
Statistical Analysis
Related t-test is used to show the significance of the new enhancement. A one-tailed t-test in the positive
direction is used with degrees of freedom equal to 19, the tabulated α is set to 0.05, so the value tcrit equal to
± 1.725
Related t-test is applied to the experimental results of AntNet against TAntNet-3, TAntNet-2 against
TAntNet-3.
The results of those t-test cases showed the following:
The related t-test analysis applied on the performance index of average travel time over the simulation
period, indicates significant decrease in the two cases as (T(experimental results) > 1.752) as illustrated
in Table 4.
Table 4. Related t-test between Average Travel Time over the Simulation Period
AntNet with TAntNet-3 TAntNet -2 with TAntNet-3
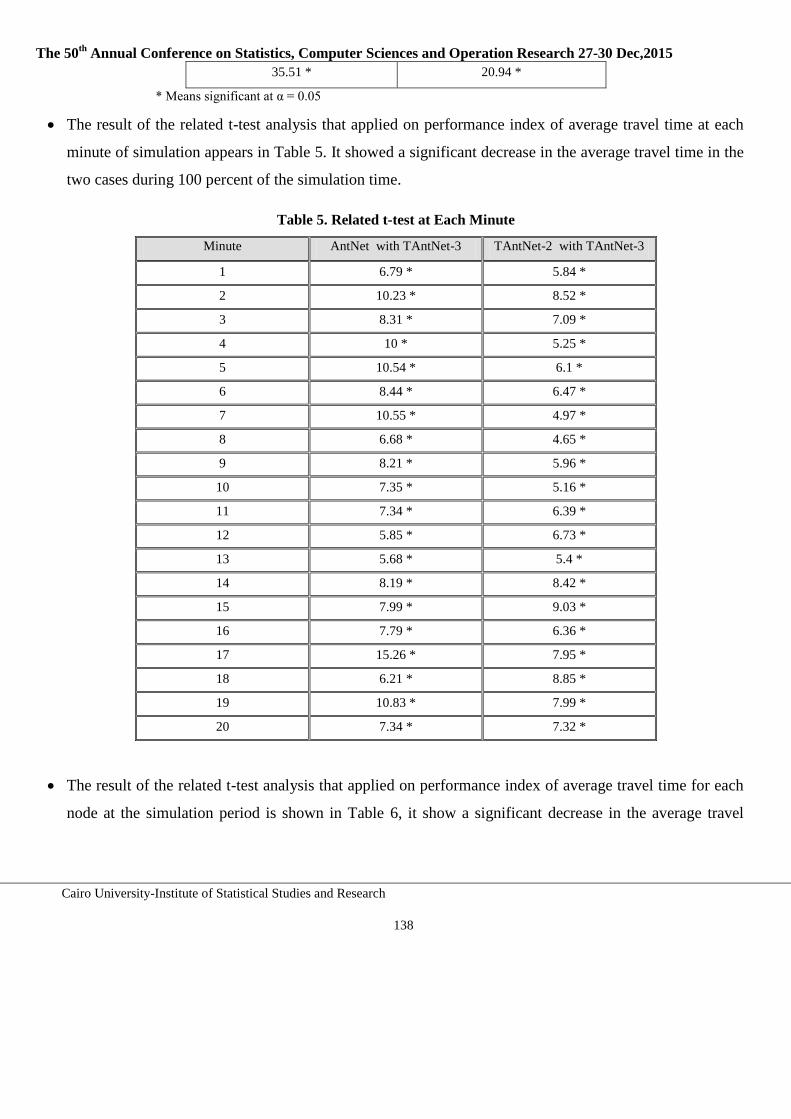
The 50th
Annual Conference on Statistics, Computer Sciences and Operation Research 27-30 Dec,2015
Cairo University-Institute of Statistical Studies and Research
138
35.51 * 20.94 *
* Means significant at α = 0.05
The result of the related t-test analysis that applied on performance index of average travel time at each
minute of simulation appears in Table 5. It showed a significant decrease in the average travel time in the
two cases during 100 percent of the simulation time.
Table 5. Related t-test at Each Minute
Minute AntNet with TAntNet-3 TAntNet-2 with TAntNet-3
1 6.79 * 5.84 *
2 10.23 * 8.52 *
3 8.31 * 7.09 *
4 10 * 5.25 *
5 10.54 * 6.1 *
6 8.44 * 6.47 *
7 10.55 * 4.97 *
8 6.68 * 4.65 *
9 8.21 * 5.96 *
10 7.35 * 5.16 *
11 7.34 * 6.39 *
12 5.85 * 6.73 *
13 5.68 * 5.4 *
14 8.19 * 8.42 *
15 7.99 * 9.03 *
16 7.79 * 6.36 *
17 15.26 * 7.95 *
18 6.21 * 8.85 *
19 10.83 * 7.99 *
20 7.34 * 7.32 *
The result of the related t-test analysis that applied on performance index of average travel time for each
node at the simulation period is shown in Table 6, it show a significant decrease in the average travel
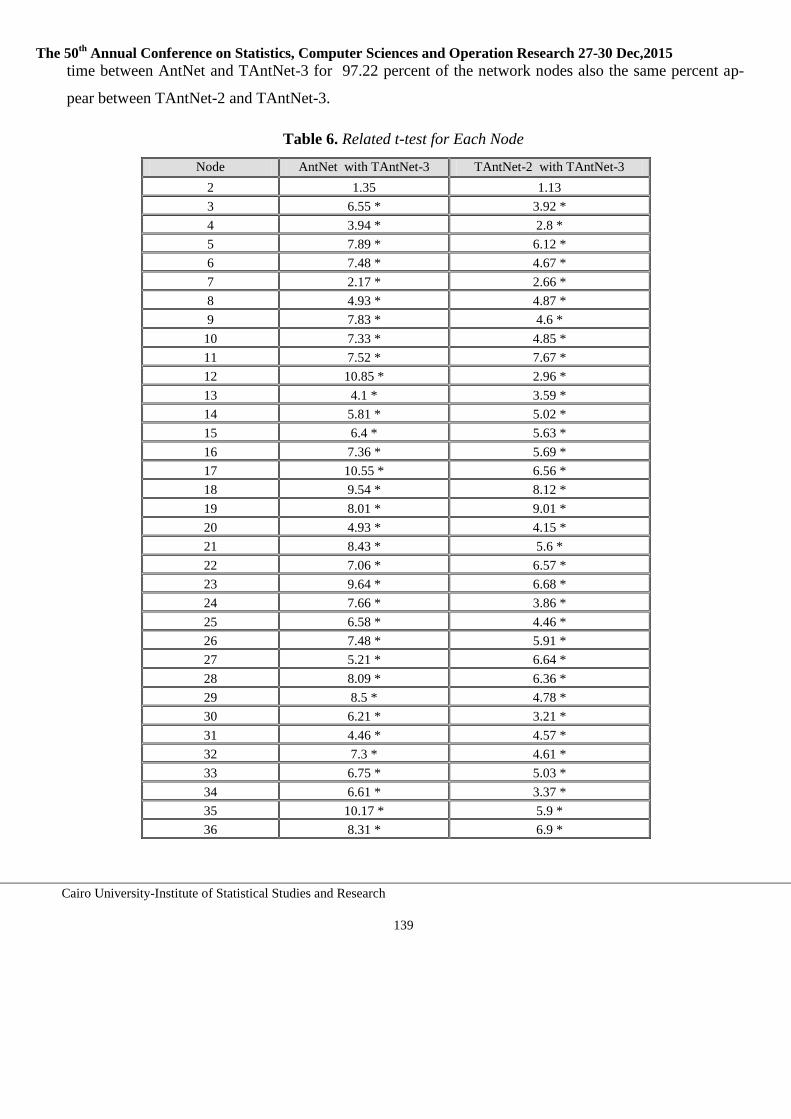
The 50th
Annual Conference on Statistics, Computer Sciences and Operation Research 27-30 Dec,2015
Cairo University-Institute of Statistical Studies and Research
139
time between AntNet and TAntNet-3 for 97.22 percent of the network nodes also the same percent ap-
pear between TAntNet-2 and TAntNet-3.
Table 6. Related t-test for Each Node
Node AntNet with TAntNet-3 TAntNet-2 with TAntNet-3
2 1.35 1.13
3 6.55 * 3.92 *
4 3.94 * 2.8 *
5 7.89 * 6.12 *
6 7.48 * 4.67 *
7 2.17 * 2.66 *
8 4.93 * 4.87 *
9 7.83 * 4.6 *
10 7.33 * 4.85 *
11 7.52 * 7.67 *
12 10.85 * 2.96 *
13 4.1 * 3.59 *
14 5.81 * 5.02 *
15 6.4 * 5.63 *
16 7.36 * 5.69 *
17 10.55 * 6.56 *
18 9.54 * 8.12 *
19 8.01 * 9.01 *
20 4.93 * 4.15 *
21 8.43 * 5.6 *
22 7.06 * 6.57 *
23 9.64 * 6.68 *
24 7.66 * 3.86 *
25 6.58 * 4.46 *
26 7.48 * 5.91 *
27 5.21 * 6.64 *
28 8.09 * 6.36 *
29 8.5 * 4.78 *
30 6.21 * 3.21 *
31 4.46 * 4.57 *
32 7.3 * 4.61 *
33 6.75 * 5.03 *
34 6.61 * 3.37 *
35 10.17 * 5.9 *
36 8.31 * 6.9 *
The 50th
Annual Conference on Statistics, Computer Sciences and Operation Research 27-30 Dec,2015
Cairo University-Institute of Statistical Studies and Research
140
5 Conclusion
In this paper, the modified version of the TAntNet-2 (TAntNet-3) algorithm, that is presented to be applied
for dynamic traffic routing on road networks is described and tested on a road network of 36 nodes. The
TAntNet-3 algorithm inspires feature from bee foraging behavior, to enhance the performance of TAntNet-2
algorithm. TAnNet-3 algorithm performs a scouting process before launching of the backward ants. The
scouting process uses a threshold to determine the accepted solution. The threshold uses the historical data
saved in the local traffic statistics table. Scouting process use retransmits of new scout, in case of rejected
first scout. TAnNet-3 algorithm prevents the bad effect of bad forward ant. Experimental results show high
performance for TAntNet-3 compared with AntNet and TAntNet-2. The average travel time from the source
node to all other nodes on the network over all the simulation period, for TAntNet-3 were less than that of
the original AntNet and TAntNet-2, also the average travel time to all network nodes for TAntNet-3 were
less than that of the original AntNet and TAntNet-2. Statistical analysis represents significant decreasing in
average travel time for TAntNwt-3 comparing with AntNet and TAntNet-2.
References
1. Kassabalidis I, El-Sharkawi MA, Marks RJ, Arabshahi P, Gray AA.: Adaptive-SDR: adaptive swarm-based dis-
tributed routing. In: Proceedings of the international joint conference on neural networks, Honolulu (HI). Vol. 1,
pp. 351–355 (2002)
2. Kroon R, Rothkrantz L.: Dynamic vehicle routing using an ABC-algorithm. In: Transportation and telecommuni-
cation in the 3rd millennium, Prague. pp. 26–33 (2003)
3. Suson A.: Dynamic routing using ant-based control. Master thesis, Faculty of Electrical Engineering, Mathematics
and Computer Science, Delft University of Technology (2010)
4. Claes R, Holvoet T: Cooperative ant colony optimization in traffic route calculations. In: Advances on Practical
Applications of Agents and Multi-Agent Systems. Springer Berlin Heidelberg. pp. 23-34 (2012)
5. Shah S., Bhaya A., Kothari R., Chandra S.: Ants find the shortest path: a mathematical proof. Swarm Intelligence.
Vol. 7, No. 1, pp. 43-62 (2013)
6. Yousefi P, Zamani R.: The Optimal Routing of Cars in the Car Navigation System by Taking the Combination of
Divide and Conquer Method and Ant Colony Algorithm into Consideration. International Journal of Machine
Learning and Computing. Vol. 3, pp. 44-48 (2013)
The 50th
Annual Conference on Statistics, Computer Sciences and Operation Research 27-30 Dec,2015
Cairo University-Institute of Statistical Studies and Research
141
7. Jabbarpour M. R., Malakooti H., Noor R. M., Anuar, N. B., Khamis, N.: Ant colony optimisation for vehicle traf-
fic systems: applications and challenges. International Journal of Bio-Inspired Computation. Vol. 6, No. 1, pp. 32-
56 (2014)
8. Di Caro G, Dorigo M.: AntNet: distributed stigmergetic control for communications networks. J ArticialIntell Res
(JAIR). Vol. 9, pp.317–65 (1998)
9. Dhillon SS, Van Mieghem P.: Performance analysis of the AntNet algorithm. Computer Networks. Vol. 51, pp.
2104–2125 (2007)
10. Baran B, Sosa R.: AntNet routing algorithm for data networks based on mobile agents. Inteligencia Artificial, Re-
vista Iberoamericana de Inteligencia Artificial. Vol. 12, pp. 75–84 (2001)
11. Tekiner F, Ghassemlooy FZ, Al-khayatt S.: The AntNet Routing Algorithm - Improved Version. In: Proceedings
of the international symposium on communication systems networks and digital signal processing (CSNDSP),
Newcastle (UK), July 2004. pp. 22–28 (2004)
12. Soltani A, Akbarzadeh-T M-R, Naghibzadeh M.: Helping ants for adaptive network routing. Journal of the Frank-
lin Institute. Vol. 343, No. 4, pp. 389-403 (2006)
13. Gupta, Anuj K, Sadawarti, Harsh, Verma, Anil K.: Computation of Pheromone Values in AntNet Algo-
rithm. International Journal of Computer Network & Information Security, Vol. 4, No. 9, pp. 47-54 (2012)
14. Radwan A, Mahmoud T, Houssein E.: AntNet-RSLR: a proposed ant routing protocol for MANETs. In: Proceed-
ings of the first Saudi international electronics, communications and electronics conference (SIECPC’11), April
23–26. pp. 1–6 (2011)
15. SHARMA, Ashish Kumar: Simulation of Route Optimization with load balancing Using AntNet System. IOSR
Journal of Computer Engineering (IOSR-JCE). Vol. 11, No. 1, pp. 1-7 (2013)
16. Tatomir B, Rothkrantz LJM.: Dynamic traffic routing using Ant based control. In: IEEE international conference
on systems, man and cybernetics (SMC 2004) on impacts of emerging cybernetics and human-machine systems,
October. Vol. 4, pp. 3970–3975 (2004)
17. Boehle´ J, Rothkrantz L, van Wezel M.: CBPRS: a city based parking and routing system. Technical report ERS-
2008-029-LIS, Erasmus Research Institute of Management, ERIM, University Rotterdam (2008)
18. Kammoun H M, Kallel I, Adel M A.: An adaptive vehicle guidance system instigated from ant colony behavior.
In: Systems Man and Cybernetics (SMC), 2010 IEEE International Conference on. IEEE, pp. 2948-2955 (2010)
19. Claes R, Holvoet T.: Ant colony optimization applied to route planning using link travel time predictions.
In: Parallel and Distributed Processing Workshops and Phd Forum (IPDPSW), 2011 IEEE International Symposi-
um on. IEEE. pp. 358-365 (2011)
The 50th
Annual Conference on Statistics, Computer Sciences and Operation Research 27-30 Dec,2015
Cairo University-Institute of Statistical Studies and Research
142
20. Ghazy A M , El-Licy F , Hefny H A .: Threshold based AntNet algorithm for dynamic traffic routing of road
networks. Egyptian Informatics Journal. Vol. 13, No. 2, pp. 111-121 (2012)
21. Mehdi Kashefikia,Nasser Nematbakhsh, Reza Askari Moghadam: Multiple Ant-Bee colony optimization for load
balancing in packet switched networks. International Journal of Computer Networks & Communications. Vol. 3,
No. 5, pp. 107-117 (2011)
22. Raghavendran, CH V., Satish, G. Naga, Varma, P. Suresh.: Intelligent Routing Techniques for Mobile Ad hoc
Networks using Swarm Intelligence.International Journal of Intelligent Systems and Applications (IJISA). Vol. 5,
No. 1, pp.81-89 (2013)
23. Rahmatizadeh, Sh., Shah-Hosseini, H. and Torkaman. The Ant-Bee Routing Algorithm: A New Agent Based Na-
ture-Inspired Routing Algorithm. Journal of Applied Sciences. Vol. 9, No. 5, pp. 983- 987 (2009)
24. Pankajavalli, P. B. and Arumugam, N.: BADSR: An Enhanced Dynamic Source Routing Algorithm for MANETs
Based on Ant and Bee Colony Optimization. European Journal of Scientific Research. Vol. 53, No. 4, pp. 576-581
(2011)
25. Kanimozhi Suguna, S. and Uma Maheswari S.: Bee - Ant Colony Optimized Routing for Manets. European Jour-
nal of Scientific Research. Vol. 74, No. 3, 364-369 (2012)
26. Ghazy A.: Enhancement of dynamic routing using ant based control algorithm. Master thesis, Institute of Statisti-
cal Studies and Research, Cairo University (2011)
27. Ghazy A.: Ants Guide You to Good Route: Dynamic Traffic Routing of Road Network using Threshold Based
AntNet, LAP LAMBERT ACADEMIC PUBLISHING (2012)
28. Ghazy, A. M., & Hefny, H. A. (2014). Improving the performance of TAntNet-2 using Scout Behavior. In A.E.
Hassanien et al. (Ed.), Advanced Machine Learning Technologies and Applications (pp. 424-435). Springer Berlin
Heidelberg.
29. Baykasoglu A., Ozbakir L., and Tapkan P.: Artificial bee colony algorithm and its application to generalized as-
signment problem. In: Felix T.S. Chan and Manoj Kumar Tiwari, editors: Swarm Intelligence. Focus on Ant and
particle swarm optimization. ITech Education and Publishing, Vienna, Austria, December. pp.113-144 (2007)
30. Akbari R., Mohammadi A., and Ziarati K.: A novel bee swarm optimization algorithm for numerical function op-
timization. Communications in Nonlinear Science and Numerical Simulation. Vol. 15, No. 10, pp. 3142-3155
(2010)
The su" Annual Conference on Statistics, Computer Sciences and Operation Research 27-30 Dec ,2015
Towards Enhanced Differentiation for Web-Based Applications
iAbeer Mosaad Ghareeb, 2Nagy Rarnadan Darwish, 'Hesham A. Hefney
Abstract
Although the importance and criticality of Web-Based Application (WBA), web development processhas a high probability of failure, and don't achieve the required return on investment. Therefore, it isvitally important to devote greater care and attention to quality of WBAs otherwise; the internetmarketers will soon lose potential customers to competitors. To attain the desired quality WBA, it isnecessary to have quality models which contain web quality factors that should be considered, and alsohave a set of excellent guidelines that can be followed to achieve the predefined quality factors. Webquality factors can be organized around three perspectives: visitor, owner, and developer. Eachperspective is mainly interested in some quality factors than others. Owner is mainly concerned withthree quality factors: differentiation, popularity, and profitability. These factors reflect the success ofWBA from the owner perspective. This paper focus on the differentiation as an example of qualityconsiderations that is more essential to the owner. Differentiation can be defined as the extent to whichthe identity and superiority of the owner are clearly demonstrated. Differentiation has two sub-factors:identity and specialty. In this paper, we propose a set of web quality guidelines for identity andspecialty sub-factors. Finally, a case study is used to evaluate and illustrate the validity of the proposedguidelines. The outcomes are explained and interpreted.
Keywords- Web-Based Application, Quality Guidelines, Differentiation. Identity, Specialty, QualityFactors.
I. INTRODUCTIONWBA is an application that accessed via a web browser over a network to accomplish a certain
business need. WBAs possess their own peculiar features that are very different from traditionalapplications. Examples of such peculiar features are: variety of content, ever evolving, multiplicity ofuser profiles, more vulnerable systems, required run uninterruptedly, and ramification of failure ordissatisfaction. Number of internet users has evolved from 16 million, in December 1995, to 3345million, in November 2015 [10]. Although the importance and critical role of WBAs, many of themdon't achieve the return on investment and they tend to be failed. Web development process is oftenad-hoc and chaotic manner, lacking systematic and disciplined approaches and lacking qualityassurance and control procedures.
:::'Computer and Information Sciences Department, Institute of Statistical Studies and Research, Cairo University, Egypt.abeer [email protected]'Computer and Information Sciences Department. Institute of Statistical Studies and Research, Cairo University, [email protected]'Computer and Information Sciences Department, Institute of Statistical Studies and Research, Cairo University, [email protected]
Cairo University-Institute of Statistical Studies and Research 143

The 50th Annual Conference on Statistics, Computer Sciences and Operation Research 27-30 Dec ,2015
Web quality is a crucial issue in a society that vitally depends on the internet. Its importance andbenefits are not fully recognized and understood in spite of its critical role. To attain the desired qualityof WBA, it is necessary to have quality models which cover web quality factors that should be takeninto account, and also have a set of excellent guidelines that can be followed to realize the predefinedquality factors otherwise; the internet marketers will soon lose potential customers to competitors.
11. LITERATURE REVIEWThe previously introduced quality models for traditional software are not adequate because WBA
possess their own peculiar characteristics that are different from traditional ones. Some proposed webquality models either directed towards a specific WBA perspective or dealing with a limited number ofquality factors .. Other studies introduced a number of quality factors, but they didn't suggest meansfor achievement or they introduced limited guidelines for each quality factors or sub-factors.Therefore, these models don't provide the developer with the required assistance for how to fulfill thepresented factors.
In [13], one layer web quality model is presented. It is based on eight quality factors. They areinteractivity/functionality, usability, correctness, real time information, information linkage, integrity,customer care, and socio-cultural aspects. Some of these quality factors require more decomposition.For example, usability can be divided into sub factors like navigability, legibility, consistency,simplicity, and audibility. At the same time, socio-cultural aspects should be considered sub factor forinternationalization factor. In addition, definition of the presented factors are not clear. For instances, itis consider that security is part of integrity while it is known in the literature that integrity is part ofsecurity [2]. The authors defined customer care factor as dealing with features like appealing andvisual appearance, and these are more related to presentation. Also it contains uniformly placedhypertext links and this is more related to navigation. Information linkage shouldn't be considered aquality factor, it is a necessity for the web. Finally, this model is directed towards the visitorperspective.
In [7], Ronan Fitzpatrick explains the manner in which web sites are developed without referenceto quality considerations. The paper addresses these quality considerations and introduced new fivequality factors, specific to the World Wide Web domain. These factors are: visibility (easy-to-communicate with), intelligibility (easy-to-assimilate), credibility (level of user confidence),engagibility (extent of user experience) and differentiation (demonstration of corporate superiority).
In late 1990s, Luis Olsina proposed a quantitative, expert-driven, and model-based methodology,for the evaluation and comparison of web site quality, called Web Site Quality Evaluation Method(WebQEM). It helps the evaluators to understand and enhance the quality of WBAs. The main stepsand activities of WebQEM can be grouped into four major phases, namely: quality requirementsdefinition and specification, elementary evaluation. partial and global evaluation, and analysis,conclusion and recommendations [6, 20, 21. 22, 24].
The authors in [16, 17] followed a decomposition mechanism to produce Web-Based ApplicationQuality Model (WBAQM). Figure (1) illustrates the structure of the proposed model. The model isfocusing on the relationship between web quality factors and sub factors as well as attempting toconnect quality perspectives with quality factors. The main idea to organize
144 Cairo University-Institute of Statistical Studies and Research
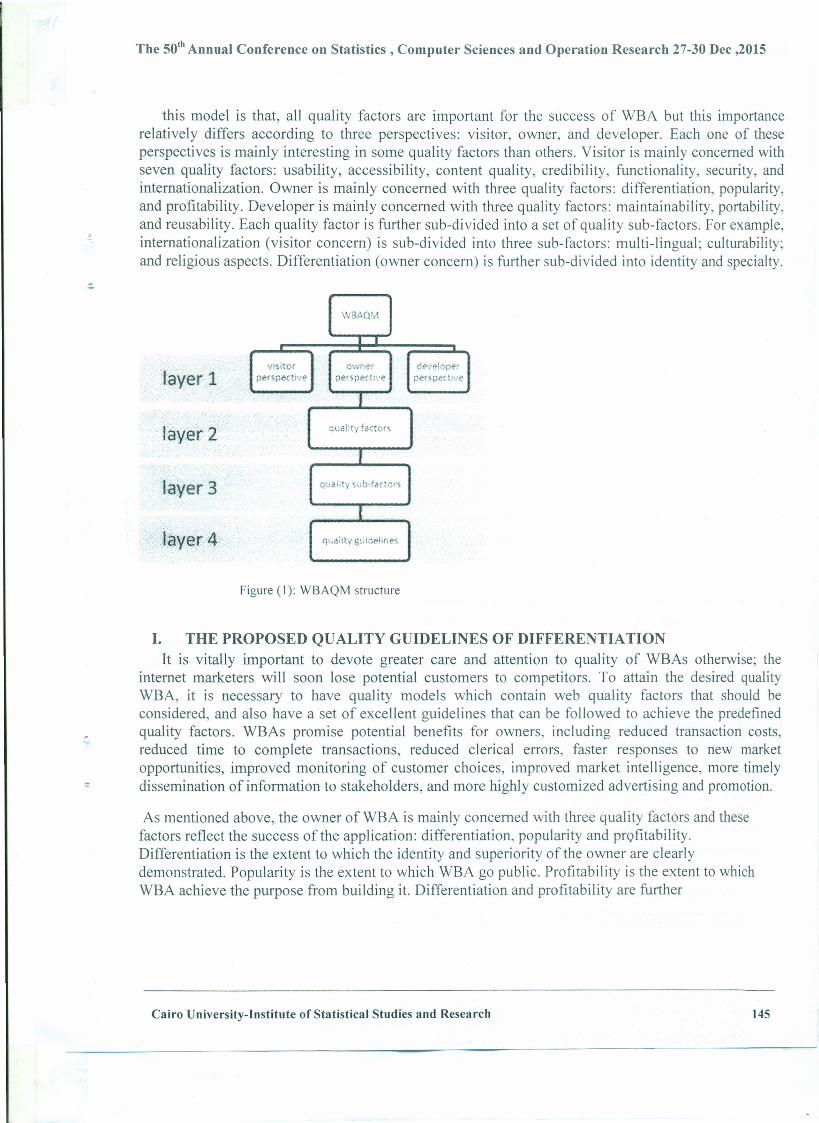
The so"Annual Conference on Statistics, Computer Sciences and Operation Research 27-30 Dec ,2015
this model is that, all quality factors are important for the success of WBA but this importancerelatively differs according to three perspectives: visitor, owner, and developer. Each one of theseperspectives is mainly interesting in some quality factors than others. Visitor is mainly concerned withseven quality factors: usability, accessibility, content quality, credibility, functionality, security, andinternationalization. Owner is mainly concerned with three quality factors: differentiation, popularity,and profitability. Developer is mainly concerned with three quality factors: maintainability, portability,and reusability. Each quality factor is further sub-divided into a set of quality sub-factors. For example,internationalization (visitor concern) is sub-divided into three sub-factors: multi-lingual; culturability;and religious aspects. Differentiation (owner concern) is further sub-divided into identity and speciaJty.
WSAQM
•
layer 1visitor
perspec Iveowner
nerspecuvedeveloperperspecuve
J
layer 2 quality factors
J
layer 3I
layer 4 qvality guidelines
Figure (I): WBAQM structure
I. THE PROPOSED QUALITY GUIDELINES OF DIFFERENTIATIONIt is vitally important to devote greater care and attention to quality of WBAs otherwise; the
internet marketers will soon lose potential customers to competitors. To attain the desired qualityWBA, it is necessary to have quality models which contain web quality factors that should beconsidered, and also have a set of excellent guidelines that can be followed to achieve the predefinedquality factors. WBAs promise potential benefits for owners, including reduced transaction costs,reduced time to complete transactions, reduced clerical errors, faster responses to new marketopportunities, improved monitoring of customer choices, improved market intelligence, more timelydissemination of information to stakeholders, and more highly customized advertising and promotion.
As mentioned above, the owner of WBA is mainly concerned with three quality factors and thesefactors reflect the success of the application: differentiation, popularity and profitability.Differentiation is the extent to which the identity and superiority of the owner are clearlydemonstrated. Popularity is the extent to which WBA go public. Profitability is the extent to whichWBA achieve the purpose from building it. Differentiation and profitability are further
Cairo University-Institute of Statistical Studies and Research 145
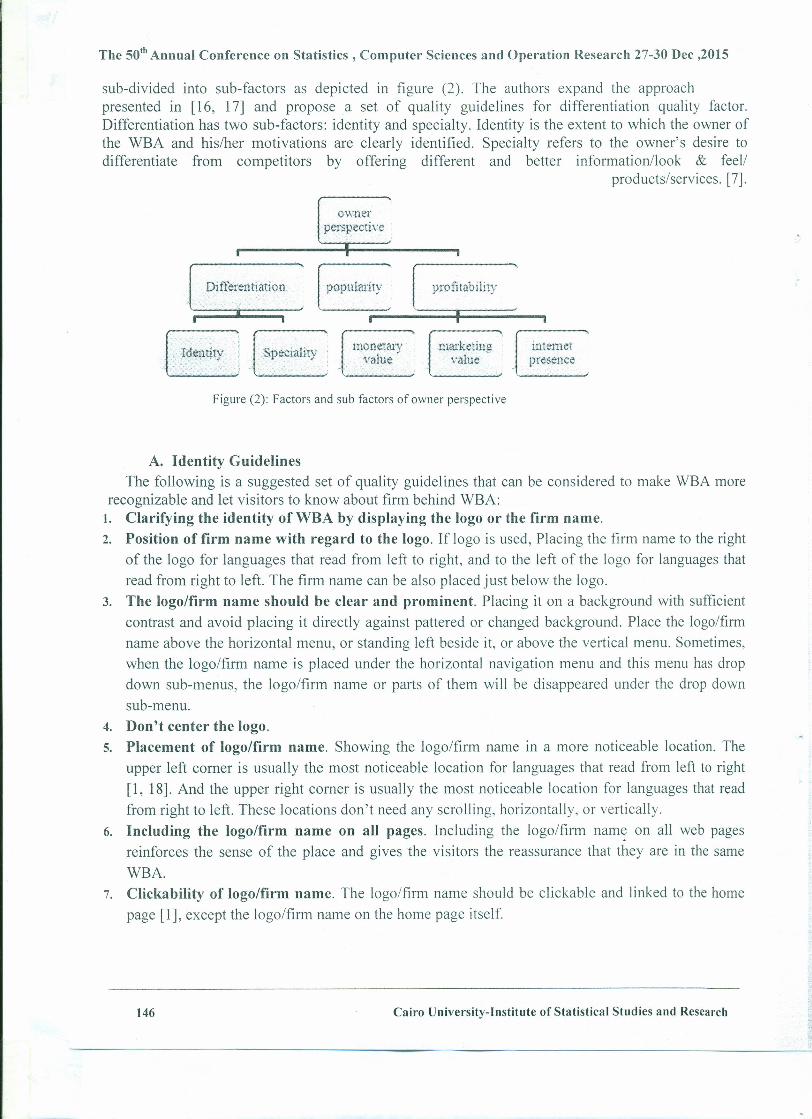
The so" Annual Conference on Statistics, Computer Sciences and Operation Research 27-30 Dec ,2015
sub-divided into sub-factors as depicted in figure (2). The authors expand the approachpresented in [16, 17] and propose a set of quality guidelines for differentiation quality factor.Differentiation has two sub-factors: identity and specialty. Identity is the extent to which the owner ofthe WBA and his/her motivations are clearly identified. Specialty refers to the owner's desire todifferentiate from competitors by offering different and better information/look & feel!
products/services. [7).
ownerperspective
Differentiation popularity profitability
IIdentity; . Speciality monetarvvalue'
marketingvalue ~
inremetpresence
Figure (2): Factors and sub factors of owner perspective
A. Identity GuidelinesThe following is a suggested set of quality guidelines that can be considered to make WBA more
recognizable and let visitors to know about firm behind WBA:1. Clarifying the identity of WBA by displaying the logo or the firm name.2. Position of firm name with regard to the logo. If logo is used, Placing the firm name to the right
of the logo for languages that read from left to right, and to the left of the logo for languages thatread from right to left. The firm name can be also placed just below the logo.
3. The logo/firm name should be clear and prominent. Placing it on a background with sufficientcontrast and avoid placing it directly against pattered or changed background. Place the logo/firmname above the horizontal menu, or standing left beside it, or above the vertical menu. Sometimes,when the logo/firm name is placed under the horizontal navigation menu and this menu has dropdown sub-menus, the logo/firm name or parts of them will be disappeared under the drop downsub-menu.
4. Don't center the logo.5. Placement of logo/firm name. Showing the logo/firm name in a more noticeable location. The
upper left corner is usually the most noticeable location for languages that read from left to right[1, 18]. And the upper right corner is usually the most noticeable location for languages that readfrom right to left. These locations don't need any scrolling, horizontally, or vertically.
6. Including the logo/firm name on all pages. Including the logo/firm nam~ on all web pagesreinforces the sense of the place and gives the visitors the reassurance that they are in the sameWBA.
7. Clickability of logo/firm name. The logo/firm name should be clickable and linked to the homepage [1], except the logo/firm name on the home page itself.
146 Cairo University-Institute of Statistical Studies and Research

The so'' Annual Conference on Statistics, Computer Sciences and Operation Research 27-30 Dec ,2015
8. Animation of identity elements. Don't animate elements such as: logo, firm name, unit signature,and tagline [18]. These elements give WBA its identity and when they are animated, they look likeadvertisements and difficult to read.
9. Logo story. Understanding the logo, and its components, contributes greatly in remembering thelogo and not forget it easily. People usually remember symbols they know their meaning. Forinstance, the web site of the faculty of Social Work-Fayoum University(www.fayoum.edu/socialwork) provides the logo story. The logo represents an integrated systemas it is comprised of three parts: the globe, the open hands, and the profession's philosophy. First,the globe symbolizes the society. Second, the open hands mean readiness for offering help for allcommunity members. The third part refers to the profession's philosophy, which is the method,which a social worker adopts, namely, working with individuals and groups (see Figure (3)).
10. Using favicon. A favicon is a small graphic that appears to the left of the URL in the address bar,and appears on the Bookmark. Favicon enables web visitors to recognize WBA more easily amongthe hundreds of others. Favicon may be a simplified version of the logo or the initials of WBA'sname.
It. Overview, history, or at a glance. Giving the visitors an overview about the firm behind theWBA, explaining its origins, the founder, foundation year, naming, etc. labeling this section/linkwith an overview, history, or at a glance.
~<ii;lSl1 J~ J ••• t..q)l a.",,1I c,K - Windows Inl."nel Explo,." p,ovided byYoh ••~· ~{J;, • r.
IFigure (3): Logo story of Faculty of Social Work-Fayoum university
12. Facts, numbers, or statistics. Informing the visitors about the essential facts, numbers, orstatistics. For instance, business application presents information about number of customers,number of employees, ratio of customer per employee, volume of investment, market share, and soon.
13. Governance and management. Information ~bout governance and management is essential,including an organization chart, management biographies, and photos.
14. Timeline. Providing the events and turning points that have shaped the firm through the years byincluding a timeline link.
15. Timeline order. Timeline should be presented in an ascending order for years to elaborate thebeginnings of the firm and its development. Descending timeline is not a logical practice. YouTubeweb site has a descending timeline (Figure (4)).
Cairo University-Institute of Statistical Studies and Research 147

The so" Annual Conference on Statistics, Computer Sciences and Operation Research 27-30 Dec ,2015
16. Financial information. Letting visitors to take a look at financial information, including revenues,expenditures, budget, financial performance, the annual report and links to archives [14].
17. Information firm grouping. Grouping all or almost of information about the firm (such as history,vision, mission, logo story, facts and numbers, timeline, ownership and leadership, financialinformation, social responsibility, photo gallery, ... ) in on distinct area, and include a link on thehome page to that area [18].
18. Label of information firm area. Labeling the previous link as "About Us" or "About <firmname>" [18]. Don't label it as "Discover Us", "Discover <firm name>, or "General Information".
19. Placement of "About Us" link. Placing "About Us" link as a first or a second (after "Home" link)item on the main navigation menu, horizontally, or vertically. Don't include the "About Us" link asan item on a sub-menu.
20. "Contact Us" link. Including a "Contact Us", or "Contact <firm name>" link that goes to a pagewith all contact information [14,18].
21. Placement of "Contact Us" link. "Contact us" link should be presented but doesn't need to be themost prominent on the page. Don't put it on the main menu. Putting it on the footer is morecommon and popular.
l,k,dil!.f.~:'llilt:S
I '''''"''l'~.;'.lr:~·.''
.~..May
Tool$9 "(1). "
Figure (4); YouTube offers descending timeline.
22. Feedback form. Including a feedback form, or a link to that form, in the contact us page.Feedback form that can be filled to send questions, comments, ideas, or suggestions to the webteam.
23. Placement of the feedback form. the more appropriate location of feedback form, or link to it, incontact page
24. Label of feedback form. "Feedback" or "Comments and Questions" are more common andunderstandable than "Message", "Inquiry", or "Request Information".
25. Something concrete. Rather than just describing the firm behind WBA, provide somethingconcrete to look at. Well chosen photos for major buildings, key administrators, and essentialevents, can convey much more than words alone. Online tours, videos and live views enjoy thevisitors and give them the sense of the place.
26. Location of these things. The most appropriate location to put these things is in "About Us"section.
148 Cairo University-Institute of Statistical Studies and Research

The so" Annual Conference on Statistics, Computer Sciences and Operation Research 27-30 Dec ,2015
B. Specialty GuidelinesThe following guidelines may be help to well demonstrate corporate superiority:
1. Demonstrating the superiority and specialty of WBA or the firm behind it. This can be doneby informing the visitors about the positive things that the firm has. These positive things may benational or international awards, national or international rankings, certificates, testimonials, pricedcompetitively, discoveries, or sampling of national or international news that coverage featuring ofthe firm or people at it.
2. Location of specialty features. Including all or almost these elements in "About" section.3. Meaningful Labels. Labeling sections or links which go to pages containing speciaJty information
as measures of excellence, marks and distinction, top distinctions, ranking and awards, orsomething with this meaning.
Ill. EVALUATION PROCESSTo evaluate and illustrate the validity of the introduced web quality guidelines, the researchers began
the evaluation process by selecting a set of WBAs and ended by analyzing and comparing theoutcomes. The evaluation process contains the following steps:
1. Selecting a set of WBAs for evaluation purpose.2. Collecting data and applying elementary evaluation.3. Aggregating elementary values to yield satisfaction level for each guideline, then, for each sub-
factor.4. Aggregating satisfaction values of each sub-factor to yield total satisfaction level for
differentiation.5. Analyzing and comparing outcomes.
A. Selecting a Set of WBAs for evaluation purposeWebometrics ranking of world universities is an initiative of the Cybermetrics Lab, a research
group belonging to SCIC (Consejo Superior de Investigaciones Cientificas), the largest public researchbody in Spain. Cybermetrics Lab is devoted to quantitative analysis of the internet. Webometricsranking is published twice a year (at the end of January and July months), covering about 20.000higher education institutions worldwide [23]. The evaluation process is performed by selecting asample of thirty WBAs that appeared in the final list of July 2012 edition (APPENDIX A). Thissample contains three groups namely: top group (ten WBAs of the highest rank), middle group (tenWBAs of the middle rank, and last group (ten WBAs of the least rank). What expected is that, topgroup will take higher rank in all examined sub-factors, then middle group will take moderate rank,and then, last group will take the lower rank. If the outcomes of the evaluation process are as above,then our guidelines are valid.
B. Collecting Data and Applying Elementary EvaluationThe researchers began collecting data from these WBAs in spreadsheets using the predefined questionsand their expected answers of the checklists (APPENDIX B). Each proposed guideline can be
quantified by binary value. 0 denotes unsatisfactory situation. 1 denotes satisfactory
Cairo University-Institute of Statistical Studies and Research 149

The 50th Annual Conference on Statistics, Computer Sciences and Operation Research 27-30 Dec ,2015
situation. In collecting data and exammmg process the researchers found that there are threeclasses of questions, as follows:
• Class one. Some questions/features need to examine one page. Example of these questions isthat what is the order of timeline?, There is no problem in this class.
• Class two. Some questions/features need to examine some pages, and once the feature appearson one page, there is no need to examine the rest. Example of these questions is that is logo notcentralized?, Also there is no problem in this class.
• Class three. Some questions/features need to examine a lot of pages or examine all pages foreach WBAs to be accurate in our answers. Examples of these questions are: is logo/firm nameincluded on all pages?, is logo/firm name clickable and linked to home page? For suchquestions, we examined number of pages, and concluded the answers. For instance, if we foundthat logo is included on all seen pages, then this is an indicator that logo is included on allpages, and so on.
By time of data collection (which began on I September and finished on 15 ovember, 2012) theresearchers did not notice changes in these WBAs that could have affected the evaluation process.
C. Aggregating Elementary Values to Yield Quality Satisfaction Level for eachGuideline, and then, for each Sub-Factor
After examining WBAs and collecting data in spread sheets, a stepwise aggregation mechanismhave been performed to yield the quality satisfaction level for each guideline, and then yield qualitysatisfaction level for each sub-factor using a scale from 0 to 100%. This can be done by calculatingpercentage of the cells which contain 1 to the total number of cells. 0% denotes a totally unsatisfactorysituation. 100% denotes a fully satisfactory situation. The values between 0% and 100% denotes apartial satisfaction. In the following sub-sections, the researchers comment some guidelines and showthe outcomes of the examining process for each sub factor.
•1. Evaluation of Identity guidelines
Logo/firm name should be clear and prominent guideline: Logo and/or university name areclear and prominent on all top WBAs. Logo and institute name of AIMS (middle) are not clear.Three WBAs in last group have unclear logo or university name. They are BPK, Dellarte, andFSCC. BPK shows logo and institute name on an image background (Figure (5)). So, Satisfactionpercentages for this guideline are 100% for top, 90% for middle, and 70% for last groups.
150 Cairo University-Institute of Statistical Studies and Research
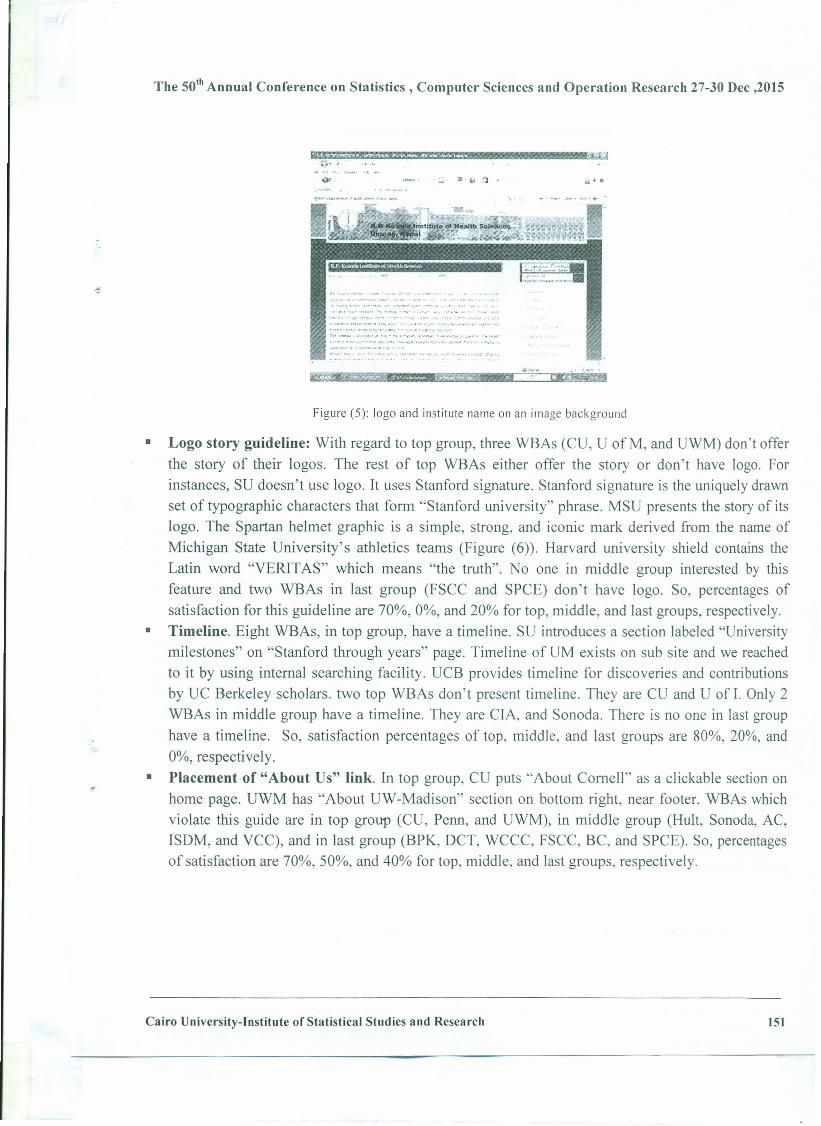
The so" Annual Conference on Statistics, Computer Sciences and Operation Research 27-30 Dec ,2015
. -:... ~ (, ') . ..+0
• 'r'> ,.>
'-:."""."," ,.,•.•.,'.",-.~, .•••• ';" • '.' •. ' ,....,,.".~; ,'''-' "'''A>' "'~.' .,
P- ••
Figure (5): logo and institute name on an image background
• Logo story guideline: With regard to top group, three WBAs (CU, U of M, and UWM) don't offerthe story of their logos. The rest of top WBAs either offer the story or don't have logo. Forinstances, SU doesn't use logo. It uses Stanford signature. Stanford signature is the uniquely drawnset of typographic characters that form "Stanford university" phrase. MSU presents the story of itslogo. The Spartan helmet graphic is a simple, strong, and iconic mark derived from the name ofMichigan State University's athletics teams (Figure (6)). Harvard university shield contains theLatin word "VERIT AS" which means "the truth". No one in middle group interested by thisfeature and two WBAs in last group (FSCC and SPCE) don't have logo. So, percentages ofsatisfaction for this guideline are 70%, 0%, and 20% for top, middle, and last groups, respectively.
• Timeline. Eight WBAs, in top group, have a timeline. SU introduces a section labeled "Universitymilestones" on "Stanford through years" page. Timeline of UM exists on sub site and we reachedto it by using internal searching facility. UCB provides timeline for discoveries and contributionsby UC Berkeley scholars. two top WBAs don't present timeline. They are CU and U of 1. Only 2WBAs in middle group have a timeline. They are CIA, and Sonoda. There is no one in last grouphave a timeline. So, satisfaction percentages of top, middle, and last groups are 80%, 20%, and0%, respectively.
• Placement of "About Us" link. In top group, CU puts "About Cornel!" as a clickable section onhome page. UWM has "About UW-Madison" section on bottom right, near footer. WBAs whichviolate this guide are in top group (CU, Penn, and UWM), in middle group (Hult, Sonoda, AC,ISDM, and VCC), and in last group (BPK, DCT, WCCC, FSCC, BC, and SPCE). So, percentagesof satisfaction are 70%, 50%, and 40% for top, middle, and last groups, respectively.
Cairo University-Institute of Statistical Studies and Research 151

The su" Annual Conference on Statistics, Computer Sciences and Operation Research 27-30 Dec ,2015
f e
-0- -"' -;l-D--'- i:iil+Q
-, -
Spartan helmet
.:"- :- ~ '" 'l"" ,.,< ..•• ',,~ - "', ",;."
" ..•.• ,,""":.- -,;<
Figure (6): Logo story ofMSU
After exammmg each identity guidelines, in each group, we found that, our proposedguidelines are satisfied in the three groups. Top group has reached 91 .92%. middle group has reached52.31 %, and last group has reached 46.54%.
2. Evaluation of Specialty GuidelinesDemonstrating the superiority and specialty of WBA or the firm behind it: All top WBAsdemonstrate academic excellence, highlight some of the most notable awards that received byuniversity's faculty, staff, students, and alumni, and feature the university wide ranking. For instance,MIT fifth overall among U.S universities in U.S news rankings. Cornell was the first university toteach modern far eastern languages. MSU is recognized internationally as a top research university anda leader in international engagement. It ranks as sixth best university to work for in the united state.MSU ranked in the top 100 in the world university rankings 2011-12 published by times highereducation. Four WBAs in middle group and three in last group are interested by this feature. Forinstances, CIA (middle) and its faculty earned seven first prize awards and two best of show honors atthe 144th salon of culinary art during the international hotel and restaurant show in New York City onNovember 12, 2012. Hult is recognized as one of the world's top business schools, 2012. So,satisfaction percentages of this edition are 100%, 40% and 30% for top, middle, and last groups,respectively.
After examrmng each specialty guidelines, in each group, we found that, our proposedguidelines are satisfied in the three groups. Top group has reached 93.33%, middle group has reached23.33%, and last group has reached 16.67%.
The partial outcomes of the evaluation process of the two quality sub-factors are shown in thegraphic diagram. Figure (7) indicates the level of satisfaction for each sub-factor in the three groups.
152 Cairo University-Institute of Statistical Studies and Research

The 50th Annual Conference on Statistics, Computer Sciences and Operation Research 27-30 Dec ,2015
D. Aggregating Satisfaction Values of each Sub-Factor to Yield total Satisfaction Levelfor differentiation in each Group
By this step, the total satisfaction level for differentiation, with regard to each group, can beobtained. Figure (8) summarized the final outcomes. Top group has reached 92.62%, middle grouphas reached 37.82%, and last group has reached 31.6%.
Figure (7): Satisfaction level for identity and speciality
100,0000 9:.62°0
90.0000
so.oo-,~O,OOoo
60,0000
Top ten \1iddle ten Last ten
Figure (8): Total Differentiation level for each group
153Cairo University-Institute of Statistical Studies and Research

The so" Annual Conference on Statistics, Computer Sciences and Operation Research 27-30 Dec ,2015
E. Analyzing and Comparing OutcomesThe process of examining thirty WBAs, from July 2012 edition ofWebometrics ranking, have
been finished and reached to partial and global satisfaction levels. The researchers analyze andcompare the outcomes as follows:
• Regarding to identity: Almost WBAs, in top group, are interested by including a lot ofinformation about the universities behind WBAs. Examples of this information are overview, factsand numbers, ownership and leadership, financial information, and timeline. While the other twogroups are not, especially last group which suffered from clear lack in this area. In general, the vastmajority of identity guidelines are satisfied in top group with high level. Consequently, top grouphas ranked first and reached to 91.92%. Then middle group has ranked second and reached to52.31%. And then last group has ranked third and reached to 46 46.54%.
• Regarding to specialty: Specialty sub factor has three guidelines and they are approximately fullysatisfied in top group. And these three guidelines are satisfied with low level in middle group, andapproximately not satisfied in last group. All WBAs, in top group, covered this sub factor well.The very low rank of middle and especially last groups, gives impression that these WBAs don'thave what to offer to their visitors about their superiority and didn't achieve excellence in theiractivities. Consequently, top group has ranked first and reached to 93.33%. Then middle group hasranked second and reached to 23.33%. And then last group has ranked third and reached to16.67%.
As a final remark, Top group has ranked first and reached 92.62%. Then middle group hasranked second and reached to 37.82%. And then last group has ranked third and reached to 31.6%.
IV. CONCLUSIONThe researchers have concluded that it is very important to have web quality models. These models
contain the desired quality considerations, serve as guidance to the development process, and can beused to evaluate WBA quality against pre-defined set of requirements. They also concluded that aspecial emphasis should be given to web quality guidelines. These guidelines provide some cues toweb developers as how to assure the quality and assist them to reduce the complexity of webdevelopment process. This paper focused on the differentiation as an example of quality considerationsthat is more essential to the owner. It suggested a set of quality guidelines for two quality sub-factorsof differentiation, which are: identity and speciality. Then, an experimental study was done to provideevidence about the suggested guidelines. The experimental study was performed by selecting a sampleof thirty WBAs that appeared in the final list of July 2012 edition of Webometrics Ranking of WorldUniversities.
154 Cairo University-Institute of Statistical Studies and Research
The 50th Annual Conference on Statistics, Computer Sciences and Operation Research 27-30 Dec ,2015
REFERENCES[1] BIBLIOGRAPHY \L 1033 25-Point Web Site Usability Checklist .. Retrieved from User
Effect: www.usereffect.com/topic/25-point-website-usability-checklist, 2009.
[2] M. Barbacci, T. H.Longstaff, M. H.Klein & C. B.Weinstock, "Quality Attributes. TechnicalReport", CMU/SEI-95-TR-021, ESC-TR-95-02 L 1995.
[3] N. Bevan, "Guidelines and Standards for Web Usability", Proceedings of HCI International,Lawrence Erlbaum. 2005.
[4] T. Chiew & S. Salim, "Webuse: Web Site Usability Evaluation tool", Malaysian journal ofcomputer science, 16 (1), 47-57, 2003.
[5] M. Cronin, "10 Principles for Readable Web Typography", Retrieved fromwww.smashingmagazine.com/2009/03/18/1 O-principles-for-readable-web- typography/, 2009.
[6] A. 1. Eldesouky, H. Arafat & H. Ramzey, "Toward Complex Academic Websites QualityEvaluation Method (QEM) Framework: Quality Requirements Phase Definition andSpecification", Mansoura University, Faculty of Engineering, Computer and SystemsEngineering Department, Cairo, Egypt, 2008.
[7] Ronan Fitzpatrick, "Additional Quality Factorsfor the World Wide Web", Retrieved 02 27,2008,from www.comp.dit.ieirfitzpatrick/papers/2RF_AQF_WWW.pdf, 2000.
[8] Hall, R. H., & Hanna, P. (2004). The Impact of Web Page Text Background ColourCombinations on Readability, Retention, Aesthetics and Behavioural Intention. Behaviour &Information Technology, 23 (3), 183-195.
[9] Hussain, W., Sohaib, 0., Ahmed, A., & Khan, M. Q. (2011). Web Readability Factors AffectingUsers of all Ages. Australian Journal of Basic and Applied Sciences, 5 (11), 972-977.
[10] Internet World Stats. Retrieved 2015, from www.internetworldstats.com. 2015.
[11] ISO/IEC. "9126-1- Software engineering - Product quality - part l: Quality model",International Organization for Standardization, 2001.
[12] ISOIIEC, "TR 9i26-4- Software Engineering - Product Quality - Part2: Quality in use Metrics",International Organization for Standardization. 2004
[13] S. Khaddaj & B. john, "Quality Model for Semantic Web Applications", internationalConference on Advanced Computing and Communication (ICACC). Kerala, India, 2010.
[14] F. Miranda, R. Cortes & C. Barriuso, "Quantitative Evaluation of e-banking Web Sites: AnEmpirical Study of Spanish Banks", Electronic Journal Information Systems Evaluation, 9 (2),73-82,2006.
Cairo University-Institute of Statistical Studies and Research 155
The su" Annual Conference on Statistics, Computer Sciences and Operation Research 27-30 Dec ,2015
[15] S. e. Murugesan, "Web Engineering: A new Discipline for Development of Web-BasedSystems", In Proceeding of First ICSE Workshop on Web Engineering, (pp. 1-9). Los Angeles,1999.
[16] Doaa Nabil, Abeer Mosaad, and Hesham A. Hefny, "A Proposed Conceptual Model forAssessing Web-Based Applications Quality Factors", Proceeding of IEEE InternationalConference on Intelligent Computing and Intelligent Systems (ICIS 2011). Guangzhou, China,2011.
[17] Doaa Nabil, Abeer Mosaad, and Hesham A. Hefny, "Web-Based Applications Quality Factors: ASurvey and a Proposed Conceptual Model", Egyptian Informatics Journal, 211-217, 201l.
[18] Jakob Nielsen, "113 Design Guidelines for Home Page Usability'' Retrieved fromwww.nngroup.com/artic1es. 2001.
[19] Jakob Nielsen, "Top 10 Mistakes in Web Design",www.nngroup.com/articles/top-I Ovmistakes-web-design/, 2011.
Retrieved from
[20] Luis Olsina & G. Rossi, "Towards Website Quantitative Evaluation: Defining QualityCharacteristics and Attributes", Proceedings of IV lnt, 1 WebNel Conference, World Conferenceon the WWW and Internet, (pp. 834-839). Hawaii, USA, 1999.
[21] Luis Olsina, G. Lafuente & G. Rossi, "E-commerce Site Evaluation: A case study", 1stInternational Conference on Electronic Commerce and Web Technology. London - Greenwich,2000.
[22] Luis Olsina, G. Rossi, D. Godoy & G. 1. Lafuente, "Specifying Quality Characteristics andAttributes for Web Sites" Proceeding of First ICSE workshop on web engineering, ACM LosAngeles, 1999.
[23] Ranking Web of Universities. (2012, July). Retrieved Sep. 2012, from Webomterics Ranking ofWorld Universities: www.webomterics.infol
[24] L. O. Santos, "Website Quality Evaluation Method: A Case Study on Museums", IC5E 99Software Engineering over the interne!. Los Angeles, US, 1999.
[25] R. Wang, & D. Strong, "Beyond Accuracy: what data quality means to data consumers",journalof management information system, 5-33, 1996
[26] Abeer Mosaad Ghareeb and Nagy Ramadan Darwish, "A proposed Approach for EnhancingUsability of Web-Based Applications", The 50th Annual International Conference in Statistics,Computer Sciences, and Operations Research, Egypt, 2015.
1••6 Cairo "niversitv-Institute of Statistical Stlldies and Research
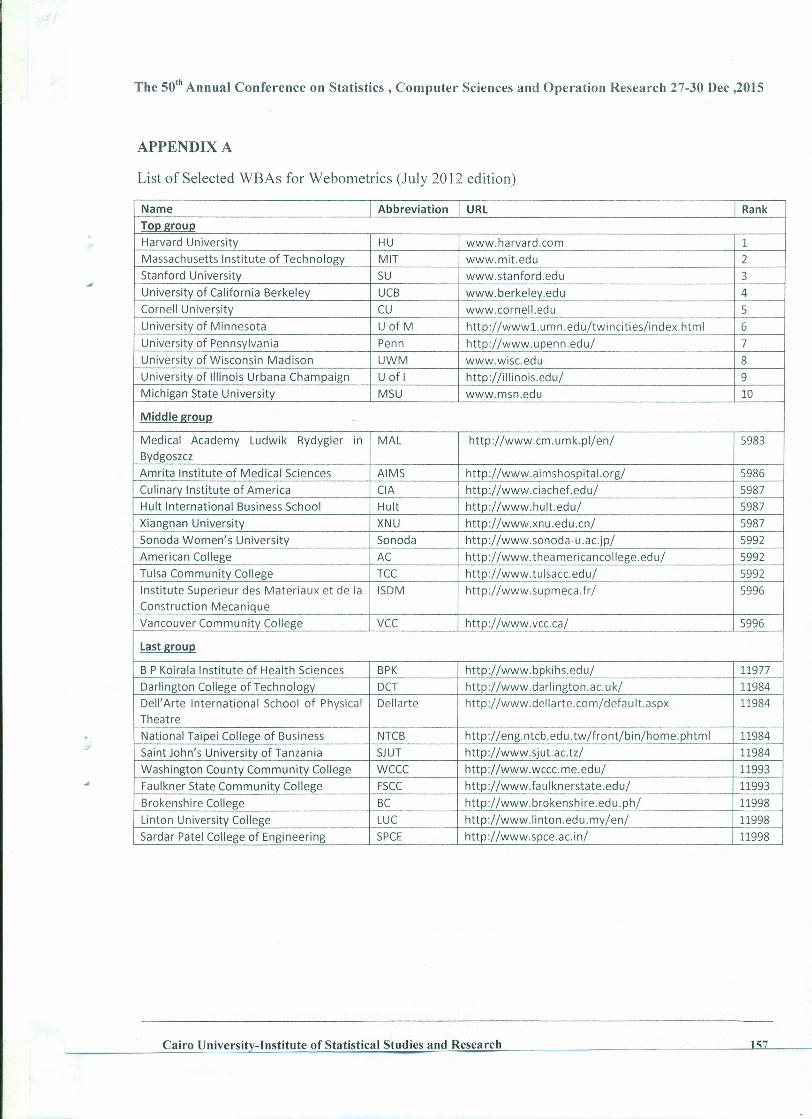
The so" Annual Conference on Statistics, Computer Sciences and Operation Research 27-30 Dec ,2015
APPENDIX A
List of Selected WBAs for Webometrics (July 2012 edition)
Name Abbreviation URl RankTop groupHarvard University HU www.harvard.com 1Massachusetts Institute of Technology MIT www.mit.edu 2Stanford University SU www.stanford.edu 3University of California Berkeley UCB www.berkeley.edu 4Cornell University CU www.comell.edu 5University of Minnesota U of M htt p:! /www1.umn.edu/twincities/index.html 6University of Pennsylvania Penn http://www.upenn.edu/ 7University of Wisconsin Madison UWM www.wisc.edu 8University of Illinois Urbana Champaign U of I http://illinois.edu/ 9Michigan State University MSU www.msn.edu 10
Middle group
Medical Academy Ludwik Rydygier in MAL http://www.cm.umk.pl/en/ 5983BydgoszczAmrita Institute of Medical Sciences AIMS http://www.aimshospital.org/ 5986Culinary Institute of America CIA http://www.ciachef.edu/ 5987Hult International Business School Hult http://www.hult.edu/ 5987Xiangnan University XNU http://www.xnu.edu.cn/ 5987Sonoda Women's University Sonoda http://www.sonoda-u.ac.jp/ 5992American College AC http://www.theamericancollege.edu/ 5992Tulsa Community College TCC http://www.tulsacc.edu/ 5992Institute Superieur des Materiaux et de la ISDM http://www.supmeca.fr/ 5996Construction MecaniqueVancouver Community College VCC http://www.vcc.ca/ 5996
last group
B P Koirala Institute of Health Sciences BPK http://www.bpkihs.edu/ 11977Darlington College of Technology DCT http://www.darlington.ac.uk/ 11984Dell' Arte International School of Physical Dellarte http://www.dellarte.com/default.aspx 11984TheatreNational Taipei College of Business NTCB http://eng.ntcb.edu.tw/front/bin/home.phtml 11984Saint John's University of Tanzania SJUT http://www.sjut.ac.tz/ 11984Washington County Community College WCCC http://www.wccc.me.edu/ 11993Faulkner State Community College FSCC http://www.faulknerstate.edu/ 11993Brokenshire College BC http://www.brokenshire.edu.ph/ 11998Linton University College LUC http://www.linton.edu.my/en/ 11998Sardar Patel College of Engineering SPCE http://www.spce.ac.in/ 11998
Cairo University-Institute of Statistical Studies and Research 157

The 50th Annual Conference on Statistics, Computer Sciences and Operation Research 27-30 Dec ,2015
APPENDIXB
Differentiation checklist
Identity checklist Yes No
1. Does WBA have a logo/firm name?
2. Where is firm name according to logo?
3. Is logo/firm name clear and prominent?
4. Is logo not centralized?
5. Where is the logo/firm name?
6. Is logo/firm name included on all pages?
7. Is logo/firm name clickable and linked to home page?
8. Are identity elements not animated?
9. Does WBA have a favicon?
10. Does WBA have a logo story?11. Is there a history, an overview, or at a glance section/page?
12. Is there a section/page about facts, numbers, or statistics?
13. Is there information about governance and management?
14. Is there a timeline?
15. What is the order of timeline?
16. Is financial information included?
17. Are all or almost of firm information grouped in one distinct area?
18. What is the label of the link which goes to that area?
19. Where is that link?
20. Is there a "contact us" link?
21. Where is "contact us" link?22. Is there a feedback form?
23. Where is feedback form/link?
24. What is the label of feedback form link?
25. Does WBA provide something concrete like photos or on line tour?
26. Where are these elements?
Speciality checklist
1. Does WBA demonstrate the firm superiority?
2. Where are all or most of speciality elements?
3. What are label of sections or links which go to pages containing specialtyinformation?
e-
158 Cairo University-Institute of Statistical Studies and Research
The 50th
Annual Conference on Statistics, Computer Sciences and Operation Research 27-30 Dec,2015
Cairo University-Institute of Statistical Studies and Research
159
An Overview On Twitter Data Analysis
Hana Anber1, Akram Salah
2, A.A. Abd El-Aziz
3
ABSTRACT
The widespread of information on social media, particularly on Twitter, as well as the
different types of information on this medium; make twitter the most appropriate virtual
environment to monitor and track these information. As we need to investigate different
analysis techniques, starting from analyzing different hashtags, analyzing the number of
users in this network, what makes the event spread over this network, who are the
influential that affect people’s opinions, and analyzing the sentiments of those users. At
this paper, we listed several and different techniques used in the analysis of twitter data.
This paper will support the future research and development work as well as to raise the
awareness for the presented approaches.
Keywords
Twitter, Big data, and Data analysis.
INTRODUCTION
The growing phenomena of the different kinds of social media, such as: Facebook,
Twitter, Linkedin, and Instgram. Each one has its own characteristics and its uses.
Facebook considers as a social network, everyone in the network has a reciprocated
relationship with another one in the network, the relationship in this case is undirected,
conversely to twitter; everyone in the network does not necessarily to have a reciprocated
relationship with others, the relationship in this case is either directed or undirected.
In this paper, we focus on Twitter for data analysis, where Twitter is and online
networking service that enables users to send and read short 140- character messages
called “tweets” [1]. In addition to the publicity nature of twitter, it is possible for
unregistered users to read and monitor most of tweets in twitter; conversely in Facebook,
since most of profile users are private, unless being a part of this network.
Twitter is a large social networking microblogging site. The massive information of
twitter such as; tweets messages, the user profile information, and the number of
followers/ followings in the network have a significant role in data analysis at the recent
few years, which in return make most researches investigate and examine various
analysis techniques to grasp the recent used technologies.
The 50th
Annual Conference on Statistics, Computer Sciences and Operation Research 27-30 Dec,2015
Cairo University-Institute of Statistical Studies and Research
160
The rest of the paper proceeds as follows: in methods section we will talk about the
various methods used to retrieve twitter data, twitter users rankings, and the network-
topolgy. In section information diffusion we will talk about the various techniques used
in information diffusion, such as; the hashtag life cycle, the network toplogy, and the
retweet rate. In section user influence on twitter we will talk about how other researches
gauge the user influence in twitter. In section sentiment analysis we will talk about the
sentiment analysis in twitter by stating two approaches “Natural Language Processing
approach” and “Machine Learning approach”. At last in section model evaluation we will
talk about the various results and evaluations where the researches found.
METHODS
To track and monitor different datasets, we have to collect the desired datasets from
twitter, some filtering techniques should be applied to these data, such as removing
redundant data or removing spam tweets. These data will be in a form of unstructured
data, to manage these data we have to parse these data into a structured form. We stated
several types of analysis that most of the researches used, such as: ranking twitter users,
homophily, and the reciprocity analysis.
A. Datasets
Using structured data in analysis have been widely used, where the traditional Relational
Database Management System (RDBMS) can deal with these data. With the increasing
amount of unstructured data on various sources, such as Web data, Social media data, and
Blog data, those consider as Big Data, in which a computer processor cannot process
those huge amount of data. Hence, the RDBMS cannot deal with those unstructured data;
a nontraditional database is needed to process these data, which is called NoSQL
database.
Most researches focused on tools, such as R (the programming language and the software
environment for data analysis). R has limitations when processing twitter data, which it is
not efficient in dealing with large volume of data. To solve this problem we need to
employ a hybrid big data framework, such as; Apache Hadoop (an open source Java
framework for processing and querying vast amounts of data on large clusters of
commodity hardware ) [2]. Hadoop also deals with structured and semi-structured data,
such as “XML/ JSON files”. The strength of using Hadoop comes in storing and
processing large volume of data; since the strength of using R comes in analyzing these
processed data.
There are different kinds of twitter data, such as user profile data, which it considers as
static data; and tweets messages, which it considers as dynamic data. Tweets could be
textual tweets, images tweets, videos tweets, URL tweets, and spam tweets.
Most researches did not take in consideration the spam tweets, and the automatic tweets
engines, as they can affect the accuracy of analysis results as well as add noise and bias in
The 50th
Annual Conference on Statistics, Computer Sciences and Operation Research 27-30 Dec,2015
Cairo University-Institute of Statistical Studies and Research
161
analysis. In [3], they employed the mechanism of FireFox add-on, Clean Tweet filter.
They used that mechanism to remove users that have been on twitter for less than a day
and they removed tweets that contain more than three hashtags.
B. Data Retrieval
Before retrieving the data, the question is what are the characteristics of these data? Are
these static data, such as the profile user information “name, user Id, and bio”; or
dynamic data, such as user’s tweets, and user’s network. Why these data are important?
How these data will be used? And how big the data are? It is important to take in
consideration that it is easier to track a certain keyword attached to a hashtag rather than a
keyword not attached to a hashtag.
To retrieve twitter data some applications should be used, the Twitter-API is a widely
used application, which it provides access to read and write twitter data. Other researches
as in [4], they used GNU/GPL application, using YourTwapperKeeper tool (is a web-
based application that stores social media data in MySQL tables). The authors stated a
limitation in using YourTwapperKeeper in storing and handling large size of data. As
MySQL and spreadsheets databases can only store a limited size of data. In our opinion it
is preferable to use a hybrid big data technology as we mentioned in the previous
subsection A.
C. Ranking and Classifying Twitter users
There are different types of user’s networks. There is network of users over specific event
(hashtag), network of users in a specific user’s account, and network of users over a
group of people talking with each other in the network, such as users in the Twitter Lists;
as it is used to group sets of users into topical or other categories to better organize and
filter incoming tweets [5].
To rank twitter users, it is important to study the characteristics of twitter by studying the
network-topology (number of followers/ followed) for each user in the dataset. There are
many techniques have been employed in ranking analysis. In [3], they ranked twitter
users by identifying the number of followers, by studying the PageRank (number of
followers/ followed), and by the Retweets rate. They used 41.7 million user profiles, 1.47
billion social relations, and 106 million tweets. In [5], they investigated a new
methodology in ranking twitter users by using the Twitter Lists to classify users into the
Elite users (Celebrities, Media news, Politicians, Bloggers, and Organizations), and the
Ordinary users.
D. Homophily
Homophily is the tendency that a contact among similar people occurs at a higher rate
than among dissimilar people [3]. Similarity among individuals means the similar users
follow each other. Homophily requires studying the static characteristics of twitter data,
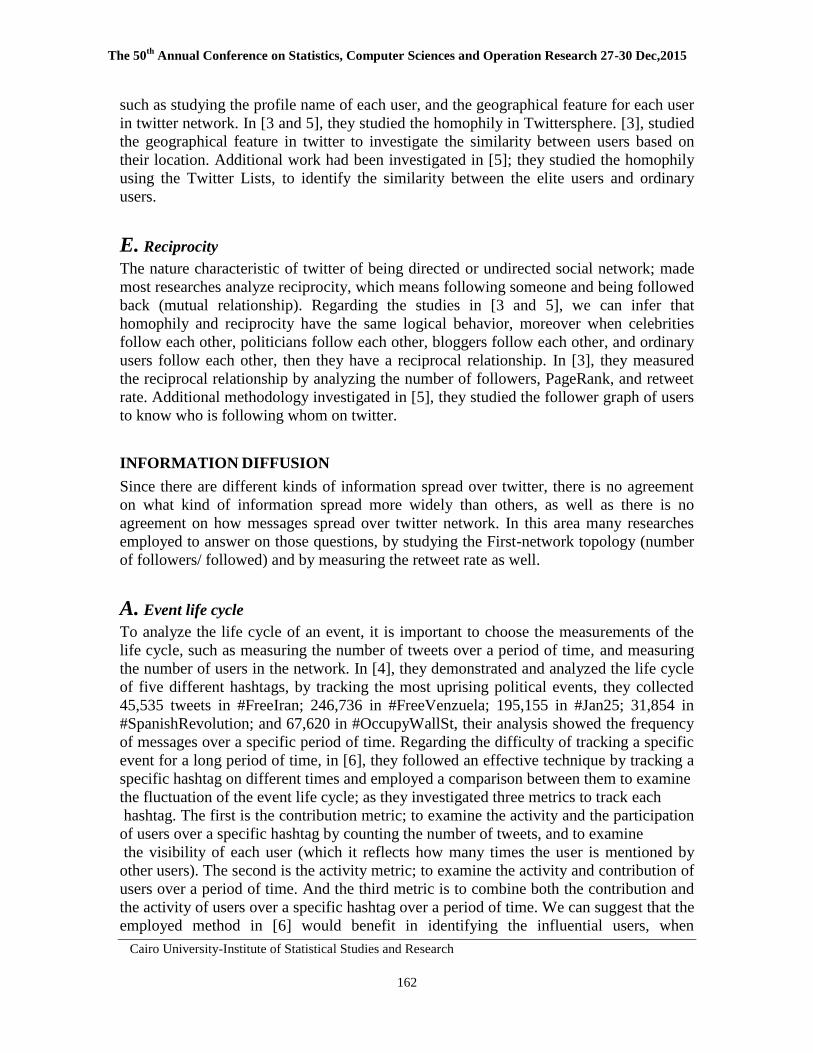
The 50th
Annual Conference on Statistics, Computer Sciences and Operation Research 27-30 Dec,2015
Cairo University-Institute of Statistical Studies and Research
162
such as studying the profile name of each user, and the geographical feature for each user
in twitter network. In [3 and 5], they studied the homophily in Twittersphere. [3], studied
the geographical feature in twitter to investigate the similarity between users based on
their location. Additional work had been investigated in [5]; they studied the homophily
using the Twitter Lists, to identify the similarity between the elite users and ordinary
users.
E. Reciprocity
The nature characteristic of twitter of being directed or undirected social network; made
most researches analyze reciprocity, which means following someone and being followed
back (mutual relationship). Regarding the studies in [3 and 5], we can infer that
homophily and reciprocity have the same logical behavior, moreover when celebrities
follow each other, politicians follow each other, bloggers follow each other, and ordinary
users follow each other, then they have a reciprocal relationship. In [3], they measured
the reciprocal relationship by analyzing the number of followers, PageRank, and retweet
rate. Additional methodology investigated in [5], they studied the follower graph of users
to know who is following whom on twitter.
INFORMATION DIFFUSION
Since there are different kinds of information spread over twitter, there is no agreement
on what kind of information spread more widely than others, as well as there is no
agreement on how messages spread over twitter network. In this area many researches
employed to answer on those questions, by studying the First-network topology (number
of followers/ followed) and by measuring the retweet rate as well.
A. Event life cycle
To analyze the life cycle of an event, it is important to choose the measurements of the
life cycle, such as measuring the number of tweets over a period of time, and measuring
the number of users in the network. In [4], they demonstrated and analyzed the life cycle
of five different hashtags, by tracking the most uprising political events, they collected
45,535 tweets in #FreeIran; 246,736 in #FreeVenzuela; 195,155 in #Jan25; 31,854 in
#SpanishRevolution; and 67,620 in #OccupyWallSt, their analysis showed the frequency
of messages over a specific period of time. Regarding the difficulty of tracking a specific
event for a long period of time, in [6], they followed an effective technique by tracking a
specific hashtag on different times and employed a comparison between them to examine
the fluctuation of the event life cycle; as they investigated three metrics to track each
hashtag. The first is the contribution metric; to examine the activity and the participation
of users over a specific hashtag by counting the number of tweets, and to examine
the visibility of each user (which it reflects how many times the user is mentioned by
other users). The second is the activity metric; to examine the activity and contribution of
users over a period of time. And the third metric is to combine both the contribution and
the activity of users over a specific hashtag over a period of time. We can suggest that the
employed method in [6] would benefit in identifying the influential users, when
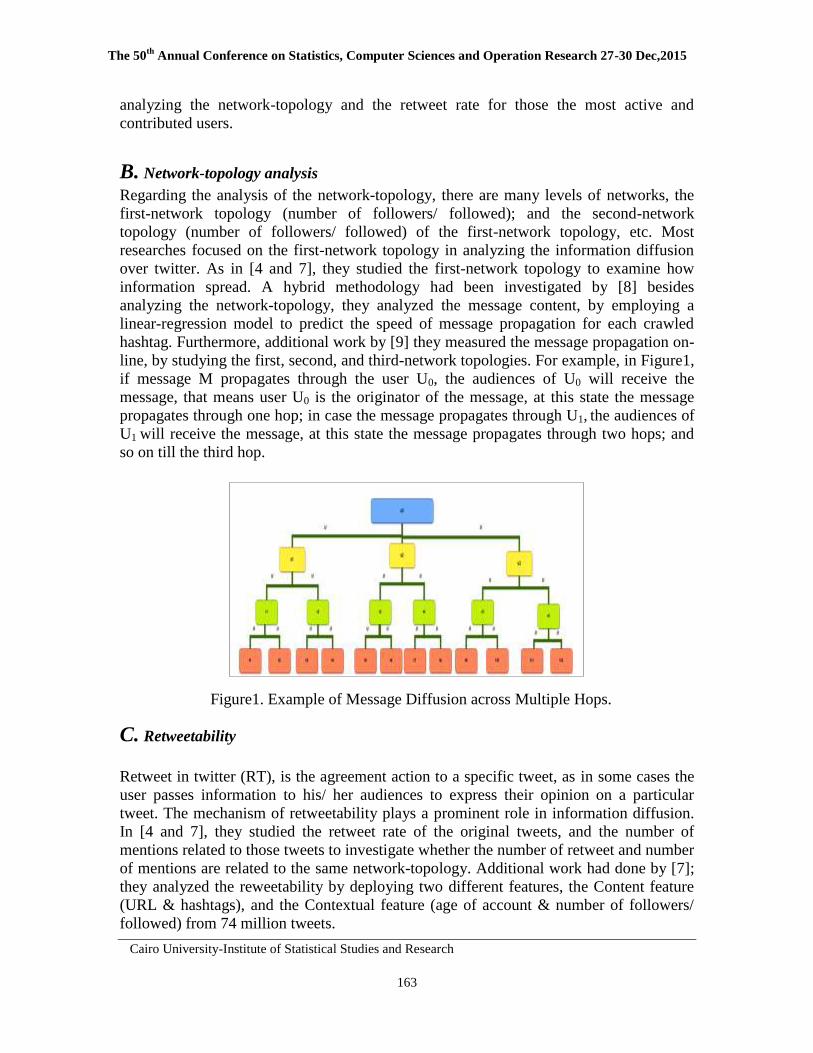
The 50th
Annual Conference on Statistics, Computer Sciences and Operation Research 27-30 Dec,2015
Cairo University-Institute of Statistical Studies and Research
163
analyzing the network-topology and the retweet rate for those the most active and
contributed users.
B. Network-topology analysis
Regarding the analysis of the network-topology, there are many levels of networks, the
first-network topology (number of followers/ followed); and the second-network
topology (number of followers/ followed) of the first-network topology, etc. Most
researches focused on the first-network topology in analyzing the information diffusion
over twitter. As in [4 and 7], they studied the first-network topology to examine how
information spread. A hybrid methodology had been investigated by [8] besides
analyzing the network-topology, they analyzed the message content, by employing a
linear-regression model to predict the speed of message propagation for each crawled
hashtag. Furthermore, additional work by [9] they measured the message propagation on-
line, by studying the first, second, and third-network topologies. For example, in Figure1,
if message M propagates through the user U0, the audiences of U0 will receive the
message, that means user U0 is the originator of the message, at this state the message
propagates through one hop; in case the message propagates through U1, the audiences of
U1 will receive the message, at this state the message propagates through two hops; and
so on till the third hop.
Figure1. Example of Message Diffusion across Multiple Hops.
C. Retweetability
Retweet in twitter (RT), is the agreement action to a specific tweet, as in some cases the
user passes information to his/ her audiences to express their opinion on a particular
tweet. The mechanism of retweetability plays a prominent role in information diffusion.
In [4 and 7], they studied the retweet rate of the original tweets, and the number of
mentions related to those tweets to investigate whether the number of retweet and number
of mentions are related to the same network-topology. Additional work had done by [7];
they analyzed the reweetability by deploying two different features, the Content feature
(URL & hashtags), and the Contextual feature (age of account & number of followers/
followed) from 74 million tweets.
The 50th
Annual Conference on Statistics, Computer Sciences and Operation Research 27-30 Dec,2015
Cairo University-Institute of Statistical Studies and Research
164
USER INFLUENCE ON TWITTER
Social influence occurs when an individual’s thoughts or actions are affected by other
people [9]. After investigating the information diffusion, examining the influential users
is related by the message propagation. We need to answer on those questions; who are the
originators of the tweets, and how many audiences they have, and what is the retweet rate
of the original tweet. From that perspective it is easy to identify the most powerful users
those who affects people’s opinions and behaviors.
Many techniques had been employed to examine the influence on twitter, most researches
agreed on analyzing the network-topology to identify the influential users. Additional
methodology had been used to examine the influence on twitter, by studying the retweet
mechanism by employing the “Centrality” technique [10].
In [10], they used the “Degree Centrality” by counting the number of links attached to
the node (user) in case of directed graph; they also employed the “Eigenvector
Centrality” by answering the question “how many users retweeted this node?”
Furthermore, they employed the “Betweeness Centrality” which it measures the number
of shortest paths to this important node. As in [3 and 5], they agreed on identifying the
influential users by ranking the users using the number of followers, the PageRank, and
the retweet rate. Additional method had been employed by [5], by studying the reply
influence metric, and by identifying the number of replies to the original tweet. In
addition to analyzing the network-topology, the authors in [11] investigated another
methodology in which they analyzed the number of tweets, the date of joining, and the
previous history of those influential users.
SENTIMENT ANALYSIS
Sentiment analysis is measuring the people’s opinions whether they agree or disagree on
a specific topic. It used to identify people’s opinion towards a product/ service, and it is
used to predict the presidential elections, as well as predicting the consumer’s opinions
towards a new product/ service. There are two approaches had been employed to study
the sentiment analysis. The first approach is by employing Natural Language Processing
approach. And the second approach is by employing the Machine Learning algorithms.
To assess the customer’s opinions in the past, some paper-based surveys had been used.
But it is difficult to monitor and collect all the customer’s opinions towards a product/
service. With the increasing phenomena of social media, it ha been easier and more
accessible to crawl all customers’ feedbacks and analyze their sentiments either it is
positive, or negative.
A. Natural Languague Processing approach
According to Wikipedia’s definition, natural language processing (NLP) is the interaction
The 50th
Annual Conference on Statistics, Computer Sciences and Operation Research 27-30 Dec,2015
Cairo University-Institute of Statistical Studies and Research
165
between computers and human (natural) languages [12]. To evaluate sentiment of users
on-line particularly on twitter, effective sentiment annotation should be used. Most
researches used the three common sentiment labels (positive, neutral, and negative). In
[13], new feature had been used to effectively annotate sentiments of users, which is the
“Mixed Sentiment label”, it exists in tweets that have two different meanings. For
example “ I love iPhone, but I hate iPad”. “iPhone” entity is annotated with positive
sentiment label, and “iPad” entity is annotated with negative sentiment label; that means
the tweet has a mixed sentiments.
B. Machine Learning approach
According to Wikipedia’s definition, machine learning is a scientific discipline that
explores the construction and the study of algorithms that can learn from data [14]. In
[15, 16, 17, and 18], they used the machine learning approach in analyzing the sentiment
of Twitter users. In [15], they applied a rule-based, supervised, and semi-supervised
technique. As they collected tweets about the president “Obama” to measure the
sentiment of people’s opinion towards his job performance, as well as they investigated a
cross-correlation analysis of time series to predict sentiments, by labeling 2500 tweets to
predict the test dataset of 550,000 unlabeled tweets.
A hybrid method had been used by [16]. As they employed an advanced classifier for
sentiment analysis, which is “ The Latent Dirichlet Allocation Model”, in which a topic
has probabilities of generating various words; they extracted the implicit topical structure
from the tweets to predict the US presidential election of 2012 by analyzing 32 million
tweets. Additional work had been used by [17 and 18], as they added additional feature to
the tweet to improve the accuracy of the sentiment classifier. In [17], they added the
Semantic feature by adding a semantic concept to each entity in the tweet to predict the
sentiments for the collected dataset. In [18], they added the emoticons feature beside the
twitter messages by employing the distant supervised learning algorithm.
MODEL EVALUATION
Regarding the homophily and reciprocity analysis in [3 and 5]. In [3], they found that the
top users by the number of followers are mostly celebrities and mass media and most of
them do not follow back their followers; as they showed that there is a low level of
reciprocity; 77.9% of users pairs are connected one-way, and only 22.1% of users have
reciprocal relationship between them. Where in [5], they also showed a low reciprocity in
their analysis of the follower graph (roughly 20%) of users have reciprocal relationship.
In return, [3 and 5] agreed that twitter is a source of information than a social networking.
In [4], they found that bloggers spread information more than other categories such as:
celebrities, media, or organizations. In [15 and 19], they found that using hashtags in
tweets improves the accuracy and the performance of the analysis. In [4 and 11], they
found that the political hashtags persisted more time than others; which it means they
have a high frequency of tweets over a long period of time.
We claimed that the period of time for each hashtag must be consistent; for example,
when crawling political hashtags, each hashtag should be breaked yearly, monthly,
The 50th
Annual Conference on Statistics, Computer Sciences and Operation Research 27-30 Dec,2015
Cairo University-Institute of Statistical Studies and Research
166
weekly, or daily. Unlikely with [4]’s ambitious but flawed analysis, where the time
breaks for the five hashtags have different time breaks, in which they measured
#FreeIran, and #FreeVenzuela on a yearly basis; for #25Jan and #OccupyWallSt on daily
basis; and for #SpanishRevolution on monthly basis. Therefore, it was important to set a
consistent time measure, as they tracked the same topic category.
We assumed that the influential users on twitter are not necessarily to be politicians,
celebrities, or activists, but they can be ordinary users. Conversely, to [4]’s findings.
They resembled the activity on twitter to the Pamphleteering action (in which, it is a
historical term for someone who create or distribute Pamphlets, where pamphlets used to
broadcast the writer’s opinions) [20]. Where in pamphleteering the political activists keep
pamphleets since they are the only influential people.
In [9], they found that it is easier to propagate text messages than photo messages; that
means users are concerned more with the information sharing rather than communicating
with other users. They also found that users reply to breaking news messages more than
ordinary messages; which means users discuss and share information and ideas towards a
specific topic rather than engaging in conversations. Moreover about their findings, they
found the network of users kept increasing in breaking news events.
The analysis in [6] benefits in identifying who are the most active and contributed users.
But to get the whole picture, it could be advantageous if they identified the retweet rate
and the network-topology of those active users to examine the influence. And to answer
the question, is there a relation between being active and being influential?. However, the
methods in [11] lack the conceptual behavior of influence, as the rate of tweets and the
date of joining are not indicators of being influential, as well as being influential in the
past does not necessarily mean being influential at present or future.
In [7 and 15], they showed that there is no strong correlation between the retweet rate and
the network-topology; as a small percentage of retweeted messages and messages with
mentions are between interconnected users. Unlikely in findings with [7], they found that
in the case of hard-political news (politics, economic, crime, and disasters) hashtags, the
retweet rate is higher between interconnected users. Conversely in finding with [15], they
found that the network-topology is not the main feature in analyzing retweetability.
Additional findings with [8], their analysis showed that the content of messages played a
strong role in the message propagation.
It has been known that there is a strong correlation between the total number of tweets
and the vocabulary size; conversely to [13]’s findings, as they found that there is no
strong correlation between the number of tweets and the size of vocabulary. Moreover, in
[16], they showed that using the well-known “geo-tagged” feature in twitter to identify
the polarity of a political candidates could be done in the US by employing the sentiment
analysis algorithms to predict the future events such as the presidential elections results.
Comparing to previous approaches in sentiment topics, additional findings by [17], which
they found that adding the semantic feature produce better Recall (the retrieved
documents) [21], and F-Score (it is a measure of a test’s accuracy as it considers both the
precision and the recall of the test to compute the score) in negative sentiment
classification (see equations 1, 2, and 3) [22]. As well as produce better Precision (the
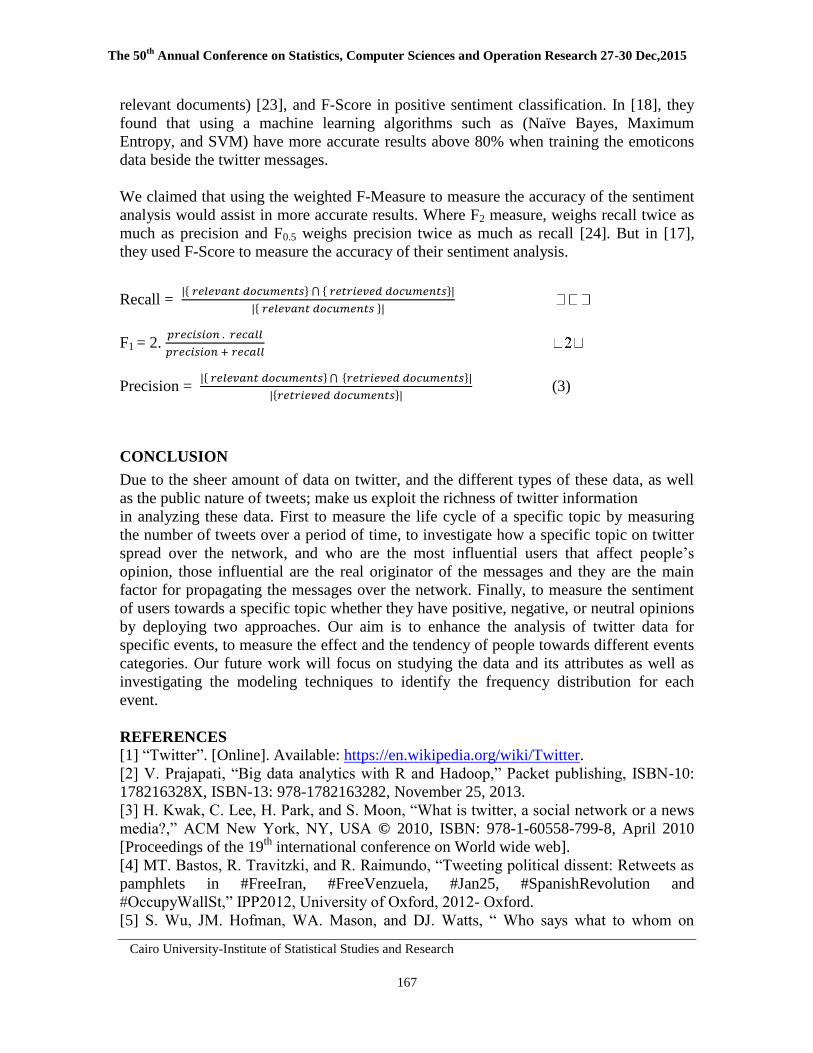
The 50th
Annual Conference on Statistics, Computer Sciences and Operation Research 27-30 Dec,2015
Cairo University-Institute of Statistical Studies and Research
167
relevant documents) [23], and F-Score in positive sentiment classification. In [18], they
found that using a machine learning algorithms such as (Naïve Bayes, Maximum
Entropy, and SVM) have more accurate results above 80% when training the emoticons
data beside the twitter messages.
We claimed that using the weighted F-Measure to measure the accuracy of the sentiment
analysis would assist in more accurate results. Where F2 measure, weighs recall twice as
much as precision and F0.5 weighs precision twice as much as recall [24]. But in [17],
they used F-Score to measure the accuracy of their sentiment analysis.
Recall = { } { }
{ }
F1 = 2.
Precision = { } { }
{ } (3)
CONCLUSION
Due to the sheer amount of data on twitter, and the different types of these data, as well
as the public nature of tweets; make us exploit the richness of twitter information
in analyzing these data. First to measure the life cycle of a specific topic by measuring
the number of tweets over a period of time, to investigate how a specific topic on twitter
spread over the network, and who are the most influential users that affect people’s
opinion, those influential are the real originator of the messages and they are the main
factor for propagating the messages over the network. Finally, to measure the sentiment
of users towards a specific topic whether they have positive, negative, or neutral opinions
by deploying two approaches. Our aim is to enhance the analysis of twitter data for
specific events, to measure the effect and the tendency of people towards different events
categories. Our future work will focus on studying the data and its attributes as well as
investigating the modeling techniques to identify the frequency distribution for each
event.
REFERENCES
[1] “Twitter”. [Online]. Available: https://en.wikipedia.org/wiki/Twitter.
[2] V. Prajapati, “Big data analytics with R and Hadoop,” Packet publishing, ISBN-10:
178216328X, ISBN-13: 978-1782163282, November 25, 2013.
[3] H. Kwak, C. Lee, H. Park, and S. Moon, “What is twitter, a social network or a news
media?,” ACM New York, NY, USA © 2010, ISBN: 978-1-60558-799-8, April 2010
[Proceedings of the 19th
international conference on World wide web].
[4] MT. Bastos, R. Travitzki, and R. Raimundo, “Tweeting political dissent: Retweets as
pamphlets in #FreeIran, #FreeVenzuela, #Jan25, #SpanishRevolution and
#OccupyWallSt,” IPP2012, University of Oxford, 2012- Oxford.
[5] S. Wu, JM. Hofman, WA. Mason, and DJ. Watts, “ Who says what to whom on
The 50th
Annual Conference on Statistics, Computer Sciences and Operation Research 27-30 Dec,2015
Cairo University-Institute of Statistical Studies and Research
168
twitter,” ACM New York, NY, USA ©2011, ISBN: 978-1-4503-0632-4, March 2011
[Proceedings of the 20th international conference on World wide web].
[6] A. Bruns, and S. Stieglitz, “Towards more systematic twitter analysis: Metrics for
tweeting activities,” International Journal of Social Research Methodology 16:2, pp. 91-
108, Jan 2013.
[7] MT. Bastos, R. Travitzki, and C. Puschmann, “What sticks with whom? Twitter
follower- followee networks and news classification,” The potential of Social Media
ational AAAI
Conference on Weblogs and Social Media, Dublin, Ireland, May 20, 2012.
[8] O. Tsur, and A. Rappoport, “What’s in a hashtag? Content based prediction of spread
of ideas in microblogging communities,”
ACM New York, NY, USA ©2012, ISBN: 978-1-4503-0747-5, pp. 643-652, 8 Feb 2012
[Proceedings of the fifth ACM international conference on Web search and data mining].
[9] S. Ye, and F. Wu, “Measuring message propagation and social influence on
Twitter.com,” International Journal of Communication Networks and Distributed
Systems 11:1, pp. 59-76, June 24, 2013.
[10] Shamanth Kumar, Fred Morstatter, and Huan Liu, “Twitter Data Analytics,”
Springer New York, Online –ISBN: 978-1-4614-9372-3.2014.
[11] DM. Romero, B. Meeder, and J. Kleiberg, “Differences in the mechanics of
information diffusion topics: Idioms, political hashtags, and complex contagion on
twitter,” ACM New York, NY, USA ©2011, ISBN: 978-1-4503-0632-4, pp. 695-704, 8
Feb 2012 [Proceedings of the 20th international conference on World wide web].
[12] “Natural Language Processing”. [Online]. Available:
https://en.wikipedia.org/wiki/Natural_language_processing.
[13] H. Saif, M. Fernándaz, Y. He, and H. Alani, “Evaluation Datasets for twitter
sentiment analysis: A survey and a new dataset, the STS-Gold,” 1st International
Workshop on Emotion and Sentiment in Social and Expressive Media: Approaches and
Perspectives from AI (ESSEM 2013), 3 December, Turin, Italy.
[14] “Machine Learning”. [Online]. Available:
https://en.wikipedia.org/wiki/Machine_learning.
[15] C. Johnson, P. Shukla, and S. Shukla, “On classifying the political sentiment of
tweets,” cs.utexas.edu, 2012.
[16] K. Jahanbakhsh, and Y. Moon, “The predictive power of social media: On the
predictability of U.S presidential elections using twitter,” arXiv preprint arXiv:
1407.0622, 2014.
[17] H. Saif, Y. He, and H. Alani, “Semantic sentiment analysis of twitter,” The Semantic
Web, pp. 508- 524, ISWC 2012, 2012.
[18] A. Go, R. Bhayani, and L. Huang, “Twitter sentiment classification using Distant
supervision,” CS224N Project Report, Stanford, 2009, pp. 1- 12, December 2009.
[19] A. Hajibagheri, and G. Sukthankar, “Political polarization over global warming:
Analyzing twitter data on climate change,” Academy of Science and Engineering (ASE),
USA ©ASE 2014.
[20] “Pamphleteer”. [Online]. Available: https://en.wikipedia.org/wiki/Pamphleteer.
[21] “Recall”. [Online]. Available:

The 50th
Annual Conference on Statistics, Computer Sciences and Operation Research 27-30 Dec,2015
Cairo University-Institute of Statistical Studies and Research
169
https://en.wikipedia.org/wiki/Precision_and_recall#Recall.
[22] “F-Score”. [Online]. Available: https://en.wikipedia.org/wiki/F1_score.
[23] “Precision”. [Online]. Available:
https://en.wikipedia.org/wiki/Precision_and_recall#Precision.
[24] Nathalie Japkowicz, Mohak Shah, “Evaluating Learning Algorithms: A
classification Perspective", CAMBRIDG UNIVERSITY
PRESS 2011 - ISBN 978-0-521-19600-0.


![arXiv:1612.09563v1 [physics.ed-ph] 30 Dec 2016](https://img.pdfslide.net/doc/110x75/634dbd907bed3bddea0390c4/arxiv161209563v1-physicsed-ph-30-dec-2016.jpg)


![83 STAT. ] PUBLIC LAW 91-172-DEC. 30, 1969 487 - GovInfo](https://img.pdfslide.net/doc/110x75/63282b685c2c3bbfa80488f2/83-stat-public-law-91-172-dec-30-1969-487-govinfo.jpg)


![arXiv:0912.5409v1 [q-bio.NC] 30 Dec 2009 - Princeton University](https://img.pdfslide.net/doc/110x75/6318e2b00255356abc080934/arxiv09125409v1-q-bionc-30-dec-2009-princeton-university.jpg)


![arXiv:2012.15230v1 [physics.soc-ph] 30 Dec 2020](https://img.pdfslide.net/doc/110x75/633d000677c94a4cac0ce8e6/arxiv201215230v1-physicssoc-ph-30-dec-2020.jpg)


