Embed Size (px)
Citation preview
3-060-13 R.Rooth
Energy-efficient neighborhood development in
Apeldoorn (NL) and Hillerød (DK), implementation and
results
R.Rooth, DNV KEMA
P.O. Box 9035
6800 ET Arnhem, Netherlands
Email: [email protected]
Y. Boerakker, DNV KEMA
P.O. Box 9035
6800 ET Arnhem, Netherlands
Email: [email protected]
P. Weitzmann, COWI
Parallelvej 2
2800 Lyngby, Denmark
Email: [email protected]
J. Uitzinger, IVAM
P.O.Box 18180
1001 ZB Amsterdam, Netherlands
Abstract
As of 31 December 2020 new buildings in the EU will have to consume 'nearly zero' energy and the energy
consumed will need to be 'to a very large extent' from renewable sources produced on-site or nearby. The overall
performance depends on the buildings and on an efficient local supply of energy based on renewable energy. In
Apeldoorn (the Netherlands) and Hillerød (Denmark) new neighborhoods have been realized. In Apeldoorn
dwellings are connected to a district heating system, running on biogas from a waste water treatment plant, with
wood chip boilers to cover peak demand. In Hillerød the dwellings are connected to a low temperature district
heating system, with a biomass boiler, gasifier (CHP) and solar thermal as heat sources. Whereas many studies
on energy performance of efficient buildings are mostly based on small samples, in Apeldoorn 117,000 m2 of
buildings, mainly residential, have been constructed and monitored (hundreds of dwellings and a neighborhood
services center). Besides monitoring the performance of the dwellings, the performance of the nearby
installations have been monitored to determine the overall performance for each of the locations. Additionally,
the satisfaction of inhabitants has been monitored, as well as potential changes in energy related behavior and
attitude. This paper describes the monitoring approach, the challenges faced, the solutions applied to the
challenges, and it includes results from surveys on customer satisfaction. Recommendations will be given for the
realization of future energy efficient neighborhoods and the monitoring of its energy performance.
Introduction
As of 31 December 2020 new buildings in the EU will have to consume 'nearly zero' energy and the energy
consumed will need be 'to a very large extent' from renewable sources produced on-site or nearby. With the
energy produced nearby, the overall performance will depend on both the performance of the building itself and
of the performance of the installations in the neighborhood (e.g. district heating based on renewable energy, PV
fields, wind turbines) and the efficiency in distributing the generated energy to the dwellings. As the Energy-
efficient Buildings Association (E2BA) Roadmap1 indicates: “The district dimension provides new energy
optimization possibilities, for instance through the connection to existing grids (electricity, heat and cooling
1 www.e2b-ei.eu
networks), via the design and operation of a set of buildings as components of an integrated energy system,
which can in turn contribute to improved peak load management.” In general, it is more and more recognized
that neighborhoods have the right scale when it comes to affordable energy efficiency improvements .
This approach was, on a large scale, already advocated since 2003 by the CONCERTO programme of the EU, as
part of its sixth Framework Programme (FP6). A combined and integrated approach to energy-efficiency,
rational use of energy and the integration of renewable energy in neighborhoods is the main target of
CONCERTO, which has found a follower in the Smart Cities and Communities initiative of the seventh
Framework Programme (FP7). By now, CONCERTO totals the implementation of projects in 58 cities;
Apeldoorn and Hillerød, participating in the SORCER project, are two of them. The general goals of
CONCERTO were stated as buildings/neighborhoods with an energy performance of 30% better than existing
regulations for new building, and comparable to new building standards for retrofitting projects. In this paper the
monitoring results of the projects in Apeldoorn and Hillerød will be described, focusing on building
performance, energy performance of the districts as a whole, and consumer satisfaction.
Background
Building standards (2006-2012) in The Netherlands and in Denmark
Building standards in the Netherlands
In the Netherlands, new buildings should comply with the Energy Performance Standard (EPC).
The EPC is based on the energy consumption of a building and includes for dwellings energy for heating and
domestic hot water and electricity consumption for ventilation, pumping and cooling. There are minimum
requirements for the performance of individual components but the EPC can be reached by a number of
packages of measures, aiming at a cost-effective set of measures.
At the time the construction of the dwellings started in Zuidbroek (2006-2011), the EPC was 0.8. Therefore this
stands as the standard against which the energy performance of the buildings in Zuidbroek will be compared.
Since 1.1.2012, new buildings have to comply with an EPC of 0.6.
The EPC also takes into account system approaches like district heating. In that case, default values can be used
to determine the EPC. As an alternative to default values, the standard allows for real savings in primary energy
to be calculated using the “equivalence principle”. In Apeldoorn, the new dwellings are connected to a district
heating system that is predominantly fired by biogas and by the recently installed peak woodchips boiler. This
significantly reduces the fossil energy content of the district heating system and therefore the 'equivalence
principle' calculation method is chosen. This means that the total energy performance (and a thus the EPC)
depends on the energy performance of the heating network. On its turn, the performance of the heating network
will depend on climate conditions and weather influences, the number of dwellings connected to the grid, etc.
Building standards in the Denmark
Denmark has a very strict building code, which is based on the Energy Performance of Buildings Directive
(EPBD) (2002/EC/91) and the EPBD recast (2010/31/EU). The energy performance is based on primary energy,
where factors are defined for different energy carriers. The energy consumption includes energy for heating and
domestic hot water and electricity consumption for ventilation, pumping and cooling. For other buildings than
dwellings, such as offices, shops etc., lighting is also included. The energy consumption is calculated using a
software tool developed to document the energy consumption. A set of predefined values for e.g. internal heat
loads, temperature set points, use of domestic hot water etc. are to be used. All other energy consumption such as
household electricity consumption is not included in the energy frame, it is only to be added to the calculation as
an internal heat load.
In addition to the energy performance there are minimum requirements for U-values of building components,
thermal bridging and specific fan power of the ventilation system, as well as the overall average U-value of the
building envelope except for windows and doors.
The building code has had three different energy performance levels;
a minimum requirement for fulfilling the building code
a low energy performance which is the expected value for the next update of the building code or around
25% lower than the current minimum requirements
a low energy performance which is the expected value after two updates to the building code or around 50%
lower than the current minimum requirements
The update interval is defined to be every five years. In the period from 2006 to 2012, Denmark has effectively
had three different building codes. However, the basic principle has been the same in the entire period. The
major difference is that the energy performance requirement has been tightened during the period as described
above.
General project overview
Main project objectives
Both the Zuidbroek project and the Hillerød project are new build, high energy-performance districts. Main
objectives of the project are:
Demonstration of low-carbon neighbourhoods based on scalable concepts
Feasibility of integrated approach combining energy efficiency and renewables integration
The requirement of scalable concepts for successful replication led to both technical and socio-economic
monitoring activities.
Project description Apeldoorn Zuidbroek
In Zuidbroek 117,000 m2 of buildings have been constructed, predominantly dwellings, but also a large
community center. The neighborhood has the following characteristics:
Energy performance coefficient of buildings (EPC - shell based) of 0.8, together with the bio-energy based
district heating system, the EPC is targeted at 0.64
2.65 GJ additional energy savings per dwelling per year (e.g. 400 Wp solar panels /dwelling)
District heating Zuidbroek (2,500 dwellings)
Sewage digester, with poultry sludge (1.5 MWe)
Woodchips peak boiler (2.8 MWth)
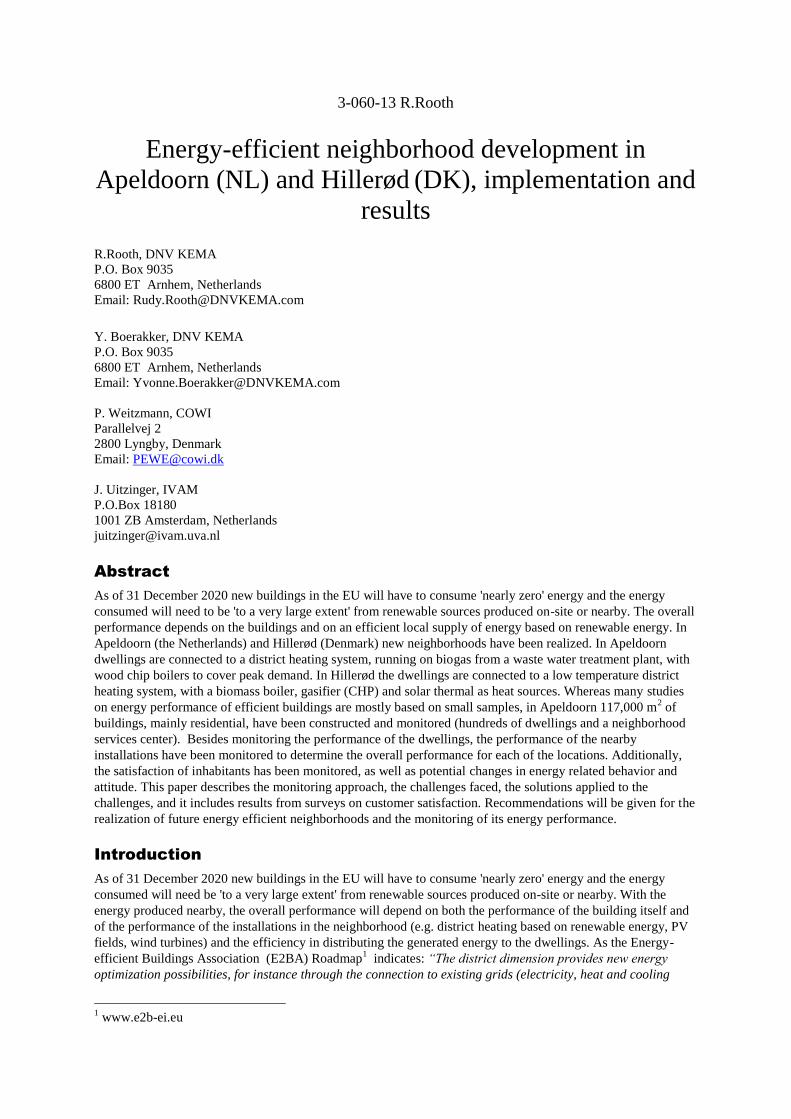
Figure 1 shows the set up of the energy system of Zuidbroek. The waste water (1) of the dwellings flows into the
waste water treatment plant (2) and after dewatering (3) the sludge is digested (4) and the biogas is burned in a
cogeneration plant (CHP) (5) generating electricity that is used (7) for the pumps of the waste water treatment
plant. The heat produced in the CHP is used for the district heating system (6). To cover peak demand, additional
boilers will be used to produce heat based on biomass chips and/or natural gas (not indicated in the picture). PV
panels are not indicated in the graph, but are an integral part of the project, and are installed on dwellings as well
as on the peak boiler building and the office building of the district water board (Waterschap Veluwe)
Figure 1. Zuidbroek energy system.
Project description Hillerød
The project in Hillerød has been changed significantly during the duration of the SORCER project. Initially. the
project was centered around 79,000 m² of low energy dwellings for single and multi family use in Ullerødbyen.
However, this had to be changed significantly due to the financial crisis, which provoked a slump in the building
activities of private homes in Hillerød as well as in Denmark in general. Against this background the project’s
focus was enlarged to the entire city of Hillerød and included also other building types such as office buildings.
This change also led to a dramatic increase in the use of solar PV panels, which moved from around 8 kWp to
over 400 kWp.
During the SORCER project the following has been realized in Ullerødbyen or its direct vicinity
Low temperature district heating network
Solar thermal collectors (>3,700 m²) in two fields
86 Class 1 Ecobuildings (-50% below building code requirements)
20 Class 2 Ecobuildings (-25% below building code requirements)
Biomass boiler (6 MW thermal)
Biomass gasifier (500 kW electrical and 1 MW thermal)
Office buildings, city college and conference centre (total 27,000 m²)
Solar PV panels (410 kWp)
Additionally school buildings in a different district in Hillerød have been renovated (3.000 m²).
Monitoring approach
The common approach is based upon guidelines given by the CONCERTO programme. Essentially they
recommend data collection on a monthly basis, both of energy consumption and renewable energy generation,
combined with information about energy costs. This paper focuses on the performance of dwellings and the
neighborhood energy system. Costs will not be discussed.
Monitoring approach Apeldoorn Zuidbroek
Monitoring of the individual dwellings (EPC=0.8) is based on energy demand for space heating and domestic
hot water (DHW), thus the energy provided by the district heating system. Electricity use has not been included
in monitoring because no specific electricity saving measures are being implemented. Electricity generated by
the PV panels is estimated on the basis of default values.
In the Netherlands energy consumption data can only be used for billing, unless the resident gives permission to
use the data for different purposes. To overcome privacy issues, letters have been sent to the inhabitants asking
them permission to use their data for analysis purposes. For the households that gave permission, energy data
have been analyzed in combination with household characteristics, dwelling size, family composition etc. For
the other households, heat consumption has been measured, but it is only available in an anonymised database,
meaning that it cannot be ascribed to specific dwellings or households.
The district heating company has monitored the heat-use of all dwellings eight times a year, excluding the
summer months. Data was collected using a car containing a radio transceiver. This for the Netherlands
relatively novel way of data collection appeared to suffer from some problems, which resulted in faulty or
missing data and limited the total amount of useful data. In the end, the aggregated data were available for
several hundreds of dwellings. In order to assess the overall performance of the district (improving the EPC=0.8
to an EPC=0.64), we looked into more detail at the district heating system. In this context, especially the source
of the heating energy is important, as well as the system losses. Three sources for heating are relevant for
Zuidbroek:
biogas from the sewage digesters
natural gas (for peak boilers)
biomass (in this case woodchips) for peak boilers.
In Zuidbroek, the desired 20% better performance for dwellings is realized by having a high “equivalent
generation efficiency” (EGE) for heat. This is necessary as the dwellings’ envelopes energy performance does
not exceed national regulations (EPC=0.8), so the improvement needs to come from the heating system. The
EGE compares the efficiency of the district heating system to that of a reference condensing boiler. Essentially it
tells how much fossil energy is being used compared to the amount used in the reference boiler.
As heat is not the only component in the calculation of the energy performance of dwellings (EPC), there is a
complicated relation between the EPC and the EGE. The relation is shown in Figure 2. This graph shows that the
EGE of Zuidbroek needs to be equal to 1.5 or better to establish an EPC for the dwellings of 0.64 (20% better
than 0.8).
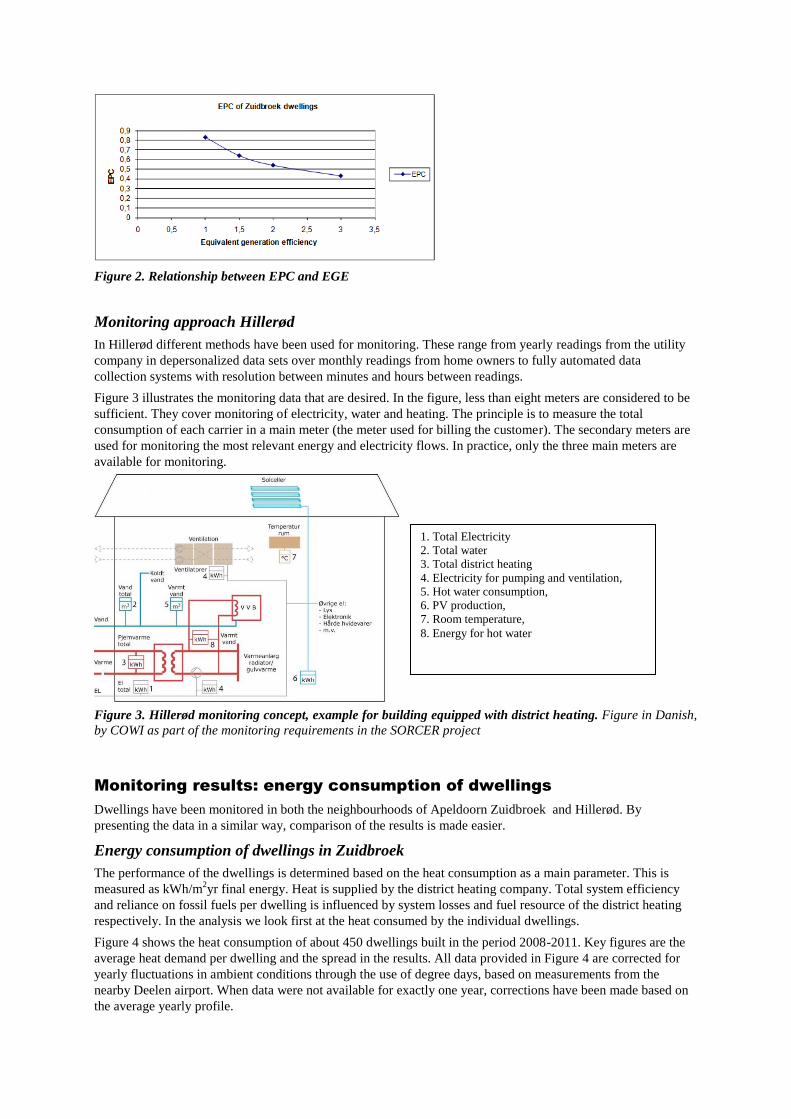
Figure 2. Relationship between EPC and EGE
Monitoring approach Hillerød
In Hillerød different methods have been used for monitoring. These range from yearly readings from the utility
company in depersonalized data sets over monthly readings from home owners to fully automated data
collection systems with resolution between minutes and hours between readings.
Figure 3 illustrates the monitoring data that are desired. In the figure, less than eight meters are considered to be
sufficient. They cover monitoring of electricity, water and heating. The principle is to measure the total
consumption of each carrier in a main meter (the meter used for billing the customer). The secondary meters are
used for monitoring the most relevant energy and electricity flows. In practice, only the three main meters are
available for monitoring.
Figure 3. Hillerød monitoring concept, example for building equipped with district heating. Figure in Danish,
by COWI as part of the monitoring requirements in the SORCER project
Monitoring results: energy consumption of dwellings
Dwellings have been monitored in both the neighbourhoods of Apeldoorn Zuidbroek and Hillerød. By
presenting the data in a similar way, comparison of the results is made easier.
Energy consumption of dwellings in Zuidbroek
The performance of the dwellings is determined based on the heat consumption as a main parameter. This is
measured as kWh/m2yr final energy. Heat is supplied by the district heating company. Total system efficiency
and reliance on fossil fuels per dwelling is influenced by system losses and fuel resource of the district heating
respectively. In the analysis we look first at the heat consumed by the individual dwellings.
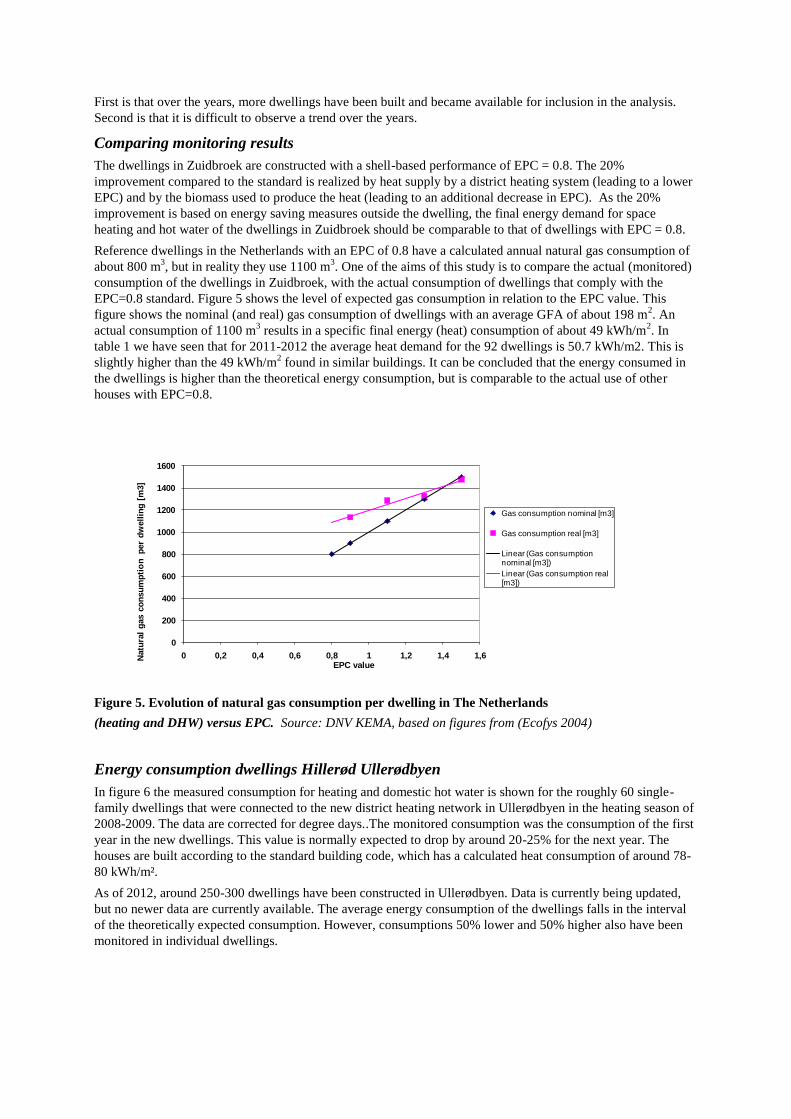
Figure 4 shows the heat consumption of about 450 dwellings built in the period 2008-2011. Key figures are the
average heat demand per dwelling and the spread in the results. All data provided in Figure 4 are corrected for
yearly fluctuations in ambient conditions through the use of degree days, based on measurements from the
nearby Deelen airport. When data were not available for exactly one year, corrections have been made based on
the average yearly profile.
1. Total Electricity
2. Total water
3. Total district heating
4. Electricity for pumping and ventilation,
5. Hot water consumption,
6. PV production,
7. Room temperature,
8. Energy for hot water
Each dot in Figure 4.a represents a dwelling. The average total energy consumption is 27.6 GJ/year. Energy
consumption varies strongly between the dwellings. The size of the dwellings also varies (large houses have 2.5
times the gross floor area (GFA) of the smaller apartments), it does not justify the variations measured in heat
consumption. Figure 4.b shows the energy consumption per square meter, for the subset of dwellings that gave
permission to monitor their heat demand. As explained, all other figures are anonymous, we don't know to what
dwelling (types) this consumption belongs.
a b
Figure 4.a and 4.b. Annual heating energy consumption degree days corrected with data from airport Deelen
4.a consumption in GJ , sorted by increasing consumption per dwelling, May 2011-April 2012
4.b consumption in kWh/m2, May 2009-April 2010
Source: DNV KEMA 78100030-SUS 12-5063
The average energy consumption of the dwellings in figure 4.b varies less than a factor 4. This is still a
considerable range in energy consumption, but seems to be more reasonable than the range shown in the
previous figure. The average energy consumption per square meter is 53.4 kWh/year.
Not all dwellings were constructed in the same year. Table 1 shows how the average energy consumption for
dwellings changes over time. The average consumption of dwellings constructed in the first year of monitoring
seems to be more or less constant in the two succeeding years.. There is no clear trend (left column: Dwellings
since year 1) that the consumption in the first year of construction is considerably higher than in the years after
that (while it is always said that the first year cannot be used for monitoring due to the moisture of construction
still being partly in the dwelling). This conclusion is supported by the dwellings constructed one year later
(dwellings since year 2), for which the average energy consumption seems to increase in the second year instead
of decreasing. The last groups of dwellings (dwellings since year 3) have been monitored for only one year.
Table 1. Energy consumption for dwellings constructed in different years. Source: (DNV KEMA 78100030-
SUS 12-5063
Energy consumption in kWh per square meter*year
Heating season
Dwellings built before
May 2009
Dwellings built May
2009-April 2010
Dwellings built May
2010-April 2011
Weighted
av.
2009-2010 53,4 53,4
2010-2011 51,3 54,7 52,0
2011-2012 52,2 59,3 43,8 50,7
Amount of dwellings 48 13 31 total 92,0
Energy consumption per dwelling in GJ/year
Heating season
Dwellings built before
May 2009
Dwellings built May
2009-April 2010
Dwellings built May
2010-April 2011
Weighted
av.
2009-2010 31,2 31,2
2010-2011 30 26,8 29,0
2011-2012 30,2 25 24,4 27,6
Amount of dwellings 223 99 123 total 445,0
In general, a few conclusions can be drawn from the data in table 1.
0102030405060708090
100
0 50 100 150 200 250 300An
nu
al e
ne
rgy
con
sum
pti
on
[kW
h/m
2]
Dwelling gross floor area [m2]
Energy consumpion (heat) May2009-April2010
Average is 53.4 kWh/m2
0
10
20
30
40
50
60
70
80
90
0 100 200 300 400 500
GJ
pe
r ye
ar f
or
spac
e h
eat
ing
plu
s D
HW
Every dot is one dwelling
Annual heat consumption (May 2011-April 30 2012) degree days corrected (Deelen)
Average is 27.6 GJ
First is that over the years, more dwellings have been built and became available for inclusion in the analysis.
Second is that it is difficult to observe a trend over the years.
Comparing monitoring results
The dwellings in Zuidbroek are constructed with a shell-based performance of EPC = 0.8. The 20%
improvement compared to the standard is realized by heat supply by a district heating system (leading to a lower
EPC) and by the biomass used to produce the heat (leading to an additional decrease in EPC). As the 20%
improvement is based on energy saving measures outside the dwelling, the final energy demand for space
heating and hot water of the dwellings in Zuidbroek should be comparable to that of dwellings with EPC = 0.8.
Reference dwellings in the Netherlands with an EPC of 0.8 have a calculated annual natural gas consumption of
about 800 m3, but in reality they use 1100 m
3. One of the aims of this study is to compare the actual (monitored)
consumption of the dwellings in Zuidbroek, with the actual consumption of dwellings that comply with the
EPC=0.8 standard. Figure 5 shows the level of expected gas consumption in relation to the EPC value. This
figure shows the nominal (and real) gas consumption of dwellings with an average GFA of about 198 m2. An
actual consumption of 1100 m3 results in a specific final energy (heat) consumption of about 49 kWh/m
2. In
table 1 we have seen that for 2011-2012 the average heat demand for the 92 dwellings is 50.7 kWh/m2. This is
slightly higher than the 49 kWh/m2 found in similar buildings. It can be concluded that the energy consumed in
the dwellings is higher than the theoretical energy consumption, but is comparable to the actual use of other
houses with EPC=0.8.
Figure 5. Evolution of natural gas consumption per dwelling in The Netherlands
(heating and DHW) versus EPC. Source: DNV KEMA, based on figures from (Ecofys 2004)
Energy consumption dwellings Hillerød Ullerødbyen
In figure 6 the measured consumption for heating and domestic hot water is shown for the roughly 60 single-
family dwellings that were connected to the new district heating network in Ullerødbyen in the heating season of
2008-2009. The data are corrected for degree days..The monitored consumption was the consumption of the first
year in the new dwellings. This value is normally expected to drop by around 20-25% for the next year. The
houses are built according to the standard building code, which has a calculated heat consumption of around 78-
80 kWh/m².
As of 2012, around 250-300 dwellings have been constructed in Ullerødbyen. Data is currently being updated,
but no newer data are currently available. The average energy consumption of the dwellings falls in the interval
of the theoretically expected consumption. However, consumptions 50% lower and 50% higher also have been
monitored in individual dwellings.
0
200
400
600
800
1000
1200
1400
1600
0 0,2 0,4 0,6 0,8 1 1,2 1,4 1,6Natu
ral
gas c
on
su
mp
tio
n p
er
dw
ell
ing
[m
3]
EPC value
Gas consumption nominal [m3]
Gas consumption real [m3]
Linear (Gas consumption nominal [m3])
Linear (Gas consumption real [m3])
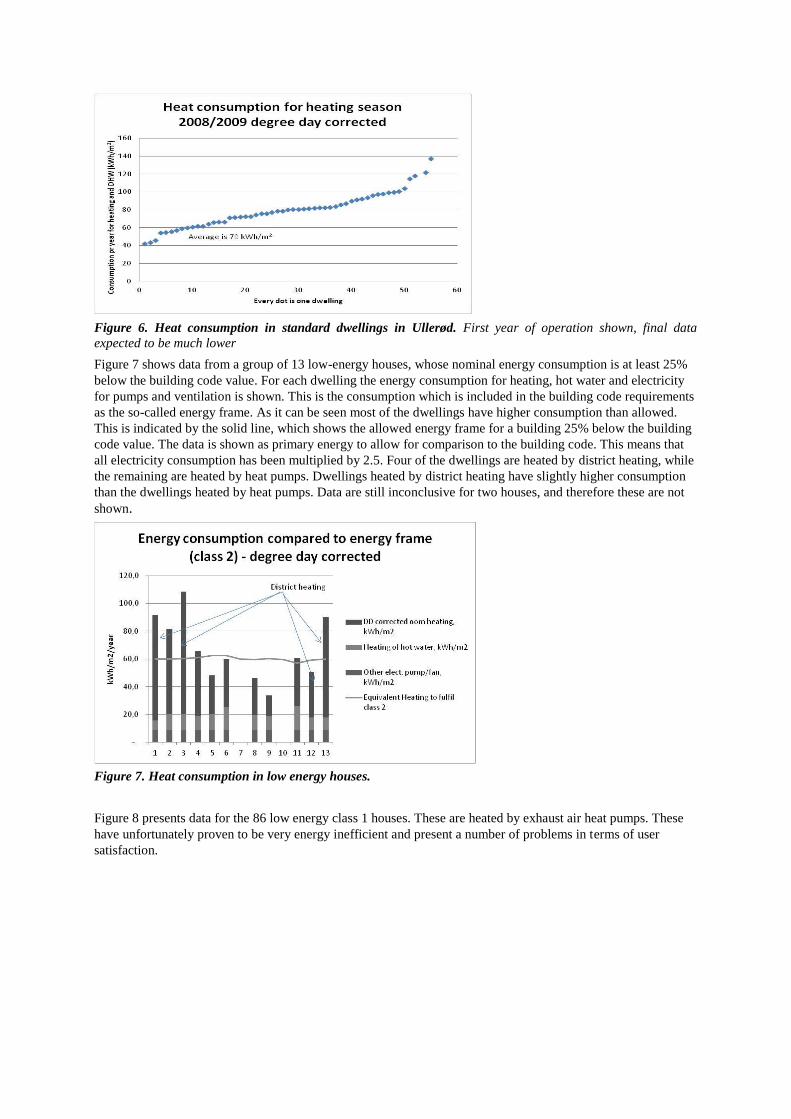
Figure 6. Heat consumption in standard dwellings in Ullerød. First year of operation shown, final data
expected to be much lower
Figure 7 shows data from a group of 13 low-energy houses, whose nominal energy consumption is at least 25%
below the building code value. For each dwelling the energy consumption for heating, hot water and electricity
for pumps and ventilation is shown. This is the consumption which is included in the building code requirements
as the so-called energy frame. As it can be seen most of the dwellings have higher consumption than allowed.
This is indicated by the solid line, which shows the allowed energy frame for a building 25% below the building
code value. The data is shown as primary energy to allow for comparison to the building code. This means that
all electricity consumption has been multiplied by 2.5. Four of the dwellings are heated by district heating, while
the remaining are heated by heat pumps. Dwellings heated by district heating have slightly higher consumption
than the dwellings heated by heat pumps. Data are still inconclusive for two houses, and therefore these are not
shown.
Figure 7. Heat consumption in low energy houses.
Figure 8 presents data for the 86 low energy class 1 houses. These are heated by exhaust air heat pumps. These
have unfortunately proven to be very energy inefficient and present a number of problems in terms of user
satisfaction.
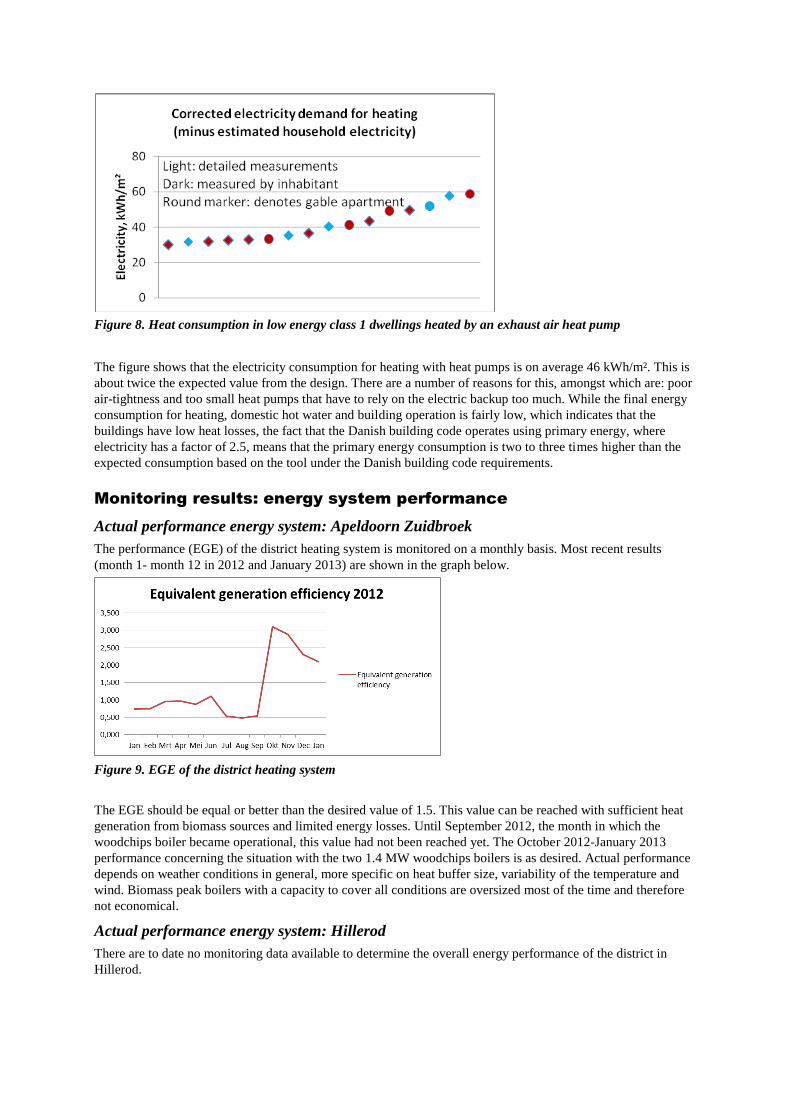
Figure 8. Heat consumption in low energy class 1 dwellings heated by an exhaust air heat pump
The figure shows that the electricity consumption for heating with heat pumps is on average 46 kWh/m². This is
about twice the expected value from the design. There are a number of reasons for this, amongst which are: poor
air-tightness and too small heat pumps that have to rely on the electric backup too much. While the final energy
consumption for heating, domestic hot water and building operation is fairly low, which indicates that the
buildings have low heat losses, the fact that the Danish building code operates using primary energy, where
electricity has a factor of 2.5, means that the primary energy consumption is two to three times higher than the
expected consumption based on the tool under the Danish building code requirements.
Monitoring results: energy system performance
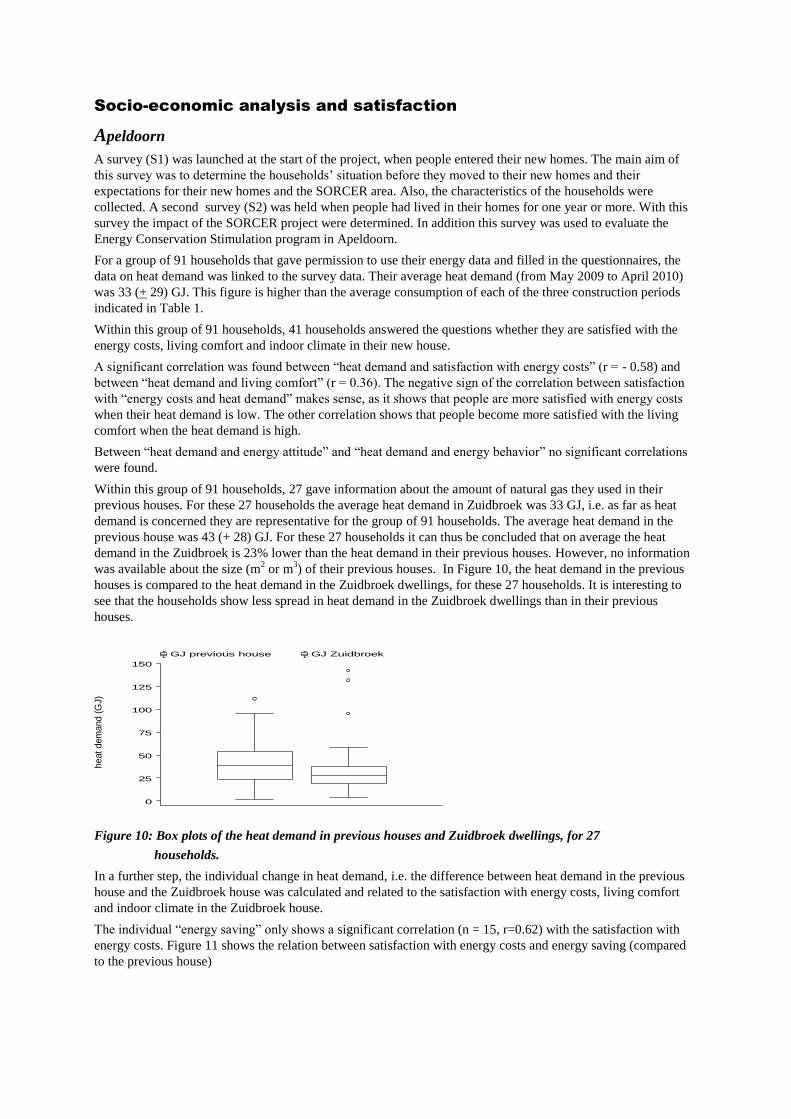
Actual performance energy system: Apeldoorn Zuidbroek
The performance (EGE) of the district heating system is monitored on a monthly basis. Most recent results
(month 1- month 12 in 2012 and January 2013) are shown in the graph below.
Figure 9. EGE of the district heating system
The EGE should be equal or better than the desired value of 1.5. This value can be reached with sufficient heat
generation from biomass sources and limited energy losses. Until September 2012, the month in which the
woodchips boiler became operational, this value had not been reached yet. The October 2012-January 2013
performance concerning the situation with the two 1.4 MW woodchips boilers is as desired. Actual performance
depends on weather conditions in general, more specific on heat buffer size, variability of the temperature and
wind. Biomass peak boilers with a capacity to cover all conditions are oversized most of the time and therefore
not economical.
Actual performance energy system: Hillerod
There are to date no monitoring data available to determine the overall energy performance of the district in
Hillerod.
Socio-economic analysis and satisfaction
Apeldoorn
A survey (S1) was launched at the start of the project, when people entered their new homes. The main aim of
this survey was to determine the households’ situation before they moved to their new homes and their
expectations for their new homes and the SORCER area. Also, the characteristics of the households were
collected. A second survey (S2) was held when people had lived in their homes for one year or more. With this
survey the impact of the SORCER project were determined. In addition this survey was used to evaluate the
Energy Conservation Stimulation program in Apeldoorn.
For a group of 91 households that gave permission to use their energy data and filled in the questionnaires, the
data on heat demand was linked to the survey data. Their average heat demand (from May 2009 to April 2010)
was 33 (+ 29) GJ. This figure is higher than the average consumption of each of the three construction periods
indicated in Table 1.
Within this group of 91 households, 41 households answered the questions whether they are satisfied with the
energy costs, living comfort and indoor climate in their new house.
A significant correlation was found between “heat demand and satisfaction with energy costs” (r = - 0.58) and
between “heat demand and living comfort” (r = 0.36). The negative sign of the correlation between satisfaction
with “energy costs and heat demand” makes sense, as it shows that people are more satisfied with energy costs
when their heat demand is low. The other correlation shows that people become more satisfied with the living
comfort when the heat demand is high.
Between “heat demand and energy attitude” and “heat demand and energy behavior” no significant correlations
were found.
Within this group of 91 households, 27 gave information about the amount of natural gas they used in their
previous houses. For these 27 households the average heat demand in Zuidbroek was 33 GJ, i.e. as far as heat
demand is concerned they are representative for the group of 91 households. The average heat demand in the
previous house was 43 (+ 28) GJ. For these 27 households it can thus be concluded that on average the heat
demand in the Zuidbroek is 23% lower than the heat demand in their previous houses. However, no information
was available about the size (m2 or m
3) of their previous houses. In Figure 10, the heat demand in the previous
houses is compared to the heat demand in the Zuidbroek dwellings, for these 27 households. It is interesting to
see that the households show less spread in heat demand in the Zuidbroek dwellings than in their previous
houses.
heat
dem
and (
GJ)
0
25
50
75
100
125
150
GJ previous house GJ Zuidbroek
Figure 10: Box plots of the heat demand in previous houses and Zuidbroek dwellings, for 27
households.
In a further step, the individual change in heat demand, i.e. the difference between heat demand in the previous
house and the Zuidbroek house was calculated and related to the satisfaction with energy costs, living comfort
and indoor climate in the Zuidbroek house.
The individual “energy saving” only shows a significant correlation (n = 15, r=0.62) with the satisfaction with
energy costs. Figure 11 shows the relation between satisfaction with energy costs and energy saving (compared
to the previous house)
'energ
y s
avin
g' (
GJ)
satisfaction with energy costs1 2 3 4 5 6 7 8 9 10
-75
-50
-25
0
25
50
75
100
2
1
1
1
1
2
1
1
1
2
2
12
1
1
Figure 11. Scatter plot of the savings in heat demand against satisfaction with energy costs, for people
who rent (1) and house owners (2).
It is interesting to see that people who rent (1) are saving energy and are satisfied with the energy costs, whereas
people who own their house are using more energy and are not satisfied. They probably have bought a larger
house than their previous one. Although it is more energy efficient it apparently uses more energy.
Figure 12 is based on survey S2 and shows that the inhabitants of Zuidbroek were on average more satisfied with
certain aspects than with others. Especially living costs and energy costs scored on average lower. Aspects
regarding the house scored on average somewhat higher; e.g. the house itself.
0% 10% 20% 30% 40% 50% 60% 70% 80% 90% 100%
Location
Size
Living costs (excl. energy, water, etc.)
Total energy costs
Living comfort
Indoor climate (temperature, moisture, draught etc.)
Neighbours
Image of the neighbourhood
Safety of the neighbourhood
The house itself
General living satisfaction
very satisfied satisfied satisfied/dissatisfied dissatisfied very dissatisfied Don't know
Figure 12. Living satisfaction in Zuidbroek (n = 243).
Socio-economic analysis Ullerødbyen
In Ullerød it was decided not to perform a general survey of the entire area as in the case for Apeldoorn. Instead
two surveys were conducted in the low energy class 1 houses. This was due to the fact that it quickly proved that
the inhabitants had problems concerning their satisfaction with the dwellings.
Figure 13. User satisfaction in low energy class 1 apartments in Ullerød Q1 2010 (n=24 or 28%)
X = Satisfaction with energy costs
on a scale from 1 to 10
Y = ‘energy saving’ , the difference
between heat demand in the
residents’ previous house and
Zuidbroek
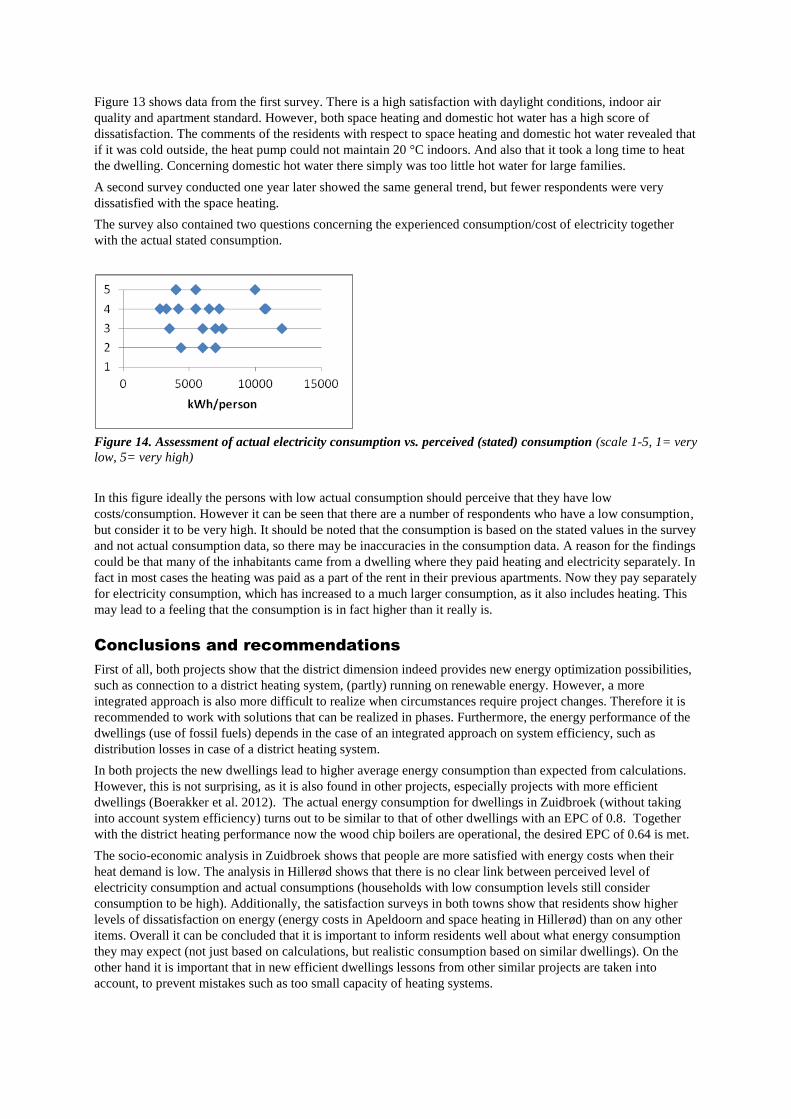
Figure 13 shows data from the first survey. There is a high satisfaction with daylight conditions, indoor air
quality and apartment standard. However, both space heating and domestic hot water has a high score of
dissatisfaction. The comments of the residents with respect to space heating and domestic hot water revealed that
if it was cold outside, the heat pump could not maintain 20 °C indoors. And also that it took a long time to heat
the dwelling. Concerning domestic hot water there simply was too little hot water for large families.
A second survey conducted one year later showed the same general trend, but fewer respondents were very
dissatisfied with the space heating.
The survey also contained two questions concerning the experienced consumption/cost of electricity together
with the actual stated consumption.
Figure 14. Assessment of actual electricity consumption vs. perceived (stated) consumption (scale 1-5, 1= very
low, 5= very high)
In this figure ideally the persons with low actual consumption should perceive that they have low
costs/consumption. However it can be seen that there are a number of respondents who have a low consumption,
but consider it to be very high. It should be noted that the consumption is based on the stated values in the survey
and not actual consumption data, so there may be inaccuracies in the consumption data. A reason for the findings
could be that many of the inhabitants came from a dwelling where they paid heating and electricity separately. In
fact in most cases the heating was paid as a part of the rent in their previous apartments. Now they pay separately
for electricity consumption, which has increased to a much larger consumption, as it also includes heating. This
may lead to a feeling that the consumption is in fact higher than it really is.
Conclusions and recommendations
First of all, both projects show that the district dimension indeed provides new energy optimization possibilities,
such as connection to a district heating system, (partly) running on renewable energy. However, a more
integrated approach is also more difficult to realize when circumstances require project changes. Therefore it is
recommended to work with solutions that can be realized in phases. Furthermore, the energy performance of the
dwellings (use of fossil fuels) depends in the case of an integrated approach on system efficiency, such as
distribution losses in case of a district heating system.
In both projects the new dwellings lead to higher average energy consumption than expected from calculations.
However, this is not surprising, as it is also found in other projects, especially projects with more efficient
dwellings (Boerakker et al. 2012). The actual energy consumption for dwellings in Zuidbroek (without taking
into account system efficiency) turns out to be similar to that of other dwellings with an EPC of 0.8. Together
with the district heating performance now the wood chip boilers are operational, the desired EPC of 0.64 is met.
The socio-economic analysis in Zuidbroek shows that people are more satisfied with energy costs when their
heat demand is low. The analysis in Hillerød shows that there is no clear link between perceived level of
electricity consumption and actual consumptions (households with low consumption levels still consider
consumption to be high). Additionally, the satisfaction surveys in both towns show that residents show higher
levels of dissatisfaction on energy (energy costs in Apeldoorn and space heating in Hillerød) than on any other
items. Overall it can be concluded that it is important to inform residents well about what energy consumption
they may expect (not just based on calculations, but realistic consumption based on similar dwellings). On the
other hand it is important that in new efficient dwellings lessons from other similar projects are taken into
account, to prevent mistakes such as too small capacity of heating systems.

Overall one could say that the SORCER project delivered, apart from showcasing several approaches to low-
carbon neighbourhoods:
Better insight into the critical parameters of popular approaches to low-carbon heating, i.e. district heating
and air to air heat pumps
Improved understanding of residents perception of energy cost
References
Ecofys, 2004. “Evaluation climate policy built environment 1995-2002 “
Boerakker, Y., and Stoops, J. (2012).” Building Energy Standards Can Fail to Deliver Expected Savings”
Glossary
CHP Combined Heat and Power
E2BA Energy-efficient Buildings Association
EBPD Energy Performance of Buildings Directive
EGE Equivalent Generation Efficiency
EPC Energy Performance Coefficient
DH District Heating
FP Framework Programme
PV Photo-Voltaics