Embed Size (px)
Citation preview
EnergySector.in
Rewave Infra Solutions
Demand
and Supply
ofCoali
nIndia
Industry Information
Insights 2014
Table ofContents
2
Coal Reserves 3Coal Production 6Coal Imports 10Coal Consumption 12
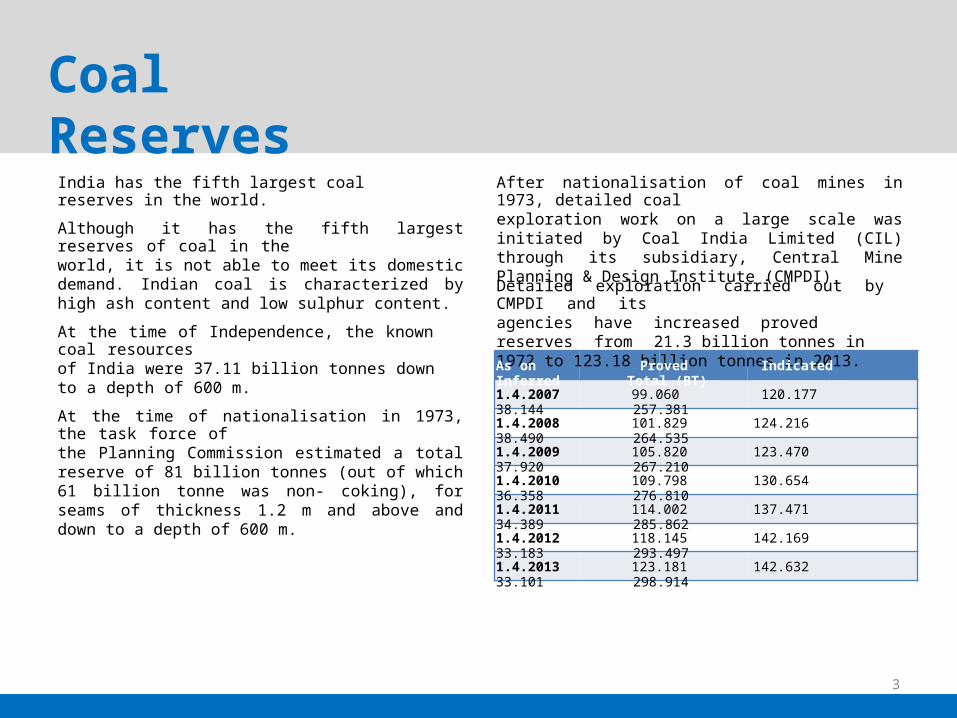
Coal ReservesIndia has the fifth largest coal reserves in the world.
After nationalisation of coal mines in 1973, detailed coalexploration work on a large scale was initiated by Coal India Limited (CIL) through its subsidiary, Central Mine Planning & Design Institute (CMPDI).
Although it has the fifth largest reserves of coal in theworld, it is not able to meet its domestic demand. Indian coal is characterized by high ash content and low sulphur content.
Detailed exploration carried out by CMPDI and itsagencies have increased proved reserves from 21.3 billion tonnes in 1972 to 123.18 billion tonnes in 2013.
At the time of Independence, the known coal resourcesof India were 37.11 billion tonnes down to a depth of 600 m.At the time of nationalisation in 1973, the task force ofthe Planning Commission estimated a total reserve of 81 billion tonnes (out of which 61 billion tonne was non- coking), for seams of thickness 1.2 m and above and down to a depth of 600 m.
3
As on Proved Indicated Inferred Total (BT)1.4.2007 99.060 120.177 38.144 257.3811.4.2008 101.829 124.216 38.490 264.5351.4.2009 105.820 123.470 37.920 267.2101.4.2010 109.798 130.654 36.358 276.8101.4.2011 114.002 137.471 34.389 285.8621.4.2012 118.145 142.169 33.183 293.4971.4.2013 123.181 142.632 33.101 298.914
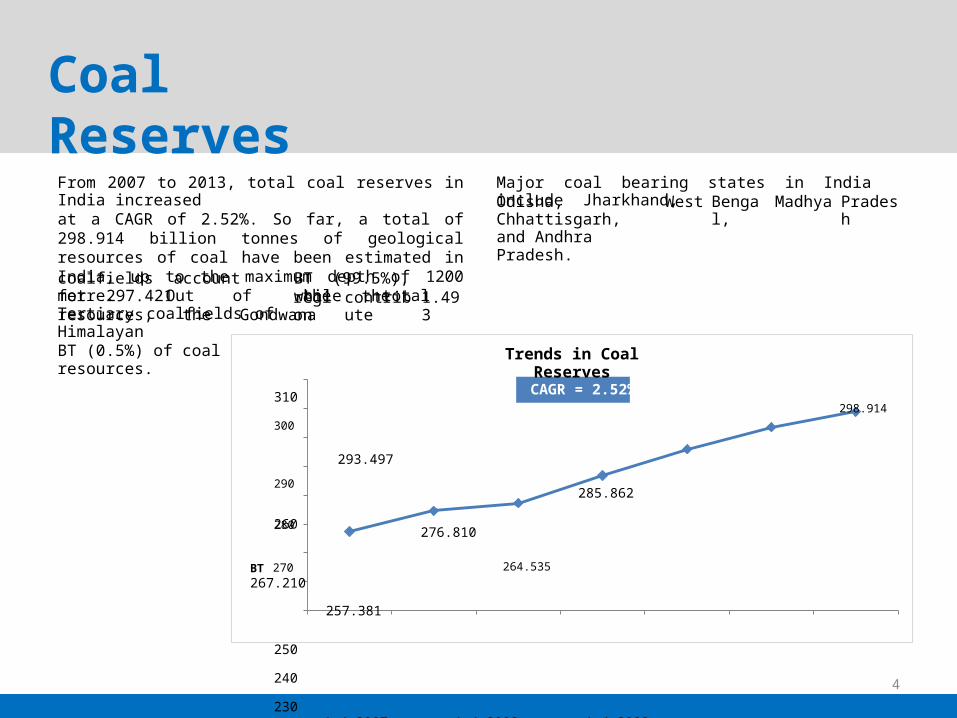
Coal ReservesFrom 2007 to 2013, total coal reserves in India increasedat a CAGR of 2.52%. So far, a total of 298.914 billion tonnes of geological resources of coal have been estimated in India, up to the maximum depth of 1200 metre. Out of the total resources, the Gondwana
Major coal bearing states in India include Jharkhand,Odisha, Chhattisgarh,and Andhra Pradesh.
West Bengal,
Madhya Pradesh
coalfields account for 297.421Tertiary coalfields of HimalayanBT (0.5%) of coal resources.
BT (99.5%), while theregion
contribute
1.493
260
4
CAGR = 2.52% 298.914
Trends in Coal Reserves
310
300 293.497290 285.862
280 276.810
BT 270 264.535 267.210
257.381
250
240
2301.4.2007 1.4.2008 1.4.2009 1.4.2010 1.4.2011 1.4.2012 1.4.2013
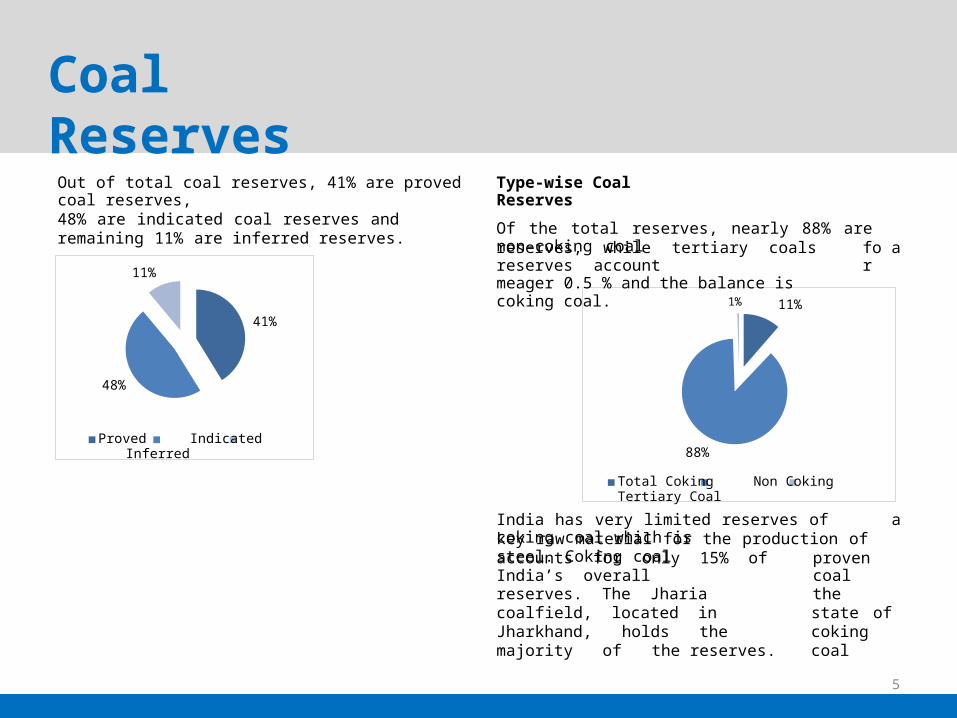
Coal ReservesOut of total coal reserves, 41% are proved coal reserves,48% are indicated coal reserves and remaining 11% are inferred reserves.
Type-wise Coal ReservesOf the total reserves, nearly 88% are non-coking coalreserves, while tertiary coals reserves accountmeager 0.5 % and the balance is coking coal.
for
a
India has very limited reserves of coking coal which is
akey raw material for the production of steel. Coking coalaccounts for only 15% of India’s overallreserves. The Jharia coalfield, located in Jharkhand, holds the majority of the reserves.
proven coalthe state of coking coal
5
1% 11%
88%
Total Coking Non Coking Tertiary Coal
11%
41%
48%
Proved Indicated Inferred
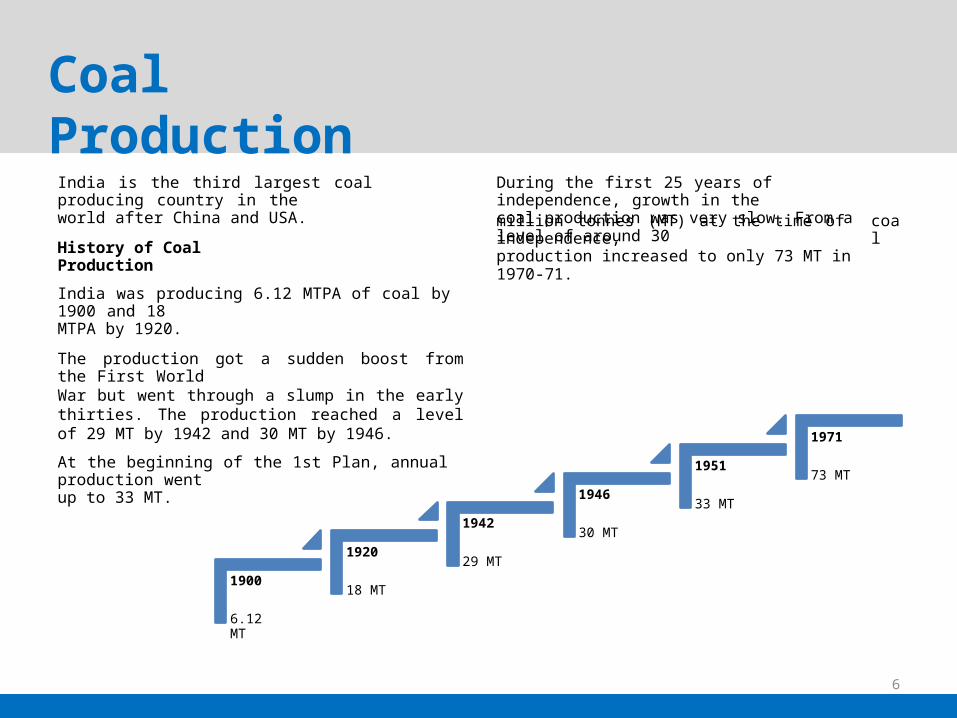
Coal ProductionIndia is the third largest coal producing country in theworld after China and USA.
During the first 25 years of independence, growth in thecoal production was very slow. From a level of around 30million tonnes (MT) at the time of independence,production increased to only 73 MT in 1970-71.
coalHistory of Coal
ProductionIndia was producing 6.12 MTPA of coal by 1900 and 18MTPA by 1920.The production got a sudden boost from the First WorldWar but went through a slump in the early thirties. The production reached a level of 29 MT by 1942 and 30 MT by 1946. 1971At the beginning of the 1st Plan, annual production wentup to 33 MT.
1951 73 MT1946 33 MT
1942 30 MT1920 29 MT
1900 18 MT
6.12 MT
6
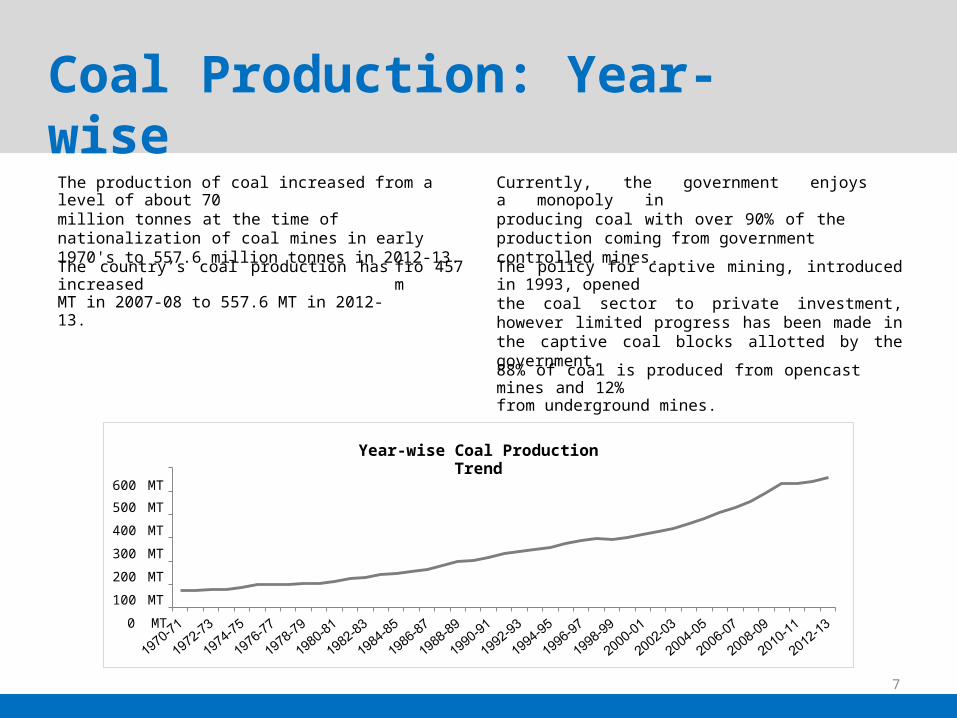
Coal Production: Year-wiseThe production of coal increased from a level of about 70million tonnes at the time of nationalization of coal mines in early 1970's to 557.6 million tonnes in 2012-13.
Currently, the government enjoys a monopoly inproducing coal with over 90% of the production coming from government controlled mines.The country’s coal production has
increasedMT in 2007-08 to 557.6 MT in 2012-13.
from
457 The policy for captive mining, introduced in 1993, openedthe coal sector to private investment, however limited progress has been made in the captive coal blocks allotted by the government.88% of coal is produced from opencast mines and 12%from underground mines.
7
Year-wise Coal Production Trend
600 MT500 MT400 MT300 MT200 MT100 MT0 MT
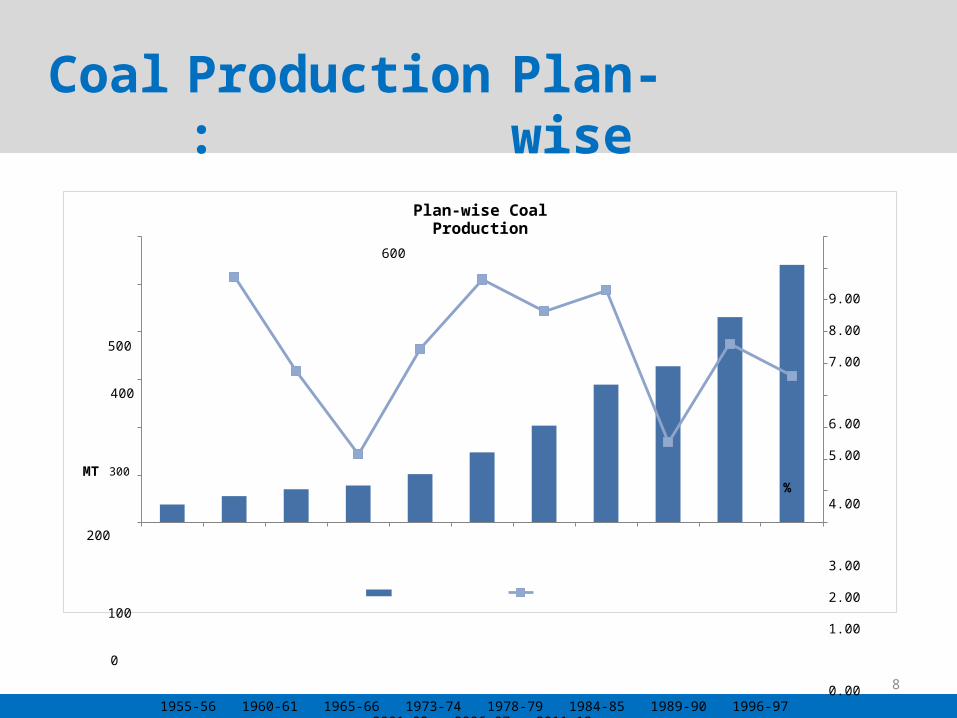
Coal Production:
Plan-wise
8
Plan-wise Coal Production
600
9.00
8.00500
7.00
400
6.00
5.00MT 300
%4.00
200
3.00
2.00100
1.00
0
0.001955-56 1960-61 1965-66 1973-74 1978-79 1984-85 1989-90 1996-97
2001-02 2006-07 2011-12Terminal Year of
FYP
Production (MT) CAGR (%)
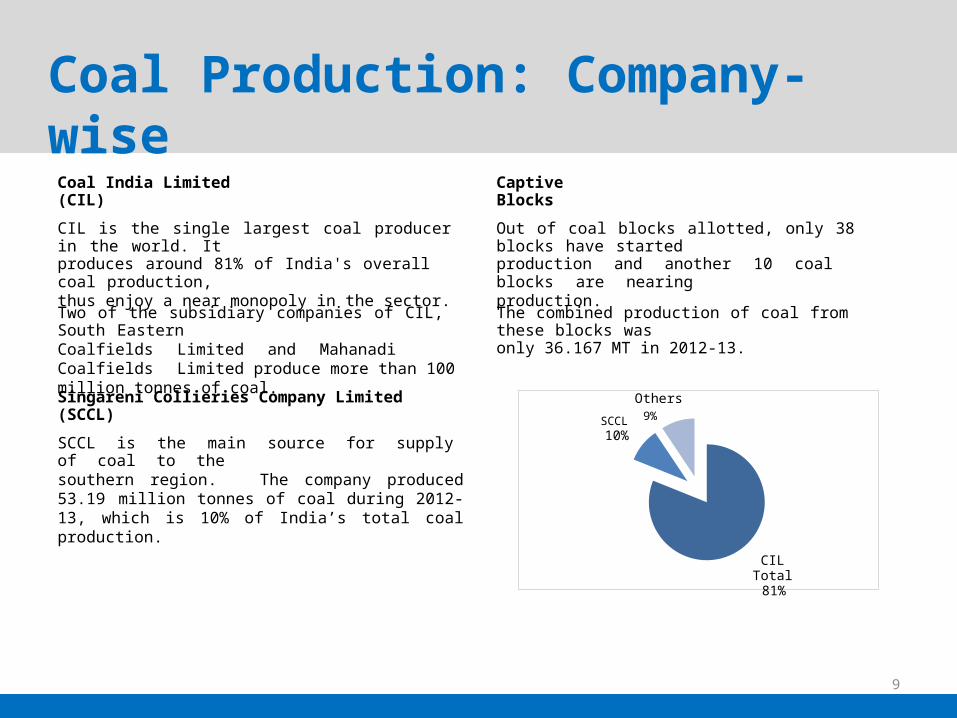
Coal Production: Company-wiseCoal India Limited (CIL)
Captive Blocks
CIL is the single largest coal producer in the world. Itproduces around 81% of India's overall coal production,thus enjoy a near monopoly in the sector.
Out of coal blocks allotted, only 38 blocks have startedproduction and another 10 coal blocks are nearingproduction.Two of the subsidiary companies of CIL,
South EasternCoalfields Limited and Mahanadi Coalfields Limited produce more than 100 million tonnes of coal.
The combined production of coal from these blocks wasonly 36.167 MT in 2012-13.
Singareni Collieries Company Limited (SCCL)SCCL is the main source for supply of coal to thesouthern region. The company produced 53.19 million tonnes of coal during 2012-13, which is 10% of India’s total coal production.
9
OthersSCCL 9%10%
CIL Total81%
Coal ImportAs per the present Import policy, coal can be freelyimported under Open General License by the consumers
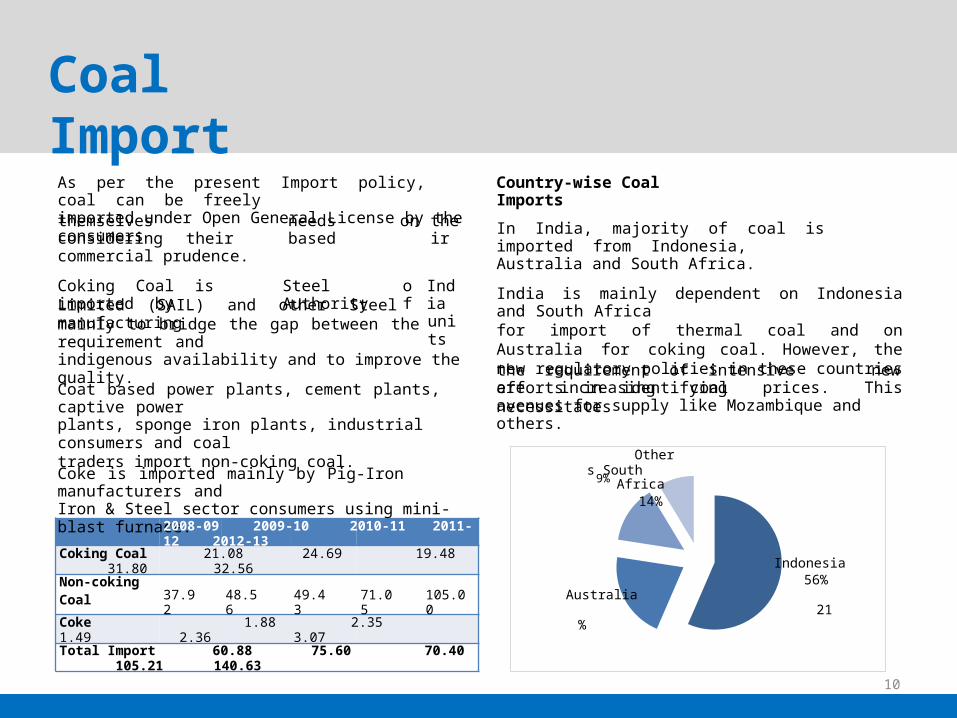
Country-wise Coal Imports
themselves considering theircommercial prudence.
needs based
on their In India, majority of coal is
imported from Indonesia,Australia and South Africa.
Coking Coal is imported by
Steel Authority
of
Indiaunits
India is mainly dependent on Indonesia and South Africafor import of thermal coal and on Australia for coking coal. However, the new regulatory policies in these countries are increasing coal prices. This necessitates
Limited (SAIL) and other Steel manufacturingmainly to bridge the gap between the requirement andindigenous availability and to improve the quality. the requirement of intensive
efforts in identifyingavenues for supply like Mozambique and others.
newCoat based power plants, cement plants, captive powerplants, sponge iron plants, industrial consumers and coaltraders import non-coking coal.Coke is imported mainly by Pig-Iron manufacturers andIron & Steel sector consumers using mini-blast furnace.
37.92
48.56
49.43
71.05
105.00
10
2008-09 2009-10 2010-11 2011-12 2012-13
Coking Coal 21.08 24.69 19.48 31.80 32.56Non-cokingCoalCoke 1.88 2.35 1.49 2.36 3.07Total Import 60.88 75.60 70.40 105.21 140.63
Others South 9% Africa
14%
Indonesia56%
Australia21
%
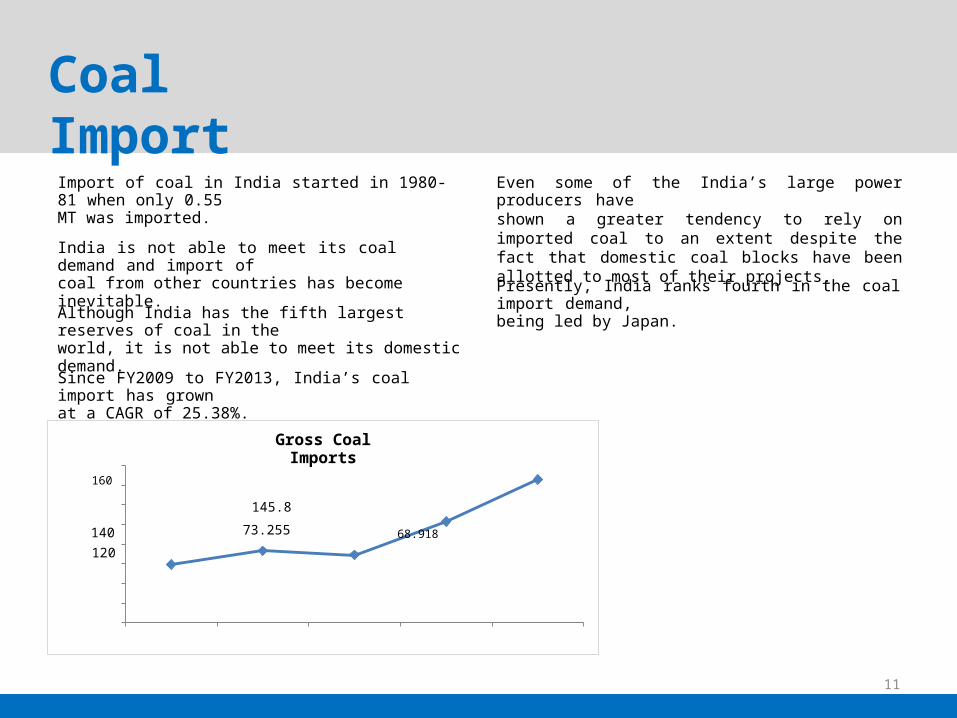
Coal ImportImport of coal in India started in 1980-81 when only 0.55MT was imported.
Even some of the India’s large power producers haveshown a greater tendency to rely on imported coal to an extent despite the fact that domestic coal blocks have been allotted to most of their projects.
India is not able to meet its coal demand and import ofcoal from other countries has become inevitable.
Presently, India ranks fourth in the coal import demand,being led by Japan.Although India has the fifth largest
reserves of coal in theworld, it is not able to meet its domestic demand.Since FY2009 to FY2013, India’s coal import has grownat a CAGR of 25.38%.
11
73.255 68.918
Gross Coal Imports
160 145.8140120 102.850100
MT 80 59.003
6040200
2008-09 2009-10 2010-11 2011-12 2012-13
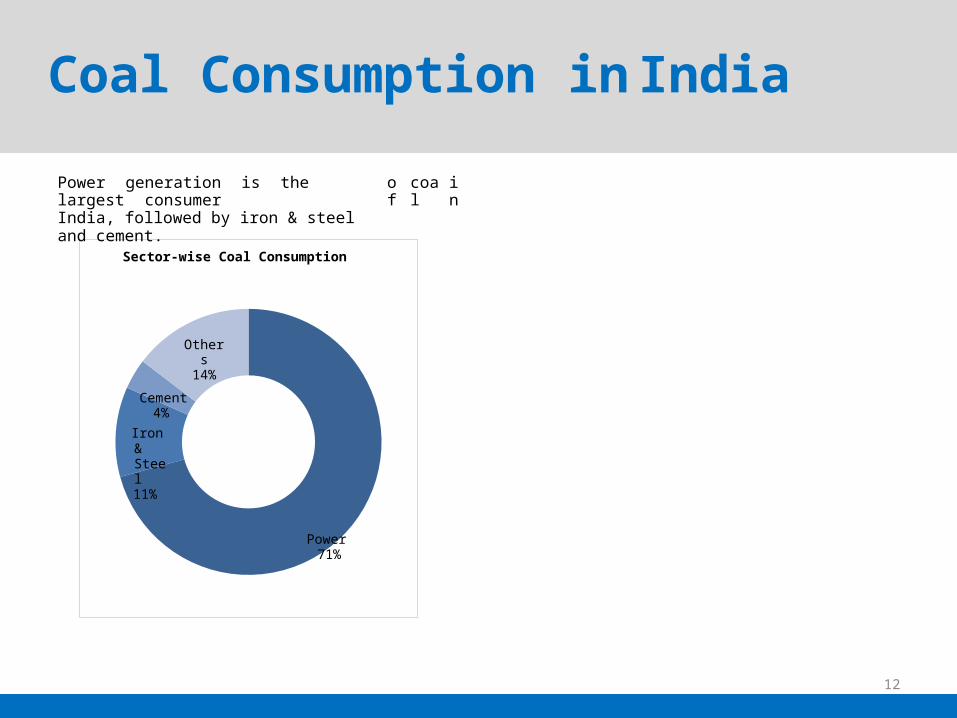
Coal Consumption inIndiaPower generation is the largest consumerIndia, followed by iron & steel and cement.
of
coal
in
12
Sector-wise Coal Consumption
Others14%
Cement4%
Iron & Steel11%
Power71%
I
ng
I
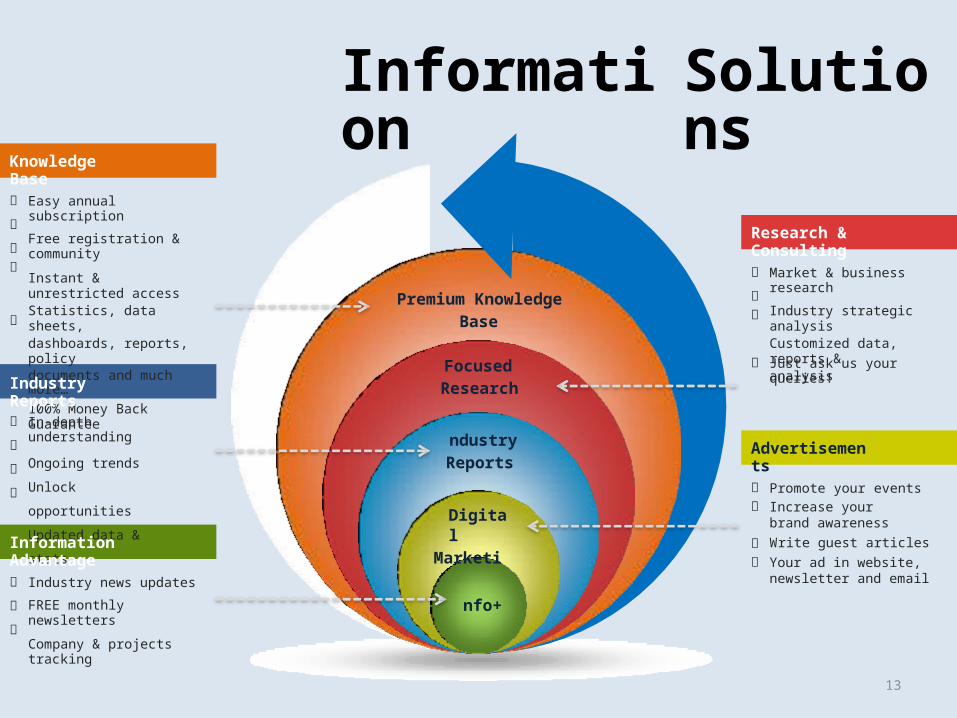
Information
Solutions
Knowledge Base
Easy annual subscriptionFree registration & communityInstant & unrestricted access Statistics, data sheets, dashboards, reports, policydocuments and much more…100% Money Back Guarantee
Research & Consulting
Market & business researchIndustry strategic analysis Customized data, reports & analysis
Premium KnowledgeBase
Just ask us your queries!
FocusedResearchIndustry
Reports
In-depth understandingOngoing trends Unlock opportunities Updated data & stats
ndustryReports
Advertisements
Promote your eventsIncrease your brand awarenessWrite guest articlesYour ad in website, newsletter and email
Digital
MarketiInformation Advantage
Industry news updatesFREE monthly newslettersCompany & projects tracking
nfo+
13

Information is
the key to success
Rewave Infra Solutions133-D, Mayur Vihar Phase - IIDelhi – 110 091 (India)
Phone: +91-95603-66515E-Mail: [email protected]
14


