Embed Size (px)
Citation preview
30th International Cotton Conference BREMEN
ProceedingsMarch 24 - 27, 2010
EditorFriedrich Marquardt, Bremer Baumwollbörse
Published byFaserinstitut Bremen e.V. and Bremer Baumwollbörse
Am Biologischen Garten 2, 28359 BremenTel.: +49 421 218-9329
E-mail: [email protected]
Wachtstr. 17-24, 28195 BremenTel.: +49 421 339700E-mail: [email protected]
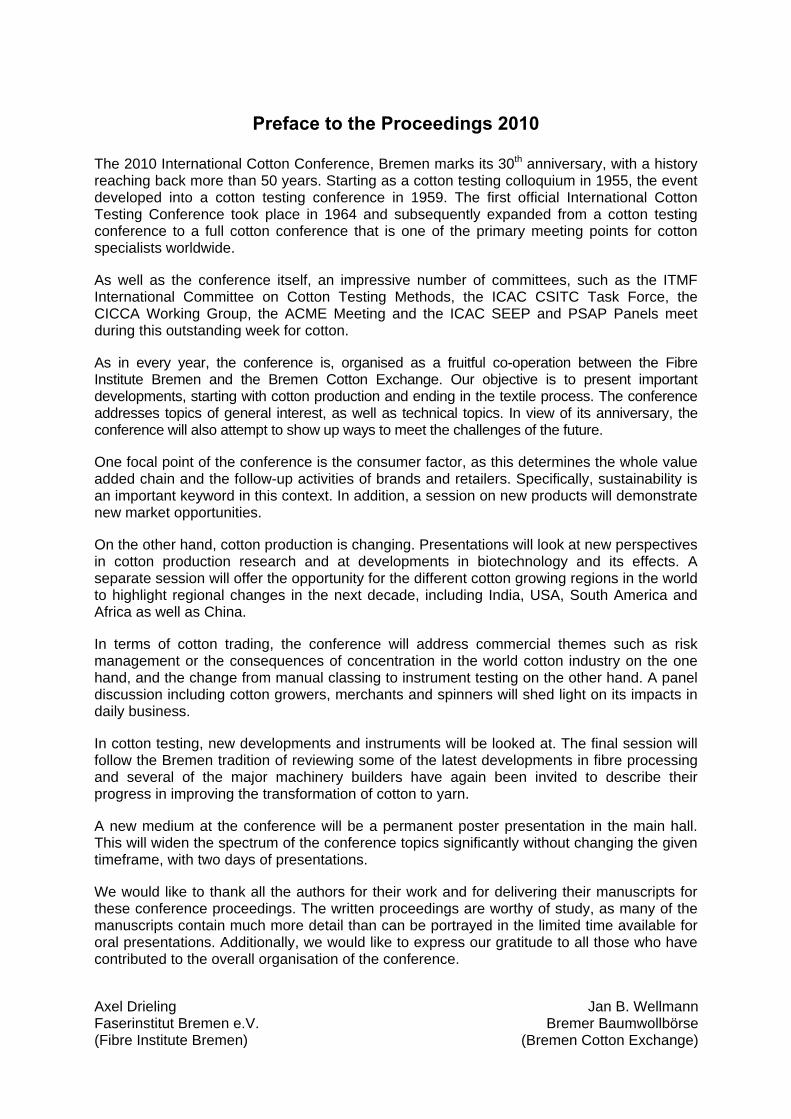
Preface to the Proceedings 2010 The 2010 International Cotton Conference, Bremen marks its 30th anniversary, with a history reaching back more than 50 years. Starting as a cotton testing colloquium in 1955, the event developed into a cotton testing conference in 1959. The first official International Cotton Testing Conference took place in 1964 and subsequently expanded from a cotton testing conference to a full cotton conference that is one of the primary meeting points for cotton specialists worldwide. As well as the conference itself, an impressive number of committees, such as the ITMF International Committee on Cotton Testing Methods, the ICAC CSITC Task Force, the CICCA Working Group, the ACME Meeting and the ICAC SEEP and PSAP Panels meet during this outstanding week for cotton. As in every year, the conference is, organised as a fruitful co-operation between the Fibre Institute Bremen and the Bremen Cotton Exchange. Our objective is to present important developments, starting with cotton production and ending in the textile process. The conference addresses topics of general interest, as well as technical topics. In view of its anniversary, the conference will also attempt to show up ways to meet the challenges of the future. One focal point of the conference is the consumer factor, as this determines the whole value added chain and the follow-up activities of brands and retailers. Specifically, sustainability is an important keyword in this context. In addition, a session on new products will demonstrate new market opportunities. On the other hand, cotton production is changing. Presentations will look at new perspectives in cotton production research and at developments in biotechnology and its effects. A separate session will offer the opportunity for the different cotton growing regions in the world to highlight regional changes in the next decade, including India, USA, South America and Africa as well as China. In terms of cotton trading, the conference will address commercial themes such as risk management or the consequences of concentration in the world cotton industry on the one hand, and the change from manual classing to instrument testing on the other hand. A panel discussion including cotton growers, merchants and spinners will shed light on its impacts in daily business. In cotton testing, new developments and instruments will be looked at. The final session will follow the Bremen tradition of reviewing some of the latest developments in fibre processing and several of the major machinery builders have again been invited to describe their progress in improving the transformation of cotton to yarn. A new medium at the conference will be a permanent poster presentation in the main hall. This will widen the spectrum of the conference topics significantly without changing the given timeframe, with two days of presentations. We would like to thank all the authors for their work and for delivering their manuscripts for these conference proceedings. The written proceedings are worthy of study, as many of the manuscripts contain much more detail than can be portrayed in the limited time available for oral presentations. Additionally, we would like to express our gratitude to all those who have contributed to the overall organisation of the conference. Axel Drieling Jan B. Wellmann Faserinstitut Bremen e.V. Bremer Baumwollbörse (Fibre Institute Bremen) (Bremen Cotton Exchange)
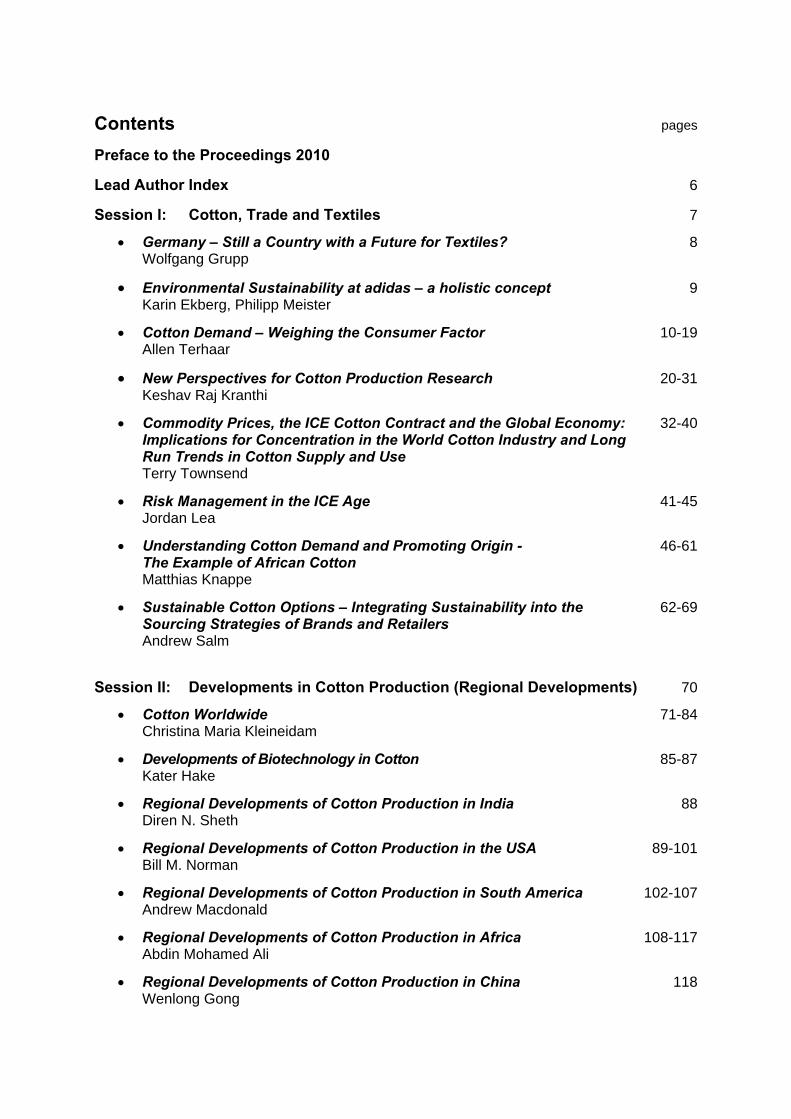
Contents pages Preface to the Proceedings 2010 Lead Author Index 6 Session I: Cotton, Trade and Textiles 7
• Germany – Still a Country with a Future for Textiles? 8 Wolfgang Grupp
• Environmental Sustainability at adidas – a holistic concept 9 Karin Ekberg, Philipp Meister
• Cotton Demand – Weighing the Consumer Factor 10-19 Allen Terhaar
• New Perspectives for Cotton Production Research 20-31 Keshav Raj Kranthi
• Commodity Prices, the ICE Cotton Contract and the Global Economy: 32-40 Implications for Concentration in the World Cotton Industry and Long Run Trends in Cotton Supply and Use Terry Townsend
• Risk Management in the ICE Age 41-45 Jordan Lea
• Understanding Cotton Demand and Promoting Origin - 46-61 The Example of African Cotton Matthias Knappe
• Sustainable Cotton Options – Integrating Sustainability into the 62-69 Sourcing Strategies of Brands and Retailers Andrew Salm
Session II: Developments in Cotton Production (Regional Developments) 70
• Cotton Worldwide 71-84 Christina Maria Kleineidam
• Developments of Biotechnology in Cotton 85-87 Kater Hake
• Regional Developments of Cotton Production in India 88 Diren N. Sheth
• Regional Developments of Cotton Production in the USA 89-101 Bill M. Norman
• Regional Developments of Cotton Production in South America 102-107 Andrew Macdonald
• Regional Developments of Cotton Production in Africa 108-117 Abdin Mohamed Ali
• Regional Developments of Cotton Production in China 118 Wenlong Gong
Contents pages Session III: Panel Discussion – The Impact of Instrument Testing on Cotton Trading 119 Session IV: Developments in Cotton Production (Agrotechnical Aspects) 121
• The ITMF Cotton Contamination Survey 2009 122 Christian Schindler
• What Can We Expect from Biotechnology in the next Decade for 123-131 Cotton Production? Michel Tahar
• Socioeconomic Impact of Genetically Modified Cotton in Developing Countries 132-139 Matin Qaim
• Sustaining Soil Productivity of Cotton-Based Cropping Systems in the 140-145 Savannahs of West and Central Africa: Challenges and Opportunities Michel Cretenet
• The Influence of Modern High Speed Roller- and Saw-ginning Systems 146 on Throughput and Cotton Quality D. P. Whitelock
Session V: Cotton Products 147
• A Spinner’s View on Organic Cotton 148-153 Leo Berginz
• Cotton-based Nonwovens 154-165
Brian Condon
• Directions for Cotton: Market Challenges and Product Opportunities 166 Mark Messura
• Cotton in Technical Applications 167-175
Malgorzata Matusiak
• Utilization of the Specific Cotton Properties for New Products 176-179 Thomas Schneider
Session VI: Cotton Testing and Harmonisation 180
ITMF International Committee on Cotton Testing Methods
• Categorization of Extraneous Matter in Cotton Using Machine 181-189 Vision Systems Derek Whitelock
• Cotton Fiber Moisture Measurement – From the Bale to the Laboratory 190-198
James Rodgers
• New Fiber Length and Strength Tester for Cotton Spinning Mills 199-208 Guntram Kugler, Dean Ethridge
• Developments in Short Fiber Measurements 209-217
James Knowlton
Contents pages
• Developments in Fiber Quality Measurements and On-line Applications 218-219 Hossein Ghorashi
• Maturity and Trash – New Parameters in Premier ART2 220-230 Varadarajan Srinivasan
Session VII: Cotton Processing 231
• New Developments in Blowroom and Carding Technology 232-242 Sabrina Zobel
• A Modular Solution to Combat the Foreign Matter Problem in 243-252 Ginning and Spinning Christoph Färber, Armin Leder
• Airjet Spinning – Technological Interrealation 253-262 Uwe Heitmann
• Autoconer 5: The Significance of Gentle Yarn Handling in 263-269 High Speed Processing Peter G. Gölden
• Texparts® Conversion PLUS – The Customized Modernisation Kit 270-300 Iris Biermann, Joachim Herzig
• Optimal Use of Resources with Compacted Ring Spinning 301-304 Albert Rusch
Poster Presentations 305
• Introducing New Egyptian Cotton Varieties 306 Mohamed A. Aziz
• Global molecular diversity and population structure analysis of 307 G. hirsutum exotic and variety germplasm recources and association mapping of the main fiber quality traits Ibrokim Abdurakhmonov
• Microscopic Imaging for Rapid Measurement of Cotton Maturity 308 Bugao Xu
• Cottonscope – a new instrument for the measurement 309 of cotton maturity Mark Brims
• CSITC Round Trials: 3 Years of Results 310 Axel Drieling
• CSITC Round Trials: Launch of the online round trial system 311 Richard Williams
• Prediction of Yarn Properties using Evaluation Programming 312 Mehmet Dayik
• Measurement of fiber orientation by image analysis 313 Ralf Bäumer
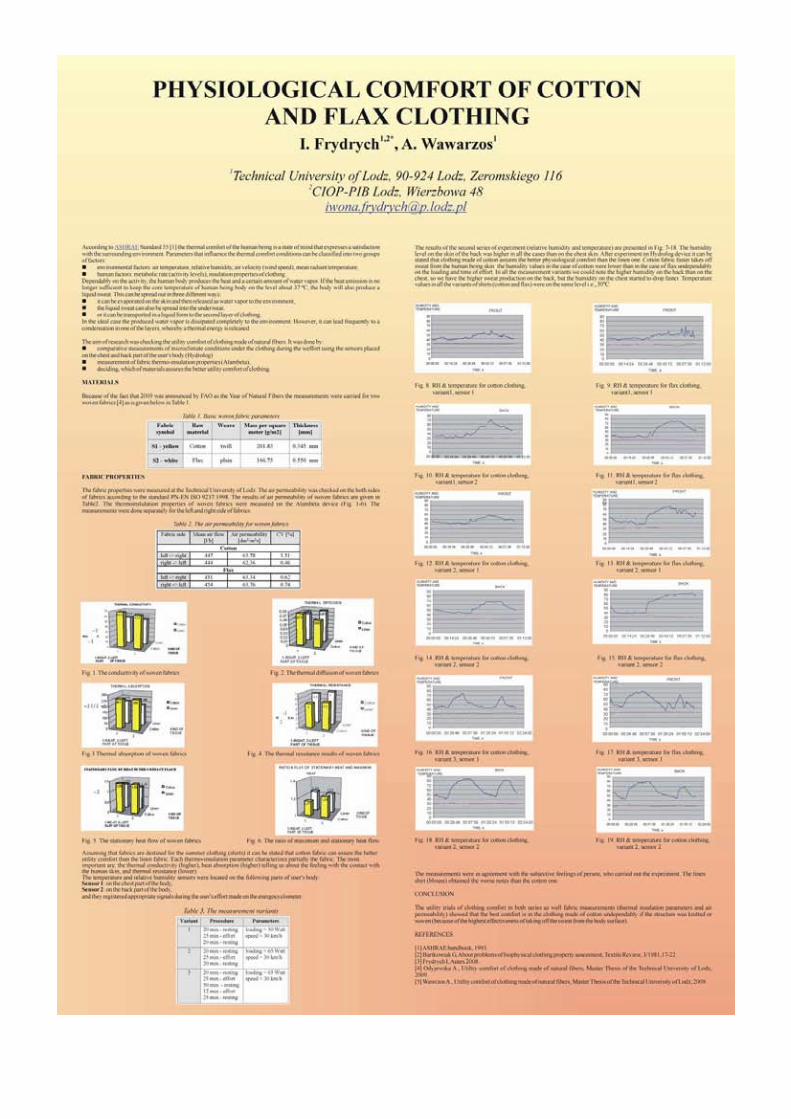
• Physiological Comfort of Cotton and Flax Clothing 314 Owona Frydrich
Ali, Abdin MohamedBerginz, LeoBiermann, IrisCondon, BrianCretenet, MichelEkberg, KarinFärber, ChristophGhorashi, HosseinGong, WenlongGölden, PeterGrupp, WolfgangHake, KaterHeitmann, UweKleineidam, Christina M.Knappe, MatthiasKnowlton, JamesKranthi, Keshav Raj.Kugler, Guntram
Lea, JordanMacdonald, Andrew Matusiak, MalgorzataMessura, MarkNorman, Bill M.Qaim, MatinRodgers, James E.Rusch, AlbertSalm, AndrewSchindler, ChristianSchneider, ThomasSheth, Diren N.Srinivasan, VaradarajanTahar, MichelTerhaar, AllenTownsend, TerryWhitelock, DerekZobel, Sabrina
30th International Cotton Conference BREMEN
Lead Author Index
March 24 - 27, 2010
Session I: Cotton, Trade and Textiles
30th International Cotton Conference BREMEN
March 24 - 27, 2010
Germany - Still a Country with a Future for Textiles?Wolfgang Grupp
Environmental Sustainablilty at adidas - a holistic conceptKarin Ekberg
Cotton Demand - Weighing the Consumer FactorAllen Terhaar
New Perspectives for Cotton Production ResearchKeshav Raj Kranthi
Commodity Prices, the ICE Cotton Contract and the Global Economy: Implications for Concentration in the World Cotton Industry and Long Run Trends in Cotton Supply and UseTerry Townsend
Risk Management in the ICE AgeJordan Lea
Understanding Cotton Demand and Promoting Origin - The Example of African CottonMatthias Knappe
Sustainable Cotton Options - Integrating Sustainability into the Sourcing Strategies of Brands and RetailersAndrew Salm
•
•
•
•
•
•
•
•

GERMANY – STILL A COUNTRY WITH A FUTURE FOR TEXTILES?
Short Statement from Wolfgang Grupp Trigema GmbH & Co. KG, Burladingen
Our economy needs our German jobs, together with our domestic production. As a location, Germany offers enough chances. We just have to use them. However, in future, our economy will also need less and less jobs! Therefore, we businessmen of all sectors are obliged not to avoid the problems by relocating abroad, but to deal with these problems and to include our fellow men in this process! It cannot be that more and more jobs are being moved abroad due to the failure of many businessmen and that our young people no longer have any perspective! In economic terms, unemployed people who are willing to work are the cheapest source of manpower for our economy! We now need again the so-called “founder entrepreneurs” with discipline, achievement, responsibility, example and motivation! We do not need businessmen who just sit in their chairs and strive only for money and power! Achievement must be rewarded again! The jobs that are relocated abroad for cost reasons are lost for Germany and clearly represent a reduction in the workforce in this country. Moreover, German producers should know that when they move jobs to a new country they are, in the long term, giving up their role as a producer, as wage costs in that country will also at some time become too expensive! Or he will become a wandering producer, moving from one low-wage country to another, leaving behind in these countries a whole host of competitors and he will also be overburdened by the constant new investment! However, if he wishes to keep his producer role, he will have to deal with the supposed problems of high German wage costs. He will then soon notice that the cause of his problems are not the high wage costs, but the non-use of these costs, i.e. not using his company to full capacity due to the senseless striving for market share and the failure to recognise change! When I am asked, if Germany is a location with a future, then I must clearly say: YES, when businesses once again begin to rely on the qualities of our grandfathers, the founder entrepreneurs, who after the war created the economic miracle!
ENVIRONMENTAL SUSTAINABILITY AT ADIDAS – A HOLISTIC CONCEPT
K. Ekberg, P. Meister adidas Global Operations, Herzogenaurach, Germany
ABSTRACT At adidas we have a long history of managing sustainability in our supply chain and products. This presentation will give you the background of our work and our achievements in this area. We will speak about environmental initiatives and programs - ranging from the work in our supply chain over our more sustainable product concepts to how we manage our own in-house environmental footprint for improvement. We will also discuss some of the challenges and opportunities we see on the road to a more sustainable business. INTRODUCTION In our presentation we will cover how adidas approaches sustainability in the value chain. We will give you the overview about our sustainability programmes, and then we will focus on the environmental aspects. We will give you a few examples from throughout the value chain, beginning with products and our adidas Better Place program, we will speak about the selection of sustainable materials and how we assess different materials. We will speak about our supply chain and the whole range of activities and programs we have there and finally we will cover our own operations, what is ‘inside our own walls’. Concluding, we will give you a highlight of our reporting and stakeholder relationships. REFERENCES Read more about Sustainability and our latest Sustainability Report 2009, at www.adidas-group.com/en/sustainability/welcome.aspx Read more about our adidas Better Place programme at www.adidas.com/better-place
COTTON DEMAND – WEIGHING THE CONSUMER FACTOR
A. Terhaar Cotton Council International, Washington, D.C., USA
ABSTRACT This article purports to explain how consumers’ perception of natural fibers, including cotton, affects global cotton consumption and prospects for cotton demand comeback. Examining economic factors, consumer demand statistics, and research into consumer preferences for fiber, and global promotion efforts by Cotton Council International (CCI) and Cotton Incorporated, relationships are drawn between consumer demand for cotton products and the cotton industry’s profitability. This relationship underscores the importance of consumer demand enhancement efforts globally, especially in the face of a weakened economy and increased competition from synthetic fibers. CCI research shows that consumers are predisposed to purchase products made from natural fibers and that promotion efforts can positively effect change in consumer behavior. Implications moving forward are the need for a continual focus on global consumer promotion to improve cotton’s share in the increasing global fiber market, particularly focused on the cotton industry’s progressive sustainability record and cotton’s unique attributes as a natural, renewable fiber. INTRODUCTION As in the past, the global cotton industry’s profitability in the future will rely heavily on consumer demand for cotton products at retail. Without end consumer demand, production surpluses occur, and prices inevitably drop. We saw this clearly during the financial crisis of 2008/09 when faltering demand caused low prices and burdensome stocks in spite of reduced cotton crops. Without a strong demand side of the equation, cotton cannot compete with food and biofuels for acreage, and prices cannot rise to a level that provides adequate market returns to producers. Without a consumer preferring and buying cotton products, manufacturers and brands lose interest and alternative products are placed on retail shelves. When we celebrated 2009 as the International Year of Natural Fibers, the global cotton industry joined hands in bringing recognition to cotton and all natural fibers. As we move into 2010 and beyond, we must not take our eye off the ball. We must continue to engage the global consumer with messages that highlight the natural, renewable and biodegradable benefits of our product. However, we should not be content with the “natural” endowment of our fiber. We must go beyond what nature has provided and work toward true sustainability throughout the cotton supply chain – from growing the fiber, through processing and all the way to the retail shelf. Some major brands and retailers are forcing the question already, with an implied message that if they cannot achieve “sustainability” with cotton, they will do so with other fibers.
Cotton’s competition is clearly synthetic fibers and their consumer products. Although it comes from a non-rapidly renewable resource (petroleum), the synthetic fiber industry is not idly standing by when it comes to arguments regarding sustainability. Instead, the synthetic industry is busy commissioning life-cycle-analysis studies that endeavor to show their fibers and products as superior to natural fibers, all things considered. A similar approach and claims are used by the regenerated cellulose fiber (e.g., rayon, viscose, and bamboo) industry. We must persist in completing research using sound science that refutes those claims, and we must focus our efforts on those aspects of the supply chain where cotton does not yet excel in sustainable practices, ensuring that we become sustainability leaders in those areas as well. Cotton Incorporated and the U.S. industry are investing significantly in this race to sustainability, and the Faserinstitut Bremen (FIBRE) and others are making similar investments. The resulting knowledge and advances should not be limited to technical applications, but must be fully integrated into future consumer demand building activities if cotton is to face the competition from synthetic fibers head on. DOES CONSUMER PREFERENCE EXHIBIT A NATURAL CYCLE? To cotton’s advantage in today’s economy, there appears to be a standard cycle in consumer demand for natural fiber that changes with urbanization and income growth. When societies are agrarian or subsistence, natural fibers, including cotton, tend to dominate in apparel and home textiles. Often these products are manufactured locally using locally available fibers. Hence, consumers a few decades ago in the Soviet Union, India, and China were all predominantly natural fiber consumers prior to the onset of modernization. For example, cotton accounted for 71 percent of total fiber demand among Chinese consumers (Figure 1) and 82 percent among Indian consumers in 1980. With industrialization and modernization not only is there greater disposable income to spend on more clothing and home textiles, but there also comes a definite shift to what is perceived to be the new and “modern” fibers (e.g., nylon, polyester, rayon, and spandex) often marketed and promoted under brand names such as Tactase, Coolmax, Modal, Tencel, or Elastane. Natural fibers (e.g., wool, cotton, silk, and linen) are all considered to be “old” fibers while this transition is underway. Natural fibers are often more difficult to process because of the inconsistencies of nature, may be higher priced, and are considered by the consumer to be harder to care for and less durable than synthetics. Per capita figures for consumption of synthetic fibers in example countries during the modernization phase tend to increase rapidly, while natural fiber consumption stagnates or even declines.
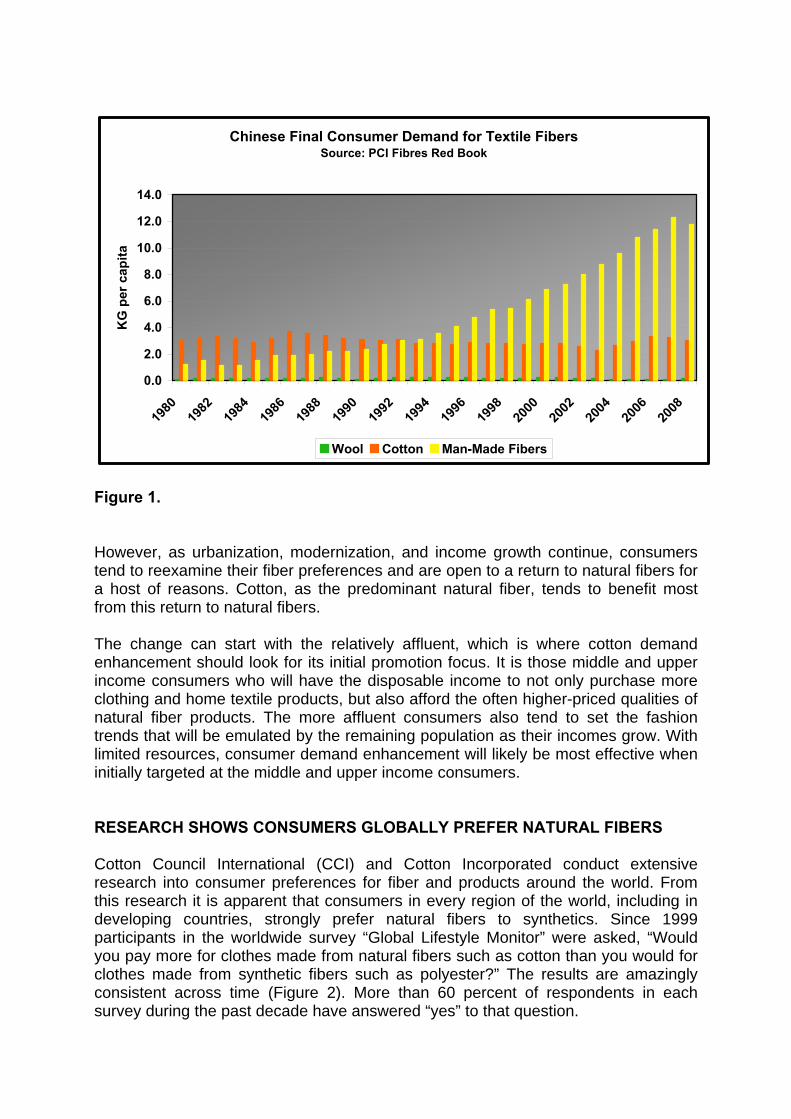
Chinese Final Consumer Demand for Textile FibersSource: PCI Fibres Red Book
0.0
2.0
4.0
6.0
8.0
10.0
12.0
14.0
1980
1982
1984
1986
1988
1990
1992
1994
1996
1998
2000
2002
2004
2006
2008
KG
per
cap
ita
Wool Cotton Man-Made Fibers
Figure 1. However, as urbanization, modernization, and income growth continue, consumers tend to reexamine their fiber preferences and are open to a return to natural fibers for a host of reasons. Cotton, as the predominant natural fiber, tends to benefit most from this return to natural fibers. The change can start with the relatively affluent, which is where cotton demand enhancement should look for its initial promotion focus. It is those middle and upper income consumers who will have the disposable income to not only purchase more clothing and home textile products, but also afford the often higher-priced qualities of natural fiber products. The more affluent consumers also tend to set the fashion trends that will be emulated by the remaining population as their incomes grow. With limited resources, consumer demand enhancement will likely be most effective when initially targeted at the middle and upper income consumers. RESEARCH SHOWS CONSUMERS GLOBALLY PREFER NATURAL FIBERS Cotton Council International (CCI) and Cotton Incorporated conduct extensive research into consumer preferences for fiber and products around the world. From this research it is apparent that consumers in every region of the world, including in developing countries, strongly prefer natural fibers to synthetics. Since 1999 participants in the worldwide survey “Global Lifestyle Monitor” were asked, “Would you pay more for clothes made from natural fibers such as cotton than you would for clothes made from synthetic fibers such as polyester?” The results are amazingly consistent across time (Figure 2). More than 60 percent of respondents in each survey during the past decade have answered “yes” to that question.
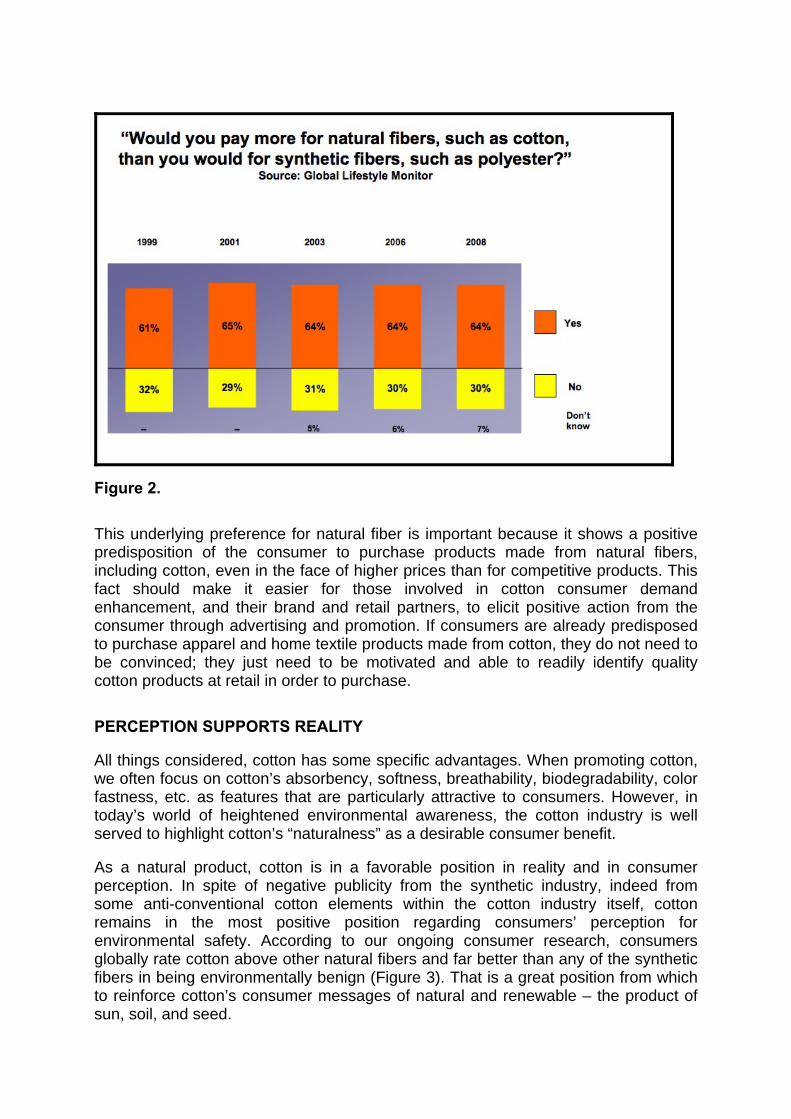
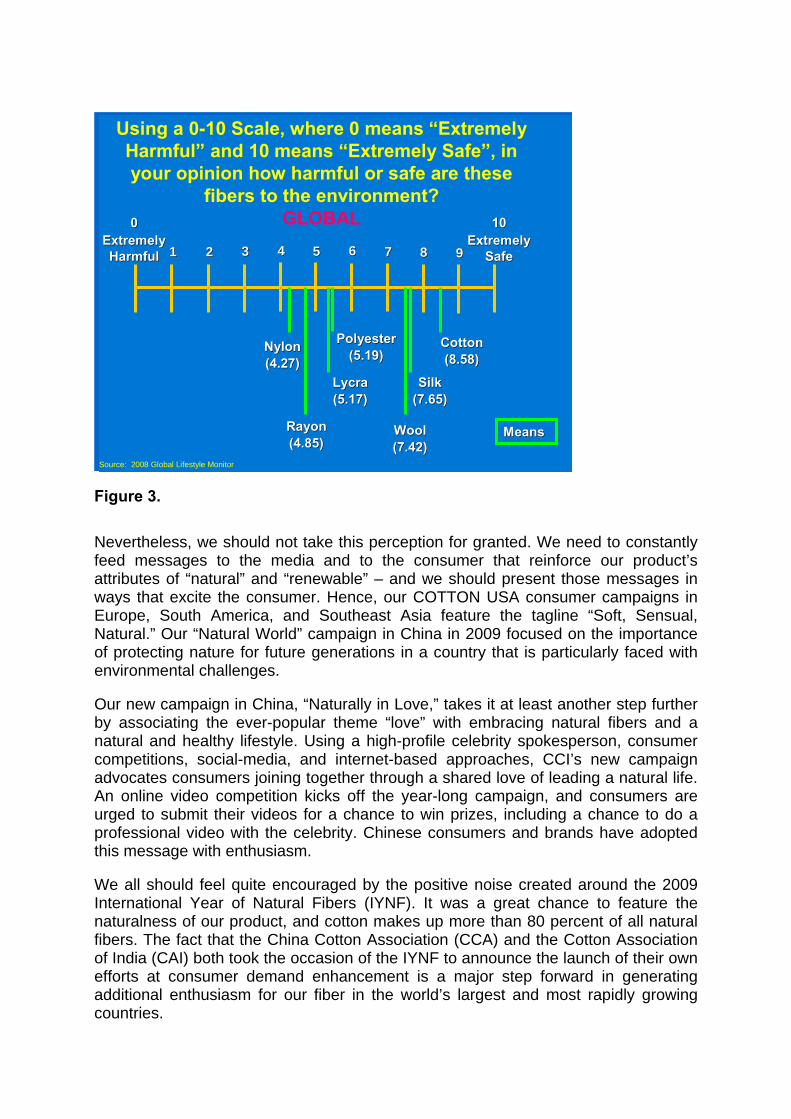
Figure 2. This underlying preference for natural fiber is important because it shows a positive predisposition of the consumer to purchase products made from natural fibers, including cotton, even in the face of higher prices than for competitive products. This fact should make it easier for those involved in cotton consumer demand enhancement, and their brand and retail partners, to elicit positive action from the consumer through advertising and promotion. If consumers are already predisposed to purchase apparel and home textile products made from cotton, they do not need to be convinced; they just need to be motivated and able to readily identify quality cotton products at retail in order to purchase. PERCEPTION SUPPORTS REALITY All things considered, cotton has some specific advantages. When promoting cotton, we often focus on cotton’s absorbency, softness, breathability, biodegradability, color fastness, etc. as features that are particularly attractive to consumers. However, in today’s world of heightened environmental awareness, the cotton industry is well served to highlight cotton’s “naturalness” as a desirable consumer benefit. As a natural product, cotton is in a favorable position in reality and in consumer perception. In spite of negative publicity from the synthetic industry, indeed from some anti-conventional cotton elements within the cotton industry itself, cotton remains in the most positive position regarding consumers’ perception for environmental safety. According to our ongoing consumer research, consumers globally rate cotton above other natural fibers and far better than any of the synthetic fibers in being environmentally benign (Figure 3). That is a great position from which to reinforce cotton’s consumer messages of natural and renewable – the product of sun, soil, and seed.
Using a 0-10 Scale, where 0 means “Extremely Harmful” and 10 means “Extremely Safe”, in your opinion how harmful or safe are these
fibers to the environment?GLOBAL00
Extremely Extremely HarmfulHarmful 11 77 88 99
1010Extremely Extremely
SafeSafe6655443322
SilkSilk(7.65)(7.65)
LycraLycra(5.17)(5.17)
PolyesterPolyester(5.19)(5.19)NylonNylon
(4.27)(4.27)
RayonRayon(4.85)(4.85)
WoolWool(7.42)(7.42)
CottonCotton(8.58)(8.58)
MeansMeans
Source: 2008 Global Lifestyle Monitor Figure 3. Nevertheless, we should not take this perception for granted. We need to constantly feed messages to the media and to the consumer that reinforce our product’s attributes of “natural” and “renewable” – and we should present those messages in ways that excite the consumer. Hence, our COTTON USA consumer campaigns in Europe, South America, and Southeast Asia feature the tagline “Soft, Sensual, Natural.” Our “Natural World” campaign in China in 2009 focused on the importance of protecting nature for future generations in a country that is particularly faced with environmental challenges. Our new campaign in China, “Naturally in Love,” takes it at least another step further by associating the ever-popular theme “love” with embracing natural fibers and a natural and healthy lifestyle. Using a high-profile celebrity spokesperson, consumer competitions, social-media, and internet-based approaches, CCI’s new campaign advocates consumers joining together through a shared love of leading a natural life. An online video competition kicks off the year-long campaign, and consumers are urged to submit their videos for a chance to win prizes, including a chance to do a professional video with the celebrity. Chinese consumers and brands have adopted this message with enthusiasm. We all should feel quite encouraged by the positive noise created around the 2009 International Year of Natural Fibers (IYNF). It was a great chance to feature the naturalness of our product, and cotton makes up more than 80 percent of all natural fibers. The fact that the China Cotton Association (CCA) and the Cotton Association of India (CAI) both took the occasion of the IYNF to announce the launch of their own efforts at consumer demand enhancement is a major step forward in generating additional enthusiasm for our fiber in the world’s largest and most rapidly growing countries.
BRANDS AND RETAILERS WANT TO BELIEVE There is no question that we are in a tough competition for the hearts and pocketbooks of consumers when it comes to “sustainability.” While the consumer will ultimately determine cotton’s demand and its competitiveness vis-à-vis synthetics, we cannot forget the important role that manufacturers, brands, and retailers play in determining the message presented to consumers. Some of these brands and retailers have been fed a heavily biased and inaccurate set of information regarding conventional cotton. We need to replace that incorrect and biased information with facts, and we should let these brands and retailers know what we are doing to further improve cotton’s sustainability record not just at the farm level, but also all the way through the supply chain. Again, the Faserinstitut Bremen (FIBRE) has been active in getting out the facts, including facts about absence of chemical contaminants in both organically- and conventionally-produced cotton fiber. The U.S. cotton industry has made sustainability a major theme of its research and promotion efforts in recent years. In addition to a heavy investment in promising technologies that will make production and processing of cotton more sustainable throughout the supply chain, during 2009/10, CCI and Cotton Incorporated conducted sustainability conferences for Asian, European, and North and South American companies. These conferences presented U.S. and global cotton supply chain sustainability efforts from field to retail shelf to those who are making sourcing decisions. We believe that, when presented with the facts and the appropriate arguments, international brands and will welcome cotton’s leading efforts in sustainability and social responsibility. We also believe that there is a lot to be learned from initiatives underway worldwide to further improve cotton’s record of sustainability, and that these efforts and successes should be communicated not only within the industry, but to brands, retailers, the press, and the consuming public. From our experience in dealing with brands and retailers through these conferences and in one-on-one discussion, we are confident that most brands are interested in the facts. Most brands and retailers do not wish to pursue products that may be sustainable at a niche level but would not be environmentally or socially responsible if brought to the mass market. They want to offer environmentally responsible products to consumers, and they want to do so without significantly raising prices or disrupting the supply chain. They want their sustainability efforts to benefit the broad base of consumers and not just society’s elite, who do not need to worry about price. Many brands and retailers want to believe that cotton and, more specifically, conventional cotton, can be the sustainable fiber of choice. They know their customers prefer cotton products for many uses, and brands and retailers want to be convinced that the cotton industry is doing everything possible to ensure our product’s environmental and social responsibility. We just need to give them the evidence and the arguments. For that reason, the U.S. cotton industry has made sustainability one of its key themes under what we are calling “Vision 21.” Vision 21 is an initiative funded through the Cotton Foundation in the USA. Its name derives from a vision for the 21st century. Its work, for now, is focused on three areas: sustainability, consumer demand research, and cotton flow.
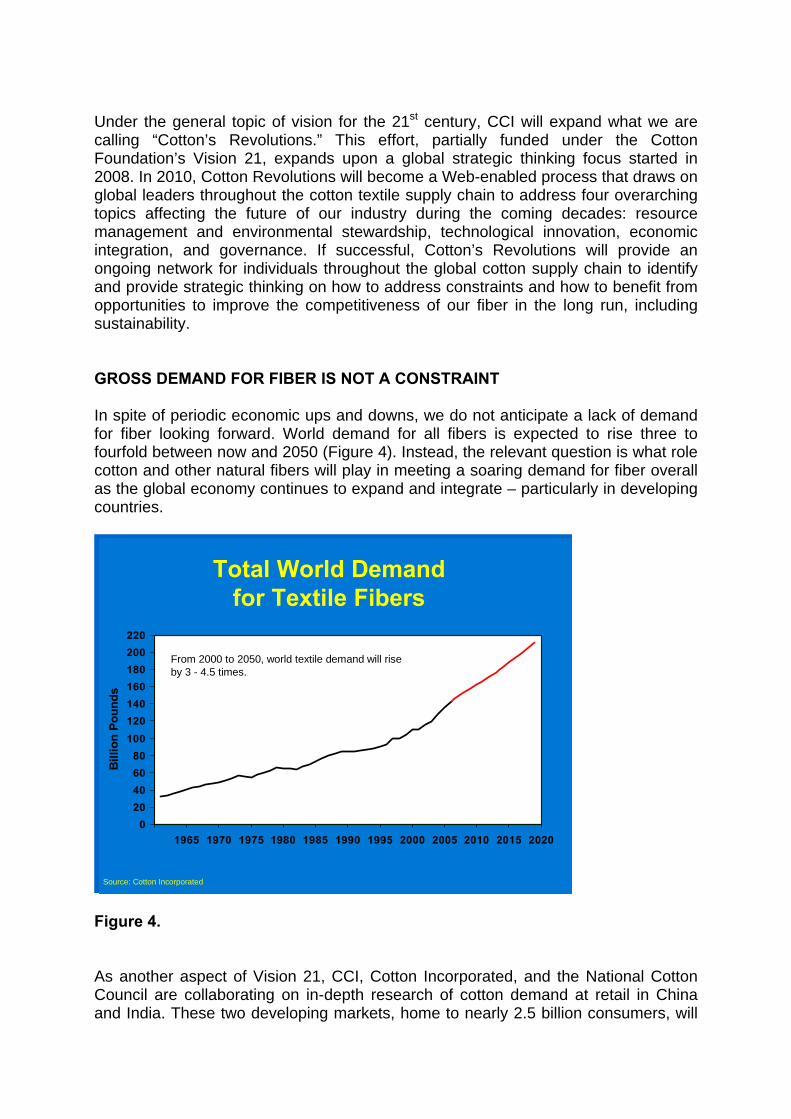
Under the general topic of vision for the 21st century, CCI will expand what we are calling “Cotton’s Revolutions.” This effort, partially funded under the Cotton Foundation’s Vision 21, expands upon a global strategic thinking focus started in 2008. In 2010, Cotton Revolutions will become a Web-enabled process that draws on global leaders throughout the cotton textile supply chain to address four overarching topics affecting the future of our industry during the coming decades: resource management and environmental stewardship, technological innovation, economic integration, and governance. If successful, Cotton’s Revolutions will provide an ongoing network for individuals throughout the global cotton supply chain to identify and provide strategic thinking on how to address constraints and how to benefit from opportunities to improve the competitiveness of our fiber in the long run, including sustainability. GROSS DEMAND FOR FIBER IS NOT A CONSTRAINT In spite of periodic economic ups and downs, we do not anticipate a lack of demand for fiber looking forward. World demand for all fibers is expected to rise three to fourfold between now and 2050 (Figure 4). Instead, the relevant question is what role cotton and other natural fibers will play in meeting a soaring demand for fiber overall as the global economy continues to expand and integrate – particularly in developing countries.
Total World Demand for Textile Fibers
020406080
100120140160180200220
1965 1970 1975 1980 1985 1990 1995 2000 2005 2010 2015 2020
Bill
ion
Poun
ds
From 2000 to 2050, world textile demand will rise by 3 - 4.5 times.
Source: Cotton Incorporated Figure 4. As another aspect of Vision 21, CCI, Cotton Incorporated, and the National Cotton Council are collaborating on in-depth research of cotton demand at retail in China and India. These two developing markets, home to nearly 2.5 billion consumers, will
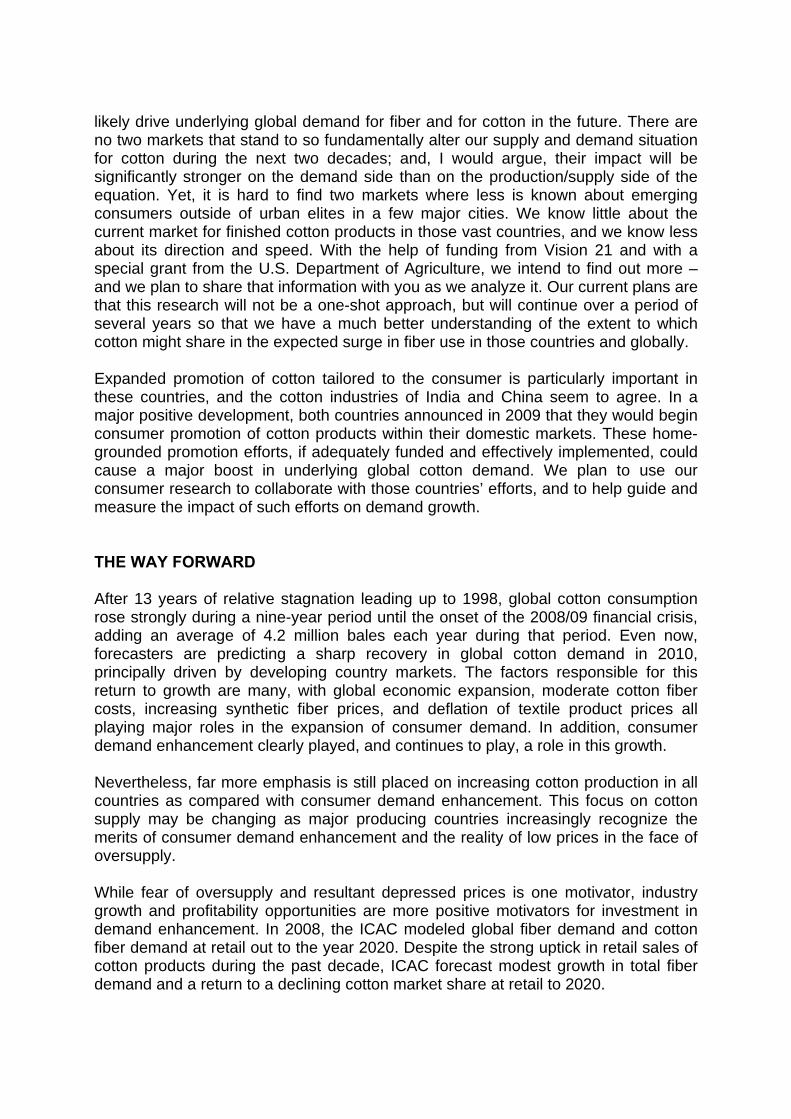
likely drive underlying global demand for fiber and for cotton in the future. There are no two markets that stand to so fundamentally alter our supply and demand situation for cotton during the next two decades; and, I would argue, their impact will be significantly stronger on the demand side than on the production/supply side of the equation. Yet, it is hard to find two markets where less is known about emerging consumers outside of urban elites in a few major cities. We know little about the current market for finished cotton products in those vast countries, and we know less about its direction and speed. With the help of funding from Vision 21 and with a special grant from the U.S. Department of Agriculture, we intend to find out more – and we plan to share that information with you as we analyze it. Our current plans are that this research will not be a one-shot approach, but will continue over a period of several years so that we have a much better understanding of the extent to which cotton might share in the expected surge in fiber use in those countries and globally. Expanded promotion of cotton tailored to the consumer is particularly important in these countries, and the cotton industries of India and China seem to agree. In a major positive development, both countries announced in 2009 that they would begin consumer promotion of cotton products within their domestic markets. These home-grounded promotion efforts, if adequately funded and effectively implemented, could cause a major boost in underlying global cotton demand. We plan to use our consumer research to collaborate with those countries’ efforts, and to help guide and measure the impact of such efforts on demand growth. THE WAY FORWARD After 13 years of relative stagnation leading up to 1998, global cotton consumption rose strongly during a nine-year period until the onset of the 2008/09 financial crisis, adding an average of 4.2 million bales each year during that period. Even now, forecasters are predicting a sharp recovery in global cotton demand in 2010, principally driven by developing country markets. The factors responsible for this return to growth are many, with global economic expansion, moderate cotton fiber costs, increasing synthetic fiber prices, and deflation of textile product prices all playing major roles in the expansion of consumer demand. In addition, consumer demand enhancement clearly played, and continues to play, a role in this growth. Nevertheless, far more emphasis is still placed on increasing cotton production in all countries as compared with consumer demand enhancement. This focus on cotton supply may be changing as major producing countries increasingly recognize the merits of consumer demand enhancement and the reality of low prices in the face of oversupply. While fear of oversupply and resultant depressed prices is one motivator, industry growth and profitability opportunities are more positive motivators for investment in demand enhancement. In 2008, the ICAC modeled global fiber demand and cotton fiber demand at retail out to the year 2020. Despite the strong uptick in retail sales of cotton products during the past decade, ICAC forecast modest growth in total fiber demand and a return to a declining cotton market share at retail to 2020.
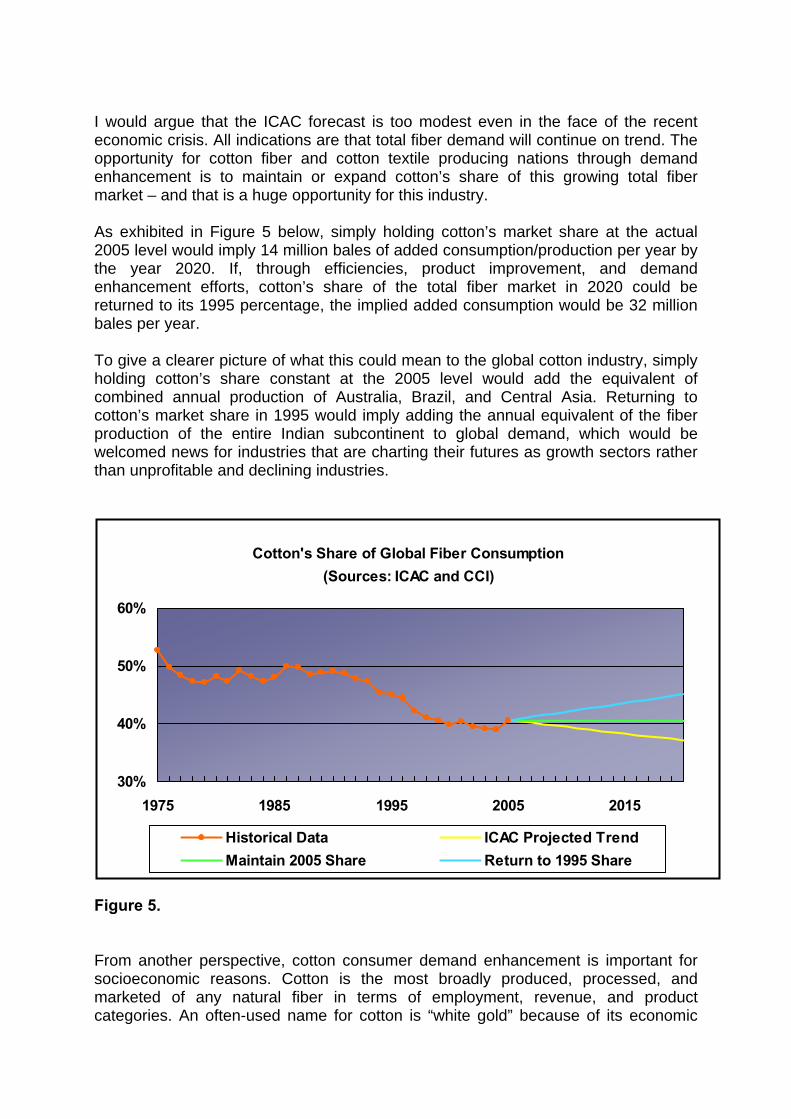
I would argue that the ICAC forecast is too modest even in the face of the recent economic crisis. All indications are that total fiber demand will continue on trend. The opportunity for cotton fiber and cotton textile producing nations through demand enhancement is to maintain or expand cotton’s share of this growing total fiber market – and that is a huge opportunity for this industry. As exhibited in Figure 5 below, simply holding cotton’s market share at the actual 2005 level would imply 14 million bales of added consumption/production per year by the year 2020. If, through efficiencies, product improvement, and demand enhancement efforts, cotton’s share of the total fiber market in 2020 could be returned to its 1995 percentage, the implied added consumption would be 32 million bales per year. To give a clearer picture of what this could mean to the global cotton industry, simply holding cotton’s share constant at the 2005 level would add the equivalent of combined annual production of Australia, Brazil, and Central Asia. Returning to cotton’s market share in 1995 would imply adding the annual equivalent of the fiber production of the entire Indian subcontinent to global demand, which would be welcomed news for industries that are charting their futures as growth sectors rather than unprofitable and declining industries.
Figure 5. From another perspective, cotton consumer demand enhancement is important for socioeconomic reasons. Cotton is the most broadly produced, processed, and marketed of any natural fiber in terms of employment, revenue, and product categories. An often-used name for cotton is “white gold” because of its economic
Cotton's Share of Global Fiber Consumption(Sources: ICAC and CCI)
30%
40%
50%
60%
1975 1985 1995 2005 2015
Historical Data ICAC Projected TrendMaintain 2005 Share Return to 1995 Share
importance to hundreds of millions of families and scores of countries globally. The financial crisis and the UN-endorsed International Year of Natural Fibers brought a renewed realization of the importance of cotton and all natural fibers to economies around the globe. Lack of demand for products made of these fibers can cause severe economic and social hardship throughout the supply chain in rural and urban settings and in both developed and developing countries. Perhaps this realization will result in more focus and more resources in the future being devoted to influencing the consumer to purchase cotton products nationally and internationally to the benefit of the entire cotton supply chain. Given recent interest in expanded consumer demand enhancement efforts around the globe, and particularly in large developing economies, there is reason to be optimistic that the tide has turned and cotton demand can chart an upward course in demand and market share to 2020 and beyond.
NEW PERSPECTIVES FOR COTTON PRODUCTION RESEARCH
K. R. Kranthi Central Institute for Cotton Research, Nagpur, India.
Abstract Recent technologies have immensely benefited cotton production all over the world. Molecular sciences have been providing exciting breakthroughs, especially in cotton improvement for resistance to biotic and abiotic stresses, herbicide resistance and fibre quality enhancement. Several new concepts in pest management have emerged that have great potential to change the way how insects pests, nematodes and pathogens can be managed in a highly precise manner with least effects on non-target flora and fauna. In recent times, new technologies are being invented at a greater frequency than ever before. Insect resistant transgenic crops, RNA interference (RNAi), Mutated genes to overcome insect resistance, molecular signalling, Wolbachia based control, pheromone and pesticide precision application technologies, nanotechnology, Molecular analysis of genetic diversity in crops, allele mining, gene mining, availability of markers for economically important traits, pests, pathogens and organisms of biological control etc., have been signalling a new era in crop improvement. While the new technologies continue to provide appropriate insurance to the crop, there has been an increase in the input costs and decrease in labour availability. Therefore all production research efforts should be oriented towards developing technologies to enhance input use efficiency and reduce drudgery associated with production practices. It is important to focus on research efforts make cotton production more profitable also through enhancement in the value-chain of fiber and cotton byproducts. Introduction Significant breakthroughs in cotton crop production research over the past two decades have resulted in yield enhancement in major cotton growing countries of the world. Cotton is an immensely important crop for the sustainable economy of many countries the Asian, African and American continents. It is cultivated in about 32 M hectares across the world, with majority of the area in India (10 M ha), China (6.3 M ha), USA (3.8 M ha) and Pakistan (3.2 M ha). Productivity and profitability in developing countries of Africa and Asia are declining and need to be improved if cotton has to compete with man-made and synthetic fibers. The main production constraints in these regions are poor soils, rain-fed farming conditions, insect pests and high input costs. Over the past several decades, research efforts through conventional plant breeding methods were focused on development of varieties resistant to biotic and abiotic stress and possessing superior fiber traits. Considerable efforts were also made to develop sustainable integrated pest management (IPM) strategies and site specific soil, water and agronomic management methods. Though production levels increased continuously over a period of time, generally due to improved pest management strategies, these were
not sustainable and were subject to uncertainties. Introduction of bollworm resistant biotech cotton led to reduction in pesticide use and enhanced productivity in many countries. Thus far, biotech cotton varieties resistant to herbicide and bollworms have been approved for commercial cultivation in 12 countries. Biotech cotton continues to be in the forefront, thereby contributing to a constant increase in global cotton productivity which reached a record 797 kg lint per hectare in 2008. The recent increase in productivity, especially in the major cotton growing countries, China, USA and India, has been largely credited to insect resistant biotech cotton that incorporates bollworm-specific-toxin cry (crystal) genes derived from a bacterium called Bacillus thuringiensis. The spectrum of trans-genes to combat biotic stress has been increasing continuously over the past two decades years to include many more genes in biotech cotton to enhance pest and disease control efficacy and also assist in resistance management. The next generation biotech cotton is expected to address various abiotic stresses such as drought, temperature and salt stress. Research efforts are underway to identify and utilize genes that can confer resistance to abiotic stress so that the crop can withstand drought or salt or water-logging or heat or chill or even adapt to climate change. The new technologies have helped farmers to combat the biotic and abiotic uncertainties thus contributing towards making cotton production profitable and sustainable. Resistance to biotic stress Biotech cotton Genetically modified biotech cotton that expresses insecticidal toxin genes from the soil bacterium Bacillus thuringiensis is popularly called Bt-cotton and currently represents an elegant pest management tool that has now been proven world-wide as one of the most ecologically acceptable options of bollworm control. Bollgard cotton (event Mon-531) was first developed by Monsanto, USA through the incorporaton of cry1Ac gene into the cultivar Coker 312, using Agrobacterium tumifasciens. It was first approved for commercial cultivation from 1996 in the US and has thus far been approved for cultivation in 13 countries. Bt cotton was released for cultivation in China, Mexico and Australia in 1997, and later in Argentina (1998), South Africa (1998), Indonesia (2001), India (2002), Colombia (2003), South Korea (2003), Brazil (2005), Burkina-Faso (2008) and Egypt (2009). Currently an estimated 14.5 m hectare area is under Bt-cotton in the world. This accounts for 45% of the total global cotton area (32 m ha). Recently, Cry2Ab and Cry1F have been released in the US for commercial cultivation. Cotton transgenic plants resistant to H. armigera have been developed using the cowpea trypsin inhibitor gene in China. Both genes, ‘Bt toxins’ and ‘protease inhibitors’ used thus far, are extremely specific in their target range and have been conclusively demonstrated to be safe to the environment. Bt-cotton has contributed immensely to pest management mainly by causing a significant reduction in the insecticide use on bollworms. More importantly, farmers in developing countries are no longer stressed with any probable impending bollworm infestation that would have otherwise caused severe damage to the crop and thereby reduce production.
Resistance Management of Biotech Bt-cotton It is important to develop Bt-cotton management strategies so that full benefits from the technology can be harnessed and the technology can be sustainable for the longest possible time. Amongst the several strategies recommended world wide, refugia has been one of the most commonly deployed resistance management strategies. The strategy is based on the fact that if a small defined area of non-trangenic plants is cultivated in close vicinity of the toxin expressing transgenic plants, they serve as hosts of the target insect pests, a major proportion of which would be susceptible insects. These would then serve as reservoirs of the susceptible alleles and when mated with the survivors from transgenic plants would result in heterozygous progeny which would express susceptibility, especially if the resistant alleles are recessive in nature. There have been significant changes in the IRM strategies world over. Since, Bollgard II accounted for more than 80% of the annual plantings in Australia over the past 2-3 years, the regulatory authorities of Australia have stipulated the following refugia conditions for Bollgard II. A grower with 100 ha of Bollgard II has four refuge options. 1) 10 ha unsprayed conventional cotton, 2) 5% irrigated unsprayed pigeon pea, 3) 15% irrigated unsprayed sorghum, and 4) 20% irrigated unsprayed maize. The refuge field has to be within two kilometers of the Bollgard II crop. In the US, the EPA has approved a natural refuge for Bollgard II for Alabama, Arkansas, Florida, Georgia, Kansas, Kentucky, Lousiana, Missouri, Mississippi, North Carolina, Oklahoma, South Carolina, Tennesse, parts of Texas and Virginia. Thus in effect the natural refuge is operational in all the states east of Texas and in most of the counties of Texas. The natural refuge option gives growers a choice to use alternate host crops instead of conventional cotton for refuge purposes. In light of the facts that the Cry1Ac expressed in the current Bt cotton events does not represent ‘high dose’ against the cotton bollworm Helicoverpa armigera and also that the allele conferring bollworm resistance to Cry1Ac, is not extremely rare and is inherited in a semi-dominant manner, it is important to develop resistance management appropriate strategies depending on the genetics, ecology and biology of the pest. More importantly, the strategies should be acceptable to cultivators and should be compatible with the existing cropping systems and management practices. Resistance management approaches generally rely on either conserving susceptibility by minimizing toxin exposure or getting rid of resistant RS and RR genotypes by using either high dose of the same toxin or by using other unrelated toxins. IRM strategies should focus more on the deployment of gene stacks such as the one (Cry1Ac+Cry2Ab) present in Bollgard-II, which has toxin combinations with different modes of action and different mechanisms of resistance and therefore do not show cross-resistance. Other strategies such as non-Bt cotton or pigeonpea as refugia and control of residual larvae on Bt cotton using biopesticides are useful options to delay the onset of resistance and ensure that the benefits of the technology are harnessed for the longest possible time. However, bollworm resistance management strategies have not been followed as prescribed, in many developing countries and the problem needs to addressed on priority. With the exception of the field results of Guo-Ping et al., (2007) in China wherein they confirmed that there was a small increase in the frequency of major,
non-recessive resistance genes to Cry1Ac in H. armigera over time, resistance to Cry1Ac in field populations of any of the lepidopteran insect pests, is yet to be detected in any part of the world, despite the fact that Bt transgenic cotton was being cultivated on a large scale in the U.S, China and Australia over the past ten-twelve years. Novel gene options for pest management There are several sources in nature that have been used to isolate insecticidal genes. Genes from endo-symbiotic bacteria of nematodes, Xenorhabdus and Photorhabdus are being actively considered for the development of transgenic crops. Amongst animal sources, anti-chymotrypsin, anti-elastase, chitinase, cholesterol oxidase and anti-trypsin were isolated from the tobacco hornworm, Manduca Sexta and used to develop biotech cotton resistant to sucking pests and lepidopteran insects. Trypsin inhibitors and spleen inhibitors isolated from cattle, protease inhibitors from plants (Soybean, Barley, Cowpea, squash, mustard, rice, potato, tomato), amylase inhibitor genes from beans and cereals and lectins from plant sources have been used to develop biotech crops resistant to insect pests. Other genes include chitinases, glucanases, peroxidase and tryptophan decarboxylase from various plant sources to develop insect and disease resistant cotton. Replicase genes and coat protein genes have been used to develop leaf curl virus resistant varieties through over-expression of the proteins or silencing of the genes through RNAi, especially for countries in Africa, India and Pakistan where the cotton leaf curl virus (CLCuV) problem can cause severe economic losses. In the context of open market economy, product discovery assumes great significance for developing countries. There is an imminent need to discover/invent/develop novel products for sustainable use in pest management, exploiting the rich biodiversity available in developing countries in the tropics and sub-tropics. An exploratory search for insecticidal plant and microbial species should be carried out. A few recent examples deal with the use of allatotropins, allatostatins, proctolin etc that have a significant effect on several lepidopteran species when consumed. Peptide phage display technology can be used to identify inhibitors for key target sites in insects. The potential of such peptides and neuropeptides for bollworm control has not yet been explored anywhere. The search for the insecticidal proteins should include plant sources (leaves, seeds, roots etc.), microbial organisms (Bacillus, Xenorhabdus, Photorhabditis etc.) and neurohormones from insect species (Helicoverpa, Pectinophora and Earias). The roadmap for such endeavor would start with generation of a database on indigenous toxin resources and generate physical library and thereafter short-listing of candidate material and preliminary insect bioassays. The resources could include native B. thuringiensis strains for the isolation of new toxins. Once toxins are found promising, these can be subjected to biochemical partitioning of the promising material and subsequent bioassays. The most promising genes can be used for the development of transgenic cotton plants. A recent report (Soberon et al., 2007) showed that Cry genes can be modified precisely based on the mechanisms of resistance, so that they can effectively overcome resistance in target pests such as the bollworms through the deployment of modified cry genes which were toxic to Cry toxin resistant bollworms. Alternative
genes (new Cry genes, lectins, protease inhibitors, genes from nematodes etc.) and RNAi based crop protection against insect pests, should be introduced as soon as possible through GM cotton for more effective pest management. Insect resistant GM crops that serve as alternate host plants of cotton bollworms (example, pigeonpea, chickpea, tomato and other vegetables, which are hosts of the cotton bollworm, Helicoverpa armigera) should be developed with genes that are not used in GM cotton. Use of the same Cry genes in all crops will enhance the chances of resistance development in insects to the genes used. Gene silencing for pest management A new biotech cotton variety expresses double stranded dsRNA of an enzyme called P450 monooxygenase CYP6AE14 which digests gossypol and enables bollworms survive on cotton. The cytochrome p450 cyp6AE14 genes of the cotton bollworm were silenced to disable the bollworm from feeding on gossypol in cotton plants (Mao et al., 2007). When bollworm eats the dsRNA the CYP6AE14 enzyme is silenced and undigested gossypol remains in the stomach and kills larvae. The technology has immense potential in pest management that can be sophisticated to the extent of being extremely specific for the control of target pests alone. The RNAi technology is in the forefront of all the ‘state of art’ technologies for pest management. Ever since the publication in Nature, 1998 and the nobel prize awarded to Drs Andrew Fire and Craig Mellow in 2006, for their discovery of dsRNA based silencing of specific genes through RNAi (RNA interference), the technology has fired the imagination of researchers all over the world. Bollworms have been found to have developed resistance to insecticides by over-expressing a few enzymes selectively that degrade insecticides. Some of the examples are, cytochrome p450 (cyp6b7) over expresses in pyrethroid resistant H. armigera; a protease over-expresses in Cry1Ac resistant H. armigera; esterase E9 over expresses in Methomyl resistant H. armigera; and esterase E5 over expresses in quinalphos resistant strains. The genes responsible for insecticide resistance can be effectively silenced throughRNAi so that the inscets show susceptibility to the toxins. Insecticide use on cotton declined significantly after the introduction of Bt cotton. As a consequence, several minor pests have been resurfacing in the cotton ecosystems mainly in India and China. Recent reports show that new pests such as the mirid bugs and mealy bugs have been causing significant economic damage, thereby necessitating the continuance of insecticides for pest management. RNAi should be used to develop insect and disease resistant varieties. The insect resistant products developed through RNAi will give India a competitive edge over other countries that have been developing GM-crops using the technology. Efforts should be made to identify ‘insect-species-specific’ genes present in the insect gut which are functionally important for feeding, digestion and other biological activities. There is a need to identify effective siRNAs and/or miRNAs and their targets. Gene sequences and the novel structures must be explored for their utility for crop protection through conventional or transgenic approaches for the management of cotton insect pests such as the bollworms, mealybugs and new pests.
Biotech crops and allelochemicals that can scare pests It is now been proven that new biotech crops that scare insects can be developed. Insects release chemicals called alarm pheromones when they are scared by their enemies. This warns their colonies to escape. New biotech crops express alarm pheromones that scare the specific insect pests. The alarm pheromone for many species of aphids, which causes dispersion in response to attack by predators or parasitoids, consists of the sesquiterpene (E)-farnesene (Ef). High levels of expression in Arabidopsis thaliana plants of an Efsynthase gene cloned from Mentha piperita were used to cause emission of pure Ef (Beale et al., 2006). These plants elicited potent effects on behavior of the aphid Myzus persicae (alarm and repellent responses) and its parasitoid Diaeretiella rapae (an arrestant response). Insect injury causes signal transduction. The signal transduction pathways leading to the release of plant volatiles have been found to alert other plants in the neighborhood. Jasmine scent reduced populations of jassids, aphids, H. armigera and enhances populations of predators and parasitoids in cotton fields Novel pest scouting gadgets Simple gadgets can be designed to scout insect pests, without having to count any insects. Some plants have been found to help cotton crop to fight pests. Insects make ultrasonic sounds or release pheromones or cause plants to emit ethylene that can be detected by simple gadgets for farmers to precisely detect insect infestations, even from home. Resistance to abiotic stress Biotech cotton to combat drought stress A few years ago attempts were made to develop biotech cotton for abiotic stress-tolerance, through the deployment of genes that are responsible for modification of a single metabolite that would confer increased tolerance to salt or drought stress. Stress-induced proteins with known functions such as water channel proteins, key enzymes for osmolyte biosynthesis of betaine, proline, trehalose, and polyamines were the initial targets of plant transformation. Now, several drought related genes have been cloned and characterized in recent times. Zhang et al (2009) reported on the nine ESTs including photosystem I psaH protein, and H+-ATPase related genes which were up-regulated at different levels in drought stress cotton seedlings. These genes are responsible for the absorption and utilization of water through adjusting the photosynthesis process. Under drought stress the two genes were found to be highly induced. cDNAs differentially expressed in response to drought stress also revealed the role of CaLEALI gene in response to various abiotic stresses.
Cotton varieties that can adapt to new environments Cotton is sensitive to photoperiod and thermal conditions and does not adjust easily to new environments. Cotton varieties from particular latitudes are known to take inordinately long time to adapt to unfamiliar latitudes across the globe. Genetic engineering can help to develop cotton varieties that can grow anywhere in the world. Cotton is sensitive to photoperiod and thermal conditions and does not adjust easily to new environments. For example, it took about 60-70 years for G. hirsutum and 150 years for G. Barbadense to adapt to the asian climatic conditions especially of latitudes that were different from the centres of origin. This clearly indicates that each of the individual cotton genotypes has a specific photoperiod and thermal requirement for optimal performance. Therefore it would be most appropriate to identify individual highest yielding genotypes for extremely specific geographical zones that have a common photo and thermal profile across the season. Genetic engineering can help to develop cotton varieties that can grow anywhere in the world. Manipulation of Rubisco activase can alter photoperiod and thermal sensitivity to enhance the adaptability of cotton to a wide range of environments. Genetic manipulation of Rubisco activase can alter photoperiod and thermal sensitivity to enhance the adaptability of cotton to a wide range of environments. Drought responsive element binding proteins (DREB) rd29A genes for drought, high-salt & cold stress have been identified and used in several crops including cotton. Superoxide dismutase (SOD) confers chilling stress and is being explored for its utility in cotton. GM cotton varieties for other traits such as drought and disease (leaf curl virus) management have not yet been released commercially and have immense potential in many countries. Herbicide resistant GM cotton in small scale production systems should find a useful place with careful planning and design of alternative placement of intercrops to avoid the direct effect of herbicide on them and also to ensure that cotton does not become the sole crop in the production systems because of the new weed management GM technology. Climate Change and Cotton Production Cotton Crop productivity is sensitive to climate induced effects like temperature, rainfall, radiation, CO2 concentration, changes in soil, pests and diseases problem. Work carried out at CICR has indicated the adaptability of select conventional cotton varieties/hybrids that are well adapted to elevated CO2 levels due to better morphophysiological and biochemical attributes. Elevated levels of CO2 significantly increased plant height, node number, sympodia number, leaf number, leaf area, dry matter production, reduced shedding of bud and bolls an delayed senescence of leaves. Productivity of cotton in terms of total number ofboll and weight increased significantly with an increase of 73%. Fibre quality improved significantly under elevated CO2 atmosphere. The photosynthetic rate increased by 34-45% while stomatal resistance decreased significantly. Microbial population increased in soil under elevated CO2 atmosphere. Elevated CO2 atmosphere of 650 ppm and temperature of 40 degrees centigrade was found to be optimum for growth of cotton plants Although it appears that cotton crop will do better in the changed atmospheric scenario during the later part of the 21st century, studies indicate that the pest problem will be aggravated further leading to an increased use of pesticides. By and large, the impact of climate change on cotton production and productivity will be favourable.
Organic cotton Organic agriculture is an ecological production management system that promotes and enhances biodiversity, biological cycles and soil biological activity. Organic cotton production must be certified to be sold as ‘organic’ for which it is to be grown without the use of any synthetic chemicals like pesticides, inorganic fertilizers etc. Scientists in several countries have been conducting experiments over the past two to three decades to standardize sustainable organic cotton production systems through the use of pest and disease tolerant varieties grown under optimal practices for conserving soil moisture and also for improving organic matter content of marginal soils. Results indicated that the improvement in cotton yield with organic supplements was gradual and additive indicating their cumulative effect in improving productivity. Further, long term use of organic supplements, besides stabilizing rainfed cotton yields on marginal soils can also reduce the dependence on nitrogenous fertilizers. Sustained use of organic components in crop production and crop protection for about 8 years over large tracts of land have been found to result in a significant increase of organic carbon, macro and micronutrients in the surface as well as sub-surface layers under organic system (Venugopalan and Tarhalkar 2003). This system appeared to be one of the most sustainable management options to enhance the organic carbon status, which in turn improves many physical and chemical properties, besides arresting the natural degradation of these soils through the formation of pedogenic CaCO3 and sodicity. The organic system reduced pest management cost and was also economically viable. However, it would be prudent for developing countries in Asia and Africa to consider the option of organic cotton cultivation only after their yields are stabilized over a few years and crop production systems are properly standardized for profitable and sustainable farming. Biotech cotton is not permitted in organic farming at present. The rapid adoption of Bt cotton cultivars into all the cotton growing agro-climatic zones has endangered organic cotton movement in their traditional niches as well as spread of organic cotton cultivation to new areas. Recently, over the past three years, India has emerged as a major producer of organic cotton. Currently it contributes 50-70% of the worlds organic cotton produce. In this context serious efforts have been initiated to identify pest and disease tolerant varieties that are most suitable for organic cultivation. Several individual components of nutrient management (FYM, Vermicompost, Bio fertilizers, Green manure, Industrial by products), pest management (predators, parasites, botanicals, etc,) crop management (inter crop, nipping, etc,) permissible under organic cultivation have been evaluated. Based on the local availability these ingredients have been integrated into economically and socially acceptable packages. To produce ‘organic cotton textiles’, certified organic cotton should be manufactured according to organic fiber processing guidelines. Therefore development of local norms and standards of certification of organic cotton farming and development of tools and techniques (protocols) for standardization and accreditation are important. Moreover, there is a need for development of a holistic integrated index (like land quality index) based on physical and socio-economic parameters to objectively assess the long term consequences of organic cotton cultivation and use these indices to monitor organic farms.
Value addition for cotton byproducts An enzyme called cytochrome P450 CYP6AE14, which helps in degradation of gossypol was identified in bollworms, which assists larvae to survive on cotton plants. Low gossypol seed’ can be possible through biotech cotton expressing cytochrome P450 CYP6AE14 genes from pink bollworm and Helicoverpa to be expressed specifically in cotton seeds. The gene sequences are known and seed specific promoters are available. These can be used to develop low gossypol seed varieties. SunilKumar et al (2006) utilized RNA interference to inhibit the expression of the δ-cadinene synthase gene in a seed-specific manner, thereby disrupting a key step in the biosynthesis of gossypol in cotton. Compared to an average gossypol value of 10 μg/mg in wild-type seeds, seeds from RNAi lines showed values as low as 0.2 μg/mg. Importantly, the levels of gossypol and related terpenoids that are derived from the same pathway were not diminished in the foliage and floral parts of mature plants and thus remain available for plant defense against insects and diseases. Further, they reported that the germinating, RNAi seedlings are capable of launching terpenoid-based defense pathway when challenged with a pathogen. Thus, the silenced state of the δ-cadinene synthase gene that existed in the seed, does not leave a residual effect that can interfere with the normal functioning of the cotton seedling during germination. Mechanization of Cotton Production Cotton production is labour intensive in almost all the developing countries. Cotton production demands labour all through, starting from sowing to harvesting which include several operations including inter-culture, spraying and hand weeding. Cotton in several countries is cultivated in small scale production systems, which demand smaller machines that are affordable for small scale farmers. Several attempts are underway to develop machines for picking and other important operations in cotton cultivation in small scale production systems. Self-propelled check row planters, solar powered sprayers and pickers have been developed in developing countries recently. Recently, brush type pickers have been developed as alternatives to spindle type machines. Such innovations, especially suited for picking in narrow spacing conditions, can assist in enhancing the density of plant population, since dense planting does not suit picking operations with spindle type machines. Small scale two-spindle machine pickers are being developed and tested in developing countries of Asia and Africa. Investment needs to be done to ensure that new machines are developed so that crop production operations are not stalled in rainy days, which is normally the case with labour intensive operations. Yield and quality enhancement Enhancing yields through ideotype breeding for narrow spacing How can yields be increased in developing countries? Yields in developing countries mostly in Africa have been stagnating. Narrow and ultra narrow spacing is practiced in China, Uzbekistan and several countries of the world where plant population of 100,000 to 200,000 per hectare results in high yields with varieties. The plant
population with hybrid cotton varieties as in countries like India, ranges from 6000 to 15000 per hectare. The cost of hybrid seed is much higher and plant growth is luxuriant and therefore does not permit high density planting. Plant population cannot be increased with hybrid cotton. Hybrids are highly input intensive and relatively more susceptible to pests and diseases and thus require more fertilizers and pesticides for optimum production. Progressive nutrient (Macro and Micro) depletion due to source sink relationship because of intensive hybrid cotton cultivation is causing long term soil nutrient problems. Bt-cotton hybrids utilize more nutrients as compared to varieties to yield more. Therefore the soils are getting progressively depleted and need more nutrient refurbishment. Due to intensive farming, cotton crop has been showing nutrient deficiency symptoms in many developing countries, especially in rainfed zones where wilt and leaf reddening problems are getting severe over the years. It should be a priority area of research in countries of Asia and Africa to develop varieties through ‘ideotype breeding’ of compact genotypes suited for narrow and ultra narrow spacing, with specific fibre traits for specific locations. Additionally the compact genotypes with specific fibre traits can be converted to insect resistant biotech cotton. Such location specific high yielding varieties ensure sustainable production in major cotton growing countries of Asia and Africa in the future. it is also important to develop varieties suitable for dense planting that are more efficient in utilizing water and nutrients and can resist pests and diseases. Such measures can not only enhance yields but can also provide sustainable options for optimal and efficient use of inputs. Quality enhancement through Molecular Breeding Plant Breeders, all over the world, have so far subjected germplasm resources to intensive breeding, so as to enhance yield, fibre quality traits, high oil content or resistance to biotic or abiotic stresses. Such programmes also inadvertently result in narrowing of the genetic base. There is a need to take a re-look at the entire germplasm collections once again in light of the molecular markers and the genes that are currently available. The markers and genes identified recently for economically important traits, can provide an elegant tool to convert some high yielding germplasm lines into elite cultivars. Out of the 50 cotton species, 5 are considered as primary germplasm pool, 21 as secondary and 24 as tertiary germplam pool, based on the relative genetic accessibility. There are several high yielding germplasm lines that are deficient in just or two economically important traits such as fibre strength or length or susceptibility to biotic or abiotic stresses. Useful genes can be transferred into cultivars through genetic engineering or desired traits, for which molecular markers are available can be back-crossed into the lines through accelerated marker assisted breeding. In addition to its lint, the oil and protein portion of the cottonseed also represents significant economic value. As far as possible, plant breeding programmes should also ensure that the newly developed cultivars should have reasonably high levels of oil and protein in seeds. The following approaches are suggested for crop improvement. High yielding elite germplasm lines, which are inferior in only one or two of the desirable traits such as fibre quality or resistance to biotic or abiotic stresses, should be chosen as recurrent parents for marker assisted accelerated back-cross breeding method. Another set of high yielding germplasm lines should be identified, which
possess the trait of interest, and can be used as donor parents. Recently (Xiao et al., 2009), 2,937 SSR primer pairs have been identified as highly informative which target unique genomic sequences and amplify about 4,000 unique marker loci in a tetraploid cotton genome. Chromosome-marker bins, each 20 cM in size, were constructed on the genetic linkage map containing the markers. Thus 207 marker bins were assigned for a total of about 4,140cM which is approximately the size of the tetraploid cotton genetic map. The markers can be used effectively to tag quantitative traits of interest in the already characterized germplasm pools and thereafter utilize in marker assisted breeding programmes for genetic enhancement of elite lines and genotypes to develop high yielding cultivars. Genes conferring strength and fineness can be identified from Ramie and utilized to enhance fibre traits in cotton through genetic transformation. Sucrose phosphate synthase and extensin genes have been shown to enhance fibre length and strength and can be further explored Cotton fibre quality assessment through instrumentation is still a challenge. There are no rapid internationally acceptable uniform methods of testing of cotton for neps, stickiness and micronaire. The testing procedures are still time consuming in many countries of the world. There is an imminent need to invent simple and rapid testing equipment and procedures for fibre quality evaluation that can give a preliminary assessment before the fibre can be subjected to HVI and other tests to ensure better returns for the producers.
References
Beale, H, Michael., Michael A. Birkett, Toby J. A. Bruce, Keith Chamberlain, Linda M. Field, Alison K. Huttly, Janet L. Martin, Rachel Parker, Andrew L. Phillips, John A. Pickett, Ian M. Prosser, Peter R. Shewry, Lesley E. Smart, Lester J. Wadhams, Christine M. Woodcock, and Yuhua Zhang (2006) Aphid alarm pheromone produced by transgenic plants affects aphid and parasitoid behavior. PNAS, 103, (27), 10509-10513
Guo-Ping, L., Kong-Ming Wu., Gould, F., Kang-Wang, J., Jin-Miao., Xi-Wugao and
Yu-Yuanguo. 2007. Increasing tolerance to Cry1Ac cotton from cotton bollworm, Helicoverpa armigera , was confirmed in Bt cotton farming area of China. Ecological Entomology. 32: 366–375
Mao, Y. B., Cai, W. J., Wang, J. W., Hong, G. J., Tao, X. Y., Wang, L. J., Huang, Y.P.
and Chen, X.Y. (2007). Silencing a cotton bollworm P450 monoxygenase gene by plant-mediated RNAi impairs larval tolerance of gossypol. Nat. Biotechnol., 25: 1307–1313.
Soberón, M., Pardo-Lopez, L., Lopez, I., Gomez, I., Tabashnik, B and A. Bravo.
2007. Engineering modified Bt toxins to counter insect resistance. Science. 318, 1640–1642.
Sunilkumar, G., LeAnne M. Campbell, Lorraine Puckhaber, Robert D. Stipanovic, and Keerti S. Rathore. (2006) Engineering cottonseed for use in human nutrition by tissue-specific reduction of toxic gossypol. PNAS, 103 (48) 18054-18059
Venugopalan M. V and Tarhalkar P. P. (2003). Evaluation of organic recycling
techniques in improving the productivity of rainfed cotton on marginal soils. Tropical Agriculture 80:163-167
Xiao, J., K. Wu, David D. Fang, David M. Stelly, John Yu, and Roy G. Cantrell (2009).
New SSR Markers for Use in Cotton (Gossypium spp.) Improvement. The Journal of Cotton Science 13:75–157.
Zhang Ling., Fu-Guang Li, Chuan-Liang Liu, Chao-Jun Zhang and Xue-Yan Zhang.
(2009) Construction and analysis of cotton (Gossypium arboreum L.) drought-related cDNA library BMC Research Notes 2009, 2, 120-128
COMMODITY PRICES, THE ICE COTTON CONTRACT AND THE GLOBAL ECONOMY: IMPLICATIONS FOR CONCENTRATION IN THE WORLD COTTON
INDUSTRY AND LONG RUN TRENDS IN COTTON SUPPLY AND USE
T. Townsend INTERNATIONAL COTTON ADVISORY COMMITTEE, Washington DC, USA
The structure of world cotton trade is changing, and 2009 was marked by financial stress experienced by a number of cotton merchants as a result of volatility in the cotton futures market in March 2008, the credit crisis causing banks to tighten lending to traders and the economic recession that curbed demand for cotton. As a result, many merchants incurred substantial losses, and several major cotton firms, mostly family owned single commodity firms, were forced into bankruptcy, merger or out of business. These events led to consolidation among existing merchants, but it has also opened doors for newcomers, mostly multi-commodity traders, to enter into the cotton business. Other consequences of the rise in speculative activities at the Intercontinental Exchange (ICE) in New York during the past two years and of tighter credit conditions include damaged hedging capacities and price discovery functions at the New York futures exchange. ICE Price Volatility1 On Monday March 3, 2008 the nearby ICE futures price increased 3¢ per pound to lock limit up at 84.86¢ per pound at 4:33 a.m. (U.S. Eastern Time), 4:38 a.m., 6:40 a.m., and again at 6:48 a.m. Thereafter, the price remained locked limit up for the rest of the day; on Tuesday March 4th, the market opened up the daily trading limit of 4¢ per pound at 1:30 a.m. and remained there until 11:37 a.m., briefly declined, and then reached limit up again at 11:58 a.m. Thereafter, the price remained locked limit up for the rest of the day; on Wednesday March 5th, the price increased 4¢ per pound to reach the limit up price of 92.86¢ per pound at 6:05 a.m., remained there until 8:16 a.m., and reached limit up again a number of times between 11:04 a.m. and 12:01 p.m. By the end of the day, however, the price had declined 3.58¢ per pound from limit up, settling at 89.28¢, an increase of 0.42¢; on Thursday March 6th, the price declined 4¢ per pound and locked limit down at 85.28¢ per pound; and, on Friday March 7th, the price declined 4¢ per pound again and locked limit down at 81.28¢ per pound. So, despite the price increases on March 3rd through 5th, the 81.28¢ per pound closing price on Friday March 7th was lower than the 81.86¢ closing price one week earlier on Friday February 29th. Because options were not subject to price limits in March 20082, the option market did not lock limit up or limit down. Thus, when the May 2008 futures contract was locked limit up or limit down, options continued to trade. When the May 2008 cotton futures market was locked limit up, market participants, including cotton merchants
1 Adapted from a Staff Report on Cotton Futures and Option Market Activity During the Week of March 3, 2008,
by the U.S. Commodity Futures Trading Commission (CFTC), issued January 4, 2010. 2 ICE has said that they intend to implement daily trading limits for options, but because of technical reasons they
had not yet done so as of January 2010.
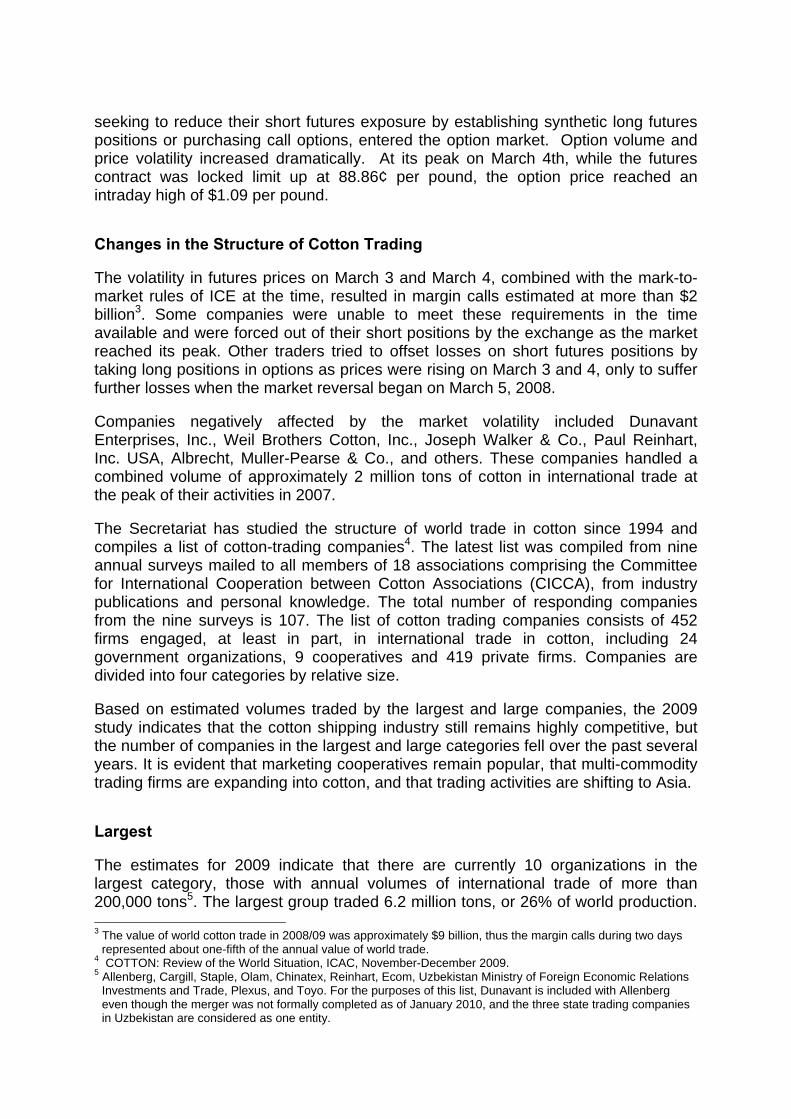
seeking to reduce their short futures exposure by establishing synthetic long futures positions or purchasing call options, entered the option market. Option volume and price volatility increased dramatically. At its peak on March 4th, while the futures contract was locked limit up at 88.86¢ per pound, the option price reached an intraday high of $1.09 per pound. Changes in the Structure of Cotton Trading The volatility in futures prices on March 3 and March 4, combined with the mark-to-market rules of ICE at the time, resulted in margin calls estimated at more than $2 billion3. Some companies were unable to meet these requirements in the time available and were forced out of their short positions by the exchange as the market reached its peak. Other traders tried to offset losses on short futures positions by taking long positions in options as prices were rising on March 3 and 4, only to suffer further losses when the market reversal began on March 5, 2008. Companies negatively affected by the market volatility included Dunavant Enterprises, Inc., Weil Brothers Cotton, Inc., Joseph Walker & Co., Paul Reinhart, Inc. USA, Albrecht, Muller-Pearse & Co., and others. These companies handled a combined volume of approximately 2 million tons of cotton in international trade at the peak of their activities in 2007. The Secretariat has studied the structure of world trade in cotton since 1994 and compiles a list of cotton-trading companies4. The latest list was compiled from nine annual surveys mailed to all members of 18 associations comprising the Committee for International Cooperation between Cotton Associations (CICCA), from industry publications and personal knowledge. The total number of responding companies from the nine surveys is 107. The list of cotton trading companies consists of 452 firms engaged, at least in part, in international trade in cotton, including 24 government organizations, 9 cooperatives and 419 private firms. Companies are divided into four categories by relative size. Based on estimated volumes traded by the largest and large companies, the 2009 study indicates that the cotton shipping industry still remains highly competitive, but the number of companies in the largest and large categories fell over the past several years. It is evident that marketing cooperatives remain popular, that multi-commodity trading firms are expanding into cotton, and that trading activities are shifting to Asia. Largest The estimates for 2009 indicate that there are currently 10 organizations in the largest category, those with annual volumes of international trade of more than 200,000 tons5. The largest group traded 6.2 million tons, or 26% of world production. 3 The value of world cotton trade in 2008/09 was approximately $9 billion, thus the margin calls during two days
represented about one-fifth of the annual value of world trade. 4 COTTON: Review of the World Situation, ICAC, November-December 2009. 5 Allenberg, Cargill, Staple, Olam, Chinatex, Reinhart, Ecom, Uzbekistan Ministry of Foreign Economic Relations
Investments and Trade, Plexus, and Toyo. For the purposes of this list, Dunavant is included with Allenberg even though the merger was not formally completed as of January 2010, and the three state trading companies in Uzbekistan are considered as one entity.
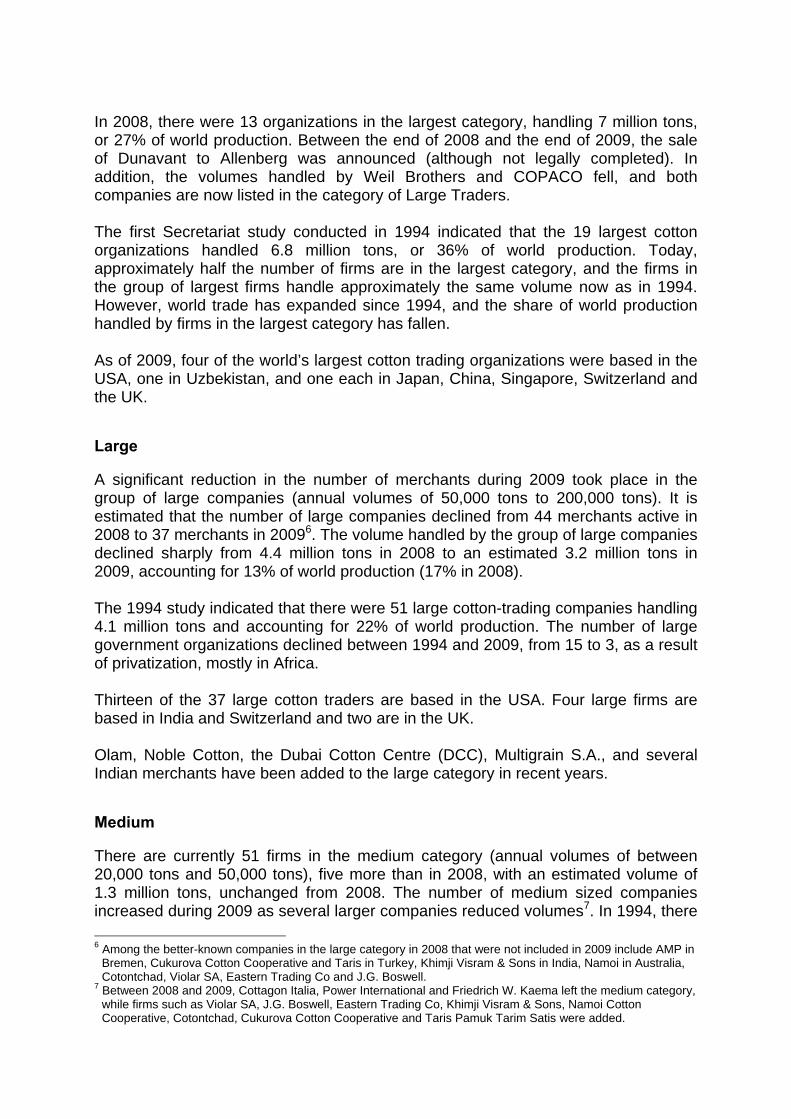
In 2008, there were 13 organizations in the largest category, handling 7 million tons, or 27% of world production. Between the end of 2008 and the end of 2009, the sale of Dunavant to Allenberg was announced (although not legally completed). In addition, the volumes handled by Weil Brothers and COPACO fell, and both companies are now listed in the category of Large Traders. The first Secretariat study conducted in 1994 indicated that the 19 largest cotton organizations handled 6.8 million tons, or 36% of world production. Today, approximately half the number of firms are in the largest category, and the firms in the group of largest firms handle approximately the same volume now as in 1994. However, world trade has expanded since 1994, and the share of world production handled by firms in the largest category has fallen. As of 2009, four of the world’s largest cotton trading organizations were based in the USA, one in Uzbekistan, and one each in Japan, China, Singapore, Switzerland and the UK. Large A significant reduction in the number of merchants during 2009 took place in the group of large companies (annual volumes of 50,000 tons to 200,000 tons). It is estimated that the number of large companies declined from 44 merchants active in 2008 to 37 merchants in 20096. The volume handled by the group of large companies declined sharply from 4.4 million tons in 2008 to an estimated 3.2 million tons in 2009, accounting for 13% of world production (17% in 2008). The 1994 study indicated that there were 51 large cotton-trading companies handling 4.1 million tons and accounting for 22% of world production. The number of large government organizations declined between 1994 and 2009, from 15 to 3, as a result of privatization, mostly in Africa. Thirteen of the 37 large cotton traders are based in the USA. Four large firms are based in India and Switzerland and two are in the UK. Olam, Noble Cotton, the Dubai Cotton Centre (DCC), Multigrain S.A., and several Indian merchants have been added to the large category in recent years. Medium There are currently 51 firms in the medium category (annual volumes of between 20,000 tons and 50,000 tons), five more than in 2008, with an estimated volume of 1.3 million tons, unchanged from 2008. The number of medium sized companies increased during 2009 as several larger companies reduced volumes7. In 1994, there 6 Among the better-known companies in the large category in 2008 that were not included in 2009 include AMP in
Bremen, Cukurova Cotton Cooperative and Taris in Turkey, Khimji Visram & Sons in India, Namoi in Australia, Cotontchad, Violar SA, Eastern Trading Co and J.G. Boswell.
7 Between 2008 and 2009, Cottagon Italia, Power International and Friedrich W. Kaema left the medium category, while firms such as Violar SA, J.G. Boswell, Eastern Trading Co, Khimji Visram & Sons, Namoi Cotton Cooperative, Cotontchad, Cukurova Cotton Cooperative and Taris Pamuk Tarim Satis were added.
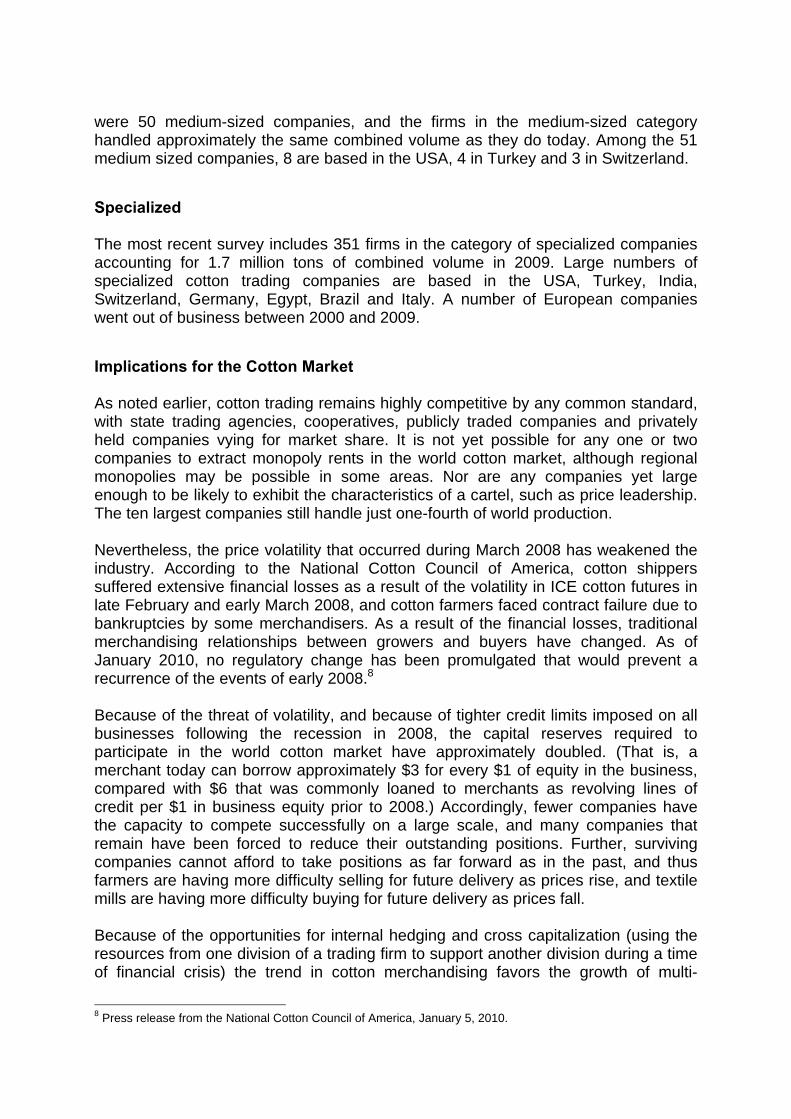
were 50 medium-sized companies, and the firms in the medium-sized category handled approximately the same combined volume as they do today. Among the 51 medium sized companies, 8 are based in the USA, 4 in Turkey and 3 in Switzerland. Specialized The most recent survey includes 351 firms in the category of specialized companies accounting for 1.7 million tons of combined volume in 2009. Large numbers of specialized cotton trading companies are based in the USA, Turkey, India, Switzerland, Germany, Egypt, Brazil and Italy. A number of European companies went out of business between 2000 and 2009. Implications for the Cotton Market As noted earlier, cotton trading remains highly competitive by any common standard, with state trading agencies, cooperatives, publicly traded companies and privately held companies vying for market share. It is not yet possible for any one or two companies to extract monopoly rents in the world cotton market, although regional monopolies may be possible in some areas. Nor are any companies yet large enough to be likely to exhibit the characteristics of a cartel, such as price leadership. The ten largest companies still handle just one-fourth of world production. Nevertheless, the price volatility that occurred during March 2008 has weakened the industry. According to the National Cotton Council of America, cotton shippers suffered extensive financial losses as a result of the volatility in ICE cotton futures in late February and early March 2008, and cotton farmers faced contract failure due to bankruptcies by some merchandisers. As a result of the financial losses, traditional merchandising relationships between growers and buyers have changed. As of January 2010, no regulatory change has been promulgated that would prevent a recurrence of the events of early 2008.8 Because of the threat of volatility, and because of tighter credit limits imposed on all businesses following the recession in 2008, the capital reserves required to participate in the world cotton market have approximately doubled. (That is, a merchant today can borrow approximately $3 for every $1 of equity in the business, compared with $6 that was commonly loaned to merchants as revolving lines of credit per $1 in business equity prior to 2008.) Accordingly, fewer companies have the capacity to compete successfully on a large scale, and many companies that remain have been forced to reduce their outstanding positions. Further, surviving companies cannot afford to take positions as far forward as in the past, and thus farmers are having more difficulty selling for future delivery as prices rise, and textile mills are having more difficulty buying for future delivery as prices fall. Because of the opportunities for internal hedging and cross capitalization (using the resources from one division of a trading firm to support another division during a time of financial crisis) the trend in cotton merchandising favors the growth of multi-
8 Press release from the National Cotton Council of America, January 5, 2010.
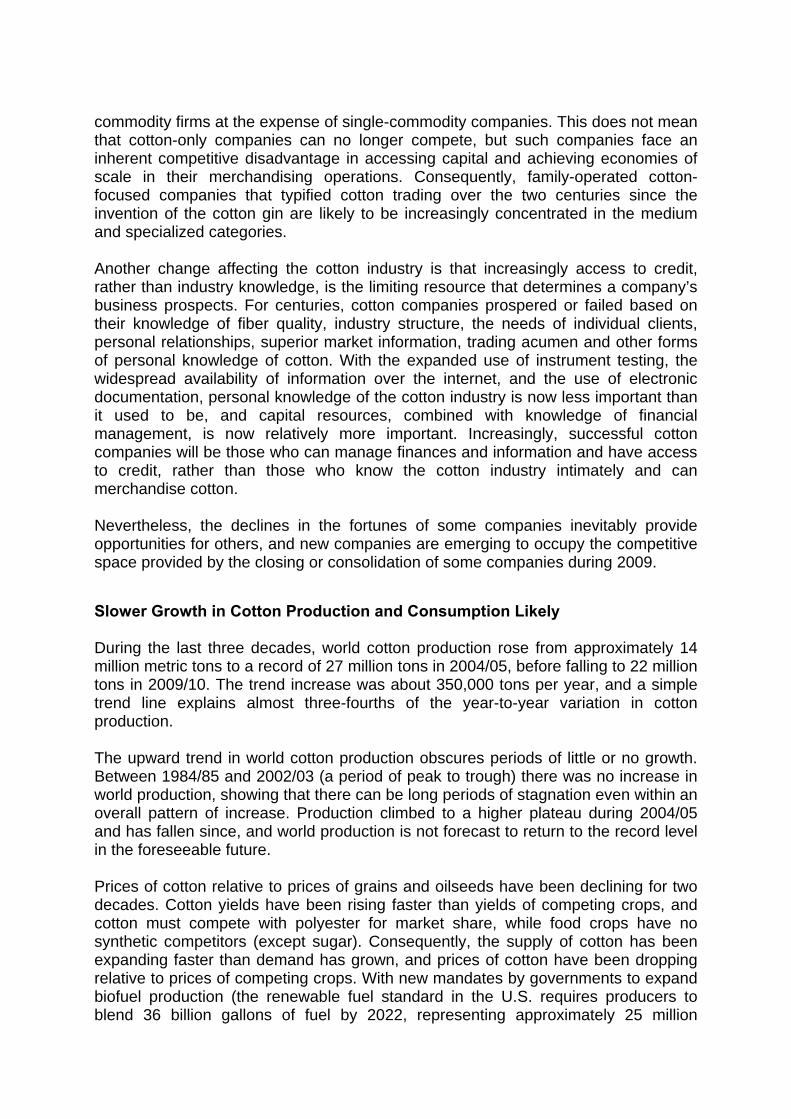
commodity firms at the expense of single-commodity companies. This does not mean that cotton-only companies can no longer compete, but such companies face an inherent competitive disadvantage in accessing capital and achieving economies of scale in their merchandising operations. Consequently, family-operated cotton-focused companies that typified cotton trading over the two centuries since the invention of the cotton gin are likely to be increasingly concentrated in the medium and specialized categories. Another change affecting the cotton industry is that increasingly access to credit, rather than industry knowledge, is the limiting resource that determines a company’s business prospects. For centuries, cotton companies prospered or failed based on their knowledge of fiber quality, industry structure, the needs of individual clients, personal relationships, superior market information, trading acumen and other forms of personal knowledge of cotton. With the expanded use of instrument testing, the widespread availability of information over the internet, and the use of electronic documentation, personal knowledge of the cotton industry is now less important than it used to be, and capital resources, combined with knowledge of financial management, is now relatively more important. Increasingly, successful cotton companies will be those who can manage finances and information and have access to credit, rather than those who know the cotton industry intimately and can merchandise cotton. Nevertheless, the declines in the fortunes of some companies inevitably provide opportunities for others, and new companies are emerging to occupy the competitive space provided by the closing or consolidation of some companies during 2009. Slower Growth in Cotton Production and Consumption Likely During the last three decades, world cotton production rose from approximately 14 million metric tons to a record of 27 million tons in 2004/05, before falling to 22 million tons in 2009/10. The trend increase was about 350,000 tons per year, and a simple trend line explains almost three-fourths of the year-to-year variation in cotton production. The upward trend in world cotton production obscures periods of little or no growth. Between 1984/85 and 2002/03 (a period of peak to trough) there was no increase in world production, showing that there can be long periods of stagnation even within an overall pattern of increase. Production climbed to a higher plateau during 2004/05 and has fallen since, and world production is not forecast to return to the record level in the foreseeable future. Prices of cotton relative to prices of grains and oilseeds have been declining for two decades. Cotton yields have been rising faster than yields of competing crops, and cotton must compete with polyester for market share, while food crops have no synthetic competitors (except sugar). Consequently, the supply of cotton has been expanding faster than demand has grown, and prices of cotton have been dropping relative to prices of competing crops. With new mandates by governments to expand biofuel production (the renewable fuel standard in the U.S. requires producers to blend 36 billion gallons of fuel by 2022, representing approximately 25 million
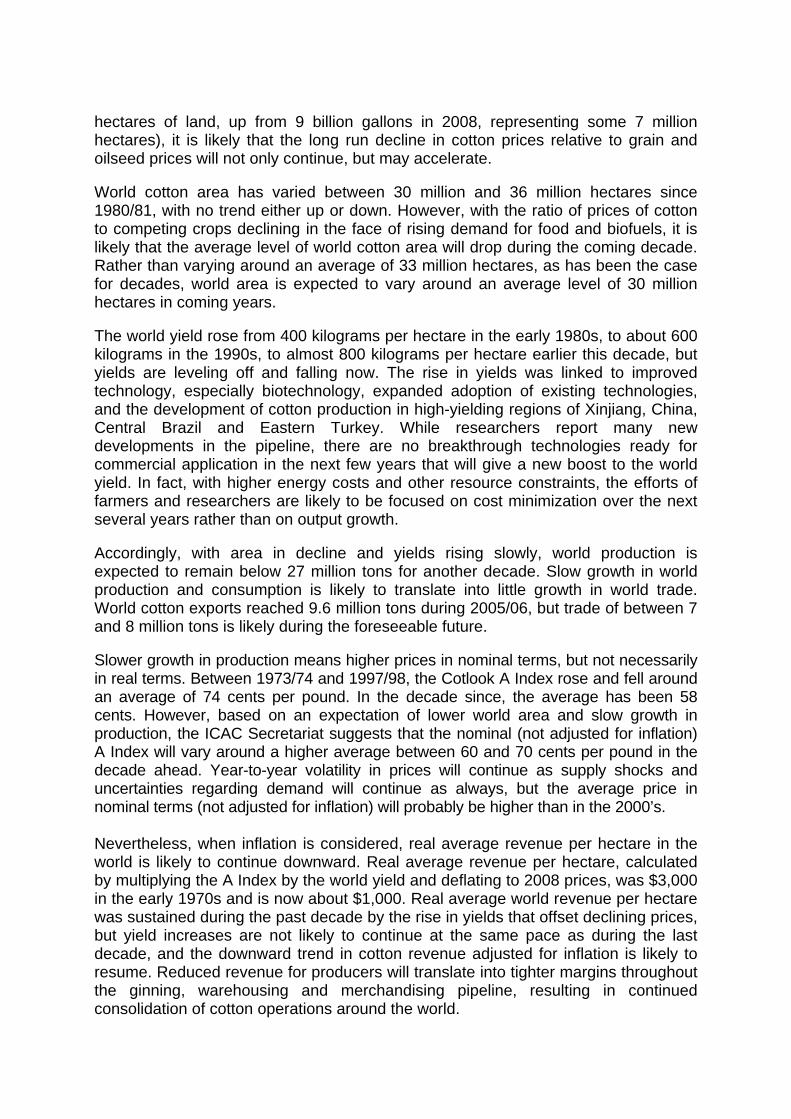
hectares of land, up from 9 billion gallons in 2008, representing some 7 million hectares), it is likely that the long run decline in cotton prices relative to grain and oilseed prices will not only continue, but may accelerate. World cotton area has varied between 30 million and 36 million hectares since 1980/81, with no trend either up or down. However, with the ratio of prices of cotton to competing crops declining in the face of rising demand for food and biofuels, it is likely that the average level of world cotton area will drop during the coming decade. Rather than varying around an average of 33 million hectares, as has been the case for decades, world area is expected to vary around an average level of 30 million hectares in coming years. The world yield rose from 400 kilograms per hectare in the early 1980s, to about 600 kilograms in the 1990s, to almost 800 kilograms per hectare earlier this decade, but yields are leveling off and falling now. The rise in yields was linked to improved technology, especially biotechnology, expanded adoption of existing technologies, and the development of cotton production in high-yielding regions of Xinjiang, China, Central Brazil and Eastern Turkey. While researchers report many new developments in the pipeline, there are no breakthrough technologies ready for commercial application in the next few years that will give a new boost to the world yield. In fact, with higher energy costs and other resource constraints, the efforts of farmers and researchers are likely to be focused on cost minimization over the next several years rather than on output growth. Accordingly, with area in decline and yields rising slowly, world production is expected to remain below 27 million tons for another decade. Slow growth in world production and consumption is likely to translate into little growth in world trade. World cotton exports reached 9.6 million tons during 2005/06, but trade of between 7 and 8 million tons is likely during the foreseeable future. Slower growth in production means higher prices in nominal terms, but not necessarily in real terms. Between 1973/74 and 1997/98, the Cotlook A Index rose and fell around an average of 74 cents per pound. In the decade since, the average has been 58 cents. However, based on an expectation of lower world area and slow growth in production, the ICAC Secretariat suggests that the nominal (not adjusted for inflation) A Index will vary around a higher average between 60 and 70 cents per pound in the decade ahead. Year-to-year volatility in prices will continue as supply shocks and uncertainties regarding demand will continue as always, but the average price in nominal terms (not adjusted for inflation) will probably be higher than in the 2000’s. Nevertheless, when inflation is considered, real average revenue per hectare in the world is likely to continue downward. Real average revenue per hectare, calculated by multiplying the A Index by the world yield and deflating to 2008 prices, was $3,000 in the early 1970s and is now about $1,000. Real average world revenue per hectare was sustained during the past decade by the rise in yields that offset declining prices, but yield increases are not likely to continue at the same pace as during the last decade, and the downward trend in cotton revenue adjusted for inflation is likely to resume. Reduced revenue for producers will translate into tighter margins throughout the ginning, warehousing and merchandising pipeline, resulting in continued consolidation of cotton operations around the world.
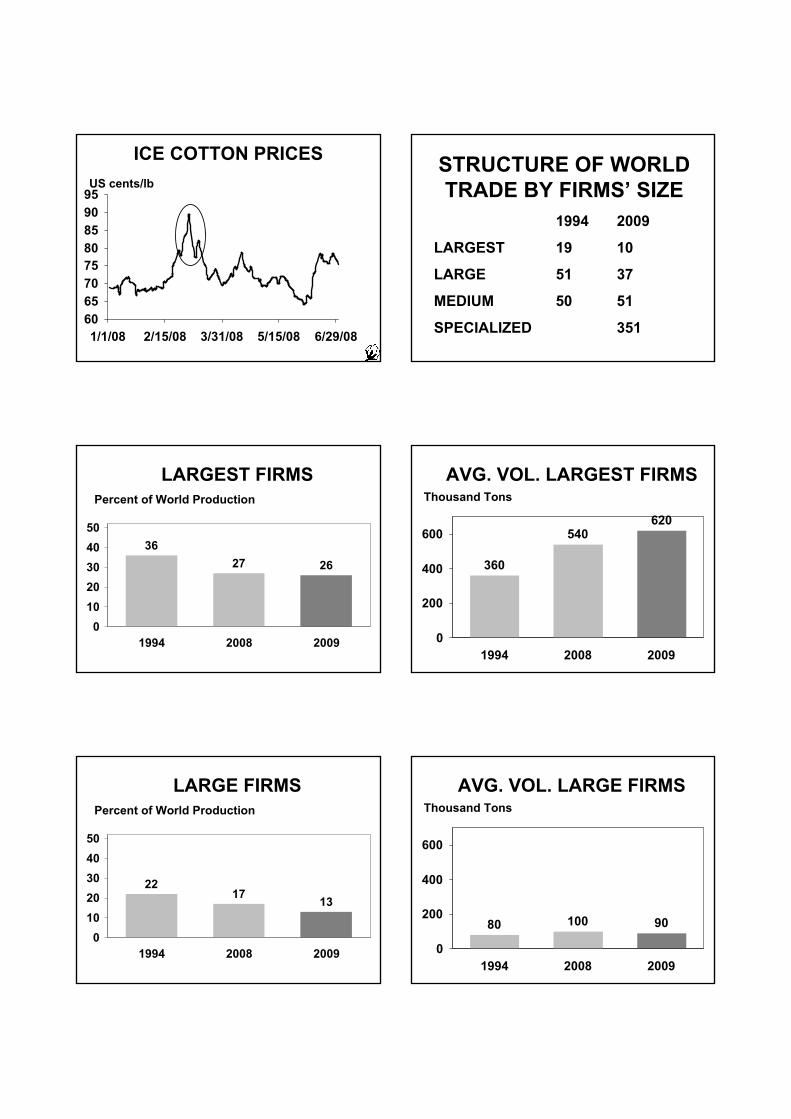
6065707580859095
1/1/08 2/15/08 3/31/08 5/15/08 6/29/08
ICE COTTON PRICESUS cents/lb
STRUCTURE OF WORLD TRADE BY FIRMS’ SIZE
1994 2009
LARGEST 19 10
LARGE 51 37
MEDIUM 50 51
SPECIALIZED 351
LARGEST FIRMS
3627 26
01020304050
1994 2008 2009
Percent of World Production
AVG. VOL. LARGEST FIRMS
360
540620
0
200
400
600
1994 2008 2009
Thousand Tons
LARGE FIRMS
2217 13
01020304050
1994 2008 2009
Percent of World Production
AVG. VOL. LARGE FIRMS
80 100 90
0
200
400
600
1994 2008 2009
Thousand Tons
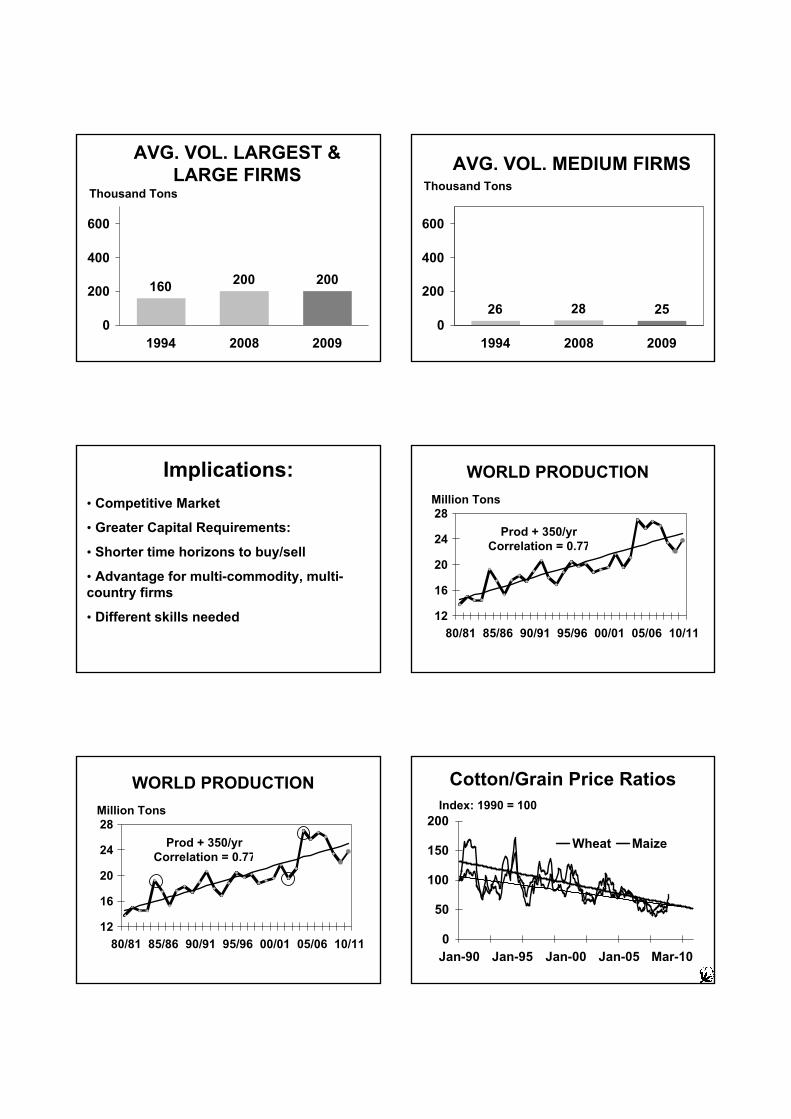
AVG. VOL. LARGEST & LARGE FIRMS
160 200 200
0
200
400
600
1994 2008 2009
Thousand Tons
AVG. VOL. MEDIUM FIRMS
26 28 250
200
400
600
1994 2008 2009
Thousand Tons
Implications:• Competitive Market
• Greater Capital Requirements:
• Shorter time horizons to buy/sell
• Advantage for multi-commodity, multi-country firms
• Different skills needed
WORLD PRODUCTION
Prod + 350/yrCorrelation = 0.77
12
16
20
24
28
80/81 85/86 90/91 95/96 00/01 05/06 10/11
Million Tons
WORLD PRODUCTION
Prod + 350/yrCorrelation = 0.77
12
16
20
24
28
80/81 85/86 90/91 95/96 00/01 05/06 10/11
Million Tons
0
50
100
150
200
Jan-90 Jan-95 Jan-00 Jan-05 Mar-10
Wheat Maize
Cotton/Grain Price RatiosIndex: 1990 = 100
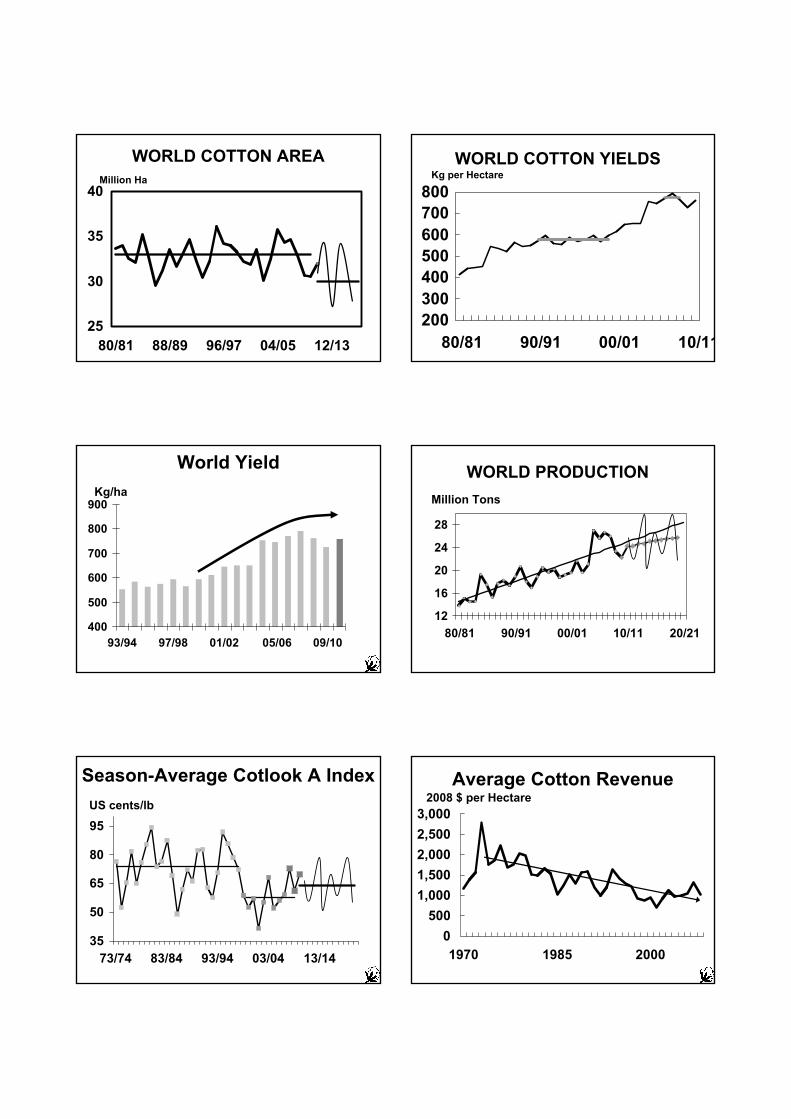
WORLD COTTON AREA
25
30
35
40
80/81 88/89 96/97 04/05 12/13
Million Ha
WORLD COTTON YIELDS
200300400500600700800
80/81 90/91 00/01 10/11
Kg per Hectare
World Yield
400
500
600
700
800
900
93/94 97/98 01/02 05/06 09/10
Kg/haWORLD PRODUCTION
12
16
20
24
28
80/81 90/91 00/01 10/11 20/21
Million Tons
35
50
65
80
95
73/74 83/84 93/94 03/04 13/14
Season-Average Cotlook A IndexUS cents/lb
0500
1,0001,5002,0002,5003,000
1970 1985 2000
2008 $ per HectareAverage Cotton Revenue
RISK MANAGEMENT IN THE ICE AGE
J. Lea Eastern Trading Company, Greenville, SC, USA
Good Morning. I am here this morning to share some of my ideas and opinions on risk management. I address you from the point of view of a United States cotton merchant. I, with Phil Canale, own and operate Eastern Trading Company and I am also the acting President of The American Cotton Shippers Association. Eastern Trading a multi-generational, medium sized concern based in Greenville, SC. We handle between 60,000 to 75,000 metric tons of cotton annually. Risk management is of constant focus for as merchants, risk management is our day to day responsibility. It is how and why we are compensated. We assume price, quality and performance risk for all parties within each transaction. As the risk manager though we must be compensated for the risk we assume. Over the last period of years in an effort to increase volumes and maintain market share much of the American Cotton Merchandising Industry and secondly, much of the International Cotton Merchandising Industry have failed themselves by negotiating away the warranted and necessary risk premium. In recent years the relationship between risk and reward has broken down with just reward no longer being available for the risk being assumed by the principal to the contract. The result we now see is an industry where its oldest and most fabled trading firms have been forced to exit the trade and a landscape where trading is more concentrated as is risk. Risk is made to be spread and shared by all participants not isolated and assumed by a few. Those situations that we might anticipate are never the ones create the most significant challenges. Risk management includes an effort to be prepared for the unexpected but it doesn’t always work well. As an example Eastern Trading managed to avoid any defaults during the previous decade’s Asian financial crisis….at least in Asia anyway. The ensuing crisis turned the US dollar into gold. As a result foreign yarn spinners flooded the US with lower priced yarns. It crushed demand in the US, carryover spiked higher and the cotton market dropped dramatically. We took over $1 million in bad debt expense in hedges alone from domestic mills that had fixed cotton at higher prices and were unable to take delivery and forced into bankruptcy. Not only did it reduce our equity but it also destroyed our customer base. For a company doing $50 million to $60 million in sales per year on often less than 2% margins I don’t need to explain the net impact on our business. Other more recent and more obvious examples would be the situation of March 2008 and then the World financial crisis that followed, but I will speak to these later. Today’s world now requires that to manage risk one must also have access to as much capital as humanly possible to withstand the expense of maintaining hedges in times of extreme volatility on a futures contract that is no longer owned an operated by the trade. The collapse of the US industry forced Eastern Trading forward towards progress. We spread our book of business out into new markets and other growths, something that should have been done many years prior. All of us here are bound by our individual
needs to survive and also by our contractual and traditional intentions to honor our commitments and provide the world industry with effective risk management. Phil and I are basis traders down to the marrow of our bones and this is the risk we manage better than others. For two generations we have been short basis traders in the tradition of Weil Brothers Cotton Company and others. The market has never owed us or promised us carry from delivery to delivery. Quality requirements were always somewhat uniform and these requirements were negotiable with almost every mill when said quality wasn’t quite produced as the cotton was actually being mercandised. The onset of high volume fiber testing technology, increased spinning technology and our exodus from the US spinning industry as our primary customer has forced us to learn to live as long the basis traders. Now we look daily at open interest, certificated stocks and what sort of surpluses it will take to keep carry in the market. We might sell short description but almost never green cards. Unless we sell a multi growth contract we are not going to go short qualities that require an optimum production environment such as Strict Middling 1 1/8” and that are in high demand in markets with a history of not negotiating solutions. The capital requirements of long basis trading are enormous. Not only must we pay for and carry inventory but also we must maintain hedges through every type of market. A hedged up long basis trader is obviously always short the corresponding futures. While this has always been an issue for anybody long the basis, this took on new meaning when the market was assumed by new ownership, The Intercontinental Exchange, or ICE. ICE is a publicly owned company with responsibilities to more than the commercial hedgers and locals that have been the traditional users of the cotton exchange. Volatility and counter party risk have always been closely linked but they are now more linked than ever and handling the two as one is the primary component of successful risk management. Merchants survive on their ability to evolve and adapt and the current environment is no different. It was impossible to imagine any of what has happened in the last 2 years in this industry. Enough has been said about March of 2008 but who would have guessed the world’s leading financial institutions would create ‘demand destruction’ for raw materials by an inability to understand and manage their own risk profile? Contract defaults rose on the buy side but exploded on the sale side. The market dropped more than 50%. This time Eastern Trading fared much better in managing counter party risk only to come to work one morning to see our bank, one of the world’s largest commercial banks , on the verge of failure within days of when we would take delivery of over 20,000 metric tons of new crop cotton and need money to pay the producers. Suddenly we were on the verge of default in a scenario beyond our wildest dreams. For better or worse governments intervened and we stayed to play another day but our new focus is where much of yours has been already and that is with Commodity Banks. Good Commodity Banks are still quite strong and deserve credit for managing this crisis well and appropriate banking relationships are now an even larger issue for all merchants, large and small. Default risk is still the largest threat to the merchandising community. Basis risk has solutions and progress has been made working with ICE towards making sure merchants can maintain hedges. This progress coupled with the management styles and systems merchants are more frequently employing make contract sanctity paramount to the well being of the merchant industry. Merchant to merchant communication through trade associations is a must have. The ICA arbitration
process has to be preserved, promoted and protected. Our customers and fellow traders must be educated on the inner workings of commodity purchase and sale contracts. This last years saw ACSA and Amcot working with foreign spinners to understand further the purchasing process. I think we will see the ICA and CCI work with ACSA and Amcot going forward to offer more of the same. I worked on more than ½ dozen arbitrations this year alone on behalf of various international and US merchants and now from experience I can say the process is fair to one and all. I would encourage everyone in every segment of the entire industry to seek membership in the ICA as well as one’s own local cotton association. I am currently President of the American Cotton Shippers Association and we also maintain default lists for informational purposes on both US (The ACEA) and foreign growth (The WCEA) cotton. Defaulters must be made known to the entire industry and there should be zero tolerance for those that deal with them around arbitral agreements. At Eastern Trading we use various strategies to insure contract sanctity while protecting our equity but ICE options is one of them. By rating a market based on our idea of its risk it helps us manage the volume of risk we are willing to assume in each market. If we rate each market A, B or C we can then devise an options strategy coupled with futures to manage our downside risk. In an A market we might stay fully hedged with no options against our sale. In a B market we will buy puts against a percentage of the sale in an amount to average less than 100 pts/lb over the entire sale and maintain long futures against it as well. When the contract is indeed performed the puts can be applied against alternate exposure or liquidated to recapture some of the option premium, further lowering the expense of said exercise. Under no circumstance do we have risk tolerance for selling calls. We saw in March of 2008 that upside volatility can and will be unlimited and can lead to critical cash flow problems. Short options multiply on an exponential basis the margin requirements and there is no limit to where they can move against the seller or writer. In a C market we might not only sell limited volumes but we will also carry a larger percentage of puts against these sales. I understand that a program like this might sound expensive but it has many advantages. Commodity banks love it and in this economy a happy banker is a better banker. It insurance that when there is a washout or collapse in an entire market beyond even a cotton consumer’s control that the shipper will not be taken with it. This again though illustrates the need for cotton shippers to be paid in adequate terms for the risk we assume. In last years market alone one 500 metric ton sale at 69.00 cts/lb was showing a loss in market difference of $350,000 when the market traded down below 40.00 cts/lb on our books. Fortunately with patience and hard work it was resolved but the volume of arbitrations and changes to the ICA, WCEA and ACEA default lists tell us that many situations came to very unfavorable endings. In addition to our efforts to maintain contract sanctity we also have to manage the financial risk posed by our desire to stay as hedged up as possible. As mentioned increased volatility not only makes sales and purchases more vulnerable it also can be very expensive in terms of cash flow. The situation in March of 2008 was a dreadful disaster for all of us. Since then we have all add had to create a strategy for dealing with how and what we will do when it happens again but I think that this industry and ICE have made successful strides towards making sure that it will be less severe if and when it ever does happen again. In addition to that recent
personnel changes at year end 2009 in the CFTC have potential to move us towards regulatory oversight and transparency that will benefit us all as well. A commodity bank that clearly understands our business is one change we have made as those banks have tried to help merchants hold and manage hedges in the past. Recently in this up trending market we have again used a program of increasing our delta neutrality buying options, specifically puts to one protect profits on our long exposure positions but also as hedges to try to manage our margin requirements. It isn’t my favorite approach but it is some protection and had thus far been effective, helped us sleep at night and use our energy and capital where it is best utilized. There are a few ideas we feel need to be explored as solutions to cash flow and margin requirements. Convergence between cash cotton and the futures price is vital. Without, both markets lose relevance and are made redundant. Lack of convergence will also bring carnage like we have seen in the previous 24 months. It is time for a system under which banks recognize international warehouse receipts and allow merchants to collateralize that cotton. It doesn’t have to be at point of origin and it might even be as certificated stock against the current contract or an ICE World Contract. The delivery locations and capacity within the US serve the industry well and should not be amended. Cotton stored in an independent, trusted location such as Dubai or Singapore should be able to qualify as collateral. By including clearing houses in the risk equation banks would be insured as to the cottons value, location and quality. If not as certificated stock then there are trusted warehouse and freight forwarding trade participants than can provide this service to the industry, especially if coupled with necessary insurance. Either way we realize increased hedging, increased collateralization, higher open interest and trade participation in the ICE Cotton Contract and a more efficient marketplace. We also need to be able also to collateralize fixed price purchase contracts for crops for further out deliveries. It works in the grain industries which are much larger and where many times the money is moving back and forth. It would strengthen the farm community and help to stabilize cotton production as producers could go out and sell crops two and three years in advance during times of high prices and further help to reduce extreme volatility. At price levels where we are currently where is increased interest by producers in hedging further and further out. A company such as ours is forced to sell of part of our new crop position fixed price to offer relief from potential cash flow constraints created by carrying hedges that cannot be collateralized. Once again such an opportunity would offer a more sophisticated and first world trading environment for the entire world cotton industry. The last idea is a program we have heard is in place but been unable to locate. Let a bank or another concern with appropriate cash reserves carry the futures for us. We transfer hedges into an account we carry with them. They make the margin calls against our purchases. Obviously we compensate them for doing so but it would be a program available to commercial hedgers only. If the market drops before delivery is realized then the bank has those funds that come back in at their disposal in addition to the premium the merchant is paying the bank or holder to carry the hedges for them. At the time of delivery or when the merchant realizes delivery of the inventory that those contracts are hedging the bank then puts back into the merchants account those futures contracts.
In conclusion I would like to thank you for your time this morning That I have had to represent both Eastern Trading Company and the American Cotton Shippers here in beautiful Bremen. It is easy to understand why it is one of cotton’s and the world’s most fabled cities. As we move forward into what will no doubt remain a volatile and exciting future I hope we can all move toward working together as and industry and help to maintain contract sanctity, restrain untoward volatility and flourish in an environment tempered with mutually beneficial relationships. Consumption and production are increasingly concentrated in India and China. It is the responsibility of all of us here today to work through the ICA, ACSA, AFCOT and Indian and Chinese Cotton Associations to harmonize trade rules and protect one another from dishonest or reckless trade practices by a very few. Risk management is challenging enough with the risks I have mentioned above. Obviously there is plenty of risk that we take that went unmentioned as well. It should not include trying to sort out defaulters or manage the effects on our own cash reserves of excess speculation. I look forward to being with you over the next few days and again I thank you for your time.
UNDERSTANDING COTTON DEMAND AND PROMOTING ORIGIN – THE EXAMPLE OF AFRICAN COTTON
M. Knappe
International Trade Centre (ITC), Geneva, Switzerland INTRODUCTION Africa, both Francophone as well as Anglophone, has traditionally been an important cotton production base. While cotton is produced in Africa, it is exported by international merchants mainly towards Asia, where today almost 80% of world cotton fibre is processed into yarn. Fibre transformation rates in Africa are at a historic low, with only 5% of Francophone and 43% of Anglophone African cotton being processed on the continent.1 Thus, on average, 83% of Sub-Saharan African cotton is exported as lint, almost exclusively through intermediaries. The high export rate of cotton demands a closer link with the market, the more so with the emergence of strong new competitors such as Brazil and India. Closer interaction with clients and cotton consumers is vital to maintain international competitiveness. African countries have traditionally focused their attention on production rather than on the market. Market linkages towards Europe were secured by Western (often French) mother companies, and since 2005 increasingly towards Asia by international cotton merchants. A market-oriented culture did not develop as market-related aspects were handled outside of Africa. Moreover, in the past cotton was almost always selling as world cotton demand was higher than world cotton production. As a result, direct market linkages with clients did not develop and therefore no direct feedback-loop from spinning mills back to ginning companies and producers emerged. This is a strategic disadvantage in a declining market, as it was the case in the 2008/9 season, and in slow growing markets as forecasted by ICAC for the seasons to come. Therefore, Africa needs to find a strategic solution to integrate a market feedback-loop into its operations and link market-related activities closer to adaptations at the production level. Modern approaches towards competitiveness stress the importance of a holistic value chain approach. During the 67th Plenary Meeting of the International Cotton Advisory Committee (ICAC) in Ouagadougou, for example, cotton experts discussed the “Competitiveness of African Cotton Production” and stressed the importance of “traditional” aspects such as activities in research, agricultural inputs, production, finance, reduction of contamination, etc., but also emphasized that “it is also necessary to promote African cotton, and … improve marketing”.2
1 Own calculations based on ICAC figures. Anglophone countries include West African countries such
as Ghana and Nigeria as well as South Africa that have more important transformation rates than most East African cotton producing countries.
2 ICAC Press Release 18 February 2009, The Competitiveness of the African Cotton Sector could benefit from Implementation of Realistic Results.
This paper analyses some of the experiences made and lessons learned in linking African cotton producers and ginning companies closer to consuming markets in Asia. Since 2007, the International Trade Centre (ITC) has been organizing value chain capacity building seminars and African cotton promotion activities in major cotton producing and consuming countries in Asia. In cotton producing countries seminars and on-the-job training were organized in the Peoples Republic of China (in 2006, 2007 and 2009), India (2006 and 2007) as well as Turkey (2008 and 2009) to understand their cotton philosophy, success factors and how the cotton value chain is actively managed. China and Turkey are also important cotton importing countries. In addition cotton value addition seminars and promotion activities were organised in Bangladesh and Thailand in 2009 to get a better understanding of the market and the quality requirements of clients. The following chapters analyse cotton marketing, including promotion of African cotton towards Asian markets. Chapter 2 describes the necessary and sufficient conditions that need to be in place so that marketing of African cotton could achieve sustainable results. Chapter 3 looks at the “4Ps” of (cotton) marketing, incorporating some of the experiences made in Asian markets. Chapter 4 describes possible initiatives that could be undertaken to enhance Africa’s cotton visibility in Asian markets. Chapter 5 concludes the paper. 2. Necessary and sufficient conditions for cotton marketing Competitiveness starts from the market. A clear understanding of the entire value chain, the market as well as the client and the client’s client is a necessary condition to become competitive. This is very obvious with regard to consumer goods such as garments. Without a clear understanding of fashion trends and market/buyer requirements will a clothing manufacturer not be successful in world markets. This, in principle, is not different for a commodity such as cotton. For example, American farmers and cooperatives and more recently also their counterparts in Brazil and India have organized market familiarization missions to cotton consuming countries in Asia to learn what their clients expect from them but also to promote their cotton. However, African cotton companies, independent ginners and producers (i.e. cotton stakeholders) have hardly ever had this opportunity. As a result, they have no clear understanding of the entire value chain nor the immediate market where their cotton is being sold to. Direct contacts with the immediate consumers of their cotton, i.e. spinning mills, have been rare and direct feedback on quality as well as buyer requirements was sporadic and often “filtered” by intermediaries. If feedback or training was given it was provided to the sales directors of ginning companies only. Feedback however, did not filter down to the producer level and thus depriving sector stakeholders of vital information to improve quality and customer services. Moreover, such a selective approach might create a dependency relationship and could be seen as favouritism if vital information and knowledge is not passed on to all cotton stakeholders. As international competitiveness starts by understanding the market, a feedback loop needs to be introduced that links producers and ginning companies closer to the market.
The African Cotton Producers Association (AProCA) has understood this requirement and the need to react. AProCA supports its members to develop clearer ideas about marketing and the quality requirements demanded by the consumer. Even though most of the producers in Africa are illiterate, AProCA attempts to make farmers more commercially minded and enable them to think about marketing and all aspects of their crop once it leaves the farm.3 This starts by understanding market behaviour and how other countries have managed the difficult world market situation. “Producers need to know how cotton is selling at the international level and they must also know the consumers needs says Mr. Taroré”4, the President of AProCA. Before cotton stakeholders could engage in a more proactive approach in marketing, the necessary condition, i.e. a full understanding of external issues i.e. the value-chain and world markets, needs to be met. In addition, cotton stakeholders need to find solutions on how to translate gained information and knowledge into know-how that is applied at national and regional level (the sufficient condition). This is a step-by-step approach. The first step is to understand the value chain and the various steps of value addition until it reaches the final consumer in the form of a cotton garment. This includes mainly the spinning process, but should extend towards the fabric-making process, the clothing manufacturing stage and the end consumers’ fibre preferences. Understanding the value chain also includes an in-depth understanding of common trading practices and their advantages and disadvantages. These include:
• Cotton trading rules in general and applied in the destination markets, including contractual terms, arbitration rules, paperwork and documentation;
• Logistics and transportation issues, including Bill of Ladings, electronic paperwork, etc.
• Cotton controlling, including underlying rules and regulations
• The role of banks and forms of payments such as e.g. Letters of Credit, etc.
• Warehouse receipt systems
• Insurance requirements 2
• Risk management, etc. The second step is to understand the specific market and buyer (client) requirements at each stage of the value chain. At each stage a processed cotton product finds a new buyer with a particular requirement. These requirements, while different, have their origin in the quality and type of cotton garment demanded by the end-consumer. Depending on the garment, specific processes need to be applied during the various textile and clothing manufacturing stages of the value chain. In addition, for each product and corresponding processing technology different types of fibres and fibre qualities are required. To offer the required fibre quality and related services to clients, cotton producers would thus need to understand these quality requirements. 3 Michael Bleby, Financial Times, Monday 1 June 2009, page 10 “African Farmers cotton on to
marketing skills” 4 dito
Understanding buyer requirements thus refers on the one hand to product quality requirements related to the fibre and its cleanness. On the other hand it refers to tailor-made solutions of business practices according to the specific needs and wishes of cotton-consuming spinning mills. In that respect cotton trading and marketing becomes a service-intensive industry. The first and second step (i.e. the necessary condition) will give cotton stakeholders a good basic knowledge and overview of the value chain and market requirements. It would defeat the purpose if all stakeholders became experts in all aspects. However, a good understanding of the major issues is necessary to address production-related aspects in Africa, such as e.g. contamination. During the third step value chain and market knowledge is applied at national and regional level to build capacity to respond to market and buyer requirements. This includes the following activities:
• Translating market knowledge and quality requirements insights into practical application at the production (i.e. ginning and farming) stage.
• Maintaining these applications at a large scale with thousands of small scale farmers.
• Building capacity of multiplier organizations in the form of national and regional producers and ginner associations.
One immediate example is that of high contamination levels found in some African origins. In order to tackle this problem at each stage of the value chain, the market consequences need to be understood. Once this is done, a sector-wide approach can be applied at home to tackle the problem. Ideally, a close relationship should be kept with the market, including the involvement of clients in solving the problem in the country. Contamination is, to a large extent, a problem at the farm and also gin level. The damage, however, is accumulated in a snowball effect at each processing step. Generally, producers nor gin operators had the opportunity to interact with spinning mills as well as fabric and garment manufacturers to understand while a small piece of e.g. white polypropylene could lead to a damage of several million US$.5 Such an understanding, however, is vital in order to tackle the problem in the long run. Additional measures such as price premiums for clean cotton (sufficient condition) would act as a catalyst to turn the knowledge on cotton contamination effects (necessary condition) into practical results. 3. Cotton marketing and promotion of African origin Once the necessary and sufficient conditions are in place, African cotton producers could more directly engage in marketing or selling cotton. Demand at the farm level is ultimately the sum of domestic and foreign consumers demand for cotton products in
5 For example, in discussions with Bangladeshi textiles and clothing manufacturers, cotton
stakeholders learned about real business cases in which major a US retailer rejected a full shipment of garments due to the fact that some garments had dying defects. Stakeholders thus could understand how a small contaminant could lead to millions of US$ rejects at the retail level, affecting each processing step in a snowball effect.
the retail market. Thus, general marketing principles of product, price, place and promotion also apply to cotton and the cotton industry, although possibly to a lesser extent. Managing the mix of the four Marketing “Ps” to optimize income and livelihood is therefore an important undertaking. As cotton is a more or less homogeneous good (a commodity), marketing possibilities are limited. Cotton marketing is nevertheless a complex operation that includes buying, selling and re-selling of cotton from the time the cotton is ginned until it reaches the textile mill.6 Among the four Ps, price policy is the most effective and widely applied for marketing of cotton. However, place (distribution policy) and promotional activities are increasing in importance as client-oriented solutions are needed to satisfy more and more demanding clients that expect tailor-made solutions for their specialized spinning operations. Analysing the four Ps of marketing with regard to African cotton reveals potential for African stakeholders to play a more active role in the market as follows: Product: The product has always been the focus when it comes to cotton marketing. Cotton as any other product needs to satisfy the wants and needs demanded by a consumer, i.e. a spinning mill. Satisfying the demand of the consumer means to produce a product for the market rather than just producing a product and then looking for a customer. This also applies increasingly to a commodity such as cotton. African competitors in e.g. the US, Australia or Brazil are actively developing new varieties that help clients to find new applications and solutions using cotton. African producers and ginners so far did not develop a direct relationship including a direct feedback-loop with existing clients or potential new clients. The marketing component of cotton production usually begins with the product, i.e. lint quality. Several quality factors can have a significant impact on the price paid. The quality factors determine the grade. The components of cotton grade determinants include leaf grade, fibre length, uniformity, strength, micronnaire, trash and colour.7 In addition, “clean”, i.e. non-contaminated cotton can get price premiums while discounts may be applied for highly contaminated cotton. Thus the higher the grade and the lower the contamination the higher are possible price premiums. The lower the grade and the more contaminated the cotton the higher are price discounts. At national level, fibre characteristics of African cotton are relatively homogenous as growing conditions are similar and the number of varieties is low. However, bale variability is much higher in Africa than in most competitor countries, because the cotton from various farmers are often mixed into one single bale.8 This is one of the reasons why African cotton is penalized on world markets. More importantly, however, is the fact that lint with high quality but that is not reliably classified (including through HVI instrument testing) will not earn a premium that it otherwise would.9
6 Cotton: From Field to Fabric, found at Cotton Counts:
Http://www.cotton.org/pubs/cottoncounts/fieldtofabric/classing.cfm 7 T. J. Dumler and S. R. Ducan, Cotton marketing basics, Kansas State Research and Extension, 8 David Tschirley, Colin Poulton, Patrick Labaste, Editors, Organization and Performance of Cotton
Sectors in Africa, Learning from Reform Experience, The World Bank, Washington D. C. , 2009, p. 83 9 dito
Price: Individual cotton producers are price takers without any possibility of influencing the price. As for any commodity, world market prices are determined by world supply and demand. These market forces are channelled through and meet at commodity exchanges where world market prices are determined for a standard product with pre-determined quality requirements. World market prices are highly volatile and expose suppliers as well as consumers to large price risks. A marketing plan therefore is often a price contingency plan of actions that the producers will take in various possible, but ultimately uncertain, future situations in the market.10 A traditional marketing plan offers growers and spinning mill customers alike a choice of contracts that include a variety of price and delivery alternatives. In essence, it is an insurance programme for a cotton company, combining elements such as forward contracting, selling at harvest, marketing pools, use of bonded warehouses, etc. This enables each party to manage its market exposure. Differentials in quality will be reflected in price changes, as with improved product quality, premiums can be achieved that increase the price. For small scale farmers this needs to be done collectively as otherwise the quantity would be insignificant. The development of a quality image or even label could also increase the possibility to achieve premiums. Probably the most important aspect for African cotton in that respect is to reduce contamination as with cleaner cotton price premiums could be achieved. For premiums to be sustainable, price policy needs to be well communicated to spinning mills, which will entail the need to closely cooperate with international cotton merchants. Since basic fibre parameters in Africa are very similar, price differentials between different African origins reflect mainly the level of contamination.11 According to the World Bank, concentrated sectors such as Zambia and Zimbabwe but also Cameroon received substantial premiums in the past. On the contrary, liberalised sectors in Tanzania and Mozambique had to live with deductions due to high contamination levels.12 Place, i.e. distribution policy appears relatively unimportant as cotton is a very storable commodity and transport is relatively inexpensive. However, as Asian spinning companies buy C&F or CIF Asian port, African ginning companies, who use to sell FOB, need to bridge the gap. Cotton of African origin is traditionally being distributed through international merchants that buy ex gin and find spinning mills in Asia that use the cotton. This takes place without the involvement nor knowledge of cotton producers and ginning companies. Distribution policy is therefore not being done directly by African cotton stakeholders. International merchants offer a mix of different origins to spinners to cater to the specific requirements of the client. This mix usually follows the product quality
10 J. R. C. Robinson, Professor, Department fo Agricultural Economics, Texas A&M University /see
http://agecon2.tamu.edu/people/faculty/robinson-john/ 11 David Tschirley, Colin Poulton, Patrick Labaste, Editors, Organization and Performance of Cotton
Sectors in Africa, Learning from Reform Experience, The World Bank, Washington D. C. , 2009, p. 84 12 Zambia received + 4 cents/lbs, Zimbabwe + 3 cents/lbs ansd Cameroon + 2 cents/lbs in the 2006/7
season, while Mozambique and tabnzanias receide deductions by 2 cents/lbs each for their cotton. Ditto pp. 85-89.
requirements (grade and contamination level) of the client but does not take account of origins, if not specifically requested. As international merchants are pure service providers, catering to the needs of spinning mills, their applied distribution policy does not necessarily cater to the needs of specific origins. There is, thus, no specific distribution policy in place for African cotton.13 Thus, if African cotton producers would like to promote their cotton more actively they would also need to take over more responsibilities and introduce flexibilities with regard to the distribution policy required by clients in the market. More services would need to be offered to spinning mills, starting with an offer that fulfils expectations on C&F or CIF delivery. Promotion: Being a commodity, promotion activities for cotton are somewhat limited, as promotional efforts have been most successful for products with brand recognition. For that reason a large part of on-going promotional activities focus as cotton as a fibre against other competing fibres mainly polyester and other man-made fibres. But this does not favour one origin over the other and attracts free-riders that benefit from promotional activities for cotton as a whole. African cotton has mainly benefitted from promotional activities undertaken by other cotton producing countries, most notably the United States. While promotional activities for a commodity such as cotton are less effective than for consumer goods such as e.g. clothing, promotional activities have nevertheless a potential impact on cotton sales in destination markets. Some major producing countries such as the United States, Australia, and Brazil have managed to create a quality image and brand recognition in the market that helps to cash-in premiums over other cotton. Also Indian cotton, of notorious bad reputation only some years ago, has been improving its cotton quality through large investments in upgrading ginning capacities and quality improvement measures undertaken under the leadership of the Ministry of Textiles. In addition, India was able to successfully communicate these improvements and reverse its image among clients. Many Asian spinning mills associate e.g. US or Australian cotton with very clean and thus non-contaminated cotton and are willing to pay a higher price (premium). While both countries work with very sophisticated classing and grading systems at bale level, the US also follows resource-intensive promotional campaigns to cement their positive brand image in the market. In contrast, African cotton is not promoted in major cotton consuming markets. In fact, the successful promotional activities of other cotton origins, combined with an existing negative reputation due to issues of contamination as well as stickiness (in the past) in some African countries, has created a negative image of African cotton among many spinning mills. While this image might not necessarily reflect the status quo of African cotton and is an undifferentiated generalization of the situation, it has created a “brand-recognition” of African cotton that is unfavourable.14 In order to
13 Exceptions can be found in cases where merchants also operate ginning factories, which is the
case in several Africa countries. 14 In fact, some African origins receive premiums for its clean cotton such as e.g. Zambia and
Zimbabwe from knowledgeable spinning companies with experience in using this specific cotton. Overall, however, this does not change the generalized view of many spinners in Asia that regard African cotton as one single origin with high contamination levels.
reverse this, promotional activities in the market are vital to communicate the efforts undertaken and results achieved to reduce contamination and enhance quality in Africa. Such efforts need to involve African stakeholders, but also international merchants. International cotton merchants follow a marketing policy that links cotton producers with spinning mills worldwide. Their aim is to develop and maintain long term relationships with reliable quality focussed spinning mills by supplying premium cottons, on time, and in accordance with the customers’ needs. However, the origin of cotton does not play an important role in this equation. Other aspects such as quality parameters, availability, government support, etc. play a more important role in their marketing strategies. International merchants thus promote their services and knowledge of cotton producing regions and their ability to deliver the right mix to individual spinners rather than promoting a specific origin, let alone African cotton. However, given the very tight financial situation of many African cotton companies and individual ginners, international merchants will have to play a more important role in promoting African cotton. In addition to the four Ps of marketing one could add a fifth one, namely “People” as in the African context the building of capacity among all cotton stakeholders is an important prerequisite in order to achieve long-lasting sustainable results. 4. Initiatives to Enhance Africa’s Visibility in Asian Markets The following is a non-exhaustive list of possible initiatives to market and promote African cotton more effectively in Asian markets and to establish closer and sustainable linkages with clients, i.e. to fulfil the necessary and sufficient conditions to start cotton marketing and apply some of the marketing tools. Capitalising on the training and marketing activities: Following the “typology of African cotton sectors” introduced by Colin Poulton and the World Bank, in Africa one could distinguish between two market-based cotton ssystems, namely competitive and concentrated systems as well as three regulated systems, i.e. national monopoly, local monopolies (concession system) and hybrid systems (most notably in Benin and Uganda).15 Capitalising on the value chain capacity building and export marketing activities organised by ITC, market-based competitive sectors and most notably Tanzania have been performing much better than regulated sectors with national or local monopolies. The entrepreneurial spirit of individual and independent ginners (combined with the pressure put by the local CRDB Bank to explore new business models) led to independent follow-up activities in Thailand, Bangladesh and Turkey. Tanzanian cotton was sold in direct marketing activities from independent ginners to spinning factories in both Bangladesh and Thailand. Feedback from Thailand on the quality of the cotton received was very good. Individual scoring card assessments of the buying spinner resulted in above average scoring for the Tanzanian cotton in almost all categories, except for contamination, which was
15 Please see David Tschirley, Colin Poulton, Patrick Labaste, Editors, Organization and Performance of Cotton
Sectors in Africa, Learning from Reform Experience, The World Bank, Washington D. C. , 2009, pp 55
slightly below average but still acceptable.16 Moreover, in Turkey, the Tanzania Cotton Board and other textiles and clothing stakeholders are actively engaging with the private sector in Turkey to establish lasting cotton development and textile investment activities. Hybrid systems (Uganda and Benin) showed good follow up initiatives although it did not lead yet to concrete individual marketing activities in the market. However, the lessons learned during the training and information gathered in the markets were actively applied in the countries. Sectors with national or local monopolies scored lower in our assessment, even though active follow up activities were highly dependent on individual initiatives of participants. Mali and Senegal, for example, showed a very pro-active approach with good results (according to individual feed-back received from CMDT and Sodefitex) while some other countries seemed to continue with business as usual.17 Table 1 attached gives an overview of the key indicators of cotton sector perfor-mance and expected performance by sector type, including for cotton export marketing, as introduced by the World Bank.18 Addressing contamination and communicating success: Problems with cotton contamination are evident but generalised and overall African cotton is labelled as contaminated. While there is still some way to go for African cotton, some success has been achieved at national level and also at regional level. Serious efforts are undertaken but ineffectively communicated in the market. The African Cotton Association (ACA) is addressing the issue of contamination and is developing a common approach and fibre quality standard at regional level.19 That will help to overcome Africa’s reputation of delivering highly contaminated cotton. ITC is helping ACA by providing the market perspective and engaging interested spinning mills and cotton stakeholders from major Asian consuming countries in the process. With reduced contamination levels, price premiums are achievable in the future. To achieve this, however, sustainable success need to be communicated and spinning mills convinced that clean cotton will be deliver every time. Moreover, under the EC All ACP Agricultural Commodity Programme, the Common Fund for Commodities, with support of the World Bank is initiating a programme for clean cotton in three pilot countries in West Africa, that targets the farm and gin level.
16 This is an interesting outcome as Tanzanian cotton is generally regarded as one of the most
polluted cotton according to the cited World Bank study pp 83-89. 17 These assessments are made by the author on feedback received from participants and on his own
judgments. They are thus subjective and not based on scientific evaluations. Moreover the results of capacity building activities and training of trade support institutions are difficult to measure and can be judged only over a long-term period.
18 This is an amended version of the table shown on page 15 of the World Bank study. The first process indicator of export marketing was added to the existing table according to the authors own experience in working with African sectors on trade capacity building and export marketing activities.
19 ACA organised in Cotonou, Benin 14-16 January 2010 the second “Journée de Qualité”, specifically addressing contamination issues.
In Eastern and Southern Africa, ITC is planning to assist progressive ginners from Tanzania and Uganda to tackle the contamination issue by involving Asian spinners and thus potential clients in the efforts. Revising an unfavourable African image in the market: Although production methods and cotton quality are not homogenous in Africa and certain African countries receive price premiums in certain markets, African cotton overall suffers from a negative image of highly contaminated cotton. This reputation is widespread and could be found in all markets visited. Only a few spinners that deal with specific origins know about the quality and price differentials for certain African cotton. But overall, among the majority of Asian spinning companies, African cotton is associated with high contamination and subsequent low prices. In order to overcome this negative image, African cotton stakeholders would need to engage in a more aggressive and long-term image-building campaign in destination markets. Such a campaign needs to target the general image of Africa in Asia, namely that of an underdeveloped and backward continent, as well as the negative image of highly contaminated cotton originating from Africa.20 Notwithstanding the existing negative image, the development situation in each African country is different and so is the situation in the cotton sector. While image building for an African label needs to be long-term and should benefit all African countries, more short to medium-term marketing efforts could target specific country origins. This needs to take into consideration the present status of each cotton-producing African country and their individual needs to promote their cotton in destination markets. Experiences made and lessons learned by individual African countries could then be shared and utilised for a common regional or multi-country approach. In addition, the promotion of African cotton in destination markets to improve the unfavourable perception of African cotton could be done, for example, through the following means21:
o Regular participation in international cotton conferences such as e.g. the China International Cotton Conference. A regular presence will sharpen the consumer’s perception of African cotton. Moreover, during such conferences many domestic spinning mills will be present and could be approached to communicate the positive characteristics of African cotton and the efforts undertaken to tackle issues such as contamination.
o Develop and distribute tailor-made promotion material to convince Asian spinners of African cotton quality and efforts undertaken to reduce contamination. In many countries spinners made reference to the promotional efforts undertaken by US cotton and the useful communication material such a buying guides, etc. distributed.
20 In some markets African cotton was also associated with high sugar content (stickiness) because in
the past some spinners had some problems with a few African origins. 21 These suggestions were made during ITC-facilitated activities in various Asian markets.
o Strengthen the cooperation with cotton associations and cotton textile associations in many producing and consuming countries. A closer cooperation with, for example, the China Cotton Association and the China Cotton Textile Association, the Bangladesh Textile Mills Association, the Thai Textile Manufacturers Association, or national ginners and farmers associations on all aspects of the value chain, including cotton trading and marketing would be very beneficial.
o Combine promotional and educational efforts about cotton as a natural product with positive sustainable effects for the environment with educational efforts on the importance of cotton for Africa’s development and the contribution to achieve the Millennium Development Goals, including contribution to poverty reduction and a sustainable environment.
Increase transparency in farm inputs and seed cotton price determinations: One important aspect of closer links with other cotton producing regions is that of increasing the knowledge of how agricultural cotton inputs are calculated and managed and how seed-cotton prices are determined. This is especially important in liberalised cotton sectors, where farmer and farmer representatives have no insights into real costs of the ginning sector and where ginneries compete against each other. Transparency in ginning cost structures and farm inputs (in the case where ginners distribute seeds, fertilizers, insecticides and pesticides and operate extension services) is vital to determine accurate seed-cotton prices and to build a fruitful relationship of trust and mutual recognition and cooperation. Knowledge leads to transparency, and with a transparent structure trust will be built, which is an important prerequisite to tackle sector-wide issues that need the involvement and full support of all sector stakeholders, such as e.g. contamination. Closer involvement of local banks: With the financial and economic crisis as well as the sudden price hikes in the cotton sector in March 2008, banks have become more cautious on lending practices. Moreover, traders receive less trade finance from their banks and are not willing to buying forward anymore, which poses big problems for African cotton farmers and ginners. In many African countries cotton shipments are only released once an international reputable buyer has signed a contract and opened an L/C. Many local banks only regard strong international merchants as fully credit worthy. This however does not support African cotton stakeholders to become equal partners in the international cotton business. The CRDB bank in Tanzania is actively engaged in understanding foreign markets, their requirements and how to help domestic ginning companies to find more advantageous markets overseas. The presence of a bank during negotiations with foreign clients makes a difference as financial and contractual concerns are immediately addressed. Moreover, CRDB bank also helps its clients to improve operations, follow internationally recognized standards and contract requirements as well as building an institutional support structure for the cotton industry. Closer cooperation with spinning mills: While most Asian spinners visited buy on price and quality quotations, an increasing number is interested in developing closer and more direct relationships with cotton companies and independent ginners in Africa. More and more spinners are concerned of a steady and secured long-term
supply to satisfy their increasing cotton needs. As a result they are interested to invest in developing closer relationships with cotton companies and independent ginners to secure supply of the specific quality requirements they need. This includes longer-term buying arrangements as well as provision of technical assistance to improve on cotton contamination at gin level and to a certain level also at farm level. For example spinning mills from Bangladesh, China, and Thailand participated in the “2eme Journée de Qualité” of the African Cotton Association in Cotonou, Benin, 14 - 16 January 2010 to get a better understanding of ACA’s efforts to reduce contamination and in establishing more direct contacts for long-term relationships. Developing a closer cooperation and more equal relationship with international merchants to market African cotton. Merchants have an important role to play as modern services providers to bridge the gap between the needs of spinning mills and the production on offer from Africa. Services include matching production with consumption, timing of purchase and sales according to client’s needs and requests, logistical arrangements, finance, risk management, buying and selling in different currencies, assessment of honesty and financial reliability of business partners, etc.22 Feedback received from African participants on ITC’s training and capacity building activities in Asian markets reveals that in the past the relationship between international merchants and African cotton companies and independent ginners was not always one of equal partners. With more transparency and full availability of market and client information and an established feedback loop on delivered cotton and quality requirements of spinning mills, cotton companies, independent ginneries and farmer representatives can cooperate more effectively with merchants to deliver the quality the market demands. An equal relationship between merchants and cotton companies/ginners as well as producers is the basis to jointly elaborate promotional approaches. With improved quality, marketing and promotion efforts could be undertaken jointly in the market, benefitting African cotton and remunerating service provision of merchants. Each side would be able to focus on its comparative advantage more effectively, while undertaking its activities in full transparency. To achieve long-lasting results, all partners need to work together and forego short-term profits to achieve long-term benefits. In the meantime, some international merchants (re-) started to invite sales managers of selected West African cotton companies to visit clients and spinning mills in Asia. While they have done so sporadically in the past this is a step in the right direction. From a development perspective, however, such market-related activities should not step at the level of sales directors. It needs to include various representatives of the African cotton value chain, including classers and farmer representatives so that the feedback loop reaches back to the production process. Moreover, it would also increase transparency and thus eliminate potential favouritism. Provision of a more regular and continuous offer: National production levels in Africa are relatively low compared to major world market competitors. As a result, cotton is on offer during the 4-5 months of the cotton season only, whereas spinning
22 Some international merchants also operate ginning factories is selected countries and provide crop
inputs such as fertilizer and funding to cotton farmers. Please also see Cotton Exporter’s Guide, International Trade Centre, Geneva 2007, pp. 169 - 174
mills need delivery throughout the year. That makes national stakeholders vulnerable in price negotiations. The need of a more consistent offer requires a closer regional cooperation within Africa. In Eastern and Southern Africa for example the four countries of Mozambique, Zambia, Zimbabwe and Malawi (MoZaZiMa) will work closely together to tackle this issue and to cooperate along the entire value chain, starting from seed development, research towards joint marketing and promotion of MoZaZiMa origin. This initiative is only at an infant stage but the direction is right. Moreover, it would be important to use other available tools to increase market presence and expand the offer in the market. One important tool is that of bonded-warehouse receipts in destination markets. The use the Free Zone Cotton warehouse such as for example in Mersin, Turkey or Qingdao or Tianjin, China, etc. would be beneficial to African cotton presence in the market. With warehouse receipts, ginners (or merchants) would still receive their payment, while having cotton bales presence in the market deliverable at any time. To test this option, some ginners might get together to send cotton bales on consignment from Africa to test the Turkish or Chinese or any other market to promote African cotton and to secure a long-term offer in the market. Utilization of duty-free and quota-free access of African cotton: The Indian government has officially announced quota and duty-free entry of African cotton to the Indian market. In addition, the Chinese Government has announced to provide duty-free and quota-free access to the Chinese market for African LDCs, including for cotton.23 While for China details are not yet available, the Ministry of Textiles, Government of India has developed a brochure that states the details of the unilateral decision.24 However, this information and the details of how to utilize this facility are not known yet. Efforts would therefore be needed to disseminate the information. In the case of China, additional diplomatic efforts would be needed to request more specific and practical details on the arrangements and how to actually make use of them. This could ideally be done together with market players, i.e. spinning companies in China as well as international merchants that would have a legitimate interest in importing African cotton quota- and duty-free. 5. Conclusions Cotton was established as a prominent industry in Africa to supply cotton with favourable quality at relatively low prices for export. Due to a shift in demand from industrialized countries to Asian emerging economies, efforts to boost cotton 23 Please refer to the full text of the Chinese premier Minister’s speech at the 4th Ministerial
Conference Forum on China – Africa Cooperation, received through the Chinese Mission to the WTO in Geneva. Also refer to the statement of the Chinese representative during the 12th meeting of the (WTO) Director-General’s Consultative Framework mechanism on Cotton, Geneva, 23 October 2009.
24 India’s Duty Free Tariff Preference (DFTP) for Least Developed Countries (LDCs), Ministry of Commerce and Industry, Government of India, India Africa Forum Summit, New Delhi, 8 April 2008; Also refer to the statement of the Indian representative during the 12th meeting of the (WTO) Director-General’s Consultative Framework mechanism on Cotton, Geneva, 23 October 2009
production in major Asian producing countries, and an increasingly integrated value chain, promotional efforts of African cotton in Asia are a vital component to sustain the industry in Africa. Competitiveness starts from the market by understanding market and buyer requirements and addressing identified bottlenecks along the entire value chain from cotton research to premiums available in the market. A clear understanding of the entire value chain, the market as well as the client and the client’s client is a necessary condition to become competitive. In addition, cotton stakeholders need to find solutions on how to translate gained information and knowledge into know-how at national and regional level (sufficient condition). Gathering knowledge about the value chain, the market and clients and subsequently applying this knowledge at home, i.e. developing the know how to engage all cotton stakeholders in Africa is a step-by-step approach. Once the necessary and sufficient conditions are in place, African cotton producers would be in a position to benefit from directly engaging in cotton marketing. The paper analysed the four Ps of a marketing mix with regard to African cotton, namely product, price, place (distribution policy) and promotion. All four areas of the marketing mix can be addressed more dynamically in Africa. While product policy mainly refers to quality of lint and tackling the issue of contamination, price policy often refers to contingency planning against price volatility and, thus, price risk and market exposure management. However, it also refers to capitalise on possible premiums for better quality and cleaner lint. Place or distribution policy in cotton refers to providing logistical and other services to bridge the gap between Africa FOB offer and clients in Asia, who buy C&F or CIF. Promotion of African cotton would need to firstly address the existing negative image of African cotton in the market. This is, to a large extent, a communication issue that starts by understanding the specific requirements of clients. The successful promotional activities of other cotton producing countries, most notably from the US, show how a brand image could be created in the market. In the African context that needs to be tackled jointly by all stakeholders, including international merchants. Some promotional activities for Africa cotton that could be undertaken include:
• Capitalising on the training and marketing activities undertaken and the contacts already established
• Addressing contamination issues and communicating success in reducing contamination
• Revising an unfavourable image of African cotton in the market
• Increase transparency in farm inputs and seed cotton price determinants to create trust among cotton stakeholders
• Closer involvement of local banks in all efforts
• Closer cooperation with interested spinning mills in the market
• Developing a closer cooperation and more equal relationship with international merchants
• Provision of a more regular and continuous offer through regional cooperation efforts on joint use of bonded warehouse facilities in destination countries (ports)
• Utilisation of quota- and duty-free access of African cotton in India and possibly China
However, cotton marketing and promotion is not a panacea or immediate solution for the African cotton industry. Overall, production needs to be stabilized, yields increased, contamination reduced and premiums for clean cotton captured. In order to achieve this and to improve African competitiveness, a more strategic orientation needs to be given to African cotton, and farmers as well as ginning companies need to be empowered. Marketing, including promotion is only one of many aspects that need to be addressed in a strategic approach. However, it is the aspect that links the entire process by understanding the client, addressing their requirements in the entire value chain operation and finally promoting the cotton to spinning mills. A sustainable feedback-loop from spinning mills to ginning companies and cotton producers is therefore vital to improve Africa’s competitiveness in a sustainable manner. Once full value chain understanding and market transparency, at both the market as well as input side, is achieved, stakeholders will also be better equipped to guide support providers such as technical assistance agencies, NGOs, and private sector bodies into areas where support is needed. In addition, their negotiation position vis-à-vis trading companies will be improved, leading to mutual benefits in a position of strength. Coordinated strategy implementation will result in synergy development among all players and will provide Africa with a more global cotton prominence. It will also ensure that benefits will be passed on to cotton farmers. Disclaimer: Views expressed in the article are the contributors’ and do not necessarily coincide with those of ITC, UN or WTO. Designations employed do not imply the expression of any opinion on the part of ITC concerning the legal status of any county, territory, city or area, or of its authorities or its boundaries; or the endorsement of any firm or product.
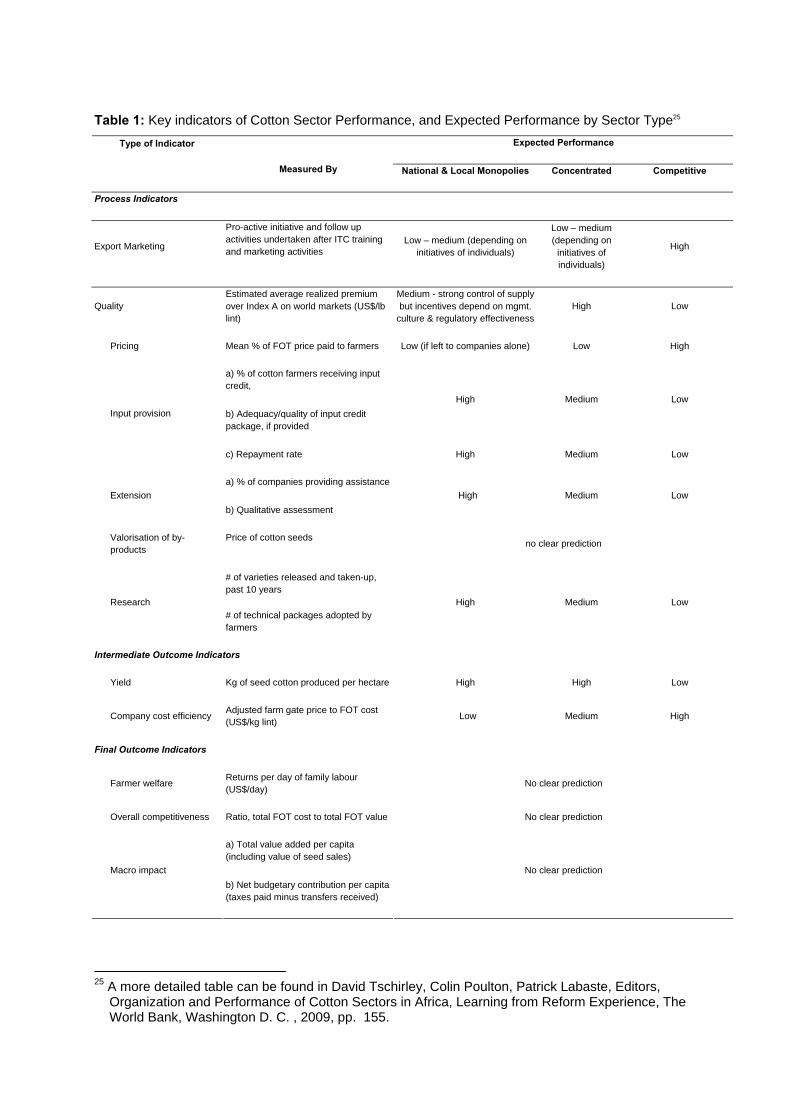
Table 1: Key indicators of Cotton Sector Performance, and Expected Performance by Sector Type25
Expected Performance Type of Indicator
Measured By National & Local Monopolies Concentrated Competitive
Process Indicators
Export Marketing
Pro-active initiative and follow up activities undertaken after ITC training and marketing activities
Low – medium (depending on initiatives of individuals)
Low – medium (depending on
initiatives of individuals)
High
Quality Estimated average realized premium over Index A on world markets (US$/lb lint)
Medium - strong control of supply but incentives depend on mgmt.
culture & regulatory effectivenessHigh Low
Pricing Mean % of FOT price paid to farmers Low (if left to companies alone) Low High
a) % of cotton farmers receiving input credit,
b) Adequacy/quality of input credit package, if provided
High Medium Low Input provision
c) Repayment rate High Medium Low
a) % of companies providing assistanceExtension
b) Qualitative assessment High Medium Low
Valorisation of by-products
Price of cotton seeds no clear prediction
Research
# of varieties released and taken-up, past 10 years
# of technical packages adopted by farmers
High Medium Low
Intermediate Outcome Indicators
Yield Kg of seed cotton produced per hectare High High Low
Company cost efficiency Adjusted farm gate price to FOT cost (US$/kg lint) Low Medium High
Final Outcome Indicators
Farmer welfare Returns per day of family labour (US$/day) No clear prediction
Overall competitiveness Ratio, total FOT cost to total FOT value No clear prediction
a) Total value added per capita (including value of seed sales)
Macro impact b) Net budgetary contribution per capita (taxes paid minus transfers received)
No clear prediction
25 A more detailed table can be found in David Tschirley, Colin Poulton, Patrick Labaste, Editors,
Organization and Performance of Cotton Sectors in Africa, Learning from Reform Experience, The World Bank, Washington D. C. , 2009, pp. 155.
SUSTAINABLE COTTON OPTIONS - INTEGRATING SUSTAINABILITY INTO THE SOURCING STRATEGIES OF BRANDS AND RETAILERS
A. Salm
Organic Exchange Europe
Increasingly consumers and brands are looking for alternatives to conventional cotton production and are actively investigating the various sustainable cotton options. Organic Exchange is a membership organisation that represents the interests of a broad spectrum of participants in the textile and apparel supply chain from farm groups through to brands and retailers. While we do have individuals as members we are an industry organisation not a consumer organisation. At retail level the turnover of our brand and retailer members exceeds 750 billion dollars. In addition we count farmers, traders, certifiers, NGOs, textiles and apparel producers and their suppliers amongst our members. OE was established principally to promote the production and consumption of organic cotton. Besides the acknowledged benefit of strong networking opportunities that membership provides, one of the outputs of OE is the annual Farm and Fiber report and the Market report which map both the production of organic cotton fibre and its consumption in a variety of forms. The original mission of OE was to catalyze market forces to deliver sustained environmental, economic and social benefits through the expansion of organic and sustainable fibre agriculture. We see our role as one in which we catalyze, connect, convene, educate and support. When we established in 2002 the emphasis on sustainable sourcing was very small as a percentage of the entire sourcing portfolio of our brand and retailer members and organic cotton was viewed as the low hanging fruit that could introduce sustainability into sourcing with positive benefits for farmers, the environment and the brands as it enabled them to tell a positive story around their engagement with environmental and social issues. This saw the production of organic cotton grow from around 6500 metric tons in the 2000/2001 season to over 175 000 metric tons on the 2008/2009 season. This growth is vibrant and dramatic and clearly indicates the willingness of retailers and consumers to commit to making purchases that are clearly more sustainable. Despite this encouraging growth the fact remains that the total production of organic cotton still remains below 1% of global cotton production. One of the obvious constraints to the unrestricted growth of organic cotton is increased costs that arise particularly when it comes to large scale producers. In production areas that are not subject to effective natural defoliation through winter frosts, cotton must be hand picked and the cost of labour is rising globally. Another
cost add-on comes from verification and certification. While organic cotton premiums have reduced drastically, particularly in India, the additional costs involved make it virtually impossible for brands and retailers to mainstream organic cotton programs as they risk becoming uncompetitive. There are also the risks that the benefits that farmers achieve through enhanced production and management techniques are eroded by the drive to the bottom in terms of cost. This has not stopped many of our members from making significant commitments to the procurement and usage of organic cotton. For example Wal-Mart has embarked on a major sustainability project which involves all of its suppliers, Nike has committed itself to using a minimum of 20% organic cotton in all of its cotton garments and C&A sourced close to 20 million garments for its chain of stores in 2009. The problem is not commitment to the promotion and consumption of organic cotton but the increasing perception among academics and the consuming public that cotton, the quintessential natural fibre, is not quite as natural as it should be or could be. This perception coupled with a new dynamic that has emerged influenced by environmental stewardship, climate change and the real element of reputational risk associated with unsustainable sourcing techniques has resulted in sustainable sourcing now moving to the mainstream with organic cotton remaining an important element within the sourcing strategy. In the 1980s and early 90s managing corporate reputational risk was thought to be limited to ensuring the social conditions were addressed in the first tier of suppliers such as apparel manufacturers. This led to a plethora of codes of conduct covering issues around working conditions such as child labour, hours of work, freedom of association, health and safety and the like. By the end of the last decade a completely different paradigm emerged with companies now looking at their entire supply chain right back to fibre production and, in some cases, through to seed production. The Uzbekistan child labour expose saw an immediate response from brands and retailers who struggled to ensure that Uzbek cotton did not enter their supply chains. 1 Other significant issues around cotton production have been highlighted including inefficient irrigation, depletion of ground water supplies and the drying up of inland lakes, damage to human health and livestock through inefficient application of agro chemicals, damage to the environment and biodiversity through excessive agro chemical usage and the scrabble for agricultural land at the expense of natural heritage. Brands and retailers recognize the reputational risk associated with unsustainable production techniques and are now demanding that the balance of their fibre supply is sourced in a manner that satisfies their requirements in terms of corporate social responsibility.
1 The Children behind Our Cotton. Environmental Justice Foundation,
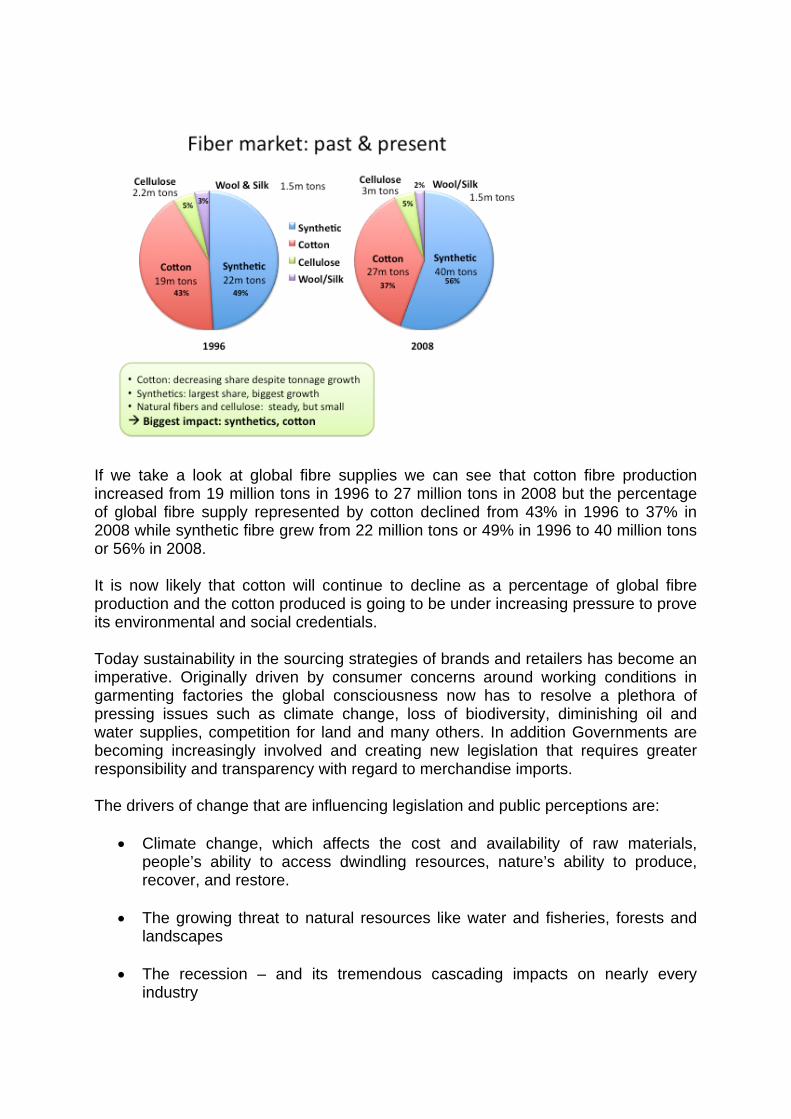
If we take a look at global fibre supplies we can see that cotton fibre production increased from 19 million tons in 1996 to 27 million tons in 2008 but the percentage of global fibre supply represented by cotton declined from 43% in 1996 to 37% in 2008 while synthetic fibre grew from 22 million tons or 49% in 1996 to 40 million tons or 56% in 2008. It is now likely that cotton will continue to decline as a percentage of global fibre production and the cotton produced is going to be under increasing pressure to prove its environmental and social credentials. Today sustainability in the sourcing strategies of brands and retailers has become an imperative. Originally driven by consumer concerns around working conditions in garmenting factories the global consciousness now has to resolve a plethora of pressing issues such as climate change, loss of biodiversity, diminishing oil and water supplies, competition for land and many others. In addition Governments are becoming increasingly involved and creating new legislation that requires greater responsibility and transparency with regard to merchandise imports. The drivers of change that are influencing legislation and public perceptions are:
• Climate change, which affects the cost and availability of raw materials, people’s ability to access dwindling resources, nature’s ability to produce, recover, and restore.
• The growing threat to natural resources like water and fisheries, forests and
landscapes
• The recession – and its tremendous cascading impacts on nearly every industry
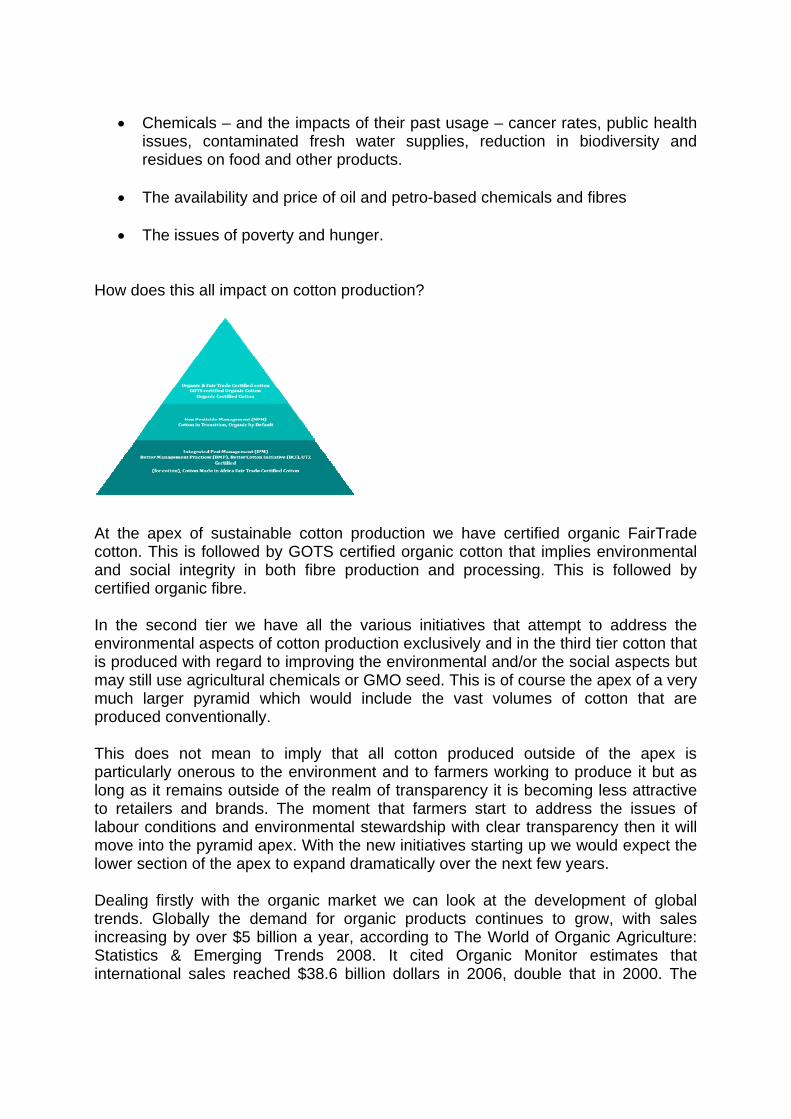
• Chemicals – and the impacts of their past usage – cancer rates, public health issues, contaminated fresh water supplies, reduction in biodiversity and residues on food and other products.
• The availability and price of oil and petro-based chemicals and fibres
• The issues of poverty and hunger.
How does this all impact on cotton production?
At the apex of sustainable cotton production we have certified organic FairTrade cotton. This is followed by GOTS certified organic cotton that implies environmental and social integrity in both fibre production and processing. This is followed by certified organic fibre. In the second tier we have all the various initiatives that attempt to address the environmental aspects of cotton production exclusively and in the third tier cotton that is produced with regard to improving the environmental and/or the social aspects but may still use agricultural chemicals or GMO seed. This is of course the apex of a very much larger pyramid which would include the vast volumes of cotton that are produced conventionally. This does not mean to imply that all cotton produced outside of the apex is particularly onerous to the environment and to farmers working to produce it but as long as it remains outside of the realm of transparency it is becoming less attractive to retailers and brands. The moment that farmers start to address the issues of labour conditions and environmental stewardship with clear transparency then it will move into the pyramid apex. With the new initiatives starting up we would expect the lower section of the apex to expand dramatically over the next few years. Dealing firstly with the organic market we can look at the development of global trends. Globally the demand for organic products continues to grow, with sales increasing by over $5 billion a year, according to The World of Organic Agriculture: Statistics & Emerging Trends 2008. It cited Organic Monitor estimates that international sales reached $38.6 billion dollars in 2006, double that in 2000. The
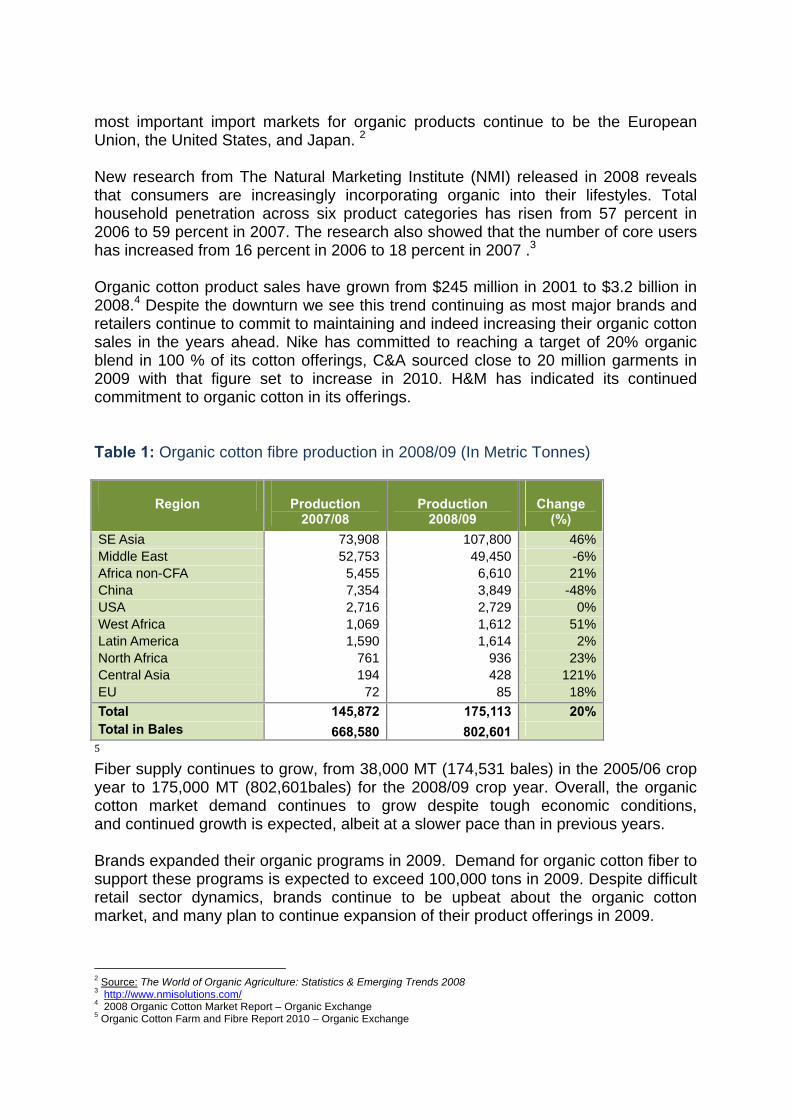
most important import markets for organic products continue to be the European Union, the United States, and Japan. 2 New research from The Natural Marketing Institute (NMI) released in 2008 reveals that consumers are increasingly incorporating organic into their lifestyles. Total household penetration across six product categories has risen from 57 percent in 2006 to 59 percent in 2007. The research also showed that the number of core users has increased from 16 percent in 2006 to 18 percent in 2007 .3 Organic cotton product sales have grown from $245 million in 2001 to $3.2 billion in 2008.4 Despite the downturn we see this trend continuing as most major brands and retailers continue to commit to maintaining and indeed increasing their organic cotton sales in the years ahead. Nike has committed to reaching a target of 20% organic blend in 100 % of its cotton offerings, C&A sourced close to 20 million garments in 2009 with that figure set to increase in 2010. H&M has indicated its continued commitment to organic cotton in its offerings. Table 1: Organic cotton fibre production in 2008/09 (In Metric Tonnes)
Region
Production
2007/08
Production
2008/09
Change
(%) SE Asia 73,908 107,800 46% Middle East 52,753 49,450 -6% Africa non-CFA 5,455 6,610 21% China 7,354 3,849 -48% USA 2,716 2,729 0% West Africa 1,069 1,612 51% Latin America 1,590 1,614 2% North Africa 761 936 23% Central Asia 194 428 121% EU 72 85 18% Total 145,872 175,113 20% Total in Bales 668,580 802,601 5 Fiber supply continues to grow, from 38,000 MT (174,531 bales) in the 2005/06 crop year to 175,000 MT (802,601bales) for the 2008/09 crop year. Overall, the organic cotton market demand continues to grow despite tough economic conditions, and continued growth is expected, albeit at a slower pace than in previous years. Brands expanded their organic programs in 2009. Demand for organic cotton fiber to support these programs is expected to exceed 100,000 tons in 2009. Despite difficult retail sector dynamics, brands continue to be upbeat about the organic cotton market, and many plan to continue expansion of their product offerings in 2009.
2 Source: The World of Organic Agriculture: Statistics & Emerging Trends 2008 3 http://www.nmisolutions.com/ 4 2008 Organic Cotton Market Report – Organic Exchange 5 Organic Cotton Farm and Fibre Report 2010 – Organic Exchange
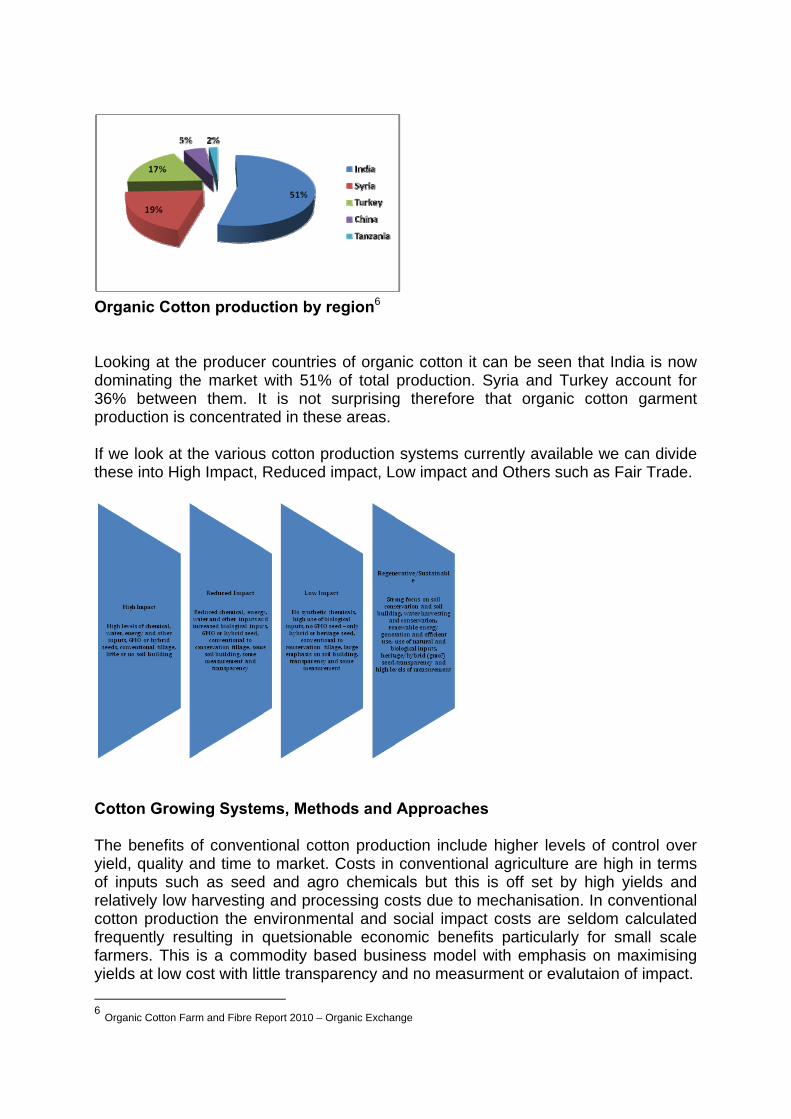
Organic Cotton production by region6 Looking at the producer countries of organic cotton it can be seen that India is now dominating the market with 51% of total production. Syria and Turkey account for 36% between them. It is not surprising therefore that organic cotton garment production is concentrated in these areas. If we look at the various cotton production systems currently available we can divide these into High Impact, Reduced impact, Low impact and Others such as Fair Trade.
Cotton Growing Systems, Methods and Approaches The benefits of conventional cotton production include higher levels of control over yield, quality and time to market. Costs in conventional agriculture are high in terms of inputs such as seed and agro chemicals but this is off set by high yields and relatively low harvesting and processing costs due to mechanisation. In conventional cotton production the environmental and social impact costs are seldom calculated frequently resulting in quetsionable economic benefits particularly for small scale farmers. This is a commodity based business model with emphasis on maximising yields at low cost with little transparency and no measurment or evalutaion of impact. 6 Organic Cotton Farm and Fibre Report 2010 – Organic Exchange
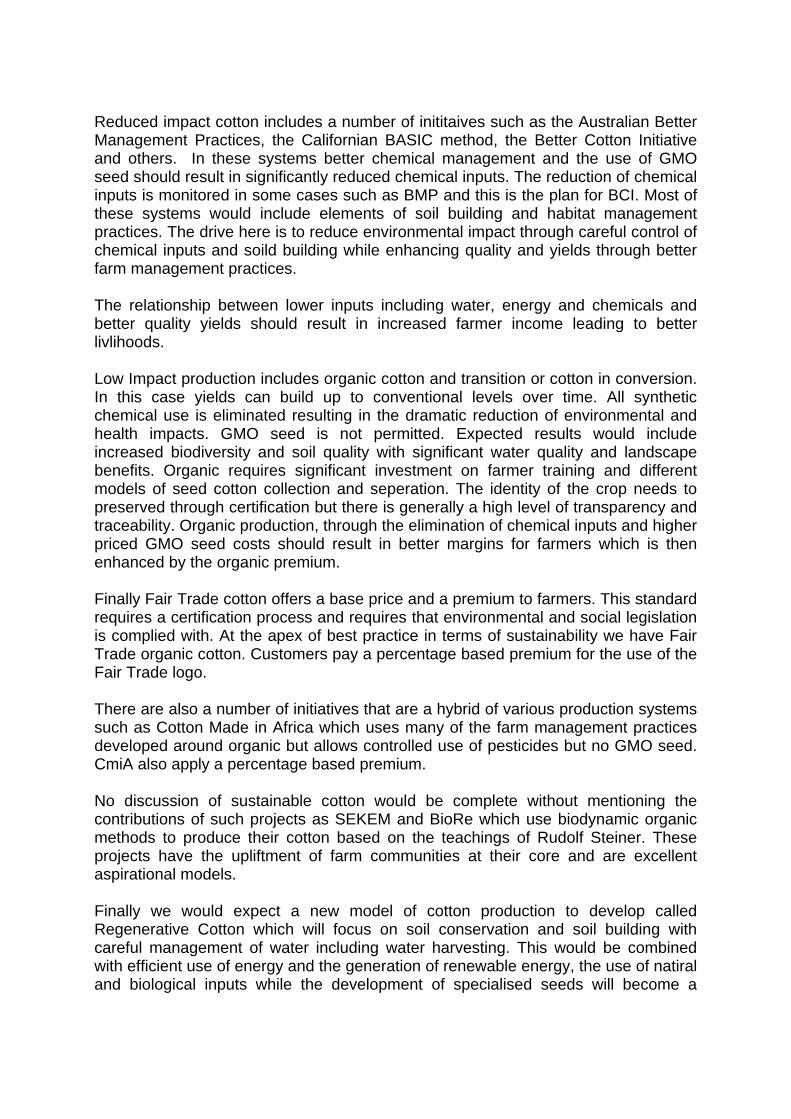
Reduced impact cotton includes a number of inititaives such as the Australian Better Management Practices, the Californian BASIC method, the Better Cotton Initiative and others. In these systems better chemical management and the use of GMO seed should result in significantly reduced chemical inputs. The reduction of chemical inputs is monitored in some cases such as BMP and this is the plan for BCI. Most of these systems would include elements of soil building and habitat management practices. The drive here is to reduce environmental impact through careful control of chemical inputs and soild building while enhancing quality and yields through better farm management practices. The relationship between lower inputs including water, energy and chemicals and better quality yields should result in increased farmer income leading to better livlihoods. Low Impact production includes organic cotton and transition or cotton in conversion. In this case yields can build up to conventional levels over time. All synthetic chemical use is eliminated resulting in the dramatic reduction of environmental and health impacts. GMO seed is not permitted. Expected results would include increased biodiversity and soil quality with significant water quality and landscape benefits. Organic requires significant investment on farmer training and different models of seed cotton collection and seperation. The identity of the crop needs to preserved through certification but there is generally a high level of transparency and traceability. Organic production, through the elimination of chemical inputs and higher priced GMO seed costs should result in better margins for farmers which is then enhanced by the organic premium. Finally Fair Trade cotton offers a base price and a premium to farmers. This standard requires a certification process and requires that environmental and social legislation is complied with. At the apex of best practice in terms of sustainability we have Fair Trade organic cotton. Customers pay a percentage based premium for the use of the Fair Trade logo. There are also a number of initiatives that are a hybrid of various production systems such as Cotton Made in Africa which uses many of the farm management practices developed around organic but allows controlled use of pesticides but no GMO seed. CmiA also apply a percentage based premium. No discussion of sustainable cotton would be complete without mentioning the contributions of such projects as SEKEM and BioRe which use biodynamic organic methods to produce their cotton based on the teachings of Rudolf Steiner. These projects have the upliftment of farm communities at their core and are excellent aspirational models. Finally we would expect a new model of cotton production to develop called Regenerative Cotton which will focus on soil conservation and soil building with careful management of water including water harvesting. This would be combined with efficient use of energy and the generation of renewable energy, the use of natiral and biological inputs while the development of specialised seeds will become a
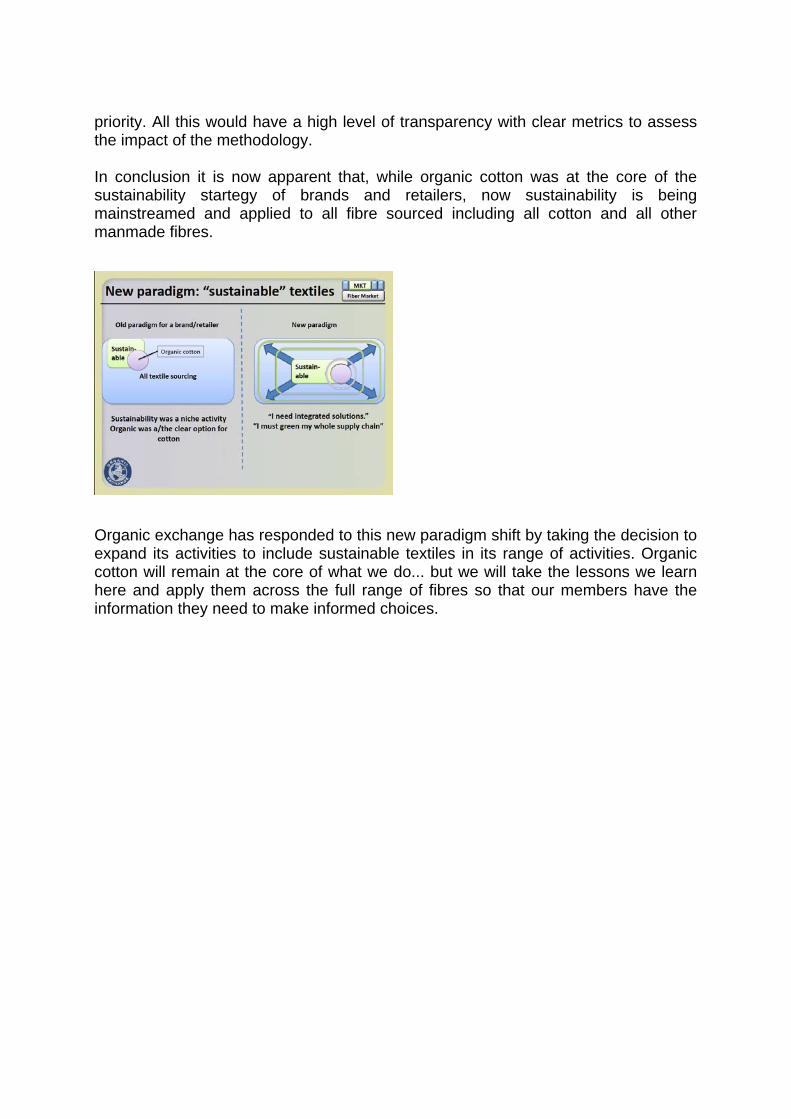
priority. All this would have a high level of transparency with clear metrics to assess the impact of the methodology. In conclusion it is now apparent that, while organic cotton was at the core of the sustainability startegy of brands and retailers, now sustainability is being mainstreamed and applied to all fibre sourced including all cotton and all other manmade fibres.
Organic exchange has responded to this new paradigm shift by taking the decision to expand its activities to include sustainable textiles in its range of activities. Organic cotton will remain at the core of what we do... but we will take the lessons we learn here and apply them across the full range of fibres so that our members have the information they need to make informed choices.
Session II: Developments in Cotton Production
30th International Cotton Conference BREMEN
March 24 - 27, 2010
Cotton WorldwideChristina Maria Kleineidam
Development of Biotechnology in CottonKater Hake
Regional Developments of Cotton Production in IndiaDiren N. Sheth
Regional Developments of Cotton Production in the USABill M. Norman
Regional Developments of Cotton Production in South AmericaAndrew Macdonald
Regional Developments of Cotton Production in AfricaAbdin Mohamed Ali
Regional Developments of Cotton Production in ChinaWenlong Gong
•
•
•
•
•
•
•
(Regional Developments)
COTTON WORLDWIDE
C. Kleineidam (Text) and H. P. Jost (Photography) A journey along the cotton chain seems to follow a cross section of society, from migrant workers to landlords, from factory workers to scientists and fashion designers. “Cotton is a microcosm of our rapidly globalizing world,” says the economist Pietra Rivoli in the introduction to our book. And she is right: Rapid changes characterize the world of cotton, often more rapidly than us, travelling by aircraft, car or train. The bankruptcy of Mali’s state cotton company CMDT is only one example: We found not running gins and oil mills because there was no money to collect the cotton harvest in the villages. Cotton is a so called high-input agriculture either in industrial or developing countries. It has the highest input of water, chemicals, fuel and human labour. We travelled in India, Uzbekistan, China, Brazil, the USA, Mali and Tanzania during 2006-2008; Here some interesting facts regarding cotton. 1. MIGRANT- OR SEASONAL WORKERS are still necessary in the cotton business: - in the agro- industry (USA, Brazil) for weeding, harvesting and ginning - in Uzbekistan for planting, weeding and harvesting. Children, often under 14 years
old, are forced to handpick cotton for the state, schools and universities remain closed during the harvesting period.
- in China an estimated 200 Million people from the countryside work in the construction sites and the factories. In the textile sector most workers are women who support even exploitation to get some independence.
2. CHINA is the World’s biggest importer, producer and processor of cotton. In Asia and Africa we noticed a strong presence of Chinese trying to satisfy the demand to raw materials and energy of their booming country: - In Mali and Tanzania former state run textile factories had been taken over by
private Chinese companies - In Mujnak, former Aral Sea harbour of Uzbekistan, we saw about 100 specialists
searching for Oil and Gas in the area of the Aralkum, the new, highly polluted desert on the former seabed
- Near Segou in Mali the Chinese bought 1.400.000 acres land for the production of organic fuel
3. THE CRUDE OIL PRICE is closely connected with the cotton business: - as base for fuel to run sewing- and harvesting machines and to transport cotton - as base for the chemicals spread on cotton fields – up to 17 times per season - as base for polyester- or other man made fibres, concurrence with the cotton
business - influences the decisions of Brazilian land owners as to what and how much to plant:
Sugar Cane (for Ethanol) or Soya (because needs less input) than of cotton - is the reason for Paolo Machado, one of the biggest ones, to produce Bio Diesel
from ginned cotton seeds in his own refinery 4. WATER Cotton needs the most water of any cultivated plant. For this reason - in Uzbekistan the Aral Sea dries out due to the irrigation and leaching of cotton
monocultures and new salt seas are spreading in the hollows of the desert instead - NGOs are demanding water management controls and a water price - correlation between water price and water saving investments; No price, no
necessity of investments in irrigation systems or the maintainance or chanals - positive example Xinjiang Province, where is realized what should be done in
Uzebekistan - Spread of water is not only a phenomen in low educated or countries with
dictatorship (we regard corrupt President Karimov from Uzebekistan as a dictator), but even in the high developed USA
- There is going to happen the dry out of the glacial underwater sea Ogalalla Aquifer, pumped out for the cotton in the Texas High Plains. This water has no price
5. CHANGE OF CLIMATE Profit, not knowledge or ethics dictate farmers- or politicians decisions: - The logging of the rainforest in Brazil to gain grazing land for a growing number of
cattle answers growing Chinese and Indian demands - The drying out of the Aral Sea in Uzbekistan due to the exploitation of the water
from the feeding rivers Amu- and Syr darja for irrigation and leaching of cotton monocultures
- Because of the decreasing water surface storms appear more often, bringing salt and poison from the former seabed, the new desert Aralkum to the glaciers in the Pamir High range, which start to melt faster
6. FOOD The production of meat and cash crops like cotton as well as growing cities and industrial areas take away farmland, necessary for food crops. - Cotton monocultures are given up only in most critical situations; During economic
crisis (Mali) or upcoming hunger due to increasing world market price for nutrition (Uzbekistan)
7. SUBSIDIES Subsidies for US- and European farmers create over production of raw cotton, which pushes down the world market price. As a result farmers in third world countries are not competitive. - Subsidies for US- and European farmers have to be abolished by 2013 to the latest
due to a decision of the WTO arbitration court. - Cotton prices will rise, so farmers in the poor countries will be competitive again. - Organic cotton will have a better chance - Subsidies as a minimum support price in India and Africa help farmers to resist in
the world competition, which is lead by high developed farmers, but, as actually happens in Mali and happened before in Tanzania, it can create the break down of state run cotton companies.
8. EDUCATION AND INFRASTRUCTURE Apart from the political systems it is education, which is necessary to be competitive - even in agriculture: - US farmers are stronger than all others in the world because of the strong
collaboration of science, industries, politics and agriculture - Illiteracy in developing countries excludes farmers from the correct use of high tech
seeds - 180.000 Indian (Cotton-)farmers committed suicide during the last 15 years due to
debts to moneylenders and also due to ignorance; - They are excluded also from access to water, pumps, electricity because of a lack
of state run infrastructure or just because of caste 9. DEVELOPMENT AID is often connected with Cotton, mostly introduced in Africa and India by former colonialists – today the donors of development aid. For a lot of farmers it is still the only cash crop, for the countries an important income. In India and Africa we met NGOs, state agencies and private, who support farmers
- The most convincing example is the Swiss trader Remei and bioRe, a foundation created by him. The company involves 9000 Indian- and Tanzanian farmers in the production of Organic cotton. The organisation is market oriented, guarantees prices not much over the prices for conventional cotton, provides social services and, very importantly, education for women and children
- In Mali a big number of national NGOs grew which function as job resource for educated and often corrupt members of the upper class.
- Money from donor countries often does not arrive at the most vulnerable and needy - “Members of NGOs are not businesspeople and their way of thinking is not
business-orientated enough” so an evaluator of the organic cotton project, the Swiss Helvetas has promoted since 1998 in Mali.
- Help organisations try increasingly to follow the value chain supporting not only projects but intelligent business plans, as the Swiss Intercooperation in Tanzania. But only recommended locals are able to create this, as the Shindika group we visited in Morogoro; We found that promises, given to the European donors for example the production of organic cotton, were not fulfilled.
- Organic Cotton is for India farmers a way out of debts and for all others, specially Africans, a long term sustainable crop
- Organic Cotton helps Malian women to get financial autonomy and to defend themselves from female circumcision
10. MITUMBA - BUSINES WITH SECOND HAND CLOTHING The consumer demand for clothing continues to accelerate in rich countries in Europe, America and Japan. Clothing tossed away in this countries emerges in the Mitumba-Markets of Tanzania. Most pieces have a real global history and have travelled at least three continents before coming back in one of its producer countries - In Tanzania Mitumba has legally been traded since 1985, after the resignation of
the republics first president Nyerere; He preferred to see his people naked than in the discarded clothing of the rich white man. Today Mitumba is, in spite of being a informal sector of the country’s economy, as important as the production of raw cotton itself
11. SOME OF OUR CONCLUSIONS - Profit dictates decisions all along the cotton chain; There is no difference between
high- or low developed countries. - Good education on one side and illiteracy on the other makes the biggest difference
between farmers in rich and poor countries, as well as political power. - „Without cotton every second person would be naked.“ Today, with man made
fibres, may be only every third person – but cotton will be in the future one of our most important cultivated plants.
- The decision to abandon input intensive monocultures is very important for the global ecological balance
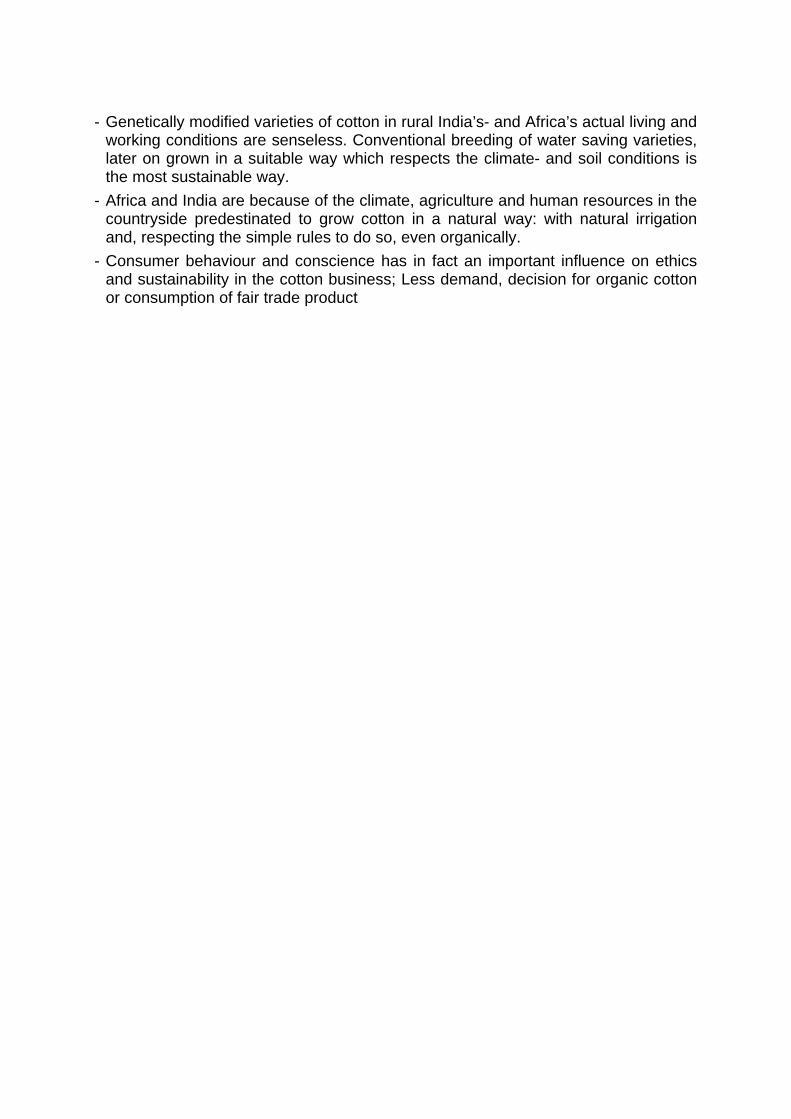
- Genetically modified varieties of cotton in rural India’s- and Africa’s actual living and working conditions are senseless. Conventional breeding of water saving varieties, later on grown in a suitable way which respects the climate- and soil conditions is the most sustainable way.
- Africa and India are because of the climate, agriculture and human resources in the countryside predestinated to grow cotton in a natural way: with natural irrigation and, respecting the simple rules to do so, even organically.
- Consumer behaviour and conscience has in fact an important influence on ethics and sustainability in the cotton business; Less demand, decision for organic cotton or consumption of fair trade product
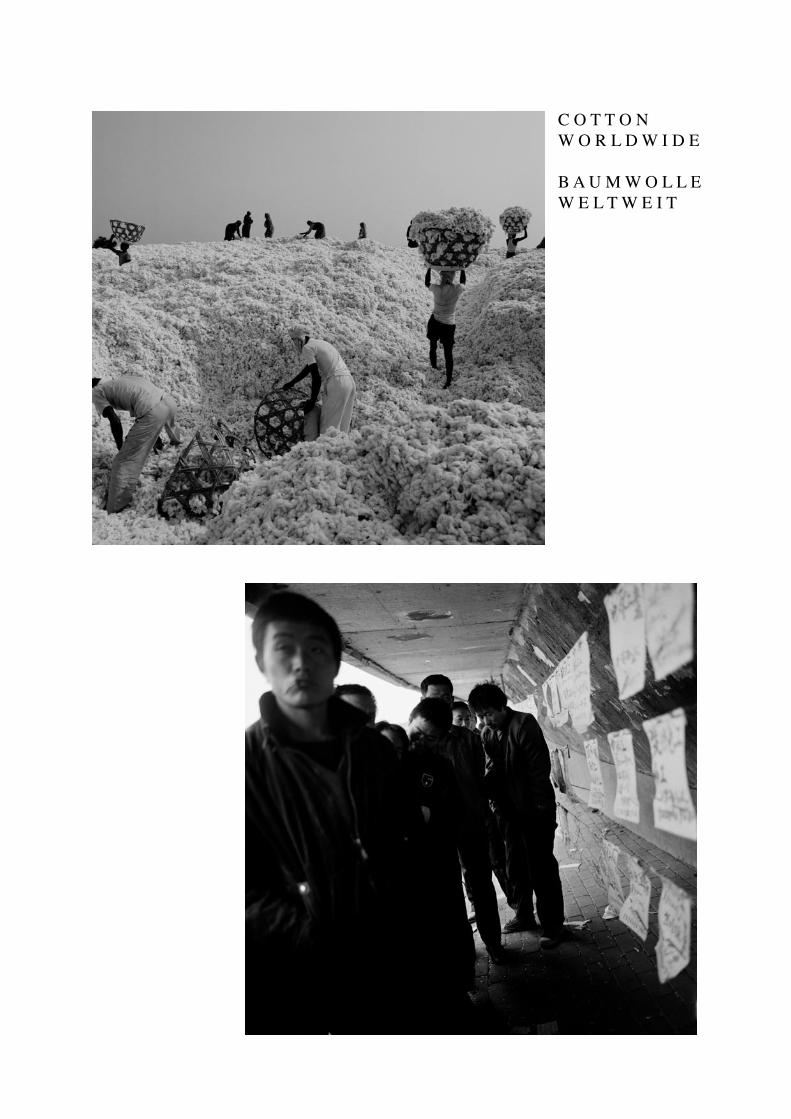
C O T T O N W O R L D W I D E
B A U M W O L L EW E L T W E I T

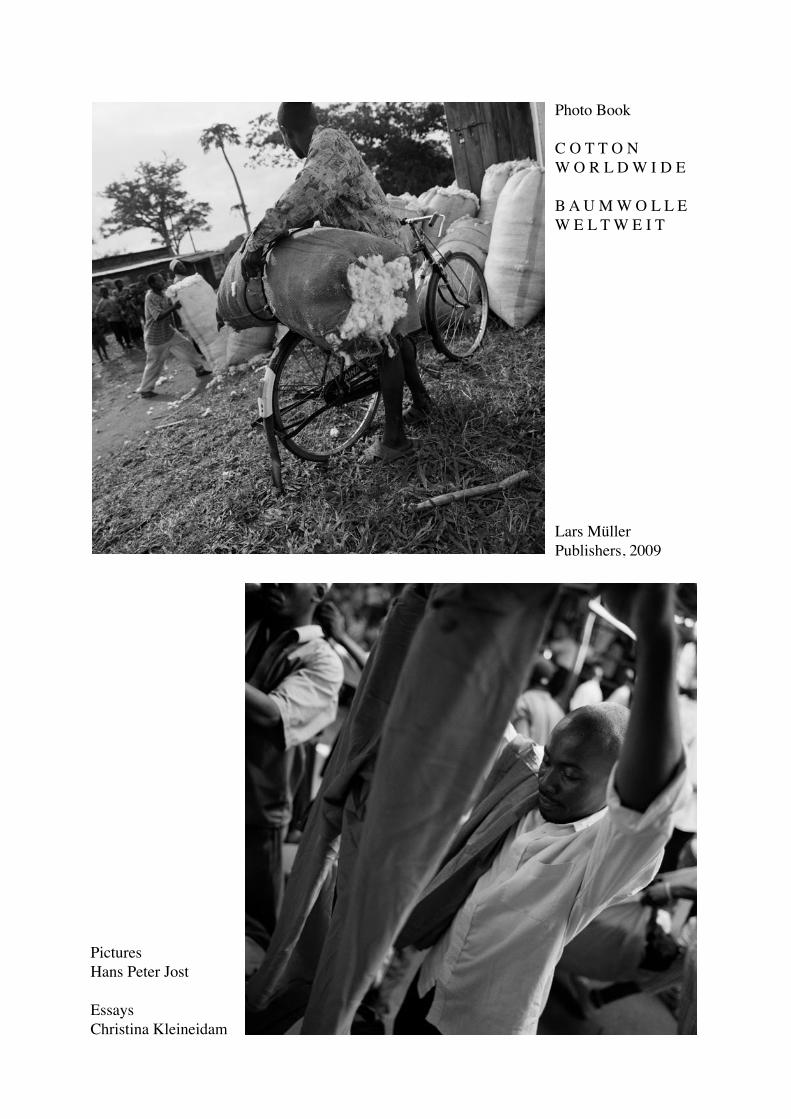
Photo Book
C O T T O N W O R L D W I D E
B A U M W O L L EW E L T W E I T
Lars MüllerPublishers, 2009
PicturesHans Peter Jost
EssaysChristina Kleineidam
DEVELOPMENT OF BIOTECHNOLOGY IN COTTON
K. D. Hake Cotton Incorporated, Cary, North Carolina, United States
Biotechnology in cotton has been adopted by farmers since 1995, but the research and field testing stretch back 30 arduous years before that. In this review we will cover the steps leading to the current role of Biotechnology in cotton and review the current status of famer adoption. Other presenters will address the socio-economic impact and future developments of Biotechnology. In 1983 Bob Horsch and Mary Dell Chilton reported on the first successful transformation and regeneration of tobacco using Agrobacterium tumefaciens. They utilized a common disease, crown gall, to insert genes into plants. The bacteria that causes crown gall inserts its own genes into the plant’s genome, which causes the production of growth promoting hormones and the resulting gall overgrowth. These scientists replaced the bacterial growth hormone with a marker gene to allow them to select for the transformed cells, but used the natural bacterial process to insert genes. Shortly after this breakthrough the regeneration of cotton plants from callus tissue was reported by Gail Davidonis and Hamilton 1984. The regeneration of fertile plants from transformed tissue is a necessary step that needs to be worked out, largely by trial and error, for each crop. Tobacco is relatively easy to transform and regenerate. The “lab rat” of botany, Arabidopsis thaliana, is even easier to transform and regenerate by just dipping the flower in a broth containing Agrobacterium. Some plants remain recalcitrant to regeneration, and cotton remains tedious but feasible if scientists carefully follow the instructions reported in the scientific literature. Three years later the transformation and regeneration of cotton using Agrobacterium tumefaciens was reported by Umbeck leading to the first field release of transgenic cotton by Agracetus in 1989. Over the next 5 years, hundreds of transformed cotton plants were tested in the field at hundreds of locations by hundreds of plant scientists. The few plants that survived this scrutiny became the first commercial cotton varieties containing transgenic material in the U.S. and Australia in 1996. While this history is interesting, it illustrates a common principle in agriculture, that of slow meticulous experimental lab and field work by many scientists which leads to farming advancements that benefit farmers globally and build the foundation for the research advancements from the next generation of scientists. Cotton transformation and regeneration is now a routine tool (if you follow the recipe) for many university and governmental labs around the world. This tool is used in all aspects of plant research; such as fiber development, stress tolerance, and disease tolerance, in addition to the commercial applications in weed and insect control. In addition to the necessary basic science to create transgenic cotton (a process that most plant science labs have now mastered) there are 4 other essential activities to creating commercial planting of Biotech cotton. These other processes – selecting an optimum event, breeding into elite cultivars, achieving regulatory approval, and
developing the appropriate management practices to support farmer adoption - are extremely challenging for plant science labs to conduct. These four activities hold the key to expanding developments of Biotechnology in cotton. Selecting the optimum transgenic insertion event includes the field and laboratory testing of hundreds of events to identify the one which provides the desired level of transgene integration, transgene expression, and plant phenotype. Transgene integration includes genetic analysis of the insertions to retain only events with complete single copy insertions. Transgene expression includes laboratory and field assays for performance of the transgenic event in different plant tissues and environments. Plant phenotype looks at the impact of the transgene on other plant characteristics. Since the insertion of a transgene is not directed to a specific chromosome site, by chance it may insert into a region with low expression in the desired plant tissue or disrupt functional chromosomal sequences. This phase of the process requires high throughput capabilities, skilled laboratory and field technicians, and costly laboratory equipment. Breeding into elite cultivars is the process of backcrossing the optimum transgenic event (the Biotech gene) into locally-adapted, high-yielding varieties that farmers want to plant. In the early phase of the introduction of Bt cotton, 1996 through 1998, the Bt insect control gene was only available by backcrossing into a few conventional varieties adapted to longer growing seasons (DP 5415, DP 5690 and DP Acala 90,). These three conventional varieties resulted in three Bt cotton varieties (NuCOTN 33B, NuCOTN 35B, and NuCOTN35B, respectively). Although these are high fiber quality cotton varieties with excellent yield potential in Mexico, Queensland Australia, and the Southern part of the U.S. Cotton Belt, they did not have the disease resistance and maturity desired by farmers in some regions where Bt cotton was originally adopted: Argentina, Northern part of the U.S. Cotton Belt, Yellow River Basin of China, and New South Wales Australia. Soon after the introduction of Bt cotton, the transgene became available in a wide range of genetic backgrounds as multiple cotton breeding entities (e.g. D&PL, Stoneville, Hartz, Paymaster, CSIRO, Mahayco, and Deltapine Australia) backcrossed the Bt transgene into their elite conventional germplasm. In addition to requiring elite germplasm, the backcrossing process itself is technically challenging requiring detailed record keeping, PCR gene verification, facilities to control out crossing, and expert technicians. The complexity in this part of the development process has increased exponentially with the use of multiple transgenes. In practicality the breeding effort to produce elite varieties with multiple transgenes is double that required to produce conventional varieties. Achieving regulatory approval has become the most significant challenge and expense for the advancement of biotechnology in crops. Because of the global trade in agricultural commodities both companies and countries are reluctant to approve the commercial planting of new biotech traits until all of their trading partners have also approved these traits for food and feed use. Since different countries have different regulatory requirements this multi-government approval delays commercial use and escalates costs. For example if an African country wanted to develop a national Bt cotton they would seek regulatory approval in their own country, other African countries with which they might exchange cottonseed, and the European countries to which they export cottonseed. This lack of harmonization and
asynchronous Biotech approvals is an impediment to the advancement of National or public sector biotech traits, despite the know how to create these products becoming widespread. As an agricultural scientist, developing appropriate management practices for new Biotech traits has been one of the most exciting activities in the entire process. This involves the close cooperation with plant breeders, farmers, agricultural consultants, Academic scientists, and private sector researchers to identify the management practices that provide maximum benefit from a novel Biotech trait. The insect and weed control traits currently employed by farmers opened up new paradigms in pest control which required adjustments in season long pest management practices. The use of beneficial insects was enhanced; new treatment thresholds and scouting methods were developed. The use of no-till became viable in many fields; herbicide applications shifted from prophylactic to responsive. In addition there were longer term management practices that needed to be developed such as: insect resistance management (which was robust), weed resistance management (which was insufficient), shifts towards longer maturing varieties, and emergence of new key insect and weed pests. Whenever a new farming practice becomes available, whether new machinery, fertilizer, rotational crop, pesticide, or Biotech trait, farmers and agricultural scientists will investigate how best to integrate this new practice into traditional farming practices. This phase of the process is still ongoing, even 14 years after the first use of Biotech traits by cotton farmers. If one examines the yield growth of countries who have adopted versus those who have not adopted Biotech traits, there is a clear shift in trajectory that reflects the long term improvements and adjustments in the agricultural sector that derives from providing farmers with innovative tools which can be integrated into existing farming practices. After the commercial approval of cotton varieties incorporating Biotech traits, local farmer experience and success with these varieties has resulted in rapid adoption, exceeding 50% farmer adoption within 3 years after approval and exceeding 80% farmer adoption after 6 years (U.S., Australia, South Africa, Mexico, China, Colombia, India, Brazil, and Argentina are good examples of this). The cotton industry is fortunate that Biotechnology has been employed to such a large extent in cotton reaching two thirds globally. These early Biotech traits represent just the beginning of the application of modern genetics to cotton improvement and bode well for cotton to continue its role as the lead natural fiber and for future growth in cotton utilization for textiles, food, feed, and various co-products.
REGIONAL DEVELOPMENTS OF COTTON PRODUCTION IN INDIA
D. N. SHETH Cotton Association of India, Mumbai, India
Editor’s Note A written paper was not provided by the author prior to the conference.
REGIONAL DEVELOPMENTS OF COTTON PRODUCTION IN THE USA
D. Cougot, S. Boyd, and B. Norman National Cotton Council of America, Cordova, TN, USA
Cotton production has played a vital part in the history of the United States (U.S.) from the colonial period until today. Cottonseed is believed to have been planted in Florida in 1556 and in Virginia in 1607. The spinning of U.S. cotton and the U.S. textile industry played a key role in the country’s historical development. This paper reviews recent developments in United States cotton production and discusses trends that are impacting planting and production decisions being made by producers today. Cotton producers take pride in their contribution to the U.S. economy and the country’s trade balance. They anticipate continued cotton production for the long term. U.S. cotton is primarily grown in four regions consisting of 17 states that utilize three different production systems (Figure 1): the Southeast (Alabama, Georgia, Florida, North and South Carolina, and Virginia), the Mid-South (Arkansas, Louisiana, Mississippi, Missouri, and Tennessee), the Southwest (Kansas, Oklahoma and Texas) and the West (Arizona, California, and New Mexico). Cotton production has played a vital part in the history of the U.S. from the colonial period until today. Cottonseed is believed to have been planted in Florida as early as 1556 and in Virginia as early as 1607. While there has been much history associated with cotton production and cotton textile manufacturing in the U.S., economic and policy changes have occurred in recent years that have exacted significant industry changes throughout the growing regions. Production Systems There are three main production systems used in the U.S. which relate to how the cotton is regionalized as mentioned previously. They can be best described as rainfall dependent, dryland supplemented with irrigation, and irrigation-dependent. Yields and quality are highly dependent on the timing of adequate moisture during the growing season in all three systems. With more than 40 inches of annual precipitation, most cotton grown in the Southeast and Mid-South is rainfall dependent. Arkansas is the only clear exception with approximately 80% of its cotton acres irrigated. In average years, total rainfall in the eastern half of the United States (east of Texas) is more than adequate for producing cotton with high yields. However, the distribution of precipitation throughout the year can be much less favorable and less predictable than annual rainfall levels. Inevitably, at any location in almost every year, yield is adversely affected by either too little or too much rainfall during the growing season.
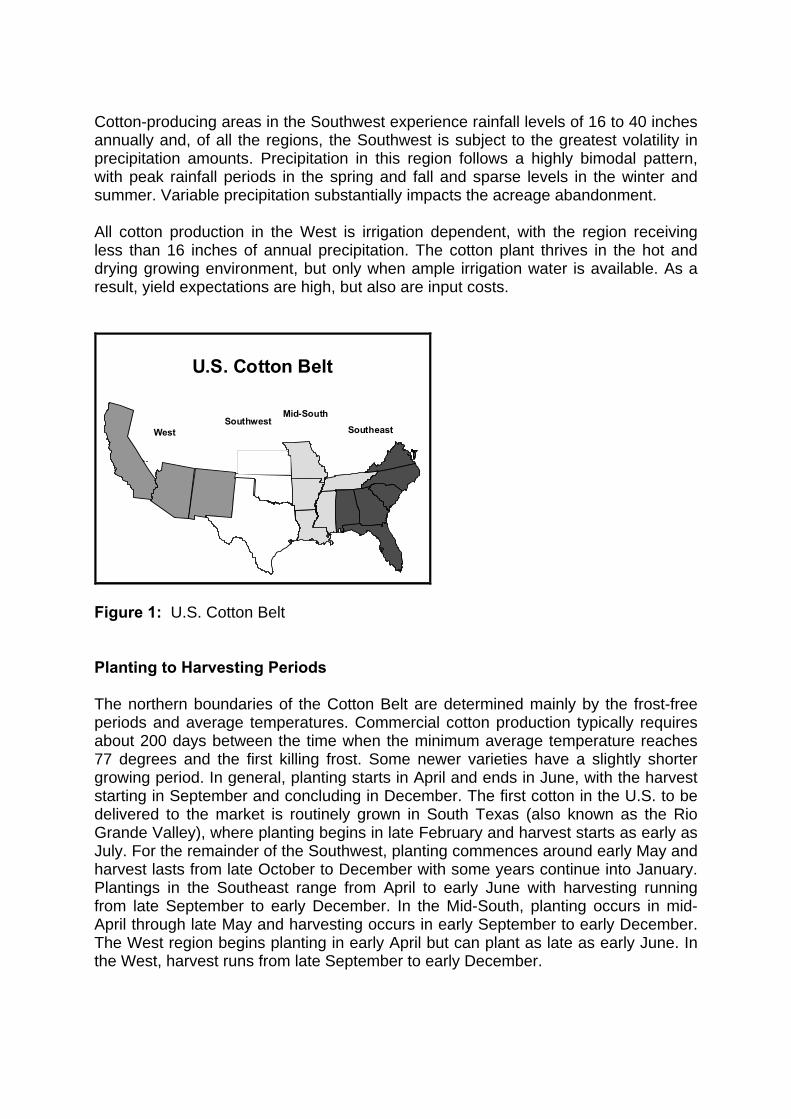
Cotton-producing areas in the Southwest experience rainfall levels of 16 to 40 inches annually and, of all the regions, the Southwest is subject to the greatest volatility in precipitation amounts. Precipitation in this region follows a highly bimodal pattern, with peak rainfall periods in the spring and fall and sparse levels in the winter and summer. Variable precipitation substantially impacts the acreage abandonment. All cotton production in the West is irrigation dependent, with the region receiving less than 16 inches of annual precipitation. The cotton plant thrives in the hot and drying growing environment, but only when ample irrigation water is available. As a result, yield expectations are high, but also are input costs.
U.S. Cotton Belt
WestSouthwestSouthwest
Mid-SouthMid-South
Southeast
Figure 1: U.S. Cotton Belt Planting to Harvesting Periods The northern boundaries of the Cotton Belt are determined mainly by the frost-free periods and average temperatures. Commercial cotton production typically requires about 200 days between the time when the minimum average temperature reaches 77 degrees and the first killing frost. Some newer varieties have a slightly shorter growing period. In general, planting starts in April and ends in June, with the harvest starting in September and concluding in December. The first cotton in the U.S. to be delivered to the market is routinely grown in South Texas (also known as the Rio Grande Valley), where planting begins in late February and harvest starts as early as July. For the remainder of the Southwest, planting commences around early May and harvest lasts from late October to December with some years continue into January. Plantings in the Southeast range from April to early June with harvesting running from late September to early December. In the Mid-South, planting occurs in mid-April through late May and harvesting occurs in early September to early December. The West region begins planting in early April but can plant as late as early June. In the West, harvest runs from late September to early December.
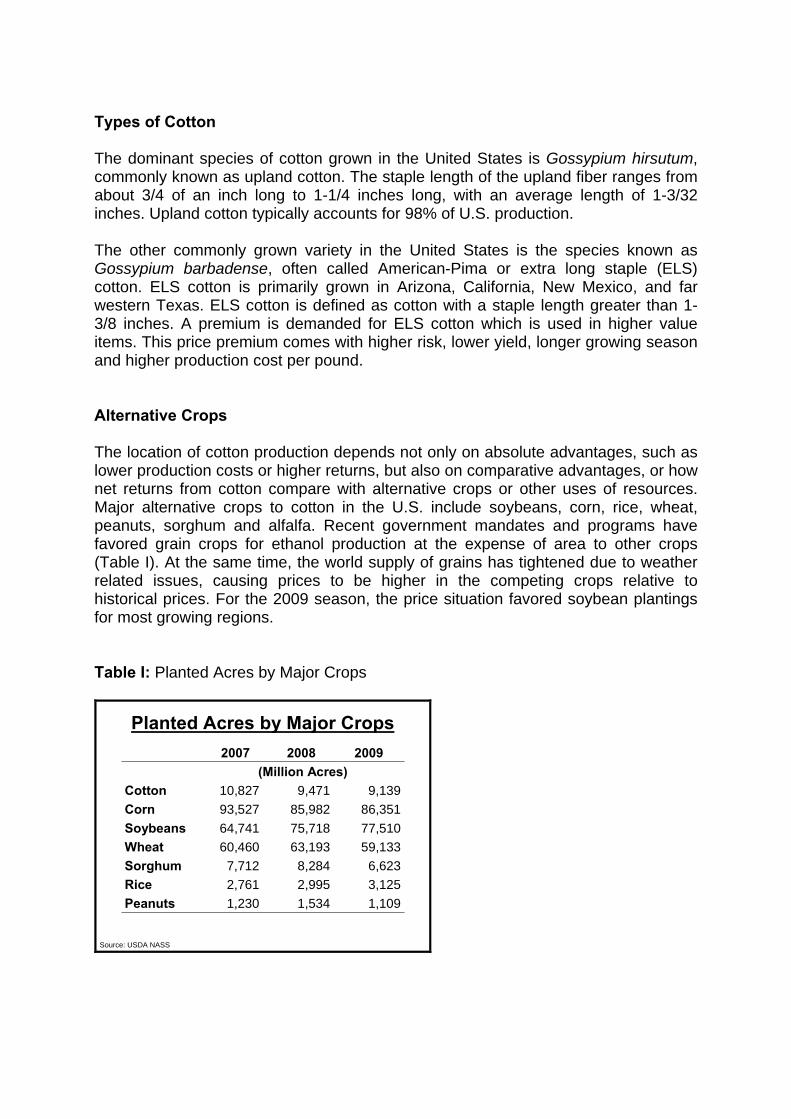
Types of Cotton The dominant species of cotton grown in the United States is Gossypium hirsutum, commonly known as upland cotton. The staple length of the upland fiber ranges from about 3/4 of an inch long to 1-1/4 inches long, with an average length of 1-3/32 inches. Upland cotton typically accounts for 98% of U.S. production. The other commonly grown variety in the United States is the species known as Gossypium barbadense, often called American-Pima or extra long staple (ELS) cotton. ELS cotton is primarily grown in Arizona, California, New Mexico, and far western Texas. ELS cotton is defined as cotton with a staple length greater than 1-3/8 inches. A premium is demanded for ELS cotton which is used in higher value items. This price premium comes with higher risk, lower yield, longer growing season and higher production cost per pound. Alternative Crops The location of cotton production depends not only on absolute advantages, such as lower production costs or higher returns, but also on comparative advantages, or how net returns from cotton compare with alternative crops or other uses of resources. Major alternative crops to cotton in the U.S. include soybeans, corn, rice, wheat, peanuts, sorghum and alfalfa. Recent government mandates and programs have favored grain crops for ethanol production at the expense of area to other crops (Table I). At the same time, the world supply of grains has tightened due to weather related issues, causing prices to be higher in the competing crops relative to historical prices. For the 2009 season, the price situation favored soybean plantings for most growing regions. Table I: Planted Acres by Major Crops
Source: USDA NASS
Planted Acres by Major Crops
1,1091,5341,230Peanuts3,1252,9952,761Rice6,6238,2847,712Sorghum
59,13363,19360,460Wheat77,51075,71864,741Soybeans86,35185,98293,527Corn9,1399,47110,827Cotton
(Million Acres)200920082007
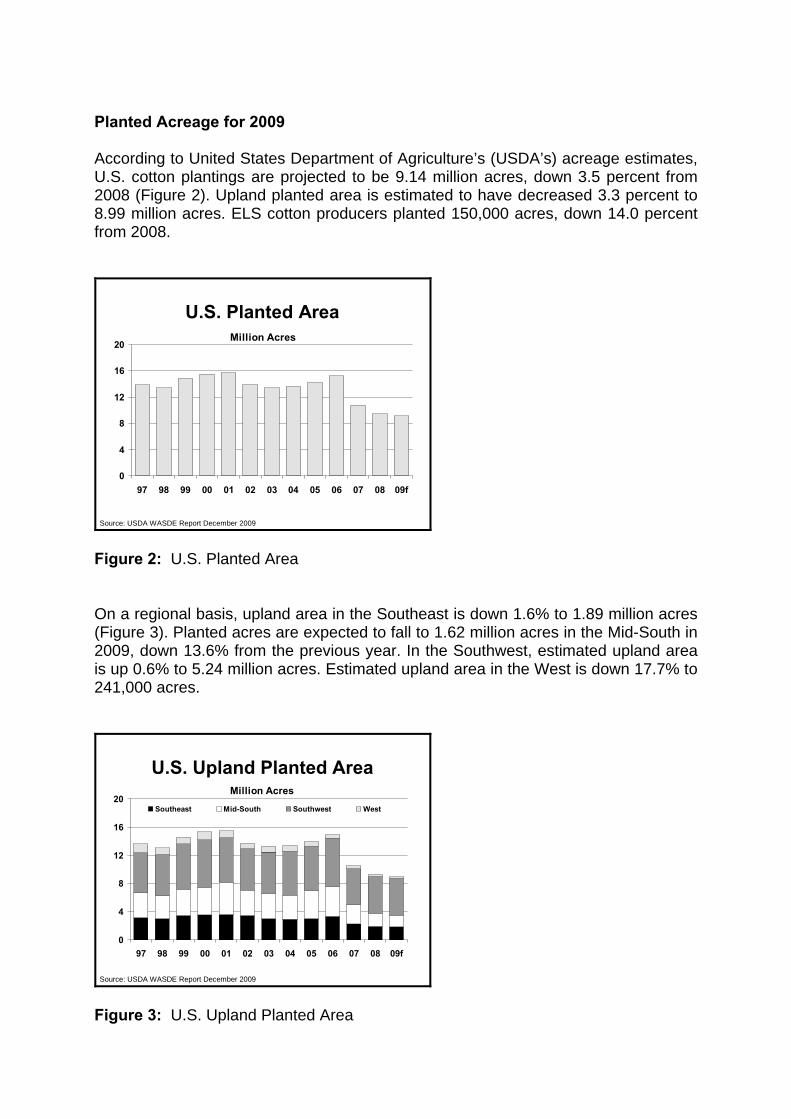
Planted Acreage for 2009 According to United States Department of Agriculture’s (USDA’s) acreage estimates, U.S. cotton plantings are projected to be 9.14 million acres, down 3.5 percent from 2008 (Figure 2). Upland planted area is estimated to have decreased 3.3 percent to 8.99 million acres. ELS cotton producers planted 150,000 acres, down 14.0 percent from 2008.
Million Acres
0
4
8
12
16
20
97 98 99 00 01 02 03 04 05 06 07 08 09f
U.S. Planted Area
Source: USDA WASDE Report December 2009 Figure 2: U.S. Planted Area On a regional basis, upland area in the Southeast is down 1.6% to 1.89 million acres (Figure 3). Planted acres are expected to fall to 1.62 million acres in the Mid-South in 2009, down 13.6% from the previous year. In the Southwest, estimated upland area is up 0.6% to 5.24 million acres. Estimated upland area in the West is down 17.7% to 241,000 acres.
Million Acres
0
4
8
12
16
20
97 98 99 00 01 02 03 04 05 06 07 08 09f
Southeast Mid-South Southwest West
U.S. Upland Planted Area
Source: USDA WASDE Report December 2009 Figure 3: U.S. Upland Planted Area
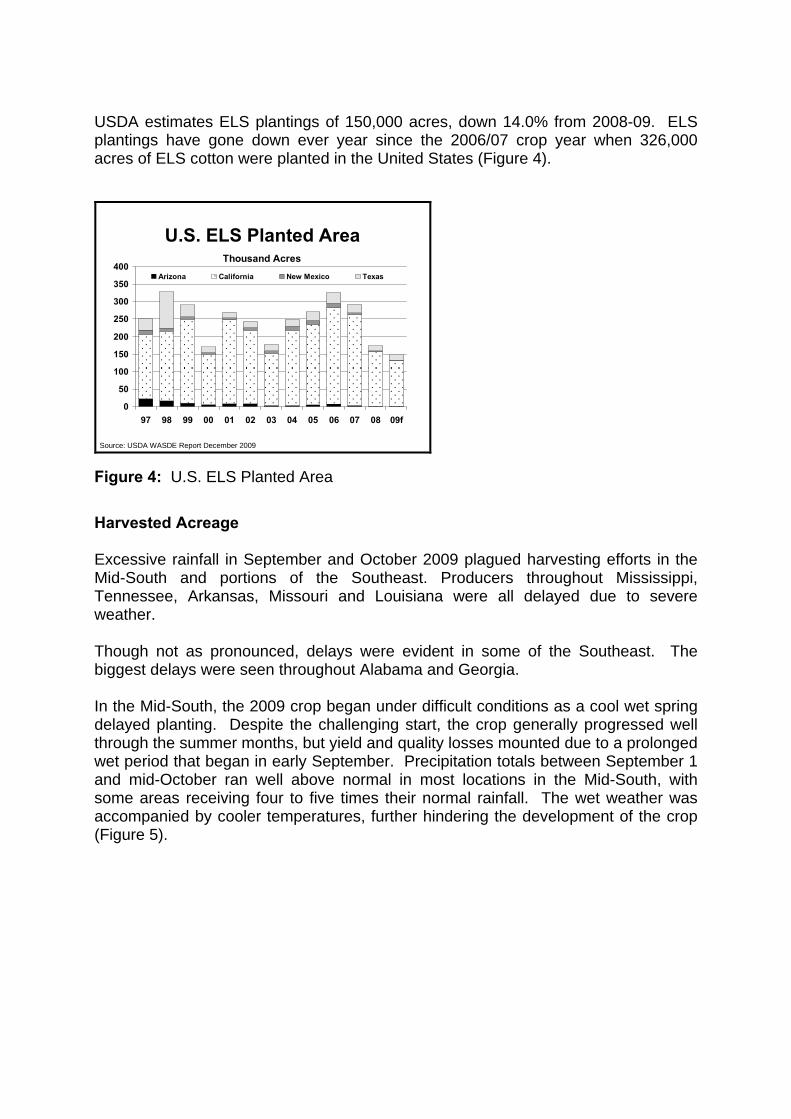
USDA estimates ELS plantings of 150,000 acres, down 14.0% from 2008-09. ELS plantings have gone down ever year since the 2006/07 crop year when 326,000 acres of ELS cotton were planted in the United States (Figure 4).
Thousand Acres
0
50
100
150
200
250
300
350
400
97 98 99 00 01 02 03 04 05 06 07 08 09f
Arizona California New Mexico Texas
U.S. ELS Planted Area
Source: USDA WASDE Report December 2009 Figure 4: U.S. ELS Planted Area Harvested Acreage Excessive rainfall in September and October 2009 plagued harvesting efforts in the Mid-South and portions of the Southeast. Producers throughout Mississippi, Tennessee, Arkansas, Missouri and Louisiana were all delayed due to severe weather. Though not as pronounced, delays were evident in some of the Southeast. The biggest delays were seen throughout Alabama and Georgia. In the Mid-South, the 2009 crop began under difficult conditions as a cool wet spring delayed planting. Despite the challenging start, the crop generally progressed well through the summer months, but yield and quality losses mounted due to a prolonged wet period that began in early September. Precipitation totals between September 1 and mid-October ran well above normal in most locations in the Mid-South, with some areas receiving four to five times their normal rainfall. The wet weather was accompanied by cooler temperatures, further hindering the development of the crop (Figure 5).
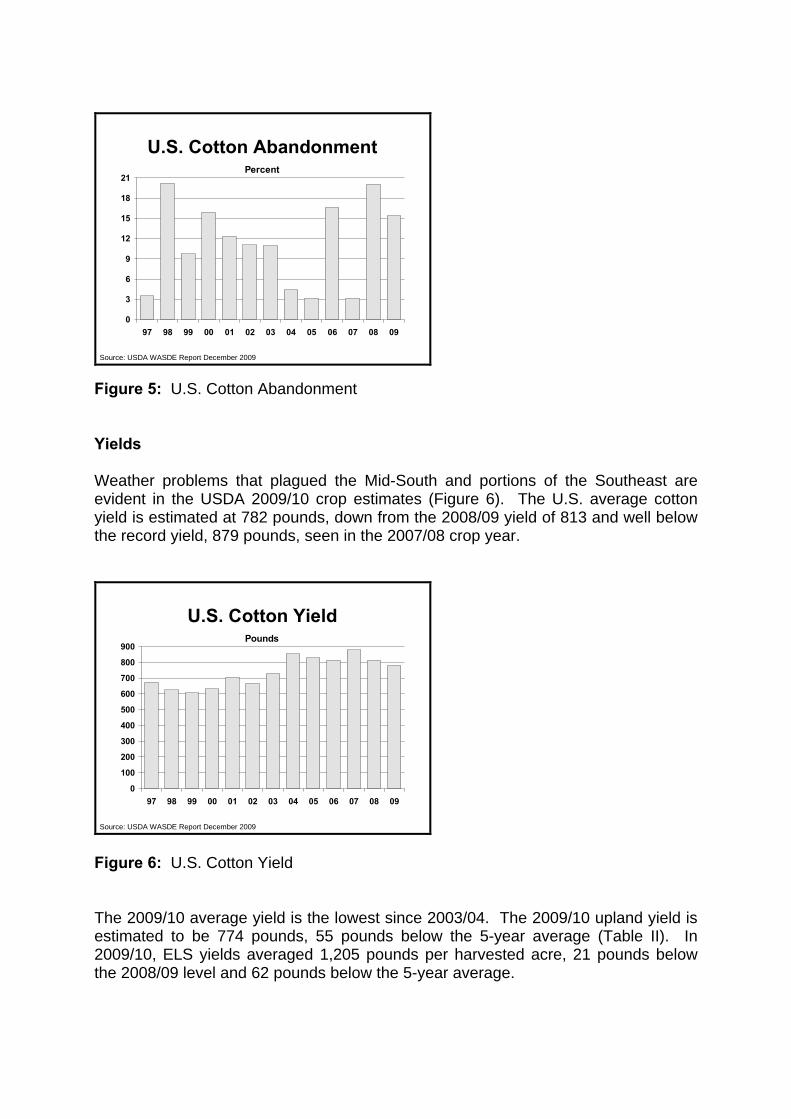
Percent
0
3
6
9
12
15
18
21
97 98 99 00 01 02 03 04 05 06 07 08 09
U.S. Cotton Abandonment
Source: USDA WASDE Report December 2009 Figure 5: U.S. Cotton Abandonment Yields Weather problems that plagued the Mid-South and portions of the Southeast are evident in the USDA 2009/10 crop estimates (Figure 6). The U.S. average cotton yield is estimated at 782 pounds, down from the 2008/09 yield of 813 and well below the record yield, 879 pounds, seen in the 2007/08 crop year.
Pounds
0
100
200
300
400
500
600
700
800
900
97 98 99 00 01 02 03 04 05 06 07 08 09
U.S. Cotton Yield
Source: USDA WASDE Report December 2009 Figure 6: U.S. Cotton Yield The 2009/10 average yield is the lowest since 2003/04. The 2009/10 upland yield is estimated to be 774 pounds, 55 pounds below the 5-year average (Table II). In 2009/10, ELS yields averaged 1,205 pounds per harvested acre, 21 pounds below the 2008/09 level and 62 pounds below the 5-year average.
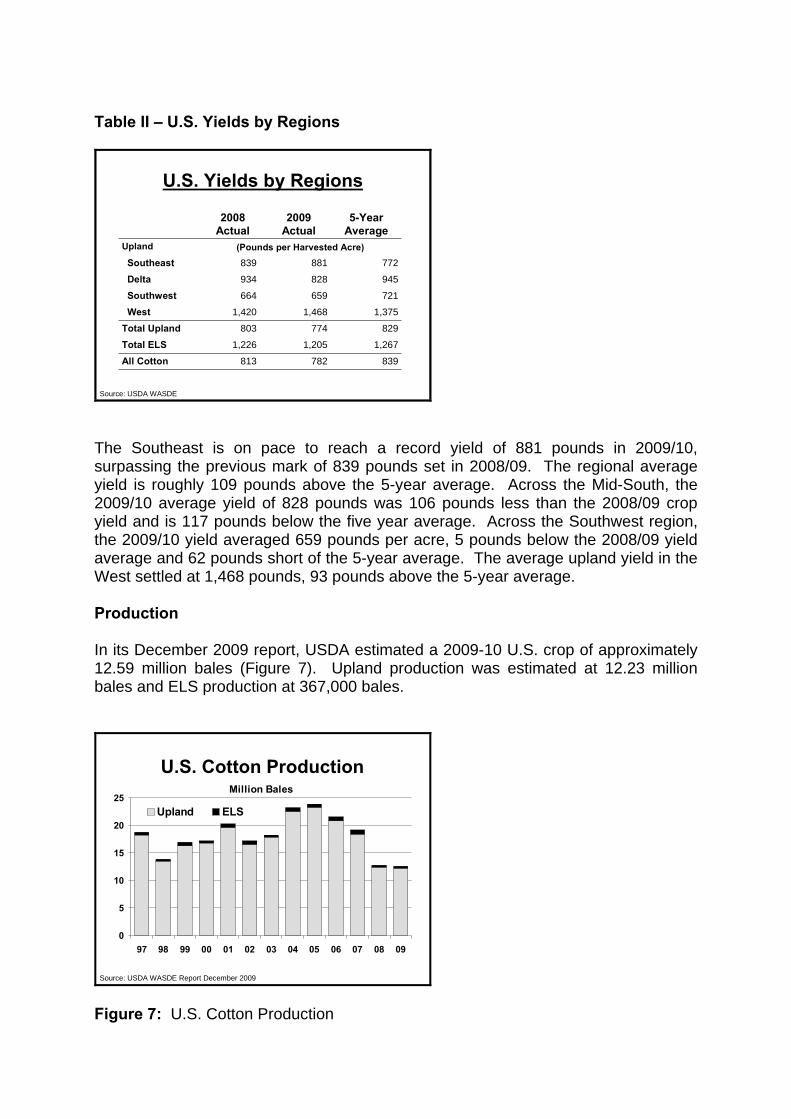
Table II – U.S. Yields by Regions
Source: USDA WASDE
U.S. Yields by Regions
Upland
839782813All Cotton1,2671,2051,226Total ELS
829774803Total Upland1,3751,4681,420West
721659664Southwest945828934Delta772881839Southeast
(Pounds per Harvested Acre)
5-Year Average
2009 Actual
2008 Actual
The Southeast is on pace to reach a record yield of 881 pounds in 2009/10, surpassing the previous mark of 839 pounds set in 2008/09. The regional average yield is roughly 109 pounds above the 5-year average. Across the Mid-South, the 2009/10 average yield of 828 pounds was 106 pounds less than the 2008/09 crop yield and is 117 pounds below the five year average. Across the Southwest region, the 2009/10 yield averaged 659 pounds per acre, 5 pounds below the 2008/09 yield average and 62 pounds short of the 5-year average. The average upland yield in the West settled at 1,468 pounds, 93 pounds above the 5-year average. Production In its December 2009 report, USDA estimated a 2009-10 U.S. crop of approximately 12.59 million bales (Figure 7). Upland production was estimated at 12.23 million bales and ELS production at 367,000 bales.
Million Bales
0
5
10
15
20
25
97 98 99 00 01 02 03 04 05 06 07 08 09
Upland ELS
U.S. Cotton Production
Source: USDA WASDE Report December 2009 Figure 7: U.S. Cotton Production
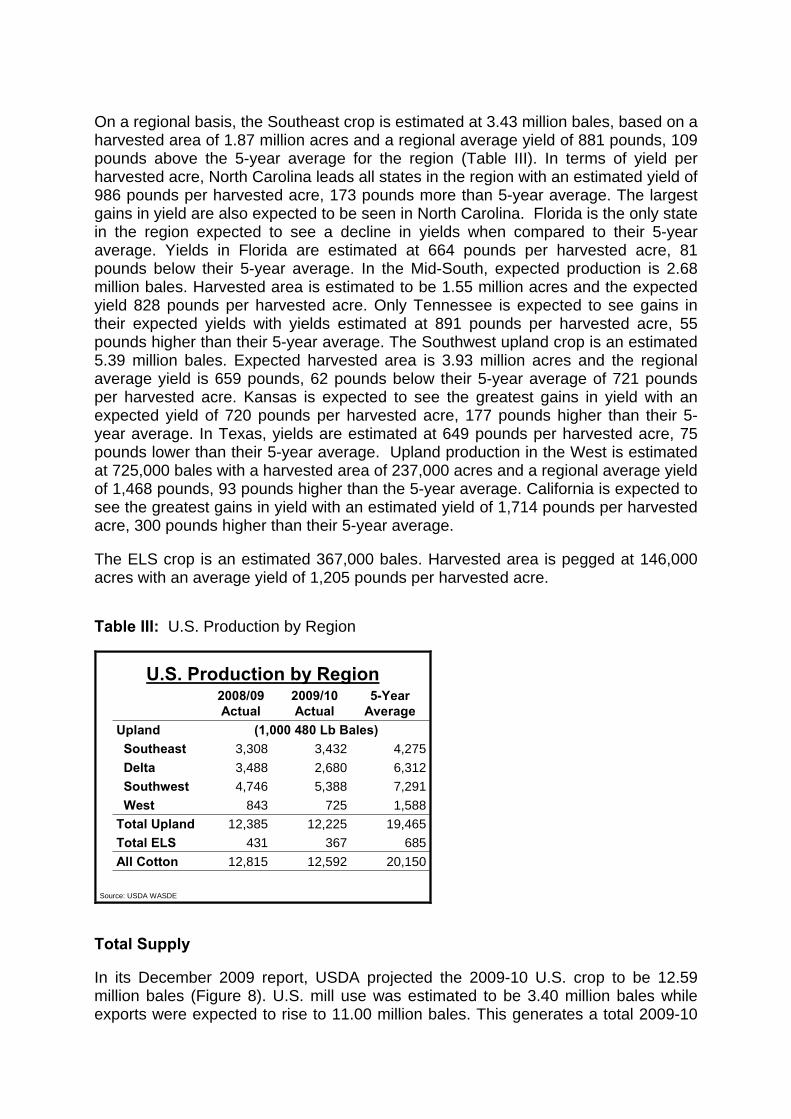
On a regional basis, the Southeast crop is estimated at 3.43 million bales, based on a harvested area of 1.87 million acres and a regional average yield of 881 pounds, 109 pounds above the 5-year average for the region (Table III). In terms of yield per harvested acre, North Carolina leads all states in the region with an estimated yield of 986 pounds per harvested acre, 173 pounds more than 5-year average. The largest gains in yield are also expected to be seen in North Carolina. Florida is the only state in the region expected to see a decline in yields when compared to their 5-year average. Yields in Florida are estimated at 664 pounds per harvested acre, 81 pounds below their 5-year average. In the Mid-South, expected production is 2.68 million bales. Harvested area is estimated to be 1.55 million acres and the expected yield 828 pounds per harvested acre. Only Tennessee is expected to see gains in their expected yields with yields estimated at 891 pounds per harvested acre, 55 pounds higher than their 5-year average. The Southwest upland crop is an estimated 5.39 million bales. Expected harvested area is 3.93 million acres and the regional average yield is 659 pounds, 62 pounds below their 5-year average of 721 pounds per harvested acre. Kansas is expected to see the greatest gains in yield with an expected yield of 720 pounds per harvested acre, 177 pounds higher than their 5-year average. In Texas, yields are estimated at 649 pounds per harvested acre, 75 pounds lower than their 5-year average. Upland production in the West is estimated at 725,000 bales with a harvested area of 237,000 acres and a regional average yield of 1,468 pounds, 93 pounds higher than the 5-year average. California is expected to see the greatest gains in yield with an estimated yield of 1,714 pounds per harvested acre, 300 pounds higher than their 5-year average. The ELS crop is an estimated 367,000 bales. Harvested area is pegged at 146,000 acres with an average yield of 1,205 pounds per harvested acre. Table III: U.S. Production by Region
Source: USDA WASDE
U.S. Production by Region
Upland
20,15012,59212,815All Cotton685367431Total ELS
19,46512,22512,385Total Upland1,588725843West7,2915,3884,746Southwest6,3122,6803,488Delta4,2753,4323,308Southeast
(1,000 480 Lb Bales)
5-Year Average
2009/10 Actual
2008/09 Actual
Total Supply In its December 2009 report, USDA projected the 2009-10 U.S. crop to be 12.59 million bales (Figure 8). U.S. mill use was estimated to be 3.40 million bales while exports were expected to rise to 11.00 million bales. This generates a total 2009-10
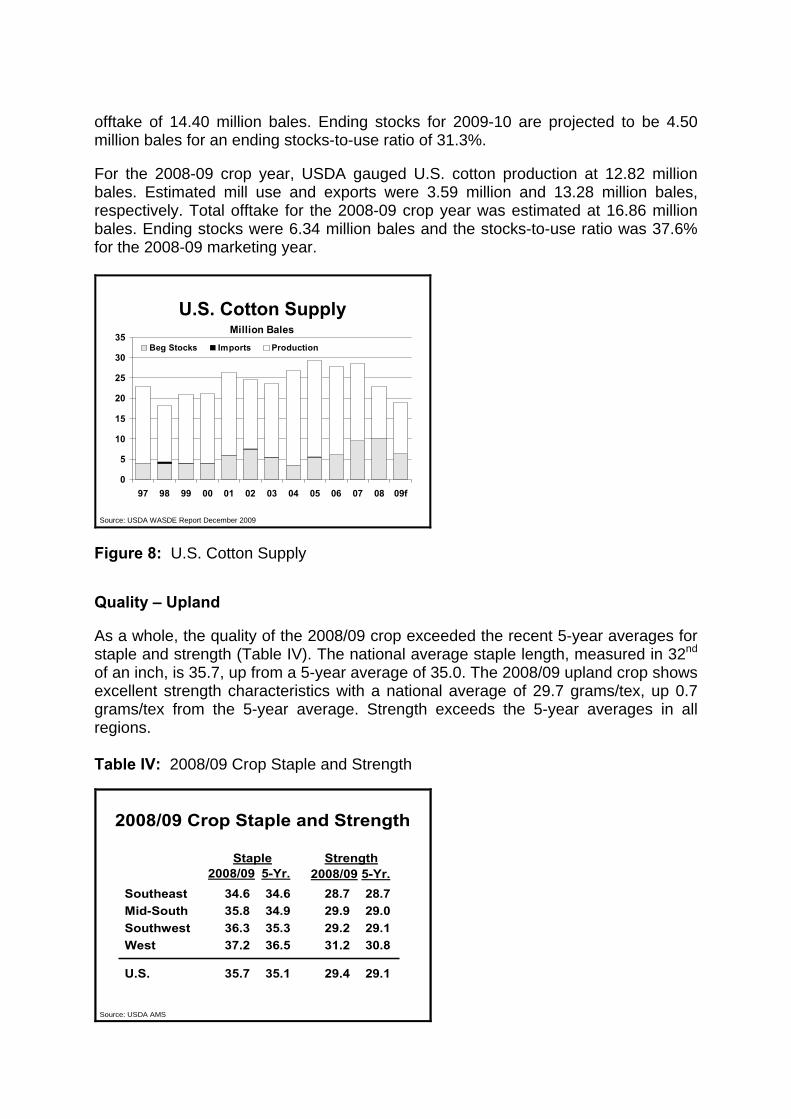
offtake of 14.40 million bales. Ending stocks for 2009-10 are projected to be 4.50 million bales for an ending stocks-to-use ratio of 31.3%. For the 2008-09 crop year, USDA gauged U.S. cotton production at 12.82 million bales. Estimated mill use and exports were 3.59 million and 13.28 million bales, respectively. Total offtake for the 2008-09 crop year was estimated at 16.86 million bales. Ending stocks were 6.34 million bales and the stocks-to-use ratio was 37.6% for the 2008-09 marketing year.
Million Bales
0
5
10
15
20
25
30
35
97 98 99 00 01 02 03 04 05 06 07 08 09f
Beg Stocks Imports Production
U.S. Cotton Supply
Source: USDA WASDE Report December 2009 Figure 8: U.S. Cotton Supply Quality – Upland As a whole, the quality of the 2008/09 crop exceeded the recent 5-year averages for staple and strength (Table IV). The national average staple length, measured in 32nd of an inch, is 35.7, up from a 5-year average of 35.0. The 2008/09 upland crop shows excellent strength characteristics with a national average of 29.7 grams/tex, up 0.7 grams/tex from the 5-year average. Strength exceeds the 5-year averages in all regions. Table IV: 2008/09 Crop Staple and Strength
Southeast 34.6 34.6 28.7 28.7Mid-South 35.8 34.9 29.9 29.0Southwest 36.3 35.3 29.2 29.1West 37.2 36.5 31.2 30.8
U.S. 35.7 35.1 29.4 29.1
2008/09 Crop Staple and Strength
2008/09 2008/095-Yr.Staple Strength
5-Yr.
Source: USDA AMS
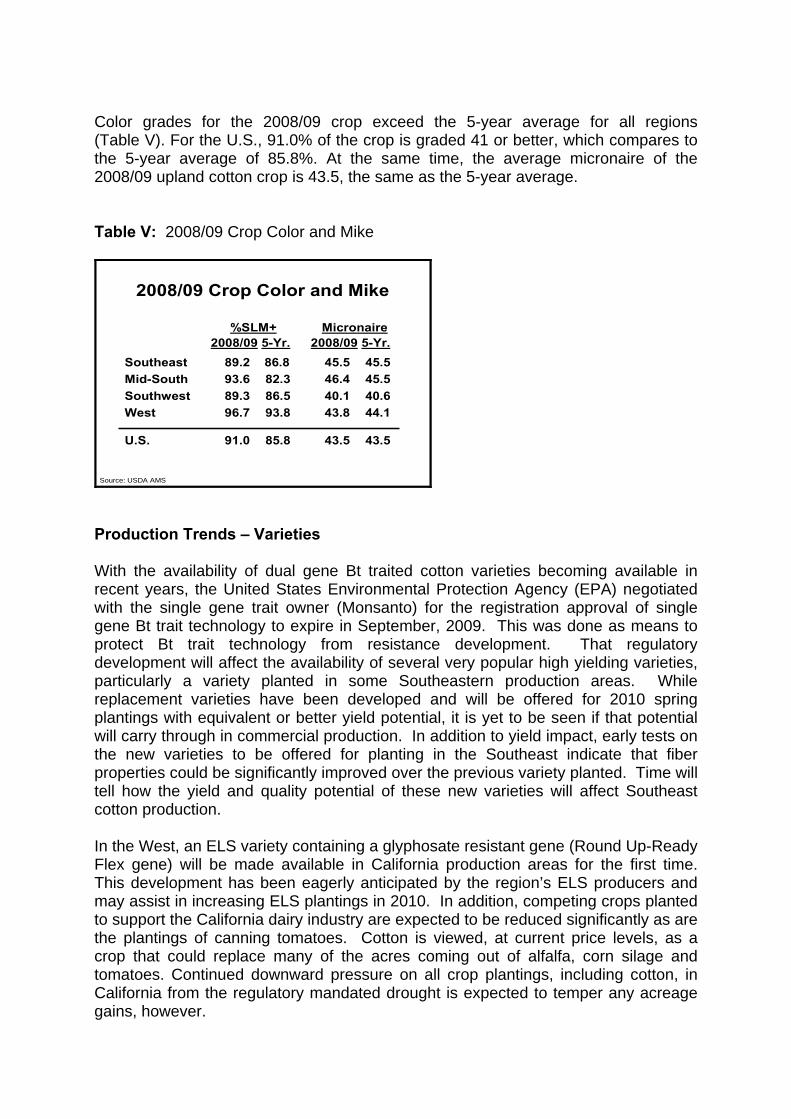
Color grades for the 2008/09 crop exceed the 5-year average for all regions (Table V). For the U.S., 91.0% of the crop is graded 41 or better, which compares to the 5-year average of 85.8%. At the same time, the average micronaire of the 2008/09 upland cotton crop is 43.5, the same as the 5-year average. Table V: 2008/09 Crop Color and Mike
Southeast 89.2 86.8 45.5 45.5Mid-South 93.6 82.3 46.4 45.5Southwest 89.3 86.5 40.1 40.6West 96.7 93.8 43.8 44.1
U.S. 91.0 85.8 43.5 43.5
2008/09 Crop Color and Mike
2008/09 2008/095-Yr.%SLM+ Micronaire
5-Yr.
Source: USDA AMS Production Trends – Varieties With the availability of dual gene Bt traited cotton varieties becoming available in recent years, the United States Environmental Protection Agency (EPA) negotiated with the single gene trait owner (Monsanto) for the registration approval of single gene Bt trait technology to expire in September, 2009. This was done as means to protect Bt trait technology from resistance development. That regulatory development will affect the availability of several very popular high yielding varieties, particularly a variety planted in some Southeastern production areas. While replacement varieties have been developed and will be offered for 2010 spring plantings with equivalent or better yield potential, it is yet to be seen if that potential will carry through in commercial production. In addition to yield impact, early tests on the new varieties to be offered for planting in the Southeast indicate that fiber properties could be significantly improved over the previous variety planted. Time will tell how the yield and quality potential of these new varieties will affect Southeast cotton production. In the West, an ELS variety containing a glyphosate resistant gene (Round Up-Ready Flex gene) will be made available in California production areas for the first time. This development has been eagerly anticipated by the region’s ELS producers and may assist in increasing ELS plantings in 2010. In addition, competing crops planted to support the California dairy industry are expected to be reduced significantly as are the plantings of canning tomatoes. Cotton is viewed, at current price levels, as a crop that could replace many of the acres coming out of alfalfa, corn silage and tomatoes. Continued downward pressure on all crop plantings, including cotton, in California from the regulatory mandated drought is expected to temper any acreage gains, however.
Production Trends – Irrigation, Pest Management, Harvesting, Infrastructure In the Texas High Plains production area, improvements in irrigation application technology are allowing water to be applied on a more concentrated acreage that allows for increased per acre yields. Underground drip irrigation technology is being installed over increasing acreage each year and this trend is predicted to continue for the foreseeable future. So while planted acreage may decrease as water is applied to a more concentrated acreage, yield per acre can be expected to increase. The expected yield increase more than compensates for the acreage reduction in almost all cases. Similar trends are occurring on acreage irrigated with overhead pivot systems utilizing high efficiency application technology. In addition, as irrigation is concentrated on fewer acres, other inputs can be reduced or concentrated as well, reducing input costs on a per acre basis. Yields of 2,000 pounds of lint per acre are not uncommon where sufficient water using drip technology is available and to a lesser extent under pivot application systems. Combined with irrigation technology improvements is the yield improvement trend resulting from the eradication of the boll weevil from practically all U.S. production regions. The boll weevil fed on late maturing bolls, primarily the “top crop” leading to crop management practices that minimized the expectation of yield contribution from that portion of the crop. However, with the eradication of this pest and the development of shorter season varieties with enhanced fiber property potential, producers are now managing their crop to take advantage of “top crop” production in almost all but the shortest growing season areas. This trend is not only evident in northern Texas growing areas, but to differing degrees throughout the Mid-South and Southeast regions as well. As producers continue to gain confidence in managing their crops to take advantage of “top crop” yield, expect yield per acre to continue to increase. For the Texas High Plains, this trend has led to the adoption of varieties, typically planted in other growing regions, with enhanced fiber properties. This trend has continued to the point that by many quality measures, the Texas crop has surpassed the Mid-South and Southeast in recent years. New harvesting technology has been commercialized in the past two to three years that increases harvest efficiency while reducing labor costs. This new harvester machinery incorporates either a “mini-module” or round module as an integral part of the harvester and is being used in increasing numbers across the U.S. production belt. This development significantly increases harvest machinery efficiency and reduces labor and support equipment costs, as additional tractors operating traditional module builders are no longer needed with this new equipment. With the reduction of planted acres in much of the cotton production belt, has come a reduction in the infrastructure (production input support, ginning, warehousing, etc.) supporting that production. The Mid-South and West production regions have witnessed the most significant reduction in infrastructure comparable to the reduction in planted acres in both regions. While an existing trend in reduced infrastructure had been in existence for some time, the sharp reduction in acreage in recent years has advanced the trend quicker than would have occurred otherwise. While there is historical precedence for such infrastructure reduction, there has not been such a steep decline over such a short time frame witnessed in many years. Time will tell
how the industry will adapt to the reduced infrastructure capacity, as much of the reduction, in the eyes of some, has occurred with older, less efficient capacity and facilities leaving more efficient capacity to support the remaining production system. Longer Term Production Trends – Trait Technology Over the longer term, varieties are now in development that will carry multiple trait technologies. In addition to insect protection and herbicide resistance traits, it is expected that within ten years, additional traits providing drought tolerance and improved nitrogen usage efficiency will be commercially available. Such traits are already beginning to appear in U.S. corn varieties and it is only a matter of time until similar traits will be incorporated in cotton varieties. The U.S. cotton producer has demonstrated that he will adopt such technology at a rapid rate. So once such traits can be incorporated in high yielding varieties and demonstrated to be adaptable on a commercial basis in the four regions, one can expect a very high adoption rate across the cotton growing belt. Vision 21 and Improved Industry Infrastructure Efficiency In 2008, leadership of the National Cotton Council of America (NCC) took the bold step of approving a strategic initiative entitled “Vision of U.S. Cotton’s 21st Century” (Vision 21). Vision 21 is a project of The Cotton Foundation, underwritten by several of the Foundation’s agribusiness members. The project is jointly managed by staff of the NCC, Cotton Council International (CCI) and Cotton Incorporated (CI). Vision 21 consists of three primary sub-projects. The first of these consists of a critical assessment of cotton textile demand and consumer preference in the fast growing consumer markets of China and India. This effort, initiated in 2009 by contractor firms on the ground in both countries, will provide a basis for ongoing monitoring of selected urban center consumer preferences in coming years, much as Cotton Incorporated currently monitors US consumer preferences. In addition, the project will provide partial support of Cotton Council International’s “Seven Revolutions” program, designed to gain better understanding of the pressures influencing global trends in consumption and product demand in coming years. These project components will continue through the 2010 calendar year. The second sub-project will provide for important life-cycle inventory and life-cycle analysis studies of cotton textile products. The goal is to strengthen U.S. cotton’s sustainability message and provide the tools to allow a thorough and accurate analysis of a cotton product’s environmental footprint from fiber production, through textile processing and on to consumer use up until a product is discarded by the consumer. This project component is scheduled to kick-off in January, 2010 at Cotton Incorporated’s Cary, North Carolina offices with a meeting among CI and NCC staff and the project’s subcontractor. The project is scheduled to be completed by December 31, 2010.
The third subproject consists of an analysis of cotton handling and transportation logistics with the goal to improve flow and shipping efficiencies of US cotton to our domestic and international textile customers. The study is evaluating ginning, warehousing and shipping practices including activities and policies that impact those practices, such as cotton classing, issuance of electronic documents, federal regulations and industry trading rules and business practices. An industry task force is overseeing this work, which is being conducted by a firm with experience in commodity logistics and is being managed by NCC staff with assistance from CI staff. This effort is scheduled to be completed by late summer of 2010. When the Vision 21 sub-projects are complete and recommendations from these three efforts are finalized, staff from NCC, CI and CCI will organize meetings with industry stakeholders from all seven industry segments. The goal of these industry wide meetings will be to provide industry leadership with information necessary for the contemplation and then, where deemed appropriate, implementation of changes to business practices, industry policy recommendations and regulatory rules so as to affect improved efficiencies in the U.S. cotton industry. Conclusions The U.S. cotton industry has witnessed significant change to overall production, shifts in production regionally, and a shift in its textile customer base over the past decade. These changes have placed unique stress on the U.S. cotton producer and on the infrastructure that supports his production. However, new technology, new crop management techniques, relative market price advantage to competing crops and a new strategic initiative offer the opportunity for the industry to reverse recent trends. Additionally, long term, trait technology and other production input breakthroughs hold the promise for sustained cotton production in the U.S. for years to come. References Glade, E.H., L.A. Meyer, and H. Stults, Editors, July 1996. The Cotton Industry in the United States. Commercial Agriculture Division, Economic Research Service, U.S. Department of Agriculture. Agricultural Economic Research Report No. 739.
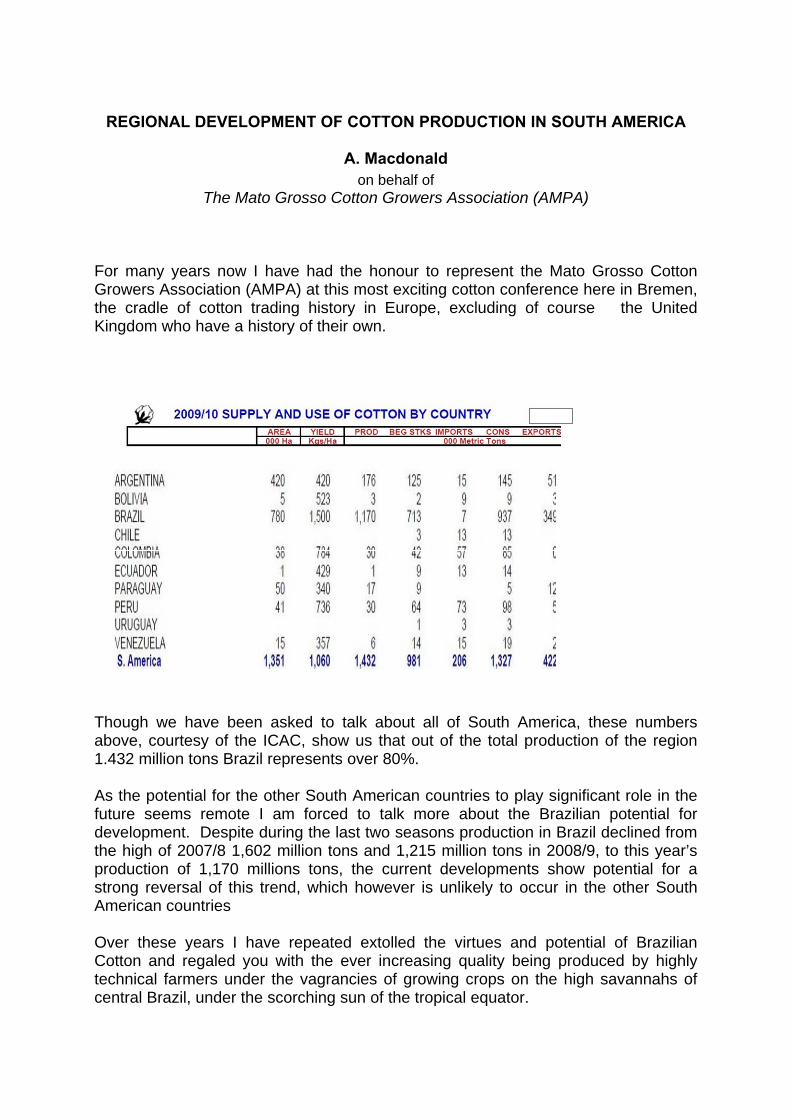
REGIONAL DEVELOPMENT OF COTTON PRODUCTION IN SOUTH AMERICA
A. Macdonald on behalf of
The Mato Grosso Cotton Growers Association (AMPA) For many years now I have had the honour to represent the Mato Grosso Cotton Growers Association (AMPA) at this most exciting cotton conference here in Bremen, the cradle of cotton trading history in Europe, excluding of course the United Kingdom who have a history of their own.
Though we have been asked to talk about all of South America, these numbers above, courtesy of the ICAC, show us that out of the total production of the region 1.432 million tons Brazil represents over 80%. As the potential for the other South American countries to play significant role in the future seems remote I am forced to talk more about the Brazilian potential for development. Despite during the last two seasons production in Brazil declined from the high of 2007/8 1,602 million tons and 1,215 million tons in 2008/9, to this year’s production of 1,170 millions tons, the current developments show potential for a strong reversal of this trend, which however is unlikely to occur in the other South American countries Over these years I have repeated extolled the virtues and potential of Brazilian Cotton and regaled you with the ever increasing quality being produced by highly technical farmers under the vagrancies of growing crops on the high savannahs of central Brazil, under the scorching sun of the tropical equator.
However the world is changing or at least our attitudes toward our planet are changing, especially as regards pollution and employment. We support this shift in emphasis, support the need to better protect the environment, and support the concept of fair employment. However these changes do not come without cost, and so today the focus is on how we can achieve better growing practices, and fairly pay our workers, without interrupting the continued improvement in our quality, and reduce costs all at the same time. So today I will make little mention of quality, since I believe today Brazilian Cotton is synonymous with quality, but rather focus on the fact that, as we should all be aware, cotton is far to cheap, especially since it can be produced in a sustainable manner, which cannot be said for those artificial products which rely on the world’s worst pollutant - OIL. Two years ago I told you that Brazil had social programs in place for many years to protect the farm workers, as well as environmental programs for sustainability, and how AMPA decided four years ago to introduce a voluntarily audit and certification compliance system, covering all the social aspects, and education, as a away of achieving full sustainability over the years. We continue to believe that without education as regards the environment, sustainability cannot be achieved. AMPA’s program is called Instituto Social de Algodão , (ISA) or Institute for Socially Responsible Cotton Production, which together with the official appointed auditors certifies that the production of each bale has complied with regulations and as such giving the producer the right to attach a label on all bales produced. In that way the consumer can be satisfied that the raw material he receives has been produced in a socially responsible manner. The program has been called an outstanding success and the National Growers Association has adopted a similar program for all cotton grown in Brazil. With the Social program meeting the world standard, we must now turn our attention to the question of costs.
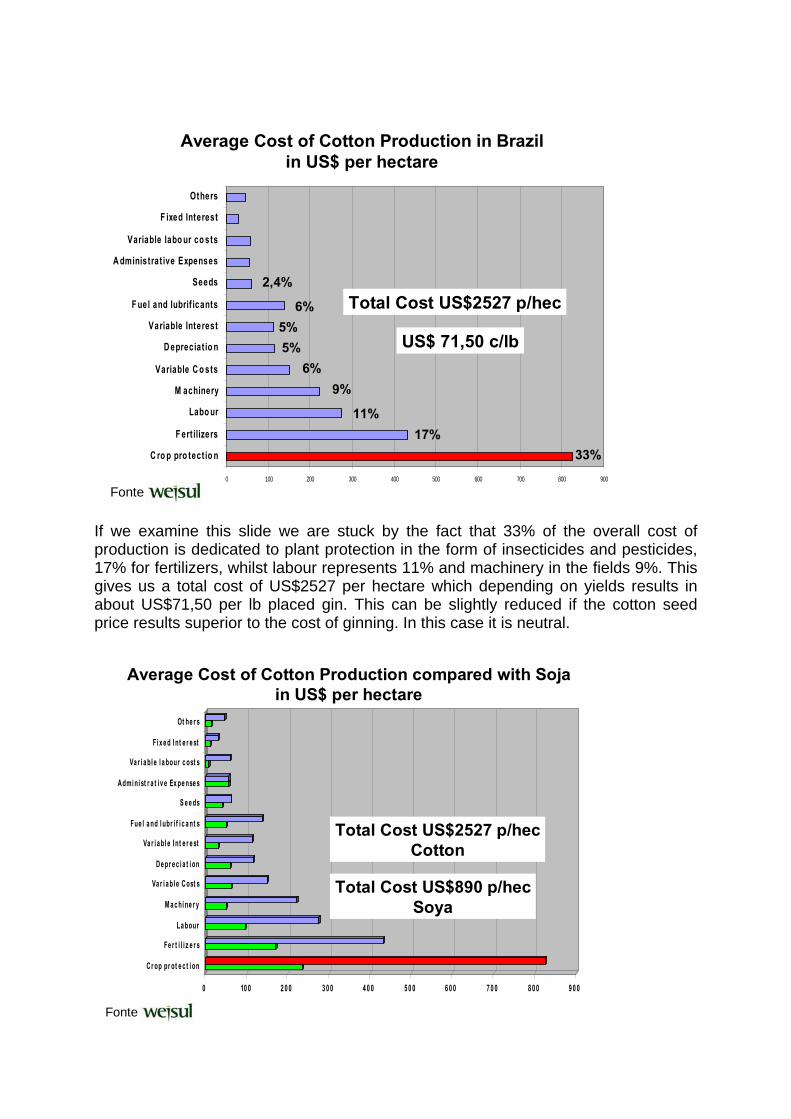
0 100 200 300 400 500 600 700 800 900
C ro p pro tect io n
F ert ilizers
Labo ur
M achinery
Variable C o sts
D epreciat io n
Variable Interest
F uel and lubrif icants
Seeds
A dministrat ive Expenses
Variable labo ur co sts
F ixed Interest
Others
33%17%
11%
9%
Fonte
Average Cost of Cotton Production in Brazilin US$ per hectare
6%5%5%
6%
2,4%Total Cost US$2527 p/hec
US$ 71,50 c/lb
If we examine this slide we are stuck by the fact that 33% of the overall cost of production is dedicated to plant protection in the form of insecticides and pesticides, 17% for fertilizers, whilst labour represents 11% and machinery in the fields 9%. This gives us a total cost of US$2527 per hectare which depending on yields results in about US$71,50 per lb placed gin. This can be slightly reduced if the cotton seed price results superior to the cost of ginning. In this case it is neutral.
0 10 0 2 0 0 3 0 0 4 0 0 5 0 0 6 0 0 7 0 0 8 0 0 9 0 0
Cr op pr ot e c t i on
Fe r t i l i z e r s
La bour
M a c hi ne r y
Va r i a bl e Cost s
De pr e c i a t i on
Va r i a bl e I nt e r e st
Fue l a nd l ubr i f i c a nt s
S e e ds
Admi ni st r a t i v e Ex pe nse s
Va r i a bl e l a bour c ost s
Fi x e d I nt e r e st
Ot he r s
Average Cost of Cotton Production compared with Sojain US$ per hectare
Total Cost US$2527 p/hecCotton
Total Cost US$890 p/hecSoya
Fonte
This we can compare with the cost of growing Soya at one third of the cost at US$890 per hectare. Note that labour cost is only US$96.00 (Cotton US$276) per hectare and machinery US$51 (US$221.00) per hectare. Clearly the selling price of soya is well below that of cotton per hectare, however price is not the only consideration. The capital outlay and/or loans from the banks is three times more for cotton than for soya. At this time of stretched credit clearly cotton is at a great disadvantage. So for cotton to survive and guarantee a return to the growers these next few years costs reductions must be achieved specifically in the area of crop protection, fertilizers, labour and machinery. Brazilian farmers do not wish to give up the cotton business they have enjoyed good years, but especially the international interest and friendships made over the years, something that does not happen in other commodities. So what are the plans:-
- More intense crop rotation (cotton-soya-corn) in order to make larger economies of pesticides since it is easier to break the cycle of pest infestation when there are few repeats of the same crop
- Extensive use of no till to reduce soil preparation - Substitute plants which are know to be more susceptible to local diseases,
using GMO when permitted - Double cropping with cotton, after soya for example, applying varieties which
have a shorter life cycle allowing closer spacing between the rows. Conventional long cycle cotton is planted with rows of 0,90 cm whilst the shorter cycle plants the rows can be reduced to 0,76 cm or even 0,45 cm, due to the rapid development of the plants. The overall advantage in reducing the crop cycle by 35 -50 days implies a very sharp reduction of cost, in terms of all four targets, crop protection, fertilizer, labour and machinery.
However it is important to maintain the quality of the fiber independently from the growing and harvesting systems, and I guess this last point is the most controversial and perhaps requires more explanatory detail to rest any doubts about the future of Brazilian Cotton. Let me first say intercropping of soya and cotton is not new, thousands of hectares have been grown during the period after soya especially when using a shorter cycle soya variety. No quality deterioration has been indentified as a result and the weather conditions are almost perfect during the years of experience. With the emphasis now focused on the environment, clearly double cropping reduces the negative impact on the environment by using less toxic chemicals during the planting and plant cycle. So let’s look at the advantages in more detail
- improved return per sq meter of land - taking advantage of the residual fertilizer from the previous crop - start harvesting when there are already 4/5 bolls on the plant instead of the
traditional 8, eventually resulting in more mature and uniform cotton
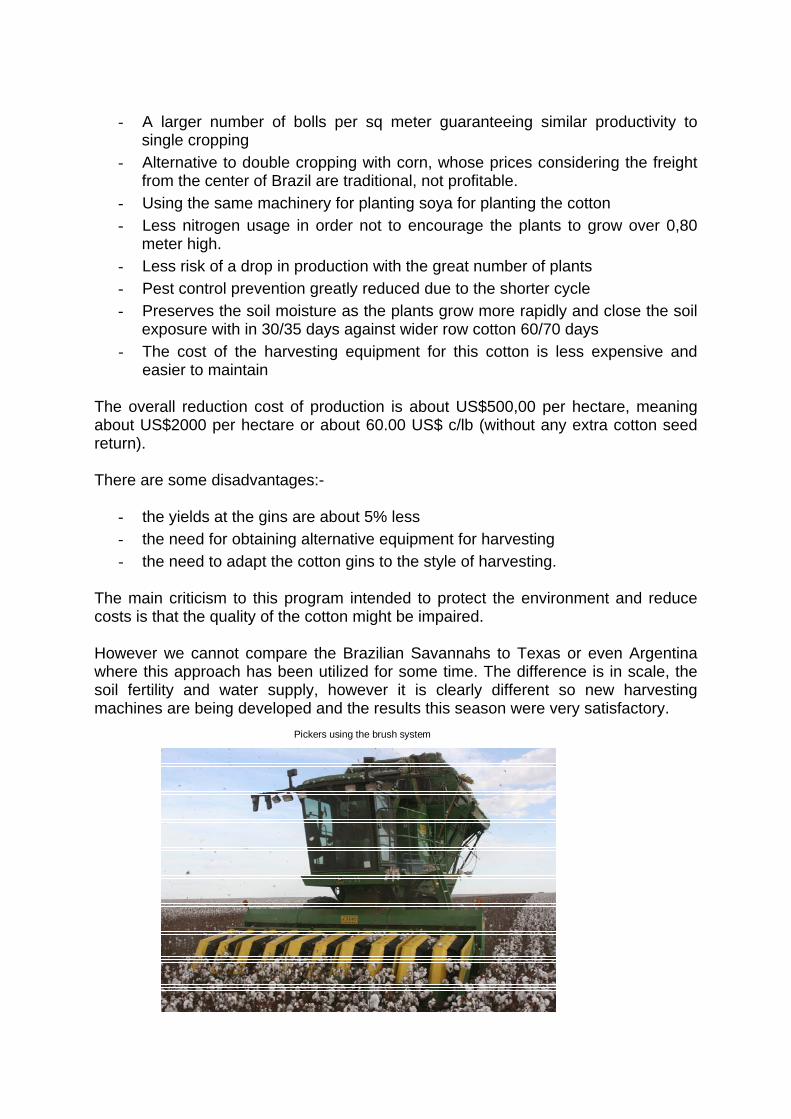
- A larger number of bolls per sq meter guaranteeing similar productivity to single cropping
- Alternative to double cropping with corn, whose prices considering the freight from the center of Brazil are traditional, not profitable.
- Using the same machinery for planting soya for planting the cotton - Less nitrogen usage in order not to encourage the plants to grow over 0,80
meter high. - Less risk of a drop in production with the great number of plants - Pest control prevention greatly reduced due to the shorter cycle - Preserves the soil moisture as the plants grow more rapidly and close the soil
exposure with in 30/35 days against wider row cotton 60/70 days - The cost of the harvesting equipment for this cotton is less expensive and
easier to maintain The overall reduction cost of production is about US$500,00 per hectare, meaning about US$2000 per hectare or about 60.00 US$ c/lb (without any extra cotton seed return). There are some disadvantages:-
- the yields at the gins are about 5% less - the need for obtaining alternative equipment for harvesting - the need to adapt the cotton gins to the style of harvesting.
The main criticism to this program intended to protect the environment and reduce costs is that the quality of the cotton might be impaired. However we cannot compare the Brazilian Savannahs to Texas or even Argentina where this approach has been utilized for some time. The difference is in scale, the soil fertility and water supply, however it is clearly different so new harvesting machines are being developed and the results this season were very satisfactory.
Pickers using the brush system
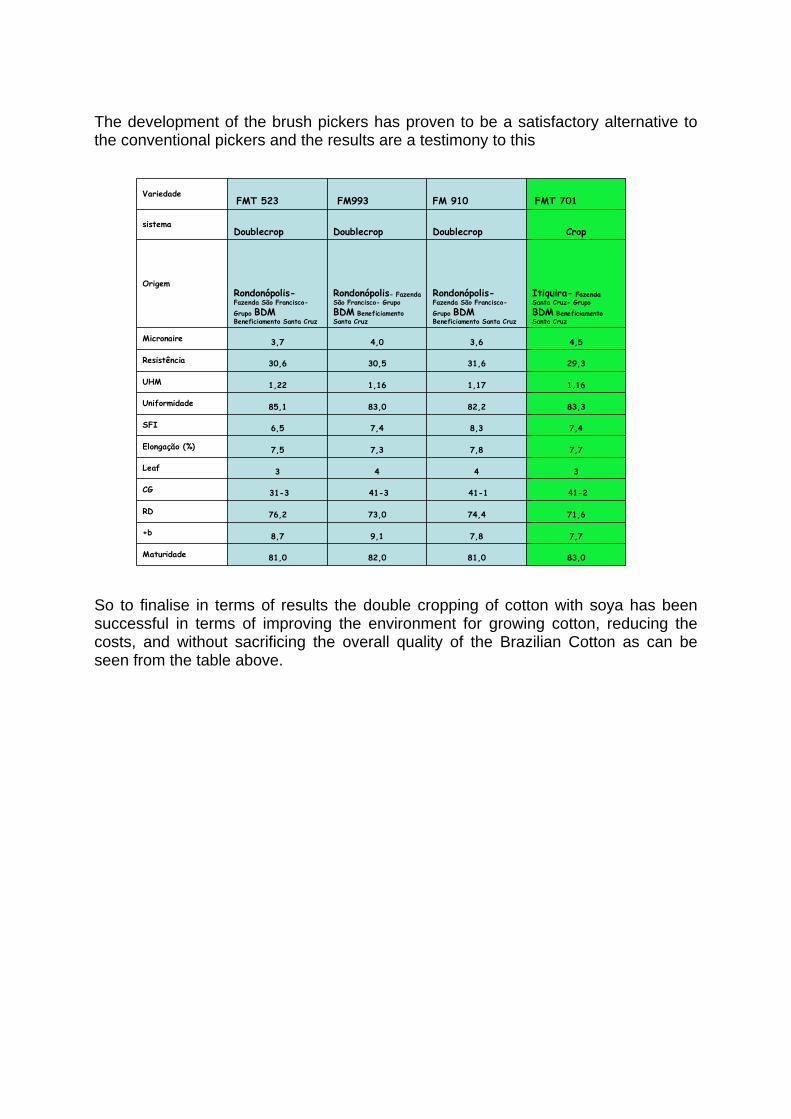
The development of the brush pickers has proven to be a satisfactory alternative to the conventional pickers and the results are a testimony to this
83,081,082,081,0Maturidade
7,77,89,18,7+b
71,674,473,076,2RD
41-241-141-331-3CG
3443Leaf
7,77,87,37,5Elongação (%)
7,48,37,46,5SFI
83,382,283,085,1Uniformidade
1,161,171,161,22UHM
29,331,630,530,6Resistência
4,53,64,03,7Micronaire
Itiquira- Fazenda Santa Cruz- Grupo BDM Beneficiamento Santa Cruz
Rondonópolis-Fazenda São Francisco-Grupo BDMBeneficiamento Santa Cruz
Rondonópolis- Fazenda São Francisco- Grupo BDM Beneficiamento Santa Cruz
Rondonópolis-Fazenda São Francisco-Grupo BDMBeneficiamento Santa Cruz
Origem
CropDoublecropDoublecropDoublecropsistema
FMT 701FM 910FM993FMT 523Variedade
So to finalise in terms of results the double cropping of cotton with soya has been successful in terms of improving the environment for growing cotton, reducing the costs, and without sacrificing the overall quality of the Brazilian Cotton as can be seen from the table above.
REGIONAL DEVOLOPMENTS IN COTTON PRODUCTION IN AFRICA
A. M. Ali The Sudan Cotton Company Ltd, Khartoum, Sudan
ABSTRACT Cotton commercial planting was introduced in Africa during the colonial period, and strongly supported after that by national governments. Having generated impressive growth during 1960-1985, cotton development in the region was indeed regarded as a success story. During that period cotton was the engine of rural growth in most of cotton producing African countries. Widespread benefits in terms of farm modernization and improved farmer livelihood were witnessed. From the mid 1980s, however, it began to generate low crop economic performance. The main factors were the International prices (cotton, inputs, currencies...Etc) which were having direct and indirect negative effects on cotton production in Africa. Sudan is not an exception where remarkable declines are going on. The African cotton segment actors, agreed on the need to unite and face the difficulties. Hence, The African Cotton Association(A.C.A.) was born. Since its inception, the A.C.A. strives to initiate actions aiming at enhancing the competitiveness of cotton produced in Africa and at protecting the interests of the actors wherever the need arises. INTRODUCTION According to history, some sources of information reveal that cotton was introduced into Africa by the Arabs prior to the 18th century. Other sources stated that the British introduced cotton to Africa in the 18th century while others believed it was introduced by the Turkish Empire in the 17th century. The shortage of cotton during the Second World War induced France to definitely opt for a cotton promotion policy in its colonies. Drawing lessons from past failures, France set up two structures assigned to jointly promote cotton growing in Tropical Africa: the Institute of Research on Cotton and Exotic Textiles (IRCT) in 1946, and the French Textile Fibers Development Company (CFDT) in 1949. It is worth noting that during the period prior to the mid 1970 cotton production research and quality was entrusted to the Empire Cotton Growing Corporation (ECGC). The ECGC was undergoing the research in several countries (Sudan, Uganda, Tanzania, Nigeria, South Africa Rhodesia…etc).The headquarters of the ECGC was the Sudan where voluminous cotton research findings were derived benefiting not only the African member countries but the cotton producing countries at large. The genetically control of the devastating bacterial blight disease is a world –wide known research achievement where the pioneer work on bacterial blight research was centered in the Sudan with the regional variety testing included most of the countries in the region.
Under the impulsion of the CFDT, in the mid ‘70s, several national companies were set up with the purpose of promoting the cotton segment while ensuring rural development in the target regions, leading to the integration of cotton in the agricultural systems and the recognition of its economic and social importance. Since then, cotton has been assuming growing importance as a key product in the economies of most of African countries. The Evolution of Cotton Production in Africa Cotton production in West and Central Africa has recorded tremendous growth, moving from about 100,000 tons in the ‘50s to 2.5 millions tons in 2004-2005. Africa accounts for 14% of the world cotton growing surface, with the exploitation of about 5 000 000 acres of land. Cotton fiber production in Africa reached 2,043,000 tons in 2004-2005, i.e. about 8% of the world production of 25,639,000 Tons. Table(1)pictures the cotton production trend over the 2000-2010 Period. As a result, following a sluggish beginning, the cotton growing activity has been constantly increasing in almost all the countries belonging to the Franc Zone. Its development, in general, moved at the same pace with the producers’ price, which is linked to the price of fiber, punctuated with some periods of rapid or slow growth. The recent crisis that hit the fiber sector and the critical Euro/Dollar exchange rate dramatically illustrates the link between production and producers’ earnings. The cotton segments in the Franc Zone had benefited from a relatively stable financial condition, up to the mid ‘80s. This financial stability was obtained in West and Central Africa, during the CFDT era, thanks to the increase in production activities and the resultant yields, reduction of fiscal charges and considerable external aids. The first years of the national cotton companies witnessed a period of favourable prices, when major projects were subsidized and cotton growing activities benefited from indirect funding. The price induced crisis of 1985 shook that vulnerable stability. It revealed the weaknesses of the segments and highlighted the limits of the system set up by CFDT. From then started the questioning of the cotton growing and marketing system introduced by the Bretton Woods institutions. In spite of opposition by the CFDT, the World Bank and the IMF embarked upon a privatization policy on the African cotton companies. The latter took position with the French company. However, the States, indebted and subjected to the structural adjustment programmes, had no choice other than to comply with the directives of the World Bank and IMF, and assisted in dismantling, little by little, all the African segments, weakened by the crisis that affected the prices between 2004-2005 and 2006-2007. This crisis, the most serious of the past few decades, worsened by the rising Euro/Dollar exchange rate, was caused by the subsidies granted to their producers by the fiber exporting countries in the North, the United States in particular.
Affected by the above , and compounded by some internal circumstances The Sudan cotton sector witnessed continuous deterioration Table (2) shows the volume of cotton produced in Sudan during the last four decades. The down trend is quite obvious. As it threatened the survival of the African segments, all the stakeholders (producers, cotton companies and the States) were obliged to unite and claim for more fairness, in international trading, on the part of the WTO. To ensure success in this struggle, the African cotton actors reviewed their organizational modus operandi. It was in this process that the African Cotton Association (A.C.A) was created on 19 September, 2002. II - The Challenges facing the African Cotton The cotton sector plays a key role in the economy of African countries. Over 20 millions persons, spread over several countries, (Benin, Burkina Faso, Cameroon, Côte d’Ivoire, Guinea, Mali, Niger, Senegal, RCA, Chad, Togo, Sudan, Uganda, Tanzania, Mozambique, Zimbabwe, South Africa …) derive their earnings from the cotton-related activities. In most of these countries, cotton plays a leading role in agricultural, economic and financial activities. In this regard, it contributes to the professional structuring of the rural areas. However, since the early 2000, it is obvious that the African cotton is sick. The underlying and long-standing causes are many, including: - The low price on the world market, coupled with an unfavorable Euro/Dollar
exchange rate; - The subsidies granted to cotton producers by some advanced countries, inducing
cheap cotton offers with utter disregard to the recognized world market prices; - Fall in agricultural yields, subsequent to reduced land fertility, capped by a poorly
funded agronomic research; - Sky-rocketing prices of agricultural inputs (fertilizers, insecticides…) The Consequences - Deficits suffered by the cotton companies in West and Central Africa have
considerably reduced their resources, owing to the absence of a suitable recapitalization process, with recurrent cash problems;
- Increasingly difficult timely accessibility to credit facilities to cover the costs of inputs and marketing;
- Adjustment is therefore made on a diminishing producers’ price which is indexed
on the world commodity prices; - Hence, discouraged cotton producers reduce the areas of land grown, resulting in
the drastic fall of cotton production outputs in 2007 and 2008, which risks to continue or worsen in 2009.
Therefore, the underlying causes and dramatic consequences of the cotton crisis are clearly identified and known by all the stakeholders. From the WTO Ministerial Conference held in Cancun, September 2003, up to date, several meetings, workshops and conferences have taken place worldwide with the aim of discussing the issue and finding a solution thereto. Nevertheless, it is sad to observe that the relevant file has not moved farther at the WTO’s level. The commitments taken by the community of donors are slow in taking shape, thus weakening their efficiency. The situation of the segment has worsened, while cotton companies are all experiencing a critical situation. The Doha Round Table was a failure: today, the cotton issue no longer seems a priority in multilateral negotiations, whereas the crisis besetting the cotton segment remains unabated. Today, the world economy is in a critical situation: financial crisis, falling prices of raw materials and commodities, fall in the demand for goods and services. Under these circumstances, the African cotton actors have no alternative option other than to mobilize themselves and revive the cotton issue in order to meet the multifaceted challenges of the segment which are agronomical, industrial, commercial, managerial and, of course, political in nature. No single African country can, alone, bail out its cotton segment from the current crisis; hence, the need for unity and mobilization. Africa and its partners in development should act now to save this key segment which is essential for the economy and stability of our countries. The fall in the African cotton production, the food crisis and the skyrocketing prices of fertilizers should be viewed as beneficial shock waves In this regard, Africa cannot remain indifferent. Rather, it should get organized. Urgent measures should be taken concerning the financing of inputs and agricultural equipment, debt issue afflicting cotton companies and their re-capitalization. Owing to these difficulties facing the African cotton segment actors, they agreed on the need to unite and pull their efforts together in order to get out of the woods, through the implementation of various actions aiming at enhancing the
competitiveness of the African white gold. Hence, the African Cotton Association was born. III - The African Cotton Association (A.C.A): Creation, Constitution, Activities &
Projects. 3.1- Creation of the African Cotton Association (A.C.A) Conscious of the fact that only the set-up of a formal framework for consultations and actions could make it possible for stakeholders to regularly meet and deal with issues pertaining to the cotton sector and employ a far-reaching solidarity in protecting their interests, the leaders of cotton companies convened to promote an institutional support unit to strengthen the relationships between the African cotton segments and support their sustainable development. Such a consultation framework would help in developing mutually profitable relationships between the African cotton segments and those of the world. The said institutional support unit, the African Cotton Association (A.C.A), has been officially launched on 19 September, 2002, in Cotonou, Benin. Mission The object of the A.C.A consists of: - Regrouping all the African cotton professionals and create a consultation forum to
deal with issues of common interests; - Collecting, processing and widely disseminating information pertaining to cotton
trade among its members, to African States, political and economical organizations;
- Ensuring the respect and inviolability of commercial contracts freely agreed upon between interested parties;
- Defending the African cotton segments within an unstable world economic environment, induced by unjustified subsidies and trade barriers evolved by some cotton producing countries;
- Participating in the implementation of strategic alliances with other producing countries affected by unorthodox trade practices;
- Organizing consultations, experience sharing forums and the pulling together of means, resources and expertise between cotton companies, particularly in the areas of agronomy, ginning, logistics and trade policy;
- Ensuring the implementation and respect of good trade practices by establishing an African type of contract.
The A.C.A is made up of active members, associate members and correspondent members. - Active Members are cotton companies in activity or associations of cotton
companies, the members of which are regularly carrying out, in Africa, cotton production and cotton-seed support production activities, as well as ginning and commercialization of cotton fiber.
- Associate Members are the organizations of cotton producers, associations of textile industrialists and associations of grinders.
- Correspondent Members are the transport, clearing and forwarding companies,
bankers, insurance companies, foreign cotton associations and international trading companies, as well as, generally speaking, any corporate bodies or any persons whose activities contribute to the development of the sector.
As of today, the A.C.A has 62 Members: 27 Active Members, 8 Associate Members and 27 Correspondent Members. Active and Associate Members are spread across Africa (Benin, Burkina Faso, Cameroon, Chad, Côte d’Ivoire, Egypt, Ghana, Mali, Mozambique, Senegal, Sudan, Tanzania, Togo, Uganda, Zambia and Zimbabwe), while Correspondent Members are based in Europe (Germany, Great Britain, France, Switzerland). 3.2 - ACTIVITES OF THE A.C.A Since its inception, the A.C.A. strives to initiate actions aiming at enhancing the competitiveness of cotton produced in Africa and at protecting the interests of the actors wherever the need arises. In this vein, the following actions were conducted by the A.C.A.: 1. In 2003, shortly after its creation, it worked with the C4 Member States (Benin,
Burkina Faso, Mali and Chad) to embark on the Cotton Sectoral Initiative Project, which enabled the African cotton actors to be heard during WTO Ministerial Conference in CANCUN (Mexico);
2. During the month of March in 2003, 2004, 2005, 2006, 2007, 2008 and 2009, the
Association organized conferences for its members, respectively in Bamako (Mali), Dakar (Senegal), Ouagadougou (Burkina Faso), Cairo (Egypt), Accra (Ghana), Lusaka (Zambia) and Arusha (Tanzania); these gatherings have always afforded members, coming from all the corners worldwide, the opportunity to share experiences and view points on various issues connected with improving the competitiveness of the African cotton.
3. To encourage its members to improve the productivity and quality of the African
cotton, the A.C.A has, so far, mobilized, at least once a year, its members around technical topics on which they are able to share their experiences and opinions.
For instance: 3.2.1 - In November 2005, in Bamako, the A.C.A. invited the actors to a workshop where they were asked to conduct a brainstorming session on the causes of the skyrocketing prices of cotton inputs. The said workshop enabled participants to identify a number of actions to be taken to induce the reduction of the cotton production cost and improve the actors’ income.
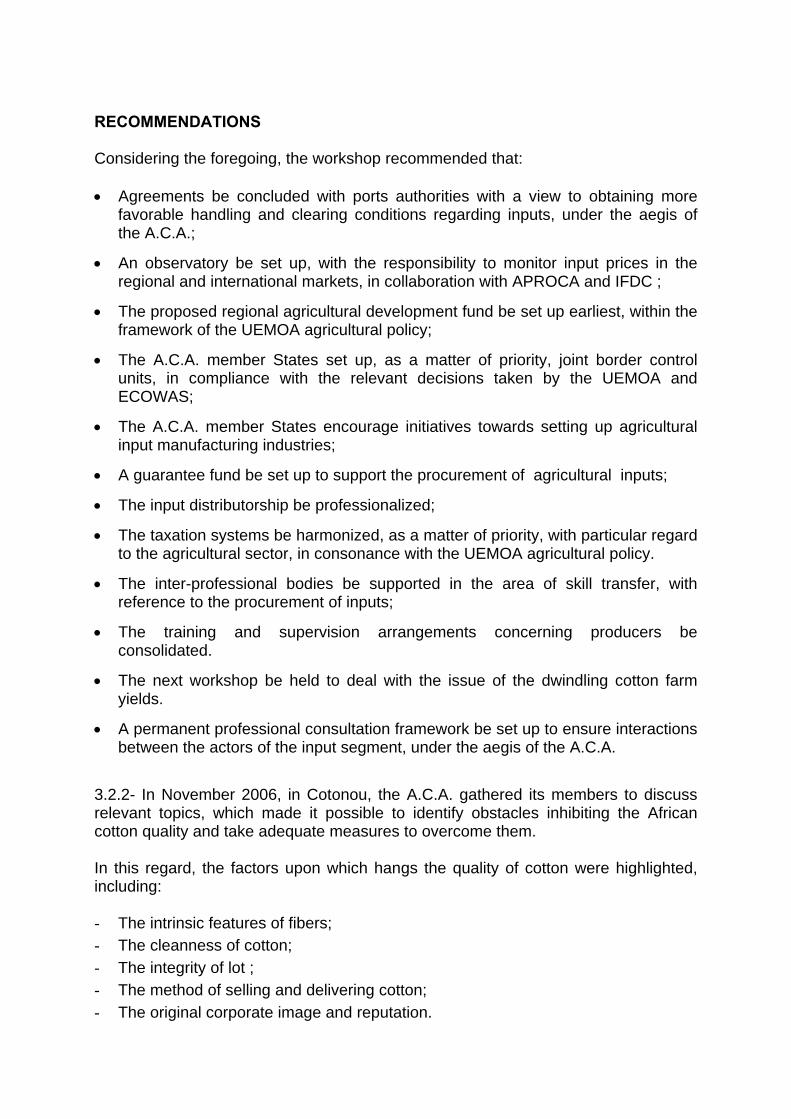
RECOMMENDATIONS Considering the foregoing, the workshop recommended that: • Agreements be concluded with ports authorities with a view to obtaining more
favorable handling and clearing conditions regarding inputs, under the aegis of the A.C.A.;
• An observatory be set up, with the responsibility to monitor input prices in the regional and international markets, in collaboration with APROCA and IFDC ;
• The proposed regional agricultural development fund be set up earliest, within the framework of the UEMOA agricultural policy;
• The A.C.A. member States set up, as a matter of priority, joint border control units, in compliance with the relevant decisions taken by the UEMOA and ECOWAS;
• The A.C.A. member States encourage initiatives towards setting up agricultural input manufacturing industries;
• A guarantee fund be set up to support the procurement of agricultural inputs;
• The input distributorship be professionalized;
• The taxation systems be harmonized, as a matter of priority, with particular regard to the agricultural sector, in consonance with the UEMOA agricultural policy.
• The inter-professional bodies be supported in the area of skill transfer, with reference to the procurement of inputs;
• The training and supervision arrangements concerning producers be consolidated.
• The next workshop be held to deal with the issue of the dwindling cotton farm yields.
• A permanent professional consultation framework be set up to ensure interactions between the actors of the input segment, under the aegis of the A.C.A.
3.2.2- In November 2006, in Cotonou, the A.C.A. gathered its members to discuss relevant topics, which made it possible to identify obstacles inhibiting the African cotton quality and take adequate measures to overcome them. In this regard, the factors upon which hangs the quality of cotton were highlighted, including: - The intrinsic features of fibers; - The cleanness of cotton; - The integrity of lot ; - The method of selling and delivering cotton; - The original corporate image and reputation.
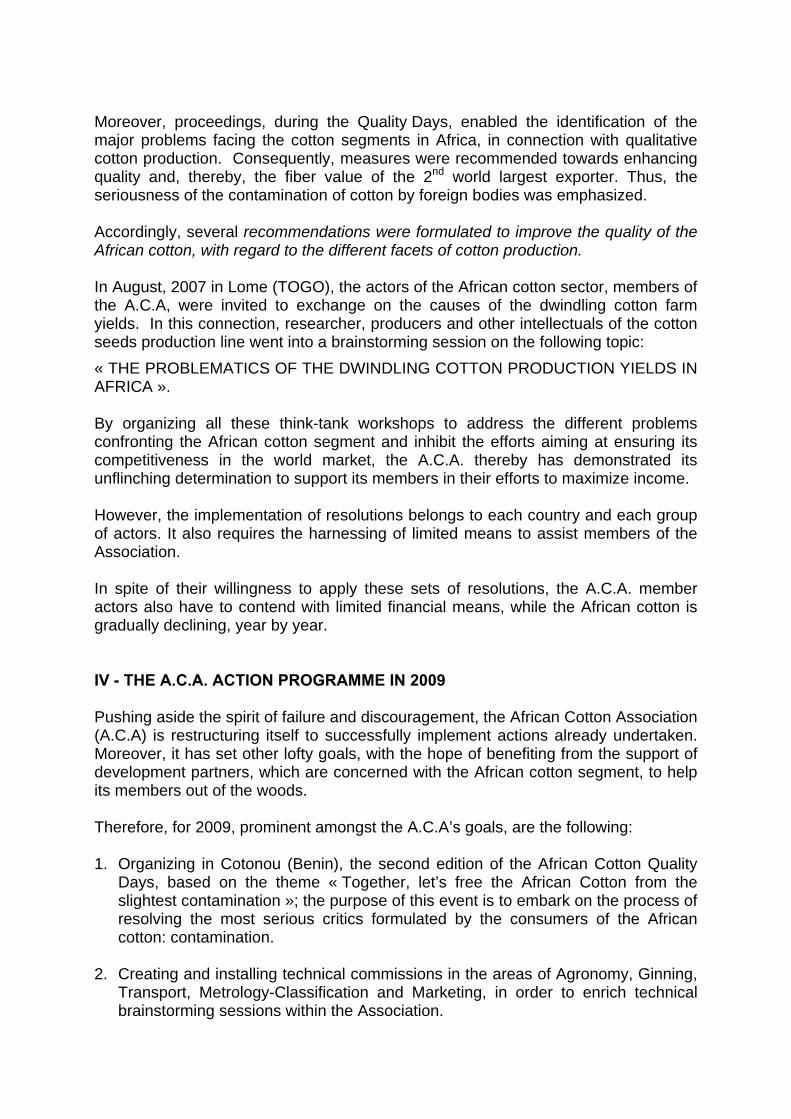
Moreover, proceedings, during the Quality Days, enabled the identification of the major problems facing the cotton segments in Africa, in connection with qualitative cotton production. Consequently, measures were recommended towards enhancing quality and, thereby, the fiber value of the 2nd world largest exporter. Thus, the seriousness of the contamination of cotton by foreign bodies was emphasized. Accordingly, several recommendations were formulated to improve the quality of the African cotton, with regard to the different facets of cotton production. In August, 2007 in Lome (TOGO), the actors of the African cotton sector, members of the A.C.A, were invited to exchange on the causes of the dwindling cotton farm yields. In this connection, researcher, producers and other intellectuals of the cotton seeds production line went into a brainstorming session on the following topic: « THE PROBLEMATICS OF THE DWINDLING COTTON PRODUCTION YIELDS IN AFRICA ». By organizing all these think-tank workshops to address the different problems confronting the African cotton segment and inhibit the efforts aiming at ensuring its competitiveness in the world market, the A.C.A. thereby has demonstrated its unflinching determination to support its members in their efforts to maximize income. However, the implementation of resolutions belongs to each country and each group of actors. It also requires the harnessing of limited means to assist members of the Association. In spite of their willingness to apply these sets of resolutions, the A.C.A. member actors also have to contend with limited financial means, while the African cotton is gradually declining, year by year. IV - THE A.C.A. ACTION PROGRAMME IN 2009 Pushing aside the spirit of failure and discouragement, the African Cotton Association (A.C.A) is restructuring itself to successfully implement actions already undertaken. Moreover, it has set other lofty goals, with the hope of benefiting from the support of development partners, which are concerned with the African cotton segment, to help its members out of the woods. Therefore, for 2009, prominent amongst the A.C.A’s goals, are the following: 1. Organizing in Cotonou (Benin), the second edition of the African Cotton Quality
Days, based on the theme « Together, let’s free the African Cotton from the slightest contamination »; the purpose of this event is to embark on the process of resolving the most serious critics formulated by the consumers of the African cotton: contamination.
2. Creating and installing technical commissions in the areas of Agronomy, Ginning,
Transport, Metrology-Classification and Marketing, in order to enrich technical brainstorming sessions within the Association.
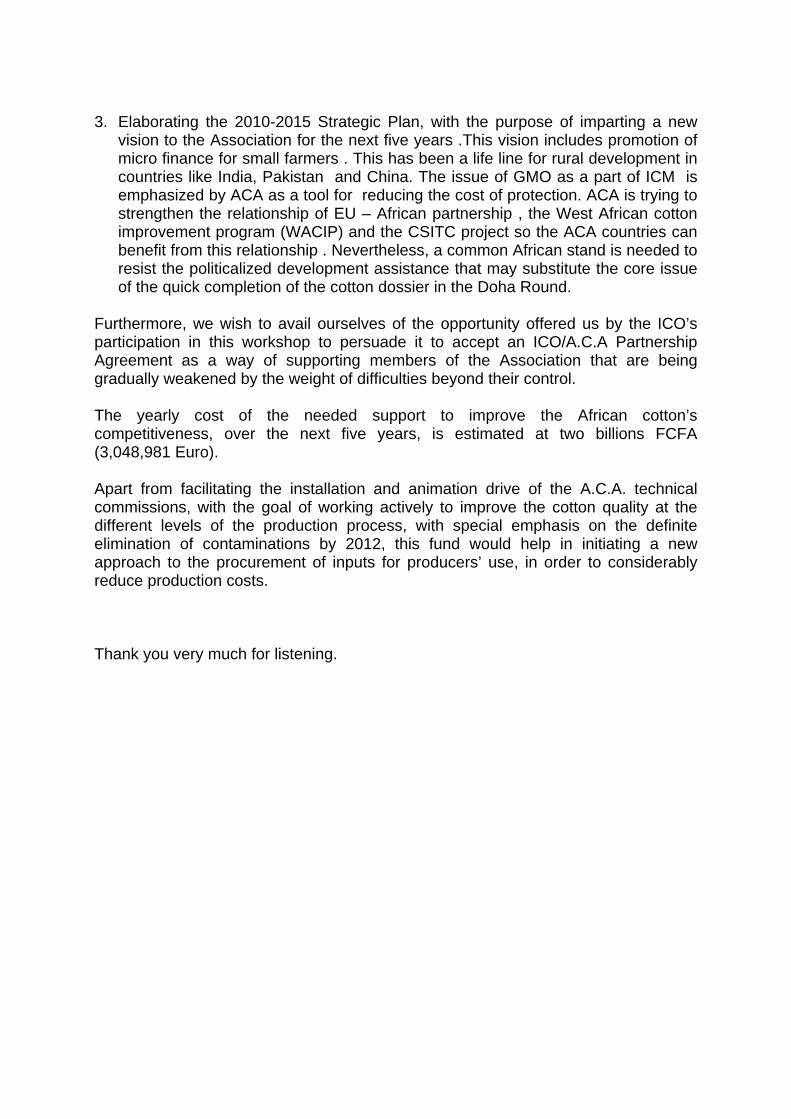
3. Elaborating the 2010-2015 Strategic Plan, with the purpose of imparting a new vision to the Association for the next five years .This vision includes promotion of micro finance for small farmers . This has been a life line for rural development in countries like India, Pakistan and China. The issue of GMO as a part of ICM is emphasized by ACA as a tool for reducing the cost of protection. ACA is trying to strengthen the relationship of EU – African partnership , the West African cotton improvement program (WACIP) and the CSITC project so the ACA countries can benefit from this relationship . Nevertheless, a common African stand is needed to resist the politicalized development assistance that may substitute the core issue of the quick completion of the cotton dossier in the Doha Round.
Furthermore, we wish to avail ourselves of the opportunity offered us by the ICO’s participation in this workshop to persuade it to accept an ICO/A.C.A Partnership Agreement as a way of supporting members of the Association that are being gradually weakened by the weight of difficulties beyond their control. The yearly cost of the needed support to improve the African cotton’s competitiveness, over the next five years, is estimated at two billions FCFA (3,048,981 Euro). Apart from facilitating the installation and animation drive of the A.C.A. technical commissions, with the goal of working actively to improve the cotton quality at the different levels of the production process, with special emphasis on the definite elimination of contaminations by 2012, this fund would help in initiating a new approach to the procurement of inputs for producers’ use, in order to considerably reduce production costs. Thank you very much for listening.
Table (1) Seasonal Campaign (Ans): 00-01 01-02 02-03 03-04 04-05 05-06 06-07 07-08 08-09 09-10 Areas (x 1000 acres) 4062 4720 4 237 4 705 5 152 4 590 4 594 3 731 3 558 3 364 Production (x 1000 T) 1 433 1 802 1 713 1 715 2 043 1 669 1 473 1 288 1 174 1 155 Yields (Kg/acres): 353 382 404 364 397 364 321 345 330 343 Table(2) Sudan Cotton Production
season Production (1000Ton)
1971 250
1977 208 1983 188 1989 136 1995 109 2001 79 2007 53 2008 49
REFERENCIES: Abdin M. Ali 2009 The role of the african cotton association (a.c.a) in improving productivity ,quality and value addition of the african cotton
REGIONAL DEVELOPMENTS OF COTTON PRODUCTION IN CHINA
W. GONG CNCRC, Beijing, P.R. China
Editor’s Note A written paper was not provided by the author prior to the conference.
Session III: Panel Discussion The Impact of Instrument Testing on Cotton Trading
Chairman:William E. MayACSA, Memphis, TN, USA
Participants:Andrew MacdonaldAmcon Consulting, Chairman CSITC Task Force, Sao Paulo, Brazil
Don CameronTerranova Ranch, Inc., Helm, CA, USA
M. N. VijayshankarRecron, Malaysia
John D. MitchellCargill Cotton, Cordova, USA
Romano BonadeiFondazione Industrie Cotone-Lino, Milano, Italy
30th International Cotton Conference BREMEN
March 24 - 27, 2010
PANEL DISCUSSION ON THE IMPACT OF INSTRUMENT TESTING ON COTTON TRADING
Chairman: William E. May, ACSA, Memphis, TN, USA
Panellists: • Andrew Macdonald, Amcon Consulting and Chairman CSITC Task Force, Sao
Paulo, Brazil • Don Cameron, Terranova Ranch Inc., Helm, CA, USA • M.N. Vijayshankar, Recron, Malaysia • John D. Mitchell, Cargill Cotton, Cordova, TN, USA • Romano Bonadei, Fondazione Ind. Cotone Lino, Milano, Italy
INTRODUCTION For the purpose of achieving reliable instrumental test results for the global cotton trade, the ICAC Task Force on Commercial Standardization of Instrument Testing of Cotton (CSITC) brought together international representatives of spinning mills, traders, cotton producers and research. This group has made several recommendations to build a worldwide system for classifying cotton productions and encourages the use of “Standardized Instrument Testing for Cotton” as it can provide reliable results that can be used in trade. CSITC aims in introducing the use of instrument testing language in the trading of cotton so that traditional descriptions of grade or type are replaced with instrument test values. Achievements of the CSITC Task Force at this stage are e.g.
• The adoption of Universal HVI Calibration Standards and procedures for commercial trading by all testing centres around the world was agreed and is facilitated.
• Currently 6 parameters were agreed to be sufficiently reliable for commercial purposes: Micronaire, Strength, Length (UHML), Uniformity Index, Colour Rd and Colour +b.
• Standardized instrument test results were included in the rules / procedures of different cotton associations, as e.g. by the Bremen Cotton Exchange, and partly by the Gdynia Cotton Exchange and the International Cotton Association.
• An international CSITC Round Trial System was installed, which offers the opportunity to evaluate the achievable accuracy of the participating testing facilities objectively, and to support them in improving accuracy and precision of test results.
• It was recommended that 100% of bales should be sampled in a standardized testing system, with the understanding that commercial agreements may stipulate different sampling percentages.
• The results of the CSITC Round Trials may be used as a suitable basis for fixing commercial trade limits.
The Panel Discussion focuses on the implementation of the CSITC achievements. The panellists will highlight the benefits as well as on the constraints for the different cotton stakeholders.
Changes in the structure of the cotton industry and cotton trading are currently arising, and the increased use of instrument data is one part of this. Cotton is traded more as a commodity than in previous generations, and the role of country buyers and small merchants is decreasing rapidly. The Panel Discussion will look ahead for the future of cotton trading with this given prerequisites.
Session IV: Developments in Cotton Production
30th International Cotton Conference BREMEN
March 24 - 27, 2010
The ITMF Cotton Contamination Survey 2009Christian Schindler
What Can We Expect from Biotechnology in the next Decade for Cotton Production?Michel Tahar
Socioeconomic Impact of Genetically Modified Cotton in Developing CountriesMatin Qaim
Sustaining Soil Productivity of Cotton-Based Crop-ping Systems in the Savannahs of West- and Central Africa: Challenges and OpportunitiesMichel Cretenet
The Influence of Modern Hight Speed Roller- and Saw-ginning Systems on Throughput and Cotton QualityDerek Whitelock
•
•
•
•
•
(Agrotechnical Aspects)

THE ITMF COTTON CONTAMINATION SURVEY 2009
C. SCHINDLER ITMF, Zurich, Switzerland
Editor’s Note A written paper was not provided by the author prior to the conference.
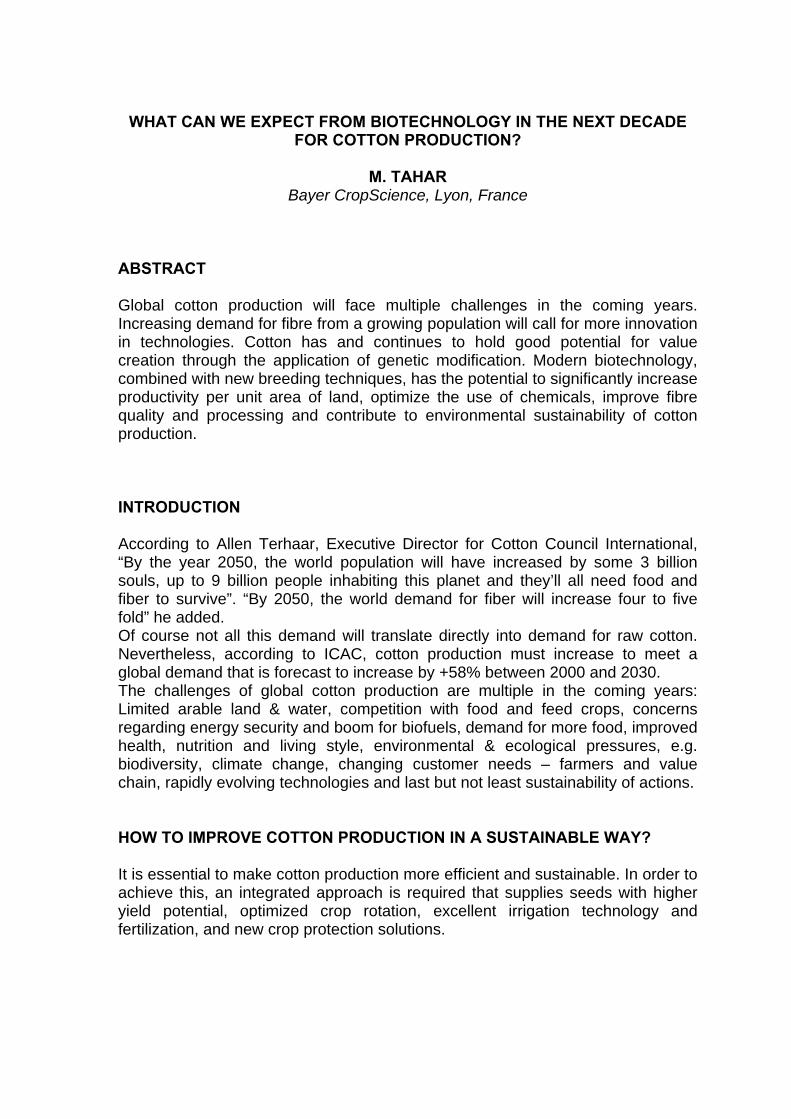
WHAT CAN WE EXPECT FROM BIOTECHNOLOGY IN THE NEXT DECADE FOR COTTON PRODUCTION?
M. TAHAR
Bayer CropScience, Lyon, France ABSTRACT Global cotton production will face multiple challenges in the coming years. Increasing demand for fibre from a growing population will call for more innovation in technologies. Cotton has and continues to hold good potential for value creation through the application of genetic modification. Modern biotechnology, combined with new breeding techniques, has the potential to significantly increase productivity per unit area of land, optimize the use of chemicals, improve fibre quality and processing and contribute to environmental sustainability of cotton production. INTRODUCTION According to Allen Terhaar, Executive Director for Cotton Council International, “By the year 2050, the world population will have increased by some 3 billion souls, up to 9 billion people inhabiting this planet and they’ll all need food and fiber to survive”. “By 2050, the world demand for fiber will increase four to five fold” he added. Of course not all this demand will translate directly into demand for raw cotton. Nevertheless, according to ICAC, cotton production must increase to meet a global demand that is forecast to increase by +58% between 2000 and 2030. The challenges of global cotton production are multiple in the coming years: Limited arable land & water, competition with food and feed crops, concerns regarding energy security and boom for biofuels, demand for more food, improved health, nutrition and living style, environmental & ecological pressures, e.g. biodiversity, climate change, changing customer needs – farmers and value chain, rapidly evolving technologies and last but not least sustainability of actions. HOW TO IMPROVE COTTON PRODUCTION IN A SUSTAINABLE WAY? It is essential to make cotton production more efficient and sustainable. In order to achieve this, an integrated approach is required that supplies seeds with higher yield potential, optimized crop rotation, excellent irrigation technology and fertilization, and new crop protection solutions.
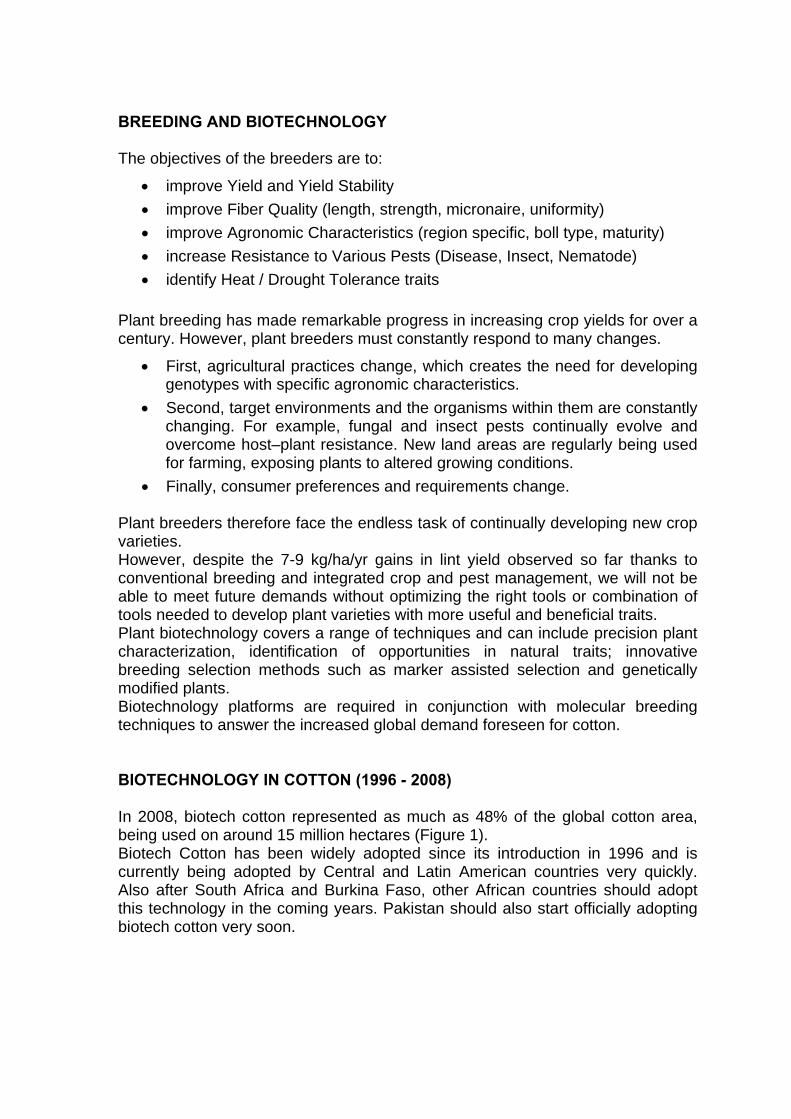
BREEDING AND BIOTECHNOLOGY The objectives of the breeders are to:
• improve Yield and Yield Stability • improve Fiber Quality (length, strength, micronaire, uniformity) • improve Agronomic Characteristics (region specific, boll type, maturity) • increase Resistance to Various Pests (Disease, Insect, Nematode) • identify Heat / Drought Tolerance traits
Plant breeding has made remarkable progress in increasing crop yields for over a century. However, plant breeders must constantly respond to many changes.
• First, agricultural practices change, which creates the need for developing genotypes with specific agronomic characteristics.
• Second, target environments and the organisms within them are constantly changing. For example, fungal and insect pests continually evolve and overcome host–plant resistance. New land areas are regularly being used for farming, exposing plants to altered growing conditions.
• Finally, consumer preferences and requirements change. Plant breeders therefore face the endless task of continually developing new crop varieties. However, despite the 7-9 kg/ha/yr gains in lint yield observed so far thanks to conventional breeding and integrated crop and pest management, we will not be able to meet future demands without optimizing the right tools or combination of tools needed to develop plant varieties with more useful and beneficial traits. Plant biotechnology covers a range of techniques and can include precision plant characterization, identification of opportunities in natural traits; innovative breeding selection methods such as marker assisted selection and genetically modified plants. Biotechnology platforms are required in conjunction with molecular breeding techniques to answer the increased global demand foreseen for cotton. BIOTECHNOLOGY IN COTTON (1996 - 2008) In 2008, biotech cotton represented as much as 48% of the global cotton area, being used on around 15 million hectares (Figure 1). Biotech Cotton has been widely adopted since its introduction in 1996 and is currently being adopted by Central and Latin American countries very quickly. Also after South Africa and Burkina Faso, other African countries should adopt this technology in the coming years. Pakistan should also start officially adopting biotech cotton very soon.
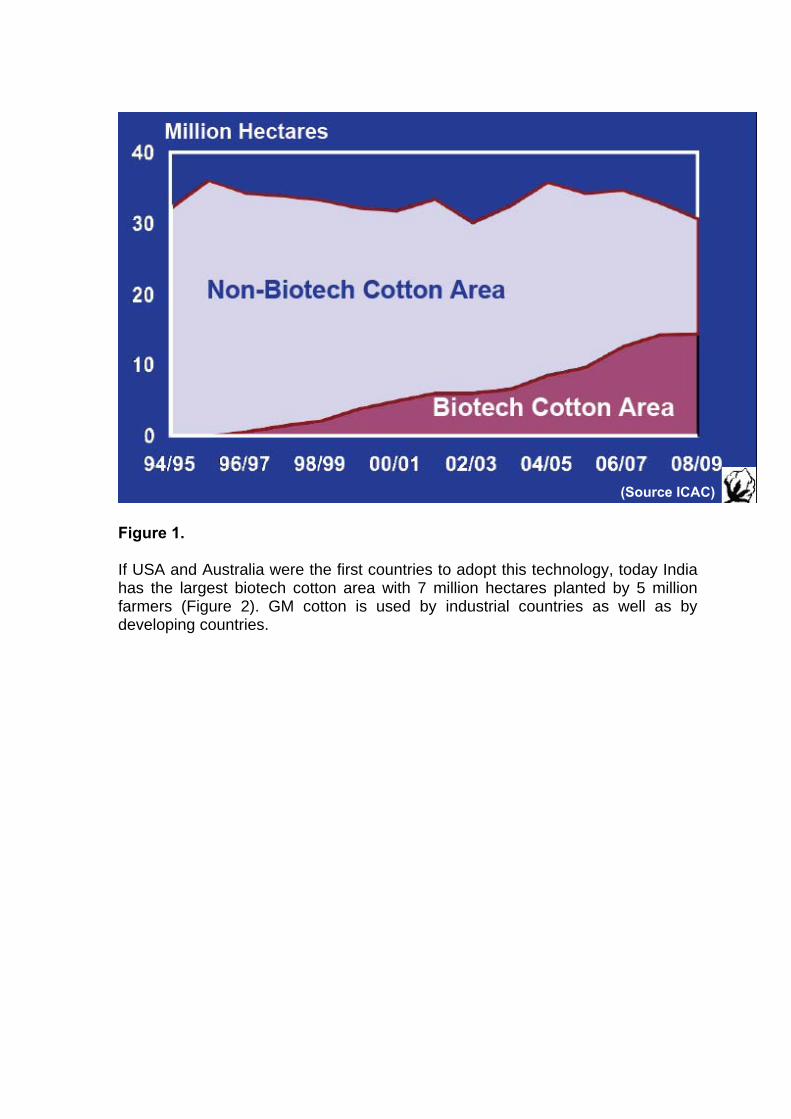
Figure 1. If USA and Australia were the first countries to adopt this technology, today India has the largest biotech cotton area with 7 million hectares planted by 5 million farmers (Figure 2). GM cotton is used by industrial countries as well as by developing countries.
(Source ICAC)
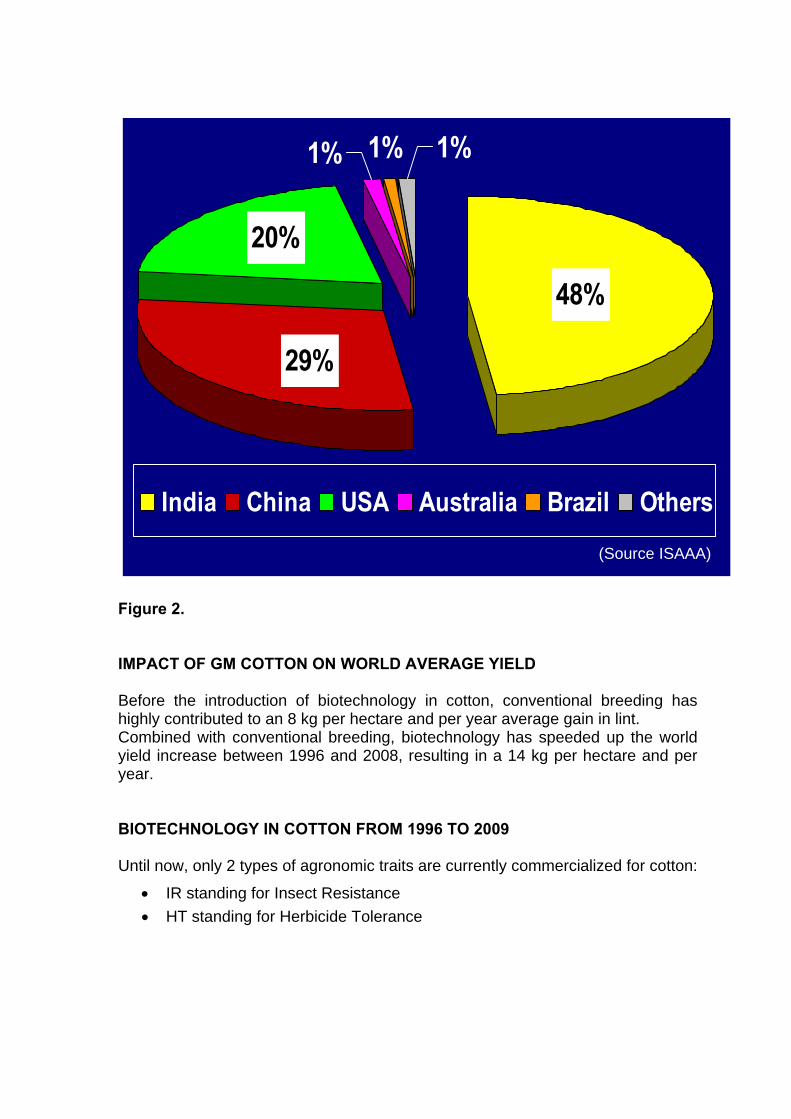
Figure 2. IMPACT OF GM COTTON ON WORLD AVERAGE YIELD Before the introduction of biotechnology in cotton, conventional breeding has highly contributed to an 8 kg per hectare and per year average gain in lint. Combined with conventional breeding, biotechnology has speeded up the world yield increase between 1996 and 2008, resulting in a 14 kg per hectare and per year. BIOTECHNOLOGY IN COTTON FROM 1996 TO 2009 Until now, only 2 types of agronomic traits are currently commercialized for cotton:
• IR standing for Insect Resistance • HT standing for Herbicide Tolerance
1%1% 1%
20%
29%
48%
India China USA Australia Brazil Others
(Source ISAAA)
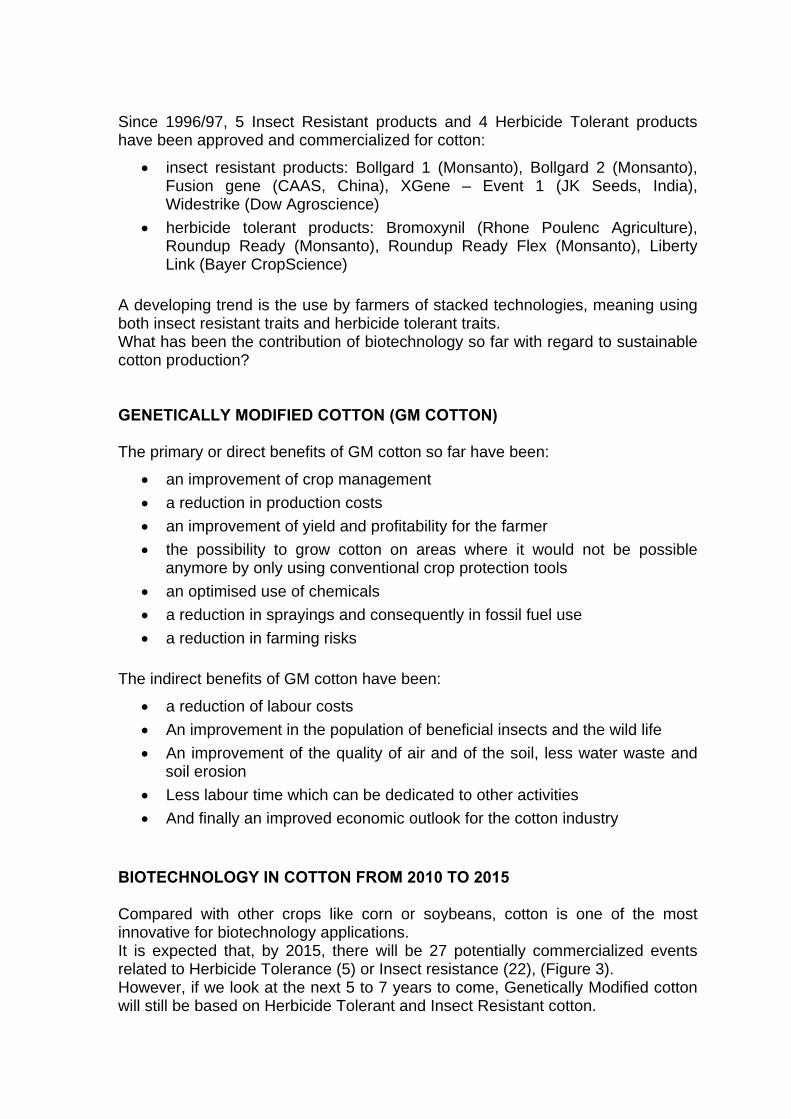
Since 1996/97, 5 Insect Resistant products and 4 Herbicide Tolerant products have been approved and commercialized for cotton:
• insect resistant products: Bollgard 1 (Monsanto), Bollgard 2 (Monsanto), Fusion gene (CAAS, China), XGene – Event 1 (JK Seeds, India), Widestrike (Dow Agroscience)
• herbicide tolerant products: Bromoxynil (Rhone Poulenc Agriculture), Roundup Ready (Monsanto), Roundup Ready Flex (Monsanto), Liberty Link (Bayer CropScience)
A developing trend is the use by farmers of stacked technologies, meaning using both insect resistant traits and herbicide tolerant traits. What has been the contribution of biotechnology so far with regard to sustainable cotton production? GENETICALLY MODIFIED COTTON (GM COTTON) The primary or direct benefits of GM cotton so far have been:
• an improvement of crop management • a reduction in production costs • an improvement of yield and profitability for the farmer • the possibility to grow cotton on areas where it would not be possible
anymore by only using conventional crop protection tools • an optimised use of chemicals • a reduction in sprayings and consequently in fossil fuel use • a reduction in farming risks
The indirect benefits of GM cotton have been:
• a reduction of labour costs • An improvement in the population of beneficial insects and the wild life • An improvement of the quality of air and of the soil, less water waste and
soil erosion • Less labour time which can be dedicated to other activities • And finally an improved economic outlook for the cotton industry
BIOTECHNOLOGY IN COTTON FROM 2010 TO 2015 Compared with other crops like corn or soybeans, cotton is one of the most innovative for biotechnology applications. It is expected that, by 2015, there will be 27 potentially commercialized events related to Herbicide Tolerance (5) or Insect resistance (22), (Figure 3). However, if we look at the next 5 to 7 years to come, Genetically Modified cotton will still be based on Herbicide Tolerant and Insect Resistant cotton.
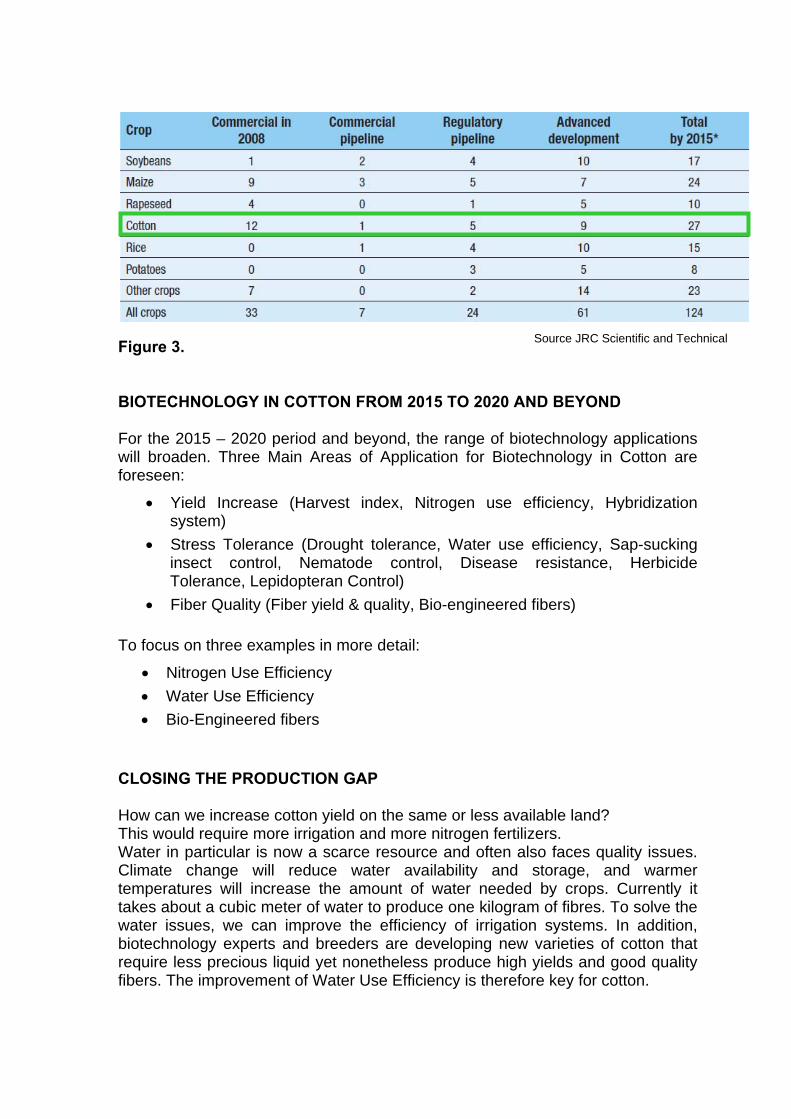
Figure 3. BIOTECHNOLOGY IN COTTON FROM 2015 TO 2020 AND BEYOND For the 2015 – 2020 period and beyond, the range of biotechnology applications will broaden. Three Main Areas of Application for Biotechnology in Cotton are foreseen:
• Yield Increase (Harvest index, Nitrogen use efficiency, Hybridization system)
• Stress Tolerance (Drought tolerance, Water use efficiency, Sap-sucking insect control, Nematode control, Disease resistance, Herbicide Tolerance, Lepidopteran Control)
• Fiber Quality (Fiber yield & quality, Bio-engineered fibers)
To focus on three examples in more detail:
• Nitrogen Use Efficiency • Water Use Efficiency • Bio-Engineered fibers
CLOSING THE PRODUCTION GAP How can we increase cotton yield on the same or less available land? This would require more irrigation and more nitrogen fertilizers. Water in particular is now a scarce resource and often also faces quality issues. Climate change will reduce water availability and storage, and warmer temperatures will increase the amount of water needed by crops. Currently it takes about a cubic meter of water to produce one kilogram of fibres. To solve the water issues, we can improve the efficiency of irrigation systems. In addition, biotechnology experts and breeders are developing new varieties of cotton that require less precious liquid yet nonetheless produce high yields and good quality fibers. The improvement of Water Use Efficiency is therefore key for cotton.
Source JRC Scientific and Technical
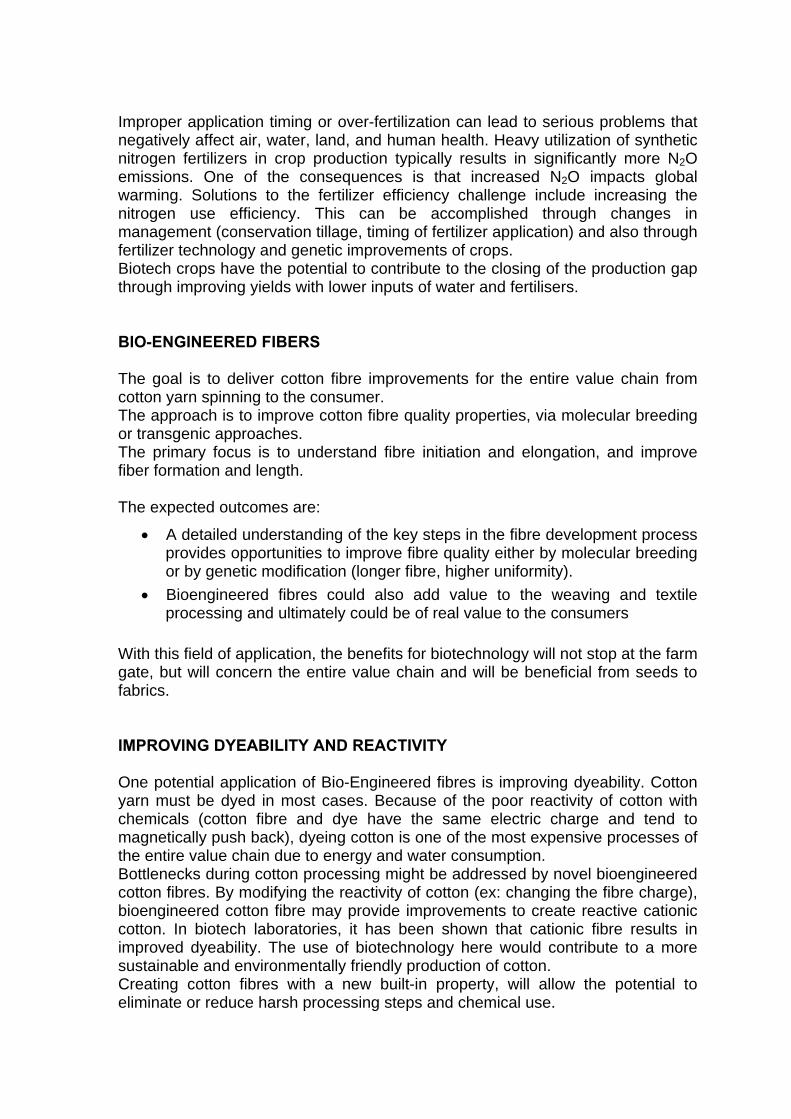
Improper application timing or over-fertilization can lead to serious problems that negatively affect air, water, land, and human health. Heavy utilization of synthetic nitrogen fertilizers in crop production typically results in significantly more N2O emissions. One of the consequences is that increased N2O impacts global warming. Solutions to the fertilizer efficiency challenge include increasing the nitrogen use efficiency. This can be accomplished through changes in management (conservation tillage, timing of fertilizer application) and also through fertilizer technology and genetic improvements of crops. Biotech crops have the potential to contribute to the closing of the production gap through improving yields with lower inputs of water and fertilisers. BIO-ENGINEERED FIBERS The goal is to deliver cotton fibre improvements for the entire value chain from cotton yarn spinning to the consumer. The approach is to improve cotton fibre quality properties, via molecular breeding or transgenic approaches. The primary focus is to understand fibre initiation and elongation, and improve fiber formation and length. The expected outcomes are:
• A detailed understanding of the key steps in the fibre development process provides opportunities to improve fibre quality either by molecular breeding or by genetic modification (longer fibre, higher uniformity).
• Bioengineered fibres could also add value to the weaving and textile processing and ultimately could be of real value to the consumers
With this field of application, the benefits for biotechnology will not stop at the farm gate, but will concern the entire value chain and will be beneficial from seeds to fabrics. IMPROVING DYEABILITY AND REACTIVITY One potential application of Bio-Engineered fibres is improving dyeability. Cotton yarn must be dyed in most cases. Because of the poor reactivity of cotton with chemicals (cotton fibre and dye have the same electric charge and tend to magnetically push back), dyeing cotton is one of the most expensive processes of the entire value chain due to energy and water consumption. Bottlenecks during cotton processing might be addressed by novel bioengineered cotton fibres. By modifying the reactivity of cotton (ex: changing the fibre charge), bioengineered cotton fibre may provide improvements to create reactive cationic cotton. In biotech laboratories, it has been shown that cationic fibre results in improved dyeability. The use of biotechnology here would contribute to a more sustainable and environmentally friendly production of cotton. Creating cotton fibres with a new built-in property, will allow the potential to eliminate or reduce harsh processing steps and chemical use.
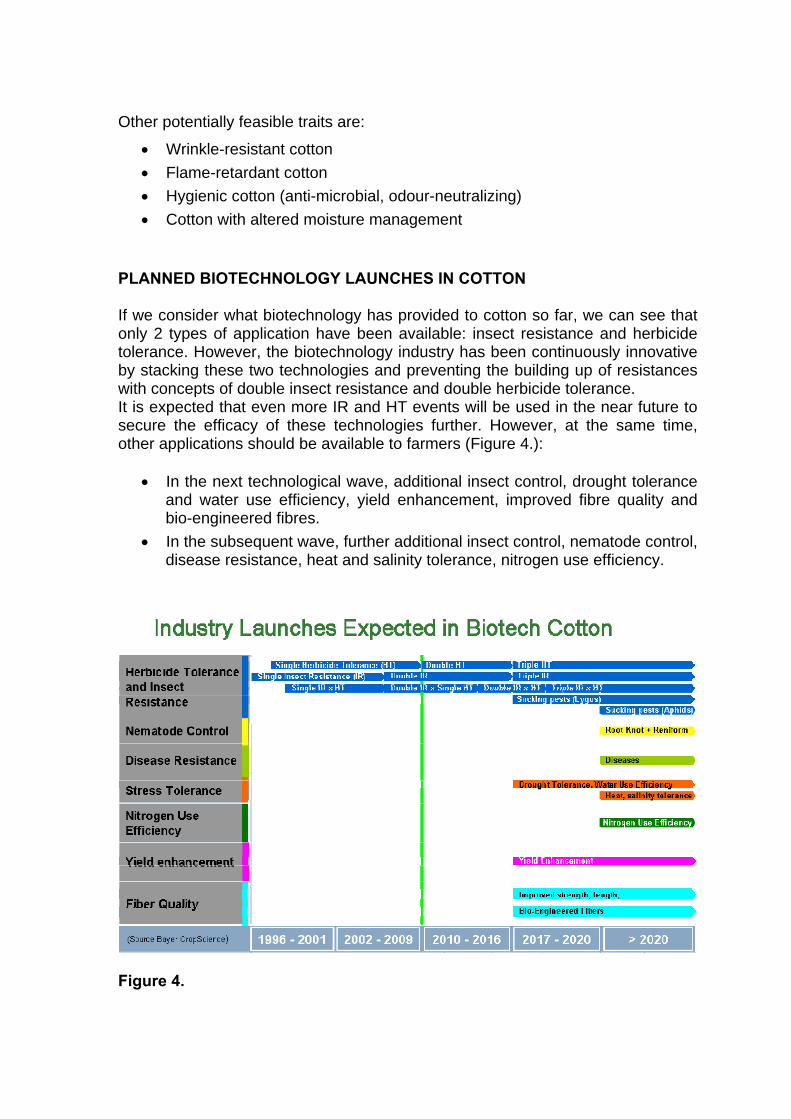
Other potentially feasible traits are:
• Wrinkle-resistant cotton • Flame-retardant cotton • Hygienic cotton (anti-microbial, odour-neutralizing) • Cotton with altered moisture management
PLANNED BIOTECHNOLOGY LAUNCHES IN COTTON If we consider what biotechnology has provided to cotton so far, we can see that only 2 types of application have been available: insect resistance and herbicide tolerance. However, the biotechnology industry has been continuously innovative by stacking these two technologies and preventing the building up of resistances with concepts of double insect resistance and double herbicide tolerance. It is expected that even more IR and HT events will be used in the near future to secure the efficacy of these technologies further. However, at the same time, other applications should be available to farmers (Figure 4.):
• In the next technological wave, additional insect control, drought tolerance and water use efficiency, yield enhancement, improved fibre quality and bio-engineered fibres.
• In the subsequent wave, further additional insect control, nematode control, disease resistance, heat and salinity tolerance, nitrogen use efficiency.
Figure 4.
CONCLUSION Cotton has and continues to hold good potential for value creation through the application of genetic modification. Biotechnology can create quality enhancements in cotton textiles, although the full realization of the improvements will be in the 10 to 15 year timeframe. In the shorter term (7-10 years), opportunities exist to create value through the application of biotechnology to increase yield and reduce costs, benefiting industrial and farm segments. REFERENCES Terhaar, A. 2009. South West Farm Press June 10, 2009 James, C. 2009. ISAAA Brief 39-2008: Executive Summary. Global Status of Commercialized Biotech/GM Crops: 2008. The First Thirteen Years, 1996 to 2008 Chaudhry, R. (International Cotton Advisory Committee). 2009. Global context of cotton production. September 21 - 25, 2009 Stein, A. J. and Rodríguez-Cerezo, E. 2009. The global pipeline of new GM crops. JRC European Commission (EUR 23486 EN – 2009)
Forward-Looking Statements This release may contain forward-looking statements based on current assumptions and forecasts made by Bayer Group or subgroup management. Various known and unknown risks, uncertainties and other factors could lead to material differences between the actual future results, financial situation, development or performance of the company and the estimates given here. These factors include those discussed in Bayer’s public reports which are available on the Bayer website at www.bayer.com. The company assumes no liability whatsoever to update these forward-looking statements or to conform them to future events or developments.
SOCIOECONOMIC IMPACTS OF GENETICALLY MODIFIED COTTON IN DEVELOPING COUNTRIES
M. Qaim
Georg-August-University of Goettingen, Goettingen, Germany ABSTRACT This paper analyzes socioeconomic impacts of genetically modified, insect-resistant cotton (so-called Bt cotton) in an international context. Bt cotton technology has already been adopted by millions of farmers around the world, including by many smallholders in developing countries. On average, farmers growing Bt cotton benefit from insecticide savings, higher effective yields through reduced crop losses, and profit gains, in spite of higher seed prices. Aggregate household incomes rise, including for rural families living below the poverty line. Hence, Bt cotton contributes to poverty reduction and rural development. INTRODUCTION Bt (Bacillus thuringiensis) cotton, which is resistant to different lepidopteran and coleopteran insect pests, was among the first genetically modified (GM) crops to be commercialized in the mid-1990s. In the US, Bt cotton was commercially approved in 1995. One year later, cotton farmers in Australia started using the technology, and in subsequent years it was commercialized in China, Mexico, Argentina, South Africa, and India, and to a limited extent also in Indonesia. Very recently, Burkina Faso has approved Bt cotton as the first low-income country in Sub-Saharan Africa. In 2008, Bt cotton was grown on almost 15 million hectares (ha), which is over 40% of the total worldwide cotton area. India is now the country with the biggest Bt cotton area (7.6 million ha in 2008), followed by China (3.8 million ha), and the US (2 million ha) (James 2008). Most of these areas are cultivated with Monsanto’s Bollgard I technology, involving the Cry1Ac Bt gene, but Bollgard II – with stacked Cry1Ac and Cry2Ab genes and a broader spectrum of target pests – has also been released in several countries. In addition to the Monsanto technology, in China, and more recently also in India, the public sector has developed and commercialized Bt cotton varieties. The widespread and rapid adoption of Bt cotton over the last 15 years suggests that farmers are satisfied with this technology from an economic point of view. Numerous studies that have been carried out in different countries confirm that the socioeconomic benefits are sizeable. This paper gives an overview of this body of literature, especially focusing on independent studies that have been published in peer-reviewed academic journals. While the experience with Bt technology in developed countries is also summarized, special emphasis is on developing countries for two reasons: first, developing countries are the main cotton producers, and they account for almost 80% of the worldwide Bt cotton area; and second, many of the cotton growers in developing countries are poor small-scale farmers, so that Bt
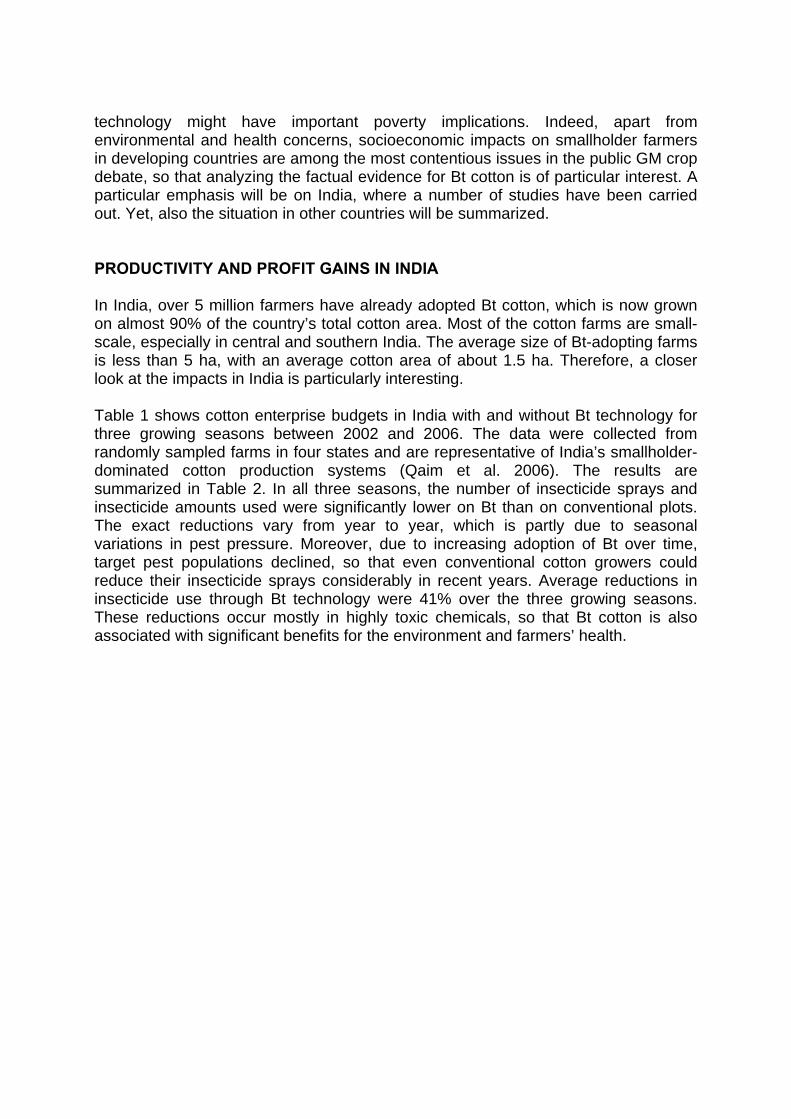
technology might have important poverty implications. Indeed, apart from environmental and health concerns, socioeconomic impacts on smallholder farmers in developing countries are among the most contentious issues in the public GM crop debate, so that analyzing the factual evidence for Bt cotton is of particular interest. A particular emphasis will be on India, where a number of studies have been carried out. Yet, also the situation in other countries will be summarized. PRODUCTIVITY AND PROFIT GAINS IN INDIA In India, over 5 million farmers have already adopted Bt cotton, which is now grown on almost 90% of the country’s total cotton area. Most of the cotton farms are small-scale, especially in central and southern India. The average size of Bt-adopting farms is less than 5 ha, with an average cotton area of about 1.5 ha. Therefore, a closer look at the impacts in India is particularly interesting. Table 1 shows cotton enterprise budgets in India with and without Bt technology for three growing seasons between 2002 and 2006. The data were collected from randomly sampled farms in four states and are representative of India’s smallholder-dominated cotton production systems (Qaim et al. 2006). The results are summarized in Table 2. In all three seasons, the number of insecticide sprays and insecticide amounts used were significantly lower on Bt than on conventional plots. The exact reductions vary from year to year, which is partly due to seasonal variations in pest pressure. Moreover, due to increasing adoption of Bt over time, target pest populations declined, so that even conventional cotton growers could reduce their insecticide sprays considerably in recent years. Average reductions in insecticide use through Bt technology were 41% over the three growing seasons. These reductions occur mostly in highly toxic chemicals, so that Bt cotton is also associated with significant benefits for the environment and farmers’ health.
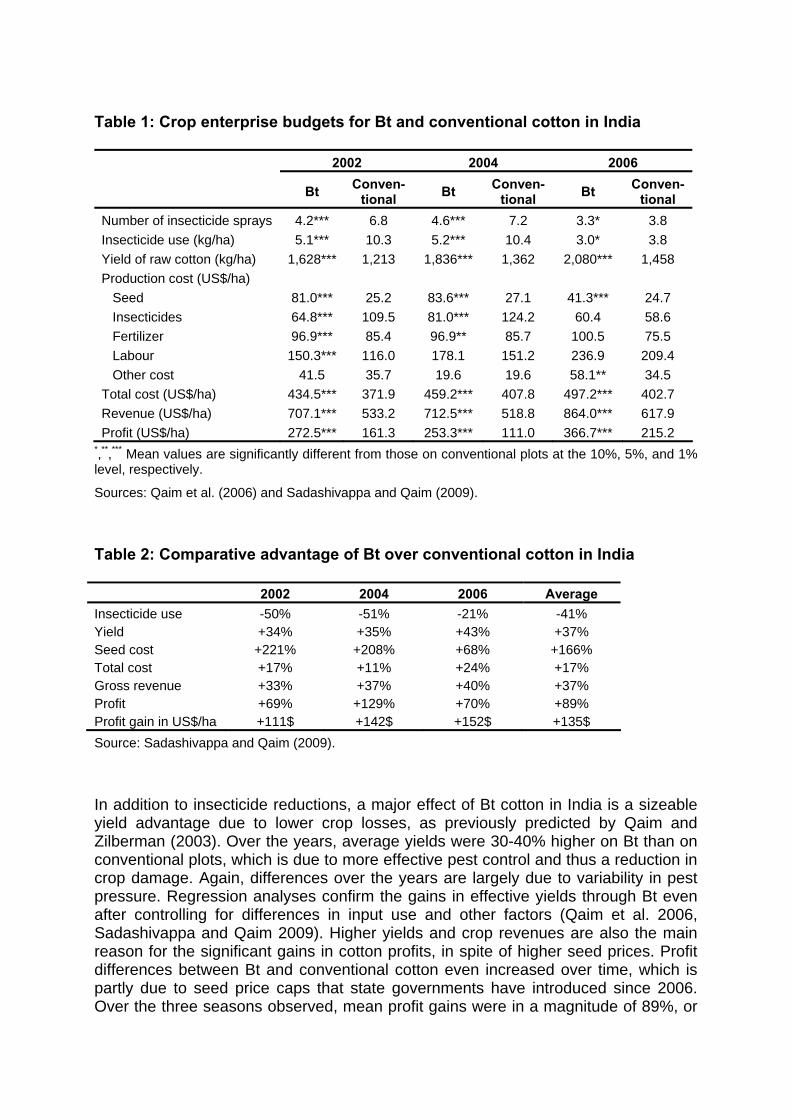
Table 1: Crop enterprise budgets for Bt and conventional cotton in India 2002 2004 2006
Bt Conven-tional Bt Conven-
tional Bt Conven-tional
Number of insecticide sprays 4.2*** 6.8 4.6*** 7.2 3.3* 3.8 Insecticide use (kg/ha) 5.1*** 10.3 5.2*** 10.4 3.0* 3.8 Yield of raw cotton (kg/ha) 1,628*** 1,213 1,836*** 1,362 2,080*** 1,458 Production cost (US$/ha) Seed 81.0*** 25.2 83.6*** 27.1 41.3*** 24.7 Insecticides 64.8*** 109.5 81.0*** 124.2 60.4 58.6 Fertilizer 96.9*** 85.4 96.9** 85.7 100.5 75.5 Labour 150.3*** 116.0 178.1 151.2 236.9 209.4 Other cost 41.5 35.7 19.6 19.6 58.1** 34.5 Total cost (US$/ha) 434.5*** 371.9 459.2*** 407.8 497.2*** 402.7 Revenue (US$/ha) 707.1*** 533.2 712.5*** 518.8 864.0*** 617.9 Profit (US$/ha) 272.5*** 161.3 253.3*** 111.0 366.7*** 215.2
*,**,*** Mean values are significantly different from those on conventional plots at the 10%, 5%, and 1% level, respectively.
Sources: Qaim et al. (2006) and Sadashivappa and Qaim (2009).
Table 2: Comparative advantage of Bt over conventional cotton in India
2002 2004 2006 Average Insecticide use -50% -51% -21% -41% Yield +34% +35% +43% +37% Seed cost +221% +208% +68% +166% Total cost +17% +11% +24% +17% Gross revenue +33% +37% +40% +37% Profit +69% +129% +70% +89% Profit gain in US$/ha +111$ +142$ +152$ +135$ Source: Sadashivappa and Qaim (2009).
In addition to insecticide reductions, a major effect of Bt cotton in India is a sizeable yield advantage due to lower crop losses, as previously predicted by Qaim and Zilberman (2003). Over the years, average yields were 30-40% higher on Bt than on conventional plots, which is due to more effective pest control and thus a reduction in crop damage. Again, differences over the years are largely due to variability in pest pressure. Regression analyses confirm the gains in effective yields through Bt even after controlling for differences in input use and other factors (Qaim et al. 2006, Sadashivappa and Qaim 2009). Higher yields and crop revenues are also the main reason for the significant gains in cotton profits, in spite of higher seed prices. Profit differences between Bt and conventional cotton even increased over time, which is partly due to seed price caps that state governments have introduced since 2006. Over the three seasons observed, mean profit gains were in a magnitude of 89%, or
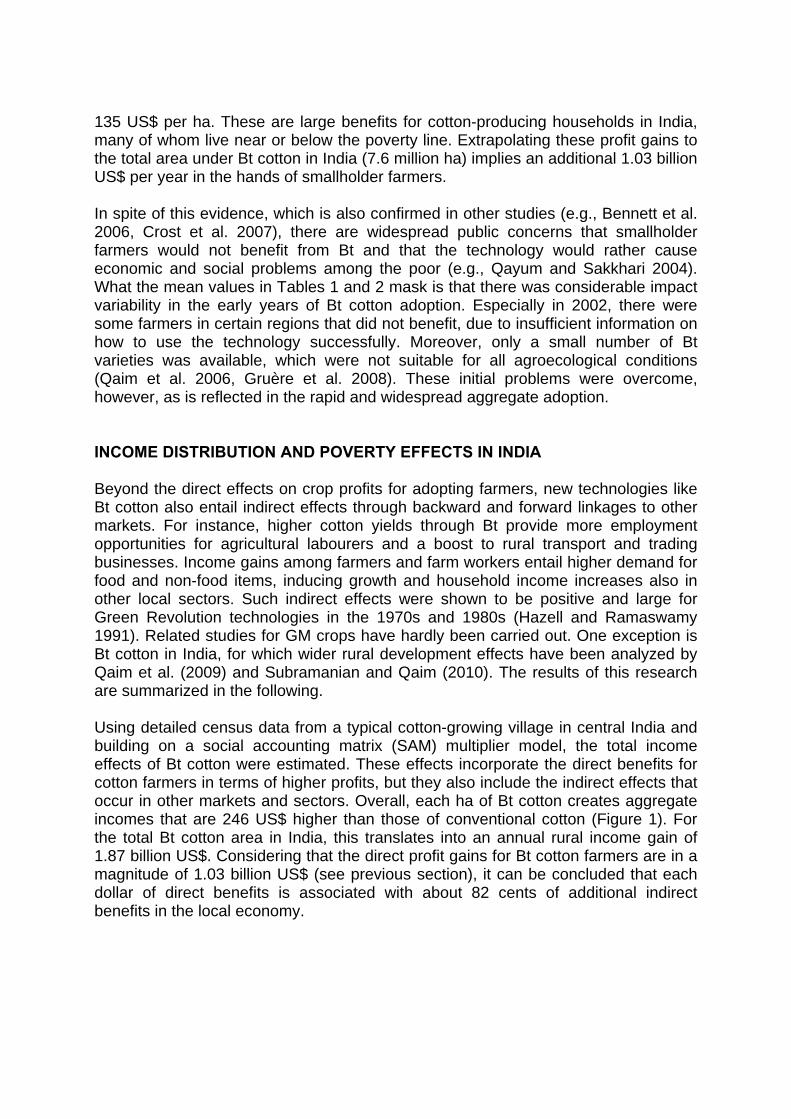
135 US$ per ha. These are large benefits for cotton-producing households in India, many of whom live near or below the poverty line. Extrapolating these profit gains to the total area under Bt cotton in India (7.6 million ha) implies an additional 1.03 billion US$ per year in the hands of smallholder farmers. In spite of this evidence, which is also confirmed in other studies (e.g., Bennett et al. 2006, Crost et al. 2007), there are widespread public concerns that smallholder farmers would not benefit from Bt and that the technology would rather cause economic and social problems among the poor (e.g., Qayum and Sakkhari 2004). What the mean values in Tables 1 and 2 mask is that there was considerable impact variability in the early years of Bt cotton adoption. Especially in 2002, there were some farmers in certain regions that did not benefit, due to insufficient information on how to use the technology successfully. Moreover, only a small number of Bt varieties was available, which were not suitable for all agroecological conditions (Qaim et al. 2006, Gruère et al. 2008). These initial problems were overcome, however, as is reflected in the rapid and widespread aggregate adoption. INCOME DISTRIBUTION AND POVERTY EFFECTS IN INDIA Beyond the direct effects on crop profits for adopting farmers, new technologies like Bt cotton also entail indirect effects through backward and forward linkages to other markets. For instance, higher cotton yields through Bt provide more employment opportunities for agricultural labourers and a boost to rural transport and trading businesses. Income gains among farmers and farm workers entail higher demand for food and non-food items, inducing growth and household income increases also in other local sectors. Such indirect effects were shown to be positive and large for Green Revolution technologies in the 1970s and 1980s (Hazell and Ramaswamy 1991). Related studies for GM crops have hardly been carried out. One exception is Bt cotton in India, for which wider rural development effects have been analyzed by Qaim et al. (2009) and Subramanian and Qaim (2010). The results of this research are summarized in the following. Using detailed census data from a typical cotton-growing village in central India and building on a social accounting matrix (SAM) multiplier model, the total income effects of Bt cotton were estimated. These effects incorporate the direct benefits for cotton farmers in terms of higher profits, but they also include the indirect effects that occur in other markets and sectors. Overall, each ha of Bt cotton creates aggregate incomes that are 246 US$ higher than those of conventional cotton (Figure 1). For the total Bt cotton area in India, this translates into an annual rural income gain of 1.87 billion US$. Considering that the direct profit gains for Bt cotton farmers are in a magnitude of 1.03 billion US$ (see previous section), it can be concluded that each dollar of direct benefits is associated with about 82 cents of additional indirect benefits in the local economy.
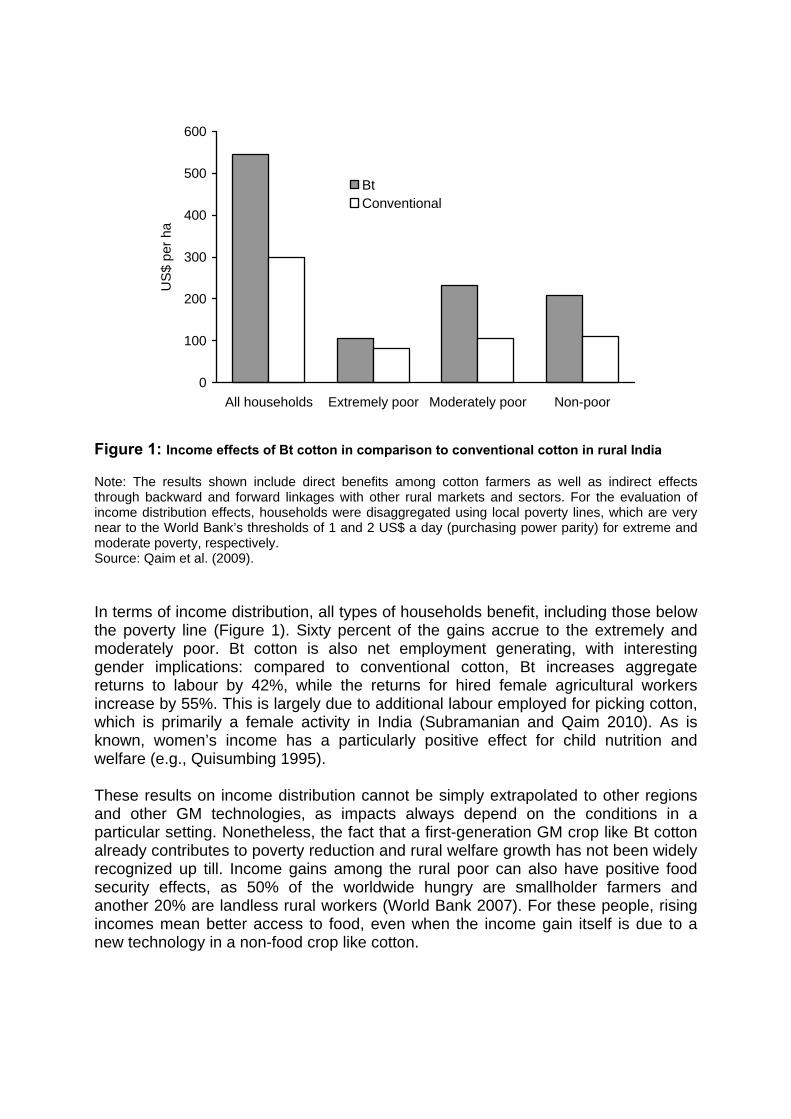
0
100
200
300
400
500
600
All households Extremely poor Moderately poor Non-poor
US
$ pe
r ha
BtConventional
Figure 1: Income effects of Bt cotton in comparison to conventional cotton in rural India
Note: The results shown include direct benefits among cotton farmers as well as indirect effects through backward and forward linkages with other rural markets and sectors. For the evaluation of income distribution effects, households were disaggregated using local poverty lines, which are very near to the World Bank’s thresholds of 1 and 2 US$ a day (purchasing power parity) for extreme and moderate poverty, respectively. Source: Qaim et al. (2009). In terms of income distribution, all types of households benefit, including those below the poverty line (Figure 1). Sixty percent of the gains accrue to the extremely and moderately poor. Bt cotton is also net employment generating, with interesting gender implications: compared to conventional cotton, Bt increases aggregate returns to labour by 42%, while the returns for hired female agricultural workers increase by 55%. This is largely due to additional labour employed for picking cotton, which is primarily a female activity in India (Subramanian and Qaim 2010). As is known, women’s income has a particularly positive effect for child nutrition and welfare (e.g., Quisumbing 1995). These results on income distribution cannot be simply extrapolated to other regions and other GM technologies, as impacts always depend on the conditions in a particular setting. Nonetheless, the fact that a first-generation GM crop like Bt cotton already contributes to poverty reduction and rural welfare growth has not been widely recognized up till. Income gains among the rural poor can also have positive food security effects, as 50% of the worldwide hungry are smallholder farmers and another 20% are landless rural workers (World Bank 2007). For these people, rising incomes mean better access to food, even when the income gain itself is due to a new technology in a non-food crop like cotton.
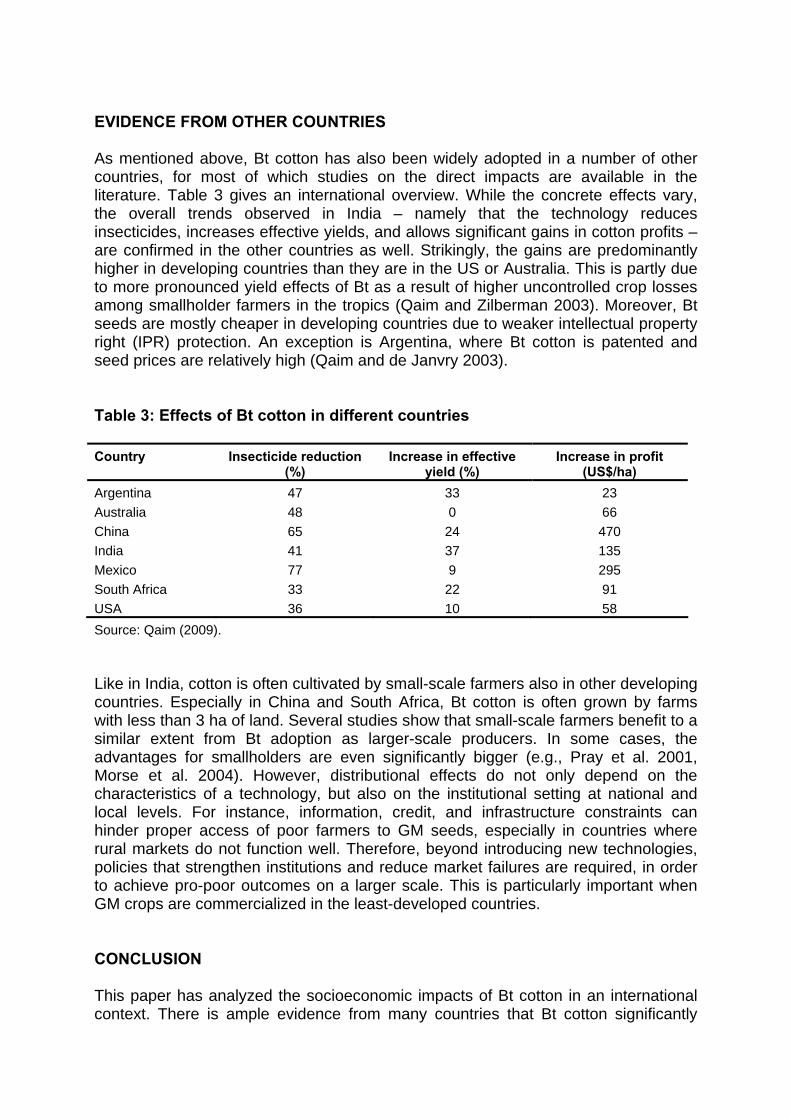
EVIDENCE FROM OTHER COUNTRIES As mentioned above, Bt cotton has also been widely adopted in a number of other countries, for most of which studies on the direct impacts are available in the literature. Table 3 gives an international overview. While the concrete effects vary, the overall trends observed in India – namely that the technology reduces insecticides, increases effective yields, and allows significant gains in cotton profits – are confirmed in the other countries as well. Strikingly, the gains are predominantly higher in developing countries than they are in the US or Australia. This is partly due to more pronounced yield effects of Bt as a result of higher uncontrolled crop losses among smallholder farmers in the tropics (Qaim and Zilberman 2003). Moreover, Bt seeds are mostly cheaper in developing countries due to weaker intellectual property right (IPR) protection. An exception is Argentina, where Bt cotton is patented and seed prices are relatively high (Qaim and de Janvry 2003). Table 3: Effects of Bt cotton in different countries Country Insecticide reduction
(%) Increase in effective
yield (%) Increase in profit
(US$/ha) Argentina 47 33 23 Australia 48 0 66 China 65 24 470 India 41 37 135 Mexico 77 9 295 South Africa 33 22 91 USA 36 10 58 Source: Qaim (2009). Like in India, cotton is often cultivated by small-scale farmers also in other developing countries. Especially in China and South Africa, Bt cotton is often grown by farms with less than 3 ha of land. Several studies show that small-scale farmers benefit to a similar extent from Bt adoption as larger-scale producers. In some cases, the advantages for smallholders are even significantly bigger (e.g., Pray et al. 2001, Morse et al. 2004). However, distributional effects do not only depend on the characteristics of a technology, but also on the institutional setting at national and local levels. For instance, information, credit, and infrastructure constraints can hinder proper access of poor farmers to GM seeds, especially in countries where rural markets do not function well. Therefore, beyond introducing new technologies, policies that strengthen institutions and reduce market failures are required, in order to achieve pro-poor outcomes on a larger scale. This is particularly important when GM crops are commercialized in the least-developed countries. CONCLUSION This paper has analyzed the socioeconomic impacts of Bt cotton in an international context. There is ample evidence from many countries that Bt cotton significantly
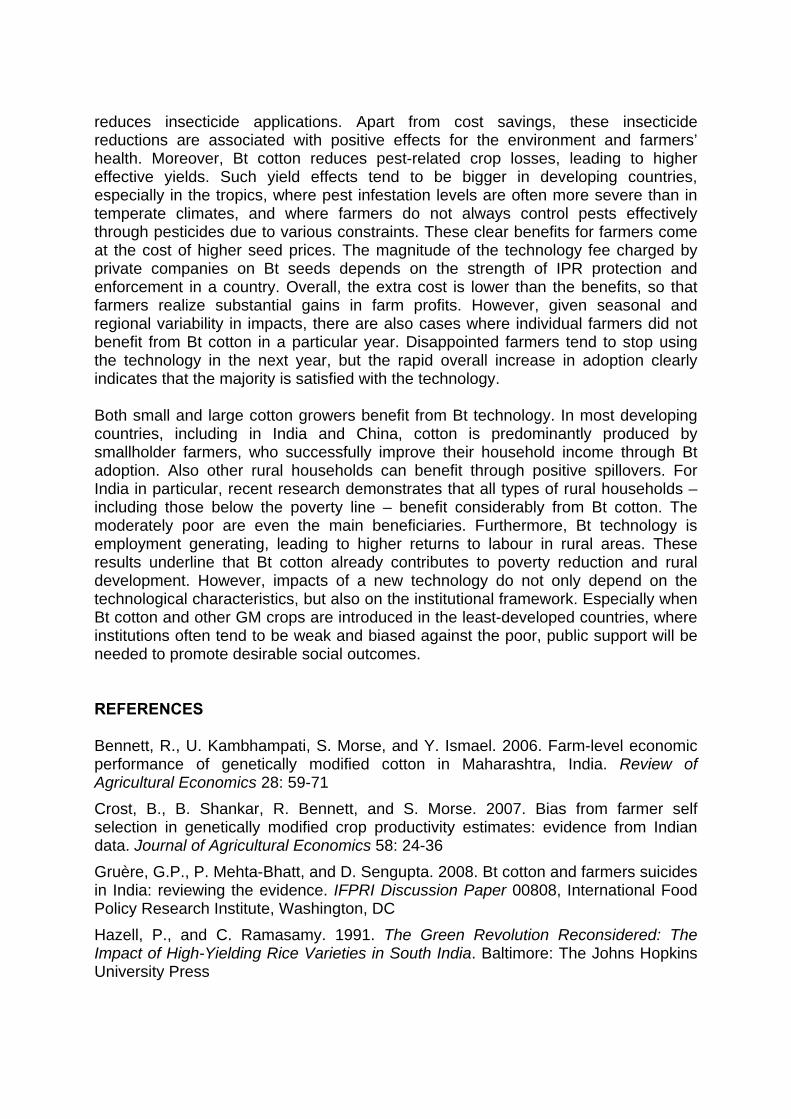
reduces insecticide applications. Apart from cost savings, these insecticide reductions are associated with positive effects for the environment and farmers’ health. Moreover, Bt cotton reduces pest-related crop losses, leading to higher effective yields. Such yield effects tend to be bigger in developing countries, especially in the tropics, where pest infestation levels are often more severe than in temperate climates, and where farmers do not always control pests effectively through pesticides due to various constraints. These clear benefits for farmers come at the cost of higher seed prices. The magnitude of the technology fee charged by private companies on Bt seeds depends on the strength of IPR protection and enforcement in a country. Overall, the extra cost is lower than the benefits, so that farmers realize substantial gains in farm profits. However, given seasonal and regional variability in impacts, there are also cases where individual farmers did not benefit from Bt cotton in a particular year. Disappointed farmers tend to stop using the technology in the next year, but the rapid overall increase in adoption clearly indicates that the majority is satisfied with the technology. Both small and large cotton growers benefit from Bt technology. In most developing countries, including in India and China, cotton is predominantly produced by smallholder farmers, who successfully improve their household income through Bt adoption. Also other rural households can benefit through positive spillovers. For India in particular, recent research demonstrates that all types of rural households – including those below the poverty line – benefit considerably from Bt cotton. The moderately poor are even the main beneficiaries. Furthermore, Bt technology is employment generating, leading to higher returns to labour in rural areas. These results underline that Bt cotton already contributes to poverty reduction and rural development. However, impacts of a new technology do not only depend on the technological characteristics, but also on the institutional framework. Especially when Bt cotton and other GM crops are introduced in the least-developed countries, where institutions often tend to be weak and biased against the poor, public support will be needed to promote desirable social outcomes. REFERENCES Bennett, R., U. Kambhampati, S. Morse, and Y. Ismael. 2006. Farm-level economic performance of genetically modified cotton in Maharashtra, India. Review of Agricultural Economics 28: 59-71 Crost, B., B. Shankar, R. Bennett, and S. Morse. 2007. Bias from farmer self selection in genetically modified crop productivity estimates: evidence from Indian data. Journal of Agricultural Economics 58: 24-36 Gruère, G.P., P. Mehta-Bhatt, and D. Sengupta. 2008. Bt cotton and farmers suicides in India: reviewing the evidence. IFPRI Discussion Paper 00808, International Food Policy Research Institute, Washington, DC Hazell, P., and C. Ramasamy. 1991. The Green Revolution Reconsidered: The Impact of High-Yielding Rice Varieties in South India. Baltimore: The Johns Hopkins University Press
James, C. 2008. Global status of commercialized biotech/GM crops: 2008. ISAAA Briefs 39, International Service for the Acquisition of Agri-biotech Applications, Ithaca, NY Morse, S., R. Bennett, and Y. Ismael. 2004. Why Bt cotton pays for small-scale producers in South Africa. Nature Biotechnology 22: 379-380 Pray, C.E., D. Ma, J. Huang, and F. Qiao. 2001. Impact of Bt cotton in China. World Development 29: 813-825 Qaim, M. 2009. The economics of genetically modified crops. Annual Review of Resource Economics 1: 665-693 Qaim, M., A. Subramanian, and P. Sadashivappa. 2009. Commercialized GM crops and yield. Nature Biotechnology 27: 803-804 Qaim, M., A. Subramanian, G. Naik, and D. Zilberman. 2006. Adoption of Bt cotton and impact variability: insights from India. Review of Agricultural Economics 28: 48-58 Qaim, M., and D. Zilberman. 2003. Yield effects of genetically modified crops in developing countries. Science 299: 900-902 Qaim, M., and A. de Janvry. 2003. Genetically modified crops, corporate pricing strategies, and farmers’ adoption: the case of Bt cotton in Argentina. American Journal of Agricultural Economics 85: 814-828 Qayum, A., and K. Sakkhari. 2004. Did Bt Cotton Fail AP Again in 2003-2004? A Season Long Study of Bt Cotton in Andhra Pradesh. Hyderabad: Deccan Development Society and Permaculture Association of India Quisumbing, A.R., L.R. Brown, H.S. Feldstein, L. Haddad, and C. Peña. 1995. Women: The Key to Food Security. Washington, DC: International Food Policy Research Institute Sadashivappa, P., and M. Qaim. 2009. Bt cotton in India: development of benefits and the role of government seed price interventions. AgBioForum 12: 172-183 Subramanian, A., and M. Qaim. 2010. The impact of Bt cotton on poor households in rural India. Journal of Development Studies (in press), DOI: 10.1080/00220380903002954 World Bank. 2007. World Development Report 2008: Agriculture for Development. Washington, DC: The World Bank
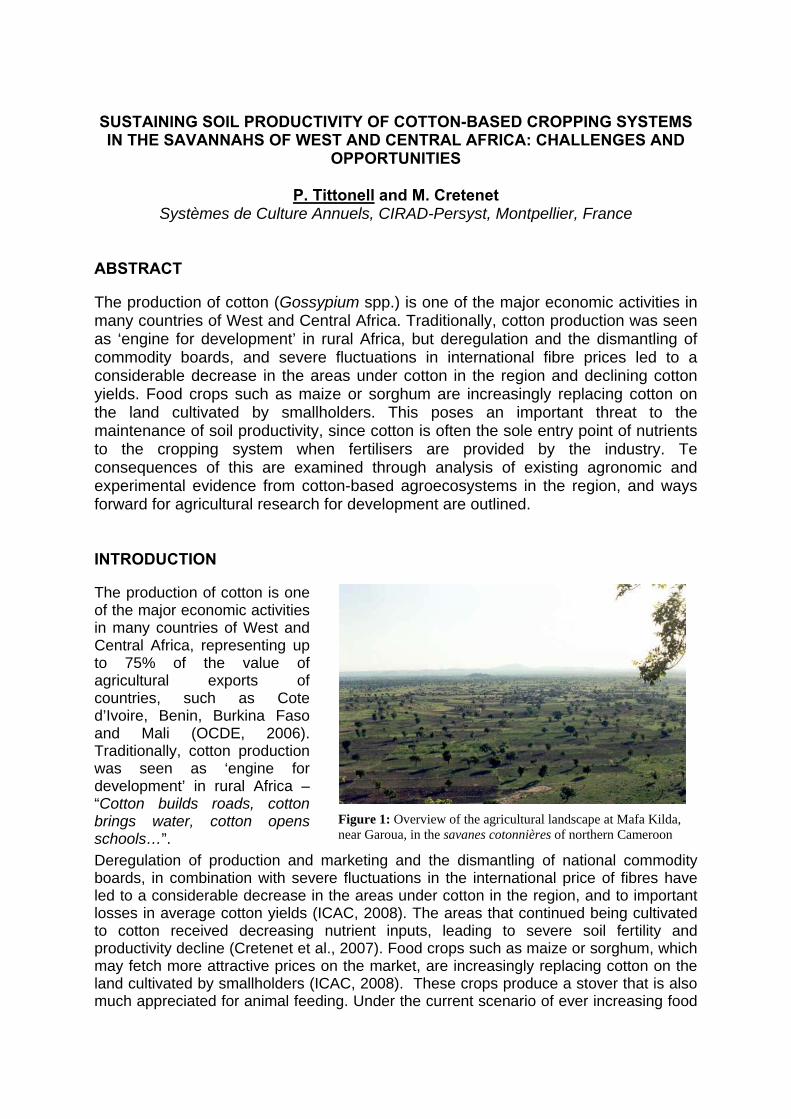
SUSTAINING SOIL PRODUCTIVITY OF COTTON-BASED CROPPING SYSTEMS IN THE SAVANNAHS OF WEST AND CENTRAL AFRICA: CHALLENGES AND
OPPORTUNITIES
P. Tittonell and M. Cretenet Systèmes de Culture Annuels, CIRAD-Persyst, Montpellier, France
ABSTRACT The production of cotton (Gossypium spp.) is one of the major economic activities in many countries of West and Central Africa. Traditionally, cotton production was seen as ‘engine for development’ in rural Africa, but deregulation and the dismantling of commodity boards, and severe fluctuations in international fibre prices led to a considerable decrease in the areas under cotton in the region and declining cotton yields. Food crops such as maize or sorghum are increasingly replacing cotton on the land cultivated by smallholders. This poses an important threat to the maintenance of soil productivity, since cotton is often the sole entry point of nutrients to the cropping system when fertilisers are provided by the industry. Te consequences of this are examined through analysis of existing agronomic and experimental evidence from cotton-based agroecosystems in the region, and ways forward for agricultural research for development are outlined. INTRODUCTION The production of cotton is one of the major economic activities in many countries of West and Central Africa, representing up to 75% of the value of agricultural exports of countries, such as Cote d’Ivoire, Benin, Burkina Faso and Mali (OCDE, 2006). Traditionally, cotton production was seen as ‘engine for development’ in rural Africa – “Cotton builds roads, cotton brings water, cotton opens schools…”. Deregulation of production and marketing and the dismantling of national commodity boards, in combination with severe fluctuations in the international price of fibres have led to a considerable decrease in the areas under cotton in the region, and to important losses in average cotton yields (ICAC, 2008). The areas that continued being cultivated to cotton received decreasing nutrient inputs, leading to severe soil fertility and productivity decline (Cretenet et al., 2007). Food crops such as maize or sorghum, which may fetch more attractive prices on the market, are increasingly replacing cotton on the land cultivated by smallholders (ICAC, 2008). These crops produce a stover that is also much appreciated for animal feeding. Under the current scenario of ever increasing food
Figure 1: Overview of the agricultural landscape at Mafa Kilda, near Garoua, in the savanes cotonnières of northern Cameroon
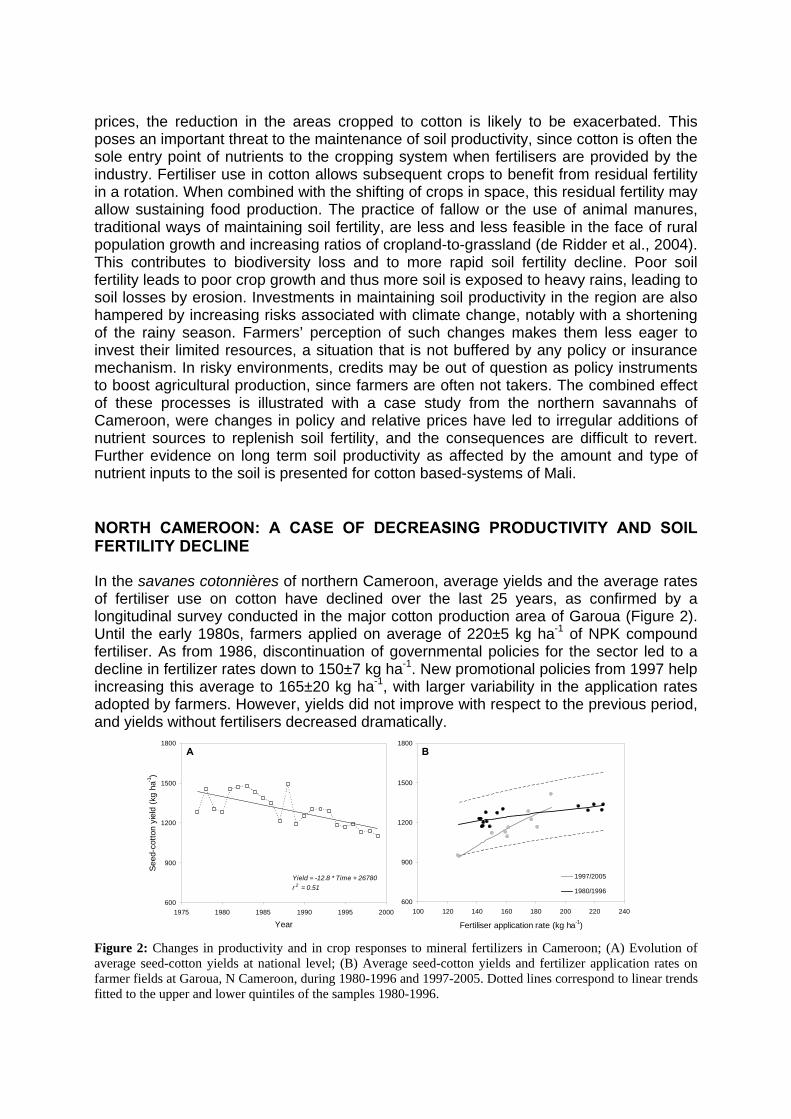
prices, the reduction in the areas cropped to cotton is likely to be exacerbated. This poses an important threat to the maintenance of soil productivity, since cotton is often the sole entry point of nutrients to the cropping system when fertilisers are provided by the industry. Fertiliser use in cotton allows subsequent crops to benefit from residual fertility in a rotation. When combined with the shifting of crops in space, this residual fertility may allow sustaining food production. The practice of fallow or the use of animal manures, traditional ways of maintaining soil fertility, are less and less feasible in the face of rural population growth and increasing ratios of cropland-to-grassland (de Ridder et al., 2004). This contributes to biodiversity loss and to more rapid soil fertility decline. Poor soil fertility leads to poor crop growth and thus more soil is exposed to heavy rains, leading to soil losses by erosion. Investments in maintaining soil productivity in the region are also hampered by increasing risks associated with climate change, notably with a shortening of the rainy season. Farmers’ perception of such changes makes them less eager to invest their limited resources, a situation that is not buffered by any policy or insurance mechanism. In risky environments, credits may be out of question as policy instruments to boost agricultural production, since farmers are often not takers. The combined effect of these processes is illustrated with a case study from the northern savannahs of Cameroon, were changes in policy and relative prices have led to irregular additions of nutrient sources to replenish soil fertility, and the consequences are difficult to revert. Further evidence on long term soil productivity as affected by the amount and type of nutrient inputs to the soil is presented for cotton based-systems of Mali. NORTH CAMEROON: A CASE OF DECREASING PRODUCTIVITY AND SOIL FERTILITY DECLINE In the savanes cotonnières of northern Cameroon, average yields and the average rates of fertiliser use on cotton have declined over the last 25 years, as confirmed by a longitudinal survey conducted in the major cotton production area of Garoua (Figure 2). Until the early 1980s, farmers applied on average of 220±5 kg ha-1 of NPK compound fertiliser. As from 1986, discontinuation of governmental policies for the sector led to a decline in fertilizer rates down to 150±7 kg ha-1. New promotional policies from 1997 help increasing this average to 165±20 kg ha-1, with larger variability in the application rates adopted by farmers. However, yields did not improve with respect to the previous period, and yields without fertilisers decreased dramatically. Figure 2: Changes in productivity and in crop responses to mineral fertilizers in Cameroon; (A) Evolution of average seed-cotton yields at national level; (B) Average seed-cotton yields and fertilizer application rates on farmer fields at Garoua, N Cameroon, during 1980-1996 and 1997-2005. Dotted lines correspond to linear trends fitted to the upper and lower quintiles of the samples 1980-1996.
600
900
1200
1500
1800
100 120 140 160 180 200 220 240
Fertiliser application rate (kg ha-1)
See
d-co
tton
yiel
d (k
g ha
-1)
1997/2005
1980/1996
B
Yield = -12.8 * Time + 26780r 2 = 0.51
600
900
1200
1500
1800
1975 1980 1985 1990 1995 2000
Year
Seed
-cot
ton
yiel
d (k
g ha
-1)
A
To unravel the effects of changes in soil fertility, or the capacity of soil nutrients to sustain crop growth, and in soil productivity, the capacity of the soil to ensure crop responses to applied nutrients in these cotton-based agroecosystems we performed a meta-analysis of yield-response data from Garoua, which consisted of 188 farmer-managed plots of cotton receiving from 0 to 500 kg ha-1 of NPK fertiliser. We used a Mitscherlitch function [yield = a + b*(1 – e-cF), with F = kg ha-1 of fertiliser] and interpreted its parameters as follows: the intersect a represented the intrinsic soil fertility (without fertilisers); the slope b the rate of response to applied fertilisers; and the asymptote a + b the production potential (soil productivity with fertilisers). We studied the variation in these parameters with respect to changes in soil quality indicators (organic C, available P, exchangeable bases) over the period considered. For the period 1980-1996, the model that best described the average yield response to fertilisers had parameter values of a = 1004 kg ha-1 and a + b = 2051 kg ha-1. Absolute responses to maximum fertilisers rates varied from 845 and 770 kg ha-1 in ‘poor’ and ‘fertile’ fields, respectively, to 1045 kg ha-1 in fields of intermediate fertility. Both soil fertility (a) and soil productivity (a + b) decreased gradually over time, reaching values of a = 598 kg ha-1 and a + b = 1651 kg ha-1 in the season 2005-2006. Soil organic carbon and the cation exchange capacity were the soil fertility indicators that correlated best with the variability in the values of a and b. These results suggest that once a certain lower threshold of soil organic matter is trespassed, soil degradation becomes hard to revert through fertiliser use, and more drastic measures (such as changing cropping sequences, or even land use) may be necessary. Knowing these thresholds for the range of soil and climatic conditions of the West Africa cotton belt may allow better targeting of agricultural development, agronomic and even policy interventions. LONG TREM EXPERIMENTS AT N’TARLA, MALI: CAN SOIL FERTILITY BE MAINTAINED WITH ORGANIC VS. MINERAL FERTILISERS APPLIED ON COTTON? Long term experiments offer a unique opportunity to assess sustainability and temporal dynamics of biogeochemical cycles in agriculture, as well as the gradual impact on these of relatively slow processes such as climate change. Soil carbon thresholds referred above may be investigated through the results of long-term trials. A long term experiment on cotton-based crop rotations representing locally common cropping systems and cultural practices was established in Mali in 1965. This experiment was designed to assess the long-term productivity of these systems under different organic matter and nutrient management regimes, applying organic and mineral soil amendments alone or in combination. The experiment was conducted during 24 years in a zone of mono-modal rainfall (c. 900 mm year-1) on an Alfisols soil type (5% clay), and consisted of quadrennial/triennial rotations of cotton (2x), sorghum and groundnuts. Organic matter was added as straw collected from adjacent fallow fields at a rate of 15 t ha-1 every three years, with and without application of N-P-K mineral fertilisers at an average rate of 30, 20 and 40 kg ha-1 year-1, respectively (Kone, 1989). Crop residues were incorporated in the soil every year. Over 24 years, seed-cotton yields were larger than the control on plots receiving organic and/or mineral soil amendments (Figure 2 A), and yields were comparable when organic fertilisers (animal manure) were applied either with or without mineral fertilisers. Soil organic C declined in control plots and in those receiving only mineral
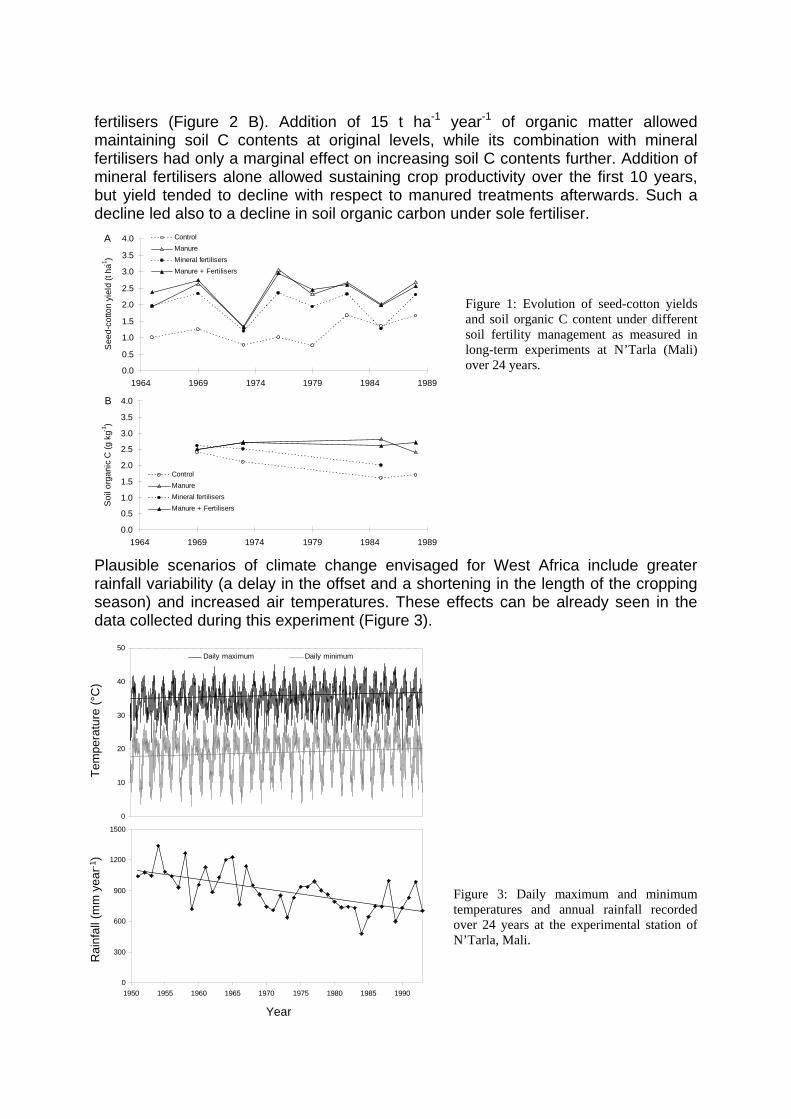
fertilisers (Figure 2 B). Addition of 15 t ha-1 year-1 of organic matter allowed maintaining soil C contents at original levels, while its combination with mineral fertilisers had only a marginal effect on increasing soil C contents further. Addition of mineral fertilisers alone allowed sustaining crop productivity over the first 10 years, but yield tended to decline with respect to manured treatments afterwards. Such a decline led also to a decline in soil organic carbon under sole fertiliser.
Figure 1: Evolution of seed-cotton yields and soil organic C content under different soil fertility management as measured in long-term experiments at N’Tarla (Mali) over 24 years.
Plausible scenarios of climate change envisaged for West Africa include greater rainfall variability (a delay in the offset and a shortening in the length of the cropping season) and increased air temperatures. These effects can be already seen in the data collected during this experiment (Figure 3).
Figure 3: Daily maximum and minimum temperatures and annual rainfall recorded over 24 years at the experimental station of N’Tarla, Mali.
0.0
0.5
1.0
1.5
2.0
2.5
3.0
3.5
4.0
1964 1969 1974 1979 1984 1989
See
d-co
tton
yiel
d (t
ha-1
)
ControlManureMineral fertilisersManure + Fertilisers
A
0.0
0.5
1.0
1.5
2.0
2.5
3.0
3.5
4.0
1964 1969 1974 1979 1984 1989
Soi
l org
anic
C (g
kg-1
)
ControlManureMineral fertilisersManure + Fertilisers
B
0
300
600
900
1200
1500
1950 1955 1960 1965 1970 1975 1980 1985 1990
0
10
20
30
40
50Daily maximum Daily minimum
Year
Tem
pera
ture
(°C
)R
ainf
all (
mm
yea
r-1)
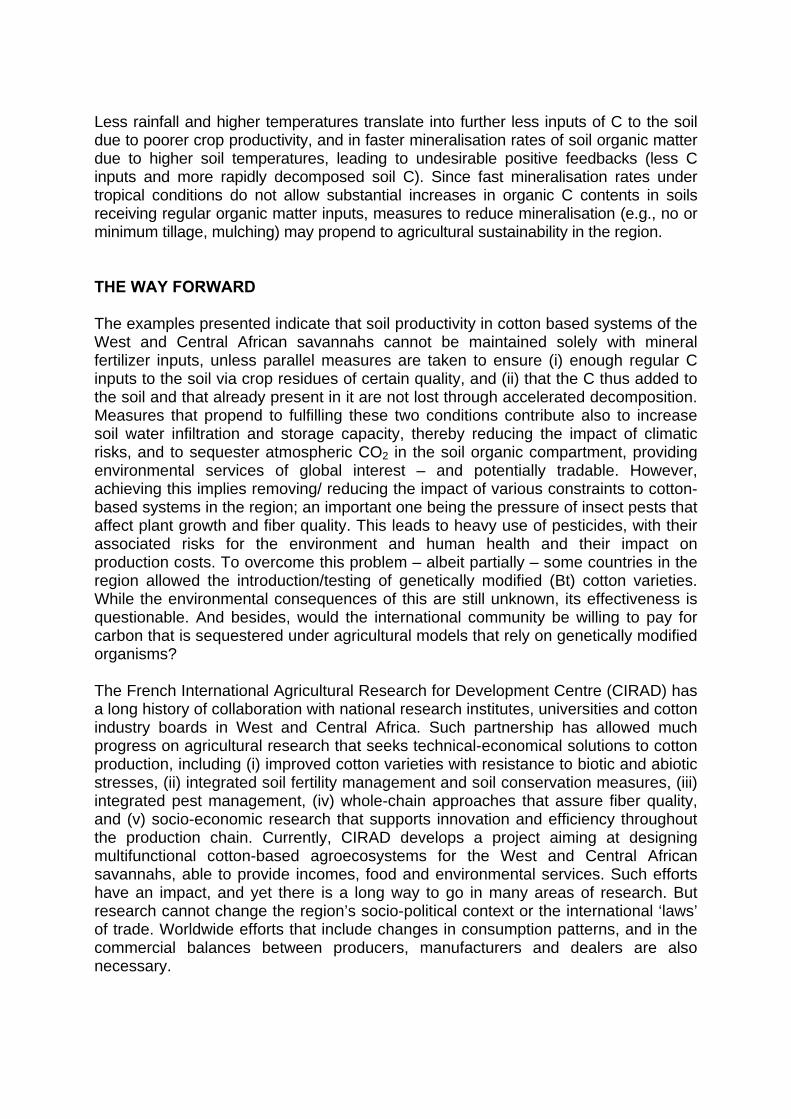
Less rainfall and higher temperatures translate into further less inputs of C to the soil due to poorer crop productivity, and in faster mineralisation rates of soil organic matter due to higher soil temperatures, leading to undesirable positive feedbacks (less C inputs and more rapidly decomposed soil C). Since fast mineralisation rates under tropical conditions do not allow substantial increases in organic C contents in soils receiving regular organic matter inputs, measures to reduce mineralisation (e.g., no or minimum tillage, mulching) may propend to agricultural sustainability in the region. THE WAY FORWARD The examples presented indicate that soil productivity in cotton based systems of the West and Central African savannahs cannot be maintained solely with mineral fertilizer inputs, unless parallel measures are taken to ensure (i) enough regular C inputs to the soil via crop residues of certain quality, and (ii) that the C thus added to the soil and that already present in it are not lost through accelerated decomposition. Measures that propend to fulfilling these two conditions contribute also to increase soil water infiltration and storage capacity, thereby reducing the impact of climatic risks, and to sequester atmospheric CO2 in the soil organic compartment, providing environmental services of global interest – and potentially tradable. However, achieving this implies removing/ reducing the impact of various constraints to cotton-based systems in the region; an important one being the pressure of insect pests that affect plant growth and fiber quality. This leads to heavy use of pesticides, with their associated risks for the environment and human health and their impact on production costs. To overcome this problem – albeit partially – some countries in the region allowed the introduction/testing of genetically modified (Bt) cotton varieties. While the environmental consequences of this are still unknown, its effectiveness is questionable. And besides, would the international community be willing to pay for carbon that is sequestered under agricultural models that rely on genetically modified organisms? The French International Agricultural Research for Development Centre (CIRAD) has a long history of collaboration with national research institutes, universities and cotton industry boards in West and Central Africa. Such partnership has allowed much progress on agricultural research that seeks technical-economical solutions to cotton production, including (i) improved cotton varieties with resistance to biotic and abiotic stresses, (ii) integrated soil fertility management and soil conservation measures, (iii) integrated pest management, (iv) whole-chain approaches that assure fiber quality, and (v) socio-economic research that supports innovation and efficiency throughout the production chain. Currently, CIRAD develops a project aiming at designing multifunctional cotton-based agroecosystems for the West and Central African savannahs, able to provide incomes, food and environmental services. Such efforts have an impact, and yet there is a long way to go in many areas of research. But research cannot change the region’s socio-political context or the international ‘laws’ of trade. Worldwide efforts that include changes in consumption patterns, and in the commercial balances between producers, manufacturers and dealers are also necessary.
REFERENCES ICAC, 2008. Résumé des perspectives cotonnières. Coton (ISSN 0010-9754) 62(1), 3 – 23. OCDE, 2006. Le coton en Afrique de l’Ouest – Un enjeu économique et social. OCDE
Editions, ISBN 92-64-02507, 131 pp. Ridder, N. de, Breman, H., van Keulen, H., Stomph, T.J., 2004. Revisiting a ‘cure against
land hunger’: soil fertility management and farming systems dynamics in the West African Sahel. Agric. Syst. 80 109–131.
THE INFLUENCE OF MODERN HIGH SPEED ROLLER- AND SAW-GINNING SYSTEMS ON THROUGHPUT AND COTTON QUALITY
S.E. Hughs, C.B. Armijo, D.P. Whitelock
USDA-ARS Southwestern Cotton Ginning Research Laboratory, Mesilla Park, NM, USA Typically roller ginning has been reserved for extra-long-staple (ELS) varieties of cotton, like American Pima, and saw ginning has been used for upland varieties, as the roller ginning production per-unit-width basis (1.25 bales/ hr·m or 0.38 bales/hr·ft) is about one-fifth that of saw ginning, making roller ginning more expensive. However, roller ginning compared to saw ginning produces fiber of better quality and, thus, the higher cost of roller ginning is justified for ELS cottons. Past research (Hughs and Leonard, 1986: Cotton Gin and Oil Mill Press 87(20):8-10; Hughs and Lalor, 1990: Beltwide Cotton Conf. p. 542-543) showed that roller ginning upland cotton improved the fiber length, length uniformity, and nep count when compared to saw ginning. Upland cotton has higher fiber-to-seed strength of attachment than Pima cotton and is more difficult to gin, adding to the already higher cost of roller ginning. Recent improvements in roller ginning technology have resulted in high-speed roller gin stands with production rates comparable to saw ginning, have higher turnout, and produce fiber with longer staple lengths and less short fiber and neps, but contain more foreign matter (Armijo and Gillum, 2007: Appl. Eng. Agric. 23(2)137-143). This technology has been embraced in areas of the US where roller ginning has historically been prevalent. Between 2005 and 2009, there were 48 roller gin stands converted to high speed and 25 new high-speed roller gins sold in California with about 440,000 bales of upland cotton ginned during the same timeframe. This paper summarizes some of the differences in roller and saw ginning technology, focusing on production rate and fiber properties of upland cottons.
Session V: Cotton Products
30th International Cotton Conference BREMEN
March 24 - 27, 2010
A Spinner‘s View on Organic CottonLeo Berginz
Cotton-based NonwovensBrian Condon
Directions for Cotton: Market Challenges and Product OpportunitiesMark Messura
Cotton in Technical ApplicationsMalgorzata Matusiak
Utilization of the Specific Cotton Properties for New ProductsThomas Schneider
•
•
•
•
•
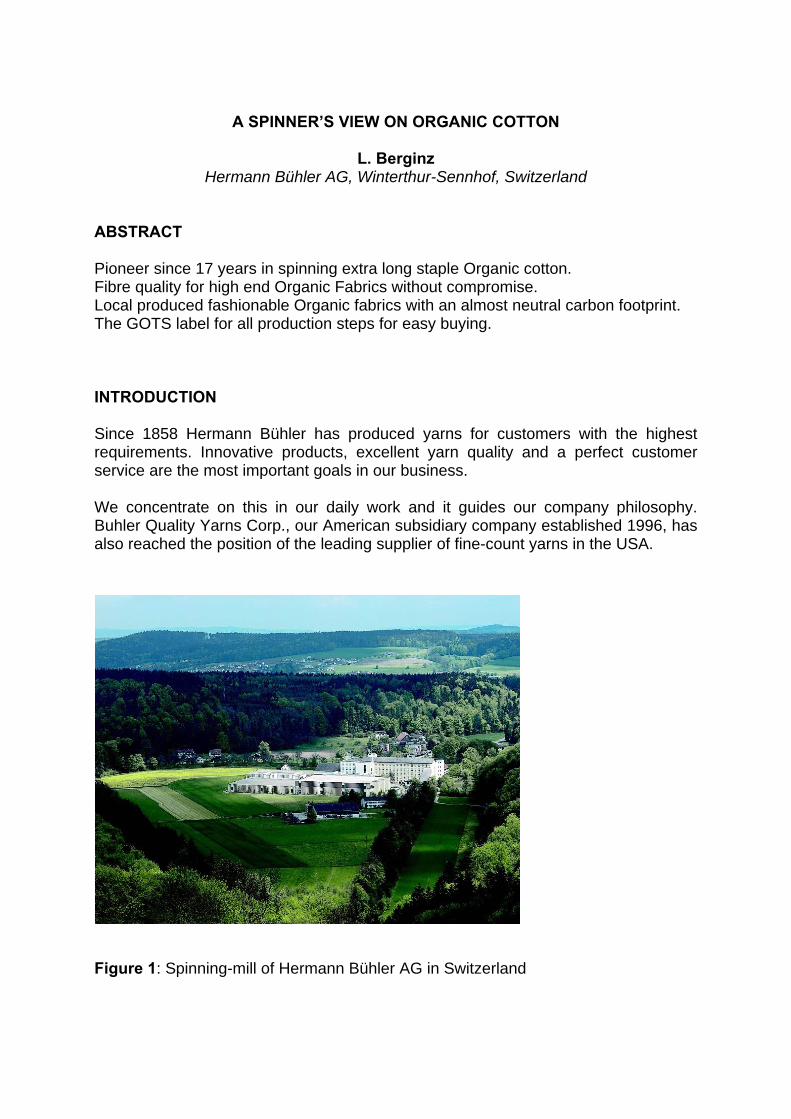
A SPINNER’S VIEW ON ORGANIC COTTON
L. Berginz Hermann Bühler AG, Winterthur-Sennhof, Switzerland
ABSTRACT Pioneer since 17 years in spinning extra long staple Organic cotton. Fibre quality for high end Organic Fabrics without compromise. Local produced fashionable Organic fabrics with an almost neutral carbon footprint. The GOTS label for all production steps for easy buying. INTRODUCTION Since 1858 Hermann Bühler has produced yarns for customers with the highest requirements. Innovative products, excellent yarn quality and a perfect customer service are the most important goals in our business. We concentrate on this in our daily work and it guides our company philosophy. Buhler Quality Yarns Corp., our American subsidiary company established 1996, has also reached the position of the leading supplier of fine-count yarns in the USA.
Figure 1: Spinning-mill of Hermann Bühler AG in Switzerland
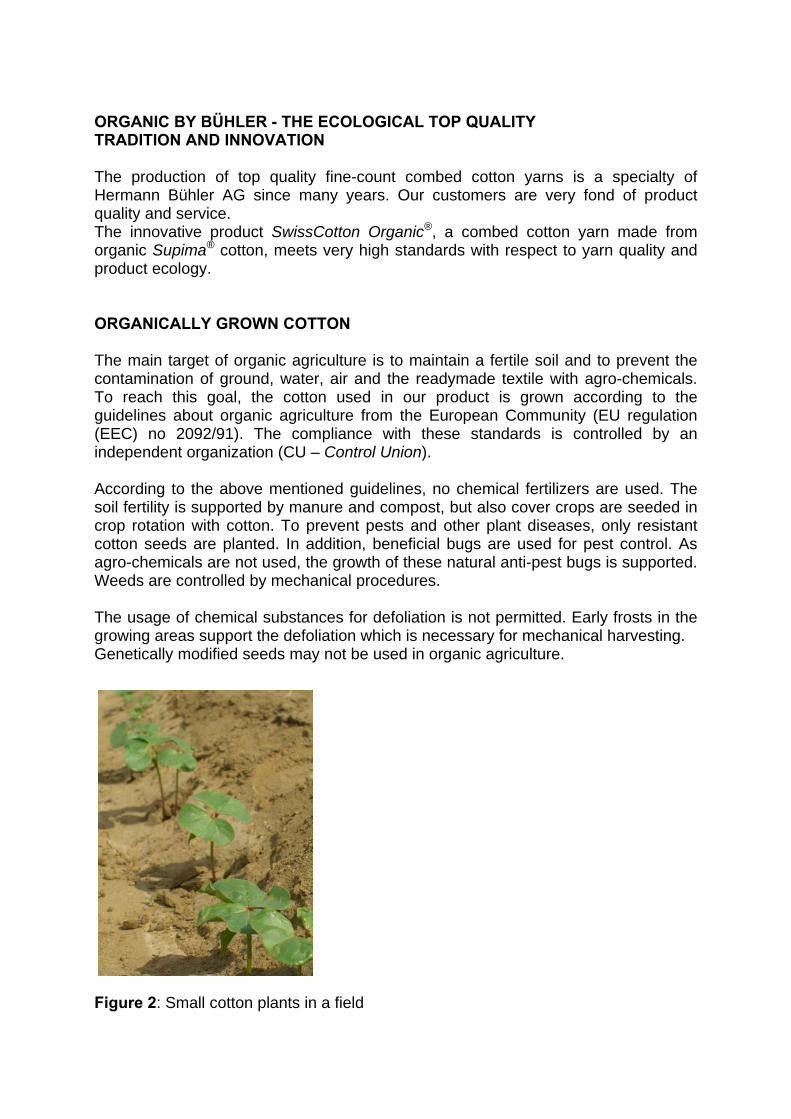
ORGANIC BY BÜHLER - THE ECOLOGICAL TOP QUALITY TRADITION AND INNOVATION The production of top quality fine-count combed cotton yarns is a specialty of Hermann Bühler AG since many years. Our customers are very fond of product quality and service. The innovative product SwissCotton Organic®, a combed cotton yarn made from organic Supima® cotton, meets very high standards with respect to yarn quality and product ecology. ORGANICALLY GROWN COTTON The main target of organic agriculture is to maintain a fertile soil and to prevent the contamination of ground, water, air and the readymade textile with agro-chemicals. To reach this goal, the cotton used in our product is grown according to the guidelines about organic agriculture from the European Community (EU regulation (EEC) no 2092/91). The compliance with these standards is controlled by an independent organization (CU – Control Union). According to the above mentioned guidelines, no chemical fertilizers are used. The soil fertility is supported by manure and compost, but also cover crops are seeded in crop rotation with cotton. To prevent pests and other plant diseases, only resistant cotton seeds are planted. In addition, beneficial bugs are used for pest control. As agro-chemicals are not used, the growth of these natural anti-pest bugs is supported. Weeds are controlled by mechanical procedures. The usage of chemical substances for defoliation is not permitted. Early frosts in the growing areas support the defoliation which is necessary for mechanical harvesting. Genetically modified seeds may not be used in organic agriculture. Figure 2: Small cotton plants in a field
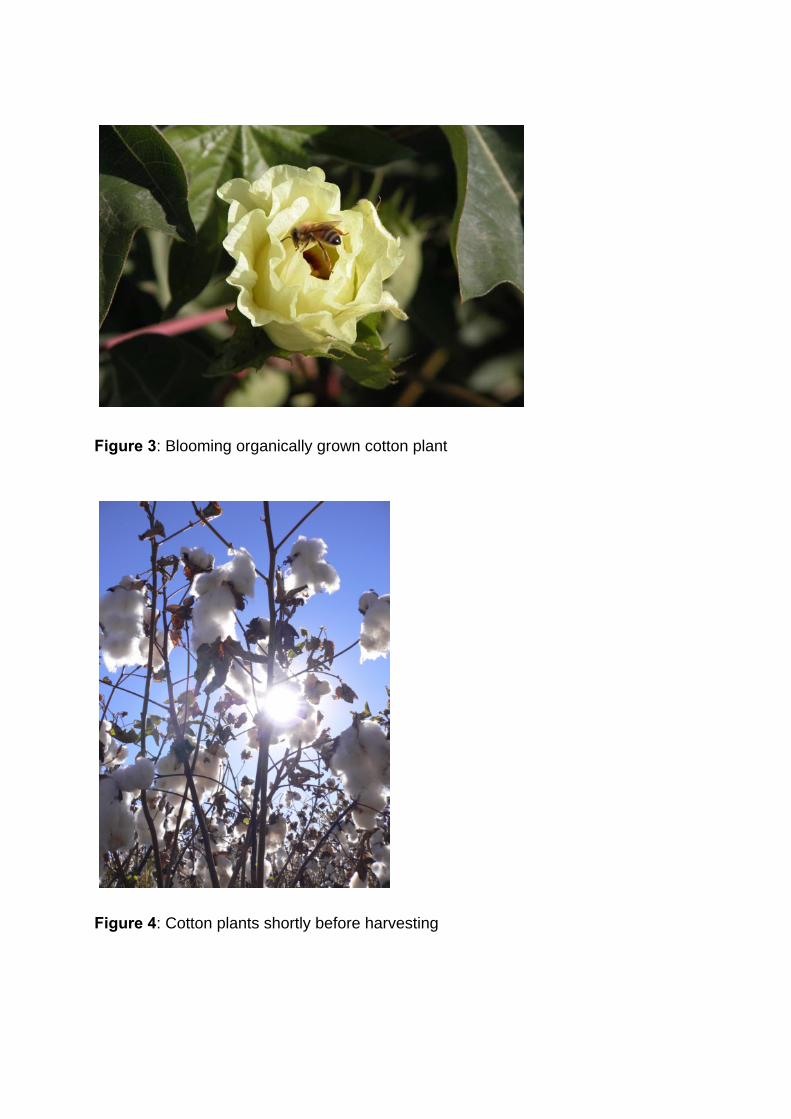
Figure 3: Blooming organically grown cotton plant Figure 4: Cotton plants shortly before harvesting
EXTRA LONG STAPLE SUPIMA® COTTON From the very first beginning, Bühler uses for the production of the SwissCotton Organic® yarns the premium American extra long staple (ELS) Supima® cotton with a staple length of at least 35 mm. To make sure that every single bale meets our strict requirements; all cotton is tested and approved on site by our specialists before shipment. Organic cotton production reached in 2008 about 150,000 metric tons which represents only 0.6 percent of the total global cotton production. Thereof only a small part of about 500 metric tons is grown as extra long staple organic cotton. Since our fine organic Supima® cotton yarns are very much “a niche of a niche” we have to make sure that we will not run out of organic cotton until the next crop is due. We therefore try the utmost to convince specific chosen farmers to contract with us at least a good part of their future crop before they even plant the cotton! This procedure allows us and the farmer to be safe on the stocking side for the whole coming season. The organic cotton grown in the USA is produced according to the NOP standards. Subsequently the production of the cotton yarn in our mill is certified according to GOTS standards. Samples from each batch undergo independent laboratory tests to ensure that genetically modified material is not used. CHALLENGE FOR A SPINNING MILL The organic agriculture has got only a few options to switching to alternative fertilisers and artificial irrigation, so that the cotton plants are much more depending on the local agro-conditions and the weather. Therefore, the fibre quality can vary being associated with the discontinuous growth of the plant and maturation of the fibres. Since the contamination of the organic raw material is higher due to the absence of the chemical defoliation, also the material loss in opening and blowing room as in carding and combing is higher. In order to achieve a constant yarn quality for normal cotton yarn production different raw material lots are blended over a period of various cotton crops. Blending several organic lots is limited due to the lack of sufficient organic ELS fibres. The strict separation of the organic material in the spinning-mill causes additional time and logistics work in the production and results also in a quite complex stock management and in additional work within the administration. In summary using organic Supima® cotton leads to further expenses occurred by much higher raw cotton prices, additional costs for inspection and certificates, higher production loss, higher costs for separate stocking and additional administration fees in the spinning-mill and last but not least also the supplementary expenses for
marketing. Taking all these extra fees in consideration then we see a price difference of a bit more than 30 % in the final yarn prices. QUALITY AND ECOLOGY ARE GUARENTEED In order to guarantee an environmentally sound production method, the spinning-mill and the raw cotton used are strictly controlled by Control Union and the approved yarns are to bear the EKO quality label. This label is registered and the buyer has the proof, that the raw cotton used is grown according to the requirements of the European Community regarding organic production methods. The production process meets the CU criteria for environment-friendly textile production. This certification is based on “GOTS standard” (Global Organic Textile Standard). Despite an environment-friendly production, the yarn quality meets the highest quality standards, which result in best yarn performance in weaving, knitting and warp-knitting. Low numbers of imperfections, evenness and hairiness enable the production of high class fabrics. Our foreign fibre clearers reduce the risk of foreign fibre contamination and second quality fabrics further. MODERN ORGANIC PRODUCTS The requirements for environment-friendly produced products are well known: Guaranteed organic production methods are as important as fashionable design and fabric quality. With SwissCotton Organic®, the following requirements can be achieved: • The EKO quality label guarantees sustainability in cotton cultivation and spinning
process.
• Long-term contracts with our farmers guarantee that the farmland can be cultivated organically on a continuous basis.
• As no agro-chemicals are used, the finished products do not contain any dangerous chemical residues.
• As no fossil fuels are used, Hermann Bühler AG’s production is CO2-neutral to a large extent. Part of our used electricity is produced in Buhler’s own two small hydroelectric power plants. The spinning mill is certified according to Oeko-Tex Standard 1000.
• Best yarn performance in fabric production stands for efficient production.
• Exclusive Supima®-cotton allows top yarn quality and the production of excellent fabrics, made from fine-count yarns (Ne 30 up to Ne 95).
THINKING GLOBAL, ACTING LOCAL - SWISS ORGANIC FABRICS The current economic crisis and raising inventories is a tough time for the organic cotton sector. Five Swiss companies have come together under the Swiss Organic Fabrics banner to promote high quality organic cotton fabrics made in Switzerland according to strict ecological criteria. In order to control the entire process chain this cooperation had to be exclusively arranged with local partners. All companies involved are within a reach of maximum 70 kilometres, which helps further to improve the carbon footprint since production distances could be substantially reduced. Most of these companies use their own hydro-electricity from the nearby rivers to power their machines. Under the label Swiss Organic Fabrics all the fabrics are certified according to GOTS standard with additional certifications ISO 14001 and Oeko-Tex 1000 Plus. The GOTS label guarantees sustainable production processes on all levels from raw material to spinning, weaving and up to finishing. It furthermore simplifies the access to 100 percent organic fabrics for interested buyers. REFERENCES Organic Cotton Farm and Fiber Report 2008 released by Organic Exchange
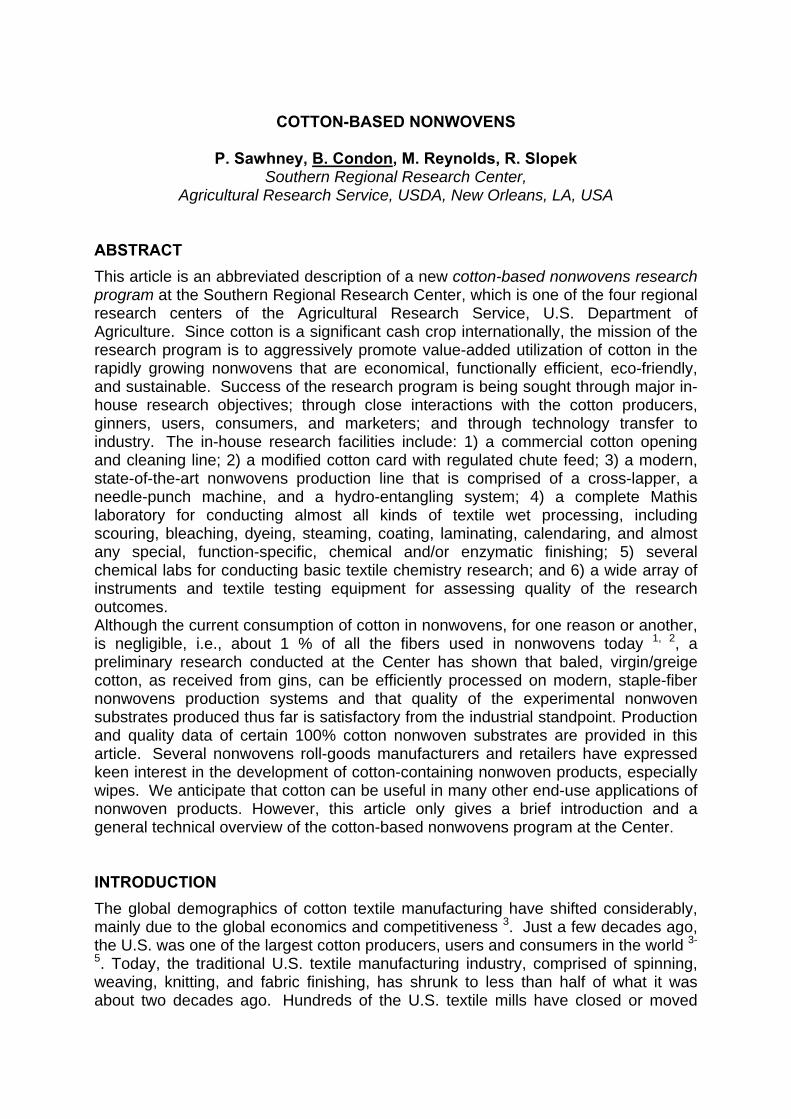
COTTON-BASED NONWOVENS
P. Sawhney, B. Condon, M. Reynolds, R. Slopek Southern Regional Research Center,
Agricultural Research Service, USDA, New Orleans, LA, USA ABSTRACT This article is an abbreviated description of a new cotton-based nonwovens research program at the Southern Regional Research Center, which is one of the four regional research centers of the Agricultural Research Service, U.S. Department of Agriculture. Since cotton is a significant cash crop internationally, the mission of the research program is to aggressively promote value-added utilization of cotton in the rapidly growing nonwovens that are economical, functionally efficient, eco-friendly, and sustainable. Success of the research program is being sought through major in-house research objectives; through close interactions with the cotton producers, ginners, users, consumers, and marketers; and through technology transfer to industry. The in-house research facilities include: 1) a commercial cotton opening and cleaning line; 2) a modified cotton card with regulated chute feed; 3) a modern, state-of-the-art nonwovens production line that is comprised of a cross-lapper, a needle-punch machine, and a hydro-entangling system; 4) a complete Mathis laboratory for conducting almost all kinds of textile wet processing, including scouring, bleaching, dyeing, steaming, coating, laminating, calendaring, and almost any special, function-specific, chemical and/or enzymatic finishing; 5) several chemical labs for conducting basic textile chemistry research; and 6) a wide array of instruments and textile testing equipment for assessing quality of the research outcomes. Although the current consumption of cotton in nonwovens, for one reason or another, is negligible, i.e., about 1 % of all the fibers used in nonwovens today 1, 2, a preliminary research conducted at the Center has shown that baled, virgin/greige cotton, as received from gins, can be efficiently processed on modern, staple-fiber nonwovens production systems and that quality of the experimental nonwoven substrates produced thus far is satisfactory from the industrial standpoint. Production and quality data of certain 100% cotton nonwoven substrates are provided in this article. Several nonwovens roll-goods manufacturers and retailers have expressed keen interest in the development of cotton-containing nonwoven products, especially wipes. We anticipate that cotton can be useful in many other end-use applications of nonwoven products. However, this article only gives a brief introduction and a general technical overview of the cotton-based nonwovens program at the Center. INTRODUCTION The global demographics of cotton textile manufacturing have shifted considerably, mainly due to the global economics and competitiveness 3. Just a few decades ago, the U.S. was one of the largest cotton producers, users and consumers in the world 3-
5. Today, the traditional U.S. textile manufacturing industry, comprised of spinning, weaving, knitting, and fabric finishing, has shrunk to less than half of what it was about two decades ago. Hundreds of the U.S. textile mills have closed or moved
abroad and thousands of mill jobs have been lost. The same scenario of deeply declining traditional textile industry occurred in the Western Europe, Japan and Canada about a decade or two before it hit the U.S 6. Although the current U.S. exports of cotton to Asia and other developing countries are keeping the U.S. cotton production business in a relatively good economic health, the dwindling traditional textile manufacturing in the U.S. remains a major concern for the domestic cotton industry and, hence, for the national economy and security. Although the U.S still is by far the largest per capita consumer of textiles, it no longer is one of the biggest players in the field of cotton textile manufacturing it once was5. The U.S. cotton industry must explore remedial solutions to revive efficient domestic utilization of cotton, in order to remain as big a cotton producer as it historically has been. In 2006, the U.S. produced about 22 million bales of cotton and merely processed about 7 million bales in its domestic textile manufacturing. In 2007, the country produced about 17 million bales and processed only 4.5 million bales, and since then the trends have been steady, if not declining, which indicates some stability at these low levels of domestic utilization of cotton 5. However, the recent increases in farm land use for non-cotton crops may further dampen metrics of the U.S cotton production and utilization. In order to improve the global and particularly the United States’ value-added, high-volume utilization of cotton, it is imperative that the cotton industry develops some new strategies. With significant inputs from the leading representatives of the U.S. cotton industry, such as the National Cotton Council and Cotton Incorporated, the Agricultural Research Service of the United States Department of Agriculture (ARS-USDA) has invested considerable resources for the research & development of cotton-based nonwoven products and their production methodologies and technologies. A new state-of-the-art nonwovens research laboratory-cum-pilot plant has been established at the Southern Regional Research Center, New Orleans, Louisiana, to develop new and improved, function-specific nonwoven substrates and end-use products of mostly cotton content. New research concepts and approaches are currently being pursued in the program. Undoubtedly, there are some challenges in the predominant use of cotton in nonwovens, but there are many good opportunities now as well to explore use of cotton in nonwoven products. The current global wave of eco-friendly and sustainable products has turned the “tide” in favor of using natural, renewable raw materials. Unlike the petroleum-derived synthetic fibers, such as polypropylene, polyethylene and polyester that presently are most commonly used in nonwoven products and applications, cotton is a naturally renewable and environmentally benign agricultural commodity that provides a favorable “life cycle” for an eco-friendly global impact. In addition, cotton offers several positive attributes, such as excellent wicking and absorbency of liquids; dyeability; static freedom; thermal and acoustical insulations; and the like. Further, considering the currently escalating fuel/energy prices and, consequently, the inevitable high overseas shipping charges for international transportation of goods, the domestic production, utilization and consumption of cotton makes more sense than ever 7-10. Furthermore, the manufacturing of nonwovens is highly productive and less labor intensive compared to traditional textile manufacturing, which offers yet another incentive for additional cotton uses by the nonwovens industries of developed countries that need to be globally competitive and, hence, profitable 7-9, 11-
16. Using existing or slightly modified nonwovens production processes and systems, such as needle-punching, hydro-entangling, thermal and/or chemical bonding, cotton,
either directly or indirectly, can be embedded in many nonwoven products for numerous applications. The following paragraphs summarize the broad reasons for the thus far lack of cotton use in nonwovens and for the potential growth in use of cotton and its byproducts in nonwovens. REASONS FOR LACK OF COTTON USE IN NONWOVENS TODAY: 1. A vast majority of the current end-use markets for nonwovens are “non-apparel” and
“disposable, or non-reusable.” Mainly because of the cost factor for bleached cotton, these markets historically have avoided cotton and, therefore, the fiber’s unique properties have not been adequately investigated, appreciated and utilized 10.
2. Based on the communications with the Director, Nonwovens Research Center,
NC State University, Raleigh, NC, the nonwovens, mainly due to their fabric structure, inherently are relatively weaker, drape-less, non-uniform, more combustible, and less stable compared to the equivalent traditional textiles. Certain cotton nonwoven structures in fabric form may be somewhat difficult to handle in wet finishing, such as scouring, bleaching, dyeing, and/or any special chemical treatment. This, in certain cases, may necessitate use of bleached cotton raw stock, which, as stated previously, is costly and technically cumbersome in down-stream processing. Certain modern nonwovens technologies, such as hydro-entangling, demand a raw stock that is largely free of foreign matter and contaminants that easily can disrupt and clog the system or increase the cost of water supply and/or its filtration. Thus, the use of costly bleached cotton in this scenario also becomes an economic issue.
3. Cotton generally needs substantial preparatory processing for its mechanical
cleaning and homogenization that are essential for attaining the desired uniformity and consistency of the nonwoven end-product. From crop to crop, the quality, price and supply of cotton may be somewhat unpredictable for an efficient manufacturing operation 17, 18.
4. Single fiber mechanical characteristics, such as the tensile strength, modulus,
dirt- and mildew- resistance, flame resistance, etc., of cotton generally are not comparable with those of comparable manufactured fibers, such as PP, PE and PET, that today are widely used in the industrial, geo, and technical nonwovens that are durable 1, 5, 19.
5. Generally, the nonwovens inherently are relatively stiffer than the traditional,
classical textiles and, hence, do not drape as well, particularly in case of apparel and household textiles where cotton essentially is the best-suited fiber 7-10.
6. Classical cotton textiles efficiently utilize stress-strain relationship of constituent
fibers and yarns 5, 17, 18, whereas the cotton nonwovens inherently lack that relationship because their constituent fibers are mechanically, thermally or chemically bonded and randomly bundled together, resulting in a plastic-like rigidity. The constituent fibers in a nonwoven structure exhibit little flexibility, slippage and yield, which for apparel are essential.
7. High capital investments and extremely high productivities of modern, ultra-high-speed nonwovens manufacturing technologies obviously necessitate continuous, uninterrupted mass-scale productions of pretty much the same (i.e., standard) nonwoven roll goods, products, or substrates day in and day out, in order to achieve a reasonable return on the investments 11-16. However, the existing business plans and systems for small-lot and diverse-style productions of traditional cotton textile fabrics/apparel (to satisfy a hugely-diverse human population) presently do not permit the high-volume advantage and, hence, the economic efficiency and justification for utilization of cotton in nonwovens, especially for the clothing applications. However, this viable argument against use of cotton in nonwovens could change with proper research and development of cotton nonwovens for certain other mass markets, such as the disposable, reusable, semi-durable, or even durable wipes, cosmetic pads, antistatic medical gowns and other products, sheeting, hospitality linens, drills, denims, towels and toweling, upholstery, automotive components, furnishing fabrics, undergarments, and the like 10.
POTENTIAL ADVANTAGES OF USING COTTON IN NONWOVENS TODAY: 1. Cotton is a naturally renewable and, hence, sustainable agricultural commodity. It
is also biodegradable, easily disposable, and, hence, ecologically friendly 7-10. Thus, extra efforts should be made to replace petroleum-based fibers with cotton, where affordability and functional performance of new products are reasonably justified. In this regard, Wal-Mart – the largest retailer in the world - is playing a very significant role for progressively increasing use of cotton in consumer and other goods by aggressively endorsing the “Vision on Sustainability and Environment” on their websites.
2. Cotton-based nonwoven products, if functionally and commercially acceptable,
can be produced at speeds that may be an order of magnitude greater than those of the traditional weaving process, which could considerably offset the high manufacturing costs that the U.S. cotton textile industry is partly suffering from. As mentioned previously, the processes of making nonwovens (excluding cotton carding that, due to its cotton dust, may be susceptible to bysynosis – a lung disease) are relatively less labor-intensive and environment-sensitive compared to the traditional spinning and weaving 7-9.
3. Because of its unique characteristics of excellent wicking and absorbency, static-
freedom, ease of blending with other fibers, and excellent substrate for functional chemical derivitization, cotton obviously should be the fiber of choice for many existing nonwoven applications, such as institutional sheets; upholstery; household furnishings; wipes; towels or toweling; medical, personal-care, cosmetic and sanitary products; and composites for certain industrial and technical applications 7-10. Cotton may also be ideally suitable for many potential new applications, such as building, construction, geo and other technical and industrial nonwoven textiles.
4. Because of varying soil and environmental conditions, cotton quality varies considerably from crop to crop 5, 18, . Almost every year, a certain portion of cotton production worldwide suffers damage of one kind or another that renders the cotton production unsuitable for its efficient utilization in the traditional textile processing, viz., yarn spinning, weaving, or knitting 5. These inferior-quality cottons are significantly discounted in price. Sometimes, they even are unsellable in the classical cotton markets. However, it is quite possible that these substantially discounted cottons, cotton ginning byproducts (motes and linters), mill-processing wastes, and even shredded/recycled cotton fibers may be efficiently used in the nonwovens arena for producing certain useful products of significant economic advantage. It is also imaginable that certain cotton varieties/cultivars of much greater yield (production per unit area of land) may process and perform as good as (or, even better than) the classical cottons in certain nonwovens processes and technologies for certain products and end-use applications.
5. Escalating costs of fuel/energy and, consequently, shipping will curb
transportation (imports and exports) of especially heavy goods and commodities, which should encourage and brighten once again the indigenous production and utilization of cotton in the U.S.
FIVE MAJOR OBJECTIVES OF THE NONWOVENS RESEARCH PROGRAM Objective 1: Enhance and promote cotton’s natural sustainability features in the
context of disposable nonwovens applications. Previous research has shown that cotton fabrics are significantly more biodegradable than most commercially available synthetic fabrics, such as polypropylene, polyester, and polyethylene, thus cotton has great potential in the area of disposable nonwovens 20-22. The focus of this objective will be to directly compare the biodegradation of cotton nonwoven fabrics to that of biodegradable synthetic nonwovens, e.g., PLA and rayon. In addition, the biodegradation of cotton nonwovens in the presence of specific enzymes and bacteria will be examined to determine if the biodegradation rate of cotton can be enhanced. Objective 2: Characterize and correlate the relationships among the cotton fiber
quality parameters, the nonwovens process-ability, and the final fabric performance characteristics.
Extensive research has shown the properties of cotton fabrics produced using the traditional weaving and knitting are strongly dependent on the classical fiber properties (such as fiber length, strength, maturity, fineness, SFC, wax and foreign-matter content) of the raw srock cotton 17,18. For nonwoven cotton fabrics, however, there is a general lack of understanding of how these fiber properties affect the cotton fabrics produced via the nonwoven processes. Using the commercial nonwovens equipment at the SRRC, the relation between the classic fiber properties of cotton and the final nonwoven fabric produced will be thoroughly examined.
Objective 3: Develop and optimize hydro-entanglement chemistry and process parameters for cotton fiber and the nonwoven fabrics thus produced.
There are several parameters, both process and chemical, that can be varied during the production of cotton nonwoven fabrics 13-16; however, the outcome of varying these parameters is presently unknown. Thus in this work, process parameters such as the water pressure and the production speed and the water chemistry parameters such as the pH, temperature, hardness, total conductivity and inert ion content will be varied and the cotton nonwoven products produced will be analyzed for the end-use requirements, such as absorbency, strength, permeability, abrasion resistance, partial bleaching, tinting, etc. Objective 4: Develop innovative end-use functional technologies that enable
increases in the amount and value of cotton in nonwoven applications. To further expand the use of cotton in nonwoven applications, nonwoven cotton fabrics will be chemically and physically modified to develop innovative end-use functional technologies. One of the main focuses of this research will be to develop antimicrobial nonwoven wipes made of greige cotton that are capable of releasing germicide agents to sanitize hard surfaces. In addition, this work will focus on the development of cost-effective and environment-friendly cotton nonwoven technical textiles for non-washable fire-retardant (FR) and antimicrobial (AM) applications, such as bedding and medical end-uses. Objective 5: Develop processes for producing nonwoven fabrics from greige
(scour/bleach-less) cotton. Ideally, we should be able to produce nonwoven fabrics from various grades of greige cotton, which, without post-fabrication chemical modification such as scouring and bleaching, are readily absorbent in the end-use applications. So, the thrust of this research will be to develop a nonwovens process capable of producing, for example, acceptable end-use absorbent wipes from low-grade, discounted cottons. In addition, nonwovens made of various grades of cotton will be made hydrophilic via in-situ modifications of the nonwovens processes. The ultimate goal of the research objectives is to develop technologies for producing innovative, cotton-based, eco-friendly, sustainable nonwoven textile structures. These structures will be based on greige or bleached cotton or cotton ginning or processing byproducts which may be converted into commercially viable end-use products through chemical or physical modifications. These nonwoven structures may be suitable for single-use or multi-use applications, such as wipes; mattress, upholstery and automotive components; blanket inserts; medical textiles, etc..
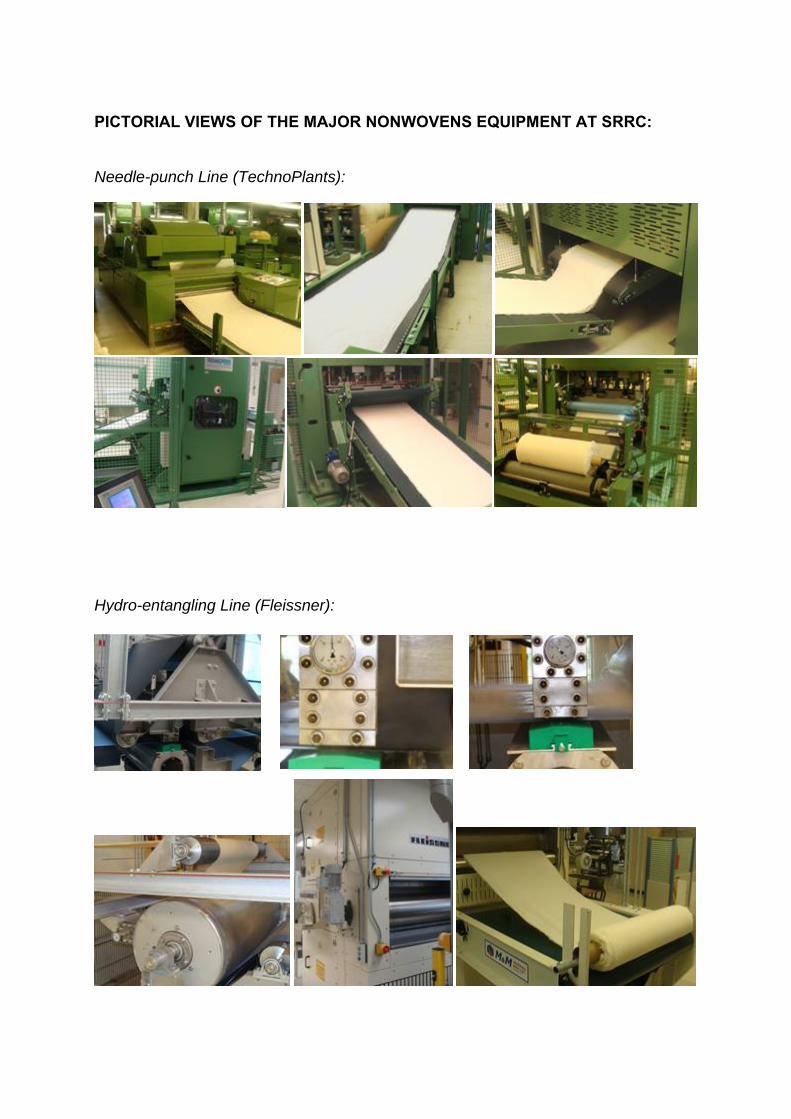
PICTORIAL VIEWS OF THE MAJOR NONWOVENS EQUIPMENT AT SRRC: Needle-punch Line (TechnoPlants):
Hydro-entangling Line (Fleissner):
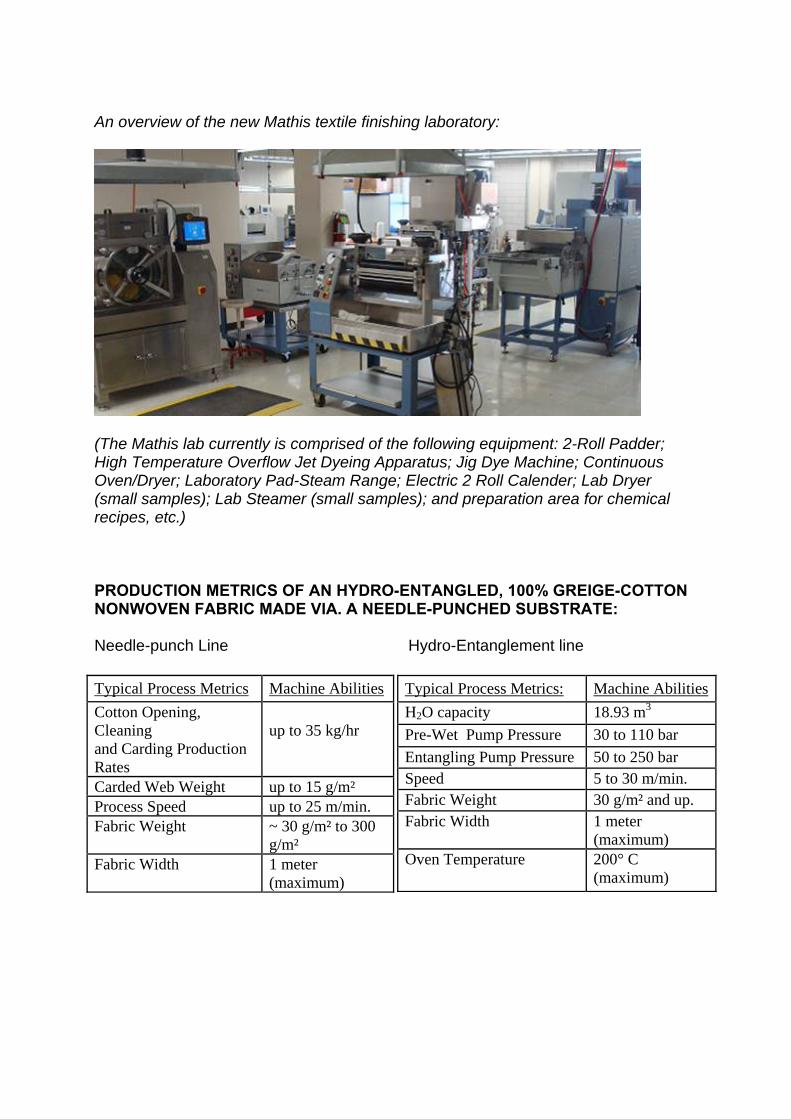
An overview of the new Mathis textile finishing laboratory:
(The Mathis lab currently is comprised of the following equipment: 2-Roll Padder; High Temperature Overflow Jet Dyeing Apparatus; Jig Dye Machine; Continuous Oven/Dryer; Laboratory Pad-Steam Range; Electric 2 Roll Calender; Lab Dryer (small samples); Lab Steamer (small samples); and preparation area for chemical recipes, etc.) PRODUCTION METRICS OF AN HYDRO-ENTANGLED, 100% GREIGE-COTTON NONWOVEN FABRIC MADE VIA. A NEEDLE-PUNCHED SUBSTRATE: Needle-punch Line Hydro-Entanglement line
Typical Process Metrics Machine Abilities Cotton Opening, Cleaning and Carding Production Rates
up to 35 kg/hr
Carded Web Weight up to 15 g/m² Process Speed up to 25 m/min. Fabric Weight ~ 30 g/m² to 300
g/m² Fabric Width 1 meter
(maximum)
Typical Process Metrics: Machine AbilitiesH2O capacity 18.93 m3
Pre-Wet Pump Pressure 30 to 110 bar Entangling Pump Pressure 50 to 250 bar Speed 5 to 30 m/min. Fabric Weight 30 g/m² and up. Fabric Width 1 meter
(maximum) Oven Temperature 200° C
(maximum)
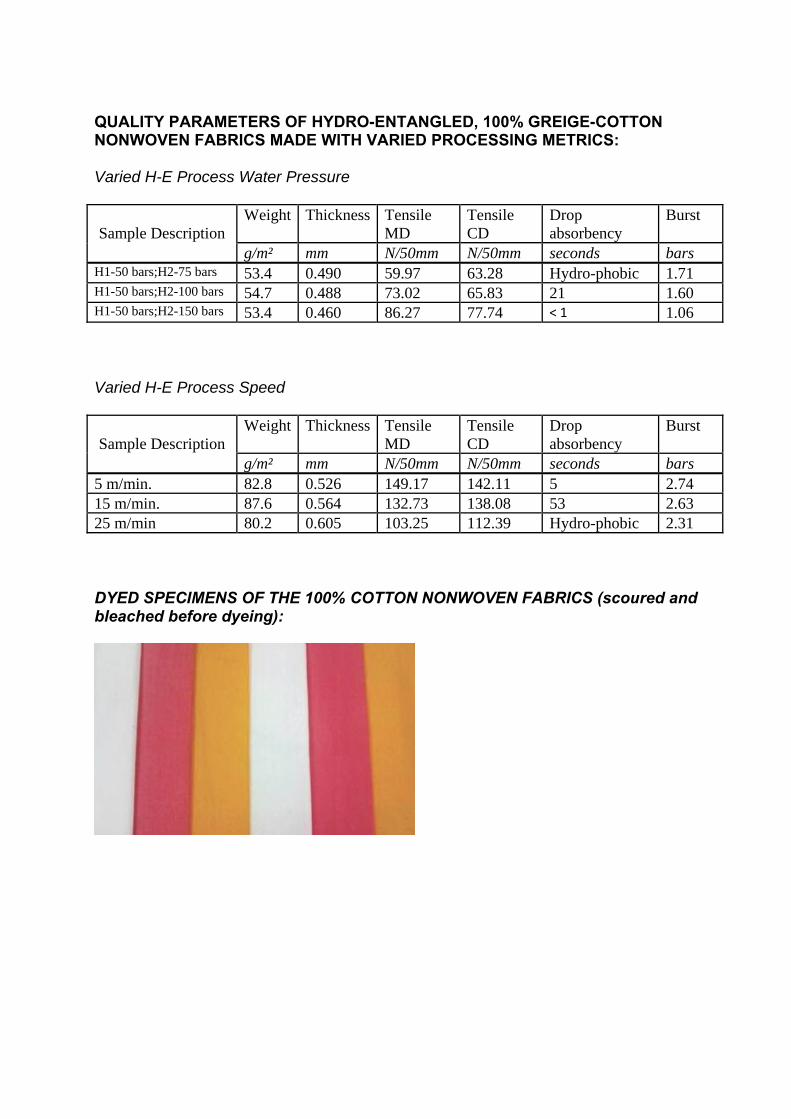
QUALITY PARAMETERS OF HYDRO-ENTANGLED, 100% GREIGE-COTTON NONWOVEN FABRICS MADE WITH VARIED PROCESSING METRICS: Varied H-E Process Water Pressure
Weight Thickness Tensile MD
Tensile CD
Drop absorbency
Burst Sample Description
g/m² mm N/50mm N/50mm seconds bars H1-50 bars;H2-75 bars 53.4 0.490 59.97 63.28 Hydro-phobic 1.71 H1-50 bars;H2-100 bars 54.7 0.488 73.02 65.83 21 1.60 H1-50 bars;H2-150 bars 53.4 0.460 86.27 77.74 < 1 1.06 Varied H-E Process Speed
Weight Thickness Tensile MD
Tensile CD
Drop absorbency
Burst Sample Description
g/m² mm N/50mm N/50mm seconds bars 5 m/min. 82.8 0.526 149.17 142.11 5 2.74 15 m/min. 87.6 0.564 132.73 138.08 53 2.63 25 m/min 80.2 0.605 103.25 112.39 Hydro-phobic 2.31 DYED SPECIMENS OF THE 100% COTTON NONWOVEN FABRICS (scoured and bleached before dyeing):
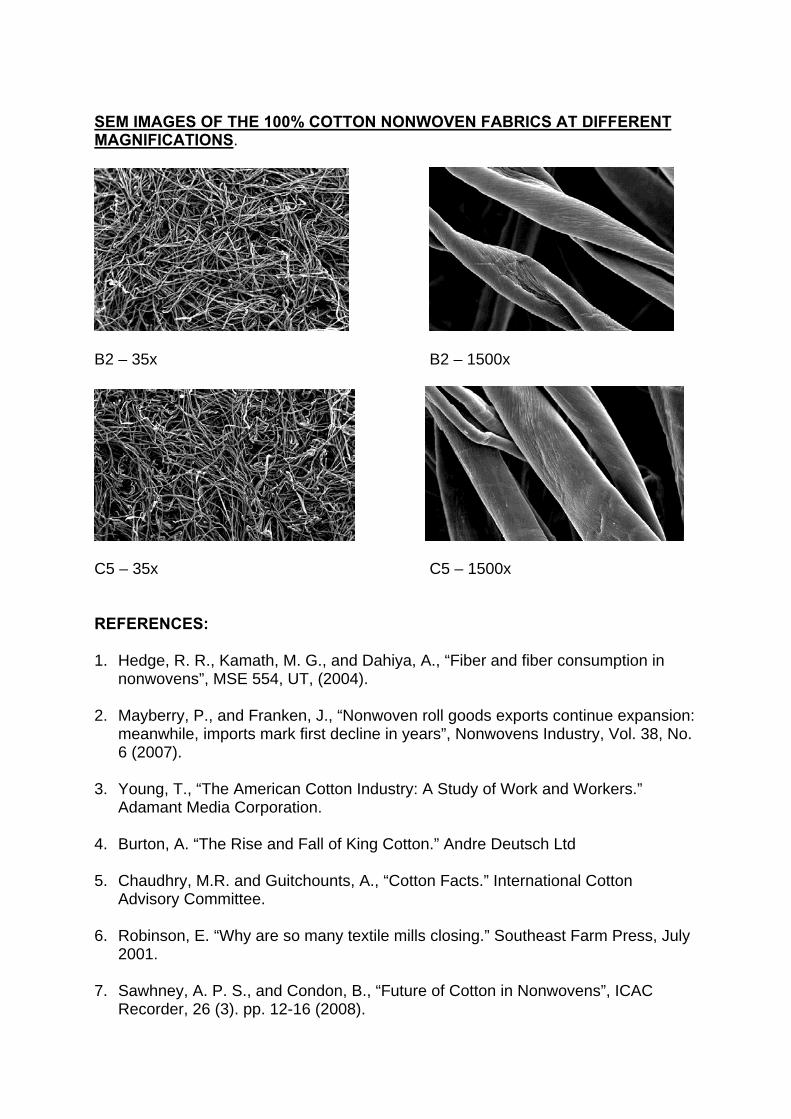
SEM IMAGES OF THE 100% COTTON NONWOVEN FABRICS AT DIFFERENT MAGNIFICATIONS.
B2 – 35x B2 – 1500x
C5 – 35x C5 – 1500x REFERENCES: 1. Hedge, R. R., Kamath, M. G., and Dahiya, A., “Fiber and fiber consumption in
nonwovens”, MSE 554, UT, (2004). 2. Mayberry, P., and Franken, J., “Nonwoven roll goods exports continue expansion:
meanwhile, imports mark first decline in years”, Nonwovens Industry, Vol. 38, No. 6 (2007).
3. Young, T., “The American Cotton Industry: A Study of Work and Workers.”
Adamant Media Corporation. 4. Burton, A. “The Rise and Fall of King Cotton.” Andre Deutsch Ltd 5. Chaudhry, M.R. and Guitchounts, A., “Cotton Facts.” International Cotton
Advisory Committee. 6. Robinson, E. “Why are so many textile mills closing.” Southeast Farm Press, July
2001. 7. Sawhney, A. P. S., and Condon, B., “Future of Cotton in Nonwovens”, ICAC
Recorder, 26 (3). pp. 12-16 (2008).
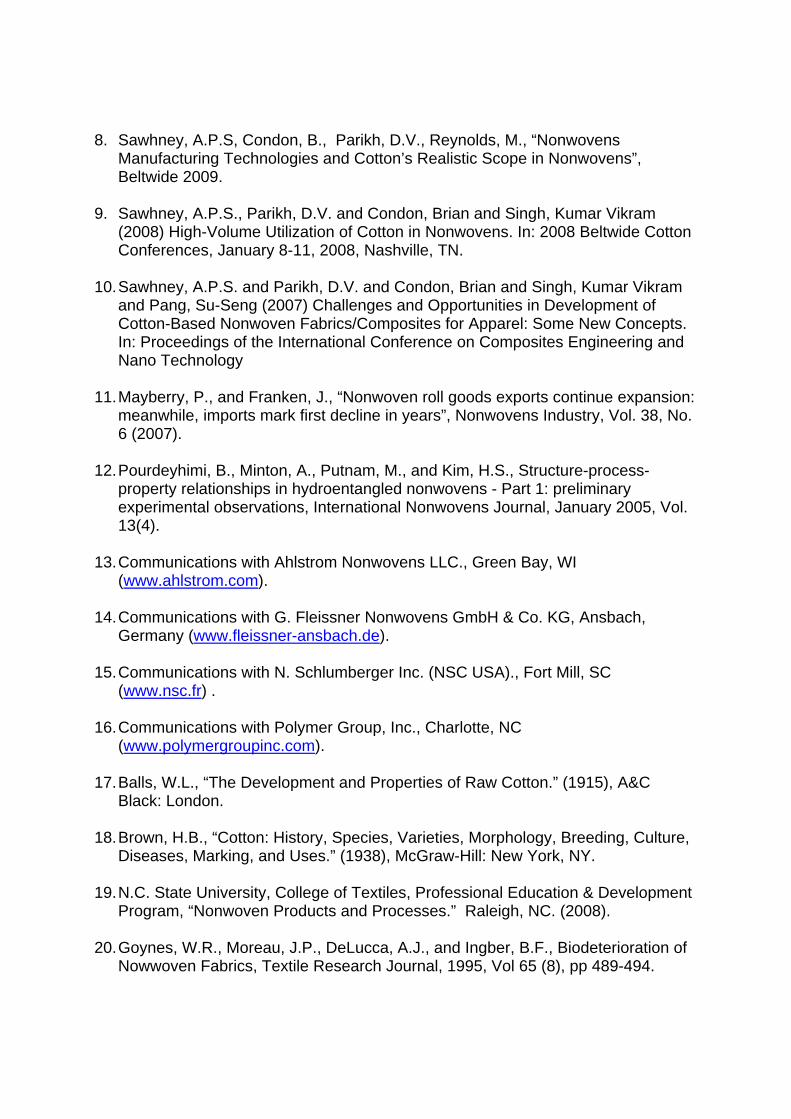
8. Sawhney, A.P.S, Condon, B., Parikh, D.V., Reynolds, M., “Nonwovens
Manufacturing Technologies and Cotton’s Realistic Scope in Nonwovens”, Beltwide 2009.
9. Sawhney, A.P.S., Parikh, D.V. and Condon, Brian and Singh, Kumar Vikram
(2008) High-Volume Utilization of Cotton in Nonwovens. In: 2008 Beltwide Cotton Conferences, January 8-11, 2008, Nashville, TN.
10. Sawhney, A.P.S. and Parikh, D.V. and Condon, Brian and Singh, Kumar Vikram
and Pang, Su-Seng (2007) Challenges and Opportunities in Development of Cotton-Based Nonwoven Fabrics/Composites for Apparel: Some New Concepts. In: Proceedings of the International Conference on Composites Engineering and Nano Technology
11. Mayberry, P., and Franken, J., “Nonwoven roll goods exports continue expansion:
meanwhile, imports mark first decline in years”, Nonwovens Industry, Vol. 38, No. 6 (2007).
12. Pourdeyhimi, B., Minton, A., Putnam, M., and Kim, H.S., Structure-process-
property relationships in hydroentangled nonwovens - Part 1: preliminary experimental observations, International Nonwovens Journal, January 2005, Vol. 13(4).
13. Communications with Ahlstrom Nonwovens LLC., Green Bay, WI
(www.ahlstrom.com). 14. Communications with G. Fleissner Nonwovens GmbH & Co. KG, Ansbach,
Germany (www.fleissner-ansbach.de). 15. Communications with N. Schlumberger Inc. (NSC USA)., Fort Mill, SC
(www.nsc.fr) . 16. Communications with Polymer Group, Inc., Charlotte, NC
(www.polymergroupinc.com). 17. Balls, W.L., “The Development and Properties of Raw Cotton.” (1915), A&C
Black: London. 18. Brown, H.B., “Cotton: History, Species, Varieties, Morphology, Breeding, Culture,
Diseases, Marking, and Uses.” (1938), McGraw-Hill: New York, NY. 19. N.C. State University, College of Textiles, Professional Education & Development
Program, “Nonwoven Products and Processes.” Raleigh, NC. (2008). 20. Goynes, W.R., Moreau, J.P., DeLucca, A.J., and Ingber, B.F., Biodeterioration of
Nowwoven Fabrics, Textile Research Journal, 1995, Vol 65 (8), pp 489-494.
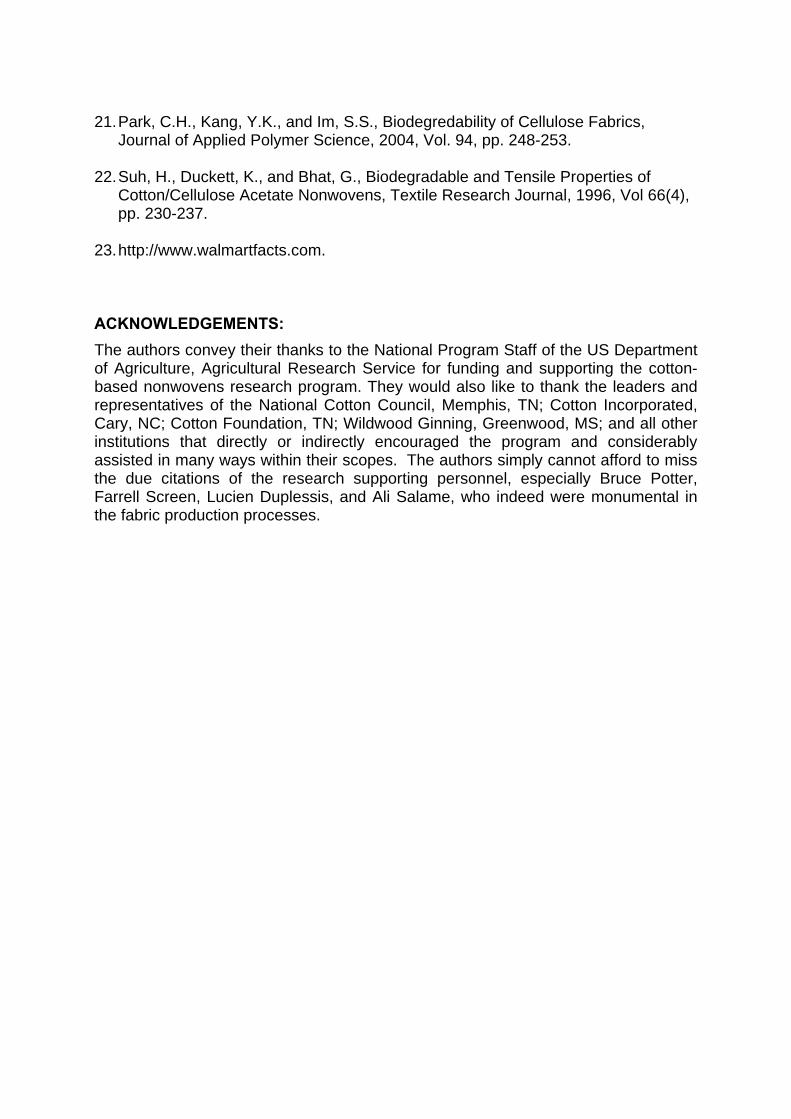
21. Park, C.H., Kang, Y.K., and Im, S.S., Biodegredability of Cellulose Fabrics, Journal of Applied Polymer Science, 2004, Vol. 94, pp. 248-253.
22. Suh, H., Duckett, K., and Bhat, G., Biodegradable and Tensile Properties of
Cotton/Cellulose Acetate Nonwovens, Textile Research Journal, 1996, Vol 66(4), pp. 230-237.
23. http://www.walmartfacts.com. ACKNOWLEDGEMENTS: The authors convey their thanks to the National Program Staff of the US Department of Agriculture, Agricultural Research Service for funding and supporting the cotton-based nonwovens research program. They would also like to thank the leaders and representatives of the National Cotton Council, Memphis, TN; Cotton Incorporated, Cary, NC; Cotton Foundation, TN; Wildwood Ginning, Greenwood, MS; and all other institutions that directly or indirectly encouraged the program and considerably assisted in many ways within their scopes. The authors simply cannot afford to miss the due citations of the research supporting personnel, especially Bruce Potter, Farrell Screen, Lucien Duplessis, and Ali Salame, who indeed were monumental in the fabric production processes.
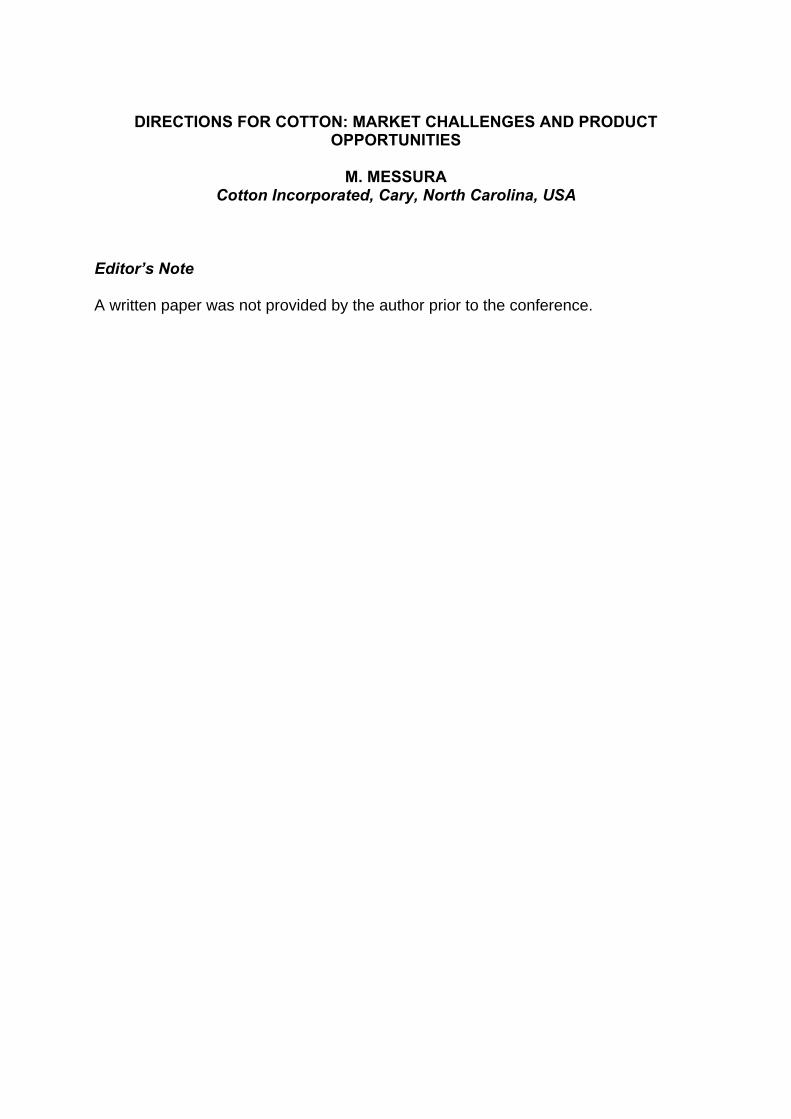
DIRECTIONS FOR COTTON: MARKET CHALLENGES AND PRODUCT OPPORTUNITIES
M. MESSURA
Cotton Incorporated, Cary, North Carolina, USA Editor’s Note A written paper was not provided by the author prior to the conference.
COTTON IN TECHNICAL APPLICATION
Matusiak M., Sikorski K., Rymarz T. Textile Research Institute, Lodz, Poland
ABSTRACT Application of cotton to clothing and home textiles is commonly known. Due to its excellent natural hygienic properties and soft handle cotton is gladly used in: underwear, summer clothing, sportswear, baby cloths, work cloths, bedclothes etc. Textiles for technical applications are very often made from the chemical fibers. Nevertheless, natural fibers can also find their place in the technical areas. In order to meet very high demands in the range of the utility parameters, especially mechanical ones in technical fabrics cotton is used together with the chemical fibers. Required high utility parameters of technical textiles made of cotton are also reached by their functionalization in the process of textile finishing. Cotton fibers and their blends with man-made fibers are applied to: medical textiles, cosemtotextiles, protective textiles, fabrics for automotive, rubber or food industry. Researchers from Textile Research Institute carried out investigation aimed at development of the innovative, high performance woven fabrics for different technical applications. In elaborated technical fabrics cotton fibers were used in connection with chemical fibers in different types of yarns. INTRODUCTION Cotton is one of the most important textile raw materials. Due to its excellent hygienic and comfort-related properties traditionally cotton is used in clothing, underwear and home textiles. For the technical textiles the chemical fibres are more suitable than natural fibres thanks to their better utility properties, especially mechanical ones. Nevertheless it is a lot of technical areas, in which cotton can be used successfully as a basic raw material or as a component of fibre blends. Wide range of technical products made of cotton and its blends can be found on the world textile market. In the Textile Research Institute different kinds of high advanced textile materials were elaborated for technical applications: rubber, automotive, food industry, building, footwear, health care, etc. In elaborated technical fabrics cotton fibres were used together with PES fibres in different types of yarns: blended yarns, twisted with PES multifilament component and ROTONA type yarn with PES core. MARKET TRENDS IN TECHNICAL TEXTILES Textile materials manufactured mainly for their technical performance and functional properties are regarded as technical textiles. They are the high performance fabrics
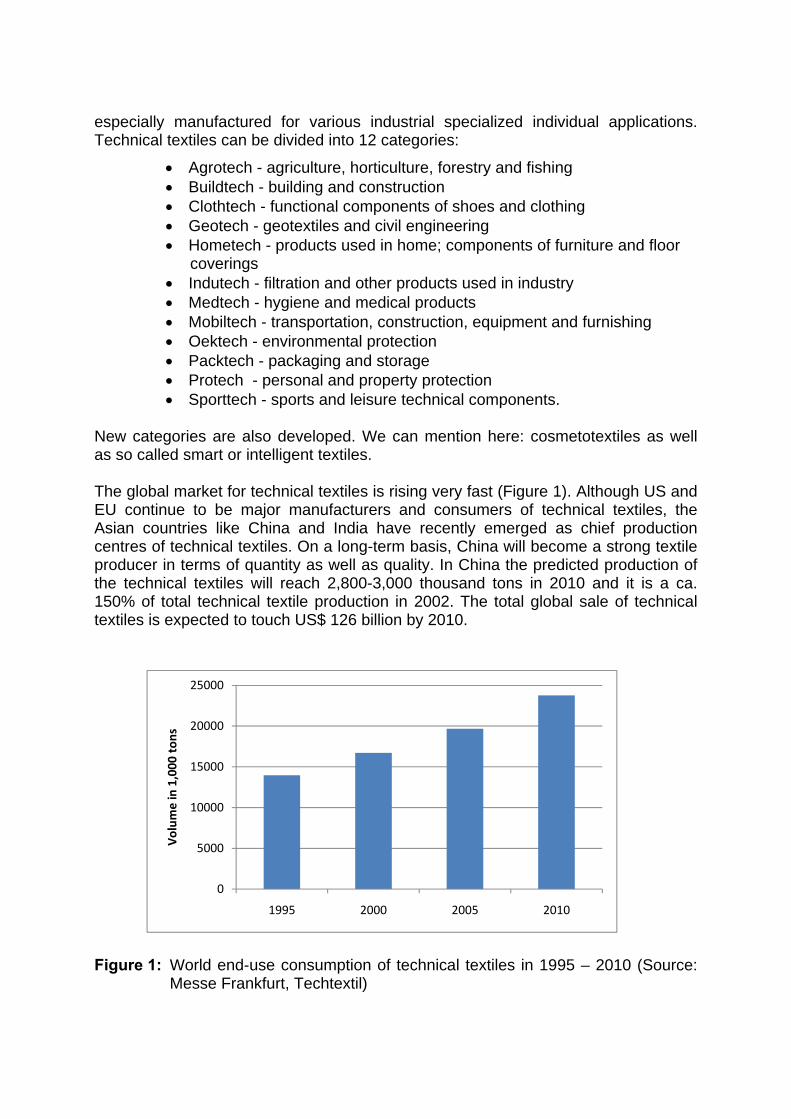
especially manufactured for various industrial specialized individual applications. Technical textiles can be divided into 12 categories:
• Agrotech - agriculture, horticulture, forestry and fishing • Buildtech - building and construction • Clothtech - functional components of shoes and clothing • Geotech - geotextiles and civil engineering • Hometech - products used in home; components of furniture and floor
coverings • Indutech - filtration and other products used in industry • Medtech - hygiene and medical products • Mobiltech - transportation, construction, equipment and furnishing • Oektech - environmental protection • Packtech - packaging and storage • Protech - personal and property protection • Sporttech - sports and leisure technical components.
New categories are also developed. We can mention here: cosmetotextiles as well as so called smart or intelligent textiles. The global market for technical textiles is rising very fast (Figure 1). Although US and EU continue to be major manufacturers and consumers of technical textiles, the Asian countries like China and India have recently emerged as chief production centres of technical textiles. On a long-term basis, China will become a strong textile producer in terms of quantity as well as quality. In China the predicted production of the technical textiles will reach 2,800-3,000 thousand tons in 2010 and it is a ca. 150% of total technical textile production in 2002. The total global sale of technical textiles is expected to touch US$ 126 billion by 2010.
0
5000
10000
15000
20000
25000
1995 2000 2005 2010
Volum
e in 1,000
ton
s
Figure 1: World end-use consumption of technical textiles in 1995 – 2010 (Source:
Messe Frankfurt, Techtextil)
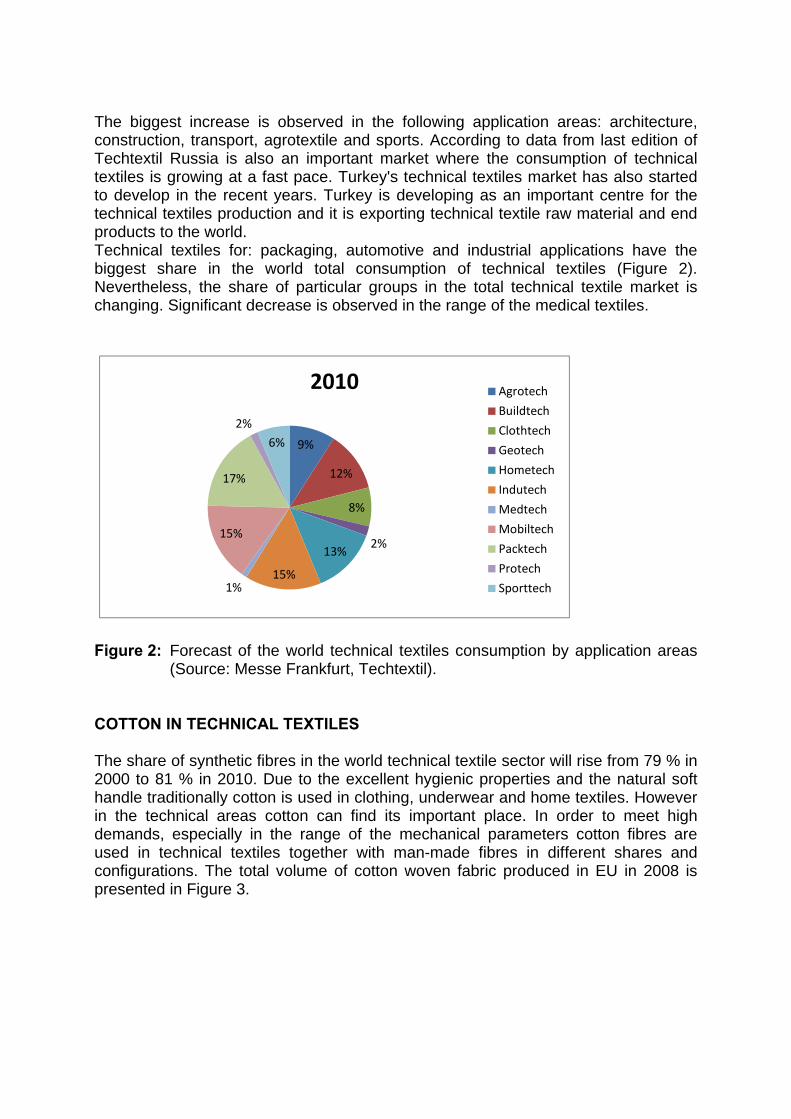
The biggest increase is observed in the following application areas: architecture, construction, transport, agrotextile and sports. According to data from last edition of Techtextil Russia is also an important market where the consumption of technical textiles is growing at a fast pace. Turkey's technical textiles market has also started to develop in the recent years. Turkey is developing as an important centre for the technical textiles production and it is exporting technical textile raw material and end products to the world. Technical textiles for: packaging, automotive and industrial applications have the biggest share in the world total consumption of technical textiles (Figure 2). Nevertheless, the share of particular groups in the total technical textile market is changing. Significant decrease is observed in the range of the medical textiles.
9%
12%
8%
2%13%
15%1%
15%
17%
2%6%
2010 Agrotech
Buildtech
Clothtech
Geotech
Hometech
Indutech
Medtech
Mobiltech
Packtech
Protech
Sporttech
Figure 2: Forecast of the world technical textiles consumption by application areas
(Source: Messe Frankfurt, Techtextil). COTTON IN TECHNICAL TEXTILES The share of synthetic fibres in the world technical textile sector will rise from 79 % in 2000 to 81 % in 2010. Due to the excellent hygienic properties and the natural soft handle traditionally cotton is used in clothing, underwear and home textiles. However in the technical areas cotton can find its important place. In order to meet high demands, especially in the range of the mechanical parameters cotton fibres are used in technical textiles together with man-made fibres in different shares and configurations. The total volume of cotton woven fabric produced in EU in 2008 is presented in Figure 3.
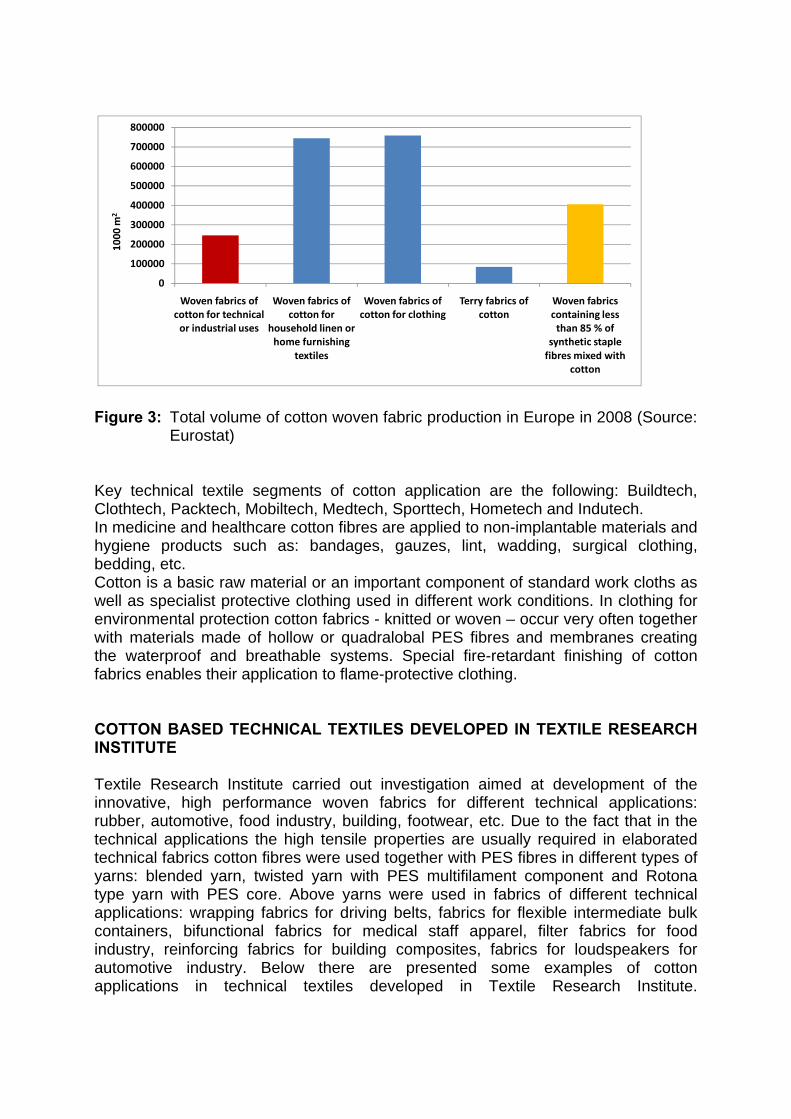
0
100000
200000
300000
400000
500000
600000
700000
800000
Woven fabrics of cotton for technical or industrial uses
Woven fabrics of cotton for
household linen or home furnishing
textiles
Woven fabrics of cotton for clothing
Terry fabrics of cotton
Woven fabrics containing less than 85 % of
synthetic staple fibres mixed with
cotton
1000
m2
Figure 3: Total volume of cotton woven fabric production in Europe in 2008 (Source:
Eurostat) Key technical textile segments of cotton application are the following: Buildtech, Clothtech, Packtech, Mobiltech, Medtech, Sporttech, Hometech and Indutech. In medicine and healthcare cotton fibres are applied to non-implantable materials and hygiene products such as: bandages, gauzes, lint, wadding, surgical clothing, bedding, etc. Cotton is a basic raw material or an important component of standard work cloths as well as specialist protective clothing used in different work conditions. In clothing for environmental protection cotton fabrics - knitted or woven – occur very often together with materials made of hollow or quadralobal PES fibres and membranes creating the waterproof and breathable systems. Special fire-retardant finishing of cotton fabrics enables their application to flame-protective clothing. COTTON BASED TECHNICAL TEXTILES DEVELOPED IN TEXTILE RESEARCH INSTITUTE Textile Research Institute carried out investigation aimed at development of the innovative, high performance woven fabrics for different technical applications: rubber, automotive, food industry, building, footwear, etc. Due to the fact that in the technical applications the high tensile properties are usually required in elaborated technical fabrics cotton fibres were used together with PES fibres in different types of yarns: blended yarn, twisted yarn with PES multifilament component and Rotona type yarn with PES core. Above yarns were used in fabrics of different technical applications: wrapping fabrics for driving belts, fabrics for flexible intermediate bulk containers, bifunctional fabrics for medical staff apparel, filter fabrics for food industry, reinforcing fabrics for building composites, fabrics for loudspeakers for automotive industry. Below there are presented some examples of cotton applications in technical textiles developed in Textile Research Institute.
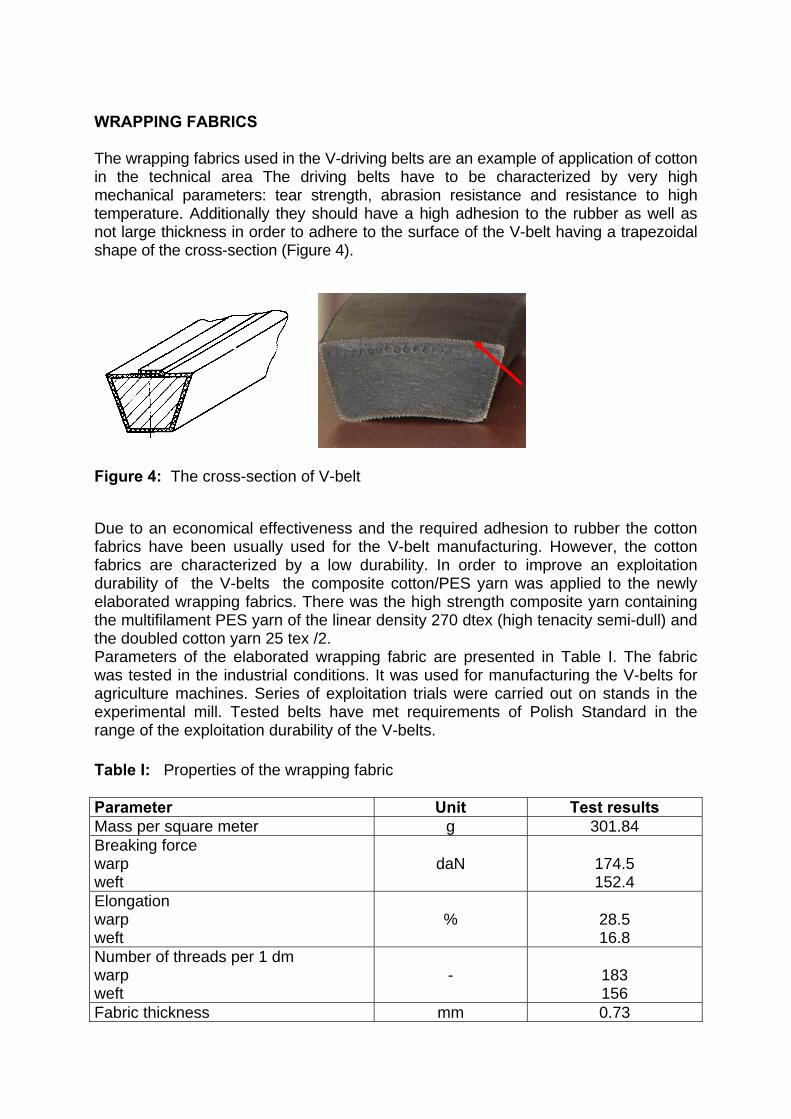
WRAPPING FABRICS The wrapping fabrics used in the V-driving belts are an example of application of cotton in the technical area The driving belts have to be characterized by very high mechanical parameters: tear strength, abrasion resistance and resistance to high temperature. Additionally they should have a high adhesion to the rubber as well as not large thickness in order to adhere to the surface of the V-belt having a trapezoidal shape of the cross-section (Figure 4).
Figure 4: The cross-section of V-belt Due to an economical effectiveness and the required adhesion to rubber the cotton fabrics have been usually used for the V-belt manufacturing. However, the cotton fabrics are characterized by a low durability. In order to improve an exploitation durability of the V-belts the composite cotton/PES yarn was applied to the newly elaborated wrapping fabrics. There was the high strength composite yarn containing the multifilament PES yarn of the linear density 270 dtex (high tenacity semi-dull) and the doubled cotton yarn 25 tex /2. Parameters of the elaborated wrapping fabric are presented in Table I. The fabric was tested in the industrial conditions. It was used for manufacturing the V-belts for agriculture machines. Series of exploitation trials were carried out on stands in the experimental mill. Tested belts have met requirements of Polish Standard in the range of the exploitation durability of the V-belts. Table I: Properties of the wrapping fabric Parameter Unit Test results Mass per square meter g 301.84 Breaking force warp weft
daN
174.5 152.4
Elongation warp weft
%
28.5 16.8
Number of threads per 1 dm warp weft
-
183 156
Fabric thickness mm 0.73
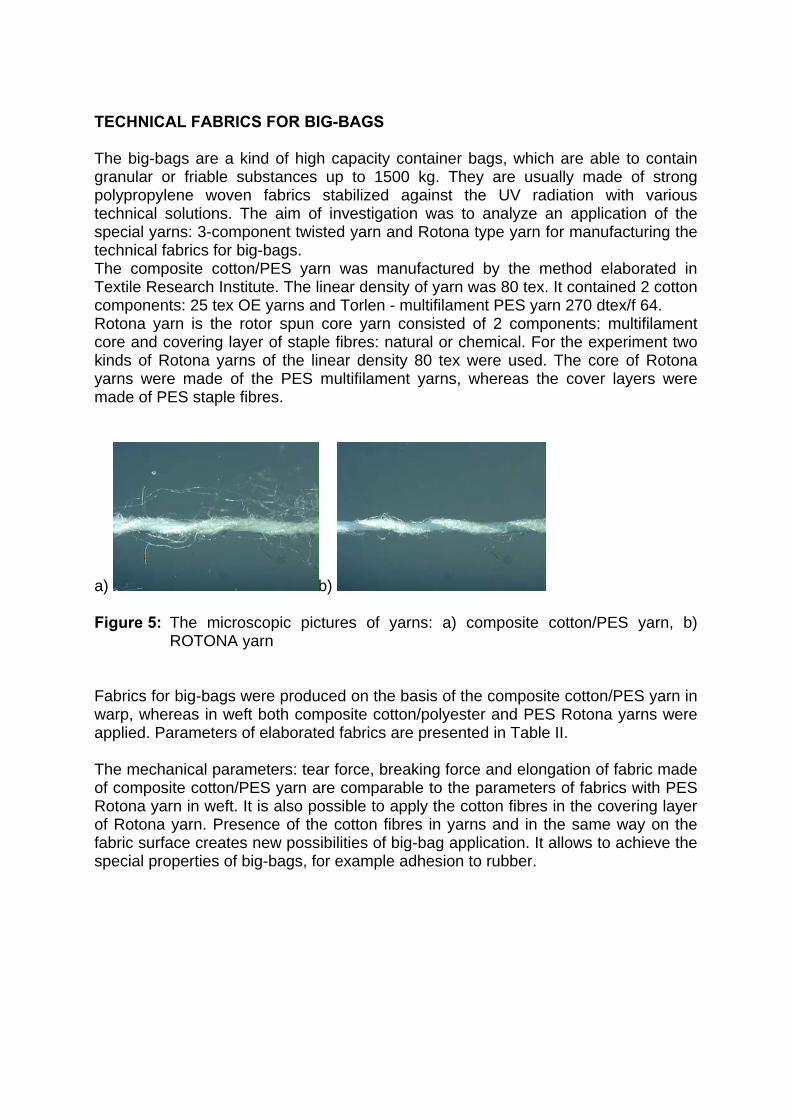
TECHNICAL FABRICS FOR BIG-BAGS The big-bags are a kind of high capacity container bags, which are able to contain granular or friable substances up to 1500 kg. They are usually made of strong polypropylene woven fabrics stabilized against the UV radiation with various technical solutions. The aim of investigation was to analyze an application of the special yarns: 3-component twisted yarn and Rotona type yarn for manufacturing the technical fabrics for big-bags. The composite cotton/PES yarn was manufactured by the method elaborated in Textile Research Institute. The linear density of yarn was 80 tex. It contained 2 cotton components: 25 tex OE yarns and Torlen - multifilament PES yarn 270 dtex/f 64. Rotona yarn is the rotor spun core yarn consisted of 2 components: multifilament core and covering layer of staple fibres: natural or chemical. For the experiment two kinds of Rotona yarns of the linear density 80 tex were used. The core of Rotona yarns were made of the PES multifilament yarns, whereas the cover layers were made of PES staple fibres.
a) b) Figure 5: The microscopic pictures of yarns: a) composite cotton/PES yarn, b)
ROTONA yarn Fabrics for big-bags were produced on the basis of the composite cotton/PES yarn in warp, whereas in weft both composite cotton/polyester and PES Rotona yarns were applied. Parameters of elaborated fabrics are presented in Table II. The mechanical parameters: tear force, breaking force and elongation of fabric made of composite cotton/PES yarn are comparable to the parameters of fabrics with PES Rotona yarn in weft. It is also possible to apply the cotton fibres in the covering layer of Rotona yarn. Presence of the cotton fibres in yarns and in the same way on the fabric surface creates new possibilities of big-bag application. It allows to achieve the special properties of big-bags, for example adhesion to rubber.
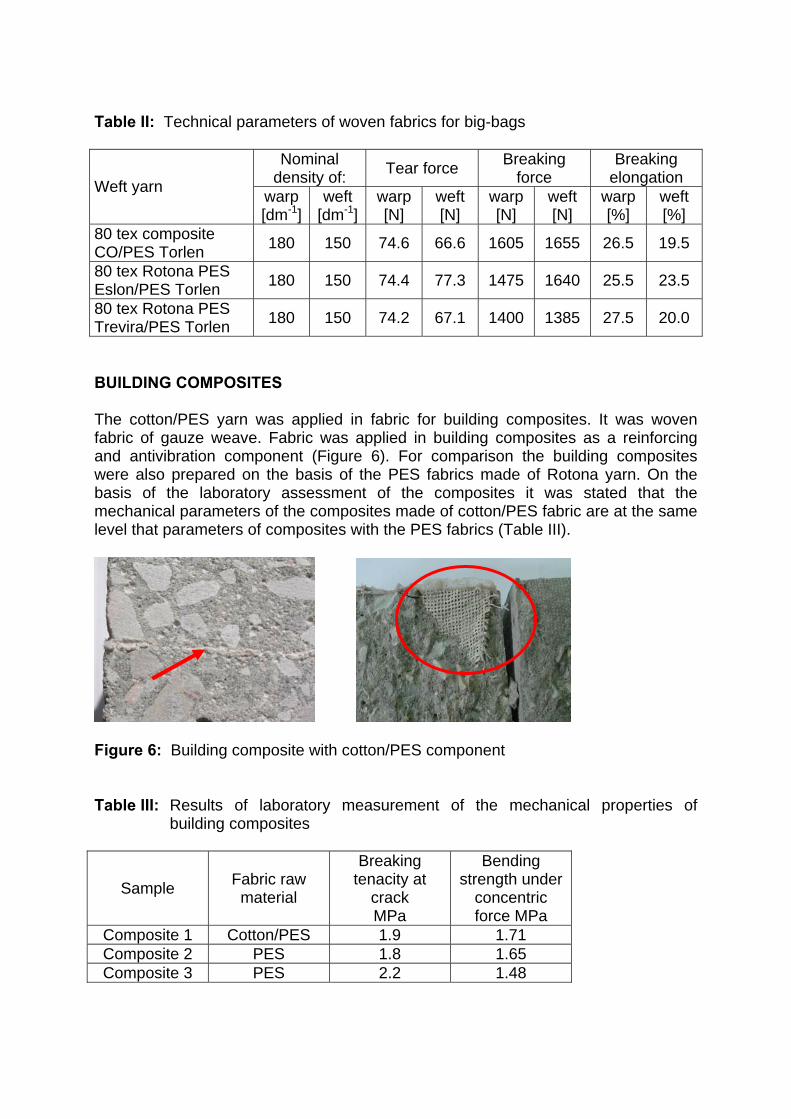
Table II: Technical parameters of woven fabrics for big-bags
Nominal density of: Tear force Breaking
force Breaking
elongation Weft yarn warp [dm-1]
weft [dm-1]
warp [N]
weft [N]
warp [N]
weft [N]
warp [%]
weft [%]
80 tex composite CO/PES Torlen 180 150 74.6 66.6 1605 1655 26.5 19.5
80 tex Rotona PES Eslon/PES Torlen 180 150 74.4 77.3 1475 1640 25.5 23.5
80 tex Rotona PES Trevira/PES Torlen 180 150 74.2 67.1 1400 1385 27.5 20.0
BUILDING COMPOSITES The cotton/PES yarn was applied in fabric for building composites. It was woven fabric of gauze weave. Fabric was applied in building composites as a reinforcing and antivibration component (Figure 6). For comparison the building composites were also prepared on the basis of the PES fabrics made of Rotona yarn. On the basis of the laboratory assessment of the composites it was stated that the mechanical parameters of the composites made of cotton/PES fabric are at the same level that parameters of composites with the PES fabrics (Table III).
Figure 6: Building composite with cotton/PES component Table III: Results of laboratory measurement of the mechanical properties of
building composites
Sample Fabric raw material
Breaking tenacity at
crack MPa
Bending strength under
concentric force MPa
Composite 1 Cotton/PES 1.9 1.71 Composite 2 PES 1.8 1.65 Composite 3 PES 2.2 1.48
MULTILAYER TEXTILE MATERIALS FOR UPPER PART OF THE TEXTILE FOOTWEAR Cotton fabrics designed in the Textile Research Institute were used in the multilayer textile material for the textile footwear ensuring high physiological comfort. There were woven fabrics of different weaves made of the naturally coloured cotton. Natural colour of fibres enabled an elimination of dyeing process and dyestuffs dangerous for environment. An excellent physiological comfort was achieved thanks to an appropriate configuration of the hydrophilic and hydrophobic layers (Figure 7). The inner layer - lining adjoining the foot skin is made of the polypropylene fibres. It is characterized by the high water-vapour permeability without the water-vapour absorption. The upper fabric, made of cotton fibres, absorbs water-vapour. Thanks to such a structure the water-vapour can be removed from the foot skin surface through the lining polypropylene fabric and it is absorbed by the upper cotton fabric. Next, water-vapour is evaporated outside the footwear. As a result of the fabric structure the microclimate generated between the foot skin and the footwear - dry air without the sweat - is not convenient for the growth of microorganisms. Table IV: Physiological properties of the multilayer textile material
Parameter Unit Material 1
Material 2
Material 3
Requirements
Tenacity: - warp - weft
N
1338 970
1452 992
1623 1174
min. 600
Elongation: - warp - weft
%
32.0 30.0
42.5 15.5
39.0 17.5
10 - 150
Tear resistance - warp - weft
N
113.7 87.8
102.0 122.0
114.8 105.8
min. 60
Water-vapour permeability mg cm-2 h-1 15.9 19.7 15.1 min. 4.0
Water-vapour absorption mg cm-2 2.2 2.0 2.4 min. 2.0
Water-vapour permeability factor mg cm-2 129.1 159.1 123.4 min. 30
Air permeability dm3 m-2 s-1 28.9 94.5 22.4 - Layer decomposition N mm-1 0.5 0.2 0.5 min. 0.2
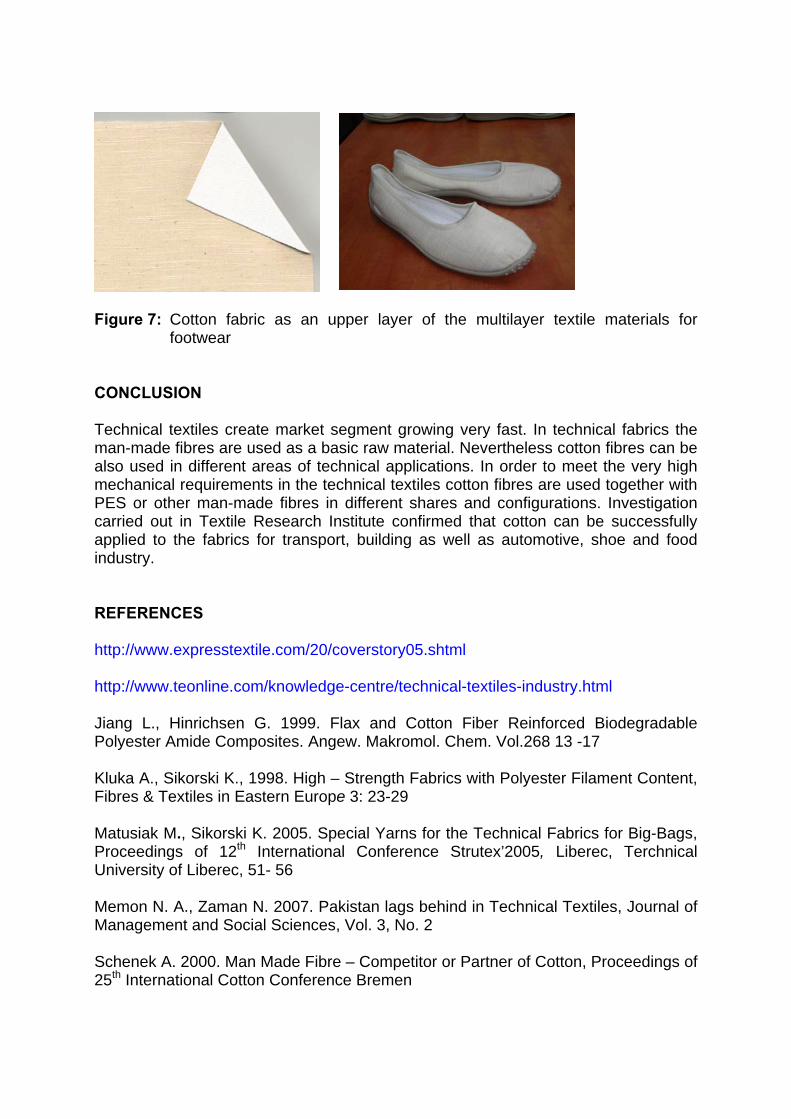
Figure 7: Cotton fabric as an upper layer of the multilayer textile materials for footwear
CONCLUSION Technical textiles create market segment growing very fast. In technical fabrics the man-made fibres are used as a basic raw material. Nevertheless cotton fibres can be also used in different areas of technical applications. In order to meet the very high mechanical requirements in the technical textiles cotton fibres are used together with PES or other man-made fibres in different shares and configurations. Investigation carried out in Textile Research Institute confirmed that cotton can be successfully applied to the fabrics for transport, building as well as automotive, shoe and food industry. REFERENCES http://www.expresstextile.com/20/coverstory05.shtml http://www.teonline.com/knowledge-centre/technical-textiles-industry.html Jiang L., Hinrichsen G. 1999. Flax and Cotton Fiber Reinforced Biodegradable Polyester Amide Composites. Angew. Makromol. Chem. Vol.268 13 -17 Kluka A., Sikorski K., 1998. High – Strength Fabrics with Polyester Filament Content, Fibres & Textiles in Eastern Europe 3: 23-29 Matusiak M., Sikorski K. 2005. Special Yarns for the Technical Fabrics for Big-Bags, Proceedings of 12th International Conference Strutex’2005, Liberec, Terchnical University of Liberec, 51- 56 Memon N. A., Zaman N. 2007. Pakistan lags behind in Technical Textiles, Journal of Management and Social Sciences, Vol. 3, No. 2 Schenek A. 2000. Man Made Fibre – Competitor or Partner of Cotton, Proceedings of 25th International Cotton Conference Bremen
UTILIZATION OF THE SPECIFIC COTTON PROPERTIES FOR NEW PRODUCTS
T. Schneider HTW Berlin, Germany
ABSTRACT To meet the markets needs and to arise cotton use also for technical purpose there must be innovation in apparel as well as in engineering textiles e.g. fiber composite materials. Variables for the implementation of this essentially comprise the technical feasibility of all interest groups involved in the value chain of cotton. Besides new products for the fashion market like overcoated or laminated clothes there are special needs in the field of technical textiles regarding ready-made manufacturing of textile area-measured material. Especially the use of controlled shrinkage to generate compressive strength within fiber reinforced composites meets the specific cotton properties and may arise and support the justification of cotton cultivation also in future. Regarding impartially the cotton cultivation at present there should be generated some additional application besides the use for apparel in general. INTRODUCTION Cotton cultivation for mass production of apparel started at the end of the 18th century. The spinning jenny and the mechanical hand loom as precursor for arising production and consumption were focussed on garments and home textiles. Because of the proper acceptance of cotton products there was up to now no real economic need for additional research to establish applications in the field of engineering textiles. The rather fast change of key markets regarding the assignments of tasks seems to challenge the use of cotton singly for garment and home textiles. To justify the economic and ecological needs requires the intensified use of cotton specific properties and to develop new markets. Besides the mass market feeded by casual wear and workwear garment as well there comes up a specific market of smart textiles and technical cotton products. Genetic engineering and also breeding cause improvement of properties like fineness by optimizing length/diameter proportion and e. g. development of seeds. Another field can be the functionalization and shrinkage purpose of textile area-measured material by combining the singular properties of the cotton itself and the engineering of the material.
1. Specific features of cotton and potential market The arising of resistance according to arising moisture content, sufficient hygienic properties, low allergy potential, uv-resistance, low electrostatic charge and adopted finishing only represent a small effect of cotton fibers. Garments and home textiles are common commodities; the use in the fields of automotive and medical application is arising. The need for the fashion market however depends on new developments in fiber fineness, coatings of fibers and the development of spinning methods processing cotton jointly with further different kinds of fibers. The attitude and the wearing comfort are important parameters for the acceptance of cotton in the upper genre of fashion. The functionalization like issues regarding e. g. the paper crash effect or the optimization of fit by reducing the fiber fineness are prospective applications for cotton fibers. Upcoming long term use or green glamour occur by the change of the attitude of people for a sustainable exposure to commodities. The additional benefit accommodates the challenge of a well care with natural resources. Another specific feature comes up thinking about the context between fiber properties and the weave construction. The use of controlled shrinkage caused by material and degree of humidity as well as caused by the weave construction on the other hand are tailored to suit a market need regarding natural fiber reinforced composite materials. The rough surface of cotton fibers and the according adhesive forces establish cotton fabrics as semi-finished parts for the composite industry. The distribution of fiber length within a population, the spinning process and the corresponding yarn properties as well as the weave construction allow a huge parameter list using the shrinkage of fabrics for proper technical applications. While apparel like casual wear and workwear garment predominantly focus on the mass market there is some opportunity for cotton in the specific market of smart textiles and technical cotton as well. An example maybe is the improvement of the proportion length/diameter for a better use of fiber tenacity and developing of microfibers by any chance also nanofibers. Breeding and genetic engineering will have progress in this field. Regarding the automotive area there are manifold applications in interior and exterior. Damping textiles or security use like coverings or even load-bearing parts like dashboards and instrument panels today partly are manufactured from recycled cotton fibers. One advantage of this kind of material is the edgeless area of fraction. Filtration textiles also serve an upcoming market. Besides the intrinsic task of filters there are additional cotton related properties for the use of aroma design by infiltration or pulverization of (recycled) cotton fibers to get a rapid dehumidification of air. Applications like autobodies using fabrics instead of sheets are new developments to adapt the aerodynamics as a function of velocity. An additional and synergistic benefit is the cooling of interior area by evaporations to save fuel and reduce emission of CO2.
2. Opportunities and prospective applications One of the most auspicious fields of research regarding the use of cotton fabrics are natural fiber reinforced composites. The use of shrinkage and the adapted effect of structure allow the implementation of controlled compressive strength within the components. The three species of woven goods like plain weave, twill weave and satin weave allow in principle the adjustment of a wide range of controlled shrinkage. Shrinkage is a disadvantage of cotton for apparel application but an immense advantage for technical use. To open the corresponding market there must be achieved two basic conditions:
- knowing the correlation between shrinkage, adiabatic expansion and weave construction
- knowing the specific properties of the curing process of adequate matrices like starch or other natural matrices able to comprehend a high water moisture content (modified polyamides)
The shrinkage in longitudinal and cross direction also depends besides the yarn construction on the concentration of warp and weft. The difference in dimension gains up to 20 % between the trim “pre-washed” and “after washing, dry”. Because of the surface related high tenacity of cotton yarns and cotton fabrics there is an arising potential of strains to be implemented within composite materials. The specific setting of shrinkage by yarn construction and the adapted structure of the textile area-measured material allow a tailored construction of the composite. Additionally and in case of blended yarns containing manmade fibers the application range expands over again. The modification of surface structure e. g. by laser irradiation allows another specific design of the fiber behaviour within the woven fabric. There was done a lot of research focussed on analysing the friction behaviour in fiber reinforced composites. The simulation of friction within fabric material pointed out that there is no reliable and physical based correlation found till now. Nevertheless there is need to devise some reliable rules to practice the potential caused by the shrinkage effect. Preliminary stages allow the conclusion that the shrinkage process can effect a strength level which corresponds to the tensile force of the cotton fiber itself. Considering this also concerning a high percentage of fiber content within the composite there should be created components for high mechanical load capacity, e. g. bend loading and fatigue strength under repeated stresses.
3. Need for action Monitoring the social acceptance regarding cotton cultivation necessitates an amplified use of the major features of cotton. Apparel combined with additional benefit and engineering textiles substantiated by computation generates the further development of natural fiber composites. Improvement of prognosis regarding the shrinkage process of fabrics will play a key role opening new markets for cotton fiber products. The key to locate new applications for cotton fibers is based on the use of the specific properties of cotton and also the specific construction of natural fiber reinforced composite materials. Utilizing the potential of cotton at present is not sufficient and searching for new products needs recognizing the signs of the times. Till today the recycling of natural fibers is not sufficient. Recycled natural fibers however outstandingly are suitable for proper use in composite materials. The conclusion is innovation in apparel as well as application in the area of engineering textiles. Proving the mass market and appliance in the slot demand rethinking by traders and weavers to include technical advise and support in their business. Another assessment and a key factor is the thinking in operation rather than in commodities. This notion necessitates to carry the specific properties of cotton into adjusted design and performance of commodities. The result is a proper synergetic effect between material and application.
Session VI: Cotton Testing and Harmonisation
30th International Cotton Conference BREMEN
March 24 - 27, 2010
ITMF International Committee on Cotton Testing MethodsChairman - M. N. VijayshankarTask Force on HVI - Mona QaudTask Force on Length - Axel DrielingTask Force on Stickiness - Jean-Paul GourlotTask Force on Neps and Trash - Jonn FoulkTask Force on Fineness and Maturity - Stuart GordonTask Force on Colour - Malgorzata Matusiak
Editor‘s Note The minutes will be published in a PROGRESS REPORT in due time.
Categorization of Extraneous Matter in Cotton Using Machine Vision SystemsDerek WhitelockCotton Fiber Moisture Measurement - From the Bale to the LaboratoryJames RodgersNew Fiber Length and Strength Tester for Cotton Spinning MillsGuntram Kugler, Dean EthridgeDevelopments in Short Fiber MeasurementsJames KnowltonDevelopments in Fiber Quality Measurements and On-line ApplicationsHossein GhorashiMaturity and Trash - New Parameters in Premier ART 2Varadarajan Srinivasan
•
•
•
•
•
•
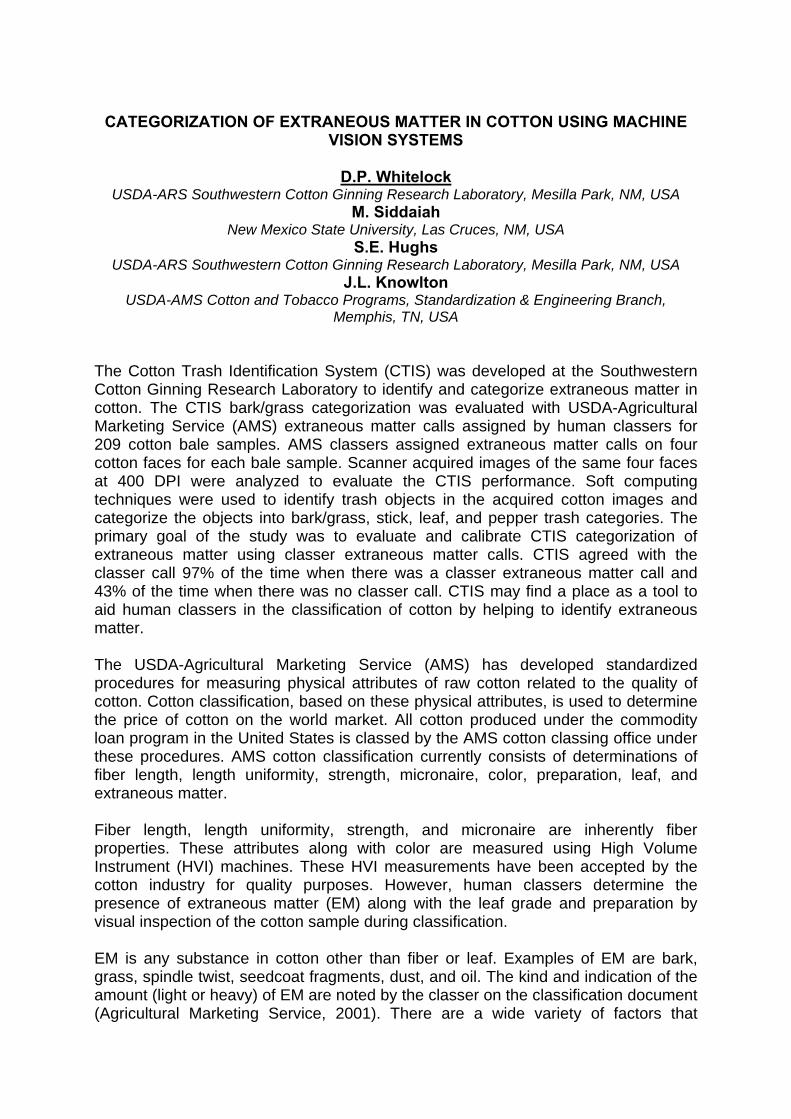
CATEGORIZATION OF EXTRANEOUS MATTER IN COTTON USING MACHINE VISION SYSTEMS
D.P. Whitelock
USDA-ARS Southwestern Cotton Ginning Research Laboratory, Mesilla Park, NM, USA M. Siddaiah
New Mexico State University, Las Cruces, NM, USA S.E. Hughs
USDA-ARS Southwestern Cotton Ginning Research Laboratory, Mesilla Park, NM, USA J.L. Knowlton
USDA-AMS Cotton and Tobacco Programs, Standardization & Engineering Branch, Memphis, TN, USA
The Cotton Trash Identification System (CTIS) was developed at the Southwestern Cotton Ginning Research Laboratory to identify and categorize extraneous matter in cotton. The CTIS bark/grass categorization was evaluated with USDA-Agricultural Marketing Service (AMS) extraneous matter calls assigned by human classers for 209 cotton bale samples. AMS classers assigned extraneous matter calls on four cotton faces for each bale sample. Scanner acquired images of the same four faces at 400 DPI were analyzed to evaluate the CTIS performance. Soft computing techniques were used to identify trash objects in the acquired cotton images and categorize the objects into bark/grass, stick, leaf, and pepper trash categories. The primary goal of the study was to evaluate and calibrate CTIS categorization of extraneous matter using classer extraneous matter calls. CTIS agreed with the classer call 97% of the time when there was a classer extraneous matter call and 43% of the time when there was no classer call. CTIS may find a place as a tool to aid human classers in the classification of cotton by helping to identify extraneous matter. The USDA-Agricultural Marketing Service (AMS) has developed standardized procedures for measuring physical attributes of raw cotton related to the quality of cotton. Cotton classification, based on these physical attributes, is used to determine the price of cotton on the world market. All cotton produced under the commodity loan program in the United States is classed by the AMS cotton classing office under these procedures. AMS cotton classification currently consists of determinations of fiber length, length uniformity, strength, micronaire, color, preparation, leaf, and extraneous matter. Fiber length, length uniformity, strength, and micronaire are inherently fiber properties. These attributes along with color are measured using High Volume Instrument (HVI) machines. These HVI measurements have been accepted by the cotton industry for quality purposes. However, human classers determine the presence of extraneous matter (EM) along with the leaf grade and preparation by visual inspection of the cotton sample during classification. EM is any substance in cotton other than fiber or leaf. Examples of EM are bark, grass, spindle twist, seedcoat fragments, dust, and oil. The kind and indication of the amount (light or heavy) of EM are noted by the classer on the classification document (Agricultural Marketing Service, 2001). There are a wide variety of factors that
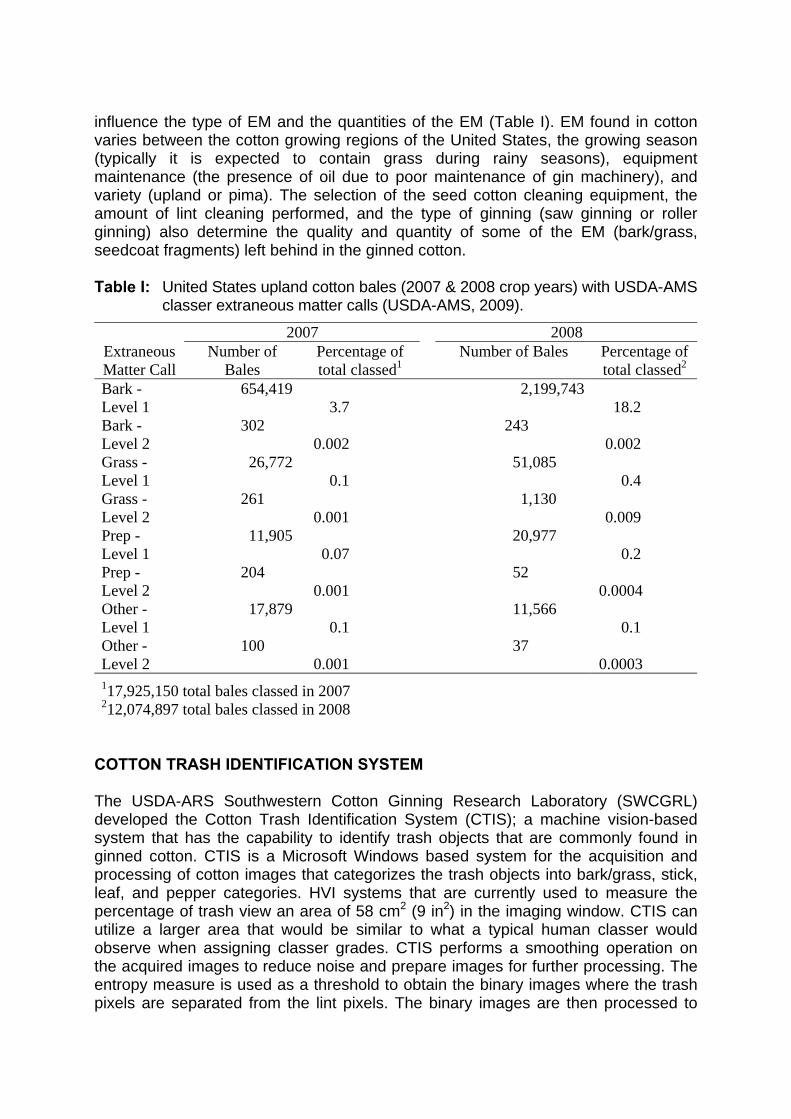
influence the type of EM and the quantities of the EM (Table I). EM found in cotton varies between the cotton growing regions of the United States, the growing season (typically it is expected to contain grass during rainy seasons), equipment maintenance (the presence of oil due to poor maintenance of gin machinery), and variety (upland or pima). The selection of the seed cotton cleaning equipment, the amount of lint cleaning performed, and the type of ginning (saw ginning or roller ginning) also determine the quality and quantity of some of the EM (bark/grass, seedcoat fragments) left behind in the ginned cotton. Table I: United States upland cotton bales (2007 & 2008 crop years) with USDA-AMS
classer extraneous matter calls (USDA-AMS, 2009).
2007 2008 Extraneous Matter Call
Number of Bales
Percentage of total classed1
Number of Bales Percentage of total classed2
Bark - Level 1
654,419 3.7
2,199,743 18.2
Bark - Level 2
302 0.002
243 0.002
Grass - Level 1
26,772 0.1
51,085 0.4
Grass - Level 2
261 0.001
1,130 0.009
Prep - Level 1
11,905 0.07
20,977 0.2
Prep - Level 2
204 0.001
52 0.0004
Other - Level 1
17,879 0.1
11,566 0.1
Other - Level 2
100 0.001
37 0.0003
117,925,150 total bales classed in 2007 212,074,897 total bales classed in 2008
COTTON TRASH IDENTIFICATION SYSTEM The USDA-ARS Southwestern Cotton Ginning Research Laboratory (SWCGRL) developed the Cotton Trash Identification System (CTIS); a machine vision-based system that has the capability to identify trash objects that are commonly found in ginned cotton. CTIS is a Microsoft Windows based system for the acquisition and processing of cotton images that categorizes the trash objects into bark/grass, stick, leaf, and pepper categories. HVI systems that are currently used to measure the percentage of trash view an area of 58 cm2 (9 in2) in the imaging window. CTIS can utilize a larger area that would be similar to what a typical human classer would observe when assigning classer grades. CTIS performs a smoothing operation on the acquired images to reduce noise and prepare images for further processing. The entropy measure is used as a threshold to obtain the binary images where the trash pixels are separated from the lint pixels. The binary images are then processed to
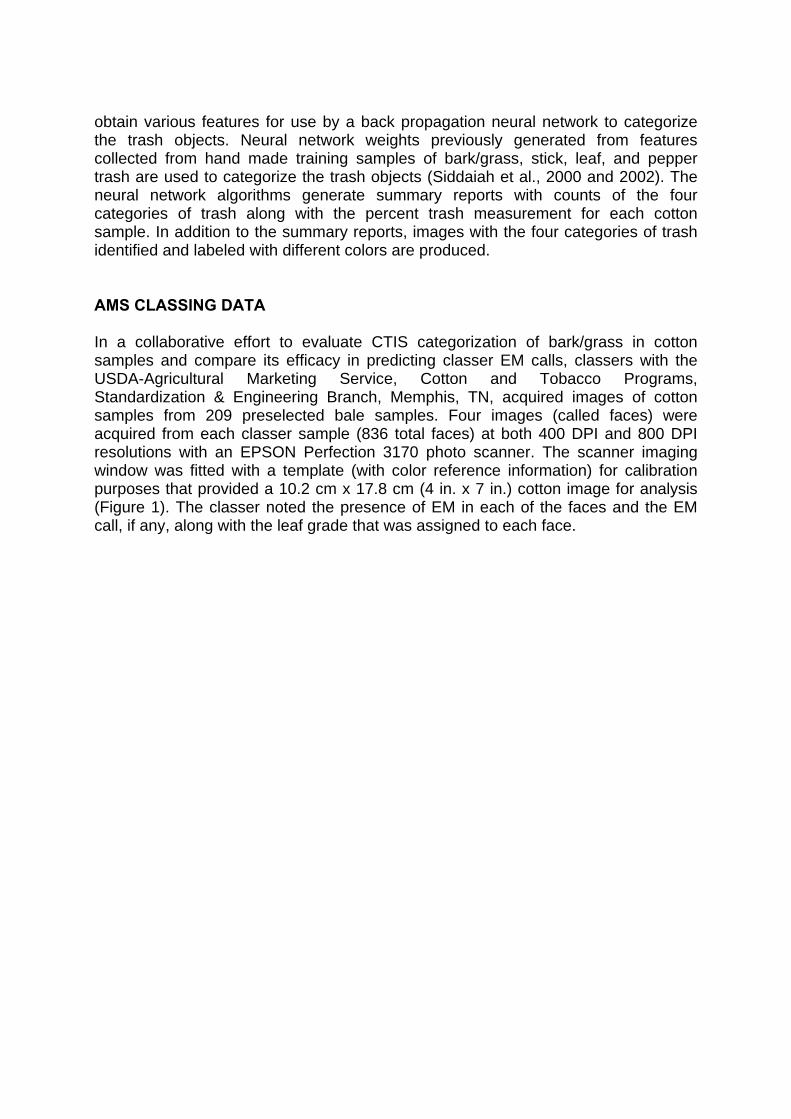
obtain various features for use by a back propagation neural network to categorize the trash objects. Neural network weights previously generated from features collected from hand made training samples of bark/grass, stick, leaf, and pepper trash are used to categorize the trash objects (Siddaiah et al., 2000 and 2002). The neural network algorithms generate summary reports with counts of the four categories of trash along with the percent trash measurement for each cotton sample. In addition to the summary reports, images with the four categories of trash identified and labeled with different colors are produced. AMS CLASSING DATA In a collaborative effort to evaluate CTIS categorization of bark/grass in cotton samples and compare its efficacy in predicting classer EM calls, classers with the USDA-Agricultural Marketing Service, Cotton and Tobacco Programs, Standardization & Engineering Branch, Memphis, TN, acquired images of cotton samples from 209 preselected bale samples. Four images (called faces) were acquired from each classer sample (836 total faces) at both 400 DPI and 800 DPI resolutions with an EPSON Perfection 3170 photo scanner. The scanner imaging window was fitted with a template (with color reference information) for calibration purposes that provided a 10.2 cm x 17.8 cm (4 in. x 7 in.) cotton image for analysis (Figure 1). The classer noted the presence of EM in each of the faces and the EM call, if any, along with the leaf grade that was assigned to each face.
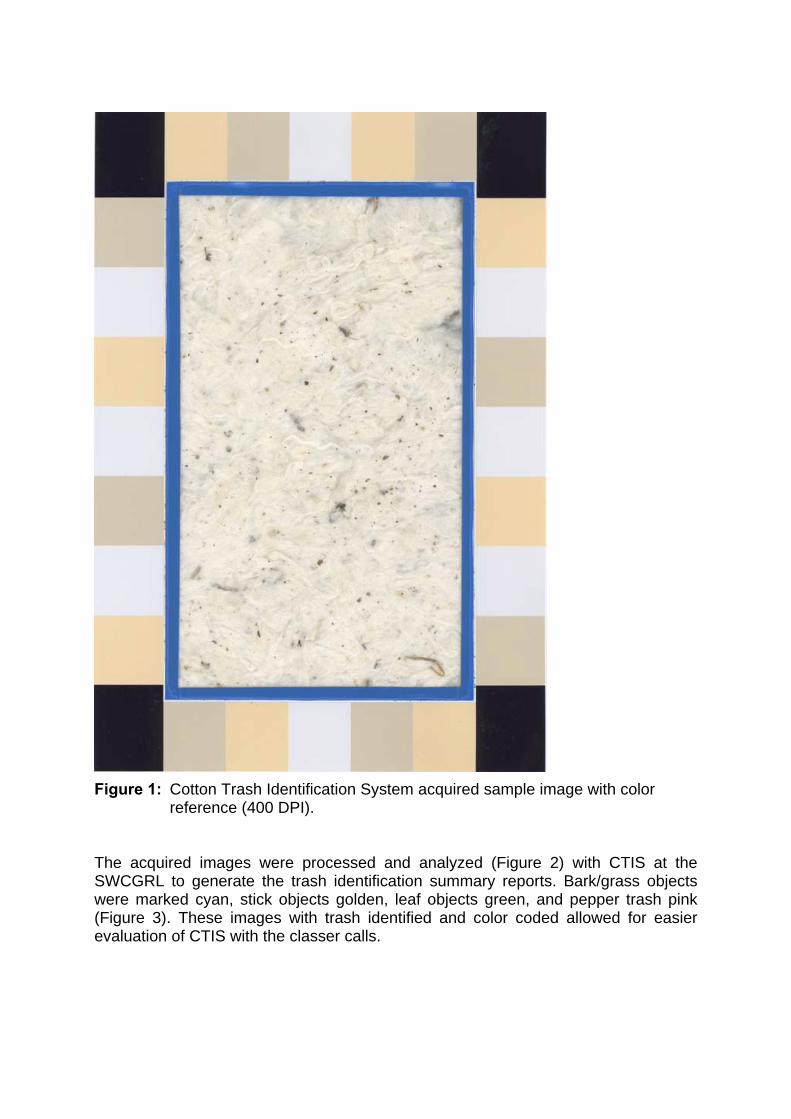
Figure 1: Cotton Trash Identification System acquired sample image with color
reference (400 DPI). The acquired images were processed and analyzed (Figure 2) with CTIS at the SWCGRL to generate the trash identification summary reports. Bark/grass objects were marked cyan, stick objects golden, leaf objects green, and pepper trash pink (Figure 3). These images with trash identified and color coded allowed for easier evaluation of CTIS with the classer calls.
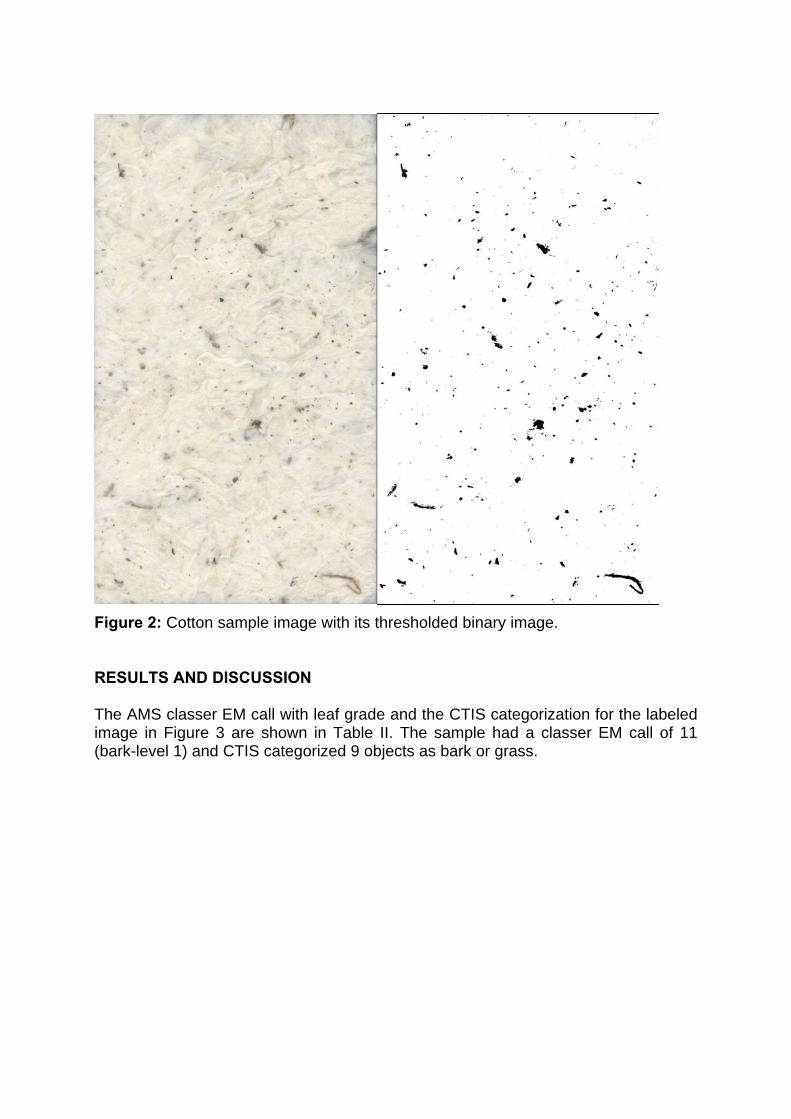
Figure 2: Cotton sample image with its thresholded binary image. RESULTS AND DISCUSSION The AMS classer EM call with leaf grade and the CTIS categorization for the labeled image in Figure 3 are shown in Table II. The sample had a classer EM call of 11 (bark-level 1) and CTIS categorized 9 objects as bark or grass.
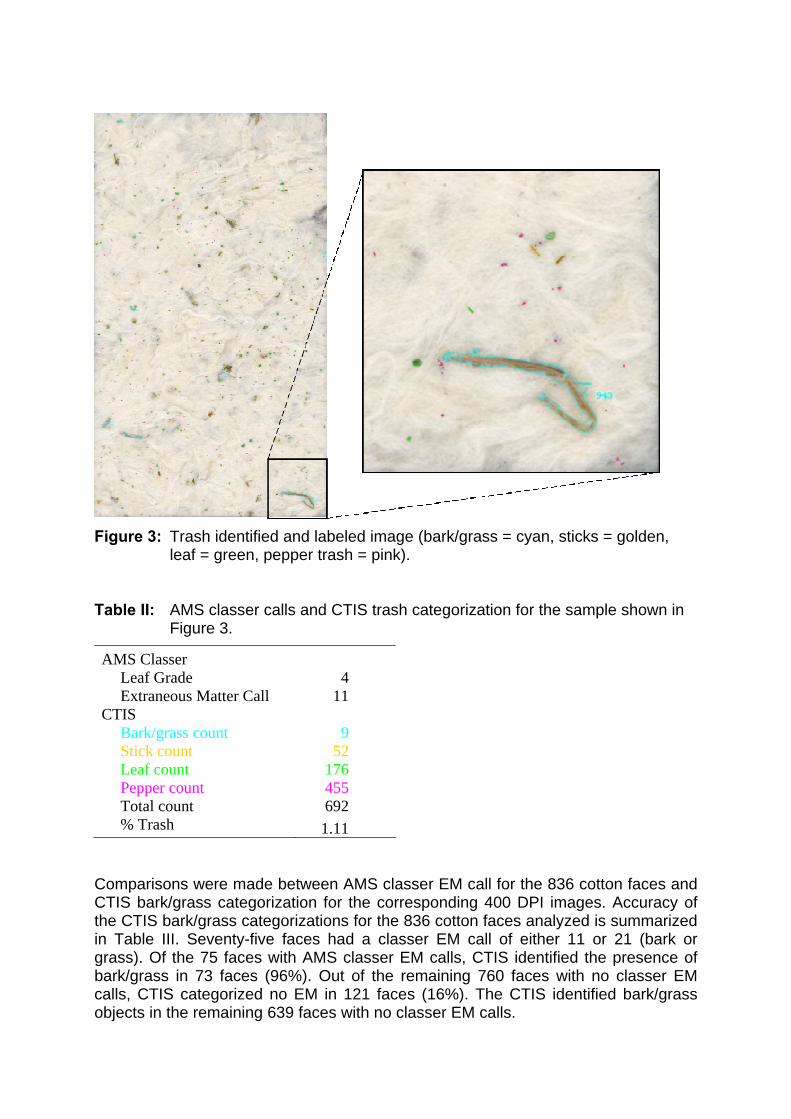
Figure 3: Trash identified and labeled image (bark/grass = cyan, sticks = golden,
leaf = green, pepper trash = pink). Table II: AMS classer calls and CTIS trash categorization for the sample shown in
Figure 3.
AMS Classer Leaf Grade 4 Extraneous Matter Call 11
CTIS Bark/grass count 9 Stick count 52 Leaf count 176 Pepper count 455 Total count 692 % Trash 1.11
Comparisons were made between AMS classer EM call for the 836 cotton faces and CTIS bark/grass categorization for the corresponding 400 DPI images. Accuracy of the CTIS bark/grass categorizations for the 836 cotton faces analyzed is summarized in Table III. Seventy-five faces had a classer EM call of either 11 or 21 (bark or grass). Of the 75 faces with AMS classer EM calls, CTIS identified the presence of bark/grass in 73 faces (96%). Out of the remaining 760 faces with no classer EM calls, CTIS categorized no EM in 121 faces (16%). The CTIS identified bark/grass objects in the remaining 639 faces with no classer EM calls.
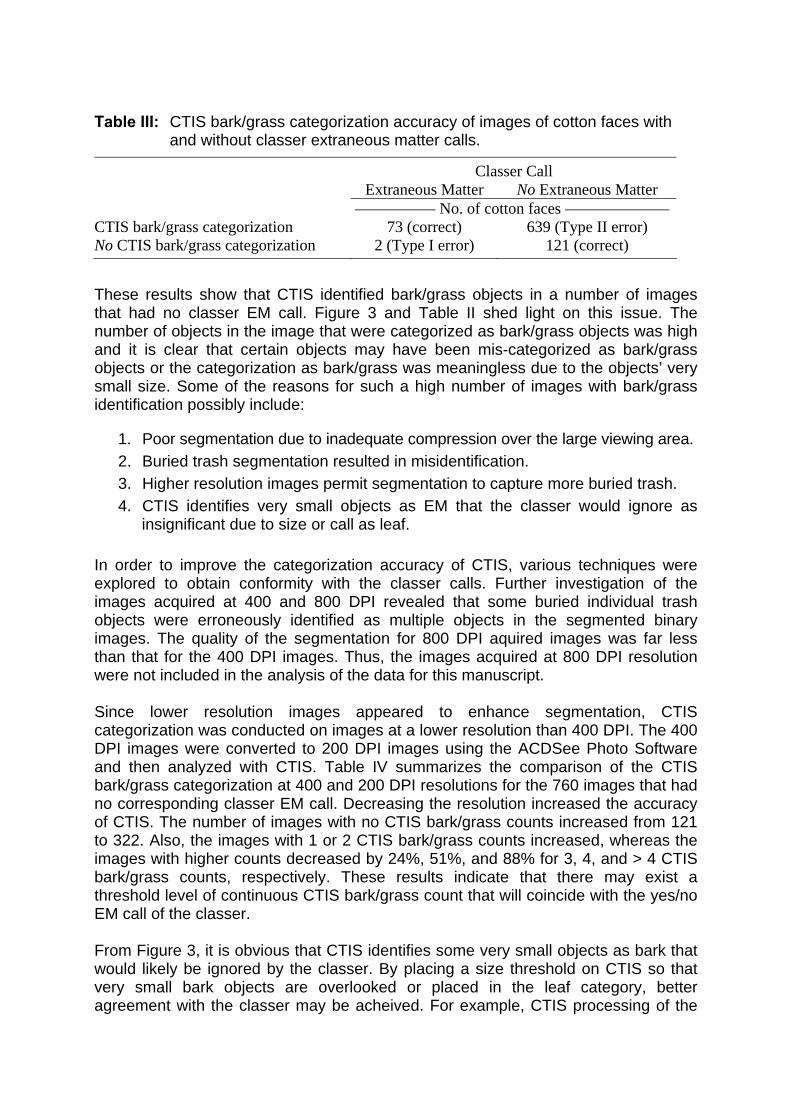
Table III: CTIS bark/grass categorization accuracy of images of cotton faces with and without classer extraneous matter calls.
Classer Call Extraneous Matter No Extraneous Matter
No. of cotton faces CTIS bark/grass categorization 73 (correct) 639 (Type II error) No CTIS bark/grass categorization 2 (Type I error) 121 (correct) These results show that CTIS identified bark/grass objects in a number of images that had no classer EM call. Figure 3 and Table II shed light on this issue. The number of objects in the image that were categorized as bark/grass objects was high and it is clear that certain objects may have been mis-categorized as bark/grass objects or the categorization as bark/grass was meaningless due to the objects’ very small size. Some of the reasons for such a high number of images with bark/grass identification possibly include:
1. Poor segmentation due to inadequate compression over the large viewing area. 2. Buried trash segmentation resulted in misidentification. 3. Higher resolution images permit segmentation to capture more buried trash. 4. CTIS identifies very small objects as EM that the classer would ignore as
insignificant due to size or call as leaf. In order to improve the categorization accuracy of CTIS, various techniques were explored to obtain conformity with the classer calls. Further investigation of the images acquired at 400 and 800 DPI revealed that some buried individual trash objects were erroneously identified as multiple objects in the segmented binary images. The quality of the segmentation for 800 DPI aquired images was far less than that for the 400 DPI images. Thus, the images acquired at 800 DPI resolution were not included in the analysis of the data for this manuscript. Since lower resolution images appeared to enhance segmentation, CTIS categorization was conducted on images at a lower resolution than 400 DPI. The 400 DPI images were converted to 200 DPI images using the ACDSee Photo Software and then analyzed with CTIS. Table IV summarizes the comparison of the CTIS bark/grass categorization at 400 and 200 DPI resolutions for the 760 images that had no corresponding classer EM call. Decreasing the resolution increased the accuracy of CTIS. The number of images with no CTIS bark/grass counts increased from 121 to 322. Also, the images with 1 or 2 CTIS bark/grass counts increased, whereas the images with higher counts decreased by 24%, 51%, and 88% for 3, 4, and > 4 CTIS bark/grass counts, respectively. These results indicate that there may exist a threshold level of continuous CTIS bark/grass count that will coincide with the yes/no EM call of the classer. From Figure 3, it is obvious that CTIS identifies some very small objects as bark that would likely be ignored by the classer. By placing a size threshold on CTIS so that very small bark objects are overlooked or placed in the leaf category, better agreement with the classer may be acheived. For example, CTIS processing of the
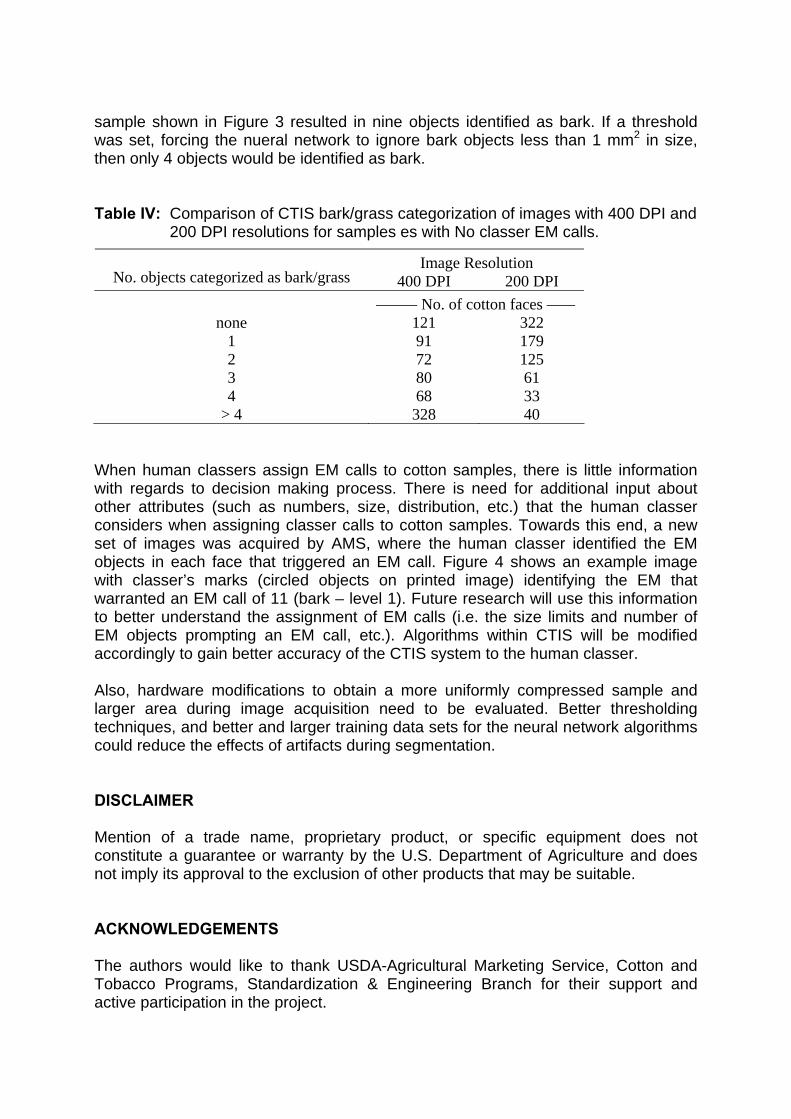
sample shown in Figure 3 resulted in nine objects identified as bark. If a threshold was set, forcing the nueral network to ignore bark objects less than 1 mm2 in size, then only 4 objects would be identified as bark. Table IV: Comparison of CTIS bark/grass categorization of images with 400 DPI and
200 DPI resolutions for samples es with No classer EM calls.
Image Resolution No. objects categorized as bark/grass 400 DPI 200 DPI
No. of cotton faces none 121 322
1 91 179 2 72 125 3 80 61 4 68 33
> 4 328 40 When human classers assign EM calls to cotton samples, there is little information with regards to decision making process. There is need for additional input about other attributes (such as numbers, size, distribution, etc.) that the human classer considers when assigning classer calls to cotton samples. Towards this end, a new set of images was acquired by AMS, where the human classer identified the EM objects in each face that triggered an EM call. Figure 4 shows an example image with classer’s marks (circled objects on printed image) identifying the EM that warranted an EM call of 11 (bark – level 1). Future research will use this information to better understand the assignment of EM calls (i.e. the size limits and number of EM objects prompting an EM call, etc.). Algorithms within CTIS will be modified accordingly to gain better accuracy of the CTIS system to the human classer. Also, hardware modifications to obtain a more uniformly compressed sample and larger area during image acquisition need to be evaluated. Better thresholding techniques, and better and larger training data sets for the neural network algorithms could reduce the effects of artifacts during segmentation. DISCLAIMER Mention of a trade name, proprietary product, or specific equipment does not constitute a guarantee or warranty by the U.S. Department of Agriculture and does not imply its approval to the exclusion of other products that may be suitable. ACKNOWLEDGEMENTS The authors would like to thank USDA-Agricultural Marketing Service, Cotton and Tobacco Programs, Standardization & Engineering Branch for their support and active participation in the project.
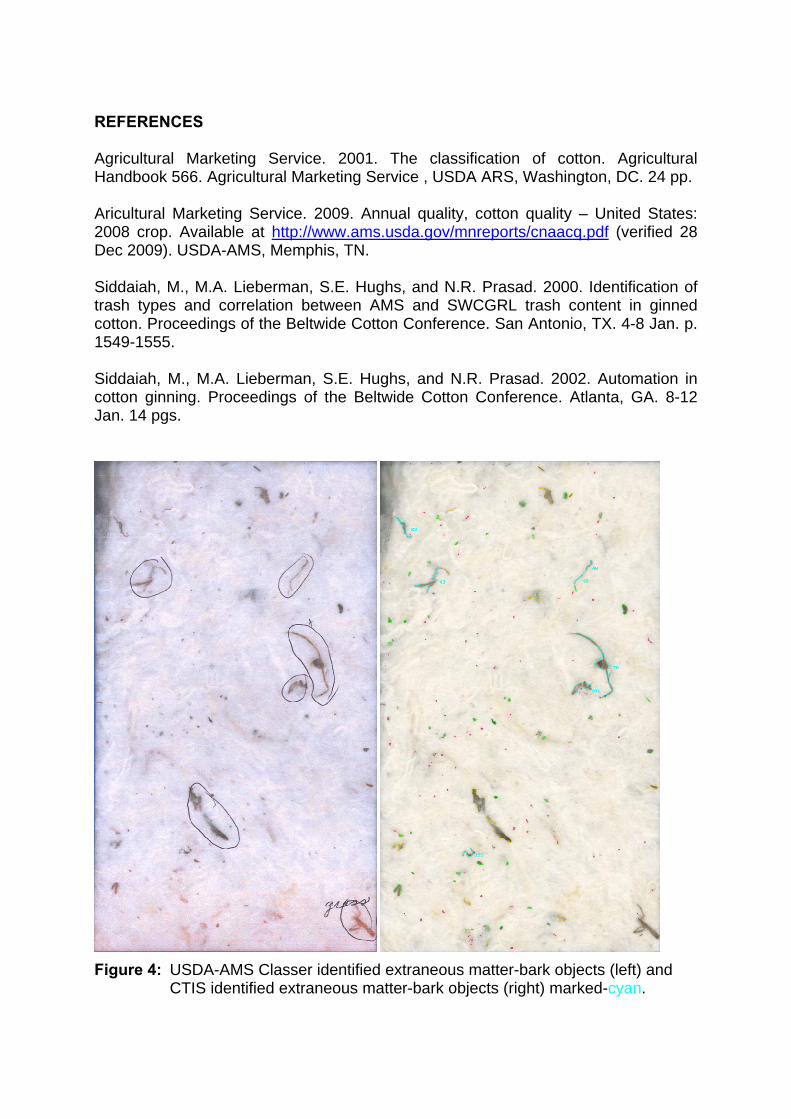
REFERENCES Agricultural Marketing Service. 2001. The classification of cotton. Agricultural Handbook 566. Agricultural Marketing Service , USDA ARS, Washington, DC. 24 pp. Aricultural Marketing Service. 2009. Annual quality, cotton quality – United States: 2008 crop. Available at http://www.ams.usda.gov/mnreports/cnaacq.pdf (verified 28 Dec 2009). USDA-AMS, Memphis, TN. Siddaiah, M., M.A. Lieberman, S.E. Hughs, and N.R. Prasad. 2000. Identification of trash types and correlation between AMS and SWCGRL trash content in ginned cotton. Proceedings of the Beltwide Cotton Conference. San Antonio, TX. 4-8 Jan. p. 1549-1555. Siddaiah, M., M.A. Lieberman, S.E. Hughs, and N.R. Prasad. 2002. Automation in cotton ginning. Proceedings of the Beltwide Cotton Conference. Atlanta, GA. 8-12 Jan. 14 pgs.
Figure 4: USDA-AMS Classer identified extraneous matter-bark objects (left) and
CTIS identified extraneous matter-bark objects (right) marked-cyan.
COTTON FIBRE MOISTURE MEASUREMENT - FROM THE BALE TO THE LABORATORY
J. Rodgers1, C. Delhom1, J. Montalvo1, D. Thibodeaux2, X. Cui1
1Southern Regional Research Centre, Agricultural Research Service, USDA, New Orleans, LA, USA; 2Cotton Quality Research Station, Agricultural Research
Service, USDA, Clemson, SC, USA Moisture is an important quality, processing, and marketing parameter for cotton fibre. The accurate and precise measurement of fibre moisture continues to be an issue of importance in the global marketplace. There are several commercially available moisture measurement instruments for fibre moisture measurements in the laboratory, at-line, and the bale (at-line and on-line). These moisture units typically use the ASTM oven method (thermal gravimetric) as the reference method for moisture. Environmental impacts (temperature, relative humidity) leading to changing moisture levels during fibre measurements can impact key fibre results. At-line and bale (at-line and on-line at the gin) moisture measurement systems are reviewed. Most often, it is desired for these at-line and on-line systems to agree closely with laboratory fibre moisture measurements. There are several forms and types of laboratory fibre moisture measurements and measurement systems, each with their own advantages and disadvantages. Moisture measurements and systems can generally be divided into gravimetric, chemical, spectroscopy, and “electric” categories. Several of the more common fibre moisture measurement systems were compared. Most of the fibre moisture measurements and systems yielded acceptable/good agreement to the oven method (within ±0.5% moisture agreement). However, few of these systems agreed to the much tighter method agreement of within ±0.3% moisture. A comprehensive Comparison Matrix was developed that combines both non-technical and technical attributes so as to assist the potential purchaser in selecting the best overall moisture measurement system for their needs. New research is focusing on a chemical method as the reference method for fibre moisture. INTRODUCTION Cotton fibre moisture is an important quality, processing, and marketing measurement for cotton fibre. Fibre moisture measurements can be performed in the laboratory, at-line, and at the bale (either at-line or on-line). At-line measurements are those performed in a manufacturing area but not on the production equipment, and on-line measurements are those that can be performed during processing on a manufacturing line (e.g., ginning). Accurate moisture measurements necessitate the use of standard environmental conditions (65% Relative Humidity (RH) and 70OF; ASTM D-1776-04). Changes in the environmental conditions (temperature, relative humidity/RH) will result in changes in the fibre’s moisture content. Industry interest in cotton fibre/lint moisture has increased significantly since 2000, due in no small part to recent concerns on the:
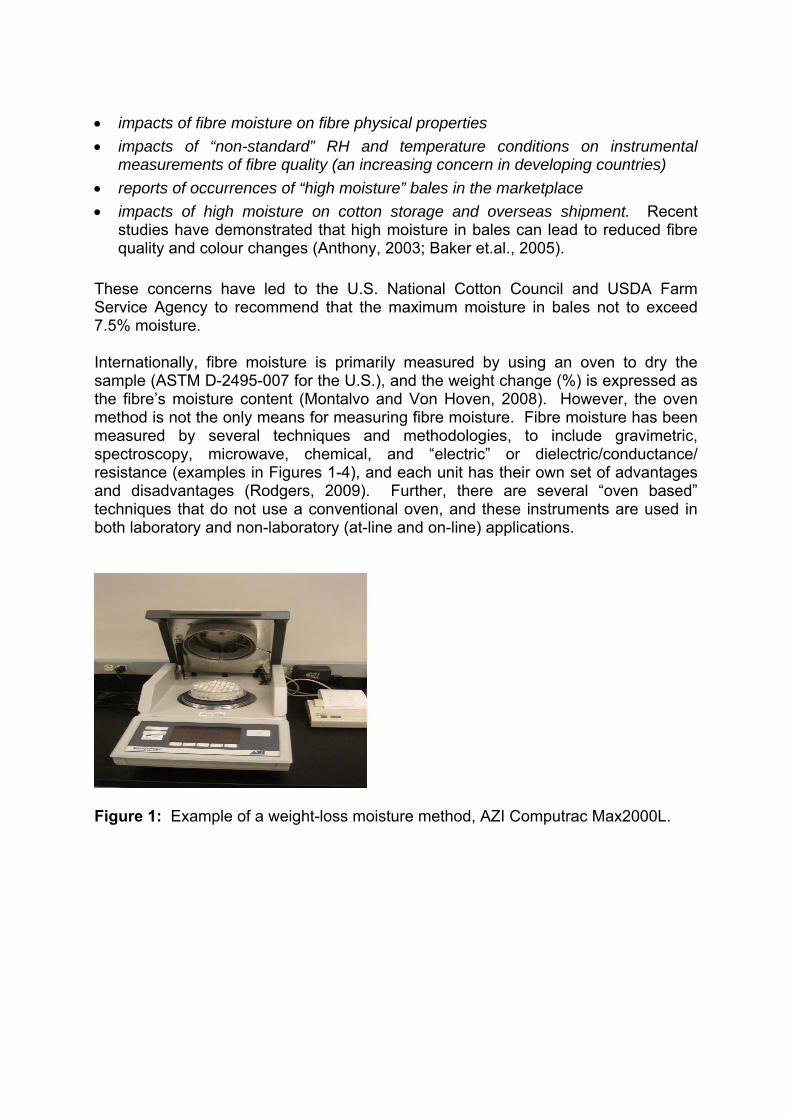
• impacts of fibre moisture on fibre physical properties • impacts of “non-standard” RH and temperature conditions on instrumental
measurements of fibre quality (an increasing concern in developing countries) • reports of occurrences of “high moisture” bales in the marketplace • impacts of high moisture on cotton storage and overseas shipment. Recent
studies have demonstrated that high moisture in bales can lead to reduced fibre quality and colour changes (Anthony, 2003; Baker et.al., 2005).
These concerns have led to the U.S. National Cotton Council and USDA Farm Service Agency to recommend that the maximum moisture in bales not to exceed 7.5% moisture. Internationally, fibre moisture is primarily measured by using an oven to dry the sample (ASTM D-2495-007 for the U.S.), and the weight change (%) is expressed as the fibre’s moisture content (Montalvo and Von Hoven, 2008). However, the oven method is not the only means for measuring fibre moisture. Fibre moisture has been measured by several techniques and methodologies, to include gravimetric, spectroscopy, microwave, chemical, and “electric” or dielectric/conductance/ resistance (examples in Figures 1-4), and each unit has their own set of advantages and disadvantages (Rodgers, 2009). Further, there are several “oven based” techniques that do not use a conventional oven, and these instruments are used in both laboratory and non-laboratory (at-line and on-line) applications.
Figure 1: Example of a weight-loss moisture method, AZI Computrac Max2000L.
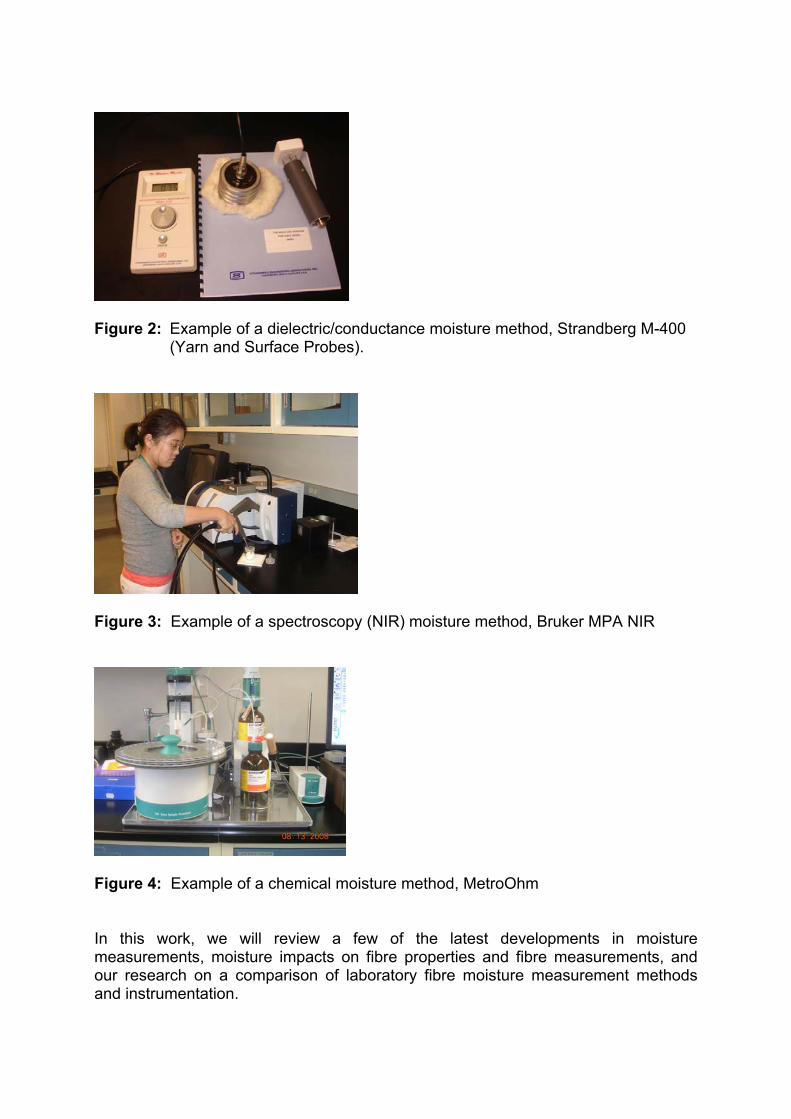
Figure 2: Example of a dielectric/conductance moisture method, Strandberg M-400
(Yarn and Surface Probes).
Figure 3: Example of a spectroscopy (NIR) moisture method, Bruker MPA NIR
Figure 4: Example of a chemical moisture method, MetroOhm In this work, we will review a few of the latest developments in moisture measurements, moisture impacts on fibre properties and fibre measurements, and our research on a comparison of laboratory fibre moisture measurement methods and instrumentation.
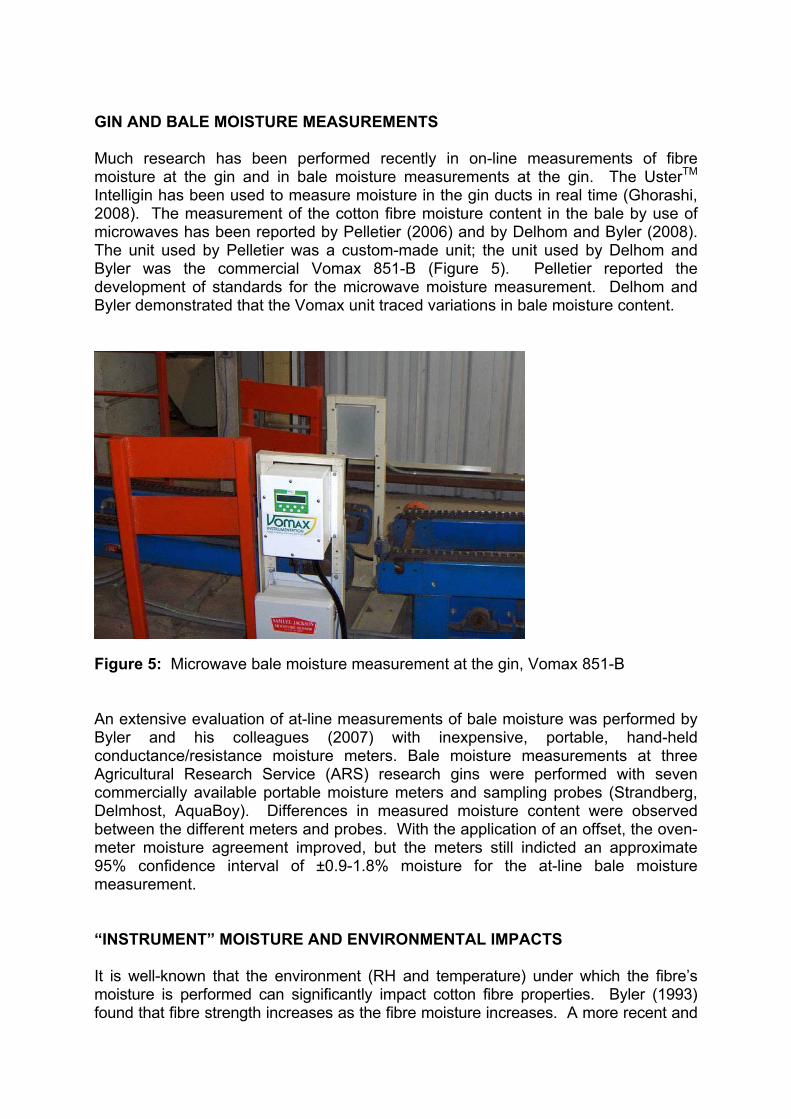
GIN AND BALE MOISTURE MEASUREMENTS Much research has been performed recently in on-line measurements of fibre moisture at the gin and in bale moisture measurements at the gin. The UsterTM Intelligin has been used to measure moisture in the gin ducts in real time (Ghorashi, 2008). The measurement of the cotton fibre moisture content in the bale by use of microwaves has been reported by Pelletier (2006) and by Delhom and Byler (2008). The unit used by Pelletier was a custom-made unit; the unit used by Delhom and Byler was the commercial Vomax 851-B (Figure 5). Pelletier reported the development of standards for the microwave moisture measurement. Delhom and Byler demonstrated that the Vomax unit traced variations in bale moisture content.
Figure 5: Microwave bale moisture measurement at the gin, Vomax 851-B An extensive evaluation of at-line measurements of bale moisture was performed by Byler and his colleagues (2007) with inexpensive, portable, hand-held conductance/resistance moisture meters. Bale moisture measurements at three Agricultural Research Service (ARS) research gins were performed with seven commercially available portable moisture meters and sampling probes (Strandberg, Delmhost, AquaBoy). Differences in measured moisture content were observed between the different meters and probes. With the application of an offset, the oven-meter moisture agreement improved, but the meters still indicted an approximate 95% confidence interval of ±0.9-1.8% moisture for the at-line bale moisture measurement. “INSTRUMENT” MOISTURE AND ENVIRONMENTAL IMPACTS It is well-known that the environment (RH and temperature) under which the fibre’s moisture is performed can significantly impact cotton fibre properties. Byler (1993) found that fibre strength increases as the fibre moisture increases. A more recent and
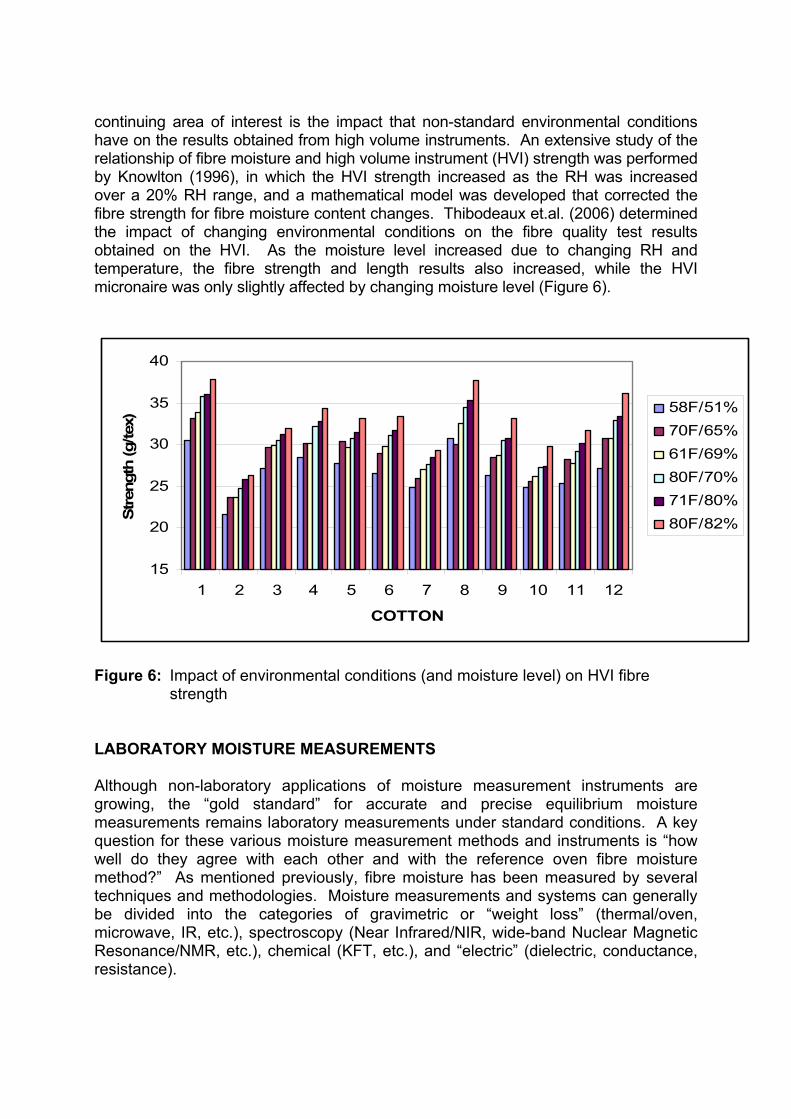
continuing area of interest is the impact that non-standard environmental conditions have on the results obtained from high volume instruments. An extensive study of the relationship of fibre moisture and high volume instrument (HVI) strength was performed by Knowlton (1996), in which the HVI strength increased as the RH was increased over a 20% RH range, and a mathematical model was developed that corrected the fibre strength for fibre moisture content changes. Thibodeaux et.al. (2006) determined the impact of changing environmental conditions on the fibre quality test results obtained on the HVI. As the moisture level increased due to changing RH and temperature, the fibre strength and length results also increased, while the HVI micronaire was only slightly affected by changing moisture level (Figure 6).
Figure 6: Impact of environmental conditions (and moisture level) on HVI fibre
strength LABORATORY MOISTURE MEASUREMENTS Although non-laboratory applications of moisture measurement instruments are growing, the “gold standard” for accurate and precise equilibrium moisture measurements remains laboratory measurements under standard conditions. A key question for these various moisture measurement methods and instruments is “how well do they agree with each other and with the reference oven fibre moisture method?” As mentioned previously, fibre moisture has been measured by several techniques and methodologies. Moisture measurements and systems can generally be divided into the categories of gravimetric or “weight loss” (thermal/oven, microwave, IR, etc.), spectroscopy (Near Infrared/NIR, wide-band Nuclear Magnetic Resonance/NMR, etc.), chemical (KFT, etc.), and “electric” (dielectric, conductance, resistance).
15
20
25
30
35
40
1 2 3 4 5 6 7 8 9 10 11 12
COTTON
Stre
ngth
(g/te
x)
58F/51%70F/65%61F/69%80F/70%71F/80%80F/82%
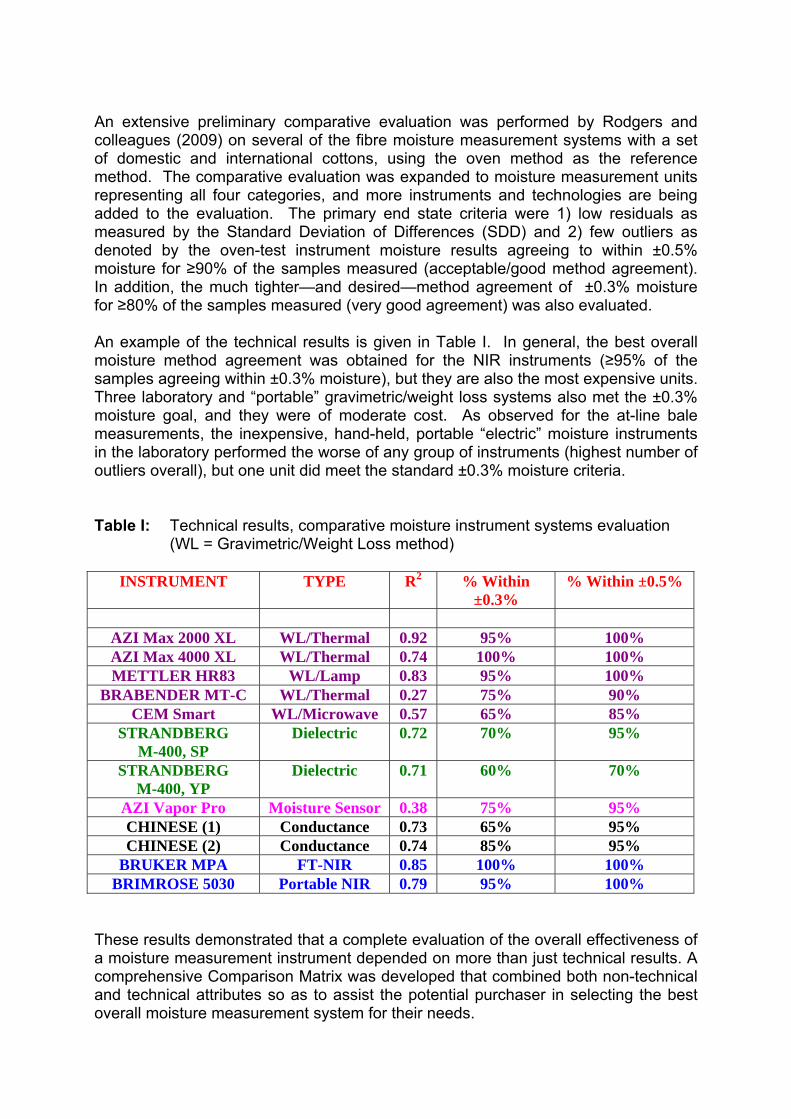
An extensive preliminary comparative evaluation was performed by Rodgers and colleagues (2009) on several of the fibre moisture measurement systems with a set of domestic and international cottons, using the oven method as the reference method. The comparative evaluation was expanded to moisture measurement units representing all four categories, and more instruments and technologies are being added to the evaluation. The primary end state criteria were 1) low residuals as measured by the Standard Deviation of Differences (SDD) and 2) few outliers as denoted by the oven-test instrument moisture results agreeing to within ±0.5% moisture for ≥90% of the samples measured (acceptable/good method agreement). In addition, the much tighter—and desired—method agreement of ±0.3% moisture for ≥80% of the samples measured (very good agreement) was also evaluated. An example of the technical results is given in Table I. In general, the best overall moisture method agreement was obtained for the NIR instruments (≥95% of the samples agreeing within ±0.3% moisture), but they are also the most expensive units. Three laboratory and “portable” gravimetric/weight loss systems also met the ±0.3% moisture goal, and they were of moderate cost. As observed for the at-line bale measurements, the inexpensive, hand-held, portable “electric” moisture instruments in the laboratory performed the worse of any group of instruments (highest number of outliers overall), but one unit did meet the standard ±0.3% moisture criteria. Table I: Technical results, comparative moisture instrument systems evaluation
(WL = Gravimetric/Weight Loss method)
INSTRUMENT TYPE R2 % Within ±0.3%
% Within ±0.5%
AZI Max 2000 XL WL/Thermal 0.92 95% 100% AZI Max 4000 XL WL/Thermal 0.74 100% 100% METTLER HR83 WL/Lamp 0.83 95% 100%
BRABENDER MT-C WL/Thermal 0.27 75% 90% CEM Smart WL/Microwave 0.57 65% 85%
STRANDBERG M-400, SP
Dielectric 0.72 70% 95%
STRANDBERG M-400, YP
Dielectric 0.71 60% 70%
AZI Vapor Pro Moisture Sensor 0.38 75% 95% CHINESE (1) Conductance 0.73 65% 95% CHINESE (2) Conductance 0.74 85% 95%
BRUKER MPA FT-NIR 0.85 100% 100% BRIMROSE 5030 Portable NIR 0.79 95% 100%
These results demonstrated that a complete evaluation of the overall effectiveness of a moisture measurement instrument depended on more than just technical results. A comprehensive Comparison Matrix was developed that combined both non-technical and technical attributes so as to assist the potential purchaser in selecting the best overall moisture measurement system for their needs.
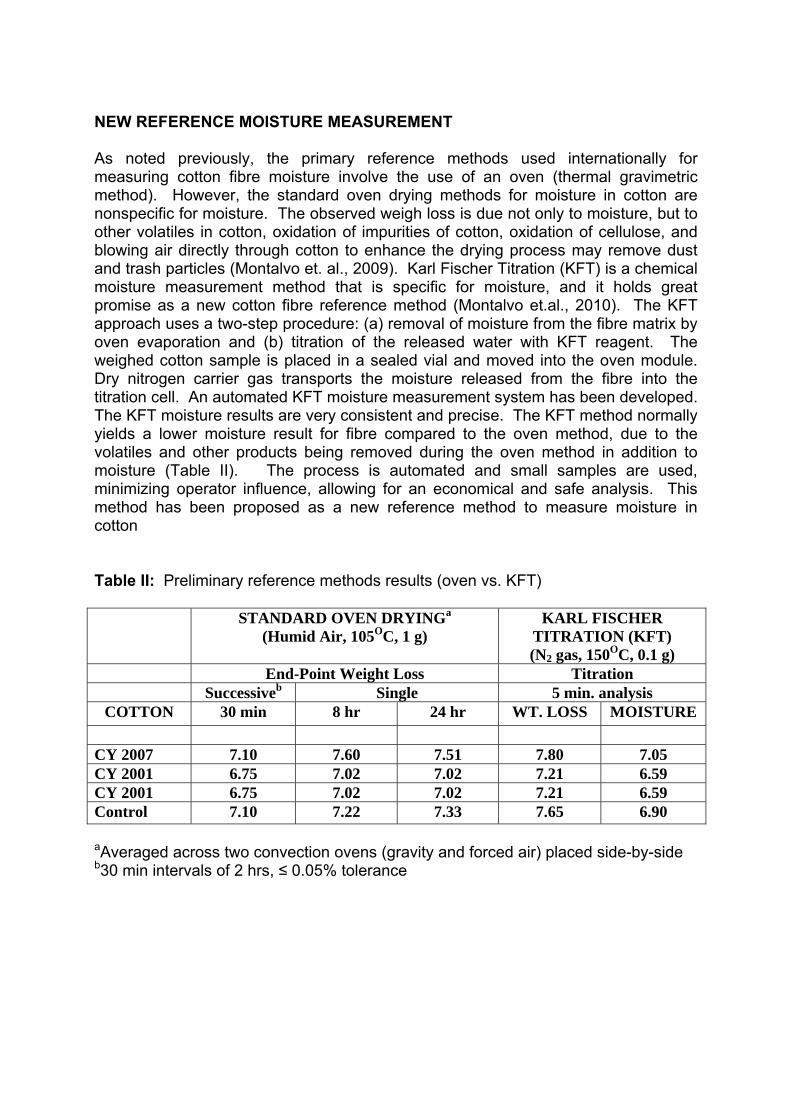
NEW REFERENCE MOISTURE MEASUREMENT As noted previously, the primary reference methods used internationally for measuring cotton fibre moisture involve the use of an oven (thermal gravimetric method). However, the standard oven drying methods for moisture in cotton are nonspecific for moisture. The observed weigh loss is due not only to moisture, but to other volatiles in cotton, oxidation of impurities of cotton, oxidation of cellulose, and blowing air directly through cotton to enhance the drying process may remove dust and trash particles (Montalvo et. al., 2009). Karl Fischer Titration (KFT) is a chemical moisture measurement method that is specific for moisture, and it holds great promise as a new cotton fibre reference method (Montalvo et.al., 2010). The KFT approach uses a two-step procedure: (a) removal of moisture from the fibre matrix by oven evaporation and (b) titration of the released water with KFT reagent. The weighed cotton sample is placed in a sealed vial and moved into the oven module. Dry nitrogen carrier gas transports the moisture released from the fibre into the titration cell. An automated KFT moisture measurement system has been developed. The KFT moisture results are very consistent and precise. The KFT method normally yields a lower moisture result for fibre compared to the oven method, due to the volatiles and other products being removed during the oven method in addition to moisture (Table II). The process is automated and small samples are used, minimizing operator influence, allowing for an economical and safe analysis. This method has been proposed as a new reference method to measure moisture in cotton Table II: Preliminary reference methods results (oven vs. KFT) STANDARD OVEN DRYINGa
(Humid Air, 105OC, 1 g) KARL FISCHER
TITRATION (KFT) (N2 gas, 150OC, 0.1 g)
End-Point Weight Loss Titration Successiveb Single 5 min. analysis
COTTON 30 min 8 hr 24 hr WT. LOSS MOISTURE CY 2007 7.10 7.60 7.51 7.80 7.05 CY 2001 6.75 7.02 7.02 7.21 6.59 CY 2001 6.75 7.02 7.02 7.21 6.59 Control 7.10 7.22 7.33 7.65 6.90
aAveraged across two convection ovens (gravity and forced air) placed side-by-side b30 min intervals of 2 hrs, ≤ 0.05% tolerance
SUMMARY Cotton fibre moisture is an important quality, processing, and marketing measurement for cotton fibre. Fibre moisture measurements can be performed in the laboratory, at-line, and at the bale (either at-line or on-line). The primary reference method for cotton fibre moisture is the oven method (thermal gravimetric). At-line and on-line bale moisture measurement systems are an increasing area of interest and research, with microwave technology evaluated for bale moisture at the gin. An extensive evaluation of several inexpensive, portable moisture meters for at-line bale moisture measurements yielded an oven-meter agreement of approximately ±1-2% moisture. Changes in laboratory temperature and relative humidity-—referred to as environmental conditions—lead to changes in laboratory fibre moisture levels during fibre measurements, and these impacts have been shown to impact the measured results of key fibre properties (e.g., strength and length). Moisture measurements and systems can generally be divided into weight loss, chemical, spectroscopy, and “electric” categories. An extensive comparative evaluation of several of the more common fibre moisture measurement systems demonstrated overall good agreement for the moisture instruments to the oven method (within ±0.5% moisture with the oven method for greater than 90% of the samples analyzed). However, few of these systems agreed to the much tighter—and desired—method agreement of within ±0.3% moisture for greater than 80% of the samples analyzed. A comprehensive Comparison Matrix, composed of a logistical/ overview section and a technical section, was developed to assist the potential purchaser in selecting the best overall moisture measurement system for their needs. New research is focusing on a chemical method as the reference method for fibre moisture. In general, the chemical method yields lower moisture compared to the oven method, due to volatiles and other products in addition to moisture being removed in the oven method. REFERENCES Anthony, S., 2003. The impact of excess moisture in the bale on fibre quality. Proceedings of the 2003 Beltwide Cotton Conference, 746-760. Baker, K., Hughs, E., McAlister, D., 2005. Bale moisture addition with a rotor spray system. Proceedings of the 2005 Beltwide Cotton Conference, 808-812. Byler, R., Anthony, S., Ramey, H., 1993. Moisture effects on strength measurement at the classing office. Proceedings of the 1993 Beltwide Cotton Conference, 1099-1100. Byler, R., Baker, K., Hughs, E., Buser, M., Holt, G., Pelletier, M., Carroll, J., 2007. Examination of some currently available portable cotton bale moisture meters, 2006. Proceedings of the 2007 Beltwide Cotton Conference, 676-684. Delhom, C., Byler, R., 2008. Performance of a commercially available microwave based bale moisture content meter. Proceedings of the 2008 Beltwide Cotton Conference, 753-758.
Ghorashi, H., 2008. On-line measurement of fibre length in the gin. Proceedings of the 29th International Cotton Conference Bremen, 155-162. Knowlton, J., 1996. Effect of moisture on cotton fibre strength. Proceedings of the 1996 Beltwide Cotton Conference, 1300-1305. Montalvo, J.G. and Von Hoven, T.M. 2008. Review of Standard Test Methods for Moisture in Lint Cotton, Journal of Cotton Science, 12:33-47. Montalvo, J.G., Jr., Von Hoven, T.M., Cheuk, S. and Schindler, A., 2009 Preliminary studies of non-aqueous volatiles in lint cotton moisture tests by thermal methods. Textile Research Journal, in press. Montalvo, J.G., Von Hoven, T.M., Cheuk, S. and North, T. 2010. Paired reference methods for moisture in cotton and preparation of ASTM Draft Standard methods. 2010. Special Session on Development of Reference Methods for Moisture in Cotton. Proceedings of the 2010 Beltwide Cotton Conferences, New Orleans, LA, in press. Pelletier, M., 2006. Absolute moisture sensing for cotton bales. Proceedings of the 2006 Beltwide Cotton Conference, 593-601. Rodgers, J., Cui, X., Martin, V., Watson, M., 2009. Comparative evaluation of laboratory fibre moisture measurement methods. Proceedings of the 2009 Beltwide Cotton Conference, 1179-1184. Thibodeaux, D., Delhom, C., Rousselle, M., Rodgers, J., Cui, L., 2006. HVI measurement at non-standard testing environment. Proceedings of the 2006 Beltwide Cotton Conference, 1899-1905. DISCLAIMER The use of a company or product name is solely for the purpose of providing specific information and does not imply approval or recommendation by the United States Department of Agriculture to the exclusion of others.
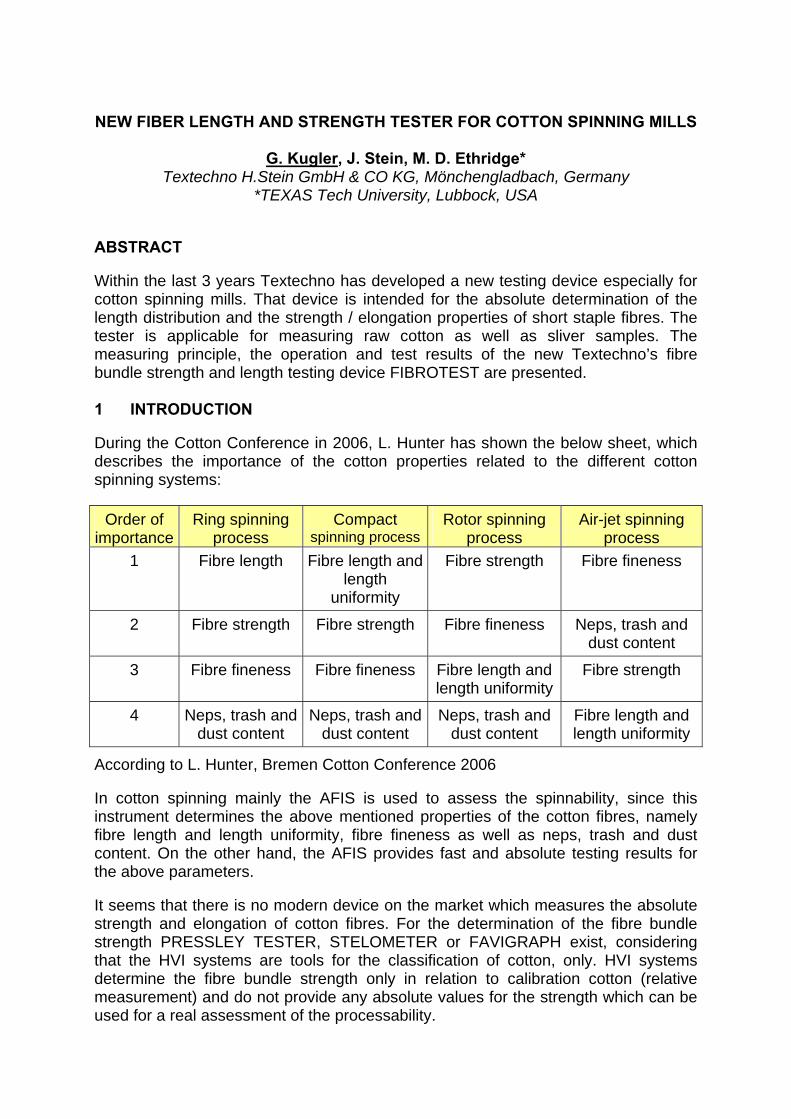
NEW FIBER LENGTH AND STRENGTH TESTER FOR COTTON SPINNING MILLS
G. Kugler, J. Stein, M. D. Ethridge* Textechno H.Stein GmbH & CO KG, Mönchengladbach, Germany
*TEXAS Tech University, Lubbock, USA ABSTRACT Within the last 3 years Textechno has developed a new testing device especially for cotton spinning mills. That device is intended for the absolute determination of the length distribution and the strength / elongation properties of short staple fibres. The tester is applicable for measuring raw cotton as well as sliver samples. The measuring principle, the operation and test results of the new Textechno’s fibre bundle strength and length testing device FIBROTEST are presented. 1 INTRODUCTION During the Cotton Conference in 2006, L. Hunter has shown the below sheet, which describes the importance of the cotton properties related to the different cotton spinning systems:
Order of importance
Ring spinning process
Compact spinning process
Rotor spinning process
Air-jet spinning process
1 Fibre length Fibre length and length
uniformity
Fibre strength Fibre fineness
2 Fibre strength Fibre strength Fibre fineness Neps, trash and dust content
3 Fibre fineness Fibre fineness Fibre length and length uniformity
Fibre strength
4 Neps, trash and dust content
Neps, trash and dust content
Neps, trash and dust content
Fibre length and length uniformity
According to L. Hunter, Bremen Cotton Conference 2006 In cotton spinning mainly the AFIS is used to assess the spinnability, since this instrument determines the above mentioned properties of the cotton fibres, namely fibre length and length uniformity, fibre fineness as well as neps, trash and dust content. On the other hand, the AFIS provides fast and absolute testing results for the above parameters. It seems that there is no modern device on the market which measures the absolute strength and elongation of cotton fibres. For the determination of the fibre bundle strength PRESSLEY TESTER, STELOMETER or FAVIGRAPH exist, considering that the HVI systems are tools for the classification of cotton, only. HVI systems determine the fibre bundle strength only in relation to calibration cotton (relative measurement) and do not provide any absolute values for the strength which can be used for a real assessment of the processability.
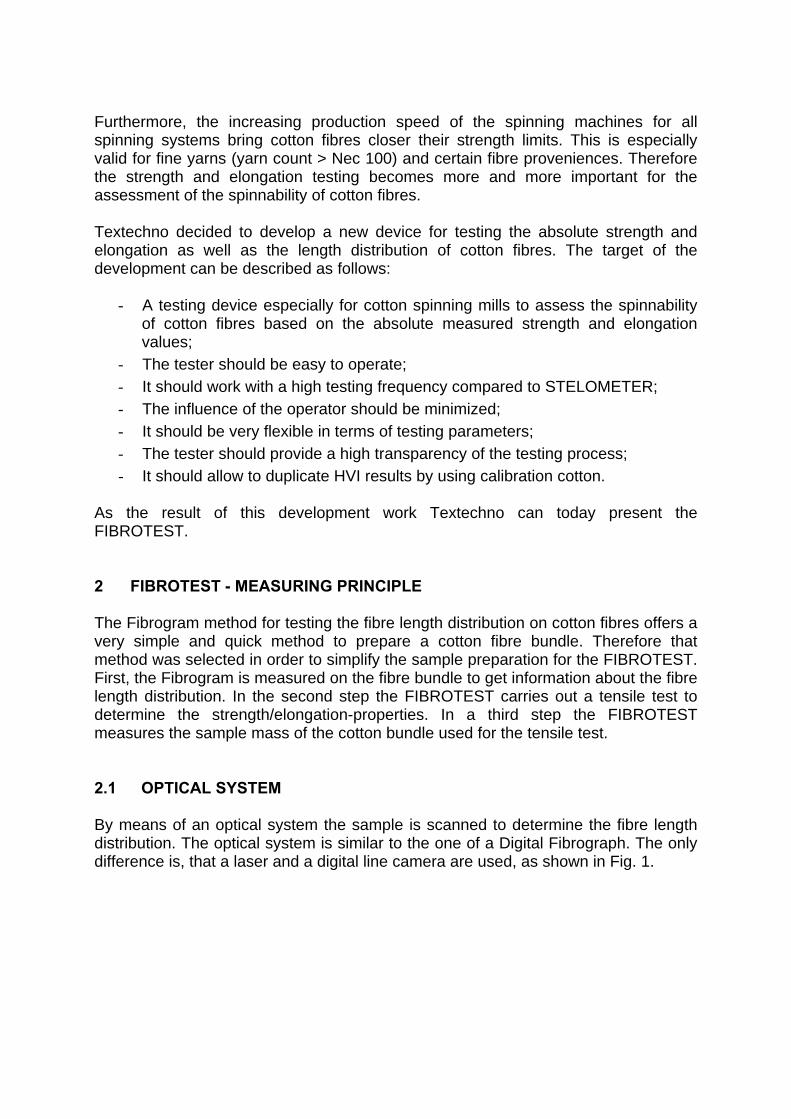
Furthermore, the increasing production speed of the spinning machines for all spinning systems bring cotton fibres closer their strength limits. This is especially valid for fine yarns (yarn count > Nec 100) and certain fibre proveniences. Therefore the strength and elongation testing becomes more and more important for the assessment of the spinnability of cotton fibres. Textechno decided to develop a new device for testing the absolute strength and elongation as well as the length distribution of cotton fibres. The target of the development can be described as follows:
- A testing device especially for cotton spinning mills to assess the spinnability of cotton fibres based on the absolute measured strength and elongation values;
- The tester should be easy to operate; - It should work with a high testing frequency compared to STELOMETER; - The influence of the operator should be minimized; - It should be very flexible in terms of testing parameters; - The tester should provide a high transparency of the testing process; - It should allow to duplicate HVI results by using calibration cotton.
As the result of this development work Textechno can today present the FIBROTEST. 2 FIBROTEST - MEASURING PRINCIPLE The Fibrogram method for testing the fibre length distribution on cotton fibres offers a very simple and quick method to prepare a cotton fibre bundle. Therefore that method was selected in order to simplify the sample preparation for the FIBROTEST. First, the Fibrogram is measured on the fibre bundle to get information about the fibre length distribution. In the second step the FIBROTEST carries out a tensile test to determine the strength/elongation-properties. In a third step the FIBROTEST measures the sample mass of the cotton bundle used for the tensile test. 2.1 OPTICAL SYSTEM By means of an optical system the sample is scanned to determine the fibre length distribution. The optical system is similar to the one of a Digital Fibrograph. The only difference is, that a laser and a digital line camera are used, as shown in Fig. 1.
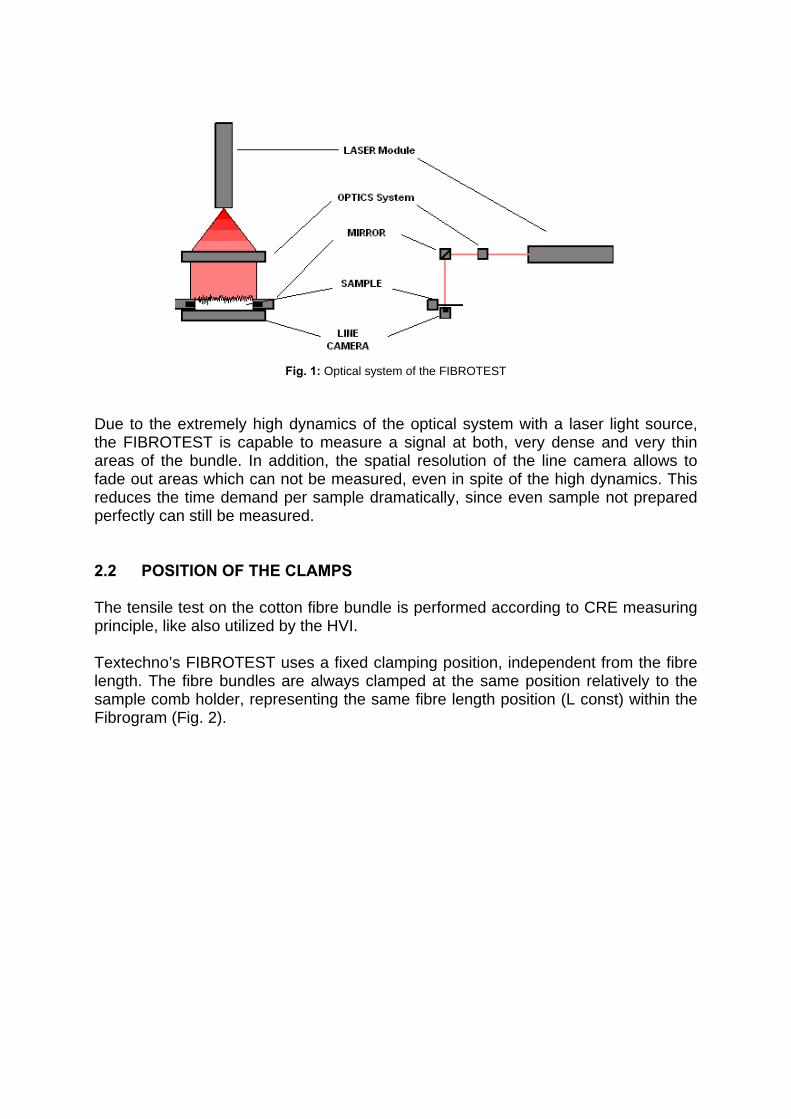
Fig. 1: Optical system of the FIBROTEST
Due to the extremely high dynamics of the optical system with a laser light source, the FIBROTEST is capable to measure a signal at both, very dense and very thin areas of the bundle. In addition, the spatial resolution of the line camera allows to fade out areas which can not be measured, even in spite of the high dynamics. This reduces the time demand per sample dramatically, since even sample not prepared perfectly can still be measured. 2.2 POSITION OF THE CLAMPS The tensile test on the cotton fibre bundle is performed according to CRE measuring principle, like also utilized by the HVI. Textechno’s FIBROTEST uses a fixed clamping position, independent from the fibre length. The fibre bundles are always clamped at the same position relatively to the sample comb holder, representing the same fibre length position (L const) within the Fibrogram (Fig. 2).
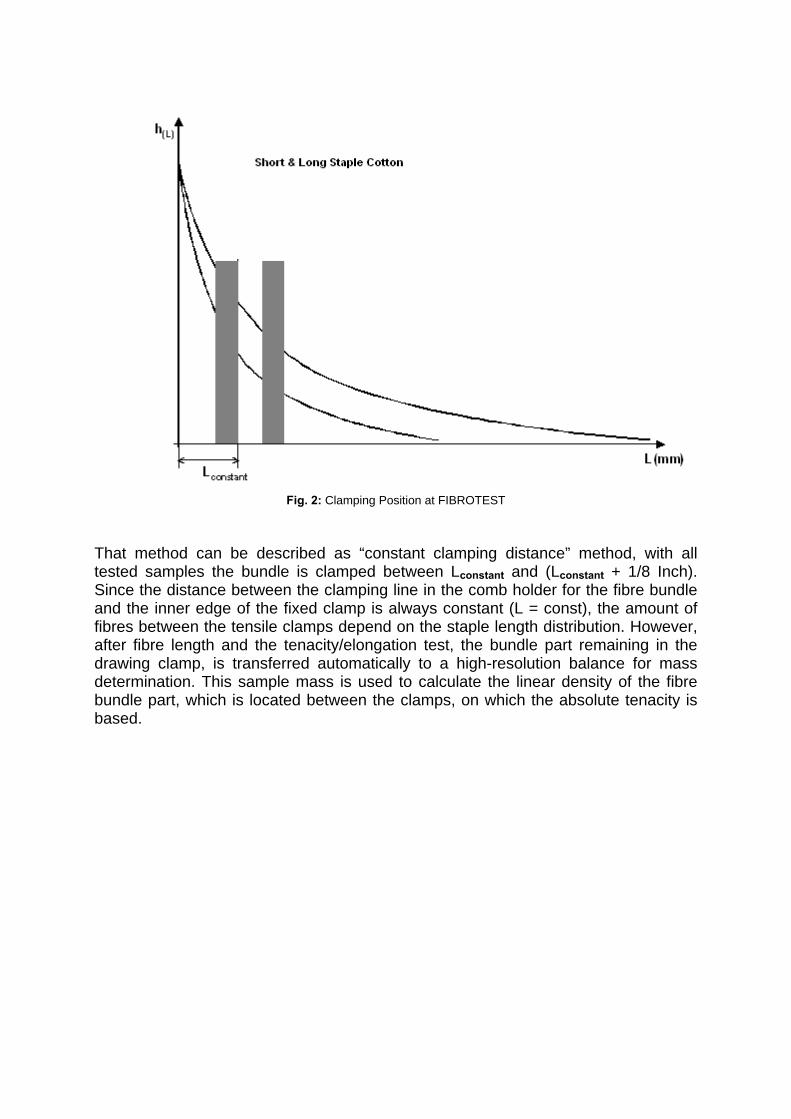
Fig. 2: Clamping Position at FIBROTEST
That method can be described as “constant clamping distance” method, with all tested samples the bundle is clamped between Lconstant and (Lconstant + 1/8 Inch). Since the distance between the clamping line in the comb holder for the fibre bundle and the inner edge of the fixed clamp is always constant (L = const), the amount of fibres between the tensile clamps depend on the staple length distribution. However, after fibre length and the tenacity/elongation test, the bundle part remaining in the drawing clamp, is transferred automatically to a high-resolution balance for mass determination. This sample mass is used to calculate the linear density of the fibre bundle part, which is located between the clamps, on which the absolute tenacity is based.
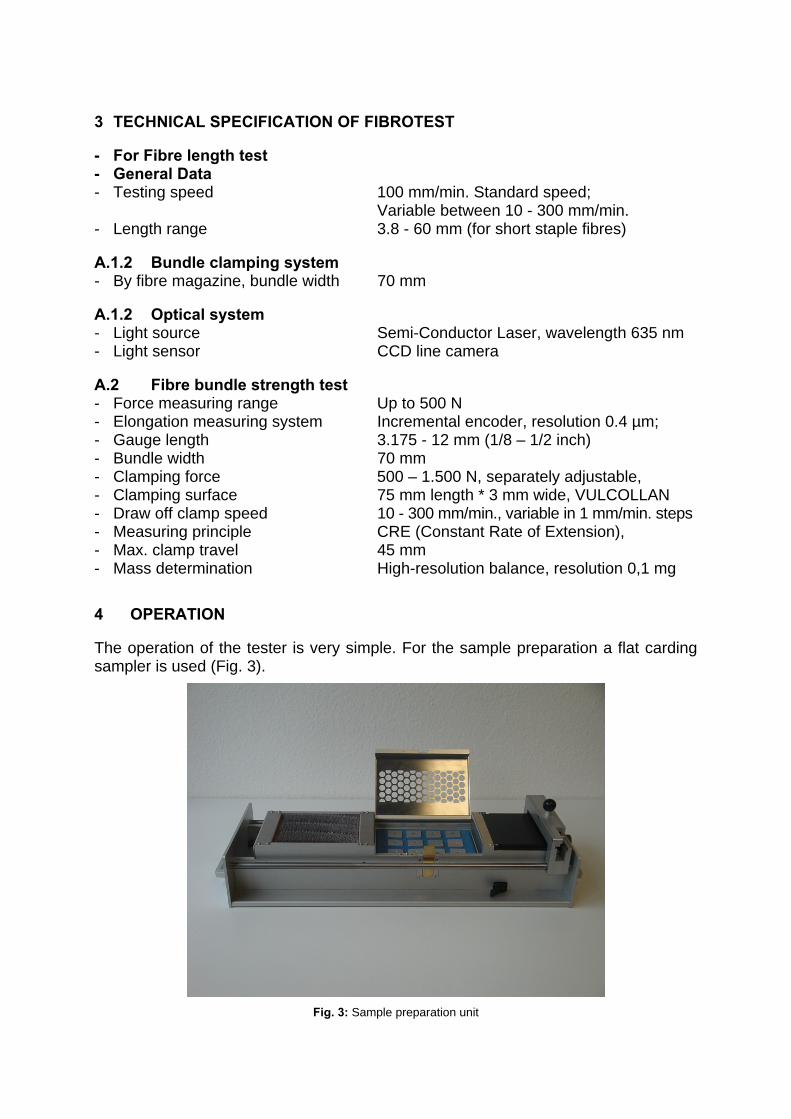
3 TECHNICAL SPECIFICATION OF FIBROTEST - For Fibre length test - General Data - Testing speed 100 mm/min. Standard speed; Variable between 10 - 300 mm/min. - Length range 3.8 - 60 mm (for short staple fibres) A.1.2 Bundle clamping system - By fibre magazine, bundle width 70 mm A.1.2 Optical system - Light source Semi-Conductor Laser, wavelength 635 nm - Light sensor CCD line camera A.2 Fibre bundle strength test - Force measuring range Up to 500 N - Elongation measuring system Incremental encoder, resolution 0.4 µm; - Gauge length 3.175 - 12 mm (1/8 – 1/2 inch) - Bundle width 70 mm - Clamping force 500 – 1.500 N, separately adjustable, - Clamping surface 75 mm length * 3 mm wide, VULCOLLAN - Draw off clamp speed 10 - 300 mm/min., variable in 1 mm/min. steps - Measuring principle CRE (Constant Rate of Extension), - Max. clamp travel 45 mm - Mass determination High-resolution balance, resolution 0,1 mg 4 OPERATION The operation of the tester is very simple. For the sample preparation a flat carding sampler is used (Fig. 3).
Fig. 3: Sample preparation unit
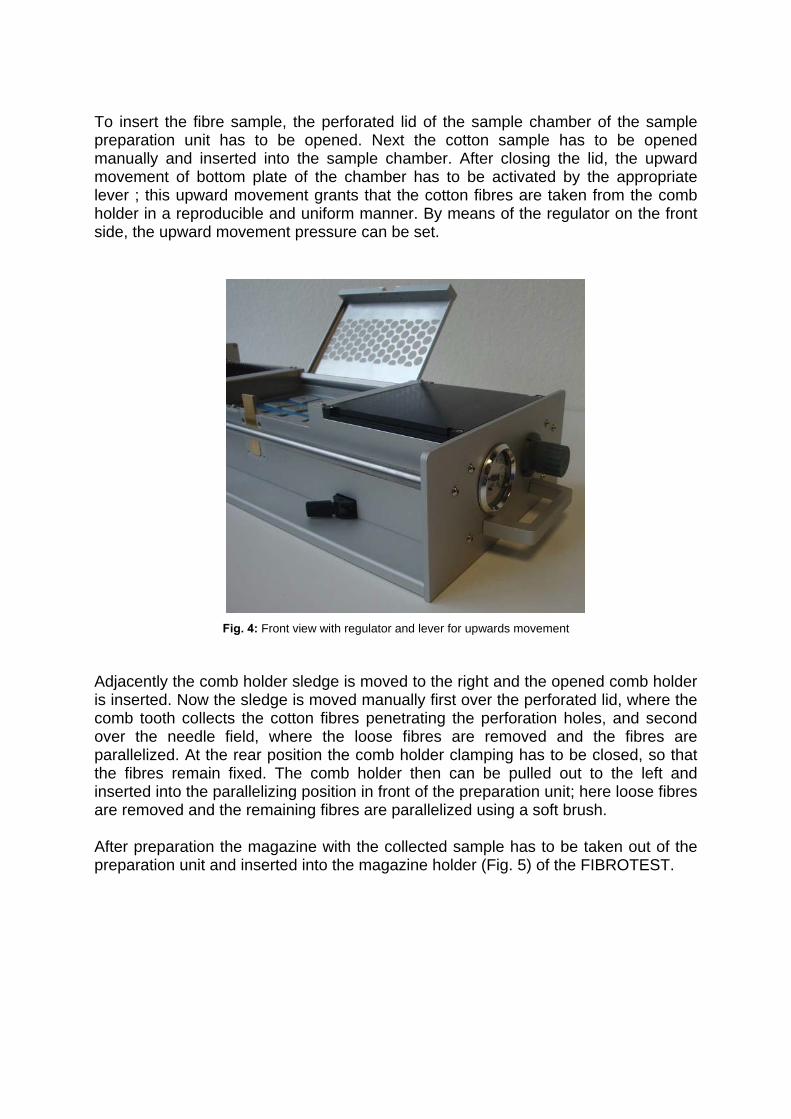
To insert the fibre sample, the perforated lid of the sample chamber of the sample preparation unit has to be opened. Next the cotton sample has to be opened manually and inserted into the sample chamber. After closing the lid, the upward movement of bottom plate of the chamber has to be activated by the appropriate lever ; this upward movement grants that the cotton fibres are taken from the comb holder in a reproducible and uniform manner. By means of the regulator on the front side, the upward movement pressure can be set.
Fig. 4: Front view with regulator and lever for upwards movement Adjacently the comb holder sledge is moved to the right and the opened comb holder is inserted. Now the sledge is moved manually first over the perforated lid, where the comb tooth collects the cotton fibres penetrating the perforation holes, and second over the needle field, where the loose fibres are removed and the fibres are parallelized. At the rear position the comb holder clamping has to be closed, so that the fibres remain fixed. The comb holder then can be pulled out to the left and inserted into the parallelizing position in front of the preparation unit; here loose fibres are removed and the remaining fibres are parallelized using a soft brush. After preparation the magazine with the collected sample has to be taken out of the preparation unit and inserted into the magazine holder (Fig. 5) of the FIBROTEST.
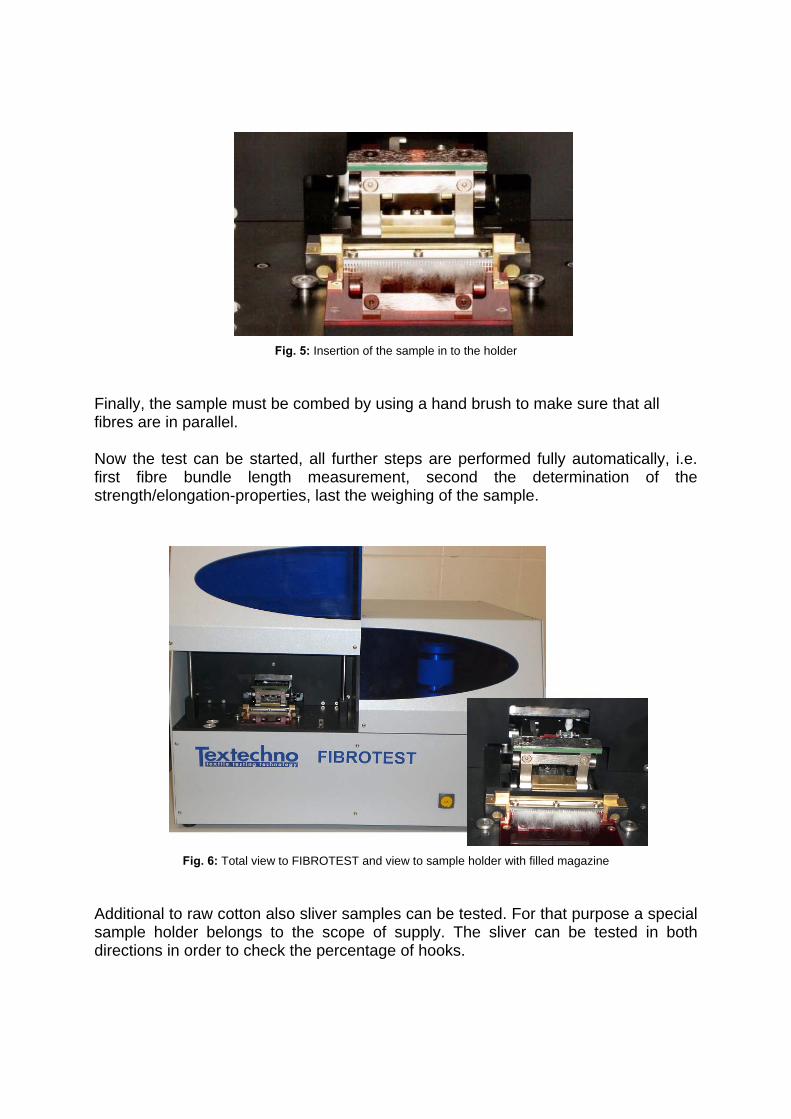
Fig. 5: Insertion of the sample in to the holder Finally, the sample must be combed by using a hand brush to make sure that all fibres are in parallel. Now the test can be started, all further steps are performed fully automatically, i.e. first fibre bundle length measurement, second the determination of the strength/elongation-properties, last the weighing of the sample.
Fig. 6: Total view to FIBROTEST and view to sample holder with filled magazine Additional to raw cotton also sliver samples can be tested. For that purpose a special sample holder belongs to the scope of supply. The sliver can be tested in both directions in order to check the percentage of hooks.
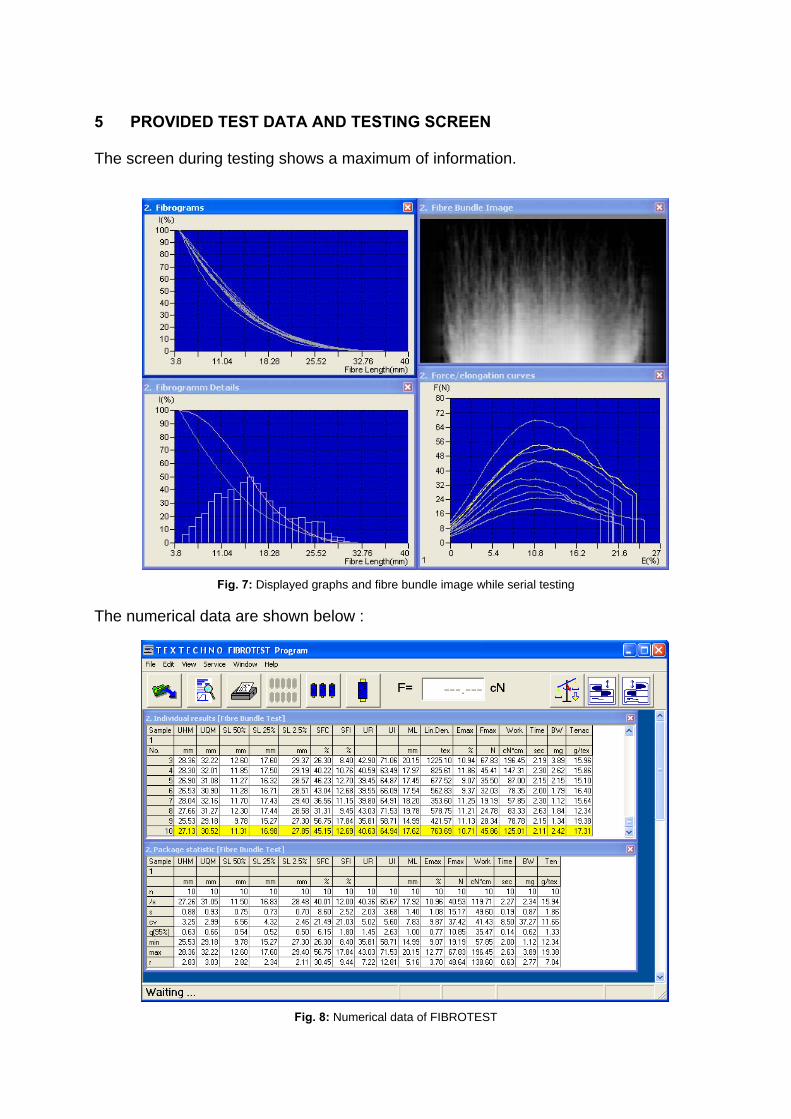
5 PROVIDED TEST DATA AND TESTING SCREEN The screen during testing shows a maximum of information.
Fig. 7: Displayed graphs and fibre bundle image while serial testing The numerical data are shown below :
Fig. 8: Numerical data of FIBROTEST
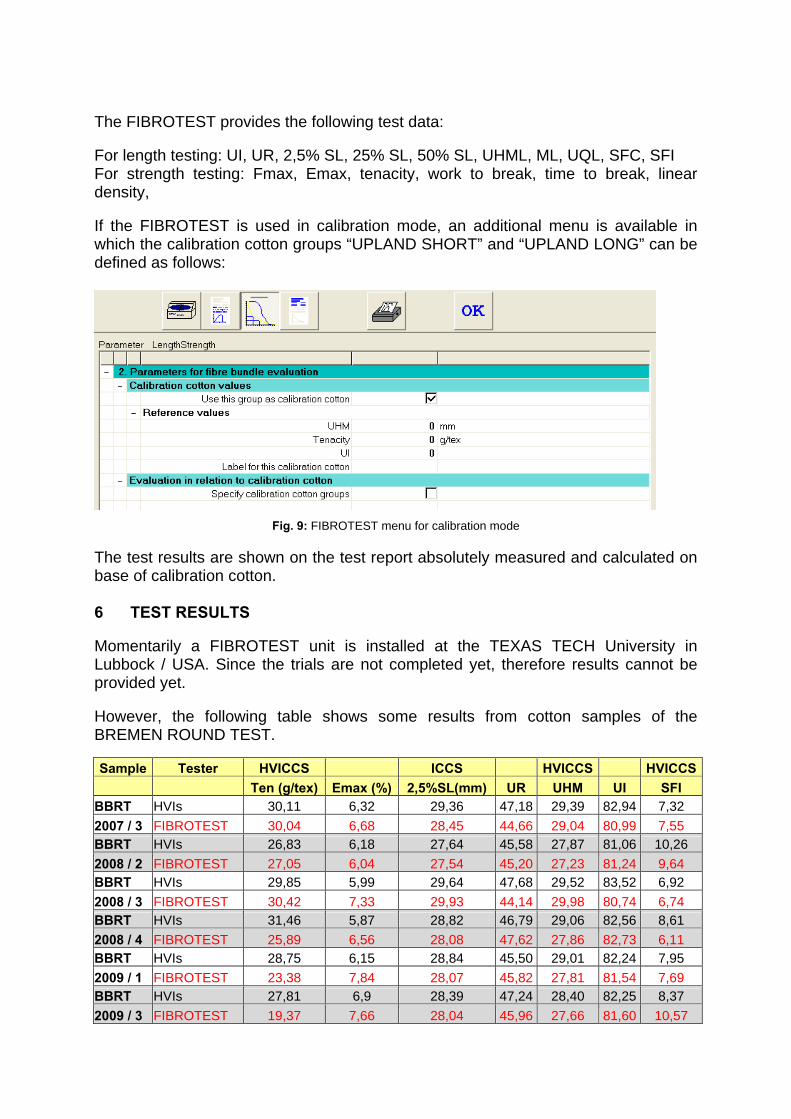
The FIBROTEST provides the following test data: For length testing: UI, UR, 2,5% SL, 25% SL, 50% SL, UHML, ML, UQL, SFC, SFI For strength testing: Fmax, Emax, tenacity, work to break, time to break, linear density, If the FIBROTEST is used in calibration mode, an additional menu is available in which the calibration cotton groups “UPLAND SHORT” and “UPLAND LONG” can be defined as follows:
Fig. 9: FIBROTEST menu for calibration mode The test results are shown on the test report absolutely measured and calculated on base of calibration cotton. 6 TEST RESULTS Momentarily a FIBROTEST unit is installed at the TEXAS TECH University in Lubbock / USA. Since the trials are not completed yet, therefore results cannot be provided yet. However, the following table shows some results from cotton samples of the BREMEN ROUND TEST. Sample Tester HVICCS ICCS HVICCS HVICCS
Ten (g/tex) Emax (%) 2,5%SL(mm) UR UHM UI SFI BBRT HVIs 30,11 6,32 29,36 47,18 29,39 82,94 7,32 2007 / 3 FIBROTEST 30,04 6,68 28,45 44,66 29,04 80,99 7,55 BBRT HVIs 26,83 6,18 27,64 45,58 27,87 81,06 10,26 2008 / 2 FIBROTEST 27,05 6,04 27,54 45,20 27,23 81,24 9,64 BBRT HVIs 29,85 5,99 29,64 47,68 29,52 83,52 6,92 2008 / 3 FIBROTEST 30,42 7,33 29,93 44,14 29,98 80,74 6,74 BBRT HVIs 31,46 5,87 28,82 46,79 29,06 82,56 8,61 2008 / 4 FIBROTEST 25,89 6,56 28,08 47,62 27,86 82,73 6,11 BBRT HVIs 28,75 6,15 28,84 45,50 29,01 82,24 7,95 2009 / 1 FIBROTEST 23,38 7,84 28,07 45,82 27,81 81,54 7,69 BBRT HVIs 27,81 6,9 28,39 47,24 28,40 82,25 8,37 2009 / 3 FIBROTEST 19,37 7,66 28,04 45,96 27,66 81,60 10,57
Regarding the fibre length results, the FIBROTEST results are very close to the average values of all HVI systems participating in the Round Test. Of course there are differences for the tenacity and elongation values due to the absolute measurement for several cotton proveniences. 7 CONCLUSION FIBROTEST is a testing device, which meets the demands of cotton spinning mills for testing the length distribution as well as the strength and elongation properties of cotton to assess the spinnability. The operation of the tester is very simple and the testing procedure is characterised by a high transparency and flexibility. That makes the tester interesting for research purposes, too. The Textechno software offers an easy to operate user interface to define the test conditions, display the test data, print the test reports and store the measured data. A big advantage of FIBROTEST is that it can be used to measure sliver samples in both directions by means of a special sliver magazine. The FIBROTEST realises a testing frequency of about 20 - 25 tests per hour.
DEVELOPMENTS IN SHORT FIBRE MEASUREMENTS
J. Knowlton USDA, AMS, Cotton Division, Memphis, Tennessee, USA
ABSTRACT Efforts to develop a short fibre measurement suitable for use in commercial cotton classification are continuing. Recent results from USDA studies and the International Cotton Advisory Committee (ICAC) Commercial Standardization of Instrument Testing of Cotton (CSITC) Round Trial show low between instrument reproducibility for the Short Fibre Index (SFI) measurement. SFI cotton calibration is slowly being implemented into late model instruments in hopes of reducing the wide range in short fibre measurement levels. Within and between instrument SFI Coefficients of Variation (CV) were found to be in the 5-6% range and 15-23% range, respectively, in two 2009 CSITC Round Trials. A short fibre prediction equation developed in 2003 by USDA utilizing length and uniformity index measurements was found to have strong agreement with the SFI measurement (R-squared = 98.3%) but with lower variability and higher reproducibility. INTRODUCTION The HVI SFI measurement has been under evaluation by the USDA, AMS, Cotton Division since 1997 (Knowlton, 2004). Although some improvements have occurred over time, high measurement variability and low between instrument reproducibility continue to be the major drawbacks. The measurements of HVI Length (L) and Uniformity Index (UI) provide a good indicator of short fibre content. Given the availability and high degree of reproducibility of these measurements, their usefulness for predicting short fibre should be recognized. In this report, both the SFI measurement and the L/UI based short fibre prediction are evaluated. Data for the analyses were derived from recent USDA standard bale value setting tests, CSITC Round Trial results, USDA in-house check cotton results and USDA office to office check results. USDA STANDARD BALE VALUE SETTING TESTS A set of 27 U.S. cotton bales was selected to represent a wide range of U.S. growing regions, lengths and short fibre contents. Approximately 200 tests were made on each bale by 10 Uster HVI 1000’s in early 2009. Given the high number of tests conducted on these bales, the values established and shown on the following figures are very precise. Figure 1 gives the SFI plotted against length for each of the 27 bales. Each point on the graph represents the overall average of all tests per bale. The graph shows the range in short fibre contents and lengths for the set. The graph also shows the strong relationship between SFI and length with R2=0.87. Figure 2
gives the SFI plotted against the Uniformity Index. The relationship between SFI and Uniformity Index is stronger than the SFI to length relationship as evidenced by R2=0.97. Figure 3 gives the SFI plotted against the L/UI predicted short fibre content as given by the following equation: L/UI Short Fibre = a + bX + cY + dX2 + eY2 + fXY
Where
X = Length (inches) Y = Uniformity Index a = 643.3879 b = -166.099 c = -12.3394 d = -15.7353 e = 0.05493 f = 2.32838
The L/UI predicted short fibre equation was first developed by USDA around 1999 and last revised in 2002 (Knowlton, 2004). Results shown in Figure 3 indicate that there is very little difference between the information provided by the SFI measurement and the information provided by the length and uniformity index measurements (R2=0.98). Figure 4 shows the relationship between the SFI measurement and within instrument SFI standard deviation over a wide range of SFI measurement levels. As expected, SFI standard deviations increase as the SFI level increases. This data indicates a threefold increase in standard deviations over the SFI measurement range illustrating why the variability is so much higher in high short fibre cottons compared to cottons with low short fibre contents. Figure 5 shows the CV of SFI over the 27 bale range. For the most part, within instrument CV’s are found in the 4.25% to 5.75% percent range.
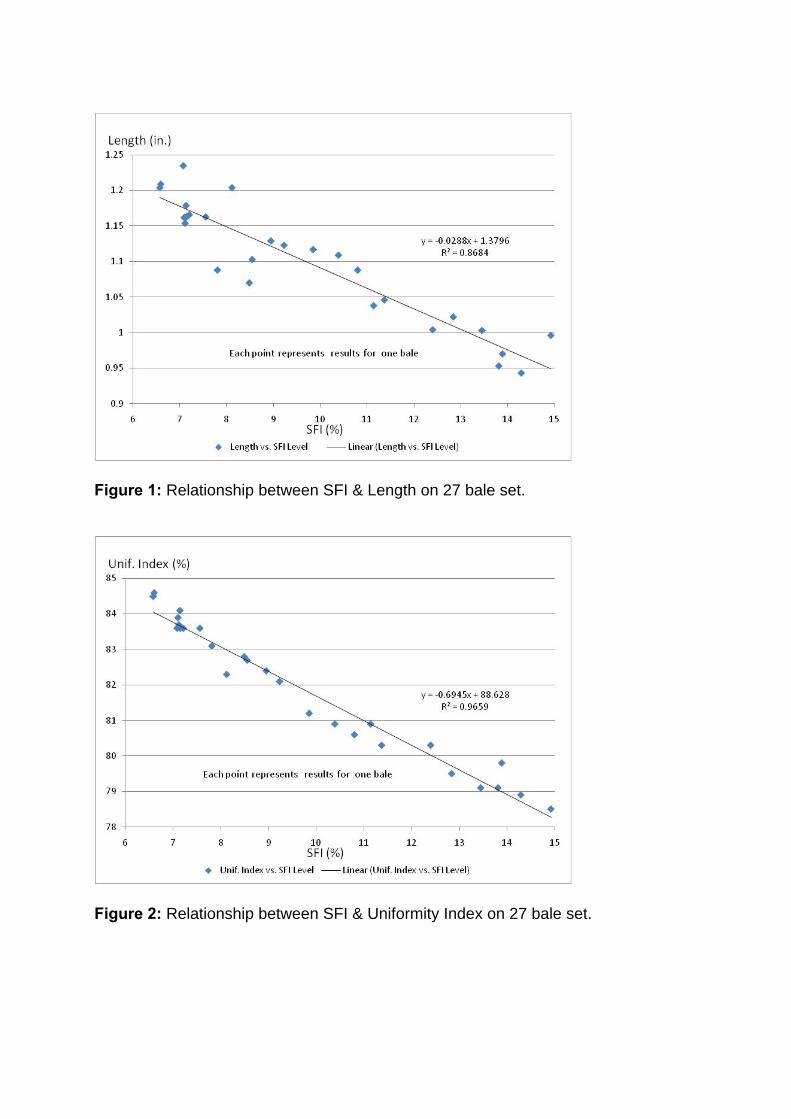
Figure 1: Relationship between SFI & Length on 27 bale set.
Figure 2: Relationship between SFI & Uniformity Index on 27 bale set.
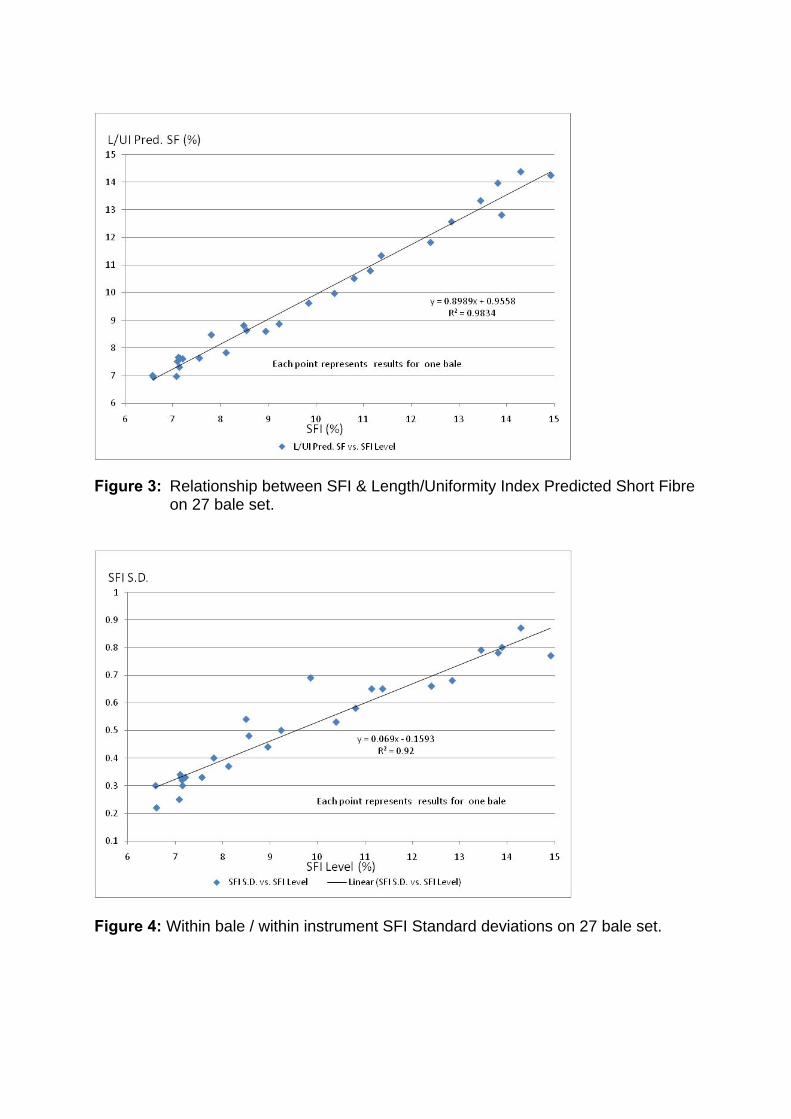
Figure 3: Relationship between SFI & Length/Uniformity Index Predicted Short Fibre on 27 bale set.
Figure 4: Within bale / within instrument SFI Standard deviations on 27 bale set.
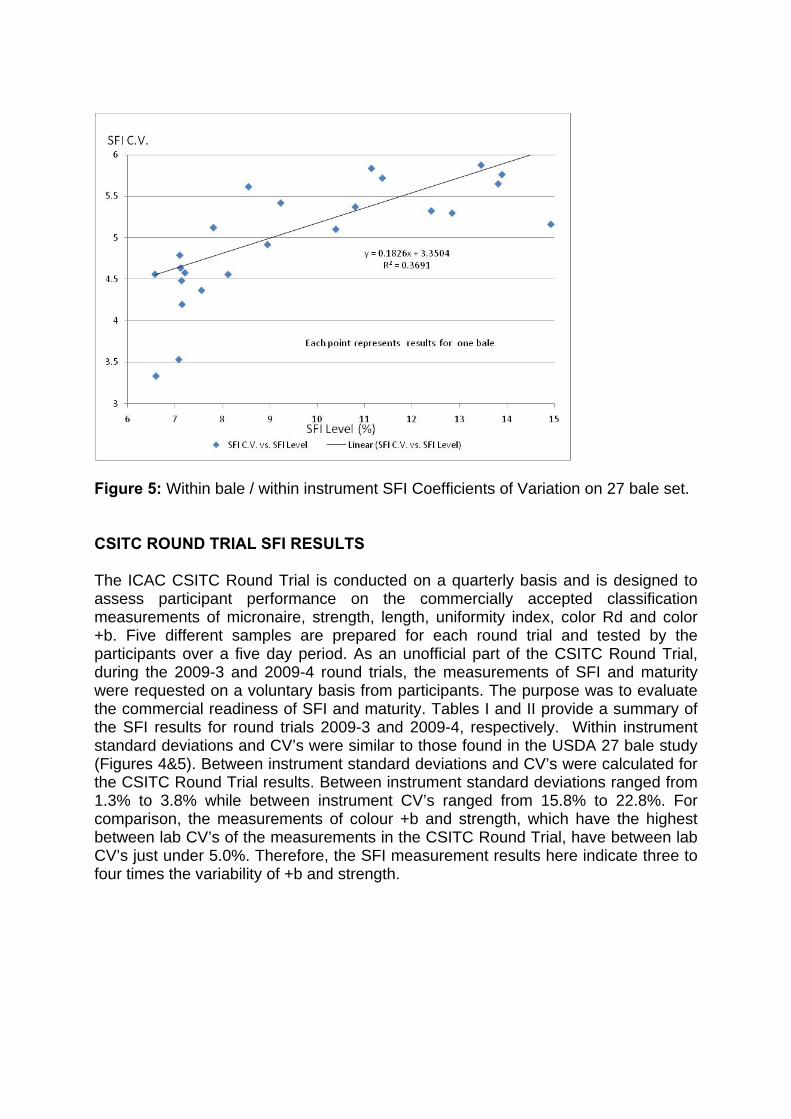
Figure 5: Within bale / within instrument SFI Coefficients of Variation on 27 bale set. CSITC ROUND TRIAL SFI RESULTS The ICAC CSITC Round Trial is conducted on a quarterly basis and is designed to assess participant performance on the commercially accepted classification measurements of micronaire, strength, length, uniformity index, color Rd and color +b. Five different samples are prepared for each round trial and tested by the participants over a five day period. As an unofficial part of the CSITC Round Trial, during the 2009-3 and 2009-4 round trials, the measurements of SFI and maturity were requested on a voluntary basis from participants. The purpose was to evaluate the commercial readiness of SFI and maturity. Tables I and II provide a summary of the SFI results for round trials 2009-3 and 2009-4, respectively. Within instrument standard deviations and CV’s were similar to those found in the USDA 27 bale study (Figures 4&5). Between instrument standard deviations and CV’s were calculated for the CSITC Round Trial results. Between instrument standard deviations ranged from 1.3% to 3.8% while between instrument CV’s ranged from 15.8% to 22.8%. For comparison, the measurements of colour +b and strength, which have the highest between lab CV’s of the measurements in the CSITC Round Trial, have between lab CV’s just under 5.0%. Therefore, the SFI measurement results here indicate three to four times the variability of +b and strength.
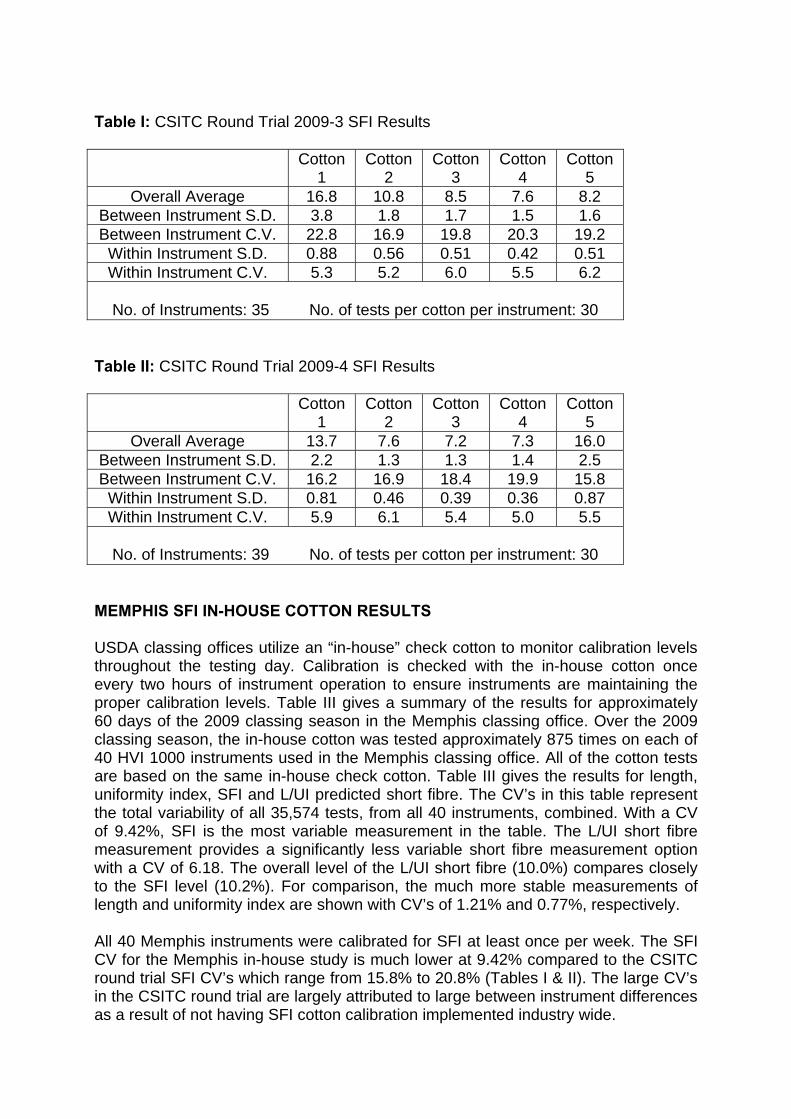
Table I: CSITC Round Trial 2009-3 SFI Results
Cotton 1
Cotton 2
Cotton 3
Cotton 4
Cotton 5
Overall Average 16.8 10.8 8.5 7.6 8.2 Between Instrument S.D. 3.8 1.8 1.7 1.5 1.6 Between Instrument C.V. 22.8 16.9 19.8 20.3 19.2
Within Instrument S.D. 0.88 0.56 0.51 0.42 0.51 Within Instrument C.V. 5.3 5.2 6.0 5.5 6.2
No. of Instruments: 35 No. of tests per cotton per instrument: 30
Table II: CSITC Round Trial 2009-4 SFI Results
Cotton 1
Cotton 2
Cotton 3
Cotton 4
Cotton 5
Overall Average 13.7 7.6 7.2 7.3 16.0 Between Instrument S.D. 2.2 1.3 1.3 1.4 2.5 Between Instrument C.V. 16.2 16.9 18.4 19.9 15.8
Within Instrument S.D. 0.81 0.46 0.39 0.36 0.87 Within Instrument C.V. 5.9 6.1 5.4 5.0 5.5
No. of Instruments: 39 No. of tests per cotton per instrument: 30
MEMPHIS SFI IN-HOUSE COTTON RESULTS USDA classing offices utilize an “in-house” check cotton to monitor calibration levels throughout the testing day. Calibration is checked with the in-house cotton once every two hours of instrument operation to ensure instruments are maintaining the proper calibration levels. Table III gives a summary of the results for approximately 60 days of the 2009 classing season in the Memphis classing office. Over the 2009 classing season, the in-house cotton was tested approximately 875 times on each of 40 HVI 1000 instruments used in the Memphis classing office. All of the cotton tests are based on the same in-house check cotton. Table III gives the results for length, uniformity index, SFI and L/UI predicted short fibre. The CV’s in this table represent the total variability of all 35,574 tests, from all 40 instruments, combined. With a CV of 9.42%, SFI is the most variable measurement in the table. The L/UI short fibre measurement provides a significantly less variable short fibre measurement option with a CV of 6.18. The overall level of the L/UI short fibre (10.0%) compares closely to the SFI level (10.2%). For comparison, the much more stable measurements of length and uniformity index are shown with CV’s of 1.21% and 0.77%, respectively. All 40 Memphis instruments were calibrated for SFI at least once per week. The SFI CV for the Memphis in-house study is much lower at 9.42% compared to the CSITC round trial SFI CV’s which range from 15.8% to 20.8% (Tables I & II). The large CV’s in the CSITC round trial are largely attributed to large between instrument differences as a result of not having SFI cotton calibration implemented industry wide.
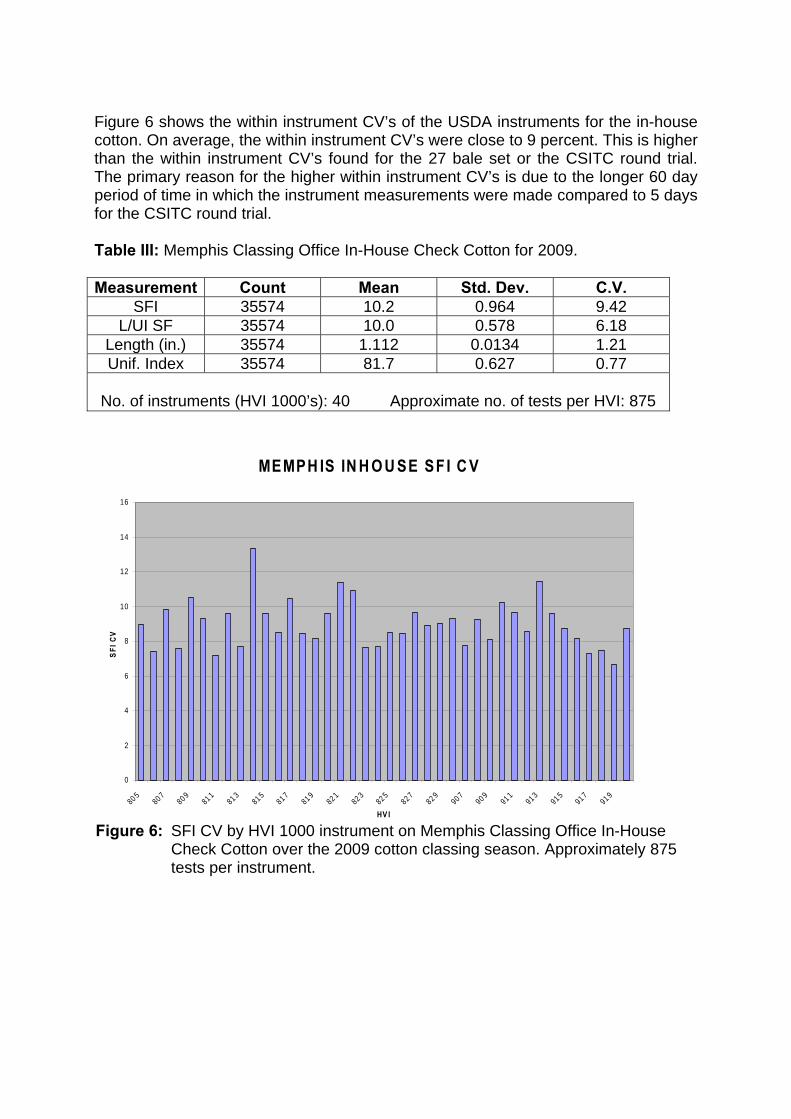
Figure 6 shows the within instrument CV’s of the USDA instruments for the in-house cotton. On average, the within instrument CV’s were close to 9 percent. This is higher than the within instrument CV’s found for the 27 bale set or the CSITC round trial. The primary reason for the higher within instrument CV’s is due to the longer 60 day period of time in which the instrument measurements were made compared to 5 days for the CSITC round trial. Table III: Memphis Classing Office In-House Check Cotton for 2009. Measurement Count Mean Std. Dev. C.V.
SFI 35574 10.2 0.964 9.42 L/UI SF 35574 10.0 0.578 6.18
Length (in.) 35574 1.112 0.0134 1.21 Unif. Index 35574 81.7 0.627 0.77
No. of instruments (HVI 1000’s): 40 Approximate no. of tests per HVI: 875
MEMPH IS IN H O U SE SF I C V
0
2
4
6
8
10
12
14
16
80 580 7
809811
813815
817819
821823
825827
829907
909911
913915
917919
HV I
SFI
CV
Figure 6: SFI CV by HVI 1000 instrument on Memphis Classing Office In-House Check Cotton over the 2009 cotton classing season. Approximately 875 tests per instrument.
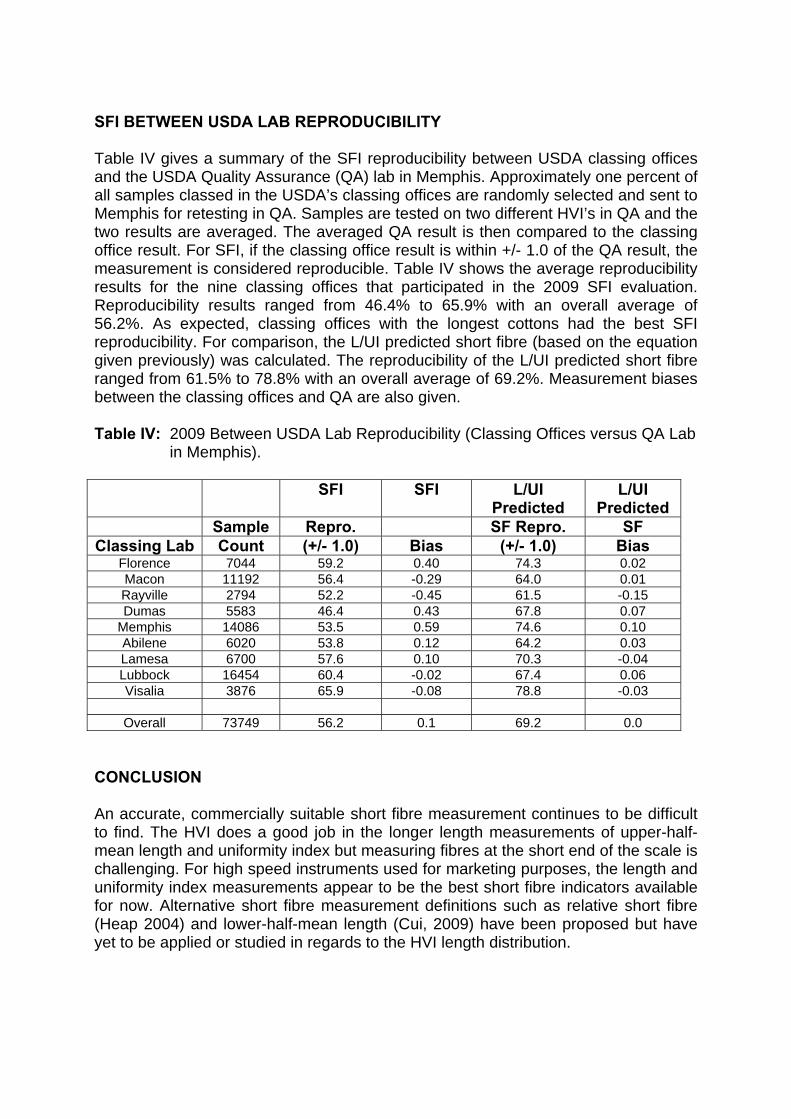
SFI BETWEEN USDA LAB REPRODUCIBILITY Table IV gives a summary of the SFI reproducibility between USDA classing offices and the USDA Quality Assurance (QA) lab in Memphis. Approximately one percent of all samples classed in the USDA’s classing offices are randomly selected and sent to Memphis for retesting in QA. Samples are tested on two different HVI’s in QA and the two results are averaged. The averaged QA result is then compared to the classing office result. For SFI, if the classing office result is within +/- 1.0 of the QA result, the measurement is considered reproducible. Table IV shows the average reproducibility results for the nine classing offices that participated in the 2009 SFI evaluation. Reproducibility results ranged from 46.4% to 65.9% with an overall average of 56.2%. As expected, classing offices with the longest cottons had the best SFI reproducibility. For comparison, the L/UI predicted short fibre (based on the equation given previously) was calculated. The reproducibility of the L/UI predicted short fibre ranged from 61.5% to 78.8% with an overall average of 69.2%. Measurement biases between the classing offices and QA are also given. Table IV: 2009 Between USDA Lab Reproducibility (Classing Offices versus QA Lab
in Memphis).
SFI SFI L/UI Predicted
L/UI Predicted
Sample Repro. SF Repro. SF Classing Lab Count (+/- 1.0) Bias (+/- 1.0) Bias
Florence 7044 59.2 0.40 74.3 0.02 Macon 11192 56.4 -0.29 64.0 0.01 Rayville 2794 52.2 -0.45 61.5 -0.15 Dumas 5583 46.4 0.43 67.8 0.07
Memphis 14086 53.5 0.59 74.6 0.10 Abilene 6020 53.8 0.12 64.2 0.03 Lamesa 6700 57.6 0.10 70.3 -0.04 Lubbock 16454 60.4 -0.02 67.4 0.06 Visalia 3876 65.9 -0.08 78.8 -0.03
Overall 73749 56.2 0.1 69.2 0.0
CONCLUSION An accurate, commercially suitable short fibre measurement continues to be difficult to find. The HVI does a good job in the longer length measurements of upper-half-mean length and uniformity index but measuring fibres at the short end of the scale is challenging. For high speed instruments used for marketing purposes, the length and uniformity index measurements appear to be the best short fibre indicators available for now. Alternative short fibre measurement definitions such as relative short fibre (Heap 2004) and lower-half-mean length (Cui, 2009) have been proposed but have yet to be applied or studied in regards to the HVI length distribution.

REFERENCES Cui, Xiaoliang “Leon”. 2009. The Advantage of Lower Half Mean Length in Characterizing Short Fibers. Beltwide Cotton Conference Proceedings. Pp. 1227-1228. Heap, S.A. 2004. Relative Short Fibre Content. Proceedings of International Cotton Conference. Bremen, Germany. Knowlton, J.L. 2004. Evaluation of Short Fibre Measurement Methods. Beltwide Cotton Conference Proceedings. pp. 2370-2377.
DEVELOPMENTS IN FIBER QUALITY MEASUREMENTS AND ON LINE APPLICATIONS
H. Ghorashi
Uster Technologies, Inc., Knoxville, TN, USA In spite of the global recession, especially in the textile market, the commitment of Uster Technologies to innovation in research and development has not changed. This paper reviews short summaries of a significant event in cotton classing and technical achievements in cotton fiber quality measurements in the past two years. A COTTON CLASSING MILESTONE IN 2009 This year marked an important milestone in the history of instrument cotton classing systems. The Chinese five year project, the largest in the world, was successfully completed with utilization of 387 Uster HVIs in 87 classing laboratories across China’s cotton regions. This grand project consisted of manufacturing, installation and meticulous acceptance process of this vast number of HVIs, with technical features such as remote diagnostics and real time data collection at a central data bank. Training programs, with participation of over 600 service technicians, operators and fiber technologists, were essential to the success of this project. These training sessions totaling to 62 weeks included refresher courses for some of the previous participants and were conducted in China and USA. In 2009 over 50% of China’s cotton production was tested on HVI with this system. The benefits of application of Uster HVI in this classing system are two fold. On the domestic front, the accurate information of fiber qualities provides all of the technical and economic benefits that the same classing program has offered to US cotton industry over the last 2 decades. On the international front, further application of HVI in China by organizations responsible for quality of imported cotton will insure harmonization with the international community through use of a worldwide standard instrument and practices. This will align and standardize China’s domestic and imported cotton quality testing with the rest of the world, and it will enhance international trade to the benefit of textile community. TECHNICAL DEVELOPMENTS New Automated Micronaire: Although Uster HVI1000 is a highly automated instrument, its micronaire measurement requires several manual steps. First, the operator must weigh a sample of cotton within a relatively narrow weight range. At times this may take a few attempts to attain the correct weight. Second, the operator transfers this sample from
the balance to the micronaire chamber and initiates the measurement by closing the chamber door. The third and last step is removal and disposal of the sample. In attempting to eliminate these seemingly simple steps the challenges associated with full automation of this measurement are revealed. One major challenge is that the current limited weight range makes an automated sampling process very difficult. Therefore, the first target for the new design was a wider weight range without negative impact on the performance of this measurement. This objective has been accomplished with new designs of the chamber, air system and sensing mechanisms increasing the weight range by several folds while duplicating the current performance of HVI 1000 micronaire. New Trashmeter for Classification of Machine harvested cottons In the US cotton classing program all but one fiber quality is measured and marketed based on Uster HVI measurements. This exception, and the last step in full instrument cotton grading services, is the measurement of leaf grade which is still determined by human classer. The disadvantages are subjective assessment, increased cost of classing, and operational inefficiencies due to integration of human and instruments in this process. The data from current HVI Trashmeter correlates well with the classer leaf grade. However, an increase in the field of view can further enhance this measurement as a larger area of the sample is scanned and measured determination of leaf grade. To achieve this objective the Large Area Trashmeter (LAT) was developed and prototypes have been delivered to USDA. Classification of non lint content is another objective of this development. This instrument, which will be integrated in the next generation of HVI, utilizes multi spectral light sources. The response of various types of non lint contents to different wave lengths will be the key to classification of these components. Identification of bark and grass is the first objective of this instrument. New Trashmeter for Classification of Hand Picked cottons Current HVI Trashmeter and the new Large Area Trashmeter have applications for the machine harvested cottons. However, their utilization for hand picked cottons can be limited. This is due to the generally smaller quantities of non-lint contents and their non uniform distribution in the bale. We are developing an automated gravimetric trashmeter for this specific application. This new instrument, which operates at compatible HVI testing speed, can be used as standalone or connected to the HVI as a component of its operation. Implementing novel technologies, its data performance will be superior to the existing instruments in the market.
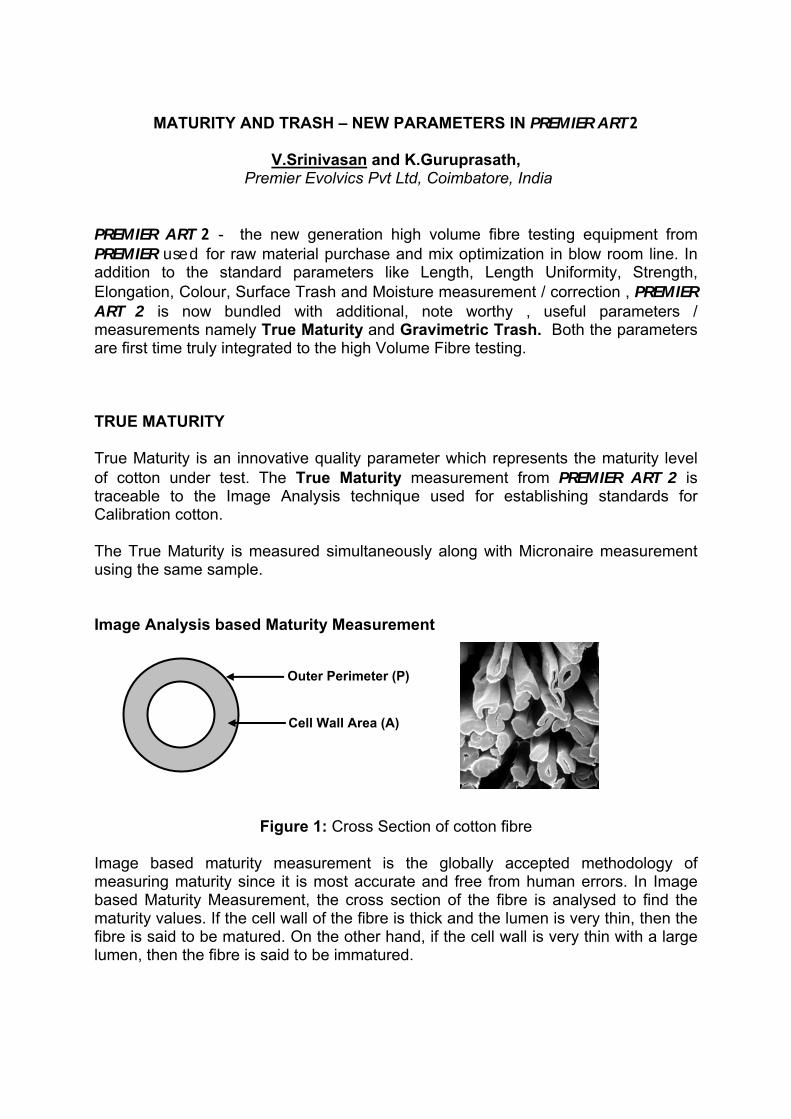
MATURITY AND TRASH – NEW PARAMETERS IN PREMIER ART 2
V.Srinivasan and K.Guruprasath, Premier Evolvics Pvt Ltd, Coimbatore, India
PREMIER ART 2 - the new generation high volume fibre testing equipment from PREMIER used for raw material purchase and mix optimization in blow room line. In addition to the standard parameters like Length, Length Uniformity, Strength, Elongation, Colour, Surface Trash and Moisture measurement / correction , PREMIER ART 2 is now bundled with additional, note worthy , useful parameters / measurements namely True Maturity and Gravimetric Trash. Both the parameters are first time truly integrated to the high Volume Fibre testing. TRUE MATURITY True Maturity is an innovative quality parameter which represents the maturity level of cotton under test. The True Maturity measurement from PREMIER ART 2 is traceable to the Image Analysis technique used for establishing standards for Calibration cotton. The True Maturity is measured simultaneously along with Micronaire measurement using the same sample. Image Analysis based Maturity Measurement
Figure 1: Cross Section of cotton fibre
Image based maturity measurement is the globally accepted methodology of measuring maturity since it is most accurate and free from human errors. In Image based Maturity Measurement, the cross section of the fibre is analysed to find the maturity values. If the cell wall of the fibre is thick and the lumen is very thin, then the fibre is said to be matured. On the other hand, if the cell wall is very thin with a large lumen, then the fibre is said to be immatured.
Outer Perimeter (P)
Cell Wall Area (A)
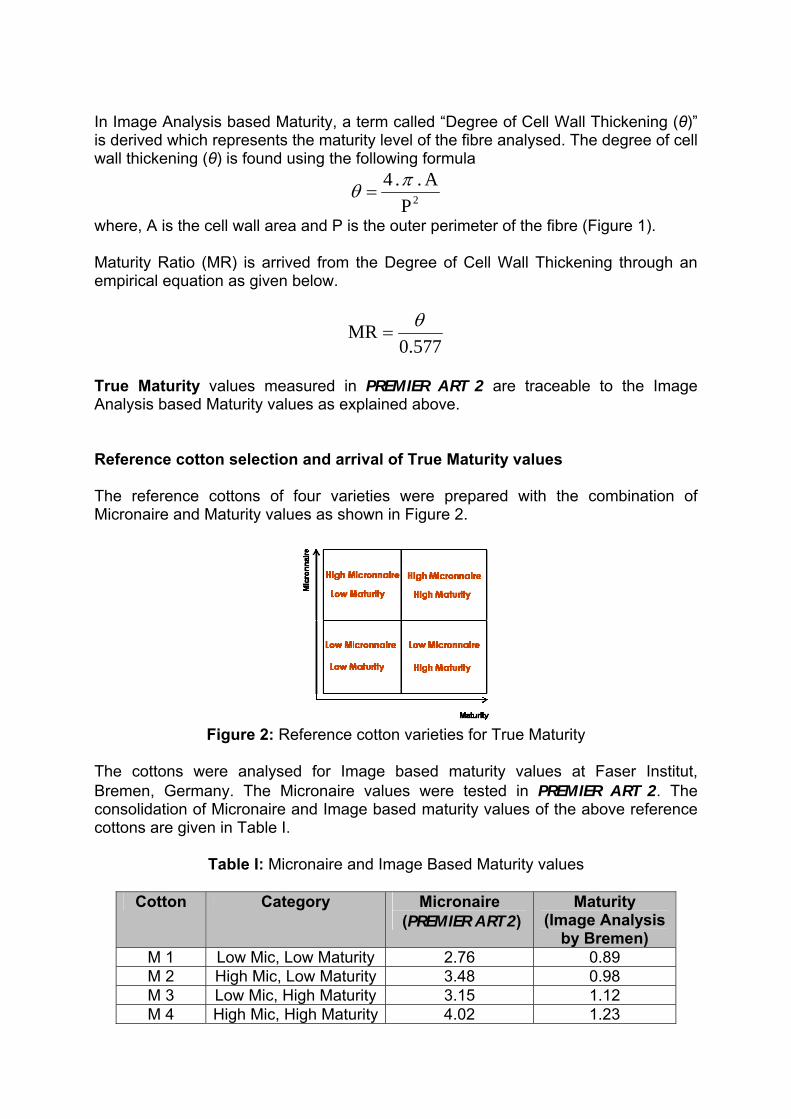
In Image Analysis based Maturity, a term called “Degree of Cell Wall Thickening (θ)” is derived which represents the maturity level of the fibre analysed. The degree of cell wall thickening (θ) is found using the following formula
2PA . . 4 πθ =
where, A is the cell wall area and P is the outer perimeter of the fibre (Figure 1). Maturity Ratio (MR) is arrived from the Degree of Cell Wall Thickening through an empirical equation as given below.
0.577MR θ
=
True Maturity values measured in PREMIER ART 2 are traceable to the Image Analysis based Maturity values as explained above. Reference cotton selection and arrival of True Maturity values The reference cottons of four varieties were prepared with the combination of Micronaire and Maturity values as shown in Figure 2.
Figure 2: Reference cotton varieties for True Maturity
The cottons were analysed for Image based maturity values at Faser Institut, Bremen, Germany. The Micronaire values were tested in PREMIER ART 2. The consolidation of Micronaire and Image based maturity values of the above reference cottons are given in Table I.
Table I: Micronaire and Image Based Maturity values
Cotton Category Micronaire (PREMIER ART 2)
Maturity (Image Analysis
by Bremen) M 1 Low Mic, Low Maturity 2.76 0.89 M 2 High Mic, Low Maturity 3.48 0.98 M 3 Low Mic, High Maturity 3.15 1.12 M 4 High Mic, High Maturity 4.02 1.23
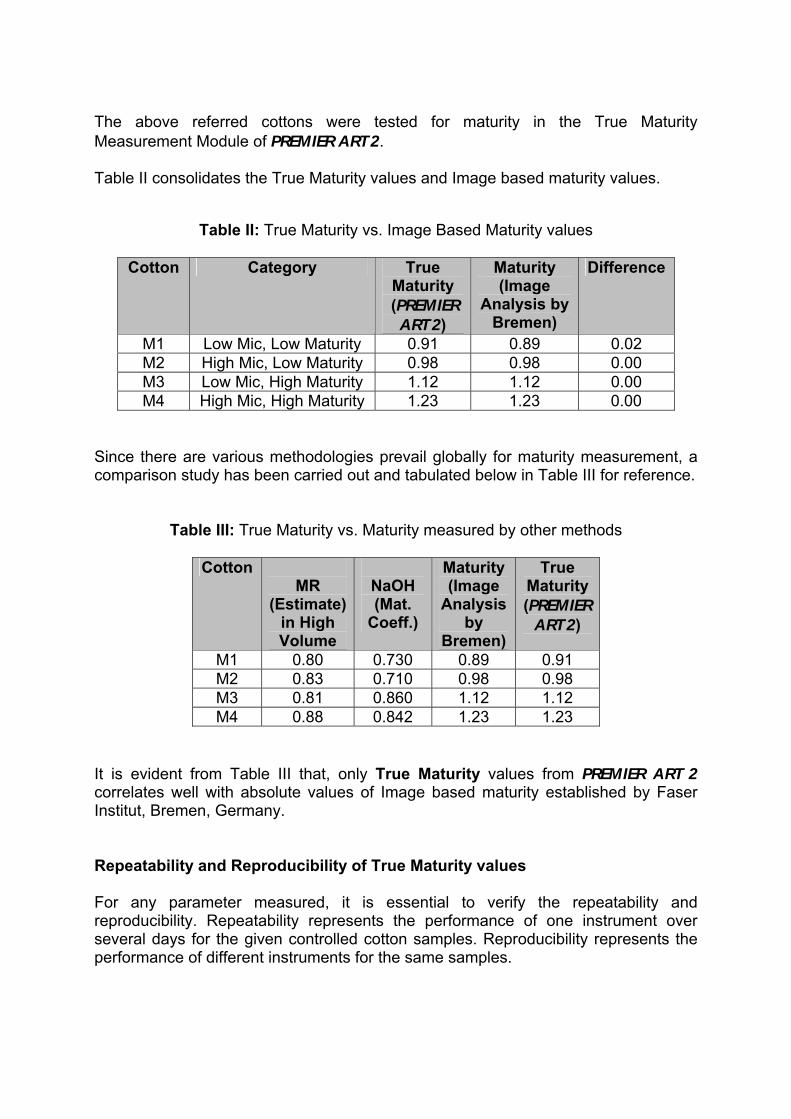
The above referred cottons were tested for maturity in the True Maturity Measurement Module of PREMIER ART 2. Table II consolidates the True Maturity values and Image based maturity values.
Table II: True Maturity vs. Image Based Maturity values
Cotton Category True Maturity
(PREMIER ART 2)
Maturity (Image
Analysis by Bremen)
Difference
M1 Low Mic, Low Maturity 0.91 0.89 0.02 M2 High Mic, Low Maturity 0.98 0.98 0.00 M3 Low Mic, High Maturity 1.12 1.12 0.00 M4 High Mic, High Maturity 1.23 1.23 0.00
Since there are various methodologies prevail globally for maturity measurement, a comparison study has been carried out and tabulated below in Table III for reference.
Table III: True Maturity vs. Maturity measured by other methods
Cotton MR
(Estimate) in High Volume
NaOH (Mat.
Coeff.)
Maturity (Image
Analysis by
Bremen)
True Maturity (PREMIER
ART 2)
M1 0.80 0.730 0.89 0.91 M2 0.83 0.710 0.98 0.98 M3 0.81 0.860 1.12 1.12 M4 0.88 0.842 1.23 1.23
It is evident from Table III that, only True Maturity values from PREMIER ART 2 correlates well with absolute values of Image based maturity established by Faser Institut, Bremen, Germany. Repeatability and Reproducibility of True Maturity values For any parameter measured, it is essential to verify the repeatability and reproducibility. Repeatability represents the performance of one instrument over several days for the given controlled cotton samples. Reproducibility represents the performance of different instruments for the same samples.
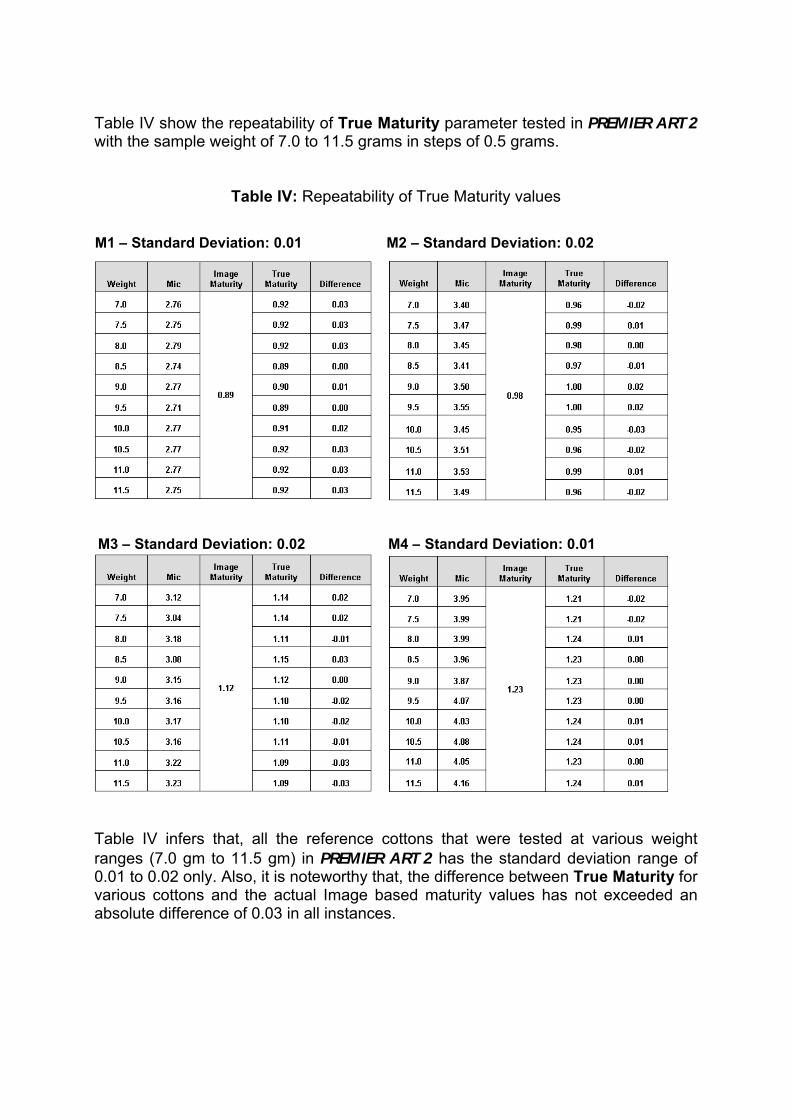
Table IV show the repeatability of True Maturity parameter tested in PREMIER ART 2 with the sample weight of 7.0 to 11.5 grams in steps of 0.5 grams.
Table IV: Repeatability of True Maturity values Table IV infers that, all the reference cottons that were tested at various weight ranges (7.0 gm to 11.5 gm) in PREMIER ART 2 has the standard deviation range of 0.01 to 0.02 only. Also, it is noteworthy that, the difference between True Maturity for various cottons and the actual Image based maturity values has not exceeded an absolute difference of 0.03 in all instances.
M1 – Standard Deviation: 0.01 M2 – Standard Deviation: 0.02
M3 – Standard Deviation: 0.02 M4 – Standard Deviation: 0.01
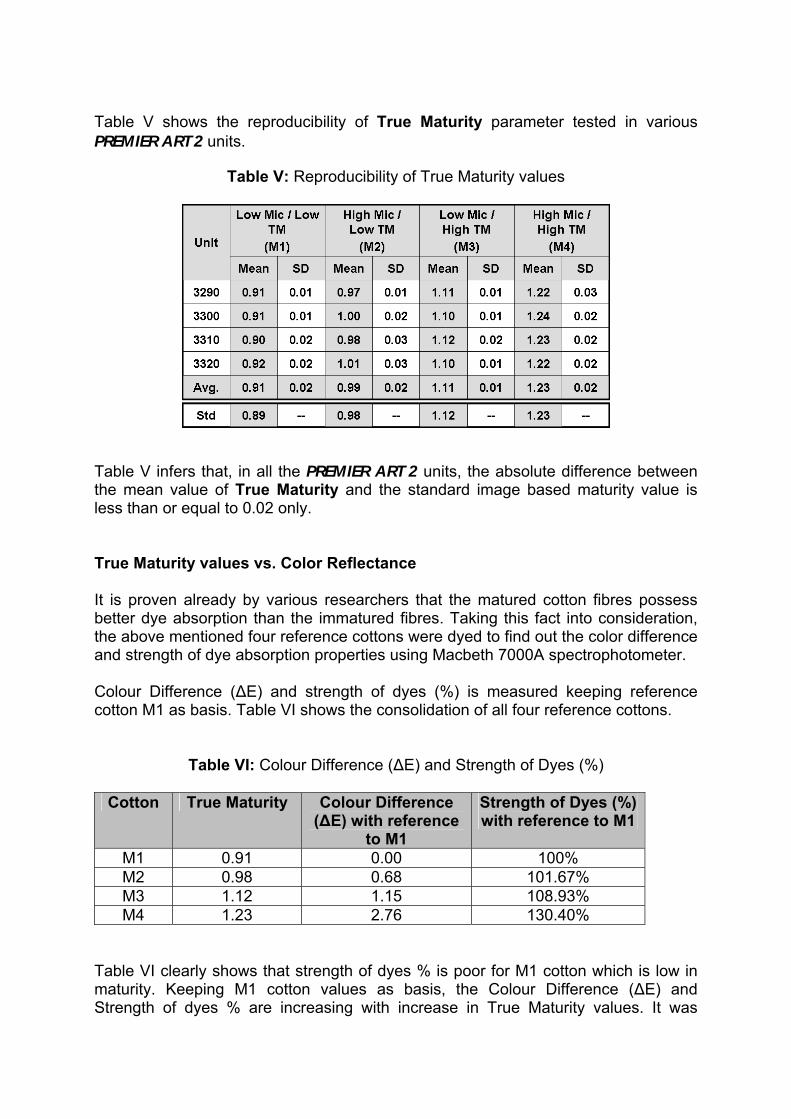
Table V shows the reproducibility of True Maturity parameter tested in various PREMIER ART 2 units.
Table V: Reproducibility of True Maturity values
Table V infers that, in all the PREMIER ART 2 units, the absolute difference between the mean value of True Maturity and the standard image based maturity value is less than or equal to 0.02 only. True Maturity values vs. Color Reflectance It is proven already by various researchers that the matured cotton fibres possess better dye absorption than the immatured fibres. Taking this fact into consideration, the above mentioned four reference cottons were dyed to find out the color difference and strength of dye absorption properties using Macbeth 7000A spectrophotometer. Colour Difference (ΔE) and strength of dyes (%) is measured keeping reference cotton M1 as basis. Table VI shows the consolidation of all four reference cottons.
Table VI: Colour Difference (ΔE) and Strength of Dyes (%)
Cotton True Maturity Colour Difference (ΔE) with reference
to M1
Strength of Dyes (%) with reference to M1
M1 0.91 0.00 100% M2 0.98 0.68 101.67% M3 1.12 1.15 108.93% M4 1.23 2.76 130.40%
Table VI clearly shows that strength of dyes % is poor for M1 cotton which is low in maturity. Keeping M1 cotton values as basis, the Colour Difference (ΔE) and Strength of dyes % are increasing with increase in True Maturity values. It was
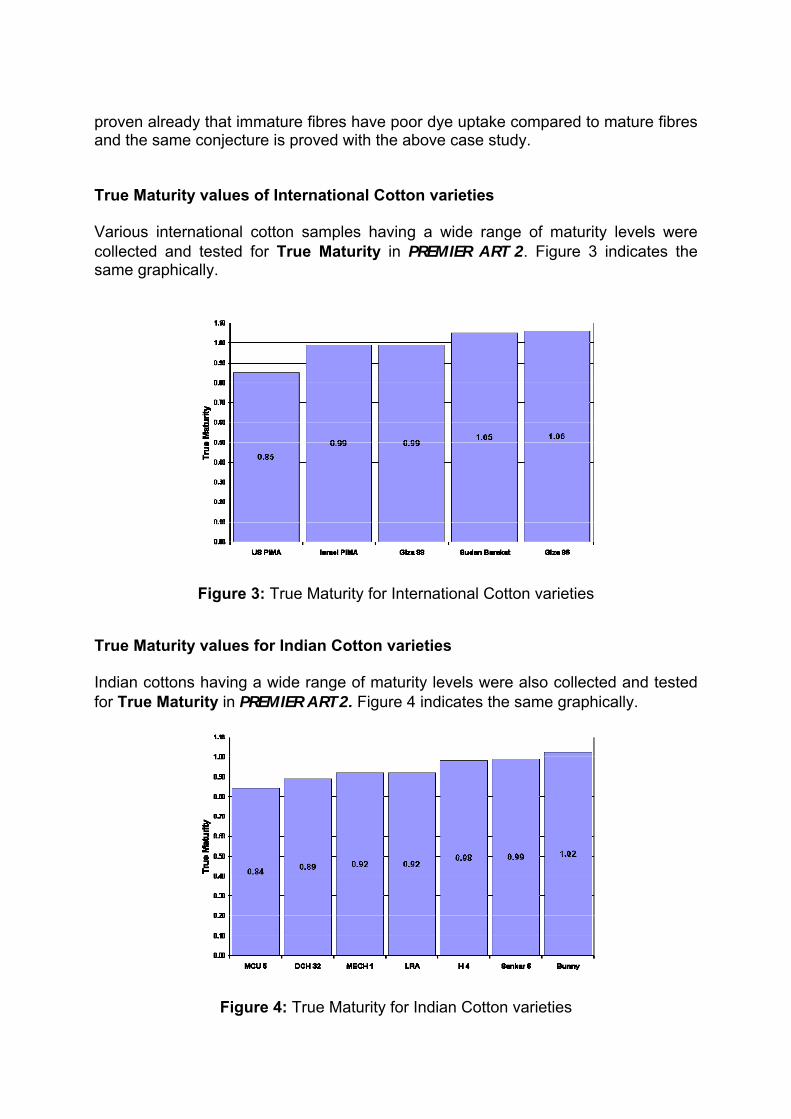
proven already that immature fibres have poor dye uptake compared to mature fibres and the same conjecture is proved with the above case study. True Maturity values of International Cotton varieties Various international cotton samples having a wide range of maturity levels were collected and tested for True Maturity in PREMIER ART 2. Figure 3 indicates the same graphically.
Figure 3: True Maturity for International Cotton varieties
True Maturity values for Indian Cotton varieties Indian cottons having a wide range of maturity levels were also collected and tested for True Maturity in PREMIER ART 2. Figure 4 indicates the same graphically.
Figure 4: True Maturity for Indian Cotton varieties
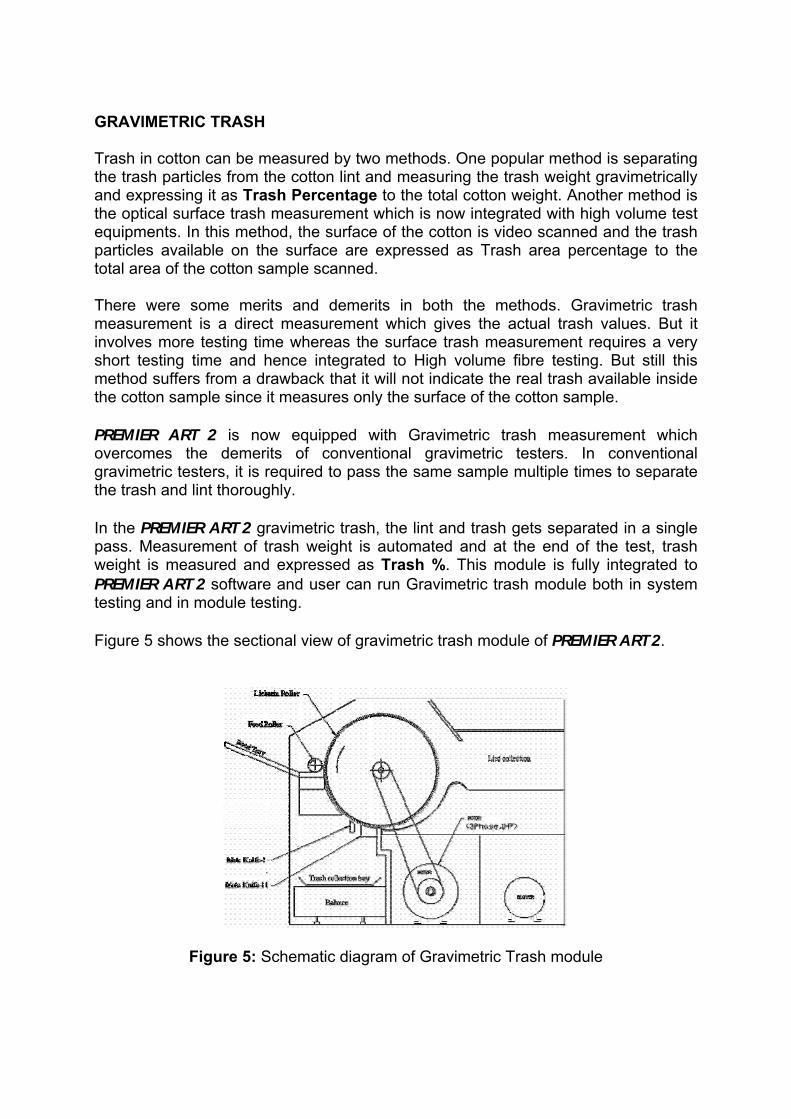
GRAVIMETRIC TRASH Trash in cotton can be measured by two methods. One popular method is separating the trash particles from the cotton lint and measuring the trash weight gravimetrically and expressing it as Trash Percentage to the total cotton weight. Another method is the optical surface trash measurement which is now integrated with high volume test equipments. In this method, the surface of the cotton is video scanned and the trash particles available on the surface are expressed as Trash area percentage to the total area of the cotton sample scanned. There were some merits and demerits in both the methods. Gravimetric trash measurement is a direct measurement which gives the actual trash values. But it involves more testing time whereas the surface trash measurement requires a very short testing time and hence integrated to High volume fibre testing. But still this method suffers from a drawback that it will not indicate the real trash available inside the cotton sample since it measures only the surface of the cotton sample. PREMIER ART 2 is now equipped with Gravimetric trash measurement which overcomes the demerits of conventional gravimetric testers. In conventional gravimetric testers, it is required to pass the same sample multiple times to separate the trash and lint thoroughly. In the PREMIER ART 2 gravimetric trash, the lint and trash gets separated in a single pass. Measurement of trash weight is automated and at the end of the test, trash weight is measured and expressed as Trash %. This module is fully integrated to PREMIER ART 2 software and user can run Gravimetric trash module both in system testing and in module testing. Figure 5 shows the sectional view of gravimetric trash module of PREMIER ART 2.
Figure 5: Schematic diagram of Gravimetric Trash module
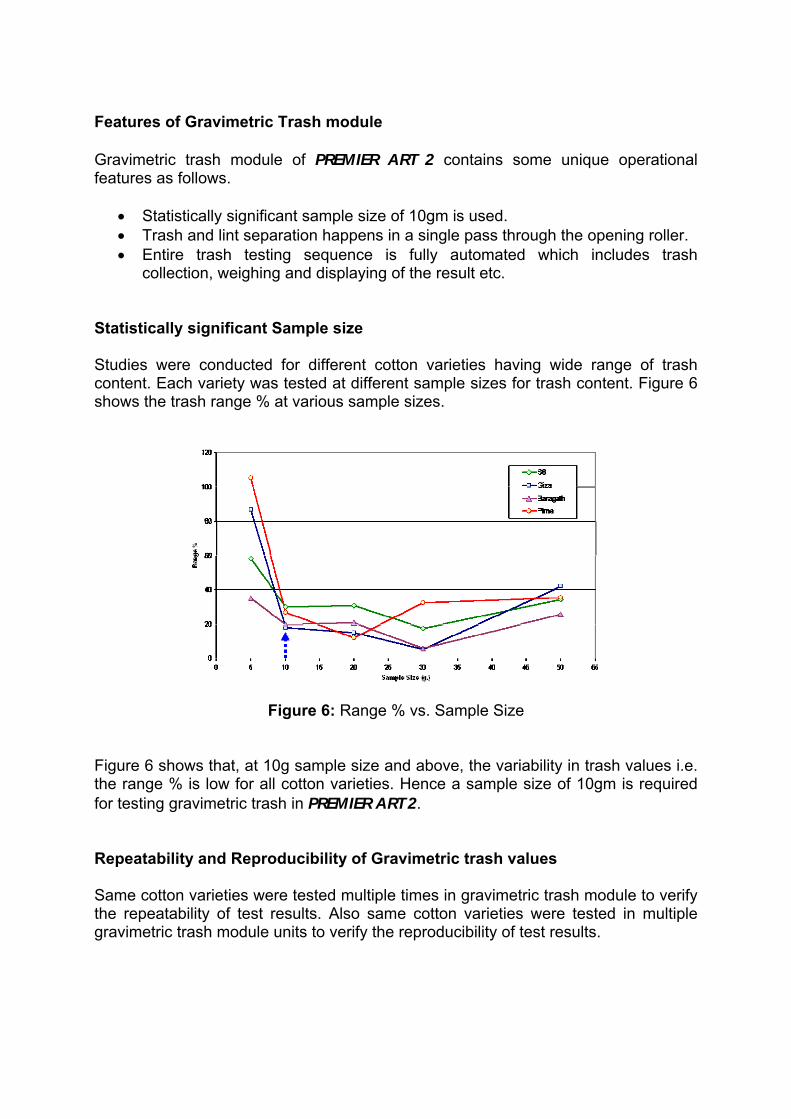
Features of Gravimetric Trash module Gravimetric trash module of PREMIER ART 2 contains some unique operational features as follows.
• Statistically significant sample size of 10gm is used. • Trash and lint separation happens in a single pass through the opening roller. • Entire trash testing sequence is fully automated which includes trash
collection, weighing and displaying of the result etc. Statistically significant Sample size Studies were conducted for different cotton varieties having wide range of trash content. Each variety was tested at different sample sizes for trash content. Figure 6 shows the trash range % at various sample sizes.
Figure 6: Range % vs. Sample Size
Figure 6 shows that, at 10g sample size and above, the variability in trash values i.e. the range % is low for all cotton varieties. Hence a sample size of 10gm is required for testing gravimetric trash in PREMIER ART 2. Repeatability and Reproducibility of Gravimetric trash values Same cotton varieties were tested multiple times in gravimetric trash module to verify the repeatability of test results. Also same cotton varieties were tested in multiple gravimetric trash module units to verify the reproducibility of test results.
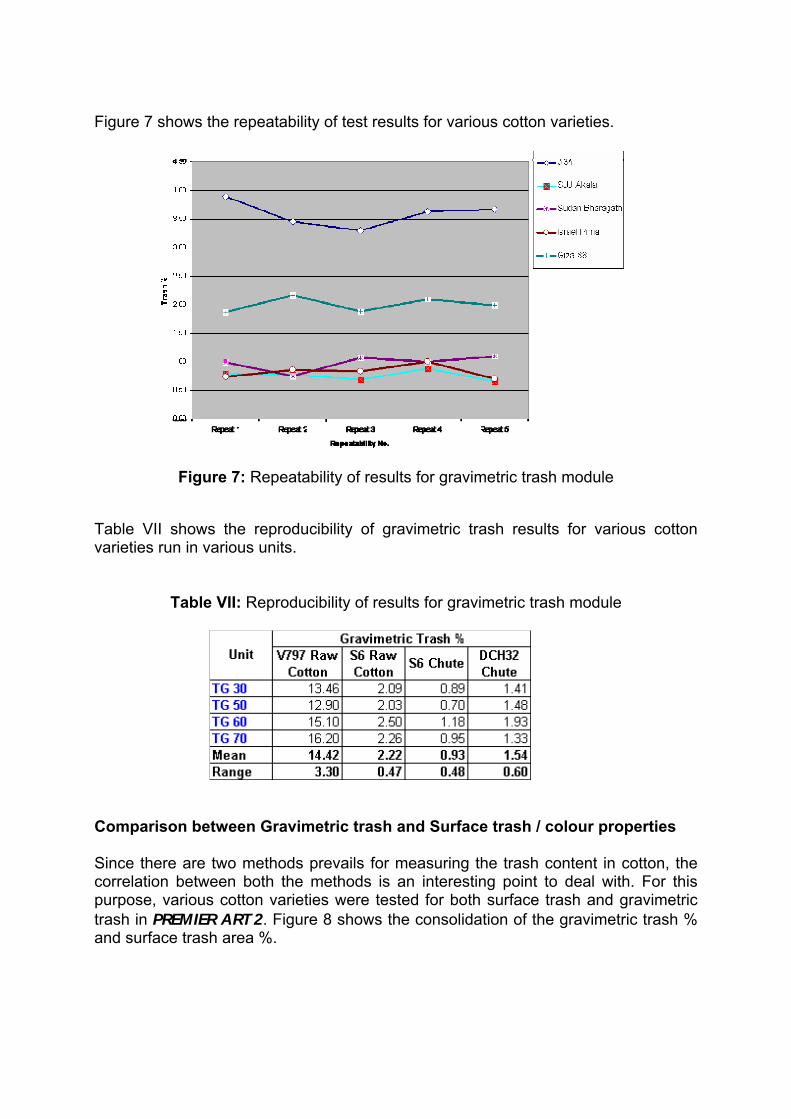
Figure 7 shows the repeatability of test results for various cotton varieties.
Figure 7: Repeatability of results for gravimetric trash module
Table VII shows the reproducibility of gravimetric trash results for various cotton varieties run in various units.
Table VII: Reproducibility of results for gravimetric trash module
Comparison between Gravimetric trash and Surface trash / colour properties Since there are two methods prevails for measuring the trash content in cotton, the correlation between both the methods is an interesting point to deal with. For this purpose, various cotton varieties were tested for both surface trash and gravimetric trash in PREMIER ART 2. Figure 8 shows the consolidation of the gravimetric trash % and surface trash area %.
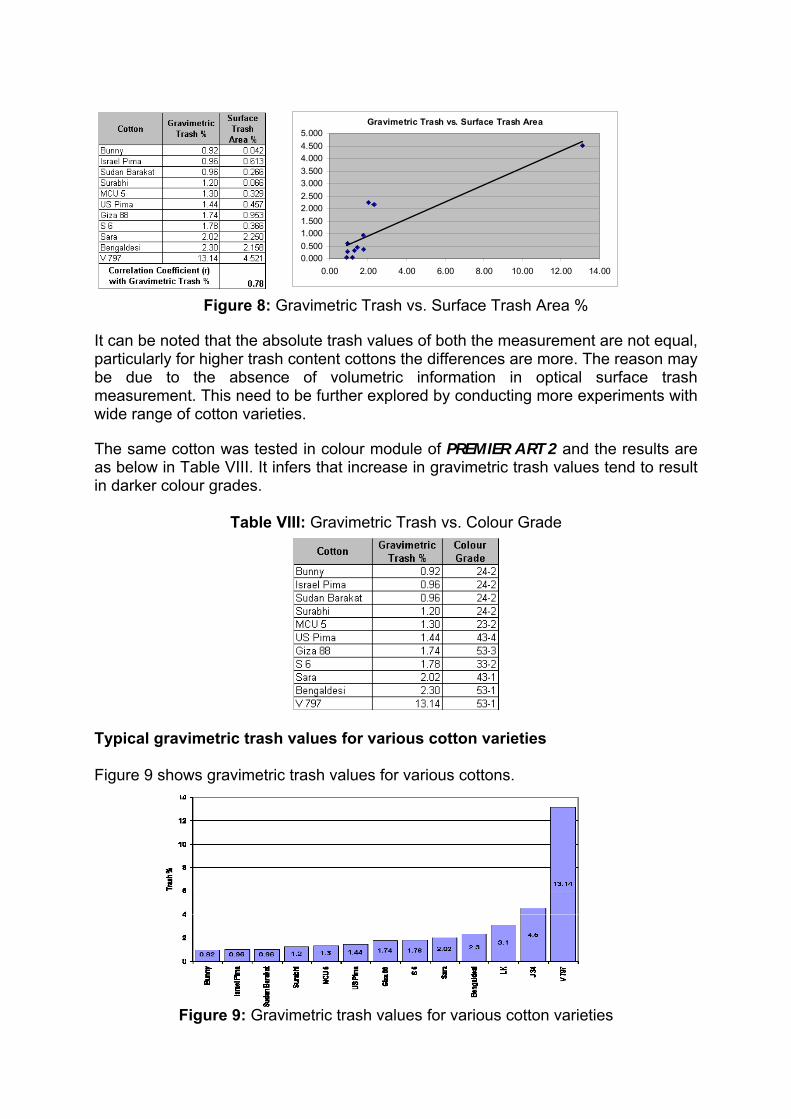
Figure 8: Gravimetric Trash vs. Surface Trash Area %
It can be noted that the absolute trash values of both the measurement are not equal, particularly for higher trash content cottons the differences are more. The reason may be due to the absence of volumetric information in optical surface trash measurement. This need to be further explored by conducting more experiments with wide range of cotton varieties. The same cotton was tested in colour module of PREMIER ART 2 and the results are as below in Table VIII. It infers that increase in gravimetric trash values tend to result in darker colour grades.
Table VIII: Gravimetric Trash vs. Colour Grade
Typical gravimetric trash values for various cotton varieties Figure 9 shows gravimetric trash values for various cottons.
Figure 9: Gravimetric trash values for various cotton varieties
Gravimetric Trash vs. Surface Trash Area
0.0000.5001.0001.5002.0002.5003.0003.5004.0004.5005.000
0.00 2.00 4.00 6.00 8.00 10.00 12.00 14.00
Application of Gravimetric trash results Gravimetric trash results have many useful applications as listed below.
• Assessing and optimizing the Ginning process. • Serves as a cotton grading tool for spinners. • Yarn realisation for spinners. • Monitoring and optimizing the cleaning efficiency in blow room. • Optimising the Trash and Neps in the blow room process.
CONCLUSIONS True Maturity by PREMIER ART 2 is traceable to image based maturity values. Since image based maturity values are more realistic and acceptable, True Maturity values from PREMIER ART 2 is said to be more reliable compared to existing methods. Gravimetric Trash module from PREMIER ART 2 gives the trash content in cotton by measuring the physical weight of the trash particles. Unlike traditional gravimetric testers, this module requires only single pass of cotton sample to separate the lint and trash particles. Being fully automated it avoids operational errors. The integration of Gravimetric Trash module to PREMIER ART 2 enable the users to get a comprehensive information of all the fibre properties.
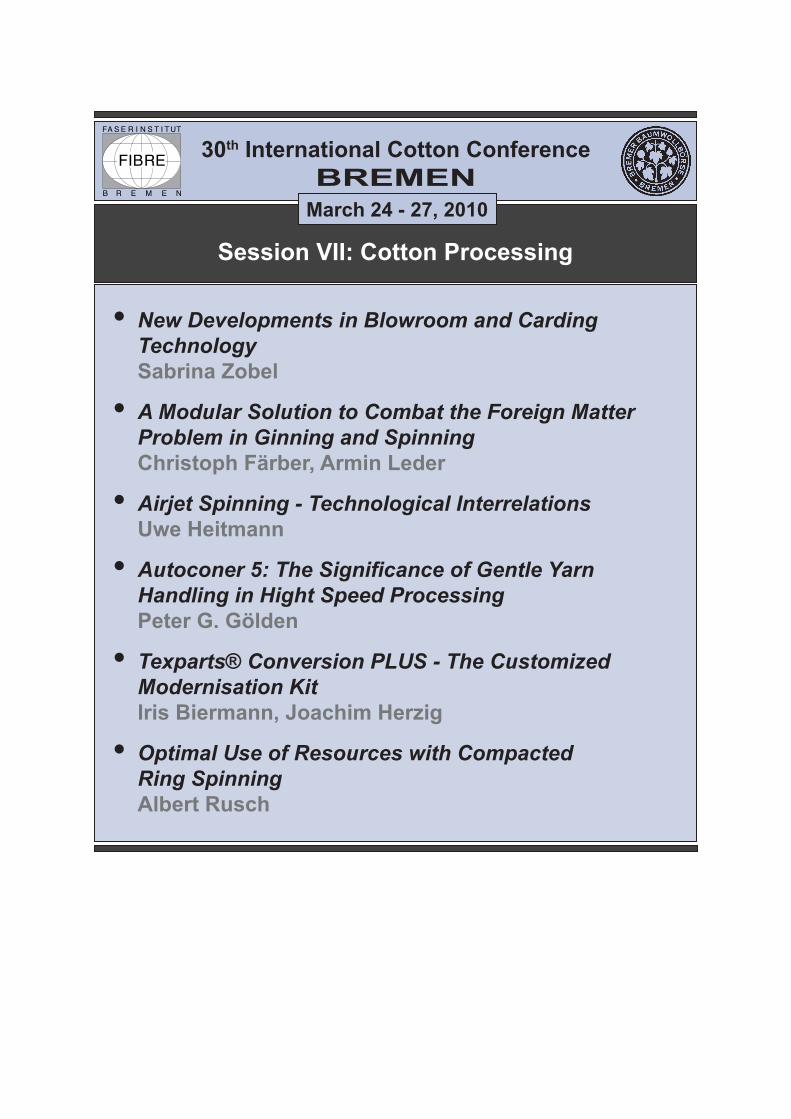
Session VII: Cotton Processing
30th International Cotton Conference BREMEN
March 24 - 27, 2010
New Developments in Blowroom and Carding TechnologySabrina Zobel
A Modular Solution to Combat the Foreign Matter Problem in Ginning and SpinningChristoph Färber, Armin Leder
Airjet Spinning - Technological InterrelationsUwe Heitmann
Autoconer 5: The Significance of Gentle Yarn Handling in Hight Speed ProcessingPeter G. Gölden
Texparts® Conversion PLUS - The Customized Modernisation KitIris Biermann, Joachim Herzig
Optimal Use of Resources with Compacted Ring SpinningAlbert Rusch
•
•
•
•
•
•
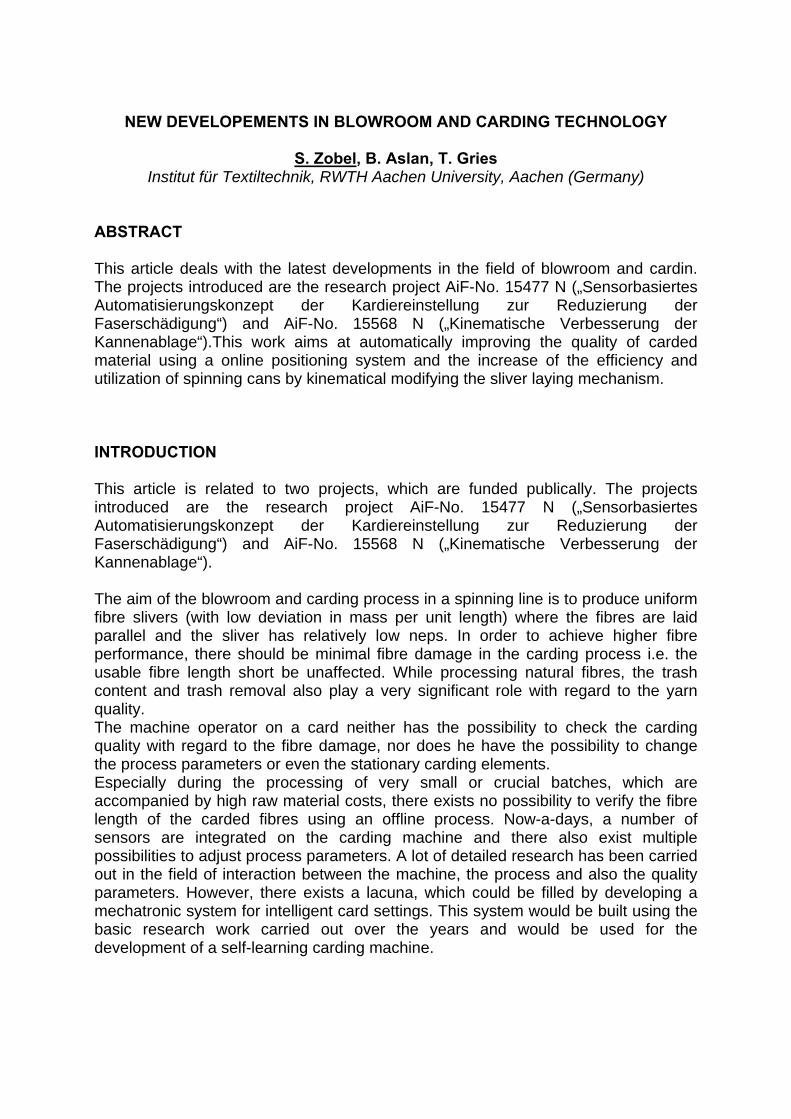
NEW DEVELOPEMENTS IN BLOWROOM AND CARDING TECHNOLOGY
S. Zobel, B. Aslan, T. Gries Institut für Textiltechnik, RWTH Aachen University, Aachen (Germany)
ABSTRACT This article deals with the latest developments in the field of blowroom and cardin. The projects introduced are the research project AiF-No. 15477 N („Sensorbasiertes Automatisierungskonzept der Kardiereinstellung zur Reduzierung der Faserschädigung“) and AiF-No. 15568 N („Kinematische Verbesserung der Kannenablage“).This work aims at automatically improving the quality of carded material using a online positioning system and the increase of the efficiency and utilization of spinning cans by kinematical modifying the sliver laying mechanism. INTRODUCTION This article is related to two projects, which are funded publically. The projects introduced are the research project AiF-No. 15477 N („Sensorbasiertes Automatisierungskonzept der Kardiereinstellung zur Reduzierung der Faserschädigung“) and AiF-No. 15568 N („Kinematische Verbesserung der Kannenablage“). The aim of the blowroom and carding process in a spinning line is to produce uniform fibre slivers (with low deviation in mass per unit length) where the fibres are laid parallel and the sliver has relatively low neps. In order to achieve higher fibre performance, there should be minimal fibre damage in the carding process i.e. the usable fibre length short be unaffected. While processing natural fibres, the trash content and trash removal also play a very significant role with regard to the yarn quality. The machine operator on a card neither has the possibility to check the carding quality with regard to the fibre damage, nor does he have the possibility to change the process parameters or even the stationary carding elements. Especially during the processing of very small or crucial batches, which are accompanied by high raw material costs, there exists no possibility to verify the fibre length of the carded fibres using an offline process. Now-a-days, a number of sensors are integrated on the carding machine and there also exist multiple possibilities to adjust process parameters. A lot of detailed research has been carried out in the field of interaction between the machine, the process and also the quality parameters. However, there exists a lacuna, which could be filled by developing a mechatronic system for intelligent card settings. This system would be built using the basic research work carried out over the years and would be used for the development of a self-learning carding machine.
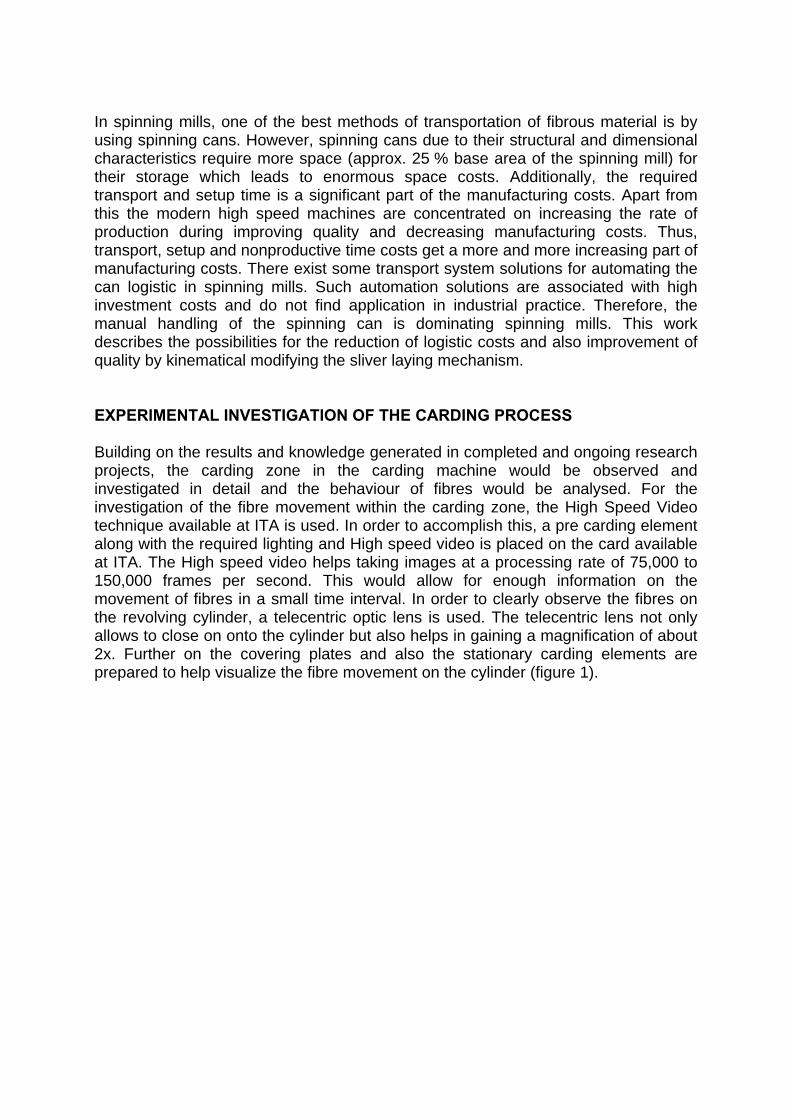
In spinning mills, one of the best methods of transportation of fibrous material is by using spinning cans. However, spinning cans due to their structural and dimensional characteristics require more space (approx. 25 % base area of the spinning mill) for their storage which leads to enormous space costs. Additionally, the required transport and setup time is a significant part of the manufacturing costs. Apart from this the modern high speed machines are concentrated on increasing the rate of production during improving quality and decreasing manufacturing costs. Thus, transport, setup and nonproductive time costs get a more and more increasing part of manufacturing costs. There exist some transport system solutions for automating the can logistic in spinning mills. Such automation solutions are associated with high investment costs and do not find application in industrial practice. Therefore, the manual handling of the spinning can is dominating spinning mills. This work describes the possibilities for the reduction of logistic costs and also improvement of quality by kinematical modifying the sliver laying mechanism. EXPERIMENTAL INVESTIGATION OF THE CARDING PROCESS Building on the results and knowledge generated in completed and ongoing research projects, the carding zone in the carding machine would be observed and investigated in detail and the behaviour of fibres would be analysed. For the investigation of the fibre movement within the carding zone, the High Speed Video technique available at ITA is used. In order to accomplish this, a pre carding element along with the required lighting and High speed video is placed on the card available at ITA. The High speed video helps taking images at a processing rate of 75,000 to 150,000 frames per second. This would allow for enough information on the movement of fibres in a small time interval. In order to clearly observe the fibres on the revolving cylinder, a telecentric optic lens is used. The telecentric lens not only allows to close on onto the cylinder but also helps in gaining a magnification of about 2x. Further on the covering plates and also the stationary carding elements are prepared to help visualize the fibre movement on the cylinder (figure 1).
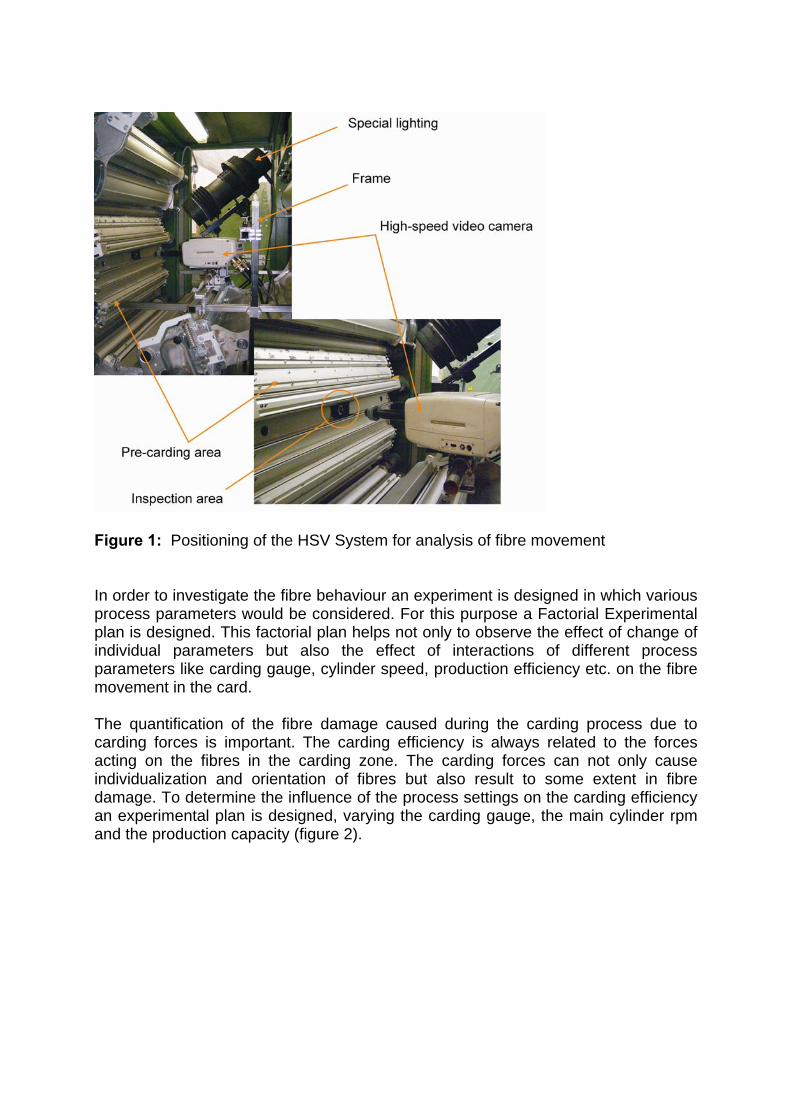
Figure 1: Positioning of the HSV System for analysis of fibre movement In order to investigate the fibre behaviour an experiment is designed in which various process parameters would be considered. For this purpose a Factorial Experimental plan is designed. This factorial plan helps not only to observe the effect of change of individual parameters but also the effect of interactions of different process parameters like carding gauge, cylinder speed, production efficiency etc. on the fibre movement in the card. The quantification of the fibre damage caused during the carding process due to carding forces is important. The carding efficiency is always related to the forces acting on the fibres in the carding zone. The carding forces can not only cause individualization and orientation of fibres but also result to some extent in fibre damage. To determine the influence of the process settings on the carding efficiency an experimental plan is designed, varying the carding gauge, the main cylinder rpm and the production capacity (figure 2).
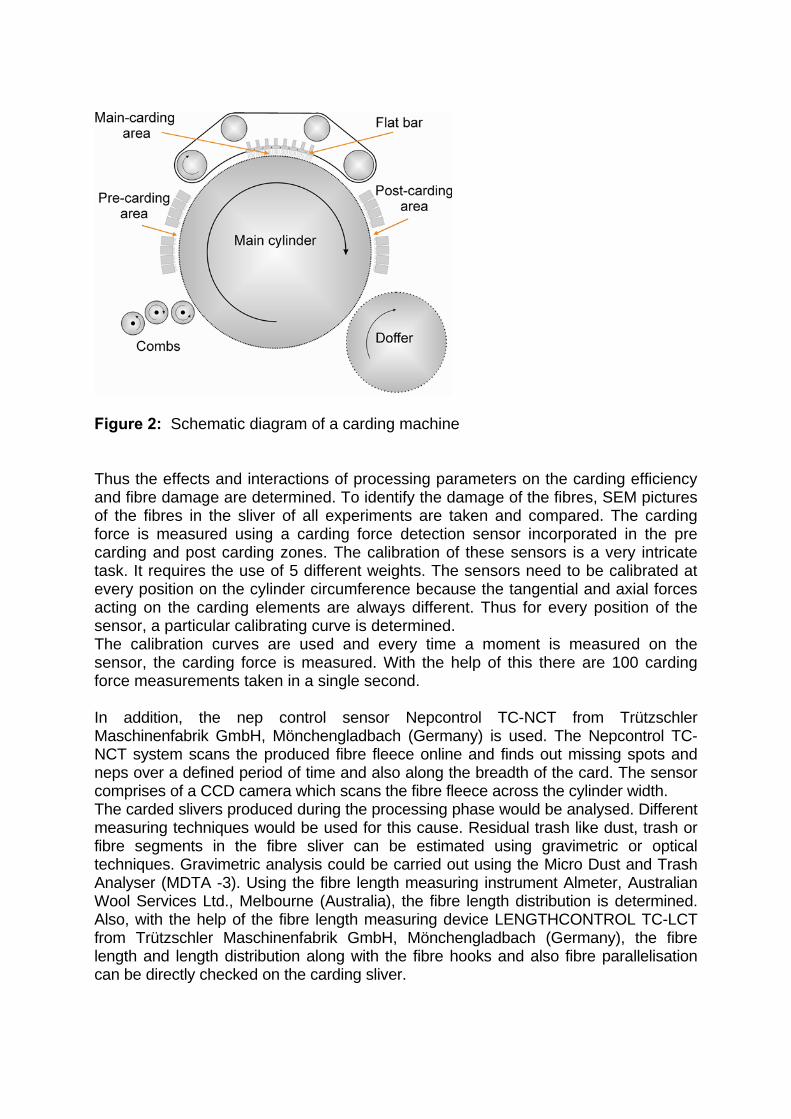
Figure 2: Schematic diagram of a carding machine Thus the effects and interactions of processing parameters on the carding efficiency and fibre damage are determined. To identify the damage of the fibres, SEM pictures of the fibres in the sliver of all experiments are taken and compared. The carding force is measured using a carding force detection sensor incorporated in the pre carding and post carding zones. The calibration of these sensors is a very intricate task. It requires the use of 5 different weights. The sensors need to be calibrated at every position on the cylinder circumference because the tangential and axial forces acting on the carding elements are always different. Thus for every position of the sensor, a particular calibrating curve is determined. The calibration curves are used and every time a moment is measured on the sensor, the carding force is measured. With the help of this there are 100 carding force measurements taken in a single second. In addition, the nep control sensor Nepcontrol TC-NCT from Trützschler Maschinenfabrik GmbH, Mönchengladbach (Germany) is used. The Nepcontrol TC-NCT system scans the produced fibre fleece online and finds out missing spots and neps over a defined period of time and also along the breadth of the card. The sensor comprises of a CCD camera which scans the fibre fleece across the cylinder width. The carded slivers produced during the processing phase would be analysed. Different measuring techniques would be used for this cause. Residual trash like dust, trash or fibre segments in the fibre sliver can be estimated using gravimetric or optical techniques. Gravimetric analysis could be carried out using the Micro Dust and Trash Analyser (MDTA -3). Using the fibre length measuring instrument Almeter, Australian Wool Services Ltd., Melbourne (Australia), the fibre length distribution is determined. Also, with the help of the fibre length measuring device LENGTHCONTROL TC-LCT from Trützschler Maschinenfabrik GmbH, Mönchengladbach (Germany), the fibre length and length distribution along with the fibre hooks and also fibre parallelisation can be directly checked on the carding sliver.
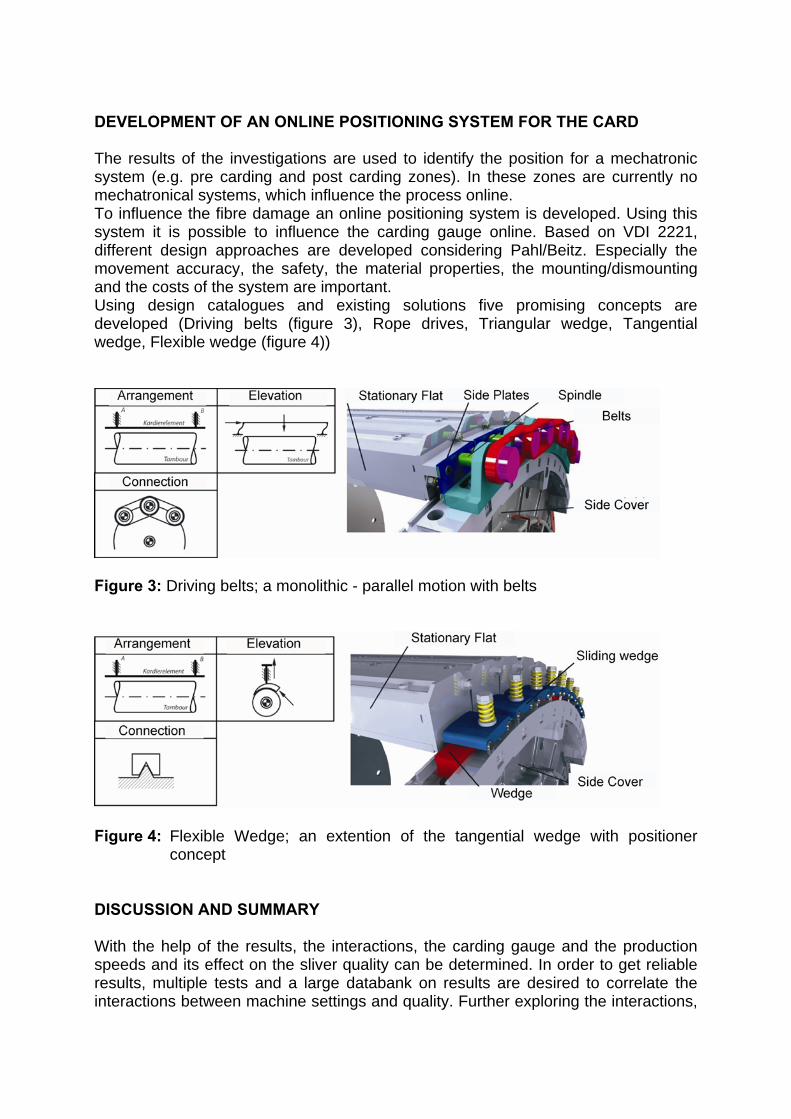
DEVELOPMENT OF AN ONLINE POSITIONING SYSTEM FOR THE CARD The results of the investigations are used to identify the position for a mechatronic system (e.g. pre carding and post carding zones). In these zones are currently no mechatronical systems, which influence the process online. To influence the fibre damage an online positioning system is developed. Using this system it is possible to influence the carding gauge online. Based on VDI 2221, different design approaches are developed considering Pahl/Beitz. Especially the movement accuracy, the safety, the material properties, the mounting/dismounting and the costs of the system are important. Using design catalogues and existing solutions five promising concepts are developed (Driving belts (figure 3), Rope drives, Triangular wedge, Tangential wedge, Flexible wedge (figure 4))
Figure 3: Driving belts; a monolithic - parallel motion with belts
Figure 4: Flexible Wedge; an extention of the tangential wedge with positioner
concept DISCUSSION AND SUMMARY With the help of the results, the interactions, the carding gauge and the production speeds and its effect on the sliver quality can be determined. In order to get reliable results, multiple tests and a large databank on results are desired to correlate the interactions between machine settings and quality. Further exploring the interactions,
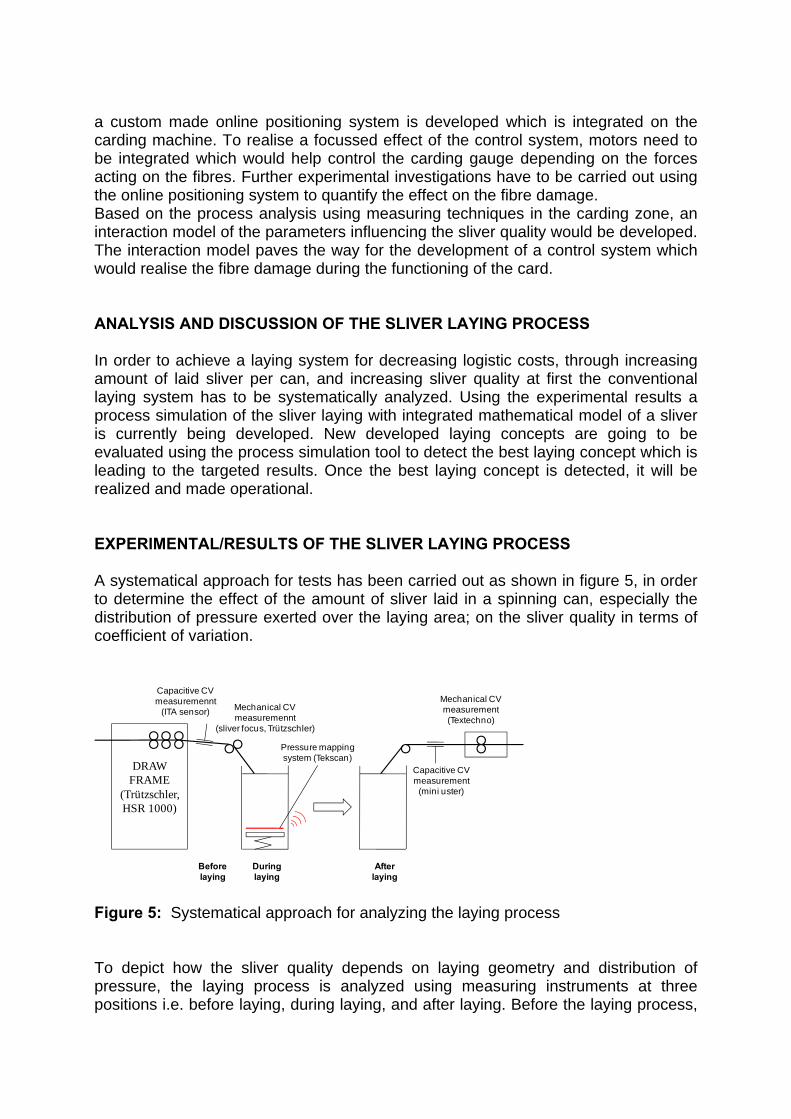
a custom made online positioning system is developed which is integrated on the carding machine. To realise a focussed effect of the control system, motors need to be integrated which would help control the carding gauge depending on the forces acting on the fibres. Further experimental investigations have to be carried out using the online positioning system to quantify the effect on the fibre damage. Based on the process analysis using measuring techniques in the carding zone, an interaction model of the parameters influencing the sliver quality would be developed. The interaction model paves the way for the development of a control system which would realise the fibre damage during the functioning of the card. ANALYSIS AND DISCUSSION OF THE SLIVER LAYING PROCESS In order to achieve a laying system for decreasing logistic costs, through increasing amount of laid sliver per can, and increasing sliver quality at first the conventional laying system has to be systematically analyzed. Using the experimental results a process simulation of the sliver laying with integrated mathematical model of a sliver is currently being developed. New developed laying concepts are going to be evaluated using the process simulation tool to detect the best laying concept which is leading to the targeted results. Once the best laying concept is detected, it will be realized and made operational. EXPERIMENTAL/RESULTS OF THE SLIVER LAYING PROCESS A systematical approach for tests has been carried out as shown in figure 5, in order to determine the effect of the amount of sliver laid in a spinning can, especially the distribution of pressure exerted over the laying area; on the sliver quality in terms of coefficient of variation.
DRAW FRAME
(Trützschler, HSR 1000)
Capacitive CV measuremennt
(ITA sensor)
Beforelaying
Duringlaying
After laying
Pressure mappingsystem (Tekscan)
Capacitive CV measurement
(mini uster)
Mechanical CV measuremennt
(sliver focus, Trützschler)
Mechanical CV measurement(Textechno)
Figure 5: Systematical approach for analyzing the laying process To depict how the sliver quality depends on laying geometry and distribution of pressure, the laying process is analyzed using measuring instruments at three positions i.e. before laying, during laying, and after laying. Before the laying process,
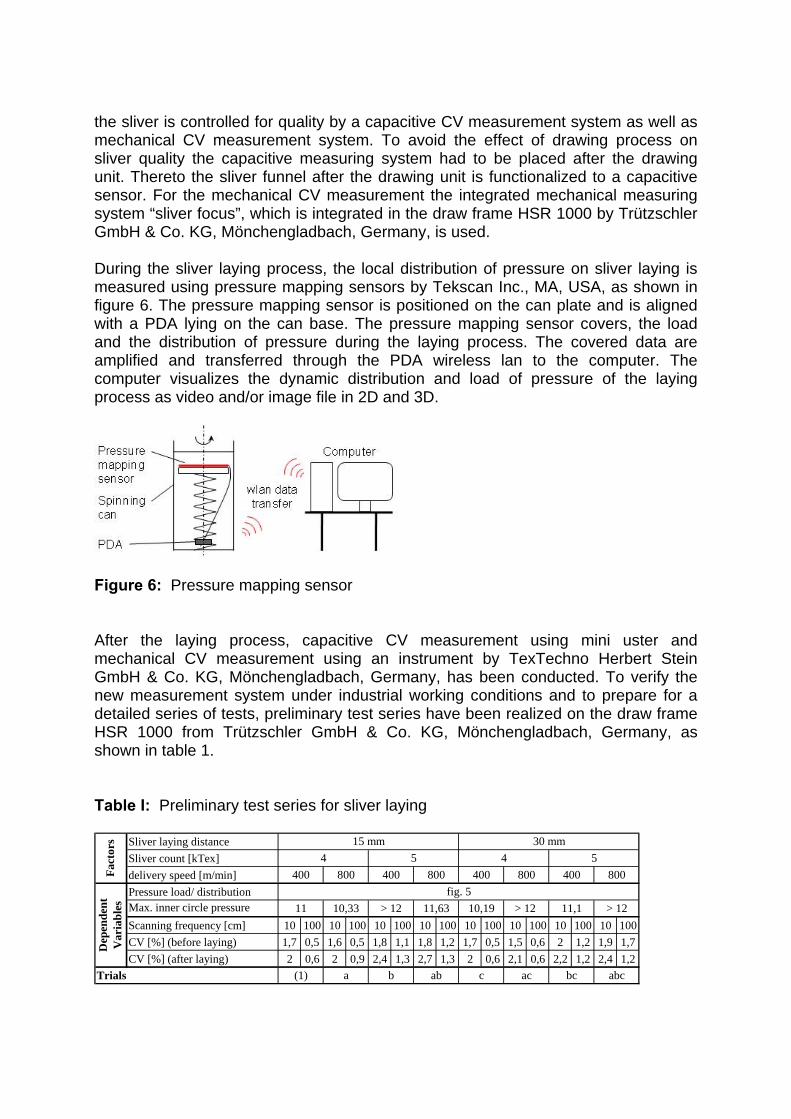
the sliver is controlled for quality by a capacitive CV measurement system as well as mechanical CV measurement system. To avoid the effect of drawing process on sliver quality the capacitive measuring system had to be placed after the drawing unit. Thereto the sliver funnel after the drawing unit is functionalized to a capacitive sensor. For the mechanical CV measurement the integrated mechanical measuring system “sliver focus”, which is integrated in the draw frame HSR 1000 by Trützschler GmbH & Co. KG, Mönchengladbach, Germany, is used. During the sliver laying process, the local distribution of pressure on sliver laying is measured using pressure mapping sensors by Tekscan Inc., MA, USA, as shown in figure 6. The pressure mapping sensor is positioned on the can plate and is aligned with a PDA lying on the can base. The pressure mapping sensor covers, the load and the distribution of pressure during the laying process. The covered data are amplified and transferred through the PDA wireless lan to the computer. The computer visualizes the dynamic distribution and load of pressure of the laying process as video and/or image file in 2D and 3D.
Figure 6: Pressure mapping sensor After the laying process, capacitive CV measurement using mini uster and mechanical CV measurement using an instrument by TexTechno Herbert Stein GmbH & Co. KG, Mönchengladbach, Germany, has been conducted. To verify the new measurement system under industrial working conditions and to prepare for a detailed series of tests, preliminary test series have been realized on the draw frame HSR 1000 from Trützschler GmbH & Co. KG, Mönchengladbach, Germany, as shown in table 1. Table I: Preliminary test series for sliver laying
Sliver laying distanceSliver count [kTex]delivery speed [m/min]Pressure load/ distributionMax. inner circle pressure Scanning frequency [cm] 10 100 10 100 10 100 10 100 10 100 10 100 10 100 10 100CV [%] (before laying) 1,7 0,5 1,6 0,5 1,8 1,1 1,8 1,2 1,7 0,5 1,5 0,6 2 1,2 1,9 1,7CV [%] (after laying) 2 0,6 2 0,9 2,4 1,3 2,7 1,3 2 0,6 2,1 0,6 2,2 1,2 2,4 1,2
Fact
ors
Dep
ende
nt
Var
iabl
es
Trials (1) a
4
abc
fig. 511 10,33 > 12 11,63 10,19 > 12 11,1 > 12
b ab c ac bc
5 4 5400 800 400 800 400 800 400 800
15 mm 30 mm
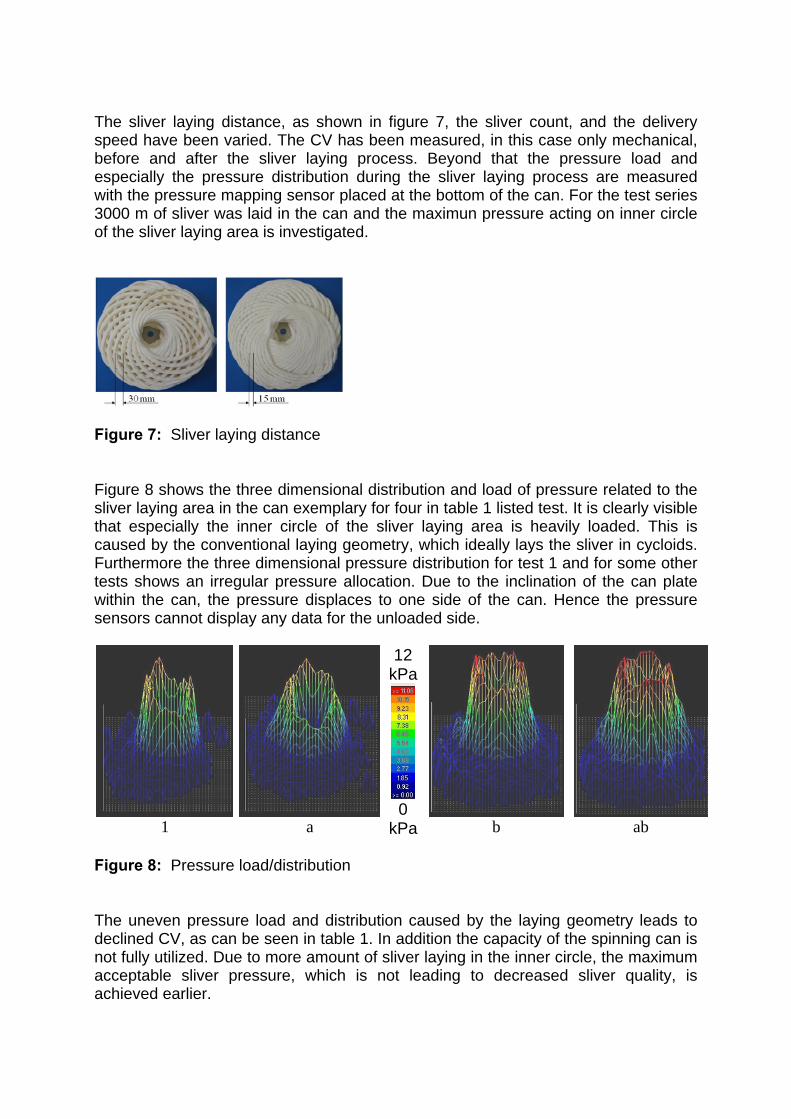
The sliver laying distance, as shown in figure 7, the sliver count, and the delivery speed have been varied. The CV has been measured, in this case only mechanical, before and after the sliver laying process. Beyond that the pressure load and especially the pressure distribution during the sliver laying process are measured with the pressure mapping sensor placed at the bottom of the can. For the test series 3000 m of sliver was laid in the can and the maximun pressure acting on inner circle of the sliver laying area is investigated.
Figure 7: Sliver laying distance Figure 8 shows the three dimensional distribution and load of pressure related to the sliver laying area in the can exemplary for four in table 1 listed test. It is clearly visible that especially the inner circle of the sliver laying area is heavily loaded. This is caused by the conventional laying geometry, which ideally lays the sliver in cycloids. Furthermore the three dimensional pressure distribution for test 1 and for some other tests shows an irregular pressure allocation. Due to the inclination of the can plate within the can, the pressure displaces to one side of the can. Hence the pressure sensors cannot display any data for the unloaded side.
1 a
12 kPa
0
kPa
b ab Figure 8: Pressure load/distribution The uneven pressure load and distribution caused by the laying geometry leads to declined CV, as can be seen in table 1. In addition the capacity of the spinning can is not fully utilized. Due to more amount of sliver laying in the inner circle, the maximum acceptable sliver pressure, which is not leading to decreased sliver quality, is achieved earlier.
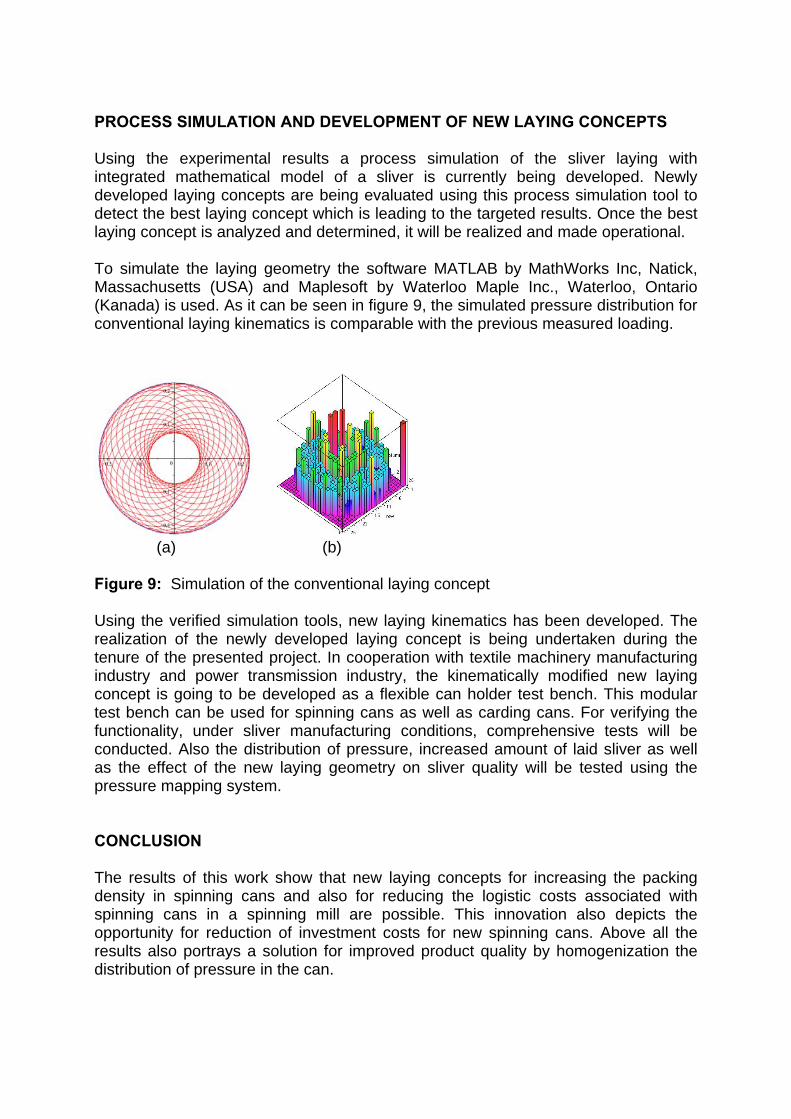
PROCESS SIMULATION AND DEVELOPMENT OF NEW LAYING CONCEPTS Using the experimental results a process simulation of the sliver laying with integrated mathematical model of a sliver is currently being developed. Newly developed laying concepts are being evaluated using this process simulation tool to detect the best laying concept which is leading to the targeted results. Once the best laying concept is analyzed and determined, it will be realized and made operational. To simulate the laying geometry the software MATLAB by MathWorks Inc, Natick, Massachusetts (USA) and Maplesoft by Waterloo Maple Inc., Waterloo, Ontario (Kanada) is used. As it can be seen in figure 9, the simulated pressure distribution for conventional laying kinematics is comparable with the previous measured loading.
(a) (b) Figure 9: Simulation of the conventional laying concept Using the verified simulation tools, new laying kinematics has been developed. The realization of the newly developed laying concept is being undertaken during the tenure of the presented project. In cooperation with textile machinery manufacturing industry and power transmission industry, the kinematically modified new laying concept is going to be developed as a flexible can holder test bench. This modular test bench can be used for spinning cans as well as carding cans. For verifying the functionality, under sliver manufacturing conditions, comprehensive tests will be conducted. Also the distribution of pressure, increased amount of laid sliver as well as the effect of the new laying geometry on sliver quality will be tested using the pressure mapping system. CONCLUSION The results of this work show that new laying concepts for increasing the packing density in spinning cans and also for reducing the logistic costs associated with spinning cans in a spinning mill are possible. This innovation also depicts the opportunity for reduction of investment costs for new spinning cans. Above all the results also portrays a solution for improved product quality by homogenization the distribution of pressure in the can.
ACKNOWLEDGMENTS We thank the Forschungsvereinigung Forschungskuratorium Textil e.V. for the financial support of the research project AiF-No. 15477 N („Sensorbasiertes Automatisierungskonzept der Kardiereinstellung zur Reduzierung der Faserschädigung“) and the research project AiF-No. 15568 N („Kinematische Verbesserung der Kannenablage“), which occured in the program for the sponsorship of the „Industriellen Gemeinschaftsforschung (IGF)“ from funds of the Bundesministerium für Wirtschaft und Technologie (BMWi) through the Arbeitsgemeinschaft industrieller Forschungsvereinigungen e.V. (AiF) We thank Trützschler Maschinenfabrik GmbH, Mönchengladbach (Germany) for their support with electronic devices. We thank HCH. Kettelhack GmbH & Co. KG, Rheine (Germany) for their support with fibre and sliver materials. REFERENCES Jehle, V. 2002. Analyse der Faservereinzelung im Kardierprozess zur Vermeidung einer Faserschädigung, Stuttgart, Univers., Diss. Klinke, R., Bedeutung der Kannenformate im Arbeitsablauf der Baumwollspinnerei unter Besonderer Berücksichtigung der Strecken, Zeitschrift für die gesamte Textilindustrie, 1959, 61, No. 9, 329-334 Lamprecht, I., Das fahrerlose Kannentransportsystem „Canny One“, Textilpraxis International, 1994, 49, No. 9, S. 566, 568, 570 Lamprecht, I.; Schlichter, S., Transportautomatisierung in der Spinnereivorbereitung, Meliand Textilberichte, 1992, 73, No. 8, 616.622 Langen, M., Transportautomatisierung von der Karde bis zur Weberei, Chemiefasern/Textilindustrie, 1988, 38/90, No. 12, 1146-1149 Mählmann, I. 2009. Verbesserung der Funktionalität von Speisemulden an Textilmaschinen. URL: http://www.ita.rwth-aachen.de/de/02_Forschung/Projekte/Spinnerei/Speisemulde.pdf Mählmann, I. and T. Gries. 2006. Verbesserung der Funktionalität von Speisemulden an Textilmaschinen. (Improvement of fiber feed systems for textile machines). DWI Reports 2006/130. Paper: P41_Maehlmann.pdf Mählmann, I. and T. Gries. 2007. Prozessanalyse an einer Speisemulde. Melliand Textilberichte 88 (2007). H. 4, S. 201-202
Mählmann, I. and T. Gries. 2008. Verbesserung der Funktionalität von Speisemulden an Textilmaschinen. (Improving the functionality of feeding troughs for textile machines). Melliand Textilberichte 89. H. 7/8, S. 247-250. (Melliand English. H. 7/8. S. E72-E74) N.N., Transport-Automation in der Spinnerei, Loy, W., Taschenbuch für die Textilindustrie, Fachverlag Schiele & Schön GmbH, Berlin, 89-96 Renner, M., Transportautomatisierung in der Spinnerei, Chemiefasern/Textilindustrie, 1990, 40/92, No. 12, S. 1211-1213 Selker, H. 1997. Ein Schlüssel zum Erfolg in der textilen Kette: Richtiges Öffnen und Kardieren von Lenzing Lyocell. Int: Internat. Lyocell Symposium 1997, 21.-23.05.1997, Burg Schlaining (Austria) Trützschler GmbH & Co. KG, Mönchengladbach (Germany). 2003. Fibre + Sliver Technology. Firmenprospekt, Wiggers, H.; Lamprecht, I., Praxiserfahrung mit einem FTS-System in einem Spinnereibetrieb, VDI-Berichte 1107, VDI Verlag, Düsseldorf, 1994, 149-168
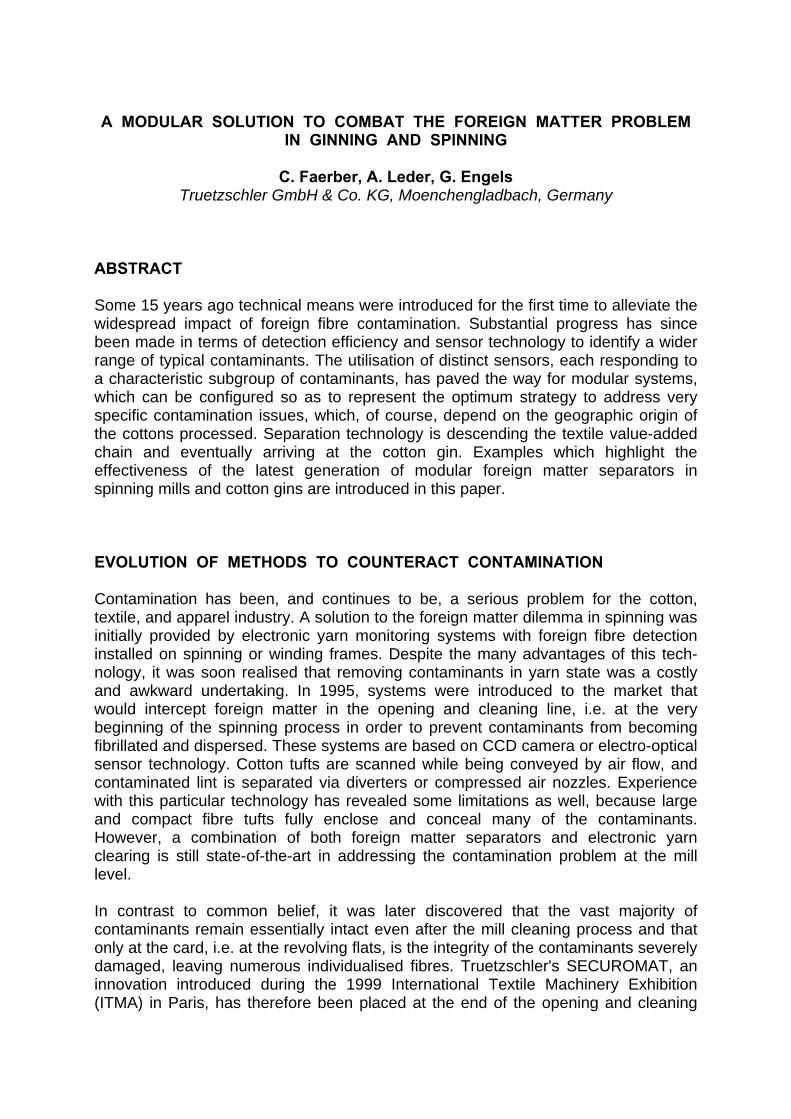
A MODULAR SOLUTION TO COMBAT THE FOREIGN MATTER PROBLEM IN GINNING AND SPINNING
C. Faerber, A. Leder, G. Engels
Truetzschler GmbH & Co. KG, Moenchengladbach, Germany ABSTRACT Some 15 years ago technical means were introduced for the first time to alleviate the widespread impact of foreign fibre contamination. Substantial progress has since been made in terms of detection efficiency and sensor technology to identify a wider range of typical contaminants. The utilisation of distinct sensors, each responding to a characteristic subgroup of contaminants, has paved the way for modular systems, which can be configured so as to represent the optimum strategy to address very specific contamination issues, which, of course, depend on the geographic origin of the cottons processed. Separation technology is descending the textile value-added chain and eventually arriving at the cotton gin. Examples which highlight the effectiveness of the latest generation of modular foreign matter separators in spinning mills and cotton gins are introduced in this paper. EVOLUTION OF METHODS TO COUNTERACT CONTAMINATION Contamination has been, and continues to be, a serious problem for the cotton, textile, and apparel industry. A solution to the foreign matter dilemma in spinning was initially provided by electronic yarn monitoring systems with foreign fibre detection installed on spinning or winding frames. Despite the many advantages of this tech-nology, it was soon realised that removing contaminants in yarn state was a costly and awkward undertaking. In 1995, systems were introduced to the market that would intercept foreign matter in the opening and cleaning line, i.e. at the very beginning of the spinning process in order to prevent contaminants from becoming fibrillated and dispersed. These systems are based on CCD camera or electro-optical sensor technology. Cotton tufts are scanned while being conveyed by air flow, and contaminated lint is separated via diverters or compressed air nozzles. Experience with this particular technology has revealed some limitations as well, because large and compact fibre tufts fully enclose and conceal many of the contaminants. However, a combination of both foreign matter separators and electronic yarn clearing is still state-of-the-art in addressing the contamination problem at the mill level. In contrast to common belief, it was later discovered that the vast majority of contaminants remain essentially intact even after the mill cleaning process and that only at the card, i.e. at the revolving flats, is the integrity of the contaminants severely damaged, leaving numerous individualised fibres. Truetzschler's SECUROMAT, an innovation introduced during the 1999 International Textile Machinery Exhibition (ITMA) in Paris, has therefore been placed at the end of the opening and cleaning
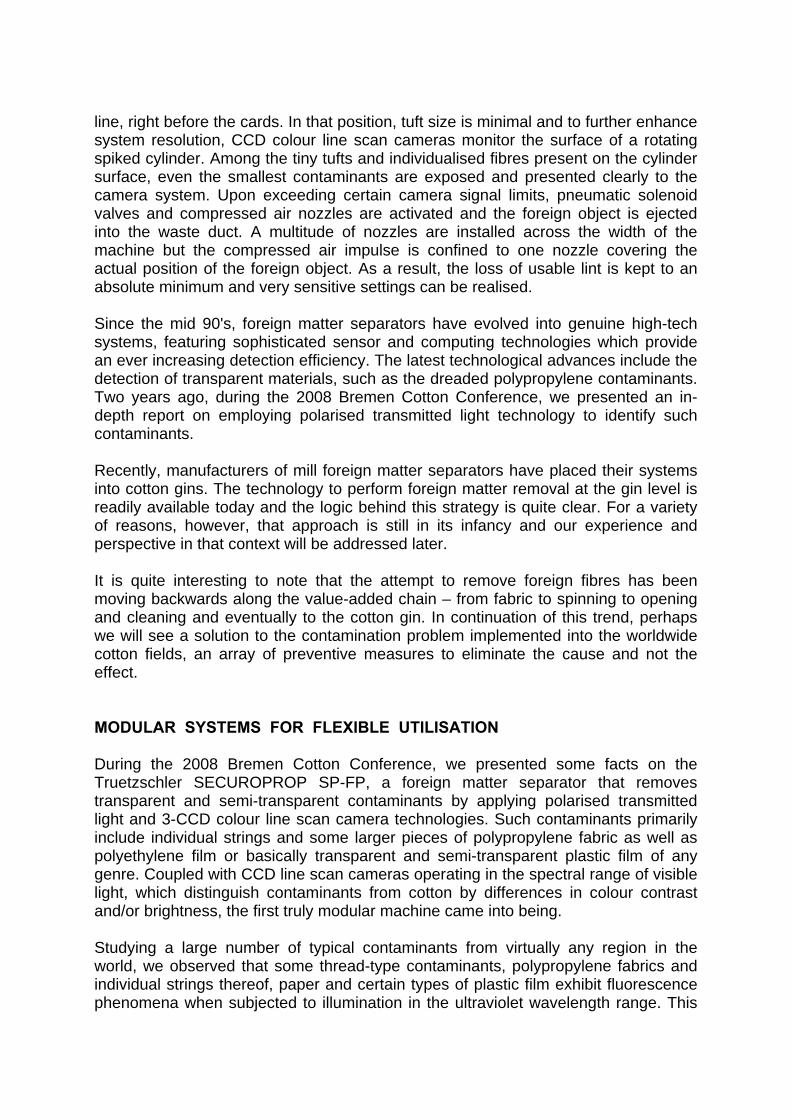
line, right before the cards. In that position, tuft size is minimal and to further enhance system resolution, CCD colour line scan cameras monitor the surface of a rotating spiked cylinder. Among the tiny tufts and individualised fibres present on the cylinder surface, even the smallest contaminants are exposed and presented clearly to the camera system. Upon exceeding certain camera signal limits, pneumatic solenoid valves and compressed air nozzles are activated and the foreign object is ejected into the waste duct. A multitude of nozzles are installed across the width of the machine but the compressed air impulse is confined to one nozzle covering the actual position of the foreign object. As a result, the loss of usable lint is kept to an absolute minimum and very sensitive settings can be realised. Since the mid 90's, foreign matter separators have evolved into genuine high-tech systems, featuring sophisticated sensor and computing technologies which provide an ever increasing detection efficiency. The latest technological advances include the detection of transparent materials, such as the dreaded polypropylene contaminants. Two years ago, during the 2008 Bremen Cotton Conference, we presented an in-depth report on employing polarised transmitted light technology to identify such contaminants. Recently, manufacturers of mill foreign matter separators have placed their systems into cotton gins. The technology to perform foreign matter removal at the gin level is readily available today and the logic behind this strategy is quite clear. For a variety of reasons, however, that approach is still in its infancy and our experience and perspective in that context will be addressed later. It is quite interesting to note that the attempt to remove foreign fibres has been moving backwards along the value-added chain – from fabric to spinning to opening and cleaning and eventually to the cotton gin. In continuation of this trend, perhaps we will see a solution to the contamination problem implemented into the worldwide cotton fields, an array of preventive measures to eliminate the cause and not the effect. MODULAR SYSTEMS FOR FLEXIBLE UTILISATION During the 2008 Bremen Cotton Conference, we presented some facts on the Truetzschler SECUROPROP SP-FP, a foreign matter separator that removes transparent and semi-transparent contaminants by applying polarised transmitted light and 3-CCD colour line scan camera technologies. Such contaminants primarily include individual strings and some larger pieces of polypropylene fabric as well as polyethylene film or basically transparent and semi-transparent plastic film of any genre. Coupled with CCD line scan cameras operating in the spectral range of visible light, which distinguish contaminants from cotton by differences in colour contrast and/or brightness, the first truly modular machine came into being. Studying a large number of typical contaminants from virtually any region in the world, we observed that some thread-type contaminants, polypropylene fabrics and individual strings thereof, paper and certain types of plastic film exhibit fluorescence phenomena when subjected to illumination in the ultraviolet wavelength range. This
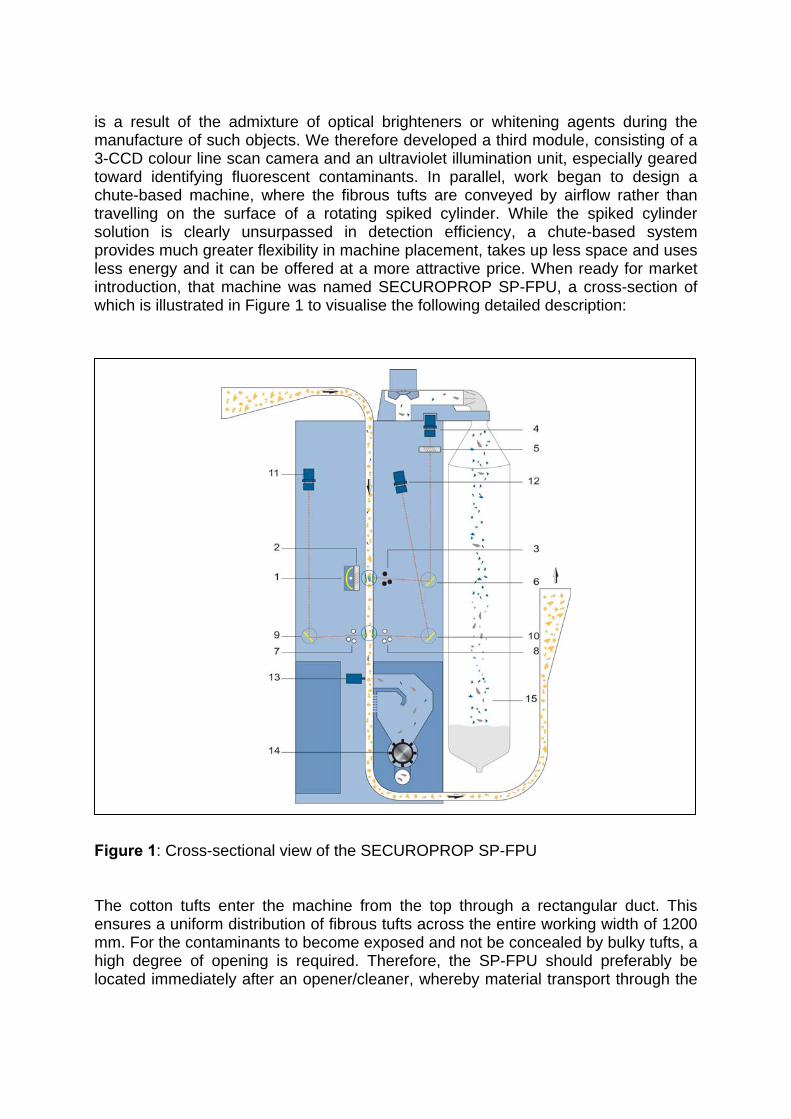
is a result of the admixture of optical brighteners or whitening agents during the manufacture of such objects. We therefore developed a third module, consisting of a 3-CCD colour line scan camera and an ultraviolet illumination unit, especially geared toward identifying fluorescent contaminants. In parallel, work began to design a chute-based machine, where the fibrous tufts are conveyed by airflow rather than travelling on the surface of a rotating spiked cylinder. While the spiked cylinder solution is clearly unsurpassed in detection efficiency, a chute-based system provides much greater flexibility in machine placement, takes up less space and uses less energy and it can be offered at a more attractive price. When ready for market introduction, that machine was named SECUROPROP SP-FPU, a cross-section of which is illustrated in Figure 1 to visualise the following detailed description:
Figure 1: Cross-sectional view of the SECUROPROP SP-FPU The cotton tufts enter the machine from the top through a rectangular duct. This ensures a uniform distribution of fibrous tufts across the entire working width of 1200 mm. For the contaminants to become exposed and not be concealed by bulky tufts, a high degree of opening is required. Therefore, the SP-FPU should preferably be located immediately after an opener/cleaner, whereby material transport through the
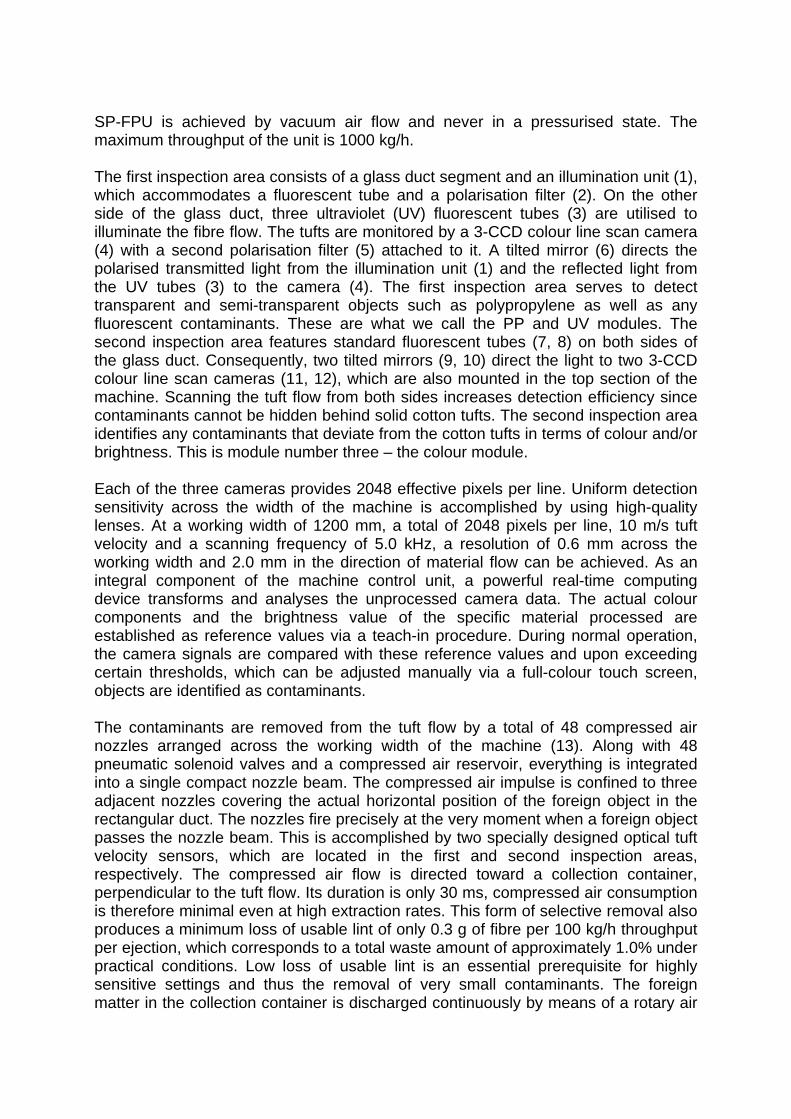
SP-FPU is achieved by vacuum air flow and never in a pressurised state. The maximum throughput of the unit is 1000 kg/h. The first inspection area consists of a glass duct segment and an illumination unit (1), which accommodates a fluorescent tube and a polarisation filter (2). On the other side of the glass duct, three ultraviolet (UV) fluorescent tubes (3) are utilised to illuminate the fibre flow. The tufts are monitored by a 3-CCD colour line scan camera (4) with a second polarisation filter (5) attached to it. A tilted mirror (6) directs the polarised transmitted light from the illumination unit (1) and the reflected light from the UV tubes (3) to the camera (4). The first inspection area serves to detect transparent and semi-transparent objects such as polypropylene as well as any fluorescent contaminants. These are what we call the PP and UV modules. The second inspection area features standard fluorescent tubes (7, 8) on both sides of the glass duct. Consequently, two tilted mirrors (9, 10) direct the light to two 3-CCD colour line scan cameras (11, 12), which are also mounted in the top section of the machine. Scanning the tuft flow from both sides increases detection efficiency since contaminants cannot be hidden behind solid cotton tufts. The second inspection area identifies any contaminants that deviate from the cotton tufts in terms of colour and/or brightness. This is module number three – the colour module. Each of the three cameras provides 2048 effective pixels per line. Uniform detection sensitivity across the width of the machine is accomplished by using high-quality lenses. At a working width of 1200 mm, a total of 2048 pixels per line, 10 m/s tuft velocity and a scanning frequency of 5.0 kHz, a resolution of 0.6 mm across the working width and 2.0 mm in the direction of material flow can be achieved. As an integral component of the machine control unit, a powerful real-time computing device transforms and analyses the unprocessed camera data. The actual colour components and the brightness value of the specific material processed are established as reference values via a teach-in procedure. During normal operation, the camera signals are compared with these reference values and upon exceeding certain thresholds, which can be adjusted manually via a full-colour touch screen, objects are identified as contaminants. The contaminants are removed from the tuft flow by a total of 48 compressed air nozzles arranged across the working width of the machine (13). Along with 48 pneumatic solenoid valves and a compressed air reservoir, everything is integrated into a single compact nozzle beam. The compressed air impulse is confined to three adjacent nozzles covering the actual horizontal position of the foreign object in the rectangular duct. The nozzles fire precisely at the very moment when a foreign object passes the nozzle beam. This is accomplished by two specially designed optical tuft velocity sensors, which are located in the first and second inspection areas, respectively. The compressed air flow is directed toward a collection container, perpendicular to the tuft flow. Its duration is only 30 ms, compressed air consumption is therefore minimal even at high extraction rates. This form of selective removal also produces a minimum loss of usable lint of only 0.3 g of fibre per 100 kg/h throughput per ejection, which corresponds to a total waste amount of approximately 1.0% under practical conditions. Low loss of usable lint is an essential prerequisite for highly sensitive settings and thus the removal of very small contaminants. The foreign matter in the collection container is discharged continuously by means of a rotary air
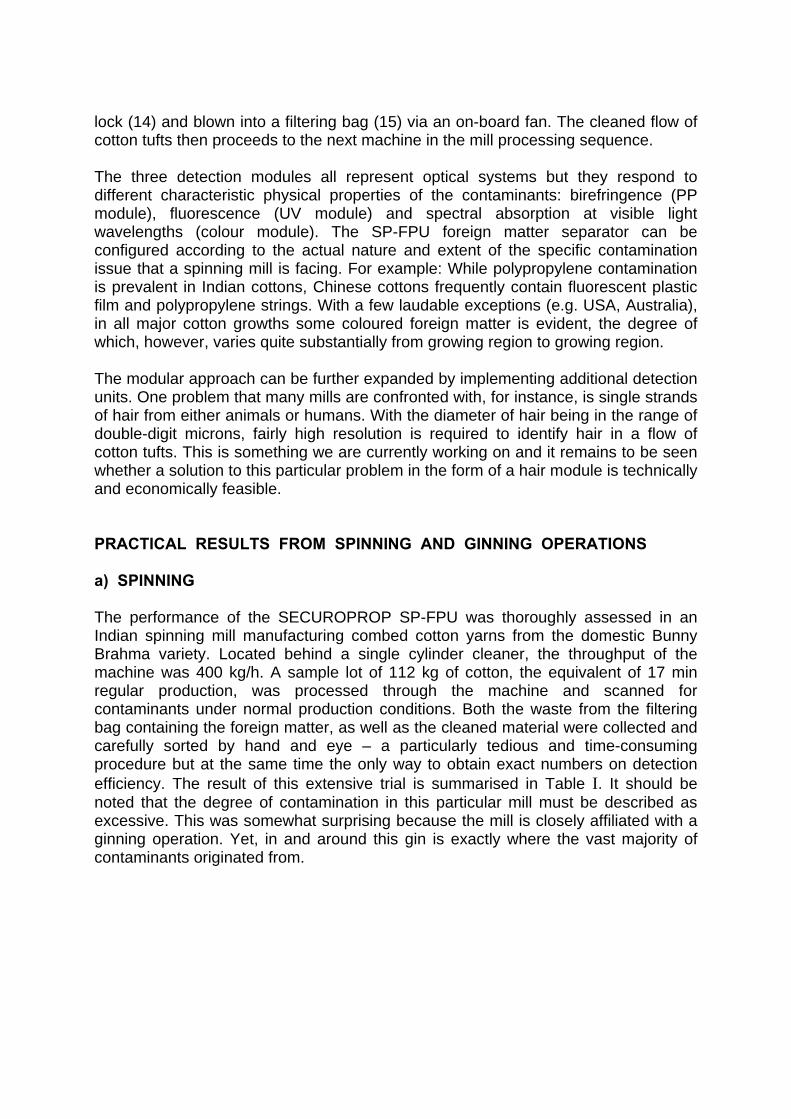
lock (14) and blown into a filtering bag (15) via an on-board fan. The cleaned flow of cotton tufts then proceeds to the next machine in the mill processing sequence. The three detection modules all represent optical systems but they respond to different characteristic physical properties of the contaminants: birefringence (PP module), fluorescence (UV module) and spectral absorption at visible light wavelengths (colour module). The SP-FPU foreign matter separator can be configured according to the actual nature and extent of the specific contamination issue that a spinning mill is facing. For example: While polypropylene contamination is prevalent in Indian cottons, Chinese cottons frequently contain fluorescent plastic film and polypropylene strings. With a few laudable exceptions (e.g. USA, Australia), in all major cotton growths some coloured foreign matter is evident, the degree of which, however, varies quite substantially from growing region to growing region. The modular approach can be further expanded by implementing additional detection units. One problem that many mills are confronted with, for instance, is single strands of hair from either animals or humans. With the diameter of hair being in the range of double-digit microns, fairly high resolution is required to identify hair in a flow of cotton tufts. This is something we are currently working on and it remains to be seen whether a solution to this particular problem in the form of a hair module is technically and economically feasible. PRACTICAL RESULTS FROM SPINNING AND GINNING OPERATIONS a) SPINNING The performance of the SECUROPROP SP-FPU was thoroughly assessed in an Indian spinning mill manufacturing combed cotton yarns from the domestic Bunny Brahma variety. Located behind a single cylinder cleaner, the throughput of the machine was 400 kg/h. A sample lot of 112 kg of cotton, the equivalent of 17 min regular production, was processed through the machine and scanned for contaminants under normal production conditions. Both the waste from the filtering bag containing the foreign matter, as well as the cleaned material were collected and carefully sorted by hand and eye – a particularly tedious and time-consuming procedure but at the same time the only way to obtain exact numbers on detection efficiency. The result of this extensive trial is summarised in Table I. It should be noted that the degree of contamination in this particular mill must be described as excessive. This was somewhat surprising because the mill is closely affiliated with a ginning operation. Yet, in and around this gin is exactly where the vast majority of contaminants originated from.
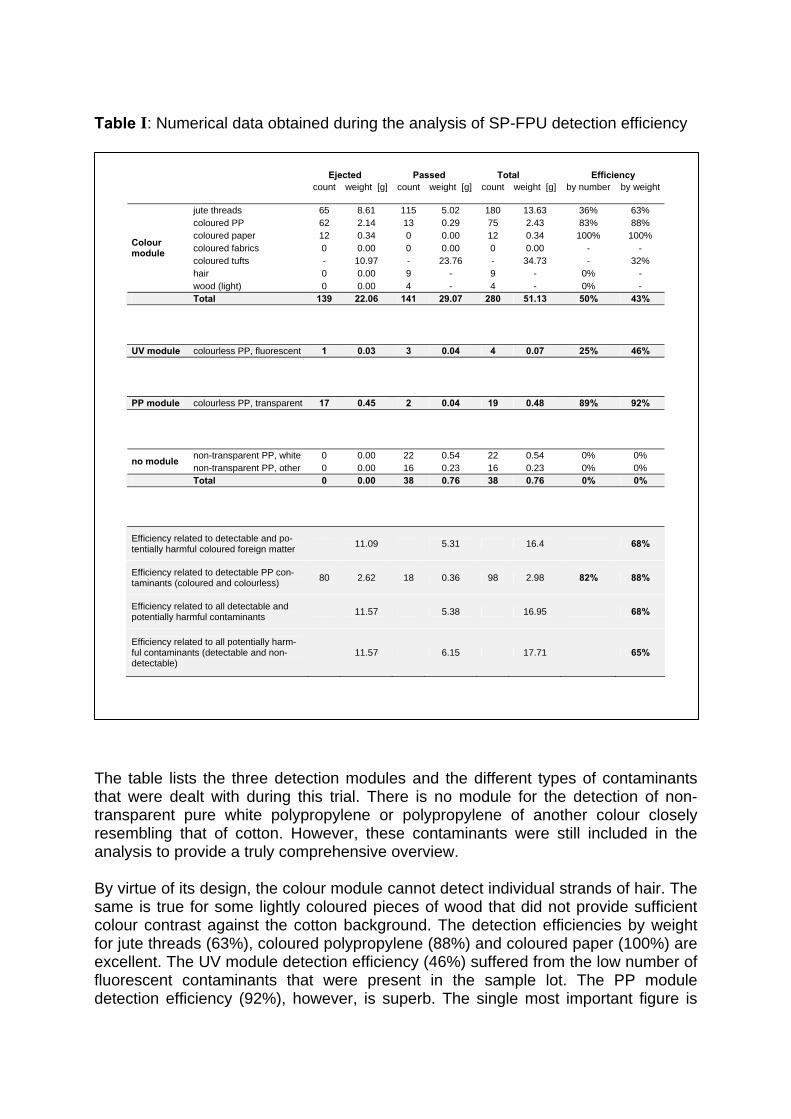
Table I: Numerical data obtained during the analysis of SP-FPU detection efficiency
Ejected Passed Total Efficiency count weight [g] count weight [g] count weight [g] by number by weight
jute threads 65 8.61 115 5.02 180 13.63 36% 63% coloured PP 62 2.14 13 0.29 75 2.43 83% 88% coloured paper 12 0.34 0 0.00 12 0.34 100% 100% coloured fabrics 0 0.00 0 0.00 0 0.00 - - coloured tufts - 10.97 - 23.76 - 34.73 - 32% hair 0 0.00 9 - 9 - 0% -
Colour module
wood (light) 0 0.00 4 - 4 - 0% - Total 139 22.06 141 29.07 280 51.13 50% 43%
UV module colourless PP, fluorescent 1 0.03 3 0.04 4 0.07 25% 46%
PP module colourless PP, transparent 17 0.45 2 0.04 19 0.48 89% 92%
non-transparent PP, white 0 0.00 22 0.54 22 0.54 0% 0% no module non-transparent PP, other 0 0.00 16 0.23 16 0.23 0% 0%
Total 0 0.00 38 0.76 38 0.76 0% 0%
Efficiency related to detectable and po- tentially harmful coloured foreign matter 11.09 5.31 16.4 68%
Efficiency related to detectable PP con- taminants (coloured and colourless) 80 2.62 18 0.36 98 2.98 82% 88%
Efficiency related to all detectable and potentially harmful contaminants 11.57 5.38 16.95 68%
Efficiency related to all potentially harm- ful contaminants (detectable and non- detectable)
11.57 6.15 17.71 65%
The table lists the three detection modules and the different types of contaminants that were dealt with during this trial. There is no module for the detection of non-transparent pure white polypropylene or polypropylene of another colour closely resembling that of cotton. However, these contaminants were still included in the analysis to provide a truly comprehensive overview. By virtue of its design, the colour module cannot detect individual strands of hair. The same is true for some lightly coloured pieces of wood that did not provide sufficient colour contrast against the cotton background. The detection efficiencies by weight for jute threads (63%), coloured polypropylene (88%) and coloured paper (100%) are excellent. The UV module detection efficiency (46%) suffered from the low number of fluorescent contaminants that were present in the sample lot. The PP module detection efficiency (92%), however, is superb. The single most important figure is
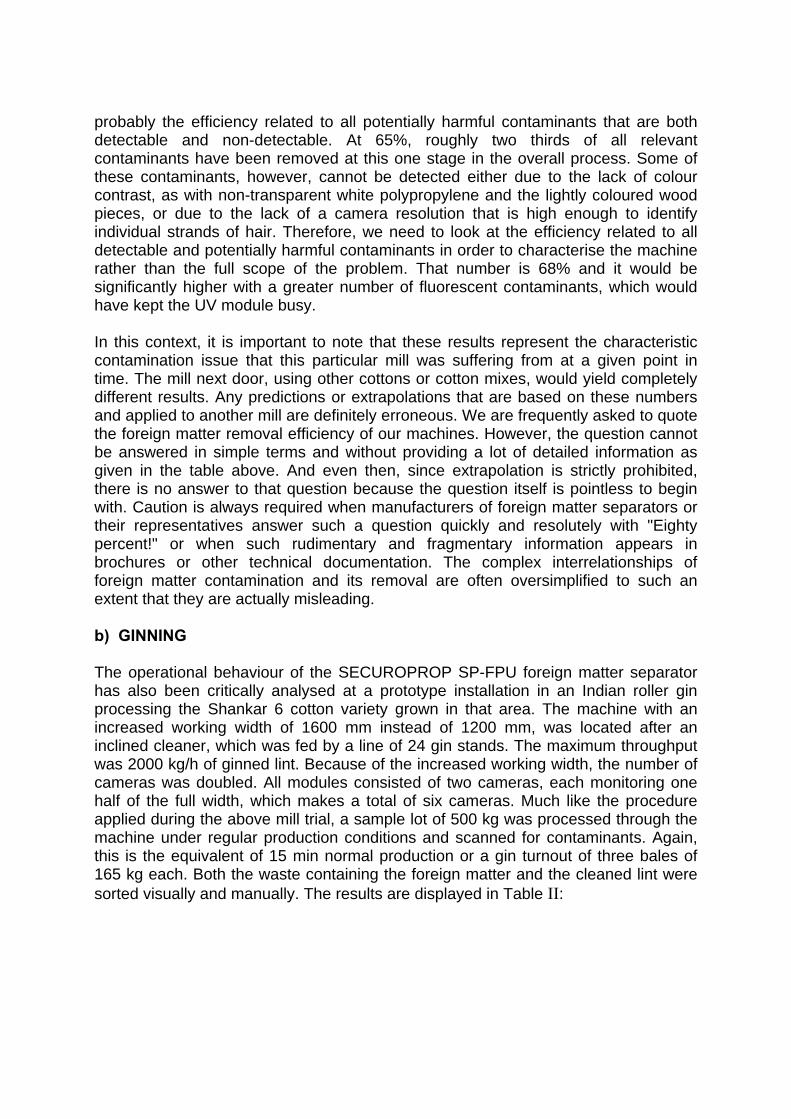
probably the efficiency related to all potentially harmful contaminants that are both detectable and non-detectable. At 65%, roughly two thirds of all relevant contaminants have been removed at this one stage in the overall process. Some of these contaminants, however, cannot be detected either due to the lack of colour contrast, as with non-transparent white polypropylene and the lightly coloured wood pieces, or due to the lack of a camera resolution that is high enough to identify individual strands of hair. Therefore, we need to look at the efficiency related to all detectable and potentially harmful contaminants in order to characterise the machine rather than the full scope of the problem. That number is 68% and it would be significantly higher with a greater number of fluorescent contaminants, which would have kept the UV module busy. In this context, it is important to note that these results represent the characteristic contamination issue that this particular mill was suffering from at a given point in time. The mill next door, using other cottons or cotton mixes, would yield completely different results. Any predictions or extrapolations that are based on these numbers and applied to another mill are definitely erroneous. We are frequently asked to quote the foreign matter removal efficiency of our machines. However, the question cannot be answered in simple terms and without providing a lot of detailed information as given in the table above. And even then, since extrapolation is strictly prohibited, there is no answer to that question because the question itself is pointless to begin with. Caution is always required when manufacturers of foreign matter separators or their representatives answer such a question quickly and resolutely with "Eighty percent!" or when such rudimentary and fragmentary information appears in brochures or other technical documentation. The complex interrelationships of foreign matter contamination and its removal are often oversimplified to such an extent that they are actually misleading. b) GINNING The operational behaviour of the SECUROPROP SP-FPU foreign matter separator has also been critically analysed at a prototype installation in an Indian roller gin processing the Shankar 6 cotton variety grown in that area. The machine with an increased working width of 1600 mm instead of 1200 mm, was located after an inclined cleaner, which was fed by a line of 24 gin stands. The maximum throughput was 2000 kg/h of ginned lint. Because of the increased working width, the number of cameras was doubled. All modules consisted of two cameras, each monitoring one half of the full width, which makes a total of six cameras. Much like the procedure applied during the above mill trial, a sample lot of 500 kg was processed through the machine under regular production conditions and scanned for contaminants. Again, this is the equivalent of 15 min normal production or a gin turnout of three bales of 165 kg each. Both the waste containing the foreign matter and the cleaned lint were sorted visually and manually. The results are displayed in Table II:
Table II: SP-FPU detection efficiencies obtained in a roller gin
Ejected Passed Total Efficiency count count count by number
jute threads 4 5 9 44% coloured PP 50 16 66 76% coloured paper 7 2 9 78% coloured fabrics 0 0 0 - hair 0 2 2 0% wood (light) 0 2 2 0%
Colour module
feathers 13 12 25 52% Total 74 39 113 65%
UV module colourless PP, fluorescent 0 0 0 -
PP module colourless PP, transparent 21 10 31 68%
non-transparent PP, white 0 5 5 0% no module non-transparent PP, other 0 2 2 0%
Total 0 7 7 0%
Efficiency related to detectable and po- tentially harmful coloured foreign matter 74 35 109 68%
Efficiency related to detectable PP con- taminants (coloured and colourless) 71 26 97 73%
Efficiency related to all detectable and potentially harmful contaminants 95 45 140 68%
Efficiency related to all potentially harm- ful contaminants (detectable and non- detectable)
95 56 151 63%
The structure of this table is almost identical to the one shown for the mill trial. The only difference is that feathers were included as an additional contaminant. Non-detectable contaminants such as hair, lightly coloured pieces of wood, non-transparent pure white polypropylene and polypropylene of cotton-like colour were present in the sample lot, albeit few in comparison with the foregoing mill trial. The absence of any fluorescent objects is probably worth mentioning but, strictly speaking, this is a characteristic of the sample lot and should not suggest that such contaminants do not exist in the cotton processed in this gin. The individual detection efficiencies are surprisingly good considering the throughput and the degree of fibre opening at that position in the entire process. The efficiency related to all potentially harmful contaminants that are both detectable and non-detectable is 63%, which is excellent. If we confine the analysis to what the machine
is capable of, then we must only consider the contaminants that are detectable. The corresponding efficiency is 68%. We were very pleased with these results. It would be interesting to explore the collective effect that could be generated by operating foreign matter separators in both the gin and the spinning mill. We can conclude from simple algebraic operations that the total detection efficiency ηtot of two successive foreign matter separators with their individual detection efficiencies of η1 in the gin and η2 in the mill equates to ηtot = η1 + η2 – η1 · η2 (1) A hypothetical example: In our trials, we have established the detection efficiency relating to all detectable and non-detectable contaminants to be 63% in the gin and 65% in the mill. Using equation (1) to calculate the resulting total detection efficiency yields an astonishing 87%. When looking only at the detection efficiency of those contaminants that can actually be identified by the machine, we find this to be 68% in the gin and also 68% in the mill. Again, using equation (1) proves that a total detection efficiency of 90% can be achieved when extracting foreign matter in both locations. It can be derived from this example, that applying foreign matter separators in the gin and in the mill is a worthwhile undertaking with very favourable results in terms of the residual contamination. The key question is: Will there be a premium in the market for cottons that have been cleaned of foreign matter in the gin? There must be an incentive and a feasible return on the investment for this to become reality. If this will not materialise and all the burden still rests on the spinner, then similar results can only be obtained with foreign matter separators placed at both the beginning and the end of a mill's opening and cleaning line. FINAL REMARKS The availability and application of sophisticated equipment like the SECUROPROP SP-FPU foreign matter separator for ginning and spinning operations should not obscure the message that everybody involved in the cotton and textile business should eventually acknowledge and respond to accordingly: There is no 100% protection against foreign fibres and cotton yarns cannot be 100% free of foreign fibres. Another aspect is very important, too: The technology utilised to intercept foreign matter is merely a cure for the symptoms but not for the disease. Since 1995, an estimated 5200 foreign matter separators from various manufacturers have been delivered and installed worldwide. This means that a large number of spinners around the globe are becoming increasingly aware of the true scope of the cotton contamination problem and also increasingly sceptical regarding the attitude and capability of their raw material suppliers in the worldwide cotton growing regions. Perhaps we are not far from the day that many spinners will unanimously and vigorously demand a solution to the contamination problem to be realised first and foremost at the cotton production end of the business.
REFERENCES Faerber, C., Meier, R. 1997. Strategien zur Bekämpfung von Fremdfasern. 11. Denkendorfer Spinnerei-Kolloquium, Eningen (Germany), May 1997. Melliand Textilberichte 10/1997. Faerber, C. 2000. Innovations in spinning and new trends in machinery develop-ment. ICAC Plenary Meeting, Cairns (Australia), November 2000. Faerber, C. 2001. A new system for the effective removal of foreign matter in spinning preparation. 7th International Gdynia Cotton Conference, Gdynia (Poland), September 2001. Faerber, C., Engels, G. 2008. Neue Lösungen zur Beseitigung von Fremdfasern im Spinnereivorwerk. Denkendorfer Spinnerei-Kolloquium, Denkendorf (Germany), May 2008. Frey, M. 1994. Erkennung und Ausscheidung von Fremdstoffen in der Putzerei. ITMF Annual Conference, São Paulo (Brazil), September 1994. Gerber, F. 1986. Fremdfasern in der Rohbaumwolle – Schadenshöhe durch Rekla-mationen. Melliand Textilberichte 12/1986. Leder, A., Faerber, C. 2008. New method for the detection and separation of foreign parts including polypropylene. 29th International Cotton Conference, Bremen (Germany), March 2008. Schindler, C. 2008. ITMF cotton contamination survey 2007. 29th International Cotton Conference, Bremen (Germany), March 2008. Schlichter, S. 1997. Foreign Particles in Cotton – Origin of Contamination and Possibilities of Detection and Removal in Processing. Beltwide Cotton Conferences, New Orleans, Louisiana (USA), January 1997. Schlichter, S., Faerber, C. 2001. Ein neues System zur wirkungsvollen Bekämpfung von Fremdfasern. International Textile Bulletin, ITB Garn- und Flächenherstellung 6/2001.
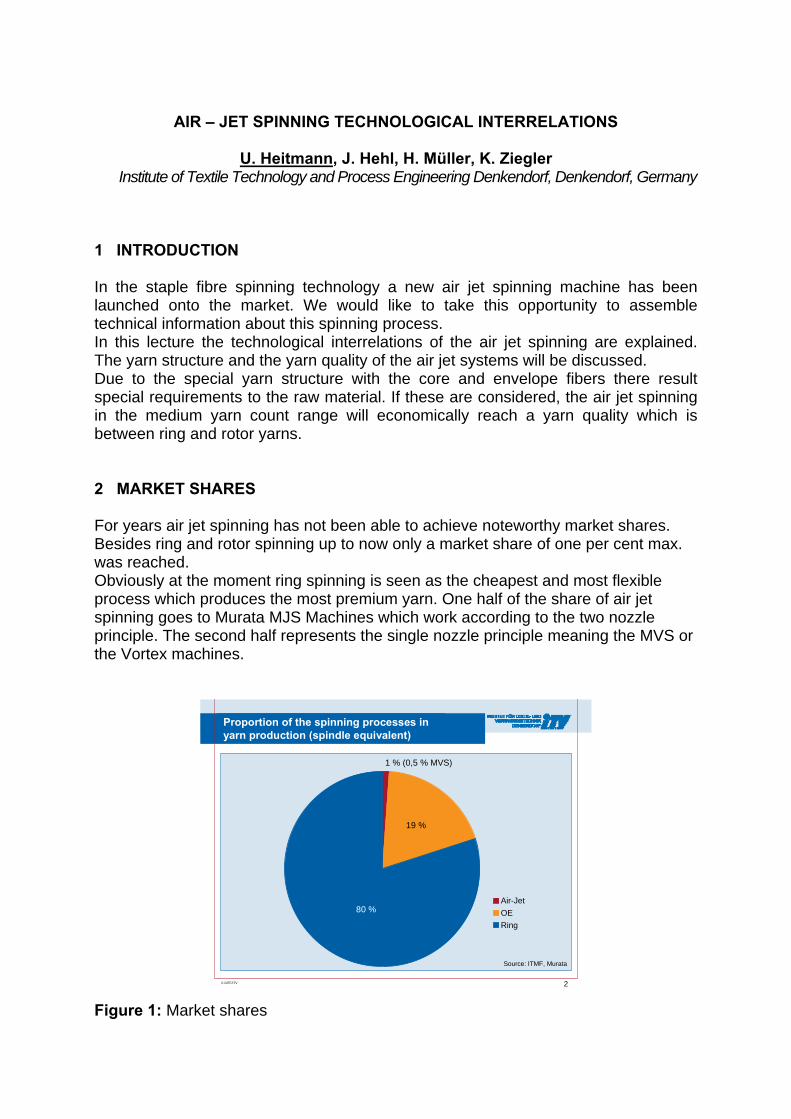
AIR – JET SPINNING TECHNOLOGICAL INTERRELATIONS
U. Heitmann, J. Hehl, H. Müller, K. Ziegler Institute of Textile Technology and Process Engineering Denkendorf, Denkendorf, Germany
1 INTRODUCTION In the staple fibre spinning technology a new air jet spinning machine has been launched onto the market. We would like to take this opportunity to assemble technical information about this spinning process. In this lecture the technological interrelations of the air jet spinning are explained. The yarn structure and the yarn quality of the air jet systems will be discussed. Due to the special yarn structure with the core and envelope fibers there result special requirements to the raw material. If these are considered, the air jet spinning in the medium yarn count range will economically reach a yarn quality which is between ring and rotor yarns. 2 MARKET SHARES For years air jet spinning has not been able to achieve noteworthy market shares. Besides ring and rotor spinning up to now only a market share of one per cent max. was reached. Obviously at the moment ring spinning is seen as the cheapest and most flexible process which produces the most premium yarn. One half of the share of air jet spinning goes to Murata MJS Machines which work according to the two nozzle principle. The second half represents the single nozzle principle meaning the MVS or the Vortex machines.
2© DITF/ITV
Proportion of the spinning processes in yarn production (spindle equivalent)
Source: ITMF, Murata
Air-JetOERing
80 %
19 %
1 % (0,5 % MVS)
Figure 1: Market shares
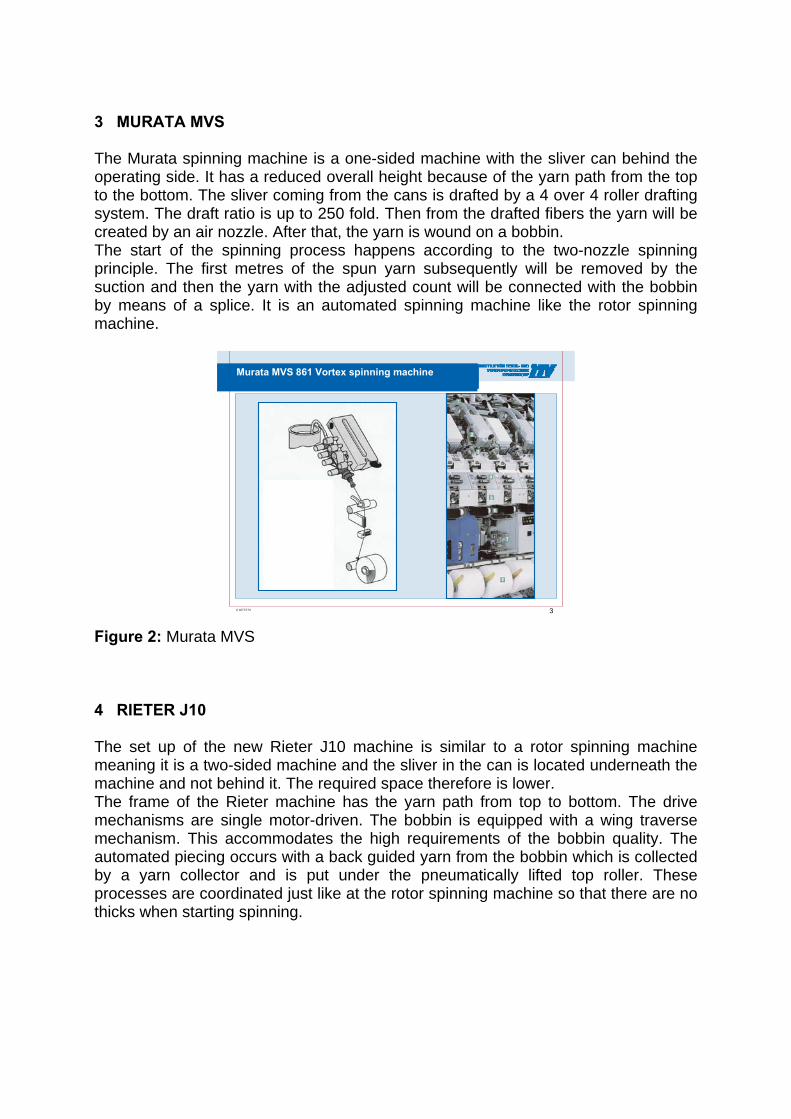
3 MURATA MVS The Murata spinning machine is a one-sided machine with the sliver can behind the operating side. It has a reduced overall height because of the yarn path from the top to the bottom. The sliver coming from the cans is drafted by a 4 over 4 roller drafting system. The draft ratio is up to 250 fold. Then from the drafted fibers the yarn will be created by an air nozzle. After that, the yarn is wound on a bobbin. The start of the spinning process happens according to the two-nozzle spinning principle. The first metres of the spun yarn subsequently will be removed by the suction and then the yarn with the adjusted count will be connected with the bobbin by means of a splice. It is an automated spinning machine like the rotor spinning machine.
3© DITF/ITV
Murata MVS 861 Vortex spinning machine
Figure 2: Murata MVS 4 RIETER J10 The set up of the new Rieter J10 machine is similar to a rotor spinning machine meaning it is a two-sided machine and the sliver in the can is located underneath the machine and not behind it. The required space therefore is lower. The frame of the Rieter machine has the yarn path from top to bottom. The drive mechanisms are single motor-driven. The bobbin is equipped with a wing traverse mechanism. This accommodates the high requirements of the bobbin quality. The automated piecing occurs with a back guided yarn from the bobbin which is collected by a yarn collector and is put under the pneumatically lifted top roller. These processes are coordinated just like at the rotor spinning machine so that there are no thicks when starting spinning.
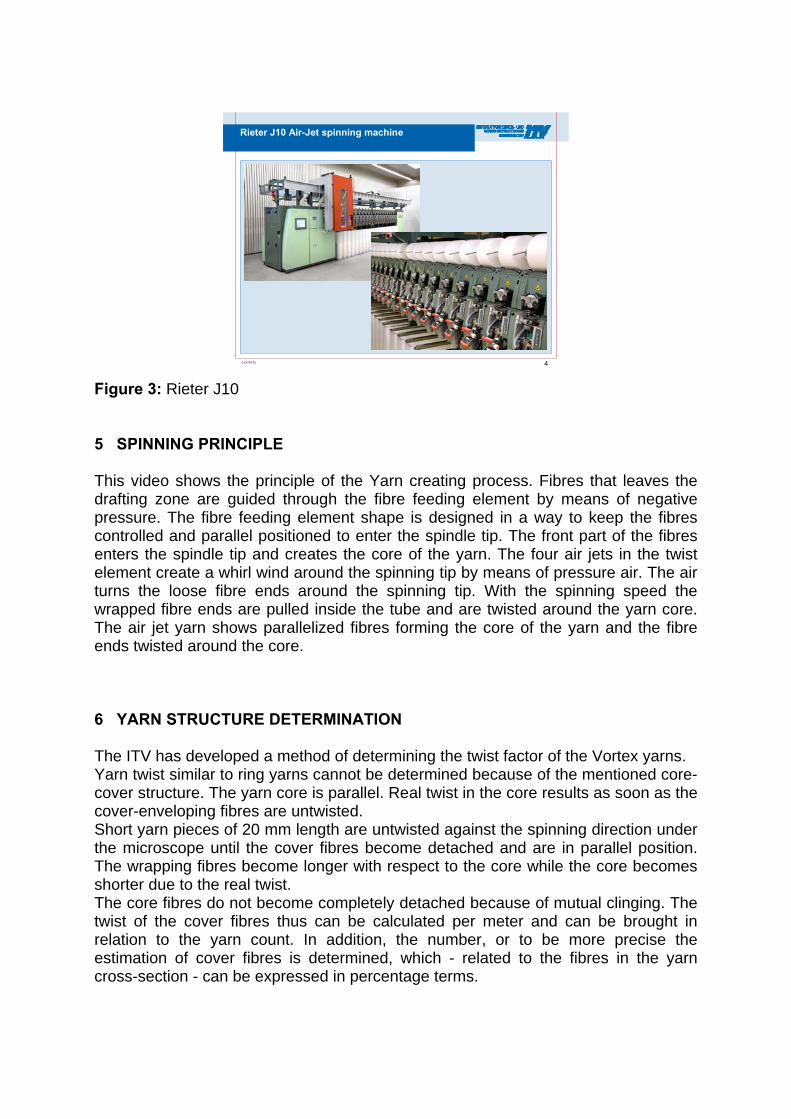
4© DITF/ITV
Rieter J10 Air-Jet spinning machine
Figure 3: Rieter J10 5 SPINNING PRINCIPLE This video shows the principle of the Yarn creating process. Fibres that leaves the drafting zone are guided through the fibre feeding element by means of negative pressure. The fibre feeding element shape is designed in a way to keep the fibres controlled and parallel positioned to enter the spindle tip. The front part of the fibres enters the spindle tip and creates the core of the yarn. The four air jets in the twist element create a whirl wind around the spinning tip by means of pressure air. The air turns the loose fibre ends around the spinning tip. With the spinning speed the wrapped fibre ends are pulled inside the tube and are twisted around the yarn core. The air jet yarn shows parallelized fibres forming the core of the yarn and the fibre ends twisted around the core. 6 YARN STRUCTURE DETERMINATION The ITV has developed a method of determining the twist factor of the Vortex yarns. Yarn twist similar to ring yarns cannot be determined because of the mentioned core-cover structure. The yarn core is parallel. Real twist in the core results as soon as the cover-enveloping fibres are untwisted. Short yarn pieces of 20 mm length are untwisted against the spinning direction under the microscope until the cover fibres become detached and are in parallel position. The wrapping fibres become longer with respect to the core while the core becomes shorter due to the real twist. The core fibres do not become completely detached because of mutual clinging. The twist of the cover fibres thus can be calculated per meter and can be brought in relation to the yarn count. In addition, the number, or to be more precise the estimation of cover fibres is determined, which - related to the fibres in the yarn cross-section - can be expressed in percentage terms.
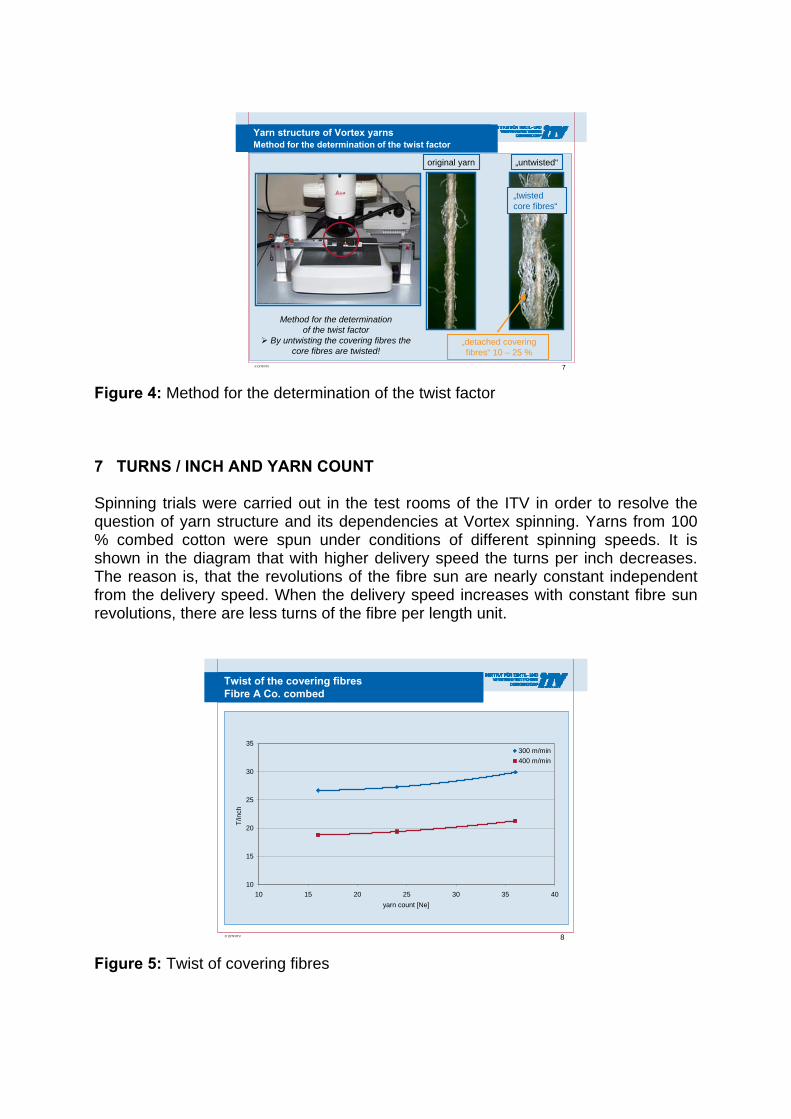
7© DITF/ITV
Yarn structure of Vortex yarnsMethod for the determination of the twist factor
Method for the determination of the twist factor
By untwisting the covering fibres the core fibres are twisted!
„detached covering fibres“ 10 – 25 %
„twistedcore fibres“
original yarn „untwisted“
Figure 4: Method for the determination of the twist factor 7 TURNS / INCH AND YARN COUNT Spinning trials were carried out in the test rooms of the ITV in order to resolve the question of yarn structure and its dependencies at Vortex spinning. Yarns from 100 % combed cotton were spun under conditions of different spinning speeds. It is shown in the diagram that with higher delivery speed the turns per inch decreases. The reason is, that the revolutions of the fibre sun are nearly constant independent from the delivery speed. When the delivery speed increases with constant fibre sun revolutions, there are less turns of the fibre per length unit.
8© DITF/ITV
Twist of the covering fibresFibre A Co. combed
10
15
20
25
30
35
10 15 20 25 30 35 40yarn count [Ne]
T/in
ch
300 m/min400 m/min
Figure 5: Twist of covering fibres
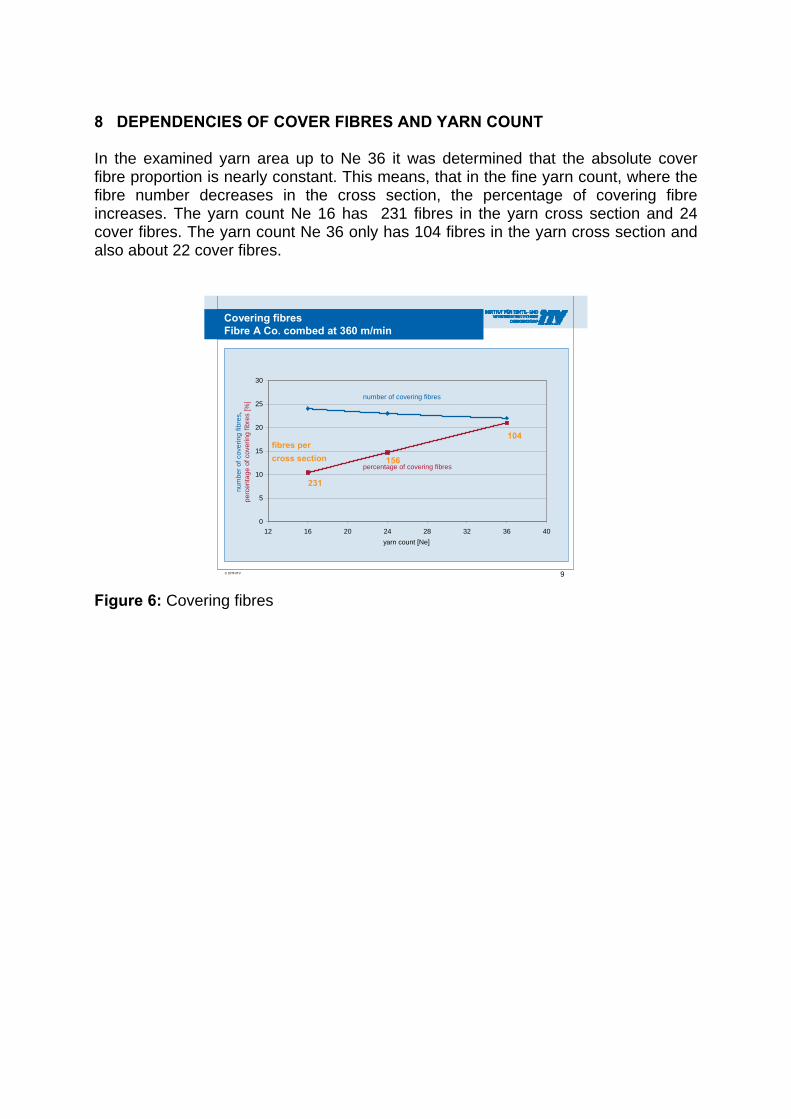
8 DEPENDENCIES OF COVER FIBRES AND YARN COUNT In the examined yarn area up to Ne 36 it was determined that the absolute cover fibre proportion is nearly constant. This means, that in the fine yarn count, where the fibre number decreases in the cross section, the percentage of covering fibre increases. The yarn count Ne 16 has 231 fibres in the yarn cross section and 24 cover fibres. The yarn count Ne 36 only has 104 fibres in the yarn cross section and also about 22 cover fibres.
9© DITF/ITV
Covering fibresFibre A Co. combed at 360 m/min
0
5
10
15
20
25
30
12 16 20 24 28 32 36 40yarn count [Ne]
num
ber o
f cov
erin
g fib
res,
perc
enta
ge o
f cov
erin
g fib
res
[%]
percentage of covering fibres
number of covering fibres
fibres percross section
231
156
104
Figure 6: Covering fibres
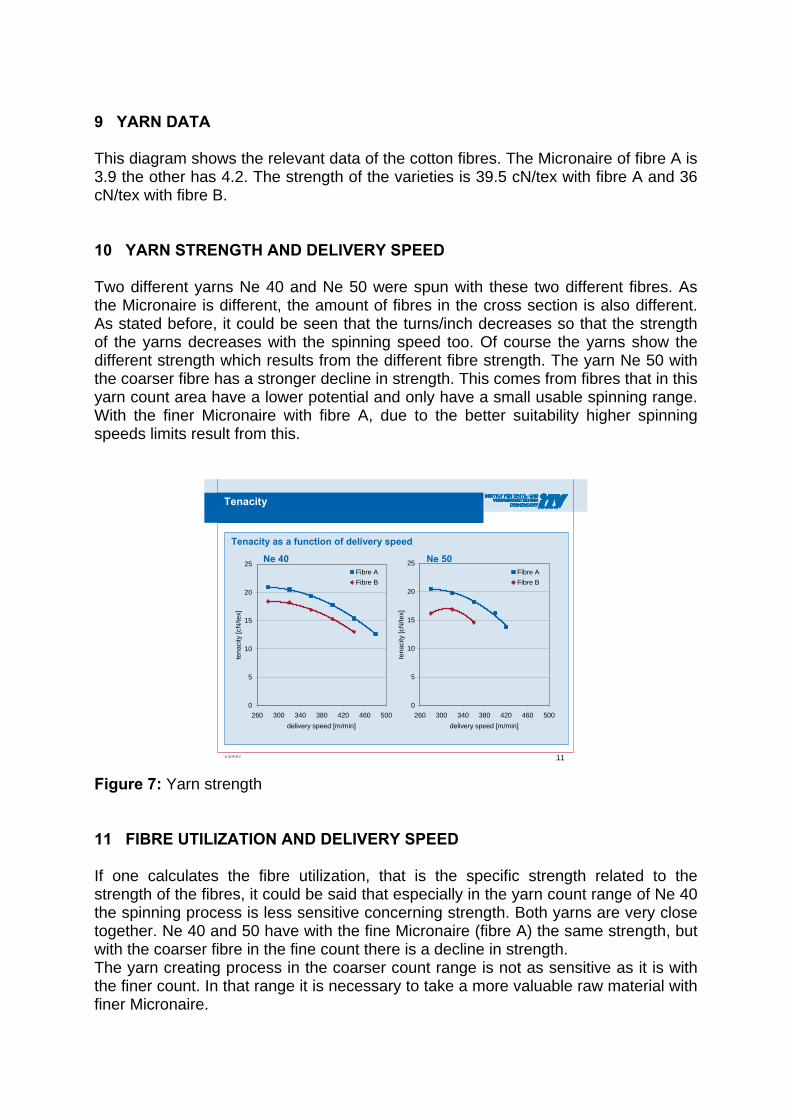
9 YARN DATA This diagram shows the relevant data of the cotton fibres. The Micronaire of fibre A is 3.9 the other has 4.2. The strength of the varieties is 39.5 cN/tex with fibre A and 36 cN/tex with fibre B. 10 YARN STRENGTH AND DELIVERY SPEED Two different yarns Ne 40 and Ne 50 were spun with these two different fibres. As the Micronaire is different, the amount of fibres in the cross section is also different. As stated before, it could be seen that the turns/inch decreases so that the strength of the yarns decreases with the spinning speed too. Of course the yarns show the different strength which results from the different fibre strength. The yarn Ne 50 with the coarser fibre has a stronger decline in strength. This comes from fibres that in this yarn count area have a lower potential and only have a small usable spinning range. With the finer Micronaire with fibre A, due to the better suitability higher spinning speeds limits result from this.
11© DITF/ITV
Tenacity
Tenacity as a function of delivery speed
Ne 40 Ne 50
0
5
10
15
20
25
260 300 340 380 420 460 500delivery speed [m/min]
tena
city
[cN
/tex]
Fibre AFibre B
0
5
10
15
20
25
260 300 340 380 420 460 500delivery speed [m/min]
tena
city
[cN
/tex]
Fibre AFibre B
Figure 7: Yarn strength 11 FIBRE UTILIZATION AND DELIVERY SPEED If one calculates the fibre utilization, that is the specific strength related to the strength of the fibres, it could be said that especially in the yarn count range of Ne 40 the spinning process is less sensitive concerning strength. Both yarns are very close together. Ne 40 and 50 have with the fine Micronaire (fibre A) the same strength, but with the coarser fibre in the fine count there is a decline in strength. The yarn creating process in the coarser count range is not as sensitive as it is with the finer count. In that range it is necessary to take a more valuable raw material with finer Micronaire.
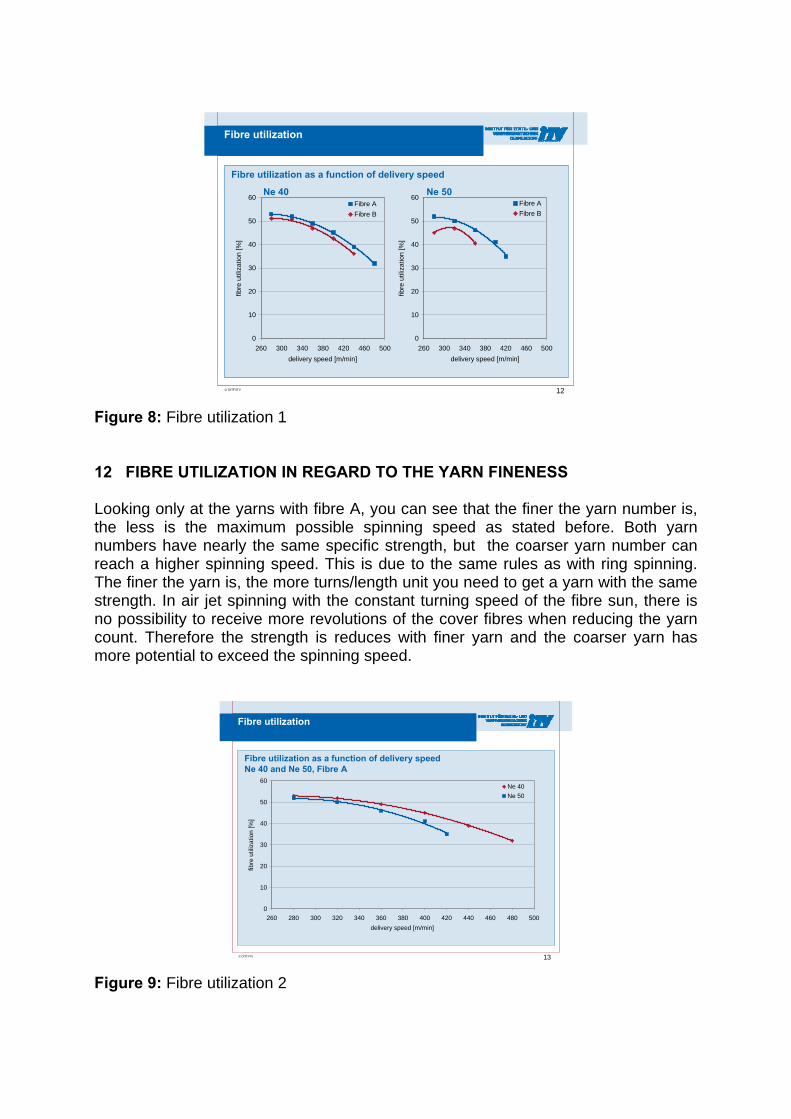
12© DITF/ITV
Fibre utilization
Fibre utilization as a function of delivery speed
Ne 40 Ne 50
0
10
20
30
40
50
60
260 300 340 380 420 460 500delivery speed [m/min]
fibre
util
izat
ion
[%]
Fibre AFibre B
0
10
20
30
40
50
60
260 300 340 380 420 460 500delivery speed [m/min]
fibre
util
izat
ion
[%]
Fibre AFibre B
Figure 8: Fibre utilization 1 12 FIBRE UTILIZATION IN REGARD TO THE YARN FINENESS Looking only at the yarns with fibre A, you can see that the finer the yarn number is, the less is the maximum possible spinning speed as stated before. Both yarn numbers have nearly the same specific strength, but the coarser yarn number can reach a higher spinning speed. This is due to the same rules as with ring spinning. The finer the yarn is, the more turns/length unit you need to get a yarn with the same strength. In air jet spinning with the constant turning speed of the fibre sun, there is no possibility to receive more revolutions of the cover fibres when reducing the yarn count. Therefore the strength is reduces with finer yarn and the coarser yarn has more potential to exceed the spinning speed.
13© DITF/ITV
Fibre utilization
Fibre utilization as a function of delivery speedNe 40 and Ne 50, Fibre A
0
10
20
30
40
50
60
260 280 300 320 340 360 380 400 420 440 460 480 500delivery speed [m/min]
fibre
util
izat
ion
[%]
Ne 40Ne 50
Figure 9: Fibre utilization 2
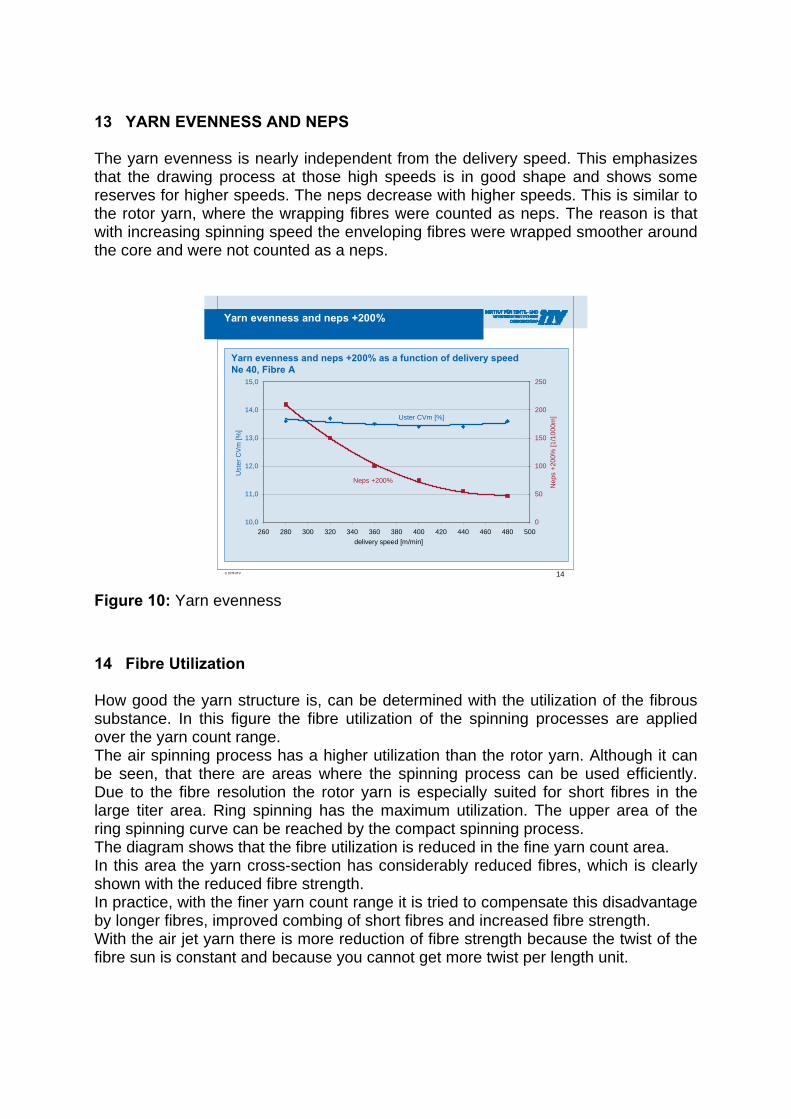
13 YARN EVENNESS AND NEPS The yarn evenness is nearly independent from the delivery speed. This emphasizes that the drawing process at those high speeds is in good shape and shows some reserves for higher speeds. The neps decrease with higher speeds. This is similar to the rotor yarn, where the wrapping fibres were counted as neps. The reason is that with increasing spinning speed the enveloping fibres were wrapped smoother around the core and were not counted as a neps.
14© DITF/ITV
Yarn evenness and neps +200%
Yarn evenness and neps +200% as a function of delivery speed Ne 40, Fibre A
10,0
11,0
12,0
13,0
14,0
15,0
260 280 300 320 340 360 380 400 420 440 460 480 500delivery speed [m/min]
Ust
er C
Vm
[%]
0
50
100
150
200
250
Nep
s +2
00%
[1/1
000m
]Uster CVm [%]
Neps +200%
Figure 10: Yarn evenness 14 Fibre Utilization How good the yarn structure is, can be determined with the utilization of the fibrous substance. In this figure the fibre utilization of the spinning processes are applied over the yarn count range. The air spinning process has a higher utilization than the rotor yarn. Although it can be seen, that there are areas where the spinning process can be used efficiently. Due to the fibre resolution the rotor yarn is especially suited for short fibres in the large titer area. Ring spinning has the maximum utilization. The upper area of the ring spinning curve can be reached by the compact spinning process. The diagram shows that the fibre utilization is reduced in the fine yarn count area. In this area the yarn cross-section has considerably reduced fibres, which is clearly shown with the reduced fibre strength. In practice, with the finer yarn count range it is tried to compensate this disadvantage by longer fibres, improved combing of short fibres and increased fibre strength. With the air jet yarn there is more reduction of fibre strength because the twist of the fibre sun is constant and because you cannot get more twist per length unit.
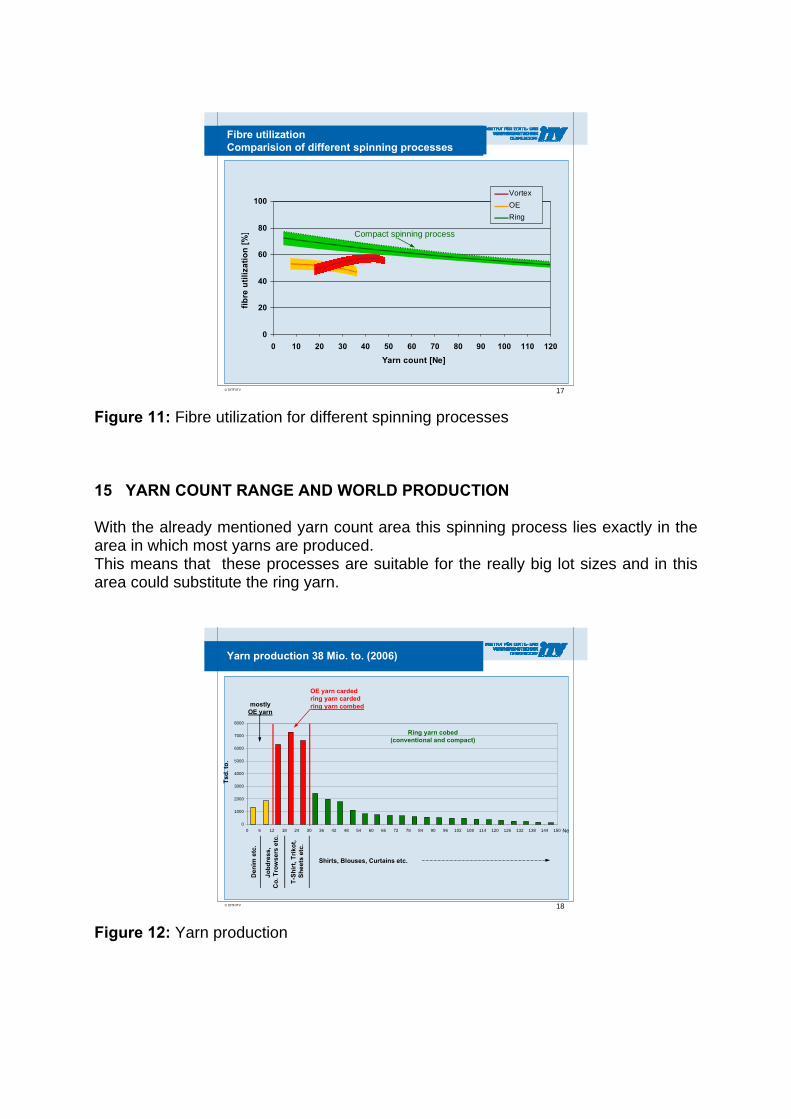
17© DITF/ITV
0
20
40
60
80
100
0 10 20 30 40 50 60 70 80 90 100 110 120
Yarn count [Ne]
fibre
util
izat
ion
[%]
VortexOERing
Fibre utilization Comparision of different spinning processes
Compact spinning process
Figure 11: Fibre utilization for different spinning processes 15 YARN COUNT RANGE AND WORLD PRODUCTION With the already mentioned yarn count area this spinning process lies exactly in the area in which most yarns are produced. This means that these processes are suitable for the really big lot sizes and in this area could substitute the ring yarn.
18© DITF/ITV
0
1000
2000
3000
4000
5000
6000
7000
8000
0 6 12 18 24 30 36 42 48 54 60 66 72 78 84 90 96 102 108 114 120 126 132 138 144 1505,9 11,8 17,7 23,6 29,5 35,4 41,3 47,2 53,1 59 64,9 70,8 76,7 82,6 88,5 94,4 100,3 106,2 112,1 118 123,9 129,8 135,7 141,6 147,5
Yarn production 38 Mio. to. (2006)
mostlyOE yarn
OE yarn cardedring yarn cardedring yarn combed
Ring yarn cobed (conventional and compact)
Shirts, Blouses, Curtains etc.
Den
imet
c.
Ne
Jobd
ress
, C
o. T
row
sers
etc.
T-Sh
irt, T
rikot
,Sh
eets
etc.
Tsd.
to.
Figure 12: Yarn production

16 SUMMARY To summarize the explanations above, we can say that the Vortex yarn has a different yarn structure compared to the ring yarn, which results from this unique process. Under the existing spinning processes it has most similarity to the ring compact yarn. It is a spinning process with a drafting system. The fibre selection, therefore, must be made carefully. The air jet spinning process is suitable for yarn count ranges where considerable amounts of Yarn are required. In this area this technology is superior to rotor spinning technology.
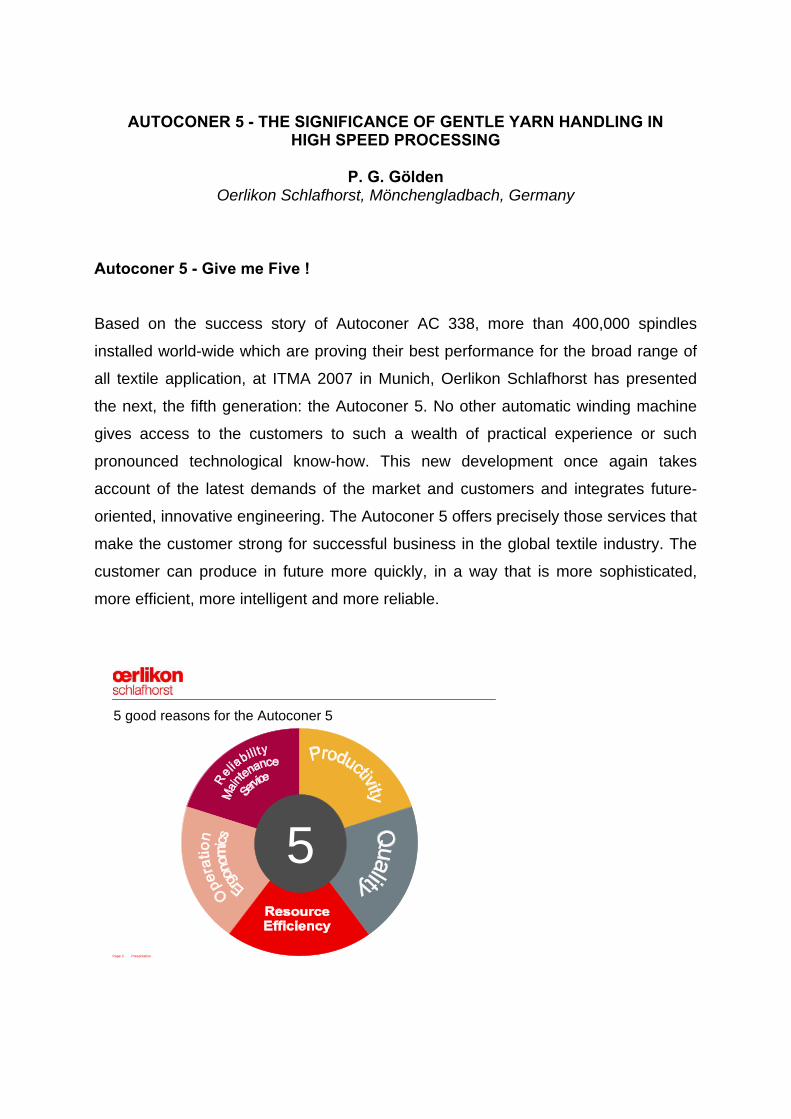
AUTOCONER 5 - THE SIGNIFICANCE OF GENTLE YARN HANDLING IN HIGH SPEED PROCESSING
P. G. Gölden
Oerlikon Schlafhorst, Mönchengladbach, Germany Autoconer 5 - Give me Five ! Based on the success story of Autoconer AC 338, more than 400,000 spindles
installed world-wide which are proving their best performance for the broad range of
all textile application, at ITMA 2007 in Munich, Oerlikon Schlafhorst has presented
the next, the fifth generation: the Autoconer 5. No other automatic winding machine
gives access to the customers to such a wealth of practical experience or such
pronounced technological know-how. This new development once again takes
account of the latest demands of the market and customers and integrates future-
oriented, innovative engineering. The Autoconer 5 offers precisely those services that
make the customer strong for successful business in the global textile industry. The
customer can produce in future more quickly, in a way that is more sophisticated,
more efficient, more intelligent and more reliable.
Page 3 Presentation
5
5 good reasons for the Autoconer 5
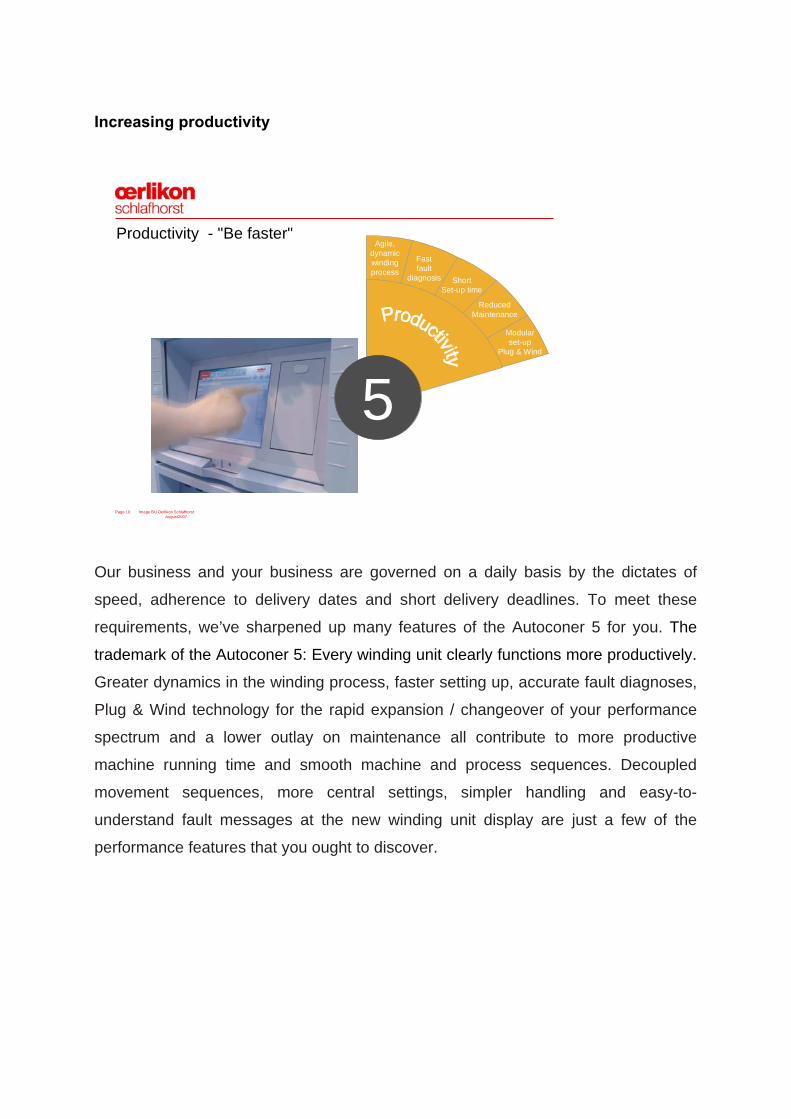
Increasing productivity
Page 10 Image BU Oerlikon Schlafhorst August2007
Productivity - "Be faster"Agile,
dynamicwindingprocess
ReducedMaintenance
ShortSet-up time
Fastfault
diagnosis
Modularset-up
Plug & Wind
5
Our business and your business are governed on a daily basis by the dictates of
speed, adherence to delivery dates and short delivery deadlines. To meet these
requirements, we’ve sharpened up many features of the Autoconer 5 for you. The
trademark of the Autoconer 5: Every winding unit clearly functions more productively.
Greater dynamics in the winding process, faster setting up, accurate fault diagnoses,
Plug & Wind technology for the rapid expansion / changeover of your performance
spectrum and a lower outlay on maintenance all contribute to more productive
machine running time and smooth machine and process sequences. Decoupled
movement sequences, more central settings, simpler handling and easy-to-
understand fault messages at the new winding unit display are just a few of the
performance features that you ought to discover.
Optimum package quality- Sophisticated technologies from Autoconer 5:
Page 13 Image BU Oerlikon Schlafhorst August2007
PackageQuality
YarnQuality
SpliceQuality
State-of-the-artMachineQuality
ReproducibleQ-data
5Quality - "Be more demanding"
Optimizing the package and yarn quality is the core concept of Schlafhorst winding
machines, as the quality of packages from the Autoconer are the decisive factors for
the efficiency, performance of the subsequent processes of the textile chain of
operations. Thanks to the FX series, with Autotense FX, Propack FX, Variopack FX
and Ecopack FX, the Autoconer 5 guarantees the highest quality of packages and
yarn. During the winding process the yarn receives gentle treatment on the
Autoconer 5 due to the greater linearity of the yarn path with its optimized
arrangement of different modules and the new waxing unit.
Its unique splicing competence is based on the universality of the splicing
technology. The modular construction of basic splicer enables the customer to
transform their splicer to process Double yarn (Cotton), compact yarn, Elasto yarn,
Polyester/viscose & blends and Wool /blends by changing the splicing components
and adding the attachments accordingly. Optimization processes can be configured
even more simply due to the central setting of the splicing parameters, now also
including the feeder arm for the first time. The dependability of the quality is no less
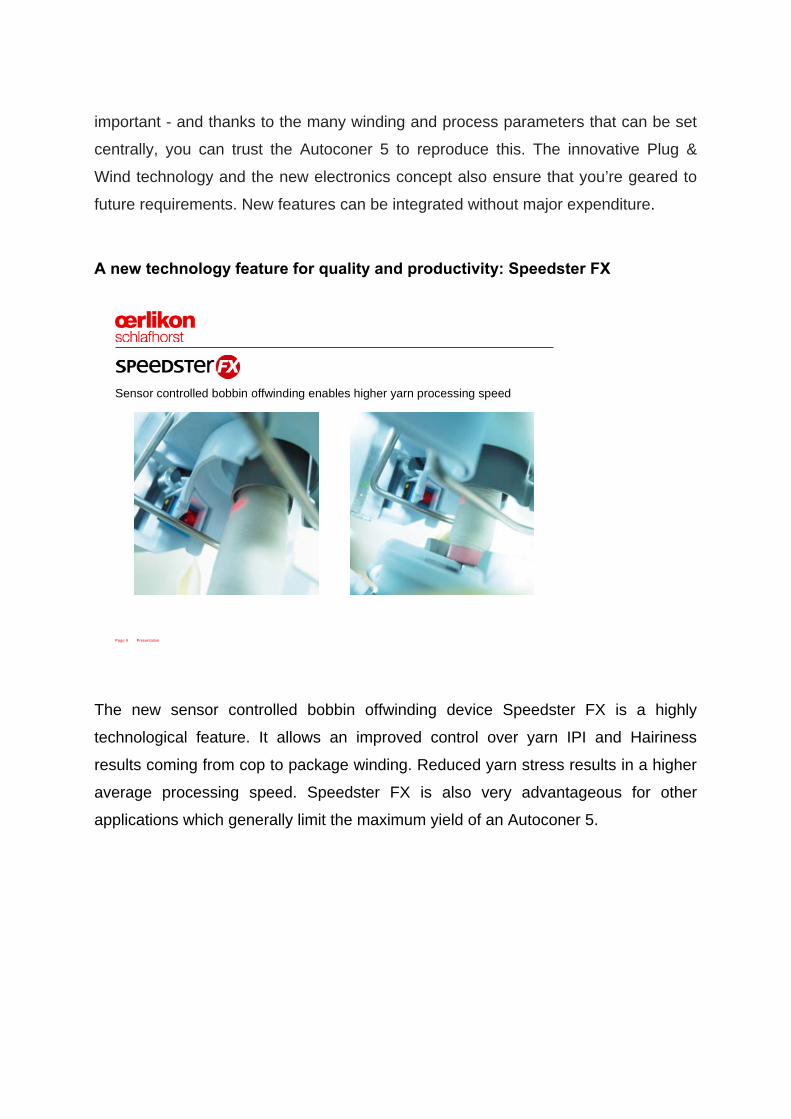
important - and thanks to the many winding and process parameters that can be set
centrally, you can trust the Autoconer 5 to reproduce this. The innovative Plug &
Wind technology and the new electronics concept also ensure that you’re geared to
future requirements. New features can be integrated without major expenditure.
A new technology feature for quality and productivity: Speedster FX
Page 9 Presentation
Sensor controlled bobbin offwinding enables higher yarn processing speed
The new sensor controlled bobbin offwinding device Speedster FX is a highly
technological feature. It allows an improved control over yarn IPI and Hairiness
results coming from cop to package winding. Reduced yarn stress results in a higher
average processing speed. Speedster FX is also very advantageous for other
applications which generally limit the maximum yield of an Autoconer 5.
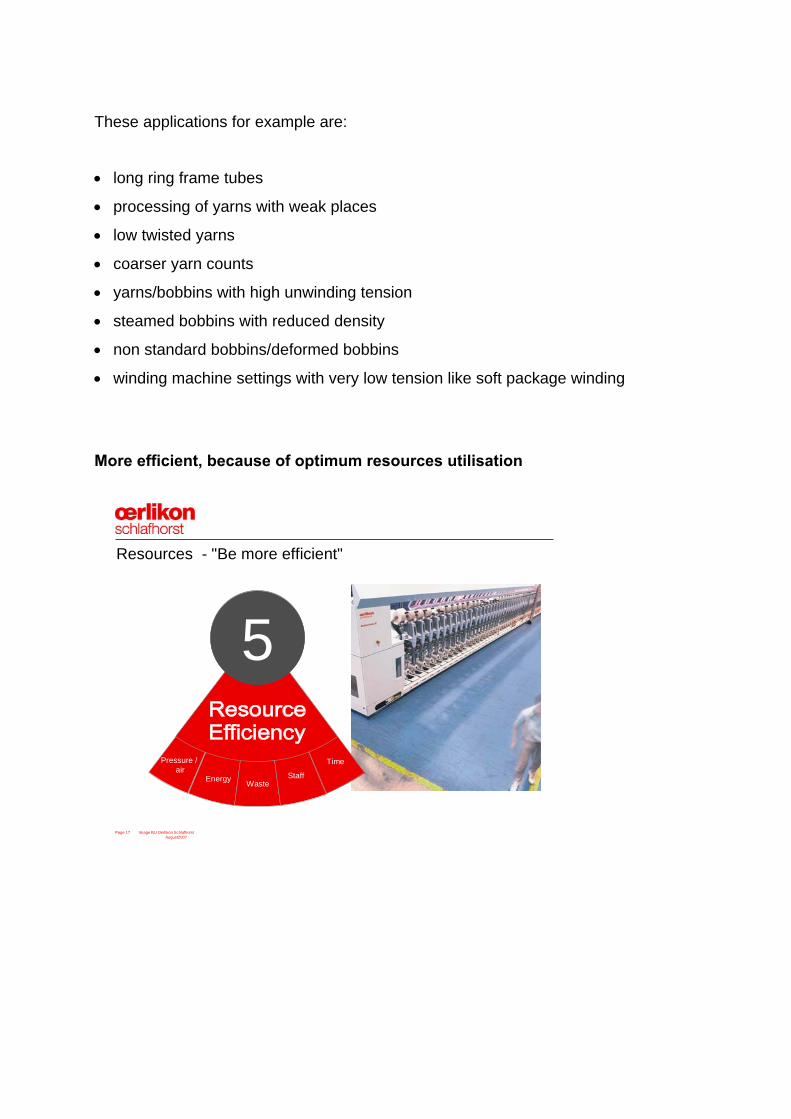
These applications for example are:
• long ring frame tubes
• processing of yarns with weak places
• low twisted yarns
• coarser yarn counts
• yarns/bobbins with high unwinding tension
• steamed bobbins with reduced density
• non standard bobbins/deformed bobbins
• winding machine settings with very low tension like soft package winding
More efficient, because of optimum resources utilisation
Page 17 Image BU Oerlikon Schlafhorst August2007
Pressure / air
Energy WasteStaff
Time
5
Resources - "Be more efficient"
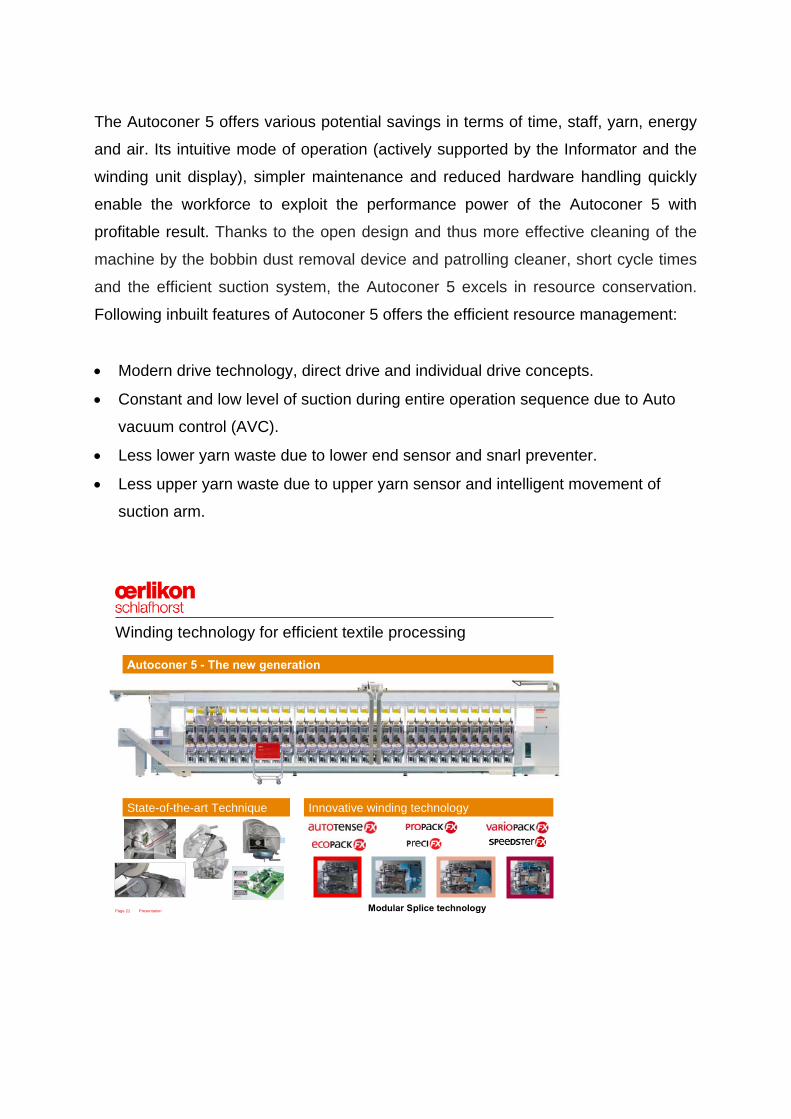
The Autoconer 5 offers various potential savings in terms of time, staff, yarn, energy
and air. Its intuitive mode of operation (actively supported by the Informator and the
winding unit display), simpler maintenance and reduced hardware handling quickly
enable the workforce to exploit the performance power of the Autoconer 5 with
profitable result. Thanks to the open design and thus more effective cleaning of the
machine by the bobbin dust removal device and patrolling cleaner, short cycle times
and the efficient suction system, the Autoconer 5 excels in resource conservation.
Following inbuilt features of Autoconer 5 offers the efficient resource management:
• Modern drive technology, direct drive and individual drive concepts.
• Constant and low level of suction during entire operation sequence due to Auto
vacuum control (AVC).
• Less lower yarn waste due to lower end sensor and snarl preventer.
• Less upper yarn waste due to upper yarn sensor and intelligent movement of
suction arm.
Page 21 Presentation
State-of-the-art Technique
Winding technology for efficient textile processing
Autoconer 5 - The new generation
Innovative winding technology
Modular Splice technology
Summary With the latest sensor technology, the innovative individual drive and control
technology, the intelligent closed-loop control systems for many process parameters
of winding and the future-oriented electronic concept, the Autoconer 5 have thrust the
quality and economic effectiveness of the winding process.
With Preci FX and Speedster FX, the Autoconer 5 proves the unique technological
leadership in yarn processing for:
• Higher Productivity
• Premium Quality
• More efficient resource exploitation
• Easier and intelligent operation and better ergonomics
• Maximum reliability, little maintenance.
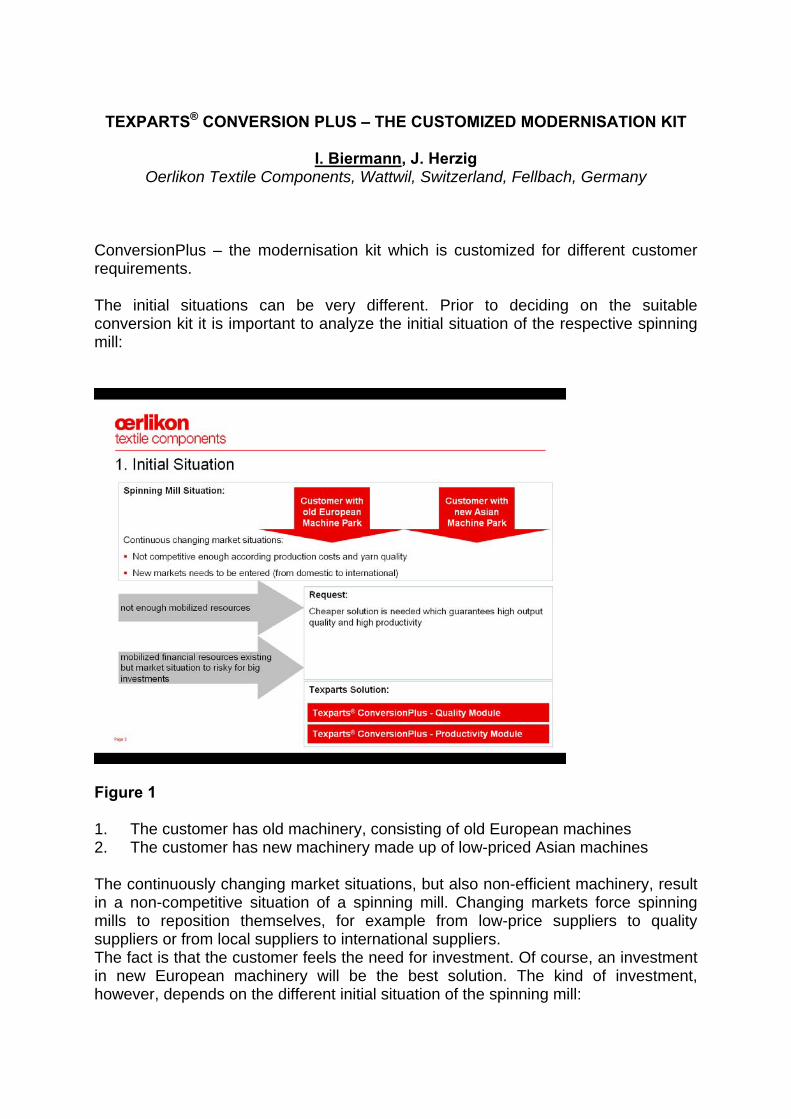
TEXPARTS® CONVERSION PLUS – THE CUSTOMIZED MODERNISATION KIT
I. Biermann, J. Herzig Oerlikon Textile Components, Wattwil, Switzerland, Fellbach, Germany
ConversionPlus – the modernisation kit which is customized for different customer requirements. The initial situations can be very different. Prior to deciding on the suitable conversion kit it is important to analyze the initial situation of the respective spinning mill:
Figure 1 1. The customer has old machinery, consisting of old European machines 2. The customer has new machinery made up of low-priced Asian machines The continuously changing market situations, but also non-efficient machinery, result in a non-competitive situation of a spinning mill. Changing markets force spinning mills to reposition themselves, for example from low-price suppliers to quality suppliers or from local suppliers to international suppliers. The fact is that the customer feels the need for investment. Of course, an investment in new European machinery will be the best solution. The kind of investment, however, depends on the different initial situation of the spinning mill:
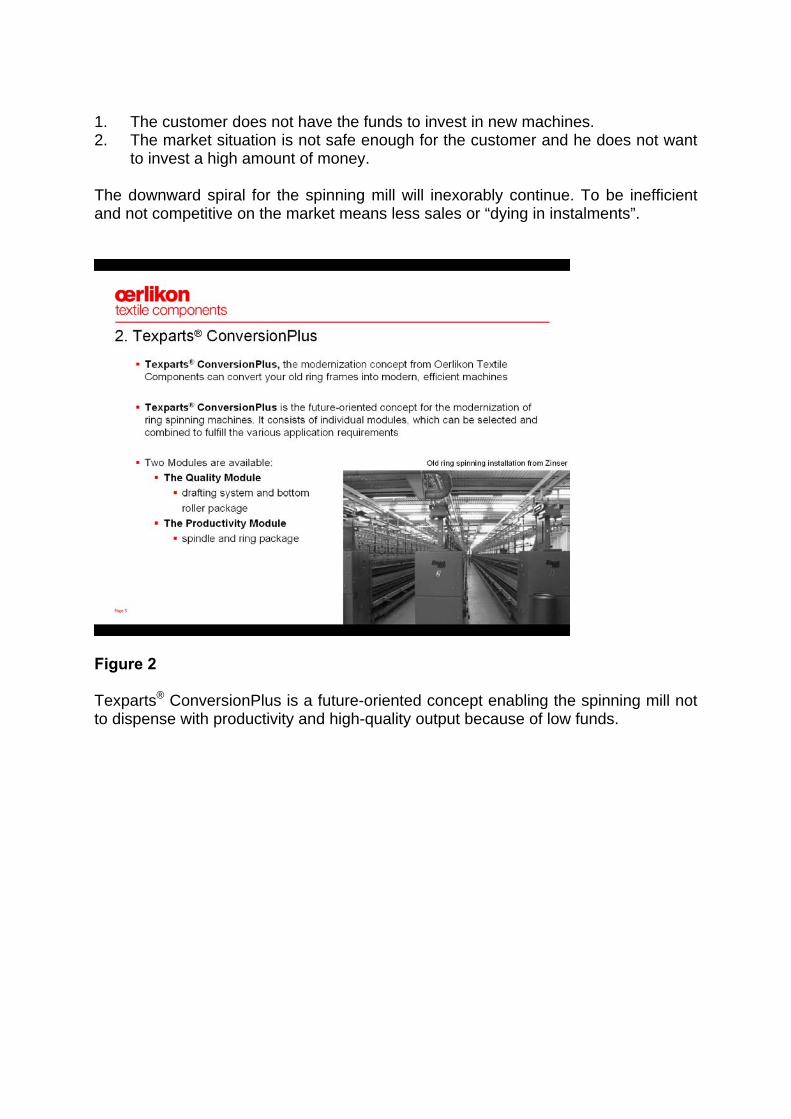
1. The customer does not have the funds to invest in new machines. 2. The market situation is not safe enough for the customer and he does not want
to invest a high amount of money. The downward spiral for the spinning mill will inexorably continue. To be inefficient and not competitive on the market means less sales or “dying in instalments”.
Figure 2 Texparts® ConversionPlus is a future-oriented concept enabling the spinning mill not to dispense with productivity and high-quality output because of low funds.
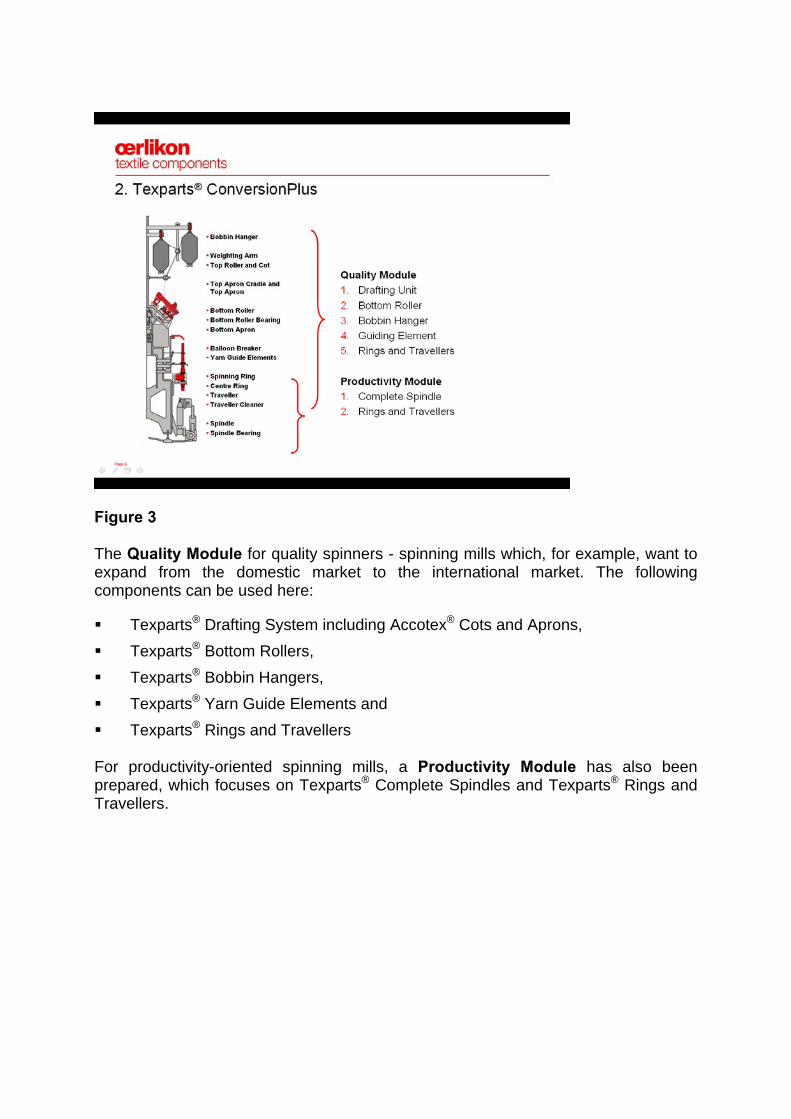
Figure 3 The Quality Module for quality spinners - spinning mills which, for example, want to expand from the domestic market to the international market. The following components can be used here:
Texparts® Drafting System including Accotex® Cots and Aprons, Texparts® Bottom Rollers, Texparts® Bobbin Hangers, Texparts® Yarn Guide Elements and Texparts® Rings and Travellers
For productivity-oriented spinning mills, a Productivity Module has also been prepared, which focuses on Texparts® Complete Spindles and Texparts® Rings and Travellers.
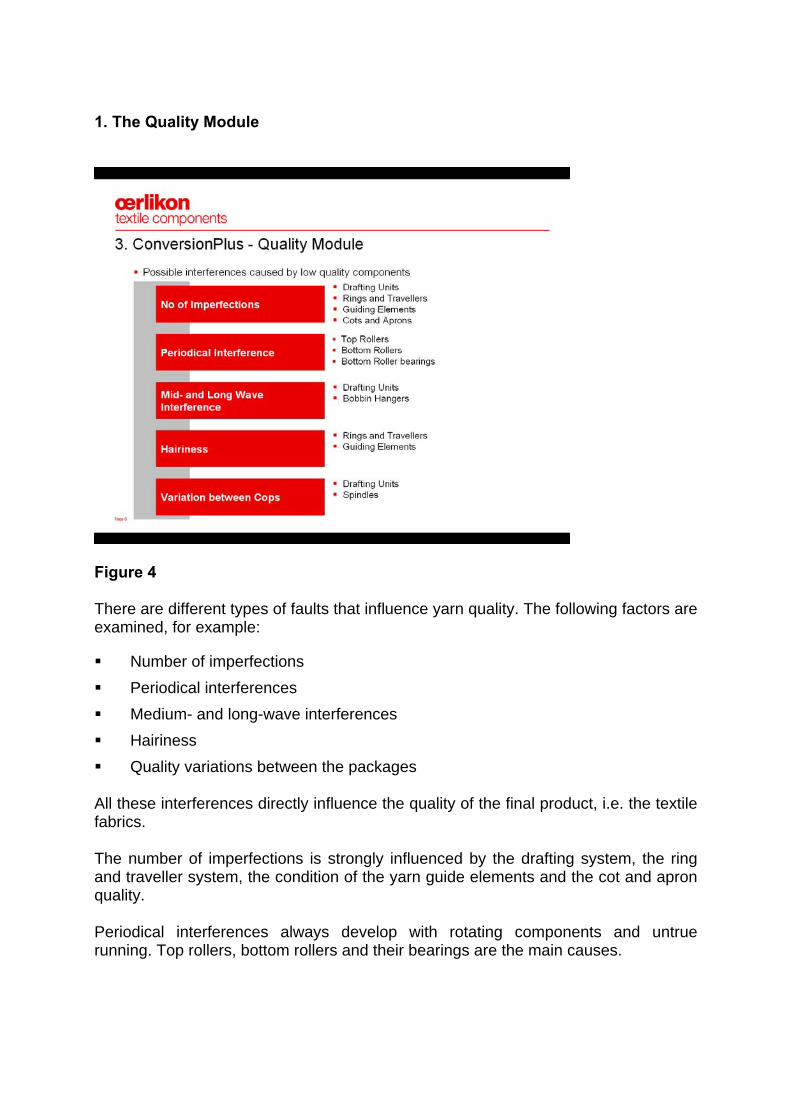
1. The Quality Module
Figure 4 There are different types of faults that influence yarn quality. The following factors are examined, for example:
Number of imperfections Periodical interferences Medium- and long-wave interferences Hairiness Quality variations between the packages
All these interferences directly influence the quality of the final product, i.e. the textile fabrics. The number of imperfections is strongly influenced by the drafting system, the ring and traveller system, the condition of the yarn guide elements and the cot and apron quality. Periodical interferences always develop with rotating components and untrue running. Top rollers, bottom rollers and their bearings are the main causes.
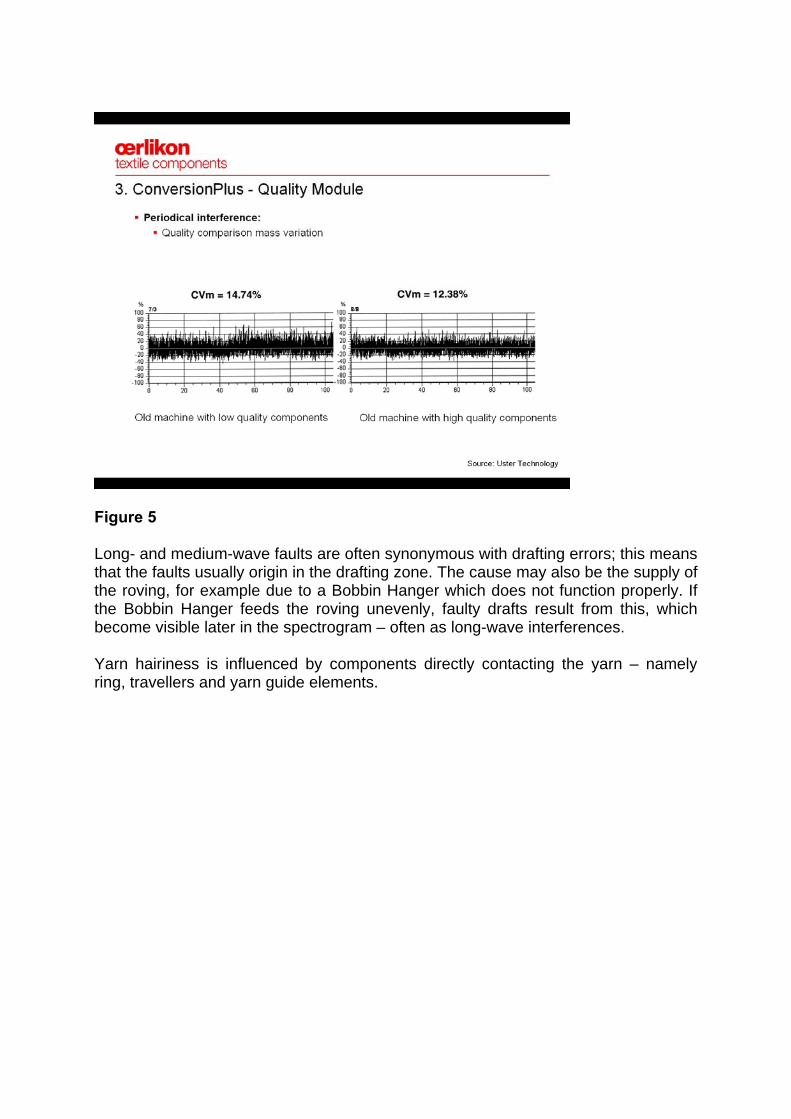
Figure 5 Long- and medium-wave faults are often synonymous with drafting errors; this means that the faults usually origin in the drafting zone. The cause may also be the supply of the roving, for example due to a Bobbin Hanger which does not function properly. If the Bobbin Hanger feeds the roving unevenly, faulty drafts result from this, which become visible later in the spectrogram – often as long-wave interferences. Yarn hairiness is influenced by components directly contacting the yarn – namely ring, travellers and yarn guide elements.
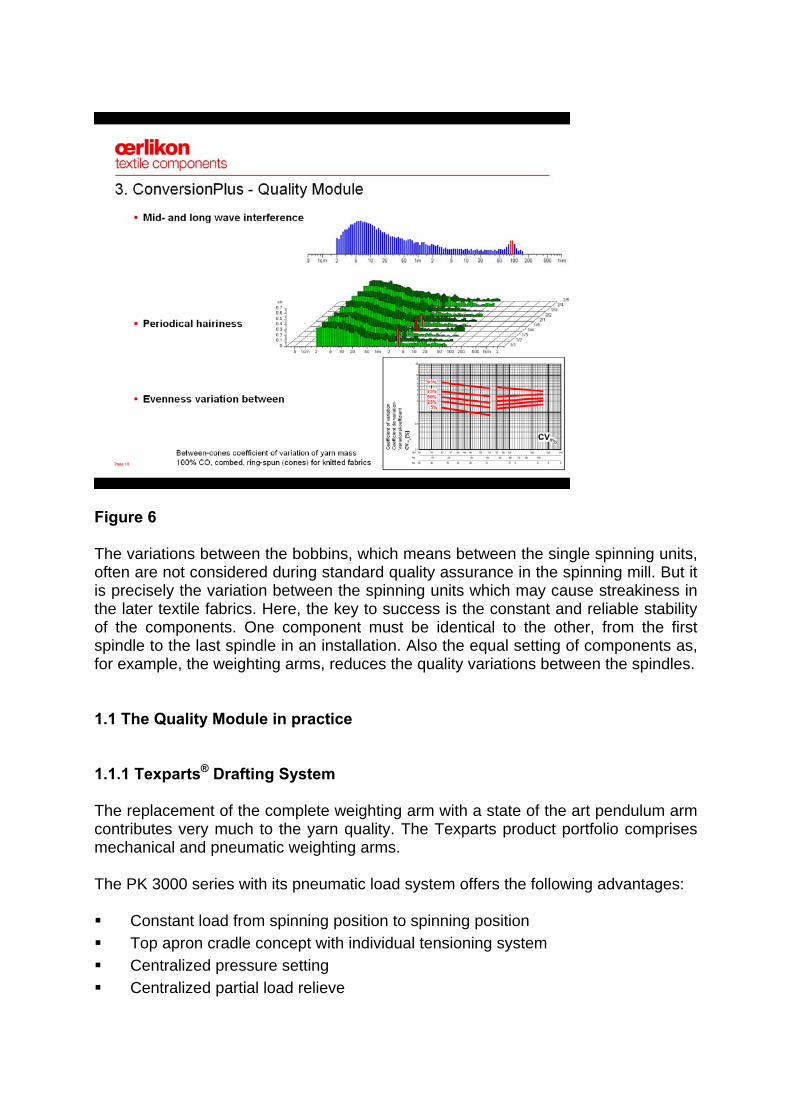
Figure 6 The variations between the bobbins, which means between the single spinning units, often are not considered during standard quality assurance in the spinning mill. But it is precisely the variation between the spinning units which may cause streakiness in the later textile fabrics. Here, the key to success is the constant and reliable stability of the components. One component must be identical to the other, from the first spindle to the last spindle in an installation. Also the equal setting of components as, for example, the weighting arms, reduces the quality variations between the spindles. 1.1 The Quality Module in practice 1.1.1 Texparts® Drafting System The replacement of the complete weighting arm with a state of the art pendulum arm contributes very much to the yarn quality. The Texparts product portfolio comprises mechanical and pneumatic weighting arms. The PK 3000 series with its pneumatic load system offers the following advantages: Constant load from spinning position to spinning position Top apron cradle concept with individual tensioning system Centralized pressure setting Centralized partial load relieve
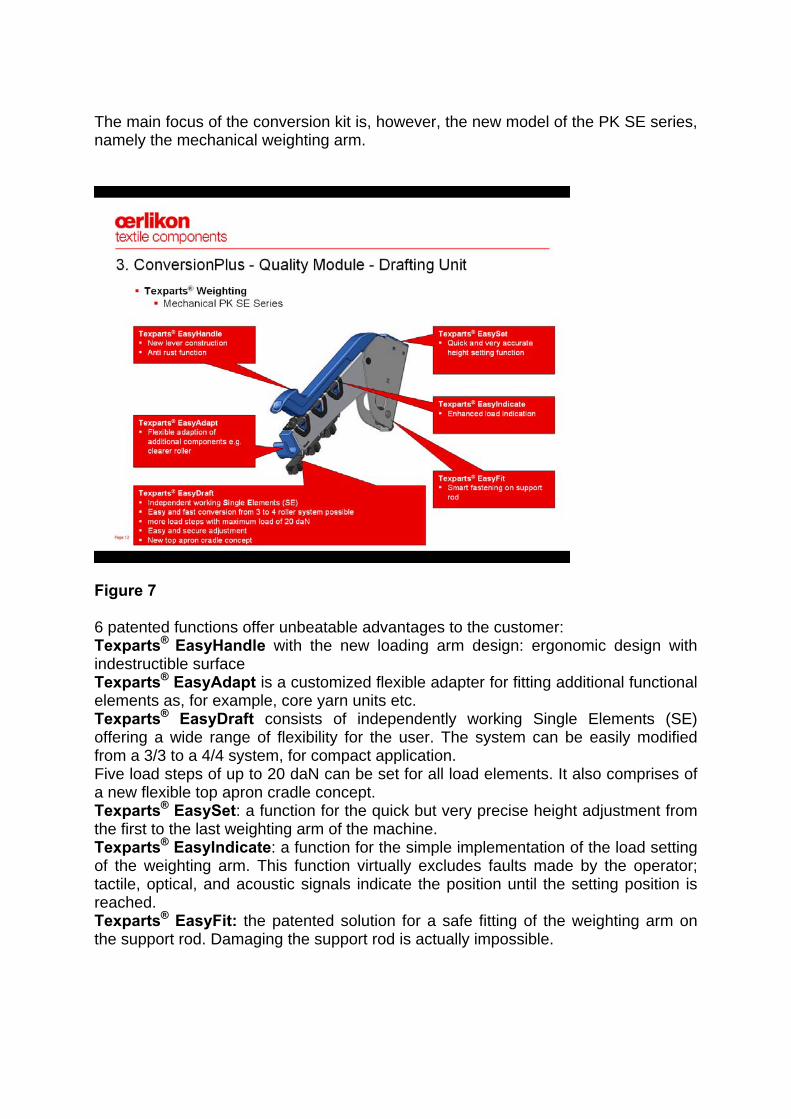
The main focus of the conversion kit is, however, the new model of the PK SE series, namely the mechanical weighting arm.
Figure 7 6 patented functions offer unbeatable advantages to the customer: Texparts® EasyHandle with the new loading arm design: ergonomic design with indestructible surface Texparts® EasyAdapt is a customized flexible adapter for fitting additional functional elements as, for example, core yarn units etc. Texparts® EasyDraft consists of independently working Single Elements (SE) offering a wide range of flexibility for the user. The system can be easily modified from a 3/3 to a 4/4 system, for compact application. Five load steps of up to 20 daN can be set for all load elements. It also comprises of a new flexible top apron cradle concept. Texparts® EasySet: a function for the quick but very precise height adjustment from the first to the last weighting arm of the machine. Texparts® EasyIndicate: a function for the simple implementation of the load setting of the weighting arm. This function virtually excludes faults made by the operator; tactile, optical, and acoustic signals indicate the position until the setting position is reached. Texparts® EasyFit: the patented solution for a safe fitting of the weighting arm on the support rod. Damaging the support rod is actually impossible.
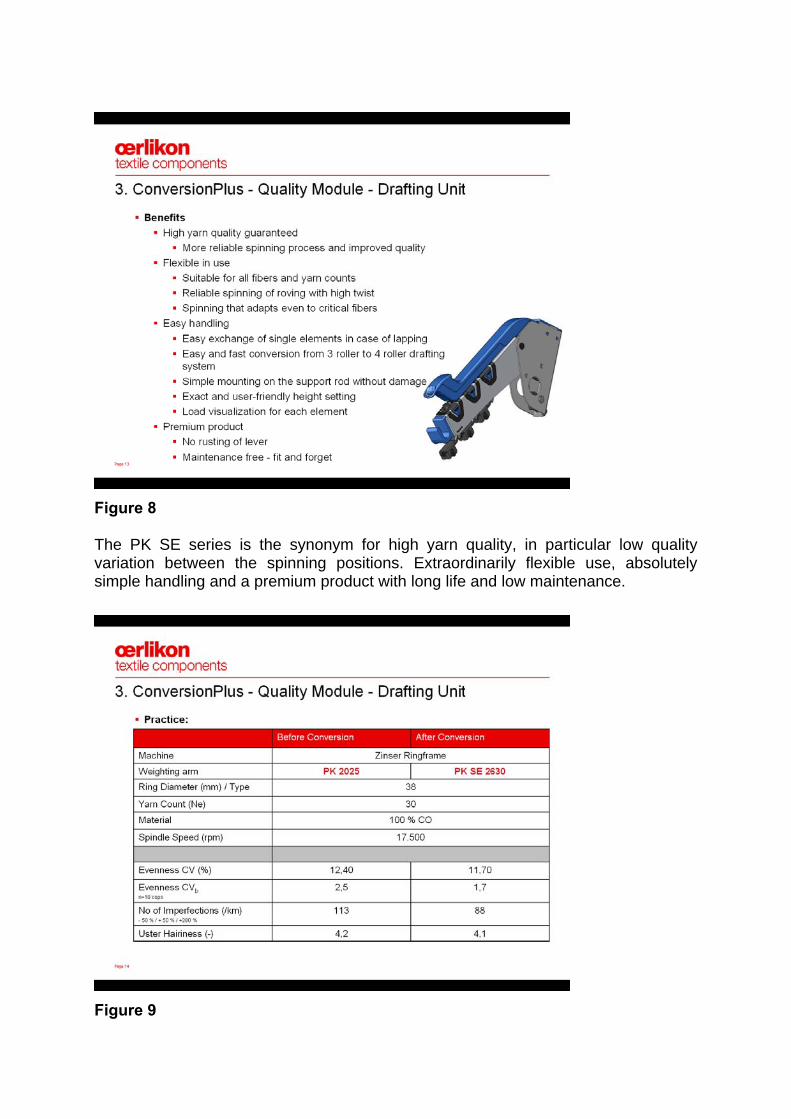
Figure 8 The PK SE series is the synonym for high yarn quality, in particular low quality variation between the spinning positions. Extraordinarily flexible use, absolutely simple handling and a premium product with long life and low maintenance.
Figure 9
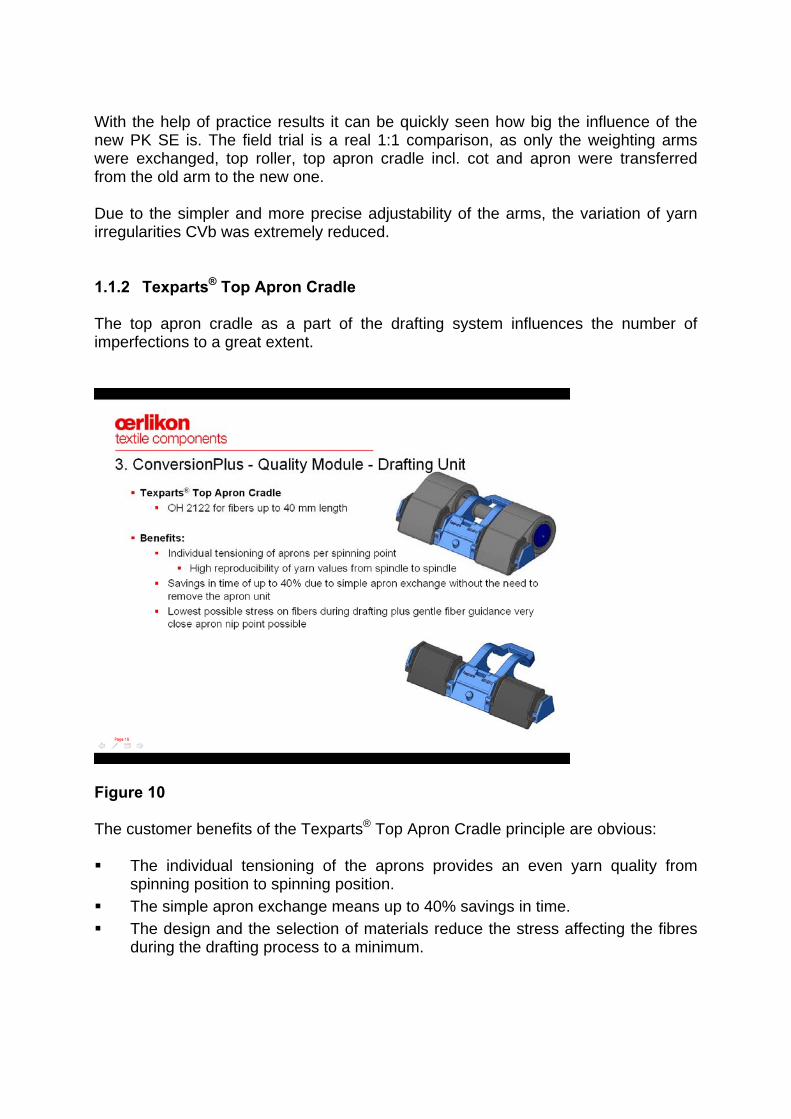
With the help of practice results it can be quickly seen how big the influence of the new PK SE is. The field trial is a real 1:1 comparison, as only the weighting arms were exchanged, top roller, top apron cradle incl. cot and apron were transferred from the old arm to the new one. Due to the simpler and more precise adjustability of the arms, the variation of yarn irregularities CVb was extremely reduced. 1.1.2 Texparts® Top Apron Cradle The top apron cradle as a part of the drafting system influences the number of imperfections to a great extent.
Figure 10 The customer benefits of the Texparts® Top Apron Cradle principle are obvious: The individual tensioning of the aprons provides an even yarn quality from
spinning position to spinning position. The simple apron exchange means up to 40% savings in time. The design and the selection of materials reduce the stress affecting the fibres
during the drafting process to a minimum.

Texparts® Top Roller
Figure 11 The front roller, apron roller, and back roller have great influence on periodical yarn faults. The new Premium Texparts® Top Roller 1200 series with a lot of new customer benefits as well as the predecessor series LP 1000, well-established on the market and millionfold approved, can be described as follows: Extremely long service life of a top roller Extended lubrication cycle or lifetime lubrication – depending on the model, and Extremely uniform and smooth running

Accotex® Cots and Aprons LPs are generally delivered with Accotex® Cots.
Figure 12 The Accotex products are characterized by a long service life and excellent spinning results. Constant product quality across different lots guarantees an equally constant yarn quality for the customer.
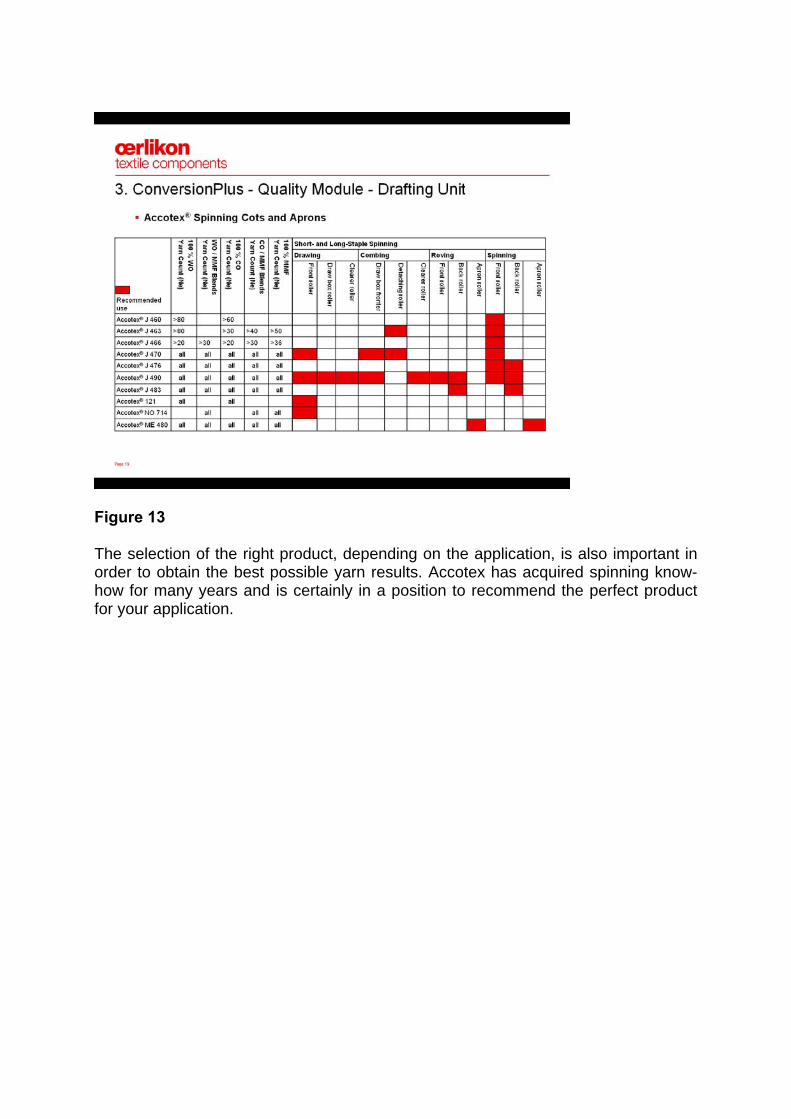
Figure 13 The selection of the right product, depending on the application, is also important in order to obtain the best possible yarn results. Accotex has acquired spinning know-how for many years and is certainly in a position to recommend the perfect product for your application.
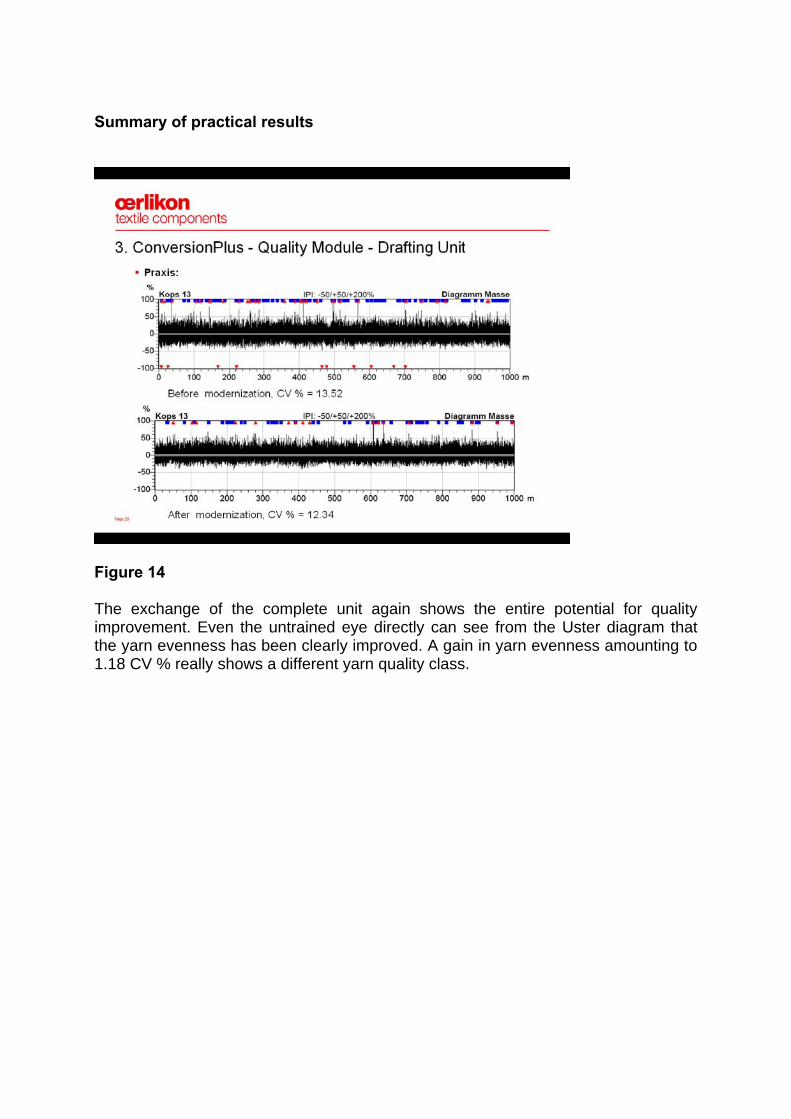
Summary of practical results
Figure 14 The exchange of the complete unit again shows the entire potential for quality improvement. Even the untrained eye directly can see from the Uster diagram that the yarn evenness has been clearly improved. A gain in yarn evenness amounting to 1.18 CV % really shows a different yarn quality class.
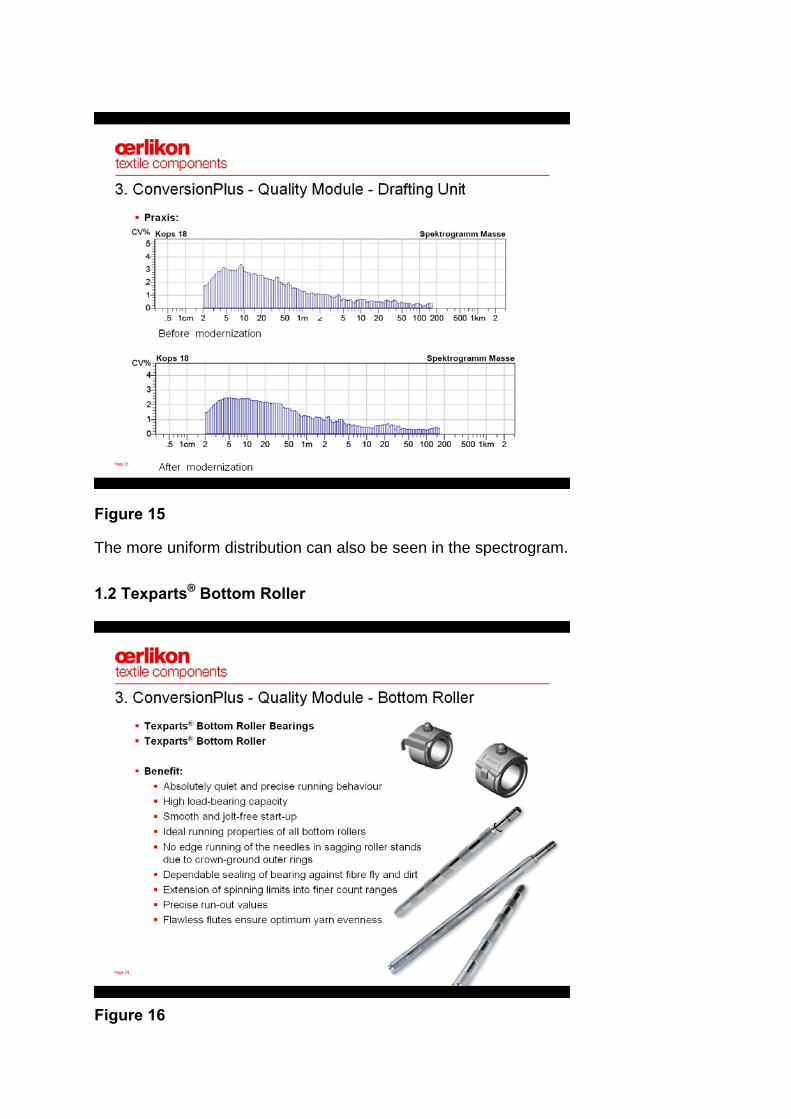
Figure 15 The more uniform distribution can also be seen in the spectrogram. 1.2 Texparts® Bottom Roller
Figure 16
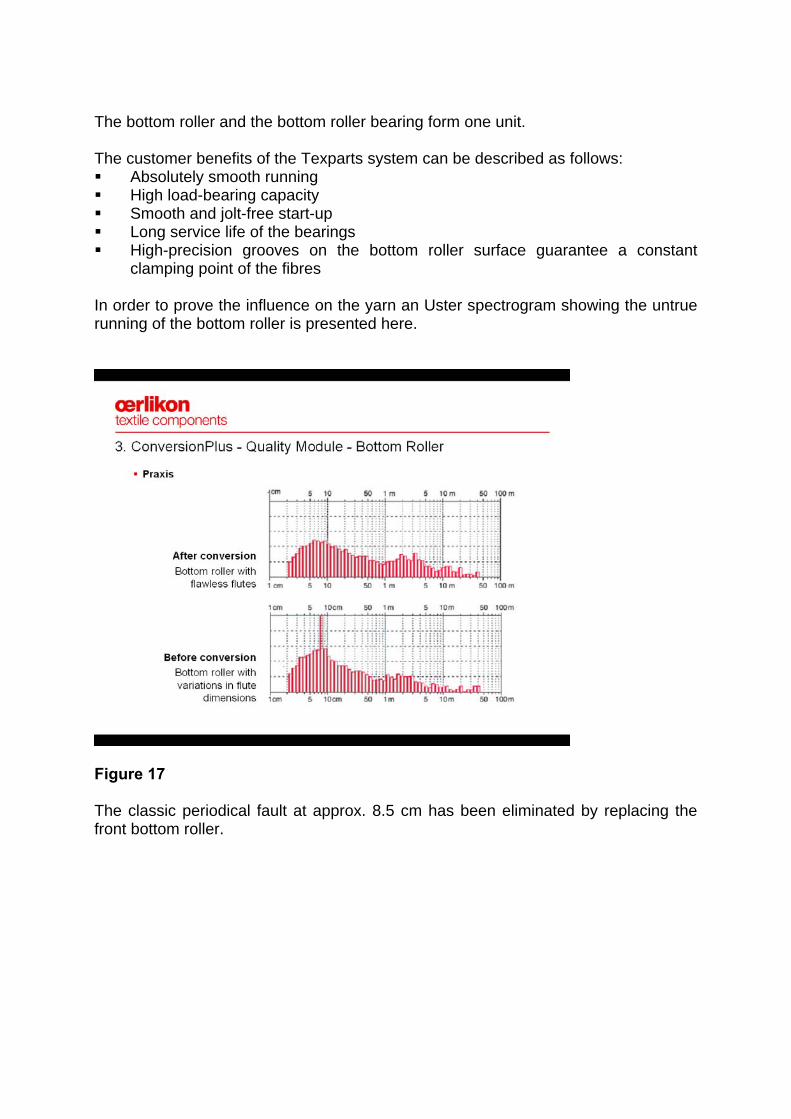
The bottom roller and the bottom roller bearing form one unit. The customer benefits of the Texparts system can be described as follows: Absolutely smooth running High load-bearing capacity Smooth and jolt-free start-up Long service life of the bearings High-precision grooves on the bottom roller surface guarantee a constant
clamping point of the fibres In order to prove the influence on the yarn an Uster spectrogram showing the untrue running of the bottom roller is presented here.
Figure 17 The classic periodical fault at approx. 8.5 cm has been eliminated by replacing the front bottom roller.
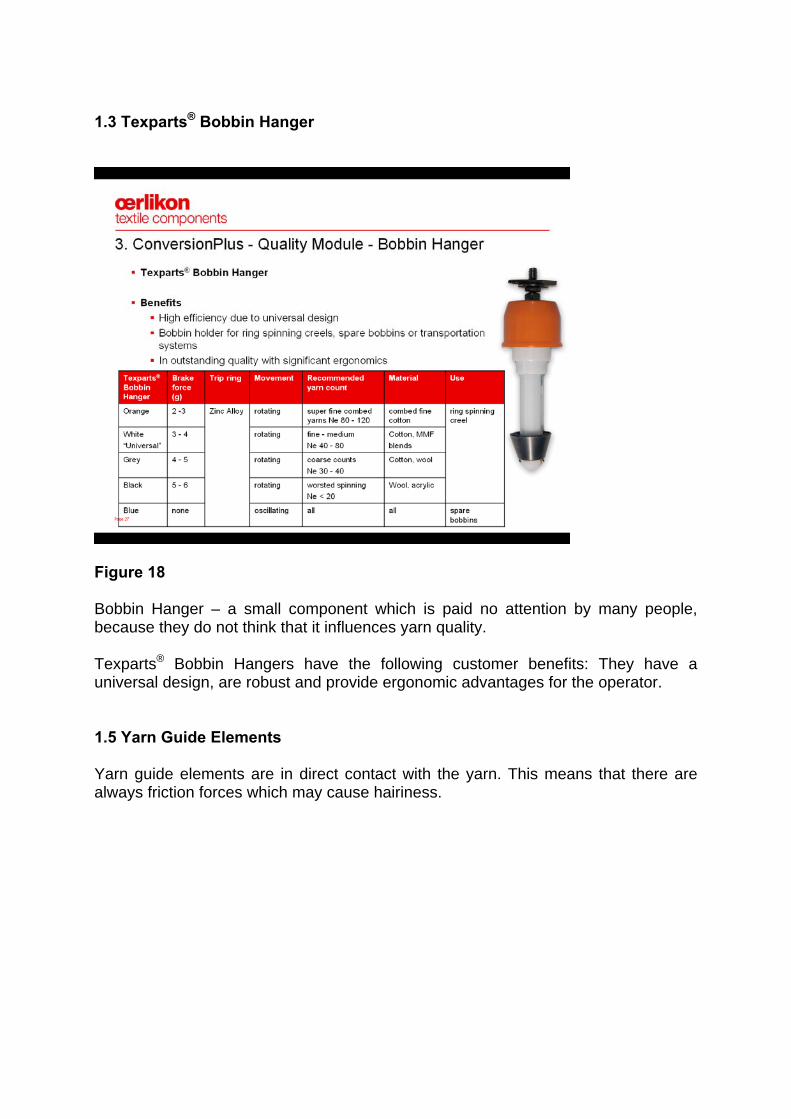
1.3 Texparts® Bobbin Hanger
Figure 18 Bobbin Hanger – a small component which is paid no attention by many people, because they do not think that it influences yarn quality. Texparts® Bobbin Hangers have the following customer benefits: They have a universal design, are robust and provide ergonomic advantages for the operator. 1.5 Yarn Guide Elements Yarn guide elements are in direct contact with the yarn. This means that there are always friction forces which may cause hairiness.
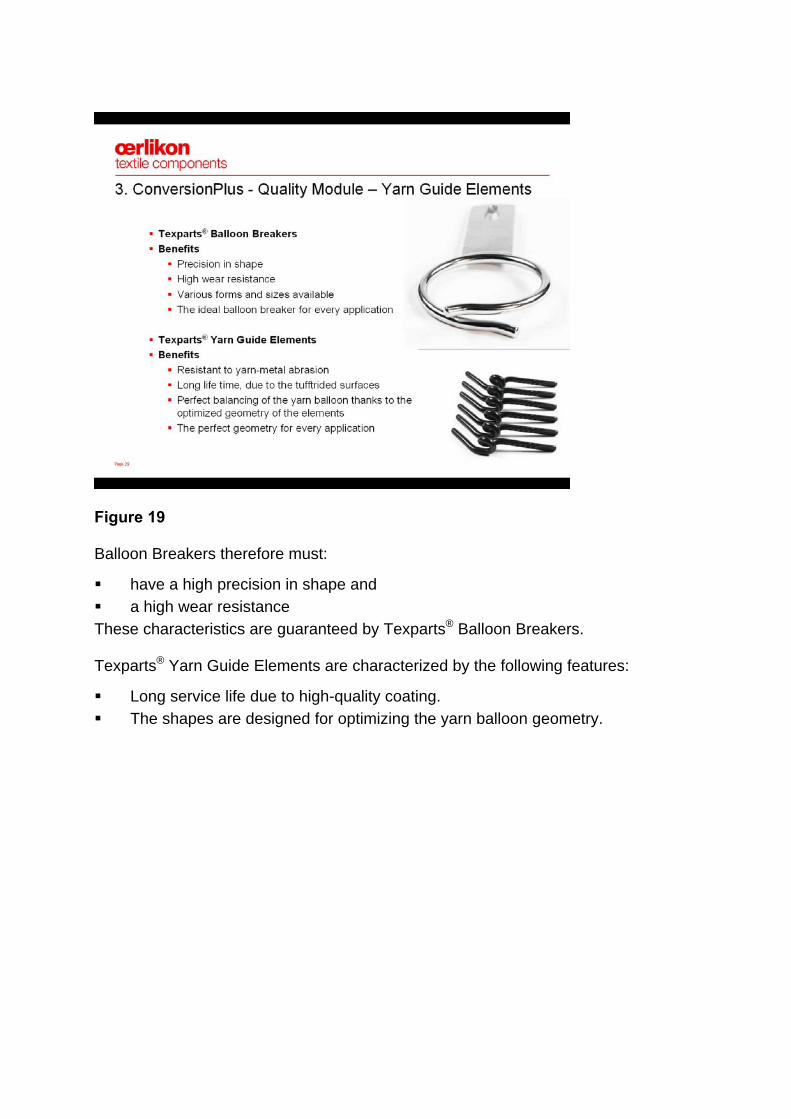
Figure 19 Balloon Breakers therefore must: have a high precision in shape and a high wear resistance
These characteristics are guaranteed by Texparts® Balloon Breakers. Texparts® Yarn Guide Elements are characterized by the following features: Long service life due to high-quality coating. The shapes are designed for optimizing the yarn balloon geometry.
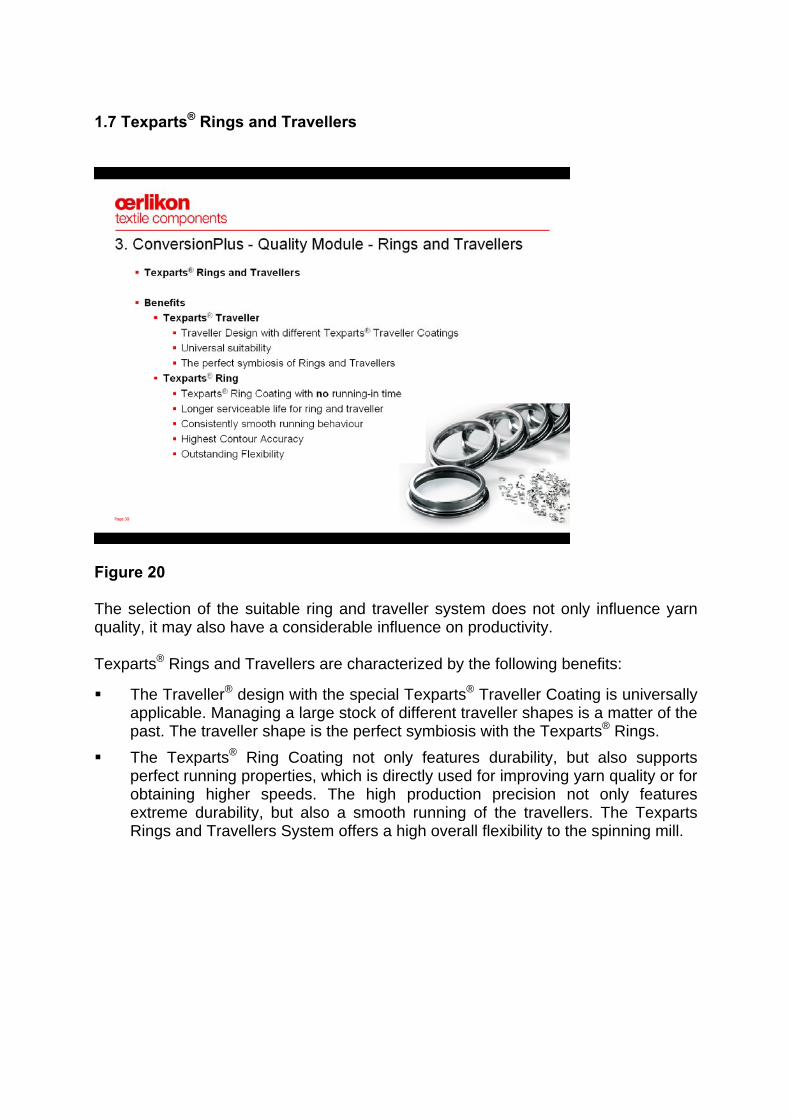
1.7 Texparts® Rings and Travellers
Figure 20 The selection of the suitable ring and traveller system does not only influence yarn quality, it may also have a considerable influence on productivity. Texparts® Rings and Travellers are characterized by the following benefits: The Traveller® design with the special Texparts® Traveller Coating is universally
applicable. Managing a large stock of different traveller shapes is a matter of the past. The traveller shape is the perfect symbiosis with the Texparts® Rings.
The Texparts® Ring Coating not only features durability, but also supports perfect running properties, which is directly used for improving yarn quality or for obtaining higher speeds. The high production precision not only features extreme durability, but also a smooth running of the travellers. The Texparts Rings and Travellers System offers a high overall flexibility to the spinning mill.
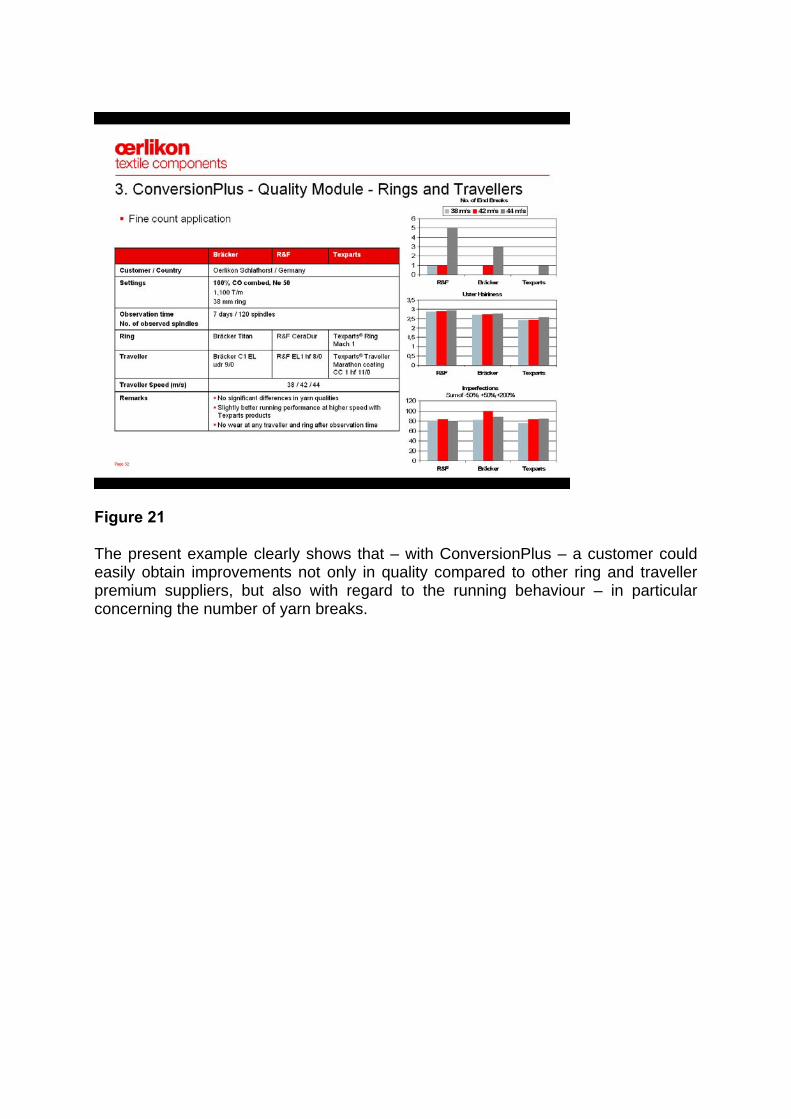
Figure 21 The present example clearly shows that – with ConversionPlus – a customer could easily obtain improvements not only in quality compared to other ring and traveller premium suppliers, but also with regard to the running behaviour – in particular concerning the number of yarn breaks.
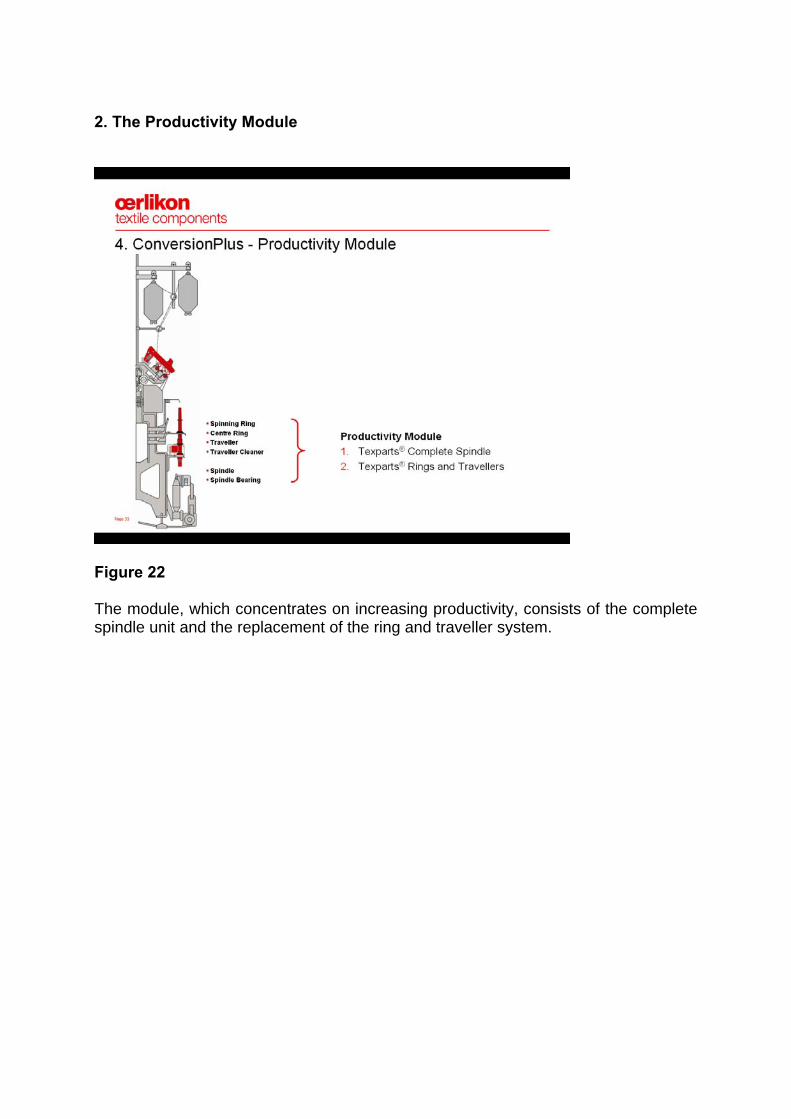
2. The Productivity Module
Figure 22 The module, which concentrates on increasing productivity, consists of the complete spindle unit and the replacement of the ring and traveller system.
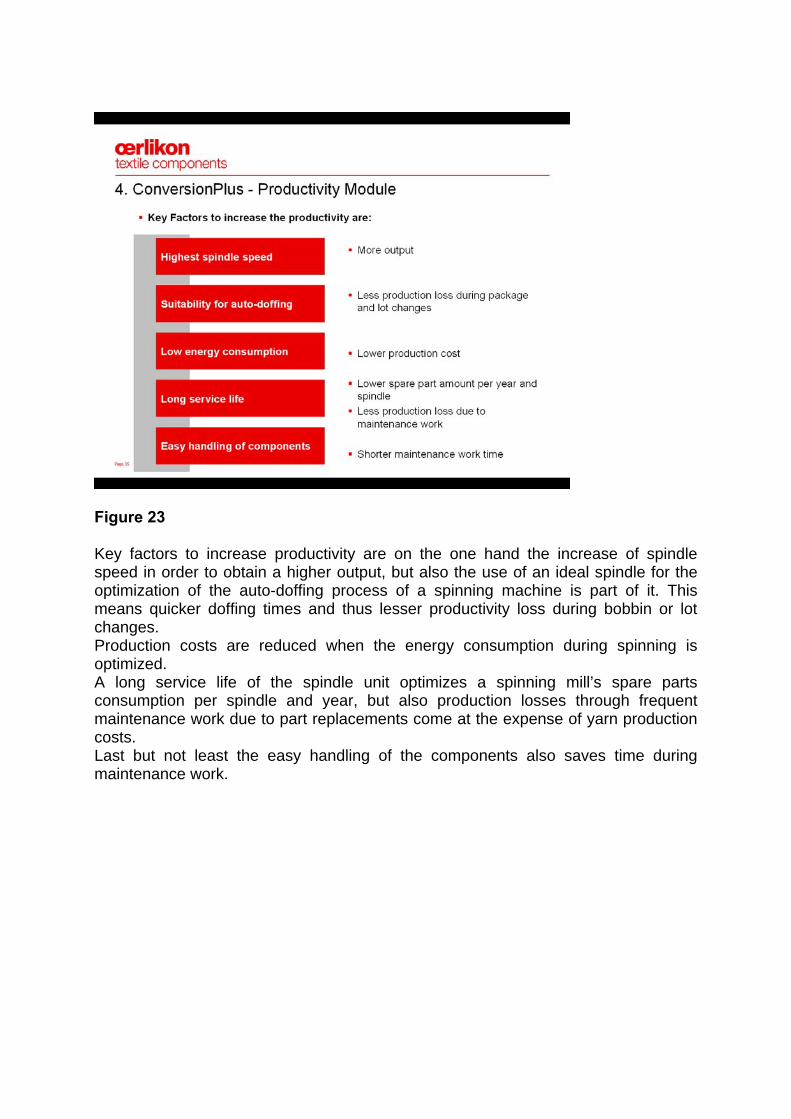
Figure 23 Key factors to increase productivity are on the one hand the increase of spindle speed in order to obtain a higher output, but also the use of an ideal spindle for the optimization of the auto-doffing process of a spinning machine is part of it. This means quicker doffing times and thus lesser productivity loss during bobbin or lot changes. Production costs are reduced when the energy consumption during spinning is optimized. A long service life of the spindle unit optimizes a spinning mill’s spare parts consumption per spindle and year, but also production losses through frequent maintenance work due to part replacements come at the expense of yarn production costs. Last but not least the easy handling of the components also saves time during maintenance work.
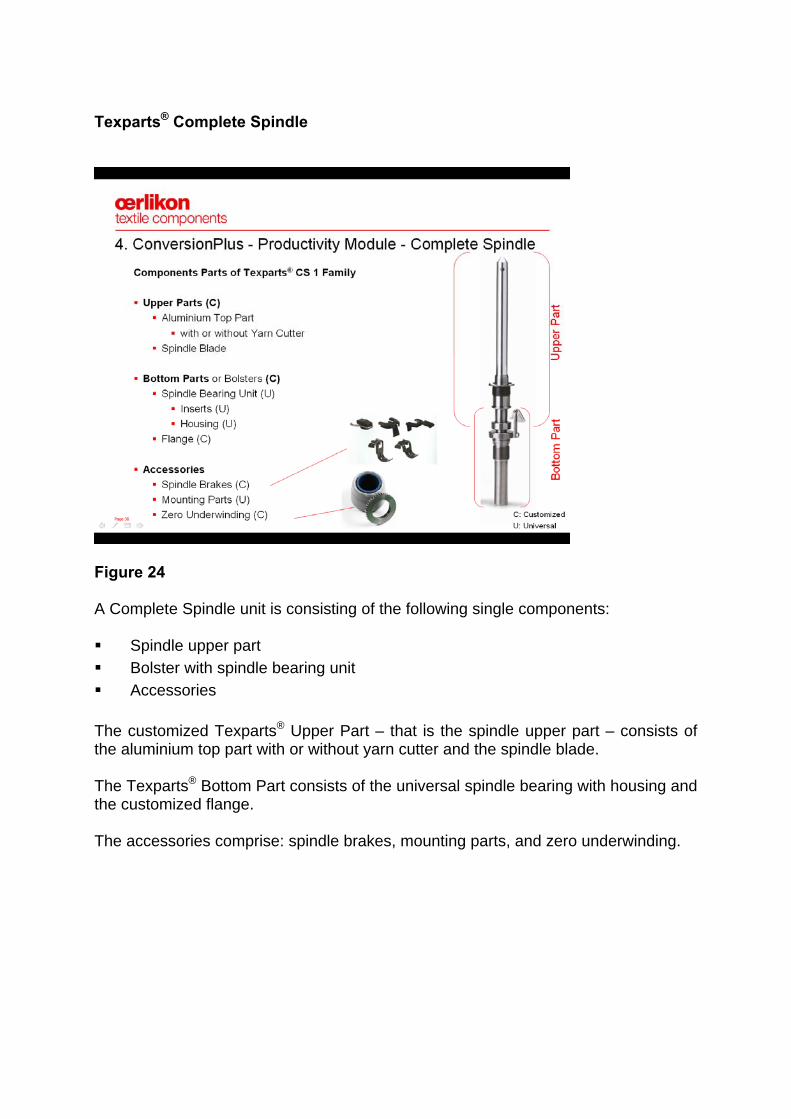
Texparts® Complete Spindle
Figure 24 A Complete Spindle unit is consisting of the following single components: Spindle upper part Bolster with spindle bearing unit Accessories
The customized Texparts® Upper Part – that is the spindle upper part – consists of the aluminium top part with or without yarn cutter and the spindle blade. The Texparts® Bottom Part consists of the universal spindle bearing with housing and the customized flange. The accessories comprise: spindle brakes, mounting parts, and zero underwinding.
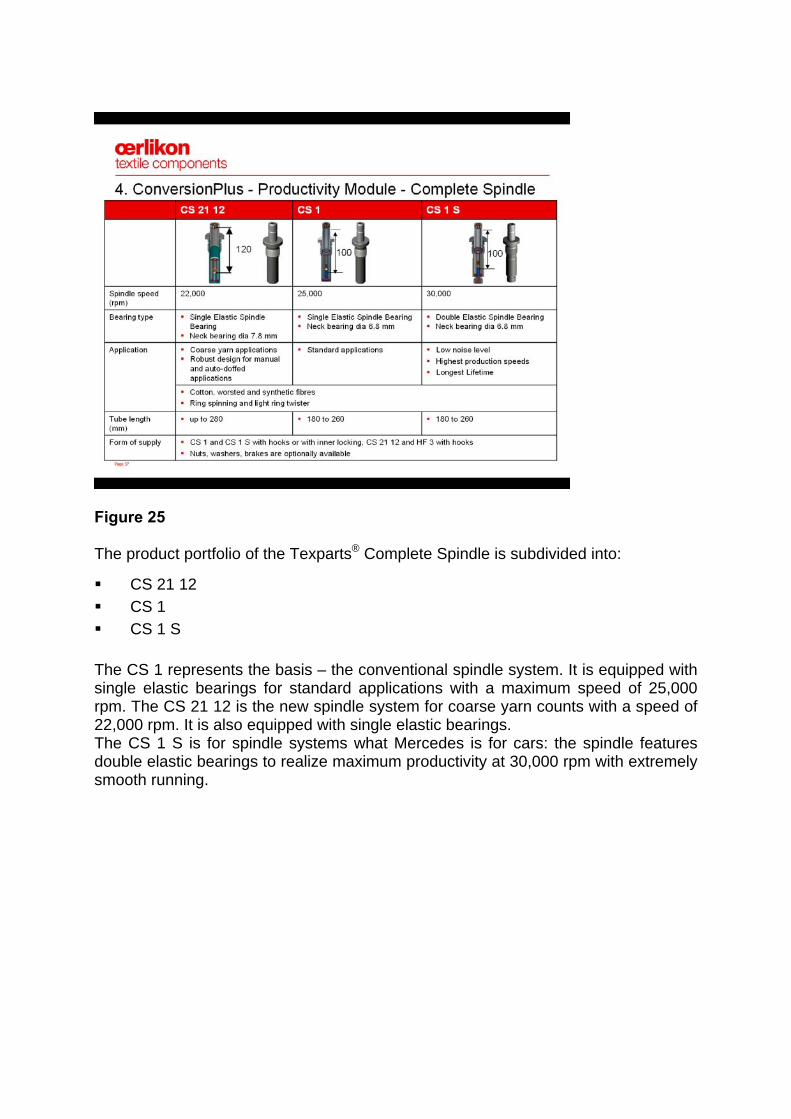
Figure 25 The product portfolio of the Texparts® Complete Spindle is subdivided into: CS 21 12 CS 1 CS 1 S
The CS 1 represents the basis – the conventional spindle system. It is equipped with single elastic bearings for standard applications with a maximum speed of 25,000 rpm. The CS 21 12 is the new spindle system for coarse yarn counts with a speed of 22,000 rpm. It is also equipped with single elastic bearings. The CS 1 S is for spindle systems what Mercedes is for cars: the spindle features double elastic bearings to realize maximum productivity at 30,000 rpm with extremely smooth running.
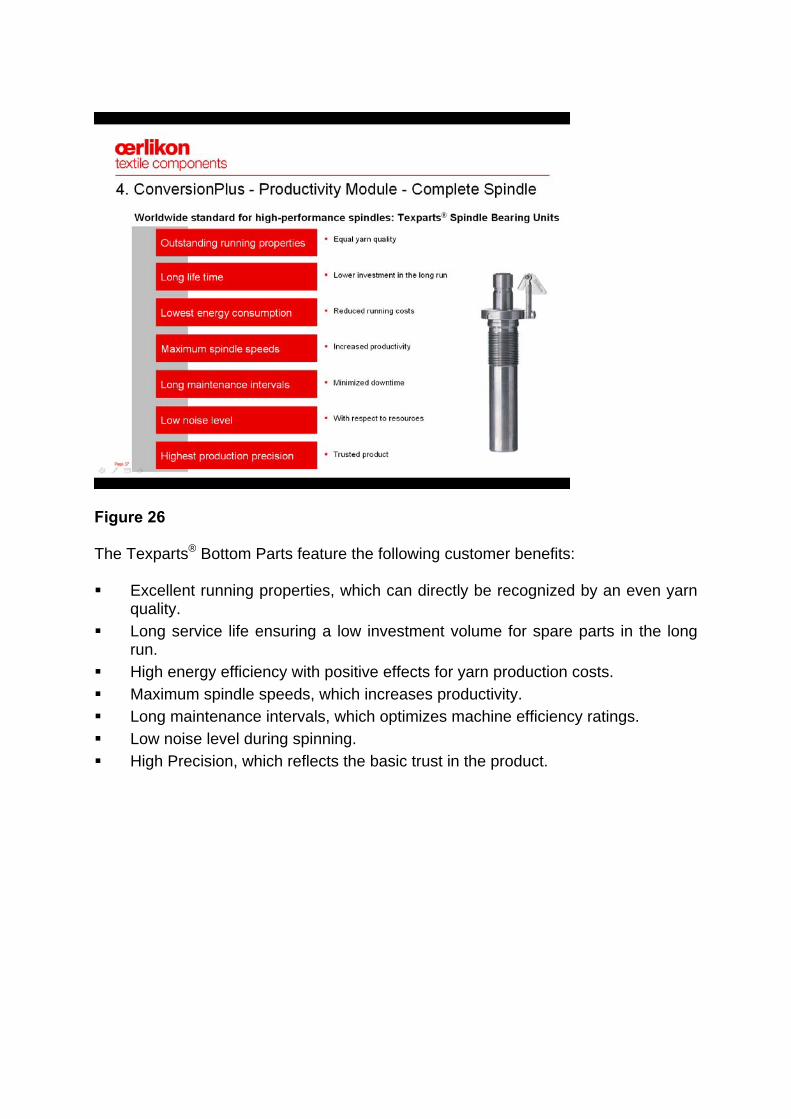
Figure 26 The Texparts® Bottom Parts feature the following customer benefits: Excellent running properties, which can directly be recognized by an even yarn
quality. Long service life ensuring a low investment volume for spare parts in the long
run. High energy efficiency with positive effects for yarn production costs. Maximum spindle speeds, which increases productivity. Long maintenance intervals, which optimizes machine efficiency ratings. Low noise level during spinning. High Precision, which reflects the basic trust in the product.
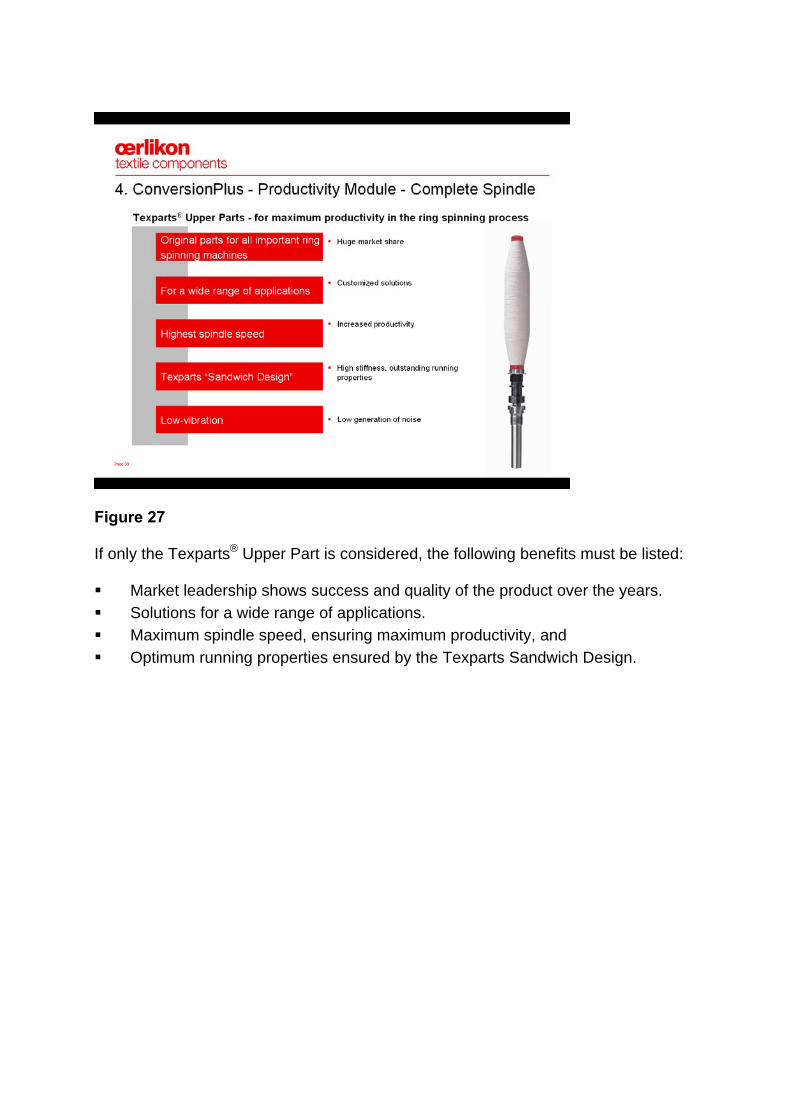
Figure 27 If only the Texparts® Upper Part is considered, the following benefits must be listed: Market leadership shows success and quality of the product over the years. Solutions for a wide range of applications. Maximum spindle speed, ensuring maximum productivity, and Optimum running properties ensured by the Texparts Sandwich Design.
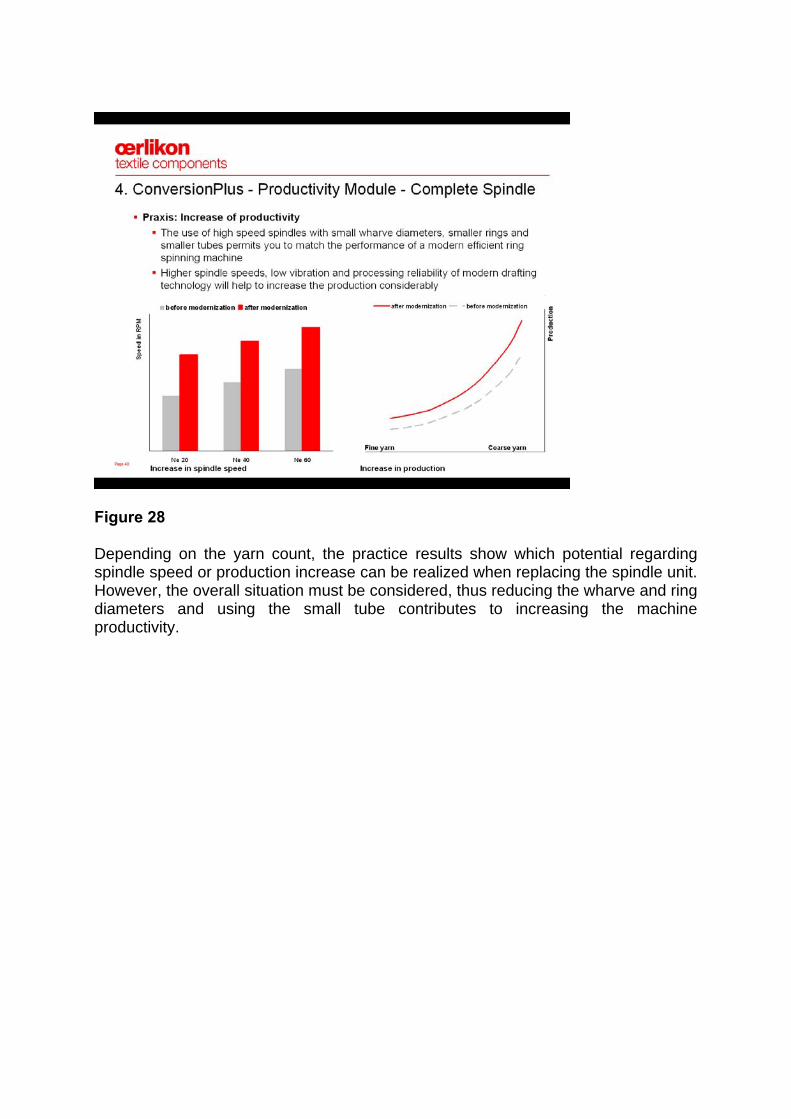
Figure 28 Depending on the yarn count, the practice results show which potential regarding spindle speed or production increase can be realized when replacing the spindle unit. However, the overall situation must be considered, thus reducing the wharve and ring diameters and using the small tube contributes to increasing the machine productivity.
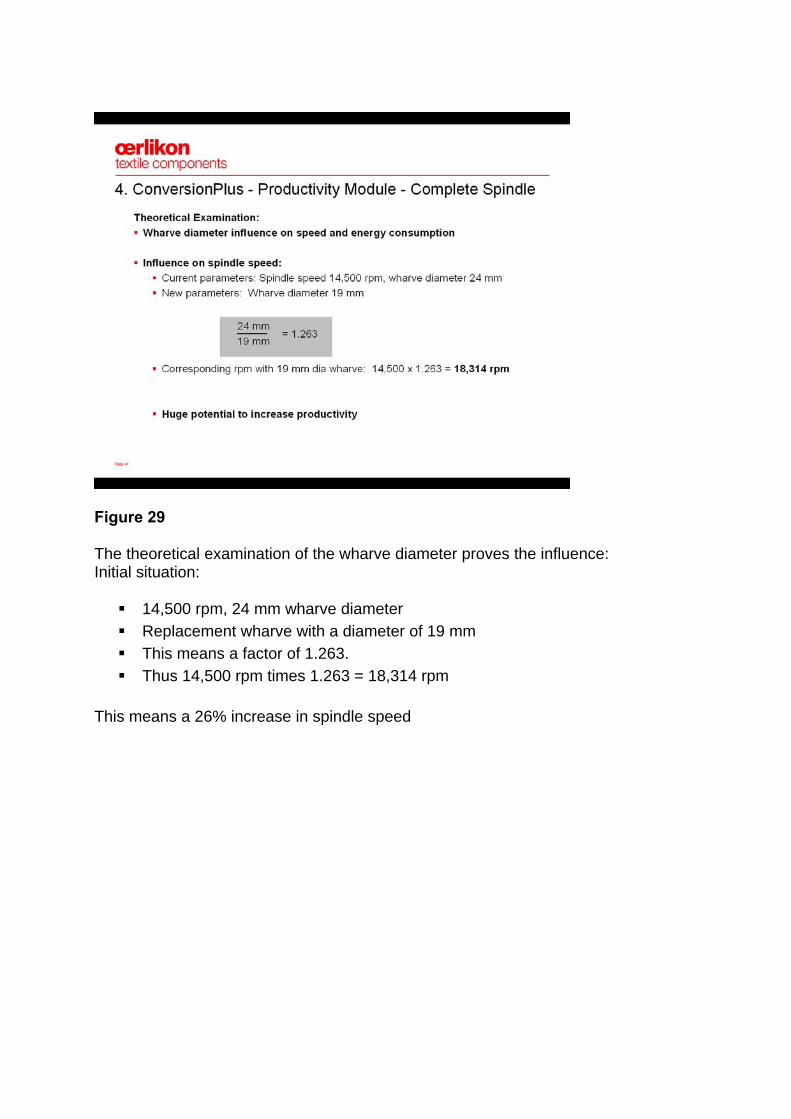
Figure 29 The theoretical examination of the wharve diameter proves the influence: Initial situation:
14,500 rpm, 24 mm wharve diameter Replacement wharve with a diameter of 19 mm This means a factor of 1.263. Thus 14,500 rpm times 1.263 = 18,314 rpm
This means a 26% increase in spindle speed
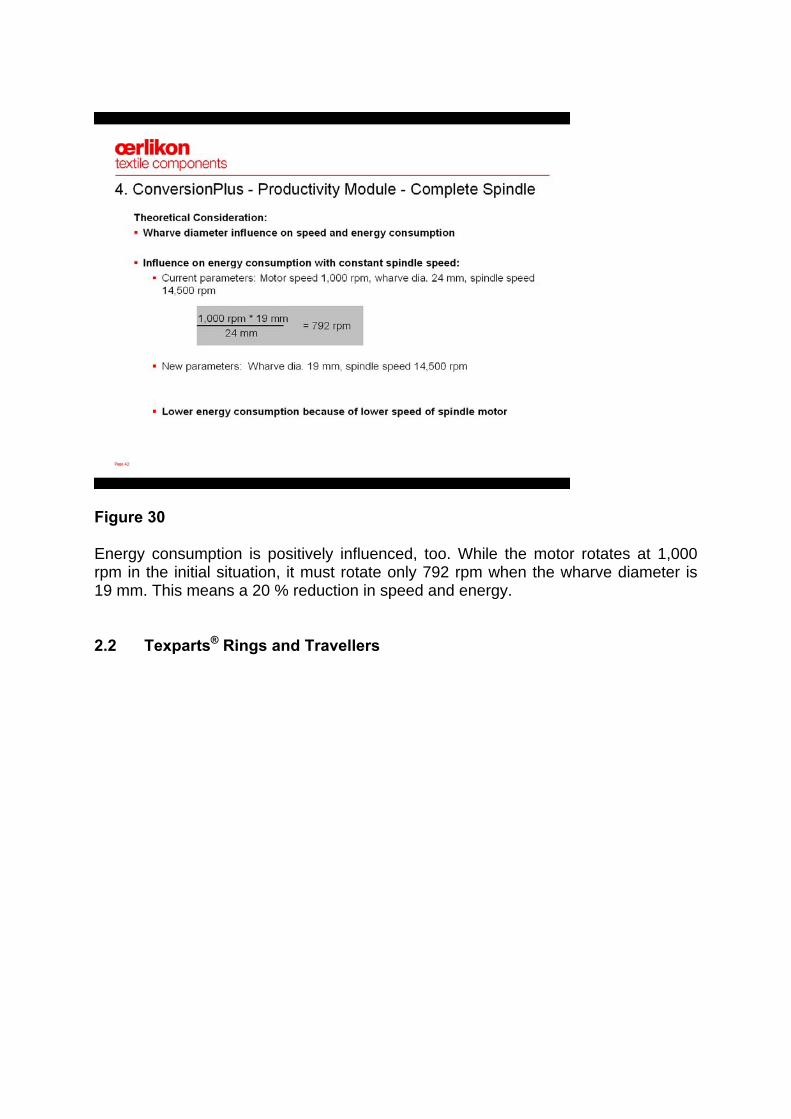
Figure 30 Energy consumption is positively influenced, too. While the motor rotates at 1,000 rpm in the initial situation, it must rotate only 792 rpm when the wharve diameter is 19 mm. This means a 20 % reduction in speed and energy. 2.2 Texparts® Rings and Travellers
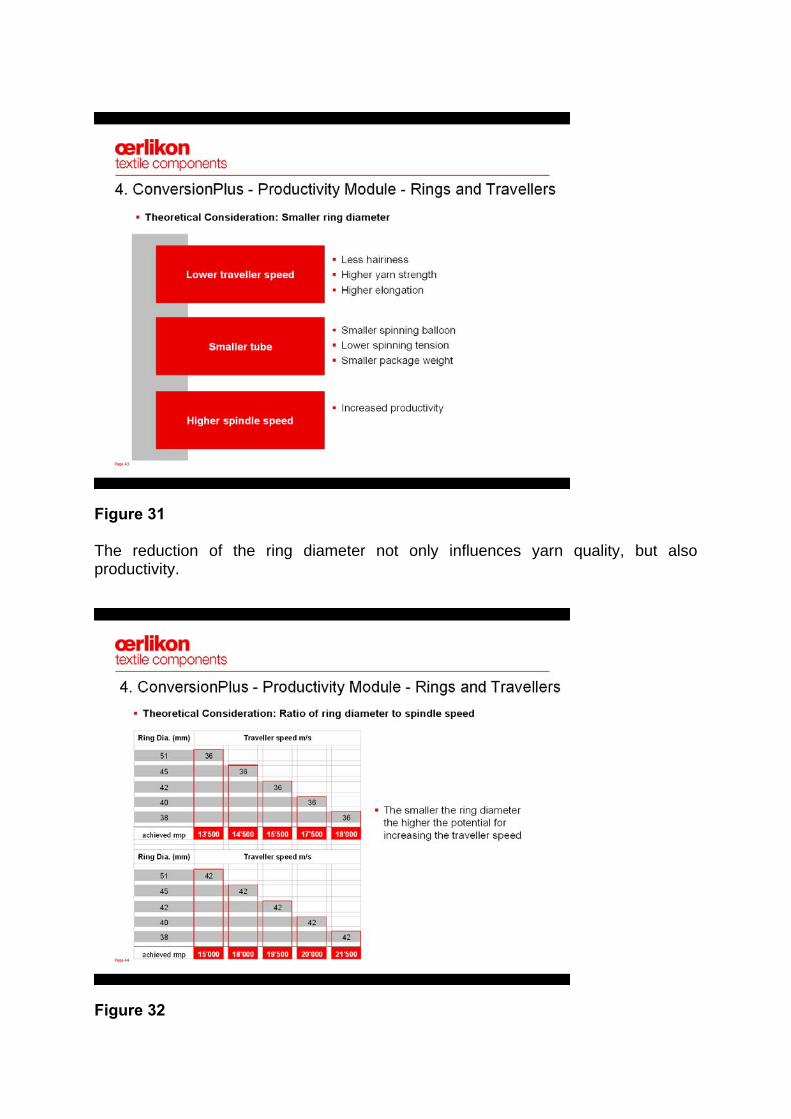
Figure 31 The reduction of the ring diameter not only influences yarn quality, but also productivity.
Figure 32
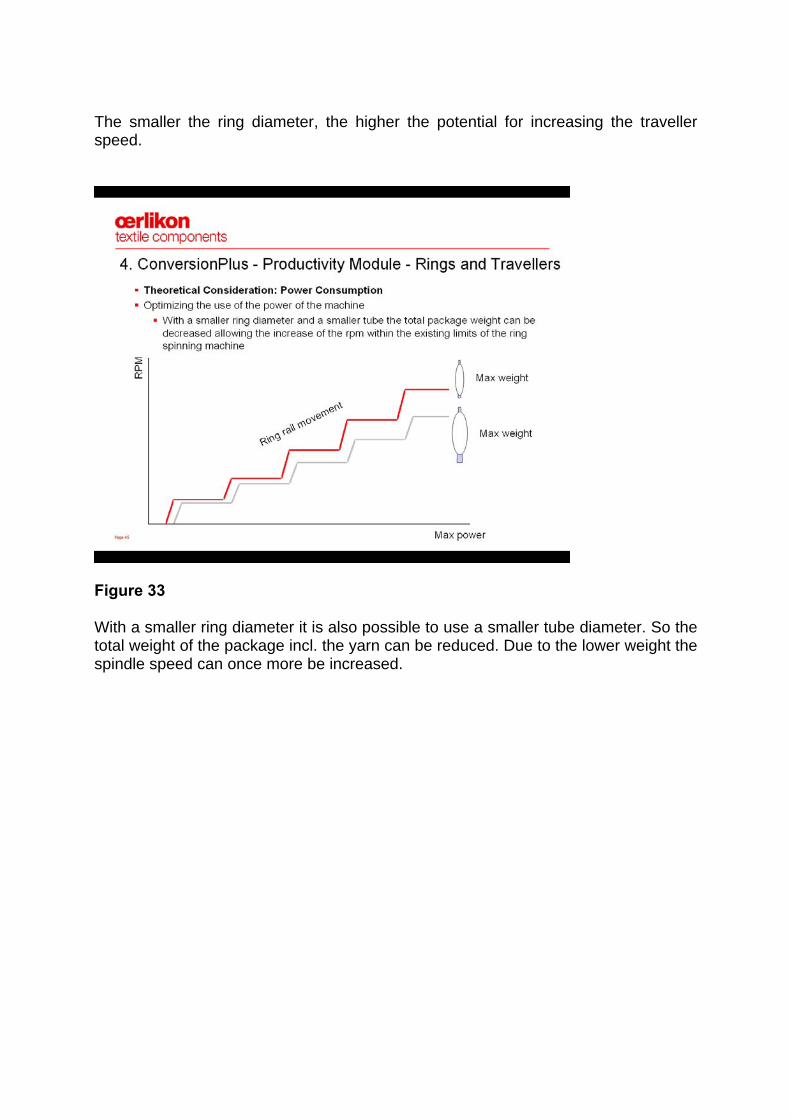
The smaller the ring diameter, the higher the potential for increasing the traveller speed.
Figure 33 With a smaller ring diameter it is also possible to use a smaller tube diameter. So the total weight of the package incl. the yarn can be reduced. Due to the lower weight the spindle speed can once more be increased.
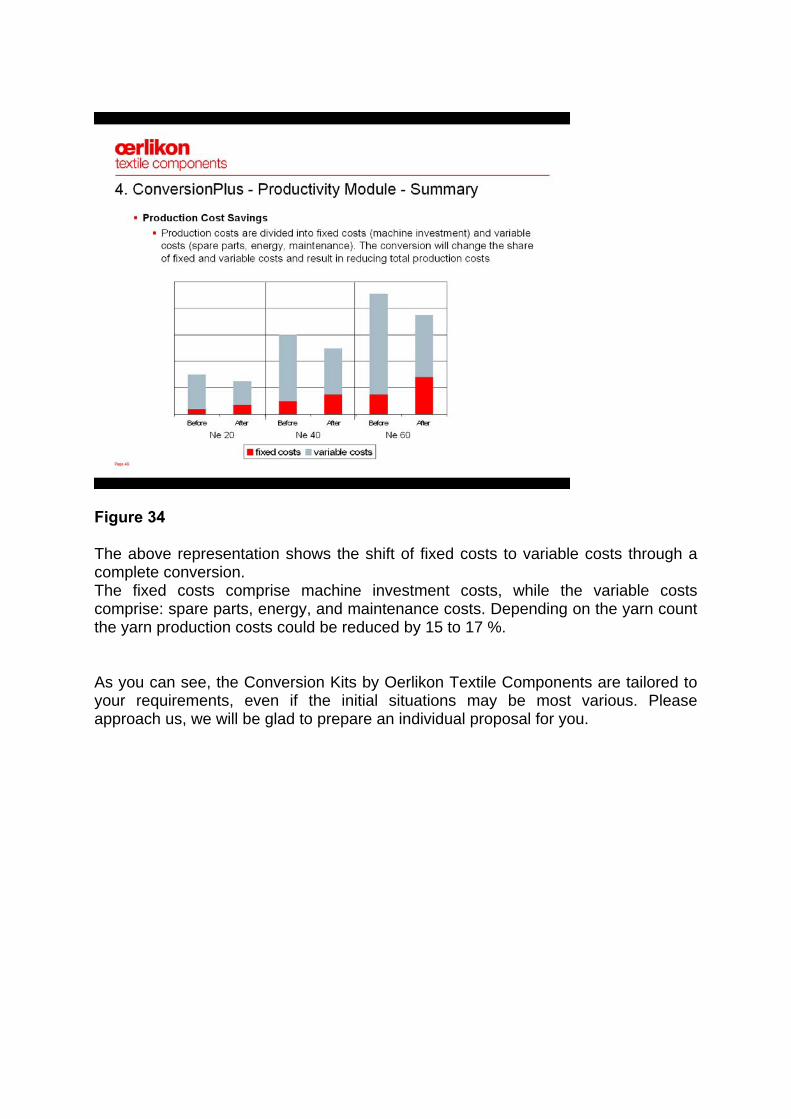
Figure 34 The above representation shows the shift of fixed costs to variable costs through a complete conversion. The fixed costs comprise machine investment costs, while the variable costs comprise: spare parts, energy, and maintenance costs. Depending on the yarn count the yarn production costs could be reduced by 15 to 17 %. As you can see, the Conversion Kits by Oerlikon Textile Components are tailored to your requirements, even if the initial situations may be most various. Please approach us, we will be glad to prepare an individual proposal for you.
OPTIMAL USE OF RESOURCES WITH COMPACT RINGSPINNING
B. Rusch Rieter Machines Works Ltd, Winterthur, Switzerland
With the recently developed Compacting Process ring yarn experienced a quality upgrading in the field of hairiness and dynamometric working performance. The technological superiority of “Compact Yarn” and the cost saving potential in the downstream processes as well as in the fabric are undisputed. However, emphasis in this paper is placed on the potential of optimising resources by varying objectives with the compact spinning process. Quality, production or raw material focused spinning objectives, are compared to conventional ring spinning. INTRODUCTION The Compacting Process was introduced to the ring spinning industry some 10 years ago, targeting primarily lower yarn hairiness and higher yarn tenacity and elongation. Two compacting systems dominate the world market – the Com4 system (Rieter Machine Works Ltd. Winterthur, Switzerland) and the “EliTe” system (Spindelfabrik Suessen GmbH, Suessen, Germany). Compact spinning was originally applied mainly for finer counts and for weaving yarns. In the meantime, application has been extended to coarser yarns and also yarns for knitted fabrics. In the table shown below, the spinning parameters and yarn properties resulting from practical experience are highlighted. SPINNING WITH CHANGING OBJECTIVES Many modern ring spinning plants operate conventional spinning and compact spinning side by side, thereby maintaining highest possible flexibility to cope with customer demands. The particular Indian mill selected for the comparison produces knit yarn, Ne 40, for hosiery – on both systems. We first compare the two processes with objectives for quality. Objectives for Quality and Production Although yarns from the conventional machines and the ones from the compact machines cannot be mixed in down stream processes, both yarns are sold as ring yarns without differentiation in the market, i.e. compact yarn is not being identified as such. The spinning data, qualities and the adaptations of parameters on the compact side are listed in Table 1. Spinning with the same spindle speed the reduction of the twist multiplier results in a 20.3% higher yarn production. The compacting process knowingly reduces the spinning triangle considerably, which contributes to a better running behaviour and lowers the end downs from 60 to 40 per 1000 spindle/h. Hence, the compact
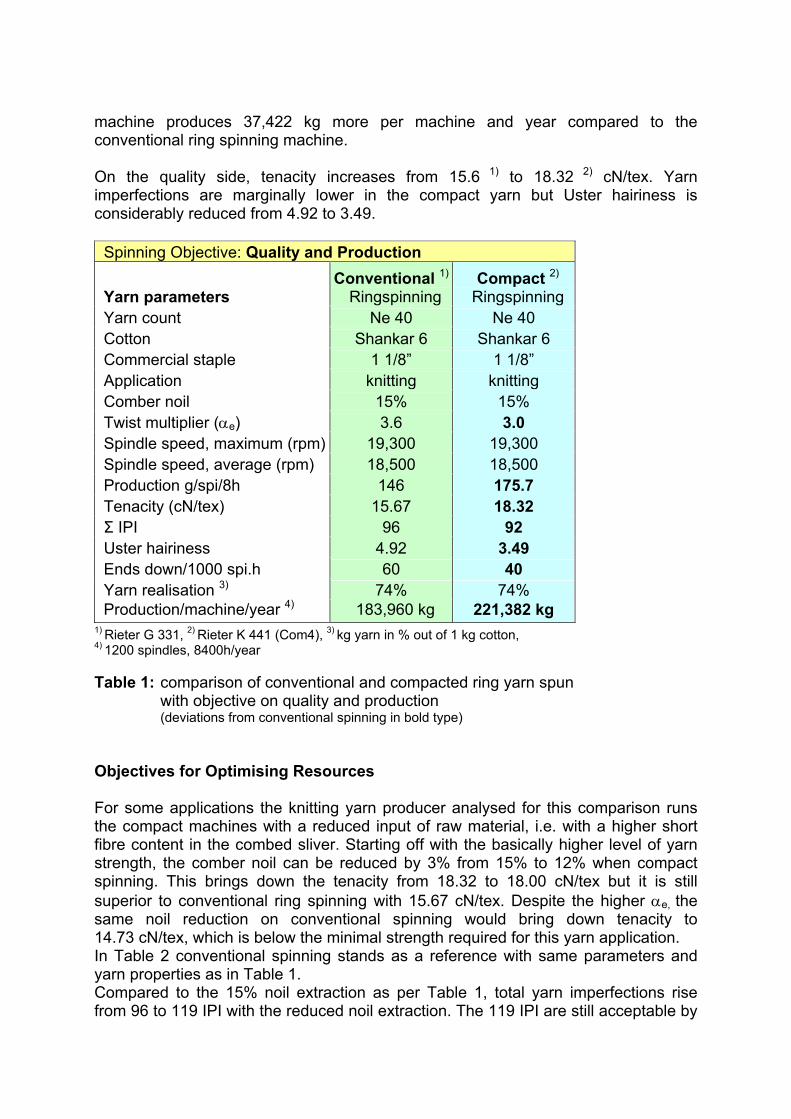
machine produces 37,422 kg more per machine and year compared to the conventional ring spinning machine. On the quality side, tenacity increases from 15.6 1) to 18.32 2) cN/tex. Yarn imperfections are marginally lower in the compact yarn but Uster hairiness is considerably reduced from 4.92 to 3.49.
Spinning Objective: Quality and Production
Yarn parameters Conventional 1)
Ringspinning Compact 2)
Ringspinning Yarn count Ne 40 Ne 40 Cotton Shankar 6 Shankar 6 Commercial staple 1 1/8” 1 1/8” Application knitting knitting Comber noil 15% 15% Twist multiplier (αe) 3.6 3.0 Spindle speed, maximum (rpm) 19,300 19,300 Spindle speed, average (rpm) 18,500 18,500 Production g/spi/8h 146 175.7 Tenacity (cN/tex) 15.67 18.32 Σ IPI 96 92 Uster hairiness 4.92 3.49 Ends down/1000 spi.h 60 40 Yarn realisation 3) 74% 74% Production/machine/year 4) 183,960 kg 221,382 kg
1) Rieter G 331, 2) Rieter K 441 (Com4), 3) kg yarn in % out of 1 kg cotton, 4) 1200 spindles, 8400h/year Table 1: comparison of conventional and compacted ring yarn spun with objective on quality and production
(deviations from conventional spinning in bold type) Objectives for Optimising Resources For some applications the knitting yarn producer analysed for this comparison runs the compact machines with a reduced input of raw material, i.e. with a higher short fibre content in the combed sliver. Starting off with the basically higher level of yarn strength, the comber noil can be reduced by 3% from 15% to 12% when compact spinning. This brings down the tenacity from 18.32 to 18.00 cN/tex but it is still superior to conventional ring spinning with 15.67 cN/tex. Despite the higher αe, the same noil reduction on conventional spinning would bring down tenacity to 14.73 cN/tex, which is below the minimal strength required for this yarn application. In Table 2 conventional spinning stands as a reference with same parameters and yarn properties as in Table 1. Compared to the 15% noil extraction as per Table 1, total yarn imperfections rise from 96 to 119 IPI with the reduced noil extraction. The 119 IPI are still acceptable by
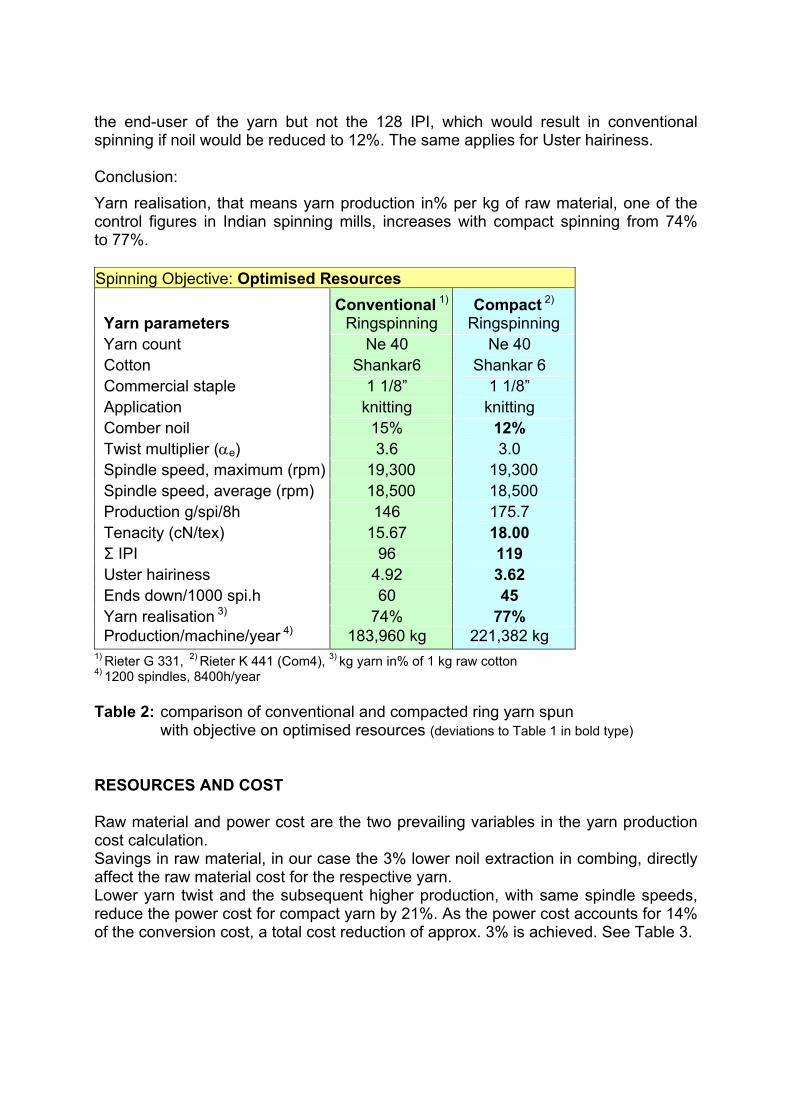
the end-user of the yarn but not the 128 IPI, which would result in conventional spinning if noil would be reduced to 12%. The same applies for Uster hairiness. Conclusion: Yarn realisation, that means yarn production in% per kg of raw material, one of the control figures in Indian spinning mills, increases with compact spinning from 74% to 77%. Spinning Objective: Optimised Resources
Yarn parameters Conventional 1)
Ringspinning Compact 2)
Ringspinning Yarn count Ne 40 Ne 40 Cotton Shankar6 Shankar 6 Commercial staple 1 1/8” 1 1/8” Application knitting knitting Comber noil 15% 12% Twist multiplier (αe) 3.6 3.0 Spindle speed, maximum (rpm) 19,300 19,300 Spindle speed, average (rpm) 18,500 18,500 Production g/spi/8h 146 175.7 Tenacity (cN/tex) 15.67 18.00 Σ IPI 96 119 Uster hairiness 4.92 3.62 Ends down/1000 spi.h 60 45 Yarn realisation 3) 74% 77% Production/machine/year 4) 183,960 kg 221,382 kg
1) Rieter G 331, 2) Rieter K 441 (Com4), 3) kg yarn in% of 1 kg raw cotton 4) 1200 spindles, 8400h/year Table 2: comparison of conventional and compacted ring yarn spun with objective on optimised resources (deviations to Table 1 in bold type) RESOURCES AND COST Raw material and power cost are the two prevailing variables in the yarn production cost calculation. Savings in raw material, in our case the 3% lower noil extraction in combing, directly affect the raw material cost for the respective yarn. Lower yarn twist and the subsequent higher production, with same spindle speeds, reduce the power cost for compact yarn by 21%. As the power cost accounts for 14% of the conversion cost, a total cost reduction of approx. 3% is achieved. See Table 3.
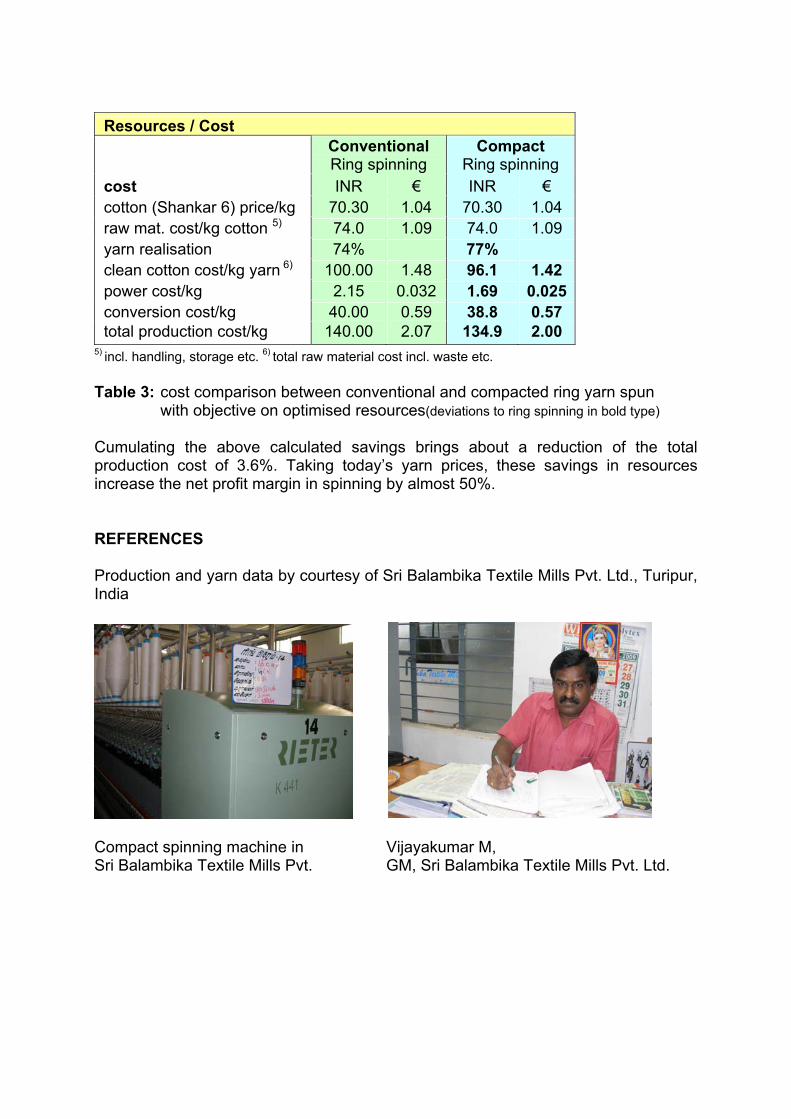
Resources / Cost
Conventional Ring spinning
Compact Ring spinning
cost INR € INR € cotton (Shankar 6) price/kg 70.30 1.04 70.30 1.04 raw mat. cost/kg cotton 5) 74.0 1.09 74.0 1.09 yarn realisation 74% 77% clean cotton cost/kg yarn 6) 100.00 1.48 96.1 1.42 power cost/kg 2.15 0.032 1.69 0.025 conversion cost/kg 40.00 0.59 38.8 0.57 total production cost/kg 140.00 2.07 134.9 2.00
5) incl. handling, storage etc. 6) total raw material cost incl. waste etc. Table 3: cost comparison between conventional and compacted ring yarn spun with objective on optimised resources(deviations to ring spinning in bold type) Cumulating the above calculated savings brings about a reduction of the total production cost of 3.6%. Taking today’s yarn prices, these savings in resources increase the net profit margin in spinning by almost 50%. REFERENCES Production and yarn data by courtesy of Sri Balambika Textile Mills Pvt. Ltd., Turipur, India
Compact spinning machine in Vijayakumar M, Sri Balambika Textile Mills Pvt. GM, Sri Balambika Textile Mills Pvt. Ltd.
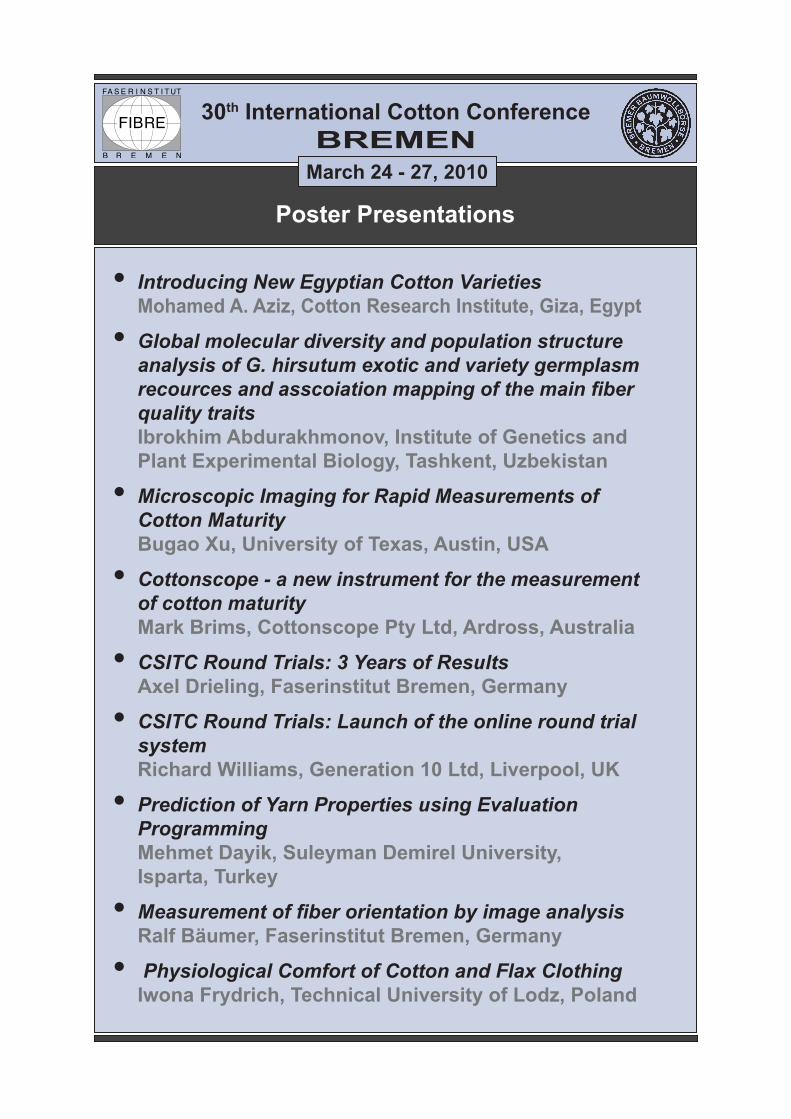
Poster Presentations
30th International Cotton Conference BREMEN
March 24 - 27, 2010
Introducing New Egyptian Cotton VarietiesMohamed A. Aziz, Cotton Research Institute, Giza, Egypt
Global molecular diversity and population structure analysis of G. hirsutum exotic and variety germplasm recources and asscoiation mapping of the main fiber quality traitsIbrokhim Abdurakhmonov, Institute of Genetics and Plant Experimental Biology, Tashkent, Uzbekistan
Microscopic Imaging for Rapid Measurements of Cotton MaturityBugao Xu, University of Texas, Austin, USA
Cottonscope - a new instrument for the measurement of cotton maturityMark Brims, Cottonscope Pty Ltd, Ardross, Australia
CSITC Round Trials: 3 Years of ResultsAxel Drieling, Faserinstitut Bremen, Germany
CSITC Round Trials: Launch of the online round trial systemRichard Williams, Generation 10 Ltd, Liverpool, UK
Prediction of Yarn Properties using Evaluation ProgrammingMehmet Dayik, Suleyman Demirel University, Isparta, Turkey
Measurement of fiber orientation by image analysisRalf Bäumer, Faserinstitut Bremen, Germany
Physiological Comfort of Cotton and Flax Clothing Iwona Frydrich, Technical University of Lodz, Poland
•
•
•
•
•
•
•
•
•
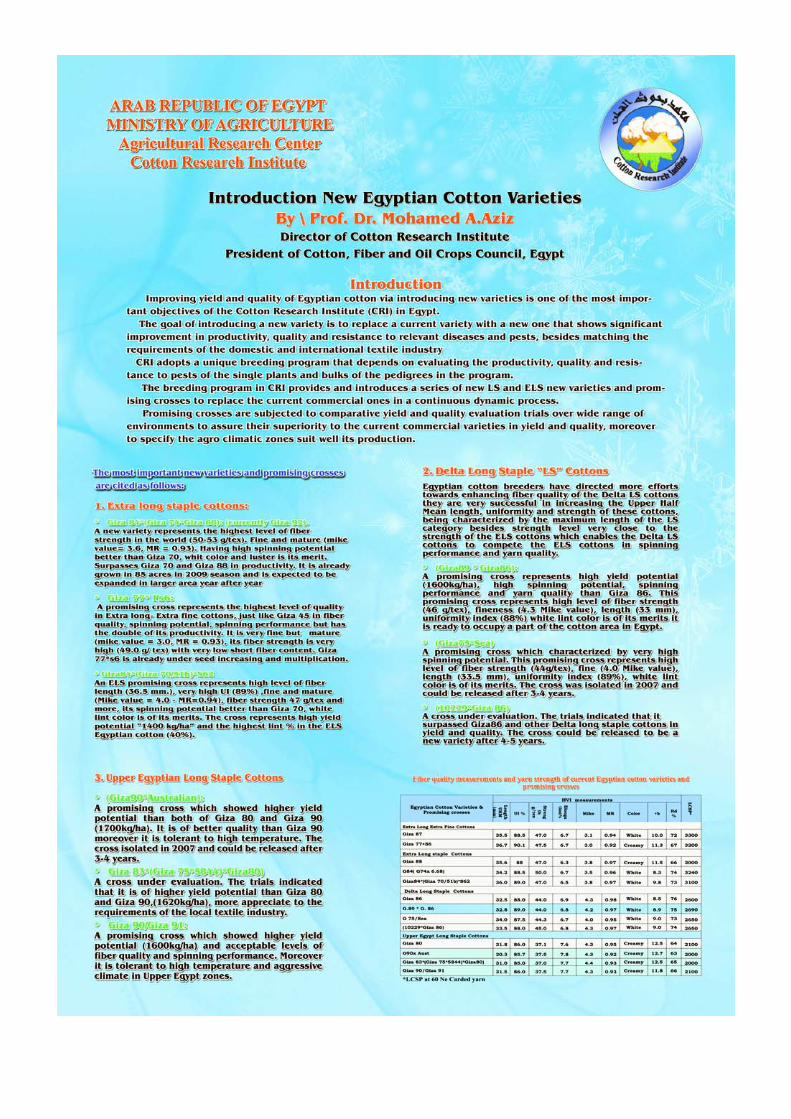
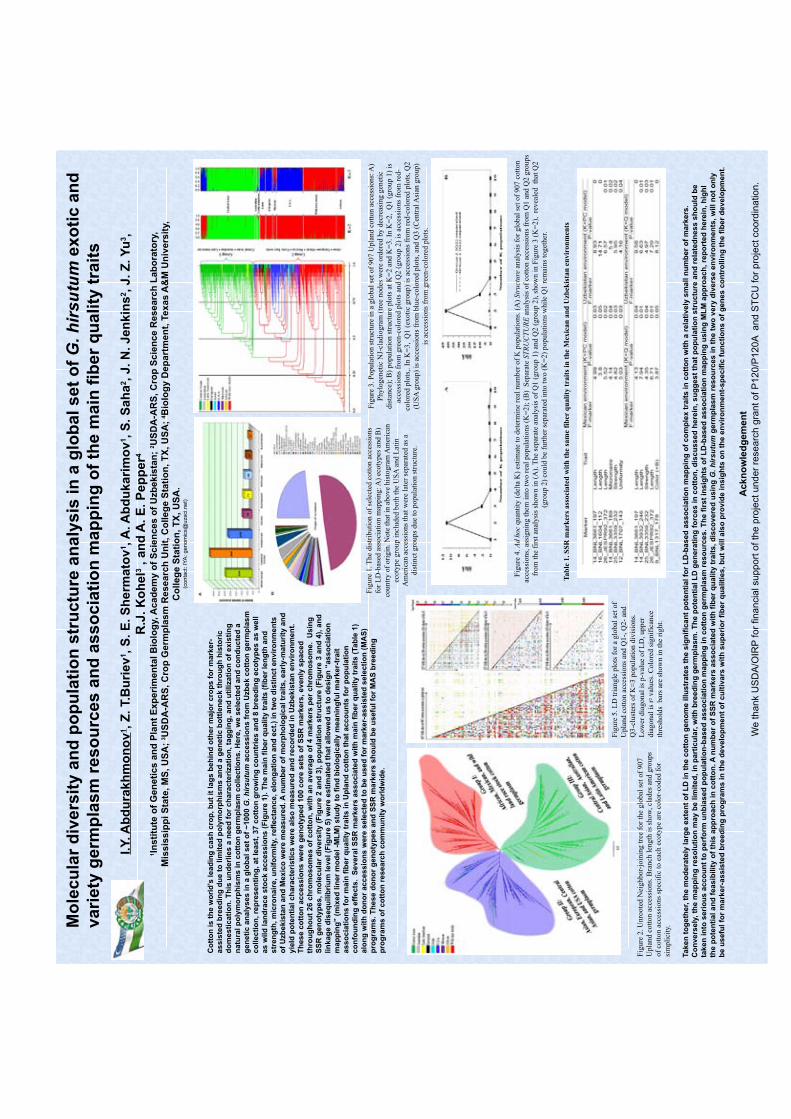
Ac
kn
ow
led
ge
me
nt
We
th
an
k U
SD
A/O
IRP
fo
r fin
an
cia
l su
pp
ort
of
the
pro
ject
un
de
r re
se
arc
h g
ran
t o
f P
12
0/P
12
0A
a
nd
ST
CU
fo
r p
roje
ct
co
ord
ina
tio
n.
Mo
lec
ula
r d
ive
rsit
y a
nd
po
pu
lati
on
str
uc
ture
an
aly
sis
in
a g
lob
al
se
t o
f G
. h
irs
utu
m e
xo
tic
an
d
va
rie
ty g
erm
pla
sm
re
so
urc
es
an
d a
ss
oc
iati
on
ma
pp
ing
of
the
ma
in f
ibe
r q
ua
lity
tra
its
I.Y. A
bd
ura
kh
mo
no
v1, Z
. T.B
uri
ev
1, S
. E
. S
herm
ato
v1, A
. A
bd
ukari
mo
v1, S
. S
ah
a2, J. N
. Jen
kin
s2, J. Z
. Y
u3,
R.J
. K
oh
el3
, a
nd
A. E
. P
ep
per4
1In
sti
tute
of
Gen
eti
cs a
nd
Pla
nt
Exp
eri
men
tal B
iolo
gy, A
cad
em
y o
f S
cie
nces o
f U
zb
ekis
tan
; 2U
SD
A-A
RS
, C
rop
Sc
ien
ce R
ese
arc
h L
ab
ora
tory
,
Mis
sis
sip
pi S
tate
, M
S, U
SA
; 3U
SD
A-A
RS
, C
rop
Germ
pla
sm
Researc
h U
nit
, C
olleg
e S
tati
on
, T
X, U
SA
; 4B
iolo
gy D
ep
art
men
t, T
ex
as A
&M
Un
ive
rsit
y,
Co
lleg
e S
tati
on
, T
X, U
SA
.(c
on
tact:
IY
A:
ge
no
mic
s@
uzsci.n
et)
Co
tto
n i
s t
he
wo
rld
’s l
ea
din
g c
as
h c
rop
, b
ut
it l
ag
s b
eh
ind
oth
er
ma
jor
cro
ps
fo
r m
ark
er-
as
sis
ted
bre
ed
ing
du
e t
o l
imit
ed
po
lym
orp
his
ms
an
d a
ge
ne
tic
bo
ttle
ne
ck
th
rou
gh
his
tori
c
do
me
sti
ca
tio
n.
Th
is u
nd
erl
ies
a n
ee
d f
or
ch
ara
cte
riza
tio
n, ta
gg
ing
, a
nd
uti
liza
tio
n o
f e
xis
tin
g
na
tura
l p
oly
mo
rph
ism
s i
n c
ott
on
ge
rmp
las
m c
oll
ec
tio
ns
. H
ere
, w
e s
ele
cte
d a
nd
co
nd
uc
ted
a
ge
ne
tic
an
aly
se
s i
n a
glo
ba
l s
et
of
~1
00
0 G
. h
irs
utu
m a
cc
es
sio
ns
fro
m U
zb
ek
co
tto
n g
erm
pla
sm
co
lle
cti
on
, re
pre
se
nti
ng
, a
t le
as
t, 3
7 c
ott
on
gro
win
g c
ou
ntr
ies
an
d 8
bre
ed
ing
ec
oty
pe
s a
s w
ell
as
wil
d l
an
dra
ce
sto
ck
ac
ce
ss
ion
s (
Fig
ure
1).
Th
e m
ain
fib
er
qu
ality
tra
its
(fi
be
r le
ng
th a
nd
str
en
gth
, m
icro
na
ire
, u
nif
orm
ity,
refl
ec
tan
ce
, e
lon
ga
tio
n a
nd
ec
t.)
in t
wo
dis
tin
ct
en
vir
on
me
nts
of
Uzb
ek
ista
n a
nd
Me
xic
o w
ere
me
as
ure
d. A
nu
mb
er
of
mo
rph
olo
gic
al
tra
its
, e
arl
y-m
atu
rity
an
d
yie
ld p
ote
nti
al
ch
ara
cte
ris
tic
s w
ere
als
o m
ea
su
red
an
d r
ec
ord
ed
in
Uzb
ek
ista
n e
nv
iro
nm
en
t.
Th
es
e c
ott
on
ac
ce
ss
ion
s w
ere
ge
no
typ
ed
10
0 c
ore
se
ts o
f S
SR
mark
ers
, e
ve
nly
sp
ac
ed
thro
ug
ho
ut
26
ch
rom
os
om
es
of
co
tto
n,
wit
h a
n a
ve
rag
e o
f 4
ma
rke
rs p
er
ch
rom
os
om
e.
Us
ing
SS
R g
en
oty
pe
s,
mo
lec
ula
r d
ive
rsit
y (
Fig
ure
2 a
nd
3),
po
pu
lati
on
str
uc
ture
(F
igu
re 3
an
d 4
), a
nd
lin
ka
ge
dis
eq
uil
ibri
um
le
ve
l (F
igu
re 5
) w
ere
es
tim
ate
d t
ha
t a
llo
we
d u
s t
o d
es
ign
“a
ss
oc
iati
on
ma
pp
ing
” (
mix
ed
lin
er
mo
de
l -M
LM
) s
tud
y t
o f
ind
bio
log
ica
lly
me
an
ing
ful
ma
rke
r-tr
ait
as
so
cia
tio
ns
fo
r m
ain
fib
er
qu
ality
tra
its
in
Up
lan
d c
ott
on
th
at
ac
co
un
ts f
or
po
pu
lati
on
co
nfo
un
din
g e
ffe
cts
. S
ev
era
l S
SR
ma
rke
rs a
ss
oc
iate
d w
ith
ma
in f
ibe
r q
ua
lity
tra
its
(Ta
ble
1)
alo
ng
wit
h d
on
or
ac
ce
ss
ion
s w
ere
se
lec
ted
to
be
us
ed
fo
r m
ark
er-
as
sis
ted
se
lec
tio
n (
MA
S)
pro
gra
ms
. T
he
se
do
no
r g
en
oty
pe
s a
nd
SS
R m
ark
ers
sh
ou
ld b
e u
se
ful
for
MA
S b
ree
din
g
pro
gra
ms
of
co
tto
n r
es
ea
rch
co
mm
un
ity
wo
rld
wid
e.
Fig
ure
1. T
he
dis
trib
uti
on o
f se
lect
ed c
ott
on a
cces
sions
for
LD
-bas
ed a
ssoci
atio
n m
appin
g: A
) ec
oty
pes
and B
)
countr
y o
f ori
gin
. N
ote
that
in a
bove
his
togra
m A
mer
ican
ecoty
pe
gro
up i
ncl
uded
both
the
US
A a
nd L
atin
Am
eric
an a
cces
sions
that
wer
e la
ter
separ
ated
as
a
dis
tinct
gro
ups
due
to p
opula
tion s
truct
ure
.
Fig
ure
2. U
nro
ote
d N
eighbo
r-jo
inin
g t
ree
for
the
glo
bal
set
of
907
Upla
nd c
ott
on a
cces
sions.
Bra
nch
len
gth
is
show
, cl
ades
and g
roups
of
cott
on a
cces
sions
spec
ific
to e
ach e
coty
pe
are
colo
r-co
ded
for
sim
pli
city
.
Fig
ure
3. P
opula
tion s
truct
ure
in a
glo
bal
set
of
907 U
pla
nd c
ott
on a
cces
sions:
A)
Phylo
gen
etic
NJ-
clad
iogra
m (
tree
nodes
wer
e ord
ered
by d
ecre
asin
g g
enet
ic
dis
tance
); B
) popula
tion s
truct
ure
plo
ts a
t K
=2 a
nd K
=3. In
K=
2, Q
1 (
gro
up 1
) is
acce
ssio
ns
from
gre
en-c
olo
red p
lots
and Q
2 (
gro
up 2
) is
acc
essi
ons
from
red
-
colo
red p
lots
,. I
n K
=3, Q
1 (
exoti
c gro
up)
is a
cces
sions
from
red
-colo
red p
lots
, Q
2
(US
A g
roup)
is a
cces
sions
from
blu
e-co
lore
d p
lots
, an
d Q
3 (
Cen
tral
Asi
an g
roup)
is a
cces
sions
from
gre
en-c
olo
red p
lots
.
Fig
ure
5. L
D t
rian
gle
plo
ts f
or
a glo
bal
set
of
Upla
nd c
ott
on a
cces
sions
and Q
1-,
Q2-
and
Q3-c
lust
ers
of
K=
3 p
opula
tion d
ivis
ions.
Lo
wer
dia
gonal
is
p-v
alue
of
LD
, upper
dia
gonal
is
r2 v
alues
. C
olo
red s
ignif
ican
ce
thre
shold
s b
ars
are
show
n i
n t
he
right.
Fig
ure
4.
Ad h
oc q
uan
tity
(del
ta K
) es
tim
ate
to d
eter
min
e re
al n
um
ber
of
K p
opula
tions.
(A
) Str
uctu
re a
nal
ysi
s fo
r glo
bal
set
of
907 c
ott
on
acce
ssio
ns,
ass
ignin
g t
hem
into
tw
o r
eal
popula
tions
(K=
2);
(B
) S
epar
ate
ST
RU
CT
UR
E a
nal
ysi
s of
cott
on a
cces
sions
fro
m Q
1 a
nd Q
2 g
roups
from
the
firs
t an
alysi
s sh
ow
n i
n (
A).
The
separ
ate
anal
ysi
s of
Q1 (
gro
up 1
) an
d Q
2 (
gro
up 2
), s
how
n i
n F
igure
3 (
K=
2),
re
vea
led th
at Q
2
(gro
up 2
) co
uld
be
furt
her
sep
arat
ed i
nto
tw
o (
K=
2)
popula
tions
whil
e Q
1 r
emai
ns
toget
her
.
Tab
le 1
. S
SR
mark
ers
ass
oci
ate
d w
ith
th
e sa
me
fib
er q
uali
ty t
rait
s in
th
e M
exic
an
an
d U
zbek
ista
n e
nvir
on
men
ts
Ta
ke
n t
og
eth
er,
th
e m
od
era
tely
la
rge
ex
ten
t o
f L
D i
n t
he
co
tto
n g
en
om
e ill
us
tra
tes
th
e s
ign
ific
an
t p
ote
nti
al
for
LD
-ba
se
d a
ss
oc
iati
on
ma
pp
ing
of
co
mp
lex
tra
its
in
co
tto
n w
ith
a r
ela
tiv
ely
sm
all
nu
mb
er
of
ma
rke
rs.
Co
nv
ers
ely
, th
e m
ap
pin
g r
es
olu
tio
n m
ay
be
lim
ite
d,
in p
art
icu
lar,
wit
h b
ree
din
g g
erm
pla
sm
. T
he
po
ten
tia
l L
D g
en
era
tin
g f
orc
es
in
co
tto
n,
dis
cu
ss
ed
he
rein
, s
ug
ge
st
tha
t p
op
ula
tio
n s
tru
ctu
re a
nd
re
late
dn
es
s s
ho
uld
be
tak
en
in
to s
eri
ou
s a
cc
ou
nt
to p
erf
orm
un
bia
se
d p
op
ula
tio
n-b
as
ed
as
so
cia
tio
n m
ap
pin
g i
n c
ott
on
ge
rmp
las
m r
es
ou
rce
s.
Th
e f
irs
t in
sig
hts
of
LD
-ba
se
d a
ss
oc
iati
on
ma
pp
ing
us
ing
ML
M a
pp
roa
ch
, re
po
rte
d h
ere
in,
hig
hl
ight
the
po
ten
tia
l a
nd
fe
as
ibil
ity
of
this
ap
pro
ac
h i
n c
ott
on
. A
nu
mb
er
of
SS
R m
ark
ers
as
so
cia
ted
wit
h f
ibe
r q
ua
lity
tra
its
, d
isc
ov
ere
d u
sin
g G
. h
irs
utu
m g
erm
pla
sm
re
so
urc
es
in
th
e t
wo
ve
ry d
ive
rse
en
vir
on
me
nts
, w
ill
no
t o
nly
be
us
efu
l fo
r m
ark
er-
as
sis
ted
bre
ed
ing
pro
gra
ms
in
th
e d
ev
elo
pm
en
t o
f c
ult
iva
rs w
ith
su
pe
rio
r fi
be
r q
ua
liti
es
, b
ut
wil
l a
lso
pro
vid
e i
ns
igh
ts o
n t
he
en
vir
on
me
nt-
sp
ec
ific
fu
nc
tio
ns
of
ge
ne
s c
on
tro
llin
g t
he
fib
er
de
ve
lop
me
nt.
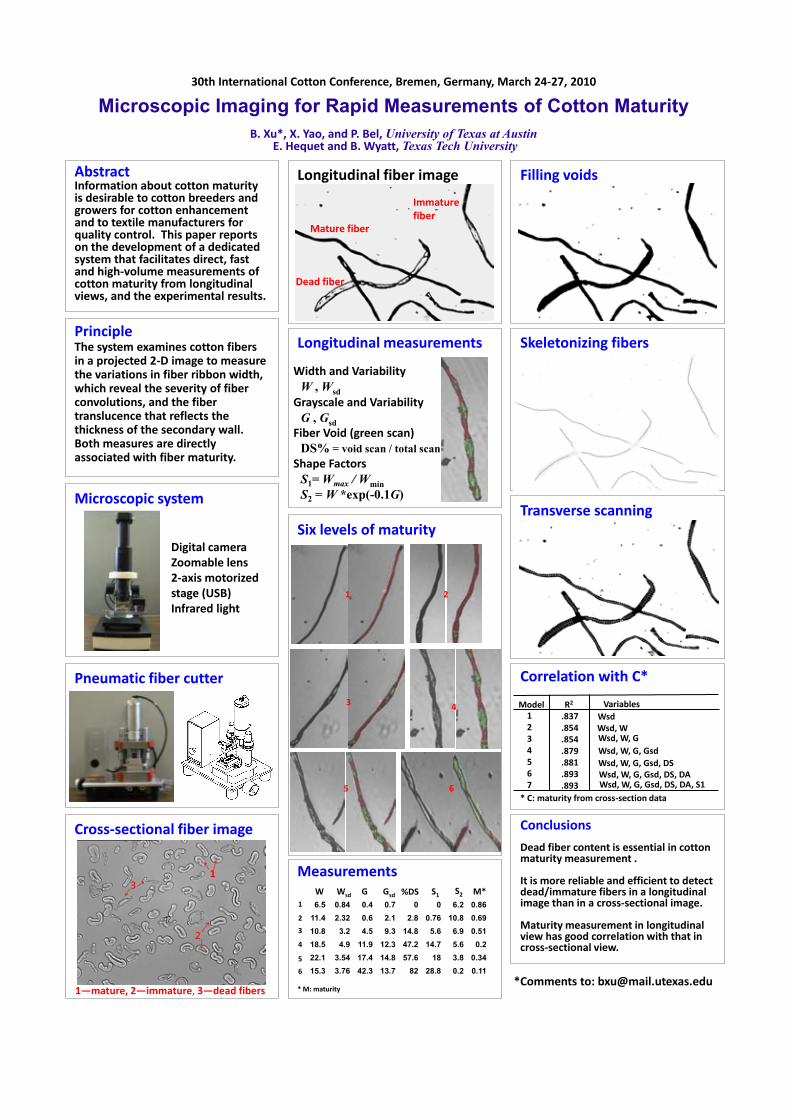
AbstractInformation about cotton maturity is desirable to cotton breeders and growers for cotton enhancement and to textile manufacturers for quality control. This paper reports on the development of a dedicated system that facilitates direct, fast and high-volume measurements of cotton maturity from longitudinal views, and the experimental results.
30th International Cotton Conference, Bremen, Germany, March 24-27, 2010
Microscopic Imaging for Rapid Measurements of Cotton MaturityB. Xu*, X. Yao, and P. Bel, University of Texas at Austin
E. Hequet and B. Wyatt, Texas Tech University
PrincipleThe system examines cotton fibers in a projected 2-D image to measure the variations in fiber ribbon width, which reveal the severity of fiber convolutions, and the fiber translucence that reflects the thickness of the secondary wall. Both measures are directly associated with fiber maturity.
Microscopic system
Digital camera Zoomable lens2-axis motorized stage (USB)Infrared light
Pneumatic fiber cutter
Cross-sectional fiber image
2
1—mature, 2—immature, 3—dead fibers
13
Longitudinal fiber image
Mature fiber
Dead fiber
Immature fiber
Longitudinal measurements
Width and VariabilityW , Wsd
Grayscale and VariabilityG , Gsd
Fiber Void (green scan)DS% = void scan / total scan
Shape FactorsS1= Wmax / WminS2 = W *exp(-0.1G)
Six levels of maturity
1 2
3 4
5 6
Measurements
* M: maturity
6.5 0.84 0.4 0.7 0 0 6.2 0.8611.4 2.32 0.6 2.1 2.8 0.76 10.8 0.6910.8 3.2 4.5 9.3 14.8 5.6 6.9 0.5118.5 4.9 11.9 12.3 47.2 14.7 5.6 0.222.1 3.54 17.4 14.8 57.6 18 3.8 0.3415.3 3.76 42.3 13.7 82 28.8 0.2 0.11
W Wsd G Gsd %DS M*S1 S2
1
2
3
4
5
6
Filling voids
Skeletonizing fibers
Transverse scanning
Correlation with C*
* C: maturity from cross-section data
.837
.854
.854
.879
.881
.893
.893
Model1234567
R2
WsdWsd, WWsd, W, GWsd, W, G, GsdWsd, W, G, Gsd, DSWsd, W, G, Gsd, DS, DAWsd, W, G, Gsd, DS, DA, S1
Variables
Conclusions
Dead fiber content is essential in cotton maturity measurement .
It is more reliable and efficient to detect dead/immature fibers in a longitudinal image than in a cross-sectional image.
Maturity measurement in longitudinal view has good correlation with that in cross-sectional view.
*Comments to: [email protected]
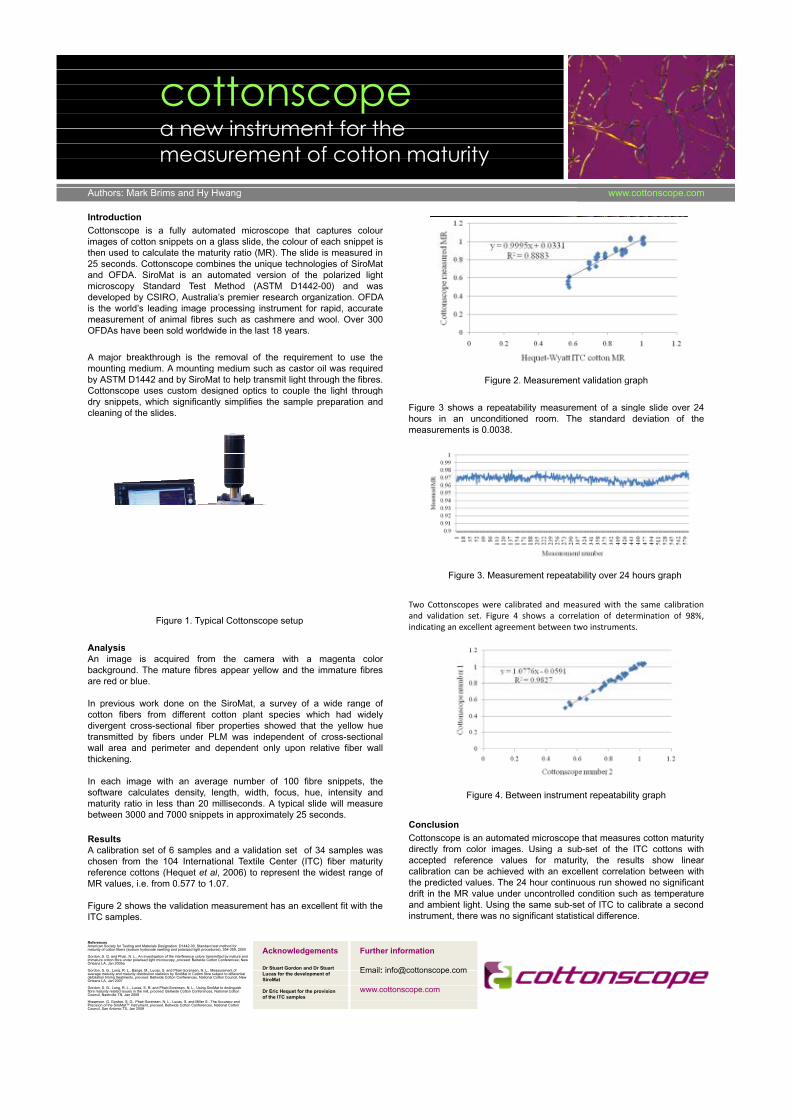
Two Cottonscopes were calibrated using the same slides from the subset. A different set of slides from the subset was then measured on both instruments.
The correlation coefficient r^2 is 98%, indicating an excellent agreement between the 2 instruments.
Two Cottonscopes were calibrated using the same slides from the subset. A different set of slides from the subset was then measured on both instruments.
The correlation coefficient r^2 is 98%, indicating an excellent agreement between the 2 instruments.
cottonscopecottonscopecottonscopea new instrument for the a new instrument for the measurement of cotton maturitymeasurement of cotton maturity
Authors: Mark Brims and Hy Hwang www.cottonscope.com
IntroductionIntroductionCottonscope is a fully automated microscope that captures colourCottonscope is a fully automated microscope that captures colourimages of cotton snippets on a glass slide, the colour of each snippet isthen used to calculate the maturity ratio (MR). The slide is measured in25 d C tt bi th i t h l i f Si M t25 seconds. Cottonscope combines the unique technologies of SiroMatand OFDA SiroMat is an automated version of the polarized lightand OFDA. SiroMat is an automated version of the polarized lightmicroscopy Standard Test Method (ASTM D1442-00) and wasdeveloped by CSIRO, Australia’s premier research organization. OFDAi th ld’ l di i i i t t f id tis the world’s leading image processing instrument for rapid, accuratemeasurement of animal fibres such as cashmere and wool Over 300measurement of animal fibres such as cashmere and wool. Over 300OFDAs have been sold worldwide in the last 18 years.y
A major breakthrough is the removal of the requirement to use theti di A ti di h t il i dmounting medium. A mounting medium such as castor oil was required
by ASTM D1442 and by SiroMat to help transmit light through the fibres Figure 2 Measurement validation graphby ASTM D1442 and by SiroMat to help transmit light through the fibres.Cottonscope uses custom designed optics to couple the light through
Figure 2. Measurement validation graphp g p p g g
dry snippets, which significantly simplifies the sample preparation andl i f h lid Figure 3 shows a repeatability measurement of a single slide over 24cleaning of the slides. Figure 3 shows a repeatability measurement of a single slide over 24
hours in an unconditioned room. The standard deviation of themeasurements is 0.0038.
Fi 3 M bili 24 h hFigure 3. Measurement repeatability over 24 hours graph
l b d d d h h l bTwo Cottonscopes were calibrated and measured with the same calibrationand validation set Figure 4 shows a correlation of determination of 98%and validation set. Figure 4 shows a correlation of determination of 98%,indicating an excellent agreement between two instruments.
Figure 1. Typical Cottonscope setup
A l i
g g
AnalysisAn image is acquired from the camera with a magenta colorAn image is acquired from the camera with a magenta colorbackground. The mature fibres appear yellow and the immature fibresare red or blue.
In previous work done on the SiroMat a survey of a wide range ofIn previous work done on the SiroMat, a survey of a wide range ofcotton fibers from different cotton plant species which had widelydivergent cross-sectional fiber properties showed that the yellow huet itt d b fib d PLM i d d t f ti ltransmitted by fibers under PLM was independent of cross-sectionalwall area and perimeter and dependent only upon relative fiber wallwall area and perimeter and dependent only upon relative fiber wallthickening.g
I h i ith b f 100 fib i t thIn each image with an average number of 100 fibre snippets, thesoftware calculates density length width focus hue intensity and Figure 4 Between instrument repeatability graphsoftware calculates density, length, width, focus, hue, intensity andmaturity ratio in less than 20 milliseconds. A typical slide will measure
Figure 4. Between instrument repeatability graph
Conclusion
y ypbetween 3000 and 7000 snippets in approximately 25 seconds.
ConclusionCottonscope is an automated microscope that measures cotton maturityResults Cottonscope is an automated microscope that measures cotton maturitydirectly from color images. Using a sub-set of the ITC cottons with
ResultsA calibration set of 6 samples and a validation set of 34 samples was y g g
accepted reference values for maturity, the results show linearA calibration set of 6 samples and a validation set of 34 samples waschosen from the 104 International Textile Center (ITC) fiber maturity
calibration can be achieved with an excellent correlation between withthe predicted values The 24 hour continuous run showed no significant
reference cottons (Hequet et al, 2006) to represent the widest range ofMR values i e from 0 577 to 1 07 the predicted values. The 24 hour continuous run showed no significant
drift in the MR value under uncontrolled condition such as temperatureMR values, i.e. from 0.577 to 1.07.
pand ambient light. Using the same sub-set of ITC to calibrate a secondFigure 2 shows the validation measurement has an excellent fit with theinstrument, there was no significant statistical difference.ITC samples.
R fReferencesAmerican Society for Testing and Materials Designation: D1442-00, Standard test method for maturity of cotton fibers (sodium hydroxide swelling and polarized light procedures), 354-359, 2000
Gordon S G and Phair N L An investigation of the interference colors transmitted by mature andAcknowledgements Further information
Gordon, S. G. and Phair, N. L., An investigation of the interference colors transmitted by mature and immature cotton fibre under polarised light microscopy, proceed. Beltwide Cotton Conferences; New Orleans LA, Jan 2005a
Gordon S G Long R L Bange M Lucas S and Phair-Sorensen N L Measurement of Dr Stuart Gordon and Dr Stuart Email: info@cottonscope comGordon, S. G., Long, R. L., Bange, M., Lucas, S. and Phair-Sorensen, N. L., Measurement of average maturity and maturity distribution statistics by SiroMat in Cotton fibre subject to differential defoliation timing treatments, proceed. Beltwide Cotton Conferences, National Cotton Council, New Orleans LA, Jan 2007
Lucas for the development of SiroMat
Email: [email protected]
Gordon, S. G., Long, R. L., Lucas, S. R. and Phair-Sorensen, N. L., Using SiroMat to distinguish fibre maturity related issues in the mill, proceed. Beltwide Cotton Conferences, National Cotton Council, Nashville TN, Jan 2008
Dr Eric Hequet for the provision of the ITC samples
www.cottonscope.comHiggerson, G, Gordon, S. G., Phair-Sorensen, N. L., Lucas, S. and Miller S., The Accuracy and Precision of the SiroMat™ Instrument, proceed. Beltwide Cotton Conferences, National Cotton Council, San Antonio TX, Jan 2009
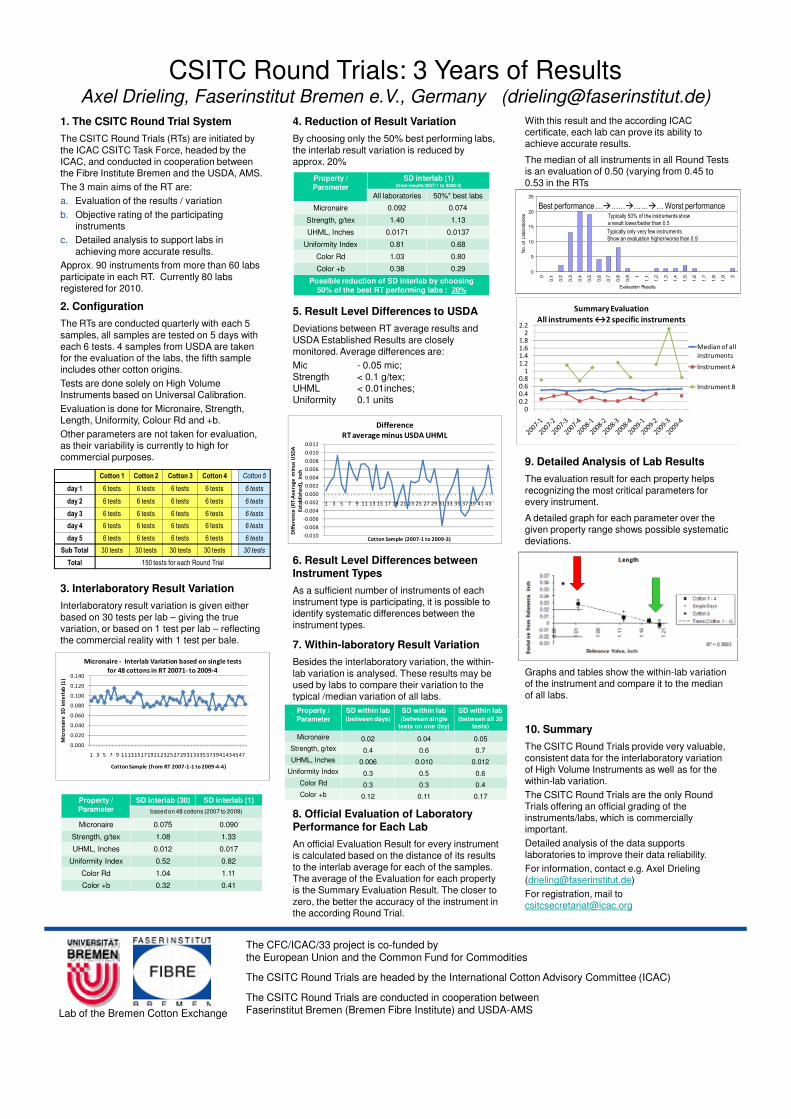
CSITC Round Trials: 3 Years of ResultsAxel Drieling, Faserinstitut Bremen e.V., Germany ([email protected])
1. The CSITC Round Trial System
The CSITC Round Trials (RTs) are initiated by
the ICAC CSITC Task Force, headed by the ICAC, and conducted in cooperation between the Fibre Institute Bremen and the USDA, AMS.
The 3 main aims of the RT are:
a. Evaluation of the results / variation
b. Objective rating of the participating instruments
c. Detailed analysis to support labs in
achieving more accurate results.
Approx. 90 instruments from more than 60 labs
participate in each RT. Currently 80 labs registered for 2010.
4. Reduction of Result Variation
By choosing only the 50% best performing labs,
the interlab result variation is reduced by approx. 20%
With this result and the according ICAC certificate, each lab can prove its ability to achieve accurate results.
The median of all instruments in all Round Tests is an evaluation of 0.50 (varying from 0.45 to
0.53 in the RTs
2. Configuration
The RTs are conducted quarterly with each 5
samples, all samples are tested on 5 days with each 6 tests. 4 samples from USDA are taken for the evaluation of the labs, the fifth sample includes other cotton origins.
5. Result Level Differences to USDA
Deviations between RT average results and
USDA Established Results are closely monitored. Average differences are:
Mic - 0.05 mic;
0
5
10
15
20
25
0
0,1
0,2
0,3
0,4
0,5
0,6
0,7
0,8
0,9 1
1,1
1,2
1,3
1,4
1,5
1,6
1,7
1,8
1,9 2
Evaluation Results
No.
of
Labora
tori
es
11.21.41.61.8
22.2
Summary EvaluationAll instruments ↔2 specific instruments
Median of all instruments
Instrument A
Property /
Parameter
SD interlab (1)(from results 2007-1 to 2008-2)
All laboratories 50%* best labs
Micronaire 0.092 0.074
Strength, g/tex 1.40 1.13
UHML, Inches 0.0171 0.0137
Uniformity Index 0.81 0.68
Color Rd 1.03 0.80
Color +b 0.38 0.29
Possible reduction of SD interlab by choosing
50% of the best RT performing labs : 20%
includes other cotton origins.
Tests are done solely on High Volume Instruments based on Universal Calibration.
Evaluation is done for Micronaire, Strength, Length, Uniformity, Colour Rd and +b.
Other parameters are not taken for evaluation, as their variability is currently to high for commercial purposes.
3. Interlaboratory Result Variation
Interlaboratory result variation is given either
based on 30 tests per lab – giving the true variation, or based on 1 test per lab – reflecting the commercial reality with 1 test per bale.
0.100
0.120
0.140
Mic
rona
ire
SD in
terl
ab (1
)
Micronaire - Interlab Variation based on single testsfor 48 cottons in RT 20071- to 2009-4
Mic - 0.05 mic;
Strength < 0.1 g/tex; UHML < 0.01inches; Uniformity 0.1 units
-0.010-0.008
-0.006-0.004
-0.0020.000
0.0020.004
0.0060.008
0.010
0.012
1 3 5 7 9 11 13 15 17 19 21 23 25 27 29 31 33 35 37 39 41 43
Diff
eren
ce (R
T-A
vera
ge m
inus
USD
A
Esta
blis
hed)
, in
ch
Cotton Sample (2007-1 to 2009-3)
Difference RT average minus USDA UHML
6. Result Level Differences between
Instrument Types
As a sufficient number of instruments of each instrument type is participating, it is possible to
identify systematic differences between the instrument types.
7. Within-laboratory Result Variation
Besides the interlaboratory variation, the within-
lab variation is analysed. These results may be used by labs to compare their variation to the typical /median variation of all labs.
00.20.40.60.8
11.2 Instrument A
Instrument B
9. Detailed Analysis of Lab Results
The evaluation result for each property helps
recognizing the most critical parameters for every instrument.
A detailed graph for each parameter over the given property range shows possible systematic deviations.
Graphs and tables show the within-lab variation of the instrument and compare it to the median of all labs.
Lab of the Bremen Cotton Exchange
The CFC/ICAC/33 project is co-funded bythe European Union and the Common Fund for Commodities
The CSITC Round Trials are headed by the International Cotton Advisory Committee (ICAC)
The CSITC Round Trials are conducted in cooperation betweenFaserinstitut Bremen (Bremen Fibre Institute) and USDA-AMS
0.000
0.020
0.040
0.060
0.080
0.100
1 3 5 7 9 11131517192123252729313335373941434547
Mic
rona
ire
SD in
terl
ab (1
)
Cotton Sample (from RT 2007-1-1 to 2009-4-4)
typical /median variation of all labs.
10. Summary
The CSITC Round Trials provide very valuable,
consistent data for the interlaboratory variation of High Volume Instruments as well as for the within-lab variation.
The CSITC Round Trials are the only Round Trials offering an official grading of the instruments/labs, which is commercially important.
Detailed analysis of the data supports laboratories to improve their data reliability.
For information, contact e.g. Axel Drieling ([email protected])
For registration, mail to [email protected]
8. Official Evaluation of Laboratory Performance for Each Lab
An official Evaluation Result for every instrument is calculated based on the distance of its results
to the interlab average for each of the samples. The average of the Evaluation for each property is the Summary Evaluation Result. The closer to
zero, the better the accuracy of the instrument in the according Round Trial.
of all labs.
Property /
Parameter
SD within lab(between days)
SD within lab(between single
tests on one day)
SD within lab(between all 30
tests)
Micronaire 0.02 0.04 0.05
Strength, g/tex 0.4 0.6 0.7
UHML, Inches 0.006 0.010 0.012
Uniformity Index 0.3 0.5 0.6
Color Rd 0.3 0.3 0.4
Color +b 0.12 0.11 0.17Property /
Parameter
SD interlab (30) SD interlab (1)
based on 48 cottons (2007 to 2009)
Micronaire 0.075 0.090
Strength, g/tex 1.08 1.33
UHML, Inches 0.012 0.017
Uniformity Index 0.52 0.82
Color Rd 1.04 1.11
Color +b 0.32 0.41

Richard Williamson, CEO, Generation 10 email: [email protected] telephone +44 151 709 0005
Newfor2010online
The CFC/ICAC/33 project is co-funded by the European Union and the Common Fund for Commodities
International CottonAdvisory Committee
Submit Your Round Trial Data OnlineUpload data files straight from your Test Instrument - save time and reduce mistakes.
Historical TrendsWith all Round Trial information from 2007 onwards, you can easily track your performance over time.
Powerful Data AnalysisCompare your Evaluation performance with the other trial participants and create your own reports.
Easy To Use, Nothing To InstallUse any of the major web browsers, from any location, to gain secure access to your data.
www.generation10.net
Combine the benefits of the CSITC Round Trials with the power of the internet to boost confidence
in your Cotton Testing Services and Quality Assurance.
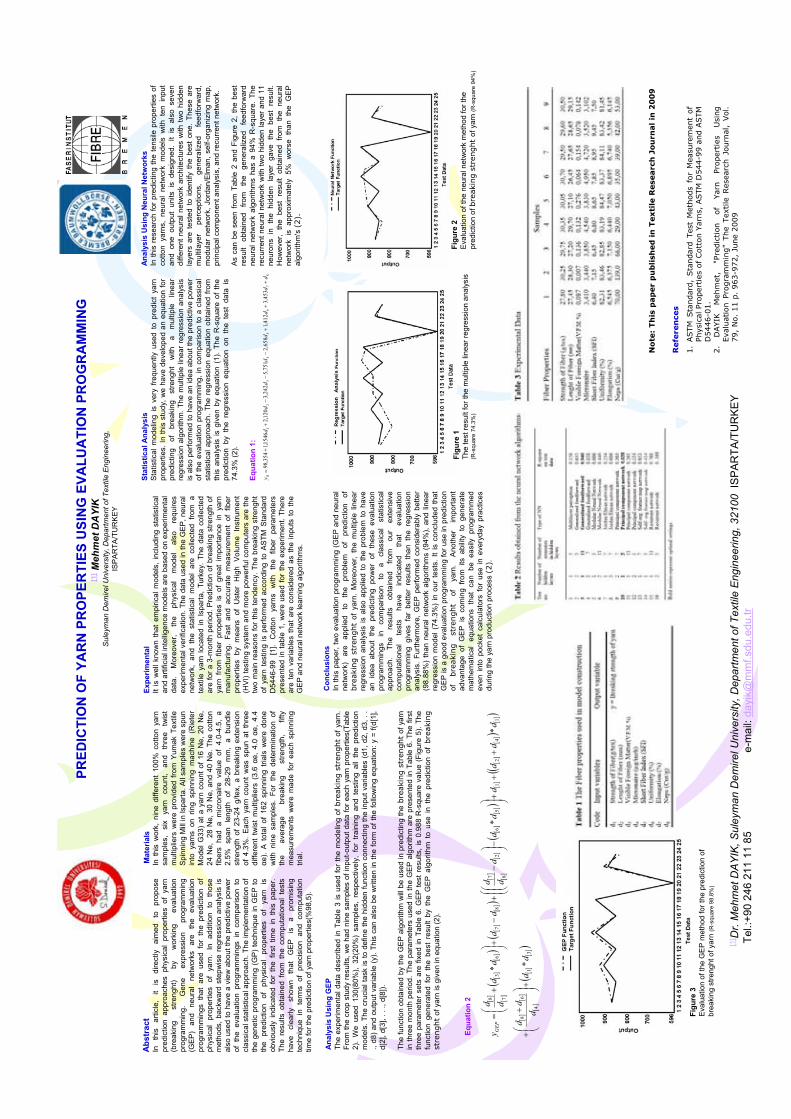
PRED
ICTI
ON
OF
YAR
N P
RO
PER
TIES
USI
NG
EVA
LUA
TIO
N P
RO
GR
AM
MIN
G[1
]M
ehm
etD
AYI
K
Sul
eym
an D
emire
l Uni
vers
ity, D
epar
tmen
t of T
extil
e E
ngin
eerin
g,IS
PA
RTA
/TU
RK
EY
[1] D
r. M
ehm
et D
AY
IK,S
uley
man
Dem
irel U
nive
rsity
, Dep
artm
ent o
f Tex
tile
Eng
inee
ring,
321
00 I
SP
AR
TA/T
UR
KE
Y
Tel.:
+90
246
211
11 8
5
e-m
ail:
dayi
k@m
mf.s
du.e
du.tr
Abs
trac
tIn
th
is
artic
le,
it is
di
rect
ly
aim
ed
to
prop
ose
pred
ictio
n ap
proa
ches
phy
sica
l pr
oper
ties
of y
arn
(bre
akin
gst
reng
ht)
by
wor
king
ev
alua
tion
prog
ram
min
g.
Gen
e ex
pres
sion
pr
ogra
mm
ing
(GE
P)
and
neur
al
netw
orks
ar
e th
e ev
alua
tion
prog
ram
min
gs t
hat
are
used
for
the
pre
dict
ion
of
phys
ical
pro
perti
es o
f ya
rn.
In a
dditi
on t
o th
ose
met
hods
, bac
kwar
d st
epw
ise
regr
essi
on a
naly
sis
is
also
use
d to
hav
e a
view
abo
ut th
e pr
edic
tive
pow
er
of t
he e
valu
atio
n pr
ogra
mm
ings
in
com
paris
on t
o cl
assi
cal s
tatis
tical
app
roac
h. T
he im
plem
enta
tion
of
the
gene
tic p
rogr
amm
ing
(GP
) te
chni
que
in G
EP
to
the
pred
ictio
n of
ph
ysic
al
prop
ertie
s of
ya
rn
is
obvi
ousl
y in
dica
ted
for
the
first
tim
e in
thi
s pa
per.
The
resu
lts o
btai
ned
from
the
com
puta
tiona
l te
sts
have
cl
early
sh
own
that
G
EP
is
a
prom
isin
g te
chni
que
in t
erm
s of
pre
cisi
on a
nd c
ompu
tatio
n tim
e fo
r the
pre
dict
ion
of y
arn
prop
ertie
s(%
98,5
).
Mat
eria
lsIn
thi
s w
ork,
nin
e di
ffere
nt 1
00%
cot
ton
yarn
sa
mpl
es,
six
yarn
co
unt,
and
thre
e tw
ist
mul
tiplie
rs w
ere
prov
ided
fro
m Y
umak
Tex
tile
Spi
nnin
g M
ill in
Ispa
rta. A
ll sa
mpl
es w
ere
spun
in
to y
arns
on
ring
spin
ning
mac
hine
(R
iete
r M
odel
G33
) at
a y
arn
coun
t of 1
6 N
e, 2
0 N
e,
24 N
e,
28 N
e, 3
0 N
e, a
nd 4
0 N
e. T
he c
otto
n fib
ers
had
a m
icro
naire
val
ue o
f 4.
0-4.
5, a
2.
5% s
pan
leng
th o
f 28
-29
mm
, a
bund
le
stre
ngth
of
23-2
4 g/
tex,
a b
reak
ing
exte
nsio
n of
4.3
%.
Eac
h ya
rn c
ount
was
spu
n at
thr
ee
diffe
rent
tw
ist
mul
tiplie
rs (
3.6
e, 4
.0
e, 4
.4
e).
A t
otal
of
162
spin
ning
tria
ls w
ere
done
w
ith n
ine
sam
ples
. Fo
r th
e de
term
inat
ion
of
the
aver
age
brea
king
st
reng
th,
fifty
m
easu
rem
ents
wer
e m
ade
for
each
spi
nnin
g tri
al.
Expe
rimen
tal
It is
wel
l kno
wn
that
em
piric
al m
odel
s, in
clud
ing
stat
istic
al
and
artif
icia
l int
ellig
ence
mod
els
are
base
d on
exp
erim
enta
l da
ta.
Mor
eove
r, th
e ph
ysic
al
mod
el
also
re
quire
s ex
perim
enta
l ver
ifica
tion.
The
dat
a us
ed in
the
GE
P, n
eura
l ne
twor
k, a
nd t
he s
tatis
tical
mod
el a
re c
olle
cted
fro
m a
te
xtile
yar
n lo
cate
d in
Isp
arta
, Tu
rkey
. Th
e da
ta c
olle
cted
ar
e fo
r a 3
-mon
th p
erio
d. P
redi
ctio
n of
bre
akin
g st
reng
th o
f ya
rn f
rom
fib
er p
rope
rties
is
of g
reat
im
porta
nce
in y
arn
man
ufac
turin
g. F
ast
and
accu
rate
mea
sure
men
t of
fib
er
prop
ertie
s by
mea
ns o
f U
ster
Hig
h V
olum
e In
stru
men
t (H
VI)
test
ing
syst
em a
nd m
ore
pow
erfu
l com
pute
rs a
re th
e tw
o m
ain
reas
ons
for
this
tend
ency
. The
bre
akin
g st
reng
htof
yar
n te
stin
g is
per
form
ed a
ccor
ding
to
AS
TM S
tand
ard
D54
46-9
9 [1
]. C
otto
n ya
rns
with
th
e fib
er
para
met
ers
pres
ente
d in
tabl
e 1,
wer
e us
ed fo
r th
e ex
perim
ent.
Ther
e ar
e te
n va
riabl
es t
hat
are
cons
ider
ed a
s th
e in
puts
to
the
GE
P a
nd n
eura
l net
wor
k le
arni
ng a
lgor
ithm
s.
Stat
istic
al A
naly
sis
Sta
tistic
al m
odel
ing
is v
ery
frequ
ently
use
d to
pre
dict
yar
n pr
oper
ties.
In th
is s
tudy
, we
have
dev
elop
ed a
n eq
uatio
n fo
r pr
edic
ting
of
brea
king
st
reng
htw
ith
a m
ultip
le
linea
r re
gres
sion
alg
orith
m. T
he m
ultip
le li
near
regr
essi
on a
naly
sis
is a
lso
perfo
rmed
to h
ave
an id
ea a
bout
the
pred
ictiv
e po
wer
of
the
eval
uatio
n pr
ogra
mm
ing,
in c
ompa
rison
to a
cla
ssic
al
stat
istic
al a
ppro
ach.
The
reg
ress
ion
equa
tion
obta
ined
from
th
is a
naly
sis
is g
iven
by
equa
tion
(1).
The
R-s
quar
e of
the
pr
edic
tion
by t
he r
egre
ssio
n eq
uatio
n on
the
tes
t da
ta i
s 74
.3%
(2).
Equa
tion
1:
87
65
43
21
453
,341
2,1
658
,275
1,5
242
,312
0,2
1546
,135
4,
98d
dd
dd
dd
dy R
Ana
lysi
s U
sing
Neu
ral N
etw
orks
In th
is r
esea
rch
for
pred
ictin
g th
e te
nsile
pro
perti
es o
f co
tton
yarn
s, n
eura
l ne
twor
k m
odel
s w
ith t
en i
nput
an
d on
e ou
tput
uni
ts i
s de
sign
ed.
It is
als
o se
ven
diffe
rent
neu
ral n
etw
ork
arch
itect
ures
with
two
hidd
en
laye
rs a
re t
este
d to
iden
tify
the
best
one
. Th
ese
are
mul
tilay
er
perc
eptio
ns,
gene
raliz
ed
feed
forw
ard,
m
odul
ar n
etw
ork,
Jor
dan/
Elm
an, s
elf-o
rgan
izin
g m
ap,
prin
cipa
l com
pone
nt a
naly
sis,
and
recu
rren
t net
wor
k.
As
can
be s
een
from
Tab
le 2
and
Figu
re 2
, th
e be
st
resu
lt ob
tain
ed
from
th
e ge
nera
lized
fe
edfo
rwar
dne
ural
net
wor
k al
gorit
hms
has
a 94
% R
-squ
are.
The
re
curr
ent n
eura
l net
wor
k w
ith tw
o hi
dden
laye
r and
11
neur
ons
in t
he h
idde
n la
yer
gave
the
bes
t re
sult.
H
owev
er,
the
best
res
ult
obta
ined
fro
m t
he n
eura
l ne
twor
k is
app
roxi
mat
ely
5% w
orse
tha
n th
e G
EP
al
gorit
hm's
(2).
Ana
lysi
s U
sing
GEP
The
expe
rimen
tal d
ata
desc
ribed
in T
able
3is
use
d fo
r th
e m
odel
ing
of b
reak
ing
stre
nght
of y
arn.
Fr
om th
e cr
op s
tudy
resu
lts, w
e ha
d ni
ne s
ampl
es o
f inp
ut-o
utpu
t dat
a fo
r eac
h ya
rn p
rope
rties
(Tab
le
2).
We
used
130
(80%
), 32
(20%
) sa
mpl
es,
resp
ectiv
ely,
for
tra
inin
g an
d te
stin
g al
l th
e pr
edic
tion
mod
els.
The
cru
cial
task
is to
def
ine
the
hidd
en fu
nctio
n co
nnec
ting
the
inpu
t var
iabl
es (d
1, d
2, d
3, .
. .,
d8) a
nd o
utpu
t var
iabl
e (y
). Th
is c
an a
lso
be w
ritte
n in
the
form
of t
he fo
llow
ing
equa
tion:
y =
f(d[
1],
d[2]
, d[3
], . .
., d
[8]).
The
func
tion
obta
ined
by
the
GE
P a
lgor
ithm
will
be
used
in p
redi
ctin
g th
e bre
akin
gst
renght
of y
arn
in th
ree
mon
th p
erio
d. T
he p
aram
eter
s us
ed in
the
GE
P a
lgor
ithm
are
pre
sent
ed in
Tab
le 6
. The
firs
t th
ree
para
met
er s
ets
are
fixed
in T
able
6. G
EP
test
res
ults
, is
0.98
8 R
-squ
are
valu
e (F
igur
e 5)
. The
fu
nctio
n ge
nera
ted
for
the
best
res
ult
by t
he G
EP
alg
orith
m t
o us
e in
the
pre
dict
ion
of b
reak
ing
stre
nght
of y
arn
is g
iven
in e
quat
ion
(2).
31
4
68
14
21
56
287
87
63
78
*
**
*
dd
dd
d
dd
dd
dd
ddd
dd
dd
ddy G
EP
Equa
tion
2
Con
clus
ions
In th
is p
aper
, tw
o ev
alua
tion
prog
ram
min
g (G
EP
and
neu
ral
netw
ork)
ar
e ap
plie
d to
th
e pr
oble
m
of
pred
ictio
n of
bre
akin
gst
renght
of y
arn.
Mor
eove
r, th
e m
ultip
le l
inea
r re
gres
sion
ana
lysi
s is
als
o ap
plie
d to
the
pro
blem
to
have
an
ide
a ab
out
the
pred
ictin
g po
wer
of
thes
e ev
alua
tion
prog
ram
min
gs
in
com
paris
on
to
a cl
assi
cal
stat
istic
al
appr
oach
. Th
e re
sults
ob
tain
ed
from
ou
r ex
tens
ive
com
puta
tiona
l te
sts
have
in
dica
ted
that
ev
alua
tion
prog
ram
min
g gi
ves
far
bette
r re
sults
tha
n th
e re
gres
sion
an
alys
is.
Furth
erm
ore,
GE
P p
erfo
rmed
con
side
rabl
y be
tter
(98.
88%
) th
an n
eura
l net
wor
k al
gorit
hms
(94%
), an
d lin
ear
regr
essi
on m
odel
(74
.3%
) in
our
tes
ts.
It is
con
clud
ed t
hat
GE
P is
a g
ood
eval
uatio
n pr
ogra
mm
ing
for u
se in
pre
dict
ion
ofbre
akin
gst
renght
of
yarn
. A
noth
er
impo
rtant
ad
vant
age
of G
EP
is
com
ing
from
its
abi
lity
to g
ener
ate
mat
hem
atic
al e
quat
ions
tha
t ca
n be
eas
ily p
rogr
amm
ed
even
into
poc
ket
calc
ulat
ors
for
use
in e
very
day
prac
tices
du
ring
the
yarn
pro
duct
ion
proc
ess
(2).
Figu
re 1
The
test
resu
lt fo
r the
mul
tiple
line
ar re
gres
sion
ana
lysi
s(R
-squ
are
74.3
%)
Figu
re 2
Eva
luat
ion
of th
e ne
ural
net
wor
k m
etho
d fo
r the
pr
edic
tion
of b
reak
ing
stre
nght
of y
arn
(R-s
quar
e94
%)
Figu
re 3
Eva
luat
ion
of th
e G
EP
met
hod
for t
he p
redi
ctio
n of
br
eaki
ngst
reng
htof
yar
n(R
-squ
are
98.8
%)
1.
ASTM
Sta
ndard
, Sta
ndard
Tes
t M
ethods
for
Mea
sure
men
t of
Phys
ical
Pro
per
ties
of
Cott
on Y
arn
s, A
STM
D544-9
9and A
STM
D
5446-0
1.
2.
DAYIK
M
ehm
et,
"Pre
dic
tion
of
Yarn
Proper
ties
Usi
ng
Eva
luat
ion
Progra
mm
ing"
The
Tex
tile
Res
earc
hJo
urn
al,
Vol.
79,
No.
11 p
. 963-9
72,
June
2009
Refe
ren
ces
No
te:
Th
isp
ap
er
pu
blish
ed
in T
exti
leR
ese
arc
hJo
urn
alin
20
09
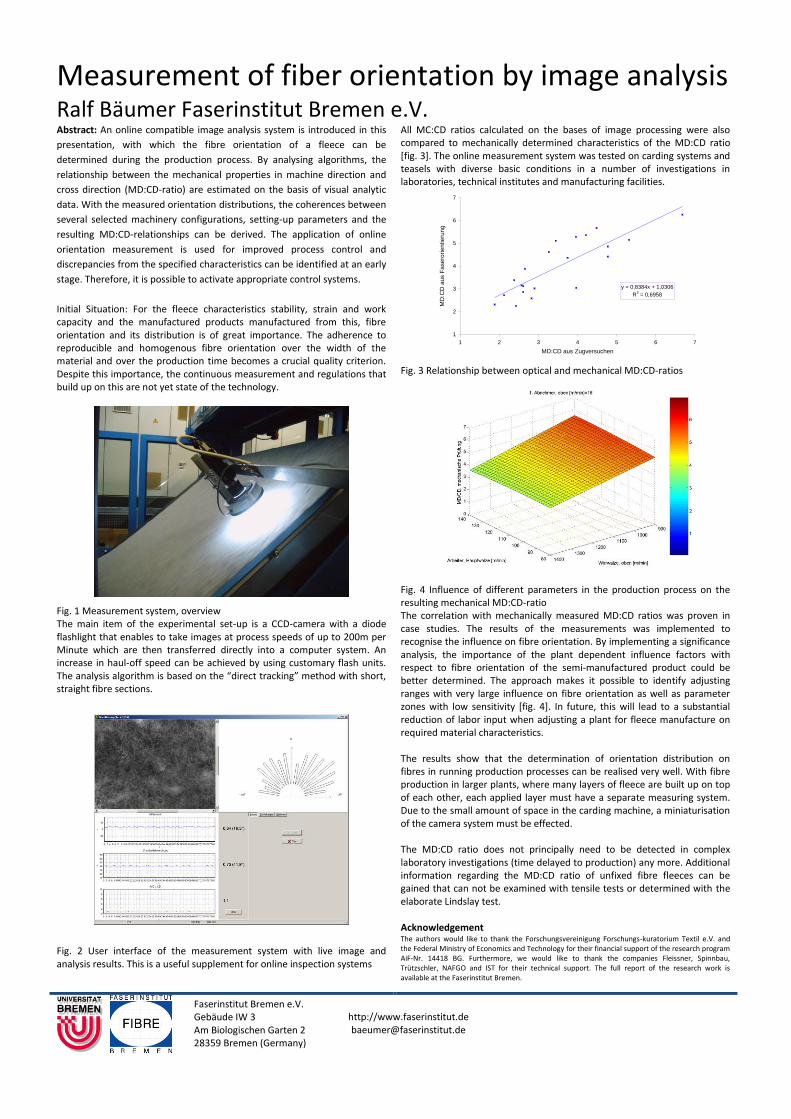
Measurement of fiber orientation by image analysis
Ralf Bäumer Faserinstitut Bremen e.V. Abstract: An online compatible image analysis system is introduced in this
presentation, with which the fibre orientation of a fleece can be
determined during the production process. By analysing algorithms, the
relationship between the mechanical properties in machine direction and
cross direction (MD:CD-ratio) are estimated on the basis of visual analytic
data. With the measured orientation distributions, the coherences between
several selected machinery configurations, setting-up parameters and the
resulting MD:CD-relationships can be derived. The application of online
orientation measurement is used for improved process control and
discrepancies from the specified characteristics can be identified at an early
stage. Therefore, it is possible to activate appropriate control systems.
Initial Situation: For the fleece characteristics stability, strain and work capacity and the manufactured products manufactured from this, fibre orientation and its distribution is of great importance. The adherence to reproducible and homogenous fibre orientation over the width of the material and over the production time becomes a crucial quality criterion. Despite this importance, the continuous measurement and regulations that build up on this are not yet state of the technology.
Fig. 1 Measurement system, overview The main item of the experimental set-up is a CCD-camera with a diode flashlight that enables to take images at process speeds of up to 200m per Minute which are then transferred directly into a computer system. An increase in haul-off speed can be achieved by using customary flash units. The analysis algorithm is based on the “direct tracking” method with short, straight fibre sections.
Fig. 2 User interface of the measurement system with live image and analysis results. This is a useful supplement for online inspection systems
All MC:CD ratios calculated on the bases of image processing were also compared to mechanically determined characteristics of the MD:CD ratio [fig. 3]. The online measurement system was tested on carding systems and teasels with diverse basic conditions in a number of investigations in laboratories, technical institutes and manufacturing facilities.
y = 0,8384x + 1,0306R2 = 0,6958
1
2
3
4
5
6
7
1 2 3 4 5 6 7MD:CD aus Zugversuchen
MD
:CD
aus
Fas
eror
ient
ieru
ng
Fig. 3 Relationship between optical and mechanical MD:CD-ratios
Fig. 4 Influence of different parameters in the production process on the resulting mechanical MD:CD-ratio The correlation with mechanically measured MD:CD ratios was proven in case studies. The results of the measurements was implemented to recognise the influence on fibre orientation. By implementing a significance analysis, the importance of the plant dependent influence factors with respect to fibre orientation of the semi-manufactured product could be better determined. The approach makes it possible to identify adjusting ranges with very large influence on fibre orientation as well as parameter zones with low sensitivity [fig. 4]. In future, this will lead to a substantial reduction of labor input when adjusting a plant for fleece manufacture on required material characteristics. The results show that the determination of orientation distribution on fibres in running production processes can be realised very well. With fibre production in larger plants, where many layers of fleece are built up on top of each other, each applied layer must have a separate measuring system. Due to the small amount of space in the carding machine, a miniaturisation of the camera system must be effected. The MD:CD ratio does not principally need to be detected in complex laboratory investigations (time delayed to production) any more. Additional information regarding the MD:CD ratio of unfixed fibre fleeces can be gained that can not be examined with tensile tests or determined with the elaborate Lindslay test. Acknowledgement The authors would like to thank the Forschungsvereinigung Forschungs-kuratorium Textil e.V. and the Federal Ministry of Economics and Technology for their financial support of the research program AiF-Nr. 14418 BG. Furthermore, we would like to thank the companies Fleissner, Spinnbau, Trützschler, NAFGO and IST for their technical support. The full report of the research work is available at the Faserinstitut Bremen.
Faserinstitut Bremen e.V. Gebäude IW 3 Am Biologischen Garten 2 28359 Bremen (Germany)
http://www.faserinstitut.de [email protected]