Embed Size (px)
Citation preview
http://jvm.sagepub.com/Journal of Vacation Marketing
http://jvm.sagepub.com/content/17/1/31The online version of this article can be found at:
DOI: 10.1177/1356766710391133
2011 17: 31Journal of Vacation MarketingMohammad Nurul Huda Mazumder, Elsadig Musa Ahmed, Md. Wahid Murad and Abul Quasem Al-Amin
Identifying economically potential inbound markets for Malaysian tourism industry
Published by:
http://www.sagepublications.com
can be found at:Journal of Vacation MarketingAdditional services and information for
http://jvm.sagepub.com/cgi/alertsEmail Alerts:
http://jvm.sagepub.com/subscriptionsSubscriptions:
http://www.sagepub.com/journalsReprints.navReprints:
http://www.sagepub.com/journalsPermissions.navPermissions:
http://jvm.sagepub.com/content/17/1/31.refs.htmlCitations:
What is This?
- Jan 25, 2011Version of Record >>
at UNIVERSITE LAVAL on October 17, 2013jvm.sagepub.comDownloaded from at UNIVERSITE LAVAL on October 17, 2013jvm.sagepub.comDownloaded from at UNIVERSITE LAVAL on October 17, 2013jvm.sagepub.comDownloaded from at UNIVERSITE LAVAL on October 17, 2013jvm.sagepub.comDownloaded from at UNIVERSITE LAVAL on October 17, 2013jvm.sagepub.comDownloaded from at UNIVERSITE LAVAL on October 17, 2013jvm.sagepub.comDownloaded from at UNIVERSITE LAVAL on October 17, 2013jvm.sagepub.comDownloaded from at UNIVERSITE LAVAL on October 17, 2013jvm.sagepub.comDownloaded from at UNIVERSITE LAVAL on October 17, 2013jvm.sagepub.comDownloaded from at UNIVERSITE LAVAL on October 17, 2013jvm.sagepub.comDownloaded from at UNIVERSITE LAVAL on October 17, 2013jvm.sagepub.comDownloaded from at UNIVERSITE LAVAL on October 17, 2013jvm.sagepub.comDownloaded from at UNIVERSITE LAVAL on October 17, 2013jvm.sagepub.comDownloaded from at UNIVERSITE LAVAL on October 17, 2013jvm.sagepub.comDownloaded from at UNIVERSITE LAVAL on October 17, 2013jvm.sagepub.comDownloaded from at UNIVERSITE LAVAL on October 17, 2013jvm.sagepub.comDownloaded from at UNIVERSITE LAVAL on October 17, 2013jvm.sagepub.comDownloaded from at UNIVERSITE LAVAL on October 17, 2013jvm.sagepub.comDownloaded from at UNIVERSITE LAVAL on October 17, 2013jvm.sagepub.comDownloaded from at UNIVERSITE LAVAL on October 17, 2013jvm.sagepub.comDownloaded from
Academic Paper
Identifying economicallypotential inbound marketsfor Malaysian tourismindustry
Mohammad Nurul Huda Mazumder and Elsadig Musa AhmedMultimedia University, Malaysia
Md. Wahid MuradUniversity of South Australia, Australia
Abul Quasem Al-AminUniversity of Malaya, Malaysia
The key objective of this study is to determine and analyze the impacts of inbound tourism on theMalaysian economy using an input-output analysis. With the view of accomplishing the key objective,this study also explores the economic potential of inbound markets for the Malaysian tourism industry.As central to any economic impact analysis, tourism multipliers are estimated from the inverse ofLeontief’s input-output matrix. The empirical results reveal two interesting observations concerninginbound tourism impacts on Malaysian economy. These are, firstly, tourism sectors that produce largermultipliers do not generate larger total economic impact, and secondly, inbound markets with highestper capita do not yield highest economic impact. Therefore, this study concludes that an economicsector with lower multipliers should not be neglected and that the contribution of inbound tourismmarket generating lower per capita expenditure should not be ignored when preparing appropriatetourism marketing and public policies for developing economies.
Keywordseconomic impacts, inbound markets, inbound tourism, input-output analysis, Malaysia
Introduction
The presence of a combination of several
industries and the absence of its inclusion in the
system of national accounts of many economies
make it difficult to quantify the total economic
impact of tourism industry in a simple way. As a
diversified industry, tourism industry generates a
variety of economic impact for which it has been
perceived to be a reliable source for economic
development for many developed and developing
nations. Developing countries, like Thailand or
Malaysia, have relied a great deal on their tourist
industries for economic growth (Chon et al.,
1993). Since, the non-traditional exports of devel-
oping countries have too often failed to prove
effective in economic development and so tourism
is increasingly seen as something of a saviour
(Durbarry, 2004). Its importance is gaining wide-
spread recognition as developing countries view
tourism industry as a cushion for their economic
development and growth. Previously undiscovered
regions of the developing economies of the world
continue to be the major player of world tourism
growth trend and promote this industry.
Corresponding author:
Mohammad Nurul Huda Mazumder, Faculty of Management,
Multimedia University, Cyberjaya Campus, Jalan Multimedia,
Cyberjaya 63100, Selangor, Malaysia
Email: [email protected]; [email protected]
Journal of Vacation Marketing17(1) 31–50ª The Author(s) 2011Reprints and permission:sagepub.co.uk/journalsPermissions.navDOI: 10.1177/1356766710391133jvm.sagepub.com
Economic impacts of tourism begin with an
injection of tourism receipts that generate multi-
plier effects on output or sales, revenue, employ-
ment, income, and not suffice to say contributing
significantly in infrastructural development of an
economy. In an attempt to measure the economic
impact of changes in the injection of inbound
markets tourist expenditure, it is important to
recognize that economic impacts occur across a
wide range of economic variables and at differ-
ent levels (Fletcher, 1989). Though primary
effects or direct impacts of inbound tourist
expenditure are those that occur within tourism
related establishments, the measurement of pri-
mary benefits provides incomplete picture of the
precise contribution made by tourism. Through
intersectoral linkages, secondary (indirect and
induced) impact of inbound tourist expenditure
affects almost all sectors of an economy. The
addition of secondary effects generates sufficient
additional income and employment to rejuvenate
the local economies (Fletcher, 1989; Hurley
et al., 1994) since secondary benefits or indirect
impacts are seen as better measure (Archer,
1982; Fletcher, 1989; Vaughan et al., 2000).
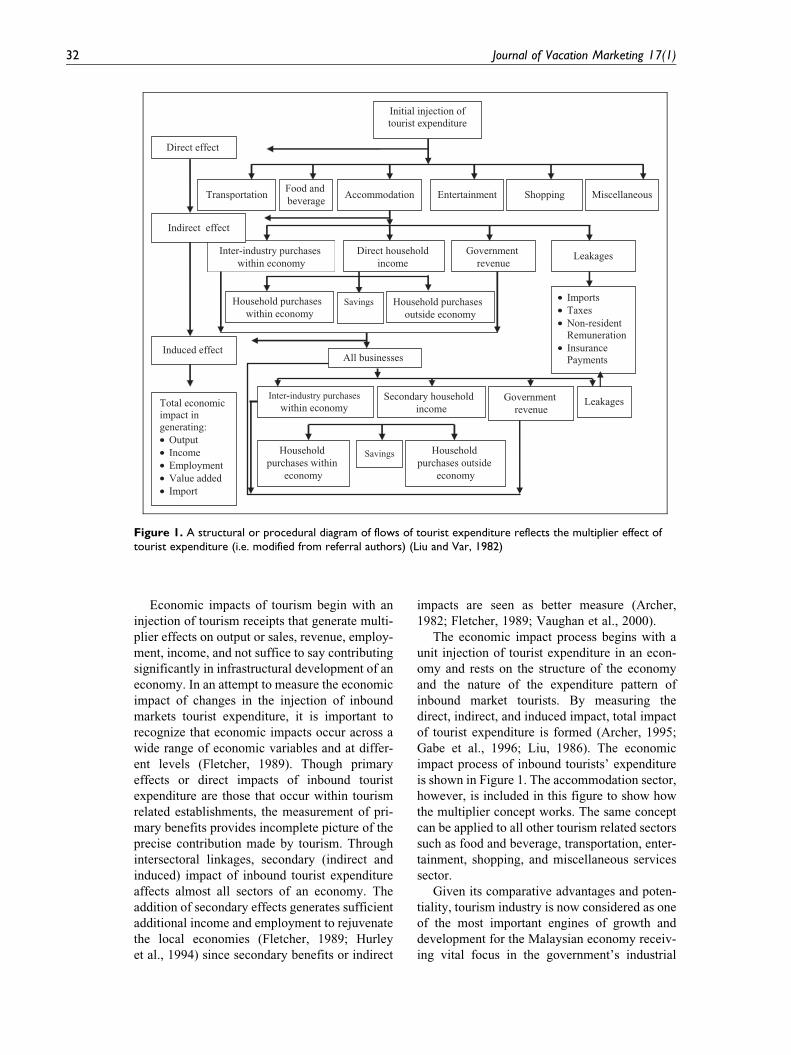
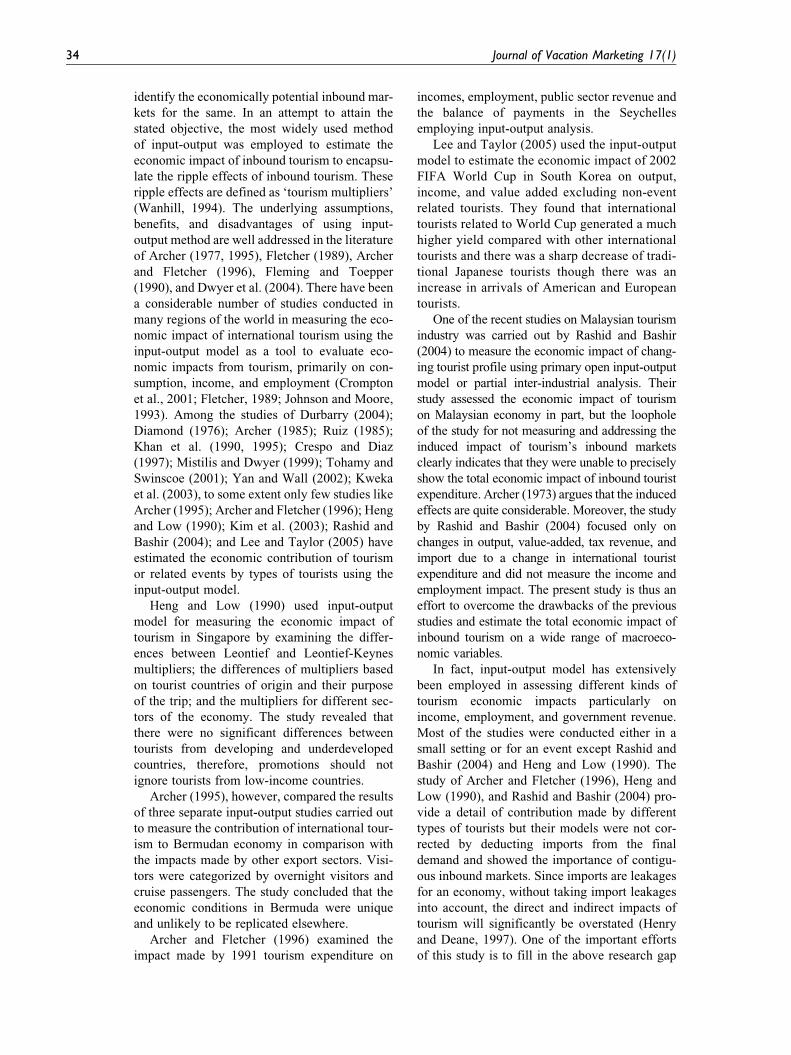
The economic impact process begins with a
unit injection of tourist expenditure in an econ-
omy and rests on the structure of the economy
and the nature of the expenditure pattern of
inbound market tourists. By measuring the
direct, indirect, and induced impact, total impact
of tourist expenditure is formed (Archer, 1995;
Gabe et al., 1996; Liu, 1986). The economic
impact process of inbound tourists’ expenditure
is shown in Figure 1. The accommodation sector,
however, is included in this figure to show how
the multiplier concept works. The same concept
can be applied to all other tourism related sectors
such as food and beverage, transportation, enter-
tainment, shopping, and miscellaneous services
sector.
Given its comparative advantages and poten-
tiality, tourism industry is now considered as one
of the most important engines of growth and
development for the Malaysian economy receiv-
ing vital focus in the government’s industrial
Direct household income
LeakagesInter-industry purchases within economy
Government revenue
All businesses
AccommodationFood and beverage
Transportation Entertainment Shopping Miscellaneous
Household purchases within economy
Savings Household purchases outside economy
Inter-industry purchases within economy
Secondary household income
Government revenue
Leakages
Household purchases within
economy
Savings Household purchases outside
economy
• Imports• Taxes• Non-resident
Remuneration • Insurance
Payments
Initial injection of tourist expenditure
Direct effect
Indirect effect
Induced effect
Total economic impact in generating:• Output• Income• Employment• Value added• Import
Figure 1. A structural or procedural diagram of flows of tourist expenditure reflects the multiplier effect oftourist expenditure (i.e. modified from referral authors) (Liu and Var, 1982)
32 Journal of Vacation Marketing 17(1)
strategy to promote the industry that is assisting
in balancing distribution of income. The devel-
opment allocation for this industry has increased
100 percent over the years from RM605.5 million
to RM1367.0 million between 7th and 9th
Malaysian plan period (EPU, 2001, 2006). As a
newly emerging industry, the industry not only
creates considerable high multiplier effects and
linkages in the economy, but also fosters national
integration and unity (GOM, 1991). As the growth
of tourism continues in Malaysia, tourism devel-
opment is viewed as an alternative economic
development tool. If this trend of tourism growth
in Malaysia continues, it may surpass manufactur-
ing sector which has been the country’s engine of
growth since 1987. The revenue earned from
inbound tourism has a pivotal role that directing
Malaysian economy to higher growth (Sadi and
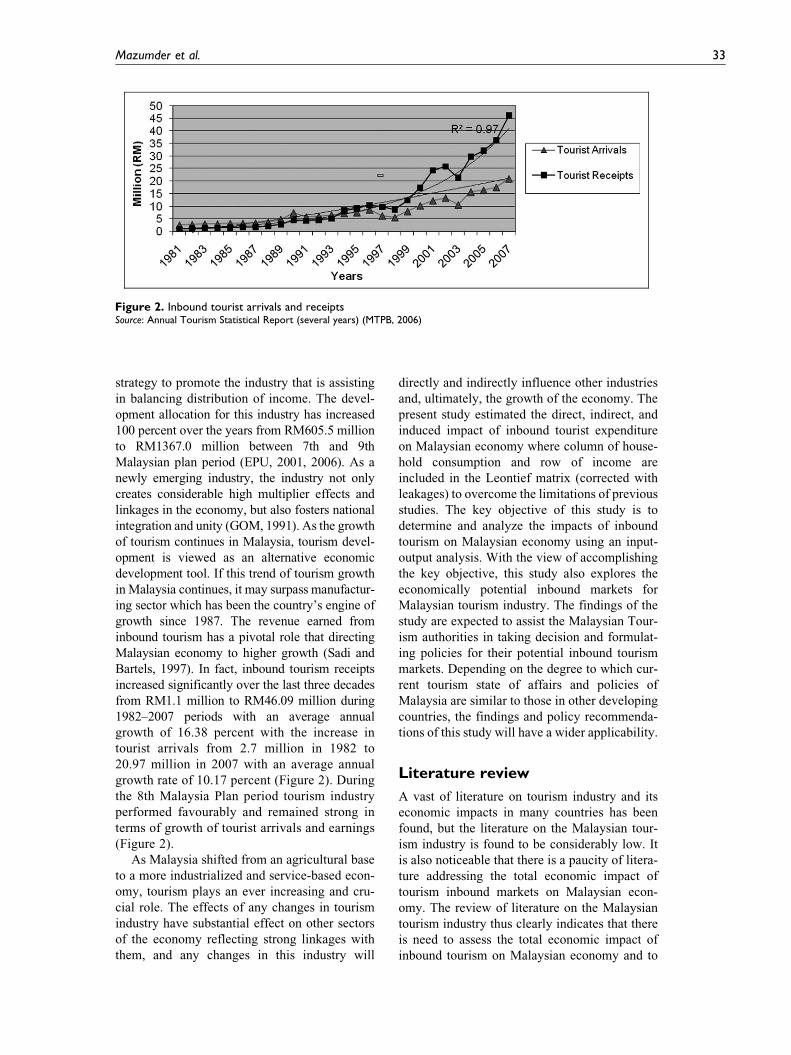
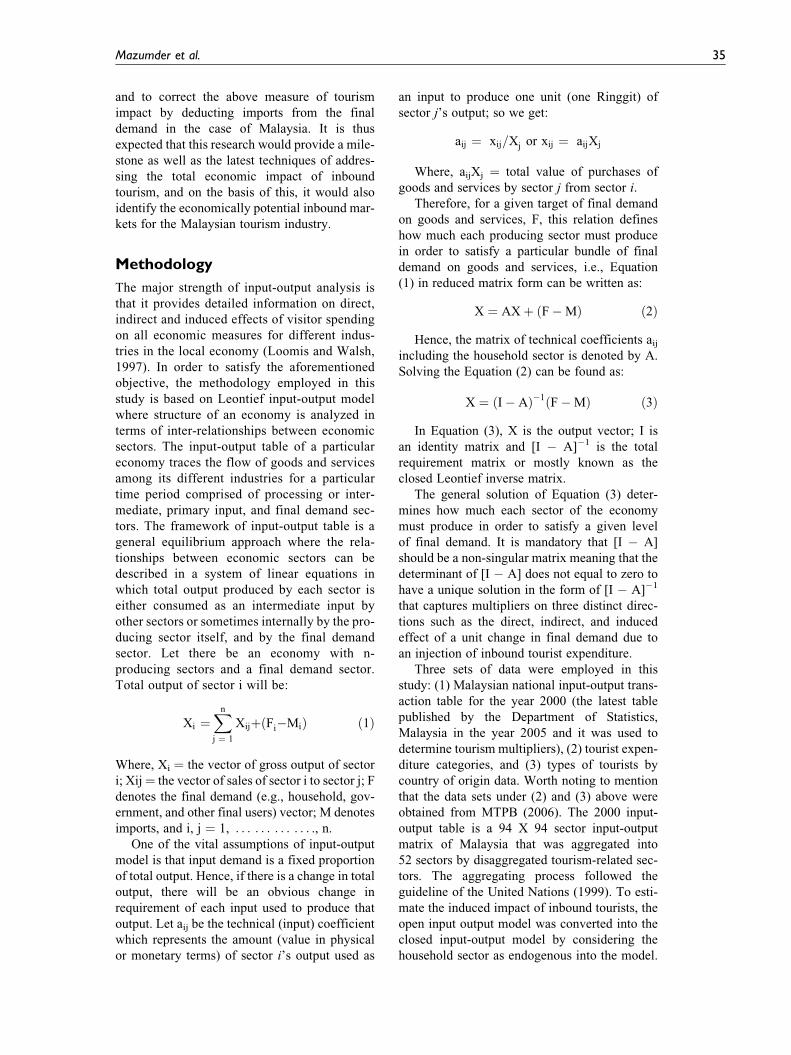
Bartels, 1997). In fact, inbound tourism receipts
increased significantly over the last three decades
from RM1.1 million to RM46.09 million during
1982–2007 periods with an average annual
growth of 16.38 percent with the increase in
tourist arrivals from 2.7 million in 1982 to
20.97 million in 2007 with an average annual
growth rate of 10.17 percent (Figure 2). During
the 8th Malaysia Plan period tourism industry
performed favourably and remained strong in
terms of growth of tourist arrivals and earnings
(Figure 2).
As Malaysia shifted from an agricultural base
to a more industrialized and service-based econ-
omy, tourism plays an ever increasing and cru-
cial role. The effects of any changes in tourism
industry have substantial effect on other sectors
of the economy reflecting strong linkages with
them, and any changes in this industry will
directly and indirectly influence other industries
and, ultimately, the growth of the economy. The
present study estimated the direct, indirect, and
induced impact of inbound tourist expenditure
on Malaysian economy where column of house-
hold consumption and row of income are
included in the Leontief matrix (corrected with
leakages) to overcome the limitations of previous
studies. The key objective of this study is to
determine and analyze the impacts of inbound
tourism on Malaysian economy using an input-
output analysis. With the view of accomplishing
the key objective, this study also explores the
economically potential inbound markets for
Malaysian tourism industry. The findings of the
study are expected to assist the Malaysian Tour-
ism authorities in taking decision and formulat-
ing policies for their potential inbound tourism
markets. Depending on the degree to which cur-
rent tourism state of affairs and policies of
Malaysia are similar to those in other developing
countries, the findings and policy recommenda-
tions of this study will have a wider applicability.
Literature review
A vast of literature on tourism industry and its
economic impacts in many countries has been
found, but the literature on the Malaysian tour-
ism industry is found to be considerably low. It
is also noticeable that there is a paucity of litera-
ture addressing the total economic impact of
tourism inbound markets on Malaysian econ-
omy. The review of literature on the Malaysian
tourism industry thus clearly indicates that there
is need to assess the total economic impact of
inbound tourism on Malaysian economy and to
Figure 2. Inbound tourist arrivals and receiptsSource: Annual Tourism Statistical Report (several years) (MTPB, 2006)
Mazumder et al. 33
identify the economically potential inbound mar-
kets for the same. In an attempt to attain the
stated objective, the most widely used method
of input-output was employed to estimate the
economic impact of inbound tourism to encapsu-
late the ripple effects of inbound tourism. These
ripple effects are defined as ‘tourism multipliers’
(Wanhill, 1994). The underlying assumptions,
benefits, and disadvantages of using input-
output method are well addressed in the literature
of Archer (1977, 1995), Fletcher (1989), Archer
and Fletcher (1996), Fleming and Toepper
(1990), and Dwyer et al. (2004). There have been
a considerable number of studies conducted in
many regions of the world in measuring the eco-
nomic impact of international tourism using the
input-output model as a tool to evaluate eco-
nomic impacts from tourism, primarily on con-
sumption, income, and employment (Crompton
et al., 2001; Fletcher, 1989; Johnson and Moore,
1993). Among the studies of Durbarry (2004);
Diamond (1976); Archer (1985); Ruiz (1985);
Khan et al. (1990, 1995); Crespo and Diaz
(1997); Mistilis and Dwyer (1999); Tohamy and
Swinscoe (2001); Yan and Wall (2002); Kweka
et al. (2003), to some extent only few studies like
Archer (1995); Archer and Fletcher (1996); Heng
and Low (1990); Kim et al. (2003); Rashid and
Bashir (2004); and Lee and Taylor (2005) have
estimated the economic contribution of tourism
or related events by types of tourists using the
input-output model.
Heng and Low (1990) used input-output
model for measuring the economic impact of
tourism in Singapore by examining the differ-
ences between Leontief and Leontief-Keynes
multipliers; the differences of multipliers based
on tourist countries of origin and their purpose
of the trip; and the multipliers for different sec-
tors of the economy. The study revealed that
there were no significant differences between
tourists from developing and underdeveloped
countries, therefore, promotions should not
ignore tourists from low-income countries.
Archer (1995), however, compared the results
of three separate input-output studies carried out
to measure the contribution of international tour-
ism to Bermudan economy in comparison with
the impacts made by other export sectors. Visi-
tors were categorized by overnight visitors and
cruise passengers. The study concluded that the
economic conditions in Bermuda were unique
and unlikely to be replicated elsewhere.
Archer and Fletcher (1996) examined the
impact made by 1991 tourism expenditure on
incomes, employment, public sector revenue and
the balance of payments in the Seychelles
employing input-output analysis.
Lee and Taylor (2005) used the input-output
model to estimate the economic impact of 2002
FIFA World Cup in South Korea on output,
income, and value added excluding non-event
related tourists. They found that international
tourists related to World Cup generated a much
higher yield compared with other international
tourists and there was a sharp decrease of tradi-
tional Japanese tourists though there was an
increase in arrivals of American and European
tourists.
One of the recent studies on Malaysian tourism
industry was carried out by Rashid and Bashir
(2004) to measure the economic impact of chang-
ing tourist profile using primary open input-output
model or partial inter-industrial analysis. Their
study assessed the economic impact of tourism
on Malaysian economy in part, but the loophole
of the study for not measuring and addressing the
induced impact of tourism’s inbound markets
clearly indicates that they were unable to precisely
show the total economic impact of inbound tourist
expenditure. Archer (1973) argues that the induced
effects are quite considerable. Moreover, the study
by Rashid and Bashir (2004) focused only on
changes in output, value-added, tax revenue, and
import due to a change in international tourist
expenditure and did not measure the income and
employment impact. The present study is thus an
effort to overcome the drawbacks of the previous
studies and estimate the total economic impact of
inbound tourism on a wide range of macroeco-
nomic variables.
In fact, input-output model has extensively
been employed in assessing different kinds of
tourism economic impacts particularly on
income, employment, and government revenue.
Most of the studies were conducted either in a
small setting or for an event except Rashid and
Bashir (2004) and Heng and Low (1990). The
study of Archer and Fletcher (1996), Heng and
Low (1990), and Rashid and Bashir (2004) pro-
vide a detail of contribution made by different
types of tourists but their models were not cor-
rected by deducting imports from the final
demand and showed the importance of contigu-
ous inbound markets. Since imports are leakages
for an economy, without taking import leakages
into account, the direct and indirect impacts of
tourism will significantly be overstated (Henry
and Deane, 1997). One of the important efforts
of this study is to fill in the above research gap
34 Journal of Vacation Marketing 17(1)
and to correct the above measure of tourism
impact by deducting imports from the final
demand in the case of Malaysia. It is thus
expected that this research would provide a mile-
stone as well as the latest techniques of addres-
sing the total economic impact of inbound
tourism, and on the basis of this, it would also
identify the economically potential inbound mar-
kets for the Malaysian tourism industry.
Methodology
The major strength of input-output analysis is
that it provides detailed information on direct,
indirect and induced effects of visitor spending
on all economic measures for different indus-
tries in the local economy (Loomis and Walsh,
1997). In order to satisfy the aforementioned
objective, the methodology employed in this
study is based on Leontief input-output model
where structure of an economy is analyzed in
terms of inter-relationships between economic
sectors. The input-output table of a particular
economy traces the flow of goods and services
among its different industries for a particular
time period comprised of processing or inter-
mediate, primary input, and final demand sec-
tors. The framework of input-output table is a
general equilibrium approach where the rela-
tionships between economic sectors can be
described in a system of linear equations in
which total output produced by each sector is
either consumed as an intermediate input by
other sectors or sometimes internally by the pro-
ducing sector itself, and by the final demand
sector. Let there be an economy with n-
producing sectors and a final demand sector.
Total output of sector i will be:
Xi ¼Xn
j ¼ 1
XijþðFi�MiÞ ð1Þ
Where, Xi ¼ the vector of gross output of sector
i; Xij¼ the vector of sales of sector i to sector j; F
denotes the final demand (e.g., household, gov-
ernment, and other final users) vector; M denotes
imports, and i, j ¼ 1, . . . . . . . . . . . . ., n.
One of the vital assumptions of input-output
model is that input demand is a fixed proportion
of total output. Hence, if there is a change in total
output, there will be an obvious change in
requirement of each input used to produce that
output. Let aij be the technical (input) coefficient
which represents the amount (value in physical
or monetary terms) of sector i’s output used as
an input to produce one unit (one Ringgit) of
sector j’s output; so we get:
aij ¼ xij=Xj or xij ¼ aijXj
Where, aijXj ¼ total value of purchases of
goods and services by sector j from sector i.
Therefore, for a given target of final demand
on goods and services, F, this relation defines
how much each producing sector must produce
in order to satisfy a particular bundle of final
demand on goods and services, i.e., Equation
(1) in reduced matrix form can be written as:
X ¼ AXþ ðF�MÞ ð2Þ
Hence, the matrix of technical coefficients aij
including the household sector is denoted by A.
Solving the Equation (2) can be found as:
X ¼ ðI� AÞ�1ðF�MÞ ð3Þ
In Equation (3), X is the output vector; I is
an identity matrix and [I � A]�1 is the total
requirement matrix or mostly known as the
closed Leontief inverse matrix.
The general solution of Equation (3) deter-
mines how much each sector of the economy
must produce in order to satisfy a given level
of final demand. It is mandatory that [I � A]
should be a non-singular matrix meaning that the
determinant of [I � A] does not equal to zero to
have a unique solution in the form of [I � A]�1
that captures multipliers on three distinct direc-
tions such as the direct, indirect, and induced
effect of a unit change in final demand due to
an injection of inbound tourist expenditure.
Three sets of data were employed in this
study: (1) Malaysian national input-output trans-
action table for the year 2000 (the latest table
published by the Department of Statistics,
Malaysia in the year 2005 and it was used to
determine tourism multipliers), (2) tourist expen-
diture categories, and (3) types of tourists by
country of origin data. Worth noting to mention
that the data sets under (2) and (3) above were
obtained from MTPB (2006). The 2000 input-
output table is a 94 X 94 sector input-output
matrix of Malaysia that was aggregated into
52 sectors by disaggregated tourism-related sec-
tors. The aggregating process followed the
guideline of the United Nations (1999). To esti-
mate the induced impact of inbound tourists, the
open input output model was converted into the
closed input-output model by considering the
household sector as endogenous into the model.
Mazumder et al. 35
The number of paid employees, import and value
added data were derived from input-output trans-
action table of 2000. But we have to acknowl-
edge an inescapable limitation of this study that
the input-output table used in this study was
found to be latest for the year 2000, which was
actually published in 2005 by the Department
of Statistics, Malaysia. While we had to fully rely
on the Malaysian government authorities for
input-output data, such limitation was beyond
our ability. Input-output, a data hungry model
(Briassoulis, 1991) requires input-output table
as data requirement. The time-lag in preparing
and publishing the table due to its complex
nature is found to be very common (Yan and
Wall, 2002) in studies using data from input-
output table. The common limitations of the
studies using input-output models as well as their
advantages, however, could be found in detail in
the studies of Fletcher (1989) and Briassoulis
(1991).
Results and discussion
In this section, economic impact of inbound tour-
ism and its implication to identify the economi-
cally significant inbound markets of tourism to
Malaysia are represented through the derivation
of multipliers in terms of output, income,
employment, value-added, and import. The suc-
cessive rounds of spending by inbound tourists
and re-spending by tourism and other sectors
(as shown in Figure 1) explaining the performing
effects of exogenous tourist expenditure on
Malaysian economy are calculated through the
derivation of tourism multipliers. Different tour-
ism multiplier values can be calculated depend-
ing on the macroeconomic variables of interest.
The impact of inbound tourists’ expenditure on
any of these macroeconomic variables can be
broken down into three categories, namely
direct, indirect and induced effects. Direct effect
of inbound tourists’ expenditure symbolizes
output, income, import, value-added and
employment generated per Ringgit of inbound
tourists’ spending on goods and services from
tourism sectors. Indirect effect signifies those
created as these sectors constitute local pur-
chases from all industries in the economy. In
addition, induced effect describes the economic
impact that is created by consumption of house-
holds due to their additional income directly or
indirectly connected with tourism. The
direct, indirect, and induced multipliers (normal
multipliers) of output, income, employment,
value-added, and import in the six tourism
related sectors are shown in Appendix,
Table A. Furthermore, the distribution and cal-
culation of economic impact of inbound tourism
expenditure on different macroeconomic vari-
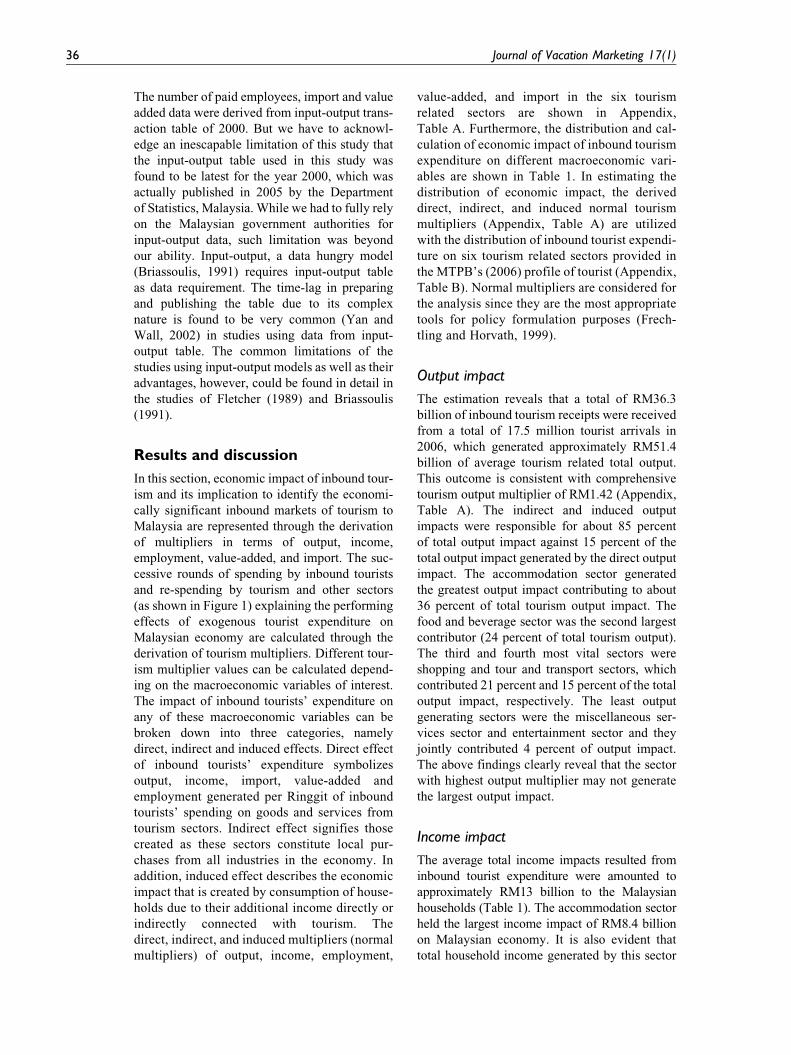
ables are shown in Table 1. In estimating the
distribution of economic impact, the derived
direct, indirect, and induced normal tourism
multipliers (Appendix, Table A) are utilized
with the distribution of inbound tourist expendi-
ture on six tourism related sectors provided in
the MTPB’s (2006) profile of tourist (Appendix,
Table B). Normal multipliers are considered for
the analysis since they are the most appropriate
tools for policy formulation purposes (Frech-
tling and Horvath, 1999).
Output impact
The estimation reveals that a total of RM36.3
billion of inbound tourism receipts were received
from a total of 17.5 million tourist arrivals in
2006, which generated approximately RM51.4
billion of average tourism related total output.
This outcome is consistent with comprehensive
tourism output multiplier of RM1.42 (Appendix,
Table A). The indirect and induced output
impacts were responsible for about 85 percent
of total output impact against 15 percent of the
total output impact generated by the direct output
impact. The accommodation sector generated
the greatest output impact contributing to about
36 percent of total tourism output impact. The
food and beverage sector was the second largest
contributor (24 percent of total tourism output).
The third and fourth most vital sectors were
shopping and tour and transport sectors, which
contributed 21 percent and 15 percent of the total
output impact, respectively. The least output
generating sectors were the miscellaneous ser-
vices sector and entertainment sector and they
jointly contributed 4 percent of output impact.
The above findings clearly reveal that the sector
with highest output multiplier may not generate
the largest output impact.
Income impact
The average total income impacts resulted from
inbound tourist expenditure were amounted to
approximately RM13 billion to the Malaysian
households (Table 1). The accommodation sector
held the largest income impact of RM8.4 billion
on Malaysian economy. It is also evident that
total household income generated by this sector
36 Journal of Vacation Marketing 17(1)
surpassed the total of all other sectors. The
second most important income impact was made
by the food and beverage sector, resulting
approximately RM2 billion of household
income. The shopping sector and tour and
transport sector were respectively the third
Table 1. Total economic impact of inbound tourist expenditure in terms of output, income, employment, andvalue-added, 2006 (in millions of Ringgit)
Tourismsector
Touristexpenditure(% of Total) Amount
Directimpact (1)
Indirectimpact
(2)
Inducedimpact
(3)
Totalimpact
(1þ2þ3) Rank
Accommodation:Output 35.4 12 847.93 2 843.49 14 998.81 677.97 18 520.27 1 (36.0%)Income 35.4 12 847.93 7 421.98 888.02 141.66 8 451.66 1 (57.1%)Employment 35.4 12 847.93 1 640.13 513.43 94.52 2 248.08 1 (35.6%)Value-added 35.4 12 847.93 4 560.47 1 911.51 343.85 6 815.84 2 (32.5%)Import 35.4 12 847.93 2 469.67 700.26 100.06 3 269.99 1 (40.1%)Food &
Beverage:Output 18.7 6 786.90 2 901.51 9 199.53 274.38 12 375.42 2 (23.6%)Income 18.7 6 786.90 1 038.62 843.27 57.34 1 939.23 2 (15.0%)Employment 18.7 6 786.90 361.84 403.92 38.26 804.02 4 (12.5%)Value-added 18.7 6 786.90 1 507.07 1 571.23 139.16 3 217.45 3 (15.8%)Import 18.7 6 786.90 850.03 702.87 40.50 1 593.39 3 (19.2%)Tour &
Transport:Output 15.2 5 516.62 1 338.88 6 103.67 327.64 7 770.19 4 (15.1%)Income 15.2 5 516.62 549.16 416.60 68.47 1 034.23 4 (8.0%)Employment 15.2 5 516.62 830.14 282.56 45.68 1 158.38 3 (18.2%)Value-added 15.2 5 516.62 1 919.26 867.71 166.17 2 953.14 4 (14.5%)Import 15.2 5 516.62 1 390.67 366.99 48.35 1 806.02 2 (21.2%)Entertainment:Output 3.7 1 342.86 207.96 1 447.71 66.44 1 722.11 5 (3.1%)Income 3.7 1 342.86 868.73 82.51 13.88 965.12 5 (7.1%)Employment 3.7 1 342.86 173.38 45.42 9.26 228.07 5 (3.6%)Value-added 3.7 1 342.86 794.65 167.18 33.70 995.52 5 (3.4%)Import 3.7 1 342.86 74.70 43.93 9.80 128.43 5 (1.3%)Shopping:Output 25.7 9 327.45 971.99 9 716.34 509.82 11 198.15 3 (21.4%)Income 25.7 9 327.45 1 297.79 295.30 106.54 1 699.63 3 (13.1%)Employment 25.7 9 327.45 1 597.52 209.01 71.18 1 877.71 2 (29.3%)Value-added 25.7 9 327.45 6 235.48 757.55 258.58 7 251.61 1 (33.6%)Import 25.7 9 327.45 1 229.20 204.98 75.24 1 509.42 4 (17.4%)Miscellaneous:Output 1.3 471.82 69.18 504.43 66.70 640.31 6 (1.2%)Income 1.3 471.82 12.54 18.50 13.94 44.98 6 (0.1%)Employment 1.3 471.82 55.84 14.77 9.30 79.90 6 (1.2%)Value-added 1.3 471.82 61.34 49.30 33.83 144.46 6 (0.6%)Import 1.3 471.82 90.72 16.19 9.84 116.75 6 (1.1%)Tourism
Average:Output 100.0 36 294 7 846.85 41 242.79 2 407.97 51 497.61 (100%)Income 100.0 36 294 9 937.83 2 426.84 503.17 12 867.85 (100%)Employment 100.0 36 294 4 537.79 1 441.04 335.79 6 314.61 (100%)Value-added 100.0 36 294 14 004.38 5 128.14 1 221.28 20 353.80 (100%)Import 100.0 36 294 5 741.83 1 896.96 355.39 7 994.17 (100%)
Source: Authors’ calculationNote: Ranking shows the relative importance of each tourism sector in terms of amount of output, income, employment,value-added and import where 1 is the most important and 6 is the least important.Figures in parentheses represent percentage of each sector against total output, income, employment, value-added, and importresulted from inbound tourist expenditure.
Mazumder et al. 37
and fourth most important business sectors, gen-
erating 13 percent and 8 percent of total house-
hold income, correspondingly. The fifth income
generating sector was the entertainment sector,
which was resulting in RM0.9 billion of house-
hold income, slightly lower than the income gen-
erated by tour and transportation sector. The least
contributing sector was the miscellaneous ser-
vices sector with less than 1 percent of the total
household income. Again, the results reveal that
the sector with higher multipliers does not inevi-
tably produce the largest income impact.
Employment impact
The tourism industry average impact on employ-
ment represents that approximately 6300 full
time equivalent employments were supported
by inbound tourism receipts of RM36.3 billion
in the year of 2006 (Table 1). The most important
contributing sector in terms of employment gen-
eration was found to be the accommodation sec-
tor which supported approximately 2248 jobs in
total. About 35 percent of total employment
impact was attributed to the accommodation
sector, reflecting this sector’s highly labour-
intensive nature among tourism sectors. The
second largest contributor in generating employ-
ment was the shopping sector that ranked third in
terms of output and income. A total of 1699 jobs
were attributed to this sector, responsible for
about 29 percent of the total employment. The
other sectors generated 36 percent of total
employment together. The sectors of accommo-
dation and shopping accounted for 64 percent
of the total employment, directing their leading
position in employment generation proved to
be comparatively highly labour-intensive. The
examination of the table also reveals that the sec-
tor with higher employment multipliers does not
necessarily hold the position of highest contri-
butor in terms of total employment impact. This
situation may have caused the employment
figures to become a bit low compared to the tour-
ism’s indirect and induced impacts. In fact, dur-
ing the period from 1997 until the end of 2000
most Southeast Asian countries had experienced
severe financial as well as economic crisis,
which resulted in a significant reduction in the
inflow of tourists from contiguous countries to
Malaysia. It’s not only Malaysia, but all other
Southeast Asian countries have, then, experi-
enced the same inflow of tourists visiting these
countries. We believe that the above reason has
greatly reduced the employment in Malaysia.
According to economic theory, the pace of
employment recovery is slower than the recov-
eries an economy experiences in other macroeco-
nomic variables such as GDP, expenditure,
investment, and so on. Employment usually
starts recovering after a considerable time period
during which investment and expenditure have
already taken place. When the investors and
businesses find confidence in what is making
their business and profit, they then start hiring
and creating employment opportunities. So it is
likely for Malaysia that the country was then able
to generate less number of jobs due to fewer
amounts of domestic and foreign investments.
But the indirect and induced impacts of tourism
were not as badly affected as the employment
was primarily affected for low direct effect of
tourists expenditures resulted from economic
downturn during the aforesaid period.
The above findings, however, may reasonably
vary from the ones obtained earlier by Rashid
and Bashir (2004). In fact, the study by Rashid
and Bashir (2004) clearly pointed out that the set
of multipliers they estimated did not represent
complete multipliers, which we think was a
major limitation for their study. Our study has
estimated the complete multiplier by including
household consumption and household income
vectors as the important contributing sectors.
Rashid and Bashir’s (2004) study used the input
output table of 1991, but we used the latest and
updated one of 2000. There has been a consider-
able time gap of 10 years between two studies
and during this period Malaysia’s all economic
variables have changed significantly. For exam-
ple, Rashid and Bashir (2004) found the highest
output multiplier for the hotel and restaurant sec-
tor (which was estimated to be 1.76) while our
study found the highest multiplier for the food
and beverage sector (which was estimated to be
1.82). Furthermore, Rashid and Bashir (2004)
mentioned that increasing arrivals of West Asian
tourists will benefit significantly to Malaysian
economy in terms of value added, tax revenue,
and import generation. Even though we acknowl-
edged the contributions made by West Asian
tourists in our study, our empirical findings
reveal their contribution is not significantly
higher than those of tourists coming to Malaysia
from its contiguous inbound markets.
Value-added impact
In 2006, RM36.3 billions of inbound tourism
receipt generated about RM20.3 billions in the
38 Journal of Vacation Marketing 17(1)
form of value-added by the tourism business
sectors as represented in Table 1. Among the
types of tourist businesses, the shopping sector
generated the highest value-added impact of
RM7 billions, accounted for about 34 percent
of total value-added impact. The accommodation
sector accounted for the second highest resulting
in about 33 percent of the total value-added
impact. The sectors of food and beverage and
tour and transport were respectively the third
and fourth most important sectors in terms of
value-added representing 15.8 percent and
14.5 percent of total value-added, correspond-
ingly. The findings also reveal that shopping
and accommodation sectors accounted for the
largest value-added impact on Malaysian econ-
omy, together account for more than 67 percent
of total value-added. Miscellaneous services
sector and entertainment sector were the least
important sectors in generating value-added
impact, representing their less capability in gen-
erating value-added (less than 5 percent).
Import impact
A total of approximately RM8 billion of imports
was required to satisfy inbound tourist consump-
tion and approximately 72 percent of total
imports were caused by direct import impact,
while the shares of the indirect and induced
impact were about 24 percent and 4 percent,
respectively (Table 1). Final imports generated
by tourism expenditure accounted for 15 percent
of the total output reflecting that an approxi-
mately 85 percent of tourist demand was satisfied
by the local production. It is also clear that
import of intermediate goods equivalent to an
amount of RM1.9 billion of tourist consumption
was significant to attain local production. Fur-
ther, to achieve local production, incomes paid
to the households generate RM355 million worth
of inbound tourist consumption as induced
import impact. The direct and indirect imports
accounted for 96 percent of all imports in Malay-
sian economy. This situation seems explaining
that induced impact of imports was the least con-
tributor to the total import impact.
The accommodation sector, however, was
found to be the highest import oriented sector,
importing RM3.2 billion worth of goods and ser-
vices from abroad and tour and transportation
sector generated RM1.8 billion imports, which
accounted for more than 60 percent of the total
imports together. Food and beverage sector was
the third most important sector in terms of
imports, whereas miscellaneous services sector
and entertainment sector were the two least
import oriented industries. It is important to note
that the sector that generated higher output
impact was found to be more import-prone.
Contribution of inbound markets toMalaysian tourism industry
In this section, the economic impact of tourism
contributed by the inbound tourist markets on
Malaysian economy in the year of 2006 has been
analyzed with emphasis given for estimating
contribution to output, income, employment,
value-added, and import. Each column in the
Tables from 2 to 6 is calculated by multiplying
per capita expenditure made by each inbound
tourist market on any business sector with the
number of tourists of the same inbound market
for the same period (Appendix, Table B). The
outcome is then again multiplied by the output
multiplier obtained for that sector (Appendix,
Table A). All figures in Tables from 2 to 6 are
calculated by applying the same method.
The estimation, however, reveals that Singa-
porean tourists generated about 51.63 percent of
total output (Table 2). The second, third, and forth
largest output impacts were made by the tourists
respectively from Indonesia, Thailand and Brunei,
representing 6.14 percent, 5.94 percent, and
5.4 percent of the total output impacts, corre-
spondingly. The inbound markets of Belgium,
Norway, and Denmark retained the least output
impact generating country with shares ranging
from 0.07 percent to 0.08 percent.
Singaporean tourists’ expenditure had also the
largest sectoral output impact (34 percent) on
accommodation sector. The results also reveal
that rest of the sectors was also highly benefited
from Singaporean inbound market. Inbound mar-
ket of Thailand accounted for the second largest
output generator on accommodation, food and
beverage, and tour and transport sector, responsi-
ble for 37 percent, 23 percent, and 16 percent of
the total output, respectively. China inbound
market was the second largest output impact gen-
erating market on entertainment sector, while
Brunei and Indonesia inbound markets created
the second largest output impact on shopping and
miscellaneous services sector, respectively.
Although Rashid and Bashir (2004) pointed out
that the West Asian inbound markets tourists
spent largest share of their expenditure on shop-
ping. But the observations from this study reveal
that largest output impact generated by this
Mazumder et al. 39
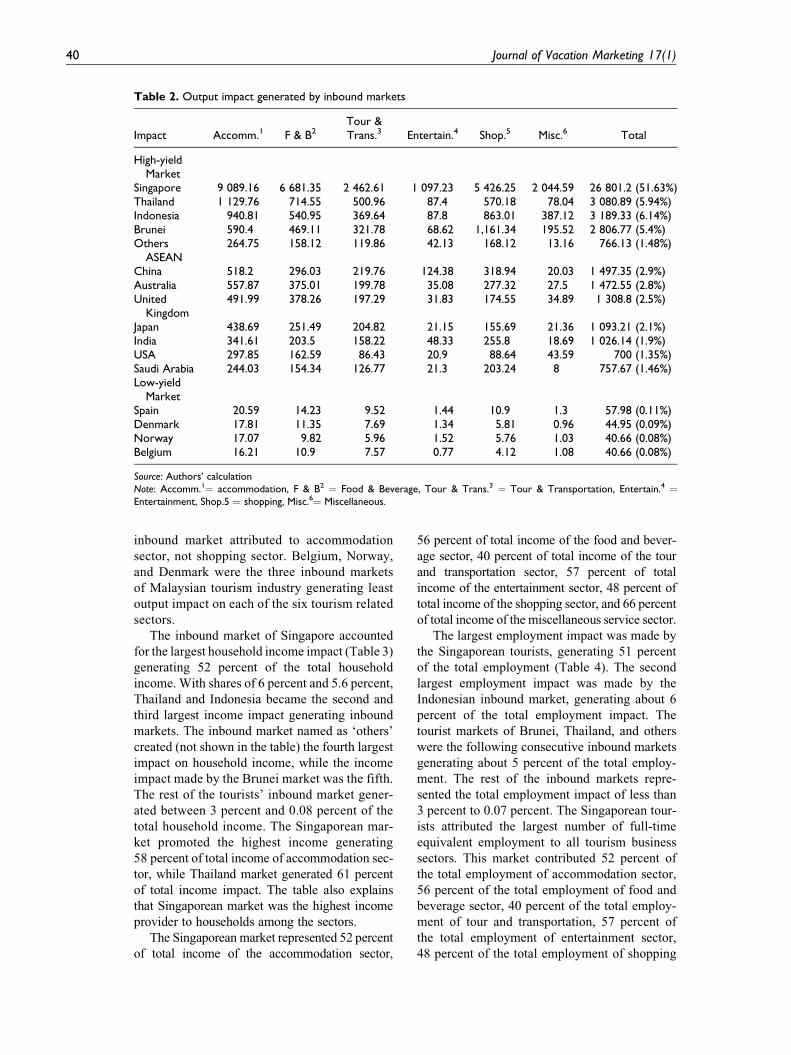
inbound market attributed to accommodation
sector, not shopping sector. Belgium, Norway,
and Denmark were the three inbound markets
of Malaysian tourism industry generating least
output impact on each of the six tourism related
sectors.
The inbound market of Singapore accounted
for the largest household income impact (Table 3)
generating 52 percent of the total household
income. With shares of 6 percent and 5.6 percent,
Thailand and Indonesia became the second and
third largest income impact generating inbound
markets. The inbound market named as ‘others’
created (not shown in the table) the fourth largest
impact on household income, while the income
impact made by the Brunei market was the fifth.
The rest of the tourists’ inbound market gener-
ated between 3 percent and 0.08 percent of the
total household income. The Singaporean mar-
ket promoted the highest income generating
58 percent of total income of accommodation sec-
tor, while Thailand market generated 61 percent
of total income impact. The table also explains
that Singaporean market was the highest income
provider to households among the sectors.
The Singaporean market represented 52 percent
of total income of the accommodation sector,
56 percent of total income of the food and bever-
age sector, 40 percent of total income of the tour
and transportation sector, 57 percent of total
income of the entertainment sector, 48 percent of
total income of the shopping sector, and 66 percent
of total income of the miscellaneous service sector.
The largest employment impact was made by
the Singaporean tourists, generating 51 percent
of the total employment (Table 4). The second
largest employment impact was made by the
Indonesian inbound market, generating about 6
percent of the total employment impact. The
tourist markets of Brunei, Thailand, and others
were the following consecutive inbound markets
generating about 5 percent of the total employ-
ment. The rest of the inbound markets repre-
sented the total employment impact of less than
3 percent to 0.07 percent. The Singaporean tour-
ists attributed the largest number of full-time
equivalent employment to all tourism business
sectors. This market contributed 52 percent of
the total employment of accommodation sector,
56 percent of the total employment of food and
beverage sector, 40 percent of the total employ-
ment of tour and transportation, 57 percent of
the total employment of entertainment sector,
48 percent of the total employment of shopping
Table 2. Output impact generated by inbound markets
Impact Accomm.1 F & B2Tour &Trans.3 Entertain.4 Shop.5 Misc.6 Total
High-yieldMarket
Singapore 9 089.16 6 681.35 2 462.61 1 097.23 5 426.25 2 044.59 26 801.2 (51.63%)Thailand 1 129.76 714.55 500.96 87.4 570.18 78.04 3 080.89 (5.94%)Indonesia 940.81 540.95 369.64 87.8 863.01 387.12 3 189.33 (6.14%)Brunei 590.4 469.11 321.78 68.62 1,161.34 195.52 2 806.77 (5.4%)Others
ASEAN264.75 158.12 119.86 42.13 168.12 13.16 766.13 (1.48%)
China 518.2 296.03 219.76 124.38 318.94 20.03 1 497.35 (2.9%)Australia 557.87 375.01 199.78 35.08 277.32 27.5 1 472.55 (2.8%)United
Kingdom491.99 378.26 197.29 31.83 174.55 34.89 1 308.8 (2.5%)
Japan 438.69 251.49 204.82 21.15 155.69 21.36 1 093.21 (2.1%)India 341.61 203.5 158.22 48.33 255.8 18.69 1 026.14 (1.9%)USA 297.85 162.59 86.43 20.9 88.64 43.59 700 (1.35%)Saudi Arabia 244.03 154.34 126.77 21.3 203.24 8 757.67 (1.46%)Low-yield
MarketSpain 20.59 14.23 9.52 1.44 10.9 1.3 57.98 (0.11%)Denmark 17.81 11.35 7.69 1.34 5.81 0.96 44.95 (0.09%)Norway 17.07 9.82 5.96 1.52 5.76 1.03 40.66 (0.08%)Belgium 16.21 10.9 7.57 0.77 4.12 1.08 40.66 (0.08%)
Source: Authors’ calculationNote: Accomm.1¼ accommodation, F & B2 ¼ Food & Beverage, Tour & Trans.3 ¼ Tour & Transportation, Entertain.4 ¼Entertainment, Shop.5 ¼ shopping, Misc.6¼ Miscellaneous.
40 Journal of Vacation Marketing 17(1)
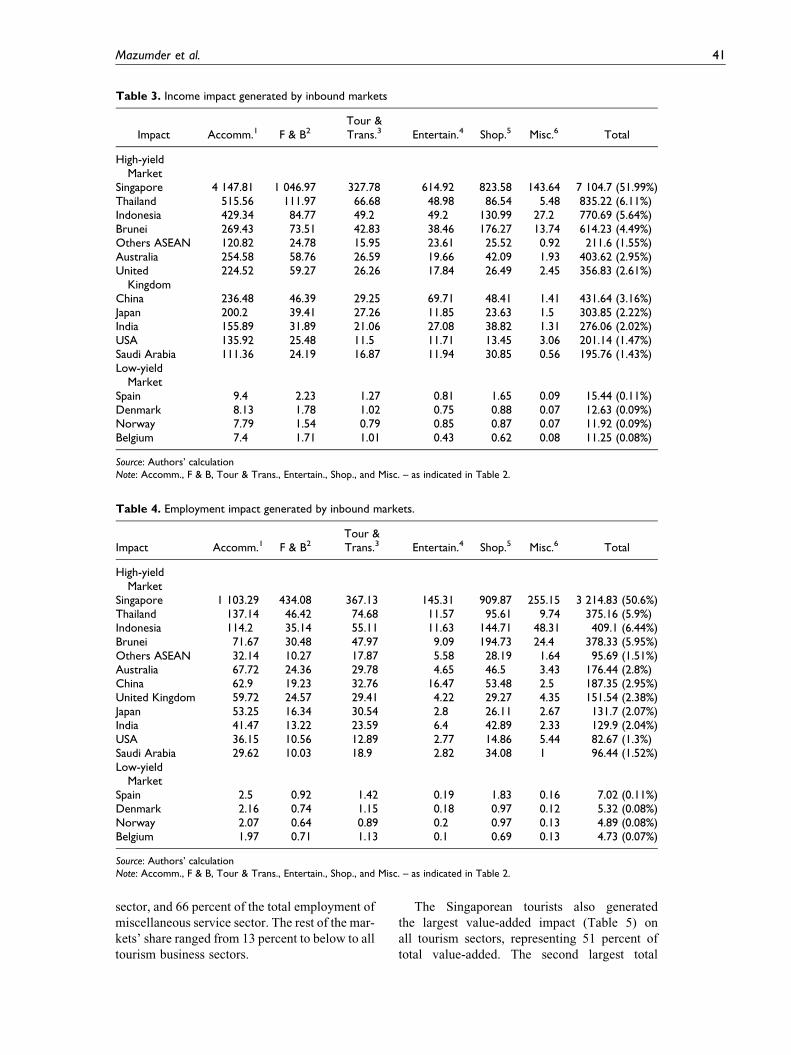
sector, and 66 percent of the total employment of
miscellaneous service sector. The rest of the mar-
kets’ share ranged from 13 percent to below to all
tourism business sectors.
The Singaporean tourists also generated
the largest value-added impact (Table 5) on
all tourism sectors, representing 51 percent of
total value-added. The second largest total
Table 3. Income impact generated by inbound markets
Impact Accomm.1 F & B2Tour &Trans.3 Entertain.4 Shop.5 Misc.6 Total
High-yieldMarket
Singapore 4 147.81 1 046.97 327.78 614.92 823.58 143.64 7 104.7 (51.99%)Thailand 515.56 111.97 66.68 48.98 86.54 5.48 835.22 (6.11%)Indonesia 429.34 84.77 49.2 49.2 130.99 27.2 770.69 (5.64%)Brunei 269.43 73.51 42.83 38.46 176.27 13.74 614.23 (4.49%)Others ASEAN 120.82 24.78 15.95 23.61 25.52 0.92 211.6 (1.55%)Australia 254.58 58.76 26.59 19.66 42.09 1.93 403.62 (2.95%)United
Kingdom224.52 59.27 26.26 17.84 26.49 2.45 356.83 (2.61%)
China 236.48 46.39 29.25 69.71 48.41 1.41 431.64 (3.16%)Japan 200.2 39.41 27.26 11.85 23.63 1.5 303.85 (2.22%)India 155.89 31.89 21.06 27.08 38.82 1.31 276.06 (2.02%)USA 135.92 25.48 11.5 11.71 13.45 3.06 201.14 (1.47%)Saudi Arabia 111.36 24.19 16.87 11.94 30.85 0.56 195.76 (1.43%)Low-yield
MarketSpain 9.4 2.23 1.27 0.81 1.65 0.09 15.44 (0.11%)Denmark 8.13 1.78 1.02 0.75 0.88 0.07 12.63 (0.09%)Norway 7.79 1.54 0.79 0.85 0.87 0.07 11.92 (0.09%)Belgium 7.4 1.71 1.01 0.43 0.62 0.08 11.25 (0.08%)
Source: Authors’ calculationNote: Accomm., F & B, Tour & Trans., Entertain., Shop., and Misc. – as indicated in Table 2.
Table 4. Employment impact generated by inbound markets.
Impact Accomm.1 F & B2Tour &Trans.3 Entertain.4 Shop.5 Misc.6 Total
High-yieldMarket
Singapore 1 103.29 434.08 367.13 145.31 909.87 255.15 3 214.83 (50.6%)Thailand 137.14 46.42 74.68 11.57 95.61 9.74 375.16 (5.9%)Indonesia 114.2 35.14 55.11 11.63 144.71 48.31 409.1 (6.44%)Brunei 71.67 30.48 47.97 9.09 194.73 24.4 378.33 (5.95%)Others ASEAN 32.14 10.27 17.87 5.58 28.19 1.64 95.69 (1.51%)Australia 67.72 24.36 29.78 4.65 46.5 3.43 176.44 (2.8%)China 62.9 19.23 32.76 16.47 53.48 2.5 187.35 (2.95%)United Kingdom 59.72 24.57 29.41 4.22 29.27 4.35 151.54 (2.38%)Japan 53.25 16.34 30.54 2.8 26.11 2.67 131.7 (2.07%)India 41.47 13.22 23.59 6.4 42.89 2.33 129.9 (2.04%)USA 36.15 10.56 12.89 2.77 14.86 5.44 82.67 (1.3%)Saudi Arabia 29.62 10.03 18.9 2.82 34.08 1 96.44 (1.52%)Low-yield
MarketSpain 2.5 0.92 1.42 0.19 1.83 0.16 7.02 (0.11%)Denmark 2.16 0.74 1.15 0.18 0.97 0.12 5.32 (0.08%)Norway 2.07 0.64 0.89 0.2 0.97 0.13 4.89 (0.08%)Belgium 1.97 0.71 1.13 0.1 0.69 0.13 4.73 (0.07%)
Source: Authors’ calculationNote: Accomm., F & B, Tour & Trans., Entertain., Shop., and Misc. – as indicated in Table 2.
Mazumder et al. 41
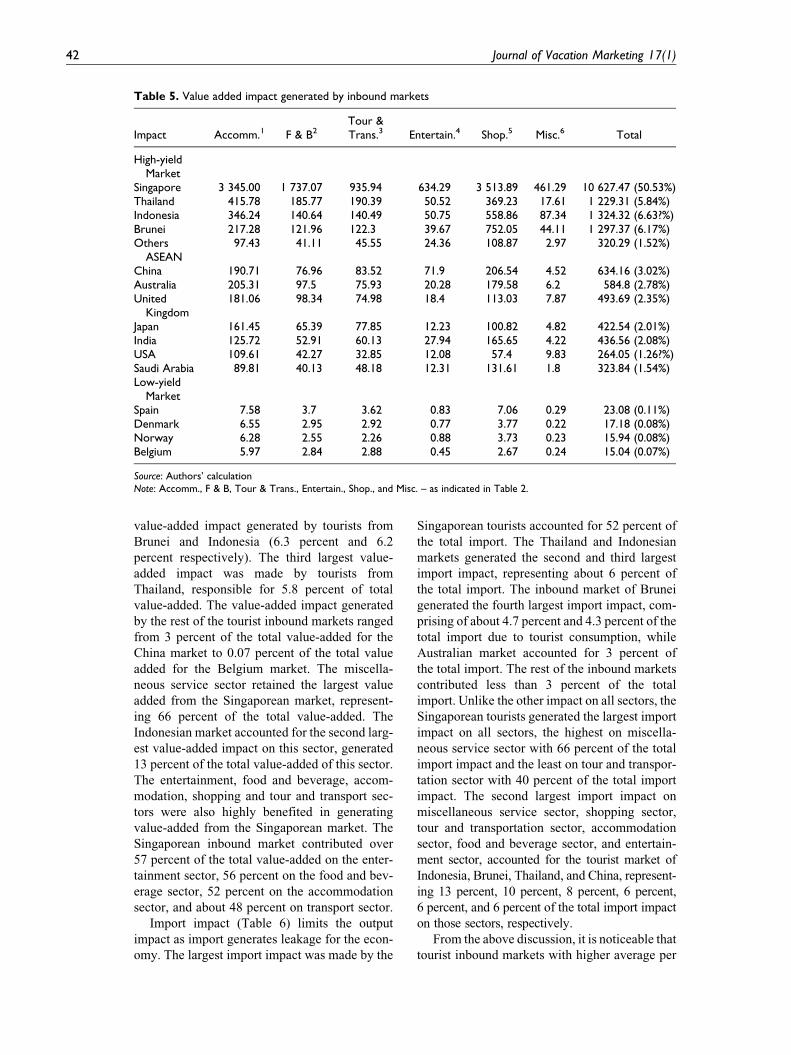
value-added impact generated by tourists from
Brunei and Indonesia (6.3 percent and 6.2
percent respectively). The third largest value-
added impact was made by tourists from
Thailand, responsible for 5.8 percent of total
value-added. The value-added impact generated
by the rest of the tourist inbound markets ranged
from 3 percent of the total value-added for the
China market to 0.07 percent of the total value
added for the Belgium market. The miscella-
neous service sector retained the largest value
added from the Singaporean market, represent-
ing 66 percent of the total value-added. The
Indonesian market accounted for the second larg-
est value-added impact on this sector, generated
13 percent of the total value-added of this sector.
The entertainment, food and beverage, accom-
modation, shopping and tour and transport sec-
tors were also highly benefited in generating
value-added from the Singaporean market. The
Singaporean inbound market contributed over
57 percent of the total value-added on the enter-
tainment sector, 56 percent on the food and bev-
erage sector, 52 percent on the accommodation
sector, and about 48 percent on transport sector.
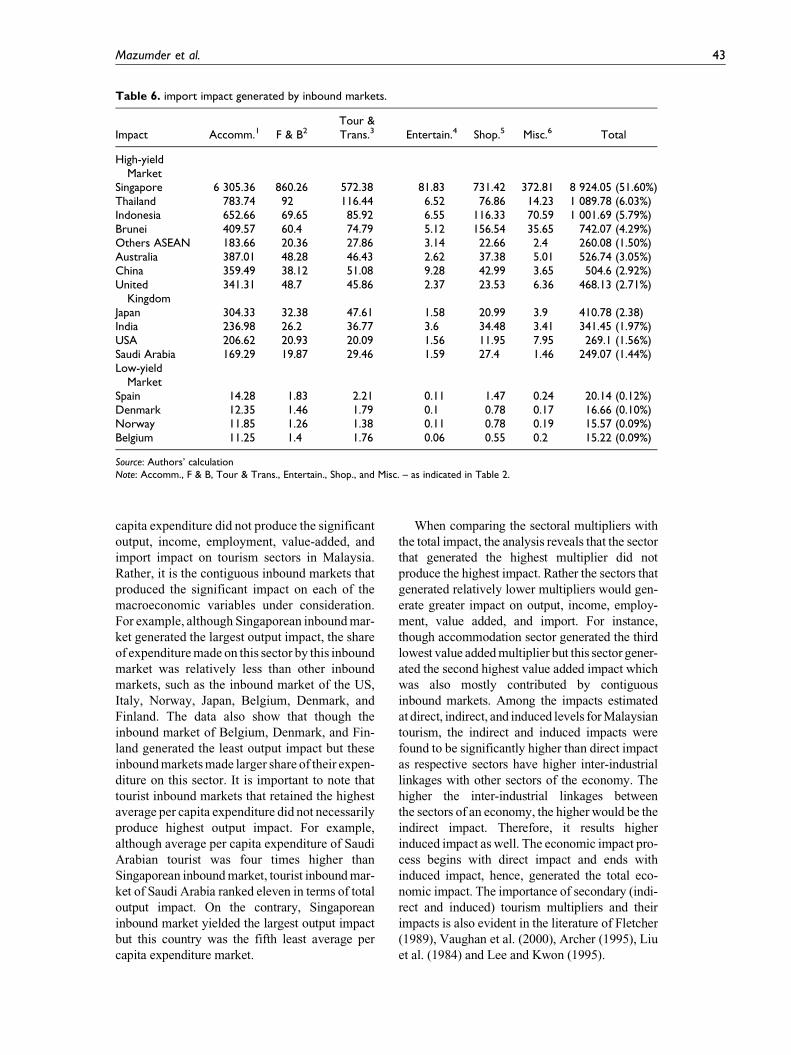
Import impact (Table 6) limits the output
impact as import generates leakage for the econ-
omy. The largest import impact was made by the
Singaporean tourists accounted for 52 percent of
the total import. The Thailand and Indonesian
markets generated the second and third largest
import impact, representing about 6 percent of
the total import. The inbound market of Brunei
generated the fourth largest import impact, com-
prising of about 4.7 percent and 4.3 percent of the
total import due to tourist consumption, while
Australian market accounted for 3 percent of
the total import. The rest of the inbound markets
contributed less than 3 percent of the total
import. Unlike the other impact on all sectors, the
Singaporean tourists generated the largest import
impact on all sectors, the highest on miscella-
neous service sector with 66 percent of the total
import impact and the least on tour and transpor-
tation sector with 40 percent of the total import
impact. The second largest import impact on
miscellaneous service sector, shopping sector,
tour and transportation sector, accommodation
sector, food and beverage sector, and entertain-
ment sector, accounted for the tourist market of
Indonesia, Brunei, Thailand, and China, represent-
ing 13 percent, 10 percent, 8 percent, 6 percent,
6 percent, and 6 percent of the total import impact
on those sectors, respectively.
From the above discussion, it is noticeable that
tourist inbound markets with higher average per
Table 5. Value added impact generated by inbound markets
Impact Accomm.1 F & B2Tour &Trans.3 Entertain.4 Shop.5 Misc.6 Total
High-yieldMarket
Singapore 3 345.00 1 737.07 935.94 634.29 3 513.89 461.29 10 627.47 (50.53%)Thailand 415.78 185.77 190.39 50.52 369.23 17.61 1 229.31 (5.84%)Indonesia 346.24 140.64 140.49 50.75 558.86 87.34 1 324.32 (6.63?%)Brunei 217.28 121.96 122.3 39.67 752.05 44.11 1 297.37 (6.17%)Others
ASEAN97.43 41.11 45.55 24.36 108.87 2.97 320.29 (1.52%)
China 190.71 76.96 83.52 71.9 206.54 4.52 634.16 (3.02%)Australia 205.31 97.5 75.93 20.28 179.58 6.2 584.8 (2.78%)United
Kingdom181.06 98.34 74.98 18.4 113.03 7.87 493.69 (2.35%)
Japan 161.45 65.39 77.85 12.23 100.82 4.82 422.54 (2.01%)India 125.72 52.91 60.13 27.94 165.65 4.22 436.56 (2.08%)USA 109.61 42.27 32.85 12.08 57.4 9.83 264.05 (1.26?%)Saudi Arabia 89.81 40.13 48.18 12.31 131.61 1.8 323.84 (1.54%)Low-yield
MarketSpain 7.58 3.7 3.62 0.83 7.06 0.29 23.08 (0.11%)Denmark 6.55 2.95 2.92 0.77 3.77 0.22 17.18 (0.08%)Norway 6.28 2.55 2.26 0.88 3.73 0.23 15.94 (0.08%)Belgium 5.97 2.84 2.88 0.45 2.67 0.24 15.04 (0.07%)
Source: Authors’ calculationNote: Accomm., F & B, Tour & Trans., Entertain., Shop., and Misc. – as indicated in Table 2.
42 Journal of Vacation Marketing 17(1)
capita expenditure did not produce the significant
output, income, employment, value-added, and
import impact on tourism sectors in Malaysia.
Rather, it is the contiguous inbound markets that
produced the significant impact on each of the
macroeconomic variables under consideration.
For example, although Singaporean inbound mar-
ket generated the largest output impact, the share
of expenditure made on this sector by this inbound
market was relatively less than other inbound
markets, such as the inbound market of the US,
Italy, Norway, Japan, Belgium, Denmark, and
Finland. The data also show that though the
inbound market of Belgium, Denmark, and Fin-
land generated the least output impact but these
inbound markets made larger share of their expen-
diture on this sector. It is important to note that
tourist inbound markets that retained the highest
average per capita expenditure did not necessarily
produce highest output impact. For example,
although average per capita expenditure of Saudi
Arabian tourist was four times higher than
Singaporean inbound market, tourist inbound mar-
ket of Saudi Arabia ranked eleven in terms of total
output impact. On the contrary, Singaporean
inbound market yielded the largest output impact
but this country was the fifth least average per
capita expenditure market.
When comparing the sectoral multipliers with
the total impact, the analysis reveals that the sector
that generated the highest multiplier did not
produce the highest impact. Rather the sectors that
generated relatively lower multipliers would gen-
erate greater impact on output, income, employ-
ment, value added, and import. For instance,
though accommodation sector generated the third
lowest value added multiplier but this sector gener-
ated the second highest value added impact which
was also mostly contributed by contiguous
inbound markets. Among the impacts estimated
at direct, indirect, and induced levels for Malaysian
tourism, the indirect and induced impacts were
found to be significantly higher than direct impact
as respective sectors have higher inter-industrial
linkages with other sectors of the economy. The
higher the inter-industrial linkages between
the sectors of an economy, the higher would be the
indirect impact. Therefore, it results higher
induced impact as well. The economic impact pro-
cess begins with direct impact and ends with
induced impact, hence, generated the total eco-
nomic impact. The importance of secondary (indi-
rect and induced) tourism multipliers and their
impacts is also evident in the literature of Fletcher
(1989), Vaughan et al. (2000), Archer (1995), Liu
et al. (1984) and Lee and Kwon (1995).
Table 6. import impact generated by inbound markets.
Impact Accomm.1 F & B2Tour &Trans.3 Entertain.4 Shop.5 Misc.6 Total
High-yieldMarket
Singapore 6 305.36 860.26 572.38 81.83 731.42 372.81 8 924.05 (51.60%)Thailand 783.74 92 116.44 6.52 76.86 14.23 1 089.78 (6.03%)Indonesia 652.66 69.65 85.92 6.55 116.33 70.59 1 001.69 (5.79%)Brunei 409.57 60.4 74.79 5.12 156.54 35.65 742.07 (4.29%)Others ASEAN 183.66 20.36 27.86 3.14 22.66 2.4 260.08 (1.50%)Australia 387.01 48.28 46.43 2.62 37.38 5.01 526.74 (3.05%)China 359.49 38.12 51.08 9.28 42.99 3.65 504.6 (2.92%)United
Kingdom341.31 48.7 45.86 2.37 23.53 6.36 468.13 (2.71%)
Japan 304.33 32.38 47.61 1.58 20.99 3.9 410.78 (2.38)India 236.98 26.2 36.77 3.6 34.48 3.41 341.45 (1.97%)USA 206.62 20.93 20.09 1.56 11.95 7.95 269.1 (1.56%)Saudi Arabia 169.29 19.87 29.46 1.59 27.4 1.46 249.07 (1.44%)Low-yield
MarketSpain 14.28 1.83 2.21 0.11 1.47 0.24 20.14 (0.12%)Denmark 12.35 1.46 1.79 0.1 0.78 0.17 16.66 (0.10%)Norway 11.85 1.26 1.38 0.11 0.78 0.19 15.57 (0.09%)Belgium 11.25 1.4 1.76 0.06 0.55 0.2 15.22 (0.09%)
Source: Authors’ calculationNote: Accomm., F & B, Tour & Trans., Entertain., Shop., and Misc. – as indicated in Table 2.
Mazumder et al. 43
Conclusions and policy implications
Input-output technique that has been used in
this study is not only estimating the economic
impact of inbound tourists’ expenditure but was
also useful in identifying the economic poten-
tial of inbound markets for Malaysian tourism.
Inbound tourism in Malaysia has a high poten-
tial for generating foreign exchange earnings,
and multiplier effect of inbound tourism
receipts helps eradicate the economy’s balance
of payment deficits. Inbound tourist expendi-
ture generates the higher average total multi-
plier of 1.42 on output and lower 0.17 on
employment (Appendix, Table A). These reveal
that tourism sectors with larger multiplier do
not necessarily produce larger total impact on
the economy. For instance, although the shop-
ping sector retains the least output multiplier,
this sector generates the third highest total out-
put impact whereas this sector with second
least income multiplier retained the third high-
est total impact on income. In fact, tourism sec-
tors with lower multiplier could have larger
total impact on an economy. Therefore, the
value of lower multipliers should not be
ignored as a valuable tool in policy making and
implementation purposes. Accommodation sec-
tor generated highest output, income, employ-
ment, and import impacts among the tourism
related sectors whereas largest value added
impact was accounted for shopping sector.
Tourism policy makers can be benefited from
this analysis in deciding which sectors should
be given more priority with regard to their eco-
nomic contribution. The importance of second-
ary (indirect and induced) effect is also evident
in generating output, income, employment,
value-added, and import. In fact, Malaysian
tourism policy makers would benefit from such
multiplier analysis as it represents what is the
change in sales, jobs, income, value added, or
import resulting from some public action.
When considering expenditure pattern of
inbound tourists, tourists from Saudi Arabia
and United Arab Emirates were the highest
spender in terms of per capita for most of the
sectors except miscellaneous services sector
while tourists from Singapore, Indonesia, and
Thailand were consecutively the largest spender
in terms of total expenditure though they
were the least spender in terms of per capita
(Appendix, Table B). In fact, tourists usually
come to Malaysia from the contiguous coun-
tries (Singapore/Thailand/Indonesia) do not
have to spend much for transportations, foods
and lodgings. This is because these tourists
come to Malaysia using relatively inexpensive
means of transportation compared to long-haul
tourists from countries such as China, India,
North Asia, Middle East, and Australia. Contig-
uous countries tourists are usually familiar with
tourism products and such familiarity is proven
as a monetary advantage for them. On the other
hand, the tourists from the above long-haul
countries have to spend more for everything
including their airfares, hotel charges for resid-
ing in and around tourist places, eating in and
around their residential hotels, using mostly
taxi cabs for visiting places of attractions, and
so on. So if focus is given on the higher per
capita tourist expenditure, Malaysia has to
attract long-haul tourists more than their con-
tiguous counterparts. But in terms of total
expenditure, the importance of attracting the
contiguous countries’ tourists lies at foremost.
From the results, however, it is also evident
that relative contributions of direct tourists’
expenditure from each of the inbound markets
are different when per capita expenditure and
total expenditure were compared. Malaysia’s
contiguous countries’ tourists were found to
be generating the greatest impact on each of
the component of Malaysian GDP though
highest per capita expenditures was made by
long-haul tourists, especially from the Middle
Eastern countries. Based on this, tourism pol-
icy makers could prepare appropriate policy
through the observation of low yield and high
yield tourists.
This study also gives evidence to the effect
that short haul tourists were the biggest generator
of output, income, employment, value-added,
and import. Therefore it can be concluded that
tourism industry in Malaysia is heavily relying
on its contiguous countries tourists. Though tour-
ists from long-haul inbound markets were the
highest spender in terms of per capita, the overall
economic impact of inbound tourists’ expendi-
ture of these markets was found to be relatively
low. Thus, tourism policies should target these
groups of inbound markets so that influx of
these tourists increases and the sectors on which
these groups of tourists made their expenditure
should maintain the desired quality while concern
should also be given to the contribution made by
inbound market of contiguous countries.
The study found that distribution of multi-
plier, international tourist expenditure per capita,
and total impact in terms of total expenditure
44 Journal of Vacation Marketing 17(1)
were not equally distributed among the tourists’
originating countries. The above analysis could
have an importance to policy and decision mak-
ers, governments, and concerned bodies for set-
ting an effective marketing strategy and
identifying tourism sector and economic vari-
ables which require increased attention. If the
concern of the government, for example, is to
increase employment, accommodation sector
should be enhanced since this sector generates
the largest employment impact. Beside multi-
plier analysis, the analysis of inbound markets
is of significance when preparing appropriate
marketing policy for the benefit of the Malaysian
tourism industry. For instance, if the Malaysian
government wants an expansion of the entertain-
ment sector of the tourism industry, the inbound
market of China, beside contiguous countries,
should be promoted since this inbound market
generated the second largest output impact on the
entertainment sector. Although tourism multi-
pliers, per capita expenditure, total number of
tourist arrivals from the inbound markets, and
expenditure patterns of inbound markets all play
a crucial role in generating the total economic
impact of the tourism industry where the role of
per capita expenditure solely is very insignificant.
In fact, it is the number of tourist arrivals that
matters to generate significant economic impact
on tourism industry for a developing economy
like Malaysia. Nevertheless, each of the aspects
discussed above could be given importance
according to the priority based objectives to
realize higher economic impact from inbound
tourism.
Since capacity constraint of the resources for
tourism industry is still not an overwhelming
problem for Malaysian economy, therefore, inte-
grated utilization of these resources will benefit
specifically to the Malaysian tourism industry,
Malaysian economy in general. Such policy will
not only enhance the coefficient of tourism
multipliers but also assist in increasing the num-
ber of tourist arrivals (since quality of tourism
product improves), per capita expenditure, and
in reshaping the expenditure patterns of inbound
markets tourists. Inter-industrial linkages in the
form of backward and forward linkages will also
increase from such enhanced utilization of tour-
ism resources. Increased inter-industrial linkages
will reduce the dependency on imports and add
more value to the locally produced goods, hence,
greater economic impact of inbound markets
results.
References
Archer BH (1973) The Uses and Abuses of Multipliers.
Tourist Research Paper, TUR 1 in Bangor: Univer-
sity College of North Wales.
Archer BH (1977) Tourism Multipliers: The State of
the Art. Bangor Occasional Papers in Economics
(No. 11). Bangor: University Wales Press.
Archer BH (1982) The value of multipliers and their
policy implications. Tourism Management 3(4):
236–241.
Archer BH (1985) Tourism in Mauritius: an economic
impact study with marketing implications. Tourism
Management 6(1): 50–54.
Archer BH (1995) The impact of international tourism
on the economy of Bermuda, 1994. Journal of
Travel Research 34(2): 27–30.
Archer BH and Fletcher J (1996) The economic
impact of tourism in the Seychelles. Annals of
Tourism Research 23(1): 32–47.
Briassoulis H (1991) Methodological issues: tourism
input-output analysis. Annals of Tourism Research
18(3): 485–495.
Chon K, Singh A and Mikula J (1993) Thailand’s tour-
ism and hotel industry. Cornell Hotel and Restau-
rant Administration Quarterly 34(3): 43–49.
Crespo N and Dı́az SN (1997) Cuban Tourism in 2007:
Economic Impact. Available at: http://lanic.utexas.
edu/la/cb/cuba/asce/cuba7/crespo.pdf (accessed
September 2008).
Crompton JL, Lee S and Shuster TJ (2001) A guide for
undertaking economic impact studies: the Springfest
example. Journal of Travel Research 40(1): 79–87.
Diamond J (1976) Tourism and development policy: a
quantitative appraisal. Bulletin of Economic
Research 28(1): 36–50.
Durbarry R (2004) Tourism and economic growth:
the case of Mauritius. Tourism Economics 10(4):
389–401.
Dwyer L, Forsyth P and Spurr R (2004) Evaluating
tourism’s economic effects: new and old
approaches. Tourism Management 25(3): 307–317.
Economic Planning Unit: EPU (2001) Eighth
Malaysia Plan 2001–2005. Putrajaya: Prime
Ministers Department.
Economic Planning Unit: EPU (2006) Ninth Malaysia
Plan 2006–2010. Putrajaya: Prime Ministers
Department.
Fleming WR and Toepper L (1990) Economic impact
studies: relating the positive and negative impacts
to tourism development. Journal of Travel
Research 29(1): 35–42.
Fletcher JE (1989) Input-output analysis and tourism
impact studies. Annals of Tourism Research
16(4): 514–529.
Mazumder et al. 45
Frechtling DC and Horvath E (1999) Estimating the
multiplier effects of tourism expenditures on a
local economy through a regional input-output
model. Journal of Travel Research 37: 324–332.
Gabe T, Kinsey J and Loveridge S (1996) Local eco-
nomic impacts of tribal casinos: the Minnesota
case. Journal of Travel Research 34(3): 81–88.
GOM (1991) Sixth Malaysia Plan 1991–1995. Kuala
Lumpur: Government of Malaysia.
Heng TM and Low L (1990) Economic impact of tour-
ism in Singapore. Annals of Tourism Research
17(2): 246–269.
Henry E and Deane B (1997) The contribution of tour-
ism to the economy of Ireland in 1990 and 1995.
Tourism Management 18(8): 535–553.
Hurley A, Archer B and Fletcher J (1994) The eco-
nomic impact of european community grants for
tourism in Republic of Ireland. Tourism Manage-
ment 15(3): 203–211.
Johnson RL and Moore E (1993) Tourism impact
estimation. Annals of Tourism Research 20(2):
279–288.
Khan H, Phang S and Toh R (1995) The multiplier effect:
Singapore’s hospitality industry. Cornell Hotel and
Restaurant Administration Quarterly 36(1): 64–69.
Khan H, Seng C and Cheong W (1990) Tourism multi-
pliers effects on Singapore. Annals of Tourism
Research 17(2): 408–418.
Kim SS, Chon K and Chung KY (2003) Convention
industry in South Korea: an economic impact anal-
ysis. Tourism Management 24(5): 533–541.
Kweka J, Morrissey O and Blake A (2003) The eco-
nomic potential of tourism in Tanzania. Journal
of International Development 15(3): 335–351.
Lee CK and Kwon KS (1995) Importance of second-
ary impact of foreign tourism receipts on the South
Korean economy. Journal of Travel Research
34(2): 50–54.
Lee CK and Taylor T (2005) Critical reflections on the
economic impact assessment of a mega-event: the
case of 2002 FIFA World Cup. Tourism Manage-
ment 26(4): 595–603.
Liu JC (1986) Relative economic contributions of visi-
tor groups in Hawaii. Journal of Travel Research
25(1): 2–9.
Liu, J and Var T (1982) Differential multipliers for the
accommodation sector. Tourism Management 3(3):
177–187.
Liu J, Var T and Timur A (1984) Tourist-income mul-
tipliers for Turkey. Tourism Management 5(4):
280–287.
Loomis JB and Walsh RG (1997) Recreation Eco-
nomic Decisions: Comparing Benefits and Costs.
State College, PA: Venture Publishing Inc.
Mistilis N and Dwyer L (1999) Tourism gateways and
regional economies: the distributional impacts of
MICE. International Journal of Tourism Research
1(6): 441–457.
MTPB (2006) Profile of Tourists by Selected Markets
2006. Malaysia Tourism Promotion Board.
Kualalumpur, Malaysia.
Rashid ZA and Bashir MS (2004) Economic impacts
of changing tourist profile in Malaysia: an inter-
industrial analysis. ASEAN Journal on Hospitality
and Tourism 3(1): 29–39.
Ruiz AL (1985) Tourism and the economy of Puerto
Rico: an input-output approach. Tourism Manage-
ment 6(1): 61–65.
Sadi M and Bartels F (1997) The rise of Malaysia’
tourism industry. Cornell Hotel and Restaurant
Administration Quarterly 38(5): 88–95.
Tohamy S and Swinscoe A (2001) The Economic
Impact of Tourism in Egypt. Available at: http://
www.eces.org.eg/Uploaded_Files/%7B02ADE2E4-
F995-4CDE-82CE-32BB9A4A15E9%7D_ECESP
VP5e.pdf (accessed September 2009).
United Nations (1999) Handbook of Input- Output
Table Compilation and Analysis. New York: UN.
Vaughan DR, Farr H and Slee RW (2000) Estimating
and interpreting the local economic benefits of
visitor spending: an explanation. Leisure Studies
19(2): 95–118.
Wanhill S (1994) The measurement of tourist
income multipliers. Tourism Management 15(4):
281–283.
Yan M and Wall G (2002) Economic perspectives on
tourism in China. Tourism and Hospitality
Research 3(3): 257–275.
46 Journal of Vacation Marketing 17(1)
Appendix
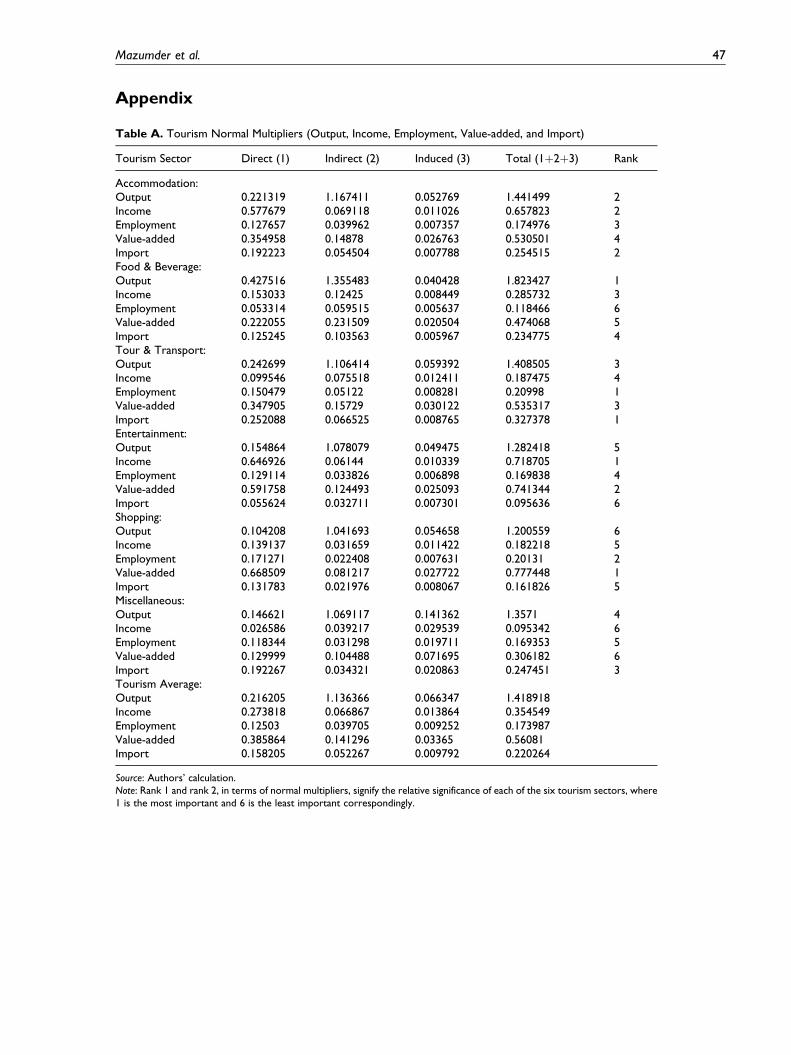
Table A. Tourism Normal Multipliers (Output, Income, Employment, Value-added, and Import)
Tourism Sector Direct (1) Indirect (2) Induced (3) Total (1þ2þ3) Rank
Accommodation:Output 0.221319 1.167411 0.052769 1.441499 2Income 0.577679 0.069118 0.011026 0.657823 2Employment 0.127657 0.039962 0.007357 0.174976 3Value-added 0.354958 0.14878 0.026763 0.530501 4Import 0.192223 0.054504 0.007788 0.254515 2Food & Beverage:Output 0.427516 1.355483 0.040428 1.823427 1Income 0.153033 0.12425 0.008449 0.285732 3Employment 0.053314 0.059515 0.005637 0.118466 6Value-added 0.222055 0.231509 0.020504 0.474068 5Import 0.125245 0.103563 0.005967 0.234775 4Tour & Transport:Output 0.242699 1.106414 0.059392 1.408505 3Income 0.099546 0.075518 0.012411 0.187475 4Employment 0.150479 0.05122 0.008281 0.20998 1Value-added 0.347905 0.15729 0.030122 0.535317 3Import 0.252088 0.066525 0.008765 0.327378 1Entertainment:Output 0.154864 1.078079 0.049475 1.282418 5Income 0.646926 0.06144 0.010339 0.718705 1Employment 0.129114 0.033826 0.006898 0.169838 4Value-added 0.591758 0.124493 0.025093 0.741344 2Import 0.055624 0.032711 0.007301 0.095636 6Shopping:Output 0.104208 1.041693 0.054658 1.200559 6Income 0.139137 0.031659 0.011422 0.182218 5Employment 0.171271 0.022408 0.007631 0.20131 2Value-added 0.668509 0.081217 0.027722 0.777448 1Import 0.131783 0.021976 0.008067 0.161826 5Miscellaneous:Output 0.146621 1.069117 0.141362 1.3571 4Income 0.026586 0.039217 0.029539 0.095342 6Employment 0.118344 0.031298 0.019711 0.169353 5Value-added 0.129999 0.104488 0.071695 0.306182 6Import 0.192267 0.034321 0.020863 0.247451 3Tourism Average:Output 0.216205 1.136366 0.066347 1.418918Income 0.273818 0.066867 0.013864 0.354549Employment 0.12503 0.039705 0.009252 0.173987Value-added 0.385864 0.141296 0.03365 0.56081Import 0.158205 0.052267 0.009792 0.220264
Source: Authors’ calculation.Note: Rank 1 and rank 2, in terms of normal multipliers, signify the relative significance of each of the six tourism sectors, where1 is the most important and 6 is the least important correspondingly.
Mazumder et al. 47
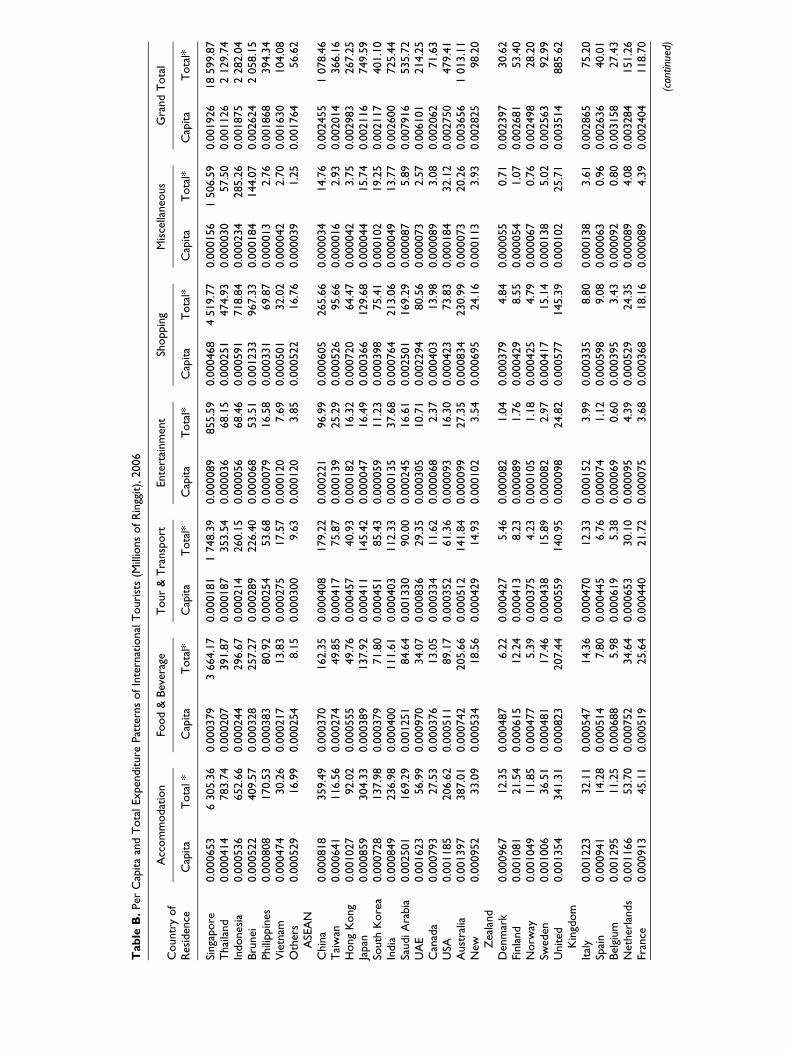
Tab
leB
.Per
Cap
ita
and
Tota
lExpen
diture
Pat
tern
sofIn
tern
atio
nal
Touri
sts
(Mill
ions
ofR
ingg
it),
2006
Countr
yof
Res
iden
ce
Acc
om
modat
ion
Food
&Bev
erag
eT
our
&T
ransp
ort
Ente
rtai
nm
ent
Shoppin
gM
isce
llaneo
us
Gra
nd
Tota
l
Cap
ita
Tota
l*
Cap
ita
Tota
l*C
apita
Tota
l*C
apita
Tota
l*C
apita
Tota
l*C
apita
Tota
l*C
apita
Tota
l*
Singa
pore
0.0
00653
6305.3
60.0
00379
3664.1
70.0
00181
1748.3
90.0
00089
855.5
90.0
00468
4519.7
70.0
00156
1506.5
90.0
01926
18
599.8
7T
hai
land
0.0
00414
783.7
40.0
00207
391.8
70.0
00187
353.5
40.0
00036
68.1
50.0
00251
474.9
30.0
00030
57.5
00.0
01126
2129.7
4In
dones
ia0.0
00536
652.6
60.0
00244
296.6
70.0
00214
260.1
50.0
00056
68.4
60.0
00591
718.8
40.0
00234
285.2
60.0
01875
2282.0
4Bru
nei
0.0
00522
409.5
70.0
00328
257.2
70.0
00289
226.4
00.0
00068
53.5
10.0
01233
967.3
30.0
00184
144.0
70.0
02624
2058.1
5Phili
ppin
es0.0
00808
170.5
30.0
00383
80.9
20.0
00254
53.6
80.0
00079
16.5
80.0
00331
69.8
70.0
00013
2.7
60.0
01868
394.3
4V
ietn
am0.0
00474
30.2
60.0
00217
13.8
30.0
00275
17.5
70.0
00120
7.6
90.0
00501
32.0
20.0
00042
2.7
00.0
01630
104.0
8O
ther
sA
SEA
N0.0
00529
16.9
90.0
00254
8.1
50.0
00300
9.6
30.0
00120
3.8
50.0
00522
16.7
60.0
00039
1.2
50.0
01764
56.6
2
Chin
a0.0
00818
359.4
90.0
00370
162.3
50.0
00408
179.2
20.0
00221
96.9
90.0
00605
265.6
60.0
00034
14.7
60.0
02455
1078.4
6T
aiw
an0.0
00641
116.5
60.0
00274
49.8
50.0
00417
75.8
70.0
00139
25.2
90.0
00526
95.6
60.0
00016
2.9
30.0
02014
366.1
6H
ong
Kong
0.0
01027
92.0
20.0
00555
49.7
60.0
00457
40.9
30.0
00182
16.3
20.0
00720
64.4
70.0
00042
3.7
50.0
02983
267.2
5Ja
pan
0.0
00859
304.3
30.0
00389
137.9
20.0
00411
145.4
20.0
00047
16.4
90.0
00366
129.6
80.0
00044
15.7
40.0
02116
749.5
9So
uth
Kore
a0.0
00728
137.9
80.0
00379
71.8
00.0
00451
85.4
30.0
00059
11.2
30.0
00398
75.4
10.0
00102
19.2
50.0
02117
401.1
0In
dia
0.0
00849
236.9
80.0
00400
111.6
10.0
00403
112.3
30.0
00135
37.6
80.0
00764
213.0
60.0
00049
13.7
70.0
02600
725.4
4Sa
udiA
rabia
0.0
02501
169.2
90.0
01251
84.6
40.0
01330
90.0
00.0
00245
16.6
10.0
02501
169.2
90.0
00087
5.8
90.0
07916
535.7
2U
AE
0.0
01623
56.9
90.0
00970
34.0
70.0
00836
29.3
50.0
00305
10.7
10.0
02294
80.5
60.0
00073
2.5
70.0
06101
214.2
5C
anad
a0.0
00793
27.5
30.0
00376
13.0
50.0
00334
11.6
20.0
00068
2.3
70.0
00403
13.9
80.0
00089
3.0
80.0
02062
71.6
3U
SA0.0
01185
206.6
20.0
00511
89.1
70.0
00352
61.3
60.0
00093
16.3
00.0
00423
73.8
30.0
00184
32.1
20.0
02750
479.4
1A
ust
ralia
0.0
01397
387.0
10.0
00742
205.6
60.0
00512
141.8
40.0
00099
27.3
50.0
00834
230.9
90.0
00073
20.2
60.0
03656
1013.1
1N
ew Zea
land
0.0
00952
33.0
90.0
00534
18.5
60.0
00429
14.9
30.0
00102
3.5
40.0
00695
24.1
60.0
00113
3.9
30.0
02825
98.2
0
Den
mar
k0.0
00967
12.3
50.0
00487
6.2
20.0
00427
5.4
60.0
00082
1.0
40.0
00379
4.8
40.0
00055
0.7
10.0
02397
30.6
2Fi
nla
nd
0.0
01081
21.5
40.0
00615
12.2
40.0
00413
8.2
30.0
00089
1.7
60.0
00429
8.5
50.0
00054
1.0
70.0
02681
53.4
0N
orw
ay0.0
01049
11.8
50.0
00477
5.3
90.0
00375
4.2
30.0
00105
1.1
80.0
00425
4.7
90.0
00067
0.7
60.0
02498
28.2
0Sw
eden
0.0
01006
36.5
10.0
00481
17.4
60.0
00438
15.8
90.0
00082
2.9
70.0
00417
15.1
40.0
00138
5.0
20.0
02563
92.9
9U
nited
Kin
gdom
0.0
01354
341.3
10.0
00823
207.4
40.0
00559
140.9
50.0
00098
24.8
20.0
00577
145.3
90.0
00102
25.7
10.0
03514
885.6
2
Ital
y0.0
01223
32.1
10.0
00547
14.3
60.0
00470
12.3
30.0
00152
3.9
90.0
00335
8.8
00.0
00138
3.6
10.0
02865
75.2
0Sp
ain
0.0
00941
14.2
80.0
00514
7.8
00.0
00445
6.7
60.0
00074
1.1
20.0
00598
9.0
80.0
00063
0.9
60.0
02636
40.0
1Bel
gium
0.0
01295
11.2
50.0
00688
5.9
80.0
00619
5.3
80.0
00069
0.6
00.0
00395
3.4
30.0
00092
0.8
00.0
03158
27.4
3N
ether
lands
0.0
01166
53.7
00.0
00752
34.6
40.0
00653
30.1
00.0
00095
4.3
90.0
00529
24.3
50.0
00089
4.0
80.0
03284
151.2
6Fr
ance
0.0
00913
45.1
10.0
00519
25.6
40.0
00440
21.7
20.0
00075
3.6
80.0
00368
18.1
60.0
00089
4.3
90.0
02404
118.7
0
(con
tinue
d)
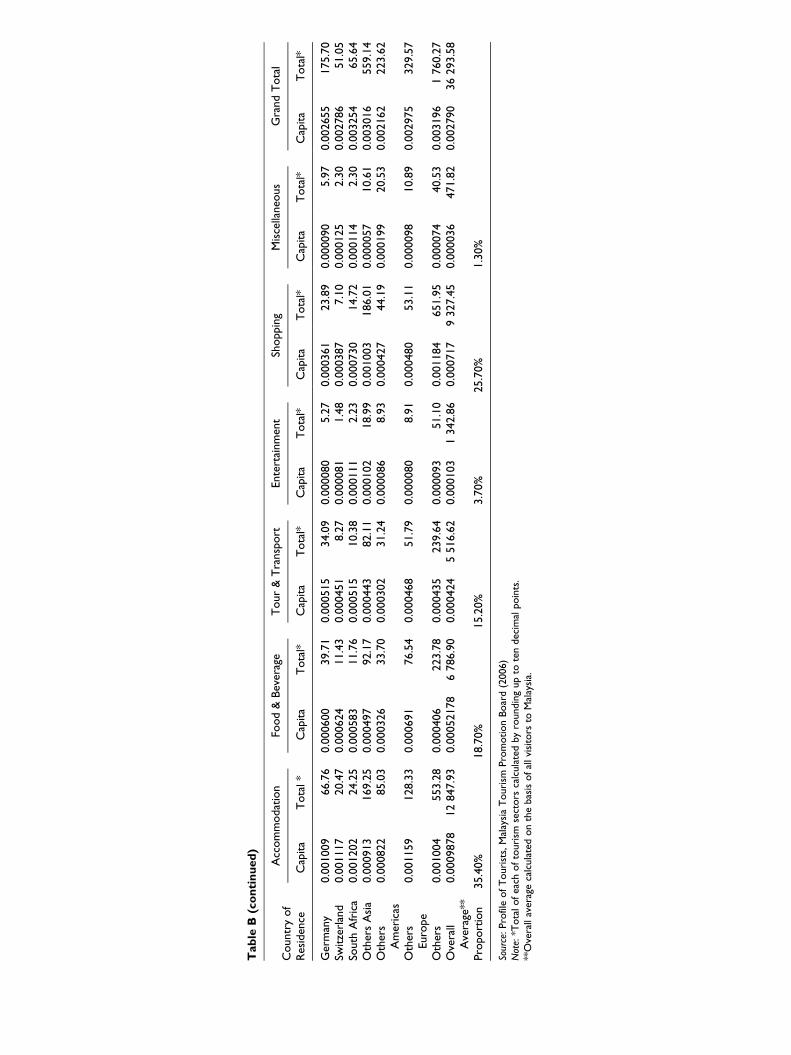
Tab
leB
(co
nti
nu
ed
)
Countr
yof
Res
iden
ce
Acc
om
modat
ion
Food
&Bev
erag
eT
our
&T
ransp
ort
Ente
rtai
nm
ent
Shoppin
gM
isce
llaneo
us
Gra
nd
Tota
l
Cap
ita
Tota
l*
Cap
ita
Tota
l*C
apita
Tota
l*C
apita
Tota
l*C
apita
Tota
l*C
apita
Tota
l*C
apita
Tota
l*
Ger
man
y0.0
01009
66.7
60.0
00600
39.7
10.0
00515
34.0
90.0
00080
5.2
70.0
00361
23.8
90.0
00090
5.9
70.0
02655
175.7
0Sw
itze
rlan
d0.0
01117
20.4
70.0
00624
11.4
30.0
00451
8.2
70.0
00081
1.4
80.0
00387
7.1
00.0
00125
2.3
00.0
02786
51.0
5So
uth
Afr
ica
0.0
01202
24.2
50.0
00583
11.7
60.0
00515
10.3
80.0
00111
2.2
30.0
00730
14.7
20.0
00114
2.3
00.0
03254
65.6
4O
ther
sA
sia
0.0
00913
169.2
50.0
00497
92.1
70.0
00443
82.1
10.0
00102
18.9
90.0
01003
186.0
10.0
00057
10.6
10.0
03016
559.1
4O
ther
sA
mer
icas
0.0
00822
85.0
30.0
00326
33.7
00.0
00302
31.2
40.0
00086
8.9
30.0
00427
44.1
90.0
00199
20.5
30.0
02162
223.6
2
Oth
ers
Euro
pe
0.0
01159
128.3
30.0
00691
76.5
40.0
00468
51.7
90.0
00080
8.9
10.0
00480
53.1
10.0
00098
10.8
90.0
02975
329.5
7
Oth
ers
0.0
01004
553.2
80.0
00406
223.7
80.0
00435
239.6
40.0
00093
51.1
00.0
01184
651.9
50.0
00074
40.5
30.0
03196
1760.2
7O
vera
llA
vera
ge**
0.0
009878
12
847.9
30.0
0052178
6786.9
00.0
00424
5516.6
20.0
00103
1342.8
60.0
00717
9327.4
50.0
00036
471.8
20.0
02790
36
293.5
8
Pro
port
ion
35.4
0%
18.7
0%
15.2
0%
3.7
0%
25.7
0%
1.3
0%
Sour
ce:Pro
file
ofT
ouri
sts,
Mal
aysi
aT
ouri
smPro
motion
Boar
d(2
006)
Not
e:*T
ota
lofea
chofto
uri
smse
ctors
calc
ula
ted
by
roundin
gup
tote
ndec
imal
poin
ts.
**O
vera
llav
erag
eca
lcula
ted
on
the
bas
isofal
lvi
sito
rsto
Mal
aysi
a.


