Embed Size (px)
Citation preview

1
Data as on March 31, 2022
FUNDFACTS
Product labelling overleaf.
31st March 2022

2
Data as on March 31, 2022
Product Label 3
Potential Risk matrix for Debt schemes 5
CEO’S View 7
Glossary 8
How to read a Factsheet 9
Equity Market Review 10
Debt Market Review 11
L&T Flexicap Fund 12
L&T Tax Advantage Fund 13
L&T Large and Midcap Fund 14
L&T Infrastructure Fund 15
L&T India Large Cap Fund 16
L&T India Value Fund 17
L&T Midcap Fund 18
L&T Emerging Businesses Fund 19
L&T Business Cycles Fund 20
L&T Focused Equity Fund 21
L&T Nifty 50 Index Fund 22
L&T Nifty Next 50 Index Fund 23
L&T Balanced Advantage Fund 24
L&T Hybrid Equity Fund 25
L&T Arbitrage Opportunities Fund 26
L&T Equity Savings Fund 27
Equity Fund Snapshot 28
Debt Fund Snapshot 29
L&T Overnight Fund 30
L&T Liquid Fund 31
L&T Ultra Short Term Fund 32
L&T Money Market Fund 33
L&T Banking and PSU Debt Fund 34
L&T Short Term Bond Fund 35
L&T Low Duration Fund 36
L&T Credit Risk Fund 37
L&T Flexi Bond Fund 38
L&T Triple Ace Bond Fund 39
L&T Gilt Fund 40
L&T Conservative Hybrid Fund 41
L&T Resurgent India Bond Fund 42
Fund Manager wise Scheme Details 43
SIP Performance Of Growth Option 44
NAV 46
Performance of Schemes 48
Minimum Investment Amount Details 52
Total Expense Ratio 52
IDCW History 53
Branches details of the Company 56
CONTENTS PG. NO CONTENTS PG. NO

3
Data as on March 31, 2022
L&T Overnight Fund - An open-ended debt scheme investing in overnight securities. A relatively low interest rate risk and relatively low credit risk:• Reasonable returns with lower volatility and higher liquidity over short term • Investment in debt and money market instruments with overnight maturity
L&T Arbitrage Opportunities Fund - An open ended scheme investing in arbitrage opportunities: • Generation of reasonable returns over short to medium term • Investment predominantly in arbitrage opportunities in the cash and derivatives segments of the equity markets; and debt and money market instruments
Product Labels
*Investors should consult their financial advisers if in doubt about whether the product is suitable for them.#The Macaulay duration is the weighted average term to maturity of the cash flows from a bond. The weight of each cash flow is determined by dividing the present value of the cash flow by the price.
Scheme name and Type of scheme This product is suitable for investors who are seeking* Riskometer of the Scheme Riskometer of the benchmark
Low
Low to
Moderate Moderate Moderately
Low
Low to
Moderate Moderate
High
Very High
High
VERYHIGHLOW
Investors understand that their principal will be at low risk
Low
Low to
Moderate Moderate Moderately
Low
Low to
Moderate Moderate
High
Very High
High
VERYHIGHLOW
Investors understand that their principal will be at low risk
Low
Low
to
ModerateModerate Moderately
Low
Low
to
ModerateModerate
High
VeryHigh
High
VERYHIGHLOW
Investors understand that their principal will be from low to moderate risk
Low
Low
to
ModerateModerate Moderately
Low
Low
to
ModerateModerate
High
VeryHigh
High
VERYHIGHLOW
Investors understand that their principal will be at moderate risk
L&T Triple Ace Bond Fund - An open-ended debt scheme predominantly investing in AA+ and above rated corporate bonds. A relatively high interest rate risk and relatively low credit risk: • Generation of regular and stable income over medium to long term • Investment predominantly in AA+ and above rated corporate bonds and money market instruments
L&T Banking and PSU Debt Fund - An open-ended debt scheme primarily investing in debt instruments of banks, public sector undertakings, public financial institutions and municipal bonds. A relatively high interest rate risk and relatively low credit risk: • Generation of reasonable returns and liquidity over short term • Investment predominantly in securities issued by Banks, Public Sector Undertakings and Public Financial Institutions and municipal corporations in India
L&T Resurgent India Bond Fund - An open ended medium term debt scheme investing in instruments such that the Macaulay duration of the portfolio is between 3 years to 4 years (please refer to page no. 18 under the section “Asset Allocation Pattern” in the SID for details on Macaulay’s Duration)#. A relatively high interest rate risk and moderate credit risk: • Generation of income over medium term • Investment primarily in debt and money market securities
L&T Equity Savings Fund - An open ended scheme investing in equity, arbitrage and debt: • Generation of regular income by predominantly investing in arbitrage opportunities in the cash and derivatives segment and long–term capital appreciation through unhedged exposure to equity and equity related instruments. • Investment in equity and equity related instruments, derivatives and debt and money market instruments
L&T Money Market Fund - An open-ended debt scheme investing in money market instruments. A relatively low interest rate risk and moderate credit risk: • Generation of regular income over short to medium term • Investment in money market instruments
L&T Ultra Short Term Fund - An open ended ultra-short term debt scheme investing in instruments such that the Macaulay duration of the portfolio is between 3 months to 6 months (please refer to page no. 18 under the section “Asset Allocation Pattern” in the SID for details on Macaulay’s Duration)#. A relatively low interest rate risk and moderate credit risk: • Generation of reasonable and stable income and liquidity over short term • Investments predominantly in highly liquid money market instruments, government securities and corporate debt
L&T Liquid Fund - An open-ended liquid scheme. A relatively low interest rate risk and moderate credit risk: • Generation of reasonable returns while maintaining safety and superior liquidity over short term • Investment predominantly in highly liquid money market instruments, government securities and corporate debt.
L&T Low Duration Fund - An open ended low duration debt scheme investing in instruments such that the Macaulay duration of the portfolio is between 6 months to 12 months (please refer to page no.17 under the section “Asset Allocation Pattern” in the SID for details on Macaulay’s Duration)#. A relatively low interest rate risk and moderate credit risk. • Generation of reasonable returns over short to medium term • Investment in fixed income securities and money market instruments
L&T Flexi Bond Fund - An open-ended dynamic debt scheme investing across duration. A relatively high interest rate risk and relatively low credit risk: • Generation of reasonable returns over medium to long term • Investment in fixed income securities
L&T Gilt Fund - An open-ended debt scheme investing in government securities across maturity. A relatively high interest rate risk and relatively low credit risk: • Generation of returns over medium to long term • Investment in Government Securities
L&T Short Term Bond Fund - An open ended short term debt scheme investing in instruments such that the Macaulay duration of the portfolio is between 1 year to 3 years (please refer to page no. 16 under the section “Asset Allocation Pattern” in the SID for details on Macaulay’s Duration)#. A moderate interest rate risk and moderate credit risk: • Generation of regular returns over short term • Investment in fixed income securities of shorter term maturity.
Low
Low
to
ModerateModerate Moderately
Low
Low
to
ModerateModerate
High
VeryHigh
High
VERYHIGHLOW
Investors understand that their principal will be at moderate risk
Low
Low
to
ModerateModerate Moderately
Low
Low
to
ModerateModerate
High
VeryHigh
High
VERYHIGHLOW
Investors understand that their principal will be at moderate risk

4
Data as on March 31, 2022
Low
Low
to
ModerateModerate Moderately
Low
Low
to
ModerateModerate
High
VeryHigh
High
VERYHIGHLOW
Investors understand that their principal will be at moderately high risk
Low
Low
to
ModerateModerate Moderately
Low
Low
to
ModerateModerate
High
VeryHigh
High
VERYHIGHLOW
Investors understand that their principal will be at moderately high risk
Low
Low
to
ModerateModerate Moderately
Low
Low
to
ModerateModerate
High
VeryHigh
High
VERYHIGHLOW
Investors understand that their principal will be at moderately high risk
Product Labels
Scheme name and Type of scheme This product is suitable for investors who are seeking* Riskometer of the Scheme Riskometer of the benchmark
Low
Low
to
ModerateModerate Moderately
Low
Low
to
ModerateModerate
High
VeryHigh
High
VERYHIGHLOW
Investors understand that their principal will be at very high risk
Low
Low
to
ModerateModerate Moderately
Low
Low
to
ModerateModerate
High
VeryHigh
High
VERYHIGHLOW
Investors understand that their principal will be at very high risk
L&T Midcap Fund - An open ended equity scheme predominantly investing in mid cap stocks: • Long term capital appreciation • Investment primarily in midcap equity and equity-related securities
L&T Flexicap Fund - An open ended dynamic equity scheme investing across large cap, mid cap, small cap stocks: • Long term capital growth • Investment predominantly in equity and equity-related securities
L&T Large and Midcap Fund - An open ended equity scheme investing in both large cap and mid cap stocks: • Long term capital growth • Investment predominantly in equity and equity-related securities, with minimum allocation of at least 35% each to large cap and mid cap companies
L&T Tax Advantage Fund - An open ended equity linked saving scheme with a statutory lock in of 3 years and tax benefit: • Long term capital growth • Investment predominantly in equity and equity-related securities
L&T Infrastructure Fund - An open-ended equity scheme investing in infrastructure sector: • Long term capital appreciation • Investment predominantly in equity and equity-related instruments of companies in the infrastructure sectorL&T India Large Cap Fund - An open ended equity scheme predominantly investing in large cap stocks: • Long term capital appreciation • Investment in equity and equity related securities, including equity derivatives in the Indian markets and foreign securities; with predominant investments in large cap stocks
L&T India Value Fund - An open ended equity scheme following a value investment strategy: • Long term capital appreciation • Investment predominantly in equity and equity-related securities in Indian markets and foreign securities, with higher focus on undervalued securities
L&T Business Cycles Fund - An open–ended equity scheme following business cycles based investing theme: • Long term capital appreciation • Investment predominantly in equity and equity-related securities, including equity derivatives in Indian markets with focus on riding business cycles through dynamic allocation between various sectors and stocks at different stages of business cycles in the economyL&T Emerging Businesses Fund - An open-ended equity scheme predominantly investing in small cap stocks: • Long term capital appreciation • Investment predominantly in equity and equity-related securities, including equity derivatives in Indian markets with key theme focus being emerging companies (small cap stocks); and foreign securities
L&T Focused Equity Fund - An open ended equity scheme investing in maximum 30 stocks in large, mid and smallcap companies: • Long term capital appreciation • Investment in a concentrated portfolio of equity and equity related instruments of maximum 30 stocks.
L&T Nifty 50 Index Fund - An open-ended Equity Scheme tracking NIFTY 50 Index: • Long term capital appreciation • Investment in equity securities covered by the NIFTY 50.
L&T Nifty Next 50 Index Fund - An open-ended Equity Scheme tracking Nifty Next 50 Index: •Long term capital appreciation • Investment in equity securities covered by the NIFTY NEXT 50
L&T Hybrid Equity Fund - An open ended hybrid scheme investing predominantly in equity and equity related instruments: • Long term capital appreciation and generation of reasonable returns • Investment in equity and equity-related securities and debt and money market instruments.
L&T Conservative Hybrid Fund - An open ended hybrid scheme investing predominantly in debt instruments: • Generation of regular income over medium to long term • Investment in debt, equity and money market securities
L&T Balanced Advantage Fund - An open ended dynamic asset allocation fund: • Long term capital appreciation and generation of reasonable returns • Investment in equity and equity related instruments, derivatives and debt and money market instruments.
L&T Credit Risk Fund - An open-ended debt scheme predominantly investing in AA and below rated corporate bonds (excluding AA+ rated corporate bonds). A relatively high interest rate risk and relatively high credit risk: • Generation of regular returns and capital appreciation over medium to long term • Investment in debt instruments(including securitized debt), government and money market securities
*Investors should consult their financial advisers if in doubt about whether the product is suitable for them.#The Macaulay duration is the weighted average term to maturity of the cash flows from a bond. The weight of each cash flow is determined by dividing the present value of the cash flow by the price.
Low
Low
to
ModerateModerate Moderately
Low
Low
to
ModerateModerate
High
VeryHigh
High
VERYHIGHLOW
Investors understand that their principal will be at low risk

5
Data as on March 31, 2022Potential Risk Class (PRC) Matrix for Debt schemes
Sr. No Scheme Type of the scheme PRC matrix
1 L&T Overnight Fund
An open-ended debt scheme investing in overnight securities. A relatively low interest rate risk and relatively low credit risk Potential Risk Class
Credit Risk → RelativelyLow (Class A)
Moderate(Class B)
RelativelyHigh (Class C)Interest Rate
Risk ↓
Relatively Low(Class I)
A-I
Moderate(Class II)
RelativelyHigh (Class III)
2L&T FMP – SERIES
XVIII Plan B (1229 Days)
A close-ended debt fund. A relatively low interest rate risk and relatively low credit risk
3L&T FMP – SERIES
XVIII Plan D (1155 Days)
A close-ended debt fund. A relatively low interest rate risk and relatively low credit risk
4L&T FMP - Series
XVII - Plan B (1452 days)
A close-ended debt fund. A relatively low interest rate risk and relatively low credit risk
5 L&T Gilt FundAn open-ended debt scheme investing in government securities across maturity. A relatively high interest rate risk and relatively low credit risk. Potential Risk Class
Credit Risk → RelativelyLow (Class A)
Moderate(Class B)
RelativelyHigh (Class C)Interest Rate
Risk ↓
Relatively Low(Class I)
Moderate(Class II)
RelativelyHigh (Class III)
A-III
6 L&T Flexi Bond Fund
An open-ended dynamic debt scheme investing across duration. A relatively high interest rate risk and relatively low credit risk.
7 L&T Triple Ace Bond Fund
An open-ended debt scheme predominantly investing in AA+ and above rated corporate bonds. A relatively high interest rate risk and relatively low credit risk.
8 L&T Banking and PSU Debt Fund
An open-ended debt scheme primarily investing in debt instruments of banks, public sector undertakings, public financial institutions and municipal bonds. A relatively high interest rate risk and relatively low credit risk.
9 L&T Low Duration Fund
An open ended low duration debt scheme investing in instruments such that the Macaulay duration of the portfolio is between 6 months to 12 months (please refer to page no.17 under the section “Asset Allocation Pattern” in the SID for details on Macaulay’s Duration)#. A relatively low interest rate risk and moderate credit risk.
Potential Risk Class
Credit Risk → RelativelyLow (Class A)
Moderate(Class B)
RelativelyHigh (Class C)Interest Rate
Risk ↓
Relatively Low(Class I)
B-I
Moderate(Class II)
RelativelyHigh (Class III)
10 L&T Liquid Fund An open-ended liquid scheme. A relatively low interest rate risk and moderate credit risk.
11 L&T Ultra Short Term Fund
An open ended ultra-short term debt scheme investing in instruments such that the Macaulay duration of the portfolio is between 3 months to 6 months (please refer to page no. 18 under the section “Asset Allocation Pattern” in the SID for details on Macaulay’s Duration)#. A relatively low interest rate risk and moderate credit risk.
12 L&T Money Market Fund
An open-ended debt scheme investing in money market instruments. A relatively low interest rate risk and moderate credit risk.
13L&T FMP SERIES
XVIII Plan C (1178 Days)
A close-ended debt fund. A relatively low interest rate risk and moderate credit risk.
#The Macaulay duration is the weighted average term to maturity of the cash flows from a bond. The weight of each cash flow is determined by dividing the present value of the cash flow by the price.

6
Data as on March 31, 2022Potential Risk Class (PRC) Matrix for Debt schemes
Sr. No Scheme Type of the scheme PRC matrix
14 L&T Short Term Bond Fund
An open ended short term debt scheme investing in instruments such that the Macaulay duration of the portfolio is between 1 year to 3 years (please refer to page no. 16 under the section “Asset Allocation Pattern” in the SID for details on Macaulay’s Duration)#. A moderate interest rate risk and moderate credit risk
Potential Risk Class
Credit Risk → RelativelyLow (Class A)
Moderate(Class B)
RelativelyHigh (Class C)Interest Rate
Risk ↓
Relatively Low(Class I)
Moderate(Class II) B-II
RelativelyHigh (Class III)
15 L&T Resurgent India Bond Fund
An open ended medium term debt scheme investing in instruments such that the Macaulay duration of the portfolio is between 3 years to 4 years (please refer to page no. 18 under the section “Asset Allocation Pattern” in the SID for details on Macaulay’s Duration)#. A relatively high interest rate risk and moderate credit risk.
Potential Risk Class
Credit Risk → RelativelyLow (Class A)
Moderate(Class B)
RelativelyHigh (Class C)Interest Rate
Risk ↓
Relatively Low(Class I)
Moderate(Class II)
RelativelyHigh (Class III)
B-III
16 L&T Credit Risk Fund
An open-ended debt scheme predominantly investing in AA and below rated corporate bonds (excluding AA+ rated corporate bonds). A relatively high interest rate risk and relatively high credit risk.
Potential Risk Class
Credit Risk → RelativelyLow (Class A)
Moderate(Class B)
RelativelyHigh (Class C)Interest Rate
Risk ↓
Relatively Low(Class I)
Moderate(Class II)
RelativelyHigh (Class III)
C-III
#The Macaulay duration is the weighted average term to maturity of the cash flows from a bond. The weight of each cash flow is determined by dividing the present value of the cash flow by the price.

7
Data as on March 31, 2022
CEO’s VIEW
KAILASH KULKARNI
CEO, L&T Mutual Fund
CEO Speak - March 2022
As we draw curtains on financial 21-22, we wish the new FY brings in good health and wealth to everyone. While we cannot predict the markets or the geopolitics of the world, we can anticipate some degree of volatility and hence be prepared. This means that one must review their portfolios from time to time and the beginning of a new financial year may be reasonable as you may want to take stock of your financial goals, your portfolio and its performance. However, reviewing one’s portfolio does not necessarily mean “exiting” from instruments/stock or funds but more on “rebalancing’ especially the ratio of debt and equity exposure that your portfolio needs basis of your financial goals and risk appetite.
I am taking this opportunity to reflect on the events and trajectory of the year gone by….
A brief overview of the financial markets in FY21-22
The fiscal year gone by - FY22 has been an eventful year for markets witnessing a roller coaster ride with the indices touching several milestones.
The data shows that in FY22, the S&P Sensex grew by 18%, however, one needs to break this down into two halves to understand it better. From April to mid-October we saw the Sensex reaching its highest level nearly reaching 62,000 from 50,000 at the beginning of the year. However, post mid-October there has been huge volatility with the Sensex falling to a low of around 53,000 from its high and then recovering to 58,700 levels mainly on account of the rally in the last 3 weeks of march.
The global events as also the war between Russia & Ukraine caused major upheaval in both the fixed income and equity markets. The cost of oil shot up and also fuelled inflation which had become a cause of worry across the globe.
On the fixed-income side global factors that central banks across the globe were poised to increase rates played on the mind of the Indian investors also. Hence people shifted to shorter-duration funds which were a result of the uncertainty of the bond markets.
Amongst all these uncertainties and events - the resilience of the Indian markets, the strength of the domestic Institutions and the growing confidence of the retail investor stood out.
Indian stock market outperformed major global peers including the US & UK in the fiscal year 2021-22. The Nifty50 index emerged as the best performing index in FY22, gaining by 19% at 17,465 levels in the period under review. In comparison, US market benchmark S&P500 index gained 16%, UK’s FTSE100 index 13% & French benchmark CAC40 11%.
The foreign investors were seen exiting India in large numbers in the latter part of the year, pulling out Rs 1.44 trillion from domestic stocks in FY22. This outflow was compensated by DII buying in significant numbers. The large SIP book of 11,000 crs also helped the equity markets when we saw a sharp fall during the year. The mutual fund industry added more than 1 Cr new investors this FY substantiating the growing and sustained confidence in the Indian mutual fund industry.
Way forward ….
We believe that markets may continue to outperform in FY23 as well, as the Indian economy is ready for multi-year growth despite short-term hiccups. Our advice to investors remains to look at the equity market for the long-term goals and not get swayed by the euphoria or short-term blips. We strongly believe that SIP (Systematic Investment Plan) remains to be one of the wisest ways to invest in the equity markets to average out the cost of investing over multiple market cycles. We believe in the growth story called India and a lot of indicators like the GST collections, government expenditures and increased activities both in the manufacturing and services sectors are all showing growth as we are coming out of the pandemic.
Your new FY resolution can revolve around Reviewing & Rebalance your portfolio and believe in our markets as India is the place to be for an investor.
Wishing you a rocking new Fiscal Year!
Mutual Fund investments are subject to market risks, read all scheme related documents carefully.
Disclaimer – The article (including market views expressed herein) is for general information only and does not have regard to specific investment objectives, financial situation and the particular needs of any specific person who may receive this information. The article provides general information and comparisons made (if any) are only for illustration purposes. Investments in mutual funds and secondary markets inherently involve risks and the recipient should consult their legal, tax and financial advisors before investing. Recipients of this document should understand that statements made herein regarding future prospects may not be realized. Recipient should also understand that any reference to the indices/ sectors/ securities/ schemes etc. in the article is only for illustration purpose and are NOT stock recommendation(s) from the author or L&T Investment Management Limited, the asset management company of L&T Mutual Fund (“the Fund”) or any of its associates. Any performance information shown refers to the past and should not be seen as an indication of future returns. The value of investments and any income from them can go down as well as up. The distribution of the article in certain jurisdictions may be restricted or totally prohibited and accordingly, persons who come into possession of the article are required to inform themselves about, and to observe, any such restrictions.
Source: AMFI, BSE, NSE, Internal

8
Data as on March 31, 2022
GLOSSARYData as on June 30, 2020
GLOSSARY
SHARPE RATIOSharpe Ratio is a risk to reward ratio, it measures portfolio returns generated in excess to the investment in risk-free asset, for per unit of total risk taken. While, positive Sharpe ratio indicates, portfolio compensating investors with excess returns (over risk-free rate) for the commensurate risk taken; negative Sharpe ratio indicates, investors are better off investing in risk-free assets.
PORTFOLIO YIELD (YIELD TO MATURITY)Weighted average yield of the securities in scheme portfolio.
YTM is calculated considering the entire debt portfolio including accrued interest, investments in Cash component (TREPS/RREPO) and Net Receivable/Payable.
RISK FREE RETURNThe theoretical rate of return of an investment with safest (zero risk) investment in a country.
BETABeta (B) of a portfolio is a number indicating the relation between portfolio returns with that of the market index i.e. it measure the volatility, or systematic risk, of a portfolio in comparison to the market as a whole.
STANDARD DEVIATIONA statistical measure that defines expected volatility/risk associated with a portfolio. This explains the variation/deviation from the average returns delivered by the portfolio. A higher standard deviation means higher volatility (risk) and a lower standard deviation means lower volatility.
The Macaulay duration is the weighted average term to maturity of the cash flows from a bond. The weight of each cash flow is determined by dividing the present value of the cash flow by the price. It is a measure of how long it takes for the priceof a bond to be repaid by the cash flows from it.
MACAULAY DURATION
A formula that expresses the measurable change in the value of a security in response to a change in interest rates. Modified duration of portfolio can be used to anticipate the change in market value of portfolio for every change in portfolio yield.
MODIFIED DURATION
TRACKING ERRORTracking error indicates how closely the portfolio return is tracking the benchmark Index return. It measures the deviation between portfolio return and benchmark index return. A lower tracking error indicates portfolio closely tracking benchmark index and higher tracking error indicates portfolio returns with higher deviation from benchmark index returns.
TOTAL EXPENSE RATIOTotal expenses charged to scheme for the month expressed as a percentage to averagemonthly net assets.
AVERAGE MATURITYWeighted average maturity of the securities in scheme.
IDCWIDCW stands for ‘Income Distribution cum Capital Withdrawal option’. The amounts can be distributed out of investors’ capital (Equalization Reserve), which is part of the sale price that represents realized gains, as may be declared by the Trustees at its discretion from time to time (subject to the availability of distributable surplus as calculated in accordance with the Regulations).Refer our notice no. 55 and addendum no. 56 dated March 26, 2021 for details on IDCW.

9
Data as on March 31, 2022
HOW TO READ A FACTSHEET
FUND MANAGERAn employee of the asset management company such as a mutual fund or life insurer, who manages investments of the scheme. He is usually part of a larger team of fund managers and research analysts.
APPLICATION AMOUNT FOR FRESH SUBSCRIPTIONThis is the minimum investment amount for a new investor in a mutual fund scheme.
MINIMUM ADDITIONAL AMOUNTThis is the minimum investment amount for an existing investor in a mutual fund scheme.
YIELD TO MATURITYThe Yield to Maturity or the YTM is the rate of return anticipated on a bond if held until maturity. YTM is expressed as an annual rate. The YTM factors in the bond’s current market price, par value, coupon interest rate and time to maturity.
SIPSIP or systematic investment plan works on the principle of making periodic investments of a fixed sum. It works similar to a recurring bank deposit. For instance, an investor may opt for an SIP that invests Rs 500 every 15th of the month in an equity fund for a period of three years.
NAVThe NAV or the net asset value is the total asset value per unit of the mutual fund after deducting all related and permissible expenses. The NAV is calculated at the end of every business day. It is the value at which the investor enters or exits the mutual fund.
BENCHMARKA group of securities, usually a market index, whose performance is used as a standard or benchmark to measure investment performance of mutual funds, among other investments. Some typical benchmarks include the Nifty, Sensex, BSE200, BSE500, 10-Year Gsec.
EXIT LOADExit load is charged at the time an investor redeems the units of a mutual fund. The exit load is deducted from the prevailing NAV at the time of redemption. For instance, if the NAV is Rs. 100 and the exit load is 1 %, the redemption price would be Rs.99 per unit.
MODIFIED DURATIONModified duration is the price sensitivity and the percentage change in price for a unit change in yield.
STANDARD DEVIATIONStandard deviation is a statistical measure of the range of an investment’s performance. When a mutual fund has a high standard deviation, its means its range of performance is wide, implying greater volatility.
SHARPE RATIOThe Sharpe Ratio, named after its founder, the Nobel Laureate William Sharpe, is a measure of risk-adjusted returns. It is calculated using standard deviation and excess return to determine reward per unit of risk.
BETA RATIO (PORTFOLIO BETA)Beta is a measure of an investment’s volatility vis-a-vis the market. Beta of less than 1 means that the security will be less volatile than the market. A beta of greater than 1 implies that the security’s price will be more volatile than the market.
AVERAGE PORTFOLIO PE (AVERAGE P/E)It is price to earnings ratio of the stocks calculated for the entire portfolio on a weighted average basis.
AVERAGE PORTFOLIO PRICE TO BOOK RATIO (AVERAGE P/BV)It is price to book value of the stocks calculated for the entire portfolio on a weighted average basis.
AVERAGE PORTFOLIO IDCW YIELD (AVERAGE IDCW YIELD)It is IDCW yield of the stocks calculated for the entire portfolio on a weighted average basis.
NET EQUITYNet equity level is the net equity exposure percentage adjusted for any derivative positions in stocks or index for hedging or rebalancing purpose.
R SQUAREDIt is a statistical measure of how closely the portfolio returns are correlated with its benchmark.
AUMAUM or assets under management refers to the recent / updated cumulative market value of investments managed by a mutual fund or any investment firm.
HOLDINGSThe holdings or the portfolio is a mutual fund’s latest or updated reported statement of investments/securities. These are usually displayed in terms of percentage to net assets or the rupee value or both. The objective is to give investors an idea of where their money is being invested by the fund manager.
NATURE OF SCHEMEThe investment objective and underlying investments determine the nature of the mutual fund scheme. For instance, a mutual fund that aims at generating capital appreciation by investing in stock markets is an equity fund or growth fund. Likewise, a mutual fund that aims at capital preservation by investing in debt markets is a debt fund or income fund. Each of these categories may have sub-categories.
RATING PROFILEMutual funds invest in securities after evaluating their
IDCWIDCW stands for ‘Income Distribution cum Capital Withdrawal option’. The amounts can be distributed out of investors’ capital (Equalization Reserve), which is part ofthe sale price that represents realized gains, as may be declared by the Trustees at its discretion from time to time(subject to the availability of distributable surplus as calculated in accordance with the Regulations).Refer our notice no. 55 and addendum no. 56 dated March 26, 2021 for details on IDCW.
creditworthiness as disclosed by the ratings. A depiction of the mutual fund in various investments based on their ratings becomes the rating profile of the fund. Typically, this is a feature of debt funds.
10
Data as on March 31, 2022
Source: Bloomberg, MSCI
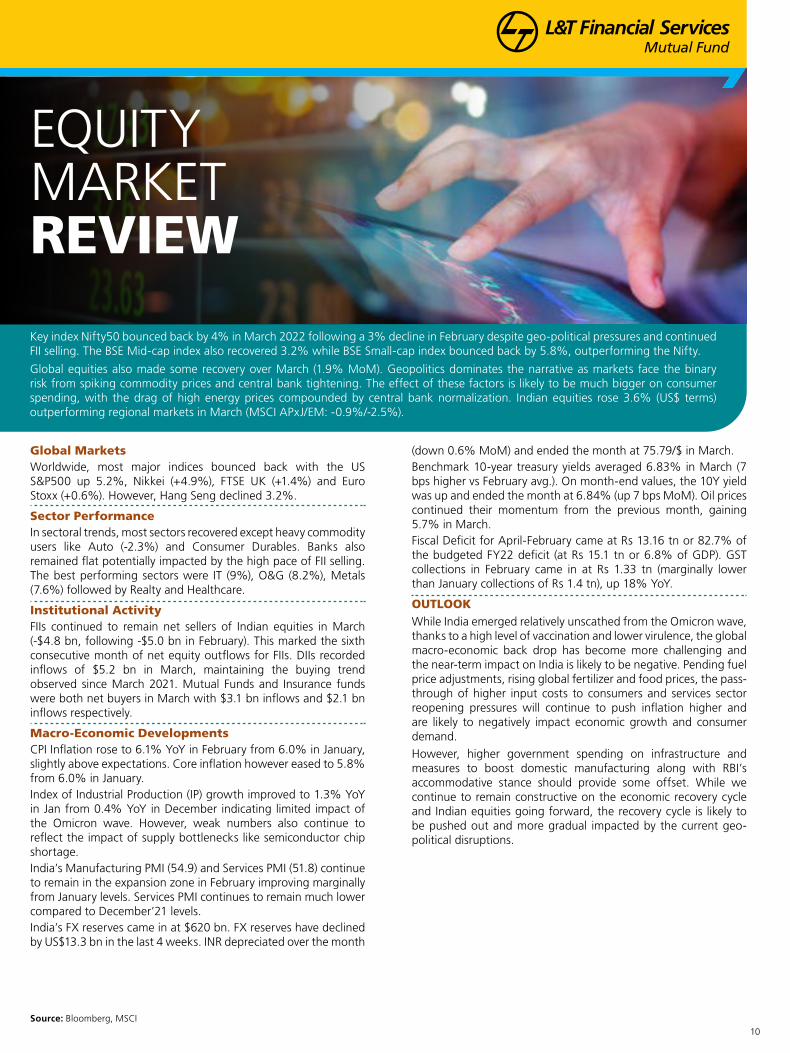
Key index Nifty50 bounced back by 4% in March 2022 following a 3% decline in February despite geo-political pressures and continued FII selling. The BSE Mid-cap index also recovered 3.2% while BSE Small-cap index bounced back by 5.8%, outperforming the Nifty.
Global equities also made some recovery over March (1.9% MoM). Geopolitics dominates the narrative as markets face the binary risk from spiking commodity prices and central bank tightening. The effect of these factors is likely to be much bigger on consumer spending, with the drag of high energy prices compounded by central bank normalization. Indian equities rose 3.6% (US$ terms) outperforming regional markets in March (MSCI APxJ/EM: -0.9%/-2.5%).
Global MarketsWorldwide, most major indices bounced back with the US S&P500 up 5.2%, Nikkei (+4.9%), FTSE UK (+1.4%) and Euro Stoxx (+0.6%). However, Hang Seng declined 3.2%.
Sector PerformanceIn sectoral trends, most sectors recovered except heavy commodity users like Auto (-2.3%) and Consumer Durables. Banks also remained flat potentially impacted by the high pace of FII selling. The best performing sectors were IT (9%), O&G (8.2%), Metals (7.6%) followed by Realty and Healthcare.
Institutional ActivityFIIs continued to remain net sellers of Indian equities in March (-$4.8 bn, following -$5.0 bn in February). This marked the sixth consecutive month of net equity outflows for FIIs. DIIs recorded inflows of $5.2 bn in March, maintaining the buying trend observed since March 2021. Mutual Funds and Insurance funds were both net buyers in March with $3.1 bn inflows and $2.1 bn inflows respectively.
Macro-Economic DevelopmentsCPI Inflation rose to 6.1% YoY in February from 6.0% in January, slightly above expectations. Core inflation however eased to 5.8% from 6.0% in January. Index of Industrial Production (IP) growth improved to 1.3% YoY in Jan from 0.4% YoY in December indicating limited impact of the Omicron wave. However, weak numbers also continue to reflect the impact of supply bottlenecks like semiconductor chip shortage. India’s Manufacturing PMI (54.9) and Services PMI (51.8) continue to remain in the expansion zone in February improving marginally from January levels. Services PMI continues to remain much lower compared to December’21 levels.India’s FX reserves came in at $620 bn. FX reserves have declined by US$13.3 bn in the last 4 weeks. INR depreciated over the month
(down 0.6% MoM) and ended the month at 75.79/$ in March. Benchmark 10-year treasury yields averaged 6.83% in March (7 bps higher vs February avg.). On month-end values, the 10Y yield was up and ended the month at 6.84% (up 7 bps MoM). Oil prices continued their momentum from the previous month, gaining 5.7% in March.Fiscal Deficit for April-February came at Rs 13.16 tn or 82.7% of the budgeted FY22 deficit (at Rs 15.1 tn or 6.8% of GDP). GST collections in February came in at Rs 1.33 tn (marginally lower than January collections of Rs 1.4 tn), up 18% YoY.
OUTLOOKWhile India emerged relatively unscathed from the Omicron wave, thanks to a high level of vaccination and lower virulence, the global macro-economic back drop has become more challenging and the near-term impact on India is likely to be negative. Pending fuel price adjustments, rising global fertilizer and food prices, the pass-through of higher input costs to consumers and services sector reopening pressures will continue to push inflation higher and are likely to negatively impact economic growth and consumer demand. However, higher government spending on infrastructure and measures to boost domestic manufacturing along with RBI’s accommodative stance should provide some offset. While we continue to remain constructive on the economic recovery cycle and Indian equities going forward, the recovery cycle is likely to be pushed out and more gradual impacted by the current geo-political disruptions.
EQUITYMARKETREVIEW

11
Data as on March 31, 2022
Note: L&T Investment Management Limited and the content providers of this article shall not be liable for any errors in the content or for any actions taken in reliance thereon. The recipient should note that the views expressed above are solely the views of L&T Investment Management Limited and/or its Fund Managers and it should not be construed as a recommendation to buy or sell any securities/stocks in any sectors. The article (including market views expressed herein) is for general information only and does not have regard to specific investment objectives, financial situation and the particular needs of any specific person who may receive this information. Investments in mutual funds and secondary markets inherently involve risks and recipient should consult their legal, tax and financial advisors before investing.
Source: MOSPI, Internal, Bloomberg
Debt Market Review
The volatility in asset classes continued as geopolitical tensions between Russia and Ukraine escalated during the month. Commodity prices remained elevated and only softened a bit towards the latter half of the month with updates on Russia pulling back troops from Kyiv. Crude prices traded above the psychological USD 100/bbl mark for most of the month while briefly breaching USD 130/bbl as concerns built around the embargo on Russian crude.
With inflation pressures being seen globally, markets continued to witness various economies exiting from ultra-easy monetary policies, with Central Banks globally hiking interest rates to stem the spiraling inflation. CPI print in the US for February 2022 came in at 7.9% (multi decade high), with Core CPI also edging further higher up to 6.4%. Against this backdrop, the FOMC in its March meeting raised the federal funds rate by 25 bps with the dot plot suggesting additional rate hikes of 150 bps expected in 2022. The FOMC also indicated that necessary steps will be taken to ensure that higher inflation does not become entrenched. The FOMC minutes suggested the possibility of 50 bps hike in the May policy along with a reduction in the Fed Balance Sheet by USD 95 bn per month. The 10-year US Treasury yields rose sharply higher from 1.80%-1.85% levels to almost 2.50% during the month and are currently trading around 2.65%. The 2-year and 5-year US Treasury yields have seen an even sharper move up with the 5-year/10-year curve now inverted.
On the domestic front, CPI inflation for February came in at 6.07% (vs 6.01% in January 2022) due to an increase in food inflation, with Core inflation broadly unchanged. WPI inflation inched slightly higher to 13.11% (from 12.96% in January 2022). This was the 11th consecutive month with WPI print in double digits resulting in the average WPI reading for FY2022 being 12.72%. IIP data for January 2022 continued to remain weak at 1.3% (vs 0.7% in Dec 2021). Trade deficit for February 2022 came in at USD 20.88 billion (USD 13.12 bn last year). GST collections continue to remain robust with revenues for March 2022 at an all-time high of INR 1.42 trillion (higher by 15% Y-o-Y).
The G-Sec calendar was announced with the borrowing frontloaded at INR 8.45 Lakh Crs for H1 FY2023, higher than market expectations. Weekly auction sizes will be INR 32,000-33,000 Crs. In line with feedback from market participants, the GOI announced that issuances will also happen in the 7-year bucket going forward. The SDL calendar for Q1 FY2023 was also announced, with a gross borrowing for the quarter at INR 1.90 Lakh Crs. Gross T-Bill borrowing for Q1 FY2023 will be INR 4.32 Lakh Crs with weekly auction sizes of INR 33,000-34,000 Crs. The WMA limit for GOI for H1 FY2023 is set at INR 1.5 Lakh Crs. RBI announced another USD/INR 1.5-year Sell Buy Swap auction worth USD 5 billion to be conducted on April 26, 2022. This can be viewed as another tool used by the RBI for pulling out surplus liquidity from the system. Petrol and diesel prices have seen price hikes over the last couple of weeks on higher Crude prices with the cumulative increase now ~ INR 10 per litre.
10-year G-Sec traded in the 6.75%-6.90% during the month. Markets continued to witness good supply from Bank CD issuances, however commensurate demand for these papers kept levels in check. OIS levels inched higher during the month by 15-20 bps. Primary issuances in corporate bonds saw good demand from end investors, with cutoffs for a few issuances coming significantly below secondary market levels. Corporate bond spreads in the longer end continue to remain tight due to a lack of primary supply.
In this backdrop of policy normalization now being seen globally, soaring Crude prices and inflation prints above RBI’s estimate, what steps the Central Bank takes to manage the growth inflation tradeoff while ensuring smooth Government borrowing this year will be the key monitorable going forward.
Monetary Policy Review
The Monetary Policy Committee (MPC) came out with their bi-monthly policy statement today. Some of the key announcements are as follows:
● The MPC members unanimously voted for keeping the policy Repo Rate unchanged at 4.0%
● The Reverse Repo Rate under LAF and the MSF rate have also been kept unchanged at 3.35% and 4.25%, respectively
● The MPC introduced the Standing Deposit Facility (SDF), which will henceforth be the floor of the LAF corridor, currently at 3.75%. Correspondingly the LAF corridor has been restored back to 50 bps
● The MPC unanimously decided to remain accommodative while focusing on withdrawal of accommodation to ensure that inflation remained within the target going forward while supporting growth
In light of the recent developments around geopolitical tensions between Russia and Ukraine, soaring energy and commodity prices and global supply chain disruptions, the MPC revised the growth and inflation projection from the previous policy. Considering a base case assumption of a normal monsoon and average crude price (Indian basket) of USD 100/bbl the projections have been revised below:
● Real GDP growth for FY2023 has been revised downwards to 7.2% (from an earlier estimate of 7.8%) with the following quarterly projections: Q1 FY2023 at 16.2%, Q2 at 6.2%, Q3 at 4.1% and Q4 at 4.0%
● CPI projection for FY2023 has been revised upwards to 5.7% (from an earlier estimate of 4.5%) with the following quarterly projections: Q1 FY2023 at 6.3%, Q2 at 5.8%, Q3 at 5.4% and Q4 at 5.1%
Although the Governor reiterated the RBI’s commitment to ensure the availability of adequate liquidity to meet the productive requirements of the economy, he also mentioned that the RBI will engage in a gradual and calibrated withdrawal of the surplus liquidity (injected in the wake of the pandemic) over a multi-year time frame in a non-disruptive manner. The Governor also mentioned that the RBI remains focused on the completion of the Government borrowing program and will deploy various instruments as and when required. As a step towards this, the RBI enhanced the limit for inclusion of SLR eligible securities in the HTM category from 22% to 23% of NDTL.
One important inference from the Governor’s speech was that the RBI is looking to prioritize inflation over growth after a period of 3 years, which is evident from the sharp revision in inflation estimates. Additionally, there were also first signs of communication from the MPC talking about focusing on withdrawal of accommodation.
With the MPC now turning hawkish, markets witnessed a sharp sell-off across the curve. Money market rates moved higher by 20-25 bps. G-Sec and Corporate Bonds in the 2-5 year segment moved higher by 20-25 bps while longer tenor papers sold off by around 15-20 bps.
Markets were clearly looking toward the Central Bank for some support to narrow the supply-demand gap for the heavy Government borrowing. However, there was no concrete communication towards achieving that. Today’s policy seems to be the first step towards the inevitable policy normalization, which probably will begin with a stance change from accommodative to neutral followed by a hike in the repo rate. For RBI, the next few quarters will be a testing time, in terms of balancing out its various mandates – managing the growth inflation tradeoffs, ensuring that Government borrowing goes through smoothly while still maintaining its hard-earned credibility. From our fund’s perspective, we continue to remain cautious in our positioning across our actively managed funds till further clarity emerges on geopolitical risks, crude prices and also RBI’s tolerance levels for critical yield levels - before they come in to support the markets.
DEBTMARKET & MPC REVIEW

12
Data as on March 31, 2022
Flexicap Fund
L&T FLEXICAP FUND
To generate long-term capital growth from a diversified portfolio of predominantly equity and equity-related securities. There is no assurance that the investment objective of the scheme will be realized.
Aims to capitalize on investment opportunities across the market spectrum
Focus on fundamentals: Quality and scalability of business, Management and Valuation
Looking to own companies with relatively strong balance sheets & attractive ratios
Individual stock weight is a function of fundamentals, valuation, market sentiment and conviction
INVESTMENT OBJECTIVE
FUND DETAILS
Date of Inception
Regular Plan Direct Plan
May 16, 2005 January 01, 2013
Portfolio Turnover
0.3190 times
Fund Manager
Mr. Vihang Naik & Mr. Venugopal Manghat (w.e.f. Dec 17, 2019)~
Benchmark
S&P BSE-500 TRI Index
Month end AUM
2,839.65 (` In Crs)
Monthly Average AUM
2,759.34 (` In Crs)
Volatility Measures*
Standard Deviation 21.10%
R-Squared 0.98
Beta 0.96
Sharpe Ratio# 0.45
*Source: ICRA MFIE #Risk free rate assumed to be 3.31% (based on 3-months Mibor NSE rate during last 3 months)
Options
Growth and IDCW. The IDCW Option offers Payout and Reinvestment facilities.
PORTFOLIO ALLOCATION
Name of Instrument % to Net Assets
EQUITY & EQUITY RELATEDListed/Awaiting Listing on the Stock ExchangesBanks
ICICI Bank Limited 4.05%HDFC Bank Limited 3.87%State Bank of India 2.36%
Canara Bank 1.42%Kotak Mahindra Bank Limited 1.40%Axis Bank Limited 1.04%Indian Bank 0.71%Punjab National Bank 0.25%Software
Infosys Limited 5.17%Tata Consultancy Services Limited 3.80%MphasiS Limited 2.43%
HCL Technologies Limited 1.30%FinanceMuthoot Finance Limited 2.10%Housing Development Finance Corporation Limited 2.04%
Bajaj Holdings & Investment Limited 1.99%Cholamandalam Investment and Finance Company Limited 1.79%
Can Fin Homes Limited 0.51%IIFL Finance Limited 0.13%Consumer Non DurablesEmami Limited 1.68%ITC Limited 1.53%Varun Beverages Limited 1.51%Godrej Consumer Products Limited 1.26%Hindustan Unilever Limited 0.88%Balrampur Chini Mills Limited 0.88%Pharmaceuticals
Dishman Carbogen Amcis Limited 2.57%Sun Pharmaceutical Industries Limited 1.56%
Sanofi India Limited 1.25%Pfizer Limited 0.91%Dr. Reddy's Laboratories Limited 0.81%Divi's Laboratories Limited 0.44%Petroleum Products
Reliance Industries Limited 5.91%Hindustan Petroleum Corporation Limited 0.87%
AutoTata Motors Limited 2.44%
Mahindra & Mahindra Limited 1.00%Maruti Suzuki India Limited 0.54%Ashok Leyland Limited 0.46%Construction
Mahindra Lifespace Developers Limited 2.36%
Ashoka Buildcon Limited 1.72%Cement & Cement ProductsThe Ramco Cements Limited 1.67%UltraTech Cement Limited 1.06%Birla Corporation Limited 0.84%
Name of Instrument % to Net Assets
Ferrous MetalsJSW Steel Limited 1.23%Maharashtra Seamless Limited 0.89%Tata Steel Limited 0.60%Telecom - ServicesBharti Airtel Limited 1.86%Tata Communications Limited 0.85%PowerPower Grid Corporation of India Limited 1.63%
NTPC Limited 1.06%Industrial ProductsSupreme Industries Limited 0.93%Finolex Cables Limited 0.90%Schaeffler India Limited 0.55%RetailingAvenue Supermarts Limited 2.02%OilOil India Limited 1.67%Industrial Capital GoodsSiemens Limited 1.08%Apar Industries Limited 0.55%Auto AncillariesTube Investment of India Limited 1.53%Varroc Engineering Limited 0.08%GasGujarat Gas Limited 0.92%GAIL India Limited 0.67%TransportationContainer Corporation of India Limited 0.92%
Aegis Logistics Limited 0.44%Non - Ferrous MetalsHindalco Industries Limited 1.25%Construction ProjectLarsen & Toubro Limited 0.94%Techno Electric & Engineering Company Limited 0.04%
PaperWest Coast Paper Mills Limited 0.96%Healthcare ServicesApollo Hospitals Enterprise Limited 0.49%EntertainmentZee Entertainment Enterprises Limited 0.49%
PesticidesSharda Cropchem Limited 0.48%Textiles - CottonVardhman Textiles Limited 0.42%Total 95.96%OTHERS(a) Tri Party Repo Dealing System (TREPS) 4.44%
(b) Net Receivables/(Payables) -0.40%Net Assets 100.00%Total number of holdings 70Indicates top ten instruments
~For investments in foreign securities - Mr. Sonal Gupta (w.e.f July 5, 2021) Exit Load: If the units redeemed or switched out are upto 10% of the units purchased or switched in (“the limit”) within 1 year from the date of allotment – Nil. If units redeemed or switched out are over and above the limit within 1 year from the date of allotment – 1%. If units are redeemed or switched out on or after 1 year from the date of allotment – Nil.-With effect from February 9, 2021, due to change in the fundamental attributes like asset allocation, investment pattern, categorization etc. L&T Equity Fund shall be re-named as L&T Flexicap Fund and shall be categorised as Flexicap Fund.For details of the change please refer Notice dated Jan 5, 2021.
TOP 10 INDUSTRYBanksSoftwareFinanceConsumer Non DurablesPharmaceuticalsPetroleum ProductsAutoConstructionCement & Cement ProductsFerrous MetalsOthers
15.10%
12.70%
8.56%
7.74%
7.54%
6.78%
4.44%
4.08%
3.57%
2.72%
22.73%

13
Data as on March 31, 2022
PORTFOLIO ALLOCATION
Name of Instrument % to Net Assets
Max Healthcare Institute Limited 1.45%RetailingAvenue Supermarts Limited 1.74%Go Fashion (India) Limited 0.49%PowerTata Power Company Limited 2.16%PharmaceuticalsCipla Limited 1.64%Divi's Laboratories Limited 0.46%J.B. Chemicals & Pharmaceuticals Limited ^
Gland Pharma Limited ^ ConstructionDLF Limited 1.51%Sobha Limited 0.48%Godrej Properties Limited 0.01%Consumer Non DurablesAsian Paints Limited 1.48%Varun Beverages Limited 0.01%Tata Consumer Products Limited ^ EntertainmentZee Entertainment Enterprises Limited 1.46%
Non - Ferrous MetalsHindalco Industries Limited 1.24%Capital MarketsComputer Age Management Services Limited 0.68%
UTI Asset Management Company Limited 0.42%
Ferrous MetalsTata Steel Limited 1.06%Industrial ProductsPolycab India Limited 1.04%Industrial Capital GoodsHoneywell Automation India Limited 0.71%GasGujarat Gas Limited 0.58%Cement & Cement ProductsBirla Corporation Limited 0.25%Dalmia Bharat Limited 0.02%UltraTech Cement Limited ^ InsuranceBajaj Finserv Limited 0.06%Total 99.08%OTHERS(a) Tri Party Repo Dealing System (TREPS) 1.41%
(b) Net Receivables/(Payables) -0.49%Net Assets 100.00%Total number of holdings 62
Name of Instrument % to Net Assets
EQUITY & EQUITY RELATEDListed/Awaiting Listing on the Stock ExchangesSoftware
Infosys Limited 7.52%Persistent Systems Limited 2.77%Wipro Limited 1.89%Tata Elxsi Limited 1.76%Coforge Limited 1.37%Larsen & Toubro Infotech Limited 1.36%MindTree Limited 1.02%KPIT Technologies Limited 0.98%C.E. Info Systems Limited 0.52%Tata Consultancy Services Limited 0.23%Route Mobile Limited ^ Tech Mahindra Limited ^ Banks
ICICI Bank Limited 7.74% State Bank of India 5.05%Kotak Mahindra Bank Limited 3.53%
HDFC Bank Limited 2.39%Axis Bank Limited 0.04%Petroleum Products
Reliance Industries Limited 8.75%ChemicalsSRF Limited 2.74%Clean Science and Technology Limited 1.46%
Tata Chemicals Limited 1.36%Navin Fluorine International Limited 1.23%Finance
Bajaj Finance Limited 3.97%Cholamandalam Investment and Finance Company Limited 2.38%
Housing Development Finance Corporation Limited 0.02%
Auto AncillariesSona BLW Precision Forgings Limited 1.90%Minda Industries Limited 1.89%Motherson Sumi Wiring India Limited 0.83%
Textile ProductsK.P.R. Mill Limited 2.79%
Page Industries Limited 1.23%Consumer Durables
Titan Company Limited 3.74%Voltas Limited ^ Leisure Services
Indian Hotels Company Limited 3.21%Jubilant Foodworks Limited ^ Auto
Tata Motors Limited 2.97%Healthcare ServicesApollo Hospitals Enterprise Limited 1.49%
Indicates top ten instruments^ indicates less than 0.01%
ELSS Fund
L&T TAX ADVANTAGE FUND
To generate long-term capital growth from a diversified portfolio of predominantly equity and equity-related securities. There is no assurance that the investment objective of the scheme will be realized.
An open-ended ELSS fund with a flexible, go-anywhere approach
Well-diversified portfolio; Bottom-up investment approach
Focus on fundamentals: quality and scalability of business, management and valuation
3-year lock-in helps the fund manager take positions in stocks with longer term return potential
INVESTMENT OBJECTIVE
FUND DETAILS PORTFOLIO ALLOCATION
Date of Inception
Regular Plan Direct Plan
February 27, 2006 January 01, 2013
Portfolio Turnover
1.3330 times
Fund Manager
Ms. Cheenu Gupta (w.e.f. July 02, 2021) & Mr. Vihang Naik (w.e.f. Dec 17, 2019)
Benchmark
S&P BSE 500 TRI
Month end AUM
3,369.31 (` In Crs)
Monthly Average AUM
3,275.90 (` In Crs)
Volatility Measures*
Standard Deviation 21.84%
R-Squared 0.96
Beta 0.98
Sharpe Ratio# 0.48
*Source: ICRA MFIE #Risk free rate assumed to be 3.31% (based on 3-months Mibor NSE rate during last 3 months)
Options
Growth and IDCW. The IDCW Option offers Payout.
Exit Load: Nil. For details of the performance of the schemes, please refer page nos 48 to 51. For product label please refer Page 3 & 4 of the factsheet.The Fund was co-managed by Mr. Venugopal Manghat till July 1, 2021.
TOP 10 INDUSTRYSoftwareBanksPetroleum ProductsChemicalsFinanceAuto AncillariesTextile ProductsConsumer DurablesLeisure ServicesAutoOthers
19.42%
18.75%
8.75%
6.79%6.37%
4.62%
4.02%
3.74%
3.21%
2.97%
20.44%

14
Data as on March 31, 2022
Large and Midcap Fund
L&T LARGE AND MIDCAP FUND
To generate long-term capital growth from a diversified portfolio of predominantly equity and equity-related securities with minimum allocation of at least 35% each to large cap and mid cap companies. There is no assurance that the investment objective of the scheme will be realized.
The fund invests in Midcaps and Large caps as per the mandate of the categorization
The large cap is expected to reduce volatility of the portfolio with exposure to mature and stable companies
Meanwhile exposure to midcap is with the expectation that it will fuel the growth prospects
A fund with exposure to blend of growth and potential stability
INVESTMENT OBJECTIVE
FUND DETAILS PORTFOLIO ALLOCATION
Date of Inception
Regular Plan Direct Plan
May 22, 2006 January 01, 2013
Portfolio Turnover
1.5510 times
Fund Manager
Ms. Cheenu Gupta (w.e.f. July 02, 2021) & Mr. Vihang Naik (w.e.f. Dec 17, 2019)~
Benchmark
NIFTY LargeMidcap 250 TRI
Month end AUM
1,526.53 (` In Crs)
Monthly Average AUM
1,460.67 (` In Crs)
Volatility Measures*
Standard Deviation 20.43%
R-Squared 0.91
Beta 0.85
Sharpe Ratio# 0.53
*Source: ICRA MFIE #Risk free rate assumed to be 3.31% (based on 3-months Mibor NSE rate during last 3 months)
Options
Growth and IDCW. The IDCW Option offers Payout and Reinvestment facilities.
~For investments in foreign securities - Mr. Sonal Gupta (w.e.f July 5, 2021) Exit Load:If the units redeemed or switched out are upto 10% of the units purchased or switched in (“the limit”) within 1 year from the date of allotment – Nil. If units redeemed or switched out are over and above the limit within 1 year from the date of allotment – 1%. If units are redeemed or switched out on or after 1 year from the date of allotment – Nil. For details of the performance of the schemes, please refer page nos 48 to 51.For product label please refer Page 3 & 4 of the factsheet.The Fund was co-managed by Mr. Venugopal Manghat till July 1, 2021.
Name of Instrument % to Net Assets
EQUITY & EQUITY RELATEDListed/Awaiting Listing on the Stock ExchangesSoftware
Infosys Limited 4.76%Persistent Systems Limited 3.43%
MphasiS Limited 2.64%Tata Elxsi Limited 1.70%Wipro Limited 1.62%Coforge Limited 1.58%MindTree Limited 1.34%L&T Technology Services Limited 1.13%C.E. Info Systems Limited 0.66%Larsen & Toubro Infotech Limited 0.44%Banks
ICICI Bank Limited 5.81%State Bank of India 4.27%
Kotak Mahindra Bank Limited 2.41%HDFC Bank Limited 0.83%Chemicals
SRF Limited 3.51%Tata Chemicals Limited 1.79%Clean Science and Technology Limited 1.62%
Navin Fluorine International Limited 0.89%Neogen Chemicals Limited 0.56%Auto AncillariesSona BLW Precision Forgings Limited 2.59%Minda Industries Limited 2.39%WABCO India Limited 1.25%Motherson Sumi Wiring India Limited 1.02%
FinanceBajaj Finance Limited 3.41%
Cholamandalam Investment and Finance Company Limited 3.05%
Consumer DurablesTitan Company Limited 3.27%
Century Plyboards (India) Limited 1.25%Dixon Technologies (India) Limited 1.09%Voltas Limited 0.23%Petroleum Products
Reliance Industries Limited 5.45%Leisure Services
Indian Hotels Company Limited 4.09%Healthcare ServicesMax Healthcare Institute Limited 1.63%Apollo Hospitals Enterprise Limited 1.58%ConstructionPhoenix Mills Limited 1.44%
Name of Instrument % to Net Assets
Sobha Limited 1.21%DLF Limited 0.50%Power
Tata Power Company Limited 3.12%Textile ProductsPage Industries Limited 2.67%AutoTata Motors Limited 2.38%RetailingAvenue Supermarts Limited 1.63%Go Fashion (India) Limited 0.66%PharmaceuticalsCipla Limited 1.57%Divi's Laboratories Limited 0.59%Industrial Capital GoodsHoneywell Automation India Limited 1.68%Ferrous MetalsAPL Apollo Tubes Limited 0.84%Tata Steel Limited 0.81%Industrial ProductsPolycab India Limited 1.27%Schaeffler India Limited 0.32%EntertainmentZee Entertainment Enterprises Limited 1.57%
Capital MarketsComputer Age Management Services Limited 0.66%
UTI Asset Management Company Limited 0.35%
Consumer Non DurablesAsian Paints Limited 0.85%Non - Ferrous MetalsHindalco Industries Limited 0.77%GasGujarat Gas Limited 0.67%Cement & Cement ProductsBirla Corporation Limited 0.27%UltraTech Cement Limited 0.13%Total 99.25%OTHERS(a) Tri Party Repo Dealing System (TREPS) 1.34%
(b) Net Receivables/(Payables) -0.59%Net Assets 100.00%Total number of holdings 56
Indicates top ten instruments
TOP 10 INDUSTRYSoftwareBanksChemicalsAuto AncillariesFinanceConsumer DurablesPetroleum ProductsLeisure ServicesHealthcare ServicesConstructionOthers
19.30%
13.32%
8.37%
7.25%
6.46%
5.84%
5.45%
4.09%
3.21%
3.15%
22.81%

15
Data as on March 31, 2022
Sectoral Fund
L&T INFRASTRUCTURE FUND
To generate capital appreciation by investing predominantly in equity and equity related instruments of companies in the infrastructure sector. There is no assurance that the investment objective of the scheme will be realized.
Provides opportunity to benefit from participation in India’s structural infrastructure growth
Potential to deliver higher returns, although with relatively higher risk
A product with potential to generate significant alpha, especially during economic recovery
A product with a minimum investment horizon of 5 years
INVESTMENT OBJECTIVE
FUND DETAILS PORTFOLIO ALLOCATION
Date of Inception
Regular Plan Direct Plan
September 27, 2007 January 01, 2013
Portfolio Turnover
0.1643 times
Fund Manager
Mr. Venugopal Manghat (w.e.f. Dec 17, 2019) & Ms. Cheenu Gupta (w.e.f. July 02, 2021)
Benchmark
Nifty Infrastructure TRI Index
Month end AUM
1,379.39 (` In Crs)
Monthly Average AUM
1,344.16 (` In Crs)
Volatility Measures*
Standard Deviation 25.09%
R-Squared 0.84
Beta 1.03
Sharpe Ratio# 0.41
*Source: ICRA MFIE #Risk free rate assumed to be 3.31% (based on 3-months Mibor NSE rate during last 3 months)
Options
Growth and IDCW. The IDCW option offers IDCW Payout and IDCW Reinvestment facilities.
Exit Load: If the units redeemed or switched out are upto 10% of the units purchased or switched in (“the limit”) within 1 year from the date of allotment – Nil. If units redeemed or switched out are over and above the limit within 1 year from the date of allotment – 1%. If units are redeemed or switched out on or after 1 year from the date of allotment – Nil.For details of the performance of the schemes, please refer page nos 48 to 51.For product label please refer Page 3 & 4 of the factsheet.The Fund was co-managed by Mr. Vihang Naik till July 1, 2021.
Name of Instrument % to Net Assets
Oberoi Realty Limited 0.78%KNR Constructions Limited 0.39%Mahindra Lifespace Developers Limited 0.02%Petroleum Products
Reliance Industries Limited 5.94%PowerTata Power Company Limited 2.71%KEC International Limited 1.19%NTPC Limited 0.66%TransportationVRL Logistics Limited 2.87%Gujarat Pipavav Port Limited 0.76%Aegis Logistics Limited 0.63%Aerospace & Defense
Bharat Electronics Limited 3.98%Telecom - Services
Bharti Airtel Limited 3.67%Non - Ferrous MetalsHindalco Industries Limited 2.90%Consumer DurablesVoltas Limited 1.79%Dixon Technologies (India) Limited 0.54%PaperCentury Textiles & Industries Limited 1.93%OilOil & Natural Gas Corporation Limited 1.09%
Ferrous MetalsTata Steel Limited 1.06%GasGAIL India Limited 0.85%Total 99.36%OTHERS(a) Tri Party Repo Dealing System (TREPS) 1.39%
(b) Net Receivables/(Payables) -0.75%Net Assets 100.00%Total number of holdings 51
Indicates top ten instruments
TOP 10 INDUSTRYIndustrial ProductsIndustrial Capital GoodsCement & Cement ProductsConstruction ProjectConstructionPetroleum ProductsPowerTransportationAerospace & DefenseTelecom - ServicesOthers
17.86%
15.71%
13.21%
12.77%
7.24%
5.94%
4.56%
4.26%
3.98%
3.67%
10.16%
Name of Instrument % to Net Assets
EQUITY & EQUITY RELATEDListed/Awaiting Listing on the Stock ExchangesIndustrial Products
Grindwell Norton Limited 5.18%RHI Magnesita India Limited 3.09%
Carborundum Universal Limited 2.80%Polycab India Limited 2.72%Finolex Cables Limited 1.46%Cummins India Limited 1.12%Timken India Limited 0.68%KEI Industries Limited 0.51%AIA Engineering Limited 0.30%Industrial Capital Goods
ABB India Limited 3.22%Kennametal India Limited 2.99%
Honeywell Automation India Limited 2.47%Isgec Heavy Engineering Limited 1.62%BEML Limited 1.39%Apar Industries Limited 1.18%Thermax Limited 1.17%Siemens Limited 0.92%Indian Hume Pipe Company Limited 0.74%Mazagon Dock Shipbuilders Limited 0.01%Cement & Cement Products
The Ramco Cements Limited 3.63%Grasim Industries Limited 3.26%
UltraTech Cement Limited 2.93%Birla Corporation Limited 2.30%Shree Cements Limited 0.67%ACC Limited 0.42%Construction Project
Larsen & Toubro Limited 9.41%H.G Infra Engineering Limited 2.68%Techno Electric & Engineering Company Limited 0.68%
ConstructionBrigade Enterprises Limited 2.63%Godrej Properties Limited 1.80%PNC Infratech Limited 1.62%

16
Data as on March 31, 2022
Large Cap Fund
L&T INDIA LARGE CAP FUND
To generate long-term capital appreciation from a diversified portfolio of predominantly equity and equity related securities, including equity derivatives, in the Indian markets. The Scheme will predominantly invest in large cap stocks. The Scheme could also additionally invest in Foreign Securities. There is no assurance that the investment objective of the scheme will be realized.
Invests predominantly in large cap companies
Focus on fundamentals: Quality and scalability of business, Management and Valuation
Looking to own companies with strong balance sheets and strong cash flows
Individual stock weight is a function of fundamentals, valuation, market sentiment and conviction
INVESTMENT OBJECTIVE
FUND DETAILS PORTFOLIO ALLOCATION
Date of Inception
Regular Plan Direct Plan
October 23, 2007 January 01, 2013
Portfolio Turnover
0.3364 times
Fund Manager
Mr. Venugopal Manghat (w.e.f. Nov 24, 2012) & Ms. Cheenu Gupta (w.e.f. July 02, 2021) ~
Benchmark
S&P BSE 100 TRI Index
Month end AUM
725.61 (` In Crs)
Monthly Average AUM
699.86 (` In Crs)
Volatility Measures*
Standard Deviation 20.49%
R-Squared 0.98
Beta 0.95
Sharpe Ratio# 0.53
*Source: ICRA MFIE #Risk free rate assumed to be 3.31% (based on 3-months Mibor NSE rate during last 3 months)
Options
Growth and IDCW. The IDCW option offers IDCW Payout and IDCW Reinvestment facilities.
~For investments in foreign securities - Mr. Sonal Gupta (w.e.f July 5, 2021) Exit Load: If the units redeemed or switched out are upto 10% of the units purchased or switched in (“the limit”) within 1 year from the date of allotment – Nil. If units redeemed or switched out are over and above the limit within 1 year from the date of allotment – 1%. If units are redeemed or switched out on or after 1 year from the date of allotment – Nil. For details of the performance of the schemes, please refer page nos 48 to 51.For product label please refer Page 3 & 4 of the factsheet.The Fund was co-managed by Mr. Vihang Naik till July 1, 2021.
Name of Instrument Rating % to Net Assets
EQUITY & EQUITY RELATED
Listed/Awaiting Listing on the Stock ExchangesBanks
ICICI Bank Limited 8.48%HDFC Bank Limited 7.24%State Bank of India 5.26%
Axis Bank Limited 1.90%Kotak Mahindra Bank Limited 1.51%Software
Infosys Limited 8.05%Tata Consultancy Services Limited 2.98%HCL Technologies Limited 2.70%
Tech Mahindra Limited 2.15%Wipro Limited 1.26%L&T Technology Services Limited 0.27%Petroleum Products
Reliance Industries Limited 8.38%FinanceBajaj Finance Limited 2.66%Housing Development Finance Corporation Limited 2.50%
Cholamandalam Investment and Finance Company Limited 1.89%
SBI Cards and Payment Services Limited 0.65%
PharmaceuticalsSun Pharmaceutical Industries
Limited 4.18%
Divi's Laboratories Limited 1.87%Consumer Non DurablesITC Limited 1.75%Hindustan Unilever Limited 1.26%Godrej Consumer Products Limited 0.68%Asian Paints Limited 0.65%Tata Consumer Products Limited 0.51%Dabur India Limited 0.33%Cement & Cement ProductsUltraTech Cement Limited 2.14%Shree Cements Limited 0.76%Dalmia Bharat Limited 0.72%Construction Project
Larsen & Toubro Limited 3.34%Telecom - Services
Bharti Airtel Limited 3.13%AutoMahindra & Mahindra Limited 1.11%Escorts Limited 1.00%
Name of Instrument Rating % to Net Assets
Maruti Suzuki India Limited 0.63%ChemicalsSRF Limited 2.49%RetailingAvenue Supermarts Limited 1.15%Trent Limited 0.71%InsuranceBajaj Finserv Limited 0.87%SBI Life Insurance Company Limited 0.85%Aerospace & DefenseBharat Electronics Limited 1.49%EntertainmentZee Entertainment Enterprises Limited 1.35%
Non - Ferrous MetalsHindalco Industries Limited 1.25%TransportationContainer Corporation of India Limited 1.21%
Consumer DurablesTitan Company Limited 1.19%ConstructionGodrej Properties Limited 0.97%Industrial Capital GoodsABB India Limited 0.96%Leisure ServicesJubilant Foodworks Limited 0.93%Healthcare ServicesApollo Hospitals Enterprise Limited 0.91%Ferrous MetalsTata Steel Limited 0.89%Auto AncillariesJamna Auto Industries Limited 0.57%Total 99.73%BONDS & NCDsListed / awaiting listing on the stock exchanges
Britannia Industries Limited CRISIL AAA ^
Total - OTHERS(a) Tri Party Repo Dealing System (TREPS) 0.93%
(b) Net Receivables/(Payables) -0.66%Net Assets 100.00%Total number of holdings 49Indicates top ten instruments^ Indicates less than 0.01%
TOP 10 INDUSTRYBanksSoftwarePetroleum ProductsFinancePharmaceuticalsConsumer Non DurablesCement & Cement ProductsConstruction ProjectTelecom - ServicesAutoOthers
24.39%
17.41%
8.38%
7.70%
6.05%
5.18%
3.62%
3.34%
3.13%
2.74%
17.79%

17
Data as on March 31, 2022
Value Fund
L&T INDIA VALUE FUND
To generate long-term capital appreciation from diversified portfolio of predominantly equity and equity related securities, in the Indian markets with higher focus on undervalued securities. The Scheme could also additionally invest in Foreign Securities in international markets. There is no assurance that the investment objective of the scheme will be realized.
Diversified equity fund with strong value bias that aims to deliver long term superior risk adjusted returns
Focus on identifying valuation anomalies versus the economic potential of a business over the medium term
Aims to minimize portfolio risk by investing in quality companies, monitoring corporate fundamentals closely
No sector/market cap bias
INVESTMENT OBJECTIVE
FUND DETAILS PORTFOLIO ALLOCATION
Date of Inception
Regular Plan Direct Plan
January 08, 2010 January 01, 2013
Portfolio Turnover
0.2753 times
Fund Manager
Mr. Venugopal Manghat (w.e.f. Nov 24, 2012) & Mr. Vihang Naik (w.e.f. Dec 17, 2019)~
Benchmark
S&P BSE 500 TRI
Month end AUM
7,828.67 (` In Crs)
Monthly Average AUM
7,570.64 (` In Crs)
Volatility Measures*
Standard Deviation 24.12%
R-Squared 0.96
Beta 1.08
Sharpe Ratio# 0.56
*Source: ICRA MFIE #Risk free rate assumed to be 3.31% (based on 3-months Mibor NSE rate during last 3 months)
Options
Growth and IDCW. The IDCW option offers IDCW Payout and IDCW Reinvestment facilities.
~For investments in foreign securities - Mr. Sonal Gupta (w.e.f July 5, 2021) Exit Load: If the units redeemed or switched out are upto 10% of the units purchased or switched in (“the limit”) within 1 year from the date of allotment – Nil. If units redeemed or switched out are over and above the limit within 1 year from the date of allotment – 1%. If units are redeemed or switched out on or after 1 year from the date of allotment – Nil. For details of the performance of the schemes, please refer page nos 48 to 51.For product label please refer Page 3 & 4 of the factsheet.
Name of Instrument % to Net Assets
Navin Fluorine International Limited 1.05%Gujarat Narmada Valley Fertilizers and Chemicals Limited 0.74%
Phillips Carbon Black Limited 0.47%Supreme Petrochem Limited 0.35%Consumer Non DurablesITC Limited 1.67%Emami Limited 1.03%Varun Beverages Limited 0.59%CCL Products (I) Limited 0.29%FertilisersChambal Fertilizers & Chemicals Limited 1.65%
Coromandel International Limited 1.31%Zuari Agro Chemicals Limited 0.07%PowerKEC International Limited 1.50%Tata Power Company Limited 1.39%Construction Project
Larsen & Toubro Limited 2.76%Textile Products
K.P.R. Mill Limited 2.60%EntertainmentZee Entertainment Enterprises Limited 2.03%
GasGAIL India Limited 1.78%Telecom - ServicesBharti Airtel Limited 1.58%Leisure ServicesIndian Hotels Company Limited 1.23%OilOil & Natural Gas Corporation Limited 1.14%
Non - Ferrous MetalsHindalco Industries Limited 1.05%Auto AncillariesBalkrishna Industries Limited 0.78%Industrial ProductsCummins India Limited 0.60%Textiles - CottonVardhman Textiles Limited 0.32%Total 99.38%OTHERS(a) Tri Party Repo Dealing System (TREPS) 0.87%
(b) Net Receivables/(Payables) -0.25%Net Assets 100.00%Total number of holdings 61
Name of Instrument % to Net Assets
EQUITY & EQUITY RELATEDListed/Awaiting Listing on the Stock ExchangesBanks
ICICI Bank Limited 8.66% State Bank of India 4.19%HDFC Bank Limited 3.18%
The Federal Bank Limited 1.77%Axis Bank Limited 1.49%Indian Bank 1.05%Canara Bank 0.32%Software
Infosys Limited 6.05%HCL Technologies Limited 2.62%
Persistent Systems Limited 1.87%Tech Mahindra Limited 1.74%Oracle Financial Services Software Limited 0.68%
Pharmaceuticals Sun Pharmaceutical Industries
Limited 4.52%
IPCA Laboratories Limited 1.22%Divi's Laboratories Limited 0.78%ConstructionKNR Constructions Limited 1.73%Oberoi Realty Limited 1.71%Brigade Enterprises Limited 1.61%PNC Infratech Limited 1.25%Petroleum Products
Reliance Industries Limited 4.38%Hindustan Petroleum Corporation Limited 1.00%
Ferrous Metals Jindal Stainless Limited 2.09%
Jindal Steel & Power Limited 1.63%Ratnamani Metals & Tubes Limited 1.42%Cement & Cement ProductsThe Ramco Cements Limited 1.43%Birla Corporation Limited 1.43%JK Lakshmi Cement Limited 1.29%Ambuja Cements Limited 0.97%AutoTata Motors Limited 1.31%Mahindra & Mahindra Limited 1.28%Escorts Limited 0.84%Maruti Suzuki India Limited 0.76%FinanceHousing Development Finance Corporation Limited 1.83%
Can Fin Homes Limited 1.13%Muthoot Finance Limited 0.96%ChemicalsDeepak Nitrite Limited 1.21%
Indicates top ten instruments
TOP 10 INDUSTRYBanksSoftwarePharmaceuticalsConstructionPetroleum ProductsFerrous MetalsCement & Cement ProductsAutoFinanceChemicalsOthers
20.66%
12.96%
6.52%
6.30%5.38%
5.14%
5.12%
4.19%
3.92%
3.82%
25.37%

18
Data as on March 31, 2022
Midcap Fund
L&T MIDCAP FUND
To generate capital appreciation by investing primarily in midcap stocks. There is no assurance that the investment objective of the scheme will be realized.
The fund invests predominantly in midcap stocks
Looks to invest in fundamentally strong companies with good growth prospects
Focus on valuations – aims to own stocks with high margin of safety to reduce overall portfolio risk
Aims at broad diversification of portfolio, with a view to manage liquidity at the aggregate portfolio level
INVESTMENT OBJECTIVE
FUND DETAILS PORTFOLIO ALLOCATION
Date of Inception
Regular Plan Direct Plan
August 09, 2004 January 01, 2013
Portfolio Turnover
0.2054 times
Fund Manager
Mr. Vihang Naik (w.e.f. June 28, 2016) & Mr. Venugopal Manghat (w.e.f. Dec 17, 2019)
Benchmark
S&P BSE Midcap 150 TRI
Month end AUM
6,607.52 (` In Crs)
Monthly Average AUM
6,378.46 (` In Crs)
Volatility Measures*
Standard Deviation 22.43%
R-Squared 0.97
Beta 0.89
Sharpe Ratio# 0.50
*Source: ICRA MFIE #Risk free rate assumed to be 3.31% (based on 3-months Mibor NSE rate during last 3 months)
Options
Growth and IDCW. The IDCW option offers IDCW Payout and IDCW Reinvestment facilities.
Exit Load:If the units redeemed or switched out are upto 10% of the units purchased or switched in (“the limit”) within 1 year from the date of allotment – Nil. If units redeemed or switched out are over and above the limit within 1 year from the date of allotment – 1%. If units are redeemed or switched out on or after 1 year from the date of allotment – Nil.For details of the performance of the schemes, please refer page nos 48 to 51.For product label please refer Page 3 & 4 of the factsheet.
Name of Instrument % to Net Assets
EQUITY & EQUITY RELATEDListed/Awaiting Listing on the Stock ExchangesPharmaceuticals
IPCA Laboratories Limited 3.03%Abbott India Limited 2.16%Suven Pharmaceuticals Limited 1.70%Alkem Laboratories Limited 1.52%Eris Lifesciences Limited 1.24%Pfizer Limited 1.22%Finance
Cholamandalam Investment and Finance Company Limited 2.74%
CRISIL Limited 2.54%Sundaram Finance Limited 2.18%Indian Railway Finance Corporation Limited 1.01%
Manappuram Finance Limited 0.91%Muthoot Finance Limited 0.49%Power Finance Corporation Limited 0.31%Industrial Products
Cummins India Limited 3.31%Supreme Industries Limited 1.65%Timken India Limited 1.65%Schaeffler India Limited 0.99%AIA Engineering Limited 0.79%Greaves Cotton Limited 0.50%Software
MphasiS Limited 4.47%BIRLASOFT Limited 1.27%Affle India Limited 1.20%Tech Mahindra Limited 0.75%Consumer Non Durables
Emami Limited 3.57%3M India Limited 1.68%Godfrey Phillips India Limited 1.06%United Spirits Limited 0.81%Berger Paints India Limited 0.24%Ferrous Metals
Ratnamani Metals & Tubes Limited 3.16%Jindal Steel & Power Limited 1.85%APL Apollo Tubes Limited 0.78%BanksCanara Bank 1.28%Indian Bank 1.23%Punjab National Bank 0.94%City Union Bank Limited 0.62%The Federal Bank Limited 0.50%ChemicalsAtul Limited 1.45%Aarti Industries Limited 1.24%Deepak Nitrite Limited 0.66%Gujarat Fluorochemicals Limited 0.41%Auto AncillariesBosch Limited 2.14%Sundram Fasteners Limited 1.13%Tube Investment of India Limited 0.49%Transportation
Blue Dart Express Limited 3.52%Aegis Logistics Limited 0.02%
Name of Instrument % to Net Assets
Consumer DurablesVoltas Limited 1.89%Johnson Controls - Hitachi Air Conditioning India Limited 1.12%
Crompton Greaves Consumer Electricals Limited 0.46%
Healthcare ServicesApollo Hospitals Enterprise Limited 1.47%Max Healthcare Institute Limited 0.91%Syngene International Limited 0.74%Pesticides
Bayer Cropscience Limited 2.90%ConstructionOberoi Realty Limited 1.52%Godrej Properties Limited 0.93%Leisure Services
Indian Hotels Company Limited 2.36%Cement & Cement ProductsThe Ramco Cements Limited 2.06%JK Lakshmi Cement Limited 0.11%Capital MarketsMulti Commodity Exchange of India Limited 1.26%
ICICI Securities Limited 0.68%FertilisersCoromandel International Limited 1.68%Industrial Capital GoodsThermax Limited 1.63%RetailingTrent Limited 1.62%InsuranceMax Financial Services Limited 1.06%General Insurance Corporation of India 0.29%Textile ProductsPage Industries Limited 1.24%AutoAshok Leyland Limited 0.74%TVS Motor Company Limited 0.26%Construction ProjectH.G Infra Engineering Limited 0.52%EntertainmentZee Entertainment Enterprises Limited 0.50%Telecom - ServicesTata Communications Limited 0.50%Petroleum ProductsCastrol India Limited 0.45%GasGujarat Gas Limited 0.36%OilOil India Limited 0.33%Total 96.00%OTHERS(a) Tri Party Repo Dealing System (TREPS) 4.05%
(b) Net Receivables/(Payables) -0.05%Net Assets 100.00%Total number of holdings 73
TOP 10 SECTORSTOP 10 INDUSTRYPharmaceuticalsFinanceIndustrial ProductsSoftwareConsumer Non DurablesFerrous MetalsBanksChemicalsAuto AncillariesTransportationOthers
10.87%
10.18%
8.89%
7.69%
7.36%
5.79%
4.57%
3.76%
3.76%
3.54%
29.59%
Indicates top ten instruments

19
Data as on March 31, 2022
Small Cap Fund
L&T EMERGING BUSINESSES FUND
To generate long-term capital appreciation from a diversified portfolio of predominantly equity and equity related securities, including equity derivatives, in the Indian markets with key theme focus being emerging companies (small cap stocks). The Scheme could also additionally invest in Foreign Securities. There is no assurance that the investment objective of the scheme will be realized.
The scheme will invest at least 65% of its total assets in small cap stocks
The focus is to invest in companies which are in early stage of development and have the potential to grow their revenue and profits at a higher rate as compared to broader market
Small cap stocks will comprise of any equity and equity related instruments of companies that are ranked beyond 250 based on the full market capitalization
Individual stock weight is a function of fundamentals, valuation, market sentiment and conviction
INVESTMENT OBJECTIVE
FUND DETAILS PORTFOLIO ALLOCATION
Date of Inception
Regular Plan Direct Plan
May 12, 2014 May 12, 2014
Portfolio Turnover
0.1593 times
Fund Manager
Mr. Venugopal Manghat & Mr. Vihang Naik (w.e.f. Dec 17, 2019)~
Benchmark
S&P BSE 250 Small Cap Index TRI
Month end AUM
7,996.33 (` In Crs)
Monthly Average AUM
7,733.59 (` In Crs)
Volatility Measures*
Standard Deviation 27.55%
R-Squared 0.97
Beta 0.90
Sharpe Ratio# 0.67
*Source: ICRA MFIE #Risk free rate assumed to be 3.31% (based on 3-months Mibor NSE rate during last 3 months)
Options
Growth and IDCW. (Payout and Reinvestment)
~For investments in foreign securities - Mr. Sonal Gupta (w.e.f July 5, 2021)Exit Load:If the units redeemed or switched out are upto 10% of the units purchased or switched in (“the limit”) within 1 year from the date of allotment – Nil. If units redeemed or switched out are over andabove the limit within 1 year from the date of allotment – 1%. If units are redeemed or switched out on or after 1 year from the date of allotment – Nil.For details of the performance of the schemes, please refer page nos 48 to 51.For product label please refer Page 3 & 4 of the factsheet.
Name of Instrument % to Net Assets
Sterling Tools Limited 0.40%Sundram Fasteners Limited 0.32%Motherson Sumi Wiring India Limited 0.32%Ferrous MetalsRatnamani Metals & Tubes Limited 1.90%APL Apollo Tubes Limited 1.58%Maharashtra Seamless Limited 0.99%Shyam Metalics and Energy Limited 0.30%Industrial Capital GoodsLakshmi Machine Works Limited 1.31%Apar Industries Limited 0.94%Isgec Heavy Engineering Limited 0.88%GMM Pfaudler Limited 0.80%PharmaceuticalsSuven Pharmaceuticals Limited 1.68%IPCA Laboratories Limited 0.79%Cement & Cement ProductsJK Lakshmi Cement Limited 1.33%The Ramco Cements Limited 1.04%Construction ProjectH.G Infra Engineering Limited 1.07%Techno Electric & Engineering Company Limited 0.80%
NCC Limited 0.25%BanksCity Union Bank Limited 1.13%Indian Bank 0.92%TransportationGujarat Pipavav Port Limited 0.75%Aegis Logistics Limited 0.36%VRL Logistics Limited 0.26%RetailingV-Mart Retail Limited 0.75%Trent Limited 0.61%Leisure ServicesEIH Limited 1.35%PesticidesSumitomo Chemical India Limited 0.98%PaperEmami Paper Limited 0.53%Orient Paper & Industries Limited 0.39%AutoV.S.T Tillers Tractors Limited 0.89%Healthcare ServicesKrishna Institute of Medical Sciences Limited 0.72%FinanceCan Fin Homes Limited 0.67%Textiles - CottonNitin Spinners Limited 0.38%Total 98.51%OTHERS(a) Tri Party Repo Dealing System (TREPS) 1.87%
(b) Net Receivables/(Payables) -0.38%Net Assets 100.00%Total number of holdings 81
Name of Instrument % to Net Assets
EQUITY & EQUITY RELATEDListed/Awaiting Listing on the Stock ExchangesIndustrial Products
Grindwell Norton Limited 3.79%RHI Magnesita India Limited 2.63%Carborundum Universal Limited 2.20%
KEI Industries Limited 1.97%Finolex Industries Limited 1.70%MM Forgings Limited 1.13%Polycab India Limited 1.11%Finolex Cables Limited 0.94%Apollo Pipes Limited 0.72%Supreme Industries Limited 0.56%WIM Plast Limited 0.23%Textile Products
K.P.R. Mill Limited 6.92%Welspun India Limited 1.13%Gokaldas Exports Limited 0.80%Dollar Industries Limited 0.57%Consumer DurablesCera Sanitaryware Limited 2.05%Amber Enterprises Limited 1.61%Greenply Industries Limited 1.51%Somany Ceramics Limited 1.18%Dixon Technologies (India) Limited 1.05%Century Plyboards (India) Limited 0.78%Kajaria Ceramics Limited 0.77%Greenpanel Industries Limited 0.36%Software
BIRLASOFT Limited 2.37%Sonata Software Limited 2.16%KPIT Technologies Limited 2.08%
Persistent Systems Limited 1.71%Happiest Minds Technologies Limited 0.80%Consumer Non Durables
Balrampur Chini Mills Limited 3.90%EID Parry India Limited 2.22%
Emami Limited 0.82%CCL Products (I) Limited 0.66%Construction
Brigade Enterprises Limited 2.79%Sunteck Realty Limited 1.57%Sobha Limited 1.26%Mahindra Lifespace Developers Limited 1.17%PNC Infratech Limited 0.51%ChemicalsSupreme Petrochem Limited 1.96%Navin Fluorine International Limited 1.26%Deepak Nitrite Limited 1.21%Alkyl Amines Chemicals Limited 0.89%Fine Organic Industries Limited 0.86%Oriental Carbon & Chemicals Limited 0.19%Auto AncillariesTube Investment of India Limited 1.25%Jamna Auto Industries Limited 1.22%Minda Industries Limited 1.06%Asahi India Glass Limited 0.90%Rolex Rings Limited 0.59%
Indicates top ten instruments
TOP 10 INDUSTRYIndustrial ProductsTextile ProductsConsumer DurablesSoftwareConsumer Non DurablesConstructionChemicalsAuto AncillariesFerrous MetalsIndustrial Capital GoodsOthers
16.98%
9.42%
9.31%
9.12%
7.60%
7.30%
6.37%
6.06%
4.77%
3.93%
17.65%

20
Data as on March 31, 2022
Thematic Fund
L&T BUSINESS CYCLES FUND
To seek to generate long-term capital appreciation from a diversified portfolio of predominantly equity and equity related securities, including equity derivatives, in the Indian market with focus on riding business cycles through dynamic allocation between various sectors and stocks at different stages of business cycles in the economy. There is no assurance that the investment objective of the scheme will be realized.
A product that is suitable for investors looking to benefit from positioning of portfolio on business up-cycle
Potential to deliver higher alpha over long term
Suitable for investors looking to benefit from economic expansion cycle
Adds style diversification to investor’s portfolio
INVESTMENT OBJECTIVE
FUND DETAILS PORTFOLIO ALLOCATION
Date of Inception
Regular Plan Direct Plan
August 20, 2014 August 20, 2014
Portfolio Turnover
0.1358 times
Fund Manager
Mr. Venugopal Manghat (w.e.f. Aug 20, 2014) & Ms. Cheenu Gupta (w.e.f. July 02, 2021)~
Benchmark
S&P BSE 500 TRI
Month end AUM
553.62 (` In Crs)
Monthly Average AUM
533.02 (` In Crs)
Volatility Measures*
Standard Deviation 25.58%
R-Squared 0.90
Beta 1.11
Sharpe Ratio# 0.42
*Source: ICRA MFIE #Risk free rate assumed to be 3.31% (based on 3-months Mibor NSE rate during last 3 months)
Options
Growth and IDCW. The IDCW option offers Payout or Reinvestment facilities.
~For investments in foreign securities - Mr. Sonal Gupta (w.e.f July 5, 2021)Exit Load:If the units redeemed or switched out are upto 10% of the units purchased or switched in (“the limit”) within 1 year from the date of allotment – Nil. If units redeemed or switched out are over and above the limit within 1 year from the date of allotment – 1%. If units are redeemed or switched out on or after 1 year from the date of allotment – Nil.For details of the performance of the schemes, please refer page nos 48 to 51.For product label please refer Page 3 & 4 of the factsheet.The Fund was co-managed by Mr. Vihang Naik till July 1, 2021.
Name of Instrument % to Net Assets
EQUITY & EQUITY RELATEDListed/Awaiting Listing on the Stock ExchangesBanks
ICICI Bank Limited 8.49%HDFC Bank Limited 6.96%State Bank of India 4.04%
Kotak Mahindra Bank Limited 1.51%Canara Bank 0.45%Industrial Products
Timken India Limited 4.47%Schaeffler India Limited 2.95%
Carborundum Universal Limited 2.09%Finolex Cables Limited 0.92%AIA Engineering Limited 0.78%Construction
KNR Constructions Limited 3.40%Ahluwalia Contracts India Limited 2.34%Godrej Properties Limited 1.85%Mahindra Lifespace Developers Limited 0.70%
PNC Infratech Limited 0.59%Cement & Cement Products
UltraTech Cement Limited 3.41%Birla Corporation Limited 2.10%The Ramco Cements Limited 1.99%Shree Cements Limited 0.85%Consumer DurablesCentury Plyboards (India) Limited 1.78%Kajaria Ceramics Limited 1.49%Titan Company Limited 1.33%Blue Star Limited 1.14%Greenpanel Industries Limited 1.13%Whirlpool of India Limited 0.39%Petroleum Products
Reliance Industries Limited 4.42%Hindustan Petroleum Corporation Limited 0.95%
Ferrous MetalsRatnamani Metals & Tubes
Limited 3.43%
Jindal Steel & Power Limited 1.84%Industrial Capital GoodsABB India Limited 2.25%Indian Hume Pipe Company Limited 1.14%
Thermax Limited 0.99%Honeywell Automation India Limited 0.60%
Name of Instrument % to Net Assets
Abb Power Products And Systems India Limited 0.12%
Construction Project Larsen & Toubro Limited 3.96%
ChemicalsDeepak Nitrite Limited 1.69%Gujarat Fluorochemicals Limited 1.18%Aarti Industries Limited 0.55%RetailingTrent Limited 2.47%Avenue Supermarts Limited 0.91%AutoMahindra & Mahindra Limited 1.07%Tata Motors Limited 1.06%Maruti Suzuki India Limited 0.47%Auto AncillariesSundram Fasteners Limited 1.28%Sona BLW Precision Forgings Limited 1.26%
TransportationContainer Corporation of India Limited 1.29%
Aegis Logistics Limited 0.82%VRL Logistics Limited 0.25%FinanceHousing Development Finance Corporation Limited 1.91%
Cholamandalam Investment and Finance Company Limited 0.44%
Non - Ferrous MetalsHindalco Industries Limited 1.92%Leisure ServicesEIH Limited 1.46%Textile ProductsGokaldas Exports Limited 1.19%PesticidesPI Industries Limited 1.04%Textiles - CottonNitin Spinners Limited 0.43%Total 99.54%OTHERS(a) Tri Party Repo Dealing System (TREPS) 0.75%
(b) Net Receivables/(Payables) -0.29%Net Assets 100.00%Total number of holdings 55Indicates top ten instruments
TOP 10 INDUSTRYBanksIndustrial ProductsConstructionCement & Cement ProductsConsumer DurablesPetroleum ProductsFerrous MetalsIndustrial Capital GoodsConstruction ProjectChemicalsOthers
21.45%
11.21%
8.88%
8.35%7.26%
5.37%
5.27%
5.10%
3.96%
3.42%
19.27%

21
Data as on March 31, 2022
Focused Fund
L&T FOCUSED EQUITY FUND
The investment objective of the scheme is to provide capital appreciation by investing in equity and equity related instruments of maximum 30 stocks. There is no assurance that the investment objective of the scheme will be realized.
An open-ended equity scheme following a concentrated strategy
The fund aims to invest using a concentrated strategy by limiting to 30 stocks in the portfolio
Concentrated risk is mitigated by investing in companies with scalable opportunities, strong corporate governance and robust balance sheet
Ability to harness opportunities across the market spectrum - No market cap, sector or style bias
INVESTMENT OBJECTIVE
FUND DETAILS PORTFOLIO ALLOCATION
Date of Inception
Regular Plan Direct Plan
November 5, 2018 November 5, 2018
Portfolio Turnover
0.3831 times
Fund Manager
Mr. Vihang Naik (w.e.f. Nov 05, 2018) & Mr. Venugopal Manghat (w.e.f. Dec 17, 2019)
Benchmark
Nifty 500 TRI Index
Month end AUM
977.68 (` In Crs)
Monthly Average AUM
947.81 (` In Crs)
Options
Growth and IDCW. The IDCW option offers IDCW Payout and IDCW Reinvestment facilities.
Exit Load:If the units redeemed or switched out are upto 10% of the units purchased or switched in (“the limit”) within 1 year from the date of allotment – Nil. If units redeemed or switched out are over and above the limit within 1 year from the date of allotment – 1%. If units are redeemed or switched out on or after 1 year from the date of allotment – Nil.For details of the performance of the schemes, please refer page nos 48 to 51.For product label please refer Page 3 & 4 of the factsheet.
Name of Instrument % to Net Assets
Power Grid Corporation of India Limited 3.66%
Industrial Capital GoodsABB India Limited 3.61%
Cement & Cement ProductsThe Ramco Cements Limited 2.42%
Ambuja Cements Limited 0.98%
AutoMaruti Suzuki India Limited 3.23%
Telecom - ServicesBharti Airtel Limited 2.81%
FinanceSundaram Finance Limited 2.51%
Auto AncillariesBosch Limited 2.20%
Ferrous MetalsTata Steel Limited 1.96%
ConstructionGodrej Properties Limited 1.78%
ChemicalsAarti Industries Limited 1.57%
Total 95.46%
OTHERS(a) Tri Party Repo DealingSystem (TREPS)
5.04%
(b) Net Receivables/(Payables) -0.50%Net Assets 100.00%
Total number of holdings 28
Name of Instrument % to Net Assets
EQUITY & EQUITY RELATED
Listed/Awaiting Listing on the Stock Exchanges
Software Infosys Limited 7.97%Tata Consultancy Services Limited 5.50%
HCL Technologies Limited 3.57%
eClerx Services Limited 3.31%
PharmaceuticalsSun Pharmaceutical Industries Limited 3.10%
Dr. Reddy's Laboratories Limited 2.88%
IPCA Laboratories Limited 2.72%
Biocon Limited 2.44%
Procter & Gamble Health Limited 0.63%
Consumer Non DurablesHindustan Unilever Limited 4.53%
ITC Limited 3.17%
Heritage Foods Limited 2.30%
Petroleum ProductsReliance Industries Limited 8.83%
TransportationBlue Dart Express Limited 4.87%
Construction Project Larsen & Toubro Limited 4.49%
Industrial ProductsGreaves Cotton Limited 4.35%
RetailingAvenue Supermarts Limited 4.07%
Power Indicates top ten instruments
TOP 10 INDUSTRYSoftwarePharmaceuticalsConsumer Non DurablesPetroleum ProductsTransportationConstruction ProjectIndustrial ProductsRetailingPowerIndustrial Capital GoodsOthers
20.35%
11.77%
10.00%
8.83%4.87%
4.49%
4.35%
4.07%
3.66%
3.61%
19.46%

22
Data as on March 31, 2022
Index Fund
L&T NIFTY 50 INDEX FUND
The scheme will adopt a passive investment strategy. The scheme will invest in stocks comprising the Nifty 50 index in the same proportion as in the index with the objective of achieving returns equivalent to the Total Returns Index of Nifty 50 index by minimizing the performance difference between the benchmark index and the scheme. The Total Returns Index is an index that reflects the returns on the index from index gain/ loss plus dividend payments by the constituent stocks. There is no assurance that the investment objective of the scheme will be realized.
INVESTMENT OBJECTIVE
PORTFOLIO ALLOCATION
Date of Inception
Regular Plan Direct Plan
April 15, 2020 April 15, 2020
Portfolio Turnover
0.1617 times
Fund Manager
Mr. Praveen Ayathan (w.e.f. Apr 15, 2020)
Benchmark
Nifty 50 Index TRI
Month end AUM
92.02 (` In Crs)
Monthly Average AUM
88.22 (` In Crs)
Tracking error
0.12%
Annualised Tracking error and computation based on Nifty 50 TRI
Options
Growth and IDCW. The IDCW option offers Payout or Reinvestment facilities.
Exit Load:If the Units redeemed or switched out are upto 10% of the units purchased or switched in (“the limit”) within 1 month from the date of allotment. – Nil. If units redeemed or switched out are over and above the limit within 1 month from the date of allotment – 1%. If units are redeemed or switched out on or after 1 month from the date of allotment – Nil For details of the performance of the schemes, please refer page nos 48 to 51.For product label please refer Page 3 & 4 of the factsheet.
Name of Instrument Rating % to Net Assets
EQUITY & EQUITY RELATEDListed/Awaiting Listing on the Stock ExchangesBanks
HDFC Bank Limited 8.41% ICICI Bank Limited 6.63%Kotak Mahindra Bank Limited 3.36%Axis Bank Limited 2.62%
State Bank of India 2.47%IndusInd Bank Limited 0.80%Software
Infosys Limited 9.12% Tata Consultancy Services Limited 5.06%
HCL Technologies Limited 1.61%Tech Mahindra Limited 1.22%Wipro Limited 1.14%Petroleum Products
Reliance Industries Limited 11.88%Bharat Petroleum Corporation Limited 0.45%Consumer Non Durables
ITC Limited 2.87%Hindustan Unilever Limited 2.39%Asian Paints Limited 1.81%Nestle India Limited 0.81%Tata Consumer Products Limited 0.61%Britannia Industries Limited 0.49%Finance
Housing Development Finance Corporation Limited 5.65%
Bajaj Finance Limited 2.53%AutoMaruti Suzuki India Limited 1.31%Tata Motors Limited 1.02%Mahindra & Mahindra Limited 1.01%Bajaj Auto Limited 0.62%Eicher Motors Limited 0.45%Hero MotoCorp Limited 0.39%PharmaceuticalsSun Pharmaceutical Industries Limited 1.29%
Divi's Laboratories Limited 0.73%Cipla Limited 0.69%Dr. Reddy's Laboratories Limited 0.68%
Name of Instrument Rating % to Net Assets
Construction Project Larsen & Toubro Limited 2.79%
InsuranceBajaj Finserv Limited 1.35%HDFC Life Insurance Company Limited 0.65%
SBI Life Insurance Company Limited 0.64%Telecom - ServicesBharti Airtel Limited 2.33%Ferrous MetalsTata Steel Limited 1.38%JSW Steel Limited 0.93%Cement & Cement ProductsUltraTech Cement Limited 1.00%Grasim Industries Limited 0.82%Shree Cements Limited 0.42%PowerPower Grid Corporation of India Limited 0.97%
NTPC Limited 0.84%Consumer DurablesTitan Company Limited 1.38%Non - Ferrous MetalsHindalco Industries Limited 1.09%OilOil & Natural Gas Corporation Limited 0.78%
TransportationAdani Ports and Special Economic Zone Limited 0.73%
Healthcare ServicesApollo Hospitals Enterprise Limited 0.60%PesticidesUPL Limited 0.55%Minerals/MiningCoal India Limited 0.50%Total 99.87%OTHERS(a) Tri Party Repo Dealing System (TREPS) 0.43%
(b) Net Receivables/(Payables) -0.30%Net Assets 100.00%Total number of holdings 50
Indicates top ten instruments
TOP 10 INDUSTRYBanksSoftwarePetroleum ProductsConsumer Non DurablesFinanceAutoPharmaceuticalsConstruction ProjectInsuranceTelecom - ServicesOthers
24.29%
18.15%
12.33%
8.98%
8.18%
4.80%
3.39%
2.79%
2.64%
2.33%
11.99%
Low cost: The fund doesn’t require a high level of active management and the stock selection is automatic hence it is cost-effective
No Active Risk: As the fund manager is not taking active calls to generate alpha, the fund doesn’t carry any active risk
Broad Diversification - Exposure to the broader market and get to know where the fund is investing
Low Portfolio Turnover - Portfolio turnover is quite low since portfolio rebalancing happens with Index rebalancing only
FUND DETAILS
`

23
Data as on March 31, 2022
Index Fund
L&T NIFTY NEXT 50 INDEX FUND
The scheme will adopt a passive investment strategy. The scheme will invest in stocks comprising the Nifty Next 50 index in the same proportion as in the index with the objective of achieving returns equivalent to the Total Returns Index of Nifty Next 50 index by minimizing the performance difference between the benchmark index and the scheme. The Total Returns Index is an index that reflects the returns on the index from index gain/ loss plus dividend payments by the constituent stocks. There is no assurance that the investment objective of the scheme will be realized.
INVESTMENT OBJECTIVE
PORTFOLIO ALLOCATION
Date of Inception
Regular Plan Direct Plan
April 15, 2020 April 15, 2020
Portfolio Turnover
0.5224 times
Fund Manager
Mr. Praveen Ayathan (w.e.f. Apr 15, 2020)
Benchmark
Nifty Next 50 Index TRI
Month end AUM
47.69 (` In Crs)
Monthly Average AUM
45.69 (` In Crs)
Tracking error
0.24%
Annualized Tracking error and computation based on Nifty Next 50 TRI
Options
Growth and IDCW. The IDCW option offers IDCW Payout and IDCW Reinvestment facilities.
Exit Load:If the units redeemed or switched out are up to 10% of the units purchased or switched in (“the limit”) within 1 month from the date of allotment – Nil. If units redeemed or switched out are over and above the limit within 1 month from the date of allotment – 1%. If units redeemed or switched out on or after 1 month from the date of allotment – Nil For details of the performance of the schemes, please refer page nos 48 to 51.For product label please refer Page 3 & 4 of the factsheet.
Name of Instrument % to Net Assets
BanksBandhan Bank Limited 1.79%Bank of Baroda 1.79%Punjab National Bank 0.90%Non - Ferrous Metals
Vedanta Limited 3.88%Cement & Cement ProductsAmbuja Cements Limited 1.90%ACC Limited 1.57%Petroleum ProductsIndian Oil Corporation Limited 2.61%Consumer DurablesHavells India Limited 2.49%GasGAIL India Limited 2.44%ConstructionDLF Limited 2.03%PesticidesPI Industries Limited 1.96%Industrial Capital GoodsSiemens Limited 1.82%Leisure ServicesJubilant Foodworks Limited 1.74%TransportationInterGlobe Aviation Limited 1.67%Telecom - ServicesIndus Towers Limited 1.55%Ferrous MetalsSteel Authority of India Limited 1.23%Capital MarketsHDFC Asset Management Company Limited 1.22%
Auto AncillariesBosch Limited 1.06%Financial Technology (Fintech)One 97 Communications Limited 0.26%Total 99.74%OTHERS(a) Tri Party Repo Dealing System (TREPS) 2.66%
(b) Net Receivables/(Payables) -2.40%Net Assets 100.00%Total number of holdings 50
Name of Instrument % to Net Assets
EQUITY & EQUITY RELATEDListed/Awaiting Listing on the Stock ExchangesConsumer Non Durables
Dabur India Limited 2.70%Godrej Consumer Products Limited 2.44%United Spirits Limited 2.28%Marico Limited 2.25%Colgate Palmolive (India) Limited 1.77%Berger Paints India Limited 1.47%Procter & Gamble Hygiene and Health Care Limited 0.72%
FinancePiramal Enterprises Limited 2.52%Cholamandalam Investment and Finance Company Limited 2.44%
SBI Cards and Payment Services Limited 1.87%Bajaj Holdings & Investment Limited 1.34%Muthoot Finance Limited 1.24%Retailing
Avenue Supermarts Limited 3.18% Info Edge (India) Limited 3.00%
Zomato Limited 0.98%FSN E-Commerce Ventures Limited 0.51%Power
Adani Green Energy Limited 3.52%Adani Transmission Limited 3.48%
Chemicals SRF Limited 3.36% Pidilite Industries Limited 3.23%
Minerals/MiningAdani Enterprises Limited 4.78%
NMDC Limited 1.60%PharmaceuticalsLupin Limited 1.55%Biocon Limited 1.32%Torrent Pharmaceuticals Limited 1.18%Gland Pharma Limited 0.92%Zydus Lifescences Limited 0.77%SoftwareLarsen & Toubro Infotech Limited 2.42%MindTree Limited 2.39%Insurance
ICICI Lombard General Insurance Company Limited 2.92%
ICICI Prudential Life Insurance Company Limited 1.68%
Indicates top ten instruments
TOP 10 INDUSTRYConsumer Non DurablesFinanceRetailingPowerChemicalsMinerals/MiningPharmaceuticalsSoftwareInsuranceBanksOthers
13.63%
9.41%
7.67%
7.00%
6.59%
6.38%5.74%
4.81%
4.60%
4.48%
29.43%
Low cost: The fund doesn’t require a high level of active management and the stock selection is automatic hence it is cost-effective
No Active Risk: As the fund manager is not taking active calls to generate alpha, the fund doesn’t carry any active risk
Broad Diversification - Exposure to the broader market and get to know where the fund is investing
Low Portfolio Turnover - Portfolio turnover is quite low since portfolio rebalancing happens with Index rebalancing only
FUND DETAILS
`
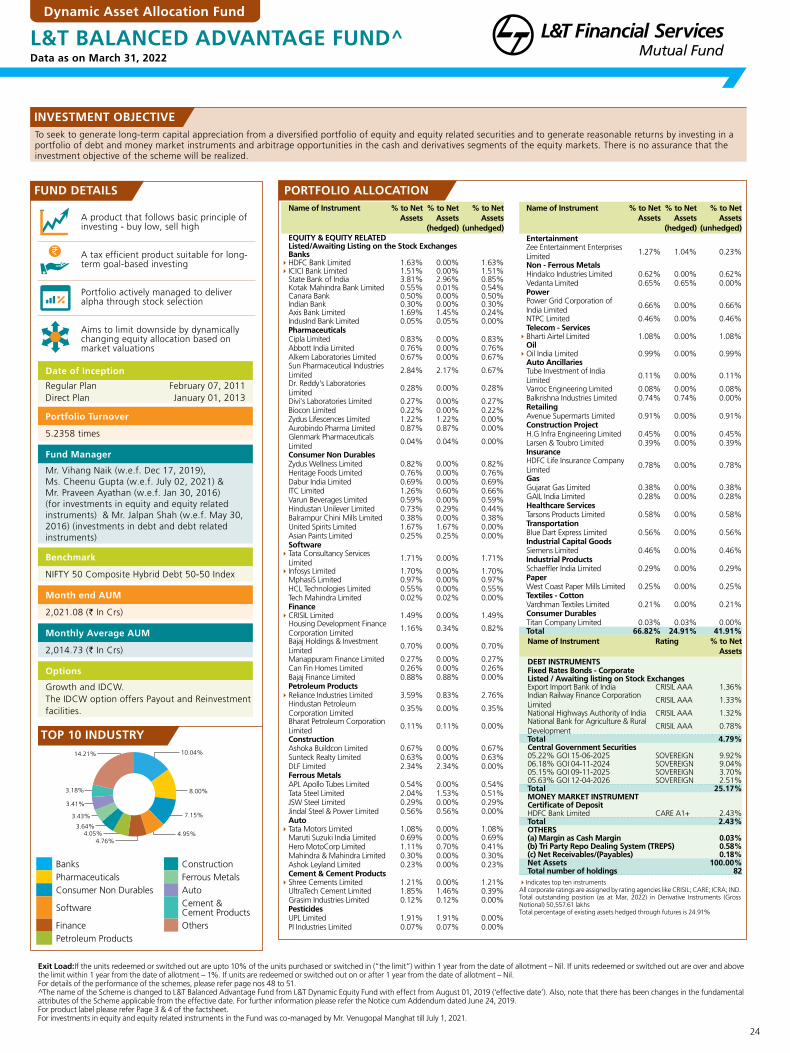
24
Data as on March 31, 2022
Dynamic Asset Allocation Fund
To seek to generate long-term capital appreciation from a diversified portfolio of equity and equity related securities and to generate reasonable returns by investing in a portfolio of debt and money market instruments and arbitrage opportunities in the cash and derivatives segments of the equity markets. There is no assurance that the investment objective of the scheme will be realized.
A product that follows basic principle of investing - buy low, sell high
A tax efficient product suitable for long-term goal-based investing
Portfolio actively managed to deliver alpha through stock selection
Aims to limit downside by dynamically changing equity allocation based on market valuations
INVESTMENT OBJECTIVE
FUND DETAILS PORTFOLIO ALLOCATION
Date of Inception
Regular Plan Direct Plan
February 07, 2011 January 01, 2013
Portfolio Turnover
5.2358 times
Fund Manager
Mr. Vihang Naik (w.e.f. Dec 17, 2019), Ms. Cheenu Gupta (w.e.f. July 02, 2021) & Mr. Praveen Ayathan (w.e.f. Jan 30, 2016) (for investments in equity and equity related instruments) & Mr. Jalpan Shah (w.e.f. May 30, 2016) (investments in debt and debt related instruments)
Benchmark
NIFTY 50 Composite Hybrid Debt 50-50 Index
Month end AUM
2,021.08 (` In Crs)
Monthly Average AUM
2,014.73 (` In Crs)
Options
Growth and IDCW. The IDCW option offers Payout and Reinvestment facilities.
Exit Load:If the units redeemed or switched out are upto 10% of the units purchased or switched in (“the limit”) within 1 year from the date of allotment – Nil. If units redeemed or switched out are over and above the limit within 1 year from the date of allotment – 1%. If units are redeemed or switched out on or after 1 year from the date of allotment – Nil.For details of the performance of the schemes, please refer page nos 48 to 51.^The name of the Scheme is changed to L&T Balanced Advantage Fund from L&T Dynamic Equity Fund with effect from August 01, 2019 (‘effective date’). Also, note that there has been changes in the fundamentalattributes of the Scheme applicable from the effective date. For further information please refer the Notice cum Addendum dated June 24, 2019.For product label please refer Page 3 & 4 of the factsheet.For investments in equity and equity related instruments in the Fund was co-managed by Mr. Venugopal Manghat till July 1, 2021.
L&T BALANCED ADVANTAGE FUND^
Name of Instrument % to Net Assets
% to Net Assets
(hedged)
% to Net Assets
(unhedged)EQUITY & EQUITY RELATEDListed/Awaiting Listing on the Stock ExchangesBanks
HDFC Bank Limited 1.63% 0.00% 1.63%ICICI Bank Limited 1.51% 0.00% 1.51%
State Bank of India 3.81% 2.96% 0.85%Kotak Mahindra Bank Limited 0.55% 0.01% 0.54%Canara Bank 0.50% 0.00% 0.50%Indian Bank 0.30% 0.00% 0.30%Axis Bank Limited 1.69% 1.45% 0.24%IndusInd Bank Limited 0.05% 0.05% 0.00%PharmaceuticalsCipla Limited 0.83% 0.00% 0.83%Abbott India Limited 0.76% 0.00% 0.76%Alkem Laboratories Limited 0.67% 0.00% 0.67%Sun Pharmaceutical Industries Limited 2.84% 2.17% 0.67%
Dr. Reddy's Laboratories Limited 0.28% 0.00% 0.28%
Divi's Laboratories Limited 0.27% 0.00% 0.27%Biocon Limited 0.22% 0.00% 0.22%Zydus Lifescences Limited 1.22% 1.22% 0.00%Aurobindo Pharma Limited 0.87% 0.87% 0.00%Glenmark Pharmaceuticals Limited 0.04% 0.04% 0.00%
Consumer Non DurablesZydus Wellness Limited 0.82% 0.00% 0.82%Heritage Foods Limited 0.76% 0.00% 0.76%Dabur India Limited 0.69% 0.00% 0.69%ITC Limited 1.26% 0.60% 0.66%Varun Beverages Limited 0.59% 0.00% 0.59%Hindustan Unilever Limited 0.73% 0.29% 0.44%Balrampur Chini Mills Limited 0.38% 0.00% 0.38%United Spirits Limited 1.67% 1.67% 0.00%Asian Paints Limited 0.25% 0.25% 0.00%Software
Tata Consultancy Services Limited 1.71% 0.00% 1.71%
Infosys Limited 1.70% 0.00% 1.70%MphasiS Limited 0.97% 0.00% 0.97%HCL Technologies Limited 0.55% 0.00% 0.55%Tech Mahindra Limited 0.02% 0.02% 0.00%Finance
CRISIL Limited 1.49% 0.00% 1.49%Housing Development Finance Corporation Limited 1.16% 0.34% 0.82%
Bajaj Holdings & Investment Limited 0.70% 0.00% 0.70%
Manappuram Finance Limited 0.27% 0.00% 0.27%Can Fin Homes Limited 0.26% 0.00% 0.26%Bajaj Finance Limited 0.88% 0.88% 0.00%Petroleum Products
Reliance Industries Limited 3.59% 0.83% 2.76%Hindustan Petroleum Corporation Limited 0.35% 0.00% 0.35%
Bharat Petroleum Corporation Limited 0.11% 0.11% 0.00%
ConstructionAshoka Buildcon Limited 0.67% 0.00% 0.67%Sunteck Realty Limited 0.63% 0.00% 0.63%DLF Limited 2.34% 2.34% 0.00%Ferrous MetalsAPL Apollo Tubes Limited 0.54% 0.00% 0.54%Tata Steel Limited 2.04% 1.53% 0.51%JSW Steel Limited 0.29% 0.00% 0.29%Jindal Steel & Power Limited 0.56% 0.56% 0.00%Auto
Tata Motors Limited 1.08% 0.00% 1.08%Maruti Suzuki India Limited 0.69% 0.00% 0.69%Hero MotoCorp Limited 1.11% 0.70% 0.41%Mahindra & Mahindra Limited 0.30% 0.00% 0.30%Ashok Leyland Limited 0.23% 0.00% 0.23%Cement & Cement Products
Shree Cements Limited 1.21% 0.00% 1.21%UltraTech Cement Limited 1.85% 1.46% 0.39%Grasim Industries Limited 0.12% 0.12% 0.00%PesticidesUPL Limited 1.91% 1.91% 0.00%PI Industries Limited 0.07% 0.07% 0.00%
Name of Instrument % to Net Assets
% to Net Assets
(hedged)
% to Net Assets
(unhedged)EntertainmentZee Entertainment Enterprises Limited 1.27% 1.04% 0.23%
Non - Ferrous MetalsHindalco Industries Limited 0.62% 0.00% 0.62%Vedanta Limited 0.65% 0.65% 0.00%PowerPower Grid Corporation of India Limited 0.66% 0.00% 0.66%
NTPC Limited 0.46% 0.00% 0.46%Telecom - Services
Bharti Airtel Limited 1.08% 0.00% 1.08%Oil
Oil India Limited 0.99% 0.00% 0.99%Auto AncillariesTube Investment of India Limited 0.11% 0.00% 0.11%
Varroc Engineering Limited 0.08% 0.00% 0.08%Balkrishna Industries Limited 0.74% 0.74% 0.00%RetailingAvenue Supermarts Limited 0.91% 0.00% 0.91%Construction ProjectH.G Infra Engineering Limited 0.45% 0.00% 0.45%Larsen & Toubro Limited 0.39% 0.00% 0.39%InsuranceHDFC Life Insurance Company Limited 0.78% 0.00% 0.78%
GasGujarat Gas Limited 0.38% 0.00% 0.38%GAIL India Limited 0.28% 0.00% 0.28%Healthcare ServicesTarsons Products Limited 0.58% 0.00% 0.58%TransportationBlue Dart Express Limited 0.56% 0.00% 0.56%Industrial Capital GoodsSiemens Limited 0.46% 0.00% 0.46%Industrial ProductsSchaeffler India Limited 0.29% 0.00% 0.29%PaperWest Coast Paper Mills Limited 0.25% 0.00% 0.25%Textiles - CottonVardhman Textiles Limited 0.21% 0.00% 0.21%Consumer DurablesTitan Company Limited 0.03% 0.03% 0.00%Total 66.82% 24.91% 41.91%Name of Instrument Rating % to Net
AssetsDEBT INSTRUMENTSFixed Rates Bonds - CorporateListed / Awaiting listing on Stock ExchangesExport Import Bank of India CRISIL AAA 1.36%Indian Railway Finance Corporation Limited
CRISIL AAA 1.33%
National Highways Authority of India CRISIL AAA 1.32%National Bank for Agriculture & Rural Development
CRISIL AAA 0.78%
Total 4.79%Central Government Securities05.22% GOI 15-06-2025 SOVEREIGN 9.92%06.18% GOI 04-11-2024 SOVEREIGN 9.04%05.15% GOI 09-11-2025 SOVEREIGN 3.70%05.63% GOI 12-04-2026 SOVEREIGN 2.51%Total 25.17%MONEY MARKET INSTRUMENTCertificate of DepositHDFC Bank Limited CARE A1+ 2.43%Total 2.43%OTHERS(a) Margin as Cash Margin 0.03%(b) Tri Party Repo Dealing System (TREPS) 0.58%(c) Net Receivables/(Payables) 0.18%Net Assets 100.00%Total number of holdings 82
Indicates top ten instrumentsAll corporate ratings are assigned by rating agencies like CRISIL; CARE; ICRA; IND.Total outstanding position (as at Mar, 2022) in Derivative Instruments (Gross Notional) 50,557.61 lakhsTotal percentage of existing assets hedged through futures is 24.91%
10.04%
8.00%
7. %15
4.95%
4. %76
4.05%
3. %64
3. %43
3. %41
3. %18
14.21%
TOP 10 INDUSTRY
Banks ConstructionPharmaceuticals Ferrous MetalsConsumer Non Durables Auto
Software Cement & Cement Products
Finance OthersPetroleum Products

25
Data as on March 31, 2022
Aggressive Hybrid Fund
L&T HYBRID EQUITY FUND
To seek to generate long-term capital appreciation from a diversified portfolio of predominantly equity and equity related securities and to generate reasonable returns through a portfolio of debt and money market instruments. There is no assurance that the investment objective of the scheme will be realized.
INVESTMENT OBJECTIVE
PORTFOLIO ALLOCATION
~For investments in foreign securities - Mr. Sonal Gupta (w.e.f July 5, 2021)Exit Load:If the units redeemed or switched out are upto 10% of the units purchased or switched in (“the limit”) within 1 year from the date of allotment – Nil. If units redeemed or switched out are over and above the limit within 1 year from the date of allotment – 1%. If units are redeemed or switched out on or after 1 year from the date of allotment – Nil.For details of the performance of the schemes, please refer page nos 48 to 51.For product label please refer Page 3 & 4 of the factsheet.For investments in equity and equity related instruments in the Fund was co-managed by Mr. Vihang Naik till July 1, 2021.
A Fund that allocates assets across equities and Debt• Invests 65-75% in equity (shares)
and equity related instruments• 25-35% allocation to debt (bonds)
and money market instruments
Equity investments well diversified across sectors and market capitalization segments
Relatively conservative approach in managing debt component to provide stability to the portfolio
FUND DETAILS
Date of Inception
Regular Plan Direct Plan
February 07, 2011 January 01, 2013
Portfolio Turnover
0.6771 times
Fund Manager
Ms. Cheenu Gupta (w.e.f. July 02, 2021) & Mr. Venugopal Manghat (w.e.f. Dec 17, 2019) (for investments in equity and equity related instruments), Mr. Shriram Ramanathan (w.e.f. May 30, 2016) (investments in debt and debt related instruments)~
Benchmark
CRISIL Hybrid 35+65 - Aggressive Index
Month end AUM
5,020.11 (` In Crs)
Monthly Average AUM
4,921.89 (` In Crs)
Volatility Measures*
Standard Deviation 16.02%
R-Squared 0.95
Beta 1.13
Sharpe Ratio# 0.55
*Source: ICRA MFIE #Risk free rate assumed to be 3.31% (based on 3-months Mibor NSE rate during last 3 months)
Options
• Growth• IDCW Option (Reinvestment and Payout)• Annual IDCW Option (Reinvestment and
Payout)
Name of Instrument Rating % to Net Assets
Industrial ProductsSupreme Industries Limited 0.62%ConstructionGodrej Properties Limited 0.28%DLF Limited 0.25%GasGujarat Gas Limited 0.47%PesticidesPI Industries Limited 0.31%Capital MarketsUTI Asset Management Company Limited 0.26%Total 73.70%MONEY MARKET INSTRUMENTCertificate of Deposit/Commercial PaperExport Import Bank of India CRISIL AAA 0.19%Total 0.19%DEBT INSTRUMENTSFixed Rates Bonds - CorporateListed / Awaiting listing on Stock ExchangesJamnagar Utilities and Power Pvt Limited CRISIL AAA 2.02%Power Finance Corporation Limited CRISIL AAA 1.04%Housing Development Finance Corporation Limited CRISIL AAA 0.82%
Housing Development Finance Corporation Limited CRISIL AAA 0.54%
Power Finance Corporation Limited CRISIL AAA 0.54%Export Import Bank of India CRISIL AAA 0.53%LIC Housing Finance Limited CRISIL AAA 0.53%National Bank for Agriculture & Rural Development CRISIL AAA 0.52%
National Bank for Agriculture & Rural Development ICRA AAA 0.51%
Housing Development Finance Corporation Limited CRISIL AAA 0.32%
Rec Limited CRISIL AAA 0.31%Sikka Ports & Terminals Limited (erstwhile Reliance Ports & Terminals Ltd) CRISIL AAA 0.24%
HDFC Bank Limited CRISIL AAA 0.22%National Bank for Agriculture & Rural Development ICRA AAA 0.21%
National Bank for Agriculture & Rural Development CRISIL AAA 0.11%
Nuclear Power Corporation Of India Limited CRISIL AAA 0.03%
Total 8.49%GOVERNMENT SECURITIESFixed Rates Bonds - Government06.18% GOI 04-11-2024 SOVEREIGN 2.70%04.26% GOI 17-05-2023 SOVEREIGN 2.02%05.22% GOI 15-06-2025 SOVEREIGN 2.00%05.15% GOI 09-11-2025 SOVEREIGN 1.99%07.32% GOI 28-01-2024 SOVEREIGN 1.26%07.27% GOI 08-04-2026 SOVEREIGN 1.07%07.17% GOI 08-01-2028 SOVEREIGN 0.52%05.79% GOI 11-05-2030 SOVEREIGN 0.48%6.70% TAMILNADU SDL - 16-10-2024 SOVEREIGN 0.31%07.26% GOI 14-01-2029 SOVEREIGN 0.21%06.79% GOI 15-05-2027 SOVEREIGN 0.21%5.60% MAHARSHTRA SDL 09-09-2024 SOVEREIGN 0.10%07.68% GOI 15-12-2023 SOVEREIGN 0.01%Total 12.88%Others(c) Tri Party Repo Dealing System (TREPS) 4.08%(d) Net Receivables/(Payables) 0.66%Net Assets 100.00%Total number of holdings 51
Name of Instrument Rating % to Net Assets
EQUITY & EQUITY RELATEDListed/Awaiting Listing on the Stock ExchangesBanks
ICICI Bank Limited 5.88% State Bank of India 3.14%HDFC Bank Limited 2.56%
Kotak Mahindra Bank Limited 1.80%Software
Infosys Limited 6.02%Persistent Systems Limited 1.50%Tata Consultancy Services Limited 1.40%Coforge Limited 1.34%MindTree Limited 1.06%L&T Technology Services Limited 0.78%BIRLASOFT Limited 0.62%Auto Ancillaries
Sona BLW Precision Forgings Limited 2.95%Minda Industries Limited 1.84%Motherson Sumi Wiring India Limited 1.09%Textile Products
K.P.R. Mill Limited 4.11%Page Industries Limited 1.26%Petroleum Products
Reliance Industries Limited 4.30%FinanceBajaj Finance Limited 1.90%Cholamandalam Investment and Finance Company Limited 1.38%
Housing Development Finance Corporation Limited 0.49%Leisure Services
Indian Hotels Company Limited 2.69%PharmaceuticalsCipla Limited 1.05%Divi's Laboratories Limited 1.00%Sun Pharmaceutical Industries Limited 0.48%Consumer Non DurablesAsian Paints Limited 1.52%Tata Consumer Products Limited 0.52%Varun Beverages Limited 0.39%Consumer Durables
Titan Company Limited 2.09%Somany Ceramics Limited 0.28%Auto
Tata Motors Limited 2.35%Healthcare ServicesApollo Hospitals Enterprise Limited 1.35%Max Healthcare Institute Limited 0.99%PowerTata Power Company Limited 1.94%ChemicalsSRF Limited 0.95%Atul Limited 0.79%Industrial Capital GoodsHoneywell Automation India Limited 1.48%RetailingAvenue Supermarts Limited 0.98%Go Fashion (India) Limited 0.44%InsuranceBajaj Finserv Limited 1.15%SBI Life Insurance Company Limited 0.25%Cement & Cement ProductsUltraTech Cement Limited 0.84%The Ramco Cements Limited 0.39%EntertainmentZee Entertainment Enterprises Limited 0.77%Ferrous MetalsTata Steel Limited 0.72%Non - Ferrous MetalsHindalco Industries Limited 0.68% Indicates top ten instruments
All corporate ratings are assigned by rating agencies like CRISIL; CARE; ICRA; IND ,BWR.
TOP 10 INDUSTRY BanksSoftwareAuto AncillariesTextile ProductsPetroleum ProductsFinanceLeisure ServicesPharmaceuticalsConsumer Non DurablesConsumer DurablesOthers
13.38%
12.72%
5.88%
5.37%4.30%
3.77%
2.69%
2.53%
2.43%
2.37%
18.26%

26
Data as on March 31, 2022
Hybrid Arbitrage Fund
L&T ARBITRAGE OPPORTUNITIES FUND
To seek to generate reasonable returns by predominantly investing in arbitrage opportunities in the cash and derivatives segments of the equity markets and by investing balance in debt and money market instruments. There is no assurance that the investment objective of the scheme will be realized.
Aims to generate returns through fully hedged exposure to equities
Tax efficient, as tax treatment is similar to equity funds
Focus on generating ‘Market-Neutral’ returns
INVESTMENT OBJECTIVE
FUND DETAILS PORTFOLIO ALLOCATION
Date of Inception
Regular Plan Direct Plan
June 30, 2014 June 30, 2014
Portfolio Turnover
13.1188 times
Fund Manager
Mr. Venugopal Manghat (w.e.f June 30, 2014) & Mr. Praveen Ayathan (w.e.f June 30, 2014) for equity portion, Mr. Jalpan Shah (w.e.f January 24, 2019) for Debt Portion~
Benchmark
Nifty 50 Arbitrage Index
Month end AUM
3,409.19 (` In Crs)
Monthly Average AUM
3,660.44 (` In Crs)
Options
•Growth •IDCW Option 1. Monthly IDCW (Payout and Re-investment) 2. Quarterly IDCW (Payout and Re-investment)
~For investments in foreign securities - Mr. Sonal Gupta (w.e.f July 5, 2021)Exit Load:For redemption on or before 1 month from the date of allotment or Purchase applying First in First out basis - 0.50% of Applicable NAV. After 1 month from the date of allotment or Purchase applying First in First out basis NIL.For details of the performance of the schemes, please refer page nos 48 to 51. For product label please refer Page 3 & 4 of the factsheet.
Name of Instrument % to NetAssets
% to NetAssets
(hedged)EQUITY & EQUITY RELATEDListed/Awaiting Listing on the Stock ExchangesFinance
Housing Development Finance Corporation Limited
2.60% 2.60%
Bajaj Finance Limited 2.43% 2.43%Piramal Enterprises Limited 1.26% 1.26%IDFC Limited 1.20% 1.20%LIC Housing Finance Limited 1.14% 1.14%Manappuram Finance Limited 0.82% 0.82%Rec Limited 0.60% 0.60%Can Fin Homes Limited 0.28% 0.28%Power Finance Corporation Limited 0.20% 0.20%Aditya Birla Capital Limited 0.12% 0.12%Muthoot Finance Limited 0.09% 0.09%Indiabulls Housing Finance Limited 0.09% 0.09%Mahindra & Mahindra Financial Services Limited 0.04% 0.04%Shriram Transport Finance Company Limited 0.02% 0.02%Cholamandalam Investment and Finance Company Limited
^ ^
Ferrous Metals Tata Steel Limited 3.12% 3.12% Jindal Steel & Power Limited 1.79% 1.79%
Steel Authority of India Limited 1.29% 1.29%JSW Steel Limited 0.01% 0.01%Non - Ferrous Metals
Vedanta Limited 3.81% 3.81%National Aluminium Company Limited 1.57% 1.57%Hindustan Copper Limited 0.52% 0.52%Transportation
Adani Ports and Special Economic Zone Limited 5.05% 5.05%Container Corporation of India Limited 0.75% 0.75%Consumer Non Durables
United Spirits Limited 3.26% 3.26%Balrampur Chini Mills Limited 0.68% 0.68%Godrej Consumer Products Limited 0.42% 0.42%Hindustan Unilever Limited 0.11% 0.11%Berger Paints India Limited 0.07% 0.07%Dabur India Limited 0.05% 0.05%Nestle India Limited 0.05% 0.05%Marico Limited 0.04% 0.04%Tata Consumer Products Limited 0.02% 0.02%United Breweries Limited 0.01% 0.01%Britannia Industries Limited 0.01% 0.01%Software
HCL Technologies Limited 2.21% 2.21%Larsen & Toubro Infotech Limited 0.86% 0.86%Firstsource Solutions Limited 0.42% 0.42%MindTree Limited 0.29% 0.29%L&T Technology Services Limited 0.20% 0.20%Oracle Financial Services Software Limited 0.20% 0.20%BIRLASOFT Limited 0.13% 0.13%Intellect Design Arena Limited 0.12% 0.12%Tata Consultancy Services Limited 0.03% 0.03%Coforge Limited 0.01% 0.01%Infosys Limited ^ ^ BanksBandhan Bank Limited 1.47% 1.47%IndusInd Bank Limited 0.81% 0.81%IDFC First Bank Limited 0.59% 0.59%City Union Bank Limited 0.43% 0.43%RBL Bank Limited 0.28% 0.28%The Federal Bank Limited 0.25% 0.25%Kotak Mahindra Bank Limited 0.16% 0.16%Axis Bank Limited 0.16% 0.16%Punjab National Bank 0.13% 0.13%State Bank of India 0.09% 0.09%ICICI Bank Limited 0.01% 0.01%PharmaceuticalsZydus Lifescences Limited 1.14% 1.14%Granules India Limited 0.59% 0.59%Lupin Limited 0.35% 0.35%Biocon Limited 0.28% 0.28%Aurobindo Pharma Limited 0.26% 0.26%Strides Pharma Science Limited 0.25% 0.25%Laurus Labs Limited 0.22% 0.22%Alembic Pharmaceuticals Limited 0.13% 0.13%Abbott India Limited 0.11% 0.11%Glenmark Pharmaceuticals Limited 0.09% 0.09%Pfizer Limited 0.01% 0.01%Divi's Laboratories Limited 0.01% 0.01%Dr. Reddy's Laboratories Limited ^ ^ Cement & Cement Products
Ambuja Cements Limited 2.31% 2.31%The Ramco Cements Limited 0.43% 0.43%The India Cements Limited 0.30% 0.30%ACC Limited 0.16% 0.16%Dalmia Bharat Limited 0.14% 0.14%UltraTech Cement Limited 0.05% 0.05%Grasim Industries Limited 0.03% 0.03%Shree Cements Limited 0.01% 0.01%Entertainment
Zee Entertainment Enterprises Limited 1.97% 1.97%Sun TV Network Limited 0.39% 0.39%PVR Limited 0.28% 0.28%Minerals/MiningNMDC Limited 1.50% 1.50%Adani Enterprises Limited 0.93% 0.93%Coal India Limited 0.16% 0.16%ConstructionOberoi Realty Limited 1.26% 1.26%Godrej Properties Limited 0.48% 0.48%NBCC (India) Limited 0.32% 0.32%DLF Limited 0.10% 0.10%InsuranceBajaj Finserv Limited 1.51% 1.51%Max Financial Services Limited 0.29% 0.29%ICICI Prudential Life Insurance Company Limited 0.13% 0.13%HDFC Life Insurance Company Limited 0.10% 0.10%ICICI Lombard General Insurance Company Limited
^ ^
Name of Instrument % to Net
Assets
% to Net
Assets
(hedged)PowerPower Grid Corporation of India Limited 1.05% 1.05%Tata Power Company Limited 0.81% 0.81%NTPC Limited 0.16% 0.16%Capital MarketsIndian Energy Exchange Limited 0.70% 0.70%Multi Commodity Exchange of India Limited 0.28% 0.28%Leisure ServicesDelta Corp Limited 0.65% 0.65%Jubilant Foodworks Limited 0.16% 0.16%Indian Hotels Company Limited 0.10% 0.10%PesticidesUPL Limited 0.81% 0.81%PI Industries Limited 0.06% 0.06%Auto AncillariesExide Industries Limited 0.59% 0.59%Balkrishna Industries Limited 0.18% 0.18%Motherson Sumi Systems Limited 0.03% 0.03%Amara Raja Batteries Limited 0.03% 0.03%Apollo Tyres Limited 0.03% 0.03%Bosch Limited 0.01% 0.01%Aerospace & DefenseBharat Electronics Limited 0.47% 0.47%Hindustan Aeronautics Limited 0.32% 0.32%RetailingTrent Limited 0.47% 0.47%Info Edge (India) Limited 0.24% 0.24%Aditya Birla Fashion and Retail Limited 0.03% 0.03%Industrial Capital GoodsSiemens Limited 0.58% 0.58%Bharat Heavy Electricals Limited 0.09% 0.09%ChemicalsRain Industries Limited 0.36% 0.36%Aarti Industries Limited 0.07% 0.07%SRF Limited 0.07% 0.07%Tata Chemicals Limited 0.03% 0.03%Deepak Nitrite Limited 0.01% 0.01%GasIndraprastha Gas Limited 0.17% 0.17%Gujarat State Petronet Limited 0.10% 0.10%Gujarat Gas Limited 0.07% 0.07%GAIL India Limited 0.05% 0.05%Mahanagar Gas Limited 0.05% 0.05%Petronet LNG Limited 0.01% 0.01%AutoAshok Leyland Limited 0.20% 0.20%Eicher Motors Limited 0.09% 0.09%Hero MotoCorp Limited 0.02% 0.02%Telecom - ServicesTata Communications Limited 0.23% 0.23%Indus Towers Limited 0.06% 0.06%Petroleum ProductsReliance Industries Limited 0.11% 0.11%Indian Oil Corporation Limited 0.08% 0.08%Bharat Petroleum Corporation Limited 0.05% 0.05%Hindustan Petroleum Corporation Limited ^ ^ Consumer DurablesCrompton Greaves Consumer Electricals Limited 0.09% 0.09%Whirlpool of India Limited 0.08% 0.08%Havells India Limited 0.01% 0.01%Bata India Limited ^ ^ OilOil & Natural Gas Corporation Limited 0.18% 0.18%Construction ProjectLarsen & Toubro Limited 0.07% 0.07%GMR Infrastructure Limited ^ ^ Healthcare ServicesSyngene International Limited 0.01% 0.01%Apollo Hospitals Enterprise Limited 0.01% 0.01%Textile ProductsPage Industries Limited 0.01% 0.01%Industrial ProductsAstral Limited 0.01% 0.01%FertilisersCoromandel International Limited ^ ^ Total 68.81% 68.81%MONEY MARKET INSTRUMENT Certificate of Deposit/Commercial PaperHDFC Bank Limited CARE A1+ 2.89%Total 2.89%Central Government Securities06.84% GOI 19-12-2022 SOVEREIGN 6.69%07.16% GOI 20-05-2023 SOVEREIGN 1.54%Total 8.23%Treasury Bill364 DAY T-BILL 30-06-2022 SOVEREIGN 2.91%364 DAY T-BILL 12-01-2023 SOVEREIGN 2.83%364 DAY T-BILL 28-04-2022 SOVEREIGN 1.46%182 DAY T-BILL 12-05-2022 SOVEREIGN 1.46%182 DAY T-BILL 14-07-2022 SOVEREIGN 1.45%364 DAY T-BILL 13-10-2022 SOVEREIGN 1.43%364 DAY T-BILL 20-10-2022 SOVEREIGN 1.43%364 DAY T-BILL 02-11-2022 SOVEREIGN 1.43%364 DAY T-BILL 19-01-2023 SOVEREIGN 1.42%182 DAY T-BILL 16-06-2022 SOVEREIGN 0.73%364 DAY T-BILL 27-10-2022 SOVEREIGN 0.72%182 DAY T-BILL 30-06-2022 SOVEREIGN 0.15%Total 17.42%OTHERS(a) Margin as Cash Margin -0.27%(b) Tri Party Repo Dealing System (TREPS) 3.15%(c) Net Receivables/(Payables) -0.23%Net Assets 100.00%Total number of holdings 148
Indicates top ten instruments^ Indicates less than 0.01%All corporate ratings are assigned by rating agencies like CRISIL; CARE; ICRA; IND,BWR.Total outstanding position (as at Mar 2022) in Derivative Instruments (Gross Notional) 235,519.81 lakhsTotal percentage of existing assets hedged through futures is 68.81%
TOP 10 INDUSTRY
Finance BanksFerrous Metals Pharmaceuticals
Non - Ferrous Metals Cement & Cement Products
Transportation EntertainmentConsumer Non Durables OthersSoftware
10.89%
6.21%
5.90%
5.80%
4.72%4.47%
4.38%
3.44%
3.43%
2.64%
16.93%
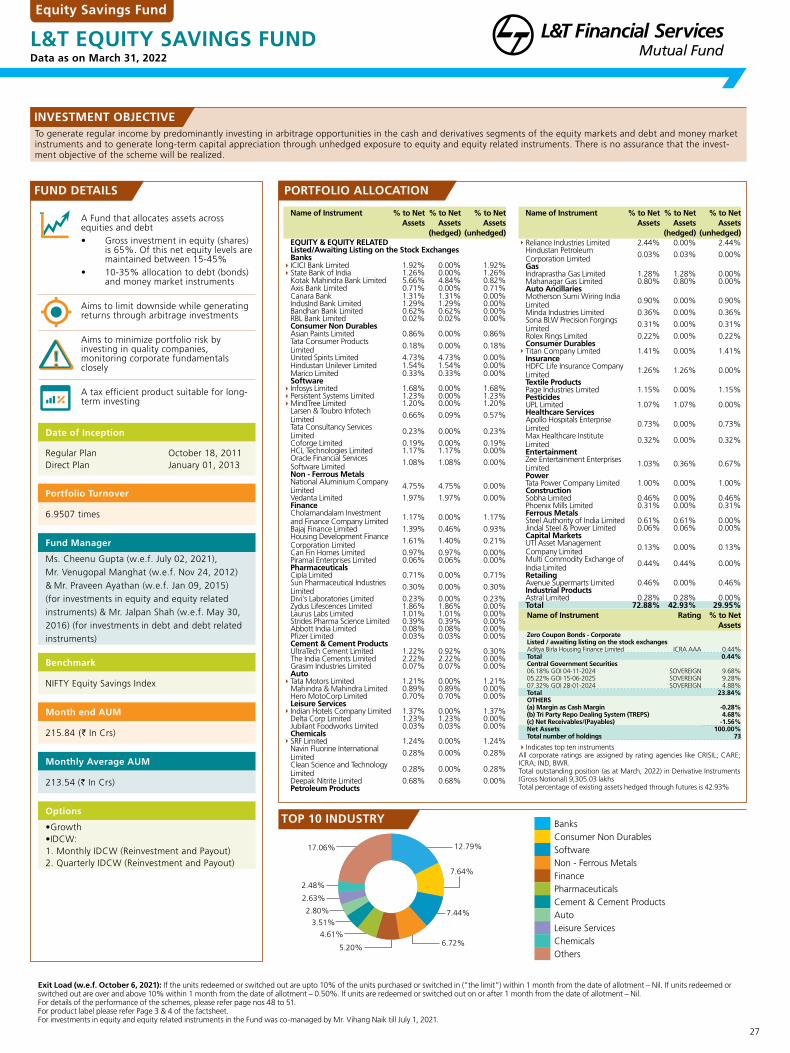
27
Data as on March 31, 2022
Equity Savings Fund
L&T EQUITY SAVINGS FUND
To generate regular income by predominantly investing in arbitrage opportunities in the cash and derivatives segments of the equity markets and debt and money market instruments and to generate long-term capital appreciation through unhedged exposure to equity and equity related instruments. There is no assurance that the invest-ment objective of the scheme will be realized.
INVESTMENT OBJECTIVE
PORTFOLIO ALLOCATION
Exit Load (w.e.f. October 6, 2021): If the units redeemed or switched out are upto 10% of the units purchased or switched in (“the limit”) within 1 month from the date of allotment – Nil. If units redeemed or switched out are over and above 10% within 1 month from the date of allotment – 0.50%. If units are redeemed or switched out on or after 1 month from the date of allotment – Nil.For details of the performance of the schemes, please refer page nos 48 to 51.For product label please refer Page 3 & 4 of the factsheet.For investments in equity and equity related instruments in the Fund was co-managed by Mr. Vihang Naik till July 1, 2021.
A Fund that allocates assets across equities and debt• Gross investment in equity (shares)
is 65%. Of this net equity levels are maintained between 15-45%
• 10-35% allocation to debt (bonds) and money market instruments
Aims to limit downside while generating returns through arbitrage investments
Aims to minimize portfolio risk by investing in quality companies, monitoring corporate fundamentals closely
A tax efficient product suitable for long-term investing
FUND DETAILS
Date of Inception
Regular Plan Direct Plan
October 18, 2011 January 01, 2013
Portfolio Turnover
6.9507 times
Fund Manager
Ms. Cheenu Gupta (w.e.f. July 02, 2021), Mr. Venugopal Manghat (w.e.f. Nov 24, 2012) & Mr. Praveen Ayathan (w.e.f. Jan 09, 2015) (for investments in equity and equity related instruments) & Mr. Jalpan Shah (w.e.f. May 30, 2016) (for investments in debt and debt related instruments)
Benchmark
NIFTY Equity Savings Index
Month end AUM
215.84 (` In Crs)
Monthly Average AUM
213.54 (` In Crs)
Options
•Growth •IDCW: 1. Monthly IDCW (Reinvestment and Payout) 2. Quarterly IDCW (Reinvestment and Payout)
Name of Instrument % to Net Assets
% to Net Assets
(hedged)
% to Net Assets
(unhedged)EQUITY & EQUITY RELATEDListed/Awaiting Listing on the Stock ExchangesBanks
ICICI Bank Limited 1.92% 0.00% 1.92%State Bank of India 1.26% 0.00% 1.26%
Kotak Mahindra Bank Limited 5.66% 4.84% 0.82%Axis Bank Limited 0.71% 0.00% 0.71%Canara Bank 1.31% 1.31% 0.00%IndusInd Bank Limited 1.29% 1.29% 0.00%Bandhan Bank Limited 0.62% 0.62% 0.00%RBL Bank Limited 0.02% 0.02% 0.00%Consumer Non DurablesAsian Paints Limited 0.86% 0.00% 0.86%Tata Consumer Products Limited 0.18% 0.00% 0.18%
United Spirits Limited 4.73% 4.73% 0.00%Hindustan Unilever Limited 1.54% 1.54% 0.00%Marico Limited 0.33% 0.33% 0.00%Software
Infosys Limited 1.68% 0.00% 1.68%Persistent Systems Limited 1.23% 0.00% 1.23%MindTree Limited 1.20% 0.00% 1.20%
Larsen & Toubro Infotech Limited 0.66% 0.09% 0.57%
Tata Consultancy Services Limited 0.23% 0.00% 0.23%
Coforge Limited 0.19% 0.00% 0.19%HCL Technologies Limited 1.17% 1.17% 0.00%Oracle Financial Services Software Limited 1.08% 1.08% 0.00%
Non - Ferrous MetalsNational Aluminium Company Limited 4.75% 4.75% 0.00%
Vedanta Limited 1.97% 1.97% 0.00%FinanceCholamandalam Investment and Finance Company Limited 1.17% 0.00% 1.17%
Bajaj Finance Limited 1.39% 0.46% 0.93%Housing Development Finance Corporation Limited 1.61% 1.40% 0.21%
Can Fin Homes Limited 0.97% 0.97% 0.00%Piramal Enterprises Limited 0.06% 0.06% 0.00%PharmaceuticalsCipla Limited 0.71% 0.00% 0.71%Sun Pharmaceutical Industries Limited 0.30% 0.00% 0.30%
Divi's Laboratories Limited 0.23% 0.00% 0.23%Zydus Lifescences Limited 1.86% 1.86% 0.00%Laurus Labs Limited 1.01% 1.01% 0.00%Strides Pharma Science Limited 0.39% 0.39% 0.00%Abbott India Limited 0.08% 0.08% 0.00%Pfizer Limited 0.03% 0.03% 0.00%Cement & Cement ProductsUltraTech Cement Limited 1.22% 0.92% 0.30%The India Cements Limited 2.22% 2.22% 0.00%Grasim Industries Limited 0.07% 0.07% 0.00%Auto
Tata Motors Limited 1.21% 0.00% 1.21%Mahindra & Mahindra Limited 0.89% 0.89% 0.00%Hero MotoCorp Limited 0.70% 0.70% 0.00%Leisure Services
Indian Hotels Company Limited 1.37% 0.00% 1.37%Delta Corp Limited 1.23% 1.23% 0.00%Jubilant Foodworks Limited 0.03% 0.03% 0.00%Chemicals
SRF Limited 1.24% 0.00% 1.24%Navin Fluorine International Limited 0.28% 0.00% 0.28%
Clean Science and Technology Limited 0.28% 0.00% 0.28%
Deepak Nitrite Limited 0.68% 0.68% 0.00%Petroleum Products
Name of Instrument % to Net Assets
% to Net Assets
(hedged)
% to Net Assets
(unhedged)Reliance Industries Limited 2.44% 0.00% 2.44%
Hindustan Petroleum Corporation Limited 0.03% 0.03% 0.00%
GasIndraprastha Gas Limited 1.28% 1.28% 0.00%Mahanagar Gas Limited 0.80% 0.80% 0.00%Auto AncillariesMotherson Sumi Wiring India Limited 0.90% 0.00% 0.90%
Minda Industries Limited 0.36% 0.00% 0.36%Sona BLW Precision Forgings Limited 0.31% 0.00% 0.31%
Rolex Rings Limited 0.22% 0.00% 0.22%Consumer Durables
Titan Company Limited 1.41% 0.00% 1.41%InsuranceHDFC Life Insurance Company Limited 1.26% 1.26% 0.00%
Textile ProductsPage Industries Limited 1.15% 0.00% 1.15%PesticidesUPL Limited 1.07% 1.07% 0.00%Healthcare ServicesApollo Hospitals Enterprise Limited 0.73% 0.00% 0.73%
Max Healthcare Institute Limited 0.32% 0.00% 0.32%
EntertainmentZee Entertainment Enterprises Limited 1.03% 0.36% 0.67%
PowerTata Power Company Limited 1.00% 0.00% 1.00%ConstructionSobha Limited 0.46% 0.00% 0.46%Phoenix Mills Limited 0.31% 0.00% 0.31%Ferrous MetalsSteel Authority of India Limited 0.61% 0.61% 0.00%Jindal Steel & Power Limited 0.06% 0.06% 0.00%Capital MarketsUTI Asset Management Company Limited 0.13% 0.00% 0.13%
Multi Commodity Exchange of India Limited 0.44% 0.44% 0.00%
RetailingAvenue Supermarts Limited 0.46% 0.00% 0.46%Industrial ProductsAstral Limited 0.28% 0.28% 0.00%Total 72.88% 42.93% 29.95%Name of Instrument Rating % to Net
AssetsZero Coupon Bonds - CorporateListed / awaiting listing on the stock exchangesAditya Birla Housing Finance Limited ICRA AAA 0.44%Total 0.44%Central Government Securities06.18% GOI 04-11-2024 SOVEREIGN 9.68%05.22% GOI 15-06-2025 SOVEREIGN 9.28%07.32% GOI 28-01-2024 SOVEREIGN 4.88%Total 23.84%OTHERS(a) Margin as Cash Margin -0.28%(b) Tri Party Repo Dealing System (TREPS) 4.68%(c) Net Receivables/(Payables) -1.56%Net Assets 100.00%Total number of holdings 73
Indicates top ten instrumentsAll corporate ratings are assigned by rating agencies like CRISIL; CARE; ICRA; IND, BWR.Total outstanding position (as at March, 2022) in Derivative Instruments (Gross Notional) 9,305.03 lakhsTotal percentage of existing assets hedged through futures is 42.93%
TOP 10 INDUSTRY BanksConsumer Non DurablesSoftwareNon - Ferrous MetalsFinancePharmaceuticalsCement & Cement ProductsAutoLeisure ServicesChemicalsOthers
12.79%
7. %64
7.44%
6.72%5.20%
4.61%
3.51%
2. %80
2. %63
2. %48
17.06%

Mutual Fund investments are subject to market risks, read all scheme related documents carefully.
EQUITY FUND SNAPSHOTData as on March 31, 2022
Portfolio at a Glance Portfolio at a Glance
Large Cap
Mid Cap
Small Cap
Hedged
Cash
Name ofthe Fund
Benchmark
Fund Category
Month end AUM(Rs in Crs)
Inception Date(Regular Plan)
Growth of `1 Lacinvested at inception
Top 10 equity holding%
Standard Deviation
R-Squared
Beta
Sharpe Ratio
Total Expense Ratio^
Top 10 Industry
L&T Flexicap L&T India Large L&T Midcap L&T Emerging L&T Large and L&T India Fund Cap Fund Fund Businesses Fund Midcap Fund Value Fund
S&P BSE-500 S&P BSE 100 S&P BSE Midcap S&P BSE 250 Small NIFTY LargeMidcap S&P BSE TRI Index TRI Index 150 TRI Cap Index TRI 250 TRI 500 TRI
Flexi Cap Large Cap Mid Cap Small Cap Large and Midcap Value
2,839.65 725.61 6,607.52 7,996.33 1,526.53 7,828.67
May 16, 2005 Oct 23, 2007 Aug 09, 2004 May 12, 2014 May 22, 2006 Jan 08, 2010
`11,80,410 `4,02,280 `20,29,700 `4,51,340 `7,02,300 `5,76,700
34.96% 53.66% 31.60% 31.06% 41.12% 41.05%
L&T Infrastructure L&T Business L&T Tax L&T Focused L&T Balanced L&T Hybrid L&T EquityFund Cycles Fund Advantage Fund Equity Fund Advantage Fund Equity Fund Savings Fund
Nifty Infrastructure S&P BSE S&P BSE Nifty 500 NIFTY 50 Composite CRISIL Hybrid 35+65 NIFTY Equity Savings TRI Index 500 TRI 500 TRI TRI Index Hybrid Debt - Aggressive Index Index
50-50 Index
Sectoral Thematic ELSS Focused Dynamic Asset Aggressive Hybrid Equity SavingsAllocation Fund
1,379.39 553.62 3,369.31 977.68 2,021.08 5,020.11 215.84
Sept 27, 2007 Aug 20, 2014 Feb 27, 2006 Nov 5, 2018 Feb 07, 2011 Feb 07, 2011 Oct 18, 2011
`2,35,700 `2,26,990 `7,92,680 `1,55,620 `3,07,160 `3,68,890 `2,32,610
44.27% 45.53% 49.27% 51.88% 15.11%$ 36.09% 14.96%#
21.10% 20.49% 22.43% 27.55% 20.43% 24.12%
0.98 0.98 0.97 0.97 0.91 0.96
0.96 0.95 0.89 0.90 0.85 1.08
0.45 0.53 0.50 0.67 0.53 0.56
2.09% 2.47% 1.89% 1.88% 2.24% 1.85%
25.09% 25.58% 21.84% - - 16.02% -
0.84 0.90 0.96 - - 0.95 -
1.03 1.11 0.98 - - 1.13 -
0.41 0.42 0.48 - - 0.55 -
2.24% 2.54% 1.98% 2.34% 2.10% 1.92% 1.58%
$Net Equity for Balanced Advantage Fund is 41.91%.#Net Equity for Equity Savings Fund is 29.95%.^Note: Expense ratio is for regular plan as on 31st March 2022.DisclaimersThe document indicates the strategy/ investment approach currently followed by the schemes and the same may change in future depending on market conditions and other factors.Past performance may or may not be sustained in future and should not be used as a basis for comparison with other investments. For performance refer page 42-43 and 46-49 of the factsheet while reading this document.
For product label please refer Page 3 of the factsheet.
Exit LoadIf the units redeemed or switched out are upto 10% of the units purchased or switched in (“the limit”) within 1 year from the date of allotment – Nil. If units redeemed or switched out are over and above the limit within 1 year from the date of allotment – 1%. If units are redeemed or switched out on or after 1 year from the date of allotment – Nil. (L&T Flexicap Fund, L&T Emerging Businesses Fund, L&T Large and Midcap Fund, L&T Focused Equity Fund, L&T India Large Cap Fund, L&T Midcap Fund, L&T India Value Fund, L&T Infrastructure Fund, L&T Business Cycles Fund, L&T Balanced Advantage Fund, L&T Hybrid Equity Fund & L&T Equity Savings Fund).
CL09293
7.65%
5.92%
13.77% 4.04% 0.57% 0.27% 9.16%4.00% 1.49% 0.32% 8.31% 0.75% 0.62% 0.64% 0.46% 6.61% 0.92% 4.54%
5.71%
48.04%
19.95%
26.30%
7.33%
2.72%
3.57%
4.08%
4.44%
6.78%
7.54%
7.74%
8.56%
12.70%
15.10%
Ferrous Metals
Cement &
Cement Products
Construction
Auto
Petroleum
Products
Pharmaceuticals
Consumer Non
Durables
Finance
Software
Banks
2.74%
3.13%
3.34%
3.62%
5.18%
6.05%
7.70%
8.38%
17.41%
24.39%
Auto
Telecom -
Services
Construction
Project
Cement &
Cement Products
Consumer
Non Durables
Pharmaceuticals
Finance
Petroleum
Products
Software
Banks
3.54%
3.76%
3.76%
4.57%
5.79%
7.36%
7.69%
8.89%
10.18%
10.87%
Transportation
Auto
Ancillaries
Chemicals
Banks
Ferrous
Metals
Consumer
Non Durables
Software
Industrial
Products
Finance
Pharmaceuticals
3.93%
4.77%
6.06%
6.37%
7.30%
7.60%
9.12%
9.31%
9.42%
16.98%
Industrial
Capital Goods
Ferrous
Metals
Auto
Ancillaries
Chemicals
Construction
Consumer
Non Durables
Software
Consumer
Durables
Textile
Products
Industrial
Products
3.15%
3.21%
4.09%
5.45%
5.84%
6.46%
7.25%
8.37%
13.32%
19.30%
Construction
Healthcare
Services
Leisure
Services
Petroleum
Products
Consumer
Durables
Finance
Auto
Ancillaries
Chemicals
Banks
Software
3.82%
3.92%
4.19%
5.12%
5.14%
5.38%
6.30%
6.52%
12.96%
20.66%
Chemicals
Finance
Auto
Cement &
Cement Products
Ferrous
Metals
Petroleum
Products
Construction
Pharmaceuticals
Software
Banks
3.67%
3.98%
4.26%
4.56%
5.94%
7.24%
12.77%
13.21%
15.71%
17.86%
Telecom -
Services
Aerospace &
Defense
Transportation
Power
Petroleum
Products
Construction
Construction
Project
Cement &
Cement Products
Industrial
Capital Goods
Industrial
Products
3.42%
3.96%
5.10%
5.27%
5.37%
7.26%
8.35%
8.88%
11.21%
21.45%
Chemicals
Construction
Project
Industrial
Capital Goods
Ferrous
Metals
Petroleum
Products
Consumer
Durables
Cement &
Cement Products
Construction
Industrial
Products
Banks
2.97%
3.21%
3.74%
4.02%
4.62%
6.37%
6.79%
8.75%
18.75%
19.42%
Auto
Leisure
Services
Consumer
Durables
Textile
Products
Auto
Ancillaries
Finance
Chemicals
Petroleum
Products
Banks
Software
3.61%
3.66%
4.07%
4.35%
4.49%
4.87%
8.83%
10.00%
11.77%
20.35%
Industrial
Capital Goods
Power
Retailing
Industrial
Products
Construction
Project
Transportation
Petroleum
Products
Consumer
Non Durables
Pharmaceuticals
Software
3.18%
3.41%
3.43%
3.64%
4.05%
4.76%
4.95%
7.15%
8.00%
10.04%
Cement &
Cement Products
Auto
Ferrous
Metals
Construction
Petroleum
Products
Finance
Software
Consumer
Non Durables
Pharmaceuticals
Banks
2.37%
2.43%
2.53%
2.69%
3.77%
4.30%
5.37%
5.88%
12.72%
13.38%
Consumer
Durables
Consumer
Non Durables
Pharmaceuticals
Leisure
Services
Finance
Petroleum
Products
Textile
Products
Auto
Ancillaries
Software
Banks
2.48%
2.63%
2.80%
3.51%
4.61%
5.20%
6.72%
7.44%
7.64%
12.79%
Chemicals
Leisure
Services
Auto
Cement &
Cement Products
Pharmaceuticals
Finance
Non - Ferrous
Metals
Software
Consumer
Non Durables
Banks
66.53%
20.31%
28
44.16%
25.88%
29.50%
61.81%
20.38%
28.34%
33.18%
24.91%
1.12%
21.50%
27.12%
42.93%
91.05%
8.11%22.52%
75.67%
54.71%
36.23% 56.09%23.35%
19.94% 41.85%
23.34%
34.17%
66.64%
25.83%
62.53%
17.47%
15.46%

Mutual Fund investments are subject to market risks, read all scheme related documents carefully.
DEBT FUND SNAPSHOTData as on March 31, 2022
Rating Profile Rating Profile
Asset Allocation Profile Asset Allocation Profile
A
A+
A-
AA+
AA
AA-
A1+
AAA
SOV
Cash & Equivalent
NAME OFTHE FUND
Benchmark
Fund Category
Month end AUM(Rs in Crs)
Inception Date(Regular Plan)
Minimum Investment Horizon
Total Expense Ratio+^
L&T Flexi Bond L&T Credit Risk L&T Triple Ace L&T Banking and L&T Gilt Fund L&T ConservativeFund Fund Bond Fund PSU Debt Fund Hybrid Fund
NIFTY Composite NIFTY Credit Risk NIFTY Corporate NIFTY Banking & PSU NIFTY All Duration CRISIL Hybrid 85+15 -Debt Index Bond Index Bond Index Debt Index G-Sec Index Conservative Index
Dynamic Bond Credit Risk Corporate Bond Banking & PSU Gilt Conservative Hybrid
57.85 175.15 8,874.41 4,445.86 243.22 38.03
September 27, 2010 October 08, 2009 March 31, 1997 September 12, 2012 March 29, 2000 July 31, 2003
1 Year + / Tactical 1 Year + 1 Year + 3 Months + 1 Year + / Tactical -
1.62% 1.66% 0.63% 0.61% 1.70% 2.26%
L&T Liquid L&T Ultra L&T Money L&T Low L&T Short Term L&T Resurgent Fund Short Term Fund Market Fund Duration Fund Bond Fund India Bond Fund
NIFTY Liquid Index NIFTY Ultra Short NIFTY Money Market NIFTY Low Duration NIFTY Short Duration NIFTY Medium DurationDuration Debt Index Index Debt Index Debt Index Debt Index
Liquid Ultra Short Term Duration Money Market Low duration Short duration Medium duration
5,108.28 1,561.61 1,012.48 842.98 4,064.23 1,037.36
October 03, 2006 April 10, 2003 August 10, 2005 December 04, 2010 December 27, 2011 February 02, 2015
1 day + 1 Month + 1 Month + 3 Months + 6 Months + 2 Years +
0.20% 0.39% 0.72% 0.91% 0.75% 1.45%
+Effective April 01, 2019 Total Expense Ratio (TER) stands revised. For the actual current expenses charged to the scheme, please refer the website of the Mutual Fund - www.ltfs.com^Note: Expense ratio is for regular plan as on 31st March 2022.
DisclaimersThe document indicates the strategy / investment approach currently followed by the schemes and the same may change in future depending on market conditions and other factors. Refer factsheet while reading this document.
For product label please refer Page 3 of the factsheet.
Exit Load• For redemption within 1 year from the date of allotment or Purchase applying First in First out basis – 0.50% of Applicable NAV. For redemption After 1 year from the date of
allotment or Purchase applying First in First out basis - Nil (L&T Flexi Bond Fund)• If the amount sought to be redeemed or switched out on or before 3 months from the date of allotment: 0.50%. If the amount sought to be redeemed or switched out is invested
for a period of more than 3 months from the date of allotment: Nil (w.e.f. June 09, 2021) (L&T Triple Ace Bond Fund)• If the units redeemed or switched out are upto 10% of the units purchased or switched in (“the limit”) within 1 year from the date of allotment – Nil. If units redeemed or
switched out are over and above the limit within 1 year from the date of allotment – 1%. If units are redeemed or switched out on or after 1 year from the date of allotment – Nil. (L&T Credit Risk Fund & L&T Conservative Hybrid Fund)
• Nil (L&T Ultra Short Term Fund, L&T Money Market Fund, L&T Banking and PSU Debt Fund, L&T Short Term Bond Fund, L&T Gilt Fund, L&T Low Duration Fund & L&T Resurgent India Bond Fund)
• Effective October 20, 2019, exit load will be applicable on all fresh investments in L&T Liquid Fund
CL09293
Treasury Bill
Securitised Debt
Government Bond
NCD
Money Market Instrument
NR/NP
TREPS Reverse Repo
Equity & Equity Related
Units redeemed / switched-out within “X” days from the date of allotment
Day 1 Day 2 Day 3 Day 4 Day 5 Day 6 Day 7 onwards
Exit Load (as a % of redemption proceeds) 0.0070% 0.0065% 0.0060% 0.0055% 0.0050% 0.0045% Nil
29
5.93%
64.01%
23.79%
6.27%
10.01%
44.18%
42.43%
3.38%21.40%
78.14%
0.46%
8.63%
3.68%
50.08%
1.60%
7.57%
28.44%
49.72%
35.24%
6.05%
3.78%
5.21%
26.21%
73.79%
13.71%
11.78%
48.21%
16.44%
9.86%
68.95%
5.51%
25.54%
1.02%
28.96%
70.02%
5.49%
14.85%
24.40%
55.26%
EQUITY & EQUITY RELATED
63.99%
36.01%
6.89%
64.02%
-0.95%
8.11%
15.69%
6.27%44.18%
42.44%
10.01%
17.13%
-13.75% -1.69%
78.14%
2.15%
21.40% 28.44%
1.70%
57.59%
3.75%
8.63%-0.10%
0.01%
0.20%
7.76%
48.85%
41.04%
2.14%
-0.34%
35.25%
4.12%5.16%
55.84%
0.09%
26.12%
7.25%
66.54%74.51%
13.81%
-0.10%
11.78%
25.54%
5.54%
68.96%
-0.03%
28.96%
1.02%
70.02%23.74%
43.36%
-7.35%
40.25%
0.76%
24.40%
5.49%14.09%
55.26%
0.20%
48.86%
43.17%
7.77%
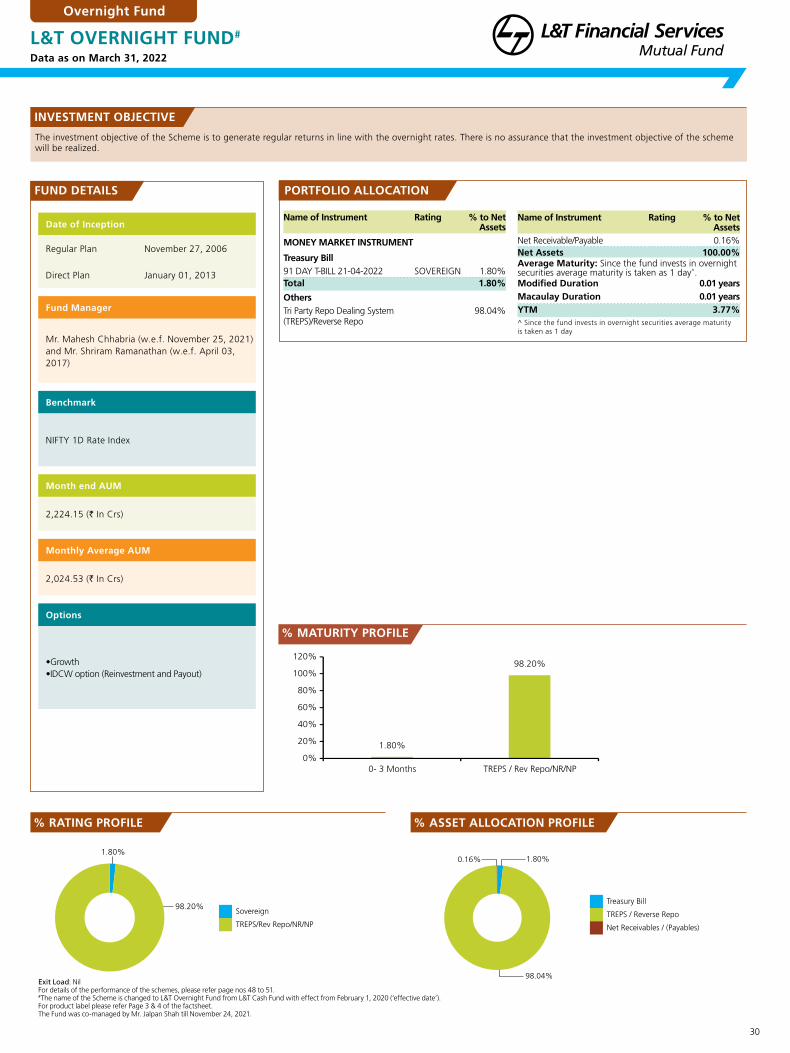
30
Data as on March 31, 2022
Overnight Fund
L&T OVERNIGHT FUND#
The investment objective of the Scheme is to generate regular returns in line with the overnight rates. There is no assurance that the investment objective of the scheme will be realized.
INVESTMENT OBJECTIVE
FUND DETAILS PORTFOLIO ALLOCATION
Date of Inception
Regular Plan November 27, 2006
Direct Plan January 01, 2013
Fund Manager
Mr. Mahesh Chhabria (w.e.f. November 25, 2021) and Mr. Shriram Ramanathan (w.e.f. April 03, 2017)
Benchmark
NIFTY 1D Rate Index
Month end AUM
2,224.15 (` In Crs)
Monthly Average AUM
2,024.53 (` In Crs)
Options
•Growth •IDCW option (Reinvestment and Payout)
Name of Instrument Rating % to Net Assets
MONEY MARKET INSTRUMENT
Treasury Bill91 DAY T-BILL 21-04-2022 SOVEREIGN 1.80%Total 1.80%
OthersTri Party Repo Dealing System (TREPS)/Reverse Repo
98.04%
Name of Instrument Rating % to Net Assets
Net Receivable/Payable 0.16%Net Assets 100.00%Average Maturity: Since the fund invests in overnight securities average maturity is taken as 1 day^.Modified Duration 0.01 yearsMacaulay Duration 0.01 yearsYTM 3.77%
Exit Load: NilFor details of the performance of the schemes, please refer page nos 48 to 51.#The name of the Scheme is changed to L&T Overnight Fund from L&T Cash Fund with effect from February 1, 2020 (‘effective date’).For product label please refer Page 3 & 4 of the factsheet.The Fund was co-managed by Mr. Jalpan Shah till November 24, 2021.
Sovereign
TREPS/Rev Repo/NR/NP
% RATING PROFILE % ASSET ALLOCATION PROFILE
98.20%
1.80%1.8 %0
98.04%
0.16%
1.80%
98.20%
0%
20%
40%
60%
80%
100%
120%
0- 3 Months TREPS / Rev Repo/NR/NP
% MATURITY PROFILE
^ Since the fund invests in overnight securities average maturity is taken as 1 day
Treasury Bill
TREPS / Reverse Repo
Net Receivables / (Payables)

31
Data as on March 31, 2022
A1+/ A1+(SO)
AAA/ AAA(SO)/ AAA(CE)
Sovereign
TREPS/Rev Repo/NR/NP
% RATING PROFILE % ASSET ALLOCATION PROFILE
23.79%
5.93%
64.01%
6.27%
-0.95%
6.89%
15.69%
6.27%
8.11%
64.02%
94.07%
5.93%
0%
20%
40%
60%
80%
100%
0 - 3 months TREPS / Rev Repo/NR/NP
% MATURITY PROFILE
L&T LIQUID FUND
The investment objective of the Scheme is to generate regular returns in line with the overnight rates.
INVESTMENT OBJECTIVE
FUND DETAILS PORTFOLIO ALLOCATION
Date of Inception
Regular Plan October 03, 2006
Direct Plan December 31, 2012
Fund Manager
Mr. Mahesh Chhabria (w.e.f. November 25, 2021) and Mr. Shriram Ramanathan (w.e.f. June 30, 2014)
Benchmark
NIFTY Liquid Index
Month end AUM
5,108.28 (` In Crs)
Monthly Average AUM
4,970.41 (` In Crs)
Options
•Growth •IDCW (Reinvestment and Payout) - Weekly IDCW •Daily IDCW Reinvestment Plan
To generate reasonable returns while maintaining safety and providing the investor superior liquidity. To achieve this objective, investments will be predominantly made in a well-diversified and highly liquid portfolio of money market instruments, government securities and corporate debt. There is no assurance that the investment objective of the scheme will be realized.
INVESTMENT OBJECTIVE
FUND DETAILS PORTFOLIO ALLOCATION
Exit Load: Effective October 20, 2019, exit load will be applicable on all fresh investments in L&T Liquid Fund
For details of the performance of the schemes, please refer page nos 48 to 51.For product label please refer Page 3 & 4 of the factsheet.The Fund was co-managed by Mr. Jalpan Shah till November 24, 2021With effect from April 01, 2022, the first tier benchmark index of the Scheme shall be NIFTY Liquid Index B-I . Refer our addendum dated March 31, 2022
Units redeemed / switched-out within “X” days from the date of allotment
Day 1 Day 2 Day 3 Day 4 Day 5 Day 6 Day 7 onwards
Exit Load (as a % of redemption proceeds) 0.0070% 0.0065% 0.0060% 0.0055% 0.0050% 0.0045% Nil
Liquid Fund
Name of Instrument Rating % to Net Assets
DEBT INSTRUMENTSMONEY MARKET INSTRUMENTS Commercial Paper (Listed / Awaiting listing on Stock Exchanges) /Certificate of Deposit
Bank of Baroda IND A1+ 6.34%National Bank for Agriculture &
Rural Development ICRA A1+ 6.34%
Axis Bank Limited CRISIL A1+ 6.33% Indian Oil Corporation Limited ICRA A1+ 5.87%HDFC Bank Limited CARE A1+ 4.38%Bharti Airtel Limited CRISIL A1+ 3.90%Reliance Jio Infocomm Limited CRISIL A1+ 3.90%
ICICI Securities Limited CRISIL A1+ 3.40%Kotak Securities Limited CRISIL A1+ 2.92%Indian Bank CRISIL A1+ 2.43%Canara Bank CRISIL A1+ 1.95%Housing Development Finance Corporation Limited CRISIL A1+ 1.95%
Kotak Mahindra Prime Limited CRISIL A1+ 1.95%SBICAP Securities Limited CRISIL A1+ 1.95%Tata Steel Limited ICRA A1+ 1.95%Adani Ports and Special Economic Zone Limited ICRA A1+ 1.94%
Berger Paints India Limited CRISIL A1+ 1.66%Godrej Industries Limited CRISIL A1+ 1.46%NIIF Infrastructure Finance Limited ICRA A1+ 1.46%HDFC Securities Limited CRISIL A1+ 0.97%Julius Baer Capital (India) Private Limited CRISIL A1+ 0.97%
Total 64.02%GOVERNMENT BONDS
08.35% GOI 14-05-2022 SOVEREIGN 5.08%08.15% GOI 11-06-2022 SOVEREIGN 3.03%Total 8.11%
Name of Instrument Rating % to Net Assets
Non Convertible DebenturesListed/Awaiting Listing on the Exchange
Housing Development Finance Corporation Limited CRISIL AAA 3.75%Small Industries Development Bank of India ICRA AAA 0.88%
Export Import Bank of India CRISIL AAA 0.84%Housing and Urban Development Corporation Limited ICRA AAA 0.80%
Total 6.27%Treasury Bill
364 DAY T-BILL 09-06-2022 SOVEREIGN 3.89%
364 DAY T-BILL 21-04-2022 SOVEREIGN 2.93%
91 DAY T-BILL 05-05-2022 SOVEREIGN 2.93%
364 DAY T-BILL 02-06-2022 SOVEREIGN 1.95%
364 DAY T-BILL 26-05-2022 SOVEREIGN 1.95%
182 DAY T-BILL 09-06-2022 SOVEREIGN 1.94%
182 DAY T-BILL 28-04-2022 SOVEREIGN 0.10%
Total 15.69%
OthersTri Party Repo Dealing System (TREPS)/Reverse Repo 6.89%
Net Receivable/Payable -0.95%
Net Assets 100.00%Average Maturity 0.12 yearsModified Duration 0.11 yearsMacaulay Duration 0.11 yearsYTM 3.87%
Money Market Instrument
Government Bonds
Non Convertible Debentures
Treasury Bill
TREPS / Reverse Repo
Net Receivables / (Payables)
Indicates top ten instruments

32
Data as on March 31, 2022
Ultra Short Term Duration Fund
L&T ULTRA SHORT TERM FUND
To generate reasonable and stable income and provide liquidity to the unit holder. To achieve this objective the scheme will invest predominantly in a well diversified and highly liquid portfolio of money market instruments, government securities and corporate debt. The scheme will not invest in equities or equity related instruments. There is no assurance that the investment objective of the scheme will be realized.
INVESTMENT OBJECTIVE
FUND DETAILS PORTFOLIO ALLOCATION
A1+/ A1+(SO)
AAA/ AAA(SO)/ AAA(CE)
Sovereign
TREPS/Rev Repo/NR/NP
Date of Inception
Regular Plan April 10, 2003
Direct Plan January 01, 2013
Fund Manager
Mr. Jalpan Shah (w.e.f June 30, 2014) & Mr. Mahesh Chhabria (w.e.f November 25, 2021)
Benchmark
NIFTY Ultra Short Duration Debt Index
Month end AUM
1,561.61 (` In Crs)
Monthly Average AUM
1,668.64 (` In Crs)
Options
•Growth •IDCW (Reinvestment and Payout) 1. Weekly IDCW 2. Monthly IDCW 3. Semi- annual IDCW •Daily IDCW Reinvestment Plan
Exit Load: NilFor details of the performance of the schemes, please refer page nos 48 to 51.For product label please refer Page 3 & 4 of the factsheet.The Fund was co-managed by Mr. Shriram Ramanathan till November 24, 2021 With effect from April 01, 2022, the first tier benchmark index of the Scheme shall be NIFTY Ultra Short Duration Debt Index B-I . Refer our addendum dated March 31, 2022
% RATING PROFILE % ASSET ALLOCATION PROFILE
42.43%
10.01%
3.38%
44.18%
44.18%
42.44%
10.01%
-13.75%
17.13%
36.19%
28.31% 27.17%
4.95%3.38%
0%
5%
10%
15%
20%
25%
30%
35%
40%
0-3
Months
3-6
Months
6 Months
1Year
2-3
Years
TREPS / RevRepo/NR/NP
% MATURITY PROFILE
Name of Instrument Rating % to Net Assets
DEBT INSTRUMENTSMONEY MARKET INSTRUMENTS Commercial Paper (Listed / Awaiting listing on Stock Exchanges) /Certificate of Deposit
HDFC Bank Limited CARE A1+ 7.76%
Axis Bank Limited CRISIL A1+ 7.29%
Reliance Jio Infocomm Limited CRISIL A1+ 6.35%
Reliance Industries Limited CRISIL A1+ 6.34%Small Industries Development
Bank of India CARE A1+ 6.14%
LIC Housing Finance Limited CRISIL A1+ 3.18%
Canara Bank CRISIL A1+ 3.07%
Kotak Mahindra Bank Limited CRISIL A1+ 1.54%
Bank of Baroda IND A1+ 0.77%
Total 42.44%Listed/Awaiting Listing on the ExchangeNon Convertible Debentures
National Bank for Agriculture & Rural Development
CRISIL AAA/ICRA AAA 6.62%
Rec Limited CRISIL AAA 3.39%
Total 10.01%
Name of Instrument Rating % to Net Assets
Treasury Bill
91 DAY T-BILL 30-06-2022 SOVEREIGN 12.69%
182 DAY T-BILL 15-09-2022 SOVEREIGN 12.57%
182 DAY T-BILL 25-08-2022 SOVEREIGN 9.45%
182 DAY T-BILL 08-09-2022 SOVEREIGN 6.29%
364 DAY T-BILL 16-06-2022 SOVEREIGN 3.18%
Total 44.18%
OthersTri Party Repo Dealing System (TREPS)/Reverse Repo 17.13%
Net Receivable/Payable -13.75%
Net Assets 100.00%
Average Maturity 0.43 years
Modified Duration 0.42 years
Macaulay Duration 0.43 years
YTM 4.19%
Indicates top ten instruments
Money Market Instrument
Non Convertible Debentures
Treasury Bill
TREPS / Reverse Repo
Net Receivables / (Payables)

33
Data as on March 31, 2022L&T MONEY MARKET FUND
The investment objective of the Scheme is to generate regular returns in line with the overnight rates.
INVESTMENT OBJECTIVE
FUND DETAILS PORTFOLIO ALLOCATION
A1+/ A1+(SO)
Sovereign
TREPS/Rev Repo/NR/NP
Exit Load: NilFor details of the performance of the schemes, please refer page nos 48 to 51.For product label please refer Page 3 & 4 of the factsheet.The fund was co-managed by Mr. Jalpan Shah till November 24, 2021.With effect from April 01, 2022, the first tier benchmark index of the Scheme shall be NIFTY Money Market Index B-I . Refer our addendum dated March 31, 2022
% RATING PROFILE % ASSET ALLOCATION PROFILE
0.46%
78.14%
21.40%
2.15% -1.69%
78.14%
21.40%
22.03%29.13%
48.38%
0.46%
0%
10%
20%
30%
40%
50%
60%
0- 3
Months
3- 6
Months
6 Months
-1Year
TREPS / Rev
Repo/NR/NP
To generate regular income through investment in a portfolio comprising substantially of money market instruments. There is no assurance that the investment objective of the scheme will be realized.
INVESTMENT OBJECTIVE
% ASSET ALLOCATION PROFILE
% MATURITY PROFILE
Money Market Fund
Date of Inception
Regular Plan August 10, 2005
Direct Plan January 01, 2013
Fund Manager
Mr. Shriram Ramanathan (w.e.f March 21, 2020) & Mr. Mahesh Chhabria (w.e.f November 25, 2021)
Benchmark
NIFTY Money Market Index
Month end AUM
1,012.48 (` In Crs)
Monthly Average AUM
1,095.17 (` In Crs)
Options
•Growth •IDCW 1. Daily IDCW (Payout) 2. Weekly IDCW (Payout) 3. Monthly IDCW (Re-investment and Payout)
Name of Instrument Rating % to Net Assets
DEBT INSTRUMENTSMONEY MARKET INSTRUMENTS Commercial Paper (Listed / Awaiting listing on Stock Exchanges) /Certificate of Deposit
Axis Bank Limited CRISIL A1+ 7.25%
HDFC Bank Limited CARE A1+/ICRA A1+ 7.16%
Kotak Mahindra Bank Limited CRISIL A1+ 7.12%National Bank for Agriculture &
Rural Development IND A1+ 7.12%Small Industries Development
Bank of India CARE A1+ 7.11%
Kotak Securities Limited CRISIL A1+ 4.90%
LIC Housing Finance Limited CRISIL A1+ 4.89%Canara Bank CRISIL A1+ 4.88% Infina Finance Limited CRISIL A1+ 4.88%
Reliance Jio Infocomm Limited CRISIL A1+ 4.84%
Export Import Bank of India CRISIL A1+ 4.72%Housing Development Finance Corporation Limited CRISIL A1+ 4.72%
Kotak Mahindra Investment Limited CRISIL A1+ 2.46%
Bajaj Financial Securities Limited CRISIL A1+ 2.45%NIIF Infrastructure Finance Limited ICRA A1+ 2.45%
Name of Instrument Rating % to Net Assets
Bank of Baroda IND A1+ 1.19%
Total 78.14%
Treasury Bill182 DAY T-BILL 15-09-2022 SOVEREIGN 9.69%
364 DAY T-BILL 16-02-2023 SOVEREIGN 3.33%
182 DAY T-BILL 04-08-2022 SOVEREIGN 2.43%
182 DAY T-BILL 11-08-2022 SOVEREIGN 2.43%
364 DAY T-BILL 02-03-2023 SOVEREIGN 2.37%
364 DAY T-BILL 23-02-2023 SOVEREIGN 1.15%
Total 21.40%
OthersTri Party Repo Dealing System (TREPS)/Reverse Repo 2.15%
Net Receivable/Payable -1.69%
Net Assets 100.00%
Average Maturity 0.58 years
Modified Duration 0.56 years
Macaulay Duration 0.58 years
YTM 4.47%
Indicates top ten instruments
Money Market Instrument
Treasury Bill
TREPS / Reverse Repo
Net Receivables / (Payables)

34
Data as on March 31, 2022
Banking & PSU Fund
L&T BANKING AND PSU DEBT FUND
To generate reasonable returns by primarily investing in debt and money market securities that are issued by Banks, Public Sector Undertakings (PSUs) and Public Financial Institutions (PFIs) in India. There is no assurance that the investment objective of the scheme will be realized.
INVESTMENT OBJECTIVE
FUND DETAILS PORTFOLIO ALLOCATION
Date of Inception
Regular Plan September 12, 2012
Direct Plan January 01, 2013
Fund Manager
Mr. Jalpan Shah (w.e.f. May 30, 2016) & Mr. Shriram Ramanathan (w.e.f. March 29, 2017)
Benchmark
NIFTY Banking & PSU Debt Index
Month end AUM
4,445.86 (` In Crs)
Monthly Average AUM
4,418.20 (` In Crs)
Options
•Growth •IDCW option (Reinvestment and Payout)
Exit Load: NilFor details of the performance of the schemes, please refer page nos 48 to 51.For product label please refer Page 3 & 4 of the factsheet.
% RATING PROFILE % ASSET ALLOCATION PROFILE
28.96%
70.02%
1.02%
28.96%
70.02%
1.02%
0.17%5.24%
20.46%
61.23%
11.88%
1.02%
0%
10%
20%
30%
40%
50%
60%
70%
0 -1
Year
1 - 2
Years
2 - 3
Years
3 - 5
Years
Greater than
5years
TREPS / Rev
Repo/NR/NP
% MATURITY PROFILE
Name of Instrument Rating % to Net Assets
DEBT INSTRUMENTS
GOVERNMENT BONDS
05.74% GOI 15-NOV-2026 SOVEREIGN 13.60%
05.63% GOI 12-04-2026 SOVEREIGN 12.30%
06.79% GOI 15-05-2027 SOVEREIGN 2.94%
07.35% GOI 22-06-2024 SOVEREIGN 0.12%
Total 28.96%Non Convertible Debentures Listed/Awaiting Listing on the Exchange
Indian Railway Finance Corporation Limited
CARE AAA/CRISIL AAA 9.82%
National Bank for Agriculture & Rural Development CRISIL AAA 9.70%
Indian Oil Corporation Limited CRISIL AAA 9.18%Small Industries Development
Bank of India CARE AAA 9.02%Power Finance Corporation
Limited CRISIL AAA 8.82%
Rec Limited CRISIL AAA 6.79%Power Grid Corporation of India
Limited CRISIL AAA 4.68%
Export Import Bank of India CRISIL AAA 3.09%
Name of Instrument Rating % to Net Assets
Housing and Urban Development Corporation Limited
ICRA AAA 2.59%
Axis Bank Limited CRISIL AAA 2.37%HDFC Bank Limited CRISIL AAA 2.23%NTPC Limited CRISIL AAA 1.59%Nuclear Power Corporation Of India Limited CRISIL AAA 0.08%
Housing Development Finance Corporation Limited CRISIL AAA 0.06%
Total 70.02%OthersTri Party Repo Dealing System (TREPS)/Reverse Repo 1.02%
Net Receivable/Payable 0.00%
Net Assets 100.00%
Average Maturity 3.79 years
Modified Duration 3.20 years
Macaulay Duration 3.36 years
YTM 5.98%
Indicates top ten instruments
AAA/ AAA(SO)/ AAA(CE)
Sovereign
TREPS/Rev Repo/NR/NP
Government Bonds
Non Convertible Debentures
TREPS / Reverse Repo

35
Data as on March 31, 2022L&T SHORT TERM BOND FUND
The investment objective of the Scheme is to generate regular returns in line with the overnight rates.
INVESTMENT OBJECTIVE
FUND DETAILS PORTFOLIO ALLOCATION
Exit Load: NilFor details of the performance of the schemes, please refer page nos 48 to 51.For product label please refer Page 3 & 4 of the factsheet.With effect from April 01, 2022, the first tier benchmark index of the Scheme shall be NIFTY Short Duration Debt Index B-II. Refer our addendum dated March 31, 2022
% RATING PROFILE % ASSET ALLOCATION PROFILE
43.17%
48.86%
7.77%
0.20%
0.20%
48.85%
41.04%
2. %14
7.76%
0.01%
8.64%
53.38%
11.10%
19.11%
7.77%
0%
10%
20%
30%
40%
50%
60%
0 -1 Year 1 - 2 Years 2 - 3 Years 3 - 5 Years TREPS / RevRepo/NR/NP
To generate regular returns and capital appreciation by investing in debt, government and money market securities. There is no assurance that the investment objective of the scheme will be realized.
INVESTMENT OBJECTIVE
% RATING PROFILE % ASSET ALLOCATION PROFILE
% MATURITY PROFILE
Short Duration Fund
Date of Inception
Regular Plan December 27, 2011
Direct Plan January 01, 2013
Fund Manager
Mr. Shriram Ramanathan & Mr. Jalpan Shah (w.e.f. May 30, 2016)
Benchmark
NIFTY Short Duration Debt Index
Month end AUM
4,064.23 (` In Crs)
Monthly Average AUM
3,900.15 (` In Crs)
Options
•Growth •IDCW (Reinvestment and Payout) •Quarterly IDCW (Reinvestment and Payout) •Annual IDCW (Reinvestment and Payout)
Name of Instrument Rating % to Net Assets
DEBT INSTRUMENTSMoney Market Instrument Commercial Paper (Listed / Awaiting listing on Stock Exchanges) / Certificate of DepositAxis Bank Limited CRISIL A1+ 0.20%
Total 0.20%
GOVERNMENT BONDS
5.27% GUJARAT SDL 19-01-2024 SOVEREIGN 9.92%
07.16% GOI 20-05-2023 SOVEREIGN 7.77%
07.35% GOI 22-06-2024 SOVEREIGN 6.66%
7.89% GUJARAT SDL 15-05-2025 SOVEREIGN 5.24%
06.30% GOI 09-APR-2023 SOVEREIGN 5.15%
05.22% GOI 15-06-2025 SOVEREIGN 3.70%8.23% MAHARASHTRA SDL 09-09-2025 SOVEREIGN 3.44%
04.26% GOI 17-05-2023 SOVEREIGN 2.49%8.15% MAHARSHTRA SDL 26-11-2025 SOVEREIGN 2.03%8.26% MAHARASHTRA SDL 12-08-2025 SOVEREIGN 0.83%
7.96% GUJARAT SDL 14-10-2025 SOVEREIGN 0.54%8.14% KARNATAKA SDL 13-11-2025 SOVEREIGN 0.54%
8.23% GUJARAT SDL 09-09-2025 SOVEREIGN 0.26%
06.17% GOI 12-JUN-2023 SOVEREIGN 0.25%
07.72% GOI 25-05-2025 SOVEREIGN 0.03%
Total 48.85%Non Convertible Debentures Listed/Awaiting Listing on the Exchange
National Bank for Agriculture & Rural Development CRISIL AAA 8.57%
Indian Railway Finance Corporation Limited CRISIL AAA 6.34%
Name of Instrument Rating % to Net Assets
Housing Development Finance Corporation Limited CRISIL AAA 4.99%
NTPC Limited CRISIL AAA 3.98%
National Housing Bank CRISIL AAA 3.62%
Bajaj Finance Limited CRISIL AAA 2.53%
Indian Oil Corporation Limited CRISIL AAA 2.53%
Bajaj Housing Finance Limited CRISIL AAA 2.51%Jamnagar Utilities and Power Pvt Limited CRISIL AAA 2.50%
Kotak Mahindra Prime Limited CRISIL AAA 1.61%
NIIF Infrastructure Finance Limited ICRA AAA 0.99%
Export Import Bank of India CRISIL AAA 0.49%Hindustan Petroleum Corporation Limited CRISIL AAA 0.38%
Total 41.04%
Securitised Debt AmortFirst Business Receivables Trust(Backed by receivables from Reliance Industries,Reliance Retail,Reliance Jio)
CRISIL AAA(SO) 2.14%
Total 2.14%
Others
Tri Party Repo Dealing System (TREPS)/Reverse Repo 7.76%
Net Receivable/Payable 0.01%
Net Assets 100.00%
Average Maturity 1.72 years
Modified Duration 1.54 years
Macaulay Duration 1.60 years
YTM 5.23%
Indicates top ten instruments
AAA/ AAA(SO)/ AAA(CE)
A1+/ A1+(SO)
Sovereign
TREPS/Rev Repo/NR/NP
Money Market Instrument
Government Bonds
Non Convertible Debentures
Securitised Debt
TREPS / Reverse Repo
Net Receivables / (Payables)

36
Data as on March 31, 2022
Low Duration Fund
L&T LOW DURATION FUND
To generate reasonable returns primarily through investments in fixed income securities and money market instruments. There is no assurance that the objective of the Scheme will be realised and the Scheme does not assure or guarantee any returns.
INVESTMENT OBJECTIVE
FUND DETAILS PORTFOLIO ALLOCATION
Date of Inception
Regular Plan December 04, 2010
Direct Plan January 01, 2013
Fund Manager
Mr. Shriram Ramanathan (w.e.f Nov 24, 2012) & Mr. Jalpan Shah (w.e.f March 21, 2020)
Benchmark
NIFTY Low Duration Debt Index
Month end AUM
842.98 (` In Crs)
Monthly Average AUM
837.07 (` In Crs)
Options
•Growth •IDCW option (Reinvestment and Payout) •Annual IDCW option (Reinvestment and Payout)
Exit Load: Nil (w.e.f. July 9, 2020)For details of the performance of the schemes, please refer page nos 48 to 51.For product label please refer Page 3 & 4 of the factsheet.With effect from April 01, 2022, the first tier benchmark index of the Scheme shall be NIFTY Low Duration Debt Index B-I. Refer our addendum dated March 31, 2022
% RATING PROFILE % ASSET ALLOCATION PROFILE
1.60%
28.44%8.63%
7.57%
3.68%
50.08%
8.63%
57.59%
3.75%
28.44%
1.70%
-0.10%
84.80%
10.55%3.05% 1.60%
0%
10%
20%
30%
40%
50%
60%
70%
80%
90%
0 -1 Year 1 - 2 Years 2 - 3 Years TREPS / RevRepo/NR/NP
% MATURITY PROFILE
Name of Instrument Rating % to Net Assets
DEBT INSTRUMENTSMONEY MARKET INSTRUMENTS Commercial Paper (Listed / Awaiting listing on Stock Exchanges) /Certificate of Deposit
Axis Bank Limited CRISIL A1+ 5.79%HDFC Bank Limited ICRA A1+ 2.84%
Total 8.63%
Government Bonds06.84% GOI 19-12-2022 SOVEREIGN 12.92%07.16% GOI 20-05-2023 SOVEREIGN 9.37%08.35% GOI 14-05-2022 SOVEREIGN 6.15%
Total 28.44%Listed/Awaiting Listing on the ExchangeNon Convertible Debentures
National Bank for Agriculture & Rural Development
CRISIL AAA/ICRA AAA 6.17%
India Grid Trust CRISIL AAA 5.25%ONGC Petro Additions Limited
(Letter of comfort from Oil & Natural Gas Corporation Limited)
ICRA AAA (CE) 4.83%
Tata Steel Limited BWR AA+ 4.43%Power Finance Corporation LimitedCRISIL AAA 4.34%
Rec Limited CRISIL AAA 3.74%Aditya Birla Fashion and Retail Limited CRISIL AA 3.68%Nabha Power Limited (Corporate Guarantee of L&T Limited) ICRA AAA (CE) 3.18%Cholamandalam Investment and Finance Company Limited ICRA AA+ 3.15%
LIC Housing Finance Limited CRISIL AAA 3.14%
Name of Instrument Rating % to Net Assets
Indian Oil Corporation Limited CRISIL AAA 3.10%Small Industries Development Bank of India CARE AAA 3.10%
Reliance Industries Limited CRISIL AAA 3.09%Housing Development Finance Corporation Limited CRISIL AAA 3.00%Oriental Nagpur Betul Highway Limited (Nhai Annuity Receivables) CRISIL AAA 1.20%
Bajaj Finance Limited CRISIL AAA 1.19%NIIF Infrastructure Finance Limited ICRA AAA 1.00%Total 57.59%Securitised Debt
First Business Receivables Trust(Backed by receivables from Reliance Industries,Reliance Retail,Reliance Jio)
CRISIL AAA(SO) 3.75%
Total 3.75%
OthersTri Party Repo Dealing System (TREPS)/Reverse Repo 1.70%
Net Receivable/Payable -0.10%
Net Assets 100.00%
Average Maturity 0.53 years
Modified Duration 0.51 years
Macaulay Duration 0.53 years
YTM 4.56%
Indicates top ten instruments
AA/ AA(SO)/ AA(CE)
AA+/ AA+(SO)/ AA+(CE)
A1+/ A1+(SO)
AAA/ AAA(SO)/ AAA (CE)
Sovereign
TREPS/Rev Repo/NR/NP
Money Market Instrument
Non Convertible Debentures
Securitised Debt
Government Bonds
Treps / Reverse Repo
Net Receivables / (Payables)
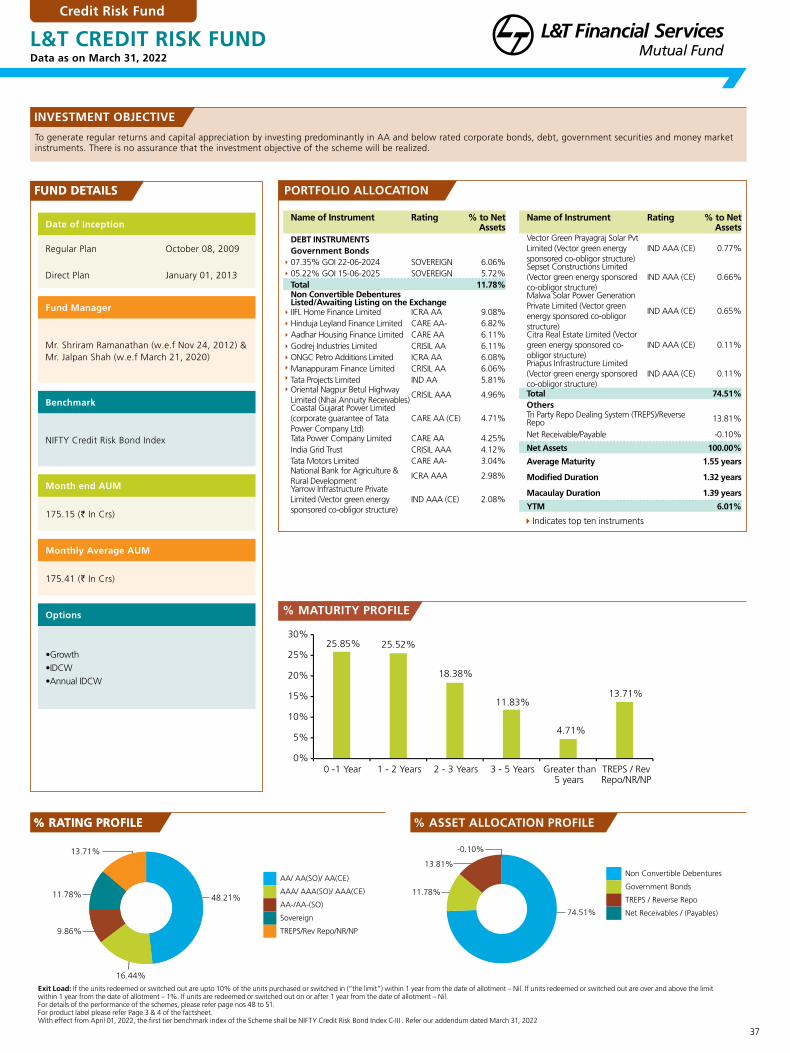
37
Data as on March 31, 2022
To generate regular returns and capital appreciation by investing predominantly in AA and below rated corporate bonds, debt, government securities and money market instruments. There is no assurance that the investment objective of the scheme will be realized.
L&T CREDIT RISK FUND
INVESTMENT OBJECTIVE
FUND DETAILS PORTFOLIO ALLOCATION
Exit Load: If the units redeemed or switched out are upto 10% of the units purchased or switched in (“the limit”) within 1 year from the date of allotment – Nil. If units redeemed or switched out are over and above the limitwithin 1 year from the date of allotment – 1%. If units are redeemed or switched out on or after 1 year from the date of allotment – Nil.For details of the performance of the schemes, please refer page nos 48 to 51.For product label please refer Page 3 & 4 of the factsheet.With effect from April 01, 2022, the first tier benchmark index of the Scheme shall be NIFTY Credit Risk Bond Index C-III . Refer our addendum dated March 31, 2022
% RATING PROFILE % ASSET ALLOCATION PROFILE
13.71%
48.21%11.78%
9.86%
16.44%
-0.10%
13.81%
74.51%
11.78%
FUND DETAILS
% RATING PROFILE
% MATURITY PROFILE
Credit Risk Fund
Date of Inception
Regular Plan October 08, 2009
Direct Plan January 01, 2013
Fund Manager
Mr. Shriram Ramanathan (w.e.f Nov 24, 2012) & Mr. Jalpan Shah (w.e.f March 21, 2020)
Benchmark
NIFTY Credit Risk Bond Index
Month end AUM
175.15 (` In Crs)
Monthly Average AUM
175.41 (` In Crs)
Options
•Growth •IDCW •Annual IDCW
Name of Instrument Rating % to Net Assets
DEBT INSTRUMENTSGovernment Bonds
07.35% GOI 22-06-2024 SOVEREIGN 6.06%05.22% GOI 15-06-2025 SOVEREIGN 5.72%
Total 11.78%Non Convertible Debentures Listed/Awaiting Listing on the Exchange
IIFL Home Finance Limited ICRA AA 9.08%Hinduja Leyland Finance Limited CARE AA- 6.82%Aadhar Housing Finance Limited CARE AA 6.11%Godrej Industries Limited CRISIL AA 6.11%ONGC Petro Additions Limited ICRA AA 6.08%Manappuram Finance Limited CRISIL AA 6.06%Tata Projects Limited IND AA 5.81%Oriental Nagpur Betul Highway
Limited (Nhai Annuity Receivables)CRISIL AAA 4.96%
Coastal Gujarat Power Limited (corporate guarantee of Tata Power Company Ltd)
CARE AA (CE) 4.71%
Tata Power Company Limited CARE AA 4.25%India Grid Trust CRISIL AAA 4.12%Tata Motors Limited CARE AA- 3.04%National Bank for Agriculture & Rural Development
ICRA AAA 2.98%
Yarrow Infrastructure Private Limited (Vector green energy sponsored co-obligor structure)
IND AAA (CE) 2.08%
Name of Instrument Rating % to Net Assets
Vector Green Prayagraj Solar Pvt Limited (Vector green energy sponsored co-obligor structure)
IND AAA (CE) 0.77%
Sepset Constructions Limited (Vector green energy sponsored co-obligor structure)
IND AAA (CE) 0.66%
Malwa Solar Power Generation Private Limited (Vector green energy sponsored co-obligor structure)
IND AAA (CE) 0.65%
Citra Real Estate Limited (Vector green energy sponsored co-obligor structure)
IND AAA (CE) 0.11%
Priapus Infrastructure Limited (Vector green energy sponsored co-obligor structure)
IND AAA (CE) 0.11%
Total 74.51%OthersTri Party Repo Dealing System (TREPS)/Reverse Repo 13.81%
Net Receivable/Payable -0.10%
Net Assets 100.00%
Average Maturity 1.55 years
Modified Duration 1.32 years
Macaulay Duration 1.39 years
YTM 6.01%
AA/ AA(SO)/ AA(CE)
AAA/ AAA(SO)/ AAA(CE)
AA-/AA-(SO)
Sovereign
TREPS/Rev Repo/NR/NP
Non Convertible Debentures
Government Bonds
TREPS / Reverse Repo
Net Receivables / (Payables)
Indicates top ten instruments
25.85% 25.52%
18.38%
11.83%
4.71%
13.71%
0%
5%
10%
15%
20%
25%
30%
0 -1 Year 1 - 2 Years 2 - 3 Years 3 - 5 Years Greater than
5 years
TREPS / Rev
Repo/NR/NP

38
Data as on March 31, 2022
Dynamic Bond Fund
L&T FLEXI BOND FUND
To generate reasonable returns through a diversified portfolio of fixed income securities. There is no assurance that the investment objective of the scheme will be real-ized.
INVESTMENT OBJECTIVE
FUND DETAILS PORTFOLIO ALLOCATION
Date of Inception
Regular Plan September 27, 2010
Direct Plan January 01, 2013
Fund Manager
Mr. Shriram Ramanathan (w.e.f. Feb 02, 2015) & Mr. Jalpan Shah (w.e.f. May 30, 2016)
Benchmark
NIFTY Composite Debt Index
Month end AUM
57.85 (` In Crs)
Monthly Average AUM
58.15 (` In Crs)
Options
•Growth •IDCW option (Reinvestment and Payout) •Annual option (Reinvestment and Payout)
Exit Load: For redemption within 1 year from the date of allotment or Purchase applying First in First out basis – 0.50% of Applicable NAV. For redemption After 1 year from the date of allotment or Purchase applying First inFirst out basis - NilFor details of the performance of the schemes, please refer page nos 48 to 51.For product label please refer Page 3 & 4 of the factsheet.With effect from April 01, 2022, the first tier benchmark index of the Scheme shall be NIFTY Composite Debt Index A-III . Refer our addendum dated March 31, 2022
% RATING PROFILE % ASSET ALLOCATION PROFILE
73.79%
26.21%
0.09%
26.12%
66.54%
7.25%
66.54%
0.92%6.33%
26.21%
0%
10%
20%
30%
40%
50%
60%
70%
0 -1 Year 1 - 2 Years Greaterthan 5 years
TREPS / RevRepo/NR/NP
% MATURITY PROFILE
Name of Instrument Rating % to Net Assets
DEBT INSTRUMENTS
GOVERNMENT BONDS
07.26% GOI 14-01-2029 SOVEREIGN 4.52%
07.17% GOI 08-01-2028 SOVEREIGN 1.81%
07.68% GOI 15-12-2023 SOVEREIGN 0.92%
Total 7.25%
Treasury Bill
364 DAY T-BILL 16-02-2023 SOVEREIGN 66.54%
Total 66.54%
Name of Instrument Rating % to Net Assets
OthersTri Party Repo Dealing System (TREPS)/Reverse Repo 26.12%
Net Receivable/Payable 0.09%
Net Assets 100.00%
Average Maturity 1.02 years
Modified Duration 0.91 years
Macaulay Duration 0.94 years
YTM 4.44%
Sovereign
TREPS/Rev Repo/NR/NPGovernment Bonds
Treasury Bill
TREPS / Reverse Repo
Net Receivable/Payable

39
Data as on March 31, 2022
To generate regular return by investing predominantly in AA+ and above rated debt and money market instruments. There is no assurance that the investment objective of the scheme will be realized.
L&T TRIPLE ACE BOND FUND
INVESTMENT OBJECTIVE
FUND DETAILS PORTFOLIO ALLOCATION
Exit Load: If the amount sought to be redeemed or switched out on or before 3 months from the date of allotment: 0.50%. If the amount sought to be redeemed or switched out is invested for a period of more than 3 months from the date of allotment: Nil (w.e.f. June 09, 2021)For details of the performance of the schemes, please refer page nos 48 to 51.For product label please refer Page 3 & 4 of the factsheet.With effect from April 01, 2022, the first tier benchmark index of the Scheme shall be NIFTY Corporate Bond Index B-III. Refer our addendum dated March 31, 2022
% RATING PROFILE % ASSET ALLOCATION PROFILE
68.95%5.51%
25.54%
-0.03%5.54%
25.54%
68.96%
0.33%
94.16%
5.51%
0%
20%
40%
60%
80%
100%
3 - 5 Years Greater than 5
years
TREPS / Rev
Repo/NR/NP
% ASSET ALLOCATION PROFILE
% MATURITY PROFILE
Corporate Bond Fund
Date of Inception
Regular Plan March 31, 1997
Direct Plan January 01, 2013
Fund Manager
Mr. Shriram Ramanathan (w.e.f. June 30, 2014) & Mr. Jalpan Shah (w.e.f. April 03, 2017)
Benchmark
NIFTY Corporate Bond Index
Month end AUM
8,874.41 (` In Crs)
Monthly Average AUM
9,068.58 (` In Crs)
Options
•Growth •IDCW (Reinvestment and Payout) 1. Quarterly IDCW 2. Semi-Annual IDCW 3. Annual IDCW
Name of Instrument Rating % to Net Assets
DEBT INSTRUMENTS
GOVERNMENT BONDS06.79% GOI 15-05-2027 SOVEREIGN 8.54%07.26% GOI 14-01-2029 SOVEREIGN 8.25%07.17% GOI 08-01-2028 SOVEREIGN 8.18%
6.47% MAHARSHTRA SDL 21-10-2028 SOVEREIGN 0.57%
Total 25.54%Non Convertible Debentures Listed/Awaiting Listing on the Exchange
National Highways Authority of India CRISIL AAA 9.72%
Indian Railway Finance Corporation Limited
CARE AAA/CRISIL AAA 9.19%
National Bank for Agriculture & Rural Development
ICRA AAA/CRISIL AAA/IND AAA
8.93%
Power Grid Corporation of India Limited CRISIL AAA 6.48%
NTPC Limited CRISIL AAA 6.10%
Export Import Bank of India CRISIL AAA 4.89%
Indian Oil Corporation Limited CRISIL AAA 4.29%
Housing and Urban Development Corporation Limited
CARE AAA/ICRA AAA 3.76%
Rec Limited CRISIL AAA 3.62%
Name of Instrument Rating % to Net Assets
ICICI Bank Limited CARE AAA 3.42%
HDFC Bank Limited CRISIL AAA 3.04%
Housing Development Finance Corporation Limited CRISIL AAA 2.99%
Nuclear Power Corporation Of India Limited CRISIL AAA 1.05%
Food Corporation of India Limited
CRISIL AAA (CE) 0.74%
NHPC Limited CARE AAA 0.74%
Total 68.96%
OthersTri Party Repo Dealing System (TREPS)/Reverse Repo 5.54%
Net Receivable/Payable -0.03%
Net Assets 100.00%
Average Maturity 6.37 years
Modified Duration 4.81 years
Macaulay Duration 5.05 years
YTM 6.63%
Indicates top ten instruments
AAA/ AAA(SO)/ AAA(CE)
Sovereign
TREPS/Rev Repo/NR/NP
Government Bonds
Non Convertible Debentures
TREPS / Reverse Repo
Net Receivable/ Payable

40
Data as on March 31, 2022
To generate returns from a portfolio from investments in Government Securities. There is no assurance that the investment objective of the scheme will be realized.
L&T GILT FUND
INVESTMENT OBJECTIVE
FUND DETAILS
Exit Load: Nil.For details of the performance of the schemes, please refer page nos 48 to 51.For product label please refer Page 3 & 4 of the factsheet.
Gilt Fund
Date of Inception
Regular Plan March 29, 2000
Direct Plan January 01, 2013
Fund Manager
Mr. Jalpan Shah (w.e.f. May 30, 2016) & Mr. Shriram Ramanathan (w.e.f. April 03, 2017)
Benchmark
NIFTY All Duration G-Sec Index
Month end AUM
243.22 (` In Crs)
Monthly Average AUM
246.42 (` In Crs)
Options
•Growth •IDCW option (Reinvestment and Payout) Quarterly IDCW
% RATING PROFILE
63.99%
36.01%
% RATING PROFILE
PORTFOLIO ALLOCATION
% ASSET ALLOCATION PROFILE
-7.35%
43.36%
40.25%
23.74%
23.74%
28.15%
12.10%
36.01%
0%
5%
10%
15%
20%
25%
30%
35%
40%
0 -1 Year 1 - 2 Years Greater than
5years
TREPS/Rev
Repo/NR/NP
% ASSET ALLOCATION PROFILE
% MATURITY PROFILE
Name of Instrument Rating % to Net Assets
DEBT INSTRUMENTS
GOVERNMENT BONDS
07.32% GOI 28-01-2024 SOVEREIGN 21.65%
07.26% GOI 14-01-2029 SOVEREIGN 11.82%
07.16% GOI 20-05-2023 SOVEREIGN 6.50%
06.19% GOI 16-09-2034 SOVEREIGN 0.28%
Total 40.25%
Treasury Bill
364 DAY T-BILL 16-02-2023 SOVEREIGN 23.74%
Total 23.74%
Name of Instrument Rating % to Net Assets
OthersTri Party Repo Dealing System (TREPS)/Reverse Repo 43.36%
Net Receivable/Payable -7.35%
Net Assets 100.00%
Average Maturity 1.52 years
Modified Duration 1.29 years
Macaulay Duration 1.33 years
YTM 4.63%
Sovereign
TREPS/Rev Repo/NR/NP
Government Bonds
Treasury Bill
TREPS / Reverse Repo
Net Receivables / (Payables)

41
Data as on March 31, 2022
To generate regular income through investments in a range of Debt, Equity and Money Market Instruments. Income will be distributed only if the same is earned by the scheme and there can be no assurance that the objective of the scheme will be realized.
L&T CONSERVATIVE HYBRID FUND
INVESTMENT OBJECTIVE
FUND DETAILSFUND DETAILS
Conservative Hybrid Fund
Date of Inception
Regular Plan July 31, 2003
Direct Plan January 01, 2013
Fund Manager
Ms. Cheenu Gupta (w.e.f. July 02, 2021) & Mr. Venugopal Manghat (w.e.f. Nov 24, 2012) (for investments in equity and equity related instruments) Mr. Jalpan Shah (w.e.f. May 30, 2016) (for investments in debt and debt related instruments)
Benchmark
CRISIL Hybrid 85+15 - Conservative Index
Month end AUM
38.03 (` In Crs)
Monthly Average AUM
37.88 (` In Crs)
Options
•Growth •IDCW (Reinvestment and Payout) 1. Monthly IDCW 2. Quarterly IDCW
Exit Load: If the units redeemed or switched out are upto 10% of the units (the limit) purchased or switched within 1 year from the date of allotment – Nil. If units redeemed or switched out are over and above the limit within1 year from the date of allotment – 1%. If units are redeemed or switched out on or after 1 year from the date of allotment – Nil.For details of the performance of the schemes, please refer page nos 48 to 51.For product label please refer Page 3 & 4 of the factsheet.For investments in equity and equity related instruments the Fund was co-managed by Mr. Vihang Naik till July 1, 2021.
% RATING PROFILE
5.49%
24.40%55.26%
14.85%
PORTFOLIO ALLOCATION
% ASSET ALLOCATION PROFILE % MATURITY PROFILE
5.49%
13.96%
41.30%
24.40%
14.85%
0%
5%
10%
15%
20%
25%
30%
35%
40%
45%
0 -1 Year 1 - 2 Years 3 - 5
Years
EQUITY
& EQUITY
RELATED
TREPS / Rev
Repo/NR/NP
Name of Instrument Rating % to Net Assets
DEBT INSTRUMENTSGovernment Bonds
07.59% GOI 11-01-2026 SOVEREIGN 28.12%07.37% GOI 16-04-2023 SOVEREIGN 13.96%05.22% GOI 15-06-2025 SOVEREIGN 13.18%
Total 55.26%EQUITY & EQUITY RELATED Listed / awaiting listing on the stock exchanges
Infosys Limited Software 1.87%K.P.R. Mill Limited Textile Products 1.68% ICICI Bank Limited Banks 1.52%Bajaj Finance Limited Finance 1.28% Indian Hotels Company
Limited Leisure Services 1.09%
Reliance Industries Limited Petroleum Products 1.09%
Minda Industries Limited Auto Ancillaries 1.08%State Bank of India Banks 1.04%Greenpanel Industries Limited
Consumer Durables 0.99%
Sona BLW Precision Forgings Limited Auto Ancillaries 0.91%
Brigade Enterprises Limited Construction 0.84%
Asian Paints Limited Consumer Non Durables 0.81%
HDFC Bank Limited Banks 0.80%Bajaj Finserv Limited Insurance 0.76%Tata Power Company Limited Power 0.63%
Clean Science and Technology Limited Chemicals 0.61%
APL Apollo Tubes Limited Ferrous Metals 0.58%Sobha Limited Construction 0.58%
UltraTech Cement LimitedCement & Cement Products
0.56%
Tata Consultancy Services Limited Software 0.54%
Titan Company Limited Consumer Durables 0.53%
Name of Instrument Rating % to Net Assets
eClerx Services Limited Software 0.49%Zee Entertainment Enterprises Limited Entertainment 0.49%
Sun Pharmaceutical Industries Limited Pharmaceuticals 0.45%
Rolex Rings Limited Auto Ancillaries 0.44%Navin Fluorine International Limited Chemicals 0.43%
VRL Logistics Limited Transportation 0.43%Happiest Minds Technologies Limited Software 0.42%
Computer Age Management Services Limited
Capital Markets 0.37%
UTI Asset Management Company Limited Capital Markets 0.37%
Cholamandalam Investment and Finance Company Limited
Finance 0.34%
MindTree Limited Software 0.25%Housing Development Finance Corporation LimitedFinance 0.13%
Total 24.40%Non Convertible Debentures Listed/Awaiting Listing on the Exchange
National Bank for Agriculture & Rural Development
CRISIL AAA 5.49%
Total 5.49%OthersTri Party Repo Dealing System (TREPS)/Reverse Repo 14.09%
Net Receivable/Payable 0.76%Net Assets 100.00%Average Maturity 2.25 years
Modified Duration 1.96 years
Macaulay Duration 2.02 yearsYTM 5.23%Indicates top ten instruments
AAA/ AAA(SO)/ AAA(CE)
Equity & Equity Related
Sovereign
TREPS/Rev Repo/NR/NP
Government Bonds
Equity & Equity Related
Non Convertible Debentures
TREPS / Reverse Repo
Net Receivables / (Payables)
55.26%
24.40%
5.49%
14.09%
0.76%

42
Data as on March 31, 2022
Medium Duration Fund
L&T RESURGENT INDIA BOND FUND
To seek to generate income by investing primarily in debt and money market securities. There is no assurance that the investment objective of the scheme will be realized.
INVESTMENT OBJECTIVE
FUND DETAILS
Exit Load: Nil (w.e.f September 16, 2021)For details of the performance of the schemes, please refer page nos 48 to 51.For product label please refer Page 3 & 4 of the factsheet.With effect from April 01, 2022, the first tier benchmark index of the Scheme shall be NIFTY Medium Duration Debt Index B-III . Refer our addendum dated March 31, 2022
% RATING PROFILE
3.78% 6.05%
49.72%
35.24%
5.21%
PORTFOLIO ALLOCATION
Date of Inception
Regular Plan February 02, 2015
Direct Plan February 02, 2015
Fund Manager
Mr. Shriram Ramanathan (w.e.f Feb 02, 2015) & Mr. Jalpan Shah (w.e.f March 21, 2020)
Benchmark
NIFTY Medium Duration Debt Index
Month end AUM
1,037.36 (` In Crs)
Monthly Average AUM
1,039.25 (` In Crs)
Options
•Growth •IDCW option (Payout and Reinvestment) •Annual IDCW (Payout and Reinvestment)
Name of Instrument Rating % to Net Assets
DEBT INSTRUMENTS
GOVERNMENT BONDS05.22% GOI 15-06-2025 SOVEREIGN 15.46%05.63% GOI 12-04-2026 SOVEREIGN 12.21%
07.16% GOI 20-05-2023 SOVEREIGN 2.54%
06.18% GOI 04-11-2024 SOVEREIGN 2.52%
06.79% GOI 15-05-2027 SOVEREIGN 2.52%
Total 35.25%Non Convertible Debentures Listed/Awaiting Listing on the Exchange
Sikka Ports & Terminals Limited (erstwhile Reliance Ports & Terminals Ltd)
CRISIL AAA 5.26%
ONGC Petro Additions Limited (Letter of comfort from Oil & Natural Gas Corporation Limited)
ICRA AAA (CE) 4.90%
Embassy Office Parks REIT CRISIL AAA 4.84% ICICI Bank Limited ICRA AAA 4.72%NIIF Infrastructure Finance
Limited ICRA AAA 4.42%
Bajaj Finance Limited CRISIL AAA 3.88%National Bank for Agriculture &
Rural Development CRISIL AAA/ICRA AAA 3.52%
Coastal Gujarat Power Limited (corporate guarantee of Tata Power Company Ltd)
CARE AA (CE) 3.18%
Oriental Nagpur Betul Highway Limited (Nhai Annuity Receivables)
CRISIL AAA 2.96%
Patel Knr Heavy Infrastructures Limited (Nhai Annuity Receivables)
CARE AA+ 2.77%
IIFL Home Finance Limited ICRA AA 2.56%
National Housing Bank CRISIL AAA 2.53%
Muthoot Finance Limited CRISIL AA+ 2.44%L&T Metro Rail (Hyderabad) Limited (Put Option On L&T Limited )
IND AAA (CE) 1.76%
Yarrow Infrastructure Private Limited (Vector green energy sponsored co-obligor structure)
IND AAA (CE) 1.41%
Name of Instrument Rating % to Net Assets
IOT Utkal Energy Services Limited (Long term take or pay agreement with IOCL)
CRISIL AAA 1.28%
Andhra Pradesh Expressway Limited (Nhai Annuity Receivables)
IND AAA 1.27%
Vector Green Prayagraj Solar Pvt Limited (Vector green energy sponsored co-obligor structure)
IND AAA (CE) 0.52%
Malwa Solar Power Generation Private Limited (Vector green energy sponsored co-obligor structure)
IND AAA (CE) 0.44%
Sepset Constructions Limited (Vector green energy sponsored co-obligor structure)
IND AAA (CE) 0.44%
Tata Power Company Limited CARE AA 0.31%Power Finance Corporation Limited CRISIL AAA 0.29%Citra Real Estate Limited (Vector green energy sponsored co-obligor structure)
IND AAA (CE) 0.07%
Priapus Infrastructure Limited (Vector green energy sponsored co-obligor structure)
IND AAA (CE) 0.07%
Total 55.84%
Securitised DebtFirst Business Receivables
Trust(Backed by receivables from Reliance Industries,Reliance Retail,Reliance Jio)
CRISIL AAA(SO) 5.16%
Total 5.16%
OthersTri Party Repo Dealing System (TREPS)/Reverse Repo 4.12%
Net Receivable/Payable -0.34%
Net Assets 100.00%
Average Maturity 2.72 years
Modified Duration 2.33 years
Macaulay Duration 2.43 years
YTM 6.16%
Indicates top ten instruments
AA/ AA(SO)/ AA(CE)
AA+/ AA+(SO)/ AA+(CE)
AAA/ AAA(SO)/ AAA(CE)
Sovereign
TREPS/Rev Repo/NR/NP
% ASSET ALLOCATION PROFILE % MATURITY PROFILE-0.34%
35.25%
55.84%
5.16%
4.12%
3.78%
24.80%
21.75%
38.91%
6.99%
3.78%
0%
5%
10%
15%
20%
25%
30%
35%
40%
0 -1
Year
1 - 2
Years
2 - 3
Years
3 - 5
Years
Greater than
5 years
TREPS / RevRepo/NR/NP
45%
Government Bonds
Non Convertible Debentures
Securitised Debt
TREPS / Reverse Repo
Net Receivables / (Payables)

43
Data as on March 31, 2022FUND MANAGER WISE SCHEME DETAILS
*Investments in Foreign Securities was managed by Alok Ranjan till June 22, 2021.
Sr. No. Mr. Shriram Ramanathan Total No. of years of experience: 20
1 L&T Liquid Fund (Co-FM)
2 L&T Low Duration Fund
3 L&T Credit Risk Fund
4 Fixed Maturity Plans (Co-FM)
5 L&T Triple Ace Bond Fund
6 L&T Resurgent India Bond Fund
7 L&T Hybrid Equity Fund (Debt Component)
8 L&T Short Term Bond Fund
9 L&T Flexi Bond Fund
10 L&T Overnight Fund (Co-FM)
11 L&T Banking and PSU Debt Fund (Co-FM)
12 L&T Gilt Fund (Co-FM)
13 L&T Money Market Fund
Sr. No. Mr. Jalpan Shah Total No. of years of experience: 16
1 L&T Ultra Short Term Fund
2 L&T Short Term Bond Fund (Co-FM)
3 L&T Flexi Bond Fund (Co-FM)
4 L&T Gilt Fund
5 L&T Banking and PSU Debt Fund
6 Fixed Maturity Plans
7 L&T Conservative Hybrid Fund (Debt Component)
8 L&T Balanced Advantage Fund (Debt Portion)
9 L&T Equity Savings Fund (Debt Portion)
10 L&T Triple Ace Bond Fund (Co-FM)
11 L&T Arbitrage Opportunities Fund (Debt Portion)
12 L&T Low Duration Fund (Co-FM)
13 L&T Credit Risk Fund (Co-FM)
14 L&T Resurgent India Bond Fund (Co-FM)
Sr. No.Ms. Cheenu Gupta Total No. of years of experience: 11
1 L&T Equity Savings Fund (Equity Component)
2 L&T Conservative Hybrid Fund (Equity Component)
3 L&T Hybrid Equity Fund (Equity Component)
4 L&T Tax Advantage Fund
5 L&T Large and Midcap Fund
6 L&T Balanced Advantage Fund (Co-FM)
7 L&T Infrastructure Fund (Co-FM)
8 L&T Business Cycles Fund (Co-FM)
9 L&T India Large Cap Fund (Co-FM)
Sr. No. Mr. Vihang Naik Total No. of years of experience: 15
1 L&T Flexicap Fund
2 L&T Large and Midcap Fund (Co-FM)
3 L&T Tax Advantage Fund (Co-FM)
4 L&T Balanced Advantage Fund (Equity Component)
5 L&T Midcap Fund
6 L&T Emerging Businesses Fund (Co-FM)
7 L&T Focused Equity Fund
8 L&T India Value Fund (Co-FM)
Sr. No. Mr. Venugopal Manghat Total No. of years of experience: 25
1 L&T India Large Cap Fund
2 L&T India Value Fund
3 L&T Conservative Hybrid Fund (Equity Component) (Co-FM)
4 L&T Equity Savings Fund (Equity Component) (Co-FM)
5 L&T Arbitrage Opportunities Fund
6 L&T Business Cycles Fund
7 L&T Flexicap Fund (Co-FM)
8 L&T Infrastructure Fund
9 L&T Hybrid Equity Fund (Equity Component) (Co-FM)
10 L&T Midcap Fund (Co-FM)
11 L&T Emerging Businesses Fund
12 L&T Focused Equity Fund (Co-FM)
Sr. No. Mr. Sonal Gupta
Total No. of years of experience: 151 L&T Flexicap Fund*
2 L&T India Large Cap Fund*
3 L&T Large and Midcap Fund*
4 L&T India Value Fund*
5 L&T Hybrid Equity Fund
6 L&T Emerging Businesses Fund*
7 L&T Arbitrage Opportunities Fund*
8 L&T Business Cycles Fund*
Sr. No. Mr. Praveen Ayathan Total No. of years of experience: 28
1 L&T Arbitrage Opportunities Fund (Co-FM)
2 L&T Equity Savings Fund (Co-FM)
3 L&T Balanced Advantage Fund (Co-FM)
4 L&T Nifty 50 Index Fund
5 L&T Nifty Next 50 Index Fund
Sr. No. Mr. Mahesh Chhabria Total No. of years of experience: 11
1 L&T Overnight Fund
2 L&T Liquid Fund
3 L&T Ultra Short Term Fund (Co-FM)
4 L&T Money Market Fund (Co-FM)

44
Data as on March 31, 2022
SIP Performance Of Equity Oriented Schemes - Growth Option
L&T Flexicap Fund - Regular Plan 1 Year 3 Year 5 Year 7 Year 10 Year Since Inception
Total Amount Invested (`) 1,20,000 3,60,000 6,00,000 8,40,000 12,00,000 20,30,000
Market value of the invested amount (`) 1,24,955 4,79,308 8,35,742 12,91,658 23,40,453 68,43,404
Scheme Returns (%) 7.79 19.54 13.23 12.09 12.82 13.04
Total Value of S&P BSE-500 TRI Index (B*) (`) 1,27,967 5,19,291 9,37,949 14,97,640 27,04,533 72,40,882
S&P BSE-500 TRI Index Returns (B*) (%) 12.61 25.36 17.93 16.24 15.52 13.61
Total Value of S&P BSE SENSEX TRI (AB*) (`) 1,28,312 4,99,161 9,32,069 14,93,804 26,21,992 73,97,051
S&P BSE SENSEX TRI Returns (AB*) (%) 13.17 22.47 17.68 16.16 14.95 13.82
L&T India Large Cap Fund - Regular Plan 1 Year 3 Year 5 Year 7 Year 10 Year Since Inception
Total Amount Invested (`) 1,20,000 3,60,000 6,00,000 8,40,000 12,00,000 17,40,000
Market value of the invested amount (`) 1,25,355 4,78,974 8,60,527 13,29,534 23,66,184 47,24,002
Scheme Returns (%) 8.43 19.50 14.42 12.90 13.03 12.76
Total Value of S&P BSE 100 TRI (B*) (`) 1,28,076 5,06,155 9,22,796 14,71,144 26,07,893 50,13,199
S&P BSE 100 TRI Returns (B*) (%) 12.79 23.48 17.27 15.74 14.85 13.48
Total Value of S&P BSE SENSEX TRI (AB*) (`) 1,28,312 4,99,678 9,32,586 14,93,804 26,21,992 50,24,083
S&P BSE SENSEX TRI Returns (AB*) (%) 13.17 22.55 17.70 16.16 14.95 13.50
L&T Tax Advantage Fund - Regular Plan 1 Year 3 Year 5 Year 7 Year 10 Year Since Inception
Total Amount Invested (`) 1,20,000 3,60,000 6,00,000 8,40,000 12,00,000 19,40,000
Market value of the invested amount (`) 1,25,882 4,88,307 8,44,126 13,34,445 24,70,101 64,65,957
Scheme Returns (%) 9.27 20.88 13.64 13.00 13.83 13.56
Total Value of S&P BSE 500 TRI (B*) (`) 1,27,967 5,19,291 9,37,949 14,97,640 27,04,533 64,22,571
S&P BSE 500 TRI Returns (B*) (%) 12.61 25.36 17.93 16.24 15.52 13.49
Total Value of S&P BSE SENSEX TRI (AB*) (`) 1,28,312 4,99,161 9,32,069 14,93,804 26,21,992 63,82,296
S&P BSE SENSEX TRI Returns (AB*) (%) 13.17 22.47 17.68 16.16 14.95 13.43
L&T India Value Fund - Regular Plan 1 Year 3 Year 5 Year 7 Year 10 Year Since Inception
Total Amount Invested (`) 1,20,000 3,60,000 6,00,000 8,40,000 12,00,000 14,70,000
Market value of the invested amount (`) 1,29,302 5,30,866 9,18,975 14,53,755 30,15,079 44,86,990
Scheme Returns (%) 14.77 26.98 17.10 15.40 17.54 16.97
Total Value of S&P BSE 500 TRI (B*) (`) 1,27,967 5,19,291 9,37,949 14,97,640 27,04,533 37,65,770
S&P BSE 500 TRI (B*) (%) 12.61 25.36 17.93 16.24 15.52 14.41
Total Value of S&P BSE SENSEX TRI (AB*) (`) 1,28,312 4,99,161 9,32,069 14,93,804 26,21,992 36,50,243
S&P BSE SENSEX TRI Returns (AB*) (%) 13.17 22.47 17.68 16.16 14.95 13.95
L&T Large and Midcap Fund - Regular Plan 1 Year 3 Year 5 Year 7 Year 10 Year Since Inception
Total Amount Invested (`) 1,20,000 3,60,000 6,00,000 8,40,000 12,00,000 19,10,000
Market value of the invested amount (`) 1,27,853 4,90,614 8,47,260 13,19,198 24,32,315 61,02,150
Scheme Returns (%) 12.43 21.22 13.79 12.68 13.54 13.33
Total Value of NIFTY LargeMidcap 250 TRI (B*) (`) 1,27,581 5,34,120 9,58,785 15,44,171 29,29,117 70,65,718
NIFTY LargeMidcap 250 (B*) (%) 11.99 27.44 18.84 17.09 17.01 14.91
Total Value of S&P BSE SENSEX TRI (AB*) (`) 1,28,312 4,99,678 9,32,586 14,93,804 26,21,992 61,50,464
S&P BSE SENSEX TRI Returns (AB*) (%) 13.17 22.55 17.70 16.16 14.95 13.42
L&T Midcap Fund - Regular Plan 1 Year 3 Year 5 Year 7 Year 10 Year Since Inception
Total Amount Invested (`) 1,20,000 3,60,000 6,00,000 8,40,000 12,00,000 21,20,000
Market value of the invested amount (`) 1,24,036 4,98,196 8,57,376 13,86,206 29,80,035 1,07,82,573
Scheme Returns (%) 6.33 22.33 14.27 14.07 17.33 16.35
Total Value of S&P BSE Midcap 150 TRI (B*) (`) 1,26,614 5,70,623 10,04,273 16,17,354 32,49,436 NA
S&P BSE Midcap 150 TRI Returns (B*) (%) 10.44 32.40 20.75 18.40 18.93 NA
Total Value of S&P BSE SENSEX TRI (AB*) (`) 1,28,312 4,99,678 9,32,586 14,93,804 26,21,992 87,15,232
S&P BSE SENSEX TRI Returns (AB*) (%) 13.17 22.55 17.70 16.16 14.95 14.34
Past performance may or may not be sustained in the future. SIP Return are calculated on XIRR basis. IDCW are assumed to be reinvested and bonus is adjusted. Load is not taken into consideration. For SIP returns, monthly investment of ` 10000 invested on the 1st day of every month has been considered.*B: Scheme Benchmark, AB: Additional Benchmark
L&T Infrastructure Fund - Regular Plan 1 Year 3 Year 5 Year 7 Year 10 Year Since Inception
Total Amount Invested (`) 1,20,000 3,60,000 6,00,000 8,40,000 12,00,000 17,50,000
Market value of the invested amount (`) 1,30,420 5,30,366 8,74,523 13,81,683 26,54,345 45,51,712
Scheme Returns (%) 16.58 26.91 15.08 13.98 15.17 12.17
Total Value of Nifty Infrastructure TRI (B*) (`) 1,30,884 5,25,950 9,23,621 13,90,820 22,00,559 32,12,953
Nifty Infrastructure TRI Returns (B*) (%) 17.34 26.30 17.30 14.16 11.67 7.89
Total Value of S&P BSE SENSEX TRI (AB*) (`) 1,28,312 4,99,161 9,32,069 14,93,804 26,21,992 50,68,186
S&P BSE SENSEX TRI Returns (AB*) (%) 13.17 22.47 17.68 16.16 14.95 13.46
Data as on March 31, 2022

45
Data as on March 31, 2022
SIP Performance Of Equity Oriented Schemes - Growth Option
L&T Focused Equity Fund - Regular Plan 1 Year 3 Year 5 Year 7 Year 10 Year Since Inception
Total Amount Invested (`) 1,20,000 3,60,000 NA NA NA 4,10,000
Market value of the invested amount (`) 1,21,212 4,59,237 NA NA NA 5,35,683
Scheme Returns (%) 1.89 16.51 NA NA NA 15.86
Total Value of Nifty 500 TRI (B*) (`) 1,27,923 5,17,569 NA NA NA 6,02,188
Nifty 500 TRI Returns (B*) (%) 12.54 25.12 NA NA NA 23.15
Total Value of S&P BSE SENSEX TRI (AB*) (`) 1,28,312 4,99,678 NA NA NA 5,83,303
S&P BSE SENSEX TRI Returns (AB*) (%) 13.17 22.55 NA NA NA 21.14
L&T Arbitrage Opportunities Fund - Regular Plan 1 Year 3 Year 5 Year 7 Year 10 Year Since Inception
Total Amount Invested (`) 1,20,000 3,60,000 6,00,000 8,40,000 NA 9,50,000
Market value of the invested amount (`) 1,22,116 3,82,315 6,74,100 10,02,957 NA 11,64,601
Scheme Returns (%) 3.30 3.95 4.61 4.99 NA 5.16
Total Value of Nifty 50 Arbitrage Index (B*) (`) 1,22,314 3,80,329 6,65,791 9,81,668 NA 11,37,652
Nifty 50 Arbitrage Index Returns (B*) (%) 3.62 3.61 4.12 4.39 NA 4.57
Total Value of CRISIL 1 Year T-Bill Index (AB*) (`) 1,22,483 3,85,171 6,86,815 10,29,357 NA 11,98,761
CRISIL 1 Year T-Bill Index Returns (AB*) (%) 3.88 4.45 5.35 5.72 NA 5.89
L&T Emerging Businesses Fund - Regular Plan 1 Year 3 Year 5 Year 7 Year 10 Year Since Inception
Total Amount Invested (`) 1,20,000 3,60,000 6,00,000 8,40,000 NA 9,50,000
Market value of the invested amount (`) 1,36,598 6,34,684 10,62,249 17,49,532 NA 21,45,660
Scheme Returns (%) 26.77 40.62 23.07 20.60 NA 20.01
Total Value of S&P BSE 250 Small Cap Index TRI (B*) (`) 1,29,236 6,02,956 9,93,245 15,30,803 NA 17,99,535
S&P BSE 250 Small Cap Index TRI Returns (B*) (%) 14.66 36.62 20.29 16.85 NA 15.72
Total Value of S&P BSE SENSEX TRI (AB*) (`) 1,28,312 4,99,678 9,32,586 14,93,804 NA 17,58,478
S&P BSE SENSEX TRI Returns (AB*) (%) 13.17 22.55 17.70 16.16 NA 15.16
L&T Balanced Advantage Fund - Regular Plan 1 Year 3 Year 5 Year 7 Year 10 Year Since Inception
Total Amount Invested (`) 1,20,000 3,60,000 6,00,000 8,40,000 12,00,000 13,40,000
Market value of the invested amount (`) 1,21,824 4,12,504 7,36,491 11,02,764 19,63,126 23,90,779
Scheme Returns (%) 2.85 9.06 8.14 7.66 9.52 9.94
Total Value of NIFTY 50 Composite Hybrid Debt 50-50 Index (B*) (`) 1,25,463 4,50,432 8,33,055 13,01,900 22,24,484 26,58,428
NIFTY 50 Composite Hybrid Debt 50-50 Index (B*) (%) 8.60 15.14 13.10 12.31 11.87 11.70
Total Value of S&P BSE SENSEX TRI (AB*) (`) 1,28,312 4,99,678 9,32,586 14,93,650 26,20,622 31,56,154
S&P BSE SENSEX TRI Returns (AB*) (%) 13.17 22.55 17.70 16.16 14.94 14.53
L&T Equity Savings Fund - Regular Plan 1 Year 3 Year 5 Year 7 Year 10 Year Since Inception
Total Amount Invested (`) 1,20,000 3,60,000 6,00,000 8,40,000 12,00,000 12,70,000
Market value of the invested amount (`) 1,25,810 4,41,294 7,70,182 11,48,544 18,74,754 20,36,045
Scheme Returns (%) 9.15 13.71 9.94 8.80 8.64 8.61
Total Value of NIFTY Equity Savings Index (B^) (`) 1,24,548 4,27,278 7,75,075 11,89,702 19,83,116 21,69,998
NIFTY Equity Savings Index Returns (B^) (%) 7.14 11.48 10.19 9.78 9.71 9.74
Total Value of CRISIL 10 Yr Gilt Index (AB^) (`) 1,19,525 3,76,840 6,81,436 10,23,272 16,57,121 17,96,220
CRISIL 10 Yr Gilt Index Returns (AB^) (%) -0.74 3.00 5.04 5.56 6.29 6.37
L&T Business Cycles Fund - Regular Plan 1 Year 3 Year 5 Year 7 Year 10 Year Since Inception
Total Amount Invested (`) 1,20,000 3,60,000 6,00,000 8,40,000 NA 9,20,000
Market value of the invested amount (`) 1,26,917 5,00,748 8,49,416 12,95,111 NA 14,59,000
Scheme Returns (%) 10.92 22.70 13.89 12.16 NA 11.77
Total Value of S&P BSE 500 TRI (B*) (`) 1,27,967 5,19,291 9,37,949 14,97,640 NA 16,92,076
S&P BSE 500 TRI Returns (B*) (%) 12.61 25.36 17.93 16.24 NA 15.53
Total Value of S&P BSE SENSEX TRI (AB*) (`) 1,28,312 4,99,161 9,32,069 14,93,804 NA 16,78,596
S&P BSE SENSEX TRI Returns (AB*) (%) 13.17 22.47 17.68 16.16 NA 15.33
L&T Hybrid Equity Fund - Regular Plan 1 Year 3 Year 5 Year 7 Year 10 Year Since Inception
Total Amount Invested (`) 1,20,000 3,60,000 6,00,000 8,40,000 12,00,000 13,40,000
Market value of the invested amount (`) 1,24,346 4,60,182 8,07,173 12,45,675 23,19,442 28,48,498
Scheme Returns (%) 6.82 16.65 11.83 11.07 12.66 12.84
Total Value of CRISIL Hybrid 35+65 - Aggressive Index (B*) (`) 1,26,015 4,71,182 8,65,627 13,65,995 23,99,586 28,84,391
CRISIL Hybrid 35+65 - Aggressive Index Returns (B*) (%) 9.48 18.33 14.66 13.66 13.29 13.05
Total Value of S&P BSE SENSEX TRI (AB*) (`) 1,28,312 4,99,678 9,32,586 14,93,650 26,20,622 31,56,474
S&P BSE SENSEX TRI Returns (AB*) (%) 13.17 22.55 17.70 16.16 14.94 14.53
Past performance may or may not be sustained in the future. SIP Return are calculated on XIRR basis. IDCW are assumed to be reinvested and bonus is adjusted. Load is not taken into consideration. For SIP returns, monthly investment of ` 10000 invested on the 1st day of every month has been considered.*B: Scheme Benchmark, AB: Additional Benchmark
Data as on March 31, 2022
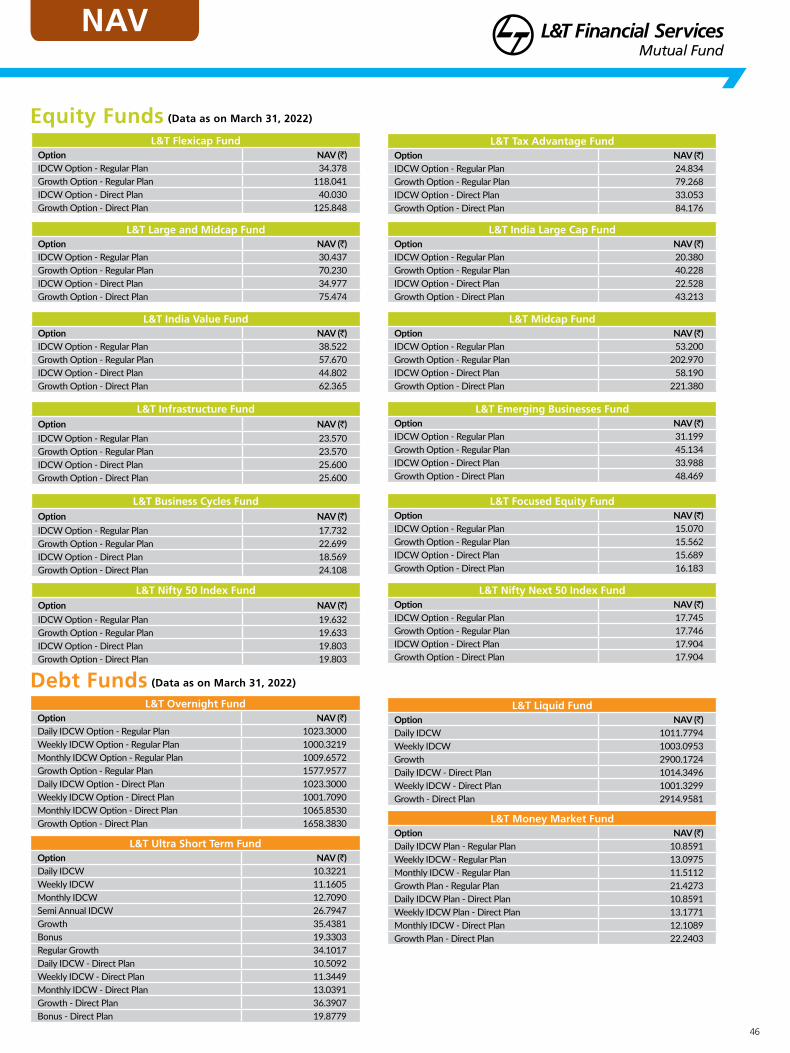
46
Data as on March 31, 2022
L&T Flexicap FundOption NAV (`)IDCW Option - Regular Plan 34.378Growth Option - Regular Plan 118.041IDCW Option - Direct Plan 40.030Growth Option - Direct Plan 125.848
L&T Business Cycles FundOption NAV (`)IDCW Option - Regular Plan 17.732Growth Option - Regular Plan 22.699IDCW Option - Direct Plan 18.569Growth Option - Direct Plan 24.108
L&T Nifty 50 Index FundOption NAV (`)IDCW Option - Regular Plan 19.632Growth Option - Regular Plan 19.633IDCW Option - Direct Plan 19.803Growth Option - Direct Plan 19.803
L&T Tax Advantage FundOption NAV (`)IDCW Option - Regular Plan 24.834Growth Option - Regular Plan 79.268IDCW Option - Direct Plan 33.053Growth Option - Direct Plan 84.176
L&T Large and Midcap FundOption NAV (`)IDCW Option - Regular Plan 30.437Growth Option - Regular Plan 70.230IDCW Option - Direct Plan 34.977Growth Option - Direct Plan 75.474
L&T India Large Cap FundOption NAV (`)IDCW Option - Regular Plan 20.380Growth Option - Regular Plan 40.228IDCW Option - Direct Plan 22.528Growth Option - Direct Plan 43.213
L&T India Value FundOption NAV (`)IDCW Option - Regular Plan 38.522Growth Option - Regular Plan 57.670IDCW Option - Direct Plan 44.802Growth Option - Direct Plan 62.365
L&T Midcap FundOption NAV (`)IDCW Option - Regular Plan 53.200Growth Option - Regular Plan 202.970IDCW Option - Direct Plan 58.190Growth Option - Direct Plan 221.380
L&T Infrastructure FundOption NAV (`)IDCW Option - Regular Plan 23.570Growth Option - Regular Plan 23.570IDCW Option - Direct Plan 25.600Growth Option - Direct Plan 25.600
L&T Emerging Businesses FundOption NAV (`)IDCW Option - Regular Plan 31.199Growth Option - Regular Plan 45.134IDCW Option - Direct Plan 33.988Growth Option - Direct Plan 48.469
L&T Focused Equity FundOption NAV (`)IDCW Option - Regular Plan 15.070Growth Option - Regular Plan 15.562IDCW Option - Direct Plan 15.689Growth Option - Direct Plan 16.183
L&T Nifty Next 50 Index FundOption NAV (`)IDCW Option - Regular Plan 17.745Growth Option - Regular Plan 17.746IDCW Option - Direct Plan 17.904Growth Option - Direct Plan 17.904
L&T Overnight FundOption NAV (`)Daily IDCW Option - Regular Plan 1023.3000Weekly IDCW Option - Regular Plan 1000.3219Monthly IDCW Option - Regular Plan 1009.6572Growth Option - Regular Plan 1577.9577Daily IDCW Option - Direct Plan 1023.3000Weekly IDCW Option - Direct Plan 1001.7090Monthly IDCW Option - Direct Plan 1065.8530Growth Option - Direct Plan 1658.3830
L&T Liquid FundOption NAV (`)Daily IDCW 1011.7794Weekly IDCW 1003.0953Growth 2900.1724Daily IDCW - Direct Plan 1014.3496Weekly IDCW - Direct Plan 1001.3299Growth - Direct Plan 2914.9581
L&T Ultra Short Term FundOption NAV (`)Daily IDCW 10.3221Weekly IDCW 11.1605Monthly IDCW 12.7090Semi Annual IDCW 26.7947Growth 35.4381Bonus 19.3303Regular Growth 34.1017Daily IDCW - Direct Plan 10.5092Weekly IDCW - Direct Plan 11.3449Monthly IDCW - Direct Plan 13.0391Growth - Direct Plan 36.3907Bonus - Direct Plan 19.8779
L&T Money Market FundOption NAV (`)Daily IDCW Plan - Regular Plan 10.8591Weekly IDCW - Regular Plan 13.0975Monthly IDCW - Regular Plan 11.5112Growth Plan - Regular Plan 21.4273Daily IDCW Plan - Direct Plan 10.8591Weekly IDCW Plan - Direct Plan 13.1771Monthly IDCW - Direct Plan 12.1089Growth Plan - Direct Plan 22.2403
NAV
(Data as on March 31, 2022)Equity Funds
(Data as on March 31, 2022)Debt Funds

47
Data as on March 31, 2022
L&T Banking and PSU Debt FundOption NAV (`)Daily IDCW Option - Regular Plan 11.1160Weekly IDCW Option - Regular Plan 10.7682Monthly IDCW Option - Regular Plan 11.1814Growth Option - Regular Plan 20.2002Daily IDCW Option - Direct Plan 11.1907Weekly IDCW Option - Direct Plan 10.7854Monthly IDCW Option - Direct Plan 11.6557Growth Option - Direct Plan 21.0165
L&T Short Term Bond FundOption NAV (`)Monthly IDCW - Regular Plan 11.2372Quarterly IDCW - Regular Plan 10.8072Annual IDCW - Regular Plan 12.2054Growth - Regular Plan 21.6605Bonus - Regular Plan 21.6605Monthly IDCW - Direct Plan 11.8623Quarterly IDCW - Direct Plan 11.5156Annual IDCW - Direct Plan 12.6165Growth - Direct Plan 22.6108
L&T Low Duration FundOption NAV (`)IDCW Option - Regular Plan 10.4266Annual IDCW Option - Regular Plan 10.4040Growth Option - Regular Plan 22.9730IDCW Option - Direct Plan 11.0756Annual IDCW Option - Direct Plan 10.7102Growth Option - Direct Plan 23.8610
L&T Flexi Bond FundOption NAV (`)IDCW Option - Regular Plan 10.7703Annual IDCW Option - Regular Plan 10.7131Growth Option - Regular Plan 23.8905IDCW Option - Direct Plan 12.7873Annual IDCW Option - Direct Plan 11.1622Growth Option - Direct Plan 25.3981
L&T Gilt FundOption NAV (`)Quarterly IDCW - Regular Plan 11.2230Growth - Regular Plan 54.4818Quarterly IDCW - Direct Plan 12.5034Growth - Direct Plan 60.0610
L&T Credit Risk FundOption NAV (`)IDCW - Regular Plan 10.1746Annual IDCW - Regular Plan 11.7755Growth - Regular Plan 23.6010Bonus - Regular Plan 23.2210IDCW - Direct Plan 10.8197Annual IDCW - Direct Plan 12.3593Growth - Direct Plan 24.9259
L&T Triple Ace Bond FundOption NAV (`)Quarterly IDCW - Regular Plan 11.3748Semi Annual IDCW - Regular Plan 17.1264Annual IDCW - Regular Plan 11.7238Growth Plan - Regular Plan 59.6662Bonus - Regular Plan 22.6645Quarterly IDCW - Direct Plan 11.7053Semi Annual IDCW - Direct Plan 20.1285Annual IDCW - Direct Plan 11.8458Growth Plan - Direct Plan 62.8597
NAV
L&T Balanced Advantage FundOption NAV (`)IDCW Option - Regular Plan 17.747Growth Option - Regular Plan 30.716IDCW Option - Direct Plan 20.017Growth Option - Direct Plan 34.050
L&T Hybrid Equity FundOption NAV (`)IDCW Option - Regular Plan 24.569Annual IDCW - Regular Plan 15.337Growth Option - Regular Plan 36.889IDCW Option - Direct Plan 28.054Annual IDCW - Direct Plan 16.573Growth Option - Direct Plan 40.506
L&T Arbitrage Opportunities FundOption NAV (`)Monthly IDCW - Regular Plan 10.161Quarterly IDCW - Regular Plan 10.945Growth - Regular Plan 15.512Monthly IDCW - Direct Plan 10.429Quarterly IDCW - Direct Plan 11.145Growth - Direct Plan 16.249
L&T Equity Savings FundOption NAV (`)Monthly IDCW - Regular Plan 13.275Quarterly IDCW - Regular Plan 14.084Growth Plan - Regular Plan 23.261Monthly IDCW - Direct Plan 14.674Quarterly IDCW - Direct Plan 15.095Growth Plan - Direct Plan 25.058
L&T Resurgent India Bond FundOption NAV (`)IDCW Option - Regular Plan 10.8918Annual IDCW - Regular Plan 11.2134Growth Option - Regular Plan 16.5368IDCW Option - Direct Plan 11.6034Annual IDCW - Direct Plan 11.9553Growth Option - Direct Plan 17.6159
L&T Conservative Hybrid FundOption NAV (`)Monthly IDCW - Regular Plan 11.4709Quarterly IDCW - Regular Plan 11.1946Growth Plan - Regular Plan 43.7461Monthly IDCW - Direct Plan 12.2985Quarterly IDCW - Direct Plan 11.8675Growth Plan - Direct Plan 46.5080
(Data as on March 31, 2022)Hybrid Funds

48
Data as on March 31, 2022
PERFORMANCE OF SCHEMES
PERFORMANCE OF GROWTH OPTION
1 year 3 year 5 year Since InceptionCAGR
Returns (%)
PTP Returns*
(in `)
CAGR Returns
(%)
PTP Returns*
(in `)
CAGR Returns
(%)
PTP Returns*
(in `)Inception Date
CAGR Returns
(%)
PTP Returns*
(in `)
Name of the Fund Managers : Mr. Vihang Naik & Mr. Venugopal Manghat (Co-FM)
L&T Flexicap Fund - Regular Plan (G)€ 17.97 11,797 12.66 14,314 10.53 16,503 16/May/2005 15.74 1,18,041
S&P BSE-500 TRI 22.26 12,226 17.06 16,061 14.79 19,940 14.90 1,04,338
S&P BSE SENSEX TRI^ 19.50 11,950 16.06 15,654 15.94 20,954 15.45 1,13,128
L&T Flexicap Fund - Direct Plan (G)€ 18.84 11,884 13.45 14,618 11.33 17,106 01/Jan/2013 13.81 33,087
S&P BSE-500 TRI 22.26 12,226 17.06 16,061 14.79 19,940 14.48 34,930
S&P BSE SENSEX TRI^ 19.50 11,950 16.06 15,654 15.94 20,954 14.05 33,722
The respective benchmark performance for the Scheme is calculated using Composite CAGR of: S&P BSE 500 PRI values from 16 May, 2005 to 29 June, 2007 and TRI values from 30 June, 2007 onwards.
L&T Midcap Fund - Regular Plan (G)§ 15.81 11,581 14.38 14,982 11.62 17,333 09/Aug/2004 18.60 2,02,970
S&P BSE Midcap 150 TRI 24.99 12,499 21.68 18,045 15.66 20,704 NA NA
S&P BSE SENSEX TRI^ 19.50 11,950 16.06 15,654 15.94 20,954 16.24 1,42,492
L&T Midcap Fund - Direct Plan (G)§ 17.15 11,715 15.72 15,514 12.82 18,287 01/Jan/2013 19.42 51,640
S&P BSE Midcap 150 TRI 24.99 12,499 21.68 18,045 15.66 20,704 17.82 45,566
S&P BSE SENSEX TRI^ 19.50 11,950 16.06 15,654 15.94 20,954 14.05 33,722
L&T Focused Equity Fund - Regular Plan (G) 11.72 11,172 13.09 14,479 NA NA 05/Nov/2018 13.88 15,562
Nifty 500 TRI 22.29 12,229 16.75 15,934 NA NA 17.67 17,397
S&P BSE SENSEX TRI^ 19.50 11,950 16.06 15,654 NA NA 17.63 17,375
L&T Focused Equity Fund - Direct Plan (G) 13.10 11,310 14.41 14,993 NA NA 05/Nov/2018 15.20 16,183
Nifty 500 TRI 22.29 12,229 16.75 15,934 NA NA 17.67 17,397
S&P BSE SENSEX TRI^ 19.50 11,950 16.06 15,654 NA NA 17.63 17,375€ Fund is co-managed by Mr. Sonal Gupta w.e.f July 05, 2021, for investment in foreign securities.
Name of the Fund Managers : Ms. Cheenu Gupta & Mr. Venugopal Manghat (Co-FM)
L&T Conservative Hybrid Fund - Regular Plan (G)¥ 8.77 10,877 8.05 12,622 6.76 13,870 31/Jul/2003 8.22 43,746
CRISIL Hybrid 85+15 - Conservative Index 6.94 10,694 9.87 13,274 8.70 15,181 8.73 47,716
CRISIL 10 Yr Gilt Index^ 1.08 10,108 6.27 12,009 5.02 12,776 5.74 28,382
L&T Conservative Hybrid Fund - Direct Plan (G)¥ 9.45 10,945 8.67 12,842 7.44 14,321 01/Jan/2013 8.21 20,743
CRISIL Hybrid 85+15 - Conservative Index 6.94 10,694 9.87 13,274 8.70 15,181 9.39 22,929
CRISIL 10 Yr Gilt Index^ 1.08 10,108 6.27 12,009 5.02 12,776 6.49 17,895¥Fund is co-managed by Mr. Jalpan Shah (Debt Portion).
L&T Hybrid Equity Fund - Regular Plan (G)$ 14.65 11,465 12.16 14,124 9.76 15,938 07/Feb/2011 12.42 36,889
CRISIL Hybrid 35+65 - Aggressive Index 15.29 11,529 14.51 15,032 12.79 18,260 11.82 34,773
S&P BSE SENSEX TRI^ 19.50 11,950 16.06 15,654 15.94 20,954 12.65 37,752
L&T Hybrid Equity Fund - Direct Plan (G)$ 15.81 11,581 13.32 14,566 10.91 16,786 01/Jan/2013 14.54 35,110
CRISIL Hybrid 35+65 - Aggressive Index 15.29 11,529 14.51 15,032 12.79 18,260 12.67 30,143
S&P BSE SENSEX TRI^ 19.50 11,950 16.06 15,654 15.94 20,954 14.05 33,722$Fund is co-managed by Mr. Shriram Ramanathan (Debt Portion) & Mr. Sonal Gupta (for investments in Foreign Securities).
L&T Equity Savings Fund - Regular Plan (G)£ 12.92 11,292 9.26 13,054 7.84 14,585 18/Oct/2011 8.41 23,261
NIFTY Equity Savings Index 9.95 10,995 9.88 13,275 9.51 15,753 9.91 26,851
CRISIL 10 Yr Gilt Index^ 1.08 10,108 6.27 12,009 5.02 12,776 6.97 20,236
L&T Equity Savings Fund - Direct Plan (G)£ 13.94 11,394 10.25 13,413 8.76 15,224 01/Jan/2013 9.23 22,619
NIFTY Equity Savings Index 9.95 10,995 9.88 13,275 9.51 15,753 9.64 23,420
CRISIL 10 Yr Gilt Index^ 1.08 10,108 6.27 12,009 5.02 12,776 6.49 17,895£Fund is co-managed by Mr. Praveen Ayathan (Equity Portion) & Jalpan Shah (Debt Portion).
Name of the Fund Manager : Mr. Venugopal Manghat
L&T Arbitrage Opportunities Fund - Regular Plan (G)§ 3.57 10,357 4.63 11,458 5.18 12,877 30/Jun/2014 5.82 15,512
Nifty 50 Arbitrage Index 3.82 10,382 4.06 11,272 4.38 12,394 5.29 14,917
CRISIL 1 Yr T-Bill Index^ 3.76 10,376 5.28 11,675 5.82 13,272 6.52 16,325
L&T Arbitrage Opportunities Fund - Direct Plan (G)§ 4.27 10,427 5.24 11,662 5.81 13,264 30/Jun/2014 6.46 16,249
Nifty 50 Arbitrage Index 3.82 10,382 4.06 11,272 4.38 12,394 5.29 14,917
CRISIL 1 Yr T-Bill Index^ 3.76 10,376 5.28 11,675 5.82 13,272 6.52 16,325§Fund is co-managed by Mr. Praveen Ayathan, Mr. Sonal Gupta (w.e.f July 05, 2021 for investments in foreign securities) & Jalpan Shah (Debt Portion).
Past performance may or may not be sustained in the future. * Point to Point (PTP) Returns in INR show the value of `10,000/- invested ^Standard Benchmark Dividends are assumed to be reinvested and bonus is adjusted. Load is not taken into consideration.Note: The since inception return is calculated on NAV of `10/- invested at inception. CAGR is Compounded Annualised Growth Rate. Date of inception is deemed to be date of allotment.a. The number of schemes managed or co managed by Mr. Vihang Naik is 9, Venugopal Manghat is 13 & Ms. Cheenu Gupta is 9, effective July 2, 2021.b. Different plans shall have a different expense structure.
As on March 31, 2022

49
Data as on March 31, 2022
Name of the Fund Managers : Ms. Cheenu Gupta & Mr. Vihang Naik (Co-FM) L&T Large and Midcap Fund - Regular Plan (G)€ 21.80 12,180 14.12 14,877 10.61 16,563 22/May/2006 13.07 70,230NIFTY LargeMidcap 250 TRI 22.90 12,290 18.28 16,569 15.11 20,217 14.02 80,253S&P BSE SENSEX TRI^ 19.50 11,950 16.06 15,654 15.94 20,954 12.98 69,354L&T Large and Midcap Fund - Direct Plan (G)€ 22.94 12,294 15.12 15,274 11.56 17,285 01/Jan/2013 14.52 35,047NIFTY LargeMidcap 250 TRI 22.90 12,290 18.28 16,569 15.11 20,217 16.06 39,658S&P BSE SENSEX TRI^ 19.50 11,950 16.06 15,654 15.94 20,954 14.05 33,722€Fund is co-managed by Mr. Sonal Gupta (w.e.f July 05, 2021), for investments in foreign securities.L&T Tax Advantage Fund - Regular Plan (G) 17.87 11,787 13.74 14,731 11.19 16,997 27/Feb/2006 13.72 79,268S&P BSE 500 TRI 22.26 12,226 17.06 16,061 14.79 19,940 12.84 69,959S&P BSE SENSEX TRI^ 19.50 11,950 16.06 15,654 15.94 20,954 12.92 70,769L&T Tax Advantage Fund - Direct Plan (G) 18.77 11,877 14.47 15,015 11.94 17,581 01/Jan/2013 14.71 35,586S&P BSE 500 TRI 22.26 12,226 17.06 16,061 14.79 19,940 14.48 34,930S&P BSE SENSEX TRI^ 19.50 11,950 16.06 15,654 15.94 20,954 14.05 33,722€Fund is co-managed by Mr. Sonal Gupta (w.e.f July 05, 2021), for investments in foreign securities.The respective benchmark performance for the Scheme is calculated using Composite CAGR of: S&P BSE 500 PRI values from 27 Feb, 2006 to 29 June, 2007 and TRI values from 30 June, 2007 onwards.
Name of the Fund Managers : Mr. Vihang Naik & Ms. Cheenu Gupta (Co-FM) L&T Balanced Advantage Fund - Regular Plan (G)§ 6.66 10,666 8.32 12,717 7.45 14,326 07/Feb/2011 10.59 30,716NIFTY 50 Composite Hybrid Debt 50-50 Index 12.66 11,266 12.97 14,431 11.84 17,502 10.84 31,492S&P BSE SENSEX TRI^ 19.50 11,950 16.06 15,654 15.94 20,954 12.65 37,752L&T Balanced Advantage Fund - Direct Plan (G)§ 8.15 10,815 9.74 13,224 8.78 15,234 01/Jan/2013 11.91 28,309NIFTY 50 Composite Hybrid Debt 50-50 Index 12.66 11,266 12.97 14,431 11.84 17,502 11.35 27,033S&P BSE SENSEX TRI^ 19.50 11,950 16.06 15,654 15.94 20,954 14.05 33,722§ Fund is co-managed by Mr. Praveen Ayathan (Equity Portion) & Mr. Jalpan Shah (Debt Portion).
PERFORMANCE OF SCHEMES
PERFORMANCE OF GROWTH OPTION
1 year 3 year 5 year Since InceptionCAGR
Returns (%)
PTP Returns*
(in `)
CAGR Returns
(%)
PTP Returns*
(in `)
CAGR Returns
(%)
PTP Returns*
(in `)Inception Date
CAGR Returns
(%)
PTP Returns*
(in `)Name of the Fund Managers : Mr. Venugopal Manghat & Mr. Vihang Naik (Co-FM)
L&T India Value Fund - Regular Plan (G)€ 26.29 12,629 16.81 15,958 12.37 17,924 08/Jan/2010 15.40 57,670S&P BSE 500 TRI 22.26 12,226 17.06 16,061 14.79 19,940 12.03 40,118S&P BSE SENSEX TRI^ 19.50 11,950 16.06 15,654 15.94 20,954 11.86 39,408L&T India Value Fund - Direct Plan (G)€ 27.52 12,752 17.94 16,427 13.43 18,782 01/Jan/2013 19.21 50,790S&P BSE 500 TRI 22.26 12,226 17.06 16,061 14.79 19,940 14.48 34,930S&P BSE SENSEX TRI^ 19.50 11,950 16.06 15,654 15.94 20,954 14.05 33,722L&T Emerging Businesses Fund - Regular Plan (G)€ 49.28 14,928 21.62 18,020 16.48 21,448 12/May/2014 21.05 45,134S&P BSE 250 Small Cap Index TRI 34.29 13,429 20.00 17,306 11.98 17,617 15.77 31,753S&P BSE SENSEX TRI^ 19.50 11,950 16.06 15,654 15.94 20,954 13.71 27,555L&T Emerging Businesses Fund - Direct Plan (G)€ 50.89 15,089 22.97 18,625 17.68 22,580 12/May/2014 22.14 48,469S&P BSE 250 Small Cap Index TRI 34.29 13,429 20.00 17,306 11.98 17,617 15.77 31,753S&P BSE SENSEX TRI^ 19.50 11,950 16.06 15,654 15.94 20,954 13.71 27,555€Fund is co-managed by Mr. Sonal Gupta (w.e.f July 05, 2021), for investments in foreign securities.
Name of the Fund Managers : Mr. Venugopal Manghat & Ms. Cheenu Gupta (Co-FM) L&T Infrastructure Fund - Regular Plan (G) 29.72 12,972 13.67 14,704 10.71 16,634 27/Sep/2007 6.08 23,570Nifty Infrastructure TRI 24.69 12,469 18.09 16,491 12.08 17,690 2.08 13,474S&P BSE SENSEX TRI^ 19.50 11,950 16.06 15,654 15.94 20,954 11.88 51,045L&T Infrastructure Fund - Direct Plan (G) 31.15 13,115 14.96 15,211 11.86 17,522 01/Jan/2013 15.65 38,381Nifty Infrastructure TRI 24.69 12,469 18.09 16,491 12.08 17,690 9.00 22,189S&P BSE SENSEX TRI^ 19.50 11,950 16.06 15,654 15.94 20,954 14.05 33,722L&T Business Cycles Fund - Regular Plan (G)€ 19.32 11,932 14.08 14,864 9.44 15,703 20/Aug/2014 11.36 22,699S&P BSE 500 TRI 22.26 12,226 17.06 16,061 14.79 19,940 13.31 25,900S&P BSE Sensex TRI^ 19.50 11,950 16.06 15,654 15.94 20,954 12.41 24,382L&T Business Cycles Fund - Direct Plan (G)€ 20.62 12,062 15.21 15,311 10.39 16,398 20/Aug/2014 12.25 24,108S&P BSE 500 TRI 22.26 12,226 17.06 16,061 14.79 19,940 13.31 25,900S&P BSE Sensex TRI^ 19.50 11,950 16.06 15,654 15.94 20,954 12.41 24,382L&T India Large Cap Fund - Regular Plan (G)€ 17.31 11,731 14.09 14,865 12.02 17,646 23/Oct/2007 10.11 40,228S&P BSE-100 TRI 20.66 12,066 15.88 15,581 14.74 19,898 9.83 38,750S&P BSE SENSEX TRI^ 19.50 11,950 16.06 15,654 15.94 20,954 9.76 38,403L&T India Large Cap Fund - Direct Plan (G)€ 18.44 11,844 15.11 15,271 12.99 18,421 01/Jan/2013 13.89 33,310S&P BSE-100 TRI 20.66 12,066 15.88 15,581 14.74 19,898 13.89 33,299S&P BSE SENSEX TRI^ 19.50 11,950 16.06 15,654 15.94 20,954 14.05 33,722€Fund is co-managed by Mr. Sonal Gupta (w.e.f July 05, 2021), for investments in foreign securities.
Past performance may or may not be sustained in the future. * Point to Point (PTP) Returns in INR show the value of `10,000/- invested ^Standard Benchmark Dividends are assumed to be reinvested and bonus is adjusted. Load is not taken into consideration.Note: The since inception return is calculated on NAV of `10/- invested at inception. CAGR is Compounded Annualised Growth Rate. Date of inception is deemed to be date of allotment.a. The number of schemes managed or co managed by Mr. Vihang Naik is 9, Venugopal Manghat is 13 & Ms. Cheenu Gupta is 9, effective July 2, 2021 and Mr. Praveen Ayathan
is 5 schemes.b. Different plans shall have a different expense structure.
As on March 31, 2022

50
Data as on March 31, 2022
PERFORMANCE OF SCHEMES
PERFORMANCE OF GROWTH OPTION
1 year 3 year 5 year Since InceptionCAGR
Returns (%)
PTP Returns*
(in `)
CAGR Returns
(%)
PTP Returns*
(in `)
CAGR Returns
(%)
PTP Returns*
(in `)Inception Date
CAGR Returns
(%)
PTP Returns*
(in `)
Name of the Fund Manager : Mr. Shriram Ramanathan & Mr. Jalpan Shah (Co-FM)L&T Short Term Bond Fund - Regular Plan (G)¥ 3.94 10,394 6.66 12,139 6.71 13,841 27/Dec/2011 7.82 21,661NIFTY Short Duration Debt Index 4.92 10,492 7.30 12,361 7.19 14,153 8.22 22,506CRISIL 10 Yr Gilt Index^ 1.08 10,108 6.27 12,009 5.02 12,776 6.87 19,786L&T Short Term Bond Fund - Direct Plan (G)¥ 4.44 10,444 7.18 12,318 7.24 14,188 01/Jan/2013 8.09 20,537NIFTY Short Duration Debt Index 4.92 10,492 7.30 12,361 7.19 14,153 7.98 20,339CRISIL 10 Yr Gilt Index^ 1.08 10,108 6.27 12,009 5.02 12,776 6.49 17,895L&T Credit Risk Fund - Regular Plan (G)¥ 5.78 10,578 3.82 11,195 4.80 12,644 08/Oct/2009 7.12 23,601NIFTY Credit Risk Bond Index 8.16 10,816 9.22 13,039 8.53 15,058 9.01 29,375CRISIL 10 Yr Gilt Index^ 1.08 10,108 6.27 12,009 5.02 12,776 6.28 21,386L&T Credit Risk Fund - Direct Plan (G)¥ 6.63 10,663 4.69 11,479 5.58 13,120 01/Jan/2013 7.41 19,374NIFTY Credit Risk Bond Index 8.16 10,816 9.22 13,039 8.53 15,058 9.22 22,611CRISIL 10 Yr Gilt Index^ 1.08 10,108 6.27 12,009 5.02 12,776 6.49 17,895L&T Resurgent India Bond Fund - Regular Plan (G)¥ 4.70 10,470 6.72 12,160 6.18 13,500 02/Feb/2015 7.28 16,537NIFTY Medium Duration Debt Index 5.68 10,568 8.49 12,777 7.63 14,449 8.05 17,413CRISIL 10 Yr Gilt Index^ 1.08 10,108 6.27 12,009 5.02 12,776 6.35 15,536L&T Resurgent India Bond Fund - Direct Plan (G)¥ 5.64 10,564 7.69 12,495 7.14 14,118 02/Feb/2015 8.23 17,616NIFTY Medium Duration Debt Index 5.68 10,568 8.49 12,777 7.63 14,449 8.05 17,413CRISIL 10 Yr Gilt Index^ 1.08 10,108 6.27 12,009 5.02 12,776 6.35 15,536L&T Triple Ace Bond Fund - Regular Plan (G)¥ 5.04 10,504 8.71 12,855 7.64 14,450 31/Mar/1997 7.40 59,666NIFTY Corporate Bond Index 5.54 10,554 8.29 12,706 7.67 14,472 NA NACRISIL 10 Yr Gilt Index^ 1.08 10,108 6.27 12,009 5.02 12,776 NA NAL&T Triple Ace Bond Fund - Direct Plan (G)¥ 5.40 10,540 9.08 12,986 8.00 14,695 01/Jan/2013 8.07 20,493NIFTY Corporate Bond Index 5.54 10,554 8.29 12,706 7.67 14,472 8.44 21,152CRISIL 10 Yr Gilt Index^ 1.08 10,108 6.27 12,009 5.02 12,776 6.49 17,895L&T Flexi Bond Fund - Regular Plan (G)¥ 2.82 10,282 6.21 11,985 5.96 13,356 27/Sep/2010 7.86 23,891NIFTY Composite Debt Index 5.12 10,512 8.47 12,772 7.43 14,310 8.07 24,438CRISIL 10 Yr Gilt Index^ 1.08 10,108 6.27 12,009 5.02 12,776 6.48 20,600L&T Flexi Bond Fund - Direct Plan (G)¥ 3.57 10,357 6.95 12,239 6.76 13,873 01/Jan/2013 8.38 21,047NIFTY Composite Debt Index 5.12 10,512 8.47 12,772 7.43 14,310 8.18 20,694CRISIL 10 Yr Gilt Index^ 1.08 10,108 6.27 12,009 5.02 12,776 6.49 17,895¥Fund is co-managed by Mr. Jalpan Shah (Debt Portion).
7 days 15 days 30 days 1 year 3 year 5 year Since Inception
Annualised Returns
(%)
PTP Returns*
(in `)
Annualised Returns
(%)
PTP Returns*
(in `)
Annualised Returns
(%)
PTP Returns*
(in `)
CAGR Returns
(%)
PTP Returns*
(in `)
CAGR Returns
(%)
PTP Returns*
(in `)
CAGR Returns
(%)
PTP Returns* (in `)
Inception Date
CAGR Returns
(%)
PTP Returns*
(in `)
Name of the Fund Manager : Mr. Shriram Ramanathan & Mr. Jalpan Shah (Co-FM)L&T Low Duration Fund - Regular Plan (G)¥ 6.20 10,012 5.52 10,023 4.24 10,036 3.59 10,359 4.67 11,472 5.70 13,194 04/Dec/2010 7.62 22,973
NIFTY Low Duration Debt Index 7.26 10,014 6.34 10,026 4.82 10,041 4.14 10,414 5.90 11,882 6.43 13,657 7.80 23,413
CRISIL 1 Yr T-Bill Index^ 5.55 10,011 5.96 10,024 5.65 10,048 3.76 10,376 5.28 11,675 5.82 13,272 6.66 20,765
L&T Low Duration Fund - Direct Plan (G)¥ 6.67 10,013 6.09 10,025 4.85 10,041 4.26 10,426 5.29 11,676 6.26 13,547 01/Jan/2013 7.75 19,938
NIFTY Low Duration Debt Index 7.26 10,014 6.34 10,026 4.82 10,041 4.14 10,414 5.90 11,882 6.43 13,657 7.45 19,446
CRISIL 1 Yr T-Bill Index^ 5.55 10,011 5.96 10,024 5.65 10,048 3.76 10,376 5.28 11,675 5.82 13,272 6.55 17,985
Name of the Fund Manager : Mr. Jalpan Shah & Mr. Mahesh Chhabria (Co-FM)L&T Ultra Short Term Fund - Regular Plan (G)§ 6.11 10,012 5.28 10,022 4.55 10,039 3.53 10,353 5.09 11,610 5.93 13,343 10/Apr/2003 7.09 36,740
NIFTY Ultra Short Duration Debt Index 4.78 10,009 4.89 10,020 4.34 10,037 4.05 10,405 5.44 11,727 6.28 13,565 7.54 39,749
CRISIL 1 Yr T-Bill Index^ 5.55 10,011 5.96 10,024 5.65 10,048 3.76 10,376 5.28 11,675 5.82 13,272 5.91 29,731
L&T Ultra Short Term Fund - Institutional Plan (G)§ 6.11 10,012 5.28 10,022 4.55 10,039 3.53 10,353 5.09 11,610 5.93 13,343 27/Nov/1997 7.73 61,383
NIFTY Ultra Short Duration Debt Index 4.78 10,009 4.89 10,020 4.34 10,037 4.05 10,405 5.44 11,727 6.28 13,565 NA NA
CRISIL 1 Yr T-Bill Index^ 5.55 10,011 5.96 10,024 5.65 10,048 3.76 10,376 5.28 11,675 5.82 13,272 6.47 45,992
L&T Ultra Short Term Fund - Direct Plan (G)§ 6.27 10,012 5.44 10,022 4.71 10,040 3.69 10,369 5.33 11,691 6.22 13,527 01/Jan/2013 7.54 19,588
NIFTY Ultra Short Duration Debt Index 4.78 10,009 4.89 10,020 4.34 10,037 4.05 10,405 5.44 11,727 6.28 13,565 7.42 19,383
CRISIL 1 Yr T-Bill Index^ 5.55 10,011 5.96 10,024 5.65 10,048 3.76 10,376 5.28 11,675 5.82 13,272 6.55 17,985§Fund is co-managed by Mr. Mahesh Chhabria.
Name of the Fund Manager : Mr. Mahesh Chhabria & Mr. Shriram Ramanathan (Co-FM) L&T Liquid Fund - Regular Plan (G)¢ 4.18 10,008 3.82 10,016 3.69 10,030 3.35 10,335 4.33 11,362 5.44 13,036 03/Oct/2006 7.11 29,002
NIFTY Liquid Index 3.93 10,008 4.07 10,017 3.92 10,032 3.61 10,361 4.45 11,401 5.45 13,042 7.25 29,597
CRISIL 1 Yr T-Bill Index^ 5.55 10,011 5.96 10,024 5.70 10,047 3.76 10,376 5.28 11,675 5.82 13,272 6.19 25,386
L&T Liquid Fund - Direct Plan (G)¢ 4.24 10,008 3.88 10,016 3.75 10,031 3.41 10,341 4.39 11,379 5.50 13,071 31/Dec/2012 6.88 18,501
NIFTY Liquid Index 3.93 10,008 4.07 10,017 3.92 10,032 3.61 10,361 4.45 11,401 5.45 13,042 6.78 18,350
CRISIL 1 Yr T-Bill Index^ 5.55 10,011 5.96 10,024 5.70 10,047 3.76 10,376 5.28 11,675 5.82 13,272 6.55 17,992
L&T Overnight Fund - Regular Plan (G)¢ 3.79 10,007 3.57 10,015 3.37 10,028 3.19 10,319 3.54 11,102 4.30 12,347 27/Nov/2006 6.50 26,299
NIFTY 1D Rate Index 3.36 10,006 3.45 10,014 3.41 10,028 3.36 10,336 3.90 11,221 4.78 12,634 6.02 24,524
CRISIL 1 Yr T-Bill Index^ 5.55 10,011 5.96 10,024 5.70 10,047 3.76 10,376 5.28 11,675 5.82 13,272 6.20 25,197
L&T Overnight Fund - Direct Plan (G)¢ 3.32 10,006 3.41 10,014 3.33 10,027 3.28 10,328 3.86 11,206 4.83 12,660 01/Jan/2013 6.36 17,689
NIFTY 1D Rate Index 3.36 10,006 3.45 10,014 3.41 10,028 3.36 10,336 3.90 11,221 4.78 12,634 6.06 17,237
CRISIL 1 Yr T-Bill Index^ 5.55 10,011 5.96 10,024 5.70 10,047 3.76 10,376 5.28 11,675 5.82 13,272 6.55 17,985¢Fund is co-managed by Mr. Shriram Ramanathan.
Name of the Fund Manager :Mr. Shriram Ramanathan & Mr. Mahesh Chhabria (Co-FM) L&T Money Market Fund - Regular Plan (G)§ 6.65 10,013 5.62 10,023 4.51 10,038 3.16 10,316 5.05 11,597 6.03 13,404 10/Aug/2005 7.26 32,141
NIFTY Money Market Index 5.36 10,010 5.15 10,021 4.29 10,036 3.76 10,376 4.98 11,574 5.82 13,271 7.51 33,373
CRISIL 1 Yr T-Bill Index^ 5.55 10,011 5.96 10,024 5.65 10,048 3.76 10,376 5.28 11,675 5.82 13,272 6.10 26,795
L&T Money Market Fund - Direct Plan (G)§ 6.64 10,013 5.88 10,024 4.88 10,041 3.64 10,364 5.55 11,763 6.54 13,732 01/Jan/2013 7.67 19,807
NIFTY Money Market Index 5.36 10,010 5.15 10,021 4.29 10,036 3.76 10,376 4.98 11,574 5.82 13,271 7.08 18,824
CRISIL 1 Yr T-Bill Index^ 5.55 10,011 5.96 10,024 5.65 10,048 3.76 10,376 5.28 11,675 5.82 13,272 6.55 17,985§Fund is co-managed by Mr. Mahesh Chhabria.Past performance may or may not be sustained in the future. * Point to Point (PTP) Returns in INR show the value of `10,000/- invested ^Standard Benchmark Dividends are assumed to be reinvested and bonus is adjusted. Load is not taken into consideration.Note: The since inception return is calculated considering the NAV of Rs. 1000/- invested in L&T Liquid Fund and L&T Overnight Fund and for Rs.10/- for all other schemes, invested at inception. CAGR is Compounded Annualised Growth Rate. Date of inception is deemed to be date of allotment.a. Mr. Shriram Ramanathan manages or co-manages 13 Schemes, Mr. Jalpan Shah manages or co-manages 14 Schemes and Mahesh Chhabria manages or co-manages 4 schemes.b. Different plans shall have a different expense structure. c. Scheme count for the total schemes managed by the Fund Managers includes all the close ended debt schemes considered as 1 scheme. d. L&T Ultra Short Term Fund is not accepting subscription under Institutional Plan.
As on March 31, 2022

51
Data as on March 31, 2022
PERFORMANCE OF GROWTH OPTION
1 year 3 year 5 year Since InceptionCAGR
Returns (%)
PTP Returns*
(in `)
CAGR Returns
(%)
PTP Returns*
(in `)
CAGR Returns
(%)
PTP Returns*
(in `)Inception Date
CAGR Returns
(%)
PTP Returns*
(in `)Name of the Fund Manager : Mr. Jalpan Shah & Mr. Shriram Ramanathan (Co-FM)
L&T Gilt Fund - Regular Plan (G)¢ 1.97 10,197 6.23 11,995 5.28 12,934 29/Mar/2000 8.00 54,482NIFTY All Duration G-Sec Index 4.03 10,403 7.77 12,525 6.96 14,001 NA NACRISIL 10 Yr Gilt Index^ 1.08 10,108 6.27 12,009 5.02 12,776 NA NAL&T Gilt Fund - Direct Plan (G)¢ 3.20 10,320 7.52 12,438 6.63 13,789 01/Jan/2013 9.20 22,567NIFTY All Duration G-Sec Index 4.03 10,403 7.77 12,525 6.96 14,001 7.49 19,507CRISIL 10 Yr Gilt Index^ 1.08 10,108 6.27 12,009 5.02 12,776 6.49 17,895L&T Banking and PSU Debt Fund - Regular Plan (G)¢ 4.10 10,410 7.30 12,362 6.93 13,985 12/Sep/2012 7.64 20,200NIFTY Banking & PSU Debt Index 4.93 10,493 7.41 12,398 6.97 14,012 7.96 20,804CRISIL 10 Yr Gilt Index^ 1.08 10,108 6.27 12,009 5.02 12,776 6.70 18,581L&T Banking and PSU Debt Fund - Direct Plan (G)¢ 4.50 10,450 7.72 12,508 7.38 14,276 01/Jan/2013 8.07 20,500NIFTY Banking & PSU Debt Index 4.93 10,493 7.41 12,398 6.97 14,012 7.89 20,192CRISIL 10 Yr Gilt Index^ 1.08 10,108 6.27 12,009 5.02 12,776 6.49 17,895L&T FMP - XVII - Plan B - (1452D) - Regular Plan (G)¢ 3.99 10,399 7.32 12,369 NA NA 28/Jun/2018 7.86 13,290CRISIL Composite Bond Fund Index 4.48 10,448 8.21 12,678 NA NA 8.67 13,668CRISIL 10 Yr Gilt Index^ 1.08 10,108 6.27 12,009 NA NA 7.34 13,049L&T FMP - XVII - Plan B - (1452D) - Direct Plan (G)¢ 4.26 10,426 7.61 12,467 NA NA 28/Jun/2018 8.16 13,428CRISIL Composite Bond Fund Index 4.48 10,448 8.21 12,678 NA NA 8.67 13,668CRISIL 10 Yr Gilt Index^ 1.08 10,108 6.27 12,009 NA NA 7.34 13,049L&T FMP - XVIII - Scheme B - (1229D) - Regular Plan (G)¢ 3.79 10,379 7.22 12,332 NA NA 30/Nov/2018 7.84 12,861CRISIL Composite Bond Fund Index 4.48 10,448 8.21 12,678 NA NA 8.50 13,128CRISIL 10 Yr Gilt Index^ 1.08 10,108 6.27 12,009 NA NA 6.58 12,369L&T FMP - XVIII - Scheme B - (1229D) - Direct Plan (G)¢ 4.05 10,405 7.48 12,425 NA NA 30/Nov/2018 8.11 12,969CRISIL Composite Bond Fund Index 4.48 10,448 8.21 12,678 NA NA 8.50 13,128CRISIL 10 Yr Gilt Index^ 1.08 10,108 6.27 12,009 NA NA 6.58 12,369L&T FMP - XVIII - Scheme C - (1178D) - Regular Plan (G)¢ 4.62 10,462 7.87 12,558 NA NA 18/Feb/2019 8.00 12,710CRISIL Composite Bond Fund Index 4.48 10,448 8.21 12,678 NA NA 8.51 12,899CRISIL 10 Yr Gilt Index^ 1.08 10,108 6.27 12,009 NA NA 6.46 12,154L&T FMP - XVIII - Scheme C - (1178D) - Direct Plan (G)¢ 4.86 10,486 8.11 12,645 NA NA 18/Feb/2019 8.25 12,802CRISIL Composite Bond Fund Index 4.48 10,448 8.21 12,678 NA NA 8.51 12,899CRISIL 10 Yr Gilt Index^ 1.08 10,108 6.27 12,009 NA NA 6.46 12,154L&T FMP - XVIII - Scheme D - (1155D) - Regular Plan (G)¢ 3.89 10,389 7.33 12,371 NA NA 12/Feb/2019 7.70 12,614CRISIL Composite Bond Fund Index 4.48 10,448 8.21 12,678 NA NA 8.47 12,900CRISIL 10 Yr Gilt Index^ 1.08 10,108 6.27 12,009 NA NA 6.37 12,133L&T FMP - XVIII - Scheme D - (1155D) - Direct Plan (G)¢ 4.05 10,405 7.49 12,427 NA NA 12/Feb/2019 7.86 12,674CRISIL Composite Bond Fund Index 4.48 10,448 8.21 12,678 NA NA 8.47 12,900CRISIL 10 Yr Gilt Index^ 1.08 10,108 6.27 12,009 NA NA 6.37 12,133¢Fund is co-managed by Mr. Shriram Ramanathan.
Name of the Fund Manager : Mr. Praveen AyathanL&T Nifty 50 Index Fund - Regular Plan (G) 19.49 11,949 NA NA NA NA 15/Apr/2020 41.11 19,633Nifty 50 TRI 20.26 12,026 NA NA NA NA 42.41 19,988L&T Nifty 50 Index Fund - Direct Plan (G) 20.03 12,003 NA NA NA NA 15/Apr/2020 41.74 19,803Nifty 50 TRI 20.26 12,026 NA NA NA NA 42.41 19,988L&T Nifty Next 50 Index Fund - Regular Plan (G) 20.27 12,027 NA NA NA NA 15/Apr/2020 34.02 17,746Nifty Next 50 TRI 21.58 12,158 NA NA NA NA 35.54 18,144Nifty 50 TRI^ 20.26 12,026 NA NA NA NA 42.41 19,988L&T Nifty Next 50 Index Fund - Direct Plan (G) 20.82 12,082 NA NA NA NA 15/Apr/2020 34.63 17,904Nifty Next 50 TRI 21.58 12,158 NA NA NA NA 35.54 18,144Nifty 50 TRI^ 20.26 12,026 NA NA NA NA 42.41 19,988Past performance may or may not be sustained in the future. * Point to Point (PTP) Returns in INR show the value of `10,000/- invested ^Standard Benchmark Dividends are assumed to be reinvested and bonus is adjusted. Load is not taken into consideration.Note: The since inception return is calculated on NAV of `10/- invested at inception. CAGR is Compounded Annualised Growth Rate. Date of inception is deemed to be date of allotment.a. Mr. Shriram Ramanathan manages or co-manages 13 Schemes, Mr. Jalpan Shah manages or co-manages 14 Schemes & Mr. Praveen Ayathan manages or co-manages 5 Schemes.b. Different plans shall have a different expense structure.c. Scheme count for the total schemes managed by the Fund Managers includes all the close ended debt schemes considered as 1 scheme. Common to all Schemes: Performance of the schemes (wherever provided) are calculated basis CAGR for the past 1 year, 3 years, 5 years and for period less than 1 year, returns are calculated on simple annualized basis. In case, the start/end date of the concerned period is a non - business day (NBD), the NAV of the previous date is considered for computation of returns, except for L&T Liquid Fund and L&T Overnight Fund, where last declared NAV is used.
PERFORMANCE OF SCHEMESAs on March 31, 2022

52
Data as on March 31, 2022
- Including Additional Expenses in terms of Reg 52(6A)(c), B30 charges in terms of Reg 52(6A)(b) and GST on Management Fees. - Total Expense Ratio is as on the last business day of the month+Effective April 01, 2019 Total Expense Ratio (TER) stands revised. For the actual current expenses charged to the scheme, please refer the website of the Mutual Fund - www.ltfs.com
Fund Name Regular Direct
L&T Flexicap Fund 2.09% 1.39%
L&T Tax Advantage Fund 1.98% 1.22%
L&T Large and Midcap Fund 2.24% 1.30%
L&T India Large Cap Fund 2.47% 1.51%
L&T India Value Fund 1.85% 0.90%
L&T Midcap Fund 1.89% 0.76%
L&T Infrastructure Fund 2.24% 1.16%
L&T Emerging Businesses Fund 1.88% 0.81%
L&T Business Cycles Fund 2.54% 1.44%
L&T Focused Equity Fund 2.34% 1.08%
L&T Nifty 50 Index Fund 0.70% 0.25%
L&T Nifty Next 50 Index Fund 0.80% 0.35%
L&T Balanced Advantage Fund 2.10% 0.70%
L&T Hybrid Equity Fund 1.92% 0.91%
L&T Arbitrage Opportunities Fund 1.04% 0.37%
L&T Equity Savings Fund 1.58% 0.69%
L&T Overnight Fund 0.20% 0.10%
L&T Liquid Fund 0.20% 0.14%
L&T Ultra Short Term Fund 0.39% 0.23%
L&T Money Market Fund 0.72% 0.24%
L&T Banking and PSU Debt Fund 0.61% 0.23%
L&T Short Term Bond Fund 0.75% 0.27%
L&T Low Duration Fund 0.91% 0.26%
L&T Credit Risk Fund 1.66% 0.86%
L&T Flexi Bond Fund 1.62% 0.90%
L&T Triple Ace Bond Fund 0.63% 0.29%
L&T Gilt Fund 1.70% 0.50%
L&T Conservative Hybrid Fund 2.26% 1.61%
L&T Resurgent India Bond Fund 1.45% 0.57%
Fund NameMinimum Application size
(Initial)Additional Investment Minimum Redemption Size
L&T Flexicap Fund `5,000 per application `1,000 per application `500 or 50 units
L&T Tax Advantage Fund `500 per application and in multiples of `500 thereafter `500 per applicationb and in multiples of `500 thereafter `500 or 50 units
L&T Large and Midcap Fund `5,000 per application `1,000 per application `500 or 50 units
L&T India Large Cap Fund `5,000 per application `1,000 per application `500 or 50 units
L&T India Value Fund `5,000 per application `1,000 per application `500 or 50 units
L&T Midcap Fund `5,000 per application and in multiples of `1 thereafter `1,000 per application and in multiples of `1 thereafter `500 or 50 units
L&T Infrastructure Fund `5,000 per application and in multiples of `1 thereafter `1,000 per application and in multiples of `1 thereafter `500 or 50 units
L&T Emerging Businesses Fund `5,000 per application `1,000 per application `500 or 50 units
L&T Business Cycles Fund `5,000 per application and inmultiples of `1 thereafter `1,000 per application and in multiples of `1 thereafter `500 or 50 units
L&T Focused Equity Fund `5,000 per application and in multiples of `1 thereafter `1,000 per application and in multiples of `1 thereafter `500 or 50 units
L&T Nifty 50 Index Fund `5,000 per application and in multiples of `1 thereafter `1,000 per application and in multiples of `1 thereafter `500 or 50 units
L&T Nifty Next 50 Index Fund `5,000 per application and in multiples of `1 thereafter `1,000 per application and in multiples of `1 thereafter `500 or 50 units
L&T Balanced Advantage Fund `5,000 per application `1,000 per application `500 or 50 units
L&T Hybrid Equity Fund `5,000 per application `1,000 per application `500 or 50 units
L&T Arbitrage Opportunities Fund `5,000 per application and in multiples of `1 thereafter `1,000 per application and in multiples of `1 thereafter `500 or 50 units or account balance, whichever is lower.
L&T Equity Savings Fund `5,000 per application and in multiples of `1 thereafter `1,000 per application and in multiples of `1 thereafter `500 or 50 units
L&T Overnight FundGrowth and IDCW: `10,000 per application and in multiples of `1 thereafter. In case of
Daily IDCW Option, `1,00,000 and in multiples of `1 thereafter.`1,000 per application and thereafter in multiples of `1 `1000 or 1 unit
L&T Liquid FundWeekly IDCW and Growth: `10,000 per application and in
multiples of `1 thereafter Daily IDCW Reinvestment Plan (“DDRIP”): `1,00,000 per application and in multiples of `1 thereafter
`1,000 per application and in multiples of `1 thereafterRegular Plan : `1000/- per application or 1 unit
Weekly IDCW/ Growth/ DDRIP: `1000 per application or 1 unit
L&T Ultra Short Term Fund
Growth/Weekly IDCW/Monthly IDCW/Semi-Annual IDCW:`10,000 per application and in multiples of `1 thereafter; Daily
IDCW Reinvestment Plan: `1,00,000 per application and inmultiples of `1 thereafter.
`1,000 per application and in multiples of `1 thereafter
Regular Plan: `500/- per application or 50 unitsWeekly IDCW/Monthly IDCW/Semi Annual IDCW/ Growth/
Bonus DDRIP: `500 per application or 50 Units
L&T Money Market Fund `10,000 per application and in multiples of `1 thereafter `1,000 per application and in multiples of `1 thereafter `500 or 50 units
L&T Banking and PSU Debt Fund `10,000 per application `1,000 per application and thereafter in multiples of `1 `500 or 50 units
L&T Short Term Bond Fund `10,000 per application and in multiples of `1 thereafter `1,000 per application and in multiples of `1 thereafter `500 or 50 units
L&T Low Duration Fund `10,000 per application `1,000 per application `500 or 50 units
L&T Credit Risk Fund `10,000 per application and in multiples of `1 thereafter. `1,000 per application and in multiples of `1 thereafter.Retail Option : `500/- per application or 50 units
IDCW/ Growth/Bonus: `500 per application or 50 units
L&T Flexi Bond Fund `10,000 per application `1,000 per application and thereafter in multiples of `1 `500 or 50 units
L&T Triple Ace Bond Fund `10,000 per application and in multiples of `1 thereafter `1,000 per application and in multiples of `1 thereafter `500 or 50 units
L&T Gilt Fund `10,000 per application and in multiples of `1 thereafter `1,000 per application and in multiples of `1 thereafter `500 or 50 units
L&T Conservative Hybrid Fund `10,000 per application and in multiples of `1 thereafter `1,000 per application and in multiples of `1 thereafter `500 or 50 units
L&T Resurgent India Bond Fund `5,000 per application and in multiples of `1 thereafter `1,000 per application and in multiples of `1 thereafter `500 or 50 units
MINIMUM INVESTMENT AMOUNT DETAILS
TOTAL EXPENSE RATIO+
Data as on March 31, 2022

53
Data as on March 31, 2022
IDCW HISTORY FOR EQUITY SCHEMES
L&T Flexicap Fund
Record Date NAV as on date of declaration (`) Quantum of IDCW (`) Per Unit
Regular Plan IDCW19-Jan-2018 36.698 2.5000 24-Jan-2019 31.507 2.5000 24-Jan-2020 31.507 2.5000 24-Feb-2021 34.611 2.5000 25-Jan-2022 38.526 2.5000 Direct Plan IDCW24-Jan-2020 36.035 2.850024-Feb-2021 39.889 2.850025-Jan-2022 44.738 2.8500
L&T Midcap FundRecord Date NAV as on date of
declaration (`)Quantum of IDCW
(`) Per UnitRegular Plan IDCW10-Aug-2017 50.380 4.000017-Aug-2018 48.880 4.000023-Aug-2019 38.240 3.250026-Aug-2020 38.480 1.500026-Aug-2021 56.110 3.5000Direct Plan IDCW23-Aug-2019 40.930 3.500026-Aug-2020 41.680 2.000026-Aug-2021 60.910 3.7500
L&T Tax Advantage FundRecord Date NAV as on date of
declaration (`)Quantum of IDCW
(`) Per UnitRegular Plan IDCW20-Mar-2020 17.780 0.800024-Dec-2020 22.438 0.900026-Mar-2021 23.129 0.900026-Nov-2021 27.119 0.800022-Mar-2022 24.514 0.8000Direct Plan IDCW26-Mar-2021 30.147 0.900026-Nov-2021 35.863 1.000022-Mar-2022 32.554 1.0000
L&T Large and Midcap Fund
Record Date NAV as on date of declaration (`)
Quantum of IDCW (`) Per Unit
Regular Plan IDCW 24-Jan-2022 33.241 0.170023-Feb-2022 29.933 0.170022-Mar-2022 29.202 0.1700Direct Plan IDCW24-Jan-2022 38.141 0.200023-Feb-2022 34.368 0.200022-Mar-2022 33.548 0.2000
L&T India Large Cap FundRecord Date NAV as on date of
declaration (`)Quantum of IDCW
(`) Per UnitRegular Plan IDCW23-Dec-2019 17.752 1.3000 24-Dec-2020 18.367 1.100024-Dec-2021 21.406 1.3000Direct Plan IDCW23-Dec-2019 19.214 1.4000 24-Dec-2020 20.071 1.200024-Dec-2021 23.614 1.4500
L&T India Value FundRecord Date NAV as on date of
declaration (`)Quantum of IDCW
(`) Per UnitRegular Plan IDCW15-Jun-2017 27.613 1.750021-Jun-2018 27.372 1.750025-Jun-2021 35.028 1.7500Direct Plan IDCW15-Jun-2017 29.698 1.500021-Jun-2018 30.105 1.400025-Jun-2021 40.413 2.0000
L&T Balanced Advantage FundRecord Date NAV as on date of
declaration (`)Quantum of IDCW
(`) Per UnitRegular Plan IDCW24-Jan-2022 18.425 0.090023-Feb-2022 17.876 0.090022-Mar-2022 17.555 0.0900Direct Plan IDCW24-Jan-2022 20.720 0.100023-Feb-2022 20.127 0.100022-Mar-2022 19.787 0.1000
L&T Hybrid Equity FundRecord Date NAV as on date of
declaration (`)Quantum of IDCW
(`) Per UnitRegular Plan IDCW23-Dec-2021 25.613 0.140024-Jan-2022 26.641 0.140023-Feb-2022 24.756 0.140022-Mar-2022 23.922 0.1400Direct Plan IDCW23-Dec-2021 29.163 0.160024-Jan-2022 30.360 0.160023-Feb-2022 28.234 0.160022-Mar-2022 27.303 0.1600Record Date NAV as on date of
declaration (`)Quantum of IDCW
(`) Per UnitRegular Plan - Annual IDCW20-Mar-2020 11.080 0.000026-Mar-2021 14.794 0.700022-Mar-2022 15.727 0.9000Direct Plan - Annual IDCW20-Mar-2020 11.710 0.000026-Mar-2021 15.803 0.750022-Mar-2022 16.965 0.9500
L&T Arbitrage Opportunities FundRecord Date NAV as on Record
Date (`)Quantum of IDCW
(`) Per UnitRegular Plan - Monthly IDCW30-Jul-2021 10.209 0.040027-Aug-2021 10.197 0.030029-Oct-2021 10.181 0.030026-Nov-2021 10.187 0.030031-Dec-2021 10.168 0.030028-Jan-2022 10.174 0.030025-Feb-2022 10.185 0.0300Direct Plan - Monthly IDCW30-Jul-2021 10.506 0.050027-Aug-2021 10.490 0.040029-Oct-2021 10.467 0.040026-Nov-2021 10.469 0.040031-Dec-2021 10.448 0.040028-Jan-2022 10.450 0.040025-Feb-2022 10.458 0.0400Record Date NAV as on date of
declaration (`)Quantum of IDCW
(`) Per Unit
Regular Plan - Quarterly IDCW24-Sep-2021 10.958 0.000027-Dec-2021 11.045 0.090017-Mar-2022 11.031 0.1000Direct Plan - Quarterly IDCW24-Sep-2021 11.255 0.100027-Dec-2021 11.263 0.120017-Mar-2022 11.236 0.1100
L&T Business Cycles FundRecord Date NAV as on date of
declaration (`)Quantum of IDCW
(`) Per UnitRegular Plan IDCW20-Jul-2018 14.520 0.900003-Oct-2019 13.452 0.700023-Jul-2021 17.496 1.0000Direct Plan IDCW20-Jul-2018 14.911 0.900003-Oct-2019 13.974 0.900023-Jul-2021 18.242 1.1000
L&T Emerging Businesses FundRecord Date NAV as on date of
declaration (`)Quantum of IDCW
(`) Per UnitRegular Plan IDCW26-Oct-2018 20.289 1.5000 23-Oct-2019 17.110 1.200022-Oct-2021 33.172 1.5000Direct Plan IDCW26-Oct-2018 21.044 1.600023-Oct-2019 17.912 1.000022-Oct-2021 36.035 1.7000
Pursuant to payment of dividend, NAV per unit of the IDCW options of the aforesaid schemes will fall to the extent of the payment and statutory levy (if applicable). Face value `10/-.Past performance of the aforesaid schemes may or may not be sustained in future. *Please note that the IDCW rates mentioned are post applicable dividend distribution tax deduction.
L&T Equity Savings FundRecord Date NAV as on date of
declaration (`)Quantum of IDCW
(`) Per Unit
Regular Plan - Monthly IDCW25-Jan-2022 13.279 0.060025-Feb-2022 13.147 0.060025-Mar-2022 13.267 0.0600Direct Plan - Monthly IDCW25-Jan-2022 14.667 0.070025-Feb-2022 14.529 0.070025-Mar-2022 14.668 0.0700
Record Date NAV as on date of declaration (`)
Quantum of IDCW (`) Per Unit
Regular Plan - Quarterly IDCW24-Sep-2021 14.324 0.180027-Dec-2021 14.129 0.180017-Mar-2022 14.003 0.1800Direct Plan - Quarterly IDCW24-Sep-2021 15.273 0.190027-Dec-2021 15.101 0.190017-Mar-2022 14.998 0.1900

54
Data as on March 31, 2022
IDCW HISTORY FOR DEBT SCHEMES
L&T Overnight FundRecord Date NAV as on Record
Date (`)Quantum of IDCW
(Corporate) (`) Per Unit
Quantum of IDCW (Non-Corporate)
(`) Per UnitRegular Plan - Monthly IDCW
25-Mar-22 1,011.24 2.2000 2.200025-Feb-22 1,011.23 2.5000 2.500025-Jan-22 1,010.97 2.5000 2.5000Direct Plan - Monthly IDCW25-Mar-22 1,067.57 2.3000 2.300025-Feb-22 1,067.47 2.6000 2.600025-Jan-22 1,067.06 2.6000 2.6000
L&T Money Market FundRecord Date NAV as on Record
Date (`)Quantum of IDCW
(Corporate) (`) Per Unit
Quantum of IDCW (Non-Corporate)
(`) Per UnitRegular - Monthly IDCW
25-Mar-22 11.5286 0.0300 0.030025-Feb-22 11.5248 0.0300 0.030025-Jan-22 11.5218 0.0300 0.0300Direct Plan - Monthly IDCW25-Mar-22 12.1256 0.0300 0.030025-Feb-22 12.1159 0.0300 0.030025-Jan-22 12.1062 0.0300 0.0300
L&T Banking and PSU Debt FundRecord Date NAV as on Record
Date (`)Quantum of IDCW
(Corporate) (`) Per Unit
Quantum of IDCW (Non-Corporate)
(`) Per UnitRegular Plan - Monthly IDCW
25-Mar-22 11.2210 0.0500 0.050025-Feb-22 11.2554 0.0500 0.050025-Jan-22 11.2416 0.0400 0.0400Direct Plan - Monthly IDCW25-Mar-22 11.6941 0.0500 0.050025-Feb-22 11.7244 0.0500 0.050025-Jan-22 11.7047 0.0400 0.0400
L&T Short Term Bond Fund
Record Date NAV as on Record Date (`)
Quantum of IDCW (Corporate) (`) Per Unit
Quantum of IDCW (Non-Corporate)
(`) Per UnitRegular Plan - Monthly IDCW25-Mar-22 11.2628 0.0400 0.040025-Feb-22 11.2821 0.0400 0.040025-Jan-22 11.2801 0.0400 0.0400Direct Plan - Monthly IDCW25-Mar-22 11.8862 0.0400 0.040025-Feb-22 11.9000 0.0400 0.040025-Jan-22 11.8909 0.0400 0.0400Record Date NAV as on date of
declaration (`)Quantum of IDCW
(Corporate) (`) Per Unit
Quantum of IDCW (Non-Corporate) (`)
Per UnitRegular Plan - Quarterly IDCW 17-Mar-22 10.8957 0.1300 0.1300 27-Dec-21 10.9708 0.1300 0.1300 24-Sep-21 11.0610 0.1400 0.1400Direct Plan - Quarterly IDCW 17-Mar-22 11.6081 0.1400 0.1400 27-Dec-21 11.6775 0.1400 0.1400 24-Sep-21 11.7501 0.1400 0.1400Regular Plan - Annual IDCW17-Mar-22 12.8076 0.6500 0.650019-Mar-21 13.0935 0.8000 0.800020-Mar-20 12.9759 0.5336 0.5763Direct Plan - Annual IDCW17-Mar-22 13.2635 0.7000 0.700019-Mar-21 13.5202 0.8500 0.850020-Mar-20 13.3607 0.5670 0.6123
L&T Low Duration FundRecord Date NAV as on Record
Date (`)Quantum of IDCW
(Corporate) (`) Per Unit
Quantum of IDCW (Non-Corporate)
(`) Per UnitRegular Plan - Monthly IDCW25-Mar-22 10.4560 0.0400 0.040025-Feb-22 10.4670 0.0400 0.040025-Jan-22 10.4768 0.0400 0.0400Direct Plan - Monthly IDCW25-Mar-22 11.1034 0.0400 0.040025-Feb-22 11.1071 0.0400 0.040025-Jan-22 11.1090 0.0400 0.0400
Record Date NAV as on date of declaration (`)
Quantum of IDCW (Corporate) (`) Per Unit
Quantum of IDCW (Non-Corporate)
(`) Per UnitRegular Plan - Annual IDCW17-Mar-22 10.8681 0.5000 0.500019-Mar-21 11.1871 0.7000 0.700020-Mar-20 11.2609 0.4669 0.5042Regular Plan - Annual IDCW17-Mar-22 11.1896 0.5200 0.520019-Mar-21 11.4276 0.7000 0.700020-Mar-20 11.4234 0.4669 0.5042
L&T Credit Risk FundRecord Date NAV as on Record
Date (`)Quantum of IDCW
(Corporate) (`) Per Unit
Quantum of IDCW (Non-Corporate)
(`) Per UnitRegular Plan - Monthly IDCW25-Mar-22 10.2165 0.0500 0.050025-Feb-22 10.2462 0.0500 0.050025-Jan-22 10.2634 0.0500 0.0500Direct Plan - Monthly IDCW25-Mar-22 10.8596 0.0500 0.050025-Feb-22 10.8813 0.0500 0.050025-Jan-22 10.8892 0.0500 0.0500
Record Date NAV as on date of declaration (`)
Quantum of IDCW (Corporate) (`) Per Unit
Quantum of IDCW (Non-Corporate)
(`) Per UnitRegular Plan - Annual IDCW17-Mar-22 11.7358 0.0000 0.000019-Mar-21 11.0601 0.0000 0.000020-Mar-20 11.4070 0.4669 0.5042Direct Plan - Annual IDCW17-Mar-22 12.3119 0.0000 0.000019-Mar-21 11.5112 0.0000 0.000020-Mar-20 11.7550 0.4669 0.5042
L&T Gilt FundRecord Date NAV as on date of
declaration (`)Quantum of IDCW
(Corporate) (`) Per Unit
Quantum of IDCW (Non-Corporate)
(`) Per UnitRegular Plan - Quarterly IDCW17-Mar-22 11.3486 0.1500 0.150027-Dec-21 11.6567 0.2000 0.200024-Sep-21 11.8993 0.2500 0.2500Direct Plan - Quarterly IDCW17-Mar-22 12.6375 0.1700 0.170027-Dec-21 12.9444 0.2200 0.2200
24-Sep-21 13.1662 0.2700 0.2700
L&T Ultra Short Term FundRecord Date NAV as on Record
Date (`)Quantum of IDCW
(Corporate) (`) Per Unit
Quantum of IDCW (Non-Corporate)
(`) Per UnitMonthly IDCW25-Mar-22 12.7361 0.0400 0.040025-Feb-22 12.7371 0.0400 0.040025-Jan-22 12.7368 0.0400 0.0400Direct Plan - Monthly IDCW25-Mar-22 13.0656 0.0400 0.040025-Feb-22 13.0640 0.0400 0.040025-Jan-22 13.0608 0.0400 0.0400Semi Annual IDCW17-Mar-22 26.7068 0.0000 0.000024-Sep-21 26.2971 0.0000 0.000019-Mar-21 25.8148 0.0000 0.0000Direct Plan - Semi Annual IDCW16-Mar-16 10.4889 0.1338 0.1445

55
Data as on March 31, 2022
IDCW HISTORY FOR DEBT SCHEMES
L&T Flexi Bond FundRecord Date NAV as on Record
Date (`)
Quantum of IDCW (Corporate) (`) Per Unit
Quantum of IDCW (Non-Corporate)
(`) Per UnitRegular Plan - Monthly IDCW25-Mar-22 10.8089 0.0500 0.050025-Feb-22 10.8452 0.0500 0.050025-Jan-22 10.8981 0.0500 0.0500Direct Plan - Monthly IDCW25-Mar-22 12.8322 0.0600 0.060025-Feb-22 12.8689 0.0600 0.060025-Jan-22 12.9244 0.0600 0.0600
Record Date NAV as on date of declaration (`)
Quantum of IDCW (Corporate) (`) Per Unit
Quantum of IDCW (Non-Corporate)
(`) Per UnitRegular Plan - Annual IDCW17-Mar-22 11.1854 0.5000 0.500019-Mar-21 11.4848 0.7000 0.700020-Mar-20 11.5612 0.4669 0.5042Direct Plan - Annual IDCW17-Mar-22 11.6487 0.5200 0.520019-Mar-21 11.8712 0.7200 0.720020-Mar-20 11.8483 0.4669 0.5042
L&T Triple Ace Bond FundRecord Date NAV as on date of
declaration (`)Quantum of IDCW
(Corporate) (`) Per Unit
Quantum of IDCW (Non-Corporate)
(`) Per UnitRegular Plan - Quarterly IDCW 17-Mar-22 11.5010 0.1800 0.1800 27-Dec-21 11.6968 0.1800 0.1800 24-Sep-21 11.7975 0.2000 0.2000Direct Plan - Quarterly IDCW 17-Mar-22 11.8376 0.1900 0.1900 27-Dec-21 12.0350 0.1900 0.1900 24-Sep-21 12.1324 0.2100 0.2100Regular Plan - Annual IDCW17-Mar-22 12.3675 0.7000 0.700019-Mar-21 12.3257 0.7000 0.700020-Mar-20 11.9928 0.3669 0.3962Direct Plan - Annual IDCW17-Mar-22 12.4865 0.7000 0.700019-Mar-21 12.3978 0.7000 0.7000Regular Plan - Semi Annual IDCW17-Mar-22 17.4451 0.4000 0.400024-Sep-21 17.7201 0.4000 0.400019-Mar-21 17.1803 0.4000 0.4000Direct Plan -Semi Annual IDCW17-Mar-22 20.4791 0.4500 0.450024-Sep-21 20.7494 0.4500 0.450019-Mar-21 20.0642 0.4500 0.4500
L&T Conservative Hybrid Fund
Record Date NAV as on Record Date (`)
Quantum of IDCW (Corporate)
Quantum of IDCW (Non-Corporate)
(`) Per Unit (`) Per Unit
Regular Plan - Monthly IDCW25-Mar-22 11.4706 0.0500 0.050025-Feb-22 11.3711 0.0500 0.050025-Jan-22 11.5404 0.0500 0.0500Direct Plan - Monthly IDCW25-Mar-22 12.3033 0.0600 0.060025-Feb-22 12.1970 0.0600 0.060025-Jan-22 12.3783 0.0600 0.0600Record Date NAV as on date of
declaration (`)Quantum of IDCW
(Corporate)Quantum of IDCW (Non-Corporate)
Regular Plan - Quarterly IDCW17-Mar-22 11.1610 0.1400 0.140027-Dec-21 11.3387 0.1700 0.170024-Sep-21 11.4991 0.2200 0.2200Direct Plan - Quarterly IDCW17-Mar-22 11.8292 0.1500 0.150027-Dec-21 12.0007 0.1800 0.180024-Sep-21 12.1477 0.2300 0.2300
L&T Focused Equity Fund
Record Date NAV as on Record Date (`)
Quantum of IDCW (Corporate)
Quantum of IDCW (Non-Corporate)
(`) Per Unit (`) Per Unit
Regular Plan - Monthly IDCW26-Nov-21 16.418 0.0500 0.0500Direct Plan - Monthly IDCW26-Nov-21 16.996 0.0500 0.0500
L&T Resurgent India Bond FundRecord Date NAV as on date of
declaration (`)Quantum of IDCW
(Corporate) (`) Per Unit
Quantum of IDCW (Non-Corporate)
(`) Per UnitRegular Plan - Monthly IDCW
25-Mar-22 10.9311 0.0500 0.050025-Feb-22 10.9641 0.0500 0.050025-Jan-22 10.9668 0.0500 0.0500Direct Plan - Monthly IDCW25-Mar-22 11.6405 0.0500 0.050025-Feb-22 11.6645 0.0500 0.050025-Jan-22 11.6555 0.0500 0.0500Regular Plan - Annual IDCW17-Mar-22 11.8657 0.7000 0.700019-Mar-21 12.0606 0.7700 0.770020-Mar-20 11.8937 0.4669 0.5042Direct Plan - Annual IDCW17-Mar-22 12.6379 0.7400 0.740019-Mar-21 12.7162 0.8000 0.800020-Mar-20 12.3921 0.4669 0.5042
Pursuant to payment of dividend, NAV per unit of the IDCW options of the aforesaid schemes will fall to the extent of the payout and statutory levy (if applicable). *Face value `1000/-. For the remaining scheme Face value is ̀ 10/-. Past performance of the aforesaid schemes may or may not be sustained in future. Please note that the IDCW rates mentioned are post applicable dividend distribution tax deduction.

56
Data as on March 31, 2022Branches details of the Company
L&T INVESTMENT MANAGEMENT LIMITED - INVESTOR SERVICE CENTRESAhmedabad : 1st Floor, Unit No. 101 & 104, Ratnaraj Spring Nr, Navrangpura Bus stand Navrangpura 380015. Bengaluru : N-111(47-43), Manipal Centre, First Floor, North Block, Dickenson Road, Bengaluru-560042. Bengaluru : Site No. 92, Zed Square, 1st Floor, Industrial Layout, JNC Road, 5th Block, Koramangala, Bangalore–560095. Bhavnagar : L&T Financial Services, Shop No.FF-5,Gopi Arcade, Waghawadi Road, Bhavnagar-364002. Bhopal : Alankar Complex, Mezzanine Floor, Above ICICI Bank, M.P.Nagar Zone-II, Bhopal-462011 Bhubaneshwar : 428/3818, 2nd Floor, Jaydev Nagar, Kalpana Square, Near Pantho Nivas, Bhubaneswar-751002 Borivali (Mumbai) : Office No. 308, 3rd Floor, Jalaram Business Center, Ganjawala Lane, Borivali (West), Mumbai-400092. Chandigarh : Plot No. 174, 3rd Floor, Industrial Area, Phase-2, Chandigarh-160002 Chennai : 6th Floor, K.G.N. Towers,No. 62 Ethiraj Salai (Commander- In- Chief Road), Egmore, Chennai-600105 Kochi: Govardhan Buildings, No. 66/3118-A, 2nd Floor, Chittoor Road, Ernakulam, Kochi-682035. Coimbatore : NO. 2-8, Third Floor, “ATRIA”, Dr. NRN Layout, Papanaickenpalayam, Coimbatore-641037. Dalamal (Mumbai) : 407 Office No.811, 8th Floor, Raheja Center, Free Press Journal Road, Nariman Point, Mumbai 400021. Ghatkopar (Mumbai) : Office No. 504, 5th Floor, Zest Business Spaces, M.G. Road, Ghatkopar (East), Mumbai-400077 Goa : 6th Floor, Bhanav Apartment, Near Mahalaxmi Temple, Dr. Atmaram Borkar Road, Panjim, Goa-403001. Gurgaon (New Delhi) : Office no 221, 2nd Floor, Galleria Market, DLF City Phase 4, Gurgaon-122002. Hyderabad : 2nd Floor, Unit No. 203/2, Block - I, 6-3-1192/1/1, Kundanbagh, White House Begumpet, Hyderabad–500016. Indore : “Dhan Trident” Block No. B-3, PU- 4, Scheme No. 54,Near Vijay Nagar Square, Indore-452010 Jaipur : Shop No. 307, Third Floor, Trimurty VJaycity Point, Ashok Marg, C - Scheme, Jaipur 302001.Jalandhar : SCO-3, 2nd Floor, Puda Complex, Adjoining Andhra Bank, Opp. Suvidha Centre, Jalandhar City-144001 Jamnagar : G-43,Ground Floor, Madhav Plaza,Opp SBI Bank,Near Lal Bunglow Jamnagar-361001 Jamshedpur : 3B, Rear Side,3rd Floor,Fairdeal Complex,HNo 7,Main Road Bishtupur,Jamshedpur-831001 Kalina (Mumbai): Ground Floor, Brindavan, Plot No 177, CST Road, Kalina, Santacruz (E),Mumbai-400098 (24-Jul-2018) Kanpur : 4th Floor, Vodafone Tower, Near Leelamani hospital, Civil line Kanpur 208001. Kolhapur : L&TFinancial Services,1st Floor,F01&F02,Jaduben Plaza,1108/E,Shahupuri,Kolhapur-416001 Kolkata : 4th Floor, 2/1, Kankaria Centre, RussellStreet, Kolkata-700 071 Lucknow : Land No. 12, Shop No. 106, 1st Floor, Saran Chamber, Near Civil Hospital, Lucknow - 226 001. Ludhiana: SBI Building, Second Floor, Plot No. 19, House 223/2, Rani Jhansi Road, Near Khalsa College for Women, Ludhiana, Punjab 141 001. Nagpur: Office No. 501, 5 Floor, Shriram Shyam Tower, Sadar, Nagpur - 440012. Nariman Point (Mumbai) : Office No. 811, 8th Floor, Raheja Center,Free Press Journal Road, Nariman Point, Mumbai- 400021. Nasik : 3rd Floor, Office No. 3&4, Bedmuthas Navkar Heights, Sharanpur Road,New Pandit Colony, Nashik 422 005. New Delhi : 6th Floor,DCM Building,16, Barakhamba Road, Connaught Place, Above BarakhambaRoad Metro Station, New Delhi-110001 Panipat : NK Tower, 2nd Floor, GT Road, Panipat-132103 Patna : Office no.201,2nd Floor, GrandAley Manawar, Ward No. 2, Circle No. 6,Street No.20,Holding No.256,Survey Plot No. 877,Gandhi Maidan Road, Patna-800001 Pune : 3rdFloor, Office No. 301 and 302, Zenith Complex, K B Joshi Path, Shivaji Nagar, Pune 411 055. Rajkot : 2nd Floor, Office No. 212, 214 to 215,Part B, Nath Edifice, Dr. Yagnik, Road, Race Course Road, Rajkot 360001. Surat : 8th Floor, Office No. 800A, International Trade Center, NearMajura Gate, Ring Road, Surat 395002. Thane (Mumbai) : 6 Floor, Unit No. 627 and 628, Lodha Supremus II, Road No. 22, Wagle Estate,Thane West 400 604. Trichy : Sri Krishna Arcade, No.60, First Floor, Thennur High Road, Trichy 621017. Trivandrum : Parmeswara Towers,T C 15/1948(4), Ganapathy Kovil Road, Opp. Canara Bank, Vazhuthacaud, Trivandrum-695014. Vadodara : Office No .202 - 203 , SecondFloor , Sahyog Atrium , Old Padra Road , Vadodara-390015 Varanasi : 2ND Floor,Unit D-64/127-CH,Arihant Complex,Sigra,Varanasi-221010Vijayawada : D 27-23-252, Gopala Reddy Road, 4th Floor, Flat No. 402, Bhaskar Plaza, Governorpet, Vijayawada, Andhra Pradesh-520002.
L&T INVESTMENT MANAGEMENT LIMITED - SALES OFFICESAgra : First Floor,108, Anand Vrindavan , Sanjay Place , Agra - 282002. Allahabad : FF109 & FF110, 1st Floor, Vinayak Complex, Elgin Road, Civil Lines, Allahabad-211 001. Amritsar : G.R Tower, 1st Floor, Mall Road, Amritsar-143001. Anand : Imperial Square, 3rd Floor,Office No. 304 & 305, Amul Dairy Road, Near Ganesh Chowkdi, Anand-388001. Aurangabad : 1st Floor, Ratnaprabha Complex, Adalat Road, Bhagyanagar, Aurangabad, Maharashtra. 431005. Calicut : 2nd Floor, Trade Link Complex, Challapuram Road,Mankave Junction, Calicut-673007. Cuttack : 1st Floor, OSL Tower-3, Badambadi Square, Cuttack-753009. Dehradun : 2nd Floor, 75-A, Mak Plaza, Rajpur Road, Dehradun-248001. Durgapur : B-27, Biplabi Rasbihari ,Basu Sarani, Bidhan Nagar, Sector 2A, Durgapur-713212. Guwahati : 3rd Floor, Kushan Plaza, Dispur, G.S Road, Guwahati - 781006. Hubli : No. 472, 473 & 474, 3rd floor, V A kalburgi Square, Beside Ganesh Hotel, Vivekananda Hospital road,Deshpande Nagar, Hubli-580 020. Jabalpur : 2nd Floor, Digamber Towers Near Chanchalla Bai College, Wright Town, Jabalpur MP-482002.Jodhpur : C-44, 2nd Floor, (Rear Portion), 5th Avenue, Pwd Road, Jodhpur-324002. Madurai : Rakesh Towers, No.30C, 3rd Floor, SubramaniaPillai Street Bypass Road, S.S Colony, Madurai-625016. Mangalore : 1st Floor, Aadheesh Avenue,Shop No.106,Opposite Besant College,M G Road, Kodiala Bail,Manglore-575003. Mysore : No.209, High Sharadadevi Nagar(North) High Tension Double Road, Mysore 570022.Pondicherry : 1st Floor, No:144, 100 feet road, ECR Main Road, Pakkamudayanpet, Lawspet, Pondicherry-605008. Raipur : 1st floor, SimranTower, Opposite LIC Building, Pandri, Raipur-492004. Ranchi : 1st Floor,45, Garikhana, Near PNB, Harmu Road, Ranchi-834001. Rourkela: Sector 19, L&T House,Ambagan, Rourkela-769005. Siliguri : 3rd Floor, Infinity Square, Sevoke Road, Siliguri-734001. Udaipur : 32/1105,Centre Point, 2nd Floor, Opp. B.N. College, Udaipur-313001. Vapi : 1st floor, Office No - 2, Jayam Complex, Plot No - 32/B, 1st Phase, NearGIDC Char Rasta, Vapi, Gujarat-396195. Vishakapatnam : D.No : 47-14-5/1, Flat No:303, 2rd Floor,Eswara Paradise,Beside State Bank ofIndia, Dwarakanagar Main road,Visakhapatnam-530016.CL09293

57
Data as on March 31, 2022
THIS FAR?
THIS FAR?
HOW FAR WOULD YOU GOTO FULFIL YOUR PASSION?
THIS FAR?
CL06709
Follow us on
#SIPTakesYouFurther
Plan ahead with SIP and go further on your favourite activity.We all have our own passion, whether it is to scale the tallest peak or drive across many countries. But the one thing that could take you there is a good plan. Start a Systematic Investment Plan (SIP) and invest monthly to help you reach your goal. Each small installment adds up over time and with the power of compounding could grow to a substantial amount. So rather than attempting basecamp, you could set your sights on the tallest peaks!
Investors should deal only with Registered Mutual Funds, to be verified on SEBI website under Intermediaries/Market Infrastructure Institutions". Refer www.ltfs.com for details on completing one-time KYC (Know Your Customer) process, change of details like address, phone number etc. and change of bank details etc. For complaints redressal, either visit www.ltfs.com or SEBI's website www.scores.gov.in. Investors may refer to the sectionon ‘Investor Education’ on the website of Mutual Fund for the details on all 'Investor Education and Awareness Initiatives' undertaken by the AMC.
An investor education & awareness initiative.
Mutual Fund investments are subject to market risks, read all scheme related documents carefully.
visit www.ltfs.com/sipcall 1800 2000 400
THIS FAR?
TOUCHGET IN
Give a missed call on92129 00020 from your registered mobile to receive total valuation on SMS and statements for all your folios and corresponding schemes on your registered email ID.
Get latest NAV ofyour scheme.SMS LNTMF NAV <Scheme Code*> to 56767#
For furtherqueries, email [email protected]
Join us on WhatsApp @ 9326929294 for financial and non-financial transactions, Account statement, etc. or you can connect with us on Chatbot as well by visiting our website (www.ltfs.com/companies/lnt-investment-management/lnt-mutual-fund.html). (For Resident individual investors only with mode of holding as single).
#Visit the Customer Service section on our website for scheme codes.
The fund invests predominantly in undervalued stocks to seek out potential winners over the long term.
Diversified equity fund with no sector/market cap bias
Focus on value stocks with sound fundamentals that have the potential to deliver reasonable returns over long term
Uncover hidden opportunities for growth.Invest in L&T India Value Fund
Aims to invest in stocks with adequate margin of safety to reduce risk in a volatile market environment
Moderately
woL
etaredoM ot woL
derato eMHigh
Very High
High
VERYHIGHLOW
Investors understand that their principal will be at very high risk
call 1800 2000 400www.ltfs.com
Riskometer is as on March 31, 2022.
Mutual Fund investments are subject to market risks, read all scheme related documents carefully. CL09321
L&T India Value Fund(An open ended equity scheme following a value investment strategy.)
This product is suitable for investors who are seeking*
• Long-term capital appreciation
• Investment predominantly in equity and equity-related securities in Indian markets and foreign securities with higher focus on undervalued securities
*Investors should consult their financial advisers if in doubt about whether the product is suitable for them.
Follow us on

58
Data as on March 31, 2022
THIS FAR?
THIS FAR?
HOW FAR WOULD YOU GOTO FULFIL YOUR PASSION?
THIS FAR?
CL06709
Follow us on
#SIPTakesYouFurther
Plan ahead with SIP and go further on your favourite activity.We all have our own passion, whether it is to scale the tallest peak or drive across many countries. But the one thing that could take you there is a good plan. Start a Systematic Investment Plan (SIP) and invest monthly to help you reach your goal. Each small installment adds up over time and with the power of compounding could grow to a substantial amount. So rather than attempting basecamp, you could set your sights on the tallest peaks!
Investors should deal only with Registered Mutual Funds, to be verified on SEBI website under Intermediaries/Market Infrastructure Institutions". Refer www.ltfs.com for details on completing one-time KYC (Know Your Customer) process, change of details like address, phone number etc. and change of bank details etc. For complaints redressal, either visit www.ltfs.com or SEBI's website www.scores.gov.in. Investors may refer to the sectionon ‘Investor Education’ on the website of Mutual Fund for the details on all 'Investor Education and Awareness Initiatives' undertaken by the AMC.
An investor education & awareness initiative.
Mutual Fund investments are subject to market risks, read all scheme related documents carefully.
visit www.ltfs.com/sipcall 1800 2000 400
THIS FAR?
TOUCHGET IN
Give a missed call on92129 00020 from your registered mobile to receive total valuation on SMS and statements for all your folios and corresponding schemes on your registered email ID.
Get latest NAV ofyour scheme.SMS LNTMF NAV <Scheme Code*> to 56767#
For furtherqueries, email [email protected]
Join us on WhatsApp @ 9326929294 for financial and non-financial transactions, Account statement, etc. or you can connect with us on Chatbot as well by visiting our website (www.ltfs.com/companies/lnt-investment-management/lnt-mutual-fund.html). (For Resident individual investors only with mode of holding as single).
#Visit the Customer Service section on our website for scheme codes.


![[31st October, 1968] - Gazettes.Africa](https://img.pdfslide.net/doc/110x75/631a7e120255356abc08b463/31st-october-1968-gazettesafrica.jpg)


