Embed Size (px)
Citation preview

JOURNAL OF EASTERN MEDITERRANEAN ARCHAEOLOGY AND HERITAGE STUDIES, VOL. 2, NO. 1, 2014Copyright © 2014 The Pennsylvania State University, University Park, PA
Digital documentation in archaeology includes appli-cations for data capture, virtual reconstruction, and visual communication (Forte 2010; 2012; Forte and Kurillo 2010; Forte and Siliotti 1997). In the last decade, the use of digital technologies, such as GIS
3D ARCHAEOLOGYNew Perspectives and Challenges—The Example of Çatalhöyük
Maurizio Forte
The project “3D-Digging at Çatalhöyük” started in 2009 as an on-site digital experiment to record every phase of an archaeological excavation in 3D, using different technol-ogies such as laser scanning, computer vision, and pho-togrammetry. The end goal was to make the excavation process virtually reversible in a simulated environment from laptop computers to virtual immersive systems. In addition, the project has introduced 3D stereo visualiza-tion systems on-site for real-time analysis and with the advent of tablet PCs, all documentation switched to a completely digital format. The use of 3D technologies for teaching and research as well as the post-processing and implementation of data generate a new digital workflow for archaeological interpretation.
ABSTRACTmapping, 3D modeling, remote sensing applications, and digital photogrammetry at archaeological sites has grown exponentially for different purposes. A revo-lutionary approach in archaeological documentation (on- and off-site) has been the generation of 3D models by overlapping a sequence of high-resolution digital photos taken by uncalibrated cameras (Forte 2012). The relevant increase of digital resolution in single-lens reflex (SLR) cameras (15–20 megapixels) has also allowed for better results in terms of 3D accuracy, performance, and speed of data processing. In fact, the application of entry-level intra-site 3D technolo-gies has encouraged archaeologists to consider 3D not just an “expensive”option, but a very affordable one for the production of maps, sections, profiles, and volumetric analyses with a high level of accuracy. For example, our tests at Çatalhöyük have demonstrated that a 3D model of a Neolithic house (25 m2) generated in Agisoft’s PhotoScan has the accuracy of about 4–5 mm (Forte 2012).
In general, the use of 3D laser scanning and 3D tech-nologies on archaeological excavations is not unusual as demonstrated by several international projects and case studies generally categorized in the domain of 3D archaeology, 3D excavations (Barceló et al. 2003; Barceló and Vicente 2004; De Felice, Silbano and Volpe 2008; Doneus, Neubauer and Studnicka 2003; Doneus and Neubauer 2006; Sanders 2011), 3D reconstructions and
JEMAHS 2.1_01_Forte.indd 1 04/02/14 1:59 AM

2 | 3D A R C H A E O L O G Y
simulations (Benko, Ishak and Feiner 2004; Earl 2007; Levy et al. 2010; Petrovic et al. 2011; Sangregio, Stanco and Tanasi 2008), 3D web, and 2.5D GIS (Katsianis et al. 2008; Tsioukas and Patias 2003). This relatively intense use of 3D technologies, however, has had different goals and objectives, mostly focused on visual and static rep-resentation of sites and artifacts rather than scientific and perceptual analyses of models. Sometimes, the side effect of 3D modeling in archaeology is the achieve-ment of cosmetic or purely visual results that are not adequately supported by advanced research questions or a strong interaction with the models. Therefore, the models are not really used for a high-resolution spatial reconstruction of archaeological stratigraphy, but for a more general presentation and contextualization of sites and monuments.
Actually, the interpretation of this kind of digital asset should come from user feedback, data observation, and the interaction of “bottom-up”(acquisition) and “top-down”(interpretation) activities. In the “bottom-up”phase, several kinds of data collection and mapping are included. In the “top-down”phase, archaeologists use data classification and scientific analyses to start to interpret and contextualize information (Forte forth-coming). Interaction between the two processes is nec-essary for generating new knowledge, that is, a new digital hermeneutic cycle. In fact it is very important to overlap and integrate both processes in the same simu-lation context (e.g., an excavation plan [either in 2D or 3D] of a building with its hypothetical reconstruction). In short, “bottom-up”and “top-down”processes should have a bidirectional (reciprocal) relation (Forte 2010).
These digital hermeneutics, which incorporate “top-down”and “bottom-up”processes in a completely digi-tal workflow, are able to create new knowledge in the domain of cyberarchaeology (Forte 2010; forthcoming). Cyberarchaeology embodies multiple interpretations through virtual simulations, embedding real-empirical and digital-virtual data. The interpretation, therefore, should be the product of digital mediated tools (vir-tual models) and empirical data (observation) (Forte forthcoming).
The main difference between new archaeology and past archaeology is that the process is completely
digital, open, and interactive with increasing amounts of information produced in a very short time. For example, at Çatalhöyük during the 2012 fieldwork season, single-antenna ground-penetrating radar (at 500 MHz) was able to collect 54 GB of data in three working days. A laser scanner (Faro Focus3D 120) was able to collect up to 976,000 points per second, totaling hundreds of mil-lions of points. All of these data are immediately avail-able for 3D interaction, collaborative work, and/or 3D immersion. This allows the archaeologist to have on-site an empirical and mediated experience simultaneously (e.g., observing a stratigraphic sequence [empirical data] and also its digital simulation [mediated experience]). Thus, cyberarchaeology is able to study unexplored syn-chronic and diachronic relations in depositional and post-depositional contexts.
Visualizing Çatalhöyük
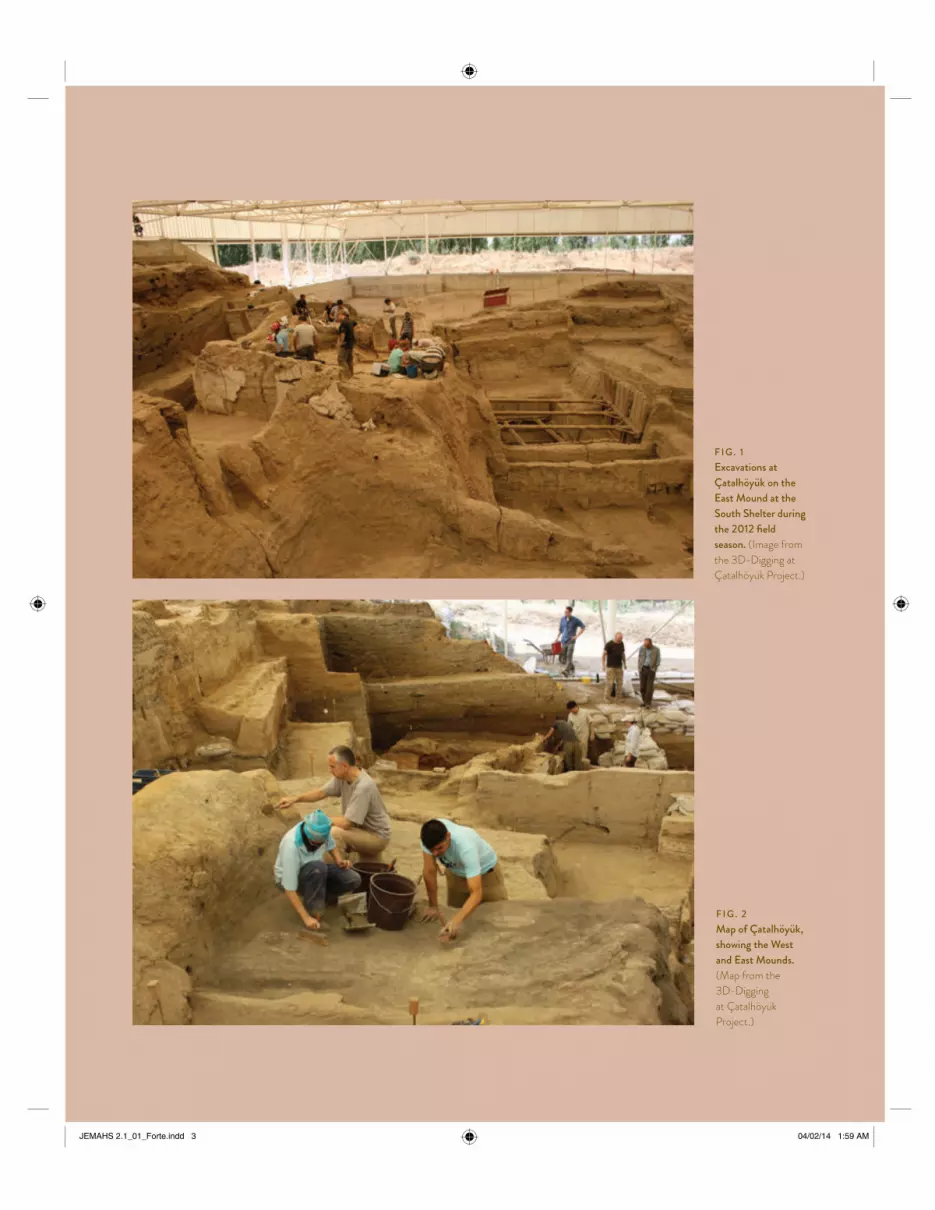
Çatalhöyük is a Neolithic site located in Central Anatolia and is considered to be one of the first “cities”in the world (Fig. 1). Excavated by J. Mellart in the 1950s–1960s and then by I. Hodder in the 1980s, it has been a special place for the introduction and experimentation of new methodologies and theoretical approaches such as multivocality, post-processualism, and, more recently, cyberarchaeology and new media (Hodder 1989; 1990; 2005a–b; 2006; 2007).
The site, dating from 7400–6000 BCE, is made up of two mounds: Çatalhöyük East and Çatalhöyük West (Fig. 2). Çatalhöyük East consists of 21 m of Neolithic depos-its. Çatalhöyük West is almost exclusively Chalcolithic (6000–5500 BCE), is located in a different position, and shows evident social-cultural changes in the settlement and the territory’s organization. The mounds span 2,000 years and show an impressive urban continuity though time where the house is the social-cultural-urban pattern of the system: ritual, domestic, and symbolic space at the same time.
When Mellaart discovered Çatalhöyük in the late 1950s, it was considered the largest known Neolithic site in the Near East at that time (Mellaart 1967). Important events such as the domestication of plants,
JEMAHS 2.1_01_Forte.indd 2 04/02/14 1:59 AM
JOURNAL OF EASTERN MEDITERRANEAN ARCHAEOLOGY AND HERITAGE STUDIES | 3
F I G . 1Excavations at Çatalhöyük on the East Mound at the South Shelter during the 2012 field season. (Image from the 3D-Digging at Çatalhöyük Project.)
F I G . 2Map of Çatalhöyük, showing the West and East Mounds. (Map from the 3D-Digging at Çatalhöyük Project.)
JEMAHS 2.1_01_Forte.indd 3 04/02/14 1:59 AM

4 | 3D A R C H A E O L O G Y
the invention of pottery in connection with the large size and dense occupation of the settlement, as well as the spectacular wall paintings and other art forms uncovered inside the houses, make Çatalhöyük critical to the study of human sedentarization. Despite several decades of study and excavation, the diachronic urban development of the site remains controversial, requir-ing more studies and analyses of the landscape and the symbolic, ritual, and social uses of the buildings. Due to its importance, Çatalhöyük became a UNESCO World Heritage site in 2012.
From the beginning of the use of computer graph-ics and 3D modeling in archaeology, Çatalhöyük attracted the attention of archaeologists interested in the application of digital technologies. In 1994 the Zentrum für Kunst und Medientechnologie in Karlsruhe, Germany, made the first 3D graphic reconstruction of a typical Neolithic house on the site (Forte and Siliotti 1997). More recently, R. Tringham and a University of California, Berkeley team made a virtual reconstruction of the entire site in Second Life, with the intent of using the purely virtual Okapi Island as a social network for teaching and telling the story of Çatalhöyük (Morgan 2009; Tringham and Stevanovic 2012).1 The same team has also recently published in digital format the Berkeley Archaeology at Çatalhöyük (BACH) project final report.2 Finally, at the 2013 Society for American Archaeology conference in Honolulu in 2013, a new computer graphics video was presented at the poster session “Archaeology and CGI: The Shrine of the Hunters at Çatalhöyük”made by Artasmedia.3
These examples are evidence of the visual power of Çatalhöyük and its importance as a case study for new media, computer graphic reconstructions, and virtual archaeology. The combination of different fac-tors such as early urbanism, architectural modeling, rituals, wall paintings, and the overall uniqueness of the site have captivated several media makers, visual artists, and digital archaeologists. The need to visu-ally re-imagine the past of Çatalhöyük is a way to make several pieces of a complicated puzzle evocative and to re-analyze the site in terms of dynamic activities and social contexts.
The 3D-Digging Project
The 3D-Digging Project started at Çatalhöyük in 2009 with the intent of digitally recording in 3D all the stratigraphy in specific areas using an integrated approach (different devices and technologies) in order to virtually reconstruct the data on 3D desktop and virtual reality systems. 3D documentation is not yet standard in archaeology, but it can change the herme-neutic outcome of an excavation since it is able to create new interpretations and thus yield new research questions.
The first experiment of 3D recording of ritual figurines by optical scanner (the NextEngine) started in 2009. The models were originally recorded in a semi-automatic way by the scanner, then optimized in MeshLab, and finally printed in 3D (Figs. 3–4). In this preliminary phase, the project aimed at the comparison and study of different kinds of laser scanners (based on different technologies and settings) in order to understand their performance in relation to the project goals (Table 1).
The first questions/issues arising from this analysis were mainly focused on the level of accuracy and scale of representation for the models. Optical and time-of-flight scanners in fact have different performance and techni-cal features. The optical ones work in a range of microns (e.g., the Minolta at about 300,000 points per second), time-of-flights in a range of mm/cm. What kind of accu-racy is required for stratigraphy, an artifact, a building, or a site? The question is not trivial since there is a fine line between representation and what something actu-ally is. How much information are we looking for in a model and at what scale? How can 3D models improve interpretation?
The strategy of the 3D-Digging Project was to com-paratively test the optical, time-of-flight, and phase-shift scanners in order to understand their performance and accuracy in relation to the archaeological data (Table 1). For example, details of the stratigraphic sur-face or micro-morphologies are not visible with the naked eye or by other means. For stratigraphy, we tested the Minolta 910 (optical), Trimble GX (time of flight), Trimble FX (phase shift), and Faro Focus3D 120 (phase shift).
JEMAHS 2.1_01_Forte.indd 4 04/02/14 1:59 AM

JOURNAL OF EASTERN MEDITERRANEAN ARCHAEOLOGY AND HERITAGE STUDIES | 5
F I G . 33D-printed artifacts from Çatalhöyük that were reproduced from optical scans. (Image from the 3D-Digging at Çatalhöyük Project.)
F I G . 4A ritual figurine from its virtual recreation to its 3D printing. (Image from the 3D-Digging at Çatalhöyük Project.)
JEMAHS 2.1_01_Forte.indd 5 04/02/14 1:59 AM

6 | 3D A R C H A E O L O G Y
In 2010 the first experiment was undertaken with the Minolta 910 for recording all the excavation layers in a midden area (Fig. 5). Middens are accumulations of rub-bish outside living areas and can indicate social/collective activities of varying purposes (construction, dedicated place for rubbish, etc.). The initial idea was to use an optical-triangulation scanner, such as the Minolta 910, for stratigraphy in order to better visualize and study the micro-layers (Shillito et al. 2011).
During the 2010 field season, 37 layers (Units 19100–19137) in a midden area identifiable as an open space con-taining the East Mound, Building 86, and Spaces 329, 344, and 445, were excavated, digitally recorded by optical scanner, and georeferenced with 2D plans. In addition, the main artifacts were georecorded using XYZ coor-dinates in order to insert them into 3D images exactly where they were found.
The 3D visualization of this area by optical laser scan-ning has allowed for a very detailed characterization of the
layers’ surfaces (Figs. 6–8). In Fig. 7 several micro-traces and micro-morphologies are visible on top of each stra-tum. The side effect of this augmented visual information on the stratigraphy is that the scratches of archaeologi-cal trowels are visible, which partially compromises the identification of micro-morphologies belonging to the Neolithic context. Nevertheless, there is a substantial increase in the visual information for stratigraphic inter-pretation because of the accuracy of the data recording.
In terms of general usability, the Minolta 910 had a lot of issues working outdoors due to sunlight and the limited field of view. This resulted in very slow sessions of data capturing and lengthy post-processing due to the segmentation of the models and data occlusion. Thus, in 2011 we opted for an integrated system able to dramati-cally shorten post-processing and allow for a daily 3D reconstruction of all the excavation phases (Forte 2012). Indeed, timing is crucial factor when discussing the daily strategy for excavation.
Laser Scanner Scan Range (Depth of Field) Accuracy Field of View Scanning SpeedFaro Focus3D 120(Phase Shift)
0.6 m–120 m to 90% reflective surface
0.6 mm at 10 m0.95 mm at 25 m
360° by 305° up to 976,000 points per second
NextEngine (Optical)
0.50 m Macro ModeA: ±0.127 mm Wide ModeB: ±0.381 mm
Macro ModeA: 129.54 by 96.52 mmWide ModeB: 342.9 by 256.54 mm
50,000 points per second
Minolta 910 (Optical)
0.6–2.5 m X-Axis: ±0.22 mmY-Axis: ±0.16 mmZ-AxisC: ±0.10 mm
Tele Lens: 111 by 84 mm at 0.6 m; 460 mm by 350 mm at 2.5 mMiddle Lens: 196 by 153 mm at 0.6 m; 830 by 622 mm at 2.5 mWide Lens: 355 by 266 mm at 0.6 m; 1200 by 903 mm at 2 m
307,000 points per second
Trimble FX (Phase Shift)
1-pass: up to 60 m to 50% reflective surface1-pass: 35 m to 30% reflective surface2-pass: up to 80 m to 50% reflective surface2-pass: 45 m to 30% reflective surface
0.4 mm at 11 m0.8 mm at 21 m2 mm at 50 m
360° by 270° 216,000 points per second
Trimble GX (Time of Flight)
350 m to 90% reflective surface200 m to 35% reflective surface155 m to 18% reflective surface
Position = 12 mm @100 mDistance = 7 mm @ 100 m
360° by 60° up to 5,000 points per second
A Macro Mode is the size of a soda can.B Wide Mode is the size of a shoebox.B Z is the distance from the sensor.
TA B L E 1 C O M PA R AT I V E D ATA F O R T H E D I F F E R E N T L A S E R S C A N N E R S U S E D AT Ç ATA L H ÖY Ü K
JEMAHS 2.1_01_Forte.indd 6 04/02/14 1:59 AM

JOURNAL OF EASTERN MEDITERRANEAN ARCHAEOLOGY AND HERITAGE STUDIES | 7
F I G . 5The University of California, Merced team excavating a midden area during the 2010 field season. (Image from the 3D-Digging at Çatalhöyük Project.)
F I G . 6A 3D visualization of stratigraphic layers in a midden area as recorded by an optical scanner during the 2010 field season. (Image from the 3D-Digging at Çatalhöyük Project.)
JEMAHS 2.1_01_Forte.indd 7 04/02/14 1:59 AM

8 | 3D A R C H A E O L O G Y
F I G . 8Another 3D visualization of stratigraphic layers in a midden area as recorded by optical scanner during the 2010 field season. (Image from the 3D-Digging at Çatalhöyük Project.)
F I G . 7Another 3D visualization of stratigraphic layers in a midden area as recorded by optical scanner during the 2010 field season. (Image from the 3D-Digging at Çatalhöyük Project.)
JEMAHS 2.1_01_Forte.indd 8 04/02/14 1:59 AM

JOURNAL OF EASTERN MEDITERRANEAN ARCHAEOLOGY AND HERITAGE STUDIES | 9
In 2011, we adopted two systems that worked simultaneously for data recording: a new phase-shift scanner (the Trimble FX) and a combination of camera-based software for computer vision and image model-ing (PhotoScan, Agisoft’s StereoScan, and MeshLab, an open-source software designed by the Istituto di Scienza e Tecnologie dell’Informazione, Consiglio Nazionale delle Ricerche). The Trimble FX is able to generate 216,000 points per second with a 360° by 270° field of view. It is a very fast and effective scanner with the capacity to generate meshes during data recording to save time in post-processing (Fig. 9). The strategy in the documenta-tion process was to simultaneously record all the layers/units in sequence of excavation using laser scanning and
computer vision. Every session of data capturing was very quick and effective— about 15–20 minutes for com-puter vision, laser scanning, and drawing by PC tablet.
At the end of the season, we generated eight differ-ent models for the phases of excavation by computer vision (3D camera image modeling, Figs. 9–10) and by laser scanning (Figs. 11–15). All 3D models were available on a daily basis for interactive visualization and spatial analysis. Table 2 shows the principal features and differ-ences between the two systems. Laser scanning requires longer post-processing, but produces higher quality data. Computer vision allows for immediate results and the abil-ity to follow the day-by-day excavation process in 3D, but not with the same geometric precision of the laser scanner.
F I G . 9The stratigraphy of B89 stratigraphy as recorded by the Trimble FX phase-shift scanner. (Image from the 3D-Digging at Çatalhöyük Project.)
JEMAHS 2.1_01_Forte.indd 9 04/02/14 1:59 AM

10 | 3D A R C H A E O L O G Y
F I G . 11Different phases of excavation of B89 as generated by PhotoScan. (Image rendered by N. Lecari. Courtesy of the 3D-Digging at Çatalhöyük Project.)
F I G . 10A team member takes digital photos of B89 for reconstructing the area in PhotoScan. (Image from the 3D-Digging at Çatalhöyük Project.)
JEMAHS 2.1_01_Forte.indd 10 04/02/14 1:59 AM

JOURNAL OF EASTERN MEDITERRANEAN ARCHAEOLOGY AND HERITAGE STUDIES | 11
F I G . 12Team members record B89 with a laser scanner and digital camera. (Image from the 3D-Digging at Çatalhöyük Project.)
F I G . 13A point-cloud visualization of B77, created from laser scans. (Image from the 3D-Digging at Çatalhöyük Project.)
JEMAHS 2.1_01_Forte.indd 11 04/02/14 1:59 AM

12 | 3D A R C H A E O L O G Y
F I G . 14A 3D model of B77 after meshing and post-processing. (Image from the 3D-Digging at Çatalhöyük Project.)
F I G . 15Another view of the 3D model of B77 after meshing and post-processing. (Image from the 3D-Digging at Çatalhöyük Project.)
JEMAHS 2.1_01_Forte.indd 12 04/02/14 1:59 AM

JOURNAL OF EASTERN MEDITERRANEAN ARCHAEOLOGY AND HERITAGE STUDIES | 13
The digital workflow for computer vision processing is: (1) aligning the photos; (2) constructing the geom-etry (i.e., meshes); and (3) texturing and generating the orthophoto. The accuracy of computer vision measured in the 2011 models was around 5 mm. The use of geore-ferenced targets on-site was implemented for the auto-matic georeferencing of 3D models with the excavation grid. As a result, the 3D information recorded during the excavation was perfectly oriented and integrated with all of the 2D maps, GIS layers, and archaeological data. The post-processing work was very quick when generating point clouds (laser scanning, using targets) and 3D mod-els (computer vision). Thus, the models recorded with the above-mentioned technologies were ready for 3D visualization a few hours after data capture. The speed of this process allowed for daily discussions about the interpretation of stratigraphy and the 3D spatial rela-tions between layers, structures, and phases of excava-tion. Digital data recording and processing by computer vision was entirely managed by students, while laser scanning required more advanced skills (in our case, the field laser scanning assistant is a post-doctoral researcher).
In addition, the excavation of an entire building (B89) permitted testing of the system in a single context to produce a 3D multilayered model of the stratigraphy of the entire building. A drawback to this approach is the interpolation of point clouds in geometric models: this
can only be done after the fieldwork, and requires inten-sive and longer lab sessions.
Excavation of the Neolithic house is an ideal case study for testing 3D data recording and puzzling for a multi-stratigraphic context since it is possible to visualize and investigate post-depositional and depo-sitional phases related to the life and abandonment of a building. Moreover, B89 is quite a big house that is well preserved with a very interesting stratigraphy (see Fig. 9).
The current workflow allows every team to indepen-dently manage almost all phases of digital data record-ing on-site and to interpret the data directly in the lab at the end of each day, using computer vision, 3D sketching, and 3D visualization. The software used for 3D modeling is MeshLab, PhotoScan, and Autodesk’s 3D Studio Max; and for 2D mapping, Esri’s ArcGIS, QGIS, OpenJump, and Autodesk’s AutoCAD and MeshMixer. For 3D modeling, PhotoScan was used for data recording, and MeshLab and 3D Studio Max for 3D post-processing, editing, and computer graphic ren-dering at different level of visualization. Moreover, the use and distribution of open source software, such as MeshLab and QGIS, was also aimed at the involvement and training of a large number of students with excel-lent results.
After three years of fieldwork, the digital workflow has become robust and consistent. Computer vision
Time-of-Flight Scanner Computer VisionAccuracy of 1 mm (Controlled by Hardware) Accuracy of 5 mm (Depending on Photos and Alignments)Slow Post-Processing (Manual) Fast Processing (Mainly Based on Computing Power; Limited Human
Involvement)Separate Texture Mapping Semi-Automatic Texture ProcessingComplex 3D Presentation Simple 3D PresentationLarge-Scale Data Capture Micro-Scale Data CaptureManual Registration or by Targets Automatic RegistrationRadical Decimation Moderate DecimationOperates in Any Environment Limited by Environment, especially Light (Camera Processing)Ideal Applications: Monuments & Structures Ideal Applications: Excavation & Stratigraphy
TA B L E 2 C O M PA R I S O N B E T W E E N L A S E R S C A N N I N G A N D C O M P U T E R V I S I O N T E C H N O L O G I E S
JEMAHS 2.1_01_Forte.indd 13 04/02/14 1:59 AM
3-5T
in a range of millions of pointsT
14 | 3D A R C H A E O L O G Y
is undoubtedly the most effective, user friendly, and robust technique in intra-site contexts. The use of stan-dard digital cameras (from 8 to 24 megapixels) and the very low cost or use of open source software (PhotoScan, MeshLab, and QGIS) makes the setup very portable and usable for sharing the same technologies. At Çatalhöyük computer vision has been typically used at intra-site level for data recording of buildings, layers, units, features, and burials, while laser scanning has also been employed on an inter-site scale (North Shelter, South Shelter, and East Mound).
The 2012 field season involved different scales of data recording: artifacts by optical scanner (accuracy: microns); stratigraphic units by computer vision (accu-racy: 0.5–1 cm); buildings and features by phase-shift scanning (accuracy: 3–5 mm); and large-scale models of the North and South Shelters by phase-shift scanners (0.5 cm).
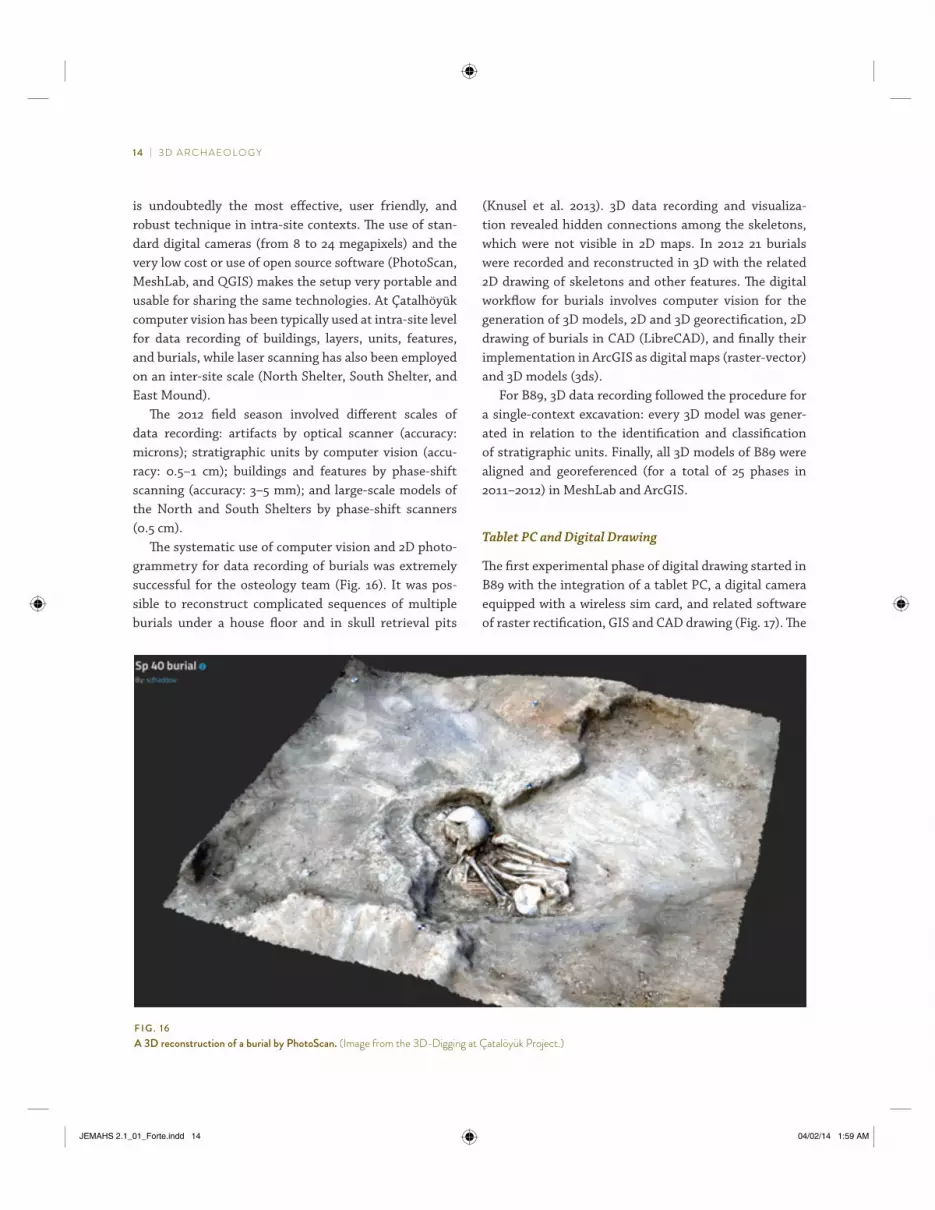
The systematic use of computer vision and 2D photo-grammetry for data recording of burials was extremely successful for the osteology team (Fig. 16). It was pos-sible to reconstruct complicated sequences of multiple burials under a house floor and in skull retrieval pits
(Knusel et al. 2013). 3D data recording and visualiza-tion revealed hidden connections among the skeletons, which were not visible in 2D maps. In 2012 21 burials were recorded and reconstructed in 3D with the related 2D drawing of skeletons and other features. The digital workflow for burials involves computer vision for the generation of 3D models, 2D and 3D georectification, 2D drawing of burials in CAD (LibreCAD), and finally their implementation in ArcGIS as digital maps (raster-vector) and 3D models (3ds).
For B89, 3D data recording followed the procedure for a single-context excavation: every 3D model was gener-ated in relation to the identification and classification of stratigraphic units. Finally, all 3D models of B89 were aligned and georeferenced (for a total of 25 phases in 2011–2012) in MeshLab and ArcGIS.
Tablet PC and Digital Drawing
The first experimental phase of digital drawing started in B89 with the integration of a tablet PC, a digital camera equipped with a wireless sim card, and related software of raster rectification, GIS and CAD drawing (Fig. 17). The
F I G . 16A 3D reconstruction of a burial by PhotoScan. (Image from the 3D-Digging at Çatalöyük Project.)
JEMAHS 2.1_01_Forte.indd 14 04/02/14 1:59 AM

JOURNAL OF EASTERN MEDITERRANEAN ARCHAEOLOGY AND HERITAGE STUDIES | 15
goal was to implement a digital georeferenced drawing on site. The digital workflow consisted of:
The target area (usually a unit or feature) is photographed with a camera installed on a monopod so that it is almost perpendicular to the ground. Most often, the tablet PC camera is used for this, which allows for quick digital recording.While the operator starts to photograph, the tablet PC downloads the pictures wirelessly in real time (unless the tablet PC itself is used for the photo).The pictures are imported into RectifierSoft’s Perspective Rectifier or QGIS and georeferenced with four control points according to the excavation grid.The software generates a TIFF or PNG picture linked with a DXF file.
The DXF file is then exported into LibreCAD or QGIS for drawing and tracing.The final output is a raster and vector overlay georeferenced in ArcGIS or other GIS software.
In the case of large-size structures, such as a house or a wide unit, an effective alternative could be the generation of orthophotos by PhotoScan, PhotoScan Pro, or Perspective Rectifier. Next, the orthophotos are imported into LibreCAD to be drawn by units and layers. The orthophotos produced by PhotoScan Pro can be geo-referenced with markers and control points using local or geographic coordinates.
The use of a tablet PC for motion computing at Çatalhöyük in 2012 was very successful. The tablet was able to download pictures in real time from the camera
F I G . 17A tablet PC with 3D visualization of B89. (Image from the 3D-Digging at Çatalhöyük Project.)
JEMAHS 2.1_01_Forte.indd 15 04/02/14 1:59 AM

16 | 3D A R C H A E O L O G Y
and export them into Perspective Rectifier and LibreCAD for rectification, georeferencing, and drawing. In addi-tion, the tablet had its own internal camera for taking snapshots during the excavation so that it was possible to make comments on overlays, drawings in LibreCAD, and sketches in 3D with Adobe Acrobat Pro.
During the 2012 season, the areas of excavation for the North and South Shelters were digitally recorded by 35–40 scans each, totaling over 350 million points for point clouds. The density of the clouds was so high that in a large-scale visualization, it was almost impossible to distinguish the points, facilitating the interpretation of the models (Fig. 18).
The experiment of daily sketching was also intro-duced for some excavation trenches (B89 and B97). The point was to have a daily 3D visual diary of the
excavation based not just on the identified units and layers, but also on potential interpretations, com-ments, ideas, and discussions. 3D sketching started on-site and continued in the lab after the generation of 3D models made with computer vision. The digital workflow consisted of: data capturing by image mod-eling and creation of 3D models of B89 at the end of the day; exporting the models into PDF using Acrobat Pro; and 3D sketching in the PDFs using overlays with annotations, comments, audio comments, and out-lines. Once created, the 3D PDF models are completely interactive, editable, and visible in any computer with a PDF reader. This portable format opens new avenues for 3D data sharing and collaboration, and offers an intermediate solution between data capture and final interpretation.
F I G . 18A 3D PDF of B89 as generated by PhotoScan. (Image from the 3D-Digging at Çatalhöyük Project.)
JEMAHS 2.1_01_Forte.indd 16 04/02/14 1:59 AM

JOURNAL OF EASTERN MEDITERRANEAN ARCHAEOLOGY AND HERITAGE STUDIES | 17
Stereo Visualization
The project involved the use of stereo pictures created by 3D cameras and stereo projected by 3D models. The combined use of stereo pictures and stereo models has allowed for the visualization of 3D archaeological data daily, stimulating debate on-site about possible inter-pretations of buildings, objects, and stratigraphy (Fig. 19). A stereo camera (the Fujitsu FinePix) was used mostly for capturing general scenes of buildings, main strata, and/or architectural details. The visualization of stereo pictures offers an additional interesting perspec-tive for fieldwork interpretation; for example, a visual summary of the excavation at the end of a week or for showing crucial phases of data recording. Moreover, 3D
stereo visualization of models was aimed at the spatial integration of measurable data.
The last part of the work was the 3D stereo implemen-tation of the models for the OgreMax viewer and Unity 3D player in order to display them in stereo projection. For this purpose, we used a DLP projector (Acer H5360) with the NVIDIA 3D Vision kit and a set of active stereo glasses. During the excavation, B77 and B89 were selected for stereo visualization in real time (walkthrough, flyth-rough, rotation, zooming, and panning).
Infrared Digital Cameras
Infrared cameras are typically used for identifying the presence of water changes (moisture and humidity),
F I G . 19Team members viewing stereo pictures and models on-site at Çatalhöyük during the 2012 field season. (Image from the 3D-Digging at Çatalhöyük Project.)
JEMAHS 2.1_01_Forte.indd 17 04/02/14 1:59 AM

18 | 3D A R C H A E O L O G Y
thermal conductivity, and the thermal mass of building material. The presence of water changes the thermal conductivity and the thermal mass of building material.The use of digital infrared cameras at Çatalhöyük was attention-grabbing in relation to the analysis of wall paintings, plaster, and mud bricks. In fact, materials with different composition reflect the light in a different way and absorb humidity differently. The experiment focused on the east wall of B80 and a sampling of stratigraphic units in B89 (19830, 19829). The infra-red visualization of the wall painting of B80 is shown in Fig. 20. The paintings and micro-layers of plaster
are better preserved in the coldest areas or where the humidity is more concentrated.
Digital Evaluation Models (DEMs)
In the northern area of the East Mound, a high- resolution DEM was created by laser scanning (Faro Focus3D 120) in order to compare the micro-relief of the mound with the geophysical survey. In this case, the laser scanner recorded the ground surface in the same area of the mound where geophysical prospections were processed during the 2012 season.
F I G . 20An infrared image from the east wall of B80. The red indicates areas of heat and blue indicates cold. (Image from the 3D-Digging at Çatalhöyük Project.)
JEMAHS 2.1_01_Forte.indd 18 04/02/14 1:59 AM

JOURNAL OF EASTERN MEDITERRANEAN ARCHAEOLOGY AND HERITAGE STUDIES | 19
The micro-topographic model generated by the scan-ner was able to identify and visualize some features/segmentations of the terrain and ground contour levels not visible to the naked eye. The DEM had originally about 1 million of points (before interpolation) with a resolution of 1 cm. Although the work is still in prog-ress, hillshade and kriging interpolation shows several orthogonal and square outlines that could be identifiable as Neolithic houses.
The second step of the experiment was the superim-position of the DEM on georadar data. Several anomalies of georadar prospection overlapped with several DEM linear features (Fig. 21).
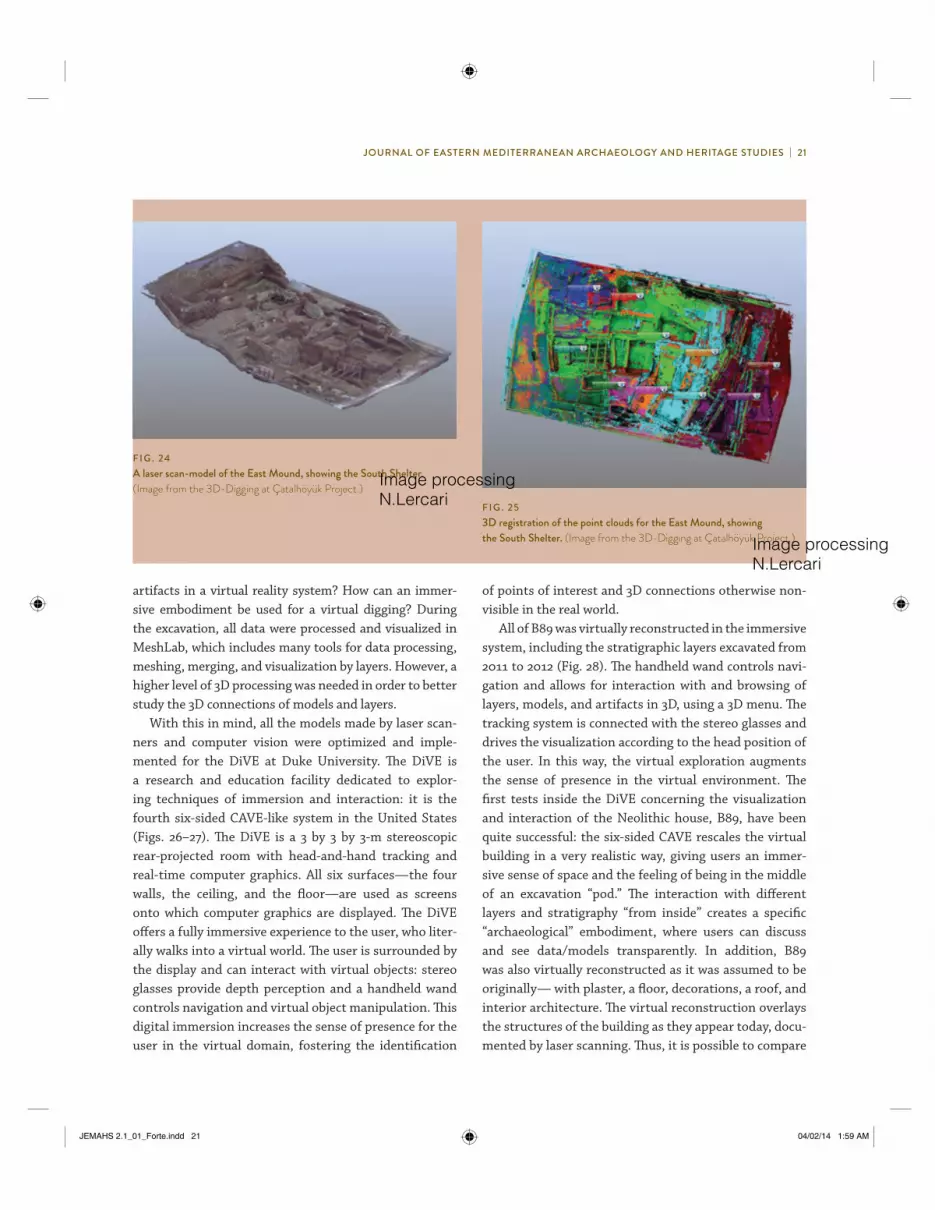
3D recording by large-scale laser scanners (both time of flight and phase shift) also involved excavation areas
on the East Mound. The North and South Shelters are shown in Figs. 22–25.
The Duke Immersive Visualization Environment (DiVE)
The digital workflow established during the excavation was able to generate a substantial amount of data in the form of point clouds, 3D models, textures, and metadata, all georeferenced in the same space. Interaction and use of 3D models are crucial for data interpretation on-site, but also during a simulation process in the lab. A quite complicated issue is how to make the digital process completely revers-ible; that is, how can we browse layers, stratigraphy, and
F I G . 21Georadar processing of the East Mound with identification of possible Neolithic houses. (Image from the 3D-Digging at Çatalhöyük Project.)
JEMAHS 2.1_01_Forte.indd 19 04/02/14 1:59 AM
Cut off the frame of this picture
Image processing by S.Campana

20 | 3D A R C H A E O L O G Y
F I G . 23Another laser-scan produced model of the East Mound, showing the North Shelter. (Image from the 3D-Digging at Çatalhöyük Project.)
F I G . 22A laser scan-produced model of the East Mound, showing the North Shelter. (Image from the 3D-Digging at Çatalhöyük Project.)
JEMAHS 2.1_01_Forte.indd 20 04/02/14 1:59 AM
Image processingN. Lercari
Image processingN.Lercari
JOURNAL OF EASTERN MEDITERRANEAN ARCHAEOLOGY AND HERITAGE STUDIES | 21
artifacts in a virtual reality system? How can an immer-sive embodiment be used for a virtual digging? During the excavation, all data were processed and visualized in MeshLab, which includes many tools for data processing, meshing, merging, and visualization by layers. However, a higher level of 3D processing was needed in order to better study the 3D connections of models and layers.
With this in mind, all the models made by laser scan-ners and computer vision were optimized and imple-mented for the DiVE at Duke University. The DiVE is a research and education facility dedicated to explor-ing techniques of immersion and interaction: it is the fourth six-sided CAVE-like system in the United States (Figs. 26–27). The DiVE is a 3 by 3 by 3-m stereoscopic rear-projected room with head-and-hand tracking and real-time computer graphics. All six surfaces—the four walls, the ceiling, and the floor—are used as screens onto which computer graphics are displayed. The DiVE offers a fully immersive experience to the user, who liter-ally walks into a virtual world. The user is surrounded by the display and can interact with virtual objects: stereo glasses provide depth perception and a handheld wand controls navigation and virtual object manipulation. This digital immersion increases the sense of presence for the user in the virtual domain, fostering the identification
of points of interest and 3D connections otherwise non-visible in the real world.
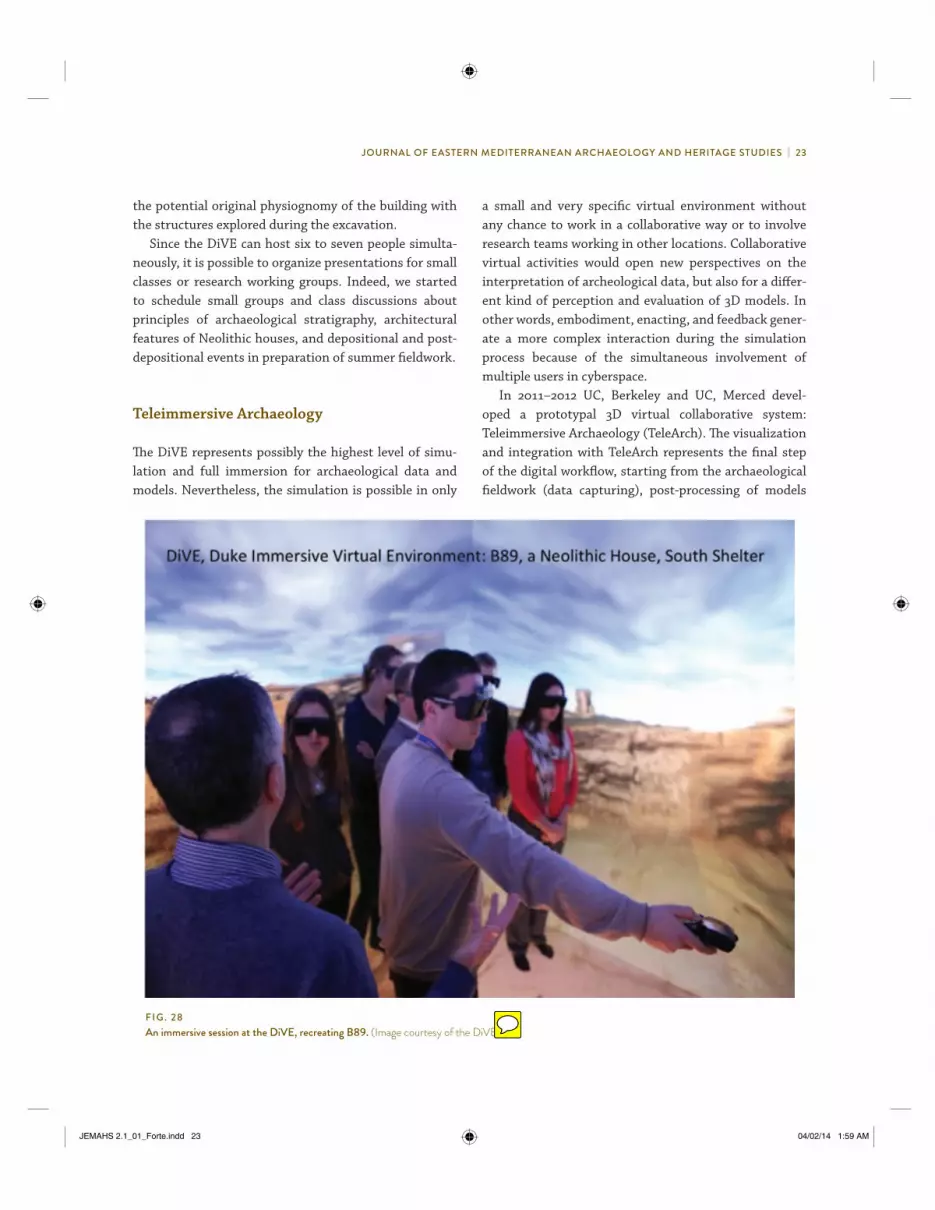
All of B89 was virtually reconstructed in the immersive system, including the stratigraphic layers excavated from 2011 to 2012 (Fig. 28). The handheld wand controls navi-gation and allows for interaction with and browsing of layers, models, and artifacts in 3D, using a 3D menu. The tracking system is connected with the stereo glasses and drives the visualization according to the head position of the user. In this way, the virtual exploration augments the sense of presence in the virtual environment. The first tests inside the DiVE concerning the visualization and interaction of the Neolithic house, B89, have been quite successful: the six-sided CAVE rescales the virtual building in a very realistic way, giving users an immer-sive sense of space and the feeling of being in the middle of an excavation “pod.” The interaction with different layers and stratigraphy “from inside” creates a specific “archaeological” embodiment, where users can discuss and see data/models transparently. In addition, B89 was also virtually reconstructed as it was assumed to be originally— with plaster, a floor, decorations, a roof, and interior architecture. The virtual reconstruction overlays the structures of the building as they appear today, docu-mented by laser scanning. Thus, it is possible to compare
F I G . 253D registration of the point clouds for the East Mound, showing the South Shelter. (Image from the 3D-Digging at Çatalhöyük Project.)
F I G . 24A laser scan-model of the East Mound, showing the South Shelter. (Image from the 3D-Digging at Çatalhöyük Project.)
JEMAHS 2.1_01_Forte.indd 21 04/02/14 1:59 AM
Image processingN.Lercari
Image processingN.Lercari

22 | 3D A R C H A E O L O G Y
F I G . 26A drawing of the DiVE at Duke University. (Image courtesy of the DiVE.)
F I G . 27How the teleimmersive system at the DiVE creates a virtual 3D environment. (Image courtesy of the DiVE.)
JEMAHS 2.1_01_Forte.indd 22 04/02/14 1:59 AM
Duke University
Duke University
JOURNAL OF EASTERN MEDITERRANEAN ARCHAEOLOGY AND HERITAGE STUDIES | 23
the potential original physiognomy of the building with the structures explored during the excavation.
Since the DiVE can host six to seven people simulta-neously, it is possible to organize presentations for small classes or research working groups. Indeed, we started to schedule small groups and class discussions about principles of archaeological stratigraphy, architectural features of Neolithic houses, and depositional and post-depositional events in preparation of summer fieldwork.
Teleimmersive Archaeology
The DiVE represents possibly the highest level of simu-lation and full immersion for archaeological data and models. Nevertheless, the simulation is possible in only
a small and very specific virtual environment without any chance to work in a collaborative way or to involve research teams working in other locations. Collaborative virtual activities would open new perspectives on the interpretation of archeological data, but also for a differ-ent kind of perception and evaluation of 3D models. In other words, embodiment, enacting, and feedback gener-ate a more complex interaction during the simulation process because of the simultaneous involvement of multiple users in cyberspace.
In 2011–2012 UC, Berkeley and UC, Merced devel-oped a prototypal 3D virtual collaborative system: Teleimmersive Archaeology (TeleArch). The visualization and integration with TeleArch represents the final step of the digital workflow, starting from the archaeological fieldwork (data capturing), post-processing of models
F I G . 28An immersive session at the DiVE, recreating B89. (Image courtesy of the DiVE.)
JEMAHS 2.1_01_Forte.indd 23 04/02/14 1:59 AM

24 | 3D A R C H A E O L O G Y
(meshing of point clouds), and digitalization of drawings and outlines to a GIS format. The primary goal of this col-laborative framework is to facilitate immersive real-time interaction among distributed users.
The proposed system for teleimmersive archaeology has been developed on the OpenGL-based open-source Vrui VR Toolkit, developed by Kreylos at UC, Davis (Kreylos 2008). The Vrui Tookit can host diverse kinds of applica-tions from laptop computers to large-scale immersive 3D display systems, such as life-size display walls and CAVE systems (Forte and Kurillo 2010; Kurillo and Forte 2012).
The collaborative extension of Vrui allows for the linking of two or more spatially distributed virtual environments: the collaboration data stream transmits the location of input devices and virtual cameras to all other clients. The conversation data stream provides communication via audio, video, or 3D video conferencing and allows geograph-ically distributed users to navigate in the environment and interact with objects and other users (Figs. 29–31).
This immersive collaborative experience can be pur-sued in first-person (the human avatar) or third-person perspective and is able to observe the location of other users throughout their virtual participation. If a 3D capturing system is available, the real-time 3D avatar
appears at their current virtual location. As the remote user moves through the space, his/her 3D avatar travels accordingly through the scene as part of the model space. If the user has only a webcam, 2D video will appear at their location as a billboard (flat) object to allow some level of visual interaction with other users. The users who have no video acquisition system can still connect and interact in the shared environment while their vir-tual location is represented by a generic 3D object/avatar.
At any time, individual users can also switch to the other user’s point of view or select face-to-face mode for direct conversation. The framework features various tools for navigation and interaction which can be linked to a wide range of input devices. Inside the environment, a user can dynamically assign the tools to different but-tons of the mouse or other input device.
The regeneration and simulation of 3D models in a cross-data platform can stimulate new interpretations and assist researchers in validating previous studies (Fig. 32). In archaeology this stage of work is crucial since during excavation a relevant amount of information is removed or destroyed.
Currently, the system is able to work with Kinect cam-eras, very portable devices typically used for 3D games
F I G . 29A visualization of B77 created by TeleArch. The user can interact with the various layers and artifacts in the Neolithic house. (Image courtesy of TeleArch.)
JEMAHS 2.1_01_Forte.indd 24 04/02/14 1:59 AM
T

JOURNAL OF EASTERN MEDITERRANEAN ARCHAEOLOGY AND HERITAGE STUDIES | 25
F I G . 30A visualization of B77 created by TeleArch, reconstructed from laser scan data and GIS in transparency. (Image courtesy of TeleArch.)
F I G . 31A visualization of B77 created by TeleArch, showing the 3D tools and various layers. (Image courtesy of TeleArch.)
JEMAHS 2.1_01_Forte.indd 25 04/02/14 1:59 AM

26 | 3D A R C H A E O L O G Y
and compatible with 3D TVs. The long-term plan is to offer TeleArch software under an open-source license to be freely available on the web to users or developers, either for standalone or collaborative use.
In the case of Çatalhöyük the collaborative experi-ment was focused on the B77 (North Shelter), a Neolithic house excavated in the last four years (Kurillo and Forte 2012). The virtual collaboration has involved a 3D model of the building produced by laser scanning with the
integration of all GIS layers, objects, finds, and databases associated with its excavation. Different users/operators browsing and interacting with such a complex simulation of archaeological data in a collaborative system are able to find 3D connections and affordances between layers, artifacts, and ecofacts, otherwise not identifiable in situ.
An additional experiment on B77 was made with a holographic screen, the Z-space system. The Z-space is a portable device able to visualize 3D models in stereo with full motion parallax and sensors tracking the viewing angle, enabling the user to look around objects according to multiple perspectives with simple head movements. Interaction is possible with stereo glasses or a designed stylus for managing direct and natural interactions with virtually holographic images. In our case, we have imple-mented the model of this Neolithic house in Unity 3D in order to make the model open to different kind of simu-lations and interactions (Fig. 33). The quality of stereo visualization is very high and permits a deeper under-standing of the excavation and its stratigraphic relations (e.g., disassembling, puzzling, and re-assembling the model). The system has great potential for research and teaching since it can involve a small team of users during the interaction process.
F I G . 32A preliminary virtual reconstruction of B89, created by a Duke University student. (Image by R. Lai. Courtesy of the DiVE.)
F I G . 33The Z-space system with a reconstruction of Neolithic house B77. (Image courtesy of the DiVE.)
JEMAHS 2.1_01_Forte.indd 26 04/02/14 1:59 AM
Duke University
Z-space Inc.

JOURNAL OF EASTERN MEDITERRANEAN ARCHAEOLOGY AND HERITAGE STUDIES | 27
Conclusions
The 3D-Digging Project has demonstrated that it is possible to integrate different tools and methods during excavation, achieving important results in terms of stan-dardization, information quality, virtual interaction, and reliability of the digital workflow. The involvement of different technologies working simultaneously on site does not slow archaeological excavation or any other related activity. The use of laser scanners, total station (for control points), and computer vision sessions usually takes 15–20 minutes for data capture or digitally draw-ing on the tablet PC. All of these activities are managed mostly by students with the supervision of digital field assistants or the director of the excavation. The exca-vation is almost completely paperless and all data are georeferenced in 2D and 3D, including spatial data from computer vision, laser scanning, and mapping (orthorec-tified pictures).
The “mediated experience” of digital documentation devices (scanners, digital cameras, geophysical devices, and tablets) is always assisted by an empirical observa-tion of data on-site. Since the 3D models can be visual-ized and made ready in a very short time, the interaction between empirical observation and mediated experiences creates new forms of knowledge and interpretation. The virtual replica of an archaeological excavation is not of course a 1:1 copy of the physical domain, but it is a way to increase the information available; edge detection, shapes, features, lighting, shaders, image enhancement, and related processing are able to give archaeologists a different perspective and vision for empirical data and potential interpretations. The core of this simulation/reconstruction process is a new kind of interaction between archaeologists and data ontologies. Empirical observation, mediated experience, 3D models, 3D visu-alization, collaborative systems, and immersive realities generate unexplored digital archaeological hermeneutics.
The entire workflow involves the following steps: on-site data-capturing, post-processing, stereo visual-ization, 3D spatial georeferencing, GIS implementation, immersive simulation, and teleimmersion. The on-site 3D documentation system is very effective and the combina-tion of laser scanning, image modeling, and computer vision is able to produce on a daily basis high-resolution models perfectly georeferenced with the excavation grid and compatible with GIS. In addition, the use of tablet PCs during the excavation of B89 actually completed the transformation of all documentation into a digital format.
The final destination of all these 3D models and data is still a disputable issue. What to do with so much infor-mation? How can we save it for future use and devel-opment? In the near future new 3D repositories and archives, and different forms of digital publications have to be rethought for archaeology. In this domain, informa-tion will be much more condensed in models and data-bases rather than in written reports or linear systems (books, e-books, etc.). Immersive reality might have an important role in the development of more advanced systems of interaction and study of archaeological data. 3D libraries might constitute the core data of future archaeological research, replacing written reports and traditional publications. The starting work of visualiza-tion and embodiment in CAVES (like the DiVE), where users are completely surrounded by six-sided virtual pro-jection, will show that when the user is surrounded and immersed in a cybersystem, a different kind of knowl-edge can be achieved. In the specific case of the Neolithic house of Çatalhöyük, floors, ceiling, walls, stratigraphy, and all architectural elements surround the users, stimu-lating the human experience in a very articulated feed-back and embodiment.
NotesI would like to thank Trimble Navigation, Scott Haddow, Stefano Campana, Gianfranco Morelli, and all of the students for their dedication and efforts during the excavation and the 3D-Digging
MAURIZIO FORTE is the William and Sue Gross Professor of Classical Studies and professor of art, art history, and visual studies at Duke University. He has coordinated archaeological fieldwork and research projects in Italy, Ethiopia, Egypt, Syria, Kazakhstan, Peru, China, Oman, India, Honduras, Turkey, the US, and Mexico. Since 2010, he has been the director of the 3D-Digging Project at Çatalhöyük.
JEMAHS 2.1_01_Forte.indd 27 04/02/14 1:59 AM

28 | 3D A R C H A E O L O G Y
Project. Special thanks to Elisa Biancifiori, Francesca Paino, and Matteo Pilati for their contributions to the success of the project. Thanks to Fabrizio Galeazzi (UC, Merced) for the first experiment of optical scanners (Minolta 910) on 3D stratigraphy; Nicola Lercari (Duke University), who coordinated time-of-flight laser scanning data recording; Rebecca Lai (Duke University) for the virtual preliminary reconstruction of B89; Nicoló Dell’ Unto (Lund University), who coordinated the computer vision and shape from modeling. The teleimmersive archeology project was supported by Center for Information Technology Research in the Interest of Society (CITRIS) at the University of California, Berkeley. I also acknowledge financial support from the the National Science Foundation (Grant nos. 0703787 and 0724681). I thank HP Labs and the European Aeronautic Defence and Space Company for the implementation of the teleimmersion software, and Ram Vasudevan and Edgar Lobaton (UC, Berkeley) for their stereo reconstruction work. Finally, I thank Tony Bernardin and Oliver Kreylos (UC, Davis) for the implementation of the 3D video rendering.
1. For more information, go to: http://okapi.wordpress.com/projects/okapi-island-in-second-life/
2. To explore the report, go to: http://www.codifi.info/last-house-on-the-hill/
3. To view the video, go to: http://www.youtube.com/watch?v=pAV8z6NesOA
ReferencesBarceló, J. A., O. De Castro, D. Travet, and O. Vicente. 2003.
A 3D Model of an Archaeological Excavation. In The Digital Heritage of Archaeology: Computer Applications and Quantitative Methods in Archaeology; Proceedings of the 30th Conference, Heraklion, Crete, April 2002, ed. M. Doerr and A. Sarris, 85–90. Athens: Archive of Monuments and Publications, Hellenic Ministry of Culture.
Barceló, J. A., and O. Vicente. 2004. Some Problems in Archaeological Excavation 3D Modelling. In Enter the Past: The E-Way into the Four Dimensions of Cultural Heritage; CAA 2003—Computer Applications and Quantitative Methods in Archaeology; Proceedings of the 31st Conference, Vienna, Austria, April 2003, ed. K. F. Ausserer, W. Borner, M. Goriany, and L. Karlhuber-Vöckl, 400–404. BAR International Series 1227. Oxford: Archaeopress.
Benko, H., E. W. Ishak, and S. Feiner. 2004. Collaborative Mixed Reality Visualization of an Archaeological Excavation. In ISMAR 2004: Procedings of the Third IEEE and ACM International Symposium on Mixed and Augmented Reality, November 2–5, Arlington, VA, 132–40. Los Alamitos, CA: IEEE Computer Society.
De Felice, G., M. G. Sibilano, and G. Volpe, eds. 2008. L’ informatica e il metodo della stratigrafia: atti del workshop, Foggia, 6–7 giugno 2008. Insulae Diomedeae 11. Bari: Edipuglia.
Doneus, M., W. Neubauer, and N. Studnicka. 2003. Digital Recording of Stratigraphic Excavations. In Proceedings of the XIXth International Symposium, CIPA 2003: New Perspectives
to Save Cultural Heritage, Antayla, Turkey, 30 September–04 October 2003, M. O. Altan, 451–56. Istanbul: CIPA.
Doneus, M., and W. Neubauer. 2006. Laser Scanners for 3D Documentation of Stratigraphic Excavations. In Recording, Modeling and Visualization of Cultural Heritage, ed. E. Baltsavias, A. Gruen, L. Van Gool, and M. Pateraki, 193–203. Balkema. London: Taylor & Francis.
Earl, G. P. 2007. De/Construction Sites: Romans and the Digital Playground. In EVA London 2007: Proceedings of the Electronic Visualisation and the Arts London 2007 Conference, Held at the London College of Communication, University of the Arts, London, 11–13 July 2007, ed. J. Bowen, S. Keene, and L. MacDonald, 1–11. London: EVA Conferences International.
Forte, M., ed. 2010. Cyber-Archaeology. BAR International Series 2177. Oxford: Archaeopress.
Forte, M. Forthcoming. Cyberarchaeology: A Post-Virtual Perspective. In Humanities and the Digital: A Visioning Statement, ed. D. T. Goldberg and P. Svensson. Boston: MIT Press.
Forte, M., and G. Kurillo. 2010. Cyber-Archaeology and Metaverse Collaborative Systems. Metaverse Creativity 1 (1):7–19.
Forte, M., and A. Siliotti. 1997. Virtual Archaeology: Re-Creating Ancient Worlds. Translated from Italian. New York: Abrams.
Forte, M., N. Dell’ Unto, J. Issavi, L. Onsurez, and N. Lercari. 2012. 3D Archaeology at Çatalhöyük. International Journal of Heritage in the Digital Era 1:351–78.
Hodder, I. 1989. The Meanings of Things: Material Culture and Symbolic Expression. One World Archaeology 6. London: Unwin Hyman.
Hodder, I. 1990. The Domestication of Europe: Structure and Contingency in Neolithic Societies. Social Archaeology. Oxford: Blackwell.
Hodder, I. 2006. The Leopard’ s Tale: Revealing the Mysteries of Çatalhöyük. New York: Thames & Hudson.
Hodder, I., ed. 2005a. Inhabiting Çatalhöyük: Reports from the 1995–99 Seasons. Çatalhöyük Research Project 4; McDonald Institute Monographs; British Institute of Archaeology at Ankara Monograph 38. Cambridge: McDonald Institute for Archaeological Research.
Hodder, I., ed. 2005b. Changing Materialities at Çatalhöyük: Reports from the 1995–99 Seasons. Çatalhöyük Research Project 5; McDonald Institute Monographs; British Institute of Archaeology at Ankara Monograph 39. London: British Institute at Ankara.
Hodder, I., ed. 2007. Excavating Çatalhöyük: South, North and KOPAL Area Reports from the 1995–99 Seasons. Çatalhöyük Research Project 3; McDonald Institute Monographs; British Institute of Archaeology at Ankara Monograph 37. Cambridge: McDonald Institute for Archaeological Research/London: British Institute at Ankara.
Katsianis, M., S. Tsipidis, K. Kotsakis, and A. Kousoulakou. 2008. A 3D Digital Workflow for Archaeological Intra-Site Research Using GIS. Journal of Archaeological Science 35:655–67.
Kreylos, O. 2008. Environment-Independent VR Development. In Advances in Visual Computing: 4th International Symposium,
JEMAHS 2.1_01_Forte.indd 28 04/02/14 1:59 AM
JOURNAL OF EASTERN MEDITERRANEAN ARCHAEOLOGY AND HERITAGE STUDIES | 29
ISVC 2008, Las Vegas NV, December 1–3, 2008, ed. G. Bebis, R. Boyle, B. Parvin, D. Koracin, P. Remagnino, F. Porikli, J. Peters, J. Klosowski, L. Arns, Y. K. Chun, T.-M. Rhyne, and L. Monroe, 901–12. Lectures Notes in Computer Science 5358. Berlin: Springer.
Knusel, C. J., S. D. Haddow, J. W. Sadvari, N. Dell’ Unto, and M. Forte. 2013. Bioarchaeology in 3D: Three-Dimensional Modeling of Human Burials at Neolithic Çatalhöyük. Poster presented at the Society for American Archaeology 78th Annual Meeting, Honolulu, Hawaii.
Kurillo, G., and M. Forte. 2012. Telearch—Integrated Visual Simulation Environment for Collaborative Virtual Archaeology. Mediterranean Archaeology and Archaeometry 12:11–20.
Levy, T. E., V. Petrovic, T. Wypych, A. Gidding, K. Knabb, D. Hernandez, N. G. Smith, J. P. Schulz, S. H. Savage, F. Kuester, E. Ben-Yosef, C. Buitenhuys, C. J. Barrett, M. Najjar, and T. DeFanti. 2010. On-Site Digital Archaeology 3.0 and Cyber-Archaeology: Into the Future of the Past—New Developments, Delivery and the Creation of a Data Avalanche. In Cyber-Archaeology, ed. M. Forte, 135–53. BAR International Series 2177. Oxford: Archaeopress.
Mellaart, J. 1967. Çatal Hüyük: A Neolithic Town in Anatolia. London: Thames & Hudson.
Morgan, C. L. 2009. (Re)Building Çatalhöyük: Changing Virtual Reality in Archaeology. Archaeologies 5:468–87.
Petrovic, V., A. Gidding, T. Wypych, F. Kuester, T. A. DeFanti, and T. E. Levy. 2011. Dealing with Archaeology’ s Data Avalanche. Computer 44 (7):56–60.
Sanders, D. H. 2011. Enabling Archaeological Hypothesis Testing in Real Time Using the REVEAL Documentation and Display System. Virtual Archaeology Review 2 (4):89–94.
Sangregorio, E., F. Stanco, and D. Tanasi. 2008. The Archeomatica Project: Towards a New Application of the Computer Graphics in Archaeology. In Proceedings of the 6th Eurographics Italian Chapter Conference, Salerno, Italy, July 2nd–4th, 2008, ed. V. Scarano, R. De Chiara, and U. Erra. Aire-la-Ville: Eurographics Association.
Shillito L.-M., W. Matthews, M. J. Almond, and I. D. Bull. 2011. The Microstratigraphy of Middens: Capturing Daily Routine in Rubbish at Neolithic Çatalhöyük, Turkey. Antiquity 85:1024–38.
Tringham, R., and M. Stevanovic, eds. 2012. Last House on the Hill: BACH Area Reports from Çatalhöyük, Turkey. Monumenta Archaeologica 27; Çatalhöyük Project 11. Los Angeles: Cotsen Institute of Archaeology Press.
Tsioukas, V., and P. Patias. 2003. Low Cost 3D Visualization and Measuring “Tool” in the Service of Archaeological Excavations. In The Digital Heritage of Archaeology: Computer Applications and Quantitative Methods in Archaeology; Proceedings of the 30th Conference, Heraklion, Crete, April 2002, ed. M. Doerr and A. Sarris, 119–24. Athens: Archive of Monuments and Publications, Hellenic Ministry of Culture.
JEMAHS 2.1_01_Forte.indd 29 04/02/14 1:59 AM


