Embed Size (px)
Citation preview
5. SHIP FINANCE
JICA-MARINA The Study on Domestic Shipping Development Plan in the Philippines (DSDP)
Final Report
5-1
5. SHIP FINANCE
This chapter reviews and assesses ship finance for domestic tonnage in the Philippines. Firstly, the study analysis covers the overall financial market (section 5.1) and then reviews the major player in public ship finance: DBP (section 5.2), by means of various financial parameters. Secondly, the assessment of DSMP I and II are done based on the documents issued by DBP and made by DSMP Consultant and a series of interviews with DBP officials and DSMP borrowers (section 5.3). Since DSMP II is still in the mobilization phase up to January 2007, its assessment is considered provisional.
5.1 Financial Market in the Philippines
5.1.1 History of Financial Market Development
1) The 1950s-60s
Different types of banks mushroomed up during this period, when bank regulation framework was not yet well established, with only basic points stated within the framework. The DBP and Rural Banks were established during this time.
2) The 1970’s
In 1972-73, the Bank Investigation Committee led by the International Monetary Fund (IMF) advised that the Philippines amend its General Banking Act and the Central Bank Act. In accordance with this advice, a law regarding bank regulation, responsibility and authority of the Central Bank, and restriction to new market entrants was established.
3) The 1980’s
In adherence with the above advice, interest rate deregulation and reinforcement of the Central Bank’s supervision and regulation were continuously implemented. The Central Bank played the leading role in providing mid/long-term loan fund through banks. Those measures resulted in fair success. However, a domestic crisis in 1983 caused a large scale capital flight. This domestic crisis and chronic external deficit brought about foreign exchange crisis. Even though the government devaluated the peso, the inflation rate went up to 50% in the peak year of 1984. Because this crisis prostrated the economy, GDP showed negative growth in 1984-85 for the first time after the war and the finance system suffered a severe blow.
The mid/long-term loan market became almost extinct. Relaxed financial regulation for company executives and shareholders caused a remarkable increase of non-performing assets of the two major state banks. Those banks virtually bankrupted, therefore the government had no choice but to bail them out in 1987.
4) The 1990’s
The finance sector showed recovery at the beginning of the 1990s and restriction on branch bank offices was relaxed. The New Central Bank Act was enacted in 1993. The non-performing assets of the old Central Bank were transferred and reformation of capital fund was implemented. The bank started with a new name as Bangko Sentral ng Pilipinas (BSP).
Foreign Exchange Control Law was significantly amended after 40 years and foreign exchange control was totally liberalized in 1991. Additionally, relaxation of foreign investment regulation in 1991 resulted in active participation of foreign investors in the
JICA-MARINA The Study on Domestic Shipping Development Plan in the Philippines (DSDP) Final Report
5-2
Philippine market. Furthermore in 1993, entry of foreign banks to the market was liberalized with certain limitations.
The Philippine Stock Exchange (PSE), which unified the then two security markets in 1992, stimulated active stock exchange.
Liberalization in the financial market promoted active dealings. However, phenomenon which aggravated vulnerability of financial market started to be observed on the other hand.
In response to liberalization of the foreign exchange control, private banks and private businesses sharply increased transactions in foreign exchange with low level of interest rate. As inflow of short-term foreign capital increased, the Peso’s exchange rate against the US dollar rose. As a result, domestic interest rate increased and this trend heightened market concerns about the macro economy.
Inflow of short-term foreign capital caused domestic credit expansion, and real estate loans increased dramatically. Inevitably, the real estate market took on the features of a bubble. Outstanding balance of real estate loans by the banking sector increased to as much as the level of 50% of the sector’s total capital amount.
5) Asian Financial Crisis and the Present
The Philippines faced the Asian Financial Crisis that started in Thailand in 1997 when its economic conditions were under enormous pressure due to the real estate bubble, sizeable influx of short-term foreign capital, assets inflation and heightened market concerns about macro-economy.
Even though the Financial Crisis hit the whole East Asian Region, especially Thailand and Indonesia severely, its influence on the Philippine economy seemed to be relatively moderate. This is mainly because its financial sector had been in the process of financial for 20 years and also because financial capacity of its banking sector was relatively strong.
5.1.2 Structure of Financial Market
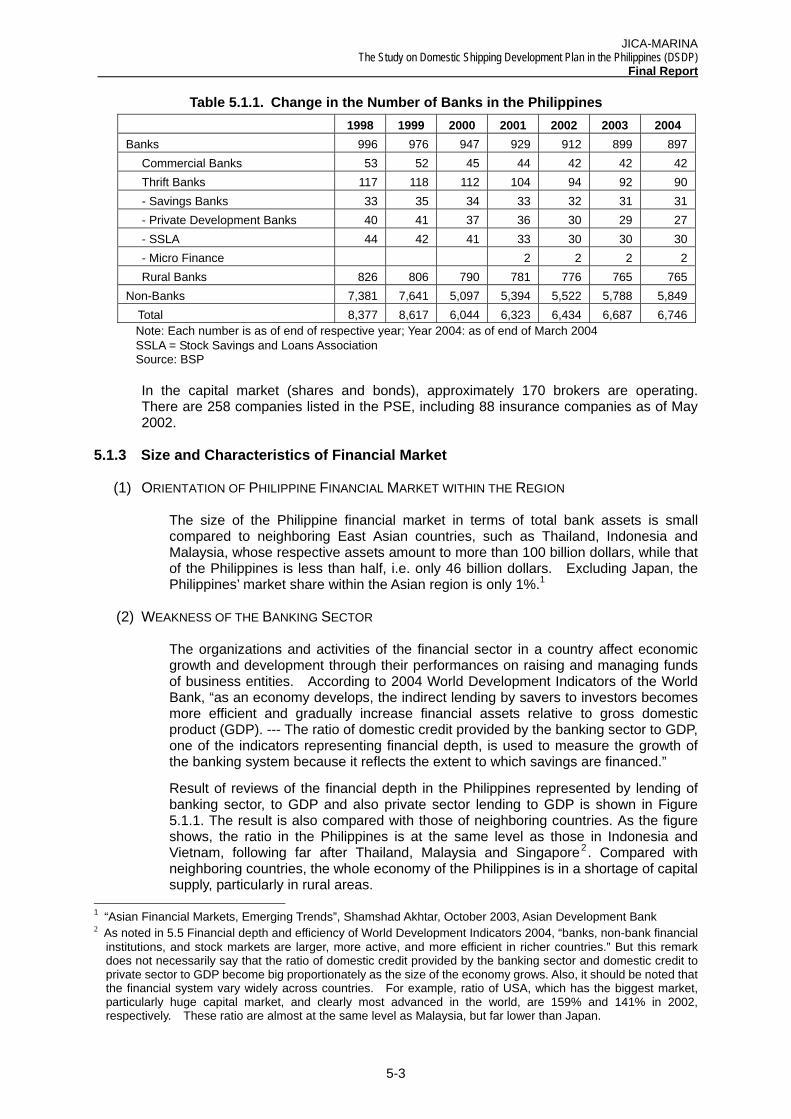
Like many other developing countries, the banking sector occupies a substantial share in the Philippine financial market. As of at the end of March 2004, around 900 banks - 42 large scale private banks or commercial banks, 850 mid to small scale financial institutions consisting of savings banks, credit unions, private development banks, or rural banks are operating. In addition, there are approximately 6,700 non-bank organizations. Changes in the number of the financial institutions in the past 7 years are shown in Table 5.1.1. Due to merger or withdrawal from the market, the number of banks has been decreasing.
JICA-MARINA The Study on Domestic Shipping Development Plan in the Philippines (DSDP)
Final Report
5-3
Table 5.1.1. Change in the Number of Banks in the Philippines 1998 1999 2000 2001 2002 2003 2004 Banks 996 976 947 929 912 899 897 Commercial Banks 53 52 45 44 42 42 42 Thrift Banks 117 118 112 104 94 92 90 - Savings Banks 33 35 34 33 32 31 31 - Private Development Banks 40 41 37 36 30 29 27 - SSLA 44 42 41 33 30 30 30 - Micro Finance 2 2 2 2 Rural Banks 826 806 790 781 776 765 765 Non-Banks 7,381 7,641 5,097 5,394 5,522 5,788 5,849 Total 8,377 8,617 6,044 6,323 6,434 6,687 6,746
Note: Each number is as of end of respective year; Year 2004: as of end of March 2004 SSLA = Stock Savings and Loans Association Source: BSP
In the capital market (shares and bonds), approximately 170 brokers are operating. There are 258 companies listed in the PSE, including 88 insurance companies as of May 2002.
5.1.3 Size and Characteristics of Financial Market
(1) ORIENTATION OF PHILIPPINE FINANCIAL MARKET WITHIN THE REGION
The size of the Philippine financial market in terms of total bank assets is small compared to neighboring East Asian countries, such as Thailand, Indonesia and Malaysia, whose respective assets amount to more than 100 billion dollars, while that of the Philippines is less than half, i.e. only 46 billion dollars. Excluding Japan, the Philippines’ market share within the Asian region is only 1%.1
(2) WEAKNESS OF THE BANKING SECTOR
The organizations and activities of the financial sector in a country affect economic growth and development through their performances on raising and managing funds of business entities. According to 2004 World Development Indicators of the World Bank, “as an economy develops, the indirect lending by savers to investors becomes more efficient and gradually increase financial assets relative to gross domestic product (GDP). --- The ratio of domestic credit provided by the banking sector to GDP, one of the indicators representing financial depth, is used to measure the growth of the banking system because it reflects the extent to which savings are financed.”
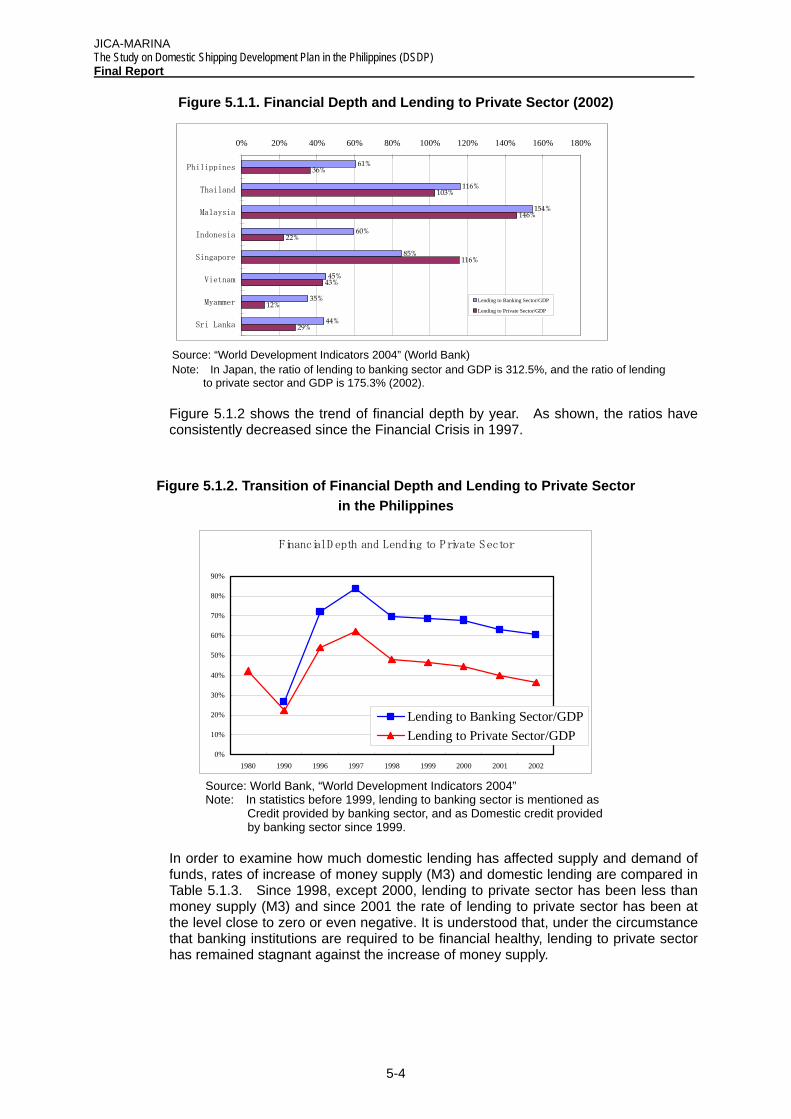
Result of reviews of the financial depth in the Philippines represented by lending of banking sector, to GDP and also private sector lending to GDP is shown in Figure 5.1.1. The result is also compared with those of neighboring countries. As the figure shows, the ratio in the Philippines is at the same level as those in Indonesia and Vietnam, following far after Thailand, Malaysia and Singapore2. Compared with neighboring countries, the whole economy of the Philippines is in a shortage of capital supply, particularly in rural areas.
1 “Asian Financial Markets, Emerging Trends”, Shamshad Akhtar, October 2003, Asian Development Bank 2 As noted in 5.5 Financial depth and efficiency of World Development Indicators 2004, “banks, non-bank financial
institutions, and stock markets are larger, more active, and more efficient in richer countries.” But this remark does not necessarily say that the ratio of domestic credit provided by the banking sector and domestic credit to private sector to GDP become big proportionately as the size of the economy grows. Also, it should be noted that the financial system vary widely across countries. For example, ratio of USA, which has the biggest market, particularly huge capital market, and clearly most advanced in the world, are 159% and 141% in 2002, respectively. These ratio are almost at the same level as Malaysia, but far lower than Japan.
JICA-MARINA The Study on Domestic Shipping Development Plan in the Philippines (DSDP) Final Report
5-4
61%
116%
154%
60%
85%
45%
35%
44%
36%
103%
146%
22%
116%
43%
12%
29%
0% 20% 40% 60% 80% 100% 120% 140% 160% 180%
Philippines
Thailand
Malaysia
Indonesia
Singapore
Vietnam
Myammer
Sri Lanka
Lending to Banking Sector/GDP
Lending to Private Sector/GDP
Figure 5.1.1. Financial Depth and Lending to Private Sector (2002)
Source: “World Development Indicators 2004” (World Bank) Note: In Japan, the ratio of lending to banking sector and GDP is 312.5%, and the ratio of lending to private sector and GDP is 175.3% (2002).
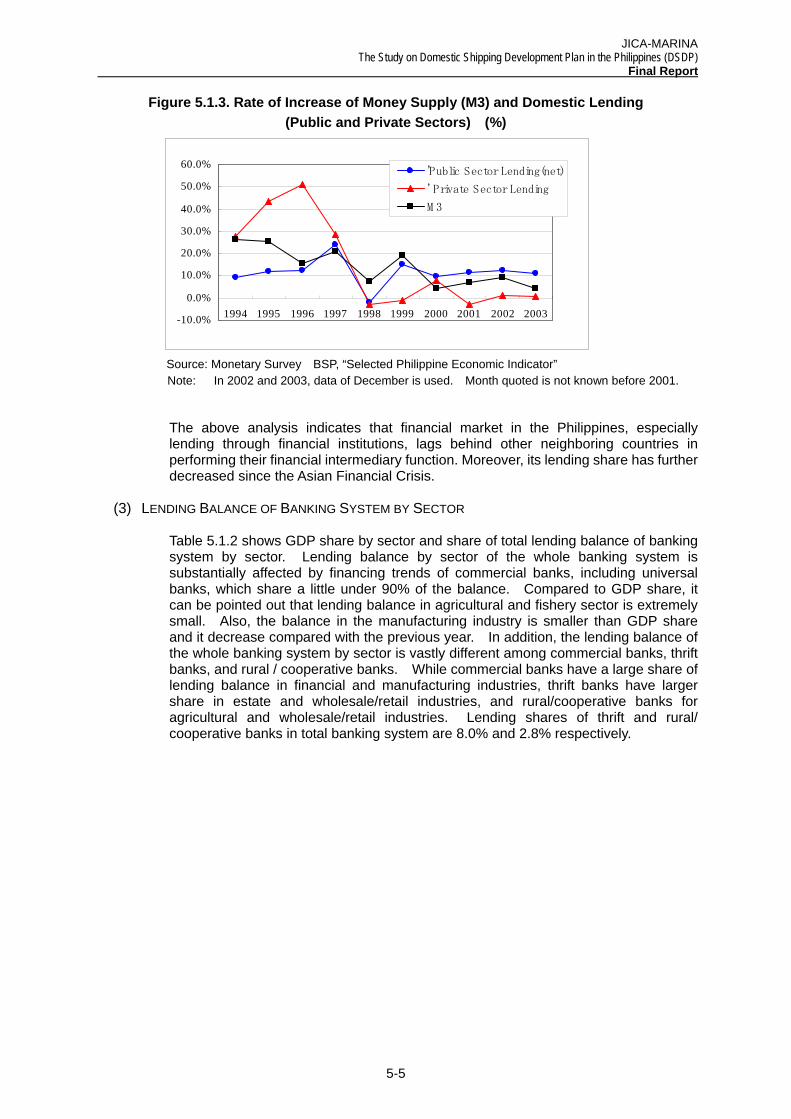
Figure 5.1.2 shows the trend of financial depth by year. As shown, the ratios have consistently decreased since the Financial Crisis in 1997.
Figure 5.1.2. Transition of Financial Depth and Lending to Private Sector in the Philippines
Financial D epth and Lending to Private Sector
0%
10%
20%
30%
40%
50%
60%
70%
80%
90%
1980 1990 1996 1997 1998 1999 2000 2001 2002
Lending to Banking Sector/GDPLending to Private Sector/GDP
Source: World Bank, “World Development Indicators 2004” Note: In statistics before 1999, lending to banking sector is mentioned as Credit provided by banking sector, and as Domestic credit provided by banking sector since 1999.
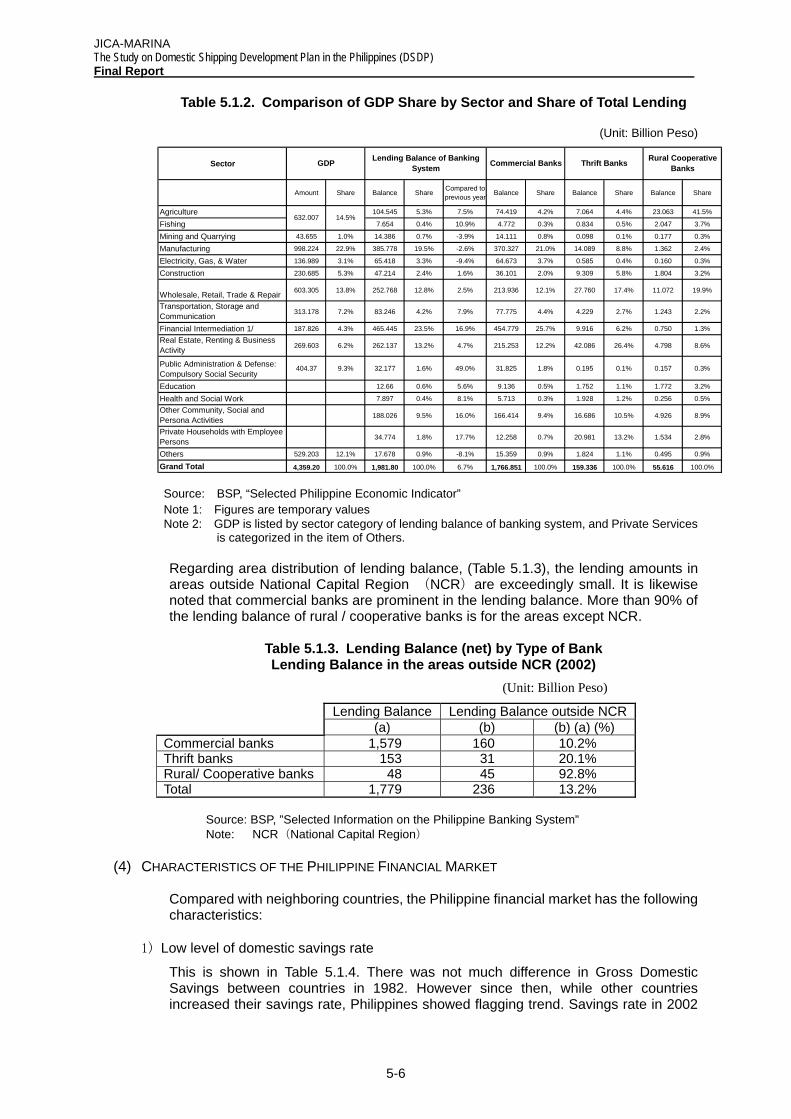
In order to examine how much domestic lending has affected supply and demand of funds, rates of increase of money supply (M3) and domestic lending are compared in Table 5.1.3. Since 1998, except 2000, lending to private sector has been less than money supply (M3) and since 2001 the rate of lending to private sector has been at the level close to zero or even negative. It is understood that, under the circumstance that banking institutions are required to be financial healthy, lending to private sector has remained stagnant against the increase of money supply.
JICA-MARINA The Study on Domestic Shipping Development Plan in the Philippines (DSDP)
Final Report
5-5
Figure 5.1.3. Rate of Increase of Money Supply (M3) and Domestic Lending (Public and Private Sectors) (%)
-10.0%
0.0%
10.0%
20.0%
30.0%
40.0%
50.0%
60.0%
1994 1995 1996 1997 1998 1999 2000 2001 2002 2003
'Public Sector Lending(net)
' Private Sector Lending
M 3
Source: Monetary Survey BSP, “Selected Philippine Economic Indicator”
Note: In 2002 and 2003, data of December is used. Month quoted is not known before 2001.
The above analysis indicates that financial market in the Philippines, especially lending through financial institutions, lags behind other neighboring countries in performing their financial intermediary function. Moreover, its lending share has further decreased since the Asian Financial Crisis.
(3) LENDING BALANCE OF BANKING SYSTEM BY SECTOR
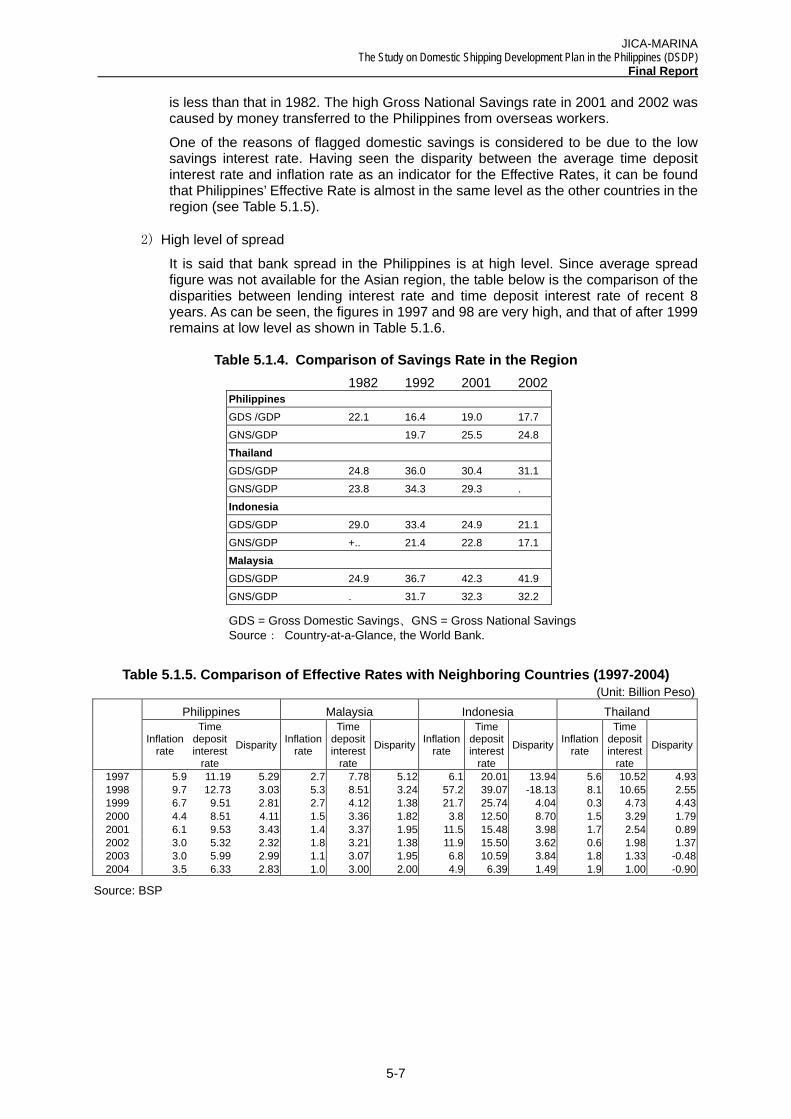
Table 5.1.2 shows GDP share by sector and share of total lending balance of banking system by sector. Lending balance by sector of the whole banking system is substantially affected by financing trends of commercial banks, including universal banks, which share a little under 90% of the balance. Compared to GDP share, it can be pointed out that lending balance in agricultural and fishery sector is extremely small. Also, the balance in the manufacturing industry is smaller than GDP share and it decrease compared with the previous year. In addition, the lending balance of the whole banking system by sector is vastly different among commercial banks, thrift banks, and rural / cooperative banks. While commercial banks have a large share of lending balance in financial and manufacturing industries, thrift banks have larger share in estate and wholesale/retail industries, and rural/cooperative banks for agricultural and wholesale/retail industries. Lending shares of thrift and rural/ cooperative banks in total banking system are 8.0% and 2.8% respectively.
JICA-MARINA The Study on Domestic Shipping Development Plan in the Philippines (DSDP) Final Report
5-6
Sector
Amount Share Balance Share Compared to previous year Balance Share Balance Share Balance Share
Agriculture 104.545 5.3% 7.5% 74.419 4.2% 7.064 4.4% 23.063 41.5%
Fishing 7.654 0.4% 10.9% 4.772 0.3% 0.834 0.5% 2.047 3.7%
Mining and Quarrying 43.655 1.0% 14.386 0.7% -3.9% 14.111 0.8% 0.098 0.1% 0.177 0.3%
Manufacturing 998.224 22.9% 385.778 19.5% -2.6% 370.327 21.0% 14.089 8.8% 1.362 2.4%
Electricity, Gas, & Water 136.989 3.1% 65.418 3.3% -9.4% 64.673 3.7% 0.585 0.4% 0.160 0.3%
Construction 230.685 5.3% 47.214 2.4% 1.6% 36.101 2.0% 9.309 5.8% 1.804 3.2%
Wholesale, Retail, Trade & Repair 603.305 13.8% 252.768 12.8% 2.5% 213.936 12.1% 27.760 17.4% 11.072 19.9%
Transportation, Storage and Communication 313.178 7.2% 83.246 4.2% 7.9% 77.775 4.4% 4.229 2.7% 1.243 2.2%
Financial Intermediation 1/ 187.826 4.3% 465.445 23.5% 16.9% 454.779 25.7% 9.916 6.2% 0.750 1.3%
Real Estate, Renting & Business Activity 269.603 6.2% 262.137 13.2% 4.7% 215.253 12.2% 42.086 26.4% 4.798 8.6%
Public Administration & Defense: Compulsory Social Security
404.37 9.3% 32.177 1.6% 49.0% 31.825 1.8% 0.195 0.1% 0.157 0.3%
Education 12.66 0.6% 5.6% 9.136 0.5% 1.752 1.1% 1.772 3.2%
Health and Social Work 7.897 0.4% 8.1% 5.713 0.3% 1.928 1.2% 0.256 0.5%
Other Community, Social and Persona Activities 188.026 9.5% 16.0% 166.414 9.4% 16.686 10.5% 4.926 8.9%
Private Households with Employee Persons 34.774 1.8% 17.7% 12.258 0.7% 20.981 13.2% 1.534 2.8%
Others 529.203 12.1% 17.678 0.9% -8.1% 15.359 0.9% 1.824 1.1% 0.495 0.9%
Grand Total 4,359.20 100.0% 1,981.80 100.0% 6.7% 1,766.851 100.0% 159.336 100.0% 55.616 100.0%
Rural Cooperative Banks
632.007 14.5%
GDP Lending Balance of Banking System Commercial Banks Thrift Banks
Table 5.1.2. Comparison of GDP Share by Sector and Share of Total Lending
(Unit: Billion Peso)
Source: BSP, “Selected Philippine Economic Indicator” Note 1: Figures are temporary values Note 2: GDP is listed by sector category of lending balance of banking system, and Private Services
is categorized in the item of Others.
Regarding area distribution of lending balance, (Table 5.1.3), the lending amounts in areas outside National Capital Region (NCR)are exceedingly small. It is likewise noted that commercial banks are prominent in the lending balance. More than 90% of the lending balance of rural / cooperative banks is for the areas except NCR.
Table 5.1.3. Lending Balance (net) by Type of Bank Lending Balance in the areas outside NCR (2002)
(Unit: Billion Peso)
Lending Balance Lending Balance outside NCR (a) (b) (b) (a) (%)
Commercial banks 1,579 160 10.2% Thrift banks 153 31 20.1% Rural/ Cooperative banks 48 45 92.8% Total 1,779 236 13.2%
Source: BSP, ”Selected Information on the Philippine Banking System” Note: NCR(National Capital Region)
(4) CHARACTERISTICS OF THE PHILIPPINE FINANCIAL MARKET
Compared with neighboring countries, the Philippine financial market has the following characteristics:
1) Low level of domestic savings rate
This is shown in Table 5.1.4. There was not much difference in Gross Domestic Savings between countries in 1982. However since then, while other countries increased their savings rate, Philippines showed flagging trend. Savings rate in 2002
JICA-MARINA The Study on Domestic Shipping Development Plan in the Philippines (DSDP)
Final Report
5-7
is less than that in 1982. The high Gross National Savings rate in 2001 and 2002 was caused by money transferred to the Philippines from overseas workers.
One of the reasons of flagged domestic savings is considered to be due to the low savings interest rate. Having seen the disparity between the average time deposit interest rate and inflation rate as an indicator for the Effective Rates, it can be found that Philippines’ Effective Rate is almost in the same level as the other countries in the region (see Table 5.1.5).
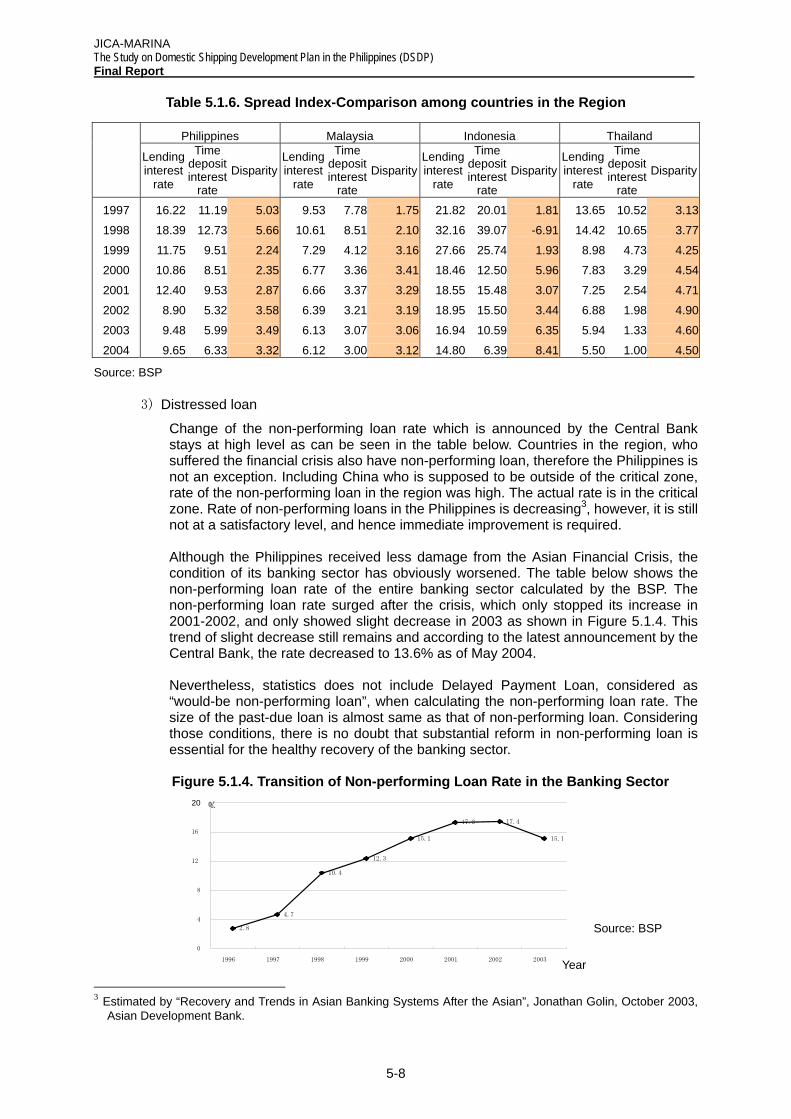
2) High level of spread
It is said that bank spread in the Philippines is at high level. Since average spread figure was not available for the Asian region, the table below is the comparison of the disparities between lending interest rate and time deposit interest rate of recent 8 years. As can be seen, the figures in 1997 and 98 are very high, and that of after 1999 remains at low level as shown in Table 5.1.6.
Table 5.1.4. Comparison of Savings Rate in the Region 1982 1992 2001 2002 Philippines GDS /GDP 22.1 16.4 19.0 17.7
GNS/GDP 19.7 25.5 24.8
Thailand GDS/GDP 24.8 36.0 30.4 31.1
GNS/GDP 23.8 34.3 29.3 .
Indonesia GDS/GDP 29.0 33.4 24.9 21.1
GNS/GDP +.. 21.4 22.8 17.1
Malaysia GDS/GDP 24.9 36.7 42.3 41.9
GNS/GDP . 31.7 32.3 32.2
GDS = Gross Domestic Savings、GNS = Gross National Savings Source: Country-at-a-Glance, the World Bank.
Table 5.1.5. Comparison of Effective Rates with Neighboring Countries (1997-2004)
(Unit: Billion Peso) Philippines Malaysia Indonesia Thailand
Inflation rate
Time deposit interest
rate
Disparity Inflation rate
Time deposit interest
rate
Disparity Inflation rate
Time deposit interest
rate
Disparity Inflation rate
Time deposit interest
rate
Disparity
1997 5.9 11.19 5.29 2.7 7.78 5.12 6.1 20.01 13.94 5.6 10.52 4.931998 9.7 12.73 3.03 5.3 8.51 3.24 57.2 39.07 -18.13 8.1 10.65 2.551999 6.7 9.51 2.81 2.7 4.12 1.38 21.7 25.74 4.04 0.3 4.73 4.432000 4.4 8.51 4.11 1.5 3.36 1.82 3.8 12.50 8.70 1.5 3.29 1.792001 6.1 9.53 3.43 1.4 3.37 1.95 11.5 15.48 3.98 1.7 2.54 0.892002 3.0 5.32 2.32 1.8 3.21 1.38 11.9 15.50 3.62 0.6 1.98 1.372003 3.0 5.99 2.99 1.1 3.07 1.95 6.8 10.59 3.84 1.8 1.33 -0.482004 3.5 6.33 2.83 1.0 3.00 2.00 4.9 6.39 1.49 1.9 1.00 -0.90
Source: BSP
JICA-MARINA The Study on Domestic Shipping Development Plan in the Philippines (DSDP) Final Report
5-8
Table 5.1.6. Spread Index-Comparison among countries in the Region
Source: BSP
3) Distressed loan
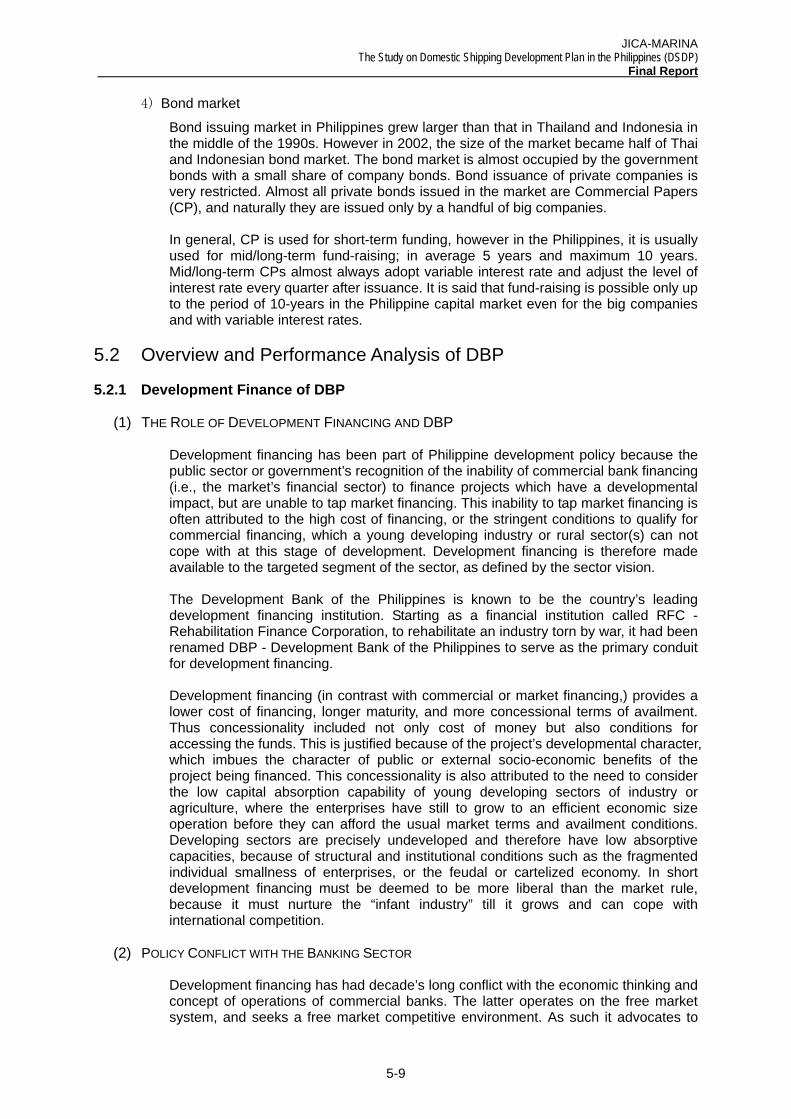
Change of the non-performing loan rate which is announced by the Central Bank stays at high level as can be seen in the table below. Countries in the region, who suffered the financial crisis also have non-performing loan, therefore the Philippines is not an exception. Including China who is supposed to be outside of the critical zone, rate of the non-performing loan in the region was high. The actual rate is in the critical zone. Rate of non-performing loans in the Philippines is decreasing3, however, it is still not at a satisfactory level, and hence immediate improvement is required.
Although the Philippines received less damage from the Asian Financial Crisis, the condition of its banking sector has obviously worsened. The table below shows the non-performing loan rate of the entire banking sector calculated by the BSP. The non-performing loan rate surged after the crisis, which only stopped its increase in 2001-2002, and only showed slight decrease in 2003 as shown in Figure 5.1.4. This trend of slight decrease still remains and according to the latest announcement by the Central Bank, the rate decreased to 13.6% as of May 2004.
Nevertheless, statistics does not include Delayed Payment Loan, considered as “would-be non-performing loan”, when calculating the non-performing loan rate. The size of the past-due loan is almost same as that of non-performing loan. Considering those conditions, there is no doubt that substantial reform in non-performing loan is essential for the healthy recovery of the banking sector.
Figure 5.1.4. Transition of Non-performing Loan Rate in the Banking Sector
Source: BSP
3 Estimated by “Recovery and Trends in Asian Banking Systems After the Asian”, Jonathan Golin, October 2003,
Asian Development Bank.
Philippines Malaysia Indonesia Thailand
Lending interest
rate
Time deposit interest
rate Disparity
Lending interest
rate
Time deposit interest
rate Disparity
Lendinginterest
rate
Time deposit interest
rate Disparity
Lending interest
rate
Time deposit interest
rate Disparity
1997 16.22 11.19 5.03 9.53 7.78 1.75 21.82 20.01 1.81 13.65 10.52 3.13
1998 18.39 12.73 5.66 10.61 8.51 2.10 32.16 39.07 -6.91 14.42 10.65 3.77
1999 11.75 9.51 2.24 7.29 4.12 3.16 27.66 25.74 1.93 8.98 4.73 4.25
2000 10.86 8.51 2.35 6.77 3.36 3.41 18.46 12.50 5.96 7.83 3.29 4.54
2001 12.40 9.53 2.87 6.66 3.37 3.29 18.55 15.48 3.07 7.25 2.54 4.71
2002 8.90 5.32 3.58 6.39 3.21 3.19 18.95 15.50 3.44 6.88 1.98 4.90
2003 9.48 5.99 3.49 6.13 3.07 3.06 16.94 10.59 6.35 5.94 1.33 4.60
2004 9.65 6.33 3.32 6.12 3.00 3.12 14.80 6.39 8.41 5.50 1.00 4.50
2.8
4.7
10.4
12.3
15.1
17.3 17.4
15.1
0
4
8
12
16
20
1996 1997 1998 1999 2000 2001 2002 2003 Year
%
JICA-MARINA The Study on Domestic Shipping Development Plan in the Philippines (DSDP)
Final Report
5-9
4) Bond market
Bond issuing market in Philippines grew larger than that in Thailand and Indonesia in the middle of the 1990s. However in 2002, the size of the market became half of Thai and Indonesian bond market. The bond market is almost occupied by the government bonds with a small share of company bonds. Bond issuance of private companies is very restricted. Almost all private bonds issued in the market are Commercial Papers (CP), and naturally they are issued only by a handful of big companies.
In general, CP is used for short-term funding, however in the Philippines, it is usually used for mid/long-term fund-raising; in average 5 years and maximum 10 years. Mid/long-term CPs almost always adopt variable interest rate and adjust the level of interest rate every quarter after issuance. It is said that fund-raising is possible only up to the period of 10-years in the Philippine capital market even for the big companies and with variable interest rates.
5.2 Overview and Performance Analysis of DBP
5.2.1 Development Finance of DBP
(1) THE ROLE OF DEVELOPMENT FINANCING AND DBP
Development financing has been part of Philippine development policy because the public sector or government’s recognition of the inability of commercial bank financing (i.e., the market’s financial sector) to finance projects which have a developmental impact, but are unable to tap market financing. This inability to tap market financing is often attributed to the high cost of financing, or the stringent conditions to qualify for commercial financing, which a young developing industry or rural sector(s) can not cope with at this stage of development. Development financing is therefore made available to the targeted segment of the sector, as defined by the sector vision.
The Development Bank of the Philippines is known to be the country’s leading development financing institution. Starting as a financial institution called RFC - Rehabilitation Finance Corporation, to rehabilitate an industry torn by war, it had been renamed DBP - Development Bank of the Philippines to serve as the primary conduit for development financing.
Development financing (in contrast with commercial or market financing,) provides a lower cost of financing, longer maturity, and more concessional terms of availment. Thus concessionality included not only cost of money but also conditions for accessing the funds. This is justified because of the project’s developmental character, which imbues the character of public or external socio-economic benefits of the project being financed. This concessionality is also attributed to the need to consider the low capital absorption capability of young developing sectors of industry or agriculture, where the enterprises have still to grow to an efficient economic size operation before they can afford the usual market terms and availment conditions. Developing sectors are precisely undeveloped and therefore have low absorptive capacities, because of structural and institutional conditions such as the fragmented individual smallness of enterprises, or the feudal or cartelized economy. In short development financing must be deemed to be more liberal than the market rule, because it must nurture the “infant industry” till it grows and can cope with international competition.
(2) POLICY CONFLICT WITH THE BANKING SECTOR
Development financing has had decade’s long conflict with the economic thinking and concept of operations of commercial banks. The latter operates on the free market system, and seeks a free market competitive environment. As such it advocates to
JICA-MARINA The Study on Domestic Shipping Development Plan in the Philippines (DSDP) Final Report
5-10
follow market based prices or interests, because this would lead to efficient allocation or use of capital resources.
The commercial banks have followed this policy advocated by the International Monetary Fund, the World Bank, and has secured the institutional support of the Central Bank and the Department of Finance. Thus the Central Bank and Department of Finance has supported a policy of reducing the concessionality of development financing provided by development financing institutions like DBP through the following measures:
• Aligning interest rates of funds sourced from ODA sources (such as JBIC’s 2 Step Loans, including DSMP) closer to the market levels of commercial interest rates.
The disparity in the rates of development financing vs commercial financing was quite evident, in the past when market interest rates were higher. Note the fact that interest rates for DSMP have been lowered is not necessarily an indication of a regression to concession, since market interest rates have gone down as well from two to one digit level.
• Standardization of availment conditions for loans such as –
• requirements for real estate mortgage as basis for loan availment; • lower or more conservative valuation of collaterals offered such as
ship valuation • trouble free or spotless credit record.
• Requiring DBP or Development Financial Institutions to go into “Wholesale Banking”.
That is to refrain or reduce its direct marketing or retail lending to borrowers. Wholesale Banking compels DFI’s to go into co-financing with private banks such that concessional funds are mixed with commercial funds of commercial banks.
Co-financing with commercial banks obliges the loan borrowers to comply with the stringent or conservative availment conditions of the private banks, even though their fund participation may be limited to 20 percent of the total loan package.
• Promulgation of Executive Order 138 which bans Direct Lending Programs
This executive order has banned the use of non-bank GOCCs to be sources of Directed Credits, which has been an important source of credit financing for SMEs and rural enterprises, in the wake of commercial banks aversion to lend money to these sectors. Because of their non-bank nature, Directed Credits through GOCCs can be more concessional and liberal with availment conditions.
The impact of this policy between advocates of development financing and free market with particular emphasis on determination of allocation and pricing of capital conflict has caused the gradual and subtle diminution of the role of development financing particularly for sectors or segments who do not have the absorptive capacity for commercial funds. But the impact of this policy has been quite clear and miserable. Capital starvation of the sectors is evident from their low technologies and productivity. The challenge of modernization has been posed by the globalization policy, but the responsiveness of the capital sector has been limited to the very few who have the financial and asset base. The well-known conservatism of commercial banks has led to a chronic shortage of capital for most sectors specially those in the rural areas. This has
JICA-MARINA The Study on Domestic Shipping Development Plan in the Philippines (DSDP)
Final Report
5-11
led to a growing role of financing by informal lenders and the emergence of non bank new schemes of financing to fill up the vacuum.
5.2.2 Performance Analysis
(1) BUSINESS CONTENTS
Top domestic banks are called as Universal banks, and they are allowed to have wide range of operation such as commercial bank operation and investment bank operation. The DBP obtained the license for Universal bank in 1995 and there are 16 domestic large banks including DBP are certified as Universal bank. With this license, the DBP extends its banking operation to the following fields:
• Lending service:As decided in 1987, it focuses on providing mid/long-term development fund to agri-industrial sector, especially to rural SMEs. It does not deal with individual lending but only corporate lending. When loaning out, it essentially requires collateral on property. Loan rate will be decided according to the market standard.
• Foreign exchange trading:Opening of credit, purchase etc. (The DBP does not have overseas branch office)
• Investment banking:Acceptance of claimable assets and securities, meditation of merger etc.
• Depositary service:Time deposit, general deposit, current deposit etc.
• Others:Domestic/overseas remittance, various fiduciary services, dealing of foreign currency and government bond etc.
(2) RECENT OPERATION PERFORMANCE
The recent performance of the DBP undergoes largely favorably. Table 5.2.1 shows major financial items of last 6 years. Figures 5.2.1 and 5.2.2 illustrate the changes in the total revenue and net profit, deposit, and outstanding balance of borrowed money.
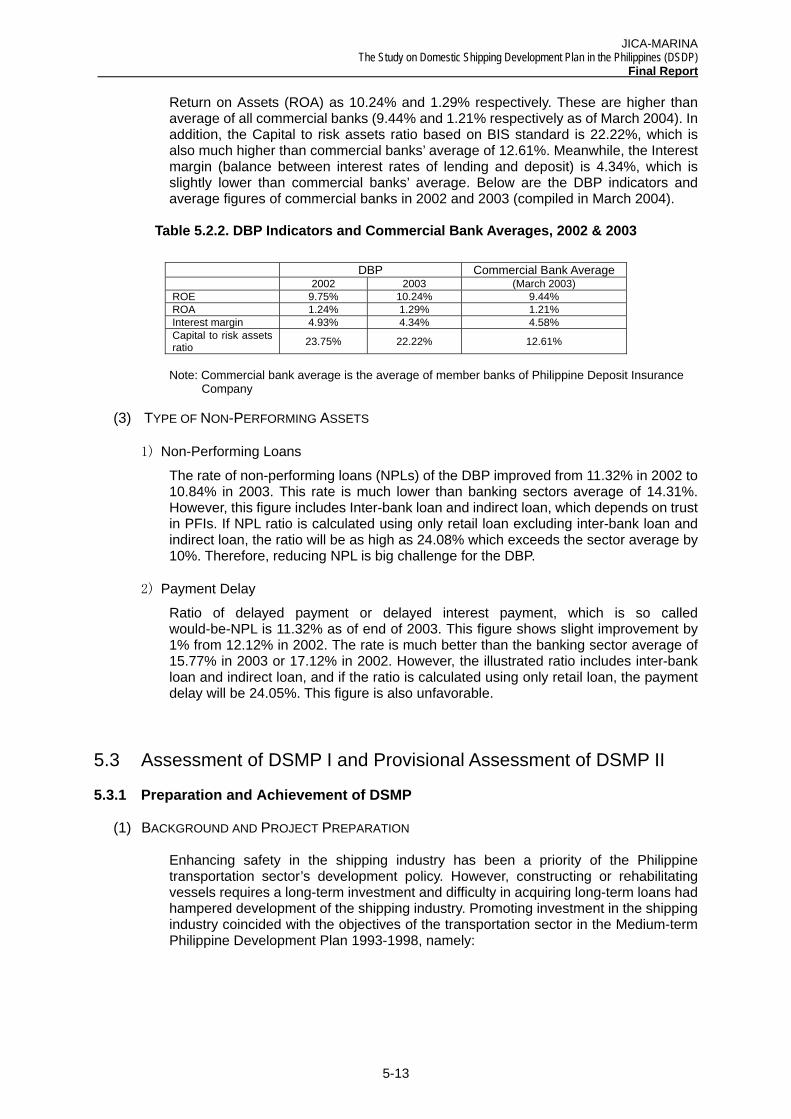
As can be noticed from Figure 5.2.1, even though the growth rate of recent 2 years stagnated, the net profit steadily increased during the past 6 years. Total revenue has been gradually increasing with slight decrease in 2003. In addition, outstanding balance, deposit or borrowed money, and outstanding gross assets have been increasing even though they show signs of leveling-off in recent years. The capital fund steadily increased. The DBP is ranked 7th among Philippine banks based on size of assets.
Lending operation of the DBP can be divided into two aspects: Retail Banking that provides loan to end-users directly, and Wholesale Banking that provides loan through private banks. Those two share almost equal proportion of the operations. Private banks, which deal with Wholesale Banking, are called as Participating Financial Institutions (PFI).
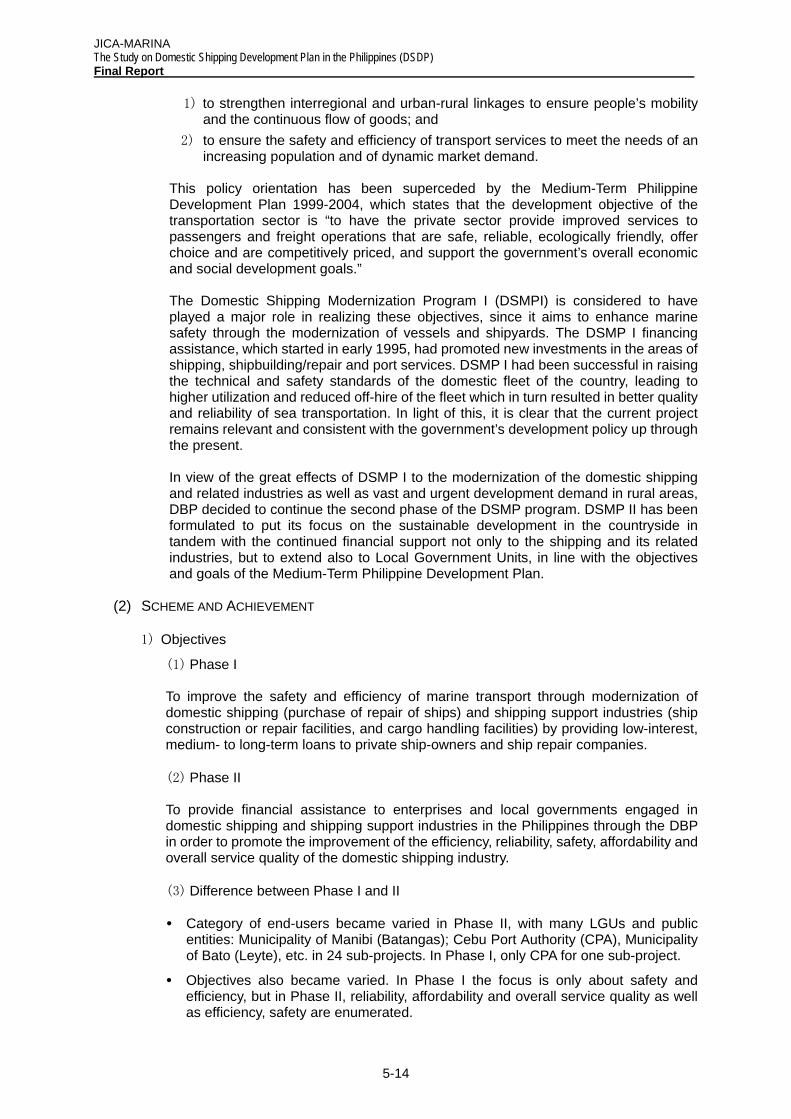
The low proportion of deposit as underlying lendable fund as well as high proportion of debt finance from the government characterizes the DBP, as state-owned development bank, because this character is very different from that of ordinary commercial banks. Most of the debt finance from the government is considered as sublease of ODA funds. Deposit financing rate has been notably increasing in recent years and deposit lending rate of 23% in 1998 increased up to 45% in 2003. It may be caused by the deposit shift from the private bank to state-owned financial institutions due to the Asian Financial Crisis, as well as increase in governmental official credit deposit. Even though deposit from private sector has increased, governmental official
JICA-MARINA The Study on Domestic Shipping Development Plan in the Philippines (DSDP) Final Report
5-12
credit deposit still remains, taking up to two-thirds of the total deposit at the end of 2003.
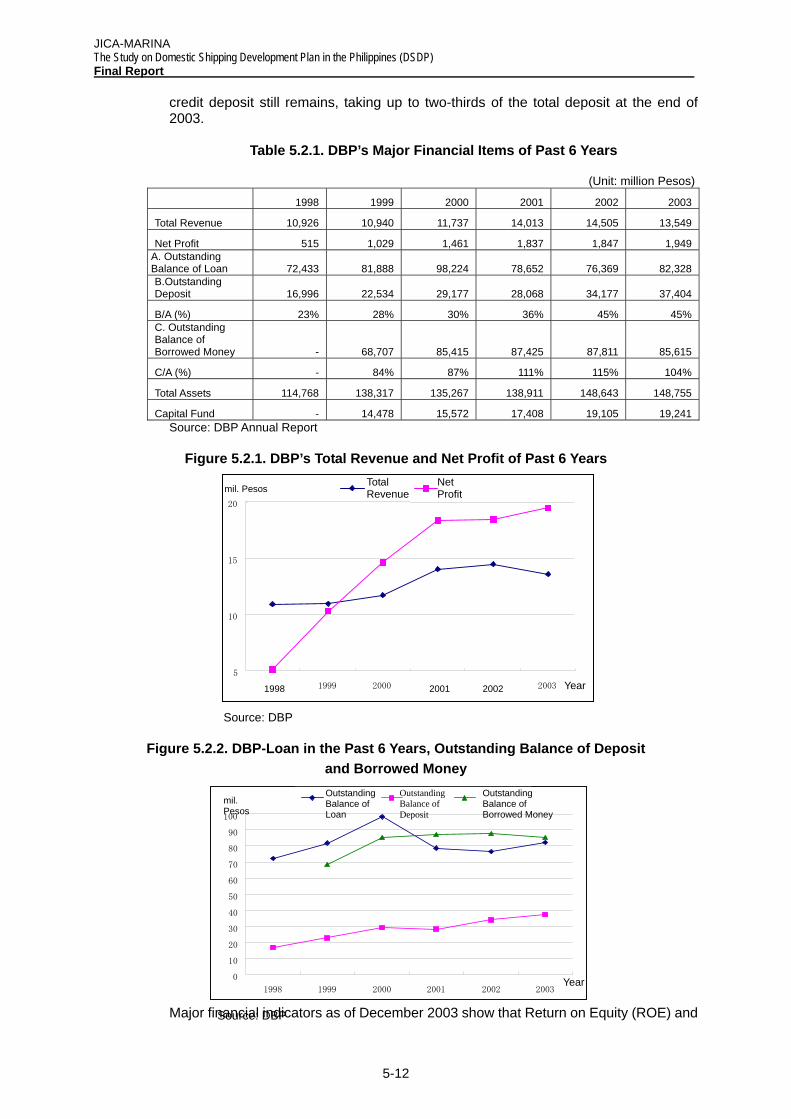
Table 5.2.1. DBP’s Major Financial Items of Past 6 Years
(Unit: million Pesos)
1998 1999 2000 2001 2002 2003
Total Revenue 10,926 10,940 11,737 14,013 14,505 13,549
Net Profit 515 1,029 1,461 1,837 1,847 1,949 A. Outstanding Balance of Loan 72,433 81,888 98,224 78,652 76,369 82,328 B.Outstanding Deposit 16,996 22,534 29,177 28,068 34,177 37,404
B/A (%) 23% 28% 30% 36% 45% 45% C. Outstanding Balance of Borrowed Money - 68,707 85,415 87,425 87,811 85,615
C/A (%) - 84% 87% 111% 115% 104%
Total Assets 114,768 138,317 135,267 138,911 148,643 148,755
Capital Fund - 14,478 15,572 17,408 19,105 19,241 Source: DBP Annual Report
Figure 5.2.1. DBP’s Total Revenue and Net Profit of Past 6 Years
Source: DBP
Figure 5.2.2. DBP-Loan in the Past 6 Years, Outstanding Balance of Deposit and Borrowed Money
Major financial indicators as of December 2003 show that Return on Equity (ROE) and
5
10
15
20
1999 2000 2003 Year
mil. Pesos Total Revenue
Net Profit
1998 2001 2002
0
10
20
30
40
50
60
70
80
90
100
1998 1999 2000 2001 2002 2003Year
mil. Pesos
Outstanding Balance of Loan
Outstanding Balance of Deposit
Outstanding Balance of Borrowed Money
Source: DBP
JICA-MARINA The Study on Domestic Shipping Development Plan in the Philippines (DSDP)
Final Report
5-13
Return on Assets (ROA) as 10.24% and 1.29% respectively. These are higher than average of all commercial banks (9.44% and 1.21% respectively as of March 2004). In addition, the Capital to risk assets ratio based on BIS standard is 22.22%, which is also much higher than commercial banks’ average of 12.61%. Meanwhile, the Interest margin (balance between interest rates of lending and deposit) is 4.34%, which is slightly lower than commercial banks’ average. Below are the DBP indicators and average figures of commercial banks in 2002 and 2003 (compiled in March 2004).
Table 5.2.2. DBP Indicators and Commercial Bank Averages, 2002 & 2003
DBP Commercial Bank Average 2002 2003 (March 2003) ROE 9.75% 10.24% 9.44% ROA 1.24% 1.29% 1.21% Interest margin 4.93% 4.34% 4.58% Capital to risk assets ratio 23.75% 22.22% 12.61%
Note: Commercial bank average is the average of member banks of Philippine Deposit Insurance
Company
(3) TYPE OF NON-PERFORMING ASSETS
1) Non-Performing Loans
The rate of non-performing loans (NPLs) of the DBP improved from 11.32% in 2002 to 10.84% in 2003. This rate is much lower than banking sectors average of 14.31%. However, this figure includes Inter-bank loan and indirect loan, which depends on trust in PFIs. If NPL ratio is calculated using only retail loan excluding inter-bank loan and indirect loan, the ratio will be as high as 24.08% which exceeds the sector average by 10%. Therefore, reducing NPL is big challenge for the DBP.
2) Payment Delay
Ratio of delayed payment or delayed interest payment, which is so called would-be-NPL is 11.32% as of end of 2003. This figure shows slight improvement by 1% from 12.12% in 2002. The rate is much better than the banking sector average of 15.77% in 2003 or 17.12% in 2002. However, the illustrated ratio includes inter-bank loan and indirect loan, and if the ratio is calculated using only retail loan, the payment delay will be 24.05%. This figure is also unfavorable.
5.3 Assessment of DSMP I and Provisional Assessment of DSMP II
5.3.1 Preparation and Achievement of DSMP
(1) BACKGROUND AND PROJECT PREPARATION
Enhancing safety in the shipping industry has been a priority of the Philippine transportation sector’s development policy. However, constructing or rehabilitating vessels requires a long-term investment and difficulty in acquiring long-term loans had hampered development of the shipping industry. Promoting investment in the shipping industry coincided with the objectives of the transportation sector in the Medium-term Philippine Development Plan 1993-1998, namely:
JICA-MARINA The Study on Domestic Shipping Development Plan in the Philippines (DSDP) Final Report
5-14
1) to strengthen interregional and urban-rural linkages to ensure people’s mobility and the continuous flow of goods; and
2) to ensure the safety and efficiency of transport services to meet the needs of an increasing population and of dynamic market demand.
This policy orientation has been superceded by the Medium-Term Philippine Development Plan 1999-2004, which states that the development objective of the transportation sector is “to have the private sector provide improved services to passengers and freight operations that are safe, reliable, ecologically friendly, offer choice and are competitively priced, and support the government’s overall economic and social development goals.”
The Domestic Shipping Modernization Program I (DSMPI) is considered to have played a major role in realizing these objectives, since it aims to enhance marine safety through the modernization of vessels and shipyards. The DSMP I financing assistance, which started in early 1995, had promoted new investments in the areas of shipping, shipbuilding/repair and port services. DSMP I had been successful in raising the technical and safety standards of the domestic fleet of the country, leading to higher utilization and reduced off-hire of the fleet which in turn resulted in better quality and reliability of sea transportation. In light of this, it is clear that the current project remains relevant and consistent with the government’s development policy up through the present.
In view of the great effects of DSMP I to the modernization of the domestic shipping and related industries as well as vast and urgent development demand in rural areas, DBP decided to continue the second phase of the DSMP program. DSMP II has been formulated to put its focus on the sustainable development in the countryside in tandem with the continued financial support not only to the shipping and its related industries, but to extend also to Local Government Units, in line with the objectives and goals of the Medium-Term Philippine Development Plan.
(2) SCHEME AND ACHIEVEMENT
1) Objectives
(1) Phase I
To improve the safety and efficiency of marine transport through modernization of domestic shipping (purchase of repair of ships) and shipping support industries (ship construction or repair facilities, and cargo handling facilities) by providing low-interest, medium- to long-term loans to private ship-owners and ship repair companies.
(2) Phase II
To provide financial assistance to enterprises and local governments engaged in domestic shipping and shipping support industries in the Philippines through the DBP in order to promote the improvement of the efficiency, reliability, safety, affordability and overall service quality of the domestic shipping industry.
(3) Difference between Phase I and II
• Category of end-users became varied in Phase II, with many LGUs and public entities: Municipality of Manibi (Batangas); Cebu Port Authority (CPA), Municipality of Bato (Leyte), etc. in 24 sub-projects. In Phase I, only CPA for one sub-project.
• Objectives also became varied. In Phase I the focus is only about safety and efficiency, but in Phase II, reliability, affordability and overall service quality as well as efficiency, safety are enumerated.
JICA-MARINA The Study on Domestic Shipping Development Plan in the Philippines (DSDP)
Final Report
5-15
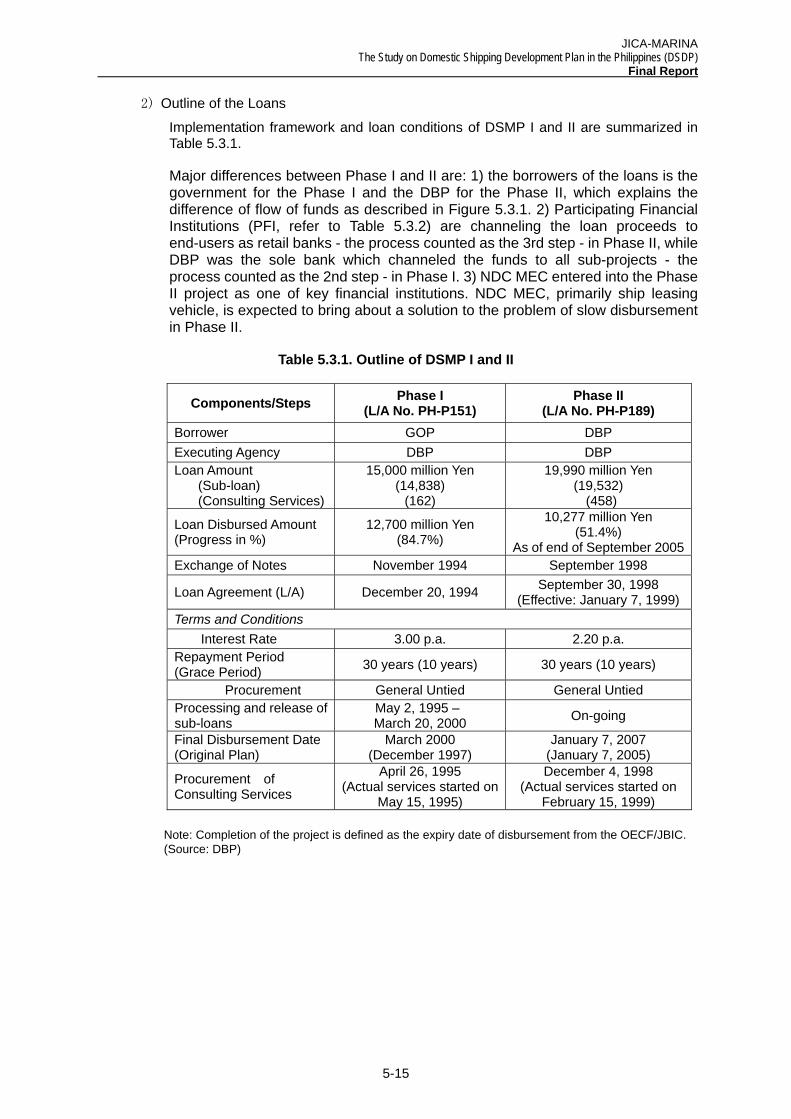
2) Outline of the Loans
Implementation framework and loan conditions of DSMP I and II are summarized in Table 5.3.1.
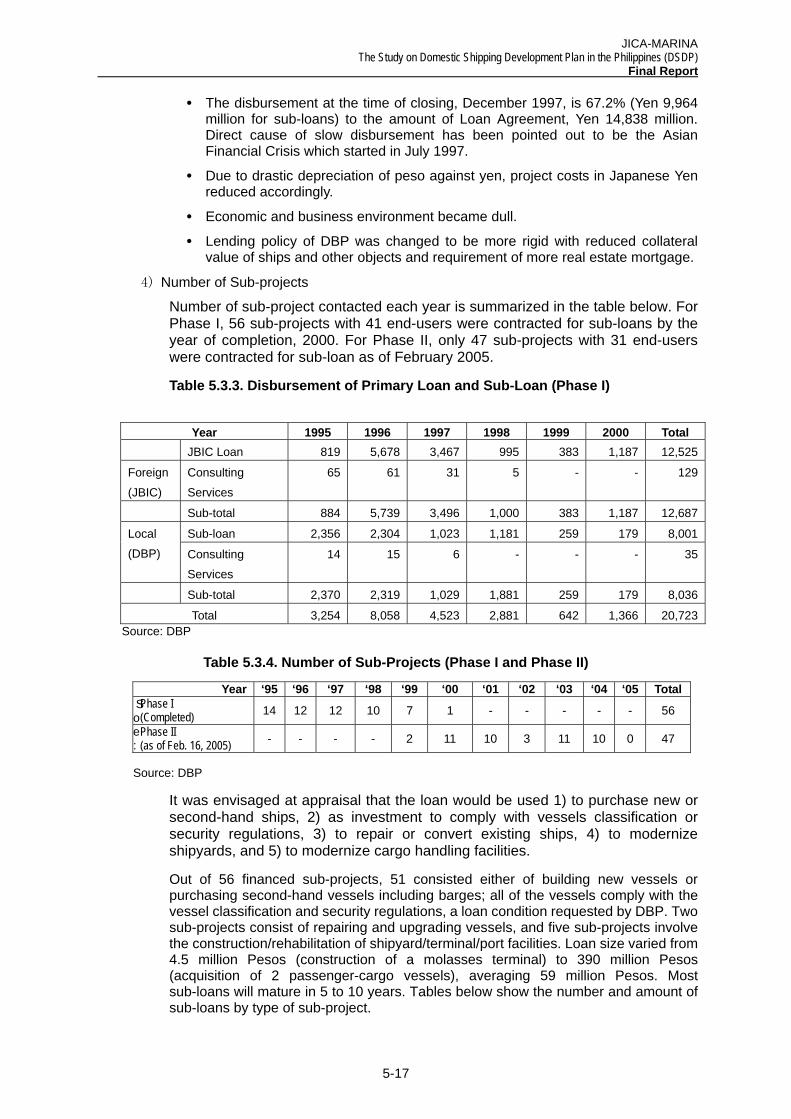
Major differences between Phase I and II are: 1) the borrowers of the loans is the government for the Phase I and the DBP for the Phase II, which explains the difference of flow of funds as described in Figure 5.3.1. 2) Participating Financial Institutions (PFI, refer to Table 5.3.2) are channeling the loan proceeds to end-users as retail banks - the process counted as the 3rd step - in Phase II, while DBP was the sole bank which channeled the funds to all sub-projects - the process counted as the 2nd step - in Phase I. 3) NDC MEC entered into the Phase II project as one of key financial institutions. NDC MEC, primarily ship leasing vehicle, is expected to bring about a solution to the problem of slow disbursement in Phase II.
Table 5.3.1. Outline of DSMP I and II
Components/Steps Phase I (L/A No. PH-P151)
Phase II (L/A No. PH-P189)
Borrower GOP DBP Executing Agency DBP DBP Loan Amount
(Sub-loan) (Consulting Services)
15,000 million Yen (14,838)
(162)
19,990 million Yen (19,532)
(458)
Loan Disbursed Amount (Progress in %)
12,700 million Yen (84.7%)
10,277 million Yen (51.4%)
As of end of September 2005Exchange of Notes November 1994 September 1998
Loan Agreement (L/A) December 20, 1994 September 30, 1998 (Effective: January 7, 1999)
Terms and Conditions Interest Rate 3.00 p.a. 2.20 p.a. Repayment Period (Grace Period) 30 years (10 years) 30 years (10 years)
Procurement General Untied General Untied Processing and release of sub-loans
May 2, 1995 – March 20, 2000 On-going
Final Disbursement Date (Original Plan)
March 2000 (December 1997)
January 7, 2007 (January 7, 2005)
Procurement of Consulting Services
April 26, 1995 (Actual services started on
May 15, 1995)
December 4, 1998 (Actual services started on
February 15, 1999)
Note: Completion of the project is defined as the expiry date of disbursement from the OECF/JBIC. (Source: DBP)
JICA-MARINA The Study on Domestic Shipping Development Plan in the Philippines (DSDP) Final Report
5-16
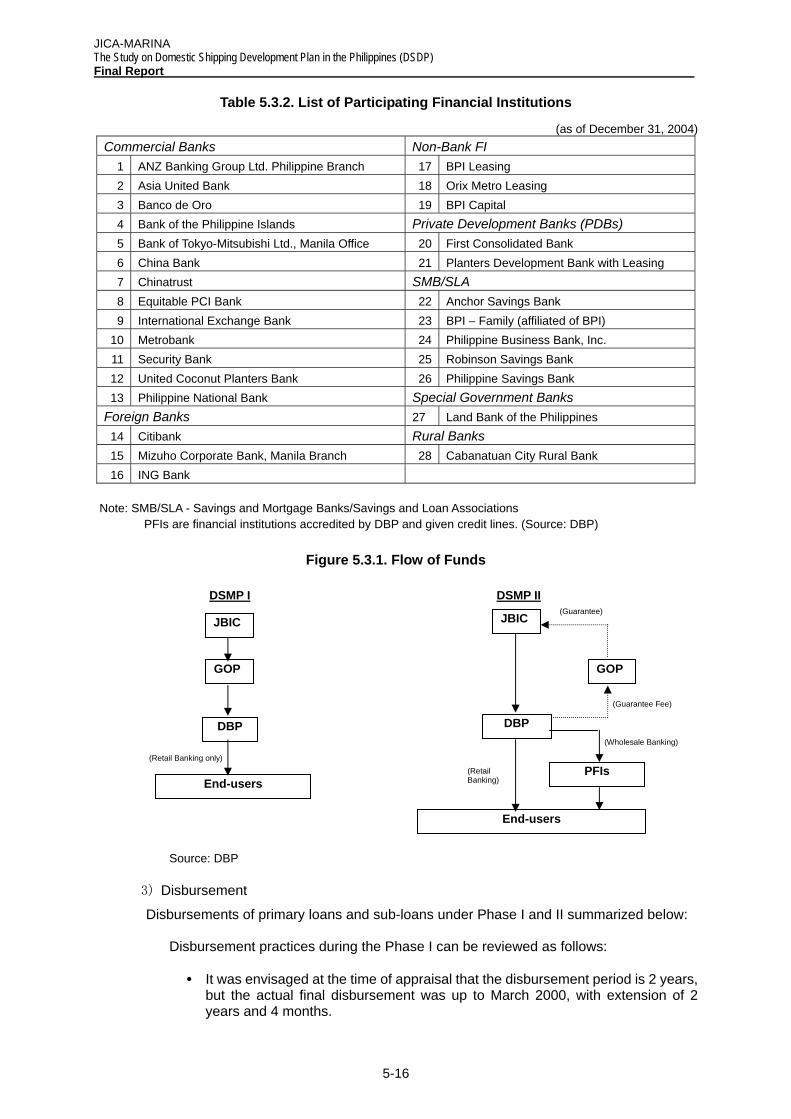
Table 5.3.2. List of Participating Financial Institutions
(as of December 31, 2004) Commercial Banks Non-Bank FI
1 ANZ Banking Group Ltd. Philippine Branch 17 BPI Leasing 2 Asia United Bank 18 Orix Metro Leasing 3 Banco de Oro 19 BPI Capital 4 Bank of the Philippine Islands Private Development Banks (PDBs) 5 Bank of Tokyo-Mitsubishi Ltd., Manila Office 20 First Consolidated Bank 6 China Bank 21 Planters Development Bank with Leasing 7 Chinatrust SMB/SLA 8 Equitable PCI Bank 22 Anchor Savings Bank 9 International Exchange Bank 23 BPI – Family (affiliated of BPI)
10 Metrobank 24 Philippine Business Bank, Inc. 11 Security Bank 25 Robinson Savings Bank 12 United Coconut Planters Bank 26 Philippine Savings Bank 13 Philippine National Bank Special Government Banks
Foreign Banks 27 Land Bank of the Philippines 14 Citibank Rural Banks 15 Mizuho Corporate Bank, Manila Branch 28 Cabanatuan City Rural Bank 16 ING Bank
Note: SMB/SLA - Savings and Mortgage Banks/Savings and Loan Associations PFIs are financial institutions accredited by DBP and given credit lines. (Source: DBP)
Figure 5.3.1. Flow of Funds
Source: DBP
3) Disbursement
Disbursements of primary loans and sub-loans under Phase I and II summarized below:
Disbursement practices during the Phase I can be reviewed as follows:
• It was envisaged at the time of appraisal that the disbursement period is 2 years, but the actual final disbursement was up to March 2000, with extension of 2 years and 4 months.
(Guarantee Fee)
(Wholesale Banking)
(Retail Banking)
(Retail Banking only)
JBIC
GOP
DBP
End-users
DSMP I DSMP II
JBIC
GOP
DBP
End-users
PFIs
(Guarantee)
JICA-MARINA The Study on Domestic Shipping Development Plan in the Philippines (DSDP)
Final Report
5-17
• The disbursement at the time of closing, December 1997, is 67.2% (Yen 9,964 million for sub-loans) to the amount of Loan Agreement, Yen 14,838 million. Direct cause of slow disbursement has been pointed out to be the Asian Financial Crisis which started in July 1997.
• Due to drastic depreciation of peso against yen, project costs in Japanese Yen reduced accordingly.
• Economic and business environment became dull.
• Lending policy of DBP was changed to be more rigid with reduced collateral value of ships and other objects and requirement of more real estate mortgage.
4) Number of Sub-projects
Number of sub-project contacted each year is summarized in the table below. For Phase I, 56 sub-projects with 41 end-users were contracted for sub-loans by the year of completion, 2000. For Phase II, only 47 sub-projects with 31 end-users were contracted for sub-loan as of February 2005.
Table 5.3.3. Disbursement of Primary Loan and Sub-Loan (Phase I)
Source: DBP
Table 5.3.4. Number of Sub-Projects (Phase I and Phase II)
Soe: Source: DBP
It was envisaged at appraisal that the loan would be used 1) to purchase new or second-hand ships, 2) as investment to comply with vessels classification or security regulations, 3) to repair or convert existing ships, 4) to modernize shipyards, and 5) to modernize cargo handling facilities.
Out of 56 financed sub-projects, 51 consisted either of building new vessels or purchasing second-hand vessels including barges; all of the vessels comply with the vessel classification and security regulations, a loan condition requested by DBP. Two sub-projects consist of repairing and upgrading vessels, and five sub-projects involve the construction/rehabilitation of shipyard/terminal/port facilities. Loan size varied from 4.5 million Pesos (construction of a molasses terminal) to 390 million Pesos (acquisition of 2 passenger-cargo vessels), averaging 59 million Pesos. Most sub-loans will mature in 5 to 10 years. Tables below show the number and amount of sub-loans by type of sub-project.
Year 1995 1996 1997 1998 1999 2000 Total JBIC Loan 819 5,678 3,467 995 383 1,187 12,525
Foreign
(JBIC)
Consulting
Services
65 61 31 5 - - 129
Sub-total 884 5,739 3,496 1,000 383 1,187 12,687
Sub-loan 2,356 2,304 1,023 1,181 259 179 8,001 Local
(DBP) Consulting
Services
14 15 6 - - - 35
Sub-total 2,370 2,319 1,029 1,881 259 179 8,036
Total 3,254 8,058 4,523 2,881 642 1,366 20,723
Year ‘95 ‘96 ‘97 ‘98 ‘99 ‘00 ‘01 ‘02 ‘03 ‘04 ‘05 Total Phase I (Completed) 14 12 12 10 7 1 - - - - - 56
Phase II (as of Feb. 16, 2005) - - - - 2 11 10 3 11 10 0 47
JICA-MARINA The Study on Domestic Shipping Development Plan in the Philippines (DSDP) Final Report
5-18
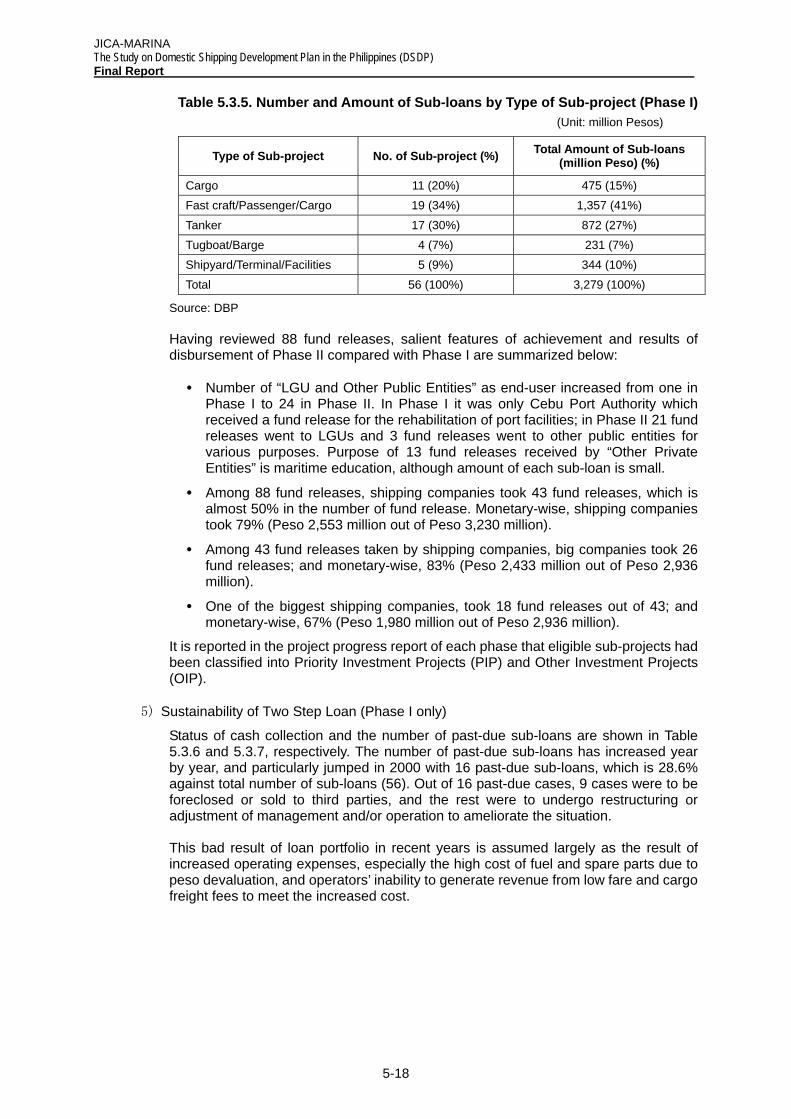
Table 5.3.5. Number and Amount of Sub-loans by Type of Sub-project (Phase I)
Source: DBP
Having reviewed 88 fund releases, salient features of achievement and results of disbursement of Phase II compared with Phase I are summarized below:
• Number of “LGU and Other Public Entities” as end-user increased from one in Phase I to 24 in Phase II. In Phase I it was only Cebu Port Authority which received a fund release for the rehabilitation of port facilities; in Phase II 21 fund releases went to LGUs and 3 fund releases went to other public entities for various purposes. Purpose of 13 fund releases received by “Other Private Entities” is maritime education, although amount of each sub-loan is small.
• Among 88 fund releases, shipping companies took 43 fund releases, which is almost 50% in the number of fund release. Monetary-wise, shipping companies took 79% (Peso 2,553 million out of Peso 3,230 million).
• Among 43 fund releases taken by shipping companies, big companies took 26 fund releases; and monetary-wise, 83% (Peso 2,433 million out of Peso 2,936 million).
• One of the biggest shipping companies, took 18 fund releases out of 43; and monetary-wise, 67% (Peso 1,980 million out of Peso 2,936 million).
It is reported in the project progress report of each phase that eligible sub-projects had been classified into Priority Investment Projects (PIP) and Other Investment Projects (OIP).
5) Sustainability of Two Step Loan (Phase I only)
Status of cash collection and the number of past-due sub-loans are shown in Table 5.3.6 and 5.3.7, respectively. The number of past-due sub-loans has increased year by year, and particularly jumped in 2000 with 16 past-due sub-loans, which is 28.6% against total number of sub-loans (56). Out of 16 past-due cases, 9 cases were to be foreclosed or sold to third parties, and the rest were to undergo restructuring or adjustment of management and/or operation to ameliorate the situation.
This bad result of loan portfolio in recent years is assumed largely as the result of increased operating expenses, especially the high cost of fuel and spare parts due to peso devaluation, and operators’ inability to generate revenue from low fare and cargo freight fees to meet the increased cost.
Type of Sub-project No. of Sub-project (%) Total Amount of Sub-loans (million Peso) (%)
Cargo 11 (20%) 475 (15%) Fast craft/Passenger/Cargo 19 (34%) 1,357 (41%) Tanker 17 (30%) 872 (27%) Tugboat/Barge 4 (7%) 231 (7%) Shipyard/Terminal/Facilities 5 (9%) 344 (10%) Total 56 (100%) 3,279 (100%)
(Unit: million Pesos)

JICA-MARINA The Study on Domestic Shipping Development Plan in the Philippines (DSDP)
Final Report
5-19
Table 5.3.6. Cash Collection Ratio of Sub-loans (Phase I only)
Source: DBP
Table 5.3.7. Arrears Ratio of Sub-loans (Phase I only)
Year 1995 1996 1997 1998 1999 2000 No. of current sub-loans (a) 14 26 38 48 55 56 N0. of past-due sub-loans (b) 0 1 3 6 8 16 Arrears ratio by number (b)/(a) 0% 3.8% 7.8% 12.5% 14.5% 28.6% Total amount outstanding (c) (million Peso)
149.9 1,169.9 2,134.7 2,274.7 2,085.8 2,310.8
Total arrears (d) (million Peso) - 8.6 1.5 16.1 28.2 316.3 Arrears ratio by amount (d)/(c) 0% 0.7% 0.07% 0.7% 1.3% 13.7%
Source: DBP
6) Status of Special Account and Revolving Fund
A special account for DSMP I was established in DBP to monitor cashflow. Details of the cash flow are summarized in Table 5.3.8
Table 5.3.8 Status of Special Account and Revolving Fund (Phase I only)
1995 1996 1997 1998 1999 2000 Beginning Balance (a) na 194.2 287.6 315.1 996.3 1,376.7 Inflow
Disbursement from JBIC (b) 419.3 1,396.0 668.3 636.4 45.2 110.1 Principal and interest received original sub-loans (c)
4.4
91.8
240.6
417.4
552.7
543.6
Total Inflow (d) = (b) + (c) 423.7 1,487.8 908.8 1,053.8 597.9 653.7 Outflow Disbursement of original sub-loans (e) 226.3 1,374.3 828.3 323.2 124.9 398.2 Disbursement of revolving fund (f) 114.4
Repayment of JBIC loan (g) 3.2 20.1 53.0 49.5 92.5 96.8 Total Outflow (h) = (e) + (f) + (g) 229.5 1,394.4 881.3 372.7 217.5 609.4
Ending Balance (i) = (a) + (d) – (h) 194.2 287.6 315.1 996.3 1,376.7 1,421.0
Source: DBP
Year 1995 1996 1997 1998 1999 2000 Principal and Interest Amount due during the Period
Interest 4,425 81,584 149,627 276,251 248,905 249,385 Principal - 18,817 92,419 157,303 331,949 610,501 Total (a) 4,425 100,401 242,046 433,554 580,854 859,887
of which repaid: Interest 4,425 72,290 150,620 263,808 231,576 156,542
Principal - 19,512 89,942 153,619 321,093 387,020 Total (b) 4,425 91,802 240,562 417,428 552,669 543,562
Cash Collection Ratio (b)/(a) 100% 91% 99% 96% 95% 63%
(Unit: thousand Pesos)
(unit: million Pesos)
JICA-MARINA The Study on Domestic Shipping Development Plan in the Philippines (DSDP) Final Report
5-20
5.3.2 Impact Evaluation
(1) PHASE I
DSMP Phase I has improved efficiency of economic activities performed in the project areas served by the vessels acquired under the project by reducing travel time and cost, efficient loading and unloading of cargoes/passengers, and by better access to more markets and optimization of the vessel utilization. Following are specific impact identified:
• The ferry project in the Pangil Bay area (bounded by the towns of Misamis Occidendal and Lanao del Norte provinces) raised the productivity level of farmers, who can now sell more because of better access to markets and post harvest facilities in the neighboring provinces. The travel distance around Pangil Bay, covering 5 towns, has been reduced drastically, from 108 to 24 kilometers. Travel time was reduced from 3 hours to a mere 15 minutes, made possible by the shuttle ferries crossing the Bay.
• The acquisition of RoRo-type vessels (servicing the routes of Cebu – Tagbilaran – Larena – Plaridel – Iligan and back; Cebu – Calbayog – Cebu; Cebu – Santa Fe – Cebu – Larena and back; Tabaco, Albay – Virac, Catanduanes; Tabaco, Albay – San Andres, Catanduanes; and other parts of the country) led to increases in cargo capacity and passenger traffic. And with the introduction of semi-mechanized cargo handling using palletized cargoes, the average standing time in ports has been shortened by 50 %, thus increasing the frequency and regularity of service.
• The acquisition of fast crafts contributed to the mobility of people. The deployment of fast ferries in Cebu – Bohol, for instance, enabled Boholanos to go to Cebu to shop and return to Bohol the same afternoon, traveling for 1 hour and 15 minutes each way. Businessmen, students and daily workers benefited from this mode of transport, saving both time and money.
The increased frequency of operations has had not only economic impacts but also social impacts, for example:
• The ferry project in Pangil Bay in Misamis Oriental and Lanao del Norte provided students the opportunity to commute daily instead of boarding in Ozamis City. This convenience allowed students to live together with their families, thereby strengthening family cohesion.
• According to DBP, a total of 1,848 crews have been newly employed by the sub-projects. If ground staff and indirect employment are added, more than 3,000 jobs have been generated by the project.
(2) PHASE II
Economic downtrend of the country was surely felt and easily visible at the time the DSMP II started in early 1999. The Asian financial crisis was creating havoc then in neighboring countries and the Philippines was not spared. The momentum created by DSMP I for the shipping industry slowed down under the economic slump generated by the financial crisis. It was during this time that the Central Bank(or BSP) raised the loan security requirements for all financial institutions. In the meantime, the DBP with a long list of loan applications on hand under the DSMP II struggled to keep abreast of the changing economic conditions.
The US dollars and the Japanese Yen gained strength as the Peso started to slide down to continue depreciating. The project consultant left the following view at the termination of the contract.
JICA-MARINA The Study on Domestic Shipping Development Plan in the Philippines (DSDP)
Final Report
5-21
“Governance in the shipping industry seemed to have lost grip in the midst of the effects of the deregulation the government had adopted earlier. For instance, shipping operators fought a price war even for a piece of maritime territory. The governing agencies were unable to stem this cutthroat fare competition to the detriment of the industry. In addition, the continued spiraling of prices of petroleum products depleted revenue generation capacities of shipowners and operators. The fear that many DSMP beneficiaries might default looked to have become a reality.”4
Under such business environment, disbursements of the phase II have remained slow from initial stage till now. As competition of shipping business, relevant loan conditions such as REM and interest rate are getting tougher even to almost prohibitive levels for private companies, especially for SMEs.
5.3.3 Identification of Improvement Needs (1) IDENTIFICATION OF PROBLEMS AND CONSTRAINTS ON DSMP
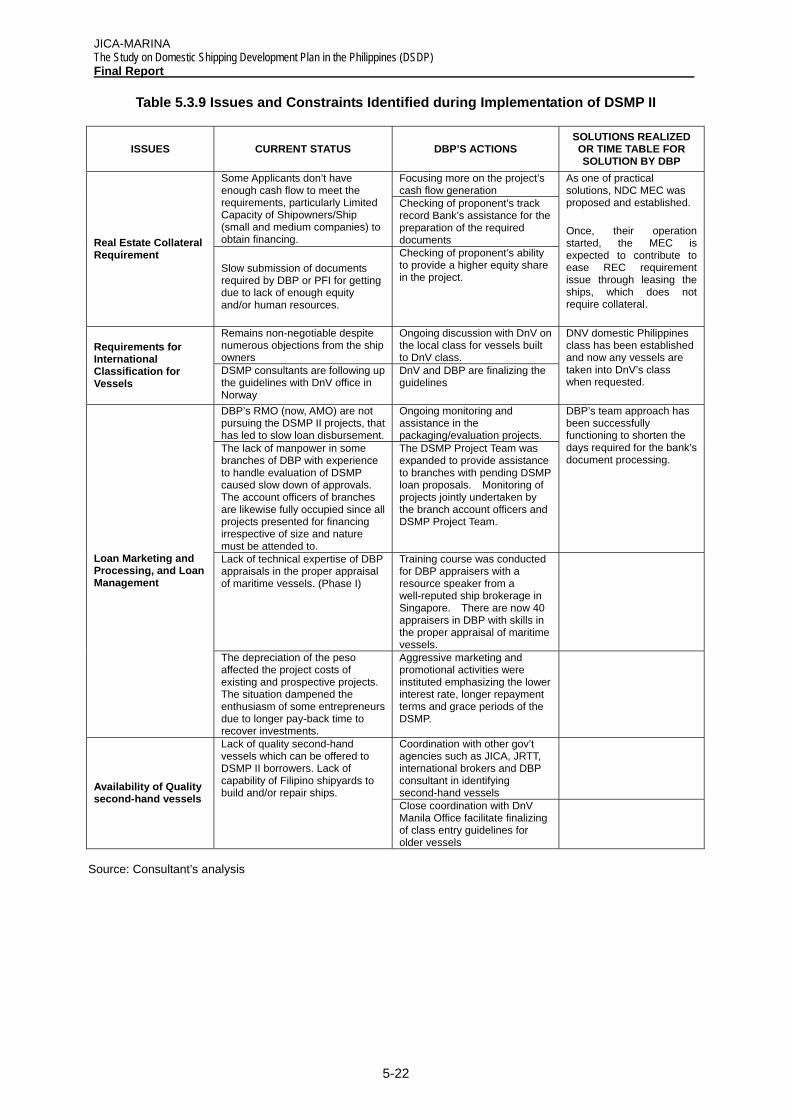
Problems and constraints pertaining to DSMP I and II, identified either through interviews with stakeholders of both lender-side and borrower-side, and studying relevant documents and reports, have been summarized in Table 5.3.9. Many of these issues resulted in slow disbursement in the program, particularly during phase II, which is considered to be the critical issue for DSMP II and needs to be addressed.
The Study has grouped those critical issues into four, i.e., (i) real estate collateral requirement, (ii) requirements for IACS services in financing vessels, (iii) loan marketing and management, and (iv) availability of quality second-hand vessels.
On the other hand, DBP reported to JBIC the problems and issues encountered during the DSMP II when both banks discussed the extension of DSMP mobilization period in October 2004. They are:
• Continued peso depreciation
• Difficulty in putting up required equity
• Reluctance of ship owners to put vessels to international class standards
• Availability of quality 2nd hand vessels vis-à-vis budgetary requirements of proponents
• Fuel oil crisis/series of price adjustments
In comparison with the four (4) grouped issues identified in the Study, DBP confirms three of the four; and, while DBP addressed external factors such as peso depreciation and oil price escalation, the Study points to its loan marketing and management performance.
4 Completion report of SHIPDECO for the consulting services of DSMP II
JICA-MARINA The Study on Domestic Shipping Development Plan in the Philippines (DSDP) Final Report
5-22
Table 5.3.9 Issues and Constraints Identified during Implementation of DSMP II
ISSUES CURRENT STATUS DBP’S ACTIONS SOLUTIONS REALIZED OR TIME TABLE FOR SOLUTION BY DBP
Focusing more on the project’s cash flow generation
Some Applicants don’t have enough cash flow to meet the requirements, particularly Limited Capacity of Shipowners/Ship (small and medium companies) to obtain financing.
Checking of proponent’s track record Bank’s assistance for the preparation of the required documents Real Estate Collateral
Requirement Slow submission of documents required by DBP or PFI for getting due to lack of enough equity and/or human resources.
Checking of proponent’s ability to provide a higher equity share in the project.
As one of practical solutions, NDC MEC was proposed and established.
Once, their operation started, the MEC is expected to contribute to ease REC requirement issue through leasing the ships, which does not require collateral.
Remains non-negotiable despite numerous objections from the ship owners
Ongoing discussion with DnV on the local class for vessels built to DnV class.
Requirements for International Classification for Vessels
DSMP consultants are following up the guidelines with DnV office in Norway
DnV and DBP are finalizing the guidelines
DNV domestic Philippines class has been established and now any vessels are taken into DnV’s class when requested.
DBP’s RMO (now, AMO) are not pursuing the DSMP II projects, that has led to slow loan disbursement.
Ongoing monitoring and assistance in the packaging/evaluation projects.
The lack of manpower in some branches of DBP with experience to handle evaluation of DSMP caused slow down of approvals. The account officers of branches are likewise fully occupied since all projects presented for financing irrespective of size and nature must be attended to.
The DSMP Project Team was expanded to provide assistance to branches with pending DSMP loan proposals. Monitoring of projects jointly undertaken by the branch account officers and DSMP Project Team.
DBP’s team approach has been successfully functioning to shorten the days required for the bank’s document processing.
Lack of technical expertise of DBP appraisals in the proper appraisal of maritime vessels. (Phase I)
Training course was conducted for DBP appraisers with a resource speaker from a well-reputed ship brokerage in Singapore. There are now 40 appraisers in DBP with skills in the proper appraisal of maritime vessels.
Loan Marketing and Processing, and Loan Management
The depreciation of the peso affected the project costs of existing and prospective projects. The situation dampened the enthusiasm of some entrepreneurs due to longer pay-back time to recover investments.
Aggressive marketing and promotional activities were instituted emphasizing the lower interest rate, longer repayment terms and grace periods of the DSMP.
Coordination with other gov’t agencies such as JICA, JRTT, international brokers and DBP consultant in identifying second-hand vessels
Availability of Quality second-hand vessels
Lack of quality second-hand vessels which can be offered to DSMP II borrowers. Lack of capability of Filipino shipyards to build and/or repair ships.
Close coordination with DnV Manila Office facilitate finalizing of class entry guidelines for older vessels
Source: Consultant’s analysis
JICA-MARINA The Study on Domestic Shipping Development Plan in the Philippines (DSDP)
Final Report
5-23
(2) ASSESSMENT ON DBP’S EFFORTS AND PERCEIVED SOLUTIONS
In the inter-bank meeting between DBP and JBIC5, DBP expressed its strategies and action plans to facilitate DSMP II disbursement. They consisted of four pillars:
• Creation of a maritime equity and leasing corporation wherein DBP can channel loan investments
• Intensification of marketing/promotion activities and technical assistance in the packaging/evaluation of projects in the pipeline
• Establish external linkages (such as JRTT) to identify supply of suitable vessels for projects in the pipeline
• Enlargement of scope of DSMP II to include Filipino corporations engaged in overseas shipping
The Study assessed DBP’s efforts and perceived solutions by each issue group as follows:
Real estate collateral requirement: In line with guidance of BSP, requirement of mortgage is severe and rigid. Loan value of vessels regarded as chattel mortgage was decreased from 80% to 50% after the Asian Financial Crisis. It may be difficult for DBP alone to change this regulatory framework. In this sense, a public ship leasing institution is strategic since it does not need to require collateral. Other archipelagic countries such as Japan and Indonesia have evolved their public ship finance methods without collateral requirements particularly for small to medium shipping companies. With addressing DSMP II underutilization issue, it is deemed to be the right time for the Philippines to institutionalize its sustainable public finance scheme rather than conventional finance based on collateral. It was also a right action for DBP to support NDC in creating its subsidiary: Maritime Equity Corporation in 2005 in order to channel DSMP II funds to ship investment through leasing.
Requirements for IACS services in financing vessels: It is widely recognized that locally established classification societies cannot provide satisfactory services because of incompetent surveyors. Therefore a locally classed ship is not considered bankable for financers and marine insurers. To address it, DBP put one requirement on a financing vessel to be classed by one of the IACS members regardless of its size. However the shipping industry objected due to costly fees to get and maintain an IACS class. To alleviate those costly charges, DBP and the DSMP II Consultant suggested DnV, one of the IACS members, to design special DnV class guidelines for Philippine domestic vessels. Although it is reported applicable, the effectiveness is questioned because of the following two reasons. Firstly, such a classed vessel will be never recognized in the international maritime community due to substandard guidelines. Secondly, it may erode MARINA’s authority to guide locally established classification societies to be engaged in domestic vessels. The Study also reveals that there are numerous non-conformity problems even on an IACS classed vessel in domestic trade (refer to Appendix to Chapter 3). Therefore what is most important to make domestic vessels seaworthy and bankable is to train domestic personnel including government ship inspectors, local classification surveyors and professional superintendents.
Loan Marketing and Management: Several problems have been raised. They are inadequate marketing efforts, lack of loan appraisal expertise and time-consuming procedures. DBP has paid internal efforts to overcome them. However some issues
5 The meeting was held in October 2004 at JBIC HQ. The DBP’s four pillars appeared on the discussion
material.
JICA-MARINA The Study on Domestic Shipping Development Plan in the Philippines (DSDP) Final Report
5-24
have remained and they must be addressed due to poor capability to manage bilateral assistant fund. Apparently, most of ship sub-loans have gone to large shipping companies, i.e., one large company has so far received 67% of the mobilized ship loan fund during DSMP II, makes it difficult to justify to mobilize public fund into the domestic shipping sector. In principle, increased capability in marketing, appraisal and sub-loan management enables more financial support to the SME. As a development finance institution, DBP must pursue it. Surprisingly, it is an argument point between the Study Team and DBP. DBP informed that they have no mission to support SME in the maritime industry within the scope of DSMP I & II. Lack of an explicit mission may have allowed DBP to manage public ship finance at an unsatisfactory level.
Insufficient availability of quality second-hand vessels: It is definitely critical for shipping companies to apply for a ship sub-loan to DBP. For this purpose, DBP has coordinated with the biggest Japanese shipowner: JRTT. It is questionable if it will work well. Although JRTT is a ship co-owner, it is however the investor who is responsible to decide whether to operate or sell its ship after the termination of co-ownership. JRTT is not in the position to make such decision on vessel disposition in the second-hand markets. In addition, there is a greater structural issue. There are some external factors attributed by big demand and small supply particularly between the developing countries of fast growing domestic trade such as Philippines, Indonesia, China and Vietnam and the developed countries such as Japan (refer to Column 5.1). Slow DBP processing service exacerbates the situation. One fundamental solution is a paradigm shift from looking for quality second-hand vessels to ordering newly built vessels. However it must be done under a strong policy package and DBP is not in a position to do it.
Enlargement of business scope: In principle, bilateral ODA fund cannot be tapped into the overseas shipping field where level shipping competition must be ensured including any donor and recipient countries corresponding domestic shipping. However exceptional arrangement may be allowed when such an exceptional case can be specified in an understandable manner. For example, the ASEAN subregional cooperation framework expects the Member Countries to develop and maintain internal sea linkages6. In the case of the Philippines, the Brunei, Indonesia, Malaysia, Philippines East ASEAN Growth Area (BIMP – EAGA) is an important subregional arena. But those subregional sea linkages have a low demand nature in general and much lower demand than domestic trunk lines in particular. As the subregional stakeholders experienced, an Indonesian semi-container vessel (MV Rimba Tuju, 200 TEU) suspended its operation after only three (3) months operation between General Santos and Bitung (North Sulawesi) due to low demand in June 2004. Taking the above analysis into account, it does not seem to hold promise in solving the DSMP II underutilization issue through enlargement of business scope to overseas shipping.
6 Subregional Transport Cooperation Initiative (ADB – ALMEC, Technical Assistance No. 4204 for Indonesia,
in 2005) for reference
JICA-MARINA The Study on Domestic Shipping Development Plan in the Philippines (DSDP)
Final Report
5-25
Column 5-1 Why have Japanese second-hand vessels dried up in the market?
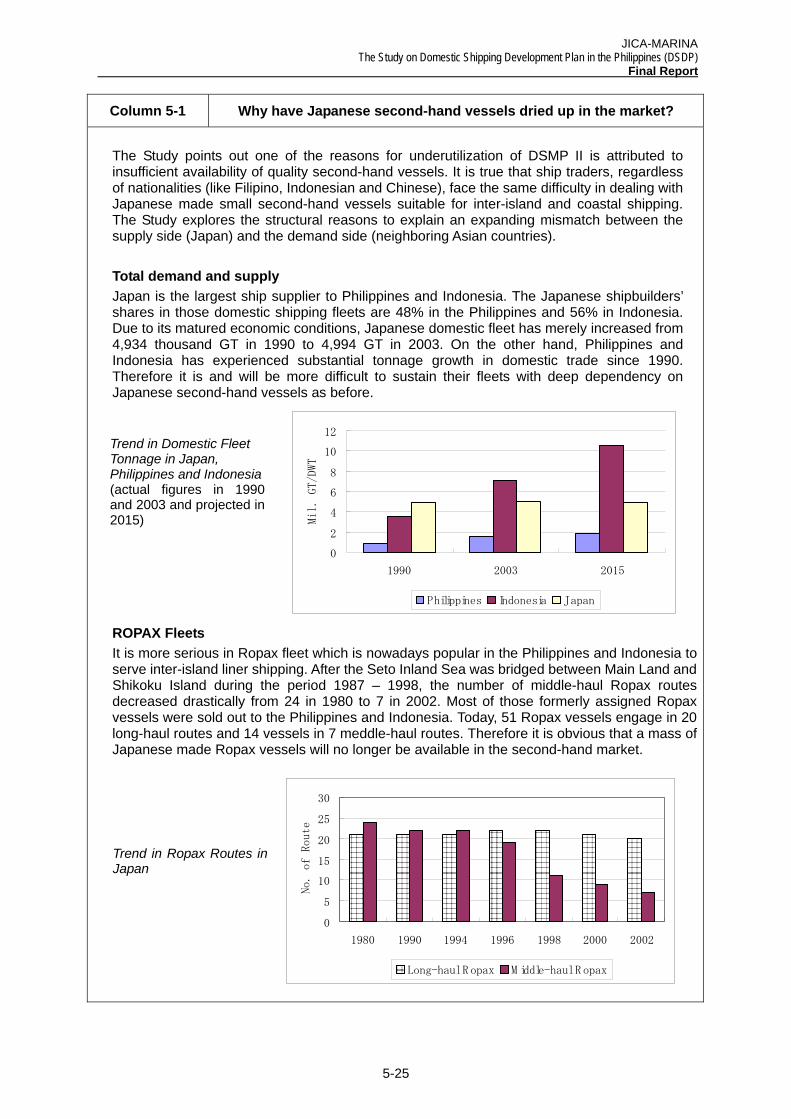
The Study points out one of the reasons for underutilization of DSMP II is attributed to insufficient availability of quality second-hand vessels. It is true that ship traders, regardless of nationalities (like Filipino, Indonesian and Chinese), face the same difficulty in dealing with Japanese made small second-hand vessels suitable for inter-island and coastal shipping. The Study explores the structural reasons to explain an expanding mismatch between the supply side (Japan) and the demand side (neighboring Asian countries). Total demand and supply Japan is the largest ship supplier to Philippines and Indonesia. The Japanese shipbuilders’ shares in those domestic shipping fleets are 48% in the Philippines and 56% in Indonesia. Due to its matured economic conditions, Japanese domestic fleet has merely increased from 4,934 thousand GT in 1990 to 4,994 GT in 2003. On the other hand, Philippines and Indonesia has experienced substantial tonnage growth in domestic trade since 1990. Therefore it is and will be more difficult to sustain their fleets with deep dependency on Japanese second-hand vessels as before.
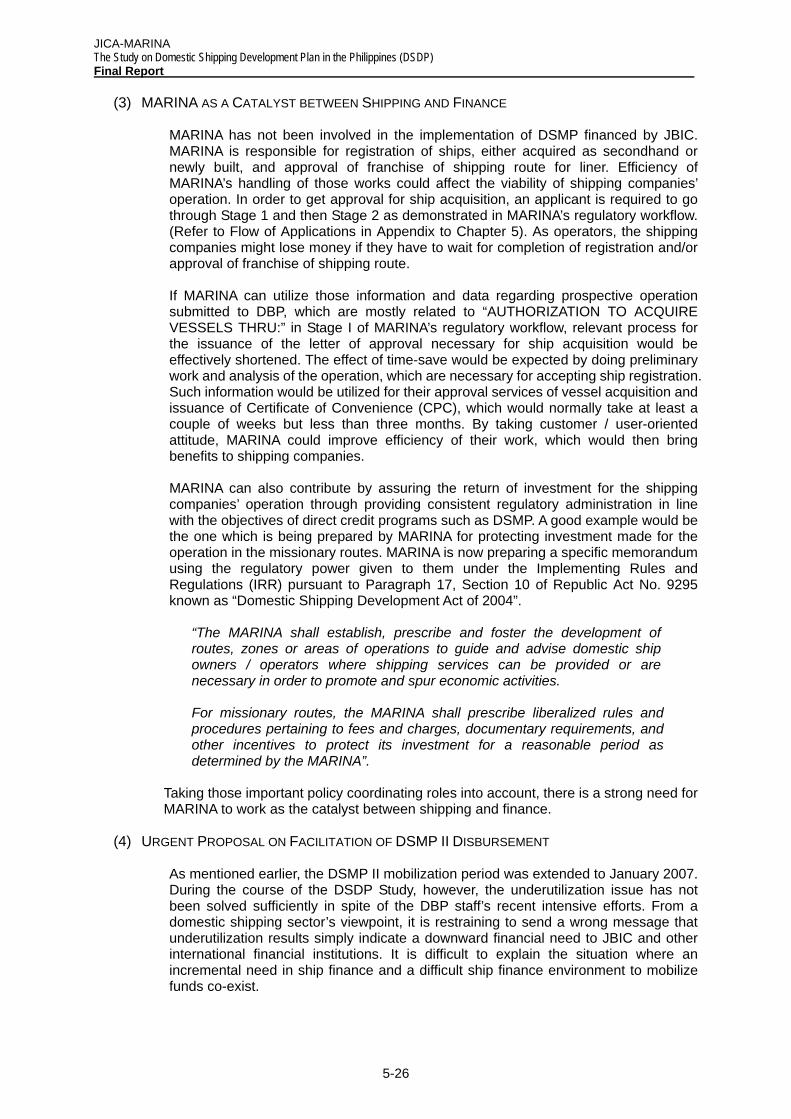
ROPAX fleets ROPAX Fleets It is more serious in Ropax fleet which is nowadays popular in the Philippines and Indonesia to serve inter-island liner shipping. After the Seto Inland Sea was bridged between Main Land and Shikoku Island during the period 1987 – 1998, the number of middle-haul Ropax routes decreased drastically from 24 in 1980 to 7 in 2002. Most of those formerly assigned Ropax vessels were sold out to the Philippines and Indonesia. Today, 51 Ropax vessels engage in 20 long-haul routes and 14 vessels in 7 meddle-haul routes. Therefore it is obvious that a mass of Japanese made Ropax vessels will no longer be available in the second-hand market.
0
2
4
6
8
10
12
1990 2003 2015
Mil. GT/DWT
Philippines Indonesia Japan
Trend in Domestic Fleet Tonnage in Japan, Philippines and Indonesia (actual figures in 1990 and 2003 and projected in 2015)
0
5
10
15
20
25
30
1980 1990 1994 1996 1998 2000 2002
No. of Route
Long-haul R opax M iddle-haul R opax
Trend in Ropax Routes in Japan
JICA-MARINA The Study on Domestic Shipping Development Plan in the Philippines (DSDP) Final Report
5-26
(3) MARINA AS A CATALYST BETWEEN SHIPPING AND FINANCE
MARINA has not been involved in the implementation of DSMP financed by JBIC. MARINA is responsible for registration of ships, either acquired as secondhand or newly built, and approval of franchise of shipping route for liner. Efficiency of MARINA’s handling of those works could affect the viability of shipping companies’ operation. In order to get approval for ship acquisition, an applicant is required to go through Stage 1 and then Stage 2 as demonstrated in MARINA’s regulatory workflow. (Refer to Flow of Applications in Appendix to Chapter 5). As operators, the shipping companies might lose money if they have to wait for completion of registration and/or approval of franchise of shipping route.
If MARINA can utilize those information and data regarding prospective operation submitted to DBP, which are mostly related to “AUTHORIZATION TO ACQUIRE VESSELS THRU:” in Stage I of MARINA’s regulatory workflow, relevant process for the issuance of the letter of approval necessary for ship acquisition would be effectively shortened. The effect of time-save would be expected by doing preliminary work and analysis of the operation, which are necessary for accepting ship registration. Such information would be utilized for their approval services of vessel acquisition and issuance of Certificate of Convenience (CPC), which would normally take at least a couple of weeks but less than three months. By taking customer / user-oriented attitude, MARINA could improve efficiency of their work, which would then bring benefits to shipping companies.
MARINA can also contribute by assuring the return of investment for the shipping companies’ operation through providing consistent regulatory administration in line with the objectives of direct credit programs such as DSMP. A good example would be the one which is being prepared by MARINA for protecting investment made for the operation in the missionary routes. MARINA is now preparing a specific memorandum using the regulatory power given to them under the Implementing Rules and Regulations (IRR) pursuant to Paragraph 17, Section 10 of Republic Act No. 9295 known as “Domestic Shipping Development Act of 2004”.
“The MARINA shall establish, prescribe and foster the development of routes, zones or areas of operations to guide and advise domestic ship owners / operators where shipping services can be provided or are necessary in order to promote and spur economic activities.
For missionary routes, the MARINA shall prescribe liberalized rules and procedures pertaining to fees and charges, documentary requirements, and other incentives to protect its investment for a reasonable period as determined by the MARINA”.
Taking those important policy coordinating roles into account, there is a strong need for MARINA to work as the catalyst between shipping and finance.
(4) URGENT PROPOSAL ON FACILITATION OF DSMP II DISBURSEMENT
As mentioned earlier, the DSMP II mobilization period was extended to January 2007. During the course of the DSDP Study, however, the underutilization issue has not been solved sufficiently in spite of the DBP staff’s recent intensive efforts. From a domestic shipping sector’s viewpoint, it is restraining to send a wrong message that underutilization results simply indicate a downward financial need to JBIC and other international financial institutions. It is difficult to explain the situation where an incremental need in ship finance and a difficult ship finance environment to mobilize funds co-exist.
JICA-MARINA The Study on Domestic Shipping Development Plan in the Philippines (DSDP)
Final Report
5-27
Time is limited to address the underutilization issue. Therefore a new idea cannot be formulated and implemented because of insufficient preparatory time. On the other hand, recent policy initiatives on government priorities should be implemented immediately by and among existing players. The Study suggests an urgent proposal which is composed of the following four (4) immediate actions:
1) Intensification of marketing/promotion activities toward regular clientele
It is very effective and time-saving. In the case of DSMP II, regular clients are large-scale shipping operators and LGUs. DBP may shorten and simplify appraisal works since DBP has experienced in providing sub-loans to them with sufficient track records. For a short time, however, it is difficult for DBP to deal with a new clientele particularly small to medium shipping operators.
2) Utilization of NMEC ship leasing channel for small to medium operators
It is strongly felt that DBP had better channel sub-loans to NMEC to a great deal particularly when NMEC provides ship-leasing services to small to medium operators, not limited to RRTS. Under current financial environments, no collateral requirement is very attractive among certain shipping operators. By using the new NMEC channel, substantial ship investment backlog consisting of additional and replacement tonnage can be solved.
3) Close coordination between DBP and MARINA
MARINA is responsible for domestic fleet quality, competitive and healthy shipping business environments, and domestic shipbuilding and repairing capabilities. MARINA’s role has been strengthened under the new maritime administration regime empowered by RA 9295. Among the Study’s identified critical DSMP issue groups, classification service requirement should be solved with MARINA’s action. Moreover, it is practical to start discussion between DBP and MARINA regarding developmental / missionary routes and their market access, and new shipbuilding at domestic shipyard(s).
4) Reinforcement of DSMP operation team
To overcome time limitation, it is also required to reinforce the present operation unit for DSMP lending. Internal staff relocation is one way and the other way is to utilize external resources within a limited scope. Consultancy service would be effective if qualified consultants, either expatriate or domestic, could be assigned with a well-designed TOR. For example, it is deemed necessary to operationalize the new lending channel between DBP and NMEC.
6. INSTITUTIONAL DEVELOPMENT
JICA-MARINA The Study on Domestic Shipping Development Plan in the Philippines (DSDP)
Final Report
6-1
6. INSTITUTIONAL DEVELOPMENT
6.1 Shipping Framework
6.1.1 Historical Overview
Philippine history has long been intertwined with shipping. Long before the Spaniards came, the Filipinos have been a sea-faring and shipbuilding people. Our forefathers constructed balanghai, one of the ancient types of sailing vessels used in Southeast Asia. They have had extensive contacts with the Chinese sea-faring merchants. The sea and shipping is in the blood of the early Filipinos.
When the Spaniards subjugated the Filipinos for more than three hundred years, shipping took further influence in the history and economy of the country. Spain was then one of the world’s major maritime powers with colonies scattered all over the world. The Galleon Trade is almost synonymous with the Spanish colonial rule in the Philippines. Galleons were built in the country (that is how Puerto Galera got its name), and these plied the trading route to Acapulco, Mexico. Shipping had its heydays then.
Viewed from this scenario, it is understandable then that the Spaniards began to regulate shipping. From 1582 to 1828, the Spanish Customs Law was the governing law on the collection of export and import duties. In 1891, the Tariff Law established specific duties on all imports and on certain exports.
The Philippines already had a well-developed maritime industry when it came under the American Rule. When the Americans came in 1898, one of the first steps undertaken by the Military Government was the reopening of the port and customs facilities of Manila. The Insular Government through the Philippine Commission enacted on 17 October 1901 a law creating the Bureau of Coast Guard and Transportation under the Department of Commerce and Police.
On 26 October 1905, the Philippine Commission Act No. 1407 abolished the Bureau of Coast Guard and Transportation and its functions were taken over by the Bureau of Navigation.
The Bureau of Navigation, in turn, was abolished on 19 December 1913. Its property, equipment, personnel, functions and duties were transferred to the Bureau of Customs and the Bureau of Public Works.
Being an American colony, the Philippines also came under the cabotage regime of the Jones Act of 1920.
In the Philippine Commonwealth era, shipping was identified as one of the public services to be regulated under the Public Service Act of 1936 (Commonwealth Act No. 146). The Public Service Commission was mandated to regulate all public utility services. This law encouraged investments in shipping through the award of exclusive franchises to liners, which gave operators security of investments and ensured viability of shipping routes with a fixed return on investments. In return, liner vessels must service fixed routes and offer fixed sailing schedules. The non-liner trade, or tramps, was not subject to the same regulations as the liner operators. They were allowed to freely negotiate their rates and contracted directly with shippers. Hence, the guarantee of having a fixed return on investments was not extended to them.
For so many years, one shipping company dominated domestic shipping. This was Compana Maritima. Many shipping companies were also active during the 50’s and 60’s. Some of these are: William Lines Inc., Gothong Lines Inc., Aboitiz Shipping
JICA-MARINA The Study on Domestic Shipping Development Plan in the Philippines (DSDP) Final Report
6-2
Corporation (these three companies merged in 1995 to become William Gothong & Aboitiz, Inc. [WG&A Inc.] to become the country’s largest shipping company), Negros Navigation Company, Sulpicio Lines, and Escano Lines.
This situation remained for many decades until Executive Order No. 1, otherwise known as the Integrated Reorganization Plan of 1972 issued by President Marcos, chopped the Public Service Commission into smaller agencies and created the Board of Transportation to regulate all transport utilities.
On 01 June 1974, the Maritime Industry Authority (MARINA) was created with the issuance of Presidential Decree No. 474. It was given the mandate to integrate the development, promotion and regulation of the maritime industry in the country. This mandate was further expanded with the transfer of the quasi-judicial function of the Board of Transportation pertaining to water transportation.
The Philippine Ports Authority was created on 11 July 1974 under Presidential Decree No. 505, which was subsequently amended by P.D. No. 857 in December 1975 and later by Executive Order No. 515 in 1978 and Executive Order No. 159 in 1987. This was to implement the recommendation of the World Bank, which stipulated the creation of a port authority to oversee the implementation of projects under a port development loan in 1973.
On 23 July 1979, the Ministry (now Department) of Transportation and Communications was created through the issuance of Executive Order No. 546. MARINA was attached to this Ministry (Department) for policy and program coordination.
Other developments also had indelible effects on domestic shipping. These are containerization, RoRo transportation system, fast ferries, the Doña Paz and Doña Marilyn maritime disasters of 1987 and 1988, and the liberalization/deregulation policy of government.
The Doña Paz and Doña Marilyn tragedies, two of world’s worst maritime peacetime accidents, prod the government to have a hard look at what’s ailing the domestic shipping industry. On 22 November 1988, the Executive Secretary, by authority of then President Corazon C. Aquino, issued Memorandum Circular No. 87, creating the Presidential Task Force on the Inter-Island Shipping Industry. This Task Force was given the mandate to formulate short-term measures and medium-term plans for the improvement of the inter-island shipping industry and to recommend appropriate measures thereto. The DOTC served as the Chairman with members from the Department of Agriculture, Department of Trade and Industry, National Economic and Development Authority, Presidential Management Staff, Philippine Coast Guard, Philippine Ports Authority, Maritime Industry Authority, and one private sector representative.
The Task Force completed its Final Report in April 1989. It recommended several policy measures intended to improve maritime safety and provide a healthy economic environment wherein the domestic shipping industry would thrive. Two of its major recommendations are to improve the maritime safety system and infrastructure and to liberalize/deregulate the domestic shipping industry.
This was a high water level mark in domestic shipping industry. The succeeding years saw more government initiatives in the development of domestic shipping, and more projects for the development of ports and lighthouses.
On 03 May 2004, the Philippine Congress enacted into law Republic Act No. 9295, otherwise known as the Domestic Shipping Development Act of 2004. We still have to see what impacts this would have on the domestic shipping industry.
JICA-MARINA The Study on Domestic Shipping Development Plan in the Philippines (DSDP)
Final Report
6-3
6.1.2 Shipping Related Laws and Regulations
The following are the laws, including Presidential issuances that have the effect of a law, which had a profound effect on Philippine shipping through the years:
(1) The Jones Act, officially known as the US Merchant Marine Act of 1920. This laid the foundation for the tenet of prohibiting foreign ship operators from carrying domestic trade. In the Philippine setting, it was initially applied to trade between the United States and the Philippine archipelago while regulatory power over sea transport between ports and places within the Philippines was delegated to Philippine authorities.
(2) The Public Service Act of 1936, or Commonwealth Act No. 146. This Act included the operation, management of “steamboat or steamship line, pontines, ferries, and water crafts, engaged in the transportation of passengers or freight or both, shipyards, marine railways, marine repair shops, [warehouse] wharfs or docks” as public service {Section 13 (b)}, and as such requires the possession of a valid and subsisting “certificate of public convenience” or certificate of public convenience and necessity” {Section 15}. The law also provided for the power of the state to regulate the rates and routes and to impose service and safety standards {Section 16}.
(3) Executive Order No. 1 of 1972 or the Internal Reorganization Plan. The Board of Transportation was created and regulatory powers of the Public Service Commission over transportation utilities were given to it.
(4) Presidential Decree No. 474 dated 01 June 1974 or the MARINA Charter. MARINA was created with the mandate to integrate the development, promotion and regulation of the maritime industry in the country.
(5) Presidential Decree No. 505, dated 11 July 1974, as amended by P.D. No. 857 and Executive Order Nos. 513 (1978) and 159 (1987), or the Philippine Ports Authority Charter. The PPA was mandated to administer and manage the country's ports and to oversee the implementation of an integrated program for the planning, development, financing, operation and maintenance of ports or port districts for the entire country.
(6) Presidential Decree No. 666 provided incentives for the Shipbuilding and Ship Repair Industry.
(7) Presidential Decree No. 667 provided incentives for the shipping industry by granting additional deductible items for income tax purposes.
(8) Executive Order No. 546 dated 23 July 1979 or the ministry (Department) of Transportation and Communications (MOTC) Charter. The Ministry of Public Works, Transportation and Communications was abolished and in its place two Ministries were created, the Ministry of Public Works and the Ministry of Transportation and Communications. A separate Ministry was created to give more focus to the transportation and communications sectors of the country. By virtue of this EO, MARINA was also transferred from the Office of the President and attached to MOTC for policy and program coordination.
(9) Executive Order No. 1011 dated 20 March 1985, abolishing the Board of Transportation and transferring the quasi-judicial functions pertaining to maritime transportation of said Board to MARINA, among others.
(10) Executive Order No. 125, dated 30 January 1987, as amended by EO 125-A dated 13 April 1987. These EOs reorganized and streamlined the functions of the MOTC and its attached agencies.
(11) Executive Order No. 477 dated 15 April 1998, transferring the Philippine Coast Guard to the Department of Transportation and Communications.
JICA-MARINA The Study on Domestic Shipping Development Plan in the Philippines (DSDP) Final Report
6-4
(12) Republic Act 5173, otherwise known as the Philippine Coast Guard Law. This law mandates the creation of the Philippine Coast Guard, which shall enforce all applicable laws on the high seas and territorial waters of the Philippines.
There are other Presidential issuances, which do not have the effect of a law that also affected domestic shipping. Some of these issuances are:
(1) Executive Order No. 185. This provided the policy guidelines in opening the domestic water transport industry to new operators and investors.
(2) Executive Order No. 213. This issued the landmark policy of deregulating domestic shipping rates.
(3) Executive Order No. 314 established a National Maritime Safety Coordinating Council.
(4) Executive Order No. 170, dated 22 January 2003, as amended by EO 170-A, dated 09 June 2003 and EO 179-B, dated 19 September 2005. This established policy guidelines to promote private sector participation and investment in the development and operation of the roll-on/roll-off terminal system.
In support to the foregoing laws and presidential proclamations, and in furtherance of its mandate to promote, develop and regulate the domestic shipping industry, the MARINA issued the following Memorandum Circulars:
(1) MC No. 9, as amended by MC No. 90. This set out the guidelines on vessel registration and documentation.
(2) MC No. 12, as amended by MC No. 13. This provided guidelines on the implementation of PD 1059.
(3) MC No. 14. This gave the amendments to the Rules and Regulations implementing PD 666.
(4) MC No. 37. This provided the guidelines on Student Fare Discounts.
(5) MC No 40, as amended by MC Nos. 40-A, 40-B and 149. This set the policy on Compulsory Passenger Insurance Coverage and set the amount thereof.
(6) MC No. 44. This put forth the requirements on Tramping Operators to secure a Certificate of Public Convenience and to pay the Annual Supervision Fee.
(7) MC No. 46, as amended by MC Nos. 57, 59 and 92. This set the implementing guidelines on the Rate Increase and Changes in Level and Structure.
(8) MC No. 48. This instituted measures to control overcrowding/overloading and scalping of tickets in inter-island vessels.
(9) MC No. 64. This set the guidelines for the legalization of “Colorum” water transport vessels in the coastwise trade.
(10) MC No. 65, as amended by MC No. 65-A. This set the Minimum Service Standards for Philippine-Registered Inter-Island Passenger Vessels.
(11) MC No. 67. This provided the Implementing Guidelines on the Automatic Fuel Adjustment Mechanism and the +10%/-15% Limit on the Fork Tariff System
(12) MC No. 72, as amended by MC No. 136. This gave the guidelines on the implementation of at least 10-minute film on the safety features of each specific Passenger or Passenger/Cargo Vessels.
(13) MC No. 74, as amended by MC No. 74-A. This issued the Rules of Practice instituting Summary Procedures in application for Certificate of Public Convenience (CPC), Provisional Authority (PA), or Special Permit (SP).
JICA-MARINA The Study on Domestic Shipping Development Plan in the Philippines (DSDP)
Final Report
6-5
(14) MC No. 79, as amended by MC Nos. 79-A and 142. This promulgated the guidelines on the accreditation of Domestic Shipping Enterprises or Entities.
(15) MC No. 88. This set the guidelines on MARINA’s assumption of its functions under the provisions of EO 125/125-A.
(16) MC No. 89, as amended by MC No. 89-A. This promulgated the implementing guidelines for Vessel Safety Regulations.
(17) MC No. 91. This repealed all MARINA Circulars and Rules pertaining to the issuance of Special Permits for Fishing Vessels to operate overseas.
(18) MC No. 94, as amended by MC No. 108. This laid down the guidelines for the accreditation of Maritime Surveying Companies/Entities for the purposes of vessel registration.
(19) MC No. 95. This set the Revised Implementing Guidelines on the Licensing of Shipbuilders, Ship Repairers, Afloat Repairers, Boatbuilders, and Shipbreakers.
(20) MC No. 100. This provided the guidelines for the annotation/cancellation of Mortgages and Transfer of Rights and Other Encumbrances of vessels.
(21) MC No. 101. This set the guidelines on the issuance of a Special Permit to carry Dangerous/Hazardous Cargoes or Goods in Packaged Form.
(22) MC No. 102. This provided the schedule of Energy Tax for the utilization /operation of Pleasure/Recreational Watercrafts
(23) MC No. 104. This set the omnibus guidelines for the acquisition of vessels for domestic operations and fishing vessels/boats.
(24) MC No. 105, as amended by MC No. 105-A. This issued the guidelines on the temporary utilization of Foreign-Owned/Registered Vessels and Philippine-Registered Overseas Vessels in the domestic trade.
(25) MC No. 106, as amended by MC No. 161. This provided the Implementing Rules and Regulations on EO 185, mandating the opening of Domestic Water Transport Industry to new operators and investors.
(26) MC No. 107, as amended by MC Nos. 187 and 202. This updated the Annual Supervision Fee.
(27) MC No. 109. This set the schedule of penalties and/or administrative fines relative to Vessel Registration/Licensing/Documentation And Vessel Safety Regulation.
(28) MC No. 110. This provided for guidelines for the Issuance/Renewal of Coastwise License (CWL), Bay and River License (BRL) and Pleasure Yacht License (PYL).
(29) MC No. 112. This set the policy guidelines on the refund/revalidation of passenger tickets for inter-island vessels, decorum of the Carrier and its employees, and delayed and unfinished voyage.
(30) MC No. 114. This promulgated preventive safety measures and other concerns.
(31) MC No. 119, as amended by MC No. 156. This set the schedule of fees on Vessel Lay-Up.
(32) MC No. 121. This laid down the policy guidelines in the regulation of High Speed Craft.
(33) MC No. 123. This provided the guidelines on the wearing of lifejackets during boarding and/or prior to departure by all passenger vessels with open deck accommodation.
(34) MC No. 124, as amended by MC Nos. 124-A and 199. This issued the revised
JICA-MARINA The Study on Domestic Shipping Development Plan in the Philippines (DSDP) Final Report
6-6
Classification Requirements for vessels in the domestic trade.
(35) MC No. 125, as amended by MC No. 140. This set the guidelines on the adoption of Passenger Service Rating System (PSRS) and the general provision for its implementation.
(36) MC No. 128. This issued the revised guidelines for tankers and barges carrying oil and petroleum products.
(37) MC No. 133. This issued the revised definition of Near-Coastal Voyages under the Philippine Merchant Marine Rules and Regulations, 1997 (PMMRR ’97)
(38) MC No. 134. This set the minimum service standards for motorbancas below 20 Gross Tons (GT).
(39) MC No. 135. This laid the rules on the implementation of voice tape on the safety features of a vessel.
(40) MC No. 139. This gave the guidelines on deputation for purposes of implementing and enforcing Maritime Safety Rules and Regulations.
(41) MC No. 143. This set the rules and regulations to implement the International Safety Management (ISM) Code in Domestic Shipping.
(42) MC No. 144, as amended by MC Nos. 157, 167 and 172. This provided the guidelines on Pro-Poor Reduced Vessel Fees.
(43) MC No. 145. This set the rules in the implementation of Rule I/6 of the PMMRR ’97 and in the conduct of Underwater Surveys for Classed Passenger and Cargo or Combination Cargo-Passenger Vessels and non-Classed Passenger and Cargo Vessels.
(44) MC No. 147. This issued the rules on compliance with clearance requirements for vehicles, animals, plants, forest products, fish and aquatic products, minerals and mineral products, and toxic and hazardous materials to be loaded onboard inter-island ships.
(45) MC No. 148. This provided amendments to Chapter XVIII of the PMMRR ’97 on minimum safe manning for ships in the domestic trade.
(46) MC No. 150. This gave guidelines on the introduction of a second-class non-air-conditioned passenger accommodation and prescribing its minimum service standards.
(47) MC No. 152, as amended by MC No. 178. This provided amendments to Chapter I, Regulation I/6 of the PMMRR ’97 on Inspection, Drydocking and Statutory Certificates.
(48) MC No. 153, as amended by MC No. 195. This issued the Revised Rules and Regulations Implementing the Deregulation of Shipping Rates.
(49) MC No. 154. This reiterated the Safety-Related Policies/Guidelines/Rules and Regulations and strict compliance thereto.
(50) MC No. 158. This adopted the Cargo Rating System.
(51) MC No. 159. This provided the guidelines for the adoption of a National Safety Management (NSM) Code and provided the Rules and Regulations for its implementation in domestic shipping.
(52) MC No. 165. This set the rules on the accreditation of Classification Societies and Entities for the purpose of classification of ships in domestic trade.
(53) MC No. 168. This set the guidelines on Mandatory Ship Reporting System.
(54) MC No. 175. This provided the guidelines for mandatory display of the maximum
JICA-MARINA The Study on Domestic Shipping Development Plan in the Philippines (DSDP)
Final Report
6-7
authorized passenger capacity for passenger-carrying motor bancas with open-deck accommodation and similar watercrafts.
(55) MC No. 176. This mandated the wearing or holding of lifejackets by passengers of motorized bancas and similar water transport carrying passengers.
(56) MC No. 177. This set the regulations amending Chapter XV of the PMMRR ’97 on the registration, documentation and licensing of ships.
(57) MC No. 179. This set the guidelines for the issuance of Minimum Safe Manning Certificate for Philippine-Registered Ships/Fishing Vessels Operating in Philippine Waters or temporarily utilized in overseas trade/international waters.
(58) MC No. 180. This set the rules to govern Passenger Manifests on board Philippine-Registered Passenger ships.
(59) MC No. 184. This issued the Revised Rules governing mandatory cover against Civil Liability for Oil Pollution Damage.
(60) MC No. 186. This laid the rules on accreditation of Maritime Enterprises.
(61) MC No. 188. This provided the Revised Rules on the mandatory submission of Annual Report of Finances and Operation.
(62) MC No. 189, as amended by MC No. 192. This promulgated the rules providing indemnity of P100,000 to each unmanned passenger onboard passenger-carrying ships in the domestic trade.
(63) MC No. 190. This laid the rules on the progressive/gradual phase out of wooden-hulled ships in the domestic trade.
(64) MC No. 196. This provided the rules on the introduction of reclining seat accommodation in passenger carrying ships in the inter-island trade.
(65) MC No. 197. This issued the revised rules to rationalize Life-Saving Appliances requirements under Chapter IX of the PMMRR ‘97
(66) MC No. 198. This set the rules on updating the Philippine Domestic Ship Registry.
Moreover, as the Flag State Administration, MARINA issued the following Flag State Advisories that directly affect domestic shipping:
(1) FSA 01 – List of Organizations Recognized by the Administration
(2) FSA 02 – Philippine Merchant Marine Rules and Regulations, 1997
(3) FSA 03 – Behavior of Seafarers Transacting with the Flag Administration
(4) FSA 05 – Carriage of Cargo Securing Manual Onboard Ships
(5) FSA 07 – Compliance with the International Convention on Civil Liability for Oil Pollution Damage, 1992
(6) FSA 08 – Implementation of the ISM Code in the Philippines
(7) FSA 09 – Exemption from Compliance/Extension of Period to Comply with the Global Maritime Distress and Safety System (GMDSS)
(8) FSA 10 – Use/Installation of Monitoring Cameras Onboard Passenger-Carrying Vessels Operating in the Domestic Trade
(9) FSA 15 – Regulations Governing the Operation of High Speed Crafts
(10) FSA 16 – Full Implementation of the International Safety Management (ISM) Code by 01 July 2002
(11) FSA 17 – Preventing and Suppressing Acts of Piracy and Armed Robbery Against
JICA-MARINA The Study on Domestic Shipping Development Plan in the Philippines (DSDP) Final Report
6-8
Ships
(12) FSA 18 – Measures to Ensure Safety of the Riding Public
(13) FSA 19 – Alert Actions on Vessels Involved in Rice Smuggling and Other Nefarious Activities
(14) FSA 21 – Wearing of Lifejackets During Boarding and Prior to Departure by All Passengers in the Domestic Trade
(15) FSA 22 – Implementation and Enforcement of the Exclusion and Safety Zones Established under Proc. No. 72
(16) FSA 23 – Implementation of the Code of Safe Practice for Cargo Stowage and Securing in Domestic Shipping
(17) FSA 24 – Special Authority to Operate Passenger and/or Cargo Liner Vessels During Lenten Season from 22 March to 01 April 2002
(18) FSA 25 – Compulsory/ Mandatory Wearing/Holding of Lifejackets for Passengers
(19) FSA 26 – Effectivity of the 2000 Amendments to the International Convention for the Safety of Life at Sea (SOLAS) 1974, as Amended
(20) FSA 27 – Additional Measures to Ensure the Safety and Security
(21) FSA 28 – Special Authority to Operate Passenger and/or Cargo Liner Ships During Holiday Season
(22) FSA 29 – Amendment to MARINA MC No. 159 on Coverage
(23) FSA 30 – Crowd/ Crisis Management and Human Behavior Training on Passenger and RoRo Passenger Ships and Training on Deck and Engine Watch keeping
(24) FSA 33 - 03 - Implementation of Shipboard Marine Pollution Emergency Plan for Noxious Liquid Substances
(25) FSA 34 - 03 - Reiteration of the Flag State Administration Advisory No. 027, Series of 2002 on the Additional Measures to Ensure the Safety and Security of Our Ships, their Passengers and Cargoes
(26) FSA 37 - 03 - Guidance on the Implementation of MARINA Memorandum Circular No. 159, otherwise known as the National Safety Management (NSM) Code
(27) FSA 38 - 03 - Revised Flag Advisory on the Special Authority to Operate Passenger and/or Cargo Liner Ships During Holiday Season
(28) FSA 39 - 03 - Guidance on the Implementation of MARINA Memorandum Circular No. 179 on the Issuance of the Minimum Safe Manning Certificate (MSMC) for Philippine-Registered Ships/Fishing Vessels Operating in the Philippine Waters or Temporarily Utilized in Overseas Trade/International Waters
(29) FSA 40 - 03 - Indemnity of Ph100,000.00 to each Unmanifested Passenger
(30) FSA 42 - 03 - Drug and Alcohol Testing of all Seafarers Serving Onboard Passenger-Carrying Ships in the Domestic Trade
(31) FSA 43 - 03 - Progressive Retirement of Passenger-Carrying Wooden-hulled Ships in the Domestic Trade
(32) FSA 44 - 03 - Mandatory Filling-up by All Passengers in the Domestic Trade of a Health Checklist From
(33) FSA 45 - 03 - Extension of Moratorium on Compliance with Certain Life-Saving Appliances Required Under the PMMRR
(34) FSA 46 - 03 - Revised Class Requirement for Philippine-Registered Domestic
JICA-MARINA The Study on Domestic Shipping Development Plan in the Philippines (DSDP)
Final Report
6-9
Ships
(35) FSA 47 - 03 - Extension of Moratorium on Compliance with Certain Life-Saving Appliances Under the PMMRR
(36) FSA 48– 03 - Deferment of the Implementation of MARINA Memorandum Circular No. 190 (Rules on the Progressive/Gradual Phase-Out of Wooden-hulled Ships in the Domestic Trade)
(37) FSA 49 - 03 - Introduction and Use of Reclining Seats in the Second Class Air-Conditioned Passenger Accommodation of Passenger-Carrying Ships Engaged in the Domestic Trade
(38) FSA 50 - 03 - Security Measures to Protect Critical Infrastructures
(39) FSA 51 - 03 - Additional Measures to Ensure the Safety and Security of our Ships, their Passengers and Cargoes
(40) FSA 52 - 03 - Effectivity of the 2001 and 2002 Amendments to the International Convention for the Safety of Life at Sea (SOLAS), As Amended
The Philippine Coast Guard (PCG) is tasked to perform functions related to the safety of life and property, search and rescue, and marine environmental protection.
The aspect of safety falls under the Maritime Safety Administration (MARSAD) function of PCG. MARSAD refers to vessel safety and navigational safety. PCG has the following policy issuances:
(1) MC 01-82 of 17 January 1982 – Rules and Regulations Prescribing the Establishment and Administration of Private Aids to Navigation and the Uniform Marking of Sunken Wrecks and Obstruction.
(2) MC 05-95 of 13 October 1995 – Vessel Safety Evaluation – as it applies to all Philippine-registered vessels plying the domestic trade – evaluating the status of safety in all aspects aboard domestic vessels, recommend corrective measures, and if necessary, conduct re-inspections to ensure compliance.
(3) MC 01-96 of 15 April 1996 – Guidelines for Checking Unauthorized Persons on Board Domestic Vessel for Every Voyage – as it applies to all Philippine registered/certified passenger vessel in the domestic trade.
(4) MC 02-96 of 9 May 1996 – Carriage of Dangerous Goods for the safe handling, carriage and transfer of dangerous goods for the promotion of safety of life at sea.
(5) MC 03-98 of 21 May 1998 – Guidelines on Movements of Vessels during Heavy Weather – in order to enhance maritime safety especially during the existence of a tropical depression or typhoon that makes sea travel dangerous.
(6) SOP 01-98 of 23 January 1998 – Flag State Control Inspection of Ships in accordance with existing laws, rules and regulations pertaining to safety of life and property at sea, marine pollution prevention, minimum standards regarding shipboard condition of employment and living arrangements, social and labor conditions, manning and competency of seafarers.
(7) MC 07-00 of 3 April 2000 – Guidelines for Checking Unauthorized Persons on Board Domestic Vessels – in order to ensure that there will be no carriage of excess passengers during any voyage and to set forth the responsibilities of all sectors involved.
On Maritime Search and Rescue, PCG issued the following:
1) SOP 07-96 – Distress Monitoring Procedures
2) SOP 08-96 – SAR Alert and Execution
JICA-MARINA The Study on Domestic Shipping Development Plan in the Philippines (DSDP) Final Report
6-10
On Marine Environmental Protection (MAREP), PCG issued the following for the prevention and control of marine pollution:
(1) Accreditation of Oily Water Separators, Oil Containment Recovery and Dispersal Equipment, and Chemical Dispersants
(2) MC 01-85 of 18 March 1985 – Rules and Regulations for Tank Cleaning Operations of Vessels/Oil Tankers
(3) MC 08-91 – Marine Pollution Inspection/Apprehension Report
(4) MC 04-93 of 8 March 1993 – Shipboard Oil Pollution Plan for Philippine Registered Vessels
(5) MC 03-94 of 26 August 1994 – Prevention, Containment, Abatement and Control of Marine Pollution
On Maritime Law Enforcement, PCG issued MC 02-84 on 16 April 1984 regarding Shipment of Vehicles, Vehicle Engine, Bodies and Chassis aboard inter-island commercial vessels and ferryboats. These shall be covered by clearance from the Constabulary Highway Patrol Group or from any of its regional offices.
Although the prime objective of the Philippine Ports Authority is to coordinate, streamline, improve and optimize the planning, development, financing, construction, maintenance and operation of ports, port facilities, port physical plants, and all equipment used in connection with the operation of a port, PPA also issues rules and regulations on Vessel Operations that directly affect domestic shipping operations.
The rules and regulations on Vessel Operations are in line with PPA’s other objectives of: (a) to ensure the smooth flow of water borne commerce passing through the country’s ports whether public or private, in the conduct of international and domestic trade and (b) to foster inter-island sea borne commerce and foreign trade. Hereunder are some of these relevant orders:
(1) PPA AO 03-92 of 25 June 1992, as amended by PPA MC 15-93 of 20 May 1993 and PPA AO 09-95 of 7 March 1995 – Implementing Guidelines of Executive Order No. 493 Entitled “Removing Red Tape and Reducing Clearance Requirements for Inter-island Vessels – referring to the deputation/delegation of clearance function to PPA.
(2) PPA MC 14-93 of 3 May 1993 – Subscription and Oath on Coasting/Passenger Manifests in Line with Executive Order No. 493 – that Coasting and Passenger Manifests of domestic vessels shall be subscribed and sworn to before the duly designated PPA Clearance Officer.
(3) PPA MC 36-94 of 15 December 1994 on MARINA/PCG Memorandum of Agreement that in the conduct of vessel inspection, the PCG-MARINA MOA states that: (a) MARINA’s inspections will be for purpose of issuance or renewal of certificates, permits or licenses that vessels are required to carry while (b) PCG’s inspections will be for purpose of verifying compliance to existing national and international laws, rules and regulations, and for law enforcement.
(4) PPA MC 13-96 of 11 March 1996 – Joint Task Force “Ligtas-Laot” (with representatives from PCG, MARINA, and PPA) to Conduct Inspections of All Domestic Passenger Vessels of 15 GRT and above, to ensure the safety of life and property on board vessels.
(5) PPA MC 19-96 of 30 April 1996 – Revised Guidelines and Standard Operating Procedures in the Port during Inclement Weather – to promote the safety of vessels, facilities, users and port operations during storms/typhoons (from Storm Signal No. 1 to Storm Signal No. 4)
JICA-MARINA The Study on Domestic Shipping Development Plan in the Philippines (DSDP)
Final Report
6-11
(6) PPA MC 20-96 of 8 May 1996 – MOA between MARINA and PCG – that the withholding of a vessel’s clearance by PPA’s Port District Office/Port Management Office shall be effective upon receipt of an official written request/notice from the PCG to hold a vessel for violation of vessel regulatory functions.
(7) PPA MO 12-97 of 23 October 1997 – Monthly Notice of Arrival/Application for Berth/Clearance of Regular-Run Fast Ferries – to facilitate the entrance/departure documentation procedures of regular-run fast ferries.
(8) PPA MC 19-99 of 19 April 1999 – MOA among DOTC, DENR, DA and DILG on the Movement of Domestic Cargoes and Motor Vehicles/Parts through the Ports – that a Port Integrated Clearance Office (PICO) shall be established in PPA-manned ports to serve as a one stop shop, which shall house authorized personnel of the agencies involved in the granting of clearances.
(9) PPA MC 04-2001 dated 15 January 2001, provided adjustments on Cargo Handling Tariff Rates.
(10) PPA MC 05-2002 dated 28 January 2002 provided the Procedures in the Conduct of Public Hearings for Rate Increases.
(11) PPA MC 13-2002 dated 07 March 2002 set the guidelines on the Reduction of Documentary Requirements for Arrival and Departure Clearance for Domestic and Foreign Vessels.
(12) PPA MC 27-2002 dated 22 July 2002 provided the Guidelines in the Collection of Port Charges and Cargo Handling Charges for Domestic Operations.
(13) PPA MC 38-2002 – Guidelines on the Proper Treatment of Vessels Operating under MARINA Memorandum Circular No. 166 (Rules on the Utilization of Domestic Ships in the Overseas Trade/Operation) – in order to ensure the proper treatment, assessment and collection of port charges on Philippine-registered vessels documented for domestic operation and granted special permit to engage in overseas operations of MARINA MC No. 166.
(14) PPA MC 40-2002 dated 16 October 2002 on the Performance Evaluation of Harbor Pilots in Rendering Pilotage Services to Vessels.
(15) PPA MC 44-2002 of 19 November 2002 – DOTC Department Order No. 2002-46 of 17 October 2002 Re: Rules and Regulations in the Implementation of the DOTC Department Order No. 2002-26 – that MARINA-PCG-PPA Joint Inspection Team shall undertake the safety inspection of all types and sizes of transport watercrafts/vessels carrying cargo and passengers in the domestic trade.
(16) PPA MC 04-2003 dated 17 February 2003 set the Guidelines on the Movement and Documentation of Domestic Containers/Cargo at South Harbor
(17) PPA MC 08-2003 dated 20 March 2003 provided the guidelines for the Accomplishment and Submission of the Revised Vessel Information Sheet.
(18) PPA MO 11-2003 of 28 July 2003 – Submission of Notice of Arrival and Application for Berth/Anchorage.
(19) PPA MO 12-2003 of 28 July 2003 – Submission of Supplementary Vessel’s Manifest – or the amended manifest that shall contain the accurate details and particulars of actual volume of cargoes loaded and passengers embarked onto a vessel.
(20) PPA MC 40-2003 of 23 December 2003 – Ship to Shore Communications Systems – in relation to the filing and submission of the Application of Berth and the Notice of Arrival with PPA through the use of either a VHF radio (Channel 16-International Marine Channel), a mobile cellular phone, or through the official telephone numbers of landline.
JICA-MARINA The Study on Domestic Shipping Development Plan in the Philippines (DSDP) Final Report
6-12
(21) PPA Administrative Order No. 03-2004 dated 15 December 2004 set the Guidelines on the Development, Construction, Management and Operation of Ferry Terminals under the Road Roll-On/Roll-Off Terminal System (RRTS)
The government agencies that have direct supervision, management and control over domestic shipping are the Department of Transportation and Communications and its attached agencies, viz.: Maritime Industry Authority, Philippine Ports Authority and the Philippine Coast Guard. However, there are still quite a number of government agencies and instrumentalities that have indirect control and supervision on domestic shipping. These are:
(1) Department of Environment and Natural Resources
(2) Department of Energy
(3) Department of Agriculture
(4) Department of Interior and Local Government
(5) Department of Tourism
(6) Bureau of Customs
(7) Bureau of Quarantine
(8) Bureau of Plant Industry
(9) Bureau of Animal Industry
(10) Bureau of Fisheries and Aquatic Resources
(11) National Food Authority
(12) Sugar Regulatory Agency
(13) Philippine National Police
(14) Philippine Atmospheric Geophysical and Astronomical Services Administration
(15) National Mapping and Resource Information Authority
(16) National Telecommunications Commission
(17) Videogram Regulatory Board Overseas Shipping
(18) Bureau of Customs
(19) Department of Labor and Employment
(20) Department of Health
(21) Commission on Higher Education Maritime Training Council
(22) Professional Regulatory Commission
(23) National Conciliation and Mediation Board
(24) National Labor Relations Commission
(25) Bureau of Investments
6.1.3 International/Regional Initiatives on Maritime Service Liberalization
In the past decades more and more sectors have been deregulated worldwide and the state-operated industries have been privatized at least in parts. Whatever restraints of trade that still remain are more and more being questioned by authorities. At the same time, liberalization of international service industries gains substantial progress
JICA-MARINA The Study on Domestic Shipping Development Plan in the Philippines (DSDP)
Final Report
6-13
concerning the reduction of restrictions on trade because of establishing the inner market as well as the worldwide agreements of WTO and GATS. However, most of the agreements reached here are for international maritime services and not cabotage or domestic shipping.
The most radical move made in the liberalization of domestic shipping is the European Economic Council Regulation (EEC) No 3577/92 of 7 December 1992, applying the principle of freedom to provide services to maritime transport within Member States (maritime cabotage). The Regulation gave the main reason for the abolition of restrictions on the provision of maritime transport services within Member States is for the establishment of the internal market and that the internal market will comprise an area in which the free movement of goods, persons, services and capital is ensured.
The Regulation, however, acknowledges that the different Member States had differing internal geographic and other characteristics. It, therefore, provided a provision that the implementation of the “freedom should be gradual and not necessarily provided for in a uniform way for all services concerned, taking into account the nature of certain specific services and the extent of the effort that certain economies in the Community showing differences in development will have to sustain;”
The European Union has become more visible in its efforts to assist the shipping industry by pressing for further liberalization in inaccessible markets or countries. Some improvements have recently been achieved in markets in the Far East, notably in China which has concluded a bilateral maritime agreement with the EU. A continued and intensified maritime dialogue is anticipated with such countries as China and India with a view of concluding bilateral agreements.
In India, a new shipping policy was initiated in 1990-91 to promote the development of Indian shipping. Since then several policy reforms have been made in conformity with the liberalization of the economy, including: automatic approval for the acquisition of ships, permission to retain sale proceeds for re-investment, relaxation of Cabotage Laws for container ships and lash barges, and decontrol of freight and passenger fares to promote coastal shipping.
In the United States of America, there was an initiative to amend the Jones Act. This, however, did not prove successful. Nonetheless, they will always point to the fact that in 1998 they passed the Overseas Shipping Reform Act, which took effect in May of 1999. Nonetheless, the cabotage rule still applies in domestic shipping, between the mainland and the States of Alaska and Hawaii.
6.2 Fleet Quality Control
6.2.1 Registration
All motorized vessels of domestic ownership and more than three (3) gross tons should be registered with the Maritime Industry Authority. If it is used in towing/pushing or carrying goods and/or passengers for hire, it should be registered with MARINA regardless of tonnage.
This requirement holds true even for vessels to be used in international waters as long as Philippine nationals own it. It is the duty of the owner or agent of the vessel to immediately file an application with MARINA.
The registration of a vessel for domestic trade is to be made at the original homeport or at the nearest MARINA office, if the homeport has no registrar. For vessels engaged in international trade, registration is to be made in Manila, or any other port
JICA-MARINA The Study on Domestic Shipping Development Plan in the Philippines (DSDP) Final Report
6-14
as designated by MARINA. This homeport shall be referred to as the Port of Registry.
As evidence of such registration, MARINA shall grant a Certificate of Philippine Registry (CPR), provided that such a vessel has secured a ship identity certificate (e.g. for Certificate of Number for vessels below 3 GT).
To secure registration of a vessel overseas, the owner, master or agent shall file the application and present the required documents for the acquisition of the vessel to be registered to MARINA at the Port of Registry of such vessel.
For domestic registration, the owner or agent shall file a request to MARINA for the inspection of the vessel upon its arrival in the country and prior to release from custody of the Bureau of Customs (BOC). After release from the custody of BOC the owner or charterer or agent shall apply with MARINA for the issuance of a CPR together with the submission of required documents.
A vessel constructed and/or acquired abroad through importation or bareboat charter or lease-purchase must first secure a Provisional Certificate of Philippine Registry (PCPR) from MARINA before it can be brought to the Philippines. The application shall be duly supported with the required documents. If the application is found in order, MARINA shall endorse the same to the Department of Foreign Affairs for the issuance of a PCPR by the nearest Embassy or Consulate.
An application for an original assignment of a proposed name for a vessel shall be made concurrently with the application for registration. MARINA shall ensure that no there are no duplication of names of the same class and rig.
Upon registration of a vessel, MARINA shall issue a Certificate of Ownership (CO).
MARINA shall maintain a registry of ships to be known as “Register of Philippine Ships.” It shall be made available for free inspection by the public during regular office hours. Separate registers shall be maintained for ships engaged in domestic and international trade. The register shall contain the following particulars of a vessel:
(1) Name of ship;
(2) Former name and registry (if applicable);
(3) Type of ship;
(4) Call sign;
(5) Official number;
(6) IMO number (applicable to pax ships of 100 GT and above, and all cargo ships of 300 GT and above)
(7) Hull material;
(8) Principal dimensions;
(9) Tonnages (Gross/Net/Deadweight);
(10) Classification Society;
(11) Horsepower (KW);
(12) Main engine;
(13) Year built;
(14) Builders and place built;
(15) Name, nationality and business address/residence of owner/operator;
JICA-MARINA The Study on Domestic Shipping Development Plan in the Philippines (DSDP)
Final Report
6-15
(16) Homeport;
(17) Date of issuance of CPR; and
(18) Any material change in respect to any of the preceding items including records of encumbrances.
Amendments, rectifications, revisions, changes and deletion in registration, homeport, vessel name, and ownership are detailed in Chapter XV of the Philippine Merchant Marine Rules and Regulation.
6.2.2 Inspection, Classification, Certification
MARINA as the Administration, enforces the provision of the Philippine Merchant Marine Rules and Regulations regarding the inspection, survey and marking of vessels, etc. MARINA is also authorized to use surveyors or organizations to carry out this mandate. Should MARINA authorize a surveyor or an organization, it shall be with the power to carry out inspections and surveys if requested by the appropriate authorities of the State and to require repairs to a ship.
As part of MARINA’s continuing efforts to keep its safety regulations and systems apace with technical advancements and cognizant of actual conditions in the field, MARINA formulated and adopted the Ship Safety Information System (SSIS) in 2003. This was revised in 2005.
Inspections of hull, boilers, machinery, firefighting/lifesaving appliances, pilot ladders, navigation lights and other details specified in the ship’s certificate are to be made annually.
When an authorized surveyor determines that the condition of the vessel does not correspond substantially with the particulars of the ship safety certificates, or if the vessel is not fit to proceed to sea without danger to the vessel or persons on board, then the authorized surveyor shall immediately ensure that corrective action is taken and should notify MARINA in due course. If such corrective action is not taken, the relevant safety certificate shall be withdrawn immediately. If the vessel is in the port of another party, the appropriate port State shall also be notified immediately.
MARINA shall fully guarantee the completeness and efficiency of the inspections and surveys, and shall undertake to establish the necessary arrangements to satisfy this obligation.
The following are the inspections/surveys to be undertaken and their frequencies:
(1) Initial Survey – This is done before the vessel is put in service. This will include the inspection of the outside of the ship’s bottom;
(2) Renewal Survey – This is done at intervals specified by MARINA, but not exceeding five years;
(3) Periodic/Intermediate Survey – This is done within three months before or after the second anniversary date or within three months before or after the third anniversary date of the Certificate. This will take the place of one of the Annual Surveys;
(4) Annual Survey – This is undertaken within three months before or after each anniversary date of the Certificate;
(5) Additional Survey – This is only required when the occasion arises;
JICA-MARINA The Study on Domestic Shipping Development Plan in the Philippines (DSDP) Final Report
6-16
(6) Inspections of the Ship’s Hull. Two inspections of this nature would be required in a five-year period. The inspection of the outside of the ship’s bottom would be included.
(7) Unclassed vessels shall be required to dry-dock every two years; unclassed passenger vessels shall be required to dry-dock every year.
MARINA maintains a roster of recognized Classification Societies to class Philippine vessels. Vessels classed by such a Classification Society shall be class-maintained and dry-docked in accordance with the schedule prescribed by the rules of the Classification Society. In addition to this requirement, classed passenger vessels shall also undergo underwater survey by a recognized underwater surveying company if it cannot undergo dry docking within the prescribed schedule pursuant to MC 152.
Table 6.2.1. Vessel Classification requirements
Vessel Type Classification Requirements Passenger-carrying ships 500 GRT and above; passenger high speed crafts International classification society (MC 25-D) Passenger-carrying ships 500 GRT and above (if vessel is acquired after January 1, 1997); Tankera and barges hauling petroleum, petroleum by-products, chemicals and other hazardous cargoes (irregardless of GRT); Bulk carriers and Cargo vessels 500 GRT and above)
Any classification society recognized by MARINA (MC 124)
Other tankers and barges 500 GRT and above (imported or chartered); Bulk carriers below 500 GRT; Cargo vessels below 500 GRT
Any international classification society or local classification society recognized by MARINA (MC 104). Classification requirement optional effective January 1, 1997 subject to petinent provisions.
Passenger-carrying ships below 500 GRT International classification society (MC 25-D). Classification requirement optional effective January 1, 1997 subject to pertinent provisions
Other tankers and barges NOT hauling petroleum or chemicals (imported or chartered); barges logically constructed as of September 20, 1990; Non-propelled boat barges over 3 GRT; vessels 3 GRT and below
No classification requirements
Vessels, depending on their class and category, are issued the following certificates:
(1) Passenger Ship Safety Certificate;
(2) Cargo Ship Safety Construction Certificate;
(3) Cargo Ship Safety Equipment Certificate;
(4) Certificate of Inspection;
(5) Load line Certificate;
(6) Tonnage Certificate;
(7) Radio Telegraphy Certificate or Radio Telephony Certificate;
(8) Exemption Certificate; and
(9) Such other certificates which may be required pursuant to the provisions of national laws, rules and regulations and International Maritime Conventions and Resolutions.
These Certificates are issued or endorsed by MARINA or by any person or organization authorized by it. Nevertheless, MARINA takes full responsibility for the Certificates so issued.
A Ship Safety Certificate is issued to a vessel after the Initial Survey or Renewal Survey shows that it complies with all the relevant requirements of the PMMRR. MARINA shall ensure the completeness of the inspections prior to the issuance of the certificate. A Record of Equipment shall supplement this Certificate.
Special purpose vessels shall be issued a Special Purpose Ship Safety Certificate based on the Initial Survey or Renewal Survey that shows that it complies with the
JICA-MARINA The Study on Domestic Shipping Development Plan in the Philippines (DSDP)
Final Report
6-17
relevant requirements of the PMMRR.
MARINA issues an Exemption Certificate to a vessel when it is granted such an exemption under and in accordance with the provisions of the PMMRR. The Exemption Certificate shall be attached to the certificate to which it refers.
A Ship Safety Certificate and a Special Purpose Ship Safety Certificate shall be issued for a period as specified by MARINA, but shall not exceed five years. An Exemption Certificate shall be valid only for the period of the certificate to which it relates. A Certificate of Inspection (CI) shall be valid for two years subject to mandatory survey on first anniversary date of the CI.
When the Renewal Survey is made within three months before the expiry date of the existing certificate, or after the expiry date of the existing certificate, the new certificate shall be valid to a date not exceeding five years from the date of expiry of the existing certificate. However, if the Renewal Survey is completed more than three months before the expiry of the existing certificate, the new certificate shall be valid to a date not exceeding five years from the completion of the Renewal Survey. If the Renewal Survey has been completed but the certificate cannot still be issued or placed on board the vessel before the expiry date of the existing certificate, the person or organization authorized by MARINA may endorse the certificate and such certificate shall be accepted as valid for a further period of not more than one month from the expiry date.
6.2.3 Wooden-hulled Vessels
Wooden-hulled vessels abound in the Philippines. Considering that many small islands, with small seaborne traffic, make up our archipelago, it is but expected that the laws of economics would dictate that services would be offered by low-cost and low maintenance wooden-hulled vessels.
This condition would have continued without much scrutiny from the public and media, except that through the years, even though the sea transport market between islands grew, the ship owners/operators still stuck with wooden-hulled vessels albeit bigger in dimensions to carry more load and passengers. They came under even stricter scrutiny when such vessels are involved in maritime incidents which resulted in great loss of lives and property.
One such an incident happened in early 1996 when ML Gretchen, a wooden-hulled vessel, capsized only a few hundred yards from its destination, killing at least 54 people. A more recent incident is the collision of MV San Nicholas, a wooden-hulled vessel, with WG&A Superferry 12 off the coast of Limbones Island in May 2003.
In response to the latest maritime incident, President Gloria Macapagal-Arroyo issued a directive to DOTC Secretary Leandro R. Mendoza to undertake the following courses of action:
• Prepare a policy recommendation governing the continued use of wooden-hulled vessels as passenger ships, including rules and regulations on classification implementation for passenger ships, particularly wooden-hulled ships. The MV San Nicolas was a wooden-hulled ship ferrying passengers from Palawan to Manila during stormy weather;
• Organize a performance and capability assessment of the Philippine Coast Guard (PCG) relative to this agency’s functions of enforcing maritime safety standards and overloading rules, and undertaking rescue operations in sea accidents. We have to identify the most immediate, affordable and cost-effective measures to enable the PCG to significantly reduce risks of accidents at sea and fatalities from
JICA-MARINA The Study on Domestic Shipping Development Plan in the Philippines (DSDP) Final Report
6-18
these accidents;
• Draft measures to improve safety in narrow inter-island passages and areas with heavy sea traffic where most accidents occur. Consideration should be given to delineating sea-lanes and implementing better monitoring and communications systems in these areas;
• Submit recommendations or structural, functional and personnel changes to improve the coordination and effectiveness of both MARINA and the PCG in assuring people’s access to safe, affordable and convenient sea travel; and
• Formulate a task force for maritime safety that would include representation from government, shipping industry, maritime schools and other stakeholders. This task force shall formulate recommendations that shall be considered for inclusion among legislative and executive priorities traditionally announced as part of the State of the Nation Address. The office of the President would like to see a non-negotiable level of provisions and standards that assure minimum safety at sea. Government shall require the private shipping industry to comply with such standards, and shall provide assistance necessary for them to comply.
The Multi-Sectoral Task Force for Maritime Safety was formed with the DOTC as the Chairman and MARINA, PCG, PRC, Philippine Ports Authority (PPA), Maritime Training Council (MTC), Philippine Interisland Shipping Association (PISA), Filipino Shipowners’ Associations (FSA), Philippine Association of Maritime Institutions (PAMI), Visayan Association of Ferryboat and Coastwise Service Organization (VAFCSO), Master and Mates Association of the Philippines (MMAP), Philippine Shipbuilders and Repairs Association (PSRA), and Philippine Chamber of Commerce and Industry (PCCI) as members.
One of the major recommendations of the Task Force is the phase out of wooden-hulled vessels. On 11 August 2003, the MARINA Board approved Memorandum Circular No. 190 on “The Progressive/Gradual Phase Out Of Wooden-Hulled Ships in the Domestic Trade.”
However, when this was presented to a forum in Cebu with the Visayan Association of Ferryboats and Coastwise Service Operators (VAFCSO), whose members operate a number of wooden-hulled vessels, it was greeted by protests. VAFCSO said the phase out would result in huge losses to ship owners, saying this would trigger the collapse of the domestic maritime fleet which is 60 percent composed of wooden-hulled vessels and motorized outriggers. Ship owners operating wooden hulled vessels would have to close down unless the government could provide affordable financing for the purchase of steel hulled ships, VAFCSO said.
As an aftermath of this debacle, MARINA was forced to issue Flag State Advisory No. 48-03- Deferment of the Implementation of MARINA Memorandum Circular No. 190 (Rules of the progressive / Gradual Phase-Out of Wooden - Hulled Ships in the Domestic Trade).
JICA-MARINA The Study on Domestic Shipping Development Plan in the Philippines (DSDP)
Final Report
6-19
COLUMN 6-1: MARINA M.C. 190 Rules on the Progressive /Gradual Phase-out of Wooden-hulled Ships in the Domestic Trade. The objectives are further enhancement of the safety of life and property at sea and acceleration of the fleet modernization of ships plying in the domestic trade. The main substances are introduced as follows;
1) The operation of existing wooden-hulled ships shall be gradually phased out.
2) The continued operation of existing wooden-hulled ships covered under this Circular shall be allowed subject to compliance with the additional safety requirements.
3) The MARINA will issue, within sixty (60) days from the effectivity, the standards for wooden-hulled ships which will serve as basis for the development of classification rules.
4) Unless otherwise specially accepted by MARINA, there shall be no approval of ship’s plans and/or registration under Philippine flag of new construction.
5) The entry of wooden-hulled ships in routes already served by steel-hulled, aluminum, fiberglass or any other technologically-improved hull material shall no longer be allowed.
6) The continuing training of ship’s officers and ratings as prescribed shall be strictly enforced. Further, the mandatory testing/actual demonstration of skills/competence of such officers and ratings shall be pursued.
For the existing wooden-hulled vessels, their phase out period with the following additional conditions and service restrictions, are specified as follows:
7) Over 100-500 GT : Three (3) years from effectivity of the Circular
1) To pass the re-inspection to be conducted by the PCG using the Wooden-Hulled Ship Inspection Checklist.
2) The minimum competency/license requirement for the Master 3) Daytime operations only
8) Over 35-100 GT : Five (5) years from effectivity of the Circular
4) To pass the re-inspection to be conducted by the PCG using the Wooden-Hulled Ship Inspection Checklist.
5) The minimum competency/license requirement for the Master 6) Daytime operations only in protected/partly-protected waters.
9) 3. 3-35 GT : Seven (7) years from effectivity of the Circular
7) To pass the re-inspection to be conducted by the PCG using the Wooden-Hulled Ship Inspection Checklist.
8) The minimum competency/license requirement for the Master 9) Daytime operations only in protected/partly-protected waters.
For the enforcement of this circular, the transitory provisions are also provided, such that; 1) Existing operators of wooden-hulled passenger and/or cargo ships may be allowed to continue in
operation, subject to compliance with the additional safety conditions and service restrictions.
2) Wooden-hulled ships which are 75% newly-built or completed, repaired or rehabilitated or converted/altered as of the effectivity of the Circular, whose ship’s plans were previously approved by the MARINA, may still be allowed to be registered under Philippine flag.
JICA-MARINA The Study on Domestic Shipping Development Plan in the Philippines (DSDP) Final Report
6-20
6.3 Recent Government Initiatives in Shipping Development
The lending program of the first Domestic Shipping Modernization Program (DSMP I) has had a positive effect on domestic shipping. The Program was instrumental in the increased procurement of vessels deployed in the domestic route. Consultants were engaged to help both the Development Bank of the Philippines (DBP) and the borrowers evaluate the feasibility studies used in the loan applications. This technical assistance is one reason why most of the borrowers were able to fulfil their repayment terms and conditions.
To pursue further the objectives of DSMP I, the governments of the Republic of the Philippines and Japan approved the implementation of the second package, DSMP II. However, some sectors feel that the new requirement imposed by DBP of real estate collaterals has dampened the enthusiasm of most prospective borrowers to avail of the loan facility.
From the side of DBP, they feel that the focus should not be shipping alone, but more holistic. In their effort to further widen out the positive effects of the program, DBP launched the Sustained Logistics Development Program (SLDP). The main components of SLDP are: a bulk grains highway; a road RoRo terminal system and a cold chain, all of which are critical in fostering economic growth particularly in the countryside. SLDP aims to improve the country’s basic infrastructure for the efficient movement of basic commodities through the introduction of modern storage handling and transport systems.
Almost in parallel with this effort of DBP, the Project Management Office – Ports (PMO-Ports) of the Department of Transportation and Communications (DOTC) and the Office of the President’s Priority Programs and Official Development Assistance Affairs Office (OP-ODAAO) were undertaking studies to further improve the efficiency in the movement of people and cargoes.
PMO-Ports undertook a RoRo Study which identified the development of the Western Seaboard Link and the Trans-Visayas Link. The Western Seaboard Link seeks to link Luzon and Mindanao through RoRo connections at Batangas – Calapan, Roxas – Caticlan, Iloilo – Guimaras, Guimaras – Bacolod and Dumaguete – Dapitan. This link will complement the existing Pan-Philippine Highway, which runs on the eastern seaboard of the country, with its RoRo connections at Matnog-San Isidro/Allen and Liloan – Lipata. The Trans-Visayas Link will link the islands of Samar, Leyte, Bohol, Cebu, Negros, Panay and Palawan, which would run transversely to the two other links. It was envisioned that with these links there will be options as to how to move people and goods faster and more efficiently.
The OP-ODAAO, for its part, was concerned with the high cost of doing business in the country and the increasing cost of moving goods within the country, thereby making even local products less competitive with imported goods that are benefiting from lower customs duties and tariffs. The OP named the project “Strong Republic Nautical Highway” to give emphasis on the political theme of the President of building a “Matatag na Republika” (which could be translated as Stable and Strong Republic).
To integrate all of these efforts, and to harness the needed support and participation of the private sector, Her Excellency President Gloria Macapagal-Arroyo issued Executive Order No. 170, dated 22 January 2003, as amended by EO 170-A, dated 09 June 2003 and EO 170-B, dated 19 September 2005. This established policy guidelines to promote private sector participation and investment in the development and operation of the roll-on/roll-off terminal system.
JICA-MARINA The Study on Domestic Shipping Development Plan in the Philippines (DSDP)
Final Report
6-21
DOTC issued Department Order No. 2003-16 dated 03 March 2003, and Department Order No. 2003-39 dated 31 July 2003 as the Implementing Rules and Regulations of EO 170 and EO 170-A, respectively. PPA issued Administrative Order No. 03-2004 dated 15 December 2004, to set the Guidelines on the Development, Construction, Management and Operation of Ferry Terminals under the Road Roll-On/Roll-Off Terminal System (RRTS).
RRTS refers to the network of terminals linked by RoRo vessels all over the country, regardless of the distance covered (this was the major amendment made by EO 170-A). The President identified the promotion of countryside development through the RRTS as one of the ten-point agenda of her administration.
The main objectives of the RRTS are:
(1) To reduce transport costs from Mindanao to Luzon, through the Visayas, specifically the cost of inter-island transport through the establishment of a safe, efficient and cost-effective RRTS;
(2) To enhance tourism, transport and commerce throughout the country;
(3) To facilitate the government’s agro-fisheries modernization and food security programs;
(4) To promote private sector participation in the establishment, construction and operation of RRTS facilities; and
(5) To establish a new policy to promote the development of RRTS.
The RRTS seeks to simplify the toll system in RRTS facilities. The RRTS toll fees have the following components:
(1) Terminal fee charged on the self-powered vehicles and passengers by the RRTS Terminal Operator for the use of the terminal;
(2) Freight or Rolling Cargo Fee charged on the self-powered vehicles by the RRTS Shipping Service Provider based on lane-meter;
(3) Passage Fee charged on passengers by the RRTS Shipping Service Provider; and
(4) Berthing Fee charged on the RoRo ship by the RRTS Terminal Operator for mooring and berthing at the RoRo Terminal.
All freight rates and passage rates (except for third class accommodations) are deregulated. It is also worthwhile to note that the EO excluded the wharfage fee from the allowed fees in the RRTS. The RRTS toll fee is only applicable to all self-powered vehicles loaded and discharged on their own wheels by their owners or drivers between a RoRo ship and shore via a ramp (some would call this Drive-On, Drive-Off [or DODO] operations). As such, cargo handling charges will not be collected unless actual work is done or performed by the cargo handler (the no-work, no-pay principle).
The Strong Republic Nautical Highway was launched in April 2003 with a caravan from Manila to Dapitan City, Zamboanga del Norte. High ranking officials from the DOTC, MARINA, PPA, DBP, Department of Agriculture (DA), Department of Trade and Industries (DTI), National Economic and Development Authority (NEDA), Department of Public Works and Highways (DPWH) Department of the Interior and Local Government (DILG) and other government agencies joined the caravan to highlight the benefits of the new nautical highway.
Moreover, a Conference on the Strong Republic Nautical Highway (SRNH) was held on October 22, 2003 at the Hotel Intercontinental Manila to heighten public awareness
JICA-MARINA The Study on Domestic Shipping Development Plan in the Philippines (DSDP) Final Report
6-22
of the President’s program.
Presently, the SRNH covers the Manila to Iligan route via Dapitan City. This can easily be extended to Cagayan de Oro and Butuan City, which are major cities of Region X and Caraga Region. It covers 919 kilometers of road and 174 nautical miles of sea travel (up to Iligan City; going to Cagayan de Oro will mean additional 95 kilometers of road travel). Two bus companies are currently offering daily bus service on the SRNH, although only up to Iloilo City. These are Bachelor Express and Philtranco.
To help travelers using SRNH, MARINA (www.marina.gov.ph/srnh/) maintains in their website the schedule of buses and vessels plying the SRNH. Alternatively, the Development Bank of the Philippines has developed an online RoRo Gateway (www.gophilippines.ph) that allows customers to book and pay for any RoRo route in real time.
DOTC is currently looking at the possibility of expanding the coverage of SRNH through the Central and Eastern Nautical Highways. The Central Nautical Highway is envisaged to connect Luzon and Mindanao via a sea link at Donsol, Albay and Aroroy, Masbate, then via road up to Placer, Masbate, and another sea link to Bogo, Cebu, then via road to Cebu City with sea connection to Tubigon, Bohol, then road link to Jagna, Bohol, to be connected with sea link to Mambajao, Camiguin, then via road to the other side of the island at Guinsiliban to be finally connected via sea link with Mindanao at Balingoan, Misamis Oriental. Alternatively, the Central Highway could traverse the island of Cebu to Toledo City, where it could connect with a sea link to San Carlos City, and continue on by land to Dumaguete City where it can connect to Mindanao via the sea link to Dapitan City.
The Eastern Nautical Highway could follow the same alignment as the Central Nautical Highway up to Aroroy, Masbate, then continue on by land to Cataingan, Masbate for a sea link to Naval, Biliran, where it connects with the Pan-Philippine Highway all the way to Mindanao.
Twenty-three out of the twenty-nine ports (or 79%) identified in the Nautical Highways are already RoRo-capable while four are being programmed by DOTC and the LGUs concerned for implementation in 2005, one is to be developed by PPA, while the remaining port (Mambajao, Camiguin) suffers from very shallow depth.
6.4 Shipping Policy Debates
6.4.1 Cabotage Regime
It has long and often been argued that to drive the domestic shipping costs down, competition from foreign ship operators should be allowed and encouraged. However, the passage of Republic Act 9295, otherwise known as the “Domestic Shipping Development Act of 2004,” on 03 May 2004 has made this issue moot and academic.
Nonetheless, it would also be good to review the merits and demerits of allowing foreign ship operators into domestic shipping.
Bouvier’s Law Dictionary gives this insightful comment on cabotage: "a nautical term from the Spanish denoting strictly navigation from cape to cape along the coast without going out into the open sea. In international law, cabotage is identified with coasting trade so that it means navigating and trading along the coast between ports thereof.... It is the universally recognized law of nations that every littoral state can exclude foreign merchantmen from the cabotage within the maritime belt, just as it can exclude foreigners from the fisheries therein . . .. The United States makes a further
JICA-MARINA The Study on Domestic Shipping Development Plan in the Philippines (DSDP)
Final Report
6-23
extension of the word so as to exclude trade between ports of the United States proper and ports in the Philippines, Puerto Rico and the Hawaiian Islands."
The basic principle is that the state has the innate power and responsibility to control and regulate the conduct of its domestic trade, domestic shipping included. The state pursues its policy guided by the principle of greatest good for the greatest number. Other considerations are national interests and national defense.
It is for this reason that different sovereign states have adopted different regimes for their domestic shipping; some opted for closed cabotage (meaning domestic shipping is limited only to the citizens of the state), others for open cabotage. Their decisions were based on the peculiar geography and particular economic leanings of the state.
Proponents for closed cabotage would argue that by reserving domestic trade to Philippine companies the regime secures for this country’s income taxes generated from employees and corporate taxes from the companies. It goes without saying that this benefit is lost when jobs are farmed-out to foreign-flag vessels employing foreign labor.
It is also argued that closed cabotage would develop not only domestic shipping but the other sectors of the industry as well, e.g., maritime manpower, shipbuilding and ship repair. With closed cabotage all of these would have an assured market with which the industry could thrive.
Another contention is the main idea of closed cabotage is to make sure that all types of economically important vessels, from tugs and barges to deep sea marine transport vessels, are always available to protect the country from being held hostage economically, and to assure that sufficient sealift capacity exists for national security.
Some arguments can also be cited in favor of allowing foreign ship operators into domestic shipping. One favorite argument is the European experience. The shipping industry in continental Europe thrived because of the open cabotage regime existing in most European countries. The exceptions are Spain, France, Greece, Italy and Portugal.
The policy of open cabotage was further entrenched with the issuance of Regulation No 3577/92. Article 1 of the Regulation identifies who the beneficiaries are: "Community shipowners who have their ships registered in, and flying the flag of a Member State, provided that these ships comply with all conditions for carrying out cabotage in that Member State". The open cabotage regime is now implemented in all member countries of the European Union, Greece having fully implemented it just this year, 2004. Still, protests were filed as to the proper application of the EU cabotage law.
Although allowing foreign ship operators into domestic shipping would certainly foster competition, there are still other issues that would linger, like:
1) Will there be a fair and level playing field?
Will the foreign ship operators be subjected to the same regulations, tariffs, duties and taxes as the domestic ship operators? Will the foreign ship operators have the privilege of buying their fuel abroad?
2) Will not there be just skimming of the cream?
It is most probable that the foreign ship operators would be employing big vessels for cost-efficiency. As such, the vessels would be deployed in big volume routes, as dictated by the dictum of cost-efficiency. Moreover, the big vessels can only call at
JICA-MARINA The Study on Domestic Shipping Development Plan in the Philippines (DSDP) Final Report
6-24
ports with deep drafts. This would mean that the secondary and tertiary routes would still be not benefited by this scheme.
3) Will the foreign ship operators be allowed to change from domestic trade to foreign trade, and vice versa, as they wish?
Considering the high seasonality of the movement of domestic cargoes and passengers, will the foreign ship operators be allowed to ply foreign trade during the lean domestic season and return during the peak domestic season? Or would they be compelled to serve the route for a fixed period, say one year? What would be the powers of the local regulating authority over the foreign ship operators in stopping them from leaving the domestic trade when it becomes non-viable?
6.4.2 Port Charges and Other Service Fees
Many decades ago, before the advent of containerization, there were distinct differences between sea freight and port charges. Sea freight is what is paid for the carriage of cargo from the port of origin to the port of destination. It is what is paid to shipping companies.
Port charges are those paid for loading the cargo onto a vessel or discharging the cargo from a vessel. The stevedoring fees due at loading and discharging ports are paid directly to the stevedores, usually the terminal operators.
Most of the cargoes then were moved under the “free-in, free-out” arrangement, wherein the shipper pays the terminal operator for the loading of the cargo onto a vessel and then pays the shipping company for the sea freight. The consignee, on the other hand, pays the terminal operator for discharging the cargo from the vessel.
However, the desire to simplify transactions, and the evolution of shipping services, more specifically containerization, brought about what is called the liner terms.
For ease of transacting business, shippers would rather just transact with one company for the whole gamut of services. So, the shipper would pay the shipping company the sea freight plus the attendant stevedoring costs at both ports. The shipping company, in turn, will be the one to pay the terminal operators for the stevedoring services. This is what is often called “liner terms.”
With the advent of containerization, the fees due the terminal operators and the shipping companies become muddled. Since containerization required huge capital investments for port equipment to handle containers which the domestic port operators do not have, shipping companies were forced to invest in cargo handling equipment, like forklifts and stackers, and absorb all the related handling costs for the movement of containers from the terminal gate at origin to the vessel and from the vessel to the terminal gate at destination. The shipping companies benefited through shorter vessel port stay, increased frequencies, streamlined labor requirements for stevedoring and cargo handling, and lower breakage and pilferage of cargo.
The shipper was charged what is called the "basic service rate" that includes the freight rate, as well as the on-board and on-dock stevedoring needed to bring the container to the terminal gate. To ensure the quick turnaround of containers, the shipping company also offered to provide the trucking service at both ends of shipment. Shipments on these terms were originally also called "liner terms".
Later on, as container shipping developed, "liner terms" became restricted to sea freight and on-board stevedoring. Work for on-dock stevedoring and for trucking services were paid for separately from sea freight by the shipper at origin and the
JICA-MARINA The Study on Domestic Shipping Development Plan in the Philippines (DSDP)
Final Report
6-25
consignee at destination.
6.4.3 Ship Safety Standards
Without a doubt, safety should be paramount in all policy considerations. Sovereign states have even bonded together to institute and implement safety rules and regulations. The Safety of Life at Sea (SOLAS) Convention is the foremost example of this. The first safety convention was adopted in 1914 in reaction to the sinking of the Titanic. It has had several amendments since then. The Convention that is currently in force is known as the SOLAS 1974, as amended, or when combined with the 1978 Protocol, the SOLAS 74/78. The convention is kept up to date by amendments by the International Maritime Organization (IMO), the latest being the May 2004 amendments. The amendments come into force through tacit acceptance procedures and are deemed binding on all member states on the date specified in the amendment. It is also accepted that the convention is mainly applicable to vessels engaged in international shipping and trade.
SOLAS 74/78 has provisions governing the following:
(1) Vessel construction, repair, modification and outfitting;
(2) Fire protection, detection and prevention;
(3) Life saving appliances;
(4) Radio communications and navigational equipment;
(5) Safety of navigation
(6) Carriage of cargo, including dangerous cargo;
(7) Management for the safe operation on ships, or the International Safety Management Code;
(8) Safety measures for passenger vessels, high speed craft, bulk carriers, tankers, roll-on roll-off vessels and other vessels;
(9) Safe manning levels;
(10) Pollution prevention for tankers and other vessels;
(11) Regulations affecting vessel traffic services; and
(12) Other similar regulations
Under its provision, responsibilities and authorities are given to “flag state” and “port state”.
The government of the flag that a vessel flies, or the “flag state”, has the responsibility to ensure that such vessel complies with the requirements of the SOLAS Convention, where applicable, and the said vessel also possesses the necessary statutory certificates to prove such compliance.
On the other hand, the Port State Control Governments of other IMO-member nations at which port a vessel may be located, sometimes called the “port states”, have the authority to inspect ships of other IMO-member countries if there are clear grounds for believing that the ship and/or its equipment do not substantially comply with the requirements of the SOLAS Convention. This is also known as the “Port State Control”.
As can be seen from the foregoing, the SOLAS Convention is the most important international treaty affecting the safety of merchant vessels. It covers different aspects of safety at sea, e.g. minimum standards for the construction and operation of ships, their equipment and proper manning, etc.
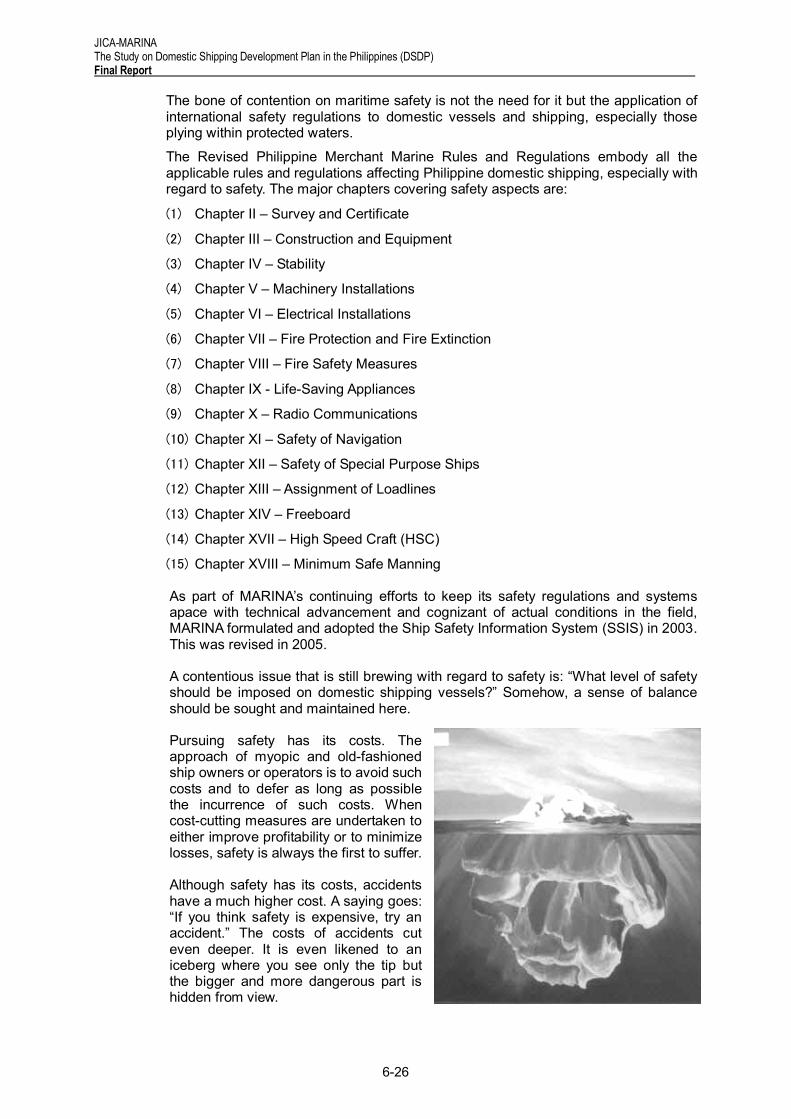
JICA-MARINA The Study on Domestic Shipping Development Plan in the Philippines (DSDP) Final Report
6-26
The bone of contention on maritime safety is not the need for it but the application of international safety regulations to domestic vessels and shipping, especially those plying within protected waters.
The Revised Philippine Merchant Marine Rules and Regulations embody all the applicable rules and regulations affecting Philippine domestic shipping, especially with regard to safety. The major chapters covering safety aspects are:
(1) Chapter II – Survey and Certificate
(2) Chapter III – Construction and Equipment
(3) Chapter IV – Stability
(4) Chapter V – Machinery Installations
(5) Chapter VI – Electrical Installations
(6) Chapter VII – Fire Protection and Fire Extinction
(7) Chapter VIII – Fire Safety Measures
(8) Chapter IX - Life-Saving Appliances
(9) Chapter X – Radio Communications
(10) Chapter XI – Safety of Navigation
(11) Chapter XII – Safety of Special Purpose Ships
(12) Chapter XIII – Assignment of Loadlines
(13) Chapter XIV – Freeboard
(14) Chapter XVII – High Speed Craft (HSC)
(15) Chapter XVIII – Minimum Safe Manning
As part of MARINA’s continuing efforts to keep its safety regulations and systems apace with technical advancement and cognizant of actual conditions in the field, MARINA formulated and adopted the Ship Safety Information System (SSIS) in 2003. This was revised in 2005.
A contentious issue that is still brewing with regard to safety is: “What level of safety should be imposed on domestic shipping vessels?” Somehow, a sense of balance should be sought and maintained here.
Pursuing safety has its costs. The approach of myopic and old-fashioned ship owners or operators is to avoid such costs and to defer as long as possible the incurrence of such costs. When cost-cutting measures are undertaken to either improve profitability or to minimize losses, safety is always the first to suffer.
Although safety has its costs, accidents have a much higher cost. A saying goes: “If you think safety is expensive, try an accident.” The costs of accidents cut even deeper. It is even likened to an iceberg where you see only the tip but the bigger and more dangerous part is hidden from view.
JICA-MARINA The Study on Domestic Shipping Development Plan in the Philippines (DSDP)
Final Report
6-27
The more visible costs of accidents are the direct costs of the incident, e.g., cost of the loss of or damage to the vessel and/or equipment, cost of indemnifying the victims of the incident, the medical costs of treating those affected by the incident and the fees in administering claims. It can be argued that most of these would be covered by the insurance taken out by the ship owner or operator. But still there are more serious concerns on the hidden costs of accidents.
The not so visible costs, and very hard to quantify, of accidents are the loss of productivity and quality of services, interruptions in the whole system of company operations, the need to replace labor and/or to require overtime work, litigation costs should there be legal cases arising out of the incident, and, damage to customer relations and public image. An accident would impress on the mind of the people that the shipping company is not safety conscious and trustworthy, and that it is dangerous to take a sea voyage.
One possible reason why the shipping route Manila to Tacloban suffered heavily from road transport competition is the occurrence of tragic shipping accidents on the route. Although there are also quite a number of road accidents, they are not as horrendous as the shipping accidents that attract a lot of media attention.
It really pays to give extra consideration for safety. It can even be said that the best returns you get from investments on safety equipment and systems is when you were not faced with an instance when you have to use them. The motto of a leading safety company says it well: “Safety Always Matters.”
Having discussed the importance and non-negotiability of safety, the issue, as has been said, is: “What level of safety should be imposed on domestic shipping vessels?” Corollary to this, “Should international standards imposed on vessels plying international waters be imposed on domestic trade vessels plying routes situated along protected waters?” Another ticklish issue is: “Should wooden hulled vessels be no longer allowed in the domestic shipping trade?”
An accepted fact in engineering design is that we cannot design for all possibilities. We cannot achieve a 100% confidence level that a designed structure could withstand all the physical forces to which it could be subjected. For most engineering design endeavors a 95% confidence level is the norm. For example, requiring that all tankers should be double-hulled would mean safer tankers; vessels with greater structural integrity even if it were buffeted by strong waves; tankers that could still safely hold its cargo even if its outer hull were ripped in an accident.
However, such a requirement would mean higher vessel cost. Considering the sizes of the local tankers, double-hulling them would make their costs prohibitive and uneconomical to operate. The requirement of double-hull can be justified for bigger tankers, as the additional cost would be divided by a bigger volume, thereby giving a smaller additional cost per capita. It would also mean that all existing domestic tankers would have to be phased out. It would mean that the nationwide distribution of oil and petroleum products would be thrown into chaos.
A more balanced approach is required. Safety regulations can be so crafted that the safety concerns are addressed, but such regulations are adapted to the conditions obtaining in the environment within which the vessels are operating.
Still using the tankers as an example, stricter regulations can be imposed as regards the periodic inspection of the tankers, especially with the thickness of the hull and the integrity of its structural members and the welding connections using modern testing equipment. Although this would also mean additional costs to the ship owner or operator, however, this would not be as costly as having to invest in a double hull tanker and, more importantly, the safety concerns are given due notice.
JICA-MARINA The Study on Domestic Shipping Development Plan in the Philippines (DSDP) Final Report
6-28
Finding balance could also be applied in the issue of wooden-hulled vessels. Ship owners and operators choose wooden-hulled vessels simply because they are cheaper to purchase and give a shorter payback period. They are also usually deployed in the thin marginal routes, where the low capital investment is crucial for the business to stay afloat.
Phasing out all of wooden-hulled vessels would mean removing roughly two-thirds of the vessels in the domestic trade. At a time when there are no clear indications where the replacements would come from, such a policy would mean economic chaos and bring about more economic woes to the country.
What could be done is to impose restrictions on their operating parameters. For example, they can be limited to operate only on specific sea-lanes or routes, say, maximum six hours sailing time. Their size and capacity should be regulated and capped. Their motive power can be limited so that their operating speed is also controlled. The franchise given to such vessels could be for a shorter period of time, which would approximate its economic lifespan. Another approach would be to give incentives to more progressive ship owners and operators to look for a better alternative if they want to improve their business, or if the business is already improving.
Let it be stated here that safety continues to be of paramount concern in any policy formulation. However, this need not be blindly pursued, but must also be tempered by other practical considerations.
6.4.4 Coordinated Policy Between Shipping and Shipbuilding
Shipping and shipbuilding are two intertwined sub-sectors of the maritime industry. A strong maritime country, as a rule, should have strong shipping and shipbuilding industries. And, logically, policies should be enunciated to promote and develop both sub-sectors. This was followed by the MARINA, as can be gleaned from the numerous MARINA Memorandum Circulars issued to that effect.
However, the translation of government policies and projects into actual new buildings is still something to be desired. As an example, in the Domestic Shipping Modernization Program, Package I, of the fifty-three (53) projects approved for implementation, only twenty-one (21) projects are for new vessels, or just forty percent (40%). Looking at it from the peso value perspective, only thirty-three percent (33%) of it was for new vessels, or just P1,057.18 M out of the total P3,229.78 Million loaned out by the program.
The domestic shipbuilding industry should not be faulted for this. New buildings, from the viewpoint of the ship operators, were simply not competitive enough with the second-hand market. Price-wise, on a peso per ton evaluation, the second hand vessels were cheaper. Time-wise, the second-hand vessels can be easily deployed within months of its procurement versus the long time needed for the design and building of a new vessel. Incentives-wise, the procurement of second-hand vessels also has the upper hand. Imported second-hand vessels are granted exemptions from import taxes and custom duties, while the engines to be used by domestically built vessels do not enjoy such privileges.
This problem is addressed by the issuance of RA 9295 which provides exemption of shipyards from the payment of Value Added Tax on the importation of spare parts and materials to be used in the construction of ships. In regard to investment, the earlier SC ruling that shipyards are not “public utilities” and thus, are not covered by limitations on foreign ownership would encourage more foreign investors as they can
JICA-MARINA The Study on Domestic Shipping Development Plan in the Philippines (DSDP)
Final Report
6-29
now acquire/set-up companies that are 100% foreign-owned. RA 9295 even stipulates restriction on vessel importation under sound evaluation of shipbuilding capability by MARINA within ten (10) years. Therefore, it can be considered that the country has newly entered a new challenge period to pursue the balanced development between shipping and shipbuilding.
6.4.5 Market Access, Competitive Assignment and Tariff Setting
Upon the affectivity of Republic Act 9295, otherwise known as the Domestic Shipping Development Act (DSDA) of 2004, the quasi-judicial functions of MARINA are now governed by this new law and its Implementing Rules and Regulations (IRR). Before this, the law in effect was the Public Service Act.
The law specifically states that a Certificate of Public Convenience for domestic trade can only be granted to a domestic ship owner/operator. The only exception is when no domestic vessel is available or suitable to provide the needed shipping service and public interest warrants the same, in which case MARINA shall issue a Special Permit to a foreign flag vessel, pursuant to Sec. 6 of RA 9295.
The main considerations for the grant of a CPC, and any amendment thereto are (1) the economic and beneficial effect which the proposed service shall have to the port, province or region which it proposes to serve, and (2) the financial capacity of the domestic ship owner/operator to provide and sustain safe, reliable, adequate, efficient and economical service in accordance with the standards set by government regulations.
In its application for a CPC, the domestic ship owner/operator shall state the route(s) it proposes to serve, and the service(s) it proposes to offer. If the domestic ship owner/operator does not intend to operate in a fixed route(s), it shall nevertheless state in its application the service(s) it proposes to offer. Examples of the second category are tug and barge operations, ferry operations/services, either offered by resort/hotel owners and/or catering to tourism and leisure/sports-related activities, as well as companies, associations or individuals who operate ships for their own use but offering their ships, for hire or compensation, whether permanent, occasional or incidental, with general or limited clientele.
The validity of the CPC varies from five (5) years for wooden-hulled vessels up to twenty-five (25) years for non-wooden-hulled vessels.
For domestic ship operators whose ships are chartered, the CPC shall be valid for a period co-terminus with the MARINA charter approval granted to the ship with the longest charter period.
There are three requirements for an applicant:
(1) Must be a MARINA-registered ship owner/operator per MARINA MC 79/79-A or their subsequent amendments;
(2) Must be financially capable to provide and sustain safe, reliable, adequate, efficient and economical service in undertaking the proposed shipping service. The applicant is deemed financially capable if it can be shown that there is excess in capitalization using the formula:
• Capitalization = (Equity – fixed assets net of long-term liabilities) + total depreciation
(3) Must provide a service that has economic and beneficial effect on the port, province or region it proposes to serve, to be determined by the MARINA on the
JICA-MARINA The Study on Domestic Shipping Development Plan in the Philippines (DSDP) Final Report
6-30
basis of any of the following documents:
• The estimated port dues and charges that are expected to be paid for the proposed service, and the estimated increase in the volume of passengers and cargoes to be transported in the route proposed to be served; or,
• The estimated amount of taxes to be paid to the local government units where the intended service will be provided; or,
• Sangguniang Bayan/ Panlalawigan Resolution on the perceived economic benefit to the town/province where the applicant proposes to serve; or,
• The estimated number of employment that may be generated in the proposed service; or,
• Any study showing probable economic/beneficial effect to the port, province or region it proposes to serve.
Sections 7 and 8 of Rule IV of the IRR of DSDA set the documentary and jurisdictional requirements, respectively, for new, extension or renewal of CPCs.
The IRR of the DSDA also introduces an innovation as to route assignment. MARINA now takes a proactive role in the development of routes. Rule IV Section 10 states that:
“The MARINA shall establish, prescribe and foster the development of routes, zones or areas of operations to guide and advise domestic ship owners/operators where shipping services can be provided or are necessary in order to promote and spur economic activities.
For missionary routes, the MARINA shall prescribe liberalized rules and procedures pertaining to fees and charges, documentary requirements, and other incentives to protect its investment for a reasonable period as determined by the MARINA.
The MARINA shall develop an integrated sea transport network by identifying viable routes suitable for long haul liner routes, short haul ferry routes, RoRo routes, tramp operations, feeder routes and hub ports.
The MARINA shall maintain a database of ship’s franchise inventory existing and potential domestic trade routes; inventory of ships per trade route/link; and, capacities of each ship both in the regional and national level.”
Whereas, previously it is just the ship owner/operator who has the duty to study and analyze the market, now MARINA will be helping out the owners/operators in identifying feasible and viable routes for each type of service. Nonetheless, this does not take away the responsibility of the owner/operator in conducting its due diligence.
The DSDA also enshrined the deregulated regime in fare setting in domestic shipping. The pertinent provision states:
“Sec. 8. Deregulation of the Domestic Shipping Industry. – In order to encourage investment in the Domestic Shipping Industry by existing domestic operators and attract new investment from new operators and investors, domestic ship operators are hereby authorized to establish their own domestic shipping rates: Provided that the effective competition is fostered and public interest is served”.
Notwithstanding this provision, the IRR of DSDA gave the following conditions:
(1) All ship owners/operators with Entity/Company CPC shall submit under oath with the MARINA their Notice for the adoption of initial/subsequent upward or
JICA-MARINA The Study on Domestic Shipping Development Plan in the Philippines (DSDP)
Final Report
6-31
downward adjustment of deregulated rates as defined in the Act and this IRR, in a prescribed form, which shall indicate, among others, the name of covered ship(s), authorized route(s)/link(s), rate(s) per route/link and the grounds for the adjustment;
(2) All ship owners/operators shall cause the publication of their Notice submitted to the MARINA in any of the five (5) major newspapers of national circulation, if the route(s)/area(s) of operation to be served is national and/or inter-regional in scope. If the route(s)/area(s) to be served is local or intra-regional in scope, publication in a newspaper of local circulation is sufficient;
(3) All ship owners/operators shall likewise cause the posting of any initial/subsequent upward or downward adjustment of deregulated rates, including the effectivity thereof, in all conspicuous places at the affected port(s), vessel(s), company premises, passenger terminals and ticketing office(s).
(4) The MARINA shall cause the posting thereof at the MARINA Central or Regional Offices and/or the MARINA website; and,
(5) The upward or downward adjusted rate shall take effect seven (7) calendar days from the publication.
However, considering the need to protect and safeguard the interest of the general public, MARINA still retains a measure of monitoring and police powers. The IRR of the DSDA mandated MARINA to undertake the following activities:
(1) Inspect books and records of the ship owners/operators;
(2) Assess the rates charged vis-à-vis the level and quality of service provided through the implementation of an amended Passenger Service Rating System (PSRS) and Cargo Service Rating System (CSRS); and,
(3) Assess the Quarterly Report and the audited Annual Report of Operations and Finances, together with the copy of the Official Receipt (OR) of Quarterly and Monthly Common Carrier’s Tax and other related tax payments to the BIR, which are hereto required to be submitted by domestic ship owners/operators, fifteen (15) days after each quarter and every June 30th of the following year, respectively.
Should such monitoring have any adverse findings or recommendations; or should there be monopoly of a route/link, lack of effective competition in a route/link, and practices which constitute combinations in restraint of trade; or any complaint against the rates charged and/or services rendered by the ship owners/operators provided sufficient basis/justification is submitted; or other analogous instances, MARINA, through the Administrator, shall intervene, following the Rules on Summary Procedure as prescribed in MARINA MC 74-A and its amendments.
Upon confirmation/determination of any of the above circumstances, the MARINA shall issue an Order prescribing the appropriate corrective measures to be undertaken by the domestic ship owner/operator, such as but not limited to, prescribing rates commensurate to the ship’s service level, or routes of operation, or upgrading the ship’s service level to prescribed standard.
6.5 Comparative Policy Study on ASEAN Shipping
The ten ASEAN countries, namely: Brunei Darussalam, Cambodia, Indonesia, Lao PDR, Malaysia, Myanmar, Philippines, Singapore, Thailand and Vietnam, although a sharing common social and cultural heritage, have differing country topography (see Figure 6.5.1). One country is land-locked (Lao PDR); another is an island state
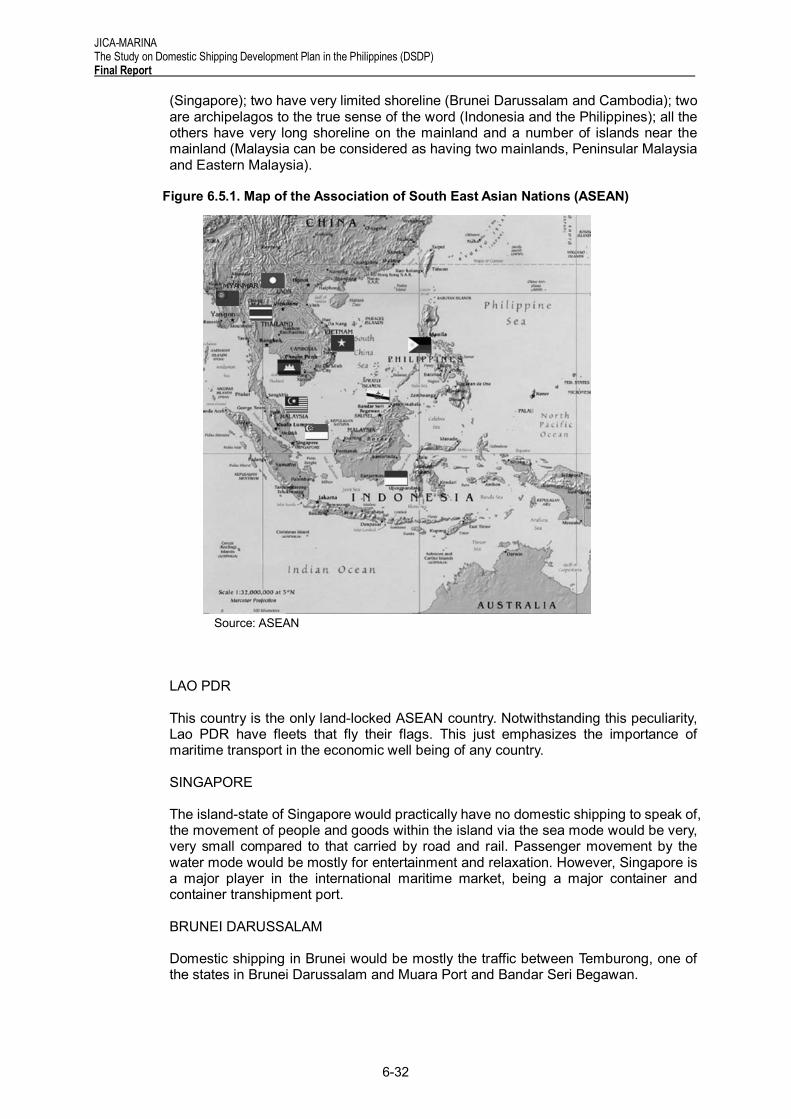
JICA-MARINA The Study on Domestic Shipping Development Plan in the Philippines (DSDP) Final Report
6-32
(Singapore); two have very limited shoreline (Brunei Darussalam and Cambodia); two are archipelagos to the true sense of the word (Indonesia and the Philippines); all the others have very long shoreline on the mainland and a number of islands near the mainland (Malaysia can be considered as having two mainlands, Peninsular Malaysia and Eastern Malaysia).
Figure 6.5.1. Map of the Association of South East Asian Nations (ASEAN)
Source: ASEAN
LAO PDR
This country is the only land-locked ASEAN country. Notwithstanding this peculiarity, Lao PDR have fleets that fly their flags. This just emphasizes the importance of maritime transport in the economic well being of any country.
SINGAPORE
The island-state of Singapore would practically have no domestic shipping to speak of, the movement of people and goods within the island via the sea mode would be very, very small compared to that carried by road and rail. Passenger movement by the water mode would be mostly for entertainment and relaxation. However, Singapore is a major player in the international maritime market, being a major container and container transhipment port.
BRUNEI DARUSSALAM
Domestic shipping in Brunei would be mostly the traffic between Temburong, one of the states in Brunei Darussalam and Muara Port and Bandar Seri Begawan.
JICA-MARINA The Study on Domestic Shipping Development Plan in the Philippines (DSDP)
Final Report
6-33
CAMBODIA
Domestic shipping industry in Cambodia is by small wooden vessels with low capacities navigating between Sihanoukville and Koh Kong province by sea and rivers. Some even go to neighbouring Thai markets near the border.
INDONESIA
Domestic shipping in Indonesia is categorized into the following:
(1) Inter-island shipping – sea linkages between main islands;
(2) Traditional shipping – services in remote areas and uses traditional wooden-hulled vessels and motorized boats;
(3) Pioneer shipping – services subsidized by the Government to remote areas to transport essential goods and to stimulate regional growth; and
(4) Special shipping – serves dedicated economic activities such as mining, forestry, oil extraction and refinery.
Cargo tariff is deregulated. Government regulates economy-class passage rates and prepares guidelines for non-economy class passage rates.
MALAYSIA
Domestic shipping in Malaysia is mostly the east-west haulage between Malay Peninsula and East Malaysia. Coastal shipping along the east and west seaboards of the Malay Peninsula has not been fully developed. The government has lifted the cabotage policy for Penang and Port Klang route to allow shipping lines to tranship cargo at local ports.
Malaysia has adopted the following policy measures to strengthen her own fleet:
(1) Corporate Tax Exemption
(2) Shipping Fund
(3) Second Register
(4) Relaxation of Crew Nationality
MYANMAR
Sea-based transport is the primary mode of cargo transport in Myanmar and so with passenger transport. Sea and inland water transport carries about a third of passengers and handle a huge percentage of the total passenger-kilometers.
With the adoption of the market economy, Myanmar restructured its State Economic Enterprises (SEEs), lowered trade barriers and simplified export/import procedures. Private sector participation is also being recognized and nurtured, as well as foreign investments are being invited into the country.
THAILAND
Domestic shipping in Thailand is reserved for domestic service suppliers only. It is also required that the vessel to be used for domestic shipping must be owned by Thai nationals, for companies this means at least 70% Thai equity. All seafarers working on Thai vessels engaged in domestic trade must be Thai citizens. Foreign vessels may be allowed in domestic shipping only under certain conditions on a case-to-case
JICA-MARINA The Study on Domestic Shipping Development Plan in the Philippines (DSDP) Final Report
6-34
basis.
Domestic shipping in Thailand is not well developed but the policy of the Thai Government is to make the industry more competitive.
VIETNAM
Domestic shipping in Vietnam is mostly coastal and for long-distance haulage. This explains why although sea transport accounts for less than ten percent of the movement of cargoes, it accounts for a little more than a quarter of the total ton-kilometer movement of cargo. Passenger traffic is negligible.
7. DEMAND FORECAST AND FUTURE FLEET REQUIREMENT
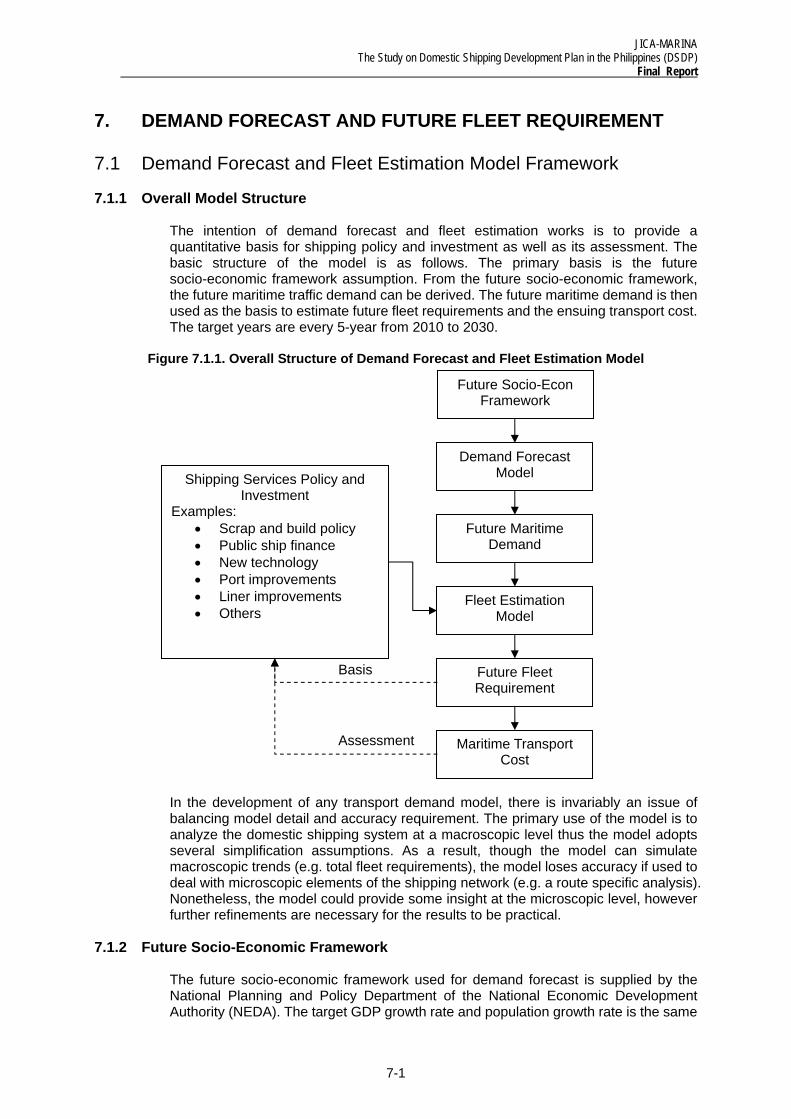
JICA-MARINA The Study on Domestic Shipping Development Plan in the Philippines (DSDP)
Final Report
7-1
Future Socio-Econ Framework
Demand Forecast Model
Future Maritime Demand
Fleet Estimation Model
Future Fleet Requirement
Shipping Services Policy and Investment
Examples: • Scrap and build policy • Public ship finance • New technology • Port improvements • Liner improvements • Others
Maritime Transport Cost
Assessment
Basis
7. DEMAND FORECAST AND FUTURE FLEET REQUIREMENT
7.1 Demand Forecast and Fleet Estimation Model Framework
7.1.1 Overall Model Structure
The intention of demand forecast and fleet estimation works is to provide a quantitative basis for shipping policy and investment as well as its assessment. The basic structure of the model is as follows. The primary basis is the future socio-economic framework assumption. From the future socio-economic framework, the future maritime traffic demand can be derived. The future maritime demand is then used as the basis to estimate future fleet requirements and the ensuing transport cost. The target years are every 5-year from 2010 to 2030.
Figure 7.1.1. Overall Structure of Demand Forecast and Fleet Estimation Model
In the development of any transport demand model, there is invariably an issue of balancing model detail and accuracy requirement. The primary use of the model is to analyze the domestic shipping system at a macroscopic level thus the model adopts several simplification assumptions. As a result, though the model can simulate macroscopic trends (e.g. total fleet requirements), the model loses accuracy if used to deal with microscopic elements of the shipping network (e.g. a route specific analysis). Nonetheless, the model could provide some insight at the microscopic level, however further refinements are necessary for the results to be practical.
7.1.2 Future Socio-Economic Framework
The future socio-economic framework used for demand forecast is supplied by the National Planning and Policy Department of the National Economic Development Authority (NEDA). The target GDP growth rate and population growth rate is the same
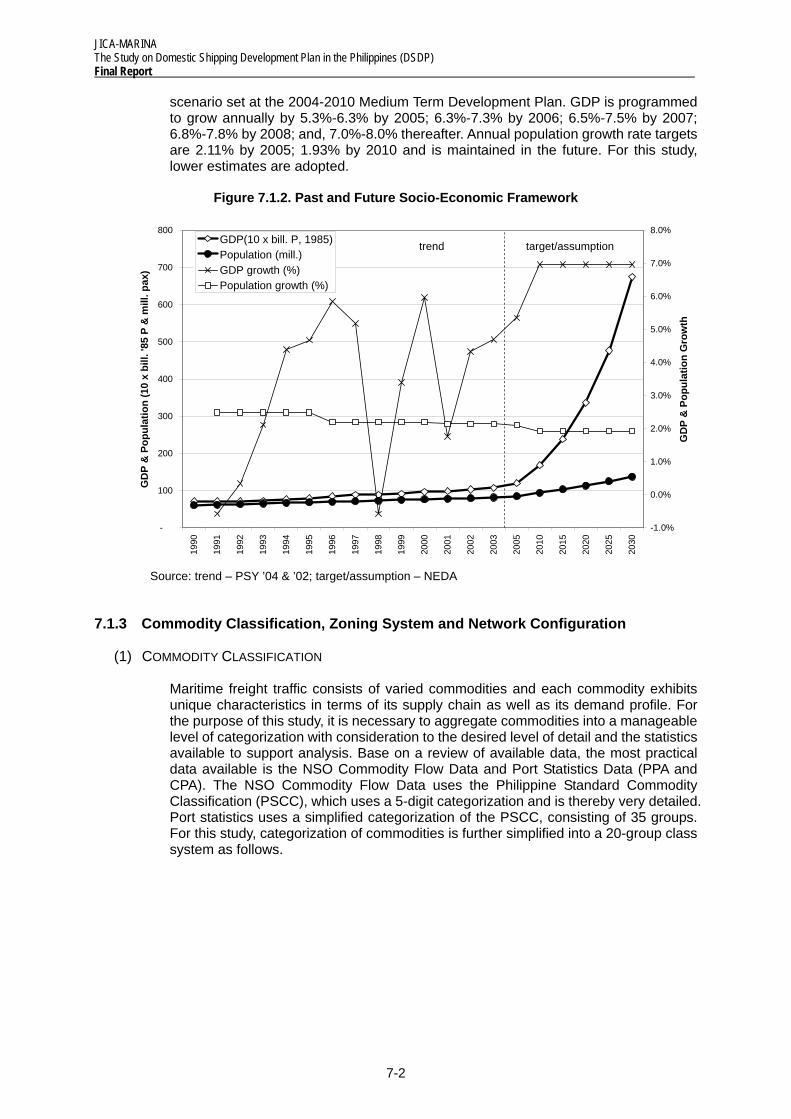
JICA-MARINA The Study on Domestic Shipping Development Plan in the Philippines (DSDP) Final Report
7-2
-
100
200
300
400
500
600
700
800
1990
1991
1992
1993
1994
1995
1996
1997
1998
1999
2000
2001
2002
2003
2005
2010
2015
2020
2025
2030
GD
P &
Pop
ulat
ion
(10
x bi
ll. '8
5 P
& m
ill. p
ax)
-1.0%
0.0%
1.0%
2.0%
3.0%
4.0%
5.0%
6.0%
7.0%
8.0%
GD
P &
Pop
ulat
ion
Gro
wth
GDP(10 x bill. P, 1985)Population (mill.)GDP growth (%)Population growth (%)
target/assumptiontrend
scenario set at the 2004-2010 Medium Term Development Plan. GDP is programmed to grow annually by 5.3%-6.3% by 2005; 6.3%-7.3% by 2006; 6.5%-7.5% by 2007; 6.8%-7.8% by 2008; and, 7.0%-8.0% thereafter. Annual population growth rate targets are 2.11% by 2005; 1.93% by 2010 and is maintained in the future. For this study, lower estimates are adopted.
Figure 7.1.2. Past and Future Socio-Economic Framework
Source: trend – PSY ’04 & ’02; target/assumption – NEDA
7.1.3 Commodity Classification, Zoning System and Network Configuration
(1) COMMODITY CLASSIFICATION
Maritime freight traffic consists of varied commodities and each commodity exhibits unique characteristics in terms of its supply chain as well as its demand profile. For the purpose of this study, it is necessary to aggregate commodities into a manageable level of categorization with consideration to the desired level of detail and the statistics available to support analysis. Base on a review of available data, the most practical data available is the NSO Commodity Flow Data and Port Statistics Data (PPA and CPA). The NSO Commodity Flow Data uses the Philippine Standard Commodity Classification (PSCC), which uses a 5-digit categorization and is thereby very detailed. Port statistics uses a simplified categorization of the PSCC, consisting of 35 groups. For this study, categorization of commodities is further simplified into a 20-group class system as follows.
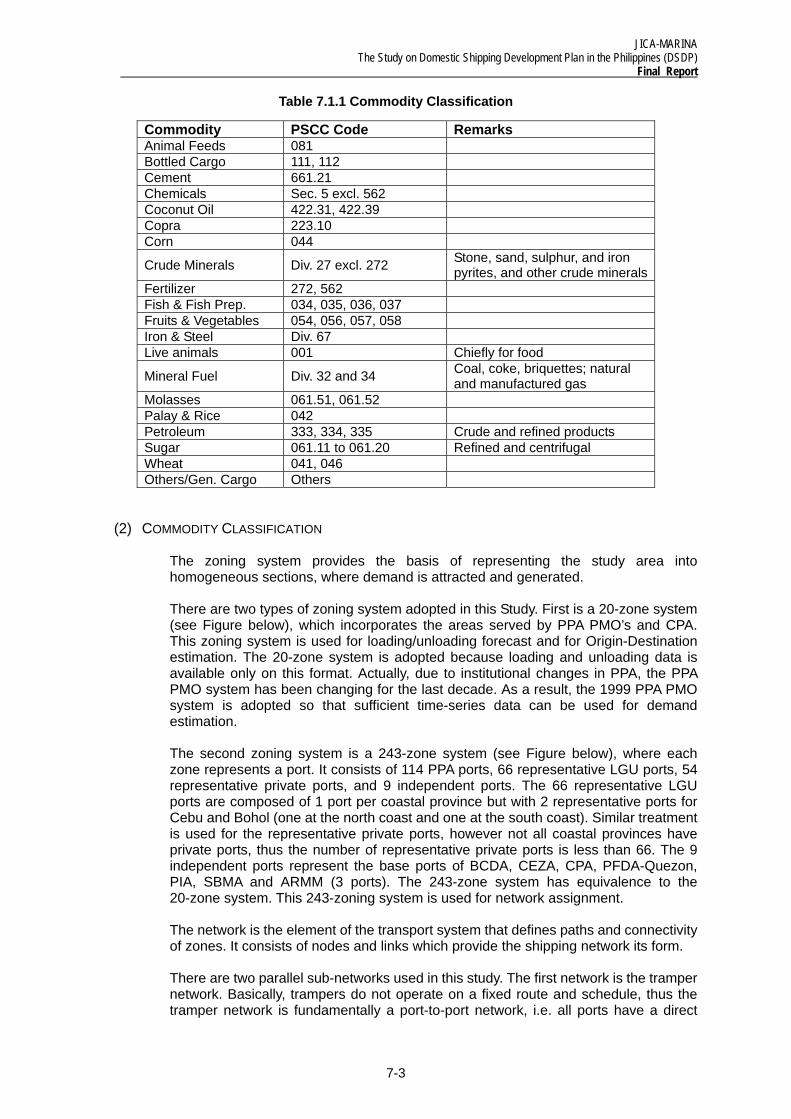
JICA-MARINA The Study on Domestic Shipping Development Plan in the Philippines (DSDP)
Final Report
7-3
Table 7.1.1 Commodity Classification
Commodity PSCC Code Remarks Animal Feeds 081 Bottled Cargo 111, 112 Cement 661.21 Chemicals Sec. 5 excl. 562 Coconut Oil 422.31, 422.39 Copra 223.10 Corn 044
Crude Minerals Div. 27 excl. 272 Stone, sand, sulphur, and iron pyrites, and other crude minerals
Fertilizer 272, 562 Fish & Fish Prep. 034, 035, 036, 037 Fruits & Vegetables 054, 056, 057, 058 Iron & Steel Div. 67 Live animals 001 Chiefly for food
Mineral Fuel Div. 32 and 34 Coal, coke, briquettes; natural and manufactured gas
Molasses 061.51, 061.52 Palay & Rice 042 Petroleum 333, 334, 335 Crude and refined products Sugar 061.11 to 061.20 Refined and centrifugal Wheat 041, 046 Others/Gen. Cargo Others
(2) COMMODITY CLASSIFICATION
The zoning system provides the basis of representing the study area into homogeneous sections, where demand is attracted and generated.
There are two types of zoning system adopted in this Study. First is a 20-zone system (see Figure below), which incorporates the areas served by PPA PMO’s and CPA. This zoning system is used for loading/unloading forecast and for Origin-Destination estimation. The 20-zone system is adopted because loading and unloading data is available only on this format. Actually, due to institutional changes in PPA, the PPA PMO system has been changing for the last decade. As a result, the 1999 PPA PMO system is adopted so that sufficient time-series data can be used for demand estimation.
The second zoning system is a 243-zone system (see Figure below), where each zone represents a port. It consists of 114 PPA ports, 66 representative LGU ports, 54 representative private ports, and 9 independent ports. The 66 representative LGU ports are composed of 1 port per coastal province but with 2 representative ports for Cebu and Bohol (one at the north coast and one at the south coast). Similar treatment is used for the representative private ports, however not all coastal provinces have private ports, thus the number of representative private ports is less than 66. The 9 independent ports represent the base ports of BCDA, CEZA, CPA, PFDA-Quezon, PIA, SBMA and ARMM (3 ports). The 243-zone system has equivalence to the 20-zone system. This 243-zoning system is used for network assignment.
The network is the element of the transport system that defines paths and connectivity of zones. It consists of nodes and links which provide the shipping network its form.
There are two parallel sub-networks used in this study. The first network is the tramper network. Basically, trampers do not operate on a fixed route and schedule, thus the tramper network is fundamentally a port-to-port network, i.e. all ports have a direct
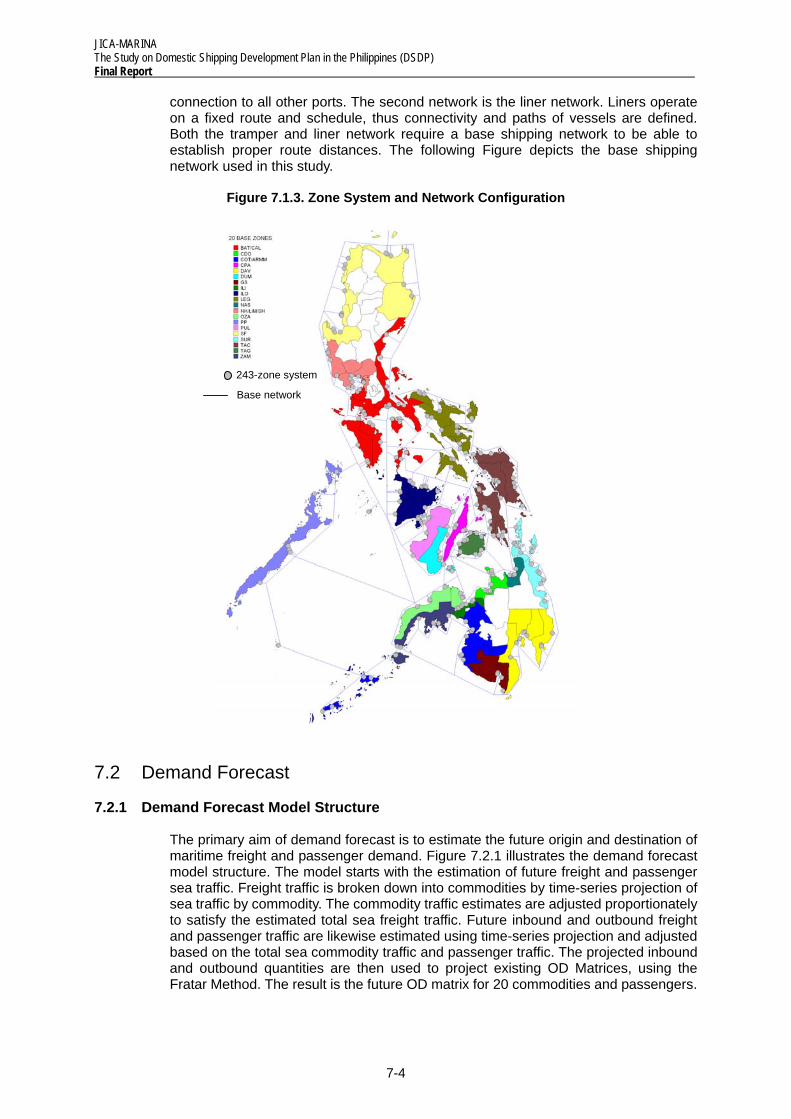
JICA-MARINA The Study on Domestic Shipping Development Plan in the Philippines (DSDP) Final Report
7-4
connection to all other ports. The second network is the liner network. Liners operate on a fixed route and schedule, thus connectivity and paths of vessels are defined. Both the tramper and liner network require a base shipping network to be able to establish proper route distances. The following Figure depicts the base shipping network used in this study.
Figure 7.1.3. Zone System and Network Configuration
7.2 Demand Forecast
7.2.1 Demand Forecast Model Structure
The primary aim of demand forecast is to estimate the future origin and destination of maritime freight and passenger demand. Figure 7.2.1 illustrates the demand forecast model structure. The model starts with the estimation of future freight and passenger sea traffic. Freight traffic is broken down into commodities by time-series projection of sea traffic by commodity. The commodity traffic estimates are adjusted proportionately to satisfy the estimated total sea freight traffic. Future inbound and outbound freight and passenger traffic are likewise estimated using time-series projection and adjusted based on the total sea commodity traffic and passenger traffic. The projected inbound and outbound quantities are then used to project existing OD Matrices, using the Fratar Method. The result is the future OD matrix for 20 commodities and passengers.
243-zone system
Base network
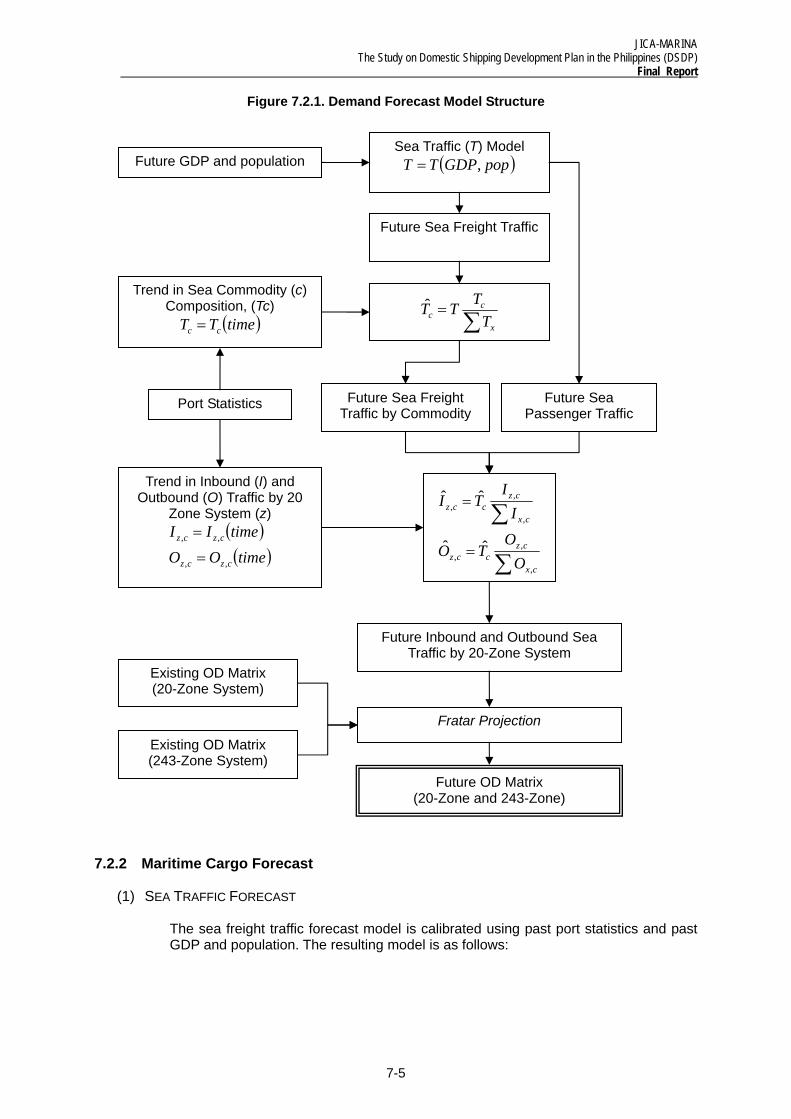
JICA-MARINA The Study on Domestic Shipping Development Plan in the Philippines (DSDP)
Final Report
7-5
Figure 7.2.1. Demand Forecast Model Structure
7.2.2 Maritime Cargo Forecast
(1) SEA TRAFFIC FORECAST
The sea freight traffic forecast model is calibrated using past port statistics and past GDP and population. The resulting model is as follows:
Future GDP and population Sea Traffic (T) Model
( )popGDPTT ,=
Future Sea Freight Traffic
Trend in Sea Commodity (c) Composition, (Tc)
( )timeTT cc =
Future Sea Passenger Traffic
Future Sea Freight Traffic by Commodity
Trend in Inbound (I) and Outbound (O) Traffic by 20
Zone System (z) ( )( )timeOOtimeII
czcz
czcz
,,
,,
=
=
∑=
x
cc T
TTT̂
∑
∑=
=
cx
czccz
cx
czccz
OO
TO
II
TI
,
,,
,
,,
ˆˆ
ˆˆ
Future Inbound and Outbound Sea Traffic by 20-Zone System
Existing OD Matrix (20-Zone System)
Fratar Projection
Future OD Matrix (20-Zone and 243-Zone)
Existing OD Matrix (243-Zone System)
Port Statistics
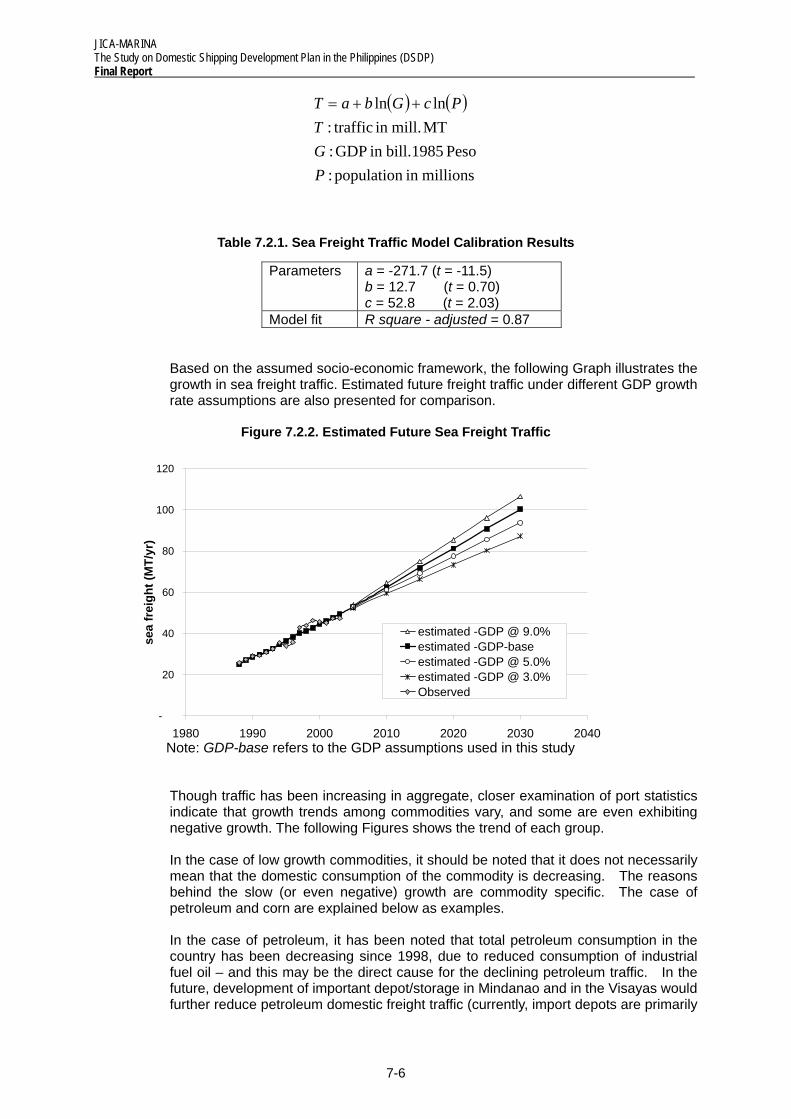
JICA-MARINA The Study on Domestic Shipping Development Plan in the Philippines (DSDP) Final Report
7-6
-
20
40
60
80
100
120
1980 1990 2000 2010 2020 2030 2040
sea
frei
ght (
MT/
yr)
estimated -GDP @ 9.0%estimated -GDP-baseestimated -GDP @ 5.0%estimated -GDP @ 3.0%Observed
( ) ( )
millionsin population :Peso 1985 bill.in GDP :
MT mill.in traffic:lnln
PGT
PcGbaT ++=
Table 7.2.1. Sea Freight Traffic Model Calibration Results
Parameters a = -271.7 (t = -11.5) b = 12.7 (t = 0.70) c = 52.8 (t = 2.03)
Model fit R square - adjusted = 0.87
Based on the assumed socio-economic framework, the following Graph illustrates the growth in sea freight traffic. Estimated future freight traffic under different GDP growth rate assumptions are also presented for comparison.
Figure 7.2.2. Estimated Future Sea Freight Traffic
Note: GDP-base refers to the GDP assumptions used in this study
Though traffic has been increasing in aggregate, closer examination of port statistics indicate that growth trends among commodities vary, and some are even exhibiting negative growth. The following Figures shows the trend of each group.
In the case of low growth commodities, it should be noted that it does not necessarily mean that the domestic consumption of the commodity is decreasing. The reasons behind the slow (or even negative) growth are commodity specific. The case of petroleum and corn are explained below as examples.
In the case of petroleum, it has been noted that total petroleum consumption in the country has been decreasing since 1998, due to reduced consumption of industrial fuel oil – and this may be the direct cause for the declining petroleum traffic. In the future, development of important depot/storage in Mindanao and in the Visayas would further reduce petroleum domestic freight traffic (currently, import depots are primarily
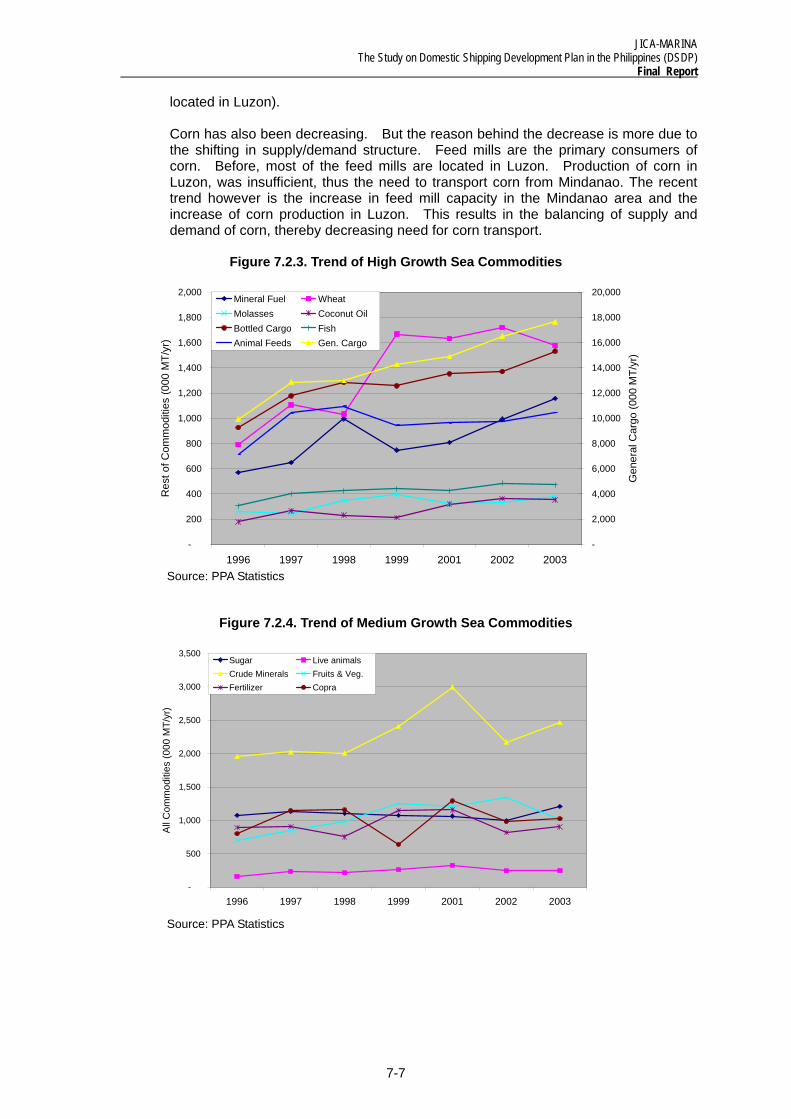
JICA-MARINA The Study on Domestic Shipping Development Plan in the Philippines (DSDP)
Final Report
7-7
-
200
400
600
800
1,000
1,200
1,400
1,600
1,800
2,000
1996 1997 1998 1999 2001 2002 2003
Res
t of C
omm
oditi
es (0
00 M
T/yr
)
-
2,000
4,000
6,000
8,000
10,000
12,000
14,000
16,000
18,000
20,000
Gen
eral
Car
go (0
00 M
T/yr
)
Mineral Fuel WheatMolasses Coconut OilBottled Cargo FishAnimal Feeds Gen. Cargo
-
500
1,000
1,500
2,000
2,500
3,000
3,500
1996 1997 1998 1999 2001 2002 2003
All
Com
mod
ities
(000
MT/
yr)
Sugar Live animalsCrude Minerals Fruits & Veg.Fertilizer Copra
located in Luzon).
Corn has also been decreasing. But the reason behind the decrease is more due to the shifting in supply/demand structure. Feed mills are the primary consumers of corn. Before, most of the feed mills are located in Luzon. Production of corn in Luzon, was insufficient, thus the need to transport corn from Mindanao. The recent trend however is the increase in feed mill capacity in the Mindanao area and the increase of corn production in Luzon. This results in the balancing of supply and demand of corn, thereby decreasing need for corn transport.
Figure 7.2.3. Trend of High Growth Sea Commodities
Source: PPA Statistics
Figure 7.2.4. Trend of Medium Growth Sea Commodities
Source: PPA Statistics
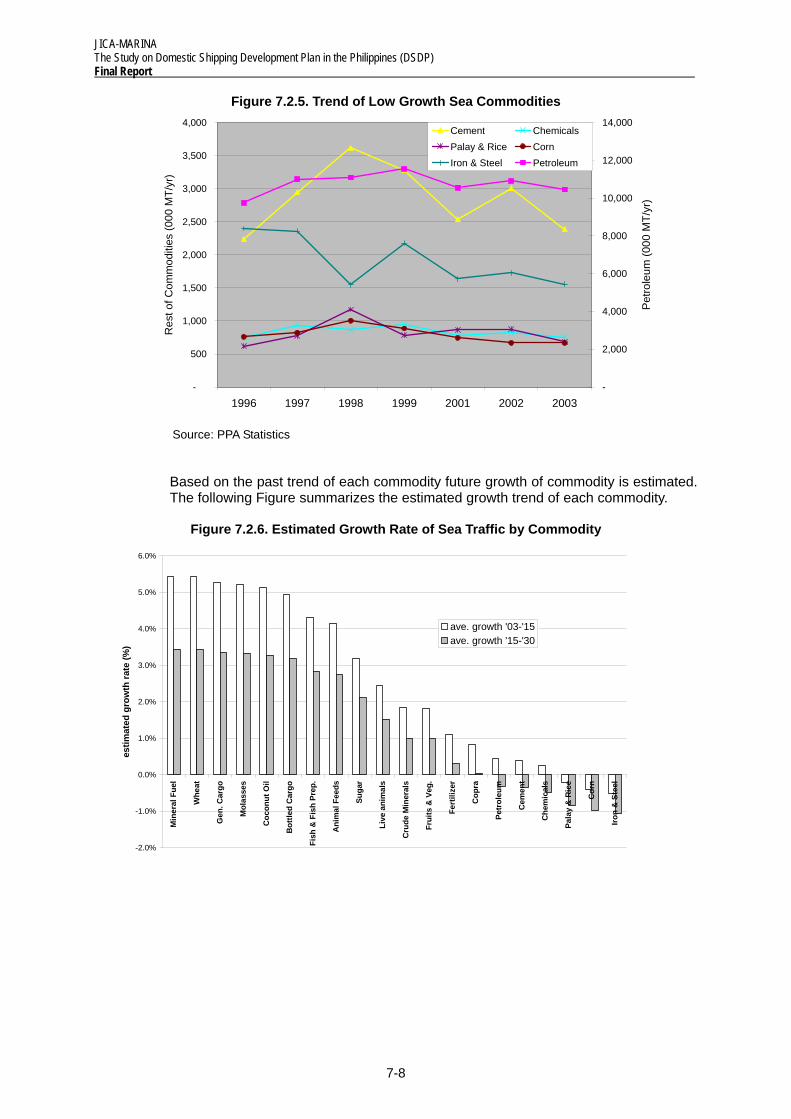
JICA-MARINA The Study on Domestic Shipping Development Plan in the Philippines (DSDP) Final Report
7-8
-
500
1,000
1,500
2,000
2,500
3,000
3,500
4,000
1996 1997 1998 1999 2001 2002 2003
Res
t of C
omm
oditi
es (0
00 M
T/yr
)
-
2,000
4,000
6,000
8,000
10,000
12,000
14,000
Petro
leum
(000
MT/
yr)
Cement ChemicalsPalay & Rice CornIron & Steel Petroleum
-2.0%
-1.0%
0.0%
1.0%
2.0%
3.0%
4.0%
5.0%
6.0%
Min
eral
Fue
l
Whe
at
Gen
. Car
go
Mol
asse
s
Coc
onut
Oil
Bot
tled
Car
go
Fish
& F
ish
Prep
.
Ani
mal
Fee
ds
Suga
r
Live
ani
mal
s
Cru
de M
iner
als
Frui
ts &
Veg
.
Fert
ilize
r
Cop
ra
Petr
oleu
m
Cem
ent
Che
mic
als
Pala
y &
Ric
e
Cor
n
Iron
& S
teel
estim
ated
gro
wth
rate
(%)
ave. growth '03-'15ave. growth '15-'30
Figure 7.2.5. Trend of Low Growth Sea Commodities
Source: PPA Statistics
Based on the past trend of each commodity future growth of commodity is estimated. The following Figure summarizes the estimated growth trend of each commodity.
Figure 7.2.6. Estimated Growth Rate of Sea Traffic by Commodity
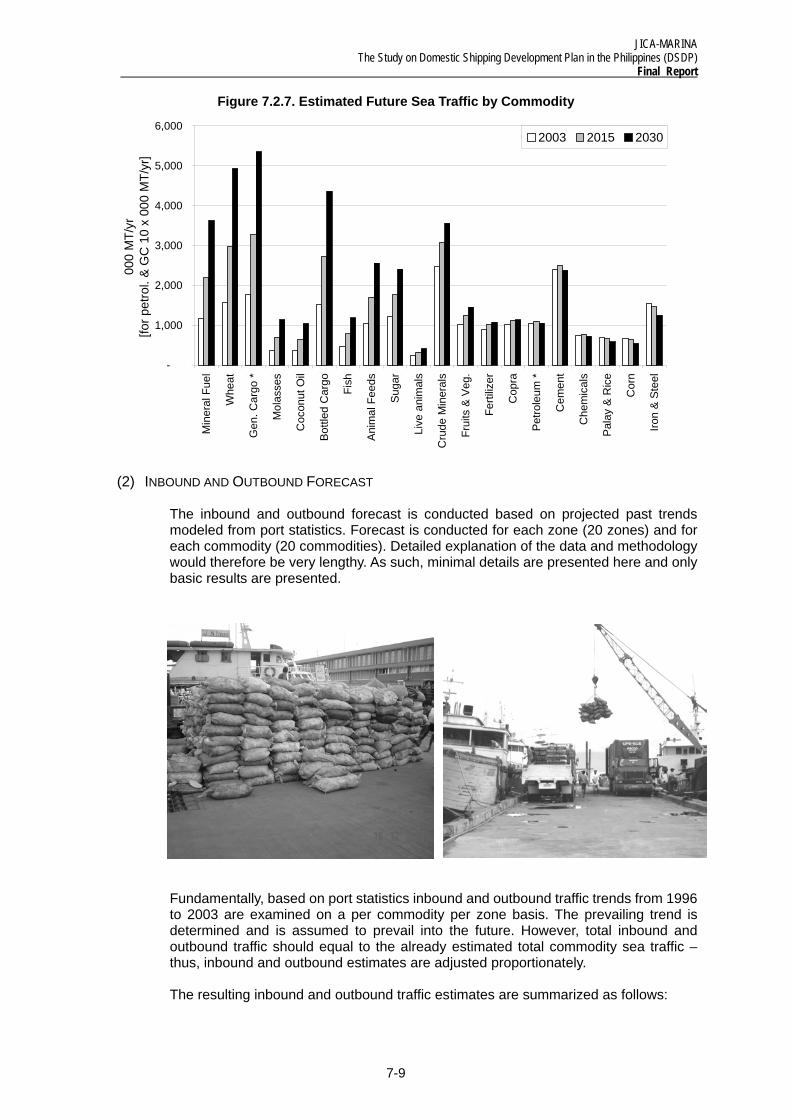
JICA-MARINA The Study on Domestic Shipping Development Plan in the Philippines (DSDP)
Final Report
7-9
-
1,000
2,000
3,000
4,000
5,000
6,000
Min
eral
Fue
l
Whe
at
Gen
. Car
go *
Mol
asse
s
Coc
onut
Oil
Bot
tled
Car
go
Fish
Ani
mal
Fee
ds
Sug
ar
Live
ani
mal
s
Cru
de M
iner
als
Frui
ts &
Veg
.
Ferti
lizer
Cop
ra
Pet
role
um *
Cem
ent
Che
mic
als
Pal
ay &
Ric
e
Cor
n
Iron
& S
teel
000
MT/
yr
[for p
etro
l. &
GC
10
x 00
0 M
T/yr
] 2003 2015 2030
Figure 7.2.7. Estimated Future Sea Traffic by Commodity
(2) INBOUND AND OUTBOUND FORECAST
The inbound and outbound forecast is conducted based on projected past trends modeled from port statistics. Forecast is conducted for each zone (20 zones) and for each commodity (20 commodities). Detailed explanation of the data and methodology would therefore be very lengthy. As such, minimal details are presented here and only basic results are presented.
Fundamentally, based on port statistics inbound and outbound traffic trends from 1996 to 2003 are examined on a per commodity per zone basis. The prevailing trend is determined and is assumed to prevail into the future. However, total inbound and outbound traffic should equal to the already estimated total commodity sea traffic – thus, inbound and outbound estimates are adjusted proportionately.
The resulting inbound and outbound traffic estimates are summarized as follows:
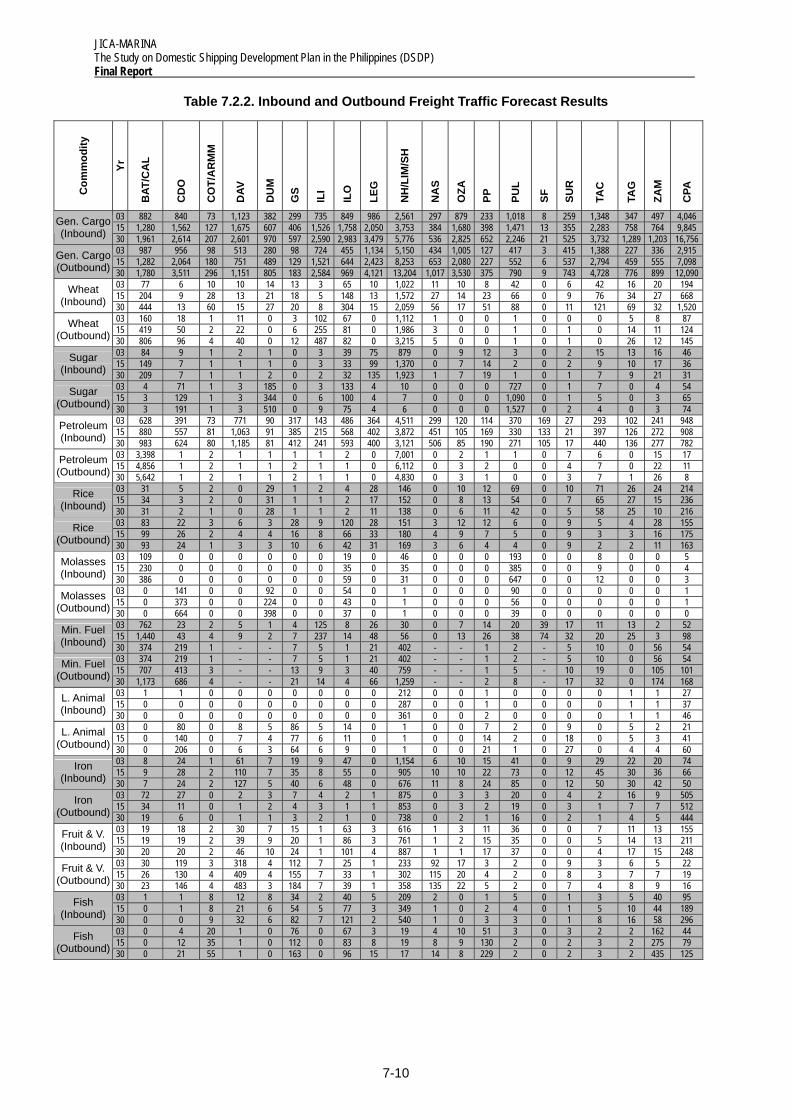
JICA-MARINA The Study on Domestic Shipping Development Plan in the Philippines (DSDP) Final Report
7-10
Table 7.2.2. Inbound and Outbound Freight Traffic Forecast Results C
omm
odity
Yr
BAT
/CA
L
CD
O
CO
T/A
RM
M
DAV
DU
M
GS
ILI
ILO
LEG
NH
/LIM
/SH
NA
S
OZA
PP
PUL
SF
SUR
TAC
TAG
ZAM
CPA
03 882 840 73 1,123 382 299 735 849 986 2,561 297 879 233 1,018 8 259 1,348 347 497 4,046 15 1,280 1,562 127 1,675 607 406 1,526 1,758 2,050 3,753 384 1,680 398 1,471 13 355 2,283 758 764 9,845 Gen. Cargo
(Inbound) 30 1,961 2,614 207 2,601 970 597 2,590 2,983 3,479 5,776 536 2,825 652 2,246 21 525 3,732 1,289 1,203 16,756 03 987 956 98 513 280 98 724 455 1,134 5,150 434 1,005 127 417 3 415 1,388 227 336 2,915 15 1,282 2,064 180 751 489 129 1,521 644 2,423 8,253 653 2,080 227 552 6 537 2,794 459 555 7,098 Gen. Cargo
(Outbound) 30 1,780 3,511 296 1,151 805 183 2,584 969 4,121 13,204 1,017 3,530 375 790 9 743 4,728 776 899 12,090 03 77 6 10 10 14 13 3 65 10 1,022 11 10 8 42 0 6 42 16 20 194 15 204 9 28 13 21 18 5 148 13 1,572 27 14 23 66 0 9 76 34 27 668 Wheat
(Inbound) 30 444 13 60 15 27 20 8 304 15 2,059 56 17 51 88 0 11 121 69 32 1,520 03 160 18 1 11 0 3 102 67 0 1,112 1 0 0 1 0 0 0 5 8 87 15 419 50 2 22 0 6 255 81 0 1,986 3 0 0 1 0 1 0 14 11 124 Wheat
(Outbound) 30 806 96 4 40 0 12 487 82 0 3,215 5 0 0 1 0 1 0 26 12 145 03 84 9 1 2 1 0 3 39 75 879 0 9 12 3 0 2 15 13 16 46 15 149 7 1 1 1 0 3 33 99 1,370 0 7 14 2 0 2 9 10 17 36 Sugar
(Inbound) 30 209 7 1 1 2 0 2 32 135 1,923 1 7 19 1 0 1 7 9 21 31 03 4 71 1 3 185 0 3 133 4 10 0 0 0 727 0 1 7 0 4 54 15 3 129 1 3 344 0 6 100 4 7 0 0 0 1,090 0 1 5 0 3 65 Sugar
(Outbound) 30 3 191 1 3 510 0 9 75 4 6 0 0 0 1,527 0 2 4 0 3 74 03 628 391 73 771 90 317 143 486 364 4,511 299 120 114 370 169 27 293 102 241 948 15 880 557 81 1,063 91 385 215 568 402 3,872 451 105 169 330 133 21 397 126 272 908 Petroleum
(Inbound) 30 983 624 80 1,185 81 412 241 593 400 3,121 506 85 190 271 105 17 440 136 277 782 03 3,398 1 2 1 1 1 1 2 0 7,001 0 2 1 1 0 7 6 0 15 17 15 4,856 1 2 1 1 2 1 1 0 6,112 0 3 2 0 0 4 7 0 22 11 Petroleum
(Outbound) 30 5,642 1 2 1 1 2 1 1 0 4,830 0 3 1 0 0 3 7 1 26 8 03 31 5 2 0 29 1 2 4 28 146 0 10 12 69 0 10 71 26 24 214 15 34 3 2 0 31 1 1 2 17 152 0 8 13 54 0 7 65 27 15 236 Rice
(Inbound) 30 31 2 1 0 28 1 1 2 11 138 0 6 11 42 0 5 58 25 10 216 03 83 22 3 6 3 28 9 120 28 151 3 12 12 6 0 9 5 4 28 155 15 99 26 2 4 4 16 8 66 33 180 4 9 7 5 0 9 3 3 16 175 Rice
(Outbound) 30 93 24 1 3 3 10 6 42 31 169 3 6 4 4 0 9 2 2 11 163 03 109 0 0 0 0 0 0 19 0 46 0 0 0 193 0 0 8 0 0 5 15 230 0 0 0 0 0 0 35 0 35 0 0 0 385 0 0 9 0 0 4 Molasses
(Inbound) 30 386 0 0 0 0 0 0 59 0 31 0 0 0 647 0 0 12 0 0 3 03 0 141 0 0 92 0 0 54 0 1 0 0 0 90 0 0 0 0 0 1 15 0 373 0 0 224 0 0 43 0 1 0 0 0 56 0 0 0 0 0 1 Molasses
(Outbound) 30 0 664 0 0 398 0 0 37 0 1 0 0 0 39 0 0 0 0 0 0 03 762 23 2 5 1 4 125 8 26 30 0 7 14 20 39 17 11 13 2 52 15 1,440 43 4 9 2 7 237 14 48 56 0 13 26 38 74 32 20 25 3 98 Min. Fuel
(Inbound) 30 374 219 1 - - 7 5 1 21 402 - - 1 2 - 5 10 0 56 54 03 374 219 1 - - 7 5 1 21 402 - - 1 2 - 5 10 0 56 54 15 707 413 3 - - 13 9 3 40 759 - - 1 5 - 10 19 0 105 101 Min. Fuel
(Outbound) 30 1,173 686 4 - - 21 14 4 66 1,259 - - 2 8 - 17 32 0 174 168 03 1 1 0 0 0 0 0 0 0 212 0 0 1 0 0 0 0 1 1 27 15 0 0 0 0 0 0 0 0 0 287 0 0 1 0 0 0 0 1 1 37 L. Animal
(Inbound) 30 0 0 0 0 0 0 0 0 0 361 0 0 2 0 0 0 0 1 1 46 03 0 80 0 8 5 86 5 14 0 1 0 0 7 2 0 9 0 5 2 21 15 0 140 0 7 4 77 6 11 0 1 0 0 14 2 0 18 0 5 3 41 L. Animal
(Outbound) 30 0 206 0 6 3 64 6 9 0 1 0 0 21 1 0 27 0 4 4 60 03 8 24 1 61 7 19 9 47 0 1,154 6 10 15 41 0 9 29 22 20 74 15 9 28 2 110 7 35 8 55 0 905 10 10 22 73 0 12 45 30 36 66 Iron
(Inbound) 30 7 24 2 127 5 40 6 48 0 676 11 8 24 85 0 12 50 30 42 50 03 72 27 0 2 3 7 4 2 1 875 0 3 3 20 0 4 2 16 9 505 15 34 11 0 1 2 4 3 1 1 853 0 3 2 19 0 3 1 7 7 512 Iron
(Outbound) 30 19 6 0 1 1 3 2 1 0 738 0 2 1 16 0 2 1 4 5 444 03 19 18 2 30 7 15 1 63 3 616 1 3 11 36 0 0 7 11 13 155 15 19 19 2 39 9 20 1 86 3 761 1 2 15 35 0 0 5 14 13 211 Fruit & V.
(Inbound) 30 20 20 2 46 10 24 1 101 4 887 1 1 17 37 0 0 4 17 15 248 03 30 119 3 318 4 112 7 25 1 233 92 17 3 2 0 9 3 6 5 22 15 26 130 4 409 4 155 7 33 1 302 115 20 4 2 0 8 3 7 7 19 Fruit & V.
(Outbound) 30 23 146 4 483 3 184 7 39 1 358 135 22 5 2 0 7 4 8 9 16 03 1 1 8 12 8 34 2 40 5 209 2 0 1 5 0 1 3 5 40 95 15 0 1 8 21 6 54 5 77 3 349 1 0 2 4 0 1 5 10 44 189 Fish
(Inbound) 30 0 0 9 32 6 82 7 121 2 540 1 0 3 3 0 1 8 16 58 296 03 0 4 20 1 0 76 0 67 3 19 4 10 51 3 0 3 2 2 162 44 15 0 12 35 1 0 112 0 83 8 19 8 9 130 2 0 2 3 2 275 79 Fish
(Outbound) 30 0 21 55 1 0 163 0 96 15 17 14 8 229 2 0 2 3 2 435 125
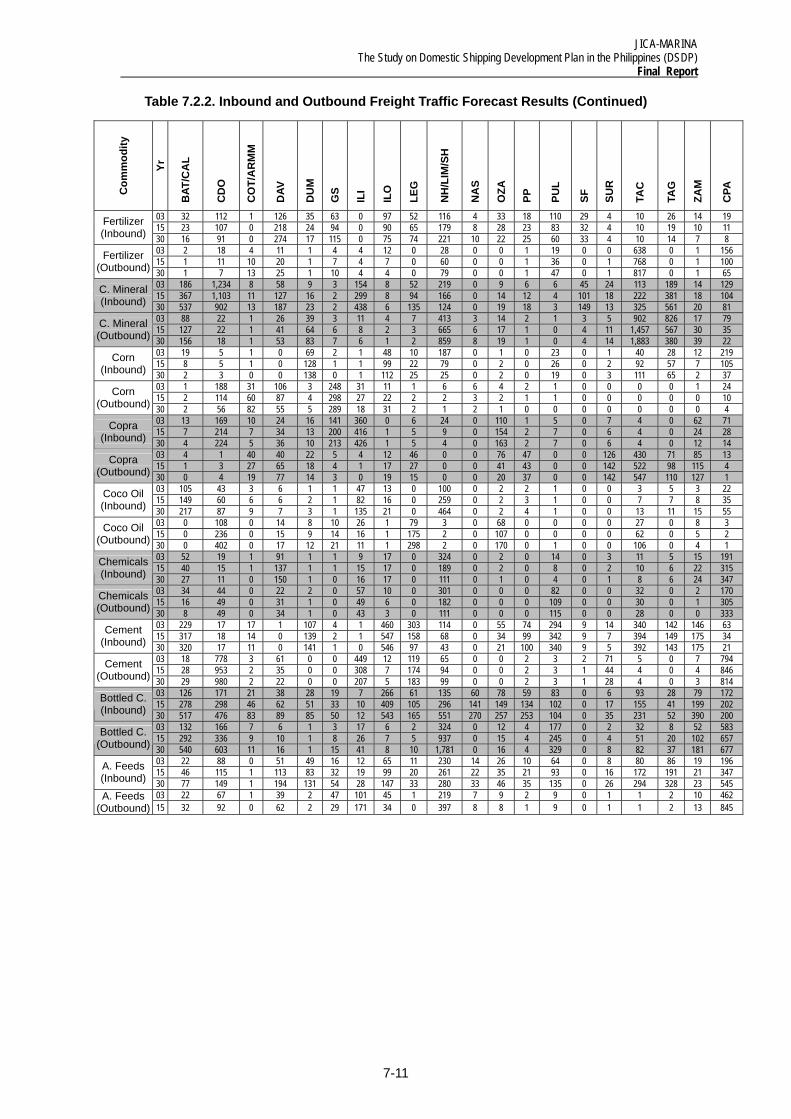
JICA-MARINA The Study on Domestic Shipping Development Plan in the Philippines (DSDP)
Final Report
7-11
Table 7.2.2. Inbound and Outbound Freight Traffic Forecast Results (Continued) C
omm
odity
Yr
BAT
/CA
L
CD
O
CO
T/A
RM
M
DAV
DU
M
GS
ILI
ILO
LEG
NH
/LIM
/SH
NA
S
OZA
PP
PUL
SF
SUR
TAC
TAG
ZAM
CPA
03 32 112 1 126 35 63 0 97 52 116 4 33 18 110 29 4 10 26 14 19 15 23 107 0 218 24 94 0 90 65 179 8 28 23 83 32 4 10 19 10 11 Fertilizer
(Inbound) 30 16 91 0 274 17 115 0 75 74 221 10 22 25 60 33 4 10 14 7 8 03 2 18 4 11 1 4 4 12 0 28 0 0 1 19 0 0 638 0 1 156 15 1 11 10 20 1 7 4 7 0 60 0 0 1 36 0 1 768 0 1 100 Fertilizer
(Outbound) 30 1 7 13 25 1 10 4 4 0 79 0 0 1 47 0 1 817 0 1 65 03 186 1,234 8 58 9 3 154 8 52 219 0 9 6 6 45 24 113 189 14 129 15 367 1,103 11 127 16 2 299 8 94 166 0 14 12 4 101 18 222 381 18 104 C. Mineral
(Inbound) 30 537 902 13 187 23 2 438 6 135 124 0 19 18 3 149 13 325 561 20 81 03 88 22 1 26 39 3 11 4 7 413 3 14 2 1 3 5 902 826 17 79 15 127 22 1 41 64 6 8 2 3 665 6 17 1 0 4 11 1,457 567 30 35 C. Mineral
(Outbound) 30 156 18 1 53 83 7 6 1 2 859 8 19 1 0 4 14 1,883 380 39 22 03 19 5 1 0 69 2 1 48 10 187 0 1 0 23 0 1 40 28 12 219 15 8 5 1 0 128 1 1 99 22 79 0 2 0 26 0 2 92 57 7 105 Corn
(Inbound) 30 2 3 0 0 138 0 1 112 25 25 0 2 0 19 0 3 111 65 2 37 03 1 188 31 106 3 248 31 11 1 6 6 4 2 1 0 0 0 0 1 24 15 2 114 60 87 4 298 27 22 2 2 3 2 1 1 0 0 0 0 0 10 Corn
(Outbound) 30 2 56 82 55 5 289 18 31 2 1 2 1 0 0 0 0 0 0 0 4 03 13 169 10 24 16 141 360 0 6 24 0 110 1 5 0 7 4 0 62 71 15 7 214 7 34 13 200 416 1 5 9 0 154 2 7 0 6 4 0 24 28 Copra
(Inbound) 30 4 224 5 36 10 213 426 1 5 4 0 163 2 7 0 6 4 0 12 14 03 4 1 40 40 22 5 4 12 46 0 0 76 47 0 0 126 430 71 85 13 15 1 3 27 65 18 4 1 17 27 0 0 41 43 0 0 142 522 98 115 4 Copra
(Outbound) 30 0 4 19 77 14 3 0 19 15 0 0 20 37 0 0 142 547 110 127 1 03 105 43 3 6 1 1 47 13 0 100 0 2 2 1 0 0 3 5 3 22 15 149 60 6 6 2 1 82 16 0 259 0 2 3 1 0 0 7 7 8 35 Coco Oil
(Inbound) 30 217 87 9 7 3 1 135 21 0 464 0 2 4 1 0 0 13 11 15 55 03 0 108 0 14 8 10 26 1 79 3 0 68 0 0 0 0 27 0 8 3 15 0 236 0 15 9 14 16 1 175 2 0 107 0 0 0 0 62 0 5 2 Coco Oil
(Outbound) 30 0 402 0 17 12 21 11 1 298 2 0 170 0 1 0 0 106 0 4 1 03 52 19 1 91 1 1 9 17 0 324 0 2 0 14 0 3 11 5 15 191 15 40 15 1 137 1 1 15 17 0 189 0 2 0 8 0 2 10 6 22 315 Chemicals
(Inbound) 30 27 11 0 150 1 0 16 17 0 111 0 1 0 4 0 1 8 6 24 347 03 34 44 0 22 2 0 57 10 0 301 0 0 0 82 0 0 32 0 2 170 15 16 49 0 31 1 0 49 6 0 182 0 0 0 109 0 0 30 0 1 305 Chemicals
(Outbound) 30 8 49 0 34 1 0 43 3 0 111 0 0 0 115 0 0 28 0 0 333 03 229 17 17 1 107 4 1 460 303 114 0 55 74 294 9 14 340 142 146 63 15 317 18 14 0 139 2 1 547 158 68 0 34 99 342 9 7 394 149 175 34 Cement
(Inbound) 30 320 17 11 0 141 1 0 546 97 43 0 21 100 340 9 5 392 143 175 21 03 18 778 3 61 0 0 449 12 119 65 0 0 2 3 2 71 5 0 7 794 15 28 953 2 35 0 0 308 7 174 94 0 0 2 3 1 44 4 0 4 846 Cement
(Outbound) 30 29 980 2 22 0 0 207 5 183 99 0 0 2 3 1 28 4 0 3 814 03 126 171 21 38 28 19 7 266 61 135 60 78 59 83 0 6 93 28 79 172 15 278 298 46 62 51 33 10 409 105 296 141 149 134 102 0 17 155 41 199 202 Bottled C.
(Inbound) 30 517 476 83 89 85 50 12 543 165 551 270 257 253 104 0 35 231 52 390 200 03 132 166 7 6 1 3 17 6 2 324 0 12 4 177 0 2 32 8 52 583 15 292 336 9 10 1 8 26 7 5 937 0 15 4 245 0 4 51 20 102 657 Bottled C.
(Outbound) 30 540 603 11 16 1 15 41 8 10 1,781 0 16 4 329 0 8 82 37 181 677 03 22 88 0 51 49 16 12 65 11 230 14 26 10 64 0 8 80 86 19 196 15 46 115 1 113 83 32 19 99 20 261 22 35 21 93 0 16 172 191 21 347 A. Feeds
(Inbound) 30 77 149 1 194 131 54 28 147 33 280 33 46 35 135 0 26 294 328 23 545 03 22 67 1 39 2 47 101 45 1 219 7 9 2 9 0 1 1 2 10 462 A. Feeds
(Outbound) 15 32 92 0 62 2 29 171 34 0 397 8 8 1 9 0 1 1 2 13 845
JICA-MARINA The Study on Domestic Shipping Development Plan in the Philippines (DSDP) Final Report
7-12
(3) ORIGIN – DESTINATION FORECAST
The most practical approach to OD forecast for this study is deemed to be the use of doubly constrained growth-factor methods. Mathematically, the future OD Matrix is defined as follows:
method by calcualtedparameter correction ,
zoneat factor growth trafficinbound ˆˆ zoneat factor growth trafficoutboundˆˆ
zone to zone from demand existing
year at zone to zone from demand future
ˆ and ˆ ..
0
0
0,
,
,,
0,,
Furness
jIIIG
iOOOG
jiv
tjiv
vOvIts
IGOGvv
ji
jtj
tj
iti
ti
ji
tji
j
tji
tj
i
tji
ti
jitj
tiji
tji
=
==
==
=
=
==
=
∑∑
βα
βα
Simply stated, the future OD traffic will increase proportionately from the existing OD traffic with respect to the growth of the outbound traffic at the origin zone; and, the growth of the inbound traffic at the destination zone. Growth factors are calculated from the projected inbound and outbound traffic.
The existing OD traffic was developed using the combination of three data sources: (1) National Statistics Commodity Flow Data (2002); (2) Philippine Port Authority Port Traffic Statistics (2003); and, (3) Cebu Port Authority Port Traffic Statistics (2003).
The NSO Data contains port-to-port traffic data, as derived from ship reports. This data was used to derive a preliminary OD Matrix. Examination of the results of the NSO Data indicates that the agency underestimated maritime traffic – only 27.5 mill. MT cargo and 16.4 mill. passengers. PPA records at least 40 mill. MT of cargo and 25 mill. passengers for 2002. Therefore, the NSO data was found to be incomplete and was determined to be biased.
PPA and CPA does not record OD information, however, they keep accurate records of port traffic, as this is a basis for changes. The PPA and CPA statistics were therefore used to complete and correct the bias of the NSO OD data.
Using Fratar Correction methodology, the correct OD structure was estimated. The current OD database was the basis for the forecasting.
OD estimation is conducted based on the 20-zone system as well as the 243-zone system and on a per commodity basis. Because it is lengthy to present OD results on a per commodity basis, the 20-commodity OD estimates are aggregated into four groups.
• Liquid cargo – Coconut oil, Molasses, and Petroleum
• Dry Bulk – Copra, Crude Minerals, Mineral Fuel, and Wheat
• Perishables – Fish, Fruits & Vegetables and Live Animals
• Unitized Cargo – the rest of the commodities
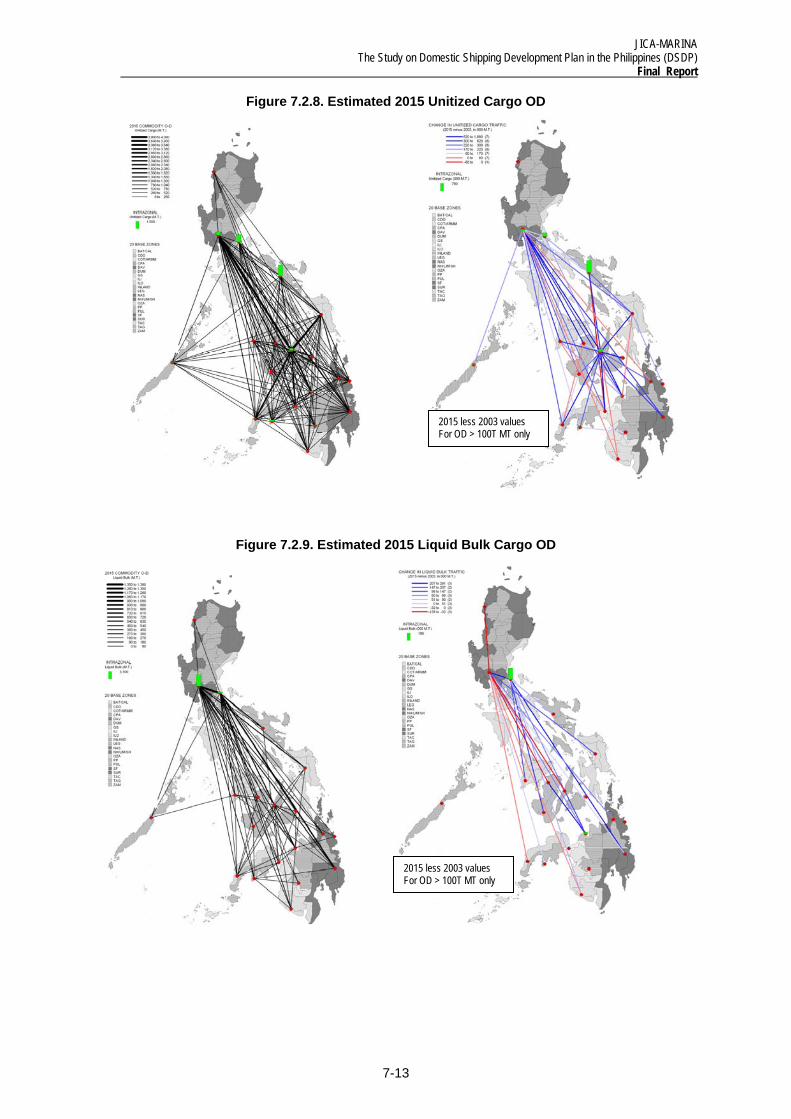
JICA-MARINA The Study on Domestic Shipping Development Plan in the Philippines (DSDP)
Final Report
7-13
Figure 7.2.8. Estimated 2015 Unitized Cargo OD
Figure 7.2.9. Estimated 2015 Liquid Bulk Cargo OD
2015 less 2003 values For OD > 100T MT only
2015 less 2003 values For OD > 100T MT only
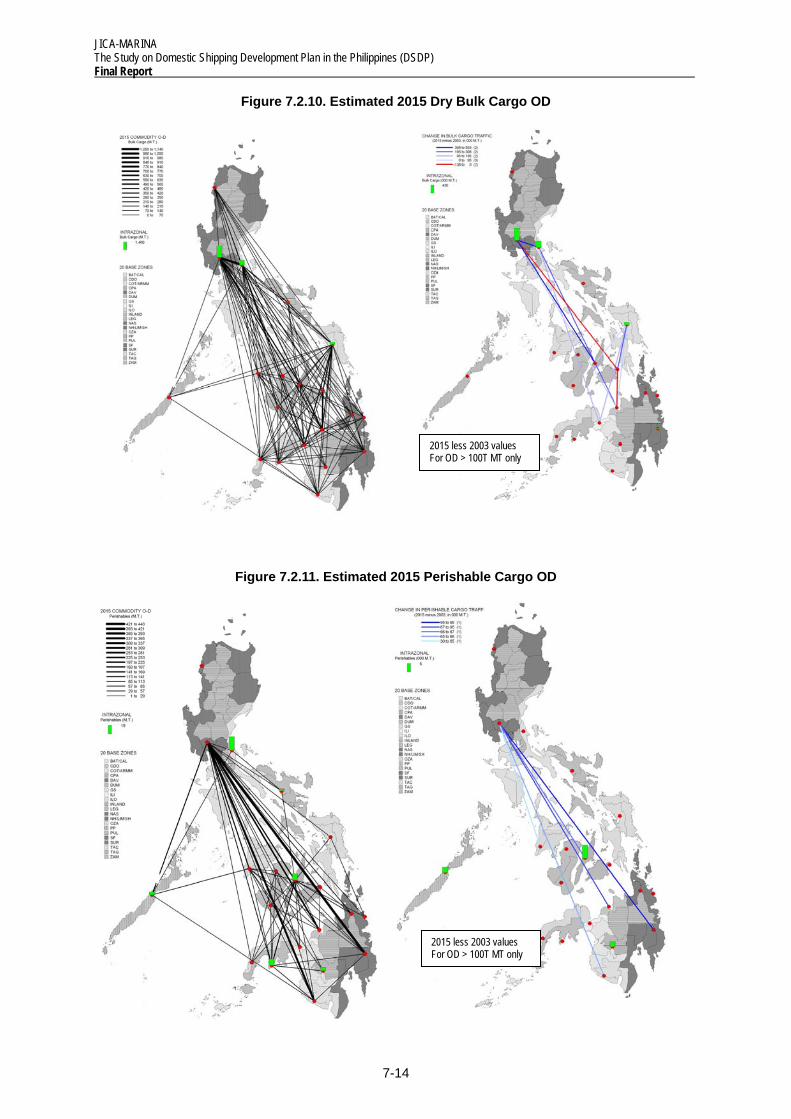
JICA-MARINA The Study on Domestic Shipping Development Plan in the Philippines (DSDP) Final Report
7-14
Figure 7.2.10. Estimated 2015 Dry Bulk Cargo OD
Figure 7.2.11. Estimated 2015 Perishable Cargo OD
2015 less 2003 values For OD > 100T MT only
2015 less 2003 values For OD > 100T MT only
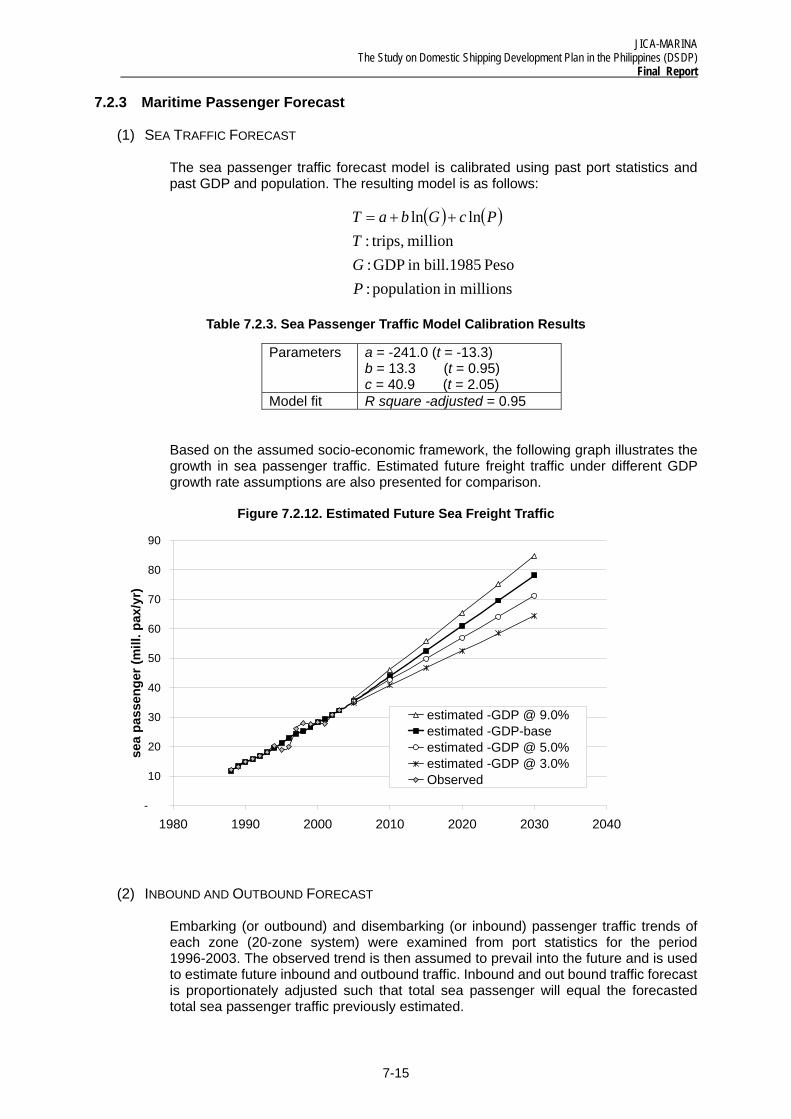
JICA-MARINA The Study on Domestic Shipping Development Plan in the Philippines (DSDP)
Final Report
7-15
-
10
20
30
40
50
60
70
80
90
1980 1990 2000 2010 2020 2030 2040
sea
pass
enge
r (m
ill. p
ax/y
r)
estimated -GDP @ 9.0%estimated -GDP-baseestimated -GDP @ 5.0%estimated -GDP @ 3.0%Observed
7.2.3 Maritime Passenger Forecast
(1) SEA TRAFFIC FORECAST
The sea passenger traffic forecast model is calibrated using past port statistics and past GDP and population. The resulting model is as follows:
( ) ( )
millionsin population :Peso 1985 bill.in GDP :
million trips,:lnln
PGT
PcGbaT ++=
Table 7.2.3. Sea Passenger Traffic Model Calibration Results
Parameters a = -241.0 (t = -13.3) b = 13.3 (t = 0.95) c = 40.9 (t = 2.05)
Model fit R square -adjusted = 0.95
Based on the assumed socio-economic framework, the following graph illustrates the growth in sea passenger traffic. Estimated future freight traffic under different GDP growth rate assumptions are also presented for comparison.
Figure 7.2.12. Estimated Future Sea Freight Traffic
(2) INBOUND AND OUTBOUND FORECAST
Embarking (or outbound) and disembarking (or inbound) passenger traffic trends of each zone (20-zone system) were examined from port statistics for the period 1996-2003. The observed trend is then assumed to prevail into the future and is used to estimate future inbound and outbound traffic. Inbound and out bound traffic forecast is proportionately adjusted such that total sea passenger will equal the forecasted total sea passenger traffic previously estimated.
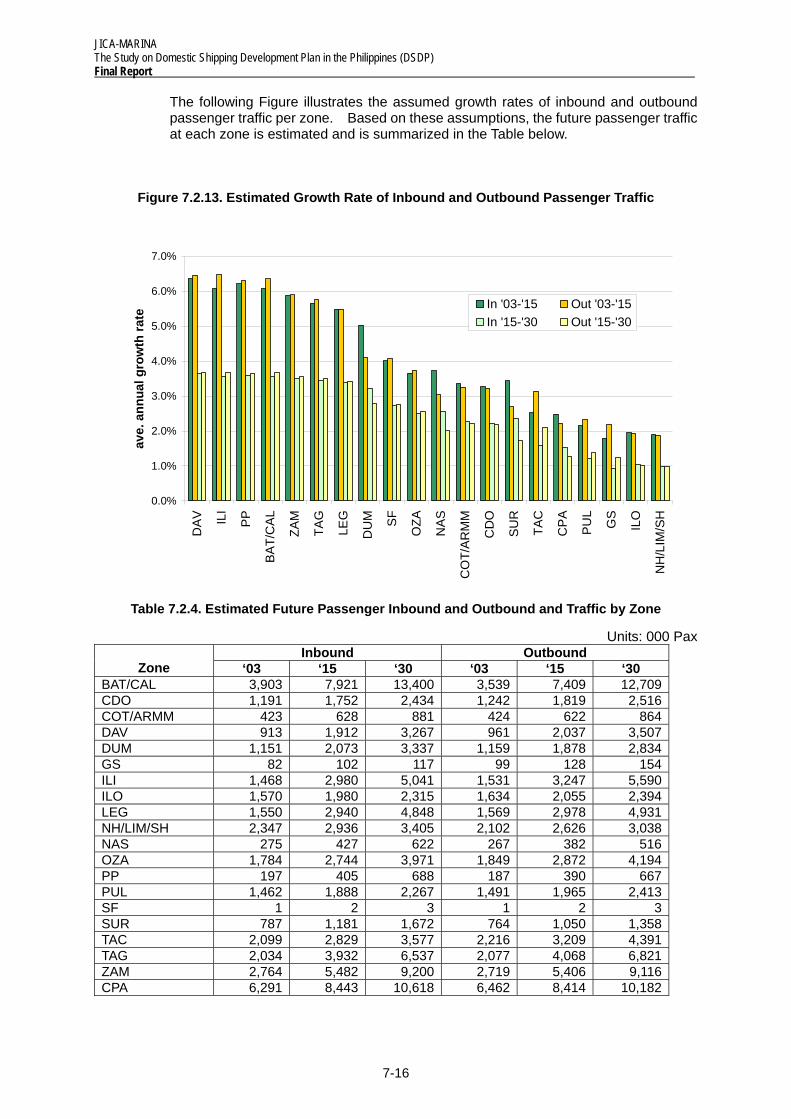
JICA-MARINA The Study on Domestic Shipping Development Plan in the Philippines (DSDP) Final Report
7-16
0.0%
1.0%
2.0%
3.0%
4.0%
5.0%
6.0%
7.0%
DA
V ILI
PP
BA
T/C
AL
ZAM
TAG
LEG
DU
M SF
OZA
NA
S
CO
T/A
RM
M
CD
O
SU
R
TAC
CP
A
PU
L
GS
ILO
NH
/LIM
/SH
ave.
ann
ual g
row
th ra
te
In '03-'15 Out '03-'15In '15-'30 Out '15-'30
The following Figure illustrates the assumed growth rates of inbound and outbound passenger traffic per zone. Based on these assumptions, the future passenger traffic at each zone is estimated and is summarized in the Table below.
Figure 7.2.13. Estimated Growth Rate of Inbound and Outbound Passenger Traffic
Table 7.2.4. Estimated Future Passenger Inbound and Outbound and Traffic by Zone
Units: 000 Pax Inbound Outbound
Zone ‘03 ‘15 ‘30 ‘03 ‘15 ‘30 BAT/CAL 3,903 7,921 13,400 3,539 7,409 12,709 CDO 1,191 1,752 2,434 1,242 1,819 2,516 COT/ARMM 423 628 881 424 622 864 DAV 913 1,912 3,267 961 2,037 3,507 DUM 1,151 2,073 3,337 1,159 1,878 2,834 GS 82 102 117 99 128 154 ILI 1,468 2,980 5,041 1,531 3,247 5,590 ILO 1,570 1,980 2,315 1,634 2,055 2,394 LEG 1,550 2,940 4,848 1,569 2,978 4,931 NH/LIM/SH 2,347 2,936 3,405 2,102 2,626 3,038 NAS 275 427 622 267 382 516 OZA 1,784 2,744 3,971 1,849 2,872 4,194 PP 197 405 688 187 390 667 PUL 1,462 1,888 2,267 1,491 1,965 2,413 SF 1 2 3 1 2 3 SUR 787 1,181 1,672 764 1,050 1,358 TAC 2,099 2,829 3,577 2,216 3,209 4,391 TAG 2,034 3,932 6,537 2,077 4,068 6,821 ZAM 2,764 5,482 9,200 2,719 5,406 9,116 CPA 6,291 8,443 10,618 6,462 8,414 10,182
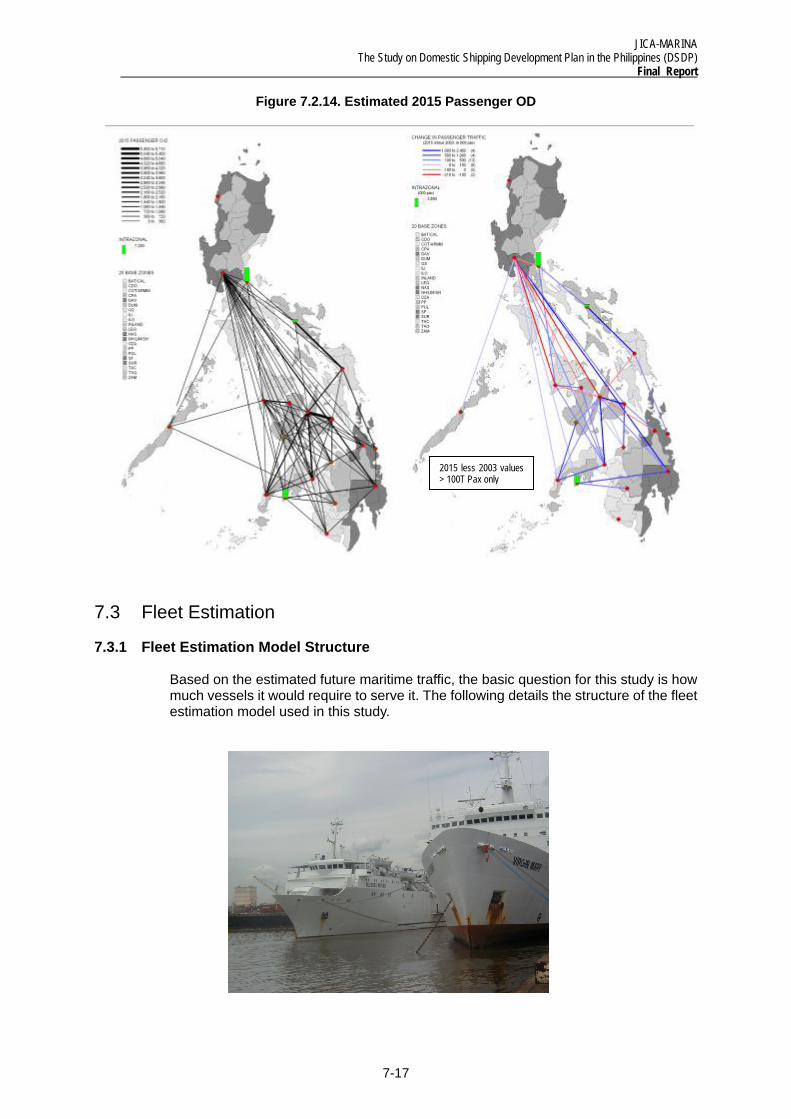
JICA-MARINA The Study on Domestic Shipping Development Plan in the Philippines (DSDP)
Final Report
7-17
Figure 7.2.14. Estimated 2015 Passenger OD
7.3 Fleet Estimation
7.3.1 Fleet Estimation Model Structure
Based on the estimated future maritime traffic, the basic question for this study is how much vessels it would require to serve it. The following details the structure of the fleet estimation model used in this study.
2015 less 2003 values > 100T Pax only
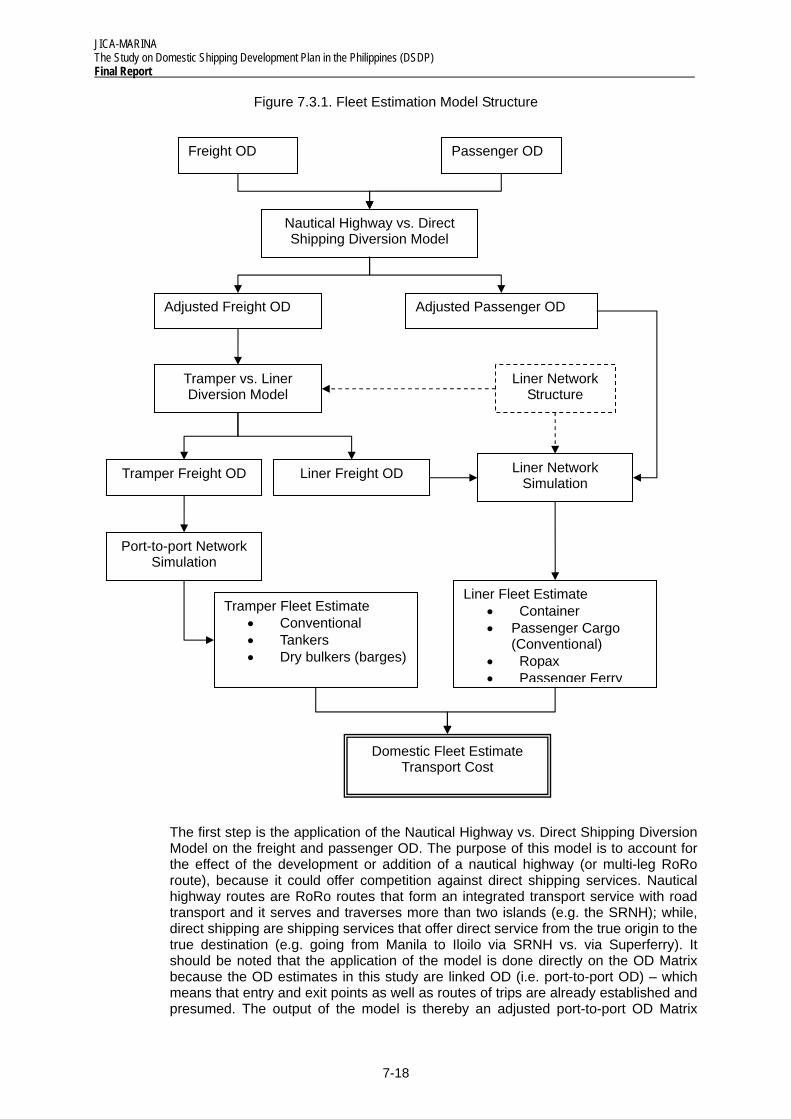
JICA-MARINA The Study on Domestic Shipping Development Plan in the Philippines (DSDP) Final Report
7-18
Figure 7.3.1. Fleet Estimation Model Structure
The first step is the application of the Nautical Highway vs. Direct Shipping Diversion Model on the freight and passenger OD. The purpose of this model is to account for the effect of the development or addition of a nautical highway (or multi-leg RoRo route), because it could offer competition against direct shipping services. Nautical highway routes are RoRo routes that form an integrated transport service with road transport and it serves and traverses more than two islands (e.g. the SRNH); while, direct shipping are shipping services that offer direct service from the true origin to the true destination (e.g. going from Manila to Iloilo via SRNH vs. via Superferry). It should be noted that the application of the model is done directly on the OD Matrix because the OD estimates in this study are linked OD (i.e. port-to-port OD) – which means that entry and exit points as well as routes of trips are already established and presumed. The output of the model is thereby an adjusted port-to-port OD Matrix
Freight OD Passenger OD
Nautical Highway vs. Direct Shipping Diversion Model
Adjusted Freight OD Adjusted Passenger OD
Tramper vs. Liner Diversion Model
Tramper Freight OD Liner Freight OD
Port-to-port Network Simulation
Liner Network Simulation
Tramper Fleet Estimate • Conventional • Tankers • Dry bulkers (barges)
Liner Network Structure
Liner Fleet Estimate • Container • Passenger Cargo
(Conventional) • Ropax • Passenger Ferry
Domestic Fleet Estimate Transport Cost
JICA-MARINA The Study on Domestic Shipping Development Plan in the Philippines (DSDP)
Final Report
7-19
which already adjusts for any potential shift in the routes of trips (i.e. from direct shipping to nautical highway or v.v.).
The second stage involves the breakdown of the freight OD into freight that will be transported via tramper service and those that will be transported via liner service. This is performed because the nature of transport via tramper service is very different from via liner service. Tramper services are basically port-to-port routing systems, so cargo is loaded and unloaded at the origin and destination port respectively. On the other hand, liner service, sometime serves several ports during a single voyage, thus traffic is accumulated along the route. Moreover, liner service in the Philippines often combines with passenger service, thus fleet estimation needs to simultaneously consider both freight and passenger traffic.
The breakdown into tramper and liner freight OD fundamentally involves a cost comparison between transporting the estimated freight volume from one port to another. The breakdown also considers technical feasibility of transport with respect to the nature of the commodity. For example, petroleum products could not be transported via liner service and is therefore automatically added into the tramper OD. Another consideration is the presence or absence of liner service. Naturally, if liner service is not available, there is no other choice but to transport via trampers.
The third stage involves the assignment of the OD traffic into the network. The objective of this exercise is to estimate the line volumes that will be transported by vessels. In the case of trampers, the OD traffic is already the line traffic because trampers operate on a port-to-port basis. However in the case of liners, the multi-port call nature of routes necessitates the use of traffic assignment methodology to calculate line volume. There are three types of liner networks considered; namely, pure cargo, pure passenger and combined passenger/cargo lines. Using the STRADA software (System for Traffic Demand Analysis, developed by JICA) the liner traffic is assigned to the liner network based on the shortest path available and with the least number of transfers (i.e. changing vessels). In the case of passenger traffic assignment, pure passenger services are given a premium over passenger/cargo service (due to faster speeds of pure passenger vessels).
The fourth stage is the estimation of the vessel mix that can serve the line demand estimated in the previous stage. Naturally, there are a variety of combinations in terms of vessel size and type that could serve the demand – it is therefore necessary to set a criterion under which the estimated fleet is defined. For this study, the vessel mix that could serve the demand at the least cost given the prevailing conditions is considered to be the adopted fleet estimate. This is conducted, by assuming a given set of vessels (of various type and size taken to be representative vessels) wherein the model could choose from and base on cost comparison between the vessels, the vessel that could feasibly serve the given OD traffic at the least cost is selected. The aggregated combination of least cost vessels is then considered to be the fleet estimate.
To be able to ensure that the fleet estimation model is practical and is representative of the conditions in the Philippine domestic maritime transport market, the model is refined and calibrated such that its results match the current vessel inventory.
Finally, along with the fleet estimate the model also outputs the corresponding transport cost.
7.3.2 Fleet Estimation Parameters
To be able to operationalize the fleet estimation model, several parameters needs to be established. Major parameters required are as follows:
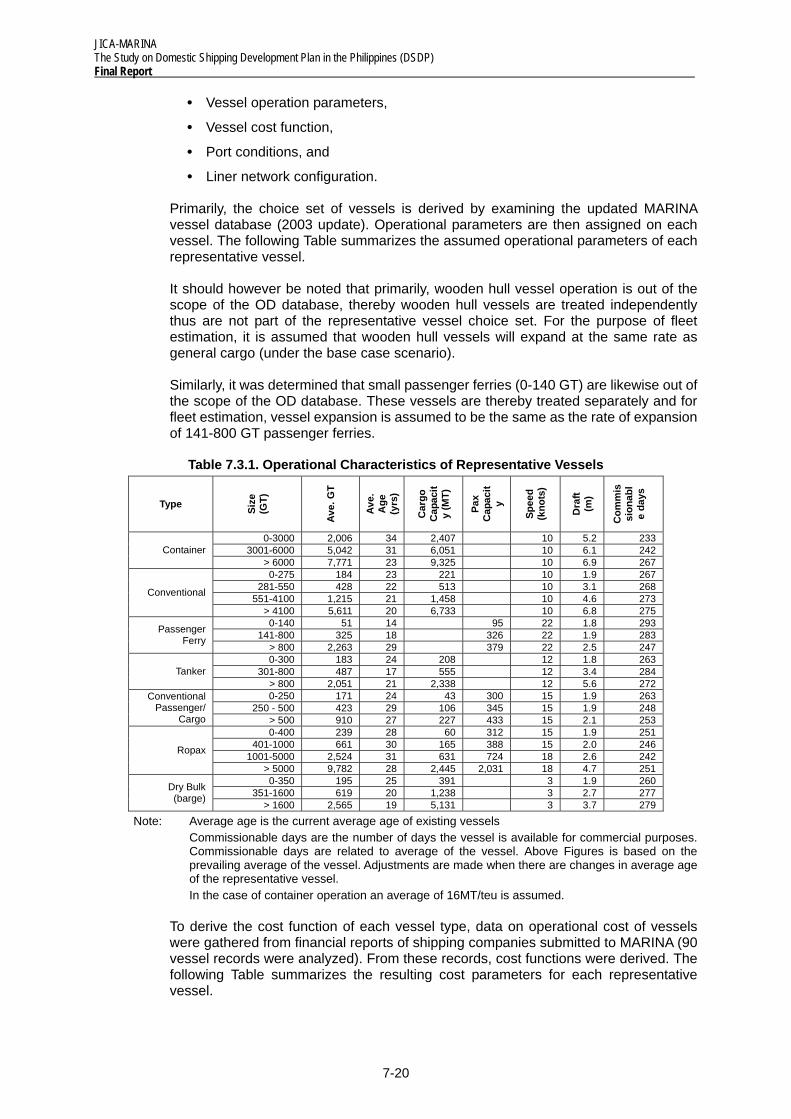
JICA-MARINA The Study on Domestic Shipping Development Plan in the Philippines (DSDP) Final Report
7-20
• Vessel operation parameters,
• Vessel cost function,
• Port conditions, and
• Liner network configuration.
Primarily, the choice set of vessels is derived by examining the updated MARINA vessel database (2003 update). Operational parameters are then assigned on each vessel. The following Table summarizes the assumed operational parameters of each representative vessel.
It should however be noted that primarily, wooden hull vessel operation is out of the scope of the OD database, thereby wooden hull vessels are treated independently thus are not part of the representative vessel choice set. For the purpose of fleet estimation, it is assumed that wooden hull vessels will expand at the same rate as general cargo (under the base case scenario).
Similarly, it was determined that small passenger ferries (0-140 GT) are likewise out of the scope of the OD database. These vessels are thereby treated separately and for fleet estimation, vessel expansion is assumed to be the same as the rate of expansion of 141-800 GT passenger ferries.
Table 7.3.1. Operational Characteristics of Representative Vessels
Type Size
(G
T)
Ave.
GT
Ave.
A
ge
(yrs
)
Car
go
Cap
acit
y (M
T)
Pax
Cap
acit
y
Spee
d (k
nots
)
Dra
ft (m
)
Com
mis
sion
abl
e da
ys
0-3000 2,006 34 2,407 10 5.2 233 3001-6000 5,042 31 6,051 10 6.1 242 Container
> 6000 7,771 23 9,325 10 6.9 267 0-275 184 23 221 10 1.9 267
281-550 428 22 513 10 3.1 268 551-4100 1,215 21 1,458 10 4.6 273 Conventional
> 4100 5,611 20 6,733 10 6.8 275 0-140 51 14 95 22 1.8 293
141-800 325 18 326 22 1.9 283 Passenger Ferry
> 800 2,263 29 379 22 2.5 247 0-300 183 24 208 12 1.8 263
301-800 487 17 555 12 3.4 284 Tanker > 800 2,051 21 2,338 12 5.6 272 0-250 171 24 43 300 15 1.9 263
250 - 500 423 29 106 345 15 1.9 248 Conventional
Passenger/ Cargo > 500 910 27 227 433 15 2.1 253
0-400 239 28 60 312 15 1.9 251 401-1000 661 30 165 388 15 2.0 246
1001-5000 2,524 31 631 724 18 2.6 242 Ropax
> 5000 9,782 28 2,445 2,031 18 4.7 251 0-350 195 25 391 3 1.9 260
351-1600 619 20 1,238 3 2.7 277 Dry Bulk (barge)
> 1600 2,565 19 5,131 3 3.7 279
Note: Average age is the current average age of existing vessels Commissionable days are the number of days the vessel is available for commercial purposes. Commissionable days are related to average of the vessel. Above Figures is based on the prevailing average of the vessel. Adjustments are made when there are changes in average age of the representative vessel. In the case of container operation an average of 16MT/teu is assumed.
To derive the cost function of each vessel type, data on operational cost of vessels were gathered from financial reports of shipping companies submitted to MARINA (90 vessel records were analyzed). From these records, cost functions were derived. The following Table summarizes the resulting cost parameters for each representative vessel.
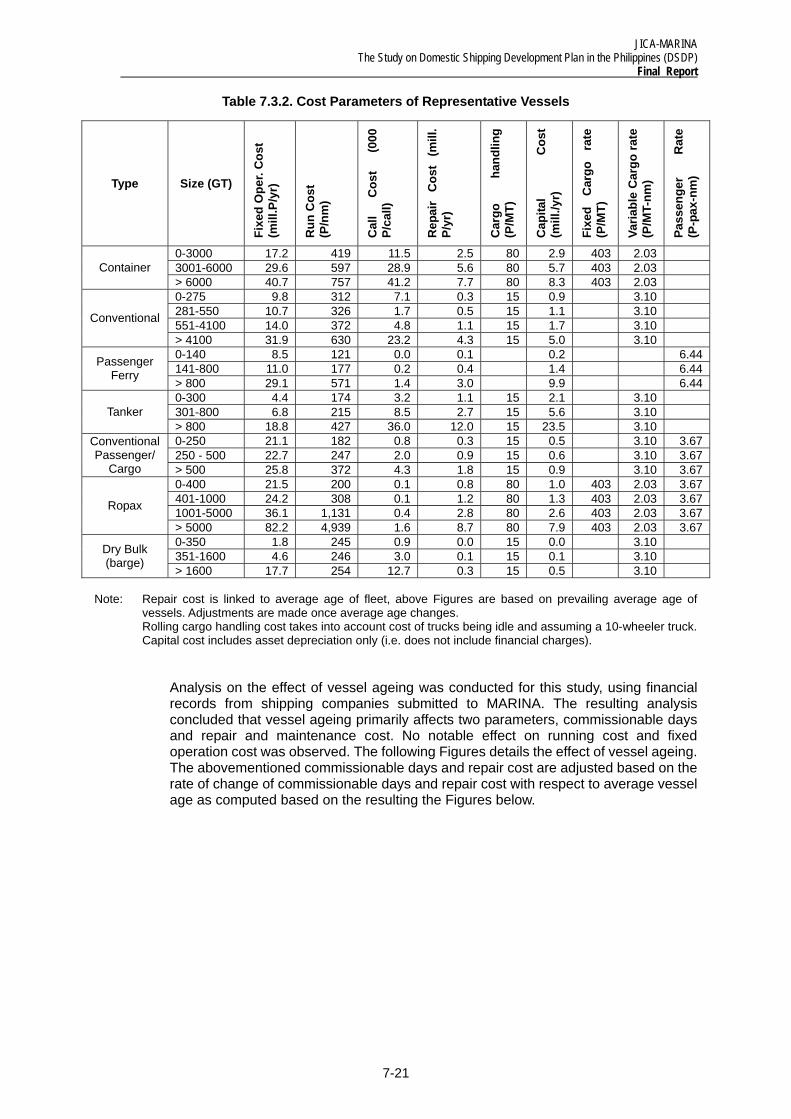
JICA-MARINA The Study on Domestic Shipping Development Plan in the Philippines (DSDP)
Final Report
7-21
Table 7.3.2. Cost Parameters of Representative Vessels
Type Size (GT)
Fixe
d O
per.
Cos
t
(mill
.P/y
r)
Run
Cos
t (P
/nm
)
Cal
l C
ost
(000
P/
call)
Rep
air
Cos
t (m
ill.
P/yr
)
Car
go
hand
ling
(P/M
T)
Cap
ital
Cos
t
(mill
./yr)
Fixe
d C
argo
ra
te
(P/M
T)
Varia
ble
Car
go ra
te
(P/M
T-nm
)
Pass
enge
r R
ate
(P-p
ax-n
m)
0-3000 17.2 419 11.5 2.5 80 2.9 403 2.03 3001-6000 29.6 597 28.9 5.6 80 5.7 403 2.03 Container > 6000 40.7 757 41.2 7.7 80 8.3 403 2.03 0-275 9.8 312 7.1 0.3 15 0.9 3.10 281-550 10.7 326 1.7 0.5 15 1.1 3.10 551-4100 14.0 372 4.8 1.1 15 1.7 3.10 Conventional
> 4100 31.9 630 23.2 4.3 15 5.0 3.10 0-140 8.5 121 0.0 0.1 0.2 6.44 141-800 11.0 177 0.2 0.4 1.4 6.44 Passenger
Ferry > 800 29.1 571 1.4 3.0 9.9 6.44 0-300 4.4 174 3.2 1.1 15 2.1 3.10 301-800 6.8 215 8.5 2.7 15 5.6 3.10 Tanker > 800 18.8 427 36.0 12.0 15 23.5 3.10 0-250 21.1 182 0.8 0.3 15 0.5 3.10 3.67 250 - 500 22.7 247 2.0 0.9 15 0.6 3.10 3.67
Conventional Passenger/
Cargo > 500 25.8 372 4.3 1.8 15 0.9 3.10 3.67 0-400 21.5 200 0.1 0.8 80 1.0 403 2.03 3.67 401-1000 24.2 308 0.1 1.2 80 1.3 403 2.03 3.67 1001-5000 36.1 1,131 0.4 2.8 80 2.6 403 2.03 3.67 Ropax
> 5000 82.2 4,939 1.6 8.7 80 7.9 403 2.03 3.67 0-350 1.8 245 0.9 0.0 15 0.0 3.10 351-1600 4.6 246 3.0 0.1 15 0.1 3.10 Dry Bulk
(barge) > 1600 17.7 254 12.7 0.3 15 0.5 3.10 Note: Repair cost is linked to average age of fleet, above Figures are based on prevailing average age of
vessels. Adjustments are made once average age changes. Rolling cargo handling cost takes into account cost of trucks being idle and assuming a 10-wheeler truck. Capital cost includes asset depreciation only (i.e. does not include financial charges).
Analysis on the effect of vessel ageing was conducted for this study, using financial records from shipping companies submitted to MARINA. The resulting analysis concluded that vessel ageing primarily affects two parameters, commissionable days and repair and maintenance cost. No notable effect on running cost and fixed operation cost was observed. The following Figures details the effect of vessel ageing. The abovementioned commissionable days and repair cost are adjusted based on the rate of change of commissionable days and repair cost with respect to average vessel age as computed based on the resulting the Figures below.
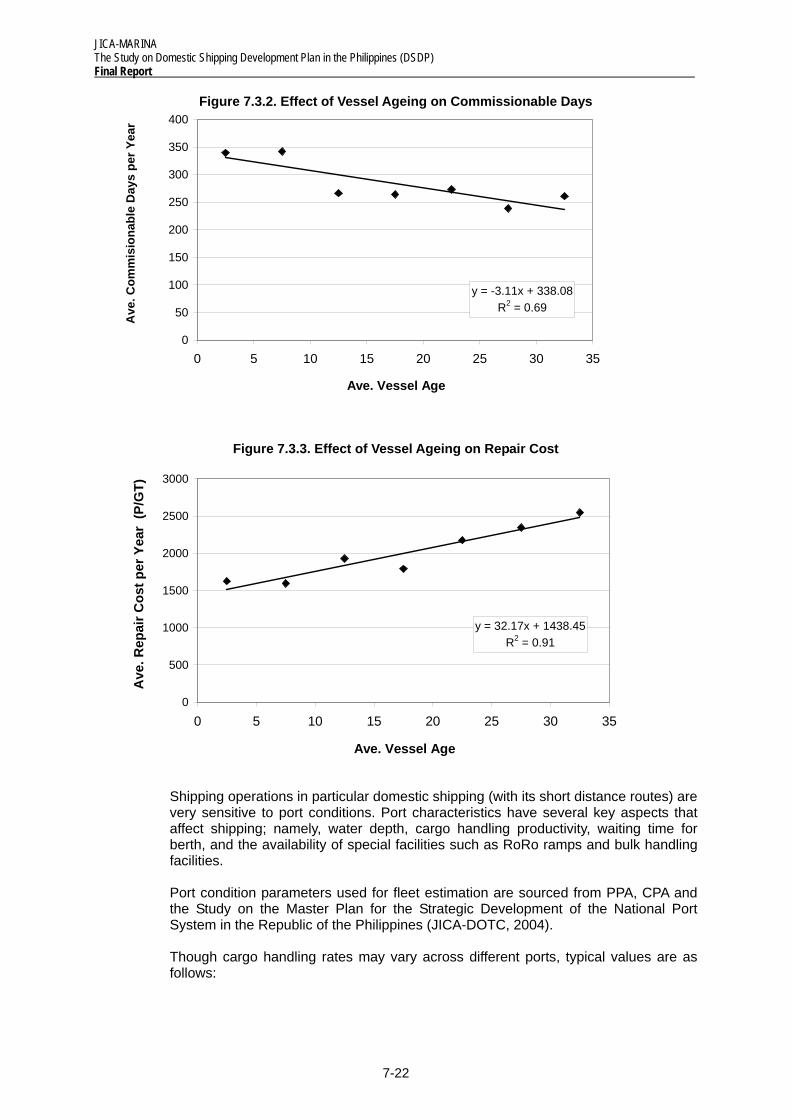
JICA-MARINA The Study on Domestic Shipping Development Plan in the Philippines (DSDP) Final Report
7-22
y = -3.11x + 338.08R2 = 0.69
0
50
100
150
200
250
300
350
400
0 5 10 15 20 25 30 35
Ave. Vessel Age
Ave
. Com
mis
iona
ble
Day
s pe
r Yea
r
y = 32.17x + 1438.45R2 = 0.91
0
500
1000
1500
2000
2500
3000
0 5 10 15 20 25 30 35
Ave. Vessel Age
Ave
. Rep
air C
ost p
er Y
ear
(P/G
T)
Figure 7.3.2. Effect of Vessel Ageing on Commissionable Days
Figure 7.3.3. Effect of Vessel Ageing on Repair Cost
Shipping operations in particular domestic shipping (with its short distance routes) are very sensitive to port conditions. Port characteristics have several key aspects that affect shipping; namely, water depth, cargo handling productivity, waiting time for berth, and the availability of special facilities such as RoRo ramps and bulk handling facilities.
Port condition parameters used for fleet estimation are sourced from PPA, CPA and the Study on the Master Plan for the Strategic Development of the National Port System in the Republic of the Philippines (JICA-DOTC, 2004).
Though cargo handling rates may vary across different ports, typical values are as follows:
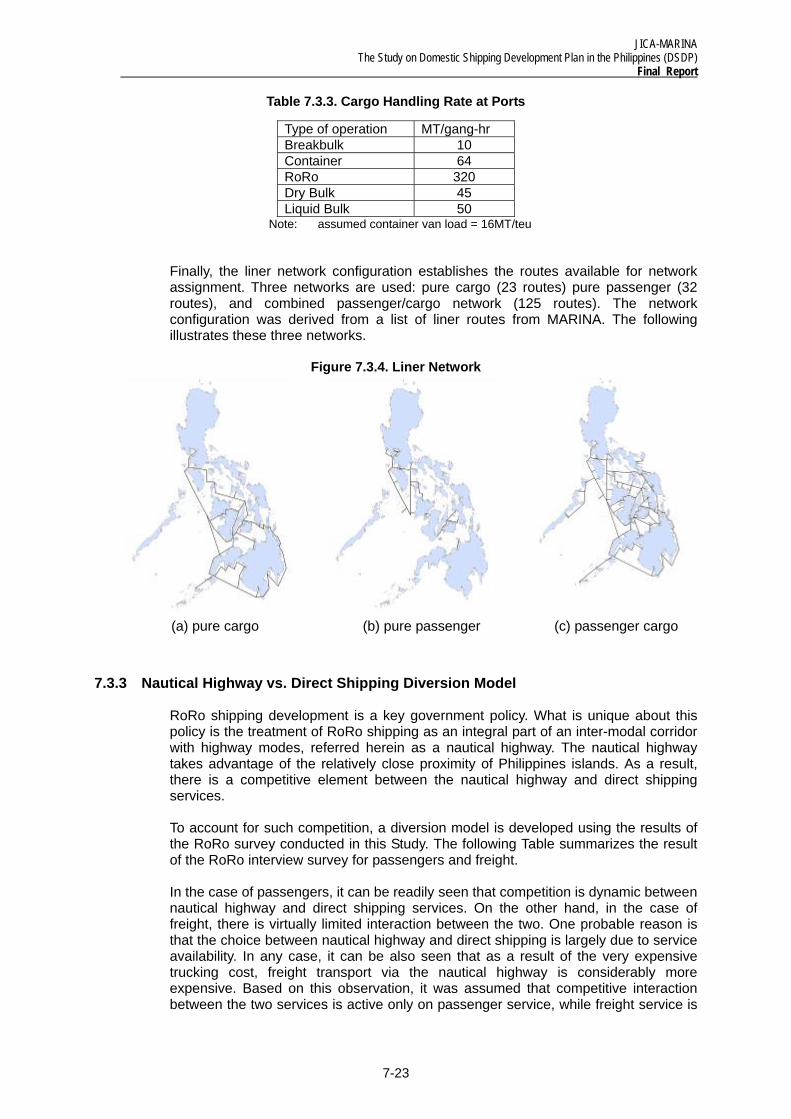
JICA-MARINA The Study on Domestic Shipping Development Plan in the Philippines (DSDP)
Final Report
7-23
Table 7.3.3. Cargo Handling Rate at Ports
Type of operation MT/gang-hr Breakbulk 10 Container 64 RoRo 320 Dry Bulk 45 Liquid Bulk 50
Note: assumed container van load = 16MT/teu
Finally, the liner network configuration establishes the routes available for network assignment. Three networks are used: pure cargo (23 routes) pure passenger (32 routes), and combined passenger/cargo network (125 routes). The network configuration was derived from a list of liner routes from MARINA. The following illustrates these three networks.
Figure 7.3.4. Liner Network
7.3.3 Nautical Highway vs. Direct Shipping Diversion Model
RoRo shipping development is a key government policy. What is unique about this policy is the treatment of RoRo shipping as an integral part of an inter-modal corridor with highway modes, referred herein as a nautical highway. The nautical highway takes advantage of the relatively close proximity of Philippines islands. As a result, there is a competitive element between the nautical highway and direct shipping services.
To account for such competition, a diversion model is developed using the results of the RoRo survey conducted in this Study. The following Table summarizes the result of the RoRo interview survey for passengers and freight.
In the case of passengers, it can be readily seen that competition is dynamic between nautical highway and direct shipping services. On the other hand, in the case of freight, there is virtually limited interaction between the two. One probable reason is that the choice between nautical highway and direct shipping is largely due to service availability. In any case, it can be also seen that as a result of the very expensive trucking cost, freight transport via the nautical highway is considerably more expensive. Based on this observation, it was assumed that competitive interaction between the two services is active only on passenger service, while freight service is
(a) pure cargo (b) pure passenger (c) passenger cargo
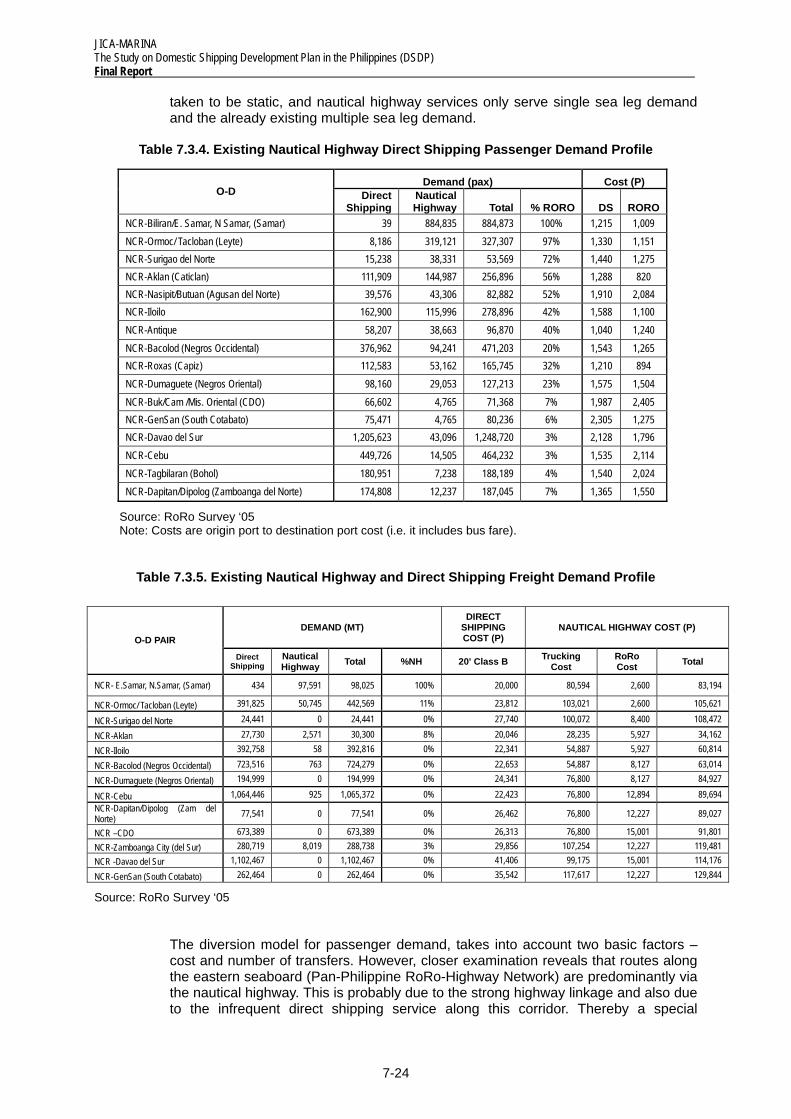
JICA-MARINA The Study on Domestic Shipping Development Plan in the Philippines (DSDP) Final Report
7-24
taken to be static, and nautical highway services only serve single sea leg demand and the already existing multiple sea leg demand.
Table 7.3.4. Existing Nautical Highway Direct Shipping Passenger Demand Profile
Demand (pax) Cost (P) O-D Direct
Shipping Nautical Highway Total % RORO DS RORO
NCR-Biliran/E. Samar, N Samar, (Samar) 39 884,835 884,873 100% 1,215 1,009 NCR-Ormoc/ Tacloban (Leyte) 8,186 319,121 327,307 97% 1,330 1,151 NCR-Surigao del Norte 15,238 38,331 53,569 72% 1,440 1,275 NCR-Aklan (Caticlan) 111,909 144,987 256,896 56% 1,288 820 NCR-Nasipit/Butuan (Agusan del Norte) 39,576 43,306 82,882 52% 1,910 2,084 NCR-Iloilo 162,900 115,996 278,896 42% 1,588 1,100 NCR-Antique 58,207 38,663 96,870 40% 1,040 1,240 NCR-Bacolod (Negros Occidental) 376,962 94,241 471,203 20% 1,543 1,265 NCR-Roxas (Capiz) 112,583 53,162 165,745 32% 1,210 894 NCR-Dumaguete (Negros Oriental) 98,160 29,053 127,213 23% 1,575 1,504 NCR-Buk/Cam /Mis. Oriental (CDO) 66,602 4,765 71,368 7% 1,987 2,405 NCR-GenSan (South Cotabato) 75,471 4,765 80,236 6% 2,305 1,275 NCR-Davao del Sur 1,205,623 43,096 1,248,720 3% 2,128 1,796 NCR-Cebu 449,726 14,505 464,232 3% 1,535 2,114 NCR-Tagbilaran (Bohol) 180,951 7,238 188,189 4% 1,540 2,024 NCR-Dapitan/Dipolog (Zamboanga del Norte) 174,808 12,237 187,045 7% 1,365 1,550
Source: RoRo Survey ‘05 Note: Costs are origin port to destination port cost (i.e. it includes bus fare).
Table 7.3.5. Existing Nautical Highway and Direct Shipping Freight Demand Profile
Source: RoRo Survey ‘05
The diversion model for passenger demand, takes into account two basic factors – cost and number of transfers. However, closer examination reveals that routes along the eastern seaboard (Pan-Philippine RoRo-Highway Network) are predominantly via the nautical highway. This is probably due to the strong highway linkage and also due to the infrequent direct shipping service along this corridor. Thereby a special
DEMAND (MT) DIRECT
SHIPPING COST (P)
NAUTICAL HIGHWAY COST (P) O-D PAIR
Direct Shipping
Nautical Highway Total %NH 20' Class B Trucking
Cost RoRo Cost Total
NCR- E.Samar, N.Samar, (Samar) 434 97,591 98,025 100% 20,000 80,594 2,600 83,194
NCR-Ormoc/ Tacloban (Leyte) 391,825 50,745 442,569 11% 23,812 103,021 2,600 105,621
NCR-Surigao del Norte 24,441 0 24,441 0% 27,740 100,072 8,400 108,472
NCR-Aklan 27,730 2,571 30,300 8% 20,046 28,235 5,927 34,162
NCR-Iloilo 392,758 58 392,816 0% 22,341 54,887 5,927 60,814
NCR-Bacolod (Negros Occidental) 723,516 763 724,279 0% 22,653 54,887 8,127 63,014
NCR-Dumaguete (Negros Oriental) 194,999 0 194,999 0% 24,341 76,800 8,127 84,927
NCR-Cebu 1,064,446 925 1,065,372 0% 22,423 76,800 12,894 89,694 NCR-Dapitan/Dipolog (Zam del Norte) 77,541 0 77,541 0% 26,462 76,800 12,227 89,027
NCR –CDO 673,389 0 673,389 0% 26,313 76,800 15,001 91,801 NCR-Zamboanga City (del Sur) 280,719 8,019 288,738 3% 29,856 107,254 12,227 119,481 NCR -Davao del Sur 1,102,467 0 1,102,467 0% 41,406 99,175 15,001 114,176
NCR-GenSan (South Cotabato) 262,464 0 262,464 0% 35,542 117,617 12,227 129,844
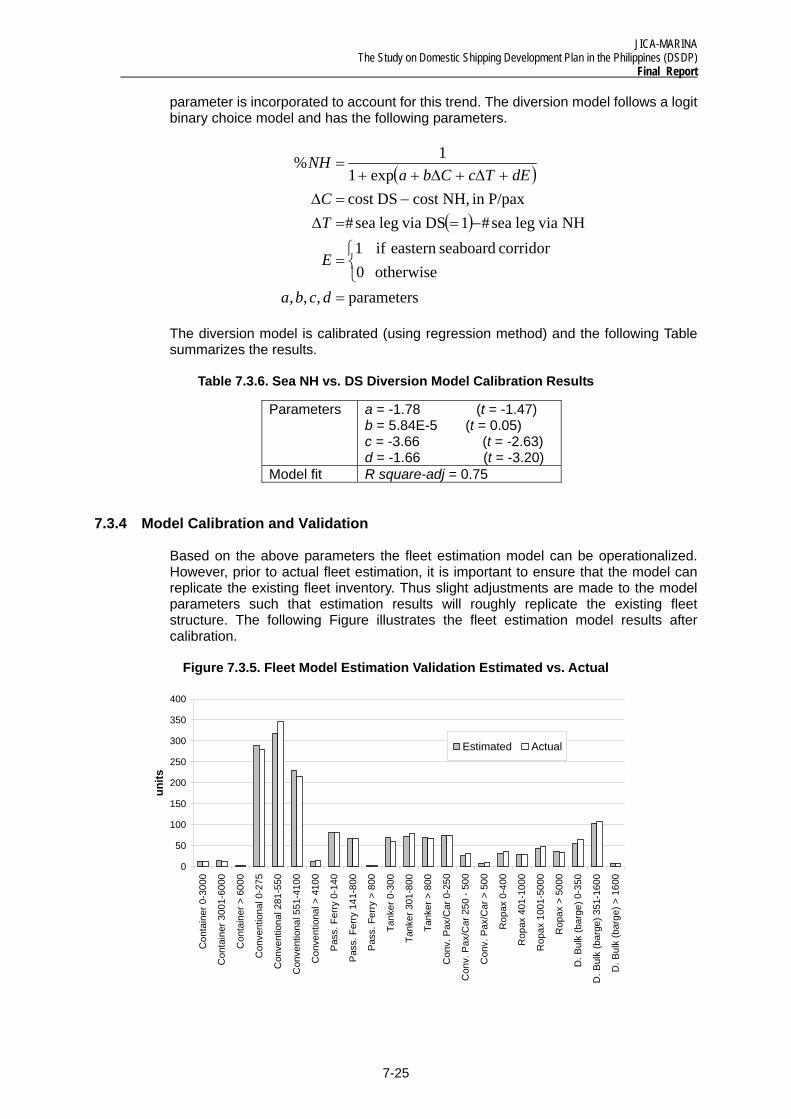
JICA-MARINA The Study on Domestic Shipping Development Plan in the Philippines (DSDP)
Final Report
7-25
0
50
100
150
200
250
300
350
400
Con
tain
er 0
-300
0
Con
tain
er 3
001-
6000
Con
tain
er >
600
0
Con
vent
iona
l 0-2
75
Con
vent
iona
l 281
-550
Con
vent
iona
l 551
-410
0
Con
vent
iona
l > 4
100
Pas
s. F
erry
0-1
40
Pas
s. F
erry
141
-800
Pas
s. F
erry
> 8
00
Tank
er 0
-300
Tank
er 3
01-8
00
Tank
er >
800
Con
v. P
ax/C
ar 0
-250
Con
v. P
ax/C
ar 2
50 -
500
Con
v. P
ax/C
ar >
500
Rop
ax 0
-400
Rop
ax 4
01-1
000
Rop
ax 1
001-
5000
Rop
ax >
500
0
D. B
ulk
(bar
ge) 0
-350
D. B
ulk
(bar
ge) 3
51-1
600
D. B
ulk
(bar
ge) >
160
0
units
Estimated Actual
parameter is incorporated to account for this trend. The diversion model follows a logit binary choice model and has the following parameters.
( )
( )
parameters,,,otherwise 0
corridor seaboardeastern if 1NH vialeg sea#1DS vialeg sea#
P/paxin NH,cost DScost exp1
1%
=⎩⎨⎧
=
−==∆−=∆
+∆+∆++=
dcba
E
TC
dETcCbaNH
The diversion model is calibrated (using regression method) and the following Table summarizes the results.
Table 7.3.6. Sea NH vs. DS Diversion Model Calibration Results
Parameters a = -1.78 (t = -1.47) b = 5.84E-5 (t = 0.05) c = -3.66 (t = -2.63) d = -1.66 (t = -3.20)
Model fit R square-adj = 0.75
7.3.4 Model Calibration and Validation
Based on the above parameters the fleet estimation model can be operationalized. However, prior to actual fleet estimation, it is important to ensure that the model can replicate the existing fleet inventory. Thus slight adjustments are made to the model parameters such that estimation results will roughly replicate the existing fleet structure. The following Figure illustrates the fleet estimation model results after calibration.
Figure 7.3.5. Fleet Model Estimation Validation Estimated vs. Actual
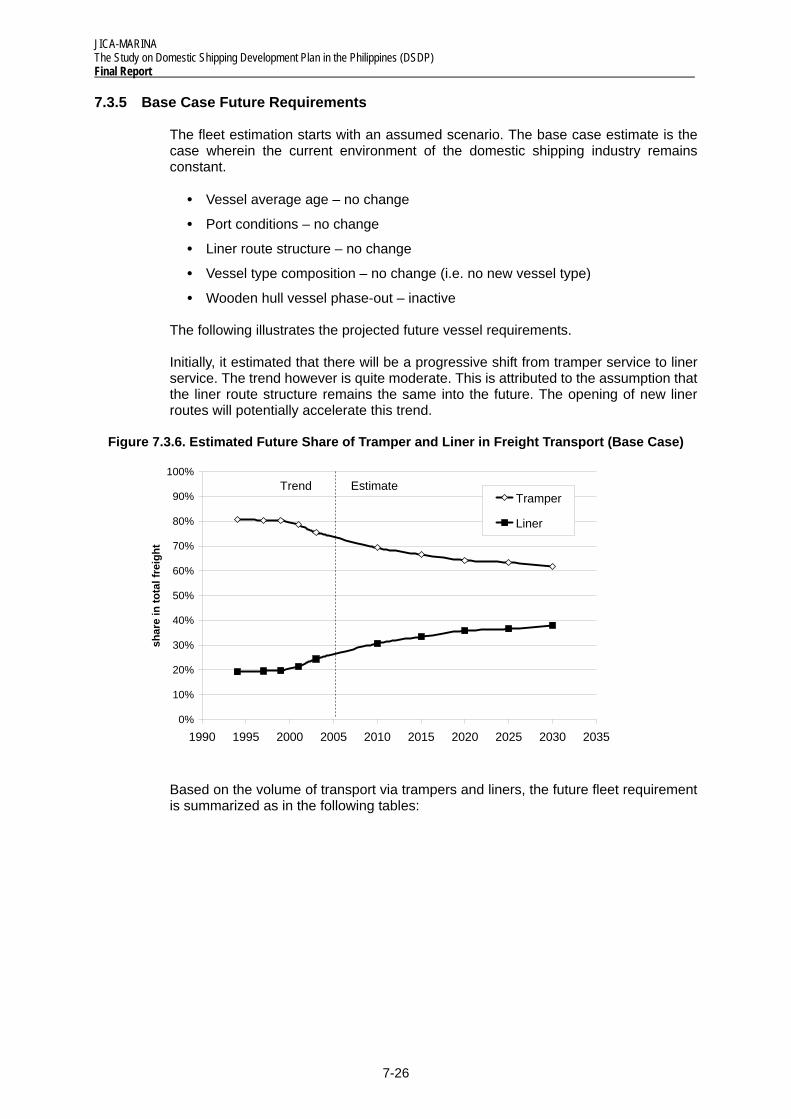
JICA-MARINA The Study on Domestic Shipping Development Plan in the Philippines (DSDP) Final Report
7-26
0%
10%
20%
30%
40%
50%
60%
70%
80%
90%
100%
1990 1995 2000 2005 2010 2015 2020 2025 2030 2035
shar
e in
tota
l fre
ight
Tramper
Liner
Trend Estimate
7.3.5 Base Case Future Requirements
The fleet estimation starts with an assumed scenario. The base case estimate is the case wherein the current environment of the domestic shipping industry remains constant.
• Vessel average age – no change
• Port conditions – no change
• Liner route structure – no change
• Vessel type composition – no change (i.e. no new vessel type)
• Wooden hull vessel phase-out – inactive
The following illustrates the projected future vessel requirements.
Initially, it estimated that there will be a progressive shift from tramper service to liner service. The trend however is quite moderate. This is attributed to the assumption that the liner route structure remains the same into the future. The opening of new liner routes will potentially accelerate this trend.
Figure 7.3.6. Estimated Future Share of Tramper and Liner in Freight Transport (Base Case)
Based on the volume of transport via trampers and liners, the future fleet requirement is summarized as in the following tables:
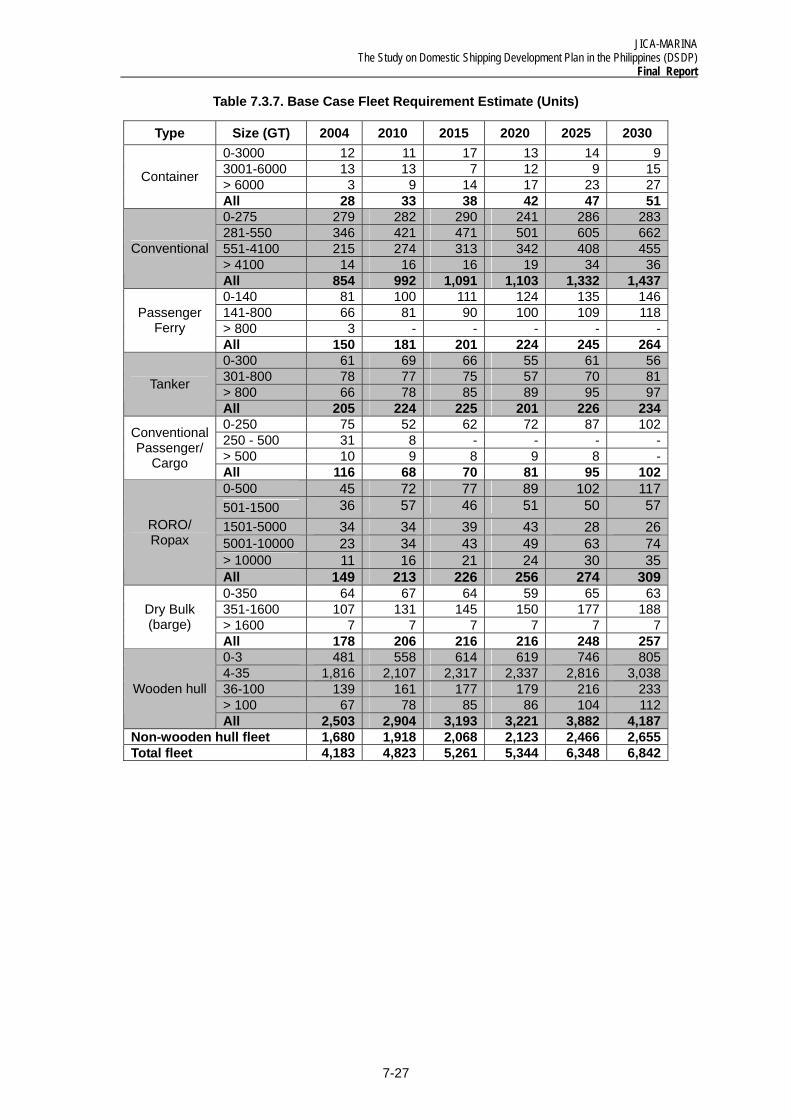
JICA-MARINA The Study on Domestic Shipping Development Plan in the Philippines (DSDP)
Final Report
7-27
Table 7.3.7. Base Case Fleet Requirement Estimate (Units)
Type Size (GT) 2004 2010 2015 2020 2025 2030 0-3000 12 11 17 13 14 93001-6000 13 13 7 12 9 15> 6000 3 9 14 17 23 27Container
All 28 33 38 42 47 510-275 279 282 290 241 286 283281-550 346 421 471 501 605 662551-4100 215 274 313 342 408 455> 4100 14 16 16 19 34 36
Conventional
All 854 992 1,091 1,103 1,332 1,4370-140 81 100 111 124 135 146141-800 66 81 90 100 109 118> 800 3 - - - - -
Passenger Ferry
All 150 181 201 224 245 2640-300 61 69 66 55 61 56301-800 78 77 75 57 70 81> 800 66 78 85 89 95 97Tanker
All 205 224 225 201 226 2340-250 75 52 62 72 87 102250 - 500 31 8 - - - -> 500 10 9 8 9 8 -
Conventional Passenger/
Cargo All 116 68 70 81 95 1020-500 45 72 77 89 102 117501-1500 36 57 46 51 50 571501-5000 34 34 39 43 28 265001-10000 23 34 43 49 63 74> 10000 11 16 21 24 30 35
RORO/ Ropax
All 149 213 226 256 274 3090-350 64 67 64 59 65 63351-1600 107 131 145 150 177 188> 1600 7 7 7 7 7 7
Dry Bulk (barge)
All 178 206 216 216 248 2570-3 481 558 614 619 746 805 4-35 1,816 2,107 2,317 2,337 2,816 3,038 36-100 139 161 177 179 216 233 > 100 67 78 85 86 104 112
Wooden hull
All 2,503 2,904 3,193 3,221 3,882 4,187 Non-wooden hull fleet 1,680 1,918 2,068 2,123 2,466 2,655 Total fleet 4,183 4,823 5,261 5,344 6,348 6,842
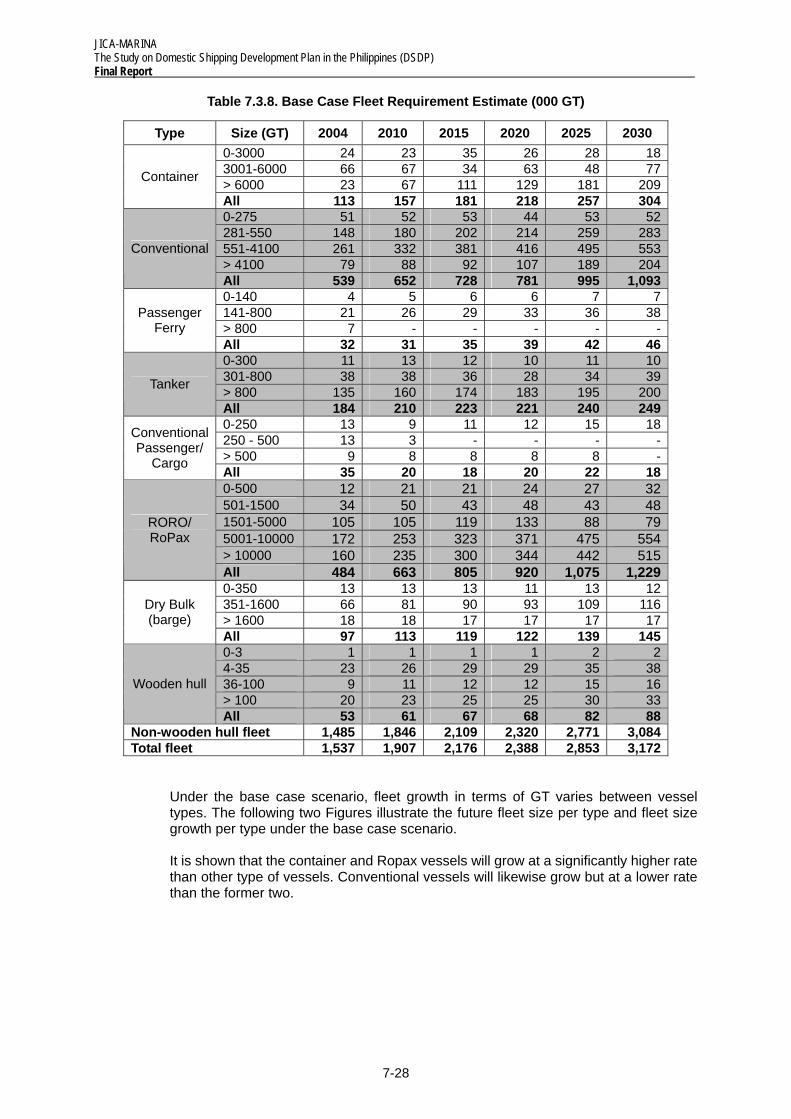
JICA-MARINA The Study on Domestic Shipping Development Plan in the Philippines (DSDP) Final Report
7-28
Table 7.3.8. Base Case Fleet Requirement Estimate (000 GT)
Type Size (GT) 2004 2010 2015 2020 2025 2030 0-3000 24 23 35 26 28 18 3001-6000 66 67 34 63 48 77 > 6000 23 67 111 129 181 209 Container
All 113 157 181 218 257 304 0-275 51 52 53 44 53 52 281-550 148 180 202 214 259 283 551-4100 261 332 381 416 495 553 > 4100 79 88 92 107 189 204
Conventional
All 539 652 728 781 995 1,093 0-140 4 5 6 6 7 7 141-800 21 26 29 33 36 38 > 800 7 - - - - -
Passenger Ferry
All 32 31 35 39 42 46 0-300 11 13 12 10 11 10 301-800 38 38 36 28 34 39 > 800 135 160 174 183 195 200 Tanker
All 184 210 223 221 240 249 0-250 13 9 11 12 15 18 250 - 500 13 3 - - - - > 500 9 8 8 8 8 -
Conventional Passenger/
Cargo All 35 20 18 20 22 18 0-500 12 21 21 24 27 32 501-1500 34 50 43 48 43 481501-5000 105 105 119 133 88 79 5001-10000 172 253 323 371 475 554 > 10000 160 235 300 344 442 515
RORO/ RoPax
All 484 663 805 920 1,075 1,229 0-350 13 13 13 11 13 12 351-1600 66 81 90 93 109 116 > 1600 18 18 17 17 17 17
Dry Bulk (barge)
All 97 113 119 122 139 145 0-3 1 1 1 1 2 2 4-35 23 26 29 29 35 38 36-100 9 11 12 12 15 16 > 100 20 23 25 25 30 33
Wooden hull
All 53 61 67 68 82 88 Non-wooden hull fleet 1,485 1,846 2,109 2,320 2,771 3,084 Total fleet 1,537 1,907 2,176 2,388 2,853 3,172
Under the base case scenario, fleet growth in terms of GT varies between vessel types. The following two Figures illustrate the future fleet size per type and fleet size growth per type under the base case scenario.
It is shown that the container and Ropax vessels will grow at a significantly higher rate than other type of vessels. Conventional vessels will likewise grow but at a lower rate than the former two.
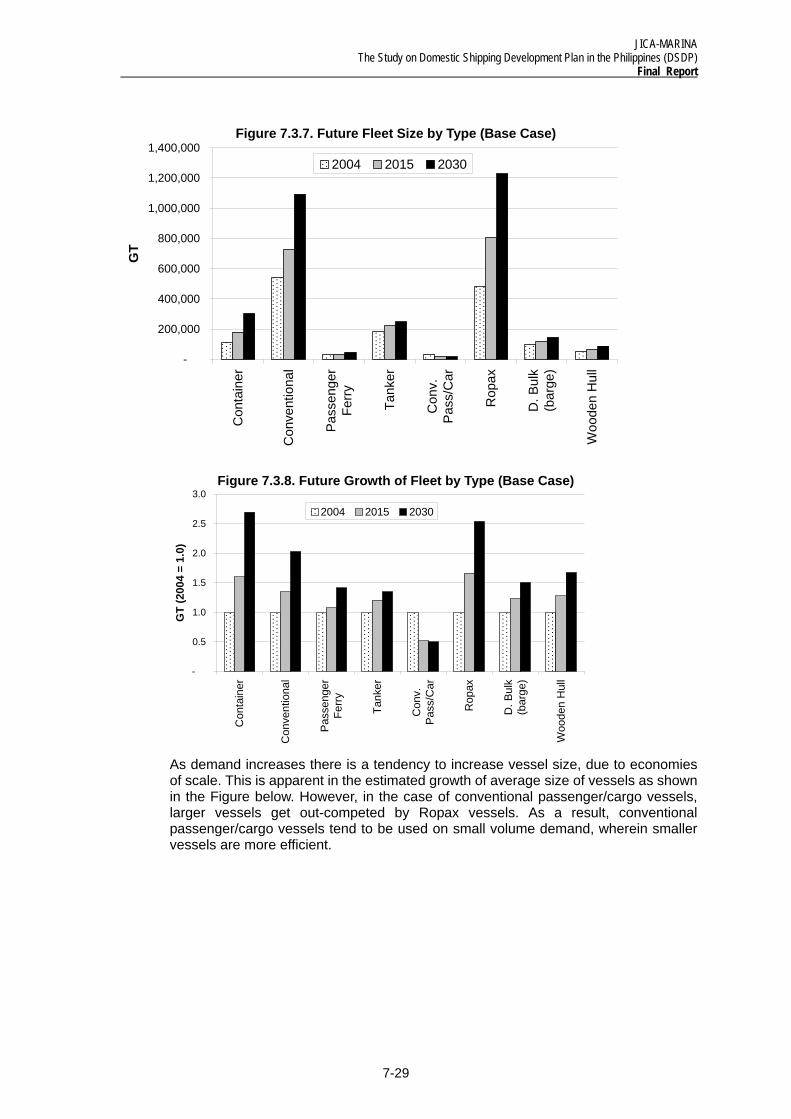
JICA-MARINA The Study on Domestic Shipping Development Plan in the Philippines (DSDP)
Final Report
7-29
-
200,000
400,000
600,000
800,000
1,000,000
1,200,000
1,400,000
Con
tain
er
Con
vent
iona
l
Pass
enge
rFe
rry
Tank
er
Con
v.P
ass/
Car
Rop
ax
D. B
ulk
(bar
ge)
Woo
den
Hul
l
GT
2004 2015 2030
-
0.5
1.0
1.5
2.0
2.5
3.0
Con
tain
er
Con
vent
iona
l
Pas
seng
erFe
rry
Tank
er
Con
v.P
ass/
Car
Rop
ax
D. B
ulk
(bar
ge)
Woo
den
Hul
l
GT
(200
4 =
1.0)
2004 2015 2030
Figure 7.3.7. Future Fleet Size by Type (Base Case)
Figure 7.3.8. Future Growth of Fleet by Type (Base Case)
As demand increases there is a tendency to increase vessel size, due to economies of scale. This is apparent in the estimated growth of average size of vessels as shown in the Figure below. However, in the case of conventional passenger/cargo vessels, larger vessels get out-competed by Ropax vessels. As a result, conventional passenger/cargo vessels tend to be used on small volume demand, wherein smaller vessels are more efficient.
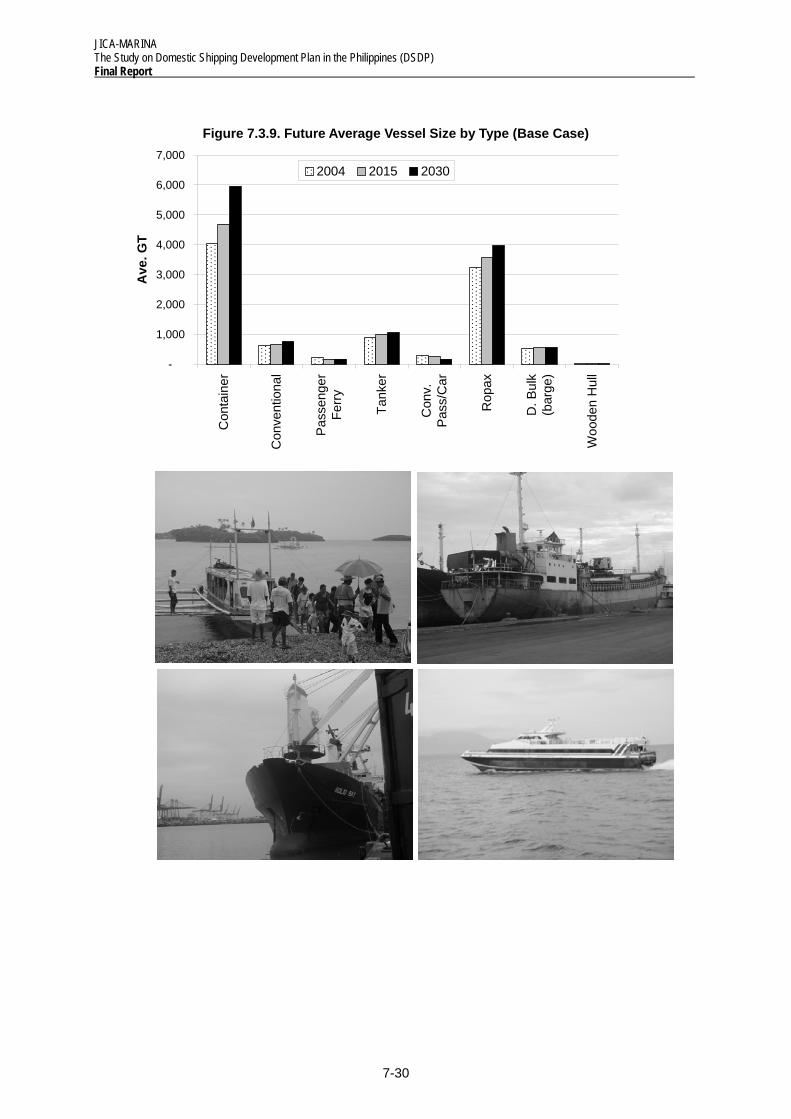
JICA-MARINA The Study on Domestic Shipping Development Plan in the Philippines (DSDP) Final Report
7-30
-
1,000
2,000
3,000
4,000
5,000
6,000
7,000
Con
tain
er
Con
vent
iona
l
Pas
seng
erFe
rry
Tank
er
Con
v.P
ass/
Car
Rop
ax
D. B
ulk
(bar
ge)
Woo
den
Hul
l
Ave
. GT
2004 2015 2030
Figure 7.3.9. Future Average Vessel Size by Type (Base Case)


