Embed Size (px)
Citation preview
Behav Ecol Sociobiol (1993) 32:199-209 Behavioral Ecology and Sociobiology ? Springer-Verlag 1993
Constraints on group size in primates and carnivores: population density and day-range as assays of exploitation competition R.W. Wrangham , J.L. Gittleman 2, and C.A. Chapman' 1 Department of Anthropology, Peabody Museum, Harvard University, Cambridge, MA 02138, USA 2 Department of Zoology, University of Tennessee, Knoxville, TN 37916, USA
Received May 14, 1991 / Accepted October 9, 1992
Summary. We hypothesise that foraging group size (FGS) and population group size (PGS) in primates and carnivores are related to quantifiable variables indexing the intensity of exploitative competition. Group size is predicted to increase with both food density and travel capabilities, as estimated by the "constraint-free day- range" (DRy), i.e. the day-range of a solitary individual uninfluenced by competition from conspecifics. We test this "exploitation competition" hypothesis among pri- mates and carnivores, using data on populations, species and genera. Food density was indexed by population density. Where DRs could be estimated by regression it was found to be correlated with observed day-range (DRm). DRs was therefore indexed by DRm in all species. Population density and DRm were associated with each other, but in a multiple regression each variable contrib- uted independently to explaining variation in group size. PGS was predicted better than FGS, but regressions in- volving either measure of group size were significant in all analyses. The multiple regression analyses were vali- dated by the method of linear contrasts, which accounts for possible lack of independence among taxa. We con- clude that species differences in group size are influenced by both food density and DRs. This suggests that varia- tion in the intensity of exploitation competition is partly responsible for differences in group size.
Introduction
Group size is determined by the trade-off of per capita costs and benefits. Although costs and benefits must both play a role, among primates and carnivores it has been suggested that selection consistently favors group- living, with the result that species differences in group size are influenced principally by their costs (Alexander 1974; Clutton-brock and Harvey 1977b; Wrangham 1980; Kruuk and MacDonald 1985; Terborgh and Jan-
Correspondence to: R.W. Wrangham
son 1986). Here we pursue this suggestion by testing the hypothesis that group size is constrained by the in- tensity of exploitation competition.
The EC hypothesis
Competition occurs when an animal seeking a resource in limited supply suffers from others seeking the same resource. Nicholson (1954) recognized two forms. In in- terference competition (IC) (also called contest or direct competition), competitors sequester resources by the use of aggression or threat. In exploitation competition (EC) (also called scramble or indirect competition), access is reduced merely by competitors using the resource, inde- pendent of any aggressive competition over it.
In previous discussions of group size, EC has been invoked in at least two different ways. First, EC accounts for the fact that large groups often have high per-capita costs. Where this occurs, therefore, it raises the problem of why large groups are favored (van Schaik and van Hooff 1983; Terborgh and Janson 1986; Dunbar 1988; van Schaik and van Noordwijk 1988; van Schaik 1989). Second, EC has been suggested to provide one answer to the question of how grouping pays. Where the cost of duplicated foraging paths is particularly high, group foraging may pay by enabling individuals to avoid areas already searched by others (Cody 1971; Ekman and Ro- sander 1987). Our approach is complementary to these two: we use EC to explain why grouping is more costly for some species than others.
Group-living results in EC whenever a group has to travel further per day than a solitary forager in order to satisfy its food requirements (Nicholson 1957; Ter- borgh 1983; Chapman 1989, 1990). We suggest that two factors directly influencing the intensity of EC are food production per distance travelled (i.e. food density) and travel efficiency (distance travelled per fitness cost). These variables are important because they influence the relationship between group size and per capita energy balance. Thus as food density rises (with travel efficiency
200
constant) more individuals can feed within a given travel distance, i.e. the intensity of EC falls. If selection favors large groups, food density will therefore be correlated positively with group size.
Similarly, as travel efficiency rises (while food density is constant) the intensity of EC falls, because by travel- ling further each individual encounters more food. Other things being equal, therefore, we predict that because of EC, group size is correlated positively with both food density and travel efficiency.
Falsification of this hypothesis could mean that group-size/benefit curves differ sufficiently among spe- cies to swamp the effects of differential cost curves; or that other kinds of cost, such as those deriving from interference competition, are more important than those from exploitation competition.
Population density and day-range as assays of the intensity of EC
In order to test the influence of EC on group size we need to index food density and travel efficiency. Com- parative measures of food density are not available across species. However, in many species of primates and carnivores changes in food supply lead to changes in population density (Schaller 1972; Dittus 1977; Clut- ton-Brock and Harvey 1979; Gittleman 1984; Sandell 1989; for review, see Damuth 1987). This suggests that populations are typically near carrying capacity, i.e. that population density is maintained by food density. Ac- cordingly, we use population density to index food den- sity, and predict a positive correlation of population density and group size.
Species differences in locomotor specializations and habitat type present obvious constraints on day-range (Garland 1983; Rodman 1984; Taylor 1989). However the appropriate metabolic data are not available to com- pare travel efficiencies across the primates or carnivores. Travel efficiencies can be assayed indirectly, however, if we assume that an animal benefits by travelling long distances whenever it can afford to do so. Benefits come, for example, from an increased rate of encountering re- source patches of maximal quality. According to this assumption, species with relatively efficient locomotor adaptations will travel relatively far, so that travel effi- ciency can be indexed across species by the distance trav- elled by a solitary individual (i.e. the "constraint-free day-range", or DRS).
DRS has been observed directly in a number of species in which solitary animals are the norm. It varies widely, e.g. primates 0.03 km (Lepilemur mustelinus, Clutton- Brock and Harvey 1977 b) to 1.50 km (Tarsius bancanus, Crompton and Andau 1987); carnivores 0.15 km (Mus- tela frenata) to 27.00 km (Hyaena brunnea) (Table 1). The variation appears related to locomotor adaptations, suggesting that the assumption that more efficient spe- cies travel further is correct. For example, there appears to be a close correlation between DRs and locomotor speed (R. Wrangham, unpubl. data). DRs therefore ap- pears to be a useful index of travel efficiency, but unfor-
tunately it is rarely observable directly in group-living species.
DRS can in theory be estimated, however, from intra- specific regressions of group size on day-range (DRm), where DRm is the mean day-range reported for a group of given size. Unfortunately we have found only 11 spe- cies with sufficient data (i.e. at least four groups or popu- lations with data on group size and day-range) for DRs to be calculated by regression. We show below that for these species DRs and DRm are closely correlated, sug- gesting that DRm is a valid index of DRs, and hence of travel efficiency. Nevertheless DRm is expected to be influenced by group size, and we therefore attempt to estimate the effect of this relationship. We do so by ana- lysing a subset of primate species for which day-range is apparently not influenced by group size, i.e. for which intraspecific EC appears trivial. Again, our results indi- cate that DRm is a valid index of DRS. On the basis of these results (below) we use DRm to index species travel efficiency. Accordingly we predict a positive corre- lation between DRm and group size.
In sum, high population densities and high DRm are expected to favor large groups. However population density and DRm may be associated with each other, e.g. if long day-ranges are favored in habitats with low food densities. There is some evidence for this. For ex- ample when feeding group weight is controlled, primate day-range length is negatively related to the amount of foliage in the diet, which in turn is positively associated with population density (Clutton-Brock and Harvey 1977 a). We therefore use both two-way correlations and multiple regressions to look at the associations among population density, day-range and group size.
Types of social group: FGS and PGS
Primates and carnivores form both foraging groups (in- dividuals travelling together) and population groups (in- dividuals associating intermittently within a shared home range). Our EC hypothesis is clearly applicable to species with cohesive groups, i.e. those for which there is no difference between foraging group size (FGS) and population group size (PGS). In fission-fusion societies, by contrast, the population group (or "social group") is dispersed among several temporary foraging groups. Examples are given in Table 1.
We are not aware of any hypotheses developed to explain variation in PGS based on costs. However there clearly must be costs to increasing PGS, similar to those that influence FGS. For example, individuals must be able to maintain regular contact with others, which pre- sumably depends on travel efficiency. Likewise, popula- tion density within the individual foraging area must not exceed the carrying capacity. This means that as before, group size is expected to be positively associated with population density and day-range.
Related studies
Most previous work on the relationship between group size and day-range has focussed on the intra-specific ef-
201
feet of group size on day-range, and has not been con- cerned with systematic inter-species comparisons. Nor have the relationships of either variable to population density been broadly examined. However, studies of par- ticular species suggest their importance. For example population density has been shown to be closely related to group size in some primates (Alouatta palliata and A. seniculus. Crockett and Eisenberg 1986) and is con- sidered one of the characteristics selecting for group liv- ing in African lions (Panthera leo) in contrast to other felids (Packer 1986; Packer et al. 1990). There are also suggestive indirect correlations, e.g. between rainfall (which could influence food density) and group size in baboons Papio cynocephalus (Altmann 1974). Day-range was found to be related to the weight of primate feeding groups when the proportion of foliage in the diet is con- trolled (Clutton-Brock and Harvey 1977a).
Methods
To avoid bias arising from selection of data, primate data on group size, population density and day-range were collected entirely from two standard sources (Clutton-Brock and Harvey 1977a; Smuts et al. 1986), with two exceptions. First, data on group size and day-range used in Fig. 1 were extracted from all available sources, in order to maximise the availability of data. Second, data for two fission-fusion species (Brachyteles arachnoides, Papio c. hama- dryas) which were not reported in the standard compilations were sought out because the standard primate sources provided only a small sample of this important social category. The procedure yielded data on 53 species (70 populations, 28 genera) (Table 1). Data from Smuts et al. (1986) were given precedence when sources disagreed. Classification of social systems followed Table A-i in Smuts et al. (1986). Carnivore data were primarily from Gittleman (1984, 1986), supplemented with recent single-species studies. The data set includes 39 species (Table 1); sample sizes were insufficient to examine the carnivore data for all relevant variables at the popu- lation level.
Only two data points were available for nocturnal primates. This was too few to treat as a separate subset, which may be necessary since the assumption that selection pressures favor large groups may not apply to them. Adding them does not change the significance or general conclusions. Carnivores are not easily classified into nocturnal and diurnal species, with most species considered to be 'arhythmic' (Gittleman 1984, 1986). All available data on carnivores are included. Because body weight is associated with a variety of social and ecological variables in these orders it could act as a confounding variable obscuring the interpretation of our results. We therefore examine the effect of body weight as an additional independent variable, even though our predictions are not affected by issues of scaling.
The compilation is subject to the typical problems of compara- tive data sets (Gittleman 1989b), including unequal distribution of data among species and the problem of statistical independence between species (Clutton-Brock and Harvey 1984; Pagel and Har- vey 1988, 1989; Gittleman and Kot 1990; Harvey and Pagel 1991; Gittleman and Luh 1992). We address these issues by using two complementary approaches. First, we tested the models at three taxonomic levels (population, species, genus), similar to previous examples of ANOVA approaches (Pagel and Harvey 1988; Gittle- man 1989b). For this analysis, data for different populations were averaged to produce species means, which were then averaged to yield genus means. We distinguished as separate "genera" those congeneric species which have different social systems according to the criteria of interest here (e.g. fission-fusion). Taxonomic rela- tionships followed Smuts et al. (1986) for primates, except for tala-
poin monkeys Cercopithecus (Miopithecus) talapoin, and Wozen- craft (1989) for carnivores. We conducted separate analyses with talapoin monkeys treated as Miopithecus and as Cercopithecus. The significance of statistical tests was not affected. In the analysis presented here talapoins are treated as belonging to a separate genus (Miopithecus) because their behavioral and ecological param- eters are markedly different from other Cercopithecus species.
In the second analysis, we employed the method of independent contrasts that calculates linear contrasts between taxa which share a common ancestor (Pagel and Harvey 1989; Harvey and Pagel 1991). The assumption is that the difference between two taxa that share an immediate common ancestor is not confounded by phylogenetic differences between them. Therefore, this difference is an independent evolutionary event, as intended in the compara- tive analysis. The calculated contrasts for each order are not collat- ed because of the obvious phylogenetic independence between the two lineages.
Least squares regression analysis is used throughout the paper, with all variables logarithmically transformed to fit a linear model. A regression model assumes that there is negligible error in the measurement of the independent variable and consequently values of slope tend to be underestimated (Pagel and Harvey 1988). Never- theless, least squares regression was used because (1) it is the only regression model for which deviations from the line of best fit are uncorrelated with the x variable (Pagel and Harvey 1988), and (2) true values of slope are not used in the analyses. Statistical probabilities are onetailed for tests of the hypotheses, twotailed elsewhere.
Results
Relationship between DRs and DR,
To assess the validity of mean day-range, DRm, as an index of day-range for solitary animals (DRs), we used intra-specific regressions of day-range on group size to predict the day-range for a solitary animal. Data sets were restricted to those with at least four samples (groups or populations) per species.
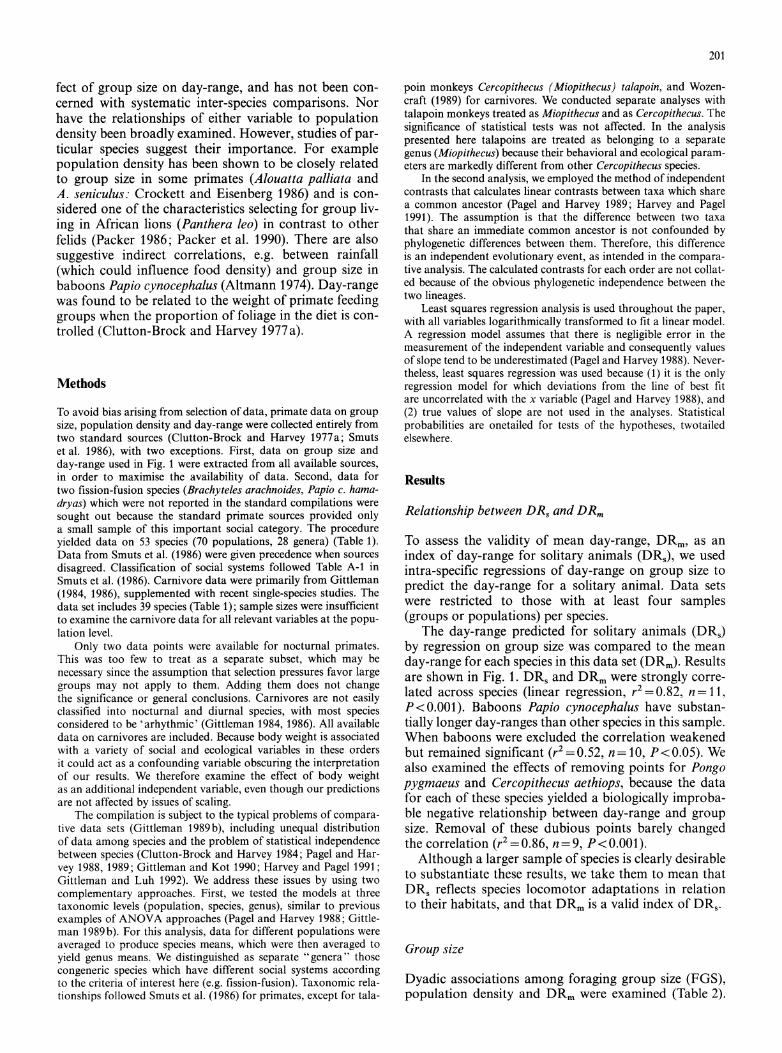
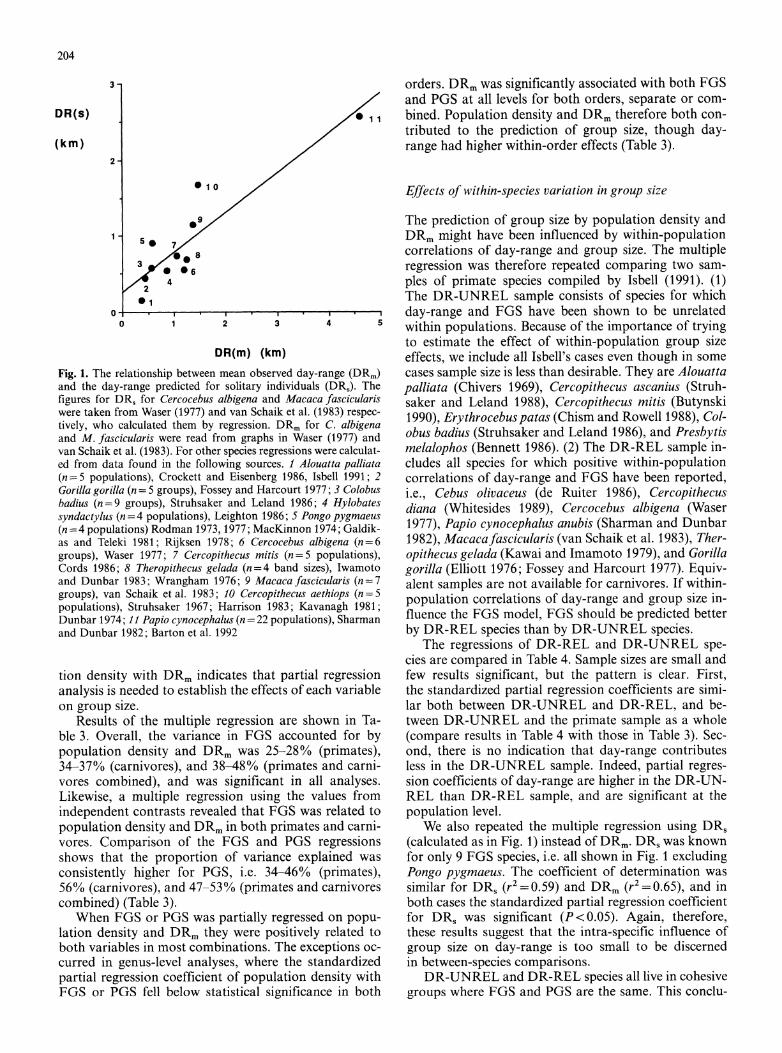
The day-range predicted for solitary animals (DRs) by regression on group size was compared to the mean day-range for each species in this data set (DRm). Results are shown in Fig. 1. DR, and DRm were strongly corre- lated across species (linear regression, r2=0.82, n=11, P<0.001). Baboons Papio cynocephalus have substan- tially longer day-ranges than other species in this sample. When baboons were excluded the correlation weakened but remained significant (r2 =0.52, n= 10, P<0.05). We also examined the effects of removing points for Pongo pygmaeus and Cercopithecus aethiops, because the data for each of these species yielded a biologically improba- ble negative relationship between day-range and group size. Removal of these dubious points barely changed the correlation (r2= 0.86, n = 9, P < 0.001).
Although a larger sample of species is clearly desirable to substantiate these results, we take them to mean that DRs reflects species locomotor adaptations in relation to their habitats, and that DRm is a valid index of DR,.
Group size
Dyadic associations among foraging group size (FGS), population density and DRm were examined (Table 2).
202
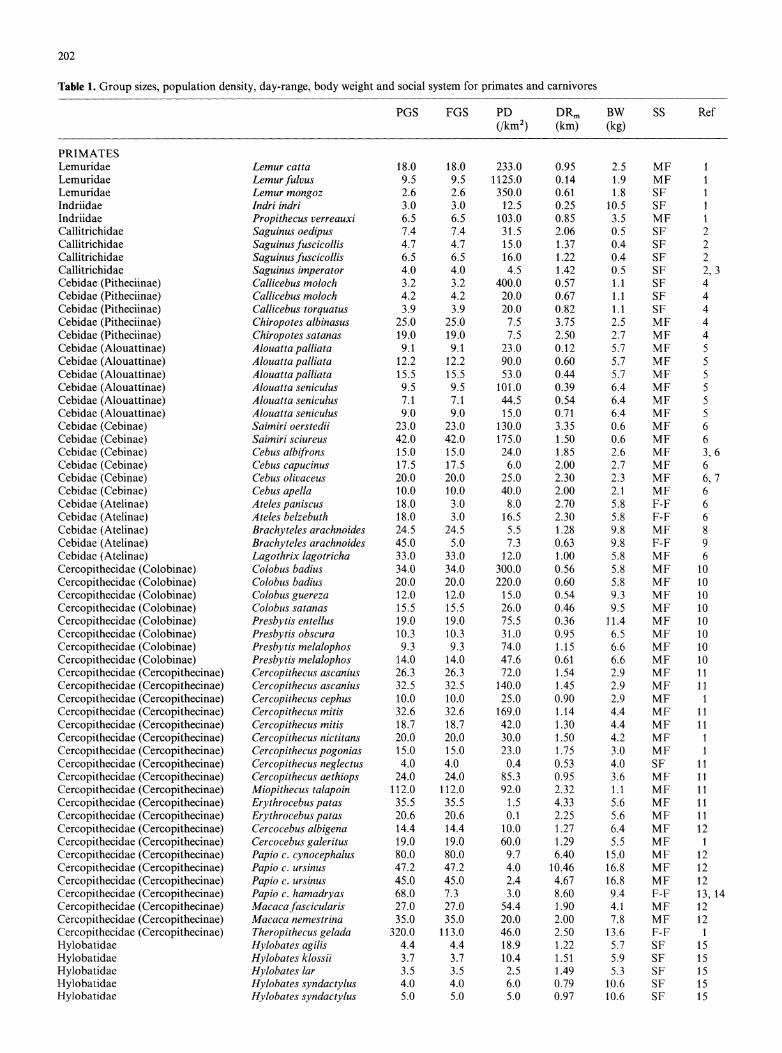
Table 1. Group sizes, population density, day-range, body weight and social system for primates and carnivores
PGS FGS PD DRm BW SS Ref (/km2) (km) (kg)
PRIMATES Lemuridae Lemur catta 18.0 18.0 233.0 0.95 2.5 MF 1 Lemuridae Lemurfulvus 9.5 9.5 1125.0 0.14 1.9 MF 1 Lemuridae Lemur mongoz 2.6 2.6 350.0 0.61 1.8 SF 1 Indriidae Indri indri 3.0 3.0 12.5 0.25 10.5 SF 1 Indriidae Propithecus verreauxi 6.5 6.5 103.0 0.85 3.5 MF 1 Callitrichidae Saguinus oedipus 7.4 7.4 31.5 2.06 0.5 SF 2 Callitrichidae Saguinusfuscicollis 4.7 4.7 15.0 1.37 0.4 SF 2 Callitrichidae Saguinus fuscicollis 6.5 6.5 16.0 1.22 0.4 SF 2 Callitrichidae Saguinus imperator 4.0 4.0 4.5 1.42 0.5 SF 2, 3 Cebidae (Pitheciinae) Callicebus moloch 3.2 3.2 400.0 0.57 1.1 SF 4 Cebidae (Pitheciinae) Callicebus moloch 4.2 4.2 20.0 0.67 1.1 SF 4 Cebidae (Pitheciinae) Callicebus torquatus 3.9 3.9 20.0 0.82 1.1 SF 4 Cebidae (Pitheciinae) Chiropotes albinasus 25.0 25.0 7.5 3.75 2.5 MF 4 Cebidae (Pitheciinae) Chiropotes satanas 19.0 19.0 7.5 2.50 2.7 MF 4 Cebidae (Alouattinae) Alouatta palliata 9.1 9.1 23.0 0.12 5.7 MF 5 Cebidae (Alouattinae) Alouatta palliata 12.2 12.2 90.0 0.60 5.7 MF 5 Cebidae (Alouattinae) Alouatta palliata 15.5 15.5 53.0 0.44 5.7 MF 5 Cebidae (Alouattinae) Alouatta seniculus 9.5 9.5 101.0 0.39 6.4 MF 5 Cebidae (Alouattinae) Alouatta seniculus 7.1 7.1 44.5 0.54 6.4 MF 5 Cebidae (Alouattinae) Alouatta seniculus 9.0 9.0 15.0 0.71 6.4 MF 5 Cebidae (Cebinae) Saimiri oerstedii 23.0 23.0 130.0 3.35 0.6 MF 6 Cebidae (Cebinae) Saimiri sciureus 42.0 42.0 175.0 1.50 0.6 MF 6 Cebidae (Cebinae) Cebus albifrons 15.0 15.0 24.0 1.85 2.6 MF 3, 6 Cebidae (Cebinae) Cebus capucinus 17.5 17.5 6.0 2.00 2.7 MF 6 Cebidae (Cebinae) Cebus olivaceus 20.0 20.0 25.0 2.30 2.3 MF 6, 7 Cebidae (Cebinae) Cebus apella 10.0 10.0 40.0 2.00 2.1 MF 6 Cebidae (Atelinae) Ateles paniscus 18.0 3.0 8.0 2.70 5.8 F-F 6 Cebidae (Atelinae) Ateles belzebuth 18.0 3.0 16.5 2.30 5.8 F-F 6 Cebidae (Atelinae) Brachyteles arachnoides 24.5 24.5 5.5 1.28 9.8 MF 8 Cebidae (Atelinae) Brachyteles arachnoides 45.0 5.0 7.3 0.63 9.8 F-F 9 Cebidae (Atelinae) Lagothrix lagotricha 33.0 33.0 12.0 1.00 5.8 MF 6 Cercopithecidae (Colobinae) Colobus badius 34.0 34.0 300.0 0.56 5.8 MF 10 Cercopithecidae (Colobinae) Colobus badius 20.0 20.0 220.0 0.60 5.8 MF 10 Cercopithecidae (Colobinae) Colobus guereza 12.0 12.0 15.0 0.54 9.3 MF 10 Cercopithecidae (Colobinae) Colobus satanas 15.5 15.5 26.0 0.46 9.5 MF 10 Cercopithecidae (Colobinae) Presbytis entellus 19.0 19.0 75.5 0.36 11.4 MF 10 Cercopithecidae (Colobinae) Presbytis obscura 10.3 10.3 31.0 0.95 6.5 MF 10 Cercopithecidae (Colobinae) Presbytis melalophos 9.3 9.3 74.0 1.15 6.6 MF 10 Cercopithecidae (Colobinae) Presbytis melalophos 14.0 14.0 47.6 0.61 6.6 MF 10 Cercopithecidae (Cercopithecinae) Cercopithecus ascanius 26.3 26.3 72.0 1.54 2.9 MF 11 Cercopithecidae (Cercopithecinae) Cercopithecus ascanius 32.5 32.5 140.0 1.45 2.9 MF 11 Cercopithecidae (Cercopithecinae) Cercopithecus cephus 10.0 10.0 25.0 0.90 2.9 MF 1 Cercopithecidae (Cercopithecinae) Cercopithecus mitis 32.6 32.6 169.0 1.14 4.4 MF 11 Cercopithecidae (Cercopithecinae) Cercopithecus mitis 18.7 18.7 42.0 1.30 4.4 MF 11 Cercopithecidae (Cercopithecinae) Cercopithecus nictitans 20.0 20.0 30.0 1.50 4.2 MF 1 Cercopithecidae (Cercopithecinae) Cercopithecus pogonias 15.0 15.0 23.0 1.75 3.0 MF 1 Cercopithecidae (Cercopithecinae) Cercopithecus neglectus 4.0 4.0 0.4 0.53 4.0 SF 11 Cercopithecidae (Cercopithecinae) Cercopithecus aethiops 24.0 24.0 85.3 0.95 3.6 MF 11 Cercopithecidae (Cercopithecinae) Miopithecus talapoin 112.0 112.0 92.0 2.32 1.1 MF 11 Cercopithecidae (Cercopithecinae) Erythrocebus patas 35.5 35.5 1.5 4.33 5.6 MF 11 Cercopithecidae (Cercopithecinae) Erythrocebus patas 20.6 20.6 0.1 2.25 5.6 MF 11 Cercopithecidae (Cercopithecinae) Cercocebus albigena 14.4 14.4 10.0 1.27 6.4 MF 12 Cercopithecidae (Cercopithecinae) Cercocebus galeritus 19.0 19.0 60.0 1.29 5.5 MF 1 Cercopithecidae (Cercopithecinae) Papio c. cynocephalus 80.0 80.0 9.7 6.40 15.0 MF 12 Cercopithecidae (Cercopithecinae) Papio c. ursinus 47.2 47.2 4.0 10.46 16.8 MF 12 Cercopithecidae (Cercopithecinae) Papio c. ursinus 45.0 45.0 2.4 4.67 16.8 MF 12 Cercopithecidae (Cercopithecinae) Papio c. hamadryas 68.0 7.3 3.0 8.60 9.4 F-F 13, 14 Cercopithecidae (Cercopithecinae) Macacafascicularis 27.0 27.0 54.4 1.90 4.1 MF 12 Cercopithecidae (Cercopithecinae) Macaca nemestrina 35.0 35.0 20.0 2.00 7.8 MF 12 Cercopithecidae (Cercopithecinae) Theropithecus gelada 320.0 113.0 46.0 2.50 13.6 F-F 1 Hylobatidae Hylobates agilis 4.4 4.4 18.9 1.22 5.7 SF 15 Hylobatidae Hylobates klossii 3.7 3.7 10.4 1.51 5.9 SF 15 Hylobatidae Hylobates lar 3.5 3.5 2.5 1.49 5.3 SF 15 Hylobatidae Hylobates syndactylus 4.0 4.0 6.0 0.79 10.6 SF 15 Hylobatidae Hylobates syndactylus 5.0 5.0 5.0 0.97 10.6 SF 15
203
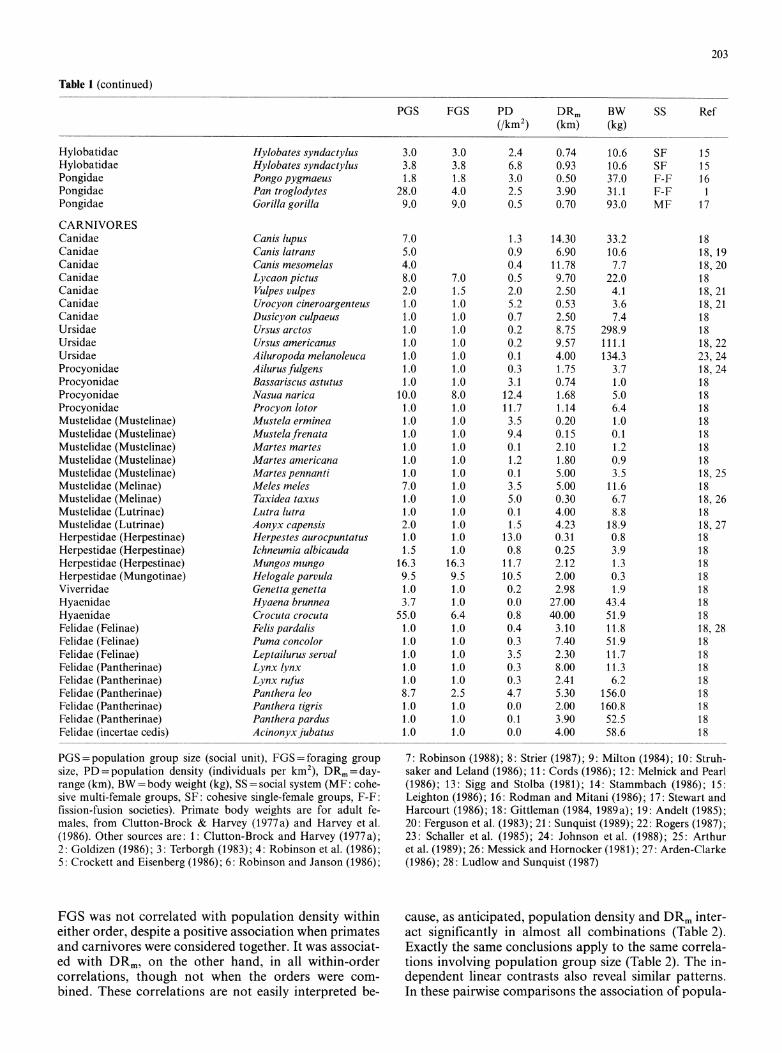
Table 1 (continued)
PGS FGS PD DRm BW SS Ref (/km2) (km) (kg)
Hylobatidae Hylobates syndactylus 3.0 3.0 2.4 0.74 10.6 SF 15 Hylobatidae Hylobates syndactylus 3.8 3.8 6.8 0.93 10.6 SF 15 Pongidae Pongo pygmaeus 1.8 1.8 3.0 0.50 37.0 F-F 16 Pongidae Pan troglodytes 28.0 4.0 2.5 3.90 31.1 F-F 1 Pongidae Gorilla gorilla 9.0 9.0 0.5 0.70 93.0 MF 17
CARNIVORES Canidae Canis lupus 7.0 1.3 14.30 33.2 18 Canidae Canis latrans 5.0 0.9 6.90 10.6 18, 19 Canidae Canis mesomelas 4.0 0.4 11.78 7.7 18, 20 Canidae Lycaon pictus 8.0 7.0 0.5 9.70 22.0 18 Canidae Vulpes vulpes 2.0 1.5 2.0 2.50 4.1 18, 21 Canidae Urocyon cineroargenteus 1.0 1.0 5.2 0.53 3.6 18, 21 Canidae Dusicyon culpaeus 1.0 1.0 0.7 2.50 7.4 18 Ursidae Ursus arctos 1.0 1.0 0.2 8.75 298.9 18 Ursidae Ursus americanus 1.0 1.0 0.2 9.57 111.1 18, 22 Ursidae Ailuropoda melanoleuca 1.0 1.0 0.1 4.00 134.3 23, 24 Procyonidae Ailurusfulgens 1.0 1.0 0.3 1.75 3.7 18, 24 Procyonidae Bassariscus astutus 1.0 1.0 3.1 0.74 1.0 18 Procyonidae Nasua narica 10.0 8.0 12.4 1.68 5.0 18 Procyonidae Procyon lotor 1.0 1.0 11.7 1.14 6.4 18 Mustelidae (Mustelinae) Mustela erminea 1.0 1.0 3.5 0.20 1.0 18 Mustelidae (Mustelinae) Mustelafrenata 1.0 1.0 9.4 0.15 0.1 18 Mustelidae (Mustelinae) Martes martes 1.0 1.0 0.1 2.10 1.2 18 Mustelidae (Mustelinae) Martes americana 1.0 1.0 1.2 1.80 0.9 18 Mustelidae (Mustelinae) Martes pennanti 1.0 1.0 0.1 5.00 3.5 18, 25 Mustelidae (Melinae) Meles meles 7.0 1.0 3.5 5.00 11.6 18 Mustelidae (Melinae) Taxidea taxus 1.0 1.0 5.0 0.30 6.7 18, 26 Mustelidae (Lutrinae) Lutra lutra 1.0 1.0 0.1 4.00 8.8 18 Mustelidae (Lutrinae) Aonyx capensis 2.0 1.0 1.5 4.23 18.9 18, 27 Herpestidae (Herpestinae) Herpestes aurocpuntatus 1.0 1.0 13.0 0.31 0.8 18 Herpestidae (Herpestinae) Ichneumia albicauda 1.5 1.0 0.8 0.25 3.9 18 Herpestidae (Herpestinae) Mungos mungo 16.3 16.3 11.7 2.12 1.3 18 Herpestidae (Mungotinae) Helogale parvula 9.5 9.5 10.5 2.00 0.3 18 Viverridae Genetta genetta 1.0 1.0 0.2 2.98 1.9 18 Hyaenidae Hyaena brunnea 3.7 1.0 0.0 27.00 43.4 18 Hyaenidae Crocuta crocuta 55.0 6.4 0.8 40.00 51.9 18 Felidae (Felinae) Felis pardalis 1.0 1.0 0.4 3.10 11.8 18, 28 Felidae (Felinae) Puma concolor 1.0 1.0 0.3 7.40 51.9 18 Felidae (Felinae) Leptailurus serval 1.0 1.0 3.5 2.30 11.7 18 Felidae (Pantherinae) Lynx lynx 1.0 1.0 0.3 8.00 11.3 18 Felidae (Pantherinae) Lynx rufus 1.0 1.0 0.3 2.41 6.2 18 Felidae (Pantherinae) Panthera leo 8.7 2.5 4.7 5.30 156.0 18 Felidae (Pantherinae) Panthera tigris 1.0 1.0 0.0 2.00 160.8 18 Felidae (Pantherinae) Panthera pardus 1.0 1.0 0.1 3.90 52.5 18 Felidae (incertae cedis) Acinonyx jubatus 1.0 1.0 0.0 4.00 58.6 18
PGS = population group size (social unit), FGS=foraging group size, PD = population density (individuals per km2), DRm=day- range (km), BW = body weight (kg), SS = social system (MF: cohe- sive multi-female groups, SF: cohesive single-female groups, F-F: fission-fusion societies). Primate body weights are for adult fe- males, from Clutton-Brock & Harvey (1977a) and Harvey et al. (1986). Other sources are: 1: Clutton-Brock and Harvey (1977a); 2: Goldizen (1986); 3: Terborgh (1983); 4: Robinson et al. (1986); 5: Crockett and Eisenberg (1986); 6: Robinson and Janson (1986);
7: Robinson (1988); 8: Strier (1987); 9: Milton (1984); 10: Struh- saker and Leland (1986); 11: Cords (1986); 12: Melnick and Pearl (1986); 13: Sigg and Stolba (1981); 14: Stammbach (1986); 15: Leighton (1986); 16: Rodman and Mitani (1986); 17: Stewart and Harcourt (1986); 18: Gittleman (1984, 1989a); 19: Andelt (1985); 20: Ferguson et al. (1983); 21: Sunquist (1989); 22: Rogers (1987); 23: Schaller et al. (1985); 24: Johnson et al. (1988); 25: Arthur et al. (1989); 26: Messick and Hornocker (1981); 27: Arden-Clarke (1986); 28: Ludlow and Sunquist (1987)
FGS was not correlated with population density within either order, despite a positive association when primates and carnivores were considered together. It was associat- ed with DRm, on the other hand, in all within-order correlations, though not when the orders were com- bined. These correlations are not easily interpreted be-
cause, as anticipated, population density and DRm inter- act significantly in almost all combinations (Table 2). Exactly the same conclusions apply to the same correla- tions involving population group size (Table 2). The in- dependent linear contrasts also reveal similar patterns. In these pairwise comparisons the association of popula-
204
3-
DR(s) *
(km) 2
*10
.9, 1 7
38
4
01 0 ' , * I . I . , .. .
0 1 2 3 4 5
DR(m) (km)
Fig. 1. The relationship between mean observed day-range (DRm) and the day-range predicted for solitary individuals (DRJ). The figures for DRs for Cercocebus albigena and Macaca fascicularis were taken from Waser (1977) and van Schaik et al. (1983) respec- tively, who calculated them by regression. DRm for C. albigena and M. fascicularis were read from graphs in Waser (1977) and van Schaik et al. (1983). For other species regressions were calculat- ed from data found in the following sources. 1 Alouatta palliata (n=5 populations), Crockett and Eisenberg 1986, Isbell 1991; 2 Gorilla gorilla (n= 5 groups), Fossey and Harcourt 1977; 3 Colobus badius (n=9 groups), Struhsaker and Leland 1986; 4 Hylobates syndactylus (n = 4 populations), Leighton 1986; 5 Pongo pygmaeus (n =4 populations) Rodman 1973, 1977; MacKinnon 1974; Galdik- as and Teleki 1981; Rijksen 1978; 6 Cercocebus albigena (n=6 groups), Waser 1977; 7 Cercopithecus mitis (n=5 populations), Cords 1986; 8 Theropithecus gelada (n=4 band sizes), Iwamoto and Dunbar 1983; Wrangham 1976; 9 Macaca fascicularis (n=7 groups), van Schaik et al. 1983; 10 Cercopithecus aethiops (n=5 populations), Struhsaker 1967; Harrison 1983; Kavanagh 1981; Dunbar 1974; 11 Papio cynocephalus (n = 22 populations), Sharman and Dunbar 1982; Barton et al. 1992
tion density with DRm indicates that partial regression analysis is needed to establish the effects of each variable on group size.
Results of the multiple regression are shown in Ta- ble 3. Overall, the variance in FGS accounted for by population density and DRm was 25-28% (primates), 34-37% (carnivores), and 38-48% (primates and carni- vores combined), and was significant in all analyses. Likewise, a multiple regression using the values from independent contrasts revealed that FGS was related to population density and DRm in both primates and carni- vores. Comparison of the FGS and PGS regressions shows that the proportion of variance explained was consistently higher for PGS, i.e. 34-46% (primates), 56% (carnivores), and 47-53% (primates and carnivores combined) (Table 3).
When FGS or PGS was partially regressed on popu- lation density and DRm they were positively related to both variables in most combinations. The exceptions oc- curred in genus-level analyses, where the standardized partial regression coefficient of population density with FGS or PGS fell below statistical significance in both
orders. DRm was significantly associated with both FGS and PGS at all levels for both orders, separate or com- bined. Population density and DRm therefore both con- tributed to the prediction of group size, though day- range had higher within-order effects (Table 3).
Effects of within-species variation in group size
The prediction of group size by population density and DRm might have been influenced by within-population correlations of day-range and group size. The multiple regression was therefore repeated comparing two sam- ples of primate species compiled by Isbell (1991). (1) The DR-UNREL sample consists of species for which day-range and FGS have been shown to be unrelated within populations. Because of the importance of trying to estimate the effect of within-population group size effects, we include all Isbell's cases even though in some cases sample size is less than desirable. They are Alouatta palliata (Chivers 1969), Cercopithecus ascanius (Struh- saker and Leland 1988), Cercopithecus mitis (Butynski 1990), Erythrocebuspatas (Chism and Rowell 1988), Col- obus badius (Struhsaker and Leland 1986), and Presbytis melalophos (Bennett 1986). (2) The DR-REL sample in- cludes all species for which positive within-population correlations of day-range and FGS have been reported, i.e., Cebus olivaceus (de Ruiter 1986), Cercopithecus diana (Whitesides 1989), Cercocebus albigena (Waser 1977), Papio cynocephalus anubis (Sharman and Dunbar 1982), Macacafascicularis (van Schaik et al. 1983), Ther- opithecus gelada (Kawai and Imamoto 1979), and Gorilla gorilla (Elliott 1976; Fossey and Harcourt 1977). Equiv- alent samples are not available for carnivores. If within- population correlations of day-range and group size in- fluence the FGS model, FGS should be predicted better by DR-REL species than by DR-UNREL species.
The regressions of DR-REL and DR-UNREL spe- cies are compared in Table 4. Sample sizes are small and few results significant, but the pattern is clear. First, the standardized partial regression coefficients are simi- lar both between DR-UNREL and DR-REL, and be- tween DR-UNREL and the primate sample as a whole (compare results in Table 4 with those in Table 3). Sec- ond, there is no indication that day-range contributes less in the DR-UNREL sample. Indeed, partial regres- sion coefficients of day-range are higher in the DR-UN- REL than DR-REL sample, and are significant at the population level.
We also repeated the multiple regression using DRs (calculated as in Fig. 1) instead of DRm. DRs was known for only 9 FGS species, i.e. all shown in Fig. 1 excluding Pongo pygmaeus. The coefficient of determination was similar for DR, (r2=0.59) and DRm (r2=0.65), and in both cases the standardized partial regression coefficient for DRS was significant (P<0.05). Again, therefore, these results suggest that the intra-specific influence of group size on day-range is too small to be discerned in between-species comparisons.
DR-UNREL and DR-REL species all live in cohesive groups where FGS and PGS are the same. This conclu-
205
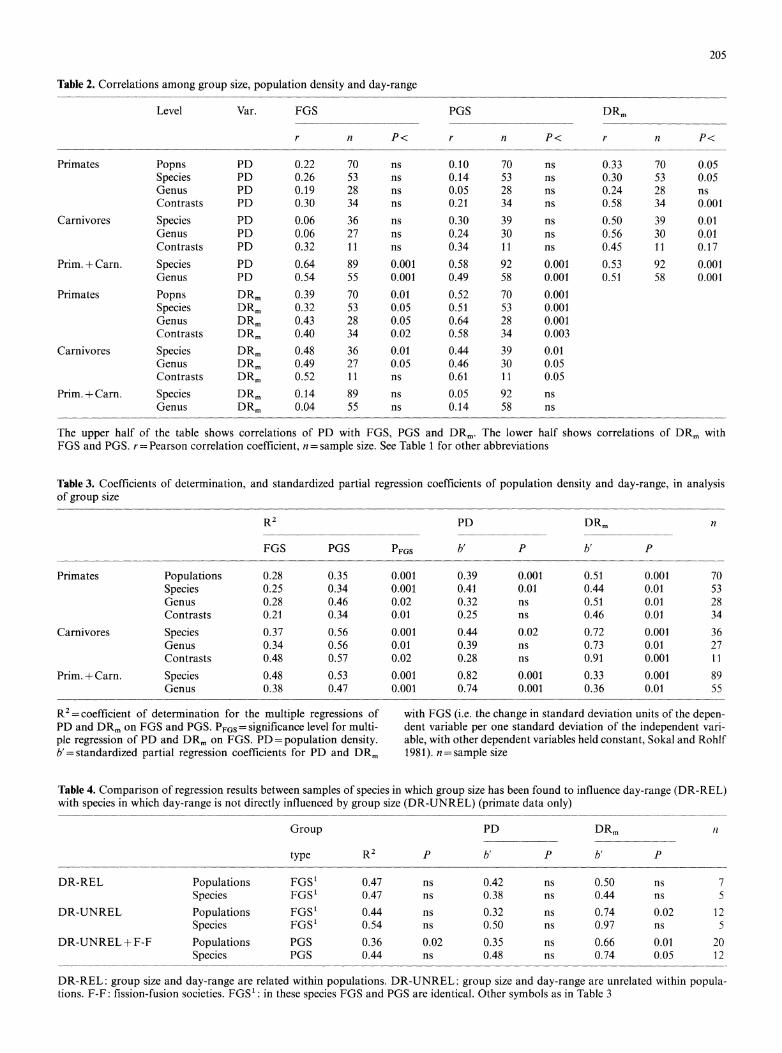
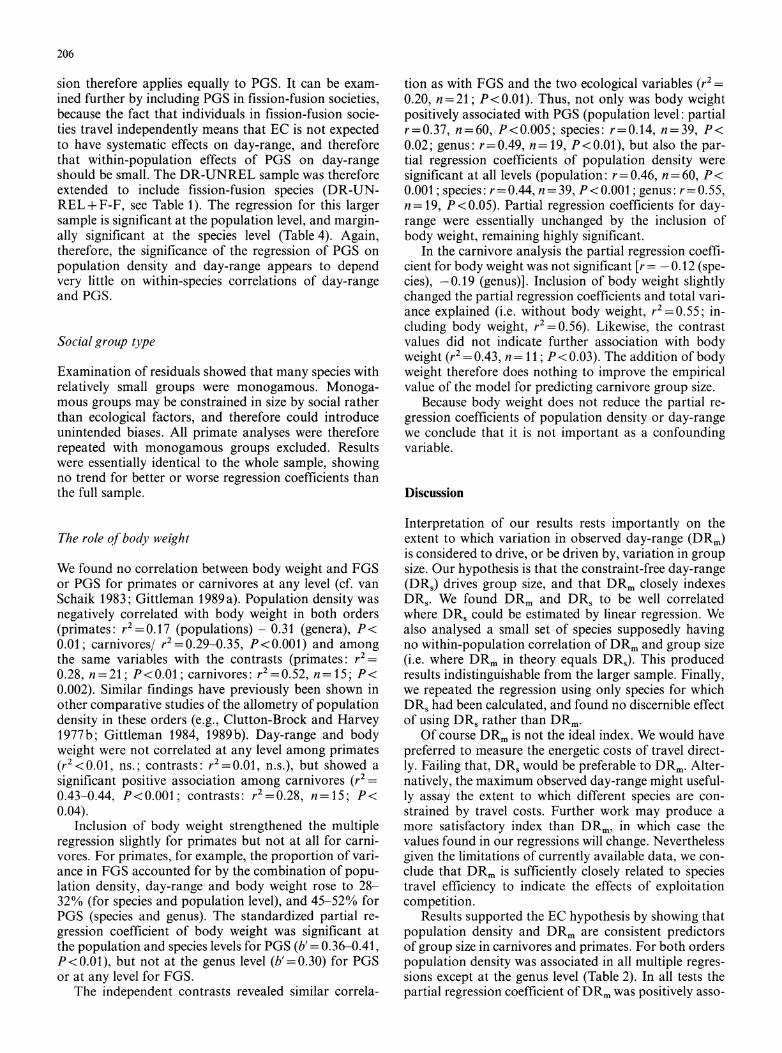
Table 2. Correlations among group size, population density and day-range
Level Var. FGS PGS DRm
r n P< r n P< r n P<
Primates Popns PD 0.22 70 ns 0.10 70 ns 0.33 70 0.05 Species PD 0.26 53 ns 0.14 53 ns 0.30 53 0.05 Genus PD 0.19 28 ns 0.05 28 ns 0.24 28 ns Contrasts PD 0.30 34 ns 0.21 34 ns 0.58 34 0.001
Carnivores Species PD 0.06 36 ns 0.30 39 ns 0.50 39 0.01 Genus PD 0.06 27 ns 0.24 30 ns 0.56 30 0.01 Contrasts PD 0.32 11 ns 0.34 11 ns 0.45 11 0.17
Prim. + Carn. Species PD 0.64 89 0.001 0.58 92 0.001 0.53 92 0.001 Genus PD 0.54 55 0.001 0.49 58 0.001 0.51 58 0.001
Primates Popns DRm 0.39 70 0.01 0.52 70 0.001 Species DRm 0.32 53 0.05 0.51 53 0.001 Genus DRm 0.43 28 0.05 0.64 28 0.001 Contrasts DRm 0.40 34 0.02 0.58 34 0.003
Carnivores Species DRm 0.48 36 0.01 0.44 39 0.01 Genus DRm 0.49 27 0.05 0.46 30 0.05 Contrasts DRm 0.52 11 ns 0.61 11 0.05
Prim. + Carn. Species DRm 0.14 89 ns 0.05 92 ns Genus DRm 0.04 55 ns 0.14 58 ns
The upper half of the table shows correlations of PD with FGS, PGS and DRm. The lower half shows correlations of DRm with FGS and PGS. r= Pearson correlation coefficient, n = sample size. See Table 1 for other abbreviations
Table 3. Coefficients of determination, and standardized partial regression coefficients of population density and day-range, in analysis of group size
R2 PD DRm n
FGS PGS PFGS b' P b' P
Primates Populations 0.28 0.35 0.001 0.39 0.001 0.51 0.001 70 Species 0.25 0.34 0.001 0.41 0.01 0.44 0.01 53 Genus 0.28 0.46 0.02 0.32 ns 0.51 0.01 28 Contrasts 0.21 0.34 0.01 0.25 ns 0.46 0.01 34
Carnivores Species 0.37 0.56 0.001 0.44 0.02 0.72 0.001 36 Genus 0.34 0.56 0.01 0.39 ns 0.73 0.01 27 Contrasts 0.48 0.57 0.02 0.28 ns 0.91 0.001 11
Prim. + Carn. Species 0.48 0.53 0.001 0.82 0.001 0.33 0.001 89 Genus 0.38 0.47 0.001 0.74 0.001 0.36 0.01 55
R2=coefficient of determination for the multiple regressions of PD and DRm on FGS and PGS. PFGS = significance level for multi- ple regression of PD and DRm on FGS. PD =population density. b'=standardized partial regression coefficients for PD and DRm
with FGS (i.e. the change in standard deviation units of the depen- dent variable per one standard deviation of the independent vari- able, with other dependent variables held constant, Sokal and Rohlf 1981). n= sample size
Table 4. Comparison of regression results between samples of species in which group size has been found to influence day-range (DR-REL) with species in which day-range is not directly influenced by group size (DR-UNREL) (primate data only)
Group PD DRm n
type R2 P b' P b' P
DR-REL Populations FGS 0.47 ns 0.42 ns 0.50 ns 7 Species FGS' 0.47 ns 0.38 ns 0.44 ns 5
DR-UNREL Populations FGS1 0.44 ns 0.32 ns 0.74 0.02 12 Species FGS' 0.54 ns 0.50 ns 0.97 ns 5
DR-UNREL +F-F Populations PGS 0.36 0.02 0.35 ns 0.66 0.01 20 Species PGS 0.44 ns 0.48 ns 0.74 0.05 12
DR-REL: group size and day-range are related within populations. DR-UNREL: group size and day-range are unrelated within popula- tions. F-F: fission-fusion societies. FGS1: in these species FGS and PGS are identical. Other symbols as in Table 3
206
sion therefore applies equally to PGS. It can be exam- ined further by including PGS in fission-fusion societies, because the fact that individuals in fission-fusion socie- ties travel independently means that EC is not expected to have systematic effects on day-range, and therefore that within-population effects of PGS on day-range should be small. The DR-UNREL sample was therefore extended to include fission-fusion species (DR-UN- REL +F-F, see Table 1). The regression for this larger sample is significant at the population level, and margin- ally significant at the species level (Table 4). Again, therefore, the significance of the regression of PGS on population density and day-range appears to depend very little on within-species correlations of day-range and PGS.
Social group type
Examination of residuals showed that many species with relatively small groups were monogamous. Monoga- mous groups may be constrained in size by social rather than ecological factors, and therefore could introduce unintended biases. All primate analyses were therefore repeated with monogamous groups excluded. Results were essentially identical to the whole sample, showing no trend for better or worse regression coefficients than the full sample.
The role of body weight
We found no correlation between body weight and FGS or PGS for primates or carnivores at any level (cf. van Schaik 1983; Gittleman 1989a). Population density was negatively correlated with body weight in both orders (primates: r2 = 0.17 (populations) - 0.31 (genera), P< 0.01; carnivores/ r2=0.29-0.35, P<0.001) and among the same variables with the contrasts (primates: r2=
0.28, n=21; P<0.01; carnivores: r =0.52, n=15; P< 0.002). Similar findings have previously been shown in other comparative studies of the allometry of population density in these orders (e.g., Clutton-Brock and Harvey 1977b; Gittleman 1984, 1989b). Day-range and body weight were not correlated at any level among primates (r2<0.01, ns.; contrasts: r2=0.01, n.s.), but showed a significant positive association among carnivores (r2 = 0.43-0.44, P<0.001; contrasts: r2=0.28, n= 15; P< 0.04).
Inclusion of body weight strengthened the multiple regression slightly for primates but not at all for carni- vores. For primates, for example, the proportion of vari- ance in FGS accounted for by the combination of popu- lation density, day-range and body weight rose to 28- 32% (for species and population level), and 45-52% for PGS (species and genus). The standardized partial re- gression coefficient of body weight was significant at the population and species levels for PGS (b' = 0.36-0.41, P<0.01), but not at the genus level (b'=0.30) for PGS or at any level for FGS.
The independent contrasts revealed similar correla-
tion as with FGS and the two ecological variables (r2= 0.20, n=21; P<0.01). Thus, not only was body weight positively associated with PGS (population level: partial r=0.37, n=60, P<0.005; species: r=0.14, n=39, P< 0.02; genus: r = 0.49, n =19, P < 0.01), but also the par- tial regression coefficients of population density were significant at all levels (population: r = 0.46, n = 60, P < 0.001; species: r =0.44, n= 39, P<0.001; genus: r=0.55, n = 19, P <0.05). Partial regression coefficients for day- range were essentially unchanged by the inclusion of body weight, remaining highly significant.
In the carnivore analysis the partial regression coeffi- cient for body weight was not significant [r = -0.12 (spe- cies), -0.19 (genus)]. Inclusion of body weight slightly changed the partial regression coefficients and total vari- ance explained (i.e. without body weight, r2 =0.55; in- cluding body weight, r2=0.56). Likewise, the contrast values did not indicate further association with body weight (r2 = 0.43, n = 11; P < 0.03). The addition of body weight therefore does nothing to improve the empirical value of the model for predicting carnivore group size.
Because body weight does not reduce the partial re- gression coefficients of population density or day-range we conclude that it is not important as a confounding variable.
Discussion
Interpretation of our results rests importantly on the extent to which variation in observed day-range (DRm) is considered to drive, or be driven by, variation in group size. Our hypothesis is that the constraint-free day-range (DRS) drives group size, and that DRm closely indexes DRS. We found DRm and DRS to be well correlated where DRS could be estimated by linear regression. We also analysed a small set of species supposedly having no within-population correlation of DRm and group size (i.e. where DRm in theory equals DRS). This produced results indistinguishable from the larger sample. Finally, we repeated the regression using only species for which DRS had been calculated, and found no discernible effect of using DRs rather than DRm.
Of course DRm is not the ideal index. We would have preferred to measure the energetic costs of travel direct- ly. Failing that, DRS would be preferable to DRm. Alter- natively, the maximum observed day-range might useful- ly assay the extent to which different species are con- strained by travel costs. Further work may produce a more satisfactory index than DRm, in which case the values found in our regressions will change. Nevertheless given the limitations of currently available data, we con- clude that DRm is sufficiently closely related to species travel efficiency to indicate the effects of exploitation competition.
Results supported the EC hypothesis by showing that population density and DRm are consistent predictors of group size in carnivores and primates. For both orders population density was associated in all multiple regres- sions except at the genus level (Table 2). In all tests the partial regression coefficient of DRm was positively asso-
207
ciated with group size. For primates the association be- tween population density and group size became signifi- cant in all contexts when body weight was included as a third independent variable, although the need to take body weight into account was not predicted by the mod- el. Nevertheless, population density and DRm were shown to be independently associated with group size in these orders. The comparative analysis using indepen- dent contrasts validated results from regressions by showing that statistical correlations were not attribut- able to taxonomic correlations.
Given that population density, day-range and group size are associated as described, our hypothesis rests on the direction of causality. Since this is not definitively resolved, alternative interpretations exist for the ob- served correlations. For instance, at a given population density group size might be argued to drive home-range, and hence day-range. Critical data for resolving such debates will come from more direct measures of theoreti- cally important variables, such as the metabolic costs of travel, and the effects of changes in food density. Again, the fact that group size often drives day-range length within species means that a component of the between-species correlation is probably due to within- species effects. We have shown however that even where these within-species effects are trivially small, the rela- tionship between group size and day-range still holds strongly across species. Where it is possible to test the direction of causality, therefore, our data are supportive of the EC hypothesis that group size is constrained by the metabolic costs of travel.
The EC hypothesis has not been proposed before as a general explanation for group size differences among species. However it has been applied to particular cases. For example, Terborgh (1983, p 227) argued that Saguin- us fuscicollis groups are constrained in size by limits on their day-range. Similarly group size of orangutans Pon- go pygmaeus was suggested to be constrained, compared to chimpanzees Pan troglodytes, by their shorter day- ranges (Wrangham 1979; Rodman 1984). In both these examples day-range length was assumed to be con- strained by anatomical and metabolic adaptations.
Previous analyses of species differences in constraints on group size, however, have focussed more on effects of patch size, i.e. interference competition (IC). While IC clearly has effects (e.g. Leighton and Leighton 1982; Kruuk and Macdonald 1985), puzzles have arisen that may be explicable better through EC. For example, foli- vorous primates are considered to have larger food patches than frugivores. IC theory therefore suggests that folivores should have larger groups. In fact, how- ever, folivores tend to have smaller groups than frugi- vores (Clutton-Brock and Harvey 1977b). This is a chal- lenge for a group size hypothesis based on IC, but not for EC. Thus the EC explanation would be that folivor- ous primates have short day-ranges, perhaps caused by a tight energy budget imposed by the nature of their diet (e.g., Milton 1980): short DRs predicts small group sizes. This example emphasizes that the size of resource patches does not directly affect the predictions of the EC hypothesis. Furthermore, the constraints from EC
do not depend on any particular type of foraging specia- lization, as shown by the regression for combined pri- mate and carnivore data. Species from ants to elephants can in principle be expected to fit the same regression so long as grouping is favored.
Deviations between observed and expected group size based on the EC hypothesis may be explicable via species differences either in the importance of interference com- petition, or in the benefits of grouping. For example, it is expected that species with relatively large positive residuals on population density and day-range may ei- ther have relatively large food patches (low IC) or be subject to a steep reduction in predator pressure as group size increases (high benefits). Inspection of our results suggests a trend in this direction, e.g. baboons have large residuals. Data on species differences in patch size and predator pressure are not currently available to test their relative importance, but ultimately it should be possible to partition the variance in group size be- tween more fine-grained ecological components in this way.
Group size covers many types of group, including population (PGS), foraging (FGS), feeding and breeding groups (Gittleman 1989b). Various functional demands are related to such different types of grouping patterns. For example, population groups reflect social networks over the long term whereas foraging groups reflect numbers of individuals during foraging or feeding on prey. In either type, these behavioral/ecological features represent characteristics that impinge on the proposed hypothesis. Differences are therefore expected in the as- sociation of different measures of group size with inde- pendent variables. PGS was predicted better than FGS by population density and day-range, but the difference was small. Larger samples and true measures of slope are required to understand the differences better.
The fact that there are many sources of error and many factors influencing group size, including the social and dietary factors identified, plus such issues as vari- ance in group size varying among species, makes it in- triguing that the simple prediction based on EC is upheld. It will be interesting to find out how well it is upheld when other taxa are added to the regression. In flying or swimming species where travel is cheaper, group size may perhaps be constrained by social rather than ecological factors, whereas we expect terrestrial spe- cies such as ants (where travel is relatively costly) to follow the principles proposed for primates and carni- vores. Further tests of the EC hypothesis may be able to distinguish alternative principles of grouping and their relevance to different species.
Acknowledgements. We are grateful to A.W. Goldizen for assistance with literature surveys, L. Chapman for statistical help, M. Pagel for the independent contrasts analysis, L. Isbell and L. Chapman for helpful discussions, and R. Dunbar for detailed and construc- tive reviews. R. Connor, A.W. Goldizen, M. Leighton and an anon- ymous reviewer gave valuable advice.
208
References
Alexander RD (1974) The evolution of social behavior. Annu Rev Ecol Syst 5:325-383
Altmann SA (1974) Baboons, space, time and energy. Am Zool 14:221-248
Andelt WF (1985) Behavioral ecology of coyotes in south Texas. Wildl Monogr 94:1-45
Arden-Clarke CHG (1986) Population density, home range size and spatial organization of the Cape clawless otter, Aonyx ca- pensis, in a marine habitat. J Zool 209:201-211
Arthur SM, Krohn WB, Gilbert JR (1989) Home range characteris- tics of adult fishers. J Wildl Manage 53:674-679
Barton RA, Whiten A, Strum SC, Byrne RW, Simpson A (1992) Habitat use and resource availability in baboons. Anim Behav 43:831-844
Bennett EL (1986) Environmental correlates of ranging behaviour in the banded langur, Presbytis melalophos. Folia Primatol 47:26-38
Butynski TM (1990) Comparative ecology of blue monkeys (Cerco- pithecus mitis) in high and low density populations. Ecol Monogr 60:1-26
Chapman CA (1989) Ecological constraints of group size in three species of neotropical primates. Folia Primatol 55:1-9
Chapman CA (1990) Association patterns of spider monkeys: the influence of ecology and sex on social organization. Behav Ecol Sociobiol 26:409-414
Chism J, Rowell TE (1988) The natural history of patas monkeys. In: Gautier-Hion A, Bourliere F, Gautier J-P, Kingdon J (eds) A Primate Radiation: Evolutionary Biology of the African Guenons. Cambridge University Press, New York, pp 412-438
Chivers DJ (1969) On the daily behavior and spacing of howling monkey groups. Folia Primatol 10:48-102
Clutton-Brock TH, Harvey PH (1977 a) Species differences in feed- ing and ranging behaviour in primates. In: Clutton-Brock TH (ed) Primate ecology. Academic Press, London, pp 557-584
Clutton-Brock TH, Harvey PH (1977b) Primate ecology and social organization. J Zool Lond 183:1-39
Clutton-Brock TH, Harvey PH (1979) Home range, population density and phylogeny in primates. In: Bernstein IS, Smith EO (eds) Primate ecology and human origins. Garland STPM Press, New York, pp 201-214
Clutton-Brock TH, Harvey PH (1984) Comparative approaches to investigating adaptation. In: Krebs JR, Davies NB (eds) Behavioural ecology. Blackwell Scientific Publications, Oxford, pp 1-29
Cody ML (1971) Finch flocks in the Mohave desert. Theor Popul Biol 18:244-256
Cords M (1986) Forest guenons and patas monkeys: male-male competition in one male groups. In: Smuts BB, Cheney DL, Seyfarth RM, Wrangham RW, Struhsaker TT (eds) Primate societies. University of Chicago Press, Chicago, pp 98-111
Crockett CM, Eisenberg JF (1986) Howlers: variation in group size and demography. In: Smuts BB, Cheney DL, Seyfarth RM, Wrangham RW, Struhsaker TT (eds) Primate societies. Univer- sity of Chicago Press, Chicago, pp 54-68
Crompton RH, Andau PM (1987) Ranging, activity rhythms, and sociality in free-ranging Tarsius bancanus: a preliminary report. Int J Primatol 8:43-71
Damuth J (1987) Interspecific allometry of population density in mammals and other animals: The independence of body mass and population energy-use. Biol J Linn Soc 31:193-246
Dittus WPJ (1977) The social regulation of population density and age-sex distribution in the Toque monkey. Behaviour 63:281-322
Dunbar RIM (1974) Observations on the ecology and social orga- nization of the green monkey, Cercopithecus sabaeus, in Sene- gal. Primates 15:341-350
Dunbar RIM (1988) Primate social systems. Comstock, Ithaca, New York
Elliott RC (1976) Observations on a small group of mountain goril- las (Gorilla gorilla berengei). Folia Primatol 25:12-24
Ekman J, Rosander B (1987) Starvation risk and flock size of the social forager: when there is a flocking cost. Theor Popul Biol 31:167-177
Ferguson JWH, Nel JAJ, de Wet MJ (1983) Social organization and movement patterns of Black-backed jackals Canis mesome- las in South Africa. J Zool 199:487-502
Fossey D, Harcourt AH (1977) Feeding ecology of free-ranging mountain gorillas (Gorilla gorilla). In: Clutton-Brock TH (ed) Primate ecology. Academic Press, London, pp 415-449
Galdikas BMF, Teleki G (1981) Variations in subsistence activities of female and male pongids: new perspectives on the origins of hominid labor division. Curr Anthropol 22:241-256
Garland T (1983) Scaling the ecological cost of transport to body mass in terrestrial mammals. Am Nat 121:571-587
Gittleman JL (1984) The behavioural ecology of carnivores. D Phil Thesis, University of Sussex
Gittleman JL (1986) Carnivore life history patterns: allometric, phylogenetic and ecological associations. Am Nat 127:744-771
Gittleman JL (1989 a) Carnivore group-living: comparative trends. In: Gittleman JL (ed) Carnivore behavior, ecology, and evolu- tion. Cornell University Press, Ithaca, New York, pp 183-207
Gittleman JL (1989b) The comparative approach in ethology: aims and limitations. In: Bateson PPG, Klopfer PH (eds) Perspec- tives in ethology. Plenum Press, New York, pp 55-83
Gittleman JL, Kot M (1990) Adaptation: statistics and a null model for estimating phylogenetic effects. Syst Zool 39:227-241
Gittleman JL, Luh HK (1992) On comparing comparative meth- ods. Annu Rev Ecol Syst 23:383-404
Goldizen AW (1986) Tamarins and marmosets: communal care of offspring. In: Smuts BB, Cheney DL, Seyfarth RM, Wrangh- am RW, Struhsaker TT (eds) Primate societies. University of Chicago Press, Chicago, pp 34-43
Harrison MJS (1983) Territorial behaviour in the green monkey, Cercopithecus sabaeus: seasonal defense of local food supplies. Behav Ecol Sociobiol 12:85-94
Harvey PH, Pagel M (1991) The comparative method in evolution- ary biology. Oxford University Press, Oxford
Harvey PH, Martin RD, Clutton-Brock TH (1986) Life histories in comparative perspective. In: Smuts BB, Cheney DL, Seyfarth RM, Wrangham RW, Struhsaker TT (eds) Primate societies. University of Chicago Press, Chicago, pp 181-196
Isbell LA (1991) Contest and scramble competition: patterns of female aggression and ranging behavior among primates. Behav Ecol2:143-155
Iwamoto T, Dunbar R (1983) Thermoregulation, habitat quality and the behavioural ecology of gelada baboons. J Anim Ecol 52:357-366
Johnson KG, Schaller GB, Jinchu H (1988) Comparative behavior of red and giant pandas in the Wolong Reserve, China. J Mamm 69:552-564
Kavanagh M (1981) Variable territoriality among tantalus monkeys in Cameroon. Folia Primatol 36:76-98
Kawai M, Iwamoto T (1979) Ecological and sociological studies of gelada baboons. (Contributions to primatology 16). Karger, Basel
Kruuk H, MacDonald DW (1985) Group territories of carnivores: empires and enclaves. In: Sibly RM, Smith RH (eds) Behav- ioural ecology: ecological consequences of adaptive behaviour. Blackwell Scientific Publications, Oxford, pp 521-536
Leighton DR (1986) Gibbons: territoriality and monogamy. In: Smuts BB, Cheney DL, Seyfarth RM, Wrangham RW, Struh- saker TT (eds) Primate societies. University of Chicago Press, Chicago, pp 134-145
Leighton M, Leighton DR (1982) The relationship of size of feed- ing aggregate to size of food patch: howler monkeys (Alouatta palliata) feeding in Trichilia cipo fruit trees on Barro Colorado Island. Biotropica 14:81-90
Ludlow ME, Sunquist ME (1987) Ecology and behavior of ocelots in Venezuela. Nat Geo Res 3:447-461
MacKinnon JR (1974) The behaviour and ecology of wild orang- utans (Pongo pygmaeus). Anim Behav 22:3-74
Melnick DJ, Pearl MC (1986) Cercopithecines in multimale groups:
209
genetic diversity and population structure. In: Smuts BB, Chen- ey DL, Seyfarth RM, Wrangham RW, Struhsaker TT (eds) Primate Societies. University of Chicago Press, Chicago, pp 121-134
Messick J, Hornocker M (1981) Ecology of the badger in south- western Idaho. Wildl Monogr 76:1-53
Milton K (1980) The foraging strategy of howler monkeys. Colum- bia University Press, New York
Milton K (1984) Habitat, diet, and activity patterns of free-ranging woolly spider monkeys (Brachyteles arachnoides E. Geoffroy 1806). Int J Primat 5:491-514
Nicholson AJ (1954) An outline of the dynamics of animal popula- tions. Aust J Zool 2:9-65
Nicholson AJ (1957) Self-adjustment of populations to change. Cold Spring Harbor Symp Quant Biol 22:153-173
Packer C (1986) The ecology of sociality in felids. In: Rubenstein DI, Wrangham RW (eds) Ecological aspects of social evolution. Princeton University Press, Princeton, pp 429-451
Packer C, Scheel D, Pusey A (1990) Why lions form groups: food is not enough. Am Nat 136:1-19
Pagel MD, Harvey PH (1988) Recent developments in the analysis of comparative data. Q Rev Biol 63:413-440
Pagel MD, Harvey PH (1989) Comparative methods for examining adaptation depend on evolutionary models. Folia Primatol 53:203-220
Rijksen HD (1978) A field study of Sumatran orang-utans (Pongo pygmaeus abelii, Lesson 1827): ecology, behaviour and conser- vation. H Veenman & Zonen, Wageningen
Robinson JG (1988) Demography and group structure in wedge- capped capuchin monkeys, Cebus olivaceus. Behaviour 104:202-232
Robinson JG, Janson CH (1986) Capuchins, squirrel monkeys and atelines: socioecological convergence with old world primates. In: Smuts BB, Cheney DL, Seyfarth RM, Wrangham RW, Struhsaker TT (eds) Primate societies. University of Chicago Press, Chicago, pp 69-82
Robinson JG, Wright PC, Kinzey WG (1986) Monogamous cebids and their relatives: intergroup calls and spacing. In: Smuts BB, Cheney DL, Seyfarth RM, Wrangham RW, Struhsaker TT (eds) Primate societies. University of Chicago Press, Chicago, pp 44-53
Rodman PS (1973) Population composition and adaptive organisa- tion among orangutans of the Kutai Reserve. In: Michael RP, Crook JH (eds) Comparative ecology and behaviour of pri- mates. Academic Press, London, pp 171-209
Rodman PS (1977) Feeding behaviour of orangutans of the Kutai Nature Reserve, East Kalimantan. In: Clutton-Brock TH (ed) Primate ecology: studies of feeding and ranging behaviour in lemurs, monkeys, and apes. Academic Press, London, pp 384- 414
Rodman PS (1984) Foraging and social systems of orangutans and chimpanzees. In: Rodman PS, Cant JGH (eds) Adaptations for foraging in nonhuman primates. Columbia University Press, New York, pp 134-160
Rodman PS, Mitani JC (1986) Orangutans: sexual dimorphism in a solitary species. In: Smuts BB, Cheney DL, Seyfarth RM, Wrangham RW, Struhsaker TT (eds) Primate societies. Univer- sity of Chicago Press, Chicago, pp 146-154
Rogers LL (1987) Effects of food supply and kinship on social behavior, movements, and population growth of black bears on northeastern Minnesota. Wildl Monogr 97:1-72
Ruiter de JR (1986) The influence of group size on predator scan- ning and foraging of wedge-capped capuchin monkeys (Cebus olivaceus). Behaviour 98:240-258
Sandell M (1989) The mating tactics and spacing patterns of soli- tary carnivores. In: Gittleman JL (ed) Carnivore behavior, ecol- ogy and evolution. Cornell University Press, Ithaca, pp 164-182
Schaik van CP (1983) Why are diurnal primates living in groups? Behaviour 87:120-144
Schaik CP can (1989) The ecology of social relationships amongst female primates. In: Standen V, Foley RA (eds) Comparative socioecology. Blackwell, Cambridge, pp 195-218
Schaik CP van, Hooff van J (1983) On the ultimate causes of primate social systems. Behaviour 85:91-117
Schaik van CP, Noordwijk van MA (1988) Scramble and contest in feeding competition among female long-tailed macaques (Macacafascicularis). Behaviour 105:77-98
Schaik van CP, van Noordwijk MA, de Boer RJ, den Tonkelaar I (1983) The effect of group size on time budgets and social behaviour in wild long-tailed macaques (Macaca fascicularis). Behav Ecol Sociobiol 13:173-181
Schaller GB (1972) The Serengeti lion: a study of predator-prey relationships. University of Chicago Press, Chicago
Schaller GB, Jinchu H, Wenshi P, Jing Z (1985) The giant pandas of Wolong. University of Chicago Press, Chicago
Sharman M, Dunbar RIM (1982) Observer bias in selection of study groups in baboon field studies. Primates 23:567-573
Sigg H, Stolba A (1981) Home range and daily march in a hamad- ryas baboon troop. Folia Primatol 36:40-75
Smuts BB, Cheney DL, Seyfarth RM, Wrangham RW, Struhsaker TT (eds) (1986) Primate societies. University of Chicago Press, Chicago
Sokal RR, Rohlf FJ (1981) Biometry. W.H. Freeman, San Fran- cisco
Stammbach E (1986) Desert, forest and montane baboons: multi- level societies. In: Smuts BB, Cheney DL, Seyfarth RM, Wrangham RW, Struhsaker TT (eds) Primate societies. Univer- sity of Chicago Press, Chicago, pp 112-120
Stewart KJ, Harcourt AH (1986) Gorillas: variation in female rela- tionships. In: Smuts BB, Cheney DL, Seyfarth RM, Wrangham RW, Struhsaker TT (eds) Primate societies. University of Chi- cago Press, Chicago, pp 155-164
Strier KB (1987) Ranging behavior of woolly spider monkeys. Int J Primatol 8:575-591
Struhsaker TT (1967) Ecology of vervet monkeys (Cercopithecus aethiops) in the Masai-Amboseli Game Reserve, Kenya. Ecolo- gy 48:891-904
Struhsaker TT, Leland L (1986) Colobines: infanticide by adult males. In: Smuts BB, Cheney DL, Seyfarth RM, Wrangham RW, Struhsaker TT (eds) Primate societies. University of Chi- cago Press, Chicago, pp 83-97
Struhsaker TT, Leland L (1988) Group fission in redtail monkeys (Cercopithecus ascanius) in the Kibale Forest, Uganda. In: Gau- tier-Hion A, Bourliere F, Gautier J-P, Kingdon J (eds) A pri- mate radiation: evolutionary biology of the African guenons. Cambridge University Press, New York, pp 364-388
Sunquist ME (1989) Comparison of spatial and temporal activity of red foxes and gray foxes in north-central Florida. Fl Field Nat 17:11-18
Taylor ME (1989) Locomotor adaptations by carnivores. In: Gitt- leman JL (ed) Carnivore behavior, ecology, and evolution.Cor- nell University Press, Ithaca, pp 382-409
Terborgh J (1983) Five New World primates. Princeton University Press, Princeton
Terborgh J, Janson C (1986) The socioecology of primate groups. Annu Rev Ecol Syst 17:111-135
Waser PM (1977) Feeding, ranging and group size in the mangabey Cercocebus albigena. In: Clutton-Brock TH (ed) Primate ecolo- gy. Academic Press, London, pp 183-222
Whitesides GH (1989) Interspecific associations of Diana monkeys, Cercopithecus diana, in Sierra Leone, West Africa: biological significance or chance? Anim Behav 37:760-776
Wozencraft WC (1989) Classification of the recent Carnivora. In: Gittleman JL (ed) Carnivore behavior, ecology and evolution. Cornell University Press, Ithaca, pp 569-593
Wrangham RW (1976) Aspects of feeding and social behaviour in gelada baboons. Mimeo report to Science Research Council, London
Wrangham RW (1979) On the evolution of ape social systems. Soc Sci Information 18:335-368
Wrangham RW (1980) An ecological model of female-bonded pri- mate groups. Behaviour 75:262-300