Embed Size (px)
Citation preview
VAJRA, SEM-2017 1
R V COLLEGE OF ENGINEERING
BANGALURU- 560059
(An Autonomous Institution Affiliated to VTU, Belagavi)
“VAJRA 2017”
Technical Report
VAJRA, SEM-2017 2
Sl.no Contents
Pg.no
1. Energy Flow
3
2. Electrical Schematic
4
3. DC to DC Convertor
7
4. Indicator Blinking Diagram
9
5. Propulsion system
10
6. Battery Specification
11
7. BMS Specification
12
8 Motor Controller
14
9 Chassis
24
10. Steering
30
11. Powertrain
38
12. Bodywork/shell
44
VAJRA, SEM-2017
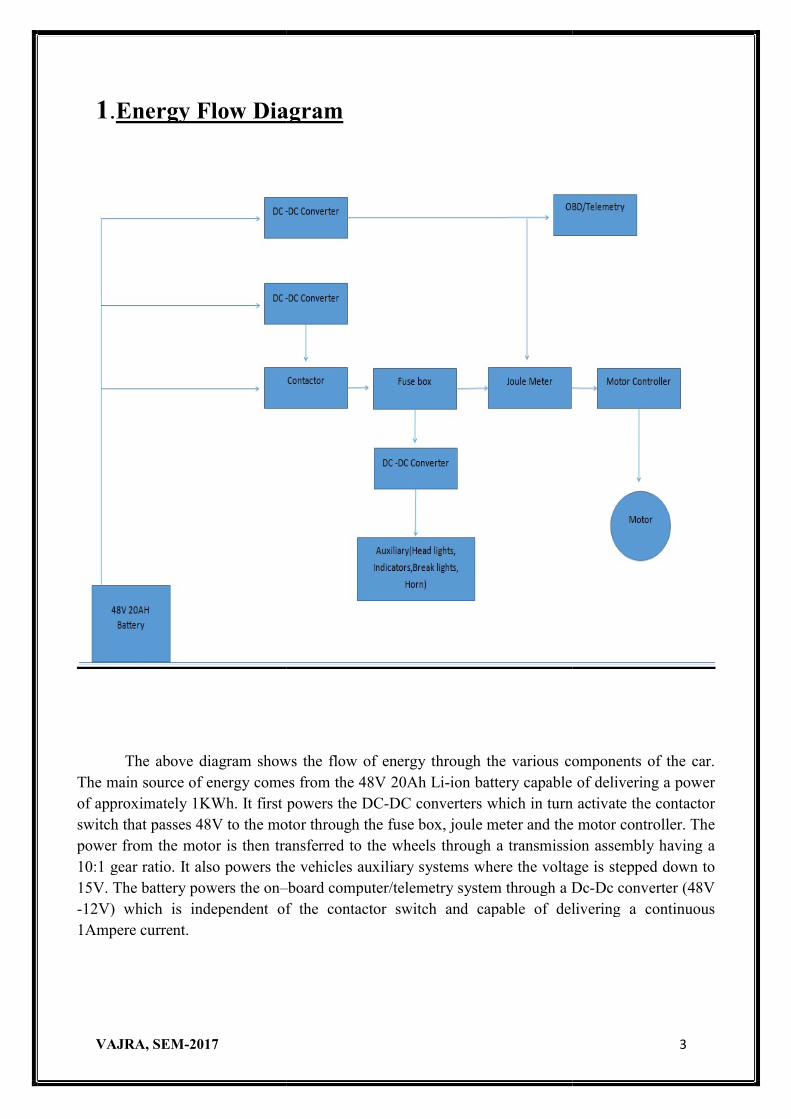
1.Energy Flow Diagram
The above diagram shows the flow of energy through the various components of the car. The main source of energy comes from the 48V 20Ah Liof approximately 1KWh. It first powers the DCswitch that passes 48V to the motor through the fuse box, joule meter and the motor controller. The power from the motor is then transferred10:1 gear ratio. It also powers the vehicles auxiliary systems where the voltage is stepped down to 15V. The battery powers the on–-12V) which is independent of the contactor switch and capable of delivering a continuous 1Ampere current.
2017
Energy Flow Diagram
The above diagram shows the flow of energy through the various components of the car. The main source of energy comes from the 48V 20Ah Li-ion battery capable of of approximately 1KWh. It first powers the DC-DC converters which in turn activate the contactor switch that passes 48V to the motor through the fuse box, joule meter and the motor controller. The power from the motor is then transferred to the wheels through a transmission assembly having a 10:1 gear ratio. It also powers the vehicles auxiliary systems where the voltage is stepped down to
–board computer/telemetry system through a Dcwhich is independent of the contactor switch and capable of delivering a continuous
2017 3
The above diagram shows the flow of energy through the various components of the car. ion battery capable of delivering a power
DC converters which in turn activate the contactor switch that passes 48V to the motor through the fuse box, joule meter and the motor controller. The
to the wheels through a transmission assembly having a 10:1 gear ratio. It also powers the vehicles auxiliary systems where the voltage is stepped down to
board computer/telemetry system through a Dc-Dc converter (48V which is independent of the contactor switch and capable of delivering a continuous
VAJRA, SEM-2017 4
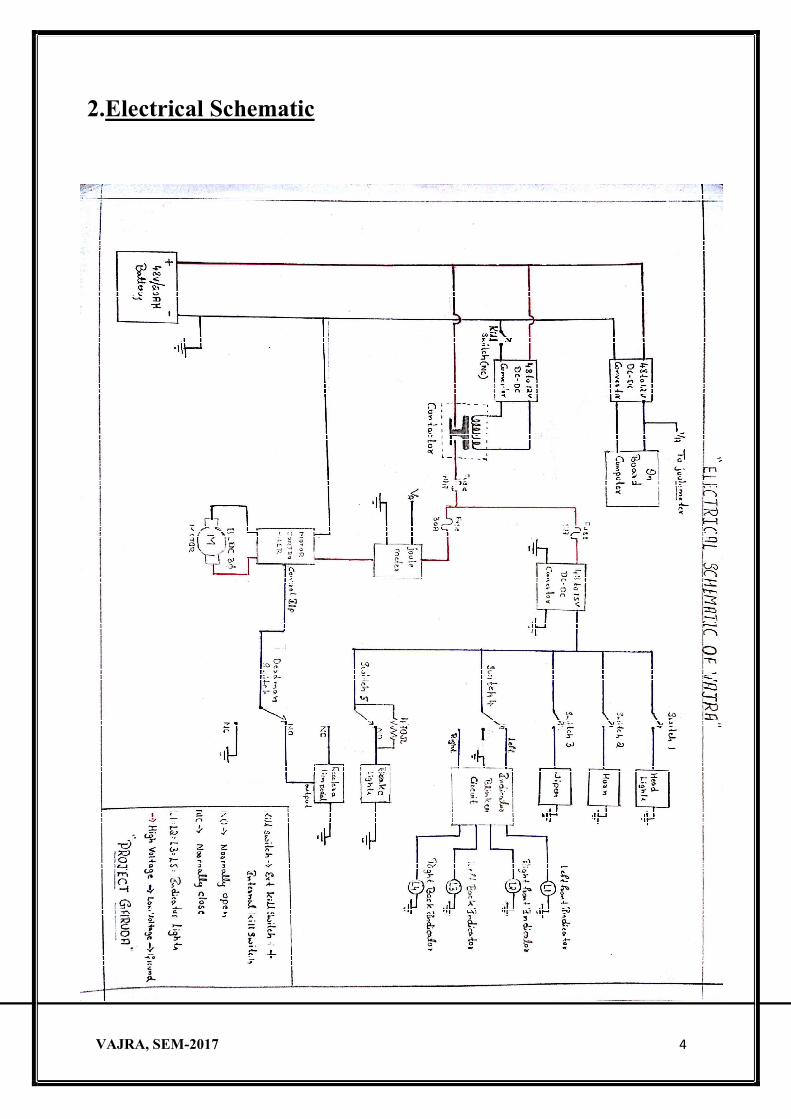
2.Electrical Schematic
VAJRA, SEM-2017 5
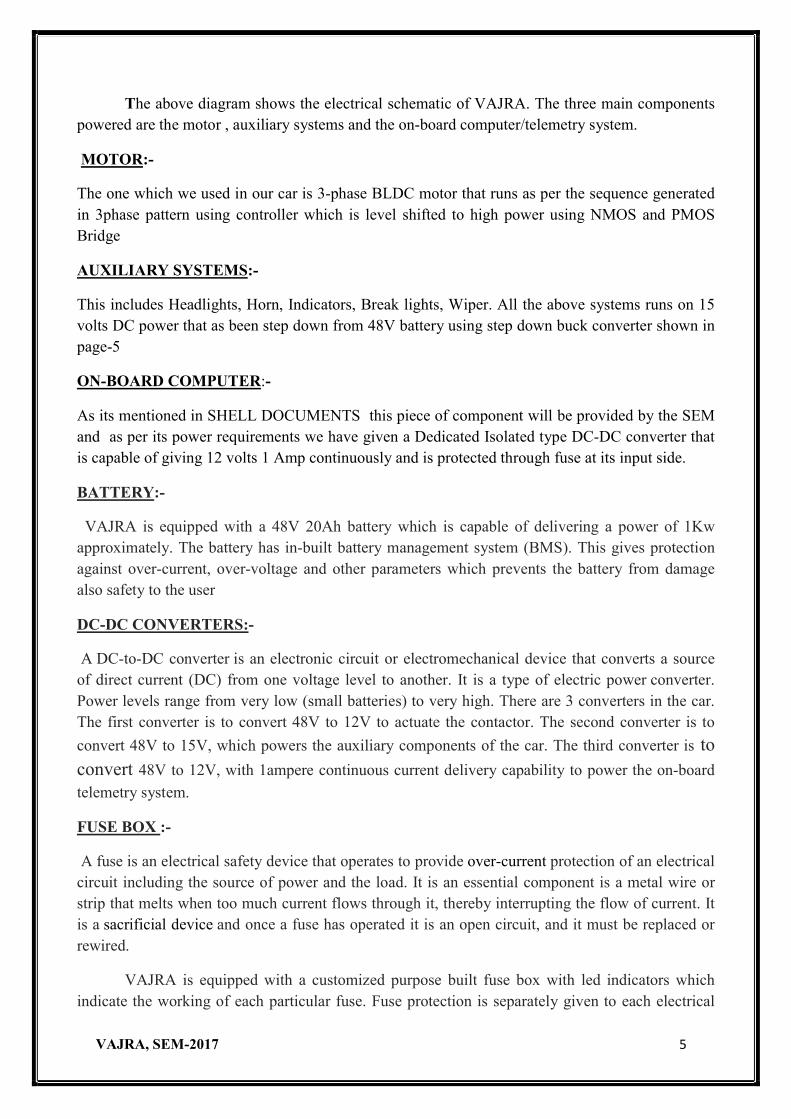
The above diagram shows the electrical schematic of VAJRA. The three main components powered are the motor , auxiliary systems and the on-board computer/telemetry system.
MOTOR:-
The one which we used in our car is 3-phase BLDC motor that runs as per the sequence generated in 3phase pattern using controller which is level shifted to high power using NMOS and PMOS Bridge
AUXILIARY SYSTEMS:-
This includes Headlights, Horn, Indicators, Break lights, Wiper. All the above systems runs on 15 volts DC power that as been step down from 48V battery using step down buck converter shown in page-5
ON-BOARD COMPUTER:-
As its mentioned in SHELL DOCUMENTS this piece of component will be provided by the SEM and as per its power requirements we have given a Dedicated Isolated type DC-DC converter that is capable of giving 12 volts 1 Amp continuously and is protected through fuse at its input side.
BATTERY:-
VAJRA is equipped with a 48V 20Ah battery which is capable of delivering a power of 1Kw approximately. The battery has in-built battery management system (BMS). This gives protection against over-current, over-voltage and other parameters which prevents the battery from damage also safety to the user
DC-DC CONVERTERS:-
A DC-to-DC converter is an electronic circuit or electromechanical device that converts a source of direct current (DC) from one voltage level to another. It is a type of electric power converter. Power levels range from very low (small batteries) to very high. There are 3 converters in the car. The first converter is to convert 48V to 12V to actuate the contactor. The second converter is to
convert 48V to 15V, which powers the auxiliary components of the car. The third converter is to convert 48V to 12V, with 1ampere continuous current delivery capability to power the on-board
telemetry system.
FUSE BOX :-
A fuse is an electrical safety device that operates to provide over-current protection of an electrical circuit including the source of power and the load. It is an essential component is a metal wire or strip that melts when too much current flows through it, thereby interrupting the flow of current. It is a sacrificial device and once a fuse has operated it is an open circuit, and it must be replaced or rewired.
VAJRA is equipped with a customized purpose built fuse box with led indicators which indicate the working of each particular fuse. Fuse protection is separately given to each electrical

VAJRA, SEM-2017 6
component. A 40A, 30A and a 5A fuse is used each for the main circuit , motor controller and other auxiliary components.
KILL SWITCHES:-
A kill switch, also known as an emergency stop or e-stop, is a safety mechanism used to shut off a device or machinery in an emergency situation in which it cannot be shut down in the usual manner. Unlike a normal shut-down switch/procedure, which shuts down all systems in an orderly fashion and turns the machine off without damaging it, a kill switch is designed and configured to completely and as quickly as possible abort the operation.
VAJRA is equipped with two kill switches, one on the shell of the car and the second one on the dashboard, which is accessible to the driver.
DEADMAN’S SWITCH:-
A dead man's switch is a switch that is automatically operated if the human operator becomes incapacitated, such as through death, loss of consciousness, or being bodily removed from control.
INDICATOR CIRCUIT:-
A customized low power consumption indicator blinking circuit is also employed in VAJRA.
VAJRA, SEM-2017 7
3.DC to DC Convertor
DC-DC CONVERTER:-

VAJRA, SEM-2017 8
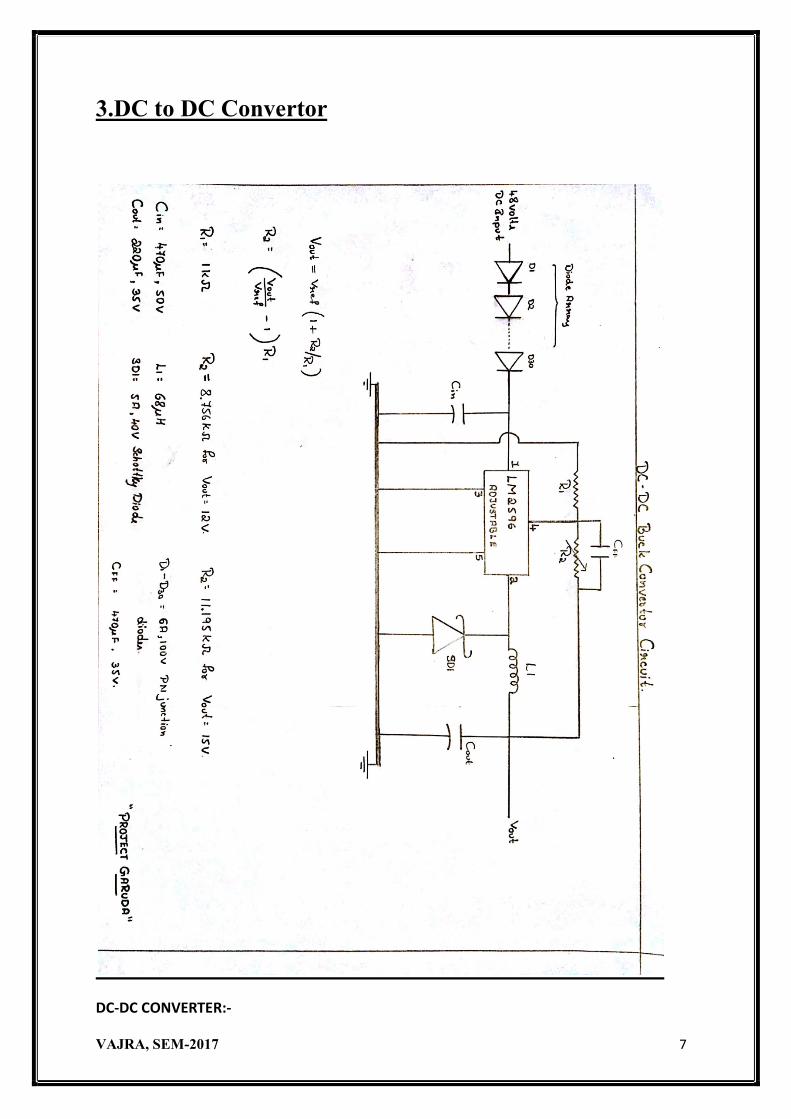
The figure in page 7 shows the circuit level diagram of Step down DC to DC converter in which we have used an array of diodes in order to bring back the input Dynamic range to the level that the rest of the Switching Buck converter can with stand and it falls in its dynamic range.
The main circuit can be seen as two separate blocks
1. Diode Array’s 2. Switching Buck converter
Diode Array:-
The main idea of going to diode array is to reduce the input dynamic range and to have compact design of the circuit so that it can easily mounted in car.
Max input voltage- 100 volts
Max current through diodes- 6A
Datasheet of diode MIC6A4 https:/www.diodes.com/assets/Datasheets/ds28009.pdf
Switching Buck Convertor:-
It uses LM2596 IC to switch the high level input dc to low voltage and also does the work of regulation
Max input supply – 45volts
Output Dynamic range 1.23- 37volts
Max current -3Amps
Datasheet of LM2596 buck converter http://www.ti.com/lit/ds/symlink/lm2596.pdf
VAJRA, SEM-2017 9
4.Indicator Blinking Circuit
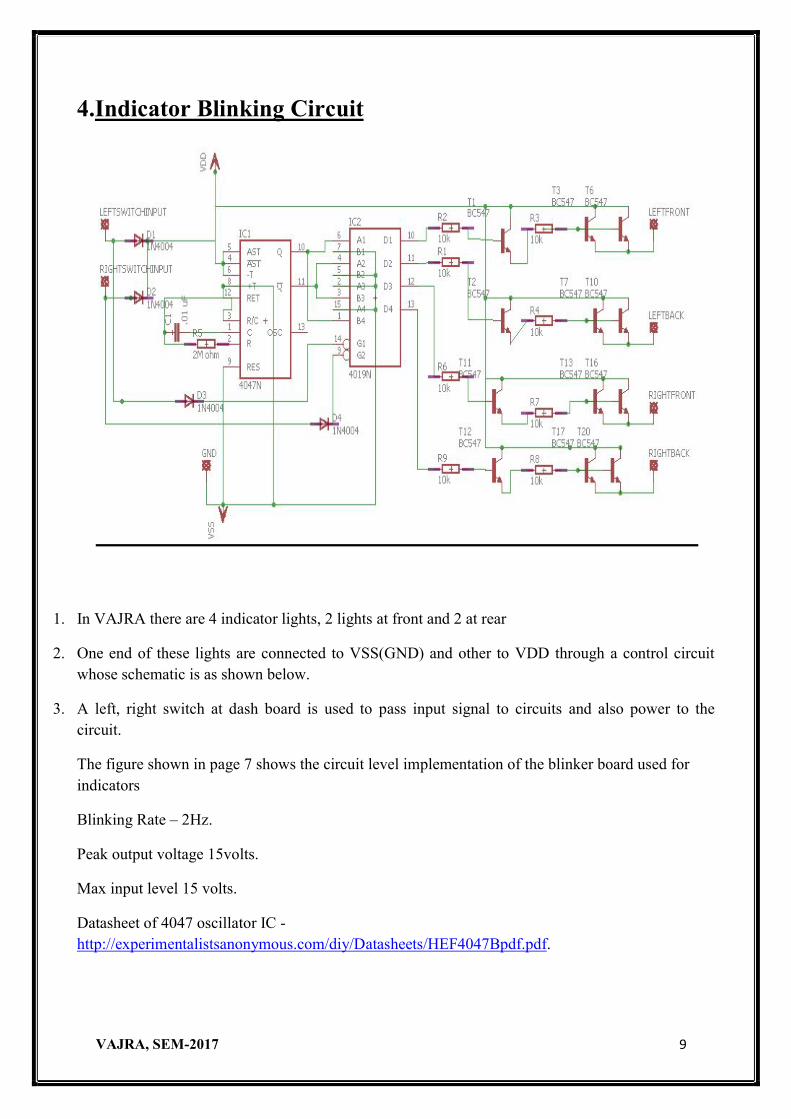
1. In VAJRA there are 4 indicator lights, 2 lights at front and 2 at rear
2. One end of these lights are connected to VSS(GND) and other to VDD through a control circuit whose schematic is as shown below.
3. A left, right switch at dash board is used to pass input signal to circuits and also power to the circuit.
The figure shown in page 7 shows the circuit level implementation of the blinker board used for indicators
Blinking Rate – 2Hz.
Peak output voltage 15volts.
Max input level 15 volts.
Datasheet of 4047 oscillator IC - http://experimentalistsanonymous.com/diy/Datasheets/HEF4047Bpdf.pdf.
VAJRA, SEM-2017
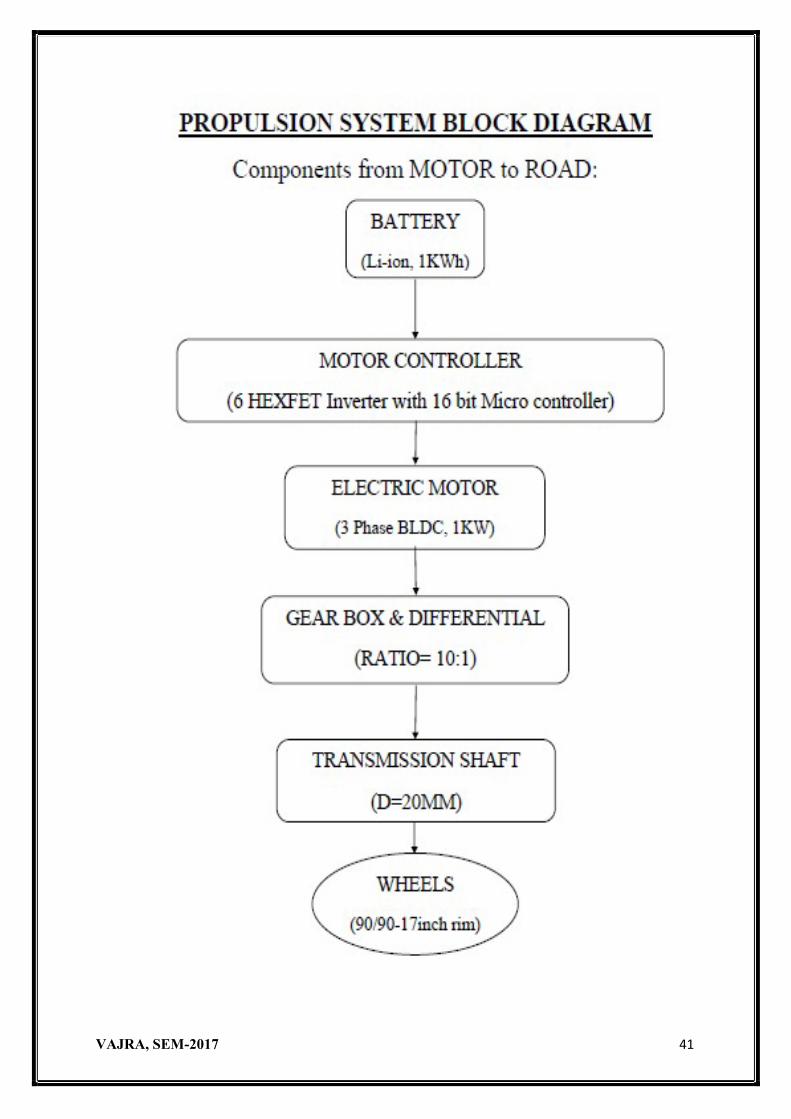
5.Propulsion System
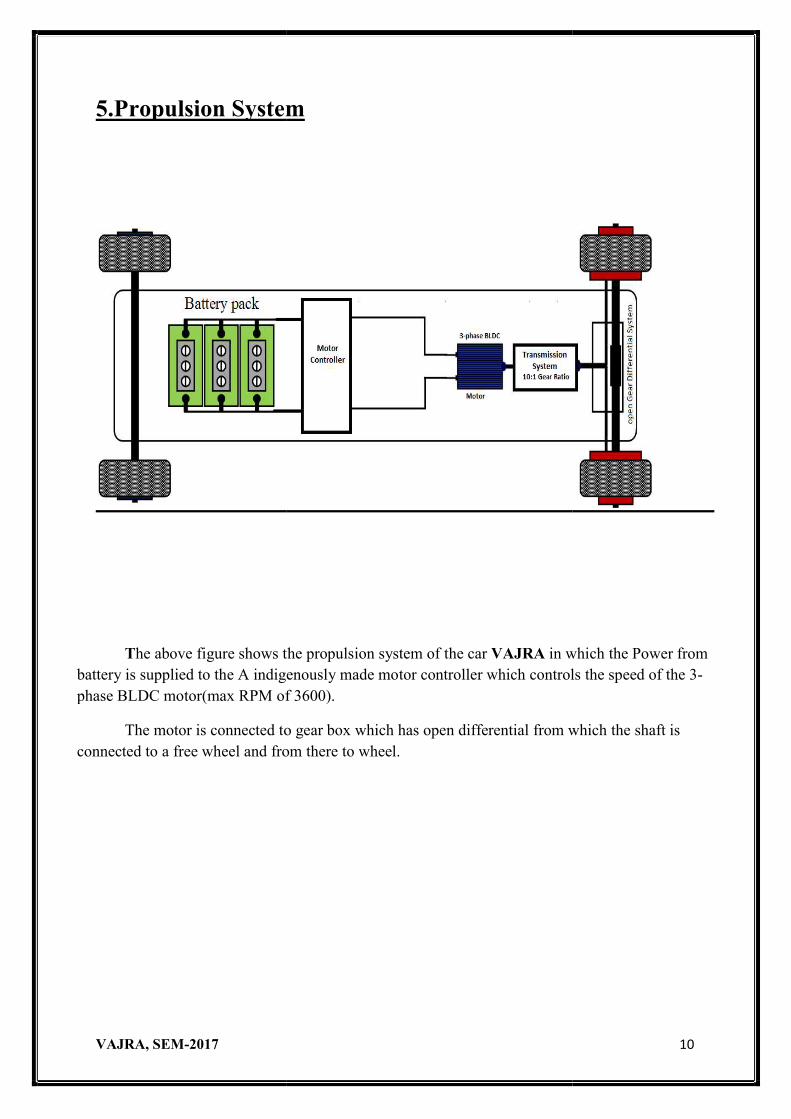
The above figure shows the propulsion system of the car battery is supplied to the A indigenously made motor controller which controls the speed of phase BLDC motor(max RPM of 3600).
The motor is connected to gear box which has open differential from which the shaft is connected to a free wheel and from there to wheel.
2017
5.Propulsion System
he above figure shows the propulsion system of the car VAJRA in which the Power from battery is supplied to the A indigenously made motor controller which controls the speed of phase BLDC motor(max RPM of 3600).
The motor is connected to gear box which has open differential from which the shaft is connected to a free wheel and from there to wheel.
2017 10
in which the Power from battery is supplied to the A indigenously made motor controller which controls the speed of the 3-
The motor is connected to gear box which has open differential from which the shaft is
VAJRA, SEM-2017
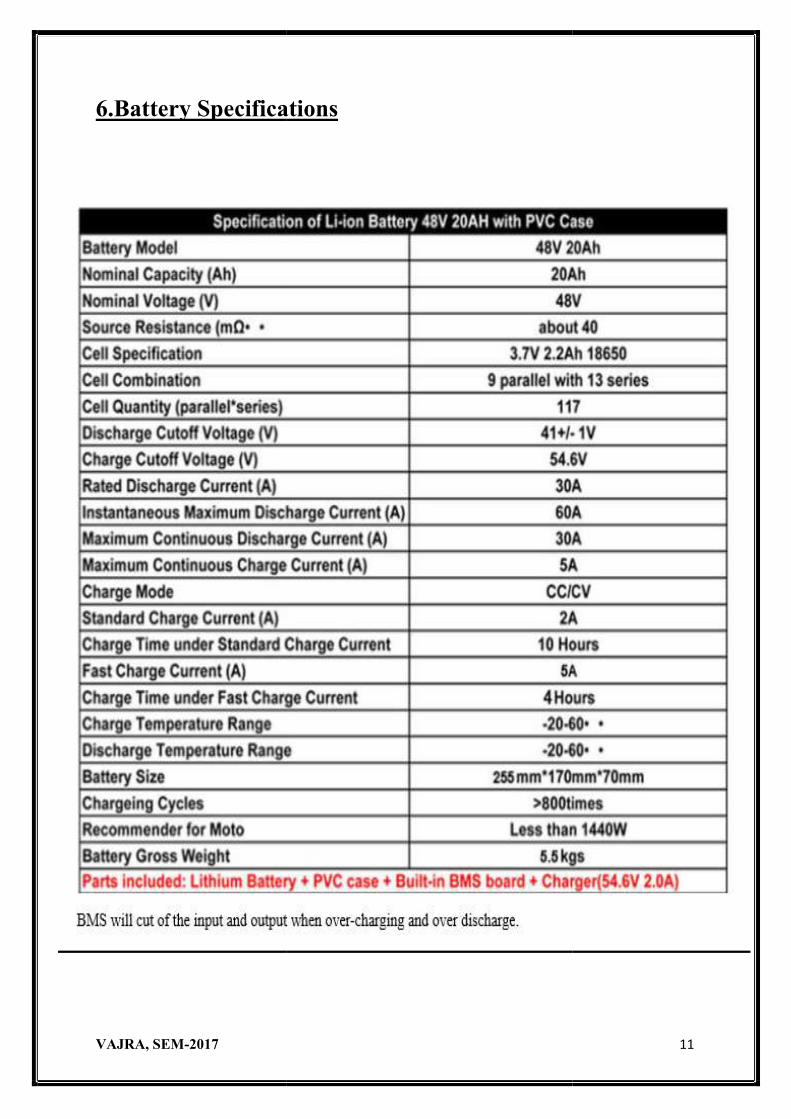
6.Battery Specifications
2017
6.Battery Specifications
2017 11
VAJRA, SEM-2017 12
7. BMS Specification
A battery management system (BMS) is any electronic system that manages a rechargeable battery (cell or battery pack), such as by protecting the battery from operating outside its Safe Operating Area, monitoring its state, calculating secondary data, reporting that data, controlling its environment, authenticating it and / or balancing it.
Application and characteristic of BMS:
1. Applies to 13 series lithium manganate/Lithium cobaltate/Lithium ion/polymer/NMC battery pack.
2. Function: Protecting the Battery from Over charging, over discharge, short circuit and To perform Cell Balance function.
3. Protection using aluminium cooling fin, with shockproof, unbreakable and increase the thermolysis and increase the strength of the function.
Main control IC with highly integrated dedicated battery protection IC, with reliable protection and stability, low self-loss and anti-ESD.
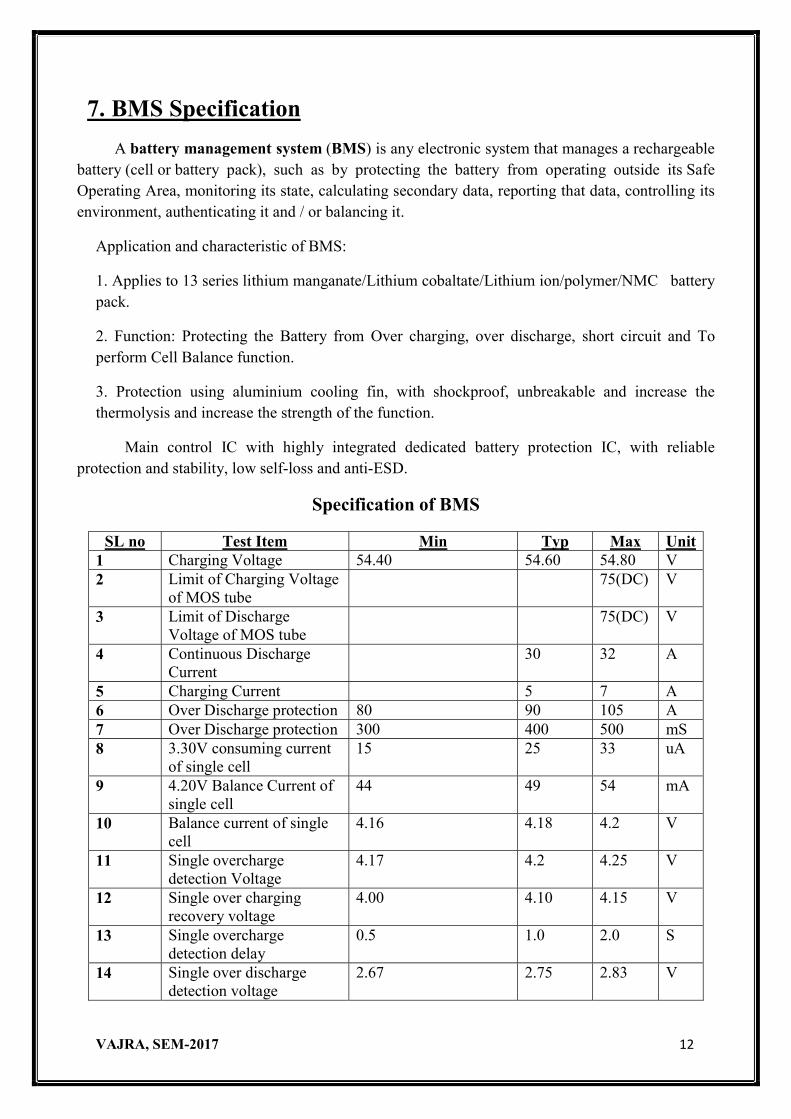
Specification of BMS
SL no Test Item Min Typ Max Unit 1 Charging Voltage 54.40 54.60 54.80 V 2 Limit of Charging Voltage
of MOS tube 75(DC) V
3 Limit of Discharge Voltage of MOS tube
75(DC) V
4 Continuous Discharge Current
30 32 A
5 Charging Current 5 7 A 6 Over Discharge protection 80 90 105 A 7 Over Discharge protection 300 400 500 mS 8 3.30V consuming current
of single cell 15 25 33 uA
9 4.20V Balance Current of single cell
44 49 54 mA
10 Balance current of single cell
4.16 4.18 4.2 V
11 Single overcharge detection Voltage
4.17 4.2 4.25 V
12 Single over charging recovery voltage
4.00 4.10 4.15 V
13 Single overcharge detection delay
0.5 1.0 2.0 S
14 Single over discharge detection voltage
2.67 2.75 2.83 V
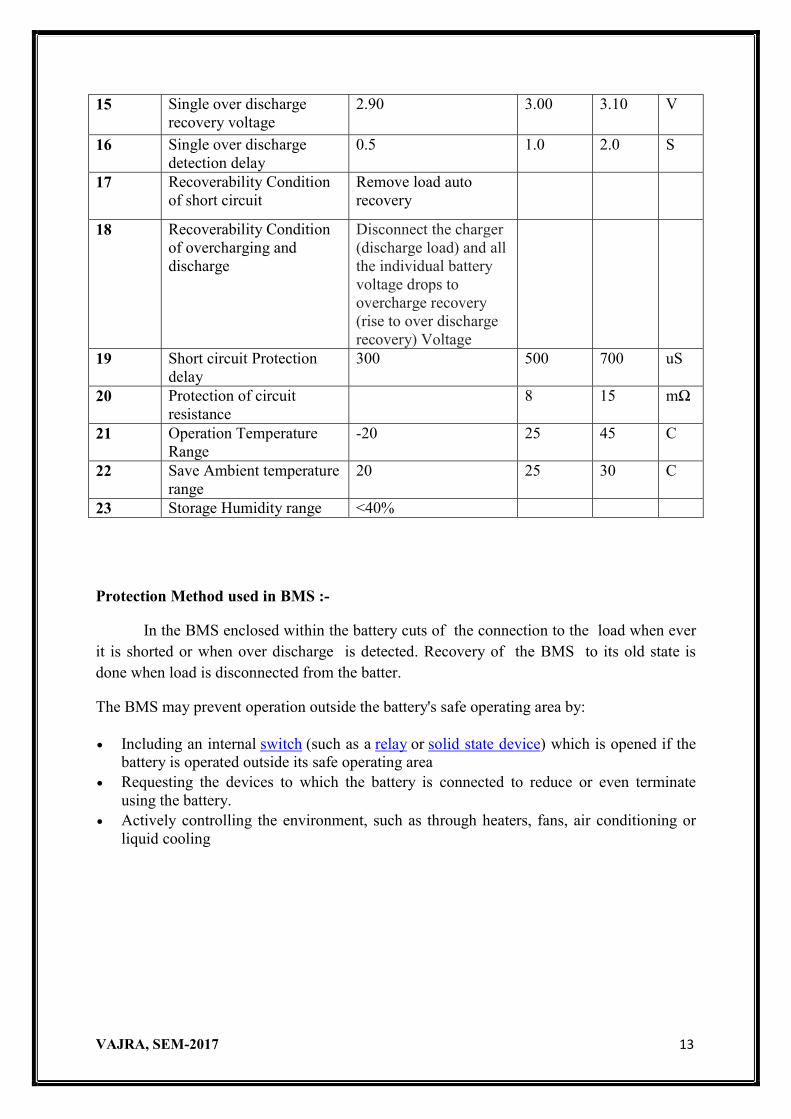
VAJRA, SEM-2017 13
15 Single over discharge recovery voltage
2.90 3.00 3.10 V
16 Single over discharge detection delay
0.5 1.0 2.0 S
17 Recoverability Condition of short circuit
Remove load auto recovery
18 Recoverability Condition of overcharging and discharge
Disconnect the charger (discharge load) and all the individual battery voltage drops to overcharge recovery (rise to over discharge recovery) Voltage
19 Short circuit Protection delay
300 500 700 uS
20 Protection of circuit resistance
8 15 mΩ
21 Operation Temperature Range
-20 25 45 C
22 Save Ambient temperature range
20 25 30 C
23 Storage Humidity range <40%
Protection Method used in BMS :-
In the BMS enclosed within the battery cuts of the connection to the load when ever it is shorted or when over discharge is detected. Recovery of the BMS to its old state is done when load is disconnected from the batter.
The BMS may prevent operation outside the battery's safe operating area by:
Including an internal switch (such as a relay or solid state device) which is opened if the battery is operated outside its safe operating area
Requesting the devices to which the battery is connected to reduce or even terminate using the battery.
Actively controlling the environment, such as through heaters, fans, air conditioning or liquid cooling
VAJRA, SEM-2017 14
8.Motor Controller
Electric motors are capable of large amounts of power, and are relatively light weight. A
typical electric motor is capable of 200 watts per kilogram, while a typical human muscle is only
capable of about 50 watts per kilogram of power.
Electric motors come in two major varieties: brushed and brushless. Brushed motors are the
most common and the easiest to use. Brushed motors work by having two magnets in the stator
and an electromagnet in the rotor. The motor continues to spin by the electromagnet changing
orientation, which is controlled by the brushes that act as contact switches. Brushed motors are
very easy to use, and will run by simply applying a dc voltage across the motor leads. The current
Electric Vehicles in the college uses exclusively brushed motors, with motor controllers set up for
the brushed motors.
There are several issues with brushed motors. The constant contact of the brushes will limit
the top speed of the motor and eventually the brushes wear out, necessitating replacement. The
brushes also result in sparking and electrical noise, which leads to variation in the motor constants,
as observed by the laboratory. Another disadvantage is that the component of the motor that heats
up, the electromagnet, is in the rotor and is nearly impossible to cool without opening the motor to
blow air through it.
Conversely, brushless motors do not contain brushes. The electromagnet for the motor is in the stator and does not rotate, while the rotor contains rare earth magnets. The changing of the polarity to continue to make the motor spin is controlled by a computer, making the control more precise and efficient, since the computer can factor in the speed of the motor. Without the brushes, the motor has less frictional losses and less variable motor constants and properties. Also, with the electromagnets in the stator the motor will be much easier to cool, which means the motor will be able to run longer at higher power values without overheating.
The major drawback of the brushless motor is that they are much more difficult to control. A brushless motor requires a computer to sense the position of the rotor and apply the appropriate voltage across the appropriate electromagnet to force the motor to spin. Hence, the goal of this project is to design and build a motor controller board to enable control of a brushless motor and create a motor controller to run the vehicle.
VAJRA, SEM-2017 15
II. Methods and Results
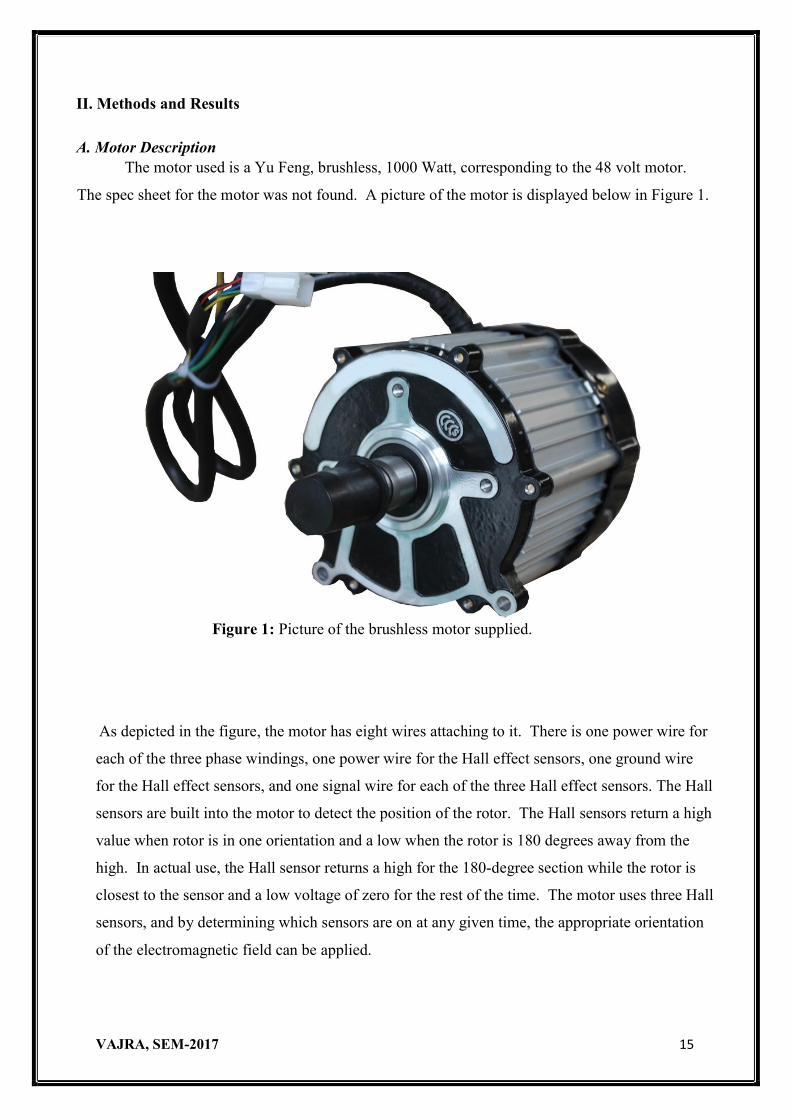
A. Motor Description The motor used is a Yu Feng, brushless, 1000 Watt, corresponding to the 48 volt motor.
The spec sheet for the motor was not found. A picture of the motor is displayed below in Figure 1.
Figure 1: Picture of the brushless motor supplied.
As depicted in the figure, the motor has eight wires attaching to it. There is one power wire for
each of the three phase windings, one power wire for the Hall effect sensors, one ground wire
for the Hall effect sensors, and one signal wire for each of the three Hall effect sensors. The Hall
sensors are built into the motor to detect the position of the rotor. The Hall sensors return a high
value when rotor is in one orientation and a low when the rotor is 180 degrees away from the
high. In actual use, the Hall sensor returns a high for the 180-degree section while the rotor is
closest to the sensor and a low voltage of zero for the rest of the time. The motor uses three Hall
sensors, and by determining which sensors are on at any given time, the appropriate orientation
of the electromagnetic field can be applied.
VAJRA, SEM-2017 16
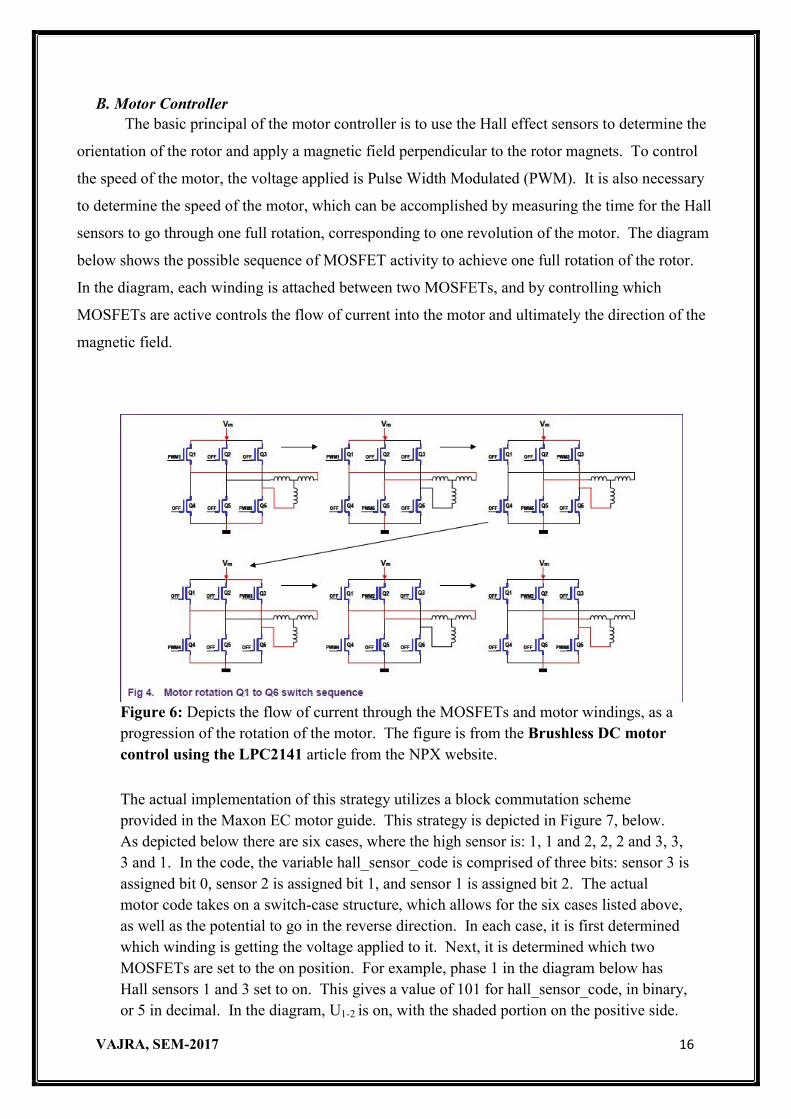
B. Motor Controller The basic principal of the motor controller is to use the Hall effect sensors to determine the
orientation of the rotor and apply a magnetic field perpendicular to the rotor magnets. To control
the speed of the motor, the voltage applied is Pulse Width Modulated (PWM). It is also necessary
to determine the speed of the motor, which can be accomplished by measuring the time for the Hall
sensors to go through one full rotation, corresponding to one revolution of the motor. The diagram
below shows the possible sequence of MOSFET activity to achieve one full rotation of the rotor.
In the diagram, each winding is attached between two MOSFETs, and by controlling which
MOSFETs are active controls the flow of current into the motor and ultimately the direction of the
magnetic field.
Figure 6: Depicts the flow of current through the MOSFETs and motor windings, as a progression of the rotation of the motor. The figure is from the Brushless DC motor control using the LPC2141 article from the NPX website.
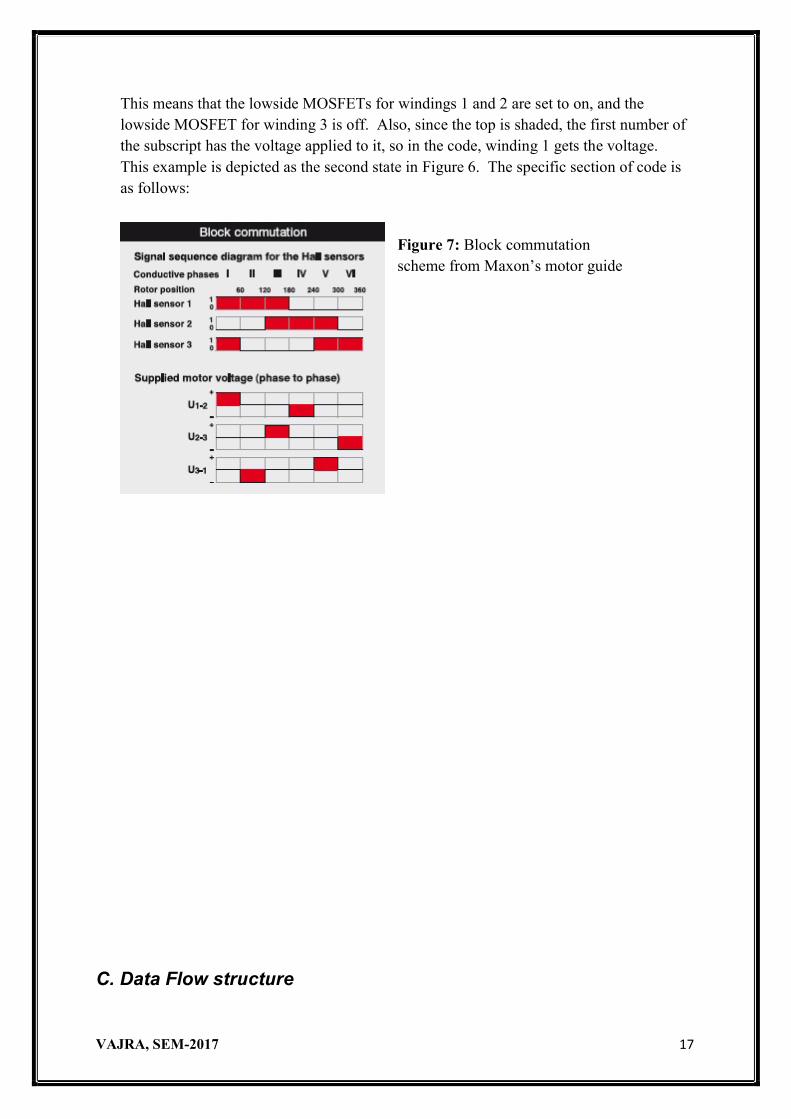
The actual implementation of this strategy utilizes a block commutation scheme provided in the Maxon EC motor guide. This strategy is depicted in Figure 7, below. As depicted below there are six cases, where the high sensor is: 1, 1 and 2, 2, 2 and 3, 3, 3 and 1. In the code, the variable hall_sensor_code is comprised of three bits: sensor 3 is assigned bit 0, sensor 2 is assigned bit 1, and sensor 1 is assigned bit 2. The actual motor code takes on a switch-case structure, which allows for the six cases listed above, as well as the potential to go in the reverse direction. In each case, it is first determined which winding is getting the voltage applied to it. Next, it is determined which two MOSFETs are set to the on position. For example, phase 1 in the diagram below has Hall sensors 1 and 3 set to on. This gives a value of 101 for hall_sensor_code, in binary, or 5 in decimal. In the diagram, U1-2 is on, with the shaded portion on the positive side.
VAJRA, SEM-2017 17
This means that the lowside MOSFETs for windings 1 and 2 are set to on, and the lowside MOSFET for winding 3 is off. Also, since the top is shaded, the first number of the subscript has the voltage applied to it, so in the code, winding 1 gets the voltage. This example is depicted as the second state in Figure 6. The specific section of code is as follows:
Figure 7: Block commutation scheme from Maxon’s motor guide
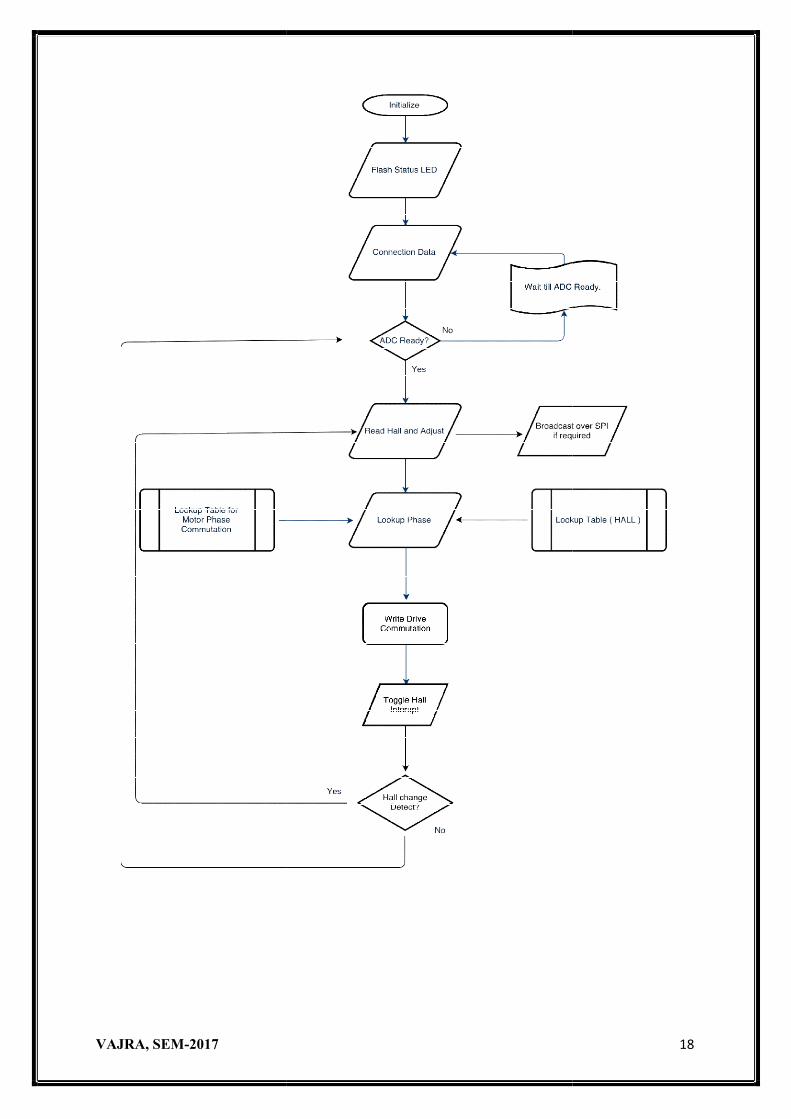
C. Data Flow structure
VAJRA, SEM-2017
2017 2017 18
VAJRA, SEM-2017
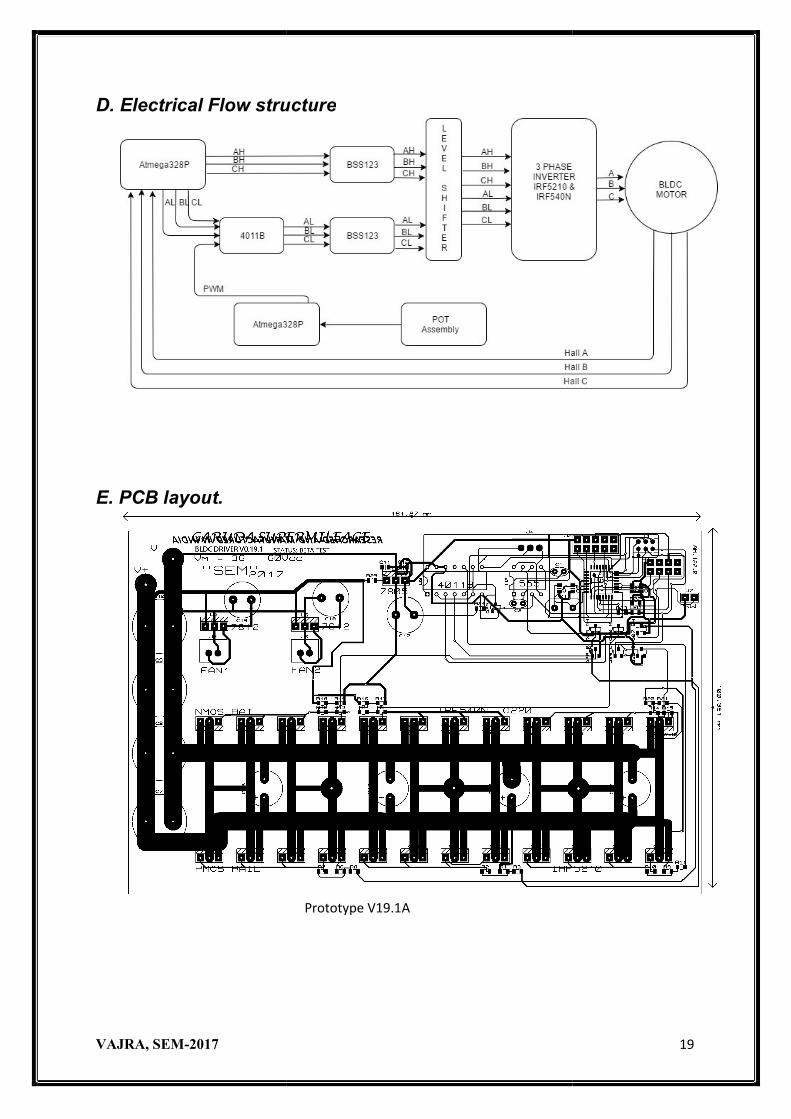
D. Electrical Flow structure
E. PCB layout.
2017
Electrical Flow structure
Prototype V19.1A
2017 19
VAJRA, SEM-2017
III. Discussion
Upon the completion of the project, we have a working motor controller for a brushless dcmotor; however, the motor controller can be improved. Currently all of the code for the motor controller is in the main loop of the c file. This may cause a problem at high speed, since the motor may be turning faster than the main loop can keep up withcould be solved by putting the code into an interrupt; let the motor run until a hall sensor switches on, then apply the necessary voltage to the necessary windings. This would also be useful for determining the speed of the motor by countcontroller has been made, but many modifications are necessary before the code is good enough to use on a vehicle.
IV. Appendices
Motor Controller Code:
volatile uint8_t phase = 0; // motor firing phasevolatile long position = 0; // current positionvolatile bool sample_and_hold_pin = false; // flag to tell loop to sample current positionvolatile byte position_buffer[] = 0, 0, 0, 0; // buffer for transfering single bytes of position over spi
2017
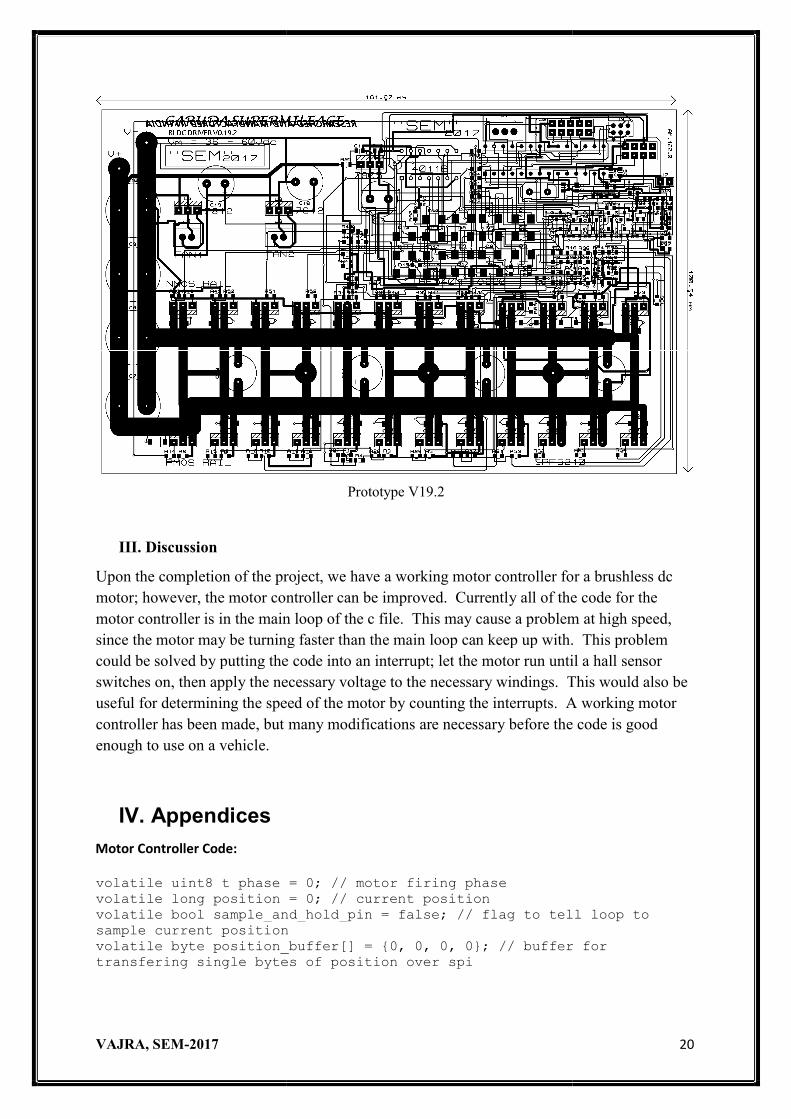
Prototype V19.2
Upon the completion of the project, we have a working motor controller for a brushless dcmotor; however, the motor controller can be improved. Currently all of the code for the motor controller is in the main loop of the c file. This may cause a problem at high speed, since the motor may be turning faster than the main loop can keep up with. This problem could be solved by putting the code into an interrupt; let the motor run until a hall sensor switches on, then apply the necessary voltage to the necessary windings. This would also be useful for determining the speed of the motor by counting the interrupts. A working motor controller has been made, but many modifications are necessary before the code is good
volatile uint8_t phase = 0; // motor firing phase position = 0; // current position
volatile bool sample_and_hold_pin = false; // flag to tell loop to sample current position volatile byte position_buffer[] = 0, 0, 0, 0; // buffer for transfering single bytes of position over spi
2017 20
Upon the completion of the project, we have a working motor controller for a brushless dc motor; however, the motor controller can be improved. Currently all of the code for the motor controller is in the main loop of the c file. This may cause a problem at high speed,
. This problem could be solved by putting the code into an interrupt; let the motor run until a hall sensor switches on, then apply the necessary voltage to the necessary windings. This would also be
ing the interrupts. A working motor controller has been made, but many modifications are necessary before the code is good
volatile bool sample_and_hold_pin = false; // flag to tell loop to
volatile byte position_buffer[] = 0, 0, 0, 0; // buffer for
VAJRA, SEM-2017 21
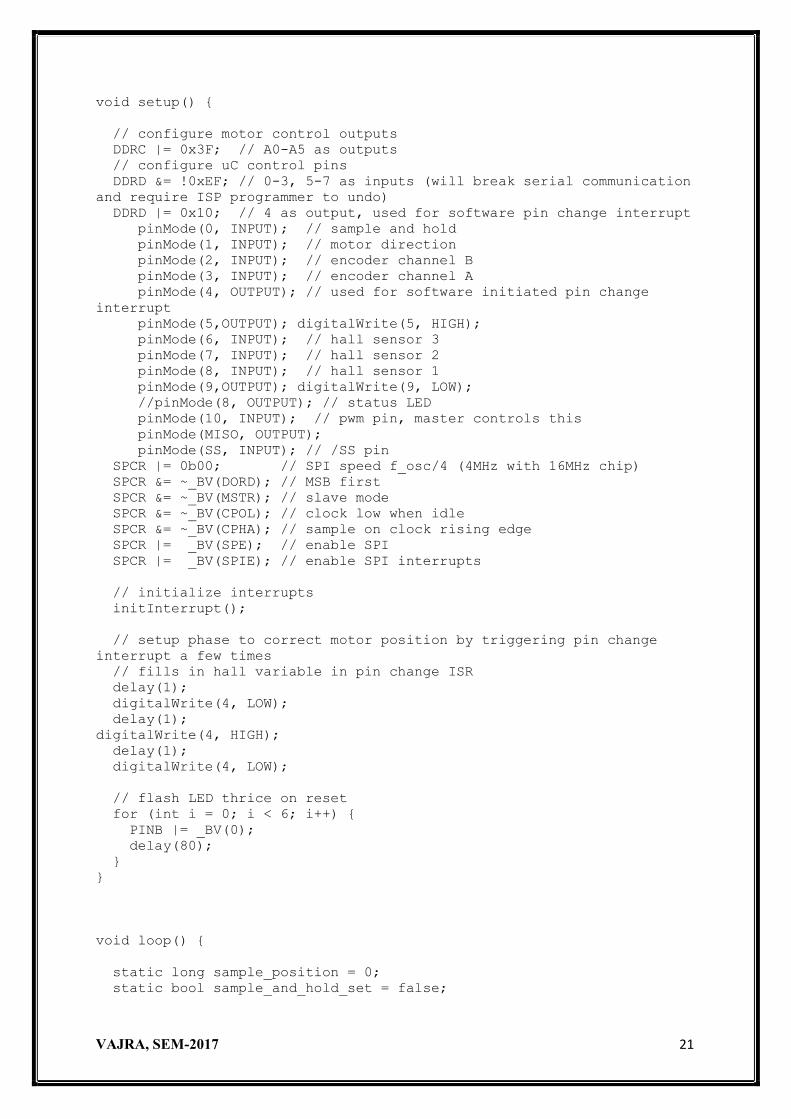
void setup() // configure motor control outputs DDRC |= 0x3F; // A0-A5 as outputs // configure uC control pins DDRD &= !0xEF; // 0-3, 5-7 as inputs (will break serial communication and require ISP programmer to undo) DDRD |= 0x10; // 4 as output, used for software pin change interrupt pinMode(0, INPUT); // sample and hold pinMode(1, INPUT); // motor direction pinMode(2, INPUT); // encoder channel B pinMode(3, INPUT); // encoder channel A pinMode(4, OUTPUT); // used for software initiated pin change interrupt pinMode(5,OUTPUT); digitalWrite(5, HIGH); pinMode(6, INPUT); // hall sensor 3 pinMode(7, INPUT); // hall sensor 2 pinMode(8, INPUT); // hall sensor 1 pinMode(9,OUTPUT); digitalWrite(9, LOW); //pinMode(8, OUTPUT); // status LED pinMode(10, INPUT); // pwm pin, master controls this pinMode(MISO, OUTPUT); pinMode(SS, INPUT); // /SS pin SPCR |= 0b00; // SPI speed f_osc/4 (4MHz with 16MHz chip) SPCR &= ~_BV(DORD); // MSB first SPCR &= ~_BV(MSTR); // slave mode SPCR &= ~_BV(CPOL); // clock low when idle SPCR &= ~_BV(CPHA); // sample on clock rising edge SPCR |= _BV(SPE); // enable SPI SPCR |= _BV(SPIE); // enable SPI interrupts // initialize interrupts initInterrupt(); // setup phase to correct motor position by triggering pin change interrupt a few times // fills in hall variable in pin change ISR delay(1); digitalWrite(4, LOW); delay(1); digitalWrite(4, HIGH); delay(1); digitalWrite(4, LOW); // flash LED thrice on reset for (int i = 0; i < 6; i++) PINB |= _BV(0); delay(80); void loop() static long sample_position = 0; static bool sample_and_hold_set = false;
VAJRA, SEM-2017 22
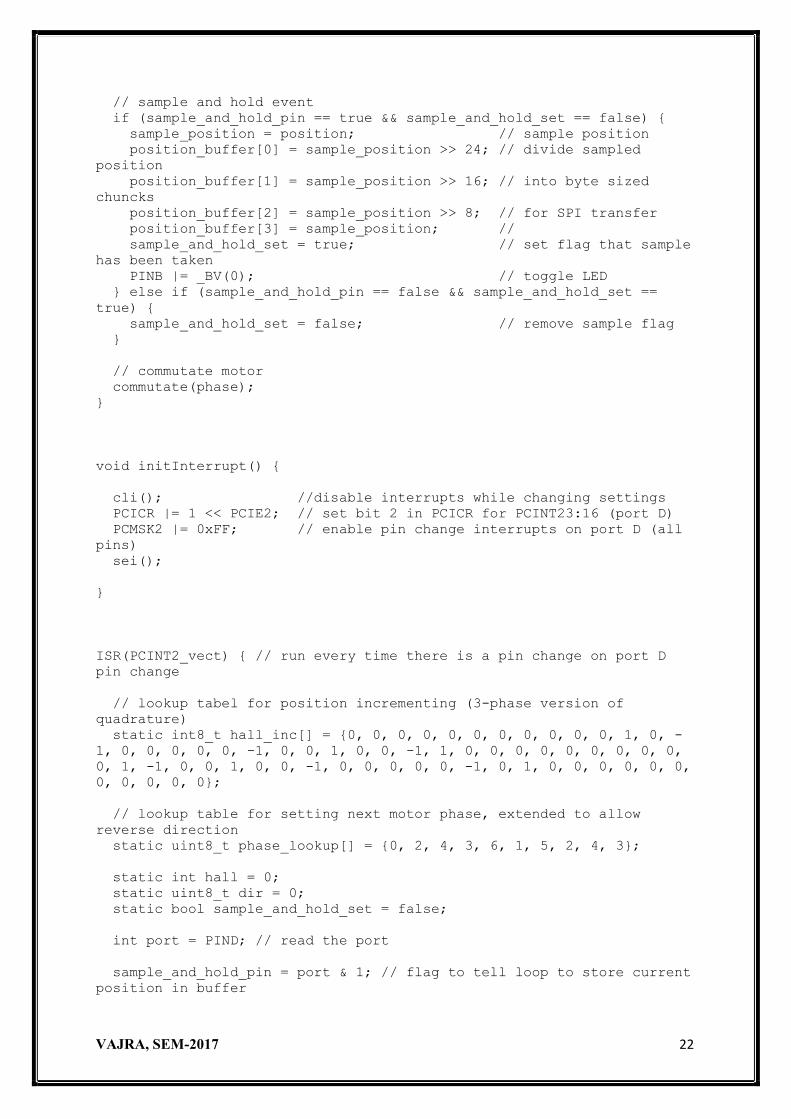
// sample and hold event if (sample_and_hold_pin == true && sample_and_hold_set == false) sample_position = position; // sample position position_buffer[0] = sample_position >> 24; // divide sampled position position_buffer[1] = sample_position >> 16; // into byte sized chuncks position_buffer[2] = sample_position >> 8; // for SPI transfer position_buffer[3] = sample_position; // sample_and_hold_set = true; // set flag that sample has been taken PINB |= _BV(0); // toggle LED else if (sample_and_hold_pin == false && sample_and_hold_set == true) sample_and_hold_set = false; // remove sample flag // commutate motor commutate(phase); void initInterrupt() cli(); //disable interrupts while changing settings PCICR |= 1 << PCIE2; // set bit 2 in PCICR for PCINT23:16 (port D) PCMSK2 |= 0xFF; // enable pin change interrupts on port D (all pins) sei(); ISR(PCINT2_vect) // run every time there is a pin change on port D pin change // lookup tabel for position incrementing (3-phase version of quadrature) static int8_t hall_inc[] = 0, 0, 0, 0, 0, 0, 0, 0, 0, 0, 0, 1, 0, -1, 0, 0, 0, 0, 0, -1, 0, 0, 1, 0, 0, -1, 1, 0, 0, 0, 0, 0, 0, 0, 0, 0, 0, 1, -1, 0, 0, 1, 0, 0, -1, 0, 0, 0, 0, 0, -1, 0, 1, 0, 0, 0, 0, 0, 0, 0, 0, 0, 0, 0; // lookup table for setting next motor phase, extended to allow reverse direction static uint8_t phase_lookup[] = 0, 2, 4, 3, 6, 1, 5, 2, 4, 3; static int hall = 0; static uint8_t dir = 0; static bool sample_and_hold_set = false; int port = PIND; // read the port sample_and_hold_pin = port & 1; // flag to tell loop to store current position in buffer
VAJRA, SEM-2017 23
dir = (port >> 1) & 1; // direction value, 1 or 0 hall = hall << 3; // preserve last read for position in/decrement hall |= port >> 5; // shift to read only hall sensors if (dir == 0) phase = phase_lookup[(hall & 0x07)]; // determine next phase to fire on the motor else phase = phase_lookup[(hall & 0x07) + 3]; // adding 3 to lookup index has the effect of reversing the motor (MAGIC!) position += hall_inc[hall & 0x3F]; // use <hall_prev><hall_current> as lookup index to which will increment, decrement or do nothing to position value PINB |= _BV(0); // toggle LED ISR(SPI_STC_vect) // spi handler byte position_byte = SPDR; // read in command from master (which byte of position to send next) SPDR = position_buffer[position_byte]; // send a single byte from position_buffer void commutate(uint8_t _phase) // lowers on, Bh:Al, Ch:Al, Ch:Bl, Ah:Bl, Ah:Cl, Bh:Cl static uint8_t phase_to_port_ABC[] = 0b000000, 0b010001, 0b100001, 0b100010, 0b001010, 0b001100, 0b010100; static uint8_t phase_to_port_ACB[] = 0b000111, 0b100001, 0b010001, 0b010100, 0b001100, 0b001010, 0b100010; static uint8_t phase_to_port_BAC[] = 0b000111, 0b001010, 0b100010, 0b100001, 0b010001, 0b010100, 0b001100; static uint8_t phase_to_port_BCA[] = 0b000111, 0b001100, 0b010100, 0b010001, 0b100001, 0b100010, 0b001010; static uint8_t phase_to_port_CAB[] = 0b000111, 0b100010, 0b001010, 0b001100, 0b010100, 0b010001, 0b100001; static uint8_t phase_to_port_CBA[] = 0b000111, 0b010100, 0b001100, 0b001010, 0b100010, 0b100001, 0b010001; // the order of the 3 motor wires will dictate which of the above lookup tables to use. PORTC = phase_to_port_ABC[_phase];
VAJRA, SEM-2017 24
9.Chassis The chassis is the internal framework, which comprises of the frame, wheels and its equipment of a vehicle. The main purpose of the chassis is to shield the inside occupants from any harm caused by external invasion. Therefore, it is expected for the chassis to be structurally sound in every way during the expected life of the vehicle while supporting the body and other components.
9.1. Design of chassis
A few ideas were evaluated and the chassis designs were done in Solidworks software following the SEMA competition rules and considering standard measurements. Computer analysis was done using Ansys software. The final design was chosen using an evaluation system where weight, cost, manufacturing, ergonomics, stress and torsion analysis were considered.
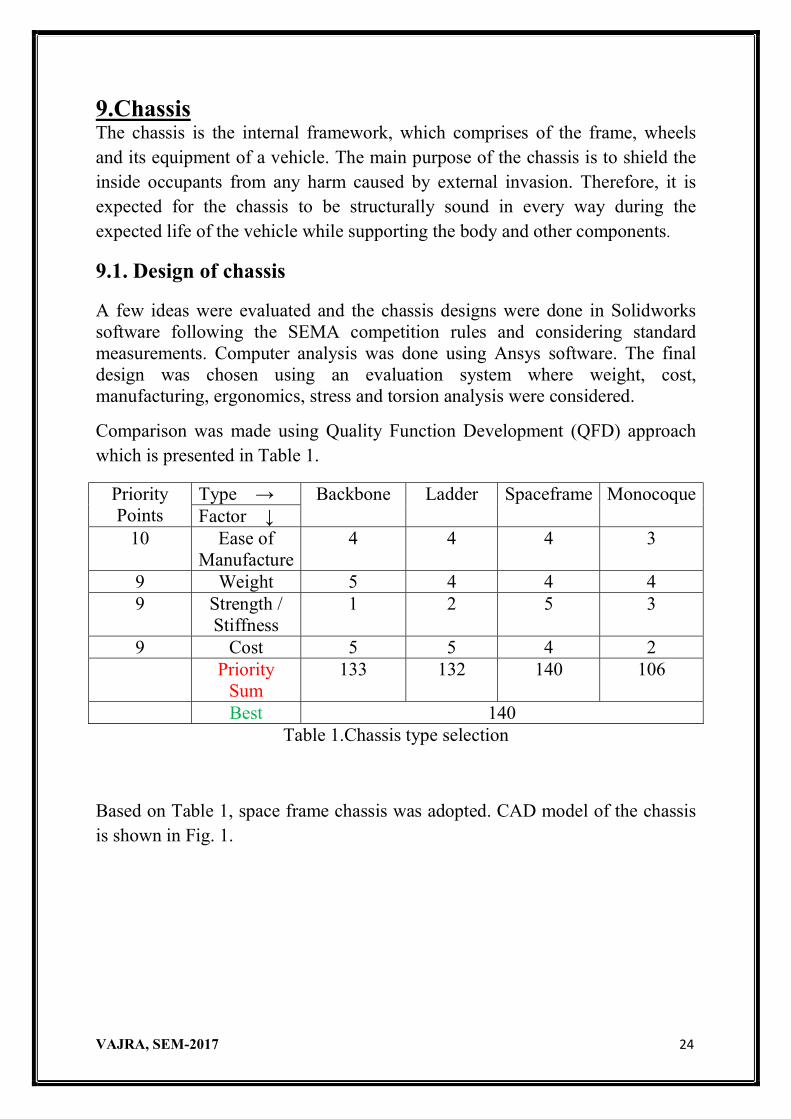
Comparison was made using Quality Function Development (QFD) approach which is presented in Table 1.
Priority Points
Type → Backbone Ladder Spaceframe Monocoque Factor ↓
10 Ease of Manufacture
4 4 4 3
9 Weight 5 4 4 4 9 Strength /
Stiffness 1 2 5 3
9 Cost 5 5 4 2 Priority
Sum 133 132 140 106
Best 140 Table 1.Chassis type selection
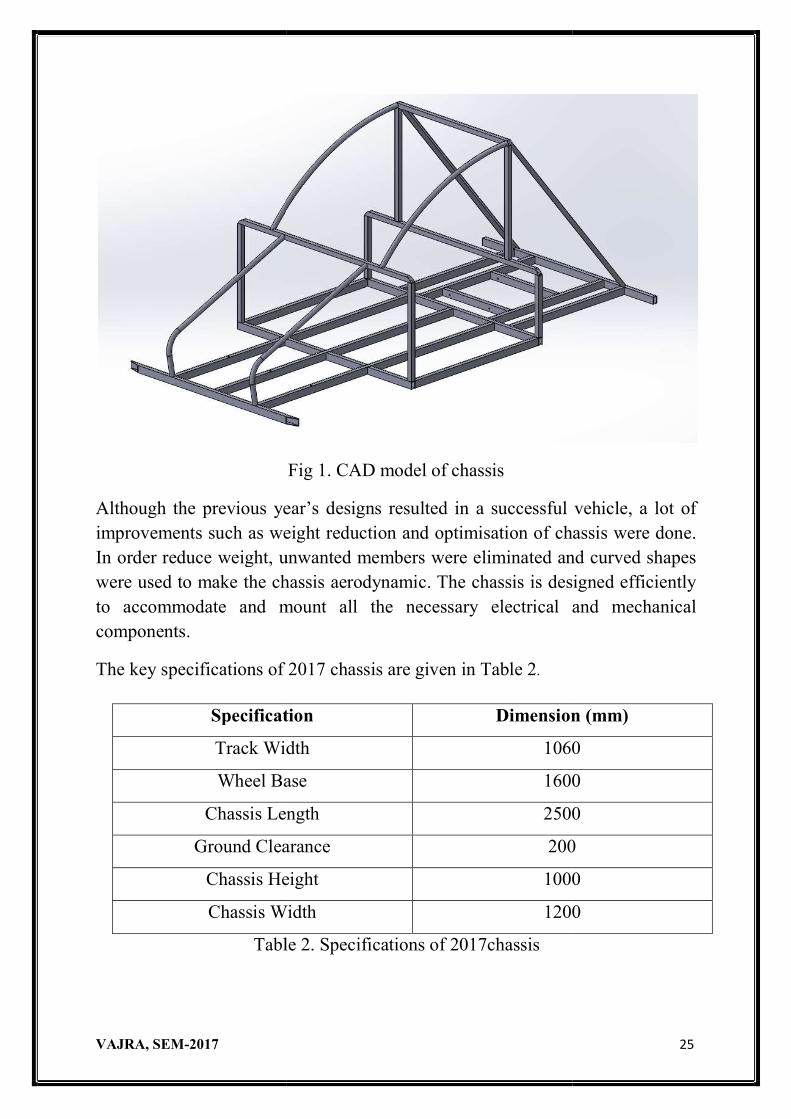
Based on Table 1, space frame chassis was adopted. CAD model of the chassis is shown in Fig. 1.
VAJRA, SEM-2017
Although the previous year’improvements such as weight reducIn order reduce weight, uwere used to make the chassis aerodynamic. The chassis is designed efficiently to accommodate and mount all the necessary electrical and mechanical components.
The key specifications of
Specification
Track Width
Wheel Base
Chassis Length
Ground Clearance
Chassis Height
Chassis Width
Table 2. Specifications of 2017chassis
2017
Fig 1. CAD model of chassis
hough the previous year’s designs resulted in a successful vehicle, a lot of improvements such as weight reduction and optimisation of chassis were doneIn order reduce weight, unwanted members were eliminated and were used to make the chassis aerodynamic. The chassis is designed efficiently to accommodate and mount all the necessary electrical and mechanical
of 2017 chassis are given in Table 2.
Specification Dimension (mm)
Track Width 1060
Wheel Base 1600
Chassis Length 2500
Ground Clearance 200
Chassis Height 1000
Chassis Width 1200
Table 2. Specifications of 2017chassis
2017 25
ccessful vehicle, a lot of tion and optimisation of chassis were done.
nwanted members were eliminated and curved shapes were used to make the chassis aerodynamic. The chassis is designed efficiently to accommodate and mount all the necessary electrical and mechanical
sion (mm)
0
00
00
200
1000
1200
VAJRA, SEM-2017 26
9.2. Material Selection
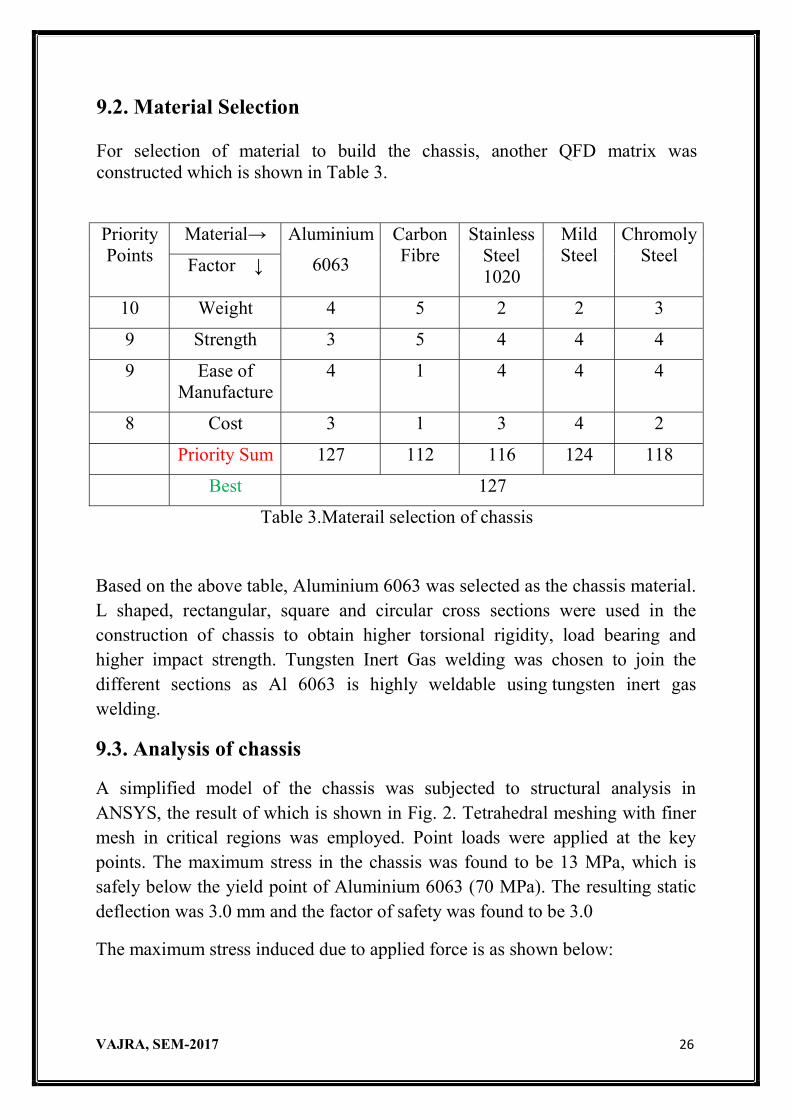
For selection of material to build the chassis, another QFD matrix was constructed which is shown in Table 3.
Priority Points
Material→ Aluminium
6063
Carbon Fibre
Stainless Steel 1020
Mild Steel
Chromoly Steel Factor ↓
10 Weight 4 5 2 2 3
9 Strength 3 5 4 4 4
9 Ease of Manufacture
4 1 4 4 4
8 Cost 3 1 3 4 2
Priority Sum 127 112 116 124 118
Best 127
Table 3.Materail selection of chassis
Based on the above table, Aluminium 6063 was selected as the chassis material. L shaped, rectangular, square and circular cross sections were used in the construction of chassis to obtain higher torsional rigidity, load bearing and higher impact strength. Tungsten Inert Gas welding was chosen to join the different sections as Al 6063 is highly weldable using tungsten inert gas welding.
9.3. Analysis of chassis
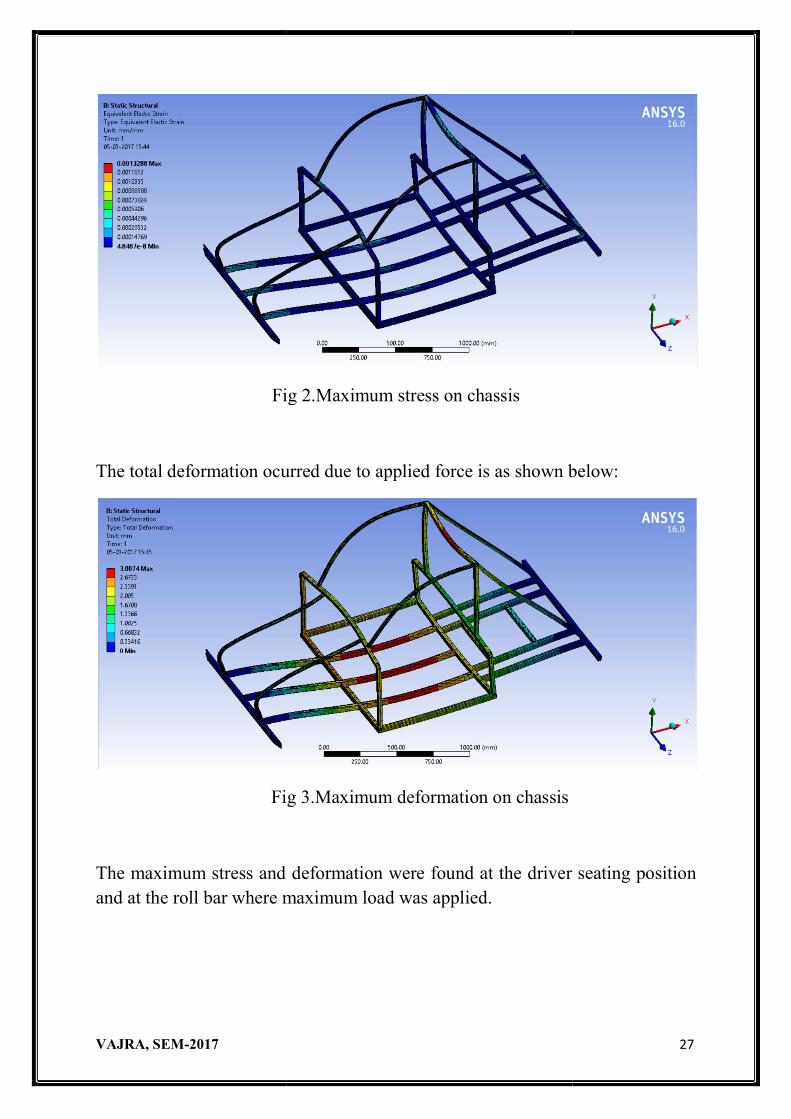
A simplified model of the chassis was subjected to structural analysis in ANSYS, the result of which is shown in Fig. 2. Tetrahedral meshing with finer mesh in critical regions was employed. Point loads were applied at the key points. The maximum stress in the chassis was found to be 13 MPa, which is safely below the yield point of Aluminium 6063 (70 MPa). The resulting static deflection was 3.0 mm and the factor of safety was found to be 3.0
The maximum stress induced due to applied force is as shown below:
VAJRA, SEM-2017
Fig 2.Maximum stress on chassis
The total deformation ocurred due to applied force is as shown below:
Fig 3.Maximum deformation on chassis
The maximum stress and deformation were found at the driver seating posand at the roll bar where maximum load was applied.
2017
Fig 2.Maximum stress on chassis
The total deformation ocurred due to applied force is as shown below:
Fig 3.Maximum deformation on chassis
The maximum stress and deformation were found at the driver seating posand at the roll bar where maximum load was applied.
2017 27
The total deformation ocurred due to applied force is as shown below:
The maximum stress and deformation were found at the driver seating position
VAJRA, SEM-2017
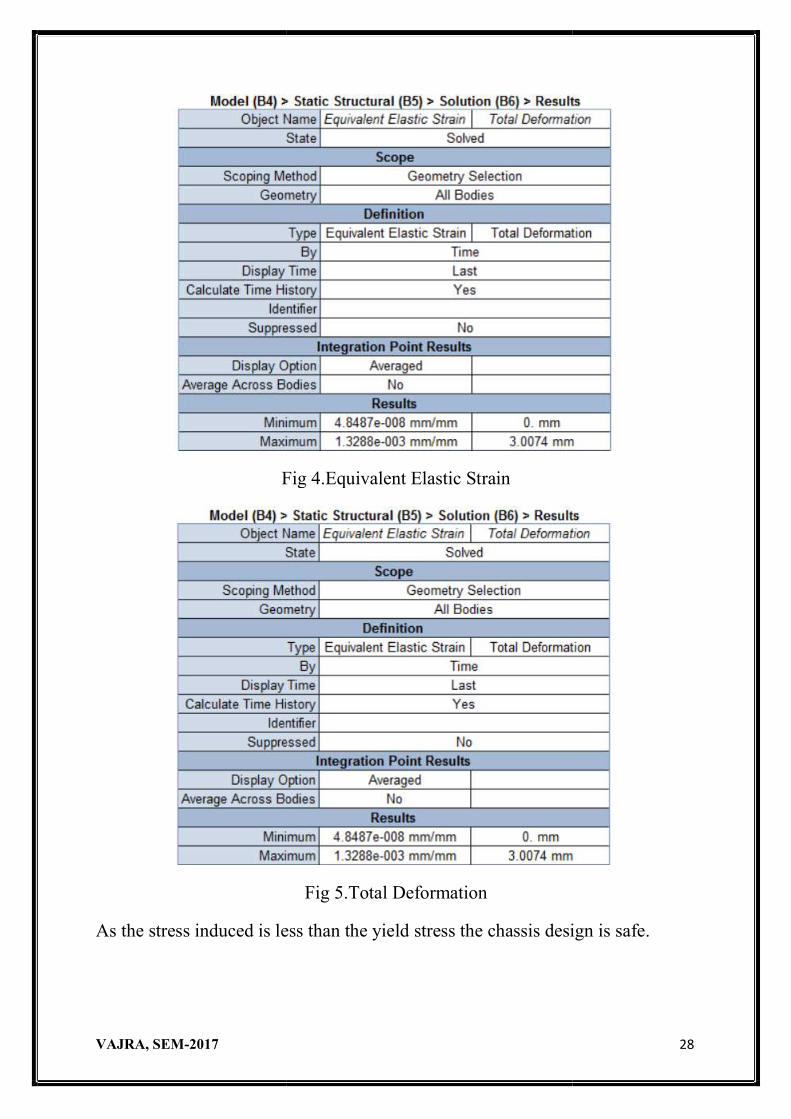
Fig 4.Equivalent Elastic Strain
As the stress induced is less than
2017
Fig 4.Equivalent Elastic Strain
Fig 5.Total Deformation
As the stress induced is less than the yield stress the chassis design is safe.
2017 28
design is safe.
VAJRA, SEM-2017 29
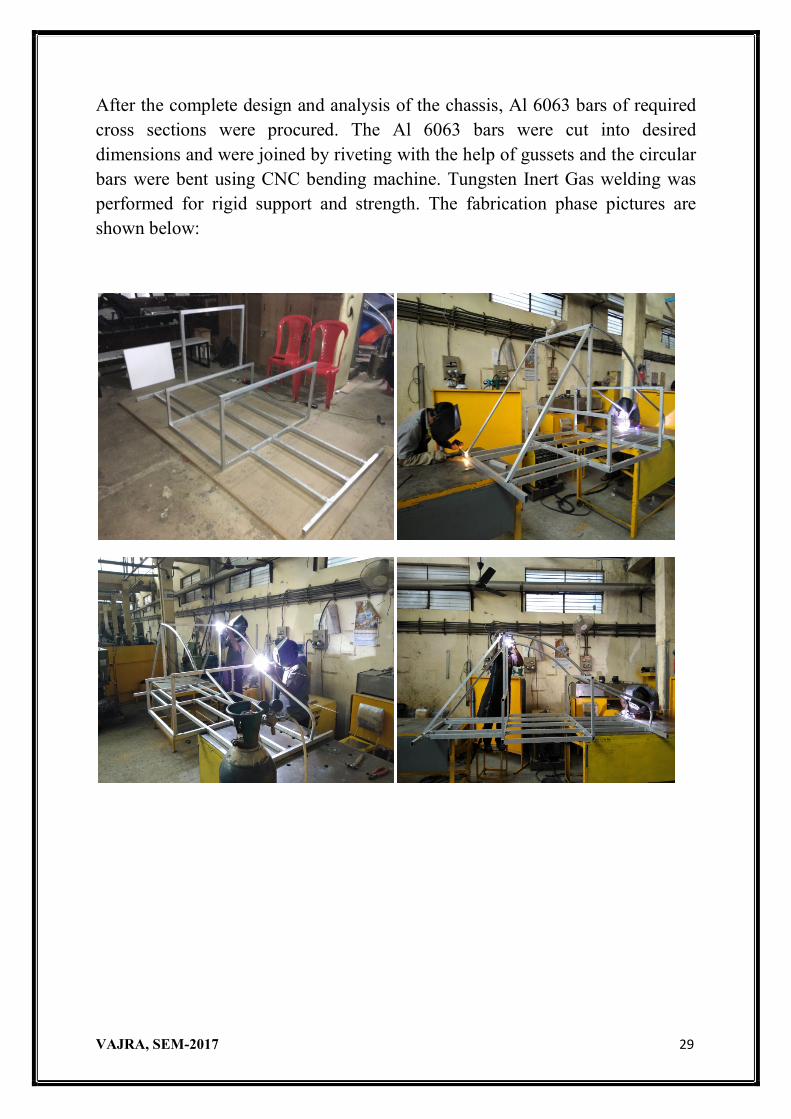
After the complete design and analysis of the chassis, Al 6063 bars of required cross sections were procured. The Al 6063 bars were cut into desired dimensions and were joined by riveting with the help of gussets and the circular bars were bent using CNC bending machine. Tungsten Inert Gas welding was performed for rigid support and strength. The fabrication phase pictures are shown below:
VAJRA, SEM-2017 30
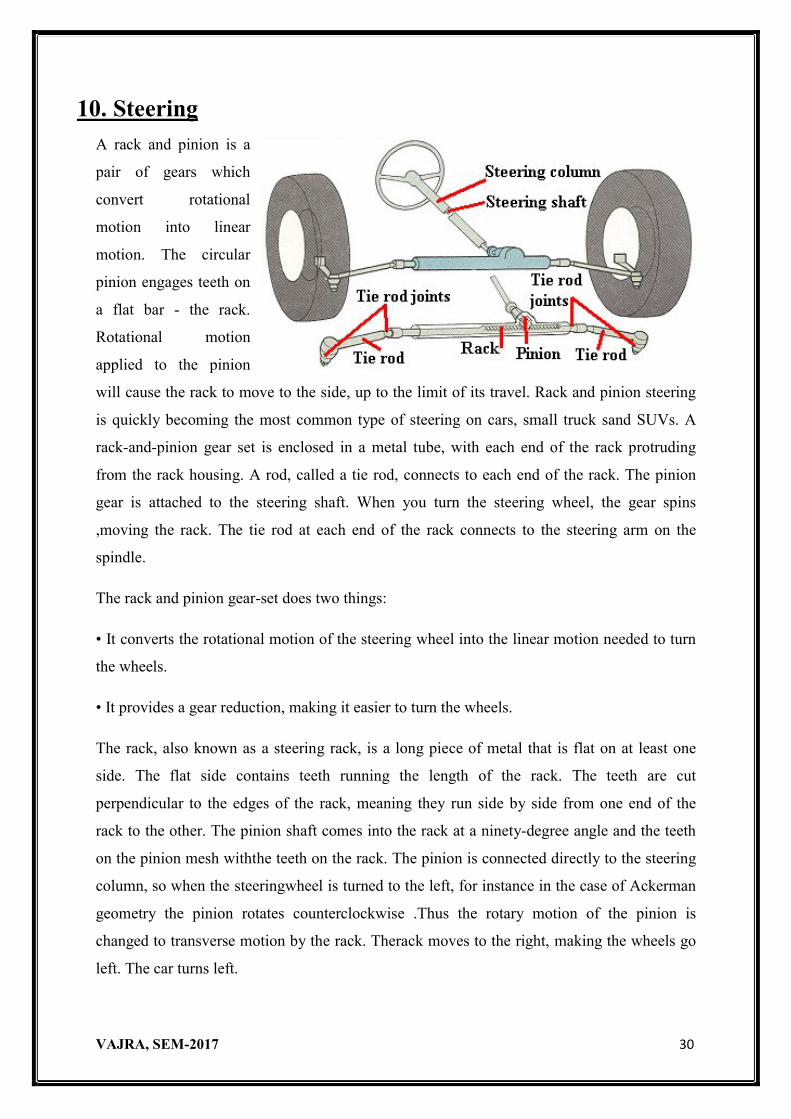
10. Steering
A rack and pinion is a
pair of gears which
convert rotational
motion into linear
motion. The circular
pinion engages teeth on
a flat bar - the rack.
Rotational motion
applied to the pinion
will cause the rack to move to the side, up to the limit of its travel. Rack and pinion steering
is quickly becoming the most common type of steering on cars, small truck sand SUVs. A
rack-and-pinion gear set is enclosed in a metal tube, with each end of the rack protruding
from the rack housing. A rod, called a tie rod, connects to each end of the rack. The pinion
gear is attached to the steering shaft. When you turn the steering wheel, the gear spins
,moving the rack. The tie rod at each end of the rack connects to the steering arm on the
spindle.
The rack and pinion gear-set does two things:
• It converts the rotational motion of the steering wheel into the linear motion needed to turn
the wheels.
• It provides a gear reduction, making it easier to turn the wheels.
The rack, also known as a steering rack, is a long piece of metal that is flat on at least one
side. The flat side contains teeth running the length of the rack. The teeth are cut
perpendicular to the edges of the rack, meaning they run side by side from one end of the
rack to the other. The pinion shaft comes into the rack at a ninety-degree angle and the teeth
on the pinion mesh withthe teeth on the rack. The pinion is connected directly to the steering
column, so when the steeringwheel is turned to the left, for instance in the case of Ackerman
geometry the pinion rotates counterclockwise .Thus the rotary motion of the pinion is
changed to transverse motion by the rack. Therack moves to the right, making the wheels go
left. The car turns left.
VAJRA, SEM-2017
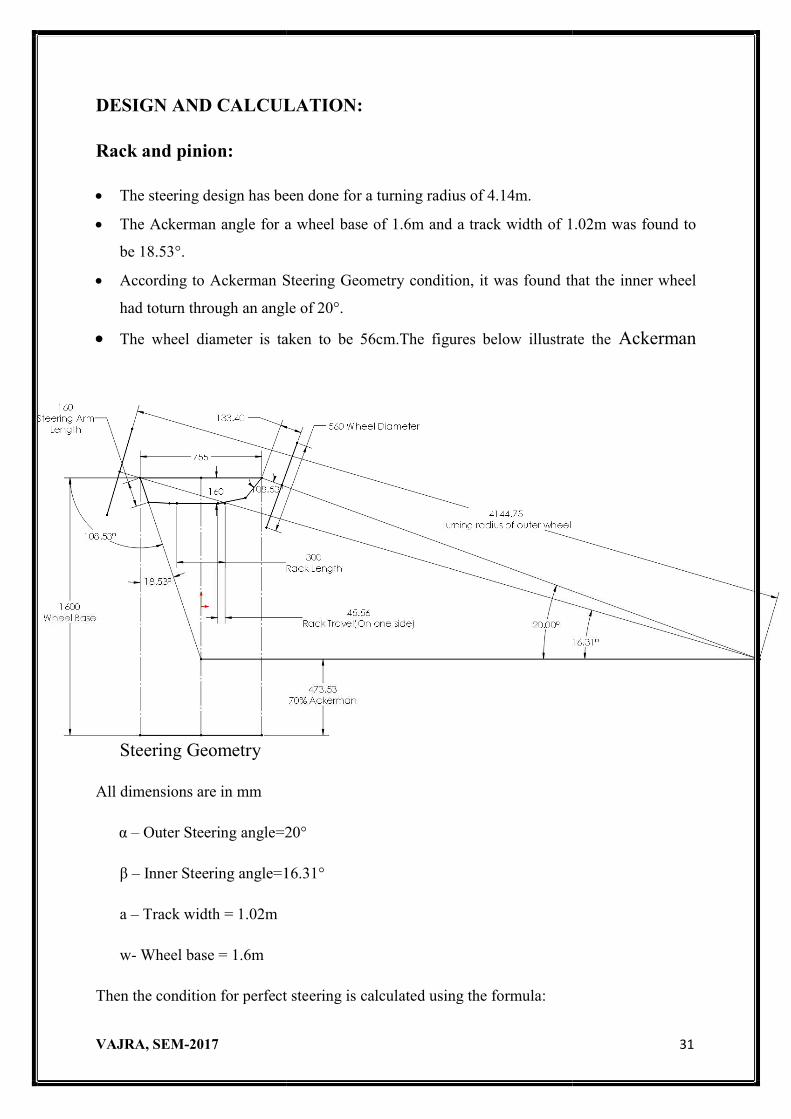
DESIGN AND CALCULATION
Rack and pinion:
The steering design has been done for a turning radius of 4.14m.
The Ackerman angle for a wheel base of 1.6m and a track width of 1.02m was found to
be 18.53°.
According to Ackerman Steering Geometry condition, it was found that the inner wheel
had toturn through an angle of 20°.
The wheel diameter is taken to be 56cm.The figures below illustrate the
Steering Geometry
All dimensions are in mm
α – Outer Steering angle=20°
β – Inner Steering angle=16.31°
a – Track width = 1.02m
w- Wheel base = 1.6m
Then the condition for perfect steering is calculated using the formula:
2017
DESIGN AND CALCULATION:
The steering design has been done for a turning radius of 4.14m.
The Ackerman angle for a wheel base of 1.6m and a track width of 1.02m was found to
Ackerman Steering Geometry condition, it was found that the inner wheel
had toturn through an angle of 20°.
The wheel diameter is taken to be 56cm.The figures below illustrate the
angle=20°
Inner Steering angle=16.31°
Then the condition for perfect steering is calculated using the formula:
2017 31
The Ackerman angle for a wheel base of 1.6m and a track width of 1.02m was found to
Ackerman Steering Geometry condition, it was found that the inner wheel
The wheel diameter is taken to be 56cm.The figures below illustrate the Ackerman
VAJRA, SEM-2017 32
− =
Rack Travel
Considering the maximum angle through which the inner wheel could be turned for the given
track width the rack travel required was calculated. Maximum angle through which the inner
wheel could be turned = 20°
For that, the rack travel required would be 91 mm.
Pinion Dimensions
For the calculated rack travel, the dimensions of the pinion are found out. Let the maximum
steering wheel rotation angle on either side be taken 60°. Therefore this angle of rotation
should match with 91 mm of rack travel.
Let, r = Pitch circle radius of pinion, X = half of total rack travel, m = module of pinion, z =
No. of teeth of pinion.
So,
= (2 × × )
3
45.5 = (2 × × )
6
Standard module for pinion and rack is chosen to be m = 1.5,
So, m= d/z: 1.5 = 45/z
Therefore z = 30 teeth.
Let: R=steering wheel radius = 250mm, z = number of pinion teeth = 30
Rack Dimensional Data
Teeth dimensions are found to be,
Pressure angle for the rack α = 20°,
Module = 1.5,
VAJRA, SEM-2017 33
Total rack length = 300mm
Force Analysis
We will study the highest value of the force required to turn the wheels. This force appears
when thecar is stopped and it starts the movement of the wheel.
The wheels rest on the floor on a surface, so two friction forces will act on it
R = Steering arm length = 160 mm
For equilibrium -
Σ Fx = 0;
FL – Fr = 0....... (1)
Σ Fy = 0;
N – mg = 0………… (2)
Σ My = 0;
FL*Rs – 2*Fr*r = 0…………….. (3)
From equation (1) we calculate:
FL = Fr
From (2) we have:
N = mg
Let the mass ‘m’ of the car be 200 kg including the driver.
Then N = 1962 Newton.
Let us assume that 50 % of the total weight is supported by the front wheels.
Then the total load on the two front wheels = 1962/2 = 981 N
Then on each wheel the load will be 981/2 = 490.5 N
To calculate the Fr:
Fr = µ*N;
Where µ is the friction coefficient. On the same way than before we are going to take a high
value of µ in order to establish a safety coefficient. So we take µ = 0.7.
VAJRA, SEM-2017 34
Now we calculate the friction force:
Fr = µ*N = 490.5 N
And from equation (1), Fr = FL
So, FL = 343.35N, It is the force that the rack has to transmit to the tie rods and these to the
steering arms to move the wheel.
To calculate the torque we use the following equation:
T= F * rpinion,
In our case we have a pinion with a diameter of 45 mm so:
T = 343.35*22.5 = 7725.37 N-mm
This is the torque in the pinion and it is transmitted through the steering column.
Steering Column Material
With this force we can calculate if the material for the steering column is adequate for the
torque that is transmitted by the force on the steering wheel.
The steering column is subjected to shear stress:
τmax = T*r / J
Where, T is the torque on the steering column
J = π * (D4)/ 32
Where: D = 16mm
J = 6434 mm4
r = 8mm
T= 7725.37 N-mm
τmax = 9.6 MPa
A universal joint is added by splitting the steering column at a suitable length, for flexibility
and ease of movement inside the driver’s compartment. A standard U joint made of alloy
steel is chosen.
VAJRA, SEM-2017
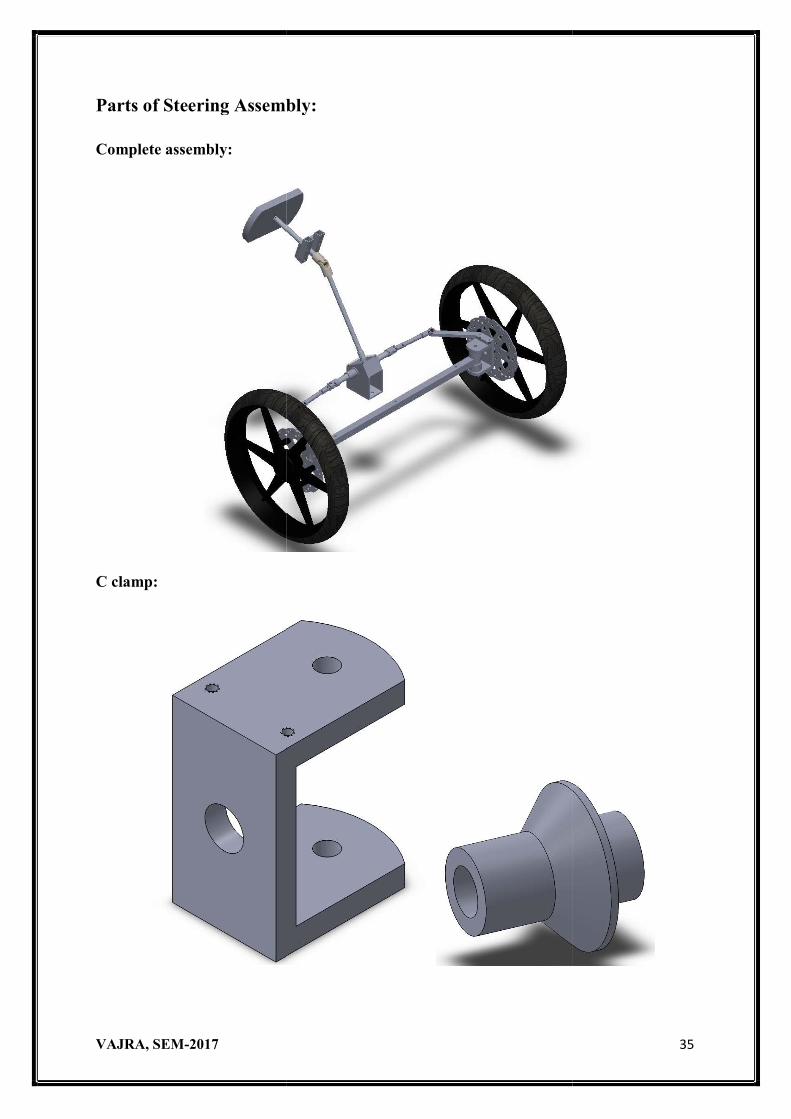
Parts of Steering Assembly:
Complete assembly:
C clamp:
2017
Parts of Steering Assembly:
2017 35
VAJRA, SEM-2017
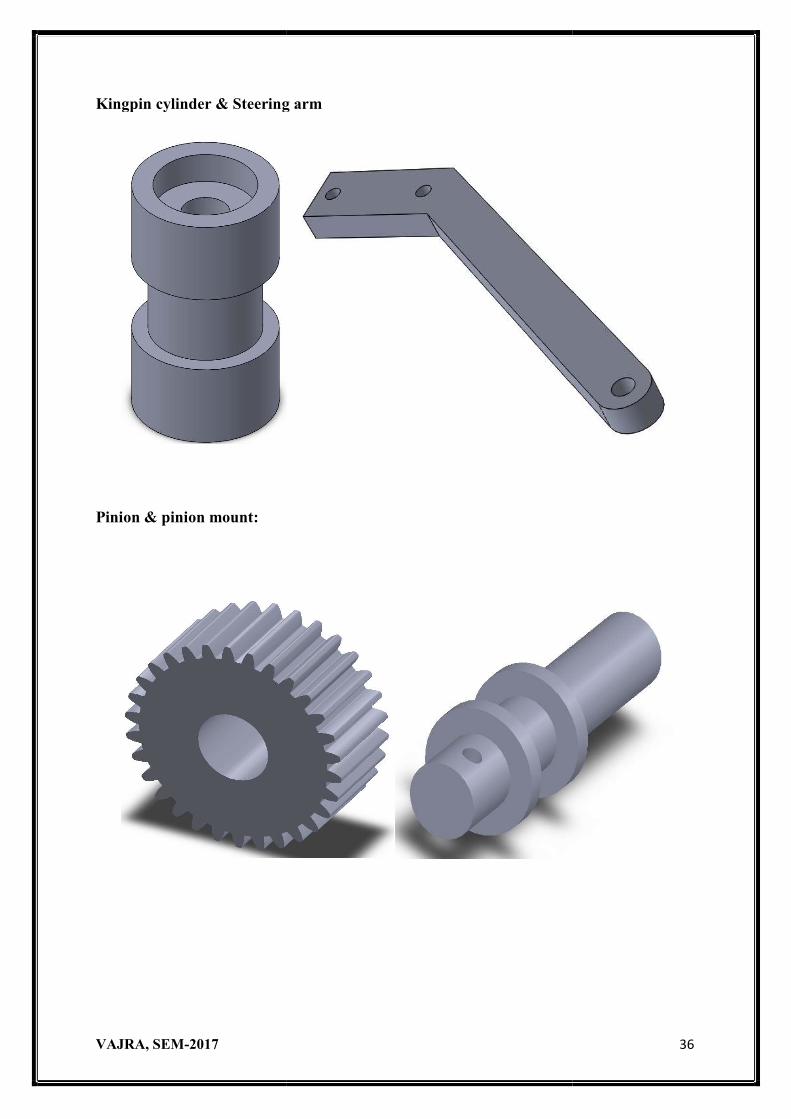
Kingpin cylinder & Steering arm
Pinion & pinion mount:
2017
Kingpin cylinder & Steering arm
2017 36
VAJRA, SEM-2017
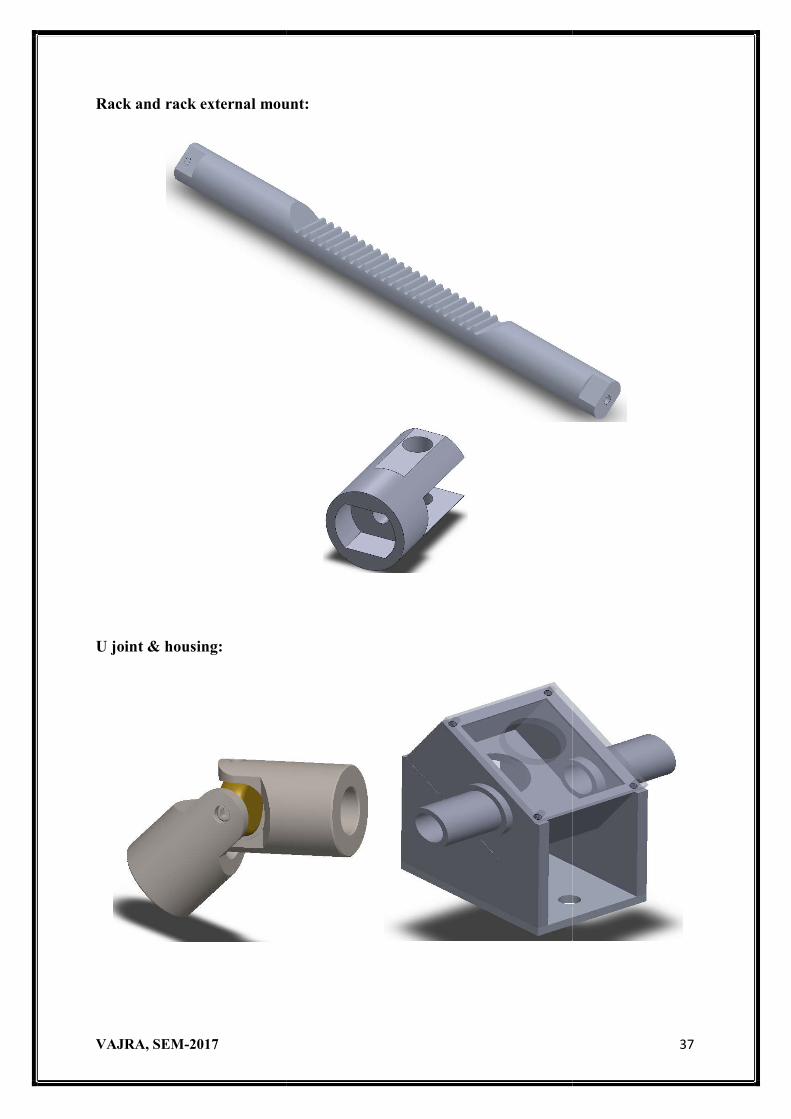
Rack and rack external mount:
U joint & housing:
2017
rack external mount:
2017 37
VAJRA, SEM-2017 38
11. Powertrain
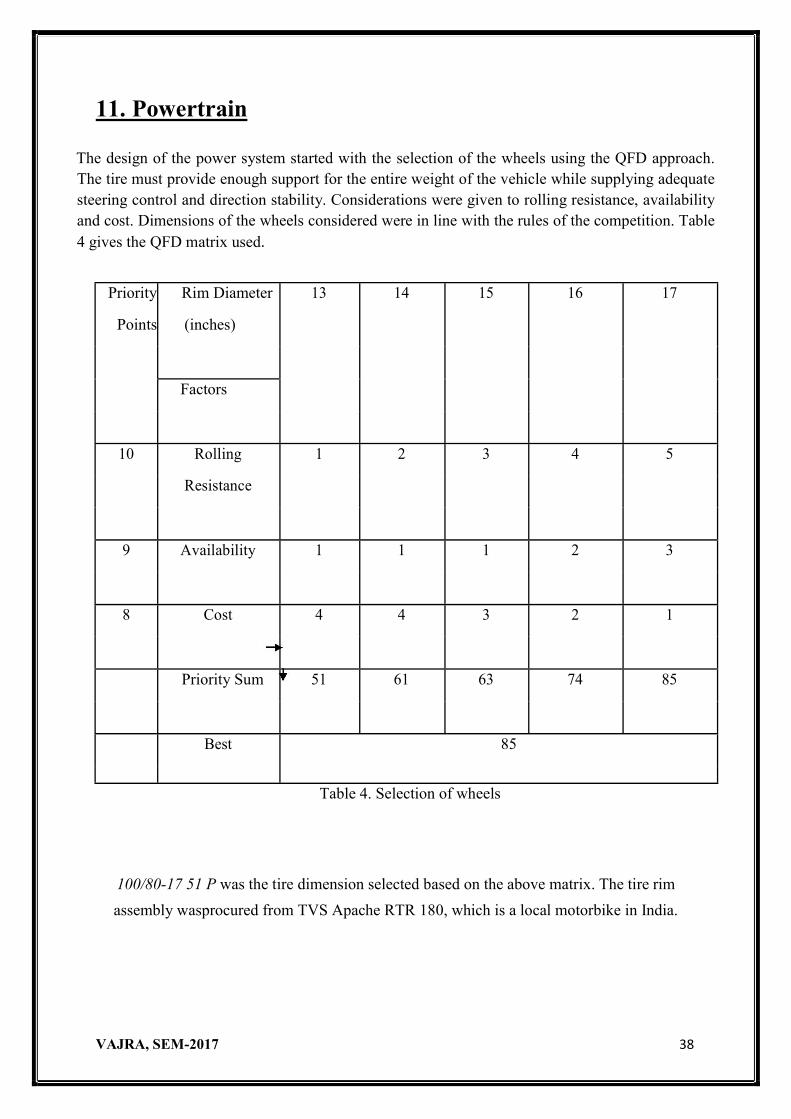
The design of the power system started with the selection of the wheels using the QFD approach. The tire must provide enough support for the entire weight of the vehicle while supplying adequate steering control and direction stability. Considerations were given to rolling resistance, availability and cost. Dimensions of the wheels considered were in line with the rules of the competition. Table 4 gives the QFD matrix used.
100/80-17 51 P was the tire dimension selected based on the above matrix. The tire rim
assembly wasprocured from TVS Apache RTR 180, which is a local motorbike in India.
Priority Rim Diameter 13 14 15 16 17
Points (inches)
Factors
10 Rolling 1 2 3 4 5
Resistance
9 Availability 1 1 1 2 3
8 Cost 4 4 3 2 1
Priority Sum 51 61 63 74 85
Best 85
Table 4. Selection of wheels
VAJRA, SEM-2017 39
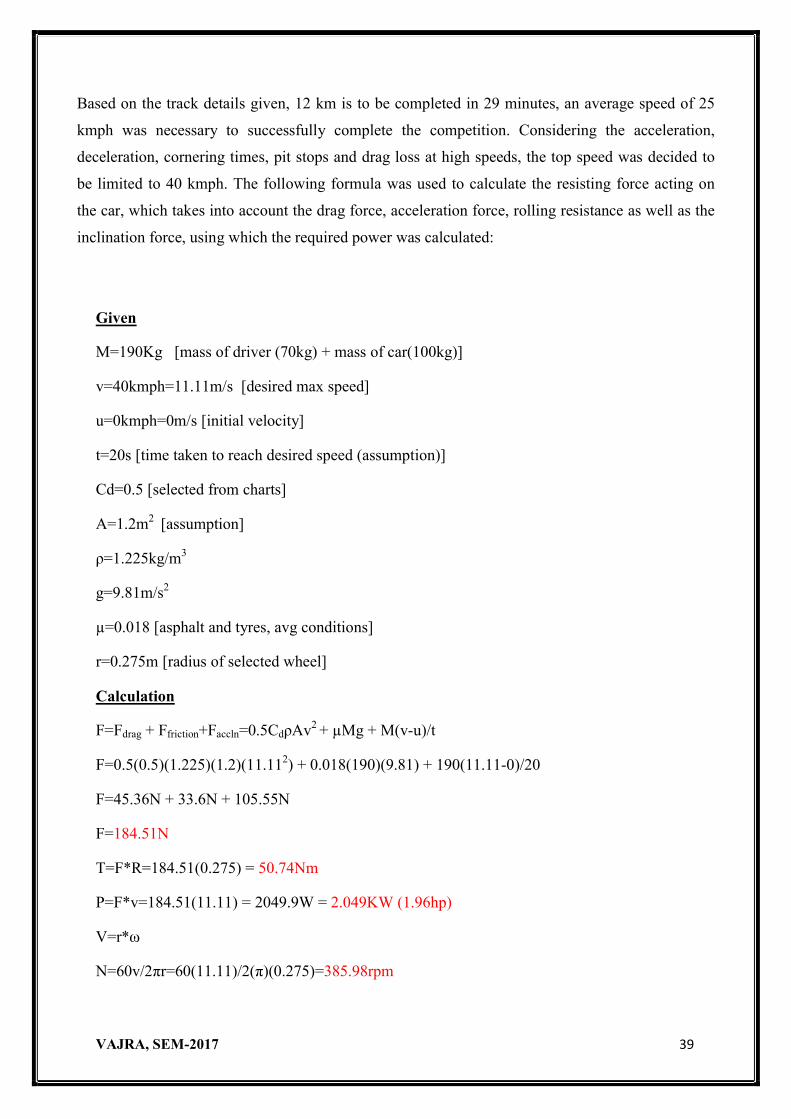
Based on the track details given, 12 km is to be completed in 29 minutes, an average speed of 25
kmph was necessary to successfully complete the competition. Considering the acceleration,
deceleration, cornering times, pit stops and drag loss at high speeds, the top speed was decided to
be limited to 40 kmph. The following formula was used to calculate the resisting force acting on
the car, which takes into account the drag force, acceleration force, rolling resistance as well as the
inclination force, using which the required power was calculated:
Given
M=190Kg [mass of driver (70kg) + mass of car(100kg)]
v=40kmph=11.11m/s [desired max speed]
u=0kmph=0m/s [initial velocity]
t=20s [time taken to reach desired speed (assumption)]
Cd=0.5 [selected from charts]
A=1.2m2 [assumption]
ρ=1.225kg/m3
g=9.81m/s2
µ=0.018 [asphalt and tyres, avg conditions]
r=0.275m [radius of selected wheel]
Calculation
F=Fdrag + Ffriction+Faccln=0.5CdρAv2 + µMg + M(v-u)/t
F=0.5(0.5)(1.225)(1.2)(11.112) + 0.018(190)(9.81) + 190(11.11-0)/20
F=45.36N + 33.6N + 105.55N
F=184.51N
T=F*R=184.51(0.275) = 50.74Nm
P=F*v=184.51(11.11) = 2049.9W = 2.049KW (1.96hp)
V=r*ω
N=60v/2πr=60(11.11)/2(π)(0.275)=385.98rpm
VAJRA, SEM-2017
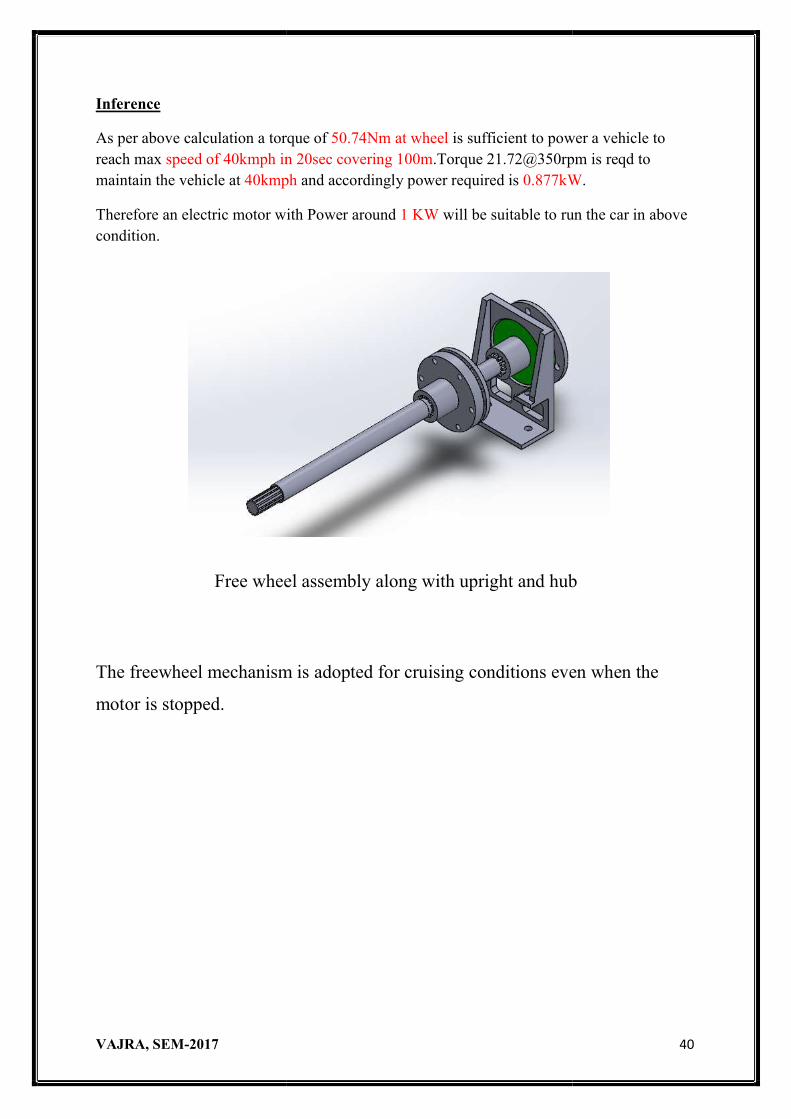
Inference
As per above calculation a torque of reach max speed of 40kmph inmaintain the vehicle at 40kmph
Therefore an electric motor with Power around condition.
Free wheel assembly
The freewheel mechanism is adopted for cruising conditions even when the
motor is stopped.
2017
As per above calculation a torque of 50.74Nm at wheel is sufficient to power a vehicle to speed of 40kmph in 20sec covering 100m.Torque 21.72@350rpm is reqd to
40kmph and accordingly power required is 0.877kW
Therefore an electric motor with Power around 1 KW will be suitable to run the car in above
Free wheel assembly along with upright and hub
The freewheel mechanism is adopted for cruising conditions even when the
2017 40
is sufficient to power a vehicle to .Torque 21.72@350rpm is reqd to
0.877kW.
will be suitable to run the car in above
along with upright and hub
The freewheel mechanism is adopted for cruising conditions even when the
VAJRA, SEM-2017 41
VAJRA, SEM-2017
2017 Shell Eco Marathon requires participants to be equipped with four disc hydraulic braking
system, with a brake pedal, with a minimum area of 25cm
on the front and rear axles or in an X pattern. A single master cylinder may be used, provided that it
has a dual circuit. The vehicle must remain immobile when
the main brake in place.
Disc brakes, which are better than drum and rim brakes, consist of two parts: the disc and the brake
caliper assembly. Hydraulic systems comprises of three basic components
slave cylinder and reservoir- and connecting tubes that are filled with incompressible fluids. The
pressure applied on the small area of the brake pedal is transferred through this fluid directly to the
slave cylinder or the piston in the brake
To calculate the breaking force required, stopping distance, initial distance and braking time of 5m, 40 kmph and 5 s respectively was assumed.
Deceleration was obtained to be a
For a car mass of 200 kg, total braking force to be achieved is 728 N. Since the brakes are applied
at all four wheels, braking force required at each wheel is 182 N.
2017
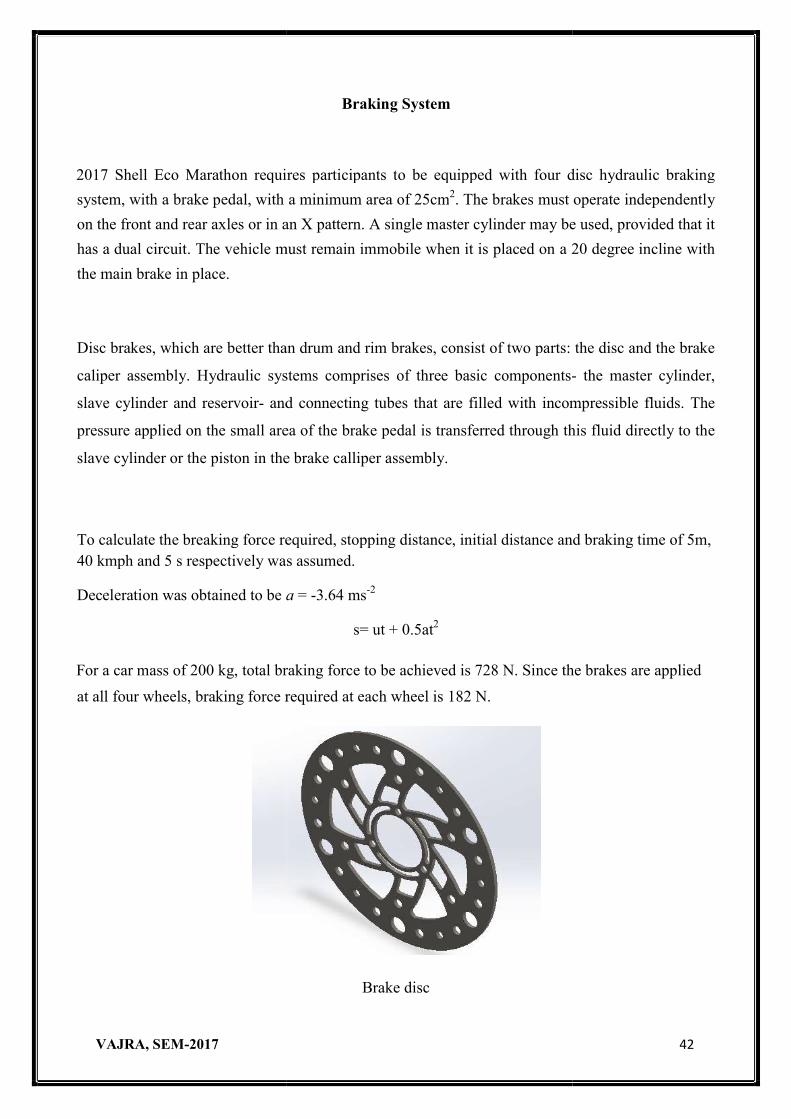
Braking System
2017 Shell Eco Marathon requires participants to be equipped with four disc hydraulic braking
system, with a brake pedal, with a minimum area of 25cm2. The brakes must operate independently
on the front and rear axles or in an X pattern. A single master cylinder may be used, provided that it
has a dual circuit. The vehicle must remain immobile when it is placed on a 20 degree incline with
Disc brakes, which are better than drum and rim brakes, consist of two parts: the disc and the brake
caliper assembly. Hydraulic systems comprises of three basic components-
and connecting tubes that are filled with incompressible fluids. The
pressure applied on the small area of the brake pedal is transferred through this fluid directly to the
slave cylinder or the piston in the brake calliper assembly.
To calculate the breaking force required, stopping distance, initial distance and braking time of 5m, 40 kmph and 5 s respectively was assumed.
a = -3.64 ms-2
s= ut + 0.5at2
braking force to be achieved is 728 N. Since the brakes are applied
at all four wheels, braking force required at each wheel is 182 N.
Brake disc
2017 42
2017 Shell Eco Marathon requires participants to be equipped with four disc hydraulic braking
. The brakes must operate independently
on the front and rear axles or in an X pattern. A single master cylinder may be used, provided that it
it is placed on a 20 degree incline with
Disc brakes, which are better than drum and rim brakes, consist of two parts: the disc and the brake
- the master cylinder,
and connecting tubes that are filled with incompressible fluids. The
pressure applied on the small area of the brake pedal is transferred through this fluid directly to the
To calculate the breaking force required, stopping distance, initial distance and braking time of 5m,
braking force to be achieved is 728 N. Since the brakes are applied
VAJRA, SEM-2017 43
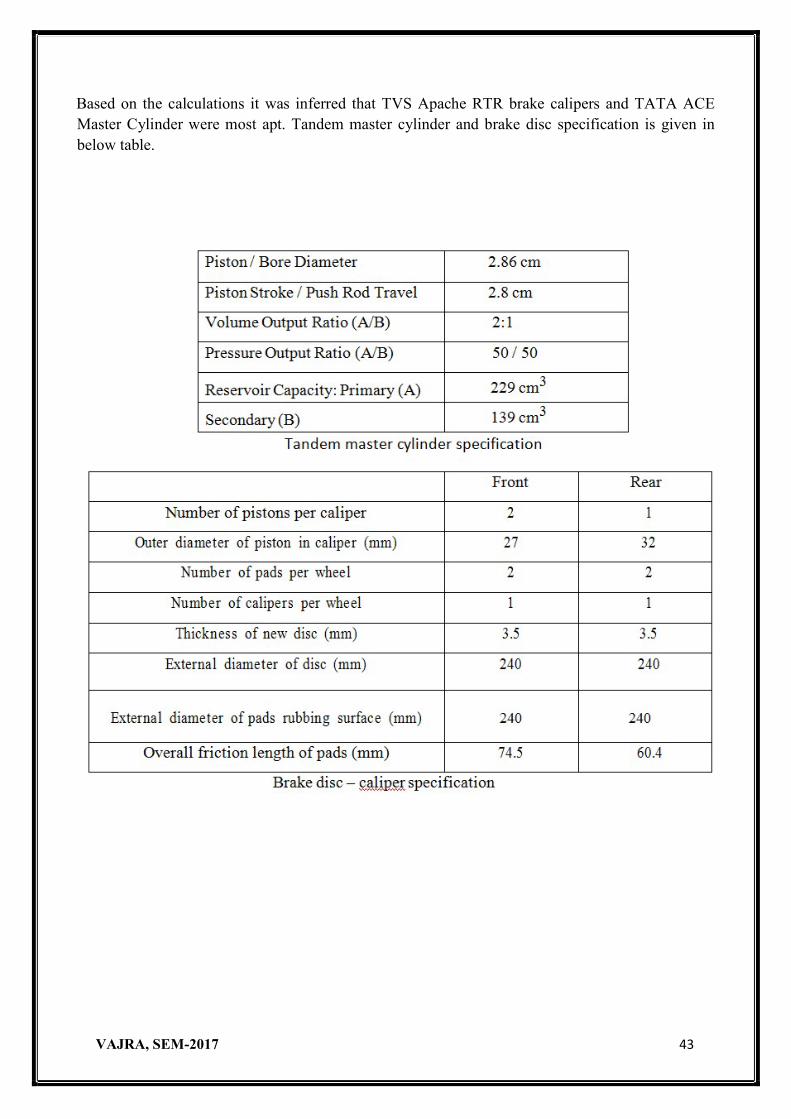
Based on the calculations it was inferred that TVS Apache RTR brake calipers and TATA ACE Master Cylinder were most apt. Tandem master cylinder and brake disc specification is given in below table.
VAJRA, SEM-2017 44
12. Body Work/Shell
The focus in this design includes producing a drag coefficient to less than 0.2, reducing therolling resistance coefficient to less than 0.007, reducing the weight of the vehicle with innovativedesigns and materials and attempting to gain a motor and drive train efficiency greater than 80%.Taking safety into account, the body and frame should combine to make a sturdy and structurallysafe aerodynamic shell. Its construction must consist of a mixture of lightweight materials:aluminium, carbon, polycarbonate sheets and glass-reinforced fibres.
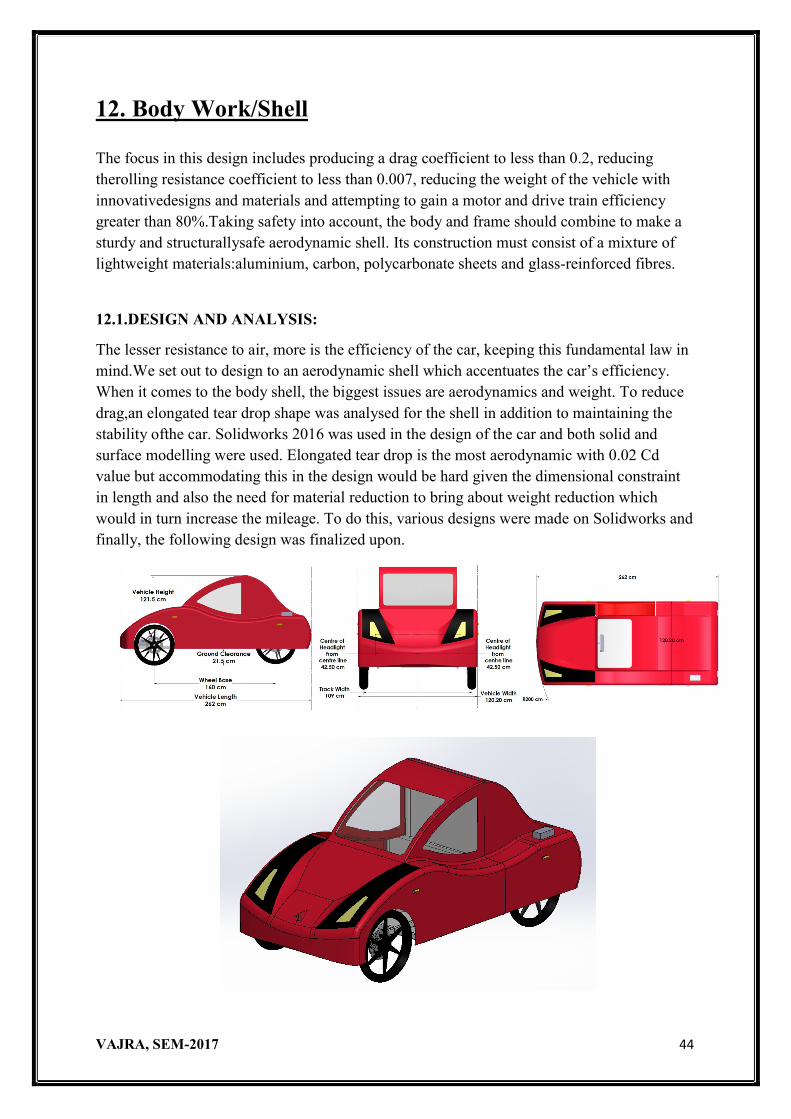
12.1.DESIGN AND ANALYSIS:
The lesser resistance to air, more is the efficiency of the car, keeping this fundamental law in mind.We set out to design to an aerodynamic shell which accentuates the car’s efficiency. When it comes to the body shell, the biggest issues are aerodynamics and weight. To reduce drag,an elongated tear drop shape was analysed for the shell in addition to maintaining the stability ofthe car. Solidworks 2016 was used in the design of the car and both solid and surface modelling were used. Elongated tear drop is the most aerodynamic with 0.02 Cd value but accommodating this in the design would be hard given the dimensional constraint in length and also the need for material reduction to bring about weight reduction which would in turn increase the mileage. To do this, various designs were made on Solidworks and finally, the following design was finalized upon.
VAJRA, SEM-2017 45
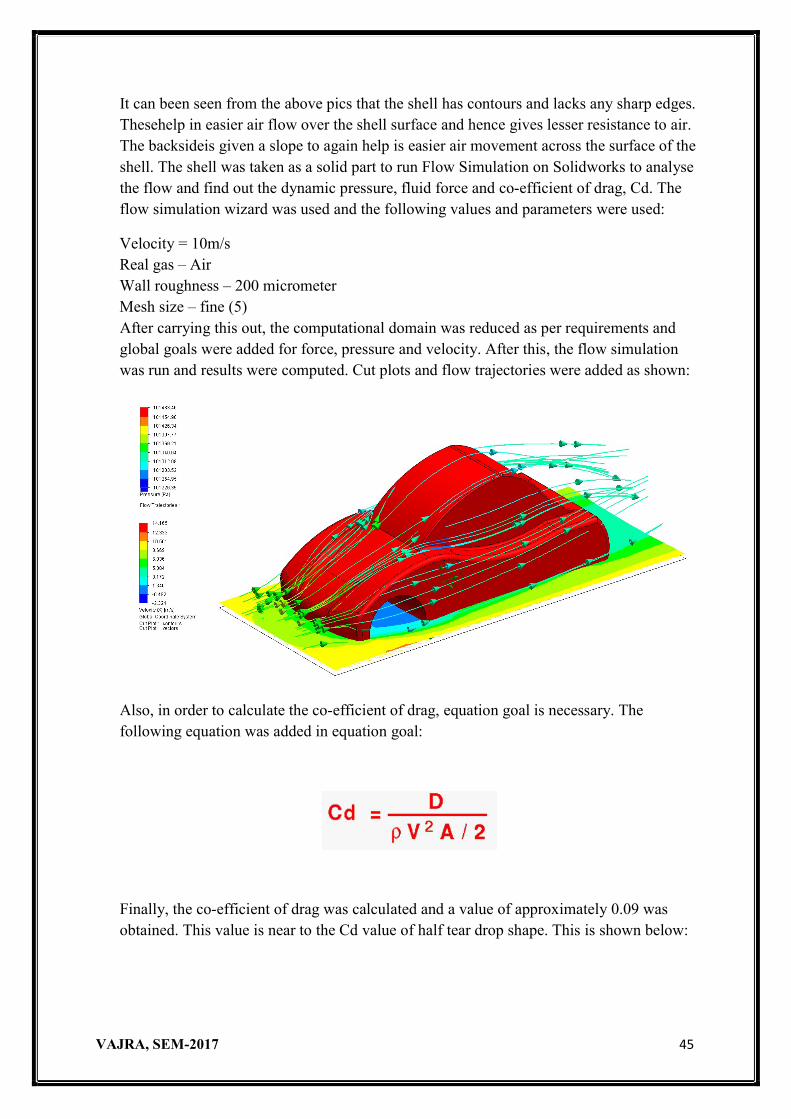
It can been seen from the above pics that the shell has contours and lacks any sharp edges. Thesehelp in easier air flow over the shell surface and hence gives lesser resistance to air. The backsideis given a slope to again help is easier air movement across the surface of the shell. The shell was taken as a solid part to run Flow Simulation on Solidworks to analyse the flow and find out the dynamic pressure, fluid force and co-efficient of drag, Cd. The flow simulation wizard was used and the following values and parameters were used:
Velocity = 10m/s Real gas – Air Wall roughness – 200 micrometer Mesh size – fine (5) After carrying this out, the computational domain was reduced as per requirements and global goals were added for force, pressure and velocity. After this, the flow simulation was run and results were computed. Cut plots and flow trajectories were added as shown:
Also, in order to calculate the co-efficient of drag, equation goal is necessary. The following equation was added in equation goal:
Finally, the co-efficient of drag was calculated and a value of approximately 0.09 was obtained. This value is near to the Cd value of half tear drop shape. This is shown below:
VAJRA, SEM-2017
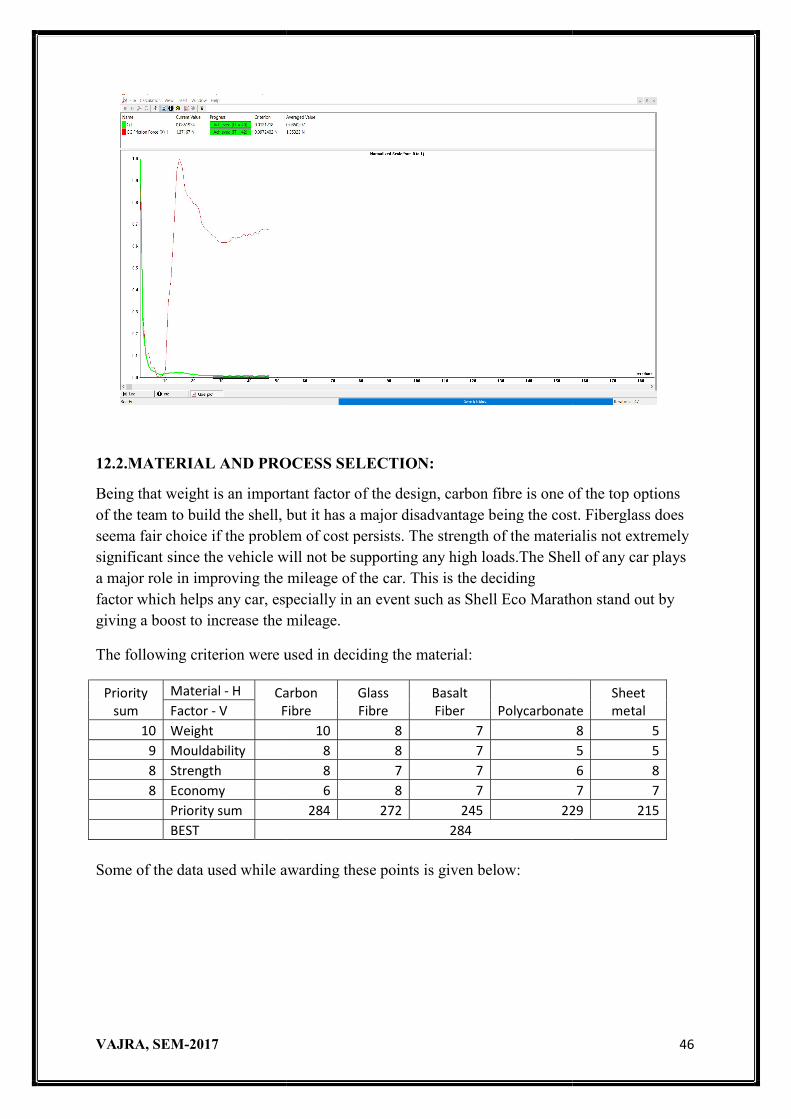
12.2.MATERIAL AND PROCESS SELECTION:
Being that weight is an important factor of the design, carbon fibre is one of the top optionsof the team to build the shell, but it has a major disadvantage being the cost. Fiberglass does seema fair choice if the problem of cost persists. The strength of tsignificant since the vehicle will not be supporting any high loads.The Shell of any car plays a major role in improving the mileage of the car. This is the decidingfactor which helps any car, especially in an event such as Shegiving a boost to increase the mileage.
The following criterion were used in deciding the material:
Priority sum
Material - H Carbon FibreFactor - V
10 Weight 9 Mouldability 8 Strength 8 Economy
Priority sum BEST Some of the data used while awarding these points is given below:
2017
MATERIAL AND PROCESS SELECTION:
ng that weight is an important factor of the design, carbon fibre is one of the top optionsof the team to build the shell, but it has a major disadvantage being the cost. Fiberglass does seema fair choice if the problem of cost persists. The strength of the materialis not extremely significant since the vehicle will not be supporting any high loads.The Shell of any car plays a major role in improving the mileage of the car. This is the deciding factor which helps any car, especially in an event such as Shell Eco Marathon stand out by giving a boost to increase the mileage.
The following criterion were used in deciding the material:
Carbon Fibre
Glass Fibre
Basalt Fiber Polycarbonate
10 8 7 8 8 7 8 7 7 6 8 7
284 272 245 229284
Some of the data used while awarding these points is given below:
2017 46
ng that weight is an important factor of the design, carbon fibre is one of the top options of the team to build the shell, but it has a major disadvantage being the cost. Fiberglass does
he materialis not extremely significant since the vehicle will not be supporting any high loads.The Shell of any car plays
ll Eco Marathon stand out by
Polycarbonate Sheet metal
8 5 5 5 6 8 7 7
229 215
VAJRA, SEM-2017 47
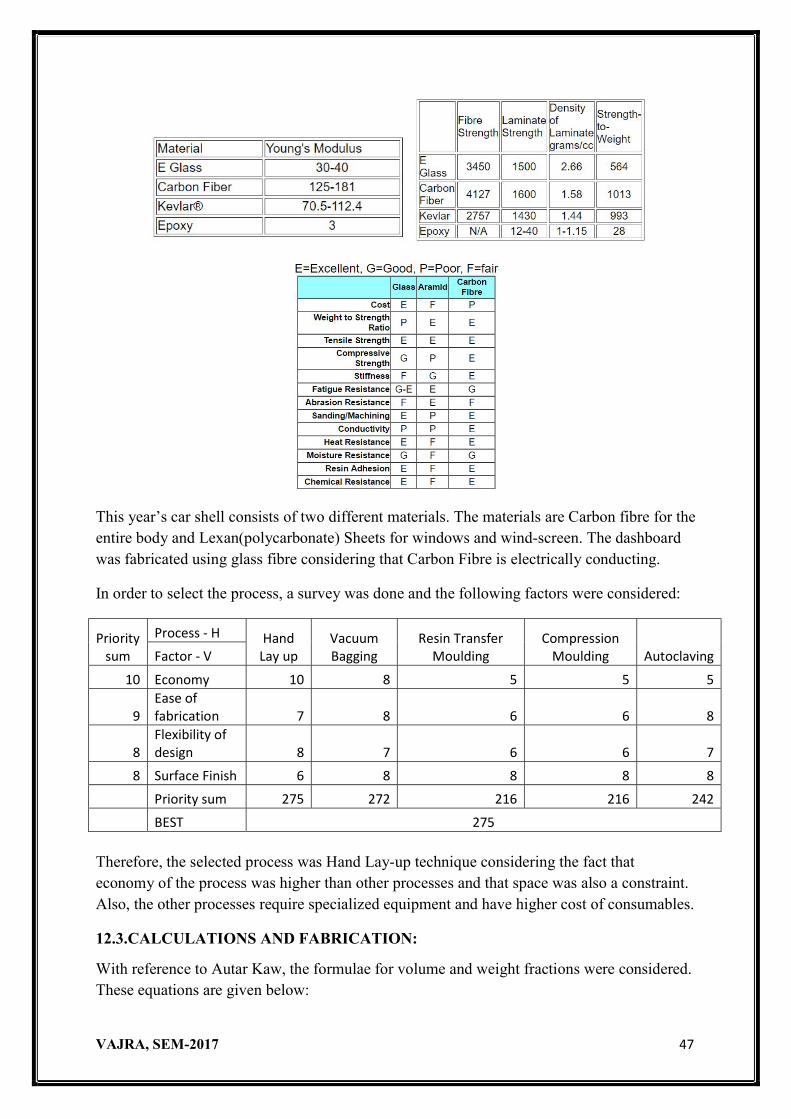
This year’s car shell consists of two different materials. The materials are Carbon fibre for the entire body and Lexan(polycarbonate) Sheets for windows and wind-screen. The dashboard was fabricated using glass fibre considering that Carbon Fibre is electrically conducting.
In order to select the process, a survey was done and the following factors were considered:
Priority sum
Process - H Hand Lay up
Vacuum Bagging
Resin Transfer Moulding
Compression Moulding Autoclaving Factor - V
10 Economy 10 8 5 5 5
9 Ease of fabrication 7 8 6 6 8
8 Flexibility of design 8 7 6 6 7
8 Surface Finish 6 8 8 8 8
Priority sum 275 272 216 216 242
BEST 275 Therefore, the selected process was Hand Lay-up technique considering the fact that economy of the process was higher than other processes and that space was also a constraint. Also, the other processes require specialized equipment and have higher cost of consumables.
12.3.CALCULATIONS AND FABRICATION:
With reference to Autar Kaw, the formulae for volume and weight fractions were considered. These equations are given below:
VAJRA, SEM-2017 48
Data used – Density of Carbon fibre = 1.5g/cc and density of epoxy resin = 1.2g/cc
Ideal volume fraction of fibre is 0.6 Hence volume fraction of matrix is 0.4. Therefore, 200g of fibre(1m2) needs 133g of resin.
Using density values, density value of composite is calculated using:
Using this, the values of weight of matrix and fiber is calculated.
and
Also, the weight of the composite is calculated as follows:
Using these formulae, the weight of the entire shell was found to be 10.4kg.
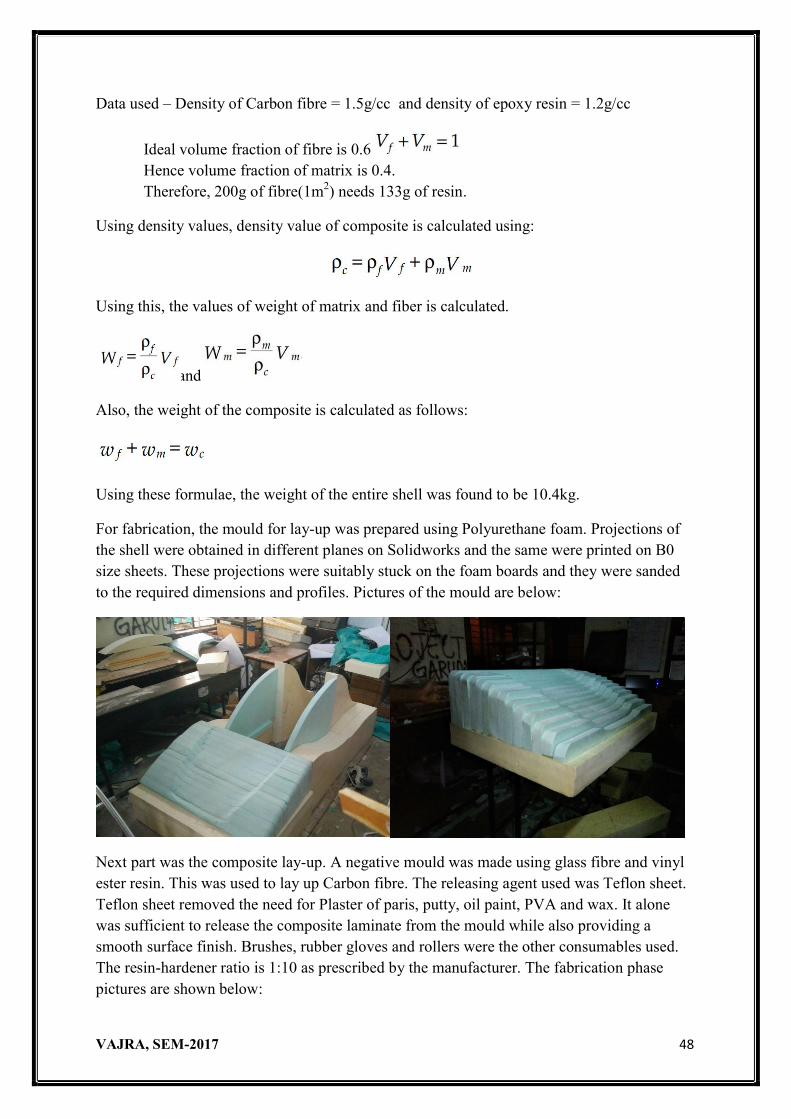
For fabrication, the mould for lay-up was prepared using Polyurethane foam. Projections of the shell were obtained in different planes on Solidworks and the same were printed on B0 size sheets. These projections were suitably stuck on the foam boards and they were sanded to the required dimensions and profiles. Pictures of the mould are below:
Next part was the composite lay-up. A negative mould was made using glass fibre and vinyl ester resin. This was used to lay up Carbon fibre. The releasing agent used was Teflon sheet. Teflon sheet removed the need for Plaster of paris, putty, oil paint, PVA and wax. It alone was sufficient to release the composite laminate from the mould while also providing a smooth surface finish. Brushes, rubber gloves and rollers were the other consumables used. The resin-hardener ratio is 1:10 as prescribed by the manufacturer. The fabrication phase pictures are shown below:
VAJRA, SEM-2017 49
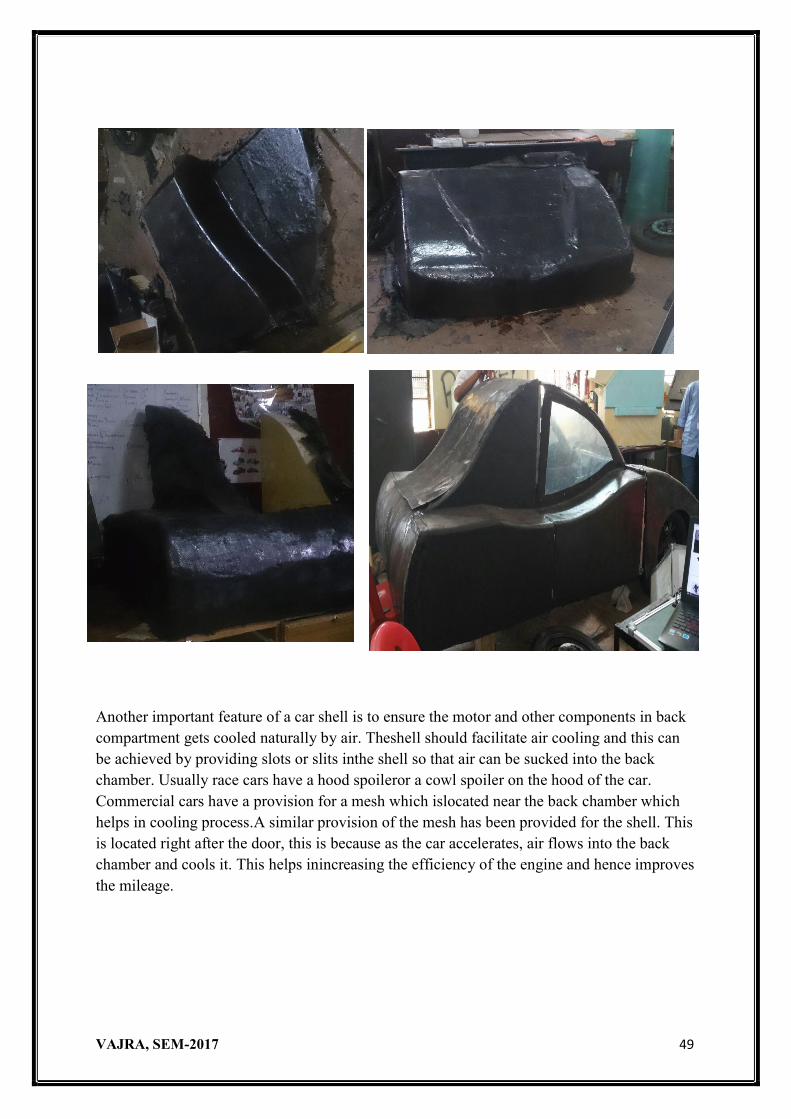
Another important feature of a car shell is to ensure the motor and other components in back compartment gets cooled naturally by air. Theshell should facilitate air cooling and this can be achieved by providing slots or slits inthe shell so that air can be sucked into the back chamber. Usually race cars have a hood spoileror a cowl spoiler on the hood of the car. Commercial cars have a provision for a mesh which islocated near the back chamber which helps in cooling process.A similar provision of the mesh has been provided for the shell. This is located right after the door, this is because as the car accelerates, air flows into the back chamber and cools it. This helps inincreasing the efficiency of the engine and hence improves the mileage.
VAJRA, SEM-2017 50
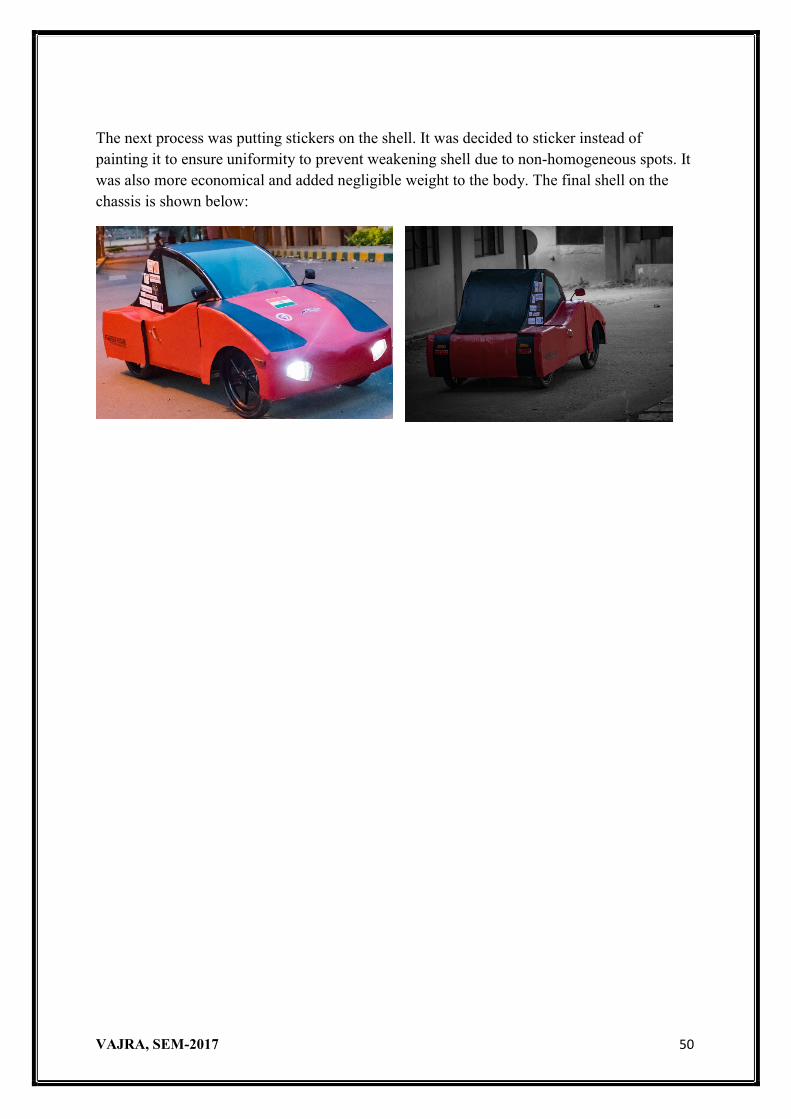
The next process was putting stickers on the shell. It was decided to sticker instead of painting it to ensure uniformity to prevent weakening shell due to non-homogeneous spots. It was also more economical and added negligible weight to the body. The final shell on the chassis is shown below:


