Embed Size (px)
Citation preview
6. MILITARY AND CIVIL SERVICES
N o . 1 6 2 . — F E D E R A L S E R V I C E — S U M M A R Y OF E M P L O Y M E N T AND P A Y R O L L S , BY C L A S S OF S E R V I C E , 1 9 4 0 , 1 9 4 1 , AND 1 9 4 2 , AND BY Q U A R T E R S , 1 9 4 2
[Pay roll in thousands of dollars]
Y E A R A N D QUARTER
TOTAL CIVILIAN SERVICE 1
EIJIECUTIVE SERVICE 1
LEGISLATIVE SERVICE
JUDICIAL SERVICE
MILITARY SERVICE 2
Y E A R A N D QUARTER
Em-ployees 3 Pay roll Em-
ployees 3 Pay roll Em-ployees3
Pay roll
Em-ployees3
Pay roll
Per-sonnel ^ Pay roll
194 0 194 1 194 2
1,040, 249 1. 413,067 2, 328, 399 1,832,310 2,163,319 2, 514,134 2, 803, 831
1, 899,100 2, 579,103 4, 509,867
871,870 1,041,879 1, 210,104 1, 386,014
1, 031, 877 1,404, 405 2, 319, 353 1, 823, 368 2,154,183 2, 505, 022 2, 794, 837
1,876,016 2, 555, 305 4, 485,152
865, 738 1, 035, 743 1, 203, 944 1, 379, 727
5,911 6,112 6,410 6,345 6, 487 6, 452 6,354
15,640 16,032 16, 622 4,124 4.137 4.138 4, 223
2,461 2,550 2,636 2, 597 2, 649 2, 660 2,640
7, 444 7, 766 8,093 2,008 1,999 2,022 2,064
573,147 n , 660, 346
(«)
(5) (6)
464,302 51,166,292
b) («)
b)
Jan.-Mar__. Apr . - June . -July-Sept...-Oct.-Dec-._.
1,040, 249 1. 413,067 2, 328, 399 1,832,310 2,163,319 2, 514,134 2, 803, 831
1, 899,100 2, 579,103 4, 509,867
871,870 1,041,879 1, 210,104 1, 386,014
1, 031, 877 1,404, 405 2, 319, 353 1, 823, 368 2,154,183 2, 505, 022 2, 794, 837
1,876,016 2, 555, 305 4, 485,152
865, 738 1, 035, 743 1, 203, 944 1, 379, 727
5,911 6,112 6,410 6,345 6, 487 6, 452 6,354
15,640 16,032 16, 622 4,124 4.137 4.138 4, 223
2,461 2,550 2,636 2, 597 2, 649 2, 660 2,640
7, 444 7, 766 8,093 2,008 1,999 2,022 2,064
573,147 n , 660, 346
(«)
(5) (6)
464,302 51,166,292
b) («)
b)
1 Data for 1940 and 1941 have been revised. 2 Includes officers and enlisted men on active duty in the Army, Navy, Marine Corps, and Coast Guard,
and nurses on active duty. 3 Data represent averages of number of persons on pay roll for last pay period of month. ^ Personnel data have been adjusted to conform to amount of pay roll obligated during month, and do
not represent an actual count on any given day. 5 Beginning December 1941, military personnel and pay-roll data have not been included in this table.
Figures for 1941, therefore, do not include December 1941 and are revised. Source: Department of Labor, Bureau of Labor Statistics; records. Monthly figures are published
currently in Monthly Labor Review.
N o . 1 6 3 . — A R M Y OF T H E U N I T E D S T A T E S — S T R E N G T H BY I D E N T I T Y : 1 9 4 2 AND 1 9 4 3
IDENTITY 1943 June 30
1943 June 30
IDENTITY 1942 June 30
1943 June 30
TotaL 3,074,184 6, 993,102 Nurses 12, 475 0)
(') (0
30,316 666 323
4,917 55,326
Officers Enlisted men Warrant officers _
3,074,184 6, 993,102 TTnQnii'iil iHpfitianc
12, 475 0)
(') (0
30,316 666 323
4,917 55,326
Officers Enlisted men Warrant officers _
190,662 2, 867, 762
3,285 G)
521, 435 6, 358, 200
16, 219 5, 700
JHU&jjll/ill U.lt/l>iLlclilo Physical therapy aides Women's Army Corp:
Officers-
12, 475 0)
(') (0
30,316 666 323
4,917 55,326 Flight officers
190,662 2, 867, 762
3,285 G)
521, 435 6, 358, 200
16, 219 5, 700 Enlisted women
12, 475 0)
(') (0
30,316 666 323
4,917 55,326
190,662 2, 867, 762
3,285 G)
521, 435 6, 358, 200
16, 219 5, 700
12, 475 0)
(') (0
30,316 666 323
4,917 55,326
1 Not available. Source: War Department; records.
N O . 1 6 4 . — N A V Y , M A R I N E C O R P S , C O A S T G U A R D — S T R E N G T H BY I D E N T I T Y : 1 9 4 3 AND 1 9 4 4
fTT.ASS
NAVY MARINE CORPS COAST GUARD
fTT.ASS 1943
Feb. 1 1944
Feb. 1 1943
Feb. 1 1944
Jan. 31 1943
Feb. 1 1944
Feb. 1
Total
Officers: Men Women's Reserve
Officer candidates
1,332,602 2,474,502 247,354 414,020 144,864 171,988 Total
Officers: Men Women's Reserve
Officer candidates
131,642 1,482
42,345 3,293
1,149,679 4,161
218,712 6,733
119,834 7,340
2,080,608 41,275
14,040 2
28,211 654
6,793 46
947
10,302 560
1,302 Nurses
131,642 1,482
42,345 3,293
1,149,679 4,161
218,712 6,733
119,834 7,340
2,080,608 41,275
6,793 46
947
10,302 560
1,302
Enlisted personnel: Men Women's Reserve
131,642 1,482
42,345 3,293
1,149,679 4,161
218,712 6,733
119,834 7,340
2,080,608 41,275
233,312 (0
374,258 10,897
137,599 479
163,508 6,261
1 None. Source: Navy Department; records.
1 6 1
162 M I L I T A R Y A N D C I V I L S E R V I C E S
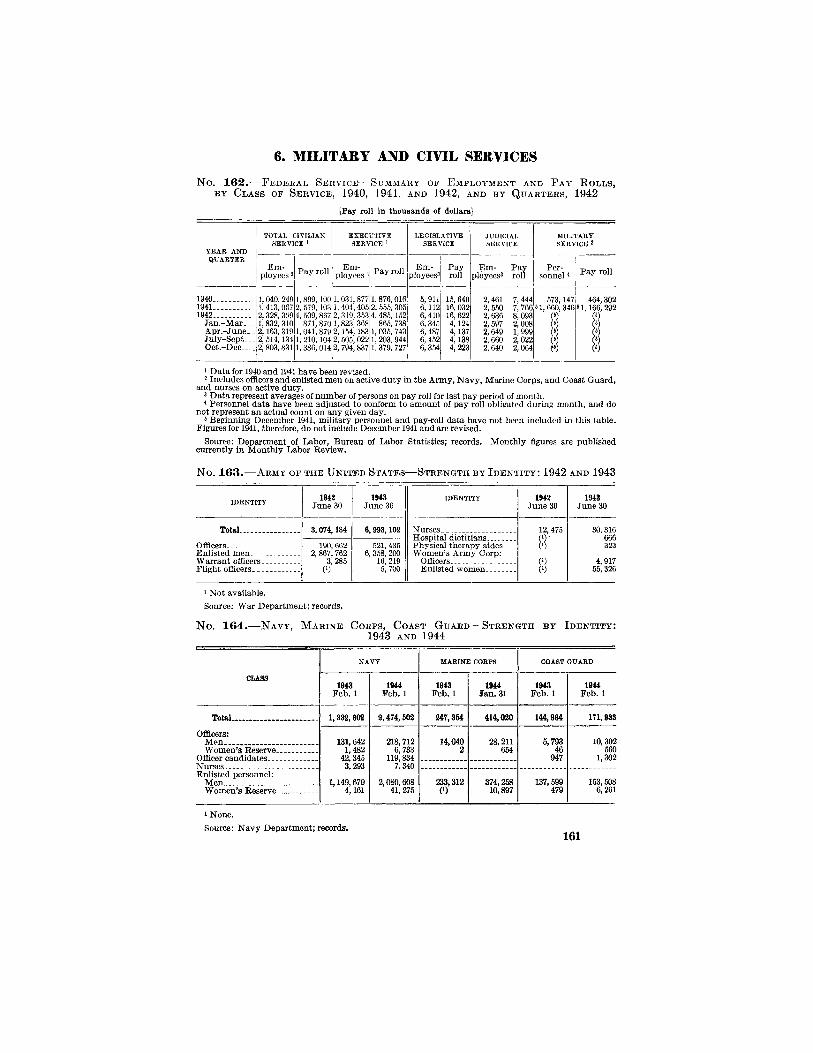
N o . 1 6 6 . — A R M Y O F T H E U N I T E D S T A T E S — S T R E N G T H O F C O M P O N E N T P A R T S : 1 8 9 0 TO 1 9 4 1
NOTE.—For period prior to 1914, table covers quinquennial years and years in which considerable changes occurred in Regular Army. Figures for Reserve officers include data for Regular Army enlisted men, and also, for years prior to 1924, for National Guard oflScers holding commissions in the Reserve. There is, therefore, some duplication in the grand totals, but the amount of this duplication is relatively small.
Grand total
REGULAR ARMY 1 NATIONAL GUARD » RESERVE FORCES
JUNE 30—
Grand total
Total OflQcers Enlisted men Total Oflacers
En-listed men
Total Oflacers Enlisted men
1890 136,624 27,089 2,168 2,154 2,486 2, 940 3, 731 3,934 3,966 4,208
24,921 109,535 112, 879 122, 213 115, 749 110,221 111, 313
8,555 9, 227 8, 246 8, 751 (*) 8,680
100,980 103, 652 113,967 106,998
(*) 102,633 102,358 109, 951 110,505 112,710 119,261 120, 693 123, 605 303,581
1895 140,051 27,172 2,168 2,154 2,486 2, 940 3, 731 3,934 3,966 4,208
26,018 65,669 78,646 71,863 63,022 72,462 80, 251
109,535 112, 879 122, 213 115, 749 110,221 111, 313
8,555 9, 227 8, 246 8, 751 (*) 8,680
100,980 103, 652 113,967 106,998
(*) 102,633 102,358 109, 951 110,505 112,710 119,261 120, 693 123, 605 303,581
1900 1901 1902
223,366 200,696 185,805
68,155 81, 586 75,584 66,956 76,428 84,459
2,168 2,154 2,486 2, 940 3, 731 3,934 3,966 4,208
26,018 65,669 78,646 71,863 63,022 72,462 80, 251
109,535 112, 879 122, 213 115, 749 110,221 111, 313
8,555 9, 227 8, 246 8, 751 (*) 8,680
100,980 103, 652 113,967 106,998
(*) 102,633 102,358 109, 951 110,505 112,710 119,261 120, 693 123, 605 303,581
»32,998 »3,361
»1, 631 «360
«31,467 «3, Oil
1905 178,269
68,155 81, 586 75,584 66,956 76,428 84,459
2,168 2,154 2,486 2, 940 3, 731 3,934 3,966 4,208
26,018 65,669 78,646 71,863 63,022 72,462 80, 251
109,535 112, 879 122, 213 115, 749 110,221 111, 313
8,555 9, 227 8, 246 8, 751 (*) 8,680
100,980 103, 652 113,967 106,998
(*) 102,633 102,358 109, 951 110,505 112,710 119,261 120, 693 123, 605 303,581
1908 187,369
68,155 81, 586 75,584 66,956 76,428 84,459
2,168 2,154 2,486 2, 940 3, 731 3,934 3,966 4,208
26,018 65,669 78,646 71,863 63,022 72,462 80, 251
110,941 118,926 119, 660 121, 852 128,043 129, 398 132,194
«314,681
8, 583 8,975 9,155
100,980 103, 652 113,967 106,998
(*) 102,633 102,358 109, 951 110,505 112,710 119,261 120, 693 123, 605 303,581
1909 203,385
68,155 81, 586 75,584 66,956 76,428 84,459
2,168 2,154 2,486 2, 940 3, 731 3,934 3,966 4,208
26,018 65,669 78,646 71,863 63,022 72,462 80, 251
110,941 118,926 119, 660 121, 852 128,043 129, 398 132,194
«314,681
8, 583 8,975 9,155
100,980 103, 652 113,967 106,998
(*) 102,633 102,358 109, 951 110,505 112,710 119,261 120, 693 123, 605 303,581
1910 200,378 80,718 91,461 97,760
105,993 107,641 250,357
4,439 4, 660 4,883 4,798 5,025 6, 332
76,279 86, 811 92, 877
101,195 102, 616 244, 025
110,941 118,926 119, 660 121, 852 128,043 129, 398 132,194
«314,681
8, 583 8,975 9,155
100,980 103, 652 113,967 106,998
(*) 102,633 102,358 109, 951 110,505 112,710 119,261 120, 693 123, 605 303,581
1912 213,313 80,718 91,461 97,760
105,993 107,641 250,357
4,439 4, 660 4,883 4,798 5,025 6, 332
76,279 86, 811 92, 877
101,195 102, 616 244, 025
110,941 118,926 119, 660 121, 852 128,043 129, 398 132,194
«314,681
9,142
100,980 103, 652 113,967 106,998
(*) 102,633 102,358 109, 951 110,505 112,710 119,261 120, 693 123, 605 303,581
1914 225,819
80,718 91,461 97,760
105,993 107,641 250,357
4,439 4, 660 4,883 4,798 5,025 6, 332
76,279 86, 811 92, 877
101,195 102, 616 244, 025
110,941 118,926 119, 660 121, 852 128,043 129, 398 132,194
«314,681
8, 792 8, 705 8,589
U1,000
100,980 103, 652 113,967 106,998
(*) 102,633 102,358 109, 951 110,505 112,710 119,261 120, 693 123, 605 303,581
»16 »19
»4, 648 64, 925
»18 •19
•4,648 »43,382
1915 235,410
80,718 91,461 97,760
105,993 107,641 250,357
4,439 4, 660 4,883 4,798 5,025 6, 332
76,279 86, 811 92, 877
101,195 102, 616 244, 025
110,941 118,926 119, 660 121, 852 128,043 129, 398 132,194
«314,681
8, 792 8, 705 8,589
U1,000
100,980 103, 652 113,967 106,998
(*) 102,633 102,358 109, 951 110,505 112,710 119,261 120, 693 123, 605 303,581
»16 »19
»4, 648 64, 925
»18 •19
•4,648 »43,382
1916 244, 483
80,718 91,461 97,760
105,993 107,641 250,357
4,439 4, 660 4,883 4,798 5,025 6, 332
76,279 86, 811 92, 877
101,195 102, 616 244, 025
110,941 118,926 119, 660 121, 852 128,043 129, 398 132,194
«314,681
8, 792 8, 705 8,589
U1,000
100,980 103, 652 113,967 106,998
(*) 102,633 102,358 109, 951 110,505 112,710 119,261 120, 693 123, 605 303,581
»16 »19
»4, 648 64, 925
»18 •19
•4,648 »43,382 1917 629,863
80,718 91,461 97,760
105,993 107,641 250,357
4,439 4, 660 4,883 4,798 5,025 6, 332
76,279 86, 811 92, 877
101,195 102, 616 244, 025
110,941 118,926 119, 660 121, 852 128,043 129, 398 132,194
«314,681
8, 792 8, 705 8,589
U1,000
100,980 103, 652 113,967 106,998
(*) 102,633 102,358 109, 951 110,505 112,710 119,261 120, 693 123, 605 303,581
»16 »19
»4, 648 64, 925 » 21,643
»18 •19
•4,648 »43,382
1918 1918 (Nov. 11) 1919 1920
2, 246,103 741,084 10, 618 730, 566 • 446,678 U2,000 7 433,678 1,059,341 10 136,380 "923,961 1918 1918 (Nov. 11) 1919 1920
3,673, 888 "3,673,888 836,882 200,367
" 188, 434 H3, 485, 454 768, 879 184,848
1918 1918 (Nov. 11) 1919 1920
931,422 363, 540
"3,673,888 836,882 200,367
78,003 16,619
H3, 485, 454 768, 879 184,848
37,210 56, 090
1,198 2, 073
36,012 54,017
57,330 107,083
« 46, 673 »68, 232
»11,767 »38,861
1921 1922 1923 1924 1925
407,920 373, 597 370,042 397,794 406,162
227,374 146,069 130,964 140, 644 134,624
14,124 14, 075 12,682 12, 501 12,909
213,250 131,994 118,282 128,143 121, 715
113,640 159,658 160,698 177,428 177, 626
5, 843 8, 744 9,675
10,996 11,595
107,797 150,914 150,923 166,432 165,930
66,906 67,870 78,480 79,722 94,013
» 66, 905 » 67, 390 « 76,923 »76, 322 »88,898
1«! i»480
1» 1, 657 1» 3,400 1» 6,115
1926 1927 1928 1929 1930
410,902 421, 519 426,075 421,466 426,825
133,033 133,079 134,331 137, 360 137,472
13,106 13,175 13,174 13,168 13,196
119,928 119,904 121,157 124,192 124, 277
174,969 181,142 181,221 176, 988 182,716
11,435 12,192 12,428 12, 535 12, 930
163, 534 168,950 168,793 164,453 169, 785
102, 900 107,298 110, 523 107,118 106,638
8 97, 125 8 101, 563 8 105, 059 8 101,926 8101,917
1« 5,776 1« 6,736 " 6,464 " 6,192 " 4,721
1931 1932 1933 1934 1935
439,081 440,162 445,449 440, 764 440,788
138, 648 133,042 135,011 136,970 137, 960
13,205 13,153 13, 223 13,147 12,862
125,443 119, 889 121, 788 123, 823 126,098
187,386 187, 412 185,925 184, 791 186,916
13,249 13, 549 13, 569 13, 607 13, 571
174,137 173,863 172, 356 171, 284 172, 344
113,047 119, 708 124, 513 119,003 116, 913
«108,210 8 114, 836 8 119, 485 8 114, 367 8 112, 590
i»4,837 i»4,872 1« 6,028 1« 4, 646 1« 4, 323
1936 1937 1938 1939 1940 1941
474,353 484,620 496,810 526,451 653, 536
»1,521,882
166,114 178,101 183, 447 187, 886 264,035 870,261
12,902 13,108 13, 296 13, 807 14, 594 15,025
163,212 164, 993 170,161 174,079 249, 441
1« 855, 236
189,173 192,161 197,188 199, 491 241, 612 452,850
13, 721 14,110 14,443
666 14, 775 21, 274
175,452 178,051 182,746 184, 825 226,837
17431,576
119, 066 114,358 116,176 139, 074 147, 889 124,169
8115,169 8 111,169 «113,177 8 116, 719 8 116, 636 8 122, 020
1' 3,897 1« 3,189 1» 2, 998
1* 22, 355 1» 31, 253
18 2,149
I Includes Philippine Scouts beginning with 1902. Figures for 1919 to 1926, inclusive, include in most cases World War emergency personnel still in service. All emergency enlisted men still in service were discharged on July 2,1921. On Nov. 11, 1926, the last emergency officer was discharged, thereby complet-ing the demobilization of the World War Army. Retired personnel on active duty are not included. (On June 30,1941, 495 retired officers and 13 retired enlisted men had returned to active duty.) Beginning with 1919, data for warrant oflacers are included; these numbered 731 on June 30,1941.
» State militia prior to act of June 3, 1916. Beginning with 1924, data for warrant oflacers are included; these numbered 200 on June 30, 1941. 3 u . S. Volunteers. < Not available. « Regular Army Reserve.
«Includes data for National Guard personnel in Federal service. ^ Estimated. 8 Oflacers' Reserve Corps. Beginning with 1924, figures do not include data for persons holding com-
missions also in National Guard. Figure for 1941 includes 57,309 officers on extended active duty. » Regular Army Reserve, 8,382; Enlisted Reserve Corps, 35,000 (estimated).
Oflacers' Reserve Corps, 86,262; i^ational Army, 49,118 (estimated). II Estimated enlisted strength of the National Army. Practically all members of the Regular Army
Reserve and the Enlisted Reserve Corps had, by this date, been assigned to duty with Regular Army, National Guard, and Isational Army organizations.
1» Estimates only. Under orders of the Secretary of War all components had been merged into one army known as "The United States Army." 13 Enliste d Reserve Corps.
i< Enlisted Reserve Corps, 1939, 3,054; 1940, 3,233; Regular Army Reserve, 1939, 19,301; 1940, 28,020. All enlistments in Regular Army Reserve suspended as of Dec. 31,1940, and members called to active duty on or before Feb. 15, 1941, except those who were deferred until July 1, 1941, in order to complete college or university courses, i« Includes 74,602 unassigned selectees.
1® Enlisted men, 491,777 Uncluding 10,919 Regular Army Reserve and 1,470 Army of United States with the Regular Army); selectees, 363,459,
17 Enlisted men, 262,722 (including 20,590 Army of United States with the National Guard); selectees, 168,854, 18 Enlisted Reserve Corps. Includes 35 enlisted Reserve Corps men on active duty.
Source: War Department, Annual Report of Secretary and records.
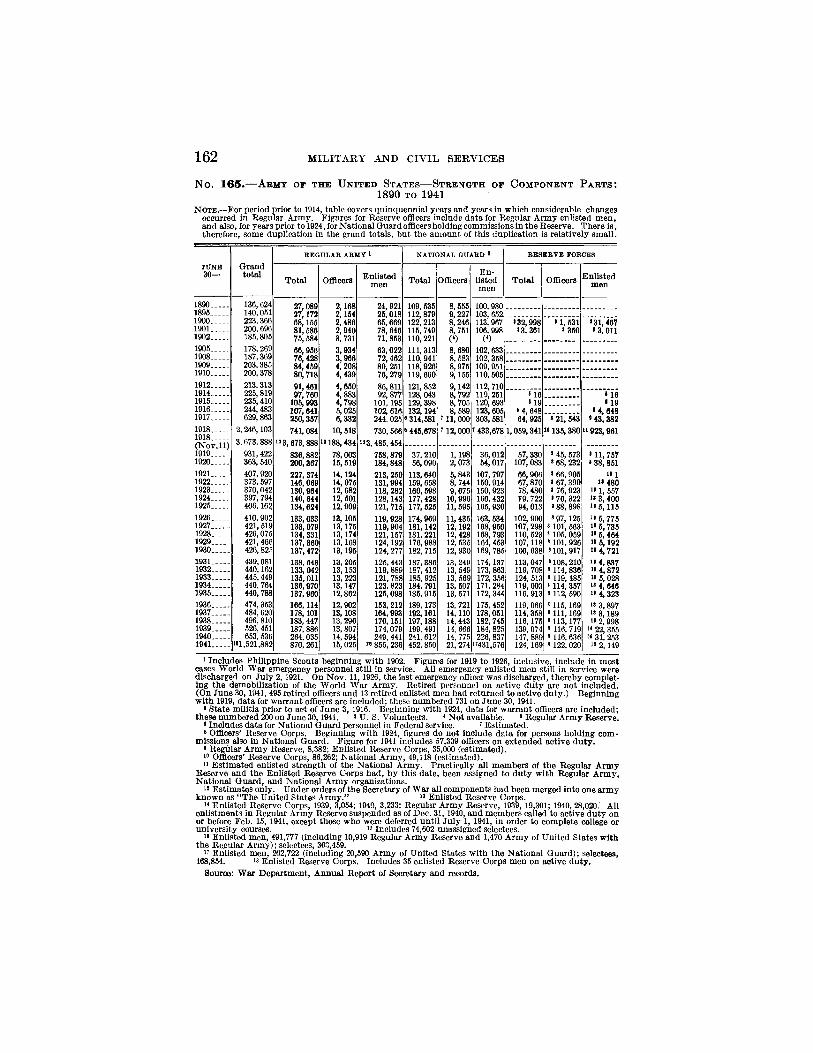
N A V Y 163
N o . 1 6 6 . ^ — N A V Y , M A R I N E C O R P S , N A V A L R E S E R V E , A N D M A R I N E C O R P S R E S E R V E — O R G A N I Z E D S T R E N G T H : 1 9 0 5 TO 1 9 4 1
JUNE 30 (EXCEPT AS INDICATED)
1905 1910 1915 1920 192 4
192 5 192 6 192 7 192 8 192 9
193 0 193 1 193 2 193 3 193 4
193 5 193 6 193 7 193 8 193 9
194 0 1941 (Nov. 1) «.
Officers
2, 252 2, 921 3, 780 9,171 8,126
8, 574 8,904 8, 856 8, 905
8, 985 9, 260 9, 423 9, 449 9, 582
9, 721 9, 735 9, 826
10,172 10, 597
10, 817 13, 322
Enlisted men
30,804 45,076 52, 561
107,601 87,327
84, 289 82,161 83, 566 84, 276 85, 284
84, 872 80,863 81,093 79, 206 80, 312
82, 818 93,054
100,161 104, 848 110,187
139, 554 225, 001
NAVAL RESERVE 1
Officers
465 540 606
2 28, 482 3, 975
3, 818 3, 736 3,771 4,091 6,078
7,002 7, 549 7,869 7, 978 8, 557
9, 571 3 11,187 3 12, 287 3 13, 395 3 14,018
3 15, 782 3 18,141
Enlisted men
4,475 5, 961 7, 706 1,349
21,015
24,457 25,654 26,293 27,072 28, 821
31, 777 34, 586 34, 802 32, 889 32, 309
32, 649 33, 629 37,138 40,012 41,985
34, 778 55, 397
MARINE CORPS
Officers
273 334 344
1,106 1,157
1,168 1,178 1,200 1,198 1,182
1, 212 1,194 1,196 1,192 1,187
1,163 1, 208 1,312 1, 358 1, 331
1,461 2,038
Enlisted men
6, 932 9,152 9, 968
16,061 19,176
18, 310 17, 956 18,000 17, 822 17, 615
18,172 17, 586 15, 355 14,876 15,174
16,097 16,040 16,911 16,997 18,013
26, 369 48, 237
MARINE CORPS RESERVE
Officers Enlisted men
564 4,750 137 501
150 483 250 2,647 378 5,685 413 8,366 445 9,119
488 10,265 536 9, 425 557 8,437 642 8,742 645 7,576
689 8,378 <715 9, 737 <848 11, 796 <923 13,944
< 1,061 14,964
< 1,186 14,976 < 1, 618 12,150
1 Naval Militia prior to 1917. 2 Enrolled. 3 Includes Aviation Cadets: 1936, 359; 1937, 554; 1938, 812; 1939, 1,032; 1940, 545; 1941 data not available.
Also includes 591 Merchant Marine Cadets in 1940; 1941 data not available. * Includes Aviation Cadets: 1936, 25; 1937, 50; 1938, 63; 1939, 83; 1940, 46; 1941 data not available. ^ For later available data, see table 164. Source: Navy Department, records.
N O . 1 6 7 . — S H I P S A N D A I R C R A F T O F T H E U . S . N A V Y AS O F J U L Y 1 , 1 9 4 0 , A N D J U L Y 3 1 , 1 9 4 3
[Figures include ships converted into Navy auxiliaries or small craft. Allowance has been made for the large number, but comi:)aratively small tonnage of landing craft, small craft and auxiliaries which have been lost or transferred. These data are not comparable with data in table 168]
DATE
SHIPS
Aircraft DATE
Total Warships 1 Other Aircraft
Number: July 1, 1940 1,076
14, 072
1, 875, 000 5,000, 000
383 613
1, 313, 000 2, 218, 000
693 13, 459
562, 000 2, 782,000
1, 744 18, 269 July 31, 1943 _ _
1,076 14, 072
1, 875, 000 5,000, 000
383 613
1, 313, 000 2, 218, 000
693 13, 459
562, 000 2, 782,000
1, 744 18, 269
Displacement (tons): July 1, 1940 --
1,076 14, 072
1, 875, 000 5,000, 000
383 613
1, 313, 000 2, 218, 000
693 13, 459
562, 000 2, 782,000
1, 744 18, 269
July 31 1943
1,076 14, 072
1, 875, 000 5,000, 000
383 613
1, 313, 000 2, 218, 000
693 13, 459
562, 000 2, 782,000
1,076 14, 072
1, 875, 000 5,000, 000
383 613
1, 313, 000 2, 218, 000
693 13, 459
562, 000 2, 782,000
1 Battleships, carriers, cruisers, destroyers, submarines. Source; Navy Department; press release, Sept. 19, 1943.
164 M I L I T A R Y A N D C I V I L S E R V I C E S
N o . 1 6 8 . — S H I P S OF T H E U . S . N A V Y F I T FOR S E R V I C E ( I N C L U D I N G T H O S E U N D E R R E P A I R ) : 1 9 0 6 TO 1 9 4 1
TOTAL FIGHTING SHIPS NONFIGHTING SHIPS
DATE Num- Displace- Num- Displace- Num- Displace-
ber ment ber ment ber ment
June 30: Tons Tons Tons 1 9 0 6 276 692, 592 2 0 0 5 1 8 , 1 1 5
8 2 8 , 6 9 5 7 6 1 7 4 , 4 7 7
1910 3 0 8 1 , 0 7 5 , 407 2 2 0 5 1 8 , 1 1 5 8 2 8 , 6 9 5 8 8 2 4 6 , 7 1 2
1915 343 1, 3 5 2 , 1 3 5 230 9 1 3 , 3 3 4 113 4 3 8 , 8 0 1 1 9 2 0 795 2, 111, 457 6 1 8 1 , 3 6 9 , 8 8 0 177 7 4 1 , 5 7 7 1925 754 2, 274, 3 7 6 567 1 , 2 6 9 , 791 187 1 , 0 0 4 , 5 8 5 1 9 3 0 685 2, 2 2 8 , 6 1 7 5 5 1 1 , 3 0 5 , 7 4 4 1 3 4 9 2 2 , 8 7 3
December 31: 9 2 2 , 8 7 3
1935 565 2 , 0 4 3 , 6 2 4 4 3 6 1 , 1 5 5 , 7 8 0 1 2 9 8 8 7 , 8 4 4 1 9 3 8 551 1, 7 7 3 , 5 8 8 4 2 2 1 , 2 7 9 , 1 3 5 1 2 9 4 9 4 , 4 5 3 1 9 3 9 - 5 8 3 1 , 8 6 8 , 6 1 3 445 1 , 3 4 3 , 1 6 0 138 5 2 5 , 4 5 3 1 9 4 0 6 6 6 ( 0 499 ( 0 167 0 )
December 1: ( 0 ( 0 0 )
1 9 4 1 2 9 4 2 0 ) 6 6 2 C) 2 8 0 0 )
1 Data not available for publication. 2 Comparable data for later years are not available for publication. Source: Navy Department, records.
For later available data, see table 167.
N o . 1 6 9 . — A M E R I C A N N A T I O N A L R E D C R O S S — E X P E N D I T U R E S AND A D U L T M E M B E R S H I P : Y E A R S E N D E D J U N E 3 0 , 1 9 3 4 TO 1 9 4 2
NOTE.—Expenditures in thousands of dollars. Chapter budgets not included. For fiscal year 1942, additional expenditures by the 3 , 7 5 0 chapters were estimated at approximately $ 1 9 , 3 1 6 , 0 0 0
ITEM 1934 1935 1936 1937 1938 1939 1940 1941 194;̂
Adult membership (thousands): Total, including insular and foreign . Continental U. S. and Alaska
Percent of total population i Expenditures, total.
3 , 8 0 2 3, 711
3 . 0 3 , 7 1 7
3 , 8 3 8 3 , 7 3 4
3 . 0 2 , 9 4 6
4 , 1 3 8 4 , 0 2 7
3 . 2 7 , 6 8 3
4 , 9 0 4 4, 774
3 . 7 2 5 , 9 8 5
5, 5 2 4 5, 3 8 0
4 . 2 10, 359
5 , 6 6 9 5, 505
4 . 2 5 , 6 4 0
7 , 1 3 9 6 , 9 5 5
5 . 3 6 , 8 9 6
9 , 1 9 0 8 , 9 8 0
6 . 8 1 3 , 0 3 8
1 5 , 1 3 0 1 4 , 9 4 0
1 L 2 2 5 , 3 1 0
DETAIL OF EXPENDITURES 2 1941 1942 DETAIL OF EXPENDITURES 2 1941 1942
Disaster relief Domestic Insular and foreign
Foreign war relief Services to the armed forces Nursing services First aid, water safety, accident
prevention, etc
1,002 9 4 7
55 6 , 8 4 8 2, 3 8 3
2 9 6
429
1 , 2 5 2 1 , 2 3 3
19 6, 2 2 9
10, 7 1 2 6 7 9
901
Civilian war aid Volunteer special services American Junior Red Cross General service, etc., to chapters 3. Other services General executive and finance Capital expenditures for addition-
al office space
181 1 , 3 1 9
212
1 , 1 9 5 136 2 7 7
1 , 9 1 0 4 4 8 5 9 0
1 Based on population estimates of Bureau of the Census. 2 Activities common to all services, such as those of the central stenographic section, files, etc., have been
prorated to the several services. 3 Includes expenditures for supervision, field service, correspondence, public information, roll call, and
fund-raising campaigns, etc. Source: The American National Red Cross; annual report, except as noted.
F E D E R A L E M P L O Y E E S 165
N o . 1 7 0 . — E M P L O Y E E S IN F E D E R A L E X E C U T I V E C I V I L S E R V I C E : 1 8 1 6 TO 1 9 4 2
[This table covers all civil employees in the executive branch of the U .S . Govt. Temporary substitute employees in the P. 0 . Dept. are excluded except for 1941 and 1942. Also excluded are employees of the District of Columbia Government. Number on and prior to June 30, 1937, refers to employees on the roll, with or without pay, on last day of month; thereafter, to employees on pay roll with pay during last regular pay period of month. Data are not comparable with June 1943 data in table 172.]
Total number
Total number
ON OR ABOUT J U N E s o -
Total number
Wash., D. C.
metrop. area
All other
1816 1821 1831 1841
1851 1861 1871 1881
1891 1901 1911 1918 1920
6,327 8, 211
19,800 23,700
33, 300 49, 200 53, 900
107,000
166,000 256,000 391, 350
2 917, 760 3 691,116
192 1 192 2 192 3 192 4
192 5 192 6 192 7 192 8
192 9 193 0 193 1 193 2 193 3
3562, 252 527, 517 515, 772 521,641
532,798 528, 542 527, 228 540,867
559, 579 580, 494 588, 206 583,196 572,091
193 4 193 5 193 6 193 7
193 8 193 9 194 0 194 1
194 2
673, 095 719, 440 824, 259 841, 664
851, 926 920,310
1, 002, 820 1, 370,110
2, 206,970
89,132 103,453 117,103 115,409
115, 590 123, 364 133, 645 184, 236
268, 383
583, 963 615,987 707,156 726,255
736,336 796,946 869,175
1,185,874
1,938, 587
1 Approximate prior to 1921. 2 As of Nov. 11. 3 As of July 31. Source: Civil Service Commission; Annual Report; Semiannual and Monthly Report of Employment.
N o . 1 7 1 . — F E D E R A L E M P L O Y E E S , BY OCCUPATIONAL G R O U P AND A G E , BY S E X W I T H P E R C E N T D I S T R I B U T I O N BY A N N U A L S A L A R Y : D E C . 3 1 , 1 9 3 8
PERCENT DISTRIBUTION BY ANNUAL SALARY
OCCUPATIONAL GROUP AND AGE $1,200 $1,800 $2,600 $3,800 Total Male Female Total Under to to to and
! $1,200 $1,799 $2,599 $3,799 over
Total 1 BOB, 715 663,180 145, 536 100.0 13.8 82.8 40.5 10.0 3.4
Technical, scientific, and profes-sional __ 74, 705 68, 540 6,165 100.0 L2 2.3 23.9 46.1 26.5
Semitechnical, semiscientific and semiprofessional _ __ 51, 990 40,465 11, 525 100. 0 6.1 28.9 39.3 20.2 5.5
Postmasters and assistants 47, 000 31, 400 15, 600 100.0 55.9 IL 6 19.2 12.2 1. 1 Managerial and administrative. __ 36, 245 30,890 5, 355 100.0 L 8 20.6 33.9 30.2 13. 5 Postal clerks and carriers 209,000 202, 600 6,400 100.0 .9 15.0 80.5 3.6 (2) Clerical 148,000 66,870 81,130 100.0 9.6 62.7 23.4 3.9 .4 Service _ . 56, 720 47, 795 8, 925 100.0 37.4 42.3 16.4 3.0 .9 Trade and manual, total 185,055 174, 620 10,435 100.0 20.7 46.5 28.8 3.9 .1
Skilled 93,150 92, 545 605 100.0 8.5 34.6 49.1 7.5 .3 Semiskilled 47,905 40, 775 7,130 100.0 16.0 68.8 14.3 .9 Unskilled 44,000 41, 300 2,700 100.0 51.2 47.8 1.0
Under 25 years 57,970 40, 515 17,455 100.0 26.4 60.0 13.1 .6 (2) 25-29 years 95,085 71, 290 23, 795 100.0 13.6 52.6 28.9 4.5 .4 30-34 years 107, 770 86, 200 21, 570 100.0 I L I 37.4 40.1 9.3 2.1 35-39 years 111, 885 91, 380 20, 505 100.0 11.7 29.0 46.4 9.8 3.1 40-44 years 141,610 120, 590 21,020 100.0 IL 8 27.0 47.6 10.0 3.6 45-49 years 111, 300 96, 655 14,645 100.0 IL 7 24.9 46.2 12.4 4.8 50-59 years 127,395 110, 515 16,880 100.0 IL 9 22.2 45.1 15.2 5.6 60 years and over. _ _ 40,495 34, 780 5, 715 100.0 18.7 2L4 35.9 16.0 8.0 Age not specified 3 . 15, 205 11, 255 3,950 15, 205 3,950
1 Number for which complete data were available and not all persons in Federal service on Dec. 31,1938. 2 Less than 0.05 percent. 3 includes persons serving without compensation (largely agents and con-
sultants), dollar-a-year employees, and workers paid on a piece-work basis. Source: Department of Labor, Bureau of Labor Statistics. Special survey made jointly by Bureau of
Labor Statistics and Civil Service Commission and published in January 1941 issue of Monthly Labor Review and in pamphlet "Occupations and Salaries in Federal Employment."
166 M I L I T A R Y A N D C I V I L S E R V I C E S
No. 172.- - E M P L O Y E E S I N F E D E R A L E X E C U T I V E C I V I L S E R V I C E , BY D E P A R T M E N T S AND I N D E P E N D E N T O F F I C E S : J U N E 1 9 4 3
[Data are for continental United States only, excluding Alaska and Panama Canal Zone. Because of revised reporting methods data in this table are not comparable with those in table 170]
DEPARTMENT OR I N D E P E N D E N T ESTABLISHMENT
N U M B E R OF EMPLOYEES
Entire service
Wash. ,D.C. metropolitan
area All other
areas
Total.
Executive Office of the President: White House Office 1. Bureau of the Budget National Resources Planning Board Other (Executive Office of the President)-.
War establishments: Office for Emergency Management:
Alien Property Custodian Central Administrative Services Coordinator of Inter-American Affairs National War Labor Board Office of Civilian Defense Office of Defense Transportation Office of Economic Stabilization Office of the Lend Lease Administrator Office of Scientific Research & Development. . Office of War Information Office of War Mobilization Smaller War Plants Corporation War Manpower Commission War Production Board War Relocation Authority War Shipping Administration
Office of Censorship Office of Economic Warfare Office of Price Administration i Office of Strategic Services Petroleum Administrator for War
Executive departments: State Treasury War Justice Post Office Navy Interior Agriculture Commerce Labor
Independent establishments: Board of Governors Federal Reserve System.... Board of Investigation and Research Civil Service Commission Employees' Compensation Commission Federal Communications Commission Federal Deposit Insurance Corporation Federal Power Commission Federal Security Agency Federal Trade Commission Federal Works Agency General Accountmg Office Government Printing Office Interstate Commerce Commission Maritime Commission National Advisory Committee for Aeronautics.. National Archives National Capital Housing Authority National Housing Agency National Labor Relations Board . . . . . Panama Canal Railroad Retirement Board Reconstruction Finance Corporation Securities and Exchange Commission Smithsonian Institution Tariff Commission Tax Court of the United States Tennessee Valley Authority Veterans' Administration Other hidependent establishments
3, 252, 598
51 558 261 75
279, 732
51 558 149 75
2 , 9 7 2 , 8 6 6
112
1,049 432 617 5,143 2,372 2, 771 1,149 881 268 4, 281 466 3,815 1, 452 699 753 4,729 832 3,897
4 4 606 591 15
1,177 593 584 4,090 g 1,158
Q 2, 932
1,135 y
299 836 223, 486 2,853 220, 633 19, 237 12, 830 6, 407 2, 053 238 1,815
10, 252 1,030 9,222 11,079 772 10, 307 3, 034 2,885 149
121,170 5,118 116,052 1,532 1,302 230 1, 394 868 526 3, 388 2,963 425
82,093 24, 425 57,668 1, 375, 596 57, 209 1,318,387
30, 952 9,282 21, 670 315,857 7, 794 308,063 606, 590 48, 492 558, 098 40,961 4, 713 36, 248
108, 676 10, 752 97, 924 40, 531 11, 774 28, 757 10, 236 2,021 8, 215
475 459 16 148 140 8
7,218 3, 328 3,890 497 30 467
1,987 1, 031 956 2,203 267 1,936
678 456 222 37, 342 7, 318 30,024
497 434 63 20,153 14, 021 6,132 8, 767 7, 254 1,513 7,973 7, 931 42 2, 241 1,552 689 8, 474 2, 937 5, 537 3,984 150 3,834
328 318 10 248 248
19, 746 3, 763 15,983 812 361 451 248 193 55
1,695 20 1,675 8,248 3, 744 4,504 1,288 10 1,278
748 736 12 302 290 12 125 125
28, 421 10 28, 411 53, 597 5,983 47,614
269 133 136
1 Includes 64,564 board members serving without compensation. Source: Civil Service Commission, Monthly Report of Employment, July 1943.
C I V I L S E R V I C E 167
N o . 1 7 3 . — C I V I L S E R V I C E — C L A S S I F I E D C O M P E T I T I V E P O S I T I O N S , P E R S O N S E X A M I N E D , P A S S E D , AND A P P O I N T E D : 1 8 8 4 TO 1 9 4 1
Com- Com-YEAR pet i t ive Per- YEAR pet i t ive Per-
ENDED classi- Ex- Passed cent Ap- ENDED classi- Ex- Passed cent Ap-JUNE fied a m i n e d Passed that pointed JUNE fied a m i n e d Passed that pointed 3 0 — posi-
tions 1 passed 30— posi-
tions 1 passed
1884 13,780 3,542 2,044 57.7 489 1914— 292,460 215, 587 147,526 68.4 41,935 1885 15, 590 6,347 4,141 65.2 1,800
1, 881 1915-... 292, 291 167, 795 114, 632 68.3 36,397
1886 17,273 7,602 5,034 66.2 1,800 1, 881 1916.— 296, 926 154, 722 113, 792 73.5 42, 058
1887 «__. 19, 345 15, 852 10, 746 6,868
67.8 4, 442 1917.... 326,899 212.114 152, 553 71.9 86, 312 1888—_ 22, 577 11, 281
10, 746 6,868 60.9 2,616 1918— 642, 432 551, 391 387, 963 70.4 213, 530
1889__.. 29,650 19, 060 11, 978 62.8 3, 781 1919 592, 961 438, 259 299, 826 68.4 179, 533 1890-_-_ 30, 626 22, 994 13,947 60.7 5,182 1920— 497, 603 293, 327 193, 915 66.1 116, 309 1891__-_ 33, 873 19, 074 12, 786 67.0 5, 395 1 9 2 1 - - 448,112 303, 309 203, 209 67.0 101, 711 1892 37, 523 19, 460 12,160 62.5 3, 961 1922 420, 688 206,007 128, 952 62.6 63, 867 1893-.-. 43, 915 24, 838 14, 008 56.4 4, 291 1923— 411, 398 204,200 122, 918 60.2 57, 694 1894-.-. 45, 821 37, 379 22,131 59.2 4, 704
4, 793 1924— 415, 593 225, 723 135, 451 60.0 67, 349
1895 54, 222 31,036 19, 811 63.8 4, 704 4, 793 1925 423, 538 201, 415 122, 495 60.8 50,164
1896-— 87, 044 31,179 20, 714 66.4 5,086 1926— 422, 300 202, 846 105. 964 52.2 38,916 1897 85, 886 50, 571 29,474 58.3 3. 047 1927— 422, 998 251, 679 106, 937 42.4 42, 063 1898—_ 89. 306 45, 712 30, 600 66.9 7, 870 1928- — 431, 763 236, 997 123, 830 52.2 40, 317 1899- 93.144 49,164 36, 312 74.0 9, 557 1929---. 445, 957 243, 510 125, 726 51.6 47, 913 1900--_ 94, 893 46, 602 34, 965 75.0 9, 889 1930— 462, 083 267, 429 132, 991 49.7 41,075 1901---_ 106, 205 48, 093 33, 521 69. 7 10. 291 1931 468, 050 248, 438 121, 670 48.9 41, 528 1902—_ 107, 990 60,558 40, 509 66.9 13, 298 1932-. . 467,161 267,109 89, 717 34.8 25, 080 1903- — 135, 453 109,829 87, 983 80.1 40, 270 1933— 456, 096 191, 771 89, 082 46.4 12, 216 1904- — 154,093 127, 846 100, 078 78.3 ^ 48, 909 1934--.. 450, 592 296,447 169,555 57.2 22, 757 1905—. 171, 807 143, 053 111,741 78.1 38.996 1935 455, 229 430,114 198, 266 46.1 36,182 1906- — 184,178 117, 277 91, 345 77.9 39, 050 1936--.. 498, 725 732. 229 389, 052 53.1 51. 777 1907- — 194, 323 129, 317 93, 920 72.6 43. 003 1937--_ 532, 073 820, 681 393, 920 48.0 75,648 1908 206, 637 161, 793 120, 760 74.6 42. 153 1938---- 562, 909 388, 404 197, 424 50.8 51, 454 1 9 0 9 - - 234, 940 158,484 123, 449 77.9 40, 943 1939— 622,832 556,571 254,095 45.7 72,108 1910- 222, 278 115, 644 87, 769 75.9 43,585
23, 256 1940-— 6726,827 839,112 374,890 44.7 7123,799
1911- — 227, 657 105, 024 70,159 66.8 43,585 23, 256 1941 990, 233 2, 447, 463 1,273,290 52.0 282, 297
1912— 217, 392 106, 078 59, 251 55.9 20, 969 2, 447, 463
1912— 217, 392 106, 078 59, 251 55.9 20, 969 1913— 282, 597 141,905 94, 350 66.5 35,154 TotaL 13,551,243 7,672,195 56.6 2,580,650
1 Figures for years prior to fiscal year ending June 30, 1934, are approximate, 3 July 16, 1883, to Jan. 15, 1884. 3 Jan. 16, 1884, to Jan. 15, 1885. < Jan. 16, 1885, to Jan. 15, 1886. « Jan. 16, 1886, to June 30, 1887. 6 Excludes 68 employees occupying classified positions in the Administrative Office of the U. S. Courts. 7 Revised.
N o . 1 7 4 . — C I V I L S E R V I C E — P E R S O N S E X A M I N E D FOR AND A P P O I N T E D TO C E R T A I N P O S I T I O N S IN T H E P O S T A L S E R V I C E : F I S C A L Y E A R S 1 9 3 8 TO 1 9 4 1
TITLE
EXAMINED APPOINTED
TITLE
1938 1939 1940 1941 1938 1939 1940 1941
Total
Clerk-carrier Laborer, Postal Service Postmaster, first class
69, 697 57, 880 84, 619 144, 468 9, 703 9, 698 14, 391 16,503 Total
Clerk-carrier Laborer, Postal Service Postmaster, first class
42, 974 8, 947
36. 073 '851 903
1,639 5,182 2,173
90 10, 654
315
43, 108 2, 873 1,498 4, 035 6, 846 2, 422
113 23, 488
236
97, 790 15, 456
337 784
2, 573 6, 889
48 20, 301
290
5,919 624
6, 561 298 28 32
239 1,870
290 321 59
9, 387 695 99
306 713
1,741 1,052
360 38
10, 521 642 46
156 569
2, 733 1, 254
534 48
Postmaster, second class- _ Postmaster, third class Postmaster, fourth class Railway postal clerk _ ^. Rural carrier Village carrier -
3, 703 78
13,472 523
36. 073 '851 903
1,639 5,182 2,173
90 10, 654
315
43, 108 2, 873 1,498 4, 035 6, 846 2, 422
113 23, 488
236
97, 790 15, 456
337 784
2, 573 6, 889
48 20, 301
290
2,447 393 207 113
6, 561 298 28 32
239 1,870
290 321 59
9, 387 695 99
306 713
1,741 1,052
360 38
10, 521 642 46
156 569
2, 733 1, 254
534 48
Source of tables 173 and 174: Civil Service Commission, Annual Report and records*
168 M I L I T A R Y A N D C I V I L S E R V I C E S
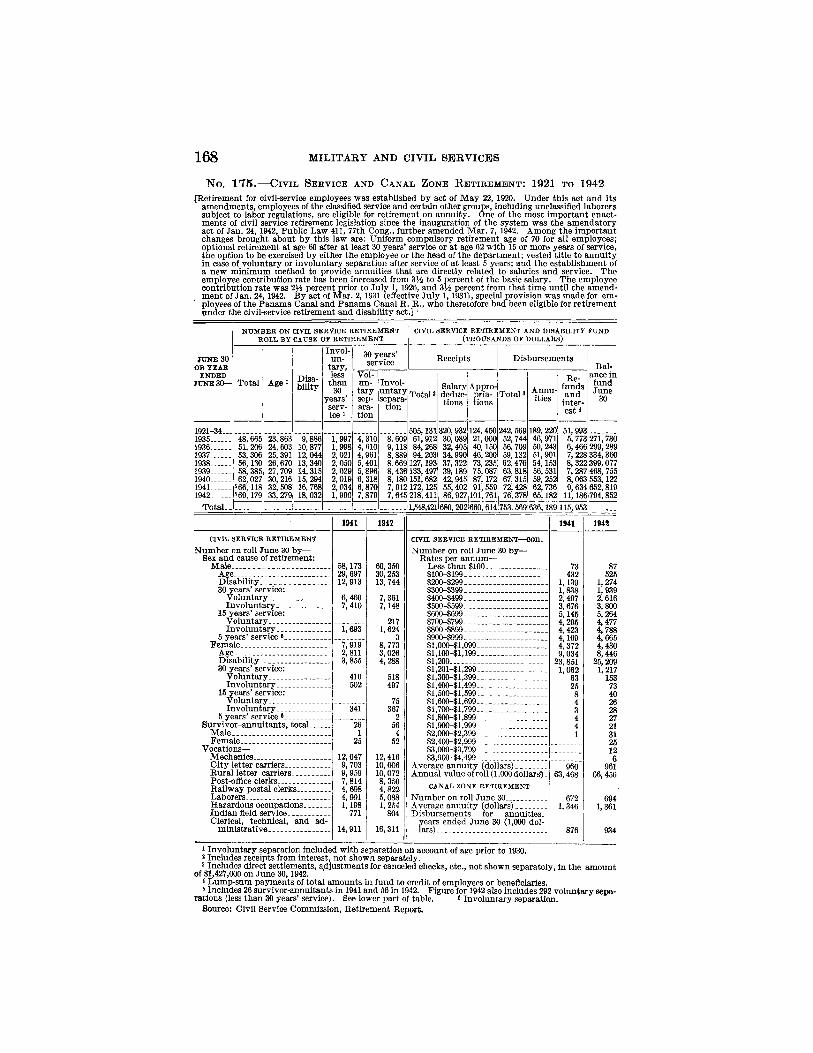
N o . 1 7 5 . — C I V I L S E R V I C E AND C A N A L Z O N E R E T I R E M E N T : 1 9 2 1 TO 1 9 4 2
[Retirement for civil-service employees was established by act of May 22, 1920. Under this act and its amendments, employees of the classified service and certain other groups, including unclassified laborers subject to labor regulations, are eligible for retirement on annuity. One of the most important enact-ments of civil service retirement legislation since the inauguration of the system was the amendatory act of Jan. 24, 1942, Public Law 411, 77th Cong., further amended Mar. 7, 1942. Among the important changes brought about by this law are: Uniform compulsory retirement age of 70 for all employees; optional retirement at age 60 after at least 30 years' service or at age 62 with 15 or more years of service, the option to be exercised by either the employee or the head of the department; vested title to annuity in case of voluntary or involuntary separation after service of at least 5 years; and the establishment of a new minimum method to provide annuities that are directly related to salaries and service. The employee contribution rate has been increased from 3 ^ to 5 percent of the basic salary. The employee contribution rate was 2 ^ percent prior to July 1, 1926, and 33^ percent from that time until the amend-ment of Jan. 24,1942. By act of Mar. 2, 1931 (effective July 1,1931), special provision was made for em-ployees of the Panama Canal and Panama Canal R. R., who theretofore had been eligible for retirement under the civil-service retirement and disability act.] '
J U N E 30 OR YEAR
ENDED JUNE 3 0 —
NUMBER ON CIVIL SERVICE RETIREMENT ROLL BY CAUSE OF RETIREMENT
Total Agei Disa-bility
Invol-un-
tary, less
than 30
years' serv-ice 1
30 years' service
W un-tary sep-ara-tion
Invol-untary separa-
tion Totals
CIVIL SERVICE RETIREMENT AND DISABILITY FUND (THOUSANDS OF DOLLARS)
Receipts
Salary deduc-tions
Appro-pria-tions
Totals
Disbursements
Annu-ities
Re-funds and
inter-est <
Bal-ance in fund June
1921-34 1935_... 1936 1937_-. 1938_-.
194 0 194 1 194 2
Total.
48, 665 51.206 53, 306 56,130 58, 385 62, 027 66,118
5 69,179
23,863 24,603 25, 391 26, 670 27,709 30, 216 32,508 33, 279
10,877 12,044 13,340 14,315 15,294 16,768 18,032
1.997 1.998 2,021 2,050 2,029 2,019 2,034 1,996
4, 310 4, 610 4,961 5,401 5,896 6, 318 6,870 7,879
9,118
8, 436 8,180 7,912 7,645
505,131 61,912 84,268 94,203
127,193 133,497 151,682 172,125 218,411
320,932 30,089 32,405 34,990 37,322 39,189 42,945 55,402 86,927
124,450 21,000 40,150 46, 200 73, 235 75,087 87,172 91, 559
101,761
242, 569 52, 744 56, 709 59,132 62,476 63,818 67,315 72,428 76,378
189, 220 46,971 50,243 51,901 54,153 56,531 59. 252 62, 736 65,182
51,993 5, 773 6,466 7,228 8, 322 7,287 8,063 9,634
11,186
271, 730 299,289 334,360 399,077 468, 755 553,122 652,819 794,852
1,548,421 680,202 660,614 753,569 636,189 115,953
1941 1942 1941 1942
CIVIL SERVICE RETIREMENT
Number on roll June 30 b y -Sex and cause of retirement:
Male Age Disability 30 years' service:
Voluntary Involuntary
15 years' service: Voluntary Involuntary
5 years' service ® Female
58,173 29,697 12,913
6,460 7,410
Disability 30 years' service:
Voluntary Involuntary.
15 years' service: Voluntary Involuntary
5 years' service ® Survivor-annuitants, total
Male Female
Vocat ions-Mechanics City letter carriers Rural letter carriers Post-office clerks Railway postal clerks Laborers Hazardous occupations Indian field service Clerical, technical, and ad-
ministrative
7,919 2,811 3,855
410 502
341
1 25
12,047 9, 703 9, 959 7, 814 4,698 4, 991 1,198
771
14,911
60, 350 30,253 13, 744
7, 361 7,148
217 1,624
3 8, 773 3,026 4,288
518 497
75 367
2 56 4
52
12, 416 10, 006 10,072 8, 350 4,822 5,088 1, 254
804
16,311
CIVIL SERVICE RETIREMENT^-COn.
Number on roll June 30 by— Rates per a n n u m -
Less than $100 $100-$199
$300-$399_ $400-$499_ $500-$599_
$700-$799_
$1,000-$1,099 $1,100-$1,199 $1,200 $1,201-$1,299 $1,300-$1,399 $1,400-$1,499 $1,500-$1,599 $1,600-$1,699 $1,700-$1,799 $1,800-$1,899 $1,900-$1,999 $2,000-$2,399 $2,400-$2,999 $3,000-$3,799 $3,900-$4,499
Average annuity (dollars) Annual value of roll (1,000 dollars).
CANAL ZONE RETIREMENT
Number on roll June 30 Average annuity (dollars) Disbursements for annuities,
years ended June 30 (1,000 dol-lars)
73 432
1,139 1,838 2,497 3,676 5,145 4,295 4,423 4,169 4, 372 9,034
23, 851 1,062
63 25 8 4 3 4 4 1
960 63,468
672 1, 346
876
87 525
1,274 1,939 2,616 3,800 5,264 4,477 4,788 4,665 4,430 8,446
25,209 1,217
153 73 40 26 28 27 21 31 25 12 6
961 66,456
1,361
934
1 Involuntary separation included with separation on account of age prior to 1930. 2 Includes receipts from interest, not shown separately. 3 Includes direct settlements, adjustments for canceled checks, etc., not shown separately, in the amount
of $1,427,000 on June 30, 1942. < Lump-sum payments of total amounts in fund to credit of employees or beneficiaries, s Includes 26 survivor-annuitants in 1941 and 56 in 1942. Figure for 1942 also includes 292 voluntary sepa-
rations (less than 30 years' service). See lower part of table. «Involuntary separation. Source: Civil Service Commission, Retirement Report.
FEDERAL EMPLOYEES 169 N o . 1 7 6 , — I N J U R I E S T O C I V I L E M P L O Y E E S O F T H E U N I T E D S T A T E S A N D C L A I M S
R E C E I V E D U N D E R U . S . E M P L O Y E E S ' A C T : S E P T . 7 , 1 9 1 6 , T O D E C . 3 1 , 1 9 4 2
NOTE—The U.S. Employees' Compensation Commission, created by act of Sept. 7,1916, is charged with the duty of administering the law providing compensation for civil employees of the United States who suffer personal injury while in the performance of official duties. This table does not include data for Civilian Conservation Corps enrollees or for persons employed as civil employees of the United States on work relief projects financed through funds provided by the several Federal emergency relief appropria-tions, excepting those administrative employees who are eligible for benefits under the act of 1916.
PERIOD COVEBBD
INJURIES REPORTED
Nonfatal Fatal Total
Percent change from
previous year
CLAIMS RECEIVED FOR DISABILITY AND DEATH
Disa-bility Death Total
Percent change from
previous year
Sept. 7, 1916, to Dec. 31,1917. Year ending Dec. 31—
191 8 -191 9 — 1920. _ -1921 . 192 2 192 3 1924. 1925 1926.. 1927. -1928 1929... 1930... 1931 1932.... 193 3 -193 4 1936 193 6 193 7 193 8 193 9 194 0 -194 1 194 2
15,831
23, 448 25, 203 19,557 18, 028 17,905 17, 713 20,260 20,377 19, 208 20,190 21,886 25,376 25,775 28,176 25,117 24,920 34,121 32,822 38,119 37,364 38, 069 42, 939 49,700 70,070
121,094
245
670 610 523 362 354 279 278 314 319 357 303 314 294 262 231 230 292 307 391 329 302 269 335 585 767
16,076
24,118 25,813 20,080 18,390 18,259 17,992 20, 538 20,691 19,527 20, 547 22,189 25,690 26,069 28,438 25,348 25,150 34,413 33,129 38,510 37, 693 38, 37! 43, 208 50,035 70, 655
121, 861
4-60.00 4-7.00
- 2 2 . 2 1 -8.42 - . 7 1
- L 4 6 4-14.15
4-. 74 -5.63 4-6.22 4-7.99
4-16.78 4-L48 4-9.09
-10.87 - . 78
4-36. 83 -3.73
4-16.24 - 2 . 1 2 4-1.80
4-12. 61 4-15. 80 4-41.21 4-72. 47
6,429
12,183 13,425 10, 505 7,857 6,804 6,466 6,890 6,987 6,830 7, 272 7, 928 9,074 9,077 9,240 7,639 7,226
10,124 8,670 7, 711 6, 754 6,101 6, 638 7, 237 9,870
13, 540
227
499 427 310 282 236 224 274 274 285 259 263 206 168 190 188 238 250 313 260 222 197 263 378 432
6,656
12, 621 13,924 10,932 8,167 7,086 6, 702 7,114 7,261 7,104 7, 557 8,187 9,337 9,283 9,408 7, 829 7,414
10,362 8,920 8,024 7,014 6, 323 6, 835 7, 500
10,248 13. 972
4-89.60 4-10.30 -21.50 -26.30 -13. 20 -6.40 4-6.15 4-2.07 -2.16 4-6.38 4-8.34
4-14.06 - .68
4-1.36 -16.78 -6.30
4-39.76 -13.92 -10.04 -12. 69 -9.85 4-8.10 4-9.73
4-36.64 4-36. 34
Source: U. S. Employees' Compensation Commission, Annual Report.
N o . 1 7 7 . ^ — R E T I R E M E N T O F F E D E R A L M I L I T A R Y P E R S O N N E L A N D O T H E R S P E C I A L C L A S S E S O F F E D E R A L E M P L O Y E E S : 1 9 3 3 T O 1 9 4 3
[Retired pay in thousands of dollars. With the exception of foreign service officers, who contribute 5 percent of their pay to the foreign service retirement fund, the personnel covered in this table make no direct contribution to their retirement pay. For data relating to Federal civil employees retired under the civil service and Canal Zone retirement acts, see table 175.]
ARMY NAVY MARINE CORPS COAST GUARD 1 OTHER ^ YEAR
ENDED JUNE 30 Number Retired Number Retired Number Retired Number Retired Number Retired
on roll 3 pay on roll 4 pay on roll 3 pay on roll 4 pay on roll 3 pay
1933 12,811 20, 218 5,176 9,151 797 1,276 1,138 1,260 558 866 1934 13,332 19, 344 5, 945
6, 869 10,059 825 1,251 1,207 L 253 636 985
1935. - 14,161 23, 444 5, 945 6, 869 11,937 894 1, 480 1, 255 1,465 671 1,121
1936 14, 530 24, 708 7, 675 13, 572 1,029 1, 747 1, 330 1,618 712 1,250 1937 14, 831 25, 387 8, 449 14,802 1,108 2,010 1, 408 1, 722 745 1, 349 1938 15,080 25, 805 9,505 16, 309 1,199 2,176 1,486 1,822 782 1, 474 1939 15, 501 26, 479 10,'681 17, 789 1, 258 2, 322 1, 581 1,962 819 1,594 1940 15, 760 27,121 12, 529 19, 901 1, 383 2, 624 1,700 2,161 931 1,771 1941 16, 056 27, 630 16, 375 18, 389 1, 553 3,013 1, 842 2, 351 1,027 1,984 1942 515, 608 26, 948 13, 753 18, 094 1, 278 2, 262 1,940 2, 349 1,071 2,156 1943_ 5 15,945 27, 320 10, 321 14, 478 1, 408 2,272 1,955 2,612 1,087 2,144
1 Includes certain members of former Life Saving Service. 2 Retired personnel for following groups of employees: Officers and employees engaged in field service
or on vessels of Lighthouse Service (except persons continuously employed in district offices and shops and 4 executive positions of the Lighthouse Service); commissioned officers of Coast and Geodetic Survey and Public Health Service; Foreign Service officers (State Department); retired judges.
3 Number on roll June 30. ^ Average number on roll. 5 Because of incomplete records, data for retired Philippine Scouts are excluded. Source: War and Navy Departments, Coast Guard, Department of Justice, and the several offices
named in footnote 2; Annual Reports and records. 5 7 8 0 7 6 ° — 4 4 - -12
170 M I L I T A R Y A N D C I V I L S E R V I C E S
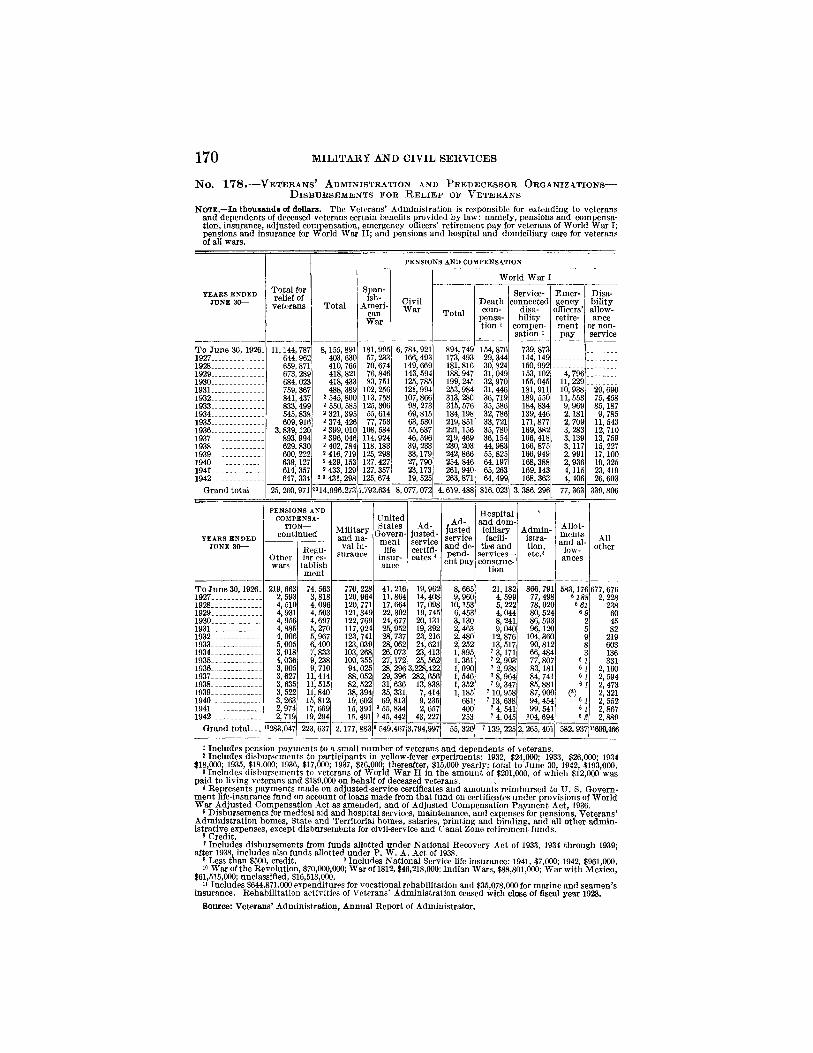
No. 1 7 8 . — V E T E R A N S ' ADMINISTRATION AND P R E D E C E S S O R O R G A N I Z A T I O N S -D I S B U R S E M E N T S FOR R E L I E F OF V E T E R A N S
NOTE.—In thousands of dollars. The Veterans' Administration is responsible for extending to veterans and dependents of deceased veterans certain benefits provided by law: namely, pensions and compensa-tion, insurance, adjusted compensation, emergency officers' retirement pay for veterans of World War I; pensions and insurance for World War II; and pensions and hospital and domiciliary care for veterans of all wars.
YEARS E N D E D J U N E s o -
Total for relief of veterans
PENSIONS AND COMPENSATION
Total Ameri-can War
Civil War
World War I
Total Death com-
pensa-tion 1
Service-connected
disa-bility
compen-sation 1
Emer-gency
officers' retire-ment pay
Disa-bility allow-ance
or non-service
To June 30, 1926 192 7 192 8 192 9 193 0 193 1 193 2 193 3 193 4 193 5 193 6 193 7 193 8 193 9 194 0 194 1 194 2
Grand total _
11,144, 787 644, 962 659,871 673, 289 684,023 759, 367 841, 437 833, 499 545,838 609,916
3,839,120 893,994 629,830 600, 222 639,127 614, 357 647, 334
8,155, 891 403, 630 410, 765 418, 821 418, 433 488, 389
2 545,800 2 550, 585 2 321, 395 2 374, 426 2 399, 010 2 396,046 2 402, 784 2 416, 719 2 429,153 2 433,129
2 3 431, 298
181, 995 57, 233 70, 674 76, 846 83, 751
102, 256 113, 758 125, 306 55, 614 77, 753
108, 584 114, 924 118,183 125, 298 127, 427 127, 357 125, 674
6, 784, 921 166, 493 149, 669 143, 594 125, 785 121,994 107,866 98, 273 69,815 63, 530 55,637 46, 596 39, 233 33,179 27, 790 23,173 19, 525
894, 749 173, 493 181,816 188, 947 199, 245 253, 984 313, 280 315, 576 184,198 219,851 221,156 2^9, 469 230, 203 242,866 254, 846 261, 940 263,871
154, 876 29, 344 30.824 31,049 32, 970 31, 446 36, 719 35, 586 32, 786 33, 721 35, 780 36,154 44,983 55.825 64,197 65, 263 64, 499
739, 873 144,149 150, 992 153,102 155,045 181, 911 189, 550 184,834 139, 446 171,877 169, 382 166, 418 166, 875 166, 949 168,388 169,143 168, 363
4,796 11, 229 10,938 11, 553 9,969 2,181 2,709 3, 283 3,139 3,117 2,991 2,936 4,115 4, 406
29,690 75, 458 85,187 9, 785
11, 543 12, 710 13,759 15, 227 17,100 19, 325 23, 419 26, 603
25, 260,971 2314,996,273 1,792,634 8, 077,072 4, 619, 488 816, 023 3, 386, 296 77,363 339,806
YEARS E N D E D J U N E 3 0 —
PENSIONS AND COMPENSA-
TION— continued
Other wars
Regu-lar es-
tablish ment
Military and na-val in-
United States
Govern-ment life
insur-ance
Ad-justed-service certifi-
, Ad-justed service and de-pend-
ent pay
Hospital and dom-iciliary facili-
ties and services— construc-
tion
Admin-istra-tion, etc.«
Allot-ments and al-
low-ances
All other
To June 30,1926. 192 7 192 8 192 9 193 0 193 1 193 2 193 3 193 4 193 5 193 6 193 7 193 8 193 9 194 0 194 1 194 2
219, 663 2,593 4, 510 4,931 4,956 4, 885 4,906 5,005 3,918 4,036 3,905 3,627 3,635 3, 522 3,263 2,974 2,719
74, 563 3, 818 4, 096 4,503 4, 697 5, 270 5,967 6,400 7,833 9, 238 9, 710
11, 414 11, 515 11,840 15,812 17, 669 19, 294
770, 228 120,964 120, 771 121, 349 122, 769 117, 924 123, 741 123,039 103, 268 100, 355 94,025 88,052 82, 522 38, 394 19, 602 15, 391 15, 491
41, 216 11,864 17,664 22, 302 24,677 25,952 28, 737 28,062 26,073 27,172 28, 296 29, 396 31, 636 35, 331 69,813
' 55,834 ' 45, 442
19,962 14,408 17, 098 19, 745 20,131 19, 392 23, 216 24,621 23,413 25, 562
3,228,422 282,656 13,838 7, 414 9,235 2, 657
43, 227
8, 665 9, 960
10,153 6, 453 3,130 2,463 2,480 2, 252 1,895 1,361 1,090 1,546 1,352 1,185
681 400 253
21,182 4, 599 5, 222 4, 044 8, 241 9,040
12,876 13, 517 7 3,171 7 2,903 7 2 , " -7 8,964 7 9, 347
7 10,958 7 13, 638 7 4, 541 7 4,045
77, 498 78, 020 80, 524 86, 593 96,120
104, 360 90, 812 66, 484 77, 807 83,181 84, 741 85,881 87, 900 94, 454 99, 541
104, 694
583,176 <^188
2 5 9 8 3
«i («)
U
677,676 2,228
238 60 45 82
219 603 136 331
2,160 2, 594 2,473 2,321 2, 552 2,867 2, 889
Grand total10283,047 223,637 2,177,883 549,467 3,794,997 55, 320 7 139, 225 2, 265, 401 582,937 "699,466
1 Includes pension payments to a small number of veterans and dependents of veterans. 2 Includes disbursements to participants in yellow-fever experiments: 1932, $24,000; 1933, $26,000; 1934
$18,000; 1935, $18.000; 1936, $17,000; 1937, $16,000; thereafter, $15,000 yearly; total to June 30, 1942, $193,000. 3 Includes disbursements to veterans of World War II in the amount of $201,000, of which $12,000 was
paid to living veterans and $189,000 on behalf of deceased veterans. < Represents payments made on adjusted-service certificates and amounts reimbursed to U. S. Govern-
ment life-insurance fund on account of loans made from that fund on certificates under provisions of World War Adjusted Compensation Act as amended, and of Adjusted Compensation Payment Act, 1936.
8 Disbursements for medical aid and hospital services, maintenance, and expenses for pensions, Veterans' Administration homes, State and Territorial homes, salaries, printing and binding, and all other admin-istrative expenses, except disbursemients for civil-service and Canal Zone retirement funds.
8 Credit. 7 Includes disbursements from funds allotted under National Recovery Act of 1933, 1934 through 1939;
after 1938, includes also funds allotted under P. W. A. Act of 1938. 8 Less than $500, credit. ® Includes National Service life insurance: 1941, $7,000; 1942, $961,000. 10 War of the Revolution, $70,000,000; War of 1812, $46,218,000; Indian Wars, $88,801,000; War with Mexico,
$61,515,000; unclassified, $16,513,000. 11 Includes $644,871,000 expenditures for vocational rehabilitation and $35,078,000 for marine and seamen's
insurance. Rehabilitation activities of Veterans' Administration ceased with close of fiscal year 1928. Source: Veterans' Administration, Annual Report of Administrator.
V E T E K A N S ' A D M I N I S T R A T I O N 171
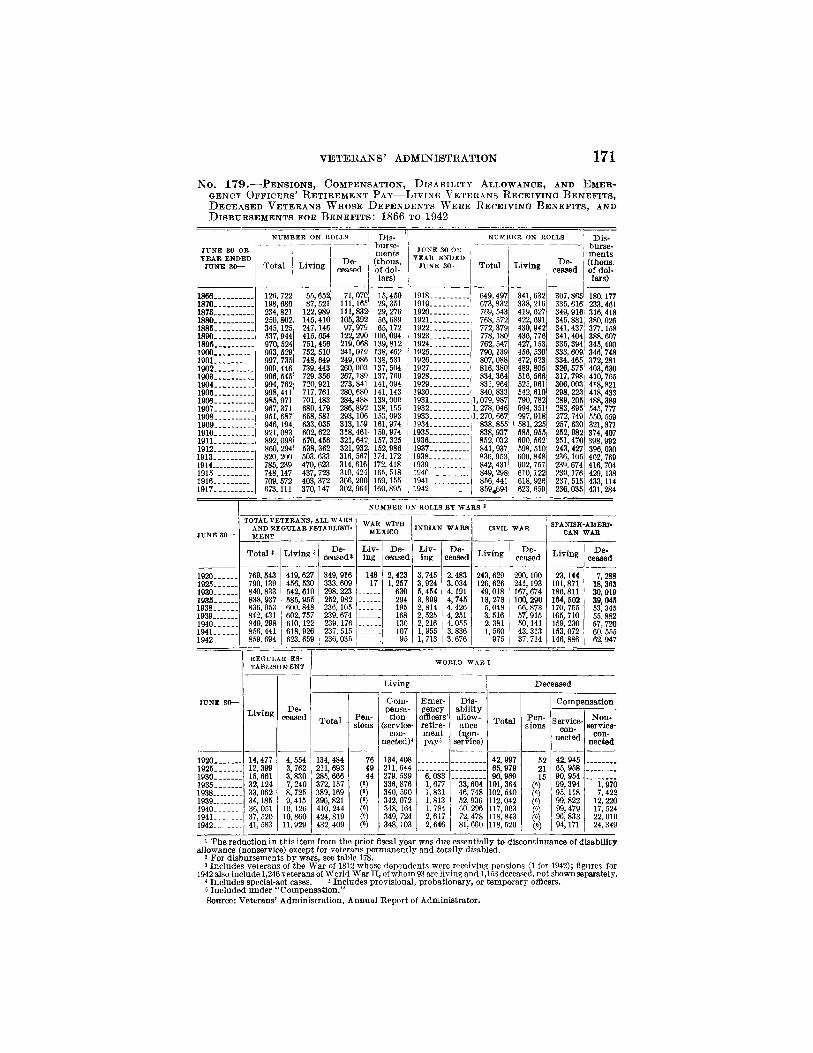
N o . 1 7 9 . — P E N S I O N S , C O M P E N S A T I O N , D I S A B I L I T Y A L L O W A N C E , AND E M E R -GENCY O F F I C E R S ' R E T I R E M E N T P A Y — L I V I N G V E T E R A N S R E C E I V I N G B E N E F I T S , D E C E A S E D V E T E R A N S W H O S E D E P E N D E N T S W E R E R E C E I V I N G B E N E F I T S , AND D I S B U R S E M E N T S FOR B E N E F I T S : 1 8 6 6 TO 1 9 4 2
JUNE 30 OR YEAR ENDED
JUNE 3 0 —
1866 1870 1875 1880 1886 1890 1896 190 0 190 1 190 2 190 3 190 4 1906. 190 6 190 7 190 8 190 9 191 0 191 1 191 2 1913-. 191 4 191 5 191 6 191 7
NUMBER ON ROLLS
Total
126, 722
234,821 250,802 345,125 537,944 970,524 993, 529 997, 735 999,446 996, 545 994,762 998,441 985,971 967,371 951, 687 946,194 921,083 892,098 860,294 820, 200 785, 239 748,147 709, 572 673, 111
Living
55,652 87, 521
122,989 145,410 247.146 415,654 751,456 752, 510 748, 649 739,443 729,356 720,921 717, 761 701,483 680,479 658,581 633,035 602,622 570,456 538,362 503, 633 470,623 437, 723 403, 372 370.147
De-
Dis-— burse-
I ments ! (thous.
of dol-lars)
71,070 111,165 111,832 105,392 97,979
122,290 219,068 241,019 249,086 260,003 267,189 273,841 280,680 284,488 286,892 293,106 313,159 318,461 321,642 321,932 316, 567 314,616 310, 424 306,200 302,964
15,450 29,351 29, 270
65,172 106,094 139,812 138,462 138, 531 137, 504 137, 760 141,094 141,143 139,000 138,155 153,093 161,974 159,974 157,325 152,986 174,172 172,418 165,518 159,155 160, 895
JUNE 30 OR YEAR ENDED
JUNE 30—
191 8 191 9 192 0 192 1 192 2 1923-. 1924 1925. 1926 -1927 -192 8 192 9 1930. 193 1 193 2 193 3 193 4 1935_ 1936-. 193 7 193 8 193 9 194 0 1941-1942
NUMBER ON ROLLS
Total
649,497 673,832 769, 543 768, 572 772, 379 778,180 762, 547 790,139 807,088 816,380 834, 364 831,964 840, 833
,079, 987 ,278,046 , 270, 667 838,855 838,937 852, 032 841,937 836, 953 842, 431 849, 298 856, 441 859^694
Living
341,632 338,216 419, 627 422,691 430,942 436, 776 427,153 456, 530 472, 623 489,805 516, 566 525,961 542, 610 790, 782 994, 351 997,918
1 581, 225 585, 955 600, 562 598, 610 600, 848 602, 757 610,122 618, 926 623, 659
De-
Dis-burse-ments (thous. of dol-lars)
307,865 335, 616 349, 916 345,881 341,437 341,404 335,394 333,609 334, 465 326, 575 317, 798 306,003 298, 223 289, 205 283,695 272, 749 257, 630 252, 982 251, 470 243,427 236,105 239, 674 239,176 237, 515 236,035
180,177 233.461 316, 418 380,026 377,158 388,607 345,490 346, 748 372,281 403,630 410,765 418,821 418,433 488,389 545, 777 550,559 321,377 374,407 398, 992 396,030 402, 769 416, 704 429,138 433,114 431, 284
NUMBER ON ROLLS BY WARS *
TOTAL VETERANS, ALL WARS AND REGULAR ESTABLISH-MENT
Tota l ' Living 3 .^J^td»
WAR WITH MEXICO
Liv- Do-ing ceased
INDIAN WARS
Liv-ing
De-ceased
SPANISH-AMERI-CAN WAR
Living De-
1920. 1925. 1930. 1936. 1938. 1939. 1940. 1941. 1942
769, 643 790,139 840, 833 838, 937 836, 953 842, 431 849, 298 856, 441 859, 694
419, 627 456, 630 542, 610 585, 955 600, 848 602, 757 610,122 618, 926 623, 659
349, 916 333, 609 298, 223 252,982 236,105 239, 674 239,176 237, 515 236,035
148 17
2,423 1,257
630 294 195 168 130 107 95
3,745 3,924 5, 454 3,899 2, 814 2, 525 2, 216 1,955 1,713
2,483 3,034 4,191 4, 746 4,426 4,251 4,055 3, 836 3, 676
243,629 126, 626 49,018 13,273 5, 048 3, 516 2, 381 1,560
975
290,100 241,193 167,674 100,290 66, 873 57,915 50,141 43, 313 37, 714
23,144 101,871 186,811 164,602 170, 755 165, 710 159, 230 153,072 146, 886
7,288 18,363 30, 919 39,046 53, 345 55, 882 57, 720 60, 555 62, 947
1920 1925 1930 1935 193 8 193 9 194 0 194 1 194 2
REGULAR ES-TABLISHMENT
Living
14,477 12, 399 15, 661 32,124 33,062 34,185 36,051 37, 520 41,583
De-ceased
4, 554 3, 762 3, 830 7,240 8, 725 9,415
10,126 10, 860 11, 929
WORLD WAR I
Living
Total
134, 484 211, 693 285, 666 372,157 389,169 396, 821 410, 244 424, 819 432, 409
Pen-sions
76 49 44
(8) (8) («) (8)
Com-pensa-
tion (service-
con-nected)<
134, 408 211, 644 279, 539 336, 876 340, 590 342, 072 348, 164 349, 724 348,103
Emer-gency
officers' retire-ment pays
6,083 1,677 1,831 1,813 1, 784 2,617 2,646
Dis-ability allow-ance
service)
33,604 46, 748 52, 936 60, 296 72, 478 81, 660
Deceased
Total
42,997 65,979 90. 969
101, 364 102, 540 112,042 117,003 118,843 118, 520
Pen-sions Service-
con-nected
52 21 15
(8) (8) (8) (8)
Compensation
42,945 65,958 90, 954 99, 394 95,118 99, 822 99, 479 96, 833 94,171
Non-service-
con-nected
1,970 7, 422
12, 220 17, 524 22, 010 24, 349
1 The reduction in this item from the prior fiscal year was due essentially to discontinuance of disability allowance (nonservice) except for veterans permanently and totally disabled.
2 For disbursements by wars, see table 178. 3 Includes veterans of the War of 1812 whose dependents were receiving pensions (1 for 1942); figures for
1942 also include 1,246 veterans of World War II, of whom 93 are living and 1,153 deceased, not shown separately. * Includes special-act cases. «Includes provisional, probationary, or temporary officers. 6 Included under "Compensation." Source: Veterans' Administration, Annual Report of Administrator.
172 M I L I T A R Y A N D C I V I L S E R V I C E S
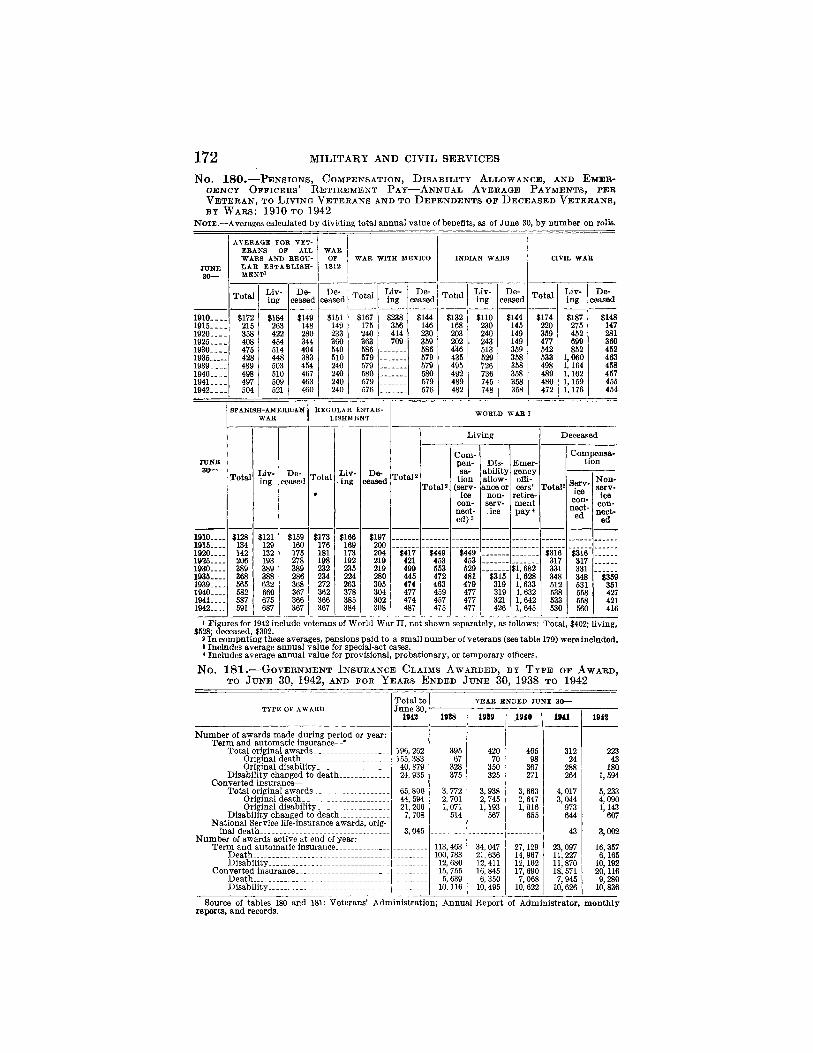
N o . 1 8 0 . — P E N S I O N S , C O M P E N S A T I O N , D I S A B I L I T Y A L L O W A N C E , A N D E M E R -G E N C Y O F F I C E R S ' R E T I R E M E N T P A Y — A N N U A L A V E R A G E P A Y M E N T S , P E R V E T E R A N , T O L I V I N G V E T E R A N S A N D T O D E P E N D E N T S O F D E C E A S E D V E T E R A N S , BY W A R S : 1 9 1 0 TO 1 9 4 2
NOTE.—Averages calculated by dividing total annual value of benefits, as of June 30, by number on rolls.
JUNE 30—
1910.— 1915-__ 1920— 1925-__ 1930-1936.-_-
1940-_. 1941-.-1942.__
AVERAGE FOR VET-ERANS OF ALL WARS AND REGU-LAR ESTABLISH-MENT!
Total
$172 216 368 408 476 428 489 498 497 504
Liv-ing
$184 263 422 454 514 448 503 510 509 521
De-
$149 148 280 344 404 383 454 467 463 460
WAR OF
1812
De-ceased
$151 149 233 360 540 510 240 240 240 240
WAR WITH MEXICO
Total
$167 175 240 363 586 579 579 580 579 576
Liv-ing
$238 356 414 709
De-ceased
$144 146 230 359 586 579 579 580 579 576
INDIAN WARS
Total
$132 168 203 202 4^6 435 495 492 489 482
Liv-ing
$110 230 240 243 513 529 726 736 745 748
De-
$144 145 149 149 359 358 358 358 358 358
Total
$174 220 359 477 542 533 498 489 480 472
Liv-
$187 275 452 699 852
1, 060 1,164 1,162 1,159 1,176
De-ceased
$148 147 281 360 462 463 468 457 455 454
SPANISH-AMERICAN WAR
JUNE s o -
Total
1910.... 1916.-. 1920.... 1925._.. 1930.... 1935.... 1939—. 1940-1941.__. 1942.-.
$128 134 142 206 389 368 565 582 587 591
Liv-ing
$121 129 132 193
632
675 687
De-
$159 160 175 278 389 286 368 367 366 367
REGULAR ESTAB-LISHMENT
Total
$173 176 181 198 232 234 272 362 366 367
Liv-ing
$166 169 173 192 235 224 263 378 385 384
De-
$197 200 204 219 219 280 305 304 302 308
WORLD WAR I
Totals
$417 421 499 446 474 477 474 487
Living
Total 2
$449 453 553 472 463 459 457 475
Com-pen-sa-
tion (serv-
ice con-nect-ed) 3
Dis-ability allow ance or
non-serv-
ice
$449 453 529 481 479 477 477 477
$316 319 319 321 426
Emer-gency ofll-cers'
retire-ment pay 4
Totals
$1. 682 1, 628 1,633 1,632 1,642 1, 645
Deceased
$316 317 331 348 512 538 533 530
Compensa-tion
Serv-ice con-
nect-ed
$316 317 331 348 531 558 558 560
Non-serv-ice
con-nect-
ed
$369 361 427 421 416
1 Figures for 1942 include veterans of World War II, not shown separately, as follows: Total, $402; living, $528; deceased, $392.
2 In computing these averages, pensions paid to a small number of veterans (see table 179) were included. 3 Includes average annual value for special-act cases. * Includes average annual value for provisional, probationary, or temporary officers.
N o . 1 8 1 . ' — G O V E R N M E N T I N S U R A N C E C L A I M S A W A R D E D , BY T Y P E O F A W A R D , T O J U N E 3 0 , 1 9 4 2 , A N D F O R Y E A R S E N D E D J U N E 3 0 , 1 9 3 8 T O 1 9 4 2
TYPE OF AWARD
Number of awards made during period or year: Term and automatic insurance—"
Total original awards Original death Original disability
Disability changed to death Converted insurance-
Total original awards Original death Original disability _..
Disability changed to death National Service life-insurance awards, orig-
inal death Number of awards active at end of year:
Term and automatic insurance Death Disability
Converted insurance Death Disability
Total to June 30,
1942
196, 262 155, 383 40, 879 24, 935
65, 800 44, 594 21, 206 7, 708
3,045
YEAR ENDED JUNE 30—
1938
395 67
328 375
3, 772 2, 701 1,071
514
113, 463 100, 783
12, 680 15, 755 5, 639
10,116
19S9
420 70
350 325
3,938 2, 745 1,193
567
34,047 21, 636 12, 411 16, 845 6, 350
10, 495
,1940
465 98
367 271
3, 663 2, 647 1, 016
655
27,129 14, 967 12,162 17,690 7,068
10, 622
1941
312 24
288 264
4, 017 3, 044
973 644
43
23,097 11, 227 11, 870 18, 571 7,945
10,626
im
223 43
180 1, 594
5,233 4,090 1,143
607
3,002
16, 357 6,165
10,192 20,116 9,280
10,836
Source of tables 180 and 181: Veterans' Administration; Annual Report of Administrator, monthly reports, and records.
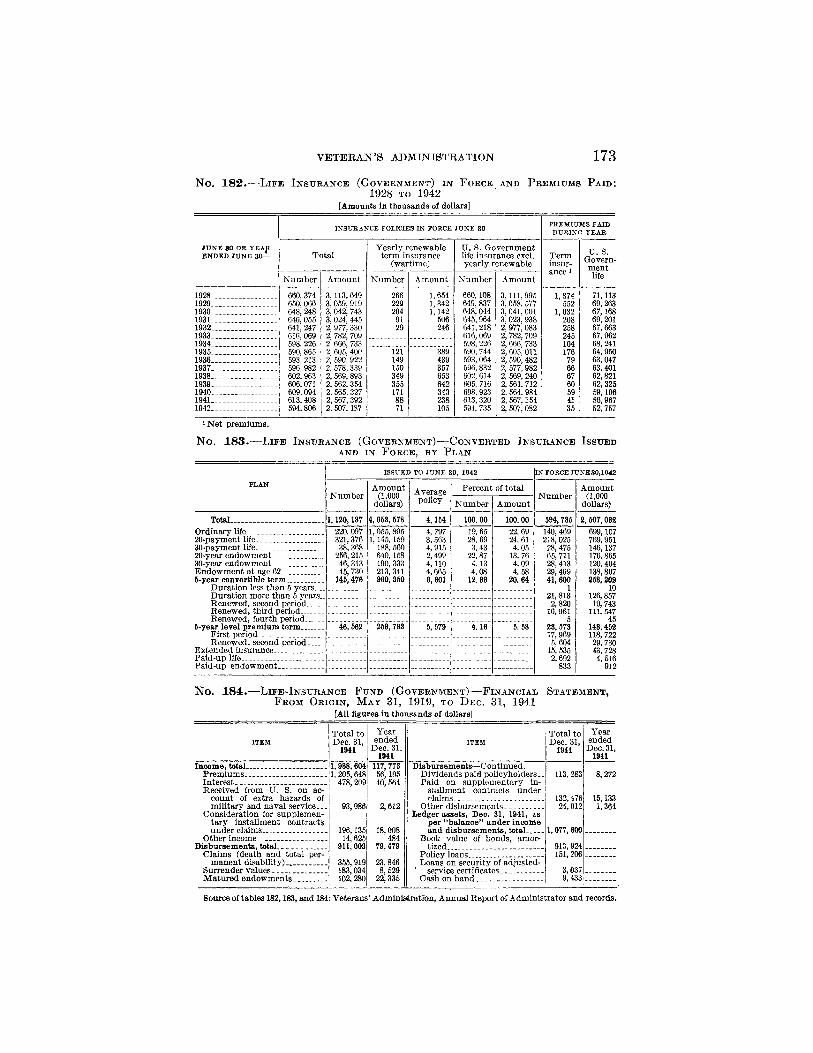
V E T E R A N ' S A D M I N I S T R A T I O N 173
N o . 1 8 2 . - — L I F E I N S U R A N C E ( G O V E R N M E N T ) IN F O R C E AND P R E M I U M S P A I D : 1 9 2 8 TO 1 9 4 2
[Amounts in thousands of dollars]
J U N E 80 OB YEAR E N D E D J U N E 3 0 —
1928. 1929. 1930. 1931. 1932 1933. 1934. 1935. 1936. 1937. 1938. 1939 1940 1941. 1942.
INSURANCE POLICIES IN FORCE J U N E 30
Total
Number Amount
660, 374 650, 066 648, 248 646, 055 641, 247 616, 069 598, 226 590, 865 593, 213 596, 982 602, 963 606, 071 609.094 613,408 594,806
3,113, 649 3, 059, 919 3, 042, 743 3, 024, 445 2, 977, 330 2, 782, 709 2, 666, 733 2, 605, 400 2, 590, 922 2, 578, 339 2, 569, 893 2, 562, 354 2, 565, 327 2, 567, 392 2, 507,187
Yearly renewable term insurance
(wartime)
Number Amount
266 229 204 91
121 149 150 349 355 171
1, 654 1,342 1,142
506 246
439 357 653 642 343 238 105
U. S. Government life insurance excl. yearly renewable
Number Amount
660,108 649, 837 648,044 645,964 641, 218 616, 069 598, 226 590, 744 593,064 596, 832 602. 614 605, 716 608, 923 613,320 594, 735
3,111,995 3, 058, 577 3,041, 601 3,023, 938 2, 977, 083 2, 782, 709 2, 666, 733 2, 605, Oil 2, 590, 482 2, 577, 982 2, 569, 240 2, 561, 712 2, 564, 984 2, 567,154 2, 507, 082
PREMIUMS PAID DURINO Y E A B
Term insur-ance 1
1,374 552
1,032 208 258 245 104 176 79 66 67 60 59 41 35
U. S. Govern-ment life
71,113 69, 263 67,168 69, 201 67, 663 67,962 68, 241 64,950 63,047 63,401 62,821 62, 325 59.196 56,967 52, 757
iNet premiums.
No. 183. L I F E I N S U R A N C E ( G O V E R N M E N T ) — C O N V E R T E D I N S U R A N C E I S S U E D AND IN F O R C E , BY P L A N
PLAN
ISSUED TO JUNE 30, 1942 IN FORCE JUNE30,1942
PLAN
Number Amount
(1,000 dollars)
Average policy
Percent of total Number
Amount (1,000
dollars)
PLAN
Number Amount
(1,000 dollars)
Average policy Number Amount
Number Amount
(1,000 dollars)
Total 1,120,187 4, 658, 578 4,154 100.00 100.00 594,785 2,507,082 Ordinary life.-. 220, 097
321, 376 38, 368
256, 215 46, 313 45, 730
145,476
1,055,895 1,145,159
188, 560 640,158 190, 333 213, 341 960, 850
4, 797 3, 563 4,915 2,499 4,110 4,665 6,601
19.65 28. 69 3. 43
22. 87 4.13 4.08
12. 99
22. 69 24. 61 4.05
13. 76 4.09 4.58
20.64
140, 469 218,025 28,475 65, 711 28, 413 29, 409 41, 600
1 21, 813 2,820
16,961 5
28, 578 17,969 5, 604
15, 535 2,692
833
699,107 769,951 146,137 176, 865 120,404 138,807 268,202
10 126, 857 19, 743
111, 547 45
148,452 118, 722 29, 730 43,728 4, 516
912
20-payment life 30-pavment l i fe . . . _ _ _ _
220, 097 321, 376 38, 368
256, 215 46, 313 45, 730
145,476
1,055,895 1,145,159
188, 560 640,158 190, 333 213, 341 960, 850
4, 797 3, 563 4,915 2,499 4,110 4,665 6,601
19.65 28. 69 3. 43
22. 87 4.13 4.08
12. 99
22. 69 24. 61 4.05
13. 76 4.09 4.58
20.64
140, 469 218,025 28,475 65, 711 28, 413 29, 409 41, 600
1 21, 813 2,820
16,961 5
28, 578 17,969 5, 604
15, 535 2,692
833
699,107 769,951 146,137 176, 865 120,404 138,807 268,202
10 126, 857 19, 743
111, 547 45
148,452 118, 722 29, 730 43,728 4, 516
912
20-year endowment .
220, 097 321, 376 38, 368
256, 215 46, 313 45, 730
145,476
1,055,895 1,145,159
188, 560 640,158 190, 333 213, 341 960, 850
4, 797 3, 563 4,915 2,499 4,110 4,665 6,601
19.65 28. 69 3. 43
22. 87 4.13 4.08
12. 99
22. 69 24. 61 4.05
13. 76 4.09 4.58
20.64
140, 469 218,025 28,475 65, 711 28, 413 29, 409 41, 600
1 21, 813 2,820
16,961 5
28, 578 17,969 5, 604
15, 535 2,692
833
699,107 769,951 146,137 176, 865 120,404 138,807 268,202
10 126, 857 19, 743
111, 547 45
148,452 118, 722 29, 730 43,728 4, 516
912
30-year endowment.. _
220, 097 321, 376 38, 368
256, 215 46, 313 45, 730
145,476
1,055,895 1,145,159
188, 560 640,158 190, 333 213, 341 960, 850
4, 797 3, 563 4,915 2,499 4,110 4,665 6,601
19.65 28. 69 3. 43
22. 87 4.13 4.08
12. 99
22. 69 24. 61 4.05
13. 76 4.09 4.58
20.64
140, 469 218,025 28,475 65, 711 28, 413 29, 409 41, 600
1 21, 813 2,820
16,961 5
28, 578 17,969 5, 604
15, 535 2,692
833
699,107 769,951 146,137 176, 865 120,404 138,807 268,202
10 126, 857 19, 743
111, 547 45
148,452 118, 722 29, 730 43,728 4, 516
912
Endowment at age 62_ _ _
220, 097 321, 376 38, 368
256, 215 46, 313 45, 730
145,476
1,055,895 1,145,159
188, 560 640,158 190, 333 213, 341 960, 850
4, 797 3, 563 4,915 2,499 4,110 4,665 6,601
19.65 28. 69 3. 43
22. 87 4.13 4.08
12. 99
22. 69 24. 61 4.05
13. 76 4.09 4.58
20.64
140, 469 218,025 28,475 65, 711 28, 413 29, 409 41, 600
1 21, 813 2,820
16,961 5
28, 578 17,969 5, 604
15, 535 2,692
833
699,107 769,951 146,137 176, 865 120,404 138,807 268,202
10 126, 857 19, 743
111, 547 45
148,452 118, 722 29, 730 43,728 4, 516
912
5-year convertible term
220, 097 321, 376 38, 368
256, 215 46, 313 45, 730
145,476
1,055,895 1,145,159
188, 560 640,158 190, 333 213, 341 960, 850
4, 797 3, 563 4,915 2,499 4,110 4,665 6,601
19.65 28. 69 3. 43
22. 87 4.13 4.08
12. 99
22. 69 24. 61 4.05
13. 76 4.09 4.58
20.64
140, 469 218,025 28,475 65, 711 28, 413 29, 409 41, 600
1 21, 813 2,820
16,961 5
28, 578 17,969 5, 604
15, 535 2,692
833
699,107 769,951 146,137 176, 865 120,404 138,807 268,202
10 126, 857 19, 743
111, 547 45
148,452 118, 722 29, 730 43,728 4, 516
912
Duration less than 5 years
220, 097 321, 376 38, 368
256, 215 46, 313 45, 730
145,476
1,055,895 1,145,159
188, 560 640,158 190, 333 213, 341 960, 850
4, 797 3, 563 4,915 2,499 4,110 4,665 6,601
19.65 28. 69 3. 43
22. 87 4.13 4.08
12. 99
22. 69 24. 61 4.05
13. 76 4.09 4.58
20.64
140, 469 218,025 28,475 65, 711 28, 413 29, 409 41, 600
1 21, 813 2,820
16,961 5
28, 578 17,969 5, 604
15, 535 2,692
833
699,107 769,951 146,137 176, 865 120,404 138,807 268,202
10 126, 857 19, 743
111, 547 45
148,452 118, 722 29, 730 43,728 4, 516
912
Duration more than 5 years
140, 469 218,025 28,475 65, 711 28, 413 29, 409 41, 600
1 21, 813 2,820
16,961 5
28, 578 17,969 5, 604
15, 535 2,692
833
699,107 769,951 146,137 176, 865 120,404 138,807 268,202
10 126, 857 19, 743
111, 547 45
148,452 118, 722 29, 730 43,728 4, 516
912
Renewed, second period
140, 469 218,025 28,475 65, 711 28, 413 29, 409 41, 600
1 21, 813 2,820
16,961 5
28, 578 17,969 5, 604
15, 535 2,692
833
699,107 769,951 146,137 176, 865 120,404 138,807 268,202
10 126, 857 19, 743
111, 547 45
148,452 118, 722 29, 730 43,728 4, 516
912
Renewed, third period-
140, 469 218,025 28,475 65, 711 28, 413 29, 409 41, 600
1 21, 813 2,820
16,961 5
28, 578 17,969 5, 604
15, 535 2,692
833
699,107 769,951 146,137 176, 865 120,404 138,807 268,202
10 126, 857 19, 743
111, 547 45
148,452 118, 722 29, 730 43,728 4, 516
912
Renewed, fourth period
140, 469 218,025 28,475 65, 711 28, 413 29, 409 41, 600
1 21, 813 2,820
16,961 5
28, 578 17,969 5, 604
15, 535 2,692
833
699,107 769,951 146,137 176, 865 120,404 138,807 268,202
10 126, 857 19, 743
111, 547 45
148,452 118, 722 29, 730 43,728 4, 516
912
5-year level premium term 46, 562 259,788 5, 579 4.16 5. 58
140, 469 218,025 28,475 65, 711 28, 413 29, 409 41, 600
1 21, 813 2,820
16,961 5
28, 578 17,969 5, 604
15, 535 2,692
833
699,107 769,951 146,137 176, 865 120,404 138,807 268,202
10 126, 857 19, 743
111, 547 45
148,452 118, 722 29, 730 43,728 4, 516
912
First period _ . 46, 562 259,788 5, 579 4.16 5. 58
140, 469 218,025 28,475 65, 711 28, 413 29, 409 41, 600
1 21, 813 2,820
16,961 5
28, 578 17,969 5, 604
15, 535 2,692
833
699,107 769,951 146,137 176, 865 120,404 138,807 268,202
10 126, 857 19, 743
111, 547 45
148,452 118, 722 29, 730 43,728 4, 516
912
Renewed, second period
140, 469 218,025 28,475 65, 711 28, 413 29, 409 41, 600
1 21, 813 2,820
16,961 5
28, 578 17,969 5, 604
15, 535 2,692
833
699,107 769,951 146,137 176, 865 120,404 138,807 268,202
10 126, 857 19, 743
111, 547 45
148,452 118, 722 29, 730 43,728 4, 516
912
Extended insurance
140, 469 218,025 28,475 65, 711 28, 413 29, 409 41, 600
1 21, 813 2,820
16,961 5
28, 578 17,969 5, 604
15, 535 2,692
833
699,107 769,951 146,137 176, 865 120,404 138,807 268,202
10 126, 857 19, 743
111, 547 45
148,452 118, 722 29, 730 43,728 4, 516
912 Paid-up life _ . . .
140, 469 218,025 28,475 65, 711 28, 413 29, 409 41, 600
1 21, 813 2,820
16,961 5
28, 578 17,969 5, 604
15, 535 2,692
833
699,107 769,951 146,137 176, 865 120,404 138,807 268,202
10 126, 857 19, 743
111, 547 45
148,452 118, 722 29, 730 43,728 4, 516
912 Paid-up endowment..
140, 469 218,025 28,475 65, 711 28, 413 29, 409 41, 600
1 21, 813 2,820
16,961 5
28, 578 17,969 5, 604
15, 535 2,692
833
699,107 769,951 146,137 176, 865 120,404 138,807 268,202
10 126, 857 19, 743
111, 547 45
148,452 118, 722 29, 730 43,728 4, 516
912
140, 469 218,025 28,475 65, 711 28, 413 29, 409 41, 600
1 21, 813 2,820
16,961 5
28, 578 17,969 5, 604
15, 535 2,692
833
699,107 769,951 146,137 176, 865 120,404 138,807 268,202
10 126, 857 19, 743
111, 547 45
148,452 118, 722 29, 730 43,728 4, 516
912
N o . 1 8 4 . — L I F E - I N S U R A N C E F U N D ( G O V E R N M E N T ) — F I N A N C I A L S T A T E M E N T , F R O M O R I G I N , M A Y 3 1 , 1 9 1 9 , TO D E C . 3 1 , 1 9 4 1
[All figures in thousands of dollars]
Income, total Prerniums Interest Received from U. S. on ac-
count of extra hazards of military and naval service...
Consideration for supplemen-tary installment contracts under claims
Other income Disbursements, total
Claims (death and total per-manent disability)
Surrender values. Matured endowments
Total to Dec. 31,
1941
1, 988, 604 1, 205,648
478, 209
93,986
196,135 14, 625
911,003
355,919 183,034 102,280
Year ended
Dec. 31. 1941
117, 773 56,105 40, 564
2,612
18,008 484
79,479
23,846 8, 529
22,335
Disbursements—Continued. Dividends paid policyholders.. Paid on supplementary in-
stallment contracts under claims -
Other disbursements ledger assets, Dec. 31, 1941, as
per "balance" under income and disbursements, total
Book value of bonds, amor-tized
Policy loans Loans on security of adjusted-
' service certificates Cash on hand
Total to Dec. 31,
1941
113, 283
132,476 24,012
1,077, 600
913, 924 151, 206
3,037 9,433!
Year ended
Dec. 31, 1941
8,272
15,133 1,364
Source of tables 182,183, and 184: Veterans' Administration, Annual Report of Administrator and records.

174 M I L I T A R Y A N D C I V I L S E R V I C E S
N o . 1 8 5 . — A D J U S T E D - C O M P E N S A T I O N A W A R D S , AS O F J U N E 3 0 , 1 9 4 2
NOTE.—Amounts in thousands of dollars. The Adjusted Compensation Payment Act, 1936, provided for payment of adjusted-service certificates on or after June 15, 1936.
Number Amount Number Amount Total awards
Dependents Less than $50 (cash) $50 or over $60 lump-sum payment s—
Veterans .
4,119,212 148, 593 12,155
136, 438
3, 970, 619 178, 071
3, 792, 548
3, 766,230 50,371
328 46, 260 3, 783
3, 715, 859 5,842
3, 710, 017
Payments on certificates ma-tured by death -
Applications certified for pay-ment -
Maturity value of certificates certified for payment
242,862
3, 515,227
239, 246
1,923,952
3, 439,447 $50 or less (cash) — Certificates —
4,119,212 148, 593 12,155
136, 438
3, 970, 619 178, 071
3, 792, 548
3, 766,230 50,371
328 46, 260 3, 783
3, 715, 859 5,842
3, 710, 017
239, 246
1,923,952
3, 439,447
N O . 1 8 6 . ^ — U N I T E D S T A T E S V E T E R A N S R E C E I V I N G H O S P I T A L OR D O M I C I L I A R Y C A R E A U T H O R I Z E D BY V E T E R A N S ' A D M I N I S T R A T I O N : 1 9 2 6 TO 1 9 4 2
NOTE.—During the fiscal year 1942, a total of 1,003,429 out-patient treatments were given and 933,812 out-patient examinations were made. On June 30, 1942, there were 5,112 veterans domiciled in State and Territorial homes who were eligible for care in facilities controlled by the Veterans' Administration. The Federal Government reimbursed these homes at the rate of $120 per year for each person through August 1939, and at the rate of $240 per year for each person thereafter.
YEAR ENDED JUNE 3 0 —
1926 193 7 1928 1 9 2 9 . _ _ . . 193 0 193 1 1 9 3 2 . 193S 193 4 193 5 193 6 1937_ — . 193 8 193 9 194 0 194 1 1942-
Total receiv-
ing hospi-tal or domi-ciliary care at end of year i
51,980 62,255 44,644 48,849 51,922 51,128 57,180 64, 924 69, 287 73,114 72,138 67, 646
VETERANS RECEIVING HOSPITAL TREAT-MENT, ALL FACILITIES AND HOSPITALS '
Aver-age
daily pa-
tients
27,012 26, 386 26,300 27,642 29,513' 32, 713 42,448 42, 526 36,192 41,172 43, 516 44, 942 49, 004 52, 805 56, 304 58, 475 57, 880
Patients remaining at end of year
Total
24, 915 25.310 25,899 27, 487 30.311 34,948 43, 567 33, 457 39,445 42, 599 41, 542 46,142 50, 670 53, 861 56, 596 58,160 56, 073
Tu-bercu-losis
7, 308 6, 658 6,045 6,121 6, 274 6,193 6, 499 5, 425 5,032 5,134 4,539 4,789 4, 857 4, 913 4, 644 4,637 4, 900
Neuro-psychi-
atrie
12, 220 12, 538 12, 839 13, 461 14,941 17,001 20,160 20,109 22, 226 23, 358 24,447 26, 394 29, 267 31,190 33, 016 34, 508 34, 659
Gen-eral
5, 387 6,114 7,015 7,905 9,096
11,754 16, 908 7, 923
12,187 14,107 12, 556 14,959 16, 546 17, 758 18, 936 19, 015 16, 514
Veter-ans
receiv-ing
domi-ciliary care at end of year i
«17,032 18, 688 11,187 9, 404 9, 323 9, 586
11,038 14, 254 15, 426 16,518 13,978 11, 573
VETERANS' ADMINISTRATION FACILITIES
Hospital »
Aver-age
daily
tients
16,567 17,305 17,801 19, 245 20, 233 22, 297 25,046 32, 666 35, 220 39,030 40, 972 41,939 45, 639 49,147 52,409 54, 582 54, 636
Oper-ating
ex-penses (1,000 dol-lars)
25,322 25, 282 26,091 28,178 28, 520 30, 414 31, 996 33, 391 32, 620 39, 856 42, 386 43, 252 44, 204 47, 988 49, 921 55, 444 59,055
Per diem cost (dol-lars) <
4.19 4.00 4.00 4.01 3.84 3. 72 3.44 2. 74 2.51 2. 78 2.82 2. 81 2. 65 2. 68 2. 60 2. 78 2. 96
Domiciliary Aver-
age daily domi-cili-ary care
Op. erat-ing ex-
penses (1,000 dolls.)
10,190 10,406 12,008 10, 364 13, 514 15, 709 16, 708 16, 696 14, 371
3,649 4,024 4,474 4, 299 4, 872 5, 218 5,546 5, 670 5, 836
VETERANS UNDER HOSPITAL OR DOMICILIARY CARE, BY CLASS OF BENEFICIARY
TYPE OF CARE AND YEAR (JUNE 30)
ALL WARS AND REGULAR ESTABLISHMENT
Total Serv-
ice con-nected
Non-service
WORLD WAR I
Total Serv-
ice con-nected
Non service®
Span-ish-
Ameri-can
Civil War
All other wars
Regular estab-lish-
ment
Hospital treatment: 1925 1930— — . 1935.. 194 0 194 1 194 2
Domiciliary care: i 1935 193 9 194 0 194 1 194 2
26, 610 30, 311 42. 599 56, 596 58,160 56, 073
9, 323 15, 426 16, 518 13, 978 11, 573
22, 771 16,219 12, 046 12, 328 12, 488
n2, 999
919 1,121 1,146
835 7 675
3,839 14,092 30,553 44, 268 45, 672 43, 074
8,404 14, 305 15, 372 13,143
710. 898
26,029 28,850 38,033 50, 912 52, 088 49,140
7, 466 14, 058 15, 242 12, 842 10, 612
22, 771 15, 297 10, 746 10, 552 10, 468 10, 201
727 863 949 691 571
3, 258 13,553 27, 287 40. 360 41, 620 38, 939
6, 739 13,195 14, 293 12,151 10, 041
564 1,313 2, 369 2,900 2,992 2, 951
1,286 764 752 693 623
79 117 37 15 18
36 2
2,010 2, 679 2, 999 3, 077
494 584 505 429 323
1 Veterans' homes were not under the jurisdiction of the Veterans' Administration prior to July 1930. »Includes Veterans' Admin, beneficiaries cared for in Army, Navy, Marine, and State and civil (con-
tract) hospitals, St. Elizabeths, and hospitals operated in connection with National Veterans' homes. » Beginning 1933, figures include hospitals operated in connection with Veterans' Admin, homes. < Excludes hospitals which operated for only part of the year under unnatural conditions. 'Includes domiciliary members receiving hospital treatment. • Includes emergency, observation, and unclassified cases. 7 Includes veterans of World Wax II, not shown separately^ as follows: Receiving hospital t rea tment -
Total, 832; service connected, 743; nonservice, 89. Receiving domiciliary care—Total, 2; nonservice,.2. Sources of tables 185 and 186: Veterans' Administration, Annua IReport of Administrator and records.