Embed Size (px)
Citation preview

Somewhere in this section, a reference to a well thought out quote that eulogizes the importance of
science or the significance of PhDs to the scientific community, should be made. But I would rather
want to identify this doctorates experience with something more related to my personality:
I am lazy and proud to be! There is no one better to choose for fulfilling a difficult task than a lazy
person, because he will find an easy way to do it.
Bill Gates

Promoter
Prof. Dr. ir. Kathy Steppe
Laboratory of Plant Ecology
Department of Plants and Crops
Faculty of Bioscience Engineering
Ghent University
Members of the examination board
Prof. Dr. Bernard De Baets (chairman)
Department of Data analysis and mathematical modelling, Ghent University
Prof. Dr. ir. Jan Van den Bulcke (secretary)
Department of Environment, Ghent University
Prof. Dr. H. Jochen Schenk
Department of Biological Science, California State University Fullerton
Prof. Dr. ir. Dimitrios G. Aggelis
Department of Mechanics of Materials and Constructions, Vrije Universiteit Brussel
Dr. Olivier Leroux
Department of Biology, Ghent University
Dean
Prof. Dr. ir. Marc Van Meirvenne
Rector
Prof. Dr. ir. Rik Van de Walle
ir. Niels De Baerdemaeker
FROM HYDRAULICS TO ACOUSTICS IN DROUGHT-INDUCED
CAVITATION IN PLANTS
Thesis submitted in fulfilment of the requirements for the degree of
Doctor (PhD) of Applied Biological Sciences
Dutch translation of the title:
Van hydraulische tot akoestische meetmethode voor droogte-geïnduceerde cavitatie
in planten
Illustration on the cover:
Acoustic wave originating from a cavitated vessel on a X-ray computed microtomography (µCT) image
of a two-year-old Fraxinus excelsior L. (common ash) tree engulfed on the left-hand-side by a
hydraulic wave. Functional and cavitated vessels on the µCT image are respectively indicated in dark-
grey and white.
Citation:
De Baerdemaeker, N.J.F. (2018) From hydraulics to acoustics in drought-induced cavitation in plants.
PhD thesis, Ghent University, Belgium
ISBN: 978-94-635-7106-7
The author and the promoter give the authorization to consult and copy parts of this work for personal
use only. Every other use is subject to copyright laws. Permission to reproduce any material contained
in this work should be obtained from the author.

i
Bij het neerpennen van deze eerste zin van mijn dankwoord, kan ik niet anders dan
te beginnen met een enorme slaak van opluchting. Eindelijk ben ik toegekomen aan
het meest stressloze en plezantste onderdeel van het schrijven van een doctoraat,
tenminste als ik mijn lieftallige voorgangers mag geloven. En terwijl ik nadenk over
welk stuk prachtig proza ik uit mijn mouwen ga schudden om de ontelbare vele
mensen te bedanken voor hun steun en toeverlaat, kan ik niet anders dan mijn
voorgangers gelijk geven. Na maanden van gezwoeg en gepuf over ieder
wetenschappelijke woord die nodig was om dit doctoraat zijn finale vorm te geven,
werkt het schrijven van een dankwoord daadwerkelijk bevrijdend!
Beginnen kan ik niet anders dan bij Kathy. Niet alleen kreeg ik van haar de once-in-
a-lifetime kans om een doctoraat te doen, ze redde mij daarmee ook na het behalen
van mijn diploma van opnieuw een jaarlang studeren en examens maken. Dodged
the bullet there! Het positivisme en enthousiasme dat Kathy uitstraalt werkt als een
onbeschrijfelijke drijfveer om nooit op te geven en er vol voor te gaan. Zo duwde ze
niet alleen mij maar ook heel haar labo naar nieuwe hoogtes waarvan je, zeker als
startende doctoraatsstudent, niet van wist dat je die kon bereiken. Ik ben u dan ook
enorm dankbaar voor alle steun en begeleiding tijdens mijn doctoraatstraject, en voor
P
PREFACE

Preface
ii
uw onafgelaten nalees en verbeter werk zodanig dat er op 22 mei 2018 een geprinte
versie van mijn 4-jaar durende doctoraatsopleiding kon klaar liggen.
Many thanks as well to the members of the examination committee for proofreading
this thesis and providing valuable comments and suggestions to improve it: prof. dr.
Bernard De Baets, prof. dr. ir. Jan Van den Bulcke, prof. dr. Jochen H. Schenk, prof.
dr. ir. Dimitrios G. Aggelis and dr. Olivier Leroux. Jochen, I am as grateful to you as
to Kathy for giving me the opportunity to start a PhD. Olivier, I came only recently in
contact with your wood anatomical skills, but I must say that your microscopic
sections are truly a work of art. Jan, from all the non-Laboratory of Plant Ecology
colleagues, you were definitely the one I bothered the most with my relentless
questions. It was thanks to you that I discovered the enormous potential of X-ray
computed microtomography for my PhD research. In my eyes, you were as much as
a promotor to me as Kathy was, and that is something I am eternally grateful for.
Voor het financieren van mijn doctoraat wil ik graag de National Science Foundation
(NSF) en het Fonds Wetenschappelijk Onderzoek Vlaanderen (FWO) bedanken.
Doorheen mijn doctoraatstraject heb ik het genoegen gehad om met veel
verschillende mensen te kunnen samenwerken en deze personen wil ik dan ook
graag bedanken. Lidewei, het was uw vooruitstrevend werk in akoestische emissies
dat de baan opende voor mijn doctoraat. Niek, onze appel paper was zowel voor u
als mij de akoestische vuurdoop maar we kunnen trots zijn op ons felbevochten
resultaat. Dat de akoestische emissies daaropvolgend enorm veel interesse kregen
was te zien aan het feit dat zelfs mijn ex-collega’s Michiel Hubeau en Jackie er zich
wouden aan wagen. Met de Spaanse olijven van Carmen, de tropische bomen van
Anaïs en de tarwe gewassen van Szanne kregen de akoestische sensoren zelfs nog
wat meer run for their money. Mijn doctoraat heeft ook mede zijn vorm gekregen
dankzij het fantastische werk van mijn master studenten Célestin, Nirmani en Bert.
Thomas en Manuel van het UGCT ben ik ook enorm dankbaar voor de vele X-stralen
experimenten waaraan ik mijn planten, en gelukkig niet mezelf, heb kunnen
blootstellen. Voor het extraheren van cavitatie-gerelateerde akoestische emissies
was dan weer Michiel Stock zijn kennis van machine leeralgoritmes onontbeerlijk.
Bij de techniekers van ons labo Geert, Philip en Erik komt er spontaan een leuze van
Urbanus in mijn gedachten die ze met recht en rede luidkeels mogen zingen: “Wij zijn
de mannen van het lab, de mannen die sensoren installeren en de PhD studenten
ambeteren. Wij zijn de mannen die den boel doen draaien, de mannen die nooit
klagen en achter Kathy’s toestemming vragen”. Dat ik bij jullie wellicht gekend sta als
de gevaarlijkste collega ever gezien mijn hoog risico op brand stichting, erlenmeyer

Preface
iii
implosies, en noodstop indrukkingen verschiet ik nauwelijks van. Geert, ik kan niet
langer op één hand tellen hoeveel verschillende houders ik u heb laten vervaardigen
voor de X-stralen en akoestische metingen, maar ze waren steeds een lust voor het
oog. Philip, dat een Campbell logger voor u nog geheimen heeft is moeilijk te
geloven gezien je mijn vele aansluitingen deed afstempelen als kinderspel. Erik, dat
de weegschaal logger nog steeds loopt als een trein heb ik volledig aan u te danken.
En wie weet krijgt ons zot idee nog het daglicht te zien. Jullie zijn alle drie
fantastische personen en ik ben jullie dan onnoemelijk dankbaar voor al jullie hulp.
Maar waar er sterke mannen zijn, zijn er natuurlijk nog sterkere vrouwen. Ann en Pui
Yi, jullie zijn het kloppend hart van dit labo met jullie ongebreidelde inzet om de
sociale cohesie te versterken met de vele koffiepauzes, iet wat ‘gedwongen’
verjaardagstraktaties, en uitstapjes. Een administratieve vraag werd door jullie steeds
met gemak verholpen en voor een goe klapke wist ik steeds waar ik moest zijn. Een
super bedanking voor super madammen.
Collega’s zoals ik ze heb leren kennen op het Labo voor Plant Ecologie vind je
volgens mij nergens anders. Ik heb het genoegen gehad om deel uit te maken van
twee fantastische lichtingen. Als rookie had ik, samen met mijn mede-musketiers
Michiel en Hannes het genoegen te mogen leren van absolute top mensen als
Maurits, Veerle, Lidewei, Hans, Jochem, Annelies, Jasper, Ingvar, Thomas, Bart,
Elizabeth en Wouter. Zeker het geduchte drieluik omschreven als de harde kern van
Ingvar, Thomas en Bart hebben daarenboven mij meermaals stevige bier
drinkavonden bezorgd in de Koe waarvan ik dacht dat mijn lever het nooit zou
aankunnen. Maar doctoreren is een proces van komen en gaan en dus komen er
steeds andere mensen in de plaats, maar die nieuwe lichting was nog zotter en
geweldiger dan die vorige, en ze gaven er zelfs nog ergere lappen op in de Koe dan
de harde kern! De twee Jonassen, Jonathan, Jeroen, Jens, Sarah, Fran, Selwyn,
Hans, Linus, Roberto en Dirk, jullie zijn stuk voor stuk fantastische collega’s! Zeker
Linus en Fran wil ik nog wat extra in de bloemetjes zetten voor de vele malen dat ze
mij meegeholpen hebben met het opzetten van akoestische experimenten. Het Labo
voor Plant Ecologie is een enorme hechte groep en een zaligheid om deel van uit te
maken. De vele drinkavonden, bowling kampioenschappen, pingpong wedstrijden,
en koffietafel discussies leverden dan ook steeds onvergetelijke momenten op.
Twee mensen die er altijd onvoorwaardelijk voor mij zullen zijn en zonder wie dit
doctoraat onmogelijk was, zijn mijn mama en papa. Het warme nestje waarin ik ben
opgegroeid en altijd welkom in ben, is mijn stimulans en drijfveer om zo ver mogelijk
in het leven te gaan als ik kan. De vrijheid die jullie me geven, alsook dat ik steeds op
jullie kan terugvallen benadruk ik soms te weinig, maar in dit dankwoord gaat mijn
Preface
iv
allergrootste merci uit naar jullie. Zus, zoals het bij vele broer-zus relaties is, was ook
de onze vaak één van water en vuur maar we dekten steeds elkaars rug en wisten
dat we op elkaar konden rekenen. Ik kan mij in ieder geval geen betere zus wensen!
Maar ook de rest van mijn familie en onofficiële schoonfamilie is een enorme
toeverlaat die ik wil bedanken.
Dan wil ik graag ook nog een klein woordje kwijt over mij mede bio-ingenieur en zelfs
mede-PhD student Stefanie. Dat een wiskundige vraag die ik niet kon beantwoorden
aan de basis stond van onze vriendschap kan ik zelf nog moeilijk geloven. Maar voor
je het wist zaten we aan elkaar vast en knalde we samen door onze studies met het
absolute hoogtepunt onze thesis in Australië. We hebben veel lief maar helaas ook
leed gedeeld, maar dat toont hoe goed we het met elkaar kunnen vinden. En uw
doctoraat wordt ongetwijfeld nog beter dan die van mij!
En hier zijn we dan, de onontbeerlijke ode aan de groep de five friends and Smallen.
Ik mag me zelf gelukkig prijzen dat ik tot zo een zalige en machtige bende behoor.
Klaarstaan voor elkaar en veel biertjes achteroverslaan sieren onze hechte groep!
Evenwel dit laatste niet opgaat voor ons fameus cola orgel! Paul Jaegerken, Sjonnie
Loetjen, Tjanne Vévéto, Bompa Dreetje en Boomzagerke Shaggy, ik wil eindigen met
Smallen zijn eeuwige dankbaarheid voor de steun en toeverlaat die jullie hem geven.
Dat vrienden belangrijk zijn, kan ik niet genoeg benadrukken in dit dankwoord en ze
zijn stuk voor stuk schatten van mensen: de augustijnbeenvrouwtjes, mijn drink-en-
game partner Maarten, de chickies met hun bijhorende dicks, De mannenavonders,
de spicey lovers Matthias en Ann-Sophie en Lembekes beste spits ever Joeri.
Met nog een laatste en daarom dus belangrijkste persoon wil ik mijn dankwoord
insluiten. Gelijktijdig met het starten van mijn doctoraat kwam er een fantastische
jonge en prachtige dame in mijn leven. Lieselotte, wat jij de afgelopen maanden al
niet hebt moeten doorstaan van geklaag en gezaag van mijn kant uit… Jawadde ;)
Zonder jou zou ik het dan ook nooit gehaald hebben en daarvoor ben ik je natuurlijk
onmetelijk dankbaar voor. Dat ik mij goed voel bij jou is een duidelijk understatement
en wil ik hier dan ook extra in de verf zetten. Lieselotte, met uw hartverwarmende
tederheid, tonnen geduld, energiek en levensvol karakter, en hart van goud beschik
je over alle kwaliteiten die nodig zijn om een relatie met yours truly te kunnen dulden,
en laat dat nu ook één van de vele redenen zijn waarom ik zoveel van jou hou!! X
Niels De Baerdemaeker
Evergem, May 2018

v
LIST OF ABBREVIATIONS AND SYMBOLS ........................................................... ix
1 INTRODUCTION AND THESIS OUTLINE ......................................................... 1
1.1 The mechanism quenching the thirst of vascular plants ................................ 3
1.2 The danger impairing water transport: cavitation ........................................... 5
1.3 From preventing to repairing: how to cope with cavitation ........................... 10
1.4 Quantifying cavitation .................................................................................. 18
1.4.1 Xylem vulnerability curve ...................................................................... 18
1.4.2 Hydraulic method .................................................................................. 20
1.4.3 Alternatives for the hyfraulic method ..................................................... 24
1.4.4 Visualization techniques ....................................................................... 24
1.4.5 Acoustic emission method .................................................................... 28
1.5 Thesis motivation and outline ...................................................................... 31
2 ASSESSMENT OF THE HYDRAULIC METHOD USING DEHYDRATING
MALUS BRANCHES AND COMPARISON TO THE ACOUSTIC EMISSION
TECHNIQUE ............................................................................................................ 35
TOC
TABLE OF CONTENTS

Table of contents
vi
2.1 Abstract ....................................................................................................... 37
2.2 Introduction .................................................................................................. 38
2.3 Materials and methods ................................................................................ 41
2.3.1 Plant material ........................................................................................ 41
2.3.2 Maximum and average vessel length .................................................... 41
2.3.3 Sampling procedure for the hydraulic, µCT and AE method ................. 42
2.3.4 Sample preparation hydraulic method .................................................. 42
2.3.5 Hydraulic conductivity apparatus .......................................................... 43
2.3.6 Hydraulic conductivity ........................................................................... 47
2.3.7 Maximum hydraulic conductivity ........................................................... 48
2.3.8 Hydraulic vulnerability curve ................................................................. 48
2.3.9 AE sample preparation and data registration ........................................ 49
2.3.10 Acoustic vulnerability curve ................................................................... 50
2.3.11 X-ray computed microtomography (µCT) .............................................. 51
2.3.12 Anatomy ................................................................................................ 53
2.3.13 Statistics................................................................................................ 54
2.4 Results ........................................................................................................ 54
2.4.1 Hydraulic method .................................................................................. 54
2.4.2 µCT method .......................................................................................... 62
2.4.3 AE method ............................................................................................ 64
2.5 Discussion ................................................................................................... 65
2.5.1 Hydraulic steady-state .......................................................................... 65
2.5.2 Assessment of the hydraulic method .................................................... 67
2.5.3 Hydraulic method induces embolism refilling: validation with µCT ........ 69
2.5.4 Hydraulic versus µCT and optical method ............................................ 70
2.5.5 Hydraulic versus AE and pneumatic method ........................................ 70
2.6 Conclusion ................................................................................................... 71
3 ACOUSTIC EMISSIONS REVEAL NEW INSIGHTS IN THE ROLE OF WOODY
TISSUE PHOTOSYNTHESIS TO REDUCE VULNERABILITY TO CAVITATION .. 73
3.1 Abstract ....................................................................................................... 75
3.2 Introduction .................................................................................................. 76
3.3 Materials and methods ................................................................................ 78
3.3.1 Plant material and experimental set-up ................................................. 78
3.3.2 Sampling procedure and acoustic vulnerability to cavitation ................. 79

Table of contents
vii
3.3.3 Statistical analyses ............................................................................... 82
3.4 Results and discussion ................................................................................ 82
3.4.1 Sugar-mediated embolism repair under tension ................................... 84
3.4.2 Sugar-mediated synthesis of xylem structural changes ........................ 86
3.4.3 Sugar-mediated synthesis of xylem surfactants and proteins ............... 86
4 THE TRIPARTITE METHOD OF ACOUSTIC VULNERABILITY, HYDRAULIC
CAPACITANCE AND XYLEM ANATOMY .............................................................. 89
4.1 Abstract ....................................................................................................... 91
4.2 Introduction .................................................................................................. 92
4.3 Materials and methods ................................................................................ 94
4.3.1 Plant material ........................................................................................ 94
4.3.2 Sampling protocol and hydraulic trait measurements ........................... 94
4.3.3 Acoustic vulnerability curve ................................................................... 98
4.3.4 Desorption curve, hydraulic capacitance and wood density ................ 102
4.3.5 Anatomy .............................................................................................. 103
4.3.6 Statistics.............................................................................................. 105
4.4 Results ...................................................................................................... 106
4.4.1 Acoustic vulnerability .......................................................................... 106
4.4.2 Hydraulic capacitance and wood density method ............................... 106
4.4.3 Xylem anatomy ................................................................................... 109
4.5 Discussion ................................................................................................. 110
4.5.1 Bark versus xylem acoustic emissions ................................................ 110
4.5.2 Stress-strain curve: linear versus linear segmented ........................... 111
4.5.3 Endpoint determination of the acoustic VC ......................................... 113
4.5.4 Mass loss versus volumetric water content in desorption curves ........ 114
4.5.5 P50 and ρb versus the tripartite method ............................................... 115
4.6 Conclusion ................................................................................................. 118
5 EXTRACTING CAVITATION-RELATED ACOUSTIC EMISSIONS: THE
POWER OF MACHINE LEARNING COMBINED WITH CONTINUOUS X-RAY
COMPUTED MICROTOMOGRAPHY .................................................................... 119
5.1 Abstract ..................................................................................................... 121
5.2 Introduction ................................................................................................ 122
5.3 Materials and methods .............................................................................. 125
5.3.1 Plant material and experimental set-up ............................................... 125

Table of contents
viii
5.3.2 Processing and linking µCT images to AE signals .............................. 130
5.3.3 Unsupervised and supervised machine learning ................................. 132
5.3.4 Wood anatomy .................................................................................... 137
5.3.5 Acoustic and µCT vulnerability curve .................................................. 138
5.3.6 Statistical analyses ............................................................................. 140
5.4 Results ...................................................................................................... 141
5.4.1 All-in VCAE ........................................................................................... 141
5.4.2 Histograms and ROC curves .............................................................. 142
5.4.3 LDA model .......................................................................................... 144
5.4.4 Cavitation-related vulnerability ............................................................ 146
5.5 Discussion ................................................................................................. 148
5.5.1 Extraction of cavitation-related AE to improve VCAE ........................... 148
5.5.2 Significance of sensor installation to extract cavitation-related AE ..... 150
5.5.3 Maximum in third derivative to define the VCAE endpoint .................... 151
5.5.4 Future perspectives for cavitation-related AE extraction ..................... 152
5.6 Conclusion ................................................................................................. 154
6 GENERAL DISCUSSION AND FUTURE PERSPECTIVES ........................... 155
6.1 General conclusions .................................................................................. 157
6.1.1 Embolism refilling questions hydraulic method reliability .................... 157
6.1.2 AE as worthy substitute of the hydraulic method ................................ 162
6.1.3 The improvement potential of AE over the hydraulic method .............. 164
6.2 Future perspectives ................................................................................... 166
6.2.1 Optimizing AE to outdoor drought stress sensor ................................. 166
6.2.2 Improving water potential quantification: the ultimate VC ................... 166
REFERENCES ....................................................................................................... 169
SUMMARY ............................................................................................................. 193
SAMENVATTING ................................................................................................... 197
CURRICULUM VITAE ............................................................................................ 201

ix
ABBREVIATIONS
AE acoustic emission
ABSENERGY absolute energy (aJ)
AFRQ absolute frequency (kHz)
AMP peak amplitude (dB)
ANOVA analysis of variance
ASL average signal level (dB)
ATP adenosine triphosphate
B branch
BP breakpoint (µm mm-1)
C control
COUN counts from peak amplitude
Cryo-SEM cryo-scanning electron microscopy
CumAE cumulative number of AE signals
CumAEder1 first derivative cumulative number of AE signals or AE activity
CumAEder3 third derivative cumulative number of AE signals
DA drought-stressed ambient
L
LIST OF ABBREVIATIONS
AND SYMBOLS

Abbreviations and symbols
x
DC desorption curve
DE drought-stressed elevated
DOY day of the year
DURATION duration from peak amplitude (µs)
EMCT environmental µCT scanner
ENER wave energy (10-14 V2 s)
FFT fast fourier transformation
FP false positive
FREQPP1 partial power in the frequency range 0-100 kHz (%)
FREQPP2 partial power in the frequency range 100-200 kHz (%)
FREQPP3 partial power in the frequency range 200-400 kHz (%)
FREQPP4 partial power in the frequency range 400-800 kHz (%)
FRQC frequency centroid (kHz)
HRCT high-resolution X-ray computed tomography
IFRQ initiation frequency (kHz)
LDA linear discriminant analysis
L-E light-excluded
LVDT linear variable displacement transducer
MRI magnetic resonance imaging
NSC non-structural carbohydrates
P phloem
PAD Percentage air discharged (%)
PCA principal component analysis
PFRQ peak frequency (kHz)
PLB pencil lead break
PLC percentage loss of conductivity (%)
POP poplar
PP pit parenchyma
PR perimedullary region
pvc polyvinyl chloride
RISE rise time (µs)
RFRQ reverberation frequency (kHz)
RM running mean
RMS root mean square voltage (µV)
RMSE root mean square error
ROC receiver operating characteristic
ROI region of interest
S stem
SE standard error
SIGSTRNGTH signal strength (10-9 V s)

Abbreviations and symbols
xi
SPAC soil-plant-atmosphere continuum
TP true positive
VC vulnerability curve
VCAE acoustic vulnerability curve
VWC volumetric water content (kg m-3)
WA well-watered ambient
WE well-watered elevated
WP water potential (MPa)
X xylem
ΔWC change in water content (g)
µCT X-ray computed microtomography
SYMBOLS
Γ surface tension of water (0.07275 N m-1 at 20°C)
Δd branch diameter shrinkage or change (mm - µm)
Δd/di relative radial branch diameter shrinkage or strain (µm mm-1)
ΔP pressure difference ((M)Pa)
θ contact angle between surface and liquid
η liquid viscosity (Pa s)
ρb basic wood density (kg m-3)
ψg gravimetric water potential (MPa)
ψleaf leaf water potential (MPa)
ψo osmotic water potential (MPa)
ψp pressure water potential (MPa)
ψx xylem water potential (MPa)
A vessel area (µm2)
AE12 water potential at 12% cavitation-related AE (MPa)
AE50 water potential at 50% cavitation-related AE (MPa)
AE88 water potential at 88% cavitation-related AE (MPa)
AE100 water potential at 100% cavitation-related AE (MPa)
C hydraulic capacitance ((k)g (m-3) MPa-1)
Cel elastic hydraulic capacitance ((k)g (m-3) MPa-1)
Cinel inelastic hydraulic capacitance ((k)g (m-3) MPa-1)
CT12 water potential at 12% cavitation detected µCT (MPa)
CT50 water potential at 50% cavitation detected µCT (MPa)
CT88 water potential at 88% cavitation detected µCT (MPa)
D diameter (m)
Dc capillary diameter (m)
d vessel diameter (µm)

Abbreviations and symbols
xii
dh hydraulic diameter (µm)
di initial branch diameter (mm)
dt branch diameter at time t (mm)
E’r apparent modulus of elasticity in the radial direction (MPa)
Fin inflow (g h-1)
Fout outflow (g h-1)
Kh hydraulic conductivity (kg s-1 m MPa-1)
Kh,i initial hydraulic conductivity (kg s-1 m MPa-1)
Kh,in inlet hydraulic conductivity (kg s-1 m MPa-1)
Kh,max maximum hydraulic conductivity (kg s-1 m MPa-1)
Kh,max,in inlet maximum hydraulic conductivity (kg s-1 m MPa-1)
Kh,max,out outlet maximum hydraulic conductivity (kg s-1 m MPa-1)
Kh,out outlet hydraulic conductivity (kg s-1 m MPa-1)
kh hydraulic conductance (kg s-1 MPa-1)
L or l length (m)
P12 water potential at 12% loss of hydraulic conductivity (MPa)
P50 water potential at 50% loss of hydraulic conductivity (MPa)
P88 water potential at 88% loss of hydraulic conductivity (MPa)
P pressure ((M)Pa)
Pin inlet pressure (MPa)
Pmin minimum pressure for stable air-water meniscus (MPa)
Pout outlet pressure (MPa)
Q flow rate (m3 s-1)
r radius (m)
t time (h)
t100% dehydration time till complete embolism formation (days)
tΔd timespan until diameter change becomes zero
t∆(Kh,in-Kh,out) timespan until inlet Kh equals outlet Kh (min)
(t b⁄ )h2 vessel cell-wall reinforcement
Vg vessel grouping index
W weight (g)

Parts of this chapter are redrafted from:
De Roo L, Vergeynst LL, De Baerdemaeker NJF, Steppe K (2016) Acoustic emissions to
measure drought-induced cavitation in plants. Applied Sciences 6: 71.
1
INTRODUCTION AND
THESIS OUTLINE


Introduction
3
Vascular plants have been around for over 400 million years (Selosse et al., 2015),
and one of the key innovations of vascular plants was the development of vascular
tissues which paved the way for the evolution of larger plants. Long-distance water
transport is vital for survival of vascular plants, and limiting factors such as drought
stress can reduce biomass production, and even lead to plant mortality (Brodribb et
al., 2010; Melcher et al., 2012). Because of climate change, frequency, duration and
severity of drought stress events increase (Allen et al., 2010), putting more strain on
the water conducting system of vascular plants. Climate change is endangering the
global future, because without vascular plants as primary producers of oxygen,
animal and human survival are at risk as well. Studying the water transport system of
plants is vital as it can deliver insights into its functionality and in the way plants are
responding to the changing environment.
1.1 The mechanism quenching the thirst of vascular plants
Uptake of water by vascular plants is regulated by a mechanism that is depicted in
the soil-plant-atmosphere continuum or SPAC (van den Honert, 1948; Fig. 1.1). The
mechanism is known as the cohesion-tension theory, passively transporting water
through the plant (Dixon & Jolly, 1895; Tyree & Zimmermann, 2002). The theory
postulates that the ascent of water is made possible by the cohesion strength
between water molecules, combined with the tension manifested in the water
transporting system (Vilagrosa et al., 2012). The structure referred to as the xylem is
specifically adapted for the transport of water and nutrients through the plant. The
xylem tissue consists of different cell types, each fulfilling their own unique
contribution to the water conducting system: (i) water transporting (dead) cells,
referred to as conduits, including vessels in angiosperms and tracheids in
gymnosperms (Myburg et al., 2013). Direct connection between these cell types
results in a continuous xylem pathway, with the difference that perforation plates,
either simple or bordered, are present to separate angiosperm vessels elements,
while this is not the case for gymnosperm tracheids. (ii) Parenchyma (living) cells,
providing storage function for water, nutrients and carbohydrates, and (iii) fibers, that,
dependent on whether the fiber is fully differentiated (dead) or still maturing (living),
can deliver mechanical (dead) or water buffering support (living) to the xylem
(Myburg et al., 2013).

Chapter 1
4
Fig. 1.1 Soil-plant-atmosphere continuum or SPAC. The tension in the xylem varies along the SPAC,
passively transporting water in accordance to the cohesion-tension theory. The driving force behind
the varying tension or water potential gradient originates from transpiration in the substomatal cavities
of the leaves (Campbell & Reece, 2008).
According to SPAC, the xylem tension or water potential gradient will vary from less
negative at soil level to most negative at atmospheric level (Fig. 1.1), allowing water
to move passively through the xylem from a less to a more negative water potential.
The driving force behind this offset in water potential comes from transpiration in the
substomatal cavities (Vilagrosa et al., 2012). The xylem water potential (ψx) can be
summarized as the total of three separate water potential quantities (Eq. 1.1): (i) the
osmotic potential (ψo), (ii) the pressure potential (ψp), and (iii) the gravimetric
potential (ψg).
ψx= ψ
o+ ψ
p+ ψ
g (Eq. 1.1)
The osmotic potential is always negative and is a direct result of solute concentration
in sap of plant cells, being more negative in the case of higher concentrations. Living
cells such as xylem parenchyma, and cells related to phloem and cambium contain

Introduction
5
higher concentrations of solutes in comparison to dead cells such as vessels,
tracheids and fibers. The pressure potential can be positive or negative, dependent
on the cell type in which it operates. Living cells capable of growing and expanding,
exhibit a positive pressure potential known as turgor pressure. Contrastingly, dead
xylem vessels and tracheids operate under negative pressure, which, in accordance
to the cohesion-tension theory, originates from stomatal evaporation of water as a
result of the difference in water vapor pressure at substomatal cavities. As water
evaporates, water menisci in the capillaries of adjacent cell walls retract and the
capillary force (i.e., adhesion force) pulls the menisci back. The strong cohesion force
between the water molecules will then transmit the negative pressure downwards,
making upstream transport of water possible. The gravimetric potential will only have
a significant contribution to the overall xylem water potential in the case of tall plants.
The major benefit of this type of transport, fueled by a water potential gradient, is that
it does not require energy from the plant. Under optimal conditions of soil-water
availability and low transpirational demand of the atmosphere, vascular plants will be
able to sufficiently and without effort transport water via the internal water conducting
system. Even though a vast amount of absorbed soil water (> 97%) evaporates into
the atmosphere via leaf transpiration (Sinha, 2004), the role of water to plant
functioning is diverse and crucial: (i) it works as a medium to transport nutrients
through the plant, (ii) it is used by living cells as a water storage buffer and enables
growth via turgor, (iii) it is used as a cooling agent to lower leaf temperature during
transpiration, and (iv) though limited (< 1%) it is a necessary building block in the
photosynthesis process (Lambers et al., 1998). However, by passively transporting
water via a water potential gradient, vascular plants run the risk of endangering this
conducting pathway under increasing evaporative demand and/or drying of the soil.
As a result, soil and/or atmospheric water potential become more negative, straining
the conducting pathway, because a more negative water potential needs to be
exerted on the internal system to maintain water transport. This could potentially
result into a blockage of xylem vessels or tracheids because resulting air bubbles can
expand or coalesce under more negative tension, ultimately affecting plant
functioning.
1.2 The danger impairing water transport: cavitation
As water transport in vascular plants is subjected to negative water potentials, the
water conducting elements operate in a so-called metastable condition (Steudle,
2001; Cochard et al., 2013). This can induce a phase transition of liquid water to

Chapter 1
6
water vapor under severe tension, replacing water-filled vessels or tracheids with
non-functional air-filled ones, and hence, resulting in a disruption of the continuous
pathway in a process defined as cavitation (Crombie et al., 1985; Tyree et al., 1994;
Mayr et al., 2014). The term cavitation in plant science is analogous to the one
referred to by physicists as inertial cavitation, where a liquid subjected to sufficiently
low pressure ruptures and forms a cavity, for instance behind the blade of a rotating
propeller (Jackson & Grace, 1994). Similar to the process of inertial cavitation, more
negative tension in plants will thus form cavities as water in plants is saturated with
gas (Schenk et al., 2015). However, cavitation can also ‘seed’ from one adjacent
vessel or tracheid to another via pits in the pit membranes (Fig. 1.2 A-D), connecting
the conducting elements, in a process defined as the air-seeding hypothesis (Sperry
& Tyree, 1988; Tyree & Zimmermann, 2002). In both cases, conducting elements will
become air-filled, but because formation and propagation of cavitation in plants is
different from inertial cavitation, the term ‘embolism’ is more preferred in plant
science.
Fig. 1.2 (A) Vessels and tracheids are interconnected via pits in the pit membrane, that offer
resistance to water transport but increase hydraulic safety. (B) In the event air enters the conducting
element, capillary forces are incapable of preserving the hydraulic integrity as the diameter of vessels
and tracheids is too large, but this diameter size is necessary for increased hydraulic efficiency. (C)
Water from the conducting elements disperses into the adjacent tissue, embolizing the vessel or
tracheid and cutting it off from the transpiration stream. (D) Pit membranes hinder a chain reaction of
embolization by exerting stronger capillary forces to withstand the propagation of air to functional
vessels or tracheids under negative xylem tension (Venturas et al., 2017).
From the moment vessels and tracheids are fully differentiated and functional, they
are completely filled with water and must maintain this state in order to fulfil their
functionality in supporting the transpiration stream (Venturas et al., 2017). As it is the

Introduction
7
case in fluid dynamics, the wider the radius of the conducting element, the greater its
transport capacity, and hence, the overall hydraulic efficiency of the plant. This can
simply be derived from Poiseuille’s law, stating that the flow rate (Q, m3 s-1) through a
pipe is proportional to the fourth power of the radius (r, m):
Q = π P r4
8 η l (Eq. 1.2)
with P the pressure gradient over the pipe (Pa), η the viscosity of the liquid (Pa s),
and l the length of the pipe (m). When conducting elements become air-filled, the
width of vessels and tracheids turns into a disadvantage to hold the air-water
meniscus in place against the negative tension (Fig. 1.2B). In order to determine the
minimum pressure (Pmin, Pa) at which an air-water meniscus remains stable in a
cylindrical capillary, the Laplace-Washburn formula described in plant hydraulics
literature can be used (Tyree & Zimmermann, 2002; Schenk et al., 2015; Venturas et
al., 2017):
Pmin = -4 Γ cos θ
Dc
(Eq. 1.3)
Γ represents the surface tension of water at 20°C (0.07275 N m-1), θ the contact
angle between surface and liquid as a measure of adhesion, and Dc the diameter of
the capillary (m). In the event that the tension drops below this Pmin, the air-water
meniscus will dissolve, embolizing the conducting element, which hence loses its
functionality (Venturas et al., 2017). However, because pit membrane pores are not
cylindrical, a pore shape factor (κ, -) needs to be incorporated in the Laplace-
Washburn formula (Schenk et al., 2015):
Pmin = -κ 4 Γ cos θ
Dc
(Eq. 1.4)
It is in accordance to this formula, that the benefit of the pit membrane comes into
place as an evolutionary adjustment to the way water is transported in vascular
plants. The small pores in the pit membranes radially connecting vessels and
tracheids (diameter ranging between 1 to 10 nm) create a considerable resistance to
the water flow path (Eq. 1.2), but at the same time significantly contribute to xylem
hydraulic safety. Without pit membranes, the small capillary force generated in the
conducting elements would not be able to withstand the negative tension required to
transport water, and thus result in a disruptive chain reaction that would completely

Chapter 1
8
hinder any form of water uptake (Venturas et al., 2017). This proves that pit
membranes, which act as a safety valve to hinder easy propagation of air from one
vessel or tracheid to another adjacent one, are vital in supporting the capillary force
behind the cohesion-tension mechanism that originates in cell walls of the leaves
(Fig. 1.2A-D). Even though the nanometer size of pits creates a considerable
protection against cavitation, the pit membranes are not impermeable and adjacent
vessels or tracheids can still embolize under more negative tension according to the
air-seeding hypothesis.
Air-seeding will also propagate differently in gymnosperms and angiosperms
because of their difference in pit membrane structure. Angiosperms are characterized
by a more homogenous pit membrane, allowing air-seeding to occur via the pit with
the largest diameter, or via membrane rupture (Venturas et al., 2017). Air bubbles will
be able to transfer into the adjacent vessels when the pressure difference between
the embolized and water-filled conduit exceeds the threshold based on the pit with
the largest diameter pore, which is formulated by the law of Laplace:
ΔP= 2 Γ
r (Eq. 1.5)
where ΔP is the pressure difference (Pa) between an embolized conduit (Pembolized =
Patm = 0 MPa), and a water-filled one under negative tension, Γ the surface tension of
water at 20°C (0.07275 N m-1), and r the radius of the largest pit (m). This equation is
essentially a simplified version of the Laplace-Washburn formula (Eq. 1.4), where the
contact angle θ between surface and liquid is presumed to be 0°, and the pore shape
factor κ equal to one (perfectly cylindrical). Assuming a pit size of 0.2 µm, the
pressure difference at which air-seeding will occur is equal to 1440000 Pa or 1.44
MPa. Or in other terms, as long as the water-filled vessel operates under a tension
that is higher than -1.44 MPa, hydraulic integrity will be preserved. To better grasp
the idea of how embolisms are formed and propagate in real-time, a visual example
of the process in the angiosperm species Fraxinus excelsior L. recorded with X-ray
computed microtomography is given (Fig. 1.3).

Introduction
9
Fig. 1.3 Real-time propagation of embolism formation, captured with X-ray computed
microtomography (µCT), during a continuous dehydration experiment in the two-year-old angiosperm
species Fraxinus excelsior L. Embolized vessels are indicated in black on all of the µCT images, while
functional conduits are indicated in grey on the 2D sections, and typical ones are highlighted in blue
on the 3D sections. Starting from the condition with one air-filled vessel at a xylem tension of -1.08
MPa (A), two additional adjacent vessels embolized over a time span of 8 minutes, in which the xylem
tension rose to -1.09 MPa (B and C).
At a xylem tension of -1.08 MPa, one vessel was embolized in the secondary growth
ring of the species (Fig. 1.3A). Over a period of 8 minutes, xylem water potential
decreased to -1.09 MPa during which two neighboring xylem conduits embolized
(Fig. 1.3 B and C). The left and center vessel were clearly connected to each other
via their pit membranes, illustrating that the left vessel most likely cavitated via air-
seeding.
The pit membrane of gymnosperm species is characterized by two special structural
alterations: (i) a central thickening with small pores known as torus, and (ii) a
surrounding ring with very wide pores known as margo that facilitates sap flow (Mayr
et al., 2014; Venturas et al., 2017). The torus is densely designed, and will be
aspirated to the pore of the pit chamber to act as a sealing agent, hindering air entry
from an embolized into a functional tracheid. The better the torus is capable of
sealing the pit aperture, the higher the resistance to air-seeding, and hence,
explaining the difference in resistance against cavitation between gymnosperm
species (Delzon et al., 2010). With increasingly negative xylem tension, embolisms
can spread further, because air enters through the torus pore, and/or via the margo

Chapter 1
10
as a result of torus seal displacement (Mayr et al., 2014; Venturas et al., 2017). The
elasticity of the margo has a substantial influence on this process as air-seeding is
facilitated when the margo is either too elastic (torus is easily pulled through the pit
aperture), or too rigid (torus cannot sufficiently seal the pit aperture; Hacke et al.,
2004).
1.3 From preventing to repairing: how to cope with cavitation
In order for vascular plants to maintain their hydraulic integrity, cavitation must be
avoided and/or repaired at all cost because it can seriously undermine plant
functionality, and even lead to plant mortality (Mcdowell et al., 2008). As illustrated in
section 1.2, the specialized pit membrane structures of angio- and gymnosperms
(Pittermann, 2005; Schulte et al., 2015), prove that xylem anatomy is well adapted to
prevent embolism formation (Brodersen et al., 2014). Species with thicker pit
membranes, smaller pit apertures between adjacent conducting elements, and more
shallow pit chambers (Lens et al., 2011), will be more resistant to air-seeding, but this
will decrease hydraulic transport efficiency. A balanced trade-off between hydraulic
safety and efficiency is thus desirable for optimal plant functioning (Sperry et al.,
2008; Blackman et al., 2010), though this trade-off is no prerequisite for plant
survival, and some species have been found to combine low hydraulic efficiency with
low hydraulic safety (Gleason et al., 2016). The trade-off between safety and
efficiency extends beyond the structure of pit membranes, and can also relate to the
anatomy of transporting conduits and tracheids. To maximize efficiency, wider
conduits are preferred (Eq. 1.2), and according to Loepfe et al. (2007), a higher
degree of vessel grouping and connectivity would also be desirable to increase water
transport capacity. This is however in contrast to the findings of Carlquist (2009), who
stated that increased connectivity acts as a safety measure to circumvent cavitation,
a hypothesis that is supported by higher connectivity implying an increased number
of pit membrane passages that are specifically designed to withstand the spread of
embolism formation (Eq. 1.4; Lens et al., 2011). In addition, shorter vessels and
tracheids also seem to be adapted to marginally promote hydraulic safety, as they
were found to be characterized by fewer pits (Lens et al., 2011). Whereas the
diameter of vessels greatly affects hydraulic efficiency, the ‘rare pit’ hypothesis
(Christman et al., 2009) states that wider vessels and tracheids should be
characterized by an increased number of leakier pits (Eq. 1.5), hence reducing
resistance to cavitation. Christman et al. (2012) tested and validated the ‘rare pit
hypothesis on Quercus gambelii L., and despite additional studies having reported
evidence for the ‘rare pit’ hypothesis through the relationship between wider vessels

Introduction
11
and lower hydraulic safety (Wheeler et al., 2005; Hacke et al., 2006; Cai & Tyree,
2010), there are also studies contradicting the validity of the hypothesis as no
unambiguous relation was found between vessel diameter and cavitation resistance
(Tyree et al., 1994; Lens et al., 2011; Scholz et al., 2013b).
To further preserve hydraulic integrity of vascular plants, the conduit and tracheid cell
wall is also reinforced to withstand negative xylem water potentials, a trait indicated
as vessel cell wall reinforcement ((t b⁄ )h2, Hacke et al., 2001). Because it has a
positive correlation with pit membrane thickness (Jansen et al., 2009), and a reduced
risk of potential implosion at low water potentials (Hacke et al., 2001), (t b⁄ )h2
significantly contributes to the trade-off between hydraulic safety and efficiency.
Apart from adaptations to conducting elements to better withstand embolism
formation, fiber anatomy can also adjust to help maintaining hydraulic integrity by
providing additional mechanical support to prevent implosion (Jacobsen, 2005).
Combining these hydraulic safety factors such as thicker fibers, increased cell-wall
reinforcement, higher degree of shorter and interconnected vessels or tracheids, and
thicker pit membranes will all contribute to a higher basic wood density (ρb, kg m-3),
henceforth proving the strong correlation between ρb and resistance to embolism
formation (Hacke et al., 2001; Pittermann et al., 2006; Martínez-Cabrera et al., 2009;
McCulloh et al., 2011; Rosner, 2017). This indicates that xylem on the long term is
well adapted to prevent loss in hydraulic transport by cavitation, and in case of
angiosperms has even resulted in two different strategies regarding xylem anatomy
construction: ring-porous (e.g., Quercus sp.) and diffuse porous (e.g., Fagus sp.).
Ring-porous species are defined by much wider earlywood vessels to maximize
hydraulic transport, while latewood vessels are intrinsically smaller and more densely
grouped to better withstand cavitation later on in the growing season when stress
conditions are more likely to occur. Diffuse porous species on the other hand are
characterized by smaller, and a more uniform distribution in vessel dimensions,
choosing for a more balanced trade-off between hydraulic efficiency and safety
during the growing season.
Vascular plants are more plastic in their response to cavitation than only defined by
the rigid construction of xylem, and hence, can use a variety of short to long-term
protections to counteract negative effects of increasing xylem tension. One of their
major resources to delay loss in hydraulic transport is by using internal water
reserves, which are represented by living cells such as xylem parenchyma, and
xylem conduits or tracheids. This process is very common in the daily life of vascular
plants, where internally stored water is used at sunrise to bridge the gap between
water loss by leaf transpiration and root water uptake. Similarly, when stomata close

Chapter 1
12
at sunset, root water uptake will replenish the internal water reserves, giving rise to a
daily pattern of shrinkage and swelling at stem-, branch-, and leaf-level (Steppe et al.,
2015). In the event that stress strains the hydraulic integrity, internally stored water
from different organs and tissues will be released into the transpiration stream to
temper the increase in xylem tension and delay the spread of cavitation (Meinzer et
al., 2009; Steppe et al., 2012). The capacity to store water in these tissue types is
referred to as the hydraulic capacitance (C, kg m-3 MPa-1; (Steppe et al., 2006;
Steppe & Lemeur, 2007; Vergeynst et al., 2015a)), which is a significant drought
tolerance strategy in drier environments (Gleason et al., 2016). C is defined as the
ratio of change in tissue volumetric water content to change in xylem water potential
(Edwards & Jarvis, 1982; Vergeynst et al., 2015a), which is measured as the amount
of water released from the tissue per unit decrease in water potential (Steppe &
Lemeur, 2007; Epila et al., 2017). Vergeynst et al. (2015a) further reports that
hydraulic capacitance can be divided into hydraulic capacitance of living tissues, i.e.,
elastic capacitance (Cel), and hydraulic capacitance originating from cavitation or
immature fibers, i.e., inelastic capacitance (Cinel), implying that embolism formation is
not strictly negative for vascular plants, because water lost to the transpiration stream
becomes available to the plant to buffer decreases in xylem water potential
(Vergeynst et al., 2015a). Not unexpectedly, a variety of studies found a positive
correlation between hydraulic capacitance and vulnerability to cavitation (Sperry et
al., 2008; Mcculloh et al., 2012, 2014; Meinzer and McCulloh, 2013; Epila et al.,
2017), with sensitive species being characterized by a greater buffer to compensate
water loss, expressed by a combination of both a high Cel and Cinel. First, the
investigated species were characterized by a low ρb, as a higher basic wood density
implies a stronger investment in xylem structure aimed at preserving hydraulic
functioning, leaving fewer resources available to build internal water reserves to
increase elastic capacitance (Mcculloh et al., 2012). The magnitude of this
capacitance also differs between plant organs, which corresponds to their respective
vulnerability to cavitation (Mcculloh et al., 2014). Trunks, for instance, were found to
be more sensitive than branches, but characterized by more internally stored water
(Mcculloh et al., 2014). Second, the higher susceptibility of these species for drought
stress resulted in an increased inelastic capacitance, as more water becomes
available by the faster succession in embolism formation per unit decrease in water
potential (Epila et al., 2017).
Stomatal closure is a second type of fast, and short-term protection utilized by
vascular plants in response to high transpirational stressors (Arve et al., 2011). By
closing the stomatal pore, transpiration is reduced, and hence hydraulic efficiency is
increased, because more water is preserved per unit CO2 that is assimilated (Farooq
et al., 2009). Similar to the role of hydraulic capacitance, water preserved by stomatal
Introduction
13
closure will halter the increase in xylem tension and reduce embolism formation
(Sperry, 2000). However, this type of protection comes with a severe disadvantage
as CO2 uptake is strongly reduced. Closing stomata for too long will ultimately result
in carbon starvation, which is as lethal to plants as the impairment of their water
conducting system (Sevanto, 2014). Therefore, two types of strategies are utilized by
vascular plants, subdividing them in isohydric and anisohydric plant behavior
(Mcdowell et al., 2008), which can occur both between and within species (Sade et
al., 2012). Isohydric plants are often referred to as ‘drought avoiders’, displaying
subsequent increase in stomatal closure in response to drought stress, aimed at
preserving their midday water potential at a constant level (Sade et al., 2012), but risk
carbon starvation. Anisohydric plants, though also exhibiting midday stomatal
closure, try to maintain their high stomatal conductance rate to maximize growth
under drought stress conditions, exposing them to increased negative xylem water
potential, and hence, run the risk of succumbing to lethal levels of cavitation. In order
to be a viable strategy, these plants have the reputation of being ‘drought tolerant’
due to their more cavitation-resistant xylem (Mcdowell et al., 2008).
Recently, the discovery of nanobubbles that exist near nanoporeus pit membranes of
angiosperms, has shed new light on the air-seeding hypothesis and the formation of
embolisms (Schenk et al., 2015). Remarkably, these nanobubbles can remain stable
under tension as long as a critical threshold is not surpassed. This threshold, which is
dependent on the surface tension, represents the critical radius at which a gas
bubble can remain stable under negative pressure (Blake, 1949). But as xylem
tension increases, nanobubbles will either enlarge or coalesce, ultimately leading to
conduit embolization (Schenk et al., 2015). Further investigation of this phenomenon
showed that carbon-based choline-containing phospholipid surfactants, and other
amphiphilic lipids and proteins exist in pit membranes of xylem vessels (Schenk et
al., 2017). Immediately after nanobubble snap-off, surfactant organic compounds will
form a coating layer around nanobubbles to stabilize them under negative pressure
(Fig. 1.4), hence lowering the surface tension and bringing the critical radius of the
gas bubble to the nanometer scale.

Chapter 1
14
Fig. 1.4 Freeze-fracture electron micrograph of a surfactant coated nanobubble. The surfactant
molecule (dark) is coated against the periphery of the nanobubble hole (white). Bar = 100 nm (Schenk
et al., 2017).
Due to this coating layer, nanobubbles are less prone to exceed the critical threshold,
hence lowering vulnerability to cavitation (Schenk et al., 2015). Vessel-associated
parenchyma cells are the most likely source of these xylem surfactants and proteins,
which are typically built-up out of phospholipids (Schenk et al., 2017). In general,
phospholipids can be classified into two groups depending on their chemical
structure: glycerophospholipids and sphingolipids (Berg et al., 2002). In vascular
plants, sphingolipids are also involved in plant signal transduction, cell membrane
stability, host-pathogen interactions and plant response against stressing elicitors
(Sperling & Heinz, 2003). Similar to adenosine triphosphate (ATP), both types of
phospholipids contain a negatively charged phosphate group suggesting a highly
dynamic behavior. Nanobubble stabilization might therefore be an energetic
demanding process for which an active phosphate group and continuous cycles of
synthesis and degradation of phospholipids are necessary.
When the different mechanisms to prevent embolism formation fail to safeguard
hydraulic integrity, vascular plants can repair cavitation by different processes.
Generally, they are characterized by a certain percentage of cavitated vessels or
tracheids, even in the absence of stressed conditions, because during plant
development and growth, some vessels or tracheids lose their functionality and
become permanently air-filled, referred to as the plant native embolism state
(Jacobsen & Pratt, 2012). Other studies confirmed that plants tolerate a controlled
level of cavitation (Tyree & Yang, 1992; Meinzer et al., 2001; Hölttä et al., 2009;

Introduction
15
Mcculloh et al., 2014; Steppe et al., 2015; Vergeynst et al., 2015a), referring to the
dual role of cavitation in lowering hydraulic conductivity, and simultaneously acting as
a water buffer (i.e., inelastic hydraulic capacitance (Cinel)) to maintain photosynthetic
activity during drought stress events.
In order to repair air-filled conduits or tracheids, two evolutionary recovery
mechanisms have been developed (Vilagrosa et al., 2012): (i) building new functional
conducting elements during secondary growth to compensate for the loss in hydraulic
efficiency (Cochard et al., 2001), and (ii) an active refill mechanism restoring
hydraulic functionality when xylem tension is near or above atmospheric pressure
(Tyree et al., 1999). The latter mechanism requires a positive pressure being exerted
on the sap in the conduits or tracheids to force the gas back in solution, and is
typically supplied by the roots during periods of low transpirational demand, and
hence indicated by the term root pressure (Sperry et al., 1987; Nardini et al., 2011).
Root pressure requires metabolic energy, which is necessary to extract ions from the
soil that decrease the osmotic potential of root xylem, allowing water to be passively
taken up from the soil via osmosis (Cochard et al., 1994; Lopez & Barclay, 2016).
The resulting flow of water will thus be driven by positive pressure (i.e., above
atmospheric pressure), creating the required condition to refill embolized conduits
and tracheids. Under certain conditions, root pressure can even lead to extrusion of
xylem sap at the edge of the leaf blade, a phenomenon known as guttation (Bacon &
Brian, 2003). Periods of low transpirational demand, which are favorable for root
pressure, will typically occur over night (Gleason et al., 2017), during transition from
winter to spring (Sperry et al., 1987; Hacke & Sauter, 2010), and during the rainy/wet
season (Cochard et al., 1994).
Recent developments have illustrated the existence of a third mechanism, capable of
removing gas from embolized conduits or tracheids, while the xylem is subjected to
negative water potentials (Holbrook & Zwieniecki, 1999; Brodersen et al., 2010;
Wegner, 2014; Knipfer et al., 2016). At first glance, this mechanism seems to be in
conflict with the principles of thermodynamics, which states that a positive pressure,
like root pressure, is required to dissolute air in solution (Clearwater & Goldstein,
2005; Nardini et al., 2011). Tyree & Yang (1992) have previously postulated that a
pressure of minimally -0.1 MPa would be required for refilling, illustrating that without
the aid of active processes, the gravitational water potential cannot be overcome. It is
therefore generally suggested that osmotically active solutes from neighboring living
cells are loaded into the embolized conduits or tracheids, creating an osmotic water
potential gradient that pushes water from these cells into the conducting elements
(Holbrook & Zwieniecki, 1999; Hacke & Sperry, 2003; Salleo et al., 2004; Secchi &
Zwieniecki, 2012; Brodersen & McElrone, 2013). With ongoing research, several

Chapter 1
16
conceptual frameworks have been designed to explain this tissue-dependent
embolism removal (Holbrook & Zwieniecki, 1999; Brodersen et al., 2010; Wegner,
2014; Knipfer et al., 2016), but is most intuitively summarized in the proposed
framework of Zwieniecki & Holbrook (2009) (Fig. 1.5).
Fig. 1.5 Methodological framework for embolism repair under tension. (a) Vessel-associated living
cells release a small steady stream of soluble carbohydrates into the xylem. (b) Starch stored in xylem
parenchyma acts as a sugar capacitator. (c) Concentrations of these solutes remain low as they are
diluted via their movement in the transpiration stream, but (d) can accumulate in an embolized conduit
or tracheid. (e) Accumulation of sugar accompanied with the increase in apoplastic solute
concentration triggers signaling pathways (f) for refilling that regulate sugar and (g) water membrane
transport, as well as (h) sugar metabolic activity. (i) Solute accumulation results in water extraction
from xylem parenchyma cells by osmosis, forming droplets with high osmotic activity on internal vessel
walls. (j) The partially non-wettable walls of xylem conduits are designed to prevent droplets from
being sucked away by still-functional vessels. (k) Condensation of water vapor provides a second
pathway by which water refills cavitated conduits, allowing adjacent conduits to provide water for
refilling. (l) As the high osmotic droplets grow to fill the vessel, the embolus is removed both by forcing
gas into solution and by pushing gas through small pores through the vessel walls to intercellular
spaces. (m) The flared opening of the bordered pit chamber acts like a check valve until the lumen is
filled, thus preventing contact with the highly wettable bordered pit membranes. Reconnection occurs
once the pressure in the lumen exceeds that of the entry threshold into the bordered pit chambers; a
hydrophobic layer within pit membranes might provide the needed simultaneity among multiple
bordered pits (Zwieniecki & Holbrook, 2009).
The real challenge however is determining how this mechanism functions, because
during refilling, conduits or tracheids must be hydraulically isolated from the
transpiration stream, or the sap flow would simply steal the solution, recavitating the
conducting element (Rockwell et al., 2014).

Introduction
17
Nonetheless, the role of living tissue, such as xylem parenchyma and phloem, is
clearly important in the scenario of embolism repair under tension (Fig. 1.5; Salleo et
al., 2004; Nardini et al., 2011), emphasizing the intimate link between xylem and
phloem functioning (Hölttä et al., 2009b; Hubeau & Steppe, 2015). In this context,
woody tissue photosynthesis, which assimilates respired CO2 that failed to radially
diffuse to the atmosphere (Saveyn et al., 2010), can play a crucial role in plant
hydraulic maintenance (Vandegehuchte et al., 2015). The strategic spatial location of
chloroplast-containing cells in stem and branches allow woody tissue photosynthesis
to constitute an immediate source of non-structural carbohydrates (NSC) for
satisfying local energetic demands (Aschan & Pfanz, 2003; Teskey et al., 2008), and
perhaps actively aid in embolism repair under tension (Schmitz et al., 2012; Bloemen
et al., 2016), as this is an energetic demanding process, requiring adequate NSC
supply to create osmotic gradients necessary to refill embolized vessels (Nardini et
al., 2011; Brodersen & McElrone, 2013). However, the response time and trigger
mechanism for NSC and starch conversion, and the activation of aquaporins and ion
transporters to fuel embolism repair under tension is still under debate (Secchi &
Zwieniecki, 2012; Wegner, 2014; Ryu et al., 2016).
With the aid of non-invasive X-ray microtomography imaging techniques (Brodersen
et al., 2010; Knipfer et al., 2016; Ryu et al., 2016), tangible evidence on the existence
of the phenomenon has been obtained as embolism repair under tension was
visualized in real-time (Fig. 1.6). Recently, Brodersen et al. (2017) repeated their X-
ray computed microtomography experiment on grapevine and found further evidence
for the spatial and temporal dynamics of embolism removal under tension. They
found, for instance, that a surface film forms around the expanding droplet, but the
influence of this film and the heterogeneity in vessel wall and perforation plate
hydrophobicity still require further investigation (Brodersen et al., 2017). Despite the
many risks accompanied with embolism formation, vascular plants clearly exhibit a
wide range of prevention and restoration techniques to cope with cavitation. But in
order to sustain viable growth and development, the impact of cavitation must be
determined.

Chapter 1
18
Fig. 1.6 Grapevine stem with vessel refilling under tension, visualized by in vivo high-resolution X-ray
computed tomography (HRCT). (A) Longitudinal sections of three adjacent vessels refilling during
approximately 4 hours (hours indicated in each section), with water droplets visible on the inner vessel
walls. Bar = 200 µm. (B) 3D rendering of the refilling process, with droplets (blue 3D shapes)
accumulating on the vessel walls (green). (C) Trans-longitudinal section showing four vessels with
different stages of droplet forming, and (D) the resulting 3D rendering. Restoring hydraulic integrity
was unsuccessful for the vessel at the far left side. Bar = 100 µm (Brodersen et al., 2010).
1.4 Quantifying cavitation
1.4.1 Xylem vulnerability curve
Because impairment of hydraulic transport can lead to plant mortality (Mcdowell et
al., 2008), assessing the negative impact of drought stress on the hydraulic integrity
of vascular plants is crucial. Methods that aim at quantifying cavitation will therefore

Introduction
19
result in the construction of a vulnerability curve (VC), which relates percentage loss
of hydraulic transport by subsequent embolism formation in function of decreasing
xylem water potential (Pammenter & Willigen, 1998; Cochard et al., 2013). VCs are
an important tool for further understanding xylem transport characteristics (Melcher et
al., 2003), and according to literature, can result in two different shapes (Fig. 1.7;
Cochard et al., 2013).
Fig. 1.7 Schematic representation of a xylem vulnerability curve (VC), relating percentage of cavitation
against xylem pressure. VCs are characterized by two distinct shapes: (i) sigmoidal (solid line),
displaying a safe range of xylem tension (grey zone), and (ii) exponential (dashed line), which are
typically the result of methodological artefacts. Vulnerability values related to 12% cavitation (P12, ▼),
50% cavitation (P50, ♦), and 88% cavitation (P88, ●), are also indicated (Cochard et al., 2013).
The shape of VCs has significant implications for the discussion of stomatal
regulation of xylem tension (Melcher et al., 2003). The sigmoidal shape is most
realistic in plant physiology, because it is characterized by a safety margin in which
plants operate on a daily basis under conditions of sufficient soil water availability
and/or low transpirational demand (Cochard et al., 2013). For this type of VC, the
xylem pressure associated with cavitation onset will be more negative than the
pressure related to leaf turgor loss and stomatal closure (Jones & Sutherland, 1991;
Hacke & Sauter, 1995). Exponential VCs on the other hand result in a strong
increase of percentage cavitation per unit drop in xylem pressure, displaying no

Chapter 1
20
safety margin, and hence, assuming that xylem pressures at optimal growth
conditions are strongly impairing water transport (Cochard et al., 2013), implying that
stomata must be extremely vigilant to prevent xylem water potentials from exceeding
cavitation thresholds (Melcher et al., 2003). Because this type of behavior seems
unlikely as a viable strategy, the exponential curve has been mainly attributed to
methodological artefacts associated with the pressure sleeve (Choat et al., 2010),
and centrifugation technique (Cochard et al., 2010). To further compare inter- and
intra-species vulnerability, values related to 12% cavitation (P12), 50% cavitation
(P50), and 88% cavitation (P88) are typically calculated (Fig. 1.7). P12 can be
associated with the onset of cavitation (i.e., the air entry point), and P88 with full
embolism as recovery is deemed impossible beyond this value (Domec & Gartner,
2001). P50 is referred to as the universal index to quantify vulnerability to drought-
induced cavitation, and is strongly related to wood density (Choat et al., 2012).
1.4.2 Hydraulic method
The rate by which water and nutrients are transported through the conducting system
of vascular plants is referred to as the hydraulic conductance (kh, kg s-1 MPa-1), or, if
normalized to the length of the investigated sample, hydraulic conductivity (Kh, kg s-1
m MPa-1), and the subsequent loss through embolism formation, the percentage loss
of conductivity (PLC, %). The original hydraulic method aims at quantifying Kh after
consecutive steps of increasing xylem tension, and relating this value to the
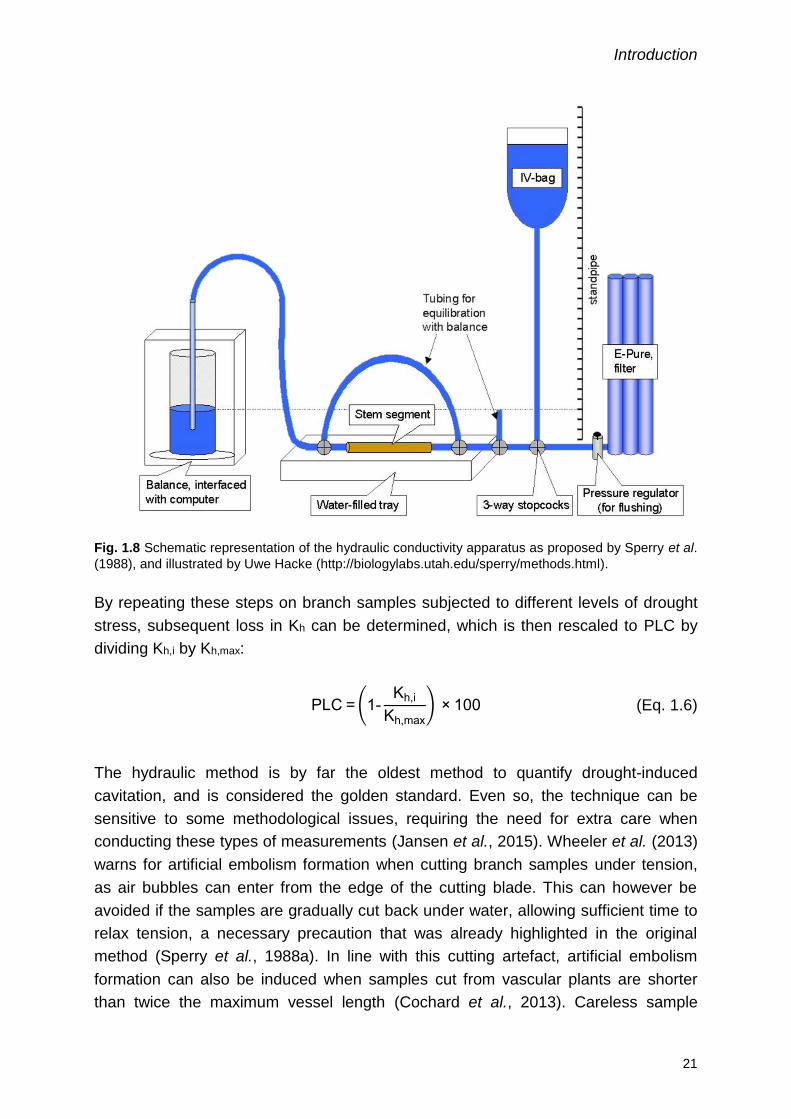
maximum achievable Kh (Sperry et al., 1988a). Samples for this method are
comprised out of branch segments, and are mounted into a setup that determines Kh
via the resistance of the sample against gravimetrical water flow (Fig. 1.8). In a first
step, the initial hydraulic conductivity (Kh,i, kg s-1 m MPa-1) of an excised sample is
determined by forcing a pressurized flow through the sample in its native state. The
pressure range is typically between 1-8 kPa (Sperry et al., 1988a), but the method
suggests applying a lower pressure head (~2 kPa) for large diameter-vesselled
species such as Quercus sp. to avoid dislocating embolisms. The applied solution is
20 mM KCl to better resemble the composition of plant sap (Sperry et al., 1988a).
The gravimetrical flow rate through the sample is determined by an electronic
precision balance placed at the outflow side, and is converted to conductivity by
incorporating the pressure difference over the sample, which results directly from the
height difference between the reservoir IV-bag and the sample (Fig. 1.8). In a second
step, the sample will be flushed at a pressure of 175 kPa (Sperry et al., 1988a), after
which the maximum hydraulic conductivity (Kh,max, kg s-1 m MPa-1) can be obtained by
repeating step 1 on the flushed segment.
Introduction
21
Fig. 1.8 Schematic representation of the hydraulic conductivity apparatus as proposed by Sperry et al.
(1988), and illustrated by Uwe Hacke (http://biologylabs.utah.edu/sperry/methods.html).
By repeating these steps on branch samples subjected to different levels of drought
stress, subsequent loss in Kh can be determined, which is then rescaled to PLC by
dividing Kh,i by Kh,max:
PLC = (1-Kh,i
Kh,max
) × 100 (Eq. 1.6)
The hydraulic method is by far the oldest method to quantify drought-induced
cavitation, and is considered the golden standard. Even so, the technique can be
sensitive to some methodological issues, requiring the need for extra care when
conducting these types of measurements (Jansen et al., 2015). Wheeler et al. (2013)
warns for artificial embolism formation when cutting branch samples under tension,
as air bubbles can enter from the edge of the cutting blade. This can however be
avoided if the samples are gradually cut back under water, allowing sufficient time to
relax tension, a necessary precaution that was already highlighted in the original
method (Sperry et al., 1988a). In line with this cutting artefact, artificial embolism
formation can also be induced when samples cut from vascular plants are shorter
than twice the maximum vessel length (Cochard et al., 2013). Careless sample

Chapter 1
22
handling and preparation must thus be avoided at all costs to diminish the artificial
effect on the accuracy of obtained PLC (Trifilò et al., 2014). In order to obtain Kh from
gravimetric flow rate, the height difference is used to determine the pressure
difference across the sample, which is in accordance with the principle of a linear and
steady pressure-flow relationship. The pressure at the outlet side is considered equal
to atmospheric pressure, but this assumption neglects passive water uptake (Torres-
Ruiz et al., 2012). To counter this problem, gravimetrical flow rate must additionally
be measured in the absence of a pressure difference (i.e., zero or background flow),
which requires the need of a bypass tubing system over the sample (Fig. 1.8; Sperry
et al., 1988). Kh can then be corrected by subtracting the zero flow from the
pressurized flow. Another issue regarding the mixture of the applied solution was
already mentioned when describing the original method (Sperry et al., 1988a). Using
only deionized water would exhaust and clog the samples, hence lowering
gravimetrical flow rate. Solutions should be chosen that resemble plant sap
composition in the best possible way, but even then, prolonged measurements can
still reduce Kh by microbial and/or suspended particle contamination. Moreover, the
sent-through solution must be degassed properly when determining Kh and Kh,max, as
it can also lead to artificial embolism formation and instable measurements (Espino &
Schenk, 2011). Though not a methodological issue, the presence of tyloses, gums,
and resins in the conduits or tracheids of some species could also potentially block
the gravimetrical flow, resulting in an underestimation of Kh and Kh,max (Hacke, 2014).
The relevant use of the hydraulic method in drought-induced cavitation research is
supported by its vast amount of published results (Choat et al., 2012), but the
technique is not fool proof and characterized by some unresolved issues: (i) the
hydraulic method is destructive and labor intensive, because many samples are
necessary to construct a single VC. Moreover, branch samples should be as uniform
as possible (i.e., same length, diameter, cutting position) to minimize statistical
variance related to sampling. (ii) Uncertainty in literature regarding the required
timespan to reach stable conductivity measurements, questions the validity of Kh
values used to construct VCs. (iii) There is no agreement in the type of solution that
is best suited to send through the branch samples. (iv) There exists uncertainty about
the effect of positive pressure heads on possible embolism repair. Relaxing samples
under water already resulted in refilled embolized vessels (Trifilò et al., 2014; Knipfer
et al., 2016), and this was also predicted to occur when forcing pressurized water
through the excised segments (Canny, 1998). Without providing a well-founded
reasoning as to why small positive pressure heads would be incapable of embolism
refilling, a variety of studies reject the assumption that the hydraulic method can
affect the degree of cavitation (Sperry et al., 1988a; Kolb et al., 1996; Melcher et al.,
2012). The lack of a well-defined consensus in the use of the hydraulic method,

Introduction
23
encourages the search for new, non-invasive, continuous, and more reliable
techniques to quantify drought-induced cavitation (Jansen et al., 2015). At first, the
results of these new methods should be benchmarked against the hydraulic method
to test their validity, but can then become stand-alone methods that might even help
explaining some unresolved issues associated with the hydraulic method.
1.4.3 Alternatives for the hydraulic method
Aside from the introduction of the acoustic emission method in 1966, which will be
emphasized in section 1.4.5, alternative techniques to measure cavitation were
scarce and thus mainly restricted to the hydraulic method at the end of the previous
century. Contrastingly, for the induction of cavitation a wide variety of different
techniques were available at that time: (i) the standard bench-top dehydration
procedure, where samples are dehydrated on the table under laboratory conditions
(Sperry et al., 1988a), (ii) the air-injection technique, where air is forced into samples
for a faster and more accurate dehydration procedure (Crombie et al., 1985; Sperry &
Tyree, 1990), and (iii) centrifugation, where a centrifugal force is applied on the
samples to increase the xylem tension (Pockman et al., 1995). Centrifugation has
similar advantages as the air-injection technique but without the inconvenience of
pressurized air present in the sample (Cochard et al., 2013).
During the first years of the new millennium, Hervé Cochard developed the ‘Cavitron’,
a device specifically designed to combat the discontinuity of the hydraulic method by
simultaneously inducing and measuring cavitation, by applying centrifugal force to
dehydrate the sample, and by immersing the open ends of the sample in degassed
water-filled vials with a different water level to induce the water flow necessary to
determine loss in Kh (Cochard, 2002). In contrast to the hydraulic method, the
‘Cavitron’ enabled the construction of an entire VC on one sample within a time frame
of approximately one hour (Cochard et al., 2013). However, the ‘Cavitron’ suffered
from a major drawback known as the open-vessel artifact due to its restriction in
sample length which cannot exceed centrifuge rotor length. This artifact led to
artificial embolism formation in open vessels of long-vesselled species, hence
resulting in exponential VCs and thus an overestimation of the species’ vulnerability
to drought-induced cavitation (Cochard et al., 2013).
Recently, a new and promising alternative known as the pneumatic method has been
developed, where air flow is not used to induce but measure cavitation (Pereira et al.,
2016). The reliability of air conductance measurements to quantify embolism
formation has previously been supported by the air permeability method of Franks et
al. (1995) and the finding of bubble production during the air-injection technique
(Ennajeh et al., 2011), but it was thanks to the development of the pneumatic method
that conclusive evidence was obtained in relating air flow to embolisms (Pereira et

Chapter 1
24
al., 2016). For the pneumatic method, long leafy cut-off branches are connected via
tubing systems to a vacuum reservoir, which is equipped with a vacuum meter to
measure pressure differences, and for which a syringe is used as vacuum source
(Fig. 1.9).
Fig. 1.9 Schematic representation of the pneumatic apparatus for measuring air inside branches. The
branch is connected to a section of silicone tubing (1), which is attached with plastic clamps. Adapter
luers connect the branch to pvc tubing (2) and then to a three-way stopcock (3). A vacuum meter
transducer is connected to the three-way stopcock, and the output signal is detected with a voltage
meter or data logger. The vacuum is created with a syringe that is directly connected to the tube
(Pereira et al., 2016).
The pneumatic method, like the ‘Cavitron’, tackles the discontinuity of the hydraulic
method by establishing an entire VC on one sample, but is in contrast to the
‘Cavitron’ not restricted to short samples, and thus not sensitive for the open-vessel
artifact (Pereira et al., 2016). VCs obtained with the pneumatic method were in strong
agreement with hydraulic reference VCs on both tropical and temperate tree species,
further emphasizing the reliability of the method (Pereira et al., 2016; Zhang et al.,
2018). Because air flow measurements are also much faster (< 3 minutes) and imply
far less manipulation of samples than hydraulic measurements, the pneumatic
method steps forth as a simple, fast (dependent on species’ bench-top dehydration
period), inexpensive and effective method in drought-induced cavitation research.
1.4.4 Visualization techniques
Visualization methods aim at quantifying drought-induced cavitation by making a
clear distinction between air- and water-filled conduits or tracheids. Cryo-scanning
electron microscopy (cryo-SEM) is capable of making such a distinction as water-
filled elements will be frozen, while air-filled elements will remain hollow (Fig. 1.10;
Jackson & Grace, 1994; Utsumi et al., 1996). The method is however destructive and
only small xylem segments can be visualized with this technique. At first, the xylem
section will be snap frozen and freeze fractured by submersion in liquid nitrogen,

Introduction
25
after which the sample will be fractured and loaded onto the cryo-SEM stage for
visualization (Canny et al., 2001; Johnson et al., 2009; Bauerle et al., 2011). Cochard
et al. (2000) warns for a second possible drawback of the method, which is that
freezing xylem samples under tension can promote embolism formation as air is
driven out of the plant sap, which is similar to how cavitation forms during freeze-
thaw cycles (Cochard, 2006).
Fig. 1.10 Cryo-SEM images taken from the cross section of a 48h dehydrated Maesopsis eminii Engl.
branch. (A, C) Embolized vessels are hollow (black), while functional vessels are frozen (grey-white).
(B) Detail of a functional conduit, with the frozen xylem sap. (D) Detail of four adjacent vessels with the
middle two embolized. The strength of cryo-SEM comes here into play as end-wall perforation plates
can be visualized in embolized conduits. Scale bars are indicated in the images.
Three other visualization methods have a clear advantage compared to cryo-SEM
because they are non-invasive, which is important if one aspires to study and the
dynamic behavior of embolism formation and repair without influencing the actual
process. MRI or magnetic resonance imaging is used in medical applications, and is
capable of detecting and measuring water content (Rucker et al., 2000). MRI has
been used in a variety of plant studies, and is capable of measuring xylem and

Chapter 1
26
phloem transport simultaneously (Fig. 1.11A, B; Clearwater & Clark, 2003; Windt et
al., 2006; Choat et al., 2010; Van de Wal et al., 2017).
Fig. 1.11 (A, B) MRI image of a tomato penducle. (A) cross section of the penducle showing stationary
water in the phloem (P), xylem (X), and perimedullary region (PR) as part of the pith parenchyma (PP).
(B) MRI flow mask showing the presence of axially moving water through X (red), P (blue), and PR
(green). Approximate voxel size = 78 µm (Van de Wal et al., 2017).
However, the spatial resolution of MRI is often inadequate to sufficiently visualize
cavitation in species with small vessels and/or tracheids (Cochard et al., 2015), and
is also restricted to laboratory conditions, even though some prototypes of portable
MRI scanners are getting increasing awareness (Windt & Blümler, 2015; Nagata et
al., 2016). X-ray computed microtomography or µCT tackles the problem associated
with MRI scanners, and are capable of achieving a resolution below 1 µm (Cochard
et al., 2015). This technique utilizes X-rays to visualize internal water presence, as X-
rays are almost exclusively absorbed by water via the photoelectric effect (Carlsson
& Carlsson, 1996; Gupta et al., 2016). X-ray scanners, even though also expensive
and restricted to laboratory setups, are more accessible compared to MRI scanners,
and have shown their relevance in providing new insights in embolism formation and
repair (Fig. 1.12A, B; Brodersen et al., 2010, 2017; Suuronen et al., 2013; Cochard et
al., 2015; Knipfer et al., 2015; Choat et al., 2016).
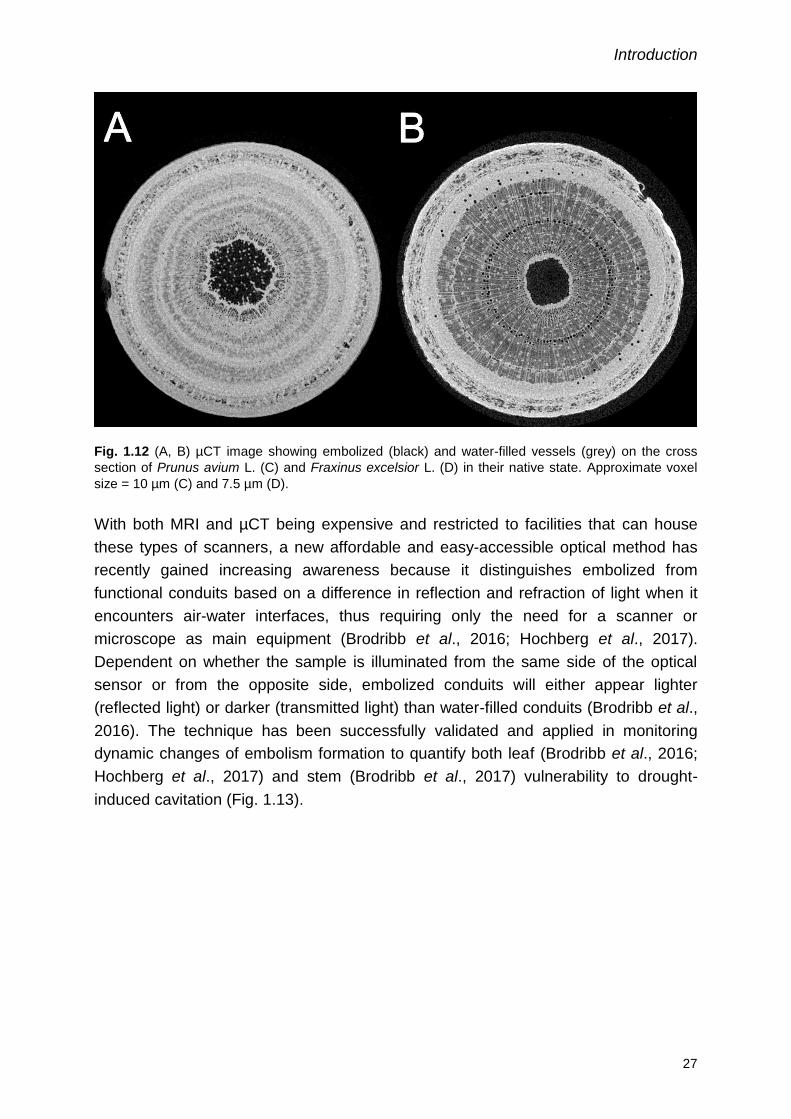
Introduction
27
Fig. 1.12 (A, B) µCT image showing embolized (black) and water-filled vessels (grey) on the cross
section of Prunus avium L. (C) and Fraxinus excelsior L. (D) in their native state. Approximate voxel
size = 10 µm (C) and 7.5 µm (D).
With both MRI and µCT being expensive and restricted to facilities that can house
these types of scanners, a new affordable and easy-accessible optical method has
recently gained increasing awareness because it distinguishes embolized from
functional conduits based on a difference in reflection and refraction of light when it
encounters air-water interfaces, thus requiring only the need for a scanner or
microscope as main equipment (Brodribb et al., 2016; Hochberg et al., 2017).
Dependent on whether the sample is illuminated from the same side of the optical
sensor or from the opposite side, embolized conduits will either appear lighter
(reflected light) or darker (transmitted light) than water-filled conduits (Brodribb et al.,
2016). The technique has been successfully validated and applied in monitoring
dynamic changes of embolism formation to quantify both leaf (Brodribb et al., 2016;
Hochberg et al., 2017) and stem (Brodribb et al., 2017) vulnerability to drought-
induced cavitation (Fig. 1.13).

Chapter 1
28
Fig. 1.13 Mosaic of color maps obtained with the optical method illustrates the spatial progression of
drought-induced cavitation through time in a stem sample of Rosmarinus officinalis. Sequential blocks
of 56 images have been stacked together (frame numbers are shown at the top portion of each tile),
with cavitated pixels colored according to the water potential at which cavitation occurred (Brodribb et
al., 2017).
1.4.5 Acoustic emission method
The use of acoustic emissions (AE) in plant physiological research dates back to the
year 1966, when Milburn and Johnson (1966) discovered that petioles of leaves
under drought stress emit audible vibrations (<20 kHz). The vibrations were recorded
by audio sound transducers, and were thought to originate from cavitation events
(Rosner et al., 2006). Because the set-up of Milburn and Johnson (1966) was too
sensitive to environmental noise distortions, Tyree and Dixon (1983) proposed to
sample in the ultrasonic frequency range (>20 kHz), which eventually led to the
development of an acoustic drought stress monitor (Tyree & Sperry, 1989b). This
proved to be an important step forward, facilitating AE experiments as working in the
ultrasonic range allowed for an easy removal of ambient noise by electronic filtering.
The fact that AE can originate from cavitating vessels or tracheids is in agreement
with the cohesion-tension theory and the air-seeding hypothesis, because the abrupt
release of tension during the transition of a water-filled conduit or tracheid under
negative pressure to an air-filled one near atmospheric pressure produces ultrasonic
sound (Tyree & Sperry, 1989b). Similar to MRI and µCT, the AE method enables
continuous and non-invasive measurements, making this technique an ideal
alternative for drought-induced cavitation research assuming that only cavitation
produces AE. But this proved to be utopic, as a wide variety of drought-stressed plant
processes results in the formation of AE: (i) dehydration of plant tissues that do not
contain vessels or tracheids such as bark (Kikuta, 2003), (ii) shrinkage of living tissue
in xylem and phloem (Vergeynst et al., 2016), (iii) cavitation of fibers (Sperry et al.,
1988b), (iv) formation of micro-cracks (Vergeynst et al., 2016) and macro-cracks
(Aggelis et al., 2010), and mechanical strain and failure during dehydration (Jackson
& Grace, 1994; Rosner et al., 2010), and (v) formation of Haines jumps, which refers

Introduction
29
to the displacement of the air-water meniscus under increasing tension between a
functional and embolized conduit or tracheid (Haines, 1930; Chotard et al., 2007;
Vergeynst et al., 2016). The nanobubble theory introduced by Schenk et al. (2015)
could result in an additional AE source during drought-stress as coalescing
nanobubbles and their subsequent collapse are likely to produce sound. Moreover,
there is still no consensus concerning the origin of the AE source related to cavitation
events, but several mechanisms have been proposed: (i) vibration of the conduit wall
when tension is released (Tyree & Dixon, 1983; Tyree & Sperry, 1989), (ii) oscillation
of hydrogen bounds when tension is released (Tyree & Dixon, 1983), (iii) transition
from liquid water to vapor water (Jackson & Grace, 1994), (iv) in case of
gymnosperms, pit membrane rupture and torus aspiration (Tyree & Dixon, 1983;
Rosner, 2012), (v) gas bubble entry via a pore in the pit membrane (Jackson &
Grace, 1994), and (vi) subsequent bubble oscillation (Ponomarenko et al., 2014).
Clearly, the major challenge in using AE as a standard method to measure drought-
induced cavitation, is determination of the source of the detected signal (Rosner,
2015). Fortunately, the past couple of years have resulted in rapid developments in
microelectronics leading to new advancements in the AE technique. High
performance acquisition systems are now available that can record and store
waveforms from multiple channels at high sample frequencies (Wolkerstorfer et al.,
2012). From acoustic waveforms, different AE parameters can be derived, describing
shape, strength and frequency spectra of the examined AE signal (Vergeynst et al.,
2016), allowing more in-depth analysis in an effort to determine the source of the
dehydration signal (Fig. 1.14).

Chapter 1
30
Fig. 1.14 Acoustic waveform extracted from a dehydrating Fraxinus excelsior L. tree. Waveform
features amplitude, duration, and counts (threshold crossings; green boxes) describe the shape of the
AE signal, and are relevant as long as the AE signal exceeds the noise threshold.
The AE signal is typically shaped by the path it travels from source to sensor
(Cochard, 1992; Wolkerstorfer et al., 2012), but the anisotropic properties of wood
make signal interpretation challenging (Vergeynst et al., 2015b). The resulting
differences in sound propagation are related to the three wood directions (axial,
radial, and tangential), wood density, xylem water content, and wood anatomy (Mayr
& Rosner, 2011). Previous AE application in drought-induced cavitation research has
mainly focused on the cumulative AE signal, following the assumption that the
majority of AE signals registered during dehydration can be linked to embolism
formation (Tyree & Dixon, 1983; Lo Gullo & Salleo, 1993). Given the many different
AE sources during dehydration, this assumption is, however, not always valid
(Wolkerstorfer et al., 2012; Cochard et al., 2013), but it does result in acoustic VCs
that provide reliable information on the effect of drought stress on plant physiology
(Rosner et al., 2006; Nolf et al., 2015; Rosner, 2015; Vergeynst et al., 2015a, 2016).
Extraction of AE signals caused by cavitation, based on their corresponding
waveform features (Fig. 1.14), is vital to further advance AE as reliable measurement
technique in drought induced cavitation research.

Introduction
31
1.5 Thesis motivation and outline
Climate change is affecting ecosystems worldwide, with the substantial increase in
atmospheric CO2 due to anthropogenic activities leading to increased global
temperature, melting of polar ice caps, sea level rising, fewer but more extreme
rainfall events, and increased drought stress. These changes impact the physiology
of vascular plants, raising questions about our future, because plants play a vital role
in safeguarding all life on earth. Measuring how plants will respond to these impacts
can provide information on what the long-term effects on plant physiology might be,
and what policy needs to be executed in order to prevent the worst-case scenario.
Determining the degree of cavitation, and the subsequent loss in hydraulic transport
caused by drought stress, can deliver vital information on how well plants will
withstand or succumb to these predicted climatic scenarios. A wide variety of
methods have been developed to serve this purpose, but the majority of them are
restricted to laboratory conditions, and are traditionally destructive, neglecting the
dynamics of embolism formation and repair. Moreover, cavitation measurements are
mainly performed by or in collaboration with specialized research groups with known
authorities in the field such as John Sperry, Melvin Tyree, Hervé Cochard and
Sylvain Delzon (derived from dataset in Choat et al. (2012)), mainly due to the
uncertainties encircling the cavitation process and used techniques. The hydraulic
method for instance, though considered to be the golden reference technique for
cavitation measurements, requires the construction of a hand-made system, for
which sufficient background knowledge is needed to properly mimic and operate it.
Additionally, this technique is labor-intensive and often prone to measurement and
sampling artifacts (Jansen et al., 2015). Visualization techniques such as MRI and
µCT have an edge as they are non-invasive and continuous, but they are quite costly
and cumbersome for routine measurements. The affordable, easy implementable and
non-invasive acoustic emission (AE) technique that enables continuous recording,
could thus be an interesting alternative. There are still some important questions
regarding the usability of the method. It is often mentioned that AE is more qualitative
than quantitative as different dehydration sources produce AE and that it cannot be
translated to percentage loss of conductivity (Cochard et al., 2013). However, state-
of-the-art AE acquisition systems can extract time, parameter and waveform data
from AE signals allowing more in-depth analysis (Wolkerstorfer et al., 2012).
Vergeynst et al. (2016) used clustering algorithms of dehydration-related AE signals,
and even though they managed to adequately seperate cavitation AE from other
sources, there was still overlap between the AE clusters, resulting in an excess of
cavitation AE over number of cavitated vessels. Nonetheless, investment and
research in further improving the AE technique can be promising to develop an easy-
to-use and easy-to-interpret diagnostic tool for drought-induced cavitation research.

Chapter 1
32
Therefore, in this doctoral thesis, the transition from hydraulic to AE method is
stimulated, by thoroughly investigating the effect of both methods on the internal
plant water relations during dehydration, and their improvement potential in being a
reliable and more comprehensive technique to assess the effect of drought stress on
plant physiology. The doctoral thesis consists of a total of six chapters (Fig. 1.15).
Fig. 1.15 Structure of the doctoral thesis. The different chapters are indicated with grey boxes, and the
accompanying experiments visualized by their respective illustrations.

Introduction
33
In Chapter 2, the hydraulic method to investigate drought-induced cavitation was
assessed on branch samples of Malus sylvestris L.. The hydraulic method is
considered the golden standard to quantify drought-induced cavitation, but there exist
many uncertainties regarding the use of pressurized water flow to measure loss of
hydraulic conductivity, and the required timespan to achieve stable readings.
Therefore, we expanded the original setup of Sperry et al. (1988a) to allow the
assessment of the uncertainties. We further validated our research findings with µCT
and compared the results of the hydraulic method with those of the AE method
(Fig. 1.15).
Woody tissue photosynthesis is an often overlooked, but important contributor to
plant total carbon income, and constitutes an immediate source of non-structural
carbohydrates (NSC) to satisfy local energetic demands and maintain hydraulic
functioning. The hydraulic method was previously used to assess the impact of
woody tissue photosynthesis on drought vulnerability, and results showed evidence
for an active role of NSC in embolism repair under tension (Schmitz et al., 2012). To
validate this finding and possibly unravel other physiological mechanisms related to
how woody tissue photosynthesis contributes to hydraulic conservation under
drought stress, acoustic emissions from dehydrating branches of control and
aluminum covered Populus nigra L. trees were analysed in Chapter 3 (Fig. 1.15).
To interpret the effect of drought stress on plant physiology, a xylem vulnerability
curve (VC) is constructed, from which the index P50 (i.e., xylem water potential
corresponding to 50% loss of hydraulic conductivity) is used as universal classifier for
drought vulnerability. However, the structure and function of the hydraulic system of
vascular plants is well-adapted to combat drought stress, not only capable in resisting
cavitation, but also in buffering increasing xylem tension by using internal water
reserves (i.e., hydraulic capacitance (C)). To better map the physiological response
to drought-induced cavitation, a tripartite methodology is introduced in Chapter 4,
using AE to construct VCs, continuous weight balance measurements to determine
hydraulic capacitance, and wood anatomy to further investigate xylem structure and
function. The framework was validated and tested on contrasting vascular plant
species occupying different climatic regions (clockwise illustrated Fig. 1.15): (i)
temperate Populus spp., (ii) temperate Malus spp., (iii) Mediterranean Olea Europaea
L., (iv) tropical Maesopsis eminii Engl., (v) tropical Erythrophleum ivorense A. Chev.
and suaveolens Guill.& Perr., and (vi) temperate species of the Triticeae tribe.
Acoustic vulnerability is often considered mainly qualitative due to the excess of
registered AE signals compared to cavitating vessels. To tackle this problem,
Vergeynst et al. (2016) used clustering based on AE signal parameterization, and

Chapter 1
34
though coming close in adequately isolating cavitation-related AE from other sources,
further refinement was still needed to improve understanding of the AE technique
and its usability in plant physiological research. Therefore, an extensive and
continuous µCT experiment was run while monitoring AE during the dehydration of
an intact Fraxinus excelsior L. tree in Chapter 5 (Fig. 1.15). Detected AE signals
were linked to visualized cavitation events with the aid of machine learning to extract
cavitation-related AE.
Finally, in Chapter 6, the most important conclusions of the previous chapters are
discussed in light of the different effect of the hydraulic and AE method on internal
plant water relations during drought vulnerability assessment, aiming to stimulate and
implement AE as a reliable diagnostic tool in drought-induced cavitation research.
The improvement potential of the AE technique compared to the hydraulic method is
highlighted and emphasized to promote AE as an easy-to-use and easy-to-interpret
outdoor stress sensor by growers and forest managers to efficiently monitor and
respond to drought stress conditions in order to retain viable yields. Future
investment and research in the AE technique is extremely important to achieve this
desired goal in regard to predicted climatic change scenarios.
2
ASSESSMENT OF THE
HYDRAULIC METHOD USING DEHYDRATING MALUS BRANCHES
AND COMPARISON TO THE
ACOUSTIC EMISSION TECHNIQUE


Assessment of hydraulic and AE method
37
2.1 Abstract
Xylem in intact plants supports dynamic water transport to ensure optimal
functioning. Maintaining transport under drought is vital, but includes a major risk
towards xylem failure when drought-induced embolisms progressively form. The
hydraulic method is considered the golden standard when it comes to quantifying
drought-induced cavitation. The method determines outlet hydraulic conductivity (Kh)
in cut branch samples, dehydrated to specific drought levels, by pushing water
through them. The technique is not foolproof, and uncertainty regarding stability in
conductivity measurements calls for a comprehensive assessment. Therefore, the
original set-up was extended to measure four parameters: (i) inlet Kh, (ii) outlet Kh,
(iii) radial flow from xylem to surrounding living tissue, and (iv) pressure difference
across the sample. To obtain a theoretically and physiologically accurate Kh value,
hydraulic steady-state is required where inflow equals outflow, and radial flow is zero.
Application of the set-up on branches of Malus sylvestris L. showed that actual
hydraulic steady-state was achieved at much longer timespans (up to 300 min) than
previously reported, and that timespans increased with negative xylem water
potentials. During each experimental run, hydraulic conductivity dynamically
increased, and xylem tension decreased, which was supported by X-ray computed
microtomography (µCT) visualization of embolism refilling when using both high (8
kPa) and low (2 kPa) pressure heads. The methodological flaw of artificial refilling of
vessels by pressurized water questions the stable Kh readings. Therefore, acoustic
sensors were applied to measure dynamics in dehydrating branches continuously,
and proved a promising substitute to quantify vulnerability to drought-induced
cavitation.

Chapter 2
38
2.2 Introduction
Vascular water transport, which is referred to as the ‘backbone of plant physiology’
(Brodribb, 2009), is vital for optimal plant functioning and consists of two pathways: (i)
the phloem, which distributes sugars throughout the plant, fueling cell maintenance
and growth (Van Bel, 2003; Sala et al., 2012; Hubeau & Steppe, 2015; Steppe et al.,
2015), and (ii) the xylem, responsible for the upward transport of water and nutrients
(Tyree & Zimmermann, 2002; Venturas et al., 2017). The xylem pathway is an
amazing structure, capable of dynamically transporting water over more than 100
meters to the canopy (Ryan et al., 2006; Kim et al., 2018). It has fascinated
generations of physiologist and physicists (Cochard et al., 2013), stimulating plant
hydraulic research to further advance the mechanistic understanding of xylem
functionality (Tyree, 2003).
Xylem can be described as a chain of continuous water columns, passively
transporting water upwards via cohesion-tension forces (Dixon & Jolly, 1895). This
transport mechanism is formulated as the cohesion-tension theory and is widely
accepted (Angeles et al., 2004). Though this transportation method does not require
energy from the plant, it comes with the disadvantage of being metastable as it is
subjected to tension i.e. negative xylem water potentials (ψx, MPa) (Steudle, 2001;
Cochard et al., 2013). Increasing tension can induce a phase transition of liquid water
to vapor (Mayr et al., 2014), resulting in a rupture of the continuous water columns,
and thus formation of embolisms (Tyree & Zimmermann, 2002). According to the air-
seeding hypothesis, a more negative ψx allows air to be drawn into water-filled xylem
vessels via pores in the pit membrane (Mayr et al., 2014), with the size of the largest
pore determining the air-seeding threshold (Tyree et al., 1994). Recently, Schenk et
al. (2015) added a new element to xylem functioning, as the authors found that
nanobubbles exist near nanoporous pit membranes, and that they can remain stable
by xylem surfactant coating (Schenk et al., 2017). However, as tension increases,
nanobubbles will either enlarge or coalesce, and once a critical threshold is
surpassed (Blake, 1949), the xylem conduit will embolize (Schenk et al., 2015). An
increase in xylem tension is typically the result of drought stress, as drying of soil
and/or atmospheric conditions put extra strain on the xylem pathway to supply water
to the canopy. Progressing drought stress can as such lead to plant mortality, and
hence limit biomass production (Brodribb et al., 2010; Melcher et al., 2012).
Quantifying a plant species’ vulnerability to drought-induced cavitation and the
resulting decrease in xylem hydraulic conductivity (Kh, kg s-1 m MPa-1), is becoming
increasingly more important as climate change increases frequency, duration and

Assessment of hydraulic and AE method
39
severity of drought and heat stress events (Allen et al., 2010). For this purpose, a
wide variety of methods have been developed, ranging from the way cavitation is
induced and how its effects are measured (Cochard et al., 2013). Despite the
existence of different techniques, the hydraulic method as introduced by Sperry et al.
(1988a) is still considered the golden standard. In this method, cavitation is induced
by bench-top dehydration and quantified by measuring loss in Kh. The technique
uses a hydraulic system where a degassed 20 mM KCl solution is sent via a small
positive pressure head (range 1 to 8 kPa) through a cut branch sample, while the
resulting flow rate at the outlet side is measured by a precision balance (Sperry et al.,
1988a). The van den Honert concept (1948) describes that stationary flow of water is
determined by the water potential gradient between two points in the hydraulic
pathway and the resistance across it (Tyree & Ewers, 1991a). Sperry et al. (1988a)
used this pressure-flow relationship to translate mass flow rate to Kh by determining
the pressure difference over the cut sample. The technique is repeated on samples
with different degrees of embolism formation in order to quantify loss of Kh, which is
then rescaled to percentage loss of conductivity (PLC, %), by calculating maximum
hydraulic conductivity (Kh,max) of the respective samples, and dividing the two
quantities (Eq. 2.1):
PLC = (1 - Kh
Kh,max
) × 100 (Eq. 2.1)
If the water potential of the cut branch samples is determined using enclosed leaves,
then a vulnerability curve (VC) can be constructed, relating percentage loss of Kh to
xylem tension (Jansen et al., 2015). The universal index P50 (MPa), representing the
xylem tension at which 50% loss of Kh occurs, can be derived from the VC and is
widely used to classify the degree of sensitivity to drought-induced cavitation in plants
(Choat et al., 2012; Melcher et al., 2012).
Following the method described by Sperry et al. (1988a), correct assessment of Kh is
based on a deviating trend in running mean (RM), and should imply a stable
condition in outflow (Melcher et al., 2012). The reported timespan to reach this
stability in Kh is typically within the first 30 min of measurement (Cochard, 2006), and
varies dependent on sample characteristics (i.e., diameter, length) and examined
species: Espino & Schenk (2011) reached stability within the first five minutes,
Nardini et al. (2012) within 20-40 min, and 10-15 min were recorded in Trifilò et al.
(2014). However, various other articles that used the hydraulic method to establish
VCs do not list the timespan (e.g. Torres-Ruiz et al., 2012; Beikircher et al., 2013),
and in the articles that did, no further information was provided on what measure
stability was based. Moreover, there is a lot of uncertainty concerning the pressure

Chapter 2
40
head that is best used to determine a species’ loss of Kh. Low-pressure heads are
typically applied as they are assumed to not cause embolism refilling during
conductivity measurements (Sperry et al., 1988a; Kolb et al., 1996; Melcher et al.,
2012). But even within the range of low-pressure heads, examined species and
research objectives make it impossible to standardize pressure heads (Table 2.1).
Table 2.1 Applied pressure heads in different studies to measure hydraulic
conductivity (Kh) of various plant species
Pressure head (kPa) Plant species Study
6-7 Acer saccharum Marshall Sperry et al. (1988a) 1.6; 7 (long vs short stems) Vitis vinifera L. Choat et al. (2010) 4-5.5 Olea europaea L. Torres-Ruiz et al. (2012) 4 Malus domestica Borkh. Beikircher et al. (2013)
6 Quercus ilex L. Martin-StPaul et al.
(2014) 8 Acer var. Nardini et al. (2012)
8 Laurus nobilis L., and Olea
europaea L. Trifilò et al. (2014)
8-8.5 Humulus lupulus L., Vitis vinifera L.,
and Clematis vitalba L. Balaz et al. (2016)
The maximum applicable pressure head that is expected to avoid embolism
displacement for a given species can be estimated from the vessel diameter
(Eq. 2.2):
P = (Γ
rv
) × 2 (Eq. 2.2)
With Γ representing the surface tension of water at 20°C (0.07275 N m-1), and rv the
radius of the widest vessel (Van Ieperen et al., 2000; Melcher et al., 2012).
Despite many advances in plant hydraulic research, physiological, theoretical nor
physical explanations are available to justify the timespan to reach stability in Kh, and
the pressure heads used. By extending the original set-up with additional
measurements, our study aimed at quantifying water flow dynamics through cut
branch samples of Malus sylvestris L. when used in the hydraulic method to explain
some of the reported uncertainties. In addition to outlet Kh, measurements of (i) inlet
Kh with a flow meter, (ii) diameter change as proxy of radial flow between xylem and
surrounding living tissue with a linear variable displacement transducer (LVDT), and
(iii) the pressure difference across the sample with pressure sensors were included.
Stability in conductivity was defined as in fluid dynamics theory, where hydraulic
steady-state is achieved when inflow equals outflow, and radial flow becomes zero.

Assessment of hydraulic and AE method
41
To assess the effect of pressure heads on conductivity measurements, a low (2 kPa)
and high (8 kPa) pressure head were applied in the set-up. In addition, the impact of
the hydraulic method on xylem tension was assessed, and X-ray computed
microtomography (µCT) was used to verify some of our findings. Finally, acoustic
emissions (AE) were measured on dehydrating Malus sylvestris L. branches to
construct acoustic VCs and assess whether these are reliable substitutes for the
hydraulic ones.
2.3 Materials and methods
2.3.1 Plant material
Malus sylvestris L. branches for hydraulic conductivity and µCT measurements were
collected during August and September 2016, while AE measurements were carried
out in August 2017 (DOY 214 till DOY 215). The study trees grew in sand-lime soil at
the Faculty of Bioscience Engineering, Ghent University, Belgium (51°03’10.3”N
latitude; 3°42’32.3”E longitude). The trees had an average diameter at breast-height
of 17.2 ± 1.7 cm, and an average height of 3.6 ± 0.7 m. They were approximately 15
years old, were pruned every two to three years, and aside from being rainfed, no
additional watering was supplied.
2.3.2 Maximum and average vessel length
Maximum vessel length was determined by connecting the proximal end of cut
branches to a compressed air tank via flexible tubing (Ewers & Fisher, 1989). Air is
then pressurized to 100 kPa, and sent through the branch, with the apex end
submerged in water. The branch is gradually cut back until a steady stream of
bubbles originates from one xylem vessel element. Branch length is measured and
represents the length of the longest vessel. Maximum vessel length of Malus
sylvestris L. was on average equal to 58.9 ± 6.4 cm (n = 10). Branches were then cut
back further until about 50% of the xylem vessels were open. This length was
considered to be the average vessel length, and was equal to 13.4 ± 3.2 cm (n = 10).

Chapter 2
42
2.3.3 Sampling procedure for the hydraulic, µCT and AE method
Branches for the hydraulic, µCT and AE method were cut underwater before sunrise,
ensuring full hydration of functional vessels. To ensure that xylem tension at the time
of cutting was near zero to avoid cutting artefacts (Cochard et al., 2013), three
alternate leaves near the apical end of the branch were covered in aluminum foil the
day prior to measurement. Wrapping the leaves in aluminum foil allows leaf water
potential to equilibrate with xylem tension by lowering stomatal conductance and
transpiration (Trifilò et al., 2014). After branch excision, xylem water potential (ψx,
MPa) was determined with a pressure chamber (Model 1000, PMS Instrument
Company, Corvalis, OR, USA), and equaled for all cut branches 0 MPa. Hydraulic
branches were on average 113 ± 7 cm long (n = 18), µCT branches 115 ± 7 cm (n =
5), and AE branches 114 ± 8 cm (n = 4). The length of the study branches was
around twice the maximum vessel length to avoid artificially created embolisms from
the cutting procedure (Melcher et al., 2012; Cochard et al., 2013). The cut end was
then submerged in a water-filled bucket, and the branches were covered with a black
polyethylene bag during transportation to the lab, which took about two minutes.
2.3.4 Sample preparation hydraulic method
A 15 cm section was marked in the middle of the branch, with average diameter of
7.56 ± 0.07 mm (n = 18). This 15 cm section was chosen based on the estimated
average vessel length of the species, and allowed to a certain extent comparison with
the 15 cm long samples used in the original hydraulic method on Acer saccharum
Marshall (Sperry et al., 1988a). Study branches were subjected to different bench-top
dehydration periods: zero, two, four, six, eight, ten, twelve, fourteen, and sixteen
hours. Two additional steps were executed prior to dehydration: (i) removal of all but
one leaf in the marked 15 cm section. Wounds were covered with superglue to limit
leakage, potentially disrupting conductivity measurements. (ii) Covering three leaves
close to the 15 cm section with aluminum foil, to determine xylem tension at the end
of each bench-top dehydration period, while the remaining leaves were left exposed
to accelerate the dehydration process. Following each dehydration period, branches
were gradually shortened underwater up to the 15 cm section, which allowed
sufficient time to relax the tension and avoid cutting artefacts (Cochard et al., 2013).
Additional care was taken to keep the remaining leaf above the water surface during
cutting. The section was then wiped and the remaining leaf covered in aluminum foil
(Fig. 2.1I, Fig. 2.2E1). From both ends of the sample, 0.5 cm of bark was removed
with a sharp knife to ensure that water directly entered the xylem vessels. To nullify
the pinching effect of the garden shears used to shorten the branches, both ends
were cut transversal with a sharp knife to reopen the vessels. Parafilm was wrapped

Assessment of hydraulic and AE method
43
around the bark at both ends to allow a smooth fit with the silicone connection tubes
of the hydraulic conductivity apparatus.
2.3.5 Hydraulic conductivity apparatus
The hydraulic conductivity apparatus was built to mimic the original setup described
by Sperry et al. (1988a), where Kh is obtained by measuring the flow rate at the outlet
side via an electronic precision balance (Fig. 2.1L; Fig. 2.2F1), but to unravel the
water flow dynamics in the study samples during Kh measurements, the apparatus
was enhanced (Fig. 2.1; Fig. 2.2), allowing for a complete assessment of the
hydraulic method.
Fig. 2.1 Schematic of the modified hydraulic conductivity apparatus used for hydraulic conductivity
measurements: (A), reservoir with Volvic water to induce required pressure head; (B), Liqui-Cel mini
module degasser; (C), vacuum pump; (D), Liqui-Flow flow meter; (E) and (J), Vegabar14 pressure
sensor; (F), bypass tube; (G), cut Malus sylvestris L. branch sample; (H), Linear Variable
Displacement Transducer (LVDT); (I), aluminum covered leaf; (K), receptacle; (L) electronic precision
balance; (M), Guardo Action Cam +; (N), Campbell Scientific CR1000 data logger; (O), computer.

Chapter 2
44
Fig. 2.2 Overview of the modified hydraulic conductivity apparatus used for hydraulic conductivity
measurements (central panel): (A), reservoir with Volvic water to induce the required pressure head;
(B), Liqui-Cel mini module degasser; (C), Liqui-Flow flow meter; (D), Vegabar14 pressure sensor; (E),
custom-built holder containing a cut Malus sylvestris L. branch sample; (E1), aluminum covered leaf;
(E2) Linear Variable Displacement Transducer (LVDT); (E3), bypass tube; (F1), electronic precision
balance; (F2) receptacle; (F3), Guardo Action Cam +.
The apparatus was expanded with a flow meter (Liqui-Flow with 0-20 g h-1 range and
0.05 g h-1 accuracy, Bronckhorst (High Tech), Montigny les Cormeilles, France) at
the inlet side (Fig. 2.1D; Fig. 2.2C), a Linear Variable Displacement Transducer
(LVDT, DF/5.0, Solartron Mobrey, Brussels, Belgium) perpendicular to the sample
surface (Fig. 2.1H; Fig. 2.2E2), and two pressure sensors (Vegabar14 with 0-10 kPa
range and 0.01 kPa accuracy, Schiltach, Germany) at both ends of the study sample
(Fig. 2.1E-J; Fig. 2.2D). Two different pressure heads (2 and 8 kPa) were applied to
assess possible embolism refilling. The pressure heads were set by changing the
height of the hydraulic head, which was a reservoir with a broad surface to ensure
that the pressure head remained fixed at 2 or 8 kPa during the course of the
conductivity experiment (Fig. 2.1A; Fig. 2.2A). The supplied solution to the reservoir
was commercially bottled mineral Volvic water (Volvic natural mineral water, Danone
waters group, France; pH = 7), because it closely resembles the ion composition of
xylem sap (Steven Jansen, pers. comm.). Micropur tablets (Micropur Forte MF 1T,

Assessment of hydraulic and AE method
45
Katadyn Inc., Switzerland) were added to the Volvic solution to prevent the formation
of bacteria and viruses. A lid prevented evaporation and contamination of the
solution, but was placed loosely onto the reservoir to avoid pressure build-up in the
system. A mini-degassing module (Liqui-Cel mini module G543, Membrana, NC,
USA), connected to a vacuum pump (MVP055-3, Pfeiffer Vacuum, Assiar, Germany),
was installed between reservoir and study sample to remove air bubbles from the
solution in order to avoid artificial embolism formation (Fig. 2.1B-C; Fig 2.2B).
Samples were installed in a custom-built holder (Fig. 2.2E), which ensured a stable
installation of both LVDT and examined sample. The silicone tubes that connect the
sample to the apparatus, were manually filled with Volvic water via a syringe. Care
was taken when connecting the sample via plastic clamps to these silicone tubes to
avoid formation of air bubbles. Tissue paper was put underneath the connections to
check for leakages. In the case of leaks, sample measurement was stopped,
discarded and repeated. A receptacle was placed at the end of the apparatus to
catch the outflowing solution (Fig. 2.1K, Fig. 2.2F2). The opening was covered with
Parafilm to avoid evaporation, but a small incision was made to avoid pressure build-
up in the system. A bypass tube was installed to flush the hydraulic apparatus before
and after each experiment (Fig. 2.1F; Fig. 2.2E3), to remove air bubbles and
contaminations as well as to determine zero or background flow. Flushing lasted for
10 min by connecting the apparatus to an inox pressure case (pressure case RVS
24L spray-matic, Air Compact, Gentbrugge, Belgium), which was filled with volvic
water and pressurized to 100 kPa (Fig. 2.3A).

Chapter 2
46
Fig. 2.3 Overview of the flushing procedure (left panel): (A) inox pressure case filled with Volvic water
at a pressure of 100 kPa; (B), visual removal of air emboli from a Malus sylvestris L. branch sample.
Five second and one minute average data of flow meter, pressure sensors and LVDT
were collected as millivolt (mV) signals via a data acquisition system (CR1000,
Campbell Scientific, Logan, UT, USA), which was connected to a computer
(Fig. 2.1N, O; Fig. 2.2). Values were monitored live with the LOGGERNET software
(LOGGERNET 4.5, Campbell Scientific, Logan, UT, USA). The precision balance
could not be logged thus photos of the display were taken every minute with a
camera (Guardo action cam +, TE-GROUP nv, Kapellen, Belgium; Fig. 2.1M;
Fig. 2.2F3).
Assessment of hydraulic and AE method
47
2.3.6 Hydraulic conductivity
Sample measurements typically lasted longer than half a day to ensure that Kh based
on hydraulic steady-state could be quantified. Hydraulic steady-state was achieved
using two approaches: (i) stability in Kh, which refers to the point where Kh at the inlet
side approximates Kh at the outlet side within a threshold range of 0.006 ± 0.001 10-5
kg s-1 m MPa-1 or the difference between both becomes minimal. This assumption is
justified, because the difference in inlet (Pin) and outlet pressure (Pout) remained
constant during the course of conductivity measurements. This condition guarantees
that the Volvic water only runs through the xylem. (ii) Stability in diameter change
(Δd, mm), which refers to the point where the change in branch diameter flattens out.
Then, water is no longer directed to living cells to replenish them and radial flow will
thus be minimal, no longer influencing xylem hydraulic conductivity. Besides aiming
for hydraulic steady-state, Kh values were also taken at the start of each conductivity
experiment, or using a deviation in running mean (RM) of the outflow (Sperry et al.,
1988a). Calculation of RMs was based on the previous five 1-min conductivity
readings, and were plotted against time to determine at which point the trend in RM
deviated from a previous decreasing/increasing trend.
Raw data extracted from the data logger (mV) was processed to get diameter change
(Δd, mm) for LVDT, inflow (Fin, g h-1) for flow sensor, and inlet (Pin, MPa) and outlet
pressure (Pout, MPa) for pressure sensors, by using their respective calibration
equations. There was a delay of several seconds between capturing and saving the
photo of the balance display, hence creating an offset between camera and logger
time that needed correction. The camera time was extracted from the metadata by
using Phyton 2.7.13 software. For each specific time interval (t, h) derived from the
metadata, weight readings of the balance (W, g) were noted manually from the
camera images and converted to outflow data (Fout, g h-1; Eq. 2.3):
Fout = Wi+1-Wi
ti+1-ti (Eq. 2.3)
The offset between camera and logger time was corrected by linearly interpolating
Fout over fixed one minute time intervals using the PhytoSim software package
(PhytoSim 2.1, Phyto-IT bvba, Mariakerke, Belgium). Inlet (Kh,in, 10-5 kg s-1 m MPa-1;
Eq. 2.4) and outlet (Kh,out, 10-5 kg s-1 m MPa-1; Eq. 2.5) hydraulic conductivity were
calculated by incorporating the length of the sample (Lsample = 0.15 m) and the
pressure difference (Pin-Pout, MPa) over it. By directly measuring the pressure drop
over the sample, corrections for passive water uptake were not required (Torres-Ruiz
et al., 2012):
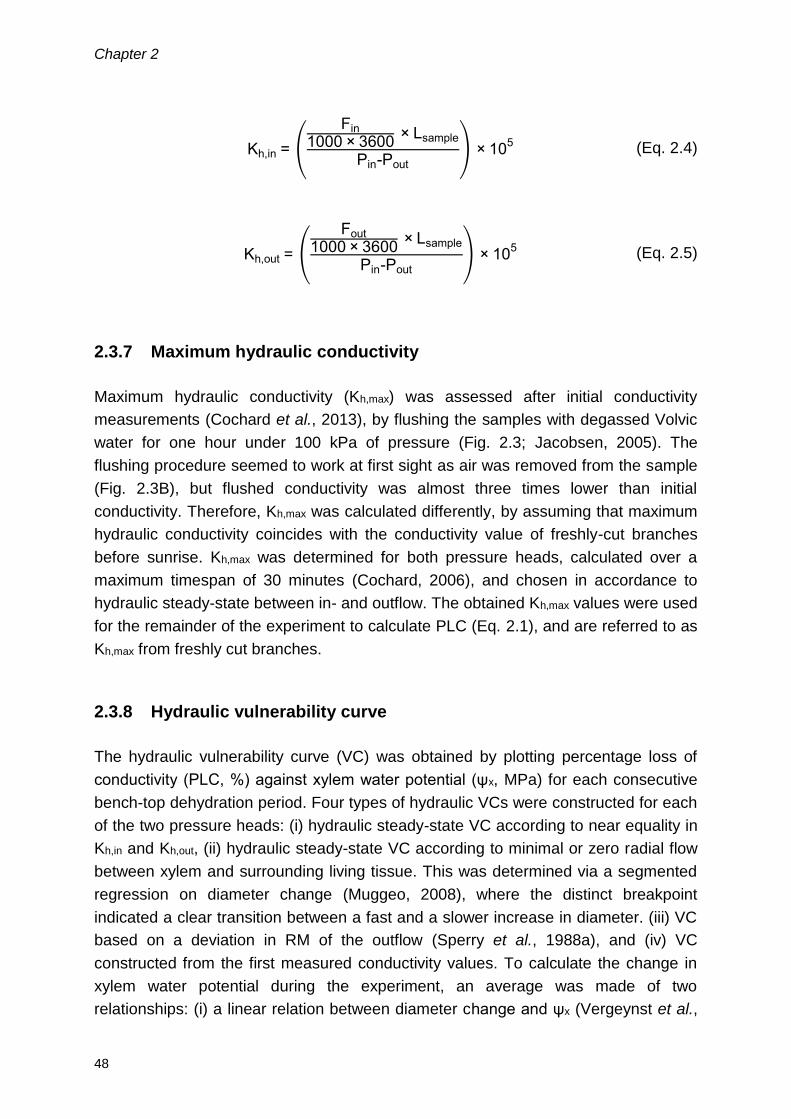
Chapter 2
48
Kh,in = (
Fin
1000 × 3600 × Lsample
Pin-Pout
) × 105 (Eq. 2.4)
Kh,out = (
Fout
1000 × 3600 × Lsample
Pin-Pout
) × 105 (Eq. 2.5)
2.3.7 Maximum hydraulic conductivity
Maximum hydraulic conductivity (Kh,max) was assessed after initial conductivity
measurements (Cochard et al., 2013), by flushing the samples with degassed Volvic
water for one hour under 100 kPa of pressure (Fig. 2.3; Jacobsen, 2005). The
flushing procedure seemed to work at first sight as air was removed from the sample
(Fig. 2.3B), but flushed conductivity was almost three times lower than initial
conductivity. Therefore, Kh,max was calculated differently, by assuming that maximum
hydraulic conductivity coincides with the conductivity value of freshly-cut branches
before sunrise. Kh,max was determined for both pressure heads, calculated over a
maximum timespan of 30 minutes (Cochard, 2006), and chosen in accordance to
hydraulic steady-state between in- and outflow. The obtained Kh,max values were used
for the remainder of the experiment to calculate PLC (Eq. 2.1), and are referred to as
Kh,max from freshly cut branches.
2.3.8 Hydraulic vulnerability curve
The hydraulic vulnerability curve (VC) was obtained by plotting percentage loss of
conductivity (PLC, %) against xylem water potential (ψx, MPa) for each consecutive
bench-top dehydration period. Four types of hydraulic VCs were constructed for each
of the two pressure heads: (i) hydraulic steady-state VC according to near equality in
Kh,in and Kh,out, (ii) hydraulic steady-state VC according to minimal or zero radial flow
between xylem and surrounding living tissue. This was determined via a segmented
regression on diameter change (Muggeo, 2008), where the distinct breakpoint
indicated a clear transition between a fast and a slower increase in diameter. (iii) VC
based on a deviation in RM of the outflow (Sperry et al., 1988a), and (iv) VC
constructed from the first measured conductivity values. To calculate the change in
xylem water potential during the experiment, an average was made of two
relationships: (i) a linear relation between diameter change and ψx (Vergeynst et al.,

Assessment of hydraulic and AE method
49
2015a), and (ii) a linear relation between time and ψx. The VC x-axes could then be
adjusted so that conductivity values matched with the prevailing steady-state xylem
tension at that time.
2.3.9 AE sample preparation and data registration
Four branches were sampled for AE measurements and transported to an
experimental room, which was illuminated with an artificial green light during
preparation steps to diminish photosynthesis and transpiration. Wet cloths were fixed
against the cut end of the branches to avoid air entry, and branches were placed in
custom-built holders to ensure an unbiased link and an equal distance (8 cm)
between the two sensor types. Broadband point-contact AE sensors (KRNBB-PC,
KRN Services, Richland, WA, USA) monitoring acoustic activity, and dendrometers
(DD-S, Ecomatik, Dachau, Germany) measuring xylem shrinkage, were installed on a
section of exposed xylem (1.5 × 0.5 cm). The AE sensor was pressed against the
xylem via a compression spring (D22050, Tevema, Amsterdam, The Netherlands) in
a small pvc tube. A droplet of vacuum grease (High-Vacuum Grease, Dow Corning,
Seneffe, Belgium) was added between sensor tip and branch to ensure good
acoustic contact, which was validated via the pencil lead break test (Tyree & Sperry,
1989; Vergeynst et al., 2015b). Petroleum jelly was applied between dendrometer tip
and xylem, to avoid evaporation from the exposed wound (Vergeynst et al., 2016).
After installation, wet cloths were removed and TL lights turned on in order to start
the bench-top dehydration experiment.
Readings from dendrometers were registered every minute via custom-built
acquisition boards. The AE signals were amplified by 35.6 decibels (dB) (AMP-1BB-
J, KRN Services, Richland, WA, USA) and waveforms of 7168 samples length were
acquired at 10 MHz sample rate. The signals were collected using two 2-channel PCI
boards and redirected to the software program AEwin (PCI-2, AEwin E4.70, Mistras
Group BV, Schiedam, The Netherlands). A 20-1000 kHz electronic band pass filter
was applied and only waveforms above the noise level of 28 dB were retained
(Vergeynst et al., 2016). To determine the decrease in xylem water potential of AE
branches, no more than three leaves were wrapped in aluminum foil at any given
time, while the remainder were left exposed to ensure a similar dehydration time
similar to hydraulic branches. Water potential readings were done every 20 minutes,
providing a sufficient one-hour timespan for a newly wrapped leaf to come in
equilibrium with branch xylem. Both during leaf removal and wrapping, AE detection
was put on hold to avoid noise disturbance.

Chapter 2
50
2.3.10 Acoustic vulnerability curve
The obtained AE signals were used to construct acoustic vulnerability curves (VCAE)
(Mayr & Rosner, 2011; Vergeynst et al., 2015a). The AE signals were cumulated over
the measurement period from which the first derivative was calculated to construct an
AE activity curve. The endpoint of the vulnerability curve was determined as the point
at which the decrease in AE activity, following the AE activity peak, decreased most
strongly. From a mathematical point of view this corresponds to the local maximum of
the third derivative (Vergeynst et al., 2016). Four branches were bench-top dried for
24 hours, providing sufficient time to reach complete dehydration, as was validated
by the µCT image of a 16-h dehydrated Malus sylvestris L. branch (Fig. 2.14),
illustrating near full embolism formation. AE activity was numerically calculated over a
15-min time interval (moving window), whereas the third derivative was determined
over a 12-h time interval (moving window), based on the time scale at which the AE
peak occurred (Vergeynst et al., 2016). The continuous x-axis of the acoustic
vulnerability curves (VCAE) was obtained via a segmented linear relation between
xylem diameter shrinkage (Δd/di, µm mm-1) and discrete measurements of ψx
(Table 2.2; Fig. 2.4).
Table 2.2 Equation of the segmented linear regression before and after the
breakpoint between point measurements of water potential and relative xylem
diameter shrinkage
Branch BP (µm.mm-1) Eq. before BP R2 Eq. after BP R2
1 -78.84 0.009* Δd di⁄ -0.008 0.95 0.19* Δd di⁄ -14 0.99 2 -36.24 0.020* Δd di⁄ -0.026 0.99 0.49* Δd di⁄ -17 0.99 3 -21.62 0.033* Δd di⁄ -0.004 0.96 0.77* Δd di⁄ -16 0.99
4 -62.98 0.012* Δd di⁄ -0.014 0.97 0.26* Δd di⁄ -16 0.99
Breakpoint (BP, µm.mm-1) between point measurements of water potential (WP, MPa) and relative
xylem diameter shrinkage (Δd/di, µm.mm-1) for the four Malus sylvestris L. branches. The linear
regression equations with enlisted R2 are used to construct the continuous water potential axis for the
acoustic VCs.

Assessment of hydraulic and AE method
51
Fig. 2.4 Linear regression before and after the breakpoint between relative xylem diameter shrinkage
(Δd/di, µm.mm-1) and water potential (MPa) for the four Malus sylvestris L. branches. The segmented
linear regression is used to obtain continuous xylem water potential axes for the acoustic VCs.
2.3.11 X-ray computed microtomography (µCT)
To unravel water flow dynamics in the study samples during conductivity
measurements, different aspects were investigated via µCT: (i) native embolism of
freshly cut branches, (ii) the effect of flushing, (iii) the duration of the bench-top
dehydration period to reach full embolism formation, and (iv) the possibility of low
pressure heads refilling embolized vessels. 15 cm long apple samples with a
diameter similar to the segments used in the hydraulic method were scanned at the
NanoWood CT facility (Laboratory of Wood Technology, Faculty of Bioscience
Engineering, Ghent University, Belgium) (Dierick et al., 2014). Samples were fixed in

Chapter 2
52
a small terostat-filled bottle (Terostat-IX, Teroson, Henkel, Düsseldorf, Germany),
and centered via screws (Fig. 2.5).
Fig. 2.5 Malus sylvestris L. sample in a custom-built holder placed on the rotation platform of the
NanoWood µCT scanner. The sample is centered by four screws and terostat is used to tightly fix the
sample and avoid dehydration during scanning.
The targeted scanning point was taken ~5 cm below the top end and was marked
with tape in the event scanning needed to be executed at the same height, which
was necessary to determine the effect of a low pressure head by first dehydrating
and scanning the sample, installing it in the hydraulic conductivity apparatus, and
finally re-scanning the sample at the marked position. The top end of the samples
was covered with terostat to avoid evaporation, after which the sample was
positioned on the rotation platform of the NanoWood µCT-scanner (Fig. 2.5).
Samples were scanned for 32 min, and the resulting 3.5 mm high 3D volume was
reconstructed from 2000 projections taken during a 360 degree rotation.
Reconstructions were made with the Octopus reconstruction software package

Assessment of hydraulic and AE method
53
(Dierick et al., 2004; Vlassenbroeck et al., 2007, distributed by XRE; www.xre.be),
and resulted in an approximate voxel pitch of 5-µm resolution.
2.3.12 Anatomy
A ~5 cm long wood sample with a diameter of 7.48 mm was taken from a freshly cut
apple branch for anatomical analysis. The sample was stored in a solution of 60%
ethanol, 30% deionized water, and 10% glycerol and stored for one year. A 35 µm
thick cross section was then cut from the sample with a sliding microtome (Hn-40,
Reichert-Jung, Saarland, Germany) at the Department of Biology (Ghent University,
Belgium). The cross section was stained for 15 min with 0.5% w/v astra blue, 0.5%
w/v chrysoidine, and 0.5% w/v acridine red and mounted in euparal after dehydration
in isopropyl alcohol. Images were captured using a Nikon Ni-U microscope equipped
with a Nikon DS-Fi1c camera (Fig. 2.6).
Fig. 2.6 35 microns thick transverse cross section of a young branch of a 15-year old Malus sylvestris
L. tree showing from inward to outward pit, xylem, cambium and bark. The cross section had a total of
7739 xylem vessels. Scale bar = 1mm. Credit Dr. Olivier Leroux.

Chapter 2
54
Anatomical analysis was restricted to manually counting the amount of xylem vessels
on the cross section with the image analysis software Fiji (Schindelin et al., 2012). A
total of 7739 vessels were obtained from the cross section and this value was used to
translate the amount of cavitated vessels derived from the µCT images of 0-h, 6-h,
12-h, and 16-h dehydrated apple samples to a percentage of cavitated vessels.
2.3.13 Statistics
Analysis of variance (ANOVA) was performed to detect differences between average
Kh of freshly cut and flushed branches (P < 0.05), performing a Wilcoxon signed rank
test and Levene test to check for normality and homogeneity. The acoustic
vulnerability curve (VCAE) was averaged over the four branches and fitted using the
smooth.spline function in the stats library in R software (RStudio version 1.1.419 - ©
2009-2017 RStudio, Inc.). Xylem water potential at which 50% of cavitation-related
AE occur (AE50, MPa) was also determined. Hydraulic VCs were fitted via the fitplc R
package in the stats library of R software (Duursma & Choat, 2017). Two types of
models were fitted to the data: (i) the reparametrized Weibull function of Ogle et al.
(2009), and (ii) a sigmoidal model as postulated by Pammenter and Van der Willigen
(1998). Only for hydraulic steady-state in Kh for 8 kPa pressure head was the use of
a Weibull fit justified, because a xylem water potential of 0 MPa coincided with 0%
PLC. From the fitplc package, P50 values of hydraulic VCs were calculated as well
(Duursma & Choat, 2017). Figures were made with RStudio and SigmaPlot 13
graphing software package.
2.4 Results
2.4.1 Hydraulic method
Measurements of hydraulic conductivity and branch diameter dynamically changed
with time when using the hydraulic method. Independent of the duration of bench-top
dehydration, Kh first decreased, reaching a local minimum, followed by an increase
towards an absolute maximum and a further decrease until the end of the
experimental run. Hydraulic steady-state in conductivity was reached when Kh,in
approximately equaled Kh,out within a threshold range of 0.006 ± 0.001 10-5 kg s-1 m
MPa-1 (Fig. 2.7 A-C), or the difference between both became minimal (Fig. 2.7 D-F).

Assessment of hydraulic and AE method
55
Fig. 2.7 Change in inlet pressure (grey, Pin, kPa), outlet pressure (light grey, Pout, kPa), stem diameter
or radial flow (orange, Δd, mm), inlet hydraulic conductivity (red, Kh,in, 10-5 kg s-1 m MPa-1), and outlet
hydraulic conductivity (blue, Kh,out, 10-5 kg s-1 m MPa-1) of Malus sylvestris L. samples for two different
pressure heads (8 kPa: A-C; 2 kPa: D-F), and for three different bench-top dehydration periods (0-h:
A, D; 6-h: B, E; 12-h: C, F) during conductivity measurements.
Overall, the timespan to reach hydraulic steady-state increased with the duration of
bench-top dehydration (Table 2.3, Fig. 2.7).

Chapter 2
56
Table 2.3 Timespan to reach hydraulic steady-state according to stability in hydraulic
conductivity (Kh) and stability in diameter change or radial flow (Δd) for the different
bench-top dehydration periods and the two pressure heads (8 and 2 kPa)
Dehydration period (h)
t∆(Kh,in-Kh,out) ≈ 0 (min) t∆d ≈ 0 (min)
8 kPa 2 kPa 8 kPa 2 kPa
0 105 232 27 205 2 105 213 28 224 4 114 216 179 81 6 223 278 93 167 8 205 / 101 / 10 279 604 160 95 12 306 308 144 100 14 348 / 163 /
Timespan for when inlet Kh approximately equals outlet Kh in a threshold range of 0.006 ± 0.001 10-5
kg s-1 m MPa-1 or the difference becomes minimal (t∆(Kh,in-Kh,out) ≈ 0, min) and timespan for when
diameter change becomes minimal (t∆d ≈ 0, min) for the different bench-top dehydration periods and
the two pressure heads (8 and 2 kPa).
Maximum Kh of hydrated samples (0 hours of dehydration) corresponded well with
Kh,max measured on freshly cut branches, but absolute values of Kh and
corresponding maximum values per experimental run decreased when longer sample
dehydration periods were used (Table 2.4; Fig. 2.7).
Table 2.4 Evolution of maximum hydraulic conductivity at the inlet (Kh,max,in) and
outlet side (Kh,max,out) for both pressure heads (8 and 2 kPa) and for the different
bench-top dehydration periods in comparison to Kh,max of freshly cut branches
Dehydration period (h)
Kh,max,in (10-5 kg s-1 m MPa-1) Kh,max,out (10-5 kg s-1 m MPa-1)
8 kPa 2 kPa 8 kPa 2 kPa
0 9.1 8.5 8.9 8.5 2 8.9 6.9 9.2 6.6 4 6.8 6.1 6.9 6.0 6 5.4 3.5 5.4 3.4 8 4.4 / 4.1 / 10 2.7 1.8 2.5 1.8 12 1.6 1.0 1.5 0.8 14 0.9 / 0.8 /
freshly cut 8.6 ± 1.5 8.6 ± 0.5 8.6 ± 1.5 8.0 ± 0.6
Value of maximum hydraulic conductivity at inlet (Kh,max,in (10-5 kg s-1 m MPa-1)) and outlet side
(Kh,max,out (10-5 kg s-1 m MPa-1)) for the different bench-top dehydration periods and the two pressure
heads (8 and 2 kPa) compared to Kh,max of freshly cut branches.
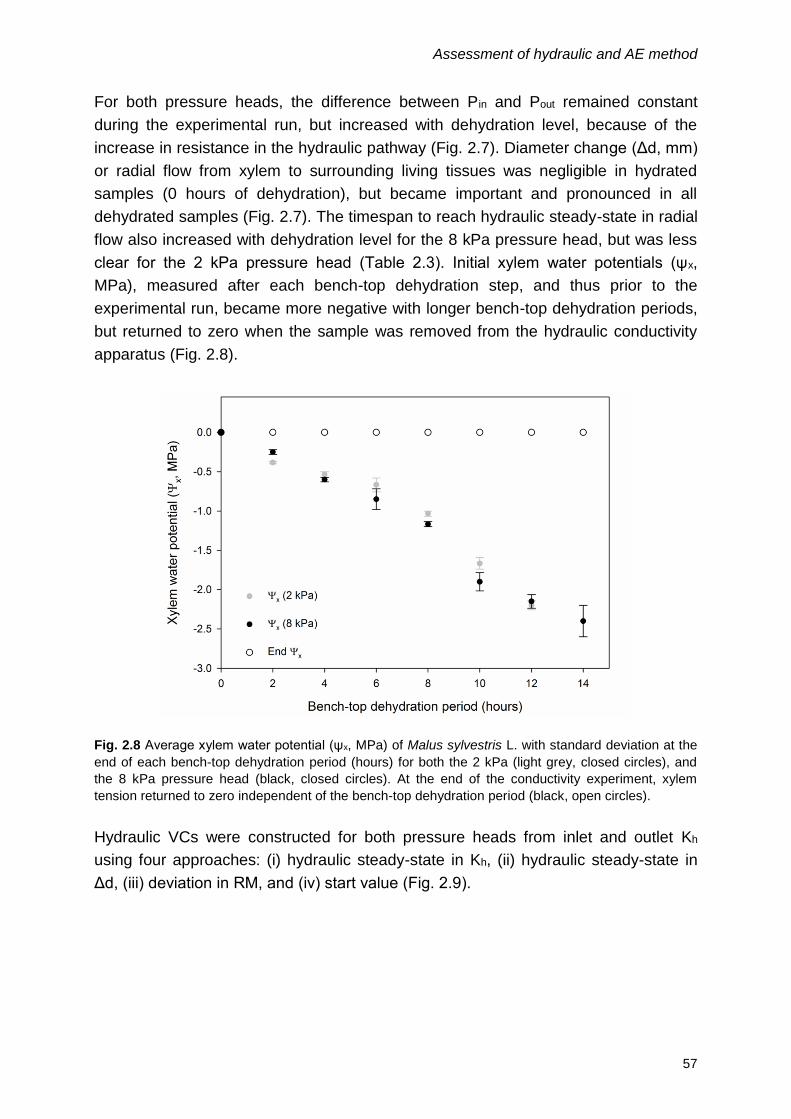
Assessment of hydraulic and AE method
57
For both pressure heads, the difference between Pin and Pout remained constant
during the experimental run, but increased with dehydration level, because of the
increase in resistance in the hydraulic pathway (Fig. 2.7). Diameter change (Δd, mm)
or radial flow from xylem to surrounding living tissues was negligible in hydrated
samples (0 hours of dehydration), but became important and pronounced in all
dehydrated samples (Fig. 2.7). The timespan to reach hydraulic steady-state in radial
flow also increased with dehydration level for the 8 kPa pressure head, but was less
clear for the 2 kPa pressure head (Table 2.3). Initial xylem water potentials (ψx,
MPa), measured after each bench-top dehydration step, and thus prior to the
experimental run, became more negative with longer bench-top dehydration periods,
but returned to zero when the sample was removed from the hydraulic conductivity
apparatus (Fig. 2.8).
Fig. 2.8 Average xylem water potential (ψx, MPa) of Malus sylvestris L. with standard deviation at the
end of each bench-top dehydration period (hours) for both the 2 kPa (light grey, closed circles), and
the 8 kPa pressure head (black, closed circles). At the end of the conductivity experiment, xylem
tension returned to zero independent of the bench-top dehydration period (black, open circles).
Hydraulic VCs were constructed for both pressure heads from inlet and outlet Kh
using four approaches: (i) hydraulic steady-state in Kh, (ii) hydraulic steady-state in
Δd, (iii) deviation in RM, and (iv) start value (Fig. 2.9).

Chapter 2
58
Fig. 2.9 Hydraulic vulnerability curves (VC) of Malus sylvestris L. showing percentage loss of
conductivity (PLC, %) against adjusted xylem water potential (ψx, MPa) derived from hydraulic steady-
state in hydraulic conductivity (Kh, 10-5 kg s-1 m MPa-1) for inlet hydraulic conductivity (Kh,in, black,
closed circles) and outlet hydraulic conductivity (Kh,out, black, open circles), derived from hydraulic
steady-state in diameter change or radial flow (Δd, mm) for Kh,in (red, closed circles) and Kh,out (red,
open circles), derived from deviation in running mean (RM) for Kh,in (light grey, closed circles) and Kh,out
(light grey, open circles), and derived from start value for Kh,in (orange, closed circles) and Kh,out
(orange, open circles). VCs are shown for the 8 kPa (A) and 2 kPa pressure head (B), and are fitted
with a sigmoidal model with the exception of the Weibull fit for hydraulic steady-state in Kh of the 8 kPa
pressure head.

Assessment of hydraulic and AE method
59
Each conductivity reading was plotted against its corresponding xylem water
potential, which was calculated, because of the release in xylem tension during each
experimental run (Fig. 2.8). For the 8 kPa pressure head, a distinct sigmoidal curve
with a strong fit was obtained for hydraulic steady-state in Kh and Δd (Table 2.5;
Fig. 2.9A).
Table 2.5 Root mean square error as a measure for goodness of fit of
Weibull/sigmoidal fits to hydraulic vulnerability of Malus sylvestris L. calculated for
adjusted and initial xylem water potential, for both inlet (Kh,in) and outlet hydraulic
conductivity (Kh,out) and for both pressure heads (8 and 2 kPa).
Adjusted ψx 8 kPa 2 kPa
RMSE Kh,in RMSE Kh,out RMSE Kh,in RMSE Kh,out
Steady-state in Kh 0.019 0.019 0.745 0.774 Steady-state in Δd 0.224 0.178 0.635 0.641 Deviation RM 0.610 0.472 0.851 0.842 Start value 0.993 0.537 0.668 0.877
Initial ψx
Steady-state in Kh / 0.016 / 0.767 Steady-state in Δd / 0.216 / 0.735
Root mean square error (RMSE, -) derived from Weibull and sigmoidal fits of obtained hydraulic VCs
from four scenarios (hydraulic steady-state in conductivity (Kh) – hydraulic steady state in radial flow
(Δd) – deviation in running mean (RM) – start value) against adjusted and initial xylem water potential
(ψx), for both inlet Kh and outlet Kh and the two pressure heads (8 and 2 kPa).
The diffirence between inlet and outlet-based VCs was also minimal, clearly pointing
to stability. VCs based on RM and start value had a weaker sigmoidal fit, and the
larger divergence between inlet and outlet PLC values showed that stability was not
reached, and dynamic water flow conditions were still occurring in these samples,
affecting the respective Kh readings (Table 2.5; Fig. 2.9A). For the 8 kPa pressure
head, a Weibull could be fitted to hydraulic steady-state in Kh, as this was the only
scenario with almost 0% PLC at a xylem water potential of 0 MPa (Fig. 2.9A). Similar
findings resulted from the 2 kPa pressure head measurements, but the goodness of
sigmoidal fit was more comparable between all scenarios (Table 2.5; Fig. 2.9B). Due
to the lower used pressure head, maximum conductivity values decreased more
rapidly for similar bench-top dehydration periods, resulting in steeper increases
towards 100% PLC compared to 8 kPa pressure head (Table 2.4). For both pressure
heads, P50 values became more negative when moving from hydraulic steady-state
in Kh to start value (Table 2.6), because the time to reach stability in Kh was the
longest (Table 2.3).
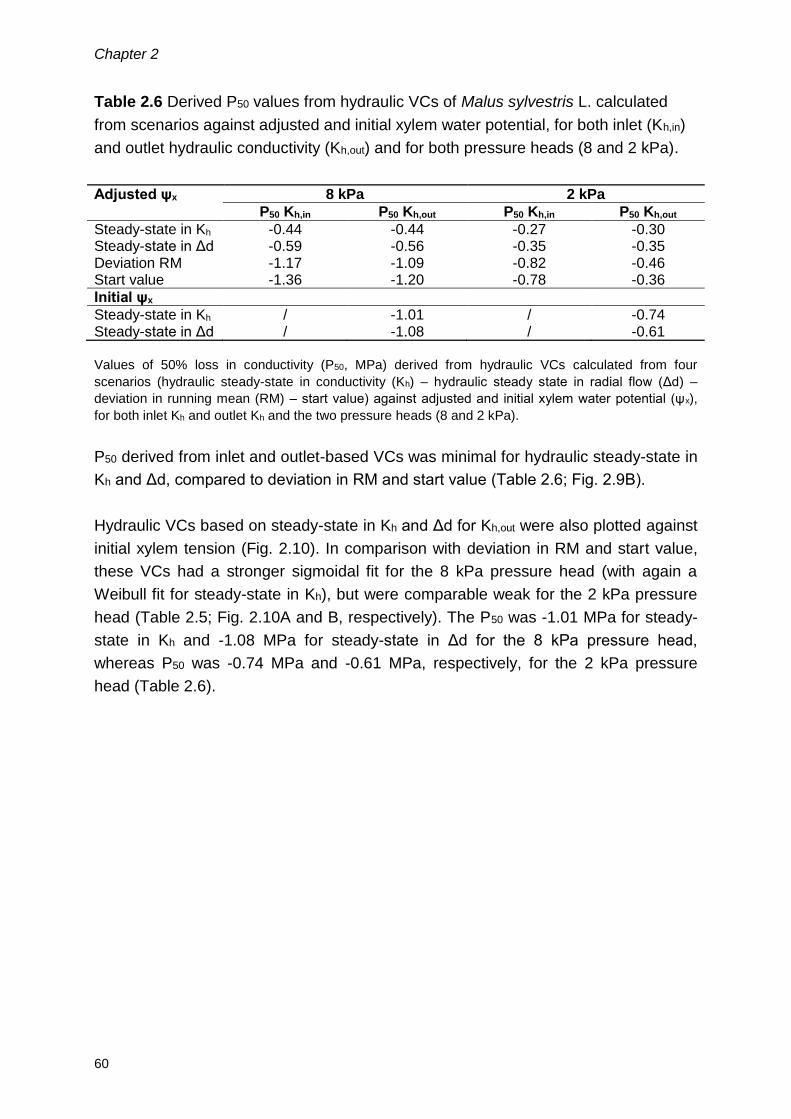
Chapter 2
60
Table 2.6 Derived P50 values from hydraulic VCs of Malus sylvestris L. calculated
from scenarios against adjusted and initial xylem water potential, for both inlet (Kh,in)
and outlet hydraulic conductivity (Kh,out) and for both pressure heads (8 and 2 kPa).
Adjusted ψx 8 kPa 2 kPa
P50 Kh,in P50 Kh,out P50 Kh,in P50 Kh,out
Steady-state in Kh -0.44 -0.44 -0.27 -0.30 Steady-state in Δd -0.59 -0.56 -0.35 -0.35 Deviation RM -1.17 -1.09 -0.82 -0.46 Start value -1.36 -1.20 -0.78 -0.36
Initial ψx
Steady-state in Kh / -1.01 / -0.74 Steady-state in Δd / -1.08 / -0.61
Values of 50% loss in conductivity (P50, MPa) derived from hydraulic VCs calculated from four
scenarios (hydraulic steady-state in conductivity (Kh) – hydraulic steady state in radial flow (Δd) –
deviation in running mean (RM) – start value) against adjusted and initial xylem water potential (ψx),
for both inlet Kh and outlet Kh and the two pressure heads (8 and 2 kPa).
P50 derived from inlet and outlet-based VCs was minimal for hydraulic steady-state in
Kh and Δd, compared to deviation in RM and start value (Table 2.6; Fig. 2.9B).
Hydraulic VCs based on steady-state in Kh and Δd for Kh,out were also plotted against
initial xylem tension (Fig. 2.10). In comparison with deviation in RM and start value,
these VCs had a stronger sigmoidal fit for the 8 kPa pressure head (with again a
Weibull fit for steady-state in Kh), but were comparable weak for the 2 kPa pressure
head (Table 2.5; Fig. 2.10A and B, respectively). The P50 was -1.01 MPa for steady-
state in Kh and -1.08 MPa for steady-state in Δd for the 8 kPa pressure head,
whereas P50 was -0.74 MPa and -0.61 MPa, respectively, for the 2 kPa pressure
head (Table 2.6).

Assessment of hydraulic and AE method
61
Fig. 2.10 Hydraulic vulnerability curves (VC) of Malus sylvestris L. showing percentage loss of
conductivity (PLC, %) against initial xylem water potential (ψx, MPa) derived from hydraulic steady-
state in hydraulic conductivity (Kh, 10-5 kg s-1 m MPa-1) for outlet hydraulic conductivity (Kh,out, black),
and derived from hydraulic steady-state in diameter change or radial flow (Δd, mm) for Kh,out (red). VCs
are shown for the 8 kPa (A) and 2 kPa pressure head (B), and are fitted with a sigmoidal model with
the exception of the Weibull fit for hydraulic steady-state in Kh of the 8 kPa pressure head.
Chapter 2
62
2.4.2 µCT method
X-ray computed microtomography was applied to further assess the impact of the
hydraulic method on hydraulic conductivity measurements. Because flushed
conductivity was significantly lower than initial conductivity of freshly cut branches
(Fig. 2.11), suggesting a possible flaw in the flushing procedure, µCT images of both
states were used to visualize xylem before and after flushing (Fig. 2.12).
Fig. 2.11 Difference between average hydraulic conductivity (Kh, 10-5 kg s-1 m MPa-1) of freshly cut
Malus sylvestris L. samples (dark grey), and average Kh of flushed samples (light grey) at both the
inlet and outlet side (n = 5) with their standard deviation. Significant differences are indicated with
different letters (P < 0.05). Freshly cut Kh was significantly higher than flushed Kh at both the inlet and
outlet side (P = 0.00031 and 0.00013, respectively).
Because all embolized vessels were completely refilled after flushing, the flushing
method was judged to work properly (Fig. 2.12B).
The effect of small pressure heads on Kh measurements was also studied using µCT
images and showed that vessels also refilled during an experimental run (Fig. 2.13).

Assessment of hydraulic and AE method
63
Fig. 2.12 (A), X-ray computed microtomography (µCT) image illustrating native embolism (black dots)
of a freshly cut Malus sylvestris L. sample. (B), flushed µCT image of the same Malus sylvestris L.
sample, showing that the flushing method was capable of refilling all embolized vessels.
Fig. 2.13 Montage of X-ray computed microtomography (µCT) images illustrating the refilling of
embolized vessels (black dots) of a 12-h dehydrated Malus sylvestris L. sample under a 8 kPa
pressure head (A, B), and the refilling of embolized vessels of a 6-h dehydrated Malus sylvestris L.
sample under a 2 kPa pressure head (C, D) during hydraulic conductivity measurements.

Chapter 2
64
For the 8 kPa pressure head, 94.7 % of embolized vessels of a 12-h dehydrated
apple sample were refilled (Fig. 2.13A, B), while for the 2 kPa pressure head, 93.4 %
of embolized vessels of a 6-h dehydrated apple sample were refilled (Fig. 2.13C, D).
Based on the number of cavitated vessels derived from 0-h, 6-h, 12-h, and 16-h
dehydrated apple samples, an approximated P50 of -0.87 MPa was obtained
(Fig. 2.14).
Fig. 2.14 Hydraulic steady-state VC in outlet hydraulic conductivity (Kh,out, 10-5 kg s-1 m MPa-1) for 8
kPa pressure head (light grey, open circles), fitted with a Weibull function, and amount of cavitation
according to X-ray computed microtomography (µCT) (black, closed circles) of Malus sylvestris L.
showing percentage loss of conductivity (PLC, %) against initial xylem water potential (ψx, MPa).
Average acoustic vulnerability curve (VCAE, red) with standard error bands (1 SE) of Malus sylvestris
L. showing percentage cumulative acoustic emissions (cum AE, %) against xylem water potential (ψx,
MPa). µCT results were derived from 0-h, 6-h, 12-h and 16-h dehydrated Malus sylvestris L. samples,
and the µCT images of the 0-h and 16-h dehydrated samples are also visualized. The Hydraulic VC
slightly underestimated vulnerability to cavitation, while AE measurements were in close proximity to
µCT results.
2.4.3 AE method
The average acoustic VC, displaying changes in AE during sample dehydration
continuously, resulted in a shape that agreed well with the point measurements
obtained from µCT (Fig. 2.14). The resulting AE50 (i.e. water potential at which 50%

Assessment of hydraulic and AE method
65
cavitation-related AE occur) was -0.86 ± 0.04 MPa, which closely corresponded to
the P50 of -0.87 MPa derived from the µCT data points (Fig. 2.14).
2.5 Discussion
2.5.1 Hydraulic steady-state
One of the major uncertainties when applying the hydraulic method is the timespan to
reach stability as this determines the value of Kh,out to construct the hydraulic VC.
According to Melcher et al. (2012), a deviation in running mean (RM) of Kh,out, as
proposed by Sperry et al. (1988a), should result in stable (steady-state)
measurement conditions. But measurement of the water flow dynamics through the
samples in the hydraulic conductivity apparatus showed that a deviation in RM did
not yield stable conditions: (i) there is a distinct difference between Kh,in and Kh,out (on
average 0.2 10-5 kg s-1 m MPa-1 for the 8 kPa pressure head, and 1.24 10-5 kg s-1 m
MPa-1 for the 2 kPa pressure head), and radial flow is rapidly increasing (on average
a slope of 0.0030 mm min-1 for the 8 kPa pressure head, and a slope of 0.0018 mm
min-1 for the 2 kPa pressure head) (Fig. 2.7). (ii) There is a distinct deviation between
hydraulic VCs constructed from Kh,in and Kh,out (Fig. 2.9), and between the resulting
P50 values (Table 2.6). (iii) The non-steady-state in hydraulic conductivity also
translates in weak sigmoidal fits (Table 2.5). Moreover, prolonging conductivity
measurements beyond a timespan of 30 min, illustrates a large variability in deviation
in RM making it impossible to select the value to construct the hydraulic VC,
especially if only measurements of Kh,out are considered (Fig. 2.7).
Based on the theory of fluid dynamics, and given a constant ΔP over the measured
sample, stability in hydraulic conductivity is reached at hydraulic steady-state, which
implies that Kh,in must be equal to Kh,out, and with radial flow zero. Only then water
flow will be restricted to the xylem, and will no longer be redirected to refill osmotically
active living cells. Theoretically, this corresponds with stationary flow described by
the van den Honert concept (van den Honert, 1948), which is the basis to calculate
xylem hydraulic conductivity (Sperry et al., 1988a). The timespan to reach hydraulic
steady-state increased with increased levels of dehydration (Table 2.3). From a
physiological point of view, this pattern corresponds to the water transport dynamics
in intact plants, and can be illustrated by the close link that exists between sap flow
and stem diameter variations (Fig. 2.15, Steppe et al., 2006, 2012).

Chapter 2
66
Fig. 2.15 Synthesis of dynamic water transport showing the diurnal course of transpiration rate (solid
black line), stem sap flow (dashed black line), and stem water content depletion rate (thick solid black
line) for a well-watered (A) and drought-stressed plant (B), and the diurnal course of diameter variation
(thick black line) for a well-watered (C) and drought-stressed plant (D). The tight coupling between
stem flow and diameter variation illustrates that the dynamic behavior emerges from the time lag
between water loss by transpiration and root water uptake. The temporal imbalance takes longer to
overcome under drought stress, putting more strain on the internal water reserves.
Water transport dynamics are a direct result of the time-lag that exists between foliar
transpiration and root water uptake (Fig. 2.15A, B; Schulze et al., 1985; Steppe et al.,
2002). This translates into a dynamic diameter variation pattern of shrinkage (i.e.
depletion of internal water reserves during the day) and swelling (i.e., replenishment
of internal water reserves overnight) to overcome the imbalance between water loss
and uptake (Fig. 2.15C, D; Herzog et al., 1995; Zweifel et al., 2001; Steppe et al.,
2002). Measurements of stem diameter variation also provide information on radial
(turgor-driven) stem increment (Steppe et al., 2006; Venturas et al., 2017), hence
justifying the use of a LVDT in our study as a means to assess the impact of radial
flow dynamics on Kh measurements. Dynamic water transport in stem and branches
can thus be best described by the flow of water in two coaxial cylinders separated by
a virtual membrane (Steppe et al., 2012). The first pathway is the direct flow path
through the xylem driven by a water potential gradient (van den Honert, 1948), and

Assessment of hydraulic and AE method
67
the second one is the radial flow path, which drives changes in stem water content in
the living tissue, also known as elastic changes. In well-watered plants, the temporal
imbalance between leaf transpiration and stem sap flow (or root water uptake) is
small, and steady-state or stationary flow conditions are quickly reached, with radial
water flow only slightly contributing to the transpiration stream (Fig. 2.15A). This
results in a limited diameter shrinkage and swelling registered by the LVDT
(Fig. 2.15C). This explains why (i) hydraulic steady-state is faster reached in samples
that are less dehydrated, and (ii) changes in diameter are negligible in these samples
(Fig. 2.7, Table 2.3). In a drought-stressed plant, the imbalance between transpiration
and stem sap flow is larger, requiring a higher contribution from radial water flow to
the transpiration stream. This results in a larger time-offset until equilibrium is
reached (Fig. 2.15B), and a more pronounced diameter shrinkage and swelling
(Fig. 2.15D). Given these dynamic water transport principles, we can conclude that
the longer the bench-top dehydration period, the longer it takes to reach hydraulic
steady-state, and the more pronounced the increase in stem diameter will be during
Kh measurements (Fig. 2.7, Table 2.3).
By extending the original hydraulic conductivity apparatus with additional
measurements, a solid background was provided to assess the impact of different
(i.e., steady-state, non-steady-state) Kh values to construct hydraulic VCs. Hydraulic
VCs based on steady-state in Kh and Δd were the only justified approaches to depict
vulnerability to drought-induced cavitation in Malus sylvestris L. (Fig. 2.9). The VCs
illustrated stability by the strong overlap between VCs based on Kh,in and Kh,out
(Table 2.6; Fig. 2.9), and could be described by a strong sigmoidal fit (Table 2.5).
Hydraulic steady-state in Δd was defined at the breakpoint distinguishing faster from
slower increases in stem diameter. While this approach is easy in use, it still includes
a small radial water flow effect, which explains why the timespan to reach stable Kh
was shorter than for stability in Kh (Table 2.3). VCs based on hydraulic steady-state
in Kh were the only ones providing near 0% PLC in hydrated samples, suggesting
that steady-state in Kh is the best determinant for overall hydraulic steady-state
(Fig. 2.9).
2.5.2 Assessment of the hydraulic method
Being able to objectively quantify hydraulic steady-state flow conditions in the study
samples, one of the major concerns regarding the use of the hydraulic method
seemed to be dealt with. But by using this approach, we discovered an additional and
substantial flaw in the theory behind the hydraulic method. According to Sperry et al.
(1988a), low pressure heads in the range of 1 to 8 kPa would be insufficient to refill
embolized vessels (Kolb et al., 1996; Melcher et al., 2012). At first glance, this

Chapter 2
68
seemed to hold because the difference between Pin and Pout (i) remained constant
during an experimental run, and (ii) increased with the duration of bench-top
dehydration, which was explained by an increased resistance in the xylem flow path
(Fig. 2.7).
In our study, the change in xylem water potential measured before and after each
experimental run (Fig. 2.8) contradicted the common belief that small positive
pressure heads are incapable of embolism refilling. By leaving one covered leaf
attached to the sample during Kh measurements, we demonstrated that xylem water
potential, independent of bench-top dehydration period, always returned to zero
(Fig. 2.8). Under the assumption that embolism refilling is impossible under small
pressure heads, xylem tension should remain constant or decrease in a detached
branch and not increase as we observed (Fig. 2.8). We therefore assume that the
water flow caused the xylem tension to dissipate, like it similarly does in a flushed
branch for Kh,max determination.
The dynamic change in ψx occurring during each experimental run required
calculation of adjusted, steady-state (instead of initial) ψx that corresponded to the
respective Kh values to construct hydraulic VCs. These hydraulic VCs strongly shifted
to the left (Fig. 2.9), with on average, across the two pressure heads, a P50 of -0.36
MPa and -0.46 MPa, respectively (Table 2.6). These values are most probably
incorrect for Malus sylvestris L. as P50 values between -0.85 MPa and -6.1 MPa have
previously been reported for this species (Choat et al., 2012; Beikircher et al., 2013;
De Baerdemaeker et al., 2018). Despite successful quantification of hydraulic steady-
state, the corresponding steady-state ψx no longer reflects the amount of embolized
vessels, which were present at the end of bench-top dehydration and characterizing
the intended level of drought stress. To avoid the issue of refilling, one might reason
that the first measured Kh then represents actual conductivity of the drought-stressed
sample. But constructing VCs with Kh start values showed similar issues as when
deviation in RM was used: no stability, and therefore violating the steady-state
precondition (Table 2.6; Fig. 2.9), and a weak sigmoidal fit (Table 2.5). To mirror the
intended drought level of the study sample, steady-state Kh and Δd values for both
pressure heads were plotted against initial ψx (Fig. 2.10). Resulting VCs showed a
stronger sigmoidal fit, and the P50 values of the 8 kPa pressure head for stability in Kh
and stability in Δd were well within the above mentioned range of reported P50's for
this species (Table 2.6), but given the principles of dynamic water transport through
the study samples, this approach should be used with care, because it combines
steady-state in Kh with initial, non-steady-state ψx.

Assessment of hydraulic and AE method
69
2.5.3 Hydraulic method induces embolism refilling: validation with µCT
X-ray computed microtomography (µCT) allows distinguishing functional from
embolized vessels without disrupting the dynamic water relations of the examined
species (Cochard et al., 2015). The µCT images showed that freshly cut branches
had approximately 9% native embolism (Fig. 2.12A), and that flushing was capable of
refilling all vessels (Fig. 2.12B). By using Kh from freshly cut branches as proxy for
Kh,max to calculate PLC, the potential risk of overestimating Kh,max by flushing vessels
that lost their functionality during plant development (Jacobsen & Pratt, 2012) was
avoided. However, we witnessed the opposite effect as flushed Kh,max was
significantly lower than Kh,max from freshly cut branches (Fig. 2.11). A possible
hypothesis might be that high-pressure flushes can dislocate the gels and tyloses
present in non-functional vessels (Jacobsen & Pratt, 2012), which can then clog the
remaining vessels of the sample. This significant problem has been previously
addressed by Espino & Schenk (2011). Another and perhaps more likely hypothesis
however is that embolisms could potentially change pit membrane structures, and
that the interaction with high-pressure flushes can then result in a reduction of
hydraulic conductivity when measured with low pressure heads.
Not only high-pressure flushing, but also low positive pressure heads were capable of
refilling embolized vessels, though this was long assumed not be the case (Sperry et
al., 1988a). Both 8 and 2 kPa pressure heads refilled about 94 % of the cavitated
vessels (Fig. 2.13), questioning the use of pressurized water to quantify drought-
induced cavitation. Moreover, application of the calculated maximum-to-use pressure
head as recommended by Van Ieperen et al. (2000) (calculated to be 6 kPa for our
Malus sylvestris L. samples using 28 µm as diameter of the largest vessel) will not
safeguard conductivity measurements from artificial embolism refilling. This refilling
also explains the increase in Kh (Fig. 2.7), and in ψx (Fig. 2.8) during each
experimental run, which is supported by the findings of Brodersen et al. (2010) and
Brodersen and McElrone (2013), who observed a decrease in xylem water potential
after vessels refilled. Moreover, Knipfer et al. (2016) already highlighted implications
for measurements with the hydraulic method, as the authors validated with µCT that
embolized vessels of grapevine stems were refilled within one hour when stems were
relaxed under water. Additionally, the 12-h dehydrated sample swelled 6.6 % due to
refilling at 8 kPa (Fig. 2.13A, B), and the 6-h dehydrated sample swelled 2.4 % due to
refilling at 2 kPa (Fig. 2.13C, D), emphasizing the importance of considering dynamic
water flow in study samples when using the hydraulic method (Fig. 2.7). The fact that
small positive pressure heads can refill embolized vessels is not that unlikely if one
considers the phenomenon of root pressure (Tyree & Sperry, 1989). Root pressure is

Chapter 2
70
a widely accepted mechanism to explain recovery from daily cycles of embolism
formation in intact plants (Tyree & Zimmermann, 2002). In general, root pressure is
very weak with values only slightly exceeding atmospheric pressure (range: 1-150
kPa; see Sperry et al., 1988b; Fisher et al., 1997; De Swaef et al., 2013; Lopez &
Barclay, 2016). During the day, its influence is negligible, but during the night, when
transpiration is zero, root pressure pushes up the sap, dissolving air bubbles and
refilling embolized vessels (Tyree & Zimmermann, 2002; Wegner, 2014).
2.5.4 Hydraulic versus µCT and optical method
Implementation of visualization techniques such as µCT and the optical method to
quantify drought-induced cavitation is increasing as they have the benefit of
continuously visualizing embolism formation and capable of generating complete VCs
from single samples (Cochard et al., 2015; Brodribb et al., 2017). µCT has an
additional advantage of being non-destructive as intact plants can be monitored.
Theoretical hydraulic conductance kh can be calculated from conduit dimensions of
functional and embolized vessels on the µCT images, hence providing a more
reliable substitute to the hydraulic method to determine PLC (Choat et al., 2016). As
such, µCT has been primordially used as reference technique to validate the
reliability and the accuracy of VCs obtained with the hydraulic method (Cochard et
al., 2015; Nolf et al., 2017). From optical images, the area of embolized vessels can
be derived, and even though this calculation does not take the fourth power influence
of vessel radius into account, vulnerability thresholds similar to techniques that
quantify loss in Kh were obtained (Brodribb et al., 2017). Also when, in Malus
sylvestris L., the hydraulic P50 from the VC displaying steady-state in Kh against initial
xylem tension under 8 kPa, which is the pressure head closest to the proposed
maximum-to-use pressure head of 6 kPa according to Van Ieperen et al. (2000), was
compared to the µCT P50 value, a close correspondence was found, with a slight
underestimation in vulnerability of 16 % when using the hydraulic approach (Table
2.6; Fig. 2.10, Fig. 2.14). But knowing now that using initial xylem tension strongly
overestimates steady-state ψx, and that using steady-state ψx would strongly
overestimate a species’ drought sensitivity questions the meaningfulness of using
steady-state values to construct hydraulic VCs.
2.5.5 Hydraulic versus AE and pneumatic method
Because quantification of vulnerability to drought-induced cavitation is crucial in
drought-related plant research, but the above new insights in the hydraulic method
may raise methodological concerns because of some flawed assumptions, we tested

Assessment of hydraulic and AE method
71
the AE method as reliable substitute to determine P50 values (Fig. 2.14). Yielding an
average AE50 (i.e. xylem water potential at 50% cavitation-related AE) of -0.86 ± 0.04
MPa for Malus sylvestris L., similar to the µCT P50, the AE method was verified to be
accurate, and can thus be used as a more easily accessible and lower-cost
technique compared to µCT. In contrast to the hydraulic method, AE can also
continuously measure changes in dehydration without the risk of embolism refilling
and xylem tension changes (Rosner et al., 2006; Mayr & Rosner, 2011; Vergeynst et
al., 2015a). Already in 1983, Tyree and Dixon highlighted the importance of the AE
technique as a powerful diagnostic tool to quantify plant water relations, and even
though further progress is required (Cochard et al., 2013), recent and ongoing
developments prove promising in the use of AE as a reliable alternative to the
hydraulic method (Wolkerstorfer et al., 2012; De Roo et al., 2016).
The pneumatic method is a similar and interesting alternative to the AE method in
that regard that by measuring air flow conductance, the method does not depend
directly on hydraulic properties, and can thus also continuously register dehydration
changes without being affected by hydraulic-related artefacts (Pereira et al., 2016).
Moreover, air flow measurements are strongly related to embolisms because the
axial resistance through lumen vessels and pit membranes is considerably lower than
the radial resistance through the periderm and cambium (Sorz & Hietz, 2006).
Consequently, the percentage of maximum air discharge (PAD) was validated to be a
quantitative substitute for PLC (Pereira et al., 2016; Zhang et al., 2018), which is a
definite edge over the AE method as collected AE signals do not solely originate from
embolism formation (Vergeynst et al., 2016). However, like the hydraulic method, the
pneumatic method is destructive and in contrast to the AE method unsuited for in situ
measurements of drought stress on living plants (De Roo et al., 2016).
2.6 Conclusion
Correctly assessing a plant species’ vulnerability to drought-induced cavitation
becomes increasingly important, especially in the light of projected climatic changes.
The hydraulic method is regarded as the golden standard to quantify vulnerability by
sending pressurized water through cut branch samples subjected to increasing levels
of dehydration. Separating branches from plants in combination with stationary flow
to measure outlet hydraulic conductivity ignores the dynamics of xylem water
transport. Expanding the hydraulic method with measurements of in- and outflow,
radial flow and pressure difference across the sample, allowed us to use the
principles of dynamic water transport to determine stable Kh. Hydraulic steady-state

Chapter 2
72
in Kh was achieved at timespans that well exceeded previously reported ones, but
more important, pushing water through the sample to measure Kh progressively
decreased xylem tension in the samples, shifting hydraulic steady-state VCs to less
negative water potentials, and hence overestimating species’ vulnerability to drought-
induced cavitation. With the use of µCT, reduction in xylem tension could be
attributed to artificial embolism refilling despite the low pressure heads that were
used to drive water through the samples, even though it has long been assumed that
these pressure heads were insufficient to promote refilling. Combination of steady-
state Kh with initial xylem tension yielded VCs with a P50 in the proximity of µCT P50,
but neglect dynamic water transport in the sample, questioning the meaningfulness of
steady-state values. Future care must be taken when using the hydraulic method to
quantify vulnerability to drought-induced cavitation. When publishing hydraulic
results, it should be reported how stable Kh values were determined, and whether the
hydraulic VCs reflect the decrease in xylem tension. Methods that can measure
dehydration continuously on a single sample, without disrupting dynamic water
relations, can be reliable substitutes for the hydraulic method. The acoustic emission
technique possesses this desirable trait, and compared to the high cost and
impracticalities of µCT installations, a promising alternative worth further investing.

After:
De Baerdemaeker NJF, Salomón RL, De Roo L, Steppe K (2017) Sugars from woody tissue
photosynthesis reduce xylem vulnerability to cavitation. New Phytologist 216(3): 720-727.
3
ACOUSTIC EMISSIONS
REVEAL NEW INSIGHTS IN THE ROLE OF WOODY TISSUE
PHOTOSYNTHESIS TO REDUCE
VULNERABILITY TO CAVITATION


AE reveals role of woody tissue photosynthesis
75
3.1 Abstract
Reassimilation of internal CO2 via woody tissue photosynthesis has a substantial
effect on tree carbon income and wood production. However, little is known about its
role in xylem vulnerability to cavitation and the effect on drought-driven tree mortality.
Young trees of Populus nigra L. were subjected to light-exclusion at branch and stem
level. After 40 days, measurements of xylem water potential, diameter variation and
acoustic emission (AE) were performed in detached branches to obtain acoustic
vulnerability curves to cavitation following bench-top dehydration. Acoustic
vulnerability curves and derived AE50 values (i.e., water potential at which 50% of
cavitation-related acoustic emissions occur) significantly differed between light-
excluded and control branches (AE50,light-excluded = -1.00 ± 0.13 MPa; AE50,control = -1.45
± 0.09 MPa; P = 0.007) denoting higher vulnerability to cavitation in light-excluded
trees. Woody tissue photosynthesis represents an alternative and immediate source
of non-structural carbohydrates (NSC) that confers lower xylem vulnerability to
cavitation via sugar-mediated mechanisms. Embolism repair and xylem structural
changes could not explain this observation as the amount of cumulative AE and
basic wood density did not differ between treatments. We suggest that woody tissue
assimilates might play a role in the synthesis of xylem surfactants for nanobubble
stabilization under tension.

Chapter 3
76
3.2 Introduction
The cohesion-tension theory postulates that water is passively transported through
the xylem, and driven by negative pressure gradients generated by transpiration at
the leaf level, implying that vascular water is metastable (Dixon & Jolly, 1895;
Steudle, 2001). Under drought stress, xylem sap is subjected to increasing tension
and xylem conduits may eventually cavitate interrupting water transport and impairing
carbon assimilation. The vulnerability to cavitation depends on the maximum pore
size of the interconduit membrane as expected from the air-seeding hypothesis
(Zimmermann, 1983; Loepfe et al., 2007). Under expected scenarios of more intense
and severe drought episodes, massive xylem embolism threatens the survival of
trees worldwide (Mcdowell et al., 2008). However, as xylem and phloem functioning
are intimately linked (Hölttä et al., 2009b; Hubeau & Steppe, 2015), tree mortality
cannot be uniquely ascribed to tree hydraulic failure or carbon starvation as
independent mechanisms (Sala et al., 2010; McDowell, 2011; Steppe et al., 2015). In
this context, woody tissue photosynthesis may play a crucial role in plant hydraulic
performance (Vandegehuchte et al., 2015).
Respired CO2 by living cells of woody tissues radially diffuses to the atmosphere, or
alternatively, accumulates within roots, stem and branches due to high resistance of
peripheral tissues to radial CO2 diffusion (Steppe et al., 2007). The internal pool of
respired CO2 accounts for the major carbon source to fuel woody tissue
photosynthesis (stem recycling photosynthesis, Ávila et al., 2014). The contribution of
woody photosynthesis to total carbon income largely varies depending on the
species and environmental conditions (see Ávila et al., 2014). Remarkably,
reassimilation of internal CO2 can completely offset respiratory carbon losses under
certain conditions (Damesin, 2003; Berveiller et al., 2007). Consequently, woody
tissue photosynthesis substantially contributes to wood production. For instance,
reductions in stem growth ranging from 25% to 56% were observed in three
California native plant species when woody tissue photosynthesis was prevented by
covering stems with aluminum foil (Saveyn et al., 2010). Similarly, it was estimated
from isotopic analyses that 11% of stem growth in eucalyptus trees relied on woody
tissue assimilates (Cernusak & Hutley, 2011).
Furthermore, due to the strategic spatial location of chloroplast-containing cells in
stem and branches, woody tissue photosynthesis constitutes an immediate source of
non-structural carbohydrates (NSC) to satisfy local energetic demands (Teskey et al.,
2008; Molares & Ladio, 2009), and actively maintain the hydraulic function (Schmitz
et al., 2012; Bloemen et al., 2016). Sugar-mediated mechanisms could explain the

AE reveals role of woody tissue photosynthesis
77
link between NSC availability and hydraulic performance. First, the capacity of xylem
to transport water does not uniquely rely on the xylem resistance to avoid cavitation,
but also on its ability to reverse embolism (Salleo et al., 2004; Zwieniecki & Holbrook,
2009). As embolism reversal under tension is an energetic demanding process,
adequate NSC supply is indispensable to create osmotic gradients necessary to refill
embolized conduits (Nardini et al., 2011; Brodersen & McElrone, 2013). Second,
greater availability of NSC ascribed to woody tissue photosynthesis may confer
xylem structural traits more resistant to vulnerability to drought-induced cavitation,
such as smaller pit membrane aperture size or/and denser wood (Hacke et al., 2001;
Choat et al., 2003). Third, surfactants may contribute to stabilize nanobubbles under
negative pressure, hence avoiding embolism formation (Schenk et al., 2017). Gas
saturation in xylem sap initially leads to nanobubble formation at the nanoporous pit
membrane that would eventually result in embolism if the bubble expands beyond a
critical threshold (Schenk et al., 2015). Nanobubbles can be stabilized under tension
via lipid-based xylem surfactants, hence inhibiting and delaying cavitation (Schenk et
al., 2017). Given that assimilated carbon is the crucial building block in the chemical
structure of xylem surfactants and proteins, carbon shortages may limit stabilization
of nanobubbles.
Despite recent evidence of the role of woody tissue assimilates to maintain hydraulic
integrity (Schmitz et al., 2012; Bloemen et al., 2016), woody tissue photosynthesis
remains largely ignored in the field of drought-driven tree mortality (Vandegehuchte
et al., 2015). To further advance in this line, we aimed at comparing vulnerability to
cavitation between light-excluded and control branches of Populus nigra L. trees. We
hypothesize that woody tissue photosynthesis mitigates vulnerability to drought-
induced cavitation. For this goal, vulnerability curves were obtained with a method
based on the analysis of acoustic emissions (AE) to detect cavitation events (Milburn
& Johnson, 1966; Tyree & Sperry, 1989b; Mayr & Rosner, 2011; Vergeynst et al.,
2015, 2016; De Roo et al., 2016), and we further discuss the significance of the
abovementioned sugar-mediated mechanisms involved in xylem vulnerability to
cavitation.
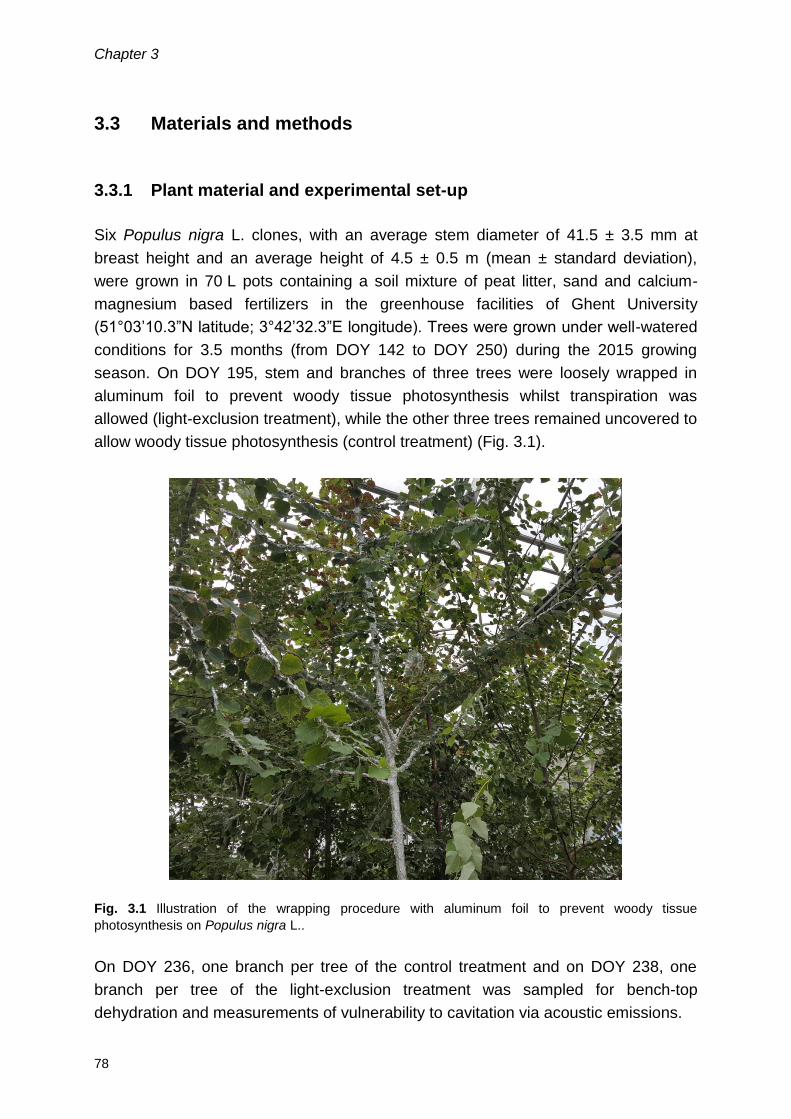
Chapter 3
78
3.3 Materials and methods
3.3.1 Plant material and experimental set-up
Six Populus nigra L. clones, with an average stem diameter of 41.5 ± 3.5 mm at
breast height and an average height of 4.5 ± 0.5 m (mean ± standard deviation),
were grown in 70 L pots containing a soil mixture of peat litter, sand and calcium-
magnesium based fertilizers in the greenhouse facilities of Ghent University
(51°03’10.3”N latitude; 3°42’32.3”E longitude). Trees were grown under well-watered
conditions for 3.5 months (from DOY 142 to DOY 250) during the 2015 growing
season. On DOY 195, stem and branches of three trees were loosely wrapped in
aluminum foil to prevent woody tissue photosynthesis whilst transpiration was
allowed (light-exclusion treatment), while the other three trees remained uncovered to
allow woody tissue photosynthesis (control treatment) (Fig. 3.1).
Fig. 3.1 Illustration of the wrapping procedure with aluminum foil to prevent woody tissue
photosynthesis on Populus nigra L..
On DOY 236, one branch per tree of the control treatment and on DOY 238, one
branch per tree of the light-exclusion treatment was sampled for bench-top
dehydration and measurements of vulnerability to cavitation via acoustic emissions.

AE reveals role of woody tissue photosynthesis
79
3.3.2 Sampling procedure and acoustic vulnerability to cavitation
One branch per tree was collected to assess xylem vulnerability to cavitation using
measurements of acoustic emissions, diameter variations and water potential (Mayr
& Rosner, 2011; Vergeynst et al., 2015a, 2016; Epila et al., 2017). Selected branches
of light-excluded and control trees did not differ in basal diameter (5.6 ± 0.5 mm) or
length (93 ± 21 cm). Predawn and midday leaf water potentials measured two weeks
prior to the AE experiment were similar (Table 3.1). Branches were cut under water
at predawn, followed by two additional re-cuts of 3 cm to avoid air-entry artefacts
(Cochard et al., 2013; Wheeler et al., 2013). To prevent preliminary dehydration, the
cut-end of the branches was covered with wet cloth and packed in black polyethylene
bags for transportation to the laboratory. Eight leaves per branch were always
covered in aluminum foil to ensure equal dehydration rates between branches
(Rosner, 2012, 2015). To further ensure equal dehydration between treatments,
aluminum foil was removed from the light-excluded branches prior to the start of
bench-top dehydration. Before the onset of the bench-top dehydration experiment,
wood samples of ~10 cm length were taken from each branch to estimate basic wood
density (ρb, kg.m-3) with a precision balance (Sartorius precision balance with 0.001 g
accuracy, Sartorius Weighing Technology, GmBH, Goettingen, Germany). Branches
were not flushed prior to initiation of bench-top dehydration. Therefore native
embolism was not integrated within the vulnerability curves. For the purpose of our
experiment, with branches that did not differ in their predawn and midday water
potential (Table 3.1), using non-flushed material is however valid to compare
differences between treatments in vulnerability to cavitation of functional vessels.
Table 3.1 Measurements of predawn and midday leaf water potential before the
onset of the acoustic vulnerability experiment of light-excluded and control Populus
nigra L. trees
Measurements DOY Light-excluded Control
Predawn ψleaf (MPa) 224 -0.22 ± 0.05a -0.21 ± 0.03a 233 -0.34 ± 0.04a -0.36 ± 0.05a Midday ψleaf (MPa) 219 -0.49 ± 0.09a -0.51 ± 0.06a 224 -0.58 ± 0.08a -0.65 ± 0.12a 233 -0.54 ± 0.09a -0.54 ± 0.15a
Predawn and midday leaf water potential (ψleaf) prior to the start of the acoustic VC experiment.
Different letters indicate significant differences (P < 0.05) between light-excluded and control
branches. Values are presented as means ± standard deviation.

Chapter 3
80
To monitor xylem shrinkage, a section of bark (1.5 × 0.5 cm) was removed with a
scalpel prior to dendrometer (DD-S, Ecomatik, Dachau, Germany) installation. Water
loss from the wound was prevented by applying petroleum jelly (Vergeynst et al.,
2016). Dendrometer read-outs were registered every minute via a custom-built
acquisition board. Xylem water potential (ψx, MPa) was measured on leaves
enclosed in aluminum foil with a pressure bomb (PMS Instrument Company,
Corvalis, OR, USA). The segmented linear relation between relative xylem diameter
shrinkage (Δd/di, µm mm-1) and discrete measurements of ψx was used to obtain
continuous ψx data (Table 3.2; Fig. 3.2).
Table 3.2 Equation of the segmented linear regression before and after the
breakpoint between point measurements of water potential and relative xylem
diameter shrinkage
Poplar Treatment BP
(µm mm-1) Eq. before BP R2 Eq. after BP R2
1 L-E -16.93 0.098* ∆d di⁄ -0.16 0.94 0.028* ∆d di⁄ -1.35 0.97
2 L-E -12.75 0.13* ∆d di⁄ -0.18 0.98 0.023* ∆d di⁄ -1.54 0.92 3 L-E -32.70 0.045* ∆d di⁄ -0.27 0.96 0.022* ∆d di⁄ -1.01 0.96
4 C -1.81 0.55* ∆d di⁄ -0.18 0.98 0.030* ∆d di⁄ -1.11 0.97 5 C -1.49 0.84* ∆d di⁄ -0.08 0.99 0.035* ∆d di⁄ -1.29 0.97
6 C -8.68 0.20* ∆d di⁄ +0.06 0.91 0.047* ∆d di⁄ -1.26 0.92
Breakpoint (BP, µm mm-1) between point measurements of water potential (WP, MPa) and relative
xylem diameter shrinkage (Δd/di, µm mm-1) for the three light-excluded (L-E, poplar 1, 2, and 3), and
control (C, poplar 4, 5, and 6) branches. The linear regression equations with enlisted R2 are used to
construct the continuous water potential axis for the acoustic VCs.
Branches were additionally equipped with a broadband point-contact acoustic
emission (AE) sensor (KRNBB-PC, KRN Services, Richland, WA, USA). A
compression spring (D22050, Tevema, Amsterdam, The Netherlands) in a small pvc
tube was used to press the AE sensors against a section of exposed xylem (1.5 × 0.5
cm) of the branches. A droplet of vacuum grease (High-Vacuum Grease, Dow
Corning, Seneffe, Belgium) between the sensor tip and branch ensured good
acoustic contact, and installation was validated by the pencil lead break test by firmly
pressing a 2H 0.3 mm propelling pencil against the surface of the branch under an
angle of 45 degrees at 5 cm distance from the AE sensor. This procedure is in
accordance to the ASTM E976 standard and installation was deemed sufficient if the
test results in an AE signal with an amplitude around 80 dB (Tyree & Sperry, 1989b;
Hamstad et al., 1994; Sause, 2011; Vergeynst et al., 2015b).

AE reveals role of woody tissue photosynthesis
81
Fig. 3.2 Linear regression before and after the breakpoint between relative xylem diameter shrinkage
(Δd/di, µm mm-1) and water potential (MPa) for (A) three light-excluded branches POP(LAR) 1,
POP(LAR) 2 and POP(LAR) 3, and for (B) three control branches POP(LAR) 4, POP(LAR) 5 and
POP(LAR) 6. The segmented linear regression is used to obtain continuous xylem water potential
axes for the acoustic VCs
To reduce noise interference from leaves and the exposed end, sensors were
installed in the middle of the leaf-free section of the branches. The distance between
the AE sensor and the dendrometer was fixed at 10 cm via a custom-built holder to
ensure an unbiased link between AE and diameter shrinkage (Epila et al., 2017). The
AE signals were amplified by 35.6 decibels (dB) with an amplifier (AMP-1BB-J, KRN
Services, Richland, WA, USA) and waveforms of 7168 samples length were acquired
at 10 MHz sample rate. The signals were collected using two 2-channel PCI boards
and redirected to the software program AEwin (PCI-2, AEwin E4.70, Mistras Group
BV, Schiedam, The Netherlands). A 20-1000 kHz electronic band pass filter was
applied and only waveforms above the noise level of 28 dB were retained (Vergeynst
et al., 2016). The low xylem tension at the start of dehydration combined with the
strong attenuation of wood ensures that low-amplitude AE signals originating too far
from the region of sensor installation will fall below the threshold (Beall, 2002a). The
frequency of water potential measurements was guided by AE signal detection (Epila
et al., 2017). When new leaves were covered, AE signal detection was put on hold to
avoid noise disturbance from the wrapping process. Registered AE signals were
cumulated over the measurement period from which the first derivative was
calculated to construct an AE activity curve. According to Vergeynst et al. (2016), the
endpoint of the vulnerability curve (AE100) is defined as the point at which the
decrease in AE activity, following the AE activity peak, decreased most strongly.

Chapter 3
82
Mathematically, this point corresponds to the local maximum of the third derivative.
Due to fast dehydration, branches were fully embolized after 2 hours so that AE
activity was numerically calculated over 15-min intervals (moving window), whereas
the third derivative was determined over 30-min intervals (moving window), based on
the time scale at which the AE peak occurred (Vergeynst et al., 2016). Absolute
cumulative acoustic emissions were then rescaled between zero and the defined
endpoint to obtain a relative percentage of cumulative AE.
3.3.3 Statistical analyses
Acoustic vulnerability curves (VCAE) were averaged within treatments and the curves
fitted using the smooth.spline function in the stats library in R software (RStudio
version 1.1.419 - © 2009-2017 RStudio, Inc.). Drought vulnerability values such as
the onset of cavitation (ψx at which 12% of cavitation-related AE occur; AE12), 50%
embolized (ψx at which 50% of cavitation-related AE occur; AE50), full embolism (ψx
at which 88% of cavitation-related AE occur; AE88), and endpoint of the VCAE (ψx at
which 100% of cavitation-related AE occur; AE100) were determined. Analyses of
variance (ANOVA) were performed to detect differences between treatments, and
parameters were validated for normality and homogeneity via Wilcoxon signed rank
test and Levene test.
3.4 Results and discussion
Compared to other species, high vulnerability to cavitation of P. nigra, with 50% of
cavitation-related AE occurring at -1.45 MPa for control branches (Table 3.3), was
consistent with the high water requirements of the species (Fichot et al., 2015).
Table 3.3 Average vulnerability to cavitation values of light-excluded and control
Populus nigra L. branches
Vulnerability values (MPa) Light-excluded Control
AE12 -0.86 ± 0.14a -1.10 ± 0.11a AE50 -1.00 ± 0.13a -1.45 ± 0.09b AE88 -1.45 ± 0.08a -1.99 ± 0.04b AE100 -1.78 ± 0.03a -2.35 ± 0.17b
Water potential at 12, 50, 88 and 100% cumulative acoustic emissions of branch xylem (AE12, AE50,
AE88 and AE100). Different letters indicate significant differences (P < 0.05) between light-excluded and
control branches. Values are presented as means ± standard deviation.

AE reveals role of woody tissue photosynthesis
83
Predawn and midday leaf water potentials measured two weeks prior to the start of
the AE experiment showed no difference between treatments, indicating that light-
exclusion of woody tissue did not influence the native embolism state of the species
(Fig. 3.3, Table 3.1).
Fig. 3.3 Average acoustic vulnerability curves (VCAE) of three control Populus nigra L. branches (light
grey) and three light-excluded branches (dark grey) with their standard error bands (1 SE).
Vulnerability values AE12 (), AE50 (), AE88 () and AE100 (dashed line) are indicated. The lowest
native water potential measured before dehydration is shown for the light-excluded (dark grey arrow)
and the control (light grey arrow) branches. Light-excluded branches experienced greater vulnerability
to drought-induced cavitation.
However, light exclusion to prevent woody tissue photosynthesis in stem and
branches increased xylem vulnerability to cavitation (Fig. 3.3, Table 3.3). Light-
excluded branches were fully embolized (AE88) at a water potential of -1.45 MPa,
whereas control branches were 50% embolized at the same water status (Fig. 3.3,
Table 3.3). Consistently, AE50, AE88 and AE100 were significantly lower in control
branches (P < 0.05; Table 3.3). Light-excluded branches experienced a steeper
increase in embolism formation for a given reduction in ψx. From the onset of
cavitation (AE12), ψx reductions of 0.010 and 0.014 MPa were representative for an
increase of 1% in cumulative AE for light-excluded and control branches, respectively
(Fig. 3.3). The most plausible consequence of impeded woody tissue photosynthesis

Chapter 3
84
is a parallel decrease of the NSC pool in parenchyma, although potential shifts in
carbon source/sink dynamics under light-exclusion may alter this relationship. In any
case, greater vulnerability to drought-induced cavitation in light-excluded branches
illustrates the clear effect that sugars play in the species’ hydraulic functioning. The
underlying mechanisms coupling xylem vulnerability to cavitation and NSC supply via
woody tissue photosynthesis remain largely unknown (Vandegehuchte et al., 2015).
To disentangle these mechanisms in our specific experiment, we have further
examined the absolute amount of cumulative AE at the endpoint of the acoustic VC
(Fig. 3.4), and the shape of the acoustic VCs.
3.4.1 Sugar-mediated embolism repair under tension
Embolism refilling is known to occur in a wide variety of species driven by positive
root pressures originated during night-time or under well-watered conditions (Fisher
et al., 1997; Ewers et al., 2001; Hao et al., 2013). Alternatively, embolism refilling
occurs under negative pressure as a complex process finely regulated by gradients
of water, sugars and ions developed between xylem and phloem cells (Zwieniecki &
Holbrook, 2009; Secchi & Zwieniecki, 2010; Nardini et al., 2011). It is hypothesized
that embolism triggers a cascade of processes − embolism sensing, starch
depolymerisation, and enrichment of solutes in the film of sap adhered to the
cavitated conduit − that creates an osmotic gradient between the cavitated vessel
and vessel-associated cells that eventually draws water from the latter for refilling
(Salleo et al., 2004; Zwieniecki & Holbrook, 2009; Brodersen et al., 2010; Nardini et
al., 2011).
The role of woody tissue photosynthesis in hydraulic functioning was first evidenced
by Schmitz et al. (2012). The authors observed reduced leaf-specific hydraulic
conductivity of five mangrove species when branches were covered with aluminum
foil to prevent woody tissue photosynthesis. This reduction in hydraulic conductivity
was attributed to an inhibition of the embolism repair process due to a depletion of
the carbon status of the branch. In their experiment, measurements were performed
on detached branches using the hydraulic method, which measures xylem hydraulic
conductivity by sending a water-based solution under small positive pressure through
the branch, hence creating favorable conditions for refilling (Hao et al., 2013). More
recently, preliminary analyses of AE were applied in P. deltoides × nigra trees to
compare xylem functionality between control and light-excluded branches after a
drought period of five days (Bloemen et al., 2016). The larger number of cumulative
AE signals registered in bench-dried control branches compared to their light-
excluded counterparts indicated that more vessels were still functional and prone to
cavitate prior to branch excision for AE measurements. Again, an active role of

AE reveals role of woody tissue photosynthesis
85
woody tissue photosynthesis in the maintenance of xylem water transport capacity
was observed, and embolism reversal was suggested as the underpinning
mechanism linking xylem functional integrity and NSC availability in living plants
(Nardini et al., 2011; Brodersen & McElrone, 2013). However, drought-induced
vulnerability curves were not obtained in any of these studies (Schmitz et al., 2012;
Bloemen et al., 2016) to provide further empirical support to this hypothesis.
Applying our methodological approach, cycles of cavitation and refilling would lead to
a greater amount of cavitation-related AE given that multiple cavitation events would
occur in the same vessel after embolism repair. However, the amount of cumulative
AE registered at the endpoint of the acoustic VC did not differ between treatments
(P = 0.49; Fig. 3.4) suggesting that embolism repair should be ruled out as a potential
mechanism mitigating vulnerability to cavitation in detached control branches.
Fig. 3.4 Number of cumulative acoustic emissions (AE) registered at the endpoint of the acoustic
vulnerability curves (VCAE), and basic wood density (ρb, kg.m-3) of three control branches (light grey)
and three light-excluded branches (dark grey) with their standard error (1 SE). The difference in
cumulative AE and ρb between treatments is not significant (P = 0.49 and 0.68, respectively).
Furthermore, recording evidence for embolism refilling under tension seems unlikely
on cut dehydrating branches. Branch detachment from the living plant is required for

Chapter 3
86
the bench-top dehydration technique, and impedes tension relaxation that might
facilitate conditions for embolism repair (Zwieniecki & Holbrook, 2009), as it could be
observed in living plants (e.g., Brodersen et al. 2010) or in detached branches when
a solution is artificially flushed at a positive pressure (e.g., Schmitz et al. 2012).
3.4.2 Sugar-mediated synthesis of xylem structural changes
Xylem structural changes due to reductions in the NSC pool could be argued as an
additional factor influencing xylem vulnerability to cavitation. Carbon shortages
ascribed to disabled woody tissue photosynthesis are known to inhibit wood
production, and may alter wood traits, which determine the trade-off between xylem
safety and optimal carbon-for-water exchange (Sperry, 2003). Hacke et al. (2001)
found in 48 tree species that wood density is the most important characteristic of the
xylem structure to assess vulnerability to cavitation, with wood density and
vulnerability to drought-induced cavitation being inversely related (Rosner, 2017). In
our experiment, poplar clones were grown under the same environmental conditions
and subjected to stem and branch light-exclusion for 40 days. One could speculate
that potential reduction in the NSC pool resulting from the period of impeded woody
tissue photosynthesis might have reduced stem growth (Saveyn et al., 2010;
Bloemen et al., 2016). However, it is very unlikely that the 40 days of light-exclusion
in our study resulted in different wood traits related to cavitation vulnerability (e.g., pit
membrane size aperture, wood density; Hacke et al. 2001; Choat et al., 2003) given
the limited temporal scale of the treatment in the context of wood phenology (e.g.,
Pérez-De-Lis et al., 2016). Wood density did not differ between treatments before
branches were detached to construct acoustic VCs (P = 0.68; Fig. 3.4). Furthermore,
the number of vessels formed during the treatment period, and thus being potentially
affected by light-exclusion, was small relative to the total amount of functional vessels
constituting sapwood in the sampled branches. Stem sapwood area increment during
light-exclusion (DOYs 195-236) relative to total stem sapwood area was only 5%, and
did not differ between treatments (registered with linear variable displacement
transducers installed on the tree stem). Therefore, xylem structural changes were not
considered as principal factor determining greater vulnerability to cavitation of light-
excluded branches.
3.4.3 Sugar-mediated synthesis of xylem surfactants and proteins
Recent findings of Schenk et al. (2017) have proven the existence of carbon-based
choline-containing phospholipid surfactants and other amphiphilic lipids and proteins
in pit membranes of xylem vessels. In the pit membrane and immediately after
AE reveals role of woody tissue photosynthesis
87
nanobubble snap-off, surfactant organic compounds form a coating layer on
nanobubbles to stabilize them under negative pressure. Due to this coating layer,
nanobubbles may be less prone to exceed the critical threshold for embolism
formation (Blake, 1947), hence lowering vulnerability to cavitation (Schenk et al.,
2015). Vessel-associated parenchyma cells are the most likely source of xylem
surfactants and proteins, which are derived from phospholipids (Schenk et al., 2017).
By disabling woody tissue photosynthesis during a well-watered regime, reduced
NSC substrate in woody tissues might downregulate metabolism in vessel-associated
cells, hence decreasing the sugar supply for the metabolic pathway of phospholipid
surfactants and proteins. Increased vulnerability to drought-induced cavitation in light-
excluded branches observed in this study could be ascribed to a limited amount of
surfactants and the consequent reduction in the capability of stabilizing nanobubbles.
This theory concurs with our results since light-excluded branches cavitated at higher
water potentials compared to the control branches (Fig. 3.3), while the total amount
of cumulative AE at the endpoint of the acoustic VC did not differ significantly
between treatments (Fig. 3.4).
Due to a limited understanding of phloem functioning in comparison with our
knowledge of xylem transport (Sevanto, 2014; Hubeau & Steppe, 2015), little
attention is paid to the potential role of phloem failure in xylem malfunction. Phloem
unloading is commonly assumed as the only NSC source to fulfill the energetic
demand of metabolic processes that occur in vessel-associated parenchyma cells.
However, water shortages negatively affect phloem transport, and consequently,
drought-driven phloem turgor collapse and increased phloem sap viscosity
compromise adequate NSC supply to vessel-associated cells (Sala et al., 2010;
Sevanto, 2014; Hubeau & Steppe, 2015). Phloem malfunction and subsequent local
carbon starvation therefore accelerates irreversible hydraulic failure, and highlights
once more complex feedbacks between tree carbon cycling and hydraulic functioning
(Sala et al., 2010; McDowell, 2011; Steppe et al., 2015). In this context, the ability of
chloroplast-containing cells in woody tissue to immediately supply sugars − avoiding
long-distance transport – to adjacent vessel-associated cells for synthesis of
surfactants (Schenk et al., 2015, 2017), or embolism reversal (Schmitz et al., 2012;
Bloemen et al., 2016), acquire major relevance to maintain xylem transport capacity.
This immediate source of NSC to face drought-induced cavitation might confer wider
margins of hydraulic safety during drought stress. Furthermore, as photosynthetic
water use efficiency in woody tissue is larger than in leaves (Cernusak & Marshall,
2000), reassimilation of internal CO2 might constitute an increasingly important
carbon source under changing climate regimes (Bloemen et al., 2013), given that leaf
gas exchange would be limited to a greater extent in scenarios of more intense and
severe drought events.

Chapter 3
88
Although woody tissue photosynthesis has been widely studied in terms of tree
carbon cycling (Berveiller et al., 2007; Molares & Ladio, 2009; Ávila et al., 2014), it is
surprisingly neglected in the field of plant hydraulics and climate-driven tree mortality
(Vandegehuchte et al., 2015). With this straightforward test, we highlight the crucial
role of woody tissue photosynthesis in vulnerability to cavitation and encourage
researchers to explore this emerging line and potential mechanisms underlying this
relationship. Studies at the tree level will be of special interest as drought vulnerability
along the soil−to−leaf continuum may differ from measurements made at the organ
scale (Tyree & Ewers, 1991b). Further development of non-destructive and non-
invasive AE techniques would be adequate for in vivo measurements of vulnerability
to cavitation in field-grown trees (De Roo et al., 2016). Moreover, several questions
related to the role of CO2 reassimilation in plant hydraulics merit further effort: What
are the primary sinks for woody tissue assimilates? What is the role of sugars in the
build-up of xylem surfactants and proteins? What is the metabolic pathway of these
surfactants and proteins? Manipulative experiments to discriminate between NSC
sources together with high-resolution tomography to study the effect of sugar
availability on xylem structure, embolism reversal and nanobubble stabilization would
help to comprehensively understand the importance of woody tissue photosynthesis
in tree hydraulic performance and drought-driven tree mortality.

4
THE TRIPARTITE METHOD OF
ACOUSTIC VULNERABILITY, HYDRAULIC CAPACITANCE AND
XYLEM ANATOMY


Tripartite method for xylem vulnerability to cavitation
91
4.1 Abstract
A reliable method to screen the impact of drought on plant hydraulic functioning is
critical for better assessing and projecting climate change effects on plant species
across the globe. Relying on 50% loss of hydraulic conductivity and/or basic wood
density only has proven to be misleading or inadequate in some reported instances,
therefore we propose a tripartite framework that combines acoustic vulnerability,
hydraulic capacitance and xylem anatomy for a more complete picture of a species’
response to drought-induced cavitation. We tested the method on temperate (Malus
and Populus), Mediterranean (Olea), and tropical (Maesopsis and Erytrophleum) tree
species, and on several species of the Triticeae tribe. Xylem vulnerability to drought-
induced cavitation of these contrasting study species was acoustically determined
with broadband point-contact sensors during bench-top dehydration, and was
complemented with hydraulic capacitance information derived from desorption curves
by continuously weighing the samples, and with xylem anatomical characterization
performed on optical micrographs of stained thin sections. Our findings demonstrate
that: (i) species with low AE50 (i.e., water potential at 50% cavitation-related AE) are
not necessarily more drought sensitive when having high hydraulic capacitance
values, (ii) dynamics in entire vulnerability and desorption curves are better suited to
determine differences in drought vulnerability between species than static values,
and (iii) trade-off between hydraulic safety and efficiency is species-dependent. The
proposed tripartite method clearly showed how contrasting species behaved under
drought, and which underlying local mechanisms were used to avoid or retard
drought-induced cavitation. We conclude that this tripartite approach is necessary
when screening and assessing any species’ hydraulic response to drought to insure
that accurate data on species vulnerability to drought are obtained, and propagated
into climate change projections.

Chapter 4
92
4.2 Introduction
Understanding the impact of climate change on plant functioning is becoming
increasingly important to improve the understanding of our climate system (Lobell &
Gourdji, 2012; Lindner et al., 2014). Climate change and its associated extremes in
temperature and drought are lowering crop productivity and fertility (Barlow et al.,
2015), and are altering growth responses (Piao et al., 2011), drought-mortality (Allen
et al., 2010) and distribution (Delzon et al., 2013) of tree species across the globe. It
is therefore more than ever necessary that reliable screening methods are used to
better map species’ hydraulic responses to drought to improve the accuracy of
process-based models with which overall plant responses to climate change are
predicted.
Physiological and anatomical traits help clarifying important aspects of a species’
hydraulic functioning (Beikircher & Mayr, 2009; De Micco & Aronne, 2012; Epila et
al., 2017; De Baerdemaeker et al., 2018). This translates into two important key
traits: hydraulic efficiency and hydraulic safety (Lauri et al., 2011). Hydraulic safety
represents the ability of xylem to avoid embolism formation (Sperry & Tyree, 1990),
whereas hydraulic efficiency is referred to as the volume flow rate of water per
pressure gradient (Lauri et al., 2011). According to the cohesion-tension theory,
water is passively transported through the plant’s vascular system. This passive
transport is driven by negative pressure gradients generated by foliar transpiration,
implying that vascular water is metastable (Dixon & Jolly, 1895; Steudle, 2001).
Drought stress increases the tension within the vascular system, resulting in a
disruption of the continuous xylem water columns (i.e., cavitation) and thus in
embolisms (Tyree & Sperry, 1989a; Tyree & Zimmermann, 2002). Following the air-
seeding hypothesis, drought-induced embolisms spread as a function of maximum
pore size in the interconduit membrane (Zimmermann, 1983; Loepfe et al., 2007;
Mayr et al., 2014), decreasing hydraulic conductivity to a maximum extent upon
which the plant will wilt, and eventually die (Vilagrosa et al., 2012).
High hydraulic safety will help protect the plant against the risks associated with
drought stress (Lauri et al., 2011). Physiological assessment of hydraulic safety is
typically done by constructing a vulnerability curve (VC), which relates percentage
loss of xylem hydraulic conductivity (PLC, %) to increasing drought stress indicated
by xylem water potential (ψx, MPa) (Pammenter & Willigen, 1998). From the VC, the
universal trait P50 is derived, representing the water potential at which 50% loss of
hydraulic conductivity occurs (Choat et al., 2012). Basic wood density (ρb, kg.m-3) is a
second widely used trait to indirectly determine a species’ hydraulic safety, with a

Tripartite method for xylem vulnerability to cavitation
93
higher ρb related to a more resistant xylem to drought-induced cavitation (Li et al.,
2016; Rosner, 2017). Both traits are widely used to determine whether species are
sensitive to drought stress or not (Hacke & Sperry, 2001; Hacke et al., 2001;
Pittermann et al., 2006; Hao et al., 2008; Rosner, 2013). However, these two traits
alone are not always sufficient to fully comprehend the hydraulic response of species
to drought, and might thus be inadequate to reveal the complete picture (Epila et al.,
2017). Quantification of hydraulic capacitance has, for instance, added value,
because it determines the capacity with which a species buffers water shortage via
internally stored water (Edwards & Jarvis, 1982; Steppe & Lemeur, 2007; Vergeynst
et al., 2015a), thereby tempering sudden decreases in water potential (Sperry et al.,
2008; Meinzer et al., 2009), and limiting or at least retarding embolism formation
(Phillips et al., 2004). Besides basic wood density, also other anatomical traits, like
conduit size, pit pore size, vessel grouping, percentage of parenchyma and conduit
cell-wall reinforcement have been reported as important factors to determine a
species’ individual trade-off between hydraulic safety and efficiency, needed to
ensure optimal plant growth (Tyree & Ewers, 1991b; Sperry & Hacke, 2004; Sperry et
al., 2008; Blackman et al., 2010).
Because of the potential limitations associated with static values to specify a species’
vulnerability to drought-induced cavitation, a methodological tripartite framework was
developed to comprehensively map or screen a species’ hydraulic response to
drought-induced cavitation by including information on embolism formation,
capacitive water release, and anatomical strategies. This tripartite method integrates:
(i) xylem vulnerability to drought-induced cavitation by using acoustic emissions from
bench-top dehydrated samples, (ii) hydraulic capacitance and capacitive water
release, derived from desorption curves by continuously weighing the samples, and
(iii) xylem anatomical analysis to underpin acoustic and capacitive water release
results. To assess its reliability and robustness, the proposed tripartite method was
applied on different plant species from contrasting environments: two temperate
(Malus and Populus), one Mediterranean (Olea), and two tropical (Maesopsis and
Erythrophleum) secondary growth tree species, and several primary growth species
belonging to the Triticeae tribe. Specific working hypotheses were that (i) a single
trait is often insufficient to characterize a species’ vulnerability to drought-induced
cavitation, which might jeopardize the accuracy of climate change projections by
process-based models, which rely on a single trait, and (ii) the trade-off between
hydraulic safety and efficiency is species-dependent.

Chapter 4
94
4.3 Materials and methods
4.3.1 Plant material
To assess the tripartite method, which gathers data on embolism formation,
capacitive water release, and anatomy, secondary growth tree species from
contrasting climatic regions as well as primary growth species of the Triticeae tribe
were selected from our experimental database.
One-year-old Malus ×domestica ‘Gala’ Borkh. saplings, one-year-old Populus
tremula L. saplings, and young three-year-old Populus nigra L. trees as temperate
species. Malus ×domestica ‘Gala’ saplings were artificially doubled from nodal
segments using colchicine to compare differences in drought stress responses
between di- (‘Gala’-2x) and tetraploid (‘Gala’-4x) plantlets (De Baerdemaeker et al.,
2018). Populus tremula saplings were grown in four treatments for two months to
assess the impact of climate change on tree physiology, and included (i) well-
watered, ambient (WA) (i.e., atmospheric CO2 concentration ([CO2]) = 400 ppm), (ii)
drought-stressed, ambient (DA), (iii) well-watered, elevated air temperature and
atmospheric [CO2] (WE) (i.e., ambient air temperature + 3°C, and [CO2]) = 700 ppm),
and (iv) drought-stressed, elevated air temperature and atmospheric [CO2] (DE)
grown saplings (Hubeau, unpublished data). Selected Populus nigra trees came from
a control and a light-exclusion treatment to study the effect of woody tissue
photosynthesis on hydraulic functioning (Chapter 2). Young two-year-old Olea
europaea L. trees served as Mediterranean species example (Padilla-Díaz,
unpublished data), and young three-year-old Maesopsis eminii Engl. trees (Epila et
al., 2017) and field-harvested branches of adult Erythrophleum ivorense A. Chev. and
E. suaveolens Guill. & Perr. trees from Cameroon represented tropical species in this
study (Gorel, unpublished data). The branches were enclosed in wet, opaque bags
and stored in a cold box (around 4°C) during transport from Cameroon to Belgium.
Besides secondary growth species, the Triticeae tribe species Triticum aestivum
‘Hartog’ L., Secale cereale ‘DuikerMax’ L., ×Triticosecale ‘US2014’ Wittm., and
×Triticosecale ‘Dublet’ Wittm. were selected as primary growth species examples
(Degraeve, unpublished data).
4.3.2 Sampling protocol and hydraulic trait measurements
From selected study species, either the stem (S) of potted plants, or branches (B)
from potted or field-grown trees are sampled. Diameter and length are measured

Tripartite method for xylem vulnerability to cavitation
95
prior to the start of the experiment to ensure uniformity between the samples for both
the acoustic emission (AE) and hydraulic capacitance (C) monitoring (Table 4.1).
Table 4.2 Diameter and length of the stems/branches investigated with the proposed
tripartite method
Species ID D (mm) L (cm) Reference
Malus ×domestica ‘Gala’ Borkh. S 7.7 ± 1.0 112 ± 14 De Baerdemaeker et al. (2018)
Populus tremula L. S 4.8 ± 0.5 74 ± 7 Hubeau, unpublished data Populus nigra L. B 5.6 ± 0.5 93 ± 21 Chapter 2
Olea europaea L. S 6.5 ± 1.0 109 ± 9 Padilla-Díaz, unpublished data
Maesopsis eminii Engl. B 6.0 ± 0.9 75 ± 22 Epila et al. (2017) Erythrophleum ivorense A. Chev. B 9.2 ± 1.8 80 ± 11 Gorel, unpublished data Erythrophleum suaveolens Guill. & Perr.
B 8.7 ± 0.8 81 ± 4 Gorel, unpublished data
Triticeae tribe species S 3.8 ± 0.4 61 ± 10 Degraeve, unpublished data
Diameter D (mm) and length L (cm) of the stems/branches of the different species investigated with
the tripartite method. ID ‘S’ refers to stems and ID ‘B’ refers to branches. Values are means ± standard
deviation.
To avoid artificial embolism formation, study samples have to be cut under water and
avoid water loss by transpiration. Therefore, branches in the field are typically cut
before sunrise, while potted plants are kept in a darkened experimental room one
day prior to sampling to mimic low transpiration at the moment of cutting. Stems of
potted plants are cut just above the root zone, whereas branches are cut as close as
possible to the junction with the stem to ensure that samples include maximum
vessel length. Branches sampled in the field are stored in black polyethylene bags
with wet towels to avoid dehydration during transport. In the darkened experimental
room, all samples are recut twice under water (~3 cm/cut) to allow for relaxation and
to avoid artefacts due to air entry (Cochard et al., 2013). To avoid sample
dehydration and air entry during subsequent sensor installation, the cut end is
wrapped with a wet cloth. Sensor positioning is marked to ensure that
stems/branches have the sensors at the center of the sample, and at equal distance
from the single cut end.
Sensor installation is performed under artificial green light to limit photosynthesis and
transpiration. In this study, a maximum of four samples could be simultaneously
measured. To develop vulnerability curves (VC), each study sample is equipped with
a broadband point-contact AE sensor with a flat frequency response between 20 and
1000 kHz (KRNBB-PC, KRN Services, Richland, WA, USA) and a dendrometer (DD-
S, Ecomatik, Dachau, Germany). A minimum of three replicate samples per run is
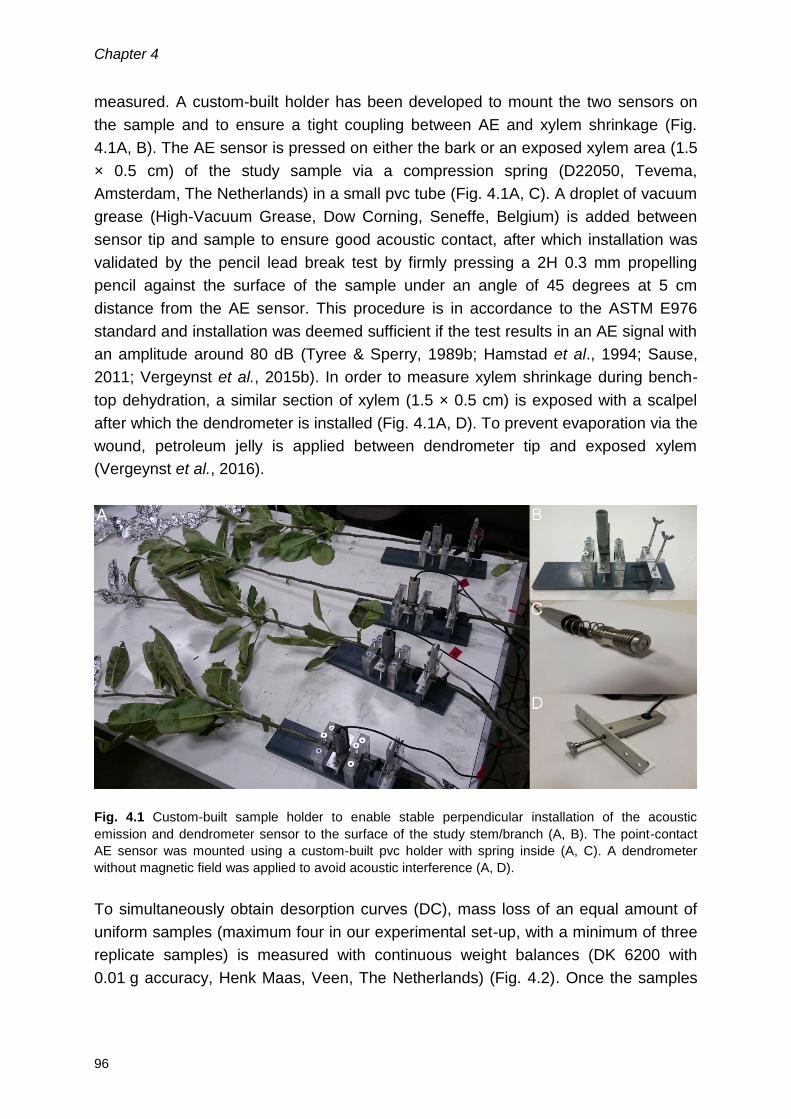
Chapter 4
96
measured. A custom-built holder has been developed to mount the two sensors on
the sample and to ensure a tight coupling between AE and xylem shrinkage (Fig.
4.1A, B). The AE sensor is pressed on either the bark or an exposed xylem area (1.5
× 0.5 cm) of the study sample via a compression spring (D22050, Tevema,
Amsterdam, The Netherlands) in a small pvc tube (Fig. 4.1A, C). A droplet of vacuum
grease (High-Vacuum Grease, Dow Corning, Seneffe, Belgium) is added between
sensor tip and sample to ensure good acoustic contact, after which installation was
validated by the pencil lead break test by firmly pressing a 2H 0.3 mm propelling
pencil against the surface of the sample under an angle of 45 degrees at 5 cm
distance from the AE sensor. This procedure is in accordance to the ASTM E976
standard and installation was deemed sufficient if the test results in an AE signal with
an amplitude around 80 dB (Tyree & Sperry, 1989b; Hamstad et al., 1994; Sause,
2011; Vergeynst et al., 2015b). In order to measure xylem shrinkage during bench-
top dehydration, a similar section of xylem (1.5 × 0.5 cm) is exposed with a scalpel
after which the dendrometer is installed (Fig. 4.1A, D). To prevent evaporation via the
wound, petroleum jelly is applied between dendrometer tip and exposed xylem
(Vergeynst et al., 2016).
Fig. 4.1 Custom-built sample holder to enable stable perpendicular installation of the acoustic
emission and dendrometer sensor to the surface of the study stem/branch (A, B). The point-contact
AE sensor was mounted using a custom-built pvc holder with spring inside (A, C). A dendrometer
without magnetic field was applied to avoid acoustic interference (A, D).
To simultaneously obtain desorption curves (DC), mass loss of an equal amount of
uniform samples (maximum four in our experimental set-up, with a minimum of three
replicate samples) is measured with continuous weight balances (DK 6200 with
0.01 g accuracy, Henk Maas, Veen, The Netherlands) (Fig. 4.2). Once the samples

Tripartite method for xylem vulnerability to cavitation
97
are installed properly, wet cloths are removed from both the VC- and DC-samples,
and room light is switched on in order to start the bench-top dehydration experiment.
Fig. 4.2 Continuous weight balances used to develop desorption curves (DC). The DK 6200 weight
balances have 0.01 g accuracy.
Readings from dendrometers and balances are registered every minute via custom-
built acquisition boards. The AE signals are amplified by 35.6 dB (AMP-1BB-J, KRN
Services, Richland, WA, USA) and waveforms of 7168 samples length are acquired
at 10 MHz sample rate. The signals are collected using two 2-channel PCI boards
and redirected to the software program AEwin (PCI-2, AEwin E4.70, Mistras Group
BV, Schiedam, The Netherlands). A 20-1000 kHz electronic band pass filter is
applied and only waveforms above the noise level of 28 decibels (dB) are retained
(Vergeynst et al., 2016). The low xylem tension at the start of dehydration results in
low-amplitude AE signals and combined with the strong attenuation of wood ensures
that low-amplitude AE signals originating too far from the region of sensor installation
will fall below the noise threshold (Beall, 2002a). Overall, in the frequency range
between 100 and 200 kHz, attenuation of AE amplitude along the grain of wood is
about 0.3 dB/cm (Beall, 2002b). As dehydration continues however, attenuation of
wood decreases, allowing for a progressive registration of low-amplitude AE signals
originating from further away.
Xylem water potential (ψx, MPa) is measured in aluminum foil wrapped excised
leaves using the pressure chamber (PMS Instrument Company, Corvalis, OR, USA;
Scholander et al., 1965). Wrapping is done to ensure equilibrium between leaf and
stem/branch water potential (Begg & Turner, 1970). Two approaches can be used to
measure evolution in ψx, but in both approaches dehydration in VC- and DC-samples
has to be similar. This implies that either all leaves of VC-samples are wrapped with
aluminum foil, and that all leaves of the corresponding DC-samples are stripped and

Chapter 4
98
wounds covered with petroleum jelly (approach 1), or that only a handful of leaves
(typically eight in this study) of the VC-samples are wrapped with aluminum foil, and
that all leaves of the DC-samples are left attached (approach 2). The latter will
increase sample dehydration due to higher leaf transpiration, and will reduce
experimental run time. The frequency of ψx readings is guided by the appearance
speed of AE signals, which are visualized as red dots in the range 28-95 dB and are
monitored in real-time with the AEwin software program. When leaves are removed,
and when new leaves are covered with aluminum foil (approach 2), AE signal
detection is put on hold to avoid noise disturbance from the cutting and wrapping
process. To ensure that newly covered leaves have sufficient time to reach
equilibrium with the xylem water potential of the sample (approach 2), a minimum of
three leaves must be wrapped at all times.
4.3.3 Acoustic vulnerability curve
The AE signals acquired per study sample are used to construct an acoustic
vulnerability curve (VCAE) (Mayr & Rosner, 2011; Vergeynst et al., 2016). The AE
signals are cumulated over the measurement period and are averaged over 1, 5 or
10 minutes depending on the duration of the bench-top dehydration experiment.
From the cumulative AE, the first derivative is calculated to construct an AE activity
curve. According to the definition in Vergeynst et al. (2016), the endpoint of the
vulnerability curve (AE100) is determined as the point at which the decrease in AE
activity, following the AE activity peak, decreases most strongly. From a
mathematical point of view, this point corresponds to the local maximum of the third
derivative (Fig. 4.3B, orange dashed line; Vergeynst et al., 2016). The AE activity is
numerically calculated over a time interval of 15 minutes (moving window). For the
third derivative, the time interval (also moving window) is based on the timespan at
which the AE peak occurs (i.e., 2 hours in Fig. 4.3B). Calculating the third derivative
over a time interval of 15 minutes results in a too fluctuating output pattern (Fig.
4.3A), which hampers quantification of the endpoint. The time interval to numerically
calculate the third derivative is, hence, dependent on the duration of the bench-top
dehydration experiment, the study species, and the dehydration conditions in order to
get meaningful results (Vergeynst et al., 2016). Absolute cumulative AE is rescaled
between zero and the defined endpoint to obtain a relative percentage of cumulative
AE.

Tripartite method for xylem vulnerability to cavitation
99
Fig. 4.3 Illustration of one-minute average cumulative acoustic emissions (CumAE, red), first
derivative or AE activity at 15-minute intervals (CumAEder1, black), and third derivative (CumAEder3,
grey) at 15-minute intervals (A) and at 2-hour intervals (B) of a branch sample of Malus ×domestica
‘Gala’-2x during the entire bench-top dehydration experiment. The endpoint of the VCAE (AE100)
corresponds to the local maximum of the third derivative (B, orange dashed line).
Measurements of xylem shrinkage with the dendrometer are used to generate a
continuous x-axis (ψx, MPa) for development of the VCAE. Two approaches can be
used to calculate ψx from xylem shrinkage (Fig. 4.4): using (i) a linear (black, open
circles) or (ii) a segmented-linear (red, open diamonds) regression relationship
between relative radial xylem shrinkage or strain (Δd/di, µm mm-1) and point
measurements of ψx (Vergeynst et al., 2015a).

Chapter 4
100
Fig. 4.4 Stress-strain curve between point measurements of water potential (MPa) and branch
diameter shrinkage or strain (µm mm-1) for a stem sample of Populus tremula (, black), and a stem
sample of Populus nigra (, red), and stress-time curve for a branch sample of Malus ×domestica
‘Gala’-2x (, grey). Continuous xylem water potential data can be calculated from: (i) linear
interpolation of water potential over time (grey line), (ii) linear regression between water potential and
strain (black line), and (iii) segmented-linear regression between water potential and strain (red line).
Plotting ψx point measurements against Δd/di produces the so-called stress-strain
curve (Fig. 4.4). Δd/di is calculated as the ratio of continuous diameter changes Δd to
initial diameter prior to dehydration (di) (modified from Vergeynst et al., 2015a; Eq.
4.1):
∆d
di
= dt-di
di
(Eq. 4.1)
with Δd the difference between the diameter (dt) measured by the dendrometer at a
given time (t) and the initial diameter (di) measured with an electronic caliper. A third
approach not requiring dendrometer measurements is linear interpolation in function
of time between the point measurements of ψx (Fig. 4.4, grey crosses; De
Baerdemaeker et al., 2018). This produces a stress-time curve that, if derived from a
strong succession of water potential measurements in time (at least three to four per

Tripartite method for xylem vulnerability to cavitation
101
hour), is regarded as a justified approach to generate a continuous ψx-axis. However,
this implies either an intensive manual assessment of ψx via the pressure chamber
(with overnight measurements during long dehydration periods), or via the installation
of stem psychrometers, which can be impractical because possible complications
with the brittle and expensive thermocouples can arise during installation (Vergeynst
et al., 2015a). The stress-strain curve is thus more beneficial as it reduces the
number of ψx measurements needed, delivers information on the strain of the
species, and importantly, the slope of the curve also represents the apparent
modulus of elasticity (E’r, MPa) in radial direction (Irvine & Grace, 1997; Eq. 4.2):
Er' =
dψ
d(Δd di⁄ ) (Eq. 4.2)
Plotting relative percentage of cumulative AE versus continuous ψx produces the
VCAE (Fig. 4.5). Values corresponding with the onset of cavitation (ψx at 12% AE;
AE12), 50% cavitation-related AE (ψx at 50% AE; AE50) and full embolism (ψx at 88%
AE; AE88) can be derived from this curve.
Fig. 4.5 Acoustic vulnerability curve (VCAE) relating percentage cumulative AE to decreasing water
potentials for a branch sample of Malus ×domestica ‘Gala’-2x. Vulnerability values AE12 (), AE50 (),
AE88 (), and AE100 (dashed line) are also indicated.

Chapter 4
102
4.3.4 Desorption curve, hydraulic capacitance and wood density
A section of ~5 cm is taken prior to dehydration from the cut ends of both the VC-
and DC-samples. At the end of the dehydration period, a second section equal in
length is taken from the samples (Vergeynst et al., 2015a). Diameter and length of
the sections are measured with an electronic caliper, and mass is determined with a
precision balance (Sartorius precision balance with 0.001 g accuracy, Sartorius
Weighing Technology GmBH, Goettingen, Germany). Each section is then oven dried
(103°C) till constant mass (Reeb & Milota, 1999). Length, diameter and mass are re-
measured, and considering a cylindrical shape, basic wood density (ρb, kg m-3) (oven
dry mass/green volume), and initial and final mass fraction of the sections (mass of
water over oven-dried mass) are calculated (Vergeynst et al., 2015a). For the
Triticeae tribe species, volume of the internal hollow cylinder is subtracted from the
total volume to avoid underestimation in ρb.
The mass loss recorded by the balances during bench-top dehydration is used as a
proxy for the overall change in water content (∆WC, g). Depending on the study
sample, ∆WC represents the change in water content of the branch/stem plus leaves
if leaves are left attached to the samples, or of the branch/stem only if leaves are
removed. If leaves are removed from the sample, mass loss can also be normalized
to volumetric water content (VWC, kg m-3) by re-scaling the mass loss data to the
range in VWC between initial and final VWC of the ~5 cm sections taken from the
VC-samples. Initial and final VWC are obtained by multiplying initial and final mass
fraction with ρb, and sections of VC-samples are used, because VC-samples supply
the ψx-axis for the DC (Vergeynst et al., 2015a).
The DC is then established by plotting either mass loss or VWC against the ψx-axis
(Fig. 4.6A-C). Two regions of interest can be distinguished using two defined
breakpoints, calculated via the Segmented package in R (Muggeo, 2008). The zone
between the first and the second breakpoint is known as the elastic shrinkage phase
or phase I. The zone after the second breakpoint till AE100 derived from VCAE is
known as the cavitation or inelastic shrinkage phase or phase II (Vergeynst et al.,
2015a). Hydraulic capacitance (C, in g MPa-1 or kg m-3 MPa-1) for both phases (Cel
and Cinel, respectively) is calculated as the slope of the linear regression between
mass loss or VWC and ψx (Vergeynst et al., 2015a; Eq. 4.3):
C = d(V)WC
dψx
=d(V)WC
d(Δd di⁄ )(
dψx
d(Δd di⁄ ))
-1
=d(V)WC
d(Δd di⁄ )(Er
' )-1
(Eq. 4.3)

Tripartite method for xylem vulnerability to cavitation
103
Fig. 4.6 Illustration of a desorption curve (DC) relating mass loss to decreasing xylem water potential
for a branch plus leaves sample of Malus ×domestica ‘Gala’-2x (A), a stem sample of Populus tremula
(C) (black open circles), and a stem sample of Secale cereale ‘DuikerMax’ (E), and of a desorption
curve relating volumetric water content against decreasing xylem water potential for a stem sample of
Populus tremula (C) (black closed circles). Elastic shrinkage (Ⅰ, red), and inelastic shrinkage (Ⅱ,
grey) are delimited by vertical dashed lines, and the corresponding hydraulic capacitance of both
phases (C, g MPa-1 or kg m-3 MPa-1) are calculated as the slope of the linear regressions (red and
grey lines). Corresponding VCAE of the Malus ×domestica ‘Gala’-2x branch sample (B), the Populus
tremula stem sample (D), and the Secale cereale ‘DuikerMax’ stem sample (F) are displayed. For
desorption curves based on mass loss or volumetric water content of the branch/stem sample (without
leaves), both defined capacitive phases can be transposed onto the corresponding VCAE (C-F).
4.3.5 Anatomy
Additional segments of ~3 cm in length are cut from the VC-samples, and stored in a
Copenhagen Mix solution, which consists of 99% ethanol, distilled water and glycerol
(70:28:2).
There is no unique method for preparing sections for microtome slicing, which is
dependent on whether the species is classified as soft- or hardwood (Gärtner &
Schweingruber, 2013). A typical preparation step is shortly heating the stored
sections in an oven at 60°C to facilitate the cutting procedure with the microtome
(e.g. sledge microtome HM 440 E, MICROM Laborgeräte GmbH, Walldorf,
Deutschland). The resulting cross-sections are dehydrated in graded series of
ethanol. To distinguish different xylem cell types, staining solutions such as the
safranin-astra blue coloring (Fig. 4.7A) (v. Aufseß, 1973), or the staining solution of
0.5% w/v astra blue, 0.5% w/v chrysoidine, and 0.5% w/v acridine red can be used
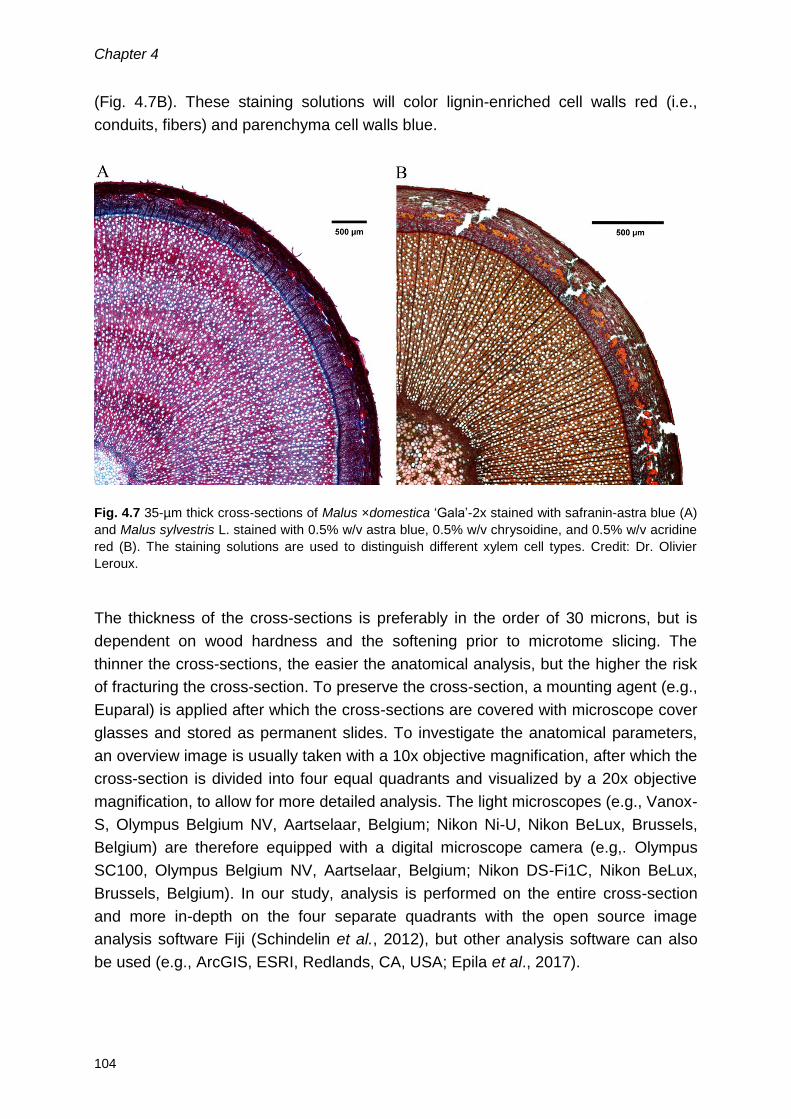
Chapter 4
104
(Fig. 4.7B). These staining solutions will color lignin-enriched cell walls red (i.e.,
conduits, fibers) and parenchyma cell walls blue.
Fig. 4.7 35-µm thick cross-sections of Malus ×domestica ‘Gala’-2x stained with safranin-astra blue (A)
and Malus sylvestris L. stained with 0.5% w/v astra blue, 0.5% w/v chrysoidine, and 0.5% w/v acridine
red (B). The staining solutions are used to distinguish different xylem cell types. Credit: Dr. Olivier
Leroux.
The thickness of the cross-sections is preferably in the order of 30 microns, but is
dependent on wood hardness and the softening prior to microtome slicing. The
thinner the cross-sections, the easier the anatomical analysis, but the higher the risk
of fracturing the cross-section. To preserve the cross-section, a mounting agent (e.g.,
Euparal) is applied after which the cross-sections are covered with microscope cover
glasses and stored as permanent slides. To investigate the anatomical parameters,
an overview image is usually taken with a 10x objective magnification, after which the
cross-section is divided into four equal quadrants and visualized by a 20x objective
magnification, to allow for more detailed analysis. The light microscopes (e.g., Vanox-
S, Olympus Belgium NV, Aartselaar, Belgium; Nikon Ni-U, Nikon BeLux, Brussels,
Belgium) are therefore equipped with a digital microscope camera (e.g,. Olympus
SC100, Olympus Belgium NV, Aartselaar, Belgium; Nikon DS-Fi1C, Nikon BeLux,
Brussels, Belgium). In our study, analysis is performed on the entire cross-section
and more in-depth on the four separate quadrants with the open source image
analysis software Fiji (Schindelin et al., 2012), but other analysis software can also
be used (e.g., ArcGIS, ESRI, Redlands, CA, USA; Epila et al., 2017).
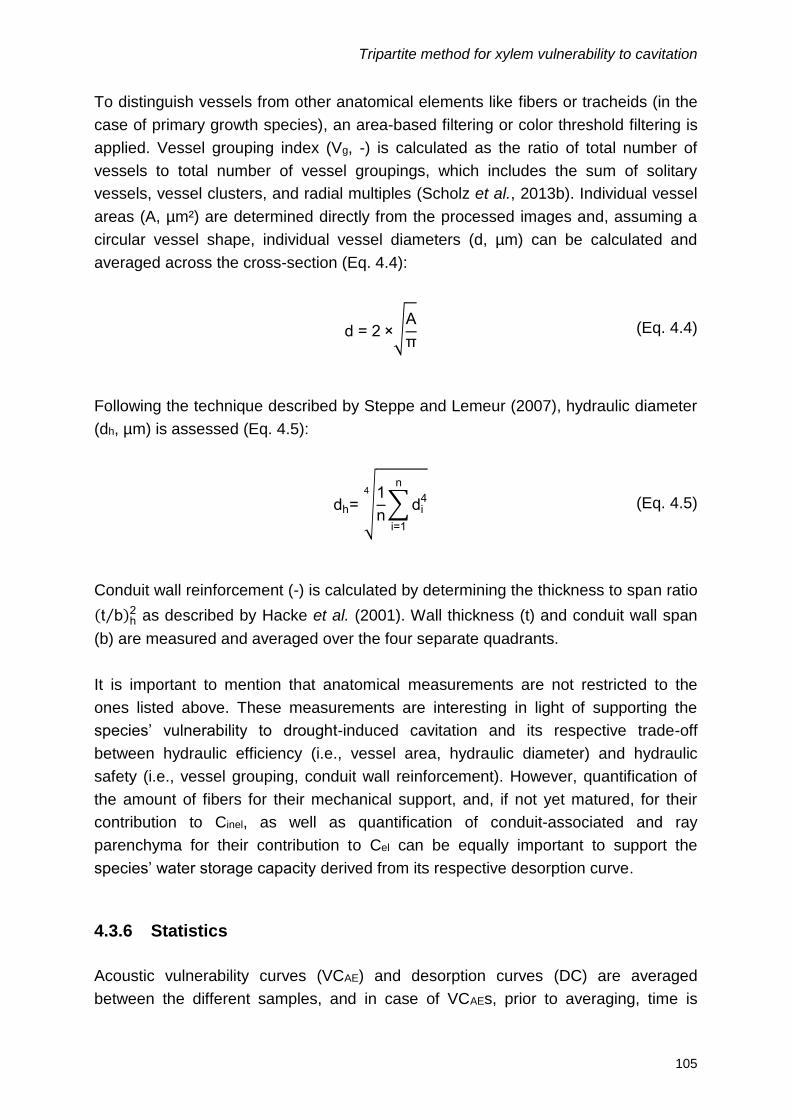
Tripartite method for xylem vulnerability to cavitation
105
To distinguish vessels from other anatomical elements like fibers or tracheids (in the
case of primary growth species), an area-based filtering or color threshold filtering is
applied. Vessel grouping index (Vg, -) is calculated as the ratio of total number of
vessels to total number of vessel groupings, which includes the sum of solitary
vessels, vessel clusters, and radial multiples (Scholz et al., 2013b). Individual vessel
areas (A, µm²) are determined directly from the processed images and, assuming a
circular vessel shape, individual vessel diameters (d, µm) can be calculated and
averaged across the cross-section (Eq. 4.4):
d = 2 ×√A
π (Eq. 4.4)
Following the technique described by Steppe and Lemeur (2007), hydraulic diameter
(dh, µm) is assessed (Eq. 4.5):
dh= √1
n∑ di
4
n
i=1
4
(Eq. 4.5)
Conduit wall reinforcement (-) is calculated by determining the thickness to span ratio
(t b⁄ )h2 as described by Hacke et al. (2001). Wall thickness (t) and conduit wall span
(b) are measured and averaged over the four separate quadrants.
It is important to mention that anatomical measurements are not restricted to the
ones listed above. These measurements are interesting in light of supporting the
species’ vulnerability to drought-induced cavitation and its respective trade-off
between hydraulic efficiency (i.e., vessel area, hydraulic diameter) and hydraulic
safety (i.e., vessel grouping, conduit wall reinforcement). However, quantification of
the amount of fibers for their mechanical support, and, if not yet matured, for their
contribution to Cinel, as well as quantification of conduit-associated and ray
parenchyma for their contribution to Cel can be equally important to support the
species’ water storage capacity derived from its respective desorption curve.
4.3.6 Statistics
Acoustic vulnerability curves (VCAE) and desorption curves (DC) are averaged
between the different samples, and in case of VCAEs, prior to averaging, time is

Chapter 4
106
removed as independent variable with the PhytoSim software (PhytoSim 2.1, Phyto-
IT bvba, Mariakerke, Belgium). VCAEs are fitted with the smooth.spline function in the
stats library in R software (RStudio version 1.1.419 - © 2009-2017 RStudio, Inc.). To
determine significant differences between VCAE, C, and xylem anatomy parameters,
analysis of variance (ANOVA) is carried out using the R software. Tests are
assessed at a probability level of 5%, and all parameters are validated for normality
via the Wilcoxon signed rank test and homogeneity via the Levene test.
4.4 Results
4.4.1 Acoustic vulnerability
Acoustic vulnerability analysis showed that the temperate study species were
amongst the more vulnerable ones (Table 4.2), with AE50 values ranging between -
0.85 MPa (M. domestica ‘Gala’-4x) and -2.57 MPa (P. tremula DA). The tropical
species E. ivorense and M. eminii also showed low negative AE50 values (-1.93 MPa
and -1.90 MPa, respectively), suggesting higher drought sensitivity for these species
(Table 4.2). The tropical tree species E. suaveolens, with an AE50 value
of -3.88 MPa, and the Mediterranean tree species O. europaea, with an AE50 value
of -5.98 MPa, showed higher tolerance to drought-induced cavitation (Table 4.2).
Triticeae tribe species were classified as drought sensitive with ×Triticosecale
‘Dublet’ the most vulnerable (AE50 = -1.33 MPa) and Secale cereale ‘DuikerMax’ the
least vulnerable (AE50 = -1.73 MPa; Table 4.2) one.
4.4.2 Hydraulic capacitance and wood density method
The tropical tree species M. eminii showed high elastic (Cel) and inelastic (Cinel)
hydraulic capacitance, releasing this capacitively stored water during the entire
timespan of bench-top dehydration up to full embolism formation (t100% = 2.75 ± 1.14)
(Table 4.2). The two other tropical tree species were characterized by lower
C-values, but in case of E. suaveolens, this internally stored water contributed to
branch hydraulics over a longer timespan (t100% = 3.73 ± 0.56), which resulted in
more pronounced values of Cel and Cinel when calculated from mass loss DCs (g
MPa-1) (Table 4.2). In the tropical tree species, an overall trend of decreasing C with
more negative AE50 and higher ρb was observed (Table 4.2, Fig. 4.8).

Tripartite method for xylem vulnerability to cavitation
107
Table 4.2 Xylem water potential at 50% cavitation-related AE, elastic capacitance, inelastic capacitance, basic wood density, and
dehydration time till complete embolism formation of different species and treatments investigated with the proposed tripartite
method
ID AE50 (MPa) Cel Cinel
ρb (kg m-3) t100% (days) kg m-3 MPa-1 g MPa-1 kg m-3 MPa-1 g MPa-1
Temperate species
M. domestica ‘Gala’-2x -0.99 ± 0.23 - 1.76 ± 0.48* - 3.01 ± 0.28* 485 ± 15 0.11 ± 0.02* M. domestica ‘Gala’-4x -0.85 ± 0.14 - 4.07 ± 0.87* - 8.74 ± 1.90* 443 ± 37 0.09 ± 0.02* P. tremula WA -2.38 ± 0.18 103 ± 14 0.51 ± 0.20 201 ± 47 1.01 ± 0.53 389 ± 23 1.01 ± 0.01 P. tremula DA -2.57 ± 0.27 83 ± 13 0.45 ± 0.19 146 ± 26 0.76 ± 0.31 349 ± 17 1.30 ± 0.08 P. tremula WE -2.08 ± 0.13 93 ± 42 0.65 ± 0.15 285 ± 32 2.06 ± 0.26 411 ± 9 0.84 ± 0.09 P. tremula DE -2.49 ± 0.04 92 ± 8 0.52 ± 0.17 254 ± 55 1.63 ± 0.30 367 ± 24 0.92 ± 0.03 P. nigra control -1.45 ± 0.09 - - - - 438 ± 31 0.07 ± 0.02* P. nigra light-excluded -1.00 ± 0.13 - - - - 421 ± 55 0.07 ± 0.01*
Mediterranean species
O. europaea -5.98 ± 0.92 72 ± 28 4.22 ± 1.22 23 ± 10 1.35 ± 0.64 611 ± 54 7.38 ± 0.02
Tropical species
M. eminii -1.90 ± 0.10 319 ± 20 6.33 ± 3.60 655 ± 56 19.94 ± 5.12 302 ± 21 2.75 ± 1.14 E. ivorense -1.93 ± 0.03 68 ± 22 3.65 ± 1.55 138 ± 34 7.40 ± 2.64 489 ± 47 1.88 ± 0.02 E. suaveolens -3.88 ± 0.70 94 ± 32 13.78 ± 8.86 35 ± 14 4.40 ± 2.10 585 ± 63 3.73 ± 0.56
Triticeae tribe species
T. aestivum ‘Hartog’ -1.62 ± 0.21 - 0.15 ± 0.08 - 0.82 ± 0.34 141 ± 20 0.94 ± 0.08 S. cereale ‘DuikerMax’ -1.73 ± 0.10 - 0.07 ± 0.02 - 1.20 ± 0.32 102 ± 3 1.49 ± 0.40 ×Triticosecale ‘US2014’ -1.47 ± 0.04 - 0.20 ± 0.04 - 0.68 ± 0.12 155 ± 13 1.14 ± 0.16 ×Triticosecale ‘Dublet’ -1.33 ± 0.06 - 0.42 ± 0.10 - 2.48 ± 0.72 170 ± 17 1.33 ± 0.19
Xylem water potential at 50% cavitation-related AE (AE50, MPa), elastic capacitance (Cel, (k)g (m-3) MPa-1), inelastic capacitance (Cinel, (k)g (m-3) MPa-1), basic
wood density (ρb, kg m-3), and dehydration time till complete embolism formation (t100%, days) of different species and treatments (ID) investigated with the
tripartite method. Cel and Cinel values with an asterix (*) refer to a combined weight loss of stem/branch and leaves. t100% values with an asterix (*) refer to VC
samples with only a handful of leaves wrapped in aluminum foil. Values are means ± standard deviation.

Chapter 4
108
Fig. 4.8 From left to right, from top to bottom, relation between 50% cavitation-related acoustic
emissions (AE50, MPa) and volumetric water content derived elastic hydraulic capacitance (Cel, kg m-3
MPa-1), change in water content derived elastic hydraulic capacitance (Cel, g MPa-1), volumetric water
content derived inelastic hydraulic capacitance (Cinel, kg m-3 MPa-1), change in water content derived
inelastic hydraulic capacitance (Cinel, g MPa-1), basic wood density (ρb, kg m-3), dehydration time till
complete embolism formation (t100%, days), vessel area (A, µm2), hydraulic diameter (dh, µm), vessel
grouping index (Vg, -), and vessel cell-wall reinforcement ((t b⁄ )h2, -) for the contrasting temperate
(black), Mediterranean (red), tropical (blue) and Triticeae tribe (orange) study species investigated with
the tripartite method.

Tripartite method for xylem vulnerability to cavitation
109
4.4.3 Xylem anatomy
Average vessel area (A) and hydraulic diameter (dh) were highest for the tropical tree
species, suggesting a high hydraulic efficiency (Table 4.3). The more negative AE50
of E. suaveolens and O. europaea corresponded with a high vessel cell-wall
reinforcement ((t b⁄ )h2), with A and dh of O. europaea lowest compared to all other
study species (Table 4.2 and 4.3). (t b⁄ )h2 was lowest for M. domestica and the
primary growth Triticeae tribe species, which corresponded to their higher
vulnerability to drought-induced cavitation (Table 4.2 and 4.3). As expected, ((t b⁄ )h2)
was linearly related with AE50 across the contrasting study species, indicating that
higher vessel cell-wall reinforcement translates to increased drought tolerance (Fig.
4.8). For P. tremula, A and dh were lowest for the drought elevated air temperature
and atmospheric [CO2] treatment (DE), which showed the highest degree of vessel
grouping (Vg) (Table 4.3). Tracheids were not included in the analysis of the primary
growth species.
Table 4.3 Anatomical parameters vessel area, hydraulic diameter, vessel grouping
index, and vessel cell-wall reinforcement of different species and treatments
investigated with the proposed tripartite method
ID A (µm2) dh (µm) Vg (-) (t b⁄ )h2 (-)
Temperate species
M. domestica ‘Gala’-2x 553 ± 43 27.2 1.21 0.012 ± 0.005 M. domestica ‘Gala’-4x 790 ± 54 32.9 1.16 0.005 ± 0.002 P. tremula WA 844 ± 422 34.7 1.61 0.029 ± 0.015 P. tremula DA 810 ± 392 33.8 1.74 0.024 ± 0.014 P. tremula WE 582 ± 253 28.4 1.61 0.026 ± 0.017 P. tremula DE 556 ± 280 28.2 2.01 0.029 ± 0.018
Mediterranean species
O. europaea 27 ± 16 6.4 1.61 0.059 ± 0.021
Tropical species
M. eminii 1359 ± 767 44.6 1.52 0.020 ± 0.010 E. ivorense 2218 ± 1613 59.1 1.62 0.010 ± 0.003 E. suaveolens 1751 ± 1297 52.7 1.78 0.038 ± 0.011
Triticeae tribe species
T. aestivum ‘Hartog’ 588 ± 306 29.0 1.22 0.023 ± 0.017 S. cereale ‘DuikerMax’ 392 ± 262 24.5 1.12 0.027 ± 0.012 ×Triticosecale ‘US2014’ 745 ± 425 33.0 1.11 0.016 ± 0.008 ×Triticosecale ‘Dublet’ 834 ± 624 36.4 1.22 0.015 ± 0.008
Vessel area (A, µm2), hydraulic diameter (dh, µm), vessel grouping index (Vg, -), and vessel cell-wall
reinforcement ((t b⁄ )h2, -) of different species and treatments (ID) investigated with the tripartite method.
Aside from dh and Vg, values are means ± standard deviation.

Chapter 4
110
4.5 Discussion
4.5.1 Bark versus xylem acoustic emissions
Acoustic emission sensors can detect dehydration-related AE signals through the
bark surface of branches and stems, and are therefore well suited to non-
destructively and non-invasively measure a species’ vulnerability to drought-induced
cavitation (Cochard et al., 2013). When using AE-sensors, it is generally
recommended to install the sensor on the xylem surface, after bark removal, to
establish a better acoustic coupling with AEs originating from cavitating vessels
(Mayr & Rosner, 2011). Bark removal damages the sample, but because the created
wound is small, given the small sensor head dimension, the wound can be readily
sealed with vacuum grease without having detrimental effects (Fig. 4.1A, C).
Against this recommendation, Vergeynst et al. (2015a) mounted broadband AE
sensors on the bark surface of Vitis vinifera L. and obtained VCAEs that were in close
agreement with the results of X-ray computed microtomography (µCT). But when
mounting the AE sensors on the bark surface of Fraxinus excelsior L., the sensors
failed to register the first stages of dehydration when acoustic and µCT VCs were
compared (Pers. Comm. Lidewei Vergeynst). In general, wood is known to have a
strong attenuation effect on AE (Beall, 2002a), which reduces with progressing
dehydration (Vergeynst et al., 2015b).
Prior to actual AE measurements, it should therefore be tested what the attenuation
factor is of the examined species and how it diminishes with ongoing dehydration and
whether differences in AE attenuation exist when mounting the sensor on the bark or
the xylem of the species. In Populus nigra L., VCAEs derived from AE measurements
on bark and xylem were in close agreement with no significant difference in AE
amplitude (42.4 ± 5.8 dB vs 44.6 ± 6.8 dB) and absolute cumulative AE (24010 ±
4385 vs 24963 ± 10913), which justifies that in this species AE measurements can be
carried out on the bark surface without losing any hydraulic information or damaging
the study sample (Fig. 4.9). Sensor-mounting on the bark has an additional
advantage that AE events resulting from shrinkage and water loss of living tissue can
also be detected and assessed (Vergeynst et al., 2016).
In monocot grasses, such as our Triticeae tribe study species, no such choice is
possible, and AE sensors have to be mounted on the outer surface of the culms.

Tripartite method for xylem vulnerability to cavitation
111
These primary growth stems or culms are hollow in the center and are surrounded by
sheaths at leaf-basis, which also contain vessels that contribute to the overall xylem
water transport (Cope & Gray, 2009). Here, VCAE can be verified with µCT imaging,
but due to the non-secondary growth nature of the Triticeae tribe, AE registration is
less prone to strong attenuation effects, making measurements on the culm surface
reliable to construct VCAEs (Degraeve, unpublished data).
Fig. 4.9 Average acoustic vulnerability curve relating percentage cumulative AE to decreasing water
potential for AE sensors installed on both the bark (VCAE bark, black), and the xylem (VCAE xylem, red)
of three Populus nigra branch samples. Vulnerability values AE12 (), AE50 (), AE88 (), and AE100
(dashed line) are indicated. Overlap in VCAEs justifies AE sensor mounting on the bark surface of this
species.
4.5.2 Stress-strain curve: linear versus linear segmented
The use of AE in drought-induced cavitation research is valuable, because AE
sensors can continuously monitor dehydration, producing entire VCAEs from single
samples. This is in contrast to, for instance, the hydraulic method, where new sample
sets per dehydration step have to be collected (Cochard et al., 2013). These different
samples are then measured and aggregated into a single hydraulic VC (Cochard et

Chapter 4
112
al., 2013), but by doing so an error associated to sample variability is introduced,
which is nonexistent in VCAE.
To benefit from the continuous AE measurements on single samples and to develop
physiologically meaningful VCAEs, the time axis is replaced by ψx, which is
considered as the golden standard for plant water status (Sperry et al., 1988a).
Manual measurements of ψx carried out on the VC-samples are however destructive
and discontinuous (Scholander et al., 1965), negating the continuous AE
measurements. We therefore used continuous ψx values, which can be calculated
from stress-time curves if sufficient ψx measurements are available (Fig. 4.4; De
Baerdemaeker et al., 2018), or from stress-strain curves (Fig. 4.4). The stress-strain
approach was first tested on Vitis vinifera L., where a linear relationship was found
between xylem shrinkage or strain (Δd/di) and ψx (Vergeynst et al., 2015a). However,
dependent on study species, a distinct breakpoint may occur in this linear
relationship, making a segmented-linear regression the better determinant to avoid
over- or underestimation of the actual ψx (Fig. 4.4) (Chapter 2; Hubeau, unpublished
data). In addition, the slope of the stress-strain curve represents the species’
modulus of elasticity in radial direction (E’r) (Eq. 4.2), which is a physiological variable
that quantifies the magnitude of elastic shrinkage in response to drought stress
(Irvine & Grace, 1997; Steppe & Lemeur, 2007) and can be used in the assessment
of the hydraulic response of plants to drought. The breakpoint that is sometimes
observed in the stress-strain curve can be attributed to the transition from elastic to
inelastic xylem shrinkage. In P. nigra, P. tremula and the Triticeae tribe species, this
breakpoint divided the stress-strain curve in two distinct parts, where the first part
showed a strong increase in ψx per unit xylem shrinkage, followed by a more steady
increase. This pattern was however reversed in E. suaveolens and O. europaea. For
the Triticeae tribe species, the breakpoint in the stress-strain curve at -0.89 ± 0.26
MPa corresponded well with the average ψx in the DC (-0.91 ± 0.26 MPa), marking
the transition from elastic to inelastic shrinkage. Similar findings were observed in E.
suaveolens: breakpoint in the stress-strain curve was around -2.37 ± 0.47 MPa, while
the transition in DC was around -2.42 ± 0.57 MPa. The agreement between
breakpoint in the stress-strain curve of P. tremula (-1.46 ± 0.33 MPa) and O.
europaea (-2.23 ± 0.19 MPa), and their respective transition from elastic to inelastic
shrinkage in DC (-1.93 ± 0.46 MPa and -3.04 ± 0.51 MPa), was however less
pronounced. Overall, these results indicate that the elastic water storage in P.
tremula, and especially in the Triticeae tribe species, is insufficient to buffer
decreases in ψx, while water released from cavitating vessels has a more substantial
contribution towards tempering xylem tension, which is also reflected in the lower
elastic and higher inelastic hydraulic capacitances (Table 4.2). In the tropical and
Mediterranean species, the capacitively released water from living tissue is often

Tripartite method for xylem vulnerability to cavitation
113
more crucial to buffer ψx and retard cavitation, which translated into higher elastic
capacitances compared to their inelastic buffering capacity (Table 4.2). For species
with a distinct linear relationship (V. vinifera in Vergeynst et al. (2015a) and E.
ivorense in this study), inelastic capacitance was higher than elastic capacitances
(Table 4.2), but more research is required to verify whether this is a general pattern.
4.5.3 Endpoint determination of the acoustic VC
The challenge in using AE to construct vulnerability curves is determining the
endpoint of the acoustic VC (Rosner, 2015). It has been shown that AE signals are
measured beyond full embolism formation, thus exceeding the amount of vessels that
can cavitate (Wolkerstorfer et al., 2012; Cochard et al., 2013), and that different AE
sources, such as shrinkage of living cells and fibers, Haines jumps and fracture
forming are also registered (Vergeynst et al., 2016). Though Tyree et al. (1984) found
a good correlation between the amount of cavitating vessels and bulk AE signals in
dehydrating sapwood of Thuja occidentalis, extraction of cavitation-related AE from
the bulk of signals is still a quest.
Vergeynst et al. (2016) approached the problem by proposing a mathematical
technique to determine the endpoint of VCAEs (see Materials and Methods – acoustic
vulnerability curves). This technique still registers excess in AE signals over
cavitating vessels, but allows demarcating a zone wherein vessels lose their
functionality. By including xylem anatomy, the amount of vessels can be determined
per individual branch/stem, verifying whether the amount of cavitated vessels
coincides with the cumulative amount of AE at the endpoint of the VCAE.
Validating acoustic results is crucial to further promote the use of AE in drought-
induced cavitation research, and to counter statements such as the one that the AE
method would be more qualitative than quantitative (Cochard et al., 2013). Regarding
the endpoint determination proposed by Vergeynst et al. (2016) independent support
was supplied by the method of Nolf et al. (2015), which originally aimed at correlating
maximum AE activity (or the first derivative of cumulative AE) to hydraulic P50.
Because hydraulic P50 implies a correct VC endpoint, the close agreement between
AE50 and hydraulic P50 demonstrates that using the maximum in third derivative to
quantify the endpoint is valid, because the same AE activity calculation was used in
both studies (Fig. 4.3). The method of Vergeynst et al. (2016) can hence be
considered as an improved extension of the method of Nolf et al. (2015), which was
originally restricted to quantify AE50 and not to construct a delineated VCAE. The
method of Vergeynst et al. (2016) thus allows to cross reference AE50 against

Chapter 4
114
hydraulic P50, and to construct VCAEs that quantitatively depict a species’ vulnerability
to drought-induced cavitation.
4.5.4 Mass loss versus volumetric water content in desorption curves
Multiple strategies are employed by vascular plants to cope with drought. These
strategies are unfortunately not all summarized in a species’ vulnerability curve,
which mainly reflects changes in hydraulic conductivity, but should also consider a
species’ ability to effectively use water storage buffers to temper decreases in ψx
(Pivovaroff et al., 2016). By simultaneous measurement of mass loss during AE
registration of bench-top dehydrating samples, corresponding desorption curves (DC)
can be constructed from which a species’ hydraulic capacitance (C) can be derived.
Samples can be dehydrated on weight balances with or without attached leaves,
which implies that the mass loss of leaves plus stem/branch or of solely the
stem/branch is measured. The leaves plus stem/branch approach supplies data on
the buffering effect of water present in leaves and the supporting stem/branch, and
enables assessment of the water storage function of both organs (De Baerdemaeker
et al., 2018). The disadvantage of this approach is that changes in water content
strictly related to the branch/stem level cannot be extracted. The two distinct
capacitive phases of the DC can therefore not be meaningfully transposed onto the
respective VCAE (Fig. 4.6A, B). When only stems/branches are used, registered mass
loss will represent the change in water content under decreasing ψx at stem/branch
level, and is the preferred approach if the ultimate goal is to map a species’ response
to drought-induced cavitation to be further related to xylem structure and function.
Values of ψx demarcating the transition from elastic to inelastic shrinkage can then be
useful transposed onto the VCAE, illustrating the tight coupling between drought
vulnerability and the effective use of hydraulic capacitance as drought survival
strategy (Fig. 4.6C-F). Hydraulic capacitance of living cells (Cel) is used to temporarily
postpone embolism formation, while water released from cavitation (Cinel) acts as a
second important buffer to temper further decrease in ψx (Vergeynst et al., 2015a).
DCs at stem/branch level can be constructed with mass loss or with volumetric water
content (VWC) (Fig. 4.6C). Both types of DCs and their derived Cel and Cinel values
have their relevance in drought-induced cavitation research. VWC DCs quantify the
absolute amount of water released per volume of sample and per unit decrease in ψx,
but could be misinterpreted when comparing contrasting species if the time to reach
complete embolism formation (t100%) is not taken into account. For instance, the
tropical species E. ivorense and E. suaveolens were characterized by low VWC Cel
and Cinel values compared to temperate tree species, but water released from these
Tripartite method for xylem vulnerability to cavitation
115
internal reserves contributed longer (higher t100%) to temper decreases in ψx (Table
4.2, Fig. 4.8). Mass loss DCs retain information on t100%, resulting in higher mass loss
Cel and Cinel values for species that take a longer time to reach complete embolism
formation (Table 4.2, Fig. 4.8). Moreover, C values derived from mass loss DCs are
often used in process-based models to simulate the effect of drought stress on plant
functioning (Steppe & Lemeur, 2007; Salomón et al., 2017). Sometimes
normalization of mass loss to VWC via basic wood density cannot be justified, which
was the case for the Triticeae tribe species in this study. Because of their hollow
culms, mass loss DCs are recommended for monocot grasses to calculate hydraulic
capacitance (Fig. 4.6E).
4.5.5 P50 and ρb versus the tripartite method
Xylem water potential corresponding with 50% loss of hydraulic conductivity (P50) and
basic wood density (ρb) are two widely used functional traits in ecophysiological
research to assess drought resistance of plant species (Choat et al., 2012; Rosner,
2017). While P50 provides information on the vulnerability of plants to cavitation
(Maherali et al., 2004), ρb adds insights on hydraulic capacitance (Chave et al., 2009;
Anderegg et al., 2016; Jupa et al., 2016). The existence or non-existence of a link
between both traits can either support the concept of a trade-off between hydraulic
safety and efficiency (Hacke et al., 2001; Lachenbruch & Mcculloh, 2014; Rosner,
2017), or reject it (Gleason et al., 2016). A positive correlation between more
negative P50 and increased ρb can be expected (Rosner, 2017), because an increase
in wood density likely promotes structural changes in pit membrane porosity by
affecting the density and arrangement of pit membrane microfibrils in order to avoid
negative effects associated with drought (Li et al., 2016), trading reduced water
transport (efficiency) for more mechanical strength against cavitation (hydraulic
safety). However, Gleason et al. (2016) demonstrated that this trade-off is
primordially weak across different species, especially angiosperms, and that the link
between P50 and ρb is not straightforward because species with high wood density
are not inherently characterized by a better mechanical strength over low wood
density species (Gleason et al., 2008; Butler et al., 2012). Although this trade-off was
pronounced in the tropical species E. suaveolens and the Mediterranean species O.
europaea, the similarity in AE50 and the large divergence in ρb for the two remaining
tropical species, as well as the spread in AE50 and the small divergence in ρb for the
temperate and Triticeae tribe species (Fig. 4.8), supports the idea of a weaker trade-
off between both quantities (Gleason et al., 2016). On the other hand, our tripartite
framework did illustrate a distinct linear relationship between AE50 and t100% and AE50
and (t b⁄ )h2 across the contrasting study species (Fig. 4.8), but similar as discussed

Chapter 4
116
for the link between P50 and ρb, these tight couplings should be investigated more
thoroughly to avoid premature conclusions.
Overall, the range in AE50 of our woody study species corresponded with the P50s
enlisted per climatic region by Maherali et al. (2004), but our tripartite method
illustrated that a combination of only AE50 and ρb of the study species was sometimes
inadequate to draw unambiguous conclusions about their response to drought-
induced cavitation. It is true that AE50 alone was sufficient to classify O. europeae as
the most and M. domestica as the least drought resistant species, but ρb of M.
domestica was in the same order of magnitude as ρb of P. tremula and P. nigra which
were characterized by more negative AE50 values (Table 4.2), again confirming that
the range in ρb not necessarily reflects a similar range in AE50 (Fig. 4.8; Gleason et
al., 2008; Butler et al., 2012). Moreover, the low ρb values of the hollow culms of the
Triticeae tribe species were not depictive for their vulnerability to drought-induced
cavitation, as their AE50s were more negative than those of woody M. domestica and
light-excluded P. nigra (Table 4.2).
Also the tropical tree species M. eminii would be classified as drought sensitive
species when only based on AE50 value of -1.9 MPa and low ρb of 302 kg m-3 (Table
4.2). However, by including the DC analysis and derived hydraulic capacitance
values, M. eminii demonstrated to effectively delay drought stress by utilizing its vast
water storage buffer originating from both cavitating vessels and living tissue (Table
4.2) (Epila et al., 2017). Furthermore, the high vessel area (A) and hydraulic diameter
(dh) illustrated that the species is characterized by a high hydraulic efficiency (Table
4.3), allowing it to maintain its rapid growth development under drought stress (Epila
et al., 2017).
Differences in vulnerability to drought-induced cavitation could be correctly depicted
using AE50 and ρb in the tropical species E. ivorense and E. suaveolens, with the
latter being characterized by higher hydraulic safety according to AE50 of -3.88 MPa
and ρb of 585 kg m-3 (Table 4.2), which is further supported by its higher vessel cell-
wall reinforcement (Table 4.3). But hydraulic capacitance data was needed to
understand the difference in AE50. E. suaveolens showed a higher Cel, which served
to temper the decrease in ψx up to the onset of embolism formation, while E. ivorense
benefitted from a higher Cinel to postpone further embolism formation (Table 4.2). The
combination of hydraulic capacitance and AE50 can better describe a species’
hydraulic response to drought (Fig. 4.8), and explained in case of Erytrophleum why
both species can safely operate although having a high vessel area (A) and hydraulic
diameter (dh) (Table 4.3). By assessing all these parameters, more clarity is shed
onto these species’ niche differentiation (Gorel, unpublished data).

Tripartite method for xylem vulnerability to cavitation
117
The effect of different water and temperature/[CO2] regimes on the hydraulic
functioning of the temperate tree species P. tremula seemed at first glance quite
insignificant based on the small, non-significant variation in AE50 and ρb, which was
also related to small differences in hydraulic capacitance and wood anatomy, with
elevated conditions having the highest Cinel and lowest A and dh. (Table 4.2 and 4.3).
This serves as a perfect example of why static values might be insufficient to reveal
the complete story, and how entire VCs and DCs can fill important knowledge gaps.
Assessment of the entire VCs showed that P. tremula WE was the most drought-
sensitive species, because it showed the steepest increase in vulnerability following
the onset of embolism formation, and the shortest timespan until complete embolism
formation (t100%) (Table 4.2) (Hubeau, unpublished data), which was further
supported by a high degree of vessel grouping (Vg) (Table 4.3). Even though the
elevated atmospheric conditions resulted in a higher Cinel for P. tremula, analysis of
DC dynamics showed that the water storage buffer was inadequately used as it only
became substantial around 50% cavitation, while Cinel became substantial at the
onset of embolism formation for P. tremula grown under ambient atmospheric
conditions (Hubeau, unpublished data). Increasing temperature and [CO2] resulted in
less hydraulic safety, especially in the well-watered treatment, a low benefit from
hydraulic capacitance to delay drought stress, and a reduced hydraulic efficiency
(Table 4.3), highlighting the important impact of climate change on the hydraulic
functioning of this species (Hubeau, unpublished data).
For the Triticeae tribe species, values of AE50 showed that S. cereale ‘Duikermax’ as
the most and ×Triticosecale ‘Dublet’ as the least drought resistant species (Table
4.2). It was again only after including hydraulic capacitance in the assessment that
‘Dublet’ was found not to be as drought vulnerable as depicted by its AE50, because
the species showed the highest Cel and Cinel (Table 4.2). Furthermore, application of
AE can be recommended here as a cutting-edge technology to quantify vulnerability
to drought-induced cavitation, because the hollow culms in these species make
determination of P50 with the hydraulic method impossible (Degraeve, unpublished
data).
By integrating the in literature often overlooked properties such as desorption curves,
hydraulic capacitances, and xylem anatomical measurements, with the more widely
researched P50 and basic wood density, species can be better mapped in their
hydraulic response to drought. The proposed tripartite method that combines data on
embolism formation, capacitive water release, and anatomy is valuable as tool to
provide a comprehensive picture of drought hydraulic strategies used by contrasting
species, and can be readily applied as screening method to generate traits that,

Chapter 4
118
when incorporated in process-based models, will improve the accuracy with which
the responses to climate change can be predicted.
4.6 Conclusion
The hydraulic architecture of plants and its plastic adaptation to drought is versatile,
and inter- and intra-species unique. Understanding the impact of drought on
hydraulic functioning is key in assessing how plants will cope and survive the
anticipated scenarios of climate change. Relying only on 50% loss in hydraulic
conductivity and/or basic wood density is often insufficient to comprehend species’
complex drought responses. The proposed tripartite method that combines acoustic
data on embolism formation, capacitive water release from desorption curves and
wood anatomical traits serves as low-cost and reliable diagnostic tool to
comprehensively map and screen a species’ drought sensitivity. Acoustic
vulnerability includes data on hydraulic safety adaptations, while hydraulic
capacitance quantifies the amount of water released from living tissue (elastic
capacitance), or during cavitation (inelastic capacitance), and can be used to delay
detrimental effects of dehydration. The acquired VCAEs and DCs point to the
existence of a tight coupling in hydraulic architecture, with elastic capacitance
contributing to a strategy of coping with mild levels of drought stress, and inelastic
capacitance kicking in when drought becomes more substantial. Xylem anatomy
provides data on xylem structural differences to further underpin acoustic and
hydraulic capacitance results. The tripartite method thus aims at providing the
underlying physiological link between xylem vulnerability to embolism formation,
hydraulic capacitance and xylem structural changes to better understand the
versatility in drought survival strategies employed by contrasting species.

5
EXTRACTING CAVITATION-
RELATED ACOUSTIC EMISSIONS: THE POWER OF MACHINE
LEARNING COMBINED WITH CONTINUOUS X-RAY COMPUTED
MICROTOMOGRAPHY


Extraction of cavitation-related AE
121
5.1 Abstract
Acoustic emissions (AE) have been used since the late 1960’s in drought-induced
cavitation research as a non-invasive and continuous method to assess the effect of
drought on plant physiology. Over the last couple of years, the AE technique has
further improved in AE sensors, data acquisition and analysis systems. Despite these
recent advancements, it still remains a challenge to extract drought-induced
cavitation events from the total AE sources registered by the sensors during
dehydration, which sometimes questions their quantitative use. In quest of a method
to separate cavitation-related AE signals from other dehydration-related signals, a
two-year-old potted Fraxinus excelsior L. tree was continuously measured with two
broadband point-contact AE sensors and simultaneously scanned by X-ray computed
microtomography (µCT), while being subjected to progressing drought. Machine
learning was used as a post-processing tool to link visually detected embolism
formation by µCT with corresponding AE signals. The resulting cavitation-related
acoustic vulnerability curve (VCAE-C) was compared with the acoustic VC constructed
from all AE signals (VCAE) and the µCT VC (VCCT). A combination of upper value
histogram thresholding and linear discriminant analysis (LDA) on the six AE
parameters amplitude, counts, duration, signal strength, absolute energy and partial
power in the range 100-200 kHz provided a VCAE-C that was in close agreement with
the golden standard VCCT, both in time and absolute amount of cavitated vessels.
Interestingly, also the all-in VCAE closely corresponded to VCCT, illustrating that
constructing VCs based on all registered AE signals did not compromise the
quantitative interpretation of the species’ vulnerability to drought-induced cavitation.
Although machine learning could extract similar amounts of cavitation-related AE as
µCT, there still is insufficient model-based evidence to conclusively attribute these
signals as originating from cavitation events. Future research should therefore focus
on similar experiments with more in-depth analysis of acoustic waveforms. Fast
Fourier transformation (FFT) could be applied to provide sufficient filtering
possibilities to remove non-cavitation related AE signals and ultimately increase the
quantitative strength of AE in drought-induced cavitation research.

Chapter 5
122
5.2 Introduction
The strategy adopted by vascular plants to absorb and transport water through their
conducting xylem tissue during transpiration could be described as brilliant, but lazy.
Where most other higher species consume energy to take in sufficient amounts of
water to fuel their metabolism, plants brilliantly developed to follow the basic principle
of water passively moving from less to more negative water potentials. Consequently,
xylem vessels and tracheids are well adapted to withstand negative water potentials
(Tyree & Zimmermann, 2002; Markesteijn et al., 2011), but in drying soil and/or
atmospheric conditions, the lazy strategy of passively up-taking water comes with the
risk of cavitation, impairing the xylem conducting system (Sperry & Tyree, 1988).
Cavitation causes water to be pulled from the vessel or tracheid and replacing it with
air, resulting in the formation of emboli (Tyree & Sperry, 1989a).
Embolism formation is accompanied by a sudden and rapid release in tension,
producing energy waves detectable as acoustic emissions (AE) (Tyree et al.,
1984a,b; Lo Gullo & Salleo, 1991). Milburn & Johnson (1966) were the first to register
acoustic emissions from a dehydrating leaf petiole, and linked these signals to
cavitation. The first commercially available AE counter to study AEs in wood was
developed by Tyree & Sperry (1989b), and both AE sensors and acquisition systems
have since then been greatly enhanced, allowing to record and analyze time,
parameter and waveform data of each AE event (Mayr & Rosner, 2011; Wolkerstorfer
et al., 2012; Vergeynst et al., 2016). Frequently used AE parameters to study wood
properties are peak amplitude, duration and energy (Beall, 2002a), and when adding
signal strength and partial power in the range 100-200 kHz (Rosner et al., 2006; Mayr
& Rosner, 2011; Vergeynst et al., 2016), they have also been classified as important
parameters related to cavitation.
To quantify drought-induced cavitation, a xylem vulnerability curve (VC) is typically
constructed, relating loss of xylem water transport capacity to xylem water potential
(Sperry et al., 1988a). While the majority of techniques to construct VCs are
destructive and discontinuous creating single VCs from extensive sampling (Cochard
et al., 2013), the continuous and non-invasive nature of the AE technique allows it (i)
to develop sample-specific VCs (Chapter 4), (ii) to characterize thin drying wood
sections (Kikuta, 2003), and (iii) to be used in outdoor applications (De Roo et al.,
2016). This method can therefore be recommended as a valuable diagnostic tool to
assess drought-induced cavitation. However, aside from the findings reported by
Tyree et al. (1984b) and Lewis (1987), the assumption that all recorded AEs are
single cavitation events (Haacs & Blank, 1990) is in most cases invalid (Zweifel &

Extraction of cavitation-related AE
123
Zeugin, 2008; Wolkerstorfer et al., 2012). Extracting cavitation-related AE is therefore
deemed necessary but remains challenging as a wide variety of AE sources is
registered during dehydration, including water loss from other xylem elements such
as fibers, tracheids and parenchyma (Ritman & Milburn, 1988; Cochard & Tyree,
1990), mechanical strains (Jackson & Grace, 1994; Rosner et al., 2010), dehydration
of bark tissue (Kikuta, 2003), nanobubble formation (Schenk et al., 2015), Haines
jumps (Vergeynst et al., 2016), and macro- and micro-crack formation (Kowalski et
al., 2004; Vergeynst et al., 2016). Because AEs do not quantify loss of hydraulic
conductivity in the same way as the hydraulic method, the AE technique has also
been indiscriminately cited to be more qualitative than quantitative (Cochard et al.,
2013), making extraction of cavitation-related AE from total measured AE even more
important.
During recent years, X-ray computed microtomography (µCT) has evolved from a
niche technology (Brodersen et al., 2010) to a more accessible reference technique
in drought-induced cavitation research (Cochard et al., 2015; Torres-Ruiz et al.,
2015; Choat et al., 2016). Reconstructed µCT images visualize the spatial distribution
of the linear attenuation coefficient µ of the X-rays within the sample, implying that
water-filled vessels are grey (high µ) and air-filled vessels black (low µ) on the image
(Suuronen et al., 2013). The µCT method is therefore capable to non-invasively and
continuously visualize embolism formation. The technique has tremendously
increased our understanding of drought-induced cavitation, including (i) resolving
issues related to artificial VCs of long-vesselled species constructed with indirect
methods (Cochard et al., 2015), (ii) providing evidence on the controversy of
embolism refilling under tension (Knipfer et al., 2016; Brodersen et al., 2017), and (iii)
when vessel dimensions are extracted from which theoretical hydraulic conductance
can be calculated, translating qualitative percentage cavitation to quantitative
percentage loss of conductance (PLC) (Choat et al., 2016).
Machine learning has been proven to be an important diagnostics tool for processing
and analyzing biological data (Swan et al., 2013). Dependent on the intended results,
machine learning is typically divided into unsupervised and supervised learning.
Unsupervised learning is used when there is only input data, with as goal to model
the data structure or distribution to identify hidden patterns in the unlabeled dataset
(Sathya & Abraham, 2013). Supervised learning additionally requires labels (output
variables) to establish a mapping function from input to output via algorithms, with as
goal to approximate the mapping function so that from new input data, output
variables can be effectively predicted (Sathya & Abraham, 2013). Unsupervised
learning typically starts with an exploratory procedure, such as principal component
analysis (PCA), to reduce high-dimensionality data into the variables that contribute

Chapter 5
124
the most in clarifying the data distribution, and correlation matrix plots (i.e.,
correlogram) to determine which variables are strongly positively and negatively
correlated to one another. Histograms and receiver operating characteristic (ROC)
curves can then be used on the PCA and correlogram results as unsupervised
learning tools to visualize the underlying data distribution, and demarcate thresholds
on the data based on the most explanatory variables to extract diverse data patterns
(Hastie et al., 2009). Supervised learning, such as linear discriminant analysis (LDA),
which incorporates output variables as labels during data analysis, can be more
beneficial when specific data needs to be extracted, and more importantly LDA can
filter out these specific data from future datasets when sufficiently trained. LDA,
which is a generative model, aims at explaining a categorical dependent variable
(i.e., label) by the values of normally distributed continuous independent variables
(McLachlan, 2004), and looks for linear combinations of these variables to explain the
data of interest (Martinez & Kak, 2001). The benefit of LDA is that variables can be
fitted efficiently, because obtained parameters are directly computed from simple
statistics such as average, variance and covariance. Additionally, prior knowledge
can be easily incorporated in the generative distribution making them suited to be
used as good classifiers.
To further advance the AE technique as valuable tool in drought-induced cavitation
research, cavitation-related AEs need to be extracted from the entire sample-specific
AE dataset. We therefore conducted an experiment consisting out of a combination
of continuous µCT imaging with machine learning algorithms during AE registration in
a stem of a progressively dehydrating two-year-old potted Fraxinus excelsior L. tree.
In the unsupervised approach, we constructed histograms of both cavitation and non-
cavitation datasets, classified by µCT results, and ROC curves of the entire dataset
using the AE parameters amplitude, counts, duration, signal strength, absolute
energy and partial power in the range of 100-200 kHz to demarcate thresholds for
these parameters, which were, according to PCA, most suited for extracting
cavitation-related AE. LDA on the same six AE parameters was executed as
supervised learning approach by incorporating the amount of cavitation events
detected by µCT as labels in both cavitation and non-cavitation datasets. Our specific
working hypothesis was that if only cavitation-related AE signals, instead of all
registered AE signals, are used to construct acoustic VCs, they will correspond better
with the reference VCCT and, hence, improve the characterization of drought-induced
vulnerability to cavitation of species when using acoustic sensors.

Extraction of cavitation-related AE
125
5.3 Materials and methods
5.3.1 Plant material and experimental set-up
Ten two-year-old Fraxinus excelsior L. trees were grown in 3 L pots containing a soil
mixture of peat litter, sand and calcium-magnesium based fertilizers in the
greenhouse facilities of Ghent University (51°03’10.3”N latitude; 3°42’32.3”E
longitude). Trees were grown under well-watered conditions for 2.5 months (from
DOY 68 to DOY 142) during the 2017 growing season. On DOY 139, the tree with
the most straight stem was selected for the measurement campaign, and replanted in
a custom-built holder designed to keep the tree straight, centered, and tightly fixed
during X-ray computed microtomography (µCT) scanning (Fig. 5.1A). The tube
enclosing the µCT scanning part of the tree was made of carbon fiber
(CarbonWinkel.nl, Tilburg, The Netherlands), because X-rays can easily penetrate
through carbon. On DOY 142, the tree was transported to the Centre for X-ray
Computed Tomography of Ghent University, Belgium (51°01’25.7”N latitude;
3°44’26.2”E longitude), where the dehydration experiment took place from DOY 142
till DOY 145.
The tree was first removed from the custom-built holder to wash off the soil mixture,
exposing the roots to speed up dehydration during scanning. The tree was then re-
inserted into the holder, and the loss in root anchoring countered by filling the excess
room surrounding the roots with packaging foam. The tree was equipped with two
broadband point-contact AE sensors with a flat frequency response between 20 and
1000 kHz (KRNBB-PC, KRN Services, Richland, WA, USA), at a respective distance
of 14.0 cm upstream (Fig. 5.1, AE1) and 24.3 cm downstream (Fig. 5.1 AE2) from the
scanning position. The diameter of the tree, measured with an electronic caliper, was
6.6 mm at the upstream AE sensor (AE1), and 6.3 mm at the downstream sensor
(AE2). At the position of the AE sensors, a section of bark (0.5 × 1.5 cm) was
removed with a scalpel to expose the xylem, ensuring a better acoustic coupling with
AEs originating from cavitating vessels (Mayr & Rosner, 2011). To seal the wound
and ensure good acoustic coupling, a droplet of vacuum grease (High-Vacuum
Grease, Dow Corning, Seneffe, Belgium) was applied between sensor tip and xylem
(Vergeynst et al., 2015a). A compression spring (D22050, Tevema, Amsterdam, The
Netherlands) in a small pvc tube was then used to press the AE sensors against the
xylem. To monitor xylem shrinkage, an additional section of bark (0.5 × 1.5 cm) was
removed between the two AE sensors, the wound was sealed with petroleum jelly to
prevent evaporation, the initial diameter (6.4 mm) was measured and the point

Chapter 5
126
dendrometer (DD-S, Ecomatik, Dachau, Germany) was installed at a distance of 19.2
cm from the scanning position (Fig. 5.1).
Fig. 5.1 Experimental setup of the Fraxinus excelsior L. tree in the custom-built holder with carbon
fiber tube designed to ensure stable and centered positioning of the tree during µCT scanning (A). The
tree is equipped with two broadband point-contact AE sensors in a pvc spring-containing holder to
continuously register AEs from the progressively dehydrating xylem (AE1, AE2), and a point
dendrometer to continuously register xylem shrinkage. This potentiometer-type of dendrometer was
selected, as its working principle does not generate a magnetic field, which would otherwise produce
acoustic interference.
The equipped tree was mounted on the rotation stage of the Environmental µCT
scanner (EMCT), a custom-built CT scanner (Fig. 5.2) (Dierick et al., 2014). This
scanner is unique in its operating procedure, because it rotates around the mounting
stage instead of having a rotating stage, which is the classic setup in most CT
scanners. Though this comes with the disadvantage that a maximum resolution of 5
µm can be achieved, the EMCT allows objects to be equipped with sensors, without
the risk for twisting and winding of cables. Furthermore, the EMCT allows continuous

Extraction of cavitation-related AE
127
scanning because a full rotation automatically brings the scanner back to its starting
position, implying that the system can do several subsequent rotations and scans
without stopping. The detector of the EMCT is a CMOS flat panel with 1316 × 1312
pixels with a 100 µm pitch, and maximum rotation speed of 12 seconds (Dierick et
al., 2014).
Fig. 5.2 Experimental setup of the Fraxinus excelsior L. tree in the Environmental µCT (EMCT)
scanner. The EMCT continuously rotates around the stationary tree without the risk for twisting and
winding of sensor cables. The red circle indicates an aluminum enclosed leaf used for pressure
chamber measurements to determine xylem water potential.
AE sensors and dendrometer were connected to their respective data acquisition
systems to enable continuous registration. Dendrometer read-outs were registered
every minute via a custom-built acquisition board. The AE signals were amplified by
35.6 decibels (dB) with an amplifier (AMP-1BB-J, KRN Services, Richland, WA, USA)
and waveforms of 7168 samples length were acquired at 10 MHz sample rate. The
signals were collected using two 2-channel PCI boards and redirected to the software

Chapter 5
128
program AEwin (PCI-2, AEwin E4.70, Mistras Group BV, Schiedam, The
Netherlands). A 20-1000 kHz electronic band pass filter was applied and only
waveforms above the noise level of 28 dB were retained (Vergeynst et al., 2016). AE
sensor installation was validated by the pencil lead break test (Tyree & Sperry,
1989b; Sause, 2011; Vergeynst et al., 2015b). Each collected AE signal was
represented by a total of 18 AE parameters (Table 5.1), with AE parameters peak
amplitude, rise time, counts from peak amplitude, wave energy, and duration from
peak amplitude describing the shape of the AE signal (Fig. 5.3). Internal clocks of
dendrometer and AE acquisition systems were also matched with the EMCT to avoid
differences in time between the datasets.
Table 5.3 AE parameters of AE signals collected with the software program AEwin,
including their respective abbreviation and unit
AE parameter Abbreviation Unit
Rise time RISE µs Counts from peak amplitude COUN - Wave energy ENER 10-14 V2 s Duration from peak amplitude DURATION µs Peak amplitude AMP dB Absolute frequency AFRQ kHz Root mean square voltage RMS µV Average signal level ASL dB Reverberation frequency RFRQ kHz Initiation frequency IFRQ kHz Signal strength SIGSTRNGTH 10-9 V s Absolute energy ABSENERGY aJ Partial power 0-100 kHz FREQPP1 % Partial power 100-200 kHz FREQPP2 % Partial power 200-400 kHz FREQPP3 % Partial power 400-800 kHz FREQPP4 % Frequency centroid FRQC kHz Peak frequency PFRQ kHz
The distance between tree and X-ray source was 27 mm (Fig. 5.2), and the distance
between X-ray source and detector 364 mm. The approximated voxel size was 7.5
µm. The tube voltage was 70 kV, the tube power 8.47 W and no additional filter was
applied. Images taken by the EMCT scanner are projections on a vertical plane that
visualize the distribution in attenuation of X-rays by the scanned sample. A total of
7200 projections were taken over six consecutive rotations (1200 projections per
rotation), with each rotation lasting four minutes, resulting in a total scan run duration
of 24 minutes.

Extraction of cavitation-related AE
129
Fig. 5.3 Waveform of a registered AE signal from a dehydrating Fraxinus excelsior L. stem. AE
parameters peak amplitude, rise time, counts from peak amplitude (several threshold crossings
indicated with green boxes), wave energy (red) and duration from peak amplitude describe the shape
of the AE signal.
Between each run the scanner was paused to prevent overheating of the X-ray tube.
A pause took 6 minutes during daytime runs, and 30 minutes during evening and
nighttime runs. A total of 15 runs was executed during daytime and 8 runs during
evening and nighttime, with the exceptions of DOY 142 with 8 daytime runs (scanner
and tree setup preparation), and DOY 145 with 6 daytime runs (end of experiment,
including dismantling the set-up). The exposure time per projection was 200 ms, and
the resulting projections had a size of 1316 × 1312 pixels. The vertical height of the
µCT scanned section of the tree was 1 mm, consisting of a total stack of 1000
reconstructed 2D slices, with each slice reconstructed from 1200 projections.
Reconstructions were automated using a Phyton wrapper for the Octopus
reconstruction software package (currently distributed by XRE; www.xre.be), which

Chapter 5
130
was used for this reconstruction, and ultimately resulted in a 3D reconstruction of the
tree (Vlassenbroeck et al., 2007).
During the daytime pauses of the EMCT scanner, measurements of xylem water
potential (ψx, MPa) were collected with the pressure chamber (Model 1000, PMS
Instrument Company, Corvalis, OR, USA). Leaves excised for ψx measurements
were wrapped in aluminum foil for at least one hour to ensure equilibration between
leaf and stem water potential (Fig. 5.2). During wrapping and excision, AE detection
was put on hold to avoid noise disturbance.
5.3.2 Processing and linking µCT images to AE signals
The open source software package Fiji for multidimensional scientific imaging was
used to process the reconstructed 2D µCT cross-sections (Schindelin et al., 2012).
To partly automate the processing procedure, we used two custom-written Fiji
macros. The first macro was developed to reduce noise, allowing a better
comparison between images of consecutive events and runs, by cropping each
image as close as possible to the contours of the cross section, and median filtering
the cropped images in the z-direction (5 images) (Fig. 5.4). The second macro was
used to compare µCT images, by first re-positioning the images (function bUnwarpJ)
to match their contours (Arganda-Carreras et al., 2006). The function ‘image
calculator’ created a differential output between the two images, resulting in an image
consisting of the absolute values of the difference in corresponding pixels. The larger
size of vessels over other xylem elements results in high absolute differences in
corresponding pixels during the transition from water-filled vessels (grey pixel area on
µCT image) to cavitated vessels (black pixel area on µCT image) between two
consecutive µCT images. The function ‘Find Maxima’ traced differences with
absolute values higher than the manually entered lower limit threshold, in order to
differentiate between cavitation events and noise. Based on the approximated voxel
size of 7.5 µm, the reduced noise by the first Fiji macro and the large size of the ring-
porous vessels, a lower limit of 30 was set as noise level, which was adequate to
only segment cavitated vessels. The region of interest (ROI) manager of Fiji will
automatically indicate the position of the ‘Find Maxima’ retained cavitated vessels,
number them and save their coordinates.

Extraction of cavitation-related AE
131
Fig. 5.4 Schematic representation of how µCT images were processed and linked to AE signals. The
left graph illustrates how cavitation (red, %) spreads throughout 2D µCT cross-sections of Fraxinus
excelsior L. as function of time (days). One stack consisting of 1000 2D µCT cross-sections resulted
from reconstruction of 1200 projections collected over a time period of 4 minutes (event). Scans were
consecutively taken over 24 minutes, resulting in one total scan run consisting of 6 events (i.e., 0-
1200; 1200-2400; 2400-3600; 3600-4800; 4800-6000; 6000-7200; note that the amount of projections
per event are vertically displayed). A break was included between each run, and lasted 6 minutes
during daytime runs and 30 minutes during evening and nighttime runs. The right graph shows the
amplitude (dB) of all AE signals registered by sensor AE1 (closest to the scanning position) during
progressive dehydration of the Fraxinus excelsior L. tree (time, days). Each dot in this graph
represents the amplitude of one AE signal collected during dehydration. For each event and for the
breaks between runs, µCT images were compared and analyzed for their total amount of visually
detected embolisms (red numbers), which totaled 457 at the end of the experiment. AE signals were
grouped according to the time spans where cavitation was detected or not detected, which resulted in
132 cavitation and non-cavitation AE datasets.
For each event and for the breaks between runs, 50 mid-centered 2D slices were
extracted from the total stack (1000 2D slices), combined and reconstructed into
single µCT images, which were pairwise compared and the amount of visually
detected embolisms quantified by the Fiji macro (Fig. 5.4). Each time a cavitation
event was detected, the start and end time of the projections used to build the

Chapter 5
132
corresponding µCT images were determined, resulting in a timespan for which
corresponding AE signals registered by sensor AE1 (closest to the scanning position)
were extracted and divided into separate AE cavitation datasets (Fig. 5.4). Also the
start and end time of the projections where no cavitation was detected in consecutive
events, breaks and runs were determined, resulting in a timespan corresponding to
the non-cavitation AE datasets (Fig. 5.4). At the end of the experiment, µCT
registered 457 cavitated vessels, for which the AE1 signals were divided into 132
cavitation and non-cavitation datasets (Fig. 5.4).
5.3.3 Unsupervised and supervised machine learning
To determine which AE sources are coupled to cavitation events, the underlying
distribution in recorded AE signals of sensor AE1 (closest to the µCT scanning point)
was determined via principal component analysis (PCA) based on the 18 parameters
describing each AE signal (Table 5.1), and was visualized by combining individual
and variable factor map plots with the R package FactoMineR (Fig. 5.5; Lê et al.,
2008). With a total of 25901 registered AE signals, PCA illustrated that the vast
majority of this amount was present within a large cluster, while a lower amount of
signals were separated from the cluster as apparent outliers (Fig. 5.5). Because µCT
detected a total of 457 cavitation events, PCA indicated that these outliers were most
likely the AE source related to cavitation. In addition, the correlogram of the
correlation matrix between the 18 AE parameters was constructed to visualize the
underlying correlations in order to decide which AE parameters were sufficiently
related to another to be used as variables in the further extraction of cavitation-
related AE.
PCA indicated that outliers in AE signals that were distinctively separated from the
major cluster (Fig. 5.5) mainly followed the direction of the AE parameters
ABSENERGY, DURATION, SIGSTRNGTH, COUN, and AMP (Table 5.1). These
parameters were positively and best (length of the arrows) correlated with the first
principal component explaining 22.06% of the data distribution. The correlogram also
illustrated that AE parameters ABSENERGY, DURATION, SIGSTRNGTH, COUN,
and AMP were positively correlated among themselves (blue gradient) (Fig. 5.6). The
AE parameter FREQPP2 was negatively and well correlated with the second
principal component explaining 21.90% of the data distribution (Fig. 5.5), and
negatively correlated to mainly AE parameters AMP and COUN (red gradient)
(Fig. 5.6). Because Vergeynst et al. (2016) indicated FREQPP2 as important in
clustering cavitation-related AE, and to establish a link between parameters
describing the shape of the AE signal and its frequency spectrum, FREQPP2 in
addition to ABSENERGY, DURATION, SIGSTRNGTH, COUN, and AMP were

Extraction of cavitation-related AE
133
selected for the consecutive machine learning steps to extract cavitation-related AE
from the total measured signals.
Fig. 5.5 Individual AE signals (red) and AE parameters (black arrows) factor map of the principal
component analysis (PCA) executed on the entire AE dataset registered by sensor AE1 on Fraxinus
excelsior L. during dehydration. Outliers separated from the major cluster correspond best with the
amount of cavitation detected by µCT (457). AE parameters ABSENERGY, DURATION,
SIGSTRNGTH, COUN, and AMP (Table 5.1) are correlated with the first dimension explaining 22.06%
of the data distribution, and AE parameter FREQPP2 (Table 5.1) negatively correlated with the second
dimension explaining 21.90% of the data distribution.
Histograms of these six AE parameters were constructed for five randomly selected
(from the total of 132) cavitation and non-cavitation AE datasets. With PCA pointing
in the direction of AE signals with the highest values in these six AE parameters as
possible sources for cavitation (outliers Fig. 5.5), an upper level histogram threshold
was calculated for each of the six AE parameters. The idea behind this approach is to
determine a threshold value per AE parameter and per AE dataset that extracts the
same amount of AE signals as cavitation events registered by µCT from the AE
datasets. To obtain a static histogram threshold value per AE parameter that can be
used to distinguish cavitation from other AE sources over the entire AE dataset, the
thresholds values per AE parameter over the 5 randomly selected cavitation AE
datasets were averaged.

Chapter 5
134
Fig. 5.6 Correlation matrix correlogram of the 18 AE parameters describing AE signals extracted from
the entire AE dataset registered by sensor AE1 on Fraxinus excelsior L. during dehydration. AE
parameters ABSENERGY, DURATION, SIGSTRNGTH, COUN, and AMP (Table 5.1) are positively
correlated amongst themselves (blue gradient), and AE parameter FREQPP2 (Table 5.1) negatively
correlated with COUN and AMP (red gradient).
Because determining histogram thresholds per AE parameter for the 132 separate
AE datasets is too cumbersome, receiver operating curves (ROC) were constructed
to determine which AE parameter yielded the most promising threshold on the entire
AE dataset. With the interest in distinguishing cavitation-related AE from other
sources, a two-class prediction problem can be considered in this case, in which the
outcomes are labeled either as positive (cavitation) or negative (non-cavitation). This
means that there are four possible outcomes, but for the construction of the ROC
curve only the true positive (i.e., the outcome from the prediction and the actual value
is cavitation, TP, y-axis) and false positive (i.e., the outcome from the prediction is
cavitation and the actual value is non-cavitation, FP, x-axis) rate are required. For
each AE parameter, the TP versus FP rate directly results from analyzing how many
AE signals are considered cavitation in cavitation AE datasets (TP) from how many
AE signals are considered cavitation in non-cavitation AE datasets (FP) for different
static AE parameter thresholds or cut points. The first cut point in the ROC curve is
the maximum value of each AE parameter over the entire dataset, typically resulting
in only a TP rate, but too strict of a cut point to filter out all the registered cavitation

Extraction of cavitation-related AE
135
events according to µCT. Therefore, each maximum cut point is gradually cut back
and the amount of AE signals in the cavitation and non-cavitation datasets is
compared to the total amount of cavitation events detected by µCT. The most suited
AE parameter to threshold the AE dataset to extract cavitation-related AE is
determined as the one for which the ROC curve stays as close as possible to the y-
axis for the most stringent cut-points (i.e., as far as possible from the first bisector)
and then deflects horizontally when the total amount of cavitation events registered
by µCT (457) is reached.
Linear discriminant analysis (LDA) was used as supervised machine learning
approach to tackle the AE classification problem. The most straightforward strategy
to tackle such a problem is to model the probability of an instance having a certain
label given the feature vector x: P(Y = y ∣ X = x), which is called the posterior
probability. Labeling an instance is done by assigning it the highest posterior
probability, and if the posterior is modeled directly, it is known as the discriminative
approach (e.g., logistic regression). Using Bayes' rule, the posterior probability can
be rewritten as (Eq. 5.1):
P(Y = y ∣ X = x)=P(X = x ∣ Y = y) P(Y = y)
P(X = x) (Eq. 5.1)
with P(X = x ∣ Y = y) the likelihood of observing a feature vector x in an instance with
a label y, P(Y = y) the prior of sampling an instance with a label y, and P(X = x) the
evidence or the probability of encountering an instance with this particular feature
vector. Note that it is not necessary to explicitly compute this last term, as it is
independent of the label. The label with the highest (arg max ()) posterior probability
(y*) is predicted for a given feature vector x (Eq. 5.2):
y*= arg maxy P(Y = y ∣ X = x) (Eq. 5.2)
In generative models that generate both input and output variables, it is the likelihood
and the prior that are modeled using the training data, in contrast to the posterior in
the discriminative approach. The posterior probability is then only computed
afterwards, using Bayes' rule. As the term generative implies, one can generate
feature vectors associated with a given label. In practice, the model of the likelihood
often does a poor job of modeling the conditional feature distribution, but can
nevertheless give rise to good predictions using Eq. 5.2. LDA is an example of a
simple generative model, where every class is modeled by a normal distribution with
the same covariance structure. In case of a binary classification problem, the features

Chapter 5
136
of the first class are distributed as N(μ0,Σ) and of the second class as N(μ
1,Σ), with μ
0
and μ1 the respective expected value of the feature vector within a class and Σ the
covariance matrix. The log-posterior of LDA also gives rise to a linear model.
In this study, μ0 represents the expected value of a feature vector of a measurement
that is not a cavitation event and μ1 the expected feature vector of a feature vector
associated with a cavitation event. Both are assumed to have the same covariance
structure Σ. We have estimated μ0 and μ
1, by taking a weighted average over the
averages feature vector of each dataset. For μ0 and μ
1, the weight for each data set
is the number of non-cavitation and cavitation events, respectively, that were
detected in a dataset. The global covariance matrix was computed in a similar way,
after which a probability was attributed to each registered AE signal based on the
weights calculated by the LDA model.
LDA probabilities were summed for each AE dataset and the resulting sum was
indicative for the expected number of AE signals classified as cavitation-related (e.g.,
LDA on AE dataset 8 resulted in 44 cavitation-related AE). These were then used to
construct the acoustic vulnerability curve. To determine whether the probability
outcomes of the LDA model were suited to threshold the entire AE dataset, a ROC
curve was constructed with the cut points representing a gradual decrease in
maximum LDA probability.
To tackle the over- and underestimation of the LDA model in extracting cavitation-
related AE compared to the amount of visually detected cavitation events by µCT, an
additional filtering was applied that combines knowledge of the LDA model output
with upper level histogram thresholding on the six AE parameters AMP, COUN,
DURATION, SIGSTRNGTH, ABSENERGY and FREQPP2. To this end, the number
of cavitation events detected by µCT and retained by the LDA model were compared
in each AE dataset. Dependent on whether the LDA model resulted in over- or
underestimation, a different approach was used, illustrated here by example: (i) AE
dataset 8 resulted in an overestimation of 44 LDA cavitation events against 29 µCT
cavitation events. The 44 AE signals with the highest LDA probabilities were
extracted from dataset 8, after which for each of these 44 AE signals, the signals with
the 29 highest values in each of the six AE parameters were determined. The
minimum value of the 29 AE signals per AE parameter was calculated, resulting in six
values, and set as additional thresholds to lower the overestimation of the LDA
model, which for dataset 8, resulted in 28 cavitation events. (ii) AE dataset 123
resulted in an underestimation of 1 LDA cavitation event against 12 µCT cavitation
events. The AE signals of dataset 123 with the 12 highest values in each of the six
AE parameters were again determined, the minimum value of the 12 AE signals per

Extraction of cavitation-related AE
137
AE parameter calculated, and set as additional thresholds to negate the
underestimation of the LDA model, which, for dataset 123, resulted in 12 cavitation
events.
5.3.4 Wood anatomy
A wood sample of ~5 cm in length was taken from the scanned section, and included
the marked position of scanning to perfectly match µCT images with the anatomical
cross-section. The sample was preserved in a mixture of 70% ethanol (99%), 15%
deionized water and 15% glycerol. A 35 µm thick cross section was cut from the
sample at the exact point of scanning with a sliding microtome (Hn-40, Reichert-
Jung, Saarland, Germany) at the Department of Biology, Ghent University. The cross
section was stained for 15 minutes with 0.5% w/v astra blue, 0.5% w/v chrysoidine,
and 0.5% w/v acridine red and mounted in euparal after dehydration in isopropyl
alcohol. Images were captured using a Nikon Ni-U epifluorescence microscope
equipped with a Nikon DS-Fi1c camera (Fig. 5.7).
Fig. 5.7 Epifluorescence (left) and stained (right) 35-µm thick cross-section of a two-year-old Fraxinus
excelsior L. stem at the µCT scanning point showing from inward to outward pit, xylem, cambium and
bark. The cross section had a total of 1100 vessels. Scale bar = 1 mm. Credit Dr. Olivier Leroux

Chapter 5
138
Anatomical analysis was restricted to manually counting the amount of xylem vessels
on the cross-section with the image analysis software Fiji, for which both the
epifluorescence and stained cross-section could be adequately used. A total of 1100
vessels were obtained from the cross-section and was used to translate the amount
of cavitated vessels derived from the µCT images to percentage cavitation.
5.3.5 Acoustic and µCT vulnerability curve
A total of 25901 AE signals were registered by sensor AE1 and 90416 by sensor
AE2, which were per sensor cumulated over the measurement period and averaged
over 10 minutes. The endpoint of the acoustic vulnerability curve (VCAE) is normally
determined via the local maximum of the third derivative of cumulative AE (Vergeynst
et al., 2016), but because not all vessels were embolized at the end of the
dehydration experiment (Fig. 5.8B), the VCAE endpoint was determined by comparing
the total amount of vessels in the anatomical cross section (Fig. 5.7) with the amount
of native embolized vessels at the start of the experiment (Fig. 5.8A), and the amount
of non-embolized vessels at the end of the experiment (Fig. 5.8B). Correct
determination of non-cavitated vessels on the µCT image was facilitated by the
anatomical cross-section, which perfectly matched with the µCT scanning point.
Fraxinus excelsior L. had a total of 1100 vessels, of which 541 were natively
embolized, and 102 were not cavitated at the end of the experiment.
Fig. 5.8 µCT image of Fraxinus excelsior L. at the start of the dehydration experiment (A), and at the
end of the dehydration experiment (B). Native embolized vessels (A), and non-embolized vessels are
highlighted in red (B). Resolution = 7.5 µm.

Extraction of cavitation-related AE
139
Because complete embolism formation was not reached at the end of the
dehydration experiment (Fig. 5.8B), all registered AE signals had to be used in
constructing the VCAE. The amount of native embolized vessels were included in the
translation of absolute cumulative AE to percentage cumulative AE (%) following the
assumption that VCs start from a fully hydrated condition (Cochard et al., 2013).
Cumulative AE of the not completely dehydrated Fraxinus excelsior L. tree was thus
translated to percentage cumulative AE by rescaling between 0 and 91% (i.e.,
(541+457/1100)*100). For the dataset derived from sensor AE1, two additional VCAEs
were constructed: one using the LDA model output, and one using the combination of
LDA model output with upper level histogram thresholding to extract cavitation-
related AE (VCAE-C). The LDA model extracted 518 cavitation-related AE signals, and
the combination of LDA and histogram thresholding 458. Signals were cumulated
over the measurement period, averaged over 10 minutes, and for LDA rescaled from
0 to 96% (i.e., (541+518/1100)*100) and for LDA + histogram thresholding from 0 to
91% (i.e., (541+458/1100)*100). The amount of embolism formation derived from the
µCT scans was used to construct a µCT vulnerability curve (VCCT), which was also
averaged over 10 minutes and rescaled between 0 and 91% to obtain percentage
cavitation (%).
The time axis of the different VCs was replaced by a continuous xylem water
potential axis using the stress-strain curve. In this curve, point measurements of
xylem water potential or stress (ψx, MPa) are plotted against xylem shrinkage or
strain (Δd/di, µm mm-1) measured with the dendrometer (Fig. 5.9). A segmented-
linear regression between ψx point measurements and continuous Δd/di with two
breakpoints was obtained with the segmented R package (Muggeo, 2008) (Fig. 5.9).
The three linear regression equations were used to calculate the continuous xylem
water potential values.

Chapter 5
140
Fig. 5.9 Stress-strain curve (black, open circles) between point measurements of xylem water
potential (MPa) and xylem shrinkage (Δd/di, µm mm-1) of Fraxinus excelsior L. during dehydration. The
segmented-linear regression with two breakpoints (black and red dashed line) divided the dataset in
three linear regressions with their own equation and R2 (black, red, and grey) from which continuous
xylem water potential was calculated.
5.3.6 Statistical analyses
A smooth.spline function in the stats library in R software was fitted to the
vulnerability curves (RStudio version 1.1.419 - © 2009-2017 RStudio, Inc.). Drought
vulnerability values such as the onset of cavitation (ψx at which 12% of cavitation-
related AE and µCT occur; AE12/CT12), 50% embolized (ψx at which 50% of
cavitation-related AE and µCT occur; AE50/CT50) and full embolism (ψx at which 88%
of cavitation-related AE and µCT occur; AE88/CT88) were determined (Domec &
Gartner, 2001). Differences in VCs were quantified using the absolute difference in
percentage cavitation compared to the reference µCT VC.

Extraction of cavitation-related AE
141
5.4 Results
5.4.1 All-in VCAE
The VCAEs constructed from all AE signals measured by sensor AE1 and AE2 were
similar in shape, with AE2 registering almost four times more signals (Fig. 5.10).
Values obtained from VCAE2, especially AE50, were shifted to higher values of
vulnerability to drought-induced cavitation (Table 5.2).
Table 5.2 Vulnerability to cavitation values for F. excelsior L. derived from the
acoustic vulnerability curve (VCAE) of sensor AE1 and of sensor AE2
Vulnerability value (MPa) AE1 AE2
AE12 -1.04 -0.90 AE50 -2.59 -2.17 AE88 -5.12 -5.08
Water potential at 12, 50 and 88% cumulative acoustic emissions for F. excelsior L. (AE12, AE50 and
AE88) of sensor AE1 and sensor AE2
Fig. 5.10 Acoustic vulnerability curve (VCAE) of F. excelsior L. during dehydration registered by sensor
AE1 (red) and sensor AE2 (black). Vulnerability values AE12 (), AE50 () and AE88 (dashed line) are
indicated. LDA model outputs for cavitation datasets 8, 69 and 120 () (Table 5.3), extracted from
Fig. 5.12, are also shown.

Chapter 5
142
5.4.2 Histograms and ROC curves
Histogram plots of the AE parameters AMP, COUN, DURATION, SIGSTRNGTH,
ABSENERGY, and FREQPP2 for both the cavitation and non-cavitation AE datasets
showed that the upper level thresholds values of these parameters were most often
associated with the cavitation events recorded by µCT (Fig. 5.11).
Histograms in the first five rows were extracted from non-cavitation datasets (red),
while the last five rows represent cavitation datasets, where in each histogram non-
cavitation AE signals (red) are distinguished from cavitation AE signals (green) by
looking for AE signals with the highest values in each of the six AE parameters in
agreement with the amount of µCT-registered cavitation events. However, the
resulting thresholds varied depending on the examined cavitation dataset, and were
not uniformly distributed. The average threshold for each parameter (dashed line)
was calculated by averaging the threshold values over the five histograms shown for
the cavitation datasets (green), but because this average threshold sometimes
includes AE signals from non-cavitation datasets and sometimes neglects AE signals
from cavitation datasets, a static threshold on these six AE parameters lacked
sufficient accuracy (Fig. 5.11).
A static threshold based on the ROC curves of the AE parameters AMP, COUN,
DURATION, SIGSTRNGTH, ABSENERGY, and FREQPP2 for the entire AE1
dataset could not be determined (Fig. 5.12). The ideal threshold is defined by a ROC
curve that first stays as close as possible to the y-axis at the start (i.e., as far as
possible from the first bisector, dashed line in Fig. 5.12) to then deflect horizontally
when the total amount of cavitation events registered by µCT is reached (457, dotted
line). In our study, all ROC curves have quite similar shapes, showing no distinct
deflexion points. Because the FREQPP2 ROC curve is farthest away from the first
bisector, thresholding on this parameter would be most successful to extract
cavitation-related AE (Fig. 5.12), but the lack of a clear deflection point results in too
much uncertainty, implying that a FREQPP2 static threshold at the 457 dotted line is
insufficient to verify whether retained signals are indeed related to cavitation.

Extraction of cavitation-related AE
143
Fig. 5.11 Histograms of the AE parameters AMP (amplitude, dB), COUN (counts, -), DURATION
(duration, µs), SIGSTRNGTH (signal strength, nVs), ABSENERGY (absolute energy, aJ) and
FREQPP2 (partial power in the range 100-200 kHz, %) for non-cavitation AE datasets (first 5 rows)
and cavitation AE datasets (last 5 rows). Retained AE signals in cavitation datasets based on upper
level histogram thresholding corresponding to the amount of cavitation registered by µCT are
highlighted in green, and non-retained AE signals in both datasets in red. The black dashed line
indicates the average threshold value for each parameter, with scaling adjusted in the case of outliers.

Chapter 5
144
Fig. 5.12 ROC curves of the AE parameters AMP (red), COUN (green), DURATION (blue),
SIGSTRNGTH (grey), ABSENERGY (black), FREQPP2 (orange) (Table 5.1) and linear discriminant
analysis (LDA) model (purple) established for the AE dataset of sensor AE1. FREQPP2 and the LDA
model produced the best ROC curves, because they were farthest away from the first bisector
(dashed line) and closest to the amount of cavitation events registered by µCT (457, dotted line).
5.4.3 LDA model
To determine which AE signals were related to cavitation events, the LDA model was
used with the six AE parameters AMP, COUN, DURATION, SIGSTRNGTH,
ABSENERGY, and FREQPP2 from the 132 AE datasets and the corresponding µCT
cavitation events as labels (Fig. 5.13). For each AE signal in the different datasets,
LDA assigned a probability between 0 and 1. Per dataset, the cumulative sum of
these probabilities (predicted number of events) was calculated and compared to the
amount of cavitation events detected by µCT (observed number of events).

Extraction of cavitation-related AE
145
Fig. 5.13 Linear discriminant analysis (LDA) modelling of the 132 AE datasets of sensor AE1 (time-
gradient colored circles), relating LDA-predicted number of cavitation events to µCT-observed number
of cavitation events.
LDA yielded mixed results in extracting cavitation-related AE: some AE datasets
resulted in a close match between predicted and observed events, while others did
not. The difference between predicted and observed events increased in function of
dehydration time (Table 5.3). LDA yielded promising results for large AE datasets,
which included a significant number of cavitation events (datasets 8, 69 and 120;
Table 5.3). These datasets were close to the first bisector (dashed line, Fig. 5.13),
and corresponded well with the all-in VCAE of sensor AE1 (Fig. 5.10). Furthermore, to
extract cavitation-related AEs, The ROC curve of LDA was most optimal compared to
the other six AE parameters (Fig. 5.12).

Chapter 5
146
Table 5.3 Number of cavitation events according to X-ray computed
microtomography (µCT), linear discriminant analysis (LDA) model and LDA with
upper level histogram thresholding (LDA + histogram) for the 132 AE datasets of
sensor AE1. Bold values illustrate sufficient cavitation-related AE extraction by LDA.
AE dataset
µCT LDA LDA +
histogram AE
dataset µCT LDA
LDA + histogram
1-2 0-2 0-0 0-2 67-68 1-0 1-0 1-0 3-4 0-2 0-0 0-2 69-70 76-0 85-5 77-0 5-6 0-1 1-0 0-1 71-72 1-0 1-1 1-0 7-8 0-29 0-44 0-28 73-74 1-0 1-1 1-0
9-10 0-6 10-1 0-4 75-76 1-0 2-1 1-0 11-12 0-9 2-1 0-10 77-78 1-0 1-6 1-0 13-14 0-3 0-1 0-3 79-80 33-0 1-2 37-0 15-16 0-1 9-0 0-1 81-82 28-0 1-5 27-0 17-18 0-1 1-0 0-0 83-84 1-0 1-3 1-0 19-20 3-0 1-0 3-0 85-86 4-0 2-3 3-0 21-22 1-0 0-1 0-0 87-88 1-0 1-1 1-0 23-24 5-0 1-1 3-0 89-90 1-0 1-1 1-0 25-26 1-0 1-2 1-0 91-92 1-0 1-16 1-0 27-28 1-0 1-5 1-0 93-94 5-0 2-3 2-0 29-30 1-0 1-1 1-0 95-96 1-0 0-2 1-0 31-32 2-0 1-1 1-0 97-98 1-0 1-3 1-0 33-34 1-0 1-2 1-0 99-100 1-0 1-14 1-0 35-36 2-0 0-1 2-0 101-102 1-0 1-0 1-0 37-38 1-0 0-3 0-0 103-104 32-1 2-4 33-0 39-40 2-0 1-2 0-0 105-106 0-6 2-1 0-6 41-42 6-0 2-12 4-0 107-108 0-4 1-4 0-4 43-44 15-0 4-1 24-0 109-110 0-1 11-1 0-1 45-46 3-0 1-1 2-0 111-112 3-0 5-4 3-0 47-48 1-0 5-11 0-0 113-114 1-0 4-10 0-0 49-50 1-19 1-4 1-23 115-116 2-0 1-1 1-0 51-52 0-2 4-1 0-1 117-118 1-4 1-5 1-4 53-54 1-0 4-1 1-0 119-120 0-62 14-73 0-60 55-56 8-0 1-1 10-0 121-122 0-16 9-0 0-16 57-58 1-0 5-0 0-0 123-124 12-0 1-0 12-0 59-60 1-0 1-2 1-0 125-126 2-0 1-4 1-0 61-62 1-0 1-1 1-0 127-128 1-0 1-1 1-0 63-64 1-0 5-1 1-0 129-130 1-0 1-8 1-0 65-66 14-0 1-1 21-0 131-132 1-0 1-7 1-0
Despite these positive indications, LDA probabilities attributed to AE signals were
generally low (not higher than 0.4). This suggests that LDA might be a first promising
step towards extracting cavitation-related AE from an acquired AE dataset, yet not
accurate enough.
5.4.4 Cavitation-related vulnerability
Over- and underestimation of LDA compared to the visually detected amount of
cavitation events with µCT was tackled by applying an AE parameter-based filter
wherein upper level histogram thresholding on the six AE parameters was done on

Extraction of cavitation-related AE
147
separate cavitation AE datasets in case of LDA underestimation, and on LDA model
outputs in case of LDA overestimation (Table 5.3). The combined LDA and histogram
filter appeared to be most suited to extract cavitation-related AE from the AE1
dataset, with the resulting VCAE-C closest resembling the reference µCT VC (VCCT)
(Fig. 5.14A).
Fig. 5.14 (A) All-in vulnerability curve (VCAE AE1, black), cavitation-related VC using LDA (VCAE-C
LDA, grey), cavitation-related VC using LDA + histogram thresholding (VCAE-C LDA_histogram, red)
and µCT VC (VCCT) established for the dataset acquired by sensor AE1 on F. excelsior L. during
dehydration. Vulnerability values AE12 (), AE50 () and AE88 (dashed line) are indicated. (B)
Absolute difference in percentage cavitation between AE1 (black), LDA (grey), LDA_histogram (red)
and µCT. LDA_histogram was most efficient in extracting cavitation-related AE.
100 .-J\------------------------------------------------~ 100
-';::R 0 -w <( Q) > +J ro :::::1 E :::::1 0 Q) 0> ro ...... c Q) (.) ..... Q)
a..
80
60
40
20
0
-e- VCAE AE1 -e- VCAE-C LDA -e- VCAE-c LDA_histogram -e- VCcr
-1 -2 -3 -4
Water potential (MPa)
15 B
- 10 '#. -Q) (.)
~ 5 .....
~ "0 Q) ...... :::::1 0 (/) .0 <( -5
20
AE1-1.JCT LDA-I.JCT LDA_histogram-I.JCT
-5 -6
1 0
-10 ~----------------------------------------------~
percentage cavitation 1-JCT (%)
80
60
40
20
-';::R 0 -c 0
+J ro ...... ·:; ro (.)
Q) 0> ro ...... c Q) (.) ..... Q) a..

Chapter 5
148
The absolute difference in percentage cavitation to the reference VCCT was over the
entire dehydration lowest for LDA + histogram VCAE-C, and resulted primordially in an
overestimation of the amount of visually detected cavitation events by µCT
(Fig. 5.14B). The LDA + histogram filter extracted cavitation-related AE events was in
closest agreement with µCT-detected cavitation events both in quantity and over time
(Table 5.3), resulting in a total of 458 signals detected at the end of dehydration
compared to 457 viewed on µCT. LDA extracted 518 cavitation-related AE signals at
the end of dehydration (Table 5.3). Vulnerability-to-cavitation values of the LDA +
histogram VCAE-C were closely related to those of VCCT (Table 5.4).
Table 5.4 Vulnerability-to-cavitation values for F. excelsior L. derived from the
acoustic vulnerability curve (VCAE) of sensor AE1, the cavitation-related VC (VCAE-C)
using LDA, the VCAE-C using LDA + histogram and the X-ray computed
microtomography VC (VCCT)
Vulnerability value (MPa) VCAE AE1 VCAE-C LDA VCAE-C LDA + histogram
VCCT
AE12/CT12 -1.04 -1.03 -1.09 -1.13 AE50/CT50 -2.59 -2.37 -2.42 -2.34 AE88/CT88 -5.12 -4.61 -4.87 -4.82
Water potential at 12, 50 and 88% cumulative acoustic emissions (AE12, AE50 and AE88), and 12, 50
and 88% cavitation (CT12, CT50 and CT88) for F. excelsior L. of sensor AE1, LDA, LDA + histogram and
µCT.
Interestingly, the all-in VCAE of sensor AE1, though registering a total of 25901 AE
signals at the end of dehydration compared to the 457 actual cavitation events,
resulted in an AE50 that only slightly underestimated CT50 with 11% (Table 5.4;
Fig. 5.14).
5.5 Discussion
5.5.1 Extraction of cavitation-related AE to improve VCAE
Supervised LDA with upper level histogram thresholding on the six AE parameters
amplitude, counts, duration, signal strength, absolute energy and partial power in the
range 100-200 kHz and µCT scanning to generate labels was successful in
extracting cavitation-related AE events from the dataset both in quantity and over
time (Table 5.3; Fig. 5.14). The resulting VCAE-C closely corresponded to VCCT (Table

Extraction of cavitation-related AE
149
5.4; Fig. 5.13), which is considered the reference to quantify a species’ vulnerability
to drought-induced cavitation (Cochard et al., 2015). Hydraulic P50 (i.e., xylem water
potential at 50% loss of hydraulic conductivity) derived from the VC established by
Lemoine et al. (2001) for 1-3 year-old branches of well-watered 15-20 year-old
Fraxinus excelsior trees was equal to -3 MPa, which agreed with the CT50-value of
our 2 year-old stem (Table 5.4). The small difference between the branches and our
stem might be attributed to the hydraulic segmentation hypothesis that postulates
that angiosperm trunks/stems (30-40 cm diameter) are between 0.7 and 1.8 MPa
more vulnerable than branches (8-14 cm diameter) (Johnson et al., 2016). However,
the close agreement between LDA + histogram VCAE-C and VCCT does not imply that
cavitation-related AE signals can be readily distinguished from other AE sources,
because the probabilities of the LDA model attributed to each AE signal were never
higher than 0.4. To further emphasize this, cumulative probabilities of all AE signals
in cavitation and non-cavitation datasets were indicative for the amount of µCT
cavitation events (Table 5.3), but the cumulative probabilities of AE signals extracted
by the LDA model (i.e., the signals with the highest probabilities according to the LDA
indicated value) were not, amounting to only 16 cavitation events instead of the
required 457. Even though additional upper level histogram thresholding on the six
AE parameters improved over- and underestimation of LDA model output compared
to µCT cavitation events (Table 5.3; Fig. 5.14), the thresholds were also not
sufficiently conclusive to extract cavitation-related AE. Uncertainty remains whether
AE signals with high values of amplitude, counts, duration, signal strength, absolute
energy and partial power in the range 100-200 kHz are indeed typical characteristics
of drought-induced cavitation events, because these signals also occur in non-
cavitation AE datasets (Fig. 5.11; 5.12).
AE parameters amplitude, duration, energy, signal strength and partial power in the
range 100-200 kHz have been associated with cavitation (Rosner et al., 2006; Mayr
& Rosner, 2011; Vergeynst et al., 2016), but extraction based on static thresholds for
these parameters will include non-cavitation AE sources (Fig. 5.11; Wolkerstorfer et
al., 2012). This is a direct result of the AE attenuation properties of wood (Beall,
2002a), which are known to decrease with ongoing dehydration (Vergeynst et al.,
2015b). AE sources registered at the start of dehydration will be more attenuated
than at the end, and this attenuation factor is not taken into account when static
thresholds on AE parameters are used. Setting the threshold too low might include
non-cavitation-related AE measured at the end of dehydration, and setting the
threshold too high might neglect the cavitation events at the start of dehydration (Fig.
5.11; 5.12). Determination of dynamic thresholds varying with time, thus incorporating
the change in attenuation during dehydration, might enable separation of cavitation-
related from other AE-related sources during dehydration.

Chapter 5
150
The all-in VCAE, though constructed from 25901 cumulated AE signals, was closely
related to VCCT (Fig. 5.14A), both in magnitude and derived vulnerability values
(Table 5.4; Fig. 5.14B), thus tackling the often misplaced perception of AE being
more qualitative, which relates to the excess of AE signals over cavitation events
registered during dehydration (Cochard et al., 2013). Compared to VCCT, this all-in
VCAE resulted in an AE50 only slightly underestimating CT50 with 11%. Thus
incorporating all AE signals for F. excelsior did not produce a qualitative, but a
quantitative VC. This suggests that all AE signals registered during dehydration can
be used to reliably assess F. excelsior’s drought vulnerability when compared to
filtered AE methods (Mayr & Rosner, 2011; Wolkerstorfer et al., 2012; Vergeynst et
al., 2016) or reference techniques (hydraulic and µCT) (Tyree et al., 1984b; Lo Gullo
& Salleo, 1991; Rosner et al., 2006; Nolf et al., 2015; Vergeynst et al., 2015a).
5.5.2 Significance of sensor installation to extract cavitation-related AE
To reduce the amount of AE signals detected by the sensor not originating from
cavitating conducting elements, sample length (with respect to maximum vessel
length) and position of the sensor must be well-conceived (Cochard, 1992). Because
F. excelsior was dehydrated by exposing the root system, and not by cutting the stem
(classic way), maximum vessel length was not an issue in our study, and also cutting
artifacts were avoided (Cochard et al., 2013). However, sensor installation did affect
the amount of registered AE signals (i.e., 25901 for AE1 vs 90416 for AE2), and
shifted VCAE2 to a slightly higher vulnerability to drought-induced cavitation (Table
5.2; Fig. 5.10). The difference in AE registration was attributed to the installation
position of sensor AE2, which was just below a leafy non-lignified side branch (Fig.
5.1), and closer to the tree’s foliage than sensor AE1 (i.e., 22.5 cm for AE1 vs 11.7
cm for AE2). With the frequency of acoustic waves changing on their path through
the wood towards the sensor (Wolkerstorfer et al., 2012; Vergeynst et al., 2015b),
less attenuation of AE sources originating from dehydrating leaves and side
branches was occurring in AE2, resulting in more detected AE signals above the
noise threshold of 28 dB.
The high attenuation factor of wood, especially at the start of dehydration, will
significantly influence amplitude, frequency, shape-related and energy-related
characteristics of registered AE signals (Beall, 2002a). If the effect of distance to the
AE sensor is not quantified, then any classification approach can include a large
amount of error. It is recommended that the effect of attenuation and its evolution
during dehydration is quantified to reduce these errors as much as possible. This
requires a mapping of the localization area of AE signals originating from the wood

Extraction of cavitation-related AE
151
sample, which can be achieved by installing multiple AE sensors at known distances
alongside the wood sample.
However, despite the 71% difference in acquired AE signals between sensor AE1
and AE2, the VCAEs were similar in shape (Table 5.2; Fig. 5.10). Nonetheless, AE2
was less suited to identify the cavitation-related signals, because to successfully
extract cavitation-related AE via machine learning techniques, cavitation to non-
cavitation signal ratio must be maximized. Cavitation to non-cavitation signal ratio
was already low in sensor AE1 (25444 non-cavitation signals vs 457 cavitation
signals), and increased in AE2, explaining why resulting histograms, ROC curves and
LDA (Fig. 5.11-5.13) were not perfect, and showed difficulties in distinguishing
cavitation from other AE sources. Sensors should therefore be installed at a
sufficiently large distance from the leaves, and in case cut branches or stems are
used, also sufficiently far from the open cut end of the sample.
5.5.3 Maximum in third derivative to define the VCAE endpoint
The µCT image taken at the end of the experiment (Fig. 5.8B) showed that 9% of the
vessels was not embolized. The AE datasets therefore did not include a VCAE
endpoint, and all registered signals were used to construct the VCAE, and to extract
cavitation-related AE signals.
In general, the VCAE endpoint is defined by the local maximum of the third derivative
of cumulative AE (Vergeynst et al., 2016). Because AEs are still recorded after full
embolism formation due to other AE sources such as water loss from other xylem
elements such as fibers, tracheids and parenchyma (Ritman & Milburn, 1988;
Cochard & Tyree, 1990), mechanical strains (Jackson & Grace, 1994; Rosner et al.,
2006), dehydration of bark tissue (Kikuta, 2003), nanobubble formation (Schenk et
al., 2015), Haines jumps (Vergeynst et al., 2016), and macro- and micro-crack
formation (Kowalski et al., 2004; Vergeynst et al., 2016), defining the endpoint of
VCAE remains a difficult and challenging task (Rosner, 2015), but is crucial to derive
physiologically-meaningful vulnerability values.
Vergeynst et al. (2016) explained in their study that the time of reaching maximum in
the first derivative or AE activity can be used to define the time interval for calculating
the third derivative (Fig. 5.15). As maximum AE1 activity occurred after two days, the
third derivate was calculated with a time interval of 48 hours. Because the resulting
third derivative kept increasing, the local maximum was never reached for AE1. This
agrees with the µCT results, which showed that 9% of the vessels were still
functional when finishing the last CT-scan, and hence indirectly supports the VCAE

Chapter 5
152
endpoint determination described by Vergeynst et al. (2016). Furthermore, xylem
water potential registered at maximum AE activity (AE50 = -2.58 MPa) coincided with
CT50 (Table 5.4) (see Nolf et al. 2015), and further supports the soundness of
Vergeynst et al. (2016)’s endpoint determination for VCAE.
Fig. 5.15 Average cumulative acoustic emissions (CumAE, red; 10-min averages), first derivative or
AE activity (CumAEder 1, black; moving window interval: 15 minutes) and third derivative
(CumAEder3, grey, moving window interval: 48 hours) of F. excelsior L. registered by sensor AE1
during dehydration. The endpoint of VCAE corresponds to the local maximum of the third derivate. The
continuous increase in the third derivative indicates that the endpoint is not yet reached.
5.5.4 Future perspectives for cavitation-related AE extraction
Extraction of cavitation-related signals from an AE dataset based on LDA modelling
and upper histogram thresholding using the parameters amplitude, counts, duration,
signal strength, absolute energy and partial power in the range 100-200 kHz was
promising in the sense that the resulting VCAE-C closely corresponded to the
reference VCCT in F. excelsior L. (Table 5.4; Fig. 5.14). However, the low cavitation
probabilities attributed by LDA to AE signals hamper the readily extraction of distinct
cavitation-related AEs from acquired datasets. Multiple combined AE-µCT
experiments on similar samples (age, species, treatment) can provide the necessary
training datasets for LDA to better distinguish between cavitation and non-cavitation
AE sources, and more importantly, for LDA to be able to extract cavitation-related AE
independent of µCT measurements, even for species for which no previous training

Extraction of cavitation-related AE
153
datasets were acquired. Experiments should also run beyond the 100% cavitation
point to confirm that (i) LDA is able to ignore AE signals originating from other
sources than cavitation beyond this point, and (ii) the technique described by
Vergeynst et al. (2016) is reliable and robust to determine the VCAE endpoint.
The non-invasive and continuous nature of AE sensors can also be applied to extract
other physiologically meaningful AE sources from a dataset. Instead of monitoring
dehydrating plants, the opposite can also be done by acoustically measuring and
continuous scanning intact and well-watered trees. It has been reported that also
shrinkage and water loss of fibers, tracheids and parenchyma produce AE (Ritman &
Milburn, 1988; Cochard & Tyree, 1990; Vergeynst et al., 2016). Given the theory of
water transport dynamics in plants, this shrinkage pattern occurs on a daily basis in
well-watered plants, as a result of the time-lag that exists between foliar transpiration
and root water uptake (Schulze et al., 1985; Steppe et al., 2002). With µCT scanning
used to validate that no cavitation occurs, parameters of the registered AE signals
can be analyzed and classified as non-cavitation signals. This subset of AE signals
can then be removed from acquired AE datasets, hence increasing the cavitation to
non-cavitation signal ratio, and increasing the efficiency of supervised machine
learning tools such as LDA to extract cavitation-related AE.
Fast Fourier transform (FFT) waveform analysis can sample AE signals over time
and divide them into frequency components, which are single sinusoidal oscillations
at distinct frequencies with their own amplitude and phase. FFT allows for a more
comprehensive comparison of acoustic waveforms, yielding frequency features that
could be vital in extracting cavitation-related AE. FFT on acoustic waveforms
obtained from tensile behavior under external loading in F. excelsior wood
demonstrated that AE signals resulting from micro- and macro-crack formation could
be distinguished (Reiterer et al., 2000). Laschimke et al. (2006) distinguished two
types of AE sources based on waveform shape analysis in dehydrating leaves of
Ulmus glabra: (i) abrupt disruption of the water column, and (ii) vibration of gas
bubbles during sap flow. Performing FFT and in-depth analysis on AE waveforms
using the combination of machine learning and µCT could provide new answers to
separate different AE sources. Furthermore, AE waveform analysis could supply
information on the link between vessel size and registered cavitation-related AE
signals. Ritman & Milburn (1988) already hypothesized and supported the existence
of an inverse relation between vessel size and main resonance frequency. This could
provide the solution to transform AE signals to percentage loss of conductivity,
ultimately addressing the concern of AE being more qualitative than quantitative.

Chapter 5
154
5.6 Conclusion
Ever since their first use in drought vulnerability research, acoustic emissions have
been considered as an interesting but unrefined technique to determine drought-
induced cavitation. The surplus of AE signals registered during dehydration not
originating from cavitation hinders correct quantitative assessment. Machine learning
with recorded cavitation events by µCT scans as labels was proposed as a new
method to extract cavitation-related AE from an AE dataset gathered in a two-year-
old F. excelsior L. tree during progressive dehydration. LDA combined with upper
level histogram thresholding using the parameters amplitude, counts, duration, signal
strength, absolute energy and partial power in the range 100-200 kHz was found
sufficient to extract cavitation-related AE signals that corresponded well with the µCT
reference ones, but the retained signals were still not readily distinguishable from
other AE sources. Because AE signal characteristics strongly depend on sensor
placement, investigated species, characteristics of the individual stem and its
respective attenuation, performing a detailed analysis of AE during each AE
experiment will be often too tedious to accomplish. Interestingly, the unfiltered
acoustic VC constructed from all collected AE signals during dehydration resulted in
vulnerability values that were in close agreement to the ones derived from the µCT
VC, hence illustrating for this two-year-old F. excelsior L. tree that the unfiltered AE
technique is precise enough to determine its vulnerability to drought-induced
cavitation. Nonetheless, future research must still aim at more in-depth analysis of
acoustic waveforms and parameters associated with cavitation to develop post-
processing machine learning tools or state-of-the-art AE sensors that can efficiently
filter cavitation-related AE signals, without the aid of µCT. That way, a major step can
be taken towards a continuous, reliable and quantitative AE method that can become
a powerful diagnostic tool in future drought stress experiments.

6
GENERAL DISCUSSION AND
FUTURE PERSPECTIVES


General discussion
157
If plants could communicate in the same way as humans do, what would they tell us
when they are suffering from drought stress? It would definitely make the diagnosis
more intuitive and the desired treatment more efficient. Sadly their plea remains silent
to human ears, requiring the need for appropriate methods to translate plants’
responses to drought stress. The destructive and labor-intensive hydraulic method
has stood for decades as the golden reference to assess drought vulnerability, but is
now being challenged by the acoustic emission technique, a continuous and non-
invasive, but still to-be-refined substitute. In light of predicted climatic changes,
thorough analysis of the hydraulic method and improvement of the AE technique is
vital for growers and forest managers to fast and accurately respond to drought
stress. In this doctoral research, the hydraulic method was analyzed to the bone in
order to tackle many questions that encircle the technique. The AE method was
compared against hydraulic results, and tested for its successful implementation as a
diagnostic tool to detect drought-induced cavitation. Moreover, the AE technique
brought new physiological insights in woody tissue photosynthesis under drought
stress. Important steps were taken to develop and promote the comprehensive
tripartite method in drought-induced cavitation research by integrating acoustic
emission data on embolism formation, capacitive water release and hydraulic
capacitance from desorption curves and wood anatomical traits. Finally, attempts
were made to further refine the AE technique in filtering and extracting cavitation-
related signals from the AE dataset, and further possible improvements were
highlighted, with the final goal to establish the AE method as a solid, continuous and
non-invasive method in plant sciences.
6.1 General conclusions
6.1.1 Embolism refilling questions hydraulic method reliability
The working principle of the hydraulic method is based on pushing pressurized water
through cut branches which are subjected to increasing drought stress levels, to
measure the resulting decrease in hydraulic conductivity (Kh) at the outlet side of the
branch in order to construct a drought vulnerability curve (VC) relating percentage
loss of Kh to xylem water potential (Sperry et al., 1988a). The method is considered
the golden reference technique in drought-induced cavitation research, but the
vaguely described term of “waiting until stability” to obtain correct Kh values, has
never physiologically nor theoretically been justified. Because the decrease in Kh
must reflect the amount of cavitation formed by the imposed drought treatment, it is
vital in view of predicted climatic change scenarios of increasing drought stress that
Chapter 6
158
results of the hydraulic method are reliable, and should therefore be properly
assessed and validated. The original setup of the hydraulic method was therefore
expanded to measure inlet Kh, outlet Kh, radial flow from xylem to surrounding living
tissue and pressure difference (Chapter 2). Theoretical and physiological accurate
Kh values were obtained at hydraulic steady-state, where inflow equals outflow and
radial flow is zero, which revealed several implications of the hydraulic method.
Hydraulic steady-state was achieved at timespans well exceeding previously reported
ones, while the in literature proposed deviation in outlet Kh running mean was
insufficient to ensure stable Kh readings. This is because the hydraulic method
assumes a stationary flow through cut branches, negating the principles of dynamic
water transport in the branch samples, which still play a role. At the start of hydraulic
measurements, supplied water is redirected to xylem living tissue to compensate cell
water loss during imposed dehydration, creating an imbalance between inlet and
outlet Kh that is resolved from the moment living tissue has refilled. The added benefit
of the expanded hydraulic method resulted in a physiological and theoretical accurate
determination of Kh, translating into hydraulic steady-state VCs with a strong
sigmoidal behavior and thus a better depiction of a species’ vulnerability to drought-
induced cavitation (Chapter 2).
The most important implication of the hydraulic method was not the uncertainty
around reported stable Kh values, but the paradox of using pressurized water to
determine the impact of drought stress. Water is sent through the branches under
small positive pressure heads, which were long assumed of being incapable of
altering the embolized condition of the branch. The expanded setup illustrated that Kh
increased towards hydraulic steady-state and that xylem tension decreased, shifting
hydraulic steady-state VCs to less negative water potentials, hence overestimating
species’ vulnerability to drought-induced cavitation and questioning the reliability of
the hydraulic method (Chapter 2). X-ray computed microtomography (µCT)
illustrated that the increase in Kh and decrease in xylem tension were attributed to
artificial embolism refilling (Fig. 6.1), which is realistic considering the effective use of
root pressure in refilling cavitated vessels (Tyree & Zimmermann, 2002). In Chapter
3, artificial embolism refilling by use of the hydraulic method led to the misguiding
assumption that woody tissue photosynthesis played an important role in restoring
hydraulic conductivity.

General discussion
159
Fig. 6.1 Schematic drawing of xylem structure (brown) with pit-membrane-interconnected embolized
(white) and functional vessels (light blue), surrounded by dehydrated (green + white) and turgid (green
+ light blue) living cells summarizing the general conclusions of Chapter 2. The pressurized flow of the
hydraulic method (dark blue arrows) promotes artificial refilling of living tissue and embolized vessels
(upper image). The acoustic emission sensor does not affect the internal water transport dynamics of
the dehydrating sample (lower image), continuously registering actual sample-specific embolism
formation (red explosions).
The hydraulic method has previously been reported of suffering from the observer
effect (Jansen et al., 2015), with sampling affecting the degree of native cavitation,
requiring the need for precautions to avoid cutting artifacts which otherwise result in
artificial emboli (Cochard et al., 2013). The method is also destructive and labor-
intensive, resulting in extensive sampling to produce a single VC (Chapter 1). The
newly discovered implications have further altered the perception of correctly using
the hydraulic method and interpreting obtained results, but where the hydraulic
method falls short, the acoustic emission (AE) technique proved more reliable by
continuously registering embolism formation on single samples (Fig. 6.1). Therefore,
techniques such as the pneumatic, optic, and X-ray computed microtomography
(µCT) method that, similar to the AE technique, do not interfere with dynamic water
transport are getting increasing awareness to quantify drought-induced cavitation.

Chapter 6
160
Dependent on which physiological question needs answering, the advantages and
disadvantages of these different techniques and those of the hydraulic method must
be weighed against each other in search for the most relevant and optimal method
(Table 6.1).
Table 6.1 Comparison of advantages and disadvantages of several methods to
assess the effect of drought-induced cavitation in plant physiology
Method Pros Cons
Hydraulic method Standard procedure; direct value for conductivity loss (PLC)
Destructive; circuitous setup extensive sampling for one VC; artificial embolism refilling; ionic effects; clogging by tyloses, gels and bacteria; wounding effects; pit aspiration; laboratory conditions
Pneumatic method One sample for one VC; air flow strongly related to embolisms; rapid measurements, easy and inexpensive setup
Destructive; percentage air discharged (PAD) indirect measure of PLC; needs correlation with PLC; laboratory conditions
Optical method One sample for one VC; dynamic visualization of embolism formation; easy and inexpensive setup
Destructive; percentage visual cavitation indirect measure of PLC; needs correlation with PLC; laboratory conditions
µCT method One sample for one VC; dynamic visualization of embolism formation; non-destructive (can measure on intact plants);
Expensive; laboratory conditions; conduit dimension quantification required for translation to PLC
Acoustic method One sample for one VC; easy and inexpensive setup; non-destructive (can measure on intact plants); outdoor applications
Cumulative AE indirect measure of PLC; needs correlation with PLC
The advantageous characteristics of the AE method provided for instance evidence
that woody tissue photosynthesis might play a substantial role in the synthesis of
xylem surfactants to stabilize nanobubbles, instead of its presumed role in embolism
repair according to the hydraulic method (Chapter 3). By preventing woody tissue
photosynthesis, it is hypothesized that the reduced supply in non-structural
carbohydrates in living tissue surrounding xylem vessels, is inadequate to produce
sufficient amounts of surfactants for stabilizing nanobubbles, hence resulting in an
increased vulnerability to drought-induced cavitation (Fig. 6.2).

General discussion
161
Fig. 6.2 Schematic drawing of aluminum covered (grey) and non-covered (brown) xylem structure with
pit-membrane-interconnected embolized (white) and functional vessels (light blue) surrounded by
dehydrated (green + white) and turgid (green + light blue) living cells summarizing the general
conclusions of Chapter 3. The higher concentration of non-structural carbohydrates in the living tissue
of the non-covered sample (top image) resulted in higher production (yellow arrows) of xylem
surfactants (yellow mantle) stabilizing nanobubbels (white circles) compared to the aluminum-covered
sample (bottom image). Nanobubbles were more sensitive to lead up to cavitation under less negative
water potential in the aluminum-covered sample (bottom image), resulting in faster embolism
formation (red explosions), and a higher vulnerability to drought-induced cavitation.
However, it is important to mention that the theory linking inhibition of woody tissue
photosynthesis to reduced nanobubble stabilization is still speculative at the moment.
Other factors might be at play as well to explain the difference in the observed
vulnerability to drought-induced cavitation. A decrease in internal CO2 concentration
of the xylem sap is for instance more than plausible as this was indirectly indicated by
a decrease in CO2 efflux in aluminum covered poplar trees (pers. Comm. Roberto
Salómon and Linus De Roo). According to Henry’s law, this will result in a decrease
of sap pH, which can affect pit membrane porosity as a lower pH stimulates an

Chapter 6
162
increased water flow by shrinkage of pectin hydrogels in the pit membranes, and thus
an increase in air-seeding vulnerability. Studies using transmission electron
microscopy highlighted however that pectins are absent in the fully matured pit
membrane, and only marginally present in the outermost rim of the pit membrane
known as the annulus region (Plavcová & Hacke, 2011; Klepsch et al., 2016). So a
decrease in sap pH is momentarily as speculative as the surfactant theory, but
emphasizes that different angles need to be investigated in order to unravel the truth
about the effect of woody tissue photosynthesis inhibition on drought vulnerability.
6.1.2 AE as worthy substitute of the hydraulic method
The AE technique was originally used for testing and health-monitoring of diverse
engineering materials, and was only later introduced in plant sciences to detect
embolism formation (Milburn & Johnson, 1966). Recent developments in AE sensors
and acquisition systems have brought the technique under renewed attention as an
important diagnostic tool in drought-induced cavitation research. The acoustic VC
(VCAE) of Malus sylvestris L. corresponded well with µCT observations (Chapter 2),
which was recently proposed as the new standard reference method for the
validation of other techniques (Cochard et al., 2015). With the hydraulic method being
destructive, labor-intensive, prone to artefacts and embolism refilling, and µCT too
expensive and cumbersome for routine drought vulnerability measurements, the non-
invasive and continuous AE method is a promising alternative.
To maximize interpretation of AE measurements, broadband sensors (20-1000 kHz)
with a flat frequency response are recommended to differentiate between sources of
collected AE signals (Chapter 5). The accessibility of the AE method, owing to its
easy installation and implementation of sensors and acquisition systems, and
encourages expanding the technique beyond just vulnerability measurements to get
more comprehensive insights into plant water dynamics under drought stress (Steppe
et al., 2015). Therefore a tripartite methodological framework for drought-induced
cavitation research was proposed in Chapter 4, incorporating continuous weight
balance measurements to provide know-how on the species’ desorption curve and
derived hydraulic capacitance, which the plant uses to buffer water shortages, and
anatomical measurements on xylem structure and function (Fig. 6.3). The linear
relation between point measurements of xylem water potential and continuous
measurements of xylem shrinkage or strain with a potentiometer-type dendrometer
causing no acoustic interference is used to approximate continuous decreases in
xylem water potential, drastically reducing the cumbersome need for excessive xylem
water potential readings with the pressure chamber.

General discussion
163
Fig. 6.3 Schematic drawing of xylem structure (brown) with pit-membrane-interconnected embolized
(white) and functional (light blue) vessels surrounded by dehydrated (green + white) and turgid (green
+ light blue) living cells summarizing the general conclusions of Chapter 4. The tripartite method of
desorption curves to quantify hydraulic capacitance, acoustic vulnerability curves and xylem structure
anatomy provided comprehensive insights into the internal water transport dynamics in samples during
dehydration (shrunken sample, bottom image) of a hydrated sample (top image). Continuous weight
balance measurements register water loss from living tissue and from embolized vessels, which is
redistributed as hydraulic capacitance (light blue arrows) to functional vessels to temper fast
decreases in xylem water potential. Acoustic emission sensors register embolism formation (red
explosions), and xylem anatomy provides information on structure and function of the sample.
The tripartite method was successfully used for secondary growth and primary
growth vascular species, resulting in a more comprehensive understanding of the
different adaptations that compromise contrasting species’ drought survival strategy
(Chapter 4). Acoustic vulnerability depicted the species’ hydraulic safety adaptations,
while hydraulic capacitance quantified the amount of water stored in living tissue
(elastic capacitance), and released during cavitation (inelastic capacitance), used to
postpone negative effects of drought stress. The combined analysis of vulnerability

Chapter 6
164
and desorption curves illustrated the existence of the tight coupling in hydraulic
architecture, with elastic capacitance contributing to cope with mild levels of drought
stress, and inelastic capacitance acting when substantial drought occurs. Anatomical
measurements provided further knowledge on xylem structural changes in relation to
the hydraulic architecture, and helped underpinning acoustic and hydraulic
capacitance results (Fig. 6.3). The tripartite method is from a physiological point of
view more complete, because species with high vulnerability are not necessarily
more drought sensitive if hydraulic capacitance is found to be substantial.
6.1.3 The improvement potential of AE over the hydraulic method
Despite the many advantages of the AE technique, it is often incorrectly referred to
as a qualitative rather than a quantitative technique as not all AE signals registered
during dehydration originate from cavitation (Cochard et al., 2013). But because
cavitation produces AE, the technique can be improved to extract this desired AE
source, in contrast to the hydraulic method where the core working principle is biased
by artificial embolism refilling (Chapter 2). State-of-the-art AE data acquisition
systems provide the required in-depth analysis of AE signals by extracting their time,
parameter and waveform data (Wolkerstorfer et al., 2012). In Chapter 5, we applied
the parametrization strength of the AEwin data acquisition system and tried to extract
cavitation-related AE from the entire AE dataset with machine learning protocols and
using cavitation events registered by µCT scans as labels.
Linear discriminant analysis (LDA) with upper level histogram thresholding on the AE
parameters amplitude, counts, duration, signal strength, absolute energy and partial
power in the range 100-200 kHz successfully extracted similar amounts of cavitation-
related AE as was detected by µCT (Chapter 5). With the vast majority of AE signals
registered during dehydration, machine learning can provide the missing link to label
different AE sources, and if sufficiently trained, filter cavitation-related AE without the
aid of µCT (Fig. 6.4).

General discussion
165
Fig. 6.4 Schematic drawing of xylem structure (brown) with pit-membrane-interconnected embolized
(white) and functional (light blue) vessels surrounded by dehydrated (green + white) and turgid (green
+ light blue) living cells summarizing the general conclusions of Chapter 5. Different AE signals from
different sources are registered during dehydration, including embolism formation (red explosions),
living tissue shrinkage (yellow explosions), and crack formation/mechanical strain (pink explosions).
Combining continuous X-ray microtomography scanning with machine learning is promising in
extracting cavitation-related acoustic emissions (transition from left to right graph, showing AE signal
amplitude against dehydration time).
AE sources can be further identified by performing Fast Fourier transformation (FFT)
on AE waveforms, dividing them into separate frequency components. AE data allow
for in-depth processing and analysis, therefore the technique can be optimized even
further, and as such become a powerful diagnostic tool in drought-induced cavitation
research.

Chapter 6
166
6.2 Future perspectives
6.2.1 Optimizing AE to outdoor drought stress sensor
With climatic change predicting more intense and more frequent drought stress
scenarios, the sensitivity of vascular plants to drought must be quantified, and this
must be done in real-time to enable growers and forest managers to sustain viable
yields, and act faster and more accurately to plant drought-related distress signals.
AE sensors can be easily installed and measurements are continuously registered by
state-of-the-art data acquisition systems. By investing resources in follow-up
experiments to extract cavitation-related AE, the signature of this AE source can be
tracked, and with the aid of machine learning, result in an efficient post-processing
tool to quantify vulnerability to drought-induced cavitation. Additionally, further
knowledge on cavitation-related AE could result in the construction of an AE sensor
that is sensitive to only cavitation signals. This would provide the ideal solution for
forest managers and growers to accurately detect the first signs of drought stress by
marking the maximum daily-allowed cavitation that does not negatively impact
internal plant-water relations, and even increase irrigation efficiency. However,
because the majority of registered AE signals are related to different sources of
dehydration negatively impacting plant physiology (i.e., shrinkage, water loss,
fracture forming, mechanical strain) it might be equally important and interesting to
incorporate all AE signals related to drought stress instead of only focusing on
cavitation-related sources. Moreover, increased accumulation in daily AE signals
could already be indicative enough for drought stressed plants, and with recent and
ongoing development aimed at producing low cost AE sensors and acquisition
systems such as MEMS (microelectromechanical systems) (Ozevin et al., 2006;
Saboonchi & Ozevin, 2013), it is also easily accessible for growers and forest
managers.
6.2.2 Improving water potential quantification: the ultimate VC
The hydraulic, µCT and AE method are different from each other in how the y-axis of
the vulnerability curve, or percentage increase in cavitation under drought stress is
quantified, but the methods share their x-axis, or decrease in xylem water potential
assessment by pressure chamber point measurements. Since its introduction in the
mid 1960’s (Scholander et al., 1965), the pressure chamber has proven to be an
important tool to detect leaf and branch xylem water potential, but the method is
destructive, discontinuous, labor-intense and highly subjective, because readings are
based on visual determination of water droplets forming at the cut surface of a

General discussion
167
leaf/branch. With µCT and especially AE aiming at continuous registration of
embolism formation under drought stress, there is a desired need to automate and
objectify xylem water potential quantification. Stem psychrometers were developed in
view of this desire and can automatically, within typical consecutive timespans of 15
minutes, monitor xylem water potential changes. However, the fragile and expensive
thermocouple cups can be considered a practical disadvantage, especially as proper
installation requires a certain amount of handling skill.
Our proposed technique of using diameter strain as a proxy for xylem tension is
valuable requiring less point measurements by the pressure chamber, and more
importantly, this relation can be determined independently from VC construction, with
the aim of creating a large database for different vascular species which can be used
as alternatives in consecutive VC experiments to determine decrease in xylem
tension. However, these relations will always remain an estimation, possibly differing
between individual branch/stem level, and are still dependent on subjective
determination with the pressure chamber. Perhaps the ideal solution can be found in
an attempt to automate and objectify pressure chamber measurements, aimed at an
automatic detection of a water droplet forming at the cut surface of a petiole/branch.
With a cut branch sufficiently protruding the automated pressure chamber, AE
sensors can be simultaneously installed to quantify drought-induced embolism
formation, implying that both y- and x-axis can be automatically and continuously
determined, hence leading to the construction of what I like to call “the ultimate
vulnerability curve”.


References
169
Aggelis DG, Soulioti D, Barkoula NM, Paipetis AS, Matikas TE, Shiotani T.
2010. Acoustic Emission Monitoring of Steel-Fiber Reinforced Concrete Beams
Under Bending. Journal of Acoustic Emission 28: 32–40.
Allen CD, Macalady AK, Chenchouni H, Bachelet D, McDowell N, Vennetier M,
Kitzberger T, Rigling A, Breshears DD, Hogg EH, et al. 2010. A global overview of
drought and heat-induced tree mortality reveals emerging climate change risks for
forests. Forest Ecology and Management 259: 660–684.
Anderegg WRL, Klein T, Bartlett M, Sack L, Pellegrini AFA, Choat B, Jansen S.
2016. Meta-analysis reveals that hydraulic traits explain cross-species patterns of
drought-induced tree mortality across the globe. Proceedings of the National
Academy of Sciences 113: 5024–5029.
Angeles G, Bond B, Boyer JS, Brodribb T, Brooks JR, Burns MJ, Cavender-
Bares J, Clearwater M, Cochard H, Comstock J, et al. 2004. The cohesion-tension
theory. New Phytologist 163: 451–452.
R
REFERENCES

References
170
Arganda-Carreras I, Sorzano COS, Marabini R, Carazo JM, Ortiz-de-Solorzano
C, Kybic J. 2006. Consistent and Elastic Registration of Histological Sections Using
Vector-Spline Regularization. In: Beichel RR, Sonka M (eds) Computer Vision
Approaches to Medical Image Analysis. CVAMIA 2006. Lecture Notes in Computer
Science, vol 4241, 85–95. Springer, Berlin.
Arve LE, Torre S, Olsen JE, Tanino KK. 2011. Stomatal responses to drought
stress and air humidity. In: Abiotic Stress in Plants - Mechanisms and Adaptations.
267–280.
Aschan G, Pfanz H. 2003. Non-foliar photosynthesis–a strategy of additional carbon
acquisition. Flora 198: 81–97.
v. Aufseß H. 1973. Mikroskopische Darstellung des Verholzungsgrades durch
Färbemethoden. Holz als Roh- und Werkstoff: European Journal of Wood and Wood
Industries 31: 24–33.
Ávila E, Herrera A, Tezara W. 2014. Contribution of stem CO2 fixation to whole-
plant carbon balance in nonsucculent species. Photosynthetica 52: 3–15.
Bacon M, Brian T. 2003. Water relations of plants | Uptake, Loss, and Control. In:
Encyclopedia of Applied Plant Sciences. Elsevier, 1466–1471.
De Baerdemaeker NJF, Hias N, Van den Bulcke J, Keulemans W, Steppe K.
2018. The effect of polyploidization on tree hydraulic functioning. American Journal of
Botany: 105: 163–173.
Barlow KM, Christy BP, O’Leary GJ, Riffkin PA, Nuttall JG. 2015. Simulating the
impact of extreme heat and frost events on wheat crop production: A review. Field
Crops Research 171: 109–119.
Bauerle TL, Centinari M, Bauerle WL. 2011. Shifts in xylem vessel diameter and
embolisms in grafted apple trees of differing rootstock growth potential in response to
drought. Planta 234: 1045–1054.
Beall FC. 2002a. Overview of the use of ultrasonic technologies in research on wood
properties. Wood Science and Technology 36: 197–212.
Beall FC. 2002b. Ultrasonic methods to monitor and control lumber drying. 4th COST
E15 Workshop "Methods for improving drying quality of wood". Santiago de
Compostela, Spain.
Begg JE, Turner NC. 1970. Water Potential Gradients in Field Tobacco. Plant
Physiology 46: 343–346.

References
171
Beikircher B, De Cesare C, Mayr S. 2013. Hydraulics of high-yield orchard trees: A
case study of three Malus domestica cultivars. Tree Physiology 33: 1296–1307.
Beikircher B, Mayr S. 2009. Intraspecific differences in drought tolerance and
acclimation in hydraulics of Ligustrum vulgare and Viburnum lantana. Tree
Physiology 29: 1–11.
Van Bel AJE. 2003. The phloem, a miracle of ingenuity. Plant, Cell and Environment
26: 125–149.
Berg J, Tymoczko J, Stryer L. 2002. There Are Three Common Types of
Membrane Lipids. In: Freeman WH (ed) Biochemistry 5th edition, section 12.3.
Springer, New York
Berveiller D, Kierzkowski D, Damesin C. 2007. Interspecific variability of stem
photosynthesis among tree species. Tree Physiology 27: 53–61.
Blackman CJ, Brodribb TJ, Jordan GJ. 2010. Leaf hydraulic vulnerability is related
to conduit dimensions and drought resistance across a diverse range of woody
angiosperms. New Phytologist 188: 1113–1123.
Blake FG. 1949. The onset of cavitation in liquids: I: cavitation threshold sound
pressures in water as a function of temperature and hydrostatic pressure.
Cambridge, MA, USA: Acoustic Research Laboratory, Department of Engineering
Sciences and Applied Physics, Harvard University.
Bloemen J, McGuire MA, Aubrey DP, Teskey RO, Steppe K. 2013. Internal
recycling of respired CO2 may be important for plant functioning under changing
climate regimes. Plant Signaling and Behavior 8: 1–3.
Bloemen J, Vergeynst LL, Overlaet-Michiels L, Steppe K. 2016. How important is
woody tissue photosynthesis in poplar during drought stress? Trees - Structure and
Function 30: 63–72.
Brodersen C, Jansen S, Choat B, Rico C, Pittermann J. 2014. Cavitation
Resistance in Seedless Vascular Plants: The Structure and Function of Interconduit
Pit Membranes. Plant Physiology 165: 895–904.
Brodersen CR, Knipfer T, Mcelrone AJ. 2017. In vivo visualization of the final
stages of xylem vessel refilling in grapevine (Vitis vinifera) stems. New Phytologist
161: 1820–1829.
Brodersen CR, McElrone AJ. 2013. Maintenance of xylem network transport
capacity: a review of embolism repair in vascular plants. Frontiers in Plant Science 4:
108.

References
172
Brodersen CR, McElrone AJ, Choat B, Matthews MA, Shackel KA. 2010. The
Dynamics of Embolism Repair in Xylem: In Vivo Visualizations Using High-Resolution
Computed Tomography. Plant Physiology 154: 1088–1095.
Brodribb TJ. 2009. Xylem hydraulic physiology: The functional backbone of
terrestrial plant productivity. Plant Science 177: 245–251.
Brodribb TJ, Bowman DJMS, Nichols S, Delzon S, Burlett R. 2010. Xylem
function and growth rate interact to determine recovery rates after exposure to
extreme water deficit. New Phytologist 188: 533–542.
Brodribb TJ, Carriqui M, Delzon S, Lucani C. 2017. Optical measurement of stem
xylem vulnerability. Plant Physiology 174: 2054–2061.
Brodribb TJ, Skelton RP, McAdam SAM, Bienaimé D, Lucani CJ, Marmottant P.
2016. Visual quantification of embolism reveals leaf vulnerability to hydraulic failure.
New Phytologist 209: 1403–1409.
Butler DW, Gleason SM, Davidson I, Onoda Y, Westoby M. 2012. Safety and
streamlining of woody shoots in wind: An empirical study across 39 species in
tropical Australia. New Phytologist 193: 137–149.
Cai J, Tyree MT. 2010. The impact of vessel size on vulnerability curves: Data and
models for within-species variability in saplings of aspen, Populus tremuloides Michx.
Plant, Cell and Environment 33: 1059–1069.
Campbell NA, Reece JB. (eds) 2008. Biology, 8th edition. Upper Sadle River (NJ):
Benjamin Cummings. 1393.
Canny MJ. 1998. Applications of the compensating pressure theory of water
transport. American Journal of Botany 85: 897–909.
Canny MJ, McCully ME, Huang CX. 2001. Cryo-scanning electron microscopy
observations of vessel content during transpiration in walnut petioles. Facts or
artefacts? Plant Physiology and Biochemistry 39: 555–563.
Carlquist S. 2009. Non-random vessel distribution in woods: patterns, modes,
diversity, correlations. Aliso 27: 39–58.
Carlsson CA, Carlsson GA. 1996. Basic physics of X-ray imaging. Linkoping
University: 3–29.
Cernusak LA, Hutley LB. 2011. Stable Isotopes Reveal the Contribution of
Corticular Photosynthesis to Growth in Branches of Eucalyptus miniata. Plant
Physiology 155: 515–523.

References
173
Cernusak LA, Marshall JD. 2000. Photosynthetic re xation in branches of Western
White Pine. Functional Ecology 14: 300–311.
Chave J, Coomes D, Jansen S, Lewis SL, Swenson NG, Zanne AE. 2009.
Towards a worldwide wood economics spectrum. Ecology Letters 12: 351–366.
Choat B, Badel E, Burlett R, Delzon S, Cochard H, Jansen S. 2016. Noninvasive
Measurement of Vulnerability to Drought-Induced Embolism by X-Ray
Microtomography. Plant Physiology 170: 273–282.
Choat B, Ball M, Luly J, Holtum J. 2003. Pit membrane porosity and water stress-
induced cavitation in four co-existing dry rainforest tree species. Plant Physiology
131: 41–8.
Choat B, Drayton WM, Brodersen C, Matthews MA, Shackel KA, Wada HIR,
McElrone AJ. 2010. Measurement of vulnerability to water stress-induced cavitation
in grapevine: A comparison of four techniques applied to a long-vesseled species.
Plant, Cell and Environment 33: 1502–1512.
Choat B, Jansen S, Brodribb TJ, Cochard H, Delzon S, Bhaskar R, Bucci SJ,
Feild TS, Gleason SM, Hacke UG, et al. 2012. Global convergence in the
vulnerability of forests to drought. Nature 491: 752–755.
Chotard T, Smith A, Quet A. 2007. Characterisation of liquid transfer processes and
water adsorption mechanism on a porous ceramic by acoustic emission means.
Journal of the European Ceramic Society 27: 457–462.
Christman MA, Sperry JS, Adler FR. 2009. Testing the ‘rare pit’ hypothesis for
xylem cavitation resistance in three species of Acer. New Phytologist 182: 664–674.
Christman MA, Sperry JS, Smith DD. 2012. Rare pits, large vessels and extreme
vulnerability to cavitation in a ring-porous tree species. New Phytologist 193: 713–
720.
Clearwater MJ, Clark CJ. 2003. In vivo magnetic resonance imaging of xylem vessel
contents in woody lianas. Plant, Cell and Environment 26: 1205–1214.
Clearwater MJ, Goldstein G. 2005. Embolism Repair and Long Distance Water
Transport. In: Vascular Transport in Plants. Elsevier, 375–399.
Cochard H. 1992. Vulnerability of several conifers to air embolism. Tree Physiology
11: 73–83.
Cochard H. 2002. A technique for measuring xylem hydraulic conductance under
high negative pressure. Plant, Cell and Environment 25: 815–819.
References
174
Cochard H. 2006. Cavitation in trees. Comptes Rendus Physique 7: 1018–1026.
Cochard H, Badel E, Herbette S, Delzon S, Choat B, Jansen S. 2013. Methods for
measuring plant vulnerability to cavitation: A critical review. Journal of Experimental
Botany 64: 4779–4791.
Cochard H, Bodet C, Améglio T, Cruiziat P. 2000. Cryo-scanning electron
microscopy observations of vessel content during transpiration in walnut petioles.
Facts or artifacts? Plant Physiology 124: 1191–1202.
Cochard H, Delzon S, Badel E. 2015. X-ray microtomography (micro-CT): A
reference technology for high-resolution quantification of xylem embolism in trees.
Plant, Cell and Environment 38: 201–206.
Cochard H, Ewers FW, Tyree MT. 1994. Water relations of a tropical vine-like
bamboo (Rhipidocladum racemiflorum): root pressures, vulnerability to cavitation and
seasonal changes in embolism. Journal of Experimental Botany 45: 1085–1089.
Cochard H, Forestier S, Améglio T. 2001. A new validation of the Scholander
pressure chamber technique based on stem diameter variations. Journal of
Experimental Botany 52: 1361–1365.
Cochard H, Herbette S, Barigah T, Badel E, Ennajeh M, Vilagrosa A. 2010. Does
sample length influence the shape of xylem embolism vulnerability curves? A test
with the Cavitron spinning technique. Plant, Cell and Environment 33: 1543–1552.
Cochard H, Tyree MT. 1990. Xylem dysfunction in Quercus: vessel sizes, tyloses,
cavitation and seasonal changes in embolism. Tree Physiology 6: 393–407.
Cope T, Gray A. 2009. Grasses of the British Isles. Botanical Society of the British
Isles, London.
Crombie DS, Hipkins MF, Milburn JA. 1985. Gas Penetration of Pit Membranes in
the Xylem of Rhododendron as the Cause of Acoustically Detectable Sap Cavitation.
Australian Journal of Plant Physiology 12: 445–453.
Damesin C. 2003. Respiration and photosynthesis characteristics of current-year
stems of Fagus sylvatica: From the seasonal pattern to an annual balance. New
Phytologist 158: 465–475.
Delzon S, Douthe C, Sala A, Cochard H. 2010. Mechanism of water-stress induced
cavitation in conifers: Bordered pit structure and function support the hypothesis of
seal capillary-seeding. Plant, Cell and Environment 33: 2101–2111.

References
175
Delzon S, Urli M, Samalens JC, Lamy JB, Lischke H, Sin F, Zimmermann NE,
Porté AJ. 2013. Field evidence of colonisation by holm oak, at the Northern Margin
of its distribution range, during the anthropocene period. PLoS ONE 8: 1–8.
Dierick M, Van Loo D, Masschaele B, Van Den Bulcke J, Van Acker J, Cnudde
V, Van Hoorebeke L. 2014. Recent micro-CT scanner developments at UGCT.
Nuclear Instruments and Methods in Physics Research, Section B: Beam Interactions
with Materials and Atoms 324: 35–40.
Dierick M, Masschaele B, Van Hoorebeke L. 2004. Octopus, a fast and user-
friendly tomographic reconstruction package developed in LabView. Measurement
Science and Technology 15: 1366–1370.
Dixon HH, Joly J. 1895. On the ascent of sap. Philosophical Transactions of the
Royal Society of London 186: 563–576.
Domec JC, Gartner BL. 2001. Cavitation and water storage capacity in bole xylem
segments of mature and young Douglas-fir trees. Trees - Structure and Function 15:
204–214.
Duursma RA, Choat B. 2017. fitplc - an R package to fit hydraulic vulnerability
curves. Journal of Plant Hydraulics 4: e-002.
Edwards WRN, Jarvis PG. 1982. Relations between water content, potential and
permeability in stems of conifers. Plant, Cell & Environment 5: 271–277.
Ennajeh M, Nouiri M, Khemira H, Cochard H. 2011. Improvement to the air-
injection technique to estimate xylem vulnerability to cavitation. Trees 25: 705–710.
Epila J, De Baerdemaeker NJF, Vergeynst LL, Maes WH, Beeckman H, Steppe
K. 2017. Capacitive water release and internal leaf water relocation delay drought-
induced cavitation in African Maesopsis eminii. Tree Physiology 37: 481–490.
Espino S, Schenk HJ. 2011. Mind the bubbles: Achieving stable measurements of
maximum hydraulic conductivity through woody plant samples. Journal of
Experimental Botany 62: 1119–1132.
Ewers FW, Améglio T, Cochard H, Beaujard F, Martignac M, Vandame M, Bodet
C, Cruiziat P. 2001. Seasonal variation in xylem pressure of walnut trees: Root and
stem pressures. Tree Physiology 21: 1123–1132.
Ewers FW, Fisher JB. 1989. Techniques for Measuring Vessel Lengths and
Diameters in Stems of Woody Plants. American Journal of Botany 76: 645.

References
176
Farooq M, Wahid A, Kobayashi N, Fujita D, Basra SMA. 2009. Plant drought
stress : effects, mechanisms and management. Agronomy for Sustainable
Development 29: 185–212.
Fichot R, Brignolas F, Cochard H, Ceulemans R. 2015. Vulnerability to drought-
induced cavitation in poplars: Synthesis and future opportunities. Plant, Cell and
Environment 38: 1233–1251.
Fisher JB, Ewers FW, López-Portillo J. 1997. Survey of Root Pressure in Tropical
Vines and Woody Species. International Journal of Plant Sciences 158: 44–50.
Franks PJ, Gibson A, Bachelard EP. 1995. Xylem permeability and embolism
susceptibility in seedlings of Eucalyptus camaldulensis Dehnh. from two different
climatic zones. Australian Journal of Plant Physiology 22: 15–21.
Gärtner H, Schweingruber FH (eds). 2013. Microscopic preparation techniques for
plant stem analysis. Kessel Publishing House, Remagen
Gleason SM, Westoby M, Jansen S, Choat B, Hacke UG, Pratt RB, Bhaskar R,
Brodribb TJ, Bucci SJ, Cao KF, et al. 2016. Weak tradeoff between xylem safety
and xylem-specific hydraulic efficiency across the world’s woody plant species. New
Phytologist 209: 123–136.
Gleason SM, Wiggans DR, Bliss CA, Young JS, Cooper M, Willi KR, Comas LH.
2017. Embolized Stems Recover Overnight in Zea mays: The Role of Soil Water,
Root Pressure, and Nighttime Transpiration. Frontiers in Plant Science 8: 1–11.
Gleason SM, Williams LJ, Read J, Metcalfe DJ, Baker PJ. 2008. Cyclone effects
on the structure and production of a tropical upland rainforest: Implications for life-
history tradeoffs. Ecosystems 11: 1277–1290.
Lo Gullo MA, Salleo S. 1993. Different vulnerabilities of Quercus ilex L. to freeze-
and summer drought-induced xylem embolism: an ecological interpretation. Plant,
Cell & Environment 16: 511–519.
Lo Gullo MA, Salleo S. 1991. Three different methods for measuring xylem
cavitation and embolism: A comparison. Annals of Botany 67: 367–368.
Gupta S, Feng J, Chan LJG, Petzold CJ, Ralston CY. 2016. Synchrotron X-ray
footprinting as a method to visualize water in proteins. Journal of Synchrotron
Radiation 23: 1056–1069.
Haacs R, Blank RW. 1990. Acoustic emission from drought-stressed red pine (Pinus
resinosa). Journal of Acoustic Emission 9: 181–187.
References
177
Hacke UG. 2014. Variable plant hydraulic conductance. Tree Physiology 34: 105–
108.
Hacke U, Sauter JJ. 1995. Vulnerability of Xylem to Embolism in Relation to Leaf
Water Potential and Stomatal Conductance in Fagus-Sylvatica F Purpurea and
Populus-Balsamifera. Journal of Experimental Botany 46: 1177–1183.
Hacke AU, Sauter JJ. 2010. Xylem Dysfunction during Winter and Recovery of
Hydraulic Conductivity in Diffuse- Porous and Ring-Porous Trees. Ecology 105: 435–
439.
Hacke UG, Sperry JS. 2001. Functional and ecologycal xylem anatomy.
Perspectives in Plant Ecology, Evolution and Systematics 4: 97–115.
Hacke UG, Sperry JS. 2003. Limits to xylem refilling under negative pressure in
Laurus nobilis and Acer negundo. Plant, Cell and Environment 26: 303–311.
Hacke UG, Sperry JS, Pittermann J. 2004. Analysis of circular bordered pit function
II. Gymnosperm tracheids with torus-margo pit membranes. American Journal of
Botany 91: 386–400.
Hacke UG, Sperry JS, Pockman WT, Davis SD, McCulloh KA. 2001. Trends in
wood density and structure are linked to prevention of xylem implosion by negative
pressure. Oecologia 126: 457–461.
Hacke UG, Sperry JS, Wheeler JK, Castro L. 2006. Scaling of angiosperm xylem
structure with safety and efficiency. Tree Physiology 26: 689–701.
Haines WB. 1930. Studies in the physical properties of soil: V. The hysteresis effect
in capillary properties, and the modes of moisture distribution associated therewith.
The Journal of Agricultural Science 20: 97–116.
Hamstad MA, Quarles ML, Lemaster RL. 1994. Experimental far-field wideband
acoustic waves in wood rods and plates. In: Pellerin RF, McDonald KA, eds.
Proceedings of the 9th International Symposium on nondestructive testing of wood.
Pullman, WA, USA: Conferences and Institutes, Washington State University, 30–44.
Hao GY, Hoffmann WA, Scholz FG, Bucci SJ, Meinzer FC, Franco AC, Cao KF,
Goldstein G. 2008. Stem and leaf hydraulics of congeneric tree species from
adjacent tropical savanna and forest ecosystems. Oecologia 155: 405–415.
Hao GY, James KW, N. Michele Holbrook, Guillermo Goldstein. 2013.
Investigating xylem embolism formation, refilling and water storage in tree trunks
using frequency domain reflectometry. Journal of Experimental Botany 64: 2321–
2332.

References
178
Hastie T, Tibshirani R, Friedman J. (eds) 2009. The Elements of Statistical
Learning, Data Mining, Inference, and Prediction, Second Edition. Springer-Verlag,
New York
Herzog KM, Häsler R, Thum R. 1995. Diurnal changes in the radius of a subalpine
Norway spruce stem: their relation to the sapflow and their use to estimate
transpiration. Trees 10: 94–101.
Hochberg U, Windt CW, Ponomarenko A, Zhang Y-J, Gersony J, Rockwell FE,
Holbrook NM. 2017. Stomatal closure, basal leaf embolism, and shedding protect
the hydraulic integrity of grape stems. Plant Physiology 174: 764–775.
Holbrook NM, Zwieniecki MA. 1999. Embolism Repair and Xylem Tension: Do We
Need a Miracle? Plant Physiology 120: 7–10.
Hölttä T, Cochard H, Nikinmaa E, Mencuccini M. 2009a. Capacitive effect of
cavitation in xylem conduits: Results from a dynamic model. Plant, Cell and
Environment 32: 10–21.
Hölttä T, Mencuccini M, Nikinmaa E. 2009b. Linking phloem function to structure:
Analysis with a coupled xylem-phloem transport model. Journal of Theoretical
Biology 259: 325–337.
van den Honert TH. 1948. Water transport in plants as a catenary process.
Discussions of the Faraday Society 3: 146–153.
Hubeau M, Steppe K. 2015. Plant-PET Scans: In Vivo Mapping of Xylem and
Phloem Functioning. Trends in Plant Science 20: 676–685.
Van Ieperen W, Van Meeteren U, Van Gelder H. 2000. Fluid ionic composition
influences hydraulic conductance of xylem conduits. Journal of Experimental Botany
51: 769–776.
Irvine J, Grace J. 1997. Continuous measurements of water tensions in the xylem of
trees based on the elastic properties of wood. Planta 202: 455–461.
Jackson G, Grace J. 1994. Cavitation and water transport in trees. Endeavour 18:
50–54.
Jacobsen AL. 2005. Do Xylem Fibers Affect Vessel Cavitation Resistance? Plant
Physiology 139: 546–556.
Jacobsen AL, Pratt RB. 2012. No evidence for an open vessel effect in centrifuge-
based vulnerability curves of a long-vesselled liana (Vitis vinifera). New Phytologist
194: 982–990.

References
179
Jansen S, Choat B, Pletsers A. 2009. Morphological variation of intervessel pit
membranes and implications to xylem function in angiosperms. American Journal of
Botany 96: 409–419.
Jansen S, Schuldt B, Choat B. 2015. Current controversies and challenges in
applying plant hydraulic techniques. New Phytologist 205: 961–964.
Johnson DM, Meinzer FC, Woodruff DR, McCulloh KA. 2009. Leaf xylem
embolism, detected acoustically and by cryo-SEM, corresponds to decreases in leaf
hydraulic conductance in four evergreen species. Plant, Cell and Environment 32:
828–836.
Johnson DM, Wortemann R, McCulloh KA, Jordan-Meille L, Ward E, Warren JM,
Palmroth S, Domec JC. 2016. A test of the hydraulic vulnerability segmentation
hypothesis in angiosperm and conifer tree species. Tree Physiology 36: 983–993.
Jones HG, Sutherland RA. 1991. Stomatal control of xylem embolism. Plant, Cell &
Environment 14: 607–612.
Jupa R, Plavcová L, Gloser V, Jansen S. 2016. Linking xylem water storage with
anatomical parameters in five temperate tree species. Tree Physiology 36: 756–769.
Kikuta SB. 2003. Ultrasound acoustic emissions from bark samples differing in
anatomical characteristics. Phyton - Annales Rei Botanicae 43: 161–178.
Kim HK, Park J, Hwang I. 2018. Investigating water transport through the xylem
network in vascular plants. Journal of Experimental Botany 65: 1895–1904.
Klepsch MM, Schmitt M, Knox JP, Jansen S. 2016. The chemical identity of
intervessel pit membranes in Acer challenges hydrogel control of xylem hydraulic
conductivity. AoB Plants 8: plw052.
Knipfer T, Brodersen CR, Zedan A, Kluepfel DA, McElrone AJ. 2015. Patterns of
drought-induced embolism formation and spread in living walnut saplings visualized
using X-ray microtomography. Tree Physiology 35: 744–755.
Knipfer T, Cuneo I, Brodersen C, McElrone AJ. 2016. In-situ visualization of the
dynamics in xylem embolism formation and removal in the absence of root pressure:
A study on excised grapevine stems. Plant Physiology 171: 1024–1036.
Kolb KJ, Sperry JS, Lamont BB. 1996. A method for measuring xylem hydraulic
conductance and embolism in entire root and shoot systems. Journal of Experimental
Botany 47: 1805–1810.

References
180
Kowalski SJ, Moliński W, Musielak G. 2004. The identification of fracture in dried
wood based on theoretical modelling and acoustic emission. Wood Science and
Technology 38: 35–52.
Lachenbruch B, Mcculloh KA. 2014. Traits, properties, and performance: How
woody plants combine hydraulic and mechanical functions in a cell, tissue, or whole
plant. New Phytologist 204: 747–764.
Lambers H, Chapin FS III, Pons TL. 1998. Photosynthesis, respiration, and long-
distance water transport. In Lambers H, Chapin FS III, Pons TL (eds) Plant
Physiological Ecology. Springer, New York, pp 10–153.
Laschimke R, Burger M, Vallen H. 2006. Acoustic emission analysis and
experiments with physical model systems reveal a peculiar nature of the xylem
tension. Journal of Plant Physiology 163: 996–1007.
Lauri PÉ, Gorza O, Cochard H, Martinez S, Celton JM, Ripetti V, Lartaud M, Bry
X, Trottier C, Costes E. 2011. Genetic determinism of anatomical and hydraulic
traits within an apple progeny. Plant, Cell and Environment 34: 1276–1290.
Lê S, Josse J, Husson F. 2008. FactoMineR: An R Package for Multivariate
Analysis. Journal of Statistical Software 25: 1–18.
Lemoine D, Peltier J-P, Marigo G. 2001. Comparative studies of the water relations
and the hydraulic characteristics in Fraxinus excelsior, Acer pseudoplatanus and A.
opalus trees under soil water contrasted conditions. Annals of Forest Science 58:
723–731.
Lens F, Sperry JS, Christman MA, Choat B, Rabaey D, Jansen S. 2011. Testing
hypotheses that link wood anatomy to cavitation resistance and hydraulic conductivity
in the genus Acer. New Phytologist 190: 709–723.
Lewis AM. 1987. Two mechanisms for the initiation of embolism in tracheary
elements and other dead plant cells under water stress. To: Dept. of Organismic and
Evolutionary Biology. Advisor: Martin Zimmermann and others. Harvard University.
Li S, Lens F, Espino S, Karimi Z, Klepsch M, Schenk HJ, Schmitt M, Schuldt B,
Jansen S. 2016. intervessel pit membrane thickness as a key determinant of
embolism resistance in angiosperm xylem. IAWA Journal 37: 152–171.
Lindner M, Fitzgerald JB, Zimmermann NE, Reyer C, Delzon S, van der Maaten
E, Schelhaas MJ, Lasch P, Eggers J, van der Maaten-Theunissen M, et al. 2014.
Climate change and European forests: What do we know, what are the uncertainties,
and what are the implications for forest management? Journal of Environmental
Management 146: 69–83.

References
181
Lobell DB, Gourdji SM. 2012. The Influence of Climate Change on Global Crop
Productivity. Plant Physiology 160: 1686–1697.
Loepfe L, Martinez-Vilalta J, Piñol J, Mencuccini M. 2007. The relevance of xylem
network structure for plant hydraulic efficiency and safety. Journal of Theoretical
Biology 247: 788–803.
Lopez FB, Barclay GF. 2016. Plant Anatomy and Physiology. In: Pharmacognosy:
Fundamentals, Applications and Strategy. Elsevier, 45–60.
Maherali H, Pockman WT, Jackson RB. 2004. Adaptive variation in the vulnerability
of woody plants to zylem cavitation. Ecology 85: 2184–2199.
Markesteijn L, Poorter L, Paz H, Sack L, Bongers F. 2011. Ecological
differentiation in xylem cavitation resistance is associated with stem and leaf
structural traits. Plant, Cell and Environment 34: 137–148.
Martínez-Cabrera HI, Jones CS, Espino S, Jochen Schenk H. 2009. Wood
anatomy and wood density in shrubs: Responses to varying aridity along
transcontinental transects. American Journal of Botany 96: 1388–1398.
Martinez AM, Kak AC. 2001. PCA versus LDA. IEEE Transactions on Pattern
Analysis and Machine Intelligence 23: 228–233.
Mayr S, Kartusch B, Kikuta S. 2014. Evidence for air-seeding: watching the
formation of embolism in conifer xylem. Journal of Plant Hydraulics 1: e0004.
Mayr S, Rosner S. 2011. Cavitation in dehydrating xylem of Picea abies: Energy
properties of ultrasonic emissions reflect tracheid dimensions. Tree Physiology 31:
59–67.
Mcculloh KA, Johnson DM, Meinzer FC, Voelker SL, Lachenbruch B, Domec JC.
2012. Hydraulic architecture of two species differing in wood density: Opposing
strategies in co-occurring tropical pioneer trees. Plant, Cell and Environment 35:
116–125.
Mcculloh KA, Johnson DM, Meinzer FC, Woodruff DR. 2014. The dynamic
pipeline: Hydraulic capacitance and xylem hydraulic safety in four tall conifer species.
Plant, Cell and Environment 37: 1171–1183.
McCulloh KA, Meinzer FC, Sperry JS, Lachenbruch B, Voelker SL, Woodruff
DR, Domec JC. 2011. Comparative hydraulic architecture of tropical tree species
representing a range of successional stages and wood density. Oecologia 167: 27–
37.

References
182
McDowell NG. 2011. Mechanisms Linking Drought, Hydraulics, Carbon Metabolism,
and Vegetation Mortality. Plant Physiology 155: 1051–1059.
Mcdowell N, Pockman WT, Allen CD, Breshears DD, Cobb N, Kolb T, Plaut J,
Sperry J, West A, Williams DG, et al. 2008. Mechanisms of Plant Survival and
Mortality during Drought : Why Do Some Plants Survive while Others Succumb to
Drought ? New Phytologist 178: 719–739.
McLachlan GJ. (ed) 2004. Discriminant analysis and statistical pattern recognition.
John Wiley & Sons Inc, New Jersey.
Meinzer FC, Clearwater MJ, Goldstein G. 2001. Water transport in trees: current
perspectives, new insights and some controversies. Environmental and Experimental
Botany 45: 239–262.
Meinzer FC, Johnson DM, Lachenbruch B, McCulloh KA, Woodruff DR. 2009.
Xylem hydraulic safety margins in woody plants: Coordination of stomatal control of
xylem tension with hydraulic capacitance. Functional Ecology 23: 922–930.
Meinzer FC, McCulloh KA. 2013. Xylem recovery from drought-induced embolism:
Where is the hydraulic point of no return? Tree Physiology 33: 331–334.
Melcher PJ, Holbrook NM, Burns MJ, Zwieniecki MA, Cobb AR, Brodribb TJ,
Choat B, Sack L. 2012. Measurements of stem xylem hydraulic conductivity in the
laboratory and field. Methods in Ecology and Evolution 3: 685–694.
Melcher PJ, Zwieniecki M a, Holbrook NM. 2003. Vulnerability of xylem vessels to
cavitation in sugar maple. Scaling from individual vessels to whole branches. Plant
physiology 131: 1775–1780.
De Micco V, Aronne G. 2012. Morpho-anatomical traits for plant adaptation to
drought. In: Plant Responses to Drought Stress: From Morphological to Molecular
Features. 37–61.
Milburn JA, Johnson RP. 1966. The conduction of sap : II. Detection of vibrations
produced by sap cavitation in Ricinus xylem. Planta 69: 43–52.
Molares S, Ladio A. 2009. Ethnobotanical review of the Mapuche medicinal flora:
Use patterns on a regional scale. Journal of Ethnopharmacology 122: 251–260.
Muggeo VMR. 2008. segmented: An R package to Fit Regression Models with
Broken-Line Relationships. R News 8: 20–25.
Myburg AA, Lev-Yadun S, Sederoff RR (eds). 2013. Xylem Structure and Function.
In: eLS. John Wiley & Sons Ltd, Chichester.

References
183
Nagata A, Kose K, Terada Y. 2016. Development of an outdoor MRI system for
measuring flow in a living tree. Journal of Magnetic Resonance 265: 129–138.
Nardini A, Lo Gullo MA, Salleo S. 2011. Refilling embolized xylem conduits: Is it a
matter of phloem unloading? Plant Science 180: 604–611.
Nolf M, Beikircher B, Rosner S, Nolf A, Mayr S. 2015. Xylem cavitation resistance
can be estimated based on time-dependent rate of acoustic emissions. New
Phytologist 208: 625–632.
Nolf M, Lopez R, Peters JMR, Flavel RJ, Koloadin LS, Young IM, Choat B. 2017.
Visualization of xylem embolism by X-ray microtomography: a direct test against
hydraulic measurements. New Phytologist 214: 890–898.
Ozevin D, Greve DW, Oppenheim IJ, Pessiki SP. 2006. Resonant capacitive
MEMS acoustic emission transducers. Smart Materials and Structures 15: 1863–
1871.
Pammenter NW, Willigen C V. 1998. A mathematical and statistical analysis of the
curves illustrating vulnerability of xylem to cavitation. Tree Physiology 18: 589–593.
Pereira L, Bittencourt PRL, Oliveira RS, Junior MBM, Barros FV, Ribeiro RV,
Mazzafera P. 2016. Plant pneumatics: stem air flow is related to embolism – new
perspectives on methods in plant hydraulics. New Phytologist 211: 357–370.
Pérez-De-Lis G, García-González I, Rozas V, Olano JM. 2016. Feedbacks
between earlywood anatomy and non-structural carbohydrates affect spring
phenology and wood production in ring-porous oaks. Biogeosciences 13: 5499–5510.
Phillips NG, Oren R, Licata J, Linder S. 2004. Time series diagnosis of tree
hydraulic characteristics. Tree Physiology 24: 879–890.
Piao S, Wang X, Ciais P, Zhu B, Wang T, Liu J. 2011. Changes in satellite-derived
vegetation growth trend in temperate and boreal Eurasia from 1982 to 2006. Global
Change Biology 17: 3228–3239.
Pittermann J. 2005. Torus-Margo Pits Help Conifers Compete with Angiosperms.
Science 310: 1924–1924.
Pittermann J, Sperry JS, Wheeler JK, Hacke UG, Sikkema EH. 2006. Mechanical
reinforcement of tracheids compromises the hydraulic efficiency of conifer xylem.
Plant, Cell and Environment 29: 1618–1628.
Pivovaroff AL, Pasquini SC, De Guzman ME, Alstad KP, Stemke JS, Santiago
LS. 2016. Multiple strategies for drought survival among woody plant species.
Functional Ecology 30: 517–526.

References
184
Plavcová L, Hacke UG. 2011. Heterogeneous distribution of pectin epitopes and
calcium in different pit types of four angiosperm species. New Phytologist 192: 885–
897.
Pockman WT, Sperry JS, O'Leary JW. 1995. Sustained and significant negative
water pressure in xylem. Nature 378: 715–716.
Ponomarenko A, Vincent O, Pietriga A, Cochard H, Badel E, Marmottant P.
2014. Ultrasonic emissions reveal individual cavitation bubbles in water-stressed
wood. Journal of The Royal Society Interface 11: 20140480–20140480.
Reeb J, Milota M. 1999. Moisture content by the oven-dry method for industrial
testing. Oregon State University, Corvallis
Reiterer A, Stanzl-Tschegg SE, Tschegg EK. 2000. Mode I fracture and acoustic
emission of softwood and hardwood. Wood Science and Technology 34: 417–430.
Ritman KT, Milburn JA. 1988. Acoustic emissions from plants: Ultrasonic and
audible compared. Journal of Experimental Botany 39: 1237–1248.
Rockwell FE, Wheeler JK, Holbrook NM. 2014. Cavitation and Its Discontents:
Opportunities for Resolving Current Controversies. Plant Physiology 164: 1649–
1660.
De Roo L, Vergeynst LL, De Baerdemaeker NJF, Steppe K. 2016. Acoustic
Emissions to Measure Drought-Induced Cavitation in Plants. Applied Sciences 6: 71.
Rosner S. 2012. Waveform features of acoustic emission provide information about
reversible and irreversible processes during spruce sapwood drying. BioResources 7:
1253–1263.
Rosner S. 2013. Hydraulic and biomechanical optimization in norway spruce
trunkwood - A review. IAWA Journal 34: 365–390.
Rosner S. 2015. A new type of vulnerability curve: Is there truth in vine? Tree
Physiology 35: 410–414.
Rosner S. 2017. Wood density as a proxy for vulnerability to cavitation : Size
matters. Journal of Plant Hydraulic 4: 1–10.
Rosner S, Klein A, Wimmer R, Karlsson B. 2006. Extraction of features from
ultrasound acoustic emissions: A tool to assess the hydraulic vulnerability of Norway
spruce trunkwood? New Phytologist 171: 105–116.

References
185
Rosner S, Konnerth J, Plank B, Salaberger D, Hansmann C. 2010. Radial
shrinkage and ultrasound acoustic emissions of fresh versus pre-dried Norway
spruce sapwood. Trees - Structure and Function 24: 931–940.
Rucker P, Holm A., Krus M. 2000. Determination of moisture and salt content
distributions by combining NMR and gamma ray measurements. Materialsweek -
Munich.
Ryan MG, Phillips N, Bond BJ. 2006. The hydraulic limitation hypothesis revisited.
Plant, Cell and Environment 29: 367–381.
Ryu J, Hwang BG, Lee SJ. 2016. In vivo dynamic analysis of water refilling in
embolized xylem vessels of intact Zea mays leaves. Annals of Botany 118: 1033–
1042.
Saboonchi H, Ozevin D. 2013. MEMS acoustic emission transducers designed with
high aspect ratio geometry. Smart Materials and Structures 22: 095006.
Sade M, Gebremedhin A, Moshelion M. 2012. Risk-taking plants: Anisohydric
behavior as a stress-resistance trait. Plant Signaling and Behavior 7: 767–770.
Sala A, Piper F, Hoch G. 2010. Physiological mechanisms of drought-induced tree
mortality are far from being resolved. New Phytologist 186: 274–281.
Sala A, Woodruff DR, Meinzer FC. 2012. Carbon dynamics in trees: Feast or
famine? Tree Physiology 32: 764–775.
Salleo S, Lo Gullo MA, Trifilò P, Nardini A. 2004. New evidence for a role of
vessel-associated cells and phloem in the rapid xylem refilling of cavitated stems of
Laurus nobilis L. Plant, Cell and Environment 27: 1065–1076.
Salomón RL, Limousin JM, Ourcival JM, Rodríguez-Calcerrada J, Steppe K.
2017. Stem hydraulic capacitance decreases with drought stress: implications for
modelling tree hydraulics in the Mediterranean oak Quercus ilex. Plant Cell and
Environment 40: 1379–1391.
Sathya R, Abraham A. 2013. Comparison of Supervised and Unsupervised Learning
Algorithms for Pattern Classification. International Journal of Advanced Research in
Artificial Intelligence 2: 34–38.
Sause MGR. 2011. Investigation of pencil-lead breaks as acoustic emission sources.
Journal of Acoustic Emission 29: 184–196.
Saveyn A, Steppe K, Ubierna N, Dawson TE. 2010. Woody tissue photosynthesis
and its contribution to trunk growth and bud development in young plants. Plant, Cell
and Environment 33: 1949–1958.
References
186
Schenk HJ, Espino S, Romo DM, Nima N, Do AYT, Michaud JM,
Papahadjopoulos-Sternberg B, Yang J, Zuo YY, Steppe K, et al. 2017. Xylem
Surfactants Introduce a New Element to the Cohesion-Tension Theory. Plant
Physiology 173: 1177–1196.
Schenk HJ, Steppe K, Jansen S. 2015. Nanobubbles: A new paradigm for air-
seeding in xylem. Trends in Plant Science 20: 199–205.
Schindelin J, Arganda-Carreras I, Frise E, Kaynig V, Longair M, Pietzsch T,
Preibisch S, Rueden C, Saalfeld S, Schmid B, et al. 2012. Fiji: An open source
platform for biological image analysis. Nature Methods 9: 676–682.
Schmitz N, Egerton JJG, Lovelock CE, Ball MC. 2012. Light-dependent
maintenance of hydraulic function in mangrove branches: Do xylary chloroplasts play
a role in embolism repair? New Phytologist 195: 40–46.
Scholander P. F, Hammel H. T, Bradstreet ED, Hemmingsen EA. 1965. Sap
pressure in vascular plants. Science 148: 339–346.
Scholz A, Klepsch M, Karimi Z, Jansen S. 2013a. How to quantify conduits in
wood? Frontiers in Plant Science 4: 1–11.
Scholz A, Rabaey D, Stein A, Cochard H, Smets E, Jansen S. 2013b. The
evolution and function of vessel and pit characters with respect to cavitation
resistance across 10 Prunus species. Tree Physiology 33: 684–694.
Schulte PJ, Hacke UG, Schoonmaker AL. 2015. Pit membrane structure is highly
variable and accounts for a major resistance to water flow through tracheid pits in
stems and roots of two boreal conifer species. New Phytologist 208: 102–113.
Schulze ED, Čermák J, Matyssek M, Penka M, Zimmermann R, Vasícek F, Gries
W, Kučera J. 1985. Canopy transpiration and water fluxes in the xylem of the trunk
of Larix and Picea trees - a comparison of xylem flow, porometer and cuvette
measurements. Oecologia 66: 475–483.
Secchi F, Zwieniecki MA. 2010. Patterns of PIP gene expression in Populus
trichocarpa during recovery from xylem embolism suggest a major role for the PIP1
aquaporin subfamily as moderators of refilling process. Plant, Cell and Environment
33: 1285–1297.
Secchi F, Zwieniecki MA. 2012. Analysis of Xylem Sap from Functional
(Nonembolized) and Nonfunctional (Embolized) Vessels of Populus nigra: Chemistry
of Refilling. Plant Physiology 160: 955–964.

References
187
Selosse MA, Strullu-Derrien C, Martin FM, Kamoun S, Kenrick P. 2015. Plants,
fungi and oomycetes: A 400-million year affair that shapes the biosphere. New
Phytologist 206: 501–506.
Sevanto S. 2014. Phloem transport and drought. Journal of Experimental Botany 65:
1751–1759.
Sinha AK. (ed) 2004. Modern Plant Physiology. Narosa Publishing House, New
Delhi.
Sperling P, Heinz E. 2003. Plant sphingolipids: Structural diversity, biosynthesis, first
genes and functions. Biochimica et Biophysica Acta - Molecular and Cell Biology of
Lipids 1632: 1–15.
Sperry JS. 2000. Hydraulic constraints on plant gas exchange. Agricultural and
Forest Meteorology 104: 13–23.
Sperry JS. 2003. Evolution of Water Transport and Xylem Structure. International
Journal of Plant Sciences 164: S115–S127.
Sperry JS, Donnelly JR, Tyree MT. 1988a. A method for measuring hydraulic
conductivity and embolisms in xylem. Plant, Cell & Environment 11: 35–40.
Sperry JS, Hacke UG. 2004. Analysis of circular bordered pit function I. Angiosperm
vessels with homogenous pit membranes. American Journal of Botany 91: 369–385.
Sperry JS, Holbrook NM, Zimmermann MH, Tyree MT. 1987. Spring filling of
xylem vessels in wild grapevine. Plant physiology 83: 414–417.
Sperry JS, Meinzer FC, McCulloh KA. 2008. Safety and efficiency conflicts in
hydraulic architecture: Scaling from tissues to trees. Plant, Cell and Environment 31:
632–645.
Sperry JS, Tyree MT. 1988. Mechanism of Water Stress-Induced. Plant physiology
88: 581–587.
Sperry JS, Tyree MT. 1990. Water‐stress‐induced xylem embolism in three species
of conifers. Plant, Cell & Environment 13: 427–436.
Sperry JS, Tyree MT, Donnelly JR. 1988b. Vulnerability of xylem to embolism in a
mangrove vs an inland species of Rhizophoraceae. Physiologia Plantarum 74: 276–
283.
Steppe K, Cochard H, Lacointe A, Améglio T. 2012. Could rapid diameter changes
be facilitated by a variable hydraulic conductance? Plant, Cell and Environment 35:
150–157.

References
188
Steppe K, Lemeur R. 2007. Effects of ring-porous and diffuse-porous stem wood
anatomy on the hydraulic parameters used in a water flow and storage model. Tree
physiology 27: 43–52.
Steppe K, Lemeur R, Samson R. 2002. Sap flow dynamics of a beech tree during
the solar eclipse of 11 August 1999. Agricultural and Forest Meteorology 112: 139–
149.
Steppe K, Pauw DJW De, Lemeur R, Vanrolleghem PA. 2006. A mathematical
model linking tree sap flow dynamics to ily stem diameterfluctuations and radial stem
growth. Tree physiology 26: 257–273.
Steppe K, Saveyn A, McGuire MA, Lemeur R, Teskey RO. 2007. Resistance to
radial CO2 diffusion contributes to between-tree variation in CO2 efflux of Populus
deltoides stems. Functional Plant Biology 34: 785–792.
Steppe K, Sterck F, Deslauriers A. 2015. Diel growth dynamics in tree stems:
Linking anatomy and ecophysiology. Trends in Plant Science 20: 335–343.
Steudle E. 2001. The cohesion -tension mechanism and the acquisition of water by
plant roots. Annual Review of Plant Physiology and Plant Molecular Biology 52: 847–
875.
Suuronen J-P, Peura M, Fagerstedt K, Serimaa R. 2013. Visualizing water-filled
versus embolized status of xylem conduits by desktop x-ray microtomography. Plant
Methods 9: 11.
De Swaef T, Hanssens J, Cornelis A, Steppe K. 2013. Non-destructive estimation
of root pressure using sap flow, stem diameter measurements and mechanistic
modelling. Annals of Botany 111: 271–282.
Swan AL, Mobasheri A, Allaway D, Liddell S, Bacardit J. 2013. Application of
Machine Learning to Proteomics Data: Classification and Biomarker Identification in
Postgenomics Biology. OMICS: A Journal of Integrative Biology 17: 595–610.
Teskey RO, Saveyn A, Steppe K, McGuire MA. 2008. Origin, fate and significance
of CO2 in tree stems. New Phytologist 177: 17–32.
Torres-Ruiz JM, Jansen S, Choat B, McElrone AJ, Cochard H, Brodribb TJ,
Badel E, Burlett R, Bouche PS, Brodersen CR, et al. 2015. Direct X-Ray
Microtomography Observation Confirms the Induction of Embolism upon Xylem
Cutting under Tension. Plant Physiology 167: 40–43.
Torres-Ruiz JM, Sperry JS, Fernández JE. 2012. Improving xylem hydraulic
conductivity measurements by correcting the error caused by passive water uptake.
Physiologia Plantarum 146: 129–135.

References
189
Trifilò P, Raimondo F, Lo Gullo MA, Barbera PM, Salleo S, Nardini A. 2014.
Relax and refill: Xylem rehydration prior to hydraulic measurements favours
embolism repair in stems and generates artificially low PLC values. Plant Cell and
Environment 37: 2491–2499.
Tyree MT. 2003. The ascent of water. Nature 423: 923.
Tyree MT, Davis SD, Cochard H. 1994. Biophysical Perspectives of Xylem
Evolution: is there a Tradeoff of Hydraulic Efficiency for Vulnerability to Dysfunction?
IAWA Journal 15: 335–360.
Tyree MT, Dixon MA. 1983. Cavitation Events in Thuja occidentalis L.? : Utrasonic
Acoustic Emissions from the Sapwood Can Be Measured. Plant Physiology 72:
1094–1099.
Tyree MT, Dixon MA, Thompson RG. 1984a. Ultrasonic Acoustic Emissions from
the Sapwood of Thuja occidentalis Measured inside a Pressure Bomb. Plant
physiology 74: 1046–9.
Tyree MT, Dixon MA, Tyree EL, Johnson R. 1984b. Ultrasonic acoustic emissions
from the sapwood of cedar and hemlock : an examination of three hypotheses
regarding cavitations. Plant Physiology 75: 988–992.
Tyree MT, Ewers FW. 1991a. Tansley Review No. 34. The Hydraulic Architecture of
Trees and Other Woody Plants. New Phytologist 119: 345–360.
Tyree M, Ewers FW. 1991b. The hydraulic architecture of trees and other woody
plants. New Phytologist 119: 345–360.
Tyree MT, Salleo S, Nardini A, Lo Gullo MA, Mosca R. 1999. Refilling of embolized
vessels in young stems of laurel. Do We need a new paradigm? Plant physiology
120: 11–21.
Tyree MT, Sperry JS. 1989a. Vulnerability of Xylem to Cavitation and Embolism.
Annual Review of Plant Physiology and Plant Molecular Biology 40: 19–36.
Tyree MT, Sperry JS. 1989b. Characterization and propagation of acoustic emission
signals in woody plants: towards an improved acoustic emission counter. Plant, Cell
& Environment 12: 371–382.
Tyree MT, Yang S. 1992. Hydraulic Conductivity Recovery versus Water Pressure in
Xylem of Acer saccharum. Plant physiology 100: 669–76.
Tyree MT, Zimmermann MH. (eds) 2002. Xylem structure and the ascent of sap,
2nd edition. Springer-Verlag, Berlin, Germany.

References
190
Utsumi Y, Sano Y, Ohtani J, Fujikawa S. 1996. Seasonal changes in the
distribution of water in the outer growth rings of Fraxinus mandshurica var. japonica:
A study by cryo-scanning electron microscopy. IAWA Journal 17: 113–124.
Vandegehuchte MW, Bloemen J, Vergeynst LL, Steppe K. 2015. Woody tissue
photosynthesis in trees: Salve on the wounds of drought? New Phytologist 208: 998–
1002.
Venturas MD, Sperry JS, Hacke UG. 2017. Plant xylem hydraulics: What we
understand, current research, and future challenges. Journal of Integrative Plant
Biology 59: 356–389.
Vergeynst LL, Dierick M, Bogaerts JAN, Cnudde V, Steppe K. 2015a. Cavitation:
A blessing in disguise? New method to establish vulnerability curves and assess
hydraulic capacitance of woody tissues. Tree Physiology 35: 400–409.
Vergeynst LL, Sause MGR, De Baerdemaeker NJF, De Roo L, Steppe K. 2016.
Clustering reveals cavitation-related acoustic emission signals from dehydrating
branches. Tree Physiology 36: 786–796.
Vergeynst LL, Sause MGR, Hamstad MA, Steppe K. 2015b. Deciphering acoustic
emission signals in drought stressed branches: the missing link between source and
sensor. Frontiers in Plant Science 6: 1–11.
Vilagrosa A, Chirino E, Peguero-Pina JJ, Barigah TS, Cochard H, Gil-Pelegrín E.
2012. Xylem Cavitation and Embolism in Plants Living in Water-Limited Ecosystems.
In: Plant Responses to Drought Stress. Berlin, Heidelberg: Springer Berlin
Heidelberg, 63–109.
Vlassenbroeck J, Dierick M, Masschaele B, Cnudde V, Van Hoorebeke L,
Jacobs P. 2007. Software tools for quantification of X-ray microtomography at the
UGCT. Nuclear Instruments and Methods in Physics Research, Section A:
Accelerators, Spectrometers, Detectors and Associated Equipment 580: 442–445.
Van de Wal BAE, Windt CW, Leroux O, Steppe K. 2017. Heat girdling does not
affect xylem integrity: an in vivo magnetic resonance imaging study in the tomato
peduncle. New Phytologist 215: 558–568.
Wegner LH. 2014. Root pressure and beyond: Energetically uphill water transport
into xylem vessels? Journal of Experimental Botany 65: 381–393.
Wheeler JK, Huggett BA, Tofte AN, Rockwell FE, Holbrook NM. 2013. Cutting
xylem under tension or supersaturated with gas can generate PLC and the
appearance of rapid recovery from embolism. Plant, Cell and Environment 36: 1938–
1949.

References
191
Wheeler JK, Sperry JS, Hacke UG, Hoang N. 2005. Inter-vessel pitting and
cavitation in woody Rosaceae and other vessel led plants: A basis for a safety versus
efficiency trade-off in xylem transport. Plant, Cell and Environment 28: 800–812.
Windt CW, Blümler P. 2015. A portable NMR sensor to measure dynamic changes
in the amount of water in living stems or fruit and its potential to measure sap flow.
Tree Physiology 35: 366–375.
Windt CW, Vergeldt FJ, De Jager PA, Van As H. 2006. MRI of long-distance water
transport: A comparison of the phloem and xylem flow characteristics and dynamics
in poplar, castor bean, tomato and tobacco. Plant, Cell and Environment 29: 1715–
1729.
Wolkerstorfer S V., Rosner S, Hietz P. 2012. An improved method and data
analysis for ultrasound acoustic emissions and xylem vulnerability in conifer wood.
Physiologia Plantarum 146: 184–191.
Zhang Y, Lamarque LJ, Torres-Ruiz JM, Schuldt B, Karimi Z, Li S, Qin D-W,
Bittencourt P, Burlett R, Cao K-F, et al. 2018. Testing the plant pneumatic method
to estimate xylem embolism resistance in stems of temperate trees. Tree Physiology,
in press.
Zimmermann MH. (ed) 1983. Xylem structure and the ascent of sap. Springer-
Verlag, Berlin, Germany.
Zweifel R, Item H, Häsler R. 2001. Link between diurnal stel radius changes and
tree water relations. Tree Physiology 21: 869–877.
Zweifel R, Zeugin F. 2008. Ultrasonic acoustic emissions in drought-stressed trees -
More than signals from cavitation? New Phytologist 179: 1070–1079.
Zwieniecki MA, Holbrook NM. 2009. Confronting Maxwell’s demon: biophysics of
xylem embolism repair. Trends in Plant Science 14: 530–534.


Summary
193
Drought stress is one of the most important environmental stresses, induced by low
soil water availability, high atmospheric demand, high temperatures or a combination
of such, endangering vascular plant physiology and with mortality often the dire end
result. With climatic change scenarios predicting increases in the occurrence and
severity of drought stress events, uncertainty rises on how vascular plants will be
able to cope and endure the drought challenges that lay ahead, especially as their
survival is key to create livable conditions for all life on earth. Drought stress will
mainly affect the hydraulic performance of the xylem conducting system that plants
utilize to transport water from soil to atmosphere, by creating gas emboli in the xylem
conduits in a process defined as cavitation. Subsequent embolism formation
drastically impairs xylem water transport, implying that plants will lose the ability to
sufficiently fuel their metabolism, as photosynthesis will be strongly reduced.
Quantifying vulnerability to drought-induced cavitation of different plant species is
crucial to increase our understanding on the working principle behind the cavitation
process and which strategies policy makers must undertake to ensure plant survival.
The hydraulic method has been developed to measure the impact of cavitation on
plant physiology and has been used for decades, but unresolved questions encircle
S
SUMMARY

Summary
194
the method on what the effect of the technique is on the cavitation process, and on
dynamic water relations. Because drought tolerance is not uniquely depicted by
vessel resistivity to embolism formation, but also in the presence of water storage
buffers and additional xylem anatomical adaptations to ward off cavitation, the need
for techniques that better map a plant species’ response to drought-induced
cavitation is vital to effectively move forward.
In this doctoral thesis, the hydraulic method was thoroughly investigated to unravel
uncertainties associated with its working principle, and the versatility and usability of
the acoustic emission (AE) technique as a continuous and non-invasive alternative to
the hydraulic method in drought-induced cavitation research was explored. Both
techniques have been around for several years, but in contrast to the hydraulic
method, the AE technique has known recent advancements in sensor and data
acquisition system development, providing an ideal platform to further unravel the
principles of cavitation. Research was aimed at conducting experiments on
dehydrating plant samples to stimulate the transition from the rather outdated
hydraulic method to the AE technique as a promising and reliable diagnostic tool to
comprehensively map plant responses to drought-induced cavitation.
The main uncertainties shrouding the hydraulic method are directly linked to its
working principle of using pressurized water on dehydrating branch samples to
quantify the degree of cavitation by measuring loss of hydraulic conductivity (Kh). The
effect of pressurized water on dynamic water relations and the correct time to
achieve stable Kh readings has never been theoretically nor physiologically clarified
in literature. Our experiment illustrated that stable Kh readings are achieved after long
time spans at hydraulic steady-state, meaning that inflow must equal outflow and
radial flow to surrounding xylem tissue zero. The main issue however is that
pressurized flow interacts with dynamic water relations, creating artificial embolism
refilling, and hence that hydraulic steady-state Kh readings are not representative for
the degree of drought-induced cavitation at the start of measuring. It is clear that the
hydraulic method needs to be redesigned from its core principle and that its non-
continuous and destructive nature slows down necessary developments in
understanding drought-induced cavitation and its complex effects on plant
physiology.
AE was tested, validated and assessed as a possible substitute to measure drought-
induced cavitation and whether the AE technique can address the shortcomings of
the hydraulic method. AE benefits from its non-invasive and continuous character,
and results indicated that compared to the hydraulic method, vulnerability curves
(VC) were obtained that respected dynamic water relations and that were conform to

Summary
195
VCs derived from X-ray computed microtomography (µCT), the state-of-the-art
reference technique that actively visualizes ongoing embolism formation. In the
search for a reliable and fast drought stress screening technique, µCT is however not
suited as routine cavitation measurements are too expensive and cumbersome.
Because published results with the hydraulic method also indicated that woody tissue
photosynthesis plays an active role in embolism repair, acoustic emissions were used
in this research to address the embolism repair statement as it was caused by
artificial refilling, and simultaneously expose the more likely role of woody tissue
photosynthesis to reduce vulnerability to cavitation in the production of xylem
surfactants necessary to stabilize nanobubbles preceding embolism formation.
Aiming for a method that better maps plant vulnerability to drought, the easy-to-use
AE technique proved to be the ideal candidate by combining acoustic VCs with xylem
anatomical measurements and continuous weight balance measurements to obtain
desorption curves from which hydraulic capacitance can be derived. The proposed
tripartite method provides information on the vulnerability of xylem to cavitation, the
buffer capacity of internally stored water to temper decreases in xylem tension, and
xylem structural adaptations to protect the hydraulic system. AE is often unjustifiably
reported of being more qualitative than quantitative, because sensors are sensitive to
different dehydration-related AE sources aside from cavitation. Combining µCT with
AE measurements in this research allowed extracting cavitation-related AE with
machine learning methods to tackle its qualitative citation and highlight the
improvement potential of this technique over the hydraulic method.
AE possesses the necessary characteristics to become a fast and reliable drought
screening technique that will be vital for growers and forest managers to effectively
counter predicted scenarios of increased drought. In a world asking for and relying on
automatization processes to provide the required information, investment in AE
research is the logical step forward to address the need for a better understanding of
plant drought stress responses.


Samenvatting
197
Droogtestress is één van de belangrijkste vormen van milieustress en ontstaat door
een lage bodemwaterbeschikbaarheid, hoge atmosferische vraag, hoge temperatuur
of een combinatie van deze oorzaken. Dit is bedreigend voor de fysiologie van
planten met mortaliteit vaak tot nefast gevolg. Klimaatsverandering voorspelt
momenteel een toename in de frequentie en de mate waarin droogtestress zich kan
voordoen. Bijgevolg stijgt de onzekerheid over hoe planten weerstand kunnen bieden
aan voorspelde droogtestress-uitdagingen en de overleving van planten onder
dergelijke omstandigheden is juist cruciaal in het creëren van levensvatbare condities
op aarde. Droogtestress resulteert voornamelijk in cavitatie, een proces waarbij
gasvormige embolieën ontstaan in de xyleemvaten, met als gevolg een afname in
hydraulische efficiëntie van het geleidend systeem dat planten gebruiken om water
van bodem naar atmosfeer te transporteren. Aanhoudende cavitatie reduceert sterk
het xyleemtransport tot op het niveau dat plantmetabolisme ondermijnd wordt door
het stilvallen van fotosynthese. Om plantoverleving te garanderen, is het
kwantificeren van hoe vatbaar planten zijn voor cavitiatie ten gevolge van droogte
belangrijk, teneinde efficiënte tegenmaatregelen te kunnen ondernemen. Om die
specifieke reden werd de hydraulische methode ontwikkeld om de impact van
S
SAMENVATTING
Samenvatting
198
cavitatie te kwantificeren. Desondanks de methode al jaren in gebruik is, zijn er toch
enkele prangende vragen omtrent het werkingsmechanisme van de methode zoals
wat het effect is op het cavitatieproces en op dynamische plant-water relaties. Omdat
droogtetolerantie niet enkel bepaald wordt door de weerstand tegen cavitatie, maar
ook door de aanwezigheid van bufferende waterreserves en structurele xyleem
aanpassingen, is er nood aan een techniek die de cavitatie respons van planten
beter beschrijft.
In dit doctoraatsproefschrift werd enerzijds de onzekerheid rond het werkingsprincipe
van de hydraulische methode onderzocht en anderzijds werd de veelzijdigheid en
bruikbaarheid van de akoestische emissie techniek (AE) als een continue en niet-
invasief alternatief voor de hydraulische methode verkent. In tegenstelling tot de
hydraulische methode, kent de AE techniek de afgelopen jaren een sterke
vooruitgang door de ontwikkeling van nieuwe sensoren en data-acquisitiesystemen.
De AE methode kan bijgevolg als ideaal lanceerplatform dienen om de principes
achter het cavitatieproces verder te ontrafelen. Onderzoek in dit proefschrift is gericht
op het uitvoeren van droogte experimenten op plantenstalen om de transitie van de
hydraulische methode naar de AE techniek te stimuleren. AE kan immers een
veelbelovende en betrouwbare diagnostische tool worden om de cavitatie respons
van planten beter in kaart te brengen.
De voornaamste onzekerheden rond het gebruik van de hydraulische methode zijn
gerelateerd aan het werkingsmechanisme, waarbij water onder positieve druk
doorheen uitgedroogde takken wordt gestuurd om het verlies aan hydraulische
geleidbaarheid (Kh) door cavitatie te kwantificeren. Het effect van water onder
positieve druk op dynamische plant-water relaties is nog nooit vanuit een theoretisch
noch fysiologisch standpunt verklaard geweest in de huidige literatuur. Ons
experiment heeft aangetoond dat hydraulisch stabiele Kh, waarvoor instroom gelijk
moet zijn aan uitstroom en radiale stroom naar het omgevende xyleem weefsel nihil,
zeer laat bereikt wordt. Het belangrijkste probleem van de hydraulische methode is
dat water onder positieve druk een belangrijke invloed heeft op dynamische plant-
water relaties doordat het resulteert in artificieel cavitatieherstel. Bijgevolg zijn
hydraulisch stabiele Kh waarden niet langer representatief voor de mate aan droogte-
geïnduceerde cavitatie bij de start van de metingen. Het is duidelijk dat het
meetprincipe van de hydraulische methode onderzocht moet worden en dat het niet-
continue en destructieve karakter van de methode nefast is voor het beter begrijpen
van het cavitatie proces en diens impact op plantfysiologie.
Om te antwoorden aan de tekortkomingen van de hydraulische methode, werd er
uitgebreid onderzoek gedaan naar de AE techniek. AE is een sterk bevoordeelde

Samenvatting
199
methode dankzij het niet-invasieve en continue karakter. De bekomen resultaten
hebben aangetoond dat, in tegenstelling tot de hydraulische methode, de
resulterende vatbaarheidscurves (VC) dynamische plant water-relaties respecteren
en conform zijn met VCs afgeleid uit X-stralen microtomografie (µCT). µCT wordt
gezien als de state-of-the-art referentietechnologie aangezien het cavitatievorming in
real-time kan visualiseren. µCT is echter duur en omslachtig voor routine cavitatie
metingen, en bijgevolg minder geschikt als snelle en betrouwbare droogtestress
screeningstechniek. Resultaten bekomen met de hydraulische methode hebben
aangetoond dat stamfotosynthese cruciaal is in het proces van cavitatie herstel, en
daarom werden AEs verzameld om te kunnen aantonen dat het gemeende cavitatie
herstel gevolg was van artificiële hervulling door de hydraulische methode.
Bovendien brachten AEs de meer waarschijnlijkere rol van stamfotosynthese aan het
licht, zijnde een actieve bijdrage in de productie van xyleemsurfactants die cruciaal
zijn voor het stabiliseren van nanobubbels die de vorming van cavitatie vooraf gaan.
De gebruiksvriendelijkheid van AEs maken van deze techniek de ideale tool om een
meer omvattende droogtestress respons methode te ontwikkelen door akoestische
VCs te combineren met xyleemanatomie metingen en continue gewichtsafname
metingen om desorptiecurves te bekomen van waaruit hydraulisch capaciteit
afleidbaar is. De voorgestelde driedelige methode in dit proefschrift biedt aldus
informatie over de weerstand van xyleem vaten tegen cavitatie, de capaciteit van
interne water reserves om toename in xyleem druk te bufferen en structurele xyleem
veranderingen om het hydraulisch systeem te beschermen. Echter wordt AE vaak
onterecht geciteerd meer kwalitatief dan kwantitatief te zijn doordat de sensoren
verschillende droogte-gerelateerde AE bronnen registreren buiten cavitatie. Door in
dit proefschrift µCT te combineren met AE, werd het mogelijk om met behulp van
machine learning de cavitatie-gerelateerde AE eruit te filteren. Daarmee kon het
kwalitatieve aspect rondom de AE methode weerlegd worden en werd hiermee het
verbeterpotentieel van de AE methode tegenover de hydraulische methode
benadrukt.
AE beschikt over de nodige kwaliteiten om een snelle en betrouwbare screening
techniek te worden, die telers en bosbeheerders kunnen gebruiken om efficiënt de
voorspelde scenario’s van toenemende droogtestress aan te pakken. In een wereld
die vraagt en vertrouwt op geautomatiseerde processen om informatie aan te
leveren, is investering in AE onderzoek de logische stap voorwaarts om het effect
van droogte gerelateerde cavitatie op planten vroegtijdig op te sporen.


Curriculum vitae
201
Personalia
Name Niels De Baerdemaeker
Date of birth 21 April 1990
Place of birth Ghent (Belgium)
Nationality Belgian
Address Hulleken 3, 9940 Evergem
Telephone +32 473 589 076
E-mail [email protected]
Education
2013-2018 PhD in Bioscience Engineering: From hydraulics to
acoustics in drought-induced cavitation research.
Promoter: Prof. Dr. ir. Kathy Steppe
CV
CURRICULUM VITAE

Curriculum vitae
202
2011-2013 Master of Science in Bioscience Engineering:
Forest and Nature Management, Ghent University
Thesis: Sap flow and growth characteristics of the
native Australian species Banksia aemula R. Br. under
subtropical conditions.
Promoter: Prof. Dr. ir. Kathy Steppe
2008-2011 Bachelor of Bioscience Engineering: Land and Forest
management, Ghent University
2002-2008 Secondary school: Science-mathematics, Sint-Franciscus
Evergem
Additional education
2013-2018 Doctoral Schools Ghent University
2014 Cost-action STReSS training school: Modelling of plant
responses to stress conditions
2016 Effective graphical displays
Job market for young researchers
Grants
Feb 2018 – … Grant supported by the EU Interreg project 2 Seas
Mers Zeeën. Title: “Bio4Safe: an innovative approach to
enhance resource efficiency and safeguarding by using
biostimulants and innovative sensors in horticulture”
April 2015 – Dec 2017 PhD grant supported by the FWO research project granted
to Kathy Steppe. Title: “11C combined with advanced plant-
based measures to unravel the plant-carbon dynamics in
current and future climatic conditions”

Curriculum vitae
203
PhD grant supported by the FWO research project granted
to Kathy Steppe. Title: “Refixation of xylem-transported
CO2 and the contribution to stem growth and light-
dependent cavitation repair”
Sep 2014 Grant from the Scientific Research Committee (CWO,
Faculty of Bioscience Engineering, Ghent University) for
participating in the Plant Hydraulics Workshop 2014, Ulm
May 2014 COST grant for participation in the training school:
“Modeling of plant responses to stress conditions”
Nov 2013 – March 2015 PhD grant supported by the NSF research project granted
to H. Jochen Schenk, Steven Jansen and Kathy Steppe.
Title: “Water in, air out: Mechanisms of xylem embolism
repair in seed plants”
Aug 2012 Master travel grant from the Scientific Research
Committee (CWO, Faculty of Bioscience Engineering,
Ghent University) to Queensland, Australia
Research stays abroad
Aug-Sep 2012 Research stay at Moreton Bay Research station in North
Stradbroke Island, Queensland, Australia for Banksia
aemula R. Br. research in context of master thesis
Teaching and tutor activities
2014-2015 Teaching of the technical notes “pressure chamber” and
“thermocouple psychrometery” and related practica for the
course “Ecofysiologie”
2015-2016 Tutor of master thesis Célestin Demuytere: Acoustics for
a sustainable future (ASuF): Real-time stress assessment
using tree monitoring

Curriculum vitae
204
2015-2016 Member of reading committee for three master theses
2016-2017 Co-tutor of master thesis Tino Baert: Cavitatie in
graangewassen: Hoe vatbaar zijn triticale, tarwe en
rogge voor droogtestress
Tutor of master thesis Keerthika Nirmani Ranathunga
Arachchige: Measuring vulnerability to drought-induced
cavitation: assessment of the hydraulic method in Malus
sylvestris L.
Tutor of master thesis Bert Peeters: The use of acoustic
emissions in drought-induced cavitation research:
establishing a link between AE and visually detected
embolisms via X-ray computed microtomography in
Prunus avium L.
Publications
International publications with peer review (A1)
De Baerdemaeker NJF*, Hias N*, Van den Bulcke J, Keulemans W, Steppe K (2018)
The effect of polyploidization on tree hydraulic functioning. American Journal
of Botany: 105: 163–173.
De Baerdemaeker NJF, Salomón RL, De Roo L, Steppe K (2017) Sugars from woody
tissue photosynthesis reduce xylem vulnerability to cavitation. New Phytologist
216(3): 720–727.
Epila J*, De Baerdemaeker NJF*, Vergeynst LL, Maes WH, Beeckman H, Steppe K
(2017) Capacitive water release and internal leaf water relocation delay
drought-induced cavitation in African Maesopsis eminii. Tree Physiology 37(4):
481–490.
De Roo L, Vergeynst LL, De Baerdemaeker NJF, Steppe K (2016) Acoustic
emissions to measure drought-induced cavitation in plants. Applied Sciences
6: 71.

Curriculum vitae
205
Vergeynst LL, Sause MGR, De Baerdemaeker NJF, De Roo L, Steppe K (2016)
Clustering reveals cavitation-related acoustic emission signals from
dehydrating branches. Tree Physiology 36: 786–796.
Vandegehuchte MW, Guyot A, Hubeau M, De Groote SRE, De Baerdemaeker NJF,
Hayes M, Welti N, Lovelock CE, Lockington DA, Steppe K (2014) Long-term
versus daily stem diameter variation in co-occurring mangrove: Environmental
versus ecophysiological drivers. Agricultural and Forest Meteorology 192–193:
51–58.
*Equally contributing first authors
Posters
Epila J, De Baerdemaeker NJF, Hubeau M, Beeckman H, Verbeeck H, Okullo JBL,
Steppe K (2015) Combining AE, PET and wood anatomy to understand
drought-stress responses of Africa’s tropical forests: A case study of Ugandan
Maesopsis Eminii Engl. seedlings. 9th symposium of the Ghent Africa Platform,
Ghent, Belgium, 17 December 2015.
Epila J, Hubeau M, De Baerdemaeker NJF, Verbeeck H, Okullo JBL, Steppe K
(2015) The non-food-tree-crop Maesopsis eminii Engl. investigated with PET
and AE: A case of technology transfer. 9th Belgian Plant Biotechnology
symposium, Brussels, Belgium, 13 November 2015.


