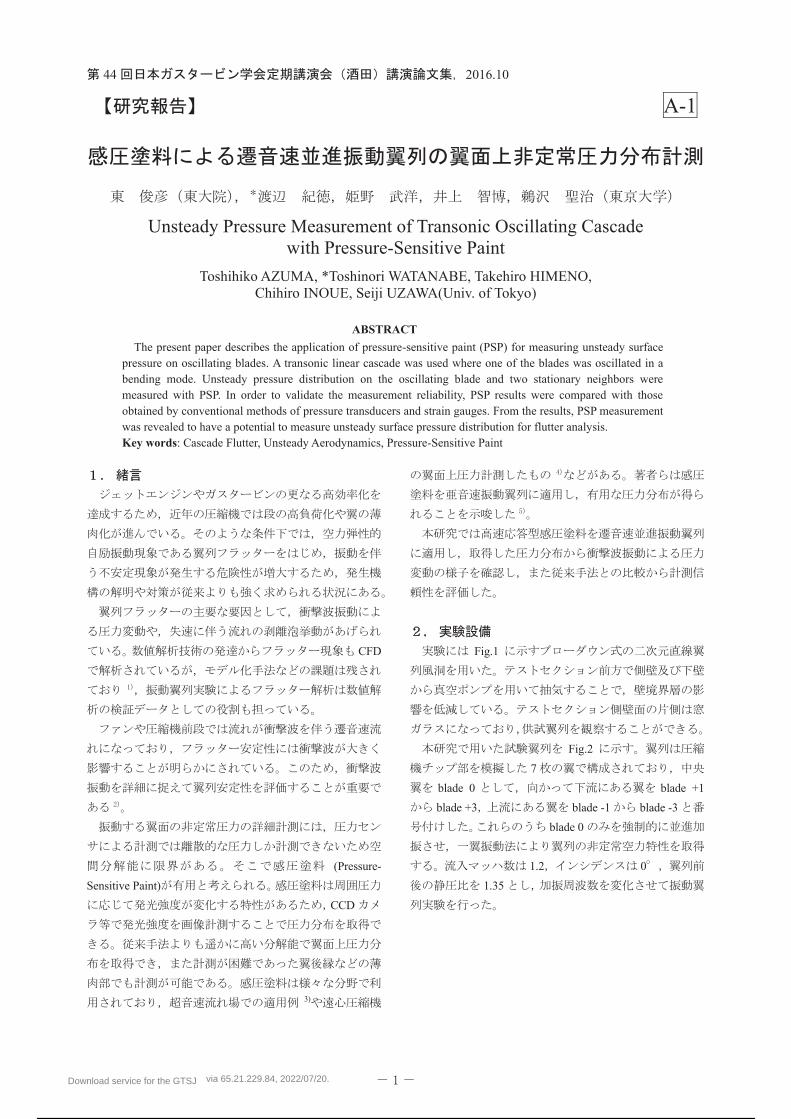
Embed Size (px)
Citation preview
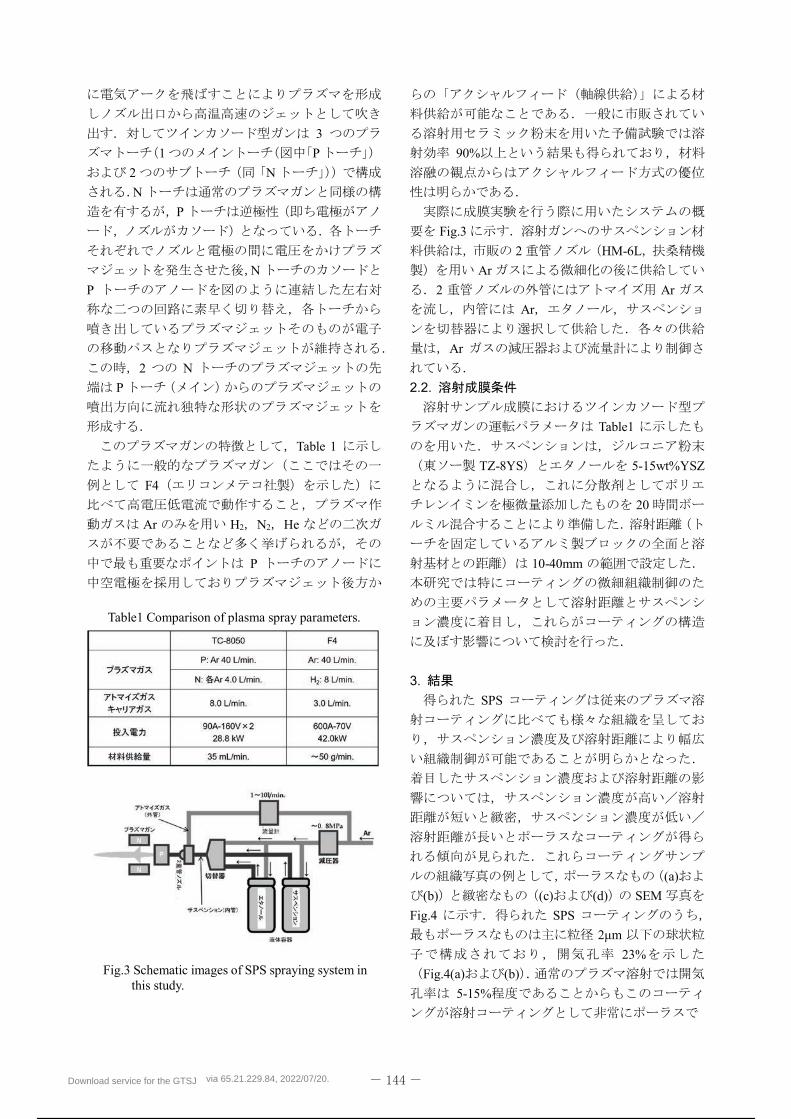
Download service for the GTSJ via 65.21.229.84, 2022/07/20.
1 / 298
Download service for the GTSJ via 65.21.229.84, 2022/07/20.
2 / 298
Download service for the GTSJ via 65.21.229.84, 2022/07/20.
3 / 298
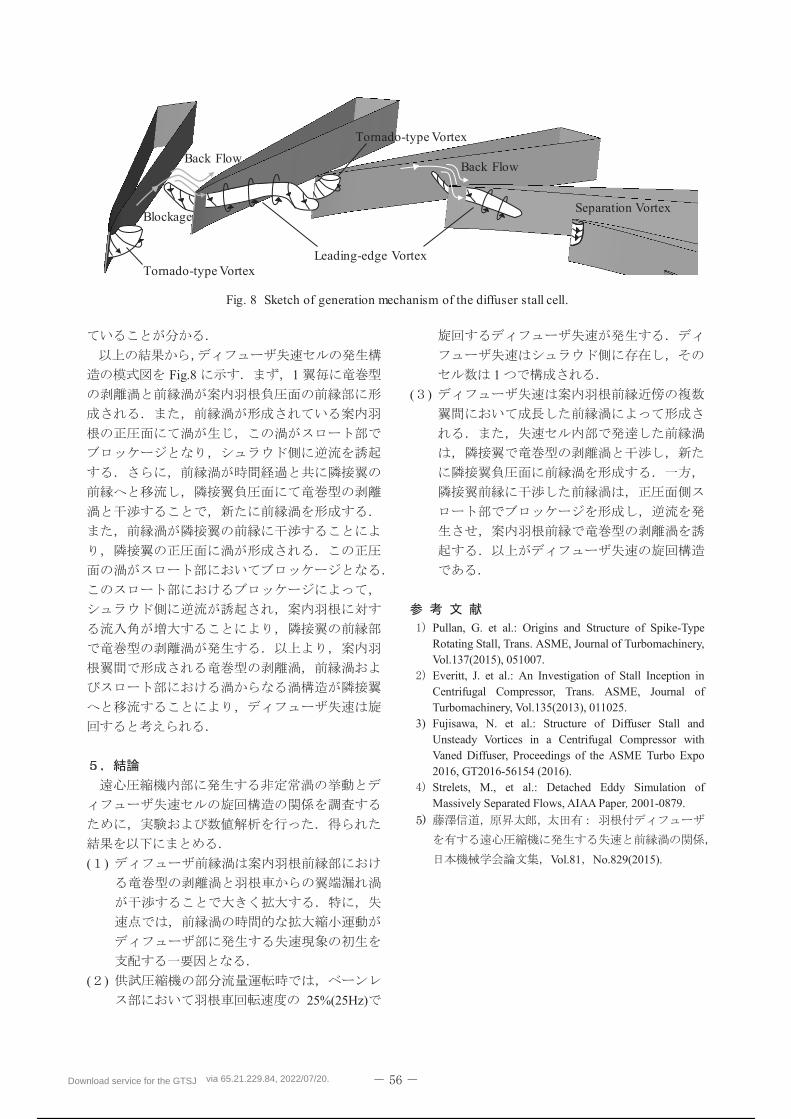
Download service for the GTSJ via 65.21.229.84, 2022/07/20.
4 / 298
Download service for the GTSJ via 65.21.229.84, 2022/07/20.
5 / 298
Download service for the GTSJ via 65.21.229.84, 2022/07/20.
6 / 298
A-2
A Data Connection Method for Fluid-Structure Interaction Analysis of Turbine Blades
*Tadashi TANUMA (Teikyo Univ.), Hiroshi OKUDA, Gaku HASHIMOTO (Tokyo Univ.) and Kumi AKIYAMA (Office Kei)
ABSTRACT
Aerodynamic optimum designs of stator blades are already introduced in many designs of actual operating
commercial steam turbine units. However, aerodynamic optimum designs of rotating blades are still difficult due
to high centrifugal force and vibration stress on rotating blades. This paper presents a data connection method
for fluid-structure interaction analysis of turbine rotating blades to enhance FSI analysis for turbine designs.
Key words: Steam turbines, Long blades, Fluid-Structure Interaction Analysis, unsteady analysis
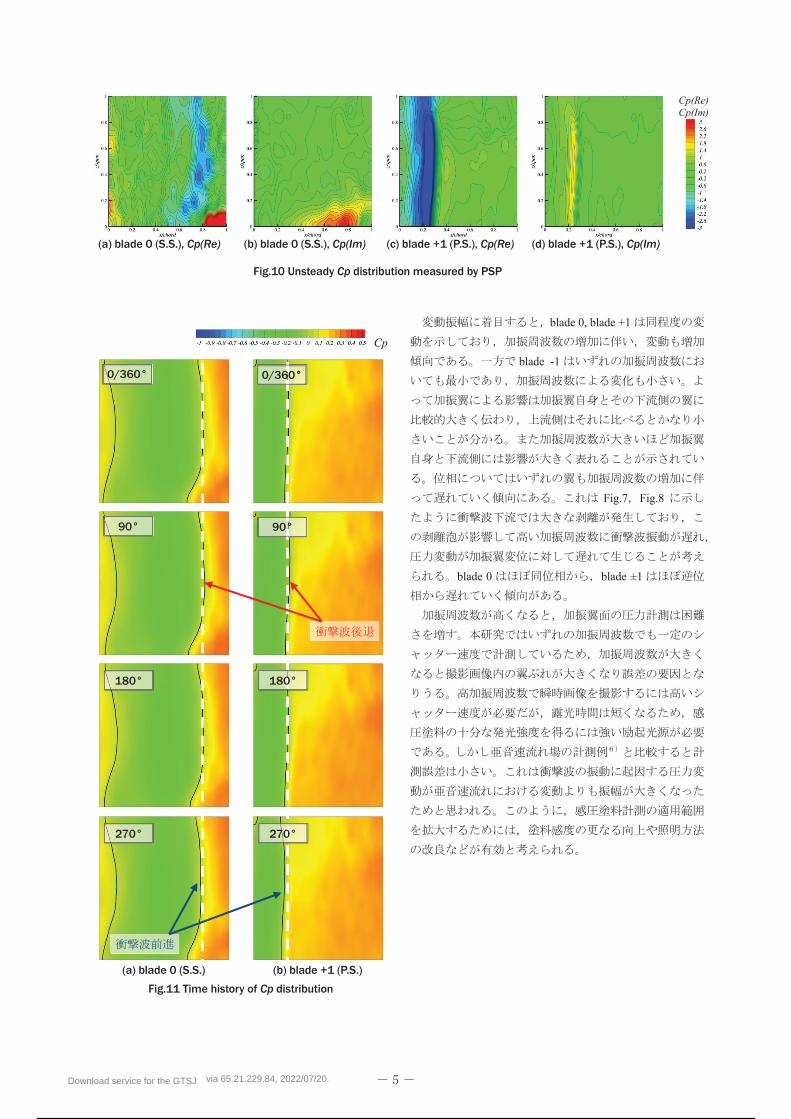
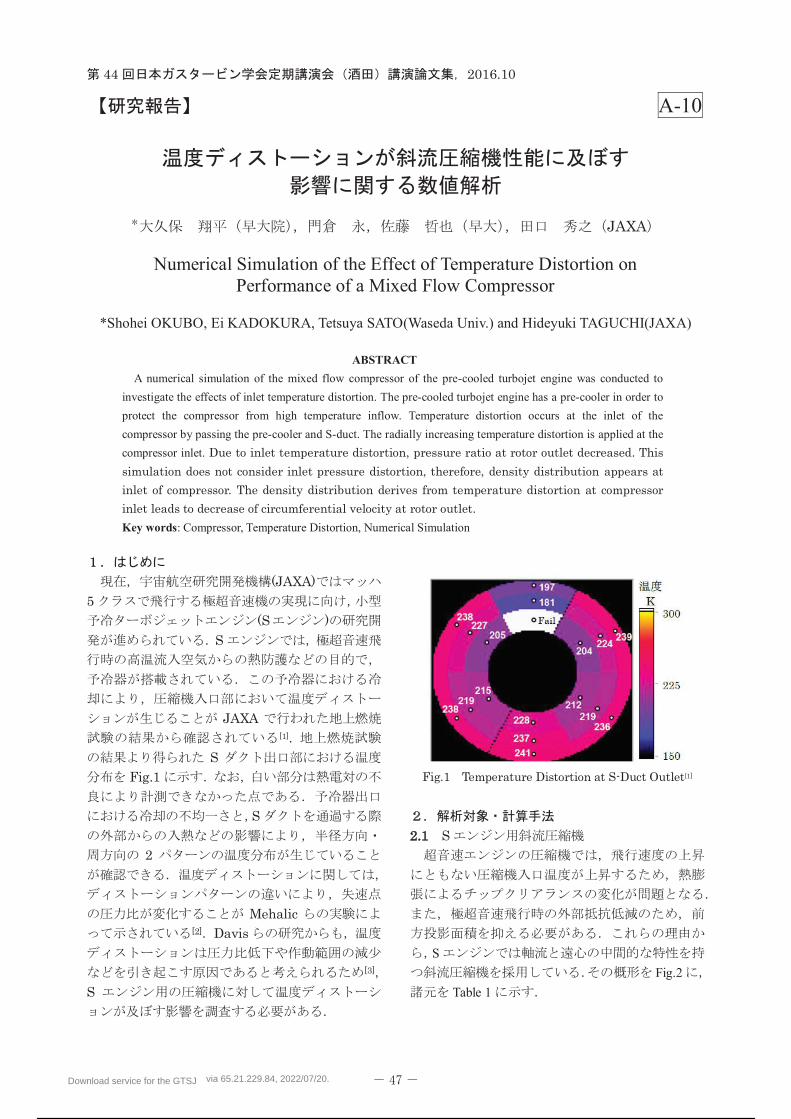
Fig.1 2) (CFD)
4)
FINETM/Turbo (NUMECA )
(CSD:
Computational Structural Dynamics) FrontISTR5)
FSI
Fig.1
2)3)
Fig.1 Flow chart of turbine blade FSI methodology
Geometry generation of deformed blades in operation
Steady FEA with centrifugal force
Aerodynamic AnalysisCFD
Structural AnalysisCSD (Computational Structural Dynamics)
CFD mesh generation
Unsteady 3D CFD of L-0 stator and rotating blades
Dynamic FEA for Detailed Model
Damping evaluation
Model steam turbine tests Wheel box tests
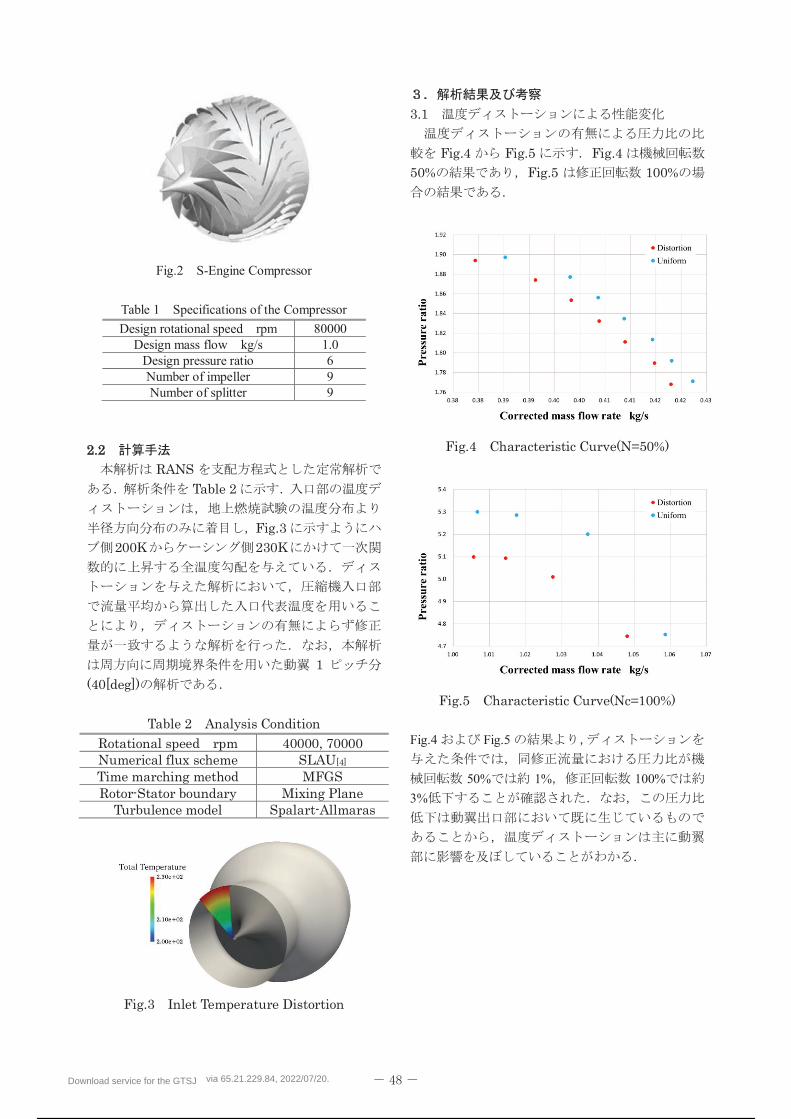
Interpolation of tractions on blade surfaces
Blade and stage geometry design CSD mesh
generation
Download service for the GTSJ via 65.21.229.84, 2022/07/20.
7 / 298
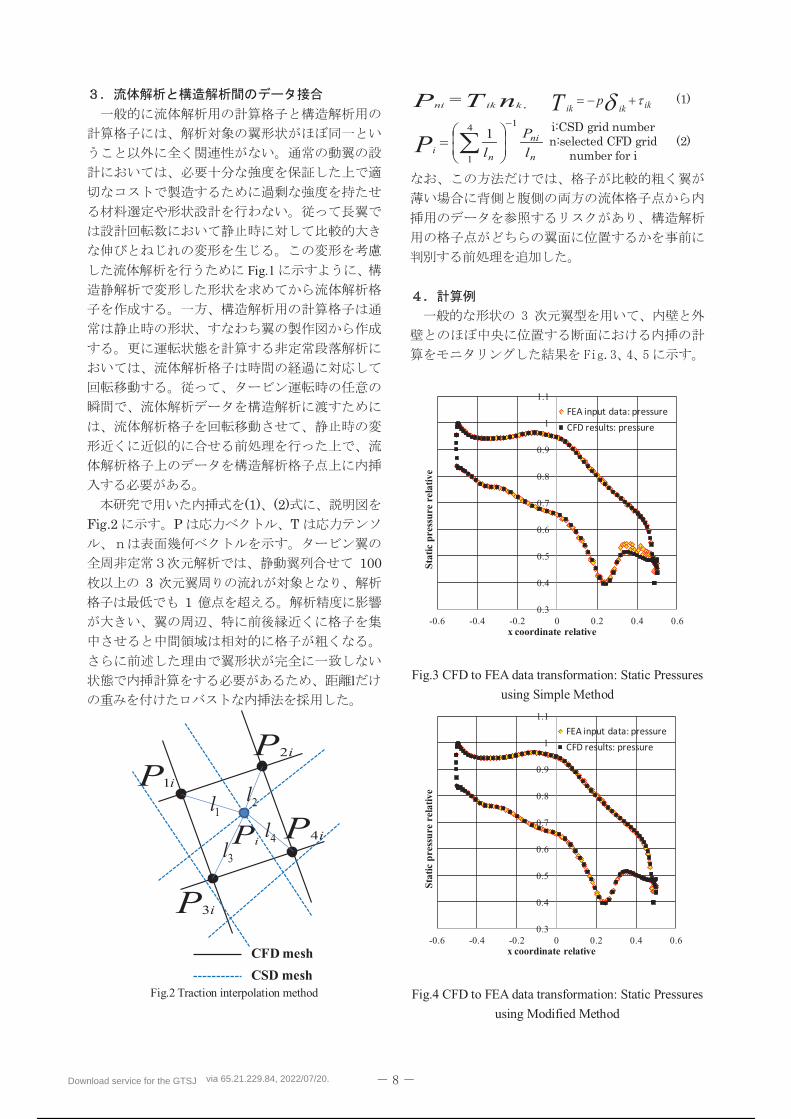
Fig.1
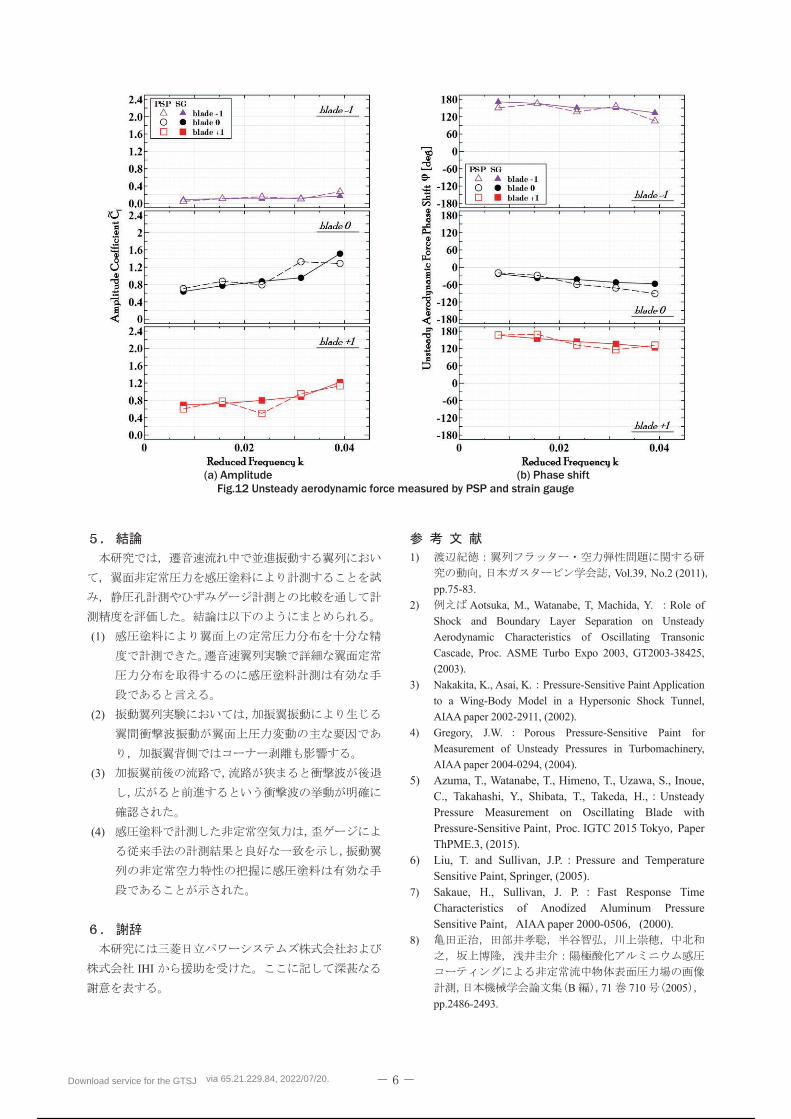
Fig.2 Traction interpolation method
0.3
0.4
0.5
0.6
0.7
0.8
0.9
1
1.1
-0.6 -0.4 -0.2 0 0.2 0.4 0.6
Stat
ic p
ress
ure
rela
tive
x coordinate relative
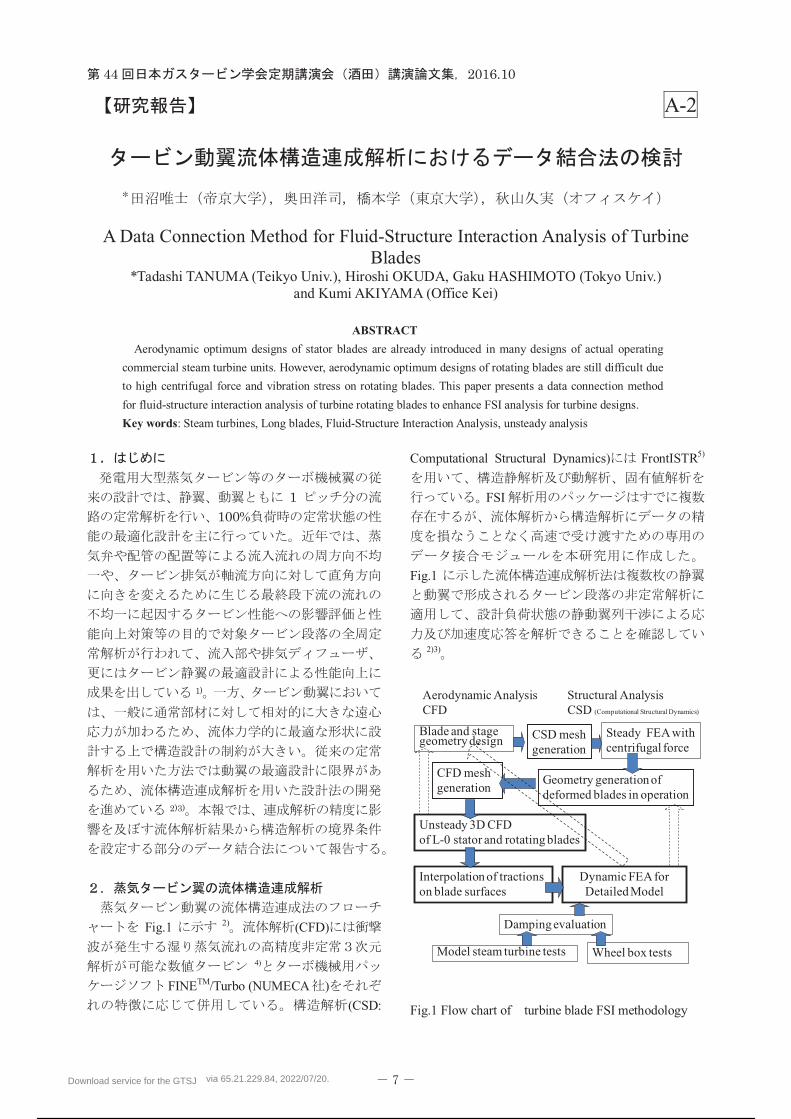
Fig.3 CFD to FEA data transformation: Static Pressures
using Simple Method
0.3
0.4
0.5
0.6
0.7
0.8
0.9
1
1.1
-0.6 -0.4 -0.2 0 0.2 0.4 0.6
Stat
ic p
ress
ure
rela
tive
x coordinate relative
Fig.4 CFD to FEA data transformation: Static Pressures
using Modified Method
Pi
P i1
P i4
P i3
P i2
CFD mesh
CSD mesh
1l 2l
3l4l
nTP kikni , ikikikpT
n
ni
ni l
P
lP14
1
1
Download service for the GTSJ via 65.21.229.84, 2022/07/20.
8 / 298
-1
-0.8
-0.6
-0.4
-0.2
0
0.2
0.4
0.6
0.8
1
1.2
-0.6 -0.4 -0.2 0 0.2 0.4 0.6
Tra
ctio
n y
rela
tive
x coordinate relative
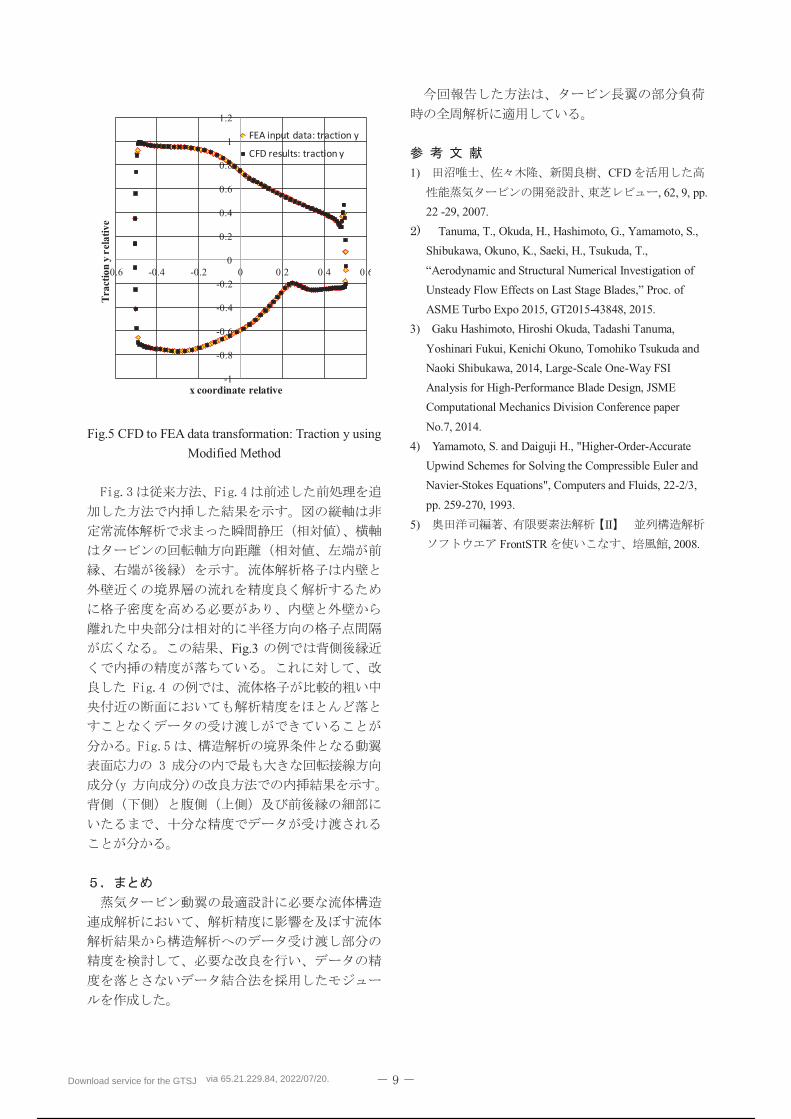
Fig.5 CFD to FEA data transformation: Traction y using
Modified Method
Fig.3
1) CFD
, 62, 9, pp.
22 -29, 2007.
Tanuma, T., Okuda, H., Hashimoto, G., Yamamoto, S.,
Shibukawa, Okuno, K., Saeki, H., Tsukuda, T.,
“Aerodynamic and Structural Numerical Investigation of
Unsteady Flow Effects on Last Stage Blades,” Proc. of
ASME Turbo Expo 2015, GT2015-43848, 2015.
3) Gaku Hashimoto, Hiroshi Okuda, Tadashi Tanuma,
Yoshinari Fukui, Kenichi Okuno, Tomohiko Tsukuda and
Naoki Shibukawa, 2014, Large-Scale One-Way FSI
Analysis for High-Performance Blade Design, JSME
Computational Mechanics Division Conference paper
No.7, 2014.
4) Yamamoto, S. and Daiguji H., "Higher-Order-Accurate
Upwind Schemes for Solving the Compressible Euler and
Navier-Stokes Equations", Computers and Fluids, 22-2/3,
pp. 259-270, 1993.
5) II
FrontSTR , 2008.
Download service for the GTSJ via 65.21.229.84, 2022/07/20.
9 / 298
Download service for the GTSJ via 65.21.229.84, 2022/07/20.
10 / 298
Download service for the GTSJ via 65.21.229.84, 2022/07/20.
11 / 298
Download service for the GTSJ via 65.21.229.84, 2022/07/20.
12 / 298
Download service for the GTSJ via 65.21.229.84, 2022/07/20.
13 / 298
Download service for the GTSJ via 65.21.229.84, 2022/07/20.
14 / 298
Download service for the GTSJ via 65.21.229.84, 2022/07/20.
15 / 298
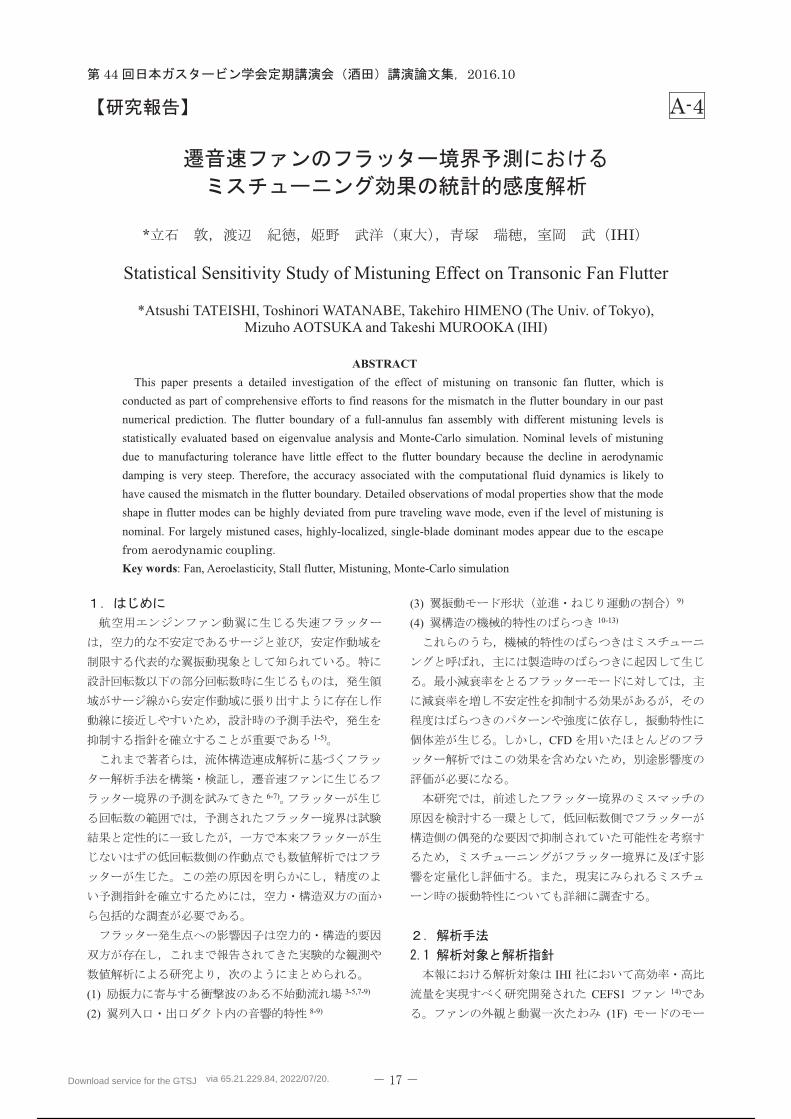
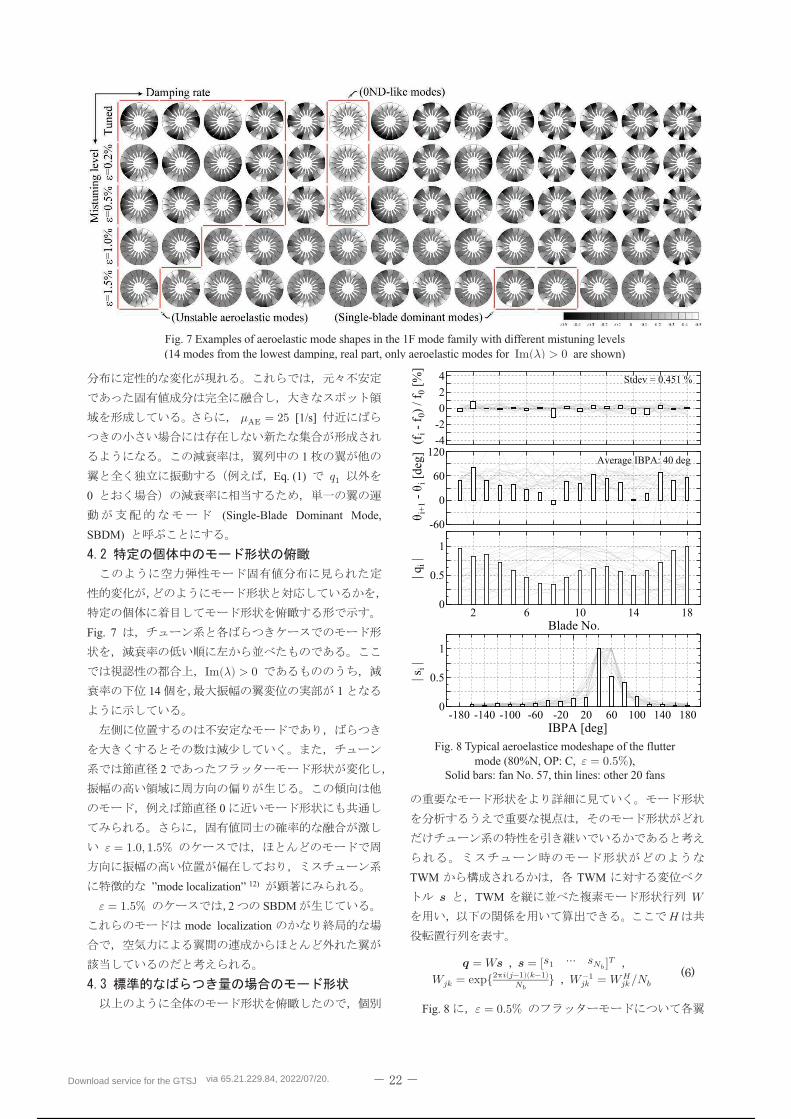
Statistical Sensitivity Study of Mistuning Effect on Transonic Fan Flutter
*Atsushi TATEISHI, Toshinori WATANABE, Takehiro HIMENO (The Univ. of Tokyo), Mizuho AOTSUKA and Takeshi MUROOKA (IHI)
ABSTRACT
This paper presents a detailed investigation of the effect of mistuning on transonic fan flutter, which is
conducted as part of comprehensive efforts to find reasons for the mismatch in the flutter boundary in our past
numerical prediction. The flutter boundary of a full-annulus fan assembly with different mistuning levels is
statistically evaluated based on eigenvalue analysis and Monte-Carlo simulation. Nominal levels of mistuning
due to manufacturing tolerance have little effect to the flutter boundary because the decline in aerodynamic
damping is very steep. Therefore, the accuracy associated with the computational fluid dynamics is likely to
have caused the mismatch in the flutter boundary. Detailed observations of modal properties show that the mode
shape in flutter modes can be highly deviated from pure traveling wave mode, even if the level of mistuning is
nominal. For largely mistuned cases, highly-localized, single-blade dominant modes appear due to the
.
Key words: Fan, Aeroelasticity, Stall flutter, Mistuning, Monte-Carlo simulation
1-5)
6-7)
(1) 3-5,7-9)
(2) 8-9)
(3) 9)
(4) 10-13)
CFD
IHI
CEFS1 14)
(1F)
Download service for the GTSJ via 65.21.229.84, 2022/07/20.
16 / 298
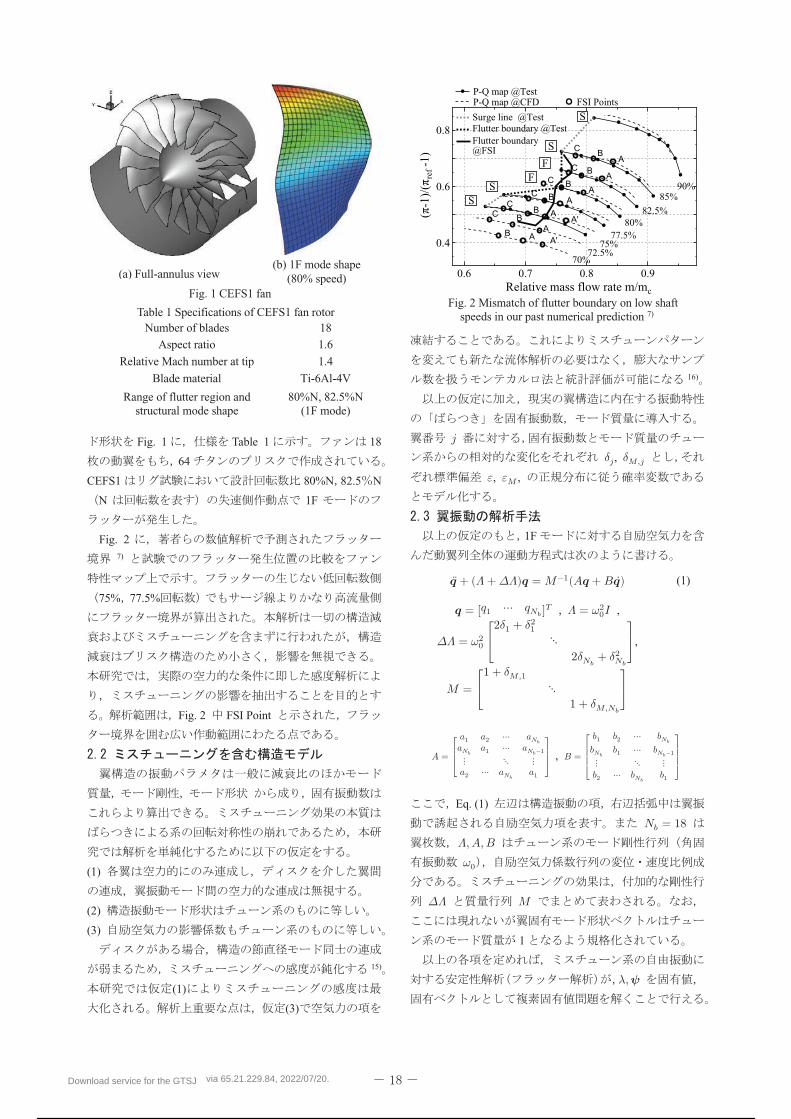
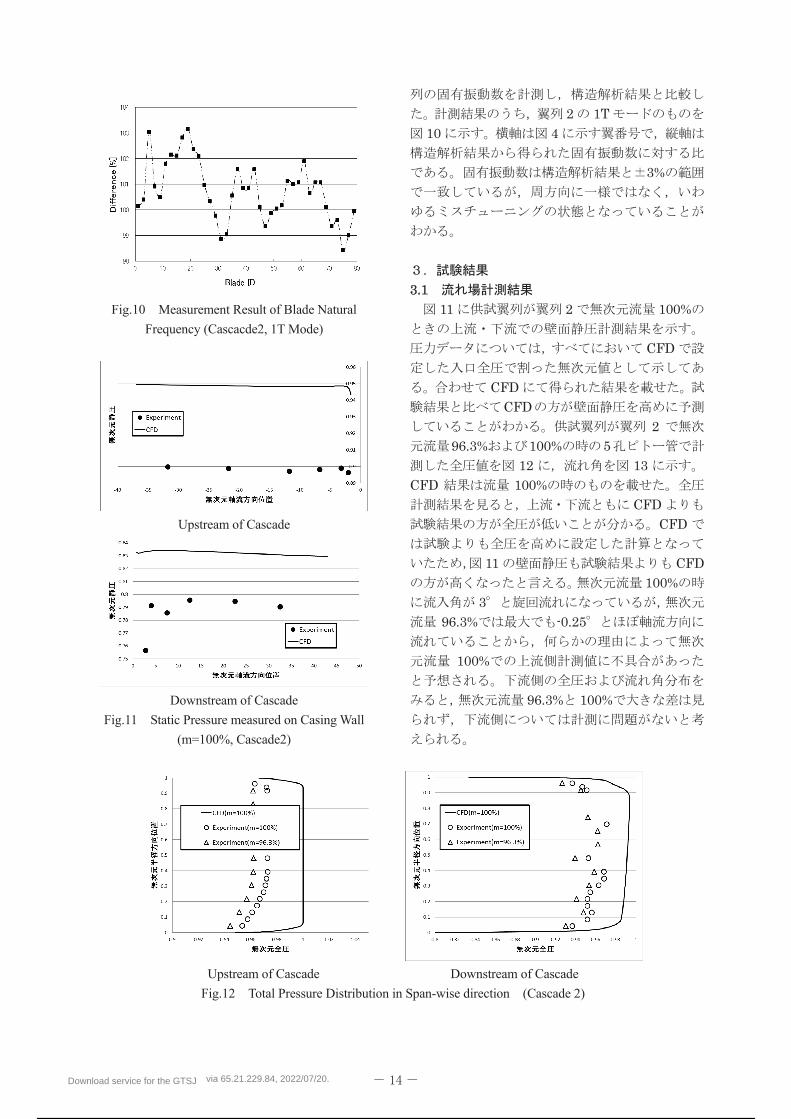
Fig. 1 Table 1 18
64
CEFS1 80%N 82.5 N
N 1F
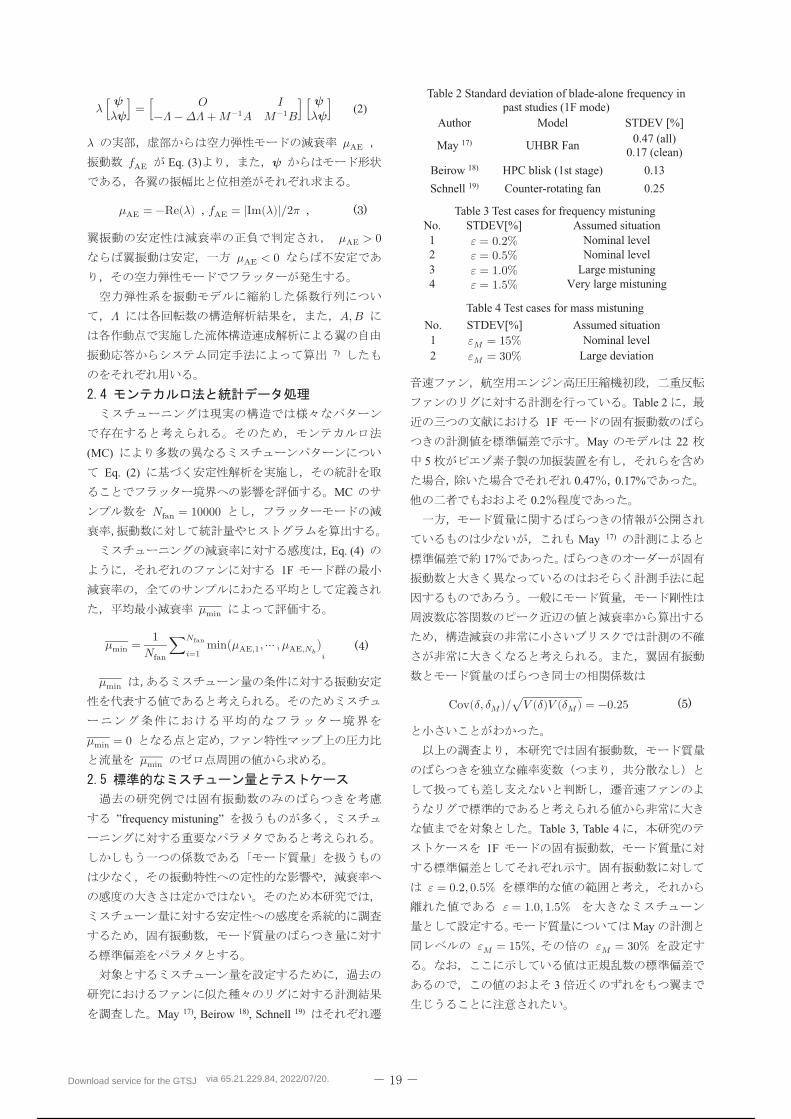
Fig. 27)
75% 77.5%
Fig. 2 FSI Point
(1)
(2)
(3)
15)
(1)
(3)
16)
𝑗𝛿𝑗, 𝛿𝑀,𝑗
𝜀, 𝜀𝑀 ,
1F
𝒒 ̈+ (𝛬 + 𝛥𝛬)𝒒 = 𝑀−1(𝐴𝒒 + 𝐵𝒒)̇ (1)
𝒒 = [𝑞1 ⋯ 𝑞𝑁𝑏]𝑇 𝛬 = 𝜔02𝐼 ,
𝛥𝛬 = 𝜔02
⎣⎢⎡
2𝛿1 + 𝛿12 ⋱2𝛿𝑁𝑏 + 𝛿𝑁𝑏
2 ⎦⎥⎤,
𝑀 =⎣⎢⎡
1 + 𝛿𝑀,1 ⋱
1 + 𝛿𝑀,𝑁𝑏⎦⎥⎤
𝐴 =⎣⎢⎢⎡
𝑎1 𝑎2 ⋯ 𝑎𝑁𝑏𝑎𝑁𝑏 𝑎1 ⋯ 𝑎𝑁𝑏−1⋮ ⋱ ⋮
𝑎2 ⋯ 𝑎𝑁𝑏 𝑎1 ⎦⎥⎥⎤
, 𝐵 =⎣⎢⎢⎡ 𝑏1 𝑏2 ⋯ 𝑏𝑁𝑏𝑏𝑁𝑏 𝑏1 ⋯ 𝑏𝑁𝑏−1
⋮ ⋱ ⋮𝑏2 ⋯ 𝑏𝑁𝑏 𝑏1 ⎦
⎥⎥⎤
Eq. (1)
𝑁𝑏 = 18𝛬, 𝐴, 𝐵𝜔0
𝛥𝛬 𝑀
1
𝜆,𝝍
Fig. 2 Mismatch of flutter boundary on low shaft speeds in our past numerical prediction 7)
Fig. 1 CEFS1 fan
Table 1 Specifications of CEFS1 fan rotor Number of blades 18
Aspect ratio 1.6
Relative Mach number at tip 1.4
Blade material Ti-6Al-4V
Range of flutter region and structural mode shape
80%N, 82.5%N(1F mode)
(a) Full-annulus view(b) 1F mode shape
(80% speed)
Download service for the GTSJ via 65.21.229.84, 2022/07/20.
17 / 298
𝜆 [ 𝝍𝜆𝝍] = [ 𝑂 𝐼
−𝛬 − 𝛥𝛬 + 𝑀−1𝐴 𝑀−1𝐵] [ 𝝍𝜆𝝍] (2)
𝜆 𝜇AE𝑓AE Eq. (3) 𝝍
𝜇AE = −Re(𝜆) 𝑓AE = |Im(𝜆)|/2𝜋𝜇AE > 0
𝜇AE < 0
𝛬 𝐴, 𝐵
7)
(MC)
Eq. (2)
MC
𝑁fan = 10000
Eq. (4)
1F
𝜇min
𝜇min = 1𝑁fan
∑ min(𝜇AE,1, ⋯ , 𝜇AE,𝑁𝑏)𝑁fan𝑖=1 𝑖
𝜇min
𝜇min = 0𝜇min
”frequency mistuning”
May 17), Beirow 18), Schnell 19)
Table 2
1F
May 22
5
0.47 0.17%
0.2
May 17)
17
Cov(𝛿, 𝛿𝑀)/√𝑉 (𝛿)𝑉 (𝛿𝑀) = −0.25
Table 3, Table 4
1F
𝜀 = 0.2, 0.5%𝜀 = 1.0, 1.5%
May
𝜀𝑀 = 15%, 𝜀𝑀 = 30%
3
Table 2 Standard deviation of blade-alone frequency in past studies (1F mode)
Author Model STDEV [%]
May 17) UHBR Fan 0.47 (all)
0.17 (clean)
Beirow 18) HPC blisk (1st stage) 0.13
Schnell 19) Counter-rotating fan 0.25
Table 3 Test cases for frequency mistuningNo. STDEV[%] Assumed situation 1 𝜀 = 0.2% Nominal level 2 𝜀 = 0.5% Nominal level 3 𝜀 = 1.0% Large mistuning 4 𝜀 = 1.5% Very large mistuning
Table 4 Test cases for mass mistuning
No. STDEV[%] Assumed situation 1 𝜀𝑀 = 15% Nominal level 2 𝜀𝑀 = 30% Large deviation
Download service for the GTSJ via 65.21.229.84, 2022/07/20.
18 / 298
Fig. 3
𝜀𝑀 , 𝜀 1F
𝜇min80% C Fig. 3 (a)
𝜀𝑀 𝜀
Fig. 3 (b) 𝜀 𝜇min
𝜀𝑀 = 0
Fig. 4
𝜀 = 0.2%
Fig. 4 Change in averaged minimum damping rate due to frequency mistuning on each rotational speed. The “F” and “S” show experimental stability limits due to surge and flutter, respectively.
Fig. 3 Effects of mass and frequency mistuning on the statistics of damping rate in the flutter mode (80%N, OP: C)(a) Cumulative probability (b) Change in averaged minimum damping rate
μ
[1/s
]m
in
μ
[1/s
]m
in
Fig. 5 Flutter boundary obtained from averaged minimum damping rate
Download service for the GTSJ via 65.21.229.84, 2022/07/20.
19 / 298
72.5%
75.0%
~ 82.5%
𝜀 =0.5% 𝜀 = 1.0%
75%
Fig. 5 Fig. 4
𝜀 = 1.0%50%
𝜀 = 1.0%75.0%,
77.5% B
𝜇min = 00.925, 0.862
75.0%,
77.5%
80% C
Fig. 6
Traveling Wave Mode (TWM)
𝜀 = 0.2%
𝜀 = 0.5%
𝜀 = 1.0, 1.5%
Fig. 6 Histogram of aeroelastic eigenvalues in the 1F mode family (80%N, OP: C)
(a) 𝜀 = 0.2% (b) 𝜀 = 0.5% (c) 𝜀 = 1.0% (d) 𝜀 = 1.5%
230
Stable
Unstable
Merging modesMerged
Single-bladedominant mode
0
20
40
60
80
240 250 260 230 240 250 260 230 240 250 260 230 240 250 260
Single-bladedominant mode
f [Hz]
μ [
1/s
]
modes
AE
AEf [Hz]
AE f [Hz]AE
f [Hz]AE
Download service for the GTSJ via 65.21.229.84, 2022/07/20.
20 / 298
𝜇AE = 25 [1/s]
1
Eq. (1) 𝑞10
(Single-Blade Dominant Mode,
SBDM)
Fig. 7
Im(𝜆) > 014 1
2
0
𝜀 = 1.0, 1.5%
”mode localization” 12)
𝜀 = 1.5% 2 SBDM
mode localization
TWM TWM
𝒔 TWM 𝑊H
𝒒 = 𝑊𝒔 𝒔 = [𝑠1 ⋯ 𝑠𝑁𝑏]𝑇𝑊𝑗𝑘 = exp {2π𝑖(𝑗−1)(𝑘−1)
𝑁𝑏 } 𝑊𝑗𝑘−1 = 𝑊𝑗𝑘𝐻/𝑁𝑏
Fig. 8 𝜀 = 0.5%
Fig. 7 Examples of aeroelastic mode shapes in the 1F mode family with different mistuning levels (14 modes from the lowest damping, real part, only aeroelastic modes for Im(𝜆) > 0 are shown)
Fig. 8 Typical aeroelastice modeshape of the flutter mode (80%N, OP: C, 𝜀 = 0.5%),
Solid bars: fan No. 57, thin lines: other 20 fans
Download service for the GTSJ via 65.21.229.84, 2022/07/20.
21 / 298
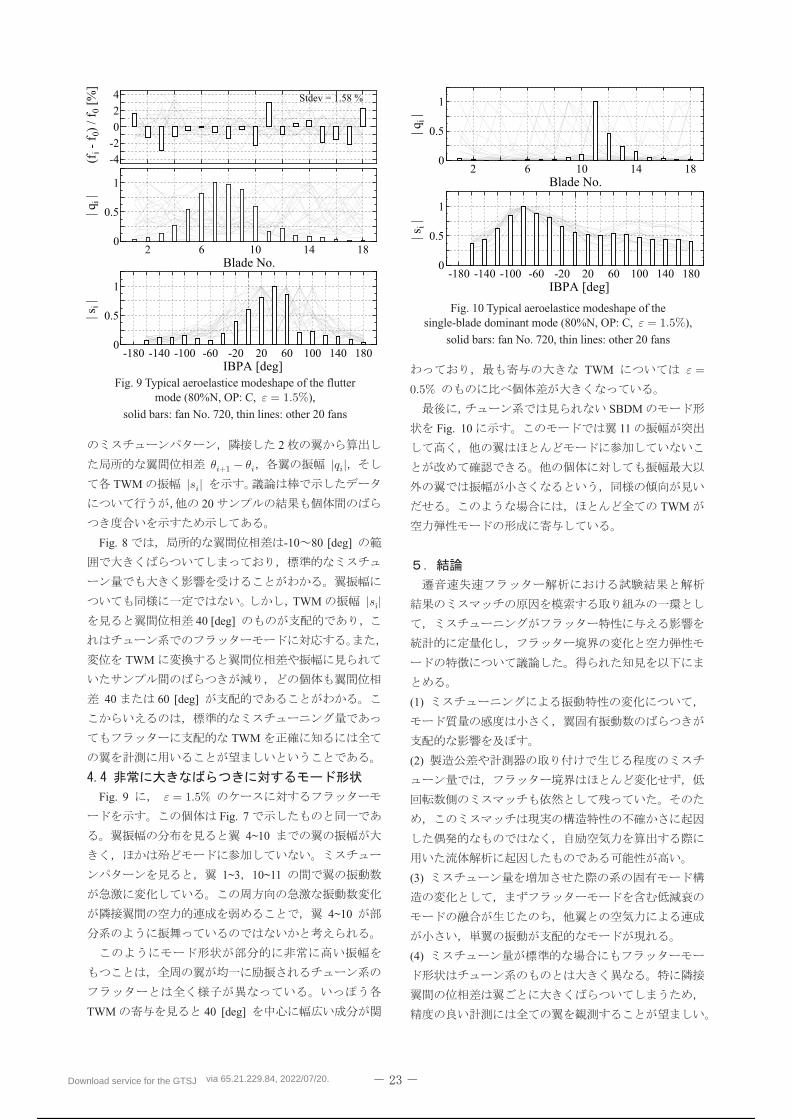
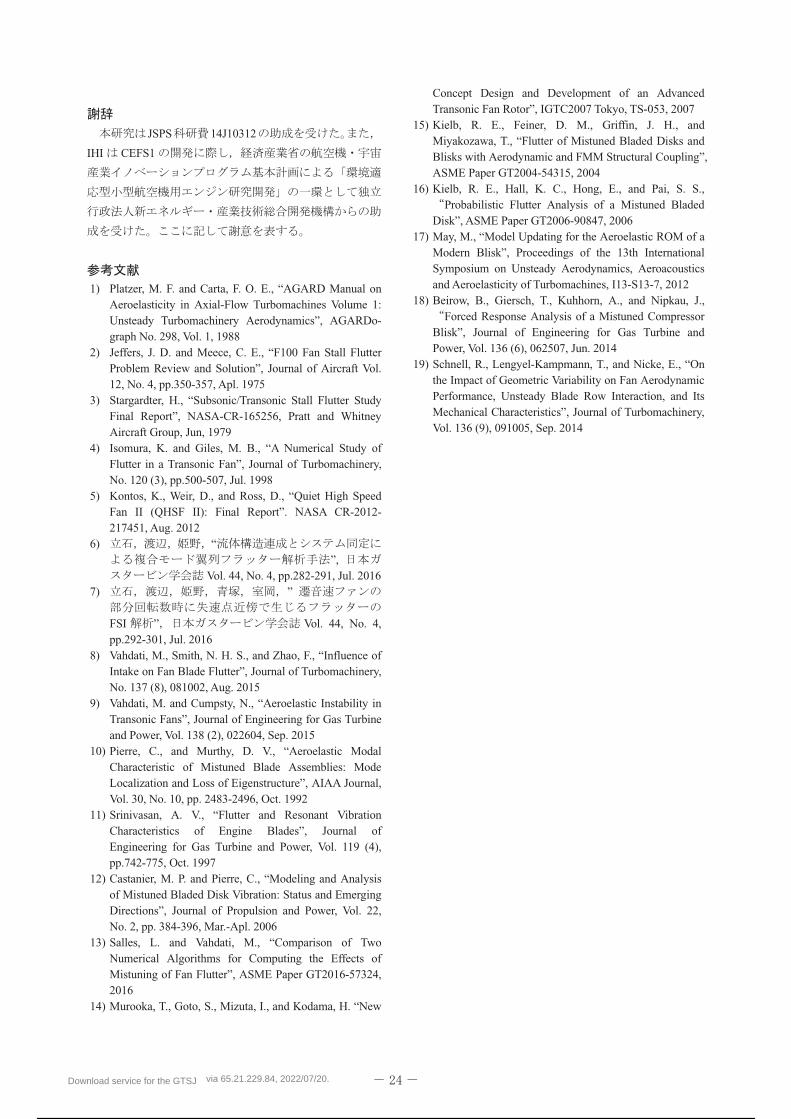
2
𝜃𝑖+1 − 𝜃𝑖 |𝑞𝑖|TWM |𝑠𝑖|
20
Fig. 8 -10 80 [deg]
TWM |𝑠i|40 [deg]
TWM
40 60 [deg]
TWM
Fig. 9 𝜀 = 1.5%Fig. 7
4~10
1~3 10~11
4~10
TWM 40 [deg]
TWM 𝜀 =0.5%
SBDM
Fig. 10 11
TWM
(1)
(2)
(3)
(4)
Fig. 10 Typical aeroelastice modeshape of the single-blade dominant mode (80%N, OP: C, 𝜀 = 1.5%),
solid bars: fan No. 720, thin lines: other 20 fans
Fig. 9 Typical aeroelastice modeshape of the flutter mode (80%N, OP: C, 𝜀 = 1.5%),
solid bars: fan No. 720, thin lines: other 20 fans
Download service for the GTSJ via 65.21.229.84, 2022/07/20.
22 / 298
JSPS 14J10312
IHI CEFS1
1) Platzer, M. F. and Carta, F. O. E., “AGARD Manual on Aeroelasticity in Axial-Flow Turbomachines Volume 1: Unsteady Turbomachinery Aerodynamics”, AGARDo- graph No. 298, Vol. 1, 1988
2) Jeffers, J. D. and Meece, C. E., “F100 Fan Stall Flutter Problem Review and Solution”, Journal of Aircraft Vol. 12, No. 4, pp.350-357, Apl. 1975
3) Stargardter, H., “Subsonic/Transonic Stall Flutter Study Final Report”, NASA-CR-165256, Pratt and Whitney Aircraft Group, Jun, 1979
4) Isomura, K. and Giles, M. B., “A Numerical Study ofFlutter in a Transonic Fan”, Journal of Turbomachinery, No. 120 (3), pp.500-507, Jul. 1998
5) Kontos, K., Weir, D., and Ross, D., “Quiet High Speed Fan II (QHSF II): Final Report”. NASA CR-2012- 217451, Aug. 2012
6) “”,
Vol. 44, No. 4, pp.282-291, Jul. 2016 7) ”
FSI ” Vol. 44, No. 4, pp.292-301, Jul. 2016
8) Vahdati, M., Smith, N. H. S., and Zhao, F., “Influence of Intake on Fan Blade Flutter”, Journal of Turbomachinery, No. 137 (8), 081002, Aug. 2015
9) Vahdati, M. and Cumpsty, N., “Aeroelastic Instability in Transonic Fans”, Journal of Engineering for Gas Turbine and Power, Vol. 138 (2), 022604, Sep. 2015
10) Pierre, C., and Murthy, D. V., “Aeroelastic Modal Characteristic of Mistuned Blade Assemblies: Mode Localization and Loss of Eigenstructure”, AIAA Journal, Vol. 30, No. 10, pp. 2483-2496, Oct. 1992
11) Srinivasan, A. V., “Flutter and Resonant Vibration Characteristics of Engine Blades”, Journal of Engineering for Gas Turbine and Power, Vol. 119 (4), pp.742-775, Oct. 1997
12) Castanier, M. P. and Pierre, C., “Modeling and Analysis of Mistuned Bladed Disk Vibration: Status and Emerging Directions”, Journal of Propulsion and Power, Vol. 22, No. 2, pp. 384-396, Mar.-Apl. 2006
13) Salles, L. and Vahdati, M., “Comparison of Two Numerical Algorithms for Computing the Effects of Mistuning of Fan Flutter”, ASME Paper GT2016-57324, 2016
14) Murooka, T., Goto, S., Mizuta, I., and Kodama, H. “New
Concept Design and Development of an Advanced Transonic Fan Rotor”, IGTC2007 Tokyo, TS-053, 2007
15) Kielb, R. E., Feiner, D. M., Griffin, J. H., and Miyakozawa, T., “Flutter of Mistuned Bladed Disks and Blisks with Aerodynamic and FMM Structural Coupling”, ASME Paper GT2004-54315, 2004
16) Kielb, R. E., Hall, K. C., Hong, E., and Pai, S. S., Probabilistic Flutter Analysis of a Mistuned Bladed
Disk”, ASME Paper GT2006-90847, 2006 17) May, M., “Model Updating for the Aeroelastic ROM of a
Modern Blisk”, Proceedings of the 13th International Symposium on Unsteady Aerodynamics, Aeroacoustics and Aeroelasticity of Turbomachines, I13-S13-7, 2012
18) Beirow, B., Giersch, T., Kuhhorn, A., and Nipkau, J., Forced Response Analysis of a Mistuned Compressor
Blisk”, Journal of Engineering for Gas Turbine and Power, Vol. 136 (6), 062507, Jun. 2014
19) Schnell, R., Lengyel-Kampmann, T., and Nicke, E., “On the Impact of Geometric Variability on Fan Aerodynamic Performance, Unsteady Blade Row Interaction, and Its Mechanical Characteristics”, Journal of Turbomachinery, Vol. 136 (9), 091005, Sep. 2014
Download service for the GTSJ via 65.21.229.84, 2022/07/20.
23 / 298
Download service for the GTSJ via 65.21.229.84, 2022/07/20.
24 / 298
Download service for the GTSJ via 65.21.229.84, 2022/07/20.
25 / 298
Download service for the GTSJ via 65.21.229.84, 2022/07/20.
26 / 298
Download service for the GTSJ via 65.21.229.84, 2022/07/20.
27 / 298
Download service for the GTSJ via 65.21.229.84, 2022/07/20.
28 / 298
A-6
Effect of Tip Clearance Gap and Wall Boundary Layer Thickness to Performance of Transonic Compressor
*Yasunori SAKUMA, Toshinori WATANABE and Takehiro HIMENO (Univ. of Tokyo)
ABSTRACT
Numerical analysis has been conducted on transonic compressor NASA Rotor 37 with 9 different tip
clearance gaps while varying the wall boundary layer thickness of the incoming flow. Overall performance,
basic flow characteristics, and near casing phenomena has been carefully observed. According to the result, it
has been shown that NASA Rotor 37 can be lead to numerical instability through two different mechanisms
depending on the size of the tip clearance gap and the wall boundary layer thickness. Stall margin became the
maximum with the tip clearance gap at which the stall mechanism switched from one to another.
Key words: Compressor, Tip Clearance, Stall Inception, Numerical Analysis
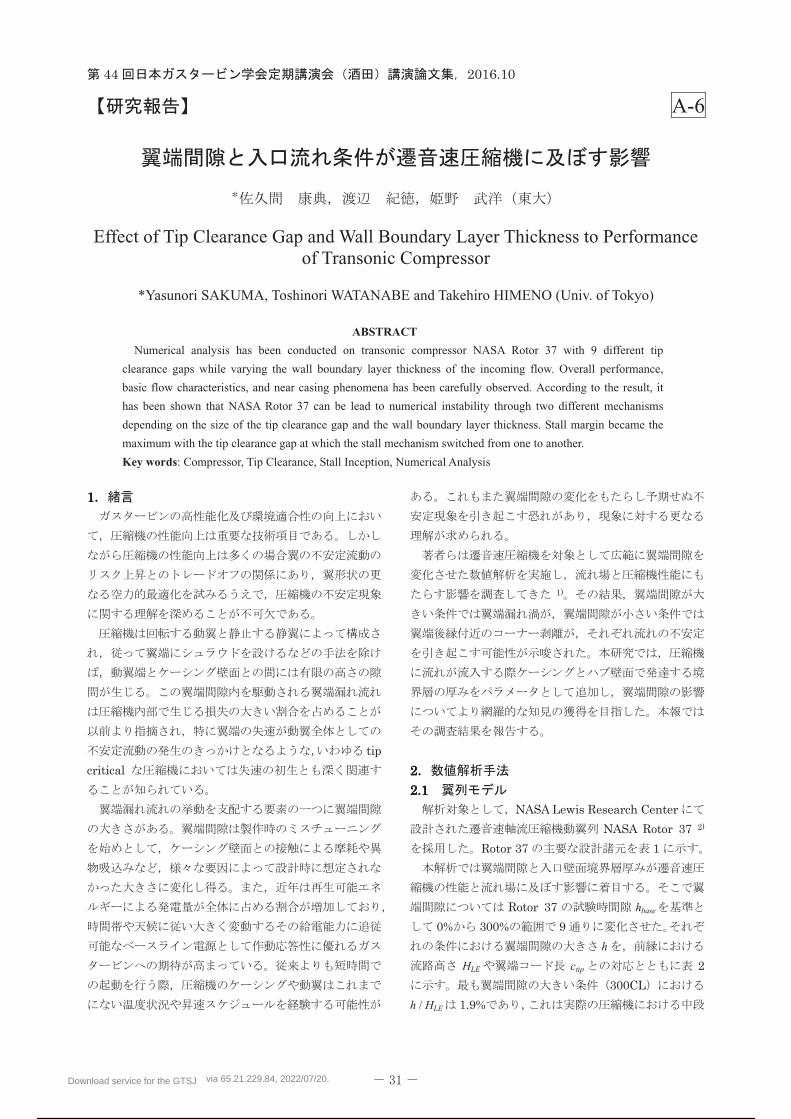
hbase
h
HLE ctip
h / HLE
Download service for the GTSJ via 65.21.229.84, 2022/07/20.
29 / 298
k-ω
2.106
1.48
17,188
0.356
252
36
Total pressure ratio
Relative Mach number at tip
Rotation speed [rpm]
Tip clearance gap [mm]
Blade tip radius [mm]
Number of rotor blades
h
h [mm] h / ctip [%]h / hbase h / HLE [%]
0.120
0.240
0.361
0.481
0.721
0.961
1.202
1.442
0.000
0.158
0.317
0.475
0.633
0.950
1.266
1.583
1.900
0.000
0.25
0.50
0.75
1.00
1.50
2.00
2.50
3.00
0.00
0.089
0.178
0.267
0.356
0.534
0.712
0.890
1.068
0.000
025CL
000CL
050CL
075CL
100CL
150CL
200CL
250CL
300CL
Station 1
Leading Edge
Shroud
Hub
Station 2Station 1a Station 3 Station 4Station 4a
Trailing Edge
30% span
50% span
70% span
90% span
95% span
Laser Anemometer
Blade-to-blade
Survey Planes
Aero Performance DataLaser Anemometer Spanwise SurveyAero Performance Data
Axial Position, x
-4.19 -5% chord 10% chord 4.57 10.16 10.67x [cm]
1 1a 2 3 4a 4Station
* x = 0 at intersection of hub and leading edge
Rad
ial
Po
siti
on
, r
Download service for the GTSJ via 65.21.229.84, 2022/07/20.
30 / 298
1≤+y
1
4
t
t
P
P=π ( )1
1
t1t4
1
14
−
−=
−
TT
PP tt γγ
η
1tP 1tT 4tP 4tT
corrm designm
reft
reft
corrPP
TTmm
1
1=
Pref = 101,325 [Pa] Tref = 288.15 [K]
1tP
1tP
SM
Outlet
InletFlow
0.995
0.986
1.000
1BL
0BL
2BL
reft PP1Mass averaged total pressure
−=designcorr
stallcorr
stall
design
m
mSM
_
_1π
π
stall design
Download service for the GTSJ via 65.21.229.84, 2022/07/20.
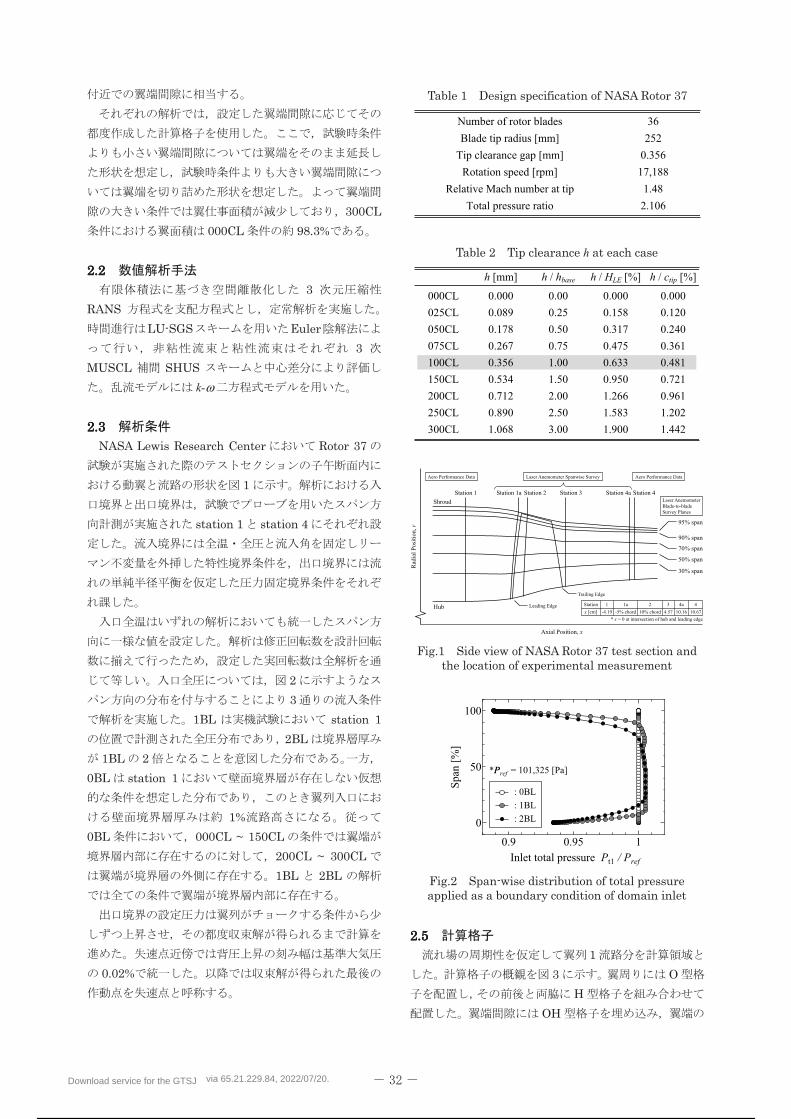
31 / 298
Download service for the GTSJ via 65.21.229.84, 2022/07/20.
32 / 298
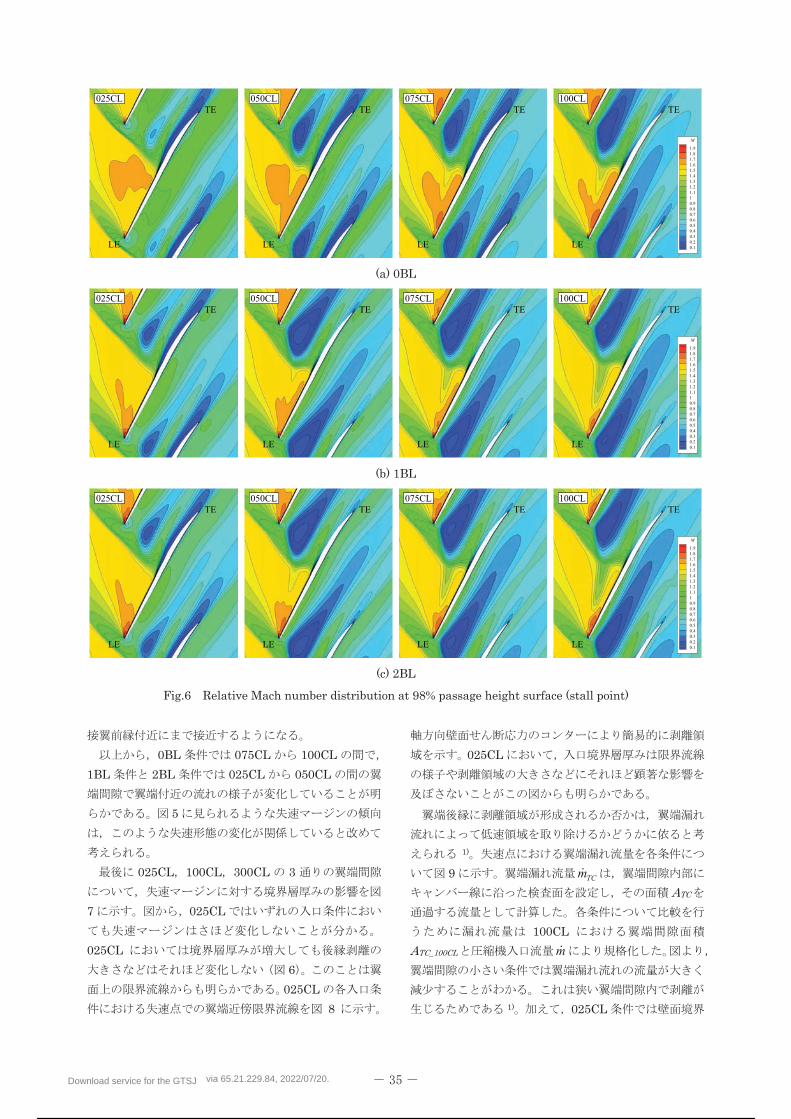
LE
TE
LE
TE
LE
TE
LE
TE
M
1.9
1.8
1.7
1.6
1.5
1.4
1.3
1.2
1.1
1
0.9
0.8
0.7
0.6
0.5
0.4
0.3
0.2
0.1
LE
TE
LE
TE
LE
TE
LE
TE
M
1.9
1.8
1.7
1.6
1.5
1.4
1.3
1.2
1.1
1
0.9
0.8
0.7
0.6
0.5
0.4
0.3
0.2
0.1
LE
TE
LE
TE
LE
TE
LE
TE
M
1.9
1.8
1.7
1.6
1.5
1.4
1.3
1.2
1.1
1
0.9
0.8
0.7
0.6
0.5
0.4
0.3
0.2
0.1
TCm
m
Download service for the GTSJ via 65.21.229.84, 2022/07/20.
33 / 298
LE
TE
LE
TE
LE
TE
xτ
60
57
54
51
48
45
42
39
36
33
30
27
24
21
18
15
12
9
6
3
TC
CL
TC
TC
AA
mm
100
_⋅
&&
Download service for the GTSJ via 65.21.229.84, 2022/07/20.
34 / 298
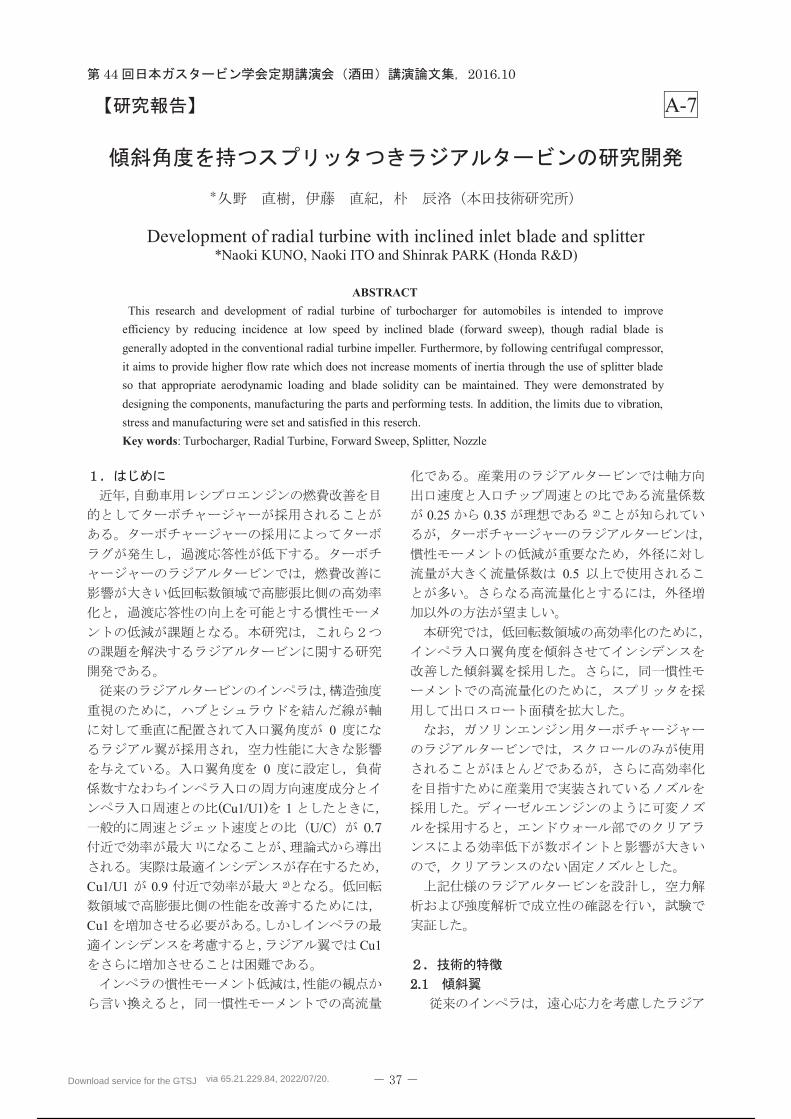
Download service for the GTSJ via 65.21.229.84, 2022/07/20.
35 / 298
Download service for the GTSJ via 65.21.229.84, 2022/07/20.
36 / 298
Download service for the GTSJ via 65.21.229.84, 2022/07/20.
37 / 298
Download service for the GTSJ via 65.21.229.84, 2022/07/20.
38 / 298
Download service for the GTSJ via 65.21.229.84, 2022/07/20.
39 / 298
Download service for the GTSJ via 65.21.229.84, 2022/07/20.
40 / 298
Download service for the GTSJ via 65.21.229.84, 2022/07/20.
41 / 298
Download service for the GTSJ via 65.21.229.84, 2022/07/20.
42 / 298
Download service for the GTSJ via 65.21.229.84, 2022/07/20.
43 / 298
Download service for the GTSJ via 65.21.229.84, 2022/07/20.
44 / 298
Download service for the GTSJ via 65.21.229.84, 2022/07/20.
45 / 298
Download service for the GTSJ via 65.21.229.84, 2022/07/20.
46 / 298
Download service for the GTSJ via 65.21.229.84, 2022/07/20.
47 / 298
Download service for the GTSJ via 65.21.229.84, 2022/07/20.
48 / 298
Download service for the GTSJ via 65.21.229.84, 2022/07/20.
49 / 298
Download service for the GTSJ via 65.21.229.84, 2022/07/20.
50 / 298
Download service for the GTSJ via 65.21.229.84, 2022/07/20.
51 / 298
Download service for the GTSJ via 65.21.229.84, 2022/07/20.
52 / 298
Download service for the GTSJ via 65.21.229.84, 2022/07/20.
53 / 298
Download service for the GTSJ via 65.21.229.84, 2022/07/20.
54 / 298
A-12
Behaviors of Tip Leakage Flows in Transonic Centrifugal Compressor with Splitter Blade at Low Flow Rate Condition
*Masanao KANEKO(Hosei Univ.) and Hoshio TSUJITA(Hosei Univ.)
ABSTRACT
In this study, the individual influence of the tip leakage flows from the main and the splitter blades on the flow
behavior and the loss generation in the transonic centrifugal compressor at low flow rate was investigated by
performing the numerical analysis at four calculation conditions, which were prescribed by the presence or the
absence of the tip clearances of the main and the splitter blades. The computed results including those for the
design condition clarified that the tip leakage vortex from the leading edge of the main blade increased the
incidence angle to the splitter blade, and consequently increased the loss. On the other hand, the presence of the
tip clearance of the splitter blade decreased the loss by reducing the incidence angle to the splitter blade. The
former influence was enhanced but the latter was reduced by the decrease of the flow rate.
Key words: Centrifugal compressor, Loss generation, Shock wave, Tip leakage flow, Transonic compressor
1
Krain1)
50,000 rpm
1.7 6.1
2.55 kg/s
Shroud
(TC TC-M TC-S NTC)
TC
0.5 mm 0.3 mm TC-M
TC-S
Shroud
NTC
CFD STAR-CD Ver.4.18
SIMPLE
Table 1 Dimensions of test impeller
Inlet hub diameter of main blade 1m,h (mm) 60
Inlet tip diameter of main blade 1m,t (mm) 156
Outlet diameter 2 (mm) 224
Number of blades / (Main/Splitter) 13/13
Inlet blade angle at main blade tip 1m,t (deg.) 63.5
Outlet blade angle 2 (deg.) 38
Outlet blade height 2 (mm) 10.2
Download service for the GTSJ via 65.21.229.84, 2022/07/20.
55 / 298
MARS(Monotone Advection and Reconstruction
Scheme)
Spalart-Allmaras
1.0×10⁻⁴
Tip 0.64
/ 2=1.89
1
1
380
39 37 +
1.0
TC
Shroud
50,000 rpm
2 80% span
=1.0
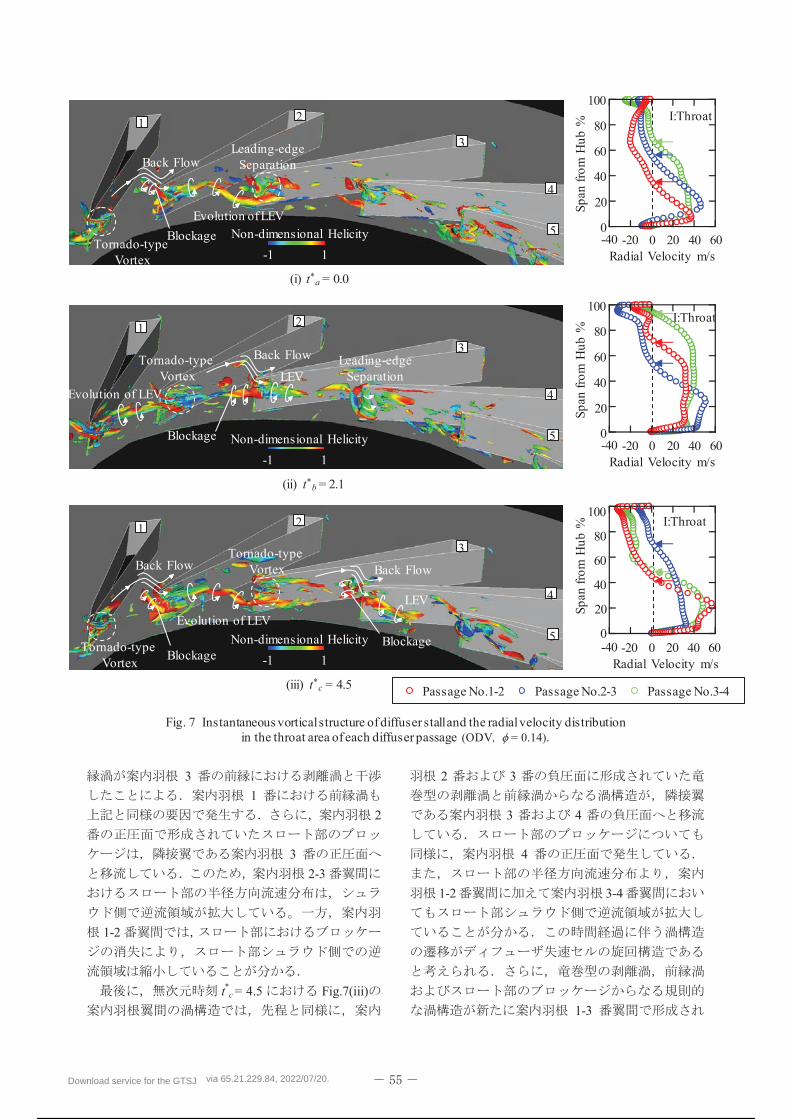
(1)
3
4
5
* *=1.3
*
(2)
(TC TC-M
TC-S)
6 5
7
TC
TC2)
2(a) 3(a)
(SWm1)
4(a)
SWm1 / 0.1
5(a)
(Vt,m-ss1)
6(a) SWm1 Vt,m-ss1
7(a)
Shroud SWm1
(LMR1)
Vt,m-ss1
7(a)
(Vt,s-ss1) 4(b) 5(a)
Vt,s-ss1
4(a)
/ 0.1
Main blade
Splitter blade
2
250
1
1
1
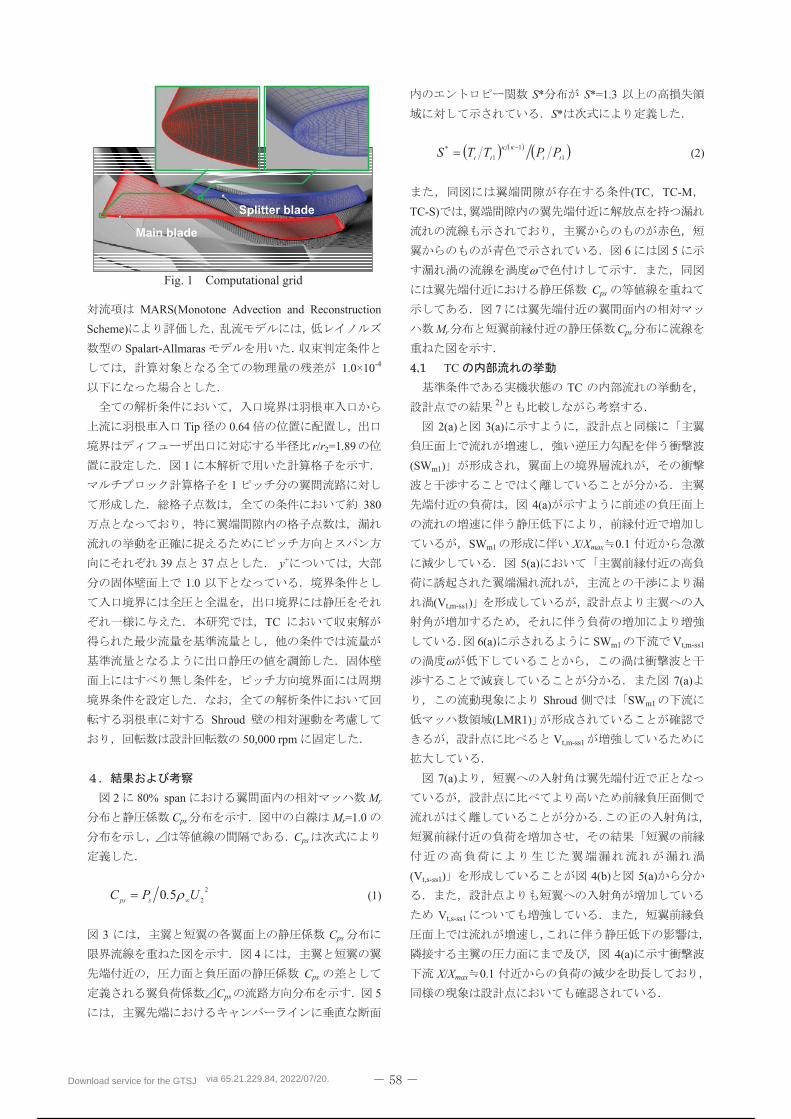
Fig. 1 Computational grid
Download service for the GTSJ via 65.21.229.84, 2022/07/20.
56 / 298
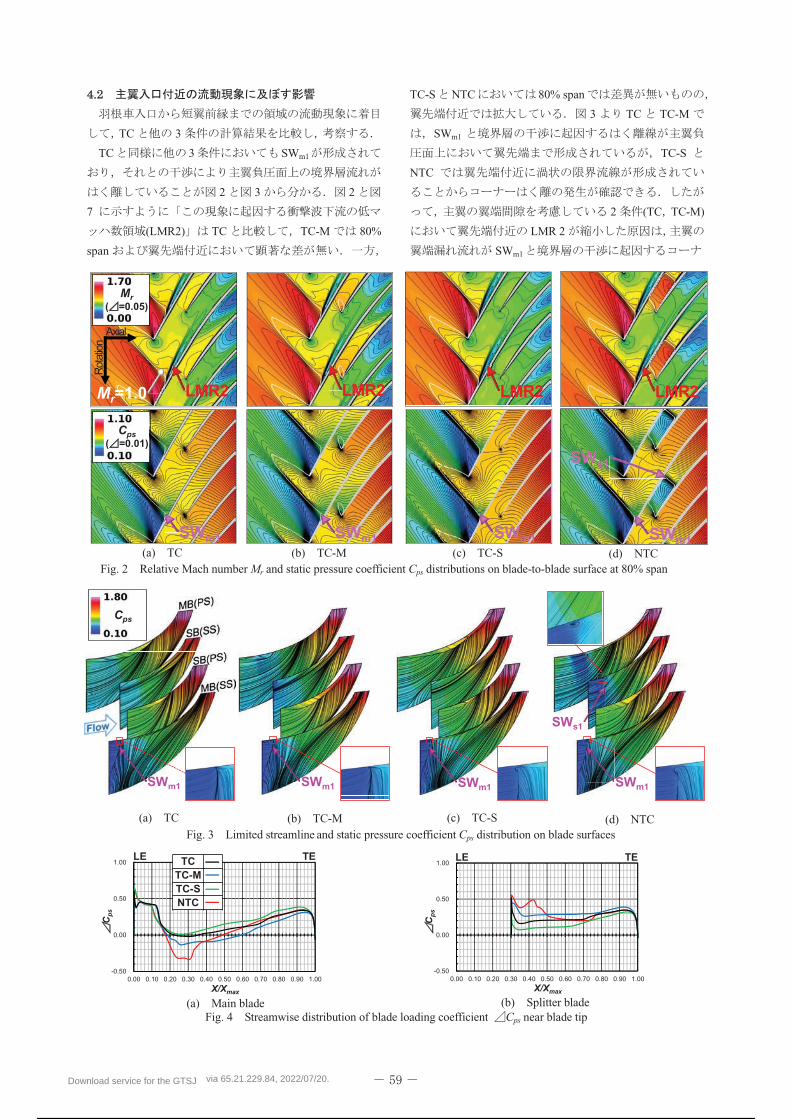
TC 3
TC 3 SWm1
2 3 2
7
(LMR2) TC TC-M 80%
span
TC-S NTC 80% span
3 TC TC-M
SWm1
TC-S
NTC
2 (TC TC-M)
LMR 2
SWm1
LMR2=1.0
SWm1 SWm1 SWm1 SWm1
SWs1
LMR2 LMR2 LMR2
SWm1 SWm1 SWm1
SWs1
SWm1
(a) TC (b) TC-M (c) TC-S (d) NTC Fig. 2 Relative Mach number and static pressure coefficient distributions on blade-to-blade surface at 80% span
( =0.05)
( =0.01)
Rot
atio
n
Axial
(a) TC (b) TC-M (c) TC-S
(a) Main blade (b) Splitter blade
Fig. 3 Limited streamline and static pressure coefficient distribution on blade surfaces
Fig. 4 Streamwise distribution of blade loading coefficient near blade tip
-0.50
0.00
0.50
1.00
0.00 0.10 0.20 0.30 0.40 0.50 0.60 0.70 0.80 0.90 1.00
LE TE
-0.50
0.00
0.50
1.00
0.00 0.10 0.20 0.30 0.40 0.50 0.60 0.70 0.80 0.90 1.00
LE TETC
TC-M
TC-S
NTC
(d) NTC
Download service for the GTSJ via 65.21.229.84, 2022/07/20.
57 / 298
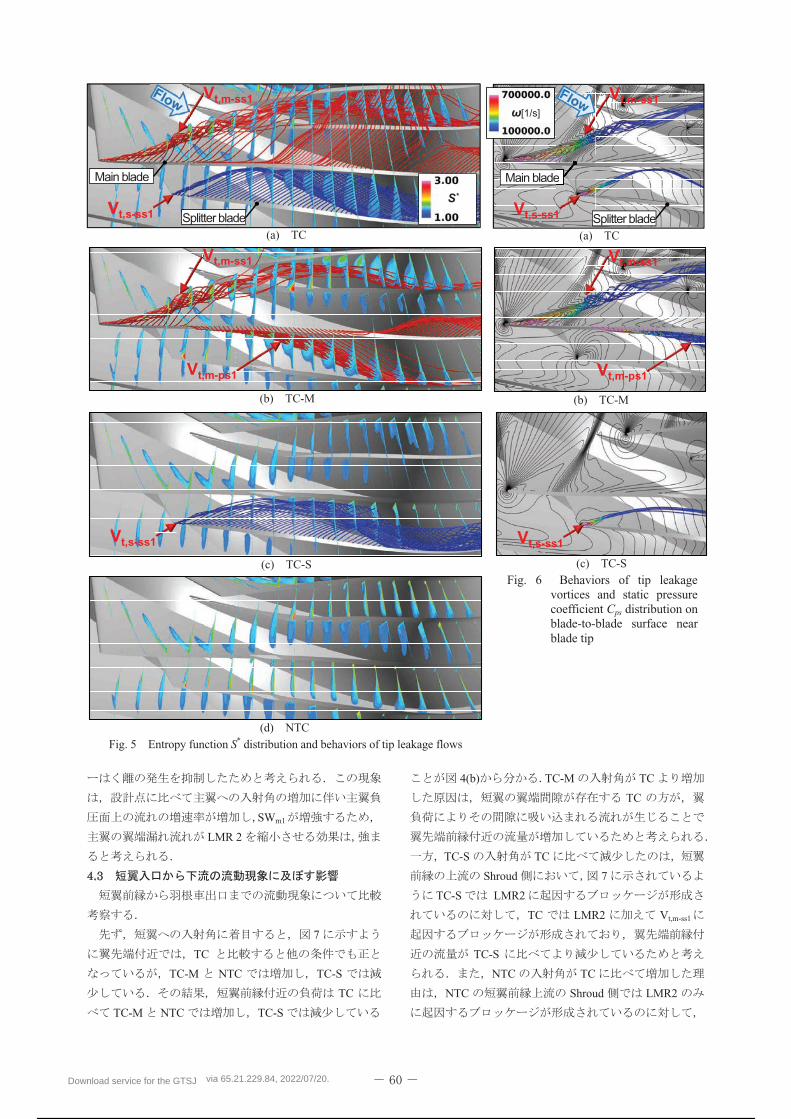
SWm1
LMR 2
7
TC
TC-M NTC TC-S
TC
TC-M NTC TC-S
4(b) TC-M TC
TC
TC-S TC
Shroud 7
TC-S LMR2
TC LMR2 Vt,m-ss1
TC-S
NTC TC
NTC Shroud LMR2
Vt,m-ss1VVVVVVVVVVVVVVVV
Vt,s-ss1 Splitter blade
Main blade
Vt,m-ps1
Vt,m-ss1VVVVVVVVVVVVVVVVV
Vt,s-ss1
(a) TC
(d) NTC Fig. 5 Entropy function * distribution and behaviors of tip leakage flows
(c) TC-S
(b) TC-M
Splitter blade
Main blade
Vt,m-ss1VVVVVVVVVVVVVVVVVVVVVVV
Vt,s-ss1
e
Vt,m-ps1
Vt,m-ss1VVVVVVVVVVVVVVVVVVVVV
Vt,s-ss1
(a) TC
(b) TC-M
(c) TC-S
[1/s]
Fig. 6 Behaviors of tip leakage vortices and static pressure coefficient distribution on blade-to-blade surface near blade tip
Download service for the GTSJ via 65.21.229.84, 2022/07/20.
58 / 298
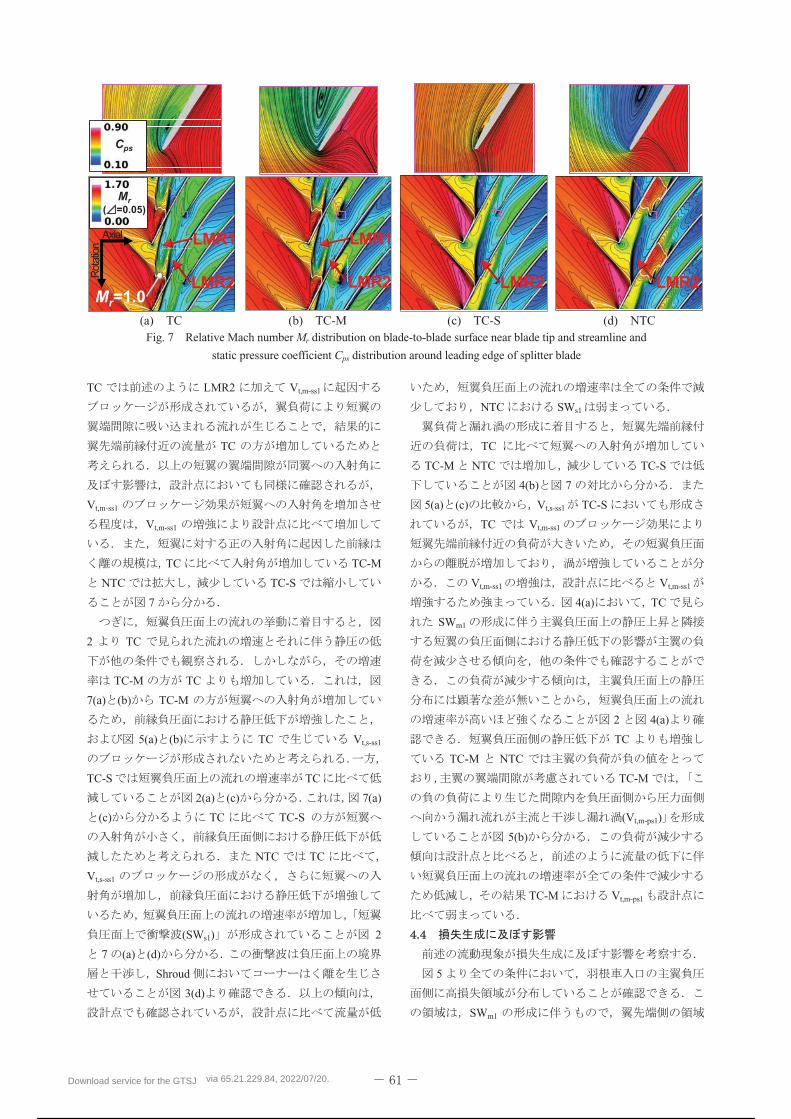
TC LMR2 Vt,m-ss1
TC
Vt,m-ss1
Vt,m-ss1
TC TC-M
NTC TC-S
7
2 TC
TC-M TC
7(a) (b) TC-M
5(a) (b) TC Vt,s-ss1
TC-S TC
2(a) (c) 7(a)
(c) TC TC-S
NTC TC
Vt,s-ss1
(SWs1) 2
7 (a) (d)
Shroud
3(d)
NTC SWs1
TC
TC-M NTC TC-S
4(b) 7
5(a) (c) Vt,s-ss1 TC-S
TC Vt,m-ss1
Vt,m-ss1 Vt,m-ss1
4(a) TC
SWm1
2 4(a)
TC
TC-M NTC
TC-M
(Vt,m-ps1)
5(b)
TC-M Vt,m-ps1
5
SWm1
=1.0LMR2
LMR1
( =0.05)
Rot
atio
n
Axial
Fig. 7 Relative Mach number distribution on blade-to-blade surface near blade tip and streamline and
static pressure coefficient distribution around leading edge of splitter blade
LMR2
LMR1
LMR2 LMR2
(a) TC (b) TC-M (c) TC-S (d) NTC
Download service for the GTSJ via 65.21.229.84, 2022/07/20.
59 / 298
2 7 LMR 2 TC
TC-M SWm1 TC-S NTC
Shroud
3 5(a) (b)
TC TC-M Shroud
Vt,m-ss1
SWm1 5
6 (a) (b)
Vt,m-ss1
5
5 7 TC Vt,s-ss1
5(a)
TC-M 5(b) Vt,m-ps1
TC-S TC Vt,s-ss1
5(c) TC Vt,m-ss1
4(b)
Vt,s-ss1
Vt,m-ss1 Vt,s-ss1
NTC Shroud SWs1
3(d) 5(d)
5
SWm1
Shroud
Vt,m-ss1
SWm1
Vt,m-ss1
Vt,s-ss1
Vt,m-ss1
Vt,m-ss1
Vt,s-ss1
SWs1 Vt,m-ps1
Shroud
Eisenlohr, G., Krain, H., Richter, FA., Valentin, T.: Investigations of the Flow Through a High Pressure Ratio Centrifugal Impeller, Proceedings of ASME Turbo Expo 2002, Amsterdam, the Netherlands, GT-2002-30394 (2002).Kaneko, M., Tsujita, H.: Influences of Tip Leakage Flows on Flow Behavior in Transonic Centrifugal Compressor with Splitter Blade at Design Condition, IGTC 2015, Tokyo, Japan, 174 (2015).
Download service for the GTSJ via 65.21.229.84, 2022/07/20.
60 / 298
A-13
Effects of Blade Tip Clearance on Hub-Corner Separation in a Stator Cascade of a Transonic Axial Compressor
* Seishiro SAITO (Kyushu Univ.), Yuki TAMURA (Kyushu Univ.), Masato FURUKAWA (Kyushu Univ.), Kazutoyo YAMADA (Kyushu Univ.),
Akinori MATUOKA (KHI) and Naoyuki NIWA (KHI)
ABSTRACT
The paper presents the effects of blade tip clearance on hub-corner separation in a stator cascade of a multi-
stage transonic axial compressor. In this study, the effects have been numerically investigated for three clearance
cases: uniform clearance, partial clearance, and no clearance. The numerical analysis shows that the leakage vortex
due to the stator blade tip clearance is the main cause for loss near the hub in the case of uniform clearance. In the
case of no clearance, low-energy fluid of the secondary flow on the hub accumulates on the suction side of the
blade, producing the separation vortex near the hub corner. In the partial clearance case, the separation vortex
occurring near the filled clearance section and the leakage vortex from the rear tip clearance produce a huge loss,
generating very complicated flow field.
Key words: Transonic Axial Compressor, RANS, Visual Data Mining, Blade Tip Clearance, Hub Corner
Separation
1
(VSV)
Yamada (1)
(2)
(3)
(4)
2
3
RANS(5)
2
2
Download service for the GTSJ via 65.21.229.84, 2022/07/20.
61 / 298
20
30 104
1
AutoGrid5 ver9.10
NUMECA
H-J-O
1
520
2 410 2
340
y+<1
3 2
3
Navier-Stokes
k- (6)
RANS
cell-centered
SHUS Simple High-resolution Upwind
Scheme (7) MUSCL
Gauss
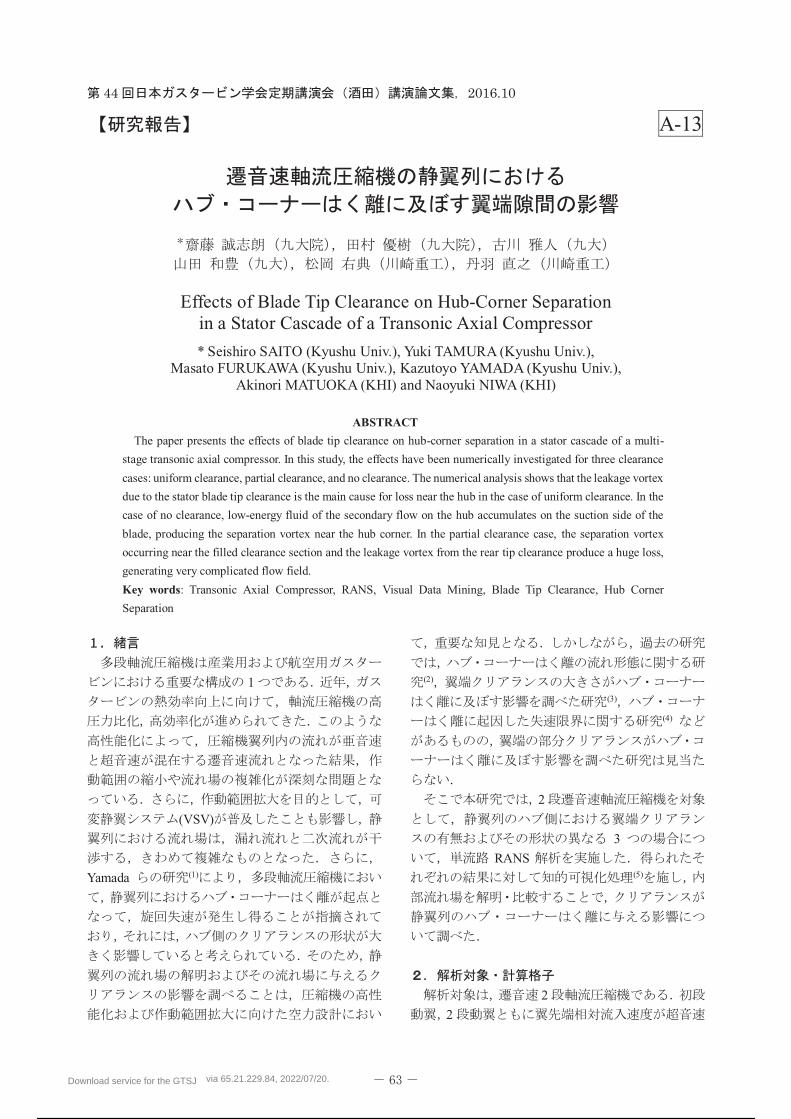
(a) Leading edge side
(b) Trailing edge side
Fig. 1 Closeup view of partial clearance
Fig. 2 Shape of blade tip clearance
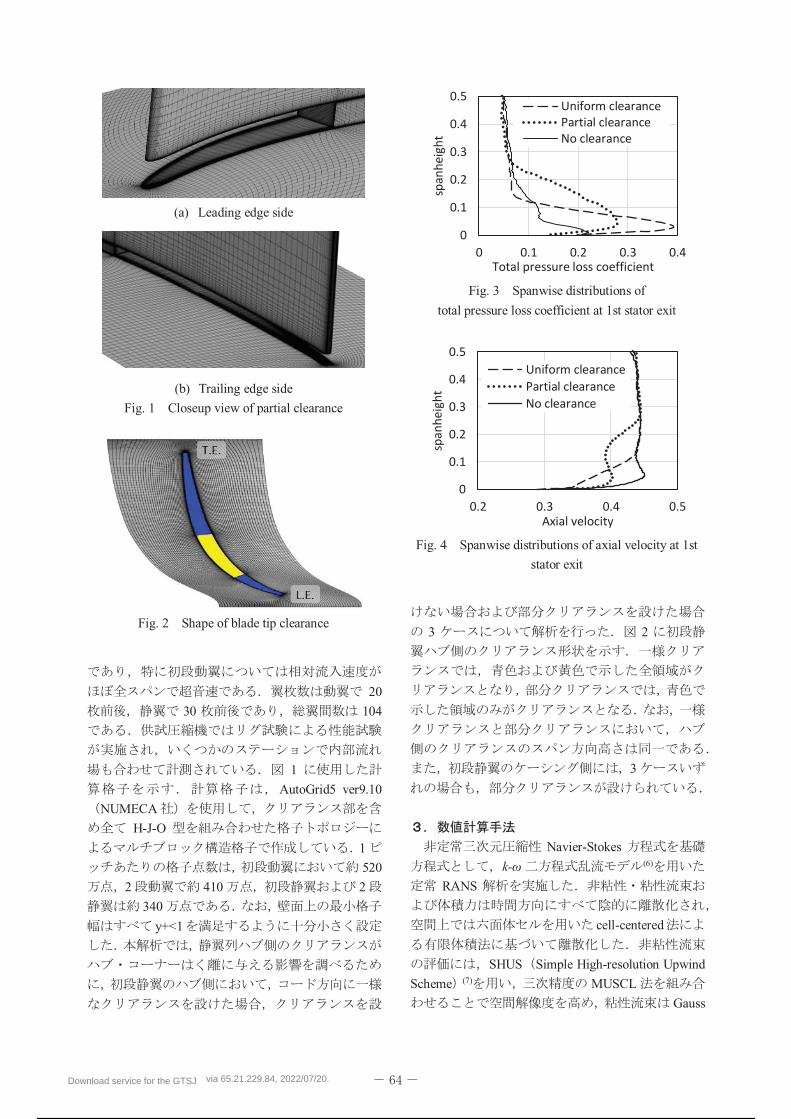
Fig. 3 Spanwise distributions of
total pressure loss coefficient at 1st stator exit
Fig. 4 Spanwise distributions of axial velocity at 1st
stator exit
Download service for the GTSJ via 65.21.229.84, 2022/07/20.
62 / 298
Euler
MFGS Matrix Free Gauss-Seidel
3 4
(1)
Pt1 Pt2
Pt0 ps0
50%
3 30% 50%
30%
15%
3%
4
15%
5%
5%
10%
10% 20%
30%
2
10% 30%
30%
5%
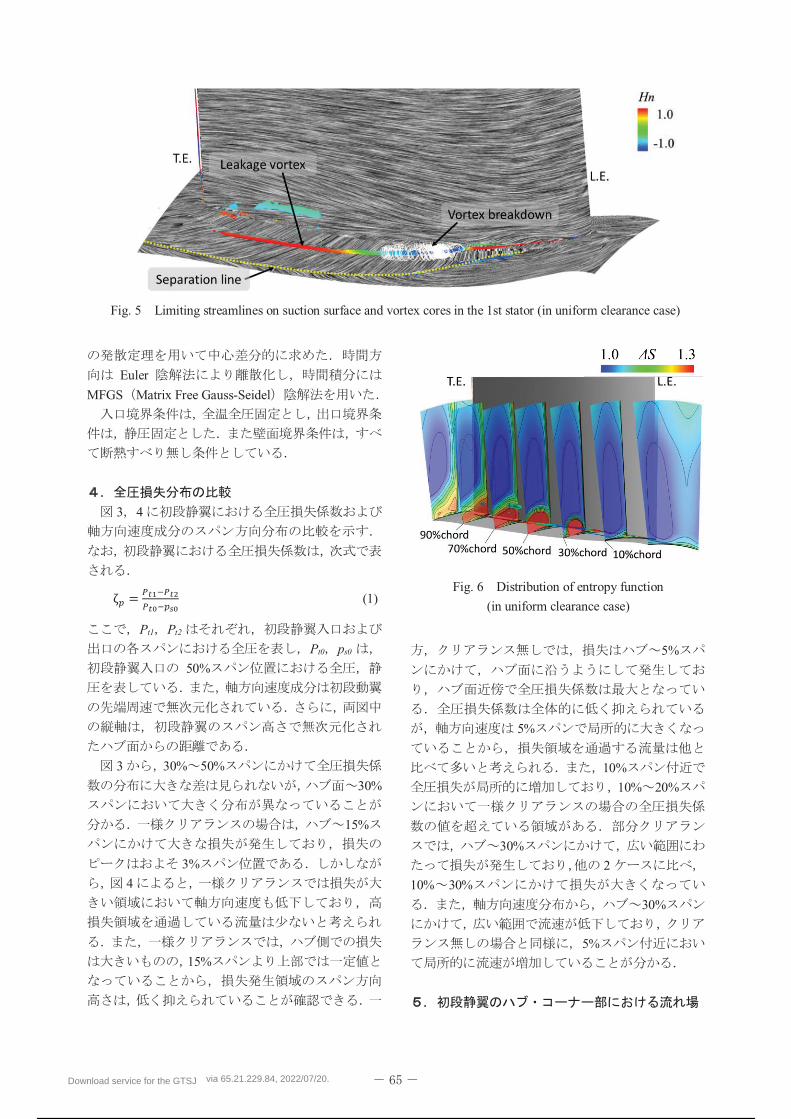
Fig. 5 Limiting streamlines on suction surface and vortex cores in the 1st stator (in uniform clearance case)
Fig. 6 Distribution of entropy function
(in uniform clearance case)
Download service for the GTSJ via 65.21.229.84, 2022/07/20.
63 / 298
5
(5)
(2)
u
5
30%
5
2
6
1
0 0
t t
t t
T PS
T P (3)
Tt, Pt
Tt0, Pt0
5
6 30%
3
3%
10% 50%
50%
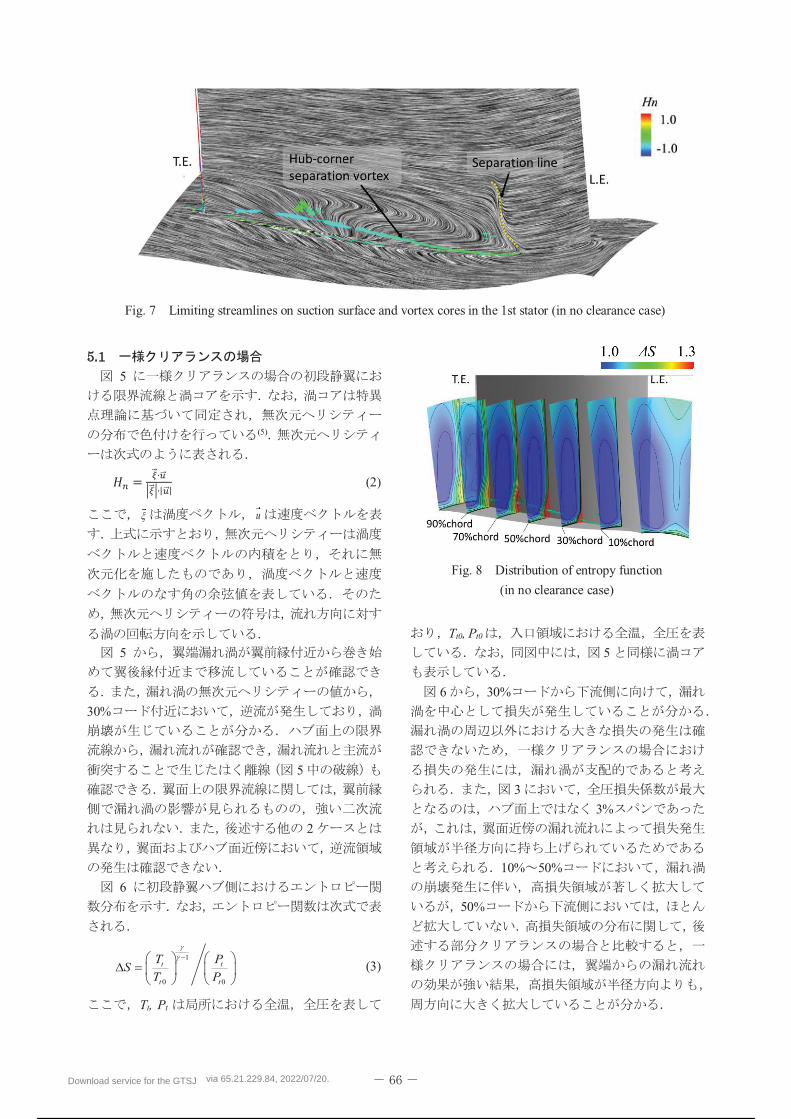
Fig. 7 Limiting streamlines on suction surface and vortex cores in the 1st stator (in no clearance case)
Fig. 8 Distribution of entropy function
(in no clearance case)
Download service for the GTSJ via 65.21.229.84, 2022/07/20.
64 / 298
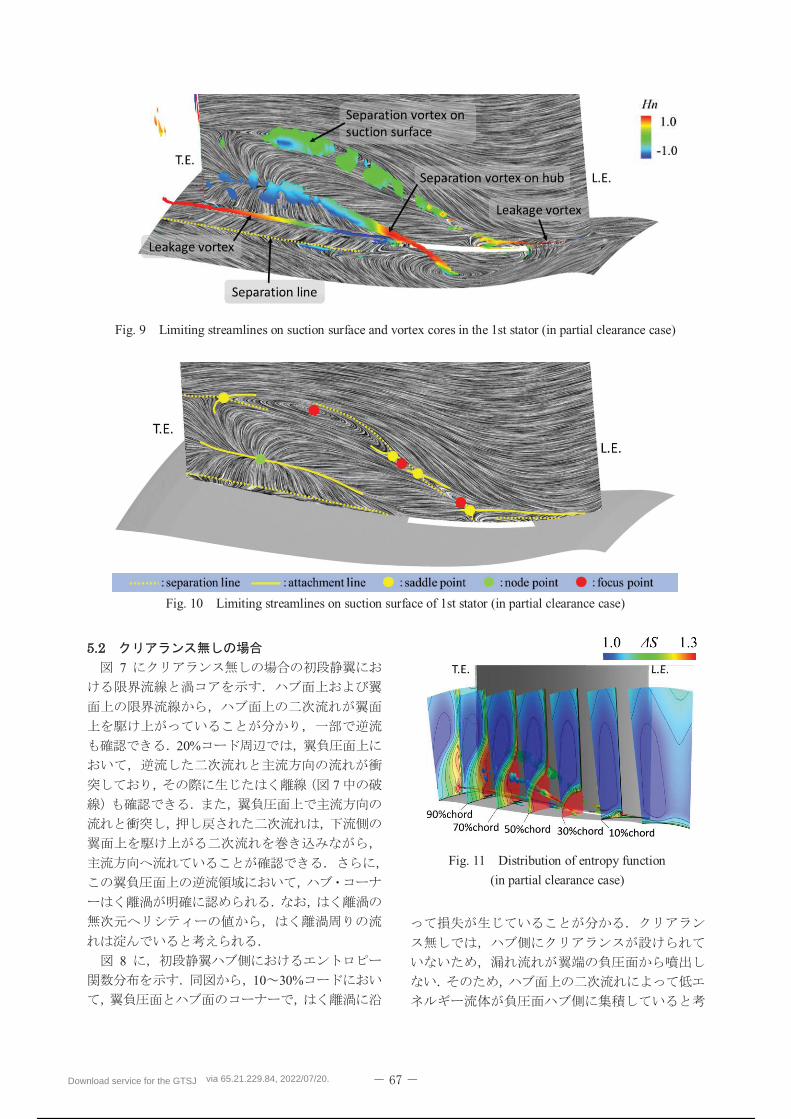
7
20%
7
8
10 30%
Fig. 9 Limiting streamlines on suction surface and vortex cores in the 1st stator (in partial clearance case)
Fig. 10 Limiting streamlines on suction surface of 1st stator (in partial clearance case)
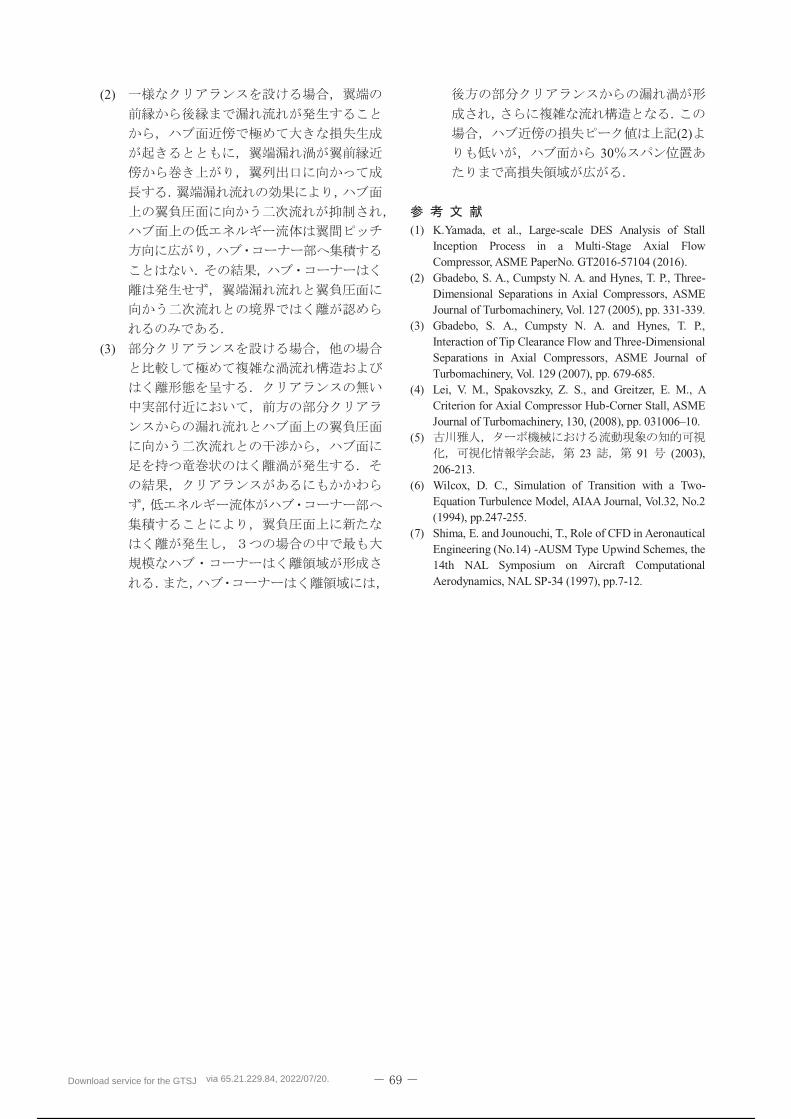
Fig. 11 Distribution of entropy function
(in partial clearance case)
Download service for the GTSJ via 65.21.229.84, 2022/07/20.
65 / 298
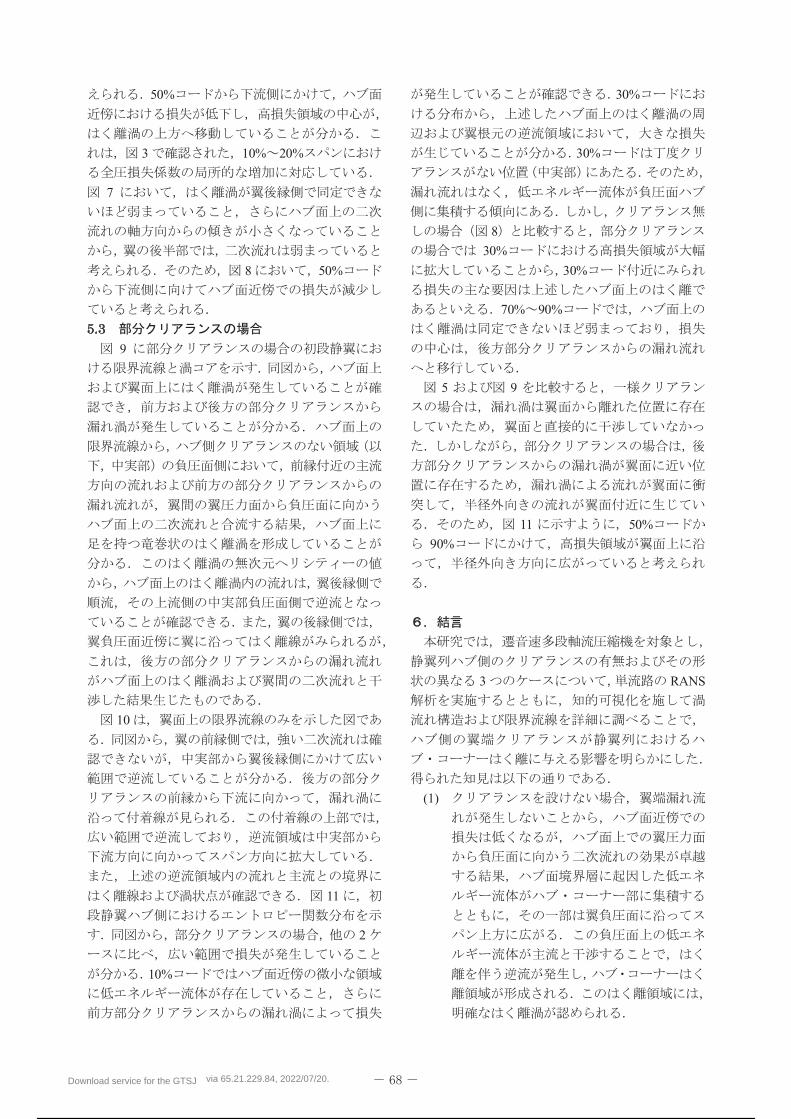
50%
3 10% 20%
7
8 50%
9
10
11
2
10%
30%
30%
8
30%
30%
70% 90%
5 9
11 50%
90%
3 RANS
(1)
Download service for the GTSJ via 65.21.229.84, 2022/07/20.
66 / 298
(2)
(3)
(2)
30
(1) K.Yamada, et al., Large-scale DES Analysis of Stall Inception Process in a Multi-Stage Axial Flow Compressor, ASME PaperNo. GT2016-57104 (2016).
(2) Gbadebo, S. A., Cumpsty N. A. and Hynes, T. P., Three-Dimensional Separations in Axial Compressors, ASME Journal of Turbomachinery, Vol. 127 (2005), pp. 331-339.
(3) Gbadebo, S. A., Cumpsty N. A. and Hynes, T. P., Interaction of Tip Clearance Flow and Three-Dimensional Separations in Axial Compressors, ASME Journal of Turbomachinery, Vol. 129 (2007), pp. 679-685.
(4) Lei, V. M., Spakovszky, Z. S., and Greitzer, E. M., A Criterion for Axial Compressor Hub-Corner Stall, ASME Journal of Turbomachinery, 130, (2008), pp. 031006 10.
(5) 23 91 (2003),
206-213. (6) Wilcox, D. C., Simulation of Transition with a Two-
Equation Turbulence Model, AIAA Journal, Vol.32, No.2 (1994), pp.247-255.
(7) Shima, E. and Jounouchi, T., Role of CFD in Aeronautical Engineering (No.14) -AUSM Type Upwind Schemes, the 14th NAL Symposium on Aircraft Computational Aerodynamics, NAL SP-34 (1997), pp.7-12.
Download service for the GTSJ via 65.21.229.84, 2022/07/20.
67 / 298
A-14
Verification of Control Effect of Tip Leakage Flow in Centrifugal Compressor by Ring-type Plasma Actuators
* Toshiyuki OHASHI, Hitoshi ISHIKAWA, Takehiko SEGAWA and Takayuki MATSUNUMA
ABSTRACT
Velocity and pressure distributions near the outlet in a centrifugal compressor system were measured by PIV
and pressure scanner for evaluating control effects of the tip leakage flow by means of a ring-type plasma
actuator. A copper wire coated with silicone was embedded in a casing surface facing tips of the impeller. Under
a rotating speed of impeller = 1,500 rpm, dielectric barrier discharge (DBD) plasma was formed in between
their clearances (s = 1.2 mm) by applying the fixed peak-to-peak voltage Vp-p = 11.7 kV with frequencies fp = 5,
10, 20, 30 and 40 kHz. In the case of fp = 5 kHz, velocity in the outside of impeller hub increased in comparison
with that without flow control, although it tends to decrease according to higher fp. Static pressure near the hub
side of diffuser was also enlarged further negative value for the particular case of fp = 5 kHz.
Key words: Tip leakage flow, Centrifugal compressor, Ring-type plasma actuator, Active flow control, PIV
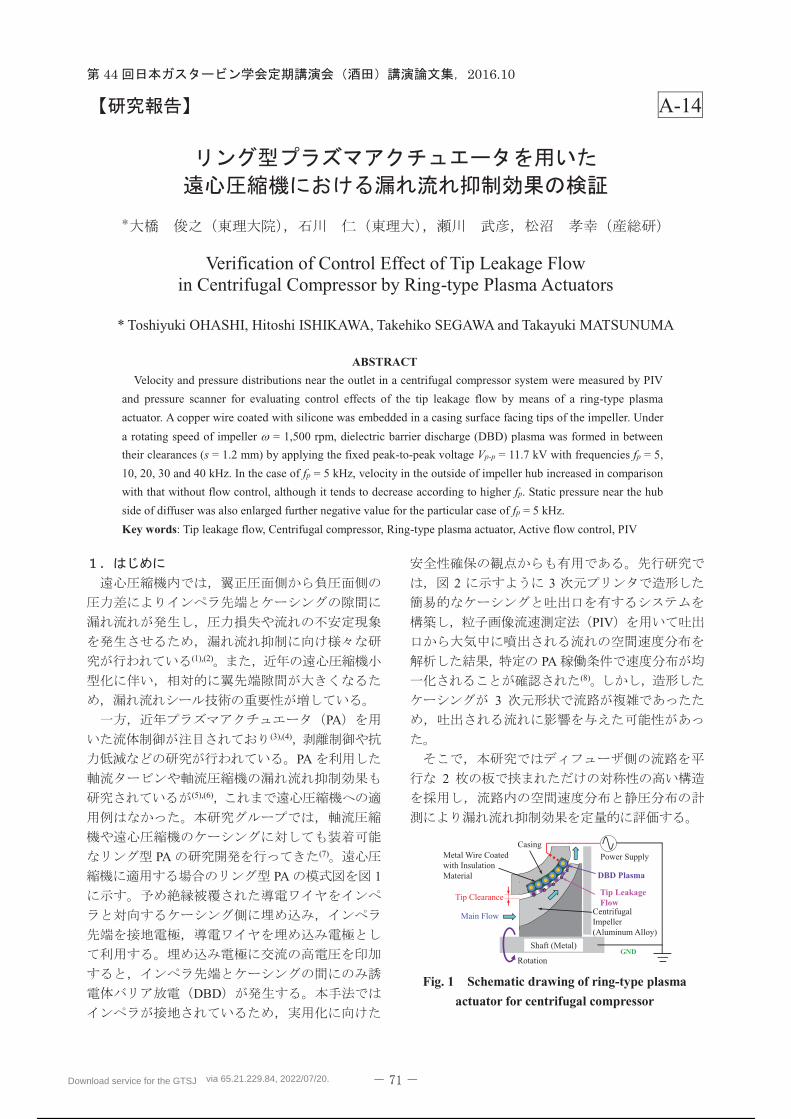
(1),(2)
PA(3),(4)
PA
(5),(6)
PA (7)
PA 1
DBD
2 3
PIV
PA(8)
3
2
Shaft (Metal)
DBD Plasma
Tip Leakage Flow
Tip Clearance
Metal Wire Coated with Insulation Material
Casing
Centrifugal Impeller(Aluminum Alloy)
Main Flow
Power Supply
RotationGND
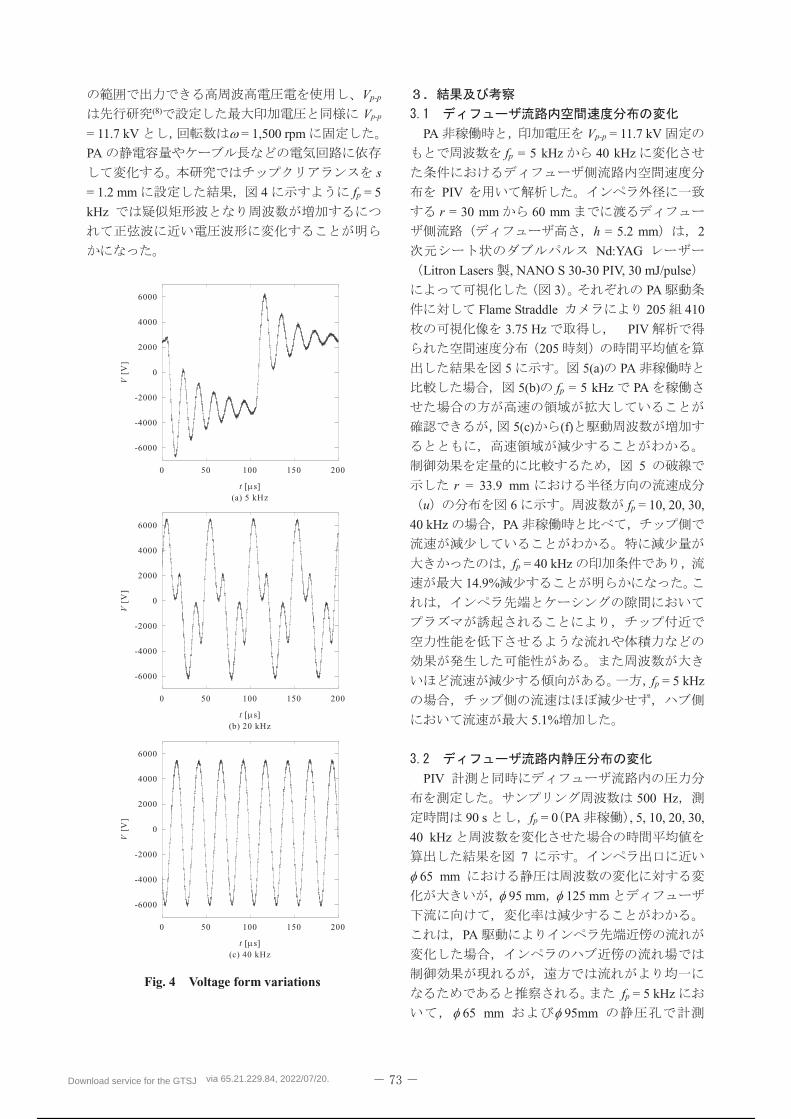
Fig. 1 Schematic drawing of ring-type plasma
actuator for centrifugal compressor
Download service for the GTSJ via 65.21.229.84, 2022/07/20.
68 / 298
3
PA 1
2,000 cc
d1 = 42.4 mm
d2 = 59 mm
7,760
rpm DC m-link , CPH50
D1 = 44.4 mm
h2 = 5.2 mm 3
c = 1 mm
0.1 mm
2 mm
1.5 mm
1.3 mm 0.45 mm
PSI , PG1040F
DBD
2
65 mm
95 mm 125 mm 4
12 Esterline NetScanner
9116 500 Hz
PA peak-to-peak Vp-p
fp Vp-p fp
Table. 1 Specifications of experimental apparatus
Impeller
Number of blade (n) 12 blade Inlet diameter (d1) 42.4 mm Outlet diameter (d2) 59 mm Outlet blade height (h1) 5.0 mm
Casing Suction diameter (D1) 44.4 mm Diffuser height (h2) 5.2 mm Groove depth for PA 1.5 mm
PA
Tip clearance (s) 1.2 mm
Wire outer diameter 1.3 mm Thickness of insulator 0.45 mm
(b) Cross section
65 mm
95 mm
Pressure Scanner
CCDCamera
Double PulseNd:YAG Laser
Static Pressure Hole 12
mm)
Suction
125 mm
PA
HV-RFPower Supply
FlowVisualization
(PIV)
r
z
(a) Top view
Impeller
h2
Fig. 3 Experimental setup
x
y
PA off PA on
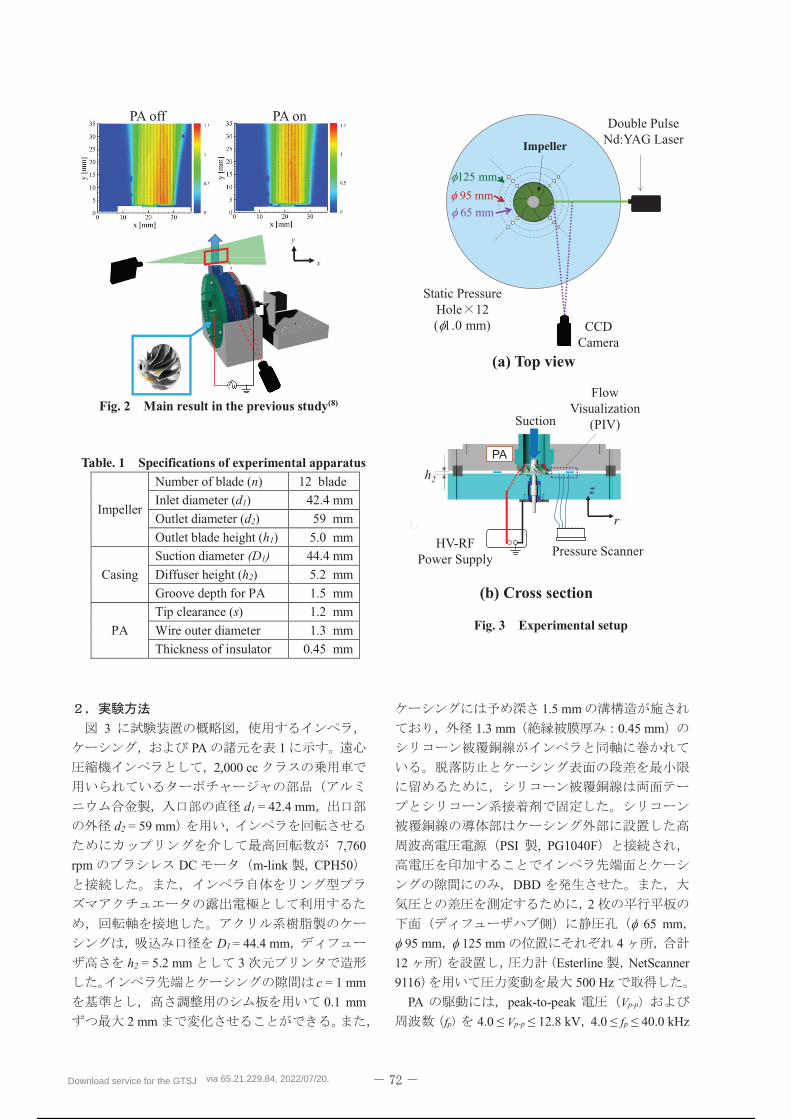
Fig. 2 Main result in the previous study(8)
Download service for the GTSJ via 65.21.229.84, 2022/07/20.
69 / 298
Vp-p
(8) Vp-p
= 11.7 kV = 1,500 rpm
PA
s
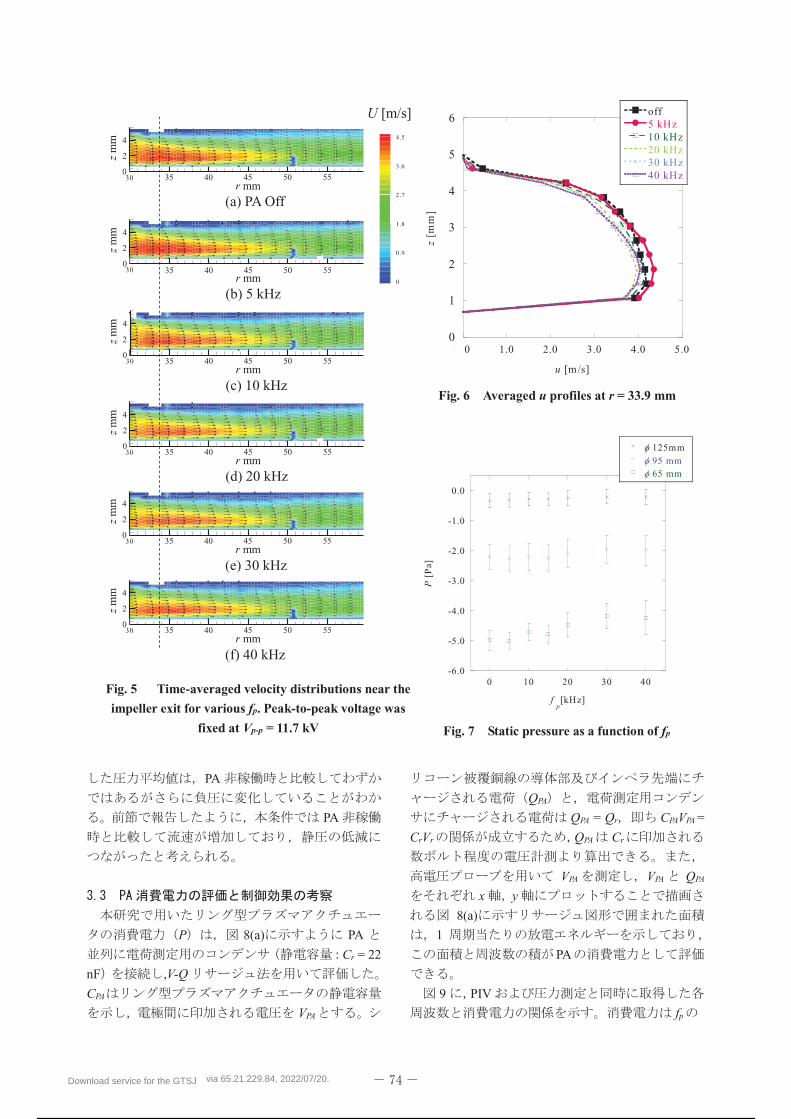
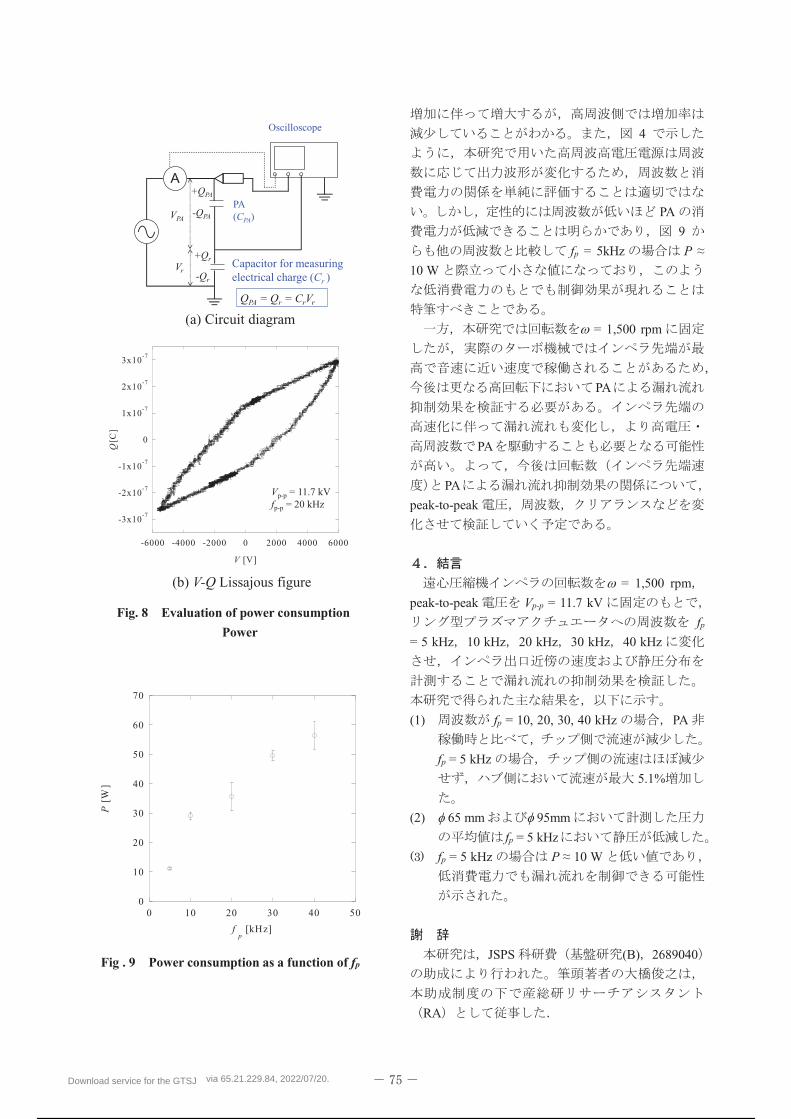
= 1.2 mm 4 fp = 5
kHz
PA Vp-p = 11.7 kV
fp = 5 kHz 40 kHz
PIV
r = 30 mm 60 mm
h = 5.2 mm 2
Nd:YAG
Litron Lasers , NANO S 30-30 PIV, 30 mJ/pulse
3 PA
Flame Straddle 205 410
3.75 Hz PIV
205
5 5(a) PA
5(b) fp = 5 kHz PA
5(c) (f)
5
r = 33.9 mm
u 6 fp = 10, 20, 30,
40 kHz PA
fp = 40 kHz
14.9%
fp = 5 kHz
5.1%
PIV
500 Hz
90 s fp = 0 PA , 5, 10, 20, 30,
40 kHz
7
65 mm
95 mm 125 mm
PA
fp = 5 kHz
65 mm 95mm
-6000
-4000
-2000
0
2000
4000
6000
0 50 100 150 200
V [
V]
t [ s](b) 20 kHz
-6000
-4000
-2000
0
2000
4000
6000
0 50 100 150 200
V [
V]
t [ s](a) 5 kHz
-6000
-4000
-2000
0
2000
4000
6000
0 50 100 150 200
V [
V]
t [ s](c) 40 kHz
Fig. 4 Voltage form variations
Download service for the GTSJ via 65.21.229.84, 2022/07/20.
70 / 298
PA
PA
P 8(a) PA
Cr = 22
nF ,V-Q
CPA
VPA
QPA
QPA = Qr CPAVPA =
CrVr QPA Cr
VPA VPA QPA
x y
8(a)
1
PA
9 PIV
fp
x mm
ym
m
510152025308
10
12
z m
m
2
4
35 40 45 50 55r mm
0
(a) PA Off
x mm
ym
m
510152025308
10
12
z m
m
2
4
35 40 45 50 55r mm
0
(f) 40 kHz
x mm
ym
m
510152025308
10
12
z m
m
0
2
4
35 40 45 50 55r mm
(e) 30 kHz
x mm
ym
m
510152025308
10
12
z m
m
0
2
4
35 40 45 50 55r mm
(c) 10 kHz
x mm
ym
m
510152025308
10
12
0
z m
m
2
4
35 40 45 50 55r mm
(d) 20 kHz
x mm
ym
m
510152025308
10
12
z m
m
0
2
4
35 40 45 50 55r mm
(b) 5 kHz
4.5
3.6
2.7
1.8
0.9
0
U [m/s]
Fig. 5 Time-averaged velocity distributions near the
impeller exit for various fp. Peak-to-peak voltage was
fixed at Vp-p = 11.7 kV
0.0 1.0 2.0 3.0 4.0 5.08
9
10
11
12
13
14off5 kHz10 kHz20 kHz30 kHz40 kHz
u [m/s]
z [m
m]
0
1
2
3
4
5
6
Fig. 6 Averaged u profiles at r = 33.9 mm
-6.0
-5.0
-4.0
-3.0
-2.0
-1.0
0.0
0 10 20 30 40
125mm 95 mm 65 mm
P [
Pa]
f p[kHz]
Fig. 7 Static pressure as a function of fp
Download service for the GTSJ via 65.21.229.84, 2022/07/20.
71 / 298
4
PA
9
fp = 5kHz P
10 W
= 1,500 rpm
PA
PA
PA
peak-to-peak
= 1,500 rpm
peak-to-peak Vp-p = 11.7 kV
fp
= 5 kHz 10 kHz 20 kHz 30 kHz 40 kHz
(1) fp = 10, 20, 30, 40 kHz PA
fp = 5 kHz
5.1%
(2) 65 mm 95mm
fp = 5 kHz
fp = 5 kHz P 10 W
JSPS (B) 2689040
RA
-6000 -4000 -2000 0 2000 4000 6000
-3x10⁻⁷
-2x10⁻⁷
-1x10⁻⁷
0
1x10⁻⁷
2x10⁻⁷
3x10⁻⁷
V [V]
Q[C
]
Vp-p = 11.7 kVfp-p = 20 kHz
Capacitor for measuring electrical charge (Cr )
VPA
Vr
A
PA (CPA)
+QPA
-QPA
+Qr
-Qr
QPA = Qr = CrVr
Oscilloscope
(a) Circuit diagram
(b) V-Q Lissajous figure
Fig. 8 Evaluation of power consumption
Power
0
10
20
30
40
50
60
70
0 10 20 30 40 50
P [
W]
f p [kHz]
Fig . 9 Power consumption as a function of fp
Download service for the GTSJ via 65.21.229.84, 2022/07/20.
72 / 298
(1) , , , ,
,
, (B ), 79 801 ,
pp. 900-916 (2013).
(2) , , ,
,
, Vol. 49, No. 1, pp. 69-74 (2012).
(3) Corke, T. C., Enloe, C. L., Wilkinson, S. P.,
Dielectric Barrier Discharge Plasma Actuators for
Flow Control, Annual Review of Fluid
Mechanics, Vol. 42, pp. 505-529 (2010).
(4) , ,
,
, Vol. 29, No. 4, pp. 243-250
(2010).
(5) Van Ness II, D. K., Corke, T. C., Morris, S. C.,
Tip Clearance Flow Visualization of a Turbine
Blade Cascade with Active and Passive Flow
Control, ASME Paper, GT2008-50703 (2008).
(6) Saddoughi, S., Bennett, G., Boespflug, M.,
Puterbaugh, S. L., and Wadia, A. R.,
Experimental Investigation of Tip Clearance
Flow in a Transonic Compressor with and without
Plasma Actuators, ASME Paper, GT2014-25294
(2014).
(7) Matsunuma, T., Segawa, T., Active Control of
Tip Leakage Flow for Low-Pressure Turbine by
Ring-Type Plasma Actuators, AIAA Paper,
2013-2726 (2013).
(8) , , ,
,
2015 , S0530402 (2015).
Download service for the GTSJ via 65.21.229.84, 2022/07/20.
73 / 298
Download service for the GTSJ via 65.21.229.84, 2022/07/20.
74 / 298
Download service for the GTSJ via 65.21.229.84, 2022/07/20.
75 / 298
Download service for the GTSJ via 65.21.229.84, 2022/07/20.
76 / 298
Download service for the GTSJ via 65.21.229.84, 2022/07/20.
77 / 298
Download service for the GTSJ via 65.21.229.84, 2022/07/20.
78 / 298
Download service for the GTSJ via 65.21.229.84, 2022/07/20.
79 / 298
Download service for the GTSJ via 65.21.229.84, 2022/07/20.
80 / 298
Download service for the GTSJ via 65.21.229.84, 2022/07/20.
81 / 298
Download service for the GTSJ via 65.21.229.84, 2022/07/20.
82 / 298
Download service for the GTSJ via 65.21.229.84, 2022/07/20.
83 / 298
Download service for the GTSJ via 65.21.229.84, 2022/07/20.
84 / 298
Download service for the GTSJ via 65.21.229.84, 2022/07/20.
85 / 298
Download service for the GTSJ via 65.21.229.84, 2022/07/20.
86 / 298
Download service for the GTSJ via 65.21.229.84, 2022/07/20.
87 / 298
Download service for the GTSJ via 65.21.229.84, 2022/07/20.
88 / 298
Download service for the GTSJ via 65.21.229.84, 2022/07/20.
89 / 298
Download service for the GTSJ via 65.21.229.84, 2022/07/20.
90 / 298
Download service for the GTSJ via 65.21.229.84, 2022/07/20.
91 / 298
Download service for the GTSJ via 65.21.229.84, 2022/07/20.
92 / 298
Download service for the GTSJ via 65.21.229.84, 2022/07/20.
93 / 298
Download service for the GTSJ via 65.21.229.84, 2022/07/20.
94 / 298
Download service for the GTSJ via 65.21.229.84, 2022/07/20.
95 / 298
Download service for the GTSJ via 65.21.229.84, 2022/07/20.
96 / 298
Download service for the GTSJ via 65.21.229.84, 2022/07/20.
97 / 298
Download service for the GTSJ via 65.21.229.84, 2022/07/20.
98 / 298
Download service for the GTSJ via 65.21.229.84, 2022/07/20.
99 / 298
Download service for the GTSJ via 65.21.229.84, 2022/07/20.
100 / 298
Download service for the GTSJ via 65.21.229.84, 2022/07/20.
101 / 298

Download service for the GTSJ via 65.21.229.84, 2022/07/20.
102 / 298
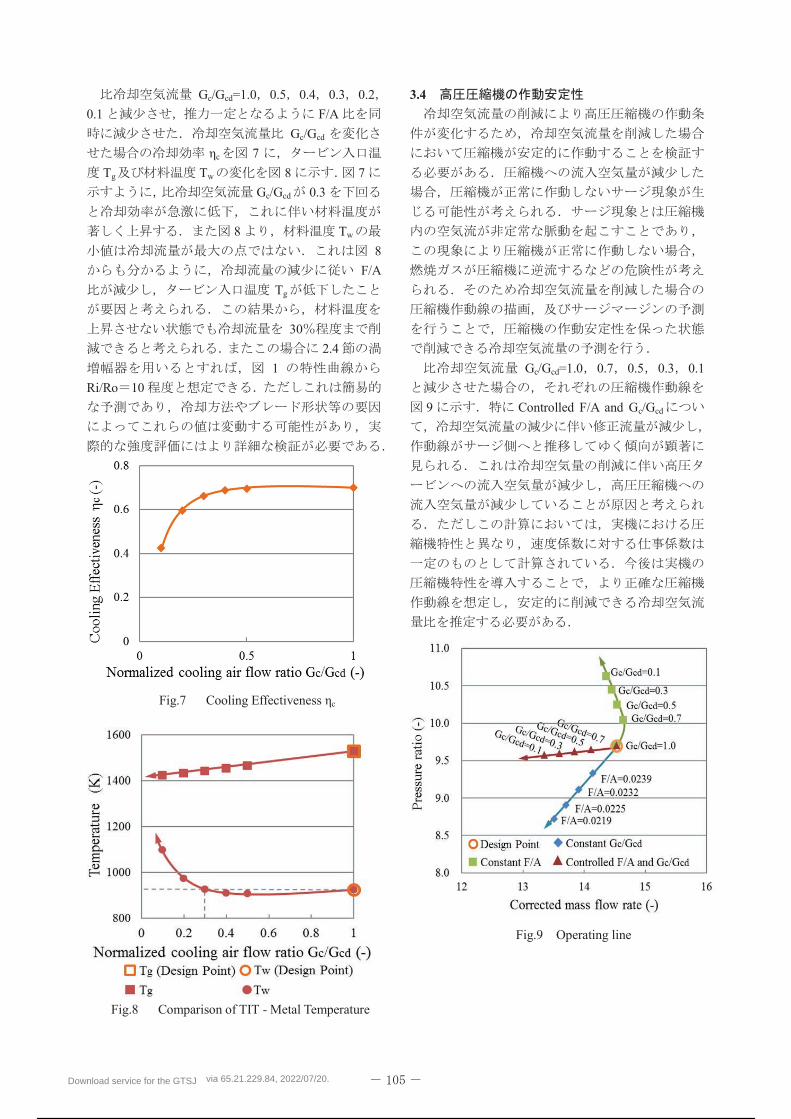
44 2016.10
B-2
Studies on Heat Transfer Coefficient and Flow Field through a Complex Cooling Channel for Turbine Blade (Influence of the channel entrance inflow condition)
Ken-ichi FUNAZAKI, Sekai TERABE(Iwate Univ.), Masahide KAZARI, Takeshi HORIUCHI(KHI)
ABSTRACT
This paper deals with experimental and numerical analysis on the heat transfer and the flow field in a realistic serpentine
internal cooling channel of turbine blade. This study aims at obtaining design guidance of the internal cooling channel
through the investigation of heat transfer coefficient with the focus on the flow condition at the channel entrance. A
transient method using Thermochromic Liquid Crystal is employed to measure the surface heat transfer distribution inside
the channel. Numerical analysis using ANSYS CFX is also carried out to enhance the knowledge of the flow field.
Key words: Internal cooling channel, Serpentine channel, Heat transfer, Flow field, CFD
1.
2.
2.1
Download service for the GTSJ via 65.21.229.84, 2022/07/20.
103 / 298
Fig. 1 Experimental set up
Fig.2 Test model
2.2
3
PS
SS
3 T1-T7,P1-P7
3
60°
2
Fig. 3 Flow channel inside the test model
3.
3.1 (5)
1st
pass, 2nd pass, 3rd pass
T1,T3,T5,T7
90°(6)
3 A-A
D(=33.4[mm])
ReD(=25,000)
4
3.2
(Hue)
RGB Hue (5).
4
Download service for the GTSJ via 65.21.229.84, 2022/07/20.
104 / 298
Hue
5 -Hue
6
Hue S
1
3
Fig. 4 Calibration device
(a)PS
(b)SS
Fig. 5 Calibration curve: (a) PS, (b) SS
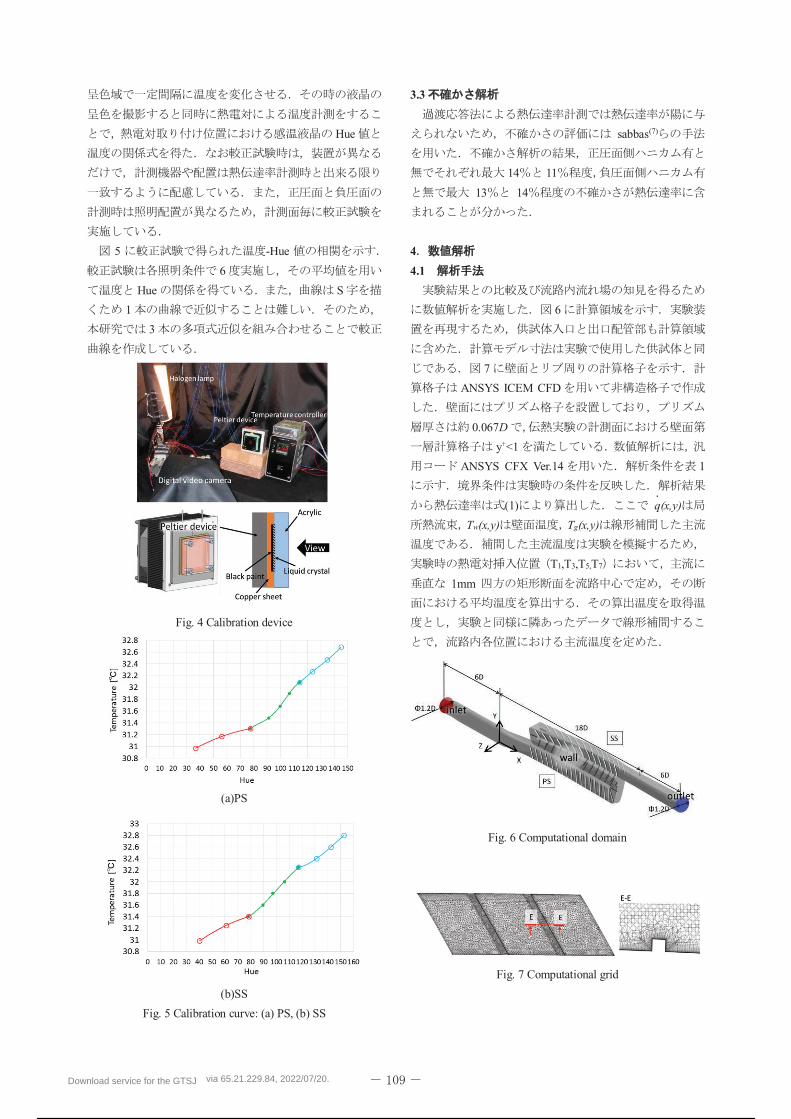
3.3
sabbas(7)
14 11
13 14
4
4.1
6
7
ANSYS ICEM CFD
0.067D
y+<1
ANSYS CFX Ver.14 1
(1) q(x,y)
Tw(x,y) Tg(x,y)
T1,T3,T5,T7
1mm
Fig. 6 Computational domain
Fig. 7 Computational grid
Download service for the GTSJ via 65.21.229.84, 2022/07/20.
105 / 298
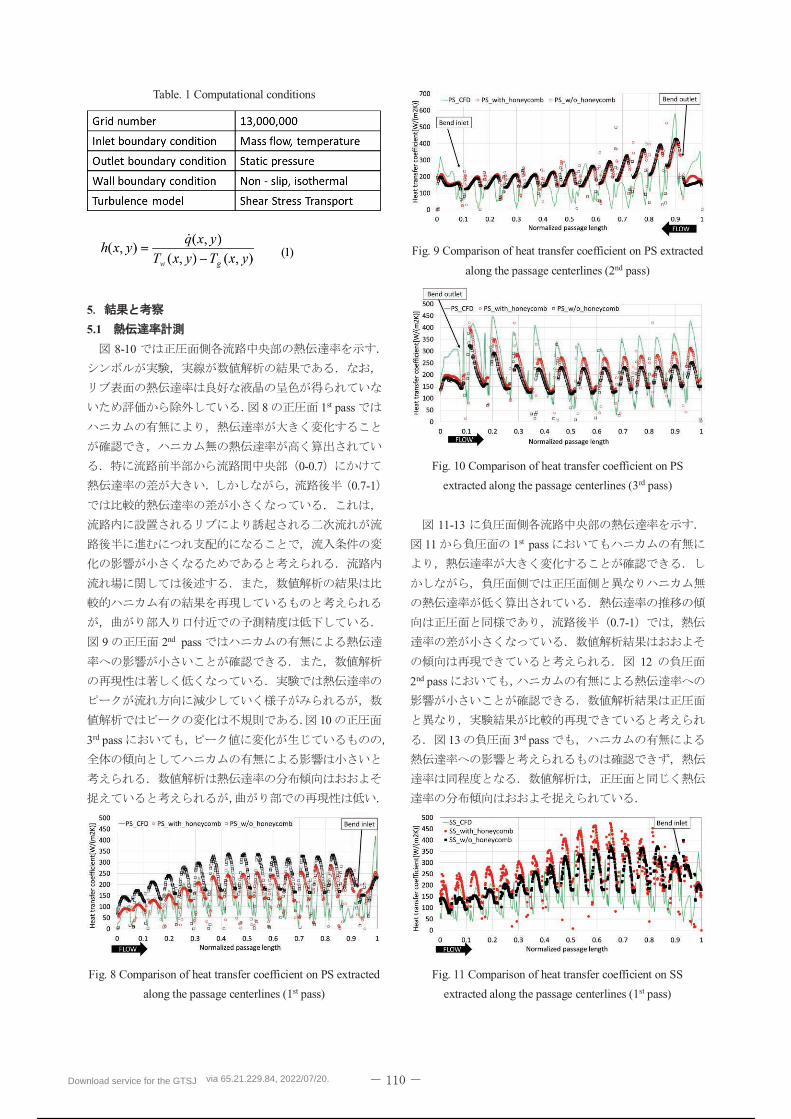
Table. 1 Computational conditions
5
5.1
8-10
8 1st pass
0-0.7
0.7-1
9 2nd pass
10
3rd pass
Fig. 8 Comparison of heat transfer coefficient on PS extracted
along the passage centerlines (1st pass)
Fig. 9 Comparison of heat transfer coefficient on PS extracted
along the passage centerlines (2nd pass)
Fig. 10 Comparison of heat transfer coefficient on PS
extracted along the passage centerlines (3rd pass)
11-13
11 1st pass
0.7-1
12
2nd pass
13 3rd pass
Fig. 11 Comparison of heat transfer coefficient on SS
extracted along the passage centerlines (1st pass)
Download service for the GTSJ via 65.21.229.84, 2022/07/20.
106 / 298
Fig. 12 Comparison of heat transfer coefficient on SS
extracted along the passage centerlines (2nd pass)
Fig. 13 Comparison of heat transfer coefficient on SS
extracted along the passage centerlines (3rd pass)
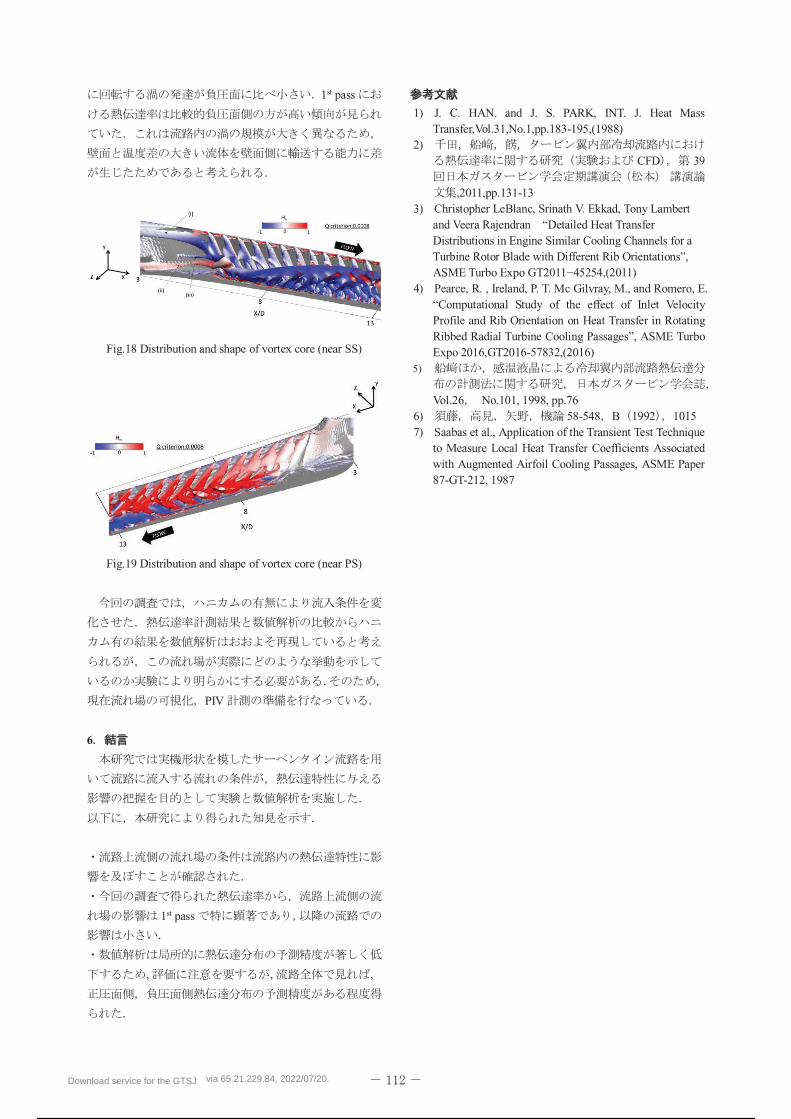
14 15
2nd pass
Fig. 14 Heat transfer coefficient distributions
(PS_with_honeycomb)
Fig. 15 Heat transfer coefficient distributions
(SS_with_honeycomb)
16
17
2nd pass
2nd pass
Fig.16 Heat transfer coefficient distributions
(PS_CFD)
Fig. 17 Heat transfer coefficient distributions
(SS_CFD)
5.2
18 19 3
1st pass X/D=3 X/D=13 Q
Hn
18 YZ
(i),(ii)
(iii) (iii) (i)
(ii)
X
19
X
Download service for the GTSJ via 65.21.229.84, 2022/07/20.
107 / 298
1st pass
Fig.18 Distribution and shape of vortex core (near SS)
Fig.19 Distribution and shape of vortex core (near PS)
PIV
6
1st pass
1) J. C. HAN. and J. S. PARK, INT. J. Heat Mass Transfer,Vol.31,No.1,pp.183-195,(1988)
2) CFD 39
,2011,pp.131-13
3) Christopher LeBlanc, Srinath V. Ekkad, Tony Lambert and Veera Rajendran Detailed Heat Transfer Distributions in Engine Similar Cooling Channels for a Turbine Rotor Blade with Different Rib OrientationsASME Turbo Expo GT2011 45254,(2011)
4) Pearce, R. , Ireland, P. T. Mc Gilvray, M., and Romero, E. omputational Study of the effect of Inlet Velocity
Profile and Rib Orientation on Heat Transfer in Rotating Ribbed Radial Turbine Cooling Passages E Turbo Expo 2016,GT2016-57832,(2016)
5)
Vol.26 No.101, 1998, pp.76
6) 58-548 B 1992 1015 7) Saabas et al., Application of the Transient Test Technique
to Measure Local Heat Transfer Coefficients Associated with Augmented Airfoil Cooling Passages, ASME Paper 87-GT-212, 1987
Download service for the GTSJ via 65.21.229.84, 2022/07/20.
108 / 298
B-3
PSP
ABSTRACT
This paper describes several attempts to optimize double flow control devices (DFCD), which was invented by some of the authors for
achieving better film cooling performance of gas turbine cooling holes. The device, which will be referred to as DFCD, is a pair of
protrusions with the shape of hemi-spheroid attached to the turbine blade surface just upstream of each of cooling holes. It has been revealed
in the previous studies that the optimized devices are able to improve film cooling effectiveness dramatically. However DFCD optimization
has only been done under low density- ratio condition, therefore there is room for the improvement of device shape and configuration for
the use at high density ratio conditions. In order to investigate the film effectiveness at a high density ratio, we use CFD-based Taguchi
Methods to optimize DFCD shape prior to the experiment. In the experimental study, we apply CO2 as the cooling air and measure film
cooling effectiveness using PSP technique for DR=1.53.
Key words: Film Cooling, Flow Control, Taguchi-Method, PSP
TIT
CRVP
CRVP
DFCD
DFCD DFCD
DBV
PSP DFCD
CFD
DFCD PSP
CFD PSP
Fig.1
150mm 250mm
CO2 CO2
ABS
PSP
UVLED
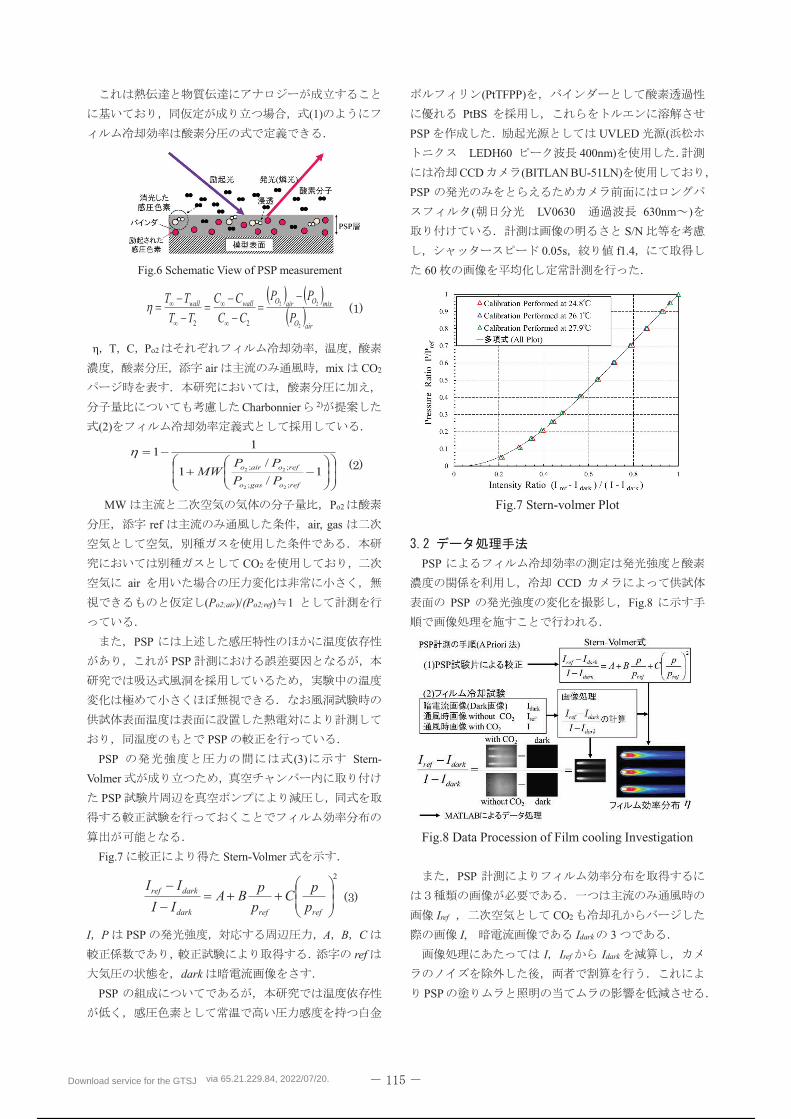
CCD
Fig.2
PSP
Download service for the GTSJ via 65.21.229.84, 2022/07/20.
109 / 298
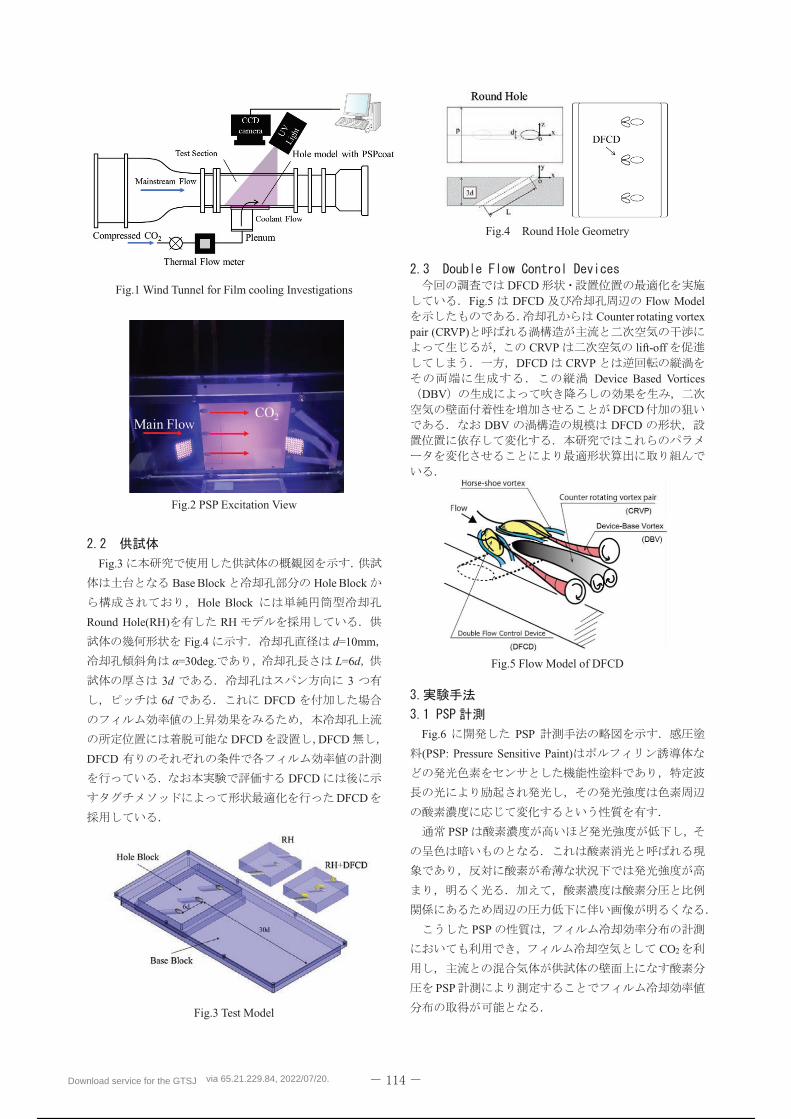
Fig.1 Wind Tunnel for Film cooling Investigations
Fig.2 PSP Excitation View
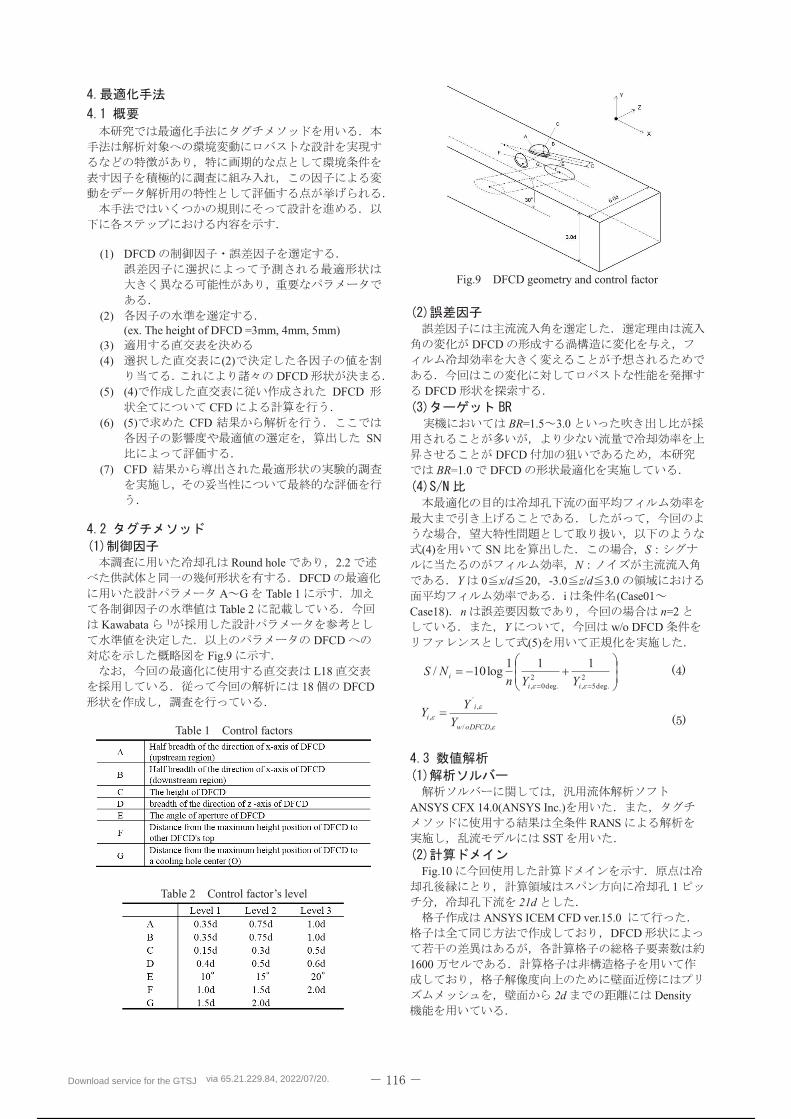
Fig.3
Base Block Hole Block
Hole Block
Round Hole(RH) RH
Fig.4 d=10mm
=30deg. L=6d
3d 3
6d DFCD
DFCD DFCD
DFCD
DFCD
DFCD
Fig.3 Test Model
Fig.4 Round Hole Geometry
DFCDFig.5 DFCD Flow Model
Counter rotating vortex pair (CRVP)
CRVP lift-offDFCD CRVP
Device Based VorticesDBV
DFCDDBV DFCD
Fig.5 Flow Model of DFCD
Fig.6 PSP
(PSP: Pressure Sensitive Paint)
PSP
PSP
CO2
PSP
Download service for the GTSJ via 65.21.229.84, 2022/07/20.
110 / 298
(1)
Fig.6 Schematic View of PSP measurement
T C Po2
air mix CO2
Charbonnier 2)
(2)
MW Po2
ref air, gas
CO2
air
(Po2;air)/(Po2;ref) 1
PSP
PSP
PSP
PSP (3) Stern-
Volmer
PSP
Fig.7 Stern-Volmer
I P PSP A B C
ref
dark
PSP
(PtTFPP)
PtBS
PSP UVLED (
LEDH60 400nm)
CCD (BITLAN BU-51LN)
PSP
( LV0630 630nm )
S/N
0.05s f1.4
60
Fig.7 Stern-volmer Plot
PSP
CCD
PSP Fig.8
Fig.8 Data Procession of Film cooling Investigation
PSP
Iref CO2
I, Idark 3
I Iref Idark
PSP
airO
mixOairOwallwall
P
PP
CCCC
TTTT
2
22
22
1/
/1
11
;;
;;
22
22
refogaso
refoairo
PP
PPMW
2
refrefdark
darkref
pp
Cpp
BAII
II
Download service for the GTSJ via 65.21.229.84, 2022/07/20.
111 / 298
(1) DFCD
(2)
(ex. The height of DFCD =3mm, 4mm, 5mm) (3) (4) (2)
DFCD (5) (4) DFCD
CFD (6) (5) CFD
SN
(7) CFD
Round hole 2.2DFCD
A G Table 1Table 2
Kawabata 1)
DFCDFig.9
L1818 DFCD
Table 1 Control factors
Table 2
Fig.9 DFCD geometry and control factor
DFCD
DFCD
BR=1.5 3.0
DFCDBR=1.0 DFCD
(4) SN SN
Y 0 x/d 20 -3.0 z/d 3.0i (Case01
Case18) n n=2Y w/o DFCD
(5)
25deg.,
20deg.,
111log10/
iii YYn
NS
,/
,´
,oDFCDw
i
i Y
YY
ANSYS CFX 14.0(ANSYS Inc.)RANS
SST
Fig.101
21d ANSYS ICEM CFD ver.15.0
DFCD
1600
2d Density
Download service for the GTSJ via 65.21.229.84, 2022/07/20.
112 / 298
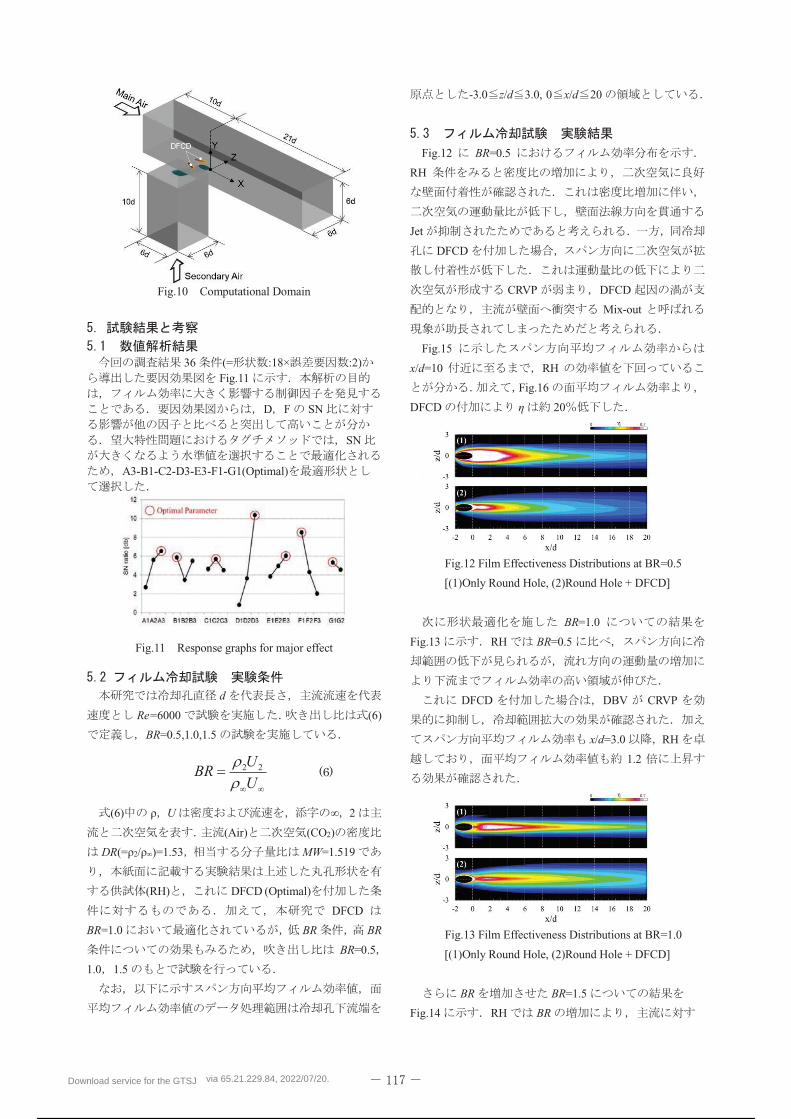
Fig.10 Computational Domain
36 (= :18× :2)Fig.11
D F SN
SN
A3-B1-C2-D3-E3-F1-G1(Optimal)
Fig.11 Response graphs for major effect
d
Re=6000 (6)
BR=0.5,1.0,1.5
(6) U 2
(Air) (CO2)
DR 2 )=1.53 MW=1.519
(RH) DFCD (Optimal)
DFCD
BR=1.0 BR BR
BR=0.5
1.0 1.5
-3.0 z/d 3.0, 0 x/d 20
Fig.12 BR=0.5
RH
Jet
DFCD
CRVP DFCD
Mix-out
Fig.15
x/d=10 RH
Fig.16
DFCD 20
Fig.12 Film Effectiveness Distributions at BR=0.5
[(1)Only Round Hole, (2)Round Hole + DFCD]
BR=1.0
Fig.13 RH BR=0.5
DFCD DBV CRVP
x/d=3.0 RH
1.2
Fig.13 Film Effectiveness Distributions at BR=1.0
[(1)Only Round Hole, (2)Round Hole + DFCD]
BR BR=1.5
Fig.14 RH BR
UU
BR 22
Download service for the GTSJ via 65.21.229.84, 2022/07/20.
113 / 298
CRVP
DFCD
x/d 2
2.7
BR DFCD
.
PSP
RH
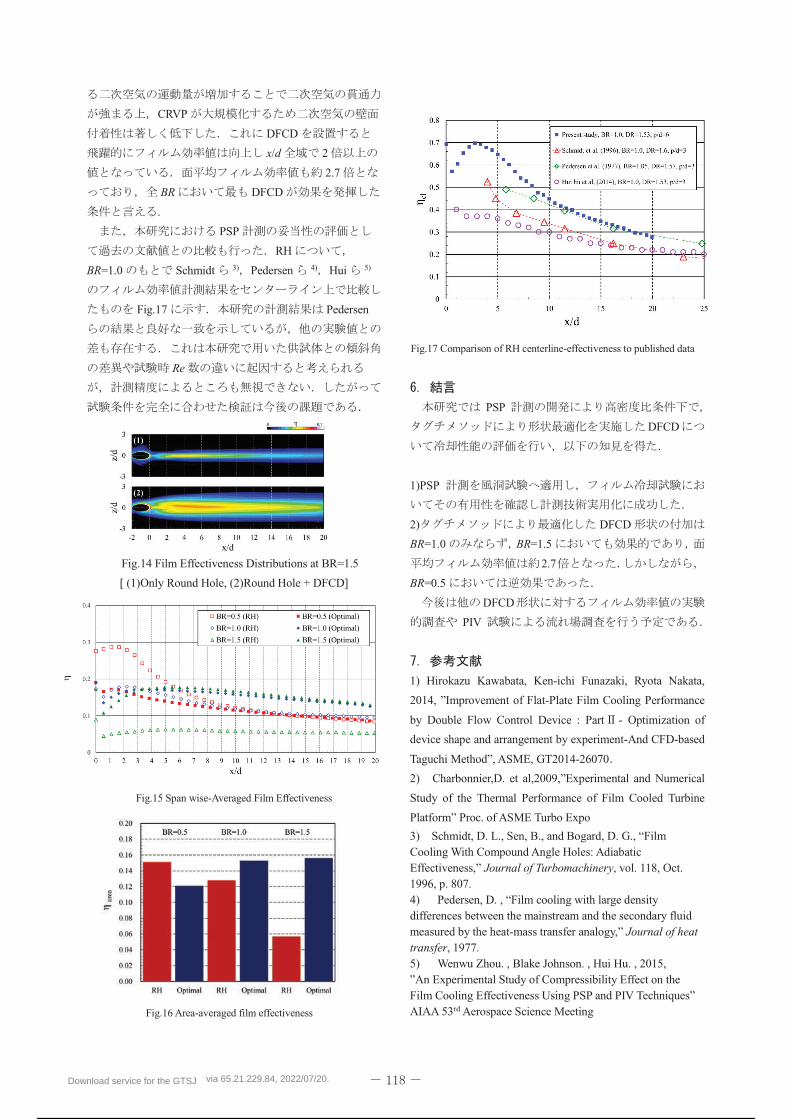
BR=1.0 Schmidt 3) Pedersen 4) Hui 5)
Fig.17 Pedersen
Re
Fig.14 Film Effectiveness Distributions at BR=1.5
[ (1)Only Round Hole, (2)Round Hole + DFCD]
Fig.15 Span wise-Averaged Film Effectiveness
Fig.16 Area-averaged film effectiveness
Fig.17 Comparison of RH centerline-effectiveness to published data
PSP
DFCD
1)PSP
2) DFCD
BR=1.0 BR=1.5
2.7
BR=0.5
DFCD
PIV
1) Hirokazu Kawabata, Ken-ichi Funazaki, Ryota Nakata,
2014, -Plate Film Cooling Performance
by Double Flow Control Device : Part - Optimization of
device shape and arrangement by experiment-And CFD-based
Taguchi Method ASME, GT2014-26070
2) Experimental and Numerical
Study of the Thermal Performance of Film Cooled Turbine
Platform Proc. of ASME Turbo Expo
3)Cooling With Compound Angle Holes: Adiabatic
Journal of Turbomachinery, vol. 118, Oct. 1996, p. 807. 4) Pedersen, D. differences between the mainstream and the secondary fluid measured by the heat- Journal of heat transfer, 1977. 5) Wenwu Zhou. , Blake Johnson. , Hui Hu. , 2015,
AIAA 53rd Aerospace Science Meeting
Download service for the GTSJ via 65.21.229.84, 2022/07/20.
114 / 298
B-4
Endwall Secondary Flow Control in Low Pressure Turbine Effect of Devices
*Ryota SATO(Iwate Univ.), Kenichi FUNAZAKI(Iwate Univ.), Teruyuki SHIOTA, Daichi MURAKAMI, Hirohumi OGURA, Kodai ITO(Iwate Univ.), Juo HURUKAWA(IHI)
ABSTRACT
The purpose of this paper is to propose a new method of secondary flow control on end-wall region for End-
wall loss reduction in Low Pressure Turbine. In this paper, the effect of dimple devices on endwall is investigated
through combined experimental and CFD studies in a low speed linear cascade. Detailed comparisons are made
on the cases with or without dimple devices on the End-wall. The results show that total pressure loss of near
endwall regions can be reduced because the vorttices generated by the dimple devices suppress the advections of
the cross-flow to the blade suction side, eventually reducing the magnitude of stream-wise vorticities of passage
vortex and counter vortex.
Key words: Low Pressure Turbine, End-wall, Secondary Flow, Cross-flow, Vortex, Control
Download service for the GTSJ via 65.21.229.84, 2022/07/20.
115 / 298
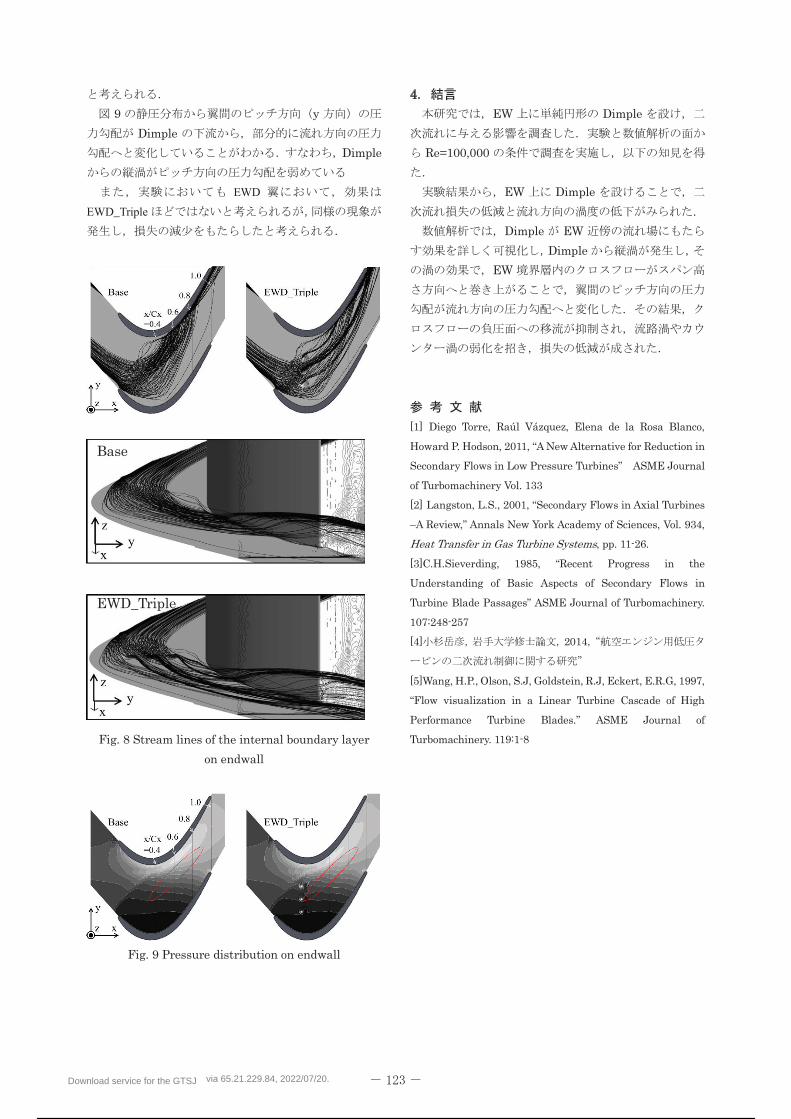
2 Dimple
1 Dimple
EWD 1 EWD_Triple
3 Dimple
2,3 Dimple
Base EWD
EWD EWD_Triple
Download service for the GTSJ via 65.21.229.84, 2022/07/20.
116 / 298
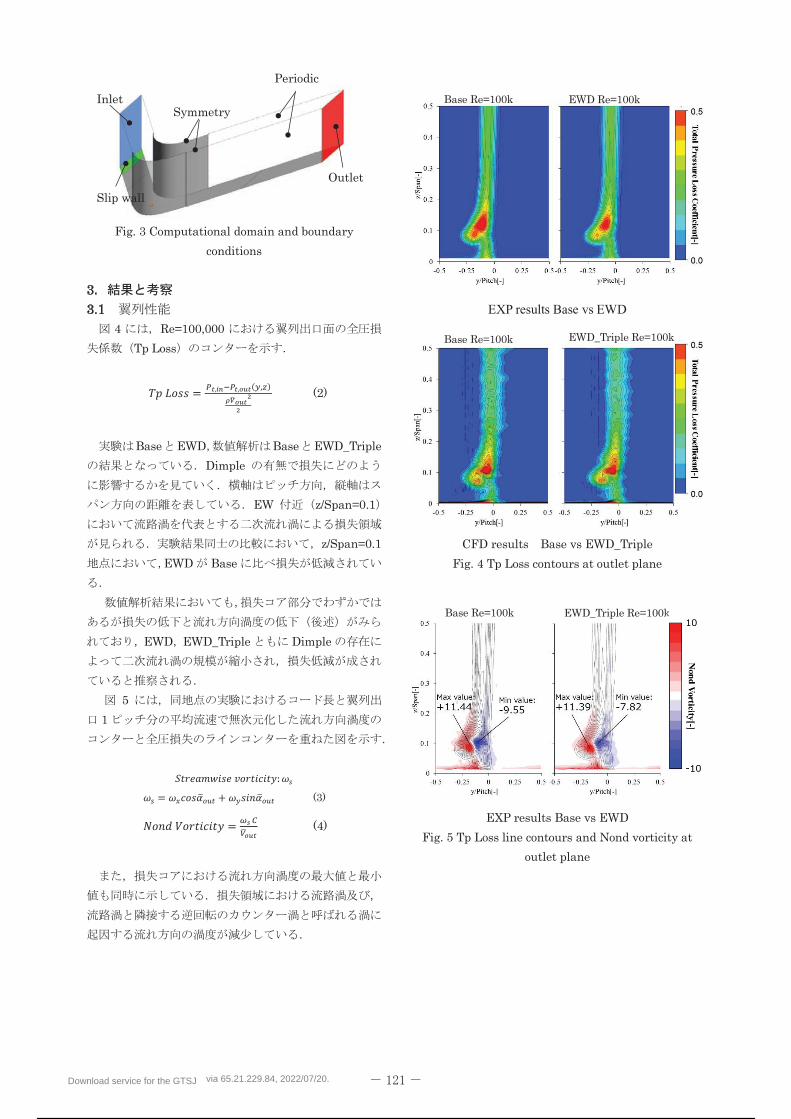
EXP results Base vs EWD
Download service for the GTSJ via 65.21.229.84, 2022/07/20.
117 / 298
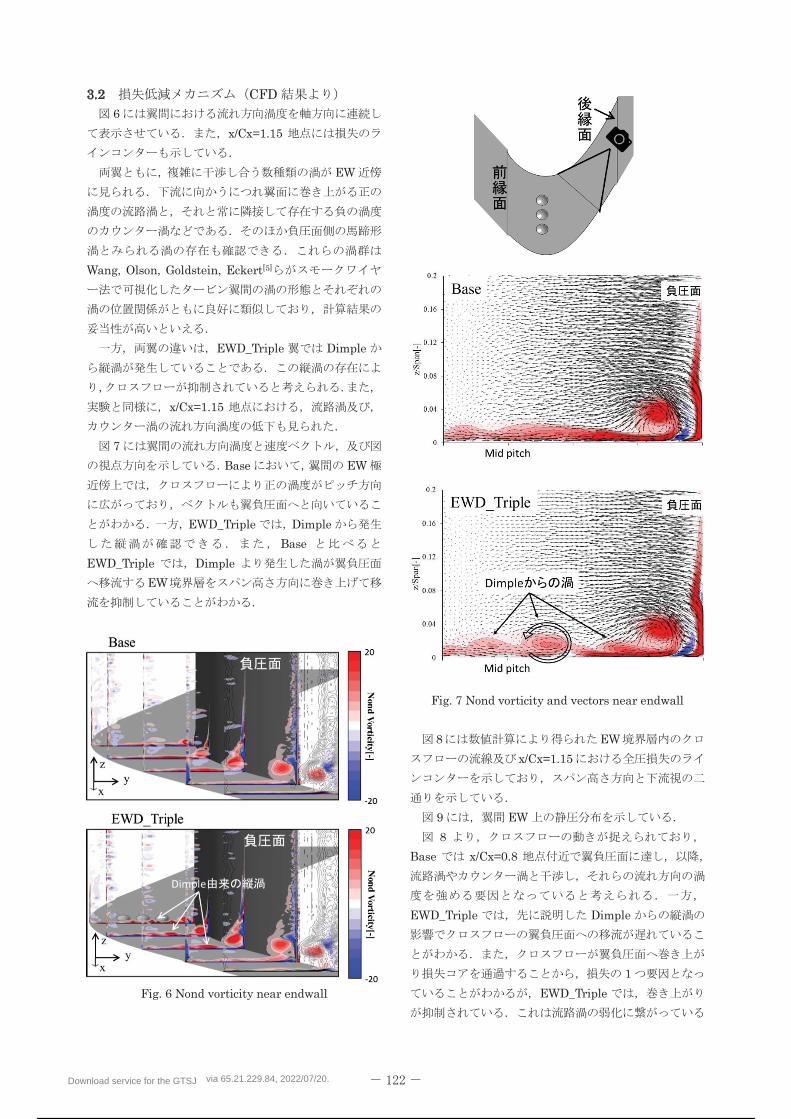
Download service for the GTSJ via 65.21.229.84, 2022/07/20.
118 / 298
EWD
EWD_Triple
Download service for the GTSJ via 65.21.229.84, 2022/07/20.
119 / 298
B-5
Application of CHT Analysis to Development of Cooled Turbine Blade for Industrial Gas Turbine
*Takeshi HORIUCHI, Tomoki TANIGUCHI, Ryozo TANAKA, Masanori RYU and Masahide KAZARI (Kawasaki Heavy Industries, Ltd.)
ABSTRACT
Advanced cooled turbine blades which have high cooling effectiveness are essential as well as rise of turbine
inlet temperature to improve thermal efficiency of industrial gas turbines. For this development, we need to
understand metal temperature distribution on the cooled turbine blades in detail. For this purpose, applicability
of CHT (Conjugate Heat Transfer) analysis to the cooled turbine blade has been investigated in terms of
prediction of metal temperature by comparing with measurement results by pyrometer. This paper describes the
details of CHT analysis method and calculation results with measurement temperature by pyrometer.
Key words: Cooled turbine blades, Metal temperature, Prediction, Conjugate heat transfer, Pyrometer
3
1
CHT Conjugate Heat
Transfer
CHT
CHT
MARK , C3X
TBC
CHT
CHT
CHT
Fig.1 CHT analysis
Download service for the GTSJ via 65.21.229.84, 2022/07/20.
120 / 298
2 30MW
“L30A”
GGT 1
1 30.1MW
40.1%
PT 2 3
GGT 1 3
PT 1 3
Fig.2 L30A gas turbine
Table 1 Characteristic feature of L30A
230.1MW 40.1% 24.9
470
ISO 13A
CHT Conjugate Heat Transfer
2
CFD FEM
STAR-CCM+ Ver.10.04
CD-adapco 3
CHT
Fig.3 Conjugate approach
4
1
STAR-CCM+
1330 1100
230
y+ y+ < 3
y+ 1
Download service for the GTSJ via 65.21.229.84, 2022/07/20.
121 / 298
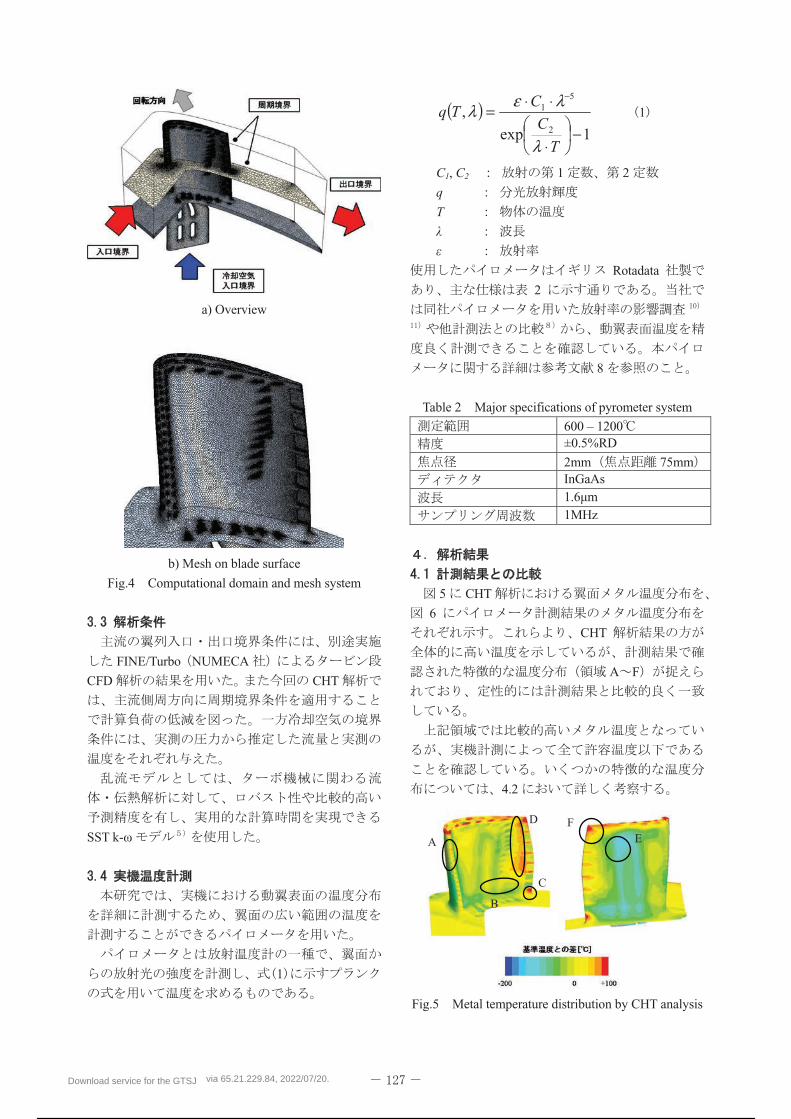
a) Overview
b) Mesh on blade surface
Fig.4 Computational domain and mesh system
FINE/Turbo NUMECA
CFD CHT
SST k-
1
( )1exp
,2
51
−⋅
⋅⋅=
−
T
C
CTq
λ
λελ 1
C1, C2 1 2
q
T
Rotadata
2
8
Table 2 Major specifications of pyrometer system
600 – 1200±0.5%RD
2mm 75mmInGaAs 1.6 m 1MHz
5 CHT
6
CHT
A F
4.2
Fig.5 Metal temperature distribution by CHT analysis
A
B
C
D
E F
Download service for the GTSJ via 65.21.229.84, 2022/07/20.
122 / 298
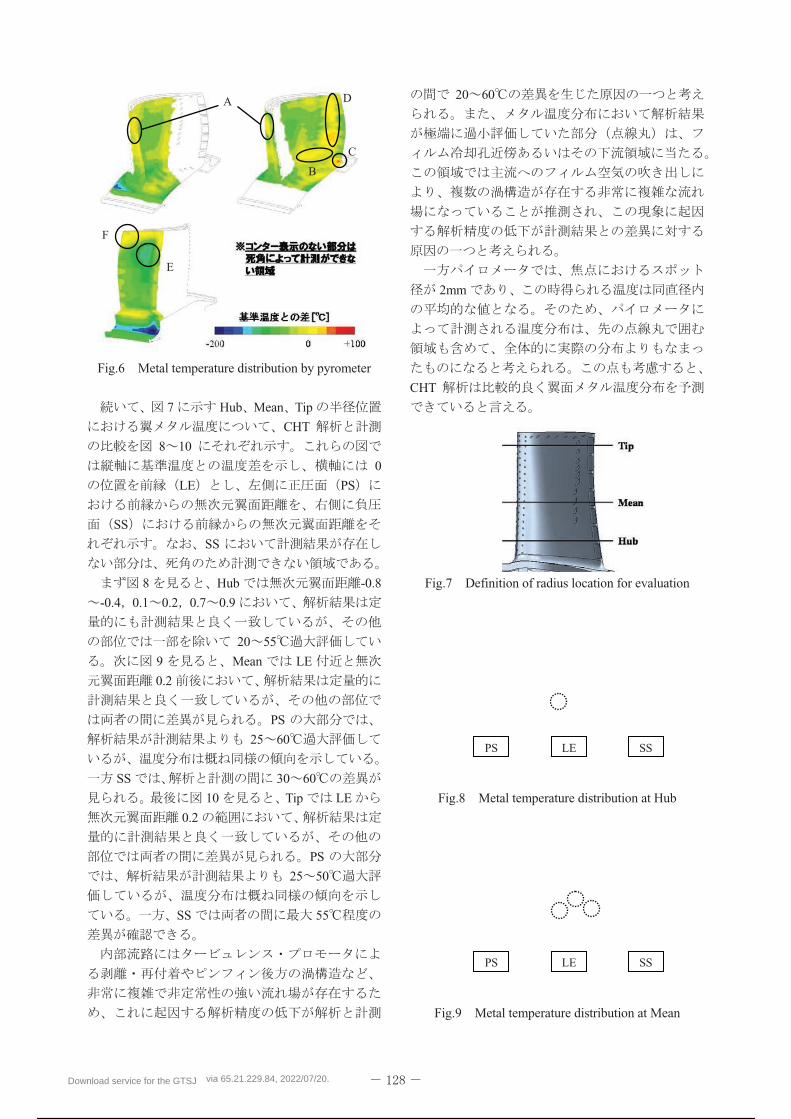
Fig.6 Metal temperature distribution by pyrometer
7 Hub Mean Tip
CHT
8 10
0
LE PS
SS
SS
8 Hub -0.8
-0.4 0.1 0.2 0.7 0.9
20 55
9 Mean LE
0.2
PS
25 60
SS 30 60
10 Tip LE
0.2
PS
25 50
SS 55
20 60
2mm
CHT
Fig.7 Definition of radius location for evaluation
Fig.8 Metal temperature distribution at Hub
Fig.9 Metal temperature distribution at Mean
LEPS SS
LEPS SS
A
B
C
D
E
F
Download service for the GTSJ via 65.21.229.84, 2022/07/20.
123 / 298
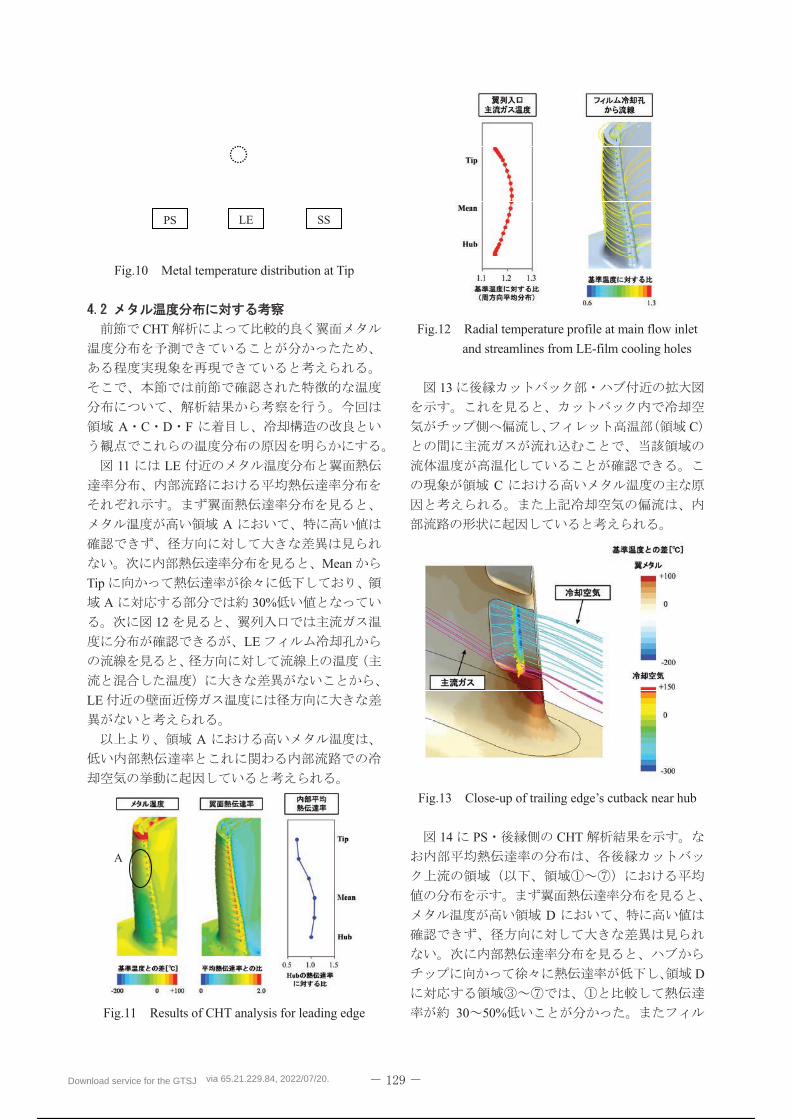
Fig.10 Metal temperature distribution at Tip
CHT
A C D F
11 LE
A
Mean
Tip
A 30%
12
LE
LE
A
Fig.11 Results of CHT analysis for leading edge
Fig.12 Radial temperature profile at main flow inlet
and streamlines from LE-film cooling holes
13
C
C
Fig.13 Close-up of trailing edge’s cutback near hub
14 PS CHT
D
D
30 50%
LEPS SS
A
Download service for the GTSJ via 65.21.229.84, 2022/07/20.
124 / 298
D
50% F
Fig.14 Results of CHT analysis for trailing edge side
CHT
CHT
CHT
CHT
K. Kusterer, et al, “CONJUGATE CALCULATIONS FOR A FILM-COOLED BLADE UNDER DIFFERENT OPERATING CONDITIONS”, ASME Paper GT2004-53719D. E. Bohn, C. Tümmers, “NUMERICAL 3-D CONJUGATE FLOW AND HEAT TRANSFER INVESTIGATION OF A TRANSONIC CONVECTION-COOLED THERMAL BARRIER COATED TURBINE GUIDE VANE WITH REDUCED COOLING FLUID MASS FLOW”, ASME PaperGT2003-38431J. Luo, E. H. Razinsky, “CONJUGATE HEAT TRANSFER ANALYSIS OF A COOLED TURBINE VANE USING THE V2F TURBULENCE MODEL”, ASME Paper GT2006-91109G. Nowak, W. Wróblewski, “APPLICATION OF CONJUGATE HEAT TRANSFER FOR COOLING OPTIMAIZATION OF A TURBINE AIRFOIL”, ASME Paper GT2009-59818Kuo-San. Ho, et al, “CONJUGATE HEAT TRANSFER ANALYSIS FOR GAS TURBINE COOLED BLADE”, ASME Paper GT2014-25952K. Tsukamoto, et al, “CONJUGATE HEAT TRANSFER ANALYSIS IN AN ACTUAL GAS TURBINE ROTOR BLADE IN COMPARISON WITH PYROMETER DATA”, ASME Paper GT2014-26962Kuo-San. Ho, et al, “CONJUGATE HEAT TRANSFER ANALYSIS FOR GAS TURBINE FILM-COOLED BLADE”, ASME Paper GT2016-56688T. Taniguchi, et al, “APPLICATION OF AN OPTICAL PYROMETER TO NEWLY DEVELOPED INDUSTRIAL GAS TURBINE”, ASME Paper GT2012-68679Bohn, D., Krüger, U., and Kusterer, K ., 2001, “Conjugate Heat Transfer : An Advanced Computational Method for the Cooling Design of Modern Gas Turbine Blades and Vanes”, Heat Transfer in Gas Turbines, eds. B. Sundén and M. Faghri, pp.58-108, WIT Press, Southampton, UKT. Taniguchi, et al,“TEMPERATURE MEASUREMENT OF HIGH SPEED ROTATING TURBINE BLADES USING A PYROMETER”, ASME Paper GT2006-90247R. Tanaka, et al, “CONTINUING IMPROVEMENTS OF 20MW-CLASS GT KAWASAKI L20A”, ASME Paper GT2006-90394
D
Download service for the GTSJ via 65.21.229.84, 2022/07/20.
125 / 298
44 2016.10
B-7
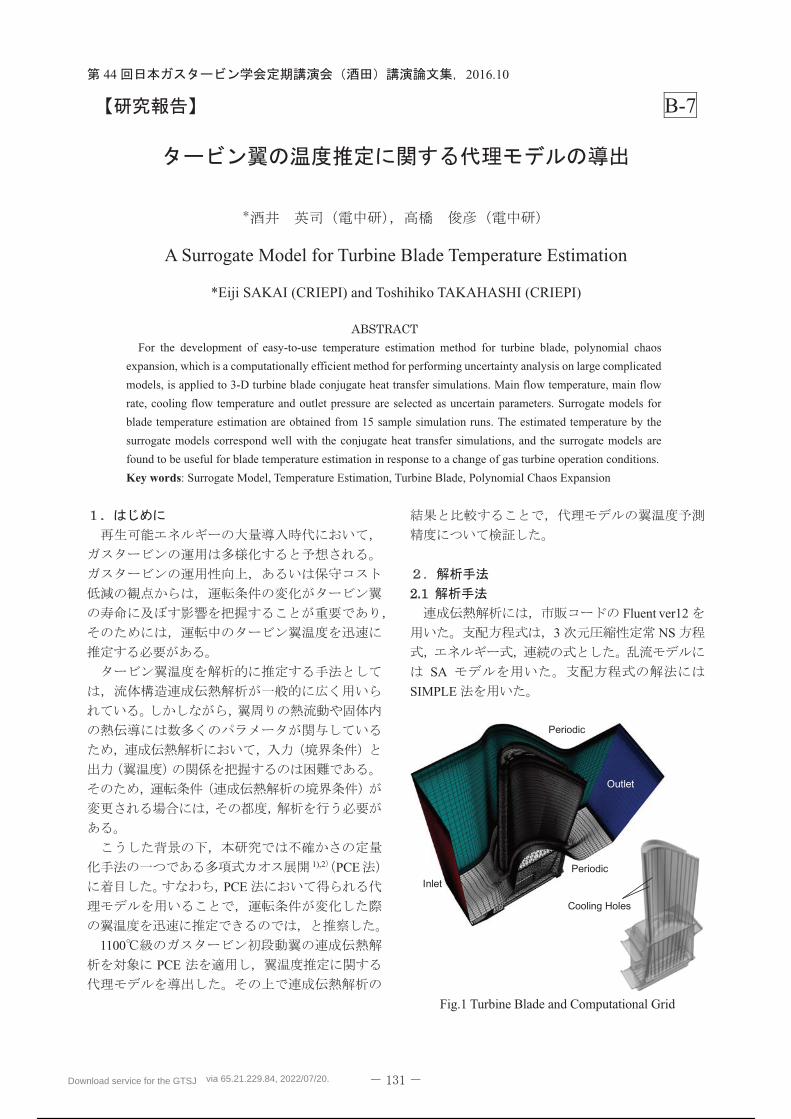
A Surrogate Model for Turbine Blade Temperature Estimation
*Eiji SAKAI (CRIEPI) and Toshihiko TAKAHASHI (CRIEPI)
For the development of easy-to-use temperature estimation method for turbine blade, polynomial chaos
expansion, which is a computationally efficient method for performing uncertainty analysis on large complicated
models, is applied to 3-D turbine blade conjugate heat transfer simulations. Main flow temperature, main flow
rate, cooling flow temperature and outlet pressure are selected as uncertain parameters. Surrogate models for
blade temperature estimation are obtained from 15 sample simulation runs. The estimated temperature by the
surrogate models correspond well with the conjugate heat transfer simulations, and the surrogate models are
found to be useful for blade temperature estimation in response to a change of gas turbine operation conditions.
Key words: Surrogate Model, Temperature Estimation, Turbine Blade, Polynomial Chaos Expansion
1),2 PCE
PCE
1100
PCE
Fluent ver12
3 NS
SA
SIMPLE
Fig.1 Turbine Blade and Computational Grid
Inlet
Outlet
Periodic
Periodic
Cooling Holes
Download service for the GTSJ via 65.21.229.84, 2022/07/20.
126 / 298
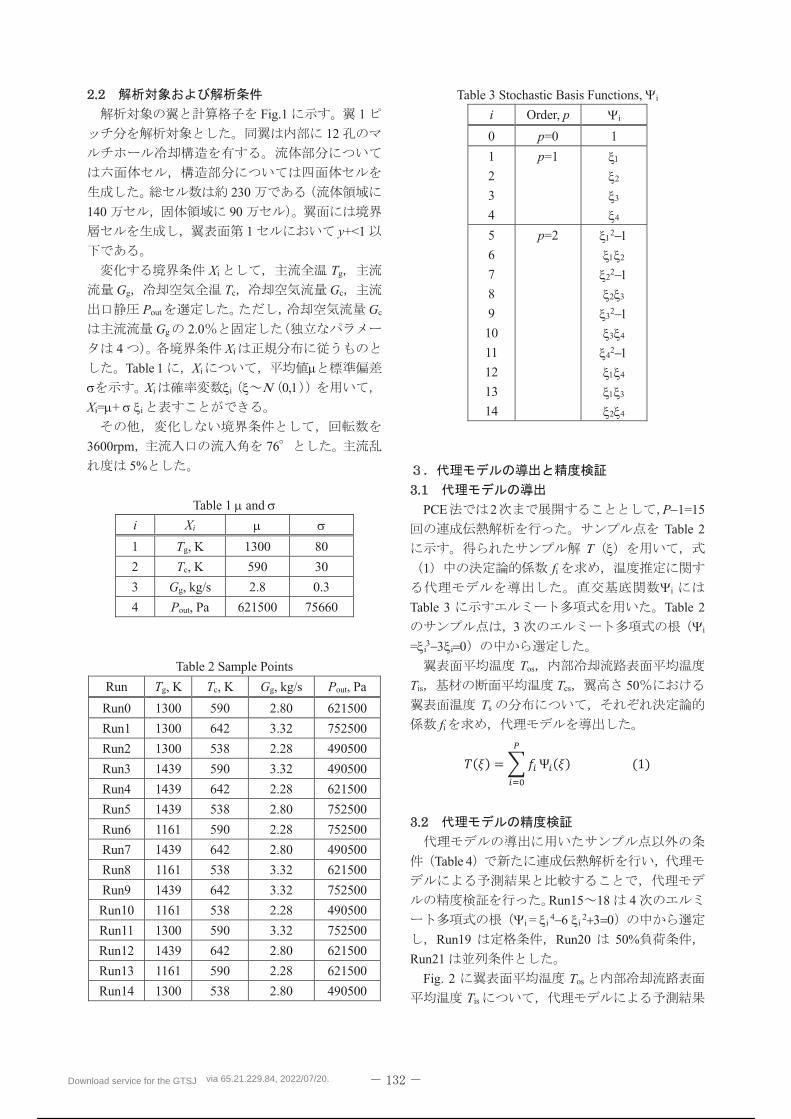
Fig.1 1
12
230
140 90
1 y+<1
Xi Tg
Gg Tc Gc
Pout Gc
Gg 2.0
4 Xi
Table 1 Xi
Xi i
Xi= + i
3600rpm 76
5%
Table 1 and
i Xi
1 Tg, K 1300 80
2 Tc, K 590 30
3 Gg, kg/s 2.8 0.3
4 Pout, Pa 621500 75660
Table 2 Sample Points
Run Tg, K Tc, K Gg, kg/s Pout, Pa
Run0 1300 590 2.80 621500
Run1 1300 642 3.32 752500
Run2 1300 538 2.28 490500
Run3 1439 590 3.32 490500
Run4 1439 642 2.28 621500
Run5 1439 538 2.80 752500
Run6 1161 590 2.28 752500
Run7 1439 642 2.80 490500
Run8 1161 538 3.32 621500
Run9 1439 642 3.32 752500
Run10 1161 538 2.28 490500
Run11 1300 590 3.32 752500
Run12 1439 642 2.80 621500
Run13 1161 590 2.28 621500
Run14 1300 538 2.80 490500
Table 3 Stochastic Basis Functions, i
i Order, p i
0 p=0 1
1
2
3
4
p=1
5
6
7
8
9
10
11
12
13
14
p=2
PCE 2 P 1=15
Table 2
T
1 fi
i
Table 3 Table 2
3 i
= i i
Tos
Tis Tcs 50
Ts
fi
Table 4
Run15 18 4
i = i i
Run19 Run20 50%
Run21
Fig. 2 Tos
Tis
Download service for the GTSJ via 65.21.229.84, 2022/07/20.
127 / 298
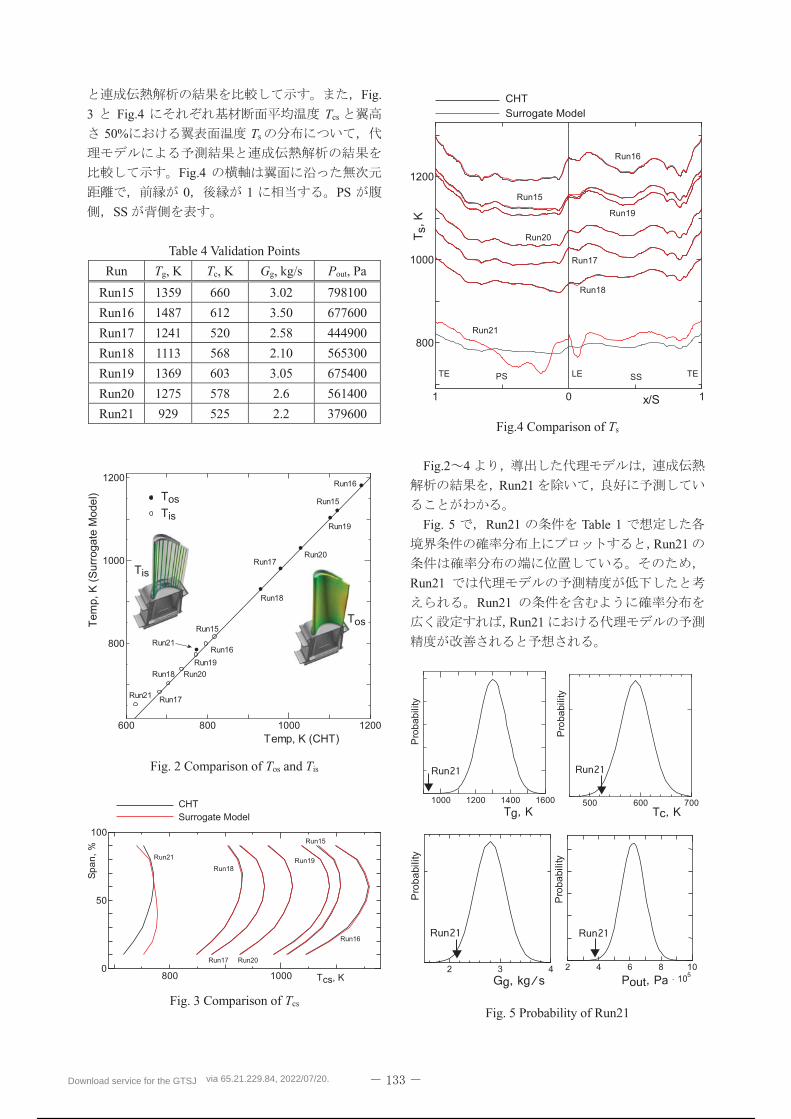
Fig.
3 Fig.4 Tcs
50% Ts
Fig.4
0 1 PS
SS
Table 4 Validation Points
Run Tg, K Tc, K Gg, kg/s Pout, Pa
Run15 1359 660 3.02 798100
Run16 1487 612 3.50 677600
Run17 1241 520 2.58 444900
Run18 1113 568 2.10 565300
Run19 1369 603 3.05 675400
Run20 1275 578 2.6 561400
Run21 929 525 2.2 379600
Fig. 2 Comparison of Tos and Tis
Fig. 3 Comparison of Tcs
Fig.4 Comparison of Ts
Fig.2 4
Run21
Fig. 5 Run21 Table 1
Run21
Run21
Run21
Run21
Fig. 5 Probability of Run21
600 800 1000 1200
800
1000
1200
Tem
p, K
(S
urro
gate
Mod
el)
Temp, K (CHT)
Run16
Run15
Run19
Run20Run17
Run18
Run21
Run21
Run18
Run16
Run15
Run19Run20
Run17
TosTis
Tis
Tos
800 10000
50
100
Tcs, K
Spa
n, %
CHTSurrogate Model
Run21
Run18
Run17 Run20
Run19
Run15
Run16
1 0 1
800
1000
1200
x/ST
s, K
LETE TEPS SS
CHTSurrogate Model
Run21
Run18
Run17
Run20
Run19
Run15
Run16
1000 1200 1400 1600
Pro
babi
lity
500 600 700
Pro
babi
lity
2 3 4
Pro
babi
lity
2 4 6 8 10105
Pro
babi
lity
Download service for the GTSJ via 65.21.229.84, 2022/07/20.
128 / 298
Fig. 6 Sensitivity Analysis
Tg Tc
Gg Pout
Fig. 6 S S
Fig.6 Tcs20, Tcs50, Tcs80
20%, 50%, 80%
Fig.6
Tg Tos
Tcs
Tis
Tos Tcs
Tg Tc
Tcs Tc Tg
1100
PCE
1) Stefanou, G.: The Stochastic Finite Element Method: Past, Present and Future, Comput. MethodsAppl. Mech. Engrg., Vol.198, No.25 (2013) pp.1031-1051.
2) Kato, H., Mashiko, H., Tokuyama, Y., Funazaki, K., and Takida, J. : Robust Aerodynamic Shape Optimization of Supersonic Turbine Using Non-Intrusive Polynomial Chaos Expansion, 9th World Congress on Structural and Multidisciplinary Optimization, (2011).
0
40
80
Tos
Tis
Tcs20 Tcs50 Tcs80
Main Flow Temperature, TgCooling Flow Temperature, TcMain Flow Rate, GgOutlet Pressure, Pout
S, K
Download service for the GTSJ via 65.21.229.84, 2022/07/20.
129 / 298
B-8
CO2
Flow visualization experiment of super critical CO2 turbine bladecooling passage
*Hisashi MATSUDA, Fumio OTOMO, Tatsuro UCHIDA, Junichi TOMINAGA,Hideyuki MAEDA and Satoru SEKINE (Toshiba Corp.)
ABSTRACT
Flow visualization experiments for super critical CO2 turbine blade cooling passage were examined using a large scale cooling flow passage model. Complex configuration of the cooling passage was exactly modeled by combination of plexiglass pipes with stereo lithography molding. Flow visualization experiments clarified that there is no measure stagnated flow through the cooling flow passage. PIV measurements were also carried out and maximum velocity of each cooling passage was obtained accurately and balance of flow volume of each cooling passage was evaluated. The supercritical CO2 turbine blade cooling passage designed was validated.
Key words: CO2 turbine, Cooling blade, Flow visualization, PIV
CO2
CO2
CO2
CCS Carbon Capture and
Storage
CO2
CO21-4)
CO2
CCS CO2
CH4
1,150
30MPa
1,150
30MPa
(CO2 H2O)
CO2
CO2
1/30
CO2
EOR Enhanced
Oil Recovery
CO2
Fig.1 CO2
CO2
1.5 2.01)
CO2
1
CO2 3 No.1
3 3 (No.4 6 ) 5
Download service for the GTSJ via 65.21.229.84, 2022/07/20.
130 / 298
(No.7 11 )
1)
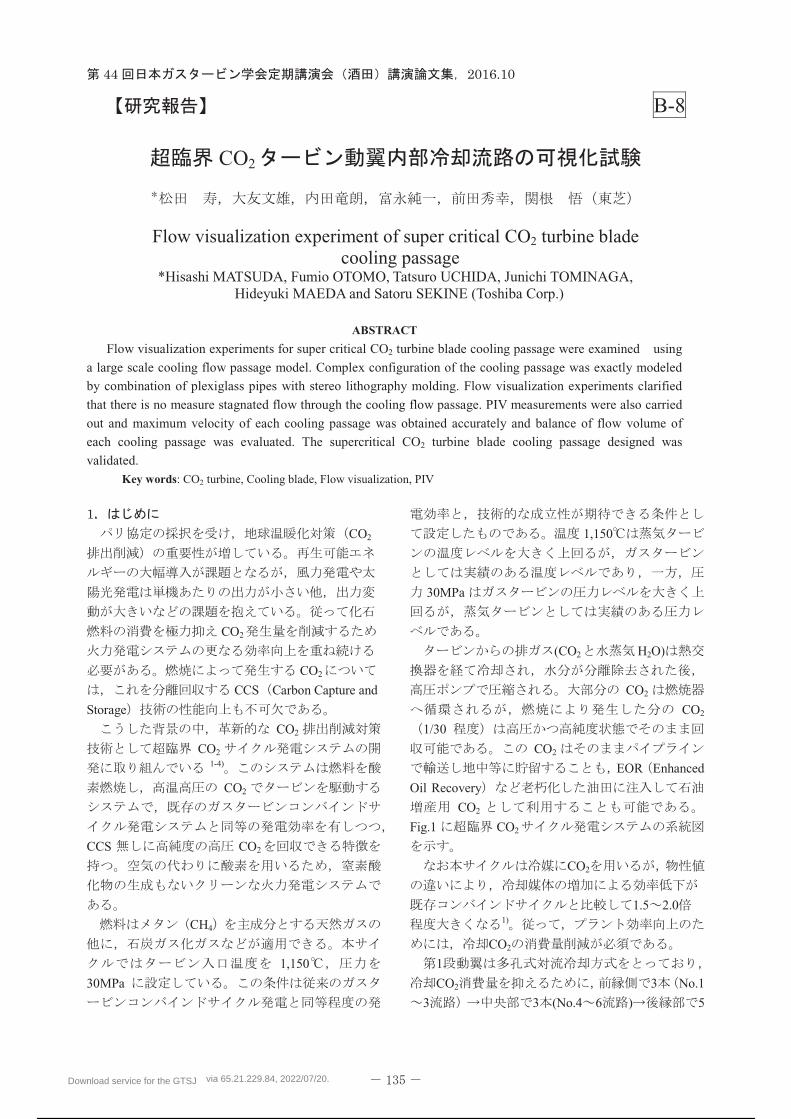
CO2
( )
PIV
CO2
CFD
CO2
ANSYS CFX v150
SST 2000
y+=3
CO2
Fig.2
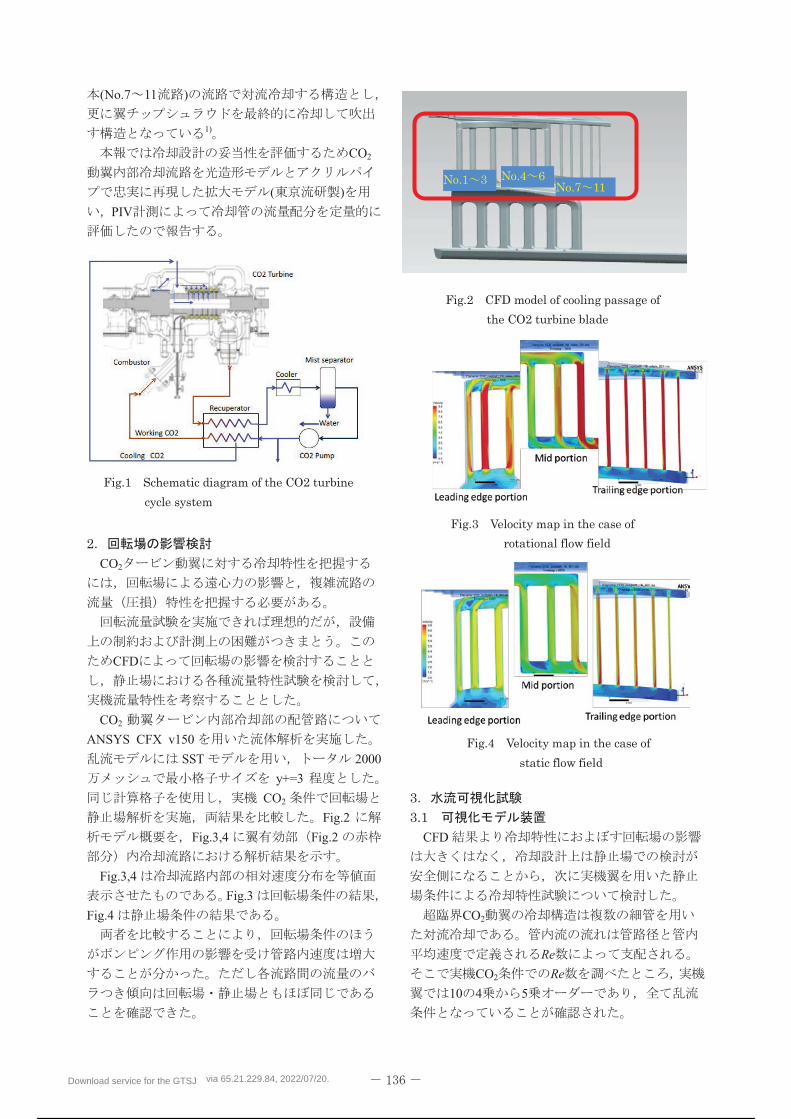
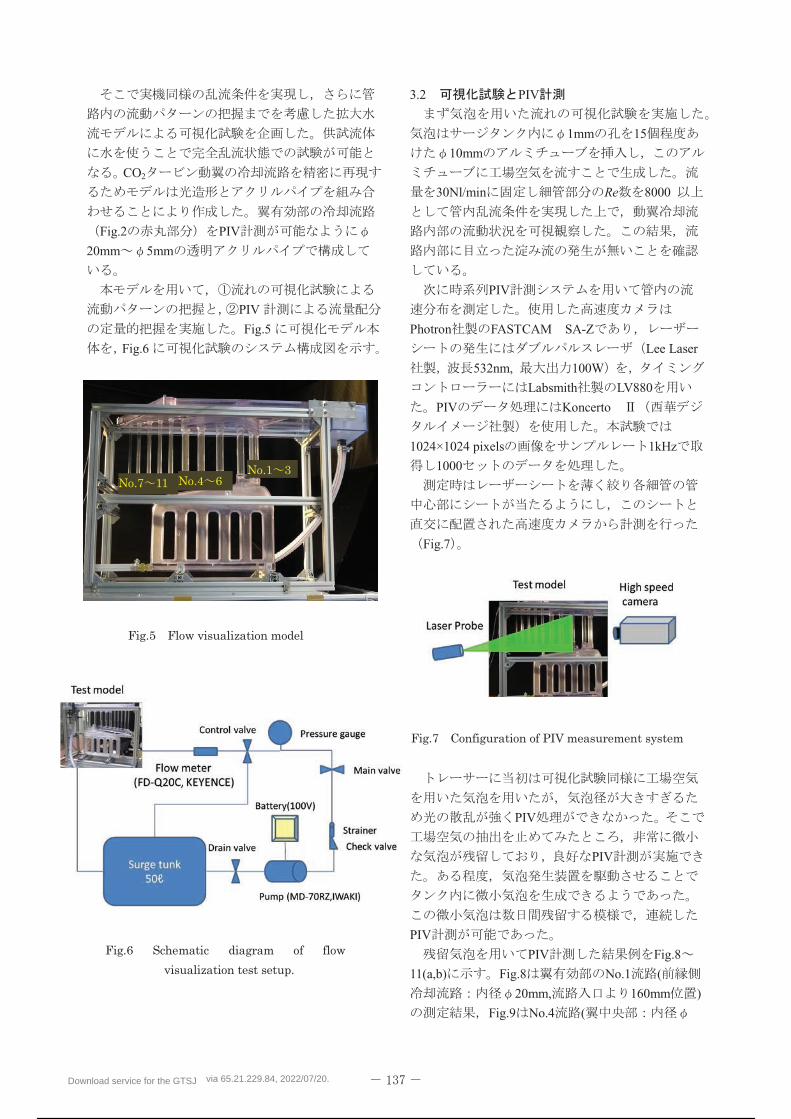
Fig.3,4 Fig.2
Fig.3,4
Fig.3
Fig.4
CFD
CO2
Re
CO2 Re
10 4 5
Download service for the GTSJ via 65.21.229.84, 2022/07/20.
131 / 298
CO2
Fig.2 PIV
20mm 5mm
PIV
Fig.5
Fig.6
3.2 PIV
1mm 15
10mm
30Nl/min Re 8000
PIV
Photron FASTCAM SA-Z
Lee Laser
532nm, 100W
Labsmith LV880
PIV Koncerto
1024×1024 pixels 1kHz
1000
Fig.7
PIV
PIV
PIV
PIV Fig.8
11(a,b) Fig.8 No.1 (
20mm, 160mm )
Fig.9 No.4 (
Download service for the GTSJ via 65.21.229.84, 2022/07/20.
132 / 298
20mm 160mm )
Fig.10 No.8 ( 8mm
160mm ) Fig.11 No.11 (
5mm 150mm )
Fig.a
Fig.b Fig.b PIV
1000
r D
(1974)5)
3mm No.11 2.5mm
PIV
Fig.10 11
8mm 5mm PIV
(32 32 16 16
) PIV
Fig.9 No.4
PIV
No.1 3 No.4 6
20mm PIV
No.7 11
Download service for the GTSJ via 65.21.229.84, 2022/07/20.
133 / 298
No.1 3 No.4
6 No.7 11
1/7 6)
No.7 No.11
Table 1 5
0.9%
PIV
PIV
CO2
Fig .12 CFD
No.1 No.3 No.4 No.6
No.7
No.11 PIV CFD
CFD
4
CO2
ANSYS CFX v150
PIV
8mm 5mm ,
PIV
PIV
CO2
41
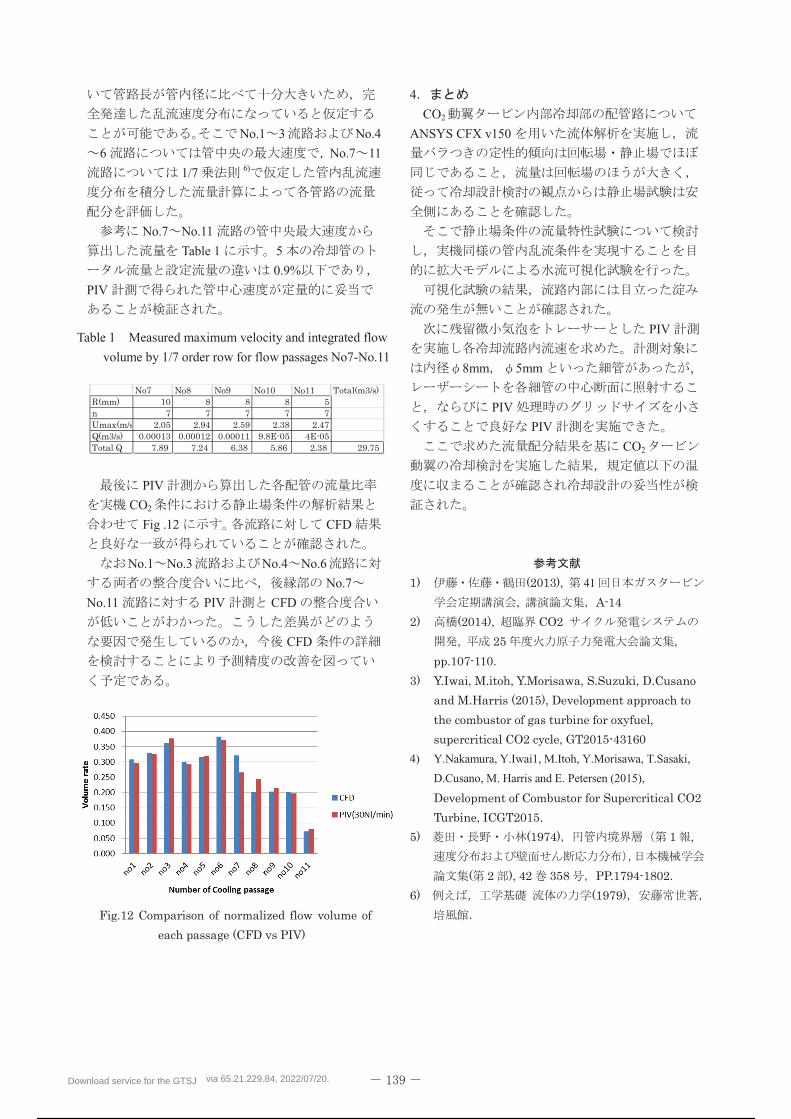
4) Y.Nakamura, Y.Iwai1, M.Itoh, Y.Morisawa, T.Sasaki,
D.Cusano, M. Harris and E. Petersen (2015),
Table 1 Measured maximum velocity and integrated flow
volume by 1/7 order row for flow passages No7-No.11
Download service for the GTSJ via 65.21.229.84, 2022/07/20.
134 / 298
Download service for the GTSJ via 65.21.229.84, 2022/07/20.
135 / 298
Download service for the GTSJ via 65.21.229.84, 2022/07/20.
136 / 298
Download service for the GTSJ via 65.21.229.84, 2022/07/20.
137 / 298
Download service for the GTSJ via 65.21.229.84, 2022/07/20.
138 / 298
Download service for the GTSJ via 65.21.229.84, 2022/07/20.
139 / 298
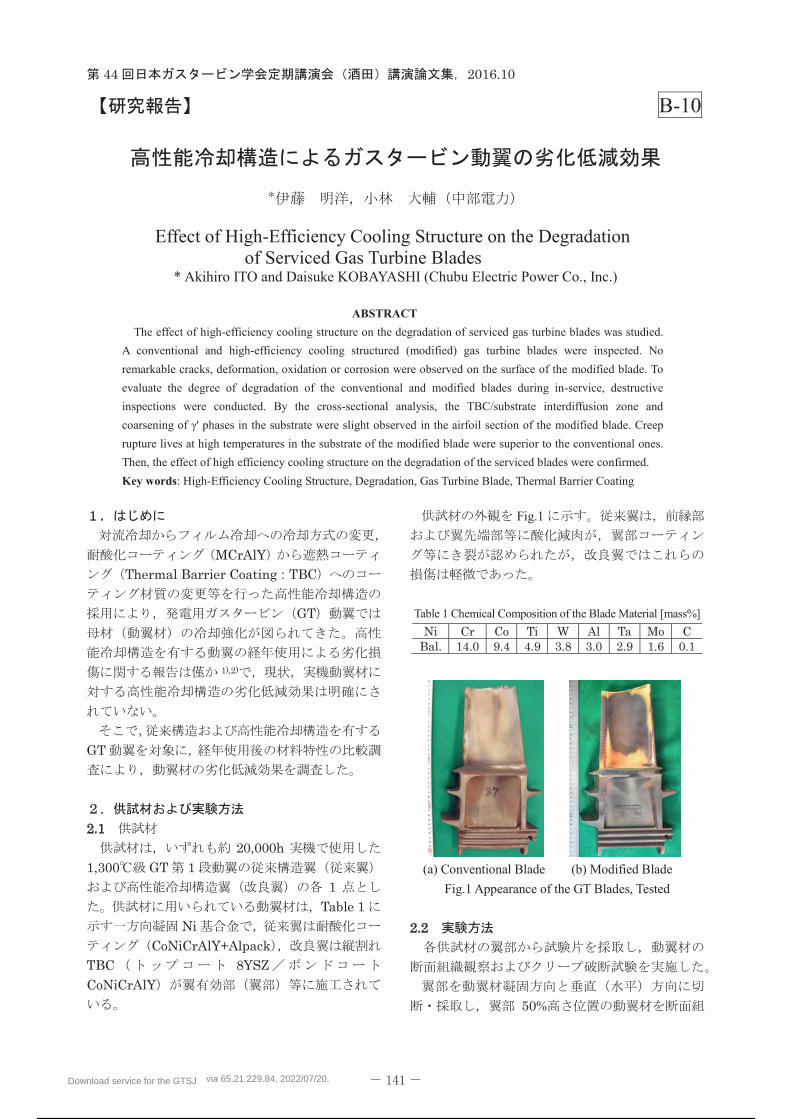
B-12
A Method of Creep Lifetime Estimation of Superalloy SpecimensPrepared from an In-Service Gas Turbine Blade
*Yohei MATSUI, Mitsutoshi OKADA, Toshihiko TAKAHASHI and Terutaka FUJIOKA(CRIEPI)
ABSTRACT
Creep lifetime estimation of a gas turbine blade is conducted by the iso-stress method. Three types of
specimens with different shapes and dimensions are prepared from an in-service blade, and creep tests are
carried out using them at high temperatures. To estimate the creep lifetime of the blade, the reference
temperature is calculated by heat transfer numerical analysis which combines convection heat transfer analysis
around the blade with heat conduction analysis in blade structure. As a result, larger differences in creep lifetime
among the three types of specimens are caused at higher test temperatures. On the basis of the result, the effects
of specimen shape and test atmosphere on creep lifetime estimation are examined. And tests at lower
temperatures with longer rupture life are desired to be performed to obtain life evaluation with smaller scatters.
Key words: Iso-Stress Method, Creep, Gas Turbine, Superalloy, Size Effect
Download service for the GTSJ via 65.21.229.84, 2022/07/20.
140 / 298
1
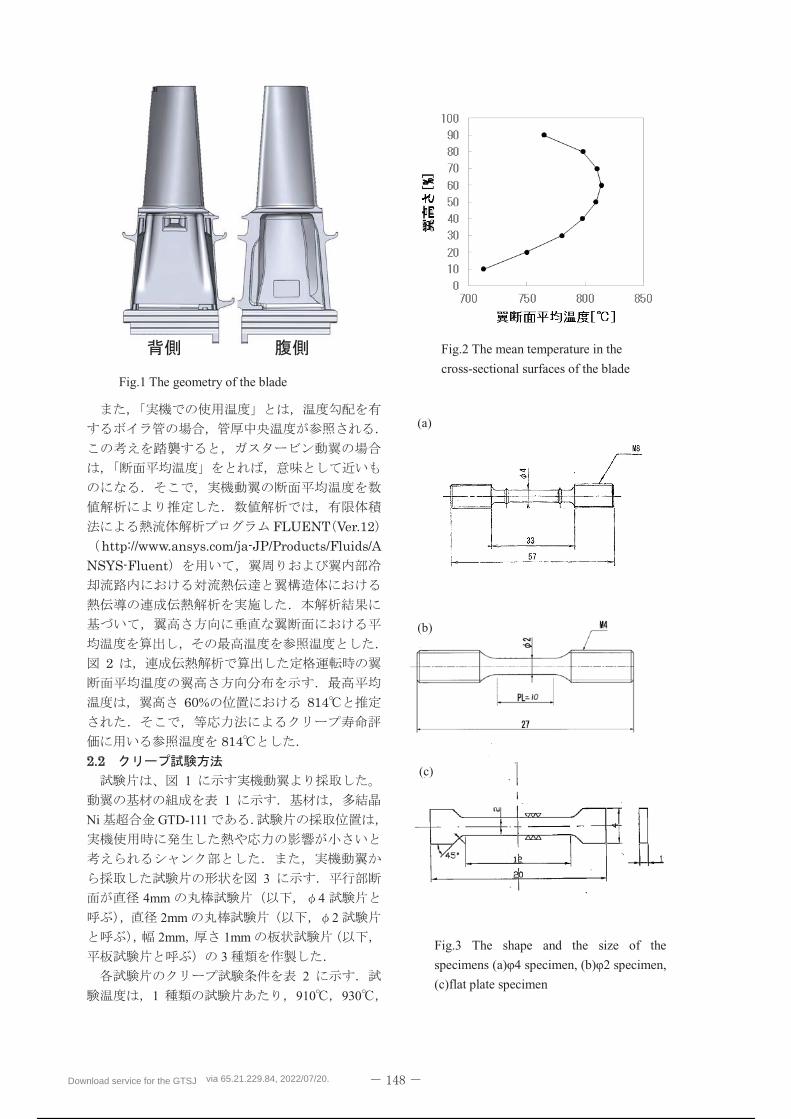
1
Ni GTD-111
3
4mm 4
2mm 2
2mm 1mm
3
2
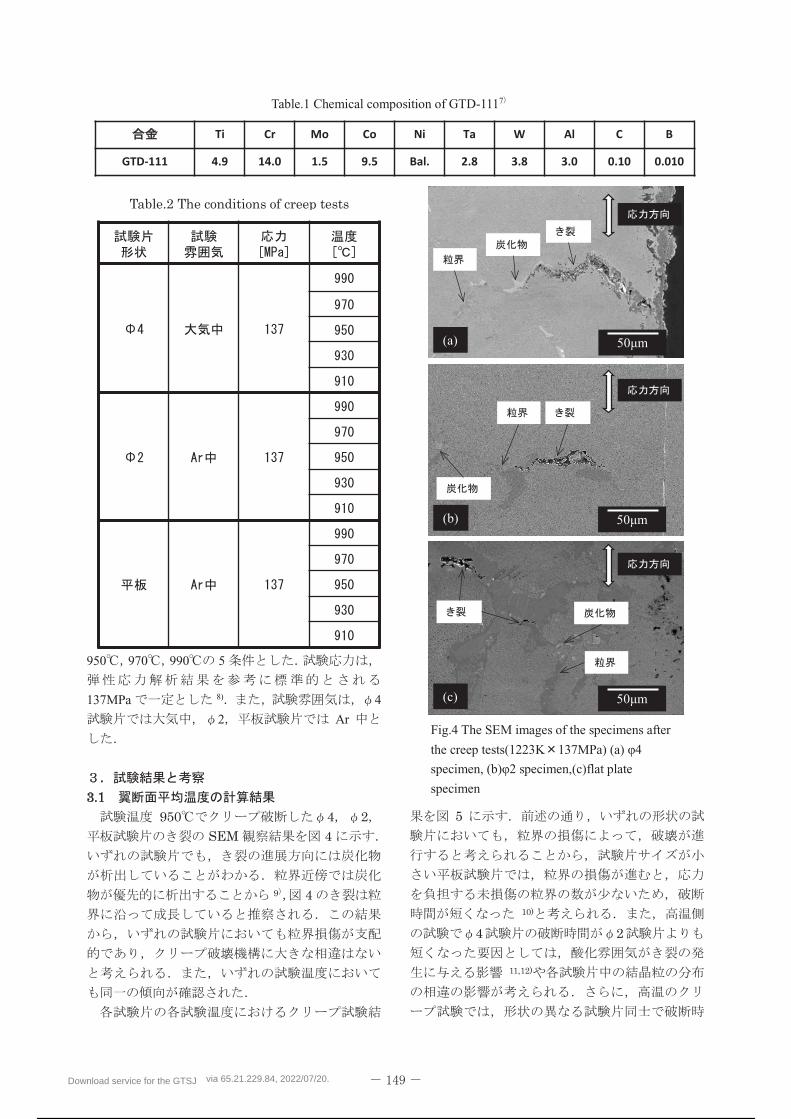
1 910 930
Fig.1 The geometry of the blade
Fig.2 The mean temperature in the
cross-sectional surfaces of the blade
Fig.3 The shape and the size of the
specimens
(c)flat plate specimen
(b)
(a)
(c)
Download service for the GTSJ via 65.21.229.84, 2022/07/20.
141 / 298
950 970 990 5
137MPa 8) 4
2 Ar
Table.1 Chemical composition of GTD-1117
Fig.4 The SEM images of the specimens after
the creep tests(1223K 137MPa) (a)
specimen,(c)flat plate
specimen
(c) 5
(b) 5
(a) 5
Download service for the GTSJ via 65.21.229.84, 2022/07/20.
142 / 298
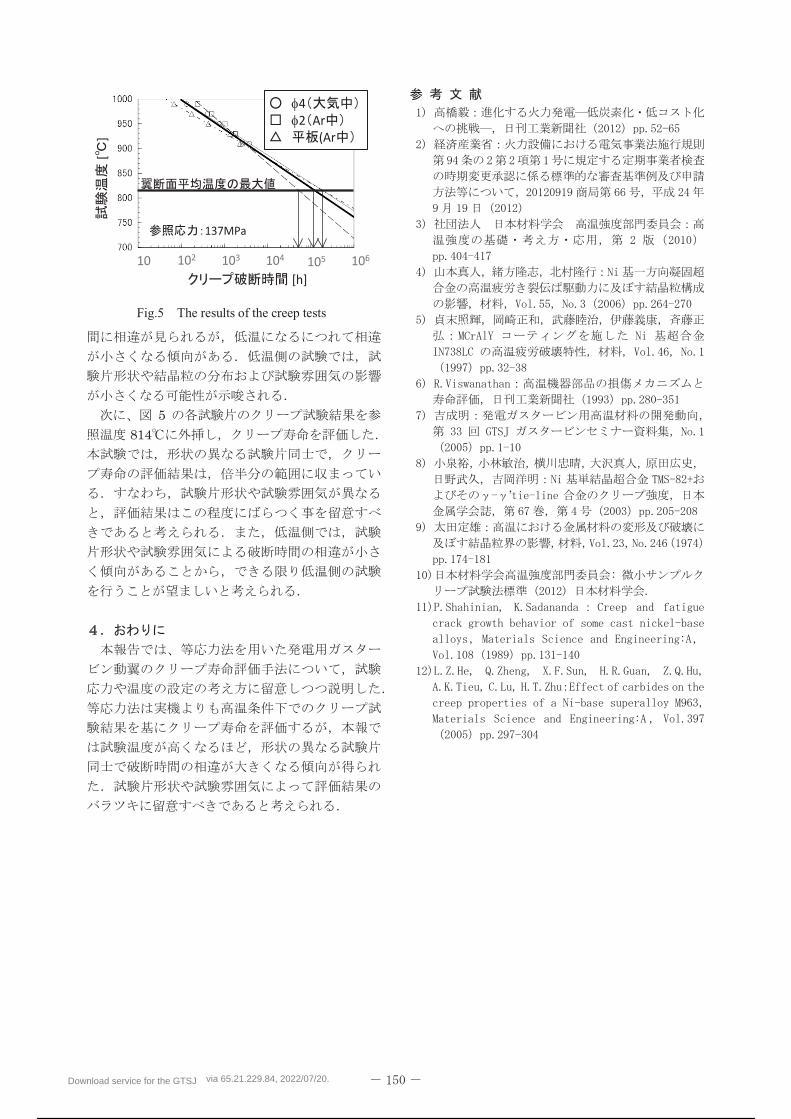
Fig.5 The results of the creep tests
Download service for the GTSJ via 65.21.229.84, 2022/07/20.
143 / 298
B-13
Temperature Estimation Method for a Gas Turbine Combustor Component
*Mitsutoshi OKADA, Toshihiko TAKAHASHI, Susumu YAMADA and Tomoharu FUJII (CRIEPI)
ABSTRACT
Temperature estimation methods for a gas turbine combustor component are developed in terms of
microstructural changes and computational fluid dynamics (CFD) for life assessment. The growth of thermally
grown oxide (TGO) in thermal barrier coating is observed, and the change in Vickers hardness is also grasped by
carrying out high-temperature heating test using the specimens prepared from the in-service combustor. On the
basis of them, temperature estimation equations are derived. The temperature estimation based on TGO thickness
is suitable for higher-temperature region while the one based on the hardness is for lower-temperature. Conjugate
heat transfer simulation, coupling heat conduction calculation in solid with CFD calculation of heat transfer in
fluid, is also conducted to estimate the temperature distribution of the combustor component. The simulation result
agrees well with the estimation using the TGO thickness and hardness.
Key words: Compressor, Combustor, Turbine, Control, Maintenance
1,2)
5)
6)
7)
GT
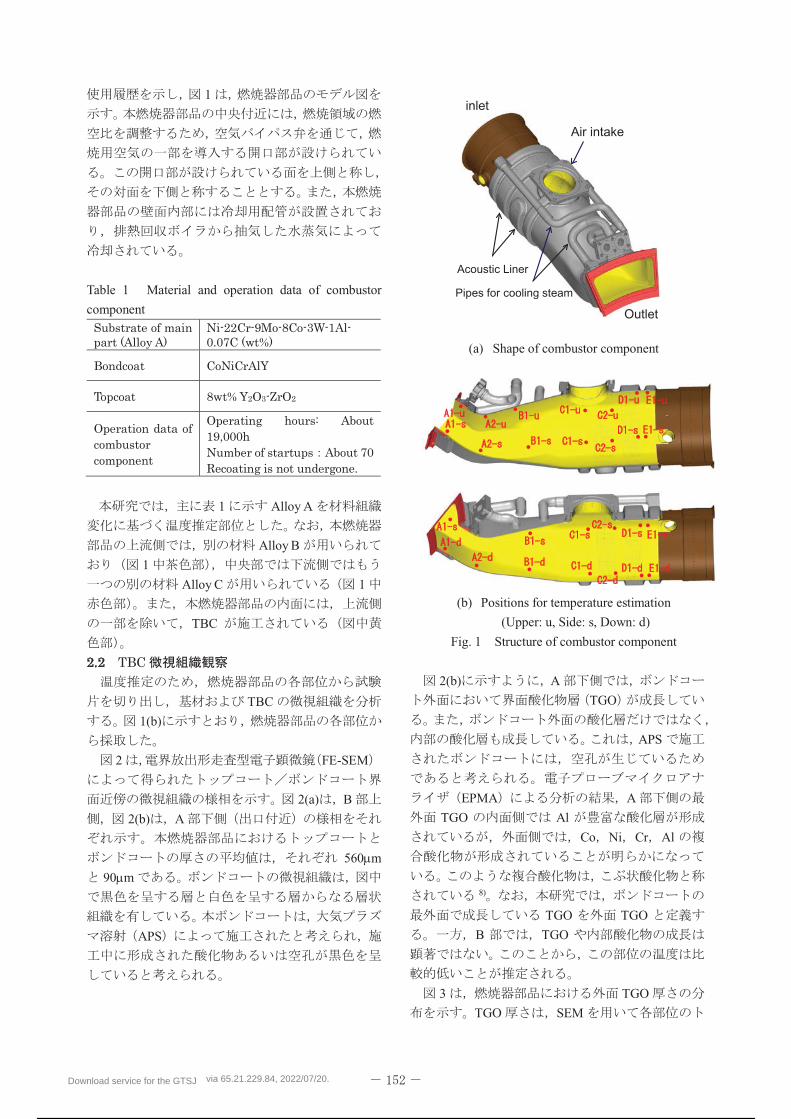
1
(Alloy A) TBC
Download service for the GTSJ via 65.21.229.84, 2022/07/20.
144 / 298
1
Table 1 Material and operation data of combustor
component
1 Alloy A
Alloy B
1
Alloy C 1
TBC
TBC
1(b)
2 FE-SEM
2(a) B
2(b) A
560 m
90 m
APS
(a) Shape of combustor component
(b) Positions for temperature estimation
(Upper: u, Side: s, Down: d)
Fig. 1 Structure of combustor component
2(b) A
TGO
APS
EPMA A
TGO Al
Co Ni Cr Al
8)
TGO TGO
B TGO
3 TGO
TGO SEM
Air intake
inlet
Outlet
Pipes for cooling steam
Acoustic Liner
Download service for the GTSJ via 65.21.229.84, 2022/07/20.
145 / 298
1000 3
TGO 10
30 TGO
TGO TGO/
TGO
A TGO
B 1 m
(a) B1-u
(b) A1-d (at the vicinity of outlet)
Fig. 2 Morphologies of interface between topcoat and
bondcoat
Fig. 3 Distribution of Outer TGO thickness
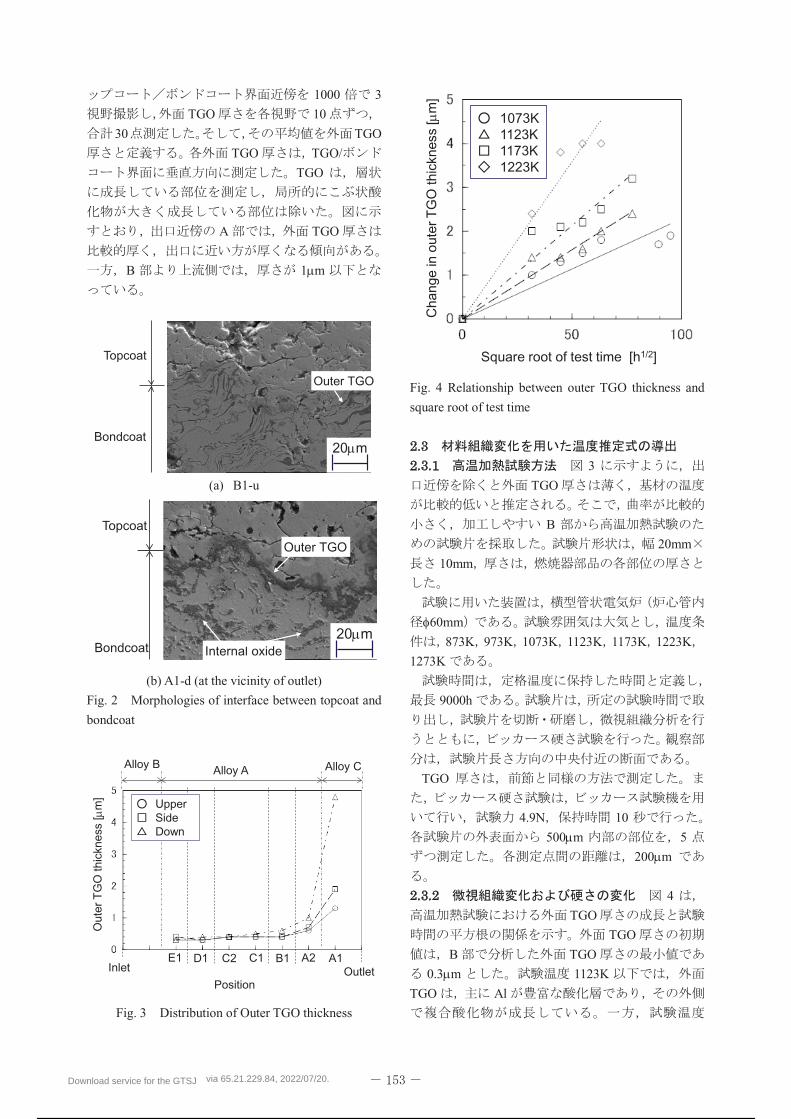
Fig. 4 Relationship between outer TGO thickness and
square root of test time
3
TGO
B
20mm
10mm
60mm
873K 973K 1073K 1123K 1173K 1223K
1273K
9000h
TGO
4.9N 10
500 m 5
200 m
4
TGO
TGO
B TGO
0.3 m 1123K
TGO Al
Topcoat
Bondcoat20 m
Outer TGO
Outer TGO
20 mInternal oxide
Topcoat
Bondcoat
Out
er T
GO
thic
knes
s [
m]
A1A2B1C1D1E1 C2
Alloy B Alloy CAlloy A
PositionOutletInlet
UpperSideDown
Square root of test time [h1/2]
Cha
nge
in o
uter
TG
O th
ickn
ess
[m
]
1073K1123K1173K1223K
Download service for the GTSJ via 65.21.229.84, 2022/07/20.
146 / 298
1273K Al
TGO
873K 973K
6000h
1073K 1223K
TGO
dTGO
t (h)
(1)
kTGO TGO
TGO
Al
2(b TGO 5 m
5 kTGO
kTGO
(2)
R 8.31J/(mol K) T
K
Fig. 5 Arrhenius plot of growth rate constant of outer
TGO thickness
Fig. 6 Relationship between Vickers hardness and test
time
Fig. 7 Relationship between Vickers hardness and
Larson-Miller parameter
6 h (Hv) t
B
208Hv 873K 973K
1073K
9)
Alloy A M23C6
7)
7 h LMP
LMP l
(3)
Gro
wth
rat
e co
nsta
nt o
f ou
ter T
GO
thci
knes
s[lo
g ek T
GO]
Temperature [1/Kx104]
Vic
ker’s
hard
ness
[Hv]
Test time [h]
873K973K1073K1123K1173K1223K1273K
Vic
kers
har
dnes
s [H
v]
Larson-Miller Parameter LMPT(20+log10t)/103
Download service for the GTSJ via 65.21.229.84, 2022/07/20.
147 / 298
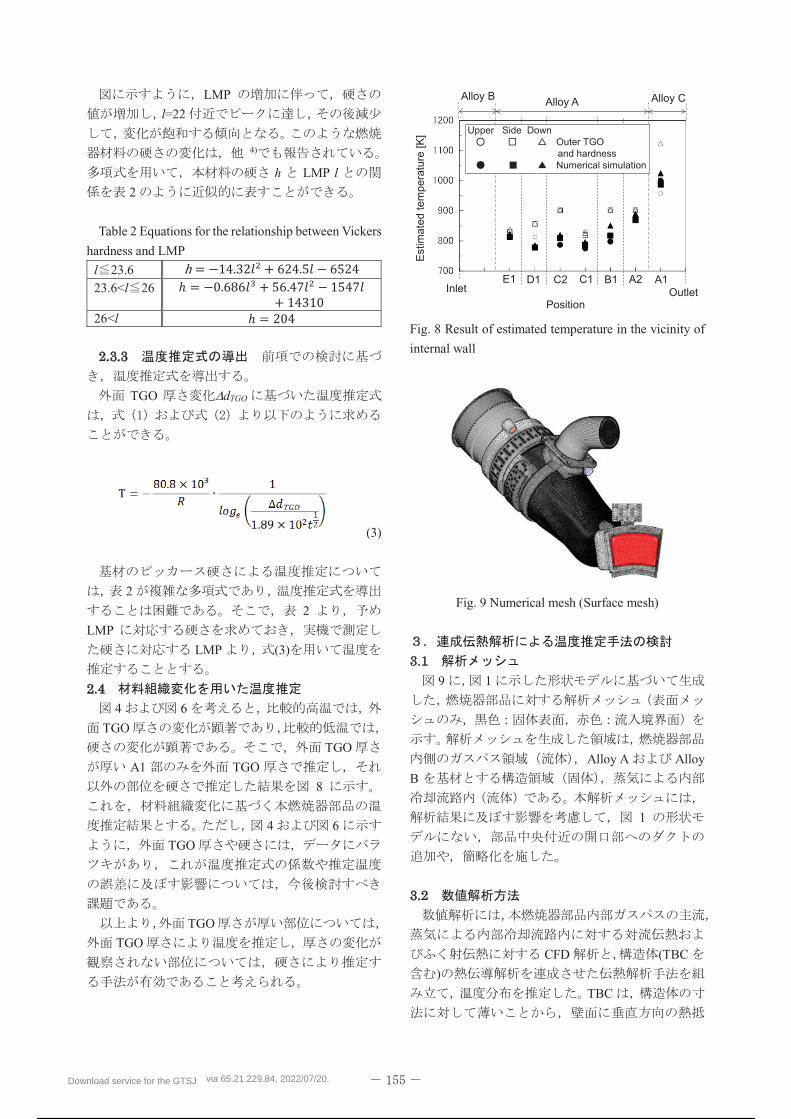
LMP
l=22
4)
h LMP l
2
Table 2 Equations for the relationship between Vickers
hardness and LMP
l 23.623.6<l 26
26<l
TGO dTGO
(3)
2
2
LMP
LMP (3)
4 6
TGO
TGO
A1 TGO
8
4 6
TGO
TGO
TGO
Fig. 8 Result of estimated temperature in the vicinity of
internal wall
Fig. 9 Numerical mesh (Surface mesh)
9 1
Alloy A Alloy
B
1
CFD (TBC
)
TBC
Est
imat
ed te
mpe
ratu
re [K
]
A1A2B1C1D1E1 C2
Alloy B Alloy CAlloy A
PositionOutletInlet
Upper Side DownOuter TGO and hardnessNumerical simulation
Download service for the GTSJ via 65.21.229.84, 2022/07/20.
148 / 298
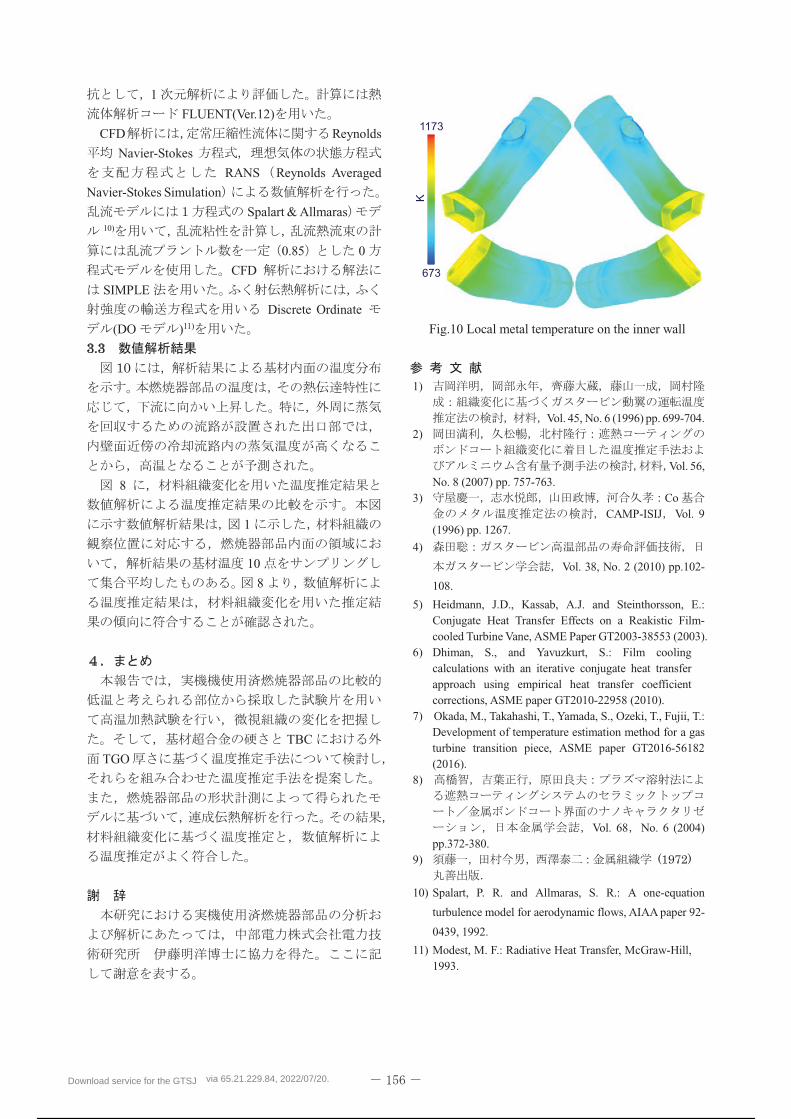
1
FLUENT(Ver.12)
CFD Reynolds
Navier-Stokes
RANS Reynolds Averaged
Navier-Stokes Simulation
Spalart & Allmaras10)
0.85 0
CFD
SIMPLE
Discrete Ordinate
(DO )11)
8
1
10
8
TBC
TGO
Fig.10 Local metal temperature on the inner wall
1)
Vol. 45, No. 6 (1996) pp. 699-704.2)
Vol. 56, No. 8 (2007) pp. 757-763.
3) CoCAMP-ISIJ Vol. 9
(1996) pp. 1267.
4)
Vol. 38, No. 2 (2010) pp.102-
108.
5) Heidmann, J.D., Kassab, A.J. and Steinthorsson, E.:Conjugate Heat Transfer Effects on a Reakistic Film-cooled Turbine Vane, ASME Paper GT2003-38553 (2003).
6) Dhiman, S., and Yavuzkurt, S.: Film cooling calculations with an iterative conjugate heat transfer approach using empirical heat transfer coefficient corrections, ASME paper GT2010-22958 (2010).
7) Okada, M., Takahashi, T., Yamada, S., Ozeki, T., Fujii, T.: Development of temperature estimation method for a gas turbine transition piece, ASME paper GT2016-56182(2016).
8)
Vol. 68 No. 6 (2004)pp.372-380.
9)
10) Spalart, P. R. and Allmaras, S. R.: A one-equation
turbulence model for aerodynamic flows, AIAA paper 92-
0439, 1992.
11) Modest, M. F.: Radiative Heat Transfer, McGraw-Hill, 1993.
1173
673
K
Download service for the GTSJ via 65.21.229.84, 2022/07/20.
149 / 298
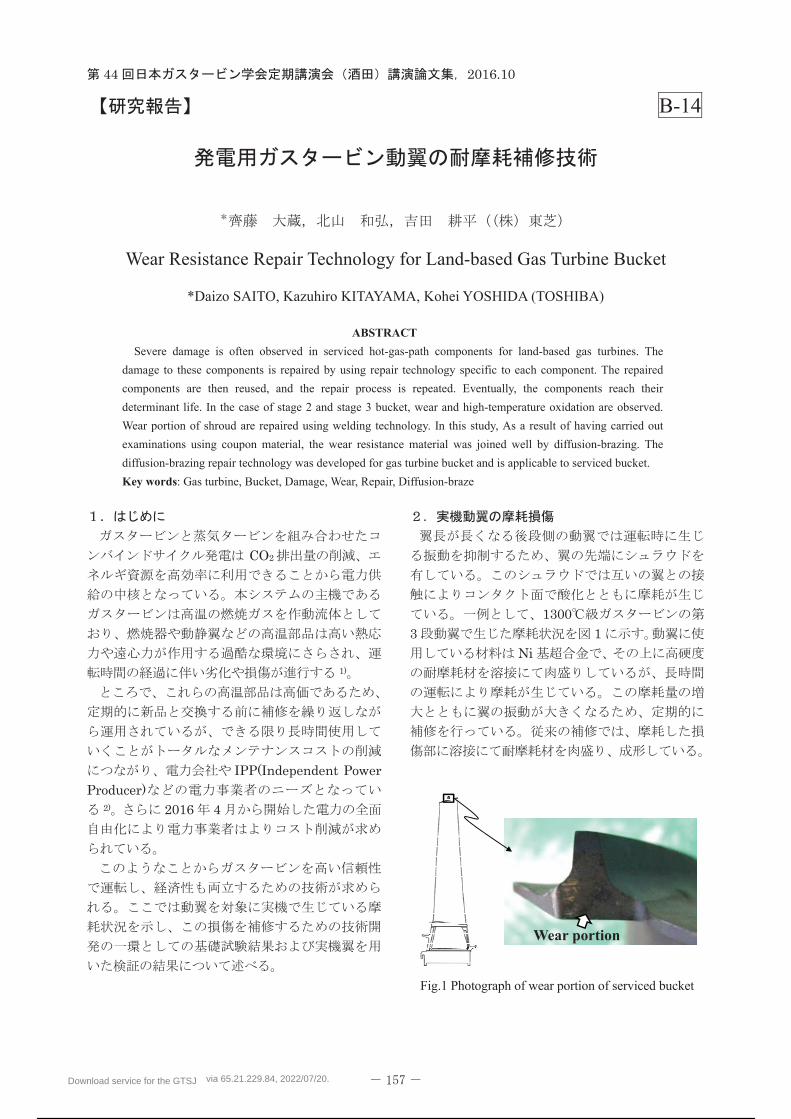
Download service for the GTSJ via 65.21.229.84, 2022/07/20.
150 / 298
Download service for the GTSJ via 65.21.229.84, 2022/07/20.
151 / 298
Download service for the GTSJ via 65.21.229.84, 2022/07/20.
152 / 298
44 2016.10
B-15
SUS316L
Strengths and Microstructure of SUS316L Fabricated by Selective Laser Melting
*Kazuki AKINO and Koji KAKEHI(TMU Univ.)
ABSTRACT
Recently, AM (Additive Manufacturing) process which can produce highly complex components is been
gaining significant attention. Ti alloys, Ni alloys, and Co-Cr alloys are the subjects of recent work.
Ni-based superalloys have phases such as and phase, and Ti alloys and Co-Cr alloys are the
multiphase alloys which have phase transformation, thus it is difficult to clarify the influential factors of
AM process on strengths of these alloys. In this study, we used SUS316L stainless steel which is a
single-phase solid-solution alloy and does not have precipitates, in order to clarify characteristic
influential factors of AM compared with a conventional material. It was found that the coarse columnar
grains grew up along the built direction and the columnar cell structure of dislocations which are induced
during the AM process. AM specimens showed higher tensile and creep strengths compared with the
conventional (hot working) material because of the high-density of dislocations.
Key words: additive manufacturing, austenite stainless steel, solid-solution alloy, built direction, molten
pool boundary
3D1) Ti Ni
Co-Cr
Ti 2) Co-Cr3) Ni
4, 5)
unexpected -Phase Formation 6)
SUS316L
LPW LPW316L (
10- SLM 3D
SLM280
Fig. 1 50 mm
AM Additive Manufacturing
3.1 mm
0 °
90 °
Fig. 1
Z Z plane X X plane
Y Y plane
PF Plastic Forming
20 mm
1080 °C SHT Solution
Heat Treatment
Download service for the GTSJ via 65.21.229.84, 2022/07/20.
153 / 298
Fig. 1 Cutting AM specimen for microstructural
observation.
SHT
as-built SHT
SHT Ar
1080 °C 1 h
4.63×10⁻⁴ s-1 24 °C
600 °C
600 °C 235 MPa 260 MPa
OM Optical
Microscope SEM/EBSD
IPF Inverse Pole Figure Map
TEM
Fig.
2 Fig. 2
Fig. 2 Laser scanning trace on Z plane of as-built
specimen.
X Y Z IPF
Fig. 3 IPF Fig. 4
Fig. 3 IPF maps of as-built specimen.
Fig. 4 IPF map of PF(SHT) specimen.
Fig. 3 X
Y
Z
Fig. 4
24 °C 600 °C
Fig. 5 Fig. 6
specimen
Download service for the GTSJ via 65.21.229.84, 2022/07/20.
154 / 298
(a) As-built specimens
(b) SHT specimens
Fig. 5 Stress-strain curves at 24 °C.
(a) As-built specimens.
(b) SHT specimens.
Fig. 6 Stress-strain curves at 600 °C.
24 °C
600 °C 90 ° 0 °
24 °C 90 °
90 °
0.2 %
600 °C 90 °
0 °
11 %
0 ° 24 °C
600 °C 2
600 °C
90 °
0 ° Fig. 6(b)
90 °
600 °C Fig. 8
600 °C 0.2 % 165 MPa
235 MPa7)
(a) Comparison between AM and PF specimens.
(b) Influence of built direction on creep curves.
Fig. 7 Creep curves of AM and PF specimens at
600 °C.
Download service for the GTSJ via 65.21.229.84, 2022/07/20.
155 / 298
235 MPa 0 °
500 h 7) 45.12
h 50.62 %
260 MPa 0 ° 610 h
12.39 % 90 ° 692 h
10.20 % 90 °
TEM Fig.8
Fig. 8 TEM microstructures of (a) AM as-built, (b)
AM(SHT), and (c) PF(SHT) specimens.
Fig. 8(a)
Fig.
8(b) Fig. 8(c)
SUS316L 0 °
90 °
SUS316L
8)
106-7 K/s 9)
Nb Mo
Ni IN718
90 °10)
316L
90 °
Fig. 9
X
MPB Molten Pool Boundary 11)
Fig. 9 OM image of defect due to lack of fusion on X
plane of as-built specimen.
1.19 /mm2
MPB
0 °
MPB11) 600 C
90
0
Fig. 6(b) 90
Download service for the GTSJ via 65.21.229.84, 2022/07/20.
156 / 298
0.2 %
MicroCT 5)
12)
Fig. 8
Fig. 8(c) 90 °
0.2 %
0 °
Fig.
7(a)
90 °
0.2 %
24 °C
0 °
0 °
0 °
(i)
0 ° 90 °
(ii)
(iii) 90 °
1) K. Kakehi: Material Stage, Technical Information Institute. 15 (2015) 45-52.
2) B. Vrancken, L. Thijs, J. Kruth and J. V. Humbeeck: Journal of Alloys and Compounds. 541 (2012) 177-185.
3) S.H. Sun, Y. Koizumi, S. Kurosu, Y. P. Li, H. Matsumoto and A. Chiba: Acta Materialia. 64 (2014) 154-168.
4) Y. Kuo and K. Kakehi: Proc. International Gas Turbine Congress 2015 (Gas Turbine Society of Japan), pp. 1031-1034.
5) L. N. Carter, C. Martin, P. J. Withers and M. M. Attallah: Journal of Alloys and Compounds. 615 (2014) 338-347.
6) Y. Idell, L. E. Levine, A. J. Allen, F. Zhang, C. E. Campbell, G. B. Olson, J. Gong, D. R. Snyder and H. Z. Deutchman: JOM. 68 (2016) 950-951
7) K. Kakehi: Master Thesis of Nagoya University, (1985).
8) M. Sugiyama, T. Umeda and J. Matsuyama: Tetsu-to-hagané. 60 (1974) 1094-1112.
9) Q. Jia and D. Gu: Optics & Laser Technology. 62 (2014) 161-171.
10) K. Kakehi: Mechanical Engineering, Nikkan Kogyo Shimbun. 64 (2016) 76-82.
11) W. Shifeng, L. Shuai, W. Qingsong, C. Yan, Z. Sheng and S. Yusheng: J. Mat. Proc. Technol. 214 (2014) 2660-2667.
12) M. Seifi, A. Salem, J. Beuth, O. Harrysson and J. J. Lewandowski: JOM. 68 (2016) 747-764.
Download service for the GTSJ via 65.21.229.84, 2022/07/20.
157 / 298
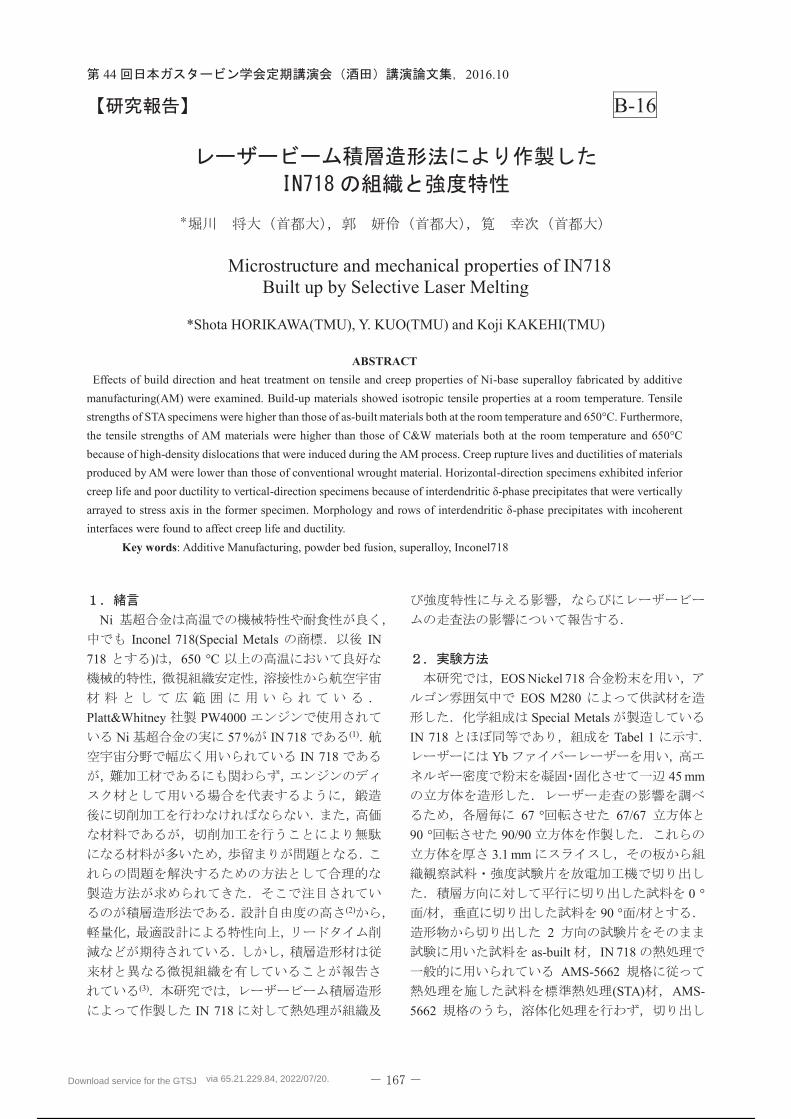
Download service for the GTSJ via 65.21.229.84, 2022/07/20.
158 / 298
Download service for the GTSJ via 65.21.229.84, 2022/07/20.
159 / 298
Download service for the GTSJ via 65.21.229.84, 2022/07/20.
160 / 298
Download service for the GTSJ via 65.21.229.84, 2022/07/20.
161 / 298
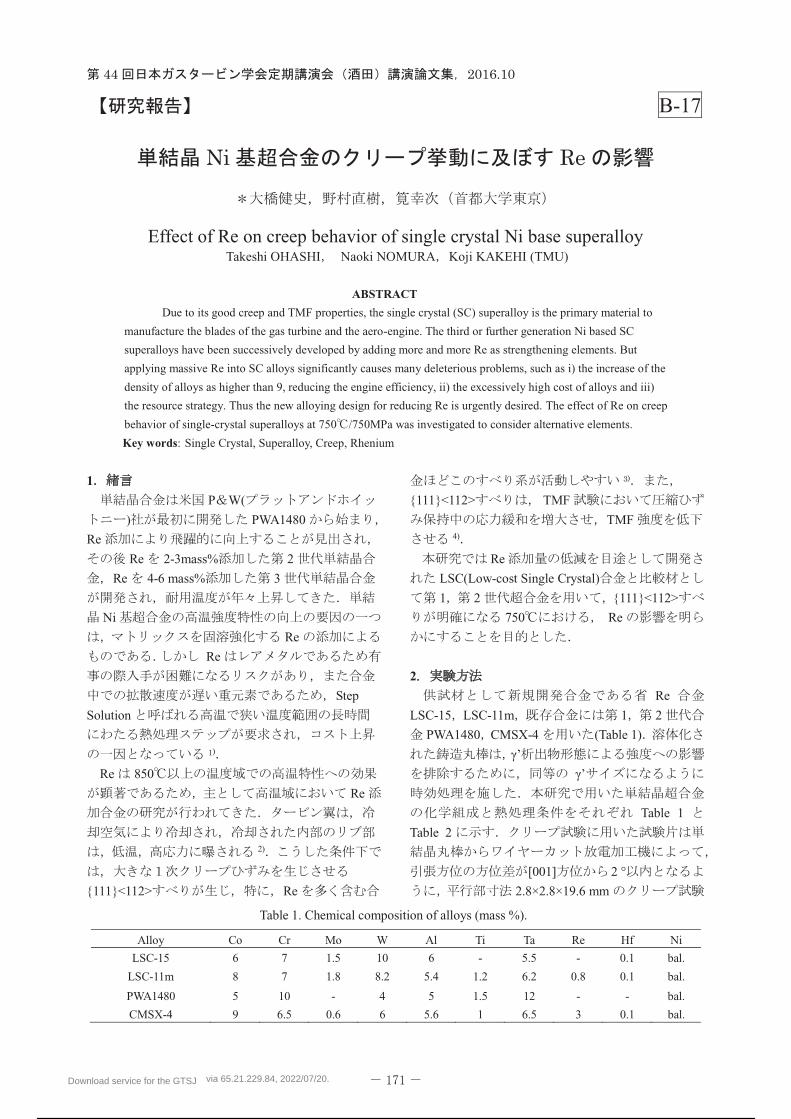
B-17
Effect of Re on creep behavior of single crystal Ni base superalloy Takeshi OHASHI Naoki NOMURA Koji KAKEHI (TMU)
ABSTRACT
Due to its good creep and TMF properties, the single crystal (SC) superalloy is the primary material to
manufacture the blades of the gas turbine and the aero-engine. The third or further generation Ni based SC
superalloys have been successively developed by adding more and more Re as strengthening elements. But
applying massive Re into SC alloys significantly causes many deleterious problems, such as i) the increase of the
density of alloys as higher than 9, reducing the engine efficiency, ii) the excessively high cost of alloys and iii)
the resource strategy. Thus the new alloying design for reducing Re is urgently desired. The effect of Re on creep
behavior of single-crystal superalloys at 750 /750MPa was investigated to consider alternative elements.
Key words: Single Crystal, Superalloy, Creep, Rhenium
1
P W(
) PWA1480
Re
Re 2-3mass% 2
Re 4-6 mass% 3
Ni
Re
Re
Step
Solution
)
Re 850
Re
2)
{111}<112> Re
{111}<112> TMF
TMF4)
Re
LSC(Low-cost Single Crystal)
1 2 {111}<112>
750 Re
2
Re
LSC-15 LSC-11m 1 2
PWA1480 CMSX-4 (Table 1)
Table 1
Table 2
[001] 2 °
2.8×2.8×19.6 mm
Alloy Co Cr Mo W Al Ti Ta Re Hf Ni
LSC-15 6 7 1.5 10 6 - 5.5 - 0.1 bal.
LSC-11m 8 7 1.8 8.2 5.4 1.2 6.2 0.8 0.1 bal.
PWA1480 5 10 - 4 5 1.5 12 - - bal.
CMSX-4 9 6.5 0.6 6 5.6 1 6.5 3 0.1 bal.
Table 1. Chemical composition of alloys (mass %).
Download service for the GTSJ via 65.21.229.84, 2022/07/20.
162 / 298
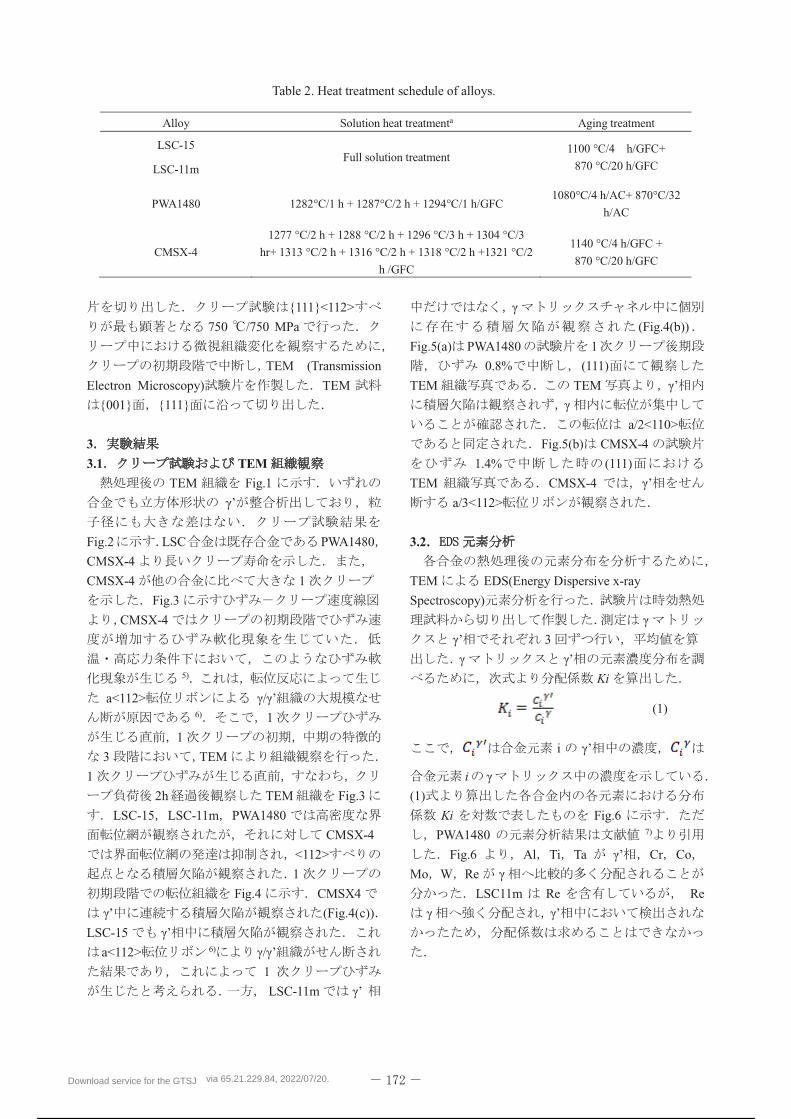
{111}<112>
750 /750 MPa
TEM (Transmission
Electron Microscopy) TEM
{001} {111}
3
3.1 TEM
TEM Fig.1
Fig.2 LSC PWA1480
CMSX-4
CMSX-4 1
Fig.3
CMSX-4
5)
a<112>6) 1
1
3 TEM
1
2h TEM Fig.3
LSC-15 LSC-11m PWA1480
CMSX-4
<112>
1
Fig.4 CMSX4
(Fig.4(c))
LSC-15
a<112> 6)
1
LSC-11m
(Fig.4(b))
Fig.5(a) PWA1480 1
0.8% (111)
TEM TEM
a/2<110>
Fig.5(b) CMSX-4
1.4% (111)
TEM CMSX-4
a/3<112>
3.2
TEM EDS(Energy Dispersive x-ray
Spectroscopy)
3
Ki
(1)
i
i
(1)
Ki Fig.6
PWA1480 7)
Fig.6 Al Ti Ta Cr Co
Mo W Re
LSC11m Re Re
Alloy Solution heat treatmenta Aging treatment
LSC-15 Full solution treatment
1100 °C/4 h/GFC+
870 °C/20 h/GFC LSC-11m
PWA1480 1282°C/1 h + 1287°C/2 h + 1294°C/1 h/GFC 1080°C/4 h/AC+ 870°C/32
h/AC
CMSX-4
1277 °C/2 h + 1288 °C/2 h + 1296 °C/3 h + 1304 °C/3
hr+ 1313 °C/2 h + 1316 °C/2 h + 1318 °C/2 h +1321 °C/2
h /GFC
1140 °C/4 h/GFC +
870 °C/20 h/GFC
Table 2. Heat treatment schedule of alloys.
Download service for the GTSJ via 65.21.229.84, 2022/07/20.
163 / 298
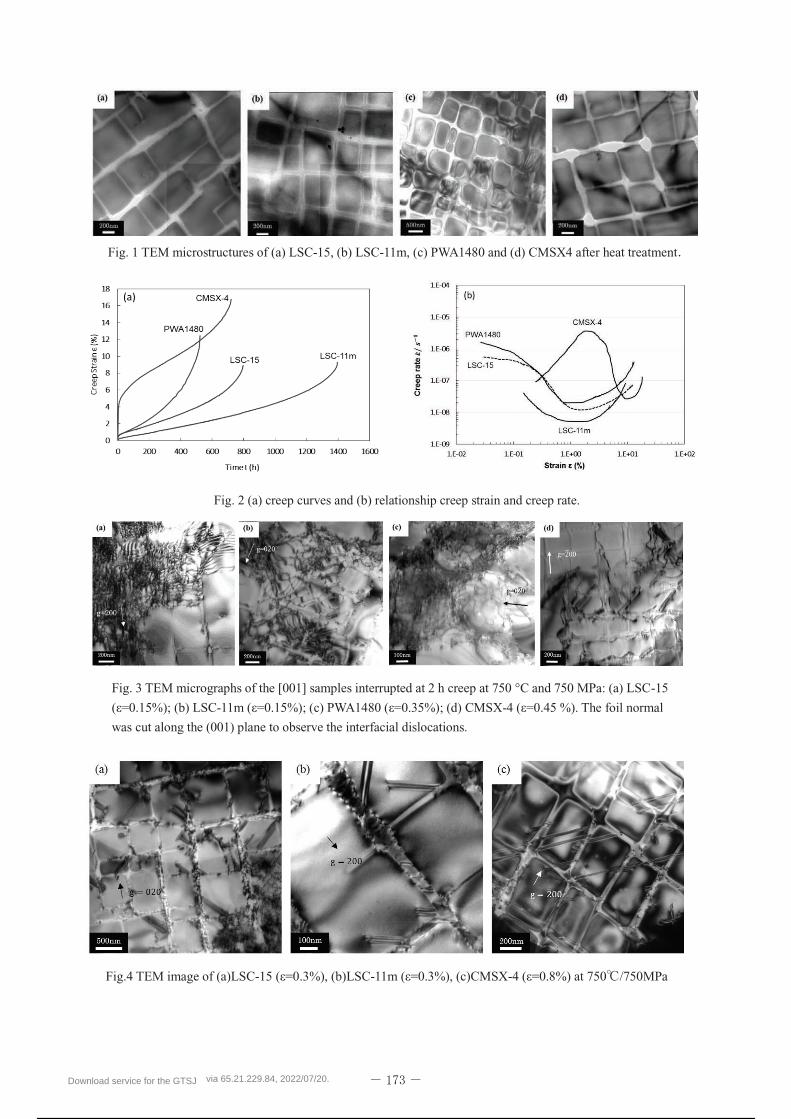
Fig. 1 TEM microstructures of (a) LSC-15, (b) LSC-11m, (c) PWA1480 and (d) CMSX4 after heat treatment
Fig. 2 (a) creep curves and (b) relationship creep strain and creep rate.
Fig. 3 TEM micrographs of the [001] samples interrupted at 2 h creep at 750 °C and 750 MPa: (a) LSC-15
.15%); (b) LSC-11m ; (c) PWA1480 ; (d) CMSX-4 ( . The foil normal
was cut along the (001) plane to observe the interfacial dislocations.
Fig.4 TEM image of (a)LSC- - - 750 /750MPa
Download service for the GTSJ via 65.21.229.84, 2022/07/20.
164 / 298
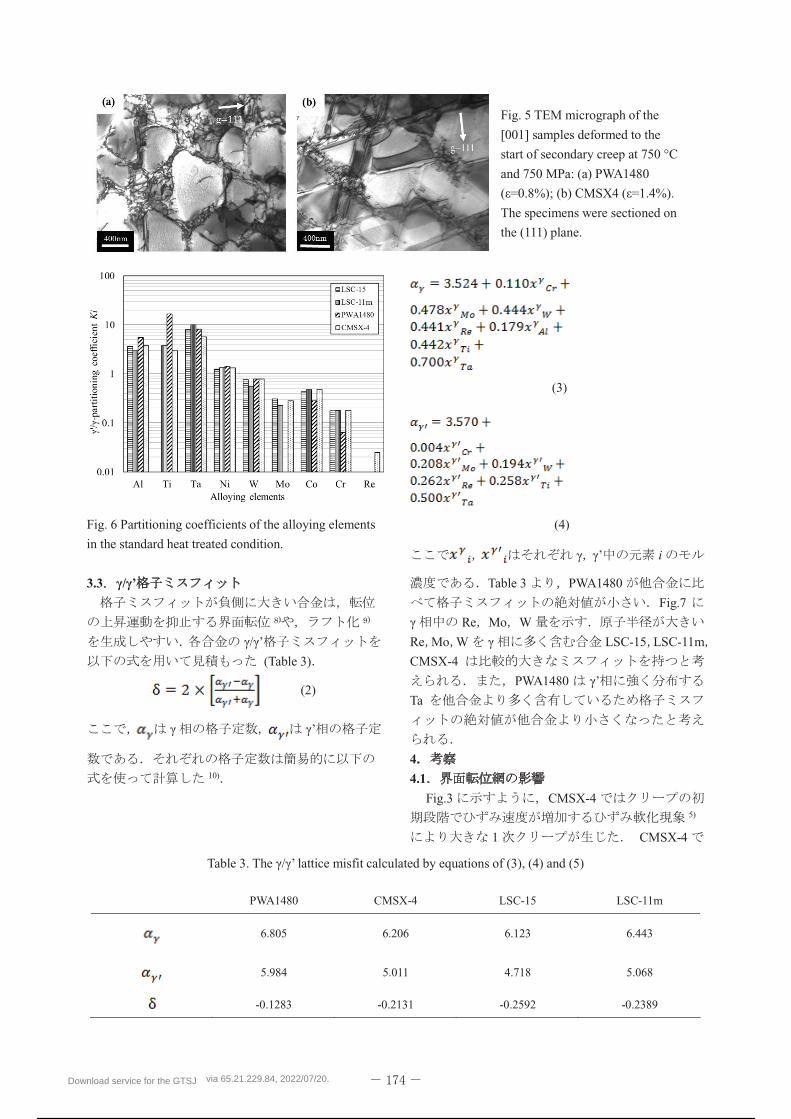
Fig. 6 Partitioning coefficients of the alloying elements
in the standard heat treated condition.
3.3
) )
(Table 3)
(2)
10)
(3)
(4)
i
Table 3 PWA1480
Fig.7
Re Mo W
Re Mo W LSC-15 LSC-11m
CMSX-4
PWA1480
Ta
4
4.1
Fig.3 CMSX-45)
1 CMSX-4
PWA1480 CMSX-4 LSC-15 LSC-11m
6.805 6.206 6.123 6.443
5.984 5.011 4.718 5.068
-0.1283 -0.2131 -0.2592 -0.2389
Table 3. calculated by equations of (3), (4) and (5)
Fig. 5 TEM micrograph of the
[001] samples deformed to the
start of secondary creep at 750 °C
and 750 MPa: (a) PWA1480
; (b) CMSX4 .
The specimens were sectioned on
the (111) plane.
Download service for the GTSJ via 65.21.229.84, 2022/07/20.
165 / 298
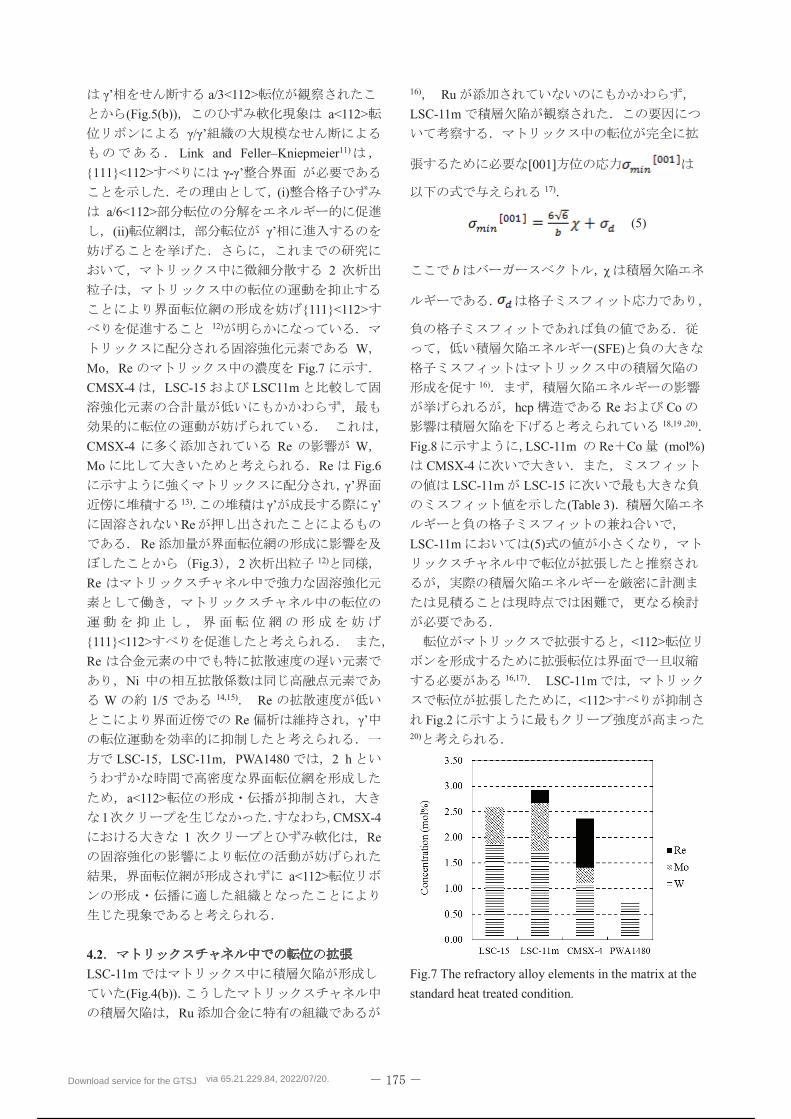
a/3<112>
(Fig.5(b)) a<112>
Link and Feller Kniepmeier11)
{111}<112> -
(i)
a/6<112>
(ii)
2
{111}<112>12)
W
Mo Re Fig.7
CMSX-4 LSC-15 LSC11m
CMSX-4 Re W
Mo Re Fig.6
13)
Re
Re
Fig.3 2 12)
Re
{111}<112>
Re
Ni
W 1/5 14,15) Re
Re
LSC-15 LSC-11m PWA1480 2 h
a<112>
1 CMSX-4
1 Re
a<112>
4.2
LSC-11m
(Fig.4(b))
Ru
16) Ru
LSC-11m
[001]
17)
(5)
b
(SFE)
16)
hcp Re Co18,19 ,20)
Fig.8 LSC-11m Re Co (mol%)
CMSX-4
LSC-11m LSC-15
(Table 3)
LSC-11m (5)
<112>
16,17) LSC-11m
<112>
Fig.220)
Fig.7 The refractory alloy elements in the matrix at the
standard heat treated condition.
Download service for the GTSJ via 65.21.229.84, 2022/07/20.
166 / 298
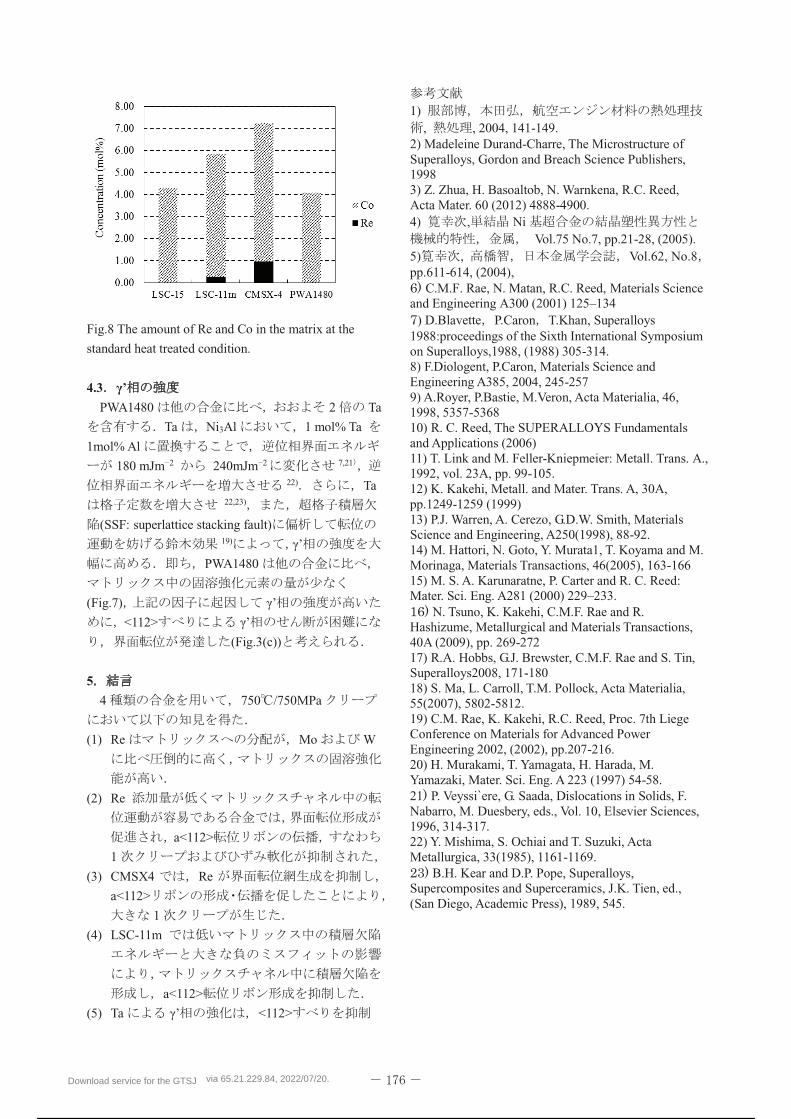
Fig.8 The amount of Re and Co in the matrix at the
standard heat treated condition.
4.3 PWA1480 2 Ta
Ta Ni3Al 1 mol% Ta
1mol% Al
180 mJm 2 240mJm 2 7,21
22) Ta
22,23)
(SSF: superlattice stacking fault)19)
PWA1480
(Fig.7)
<112>
(Fig.3(c))
5
4 750 /750MPa
(1) Re Mo W
(2) Re
a<112>
1
(3) CMSX4 Re
a<112>
1
(4) LSC-11m
a<112>
(5) Ta <112>
1)
, , 2004, 141-149. 2) Madeleine Durand-Charre, The Microstructure of Superalloys, Gordon and Breach Science Publishers, 1998 3) Z. Zhua, H. Basoaltob, N. Warnkena, R.C. Reed, Acta Mater. 60 (2012) 4888-4900. 4) , Ni
Vol.75 No.7, pp.21-28, (2005). 5) , Vol.62, No.8pp.611-614, (2004),
C.M.F. Rae, N. Matan, R.C. Reed, Materials Science and Engineering A300 (2001) 125 134
) D.Blavette P.Caron T.Khan, Superalloys 1988:proceedings of the Sixth International Symposium on Superalloys,1988, (1988) 305-314.8) F.Diologent, P.Caron, Materials Science and Engineering A385, 2004, 245-257 9) A.Royer, P.Bastie, M.Veron, Acta Materialia, 46, 1998, 5357-5368 10) R. C. Reed, The SUPERALLOYS Fundamentals and Applications (2006) 11) T. Link and M. Feller-Kniepmeier: Metall. Trans. A., 1992, vol. 23A, pp. 99-105. 12) K. Kakehi, Metall. and Mater. Trans. A, 30A, pp.1249-1259 (1999) 13) P.J. Warren, A. Cerezo, G.D.W. Smith, Materials Science and Engineering, A250(1998), 88-92. 14) M. Hattori, N. Goto, Y. Murata1, T. Koyama and M. Morinaga, Materials Transactions, 46(2005), 163-166 15) M. S. A. Karunaratne, P. Carter and R. C. Reed: Mater. Sci. Eng. A281 (2000) 229 233.
N. Tsuno, K. Kakehi, C.M.F. Rae and R. Hashizume, Metallurgical and Materials Transactions, 40A (2009), pp. 269-27217) R.A. Hobbs, G.J. Brewster, C.M.F. Rae and S. Tin, Superalloys2008, 171-180 18) S. Ma, L. Carroll, T.M. Pollock, Acta Materialia, 55(2007), 5802-5812. 19) C.M. Rae, K. Kakehi, R.C. Reed, Proc. 7th Liege Conference on Materials for Advanced Power Engineering 2002, (2002), pp.207-216. 20) H. Murakami, T. Yamagata, H. Harada, M. Yamazaki, Mater. Sci. Eng. A 223 (1997) 54-58. 21 P. Veyssi`ere, G. Saada, Dislocations in Solids, F. Nabarro, M. Duesbery, eds., Vol. 10, Elsevier Sciences, 1996, 314-317. 22) Y. Mishima, S. Ochiai and T. Suzuki, Acta Metallurgica, 33(1985), 1161-1169.
B.H. Kear and D.P. Pope, Superalloys, Supercomposites and Superceramics, J.K. Tien, ed., (San Diego, Academic Press), 1989, 545.
Download service for the GTSJ via 65.21.229.84, 2022/07/20.
167 / 298
44 2016.10
B-18
Ni
Present Research Status of the Direct and Complete Recycling Method for
Ni-base Single Crystal Superalloy Turbine Airfoils
*Satoshi UTADA, Shinsuke SUZUKI (Waseda Univ.), Hiroshi HARADA, Makoto OSAWA, Kyoko KAWAGISHI,
Toshiharu KOBAYASHI and Tadaharu YOKOKAWA (NIMS)
ABSTRACT
In collaborative work of Waseda University and National Institute for Materials Science (NIMS), we proposed
direct and complete recycle method that enables drastic cost reduction and stable supply of Ni-base single
crystal superalloy turbine components. The method includes collecting the turbine components, remelting and
single crystals. Recycled material showed high-temperature properties equal to or better than genuine ingot
material. The project is scheduled to scale up to commercial ingot size for practical use. This paper introduces
research results and status of our recycling method.
Key words: Ni-base single crystal superalloys, Recycle, Creep, Cyclic oxidation, Turbine airfoil
Ni1) Ni
(
)
(NIMS) Ni
Trent1000
1150°C2)
W Ta Re Ru
NIMS
4 6 Ni 3 5)
JST/ALCA ( :
Advanced Low Carbon Technology Research and
Development Program)
2013-19
4
Ni
2.1
1980 Curwick 6) deBarbadillo7) Papp8)
Papp 1986
5500
70% 20%
Download service for the GTSJ via 65.21.229.84, 2022/07/20.
168 / 298
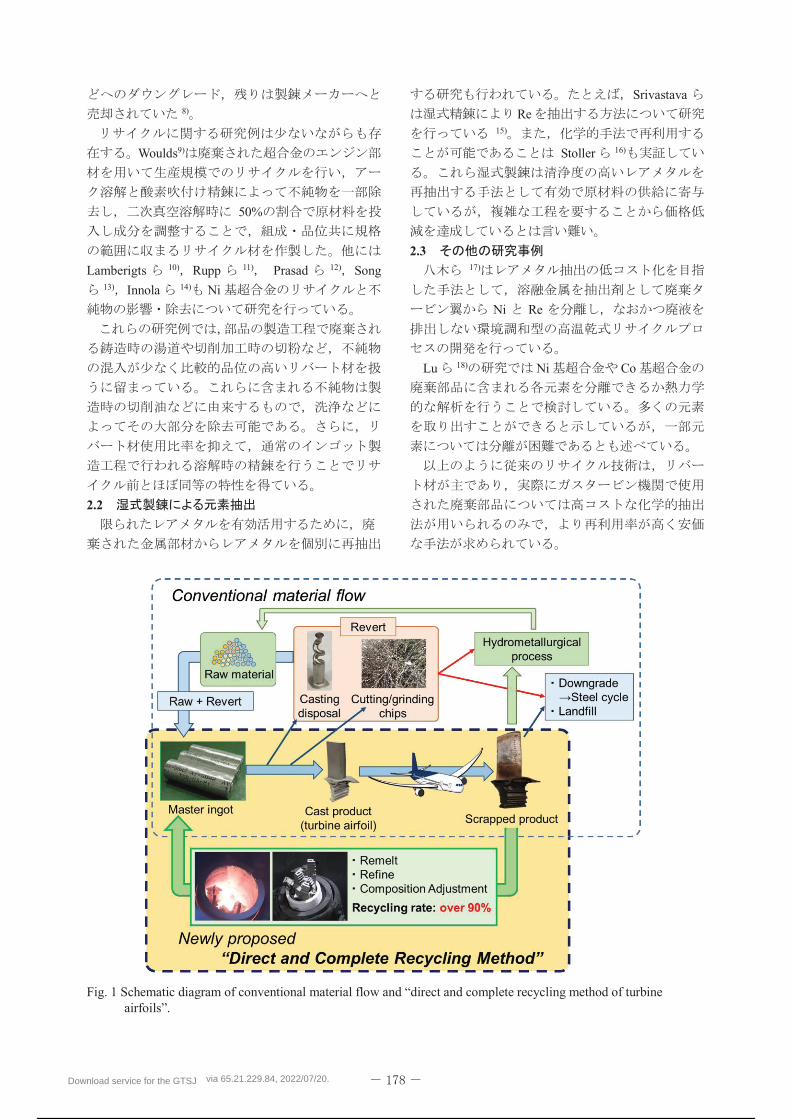
8)
Woulds9)
50%
Lamberigts 10) Rupp 11) Prasad 12) Song13) Innola 14) Ni
2.2
Srivastava
Re15)
Stoller 16)
2.3 17)
Ni Re
Lu 18) Ni Co
Fig. 1 Schematic diagram of conventional
Download service for the GTSJ via 65.21.229.84, 2022/07/20.
169 / 298
3.1
Ni PWA1484
21)
TMS-1700(MGA1700)
PWA1484
10ppm
22 24)
(1)
(2)
(3) (
)
(4)
CaO 25) 100ppm
Ni CaO
8ppm24) CaO
(
)
3.2
2 Ni
PWA148426)
PWA1484
(1) (Genuine)
Al2O3
(2) (Simple recycle)
Al2O3
(3) CA Al2O3
(4) CA+CaO CaO
(
X
)
CA+CaO CA
PWA1484
( 1315°C 4h 1080°C 4h
704°C 24h) 26)
1100°C /137MPa
1100°C 1h 1
3.3
Figure 220)
Al2O3 2
CaO CA+CaO
CaO
Genuine Simple recycle CA CA+CaO0
5
10
Impu
rity
Con
tent
(pp
m)
Materials
S NO S NO
S
N
O
S
NO
Fig. 2 Content of major impurities such as sulfur, oxygen, and
nitrogen for each material. Standard deviations of
each impurity content are shown as error bars.20)
Download service for the GTSJ via 65.21.229.84, 2022/07/20.
170 / 298
Ni
Fig.319) CA+CaO
TCP
CA+CaO
NIMS-ADP (Alloy
Designing Program, )27)
Fig.4
Fig.520)
( )
Zr Si
Y Ni
CA+CaO
3.4
CaO
Ni
(1)
(2) CaO
( )
0 50 100 150
0
5
10
15
20
103%
CA
Stra
in (
%)
Time /h
Simple recycleCA+CaO
Genuine
70%
Fig. 3 The results of creep test at 1100 °C / 137 MPa. 19)
150 175 200 225
100
125
150
103%
100%
79%
70%
Genuine
CA+CaO
CA
Act
ual C
reep
Rup
utre
Tim
e /h
Predicted Creep Rupture Time /h
Simple recycle
Fig.4 The results of creep test at 1100 °C / 137 MPa and the
relationship between predicted and actual creep rupture
time are shown. 20)
0 20 40 60-0.015
-0.010
-0.005
0.000
0.005 CA+CaO
CA
Simplerecycle
Wei
ght C
hang
e / m
gm
m-2
Number of 1h Oxidation Cycles
Genuine
Fig. 5 Results of cyclic oxidation test up to 50 cycles at
1100°C are shown as weight changes of specimens. 20)
Download service for the GTSJ via 65.21.229.84, 2022/07/20.
171 / 298
(3)
(4)
Ni
NIMS
NIMS
JST ALCA
2013-19
1)
: :
vol. 43, No. 5 (2015), pp. 349-356. 2) Yokokawa, T., Harada, H., Mori, Y., Kawagishi, K.,
Koizumi, Y., and Kobayashi, T.: Design of Next Generation Ni-base Single Crystal Superalloys Containing Ir: Towards 1150 Temperature Capability, Proceedings of Superalloy 2016, (2016), to be published.
3) Koizumi, Y., Kobayashi, T., Yokokawa, T., Zhang, J., Osawa, M., Harada, H., Aoki, Y., and Arai, M.: Development of next-generation Ni-base single crystal superalloys, Proceedings of Superalloys 2004, (2004), pp. 35 43.
4) Sato, A., Harada, H., Yeh, A.-C., Kawagishi, K., Kobayashi, T., Koizumi, Y., Yokokawa, T., and Zhang, J. X.: A 5th generation SC superalloy with balanced high temperature properties and processability, Proceedings of Superalloys 2008, (2008), pp. 131 138.
5) Kawagishi, K., Yeh, A., Yokokawa, T., Kobayashi, T., Koizumi, Y., and Harada, H.: Development of an Oxidation-resistant High-Strength Sixth-Generation Single-Crystal Superalloy TMS-238, Proceedings of Superalloys 2012, (2012), pp. 9 13.
6) Curwick, L. R., Petersen, W. A., and DeBarbadillo, J. J.: Superalloy Scrap-Generation and Recycling, Proceedings of Superalloys 1980, (1980), pp. 21 30.
7) deBarbadillo, J. J.: Nickel-Base Superalloys; Physical Metallurgy of Recycling, Metallurgical Transactions A, Physical Metallurgy and Materials Science, Vol. 14 A, No. 3 (1983). pp. 329 341.
8) Papp, J. F.: Superalloy Recycling 1976-1986, Proceedings of Superalloys 1988, (1988), pp. 367 376.
9) Woulds, M. J.: Recycling of Engine Serviced Superalloys, Proceedings of Superalloys 1980, (1980), pp. 31 41.
10) Lamberigts, M., Lecomte-Beckers, J., and Drapier, J.-M.: Reverting foundry nickel-base superalloys, Proceedings of International Conference on High Temperature Alloys for Gas Turbine and Other Applications, (1986), pp. 777 786.
11) Rupp, S., Bienvenu, Y., Massol, J., Ablitzer, D., Gardaix, E., Mancha, H., Allibert, M., and Martin-Garin, R.: Laboratory Study on the Recycling of Nickel Base Superalloy Foundry Scrap, Proceedings of International Conference on High Temperature Alloys for Gas Turbine and Other Applications, (1986), pp. 787 797.
12) Prasad, V. V. S., Rao, A. S., Prakash, U., Rao, V. R., Rao, P. K., and Gupt, K. M.: Recycling of superalloy scrap through electro slag remelting, ISIJ International, Vol. 36, No. 12 (1996), pp. 1459 1464.
13) Song, J., Xiao, Q., Zang, C., Xiao, C., Li, S., and Han, Y.: Microstructure and Mechanical Properties of Recycled Ni3Al Base Alloy IC6, Chinese Journal of Aeronautics, Vol. 15, No. 1 (2002), pp. 55 60.
14) Innola, M., Victor, S., and Heorhiy, M.: Refining and recycling of the Nickel based heat-resistant alloys used in Aviation, Proceedings of 3rd International Conference on Life Cycle Management, 2007.
15) Srivastava, R. R., Kim, M., Lee, J., Jha, M. K., and Kim, B.-S.: Resource recycling of superalloys and hydrometallurgical challenges, Journal of Material Science, Vol. 49, No. 14 (2014), pp. 4671 4686.
16) Stoller, V., Olbrich, A., Meese-Marktscheffel, J., Mathy, W., Erb, M., Nietfeld, G., and Gille, G.: Process for electrochemical decomposition of superalloys, Patent, US20080110767 A1, 15-May-2008.
17) :
Vol. 2, No. 2 (2015). 18) Lu, X., Matsubae, K., Nakajima, K., Nakamura, S., and
Nagasaka, T.: Thermodynamic Considerations of Contamination by Alloying Elements of Remelted End-of-Life Nickel- and Cobalt-Based Superalloys, Metallurgical and Materials Transactions B, Vol. 47, No. 3 (2016), pp. 1785 1795.
19) Utada, S., Joh, Y., Osawa, M., Yokokawa, T., Kobayashi, T., Kawagishi, K., Suzuki, S., and Harada, H.: Direct Recycle of Used Single Crystal Superalloy Turbine Blades, Proceedings of the International Gas Turbine Congress 2015 Tokyo, (2015), pp. 1039 1043.
20) Utada, S., Joh, Y., Osawa, M., Yokokawa, T., Kobayashi,
Download service for the GTSJ via 65.21.229.84, 2022/07/20.
172 / 298
T., Kawagishi, K., Suzuki, S., and Harada, H.: High Temperature Properties of a Single Crystal Superalloy PWA1484 Directly Recycled after Turbine Blade Use, Proceedings of Superalloys 2016, (2016), to be published.
21) : Ni
40(2012), pp. 181-184.
22) Joh, Y., Kobayashi, T., Yokokawa, T., Kawagishi, K., Osawa, M., Suzuki, S., and Harada, H.: Effects of Sulphur on High Temperature Properties of a Ni-base Single Crystal Superalloy, TMS-1700, Proceedings of10th Liège Conference on Materials for Advanced Power Engineering, (2014), pp. 538 544.
23) Joh, Y., Utada, S., Osawa, M., Kobayashi, T., Yokokawa, T., Kawagishi, K., Suzuki, S., and Harada, H.: Effect of Sulfur on Creep Strength of Ni-Base Single-Crystal Superalloy, TMS-1700, Materials Transactions, Vol. 57, No. 8 (2016), pp. 1305 1308.
24) : 2 Ni
PWA1484 CaO
(2015), p. 71. 25) : Al
Al Vol. 14, (1987), pp. 1684-1960.
26) Cetel, A. D. and Duhl, D. N.: Second-Generation Nickel-Base Single Crystal Superalloy, Proceedings of Superalloys 1988, (1988), pp. 235-244.
27) Harada, H., Ohno, K., Yamagata, T., Yokokawa, T., and Yamazaki, M.: Phase Calculation and its Use in Alloy Design Program for Nickel-Base Superalloys, Proceedings of Superalloys 1988, (1988), pp. 733 742.
Download service for the GTSJ via 65.21.229.84, 2022/07/20.
173 / 298
Download service for the GTSJ via 65.21.229.84, 2022/07/20.
174 / 298
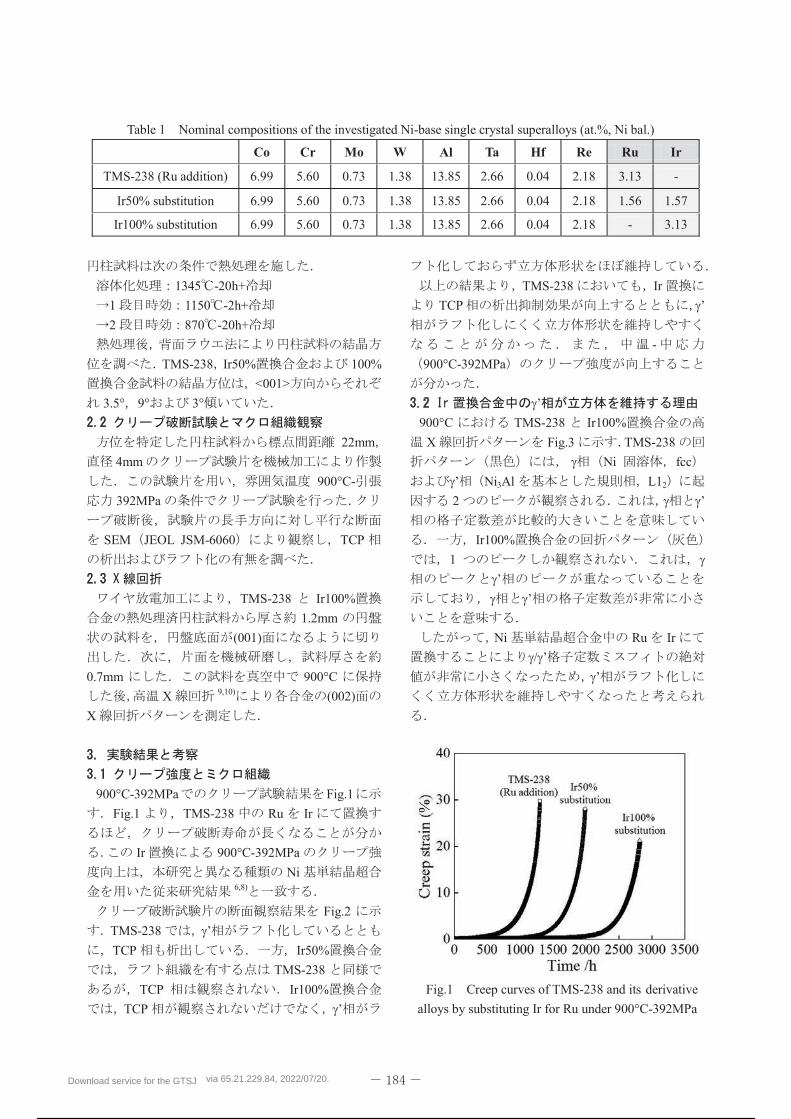
Download service for the GTSJ via 65.21.229.84, 2022/07/20.
175 / 298
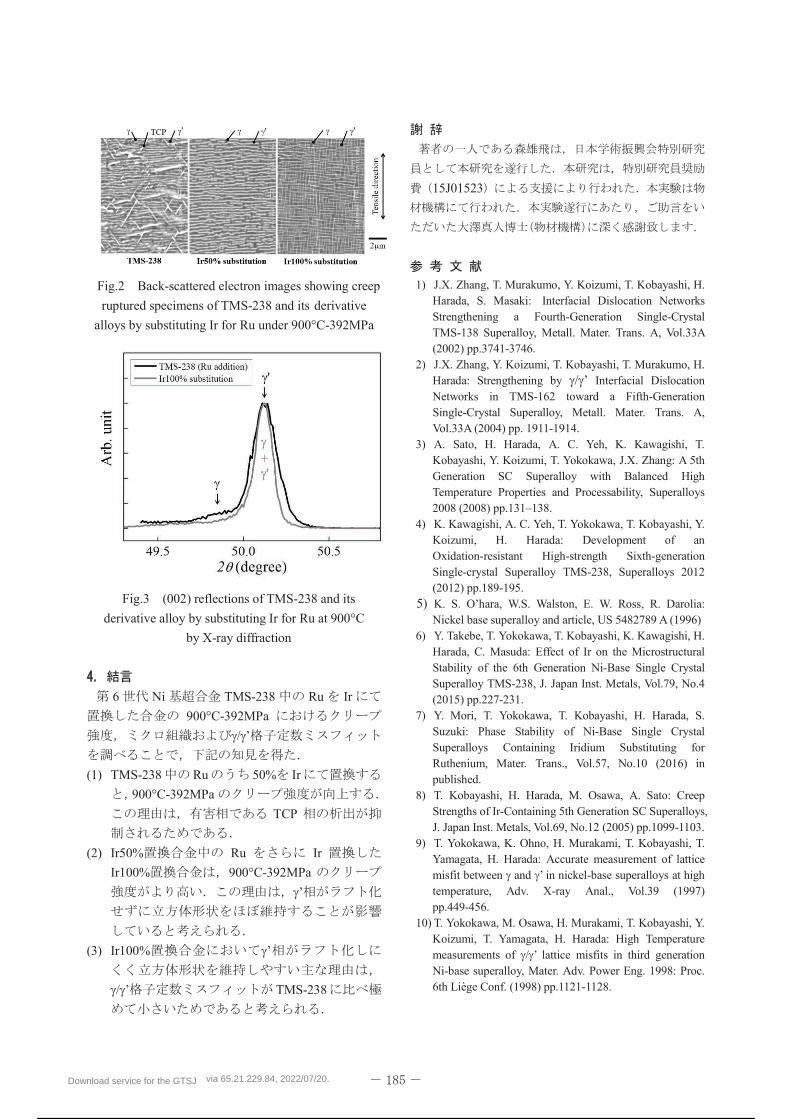
Download service for the GTSJ via 65.21.229.84, 2022/07/20.
176 / 298
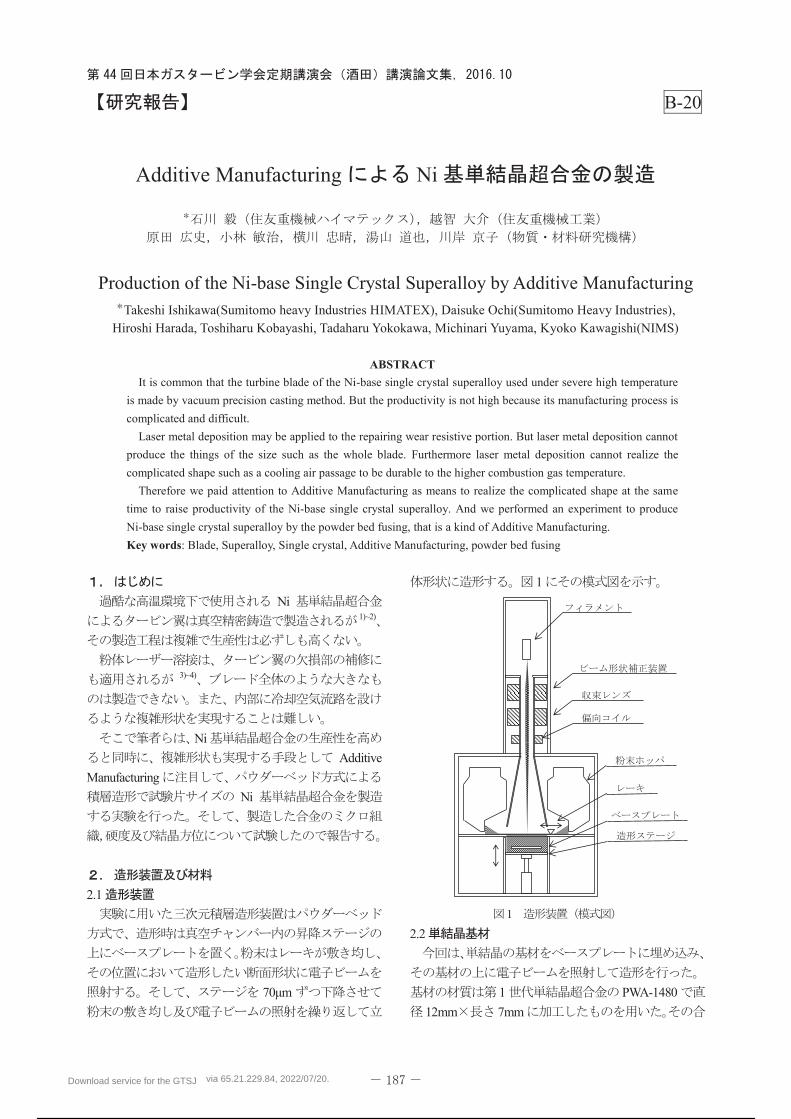
Download service for the GTSJ via 65.21.229.84, 2022/07/20.
177 / 298
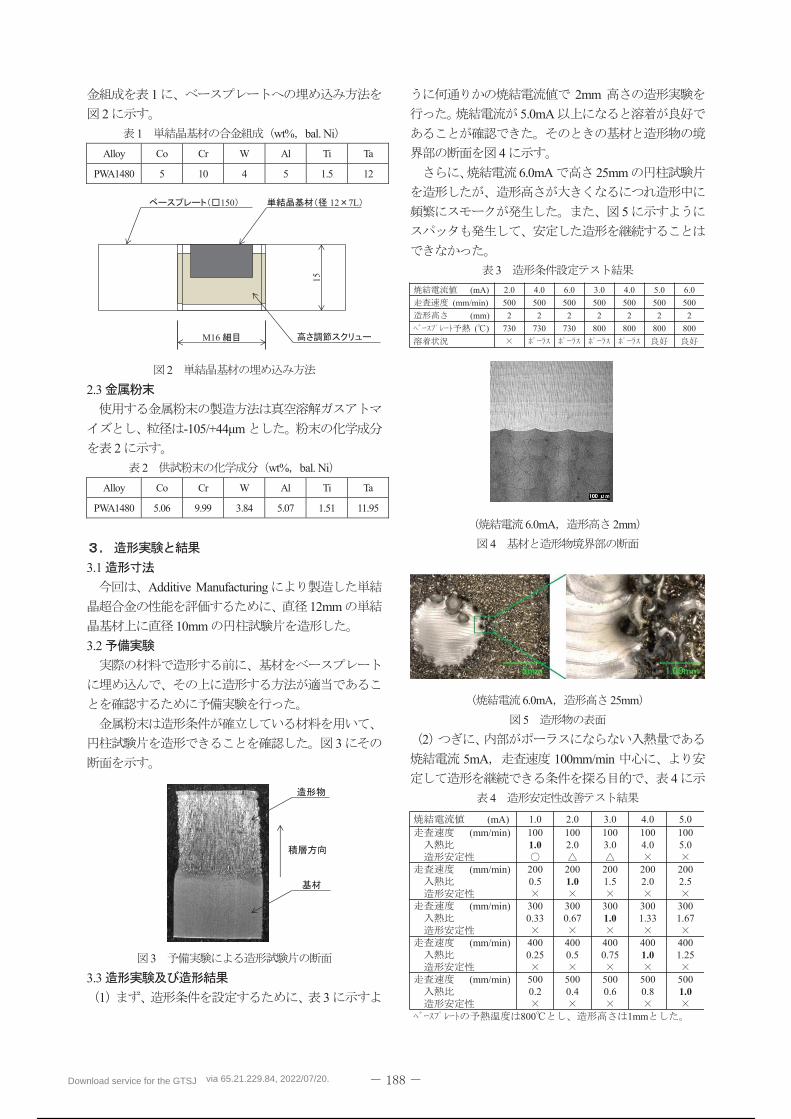
Download service for the GTSJ via 65.21.229.84, 2022/07/20.
178 / 298
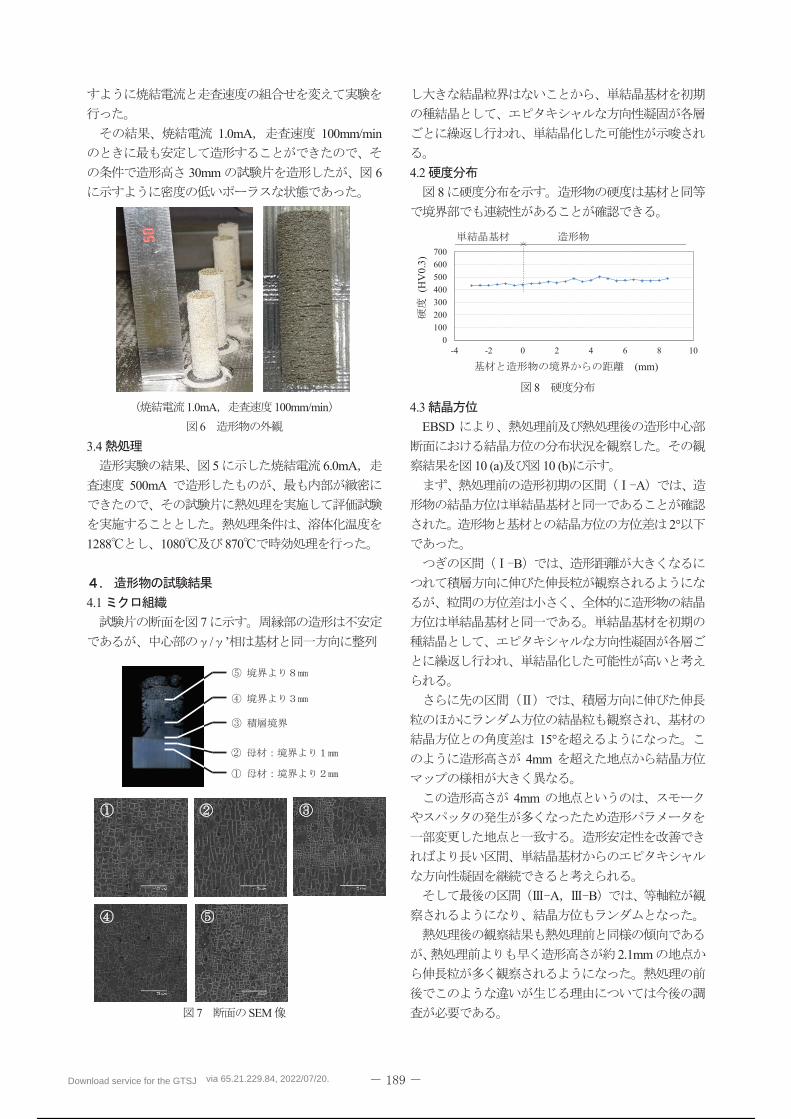
Download service for the GTSJ via 65.21.229.84, 2022/07/20.
179 / 298
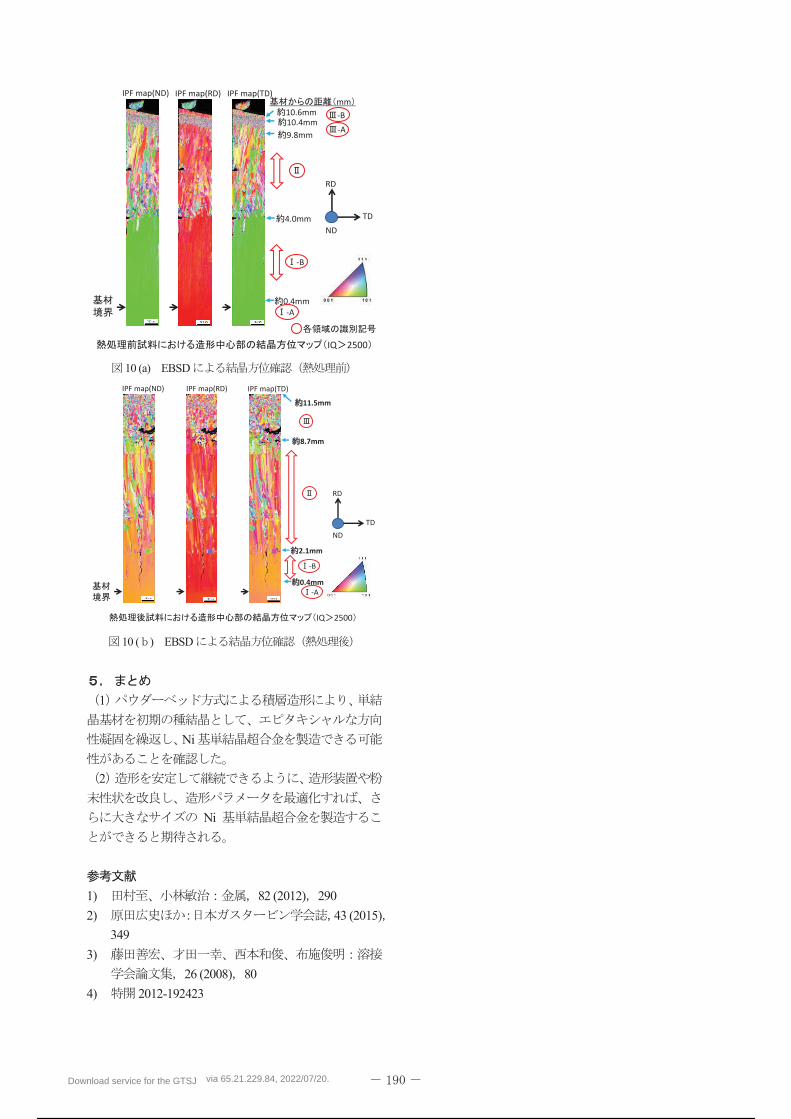
Download service for the GTSJ via 65.21.229.84, 2022/07/20.
180 / 298
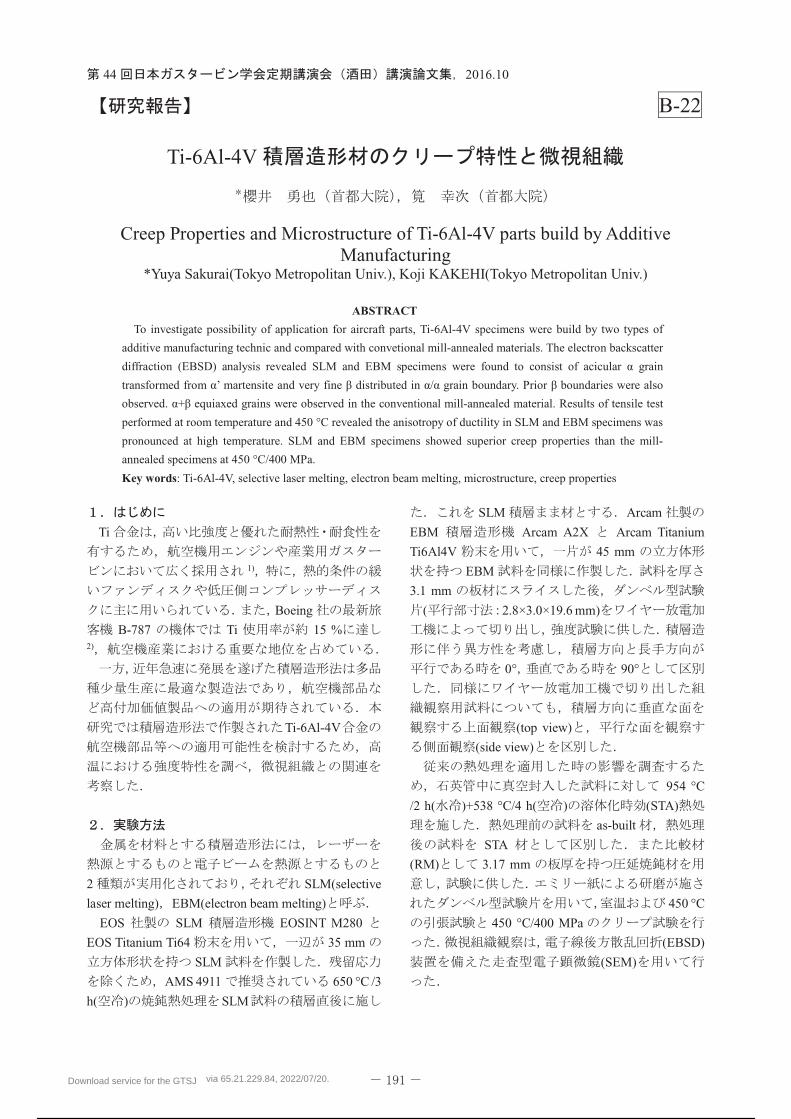
44 2016.10
B-22
Ti-6Al-4V
Creep Properties and Microstructure of Ti-6Al-4V parts build by Additive Manufacturing
*Yuya Sakurai(Tokyo Metropolitan Univ.), Koji KAKEHI(Tokyo Metropolitan Univ.)
ABSTRACT
To investigate possibility of application for aircraft parts, Ti-6Al-4V specimens were build by two types of
additive manufacturing technic and compared with convetional mill-annealed materials. The electron backscatter
diffraction (EBSD) analysis revealed SLM and EBM specimens were found to consist of acicul
-annealed material. Results of tensile test
performed at room temperature and 450 °C revealed the anisotropy of ductility in SLM and EBM specimens was
pronounced at high temperature. SLM and EBM specimens showed superior creep properties than the mill-
annealed specimens at 450 °C/400 MPa.
Key words: Ti-6Al-4V, selective laser melting, electron beam melting, microstructure, creep properties
Ti
1)
Boeing
B-787 Ti 15 %2)
Ti-6Al-4V
2 SLM(selective
laser melting) EBM(electron beam melting)
EOS SLM EOSINT M280
EOS Titanium Ti64 35 mm
SLM
AMS 4911 650 °C /3
h( ) SLM
SLM Arcam
EBM Arcam A2X Arcam Titanium
Ti6Al4V 45 mm
EBM
3.1 mm
( 2.8×3.0×19.6 mm)
0° 90°
(top view)
(side view)
954 °C
/2 h( )+538 °C/4 h( ) (STA)
as-built
STA
(RM) 3.17 mm
450 °C
450 °C/400 MPa
(EBSD)
(SEM)
Download service for the GTSJ via 65.21.229.84, 2022/07/20.
181 / 298
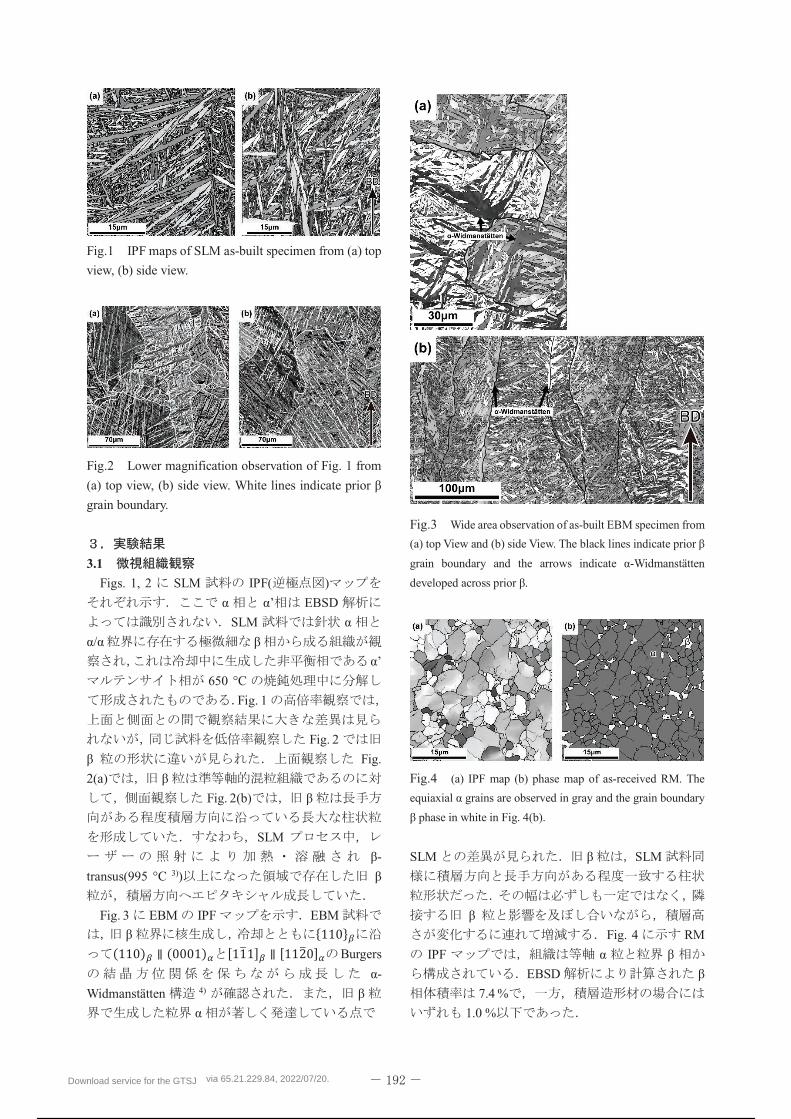
Fig.1 IPF maps of SLM as-built specimen from (a) top
view, (b) side view.
Fig.2 Lower magnification observation of Fig. 1 from
grain boundary.
3.1
Figs. 1, 2 SLM IPF( )
EBSD
SLM
650 °C
Fig. 1
Fig. 2
Fig.
2(a)
Fig. 2(b)
SLM
-
transus(995 °C 3))
Fig. 3 EBM IPF EBM
Burgers
-
Widmanstätten 4)
Fig.3 Wide area observation of as-built EBM specimen from
-Widmanstätten
Fig.4 (a) IPF map (b) phase map of as-received RM. The
SLM SLM
Fig. 4 RM
IPF
EBSD
7.4 %
1.0 %
Download service for the GTSJ via 65.21.229.84, 2022/07/20.
182 / 298
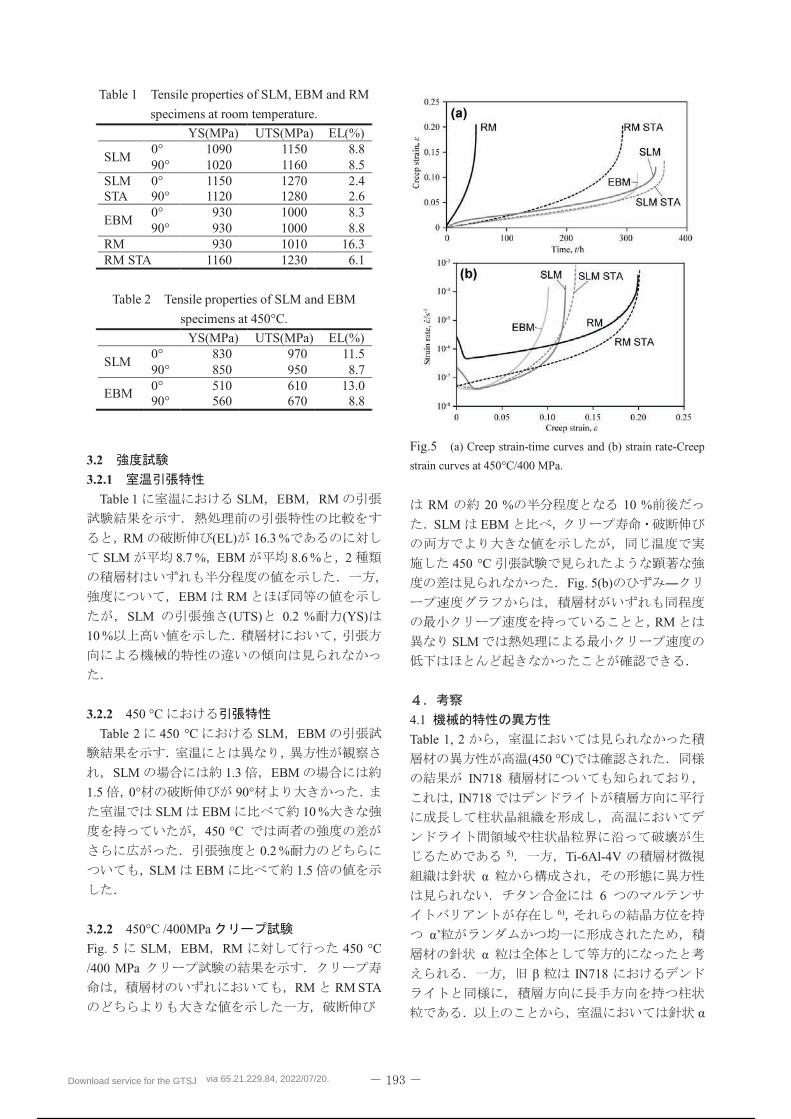
Table 1 Tensile properties of SLM, EBM and RM
specimens at room temperature.
YS(MPa) UTS(MPa) EL(%)
SLM0° 1090 1150 8.890° 1020 1160 8.5
SLMSTA
0°90°
11501120
12701280
2.42.6
EBM0° 930 1000 8.390° 930 1000 8.8
RM 930 1010 16.3RM STA 1160 1230 6.1
Table 2 Tensile properties of SLM and EBM
specimens at 450°C.
YS(MPa) UTS(MPa) EL(%)
SLM0° 830 970 11.590° 850 950 8.7
EBM0°90°
510560
610670
13.08.8
3.2
3.2.1
Table 1 SLM EBM RM
RM (EL) 16.3 %
SLM 8.7 % EBM 8.6 % 2
EBM RM
SLM (UTS) 0.2 % (YS)
10 %
3.2.2 450 °C
Table 2 450 °C SLM EBM
SLM 1.3 EBM
1.5 0° 90°
SLM EBM 10 %
450 °C
0.2 %
SLM EBM 1.5
3.2.2 450°C /400MPa
Fig. 5 SLM EBM RM 450 °C
/400 MPa
RM RM STA
Fig.5 (a) Creep strain-time curves and (b) strain rate-Creep
strain curves at 450°C/400 MPa.
RM 20 % 10 %
SLM EBM
450 °C
Fig. 5(b)
RM
SLM
4.1
Table 1, 2
(450 °C)
IN718
IN718
5) Ti-6Al-4V
66)
IN718
Download service for the GTSJ via 65.21.229.84, 2022/07/20.
183 / 298
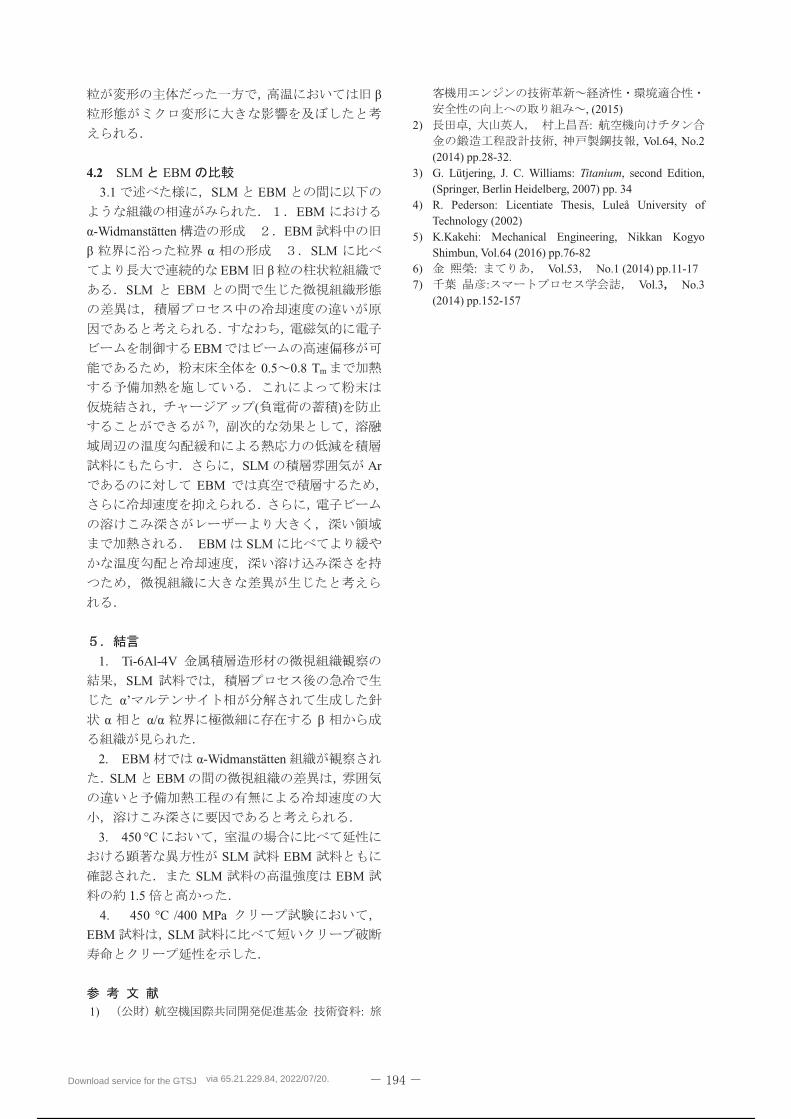
4.2 SLM EBM
3.1 SLM EBM
EBM
-Widmanstätten EBM
SLM
EBM
SLM EBM
EBM
0.5 0.8 Tm
( )7)
SLM Ar
EBM
EBM SLM
1. Ti-6Al-4V
SLM
2. EBM -Widmanstätten
SLM EBM
3. 450 °C
SLM EBM
SLM EBM
1.5
4. 450 °C /400 MPa
EBM SLM
1) :
, (2015)2) , :
, , Vol.64, No.2 (2014) pp.28-32.
3) G. Lütjering, J. C. Williams: Titanium, second Edition, (Springer, Berlin Heidelberg, 2007) pp. 34
4) R. Pederson: Licentiate Thesis, Luleå University of Technology (2002)
5) K.Kakehi: Mechanical Engineering, Nikkan Kogyo Shimbun, Vol.64 (2016) pp.76-82
6) : Vol.53 No.1 (2014) pp.11-177) : Vol.3 No.3
(2014) pp.152-157
Download service for the GTSJ via 65.21.229.84, 2022/07/20.
184 / 298
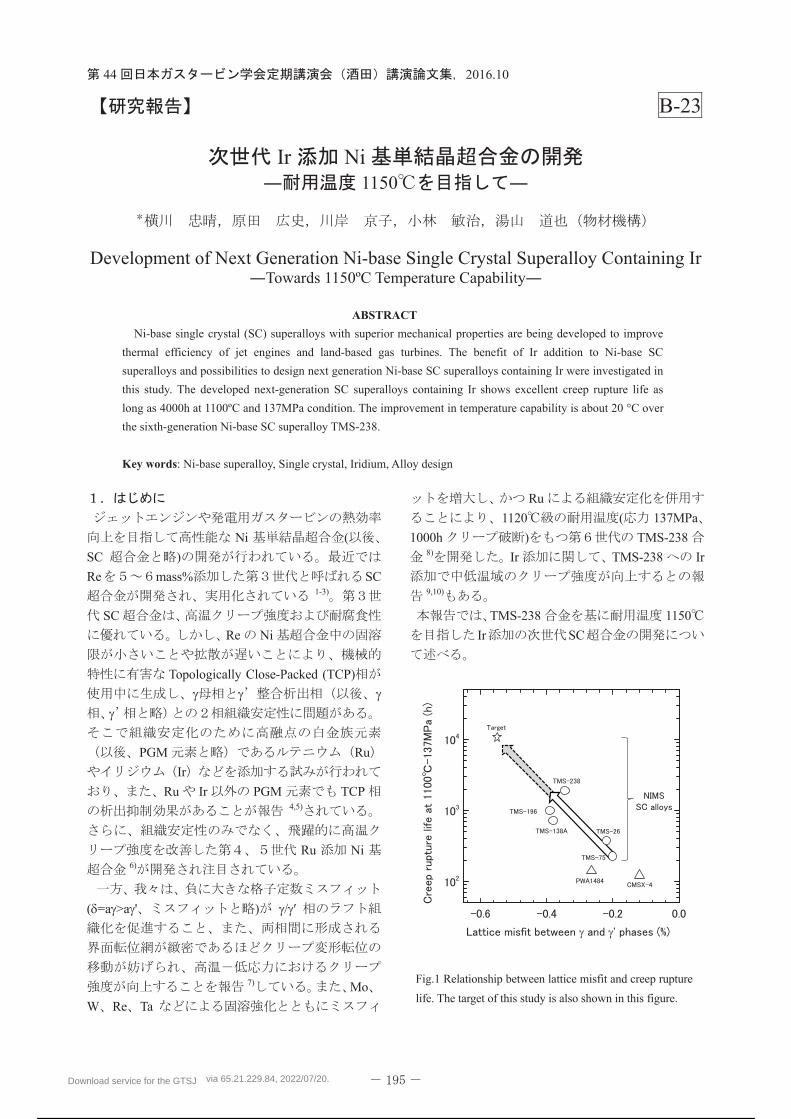
ABSTRACT
Key words
Download service for the GTSJ via 65.21.229.84, 2022/07/20.
185 / 298
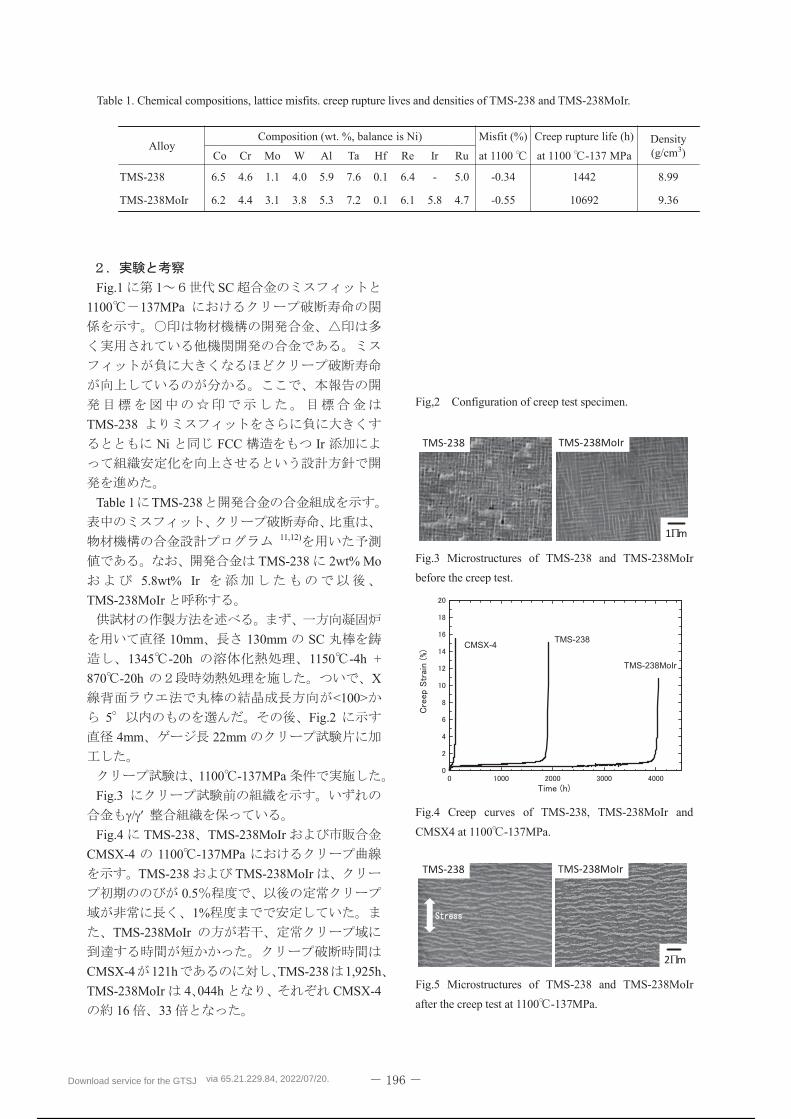
TMS-238
TMS-238MoIr
CMSX-4
Download service for the GTSJ via 65.21.229.84, 2022/07/20.
186 / 298
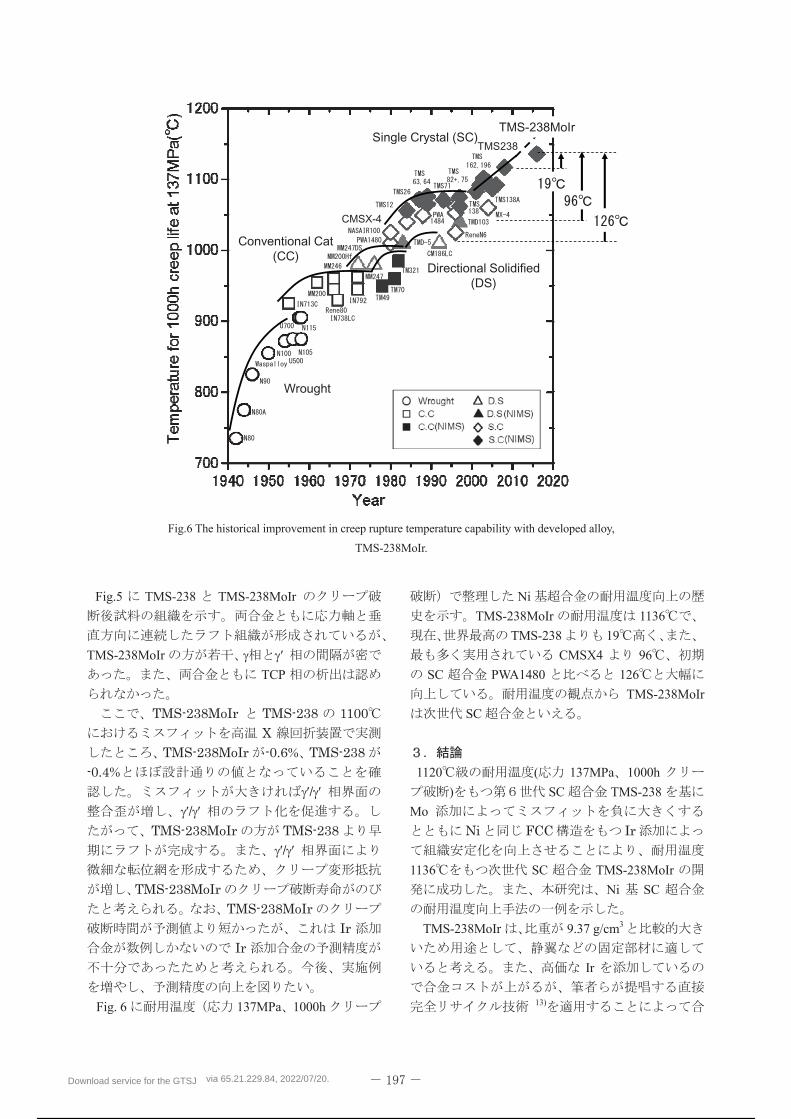
TMS238Single Crystal (SC)
Directional Solidified(DS)
Conventional Cat(CC)
Wrought
TMS-238MoIr
CMSX-4
Download service for the GTSJ via 65.21.229.84, 2022/07/20.
187 / 298
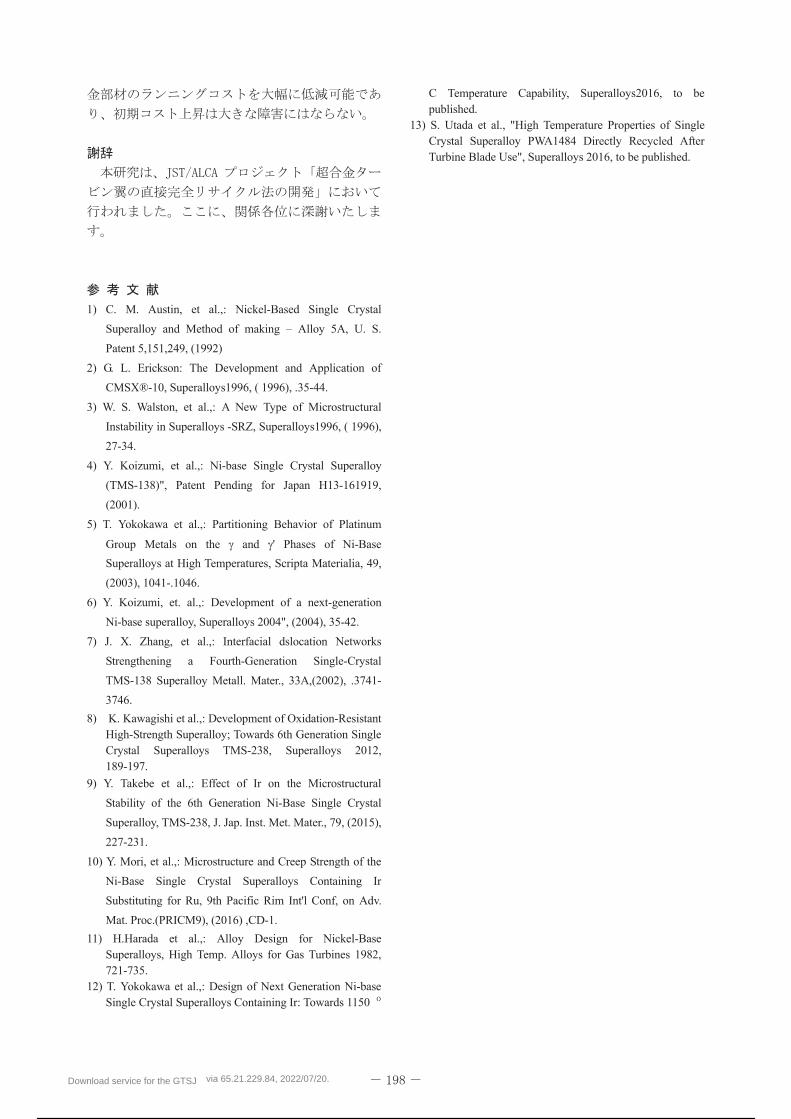
Download service for the GTSJ via 65.21.229.84, 2022/07/20.
188 / 298
C-1
Measurement of Heat Release Fluctuationin Gas Turbine Combustor at High Temperature and Pressure
*Shinichi FUKBA, Yuichiro KIMURA, Yusuke TANAKA,Toshihiko SAITOH, Satoshi TAKIGUCHI, Keijiro SAITOH (MHI)
ABSTRACT
Mitsubishi Hitachi Power Systems, Ltd. (MHPS) has been developing highly-efficient gas turbine combined
cycle (GTCC) power generation with the Research & Innovation Center of Mitsubishi Heavy Industries, Ltd.
(MHI). M501J type, the world's first 1600°C-class gas turbine was developed by utilizing the technology
acquired in the national project “The technology development of high efficiency gas turbine which started
from fiscal 2004. For the next generation GTCC, it is essential to understand the details of unsteady phenomena
of the combustion process, which is the key to enhance the capability of low emissions and reliability under the
condition of high combustion temperature.
This paper presents the evaluation of combustion characteristics of a full-scale gas turbine combustor under a
fully reproduced condition of an actual engine, by means of both the experiment and numerical simulation. The
flame chemiluminescence data from high pressure combustion test are analyzed to understand the flame
structure. In addition, Large Eddy Simulation (LES) are conducted and simulation results are validated with
experimental results.
Key words: Combustor, Flame Chemiluminescence, LES
Download service for the GTSJ via 65.21.229.84, 2022/07/20.
189 / 298
Table 1
10mm
Table
Fig.1 Fig.2
1700
Fig.3
8
2
7
( ~ )
Fig.3
5 kHz
Fig.1 GT
31ata 550°C
Figure. 1
Figure. 2
Download service for the GTSJ via 65.21.229.84, 2022/07/20.
190 / 298
Figure. 3
Table 2 ,
Fig.4
7mm
300-340nm
OH* (307nm)3)
50kHz
Figure. 4
Table
Fig.5
(20sec)
LES
FLUENT ver15.0
LES SGS Smagorinsky Lilly
FGM (Flamelet Generated
Manifold)
~ ~
NOx
NOx
FGM
Download service for the GTSJ via 65.21.229.84, 2022/07/20.
191 / 298
Figure.5
(1)
Fig.6 a) b)
c)
d) e)
a)
b)
c)
Fig.6-e)
Fig.6-b) c)
Fig.6-d)
~
~
45deg
90deg
(2) 4)
Fig.6-d)
ave
)(22
v
Lxff (2)
f x
L
avev 0x
Download service for the GTSJ via 65.21.229.84, 2022/07/20.
192 / 298
(2)
~
5)
LES
FGM
1700
1700 C )
1), , Vol.52, No.2 (2015)
pp.2-9.2)
, , Vol.52, No.2 (2015) pp.15-22.
3) F.Güthe, D.Guyot, et al.: Chemiluminescence as diagnostic tool in the development of gas turbines, Applied Physics B, Vol.107, Issue.3 (2012) pp.619-636.
4) CFD
53 (2015)pp.106-107.
5) A.Innocenti, A.Andreini, et al.: Numerical analysis of the dynamic flame response and thermo-acoustic stability of a full-annular lean partially-premixed combustor,Proceedings of ASME Turbo Expo 2016,GT2016-57182.
Download service for the GTSJ via 65.21.229.84, 2022/07/20.
193 / 298
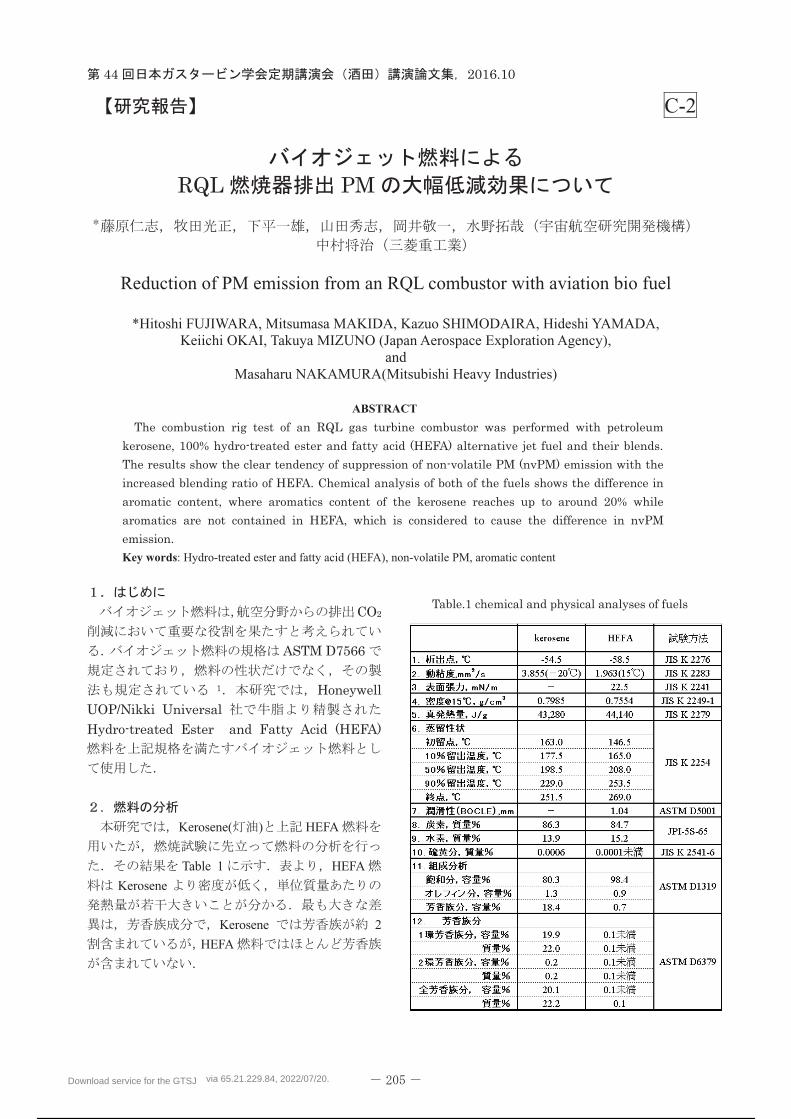
C-2
Reduction of PM emission from an RQL combustor with aviation bio fuel
*Hitoshi FUJIWARA, Mitsumasa MAKIDA, Kazuo SHIMODAIRA, Hideshi YAMADA, Keiichi OKAI, Takuya MIZUNO (Japan Aerospace Exploration Agency),
andMasaharu NAKAMURA(Mitsubishi Heavy Industries)
ABSTRACT
Key words: Hydro-treated ester and fatty acid (HEFA), non-volatile PM, aromatic content
Kerosene( ) HEFA
Table 1 HEFA
Kerosene
Kerosene 2
HEFA
Download service for the GTSJ via 65.21.229.84, 2022/07/20.
194 / 298
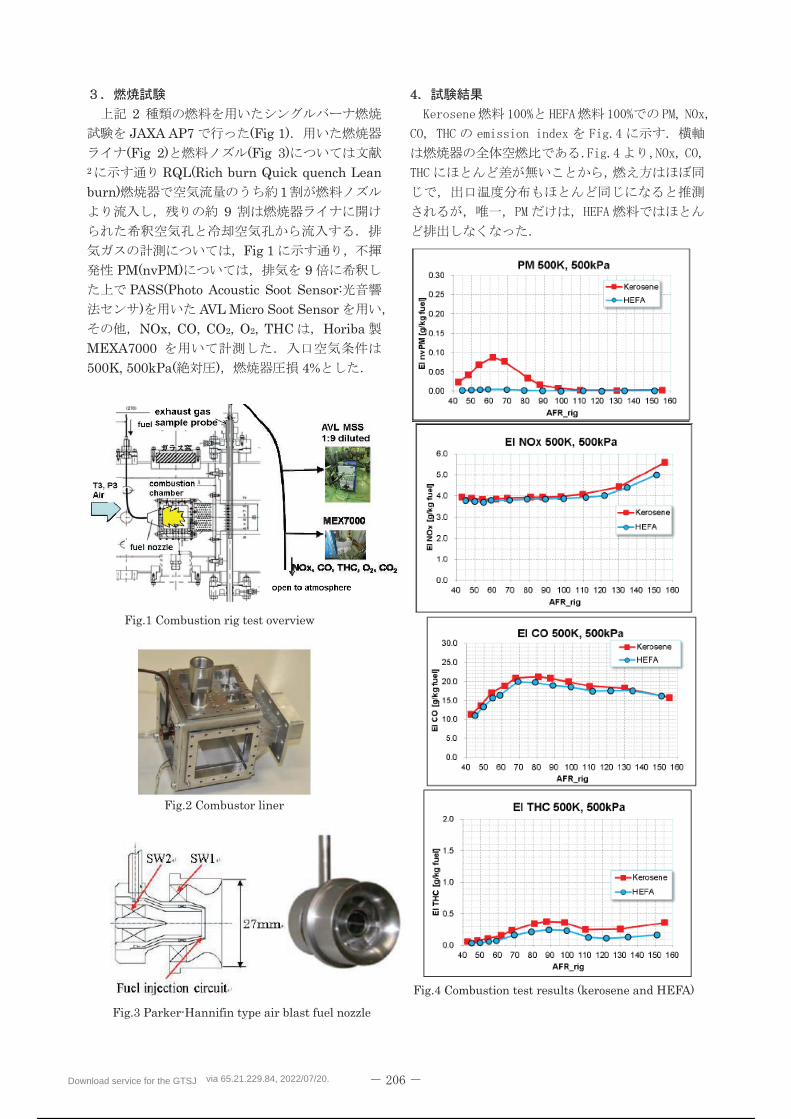
Download service for the GTSJ via 65.21.229.84, 2022/07/20.
195 / 298
Makida, M., Yamada, H. and Shimodaira, K., “Detailed Research on Rich-Lean Type Single Sector and full annular combustor for small aircraft engine,” ICAS2014-0628, 2014.
Download service for the GTSJ via 65.21.229.84, 2022/07/20.
196 / 298
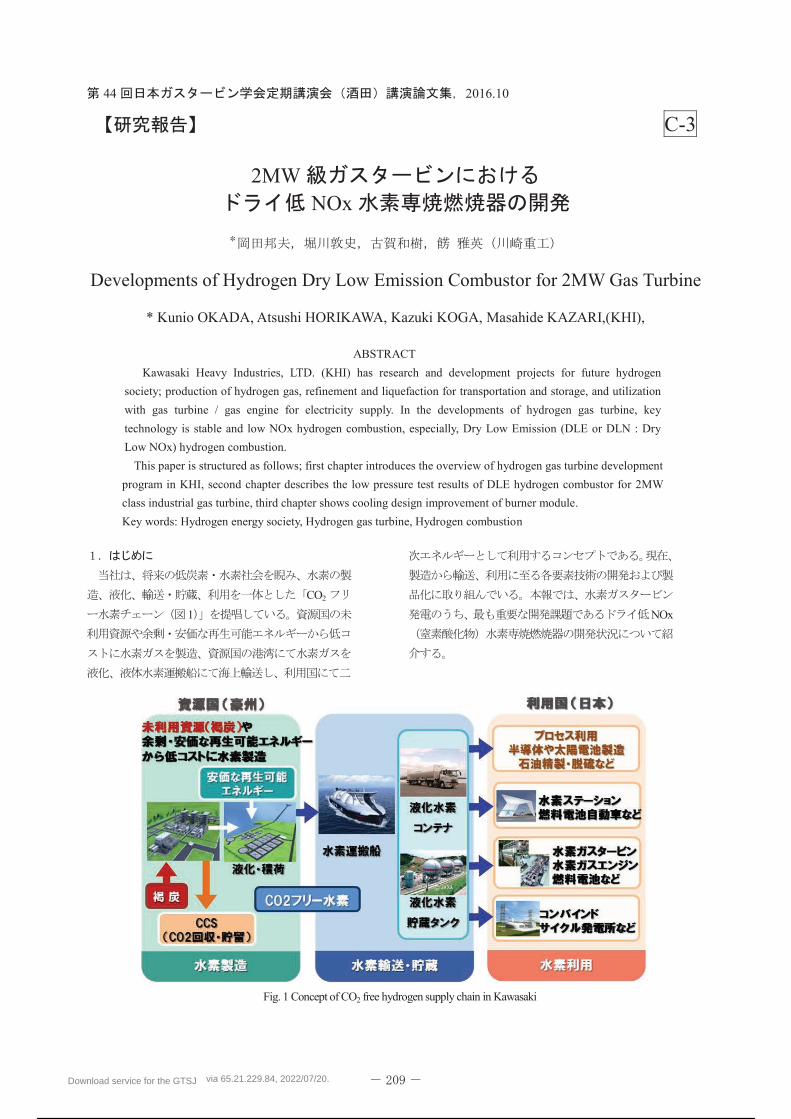
Download service for the GTSJ via 65.21.229.84, 2022/07/20.
197 / 298
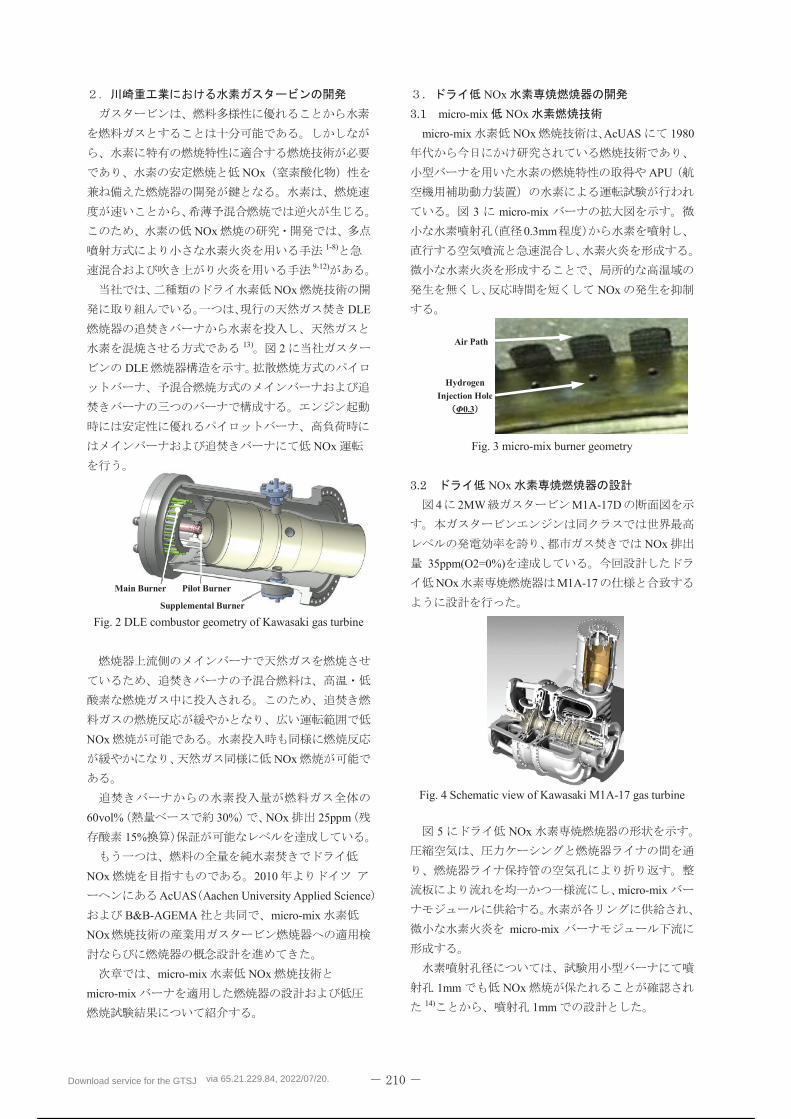
Download service for the GTSJ via 65.21.229.84, 2022/07/20.
198 / 298
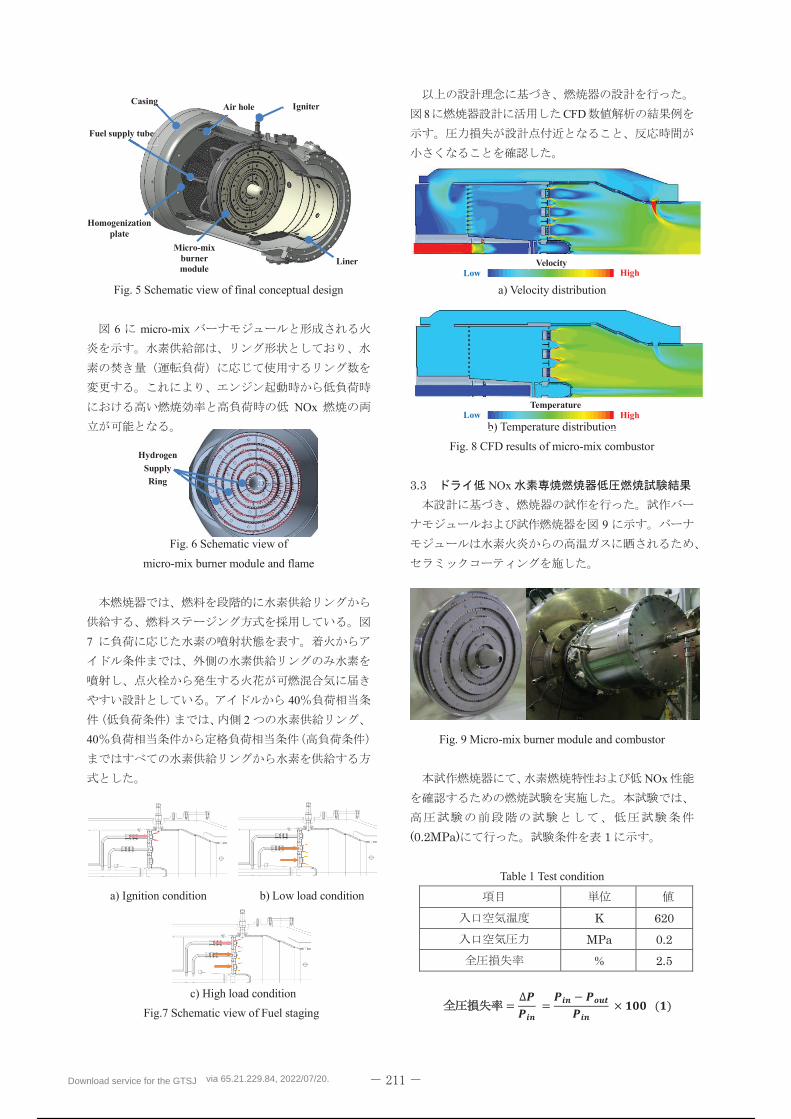
Download service for the GTSJ via 65.21.229.84, 2022/07/20.
199 / 298
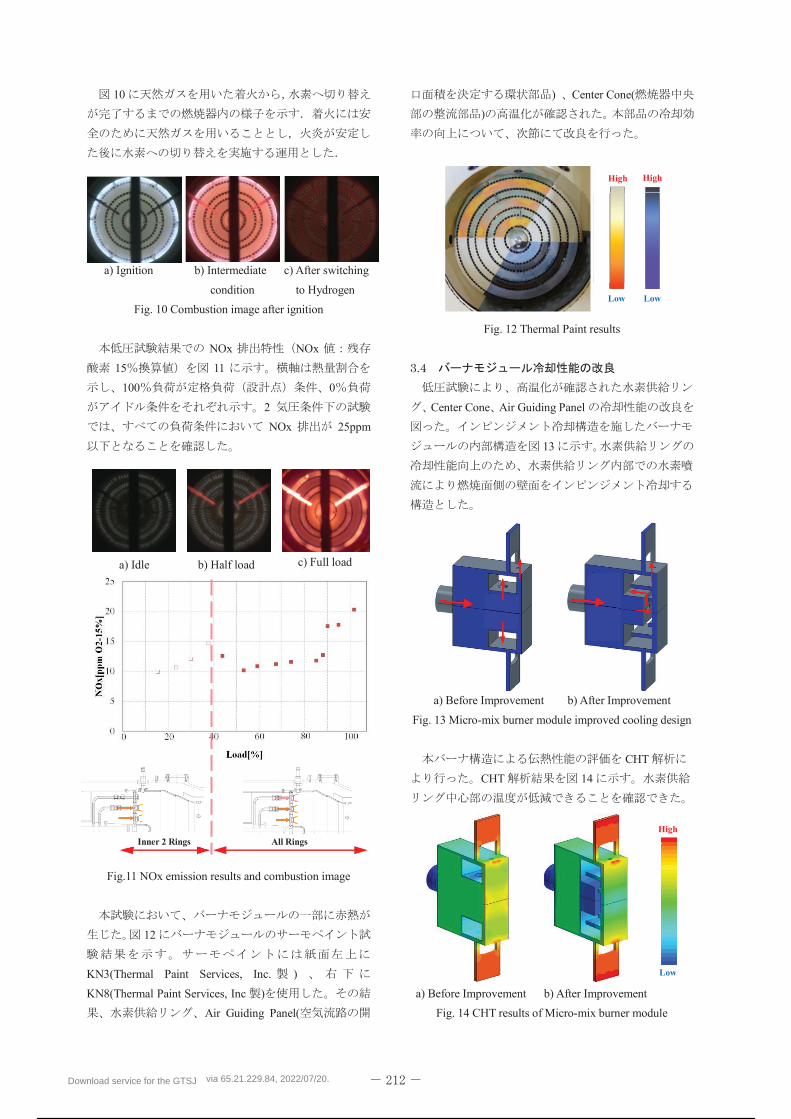
Download service for the GTSJ via 65.21.229.84, 2022/07/20.
200 / 298
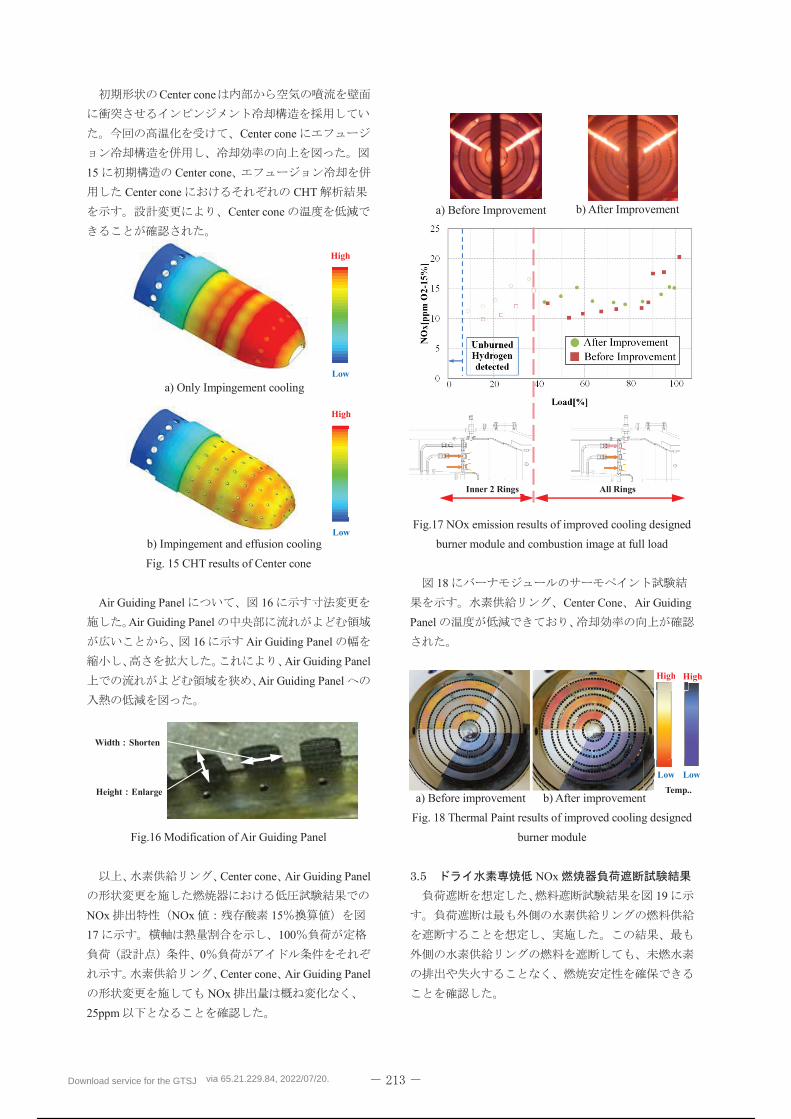
Download service for the GTSJ via 65.21.229.84, 2022/07/20.
201 / 298
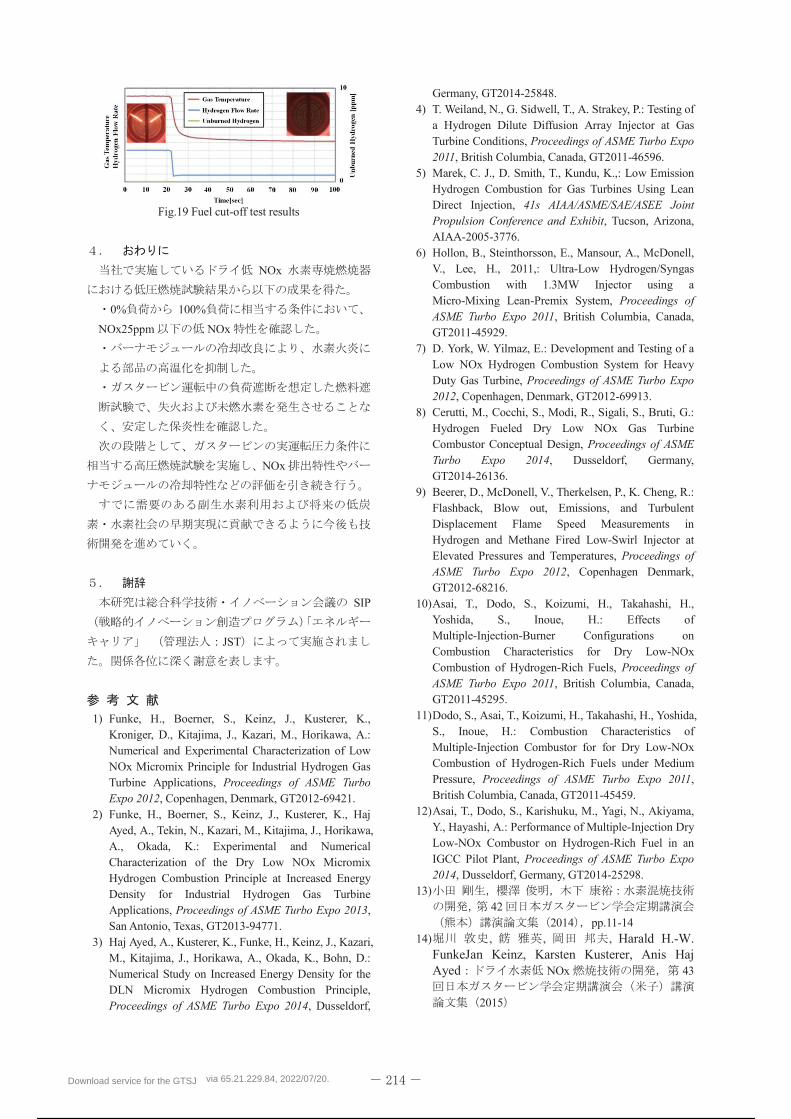
Download service for the GTSJ via 65.21.229.84, 2022/07/20.
202 / 298
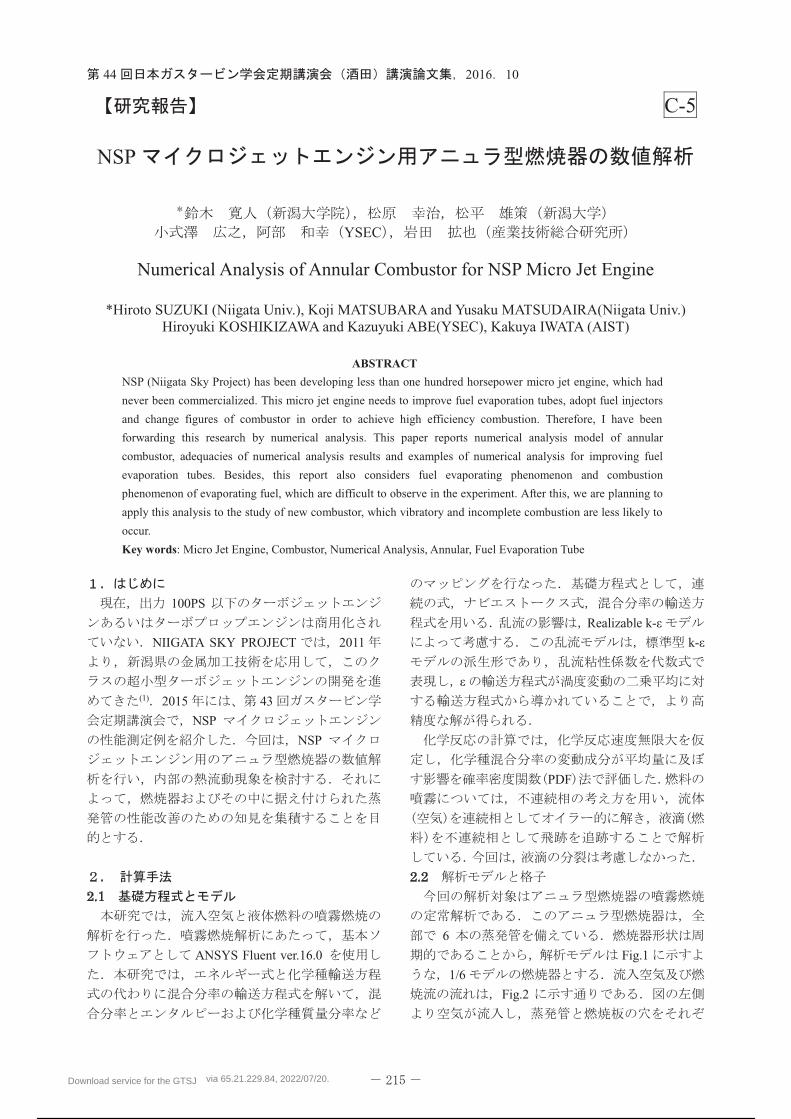
44 2016 10
C-5 NSP
YSEC
Numerical Analysis of Annular Combustor for NSP Micro Jet Engine
*Hiroto SUZUKI (Niigata Univ.), Koji MATSUBARA and Yusaku MATSUDAIRA(Niigata Univ.)
Hiroyuki KOSHIKIZAWA and Kazuyuki ABE(YSEC), Kakuya IWATA (AIST)
ABSTRACT
NSP (Niigata Sky Project) has been developing less than one hundred horsepower micro jet engine, which had
never been commercialized. This micro jet engine needs to improve fuel evaporation tubes, adopt fuel injectors
and change figures of combustor in order to achieve high efficiency combustion. Therefore, I have been
forwarding this research by numerical analysis. This paper reports numerical analysis model of annular
combustor, adequacies of numerical analysis results and examples of numerical analysis for improving fuel
evaporation tubes. Besides, this report also considers fuel evaporating phenomenon and combustion
phenomenon of evaporating fuel, which are difficult to observe in the experiment. After this, we are planning to
apply this analysis to the study of new combustor, which vibratory and incomplete combustion are less likely to
occur.
Key words: Micro Jet Engine, Combustor, Numerical Analysis, Annular, Fuel Evaporation Tube
100PS
NIIGATA SKY PROJECT 2011
(1) 2015 43
NSP
NSP
ANSYS Fluent ver.16.0
Realizable k-
k-
6
Fig.1
1/6
Fig.2
Download service for the GTSJ via 65.21.229.84, 2022/07/20.
203 / 298
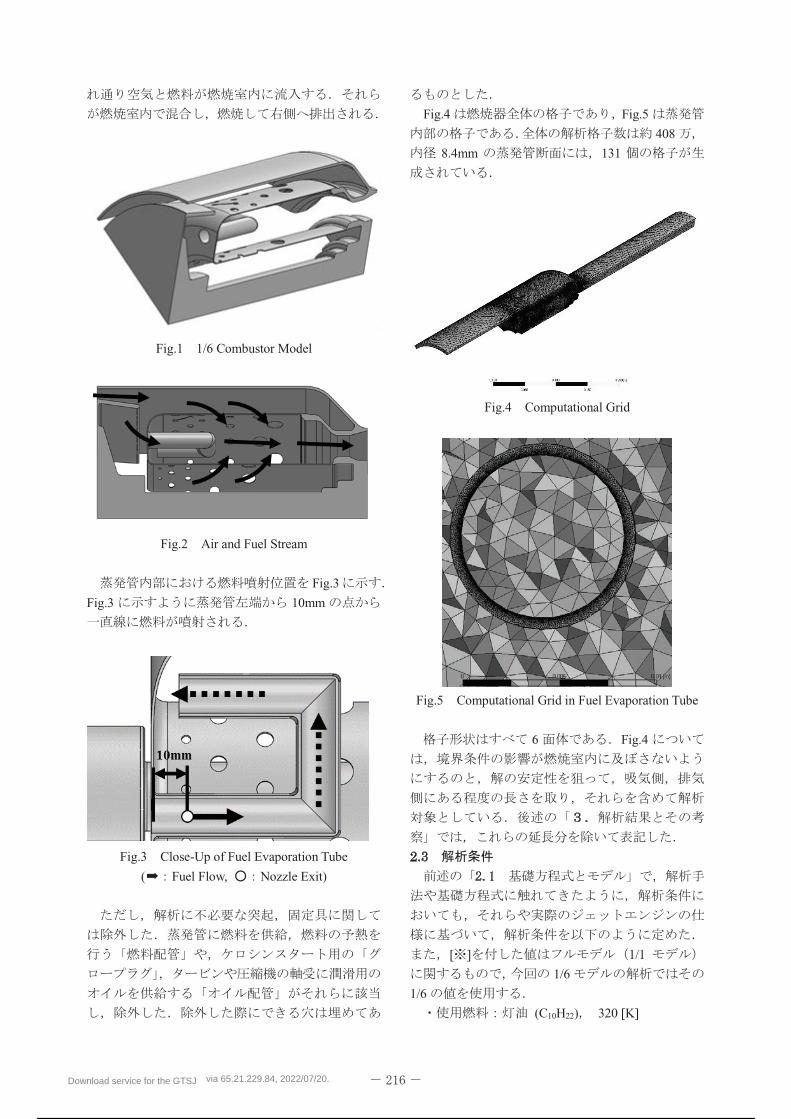
Fig.1 1/6 Combustor Model
Fig.2 Air and Fuel Stream
Fig.3
Fig.3 10mm
Fig.3 Close-Up of Fuel Evaporation Tube
( Fuel Flow, Nozzle Exit)
Fig.4 Fig.5
408
8.4mm 131
Fig.4 Computational Grid
Fig.5 Computational Grid in Fuel Evaporation Tube
6 Fig.4
[ ] 1/1
1/6
1/6
(C10H22) 320 [K]
Download service for the GTSJ via 65.21.229.84, 2022/07/20.
204 / 298
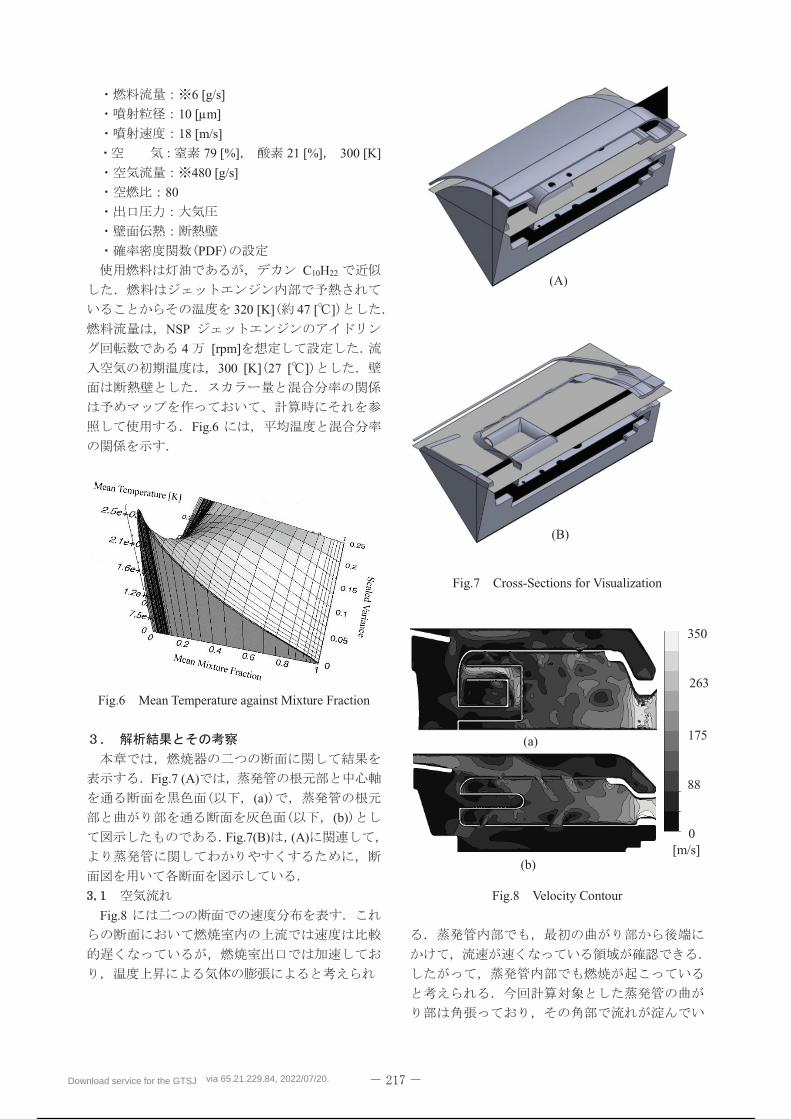
6 [g/s]
10 [μm]
18 [m/s]
79 [%] 21 [%] 300 [K]
480 [g/s]
80
C10H22
320 [K] 47 [ ]
NSP
4 [rpm]
300 [K] 27 [ ]
Fig.6
Fig.6 Mean Temperature against Mixture Fraction
Fig.7 (A)
(a)
(b)
Fig.7(B) (A)
Fig.8
Fig.7 Cross-Sections for Visualization
Fig.8 Velocity Contour
(a)
(b)[m/s]
0
350
175
88
263
(B)
(A)
Download service for the GTSJ via 65.21.229.84, 2022/07/20.
205 / 298
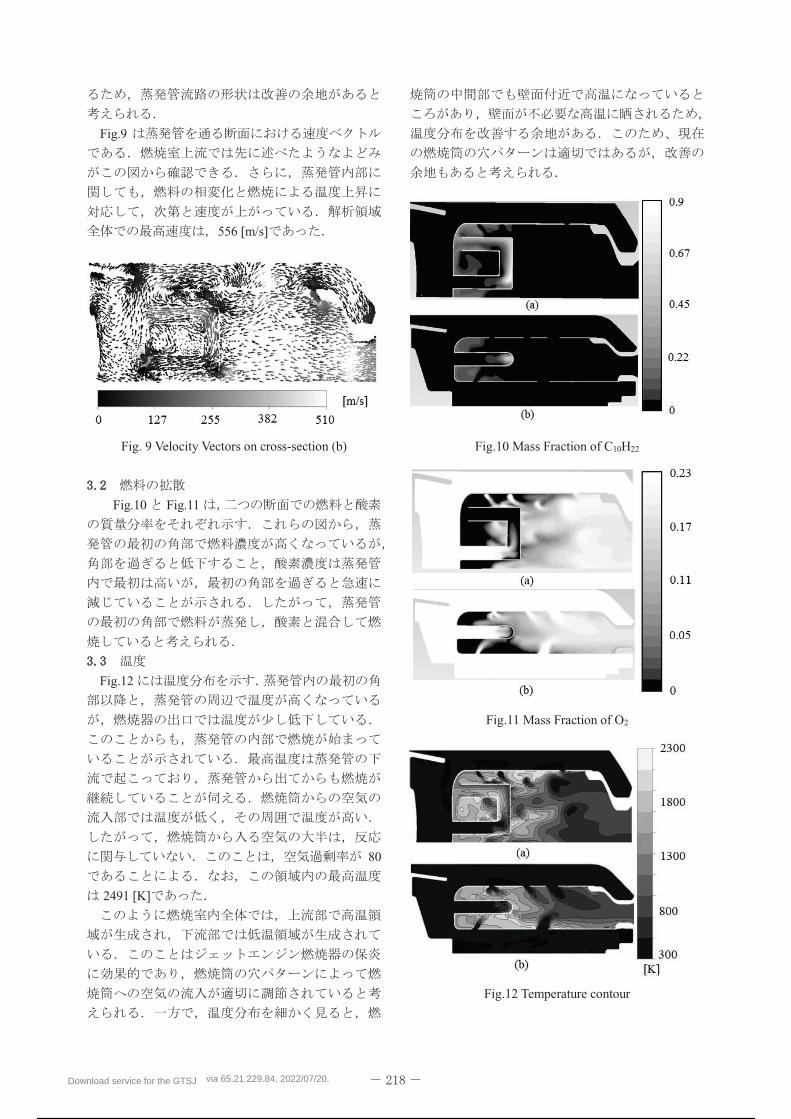
Fig.9
556 [m/s]
Fig. 9 Velocity Vectors on cross-section (b)
Fig.10 Fig.11
Fig.12
80
2491 [K]
Fig.10 Mass Fraction of C10H22
Fig.11 Mass Fraction of O2
Fig.12 Temperature contour
Download service for the GTSJ via 65.21.229.84, 2022/07/20.
206 / 298
Table 1(2)
80
Table 1 Comparison of Simulated Temperatures
with Theory (K) Present Theory Maximum 2491.8 2464.0 Exit 809.8 801.8
Table 1 27.8[K]
8[K]
1/6
NIIGATA SKY PROJECT
1)
50 2A11 (2012)
2) JSME pp
124 (2002)
3)
43
C-3 (2015)
Download service for the GTSJ via 65.21.229.84, 2022/07/20.
207 / 298
Download service for the GTSJ via 65.21.229.84, 2022/07/20.
208 / 298
Download service for the GTSJ via 65.21.229.84, 2022/07/20.
209 / 298
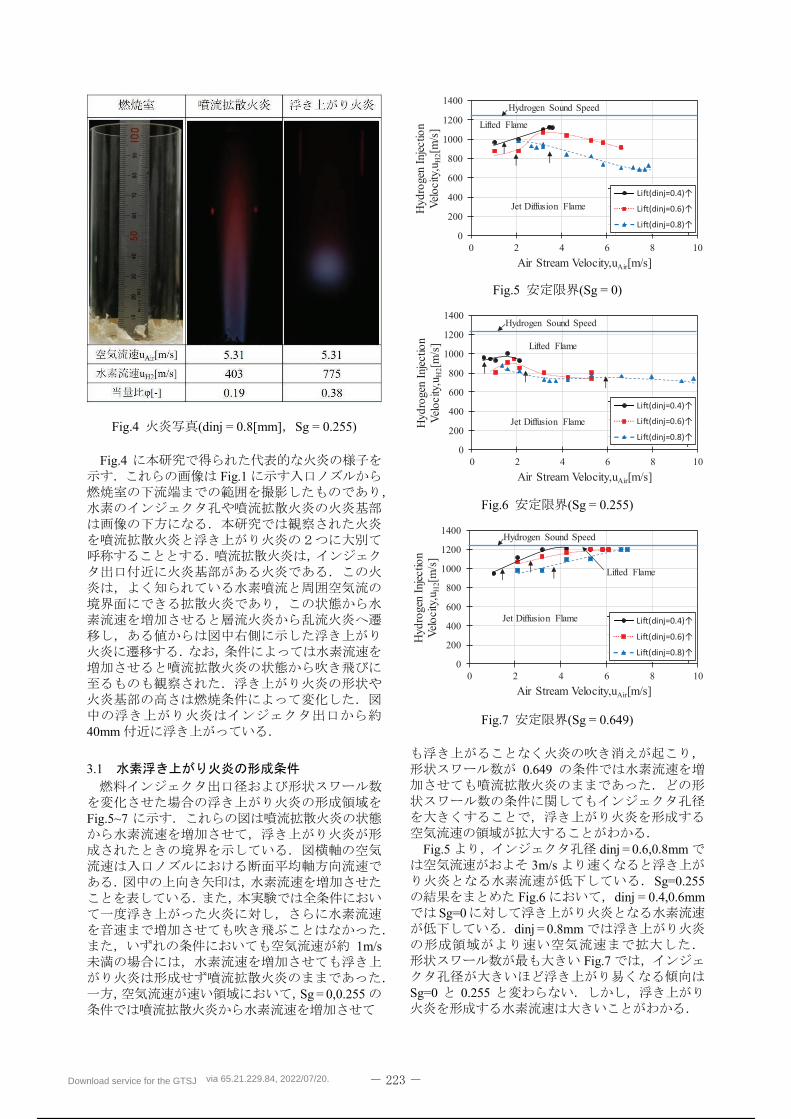
Download service for the GTSJ via 65.21.229.84, 2022/07/20.
210 / 298
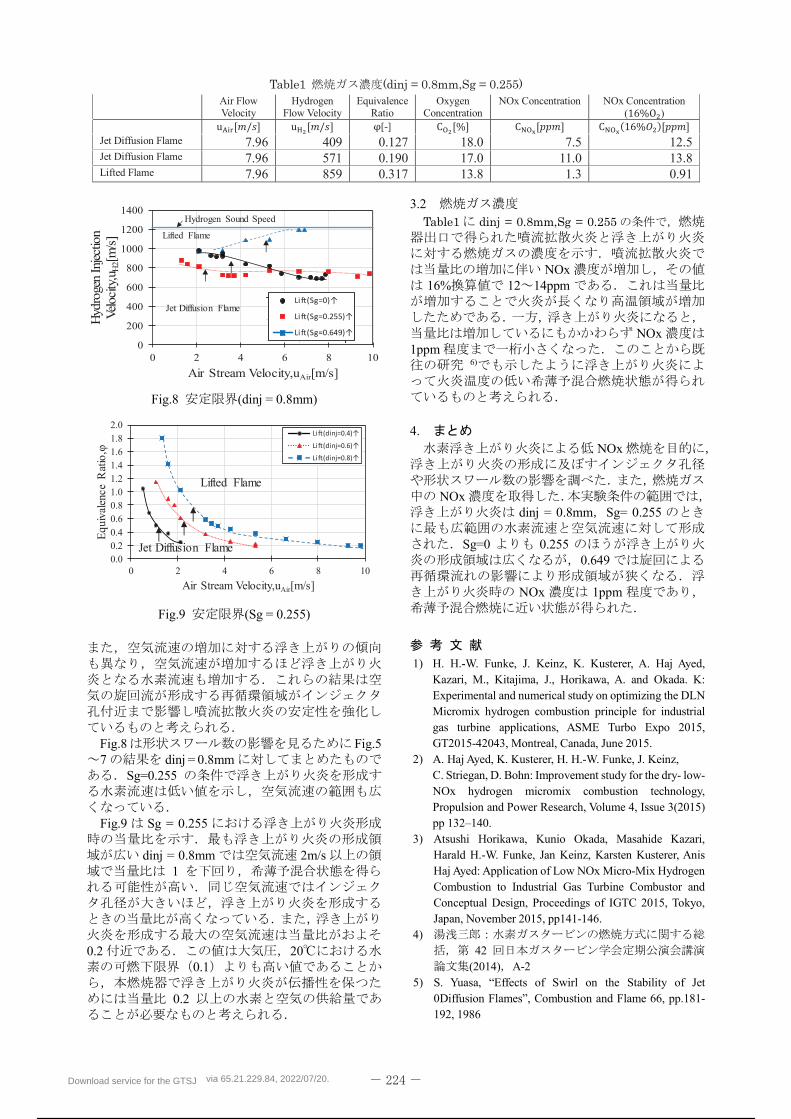
Download service for the GTSJ via 65.21.229.84, 2022/07/20.
211 / 298

Download service for the GTSJ via 65.21.229.84, 2022/07/20.
212 / 298
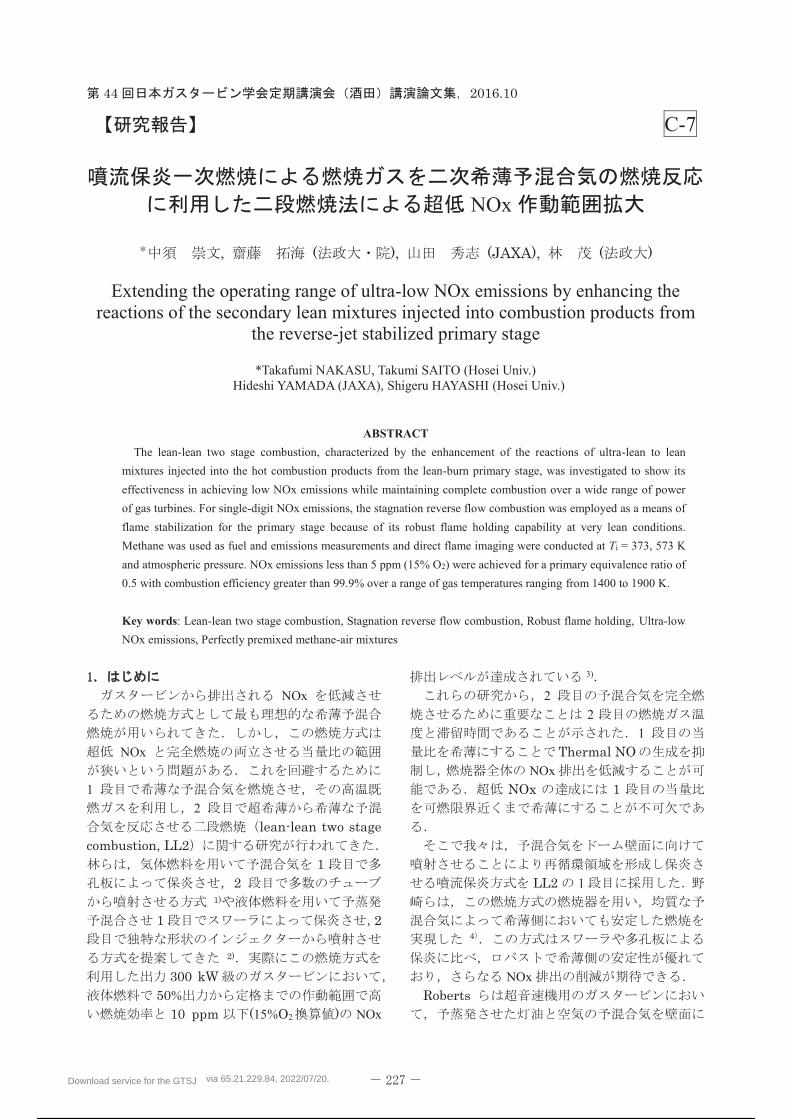
Download service for the GTSJ via 65.21.229.84, 2022/07/20.
213 / 298
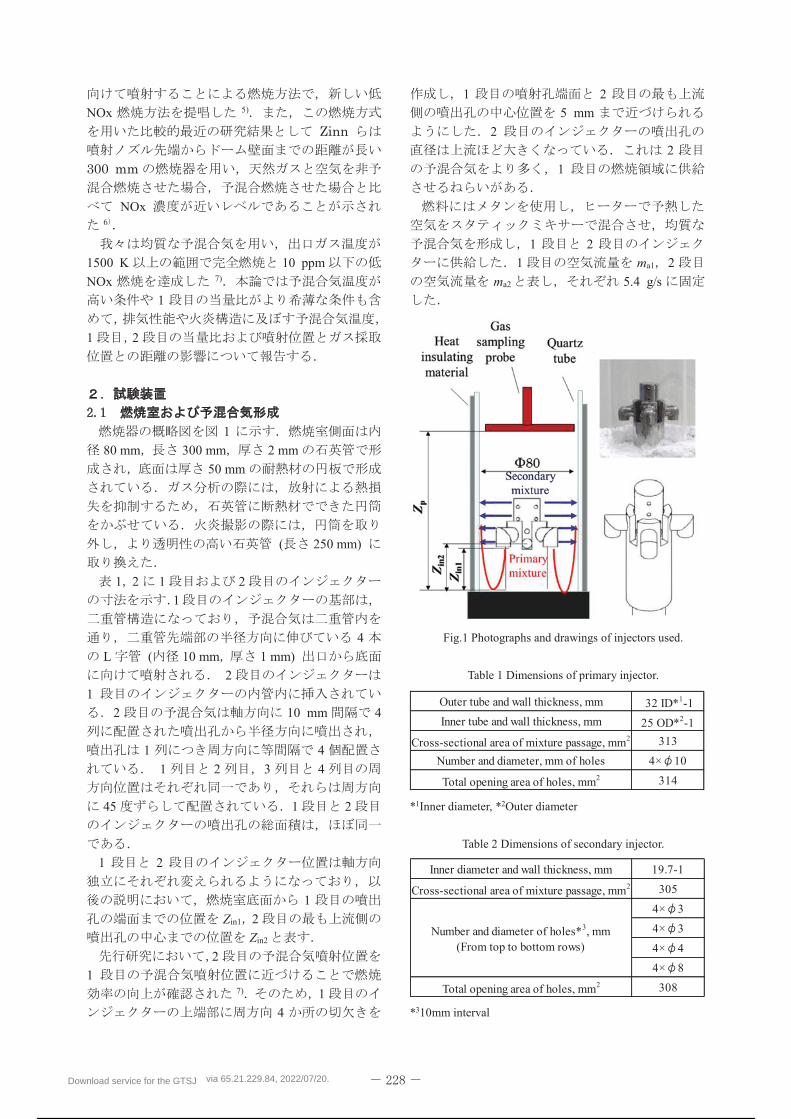
Download service for the GTSJ via 65.21.229.84, 2022/07/20.
214 / 298
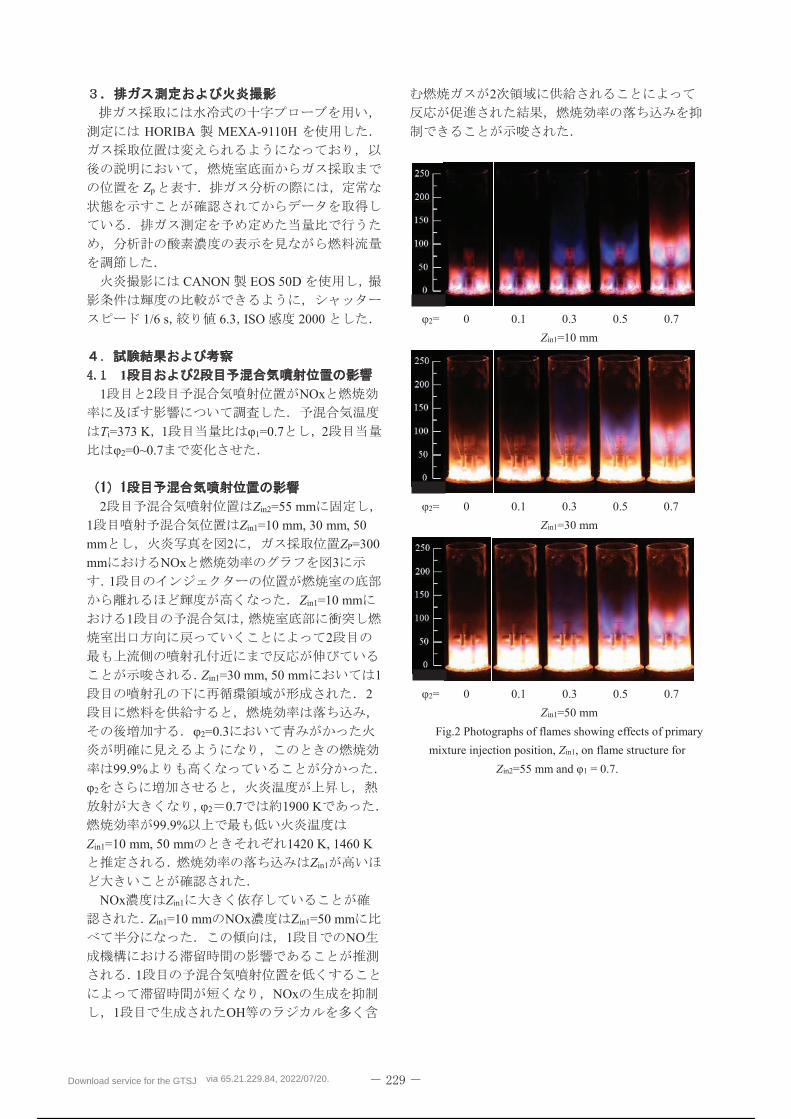
Download service for the GTSJ via 65.21.229.84, 2022/07/20.
215 / 298
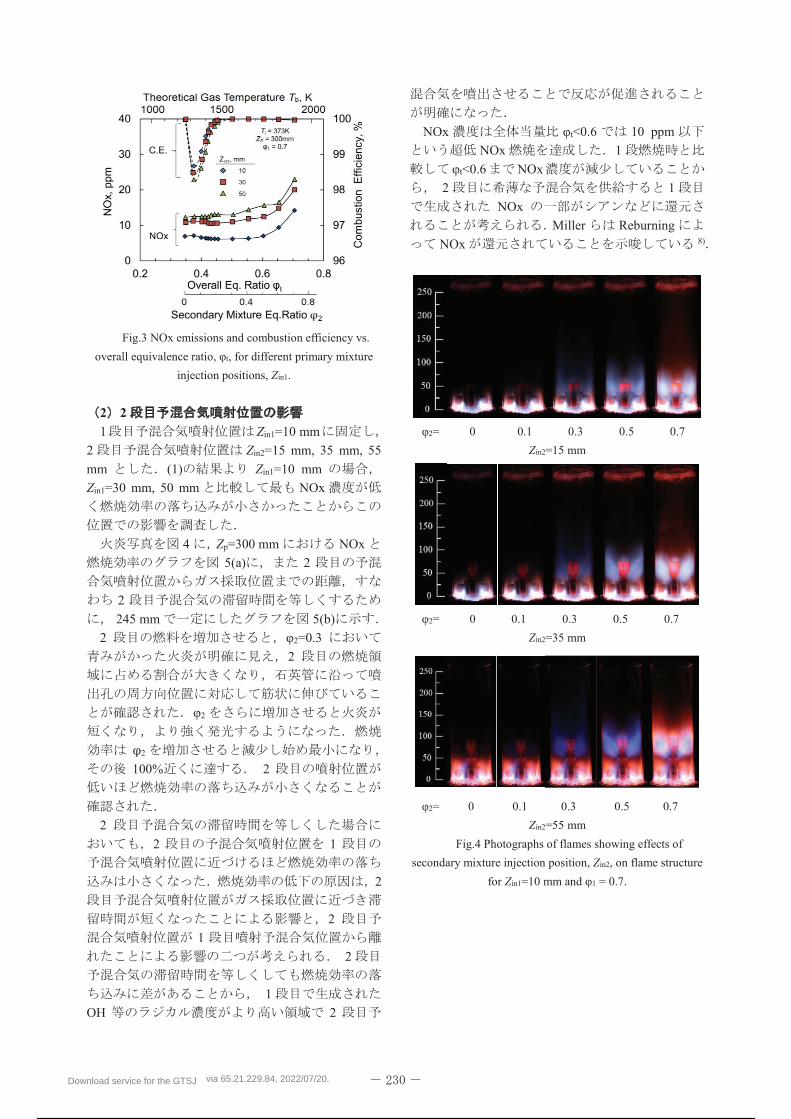
Download service for the GTSJ via 65.21.229.84, 2022/07/20.
216 / 298
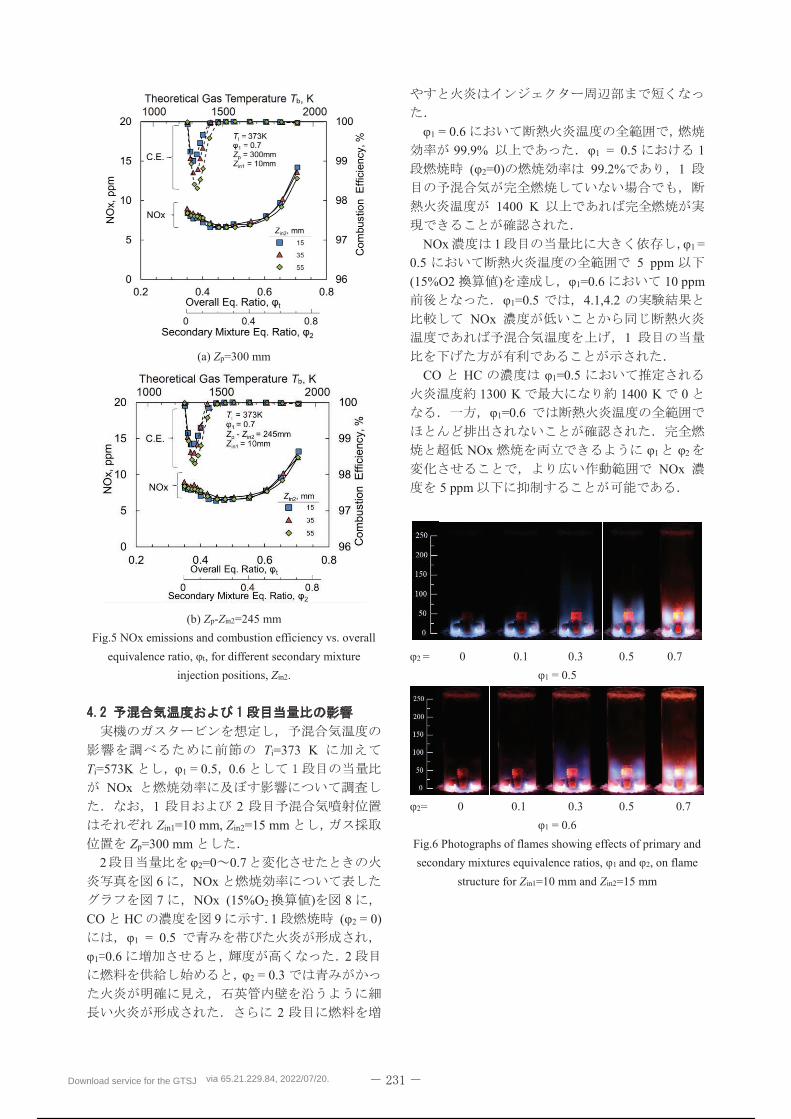
Download service for the GTSJ via 65.21.229.84, 2022/07/20.
217 / 298
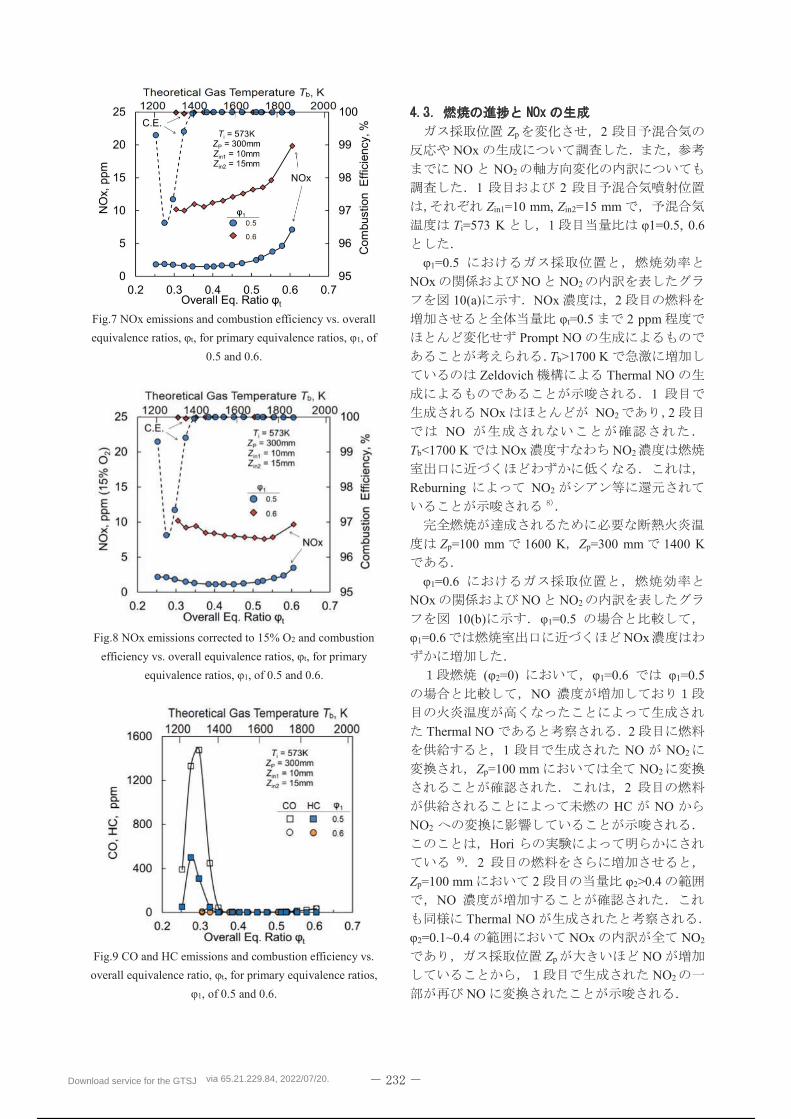
Download service for the GTSJ via 65.21.229.84, 2022/07/20.
218 / 298
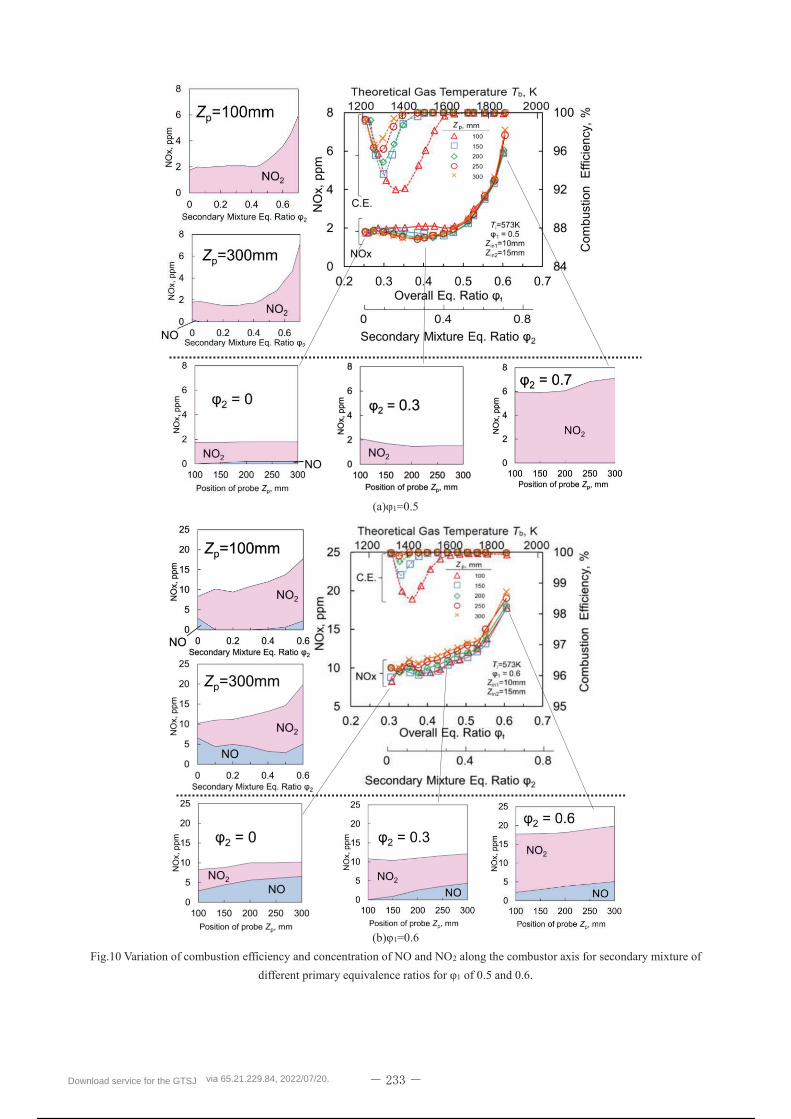
Download service for the GTSJ via 65.21.229.84, 2022/07/20.
219 / 298
Download service for the GTSJ via 65.21.229.84, 2022/07/20.
220 / 298
Download service for the GTSJ via 65.21.229.84, 2022/07/20.
221 / 298
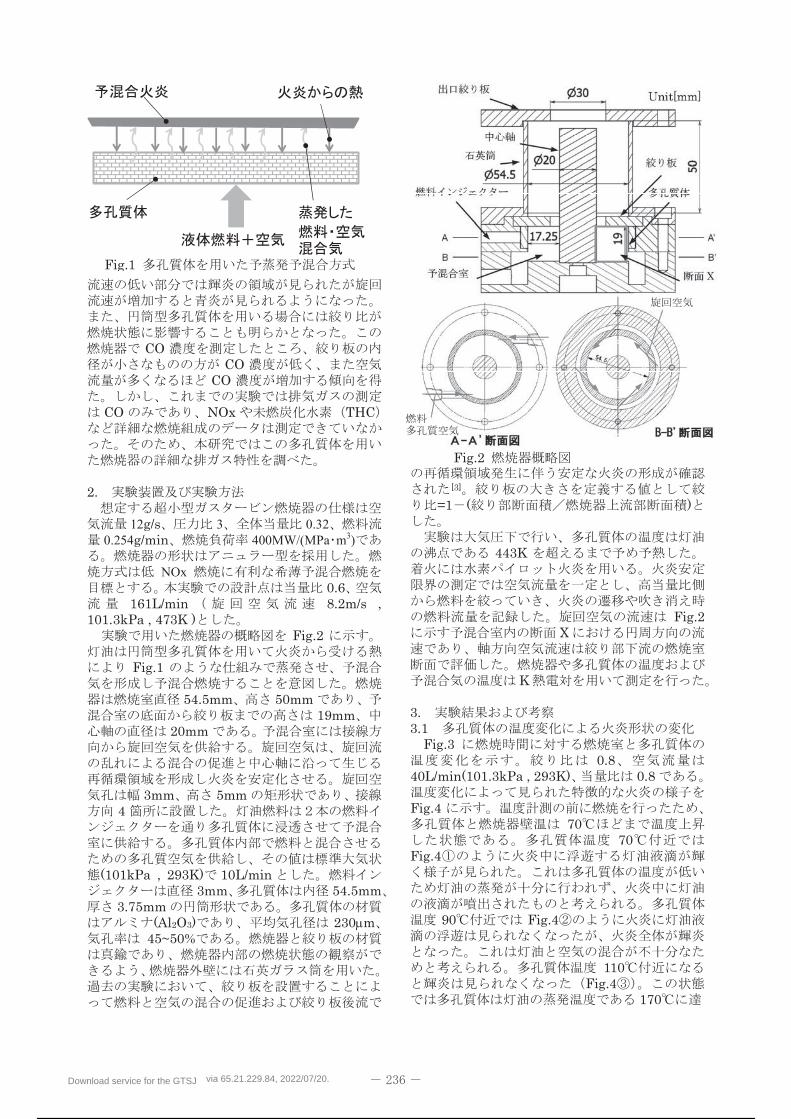
Download service for the GTSJ via 65.21.229.84, 2022/07/20.
222 / 298
Download service for the GTSJ via 65.21.229.84, 2022/07/20.
223 / 298
Download service for the GTSJ via 65.21.229.84, 2022/07/20.
224 / 298
Download service for the GTSJ via 65.21.229.84, 2022/07/20.
225 / 298
Download service for the GTSJ via 65.21.229.84, 2022/07/20.
226 / 298
Download service for the GTSJ via 65.21.229.84, 2022/07/20.
227 / 298
Download service for the GTSJ via 65.21.229.84, 2022/07/20.
228 / 298
Download service for the GTSJ via 65.21.229.84, 2022/07/20.
229 / 298
Download service for the GTSJ via 65.21.229.84, 2022/07/20.
230 / 298
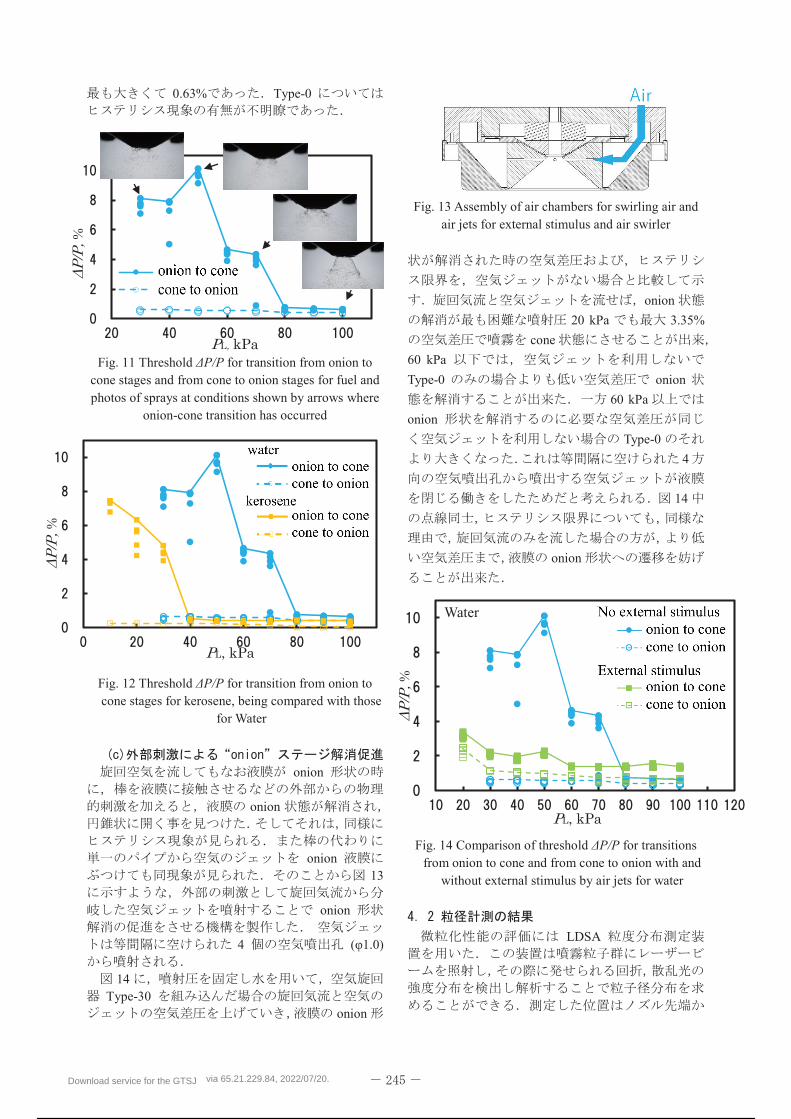
Download service for the GTSJ via 65.21.229.84, 2022/07/20.
231 / 298
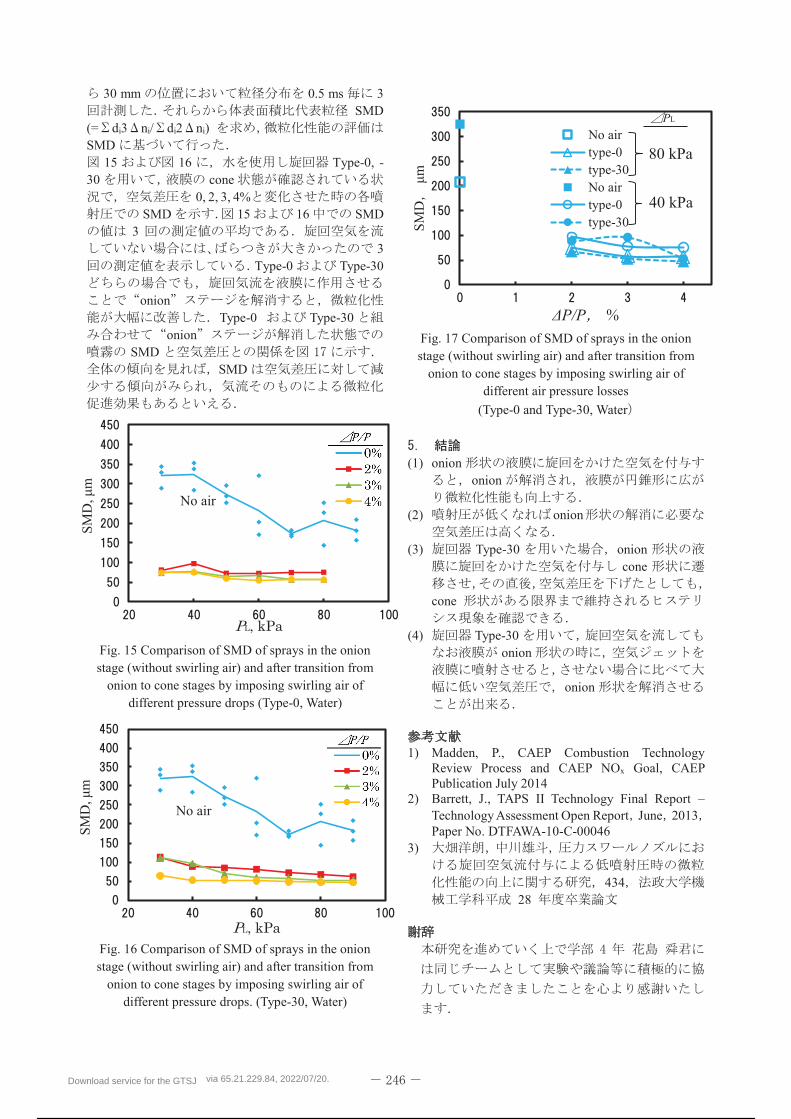
Download service for the GTSJ via 65.21.229.84, 2022/07/20.
232 / 298
C-10
Development of the Micro Gas Turbine for 250kW class SOFC-MGT hybrid systems
*Masato Kawano, Keisuke Arai and Yoshinori Yasui (Toyota Turbine and Systems Inc.)
ABSTRACT
This report describes development and a proof evaluation of the micro gas turbine to use for the hybrid system
which coupled micro gas turbine with SOFC(Solid Oxide Fuel Cells). Gas turbine supplies compressed air to
SOFC. Gas turbine generates electricity with the fuel which finished a reaction in SOFC and with the air which
finished a reaction in SOFC. We remodeled the main body of gas turbine to fit SOFC system, and developed the
combustor which could burn with low-calorie fuel from SOFC. We developed the control to link SOFC, and to
control the gas turbine for SOFC.
Key words: Micro Gas Turbine, Solid Oxide Fuel Cells (SOFCs), Hybrid System, Compressor, Combustor,
Control,
Download service for the GTSJ via 65.21.229.84, 2022/07/20.
233 / 298
Fig.1 Flow diagram of SOFC-MGT hybrid system.
Download service for the GTSJ via 65.21.229.84, 2022/07/20.
234 / 298
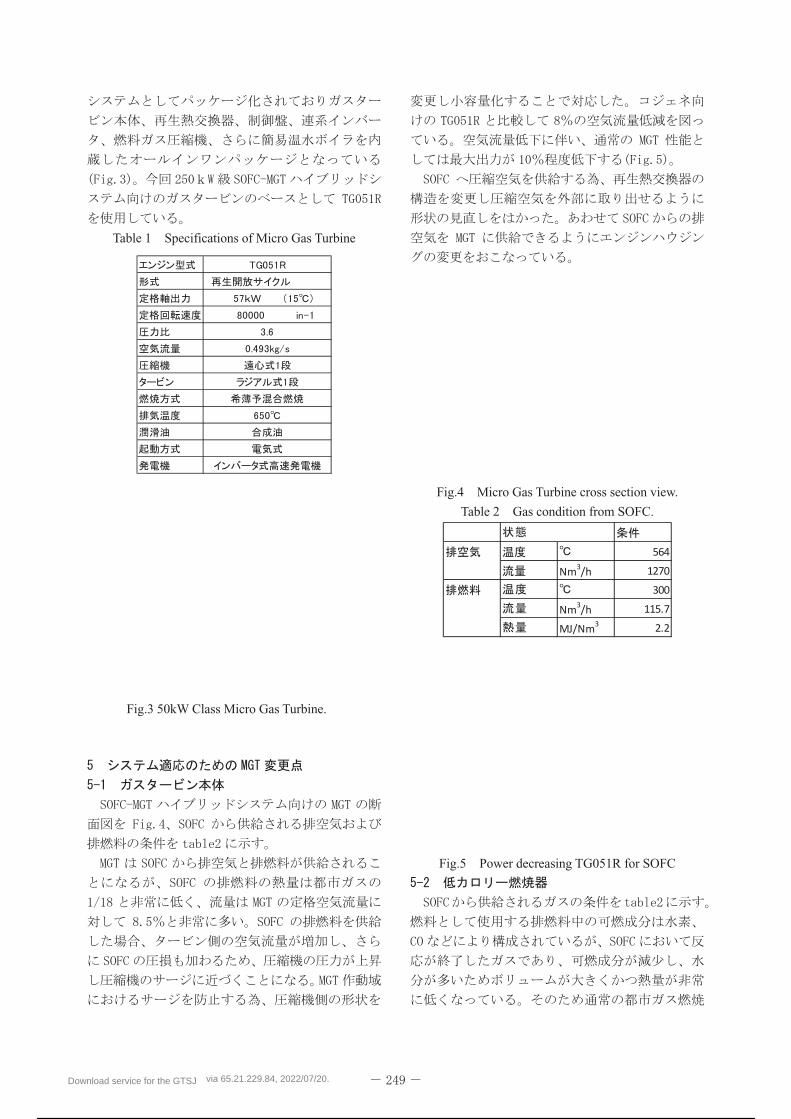
Table 1 Specifications of Micro Gas Turbine
Fig.4 Micro Gas Turbine cross section view.
Table 2 Gas condition from SOFC.
Fig.5 Power decreasing TG051R for SOFC
Fig.3 50kW Class Micro Gas Turbine.
Download service for the GTSJ via 65.21.229.84, 2022/07/20.
235 / 298
Fig.6 Combustor cross section view
Fig.7 Combustion test Result
Fig.8 Operation mode change
Download service for the GTSJ via 65.21.229.84, 2022/07/20.
236 / 298
Fig.9 Appearance of model 10 SOFC-MGT
Installed at the Tokyo Gas Co.,Ltd’.s Senju Techno
Station It was provided by MHPS
Fig.10 Long term behavior of model 10 SOFC-MGT
hybrid system installed at Tokyo Gas Co.,Ltd’.s Senju
Techno Station It was provided by MHPS
Fig.11 Experiment to reduce main fuel
Fig.12 Appearance of model 15 SOFC-MGT hybrid
system installed at the Next-Generation Fuel Cell
Research Center(NEXT-FC) in Kyushu University
It was provided by MHPS
Fig.13 MGT installed in SOFC.BOP.
Download service for the GTSJ via 65.21.229.84, 2022/07/20.
237 / 298
Download service for the GTSJ via 65.21.229.84, 2022/07/20.
238 / 298
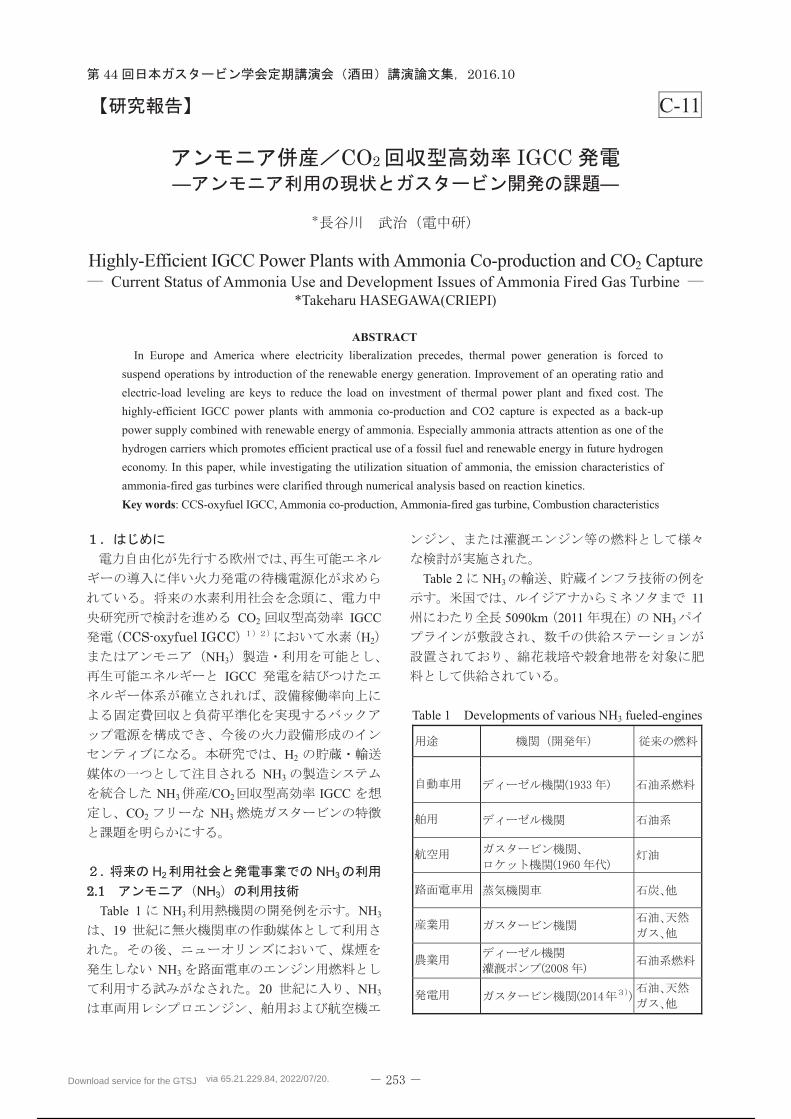
Download service for the GTSJ via 65.21.229.84, 2022/07/20.
239 / 298
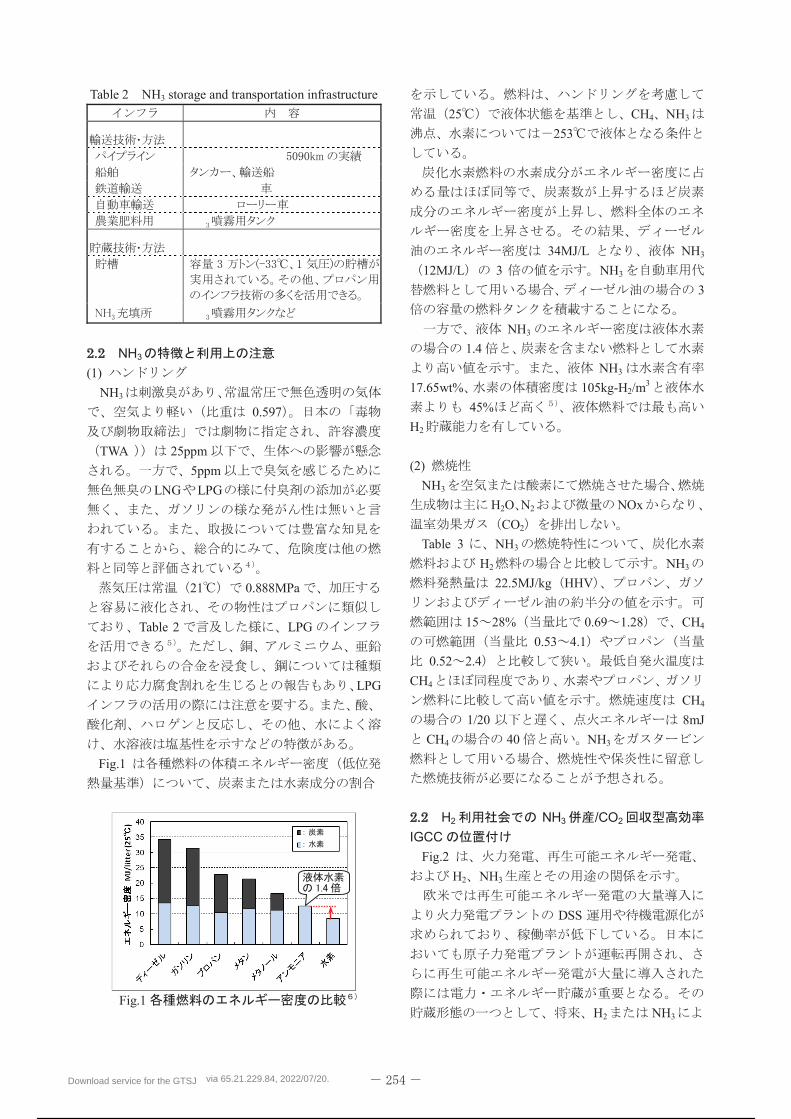
Download service for the GTSJ via 65.21.229.84, 2022/07/20.
240 / 298
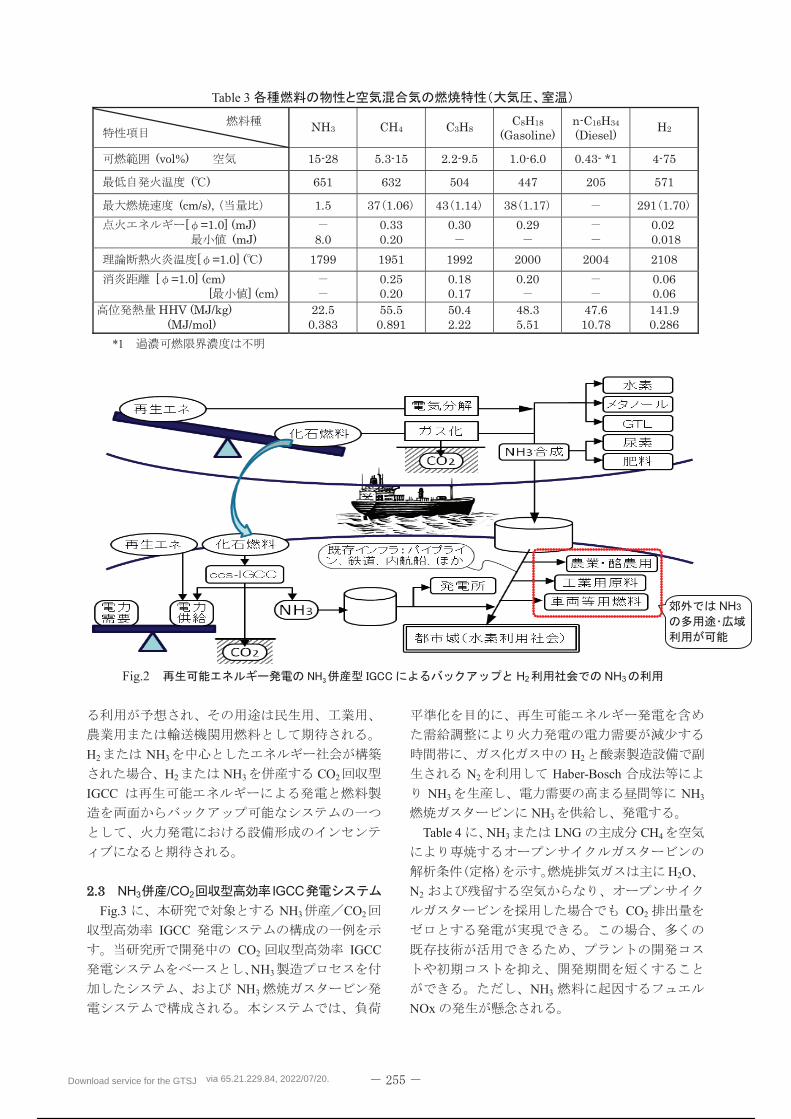
Download service for the GTSJ via 65.21.229.84, 2022/07/20.
241 / 298
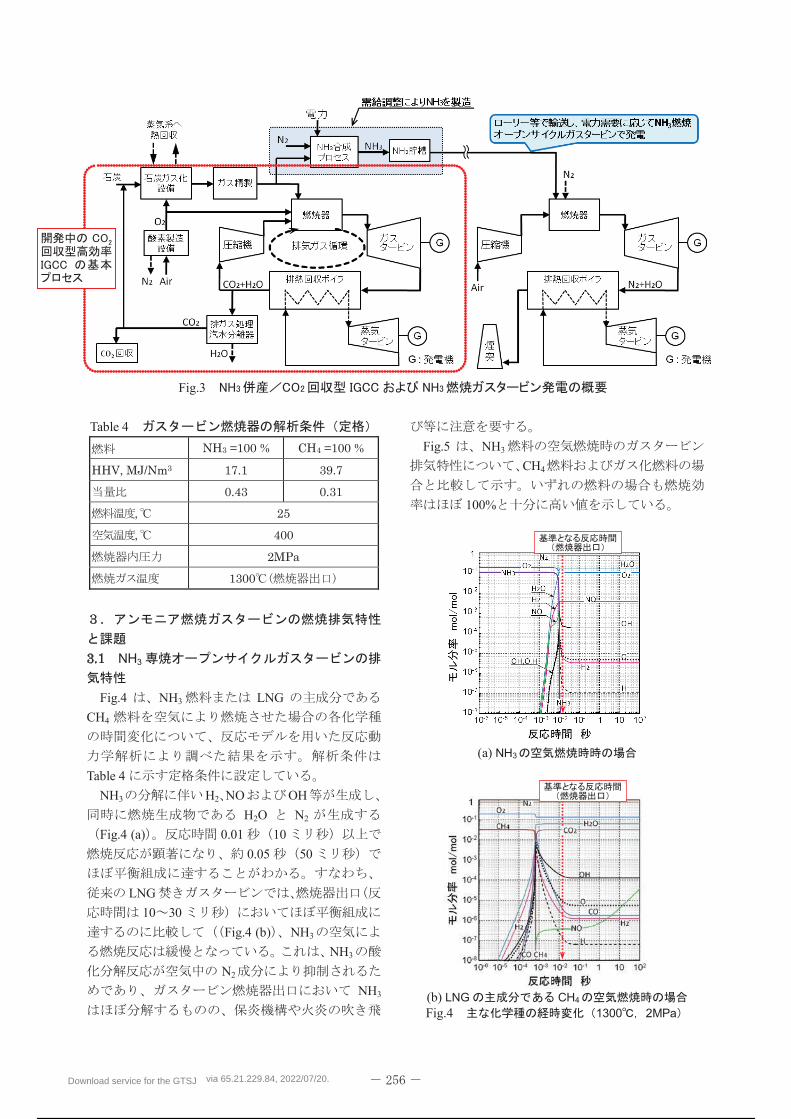
Download service for the GTSJ via 65.21.229.84, 2022/07/20.
242 / 298
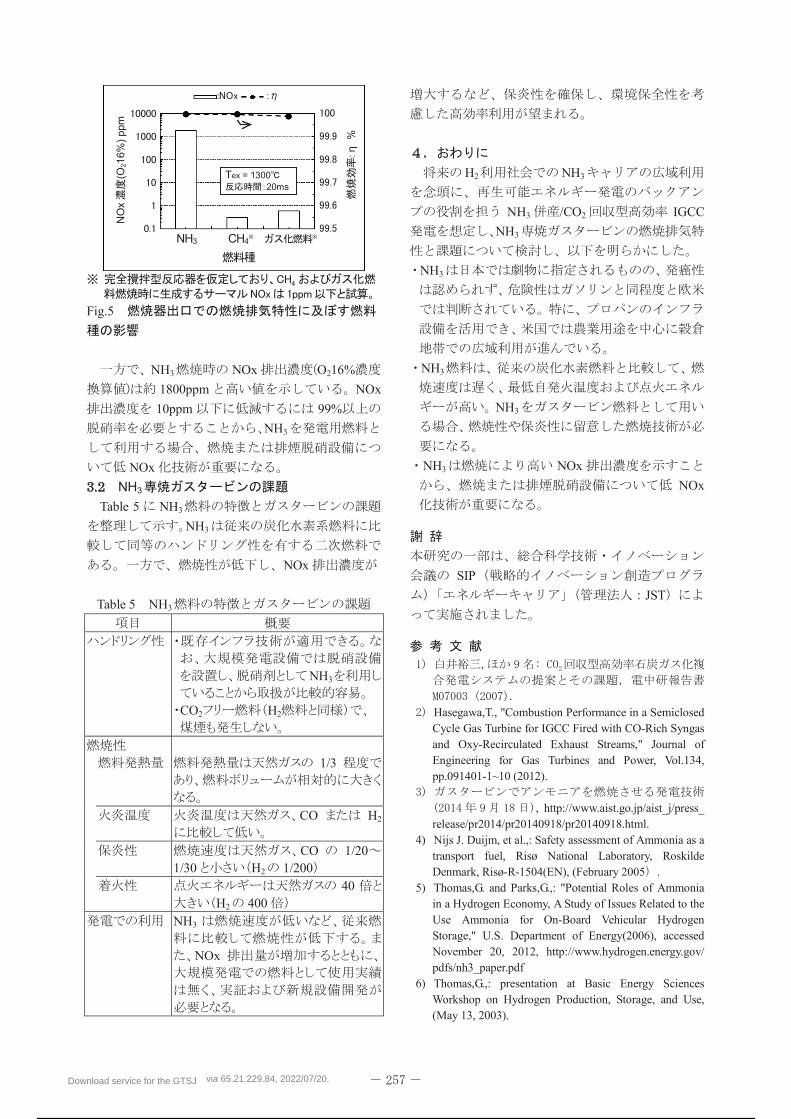
Download service for the GTSJ via 65.21.229.84, 2022/07/20.
243 / 298
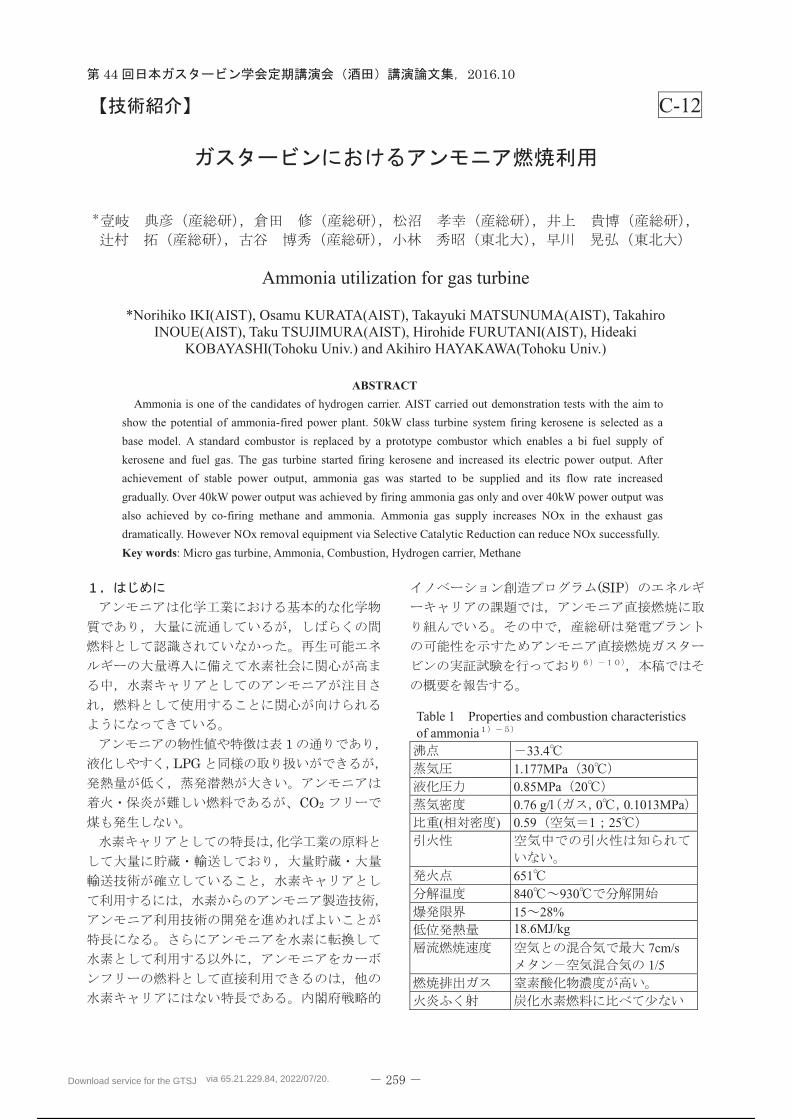
C-12
Ammonia utilization for gas turbine
*Norihiko IKI(AIST), Osamu KURATA(AIST), Takayuki MATSUNUMA(AIST), Takahiro INOUE(AIST), Taku TSUJIMURA(AIST), Hirohide FURUTANI(AIST), Hideaki
KOBAYASHI(Tohoku Univ.) and Akihiro HAYAKAWA(Tohoku Univ.)
ABSTRACT
Ammonia is one of the candidates of hydrogen carrier. AIST carried out demonstration tests with the aim to
show the potential of ammonia-fired power plant. 50kW class turbine system firing kerosene is selected as a
base model. A standard combustor is replaced by a prototype combustor which enables a bi fuel supply of
kerosene and fuel gas. The gas turbine started firing kerosene and increased its electric power output. After
achievement of stable power output, ammonia gas was started to be supplied and its flow rate increased
gradually. Over 40kW power output was achieved by firing ammonia gas only and over 40kW power output was
also achieved by co-firing methane and ammonia. Ammonia gas supply increases NOx in the exhaust gas
dramatically. However NOx removal equipment via Selective Catalytic Reduction can reduce NOx successfully.
Key words: Micro gas turbine, Ammonia, Combustion, Hydrogen carrier, Methane
Table 1 Properties and combustion characteristics of ammonia
33.4 1.177MPa 30
0.85MPa 20 0.76 g/l 0 0.1013MPa
( ) 0.59 1 25
651
840 930 15 28%
18.6MJ/kg
7cm/s 1/5
Download service for the GTSJ via 65.21.229.84, 2022/07/20.
244 / 298
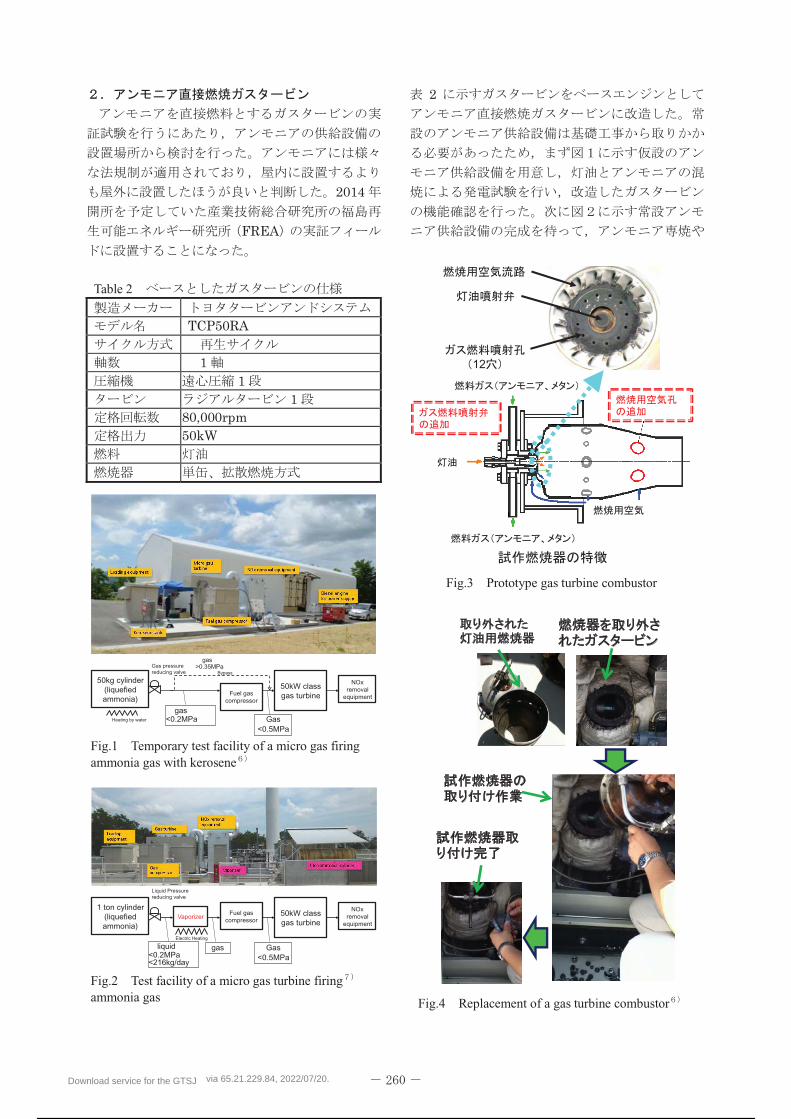
Table 2
Gas pressure reducing valve
50kW classgas turbine
NOxremoval
equipmentFuel gas compressor
50kg cylinder (liquefied ammonia)
gas<0.2MPa Gas
<0.5MPa
Bypass
Heating by water
gas>0.35MPa
Fig.1 Temporary test facility of a micro gas firing ammonia gas with kerosene
Fuel gas compressor
50kW classgas turbine
NOxremoval
equipment
1 ton cylinder (liquefied ammonia)
Vaporizer
Gas<0.5MPa
Liquid Pressure reducing valve
gasliquid<0.2MPa<216kg/day
Electric Heating
Fig.2 Test facility of a micro gas turbine firingammonia gas
Fig.4 Replacement of a gas turbine combustor
12
Fig.3 Prototype gas turbine combustor
Download service for the GTSJ via 65.21.229.84, 2022/07/20.
245 / 298
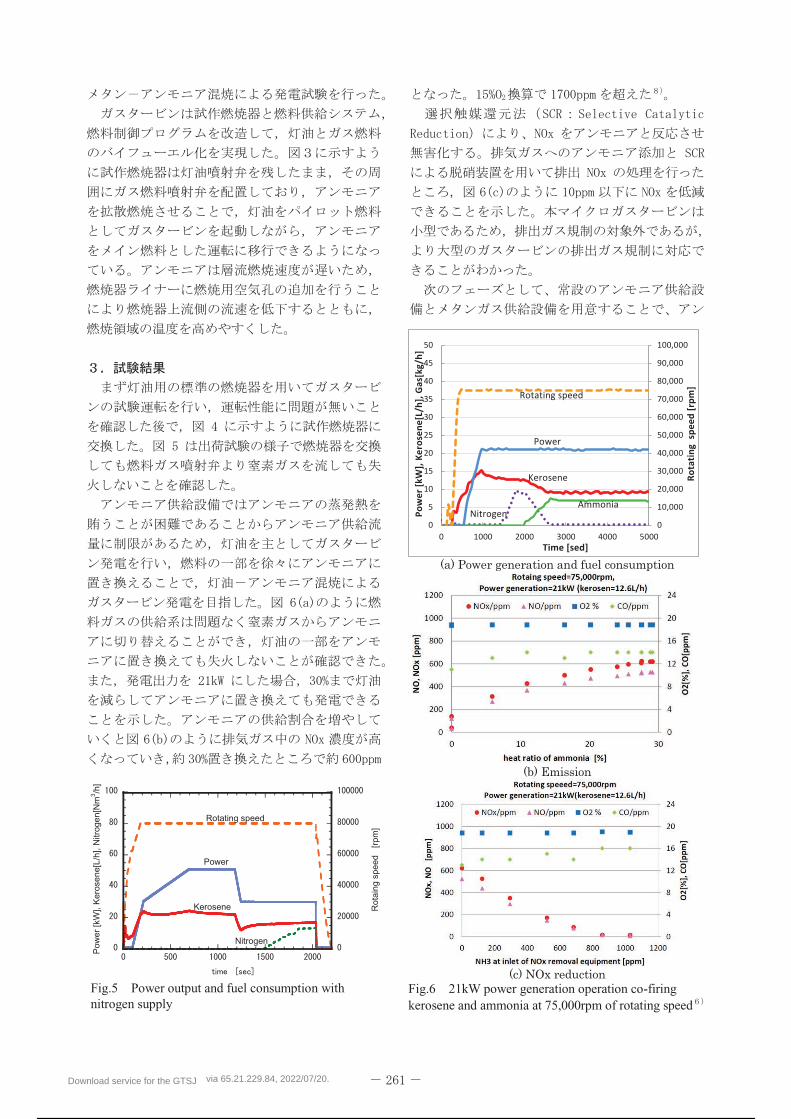
Pow
er [k
W],
Ker
osen
e[L/
h], N
itrog
en[N
m3 /h
]
Rot
aing
spe
ed
[rpm
]
Power
Kerosene
Rotating speed
Nitrogen
Fig.5 Power output and fuel consumption with nitrogen supply
Fig.6 21kW power generation operation co-firing kerosene and ammonia at 75,000rpm of rotating speed
Download service for the GTSJ via 65.21.229.84, 2022/07/20.
246 / 298
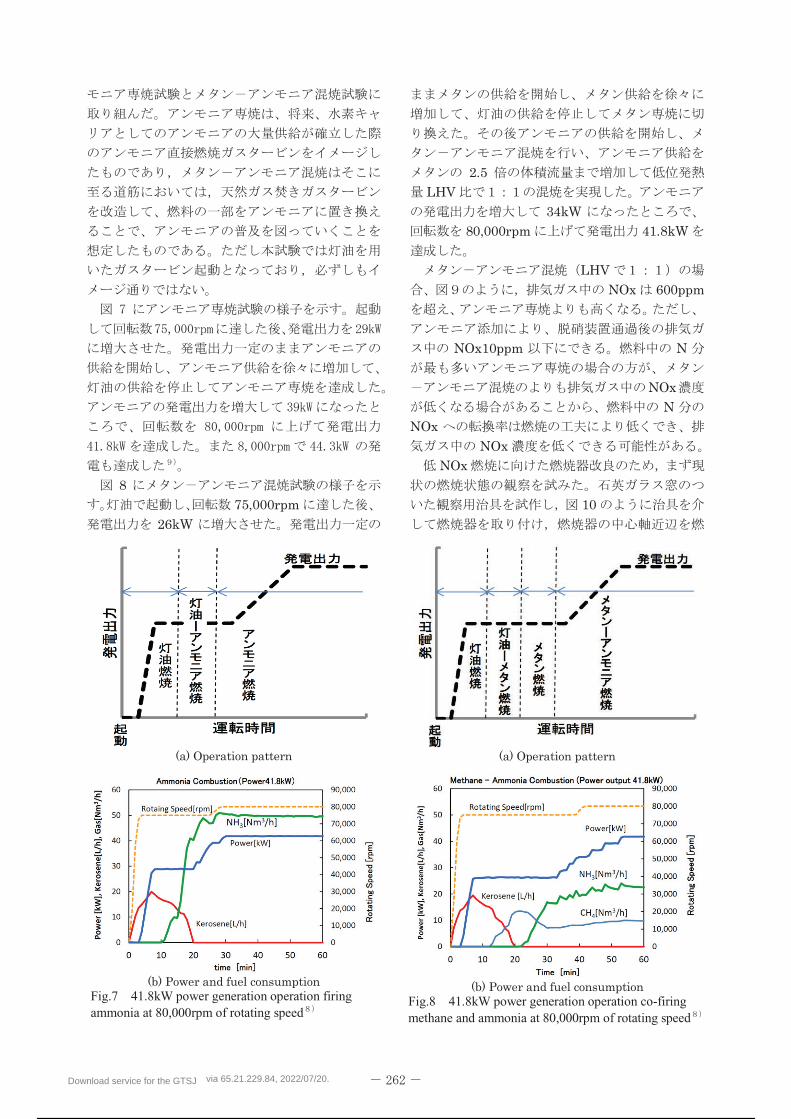
Fig.7 41.8kW power generation operation firing ammonia at 80,000rpm of rotating speed
Fig.8 41.8kW power generation operation co-firing methane and ammonia at 80,000rpm of rotating speed
Download service for the GTSJ via 65.21.229.84, 2022/07/20.
247 / 298
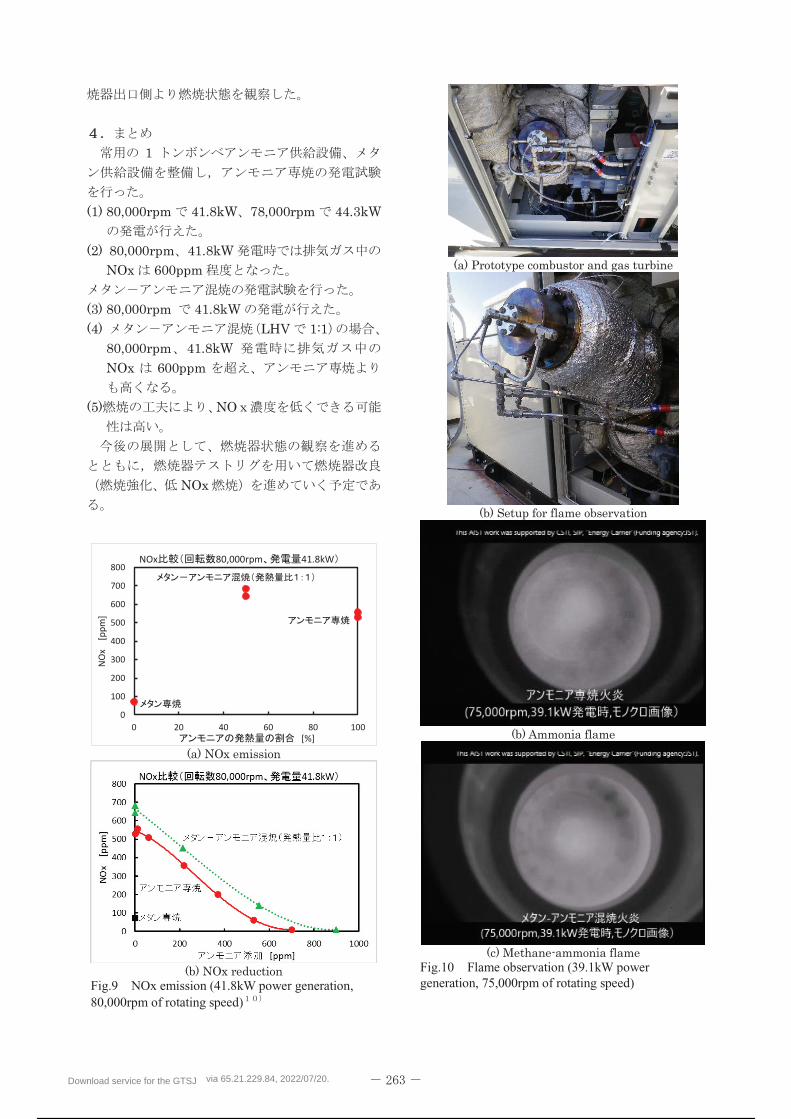
Fig.9 NOx emission (41.8kW power generation, 80,000rpm of rotating speed)
Fig.10 Flame observation (39.1kW power generation, 75,000rpm of rotating speed)
Download service for the GTSJ via 65.21.229.84, 2022/07/20.
248 / 298
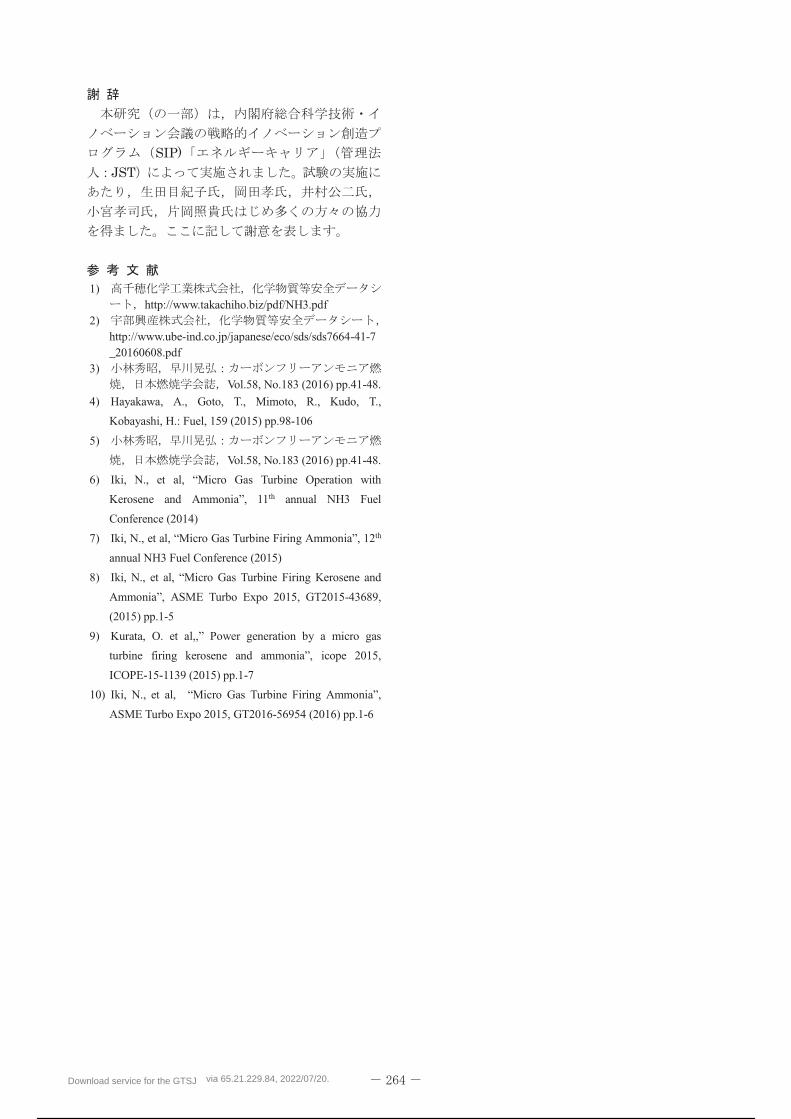
1) http://www.takachiho.biz/pdf/NH3.pdf
2) http://www.ube-ind.co.jp/japanese/eco/sds/sds7664-41-7_20160608.pdf
3) Vol.58, No.183 (2016) pp.41-48.
4) Hayakawa, A., Goto, T., Mimoto, R., Kudo, T.,
Kobayashi, H.: Fuel, 159 (2015) pp.98-106
5)
Vol.58, No.183 (2016) pp.41-48.
6) th annual NH3 Fuel
Conference (2014)
7) F th
annual NH3 Fuel Conference (2015)
8) e Firing Kerosene and
-43689,
(2015) pp.1-5
9) Kurata, O. et al,,
icope 2015,
ICOPE-15-1139 (2015) pp.1-7
10)
ASME Turbo Expo 2015, GT2016-56954 (2016) pp.1-6
Download service for the GTSJ via 65.21.229.84, 2022/07/20.
249 / 298
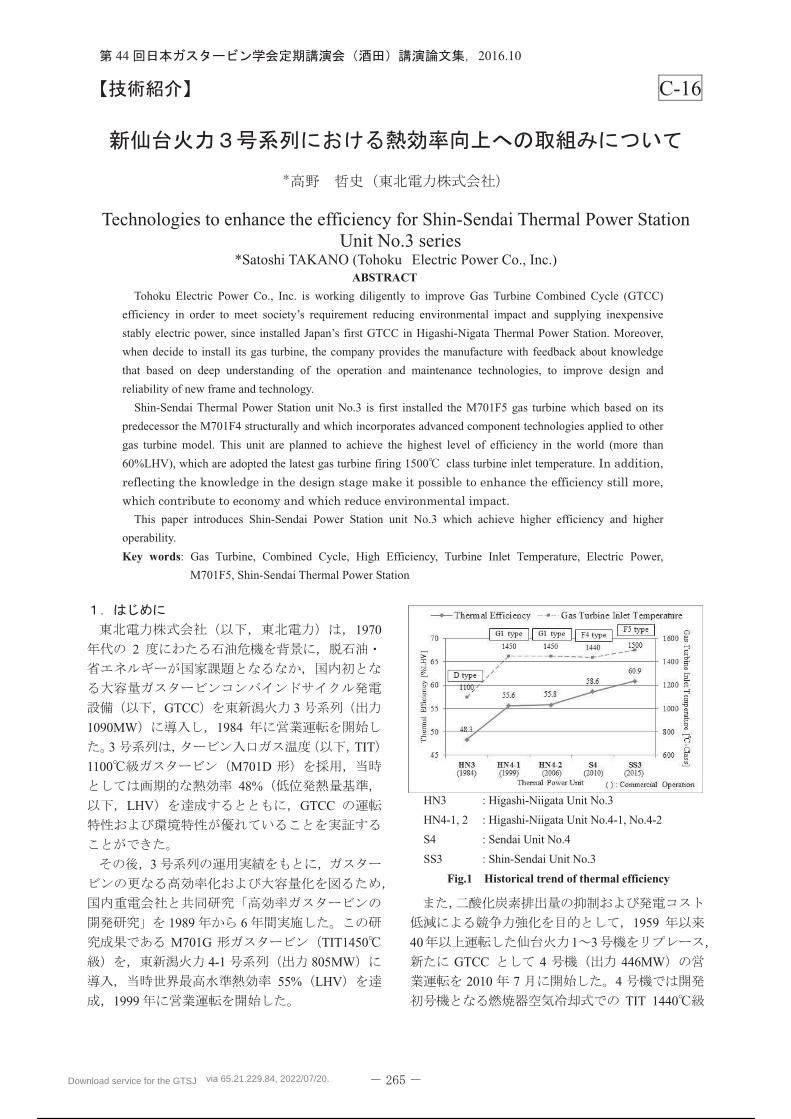
C-16
Technologies to enhance the efficiency for Shin-Sendai Thermal Power Station Unit No.3 series
*Satoshi TAKANO (Tohoku Electric Power Co., Inc.) ABSTRACT
Tohoku Electric Power Co., Inc. is working diligently to improve Gas Turbine Combined Cycle (GTCC)
efficiency in order to meet society’s requirement reducing environmental impact and supplying inexpensive
stably electric power, since installed Japan’s first GTCC in Higashi-Nigata Thermal Power Station. Moreover,
when decide to install its gas turbine, the company provides the manufacture with feedback about knowledge
that based on deep understanding of the operation and maintenance technologies, to improve design and
reliability of new frame and technology.
Shin-Sendai Thermal Power Station unit No.3 is first installed the M701F5 gas turbine which based on its
predecessor the M701F4 structurally and which incorporates advanced component technologies applied to other
gas turbine model. This unit are planned to achieve the highest level of efficiency in the world (more than
60%LHV), which are adopted the latest gas turbine firing 1500 class turbine inlet temperature.
This paper introduces Shin-Sendai Power Station unit No.3 which achieve higher efficiency and higher
operability.
Key words: Gas Turbine, Combined Cycle, High Efficiency, Turbine Inlet Temperature, Electric Power,
M701F5, Shin-Sendai Thermal Power Station
1970
2
GTCC 3
1090MW 1984
3 TIT
1100 M701D
48%
LHV GTCC
3
1989 6
M701G TIT1450
4-1 805MW
55% LHV
1999
1959
40 1 3
GTCC 4 446MW
2010 7 4
TIT 1440
HN3 : Higashi-Niigata Unit No.3
HN4-1, 2 : Higashi-Niigata Unit No.4-1, No.4-2
S4 : Sendai Unit No.4
SS3 : Shin-Sendai Unit No.3
Fig.1 Historical trend of thermal efficiency
Download service for the GTSJ via 65.21.229.84, 2022/07/20.
250 / 298
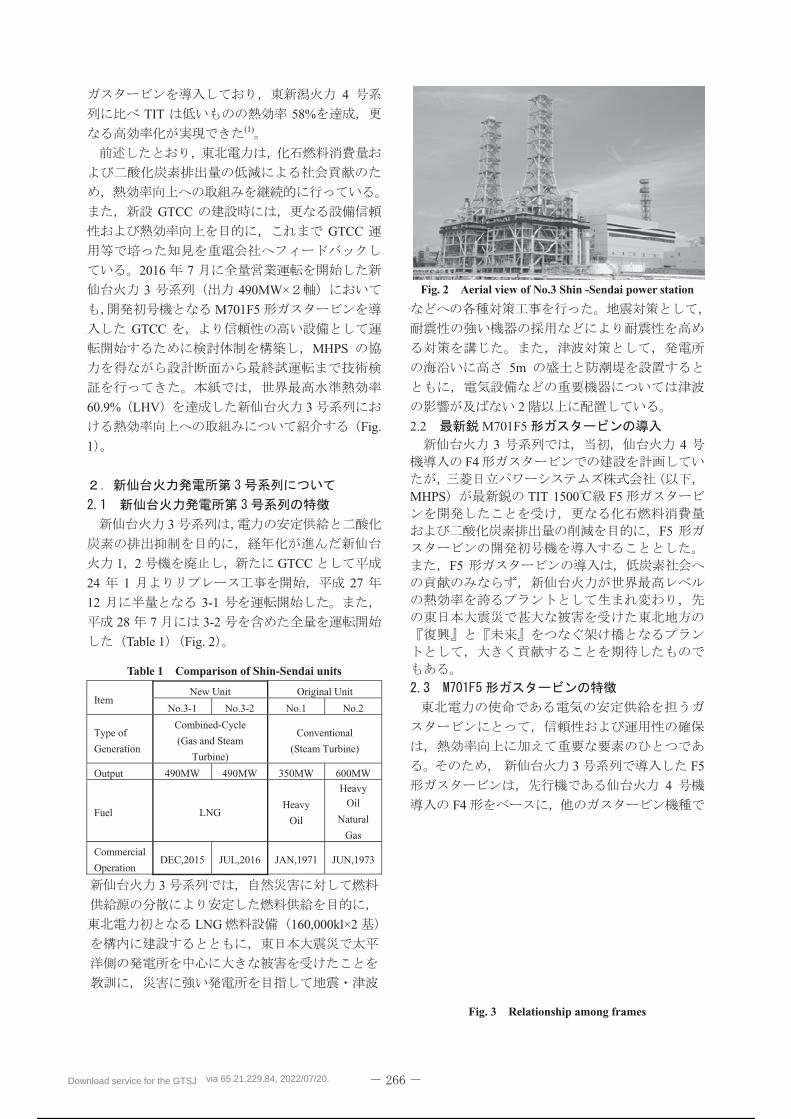
4
TIT 58%(1)
GTCC
GTCC
2016 7
3 490MW×
M701F5
GTCC
MHPS
60.9% LHV 3
Fig.
1
3
1 2 GTCC
24 1 27
12 3-1
28 7 3-2
Table 1 Fig. 2
Table 1 Comparison of Shin-Sendai units
3
LNG 160,000kl×2
Fig. 2 Aerial view of No.3 Shin -Sendai power station
5m
2
2.2 M701F53 4
F4
MHPS TIT 1500 F5
F5
F5
3 F5
4
F4
Fig. 3 Relationship among frames
Item New Unit Original Unit
No.3-1 No.3-2 No.1 No.2
Type of
Generation
Combined-Cycle
(Gas and Steam
Turbine)
Conventional
(Steam Turbine)
Output 490MW 490MW 350MW 600MW
Fuel LNG Heavy
Oil
Heavy Oil
Natural
Gas
Commercial
Operation DEC,2015 JUL,2016 JAN,1971 JUN,1973
Download service for the GTSJ via 65.21.229.84, 2022/07/20.
251 / 298
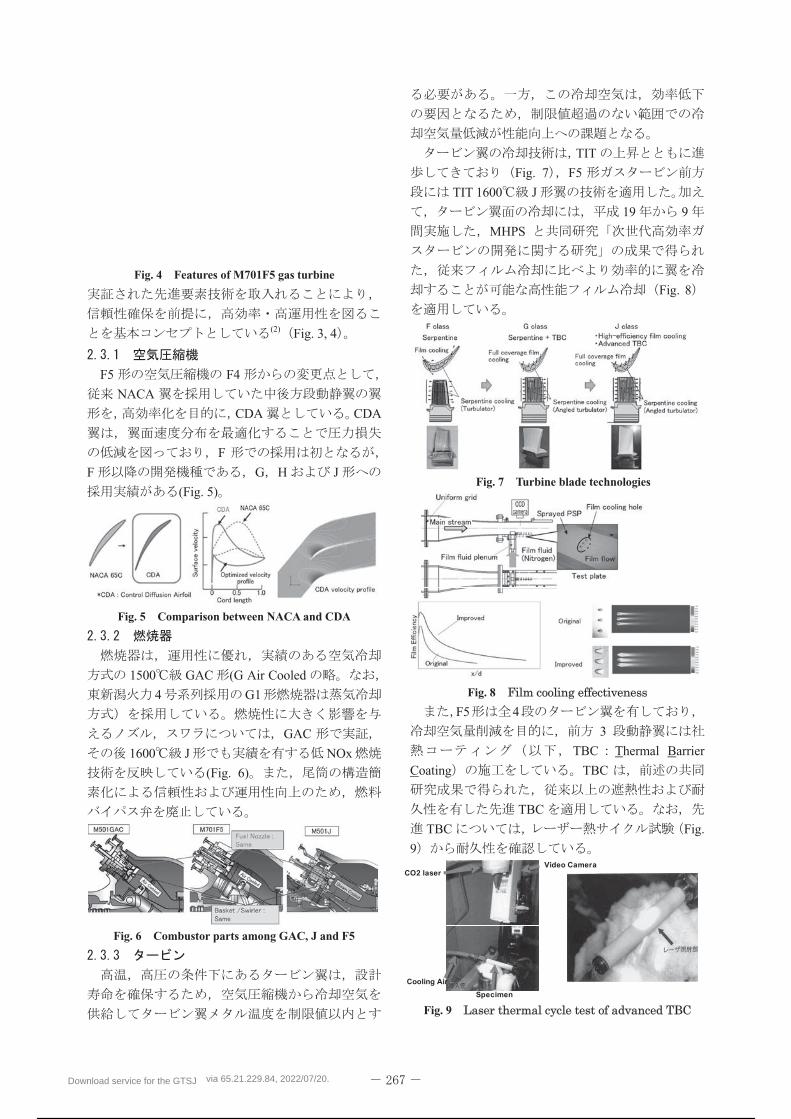
Fig. 4 Features of M701F5 gas turbine
(2) Fig. 3, 4
F5 F4
NACA
CDA CDA
F
F G H J
(Fig. 5)
Fig. 5 Comparison between NACA and CDA
1500 GAC (G Air Cooled
4 G1
GAC
1600 J NOx
(Fig. 6)
Fig. 6 Combustor parts among GAC, J and F5
TIT
Fig. 7 F5
TIT 1600 J
19 9
MHPS
Fig. 8
Fig. 7 Turbine blade technologies
Fig. 8
F5 4
3
TBC Thermal Barrier
Coating TBC
TBC
TBC Fig.
9
Fig. 9
Note: as of September 2015
CO2 laser
Cooling Air
Video Camera
Specimen
Download service for the GTSJ via 65.21.229.84, 2022/07/20.
252 / 298
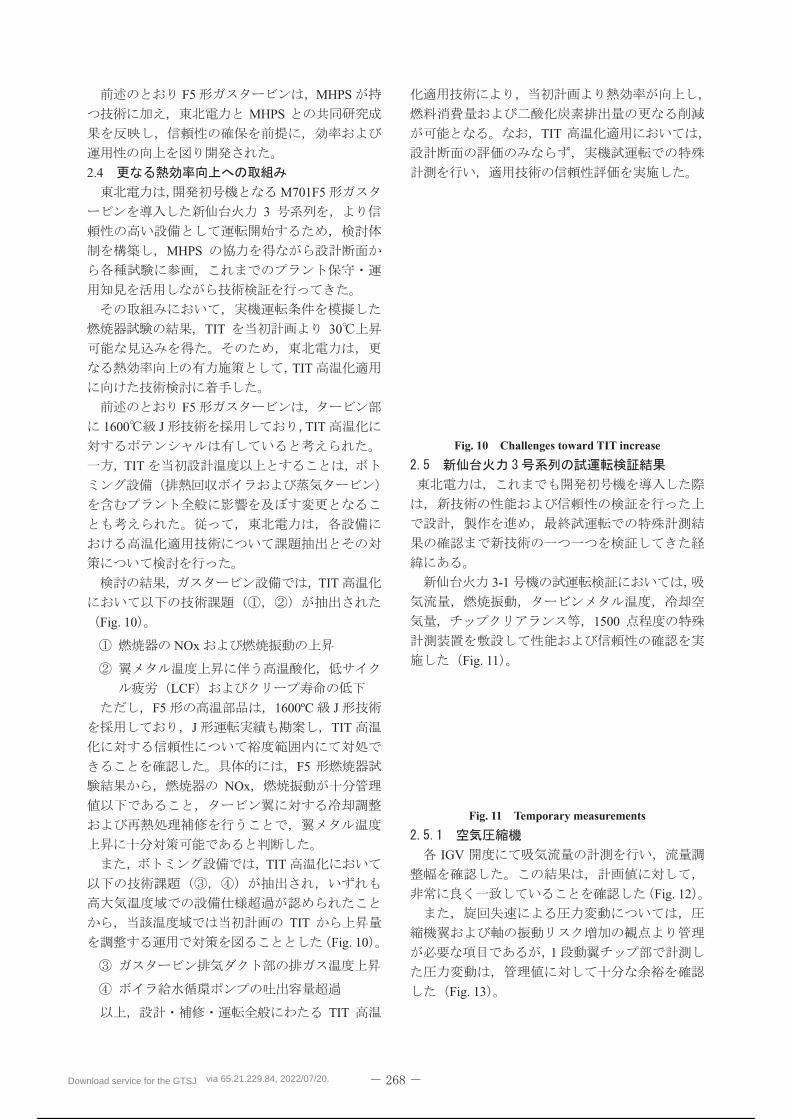
F5 MHPS
MHPS
2.4
M701F5
3
MHPS
TIT 30
TIT
F5
1600 J TIT
TIT
TIT
Fig. 10
NOx
LCF
F5 1600ºC J
J TIT
F5
NOx
TIT
TIT
Fig. 10
TIT
TIT
Fig. 10 Challenges toward TIT increase
3-1
1500
Fig. 11
Fig. 11 Temporary measurements
IGV
Fig. 12
1
Fig. 13
Download service for the GTSJ via 65.21.229.84, 2022/07/20.
253 / 298
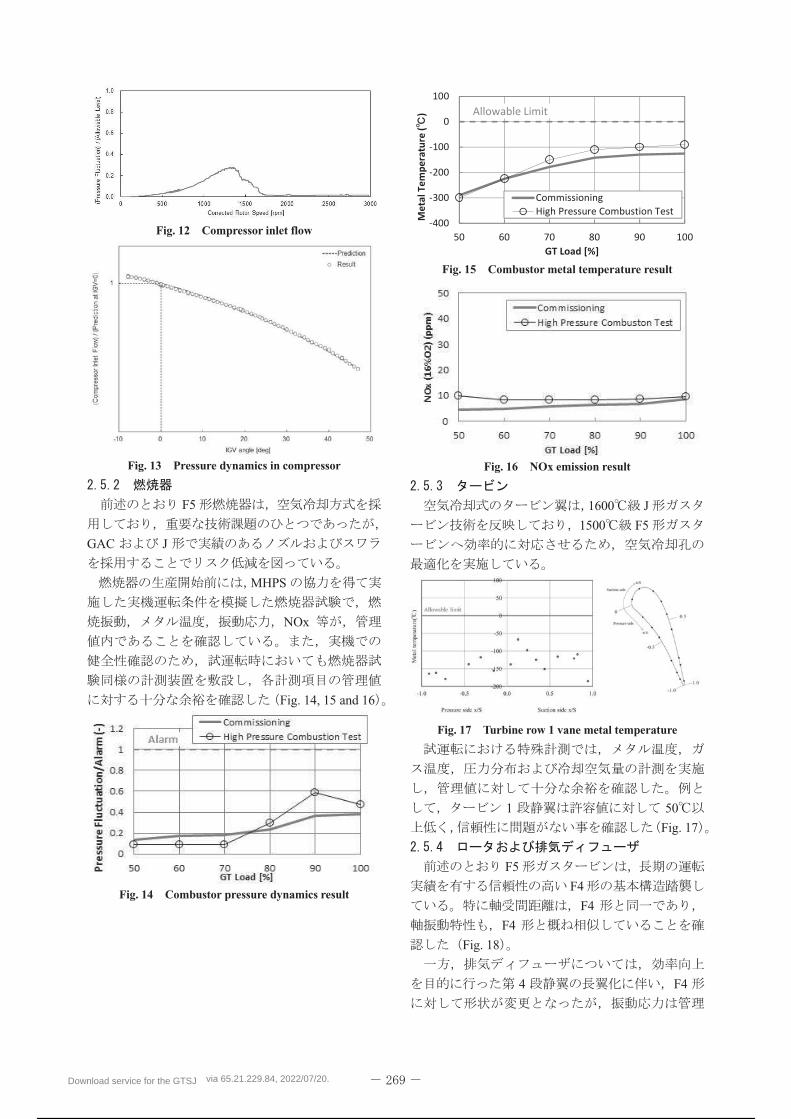
Fig. 12 Compressor inlet flow
Fig. 13 Pressure dynamics in compressor
F5
GAC J
MHPS
NOx
Fig. 14, 15 and 16
Fig. 14 Combustor pressure dynamics result
Fig. 15 Combustor metal temperature result
Fig. 16 NOx emission result
1600 J
1500 F5
Fig. 17 Turbine row 1 vane metal temperature
1 50
Fig. 17
F5
F4
F4
F4
Fig. 18
4 F4
Download service for the GTSJ via 65.21.229.84, 2022/07/20.
254 / 298
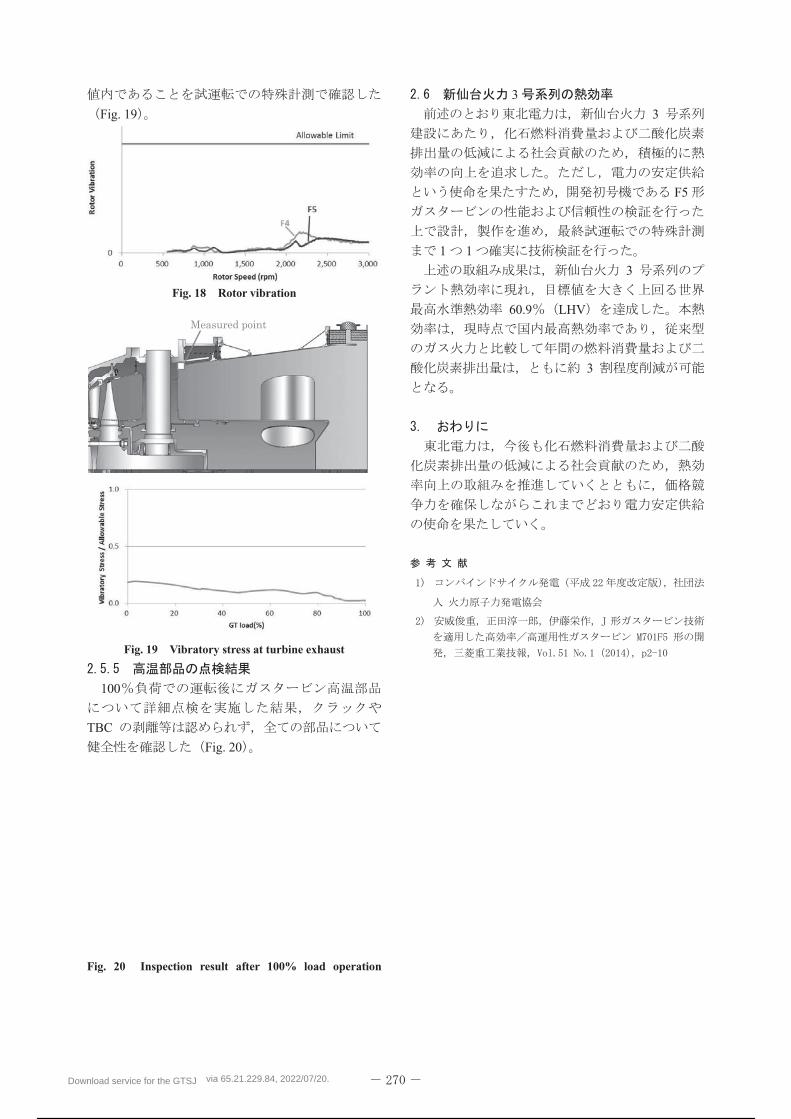
Fig. 19
Fig. 18 Rotor vibration
Fig. 19 Vibratory stress at turbine exhaust
100
TBC
Fig. 20
Fig. 20 Inspection result after 100% load operation
3
3
F5
1 1
3
60.9 LHV
3
Download service for the GTSJ via 65.21.229.84, 2022/07/20.
255 / 298
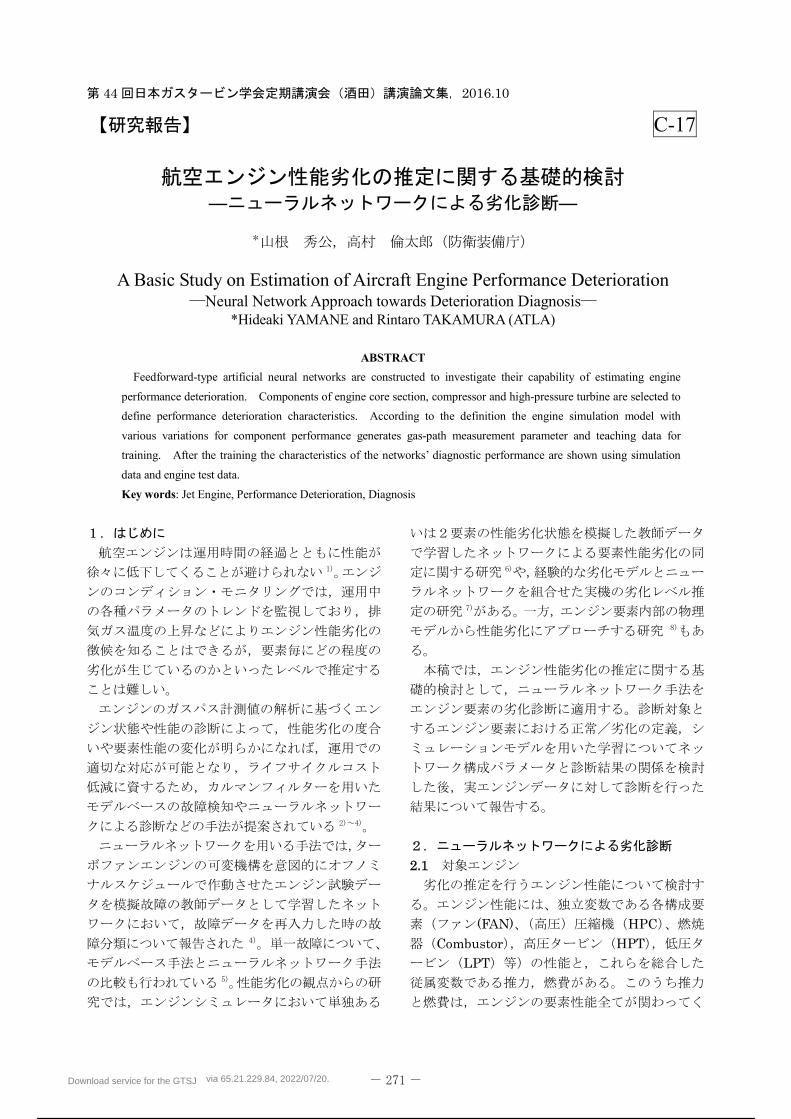
Download service for the GTSJ via 65.21.229.84, 2022/07/20.
256 / 298
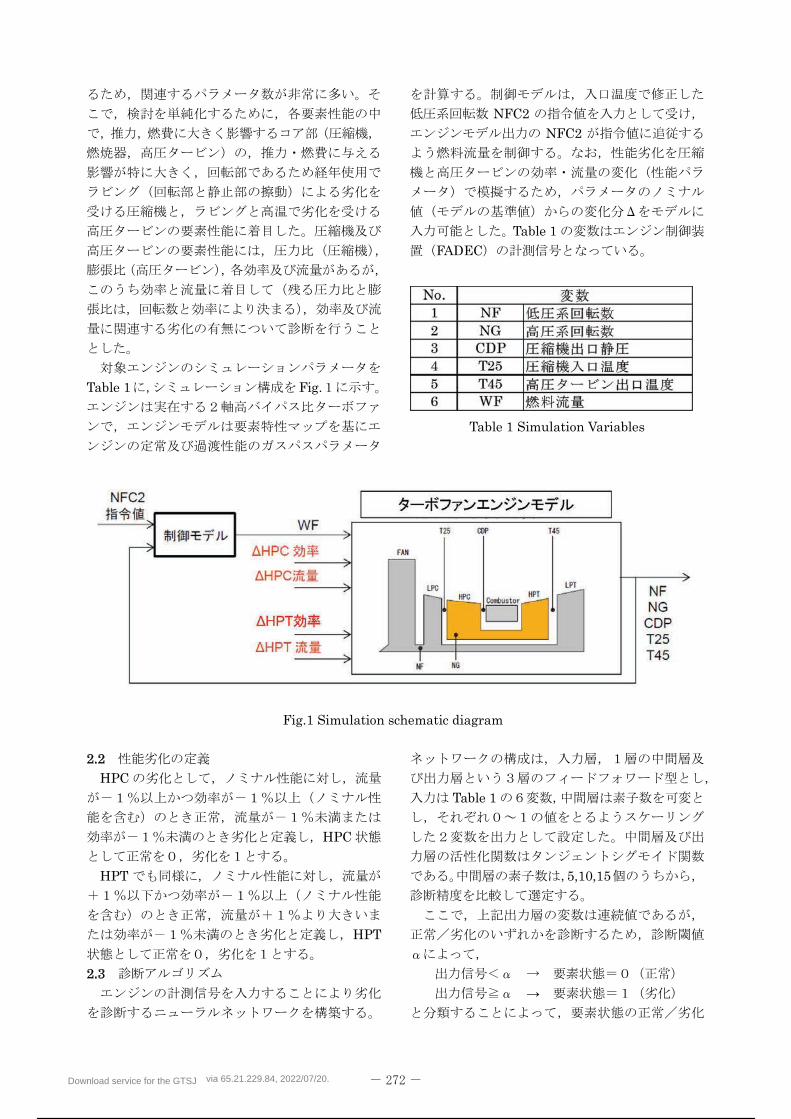
Download service for the GTSJ via 65.21.229.84, 2022/07/20.
257 / 298
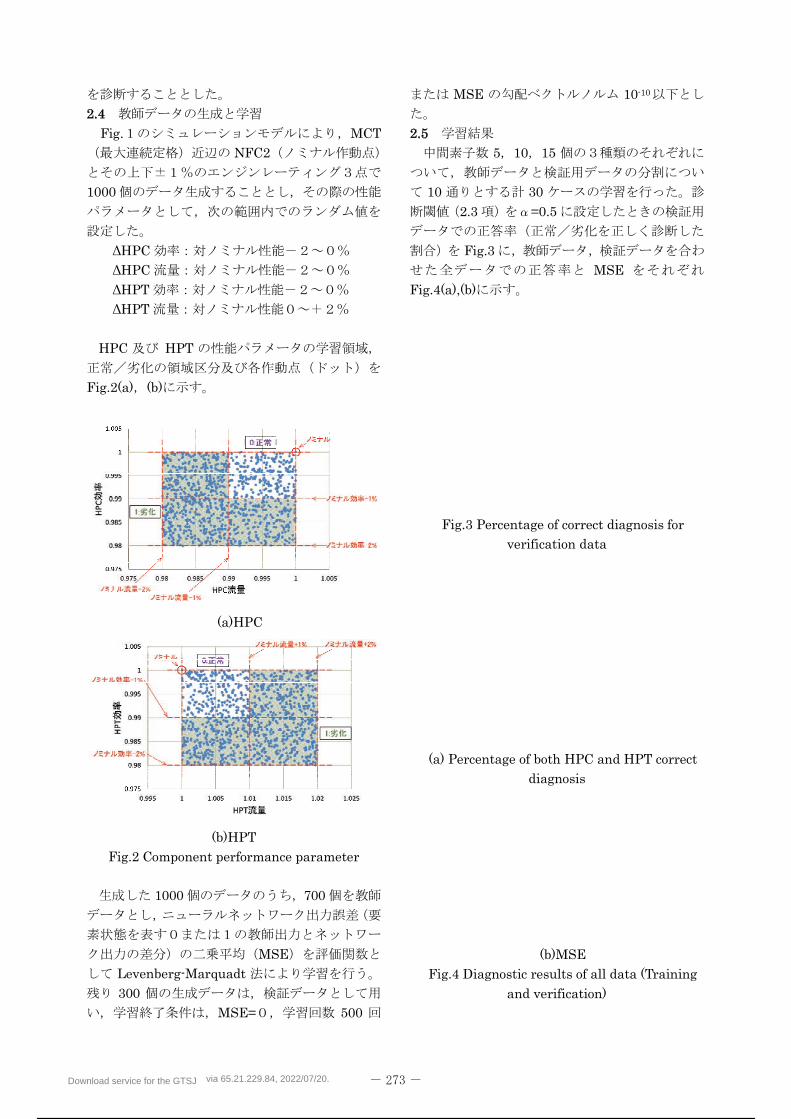
Download service for the GTSJ via 65.21.229.84, 2022/07/20.
258 / 298
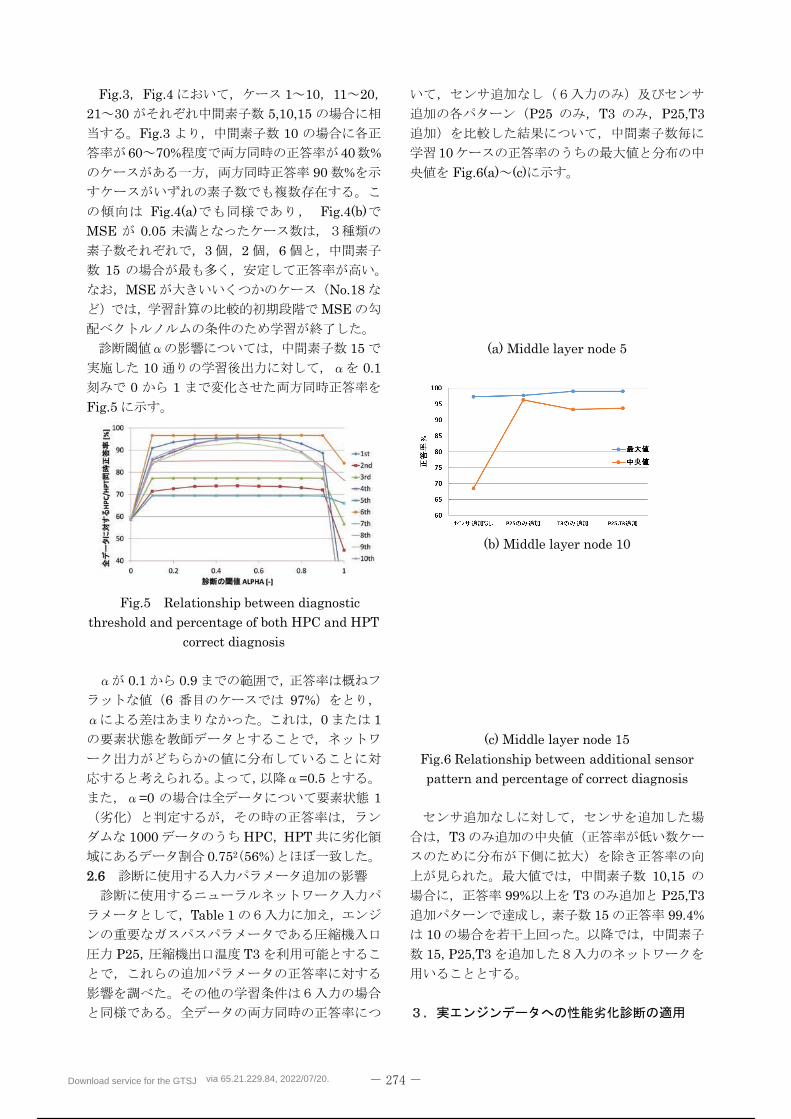
Download service for the GTSJ via 65.21.229.84, 2022/07/20.
259 / 298
Download service for the GTSJ via 65.21.229.84, 2022/07/20.
260 / 298
Download service for the GTSJ via 65.21.229.84, 2022/07/20.
261 / 298
C-18
Fundamental research and technology development of JAXA AeroenginesAnalysis, instrumentation, and testing technologies for jet engine R&D
*Hisao FUTAMURA, Takeshi YAMAMOTO (JAXA)
ABSTRACT
JAXA Propulsion research unit holds various test facilities relating aircraft propulsion systems, those are kept
good condition for our own research use and for others’ demands. In order to lead developing engine
technologies up to date, we have to introduce advanced technologies for analysis, instrumentation, and testing to
support precise and accurate data production. The current fundamental research activities and facilities
innovation are presented in this paper with research projects and background information.
Key words: Engine testing, Exhaust emission, Engine noise, Numerical analysis, Thermodynamics
5%
JAXA
2014 (2014 6 )1)
( 26 8
)2)
( 1)3) 27 4
Download service for the GTSJ via 65.21.229.84, 2022/07/20.
262 / 298
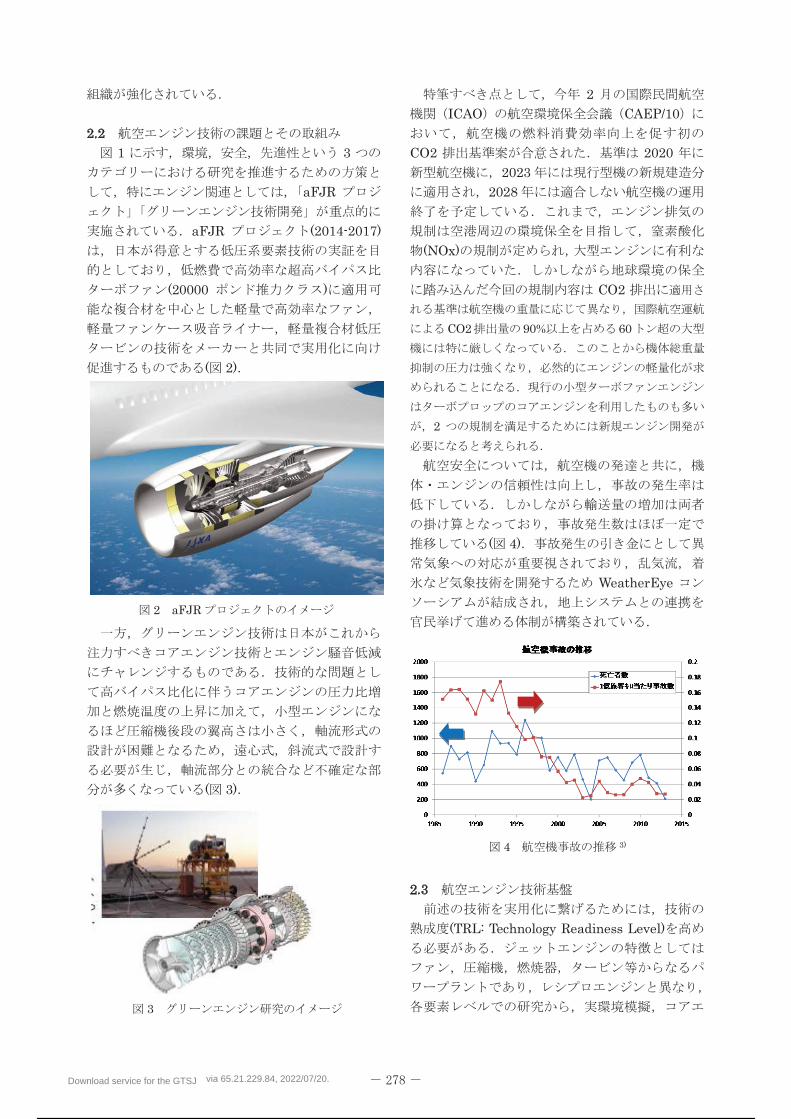
Download service for the GTSJ via 65.21.229.84, 2022/07/20.
263 / 298
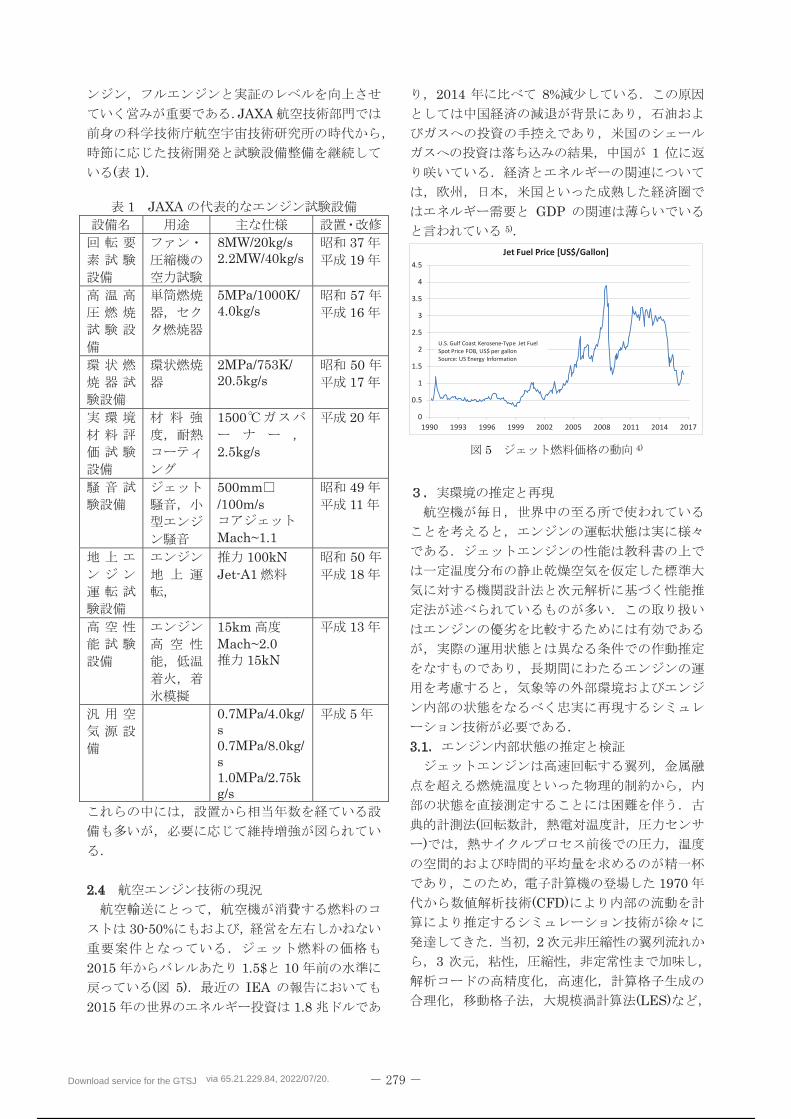
Download service for the GTSJ via 65.21.229.84, 2022/07/20.
264 / 298
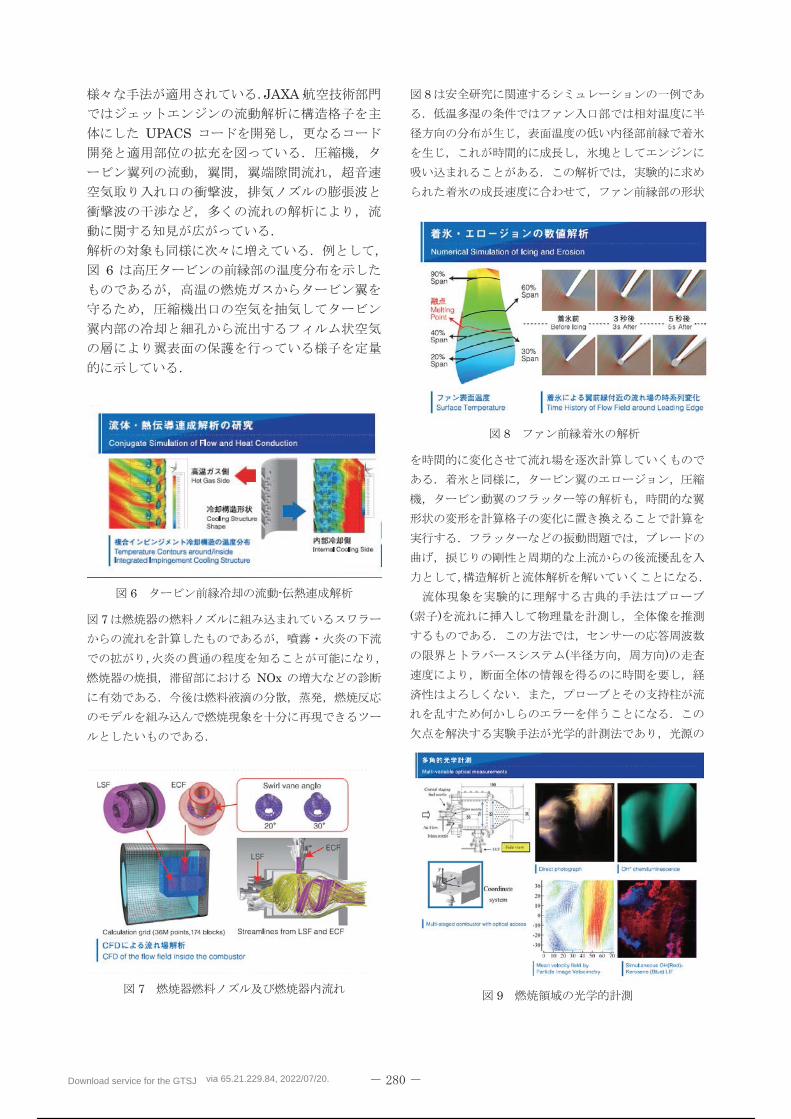
Download service for the GTSJ via 65.21.229.84, 2022/07/20.
265 / 298
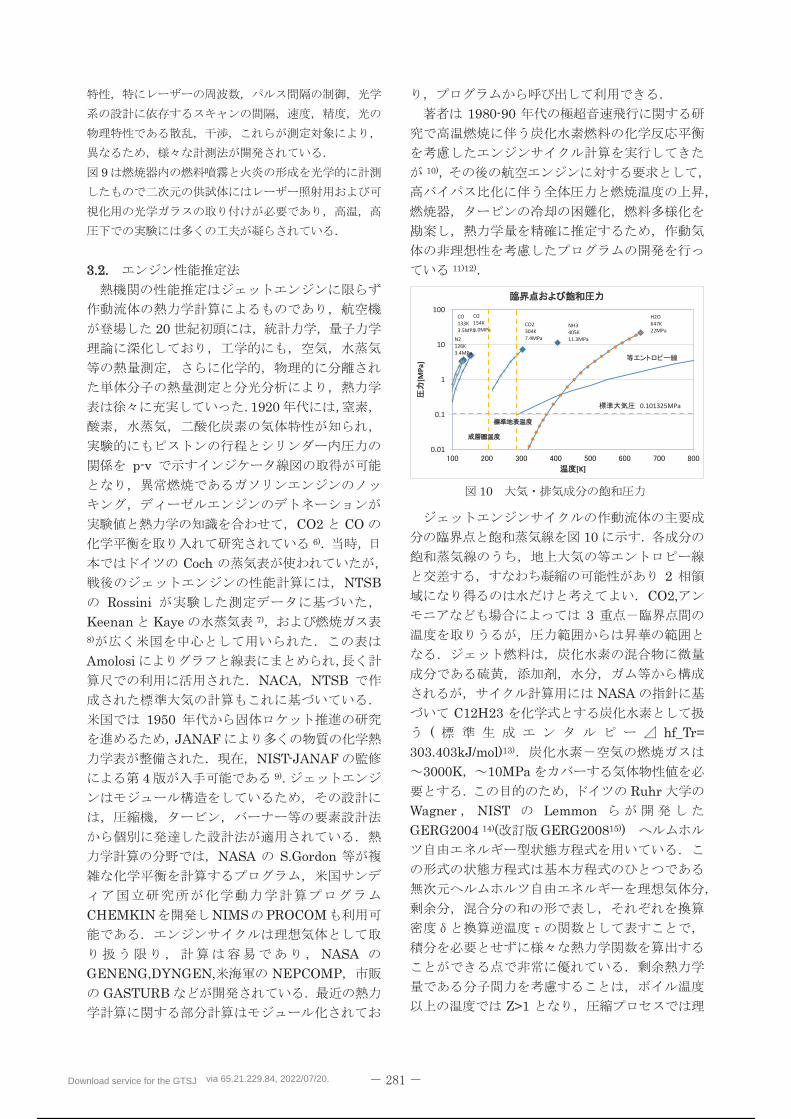
Download service for the GTSJ via 65.21.229.84, 2022/07/20.
266 / 298
4) U.S. Gulf Coast Kerosene-Type Jet Fuel Spot Price FOB, US$ per gallon, US Energy Information Administration
5) World energy investment 2016, OECD/IEA, 20166) 6.
1944 2 Pp.4827) GAS TABLES, J. H. Keenan, J. Kaye, John Wiley &
sons, 19458) GAS TABLES international version, J. Keenan, J. Chao,
J. Kaye, John wiley & sons, 19839) NIST-JANAF Thermochemical Tables 4th Edition, M.
Chase, JPCRD monograph No.9, NIST, 199810) Conceptual design analysis on the Porpulsion system for
High-speed transport aircrafts, 2005/9/10, ISABE 2005-1294, H. Futamura, R. Yanagi
11), 2011/2/28,
, ,JAXA-RM-10-016,
12)
( 2), 2014/3/1,, ,
JAXA-RM-13-019,13) NASA Glenn Coefficients for Calculating
Thermodynamic Properties of Individual Species, B. McBride, M. Zehe, S. Gordon, NASA/TP-2002-211556, Sept. 2002
14) The GERG-2004 Wide-Range Equation of State for Natural Gases and Other Mixtures, O. Kunz, R. Klimeck, W. Wagner, M. Jaeschke, GERG TM15, 2007
15) The GERG-2008 Wide-Range Equation of State for Natural Gases and Other Mixtures: An Expasion of GERG-2004, O. Kunz, W. Wagner, J. Chemical & engineering data 2012, vol. 57, pp.3032-3091
Download service for the GTSJ via 65.21.229.84, 2022/07/20.
267 / 298
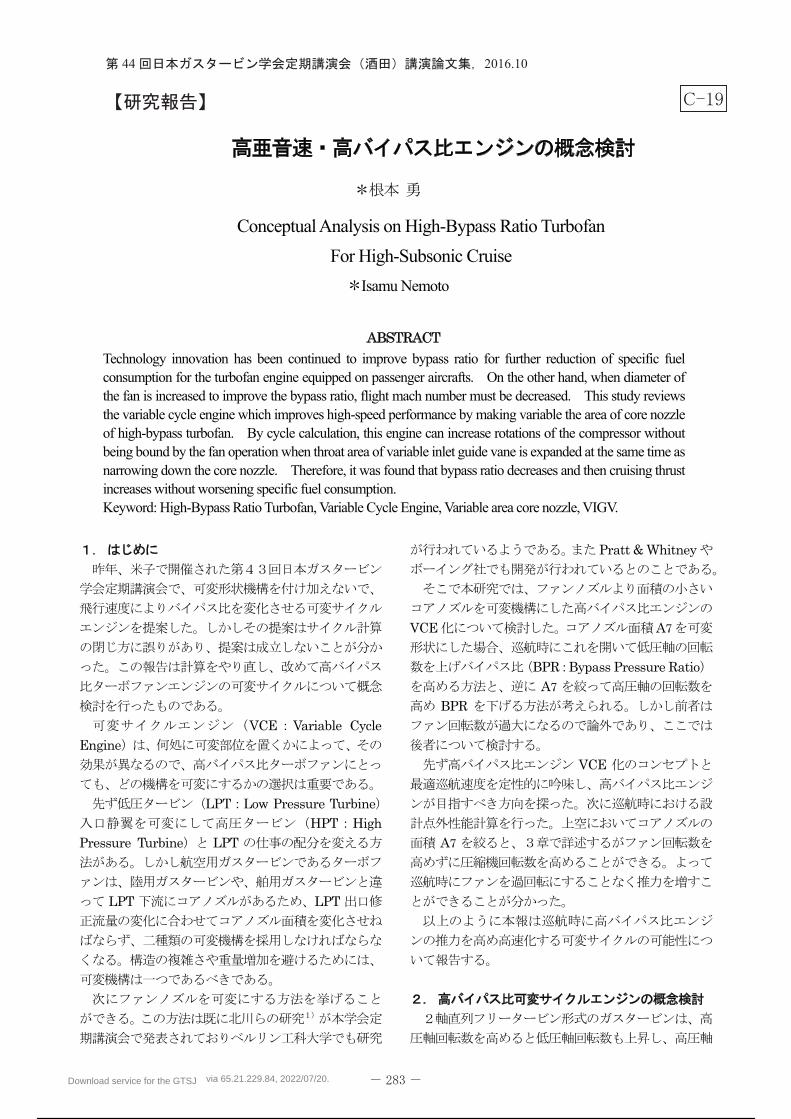
Download service for the GTSJ via 65.21.229.84, 2022/07/20.
268 / 298
Download service for the GTSJ via 65.21.229.84, 2022/07/20.
269 / 298
=δ
θδ
θ
−−−×
( )
−−
=
−κ
κκ
κκ
Download service for the GTSJ via 65.21.229.84, 2022/07/20.
270 / 298
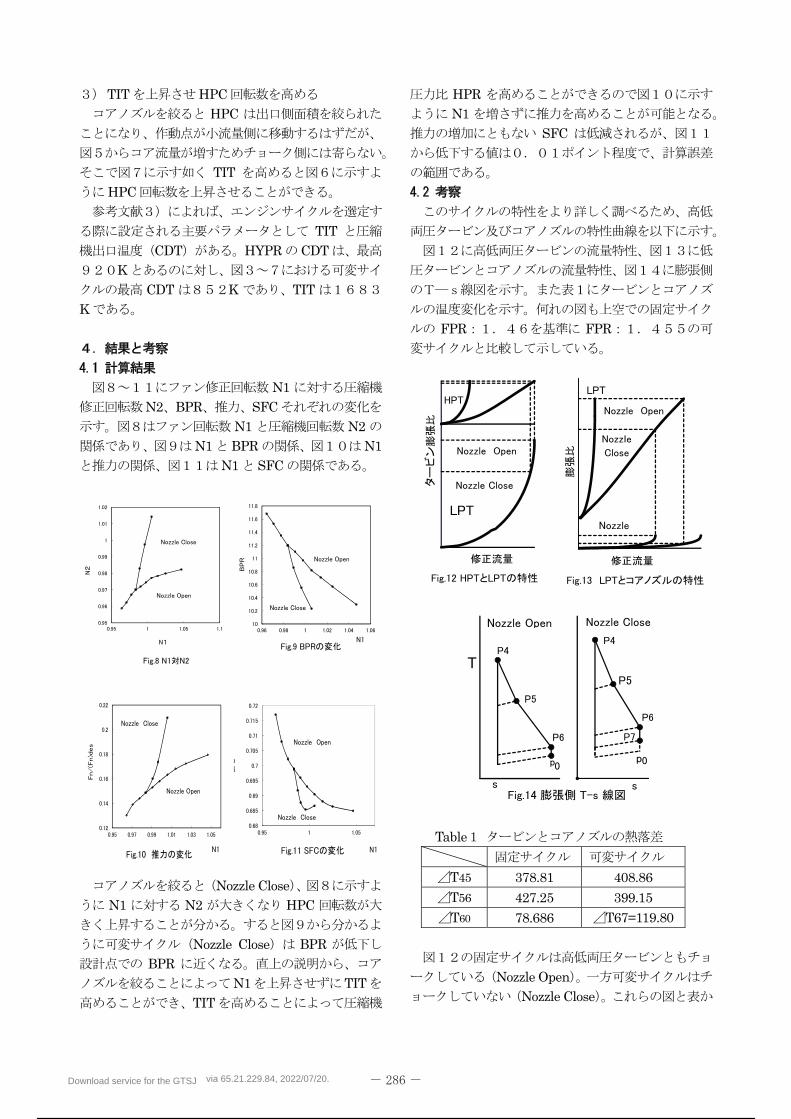
Download service for the GTSJ via 65.21.229.84, 2022/07/20.
271 / 298
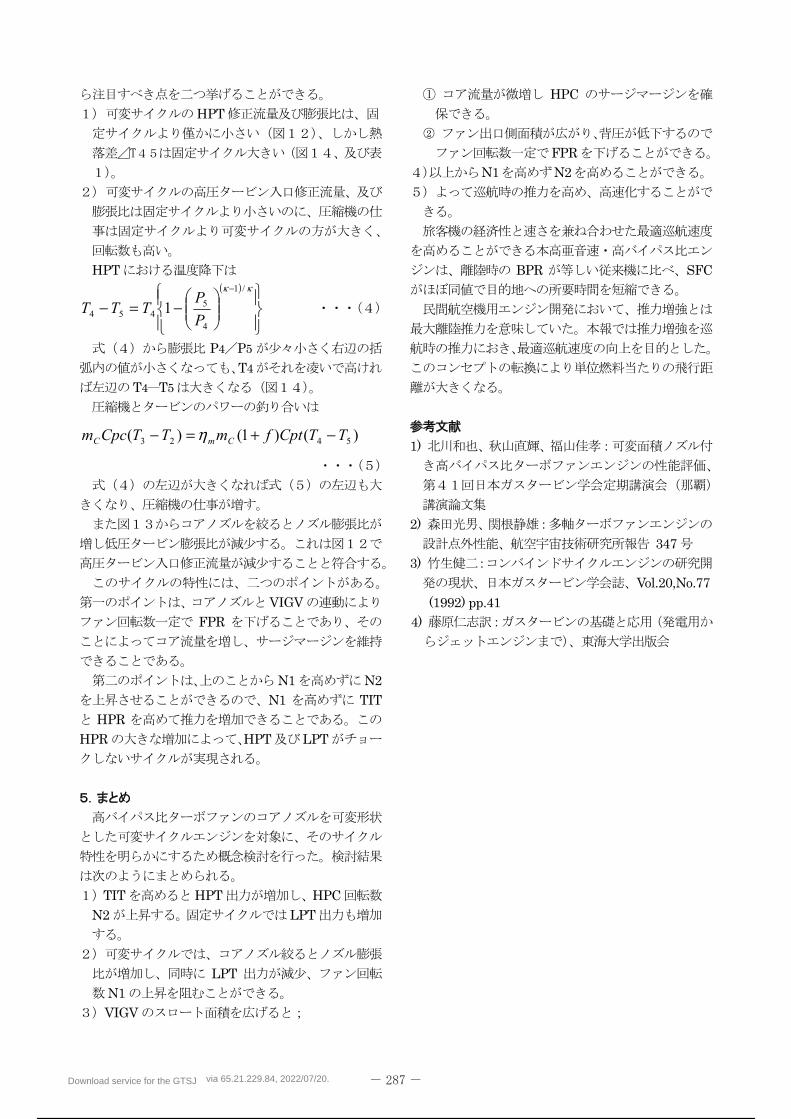
( )
−=−− κκ
−+=− η
Download service for the GTSJ via 65.21.229.84, 2022/07/20.
272 / 298
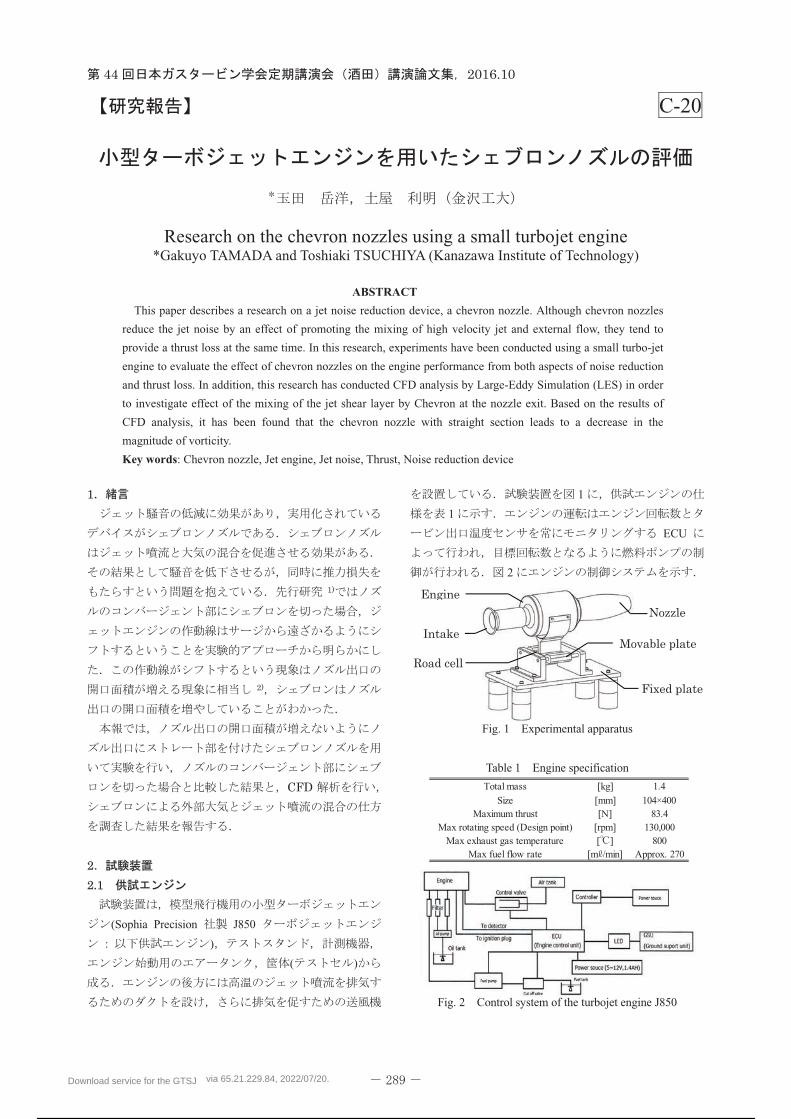
Total mass [kg] 1.4Size [mm] 104×400
Maximum thrust [N] 83.4Max rotating speed (Design point) [rpm] 130,000
Max exhaust gas temperature [ ] 800Max fuel flow rate [m /min] Approx. 270
C-20
Research on the chevron nozzles using a small turbojet engine *Gakuyo TAMADA and Toshiaki TSUCHIYA (Kanazawa Institute of Technology)
ABSTRACT
This paper describes a research on a jet noise reduction device, a chevron nozzle. Although chevron nozzles
reduce the jet noise by an effect of promoting the mixing of high velocity jet and external flow, they tend to
provide a thrust loss at the same time. In this research, experiments have been conducted using a small turbo-jet
engine to evaluate the effect of chevron nozzles on the engine performance from both aspects of noise reduction
and thrust loss. In addition, this research has conducted CFD analysis by Large-Eddy Simulation (LES) in order
to investigate effect of the mixing of the jet shear layer by Chevron at the nozzle exit. Based on the results of
CFD analysis, it has been found that the chevron nozzle with straight section leads to a decrease in the
magnitude of vorticity.
Key words: Chevron nozzle, Jet engine, Jet noise, Thrust, Noise reduction device
(Sophia Precision J850
: )
( )
1
1
ECU
2
Fig. 1 Experimental apparatus
Table 1 Engine specification
Fig. 2 Control system of the turbojet engine J850
Download service for the GTSJ via 65.21.229.84, 2022/07/20.
273 / 298
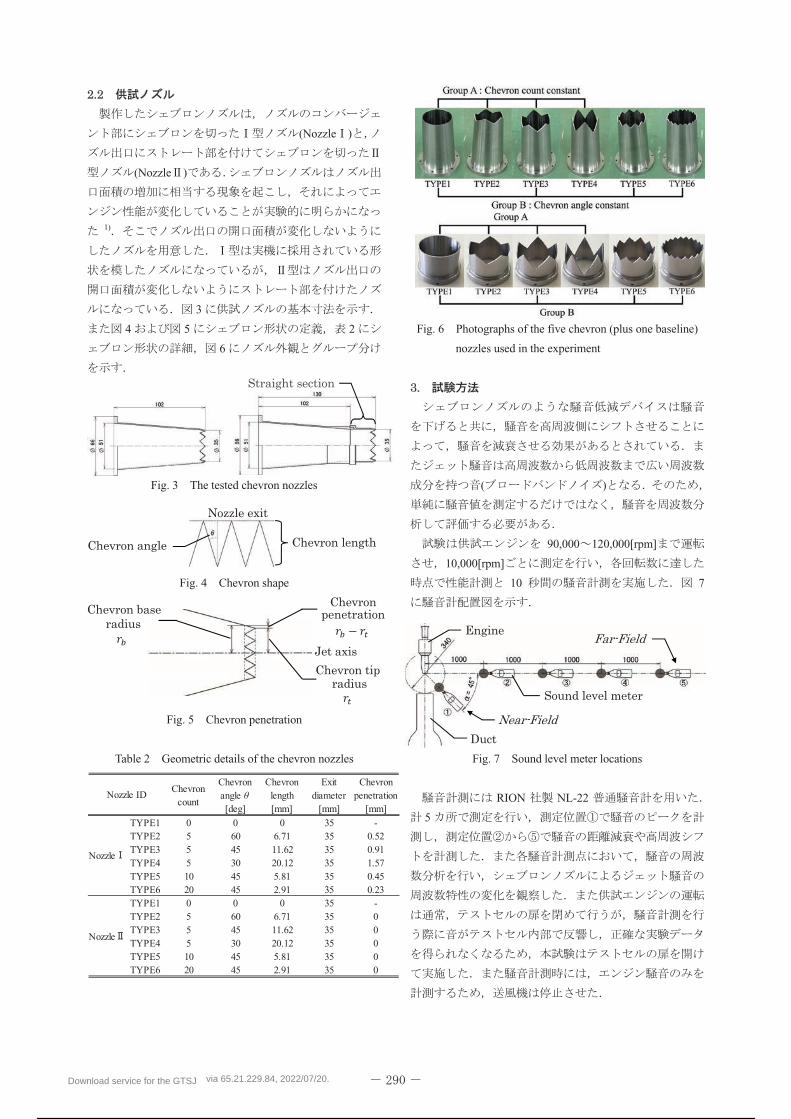
(Nozzle )
(Nozzle )
1)
3
4 5 2
6
Fig. 3 The tested chevron nozzles
Fig. 4 Chevron shape
Fig. 5 Chevron penetration
Table 2 Geometric details of the chevron nozzles
Fig. 6 Photographs of the five chevron (plus one baseline)
nozzles used in the experiment abcdefghijk
( )
90,000 120,000[rpm]
10,000[rpm]
10 7
Fig. 7 Sound level meter locations
RION NL-22
5
Chevroncount
Chevronangle [deg]
Chevronlength[mm]
Exitdiameter
[mm]
Chevronpenetration
[mm]TYPE1 0 0 0 35 -TYPE2 5 60 6.71 35 0.52TYPE3 5 45 11.62 35 0.91TYPE4 5 30 20.12 35 1.57TYPE5 10 45 5.81 35 0.45TYPE6 20 45 2.91 35 0.23TYPE1 0 0 0 35 -TYPE2 5 60 6.71 35 0TYPE3 5 45 11.62 35 0TYPE4 5 30 20.12 35 0TYPE5 10 45 5.81 35 0TYPE6 20 45 2.91 35 0
Nozzle ID
Nozzle
Nozzle
Download service for the GTSJ via 65.21.229.84, 2022/07/20.
274 / 298
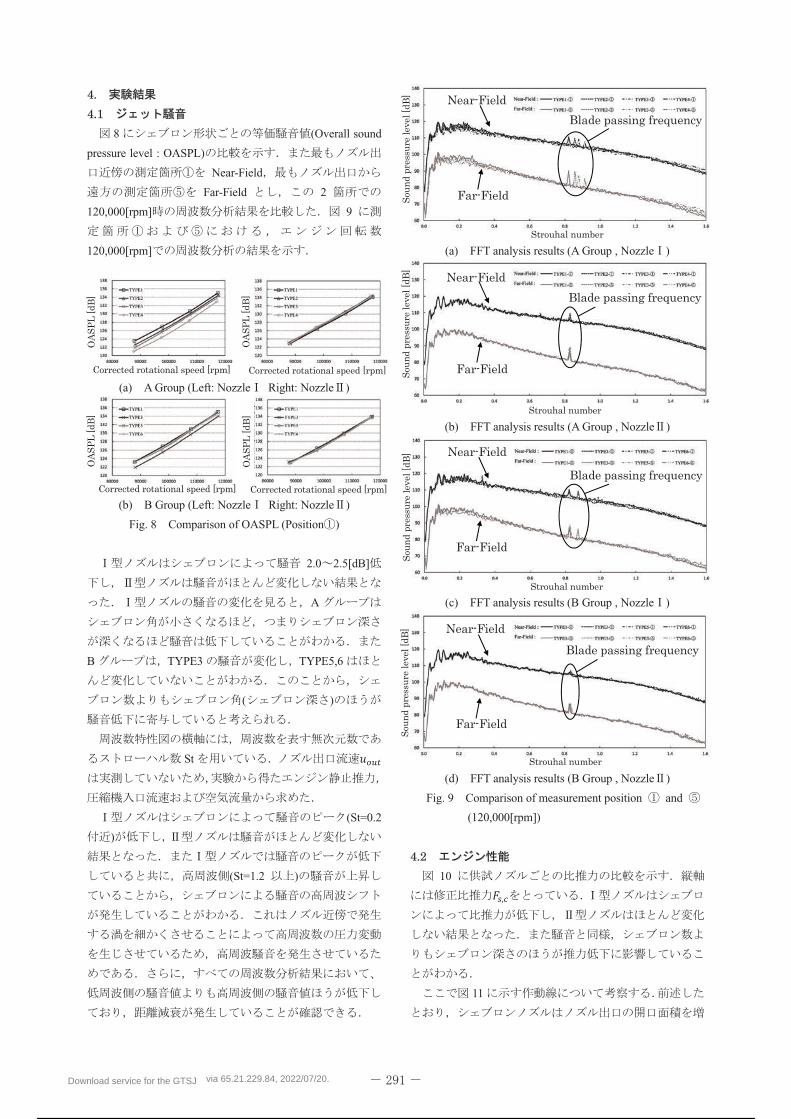
8 (Overall sound
pressure level : OASPL)
Near-Field
Far-Field 2
120,000[rpm] 9
120,000[rpm]
(a) A Group (Left: Nozzle Right: Nozzle )
(b) B Group (Left: Nozzle Right: Nozzle )
Fig. 8 Comparison of OASPL (Position )
2.0 2.5[dB]
A
B TYPE3 TYPE5,6
( )
St
(St=0.2
)
(St=1.2 )
(a) FFT analysis results (A Group , Nozzle )
(b) FFT analysis results (A Group , Nozzle )
(c) FFT analysis results (B Group , Nozzle )
(d) FFT analysis results (B Group , Nozzle )
Fig. 9 Comparison of measurement position and
(120,000[rpm])Abcdefghijklmnopqrst
10
11
Download service for the GTSJ via 65.21.229.84, 2022/07/20.
275 / 298
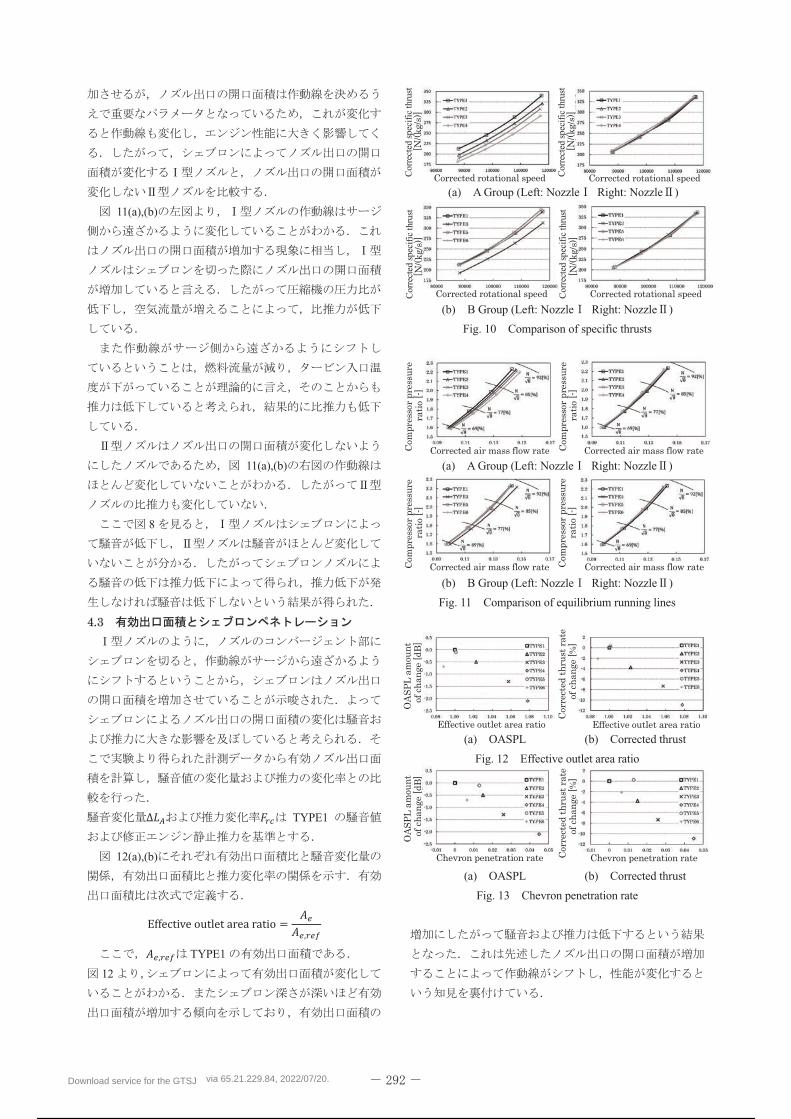
11(a),(b)
11(a),(b)
8
TYPE1
12(a),(b)
TYPE1
12
(a) A Group (Left: Nozzle Right: Nozzle )
(b) B Group (Left: Nozzle Right: Nozzle )
Fig. 10 Comparison of specific thrusts
(a) A Group (Left: Nozzle Right: Nozzle )
(b) B Group (Left: Nozzle Right: Nozzle )
Fig. 11 Comparison of equilibrium running lines
(a) OASPL (b) Corrected thrust
Fig. 12 Effective outlet area ratio
(a) OASPL (b) Corrected thrust
Fig. 13 Chevron penetration rate
Cor
rect
ed s
peci
fic
thru
st
Cor
rect
ed s
peci
fic
thru
st
Cor
rect
ed s
peci
fic
thru
st
Cor
rect
ed s
peci
fic
thru
st
Download service for the GTSJ via 65.21.229.84, 2022/07/20.
276 / 298
13(a),(b) (Chevron
penetration rate)
( )
13
14
Fig.14 Chevron penetration rate vs. Effective outlet area
ratio0123456789012345678901234567
0
LES
Software Cradle SCRYU/Tetra V11
SGS (Subgrid Scale model) DSM(Dynamic
Smagorinsky Model)
2 (Q )
15
(a) Z=0
(b) X=0 (Nozzle exit)
Fig.15 The cut section view of the mesh
(Nozzle inlet)
(Inlet)
( ) (Outlet)
(Nozzle)
(Side)
16
Download service for the GTSJ via 65.21.229.84, 2022/07/20.
277 / 298
Fig.16 Cut pattern along jet axis
Fig.17 Contours of the average magnitude of vorticity
(Left:TYPE1 Right:TYPE4)1234567
Fig.18 Iso-surfaces of Q parameter colored by the
magnitude of vorticity (Left:TYPE1 Right:TYPE4)
(a) TYPE1
(b) TYPE4
Fig.19 Magnitude of vorticity contours of the jet shear
layer at X/Dout=0.0~5.01234567890
17,19 TYPE4 TYPE1
18
20
20 0.0 5.0
TYPE1 TYPE4
Fig.20 Magnitude of vorticity (With and without chevrons)
CFD
(1)
(2)
(3)
(4)
(5)
1)
2)
,
53
No.167-1,(2016)
TYPE1 TYPE4
TYPE1 TYPE4
Vorticity
Download service for the GTSJ via 65.21.229.84, 2022/07/20.
278 / 298
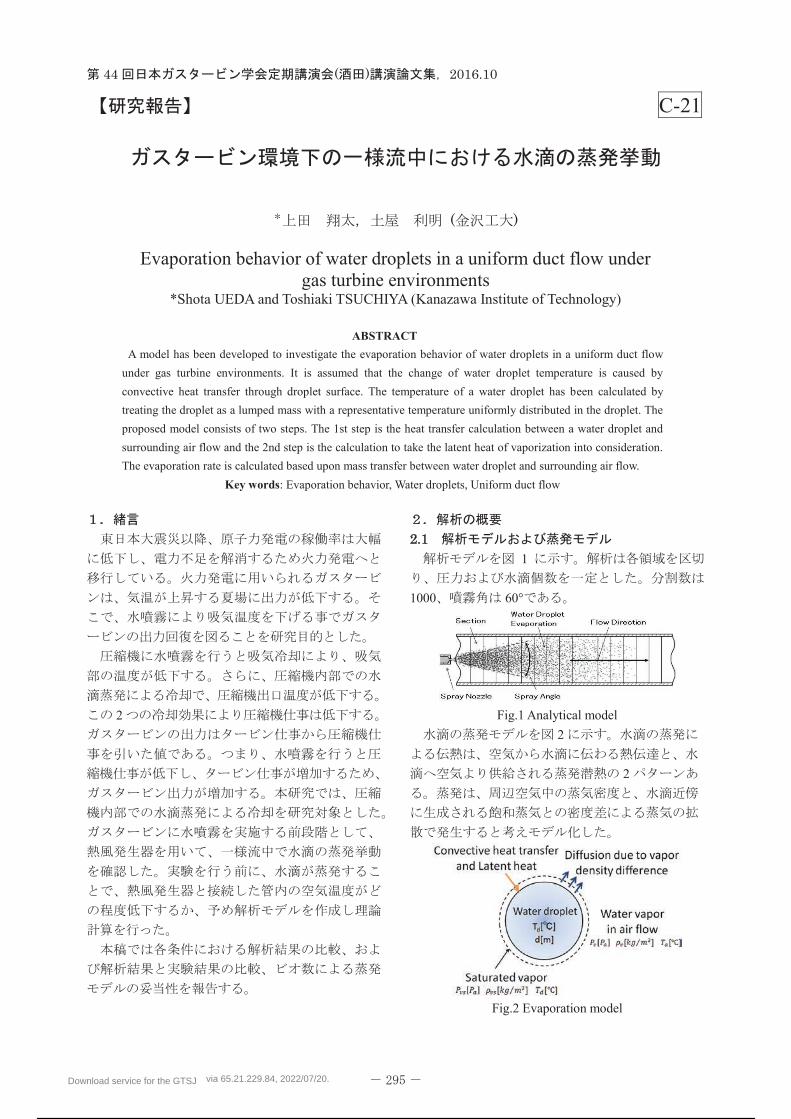
Download service for the GTSJ via 65.21.229.84, 2022/07/20.
279 / 298
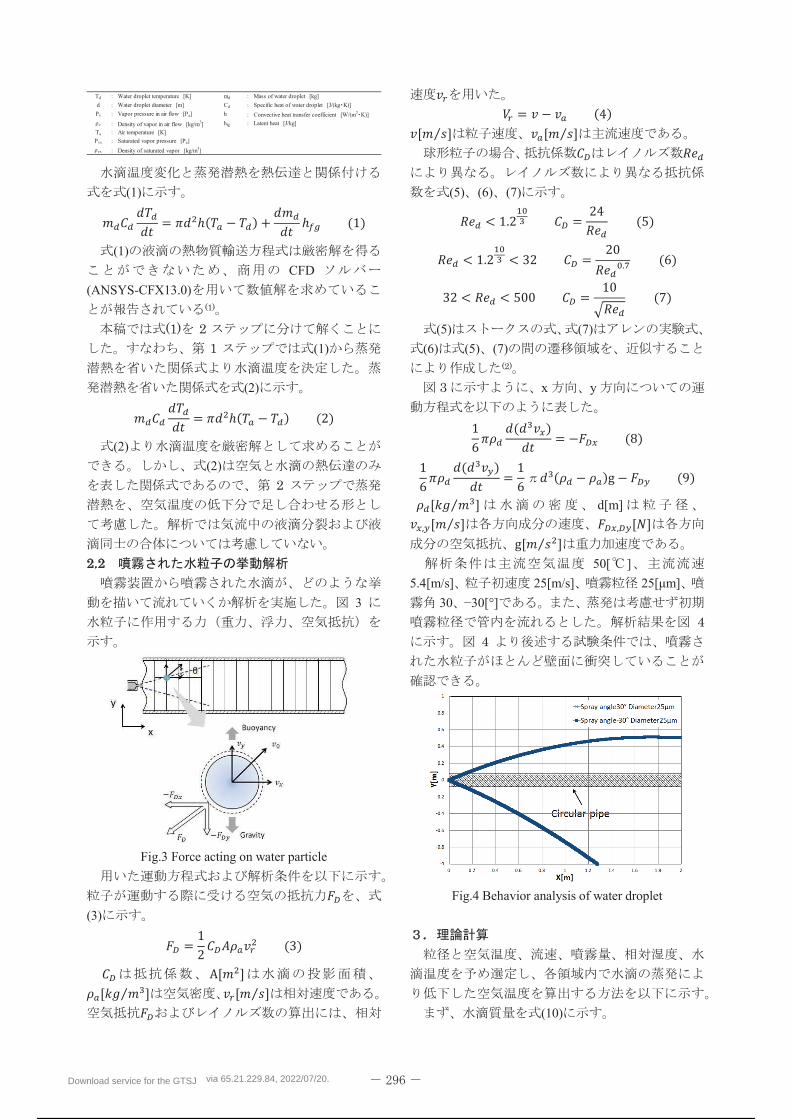
Download service for the GTSJ via 65.21.229.84, 2022/07/20.
280 / 298
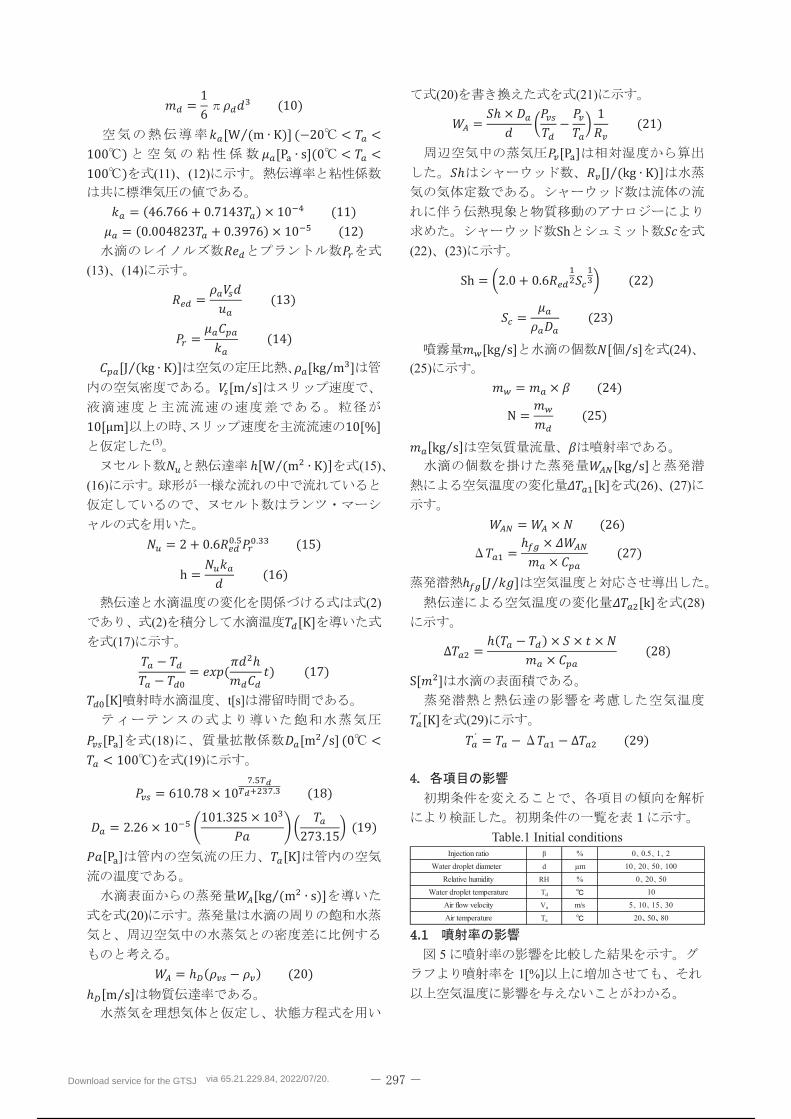
Download service for the GTSJ via 65.21.229.84, 2022/07/20.
281 / 298
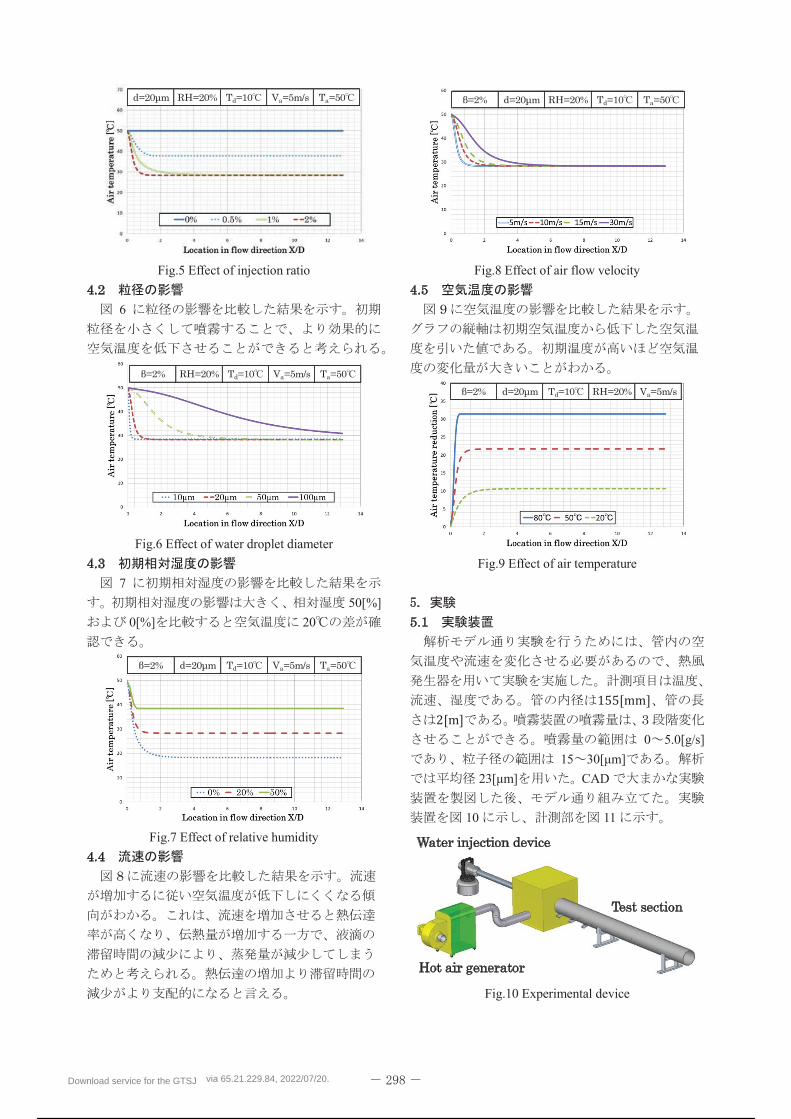
Download service for the GTSJ via 65.21.229.84, 2022/07/20.
282 / 298
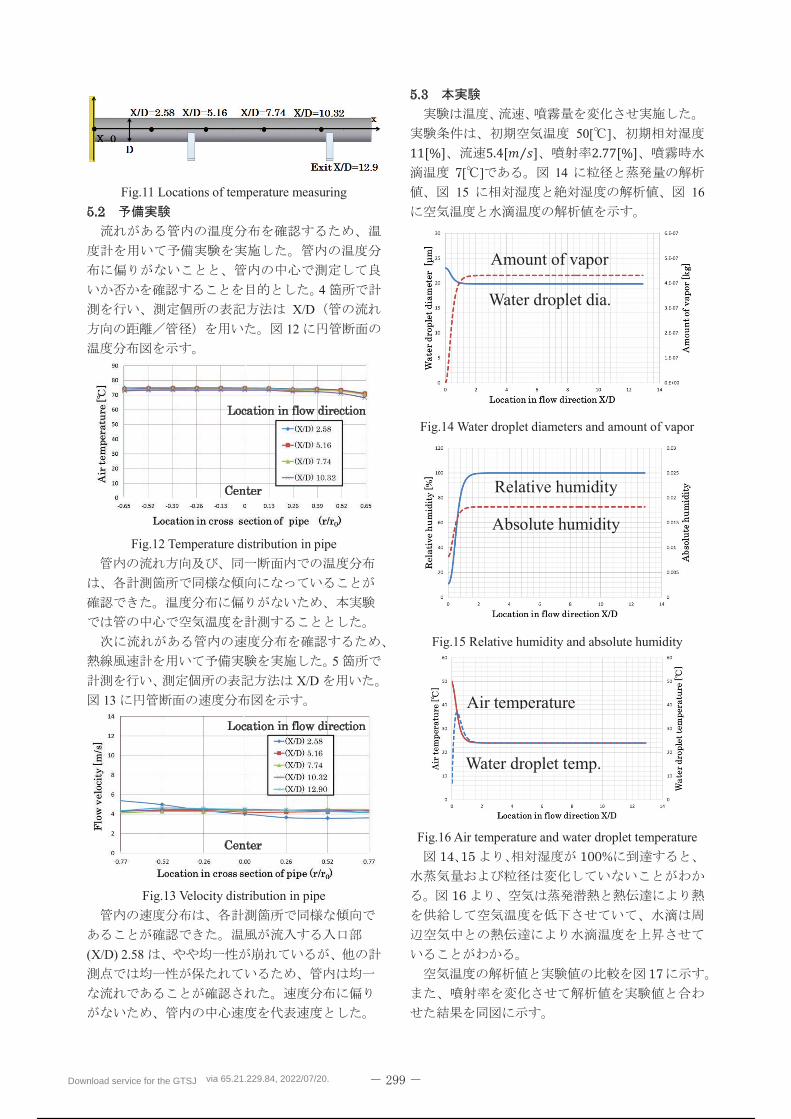
Download service for the GTSJ via 65.21.229.84, 2022/07/20.
283 / 298
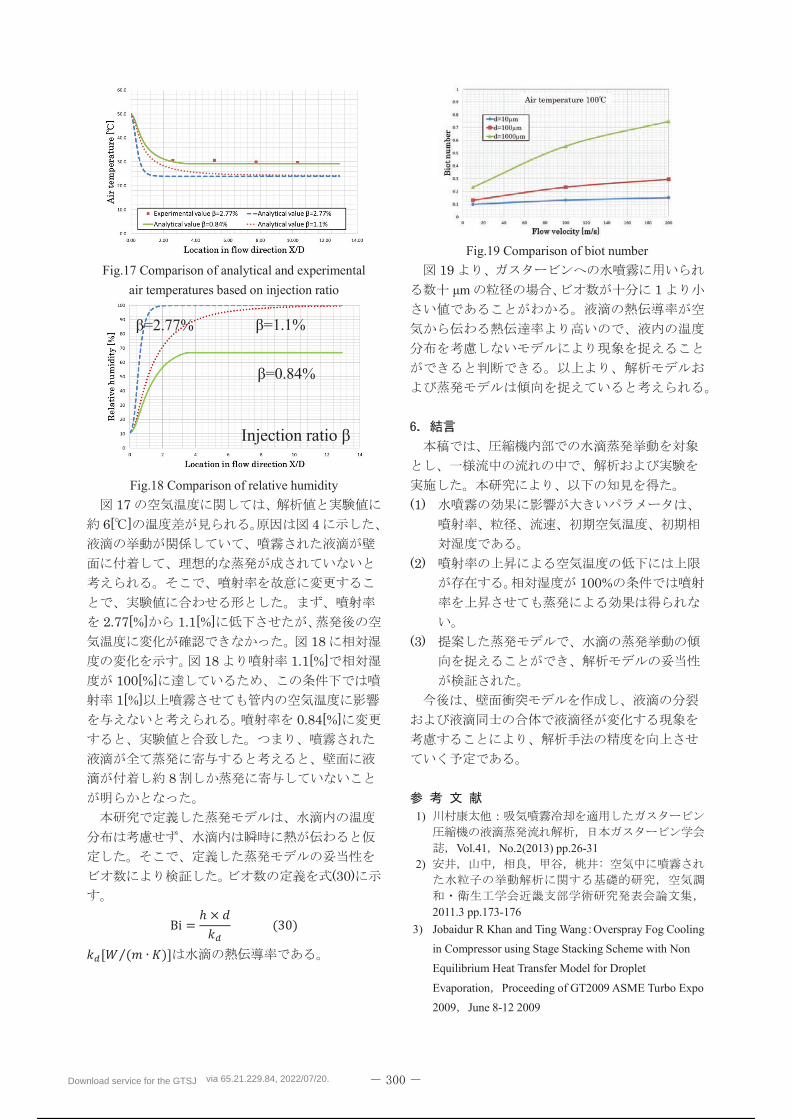
Download service for the GTSJ via 65.21.229.84, 2022/07/20.
284 / 298
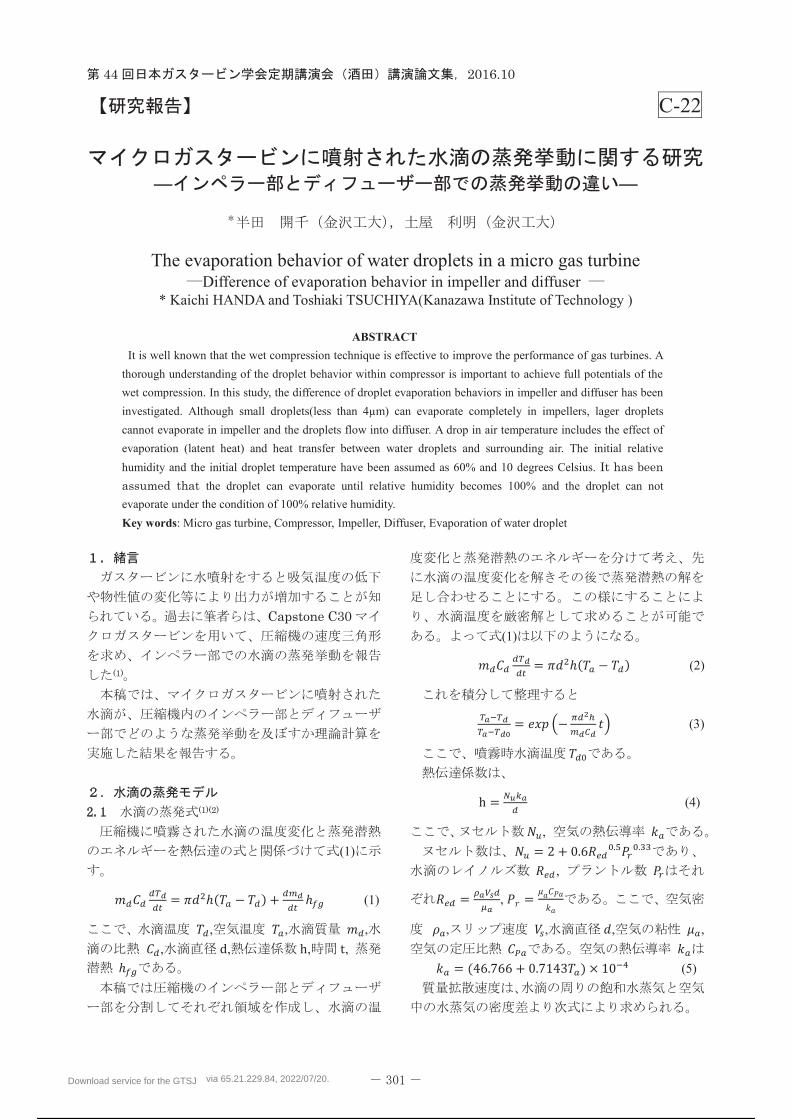
Download service for the GTSJ via 65.21.229.84, 2022/07/20.
285 / 298
Download service for the GTSJ via 65.21.229.84, 2022/07/20.
286 / 298
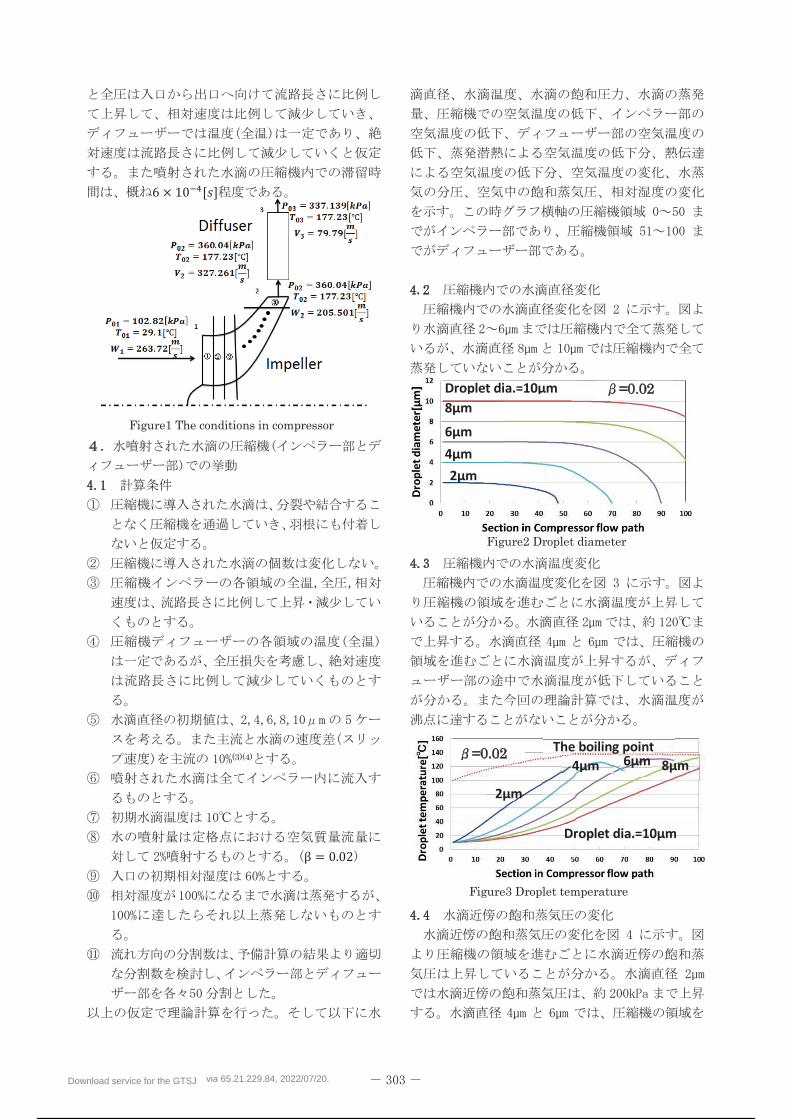
Download service for the GTSJ via 65.21.229.84, 2022/07/20.
287 / 298
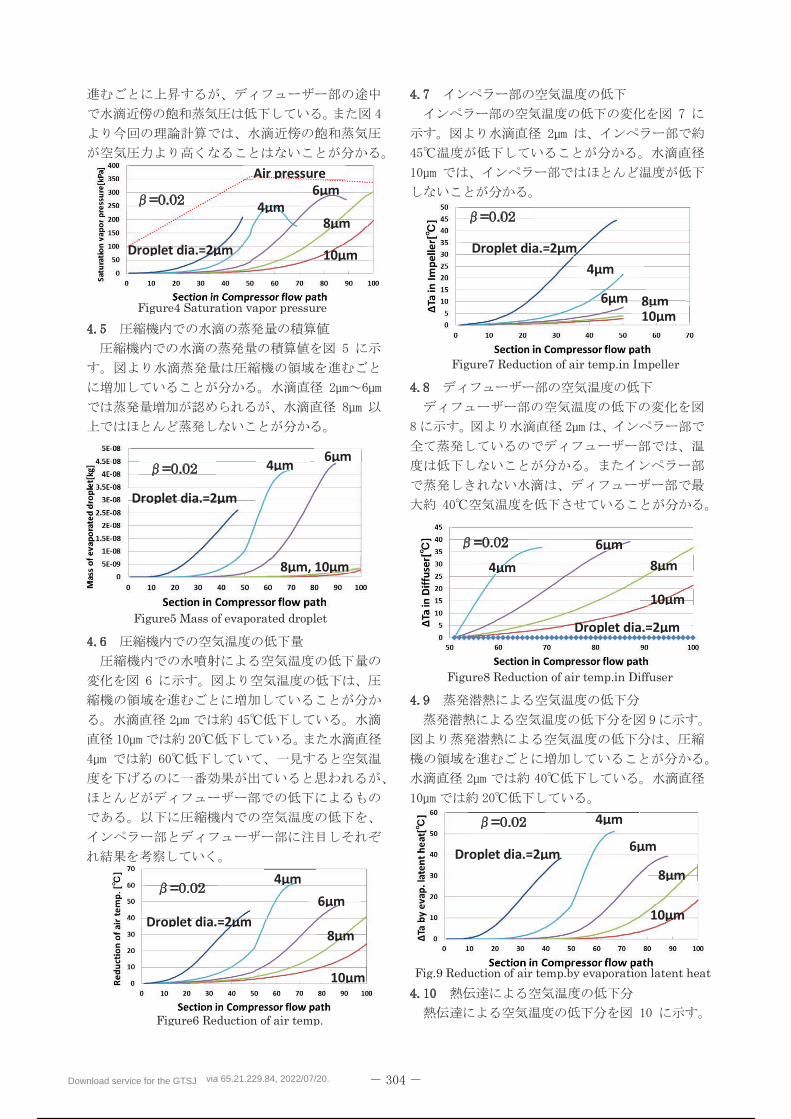
Download service for the GTSJ via 65.21.229.84, 2022/07/20.
288 / 298
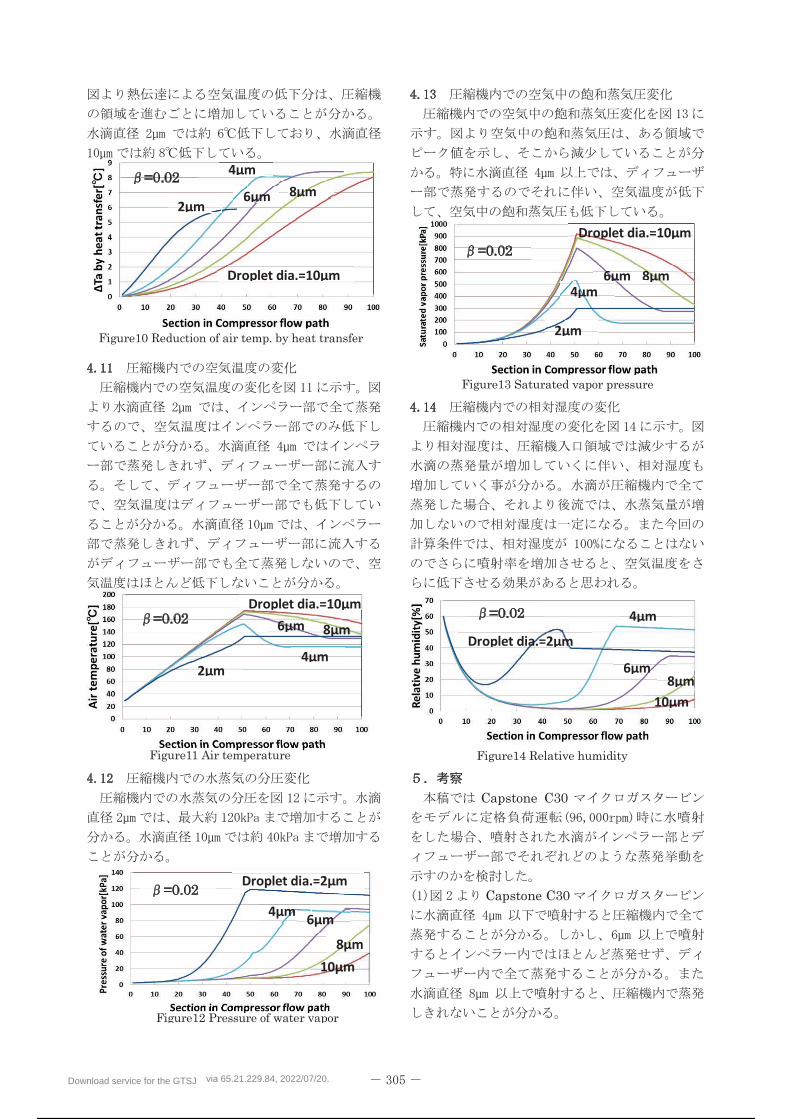
Download service for the GTSJ via 65.21.229.84, 2022/07/20.
289 / 298
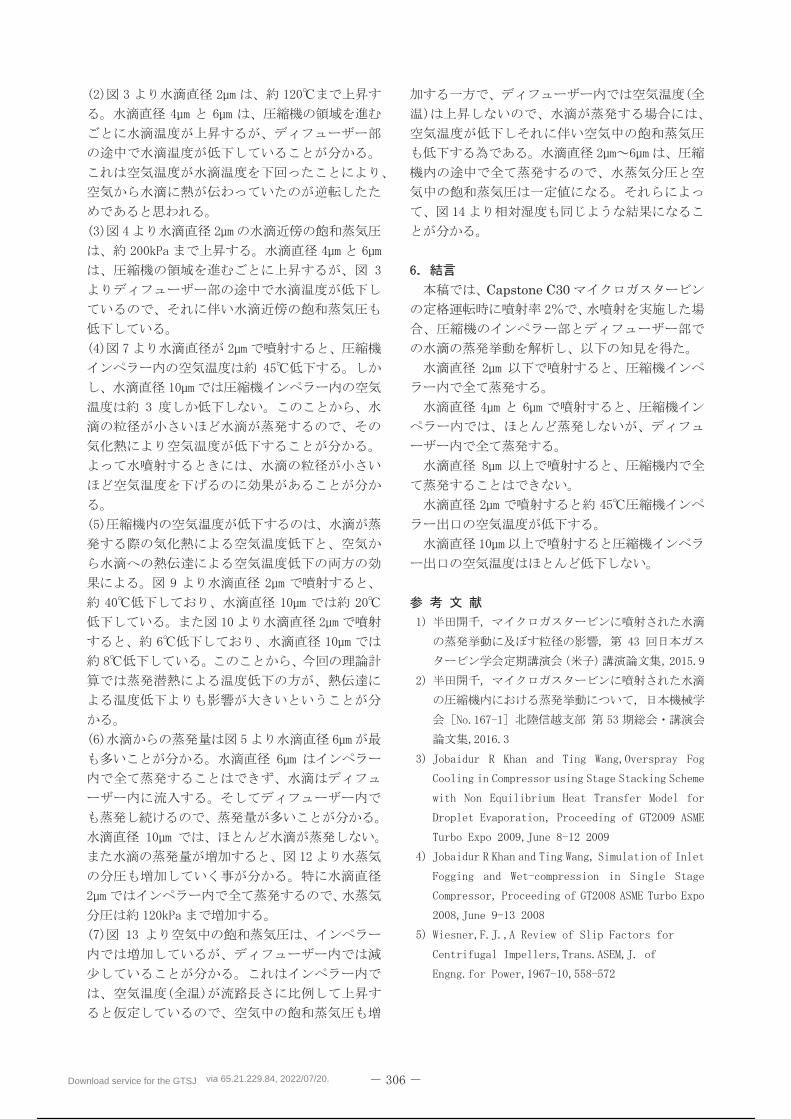
Download service for the GTSJ via 65.21.229.84, 2022/07/20.
290 / 298
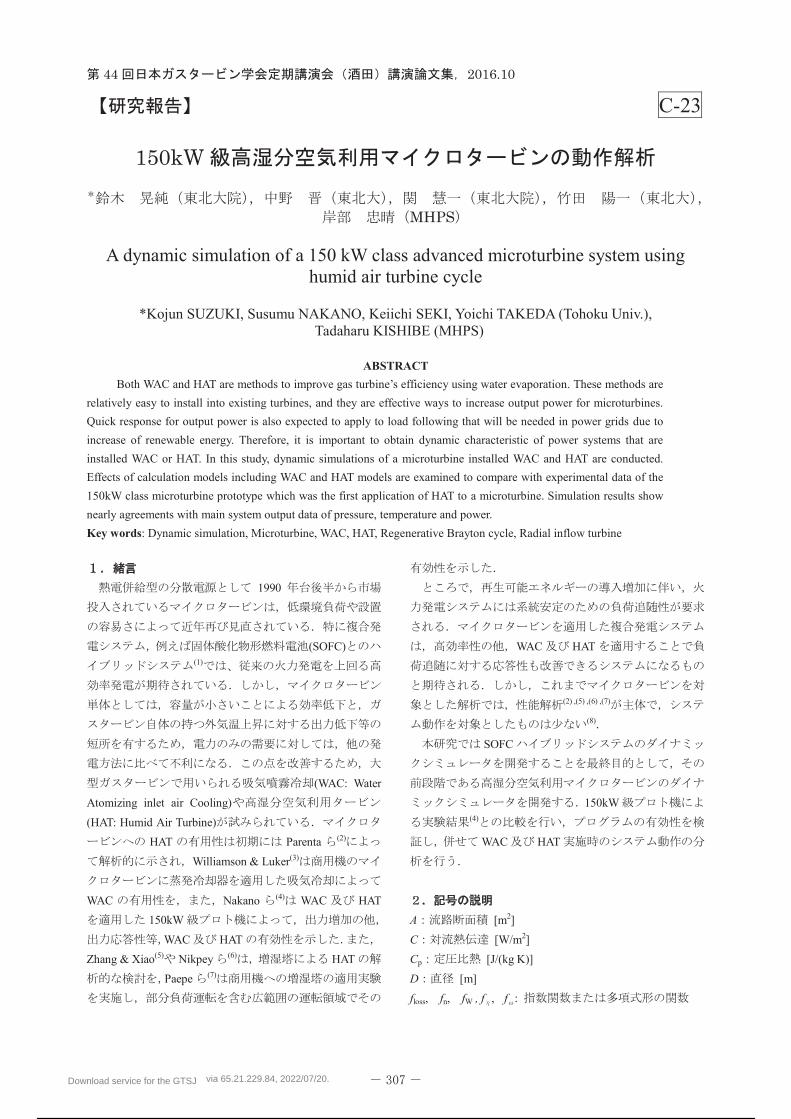
Download service for the GTSJ via 65.21.229.84, 2022/07/20.
291 / 298
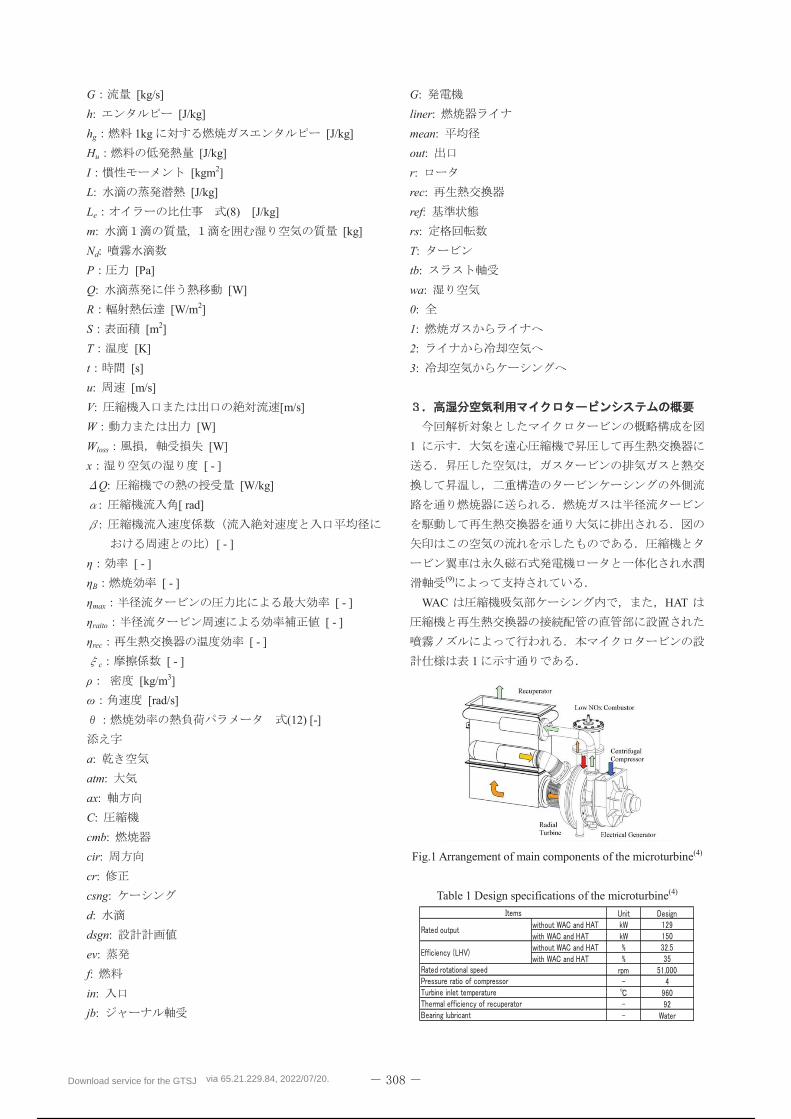
Download service for the GTSJ via 65.21.229.84, 2022/07/20.
292 / 298
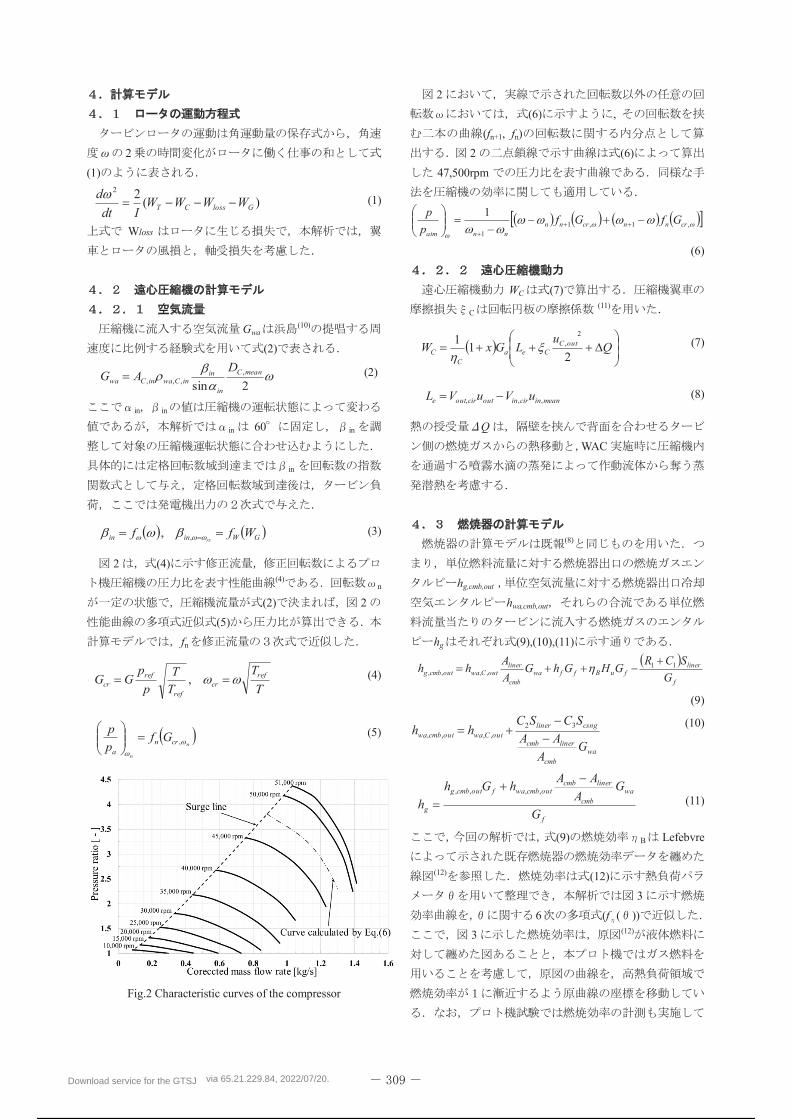
Download service for the GTSJ via 65.21.229.84, 2022/07/20.
293 / 298
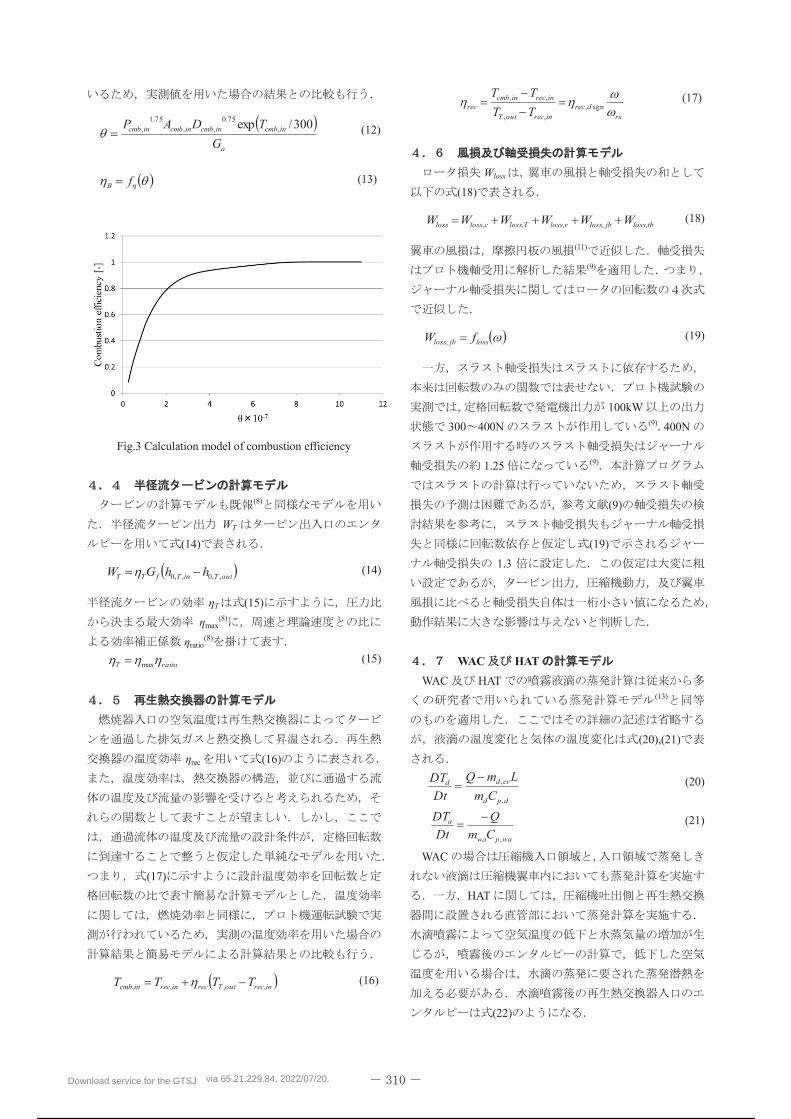
Download service for the GTSJ via 65.21.229.84, 2022/07/20.
294 / 298
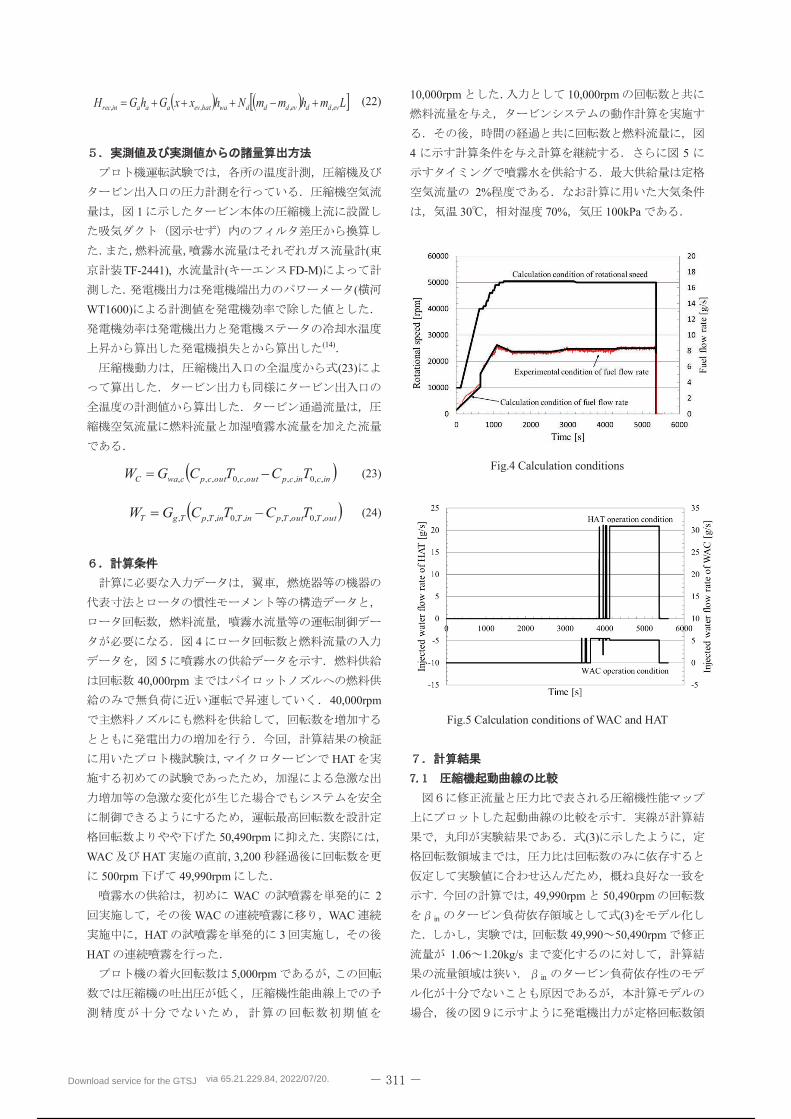
Download service for the GTSJ via 65.21.229.84, 2022/07/20.
295 / 298
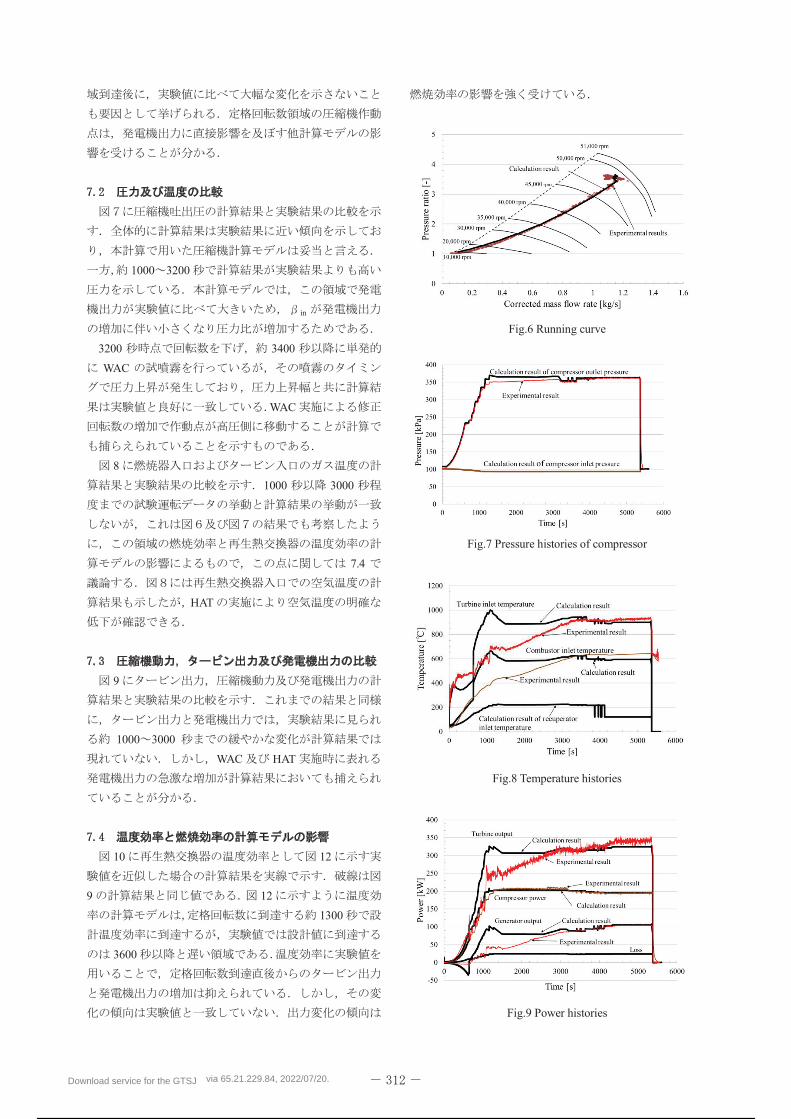
Download service for the GTSJ via 65.21.229.84, 2022/07/20.
296 / 298
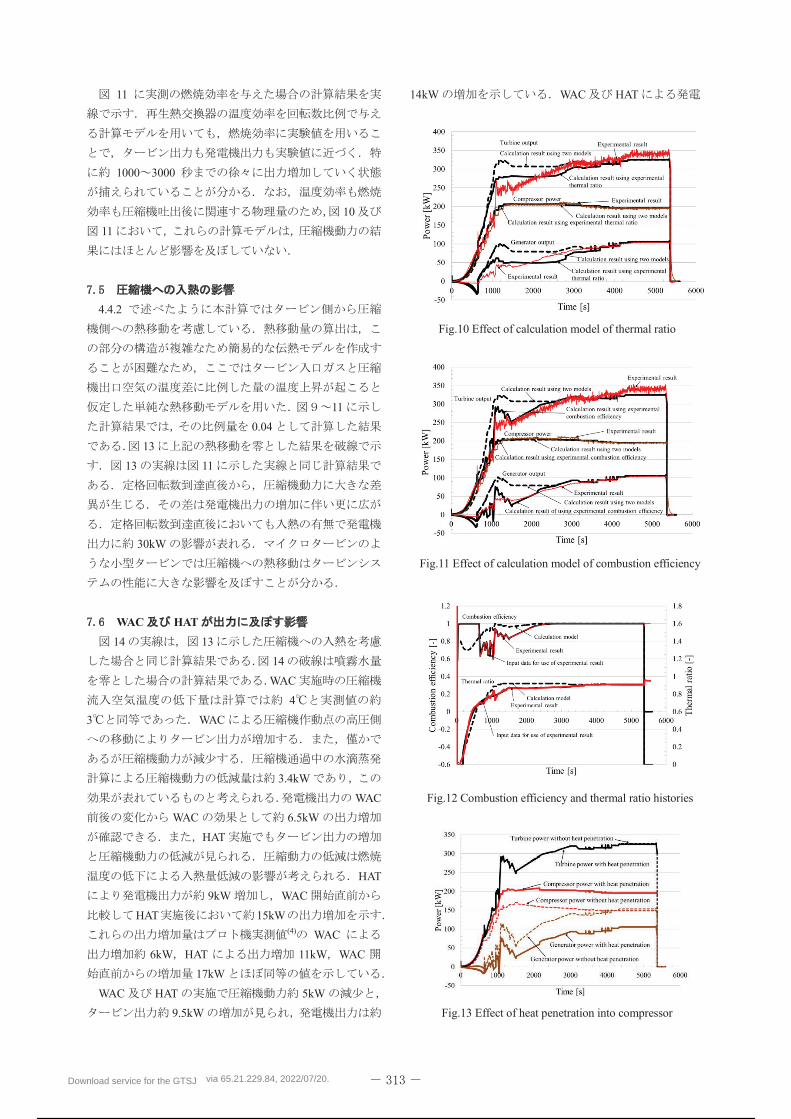
Download service for the GTSJ via 65.21.229.84, 2022/07/20.
297 / 298
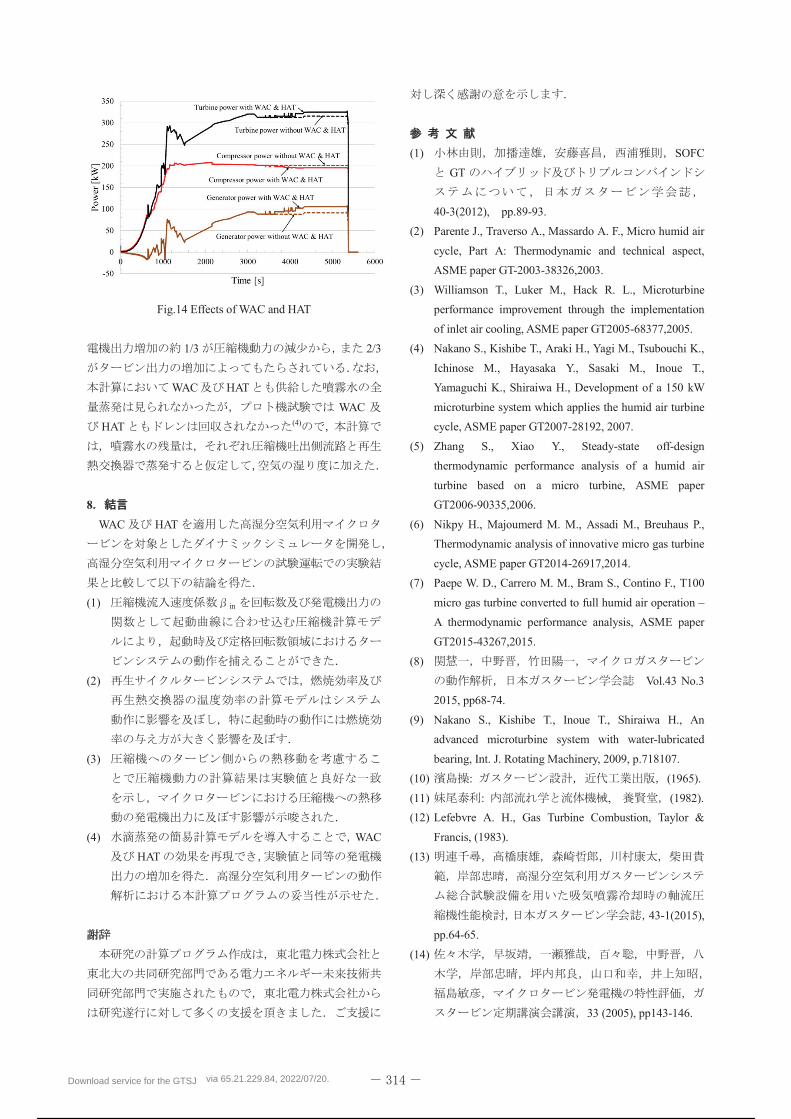
Download service for the GTSJ via 65.21.229.84, 2022/07/20.
Powered by TCPDF (www.tcpdf.org)
298 / 298


![アート&テクノロジーの歴史[16]:非物質のマテリアル・マニアラ――ライト・アート、エンヴァラメンタル・アートなど The History](https://img.pdfslide.net/doc/110x75/63316b718d2c463a580061d7/16the.jpg)