Embed Size (px)
Citation preview

www.elsevier.com/locate/foreco
Forest Ecology and Management 206 (2005) 207–219
A bio-economic model for optimal harvest of timber and moose
Hilde Karine Wama,*, Ole Hofstada, Eric Nævdalb,c, Prem Sankhayana
aDepartment of Ecology and Natural Resource Management, Agricultural University of Norway, P.O. Box 5003, 1432 As, NorwaybWoodrow Wilson School, Princeton University, Princeton, NJ 08544-1013, USA
cDepartment of Economics and Resource Management, Agricultural University of Norway, P.O. Box 5003, Norway
Received 6 May 2004; received in revised form 18 October 2004; accepted 20 October 2004
Abstract
We present a dynamic optimization model for harvesting timber and moose when the moose inflicts costs by browsing young
trees. To illustrate its behaviour, the model was run numerically for Norwegian market conditions. Optimal management in our
model kept moose at an approximately 70% lower density than if managed without concern for timber production. Further, the
harvest of moose was slightly reduced around the time of timbering to take advantage of increased forage production in coming
years. Thereby a fluctuating pattern in moose harvest was generated over time. The amplitude of these fluctuations depended on
the productivity of the site, while the period of the fluctuations depended on the fixed costs of harvesting timber. On a particular
land, the optimal harvesting strategy for timber was determined by (i) the relationship between timber prices and fixed costs of
harvesting, (ii) the relationship between prices of timber and moose, and (iii) the length of the planning period in relation to
initial standing biomass of trees. Within a wide range of the present market regime, combined production of both timber and
moose was the most profitable strategy. Still, for all our planning scenarios more than 90% of the income came from timber. To
give this and similar models accurate applied value, more field data are needed to adequately quantify the interactions between
moose and forest vegetation.
# 2004 Elsevier B.V. All rights reserved.
Keywords: Alces alces; Bio-economic model; Forest; Harvest; Moose; Picea abies; Pine
1. Introduction
Traditionally, Norwegian forest owners with moose
on their land manage timber production and moose
harvesting separately. The lack of co-ordinated
planning typically results in a non-optimal situation:
too many moose locally retard forest regeneration
* Corresponding author. Tel.: +47 64948909; fax: +47 64948890.
E-mail address: [email protected] (H.K. Wam).
0378-1127/$ – see front matter # 2004 Elsevier B.V. All rights reserved
doi:10.1016/j.foreco.2004.10.062
(Lykke, 1964; Solbraa, 1998; Sæther et al., 1992),
while moose weights drop as forage production
changes with forest succession (Hjeljord and Histøl,
1995).
Although not equally valuable, both timber and
moose are of substantial importance for rural economy
in Norway. At present, the annual timber yield is
approximately 10 mm3, while almost 40.000 moose
are shot each year (SSB, 2002). The timber has a
market value eight to nine times the meat value of
.

H.K. Wam et al. / Forest Ecology and Management 206 (2005) 207–219208
moose (Gasdal and Rysstad, 1999). However, in
coming years we expect a higher relative value of
moose as the hunt is increasingly commercialised, and
more of its recreational value is realised (Mattson,
1990). Accordingly, the need for forest owners to
co-ordinate their harvests of timber and moose will
intensify.
We have built a bio-economic optimization model
for the combined harvest of timber and moose, where
we incorporate both the negative impact of moose on
forest trees and the positive impact of forest trees on
moose. Our objective function seeks to maximise the
profit over time, irrespectively of whether the main
income comes from harvest of timber or from moose.
Our model framework consists of a dynamic set of
logistic growth functions that can be used for both
mono-cultural and multi-species forests. We assume
that all seasonal migration of moose occurs within
the forest boundaries, and that the decision makers
are the same for the whole area. Consequently, we do
not discuss distribution issues among forest owners
(for such a discussion, see Olaussen and Skonhoft,
2002).
The greatest challenge when modelling this system
is to quantify the interactions between the herbivore
and its foraging plants. These interactions are not
simple functions of biomass densities, as quantitative
aspects of moose browsing naturally depend on the
quality of what is available (see e.g. Niemela and
Danell, 1988; Heikkila, 1990; Shipley et al., 1998;
Ball et al., 2000). Furthermore, the moose itself
Fig. 1. Model outline for the bio-economic modelli
contributes to form the quality of what is available (see
Pastor et al., 1997 and references therein). However,
quantitative data on moose–forest interactions are
accumulating (see e.g. Danell et al., 1991a, 1991b;
Bergstrom and Danell, 1987; Bergstrom and Hjeljord,
1987; Danell and Bergstrom, 1989; Edenius, 1992;
Edenius et al., 1993; Andren and Angelstam, 1993;
Heikkila and Loyttyniemi, 1992; Heikkila and
Mikkonen, 1992; Hornberg, 2001; Bergqvist et al.,
2003; Persson, 2003), making a general model
approach feasible.
2. The model
Our model is developed for forest planning when
potential timber trees are affected by moose browsing
in two ways: (i) the moose consumes part of the
biomass of young trees, and (ii) browsing damages
some trees to the extent that all their monetary value is
lost. Growth projections and interaction components
are modelled using a set of difference equations, with
the ultimate objective to maximise forest income
(Fig. 1). The model has a spatial structure where forest
growth in each individual stand is modelled separately.
Moose is supposed to distribute themselves optimally
according to density so that the relative foraging
opportunities are equalized across stands.
Let xt,s be the stock of stem volume (m3 ha�1) of
undamaged trees and yt,s the stem volume of damaged
ng of combined harvest of timber and moose.

H.K. Wam et al. / Forest Ecology and Management 206 (2005) 207–219 209
trees at time t in stand s. Let S be the total number of
stands. The stock is assumed to develop according to:
xtþ1;s ¼ ð1 � ut;sÞ½xt;s þ f ðxt;s; yt;sÞ�þ ut�c;snse
crs ½1 � bðmt;sÞ�;ytþ1;s ¼ ½yt;s þ gðxt;s; yt;sÞþ ut�c;snse
crs bðmt;sÞdðmt;sÞ�� ½1 � bðmt;sÞvðyt;sÞ� (1)
In (1) f(xt,s, yt,s) and g(xt,s, yt,s) are respectively the
growth of undamaged and damaged stem volume
during time period t, and they follow logistic growth
functions given by
f ðxt;s; yt;sÞ ¼ rsxt;s 1 � xt;s þ yt;s
Kfs
� �;
gðxt;s; yt;sÞ ¼ qsyt;s 1 � xt;s þ yt;s
Kfs
� �(2)
where rs is the intrinsic growth rate of undamaged
forest, qs is the intrinsic growth rate of damaged forest
and Kfs is the maximum volume of forest attainable in
the land in stand s.
In (1) ut,s is the fraction of the stock in stand s that is
cut at time t. Note that our model does not specify
whether a reduction in biomass density comes from
clear-felling one large or several smaller parts of the
stand. After cutting, new forest ns is recruited through
planting within the same year. The new forest does not
become part of the main stock until it reaches a certain
age of c years, i.e. the age when it first become
susceptible to moose browsing (assuming an average
snow depth of 50 cm throughout the winter). The
growth of new forest is not density-dependant within
the period of c years, and has the same growth rate rs as
the main stock.
In (1) b(mt,s) is a fraction of the young or damaged
forest that is either eaten or (further) damaged by
moose through browsing. The fraction depends on the
density of moose (mt,s) relative to its carrying capacity
(Kt,s) in the stand at time t, and is parameterised as
bðmt;sÞ ¼ asðmt;s=Kt;sÞbs , where as and bs are stand-
specific constants that quantify the amount of biomass
browsed by each moose during the time period t. The
fraction of the browsed biomass that is damaged, i.e. it
forever loses its monetary value because of stem
breakage, bark stripping or prolonged browsing of
apical leaders, is called d(mt,s). Like b(mt,s), d(mt,s)
depends on the density of moose in the stand at time t,
and it is parameterised as dðmtÞ ¼ 1 � e�gsmt;s , where
g is a stand-specific constant that quantify the amount
of biomass damaged during the time period t.
Due to repeated browsing and retarded height
growth, damaged trees may remain vulnerable
for more years than undamaged trees (Lavsund,
1987). In (1) the vulnerability of damaged forest to
further moose browsing follows the function
vðyt;sÞ ¼ 1 � e�ðls�yt;sÞ, so that the forest is no longer
vulnerable if it reaches a certain density set by the
constant ls (assuming that an increment in biomass
density to some extent corresponds to height growth).
The stock of moose also follows a logistic growth
function:
mtþ1 ¼ mt þ mtw
� 1� mPs¼Ss¼1 Kms þ esyt;s þ esns
Pj¼t�c2
j¼t�c1uj;s
� �As
h i24
35
� ht; (3)
where mt is the number of moose ha�1 at time t (counted
at the end of April each year), w the intrinsic growth rate
of moose in the area, ht the number of moose hunted
ha�1 at time t, Kms þ esyt;s þ esns
Puj
� is the carry-
ing capacity (Kt,s) for moose in stand s at time t, and As
is the proportion of stand s within the entire forest
area. We have not included natural mortality. In a real
planning scenario it can easily be incorporated, though,
either indirectly through the growth rate, or directly
as a mortality function.
In (3) Kms denotes a basic carrying capacity for
moose in stand s expressed as the density of moose
sustained over the winter without any extra forage
available from clear-cutting. This applies to the
situation when all the forest stock is close to its
carrying capacity (i.e. mature). The winter browse for
moose then must come from a patch mosaic of other
tree species, e.g. rowan (Sorbus aucuparia) or willow
(Salix ssp.).
In (3) e is a constant that transforms forest biomass
into nutritional value for moose in terms of increased
carrying capacity in winter. We assume that forest
regeneration contributes to moose carrying capacity
from (t � c1) to (t � c2) years of age, corresponding to
the heights within reach for moose with a snow depth
of 50 cm. Most of this contribution is indirectly
through increased growth of deciduous saplings after
clear-cutting.

H.K. Wam et al. / Forest Ecology and Management 206 (2005) 207–219210
Moose do not respect stand boundaries. In an ideal
world they will distribute themselves according to
optimal foraging theory, i.e. to go where food intake
will be higher in relation to costs (McArthur and
Pinka, 1966; Charnov, 1976). Assuming that they do
so, and that migration is effortless, the moose in our
model will disperse according to the following
condition:
mt;1
Km1 þ e1yt;1 þ e1n1
Pj¼t�c1
j¼t�c2uj;s
¼ mt;s
Kms þ esyt;s þ esns
Pj¼t�c1
j¼t�c2uj;s
8 s
¼ 2; 3; . . . ; S (4)
Eq. (4) postulates that the ratio of moose density to the
available forage is the same for all stands. We need one
more condition to determine the system:
Xs¼S
s¼1
mt;s ¼ mt 8 t: (5)
Timber is harvested and sold as different log quality
assortments. We have assigned one price for all the
timber cut in each stand, assuming an average dis-
tribution of quality assortments. A more specific price
differentiation is not applicable when harvest is simply
measured with a biomass index. The profit from
harvesting and replanting is given by
pf ¼XT
t¼1
XS
s¼1
dtðpfsut;sxt;sAs � cfsÞ; (6)
where pf, pfs and cfs, respectively are the profit,
average net price/m3 of timber cut and fixed cost of
cutting in stand s. cfs naturally is zero as long as no
timber is cut. dt is the discount factor.
Moose is harvested with a net price pm that may
include not only the meat value of the animal, but also
profits from trading the hunt itself and non-marketable
goods like recreational value for the hunters:
pm ¼XT
t¼1
dtpmht: (7)
To investigate how the model behaves for different
forest scenarios, it was run as a non-linear optimiza-
tion problem in GAMS (distribution 20.7—Windows
NT) using CONOPT21 as the solver (Brooke et al.,
1998). We first apply the model to a forest where
Scots pine (Pinus silvestris) is the only tree species
with economic value, and the pine is distributed in
stands of varying productivity. Thereafter, we apply
the model to a forest where pine, Norway spruce
(Picea abies), and birch (Betula pubescens) are
considered.
2.1. Optimal harvest in a pine forest with
varying site productivity
As a numerical example we have chosen a
hypothetical pine forest with three stands of varying
productivity: high, intermediate and low in terms of
timber production in Norway. This is a typical
situation as most forest owners in Norway have an
altitudinal gradient on their land (Eid et al., 1998).
Mathematically, the actual size of our example forest
does not matter (since all calculations are relative),
but practically it can be thought to represent one
large Norwegian moose hunting unit (i.e. 30–
50 km2, which normally includes several overlap-
ping moose home ranges, Cederlund, 1995). Note
that although the three stands are projected
separately in the model, in the real world this
may represent a diversity of different spatial
arrangements. A stand in our model is simply
outlined as a proportion of the land in question.
Therefore, it may just as well be viewed as several
smaller stands of equal productivity scattered within
the forest property. Traditionally this has been
termed a stratum in the forest management literature
(Clutter et al., 1983).
We start from a base scenario of general high
productivity (Table 1), and then re-scale parameters
from here to investigate what effect a particular
parameter has on our objective function. All model
parameters are adjusted to fit productivity and market
conditions in Norway. The planning period is set to
100 years.
The pine growth parameters Kf, rs and ns are chosen
in accordance with those given in Brantseg (1967).
There is no adequate data available on growth rates of
browsed-damaged pine, but we assume they are lower
than for undamaged trees. The actual level of qs is of
little importance here, though, as the density of
damaged pine stays negligible throughout the plan-
ning period for all realistic values (i.e. it never grows
out of reach for moose).

H.K. Wam et al. / Forest Ecology and Management 206 (2005) 207–219 211
Table 1
Base scenario for an optimization model of harvest in a pine forest where moose inflicts costs by browsing young trees
Stand Pine growth
parameters
Moose growth
parameters
Moose browsing
impact parameters
Miscellaneous
parameters
Kf rs qs ns Kms w e as bs c1, c2 gs ls d pfs As cfs pm
1 pine 400 0.07 0.06 15 0.003 0.35 0.005 5.0 0.94 5, 15 23 40 0.03 1.0 0.5 10 50
2 pine 200 0.06 0.05 10 0.004 0.35 0.005 5.0 0.94 5, 15 23 40 0.03 0.9 0.3 10 50
3 pine 100 0.05 0.04 5 0.005 0.35 0.005 5.0 0.94 5, 15 23 40 0.03 0.6 0.2 10 50
The net value of 1 m3 timber (pf), the fixed costs of harvesting it (cf) and the price of moose (pm) is set relative to the net value of pine in the most
productive stand, which has a value of 1. Kf, Km: carrying capacity of pine and moose per ha; r, q, w: intrinsic growth rates of undamaged pine,
damaged pine and moose; a, b: constants that quantify moose browsing in undamaged pine; c: age at which saplings first become susceptible to
moose browsing; g: constant that quantify moose damage; l: constant that determine vulnerability of damaged saplings to further browsing.
The growth rate for moose ws is set to represent an
intermediately productive moose population in Nor-
way (Solberg et al., 2003). Since all moose popula-
tions in Norway are hunted, it is difficult to estimate
even rough figures for the carrying capacity Km. Our
effort is therefore a completely subjective one,
comparing harvest statistics, population levels and
forest productivity in Norway with a few studies
internationally that have shed some light on carrying
capacity for moose (Crete, 1989; Schwartz and
Franzmann, 1989; McLaren and Peterson, 1994).
Moose browsing impact parameters have been
quantified using the work of Edenius (1992),
Harkonen (1998) and Persson (2003), which are all
studies geographically close to Norway. The level of
browsing impact will in any way be site-specific, and
thus need to be adjusted if the model is implemented in
a real planning scenario. Factors that may influence
moose browsing pattern and -pressure on pine are, e.g.
site productivity (Danell et al., 1991a, 1991b), feeding
loops (i.e. present herbivory is influenced by the
Table 2
Base scenario for an optimization model of harvest in a forest with seve
browsing young trees
Stand Tree growth
parameters
Moose growth
parameters
Mo
im
Kf rs qs ns Kms w e as
1 pine 300 0.06 0.05 12 0.004 0.35 0.005 5.0
2 spruce 280 0.05 0.04 12 0.001 0.35 0.005 0.5
3 birch 180 0.07 0.06 18 0.006 0.35 0.005 3.0
The net value of 1 m3 of timber (pf), the fixed costs of harvesting it (cf) and
most productive stand, which has a value of 1. Kf, Km: carrying capacity of
trees, damaged trees and moose; a, b: constants that quantify moose br
susceptible to moose browsing; g: constant that quantify moose damage; l:
browsing.
previous) (Lyttyniemi, 1985; Bergqvist et al., 2003)
and silvacultural treatments like the use of artificial
fertilizers (Ball et al., 2000).
2.2. Optimal harvest in a multi-species forest
If we instead want to run the model for a forest with
several tree species having economic value, we let the
previous three stands denote one species each. Again
we have chosen a base scenario from which to re-scale
parameters to illustrate how the model runs (Table 2).
Tree growth parameters for spruce and birch are set
in accordance with Braastad (1966, 1975) to represent
stands of intermediate to high productivity. We have
used the work of Bergstrom and Danell (1987),
Randveer and Heikkila (1996), Danell et al. (1985,
1997), Bergstrom and Bergqvist (1999) and Jalkanen
(2001) to adjust moose browsing impact parameters
for birch and spruce compared to those given in
Table 1.
ral species having economic value, where moose inflicts costs by
ose browsing
pact parameters
Miscellaneous
parameters
bs c1, c2 gs ls d pfs As cfs pm
0.94 5, 15 23 40 0.03 1.0 0.3 10 50
0.94 5, 15 23 45 0.03 0.8 0.5 10 50
0.94 5, 15 11 35 0.03 0.9 0.2 10 50
the price of moose (pm) is set relative to the net value of pine in the
trees and moose per ha; r, q, w: intrinsic growth rates of undamaged
owsing in undamaged trees; c: age at which saplings first become
constant that determine vulnerability of damaged saplings to further

H.K. Wam et al. / Forest Ecology and Management 206 (2005) 207–219212
3. Results
3.1. Optimal harvest in a pine forest with varying
site productivity
For all the described scenarios, the optimal solution
in our model was a combined production of timber and
moose. The most influencing factor was the fixed costs
of cutting timber. When fixed costs were set to be
negligible the optimal harvest strategy was to cut
small amounts of the standing pine stock at a few years
intervals (Fig. 2A). With increased fixed costs the
optimal strategy approached clear-felling (Fig. 2D and
E). Note how the harvest strategy differed between
the stands. The most productive stand was cut most
frequently.
The second most important parameter to determine
the optimal harvest strategy was the impact of moose
browsing (Fig. 2A–C). With an increasingly negative
impact, the moose was kept at lower densities.
Accordingly, the amount of tree biomass removed
was kept at more or less the same level, determined by
the relative value of moose to timber. Of course, forest
productivity also influenced the optimal harvest
strategy. With less productive forest sites, less timber
was cut and the moose population was kept slightly
higher as it was relatively more valued. Within our
range of scenarios neither the price nor the produc-
tivity of moose had any noticeable influence on the
harvest strategy.
In our model the harvest of moose followed the
same cyclical pattern as the timber harvest. With
frequent cutting of pine, the moose population was
kept two to five times higher than their basic carrying
capacity (i.e. the density of moose supported when all
pine is mature) through most of the rotation period
(Fig. 2A and B). When the extra forage availability
diminished 15 years after a cutting, the population was
abruptly harvested down to the level of the basic
carrying capacity. With large timber harvests at long
intervals, however, the upper limit of moose was set by
their basic carrying capacity for most of the rotation
period (Fig. 2D and E).
Timber was the main contributor to forest income
for all our planning scenarios. Its relative contribution
varied from 94.5 to 98.5% of the net present value
(Table 3). Decreased forest productivity, increased
moose productivity, higher fixed costs of cutting and a
higher price of moose all reduced the relative
contribution of pine to forest income. Conversely,
with increasingly negative impact of moose, a greater
proportion of the income came from pine.
The factors which influenced the actual level of
total profit over time the most (apart from the price of
pine of course), was the fixed costs of cutting timber. A
five-fold increase in the fixed cost of cutting led to a
50% reduction in the net present value. Secondly,
forest productivity and the price of moose had
noticeable influence on the level of income, while a
change in the remaining parameters only had marginal
impacts.
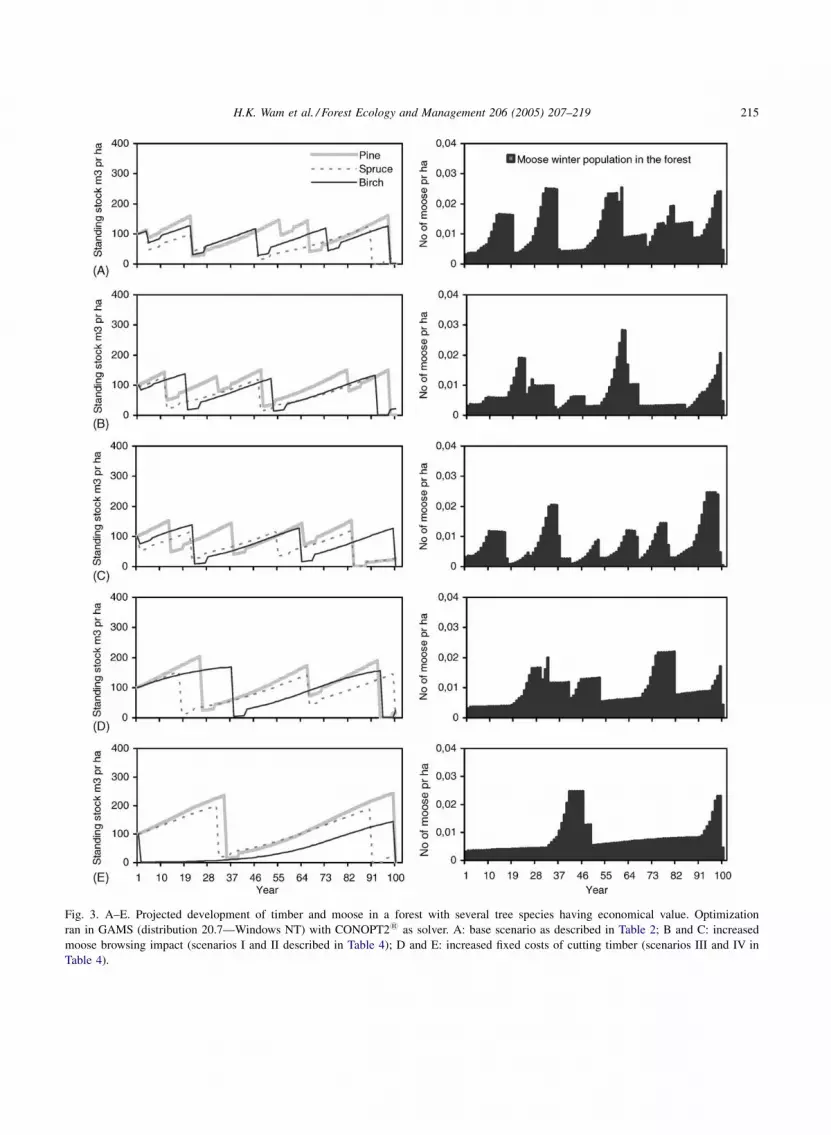
3.2. Optimal harvest in a multi-species forest
Also in this forest we found that a combined
production of timber and moose was optimal for all the
described scenarios. The actual harvest pattern was
slightly different, though. In the multi-species forest,
more cuttings occurred simultaneously, creating an
even greater temporary effect on forage availability
for moose (Fig. 3A). Still, the relative directional
impacts of changing one or another parameter
(Fig. 3B–E) were the same as for the forest with
only pine having economic value.
As for the pine forest, timber production in the
multi-species forest was the main contributor to
forest income. Here, it accounted for 91.4–97.1% of
the net present value (Table 4), slightly lower than for
the pine forest. Again, decreased forest productivity,
increased moose productivity, higher fixed costs of
cutting and a higher price of moose all reduced the
relative contribution of timber to forest income.
Conversely, relatively more of the income came from
timber when the negative impacts of moose browsing
increased.
As before the factor which influenced the
actual level of total profit over time the most (apart
from the obvious timber prices), was the fixed costs of
cutting timber. In this multi-species forest a five-fold
increase in the fixed cost of cutting led to a 70%
reduction in the net present value. Secondly, forest
productivity and the price of moose determined the
actual level of income (in that order). Even in this case
was the influence of moose productivity and browsing
impact relatively low compared to the other three
parameters.

H.K. Wam et al. / Forest Ecology and Management 206 (2005) 207–219 213
Fig. 2. A–E. Projected development of timber and moose in a pine forest of varying productivity. Optimization ran in GAMS (distribution
20.7—Windows NT) with CONOPT21 as solver. A: base scenario as described in Table 1; B and C: increased moose browsing impact (scenarios
I and II described in Table 3); D and E: increased fixed costs of cutting timber (scenarios III and IV in Table 3).

H.K. Wam et al. / Forest Ecology and Management 206 (2005) 207–219214
Table 3
Total profit per ha (ptot) from combined harvest of pine and moose in a forest of varying productivity
Base scenario Re-scaled scenarios
Forest growth parameters Re-scaling of forest growth parameters (other parameters kept as in base scenario)
Stand Kf ra ptot %pine Kf ra ptot %pine Kf ra ptot %pine Kf ra ptot %pine
1 400 0.007 300 0.006 80.6 97.0 300 0.006 200 0.006
2 200 0.006 99.5 97.9 200 0.006 150 0.005 77.8 96.8 150 0.005 70.4 96.4
3 100 0.005 100 0.005 80 0.004 50 0.004
Moose growth parameters Re-scaling of moose growth parameters (other parameters kept as in base scenario)
Stand Km w ptot %pine Km w ptot %pine Km w ptot %pine Km w ptot %pine
1 0.003 0.35 0.005 0.35 99.5 97.7 0.005 0.40 0.006 0.45
2 0.004 0.35 99.5 97.9 0.006 0.35 0.006 0.40 99.6 97.1 0.007 0.45 99.8 96.5
3 0.005 0.35 0.007 0.35 0.007 0.40 0.008 0.45
Moose browsing impact
parameters
Re-scaling of moose browsing impact parameters (other parameters kept as in base scenario)
Stand a g, l ptot %pine a g, l ptot %pine a g, l ptot %pine a g, l ptot %pine
1 5.0 23, 40 12.5 23, 40 98.9
(scenario I)
98.0 25 23, 40 25 45,55 98.7 98.5
(scenario II)2 5.0 23, 40 99.5 97.9 12.5 23, 40 25 23, 40 96.9 98.5 25 45,55
3 5.0 23, 40 12.5 23, 40 25 23, 40 25 45,55
Miscellaneous
parameters
Re-scaling of miscellaneous parameters (other parameters kept as in base scenario)
Stand cf pm ptot %pine cf pm ptot %pine cf pm ptot %pine cf pm ptot %pine
All 10 50 99.5 97.9 10 70 100.5 (scenario III) 96.6 (scenario III) 10 90 101.5 95.6 10 110 102.5 (scenario IV) 94.5 (scenario IV)
All 10 50 99.5 97.9 20 50 76.5 (scenario III) 97.6 (scenario III) 30 50 60.7 97.4 40 50 47.9 (scenario IV) 96.9 (scenario IV)
Optimization ran in GAMS (distribution 20.7—Windows NT) using CONOPT21 as the solver. Pine contribution to profit is given as percentage
(%pine). Kf, Km: carrying capacity; r, w: intrinsic growth rates; a, g: constants that quantify moose browsing; cf: fixed costs of harvesting timber;
pm: price of moose (cf and pm relative to price of pine, which has a value of 1). Shaded scenarios are illustrated in Fig. 2 along with the base
scenario.a The growth rate of damaged trees is reduced accordingly.
4. Discussion
Moose contribution to total income was very low
for all described scenarios ran with our model. At first
thought some may find this surprising, considering the
current optimistic view on potential income from
moose harvesting in Norway (see e.g. Aanesland and
Holm, 2003). However, if we set our objective
function to maximize income from moose and timber
separately instead of maximizing total income, we see
that it is in fact reasonable.
When maximizing moose income in our multi-
species base scenario (Table 2), the moose winter
population is kept at an average of 0.04 S.E. 0.001
animals per ha. Of this 0.01 S.E. 0.008 is hunted
each year. With a planning period of 100 years, the
total discounted moose value will be 9.1 (indexed
relative to the net value of 1 m3 with pine timber) per
ha for the whole period. In comparison, around 0.005
moose are harvested per ha in the most moose
productive counties in Norway today (SSB, 2002).
When maximizing income from timber, however,
the total discounted timber value will be 75.5 ha�1 over
the 100 years. The price of moose (per animal) then
must be 400 times the net value of 1 m3 pine to match
the income from timber alone. With the present timber
prices in Norway, this would be close tos12.000. Such
a high price for moose does not seem realistic. Hence,
for moose to be the main contributor to forest income,
all the factors promoting moose production rather than
timber production must be combined, i.e. low timber
productivity, high moose productivity, low fixed costs
and a high price for moose. In Norway such a scenario
may occur, e.g. on some costal islands along Trøndelag
H.K. Wam et al. / Forest Ecology and Management 206 (2005) 207–219 215
Fig. 3. A–E. Projected development of timber and moose in a forest with several tree species having economical value. Optimization
ran in GAMS (distribution 20.7—Windows NT) with CONOPT21 as solver. A: base scenario as described in Table 2; B and C: increased
moose browsing impact (scenarios I and II described in Table 4); D and E: increased fixed costs of cutting timber (scenarios III and IV in
Table 4).

H.K. Wam et al. / Forest Ecology and Management 206 (2005) 207–219216
Table 4
Total profit per ha (ptot) from combined harvest of timber and moose in a multi-species forest
Base scenario Re-scaled scenarios
Forest growth parameters Re-scaling of forest growth parameters (other parameters kept as in base scenario)
Stand Kf ra ptot %pine Kf ra ptot %timb Kf ra ptot %timb Kf ra ptot %timb
1 300 0.006 77.5 96.0 200 0.005 70.3 95.4 200 0.005 62.5 94.9 200 0.005
2 280 0.005 280 0.005 200 0.004 180 0.004 54.5 94.5
3 180 0.007 180 0.007 150 0.006 100 0.005
Moose growth parameters Re-scaling of moose growth parameters (other parameters kept as in base scenario)
Stand Km w ptot %timb Km w ptot %timb Km w ptot %timb Km w ptot %timb
1 0.004 0.35 77.5 96.0 0.006 0.35 78.4 95.8 0.006 0.40 79.0 95.0 0.007 0.45 79.5 94.2
2 0.001 0.35 0.003 0.35 0.003 0.40 0.004 0.45
3 0.006 0.35 0.008 0.35 0.008 0.40 0.009 0.45
Moose browsing impact
parameters
Re-scaling of moose browsing impact parameters (other parameters kept as in base scenario)
Stand a g, l ptot %timb a g, l ptot %timb a g, l ptot %timb a g, l ptot %timb
1 5.0 23, 40 77.5 96.0 12.5 23, 40 77.3
(scenario I)
97.0
(scenario I)
25.0 23 77.0 97.1 25.0 45,55 76.8 97.0
2 0.5 23, 45 2.5 23, 45 2.5 23 2.5 45,60
3 3.0 11, 35 10.0 11, 35 20.0 11 20.0 20,50 (scenario II) (scenario II)
Miscellaneous parameters Re-scaling of miscellaneous parameters (other parameters kept as in base scenario)
Stand cf pm ptot %timb cf pm ptot %timb cf pm ptot %timb cf pm ptot %timb
All 10 50 77.5 96.0 10 70 78.8 (scenario III) 94.4 (scenario III) 10 90 80.0 93.0 10 110 81.4 (scenario IV) 91.4 (scenario IV)
All 10 50 77.5 96.0 20 50 50.3 (scenario III) 95.0 (scenario III) 30 50 31.9 93.2 40 50 23.3 (scenario IV) 91.4 (scenario IV)
Optimization ran in GAMS (distribution 20.7-Windows NT) using CONOPT21. Timber contribution to profit is given as percentage (%timb). Kf,
Km: carrying capacity; r, w: intrinsic growth rates; a, g: constants that quantify moose browsing; cf: fixed costs of harvesting timber and pm: price
of moose (cf and pm relative to price of pine, which has a value of 1). Shaded scenarios are illustrated in Fig. 3 along with the base scenario.a The growth rate of damaged trees is reduced accordingly.
and Nordland, where a highly productive moose
population thrive on very low-productive forest land
(Sæther et al., 2004). It is important to note that not only
the total income, but also the optimal management path
will depend on the initial conditions of the forest
(Crepin, 2003). For example with no mature trees at the
beginning of the planning period, and the planning
period being shorter, the moose can have a relatively
higher influence on the optimal management of a
specific property.
Although the harvest principles were the same in
the multi-species and the single-species forest, to
some degree the actual harvest pattern differed
between the two. The basic underlying factor for this
is productivity per se. All else being equal, the more
productive a stand, the more frequently it is cut
(Faustmann, 1849). Overall, the multi-species forest in
our model was not as productive as the single-species
forest, and hence it was cut less frequently. Accord-
ingly, there were fewer peaks in the moose population
within this forest, as the number and magnitude of
forest cuttings determined moose carrying capacity.
In contrast to the more regular cuttings of the pine
forest, there was a wide range in the time span between
cuttings of the multi-species forest. This made the
amplitude of moose peaks to be highly variable,
depending also on the size of cuttings. If cuttings had
been more separated in time, the moose density would
instead be kept intermediately high for more of the
planning period. Apparently, the relative value of the
moose in our described scenarios was too low for this
to be an optimal strategy.
All our model specifications and parameter
assumptions are not equally realistic. While a
biological model has to be realistically founded, some
level of detail must be omitted to give the model
general value. The major simplification in our model is
the framework of difference equations, which limits the

H.K. Wam et al. / Forest Ecology and Management 206 (2005) 207–219 217
possibilities for having several unique classes of the
same species. Ideally, a moose–forest model should at
least distinguish between sex- and age-groups of
animals, and age- or size-groups of trees. Particularly
for moose, essential dynamics are lost when resources
are grouped into one single measure of biomass. For
timber production, using only a biomass index reduces
the opportunity to differentiate between qualitative
aspects related to age (e.g. growth rates, marked price)
and spatial scale. Biomass density may be an adequate
indicator of timber trees if stock development is
uniform throughout the stand. In Scandinavia, however,
this is often not the case, and there is an increasingly
interest in focusing on the individual tree both in
modelling (see e.g. Holthe and Solberg, 1989; Eid and
Tuhus, 2001; Andreassen and Tomter, 2003) and in
actual harvesting (Lexerød, 2003).
By increasing the number of stands in our model,
though, we can in fact make it work for more spatially
heterogeneous forests. Mathematically our model
treats a stand simply as a proportion of the land in
question. By assigning the stand label to specific age
groups for each species we can make the model work
even for mixed-species forests (i.e. forests with no
distinctive stand formation). Practically of course,
such a forest would demand selective harvest in its
uttermost form, which currently is not a prevalent
practice in Norway. Such a model alteration would
also imply some adjustments in the moose–forest
interactions. Browsing pattern and pressure on one
species may to various extent be affected by
neighbouring species in such mixed-species forests
(see e.g. Heikkila, 1990; Edenius, 1991; Heikkila and
Harkonen, 1993, 1996; Ball and Dahlgren, 2002).
In the same way as we could easily incorporate
more stands into our model, we could add different
categories of timber quality. At present all browsed
plants either escape relatively unharmed (i.e. with less
biomass) or completely damaged. Alternatively we
could assign some low marked value to parts of the
latter category (e.g. as pulpwood or firewood). This
would eventually and to some extent mitigate for the
negative impact of moose browsing, and thereby more
moose would be acceptable in the forest.
Neither does our model take stochastic events into
account. Carrying capacity for moose over time is a
stochastic and seasonal phenomenon that cannot
adequately be represented by a single number.
However, we believe that for our particular model
stochastic elements would add unnecessary complexity.
Our model is developed to aid in long-term planning.
While we believe that stochasticity may influence the
optimal management of boreal forests for shorter
periods of time, we also believe that the effects are
balanced within our planning period (as opposed to the
severity of stochastic events in more extreme areas such
as the Sahel, see e.g. Lybbert et al., 2004). The actual
outtake of a forest system like ours may in any way be
adjusted if and when stochastic events occur. If more
complexity should be added, it should preferentially be
interactions with additional species, mainly those of
great functional importance in the forest ecosystem.
Our assumptions on moose browsing are loosely
built on empirical research. At present the data we
have available are sufficient to give only a rough idea
of the mutual impacts of moose browsing. While this
may not be a major concern for the purpose of this
article, it will be if the model is implemented in a real
planning scenario. Moose browsing will in any way be
site-specific, but it should be possible to identify some
general quantitative relationships given specific
common factors.
On the basis of this work, two lines of future research
can be recommended: bio-economic modelling which
incorporates a more complex class partition, and further
studies of the feedback mechanisms between moose
and its foraging plants. With some more effort on these
aspects, we should soon be able to optimize the
combined management of timber and moose produc-
tion quite adequately on specific properties.
Acknowledgements
The authors are grateful to the Norwegian Research
Council and the Agricultural University of Norway for
financing this research project. We also appreciate the
valuable comments given by the reviewers of this
manuscript.
References
Aanesland, N., Holm, O., 2003. Rovdyr og jaktinntekter (in Nor-
wegian). Norges landbrukshøgskole, Institutt for økonomi og
ressursforvaltning, Rapport Nr. 27, pp. 1–37.

H.K. Wam et al. / Forest Ecology and Management 206 (2005) 207–219218
Andreassen, K., Tomter, S.M., 2003. Basal area growth models
for individual trees of Norway spruce, Scots pine, birch
and other broadleaves in Norway. For. Ecol. Manage. 180,
11–24.
Andren, H., Angelstam, P., 1993. Moose browsing on Scots pine in
relation to stand size and distance to forest edge. J. Appl. Ecol.
30, 133–142.
Ball, J.P., Dahlgren, J., 2002. Browsing damage on pine (Pinus
sylvestris and P. contorta) by a migrating moose (Alces alces)
population in winter: relation to habit at composition and road
barriers. SCAND. J. For. Res. 17 (5), 427–435.
Ball, J.P., Danell, K., Sunesson, P., 2000. Response of a herbivore
community to increased food quality and quantity, an
experiment with nitrogen fertilizer. J. Appl. Ecol. 37, 247–
255.
Bergqvist, G., Bergstrom, R., Edenius, L., 2003. Effect of moose
(Alces alces) rebrowsing on damage development in young
stands of Scots pine (Pinus silvestris). For. Ecol. Manage.
176, 397–403.
Bergstrom, R., Danell, K., 1987. Effects of simulated winter brows-
ing by moose on morphology and biomass of two birch species.
J. Ecol. 75, 533–544.
Bergstrom, R., Hjeljord, O., 1987. Moose and vegetation interac-
tions in northwestern Europe and Poland. Swedish Wildl.
Res.(Suppl. 1), 213–228.
Bergstrom, R., Bergqvist, G., 1999. Large herbivore browsing on
conifer seedlings related to seedling morphology. Scand. J. For.
Res. 14, 361–367.
Braastad, H., 1966. Volume tables for birch (in Norwegian
with English summary). Rep. Norwegian For. Res. Inst. 21,
23–78.
Braastad, H., 1975. Yield tables and growth models for Picea abies
(in Norwegian with English summary). Rep. Norwegian For.
Res. Inst. 31, 357–540.
Brantseg, A., 1967. Volume functions and tables for Scots pine.
South Norway (in Norwegian). Rep. Norwegian For. Res. Inst.
22, 695–739.
Brooke, A., Kendrick, D., Meeraus, A., Raman, R., 1998. GAMS-
User Guide. GAMS Development Corporation, Washington,
DC, USA.
Cederlund, G., 1995. Hvor stort leveomrade har elgen? (in
Norwegian). Elgen 52–55.
Charnov, E.L., 1976. Optimal foraging, the marginal value theorem.
Theor. Pop. Biol. 9, 129–136.
Clutter, J.L., Fortson, J.C., Pienaar, L.V., Brister, G.H., Bailey, R.L.,
1983. Timber Management: A Quantitative Approach. Wiley,
New York.
Crepin, A.-S., 2003. Multiple Species Boreal Forests - What Faust-
mann Missed. Environ. Reson. Econ. 26, 625–646.
Crete, M., 1989. Approximation of K carrying capacity for moose in
eastern Quebec. Can. J. Can. Zool. 67, 377–380.
Danell, K., Bergstrom, R., 1989. Winter browsing by moose on
two species of birch, impact on food resources. Oikos 54,
11–18.
Danell, K., Huss-Danell, K., Bergstrom, R., 1985. Interactions
between browsing moose and two species of birch in Sweden.
Ecology 66, 1867–1878.
Danell, K., Edenius, L., Lundberg, P., 1991a. Herbivory and tree
stand composition, moose patch use in winter. Ecology 72,
1350–1357.
Danell, K., Niemela, P., Varvikko, T., Vuorisalo, T., 1991b. Moose
browsing on Scots pine along a gradient of plant productivity.
Ecology 72, 1624–1633.
Danell, K., Haukioja, E., Huss-Danell, K., 1997. Morphological and
chemical responses of mountain birch leaves and shoots to
winter browsing along a gradient of plant productivity.
Ecoscience 4, 296–303.
Edenius, L., 1991. The effect of resource depletion on the feeding
behaviour of a browser: Winter foraging by moose on Scots pine.
J. Appl. Ecol. 28, 318–328.
Edenius, L., 1992. Interactions between a large generalist herbivore,
the moose, and Scots pine. PhD Thesis, Swedish University of
Agricultural Sciences.
Edenius, L., Danell, K., Nyquist, H., 1993. Effects of simulated
moose browsing on growth, mortality and fecundity in Scots
pine: relations to plant productivity. Can. J. For. Res. 25,
529–535.
Eid, T., Tuhus, E., 2001. Models for individual tree mortality in
Norway. For. Ecol. Manage. 154, 69–84.
Eid, T., Hoen, H.F., Økseter, P., 1998. Økonomiske konsekvenser av
tiltak for et bærekraftig skogbruk, resultater for noen gardssko-
geiendommer (in Norwegian). Rapport fra skogforskningen. 9,
1–41.
Faustmann, M., 1849. Berechnung des wertes welchen Waldboden
sowie noch nicht haubare Holzbestande fur die Waldwirtschaft
besitzen. Allgemeine Forst- und Jagt-Zeitung, 15. (Reprinted as:
Faustmann, M. 1995. Calculation of the value which forest land
and immature stands possess for forestry. J. For. Econ. 1(1), 7–44).
Gasdal, O., Rysstad, S., 1999. Elgjakt som fellesgode og inntekts-
kilde (in Norwegian). Tidsskrift for samfunnsforskning 4,
467–490.
Harkonen, S., 1998. Effects of moose browsing in relation to food
alternatives in Scots pine stands. PhD Thesis, University of
Helsinki, Finland.
Heikkila, R., 1990. Effect of plantation characteristics on moose
browsing on Scots pine. Silva Fenn. 24, 341–351.
Heikkila, R., Loyttyniemi, K., 1992. Growth response of young
Scots pines to artificial shoot breaking simulating moose
damage. Silva Fenn. 26, 19–26.
Heikkila, R., Mikkonen, T., 1992. Effects of density of young Scots
pine (Pinus sylvestris) stand on moose (Alces alces) browsing.
Acta For. Fenn. 231, 14.
Heikkila, R., Harkonen, S., 1993. Moose (Alces alces L.) browsing
in young Scots pine stands in relation to the characteristics of
their winter habitats. Silva Fenn. 27, 127–143.
Heikkila, R., Harkonen, S., 1996. Moose browsing in young pine
stands in relation to forest management. For. Ecol. Manage. 88,
179–186.
Hjeljord, O., Histøl, T., 1995. Range-body mass interactions of a
northern ungulate—a test of hypothesis. Oecologia 119,
326–339.
Holthe, A., Solberg, B., 1989. A test of the accuracy of two
individual growth functions of Picea abies. Scand. J. For.
Res. 4, 247–257.

H.K. Wam et al. / Forest Ecology and Management 206 (2005) 207–219 219
Hornberg, S., 2001. Changes in population density of moose (Alces
alces) and damage to forests in Sweden. For. Ecol. Manage. 149,
141–151.
Jalkanen, A., 2001. The probability of moose damage at the stand
level in Finland. Silva Fenn. 35, 159–168.
Lavsund, S., 1987. Moose relationships to forestry in Finland,
Norway and Sweden. Sweden Wildl. Res. Suppl. 1, 229–244.
Lexerød, N., 2003. Økonomiske analyser av selektive foryngelse-
shogster (in Norwegian). Norsk Skogbruk 49, 28–31.
Lybbert, T.J., Barret, C.B., Desta, S., Coppock, D.L., 2004. Sto-
chastic wealth dynamics and risk management among a poor
population. Econ. J. 114, 750–777.
Lykke, J., 1964. Studies of moose damage in a conifer forest area
in Norway. Papers of the Norwegian State Game Research
Institute, Series 2, no. 17.
Lyttyniemi, K., 1985. On repeated browsing of Scots pine saplings
by moose (Alces alces). Silva Fenn. 19, 387–391.
Mattson, L., 1990. Moose management and the economic value of
hunting: towards bio-economic analysis. Scand. J. For. Res. 5,
575–581.
McArthur, P.H., Pinka, E.R., 1966. An optimal use of a patchy
environment. Am. Nat. 100, 603–609.
McLaren, B.M., Peterson, R.O., 1994. Wolves, moose and tree rings
on Isle Royale. Science 266, 1555–1558.
Niemela, P., Danell, K., 1988. Comparison of moose browsing
on Scots pine (Pinus sylvestris) and lodgepole pine (Pinus
contorta). J. Appl. Ecol. 25, 761–775.
Olaussen, J.O., Skonhoft, A., 2002. Naturressursutnyttelse ved
assymetrisk nytte og kostnad. Elgforvaltning i Norge (in
Norwegian). Norsk økonomisk tidsskrift 116, 103–126.
Pastor, J., Moen, R., Cohen, Y., 1997. Spatial heteriogenities,
carrying capacity, and feedbacks in animal–landscape interac-
tions. J. Mammal. 78, 1040–1052.
Persson, I.-L., 2003. Moose population density and habitat
productivity as drivers of ecosystem processes in northern
boreal forest. PhD Thesis, Swedish University of Agricultural
Sciences.
Randveer, T., Heikkila, R., 1996. Damage caused by moose (Alces
alces L.) by bark stripping of Picea abies. Scand. J. For. Res. 11,
153–158.
Sæther, B.-E., Solbraa, K., Sødal, D.P., Hjeljord, O., 1992. Sluttrap-
port Elg-Skog-Samfunn (in Norwegian with English abstract).
NINA Fagrapport 28. Norwegian Institute for Nature Research,
Trondheim.
Sæther, B.-E., Solberg, E.J., Heim, M., Stacy, J.E., Jakobsen, K.S.,
Olstad, R., 2004. Offspring sex ratio in moose Alces alces in
relation to paternal age: an experiment. Wildl. Biol. 51–57.
Schwartz, C.C., Franzmann, A.W., 1989. Bears, wolves, moose, and
forest succession, some management considerations on the
Kenai Peninsula. Alces 25, 1–10.
Shipley, L.A., Blomquist, S., Danell, K., 1998. Diet choices made by
free-ranging moose in northern Sweden in relation to plant
distribution, chemistry and morphology. Can. J. Zool. 76,
1722–1733.
Solberg, E.J., Sand, H., Linnell, J., Brainerd, S., Andersen, R.,
Odden, J., Brøseth, H., Swenson, J., Strand, O., Wabakken,
P., 2003. The effects of large carnivores on wild ungulates in
Norway: implications for ecological processes, harvest and
hunting methods (in Norwegian with English abstract). NINA
Fagrapport 63. Norwegian Institute for Nature Research,
Trondheim.
Solbraa, K., 1998. Elg og skogbruk—biologi, økonomi, beite,
taksering, forvaltning (in Norwegian). Skogbrukets kursinstitutt,
Biri.
SSB (Central Bureau of Statistics Norway), 2002. Hunting Statistics
2002 (in Norwegian). Central Bureau of Statistics, Oslo.


