Embed Size (px)
Citation preview
Pacific Graphics 2019C. Theobalt, J. Lee, and G. Wetzstein(Guest Editors)
Volume 38 (2019), Number 7
A Color-Pair Based Approach for Accurate Color HarmonyEstimation
B. Yang1, T. Wei1, X. Fang2, Z. Deng3, F. W. B. Li4,Y. Ling1, and X. Wang1
1Zhejiang Gongshang University, China2Anhui University, China
3University of Houston, USA4University of Durham, United Kingdom
AbstractHarmonious color combinations can stimulate positive user emotional responses. However, a widely open research question is:how can we establish a robust and accurate color harmony measure for the public and professional designers to identify theharmony level of a color theme or color set. Building upon the key discovery that color pairs play an important role in harmonyestimation, in this paper we present a novel color-pair based estimation model to accurately measure the color harmony. Itfirst takes a two-layer maximum likelihood estimation (MLE) based method to compute an initial prediction of color harmonyby statistically modeling the pair-wise color preferences from existing datasets. Then, the initial scores are refined through aback-propagation neural network (BPNN) with a variety of color features extracted in different color spaces, so that an accurateharmony estimation can be obtained at the end. Our extensive experiments, including performance comparisons of harmonyestimation applications, show the advantages of our method in comparison with the state of the art methods.
CCS Concepts•Computing methodologies → Perception;
1. Introduction
Color harmony studies the visually harmonious color combinationfor arising a harmoniously emotional and environmental percep-tion on a scene or an object. Obtaining an expected harmony of acolor combination is critical for design; however, this task is chal-lenging even for professionals. Therefore, designers often preferseeking inspirations from different sources, such as artistic works,photographies, or color palette guides. There are some generallyaccepted aesthetic rules, e.g., complementary coloring and warm-versus-cool coloring. But these rules or guidelines need non-trivialmanual involvements or judgments.
Previous harmony estimation studies [OL06, OCLM11, SBS10]use psychological analyses from a limited number of volun-teers with limited color ranges and combinations, which can eas-ily lead to an unstable model. Large database based learningworks [LKPL14, OAH11, OAH14, GLS17] fall short of obtainingaccurate results for real-world datasets [OAH11,COL18a,COL18b,KM16] in comparison with ground-truth user evaluations. Indeed,despite the above progresses have been made on quantifying theharmony level of a color set, this problem is far away from beingresolved.
We performed statistical analysis on some publicly available,color harmony datasets, and found single colors based methods
would be difficult to reliably estimate the color harmony of a colortheme. On the other hand, ideally, we should collect large-scaleuser evaluations on all possible or at least a large number of N-color themes (N≥3, where N is typically set to 5, since existingpublicly available color harmony datasets are often based on 5-colors themes). Due to the combination issue, it is impractical toconduct and collect such large-scale user evaluations.
As a trade-off, in this work we utilize the concept of color pairsas the basis to effectively measure the color harmony of a colortheme. Specifically, we propose a more accurate color harmonyprediction model based on statistical inferences and learning fromthe color pairs. In our approach, the distribution of each color pair isutilized so that a two-layer maximum likelihood estimation (MLE)based method can be used to compute an initial harmony estima-tion. The initial estimation is then further refined with a set ofselected color features in different color spaces through a back-propagation neural network (BPNN). To this end, an accurate colorharmony prediction can be obtained. We performed comprehen-sive experiments as well as comparisons with existing methods todemonstrate the accuracy and robustness of our method.
The main contributions of this work include:
• To the best of our knowledge, our work is the first to report theusefulness of color pairs for harmony estimation.
c© 2019 The Author(s)Computer Graphics Forum c© 2019 The Eurographics Association and JohnWiley & Sons Ltd. Published by John Wiley & Sons Ltd.
Yang et al. / A Color-Pair Based Approach for Accurate Color Harmony Estimation
• We introduce a novel color-pair based approach for an accuratecolor harmony estimation, where a two-layer MLE and BPNNare utilized to obtain a coarse-to-fine harmony estimation.
The remainder of this paper is organized as follows. The relatedwork and the overview of our method are first introduced in Sec-tion 2 and Section 3, respectively. Then, the key observation on thecolor pair basis is discussed in Section 4. After that, the techni-cal details of our method including the two-layer MLE based ini-tial estimation and the BPNN based on refinement are presentedin Section 5 and Section 6, respectively. Experimental results andapplications are introduced in Section 7 and Section 8 separately,with the whole paper concluded in Section 9.
2. Related Work
In this section, we first review the development of color harmonytheories and estimation, and then briefly review its recent applica-tions.
2.1. Color Harmony
Color harmony theories can date back the early 20th century alongwith the development of the modern color theory [Ost69, Mun69].Perhaps the most popular method is the color wheel which linkscolor harmony to the relative color positions around a circle. It-ten [Itt61] designed a 12-hue color wheel where two comple-mentary colors are separated apart by 180◦. Matsuda [Mat95] in-troduced an 8-hue color wheel consisting of different hue tem-plates. These wheels and various extensions, such as N-color har-mony, have been widely adopted for some fields, including colordesign [COSG∗06, TMWW11, LZNH15] and color harmony the-ory [OAH11]. However, color wheels only consider color harmonywithout any quantification for harmony estimation. They may sug-gest ambiguous color pairs and make the combination of colors atedious and non-trivial task.
Some studies investigated color ordering or relationshipsfrom various properties, such as hue, lightness, and chro-maticity [Nem93, vG70, Che81, MS44b, MS44c, MS44a, Alb13].Palmer [PS10] statistically analyzed the color preferences of vol-unteers and presented an ecological valence theory. However, theabove studies are still subjective by nature and do not provide anyquantitative ways to quantify color harmony, which is similar to theabove color wheels based methods.
Numerical representations of color harmony have been studiedphysiologically in some controlled situations where color prefer-ences of volunteers are collected to build harmony prediction mod-els. For example, researchers invited volunteers to observe andscore color pairs through physical experiments for possible factorsaffecting color harmony [OL06,OCLM11,SBS10]. However, theirmodels are obtained with limited numbers of participants, colorranges and combinations. Consequently, their results can hardly beapplicable in practice.
Statistical learning based approaches have also been proposed,including the hierarchical unsupervised learning model [LKPL14],regression [OAH11, LH13], collaborative filtering [OAH14], etc.Gramazio et al. [GLS17] proposed a five-color palette generation
system, Colorgorical. It takes iteratively semi-random sampling topick colors from the CIELAB space and customizes a valid palettebased on the color preferences of different users. However, the pre-ferred color palette generated with limited users may not be effec-tive as harmonious colors. Kita and Miyata [KM16] evaluated anycolor combinations based on LASSO regression [OAH11]. How-ever, this method can produce less harmonious colors than the five-color based method [OAH11]. Lu et al. [LPZL16] proposed a sta-tistical learning framework for image harmony from a large numberof natural images.
2.2. Applications of Color Harmony
Color harmony has been intensively applied for image recoloringand harmonization [LZNH15, COSG∗06, TMWW11, LZNH15].Recently, Tan et al. [TEG18] decomposed an image into a set ofadditive mixing layers, each of which corresponds to a color palettewith varying weights. Through simultaneously recoloring the five-dimensional space RGBXY, it can be several orders higher of mag-nitude in efficiency than the work by Cohen et al. [COSG∗06].
Chang et al. [CFL∗15] allowed users to recolor photos by chang-ing some palette colors interactively. Junho et al. [CYLC17] ap-plied a deep learning based recoloring algorithm based on a targetpalette by optimizing the Euclidean and adversarial losses. Zhanget al. [ZXST17] and Mairéad [GDS17] took color decompositionand L2 based cost function [CFL∗15] for recoloring.
Color harmony has also been applied for dress-up. Yu etal. [YYTC12] developed a probabilistic framework based on themodel of O’Donovan et al. [OAH11], which exploits a Bayesiannetwork trained on example images of real-world outfits. In con-trast, our method can suggest the appropriate colors for clothing bymaximizing the color harmony degree.
3. Overview
In this section, we briefly describe the pipeline of our method andthe datasets used for our analysis and learning.
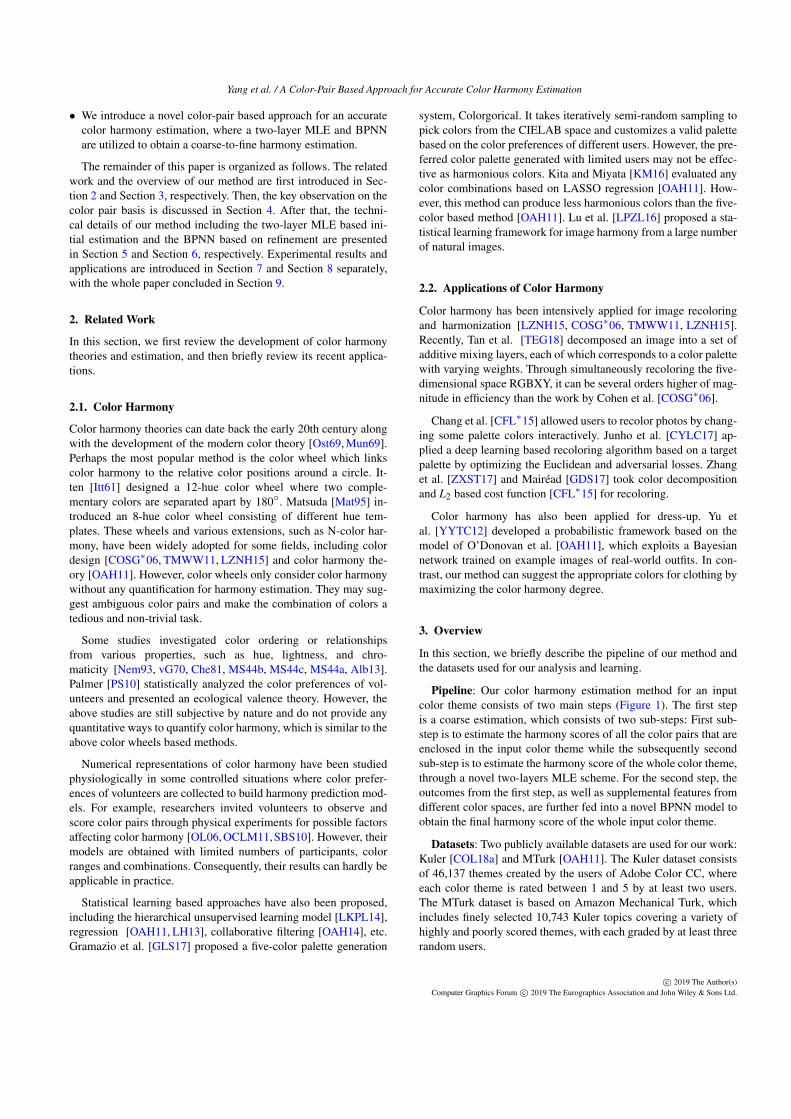
Pipeline: Our color harmony estimation method for an inputcolor theme consists of two main steps (Figure 1). The first stepis a coarse estimation, which consists of two sub-steps: First sub-step is to estimate the harmony scores of all the color pairs that areenclosed in the input color theme while the subsequently secondsub-step is to estimate the harmony score of the whole color theme,through a novel two-layers MLE scheme. For the second step, theoutcomes from the first step, as well as supplemental features fromdifferent color spaces, are further fed into a novel BPNN model toobtain the final harmony score of the whole input color theme.
Datasets: Two publicly available datasets are used for our work:Kuler [COL18a] and MTurk [OAH11]. The Kuler dataset consistsof 46,137 themes created by the users of Adobe Color CC, whereeach color theme is rated between 1 and 5 by at least two users.The MTurk dataset is based on Amazon Mechanical Turk, whichincludes finely selected 10,743 Kuler topics covering a variety ofhighly and poorly scored themes, with each graded by at least threerandom users.
c© 2019 The Author(s)Computer Graphics Forum c© 2019 The Eurographics Association and John Wiley & Sons Ltd.
Yang et al. / A Color-Pair Based Approach for Accurate Color Harmony Estimation
Figure 1: The pipeline of our method. The number on the right side of each color set, including the five-color palettes and color pairs,represents the harmony score of the corresponding set.
4. Color Pairs: a Novel Basis for Harmony Estimation
This section introduces the key finding of this work: color pairs canbe an effective basis for color harmony estimation. Specifically, wefirst analyze the limitation of using single colors as the evaluationbasis, and then discuss the new finding on the use of color pairs forharmony estimation.
4.1. Analysis of Single Colors Basis
In some scenarios we may prefer one color over others. However,it is unclear whether such a single colors based preference can bereliably used for estimating the color harmony of a color theme.To answer this question, we statistically look into the relationshipbetween individual colors and the harmony scores.
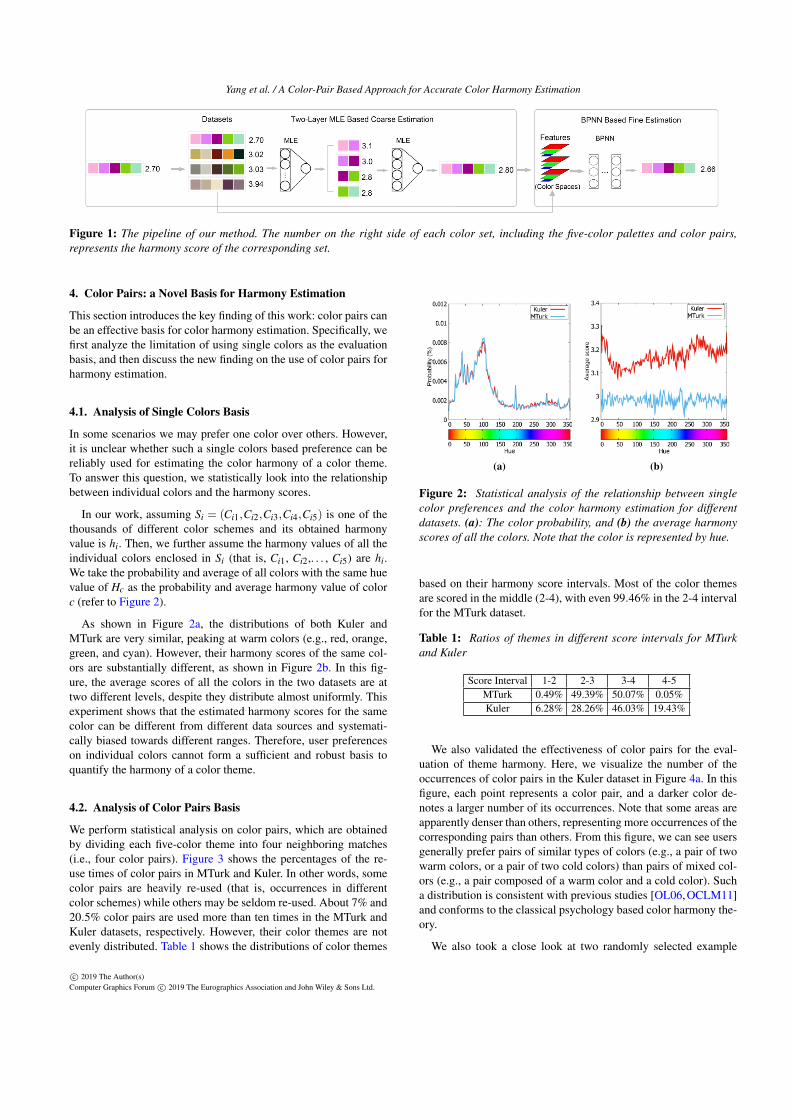
In our work, assuming Si = (Ci1,Ci2,Ci3,Ci4,Ci5) is one of thethousands of different color schemes and its obtained harmonyvalue is hi. Then, we further assume the harmony values of all theindividual colors enclosed in Si (that is, Ci1, Ci2,. . . , Ci5) are hi.We take the probability and average of all colors with the same huevalue of Hc as the probability and average harmony value of colorc (refer to Figure 2).
As shown in Figure 2a, the distributions of both Kuler andMTurk are very similar, peaking at warm colors (e.g., red, orange,green, and cyan). However, their harmony scores of the same col-ors are substantially different, as shown in Figure 2b. In this fig-ure, the average scores of all the colors in the two datasets are attwo different levels, despite they distribute almost uniformly. Thisexperiment shows that the estimated harmony scores for the samecolor can be different from different data sources and systemati-cally biased towards different ranges. Therefore, user preferenceson individual colors cannot form a sufficient and robust basis toquantify the harmony of a color theme.
4.2. Analysis of Color Pairs Basis
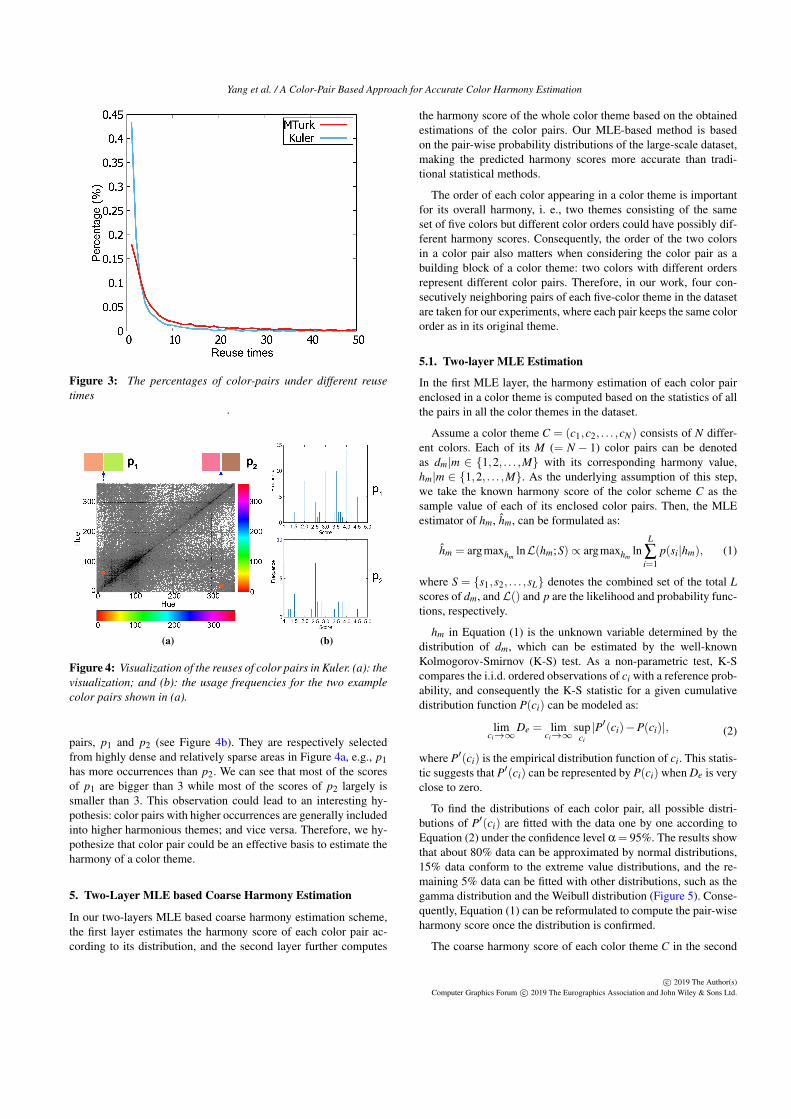
We perform statistical analysis on color pairs, which are obtainedby dividing each five-color theme into four neighboring matches(i.e., four color pairs). Figure 3 shows the percentages of the re-use times of color pairs in MTurk and Kuler. In other words, somecolor pairs are heavily re-used (that is, occurrences in differentcolor schemes) while others may be seldom re-used. About 7% and20.5% color pairs are used more than ten times in the MTurk andKuler datasets, respectively. However, their color themes are notevenly distributed. Table 1 shows the distributions of color themes
(a) (b)
Figure 2: Statistical analysis of the relationship between singlecolor preferences and the color harmony estimation for differentdatasets. (a): The color probability, and (b) the average harmonyscores of all the colors. Note that the color is represented by hue.
based on their harmony score intervals. Most of the color themesare scored in the middle (2-4), with even 99.46% in the 2-4 intervalfor the MTurk dataset.
Table 1: Ratios of themes in different score intervals for MTurkand Kuler
Score Interval 1-2 2-3 3-4 4-5MTurk 0.49% 49.39% 50.07% 0.05%Kuler 6.28% 28.26% 46.03% 19.43%
We also validated the effectiveness of color pairs for the eval-uation of theme harmony. Here, we visualize the number of theoccurrences of color pairs in the Kuler dataset in Figure 4a. In thisfigure, each point represents a color pair, and a darker color de-notes a larger number of its occurrences. Note that some areas areapparently denser than others, representing more occurrences of thecorresponding pairs than others. From this figure, we can see usersgenerally prefer pairs of similar types of colors (e.g., a pair of twowarm colors, or a pair of two cold colors) than pairs of mixed col-ors (e.g., a pair composed of a warm color and a cold color). Sucha distribution is consistent with previous studies [OL06,OCLM11]and conforms to the classical psychology based color harmony the-ory.
We also took a close look at two randomly selected example
c© 2019 The Author(s)Computer Graphics Forum c© 2019 The Eurographics Association and John Wiley & Sons Ltd.
Yang et al. / A Color-Pair Based Approach for Accurate Color Harmony Estimation
Figure 3: The percentages of color-pairs under different reusetimes
.
(a) (b)
Figure 4: Visualization of the reuses of color pairs in Kuler. (a): thevisualization; and (b): the usage frequencies for the two examplecolor pairs shown in (a).
pairs, p1 and p2 (see Figure 4b). They are respectively selectedfrom highly dense and relatively sparse areas in Figure 4a, e.g., p1has more occurrences than p2. We can see that most of the scoresof p1 are bigger than 3 while most of the scores of p2 largely issmaller than 3. This observation could lead to an interesting hy-pothesis: color pairs with higher occurrences are generally includedinto higher harmonious themes; and vice versa. Therefore, we hy-pothesize that color pair could be an effective basis to estimate theharmony of a color theme.
5. Two-Layer MLE based Coarse Harmony Estimation
In our two-layers MLE based coarse harmony estimation scheme,the first layer estimates the harmony score of each color pair ac-cording to its distribution, and the second layer further computes
the harmony score of the whole color theme based on the obtainedestimations of the color pairs. Our MLE-based method is basedon the pair-wise probability distributions of the large-scale dataset,making the predicted harmony scores more accurate than tradi-tional statistical methods.
The order of each color appearing in a color theme is importantfor its overall harmony, i. e., two themes consisting of the sameset of five colors but different color orders could have possibly dif-ferent harmony scores. Consequently, the order of the two colorsin a color pair also matters when considering the color pair as abuilding block of a color theme: two colors with different ordersrepresent different color pairs. Therefore, in our work, four con-secutively neighboring pairs of each five-color theme in the datasetare taken for our experiments, where each pair keeps the same colororder as in its original theme.
5.1. Two-layer MLE Estimation
In the first MLE layer, the harmony estimation of each color pairenclosed in a color theme is computed based on the statistics of allthe pairs in all the color themes in the dataset.
Assume a color theme C = (c1,c2, . . . ,cN) consists of N differ-ent colors. Each of its M (= N − 1) color pairs can be denotedas dm|m ∈ {1,2, . . . ,M} with its corresponding harmony value,hm|m ∈ {1,2, . . . ,M}. As the underlying assumption of this step,we take the known harmony score of the color scheme C as thesample value of each of its enclosed color pairs. Then, the MLEestimator of hm, hm, can be formulated as:
hm = argmaxhmlnL(hm;S)∝ argmaxhm
lnL
∑i=1
p(si|hm), (1)
where S = {s1,s2, . . . ,sL} denotes the combined set of the total Lscores of dm, and L() and p are the likelihood and probability func-tions, respectively.
hm in Equation (1) is the unknown variable determined by thedistribution of dm, which can be estimated by the well-knownKolmogorov-Smirnov (K-S) test. As a non-parametric test, K-Scompares the i.i.d. ordered observations of ci with a reference prob-ability, and consequently the K-S statistic for a given cumulativedistribution function P(ci) can be modeled as:
limci→∞
De = limci→∞
supci
|P′(ci)−P(ci)|, (2)
where P′(ci) is the empirical distribution function of ci. This statis-tic suggests that P′(ci) can be represented by P(ci) when De is veryclose to zero.
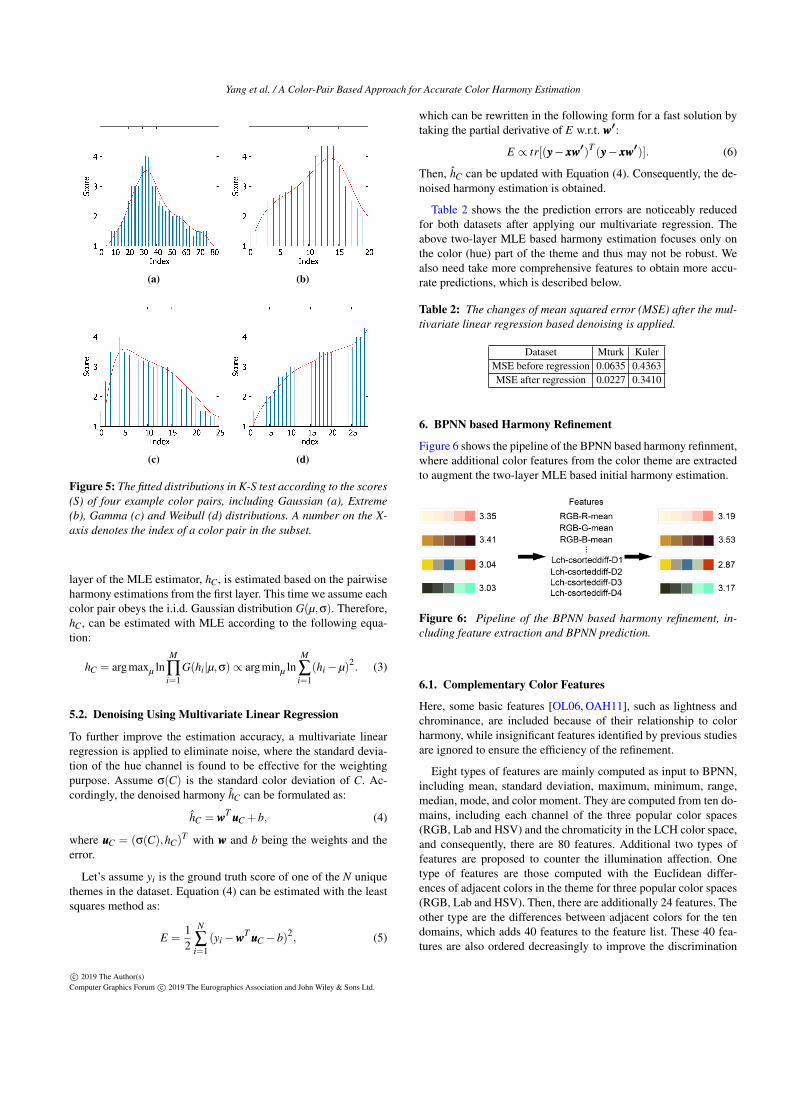
To find the distributions of each color pair, all possible distri-butions of P′(ci) are fitted with the data one by one according toEquation (2) under the confidence level α = 95%. The results showthat about 80% data can be approximated by normal distributions,15% data conform to the extreme value distributions, and the re-maining 5% data can be fitted with other distributions, such as thegamma distribution and the Weibull distribution (Figure 5). Conse-quently, Equation (1) can be reformulated to compute the pair-wiseharmony score once the distribution is confirmed.
The coarse harmony score of each color theme C in the second
c© 2019 The Author(s)Computer Graphics Forum c© 2019 The Eurographics Association and John Wiley & Sons Ltd.
Yang et al. / A Color-Pair Based Approach for Accurate Color Harmony Estimation
(a) (b)
(c) (d)
Figure 5: The fitted distributions in K-S test according to the scores(S) of four example color pairs, including Gaussian (a), Extreme(b), Gamma (c) and Weibull (d) distributions. A number on the X-axis denotes the index of a color pair in the subset.
layer of the MLE estimator, hC, is estimated based on the pairwiseharmony estimations from the first layer. This time we assume eachcolor pair obeys the i.i.d. Gaussian distribution G(µ,σ). Therefore,hC, can be estimated with MLE according to the following equa-tion:
hC = argmaxµ lnM
∏i=1
G(hi|µ,σ)∝ argminµ lnM
∑i=1
(hi−µ)2. (3)
5.2. Denoising Using Multivariate Linear Regression
To further improve the estimation accuracy, a multivariate linearregression is applied to eliminate noise, where the standard devia-tion of the hue channel is found to be effective for the weightingpurpose. Assume σ(C) is the standard color deviation of C. Ac-cordingly, the denoised harmony hC can be formulated as:
hC = wwwT uuuC +b, (4)
where uuuC = (σ(C),hC)T with www and b being the weights and the
error.
Let’s assume yi is the ground truth score of one of the N uniquethemes in the dataset. Equation (4) can be estimated with the leastsquares method as:
E =12
N
∑i=1
(yi−wwwT uuuC−b)2, (5)
which can be rewritten in the following form for a fast solution bytaking the partial derivative of E w.r.t. www′:
E ∝ tr[(yyy− xxxwww′)T (yyy− xxxwww′)]. (6)
Then, hC can be updated with Equation (4). Consequently, the de-noised harmony estimation is obtained.
Table 2 shows the the prediction errors are noticeably reducedfor both datasets after applying our multivariate regression. Theabove two-layer MLE based harmony estimation focuses only onthe color (hue) part of the theme and thus may not be robust. Wealso need take more comprehensive features to obtain more accu-rate predictions, which is described below.
Table 2: The changes of mean squared error (MSE) after the mul-tivariate linear regression based denoising is applied.
Dataset Mturk KulerMSE before regression 0.0635 0.4363MSE after regression 0.0227 0.3410
6. BPNN based Harmony Refinement
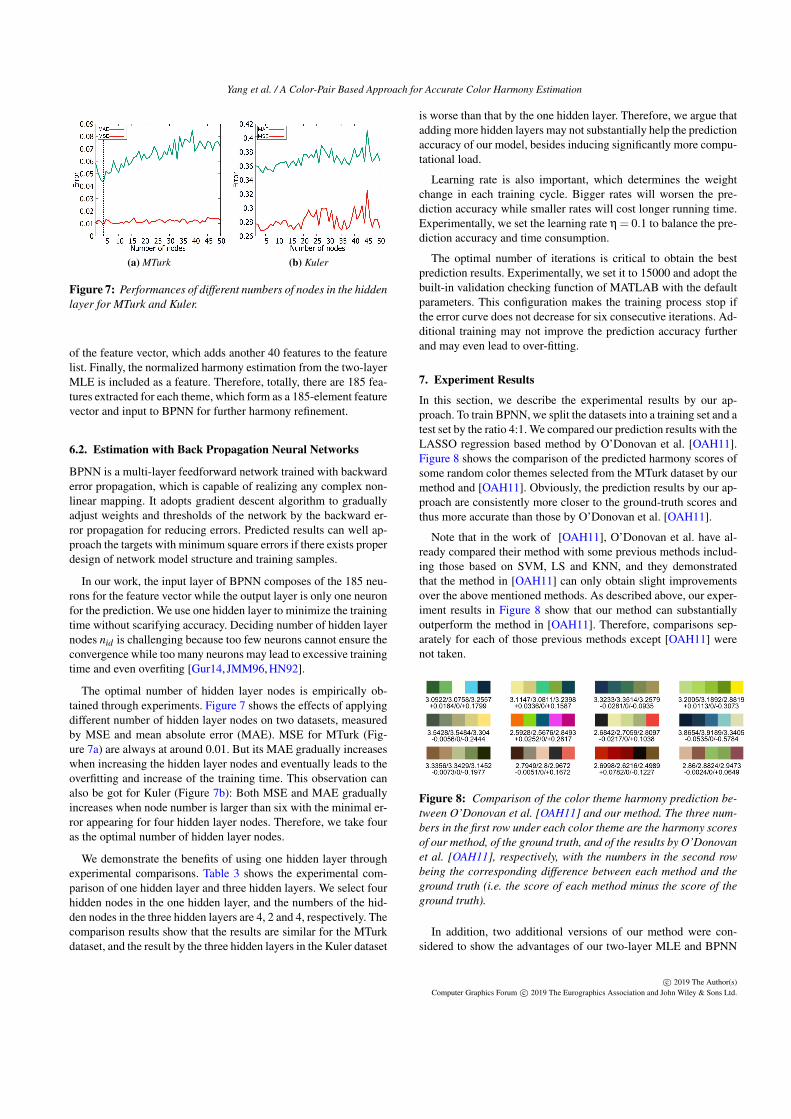
Figure 6 shows the pipeline of the BPNN based harmony refinment,where additional color features from the color theme are extractedto augment the two-layer MLE based initial harmony estimation.
Figure 6: Pipeline of the BPNN based harmony refinement, in-cluding feature extraction and BPNN prediction.
6.1. Complementary Color Features
Here, some basic features [OL06, OAH11], such as lightness andchrominance, are included because of their relationship to colorharmony, while insignificant features identified by previous studiesare ignored to ensure the efficiency of the refinement.
Eight types of features are mainly computed as input to BPNN,including mean, standard deviation, maximum, minimum, range,median, mode, and color moment. They are computed from ten do-mains, including each channel of the three popular color spaces(RGB, Lab and HSV) and the chromaticity in the LCH color space,and consequently, there are 80 features. Additional two types offeatures are proposed to counter the illumination affection. Onetype of features are those computed with the Euclidean differ-ences of adjacent colors in the theme for three popular color spaces(RGB, Lab and HSV). Then, there are additionally 24 features. Theother type are the differences between adjacent colors for the tendomains, which adds 40 features to the feature list. These 40 fea-tures are also ordered decreasingly to improve the discrimination
c© 2019 The Author(s)Computer Graphics Forum c© 2019 The Eurographics Association and John Wiley & Sons Ltd.
Yang et al. / A Color-Pair Based Approach for Accurate Color Harmony Estimation
(a) MTurk (b) Kuler
Figure 7: Performances of different numbers of nodes in the hiddenlayer for MTurk and Kuler.
of the feature vector, which adds another 40 features to the featurelist. Finally, the normalized harmony estimation from the two-layerMLE is included as a feature. Therefore, totally, there are 185 fea-tures extracted for each theme, which form as a 185-element featurevector and input to BPNN for further harmony refinement.
6.2. Estimation with Back Propagation Neural Networks
BPNN is a multi-layer feedforward network trained with backwarderror propagation, which is capable of realizing any complex non-linear mapping. It adopts gradient descent algorithm to graduallyadjust weights and thresholds of the network by the backward er-ror propagation for reducing errors. Predicted results can well ap-proach the targets with minimum square errors if there exists properdesign of network model structure and training samples.
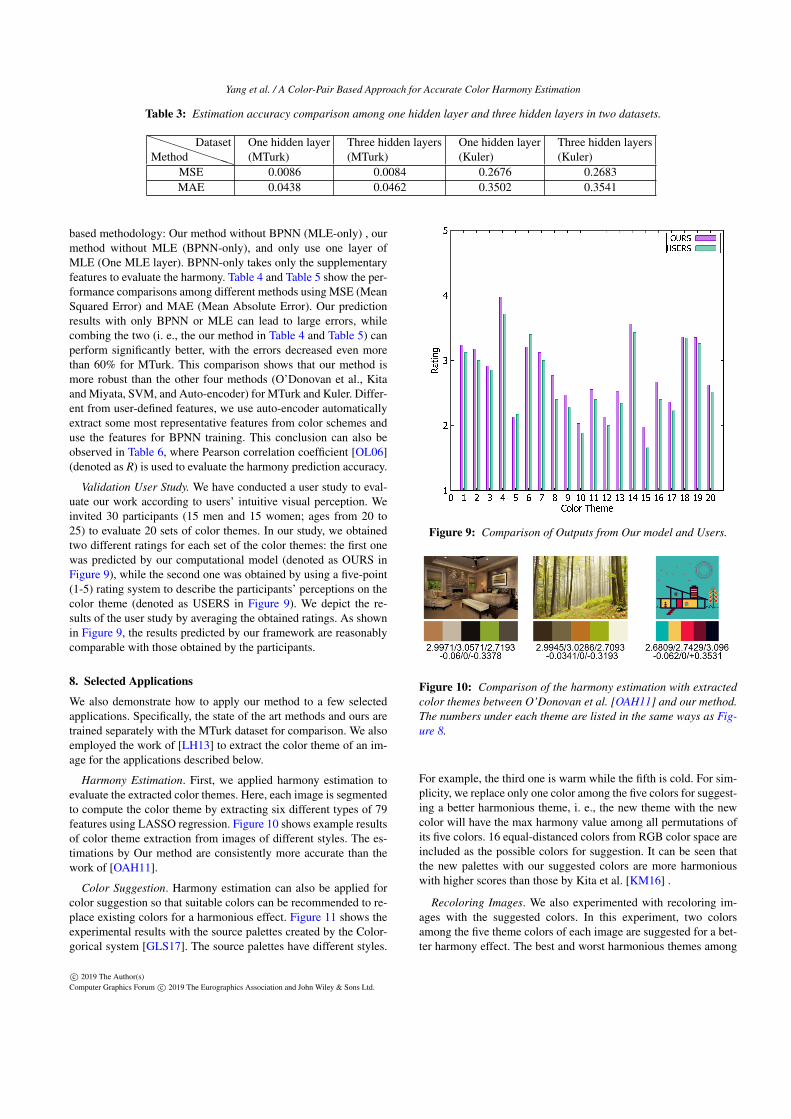
In our work, the input layer of BPNN composes of the 185 neu-rons for the feature vector while the output layer is only one neuronfor the prediction. We use one hidden layer to minimize the trainingtime without scarifying accuracy. Deciding number of hidden layernodes nid is challenging because too few neurons cannot ensure theconvergence while too many neurons may lead to excessive trainingtime and even overfiting [Gur14, JMM96, HN92].
The optimal number of hidden layer nodes is empirically ob-tained through experiments. Figure 7 shows the effects of applyingdifferent number of hidden layer nodes on two datasets, measuredby MSE and mean absolute error (MAE). MSE for MTurk (Fig-ure 7a) are always at around 0.01. But its MAE gradually increaseswhen increasing the hidden layer nodes and eventually leads to theoverfitting and increase of the training time. This observation canalso be got for Kuler (Figure 7b): Both MSE and MAE graduallyincreases when node number is larger than six with the minimal er-ror appearing for four hidden layer nodes. Therefore, we take fouras the optimal number of hidden layer nodes.
We demonstrate the benefits of using one hidden layer throughexperimental comparisons. Table 3 shows the experimental com-parison of one hidden layer and three hidden layers. We select fourhidden nodes in the one hidden layer, and the numbers of the hid-den nodes in the three hidden layers are 4, 2 and 4, respectively. Thecomparison results show that the results are similar for the MTurkdataset, and the result by the three hidden layers in the Kuler dataset
is worse than that by the one hidden layer. Therefore, we argue thatadding more hidden layers may not substantially help the predictionaccuracy of our model, besides inducing significantly more compu-tational load.
Learning rate is also important, which determines the weightchange in each training cycle. Bigger rates will worsen the pre-diction accuracy while smaller rates will cost longer running time.Experimentally, we set the learning rate η = 0.1 to balance the pre-diction accuracy and time consumption.
The optimal number of iterations is critical to obtain the bestprediction results. Experimentally, we set it to 15000 and adopt thebuilt-in validation checking function of MATLAB with the defaultparameters. This configuration makes the training process stop ifthe error curve does not decrease for six consecutive iterations. Ad-ditional training may not improve the prediction accuracy furtherand may even lead to over-fitting.
7. Experiment Results
In this section, we describe the experimental results by our ap-proach. To train BPNN, we split the datasets into a training set and atest set by the ratio 4:1. We compared our prediction results with theLASSO regression based method by O’Donovan et al. [OAH11].Figure 8 shows the comparison of the predicted harmony scores ofsome random color themes selected from the MTurk dataset by ourmethod and [OAH11]. Obviously, the prediction results by our ap-proach are consistently more closer to the ground-truth scores andthus more accurate than those by O’Donovan et al. [OAH11].
Note that in the work of [OAH11], O’Donovan et al. have al-ready compared their method with some previous methods includ-ing those based on SVM, LS and KNN, and they demonstratedthat the method in [OAH11] can only obtain slight improvementsover the above mentioned methods. As described above, our exper-iment results in Figure 8 show that our method can substantiallyoutperform the method in [OAH11]. Therefore, comparisons sep-arately for each of those previous methods except [OAH11] werenot taken.
Figure 8: Comparison of the color theme harmony prediction be-tween O’Donovan et al. [OAH11] and our method. The three num-bers in the first row under each color theme are the harmony scoresof our method, of the ground truth, and of the results by O’Donovanet al. [OAH11], respectively, with the numbers in the second rowbeing the corresponding difference between each method and theground truth (i.e. the score of each method minus the score of theground truth).
In addition, two additional versions of our method were con-sidered to show the advantages of our two-layer MLE and BPNN
c© 2019 The Author(s)Computer Graphics Forum c© 2019 The Eurographics Association and John Wiley & Sons Ltd.
Yang et al. / A Color-Pair Based Approach for Accurate Color Harmony Estimation
Table 3: Estimation accuracy comparison among one hidden layer and three hidden layers in two datasets.
PPPPPPPMethodDataset One hidden layer
(MTurk)Three hidden layers(MTurk)
One hidden layer(Kuler)
Three hidden layers(Kuler)
MSE 0.0086 0.0084 0.2676 0.2683MAE 0.0438 0.0462 0.3502 0.3541
based methodology: Our method without BPNN (MLE-only) , ourmethod without MLE (BPNN-only), and only use one layer ofMLE (One MLE layer). BPNN-only takes only the supplementaryfeatures to evaluate the harmony. Table 4 and Table 5 show the per-formance comparisons among different methods using MSE (MeanSquared Error) and MAE (Mean Absolute Error). Our predictionresults with only BPNN or MLE can lead to large errors, whilecombing the two (i. e., the our method in Table 4 and Table 5) canperform significantly better, with the errors decreased even morethan 60% for MTurk. This comparison shows that our method ismore robust than the other four methods (O’Donovan et al., Kitaand Miyata, SVM, and Auto-encoder) for MTurk and Kuler. Differ-ent from user-defined features, we use auto-encoder automaticallyextract some most representative features from color schemes anduse the features for BPNN training. This conclusion can also beobserved in Table 6, where Pearson correlation coefficient [OL06](denoted as R) is used to evaluate the harmony prediction accuracy.
Validation User Study. We have conducted a user study to eval-uate our work according to users’ intuitive visual perception. Weinvited 30 participants (15 men and 15 women; ages from 20 to25) to evaluate 20 sets of color themes. In our study, we obtainedtwo different ratings for each set of the color themes: the first onewas predicted by our computational model (denoted as OURS inFigure 9), while the second one was obtained by using a five-point(1-5) rating system to describe the participants’ perceptions on thecolor theme (denoted as USERS in Figure 9). We depict the re-sults of the user study by averaging the obtained ratings. As shownin Figure 9, the results predicted by our framework are reasonablycomparable with those obtained by the participants.
8. Selected Applications
We also demonstrate how to apply our method to a few selectedapplications. Specifically, the state of the art methods and ours aretrained separately with the MTurk dataset for comparison. We alsoemployed the work of [LH13] to extract the color theme of an im-age for the applications described below.
Harmony Estimation. First, we applied harmony estimation toevaluate the extracted color themes. Here, each image is segmentedto compute the color theme by extracting six different types of 79features using LASSO regression. Figure 10 shows example resultsof color theme extraction from images of different styles. The es-timations by Our method are consistently more accurate than thework of [OAH11].
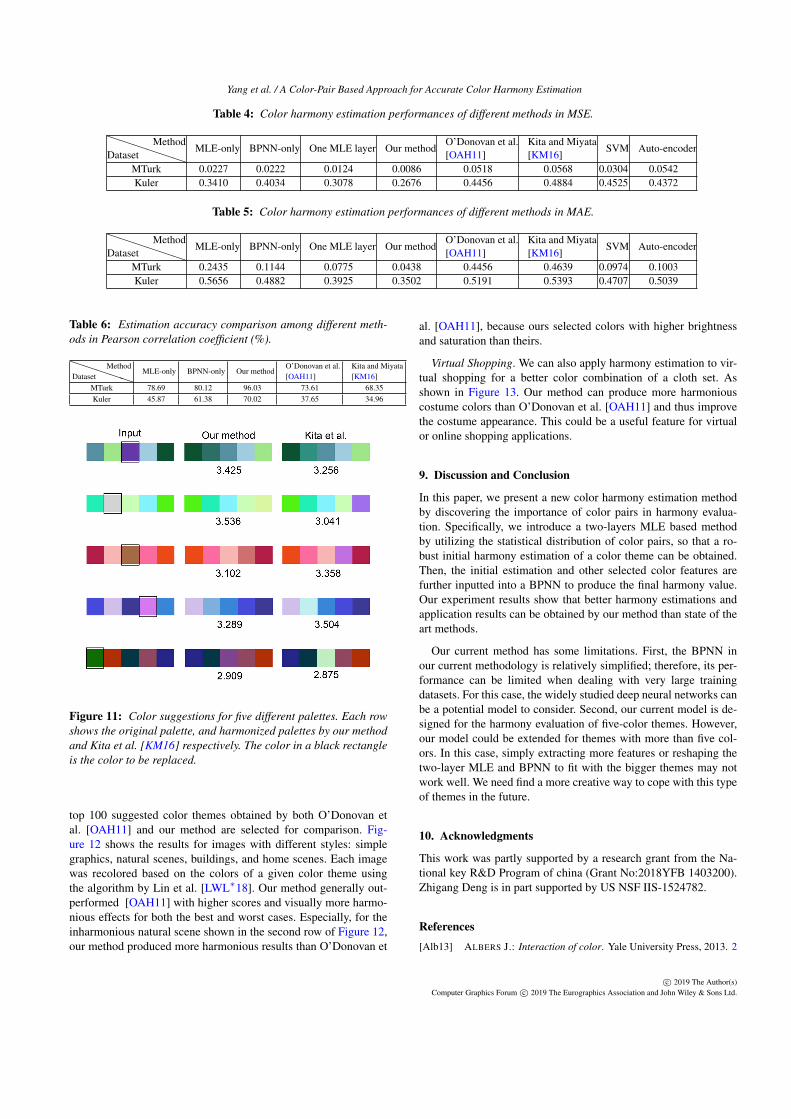
Color Suggestion. Harmony estimation can also be applied forcolor suggestion so that suitable colors can be recommended to re-place existing colors for a harmonious effect. Figure 11 shows theexperimental results with the source palettes created by the Color-gorical system [GLS17]. The source palettes have different styles.
Figure 9: Comparison of Outputs from Our model and Users.
Figure 10: Comparison of the harmony estimation with extractedcolor themes between O’Donovan et al. [OAH11] and our method.The numbers under each theme are listed in the same ways as Fig-ure 8.
For example, the third one is warm while the fifth is cold. For sim-plicity, we replace only one color among the five colors for suggest-ing a better harmonious theme, i. e., the new theme with the newcolor will have the max harmony value among all permutations ofits five colors. 16 equal-distanced colors from RGB color space areincluded as the possible colors for suggestion. It can be seen thatthe new palettes with our suggested colors are more harmoniouswith higher scores than those by Kita et al. [KM16] .
Recoloring Images. We also experimented with recoloring im-ages with the suggested colors. In this experiment, two colorsamong the five theme colors of each image are suggested for a bet-ter harmony effect. The best and worst harmonious themes among
c© 2019 The Author(s)Computer Graphics Forum c© 2019 The Eurographics Association and John Wiley & Sons Ltd.
Yang et al. / A Color-Pair Based Approach for Accurate Color Harmony Estimation
Table 4: Color harmony estimation performances of different methods in MSE.
PPPPPPDatasetMethod
MLE-only BPNN-only One MLE layer Our methodO’Donovan et al.[OAH11]
Kita and Miyata[KM16]
SVM Auto-encoder
MTurk 0.0227 0.0222 0.0124 0.0086 0.0518 0.0568 0.0304 0.0542Kuler 0.3410 0.4034 0.3078 0.2676 0.4456 0.4884 0.4525 0.4372
Table 5: Color harmony estimation performances of different methods in MAE.
PPPPPPDatasetMethod
MLE-only BPNN-only One MLE layer Our methodO’Donovan et al.[OAH11]
Kita and Miyata[KM16]
SVM Auto-encoder
MTurk 0.2435 0.1144 0.0775 0.0438 0.4456 0.4639 0.0974 0.1003Kuler 0.5656 0.4882 0.3925 0.3502 0.5191 0.5393 0.4707 0.5039
Table 6: Estimation accuracy comparison among different meth-ods in Pearson correlation coefficient (%).
PPPPPDatasetMethod
MLE-only BPNN-only Our methodO’Donovan et al.[OAH11]
Kita and Miyata[KM16]
MTurk 78.69 80.12 96.03 73.61 68.35Kuler 45.87 61.38 70.02 37.65 34.96
Figure 11: Color suggestions for five different palettes. Each rowshows the original palette, and harmonized palettes by our methodand Kita et al. [KM16] respectively. The color in a black rectangleis the color to be replaced.
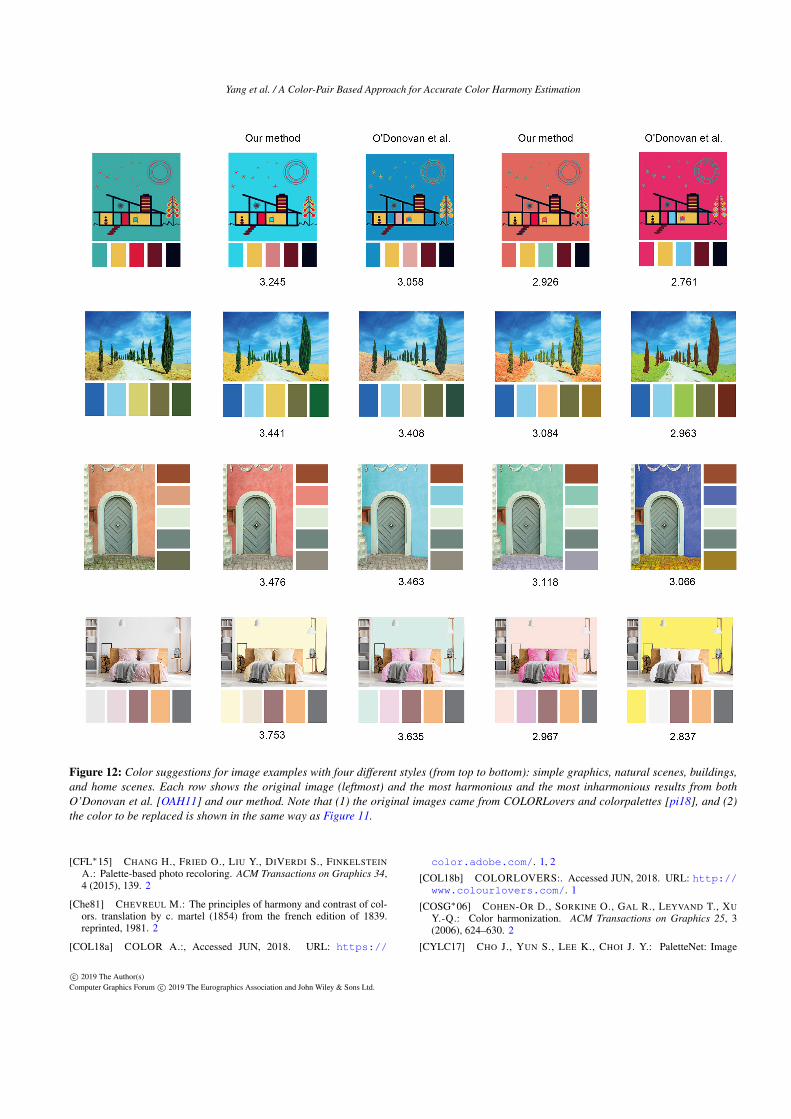
top 100 suggested color themes obtained by both O’Donovan etal. [OAH11] and our method are selected for comparison. Fig-ure 12 shows the results for images with different styles: simplegraphics, natural scenes, buildings, and home scenes. Each imagewas recolored based on the colors of a given color theme usingthe algorithm by Lin et al. [LWL∗18]. Our method generally out-performed [OAH11] with higher scores and visually more harmo-nious effects for both the best and worst cases. Especially, for theinharmonious natural scene shown in the second row of Figure 12,our method produced more harmonious results than O’Donovan et
al. [OAH11], because ours selected colors with higher brightnessand saturation than theirs.
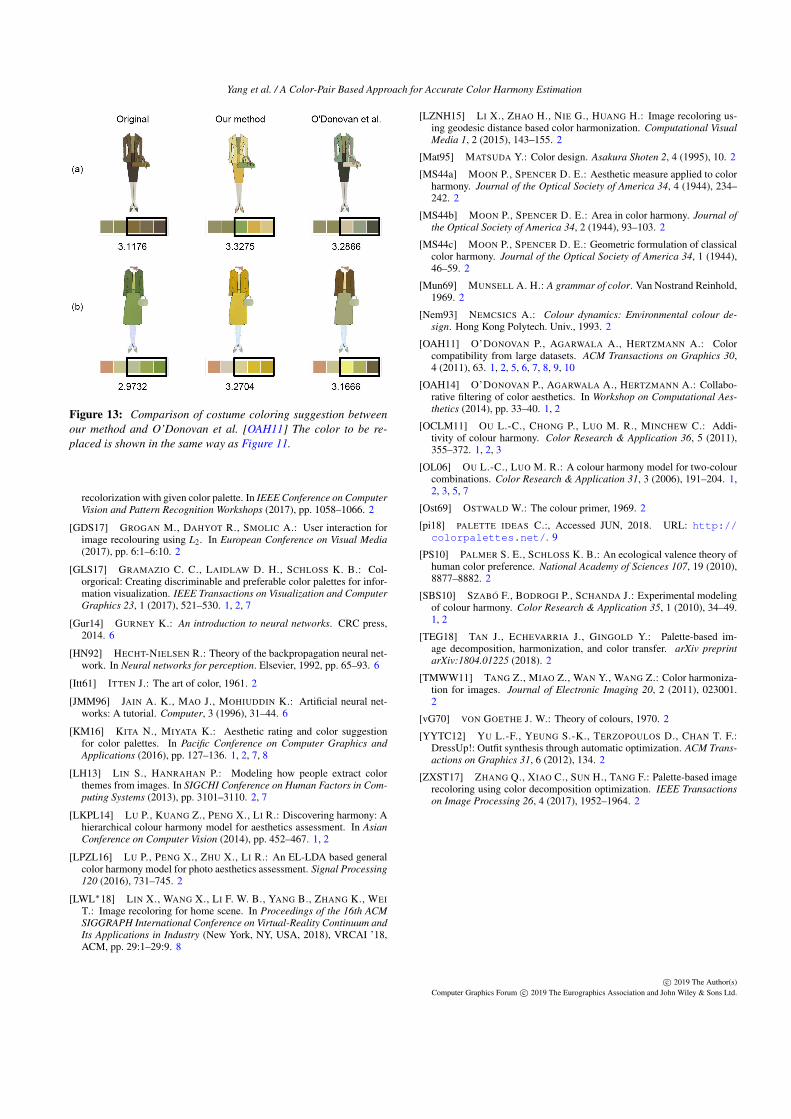
Virtual Shopping. We can also apply harmony estimation to vir-tual shopping for a better color combination of a cloth set. Asshown in Figure 13. Our method can produce more harmoniouscostume colors than O’Donovan et al. [OAH11] and thus improvethe costume appearance. This could be a useful feature for virtualor online shopping applications.
9. Discussion and Conclusion
In this paper, we present a new color harmony estimation methodby discovering the importance of color pairs in harmony evalua-tion. Specifically, we introduce a two-layers MLE based methodby utilizing the statistical distribution of color pairs, so that a ro-bust initial harmony estimation of a color theme can be obtained.Then, the initial estimation and other selected color features arefurther inputted into a BPNN to produce the final harmony value.Our experiment results show that better harmony estimations andapplication results can be obtained by our method than state of theart methods.
Our current method has some limitations. First, the BPNN inour current methodology is relatively simplified; therefore, its per-formance can be limited when dealing with very large trainingdatasets. For this case, the widely studied deep neural networks canbe a potential model to consider. Second, our current model is de-signed for the harmony evaluation of five-color themes. However,our model could be extended for themes with more than five col-ors. In this case, simply extracting more features or reshaping thetwo-layer MLE and BPNN to fit with the bigger themes may notwork well. We need find a more creative way to cope with this typeof themes in the future.
10. Acknowledgments
This work was partly supported by a research grant from the Na-tional key R&D Program of china (Grant No:2018YFB 1403200).Zhigang Deng is in part supported by US NSF IIS-1524782.
References
[Alb13] ALBERS J.: Interaction of color. Yale University Press, 2013. 2
c© 2019 The Author(s)Computer Graphics Forum c© 2019 The Eurographics Association and John Wiley & Sons Ltd.
Yang et al. / A Color-Pair Based Approach for Accurate Color Harmony Estimation
Figure 12: Color suggestions for image examples with four different styles (from top to bottom): simple graphics, natural scenes, buildings,and home scenes. Each row shows the original image (leftmost) and the most harmonious and the most inharmonious results from bothO’Donovan et al. [OAH11] and our method. Note that (1) the original images came from COLORLovers and colorpalettes [pi18], and (2)the color to be replaced is shown in the same way as Figure 11.
[CFL∗15] CHANG H., FRIED O., LIU Y., DIVERDI S., FINKELSTEINA.: Palette-based photo recoloring. ACM Transactions on Graphics 34,4 (2015), 139. 2
[Che81] CHEVREUL M.: The principles of harmony and contrast of col-ors. translation by c. martel (1854) from the french edition of 1839.reprinted, 1981. 2
[COL18a] COLOR A.:, Accessed JUN, 2018. URL: https://
color.adobe.com/. 1, 2
[COL18b] COLORLOVERS:. Accessed JUN, 2018. URL: http://www.colourlovers.com/. 1
[COSG∗06] COHEN-OR D., SORKINE O., GAL R., LEYVAND T., XUY.-Q.: Color harmonization. ACM Transactions on Graphics 25, 3(2006), 624–630. 2
[CYLC17] CHO J., YUN S., LEE K., CHOI J. Y.: PaletteNet: Image
c© 2019 The Author(s)Computer Graphics Forum c© 2019 The Eurographics Association and John Wiley & Sons Ltd.
Yang et al. / A Color-Pair Based Approach for Accurate Color Harmony Estimation
Figure 13: Comparison of costume coloring suggestion betweenour method and O’Donovan et al. [OAH11] The color to be re-placed is shown in the same way as Figure 11.
recolorization with given color palette. In IEEE Conference on ComputerVision and Pattern Recognition Workshops (2017), pp. 1058–1066. 2
[GDS17] GROGAN M., DAHYOT R., SMOLIC A.: User interaction forimage recolouring using L2. In European Conference on Visual Media(2017), pp. 6:1–6:10. 2
[GLS17] GRAMAZIO C. C., LAIDLAW D. H., SCHLOSS K. B.: Col-orgorical: Creating discriminable and preferable color palettes for infor-mation visualization. IEEE Transactions on Visualization and ComputerGraphics 23, 1 (2017), 521–530. 1, 2, 7
[Gur14] GURNEY K.: An introduction to neural networks. CRC press,2014. 6
[HN92] HECHT-NIELSEN R.: Theory of the backpropagation neural net-work. In Neural networks for perception. Elsevier, 1992, pp. 65–93. 6
[Itt61] ITTEN J.: The art of color, 1961. 2
[JMM96] JAIN A. K., MAO J., MOHIUDDIN K.: Artificial neural net-works: A tutorial. Computer, 3 (1996), 31–44. 6
[KM16] KITA N., MIYATA K.: Aesthetic rating and color suggestionfor color palettes. In Pacific Conference on Computer Graphics andApplications (2016), pp. 127–136. 1, 2, 7, 8
[LH13] LIN S., HANRAHAN P.: Modeling how people extract colorthemes from images. In SIGCHI Conference on Human Factors in Com-puting Systems (2013), pp. 3101–3110. 2, 7
[LKPL14] LU P., KUANG Z., PENG X., LI R.: Discovering harmony: Ahierarchical colour harmony model for aesthetics assessment. In AsianConference on Computer Vision (2014), pp. 452–467. 1, 2
[LPZL16] LU P., PENG X., ZHU X., LI R.: An EL-LDA based generalcolor harmony model for photo aesthetics assessment. Signal Processing120 (2016), 731–745. 2
[LWL∗18] LIN X., WANG X., LI F. W. B., YANG B., ZHANG K., WEIT.: Image recoloring for home scene. In Proceedings of the 16th ACMSIGGRAPH International Conference on Virtual-Reality Continuum andIts Applications in Industry (New York, NY, USA, 2018), VRCAI ’18,ACM, pp. 29:1–29:9. 8
[LZNH15] LI X., ZHAO H., NIE G., HUANG H.: Image recoloring us-ing geodesic distance based color harmonization. Computational VisualMedia 1, 2 (2015), 143–155. 2
[Mat95] MATSUDA Y.: Color design. Asakura Shoten 2, 4 (1995), 10. 2
[MS44a] MOON P., SPENCER D. E.: Aesthetic measure applied to colorharmony. Journal of the Optical Society of America 34, 4 (1944), 234–242. 2
[MS44b] MOON P., SPENCER D. E.: Area in color harmony. Journal ofthe Optical Society of America 34, 2 (1944), 93–103. 2
[MS44c] MOON P., SPENCER D. E.: Geometric formulation of classicalcolor harmony. Journal of the Optical Society of America 34, 1 (1944),46–59. 2
[Mun69] MUNSELL A. H.: A grammar of color. Van Nostrand Reinhold,1969. 2
[Nem93] NEMCSICS A.: Colour dynamics: Environmental colour de-sign. Hong Kong Polytech. Univ., 1993. 2
[OAH11] O’DONOVAN P., AGARWALA A., HERTZMANN A.: Colorcompatibility from large datasets. ACM Transactions on Graphics 30,4 (2011), 63. 1, 2, 5, 6, 7, 8, 9, 10
[OAH14] O’DONOVAN P., AGARWALA A., HERTZMANN A.: Collabo-rative filtering of color aesthetics. In Workshop on Computational Aes-thetics (2014), pp. 33–40. 1, 2
[OCLM11] OU L.-C., CHONG P., LUO M. R., MINCHEW C.: Addi-tivity of colour harmony. Color Research & Application 36, 5 (2011),355–372. 1, 2, 3
[OL06] OU L.-C., LUO M. R.: A colour harmony model for two-colourcombinations. Color Research & Application 31, 3 (2006), 191–204. 1,2, 3, 5, 7
[Ost69] OSTWALD W.: The colour primer, 1969. 2
[pi18] PALETTE IDEAS C.:, Accessed JUN, 2018. URL: http://colorpalettes.net/. 9
[PS10] PALMER S. E., SCHLOSS K. B.: An ecological valence theory ofhuman color preference. National Academy of Sciences 107, 19 (2010),8877–8882. 2
[SBS10] SZABÓ F., BODROGI P., SCHANDA J.: Experimental modelingof colour harmony. Color Research & Application 35, 1 (2010), 34–49.1, 2
[TEG18] TAN J., ECHEVARRIA J., GINGOLD Y.: Palette-based im-age decomposition, harmonization, and color transfer. arXiv preprintarXiv:1804.01225 (2018). 2
[TMWW11] TANG Z., MIAO Z., WAN Y., WANG Z.: Color harmoniza-tion for images. Journal of Electronic Imaging 20, 2 (2011), 023001.2
[vG70] VON GOETHE J. W.: Theory of colours, 1970. 2
[YYTC12] YU L.-F., YEUNG S.-K., TERZOPOULOS D., CHAN T. F.:DressUp!: Outfit synthesis through automatic optimization. ACM Trans-actions on Graphics 31, 6 (2012), 134. 2
[ZXST17] ZHANG Q., XIAO C., SUN H., TANG F.: Palette-based imagerecoloring using color decomposition optimization. IEEE Transactionson Image Processing 26, 4 (2017), 1952–1964. 2
c© 2019 The Author(s)Computer Graphics Forum c© 2019 The Eurographics Association and John Wiley & Sons Ltd.


