Embed Size (px)
Citation preview
doi:10.1111/j.1365-2052.2008.01786.x
A combined AFLP and microsatellite linkage map and pilotcomparative genomic analysis of European sea bass Dicentrarchuslabrax L.
D. A. Chistiakov*, C. S. Tsigenopoulos†, J. Lagnel†, Y.-M. Guo‡, B. Hellemans*, C. S. Haley§,
F. A. M. Volckaert* and G. Kotoulas†
*Laboratory of Animal Diversity and Systematics, Katholieke Universiteit Leuven, Ch. Deberiotstraat 32, B-3000 Leuven, Belgium.†Hellenic Centre for Marine Research Crete, Institute of Marine Biology and Genetics, Thalassocosmos, PO Box 2214, Gournes Pediados,
715 00 Heraklion, Crete, Greece. ‡Key Laboratory for Animal Biotechnology of Jiangxi Province and the Ministry of Agriculture of China,
Jiangxi Agricultural University, Nanchang 330045, China. §Roslin Institute (Edinburgh), Roslin, Midlothian EH25 9PS, UK
Summary European sea bass (Dicentrarchus labrax L., Moronidae, Teleostei) sustains a regional fishery
and is commonly farmed in the Mediterranean basin, but has not undergone much long-
term genetic improvement. An updated genetic linkage map of the European sea bass was
constructed using 190 microsatellites, 176 amplified fragment length polymorphisms and
two single nucleotide polymorphisms. From the 45 new microsatellite markers (including
31 type I markers) reported in this study, 28 were mapped. A total of 368 markers were
assembled into 35 linkage groups. Among these markers, 28 represented type I (coding)
markers, including those located within the peptide Y, SOX10, PXN1, ERA and TCRB genes
(linkage groups 1, 7, 16, 17 and 27 respectively). The sex-averaged map spanned
1373.1 centimorgans (cM) of the genome. The female map measured 1380.0 cM, whereas
the male map measured 1046.9 cM, leading to a female-to-male (F:M) recombination rate
ratio of 1.32:1. The intermarker spacing of the second-generation linkage map of the
European sea bass was 3.67 cM, which is smaller than that of the first-generation linkage
map (5.03 cM). Comparative mapping of microsatellite flanking regions was performed
with five model teleosts and this revealed a high percentage (33.6%) of evolutionarily
conserved regions with the three-spined stickleback.
Keywords amplified fragment length polymorphism, comparative map, Dicentrarchus
labrax, genomics, microsatellite, single nucleotide polymorphism, synteny.
Introduction
Among vertebrates, fishes are evolutionarily and ecologi-
cally a highly diverse and successful group. They offer key
answers to questions on human evolution and are a main
source of animal protein through fisheries and aquaculture
(Boffelli et al. 2004). Although the role of aquaculture is
increasing annually, most species of fish have a very short
domestication history. There is an obvious lack of genetic
knowledge on fishes and their populations, but the steadily
growing access to genomic resources provides great
opportunities for enhanced genetic improvement. Increased
production can be envisaged through selective breeding for
a range of traits (such as growth, oxygen stress, disease
resistance and production traits), breeding of sex-controlled
populations, hybridization, chromosome and gene manip-
ulation (Hulata 2001). A high-density linkage map greatly
benefits the location of molecular markers for traits suitable
for selective breeding. Moreover, high-density genetic maps
were a prerequisite for the location of a growing number of
quantitative trait loci (QTL) in fish (Liu 2003; Rogers &
Bernatchez 2005; Shirak et al. 2006).
The comparison of teleost genomes facilitates the identi-
fication of evolutionarily conserved chromosomal fragments
(Chen et al. 2004). The genomes of the model species
medaka, zebrafish, fugu and spotted green pufferfish are
widely used for such comparisons (Woods et al. 2000;
Address for correspondence
D. A. Chistiakov, Laboratory of Animal Diversity and Systematics,
Katholieke Universiteit Leuven, Ch. Deberiotstraat 32, B-3000 Leuven,
Belgium.
E-mail: [email protected]
Accepted for publication 18 June 2008
� 2008 The Authors, Journal compilation � 2008 International Society for Animal Genetics, Animal Genetics, 39, 623–634 623
Rexroad et al. 2005; Kasahara et al. 2007). Comparisons of
genomes within fish families, such as for the Salmonidae
(Gharbi et al. 2006), have also been made. Major findings
include evidence for an ancestral vertebrate karyotype of 12
chromosomes and high levels of conservation of synteny,
although this decreases with increasing phylogenetic
distance (Chen et al. 2004; Jaillon et al. 2004). Once
conservation of synteny is established, the identification of
heritable traits of interest will be facilitated. This can be
achieved either by a genome scan or by comparative QTL
analyses directed in a targeted way by synteny conservation
and associated gene content information.
Over the past few years, European sea bass Dicentrarchus
labrax L. (Moronidae, Perciformes, Teleostei) has become
one of the most intensively studied fish species because of its
importance as a food source and because of some unique
characteristics such as temperature-dependent sex change
(Pavlidis et al. 2000; Piferrer et al. 2005), adaptive plasticity
to a range of habitats (Nebel et al. 2005) and feeds (Kaushik
et al. 2004) and its compact genome size (Peruzzi et al.
2005). Genomic resources have expanded at a steady pace
over the past 10 years (for a review, see Volckaert et al.
2008). Several kinds of polymorphic genetic markers were
developed, including microsatellites (Garcıa de Leon et al.
1995; Castilho & McAndrew 1998; Ciftci et al. 2002;
Tsigenopoulos et al. 2003; Chistiakov et al. 2004, 2005),
random amplified polymorphic DNA (Caccone et al.
1997), mitochondrial DNA markers (Patarnello et al. 1993;
Cesaroni et al. 1997), amplified fragment length polymor-
phisms (AFLPs, this study) and single nucleotide polymor-
phisms (SNPs) (Chistiakov et al. 2007). Except for AFLPs, all
markers were successfully used in studies of the population
structure of sea bass and particularly microsatellites (Naciri
et al. 1999; Bahri-Sfar et al. 2000; Lemaire et al. 2000,
2005; Castilho & Ciftci 2005).
In sea bass, the first exploratory mapping experiment was
based on 23 microsatellites and resulted in a genetic map of
eight linkage groups (Chistiakov et al. 2004). Then, a first-
generation linkage map comprised 162 microsatellite
markers (including two genes) assembled into 25 linkage
groups; the length of the sex-average map was 815 centi-
morgans (cM); the map based on female meioses covered
906 cM and was 1.6-fold longer than the male map, which
encompassed 567 cM (Chistiakov et al. 2005).
Microsatellites are very useful for building solid map
frameworks, which could be later enriched with other types
of markers, as for example, the case with the linkage maps
of rainbow trout (Nichols et al. 2003), brown trout (Gharbi
et al. 2006) and zebrafish (Woods et al. 2000). A limited
number of AFLP maps were made in animals to provide
quick and high-density genome coverage (Liao et al. 2007).
The dominant nature of the marker complicates the inte-
gration of an AFLP map into any other inter- or intraspecific
genetic map that is based on codominant markers. More
recently, SNPs have become increasingly popular because of
their common occurrence in the genome (on average every
90 bp in sea bass; E. Souche, personal communication),
uniqueness, ease of scoring and, above all, reproducibility
(Liu & Cordes 2004).
Here, an updated linkage map of the European sea bass is
presented. It is significantly denser than a first-generation
map (Chistiakov et al. 2005) and consists of a higher
number of microsatellites and additional types of polymor-
phic markers such as AFLPs and SNPs. The effectiveness of
this map was assessed in a pilot comparative analysis of
microsatellite flanking regions between the European sea
bass and five model ray-finned fish species. A high level of
conservation of synteny in comparison with the three-
spined stickleback was established.
Materials and methods
Isolation of polymorphic markers
Microsatellites were isolated from microsatellite-enriched
genomic libraries as described by Tsigenopoulos et al.
(2003) and Chistiakov et al. (2004). Microsatellites from
genes and mRNA of D. labrax, expression sequence tags
(ESTs) from a liver cDNA library (Chini et al. 2006) avail-
able in the GenBank database and ESTs from a brain cDNA
library were developed as reported by Chistiakov et al.
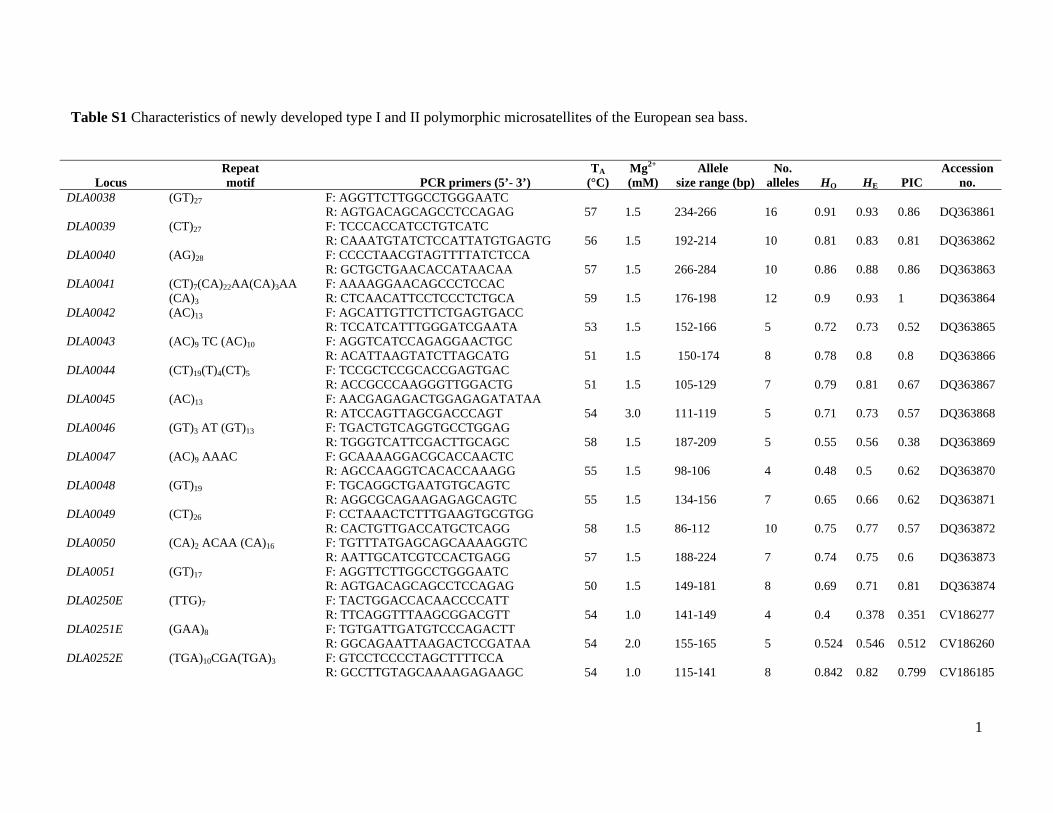
(2005). Characteristics of new polymorphic microsatellite
markers are shown in Table S1.
AFLP markers were developed using a total of 64 com-
binations of each of EcoRI-specific (EcoRI-ACC and EcoRI-
ACG) primers with each of MseI-specific primers. The AFLP
procedure was performed essentially as described by Vos
et al. (1995). The Venezia Fbis family consisting of both
parents and 50 full-sib progeny (biparental diploids) (Chis-
tiakov et al. 2004) was fingerprinted using the LI-COR 4200
DNA sequencer (LI-COR BioSciences).
SNPs were developed by resequencing several genes and
cDNAs of D. labrax, whose sequences were available in the
GenBank database, in 10 unrelated sea bass individuals,
using the ABI 3130 Genetic Analyzer (Applied Biosystems).
A PCR-RFLP approach was used to develop new SNPs. SNP
characteristics are summarized in Table 1.
Linkage analysis
For linkage analysis, the Venezia Fbis family was genotyped
using the newly developed microsatellite, AFLP and SNP
markers. Using the CRI-MAP program v3.0 (Green et al.
1990), the analysis was performed as described by Chis-
tiakov et al. (2005). The microsatellite-based linkage map of
Chistiakov et al. (2005) was used as a framework to
incorporate new markers mainly represented by AFLPs.
Sex-averaged and sex-specific linkage distances were
estimated for each linkage group assuming the Kosambi
(1944) mapping function.
� 2008 The Authors, Journal compilation � 2008 International Society for Animal Genetics, Animal Genetics, 39, 623–634
Chistiakov et al.624
Comparative genomics
The genomes of teleost fishes, the spotted green pufferfish
Tetraodon nigroviridis (v. 7.40), the tiger pufferfish or fugu
Takifugu rubripes (v. 4.40), medaka Oryzias latipes (v. 1.41),
the three-spined stickleback Gasterosteus aculeatus (v. 1.41)
and zebrafish Danio rerio (v. 6.40), were downloaded from
ftp://ftp.ensembl.org/pub/. Local BLAST searches were per-
formed under default settings using individual sequences of
186 sea bass genomic clones as queries and the different
genomes� repeat-masked sequences as subjects. Hits with
e < 10)5 were considered significant. The aligned region
and the flanking sequence of the subject (±1 kb) were then
extracted from the genomes. Searches for non-repeat-
masked sequences and a Smith–Waterman alignment were
performed with the FASTA v.2.0 package (Pearson & Lipman
1988) with sea bass microsatellite clones as queries.
Microsatellites were identified and characterized with a PERL
script based on the MISA script (http://pgrc.ipk-gatersleben.
de/misa). The parameters were set for the detection of di- to
hexanucleotide motifs with a minimum of 6, 4, 3, 3 and 3
repeats respectively. For the analysis of the structure of the
transcripts, local SQL expressions were developed on the
Ensembl (Hubbard et al. 2007) databases (v. 40 and 41 for
both Ensembl and MART ftp://ftp.ensembl.org/pub). The
MAPCHART software v2.2 (Voorrips 2002) was used for the
graphical visualization of the maps. The above procedure
was automated in a pipeline; Perl scripts are available upon
request to JL.
Results
Development of new microsatellite markers
Fourteen new type II (non-coding) polymorphic dinucleo-
tide microsatellites (DLA0038–DLA0051) were isolated
from two (AC)12 and (AG)12 microsatellite-enriched DNA
libraries of D. labrax (Table S1). The screening of 510 sea
bass liver ESTs and 179 brain ESTs resulted in the selection
of 111 sequences containing putative microsatellites.
Thirty-one type I markers (13 extracted from the liver and
18 from brain cDNA libraries respectively) showed poly-
morphism in the population sample of 21 unrelated sea bass
individuals. The polymorphic microsatellites were desig-
nated DLA0250E–DLA269E and DLA271E–DLA281E
(Table S1). Locus DLA0254PXN1 showed strong homology
with pentraxin-1, a member of the family of pentraxins
representing cytokine-inducible acute phase proteins, which
are implicated in a variety of functions, such as innate
immunity, sperm-egg fusion and neuronal synapses.
Table 1 Characteristics of newly developed SNPs of the European sea bass, including location (gene and SNP position), PCR primer sequences and
conditions (annealing temperature, Mg2+ concentration and number of PCR cycles), restriction enzyme digestion information (name of enzymes,
definitions of alleles and lengths of digestion products) and allelic frequencies.
Gene SNP location PCR primers (5¢–3¢)TA
(�C)
Mg2+
(mM)
No.
PCR
cycles
Restriction
enzyme to
digest PCR
product
Definition of alleles
and lengths of
digestion
products (bp)
Allelic frequency
(no. individuals
tested, n)
ACTB c.*575T>C F: CATGGTTGTAGTATCGCTTGTA
R: GCACCCCATGTTACCCCTTG
60 2.0 40 AatII C: 178+20
T: 198
C/T = 0.675/0.325 (20)
ERB1 c.*147C>T F: GACACACACATTTTTAGAACGGAA
R: GGCACATGAAGTCGTTCATTATC
54 2.0 35 EcoRI C: 222
T: 220+20
C/T = 0.864/0.136 (22)
IL1B c.76+52C>T F: TTCTGGAGCAGATTTTAATCA
R: CATCCGACAGAATAGATCTG
54 2.0 40 PagI T: 129+19
C: 148
C/T = 0.952/0.048 (21)
IL1B c.76+157A>G F: TTCTGGAGCAGATTTTAATCA
R: CATCCGACAGAATAGATCTG
54 2.0 40 NheI A: 128+22
G: 148
A/G = 0.952/0.048 (21)
IL1B c.76+215A>G F: CTATGATATGGCAGCTGTACGC
R: CATTTCCTTTCCTTGAATATAAA
54 2.0 40 PauI A: 143
G: 122+21
A/G = 0.975/0.025 (20)
IL1B c.76+310A>G F: CTATGATATGGCAGCTGTACGC
R: CATTTCCTTTCCTTGAATATAAA
54 2.0 40 SspI A: 119+24
G: 143
A/G = 0.868/0.132 (19)
IL1B c.300+263C>T F: CATGCTGGAGAGCATAGTGG
R: CAGACAACAGGACAATAATAGACAT
58 1.0 35 XceI C: 270+24
T: 294
C/T = 0.929/0.061 (21)
IL1B c.300+329C>T F: GGTGTTTAGGGTTTGTTAAAAGGC
R: TGTGTCTCTTCATGCGCAATCGA
58 2.0 35 Eco147I C: 127+23
T: 150
C/T = 0.976/0.024 (21)
IL1B c.300+431A>C F: GGTGTTTAGGGTTTGTTAAAAGGC
R: TGTGTCTCTTCATGCGCAATCGA
58 2.0 35 Bsu15I A: 128+22
C: 150
A/C = 0.905/0.095 (21)
TCRB c.*241C>T F: GTTCAAAGGGAAAGCAGAACTAC
R: CTCTGAAAAGTTTTTATTTAGATGAAT
58 1.0 35 Eco47III C: 258+49
T: 307
C/T = 0.818/0.182 (22)
SOX10 c.86+148C>A F: AATTATAAGCTCAAATTGTTGATTT
R: AAATAAAGTTTGAGTAAAAATTATAT
55 2.0 40 DraI C: 129
A: 104+25
A/C = 0.773/0.237 (22)
� 2008 The Authors, Journal compilation � 2008 International Society for Animal Genetics, Animal Genetics, 39, 623–634
Genomic analysis of D. labrax 625
Analysis of the nucleotide sequence of several D. labrax
genes and cDNAs revealed two sequences containing poly-
morphic type I microsatellites. DLA0261ERA contains a
dinucleotide motif located at intron 3 of the ERA gene
encoding estrogen receptor-a, and DLA0281NROB1 is
situated within the NROB1 gene. DAX-1, a product of the
NROB1 gene, has a DNA-binding domain and functions as
an anti-testis gene by acting antagonistically to the Sry
locus (Zhang et al. 2000). Thus, the addition of 45 new
microsatellites (31 type I) reported here increases the total
number of available microsatellite loci of D. labrax to 246,
including 59 type I markers. Of the 59 coding (type I)
markers, eight microsatellites reside in known genes.
Development of AFLPs
The analysis of 64 combinations of EcoRI/MseI primers in
the Venezia Fbis family revealed a total of 221 AFLPs,
which, on average, corresponded to 3.45 polymorphic
bands per primer combination (Table S2). Various numbers
of markers were produced depending on the primer com-
binations. The combinations of MseI-CAG/EcoRI-ACC and
MseI-ACC/EcoRI-ACC were the most informative primers,
resulting in 14 and 10 polymorphic bands respectively.
Among the 221 AFLPs detected, 44 were heterozygous in
both parents, while the remaining 177 were sex-specific [i.e.
heterozygous in the male (96 bands) or female (81 bands)
parent].
Identification of SNPs
For SNPs, we screened the following sequences: 3¢untranslated regions (UTRs) of mRNA encoding estrogen
receptor b1 (ERB1; AJ489523) and b2 (AJ489524), cyclo-
oxygenase 2 (COX2; AY336080), gonadotropin-releasing
hormone receptor (GRHR; AJ419594), actin b (ACTB;
AJ537421) and T-cell receptor b (TCRB; AJ493441);
intronic sequences of genes encoding sex-determining re-
gion Y-box 10 (COX10; AY247003) and fructose 1,6
diphosphate aldolase (FDA; AJ493441) and the complete
genomic sequence of the interleukin-1b gene (IL1B;
AJ311925). A total of eleven SNPs were developed
(Table 1). These SNPs include ACTB c.*575T>C, ERB1
c.*147C>T and TCRB c.*241C>T and are located at the
3¢ UTRs of the corresponding mRNAs. The SOX10
c.86+148C>A was found in the intronic sequence of the
sex-determining region Y-box 10 gene. Within the IL1B
gene, a total of seven polymorphic nucleotide
substitutions were identified. Four of them, c.76+52C>T,
c.76+157A>G, c.76+215A>G and c.76+310A>G, are
located in intron 1. Three other SNPs, c.300+
263C>T, c.300+329C>T and c.300+431A>C, reside in
intron 2 of the IL1B gene (Fig. S1). All polymorphisms
found in the IL1B gene were in strong linkage disequi-
librium.
Linkage mapping
As mentioned above, the first-generation microsatellite-
based linkage map (Chistiakov et al. 2005) was used as a
framework for incorporating new markers, mainly AFLPs.
Of the 45 newly developed microsatellites, 28 were infor-
mative. Of the 246 polymorphic microsatellites in total, 201
were informative (i.e. heterozygous at least in one of the
parents) in the Venezia Fbis family. Before linkage analysis,
AFLPs were checked to determine whether their frequency
distribution in the F1 progeny followed Mendelian inheri-
tance, either 3:1 or 1:1 (for dominant markers heterozygous
in both parents or in one of the parents respectively), using
a chi-squared test. The screening resulted in the elimination
of 15 AFLPs the observed genotype distribution of which
significantly deviated from Mendelian inheritance. The
remaining 221 AFLP markers were used in linkage analysis.
Linkage mapping resulted in a new version of the linkage
map of D. labrax consisting of 368 genetic markers: 190
microsatellites, 176 AFLPs and two SNPs grouped in 35
linkage groups. Sixty-seven markers (11 microsatellites, 47
AFLPs and nine SNPs) remained unlinked. The current
linkage map includes 24 anonymous type I microsatellites
derived from ESTs and six genes including peptide Y
(DLA0237; LG1), CYP19 (DLA0238; LG6), SOX10 (LG7),
PXN1 (DLA0254, LG16), ERA (DLA0261; LG17) and TCRB
(LG27).
The total length of the sex-averaged map is 1373.1 cM
(Fig. 1). The number of markers ranged from 2 to 39 per
linkage group. Among linkage groups, LG1 is the longest
having a size of 162.4 cM; LG18 is a fusion of the first-
generation LG18 and LG21. In the map, the intermarker
distance varies from 0 to 27.3 cM, with an average of
3.67 cM; 71.5% of the intermarker intervals are in the
range from 0 to 5 cM, 16.7% range from 5 to 10 cM, 10.3%
range from 10 to 20 cM and only 1.5% are larger than
20 cM.
We also built sex-specific linkage maps. The male map
has a length of 1046.9 cM, an average distance between
markers of 3.03 cM and a maximum marker interval of
24.3 cM (Fig. S2). The length of the female map is
1380.0 cM, with an average intermarker distance of
4.05 cM and a maximum marker interval of 37.8 cM
(Fig. S3). The female map is thus 1.32-fold that of the male
map. Most linkage groups are smaller in males than in
females.
Comparative mapping between the sea bass linkagemap and the genomes of five model fish species
Similarity searches of the microsatellite sequences of
D. labrax against the genome sequences of five teleosts
(green spotted pufferfish, fugu, medaka, three-spined stick-
leback and zebrafish) revealed a high percentage of evolu-
tionarily conserved regions (ECRs) between pairs of species.
� 2008 The Authors, Journal compilation � 2008 International Society for Animal Genetics, Animal Genetics, 39, 623–634
Chistiakov et al.626
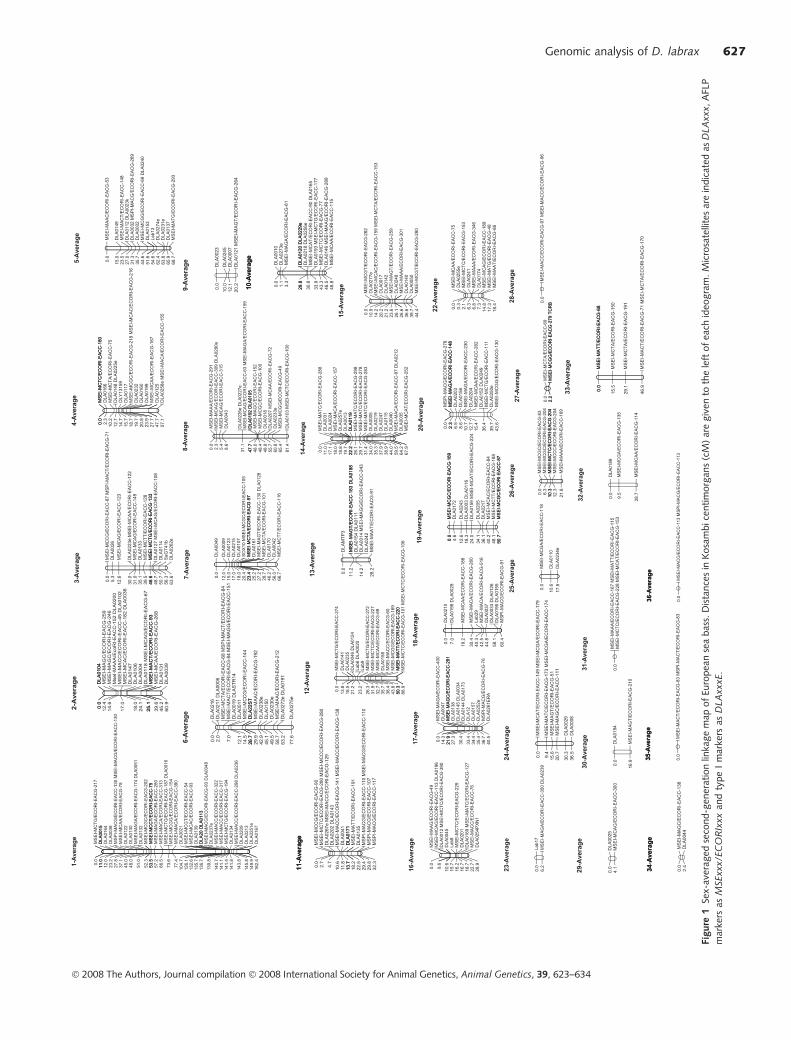
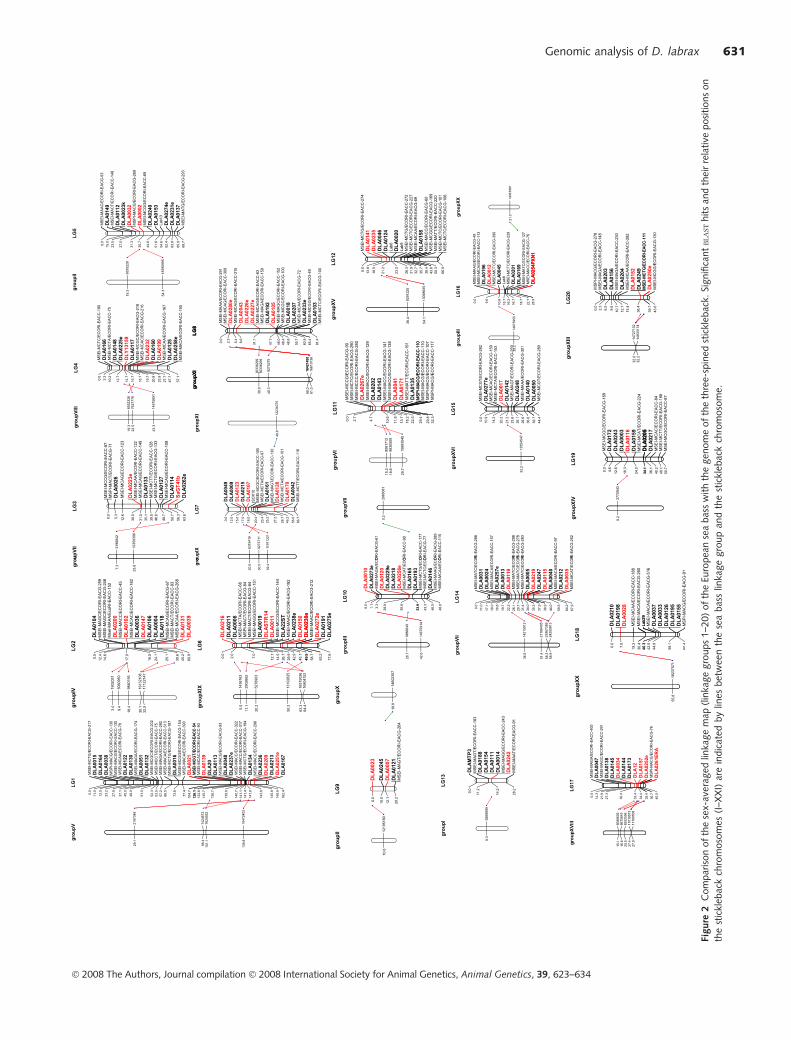
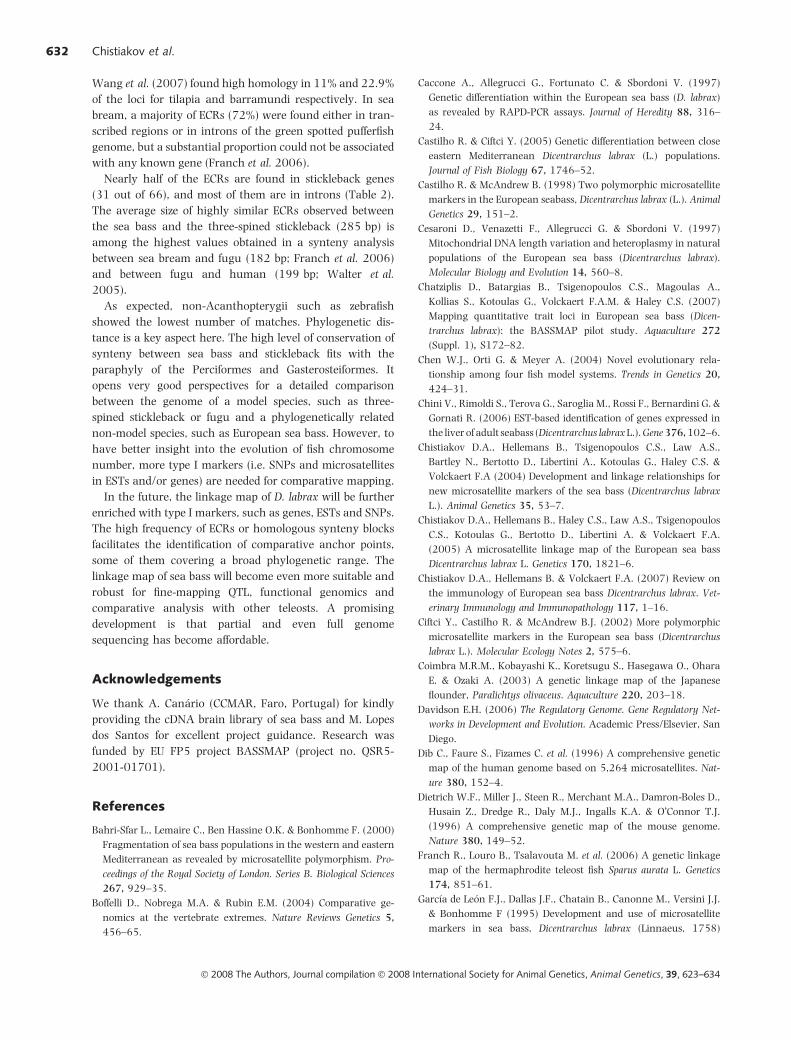
Figure
1Se
x-av
erag
edse
cond-g
ener
atio
nlin
kage
map
of
Euro
pea
nse
abas
s.D
ista
nce
sin
Kosa
mbic
entim
org
ans
(cM
)ar
egiv
ento
the
left
of
each
ideo
gra
m.M
icro
sate
llite
sar
ein
dic
ated
asD
LA
xxx,A
FLP
mar
kers
asM
SExxx/E
CO
RIx
xx
and
type
Im
arke
rsas
DLA
xxxE.
� 2008 The Authors, Journal compilation � 2008 International Society for Animal Genetics, Animal Genetics, 39, 623–634
Genomic analysis of D. labrax 627
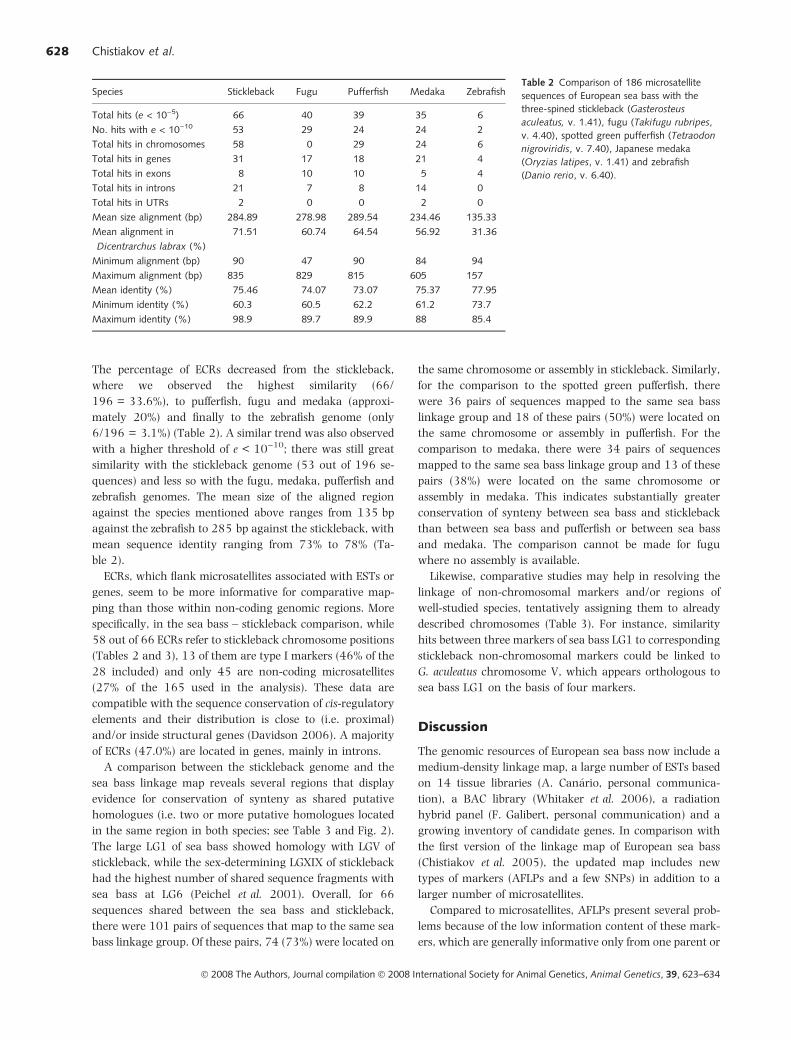
The percentage of ECRs decreased from the stickleback,
where we observed the highest similarity (66/
196 = 33.6%), to pufferfish, fugu and medaka (approxi-
mately 20%) and finally to the zebrafish genome (only
6/196 = 3.1%) (Table 2). A similar trend was also observed
with a higher threshold of e < 10)10; there was still great
similarity with the stickleback genome (53 out of 196 se-
quences) and less so with the fugu, medaka, pufferfish and
zebrafish genomes. The mean size of the aligned region
against the species mentioned above ranges from 135 bp
against the zebrafish to 285 bp against the stickleback, with
mean sequence identity ranging from 73% to 78% (Ta-
ble 2).
ECRs, which flank microsatellites associated with ESTs or
genes, seem to be more informative for comparative map-
ping than those within non-coding genomic regions. More
specifically, in the sea bass – stickleback comparison, while
58 out of 66 ECRs refer to stickleback chromosome positions
(Tables 2 and 3), 13 of them are type I markers (46% of the
28 included) and only 45 are non-coding microsatellites
(27% of the 165 used in the analysis). These data are
compatible with the sequence conservation of cis-regulatory
elements and their distribution is close to (i.e. proximal)
and/or inside structural genes (Davidson 2006). A majority
of ECRs (47.0%) are located in genes, mainly in introns.
A comparison between the stickleback genome and the
sea bass linkage map reveals several regions that display
evidence for conservation of synteny as shared putative
homologues (i.e. two or more putative homologues located
in the same region in both species; see Table 3 and Fig. 2).
The large LG1 of sea bass showed homology with LGV of
stickleback, while the sex-determining LGXIX of stickleback
had the highest number of shared sequence fragments with
sea bass at LG6 (Peichel et al. 2001). Overall, for 66
sequences shared between the sea bass and stickleback,
there were 101 pairs of sequences that map to the same sea
bass linkage group. Of these pairs, 74 (73%) were located on
the same chromosome or assembly in stickleback. Similarly,
for the comparison to the spotted green pufferfish, there
were 36 pairs of sequences mapped to the same sea bass
linkage group and 18 of these pairs (50%) were located on
the same chromosome or assembly in pufferfish. For the
comparison to medaka, there were 34 pairs of sequences
mapped to the same sea bass linkage group and 13 of these
pairs (38%) were located on the same chromosome or
assembly in medaka. This indicates substantially greater
conservation of synteny between sea bass and stickleback
than between sea bass and pufferfish or between sea bass
and medaka. The comparison cannot be made for fugu
where no assembly is available.
Likewise, comparative studies may help in resolving the
linkage of non-chromosomal markers and/or regions of
well-studied species, tentatively assigning them to already
described chromosomes (Table 3). For instance, similarity
hits between three markers of sea bass LG1 to corresponding
stickleback non-chromosomal markers could be linked to
G. aculeatus chromosome V, which appears orthologous to
sea bass LG1 on the basis of four markers.
Discussion
The genomic resources of European sea bass now include a
medium-density linkage map, a large number of ESTs based
on 14 tissue libraries (A. Canario, personal communica-
tion), a BAC library (Whitaker et al. 2006), a radiation
hybrid panel (F. Galibert, personal communication) and a
growing inventory of candidate genes. In comparison with
the first version of the linkage map of European sea bass
(Chistiakov et al. 2005), the updated map includes new
types of markers (AFLPs and a few SNPs) in addition to a
larger number of microsatellites.
Compared to microsatellites, AFLPs present several prob-
lems because of the low information content of these mark-
ers, which are generally informative only from one parent or
Table 2 Comparison of 186 microsatellite
sequences of European sea bass with the
three-spined stickleback (Gasterosteus
aculeatus, v. 1.41), fugu (Takifugu rubripes,
v. 4.40), spotted green pufferfish (Tetraodon
nigroviridis, v. 7.40), Japanese medaka
(Oryzias latipes, v. 1.41) and zebrafish
(Danio rerio, v. 6.40).
Species Stickleback Fugu Pufferfish Medaka Zebrafish
Total hits (e < 10)5) 66 40 39 35 6
No. hits with e < 10)10 53 29 24 24 2
Total hits in chromosomes 58 0 29 24 6
Total hits in genes 31 17 18 21 4
Total hits in exons 8 10 10 5 4
Total hits in introns 21 7 8 14 0
Total hits in UTRs 2 0 0 2 0
Mean size alignment (bp) 284.89 278.98 289.54 234.46 135.33
Mean alignment in
Dicentrarchus labrax (%)
71.51 60.74 64.54 56.92 31.36
Minimum alignment (bp) 90 47 90 84 94
Maximum alignment (bp) 835 829 815 605 157
Mean identity (%) 75.46 74.07 73.07 75.37 77.95
Minimum identity (%) 60.3 60.5 62.2 61.2 73.7
Maximum identity (%) 98.9 89.7 89.9 88 85.4
� 2008 The Authors, Journal compilation � 2008 International Society for Animal Genetics, Animal Genetics, 39, 623–634
Chistiakov et al.628
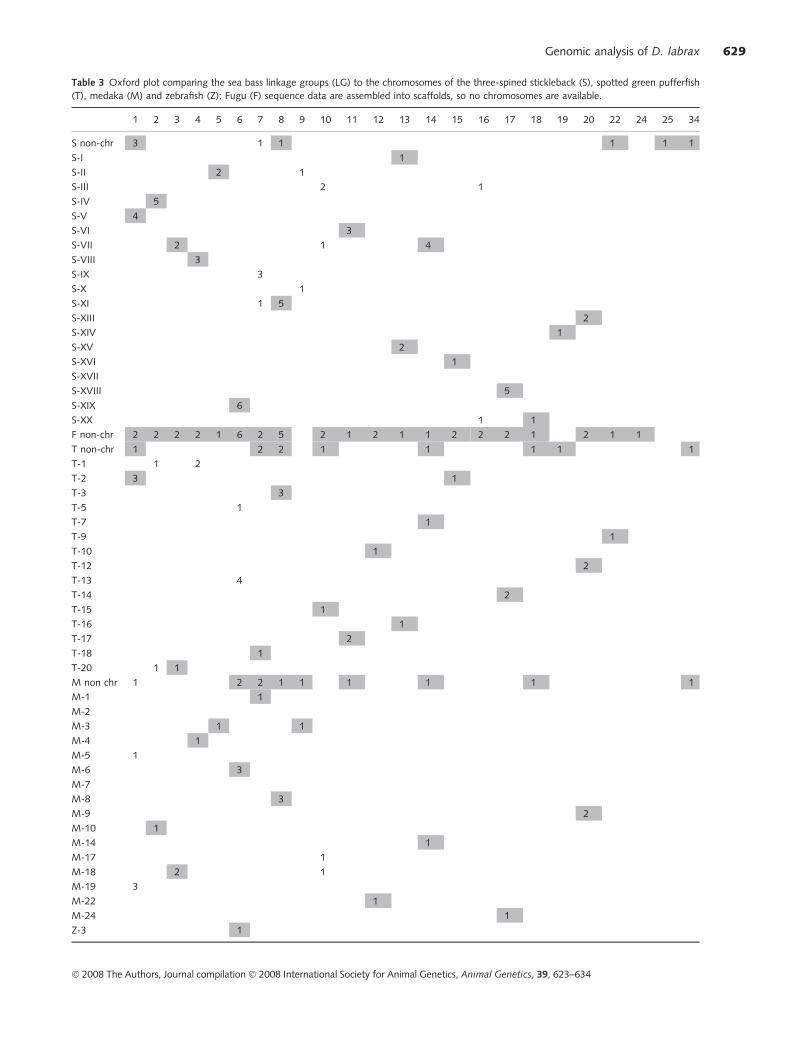
Table 3 Oxford plot comparing the sea bass linkage groups (LG) to the chromosomes of the three-spined stickleback (S), spotted green pufferfish
(T), medaka (M) and zebrafish (Z); Fugu (F) sequence data are assembled into scaffolds, so no chromosomes are available.
1 2 3 4 5 6 7 8 9 10 11 12 13 14 15 16 17 18 19 20 22 24 25 34
S non-chr 3 1 1 1 1 1
S-I 1
S-II 2 1
S-III 2 1
S-IV 5
S-V 4
S-VI 3
S-VII 2 1 4
S-VIII 3
S-IX 3
S-X 1
S-XI 1 5
S-XIII 2
S-XIV 1
S-XV 2
S-XVI 1
S-XVII
S-XVIII 5
S-XIX 6
S-XX 1 1
F non-chr 2 2 2 2 1 6 2 5 2 1 2 1 1 2 2 2 1 2 1 1
T non-chr 1 2 2 1 1 1 1 1
T-1 1 2
T-2 3 1
T-3 3
T-5 1
T-7 1
T-9 1
T-10 1
T-12 2
T-13 4
T-14 2
T-15 1
T-16 1
T-17 2
T-18 1
T-20 1 1
M non chr 1 2 2 1 1 1 1 1 1
M-1 1
M-2
M-3 1 1
M-4 1
M-5 1
M-6 3
M-7
M-8 3
M-9 2
M-10 1
M-14 1
M-17 1
M-18 2 1
M-19 3
M-22 1
M-24 1
Z-3 1
� 2008 The Authors, Journal compilation � 2008 International Society for Animal Genetics, Animal Genetics, 39, 623–634
Genomic analysis of D. labrax 629
one sex in our case and exhibit a potentially higher error rate
in genotyping. As a consequence, AFLP markers largely
developed the existing map and in a few cases, we may expect
AFLP markers to link existing maps. Here, this happened
when LG18 and LG21 of the first-generation map fused into a
single linkage group designated LG18 + 21 through the link
between two AFLPs, MSEI-MCAA/ECORI-EACC-188 and
MSEI-MACA/ECORI-EACG-260.
The total sex-averaged length was increased 1.7-fold,
from 815 to 1373.1 cM. The number of linkage groups has
also increased from 25 to 35, including six new linkage
groups that contain only AFLPs. In the current map, 29
linkage groups have three or more markers. The recombi-
nation length is close to the estimated map size of D. labrax
(1769.5 cM; calculations are based on the method of
Postlethwait et al. 1994). We expect that the addition of
new markers will make the direct correspondence of the 24
linkage groups to the 24 chromosomes (Sola et al. 1993) a
biological reality for the European sea bass. This may also
be independently achieved by the development of physical
maps, such as BAC clone paired-end sequencing (H. Kuhl,
personal communication), assembly of a partially or fully
sequenced genome or/and the recombination-indepen-
dent radiation hybrid map (F. Galibert, personal
communication).
With the addition of markers, the new map became
denser, as is reflected by a decrease in the intermarker
spacing from 5.03 to 3.67 cM. Despite the increase in
length of the current sex-specific maps compared to the first
generation maps, their average intermarker interval has
decreased from 3.5 to 3.03 cM (male, M) and from 5.59 to
4.05 cM (female, F). It is consistent with the results from the
first-generation map (Chistiakov et al. 2005). The F:M
recombination ratio in sea bass is typical for most vertebrate
species, whose sex recombination rate was measured. In
higher vertebrates, this ratio varies between 1.0 and 2.0
(Dib et al. 1996; Dietrich et al. 1996; Mellersh et al. 1997).
The F:M ratio in sea bass is the lowest among those reported
in fishes, for which F:M recombination usually exceeds 2.0,
such as in rainbow trout (Sakamoto et al. 2000), zebrafish
(Singer et al. 2002), Arctic char (Woram et al. 2003) and
fugu (Kai et al. 2005). However, in fish such as Japanese
flounder, a higher recombination rate was shown in males
compared to females (Coimbra et al. 2003). The association
of sea bass LG6 with stickleback LGXIX, which hosts the
sex-determining locus at the distal end and the somewhat
reduced recombination rates in the male, make this LG the
target for further analysis. The mechanism of sex determi-
nation in sea bass remains unknown. The DAX1 (NROB1)
gene was shown to be involved in sex differentiation in
several vertebrates, but not in sea bass (Martins et al. 2007).
Sex differentiation is dependent on strain and parents and is
environmentally (temperature) induced (Pavlidis et al.
2000; Piferrer et al. 2005). As the male-specific suppression
in recombination rate (Haldane�s rule) seems common in a
range of fishes and vertebrates, sexual heterogeneity is likely
to be an ancestral feature.
In the updated map, microsatellites represent half of the
mapped markers. Sequenced markers such as microsatel-
lites and ESTs can be easily related to physical maps and
genome sequences. In addition, the current map is
sufficiently dense to be used for the medium-resolution
mapping of economically and physiologically important
QTL. Mapped genes such as SOX10, ERA and CYP19
(with known polymorphic markers inside) are functional
candidates for searching quantitative traits related to sex
differentiation and maturation, whereas TCRB seems sig-
nificant in mapping traits associated with the resistance to
pathogens and immunity. The collection of microsatellites
would be useful for marker-assisted selective breeding to
establish commercially improved strains of farmed sea bass
(Chatziplis et al. 2007). The collection of markers is also
critical for characterizing the genetic background of wild
and cultured sea bass to maintain heterozygosity of cul-
tured stock and for assigning parentage (Garcıa de Leon
et al. 1995).
A growing number of the sea bass microsatellites originate
from coding regions, which may improve the chances for
matches between genomes. A total of 33.6% of the sea bass
microsatellite sequences match with three-spined stickleback
and a lower, but still considerable number with other
Acanthopterygii. Only forty hits (20.4%) were found between
the sea bass and pufferfish. Using the same stringency
(e < 10)5), Stemshorn et al. (2005) and Franch et al. (2006)
reported higher rate of similarity for microsatellite sequences
between the bullhead sea bream and pufferfish (45.0%) and
between the gilthead sea bream and pufferfish (30.4%). Using
a more stringent threshold for BLASTN searches (e < 10)8),
Table 3 Continued.
1 2 3 4 5 6 7 8 9 10 11 12 13 14 15 16 17 18 19 20 22 24 25 34
Z-5 1 1
Z-6 1
Z-8 1
Z-18 1
Only the sea bass LGs (24 out of 35) and the five species chromosomes (or scaffolds) that show a hit (e < 10)5) are presented. Sea bass sequence hits
against unique chromosomes (excluding non-chromosomal sequences) are shaded.
� 2008 The Authors, Journal compilation � 2008 International Society for Animal Genetics, Animal Genetics, 39, 623–634
Chistiakov et al.630
Figure
2C
om
par
ison
of
the
sex-
aver
aged
linka
ge
map
(lin
kage
gro
ups
1–2
0)
of
the
Euro
pea
nse
abas
sw
ith
the
gen
om
eof
the
thre
e-sp
ined
stic
kleb
ack.
Signifi
cant
BL
AS
Thits
and
thei
rre
lative
posi
tions
on
the
stic
kleb
ack
chro
moso
mes
(I–X
XI)
are
indic
ated
by
lines
bet
wee
nth
ese
abas
slin
kage
gro
up
and
the
stic
kleb
ack
chro
moso
me.
� 2008 The Authors, Journal compilation � 2008 International Society for Animal Genetics, Animal Genetics, 39, 623–634
Genomic analysis of D. labrax 631
Wang et al. (2007) found high homology in 11% and 22.9%
of the loci for tilapia and barramundi respectively. In sea
bream, a majority of ECRs (72%) were found either in tran-
scribed regions or in introns of the green spotted pufferfish
genome, but a substantial proportion could not be associated
with any known gene (Franch et al. 2006).
Nearly half of the ECRs are found in stickleback genes
(31 out of 66), and most of them are in introns (Table 2).
The average size of highly similar ECRs observed between
the sea bass and the three-spined stickleback (285 bp) is
among the highest values obtained in a synteny analysis
between sea bream and fugu (182 bp; Franch et al. 2006)
and between fugu and human (199 bp; Walter et al.
2005).
As expected, non-Acanthopterygii such as zebrafish
showed the lowest number of matches. Phylogenetic dis-
tance is a key aspect here. The high level of conservation of
synteny between sea bass and stickleback fits with the
paraphyly of the Perciformes and Gasterosteiformes. It
opens very good perspectives for a detailed comparison
between the genome of a model species, such as three-
spined stickleback or fugu and a phylogenetically related
non-model species, such as European sea bass. However, to
have better insight into the evolution of fish chromosome
number, more type I markers (i.e. SNPs and microsatellites
in ESTs and/or genes) are needed for comparative mapping.
In the future, the linkage map of D. labrax will be further
enriched with type I markers, such as genes, ESTs and SNPs.
The high frequency of ECRs or homologous synteny blocks
facilitates the identification of comparative anchor points,
some of them covering a broad phylogenetic range. The
linkage map of sea bass will become even more suitable and
robust for fine-mapping QTL, functional genomics and
comparative analysis with other teleosts. A promising
development is that partial and even full genome
sequencing has become affordable.
Acknowledgements
We thank A. Canario (CCMAR, Faro, Portugal) for kindly
providing the cDNA brain library of sea bass and M. Lopes
dos Santos for excellent project guidance. Research was
funded by EU FP5 project BASSMAP (project no. QSR5-
2001-01701).
References
Bahri-Sfar L., Lemaire C., Ben Hassine O.K. & Bonhomme F. (2000)
Fragmentation of sea bass populations in the western and eastern
Mediterranean as revealed by microsatellite polymorphism. Pro-
ceedings of the Royal Society of London. Series B. Biological Sciences
267, 929–35.
Boffelli D., Nobrega M.A. & Rubin E.M. (2004) Comparative ge-
nomics at the vertebrate extremes. Nature Reviews Genetics 5,
456–65.
Caccone A., Allegrucci G., Fortunato C. & Sbordoni V. (1997)
Genetic differentiation within the European sea bass (D. labrax)
as revealed by RAPD-PCR assays. Journal of Heredity 88, 316–
24.
Castilho R. & Ciftci Y. (2005) Genetic differentiation between close
eastern Mediterranean Dicentrarchus labrax (L.) populations.
Journal of Fish Biology 67, 1746–52.
Castilho R. & McAndrew B. (1998) Two polymorphic microsatellite
markers in the European seabass, Dicentrarchus labrax (L.). Animal
Genetics 29, 151–2.
Cesaroni D., Venazetti F., Allegrucci G. & Sbordoni V. (1997)
Mitochondrial DNA length variation and heteroplasmy in natural
populations of the European sea bass (Dicentrarchus labrax).
Molecular Biology and Evolution 14, 560–8.
Chatziplis D., Batargias B., Tsigenopoulos C.S., Magoulas A.,
Kollias S., Kotoulas G., Volckaert F.A.M. & Haley C.S. (2007)
Mapping quantitative trait loci in European sea bass (Dicen-
trarchus labrax): the BASSMAP pilot study. Aquaculture 272
(Suppl. 1), S172–82.
Chen W.J., Orti G. & Meyer A. (2004) Novel evolutionary rela-
tionship among four fish model systems. Trends in Genetics 20,
424–31.
Chini V., Rimoldi S., Terova G., Saroglia M., Rossi F., Bernardini G. &
Gornati R. (2006) EST-based identification of genes expressed in
the liver of adult seabass (Dicentrarchus labrax L.). Gene 376, 102–6.
Chistiakov D.A., Hellemans B., Tsigenopoulos C.S., Law A.S.,
Bartley N., Bertotto D., Libertini A., Kotoulas G., Haley C.S. &
Volckaert F.A (2004) Development and linkage relationships for
new microsatellite markers of the sea bass (Dicentrarchus labrax
L.). Animal Genetics 35, 53–7.
Chistiakov D.A., Hellemans B., Haley C.S., Law A.S., Tsigenopoulos
C.S., Kotoulas G., Bertotto D., Libertini A. & Volckaert F.A.
(2005) A microsatellite linkage map of the European sea bass
Dicentrarchus labrax L. Genetics 170, 1821–6.
Chistiakov D.A., Hellemans B. & Volckaert F.A. (2007) Review on
the immunology of European sea bass Dicentrarchus labrax. Vet-
erinary Immunology and Immunopathology 117, 1–16.
Ciftci Y., Castilho R. & McAndrew B.J. (2002) More polymorphic
microsatellite markers in the European sea bass (Dicentrarchus
labrax L.). Molecular Ecology Notes 2, 575–6.
Coimbra M.R.M., Kobayashi K., Koretsugu S., Hasegawa O., Ohara
E. & Ozaki A. (2003) A genetic linkage map of the Japanese
flounder, Paralichtys olivaceus. Aquaculture 220, 203–18.
Davidson E.H. (2006) The Regulatory Genome. Gene Regulatory Net-
works in Development and Evolution. Academic Press/Elsevier, San
Diego.
Dib C., Faure S., Fizames C. et al. (1996) A comprehensive genetic
map of the human genome based on 5,264 microsatellites. Nat-
ure 380, 152–4.
Dietrich W.F., Miller J., Steen R., Merchant M.A., Damron-Boles D.,
Husain Z., Dredge R., Daly M.J., Ingalls K.A. & O�Connor T.J.
(1996) A comprehensive genetic map of the mouse genome.
Nature 380, 149–52.
Franch R., Louro B., Tsalavouta M. et al. (2006) A genetic linkage
map of the hermaphrodite teleost fish Sparus aurata L. Genetics
174, 851–61.
Garcıa de Leon F.J., Dallas J.F., Chatain B., Canonne M., Versini J.J.
& Bonhomme F (1995) Development and use of microsatellite
markers in sea bass, Dicentrarchus labrax (Linnaeus, 1758)
� 2008 The Authors, Journal compilation � 2008 International Society for Animal Genetics, Animal Genetics, 39, 623–634
Chistiakov et al.632
(Perciformes: Serrandidae). Molecular Marine Biology and
Biotechnology 4, 62–8.
Gharbi K., Gautier A., Danzmann R.G. et al. (2006) A linkage map
for brown trout (Salmo trutta): chromosome homologies and
comparative genome organization with other salmonid fish.
Genetics 172, 2405–19.
Green P., Falls K. & Crooks S. (1990) Documentation for CRI-MAP
Version 2.4. Washington University School of Medicine, St Louis.
Hubbard T.J., Aken B.L., Beal K. et al. (2007) Ensembl 2007.
Nucleic Acids Research 35, D610–7.
Hulata G. (2001) Genetic manipulations in aquaculture: a review of
stock improvement by classical and modern technologies.
Genetica 111, 155–73.
Jaillon O., Aury J.M., Brunet F. et al. (2004) Genome duplication in
the teleost fish Tetraodon nigroviridis reveals the early vertebrate
proto-karyotype. Nature 431, 946–57.
Kai W., Kikuchi K., Fujita M., Suetake H., Fujiwara A., Yoshiura Y.,
Ototake M., Venkatesh B., Miyaki K. & Suzuki Y. (2005) A
genetic linkage map for the tiger pufferfish, Takifugu rubripes.
Genetics 171, 227–38.
Kasahara M., Naruse K., Sasaki S. et al. (2007) The medaka draft
genome and insights into vertebrate genome evolution. Nature
447, 714–9.
Kaushik S.J., Coves D., Dutto G. & Blanc D. (2004) Almost total
replacement of fish meal by plant protein sources in the diet of a
marine teleost, the European seabass, Dicentrarchus labrax.
Aquaculture 230, 391–404.
Kosambi D.D. (1944) The estimation of map distances from
recombination values. Annals of Eugenics 12, 172–5.
Lemaire C., Allegrucci G., Naciri M., Bahri-Sfar L., Kara H. &
Bonhomme F. (2000) Do discrepancies between microsatellite
and allozyme variation reveal differential selection between sea
and lagoon in the sea bass (Dicentrarchus labrax)? Molecular
Ecology 9, 457–68.
Lemaire C., Versini J.J. & Bonhomme F. (2005) Maintenance of
genetic differentiation across a transition zone in the sea: dis-
cordance between nuclear and cytoplasmic markers. Journal of
Evolutionary Biology 18, 70–80.
Liao M., Zhang L., Yang G., Zhu M., Wang D., Wei Q., Zou G. &
Chen D. (2007) Development of silver carp (Hypophthalmichthys
molitrix) and bighead carp (Aristichthys nobilis) genetic maps
using microsatellite and AFLP markers and a pseudo-testcross
strategy. Animal Genetics 38, 364–70.
Liu Z.J. (2003) A review of catfish genomics: progress and
perspectives. Comparative and Functional Genomics 4, 259–65.
Liu Z.J. & Cordes J.F. (2004) DNA marker technologies and
their applications in aquaculture genetics. Aquaculture 238, 1–37.
Martins R.S., Deloffre L.A., Mylonas C.C., Power D.M. & Canario
A.V. (2007) Developmental expression of DAX1 in the European
sea bass, Dicentrarchus labrax: lack of evidence for sexual dimor-
phism during sex differentiation. Reproductive Biology and Endo-
crinology 5, 19.
Mellersh C.S., Langston A.A., Acland G.M., Fleming M.A., Ray K.,
Wiegand N.A., Francisco L.V., Gibbs M., Aguirre G.D. & Ostra-
nder E.A. (1997) A linkage map of the canine genome. Genomics
46, 326–36.
Naciri M., Lemaire C., Borsa P. & Bonhomme F. (1999) Genetic
study of the Atlantic/Mediterranean transition in sea bass
(Dicentrarchus labrax). Journal of Heredity 90, 591–6.
Nebel C., Romestand B., Negre-Sadargues G., Grousset E., Aujoulat
F., Bacal J., Bonhomme F. & Charmantier G. (2005) Differential
freshwater adaptation in juvenile sea-bass Dicentrarchus labrax:
involvement of gills and urinary system. Journal of Experimental
Biology 208, 3859–71.
Nichols K.M., Young W.P., Danzmann R.G. et al. (2003) A
consolidated linkage map for rainbow trout (Oncorhynchus
mykiss). Animal Genetics 34, 102–15.
Patarnello T., Bargelloni L., Caldara F. & Colombo L. (1993) Mito-
chondrial DNA sequence variation in the European sea bass,
Dicentrarchus labrax L. (Serranidae): evidence of differential hap-
lotype distribution in natural and farmed populations. Molecular
Marine Biology and Biotechnology 2, 333–7.
Pavlidis M., Koumoundouros G., Sterioti A., Somarakis S., Divanach
P. & Kentouri M. (2000) Evidence of temperature-dependent sex
determination in the European sea bass (Dicentrarchus labrax L.).
Journal of Experimental Zoology 287, 225–32.
Pearson W.R. & Lipman D.J. (1988) Improved tools for biological
sequence comparison. Proceedings of the National Academy of Sci-
ences of the United States of America 85, 2444–8.
Peichel C.L., Nereng K.S., Ohgi K.A., Cole B.L.E., Colosimo P.F.,
Buerkle C.A., Schluter D. & Kingsley D.M. (2001) The genetic
architecture of divergence between threespine stickleback species.
Nature 414, 901–5.
Peruzzi S., Chatain B. & Menu B. (2005) Flow cytometric determi-
nation of genome size in European seabass (Dicentrarchus labrax),
gilthead seabream (Sparus aurata), thinlip mullet (Liza ramada),
and European eel (Anguilla anguilla). Aquatic Living Resources 18,
77–81.
Piferrer F., Blazquez M., Navarro L. & Gonzalez A. (2005) Genetic,
endocrine and environmental components of sex determination
and differentiation in the European sea bass (Dicentrarchus labrax
L.). General and Comparative Endocrinology 142, 102–10.
Postlethwait J.H., Johnson S.L., Midson C.N. et al. (1994) A genetic
linkage map for the zebrafish. Science 264, 699–703.
Rexroad C.E. III, Rodriguez M.F., Coulibaly I., Gharbi K., Danzmann
R.G., Dekoning J., Phillips R. & Palti Y. (2005) Comparative
mapping of expressed sequence tags containing microsatellites in
rainbow trout (Oncorhynchus mykiss). BMC Genomics 6, 54.
Rogers S.M. & Bernatchez L. (2005) Integrating QTL mapping and
genome scans towards the characterization of candidate loci
under parallel selection in the lake whitefish (Coregonus clupea-
formis). Molecular Ecology 14, 351–61.
Sakamoto T., Danzmann R.G., Gharbi K. et al. (2000) A microsat-
ellite linkage map of rainbow trout (Oncorhynchus mykiss) char-
acterized by large sex-specific differences in recombination rates.
Genetics 155, 1331–45.
Shirak A., Seroussi E., Cnaani A., Howe A.E., Domokhovsky R.,
Zilberman N., Kocher T.D., Hulata G. & Ron M. (2006) Amh and
Dmrta2 genes map to tilapia (Oreochromis spp.) linkage group 23
within quantitative trait locus regions for sex determination.
Genetics 174, 1573–81.
Singer A., Perlman H., Yan Y., Walker C., Corley-Smith G.,
Brandhorst B. & Postlethwait J. (2002) Sex-specific recombina-
tion rates in zebrafish (Danio rerio). Genetics 160, 649–57.
Sola L., Bressanello S., Rossi A.R., Laselli V., Crosetti D. &
Cataudella S. (1993) A karyotype analysis of the genus
Dicentrarchus by different staining techniques. Journal of Fish
Biology 43, 329–37.
� 2008 The Authors, Journal compilation � 2008 International Society for Animal Genetics, Animal Genetics, 39, 623–634
Genomic analysis of D. labrax 633
Stemshorn K.C., Nolte A.W. & Tautz D. (2005) A genetic map of
Cottus gobio (Pisces, Teleostei) based on microsatellites can be
linked to the physical map of Tetraodon nigroviridis. Journal of
Evolutionary Biology 18, 1619–24.
Tsigenopoulos C.S., Hellemans B., Chistiakov D.A., Libertini A.,
Kotoulas G. & Volckaert F. (2003) Eleven new microsatellites of the
sea bass (Dicentrarchus labrax L.). Molecular Ecology Notes 3, 352–4.
Volckaert F.A.M., Batargias C., Canario A., Chatziplis D., Chistiakov
D.A., Haley C., Libertini A. & Tsigenopoulos C.S. (2008) The
European sea bass (Dicentrarchus labrax L.) and its genomic
resources. In: Genome Mapping and Genomics in Fishes and Aquatic
Animals (Ed. by C. Kole), pp. 117–34. Springer Verlag, Berlin.
Voorrips R.E. (2002) MAPCHART: software for the graphical
presentation of linkage maps and QTLs. Journal of Heredity 93,
77–8.
Vos P., Hogers R., Bleeker M. et al. (1995) AFLP: a new technique
for DNA fingerprinting. Nucleic Acids Research 23, 4407–14.
Walter K., Abnizova I., Elgar G. & Gilks W.R. (2005) Striking
nucleotide frequency pattern at the borders of highly conserved
vertebrate non-coding sequences. Trends in Genetics 21,
436–40.
Wang C.M., Zhu Z.Y., Lo L.C., Feng F., Lin G., Yang W.T., Li J. &
Yue G.H. (2007) A microsatellite linkage map of barramundi,
Lates calcarifer. Genetics 175, 907–15.
Whitaker H.A., McAndrew B.J. & Taggart J.B. (2006) Construction
and characterization of a BAC library for the European sea bass
Dicentrarchus labrax. Animal Genetics 37, 526.
Woods I.G., Kelly P.D., Chu F., Ngo-Hazelett P., Yan Y.L., Huang H.,
Poslethwait J.H. & Talbot W.S. (2000) A comparative map of the
zebrafish genome. Genome Research 10, 1903–14.
Woram R.A., Gharbi K., Sakamoto T. et al. (2003) Comparative
genome analysis of the primary sex-determining locus in
salmonid fishes. Genome Research 13, 272–80.
Zhang H., Thomsen J.S., Johansson L., Gustaffson J.A. & Treuter E.
(2000) DAX-1 functions as an LXXLL-containing corepressor for
activated estrogen receptors. Journal of Biological Chemistry 275,
39855–9.
Supporting information
Additional supporting information may be found in the
online version of this article.
Figure S1 Locations of SNPs within the nucleotide
sequences of Dicentrarchus labrax genes.
Figure S2 Male sex-specific linkage maps of European sea
bass. Distances in Kosambi centimorgans (cM) are given to
the left of each ideogram. Microsatellites are indicated as
DLAxxx, AFLP markers as MSEIxxx/ECORIxxx and type I
markers as DLAxxxE.
Figure S3 Female-specific linkage map of European sea
bass. Distances in Kosambi centimorgans (cM) are given to
the left of each ideogram. Microsatellites are indicated as
DLAxxx, AFLP markers as MSEIxxx/ECORIxxx and type I
markers as DLAxxxE.
Table S1 Characteristics of newly developed type I and II
polymorphic microsatellites of the European sea bass.
Table S2 AFLP primer combinations used and number of
markers generated with each primer combination specific
for the male parent, female parent and both parents of
European sea bass.
Please note: Wiley-Blackwell is not responsible for the
content or functionality of any supporting information
supplied by the authors.
� 2008 The Authors, Journal compilation � 2008 International Society for Animal Genetics, Animal Genetics, 39, 623–634
Chistiakov et al.634

Figure S1 Locations of SNPs within the nucleotide sequences of D. labrax genes. Coding
sequences are shown in bold. The translation start ATG codon is capitalized. Nucleotide
substitutions (SNPs) are highlighted in red.
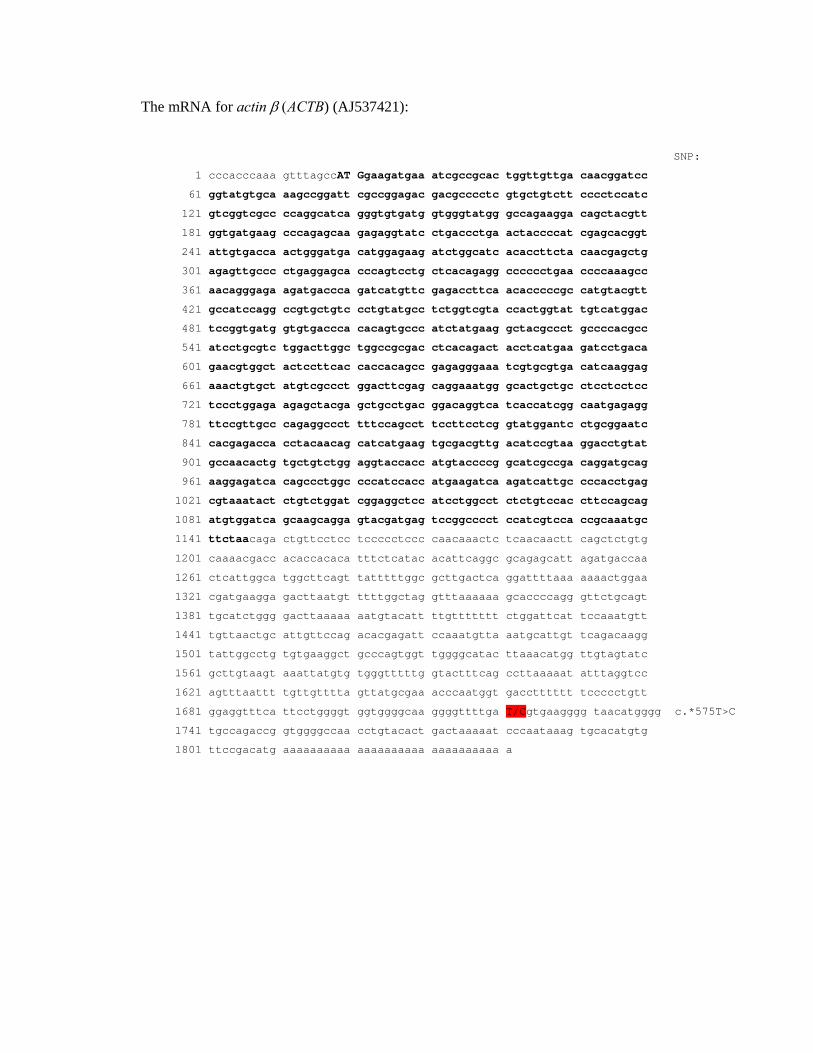
The mRNA for actin β (ACTB) (AJ537421):
SNP:
1 cccacccaaa gtttagccAT Ggaagatgaa atcgccgcac tggttgttga caacggatcc
61 ggtatgtgca aagccggatt cgccggagac gacgcccctc gtgctgtctt cccctccatc
121 gtcggtcgcc ccaggcatca gggtgtgatg gtgggtatgg gccagaagga cagctacgtt
181 ggtgatgaag cccagagcaa gagaggtatc ctgaccctga actaccccat cgagcacggt
241 attgtgacca actgggatga catggagaag atctggcatc acaccttcta caacgagctg
301 agagttgccc ctgaggagca cccagtcctg ctcacagagg cccccctgaa ccccaaagcc
361 aacagggaga agatgaccca gatcatgttc gagaccttca acacccccgc catgtacgtt
421 gccatccagg ccgtgctgtc cctgtatgcc tctggtcgta ccactggtat tgtcatggac
481 tccggtgatg gtgtgaccca cacagtgccc atctatgaag gctacgccct gccccacgcc
541 atcctgcgtc tggacttggc tggccgcgac ctcacagact acctcatgaa gatcctgaca
601 gaacgtggct actccttcac caccacagcc gagagggaaa tcgtgcgtga catcaaggag
661 aaactgtgct atgtcgccct ggacttcgag caggaaatgg gcactgctgc ctcctcctcc
721 tccctggaga agagctacga gctgcctgac ggacaggtca tcaccatcgg caatgagagg
781 ttccgttgcc cagaggccct tttccagcct tccttcctcg gtatggantc ctgcggaatc
841 cacgagacca cctacaacag catcatgaag tgcgacgttg acatccgtaa ggacctgtat
901 gccaacactg tgctgtctgg aggtaccacc atgtaccccg gcatcgccga caggatgcag
961 aaggagatca cagccctggc cccatccacc atgaagatca agatcattgc cccacctgag
1021 cgtaaatact ctgtctggat cggaggctcc atcctggcct ctctgtccac cttccagcag
1081 atgtggatca gcaagcagga gtacgatgag tccggcccct ccatcgtcca ccgcaaatgc
1141 ttctaacaga ctgttcctcc tccccctccc caacaaactc tcaacaactt cagctctgtg
1201 caaaacgacc acaccacaca tttctcatac acattcaggc gcagagcatt agatgaccaa
1261 ctcattggca tggcttcagt tatttttggc gcttgactca ggattttaaa aaaactggaa
1321 cgatgaagga gacttaatgt ttttggctag gtttaaaaaa gcaccccagg gttctgcagt
1381 tgcatctggg gacttaaaaa aatgtacatt ttgttttttt ctggattcat tccaaatgtt
1441 tgttaactgc attgttccag acacgagatt ccaaatgtta aatgcattgt tcagacaagg
1501 tattggcctg tgtgaaggct gcccagtggt tggggcatac ttaaacatgg ttgtagtatc
1561 gcttgtaagt aaattatgtg tgggtttttg gtactttcag ccttaaaaat atttaggtcc
1621 agtttaattt tgttgtttta gttatgcgaa acccaatggt gacctttttt tccccctgtt
1681 ggaggtttca ttcctggggt ggtggggcaa ggggttttga T/Cgtgaagggg taacatgggg c.*575T>C
1741 tgccagaccg gtggggccaa cctgtacact gactaaaaat cccaataaag tgcacatgtg
1801 ttccgacatg aaaaaaaaaa aaaaaaaaaa aaaaaaaaaa a
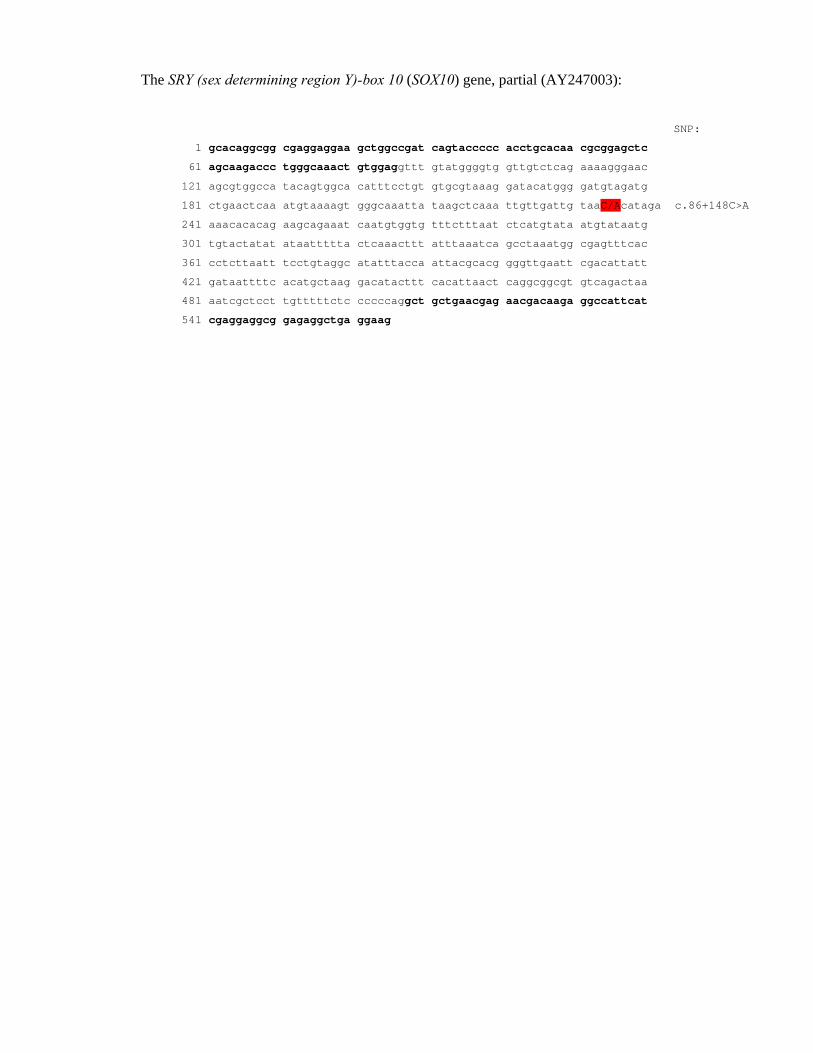
The SRY (sex determining region Y)-box 10 (SOX10) gene, partial (AY247003):
SNP:
1 gcacaggcgg cgaggaggaa gctggccgat cagtaccccc acctgcacaa cgcggagctc
61 agcaagaccc tgggcaaact gtggaggttt gtatggggtg gttgtctcag aaaagggaac
121 agcgtggcca tacagtggca catttcctgt gtgcgtaaag gatacatggg gatgtagatg
181 ctgaactcaa atgtaaaagt gggcaaatta taagctcaaa ttgttgattg taaC/Acataga c.86+148C>A
241 aaacacacag aagcagaaat caatgtggtg tttctttaat ctcatgtata atgtataatg
301 tgtactatat ataattttta ctcaaacttt atttaaatca gcctaaatgg cgagtttcac
361 cctcttaatt tcctgtaggc atatttacca attacgcacg gggttgaatt cgacattatt
421 gataattttc acatgctaag gacatacttt cacattaact caggcggcgt gtcagactaa
481 aatcgctcct tgtttttctc cccccaggct gctgaacgag aacgacaaga ggccattcat
541 cgaggaggcg gagaggctga ggaag
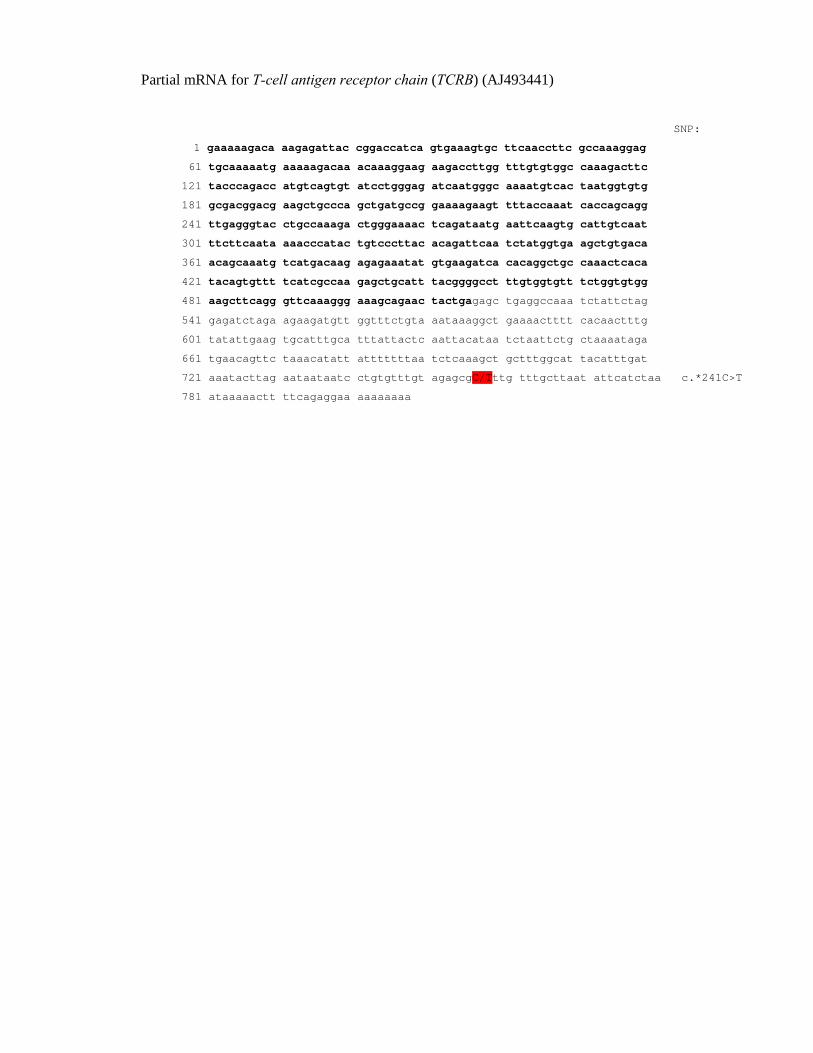
Partial mRNA for T-cell antigen receptor chain (TCRB) (AJ493441)
SNP:
1 gaaaaagaca aagagattac cggaccatca gtgaaagtgc ttcaaccttc gccaaaggag 61 tgcaaaaatg aaaaagacaa acaaaggaag aagaccttgg tttgtgtggc caaagacttc
121 tacccagacc atgtcagtgt atcctgggag atcaatgggc aaaatgtcac taatggtgtg
181 gcgacggacg aagctgccca gctgatgccg gaaaagaagt tttaccaaat caccagcagg
241 ttgagggtac ctgccaaaga ctgggaaaac tcagataatg aattcaagtg cattgtcaat
301 ttcttcaata aaacccatac tgtcccttac acagattcaa tctatggtga agctgtgaca
361 acagcaaatg tcatgacaag agagaaatat gtgaagatca cacaggctgc caaactcaca
421 tacagtgttt tcatcgccaa gagctgcatt tacggggcct ttgtggtgtt tctggtgtgg
481 aagcttcagg gttcaaaggg aaagcagaac tactgagagc tgaggccaaa tctattctag
541 gagatctaga agaagatgtt ggtttctgta aataaaggct gaaaactttt cacaactttg
601 tatattgaag tgcatttgca tttattactc aattacataa tctaattctg ctaaaataga
661 tgaacagttc taaacatatt atttttttaa tctcaaagct gctttggcat tacatttgat
721 aaatacttag aataataatc ctgtgtttgt agagcgC/Tttg tttgcttaat attcatctaa c.*241C>T
781 ataaaaactt ttcagaggaa aaaaaaaa
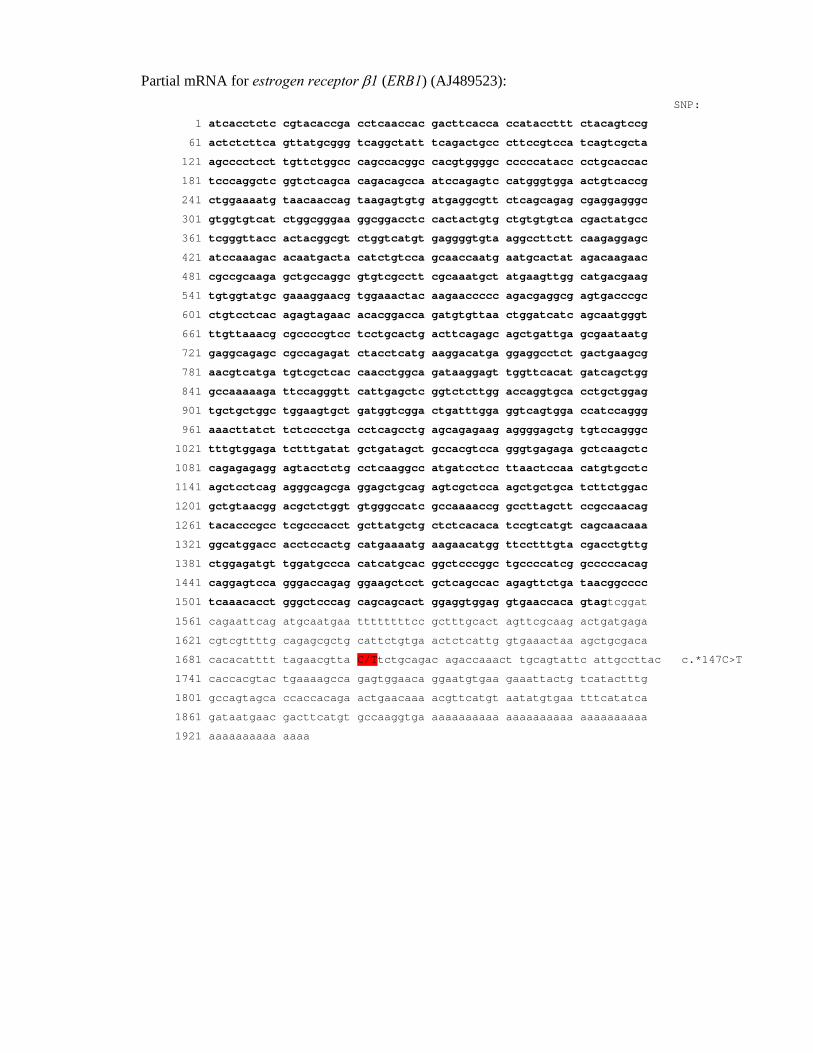
Partial mRNA for estrogen receptor β1 (ERB1) (AJ489523): SNP:
1 atcacctctc cgtacaccga cctcaaccac gacttcacca ccataccttt ctacagtccg 61 actctcttca gttatgcggg tcaggctatt tcagactgcc cttccgtcca tcagtcgcta
121 agcccctcct tgttctggcc cagccacggc cacgtggggc cccccatacc cctgcaccac
181 tcccaggctc ggtctcagca cagacagcca atccagagtc catgggtgga actgtcaccg
241 ctggaaaatg taacaaccag taagagtgtg atgaggcgtt ctcagcagag cgaggagggc
301 gtggtgtcat ctggcgggaa ggcggacctc cactactgtg ctgtgtgtca cgactatgcc
361 tcgggttacc actacggcgt ctggtcatgt gaggggtgta aggccttctt caagaggagc
421 atccaaagac acaatgacta catctgtcca gcaaccaatg aatgcactat agacaagaac
481 cgccgcaaga gctgccaggc gtgtcgcctt cgcaaatgct atgaagttgg catgacgaag
541 tgtggtatgc gaaaggaacg tggaaactac aagaaccccc agacgaggcg agtgacccgc
601 ctgtcctcac agagtagaac acacggacca gatgtgttaa ctggatcatc agcaatgggt
661 ttgttaaacg cgccccgtcc tcctgcactg acttcagagc agctgattga gcgaataatg
721 gaggcagagc cgccagagat ctacctcatg aaggacatga ggaggcctct gactgaagcg
781 aacgtcatga tgtcgctcac caacctggca gataaggagt tggttcacat gatcagctgg
841 gccaaaaaga ttccagggtt cattgagctc ggtctcttgg accaggtgca cctgctggag
901 tgctgctggc tggaagtgct gatggtcgga ctgatttgga ggtcagtgga ccatccaggg
961 aaacttatct tctcccctga cctcagcctg agcagagaag aggggagctg tgtccagggc
1021 tttgtggaga tctttgatat gctgatagct gccacgtcca gggtgagaga gctcaagctc
1081 cagagagagg agtacctctg cctcaaggcc atgatcctcc ttaactccaa catgtgcctc
1141 agctcctcag agggcagcga ggagctgcag agtcgctcca agctgctgca tcttctggac
1201 gctgtaacgg acgctctggt gtgggccatc gccaaaaccg gccttagctt ccgccaacag
1261 tacacccgcc tcgcccacct gcttatgctg ctctcacaca tccgtcatgt cagcaacaaa
1321 ggcatggacc acctccactg catgaaaatg aagaacatgg ttcctttgta cgacctgttg
1381 ctggagatgt tggatgccca catcatgcac ggctcccggc tgccccatcg gcccccacag
1441 caggagtcca gggaccagag ggaagctcct gctcagccac agagttctga taacggcccc
1501 tcaaacacct gggctcccag cagcagcact ggaggtggag gtgaaccaca gtagtcggat
1561 cagaattcag atgcaatgaa ttttttttcc gctttgcact agttcgcaag actgatgaga
1621 cgtcgttttg cagagcgctg cattctgtga actctcattg gtgaaactaa agctgcgaca
1681 cacacatttt tagaacgtta C/Ttctgcagac agaccaaact tgcagtattc attgccttac c.*147C>T
1741 caccacgtac tgaaaagcca gagtggaaca ggaatgtgaa gaaattactg tcatactttg
1801 gccagtagca ccaccacaga actgaacaaa acgttcatgt aatatgtgaa tttcatatca
1861 gataatgaac gacttcatgt gccaaggtga aaaaaaaaaa aaaaaaaaaa aaaaaaaaaa
1921 aaaaaaaaaa aaaa
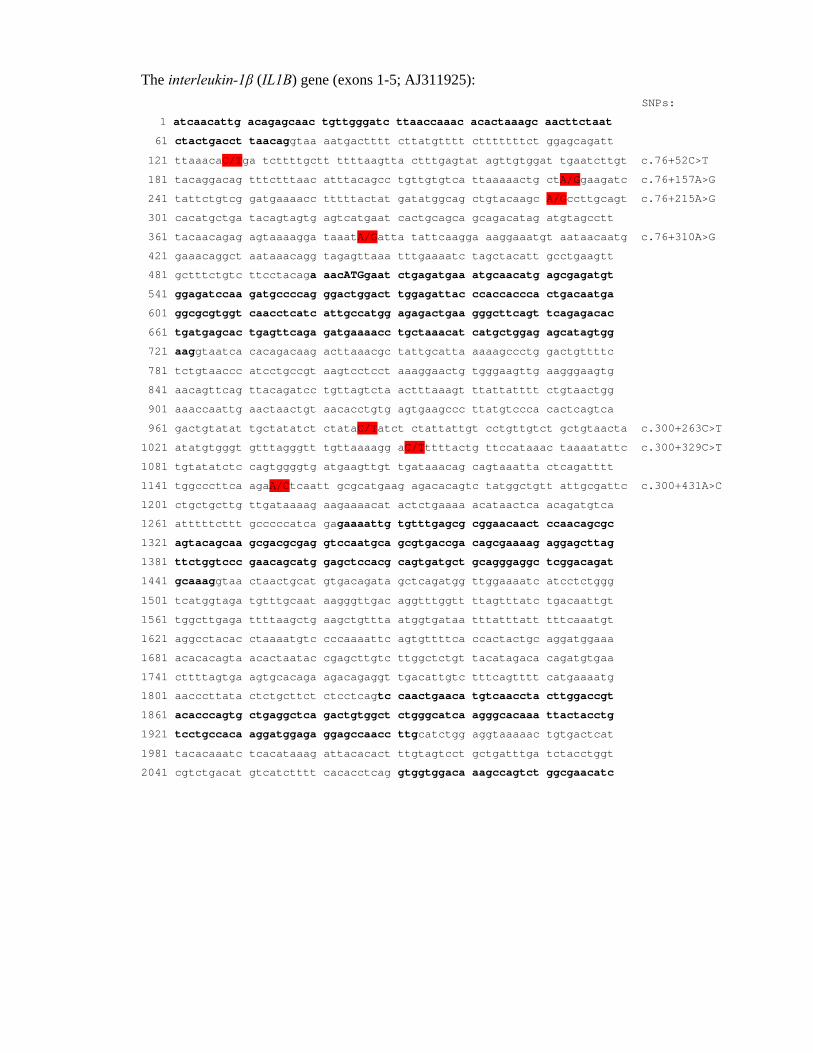
The interleukin-1β (IL1B) gene (exons 1-5; AJ311925): SNPs: 1 atcaacattg acagagcaac tgttgggatc ttaaccaaac acactaaagc aacttctaat 61 ctactgacct taacaggtaa aatgactttt cttatgtttt ctttttttct ggagcagatt
121 ttaaacaC/Tga tcttttgctt ttttaagtta ctttgagtat agttgtggat tgaatcttgt c.76+52C>T
181 tacaggacag tttctttaac atttacagcc tgttgtgtca ttaaaaactg ctA/Ggaagatc c.76+157A>G
241 tattctgtcg gatgaaaacc tttttactat gatatggcag ctgtacaagc A/Gccttgcagt c.76+215A>G
301 cacatgctga tacagtagtg agtcatgaat cactgcagca gcagacatag atgtagcctt
361 tacaacagag agtaaaagga taaatA/Gatta tattcaagga aaggaaatgt aataacaatg c.76+310A>G
421 gaaacaggct aataaacagg tagagttaaa tttgaaaatc tagctacatt gcctgaagtt
481 gctttctgtc ttcctacaga aacATGgaat ctgagatgaa atgcaacatg agcgagatgt
541 ggagatccaa gatgccccag ggactggact tggagattac ccaccaccca ctgacaatga
601 ggcgcgtggt caacctcatc attgccatgg agagactgaa gggcttcagt tcagagacac
661 tgatgagcac tgagttcaga gatgaaaacc tgctaaacat catgctggag agcatagtgg
721 aaggtaatca cacagacaag acttaaacgc tattgcatta aaaagccctg gactgttttc
781 tctgtaaccc atcctgccgt aagtcctcct aaaggaactg tgggaagttg aagggaagtg
841 aacagttcag ttacagatcc tgttagtcta actttaaagt ttattatttt ctgtaactgg
901 aaaccaattg aactaactgt aacacctgtg agtgaagccc ttatgtccca cactcagtca
961 gactgtatat tgctatatct ctataC/Tatct ctattattgt cctgttgtct gctgtaacta c.300+263C>T
1021 atatgtgggt gtttagggtt tgttaaaagg aC/Tttttactg ttccataaac taaaatattc c.300+329C>T
1081 tgtatatctc cagtggggtg atgaagttgt tgataaacag cagtaaatta ctcagatttt
1141 tggcccttca agaA/Ctcaatt gcgcatgaag agacacagtc tatggctgtt attgcgattc c.300+431A>C
1201 ctgctgcttg ttgataaaag aagaaaacat actctgaaaa acataactca acagatgtca
1261 atttttcttt gcccccatca gagaaaattg tgtttgagcg cggaacaact ccaacagcgc
1321 agtacagcaa gcgacgcgag gtccaatgca gcgtgaccga cagcgaaaag aggagcttag
1381 ttctggtccc gaacagcatg gagctccacg cagtgatgct gcagggaggc tcggacagat
1441 gcaaaggtaa ctaactgcat gtgacagata gctcagatgg ttggaaaatc atcctctggg
1501 tcatggtaga tgtttgcaat aagggttgac aggtttggtt ttagtttatc tgacaattgt
1561 tggcttgaga ttttaagctg aagctgttta atggtgataa tttatttatt tttcaaatgt
1621 aggcctacac ctaaaatgtc cccaaaattc agtgttttca ccactactgc aggatggaaa
1681 acacacagta acactaatac cgagcttgtc ttggctctgt tacatagaca cagatgtgaa
1741 cttttagtga agtgcacaga agacagaggt tgacattgtc tttcagtttt catgaaaatg
1801 aacccttata ctctgcttct ctcctcagtc caactgaaca tgtcaaccta cttggaccgt
1861 acacccagtg ctgaggctca gactgtggct ctgggcatca agggcacaaa ttactacctg
1921 tcctgccaca aggatggaga ggagccaacc ttgcatctgg aggtaaaaac tgtgactcat
1981 tacacaaatc tcacataaag attacacact ttgtagtcct gctgatttga tctacctggt
2041 cgtctgacat gtcatctttt cacacctcag gtggtggaca aagccagtct ggcgaacatc
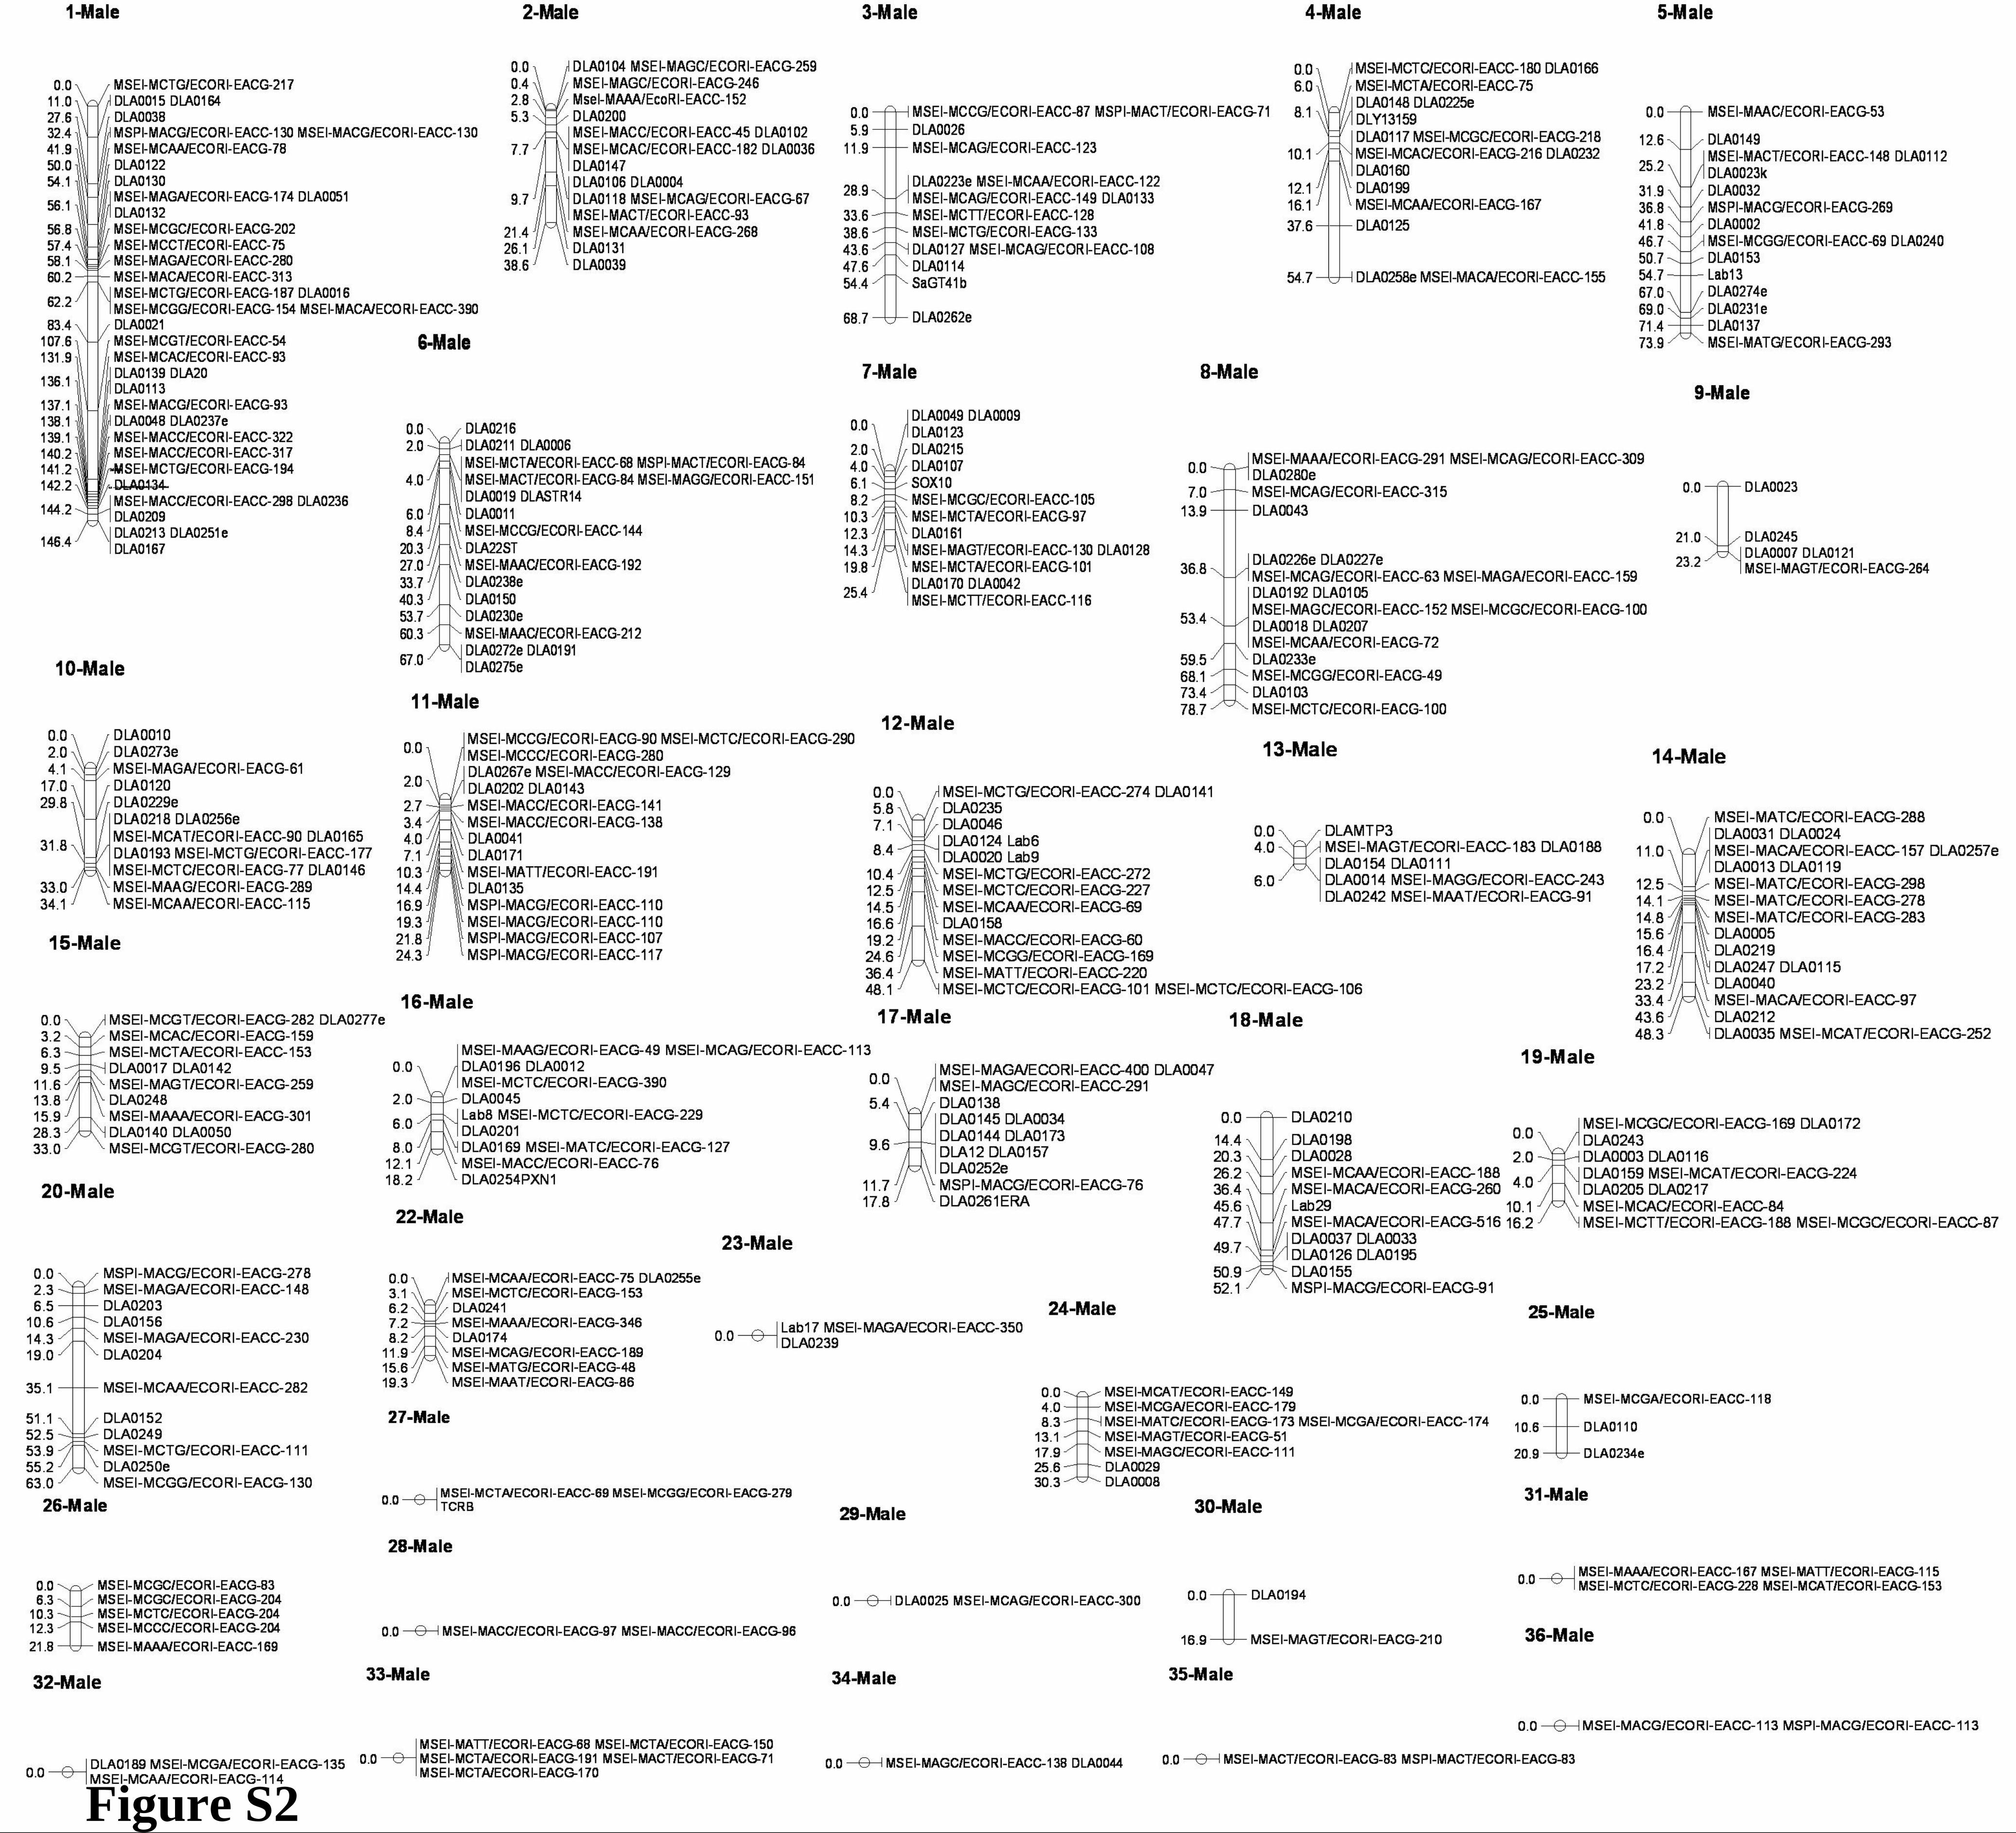
Figure S2
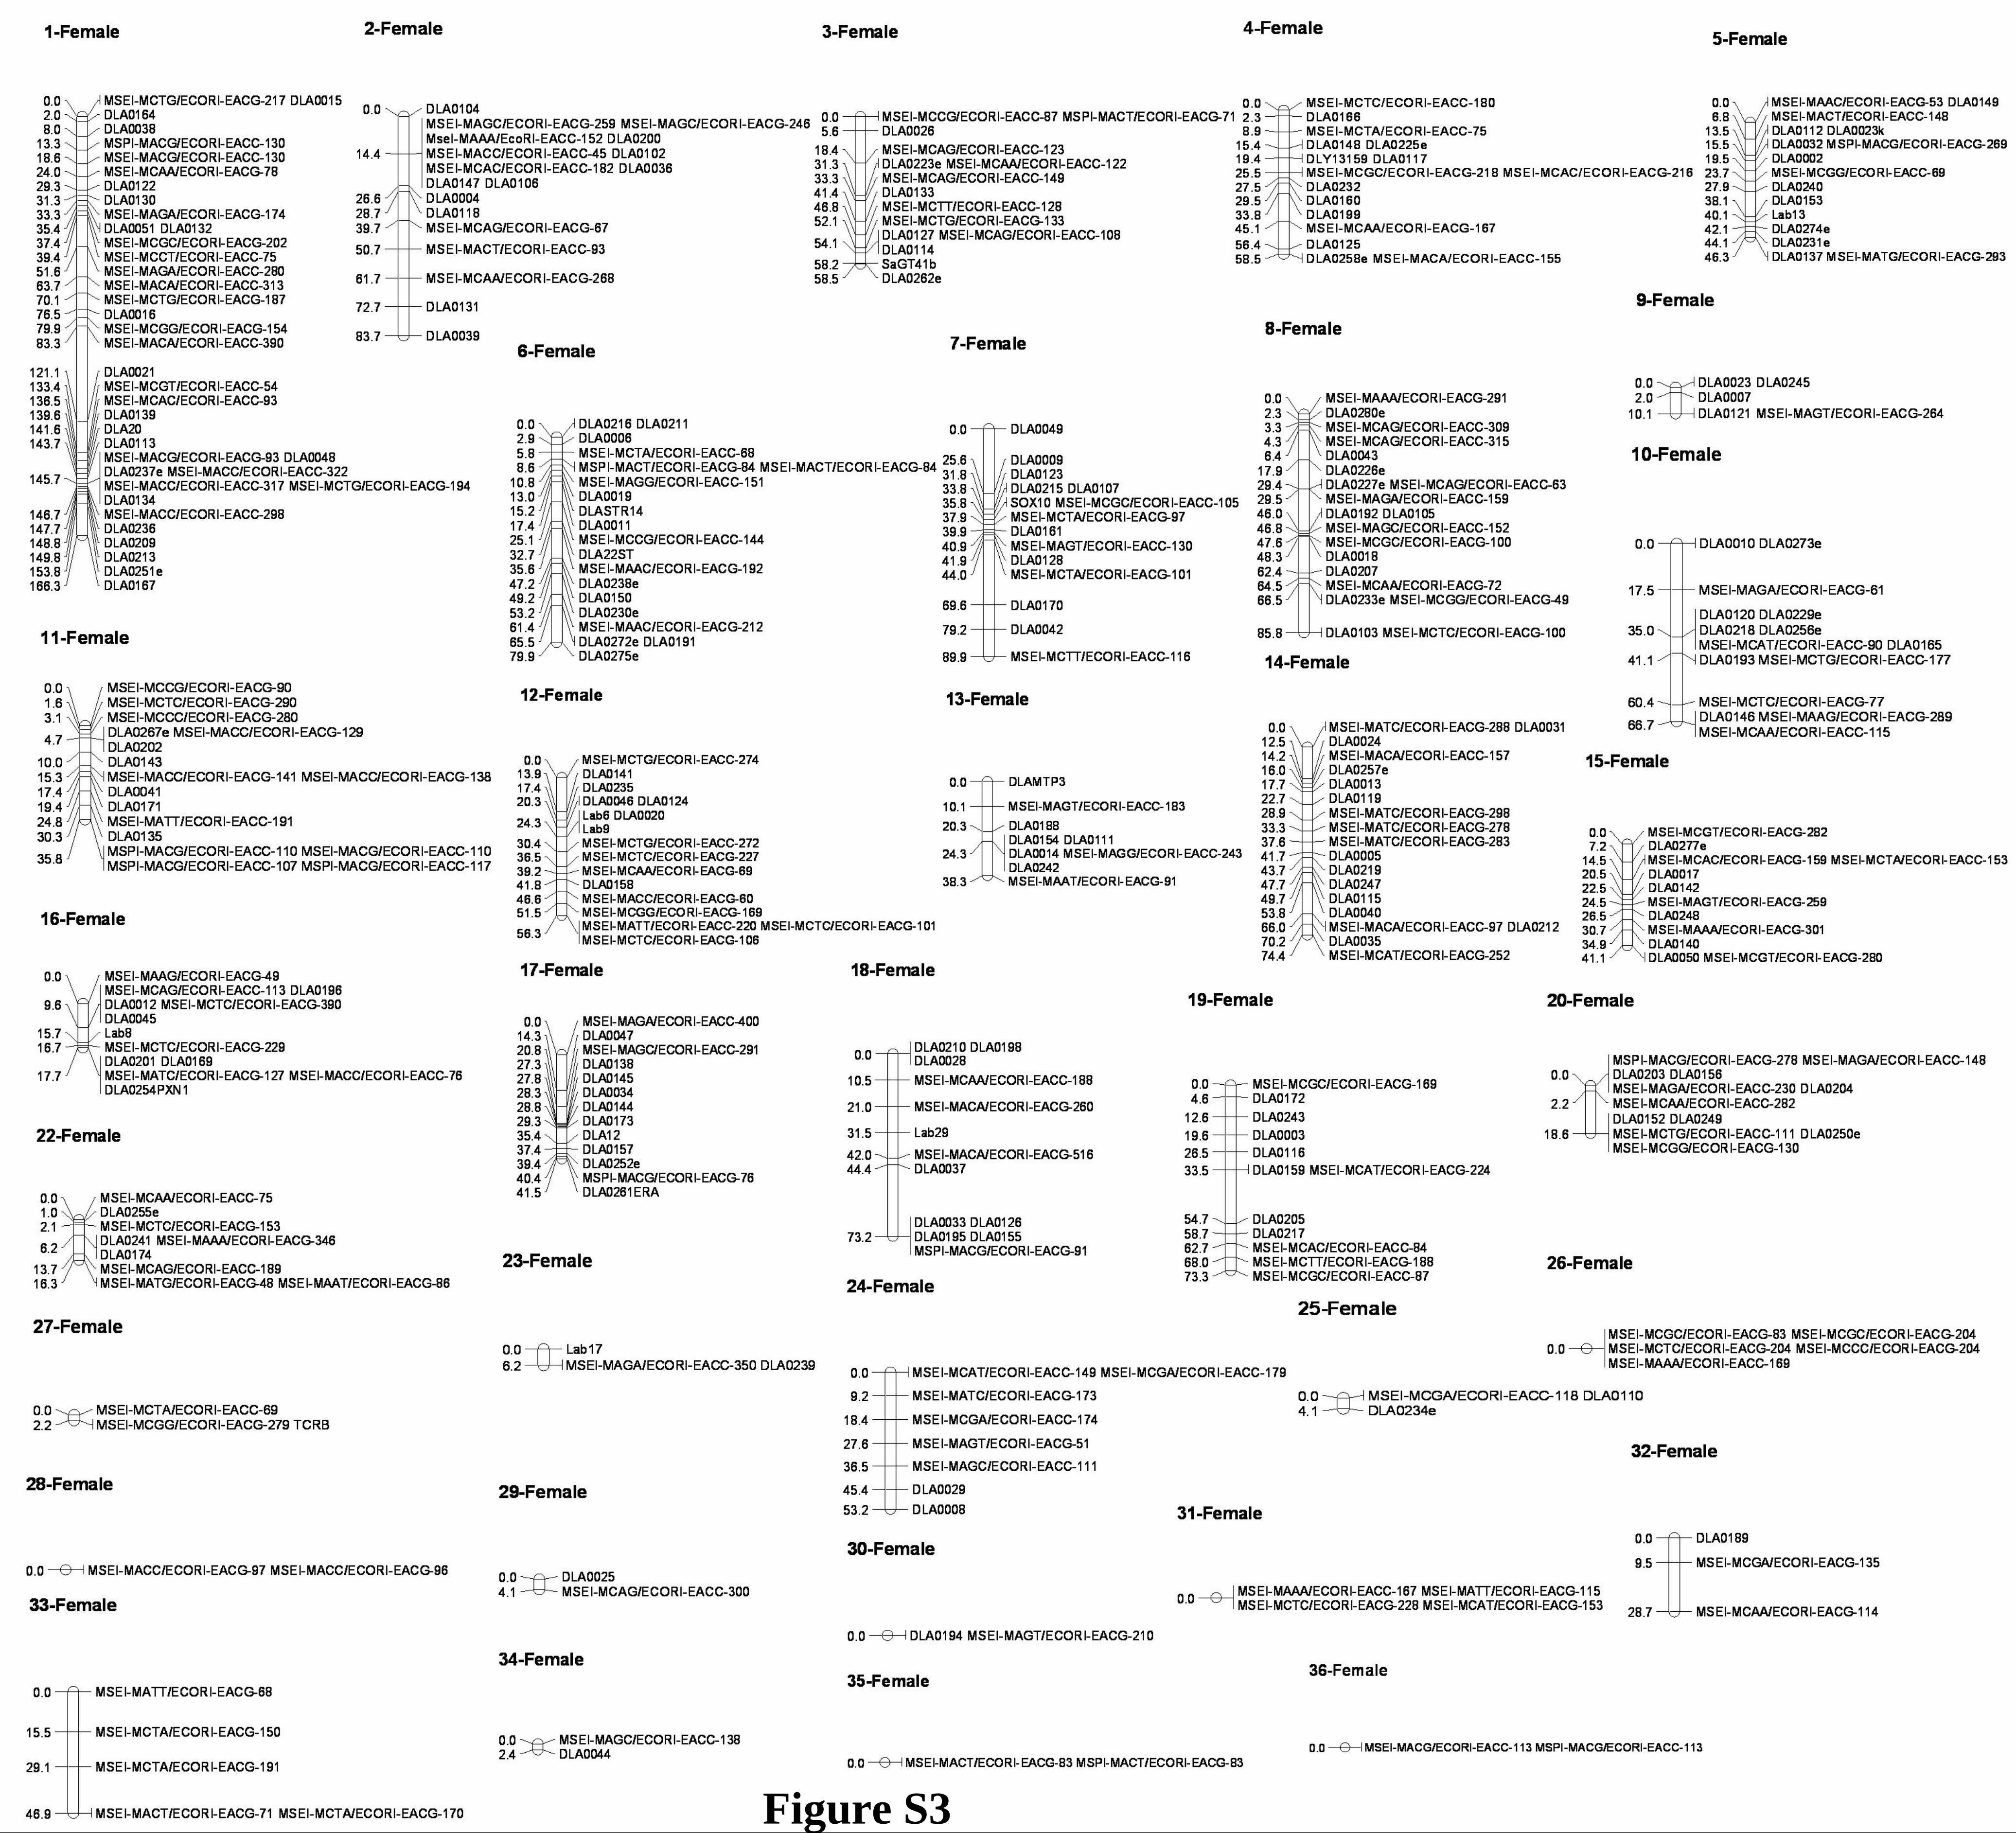
Figure S3
1
Table S1 Characteristics of newly developed type I and II polymorphic microsatellites of the European sea bass.
Locus Repeat motif PCR primers (5’- 3’)
TA (°C)
Mg2+ (mM)
Allele size range (bp)
No. alleles HO HE PIC
Accession no.
DLA0038
(GT)27 F: AGGTTCTTGGCCTGGGAATC R: AGTGACAGCAGCCTCCAGAG 57 1.5 234-266 16 0.91 0.93 0.86 DQ363861
DLA0039
(CT)27 F: TCCCACCATCCTGTCATC R: CAAATGTATCTCCATTATGTGAGTG 56 1.5 192-214 10 0.81 0.83 0.81 DQ363862
DLA0040
(AG)28 F: CCCCTAACGTAGTTTTATCTCCA R: GCTGCTGAACACCATAACAA 57
1.5 266-284 10 0.86 0.88 0.86 DQ363863
DLA0041
(CT)7(CA)22AA(CA)3AA (CA)3
F: AAAAGGAACAGCCCTCCAC R: CTCAACATTCCTCCCTCTGCA 59
1.5 176-198 12 0.9 0.93 1 DQ363864
DLA0042
(AC)13 F: AGCATTGTTCTTCTGAGTGACC R: TCCATCATTTGGGATCGAATA 53
1.5 152-166 5 0.72 0.73 0.52 DQ363865
DLA0043
(AC)9 TC (AC)10 F: AGGTCATCCAGAGGAACTGC R: ACATTAAGTATCTTAGCATG 51
1.5 150-174 8 0.78 0.8 0.8 DQ363866
DLA0044
(CT)19(T)4(CT)5 F: TCCGCTCCGCACCGAGTGAC R: ACCGCCCAAGGGTTGGACTG 51
1.5 105-129 7 0.79 0.81 0.67 DQ363867
DLA0045
(AC)13 F: AACGAGAGACTGGAGAGATATAA R: ATCCAGTTAGCGACCCAGT 54 3.0 111-119 5 0.71 0.73 0.57 DQ363868
DLA0046
(GT)3 AT (GT)13 F: TGACTGTCAGGTGCCTGGAG R: TGGGTCATTCGACTTGCAGC 58
1.5 187-209 5 0.55 0.56 0.38 DQ363869
DLA0047
(AC)9 AAAC F: GCAAAAGGACGCACCAACTC R: AGCCAAGGTCACACCAAAGG
55
1.5
98-106
4
0.48
0.5
0.62
DQ363870
DLA0048
(GT)19 F: TGCAGGCTGAATGTGCAGTC R: AGGCGCAGAAGAGAGCAGTC 55
1.5 134-156 7 0.65 0.66 0.62 DQ363871
DLA0049
(CT)26 F: CCTAAACTCTTTGAAGTGCGTGG R: CACTGTTGACCATGCTCAGG 58
1.5 86-112 10 0.75 0.77 0.57 DQ363872
DLA0050
(CA)2 ACAA (CA)16 F: TGTTTATGAGCAGCAAAAGGTC R: AATTGCATCGTCCACTGAGG 57
1.5 188-224 7 0.74 0.75 0.6 DQ363873
DLA0051
(GT)17 F: AGGTTCTTGGCCTGGGAATC R: AGTGACAGCAGCCTCCAGAG 50
1.5 149-181 8 0.69 0.71 0.81 DQ363874
DLA0250E
(TTG)7 F: TACTGGACCACAACCCCATT R: TTCAGGTTTAAGCGGACGTT 54 1.0
141-149
4
0.4
0.378
0.351
CV186277
DLA0251E
(GAA)8 F: TGTGATTGATGTCCCAGACTT R: GGCAGAATTAAGACTCCGATAA 54 2.0
155-165
5
0.524
0.546
0.512
CV186260
DLA0252E
(TGA)10CGA(TGA)3 F: GTCCTCCCCTAGCTTTTCCA R: GCCTTGTAGCAAAAGAGAAGC 54 1.0
115-141
8
0.842
0.82
0.799
CV186185
2
DLA0253E
(GAG)5AAG(GAG) F: CTCAGCAGCAGCATGTGAAG R: GCTGCGTGTGATCCTTCTCT 54 1.0
157-165
3
0.381
0.468
0.415
CV186183
DLA0254PXN1
(CAA)2CGG(CAA)3 F: CGAATCAATGGAGCCGAGAT R: GCCATCCATCCCATTACACT 54 2.0
294-310
3
0.143
0.135
0.13
CV186181
DLA0255E
(TCC)5…( TCC)3… (TCC)3(CCT)2(TCC)7
F: TCCCCCTTCTTACTCTCACCT R: TCCTTCCTGTTCTCGCTTGT 54 1.0
153-155
2
0.143
0.133
0.129
CV186155
DLA0256E
(ATC)3GTC(ATC) F: CAGTTGCTGATCCTGCTG R: TTACTGGATGAAGCGTCTGA 54 2.0
109-137
3
0.714
0.564
0.502
CV186144
DLA0257E
(TA)7 F: CTGGGAGAACCAGCCTACAA R: AGGAGGCCAAATCAACCTTT 54 2.0
135-139
3
0.333
0.541
0.453
CV186125
DLA0258E
(GCAGACCAGAACTAGCA)11
F: CAGTTCTCAAGTTCAACTCTCAA R: TCCACCAATCAGAACCTG 54 2.0
184-370
9
0.75
0.836
0.819
CV186114
DLA0259E
(TG)6 F: TGTTTCTTTGACTTGGATGC R: AAATAAACCAGCTCTGACTGC 54 2.0
120-124
2
0.05
0.21
0.188
CV186113
DLA0260E
(AAAA)(TAAA) (TAAAA)3
F: AACAGTCTCATTCCTTTTTAGCC R: CACGGATCCATTGTTGATGA 54 2.0
131-136
2
0.25
0.375
0.3
CB043827
DLA0261ERA
(GT)20 F: GCTGGTGGATGCAGATAAGC R: ACACAGCAGGGGTTTAATGC 58 1.0
297-321
8
0.905
0.799
0.774
AJ505009
DLA0262E
(AATG)7 F: GGAACGTGTAAATTACCATCCTCA R: ACCCACGCTCAAGCTAACTC 54 2.0
122-132
3
0.714
0.602
0.562
DQ020006
DLA0263E
(TAGCC)6(TAGCA) F: TGCAAAGAATATGAAGCTGGAG R: TTTTTAGAGGGAGTTACGTGGTG 54 1.0
105-110
2
0.476
0.472
0.417
DQ020007
DLA0264E
(AAT)3C(AAT)2 F: ACCAGCGTGGAGAAAGAGAA R:TCTGTCAGTTATTGGTTTATTGTTG 54 2.0
121-124
2
0.268
0.289
0.35
CX535581
DLA0265E
(TA)2TG(TA)6 F: TGTGAACTTAAGCCCCGAAT R: CATATTTAGCGCAGGCATCA 54 1.0
131-141
3
0.0
0.177
0.173
DQ020005
DLA0266E
(AC)3AG(AC)4AG(AC)2 GT(AC)3(AC)AT(AC)AT (AC)2
F: TCATCAACCAACAGAGTGCAA R: GCTCAGCCTGTATCCATTTCA
54 1.0
134-148
4
0.238
0.218
0.213
DQ020008
DLA0267E
(TG)19 F: TGTGTTTGACAGAGTATGTGTGAGAG R: GAGCTGCACACTTTCCCATT 54 1.0
109-127
8
0.952
0.827
0.815
DQ020009
DLA0268E
(TG)3(TTG)3(TG)(TTG) F: TGGCACTTAACTCAAGAGCGTA R: TCATGCGCTACAATTGGCTA 54 1.0
165-171
2
0.414
0.439
0.415
DQ020010
DLA0269E
(AT)3(A)2(AT)3(A)2(AT)2 F: GACGAGAATGATCGCCTACC R: GCTGATCCAGAACCGTGAAT
54
1.0
133-137
2
0.191
0.172
0.165
DQ020013
DLA0271E
(CT)9 F: CGTAAGCTCCCTCGCTTT R: CTTTCACCTCAAGATATGAAGATCC 54 1.0
141-145
3
0.572
0.444
0.421
DQ020015
DLA0272E
(TAT)8 F: GTTCAGATAGATCCTATGTTC R: AATTCTTTAA ATTCTCAGGT 54 1.0
229-238 4 0.614 0.456 0.437 DQ020016
DLA0273E
(TG)6AG(TG)8 F: GTGCGTTTCCTACCACTGCT R: GCCACATACAAAGCCCAGAG
54
1.0
99-109
4
0.524
0.423
0.405
DQ020017
3
DLA0274E
(GT)9 F: CATGCGCATACACACAATGA R: AAAACCTCAGCCGTGTTCTG 54 1.0
150-160
4
0.35
0.379
0.367
DQ020018
DLA0275E
(ATCA)2...(ATCA)3 F: GGGGCTCGAAGAAATAACAG R: ATTGAGCGCTTGTGTGTCAG 54 1.0
115-119
2
0.368
0.301
0.278
DQ020011
DLA0276E
(TG)6 F: GCCCCTAGCGTTGTGTTTTA R: CTCAGAGGGGGTTTCATTCA 54 1.0
158-162
3
0.2
0.267
0.264
DQ020012
DLA0277E
(AC)10(GC)2(AC)3 F: CCACTTGTCAGTTGCTTTGC R: CCACTGATGTCATTACTGTACAAAC 54 1.0
188-192
2
0.45
0.469
0.414
DQ020019
DLA0278E
(AC)9 F: GTATTTGACCGTGGGCTGAT R: TCCCCGTTCTGACTTCTGAC 54 1.0
193-198
5
0.5
0.701
0.675
DQ020020
DLA0279E
(TTG)2(GT)3(TTG)3 F: TCCACAGCGTTTGTTACTGG R: TAAGCGGACGTTGTGTTTCA 54 2.0
164-173
4
0.35
0.306
0.297
DQ020021
DLA0280E
(GTT)3(GT)(GTT)2 GTAT(GTT)2
F: GAAGCGTTCAGAGGTCCATC R: CGTACGACGTGACTCATGCT 54 1.0
137-149
6
0.65
0.664
0.64
CX535572
DLA0281NR0B1
(CAA)13 F: AGAGTGACAGCCTTGCGACT R: GGTGGAGGAGGTCTTGTGAA 54 2.0
124-144
6
0.333
0.435
0.425
AJ633646
Table S2 AFLP primer combinations used and number of markers generated with each primer combination specific for the male parent, female parent and both parents of European sea bass.
EcoRI-ACC primer EcoRI-ACG primer
MseI
primers Male parent
Female
parent
Both
parents Male parent
Female
parent
Both
parents Total
AAA 1 1 1 1 2 0 6
AAT 0 0 0 2 2 0 4
AAG 0 0 0 0 2 1 3
AAC 0 2 0 3 3 1 9
ATT 2 1 0 2 1 3 9
ATG 0 0 0 1 1 0 2
ATC 0 0 0 4 2 0 6
ATA 1 0 0 0 0 0 1
ACA 2 2 1 1 1 0 7
ACT 1 0 1 0 1 2 5
ACG 3 2 0 3 2 1 11
ACC 5 4 1 3 4 0 17
AGA 3 2 3 3 0 0 11
AGT 2 0 0 1 4 0 7
AGG 2 0 0 0 0 0 2
AGC 3 1 0 1 0 3 8
CCC 0 0 1 2 0 1 4
CCA 1 0 0 1 0 0 2
CCT 0 1 0 0 0 1 2
CCG 1 0 1 1 1 0 4
CAC 1 2 0 0 2 0 5
CAA 2 3 1 4 2 1 13
CAT 3 0 0 0 2 1 6
CAG 4 5 5 1 0 0 15
CTC 0 2 0 5 3 4 14
CTA 2 2 0 2 4 0 10
CTT 1 2 0 2 0 0 5
CTG 1 2 1 2 2 1 9
CGC 0 2 0 3 3 2 10
CGA 2 0 1 0 1 0 4
CGT 1 1 0 1 1 0 4
CGG 1 0 0 2 1 2 6
Total 45 37 20 51 47 24 221


