Embed Size (px)
Citation preview

A Comparative Cluster Analysis of NicotinamideAdenine Dinucleotide Phosphate (NADPH)-diaphoraseHistochemistry in the Brains of Amphibians
Claudia Pinelli,1 Rakesh K. Rastogi,2 Anna Scandurra,1 Arun G. Jadhao,3 Massimo Aria,4
and Biagio D’Aniello2*1Department of Environmental, Biological, and Pharmaceutical Sciences and Technologies, Second University of Naples, 81100
Caserta, Italy2Department of Biology, University of Naples Federico II, 80126 Naples, Italy3Department of Zoology, RTM Nagpur University, Nagpur, 440033 (M.S.), India4Department of Economics and Statistical Science, University of Naples Federico II, 80126 Naples, Italy
ABSTRACTNicotinamide adenine dinucleotide phosphate–diapho-
rase (NADPH-d) is a key enzyme in the synthesis of the
gaseous neurotransmitter nitric oxide. We compare the
distribution of NADPH-d in the brain of four species of
hylid frogs. NADPH-d–positive fibers are present
throughout much of the brain, whereas stained cell
groups are distributed in well-defined regions. Whereas
most brain areas consistently show positive neurons in
all species, in some areas species-specific differences
occur. We analyzed our data and those available for
other amphibian species to build a matrix on NADPH-d
brain distribution for a multivariate analysis. Brain dis-
similarities were quantified by using the Jaccard index
in a hierarchical clustering procedure. The whole brain
dendrogram was compared with that of its main subdi-
visions by applying the Fowlkes–Mallows index for den-
drogram similarity, followed by bootstrap replications
and a permutation test. Despite the differences in the
distribution map of the NADPH-d system among spe-
cies, cluster analysis of data from the whole brain and
hindbrain faithfully reflected the evolutionary history
(framework) of amphibians. Dendrograms from the sec-
ondary prosencephalon, diencephalon, mesencephalon,
and isthmus showed some deviation from the main
scheme. Thus, the present analysis supports the major
evolutionary stability of the hindbrain. We provide evi-
dence that the NADPH-d system in main brain subdivi-
sions should be cautiously approached for comparative
purposes because specific adaptations of a single spe-
cies could occur and may affect the NADPH-d distribu-
tion pattern in a brain subdivision. The minor
differences in staining pattern of particular subdivisions
apparently do not affect the general patterns of staining
across species. J. Comp. Neurol. 000:000–000, 2014.
VC 2014 Wiley Periodicals, Inc.
INDEXING TERMS: NADPH-diaphorase; Amphibians; Nitric oxide; Brain evolution; Cluster analysis
One of the most widely distributed brain molecules is
the unconventional diffusible chemical messenger nitric
oxide (NO), which plays multiple diverse roles in both
vertebrates and invertebrates (for review, see Toda and
Ayajiki, 2006; Knott and Bossy-Wetzel, 2009). Within the
central nervous system, NO has been recognized as a
neurotransmitter and might modulate synaptic functions
(Park et al., 1998a, b; Renter�ıa and Constantine-Paton,
1999; Steinbusch et al., 2000; Prast and Philippu, 2001;
Esplugues, 2002). Furthermore, NO has been implicated
in olfaction, food and liquid intake, the modulation of
nociception, and the release of other neurotransmitters
(Ernst et al., 1999; Villani et al., 2001; Moreno et al.,
2002a, b). Moreover, this molecule has also been associ-
ated with certain neuronal disorders (Bruhwlyler et al.,
1993; Prast and Philippu, 2001; Gotti et al., 2004; Guix
et al., 2005).
NO is derived from L-arginine through a reaction that
requires nicotinamide adenine dinucleotide phosphate
(NADPH), O2, and mediation of the constitutive neuro-
nal isoform of nitric oxide synthase (nNOS). NADPH-
*CORRESPONDENCE TO: B. D’Aniello, Department of Biology, Universityof Naples Federico II, 80126 Naples, Italy. E-mail: [email protected]
Received December 13, 2013; Revised February 8, 2014;Accepted February 11, 2014.DOI 10.1002/cne.23561Published online February 18, 2014 in Wiley Online Library(wileyonlinelibrary.com)VC 2014 Wiley Periodicals, Inc.
The Journal of Comparative Neurology | Research in Systems Neuroscience 00:00–00 (2013) 1
RESEARCH ARTICLE

diaphorase (d) reduces chromogens, such as tetrazo-
lium salts, to insoluble dark formazan reaction products
in histochemical reactions (Thomas and Pears, 1961),
which allows NADPH-d histochemistry to be used to
localize this enzyme (Dawson et al., 1991; Hope et al.,
1991) in the nervous system.
Among amphibians, NADPH-d patterns have been
studied in the nervous systems of some urodeles
(Artero et al., 1995; Gonz�alez et al., 1996; Porteros
et al., 1996), a caecilian (Gonz�alez et al., 2002), and
several anurans (Br€uning and Mayer, 1996, 2001;
Mu~noz et al., 1996, 2000; Porteros et al., 1996; Pitzer
and Wirtshafter, 1997; Prasada Rao et al., 1997; L�az�ar
and Losonczy, 1999; Huynh and Boyd, 2007). Although
in some of these studies, the entire brain NADPH-d sys-
tem remains unavailable, the ongoing general observa-
tion is that such a substrate is present in all brain
subdivisions.
These data revealed that the NADPH-d brain peri-
karya pattern does not entirely overlap in any two of
the amphibian species, showing that this neuroanatomi-
cal system is variable. Indeed, comparison of phyloge-
netically related species (Pyron and Wiens, 2011), i.e.,
Rana (Pelophylax) esculenta (esculentus) and R. (P.)
perezi, considered as sibling species (Casola et al.,
2004), revealed that there are nine NADPH-d–positive
nuclei in the R. perezi brain, which were not reported in
the R. esculenta brain, and conversely, eight NADPH-d–
positive nuclei in the latter species were not present in
the brain of the former (compare Mu~noz et al., 1996
and L�az�ar and Losonczy, 1999). However, these obser-
vations are not surprising, because the brain could
respond to environmental variations through rapid
adaptive mechanisms, whereby different types of brain
organization could be observed in closely related spe-
cies within a subgroup of vertebrates, with respect to
Abbreviations
A anterior thalamic nucleusAC anterior commissureAD anterodorsal tegmental nucleusAMY amygdalaAMYl lateral amygdalaAMYm medial amygdalaAOB accessory olfactory bulbAQ aqueduct of SylviusAV anteroventral tegmental nucleusC central thalamic nucleusCB cerebellar nucleusCBL cerebellumCG central grayCGT thalamic geniculate bodyCOT commissural nucleus of the torus semicircularisDBB nucleus of the diagonal band of BrocaDCN dorsal column nucleusDG dorsal grayDHyp dorsal hypothalamusDP dorsal palliumDTh dorsal thalamusEa anterior entopeduncular nucleusFS fasciculus solitariusGR granular layer of cerebellumHB habenulaHR hindbrain reticular formationig internal granular layerIII third ventricleIN interpeduncular nucleusIR infundibular recessIV fourth ventricleIXm motor nucleus of glossopharyngeal nerveLa lateral thalamic nucleusLAM laminar nucleus of the torus semicircularisLC locus coeruleusLFB lateral forebrain bundleLP lateral palliumLpv lateral thalamic nucleus posteroventral divisionLV lateral ventricleMOB main olfactory bulbMOL molecular layer of cerebellumMP medial palliumMT magnocellular nucleus of the torus semicircularisNAC nucleus accumbensnB nucleus of BellonciNFLM nucleus of the medial longitudinal fasciculusNI nucleus isthmiNPC nucleus of the posterior commissureNPv nucleus of the periventricular organOB olfactory bulbsOC optic chiasma
ON optic nerveOT optic tectumOV optic ventricleP posterior thalamic nucleusPalC pallial commissurePC posterior commissurePD posterodorsal tegmental nucleusPOA preoptic areaPOAp posterior preoptic areaPON preoptic nucleusPONa anterior preoptic nucleusPOR preoptic recessPR principal nucleus of the torus semicircularisPRM nucleus profundus of mesencephaliPTG pretectal grayPTn pretectal nucleusPTN pretrigeminal nucleusPTRG pretoral grayPV posteroventral tegmental nucleusPVO nucleus of periventricular organR raphe nucleusSCN suprachiasmatic nucleusSl lateral septumSm medial septumSO superior oliveSol nucleus of the solitary tractSP Purkinje layer (cerebellum)STR striatumTC tectal commissureTEG tegmentumTEGd dorsal tegmentumTEGv ventral tegmentumTEL telencephalonTP posterior tubercleTR trigeminal nucleusTrVds descending trigeminal tractVds descending trigeminal nucleusVG ventral grayVHyp ventral hypothalamusVII facial nucleusVIII octaval nucleusVIIIv ventral octaval nucleusVisc nucleus visceralis secundariusVL ventrolateral thalamic nucleusVLs superficial ventral nucleusVM ventromedial thalamic nucleusVpr principal sensory trigeminal nucleusVTh ventral thalamusX motor nucleus of the vagusXII nucleus of hypoglossal nerve
C. Pinelli et al.
2 The Journal of Comparative Neurology |Research in Systems Neuroscience

different life histories (Northcutt, 2002; Kolm et al.,
2009), or even in the same species. In this regard, one
of the most common differences in brain anatomy con-
cerns sexual dimorphism (Morris et al., 2004); in some
cases, up to four different types of preoptic nucleus
morphologies have been described in the same species
(Jadhao et al., 2001). Of course this strong adaptive
brain plasticity can make brain comparisons difficult for
evolutionary purposes, because some adaptations can
originate in a species as a response to a contingent
environmental request, and thus do not reflect the real
evolutionary history.
In this study we aimed to explore whether a statisti-
cal approach could help to overcome this problem, in
conjunction with an investigation of a widely distributed
substance within the brain in order to present a more
extensive comparison of all brain areas. The wide
NADPH-d distribution in different brain areas, together
with its extensive variability, offers a valuable tool for
this purpose.
To this end we first examined the brains of four
hylids (Anura, Hylidae) to survey comparative NADPH-d
neuronal distribution. Then we utilized the existing
amphibian database to build a matrix of the presence/
absence of NADPH-d brain cell distribution for a multi-
variate statistical analysis. In this way, we obtained a
graphical representation based on brain NADPH-d dis-
similarities for a comparison with that deriving from
molecular phylogenetic studies. This analysis was per-
formed for the whole brain, as well as for its main sub-
divisions, following the current prosomeric model
(Puelles and Rubenstein, 2003). Despite some contro-
versy, the morphological studies match the molecular
data with regard to phylogenetic affinities (Wiens,
2004). Therefore, if the NADPH-d brain system has not
undergone extensive modifications due to different
selective pressures, we expected that a cluster analysis
of the presence and distribution pattern of NADPH-d in
the brain (and its main subdivisions) would agree with
the results of molecular studies. Otherwise the dendro-
grams obtained would not reflect the actual evolution-
ary affinities of amphibians.
MATERIALS AND METHODS
AnimalsThe following hylid species were studied: the Cuban
tree frog, Hyla (Osteopilus) septentrionalis, native to the
Bahamas, Cayman Islands, and Cuba, but introduced
elsewhere; the common tree frog, H. arborea, distrib-
uted in most parts of Europe; the Assam tree frog, H.
annectans, found in southwestern and central China,
northeast India, northern Myanmar, and Viet Nam; and
the green tree frog, Litoria caerulea, a widespread spe-
cies in Australia.
All samples (one female and four male H. septentrio-
nalis and H. annectans, two female and two male
H. arborea and L. caerulea) were purchased from a
commercial dealer. All animals were obtained in a non-
reproductive state and were acclimatized to the same
conditions (thermal, photoperiodic, and food) for 4
weeks, with food ad libitum. The study protocol was
performed in accordance with legislation on the care
and use of animals in research.
The animals were anesthetized through immersion in
0.03% MS-222 (tricaine methanesulfonate; Sigma, St.
Louis, MO) and intraventricularly perfused with 0.1 M
phosphate-buffered saline (PBS; pH 7.4), followed by
perfusion with 4% paraformaldehyde solution in PBS.
The entire procedure was performed in approximately
20 minutes. Subsequently, the brains were quickly
removed and immersed in the same fixative for 4 hours
at 4�C. Before freezing, the brains were cryoprotected
in 30% sucrose solution in 0.1 M PBS overnight and
subsequently placed in embedding medium (Tissue-Tek;
Sakura, Torrance, CA) for cryostat sectioning. Serial
transverse sections (20 lm) were mounted on polylysi-
nated glass slides and stored at 220�C.
NADPH-d histochemistryThe sections were rinsed in 0.1 M PBS (pH 7.4).
NADPH-d histochemistry was performed using the origi-
nal method (Scherer-Singler et al., 1983) with modifica-
tions. The sections were incubated in 100 ml PBS
containing 0.2% Triton X-100, 0.1% NADPH, reduced-
Na4 salt (Serva, Heidelberg, Germany), and 50 mg nitro
blue tetrazolium chloride (NBT; Serva) for 2 hours at
37�C. Subsequently, the sections were rinsed in PBS,
dehydrated, and coverslipped in Eukitt mounting media
(Sigma).
Microscopy and photodocumentationDigital photomicrographs were captured with a
Canon digital camera on a DMBR Leica photomicro-
scope. The images were slightly adjusted for brightness
and contrast by using Adobe Photoshop. The photomon-
tages and lettering were constructed by using Corel-
Draw software. The images were drawn with a camera
lucida.
NomenclatureFor the identification and nomenclature of various
brain areas and nuclei, we used the terminology
adopted from Nieuwenhuys et al. (1998), integrated
with several additional sources, including Frontera
(1952), Kemali and Braitenberg (1969), Northcutt and
NADPH-Diaphorase in Amphibian Brains
The Journal of Comparative Neurology | Research in Systems Neuroscience 3

Kicliter (1980), Wada et al. (1980), Neary (1990), Butler
and Hodos (1996), Mu~noz et al. (1996), Pinelli et al.
(1999), L�az�ar and Losonczy (1999), Huynh and Boyd
(2007), and Morona and Gonz�alez (2008, 2009). The
localization of various brain areas and nuclei was
framed within the newly defined territories in the telen-
cephalon (Mar�ın et al., 1998; Moreno and Gonz�alez,
2006; Endepols et al., 2006; Morona and Gonz�alez
2008, 2009) and the segmental model proposed for the
caudal prosencephalon (Puelles and Rubinstein, 2003)
adapted for anurans and urodeles.
Data analysisThe data for the presence/absence of brain NADPH-
d were organized according to a matrix (Table 1), which
was constructed by inserting a row for each of the
areas/nuclei of the brain where NADPH-d–positive cells
have been observed in at least one of the amphibian
species studied, and using data from previous studies
(Br€uning and Meyer, 1996; Gonz�alez et al., 1996, 2002;
Mu~noz et al., 1996; L�az�ar and Losonczy, 1999; Huynh
and Boyd, 2007), with the exception of R. pipiens, for
which only partial data are available (Pitzer and Wirtsh-
after, 1997).
Some NADPH-d areas described in Apoda and Cau-
data, such as the dorsal thalamic and tegmental nuclei,
comprise multiple entities in the anuran group, whereas
in other amphibian groups, these areas are organized
as single structures (Neary and Northcutt, 1983).
Furthermore, some studies did not precisely indicate
the nuclei, but rather only identified the main areas of
the brain where NADPH-d–positive neurons were
observed. To overcome these problems and to avoid
losing information, we utilized a matrix with additional
lines, specifying the areas consisting of multiple nuclei,
generically described as the “dorsal thalamus” and
“mesencephalic tegmentum.” Hence, these brain areas
are included as either a specific brain area and or an
aggregate.
Thus, 76 rows were obtained for the whole brain, of
which 40 rows corresponded to the forebrain (22 for
the secondary prosencephalon and 18 for the
diencephalon) and 36 rows to the brainstem (9 for the
mesencephalon, 3 for the isthmus, and 24 for the
hindbrain).
The presence of NADPH-d is indicated with “1” and
the absence of NADPH-d is indicated with “0.” To
explain dissimilarity between the areas/nuclei of the
brain, we used a hierarchical cluster analysis and
obtained dendrograms based on these measurements.
We were interested in comparing species by the pres-
ence of NADPH-d, because the co-absence for our goal
does not mean similarity. To this end, we chose the
Jaccard algorithm (Jaccard, 1908), also known as the
Jaccard similarity coefficient, which assigns a weight of
0 to each binary comparison showing the absence of
NADPH-d. So, not taking into account “0–0” negative
matches, the dissimilarity between two operational tax-
onomic units is not influenced by other variables not
included in the analysis (i.e., other molecules), and its
value is independent of the number of variables stud-
ied. Using these data sets, we quantified and graphi-
cally represented the level of dissimilarity of NADPH-d
brain distribution, considering the whole brain and its
main subdivisions. All data, which were analyzed by
using MATLAB (Mathworks, Union, NJ), can be freely
downloaded from the MATLAB File Exchange website
(Aria, 2014).
To compare the dendrogram obtained for the whole
brain with those originating from its main subdivisions,
we used the Fowlkes–Mallows (FM) index (1983; Aria,
2014), which measures the similarity between two par-
titions (clusters obtained after a clustering algorithm); it
can also be interpreted as the proportion of observa-
tions that are common (in the same cluster) in the two
hierarchical partitions (Meila, 2007). The FM index
range in the interval [0–1] and higher is the value
greater is the similarity between the clusters. To obtain
a more accurate estimation of the FM index, it was cal-
culated as the average value of a bootstrap resampling
procedure with 1,000 replications, so that the data
were modeled by resampling with replication of the
original sample (Efron and Tibshirani, 1993). In this
way, the estimation of the unknown parameter is
obtained as the expected value measured on the 1,000
bootstrapped samples. The statistical significance of
bootstrap estimations of the FM index was evaluated
by a permutation test (randomization test, rerandomiza-
tion test, and exact test). Because only 10 species
were available for testing, we were forced to limit our
comparison to partitions composed of two, three, and
four clusters, as further partitioning would take into
account few informative groups.
RESULTS
NADPH-d neuroanatomical distributionThe overall neuroanatomical pattern of NADPH-d in
the brains of the four hylids studied is illustrated in the
representative rostrocaudal progressive transverse sec-
tions shown in Figure 1. The NADPH-d activity was
rather diffuse, revealing the widespread distribution of
cells and fibers in all segments of the brain. The posi-
tive blue reaction was easily identified, although the
intensity, morphology, and size of the stained cell could
vary.
C. Pinelli et al.
4 The Journal of Comparative Neurology |Research in Systems Neuroscience

TABLE 1.
Matrix of NADPH-d Presence (1) and Absence (0) in Amphibian Brain1
Brain area 1 2 3 4 5 6 7 8 9 10
ForebrainSecondary prosencephalon
MOB 0 1 1 0 1 1 1 0 1 1AOB 0 0 0 0 1 0 0 0 1 1DP 0 1 1 1 1 1 1 1 1 1MP 0 1 1 0 1 1 1 1 1 1LP 1 1 1 1 1 1 1 1 1 1STR 1 1 1 1 1 1 1 1 1 1Sm 1 1 1 0 1 1 1 1 1 1Sl 1 1 1 1 1 0 1 1 0 1DBB 1 1 1 0 1 1 1 0 0 0NAC 1 1 1 1 1 1 1 1 0 0AMY 1 1 1 1 1 1 1 1 1 1POA 1 1 1 1 1 1 1 0 1 1PON 1 1 1 1 1 1 1 1 1 1Ea 0 0 0 0 0 0 0 1 0 0AC 1 0 1 1 0 0 0 0 0 0POAp 0 0 0 0 0 0 0 0 1 0SCN 1 0 0 0 1 1 1 0 0 1DHyp 1 1 1 1 1 0 0 0 0 0VHyp 1 1 1 1 1 1 1 1 1 1NPv 0 0 0 0 1 0 1 0 0 0OC 0 1 0 0 0 0 0 0 0 0PVO 0 0 0 0 0 0 1 0 0 0
DiencephalonHB 0 0 0 0 1 0 0 0 0 1DTh 1 1 1 1 1 1 1 1 0 1A 0 0 0 0 1 1 0 1 0 0C 1 1 1 1 0 1 1 0 0 0P 0 0 0 0 0 0 0 1 0 0La 1 1 1 1 1 1 1 1 0 0VM 1 0 0 1 0 0 0 1 0 0VL 1 1 1 1 0 0 0 1 0 0nB 0 0 0 0 1 1 1 0 0 0VLs 0 1 1 0 1 0 0 0 0 0CGT 0 1 0 0 1 1 1 0 0 0TP 1 1 1 1 1 1 1 1 0 1Lpv 0 0 1 0 0 0 0 0 0 0PTn 0 0 0 0 0 0 0 0 0 1PTG 1 1 0 1 1 1 1 1 1 0PTRG 0 1 1 1 0 1 1 0 1 0NPC 0 0 0 0 1 0 0 0 0 0NFLM 0 0 0 0 1 1 1 0 0 0
BrainstemMesencephalon
OT 1 1 0 1 1 1 1 1 1 1LAM 1 1 1 0 1 1 1 0 0 0PR 1 1 1 1 1 1 1 1 0 0MT 1 1 1 1 1 1 1 1 0 0COT 0 0 0 0 1 1 1 0 0 0TEG 1 1 1 1 1 1 1 1 1 1AD 1 1 1 1 1 1 1 1 1 0AV 1 1 1 1 1 1 0 1 1 0PRM 1 0 0 1 1 1 1 0 0 0
IsthmusPD 1 1 1 1 1 1 0 1 1 0PV 1 1 1 1 1 1 0 1 1 0NI 0 0 0 0 1 0 0 1 1 1
HindbrainMOL 1 1 1 1 1 1 1 0 0 0P 0 0 1 0 0 0 0 1 0 0GR 1 0 1 0 1 1 1 0 0 0
NADPH-Diaphorase in Amphibian Brains
The Journal of Comparative Neurology | Research in Systems Neuroscience 5

In the four samples belonging to the same species,
we did not record appreciable differences in either the
distribution pattern or the neuron and fiber densities.
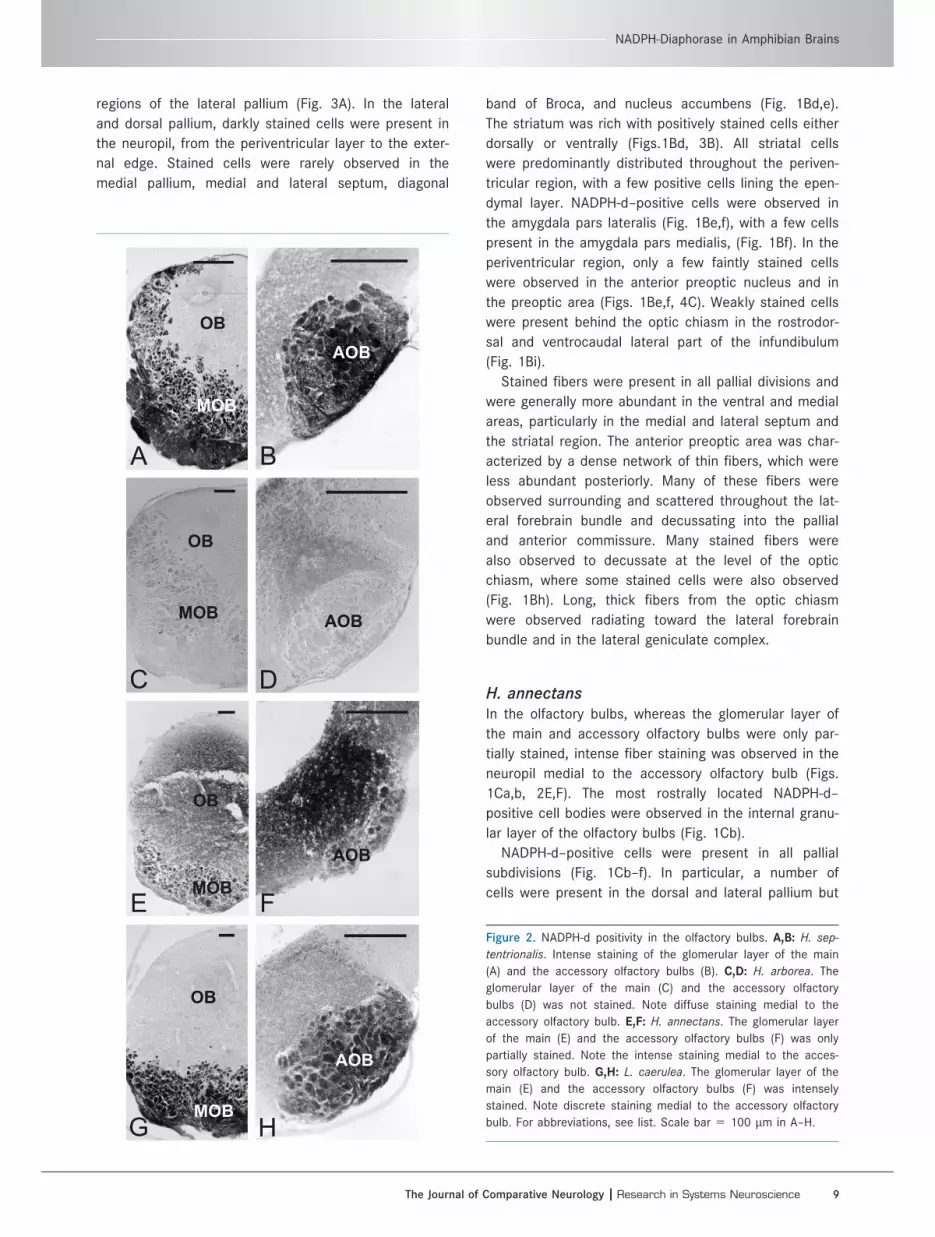
Secondary prosencephalonH. septentrionalisIn the rostral brain regions, the olfactory and the vom-
eronasal nerves, their encephalic targets, and the glo-
merular layers of the main and accessory olfactory
bulbs were intensely stained (Figs. 1Aa,b, 2A,B). Nota-
bly, some stained fibers of the olfactory tract were
observed running ventromedially into the medial septal
area (Fig. 1Ab,c).
The rostralmost NADPH-d–positive cell bodies were
dispersed in the diagonal band of Broca and nucleus
accumbens (Fig. 1Ad,e). The first discrete brain nucleus
of NADPH-d–positive cells was present in the lateral
septal nucleus (Fig. 3C–E). In the same sections, a few
stained cells were observed in the medial septal
nucleus, lateral pallium, and ventral striatum, and most
cells were located near the ventricle (Fig. 1Ad). At the
level of the anterior preoptic area, we observed round,
darkly stained cells intermingled with unstained cells in
the periventricular layer of the anterior preoptic nucleus
(Fig. 4D). Other stained cells were observed in the ante-
rior preoptic area (Fig. 1Ae,f), and a few were present
near the lateral forebrain bundle in the amygdala pars
lateralis, underneath the pallial commissure in the
amygdala pars medialis (Fig. 1Ae,f) and in the anterior
commissure (Fig. 1Af). In the chiasmatic region, stained
cells were present in the suprachiasmatic nucleus (Fig.
1Ag). At the level of the infundibular ventricle, many
densely packed and darkly stained NADPH-d–positive
neurons were observed in the ventral hypothalamus,
near the infundibular recess of the third ventricle (Figs.
1Ah,i, 4L). A few stained cells were also observed in
the dorsal hypothalamus.
Stained NADPH-d fibers were visible throughout the
pallium, septum, and striatum, with a dense network in
the proximity of the neurons of the septal area and
striatum (Fig. 1Ac–e). At the preoptic level, widespread
fiber staining of a different caliber typified the ventral
region of the brain, with the greatest intensity near the
lateral longitudinal fascicle region. In the chiasmatic
region, a dense network of thick fibers surrounded the
stained cells of the suprachiasmatic nucleus, a few of
which decussated through the optic chiasm (Fig. 1Ag).
A denser fiber network was observed immediately pos-
terior to the optic chiasm, at the level of the infundibu-
lar ventricle (Fig. 1Ah,i).
H. arboreaThe glomerular layers of the main and accessory olfactory
bulbs were not stained, whereas diffuse fiber staining
was observed in the medial neuropil from the accessory
olfactory bulb to the periventricular layer (Figs. 1Ba,b,
2C,D). Small stained cells were located in the internal
granular layer of the main olfactory bulb, close to the ros-
tral extent of the lateral ventricles (Fig. 1Bb).
All pallial divisions were characterized by scattered
cells (Fig. 1Bb–g) concentrated in the more posterior
TABLE 1. Continued
Brain area 1 2 3 4 5 6 7 8 9 10
CB 1 1 1 1 0 1 1 0 1 0IN 1 0 0 0 0 0 0 0 0 0Vpr 0 1 0 1 1 1 1 1 0 0Vds 1 1 1 0 1 1 1 1 0 0TR 0 0 0 0 0 0 0 0 1 0PTN 0 0 0 0 0 0 1 1 1 0VII 0 0 0 0 0 1 0 0 0 0VIII 0 1 0 0 1 1 1 0 0 0IXm 0 1 0 0 0 0 0 0 0 0X 0 0 0 0 0 0 1 0 0 0XII 0 1 0 0 0 1 0 0 0 0Sol 0 1 1 1 1 1 1 1 1 1DG 0 0 0 0 0 0 0 0 0 1VG 0 0 0 0 0 0 0 0 0 1CG 1 1 1 1 0 1 1 1 0 0SO 0 1 0 0 0 0 1 0 0 0LC 0 0 0 0 0 0 1 0 0 0DCN 0 0 0 0 1 1 1 0 0 1R 0 0 0 0 1 1 1 0 1 1Visc 0 0 0 0 0 0 0 1 0 0HR 1 1 1 1 1 1 0 1 1 1
1For brain areas, see abbreviations list. In the first line: 1, Hyla septentrionalis; 2, H. arborea; 3, H. annectans; 4, Litoria caerulea; 5, Rana perezi
(from Mu~noz et al., 1996); 6, R. esculenta (from L�az�ar and Losonczy, 1999); 7, R. catesbeiana (from Huynh and Boyd, 2007); 8, Xenopus laevis
(from Br€uning and Mayer, 1996); 9, Pleurodeles waltl (from Gonz�alez et al., 1996); 10, Dermophis mexicanus (from Gonz�alez et al., 2002).
C. Pinelli et al.
6 The Journal of Comparative Neurology |Research in Systems Neuroscience

Figure 1. (Parts I and II). Distribution of NADPH-d–positive cell bodies and fibers in the brain of four anuran amphibians. A–D: Camera
lucida drawings of rostrocaudal progressive transverse sections of the brain of H. septentrionalis (A), H. arborea (B), H. annectans (C), and
L. caerulea (D) at the levels indicated by lowercase letters in the schematic dorsal view of the frog brain at the lower left. NADPH-d–
positive cell bodies are indicated as large dots, and the fibers are indicated as dashes and fine dots. The number of dots corresponds to
the densities of the NADPH-d–positive elements, as described in the Results section. Empty dots in the olfactory bulbs indicate the glo-
meruli. For abbreviations, see list. Scale bar 5 100 lm in A–D.
NADPH-Diaphorase in Amphibian Brains
The Journal of Comparative Neurology | Research in Systems Neuroscience 7

Figure 1. continued
C. Pinelli et al.
8 The Journal of Comparative Neurology |Research in Systems Neuroscience
regions of the lateral pallium (Fig. 3A). In the lateral
and dorsal pallium, darkly stained cells were present in
the neuropil, from the periventricular layer to the exter-
nal edge. Stained cells were rarely observed in the
medial pallium, medial and lateral septum, diagonal
band of Broca, and nucleus accumbens (Fig. 1Bd,e).
The striatum was rich with positively stained cells either
dorsally or ventrally (Figs.1Bd, 3B). All striatal cells
were predominantly distributed throughout the periven-
tricular region, with a few positive cells lining the epen-
dymal layer. NADPH-d–positive cells were observed in
the amygdala pars lateralis (Fig. 1Be,f), with a few cells
present in the amygdala pars medialis, (Fig. 1Bf). In the
periventricular region, only a few faintly stained cells
were observed in the anterior preoptic nucleus and in
the preoptic area (Figs. 1Be,f, 4C). Weakly stained cells
were present behind the optic chiasm in the rostrodor-
sal and ventrocaudal lateral part of the infundibulum
(Fig. 1Bi).
Stained fibers were present in all pallial divisions and
were generally more abundant in the ventral and medial
areas, particularly in the medial and lateral septum and
the striatal region. The anterior preoptic area was char-
acterized by a dense network of thin fibers, which were
less abundant posteriorly. Many of these fibers were
observed surrounding and scattered throughout the lat-
eral forebrain bundle and decussating into the pallial
and anterior commissure. Many stained fibers were
also observed to decussate at the level of the optic
chiasm, where some stained cells were also observed
(Fig. 1Bh). Long, thick fibers from the optic chiasm
were observed radiating toward the lateral forebrain
bundle and in the lateral geniculate complex.
H. annectansIn the olfactory bulbs, whereas the glomerular layer of
the main and accessory olfactory bulbs were only par-
tially stained, intense fiber staining was observed in the
neuropil medial to the accessory olfactory bulb (Figs.
1Ca,b, 2E,F). The most rostrally located NADPH-d–
positive cell bodies were observed in the internal granu-
lar layer of the olfactory bulbs (Fig. 1Cb).
NADPH-d–positive cells were present in all pallial
subdivisions (Fig. 1Cb–f). In particular, a number of
cells were present in the dorsal and lateral pallium but
Figure 2. NADPH-d positivity in the olfactory bulbs. A,B: H. sep-
tentrionalis. Intense staining of the glomerular layer of the main
(A) and the accessory olfactory bulbs (B). C,D: H. arborea. The
glomerular layer of the main (C) and the accessory olfactory
bulbs (D) was not stained. Note diffuse staining medial to the
accessory olfactory bulb. E,F: H. annectans. The glomerular layer
of the main (E) and the accessory olfactory bulbs (F) was only
partially stained. Note the intense staining medial to the acces-
sory olfactory bulb. G,H: L. caerulea. The glomerular layer of the
main (E) and the accessory olfactory bulbs (F) was intensely
stained. Note discrete staining medial to the accessory olfactory
bulb. For abbreviations, see list. Scale bar 5 100 lm in A–H.
NADPH-Diaphorase in Amphibian Brains
The Journal of Comparative Neurology | Research in Systems Neuroscience 9

were rarely observed in the medial pallium. A few cells
were also observed in the medial and lateral septum
(Fig. 1Ce,f). The striatum was rich in stained cells, pre-
dominantly located in the periventricularly, with den-
drites pointing lateroventrally (Fig. 1Cd). Other
telencephalic cells were observed in the diagonal band
of Broca and in the nucleus accumbens (Fig. 1Cc,d). In
the sections at the level of the preoptic area, intensely
stained cells were present in the amygdala, under the
anterior commissure (Figs. 1Ce,f, 4B), and a few faintly
stained cells could be observed in the periventricular
region of the anterior preoptic nucleus and scattered
into the anterior preoptic area (Fig. 1Ce). In the hypo-
thalamus, behind the optic chiasm, numerous round,
darkly stained cells were present in the ventral hypo-
thalamus, in a periventricular position (Fig. 1Ci–m),
whereas only a few cells were observed in the dorsal
hypothalamus (Fig. 1Cl,m).
A dense network of thin, stained fibers was present
in all telencephalic divisions, generally more abundant
in the ventral and medial areas. Notably, an aggregate
of fibers was present in the striatal region and the
ventrolateral wall of the hemispheres, at the boundary
between the striatum and lateral pallium (Fig. 1Cc,d).
Figure 3. NADPH-d–positive elements in the telencephalon. A: NADPH-d–positive neurons (arrows) in the lateral pallium (LP) of H. arborea.
B: NADPH-d–positive neurons (arrows) in the striatum (STR) of H. arborea. C: NADPH-d–positive neurons in the lateral septum (Sl) of H.
septentrionalis. D: Enlargement of the boxed area in C, showing the NADPH-d–positive cells (arrows) of the lateral septum located dorsally.
E: Enlargement of the boxed area in C, showing the NADPH-d–positive cells (arrows) located ventrally, leaning against the ventricular wall.
Scale bar 5 100 lm in A–E.
C. Pinelli et al.
10 The Journal of Comparative Neurology | Research in Systems Neuroscience

Figure 4. NADPH-d–positive elements in the diencephalon. A: Asymmetrical NADPH-d staining of the dorsal habenular nuclei of H. arborea.
B: NADPH-d–positive neurons (arrows) in the amygdala pars lateralis (AMYl) of H. annectans. C: A solitary NADPH-d–positive neuron
(arrow) in the preoptic area (POA) of H. arborea. D: Stained NADPH-d–positive cells in the periventricular cell layer of the anterior preoptic
nucleus (PONa) intermingled with the unstained cells of H. septentrionalis. E: A dense network of NADPH-d–positive fibers (arrowheads) of
various thicknesses, decussating into the optic chiasm (OC) of L. caerulea. F: NADPH-d–positive cells and fibers at the level of the lateral
geniculate complex (CGT) of H. annectans. G: Dense terminal network of NADPH-d–positive fibers in the dorsal thalamus (DTh) of H.
annectans. H: NADPH-d–positive cells (arrows) in the anterior division of the lateral thalamic nucleus of H. arborea. I: NADPH-d–positive
cells (arrows) in the ventral part of the lateral thalamic nucleus of H. arborea. – Many round, NADPH-d–positive densely packed neurons
in the ventral hypothalamus (VHyp) of H. septentrionalis, around the infundibular recess (IR). Scale bar 5 100 lm in A–I,L.
NADPH-Diaphorase in Amphibian Brains
The Journal of Comparative Neurology | Research in Systems Neuroscience 11

The fibers were particularly abundant at the level of
the amygdala pars lateralis, dorsally and laterally to the
lateral forebrain bundle and in the anterior preoptic
area. A few fibers were observed decussating through-
out the pallial and anterior commissure (Fig. 1Cf). The
hypothalamus showed major fiber concentrations, with
many fibers decussating through the optic chiasm.
L. caeruleaBoth the glomerular layers of the main and accessory
olfactory bulb were intensely stained (Fig. 2G,H). Dis-
crete staining was also visible in the neuropil medial to
the accessory olfactory bulb (Fig. 2H).
Few NADPH-d–positive cells were present in the dor-
sal and lateral pallium (Fig. 1Dd). In the septum, only
the lateral region contained stained cells, with a major
concentration of cells in the ventral region and the peri-
ventricular cell layer (Fig. 1Dd). Scattered positive cells
were also located in both the dorsal and ventral stria-
tum, predominantly located periventricularly, and a few
cells were located in the nucleus accumbens (Fig. 1Dd).
At the level of the preoptic area, some cells were
observed in the amygdala, concentrated in its pars lat-
eralis (Fig. 1De,f). Some cells were present in the ante-
rior commissure and the anterior preoptic area. Faintly
stained cells characterized the periventricular layer of
the preoptic nucleus around the rostral preoptic recess
(Fig. 1Df,g). In the infundibular nuclei, a few cells were
present both dorsally and ventrally (Fig. 1Di,l).
The pallium, septum, and striatum were characterized
by a diffuse network of weakly stained fibers, not well
discriminated in the pallial division, but more abundant
in the ventral and medial areas, with a major concentra-
tion in the ventrolateral wall of the hemispheres at the
boundary between the striatum and lateral pallium (Fig.
1Dd,e). The anterior preoptic area was characterized by
a dense network of thin fibers, particularly abundant
ventrally in the neuropil around the preoptic recess.
Thicker fibers were observed decussating into the optic
chiasm (Fig. 4E).
DiencephalonH. septentrionalisIn the thalamus, darkly stained NADPH-d–positive cells
were scattered throughout the ventromedial and ventro-
lateral thalamic nuclei, and many neurons were present
in the central and lateral thalamic nuclei (Fig. 1Ag,h).
NADPH-d–positive cells were also observed in the pos-
terior tubercle, and a few scattered cells were present
in the pretectal gray matter (Fig. 1Ai).
H. arboreaThe diencephalon showed diffuse positivity. Weak asym-
metrical staining was observed only in the dorsal habe-
nular nuclei (Fig. 4A). Stained cells were present in the
lateral geniculate complex (Fig. 1Bg) and in the central,
lateral, and ventrolateral nuclei of the thalamus (Figs.
1Bh,i, 4H). In the ventral region of the lateral thalamic
nucleus, the cells had a pyramidal body and conspicu-
ous vertically oriented dendrites (Fig. 4I). Some NADPH-
d–positive cells were also observed in the superficial
ventral nucleus (Fig. 1Bi) and in the posterior tubercle
(Fig. 1Bl). Distinct intensely stained cells were spread
throughout the pretectal and pretoral gray (Fig. 1Bl).
The entire diencephalon contained a densely stained
neuropil (Fig. 1Bh,i). The dorsal and central thalamic
neuropil were crowded with tiny stained fibers,
arranged in parallel bands, whereas fibers of various
thicknesses and lengths were observed in the lateral
and ventral regions. Furthermore, a concentration of
stained fibers was present at the level of the eminentia
thalami and the olfactohabenularis anterior tract.
H. annectansIn the thalamus, a few stained cells appeared in the lat-
eral and central nuclei and the superficial ventral
nucleus. However, the major cellular density was seen in
the thalamic ventrolateral nucleus and in the lateral tha-
lamic nucleus posteroventral division (Fig. 1Cg,h).
Stained cells were also observed in the posterior tuber-
cle and into the pretoral gray. The diencephalon showed
a weak fiber staining into the dorsal habenular nuclei,
decussating into the habenular commissure. The entire
thalamus was characterized by a dense and diffuse ter-
minal network of thin, stained fibers. In the central tha-
lamic neuropil, the fibers were arranged in parallel bands
(Fig. 4G), whereas in the lateral and ventral regions,
fibers of various thicknesses and lengths were observed.
Furthermore, a conspicuous aggregate of stained fibers
was observed above the lateral forebrain bundle in the
lateral geniculate complex (Figs. 1Ch, 4F).
L. caeruleaIn the thalamus, NADPH-d activity was observed in the
central, lateral, and ventral nuclei of the thalamus (Fig.
1Dh). More caudally, a few NADPH-d–positive cells
were observed in the posterior tubercle and fusiform,
and moderately stained cells spread into the pretectal
and pretoral gray (Fig. 1Di). The habenular nuclei were
weakly and asymmetrically stained; some stained fibers
were observed in the habenular commissure. Most tha-
lamic subdivisions contained thin, diffuse NADPH-d–
positive fibers, with the densest distribution in the ven-
tral portion. In the anterior and ventromedial thalamic
nuclei, the fibers were typically arranged in parallel
bands. Thicker fibers were observed in the more lateral
and ventral portions of the neuropil. Numerous fibers
C. Pinelli et al.
12 The Journal of Comparative Neurology | Research in Systems Neuroscience

were observed crossing into the posterior and tectal
commissure.
MesencephalonH. septentrionalisNADPH-d–positive cells were rarely observed in the
optic tectum located in the more external layer, and a
few weakly stained fibers were arranged into different
layers (Fig. 5A). Numerous NADPH-d–positive cells were
present either dorsally or ventrally in the anterior and
posterior tegmentum (Fig. 1Ai–n). Moderately stained
cells, located below the optic lobes, were observed in
the torus semicircularis in the laminar nucleus, the
nucleus principalis of the torus semicircularis, and the
Figure 5. NADPH-d–positive elements in the transverse sections of the hylid optic tectum. The ependyma is shown at the bottom. A: H. sep-
tentrionalis. Weakly stained fibers were arranged into the different layers (arrowheads). B: H. arborea. Several NADPH-d–positive cells (arrows)
were preferentially distributed throughout layers 4 and 6. C: H. annectans. Conspicuous aggregates of stained fibers were ordinately arranged
throughout layers 3, 5, 7, and 9; a few fibers were also present in the superficial neuropil. D: L. caerulea. A few weakly stained cells (arrows)
were predominantly located in layers 4 and 6, and the fibers were ordinately arranged in all layers. Scale bar 5 100 lm in A–D.
NADPH-Diaphorase in Amphibian Brains
The Journal of Comparative Neurology | Research in Systems Neuroscience 13

anterodorsal and anteroventral tegmental nuclei, and
darkly stained cells characterized the toral magnocellu-
lar nucleus (Fig. 1Ai,l). Rare well-stained cells were also
observed in the nucleus profundus mesencephali (Fig.
1Al). NADPH-d–stained fibers were abundant through-
out the entire tegmentum.
H. arboreaIn the optic tectum, several NADPH-d–positive cells were
preferentially distributed in layers 4 and 6 (Figs. 1Bm, 5B)
and alternated with stained fibers arranged predominantly
in layers 3, 5, and 7 (Fig. 5B). Many stained cells were
observed in the anterodorsal (Fig. 6C) and anteroventral
(Fig. 6E,F) tegmental nuclei and in the nucleus principalis,
magnocellularis (Fig. 6C,D) and laminaris of the torus
semicircularis (Fig. 1Bm,n). Moderately stained cells were
observed in the anterior portion of the anteroventral teg-
mental nucleus and the medial portion of the anterodorsal
tegmental nucleus (Fig. 6C) compared with the other
regions. The cell size and typology of these mesencephalic
nuclei were extremely variable. Small or medium-sized
cells were predominantly observed in the nucleus lamina-
ris of the torus semicircularis, medial region of the antero-
dorsal tegmental nucleus (Fig. 6C) and anteroventral
tegmental nuclei. In contrast, large multipolar cells charac-
terized the nucleus magnocellularis (Fig. 6C,D) and princi-
palis of the torus semicircularis, the lateral part of the
anterodorsal tegmental nucleus (Fig. 6C). Stained fibers
were particularly abundant, extending throughout almost
all subdivisions in the mesencephalon. A dense and dif-
fuse network of thin fibers was present in the neuropil
among the stained cell groups and near the ventricle, and
thick, intensely stained bundles were observed laterally
and ventrally. Some fibers were observed crossing the
dorsal tectal and posterior commissure.
H. annectansConspicuous aggregates of stained fibers were ordi-
nately arranged in the optic tectum, predominantly in
layers 3, 5, 7, and 9 (Fig. 5C). Abundant positive cells
were present in the nucleus principalis of the torus
semicircularis and the nucleus magnocellularis (Fig.
1Cm). Fewer cells were present in the nucleus laminaris
of the torus semicircularis, in the anterodorsal and
anteroventral tegmental nuclei (Fig. 1Cm–o). Almost all
subdivisions of the mesencephalon were characterized
by the presence of a dense background of thin, stained
fibers. As in the diencephalon, in the central body of
the tegmentum, the fibers were arranged in parallel
bands, whereas thicker and longer fibers were observed
in the lateral and ventral areas. Many of these fibers
also decussated into the tectal and posterior commis-
sure (Fig. 6A).
L. caeruleaThe optic tectum had some weakly stained cells, pre-
dominantly located in layers 4 and 6, and fibers were
present in all layers (Figs. 1Dl, 5D). An intense enzy-
matic reaction was observed in the principal and mag-
nocellular nuclei of the torus semicircularis and in the
anterodorsal tegmental nucleus. Moderate staining was
revealed in the anteroventral tegmental nucleus (Fig.
6B) and nucleus profundus. Stained fibers were particu-
larly abundant in the mesencephalon, and they com-
pletely filled in almost all subdivisions with a dense and
diffuse network of thin fibers, whereas thicker fibers
were observed near the stained cells and in the lateral
and ventral neuropil.
IsthmusH. septentrionalisStained cells were observed medially and ventrally in
the posterodorsal and posteroventral tegmental nuclei,
extending caudally and disposed lateroventrally to the
fourth ventricle (Fig. 1Am,n). A dense plexus of fibers
emerged from these nuclei, which encircled and pene-
trated the isthmic nucleus. Other stained cells were
observed in the interpeduncular nucleus (Fig. 1Am).
H. arboreaMany stained cells were observed in posterodorsal (Fig.
6E,F) and posteroventral tegmental nuclei. Small or
medium-sized cells were predominantly observed in the
posteroventral tegmental nuclei. In contrast, large multi-
polar cells characterized the posterodorsal tegmental
nucleus (Fig. 6E). The stained cells were particularly
abundant, were intensely stained, and occurred medial
and ventral to the isthmic nucleus, with most dendrites
pointing ventrally and ventrolaterally toward the reticu-
lar formation (Figs. 1Bn, 6E,F). The isthmic nucleus
itself was not stained; however, because a few thick
axons originating from the posterodorsal tegmental cell
group traversed the body, this region appeared to be
striped, with intense enzymatic activity in the surround-
ing cells and fibers (Fig. 6E).
H. annectansWhereas fewer cells were present in the posteroventral
tegmental nuclei, a conspicuous group of large and
darkly stained NADPH-d–positive cells was present in
the posterodorsal tegmental nucleus (Fig. 1Cl–o),
located medial and ventral to the isthmic nucleus and
crossed by thick axons.
L. caeruleaWhereas weak staining characterized the posteroventral
tegmental nucleus (Fig. 1Dl–n), the most conspicuous
C. Pinelli et al.
14 The Journal of Comparative Neurology | Research in Systems Neuroscience
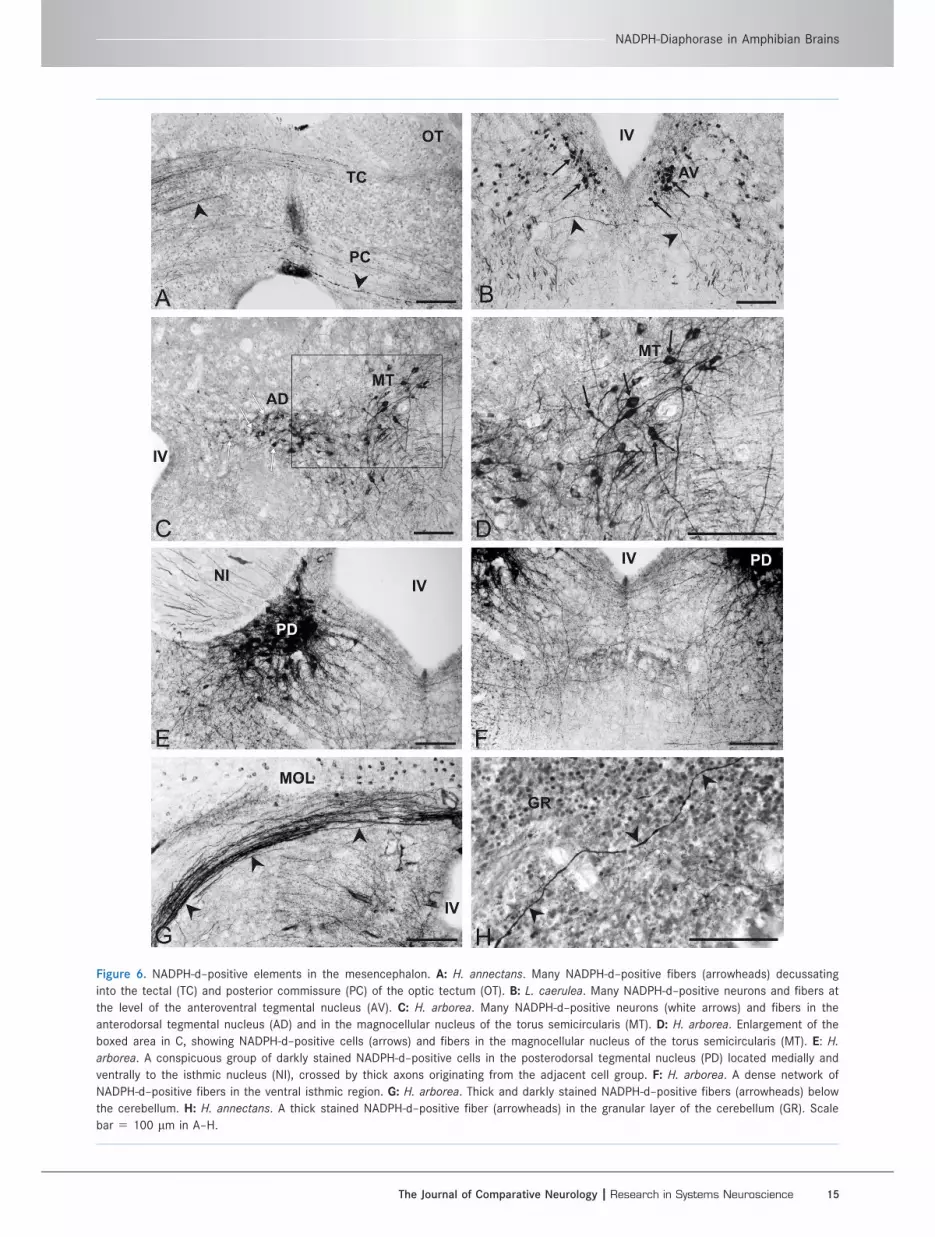
Figure 6. NADPH-d–positive elements in the mesencephalon. A: H. annectans. Many NADPH-d–positive fibers (arrowheads) decussating
into the tectal (TC) and posterior commissure (PC) of the optic tectum (OT). B: L. caerulea. Many NADPH-d–positive neurons and fibers at
the level of the anteroventral tegmental nucleus (AV). C: H. arborea. Many NADPH-d–positive neurons (white arrows) and fibers in the
anterodorsal tegmental nucleus (AD) and in the magnocellular nucleus of the torus semicircularis (MT). D: H. arborea. Enlargement of the
boxed area in C, showing NADPH-d–positive cells (arrows) and fibers in the magnocellular nucleus of the torus semicircularis (MT). E: H.
arborea. A conspicuous group of darkly stained NADPH-d–positive cells in the posterodorsal tegmental nucleus (PD) located medially and
ventrally to the isthmic nucleus (NI), crossed by thick axons originating from the adjacent cell group. F: H. arborea. A dense network of
NADPH-d–positive fibers in the ventral isthmic region. G: H. arborea. Thick and darkly stained NADPH-d–positive fibers (arrowheads) below
the cerebellum. H: H. annectans. A thick stained NADPH-d–positive fiber (arrowheads) in the granular layer of the cerebellum (GR). Scale
bar 5 100 lm in A–H.
NADPH-Diaphorase in Amphibian Brains
The Journal of Comparative Neurology | Research in Systems Neuroscience 15

group of large and strongly stained cells was observed
in the posterodorsal tegmental nucleus, located medial
to the isthmic nucleus (Fig. 1Dn). Most of the dendrites
originating from these cells pointed ventrally and ven-
trolaterally in the reticular formation, and only a few
cells were directed dorsally to the isthmic nucleus.
HindbrainH. septentrionalisIn the cerebellum, faintly stained cells were observed in
both the granular and molecular layer, whereas Purkinje
cells were not stained. Thick, intensely stained fibers
were observed running lateral and medial to the region
above the fourth ventricle in the granular and Purkinje
cell layers (Figs. 1Ao, 7A). In the basal rhombence-
phaon, NADPH-d activity was present in weakly stained
cells of the cerebellar nucleus (Fig. 1Ao), in a few cells
of the descending trigeminal nucleus and the central
gray and hindbrain reticular formation (Fig. 1Ap,q).
H. arboreaIn the cerebellum, many darkly stained cells of the
molecular layer were NADPH-d–positive (Figs. 1Bo, 7B).
Thick, darkly stained fibers were observed in the granular
and Purkinje cell layers, whereas cell staining was rarely
observed in the molecular layer (Figs. 6G, 7B). In the
caudal brainstem, many NADPH-d–labeled cells of differ-
ent morphologies and staining intensities were observed
in the cerebellar nucleus, sensory and descending tri-
geminal nucleus, motor nucleus of the glossopharyngeal
nerve, ventral octaval nucleus, oliva superioris, motor
nucleus of hypoglossal nerve, and nucleus of the solitary
tract. Moreover, scattered positively stained cells were
present ventromedially throughout the central gray
region and in the reticular formation (Figs. 1Bo–q, 8A,B).
All NADPH-d–positive cells were associated with an intri-
cate network of stained fibers that could easily be traced
for long distances. Whereas almost the entire neuropil
was densely innervated with thin fibers, in the reticular
formation there was a profusion of thicker fibers running
medially and laterally, and these fibers frequently decus-
sated at different levels.
H. annectansIn the cerebellum, intensely stained cell bodies were
present in the granular layers, whereas in the molecular
and Purkinje cell layers the cells were faintly stained
(Figs. 1Cp,q, 7C). Thick, darkly stained fibers were
observed among granular (Fig. 6H) and Purkinje cells,
whereas these cells were rarely observed in the molec-
ular layer (Fig. 7C). In the basal rhombencephalon,
weakly NADPH-d–positive cells were revealed in the
cerebellar nucleus (Fig. 1Cq), whereas well-stained cells
were present in the descending trigeminal nucleus,
scattered in the central gray, in the reticular formation,
and ventrolateral to the solitary tract (Fig. 1Cr,s). Posi-
tive thin NADPH-d fibers were scattered throughout all
brainstem divisions, whereas thick and abundant fibers
appeared ventromedially and laterally (Fig. 8C).
L. caeruleaIn the cerebellar division, faintly NADPH-d–positive cells
were present in the molecular layer, whereas thick, darkly
stained fibers were observed in the molecular and Pur-
kinje cell layers (Figs. 1Do, 7D). In the basal rhombence-
phalon, round, weakly stained cells were seen in the
central gray, principal sensory trigeminal nucleus, with
some cells scattered in the reticular formation and many
well-stained cells surrounding the solitary tract (Figs.
1Do–q, 8D). Positive thin NADPH-d fibers characterized
most of the rhombencephalic neuropil, whereas thick
fibers were more abundant ventromedially and laterally.
Cluster analysisIn terms of the distribution of NADPH-d in the brain of
all amphibians studied so far, the degree of dissimilarity
between different samples, calculated by using MATLAB
software, is shown in Figure 9. The results obtained from
the statistical analysis of the matrix associated with the
whole brain (Fig. 9A) revealed dissimilarity ranging
between 26% and 64%. The lowest percentage of dissimi-
larity occurred between R. perezi and R. esculenta, which
in turn had 30% dissimilarity with R. catesbeiana as an
outgroup. A 27% dissimilarity was observed between the
cluster of H. septentrionalis and L. caerulea and also
between H. arborea and H. annectans. The highest per-
centage of dissimilarity between Hylidae was 34%. Xeno-
pus laevis, with 49% dissimilarity, is represented as an
outgroup of Ranidae and Hylidae, which are sister groups
(Neobatrachia). The cluster comprising the newt Pleuro-
deles waltl and the Mexican burrowing caecilian Dermo-
phis mexicanus, with a 53% dissimilarity, differed from
the anuran group by 64%.
Secondary prosencephalon (Fig. 9B)Compared with the results obtained using whole brain
data, the secondary prosencephalon alone showed a
high degree of dissimilarity ranging between 6% and
44%. The lowest degree of brain dissimilarity was
observed between H. arborea and H. annectans. R. cat-
esbeiana and R. perezi had a 17% dissimilarity, with R.
esculenta as an outgroup (22% dissimilarity). The ranids
differed by 25% from the cluster H. arborea and H.
annectans. P. waltl and D. mexicanus, with 22% dissimi-
larity between them, had a 35% dissimilarity from all
the species listed above. The outgroup of all these
C. Pinelli et al.
16 The Journal of Comparative Neurology | Research in Systems Neuroscience

species was X. laevis (42% dissimilarity). Finally, H. sep-
tentrionalis and L. caerulea, which together clustered
with 28% brain dissimilarity, appeared to be outside all
the other samples studied, with 44% dissimilarity.
Comparison of the dendrogram of the secondary
prosencephalon with that of the whole brain by the FM
index gave low values of similarity, and the permutation
test showed no significant values (Table 2).
Diencephalon (Fig. 9C)Analysis of the diencephalon revealed a large range of
dissimilarity, between 10% and 85%. The closest pattern
Figure 7. Transverse sections of the hylid cerebellum. A: H. septentrionalis. Thick, intensely stained NADPH-d–positive fibers were observed
in the granular cell layer (GR) (thick black arrow) and in the Purkinje cell layer (SP) (thick white arrow). The insets show faintly stained cells
(arrows) in the molecular cell layer (MOL) and GR. Note that the cells of the SP were not stained. B: H. arborea. Thick, darkly NADPH-d–
stained fibers were observed in the GR (thick black arrow) and SP (thick white arrow), up to the fourth ventricle. The inset shows many
darkly stained NADPH-d–positive cells (arrows) in the MOL. C: H. annectans. Thick, darkly NADPH-d–stained fibers were observed in the GR
(thick black arrow) and SP (thick white arrow). The inset shows well-stained NADPH-d cell bodies (white arrows head) in the GR and faintly
stained cells in the MOL (black arrowheads) and SP (arrows). D: L. caerulea. Thick, darkly NADPH-d–stained fibers were observed in the GR
and SP. The inset shows faintly NADPH-d–positive cells (arrows) in the MOL. Scale bar 5 50 lm in D (applies to A–D).
NADPH-Diaphorase in Amphibian Brains
The Journal of Comparative Neurology | Research in Systems Neuroscience 17

was for the cluster of R. esculenta and R. catesbeiana,
followed by H. septentrionalis and L. caerulea, with
13%, and H. arborea and H. annectans, with 30%. R.
perezi was a sister species of the other two ranids,
with 43% dissimilarity. X. laevis was situated in
between hylids as a sister species of H. septentrionalis
and L. caerulea, with 37% dissimilarity, and 48% with
the cluster of H. arborea and H. annectans. The hylids
(including X. laevis) differed from ranids by 58%. D.
mexicanus was represented in the dendrogram as an
outgroup of Anura, with 80% dissimilarity, and P. waltl
had 85% dissimilarity as outgroup of all the other spe-
cies listed.
Comparison of the dendrogram of the diencephalon
with that of the whole brain by the FM index gave high
similarity values, and the permutation test showed
strongly significant values (Table 2).
Mesencephalon (Fig. 9D)The percentage of mesencephalon dissimilarity ranged
between 0% and 64%. The cluster of R. perezi and R.
esculenta showed no dissimilarity, having as an out-
group R. catesbeiana, with 12% dissimilarity. H. arborea
and H. septentrionalis clustered with 13% dissimilarity.
Another cluster was L. caerulea and X. laevis, with 15%
dissimilarity, which in turn had an 18% dissimilarity with
the cluster of H. arborea and H. septentrionalis. These
four species had a 25% dissimilarity with ranids. H.
annectans appeared as an external species of anurans,
with 31% dissimilarity. P. waltl and D. mexicanus clus-
tered with 50% dissimilarity and were an external group
of anurans with 64% dissimilarity.
Comparison of the dendrogram of the mesencepha-
lon with that of the whole brain by the FM index gave
high values of similarity, and the permutation test
showed moderately significant values for partitions with
two and three clusters, but no significant values for
four clusters (Table 2).
Isthmus (Fig. 9E)The dendrogram obtained from the isthmus was totally
anomalous. Comparison with that of the whole brain by
the FM index gave low values of similarity, and the per-
mutation test showed no significant values (Table 2).
Hindbrain (Fig. 9F)The hindbrain showed a dissimilarity ranging between
31% and 77%. R. perezi and R. esculenta clustered with
the lower dissimilarity, with R. catesbeiana (dissimilarity
44%) as a sister species. H. septentrionalis and
H. annectans clustered with 33% dissimilarity, and
H. arborea and L. caerulea with 46%. These last two
clusters differed by 54%. Ranids and hylids had 58%
dissimilarity. X. laevis, with 66% dissimilarity, is repre-
sented as an outgroup of Neobatrachia. The cluster
comprising the newt P. waltl and D. mexicanus, with
Figure 8. NADPH-d–positive elements in the rhombencephalon. A:
H. arborea. Corresponds to a level similar to “p” in Figure 1. The
inset is an enlargement of the boxed area. CG, central gray; HR,
reticular formation; IV, fourth ventricle; IXm, motor nucleus of glos-
sopharyngeal nerve; SO, oliva superioris; Vds, decending trigeminal
nucleus; VIIIv, ventral octaval nucleus. B: H. arborea. Positive cells
(arrows) at the level of the motor nucleus of the hypoglossal nerve
(XII). C: H. annectans. Positive fibers in the hindbrain reticular for-
mation (HR). Note the decussation of thick axons. D: L. caerulea.
NADPH-d–positive cells (arrows) in the nucleus of the solitary tract
(Sol) and fibers in the descending trigeminal tract (TrVds). Scale
bar 5 100 lm in A–D; 50 lm inset of A.
C. Pinelli et al.
18 The Journal of Comparative Neurology | Research in Systems Neuroscience

66% dissimilarity, differed from the anuran group by
77%.
Comparison of the dendrogram of the hindbrain with
that of the whole brain by the FM index gave high val-
ues of similarity, and the permutation test showed mod-
erately significant values for partitions with two and
three clusters and strongly significant values for four
clusters (Table 2).
DISCUSSION
The histochemical method used in this work facili-
tated the identification of several areas of the brain
where NADPH-d is expressed. In general, NADPH-d was
widely distributed throughout the brain subdivisions.
Whereas positive neurons were found in most brain
areas or discrete nuclei, the fibers were more or less
densely scattered throughout the brain.
Figure 9. – Dissimilarities in NADPH-d distribution in amphibian brains. Dendrograms showing the dissimilarity degree in the NADPH-d dis-
tribution of the whole amphibian brain and its main subdivisions obtained by using the Jaccard index in a hierarchical clustering procedure.
1, Hyla septentrionalis; 2, H. arborea; 3, H. annectans; 4, Litoria caerulea; 5, Rana perezi; 6, R. esculenta; 7, R. catesbeiana; 8, Xenopus lae-
vis; 9, Pleurodeles waltl; 10, Dermophis mexicanus.
NADPH-Diaphorase in Amphibian Brains
The Journal of Comparative Neurology | Research in Systems Neuroscience 19

A clear-cut comparative analysis of the present
results and those reported in other amphibian species
is complicated by the fact that in several studies, the
authors used a slightly different nomenclature for the
same brain areas or provided general indications.
Comparative analysisSecondary prosencephalonIn the frog species studied to date, a certain degree of
variability in the distribution of NADPH-d in the olfac-
tory bulbs has emerged. Our data showed that positive
neurons are present in the main olfactory bulb of H.
arborea and H. annectans, a feature shared with a uro-
dele and an apodan amphibian (Gonz�alez et al., 1996,
2002) and other species of anurans (Mu~noz et al.,
1996; L�az�ar and Losonczy, 1999; Huynh and Boyd,
2007), except for R. pipiens (Pitzer and Wirtshafter,
1997) and X. laevis (Br€uning and Mayer, 1996). Con-
versely, positive neurons in the accessory olfactory bulb
were not observed in any of the hylid species studied,
but these cells were reported in R. pipiens, P. waltl, and
D. mexicanus (Mu~noz et al., 1996; Pitzer and Wirtsh-
after, 1997; Gonz�alez et al., 1996, 2002).
A considerable variability in NADPH-d reactivity in
olfactory components was also observed in the fibers,
for which NADPH-d positivity was detected in almost all
the anuran species studied and in P. waltl (Gonz�alez
et al., 1996). However, in some frog species, such as
H. arborea, both the main and accessory olfactory bulbs
were completely negative; in other cases, such as Pipa
sp., only the part of the olfactory bulb pertaining to the
lateral diverticulum was very positive, and a few fibers
were described in the main olfactory bulb associated
with the medial diverticulum, whereas no fibers were
observed in the accessory olfactory bulb (Meyer et al.,
1997). Olfactory NADPH-d–positive fibers were not
reported in the main and accessory olfactory bulbs in
D. mexicanus (Gonz�alez et al., 2002).
In all species studied, other areas of the secondary
prosencephalon, such as the lateral pallium, the stria-
tum, and the amygdala, showed consistently positive
NADPH-d neuronal expression, and a high percentage
of homology was observed in other areas, such as the
dorsal and medial pallium, the medial and lateral sep-
tum, the diagonal band of Broca, the nucleus accum-
bens, the preoptic area, and the preoptic nucleus.
Occasionally, some species showed unique features,
as in the case of NADPH-d neurons of the entopedun-
cular nucleus, described only in X. laevis, R. esculenta,
and R. pipiens (Br€uning and Mayer, 1996; Pitzer and
Wirtshafter, 1997; L�az�ar and Losonczy, 1999). Interest-
ingly, NADPH-d neurons in the anterior commissure of
the hylids (except for H. arborea) were not observed in
any other species of amphibian studied so far. Another
peculiarity is the presence of NADPH-d neurons in the
olfactory tubercle of R. pipiens (Pitzer and Wirtshafter,
1997). However, this brain nucleus is quite controver-
sial: Hoffmann (1973) and Kicliter and Ebbesson (1976)
included this region in the diagonal band of Broca,
whereas R€othig (1912), Scalia et al. (1968), and North-
cutt and Royce (1975) considered this region as part of
the nucleus of the medial septum.
All amphibian species studied so far were reported
to contain NADPH-d–positive areas in the ventral hypo-
thalamus, whereas NADPH-d positivity in the dorsal
TABLE 2.
Statistical Significance of Bootstrap Estimations of the Fowlkes–Mallows (FM) Index Evaluated by a Permutation Test1
Brain area
Nbs. of
clusters Mean SE CI 95% P value
Secondary prosencephalon 2 0.6159 0.1483 0.4377–0.7710 0.3843 0.6055 0.1484 0.4252–0.7461 0.2164 0.5987 0.1710 0.3819–0.7770 0.076
Diencephalon 2 0.9010 0.1455 0.5690–0.9826 <0.0013
3 0.9308 0.1278 0.6142–1.0000 0.0023
4 0.7963 0.1240 0.4910–0.8660 <0.0013
Mesencephalon 2 0.8238 0.1526 0.5690–0.9826 0.0162
3 0.8329 0.1649 0.5791–1.0000 0.0142
4 0.5234 0.1370 0.3629–0.7235 0.128Isthmus 2 0.5493 0.0697 0.4377–0.6339 0.736
3 0.5289 0.0853 0.4009–0.6447 0.3454 0.4525 0.2017 0.3086–0.6979 0.234
Hindbrain 2 0.8412 0.1646 0.5639–0.9826 0.0302
3 0.8782 0.1680 0.5252–1.0000 0.0262
4 0.8482 0.1912 0.5819–0.9770 0.0103
1P values were obtained by permutation test with 1,000 replications. CI, confidence interval; SE, standard error.2Moderately significant, 0.01 < P � 0.05.3Strongly significant, P � 0.01.
C. Pinelli et al.
20 The Journal of Comparative Neurology | Research in Systems Neuroscience

hypothalamus was a more specific feature of hylids and
R. perezi (Mu~noz et al., 1996). Although the dorsal
hypothalamus was not explicitly mentioned by Mu~noz
et al. (1996), we were able to detect this region by
using their proposed schemes.
Some particular features are the presence of NADPH-
d–positive neurons in the periventricular organ of R. cat-
esbeiana (Huynh and Boyd, 2007) and R. perezi (Mu~noz
et al., 1996), and in the optic chiasm of H. arborea.
DiencephalonAll anuran species studied so far have been reported to
contain NADPH-d–positive perikarya in the posterior
tubercle and the lateral thalamic nucleus. The posterior
tubercle was also positive in D. mexicanus (Gonz�alez
et al., 2002). Some areas of the diencephalon were
more specific features of hylids, such as the NADPH-d
neuronal distribution in the ventrolateral thalamic
nucleus. Furthermore, the central thalamic nucleus was
NADPH-d–positive in R. esculenta (L�az�ar and Losonczy,
1999), and R. catesbeiana (Huynh and Boyd, 2007) and
in hylids. In any case, NADPH-d–positive cells were
detected in these areas and also in non-anuran amphib-
ians. Conversely, diencephalic areas, such as the genic-
ulate body (except for H. arborea) and the thalamic
nucleus of Bellonci, were also common features of Rani-
dae, which were not shared by Hylidae.
Some particular features are the presence of
NADPH-d–positive neurons in the posteroventral subdi-
vision of the lateral thalamic nucleus of H. annectans
and R. perezi (Mu~noz et al., 1996) and in the habenulae
of R. perezi (Mu~noz et al., 1996). This latter feature was
shared with D. mexicanus (Gonz�alez et al., 2002).
The NADPH-d neurons in the fasciculus longitudinalis
medialis and the tectal commissure were only reported
in ranids (Mu~noz et al., 1996; L�az�ar and Losonczy,
1999; Huynh and Boyd, 2007) as a characteristic of the
family.
Notably, the presence of NADPH-d in the nucleus of the
posterior commissure of R. perezi (Mu~noz et al., 1996)
and the pretectal nucleus of D. mexicanus (Gonz�alez et al.,
2002) was not reported in any other species studied.
MesencephalonThe presence of NADPH-d positivity in the midbrain
showed homogeneity in the anterodorsal and anteroven-
tral tegmental nuclei; with the exception of R. catesbei-
ana (Huynh and Boyd, 2007) and D. mexicanus
(Gonz�alez et al., 2002), this feature has been noted in
almost all amphibians. Another area of the brain in
which NADPH-d–positive neurons were largely spread
among different amphibian subgroups was the optic
lobe, except for H. annectans. The areas widely shared
among anurans include the laminar, principal, and mag-
nocellular nuclei of the torus semicircularis. A feature
present only in ranids was the presence of NADPH-d–
positive neurons in the commissural nucleus of the
torus semicircularis.
IsthmusThe presence of NADPH-d positivity in the isthmus
showed homogeneity in the posterodorsal and postero-
ventral nuclei, with the exception of R. catesbeiana
(Huynh and Boyd, 2007) and D. mexicanus (Gonz�alez
et al., 2002). The nucleus isthmi was negative for
NADPH-d in all four hylid species, whereas positivity
was reported in this brain area in R. perezi (Mu~noz
et al., 1996) and X. laevis (Br€uning and Mayer, 1996),
as well as in both non-anuran amphibians.
HindbrainThe hindbrain showed the greatest variability: no con-
sistently NADPH-d–positive area was observed for any
of the amphibians studied thus far. A high percentage
of similarity in amphibians was recorded in the nucleus
of the solitary tract, with the exception of H. septentrio-
nalis, and in the reticular formation, except for R. cates-
beiana (Huynh and Boyd, 2007). Other constantly
positive, highly shared nuclei included the descending
trigeminal nucleus, with the exception of L. caerulea, R.
catesbeiana (Huynh and Boyd, 2007), and D. mexicanus
(Gonz�alez et al., 2002), and the central gray, except for
R. perezi (Mu~noz et al., 1996), D. mexicanus (Gonz�alez
et al., 2002), and P. waltl (Gonz�alez et al., 1996).
The unique features of the Ranidae among anurans
included NADPH-d activity in the dorsal column nucleus
and the raphe nucleus. The raphe nucleus was also
positive in P. waltl (Gonz�alez et al., 1996) and D. mexi-
canus (Gonz�alez et al., 2002).
Many peculiarities were revealed for the hindbrain,
including at least four areas that were specific charac-
teristics of the NADPH-d neuronal distribution of single
species. Among anurans, the nucleus of the nervi facia-
lis was noted to contain NADPH-d–positive neurons
only in R. esculenta (L�az�ar and Losonczy, 1999), the
nucleus visceralis secundarius only in X. laevis (Br€uning
and Mayer, 1996), the dorsal and ventral gray only in
D. mexicanus (Gonz�alez et al., 2002), and the interpe-
duncular nucleus only in H. septentrionalis.
Cluster analysisIn the present study, we used a statistical approach
to quantify the degree of dissimilarities in brain NADPH-
d distribution among different species, taking into
account both the entire brain and its main subdivisions.
This analysis was made possible because of the great
NADPH-Diaphorase in Amphibian Brains
The Journal of Comparative Neurology | Research in Systems Neuroscience 21

number of brain areas/nuclei showing NADPH-d–
positive cells.
There is some dispute on the use of the data to
obtain morphological or molecular phylogenetic trees
(Wiens, 2004). However, assuming that the phyloge-
netic trees of amphibians obtained on the basis of
molecular data are correct, our data for the entire brain
based on a simple morphological character are appa-
rently consistent with the molecular data. In particular,
the dendrogram obtained here by hierarchical clustering
using the Jaccard index was similar to those achieved
in molecular biological studies on amphibians (Ford and
Cannatella, 1993; Hay et al., 1995; Biju and Bossuyt,
2003; Roelants and Bossuyt, 2005; Zhang et al., 2005;
Pyron and Wiens, 2011; Pyron, 2011), by grouping Rani-
dae and Hylidae (Neobatrachia) (and having as an
external group X. laevis [Pipidae]) and combining Gym-
nophiona and Caudata together in the Procera clade, as
supported by some studies (Feller and Hedges, 1998;
Zhang et al., 2005; San Mauro et al., 2005; Marjanovic
and Laurin, 2007). However, our dendrogram contrasts
with other studies in which a sister group relationship
between Anura and Caudata was proposed (Frost et al.,
2006; Pyron, 2011; Roelants et al., 2007; San Mauro,
2010; Wiens, 2011; Zhang et al., 2005).
In acceptance of the reliability of the dissimilarity den-
drogram obtained for NADPH-d distribution for the whole
brain in reflecting the evolution of amphibians, among
the main brain subdivisions only the hindbrain agrees
quite well. Indeed, the dendrogram obtained from this
area is significantly similar to that extrapolated from the
whole brain. In contrast, the secondary prosencephalon
and isthmus dendrograms do not reflect the amphibian
phylogenetic relationships, and comparison with that of
the whole brain did not support a significant similarity.
The diencephalon and the mesencephalon only partially
reflected the evolutionary relationship among amphib-
ians, with X. laevis in an anomalous position (i.e., in
between hylid species). These results might indicate that
the diencephalic and mesencephalic NADPH-d system of
X. laevis has undergone an adaptation converging toward
the hylids. Furthermore, the apodan D. mexicanus had a
diencephalic NADPH-d system that was closer to that of
the anurans with respect to P. waltl. Nevertheless, com-
parison of the diencephalic dendrogram with that of the
whole brain revealed a significant similarity; at the same
time, values for the mesencephalon were only partially
significant.
CONCLUSIONS
In the present study, we mapped the distribution of
NADPH-d–positive cells in the brains of four species of
treefrogs.
A total of 76 NADPH-d–positive brain areas of
amphibians studied to date were found. Some of these
areas, such as the anterior commissure in H. septentrio-
nalis, H. annectans, and L. caerulea, the optic chiasm
and the motor nucleus of the glossopharyngeal nerve in
H. arborea, and the interpeduncular nucleus of H. sep-
tentrionalis, have not previously been described. Among
the total number of NADPH-d–positive areas, only five
regions were consistently positive in all species studied,
representing 6.6% of the whole data set.
Although no individual differences in the distribution
of NADPH-d were found in samples from the same spe-
cies, comparison between different species revealed
appreciable diversity. Nevertheless, our data, when stat-
istically analyzed and combined with those obtained
from previous studies, faithfully reflected the evolution-
ary history of amphibians when we considered the
whole brain and the hindbrain; for the other brain areas,
our dendrograms did not match those from phyloge-
netic history. Natural selection could potentially act
selectively on brain areas, leading to specific character-
istics, a possibility that would confirm a previous study
showing that selection acts independently on different
brain regions in cichlid fish (Pollen et al., 2007;
Gonzalez-Voyer et al., 2009). In this context, and in
terms of NADPH-d brain distribution in amphibians, our
data support the concept of a major evolutionary stabil-
ity of the hindbrain, which is consistent with other hind-
brain studies in vertebrates. For example, the medulla
is more conservative because it has changed little/very
little in vertebrate phylogeny (Finlay et al., 2001; North-
cutt, 2002; Gonzalez-Voyer et al., 2009).
Overall, in this study we provide evidence that, at
least for the NADPH-d brain system, the use of main
brain subdivisions should be approached carefully for
comparative purposes because specific adaptations
may occur in a single species, a phenomenon that
apparently has no effect on the whole brain, because it
is hidden by the great number of brain areas in which
NADPH-d is present.
CONFLICT OF INTEREST STATEMENT
The authors have no conflicts of interest.
ROLE OF AUTHORS
All authors had full access to all the data in the
study and take responsibility for the integrity of the
data and the accuracy of the data analysis. Study con-
cept and design: C.P., B.D., R.K.R. Acquisition of data:
C.P., A.S. Analysis and interpretation of data: C.P., B.D.,
A.G.J. Drafting of the manuscript: C.P., B.D. Critical
C. Pinelli et al.
22 The Journal of Comparative Neurology | Research in Systems Neuroscience

revision of the manuscript for important intellectual
content: R.K.R. Statistical analysis: M.A.
LITERATURE CITEDAria M, 2014. Hierarchical cluster comparison by E.B. Fowlkes
and C.L. Mallows. 1983. Available from: http://www.mathworks.com/matlabcentral/fileexchange/45222-hier-archical-cluster-comparison.
Artero C, Mazzi V, Masucci A, Barale E, Franzoni MF. 1995.Dihydronicotinamide adenine dinucleotide diaphorase inthe central nervous system of the crested newt. Eur JHistochem 39:83–194.
Biju SD, Bossuyt F. 2003. New frog family from India revealsan ancient biogeographical link with the Seychelles.Nature 425:711–714.
Bruhwlyler J, Chleide E, Liegeois JF, Carreer F. 1993. Nitricoxide: a new messenger in the brain. Neurosci BiobehavRev 17:373–384.
Br€uning G, Mayer B. 1996. Localization of nitric oxidase syn-thase in the brain of the frog, Xenopus laevis. Brain Res741:331–343.
Br€uning G, Mayer B. 2001. Nitric oxidase synthase in the spi-nal cord of the frog, Xenopus laevis. Cell Tissue Res 305:457–462.
Butler AB, Hoods W. 1996. Comparative vertebrate neuronat-omy: evolution and adaptiation. New York: Wiley–Liss.
Casola C, Marracci S, Bucci S, Ragghianti M, Mancino G, HotzH, Uzell T, Guex GD. 2004. A hAT- related family of inter-spersed repetitive elements in genomes of westernPalaearctic water frogs. J Zool Syst Evol Res 42:234–244.
Dawson TM, Bredt DS, Fotuhi M, Hwang PM, Snyder SH.1991. Nitric oxide synthase and neuronal NADPH diapho-rase are identical in brain and peripheral tissues. ProcNatl Acad Sci U S A 88:7797–7801.
Efron B, Tibshirani R. 1993. An introduction to the bootstrap.Boca Raton, FL: Chapman & Hall/CRC.
Endepols H, M€uhlenbrock-Lenter S, Roth G, Walkowiak W.2006. The septal complex of the fire-bellied toad Bombinaorientalis: chemoarchitecture. J Chem Neuroanat 31:59–76.
Ernst AF, Wu HH, El-Fakahany EE, McLoon SC. 1999. NMDAreceptor-mediated refinement of a transient retinotectalprojection during development requires nitric oxide. JNeurosci 19:229–235.
Esplugues JV. 2002. NO as a signaling in the nervous system.Br J Pharmacol 135:1079–1095.
Feller AE, Hedges SB. 1998. Molecular evidence for the earlyhistory of living amphibians. Mol Phylogenet Evol 9:509–516.
Finlay B, Darlington RB, Nicastro N. 2001. Developmentalstructure in brain evolution. Behav Brain Sci 24:263–308.
Ford LS, Cannatella DC. 1993. The major clades of frogs. Her-petol Monogr 7:94–117.
Fowlkes EB, Mallows CL. 1983. A method for comparing twohierarchical clusterings. J Am Stat Assoc 78:553–569.
Frontera JG. 1952. A study of the anuran diencephalon. JComp Neurol 96:1–67.
Frost D, Grant T, Faivovich J, Bain RH, Haas A, Haddad CFB,De Sa RO, Channing A, Wilkinson M, Donnellan SC,Raxworthy CJ, Campbell JA, Blotto BL, Moler P, DrewesRC, Nussbaum RA, Lynch JD, Green DM, Wheeler WC.2006. The amphibian tree of life. Bull Am Mus Natl Hist297:8–370.
Gonz�alez A, Mu~noz A, Mu~noz M, Marin O, Arevalo R, PorterosA, Alonso JR. 1996. Nitric oxide synthase in the brain of
a urodele amphibian (Pleurodeles waltl) and its relationto catecholaminergic neuronal structures. Brain Res 727:49–64.
Gonz�alez A, Moreno N, Lopez JM. 2002. Distribution ofNADPH-diaphorase/nitric oxide synthase in the synthasein the brain of the caecilian Dermophis mexicanus(Amphibia: Gymnophiona): comparative aspects inamphibians. Brain Behav Evol 60:80–100.
Gonzalez-Voyer A, Winberg S, Kolm N. 2009. Brain structureevolution in a basal vertebrate clade: evidence from phy-logenetic comparative analysis of cichlid fishes. BMCEvol Biol 9:238–250.
Gotti S, Chiavegatto S, Sica M, Viglietti-Panzica C, Nelson RJ,Panzica G. 2004. Alteration of NO-producing system inthe basal forebrain and hypothalamus of Ts65Dn mice:an immunohistochemical and histochemical study of amurine model for Down syndrome. Neurobiol Dis 16:563–571.
Guix FX, Uribesalgo I, Coma M, Mu~noz FJ. 2005. The physiol-ogy and pathophysiology of nitric oxide in the brain. ProgNeurobiol 76:126–152.
Hay JM, Ruvinsky I, Hedges SB, Maxson LR. 1995. Phyloge-netic relationships of amphibian families inferred fromDNA sequences of mitochondrial 12S and 16S ribosomalRNA genes. Mol Biol Evol 12:928–937.
Hoffmann A. 1973. Stereotaxic atlas of the toad’s brain. ActaAnat (Basel) 84:416–451.
Hope BT, Michael GJ, Knigge KM, Vincent SR. 1991. NeuronalNADPH diaphorase is a nitric oxide synthase. Proc NatlAcad Sci U S A 88:2811–2814.
Huynh P, Boyd SK. 2007. Nitric oxide synthase and NADPHdiaphorase distribution in the bullfrog (Rana catesbeiana)CNS: pathways and functional implications. Brain BehavEvol 70:145–163.
Jaccard P. 1908. Nouvelles recherches sur la distribution flor-ale. Bull Soc Vaudoise Sci Nat 44:223–270.
Jadhao AG, D’Aniello B, Malz CR, Pinelli C, Meyer DL. 2001.Intrasexual and intersexual dimorphisms of the redsalmon prosencephalon. Cell Tissue Res 304:121–140.
Kemali M, Braitenberg V. 1969. Atlas of the frog’s brain. Ber-lin: Springer-Verlag.
Kicliter E, Ebbesson SO. 1976. Organization of the “non-olfactory” telencephalon. In: Lin�as R, Precht W, editors.Frog neurobiology. New York: Springer-Verlag. p 946–972.
Knott AB, Bossy-Wetzel E. 2009. Nitric oxide in health anddisease of the nervous system. Antioxid Redox Signal11:541–554.
Kolm N, Gonz�alez-Voyer A, Brelin D, Winberg S. 2009. Evi-dence for small scale variation in the vertebrate brain:mating strategy and sex affect brain size and structurein wild brown trout (Salmo trutta). J Evol Biol 22:2524–31.
L�az�ar G, Losonczy A. 1999. NADPH-diaphorase-positive neu-rons and pathways in the brain of the frog Rana escu-lenta. Anat Embryol 199:185–198.
Mar�ın O, Smeets WJAJ, Gonz�alez A. 1998. Evolution of the basalganglia in tetrapods: a new perspective based on recentstudies in amphibians. Trends Neurosci 21:487–494.
Marjanovic D, Laurin M. 2007. Fossils, molecules, divergencetimes, and the origin of lissamphibians. Syst Biol 56:369–388.
Meila M. 2007. Comparing clusterings—an information baseddistance. J Multivariate Anal 98:873–895.
Meyer DL, Fackler IR, Jadhao AG, D’Aniello B, Kicliter E. 1997.Differential labeling of primary olfactory system subcom-ponents by SBA (lectin) and NADPH-d histochemistry inthe frog Pipa. Brain Res 762:275–280.
NADPH-Diaphorase in Amphibian Brains
The Journal of Comparative Neurology | Research in Systems Neuroscience 23

Moreno N, Gonz�alez A. 2006. The common organization of theamygdaloid complex in tetrapods: new concepts basedon developmental, hodological and neurochemical datain anuran amphibians. Prog Neurobiol 78:61–90.
Moreno N, L�opez JM, S�anchez-Camacho C, Crespo M, Mu~nozM, Gonz�alez A. 2002a. Early development of NADPHdiaphorase-expressing neurons in the brain of the urodeleamphibian Pleurodeles waltl. Brain Res Bull 57:409–412.
Moreno N, L�opez JM, S�anchez-Camacho C, Gonz�alez A.2002b. Development of NADPH-diaphorase/nitric oxidesynthase in the brain of the urodele amphibian Pleuro-deles waltl. J Chem Neuroanat 23:105–121.
Morona R, Gonz�alez A. 2008. Calbindin-D28k and calretininexpression in the forebrain of anuran and urodeleamphibians: further support for newly identified subdivi-sions. J Comp Neurol 511:187–220.
Morona R, Gonz�alez A. 2009. Immunohistochemical localiza-tion of calbindin-D28k and calretinin in the brainstem ofanuran and urodele amphibians. J Comp Neurol 515:503–537.
Morris JA, Jordan CL, Breedlove SM. 2004. Sexual differentia-tion of the vertebrate nervous system. Nat Neurosci 7:1034–1039.
Mu~noz M, Mu~noz A, Marin O, Alonso JR, Arevalo R, PorterosA, Gonz�alez A. 1996. Topographical distribution ofNADPH-diaphorase activity in the central nervous systemof the frog Rana perezi. J Comp Neurol 367:54–69.
Mu~noz M, Mar�ın O, Gonz�alez A. 2000. Localization of NADPHdiaphorase/nitric oxide synthase and choline acetyltrans-ferase in the spinal cord of the frog, Rana perezi. J CompNeurol 419:451–470.
Neary D. 1990. Non Alzheimer’s disease forms of cerebralatrophy. J Neurol Neurosurg Psychiatry 53:929–931.
Neary TJ, Northcutt RG. 1983. Nuclear organization of thebullfrog diencephalon. J Comp Neurol 213:262–278.
Nieuwenhuys R, Donkelaar HJT, Nicholson C. 1998. The cen-tral nervous system of vertebrates. Heidelberg: Springer-Verlag.
Northcutt G. 2002. Understanding vertebrate brain evolution.Integr Comp Biol 42:743–756.
Northcutt RG, Kicliter E. 1980. Organization of the amphibian tel-encephalon. In: Ebbesson SOE, editor. Comparative neurol-ogy of the telencephalon. New York: Plenum. p 203–255.
Northcutt RG, Royce GJ. 1975. Olfactory bulb projections inthe bullfrog Rana catesbeiana. J Morphol 145:251–268.
Park JH, Straub VA, O’Shea M. 1998a. Anterograde signalingby nitric oxide: characterization and in vitro reconstitutionof an identified nitrergic synapse. J Neurosci 18:5463–5476.
Park JK, Tran PH, Chao JK, Ghodadra R, Rangarajan R, ThakorNV. 1998b. In vivo nitric oxide sensor using non-conducting polymer-modified carbon fiber. Biosens Bioe-lectron 13:1187–1195.
Pinelli C, D’Aniello B, Fiorentino M, Calace P, di Meglio M, IelaL, Meyer DL, Bagnara JT, Rastogi RK. 1999. Distributionof FMRFamide-like immunoreactivity in the amphibianbrain: comparative analysis. J Comp Neurol 414:275–305.
Pitzer MR, Wirtshafter D. 1997. The distribution of reducednicotinamide adenine dinucleotide phosphate-diaphorasein the leopard frog telencephalon and related projec-tions. Brain Behav Evol 50:152–166.
Pollen AA, Dobberfuhl AP, Scace J, Igulu MM, Renn SCP,Shumway CA, Hofmann HA. 2007. Environmental com-plexity and social organization sculpt the brain in LakeTanganyikan cichlid fish. Brain Behav Evol 70:21–39.
Porteros A, Arevalo R, Crespo C, Brinon JG, Weruaga E, AijonJ, Alonso JR. 1996. Nitric oxide synthase activity in the
olfactory bulb of anuran and urodele amphibians. BrainRes 724:67–72.
Prasada Rao PD, Sato T, Ueck M. 1997. Distribution of NADPH-diaphorase activity in the hypothalamo-hypophysial systemof the frog, Rana esculenta. Neurosci Lett 235:61–64.
Prast H, Philippu A. 2001. Nitric oxide as modulator of neuro-nal function. Prog Neurobiol 64:51–68.
Puelles L, Rubenstein JL. 2003. Forebrain gene expressiondomains and the evolving prosomeric model. TrendsNeurosci 26:469–476.
Pyron A, Wiens J. 2011. A large-scale phylogeny of Amphibiaincluding over 2800 species, and a revised classificationof extant frogs, salamanders, and caecilians. Mol Phylo-genet Evol 61:543–583.
Pyron RA. 2011. Divergence time estimation using fossils asterminal taxa and the origins of Lissamphibia. Syst Biol60:466–481.
Renter�ıa RC, Constantine-Paton M. 1999. Nitric oxide in theretinotectal system: a signal but not a retrograde mes-senger during map refinement and segregation. J Neuro-sci 19:7066–7076.
Roelants K, Bossuyt F. 2005. Archaeobatrachian paraphly andpangaean diversification of crown-group frogs. Syst Biol54:111–126.
Roelants K, Gower DJ, Wilkinson M, Loader SP, Biju SD,Guillaume K, Moriau L, Bossuyt F. 2007. Global patternsof diversification in the history of modern amphibians.Proc Natl Acad Sci U S A 104:887–892.
R€othig P. 1912. Beitr€age zur Studium des Zentralnervensystemsder Wirbelthiere. 5. Die Zellanordnungen im Vorderhirn derAmphibien, mit besonderer Ber€ucksichtigung der Septum-kerne und ihr Vergleich mit den Verh€altnissen bei Testudound Lacerta. Verh K Akad Wet Amsterdam (Ser 2) 17:1–73.
San Mauro D. 2010. A multilocus timescale for the origin ofextant amphibians. Mol Phylogenet Evol 56:554–561.
San Mauro D, Vences M, Alcobendas M, Zardoya R, Meyer A.2005. Initial diversification of living amphibians predatedthe breakup of Pangaea. Am Nat 165:590–599.
Scalia F, Harpern M, Knapp H, Riss W. 1968. The efferentconnections of the olfactory bulb in the frog: a study ofdegenerating unmyelinated fibers. J Anat 103:245–262.
Scherer-Singler U, Vincent SR, Kimura H, McGeer EG. 1983.Demonstration of unique population of neurons withNADPH-diaphorase histochemistry. J Neurosci Meth 9:229–234.
Steinbusch HWM, De Vente J, Vincent SR. 2000. Functionalneuroanatomy of the nitric oxide system. Vol. 17, Hand-book of chemical neuroanatomy. Amsterdam: Elsevier.
Thomas E, Pears AGE. 1961. The fine localization of dehydro-genases in the nervous system. Histochemie 2:266–282.
Toda N, Ayajiki K. 2006. Phylogenesis of constitutively formednitric oxide in non-mammals. Rev Physiol Biochem Phar-macol 157:31–80.
Villani L, Minelli D, Giuliani A, Quaglia A. 2001. The develop-ment of NADPH-diaphorase and nitric oxide synthase inthe visual system of the cichlid fish, Tilapia mariae. BrainRes Bull 54:569–574.
Wada M, Urano A, Gorbman A. 1980. A stereotaxic atlas fordiencephalic nuclei of the frog, Rana pipiens. Arch HistolJpn 43:157–173.
Wiens J. 2004. The role of morphological data in phylogenyreconstruction. Syst Biol 53:653–661.
Wiens JJ. 2011. Re-evolution of lost mandibular teeth in frogsafter more than 200 million years, and re-evaluating Dol-lo’s law. Evolution 65:1283–1296.
Zhang, P, Zhou H, Chen YQ, Liu YF, Qu LH. 2005. Mitoge-nomic perspectives on the origin and phylogeny of livingamphibians. Syst Biol 54:391–400.
C. Pinelli et al.
24 The Journal of Comparative Neurology | Research in Systems Neuroscience


