Embed Size (px)
Citation preview

132
Chapter 8
A COMPARISON OF BIFACE REDUCTION AND
CURATION INDICES
Rachel A. Horowitz Tulane University
INTRODUCTION
Currently several indices designed to measure biface reduction and
curation exist, but no information concerning their relationships or
comparability is known. As such, biface assemblages measured using different
indices cannot be compared, impeding the ability to perform integrative
studies concerning mobility and technological organization, especially among
assemblages dominated by bifaces.
Varying definitions of both reduction and curation exist, thus increasing
the difficulties in determining ways to quantify the two concepts. Reduction is
usually separated into two phases: production and use, with which curation is
usually associated. Many tools, however, are used and retouched continuously,
implying no concrete separation exists between the production and use phases
of tools. Hiscock and Attenbrow (2005) suggest that some tools are subjected
to almost continuous modification of morphology and no separation between
reduction and curation is possible. Therefore, the separation of reduction and
curation, and their respective quantifications, is difficult.
Shott (1996: 267) defines curation as ―the degree of use or utility
extracted, expressed as a relationship between how much utility a tool starts

133
A Comparison of Biface Reduction and Curation Indices
with its maximum utility- and how much of that utility is realized before
discard.‖ In other words, curation is a continuous alteration of materials and
the rate and degree of alteration vary in response to environmental conditions
(Nelson 1991). Since the utility of a tool changes throughout its use-life and
curation is connected with these changes, curation can be discussed as a
measure of the entirety of a tool‘s use-life. Most people refer to the rising
segment of the utility curve as reduction or production (to the left of the line in
Figure 8.1) and to the decrease from maximum utility as curation and use (to
the right of the line in Figure 8.1).
Figure 8.1. Utility curve over time as normally represented.
This model, however, does not consider multiple peaks of utility (Figure 8.2).
Which, when considered, suggest curation actually spans all stages of tool
production and use. As Andrefsky (2008) states, all tools are in various stages
of curation, it is simply that part of curation is commonly called production;
therefore, reduction cannot be arbitrarily divided between the production and
use phases of a tool. As curation covers the entire use-life of a tool and all
tools are in states of curation, studies concerning the reduction process of a
tool can also discuss curation. Additionally, reduction refers to the process
from the initial procurement of materials to the discard of the tool, the same
span considered by curation. As such, reduction and curation indices, although
often differentiated, are difficult concepts to separate. To alleviate this issue, in
this paper the indices will be referred to as measures of both reduction and
curation.

134
Rachel A. Horowitz
Figure 8.2. Utility curve representing multiple peaks of utility.
In order to rectify the lack of comparability between biface assemblages,
this paper examines six indices of bifacial reduction and curation using an
assemblage of bifaces from the Great Basin Paleoarchaic period, which
corresponds chronologically to the terminal Pleistocene and early Holocene
(TP/EH) (11,500-8,000 RCYBP) (Beck and Jones 1997). Bifaces from four
assemblages, representing both quarry and habitation sites, in central and
eastern Nevada were analyzed (see Beck et al. 2002): Knudtsen 1 and 2,
Cowboy Rest Creek Locality 1 (CRCL1) and Locality 2 (CRCL2) and Little
Smoky Quarry (LSQ) (Figure 8.3).
Figure 8.3. Map of relevant sites in the Great Basin (Beck et al. 2002: 483).
The Knudtsen site and the CRC quarries are located in Grass Valley, while
LSQ is located in Little Smoky Valley. 122 bifaces from Knudtsen, 176 from
135
A Comparison of Biface Reduction and Curation Indices
CRCL1 and 2, and 290 from LSQ, for a total of 588 bifaces, were examined.
All bifaces were collected during investigations by Hamilton College. The
comparisons and evaluations of the indices should alleviate the present lack of
comparability of measures of biface reduction and curation.
THE INDICES
The goal of this study is to compare indices of biface reduction and
curation to determine the comparability of these indices. The comparison of
the different indices will determine whether the indices are measuring the
same thing and to see if data produced by one index can be compared with
data obtained from another. Six indices were chosen for examination:
Callahan‘s (1979) stages, the edge angle, the Johnson Thinning Index (JTI)
(Johnson 1981), a combination of Clarkson‘s (2002) Index of Invasiveness (II)
and Andrefsky‘s (2006) Hafted Retouch Index (HRI), the Ridge Count
Retouch Index (RCRI) (Wilson and Andrefsky 2008), and the edge offset.
These indices represent the three types of indices defined by Shott and
Weedman (2007): geometric, which consider how the plan of the tool changes
with use, allometric, which consider the relationship between the size and
shape of the artifact, and direct, which consist of original measurements of tool
size. As all three types of indices are discussed here, the relative benefits of the
different types of indices will also be discussed.
Biface Stages
The traditional method of measuring reduction is by application of a stage
classification such as the one described by Callahan (1979). Callahan created a
guide to generalized biface reduction using the edge angle and the ratio
between the width and thickness of the biface to make assignments to five
stage classes. The classification used in this study is a modification (see Beck
et al. 2002) of Callahan‘s (1979) stages. The modifications made by Beck et
al. (2002) result in four stages numbered zero to three. The definitions were
based on form, number and shape of flake scars, edge sinuosity, and thickness
(Table 1). The stages were measured on the bifaces by two analysts and the
resulting stage assignments of each biface were averaged, resulting in a total
of seven stages (see Beck et al. 2002). The averaging of the stage

136
Rachel A. Horowitz
classifications was a result of disparities in the stage assignments. One of the
drawbacks of this index is that it is subjective in the different emphases placed
on various attributes by analysts. As Beck and Jones (1989) state, differences
in perception and emphasis can be a source of error in class assignments. As
such, clear definitions of the classes are necessary to limit such error.
Table 8.1. Biface stage characteristics (Beck et al. 2002: 494).
Stage Characteristics
0
Large biface with irregular shape and low symmetry; few very
widely and/or variably spaced flake scars; very wide edge offset
(very sinuous); very thick and irregular cross-section
1 Large biface with irregular shape; widely and/or variably shaped
flakes; wide offset; thick and irregular cross-section
2
Large biface with semi-regular and symmetrical shape; closely
and/or semi-regularly spaced flake scars; edge offset moderate;
cross-section semi-regular
3
Regular, symmetrical biface; closely and/or quite regularly spaced
flake scars (pressure flaking often present); offset close (little edge
sinuosity); cross-section thin and regular; later edge grinding
evident on haft
Edge Angle
One of the simple aspects used in Callahan‘s original stage classification
was the edge angle. The edge angle of a biface becomes more acute as the
production of the biface proceeds, as one goal of biface manufacture is to thin
the biface (Johnson 1981, Callahan 1979). Moreover, as production proceeds,
errors such as step fractures are removed, thus decreasing the overall edge
angle of the biface. Therefore, smaller edge angles should result from more
reduced bifaces and the average edge angle of a biface should decrease
through production and use. Similarly, the range of the angle should decrease
throughout production as bifaces become more uniform. Once a biface has
reached a stable thickness, further narrowing of the biface will cause the edge
angle to increase, particularly in instances when edge retouch flakes are not
very invasive.
The edge angle of the bifaces was measured using a goniometer. Angle
measurements were taken around the circumference of the biface at two

137
A Comparison of Biface Reduction and Curation Indices
centimeter intervals, so as to include any variation present. Broken areas,
caused either by production error or post-depositional processes, were
excluded from the measurements as they tend to have higher angles which
could increase the angle measure. The average angle and angle range for each
biface were then determined. A problem with the use of the edge angle as a
measure of reduction is that larger bifaces naturally have larger angle
measures due to the greater thickness of the biface (Johnson 1981). Problems
may result from this index in the comparisons of bifaces of varying sizes.
Thinning Index
As stated above it is generally accepted that thinner bifaces represent later
stages in production. Johnson (1981) states that one of the aims in producing a
biface is to maintain the width while reducing the thickness of the tool. He
points out, however, that larger bifaces are naturally thicker than smaller ones,
a difference which must be compensated for when measuring the reduction of
the biface. Johnson (1981) developed the Johnson Thinning Index (JTI) as a
method to compensate for natural size differences. The JTI uses the weight of
the artifact divided by the plan view area to determine a measure of reduction
and curation and is measured in grams per centimeters squared. The JTI
should decrease through the production and use of the biface due to the
thinning and loss of mass caused by the production, use, and retouch of the
biface. The measurements used here were performed for the study presented in
Beck et al. (2002).
Retouch Invasiveness Index
Indices of invasiveness are also valid ways of measuring biface reduction
and curation. Two such indices are Clarkson‘s (2002) Index of Invasiveness
(II) and Andrefsky‘s (2006) Hafted Retouch Index (HRI). These indices
measure the density of retouch as a proxy for tool curation. The retouch flakes
are an effort to increase the utility of the tool (Andrefsky 2006). With use, a
tool is dulled and becomes less efficient, signifying a drop in the potential
utility of a tool and indicating the necessity of retouch. To return an edge to
sharpness, retouch is applied. As the number of retouch flakes increases, its
138
Rachel A. Horowitz
level of curation rises. Given this relationship between retouch and curation, a
measure of invasiveness of retouch flakes would be a measure of curation.
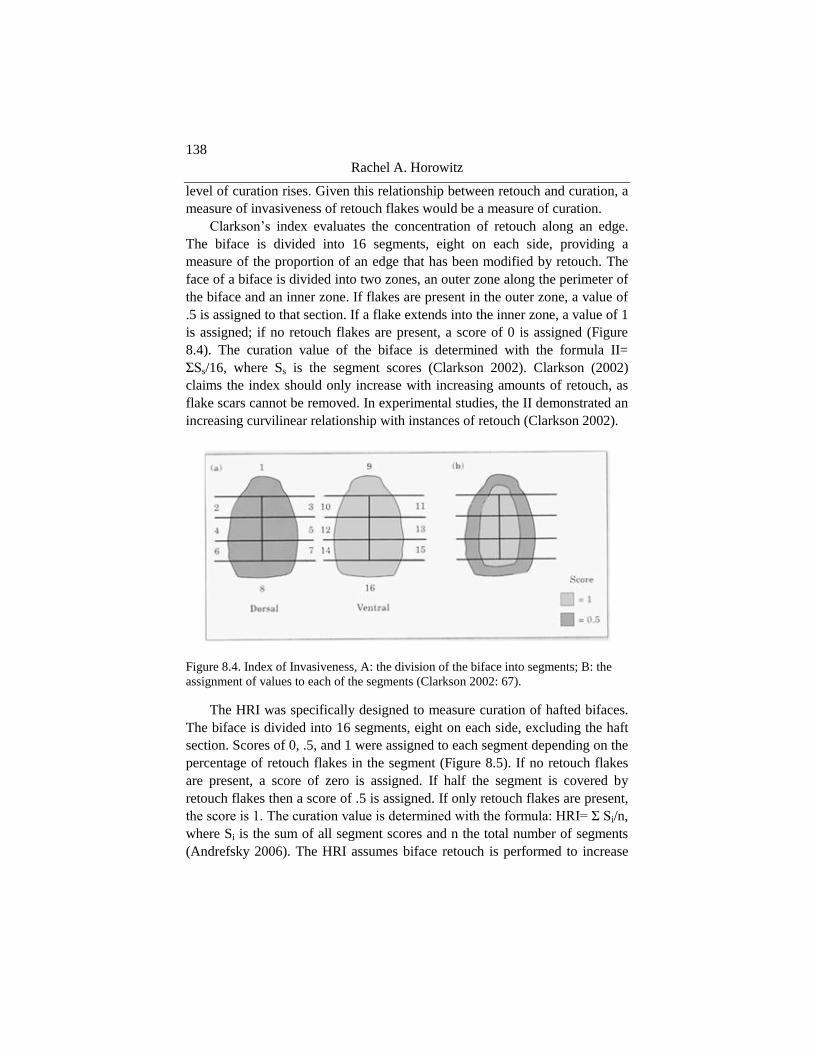
Clarkson‘s index evaluates the concentration of retouch along an edge.
The biface is divided into 16 segments, eight on each side, providing a
measure of the proportion of an edge that has been modified by retouch. The
face of a biface is divided into two zones, an outer zone along the perimeter of
the biface and an inner zone. If flakes are present in the outer zone, a value of
.5 is assigned to that section. If a flake extends into the inner zone, a value of 1
is assigned; if no retouch flakes are present, a score of 0 is assigned (Figure
8.4). The curation value of the biface is determined with the formula II=
ΣSs/16, where Ss is the segment scores (Clarkson 2002). Clarkson (2002)
claims the index should only increase with increasing amounts of retouch, as
flake scars cannot be removed. In experimental studies, the II demonstrated an
increasing curvilinear relationship with instances of retouch (Clarkson 2002).
Figure 8.4. Index of Invasiveness, A: the division of the biface into segments; B: the
assignment of values to each of the segments (Clarkson 2002: 67).
The HRI was specifically designed to measure curation of hafted bifaces.
The biface is divided into 16 segments, eight on each side, excluding the haft
section. Scores of 0, .5, and 1 were assigned to each segment depending on the
percentage of retouch flakes in the segment (Figure 8.5). If no retouch flakes
are present, a score of zero is assigned. If half the segment is covered by
retouch flakes then a score of .5 is assigned. If only retouch flakes are present,
the score is 1. The curation value is determined with the formula: HRI= Σ Si/n,
where Si is the sum of all segment scores and n the total number of segments
(Andrefsky 2006). The HRI assumes biface retouch is performed to increase

139
A Comparison of Biface Reduction and Curation Indices
the utility of the tool. Therefore, if more retouch is present, the tool is more
curated. In experimental studies, the HRI increased through various episodes
of retouch, but not at a uniform rate; the HRI was less sensitive to the later
episodes of sharpening (Andrefsky 2006).
Figure 8.5. Hafted Retouch Index; shows the division of the biface into segments
(Andrefsky 2006: 746).
The II and the HRI differ in minor details. For this study they were
combined with slight modifications (Combined Index of Invasiveness (CII))
(Figure 8.6). In the CII the biface was divided into 16 segments and the
midpoint of each section was determined.
Figure 8.6. Combined Index of Invasiveness, A: the divisions of the biface, B: values
assigned to the segments.

140
Rachel A. Horowitz
Values of 0, .5, or 1 were assigned depending on the presence of flake scares
and if they extended past the midline of the segment. Scores of 0 are assigned
if no flakes are present in the segment. Scores of .5 are assigned if flake scars
exist but do not extend past the midline of the segment. Scores of 1 are
assigned when the scars extend over the midpoint of the section. The CII is
determined using the formula: CII= Σ Si/n, where Si is the sum of all section
scores and n the total number of segments.
The CII is an adaptation of the II and the HRI to measure bifaces in all
stages, including those in the production stage. The index should still function
as invasiveness of flakes changes throughout the production of a biface.
However, the relationship between the use-life of the biface and the CII value
will probably not be linear. For instance, early stage bifaces usually have large
biface thinning flakes that reach or pass the midline of the biface, thus
covering many segments of the tool. In such instances, a biface would be
assigned a high value for the index. As the biface nears completion increasing
numbers of less invasive flakes are removed along the edges for shaping,
resulting in a decrease in the index score. With use and retouch, the level of
curation would rise again, but probably not to the level of the production
bifaces. Retouch on tools tends to be focused along the edges and the flakes
tend to be less invasive than early production flakes.
To expedite the process of measuring the CII templates were created by
tracing bifaces onto graph paper and measuring the sections and their
midpoints. The templates were transferred to transparencies so they could
easily be placed on the bifaces with the guidelines visible. Although the
method may produce errors in that the guides are not specific to each artifact,
leading to circumstances where the sections and midline are not exact for the
tool, it proved to be the most efficient manner for measuring the CII.
Additional variability in index scores comes from the subjectivity of the
index. The analyst must determine whether flake scars that fall into two
segments will be counted in one or both segments. The decision could increase
or decrease the measure of curation of the biface. In this study, flake scars that
fall into two segments are assigned a value in only one segment, the one from
which the flake originated, and the other segment(s) was assigned a score of
zero, unless another flake scar was present. Comparisons between assemblages
would be affected by this issue unless standardized.

141
A Comparison of Biface Reduction and Curation Indices
Ridge Count Retouch Index
In an adjustment of Clarkson‘s (2002) II to encompass biface production,
Wilson and Andrefsky (2008) created a Ridge Count Retouch Index (RCRI).
They found that the II assigned high levels of curation to bifaces in early
stages of production. Therefore, they felt a manner of measuring biface
reduction that would encompass both the production and use phases of
reduction was necessary. The RCRI is an estimate of the number of flake scars
on the surface of the biface and is based on the observation that the number of
flake scars increases as production proceeds, as more flakes are removed from
a biface. Rather than counting flake scars, the Wilson and Andrefsky (2008)
index samples the number of flake scars using the number of ridges on the
surface of the biface.
The RCRI divides bifaces into eight segments on each side, as seen in the
CII. Six one by one cm squares were placed on the grid, three on each side of
the biface. The squares are placed in the same location for the measure of all
bifaces (Figure 8.7). The use of standardized boxes ensures equivalent
amounts of surface area are tested on each biface. The number of dorsal ridges
in each square is counted, summed, and divided by six to determine the
average ridge count for each biface (Wilson and Andrefsky 2008).
Figure 8.7. Ridge Count Retouch Index Schematic: shows the location of the analyzed
sections of the bifaces, the 1x1 cm squares, demarcated by the dotted lines (Wilson and
Andrefsky 2008: 97).

142
Rachel A. Horowitz
Once again, templates for measuring the RCRI were formed by tracing
bifaces onto graph paper, measuring the section divisions, and placing the
boxes in the locations specified by Wilson and Andrefsky (2008). The
templates were transferred to transparencies so they could easily be placed on
the bifaces with the guidelines and boxes visible. Bifaces of differing sizes
were used as models to attempt to ensure measurements would not be affected.
Wilson and Andrefsky (2008) determined, using experimental studies, that
the number of ridges on bifaces increased until resharpening began. They
attribute the decrease in ridges at this point to the type of hammer used in the
study. The decrease in ridges was associated with a change from hard hammer
to soft hammer percussion. Changes in hammer type and density can affect the
manner in which flakes are removed from a tool, causing the RCRI to be
sensitive to the hammer type used in biface reduction. Flakes removed using
soft hammer percussion tend to be large, flat, and thin (Whittaker 1994),
which would remove large areas of the surface, thus erasing evidence of
previously removed flakes. Wilson and Andrefsky (2008) also mention that
variation in the reduction levels of individual bifaces can be explained by
material flaws or knapping error, which might cause a large portion of the
biface surface to be removed, thus erasing previous flake scars.
Variability in the index might result from the sample size of the surface
area of the biface measured. In some cases, the selected areas might have
fewer ridges than found on other parts of the biface, indicating the biface was
in an earlier stage of reduction than in actuality. Further variability could be
caused as the proportion of the surface area measured on bifaces of varying
sizes differs. On a biface with a surface area of six cm2, three cm
2 on each side,
100% of the biface surface is examined. If the biface has a surface area of 30
cm2, 15 cm
2 on each side, only five percent of the biface is examined.
Therefore, smaller bifaces have a more realistic representation of the number
of ridges present than larger bifaces. Wilson and Andrefsky (2008) do not
address the issue of sample size in their index, but from the experimental
results it appears as though the index values are stable at the current sample
size. For bifaces with a surface area less than six cm2
total, or less than three
cm2 on each side, this index cannot be applied. An increase in the number of
boxes in which ridges were counted would decrease the variability of surface
area percentage but would also further limit the number of bifaces which could
be measured using this index. Increasing the number of boxes could also lead
to situations of over-counting ridges, where the same ridge appears in more
than one box, thus skewing the RCRI value.

143
A Comparison of Biface Reduction and Curation Indices
Further complications for this index could result from the difficulties in
determining the number of ridges present on the surface of the biface.
Depending on the material from which the biface was made ridges are more or
less obvious. For instance, ridges can be seen more easily on obsidian than on
fine grained volcanics (FGV). Physical and chemical weathering can obscure
traces of ridges, amplifying the difficulty of identifying the number of ridges
on the surface of a biface. Application of this index to an archaeological
assemblage should determine if this is a serious drawback to the use of the
RCRI.
Edge offset Index
The edge offset index measures the sinuosity of the edge of a biface, a
characteristic included in Callahan‘s (1979) stage assignment qualities; in
other words it measures the displacement of the edge from a straight line
(Schmidt 2006). Callahan (1979) suggests the sinuosity of the biface edge
should decrease throughout the reduction process as the biface becomes more
uniform (Figure 8.8). Stork (1997) employed a measure of edge sinuosity and
states sinuosity decreased as bifaces were reduced. Early stage bifaces are
more sinuous due to the depth, spacing, and uneven size of flake scars present
on the edges. Throughout reduction, bifaces become more uniform, thus
decreasing the edge sinuosity. Stork (1997) measured the offset of the edge
simply as the width of the area of maximum edge displacement.
Figure 8.8. The decreasing sinuosity of the edge through reduction (Callahan 1979).

144
Rachel A. Horowitz
In order to quantify the edge offset of the biface, scans were taken of each
edge of the biface using a flatbed scanner. Two parallel lines were then drawn
on the scan, one on each side of the line representing the edge at the locations
of maximum displacement on each side. The lines were drawn to align with
the apex and trough of the curve. The distance between the two lines was
measured at several points along the curve, especially in areas of high
variation. The maximum, minimum, and average displacement for each biface
were determined by calculating the average and maximum and minimum
values of the series of measurements. The measurements used in this study
were performed by Schmidt (2006), so the sample size for this index is only
127 bifaces.
One issue facing the measurement of the edge offset is that the scanning
of the edge of the biface may lead to distortion. As the edge of a biface is
rarely flat, the edge does not lie evenly on the scanner surface, which might
cause distortion. Additionally, measuring the index is fairly laborious due to
the number of measurements that must be taken (Schmidt 2006).
RESULTS AND ANALYSIS
Presently, reduction and curation levels measured with different indices
cannot be compared (Kuhn 1990). This study should provide evidence as to
whether it is possible to compare levels of reduction and curation measured
with alternative indices. As the study compares both discrete (stage
assignments) and continuous (edge angle, JTI, CII, RCRI, and edge offset)
measures of reduction and curation, a comparison can be made as to whether
the two types of measures provide the same information. Shott (1996) suggests
curation is a continuous process, signifying that a continuous variable should
be a better manner of quantifying reduction and curation. Also, the edge angle,
edge sinuosity, and RCRI are direct measures, the JTI an allometric measure,
and the CII a geometric measure, allowing comparison of the three types of
indices suggested by Shott and Weedman (2007).
Stage Assignments
The biface stage assignments are difficult to analyze both quantitatively
and as an individual index. Despite these difficulties, it appears as though the
145
A Comparison of Biface Reduction and Curation Indices
stage assignments are an adequate measure of the level of reduction and
curation of bifaces. This index partitions variability in biface morphology
based on the critical goals of biface manufacture: thinning, symmetry, and the
linearity of the edge (Whittaker 1994, Callahan 1979). As such, more uniform,
and thus more finished, bifaces are classified as later stage bifaces than more
variable bifaces in early stages of production. As a classification based on the
goals of biface reduction, the stage assignments are a valid measure of
reduction and can be further used to evaluate the other indices.
Continuous Indices
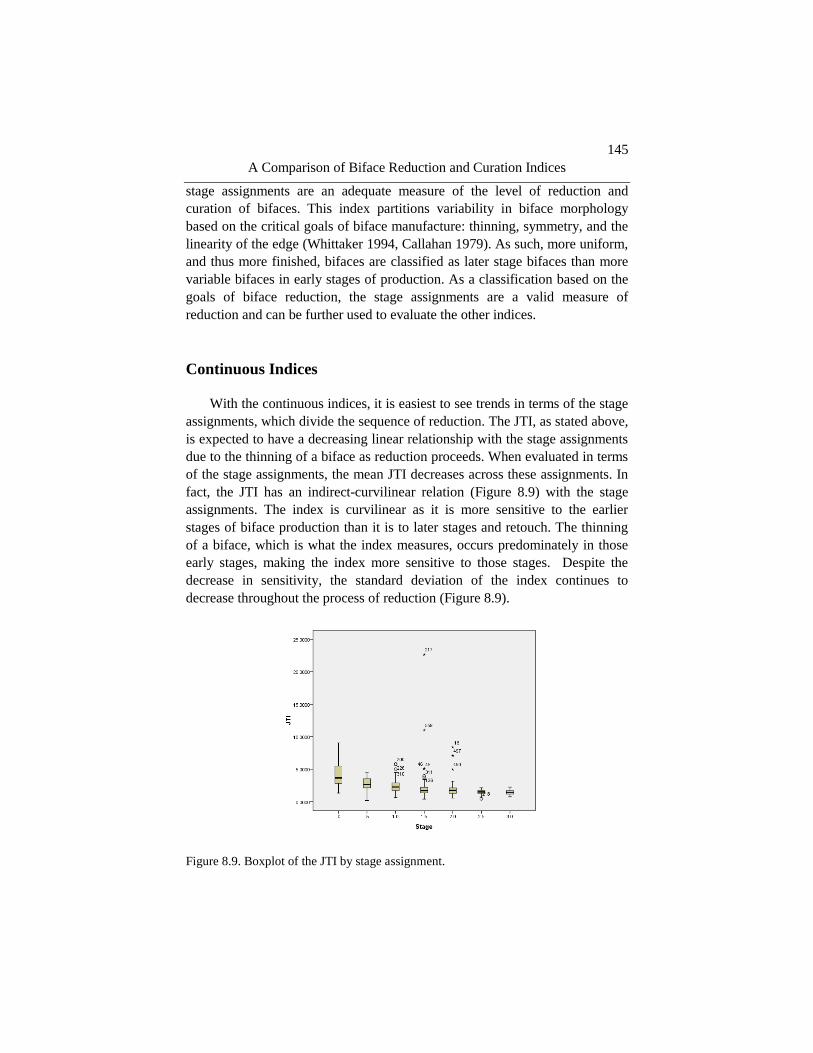
With the continuous indices, it is easiest to see trends in terms of the stage
assignments, which divide the sequence of reduction. The JTI, as stated above,
is expected to have a decreasing linear relationship with the stage assignments
due to the thinning of a biface as reduction proceeds. When evaluated in terms
of the stage assignments, the mean JTI decreases across these assignments. In
fact, the JTI has an indirect-curvilinear relation (Figure 8.9) with the stage
assignments. The index is curvilinear as it is more sensitive to the earlier
stages of biface production than it is to later stages and retouch. The thinning
of a biface, which is what the index measures, occurs predominately in those
early stages, making the index more sensitive to those stages. Despite the
decrease in sensitivity, the standard deviation of the index continues to
decrease throughout the process of reduction (Figure 8.9).
Figure 8.9. Boxplot of the JTI by stage assignment.

146
Rachel A. Horowitz
The edge angle was also predicted to decrease throughout the process of
reduction, and hence decrease across the stage assignments. In early stages,
bifaces could be unevenly thinned or be suffering from production problems,
such as step-fractures, which would lead to high variability in the angle
measures. Both the average angle, which was predicted to decrease due to the
thinning of later stage bifaces, and the angle range, which should decrease
with the increased uniformity of bifaces, were examined. The average angle
remained fairly consistent, with a slight decrease at stage one (Figure 8.10).
The lack of variation of the average angle across the stages is surprising as
bifaces earlier in production tend to be larger, which affects the angle, and also
tend to be thicker, which should also result in a larger edge angle. The angle
range generally decreased, but with a few areas of increasing value.
Figure 8.10. Angle range and average across the stage assignments.
The patterns demonstrated by the angle range and average can be
explained through an examination of the process of biface reduction. The
slight increase in the range between stages 0 and .5 might simply be a result of
the averaging of the stage measures or could be due to early flaking which
occurred along the edge of the biface. The decrease in the angle range from
stages .5 to 2 would be a result of the thinning occurring on the biface, which
should reduce the edge angle. The increase between stages 2 and 2.5 might be
explained through edge retouch and shaping. As stated earlier, retouch and
shaping can increase the edge angle, as the width of the biface decreases and

147
A Comparison of Biface Reduction and Curation Indices
non-invasive flake scars create a steeper edge angle. With this explanation, the
angle range is shown to be more sensitive to changes that occur in the later
stages of production and use than the JTI. However, with only the angle
measurements, it would not be possible to differentiate between bifaces with
slightly larger angles which were in earlier stages of production and those
angles which were more obtuse due to shaping and retouch. Therefore,
although the edge angle is a sensitive index, it is not a particularly useful
measure of reduction and curation as the value of the index is not unique
across the reduction sequence.
The CII was expected to have a non-linear, perhaps U-shaped relationship,
with the stage assignments. However, no clear pattern across the stages seems
to exist (Figure 8.11). Although this index was created specifically to deal with
biface retouch, not production, as was measured here, the index should still
distribute in a patterned way as a biface moves through manufacture. The CII
seems highly problematic, due not only to the inconsistent results in this study,
but also to the difficulties in applying the index. The index appears to be
largely subjective in its application, despite efforts to add consistency to its
application.
Figure 8.11. CII in terms of stage assignments.
The RCRI was expected to generally increase across reduction stages as
seen in the experimental study (Wilson and Andrefsky 2008). In fact, the

148
Rachel A. Horowitz
RCRI did generally increase across the stages with the exception of between
stages 0 and .5, when there was a marked decrease (Figure 8.12).
Figure 8.12. RCRI across stage assignments, showing relative sample size (circles) and
one standard deviation (stars).
This decrease is not significant due to the standard deviation at these areas. As
such, the RCRI demonstrates that more flake scars are present on a biface as
the stage of reduction increases. One caution that should be associated with
this index is that, for the most part, the bifaces examined in this study were of
similar or the same materials, so, any differences associated with the varying
difficulty in counting ridges on bifaces of different materials are not accounted
for in this study.
The edge offset index was expected to decrease throughout the stage
assignments as the biface became more uniform. Upon examination of the
maximum, minimum, and average offsets, the edge offset generally decreases,
although with some variability (Figure 8.13). The maximum, minimum, and
average edge offset all decrease except between stages 1 and 1.5 and 2 and 2.5
when there is a slight increase. The reason for the slight increase at this stage
is unknown, although it could be an issue of sample size. For this index, the
sample size for the early and late stages is smaller than that in the middle
stages. The general decreasing trend of the index was expected as bifaces tend

149
A Comparison of Biface Reduction and Curation Indices
to become more uniform throughout production, thus decreasing the variability
and sinuosity of the edge. Although the measurement of this index can be time
consuming, it seems to act consistently across the stage assignments.
Figure 8.13. Maximum, minimum, and average edge offset in terms of the stage
assignments.
In terms of relationships between the continuous indices, the only indices
that demonstrate a significant correlation are the average edge offset and the
JTI (R2: .588) (Figure 8.14). The lack of correlation of the JTI and the RCRI is
unusual, as a negative correlation would be expected between these indices
since both seem to be effective measure of reduction and curation. The lack of
correlation between the indices does not negatively impact the effectiveness of
these indices as measures of reduction and curation.
Figure 14. Scatterplot of the average edge offset and the JTI.

150
Rachel A. Horowitz
DISCUSSION AND CONCLUSION
The goal of this study was to examine measures of bifacial reduction and
curation in order to determine the effectiveness and comparability of different
indices. If the measurement of reduction and curation levels of bifaces is more
uniform and comparisons between assemblages are possible, integrative
studies concerning lithic assemblages from different localities and those
analyzed by different individuals could be performed.
From the relationships between the varying indices and their distribution
across the stage assignments, it is demonstrated that some of the indices better
measure the reduction continuum than others. The stage assignments provide a
basic manner for separating bifaces, but have some analytical limitations as it
is a discreet index.
In terms of the continuous indices, several of those examined here are not
at all useful for measuring reduction or curation. The CII is not sensitive to
any stage of the reduction continuum, although it might be useful for bifaces
that have been used and retouched. This aspect of the CII was not investigated
here. The angle range is a sensitive index, but the measurement of the index
does not provide a manner of differentiation between bifaces with higher angle
ranges due to shaping and retouch and those with higher ranges in earlier
stages of production. It is not a particularly useful index for measuring
reduction and curation.
The JTI is a useful index for the measurement of reduction and curation as
it is easily measured and is differentiable across the reduction sequence. The
only drawback of this index is that it becomes less sensitive in the later stages
of reduction, so the JTI is more useful for assemblages dominated by early
stage bifaces, such as those found at quarry sites, than it is for assemblages
dominated by later stage bifaces.
The average edge offset decreases fairly consistently across the reduction
continuum. At a few stages, however, the average edge offset increases, which
could lead to similar problems as the angle range: that it is difficult to
differentiate between earlier and later stage bifaces with similar measurements.
As the index correlates with the JTI, an effective measure, the average edge
offset should also be an effective measure of reduction and curation. When
used with caution, the average edge offset is a useful indicator of reduction
and curation levels.
At first glance the RCRI seemed to be an extremely subjective index with
difficulties in defining the precise aspects of the biface to be measured, but

151
A Comparison of Biface Reduction and Curation Indices
upon examination of the results, the RCRI increases steadily across the
reduction continuum. It does not correlate with any other index, and a negative
correlation with the other indices would be expected. Despite the lack of
significant correlations, the RCRI appears to be a valid method for measuring
reduction and curation.
The stage assignments, average edge offset, the JTI, and the RCRI are the
four measures of bifacial reduction and curation discussed here that are most
useful for measuring reduction and curation. Each is a different type of index;
the stage assignments are a discrete index, and the others are all continuous
measures. The RCRI and the average edge offset are direct measures and the
JTI an allometric measure. Since each of these indices functions as an estimate
for the reduction and curation levels of bifaces, it appears that both discrete
and continuous indices as well as direct and allometric indices are viable types
of indices for determining bifacial reduction and curation. Variation found in
different indices reflects the quality of the indices themselves and not the type
of index.
In addition to determining which indices were effective measures of biface
reduction and curation, the relative comparability of effective measures was
also an aspect of this study. Due to the lack of significant correlations between
continuous indices, it appears as though comparisons of assemblages measured
with different indices would be ineffective. The JTI and average edge offset do
correlate significantly, but comparisons between the two would be difficult
due to the differing scales of the two indices. At this point it seems as though it
is impossible to compare assemblages measured with different reduction or
curation indices.
Of the four indices described here which effectively measure reduction
and curation each has different strengths and weaknesses. Depending on what
is being studied, a different index should be chosen, or as Eren and
Prendergast (2008) suggested, analysts should determine what question they
wish to answer before choosing an index. For some analyses, a discrete index
might be more useful, so the stage assignments should be employed. For
quarry assemblages, the JTI would be most useful. The RCRI should not be
used on an assemblage with many small bifaces, as the index would not be
applicable to many of the bifaces.
Despite the lack of correlation between indices, and the difficulties in
comparing different indices of biface reduction and curation, such indices are
still important tools in lithic analysis. Indices provide an objective measure of
the level of production or use that a biface has experienced. As such, studies

152
Rachel A. Horowitz
which employ these measures are less subjective, and through the use of
indices future studies can employ published data from other assemblages in
integrative studies. Such integrations of data are more difficult when using
subjective measures of the stage of production or level of use of a biface.
This study has related the process of measuring and the drawbacks and
advantages of six indices used to measure bifacial curation and reduction. Four
of these indices are viable indicators of different levels of reduction and
curation. Through the use of these indices, the study of biface curation and
reduction should be simplified. Additionally, through the methods described
here, a more uniform method of applying these indices is established, which
will increase the comparability of biface assemblages examined by different
analysts. The increased comparability should contribute to the use of biface
reduction and curation in the study of tool use, the organization of technology,
and mobility.
ACKNOWLEDGMENTS
Many thanks to Nathan Goodale and Tom Jones for their advice,
assistance, and guidance while I was writing my senior thesis, from which this
paper comes. Thanks also to Grant McCall, Lisa Fontes, Jessica Wheeler, and
Erlend Johnson for their comments.
REFERENCES
Andrefsky, W. Jr. 2006 Experimental and Archaeological Verification of an
Index of Retouch for Hafted Bifaces. American Antiquity 71(4): 743-757.
2008 An Introduction to Stone Tool Life History and Technological
Organization. In Lithic Technology: Measures of Production, Use, and
Curation. William Andrefsky, ed., pp 3-22. Cambridge University Press,
Cambridge.
Beck, C., A. K. Taylor, G. T. Jones, C. M. Fadem, C. R. Cook, and S. A.
Millward. 2002 Rocks are Heavy: Transport Costs and Paleoarchaic
Quarry Behavior in the Great Basin. Journal of Anthropological
Archaeology 21: 481-507.
Beck, C. and G. T. Jones. 1989 Bias and Archaeological Classification.
American Antiquity 54(2): 244-262.

153
A Comparison of Biface Reduction and Curation Indices
1997 The Terminal Pleistocene/Early Holocene Archaeology of the Great
Basin. Journal of World Prehistory 11(2): 161-236.
Callahan, E. 1979 The Basics of Biface Knapping in the Eastern Fluted Point
Tradition: A Manuel for Flint Knappers and Lithic Analysts. Archaeology
of North America Volume 7.
Clarkson, C. 2002 An Index of Invasiveness for the Measurement of Unifacial
and Bifacial Retouch: A Theoretical, Experimental and Archaeological
Verification. Journal of Archaeological Science 29: 65-75.
Eren, M.I. and M.E. Prendergast. 2008 Comparing and Synthesizing Unifacial
Stone Tool Reduction Indices. In Lithic Technology: Measures of
Production, Use, and Curation. W. Andrefsky, ed., pp 49-85. University of
Cambridge Press, Cambridge.
Hiscock, P. and V. Attenbrow. 2005 Reduction Continuums and Tool Use In
Lithics 'Down Under': Australian Perspectives on Lithic Reduction, Use,
and Classification. Christopher Clarkson and Lara Lamb, ed., pp 43-55.
BAR International Series 1408. Archaeopress, Oxford.
Johnson, J. K. 1981 Yellow Creek Archaeological Project Volume 2.
Tennessee Valley Authority Publications in Anthropology Number 28.
Kuhn, S. L. 1990 Geometric Index of Reduction for Unifacial Stone Tools.
Journal of Archaeological Science (17): 583-593.
Nelson, M. C. 1991 The Study of Technological Organization. In
Archaeological Method and Theory Volume 3. Michael B. Schiffer, ed.,
pp 57-100. The University of Arizona Press, Tuscon.
Schmidt, S. 2006 Edge Offset Indices in Biface Analysis. Unpublished Senior
Thesis. Hamilton College.
Shott, M. J. 1996 An Exegesis of the Curation Concept. Journal of
Anthropological Research 52(3): 259-280.
Shott, M. J. and K. J. Weedman. 2007 Measuring Reduction in Stone Tools:
An Ethnoarchaeological Study of Gamo Hidescrapers from Ethiopia.
Journal of Archaeological Science 24: 1016-1035.
Stork, P. L. 1997 The Fisher Site: Archaeological, Geological, and
Paleobotanical Studies at an Early Paleo-Indian Site in Southern Ontario,
Canada. Memoirs of the Museum of Anthropology, Number 30.
University of Michigan, Ann Arbor.
Whittaker, J. C. 1994 Flintknapping: Making and Understanding Stone Tools.
University of Texas Press, Austin.
Wilson, J. and W. Andrefsky, Jr. 2008 Exploring Retouch on Bifaces:
Unpacking Production, Resharpening, and Hammer Types. In Lithic

154
Rachel A. Horowitz
Technology: Measures of Production, Use, and Curation. William
Andrefsky, ed., pp 86-105. Cambridge University Press, Cambridge.


