Embed Size (px)
Citation preview
A computer-based image analysis for tearferning featuring
Ali S. Saad*,‡, Gamal A. El-Hiti† and Ali M. Masmali†
*Department of Biomedical TechnologyCollege of Applied Medical Sciences
King Saud University, P. O. Box 10219Riyadh 11433, Saudi Arabia
†Cornea Research Chair (CRC), Department of OptometryCollege of Applied Medical Sciences, King Saud University
Riyadh 11433, Saudi Arabia‡[email protected]
Received 16 September 2014Accepted 14 October 2014
Published 14 November 2014
The present work focuses on the development of a novel computer-based approach for tearferning (TF) featuring. The original TF images of the recently developed ¯ve-point grading scalehave been used to assign a grade for any TF image automatically. A vector characteristic (VC)representing each grade was built using the reference images. A weighted combination betweenfeatures selected from textures analysis using gray level co-occurrence matrix (GLCM), powerspectrum (PS) analysis and linear speci¯city of the image were used to build the VC of eachgrade. A total of 14 features from texture analysis were used. PS at di®erent frequency points andnumber of line segments in each image were also used. Five features from GLCM have shownsigni¯cant di®erences between the recently developed grading scale images which are: angularsecond moment at 0� and 45�, contrast, and correlation at 0� and 45�; these ¯ve features were allincluded in the characteristic vector. Three speci¯c power frequencies were used in the VCbecause of the discrimination power. Number of line segments was also chosen because of dis-similarities between images. A VC for each grade of TF reference images was constructed and wasfound to be signi¯cantly di®erent from each other's. This is a basic and fundamental step towardan automatic grading for computer-based diagnosis for dry eye.
Keywords: Objective grading; tear ferning new grading scale; texture analysis; image pro-cessing; PS.
‡Corresponding author.
This is an Open Access article published by World Scienti¯c Publishing Company. It is distributed under the terms of the CreativeCommons Attribution 3.0 (CC-BY) License. Further distribution of this work is permitted, provided the original work is properlycited.
Journal of Innovative Optical Health SciencesVol. 8, No. 5 (2015) 1550015 (10 pages)#.c The AuthorsDOI: 10.1142/S1793545815500157
1550015-1
J. I
nnov
. Opt
. Hea
lth S
ci. D
ownl
oade
d fr
om w
ww
.wor
ldsc
ient
ific
.com
by 2
12.5
7.21
5.21
0 on
11/
18/1
4. F
or p
erso
nal u
se o
nly.
1. Introduction
Tears production is very important for clear visionand eye health. Dry eye patients su®er from dis-comfort such as sensitivity to light, stinging, burn-ing, blurriness, grittiness, or scratchy and itchyeye.1–3 Such experiences could arise from the ocularsurface due to changes in the quantity and qualityof the overlaying tears. The multiple causes of dryeye make its diagnoses and treatment di±cult.4
Moreover, the currently available methods for thedry eye diagnosis are far from perfection.5
Di®erent tear ¯lm quality and quantity tests areavailable and used daily in the clinic, such as, Schir-mer's test,6 phenol red thread test,6 Rose Bengalstaining,7 tear break-up time (TBUT),8 tear menis-cus measurement,9 and tear osmolarity.10–12 The tearferning (TF) test, which is simple and inexpensive13
and can be used to examine the quality of the oc-ular tear ¯lm, has showed good speci¯city andsensitivity.14 When a tear sample is allowed to dry
on a glass slide under normal room temperatureand humidity, di®erent crystal ferning patterns canbe observed under light microscopy. In 1984,Rolando suggested a four-type TF grading scale(types I�IV) in which types I and II were moreoften observed in normal eye subjects, and types IIIand IV were observed in dry eye patients.15 Vari-ous other TF grading scales have been introducedsince then,16,17 however the Rolando TF gradingscale remains the most commonly used in terms ofpopularity18 and repeatability.19
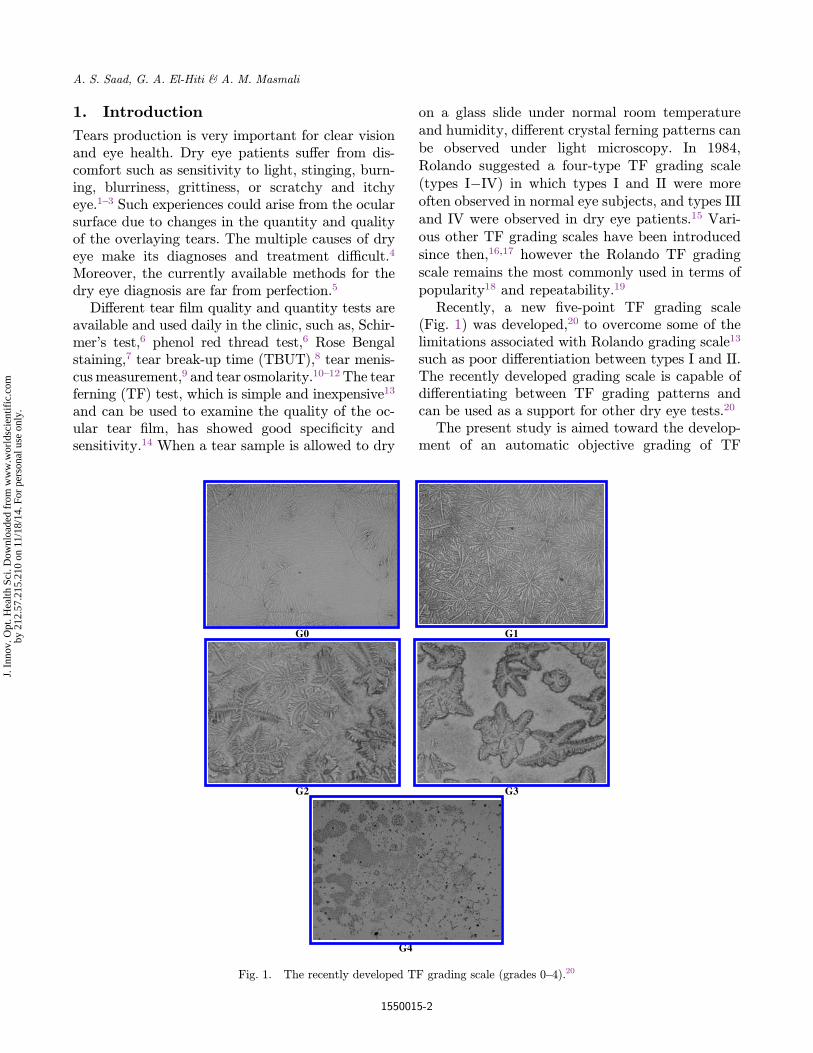
Recently, a new ¯ve-point TF grading scale(Fig. 1) was developed,20 to overcome some of thelimitations associated with Rolando grading scale13
such as poor di®erentiation between types I and II.The recently developed grading scale is capable ofdi®erentiating between TF grading patterns andcan be used as a support for other dry eye tests.20
The present study is aimed toward the develop-ment of an automatic objective grading of TF
G1G0
G3G2
G4
Fig. 1. The recently developed TF grading scale (grades 0–4).20
A. S. Saad, G. A. El-Hiti & A. M. Masmali
1550015-2
J. I
nnov
. Opt
. Hea
lth S
ci. D
ownl
oade
d fr
om w
ww
.wor
ldsc
ient
ific
.com
by 2
12.5
7.21
5.21
0 on
11/
18/1
4. F
or p
erso
nal u
se o
nly.
images to assign a grade to a TF image using fea-tures extracted from the image itself. The featuresare grouped into characteristics vector and com-pared to pre-constructed feature vectors of referencegraded images of TF.
There have been many studies in solving classi¯-cation problem based on various types of featuresand di®erent methods of feature extraction.21–23
Most of the features are generally obtained fromtexture by the application of a local operator, sta-tistical analysis, or measurement in a transformeddomain.24 Gray level co-occurrence matrix (GLCM)is one of the earliest methods for the texture featureextraction proposed by Haralick et al.25 in 1973 andremains as an important feature extraction methodin the domain of texture analysis. A total of 14 fea-tures were extracted by Haralick from the GLCMsto characterize texture.26 Many quantitative mea-sures of texture are found in the literature.27–30
Recently, special multi-dimensional co-occurrencematrices were used for object recognition andmatching.31–33Dacheng et al.34 used 3D co-occurrencematrices in content-based image retrieval (CBIR)applications.
The PS is an important tool to encode structuralinformation. It gives global information about thebasic elements that form the image. The powerspectra of real-world images exhibit very di®erentenergy distributions for each orientations and spa-tial frequencies. In analyzing images from a wide setof real-world environments, a strong bias towardhorizontal and vertical orientation are observed.35
PS is also used for texture classi¯cation.36 For thisreason, PS is considered here for classi¯cation andwas used for image registration and watermarkingrecently.37 Here, we are not interested in a detailedanalysis of the PS which would be as complicated asstudying the pixelated image itself. For our appli-cation, the PS of the ¯ve-grade scale images hasdiscriminative features at di®erent frequency ran-ges. In this paper, the proposed VCs of grade imageis a weighted combination between features fromGLCM, PS, and linear speci¯city of the image.
2. Materials and Methods
The ¯ve reference images (Fig. 1) of the new grad-ing scale20 were used in our experimental study. Inorder to distinguish between grades, speci¯c obser-vations have been made to the images representingthem. An observation is related to the frequency
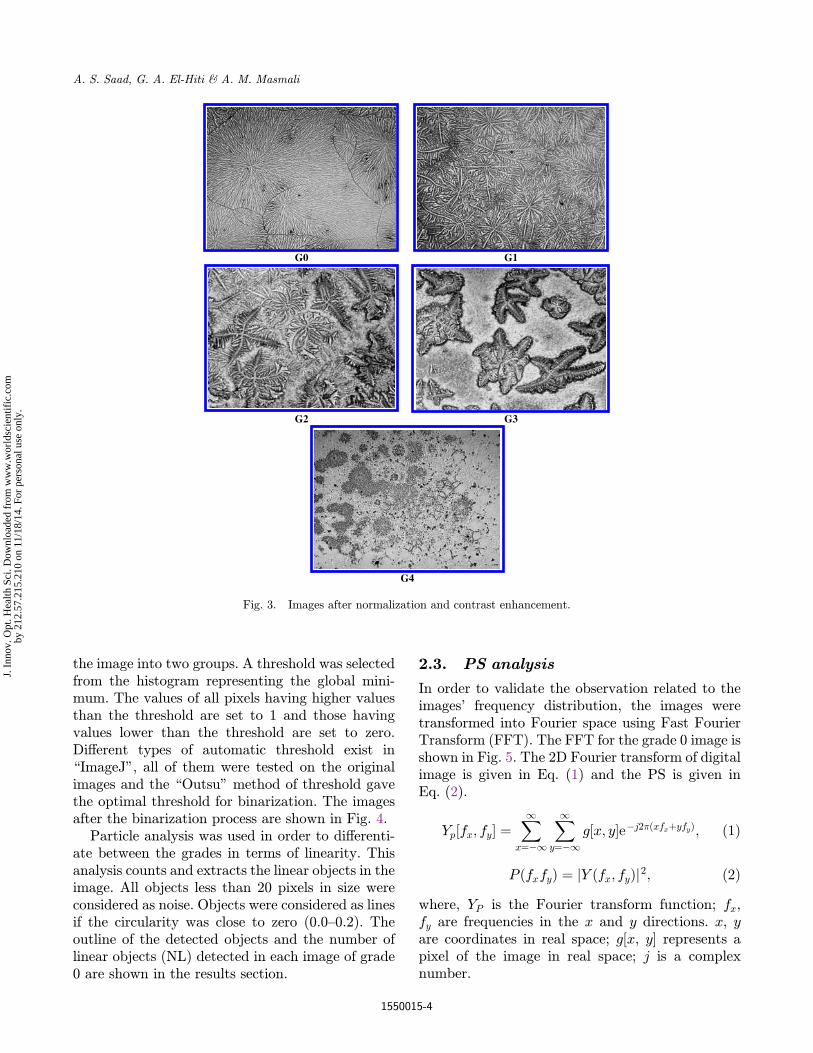
domain of the images, small details are more presentin the low-grade images which represent in the fre-quency domain a high-frequency component in theFourier space. The second observation is the morefrequent presence of a line segment in the lowergrades more than the higher ones. The third is thepresence of di®erent textures in the images repre-senting each grade. For these reasons, we proposeVCs combining all three observations; it includestexture analysis, linear structure analysis in timedomain, and PS analysis in Fourier space. Figure 2shows the block diagram of the method used for theconstruction of the VC.
All technical processing of digital images wasmade using ImageJ NIH software and Matlab 7.The following section describes each componentmethod of VCs construction.
2.1. Preprocessing of the original
images
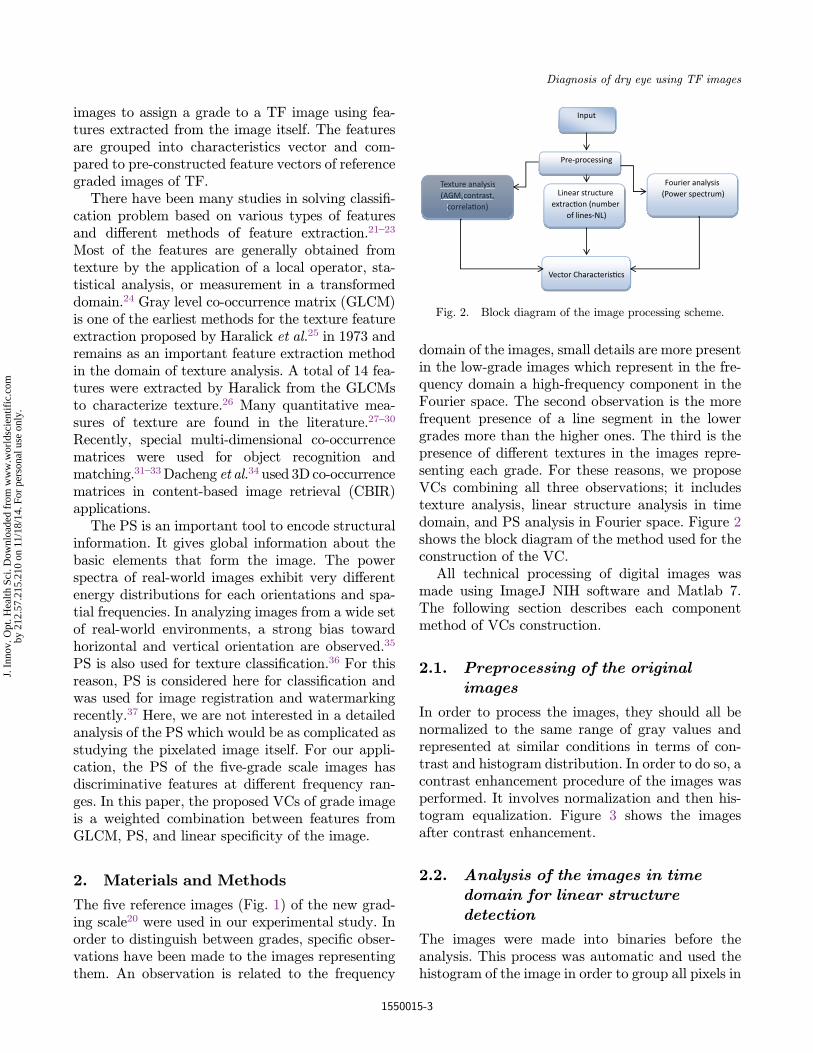
In order to process the images, they should all benormalized to the same range of gray values andrepresented at similar conditions in terms of con-trast and histogram distribution. In order to do so, acontrast enhancement procedure of the images wasperformed. It involves normalization and then his-togram equalization. Figure 3 shows the imagesafter contrast enhancement.
2.2. Analysis of the images in timedomain for linear structure
detection
The images were made into binaries before theanalysis. This process was automatic and used thehistogram of the image in order to group all pixels in
Input
Pre-processing
Texture analysis(AGM, contrast,
correla�on)
Linear structure extrac�on (number
of lines-NL)
Fourier analysis (Power spectrum)
Vector Characteris�cs
Texture analysis(AGM,contrast,
correla�on)
Fig. 2. Block diagram of the image processing scheme.
Diagnosis of dry eye using TF images
1550015-3
J. I
nnov
. Opt
. Hea
lth S
ci. D
ownl
oade
d fr
om w
ww
.wor
ldsc
ient
ific
.com
by 2
12.5
7.21
5.21
0 on
11/
18/1
4. F
or p
erso
nal u
se o
nly.
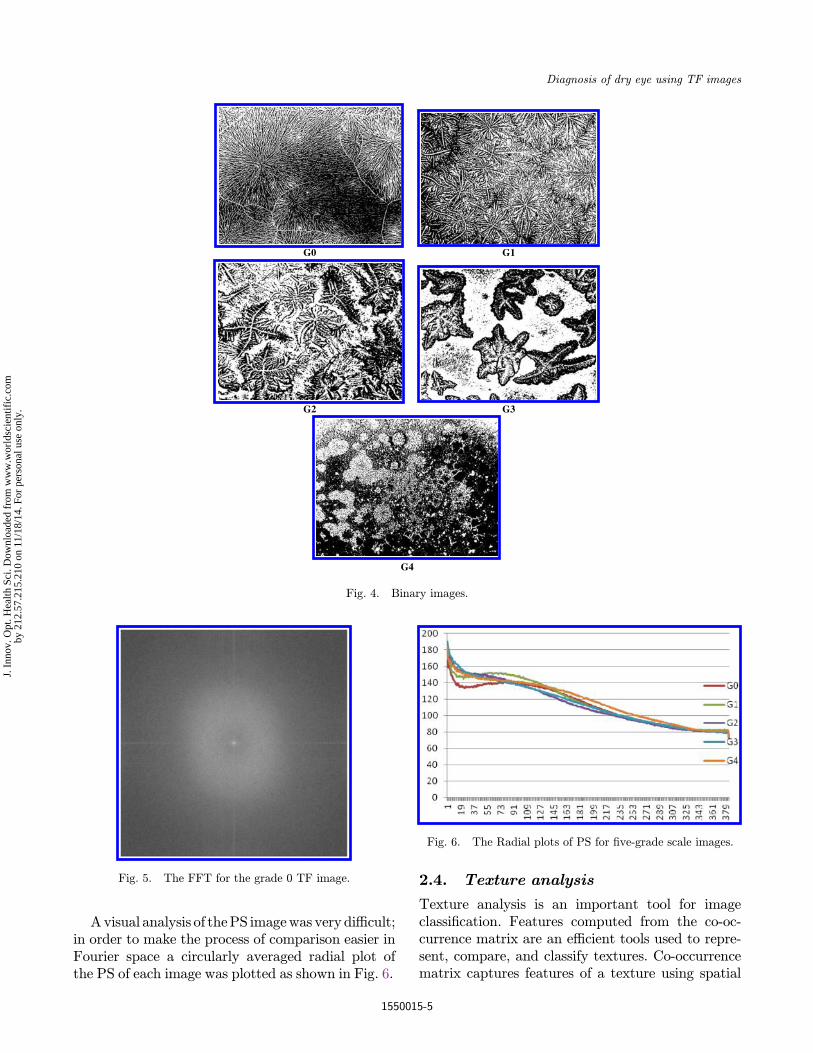
the image into two groups. A threshold was selectedfrom the histogram representing the global mini-mum. The values of all pixels having higher valuesthan the threshold are set to 1 and those havingvalues lower than the threshold are set to zero.Di®erent types of automatic threshold exist in\ImageJ", all of them were tested on the originalimages and the \Outsu" method of threshold gavethe optimal threshold for binarization. The imagesafter the binarization process are shown in Fig. 4.
Particle analysis was used in order to di®erenti-ate between the grades in terms of linearity. Thisanalysis counts and extracts the linear objects in theimage. All objects less than 20 pixels in size wereconsidered as noise. Objects were considered as linesif the circularity was close to zero (0.0–0.2). Theoutline of the detected objects and the number oflinear objects (NL) detected in each image of grade0 are shown in the results section.
2.3. PS analysis
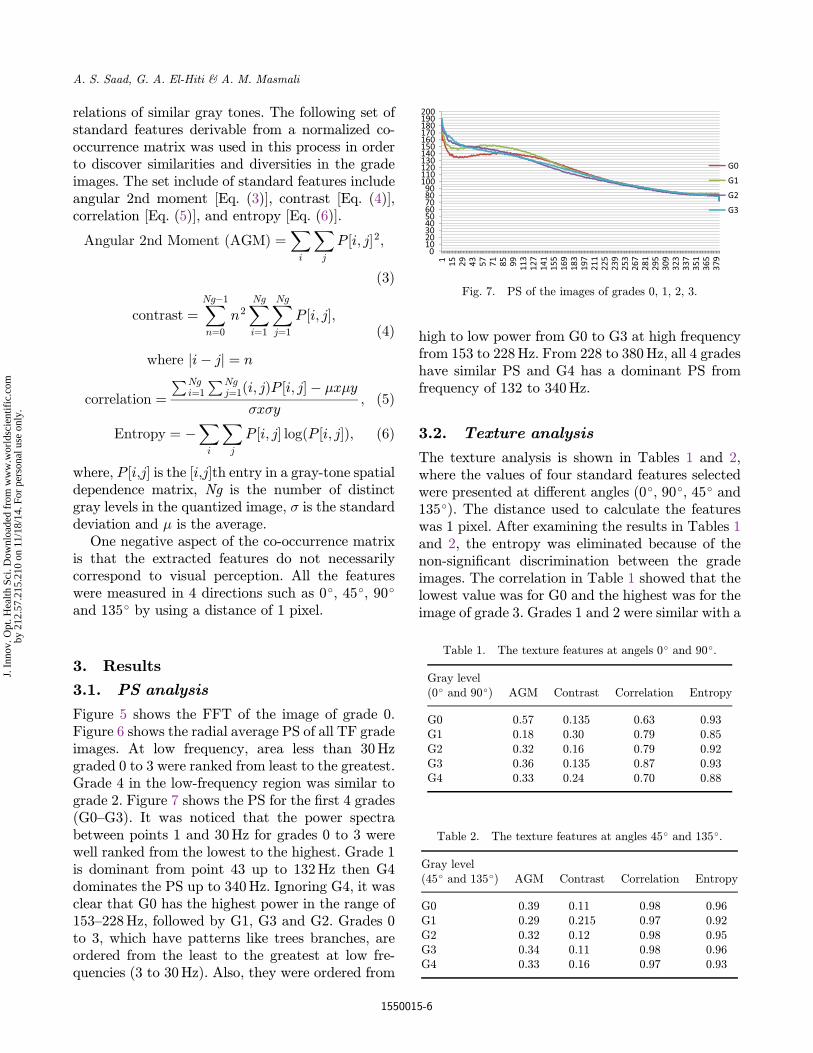
In order to validate the observation related to theimages' frequency distribution, the images weretransformed into Fourier space using Fast FourierTransform (FFT). The FFT for the grade 0 image isshown in Fig. 5. The 2D Fourier transform of digitalimage is given in Eq. (1) and the PS is given inEq. (2).
Yp½fx; fy� ¼X1
x¼�1
X1
y¼�1g½x; y�e�j2�ðxfxþyfyÞ; ð1Þ
P ðfxfyÞ ¼ jY ðfx; fyÞj2; ð2Þwhere, YP is the Fourier transform function; fx,fy are frequencies in the x and y directions. x, yare coordinates in real space; g[x, y] represents apixel of the image in real space; j is a complexnumber.
G1G0
G3G2
G4
Fig. 3. Images after normalization and contrast enhancement.
A. S. Saad, G. A. El-Hiti & A. M. Masmali
1550015-4
J. I
nnov
. Opt
. Hea
lth S
ci. D
ownl
oade
d fr
om w
ww
.wor
ldsc
ient
ific
.com
by 2
12.5
7.21
5.21
0 on
11/
18/1
4. F
or p
erso
nal u
se o
nly.
Avisual analysis of thePS imagewas very di±cult;in order to make the process of comparison easier inFourier space a circularly averaged radial plot ofthe PS of each image was plotted as shown in Fig. 6.
2.4. Texture analysis
Texture analysis is an important tool for imageclassi¯cation. Features computed from the co-oc-currence matrix are an e±cient tools used to repre-sent, compare, and classify textures. Co-occurrencematrix captures features of a texture using spatial
Fig. 6. The Radial plots of PS for ¯ve-grade scale images.
G1
G3
G0
G2
G4
Fig. 4. Binary images.
Fig. 5. The FFT for the grade 0 TF image.
Diagnosis of dry eye using TF images
1550015-5
J. I
nnov
. Opt
. Hea
lth S
ci. D
ownl
oade
d fr
om w
ww
.wor
ldsc
ient
ific
.com
by 2
12.5
7.21
5.21
0 on
11/
18/1
4. F
or p
erso
nal u
se o
nly.
relations of similar gray tones. The following set ofstandard features derivable from a normalized co-occurrence matrix was used in this process in orderto discover similarities and diversities in the gradeimages. The set include of standard features includeangular 2nd moment [Eq. (3)], contrast [Eq. (4)],correlation [Eq. (5)], and entropy [Eq. (6)].
Angular 2nd Moment ðAGMÞ ¼X
i
X
j
P ½i; j�2;
ð3Þ
contrast ¼XNg�1
n¼0
n2XNg
i¼1
XNg
j¼1
P ½i; j�;
where ji� jj ¼ n
ð4Þ
correlation ¼PNg
i¼1
PNgj¼1ði; jÞP ½i; j� � �x�y
�x�y; ð5Þ
Entropy ¼ �X
i
X
j
P ½i; j� logðP ½i; j�Þ; ð6Þ
where, P [i,j] is the [i,j]th entry in a gray-tone spatialdependence matrix, Ng is the number of distinctgray levels in the quantized image, � is the standarddeviation and � is the average.
One negative aspect of the co-occurrence matrixis that the extracted features do not necessarilycorrespond to visual perception. All the featureswere measured in 4 directions such as 0�, 45�, 90�and 135� by using a distance of 1 pixel.
3. Results
3.1. PS analysis
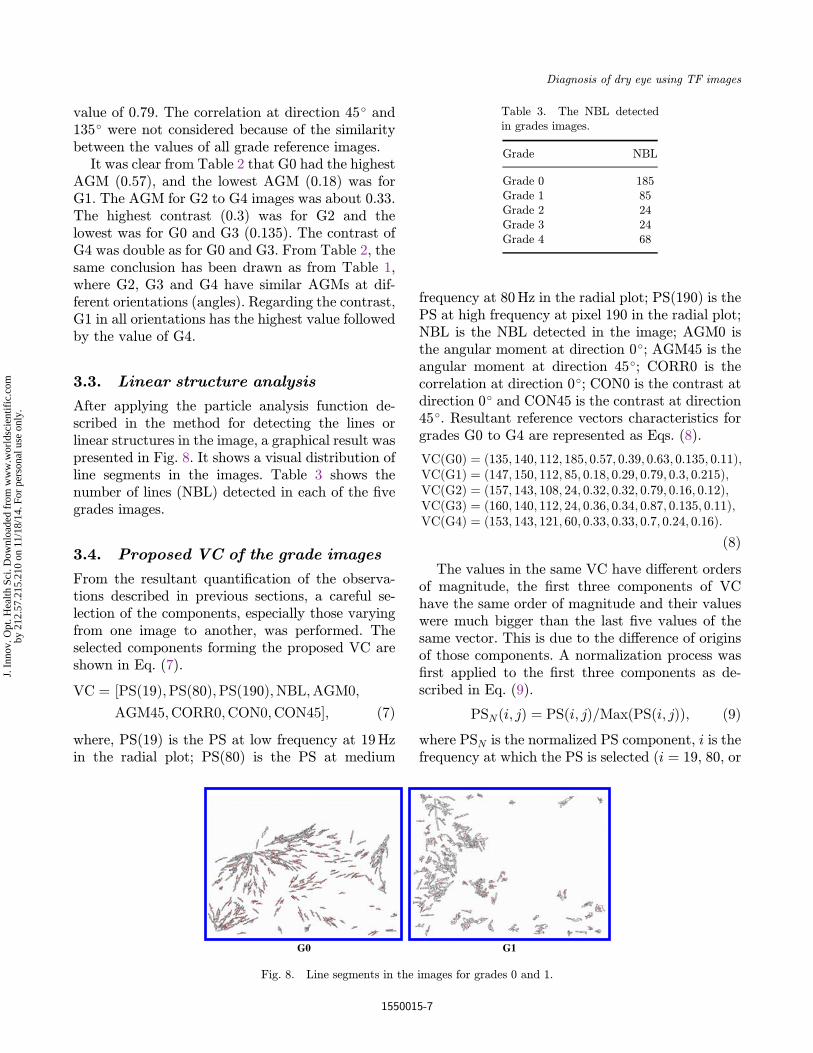
Figure 5 shows the FFT of the image of grade 0.Figure 6 shows the radial average PS of all TF gradeimages. At low frequency, area less than 30Hzgraded 0 to 3 were ranked from least to the greatest.Grade 4 in the low-frequency region was similar tograde 2. Figure 7 shows the PS for the ¯rst 4 grades(G0–G3). It was noticed that the power spectrabetween points 1 and 30Hz for grades 0 to 3 werewell ranked from the lowest to the highest. Grade 1is dominant from point 43 up to 132Hz then G4dominates the PS up to 340Hz. Ignoring G4, it wasclear that G0 has the highest power in the range of153–228Hz, followed by G1, G3 and G2. Grades 0to 3, which have patterns like trees branches, areordered from the least to the greatest at low fre-quencies (3 to 30Hz). Also, they were ordered from
high to low power from G0 to G3 at high frequencyfrom 153 to 228Hz. From 228 to 380Hz, all 4 gradeshave similar PS and G4 has a dominant PS fromfrequency of 132 to 340Hz.
3.2. Texture analysis
The texture analysis is shown in Tables 1 and 2,where the values of four standard features selectedwere presented at di®erent angles (0�, 90�, 45� and135�). The distance used to calculate the featureswas 1 pixel. After examining the results in Tables 1and 2, the entropy was eliminated because of thenon-signi¯cant discrimination between the gradeimages. The correlation in Table 1 showed that thelowest value was for G0 and the highest was for theimage of grade 3. Grades 1 and 2 were similar with a
0102030405060708090
100110120130140150160170180190200
1 15 29 43 57 71 85 99 113
127
141
155
169
183
197
211
225
239
253
267
281
295
309
323
337
351
365
379
G0
G1
G2
G3
Fig. 7. PS of the images of grades 0, 1, 2, 3.
Table 1. The texture features at angels 0� and 90�.
Gray level(0� and 90�) AGM Contrast Correlation Entropy
G0 0.57 0.135 0.63 0.93G1 0.18 0.30 0.79 0.85G2 0.32 0.16 0.79 0.92G3 0.36 0.135 0.87 0.93G4 0.33 0.24 0.70 0.88
Table 2. The texture features at angles 45� and 135�.
Gray level(45� and 135�) AGM Contrast Correlation Entropy
G0 0.39 0.11 0.98 0.96G1 0.29 0.215 0.97 0.92G2 0.32 0.12 0.98 0.95G3 0.34 0.11 0.98 0.96G4 0.33 0.16 0.97 0.93
A. S. Saad, G. A. El-Hiti & A. M. Masmali
1550015-6
J. I
nnov
. Opt
. Hea
lth S
ci. D
ownl
oade
d fr
om w
ww
.wor
ldsc
ient
ific
.com
by 2
12.5
7.21
5.21
0 on
11/
18/1
4. F
or p
erso
nal u
se o
nly.
value of 0.79. The correlation at direction 45� and135� were not considered because of the similaritybetween the values of all grade reference images.
It was clear from Table 2 that G0 had the highestAGM (0.57), and the lowest AGM (0.18) was forG1. The AGM for G2 to G4 images was about 0.33.The highest contrast (0.3) was for G2 and thelowest was for G0 and G3 (0.135). The contrast ofG4 was double as for G0 and G3. From Table 2, thesame conclusion has been drawn as from Table 1,where G2, G3 and G4 have similar AGMs at dif-ferent orientations (angles). Regarding the contrast,G1 in all orientations has the highest value followedby the value of G4.
3.3. Linear structure analysis
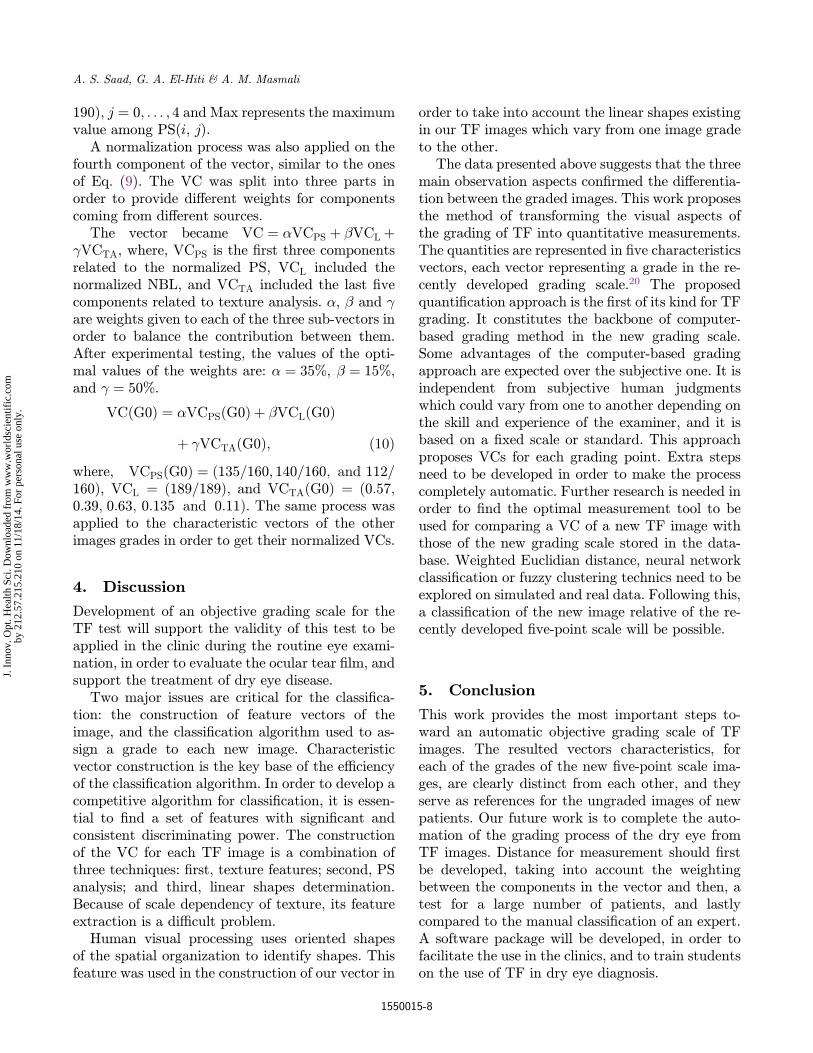
After applying the particle analysis function de-scribed in the method for detecting the lines orlinear structures in the image, a graphical result waspresented in Fig. 8. It shows a visual distribution ofline segments in the images. Table 3 shows thenumber of lines (NBL) detected in each of the ¯vegrades images.
3.4. Proposed VC of the grade images
From the resultant quanti¯cation of the observa-tions described in previous sections, a careful se-lection of the components, especially those varyingfrom one image to another, was performed. Theselected components forming the proposed VC areshown in Eq. (7).
VC ¼ ½PSð19Þ;PSð80Þ;PSð190Þ;NBL;AGM0;
AGM45;CORR0;CON0;CON45�; ð7Þwhere, PS(19) is the PS at low frequency at 19Hzin the radial plot; PS(80) is the PS at medium
frequency at 80Hz in the radial plot; PS(190) is thePS at high frequency at pixel 190 in the radial plot;NBL is the NBL detected in the image; AGM0 isthe angular moment at direction 0�; AGM45 is theangular moment at direction 45�; CORR0 is thecorrelation at direction 0�; CON0 is the contrast atdirection 0� and CON45 is the contrast at direction45�. Resultant reference vectors characteristics forgrades G0 to G4 are represented as Eqs. (8).
VCðG0Þ ¼ ð135; 140; 112; 185; 0:57; 0:39; 0:63; 0:135; 0:11Þ;VCðG1Þ ¼ ð147; 150; 112; 85; 0:18; 0:29; 0:79; 0:3; 0:215Þ;VCðG2Þ ¼ ð157; 143; 108; 24; 0:32; 0:32; 0:79; 0:16; 0:12Þ;VCðG3Þ ¼ ð160; 140; 112; 24; 0:36; 0:34; 0:87; 0:135; 0:11Þ;VCðG4Þ ¼ ð153; 143; 121; 60; 0:33; 0:33; 0:7; 0:24; 0:16Þ:
ð8ÞThe values in the same VC have di®erent orders
of magnitude, the ¯rst three components of VChave the same order of magnitude and their valueswere much bigger than the last ¯ve values of thesame vector. This is due to the di®erence of originsof those components. A normalization process was¯rst applied to the ¯rst three components as de-scribed in Eq. (9).
PSNði; jÞ ¼ PSði; jÞ=MaxðPSði; jÞÞ; ð9Þwhere PSN is the normalized PS component, i is thefrequency at which the PS is selected (i ¼ 19, 80, or
G1G0
Fig. 8. Line segments in the images for grades 0 and 1.
Table 3. The NBL detectedin grades images.
Grade NBL
Grade 0 185Grade 1 85Grade 2 24Grade 3 24Grade 4 68
Diagnosis of dry eye using TF images
1550015-7
J. I
nnov
. Opt
. Hea
lth S
ci. D
ownl
oade
d fr
om w
ww
.wor
ldsc
ient
ific
.com
by 2
12.5
7.21
5.21
0 on
11/
18/1
4. F
or p
erso
nal u
se o
nly.
190), j ¼ 0; . . . ; 4 and Max represents the maximumvalue among PS(i, j).
A normalization process was also applied on thefourth component of the vector, similar to the onesof Eq. (9). The VC was split into three parts inorder to provide di®erent weights for componentscoming from di®erent sources.
The vector became VC ¼ �VCPS þ �VCL þ�VCTA, where, VCPS is the ¯rst three componentsrelated to the normalized PS, VCL included thenormalized NBL, and VCTA included the last ¯vecomponents related to texture analysis. �, � and �are weights given to each of the three sub-vectors inorder to balance the contribution between them.After experimental testing, the values of the opti-mal values of the weights are: � ¼ 35%, � ¼ 15%,and � ¼ 50%.
VCðG0Þ ¼ �VCPSðG0Þ þ �VCLðG0Þþ �VCTAðG0Þ; ð10Þ
where, VCPSðG0Þ ¼ ð135=160; 140=160; and 112=160Þ, VCL ¼ ð189=189Þ, and VCTAðG0Þ ¼ ð0:57;0:39; 0:63; 0:135 and 0:11Þ. The same process wasapplied to the characteristic vectors of the otherimages grades in order to get their normalized VCs.
4. Discussion
Development of an objective grading scale for theTF test will support the validity of this test to beapplied in the clinic during the routine eye exami-nation, in order to evaluate the ocular tear ¯lm, andsupport the treatment of dry eye disease.
Two major issues are critical for the classi¯ca-tion: the construction of feature vectors of theimage, and the classi¯cation algorithm used to as-sign a grade to each new image. Characteristicvector construction is the key base of the e±ciencyof the classi¯cation algorithm. In order to develop acompetitive algorithm for classi¯cation, it is essen-tial to ¯nd a set of features with signi¯cant andconsistent discriminating power. The constructionof the VC for each TF image is a combination ofthree techniques: ¯rst, texture features; second, PSanalysis; and third, linear shapes determination.Because of scale dependency of texture, its featureextraction is a di±cult problem.
Human visual processing uses oriented shapesof the spatial organization to identify shapes. Thisfeature was used in the construction of our vector in
order to take into account the linear shapes existingin our TF images which vary from one image gradeto the other.
The data presented above suggests that the threemain observation aspects con¯rmed the di®erentia-tion between the graded images. This work proposesthe method of transforming the visual aspects ofthe grading of TF into quantitative measurements.The quantities are represented in ¯ve characteristicsvectors, each vector representing a grade in the re-cently developed grading scale.20 The proposedquanti¯cation approach is the ¯rst of its kind for TFgrading. It constitutes the backbone of computer-based grading method in the new grading scale.Some advantages of the computer-based gradingapproach are expected over the subjective one. It isindependent from subjective human judgmentswhich could vary from one to another depending onthe skill and experience of the examiner, and it isbased on a ¯xed scale or standard. This approachproposes VCs for each grading point. Extra stepsneed to be developed in order to make the processcompletely automatic. Further research is needed inorder to ¯nd the optimal measurement tool to beused for comparing a VC of a new TF image withthose of the new grading scale stored in the data-base. Weighted Euclidian distance, neural networkclassi¯cation or fuzzy clustering technics need to beexplored on simulated and real data. Following this,a classi¯cation of the new image relative of the re-cently developed ¯ve-point scale will be possible.
5. Conclusion
This work provides the most important steps to-ward an automatic objective grading scale of TFimages. The resulted vectors characteristics, foreach of the grades of the new ¯ve-point scale ima-ges, are clearly distinct from each other, and theyserve as references for the ungraded images of newpatients. Our future work is to complete the auto-mation of the grading process of the dry eye fromTF images. Distance for measurement should ¯rstbe developed, taking into account the weightingbetween the components in the vector and then, atest for a large number of patients, and lastlycompared to the manual classi¯cation of an expert.A software package will be developed, in order tofacilitate the use in the clinics, and to train studentson the use of TF in dry eye diagnosis.
A. S. Saad, G. A. El-Hiti & A. M. Masmali
1550015-8
J. I
nnov
. Opt
. Hea
lth S
ci. D
ownl
oade
d fr
om w
ww
.wor
ldsc
ient
ific
.com
by 2
12.5
7.21
5.21
0 on
11/
18/1
4. F
or p
erso
nal u
se o
nly.
Con°ict of interest statement
None declared.
Acknowledgments
The authors extend their appreciation to the Col-lege of Applied Medical Sciences Research Centreand the Deanship of Scienti¯c Research at KingSaud University for its funding for this research.
References
1. M. M. Jumblatt, R. W. McKenzie, P. S. Steele, C.G. Emberts, J. E. Jumblatt, \MUC7 expression inthe human lacrimal gland and conjunctiva," Cornea22, 41–45 (2003).
2. M. B. Abelson, G. Ousler 3rd, \The pros and cons ofdry-eye test," Rev. Opthalmol. 7, 62–65 (2011).
3. M. B. Abelson, G. Ousler 3rd, L. A. Nally, T. B.Emory, \Dry eye syndromes: Diagnosis, clinicaltrials and pharmaceutical treatment–improvingclinical trials," Adv. Exp. Med. Biol. 506, 1079–1086(2002).
4. C. Kent, \Dry eye diagnosis: 21st–Century tools,"Rev. Ophthalmol. 13, 28–41 (2013).
5. G. Savini, P. Prabhawsat, T. Kojima, M. Grueter-ich, E. Espana, E. Goto, \The challenge of dry eyediagnosis," Clin. Ophthalmol. 2, 31–55 (2008).
6. A. Masmali, T. A. Alqahtani, A. Alharbi, G. A. El-Hiti, \Comparative study of repeatability of phenolred thread test versus Schirmer's test in normaladults in Saudi Arabia," Eye Contact Lens 40, 127–131 (2014).
7. J. E. Rose, M. H. Roepke, \An acidi¯ed antigen fordetection of nonspeci¯c reactions in the plate-ag-glutination test for bovine brucellosis," Am. J. Vet.Res. 18, 550–555 (1957).
8. M. A. Lemp, \Breakup of the tear ¯lm," Int. Oph-thalmol. Clin. 13, 97–102 (1973).
9. J. M. Ti®any, \Surface tension in tears," Arch. Soc.Esp. Ophthalmol. 81, 363–366 (2006).
10. M. A. Lemp, A. J. Bron, C. Baudouin, J. M. BenítezDel Castilo, D. Ge®en, J. Tauber, G. N. Foulks, J. S.Pepose, D. Sullivan, \Tear osmolarity in the diag-nosis and management of dry eye disease," Am. J.Ophthalmol. 151, 792–799 (2011).
11. E. Szalai, A. Berta, Z. Szekanecz, G. Szûcs, L.Módis, \Evaluation of tear osmolarity in non-Sj€ogren and Sj€ogren syndrome dry eye patients withthe TearLab system," Cornea 31, 867–871 (2012).
12. A. Masmali, S. Alrabiah, A. Alharbi, G. A. El-Hiti,T. Almubrad, \Investigation of tear osmolarityusing the TearLabTM osmolarity system in normal
adults in Saudi Arabia," Eye Contact Lens 40, 74–78(2014).
13. K. F. Tabbara, M. Okumoto, \Ocular ferning test.A qualitative test for mucus de¯ciency," Ophthal-mology 89, 712–714 (1982).
14. M. Maragou, E. Vaikousis, A. Ntre, N. Koronis,P. Georgiou, M. Hatzidimitriou, F. Sotsiou, P.Dantis, \Tear and saliva ferning tests in Sjogren'ssyndrome (SS)," Clin. Rheumatol. 15, 125–132(1996).
15. M. Rolando, \Tear mucus ferning test in normal andkeratoconjunctivitis sicca eyes," Chibret Int. J.Ophthalmol. 2, 32–41 (1984).
16. M. Norn, \Quantitative tear ferning. Clinicalinvestigations,"ActaOphthalmol.72, 369–372 (1994).
17. E. Vaikoussis, P. Georgiou, D. Nomicarios, \Tearmucus ferning in patients with Sjogren's syndrome,"Doc. Ophthalmol. 87, 145–151 (1994).
18. S. Srinivasan, E. Joyce, L. W. Jones, \Tear osmo-larity and ferning patterns in postmenopausalwomen," Optom. Vis. Sci. 84, 588–592 (2007).
19. C. Pensyl, S. Dillehay, \The repeatability of tearmucus ferning grading," Optom. Vis. Sci. 745, 600–604 (1998).
20. A. M. Masmali, P. J. Murphy, C. Purslow,\Development of a new grading scale for tearferning," Cont. Lens Anterior Eye 37, 178–184(2014).
21. M. H. Bharati, J. Liu, J. F. MacGregor, \Imagetexture analysis: Methods and comparisons," Che-mometrics Intell. Lab. 72, 57–71 (2004).
22. J. Zhang, T. Tan, \Brief review of invariant textureanalysis methods," Pattern Recogn. 35, 735–747(2002).
23. J. Y. Tou, Y. H. Tay, P. Y. Lau, \Recent trends intexture classi¯cation: A review, Proc. Symp. Prog-ress in Information and Communication Technology(SPICT 2009)," Kuala Lumpur, Malaysia, pp. 63–68 (2009).
24. B. V. Ramana Reddy, A. Suresh, M. Radhika Mani,V. Vijaya Kumar, \Classi¯cation of textures basedon features extracted from preprocessing images onRandom windows," Int. J. Adv. Sci. Tech. 9, 9–17(2009).
25. R. M. K. Haralick, K. Shanmugam, I. Dinstein,\Textural features for image classi¯cation," IEEETrans. Syst. Man. Cybern. SMC-3, 610–621 (1973).
26. R. M. Haralick, \Statistical and structural approa-ches to texture," Proc. IEEE 67, 786–804 (1979).
27. M. Gipp, G. Marcus, N. Harder, A. Suratanee, K.Rohr, R. K€onig, R. Männer, \Haralick's texturefeatures computed by GPUs for biologicalapplications," 36, 36109 (2009).
28. L. M. Carey, T. A. Matyas, L. E. Oke, \Evaluationof impaired ¯ngertip texture discrimination and
Diagnosis of dry eye using TF images
1550015-9
J. I
nnov
. Opt
. Hea
lth S
ci. D
ownl
oade
d fr
om w
ww
.wor
ldsc
ient
ific
.com
by 2
12.5
7.21
5.21
0 on
11/
18/1
4. F
or p
erso
nal u
se o
nly.
wrist position sense in patients a®ected by stroke:Comparison of clinical and new quantitativemeasures," J. Hand Ther. 15, 71–82 (2002).
29. Y. Rubner, J. Puzicha, C. Tomasi, J. M. Buhmann,\Empirical evaluation of dissimilarity measures forcolor and texture," Comput Vis Image Underst 84,25–43 (2001).
30. T. Ojala, M. Pietikäinen, T. Maenpää,\Multiresolution gray-scale and rotation invarianttexture classi¯cation with local binary patterns,"IEEE T. Pattern Anal. 24, 735–743 (2002).
31. V. Bino Sebastian, A. Unnikrishnan, K. Balakrish-nan, \Grey level co-occurrence matrices: Generali-zation and some new features," Int. J. Comput. Sci.2, 151–157 (2012).
32. V. A. Kovalev, M. Petrou, \Multidimensional co-occurrence matrices for object recognition andmatching," Graph. Models Image Process. 58, 187–197 (1996).
33. K. Hammouche, J.-G. Postaire, \Multidimensionaltexture analysis for unsupervised pattern classi-¯cation," in Pattern Recognition Techniques,
Technology and Applications, Chap. 7, P.-Y. Yin,Ed., pp. 163–196, I-Tech, Vienna, Austria (2008).
34. T. Dacheng, L. Xuelong, Y. Yuan, Y. Nenghai, L.Zhengkai, T. Xiao-ou, \A set of novel textural fea-tures based on 3D co-occurrence matrix for content-based image retrieval," Proc. Fifth InternationalConference on Information Fusion, Vol. 2, pp. 1403–1407 (2002).
35. A. Oliva, A. B. Torralba, A. Guerin-Dugue, J.Herault, \Global semantic classi¯cation of scenesusing power spectrum templates," Challenge ofImage Retrieval (CIR99), BCS Electronic Work-shops in Computing Series, pp. 1–11, Springer VerlagNewcastle, UK (1999).
36. L. Wang, D.-C. He, \Texture classi¯cation usingtexture spectrum," Pattern Recogn. 23, 905–910(1990).
37. D.-J. Lee, T. F. Krile, S. Mitra, \Power spectrumand spectrum techniques applied to imageregistration," Appl. Opt. 27, 1099–1106 (1988).
A. S. Saad, G. A. El-Hiti & A. M. Masmali
1550015-10
J. I
nnov
. Opt
. Hea
lth S
ci. D
ownl
oade
d fr
om w
ww
.wor
ldsc
ient
ific
.com
by 2
12.5
7.21
5.21
0 on
11/
18/1
4. F
or p
erso
nal u
se o
nly.


