Embed Size (px)
Citation preview
ORIGINAL CONTRIBUTIONS
A DESCRIPTIVE ANALYSIS OF EMERGENCY MEDICAL SERVICE SYSTEMS
PARTICIPATING IN THE RESUSCITATION OUTCOMES CONSORTIUM
(ROC) NETWORK
Daniel P. Davis, MD, Lisa A. Garberson, PhD, Douglas L. Andrusiek, MSc, David Hostler, PhD,Mohamud Daya, MD, MS, Ronald Pirrallo, MD, Alan Craig, MSc, Shannon Stephens,
NREMT-P, Jonathan Larsen, NREMT-P, Alexander F. Drum, NREMT-P, Raymond Fowler, MDand the Resuscitation Outcomes Consortium Investigators
ABSTRACT
Background. The optimal Emergency Medical Services (EMS)system characteristics have not been defined, resulting insubstantial variability across systems. The Resuscitation Out-comes Consortium (ROC) is a United States-Canada researchnetwork that organized EMS agencies from 11 different sys-tems to perform controlled trials in cardiac arrest and life-threatening trauma resuscitation. Objectives. To describeEMS systems participating in ROC using a novel framework.Methods. Standardized surveys were created by ROC inves-tigators and distributed to each site for completion. Theseincluded separate questions for individual hospitals, EMSagencies, and dispatch centers. Results were collated and an-alyzed by using descriptive statistics. Results. A total of 264EMS agencies, 287 hospitals, and 154 dispatch centers wereincluded. Agencies were described with respect to the type(fire-based, non-fire governmental, private), transport sta-tus (transport/non-transport), and training level (BLS/ALS).Hospitals were described with regard to their trauma des-ignation and the presence of electrophysiology and cardiac
Received June 1, 2006, from the University of California San Diego,Department of Emergency Medicine, San Diego, CA (DPD); ClinicalTrial Center, University of Washington, Seattle, WA (LAG); BritishColumbia Ambulance Service, Vancouver, BC (DA); Universityof Pittsburgh, Department of Emergency Medicine, Pittsburgh,PA (DH); Oregon Health & Science University, Department ofEmergency Medicine, Portland, OR (MD); Medical College ofWisconsin, Department of Emergency Medicine, Milwaukee, WI(RP); Toronto Emergency Medical Services, Toronto, ON (AC); Uni-versity of Alabama at Birmingham, Department of EmergencyMedicine, Birmingham, AL (SS); Seattle Medic One Program, SeattleFire Department (JL); University of Iowa Carver College of Medicine,Iowa City, IA (FD); kUniversity of Texas Southwestern Medical Centerand the Parkland Health and Hospital System, Department of Emer-gency Medicine, Dallas, TX (RF). Revision received June 14, 2007;accepted for publication June 14, 2007.
doi: 10.1080/10903120701537147
catheterization laboratories. Dispatch center characteristics,including primary versus secondary public safety answer-ing point (PSAP) status and the use of prearrival instruc-tions, were also described. Differences in EMS system char-acteristics between ROC sites were observed with multi-ple intriguing patterns. Rural areas and fire-based agencieshad more EMS units and providers per capita. This mayreflect longer response and transport distances in rural ar-eas and the additional duties of most fire-based providers.In addition, hospitals in the United States typically hadcatheterization laboratories, whereas Canadian hospitals gen-erally did not. The vast majority of both primary and sec-ondary PSAPs use computer-aided dispatch. Conclusions.Similarities and differences among EMS systems participat-ing in the ROC network were described. The frameworkused in this analysis may serve as a template for future EMSresearch. Key words:
PREHOSPITAL EMERGENCY CARE 2007;11:369–382
INTRODUCTION
The development of modern civilian emergency medi-cal services (EMS) systems can be traced back to the bat-tlefields of the Napoleonic Wars and the United StatesCivil War.1–4 Yet it was not until the second half ofthe 20th century that organized EMS systems beganto appear throughout North America. A 1966 NationalAcademy of Sciences article described the inadequaciesof prehospital and emergency care in the United Statesand suggested guidelines for the training of prehospi-tal emergency care providers and the development ofEMS systems.5 In response, the 1966 Highway SafetyAct and 1973 EMS Act were passed to provide stan-dards and funding for EMS.1 In Canada, substantialvariability in EMS services existed from community tocommunity until the mid-1970s.3 EMS services werelargely provided by small private ambulance services
369
Preh
osp
Em
erg
Car
e D
ownl
oade
d fr
om in
form
ahea
lthca
re.c
om b
y 73
.25.
161.
65 o
n 06
/12/
15Fo
r pe
rson
al u
se o
nly.
370 PREHOSPITAL EMERGENCY CARE OCTOBER/DECEMBER 2007 VOLUME 11 / NUMBER 4
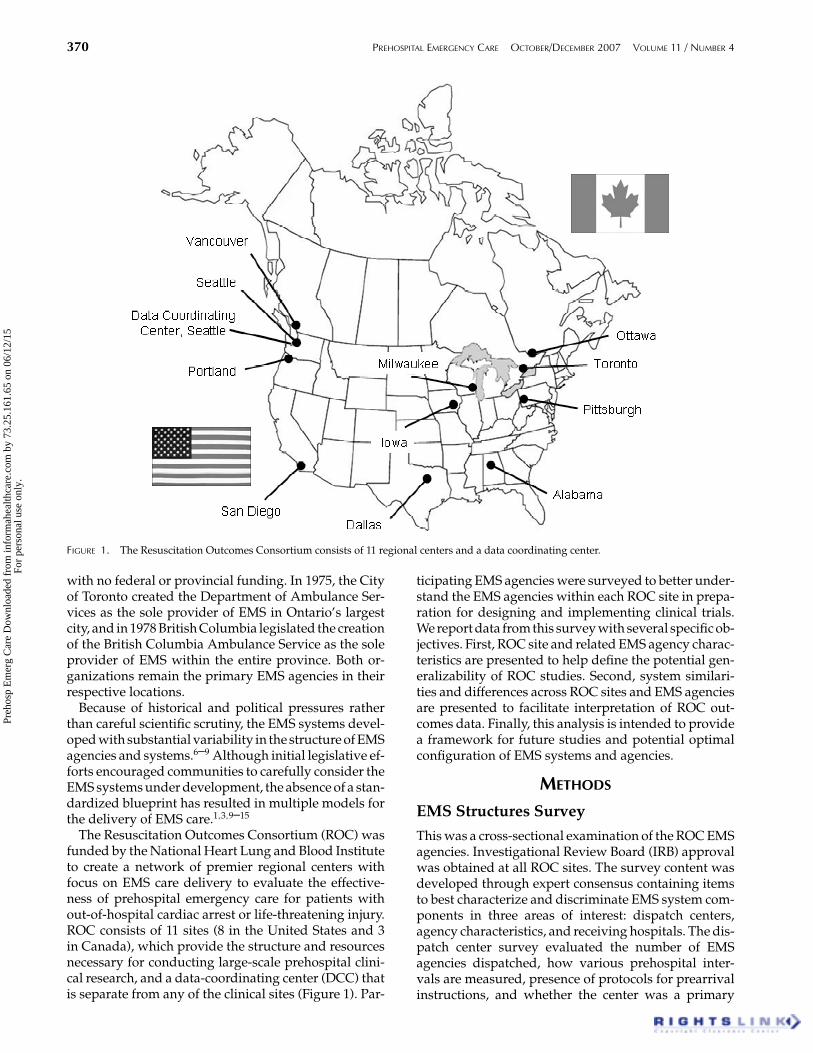
FIGURE 1. The Resuscitation Outcomes Consortium consists of 11 regional centers and a data coordinating center.
with no federal or provincial funding. In 1975, the Cityof Toronto created the Department of Ambulance Ser-vices as the sole provider of EMS in Ontario’s largestcity, and in 1978 British Columbia legislated the creationof the British Columbia Ambulance Service as the soleprovider of EMS within the entire province. Both or-ganizations remain the primary EMS agencies in theirrespective locations.
Because of historical and political pressures ratherthan careful scientific scrutiny, the EMS systems devel-oped with substantial variability in the structure of EMSagencies and systems.6–9 Although initial legislative ef-forts encouraged communities to carefully consider theEMS systems under development, the absence of a stan-dardized blueprint has resulted in multiple models forthe delivery of EMS care.1,3,9–15
The Resuscitation Outcomes Consortium (ROC) wasfunded by the National Heart Lung and Blood Instituteto create a network of premier regional centers withfocus on EMS care delivery to evaluate the effective-ness of prehospital emergency care for patients without-of-hospital cardiac arrest or life-threatening injury.ROC consists of 11 sites (8 in the United States and 3in Canada), which provide the structure and resourcesnecessary for conducting large-scale prehospital clini-cal research, and a data-coordinating center (DCC) thatis separate from any of the clinical sites (Figure 1). Par-
ticipating EMS agencies were surveyed to better under-stand the EMS agencies within each ROC site in prepa-ration for designing and implementing clinical trials.We report data from this survey with several specific ob-jectives. First, ROC site and related EMS agency charac-teristics are presented to help define the potential gen-eralizability of ROC studies. Second, system similari-ties and differences across ROC sites and EMS agenciesare presented to facilitate interpretation of ROC out-comes data. Finally, this analysis is intended to providea framework for future studies and potential optimalconfiguration of EMS systems and agencies.
METHODS
EMS Structures SurveyThis was a cross-sectional examination of the ROC EMSagencies. Investigational Review Board (IRB) approvalwas obtained at all ROC sites. The survey content wasdeveloped through expert consensus containing itemsto best characterize and discriminate EMS system com-ponents in three areas of interest: dispatch centers,agency characteristics, and receiving hospitals. The dis-patch center survey evaluated the number of EMSagencies dispatched, how various prehospital inter-vals are measured, presence of protocols for prearrivalinstructions, and whether the center was a primary
Preh
osp
Em
erg
Car
e D
ownl
oade
d fr
om in
form
ahea
lthca
re.c
om b
y 73
.25.
161.
65 o
n 06
/12/
15Fo
r pe
rson
al u
se o
nly.
Davis et al. A DESCRIPTION ANALYSIS OF EMS SYSTEMS 371
or secondary public safety answering point (PSAP).The agency characteristics survey evaluated servicesinvolved (fire, EMS, rescue), staffing, vehicle types,crew configuration, scope of practice, call volume, ge-ographic coverage, and documentation practices. Thehospital survey evaluated trauma center certificationlevel and invasive cardiology capabilities (catheteriza-tion and/or electrophysiology lab). The three surveysand a list of standardized terms and definitions weresent to site coordinators by the DCC from May 2005to July 2005. Each site coordinator and principal in-vestigator was responsible for ensuring completion ofthe survey by each EMS agency, dispatch center, andhospital in that site. This was generally accomplishedthrough telephone contact, electronic mail, and face-to-face encounters.
EMS Agency Service AreaIndividual ROC agency service areas were mapped toestimate population served, population density, andoverlap among agencies. If an agency’s service areafollowed the geographic boundaries of a town, city, orcounty, population figures were obtained from the 2000U.S. Census and the 2001 Statistics Canada communityprofile. The areas served by some of the U.S. agenciesdid not follow the geographic boundaries of a specifictown, city, or county. Population figures for thoseagencies were based on the census tracts within theservice area. Service areas were further categorized intorural (0–99 residents/km2 or 0–278 residents/mi2),suburban (100–400 residents/km2 or 279–1,108residents/mi2), and urban (>400 residents/km2 or>1 108 residents/mi2) based on Census Canada andthe Organisation for Economic Cooperation andDevelopment (OECD) definitions for urban and ruralpopulations.16,17
EMS Agency Service ModelsROC agencies were grouped into service models basedon agency type, transport status, and provider traininglevel. They were classified as 1) fire, 2) governmental(non-fire), and 3) private (non-fire). The term “non-fire governmental” was preferred over other morecommonly used terms, such as “service,” because itbetter represents both the Canadian and U.S. servicemodels. Agencies were also categorized as transportingand non-transporting (first response only). The multi-ple levels of care across sites were also categorized asBLS and combined BLS/ALS (including ALS-only ser-vices) based on the typical response level. BLS servicewas defined as non- or semi-invasive emergency life-saving care used to treat airway obstruction, respiratoryarrest, or cardiac arrest. This included BLS-D (defibrilla-tion using an Automated External Defibrillator [AED])and BLS+ (IV start, administration of some medica-tions, and use of supraglottic airways). ALS servicewas defined as delivery of advanced procedures, in-
cluding cardiac monitoring, administration of IV fluidsand medications, and invasive airway management.
Statistical AnalysisDescriptive analyses were calculated, and data werepresented as mean/median or prevalence with 95%confidence intervals.
RESULTS
GeneralSurveys were initially distributed to 264 EMS agencies,154 dispatch centers, and 287 hospitals. All surveyswere completed and returned for a 100% response rate.
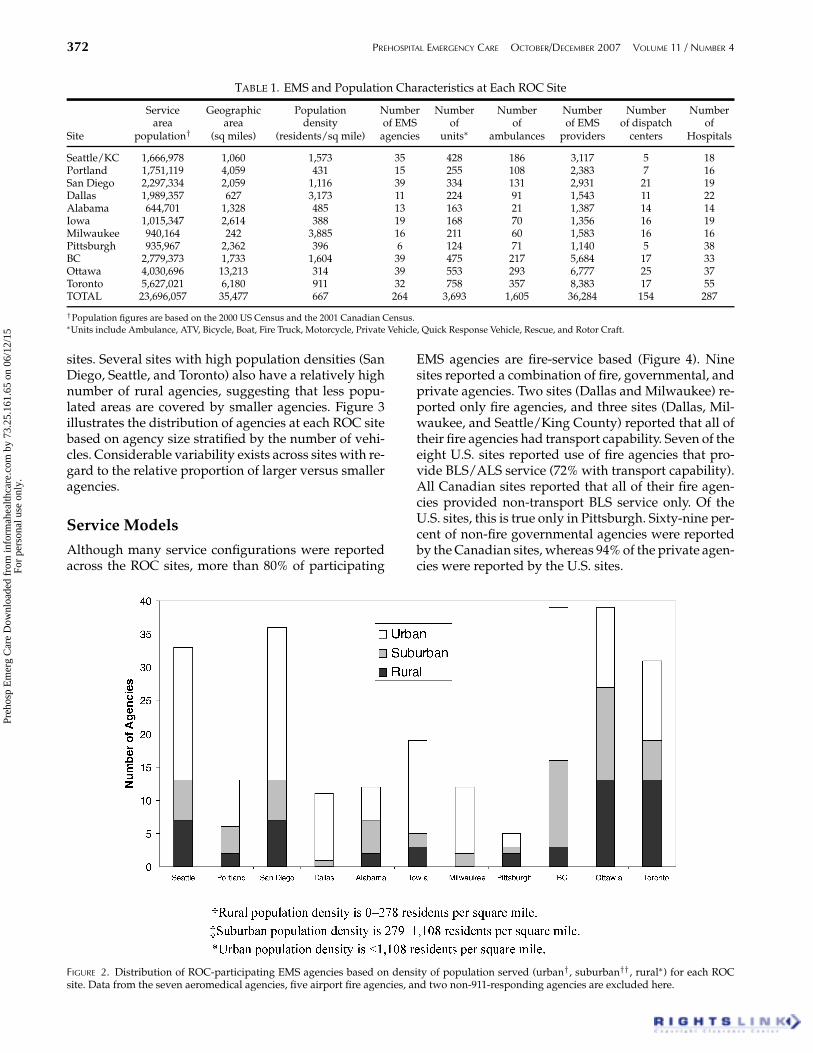
Site OverviewA total of 264 agencies were included from the 11 re-gional sites. Site names were generally chosen to de-scribe the “central” physical location of the researchsite (i.e., Portland and Pittsburgh) but often representthe larger region (i.e., Seattle/King County), province(British Columbia), or state (Iowa and Alabama)surrounding the center. Considerable heterogeneitywas observed with regard to EMS system configura-tion across the participating sites (Table 1). Severalsites cover vast geographic areas. The Ottawa andToronto sites have EMS agencies located throughoutthe province of Ontario, the Iowa site has agenciesin 10 counties throughout the state, and the Portlandsite covers portions of four counties in two states.Other sites, such as Milwaukee, Dallas, San Diego, andSeattle/King County, cover a single county or largemetropolitan area. The British Columbia and Pittsburghsites cover diverse geographic areas; however, the ma-jority of their EMS agencies are concentrated in urbanareas.
Sites that serve the largest population includedToronto, Ottawa, British Columbia, and San Diego. Thesame sites reported a larger number of EMS agen-cies and EMS providers. The Canadian sites (Toronto,Ottawa, and British Columbia) use more EMS providersthan any of the U.S. sites. For example, the Ottawa,British Columbia, and San Diego sites all have 39 agen-cies, but employ 6,777, 5,684, and 2,931 EMS profession-als, respectively. The Toronto site has the largest num-ber of EMS providers, with 8,383 individuals employedby 32 agencies.
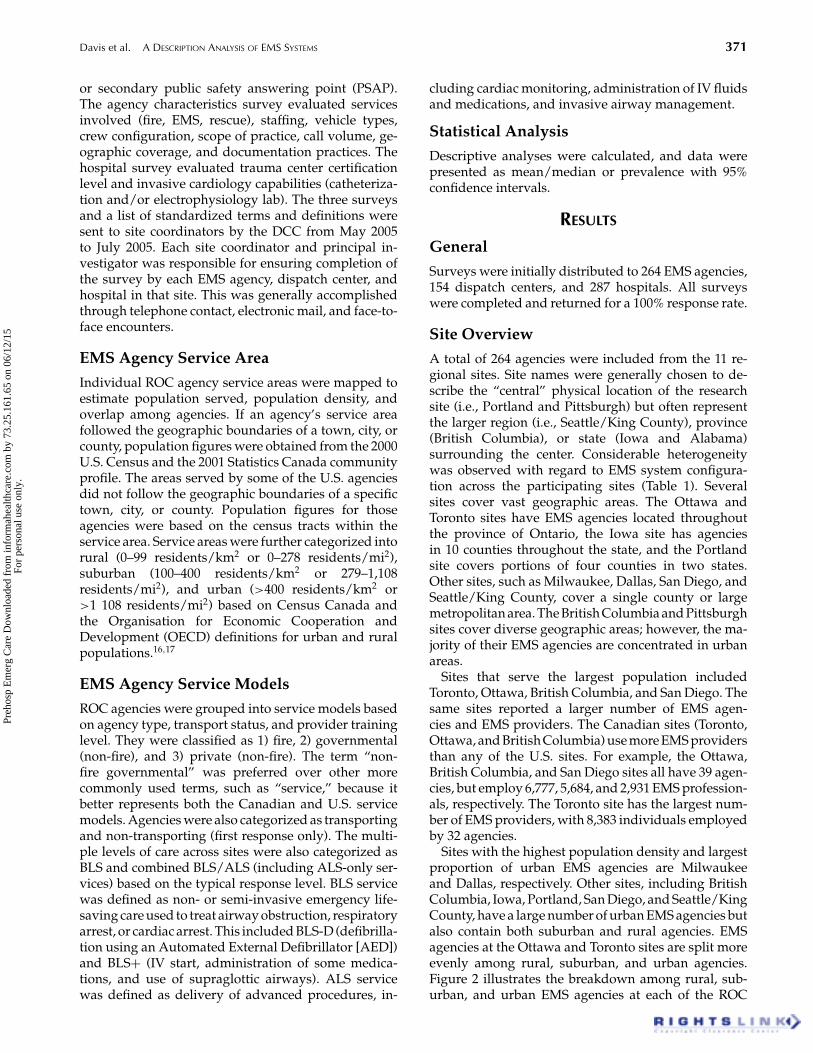
Sites with the highest population density and largestproportion of urban EMS agencies are Milwaukeeand Dallas, respectively. Other sites, including BritishColumbia, Iowa, Portland, San Diego, and Seattle/KingCounty, have a large number of urban EMS agencies butalso contain both suburban and rural agencies. EMSagencies at the Ottawa and Toronto sites are split moreevenly among rural, suburban, and urban agencies.Figure 2 illustrates the breakdown among rural, sub-urban, and urban EMS agencies at each of the ROC
Preh
osp
Em
erg
Car
e D
ownl
oade
d fr
om in
form
ahea
lthca
re.c
om b
y 73
.25.
161.
65 o
n 06
/12/
15Fo
r pe
rson
al u
se o
nly.
372 PREHOSPITAL EMERGENCY CARE OCTOBER/DECEMBER 2007 VOLUME 11 / NUMBER 4
TABLE 1. EMS and Population Characteristics at Each ROC Site
Service Geographic Population Number Number Number Number Number Numberarea area density of EMS of of of EMS of dispatch of
Site population† (sq miles) (residents/sq mile) agencies units∗ ambulances providers centers Hospitals
Seattle/KC 1,666,978 1,060 1,573 35 428 186 3,117 5 18Portland 1,751,119 4,059 431 15 255 108 2,383 7 16San Diego 2,297,334 2,059 1,116 39 334 131 2,931 21 19Dallas 1,989,357 627 3,173 11 224 91 1,543 11 22Alabama 644,701 1,328 485 13 163 21 1,387 14 14Iowa 1,015,347 2,614 388 19 168 70 1,356 16 19Milwaukee 940,164 242 3,885 16 211 60 1,583 16 16Pittsburgh 935,967 2,362 396 6 124 71 1,140 5 38BC 2,779,373 1,733 1,604 39 475 217 5,684 17 33Ottawa 4,030,696 13,213 314 39 553 293 6,777 25 37Toronto 5,627,021 6,180 911 32 758 357 8,383 17 55TOTAL 23,696,057 35,477 667 264 3,693 1,605 36,284 154 287
†Population figures are based on the 2000 US Census and the 2001 Canadian Census.∗Units include Ambulance, ATV, Bicycle, Boat, Fire Truck, Motorcycle, Private Vehicle, Quick Response Vehicle, Rescue, and Rotor Craft.
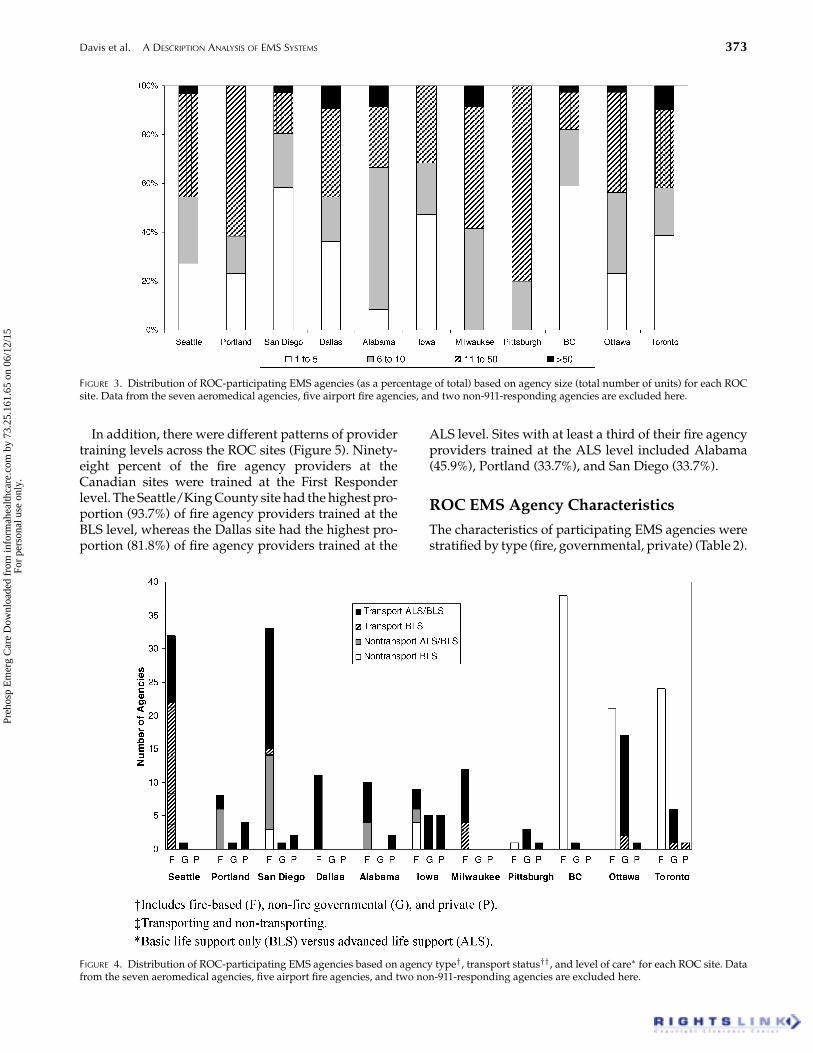
sites. Several sites with high population densities (SanDiego, Seattle, and Toronto) also have a relatively highnumber of rural agencies, suggesting that less popu-lated areas are covered by smaller agencies. Figure 3illustrates the distribution of agencies at each ROC sitebased on agency size stratified by the number of vehi-cles. Considerable variability exists across sites with re-gard to the relative proportion of larger versus smalleragencies.
Service ModelsAlthough many service configurations were reportedacross the ROC sites, more than 80% of participating
FIGURE 2. Distribution of ROC-participating EMS agencies based on density of population served (urban†, suburban††, rural∗) for each ROCsite. Data from the seven aeromedical agencies, five airport fire agencies, and two non-911-responding agencies are excluded here.
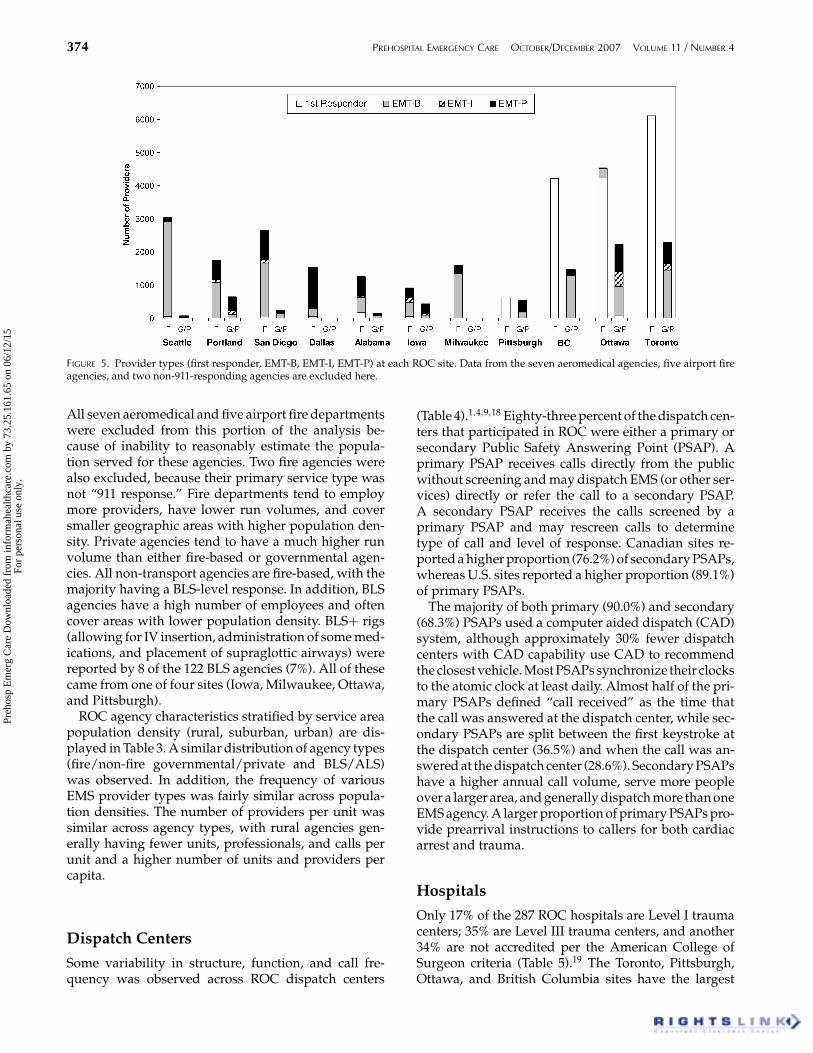
EMS agencies are fire-service based (Figure 4). Ninesites reported a combination of fire, governmental, andprivate agencies. Two sites (Dallas and Milwaukee) re-ported only fire agencies, and three sites (Dallas, Mil-waukee, and Seattle/King County) reported that all oftheir fire agencies had transport capability. Seven of theeight U.S. sites reported use of fire agencies that pro-vide BLS/ALS service (72% with transport capability).All Canadian sites reported that all of their fire agen-cies provided non-transport BLS service only. Of theU.S. sites, this is true only in Pittsburgh. Sixty-nine per-cent of non-fire governmental agencies were reportedby the Canadian sites, whereas 94% of the private agen-cies were reported by the U.S. sites.
Preh
osp
Em
erg
Car
e D
ownl
oade
d fr
om in
form
ahea
lthca
re.c
om b
y 73
.25.
161.
65 o
n 06
/12/
15Fo
r pe
rson
al u
se o
nly.
Davis et al. A DESCRIPTION ANALYSIS OF EMS SYSTEMS 373
FIGURE 3. Distribution of ROC-participating EMS agencies (as a percentage of total) based on agency size (total number of units) for each ROCsite. Data from the seven aeromedical agencies, five airport fire agencies, and two non-911-responding agencies are excluded here.
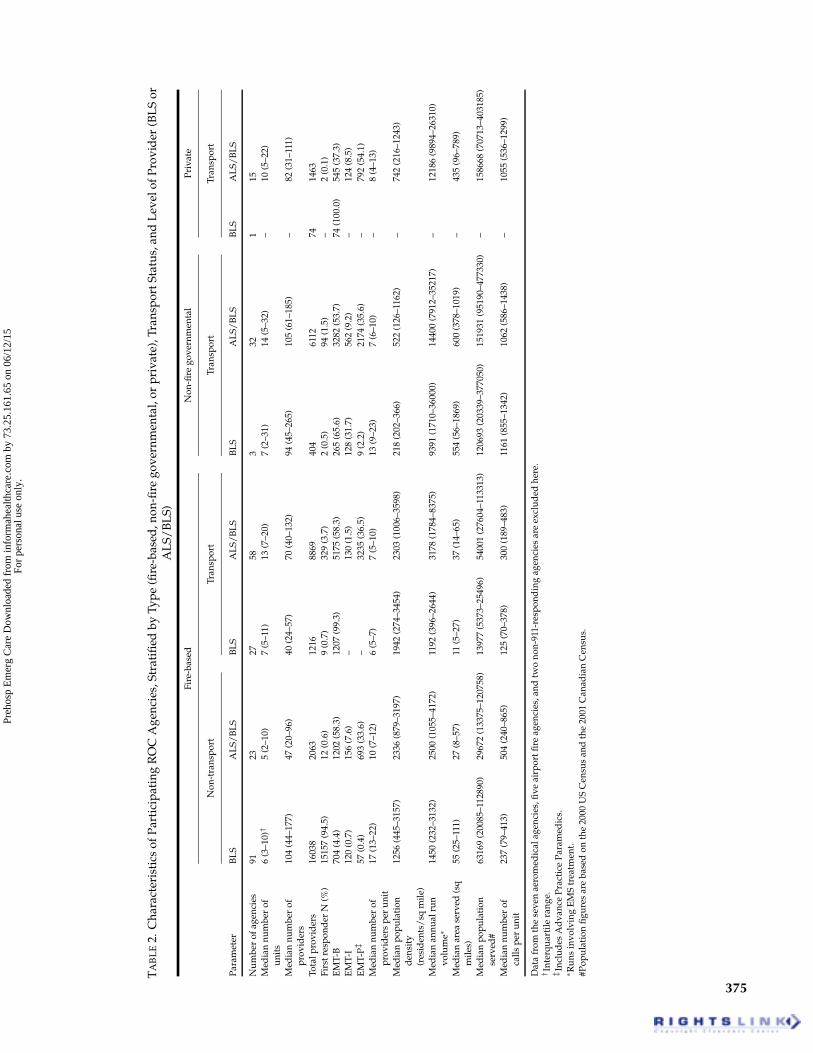
In addition, there were different patterns of providertraining levels across the ROC sites (Figure 5). Ninety-eight percent of the fire agency providers at theCanadian sites were trained at the First Responderlevel. The Seattle/King County site had the highest pro-portion (93.7%) of fire agency providers trained at theBLS level, whereas the Dallas site had the highest pro-portion (81.8%) of fire agency providers trained at the
FIGURE 4. Distribution of ROC-participating EMS agencies based on agency type†, transport status††, and level of care∗ for each ROC site. Datafrom the seven aeromedical agencies, five airport fire agencies, and two non-911-responding agencies are excluded here.
ALS level. Sites with at least a third of their fire agencyproviders trained at the ALS level included Alabama(45.9%), Portland (33.7%), and San Diego (33.7%).
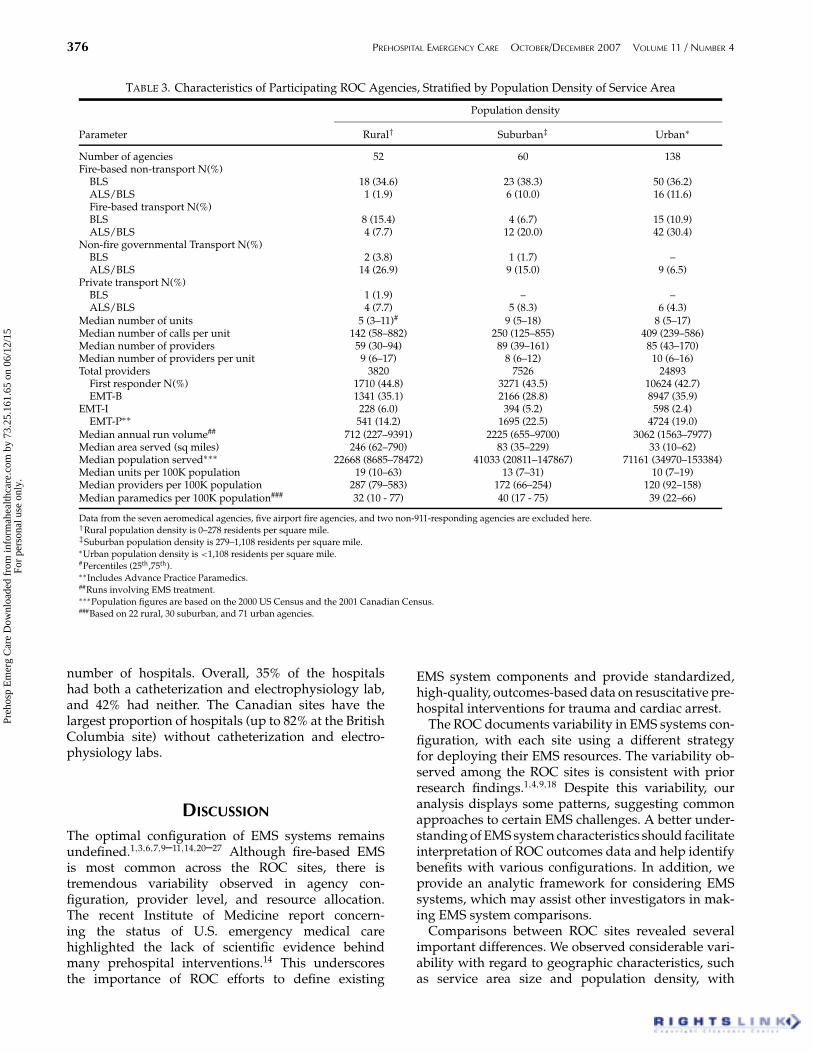
ROC EMS Agency CharacteristicsThe characteristics of participating EMS agencies werestratified by type (fire, governmental, private) (Table 2).
Preh
osp
Em
erg
Car
e D
ownl
oade
d fr
om in
form
ahea
lthca
re.c
om b
y 73
.25.
161.
65 o
n 06
/12/
15Fo
r pe
rson
al u
se o
nly.
374 PREHOSPITAL EMERGENCY CARE OCTOBER/DECEMBER 2007 VOLUME 11 / NUMBER 4
FIGURE 5. Provider types (first responder, EMT-B, EMT-I, EMT-P) at each ROC site. Data from the seven aeromedical agencies, five airport fireagencies, and two non-911-responding agencies are excluded here.
All seven aeromedical and five airport fire departmentswere excluded from this portion of the analysis be-cause of inability to reasonably estimate the popula-tion served for these agencies. Two fire agencies werealso excluded, because their primary service type wasnot “911 response.” Fire departments tend to employmore providers, have lower run volumes, and coversmaller geographic areas with higher population den-sity. Private agencies tend to have a much higher runvolume than either fire-based or governmental agen-cies. All non-transport agencies are fire-based, with themajority having a BLS-level response. In addition, BLSagencies have a high number of employees and oftencover areas with lower population density. BLS+ rigs(allowing for IV insertion, administration of some med-ications, and placement of supraglottic airways) werereported by 8 of the 122 BLS agencies (7%). All of thesecame from one of four sites (Iowa, Milwaukee, Ottawa,and Pittsburgh).
ROC agency characteristics stratified by service areapopulation density (rural, suburban, urban) are dis-played in Table 3. A similar distribution of agency types(fire/non-fire governmental/private and BLS/ALS)was observed. In addition, the frequency of variousEMS provider types was fairly similar across popula-tion densities. The number of providers per unit wassimilar across agency types, with rural agencies gen-erally having fewer units, professionals, and calls perunit and a higher number of units and providers percapita.
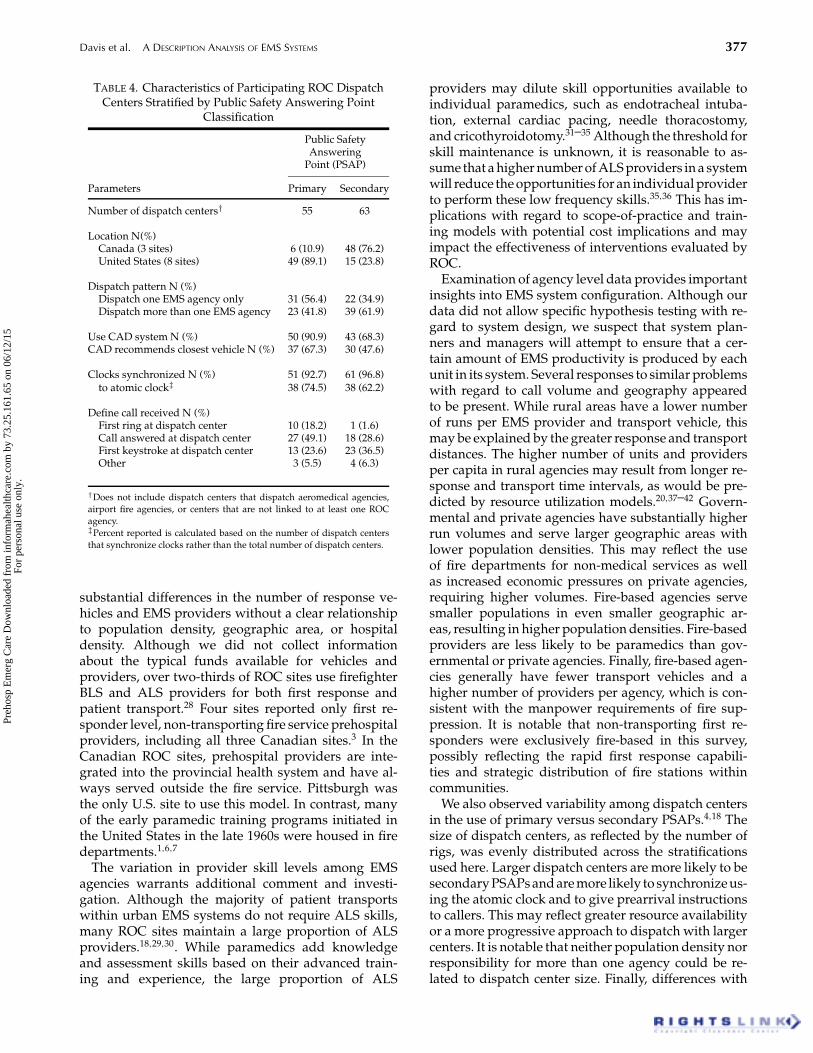
Dispatch CentersSome variability in structure, function, and call fre-quency was observed across ROC dispatch centers
(Table 4).1,4,9,18 Eighty-three percent of the dispatch cen-ters that participated in ROC were either a primary orsecondary Public Safety Answering Point (PSAP). Aprimary PSAP receives calls directly from the publicwithout screening and may dispatch EMS (or other ser-vices) directly or refer the call to a secondary PSAP.A secondary PSAP receives the calls screened by aprimary PSAP and may rescreen calls to determinetype of call and level of response. Canadian sites re-ported a higher proportion (76.2%) of secondary PSAPs,whereas U.S. sites reported a higher proportion (89.1%)of primary PSAPs.
The majority of both primary (90.0%) and secondary(68.3%) PSAPs used a computer aided dispatch (CAD)system, although approximately 30% fewer dispatchcenters with CAD capability use CAD to recommendthe closest vehicle. Most PSAPs synchronize their clocksto the atomic clock at least daily. Almost half of the pri-mary PSAPs defined “call received” as the time thatthe call was answered at the dispatch center, while sec-ondary PSAPs are split between the first keystroke atthe dispatch center (36.5%) and when the call was an-swered at the dispatch center (28.6%). Secondary PSAPshave a higher annual call volume, serve more peopleover a larger area, and generally dispatch more than oneEMS agency. A larger proportion of primary PSAPs pro-vide prearrival instructions to callers for both cardiacarrest and trauma.
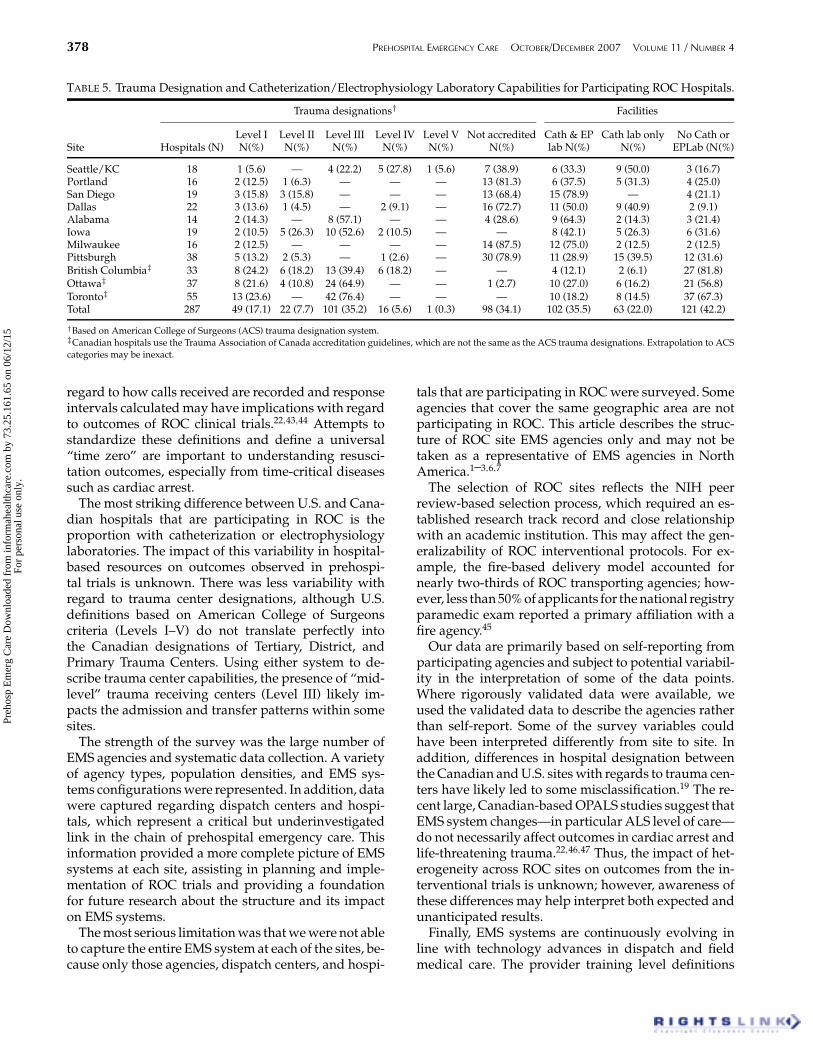
HospitalsOnly 17% of the 287 ROC hospitals are Level I traumacenters; 35% are Level III trauma centers, and another34% are not accredited per the American College ofSurgeon criteria (Table 5).19 The Toronto, Pittsburgh,Ottawa, and British Columbia sites have the largest
Preh
osp
Em
erg
Car
e D
ownl
oade
d fr
om in
form
ahea
lthca
re.c
om b
y 73
.25.
161.
65 o
n 06
/12/
15Fo
r pe
rson
al u
se o
nly.
TA
BL
E2.
Cha
ract
eris
tics
ofPa
rtic
ipat
ing
RO
CA
genc
ies,
Stra
tifi
edby
Type
(fire
-bas
ed,n
on-fi
rego
vern
men
tal,
orpr
ivat
e),T
rans
port
Stat
us,a
ndL
evel
ofPr
ovid
er(B
LS
orA
LS/
BL
S)
Fire
-bas
edN
on-fi
rego
vern
men
tal
Priv
ate
Non
-tra
nspo
rtTr
ansp
ort
Tran
spor
tTr
ansp
ort
Para
met
erB
LS
AL
S/B
LS
BL
SA
LS/
BL
SB
LS
AL
S/B
LS
BL
SA
LS/
BL
S
Num
ber
ofag
enci
es91
2327
583
321
15M
edia
nnu
mbe
rof
unit
s6
(3–1
0)†
5(2
–10)
7(5
–11)
13(7
–20)
7(2
–31)
14(5
–32)
–10
(5–2
2)
Med
ian
num
ber
ofpr
ovid
ers
104
(44–
177)
47(2
0–96
)40
(24–
57)
70(4
0–13
2)94
(45–
265)
105
(61–
185)
–82
(31–
111)
Tota
lpro
vid
ers
1603
820
6312
1688
6940
461
1274
1463
Firs
tres
pond
erN
(%)
1515
7(9
4.5)
12(0
.6)
9(0
.7)
329
(3.7
)2
(0.5
)94
(1.5
)–
2(0
.1)
EM
T-B
704
(4.4
)12
02(5
8.3)
1207
(99.
3)51
75(5
8.3)
265
(65.
6)32
82(5
3.7)
74(1
00.0
)54
5(3
7.3)
EM
T-I
120
(0.7
)15
6(7
.6)
–13
0(1
.5)
128
(31.
7)56
2(9
.2)
–12
4(8
.5)
EM
T-P‡
57(0
.4)
693
(33.
6)–
3235
(36.
5)9
(2.2
)21
74(3
5.6)
–79
2(5
4.1)
Med
ian
num
ber
ofpr
ovid
ers
per
unit
17(1
3–22
)10
(7–1
2)6
(5–7
)7
(5–1
0)13
(9–2
3)7
(6–1
0)–
8(4
–13)
Med
ian
popu
lati
ond
ensi
ty(r
esid
ents
/sq
mile
)
1256
(445
–315
7)23
36(8
79–3
197)
1942
(274
–345
4)23
03(1
006–
3598
)21
8(2
02–3
66)
522
(126
–116
2)–
742
(216
–124
3)
Med
ian
annu
alru
nvo
lum
e∗14
50(2
32–3
132)
2500
(105
5–41
72)
1192
(396
–264
4)31
78(1
784–
8375
)93
91(1
710–
3600
0)14
400
(791
2–35
217)
–12
186
(989
4–26
310)
Med
ian
area
serv
ed(s
qm
iles)
55(2
5–11
1)27
(8–5
7)11
(5–2
7)37
(14–
65)
554
(56–
1869
)60
0(3
78–1
019)
–43
5(9
6–78
9)
Med
ian
popu
lati
onse
rved
#63
169
(200
85–1
1289
0)29
672
(133
75–1
2075
8)13
977
(537
3–25
496)
5400
1(2
7604
–113
313)
1206
93(2
0339
–377
050)
1519
31(9
5190
–477
330)
–15
8668
(707
13–4
0318
5)
Med
ian
num
ber
ofca
llspe
run
it23
7(7
9–41
3)50
4(2
40–8
65)
125
(70–
378)
300
(189
–483
)11
61(8
55–1
342)
1062
(586
–143
8)–
1055
(536
–129
9)
Dat
afr
omth
ese
ven
aero
med
ical
agen
cies
,five
airp
ortfi
reag
enci
es,a
ndtw
ono
n-91
1-re
spon
din
gag
enci
esar
eex
clud
edhe
re.
†In
terq
uart
ilera
nge.
‡ Inc
lud
esA
dva
nce
Prac
tice
Para
med
ics.
∗ Run
sin
volv
ing
EM
Str
eatm
ent.
#Pop
ulat
ion
figu
res
are
base
don
the
2000
US
Cen
sus
and
the
2001
Can
adia
nC
ensu
s.
375
Preh
osp
Em
erg
Car
e D
ownl
oade
d fr
om in
form
ahea
lthca
re.c
om b
y 73
.25.
161.
65 o
n 06
/12/
15Fo
r pe
rson
al u
se o
nly.
376 PREHOSPITAL EMERGENCY CARE OCTOBER/DECEMBER 2007 VOLUME 11 / NUMBER 4
TABLE 3. Characteristics of Participating ROC Agencies, Stratified by Population Density of Service Area
Population density
Parameter Rural† Suburban‡ Urban∗
Number of agencies 52 60 138Fire-based non-transport N(%)
BLS 18 (34.6) 23 (38.3) 50 (36.2)ALS/BLS 1 (1.9) 6 (10.0) 16 (11.6)Fire-based transport N(%)BLS 8 (15.4) 4 (6.7) 15 (10.9)ALS/BLS 4 (7.7) 12 (20.0) 42 (30.4)
Non-fire governmental Transport N(%)BLS 2 (3.8) 1 (1.7) –ALS/BLS 14 (26.9) 9 (15.0) 9 (6.5)
Private transport N(%)BLS 1 (1.9) – –ALS/BLS 4 (7.7) 5 (8.3) 6 (4.3)
Median number of units 5 (3–11)# 9 (5–18) 8 (5–17)Median number of calls per unit 142 (58–882) 250 (125–855) 409 (239–586)Median number of providers 59 (30–94) 89 (39–161) 85 (43–170)Median number of providers per unit 9 (6–17) 8 (6–12) 10 (6–16)Total providers 3820 7526 24893
First responder N(%) 1710 (44.8) 3271 (43.5) 10624 (42.7)EMT-B 1341 (35.1) 2166 (28.8) 8947 (35.9)
EMT-I 228 (6.0) 394 (5.2) 598 (2.4)EMT-P∗∗ 541 (14.2) 1695 (22.5) 4724 (19.0)
Median annual run volume## 712 (227–9391) 2225 (655–9700) 3062 (1563–7977)Median area served (sq miles) 246 (62–790) 83 (35–229) 33 (10–62)Median population served∗∗∗ 22668 (8685–78472) 41033 (20811–147867) 71161 (34970–153384)Median units per 100K population 19 (10–63) 13 (7–31) 10 (7–19)Median providers per 100K population 287 (79–583) 172 (66–254) 120 (92–158)Median paramedics per 100K population### 32 (10 - 77) 40 (17 - 75) 39 (22–66)
Data from the seven aeromedical agencies, five airport fire agencies, and two non-911-responding agencies are excluded here.†Rural population density is 0–278 residents per square mile.‡Suburban population density is 279–1,108 residents per square mile.∗Urban population density is <1,108 residents per square mile.#Percentiles (25th,75th).∗∗Includes Advance Practice Paramedics.##Runs involving EMS treatment.∗∗∗Population figures are based on the 2000 US Census and the 2001 Canadian Census.###Based on 22 rural, 30 suburban, and 71 urban agencies.
number of hospitals. Overall, 35% of the hospitalshad both a catheterization and electrophysiology lab,and 42% had neither. The Canadian sites have thelargest proportion of hospitals (up to 82% at the BritishColumbia site) without catheterization and electro-physiology labs.
DISCUSSION
The optimal configuration of EMS systems remainsundefined.1,3,6,7,9–11,14,20–27 Although fire-based EMSis most common across the ROC sites, there istremendous variability observed in agency con-figuration, provider level, and resource allocation.The recent Institute of Medicine report concern-ing the status of U.S. emergency medical carehighlighted the lack of scientific evidence behindmany prehospital interventions.14 This underscoresthe importance of ROC efforts to define existing
EMS system components and provide standardized,high-quality, outcomes-based data on resuscitative pre-hospital interventions for trauma and cardiac arrest.
The ROC documents variability in EMS systems con-figuration, with each site using a different strategyfor deploying their EMS resources. The variability ob-served among the ROC sites is consistent with priorresearch findings.1,4,9,18 Despite this variability, ouranalysis displays some patterns, suggesting commonapproaches to certain EMS challenges. A better under-standing of EMS system characteristics should facilitateinterpretation of ROC outcomes data and help identifybenefits with various configurations. In addition, weprovide an analytic framework for considering EMSsystems, which may assist other investigators in mak-ing EMS system comparisons.
Comparisons between ROC sites revealed severalimportant differences. We observed considerable vari-ability with regard to geographic characteristics, suchas service area size and population density, with
Preh
osp
Em
erg
Car
e D
ownl
oade
d fr
om in
form
ahea
lthca
re.c
om b
y 73
.25.
161.
65 o
n 06
/12/
15Fo
r pe
rson
al u
se o
nly.
Davis et al. A DESCRIPTION ANALYSIS OF EMS SYSTEMS 377
TABLE 4. Characteristics of Participating ROC DispatchCenters Stratified by Public Safety Answering Point
Classification
Public SafetyAnswering
Point (PSAP)
Parameters Primary Secondary
Number of dispatch centers† 55 63
Location N(%)Canada (3 sites) 6 (10.9) 48 (76.2)United States (8 sites) 49 (89.1) 15 (23.8)
Dispatch pattern N (%)Dispatch one EMS agency only 31 (56.4) 22 (34.9)Dispatch more than one EMS agency 23 (41.8) 39 (61.9)
Use CAD system N (%) 50 (90.9) 43 (68.3)CAD recommends closest vehicle N (%) 37 (67.3) 30 (47.6)
Clocks synchronized N (%) 51 (92.7) 61 (96.8)to atomic clock‡ 38 (74.5) 38 (62.2)
Define call received N (%)First ring at dispatch center 10 (18.2) 1 (1.6)Call answered at dispatch center 27 (49.1) 18 (28.6)First keystroke at dispatch center 13 (23.6) 23 (36.5)Other 3 (5.5) 4 (6.3)
†Does not include dispatch centers that dispatch aeromedical agencies,airport fire agencies, or centers that are not linked to at least one ROCagency.‡Percent reported is calculated based on the number of dispatch centersthat synchronize clocks rather than the total number of dispatch centers.
substantial differences in the number of response ve-hicles and EMS providers without a clear relationshipto population density, geographic area, or hospitaldensity. Although we did not collect informationabout the typical funds available for vehicles andproviders, over two-thirds of ROC sites use firefighterBLS and ALS providers for both first response andpatient transport.28 Four sites reported only first re-sponder level, non-transporting fire service prehospitalproviders, including all three Canadian sites.3 In theCanadian ROC sites, prehospital providers are inte-grated into the provincial health system and have al-ways served outside the fire service. Pittsburgh wasthe only U.S. site to use this model. In contrast, manyof the early paramedic training programs initiated inthe United States in the late 1960s were housed in firedepartments.1,6,7
The variation in provider skill levels among EMSagencies warrants additional comment and investi-gation. Although the majority of patient transportswithin urban EMS systems do not require ALS skills,many ROC sites maintain a large proportion of ALSproviders.18,29,30. While paramedics add knowledgeand assessment skills based on their advanced train-ing and experience, the large proportion of ALS
providers may dilute skill opportunities available toindividual paramedics, such as endotracheal intuba-tion, external cardiac pacing, needle thoracostomy,and cricothyroidotomy.31–35 Although the threshold forskill maintenance is unknown, it is reasonable to as-sume that a higher number of ALS providers in a systemwill reduce the opportunities for an individual providerto perform these low frequency skills.35,36 This has im-plications with regard to scope-of-practice and train-ing models with potential cost implications and mayimpact the effectiveness of interventions evaluated byROC.
Examination of agency level data provides importantinsights into EMS system configuration. Although ourdata did not allow specific hypothesis testing with re-gard to system design, we suspect that system plan-ners and managers will attempt to ensure that a cer-tain amount of EMS productivity is produced by eachunit in its system. Several responses to similar problemswith regard to call volume and geography appearedto be present. While rural areas have a lower numberof runs per EMS provider and transport vehicle, thismay be explained by the greater response and transportdistances. The higher number of units and providersper capita in rural agencies may result from longer re-sponse and transport time intervals, as would be pre-dicted by resource utilization models.20,37–42 Govern-mental and private agencies have substantially higherrun volumes and serve larger geographic areas withlower population densities. This may reflect the useof fire departments for non-medical services as wellas increased economic pressures on private agencies,requiring higher volumes. Fire-based agencies servesmaller populations in even smaller geographic ar-eas, resulting in higher population densities. Fire-basedproviders are less likely to be paramedics than gov-ernmental or private agencies. Finally, fire-based agen-cies generally have fewer transport vehicles and ahigher number of providers per agency, which is con-sistent with the manpower requirements of fire sup-pression. It is notable that non-transporting first re-sponders were exclusively fire-based in this survey,possibly reflecting the rapid first response capabili-ties and strategic distribution of fire stations withincommunities.
We also observed variability among dispatch centersin the use of primary versus secondary PSAPs.4,18 Thesize of dispatch centers, as reflected by the number ofrigs, was evenly distributed across the stratificationsused here. Larger dispatch centers are more likely to besecondary PSAPs and are more likely to synchronize us-ing the atomic clock and to give prearrival instructionsto callers. This may reflect greater resource availabilityor a more progressive approach to dispatch with largercenters. It is notable that neither population density norresponsibility for more than one agency could be re-lated to dispatch center size. Finally, differences with
Preh
osp
Em
erg
Car
e D
ownl
oade
d fr
om in
form
ahea
lthca
re.c
om b
y 73
.25.
161.
65 o
n 06
/12/
15Fo
r pe
rson
al u
se o
nly.
378 PREHOSPITAL EMERGENCY CARE OCTOBER/DECEMBER 2007 VOLUME 11 / NUMBER 4
TABLE 5. Trauma Designation and Catheterization/Electrophysiology Laboratory Capabilities for Participating ROC Hospitals.
Trauma designations† Facilities
Level I Level II Level III Level IV Level V Not accredited Cath & EP Cath lab only No Cath orSite Hospitals (N) N(%) N(%) N(%) N(%) N(%) N(%) lab N(%) N(%) EPLab (N(%)
Seattle/KC 18 1 (5.6) — 4 (22.2) 5 (27.8) 1 (5.6) 7 (38.9) 6 (33.3) 9 (50.0) 3 (16.7)Portland 16 2 (12.5) 1 (6.3) — — — 13 (81.3) 6 (37.5) 5 (31.3) 4 (25.0)San Diego 19 3 (15.8) 3 (15.8) — — — 13 (68.4) 15 (78.9) — 4 (21.1)Dallas 22 3 (13.6) 1 (4.5) — 2 (9.1) — 16 (72.7) 11 (50.0) 9 (40.9) 2 (9.1)Alabama 14 2 (14.3) — 8 (57.1) — — 4 (28.6) 9 (64.3) 2 (14.3) 3 (21.4)Iowa 19 2 (10.5) 5 (26.3) 10 (52.6) 2 (10.5) — — 8 (42.1) 5 (26.3) 6 (31.6)Milwaukee 16 2 (12.5) — — — — 14 (87.5) 12 (75.0) 2 (12.5) 2 (12.5)Pittsburgh 38 5 (13.2) 2 (5.3) — 1 (2.6) — 30 (78.9) 11 (28.9) 15 (39.5) 12 (31.6)British Columbia‡ 33 8 (24.2) 6 (18.2) 13 (39.4) 6 (18.2) — — 4 (12.1) 2 (6.1) 27 (81.8)Ottawa‡ 37 8 (21.6) 4 (10.8) 24 (64.9) — — 1 (2.7) 10 (27.0) 6 (16.2) 21 (56.8)Toronto‡ 55 13 (23.6) — 42 (76.4) — — — 10 (18.2) 8 (14.5) 37 (67.3)Total 287 49 (17.1) 22 (7.7) 101 (35.2) 16 (5.6) 1 (0.3) 98 (34.1) 102 (35.5) 63 (22.0) 121 (42.2)
†Based on American College of Surgeons (ACS) trauma designation system.‡Canadian hospitals use the Trauma Association of Canada accreditation guidelines, which are not the same as the ACS trauma designations. Extrapolation to ACScategories may be inexact.
regard to how calls received are recorded and responseintervals calculated may have implications with regardto outcomes of ROC clinical trials.22,43,44 Attempts tostandardize these definitions and define a universal“time zero” are important to understanding resusci-tation outcomes, especially from time-critical diseasessuch as cardiac arrest.
The most striking difference between U.S. and Cana-dian hospitals that are participating in ROC is theproportion with catheterization or electrophysiologylaboratories. The impact of this variability in hospital-based resources on outcomes observed in prehospi-tal trials is unknown. There was less variability withregard to trauma center designations, although U.S.definitions based on American College of Surgeonscriteria (Levels I–V) do not translate perfectly intothe Canadian designations of Tertiary, District, andPrimary Trauma Centers. Using either system to de-scribe trauma center capabilities, the presence of “mid-level” trauma receiving centers (Level III) likely im-pacts the admission and transfer patterns within somesites.
The strength of the survey was the large number ofEMS agencies and systematic data collection. A varietyof agency types, population densities, and EMS sys-tems configurations were represented. In addition, datawere captured regarding dispatch centers and hospi-tals, which represent a critical but underinvestigatedlink in the chain of prehospital emergency care. Thisinformation provided a more complete picture of EMSsystems at each site, assisting in planning and imple-mentation of ROC trials and providing a foundationfor future research about the structure and its impacton EMS systems.
The most serious limitation was that we were not ableto capture the entire EMS system at each of the sites, be-cause only those agencies, dispatch centers, and hospi-
tals that are participating in ROC were surveyed. Someagencies that cover the same geographic area are notparticipating in ROC. This article describes the struc-ture of ROC site EMS agencies only and may not betaken as a representative of EMS agencies in NorthAmerica.1–3,6,7
The selection of ROC sites reflects the NIH peerreview-based selection process, which required an es-tablished research track record and close relationshipwith an academic institution. This may affect the gen-eralizability of ROC interventional protocols. For ex-ample, the fire-based delivery model accounted fornearly two-thirds of ROC transporting agencies; how-ever, less than 50% of applicants for the national registryparamedic exam reported a primary affiliation with afire agency.45
Our data are primarily based on self-reporting fromparticipating agencies and subject to potential variabil-ity in the interpretation of some of the data points.Where rigorously validated data were available, weused the validated data to describe the agencies ratherthan self-report. Some of the survey variables couldhave been interpreted differently from site to site. Inaddition, differences in hospital designation betweenthe Canadian and U.S. sites with regards to trauma cen-ters have likely led to some misclassification.19 The re-cent large, Canadian-based OPALS studies suggest thatEMS system changes—in particular ALS level of care—do not necessarily affect outcomes in cardiac arrest andlife-threatening trauma.22,46,47 Thus, the impact of het-erogeneity across ROC sites on outcomes from the in-terventional trials is unknown; however, awareness ofthese differences may help interpret both expected andunanticipated results.
Finally, EMS systems are continuously evolving inline with technology advances in dispatch and fieldmedical care. The provider training level definitions
Preh
osp
Em
erg
Car
e D
ownl
oade
d fr
om in
form
ahea
lthca
re.c
om b
y 73
.25.
161.
65 o
n 06
/12/
15Fo
r pe
rson
al u
se o
nly.
Davis et al. A DESCRIPTION ANALYSIS OF EMS SYSTEMS 379
remain in flux and hospital closures and openings overthe time course of the ROC trials should be consideredwhen interpreting these findings as well as the datafrom the interventional ROC trials.
CONCLUSIONS
We developed a taxonomy to characterize EMS systemcomponents using a collection of agencies participatingin a large, prehospital resuscitation-oriented researchnetwork. We identified variations in EMS system de-sign and implementation as well as use of health careresources. Understanding the variability among ROC-participating EMS systems should enhance our inter-pretation of the prehospital interventions that will beexamined by the ROC interventional trials in cardiacarrest and life-threatening trauma.
This study was supported by a cooperative agreement (5U01HL077863) with the National Heart, Lung and Blood Institute in part-nership with the National Institute of Neurological Disorders andStroke, The Canadian Institutes of Health Research (CIHR)-Instituteof Circulatory and Respiratory Health, Defence Research and De-velopment Canada, and the Heart and Stroke Foundation of Canada.All ROC investigators have completed a conflict of interest statement.There were no reported conflicts of interest with regard to the presentwork.
References1. Pozner CN, Zane R, Nelson SJ, Levine M. International EMS sys-
tems: :The United States: past, present, and future. Resuscitation.2004;60(3):239–44.
2. Mullins RJ. A historical perspective of trauma system develop-ment in the United States. J Trauma. 1999;47(3 Suppl):S8–14.
3. Symons P, Shuster M. International EMS Systems: Canada. Re-suscitation. 2004;63(2):119–22.
4. Zachariah BS, Pepe PE. The development of emergency medicaldispatch in the USA: a historical perspective. Eur J Emerg Med.1995;2(3):109–12.
5. Sciences NAo. Accidental death and disability: the neglected dis-ease of modern society. National Academy Press;.1966.
6. Boyd DR. The conceptual development of EMS systems in theUnites States. Part II. Emerg Med Serv. 1982;11(2):28–30.
7. Boyd DR. The conceptual development of EMS systems in theUnited States. Part I. Emerg Med Serv. 1982;11(1):19–23.
8. Boyd DR, Cowley RA. Comprehensive regional trauma/emerge-ncy medical services (EMS) delivery systems: the United Statesexperience. World J Surg. 1983;7(1):149–57.
9. Braun O, McCallion R, Fazackerley J. Characteristics of midsizedurban EMS systems. Ann Emerg Med. 1990;19(5):536–46.
10. Joint position statement on emergency medical services andemergency medical services systems. National Association ofState EMS Directors and National Association of EMS Physicians.Prehospital Disaster Med 1993;8(4):288–9.
11. Boyd DR. A systems approach to EMS. Emerg Med Serv.1977;6(6):93–104.
12. Hughes JH. Reevaluation of EMS systems. Emt J. 1978;2(2):42.13. Sayre MR, White LJ, Brown LH, McHenry SD. National EMS
Research Agenda. Prehosp Emerg Care. 2002;6(3 Suppl):S1–43.14. Medicine Io. Emergency Medical Services: At the Crossroads. In-
stitute of Medicine;.2006.15. McCall CH Jr. EMS systems evaluation. Emerg Med Serv.
1976;5(2):46–8.
16. Canada S. 2001 Census of Population. Statistics Canada;.2001.17. Development OfECa. OECD Factbook 2006: Economic, Envi-
ronmental and Social Statistics Paris: OECD Publishing; 2006.(OECD, ed)..
18. Wilson S, Cooke M, Morrell R, Bridge P, Allan T. A systematicreview of the evidence supporting the use of priority dispatch ofemergency ambulances. Prehosp Emerg Care. 2002;6(1):42–9.
19. Trauma ACoSCo. Resources for Optimal Care of the Injured Pa-tient Chicago: American College of Surgeons; 2006.
20. Donabedian A. Evaluating the quality of medical care. MilbankMem Fund Q. 1966;44(3):166–206.
21. Maio RF. EMS systems: opening the “black box.”. Ann EmergMed. 1993;22(4):730–1.
22. Spaite DW. Outcome analysis in EMS systems. Ann Emerg Med.1993;22(8):1310–1.
23. Schrader ES. EMS systems are a matter of life and death. Aorn J.1974;19(6):1207–8.
24. O’Connor RE, Cone DC, De Lorenzo RA, et al. EMS systems:foundations for the future. Acad Emerg Med. 1999;6(1):46–53.
25. Mustalish AC. Emergency medical services: twenty years ofgrowth and development. N Y State J Med. 1986;86(8):414–20.
26. Policy statement 9306: EMS and trauma care systems. AmericanPublic Health Association. Am J Public Health. 1994;84(3):516.
27. EMS Education Agenda for the Future: a systems approach. Pre-hosp Emerg Care. 2000;4(4):365–6.
28. Ornato JP, Racht EM, Fitch JJ, Berry JF. The need for ALS in urbanand suburban EMS systems. Ann Emerg Med. 1990;19(12):1469–70.
29. Pepe PE, Mattox KL, Fischer RP, Matsumoto CM. Geographicpatterns of urban trauma according to mechanism and severityof injury. J Trauma. 1990;30(9):1125–31.
30. Spaite D.W, Tse DJ, Valenzuela TD, Criss EA, Meislin HW, Ma-honey M, Ross J. The impact of injury severity and prehospitalprocedures on scene time in victims of major trauma. Ann EmergMed. 1991;20(12):1299–305.
31. Hedges JR, Feero S, Shultz B, Easter R, Syverud SA, DalseyWC. Prehospital transcutaneous cardiac pacing for symptomaticbradycardia. Pacing Clin Electrophysiol. 1991;14(10):1473–8.
32. Burton JH, Baumann MR, Maoz T, Bradshaw JR, Lebrun JE. Endo-tracheal intubation in a rural EMS state: procedure utilization andimpact of skills maintenance guidelines. Prehosp Emerg Care.2003;7(3):352–6.
33. Marcolini EG, Burton JH, Bradshaw JR, Baumann MR. Astanding-order protocol for cricothyrotomy in prehospital emer-gency patients. Prehosp Emerg Care. 2004;8(1):23–8.
34. Wang HE, Min A, Hostler D, Chang CC, Callaway CW. Dif-ferential effects of out-of-hospital interventions on short- andlong-term survival after cardiopulmonary arrest. Resuscitation.2005;67(1):69–74.
35. Wang HE, Seitz SR, Hostler D, Yealy DM. Defining the learningcurve for paramedic student endotracheal intubation. PrehospEmerg Care. 2005;9(2):156–62.
36. Cady CE, Pirrallo RG. The effect of Combitube use on paramedicexperience in endotracheal intubation. Am J Emerg Med.2005;23(7):868–71.
37. Meyer JW. Dual response in rural EMS systems. Emerg Med Serv.1975;4(1):22–3.
38. Helling TS. The challenges of trauma care in the rural setting. MoMed. 2003;100(5):510–4.
39. Koenig KL, Salvucci AA, Zachariah BS, O’Connor RE. EMSsystems and managed care integration. Prehosp Emerg Care.1998;2(1):67–9.
40. Altekruse J, Jacobs P. Economic evaluation of EMS systems. JEmerg Nurs. 1978;4(6):29–34.
41. Donabedian A. The quality of medical care. Science.1978;200(4344):856–64.
42. Swor RA. Quality assurance in EMS systems. Emerg Med ClinNorth Am. 1992;10(3):597–610.
Preh
osp
Em
erg
Car
e D
ownl
oade
d fr
om in
form
ahea
lthca
re.c
om b
y 73
.25.
161.
65 o
n 06
/12/
15Fo
r pe
rson
al u
se o
nly.
380 PREHOSPITAL EMERGENCY CARE OCTOBER/DECEMBER 2007 VOLUME 11 / NUMBER 4
43. Sobo EJ, Andriese S, Stroup C, Morgan D, Kurtin P. Developingindicators for emergency medical services (EMS) system evalu-ation and quality improvement: a statewide demonstration andplanning project. Jt Comm J Qual Improv. 2001;27(3):138–54.
44. Braun O. EMS system performance: the use of cardiac arrest time-lines. Ann Emerg Med. 1993;22(1):52–61.
45. Dickison P, Hostler D, Platt TE, Wang HE. Program accredita-tion effect on paramedic credentialing examination success rate.Prehosp Emerg Care. 2006;10(2):224–8.
46. Stiell IG, Wells GA, Field B, et al. Advanced cardiac life support inout-of-hospital cardiac arrest. N Engl J Med 2004;351(7):647–56.
47. Stiell I. The impact of advanced life support on outcome fromtraumatic brain injury [abstract]. Acad Emerg Med. 2005;12(5suppl):138.
ROC EMS STRUCTURES APPENDIX
(Please go to the ROC website at www.uwctc.org and click on ROCfor additional acknowledgments)
Alabama Resuscitation Center, University of Alabama at Birming-ham, Birmingham, AL: Jeffrey D. Kerby, MD, PhD, Principal Inves-tigatorCore Investigators: Todd B. Brown, MD, MSPH, Thomas Terndrup,MDCoordinators: Shannon W. Stephens, EMT-P, Carolyn R. Williams,BSN, BSMEEMS Investigators/Collaborators: Joe E. Acker, EMT-P, MPH,Michael L. Minor, EMT-PHospital Investigators/Collaborators: Paul A. MacLennan, PhD,Patrick R. Pritchard, MD, Sandra Caldwell, MA, Katherine R. Lai,BSParticipating EMS Agencies:Alabama LifeSaver, Bessemer Fire and Rescue, Birmingham Fire andRescue, Center Point Fire District, Chelsea Fire and Rescue, AmericanMedical Response, Homewood Fire Dept., Pelham Fire Dept., RockyRidge Fire Dept., Regional Paramedic Services, Trussville Fire Dept.,Vestavia Hills Fire and Rescue
Dallas Center for Resuscitation Research, University of TexasSouthwestern Medical Center, Dallas, TX: Ahamed H. Idris, MD,Principal InvestigatorCore Investigators: Fernando Benitez, MD, Raymond Fowler, MD,Dorothy Lemecha, MD, Joseph Minei, MD, Paul Pepe, MD, MichaelRamsay, MD, Robert Simonson, MD, Jane Wigginton, MDCoordinators: Dixie Climer, RN, Melinda Moffat, RN, Kate Newman,RN, Pamela Owens, Andrea Bennett, BSEMS Investigators/Collaborators: Richard Black, EMTP, Debra Ca-son, RN, Billy Craft, EMTP, Lucy Detamble, RN, Ryan Dykes, EMTP,Tony Harvey, EMTP, Suzanne Hewitt, RN, Marshal Isaacs, MD, JoeKay, EMTP, Tami Kayea, EMTP, Richard LaChance, EMTP, ThomasLehman, Paul Mayer, MD, Jeffrey Metzger, MD, Danny Miller, EMTP,Kenneth Navarro, EMTP, Steven Parker, EMTP, Karen Pickard, RN,Warren Porter, EMTP, TJ Starling, EMTP, Tommy Tine, EMTP, ChrisVinson, EMTPHospital Investigators/Collaborators: David Abebefe, MD, StevenArze, MD, Sean Black, MD, Matthew Bush, MD, Michael Forman,MD, Jeffery Goodloe, MD, Ralph Kelly, DO, Gregory Lachar, MD,Alicia Mangram, MD, Marc Morales, MD, Edward Thornton, MD,Robert Wiebe, MDParticipating EMS Agencies:Carrollton Fire Dept., Dallas Fire and Rescue, DeSoto Fire Dept., Dun-canville Fire Dept., Farmers Branch Fire Dept., Garland Fire Dept.,Highland Park Dept. of Public Safety, Irving Fire Dept., LancasterFire Dept., Mesquite Fire Dept., Careflite (North Central Texas Ser-vices), PHI Air Medical, Plano Fire Dept., University Park Fire Dept.
University of Iowa Carver College of Medicine-Iowa ResuscitationNetwork, University of Iowa, Iowa City, IA: Richard Kerber, MD,Principal InvestigatorCore Investigator: Steve Hata, MD, Dianne Atkins, MDCoordinators: Catherine Rost, Alexander Drum, EMT-P, MichaelHartley, EMT-PParticipating EMS Agencies:Area Ambulance Service, Davenport Hospital Ambulance Corpo-ration, Covenant Health System - Covenant Ambulance, CovenantHealth System - Mercy Oelwein, Covenant Health System - Sartori,City of Dubuque Fire Dept., Dallas County Emergency Medical Ser-vices, West Des Moines Emergency Medical Services, Des MoinesFire Dept. EMS, Henry County Health Center Emergency MedicalServices, Johnson County Ambulance, Siouxland Paramedics, Inc.,Waterloo Fire Rescue
Milwaukee Resuscitation Research Center, Medical College of Wis-consin, Milwaukee, WI: Tom P. Aufderheide, MD, Principal Investi-gatorCore Investigators: Ronald G. Pirrallo, MD, MHSA, Karen J. Brasel,MD, MPH, Andrea L. Winthrop, MD, John P. Klein, PhDCoordinators: David J. Kitscha, BS, MS, Barbara J. Burja, BA, EMT,Chris von Briesen, BA, CCRC, Christopher W. Sparks, EMT, SaraKaebisch, BSEMS Investigators/Collaborators: John Chianelli, MS, RosemarieForster, MSOLQ, RHIA, EMT-P, Michael Milbrath, EMT-P, LaurylPukansky, BS, RHIA, Kenneth Sternig, MS-EHS, BSN, EMT-P, Eu-gene Chin, RN, EMT-P, Nancy Frieberg, RN, EMT-P, Kim Krueger,RN, EMT-P, Del Szewczuga, RN, EMT-P Thomas Duerr, RebeccaFunk, BS, RHIA, EMT-B, Gail Jacobsen, BS, Janis Spitzer, RichardDemien, James Martins, John Cohn, Russell R. Spahn, M.A., EMT-P,Mike Jankowski, B.A., EMT-P, Timothy James, William E. WentlandtJr., MBA, EFO, David Berousek, Brian M. Satula, B.A., NREMT, JayB. Behling, B.S., EMT-B, Dean K. Redman, B.A., EFO, Steven Hook,B.S., CFOD, Andrew Neargarder, and Jim Singer, RNHospital Investigators/Collaborators: Thomas Reminga, MD, Den-nis Shepherd, MD, Peter Holzhauer, MD, Jonathan Rubin, MD, CraigSkold, MD, Orlando Alvarez, MD, Heidi Harkins, MD, EdwardBarthell, MD, William Haselow, MD, Albert Yee, MD, John Whit-comb, MD, Eduardo E. Castro, MD, Steven Motarjeme, MDParticipating EMS Agencies:
Cudahy Fire Dept., Flight for Life, Franklin Fire Dept., GreendaleFire Dept., Greenfield Fire Dept., Hales Corners Fire Dept., Milwau-kee County Airport Fire Dept., Milwaukee Fire Dept., North ShoreFire Dept., Oak Creek Fire Dept., South Milwaukee Fire Dept., St.Francis Fire Dept., Wauwatosa Fire Dept., West Allis Fire Dept.
Ottawa/OPALS/British Columbia RCC, Ottawa Health ResearchInstitute, University of Ottawa, Ontario and St. Paul’s Hospital,University of British Columbia, British Columbia, Canada: IanStiell, MD, Principal InvestigatorCore Investigator: Jim Christenson, MDCoordinators: Jane Banek, CCHRA, Barb Boychuk, RN, Sarah Pen-nington, RN, Helen Connolly, RNResearch Assistants: Christina Aguirre, Nadia Douglas, Bharat Mis-try, Carla FastEMS Investigators/Collaborators: Ann Wilson, BSc, ACP, KennethBoyle, EMCA, RRT, CMA, Lorraine Luinstra-Toohey, BScN, MHA,John Trickett, BScN, Nicole Sykes, BScN, RN, Elaine Graham, ACP,Kieran Ballah, EMCA, Cathy Hedges, A-EMCA, ACP, Dug An-drusiek, PCP, Dan Bishop, ACP, Ron Straight, ACP, Brian Twaites,ACP, Stuart Donn, PhDParticipating EMS Agencies:A.A. and M. Volunteer Ambulance Service, Burlington Fire and Res-cue, Cambridge Fire Dept., Cornwall Fire and Rescue, CornwallSDG Emergency Medical Services, Essex-Windsor Emergency Medi-cal Services, Essex-Windsor Fire and Rescue, Frontenac ParamedicService, Halton Emergency Medical Services, Harrow Ambulance
Preh
osp
Em
erg
Car
e D
ownl
oade
d fr
om in
form
ahea
lthca
re.c
om b
y 73
.25.
161.
65 o
n 06
/12/
15Fo
r pe
rson
al u
se o
nly.
Davis et al. A DESCRIPTION ANALYSIS OF EMS SYSTEMS 381
Service Ltd., Kawartha Lakes Emergency Medical Services, KawarthaLakes Fire and Rescue, Kingston Fire and Rescue, Kitchener FireDept., Lambton County Emergency Medical Services, Lasalle FireDept., London Fire Dept., Niagara Emergency Medical Services, Nia-gara Falls Fire and Rescue, Northumberland Emergency Medical Ser-vice, Oakville Fire Dept., Ottawa Fire and Rescue, Ottawa ParamedicService, Peterborough Emergency Medical System, PeterboroughFire Dept., Prescott-Russell Emergency Medical Services, Sarnia FireServices, St. Catharine’s Fire and Rescue, Sudbury Emergency Med-ical Services, Sudbury Fire and Rescue, SunParlour Emergency Ser-vices Inc., Superior North Emergency Medical Services, TecumsehFire Dept., Thames Emergency Medical Services, Thunder Bay Fireand Rescue, Waterloo Fire and Rescue, Waterloo Regional EmergencyMedical Services, Welland Fire and Rescue, Windsor Fire and Rescue,British Columbia Ambulance Service, Abbotsford Fire Dept., Aggas-siz Valley Fire Dept., Burnaby Fire Dept., Campbell River Fire Dept.,Central Saanich Fire Dept., City of North Vancouver Fire Dept., Co-quitlam Fire Dept., Delta Fire Dept., Esquimalt Fire Dept., KamloopsFire Dept., Kelowna Fire Dept., Lake Country V Fire Dept., LangfordFire Dept., Langley City Fire Dept., Langley Township Fire Dept.,Maple Ridge Fire Dept., Mission Fire Dept., Nanaimo Fire Dept.,New Westminster Fire Dept., North Vancouver District Fire Dept.,Oak Bay Fire Dept., Peachland Valley Fire Dept., Pitt Meadows FireDept., Port Coquitlam Fire Rescue, Port Moody Fire Dept., PrinceGeorge Fire Dept., Prince Rupert Fire Dept., Qualicum Beach FireDept., Richmond Fire Dept., Saanich Fire Dept., Sooke V Fire Dept.,Squamish Fire Dept., Surrey Fire Dept., Trail Fire Dept., VancouverFire Dept., Victoria Fire Dept., West Vancouver Fire Dept., WhistlerFire Dept., White Rock Fire Dept.
Pittsburgh Resuscitation Network, the University of Pittsburgh,Pittsburgh, PA: Clifton Callaway, MD, PhD, Principal InvestigatorCore Investigators: Samuel Tisherman, MD, Jon Rittenberger, MD,David Hostler, PhDCoordinators: Joseph Condle, Mitch Kampmeyer, TimothyMarkham, Maureen MorganEMS Investigators/Collaborators: Paul Sabol, Gina Sicchitano, ScottSherry, Anthony Shrader, Greg Stull, Manuel Torres, MS, WilliamGroft, Robert McCaughan, Rodney Rohrer, John Cole, MD, DavidFuchs, MD, Francis Guyette, MD, MS, William Jenkins, MD, RonaldRoth, MD, Heather Walker, MDHospital Investigators: Alain Corcos, MD, Ankur Doshi, MD, AdrianOng, MD, Andrew Peitzman, MDParticipating EMS Agencies: Ambulance and Chair, City of Pitts-burgh Emergency Medical Services, City of Pittsburgh Fire, MutualAid, STAT Medevac
Portland Resuscitation Outcomes Consortium, Oregon Health andScience University, Portland, OR: Principal Investigator: Jerris R.Hedges, MD, MS,Core Investigators: Craig D. Newgard, MD, MPH, Mohamud R.Daya, MD, MS, Robert A. Lowe, MD, MPHCoordinators: Denise Griffiths, BS, John Brett, EMT-P, Dana Zive,MPH, Abdolaziz Yekrang, MPA, MA, Aaron Monnig, EMT-PEMS Investigators/Collaborators: Jonathan Jui, MD, MPH, Terri A.Schmidt, MD, MS, Ritu Sahni, MD, Craig R. Warden, MD, MPH, MarcD. Muhr, EMT-P2, John A. Stouffer, EMT-P, Kyle Gorman, MBA, EMT-P, Pontine Rosteck EMT-P, Karl Koenig EMT-P, Jan Lee EMT-P, RoxyBarnes EMT-P, Heather Tucker EMT-P, Brad Allen EMT-P, TJ BishopEMT-P, Adam Glaser EMT-PHospital Investigators/Coordinators: Martin A. Schreiber, MD, JimAnderson, MD, Ameen I. Ramzy, MD, K. Dean Gubler, DO, Lynn K.Wittwer, MD, Samantha Underwood, MS, Brooke Barone, BS, DeniseHaun-Taylor, RN, Elizabeth Bryant, RN, Joanne Miller, ARNPParticipating EMS Agencies:American Medical Response - Clackamas, Clark, and MultnomahCounties, Camas Fire Dept., Clackamas County Fire District #1, ClarkCounty Fire District #6, Lake Oswego Fire Dept., LifeFlight, MetroW-
est Ambulance, North Country Ambulance, Tualatin Valley Fire andRescue, Vancouver Fire Dept., Portland Fire and Rescue, Portland In-ternational Airport Fire Dept., Gresham Fire and Emergency Services
UCSD-San Diego Resuscitation Research Center, University of Cal-ifornia at San Diego, San Diego, CA: Daniel Davis, MD, PrincipalInvestigatorCore Investigators: David Hoyt, MD, Raul Coimbra, MD, PhD, GaryVilke, MDCoordinators: Donna Kelly, RN, Lana McCallum-Brown, RNEMS Investigators/Collaborators: Bruce Haynes, MD, BradSchwartz, MDHospital Investigators: Michael Sise, MD, Frank Kennedy, MD, FredSimon, MD, Gail Tominaga, MD, Tom Velky, MDParticipating EMS Agencies:Alpine Fire Protection District, American Medical Response, BaronaFire Dept., Bonita/Sunnyside Fire Protection, Borrego Springs FireProtection District, Carlsbad Fire Dept., Chula Vista Fire Dept., Coro-nado Fire Dept., CSA-17 ALS Transporting Agency, Deer Springs,Del Mar Fire Dept., East County Fire Protection District, El CajonFire Dept., Elfin Forest CSA 107, Encinitas Fire Protection District,Escondido Fire Dept., Federal Fire Dept. San Diego, Imperial BeachFire Dept., Julian-Cuyamaca Fire Dept., La Mesa Fire Dept., LakesideFire Protection District, Lemon Grove Fire Dept., Mercy Air, MiramarFire Dept., National City Fire Dept., North County Fire, OceansideFire Dept., Pala Fire Dept., Poway Fire Dept., Ramona Fire Dept., Ran-cho Santa Fe Fire Protection District, San Diego Rural Fire ProtectionDistrict, San Marcos Fire Dept., San Miguel Fire Protection District,Santee Fire Dept., Solana Beach Fire Dept., Sycuan Fire Dept., ValleyCenter/Mercy Ambulance, Viejas Fire Dept., Vista Fire Dept.
Seattle-King County Center for Resuscitation Research at the Uni-versity of Washington, University of Washington, Seattle, WA: PeterJ. Kudenchuk, MD, Principal InvestigatorCore Investigators: Tom D. Rea, MD, Eileen Bulger, MD, Mickey S.Eisenberg, MD, Michael Copass, MDCoordinators: Michele Olsufka, RN, Sally Ragsdale, ARNP, Debi Sol-berg, RN, MN, Susan Damon, RN, Randi Phelps, Jeanne O’Brien, RN,MNEMS Investigators/Collaborators: Earl Sodeman, Marty LaFave,James Boehl, Dave Jones, Gary Somers, Deborah Ayrs, Adrian Whor-ton, Sam Warren, Jim Fogarty, Jonathan Larsen, Mike HelbockParticipating EMS Agencies:Bellevue Fire Dept., Redmond Fire Dept., Seattle Fire Dept., Shore-line Fire Dept., King Co Medic 1, Vashon Island Medic One, Both-ell Fire Dept., Burien Fire Dept., Kirkland Fire Dept., Renton FireDept., Snoqualmie Fire Dept., Duvall Fire Dept., Eastside Fire andRescue, Enumclaw Fire Dept., Fall City Fire Dept., Skyway Fire Dept.,Kent Fire Dept., Maple Valley Fire and Life Safety, Mercer IslandFire Dept., Mountain View Fire Dept., North Highline Fire Dept.,Northshore/Kenmore Fire Dept., Port of Seattle Fire Dept., KingCounty Fire District #47, King County Fire District #40, SeaTac FireDept., Skykomish Fire Dept., Snoqualmie Pass, South King Co Medic1, South King Fire and Rescue, Tukwila Fire Dept., Valley RegionalFire Authority, Vashon Island Fire and Rescue, Woodinville Fire Dept.
Toronto Regional Resuscitation Research out of hospital Network(Toronto Regional RESCUeNET), University of Toronto, Toronto,Ontario, Canada: Arthur Slutsky, MD, Principal InvestigatorCore Investigators: Laurie Morrison, MD, MSc, Paul Dorian MD,PhDCoordinators: Craig Beers, Blair Bigham, Dina Braga, Grace Burgess,Bruce Cameron, Suzanne Chung, Pete De Maio, Steve Driscoll, LynneFell, Jamie Frank, Mark McLennan, Lesley Ann Molyneaux, TyronePerreira, Welson Ryan, Angela Schotsman, Jacob Simonini, LyndaTurcotte, Flo Veel, Amy Wassenaar, Cathy ZahnEMS Investigators/Collaborators: Ben Addley, Dana Bradshaw, RobBurgess, Bruce Cameron, Sandra Chad, Sheldon Cheskes, Allan
Preh
osp
Em
erg
Car
e D
ownl
oade
d fr
om in
form
ahea
lthca
re.c
om b
y 73
.25.
161.
65 o
n 06
/12/
15Fo
r pe
rson
al u
se o
nly.

382 PREHOSPITAL EMERGENCY CARE OCTOBER/DECEMBER 2007 VOLUME 11 / NUMBER 4
Craig, Steve Dewar, Tim Dodd, Rob Duquette, Marty Epp, MichaelFeldman, Verena Jones, Russell MacDonald, Larry MacKay, SteveMcNenley, Judy Moore, Philip Moran, Michael Murray, MichaelNemeth, Russ Olnyk, Richard Renaud, Karen Roche, Jennifer Shield,Doug Silver, Jacob Stevens, Rick Verbeek, Tim Waite, Ken Webb,Michelle WelsfordParticipating EMS Agencies:Ajax Fire and Emergency Services, Barrie Fire and Emergency Ser-vice, Beausoleil First Nation Emergency Medical Services, BradfordWest Gwillimbury Fire and Emergency Services, Brampton Fire andEmergency Services, Brock Township Fire Dept., Caledon Fire andEmergency Services, City of Hamilton Emergency Services – EMS,City of Hamilton Emergency Services – Fire, City of Orillia FireDept., Clarington Emergency and Fire Services, County of SimcoeParamedic Services, Durham Regional Emergency Medical Services,Innisfil Fire and Rescue Service, Mississauga Fire and Emergency Ser-vices, Mnjikaning Fire Rescue Service, Muskoka Ambulance Service,Muskoka Ambulance Communication Center, New Tecumseth FireDept., OrangeTransport Medicine, Oro Medonte Fire and EmergencyServices, Oshawa Fire Services, Pickering Fire Services, The RamaraTownship Fire and Rescue Service, Peel Regional Paramedic Services,Toronto EMS, Toronto Fire Services, Township of Essa Fire Dept,
Township of Georgian Bay Fire Dept., Township of Scugog Fire Dept.,Township of Uxbridge Fire Dept., Wasaga Beach Fire Dept., WhitbyFire and Emergency Services, Durham Regional Basehospital, Sun-nybrook Osler Center for Prehospital Care, Hamilton Health SciencesParamedic Base Hospital Program, Simcoe Muskoka Basehospital
Steering Committee Chair, Myron Weisfeldt, MD, Johns Hopkins Uni-versity School of Medicine, Baltimore, MD, Co-Chair-Cardiac, Joseph P.Ornato, MD, Virginia Commonwealth University Health System, Rich-mond, VA, Co-Chair-Trauma, David B. Hoyt, MD, University of Califor-nia Irvine, Irvine, CA, replacing Col. John B. Holcomb, MD, Commander,U.S. Army ISR.
National Heart, Lung, and Blood Institute, Bethesda, MD: TraceyHoke, MD, George Sopko, MD MPH, David Lathrop, PhD, Alice Ma-scette, MD, Patrice Desvigne Nickens, MD.
Clinical Trial Center, University of Washington, Seattle, WA: Gra-ham Nichol, MD, MPH, Scott Emerson, MD, PhD, Judy Powell, BSN,Lisa A. Garberson, PhD, Berit Bardarson, RN, Gena Sears, BSN, LoisVan Ottingham, BSN, Anna Leonen, MS, Robert B. Ledingham, MS,Chris Finley, Richard Moore, BS.
Preh
osp
Em
erg
Car
e D
ownl
oade
d fr
om in
form
ahea
lthca
re.c
om b
y 73
.25.
161.
65 o
n 06
/12/
15Fo
r pe
rson
al u
se o
nly.