Embed Size (px)
Citation preview

Int. J. Environ. Res. Public Health 2022, 19, 2935. https://doi.org/10.3390/ijerph19052935 www.mdpi.com/journal/ijerph
Article
Weekly Variations of Well-Being and Interactions with
Training and Match Intensities: A Descriptive Case Study
in Youth Male Soccer Players
Ana Filipa Silva 1,2,3, Rafael Oliveira 3,4,5, Stefania Cataldi 6, Filipe Manuel Clemente 1,2,7, Francesca Latino 6,
Georgian Badicu 8, Gianpiero Greco 6, César Leão 1,2, Valerio Bonavolontà 6,* and Francesco Fischetti 6
1 Escola Superior Desporto e Lazer, Instituto Politécnico de Viana do Castelo, Rua Escola Industrial e
Comercial de Nun’Álvares, 4900-347 Viana do Castelo, Portugal; [email protected] (A.F.S.);
[email protected] (F.M.C.); [email protected] (C.L.) 2 Research Center in Sports Performance, Recreation, Innovation and Technology (SPRINT),
4960-320 Melgaço, Portugal 3 The Research Centre in Sports Sciences, Health Sciences and Human Development (CIDESD),
5001-801 Vila Real, Portugal; [email protected] 4 Sports Science School of Rio Maior-Polytechnic Institute of Santarém, 2040-413 Rio Maior, Portugal 5 Life Quality Research Centre, 2040-413 Rio Maior, Portugal 6 Department of Basic Medical Sciences, Neuroscience and Sense Organs, University of Study of Bari,
70124 Bari, Italy; [email protected] (S.C.); [email protected] (F.L.);
[email protected] (G.G.); [email protected] (F.F.) 7 Instituto de Telecomunicações, Delegação da Covilhã, 1049-001 Lisboa, Portugal 8 Department of Physical Education and Special Motricity, University Transilvania of Brasov,
500068 Brasov, Romania; [email protected] (G.B.)
* Correspondence: [email protected]
Abstract: The aim of this study was two-fold: (i) analyze the weekly variations of well-being and
training/match intensity measures in youth soccer players, and (ii) test relations between well-being
and training intensity outcomes. The study followed a descriptive case study design. Twenty-seven
under-17 male soccer players were monitored for well-being and training intensity parameters over
seventeen consecutive weeks. An adjusted version of the Hooper questionnaire was used to monitor
the perceptive sleep quality, readiness, fatigue, and delayed onset muscle soreness (DOMS) early in
the morning. The CR-10 Borg’s scale was also used for monitoring the rate of perceived exertion
(RPE) of players after training sessions. Repeated-measures analysis of variance was executed to
test the between-week variations of both well-being and training intensity outcomes. Moreover,
Pearson product moment correlation was used to test the relations between well-being and training
intensity outcomes. Repeated measures ANOVA revealed significant differences between weeks in
the sleep quality (F = 0.422; p < 0.001; 𝜂𝑝2 = 0.140), readiness (F = 0.8.734; p < 0.001; 𝜂𝑝
2 = 0.251), fatigue
(F = 4.484; p < 0.001; 𝜂𝑝2 = 0.147), DOMS (F = 3.775; p = 0.001; 𝜂𝑝
2 = 0.127), RPE (F = 7.301; p < 0.001;
𝜂𝑝2 = 0.219), and session-RPE (F = 17.708; p < 0.001; 𝜂𝑝
2 = 0.405). Correlations between well-being and
training intensity outcomes in the same week revealed moderate correlations between fatigue and
session-RPE (r = 0.325). As conclusions, it was found that well-being and training intensity fluctu-
ates over the season, while well-being outcomes seems to be related with training intensity, alt-
hough with a small magnitude.
Keywords: football; wellness; exercise; fatigue; sleep; readiness; muscle soreness; perceived exer-
tion; load
1. Introduction
Managing the training process while monitoring the impact of training stimulus on
the soccer players makes up part of the tasks of coaches and practitioners [1,2]. Currently,
Citation: Silva, A.F.; Oliveira, R.;
Cataldi, S.; Clemente, F.M.; Latino,
F.; Badicu, G.; Greco, G.; Leão, C.;
Bonavolontà, V.; Fischetti, F. Weekly
Variations of Well-Being and
Interactions with Training and
Match Intensities: A Descriptive
Case Study in Youth Male Soccer
Players. Int. J. Environ. Res. Public
Health 2022, 19, 2935. https://doi.org/
10.3390/ijerph19052935
Academic Editors: Giancarlo
Condello and Corrado Lupo
Received: 10 February 2022
Accepted: 1 March 2022
Published: 2 March 2022
Publisher’s Note: MDPI stays neu-
tral with regard to jurisdictional
claims in published maps and institu-
tional affiliations.
Copyright: © 2022 by the authors. Li-
censee MDPI, Basel, Switzerland.
This article is an open access article
distributed under the terms and con-
ditions of the Creative Commons At-
tribution (CC BY) license (https://cre-
ativecommons.org/licenses/by/4.0/).

Int. J. Environ. Res. Public Health 2022, 19, 2935 2 of 11
applying an athlete’s monitoring cycle in which training demands is a well-implemented
practice in soccer clubs. As an example, a study summarizing results of a survey per-
formed at twenty-eight European soccer clubs [3] revealed that 100% of the clubs use mon-
itoring processes, most of them monitoring locomotor demands and half of them addi-
tionally monitoring psychophysiological demands. Additionally, in a survey conducted
on 84 coaches and 88 practitioners it was revealed that coaches and practitioners some-
times adjust training sessions based on previous training intensity monitoring, and that
training intensity reports are often provided to coaches [4]. Thus, monitoring locomotor
and psychophysiological demands imposed by training and/or matches is a usual practice
in both adults and youth categories [3,5].
While monitoring training demands is current practice, other factors should be con-
sidered for properly understanding the impact of training and match stimulus on the
players’ responses [6]. Thus, an athletes’ monitoring cycle is proposed as a recommended
practice to implement in any training scenario [7]. The athletes’ monitoring cycle consists
of monitoring training demands (e.g., locomotor/mechanical and psychophysiological),
as well as the well-being and the readiness of players [7]. In this conceptual framework,
perceptual well-being is related to training intensity, namely representing the way players
are coping with training demands [7]. The authors of this concept [7] also suggest that
poor perceptual well-being and high training demands should adhere to an adjustment
in the training dose, while a high training demand followed by a good level of perceptual
well-being is a signal to continue the training process.
Descriptive studies have been tried to test this interaction between training intensity
and well-being outcomes in soccer, covering adults [8–10], and youth [11,12]. While direct
relations between well-being outcomes (e.g., sleep quality, delayed onset muscle soreness
(DOMS) mood, fatigue, stress) and training intensity (e.g., rate of perceived exertion, RPE)
have revealed small-to-moderate magnitudes of correlation [13], specific original studies
have been suggesting large magnitudes of correlations between well-being outcomes and
some measures that identify accumulated training intensities and variability of these de-
mands [11]. Possibly, fluctuations over the season can be a cause of that.
Seasonal variations of training intensities [14] and well-being outcomes [15] in soccer
players have been described. In youth, well-being scores seem to be more stable in the
middle of the season, while in early and ending phases of the season presents greater var-
iability [15]. Interestingly, also in youth soccer players, significantly greater accumulated
training demands were found in the middle of the season [11].
Although well-established psychometric instruments such as CR-10 Borg’s scale
have been confirmed for their validity, reliability, and sensitivity [16], as well as well-
being questionnaires as proposed by Hooper and colleagues [17], there are some factors
that can influence the direction and magnitude of correlations between well-being and
training intensity. For example, relationships between well-being outcomes and training
intensity in the same day can be different to testing well-being and training intensity out-
comes considering days of difference. This has not been reported, and it could be interest-
ing to understand the possible delayed effects of accumulated training demands or accu-
mulated poor well-being reports in the following training process. Possibly, better identi-
fication of such relationships may provide useful insight to coaches and parents for being
attentive to some signals in players [18,19].
Considering the above-mentioned gap in the current research, it is important to de-
scribe the variations of well-being and training intensity outcomes and particularly in-
spect the relations between these outcomes with special attention to the effects of previ-
ously accumulated training intensity or accumulated well-being scores on the variations
of the other parameters. Thus, the purpose of this study was two-fold: (i) analyze the
weekly variations of well-being measures in youth soccer players, and (ii) test relations
between well-being and training intensity outcomes.

Int. J. Environ. Res. Public Health 2022, 19, 2935 3 of 11
2. Materials and Methods
2.1. Study Design
The study followed a descriptive case study design.
2.2. Setting
The observational period occurred between 29 July 2021 and 17 November 2021. Sev-
enteen consecutive weeks were observed, including a total of 64 training sessions and 19
matches. The details about the observed period can be observed in Table 1. Over the pe-
riod, the players were asked to fill out a wellness questionnaire (adjusted version of the
Hooper questionnaire) and to rate the perceived exertion (RPE) regarding the effort asso-
ciated with the training intensity. Moreover, the duration of the training sessions and/or
matches was registered for further data treatment. Players only registered wellness scores
in the same days in which the training and/or match occurred. The wellness scores were
provided before the training started, while the RPE was scored between 20 and 30 minutes
after the end of the training session and/or match. Typically, training sessions were struc-
tured in a warm-up, followed by analytic exercises focusing on the conditioning of players
(e.g., aerobic, anaerobic, speed, or change-of-direction) and a period of exercise with
small-sided games and positioning games. After that, a short period of 11 vs. 11 between
players and a period of cool-down was implemented.
Table 1. Timeline of the study.
Week Start Date End Date Sessions (N) Matches (N)
Week 1 29 July 2022 1 August 2021 3 0
Week 2 3 August 2021 8 August 2021 4 1
Week 3 10 August 2021 14 August 2021 4 1
Week 4 17 August 2021 20 August 2021 4 0
Week 5 24 August 2021 28 August 2021 4 1
Week 6 30 August 2021 5 September 2021 3 2
Week 7 6 September 2021 12 September 2021 5 0
Week 8 13 September 2021 18 September 2021 4 1
Week 9 20 September 2021 26 September 2021 4 1
Week 10 27 September 2021 3 October 2021 4 2
Week 11 4 October 2021 10 October 2021 3 2
Week 12 11 October 2021 16 October 2021 3 2
Week 13 18 October 2021 24 October 2021 4 2
Week 14 25 October 2021 31 October 2021 4 2
Week 15 1 November 2021 6 November 2021 5 0
Week 16 8 November 2021 14 November 2021 4 2
Week 17 15 November 2021 17 November 2021 2 0
2.3. Participants
Convenience sampling was used in the current study. The players were recruited
from the same team. Twenty-seven male soccer players (age: 16.3 ± 0.3 years; height: 1.8 ±
0.1 m; body mass: 67.7 ± 7.4 kg; body mass index: 22.1 ± 0.9 kg/m2) voluntarily participated
in the observational period. The following eligibility criteria was considered for including
players in the data treatment: (i) reported wellness and RPE scores every time they were
part of training sessions and/or matches; (ii) participate in >90% of the training sessions
occurring in the period of observation; (iii) participate in at least 50% of the matches oc-
curring in the observational period; (iv) not exceed more than one week in missing data.
The study design and protocol were preliminarily explained and detailed to the players
and their parents. After being informed about the risks and benefits, they signed a free
consent. The study has followed the ethical standards for the study in humans, in accord-
ance with the Declaration of Helsinki.

Int. J. Environ. Res. Public Health 2022, 19, 2935 4 of 11
2.4. Well-Being Questionnaire
An adjusted version from the proposed Hooper questionnaire [17] was used. An or-
dinal 10-point scale was used. The score and verbal anchors can be found in Table 2. The
questionnaire was preliminarily introduced to the athletes in the previous two weeks be-
fore starting the observational period, aiming to familiarize them. The scores were pro-
vided before each training session and/or match, about thirty minutes before. The scores
were provided individually, and the answers were registered by the observer in a data-
base. The main outcomes extracted for further data treatment were the scores in sleep
quality, readiness, fatigue, and delayed onset muscle soreness (DOMS) categories ana-
lyzed by the questionnaire.
Table 2. Wellness questionnaire (score and verbal anchors) used in the current study.
Score Sleep Quality Readiness Fatigue DOMS
10 Excellent Totally available Tired/Exhaustion Extremely sore
9
8 Good Available Very high Very sore
7
6 Sore
5 Moderate Moderate Moderate Moderate
4
3 Bad Little available
2 Light Light
1 Very bad Very little available
0 No sleep Nothing available None None
DOMS: delayed onset muscle soreness.
2.5. Training and Match Intensity
The training intensity was monitored using the CR-10 Borg’s scale [20]. The score of
the scale varies between 0 (nothing at all) and 10 (extremely strong) to the question “how
intense was your training session?”. The scores can be provided from 0.5 to 0.5. The CR-
10 Borg’s scale was applied between 20 to 30 minutes from the end of training session
and/or match. The scores were provided individually, and the observer collected the in-
formation in a database. The players were previously familiarized with the scale. The
score provided was used as RPE outcome for further statistical treatment. Additionally,
the session-RPE [21] per each training session and/or match was calculated as follows:
CR10 Borg’s scale score × time of the entire session (minutes). The session-RPE was also
used as main outcome of the current research.
2.6. Statistical Procedures
The descriptive statistics are presented in the form of average and standard devia-
tion. Normality and homogeneity of the sample was tested using the Shapiro–Wilk test
and Levene’s test, respectively. After confirmation of the normality and homogeneity as-
sumptions (p > 0.05), a repeated measures ANOVA was conducted to analyze the varia-
tions of wellness and training intensity scores over the seventeen weeks. The Bonferroni’s
post hoc test was used to test the pairwise comparisons. Partial eta squared was executed
to determine the effect size of analysis of variation. Aiming to analyze the relations be-
tween wellness and training intensity outcomes, a Pearson product moment correlation
test was executed. Average and confidence intervals of correlation coefficient (r) were pre-
sented. Magnitude of correlations were classified based on the following thresholds [22]:
(0.0–0.1) trivial; (0.1–0.3) small; (0.3–0.5) moderate; (0.5–0.7) large; (0.7–0.9) very large;
(0.90-1.00) nearly perfect. All the statistical procedures were executed in the SPSS (version
28.0.0.0, IBM, Chicago, IL, USA) for a p < 0.05.

Int. J. Environ. Res. Public Health 2022, 19, 2935 5 of 11
3. Results
Descriptive statistics of well-being and training intensity outcomes can be found in
Table 3. Moreover, a graphical representation of the outcomes over the period of observa-
tion can be observed in Figure 1.
Figure 1. Weekly average values of sleep, readiness, fatigue, delayed onset muscle soreness
(DOMS), CR10 Borg’s scale (RPE: rate of perceived exertion), and session-RPE. W: week; A.U.: arbi-
trary units.
Repeated measures ANOVA revealed significant differences between weeks in the
sleep quality (F = 0.4216; p < 0.001; 𝜂𝑝2 = 0.140), readiness (F = 8.734; p < 0.001; 𝜂𝑝
2 = 0.251),
fatigue (F = 4.484; p < 0.001; 𝜂𝑝2 = 0.147), DOMS (F = 3.775; p = 0.001; 𝜂𝑝
2 = 0.127), RPE (F =
7.301; p < 0.001; 𝜂𝑝2 = 0.219), and session-RPE (F = 17.708; p < 0.001; 𝜂𝑝
2 = 0.405).
0
2
4
6
8
10
12
W1
W2
W3
W4
W5
W6
W7
W8
W9
W1
0
W1
1
W1
2
W1
3
W1
4
W1
5
W1
6
W1
7
Slee
p q
ual
ity
(A.U
.)
Sleep
0
2
4
6
8
10
12
W1
W2
W3
W4
W5
W6
W7
W8
W9
W1
0W
11
W1
2W
13
W1
4W
15
W1
6W
17
Rea
din
ess
(A.U
.)
Readiness
0
2
4
6
8
10
12
W1
W2
W3
W4
W5
W6
W7
W8
W9
W1
0
W1
1
W1
2
W1
3
W1
4
W1
5
W1
6
W1
7
Fati
gue
(A.U
.)
Fatigue
0
2
4
6
8
10
12W
1W
2W
3W
4W
5W
6W
7W
8W
9W
10
W1
1W
12
W1
3W
14
W1
5W
16
W1
7
DO
MS
(A.U
.)
DOMS
0
2
4
6
8
10
12
W1
W2
W3
W4
W5
W6
W7
W8
W9
W1
0
W1
1
W1
2
W1
3
W1
4
W1
5
W1
6
W1
7
RP
E (A
.U.)
RPE
0
100
200
300
400
500
600
700
W1 W3 W5 W7 W9 W11 W13 W15 W17
sess
ion
-RP
E (A
.U.)
session-RPE

Int. J. Environ. Res. Public Health 2022, 19, 2935 6 of 11
The sleep quality score on week 2 was significantly smaller than in week 6 (−0.8 A.U.;
p = 0.013). Regarding readiness scores, week 1 had significant smaller values than weeks
11 (−0.5 A.U.; p = 0.028), 12 (−0.6 A.U.; p = 0.002), and 14 (−0.5 A.U.; p = 0.024). Week 2 also
had significantly smaller readiness scores than weeks 12 (−0.7 A.U.; p = 0.008) and 13 (−0.6
A.U.; p = 0.042). Week 3 presented significantly smaller readiness scores than weeks 11
(−0.5 A.U.; p = 0.031), 12 (−0.6 A.U.; p < 0.001), 13 (−0.5 A.U.; p = 0.025), and 14 (−0.6 A.U.; p
= 0.025). Week 4 presented significantly smaller readiness scores than weeks 6 (−0.4 A.U.;
p = 0.005), 9 (−0.4 A.U.; p = 0.043), 11 (−0.6 A.U.; p = 0.010), 12 (−0.7 A.U.; p < 0.001), 13 (−0.6
A.U.; p < 0.001), and 14 (−0.6 A.U.; p = 0.001). Week 5 presented significantly smaller values
of readiness scores than week 12 (–1.1 A.U.; p = 0.043).
Considering fatigue, week 11 presented significantly smaller values than week 1 (−0.7
A.U.; p = 0.003), week 2 (−0.9 A.U.; p = 0.003), week 4 (–1.0 A.U.; p < 0.001), and week 8
(−0.7 A.U.; p = 0.009). Week 4 had significantly greater fatigue scores than week 6 (+0.8
A.U.; p = 0.003), week 9 (+0.6 A.U.; p = 0.032), week 10 (+0.7 A.U.; p = 0.012), and week 14
(+0.7 A.U.; p = 0.029).
Week 1 had significantly greater DOMS scores than week 5 (+0.8 A.U.; p = 0.023),
week 6 (+0.9 A.U.; p < 0.001), week 11 (+1.3 A.U.; p < 0.001), week 13 (+1.0 A.U.; p = 0.007),
and week 14 (+0.9 A.U.; p = 0.016). Week 11 had significantly smaller DOMS scores than
week 8 (−0.9 A.U.; p = 0.002), week 12 (−0.7 A.U.; p = 0.009), and week 16 (−0.8 A.U.; p =
0.022).
Table 3. Descriptive statistics (mean ± standard-deviation) of well-being and training/match inten-
sity outcomes over the observed period.
Week
Sleep
Quality
(A.U.)
Readiness (A.U.) Fatigue (A.U.) DOMS (A.U.) RPE (A.U.) Session-RPE (A.U.)
W1 8.3 ± 0.9 9.3 ± 0.5 w11,w12,w14 2.4 ± 0.6 w11 2.8 ± 0.8 w5,w6,w11,w13,w14 6.5 ± 0.7 w7,w12,w15,w17 450.7 ± 106.9 w4,w11,w12,w17
W2 8.0 ± 0.9 w6 9.2 ± 0.7 w12,w13 2.6 ± 0.7 w11 2.2 ± 1.0 6.3 ± 1.0 483.5 ± 130.6 w6,w10,w11,w12,w14,w16,w17
W3 8.3 ± 0.8 9.3 ± 0.6 w11,w12,w13,w14 2.4 ± 0.9 1.9 ± 1.1 6.1 ± 1.0 474.2 ± 129.3 w11,w12,w14,w16,w17
W4 8.0 ± 0.7 9.2 ± 0.6 w6,w9,w11,w12,w13,w14 2.7 ± 0.8 w6,w9,w10,w11,w14 2.2 ± 0.8 6.7 ± 0.4 w7,w10,w11,w12,w15,w16,w17 563.4 ± 69.1 w1,w6-w17
W5 8.6 ± 0.6 8.6 ± 1.7 w12 2.2 ± 0.8 2.0 ± 0.9 6.6 ± 0.7 w7,w12,w15,w17 463.7 ± 118.8 w4,w11,w12,w14,w16,w17
W6 8.8 ± 0.7 w2 9.6 ± 0.4 w4 1.9 ± 0.9 w4 1.9 ± 0.7 6.0 ± 0.9 342.2 ± 114.6 w2,w4
W7 8.2 ± 0.6 9.6 ± 0.4 2.2 ± 0.8 2.1 ± 0.9 6.0 ± 0.5 w1,w4,w5,w13 399.2 ± 80.6 w4,w17
W8 8.2 ± 0.5 9.6 ± 0.5 2.4 ± 0.6 w11 2.4 ± 0.9 w11 6.4 ± 0.5 w12,w17 424.0 ± 117.4 w4,w11,w17
W9 8.2 ± 0.6 9.6 ± 0.4 w4 2.1 ± 0.9 w4 2.1 ± 1.2 6.2 ± 0.7 419.2 ± 117.4 w4,w17
W10 8.2 ± 0.6 9.7 ± 0.4 2.0 ± 0.8 w4 2.1 ± 1.0 6.2 ± 0.4 w4,w12 369.2 ± 67.9 w2,w4,w17
W11 8.7 ± 0.6 9.8 ± 0.3 w1,w3,w4 1.7 ± 0.7 w1,w2,w4,w8 1.5 ± 1.0 w8,w12,w16 5.8 ± 1.0 w4 336.2 ± 81.8 w1,w2,w3,w4,w5,w8,w17
W12 8.4 ± 0.6 9.9 ± 0.2 w1,w2,w3,w4,w5 2.3 ± 1.0 2.2 ± 1.0 w11 5.7 ± 0.5 w1,w4,w5,w8,w10,w13,w16 324.3 ± 71.9 w1,w2,w3,w4,w5
W13 8.4 ± 0.6 9.8 ± 0.4 w2,w3,w4 1.9 ± 0.7 1.8 ± 0.8 6.7 ± 0.6 w7,w12,w15,w16,w17 387.7 ± 88.7 w4,w17
W14 8.5 ± 0.6 9.8 ± 0.3 w1,w3,w4 2.0 ± 0.7 w4 1.9 ± 0.8 6.2 ± 0.7 368.5 ± 77.4 w2,w3,w4,w5,w17
W15 8.4 ± 0.7 9.8 ± 0.4 2.0 ± 0.9 2.4 ± 1.1 6.0 ± 0.5 w1,w4,w5,w13 386.0 ± 109.4 w4,w17
W16 8.5 ± 0.6 9.7 ± 0.7 2.3 ± 0.7 2.3 ± 1.0 w11 6.1 ± 0.5 w4,w12,w13 366.1 ± 72.2 w2,w3,w4,w5,w17
W17 8.3 ± 0.8 9.8 ± 0.6 2.0 ± 0.9 2.2 ± 1.1 5.4 ± 0.9 w1,w4,w5,w8,w13 251.7 ± 61.0 w1–w5;w7-w11,w13–w16
W: week; DOMS: delayed onset muscle soreness; A.U.: arbitrary units; RPE: Rate of perceived
exertion measured in the CR-10 Borg’s scale; session-RPE: multiplication of time of session by the
Borg’s scale score; w: significant different at p < 0.05 in comparison to weeks 1w1, 2w2, 3w3, 4w4, 5w5,
6w6, 7w7,8w8, 9w9, 10w10, 11w11, 12w12, 13w13, 14w14, 15w15, 16w16, and 17w17.
Regarding RPE scores, Week 1 had significantly greater values than week 7 (+0.5
A.U.; p = 0.025), week 12 (+0.7 A.U.; p < 0.001), week 15 (+0.5 A.U.; p = 0.022), and week 17
(+0.9 A.U.; p = 0.007). Significantly greater RPE scores were found in week 4 in comparison
to weeks 7 (+0.7 A.U.; p < 0.001), 10 (+0.5 A.U.; p = 0.020), 11 (+0.9 A.U.; p = 0.018), 12 (+1.0
A.U.; p < 0.001), 15 (+0.7 A.U.; p < 0.001), 16 (+0.6 A.U.; p < 0.001), and 17 (+1.3 A.U.; p <
0.001). Significantly greater RPE scores were found in week 5 than in weeks 7 (+0.6 A.U.;
p = 0.008), 12 (+0.9 A.U.; p < 0.001), 15 (+0.6 A.U.; p = 0.010), and 17 (+1.2 A.U.; p = 0.002).
Week 7 had significantly smaller RPE scores than week 13 (−0.7 A.U.; p = 0.004).
Int. J. Environ. Res. Public Health 2022, 19, 2935 7 of 11
Significantly greater RPE scores were found at week 8 in comparison to weeks 12 (+0.7
A.U.; p < 0.001) and 17 (+1.0 A.U.; p = 0.031). Significantly greater RPE scores were found
at week 10 than in week 12 (+0.5 A.U.; p = 0.009). Significantly smaller RPE scores were
found at week 12 than in weeks 13 (–1.0 A.U.; p < 0.001) and 16 (−0.4 A.U.; p = 0.007). Week
13 had significantly greater RPE scores than weeks 15 (+0.7 A.U.; p = 0.002), 16 (+0.6 A.U.;
p = 0.023), and 17 (+1.3 A.U.; p < 0.001).
Regarding the session-RPE, week 1 presented significantly greater values than weeks
11 (+114.5 A.U.; p = 0.026), 12 (+126.4 A.U.; p < 0.001), and 17 (+199.0 A.U.; p < 0.001), while
presented significantly smaller than week 4 (–112.7 A.U.; p = 0.003). Week 2 presented
significantly greater session-RPE scores than weeks 6 (+141.3 A.U.; p = 0.019), 10 (+114.3
A.U.; p = 0.046), 11 (+147.3 A.U.; p = 0.011), 12 (+115.0 A.U.; p < 0.001), 14 (+115.0 A.U.; p <
0.001), 16 (+117.4 A.U.; p = 0.012), and 17 (+231.8 A.U.; p < 0.001). Week 3 had significantly
greater session-RPE scores than weeks 11 (+138.0 A.U.; p = 0.017), 12 (+149.9 A.U.; p <
0.001), 14 (+105.7 A.U.; p = 0.008), 16 (+108.1 A.U.; p = 0.003), and 17 (+222.5 A.U.; p < 0.001).
Week 4 had significantly greater session-RPE scores than weeks 6 (+221.2 A.U.; p < 0.001),
7 (+164.2 A.U.; p < 0.001), 8 (+139.4 A.U.; p < 0.001), 9 (+144.2 A.U.; p < 0.001), 10 (+194.2
A.U.; p < 0.001), 11 (+227.2 A.U.; p < 0.001), 12 (+239.1p A.U.; p < 0.001), 13 (+175.7 A.U.; p
< 0.001), 14 (+194.9 A.U.; p < 0.001), 15 (+177.415 A.U.; p < 0.001), 16 (+197.3 A.U.; p < 0.001),
and 17 (+311.7 A.U.; p < 0.001). Week 5 had significantly greater session-RPE scores than
weeks 12 (+139.4 A.U.; p = 0.007), 14 (+95.2 A.U.; p = 0.039), 16 (+97.6 A.U.; p = 0.043), and
17 (+212.0 A.U.; p < 0.001). Week 7 had significantly greater session-RPE than week 17
(+147.5; p < 0.001). Significantly greater session-RPE was found in week 8 in comparison
to weeks 11 (+99.7; p = 0.029) and 17 (+172.3; p < 0.001). Week 17 had significantly smaller
session-RPE than weeks 9 (–167.5 A.U.; p < 0.001), 10 (–117.5 A.U.; p < 0.001), 11 (–84.5
A.U.; p = 0.023), 13 (–136.0 A.U.; p = 0.023), 14 (–116.8 A.U.; p < 0.001), 15 (–134,.3 A.U.; p <
0.001), and 16 (–114.4 A.U.; p < 0.001).
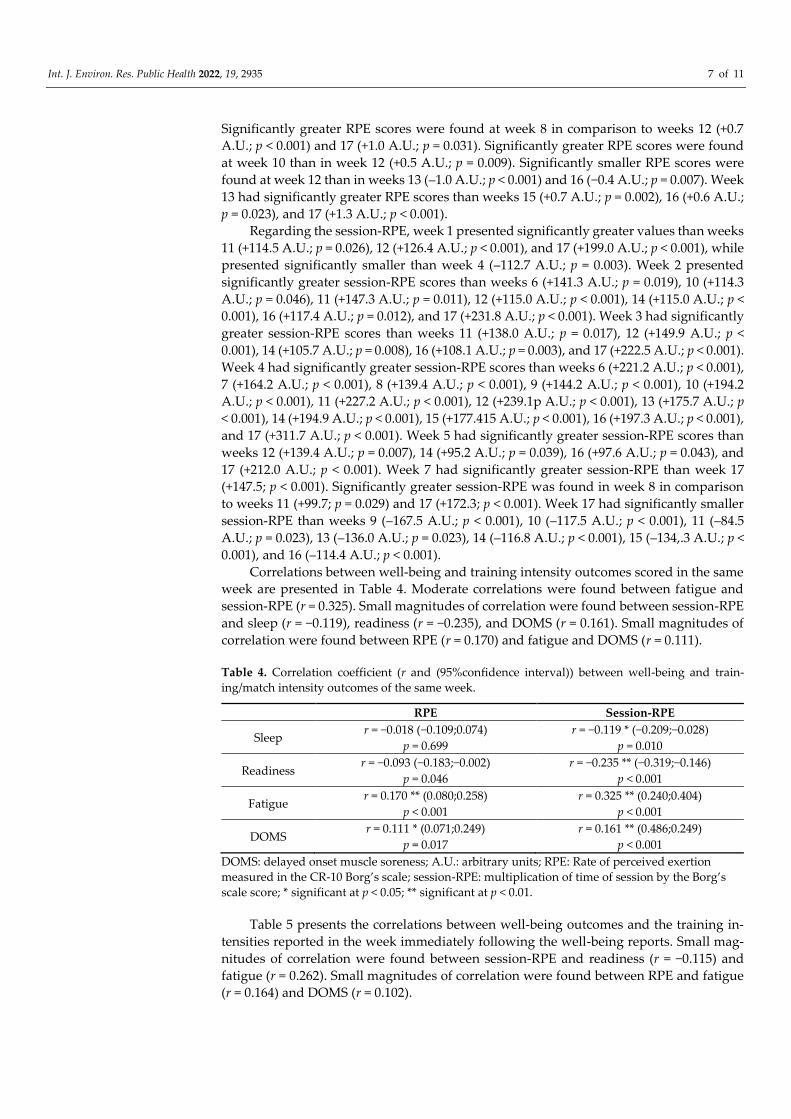
Correlations between well-being and training intensity outcomes scored in the same
week are presented in Table 4. Moderate correlations were found between fatigue and
session-RPE (r = 0.325). Small magnitudes of correlation were found between session-RPE
and sleep (r = −0.119), readiness (r = −0.235), and DOMS (r = 0.161). Small magnitudes of
correlation were found between RPE (r = 0.170) and fatigue and DOMS (r = 0.111).
Table 4. Correlation coefficient (r and (95%confidence interval)) between well-being and train-
ing/match intensity outcomes of the same week.
RPE Session-RPE
Sleep r = −0.018 (−0.109;0.074)
p = 0.699
r = −0.119 * (−0.209;−0.028)
p = 0.010
Readiness r = −0.093 (−0.183;−0.002)
p = 0.046
r = −0.235 ** (−0.319;−0.146)
p < 0.001
Fatigue r = 0.170 ** (0.080;0.258)
p < 0.001
r = 0.325 ** (0.240;0.404)
p < 0.001
DOMS r = 0.111 * (0.071;0.249)
p = 0.017
r = 0.161 ** (0.486;0.249)
p < 0.001
DOMS: delayed onset muscle soreness; A.U.: arbitrary units; RPE: Rate of perceived exertion
measured in the CR-10 Borg’s scale; session-RPE: multiplication of time of session by the Borg’s
scale score; * significant at p < 0.05; ** significant at p < 0.01.
Table 5 presents the correlations between well-being outcomes and the training in-
tensities reported in the week immediately following the well-being reports. Small mag-
nitudes of correlation were found between session-RPE and readiness (r = −0.115) and
fatigue (r = 0.262). Small magnitudes of correlation were found between RPE and fatigue
(r = 0.164) and DOMS (r = 0.102).

Int. J. Environ. Res. Public Health 2022, 19, 2935 8 of 11
Table 5. Correlation coefficient (r) between well-being of the previous week and training/match
intensity outcomes of the following week.
RPE Session-RPE
Sleep r = −0.091 (−0.184;0.004)
p = 0.059
r = −0.091 (−0.184;0.003)
p = 0.058
Readiness r = −0.075 (−0.168;0.020)
p = 0.122
r = −0.115 * (−0.207;−0.021)
p = 0.017
Fatigue r = 0.164 ** (0.070;0.254)
p < 0.001
r = 0.262 ** (0.171;0.347)
p < 0.001
DOMS r = 0.102 * (0.004;0.191)
p = 0.035
r = 0.099 * (0.497;0.626)
p = 0.040
DOMS: delayed onset muscle soreness; A.U.: arbitrary units; RPE: Rate of perceived exertion
measured in the CR-10 Borg’s scale; session-RPE: multiplication of time of session by the Borg’s
scale score; * significant at p < 0.05; ** significant at p < 0.01.
Correlation coefficients between training intensity and well-being outcomes reported
the week after the training intensity reports can be found in Table 6. Small magnitudes of
correlation were found between RPE and readiness (r = −0.135), fatigue (r = 0.202), and
DOMS (r = 0.122). Similarly, small magnitudes of correlation were found between session-
RPE and readiness (r = −0.167), fatigue (r = 0.282) and DOMS (r = 0.134).
Table 6. Correlation coefficient (r) between training/match intensity of the previous week and well-
being outcomes of the following week.
Sleep Readiness Fatigue DOMS
RPE r = 0.049 (−0.046;0.142)
p = 0.311
r = −0.135 ** (−0.227;−0.041)
p = 0.005
r = 0.202 ** (0.109;0.290)
p < 0.001
r = 0.122 * (0.028; 0.214)
p = 0.011
Session-RPE r = 0.021 (−0.074;0.115)
p = 0.667
r = −0.167 ** (−0.257;−0.073)
p < 0.001
r = 0.282 ** (0.193;0.367)
p < 0.001
r = 0.134 * (0.040; 0.225)
p = 0.005
DOMS: delayed onset muscle soreness; A.U.: arbitrary units; RPE: Rate of perceived exertion
measured in the CR-10 Borg’s scale; session-RPE: multiplication of time of session by the Borg’s
scale score; * significant at p < 0.05; ** significant at p < 0.01.
4. Discussion
The aims of this study were to analyze the variations of well-being and intensity
measures across 17 weeks in youth soccer players and to test associations between well-
being and training intensity measures. Regarding the first aim, several significant differ-
ences between weeks for all well-being measures and training intensity were found.
Specifically, sleep quality was reported as good or higher for all weeks, and overall
it seems that weeks with two matches reported higher values of sleep quality. This finding
seems to be in line with previous studies that found that high-intensity training sessions
performed in the evenings for young soccer players [23], or matches for professional soc-
cer players, had no impact on sleep quality [9,24].
Readiness showed a tendency of higher values from week 6 forward. It seems that
weeks with more matches cause a perception of higher readiness. Following the same line,
fatigue and DOMS perceptions where higher values occurred in the first weeks and from
week 6 forward, a tendency to lower the values occurred. Intensity measures of RPE and
session-RPE seem to be in line with well-being measures, although there were some vari-
ations as well after week 6; a tendency in lowering the RPE and session-RPE values was
observed until the last week analyzed.
Following a previous study, the well-being results seem to be in line, although dif-
ferent approaches for data analysis had been used [11]. In the Nobari et al. study, weekly
accumulated data was used instead of weekly average data and the original Hooper index
was used [11], but the results seem to be aligned. Other studies found lower values during
mid-season (weeks 14 to 31) for sleep quality, DOMS, and fatigue than in earlier seasons

Int. J. Environ. Res. Public Health 2022, 19, 2935 9 of 11
(weeks 6 to 13) [12]. Although our study presents a different design and only 17 weeks in
analysis, we would speculate different results because our data seems to support that the
weeks with higher number of matches show a tendency to increase the well-being percep-
tion and to reduce the intensity. Indeed, this was in opposition to a previous study con-
ducted with professional soccer players where weeks with two matches showed higher
values of fatigue and DOMS than weeks with only one match [9].
Regarding intensity, previous studies also showed higher values from week 6 for-
ward when compared to the results of the present study [11,12,25], but there was one
study that showed higher values in the first month that tended to be reduced in the fol-
lowing two months [26] which seems to be in line with the present study. Despite the
differences between studies, the RPE and session-RPE values found in this study seems
to overcome the range values found in a recent systematic review conducted in young
soccer players (RPE = 2.3–6.3 A.U.; session-RPE = 156–394 A.U.)[27].
From the second aim of this study, there was a moderate correlation between fatigue
and session-RPE and small correlations between session-RPE and sleep, readiness, and
DOMS; RPE and DOMS in the same week. The correlation between fatigue and session-
RPE was also found in another study that used weekly accumulated data [12]. In fact, that
study found correlations between session-RPE and DOMS and fatigue [12]. Another study
in young soccer players also showed that fatigue, DOMS, and sleep were largely related
to session-RPE [11]. In professional soccer players, session-RPE also displayed moderate
correlations with fatigue and DOMS [28,29]. The previous correlations seem to support
the findings of the present study.
Despite the fact that some differences exist, it seems that with higher intensity, higher
levels of fatigue and DOMS occur, while at the same time higher levels of intensity seem
to be associated with better readiness and sleep quality. This was also observed in our
analysis when readiness and fatigue values were associated with both RPE and session-
RPE of the week after. Furthermore, both RPE and session-RPE also showed associations
with readiness, fatigue, and DOMS. It seems that this was the first study that conducted
this type of analysis. Therefore, future studies should consider it to amplify knowledge in
this field.
As mentioned in the beginning of this discussion, and despite the correlation shown,
our data revealed that weeks with two matches tended to show better well-being and
lower intensity. However, it important to highlight that the number of matches was not
considered in the correlation analysis, which is required for future studies.
The present study presents some limitations, namely: the small sample size that came
from only one team; an analysis of 17 weeks and not the entire season; the lack of locomo-
tor measures (e.g., high-speed running, sprint, and accelerations) that could amplify the
present results; and the lack of dietary control and supplementation. Finally, an intra-in-
dividual analysis considering the interaction between locomotor demands, playing posi-
tion, physical fitness, and lifestyle was not analyzed and should be performed in future
research aiming to explain the causes for variations. Therefore, future studies should
avoid previous limitations and use: larger sample sizes and full-season analysis and ex-
ternal load measures. In addition, other contextual variables such as match results could
influence the results and should be considered for future studies as previously suggested.
For instance, a match win showed to provide better sleep quality when compared with a
draw or a loss [30]. In the same line, match location should be taken in consideration in
future analysis because it has been shown that away matches that required longer distance
of travelling showed sleep/wake behavior impairment [31]. Moreover, analysis of dietary
intake and supplementation should be considered, namely trying to establish relation-
ships with wellness and coping with training demands.
Moreover, some studies have shown the importance of playing positions due to the
different physical and physiological demands [27] and several variations in well-being
[15], as well as playing status (starters and non-starters) that reflect differences across the

Int. J. Environ. Res. Public Health 2022, 19, 2935 10 of 11
season in young soccer players [26]. For that reason, they should be considered in future
research.
Lastly, similar designs should be replicated not only for young soccer players, but
also for professional elite men and women players. Additionally, future studies should
analyze the influence of congested periods (weeks with two or more matches) compared
with regular weeks (weeks with only one match).
Nonetheless, this study should be considered by coaches and their staff to
acknowledge the importance of internal intensity and wellbeing measures such as readi-
ness, sleep quality, fatigue, and DOMS variables as a mandatory daily task.
5. Conclusions
This study showed that well-being and training intensity fluctuates over the weeks.
In addition, well-being measures seem to be related to training intensity, although with a
small magnitude (only a moderate correlation was found between session-RPE and fa-
tigue). Even so, this study showed a tendency of lower internal intensity and better well-
being in the weeks with two matches.
Author Contributions: Conceptualization, A.F.S. and F.M.C.; methodology, A.F.S., F.M.C. and
G.G.; formal analysis, S.C. and F.M.C.; investigation, C.L. and F.L.; data curation, C.L., F.L. and V.B.;
writing—original draft preparation, A.F.S., R.O., S.C., G.B., C.L. and F.M.C.; writing—review and
editing, A.F.S., R.O., G.B., C.L., F.M.C., G.G., V.B. and F.F.; supervision, F.M.C. and F.F. All authors
have read and agreed to the published version of the manuscript.
Funding: This work is funded by Fundação para a Ciência e Tecnologia/Ministério da Ciência,
Tecnologia e Ensino Superior through national funds and when applicable co-funded EU funds un-
der the project UIDB/50008/2020.
Institutional Review Board Statement: The study was conducted in accordance with the Declara-
tion of Helsinki and approved by the Escola Superior de Desporto e Lazer ethical committee with
the code CTC-ESDL-CE001-2021.
Data Availability Statement: Data available on request due to privacy. The data presented in this
study are available on request from the first author.
Informed Consent Statement: Informed consent was obtained from all subjects involved in the
study.
Conflicts of Interest: The authors declare no conflict of interest.
References
1. Halson, S.L. Monitoring Training Load to Understand Fatigue in Athletes. Sport. Med. 2014, 44, 139–147.
2. Williams, S.; Trewartha, G.; Cross, M.J.; Kemp, S.P.T.; Stokes, K.A. Monitoring What Matters: A Systematic Process for Selecting
Training-Load Measures. Int. J. Sports Physiol. Perform. 2017, 12, S2-101–S2-106.
3. Akenhead, R.; Nassis, G.P. Training load and player monitoring in high-level football: Current practice and perceptions. Int. J.
Sports Physiol. Perform. 2016, 11, 587–593.
4. Weston, M. Training load monitoring in elite English soccer: A comparison of practices and perceptions between coaches and
practitioners. Sci. Med. Footb. 2018, 2, 216–224.
5. Salter, J.; De Ste Croix, M.B.A.; Hughes, J.D.; Weston, M.; Towlson, C. Monitoring Practices of Training Load and Biological
Maturity in UK Soccer Academies. Int. J. Sports Physiol. Perform. 2021, 16, 395–406.
6. Esposito, G.; Raiola, G. Monitoring the performance and technique consolidation in youth football players. Trends Sport Sci.
2020, 27, 93–100.
7. Gabbett, T.J.; Nassis, G.P.; Oetter, E.; Pretorius, J.; Johnston, N.; Medina, D.; Rodas, G.; Myslinski, T.; Howells, D.; Beard, A.; et
al. The athlete monitoring cycle: A practical guide to interpreting and applying training monitoring data. Br. J. Sports Med. 2017,
51, 1451–1452.
8. Selmi, O.; Ouergui, I.; Castellano, J.; Levitt, D.; Bouassida, A. Effect of an intensified training period on well-being indices,
recovery and psychological aspects in professional soccer players. Rev. Eur. Psychol. Appl. 2020, 70, 100603.
9. Clemente, F.M.; Mendes, B.; Nikolaidis, P.T.; Calvete, F.; Carriço, S.; Owen, A.L. Internal training load and its longitudinal
relationship with seasonal player wellness in elite professional soccer. Physiol. Behav. 2017, 179, 262–267.

Int. J. Environ. Res. Public Health 2022, 19, 2935 11 of 11
10. Novack, L.F.; de Souza, G.C.; Conde, J.H.S.; de Souza, R.O.; Osiecki, R. Quantification of match internal load and its relationship
with physical fitness and recovery state of professional soccer athletes during the competitive period. Hum. Mov. 2018, 19, 30–
37.
11. Nobari, H.; Aquino, R.; Clemente, F.M.; Khalafi, M.; Adsuar, J.C.; Pérez-Gómez, J. Description of acute and chronic load, training
monotony and strain over a season and its relationships with well-being status: A study in elite under-16 soccer players. Physiol.
Behav. 2020, 225, 113117.
12. Nobari, H.; Alves, A.R.; Haghighi, H.; Clemente, F.M.; Carlos-Vivas, J.; Pérez-Gómez, J.; Ardigò, L.P. Association between train-
ing load and well-being measures in young soccer players during a season. Int. J. Environ. Res. Public Health 2021, 18, 4451.
13. Duignan, C.; Doherty, C.; Caulfield, B.; Blake, C. Single-item self-report measures of team-sport athlete wellbeing and their
relationship with training load: A systematic review. J. Athl. Train. 2020, 55, 944–953.
14. Hasan, U.C.; Silva, R.; Clemente, F. Weekly variations of biomechanical load variables in professional soccer players: Compar-
isons between playing positions. Hum. Mov. 2021, 22, 19–34.
15. Nobari, H.; Fani, M.; Clemente, F.M.; Carlos-Vivas, J.; Pérez-Gómez, J.; Ardigò, L.P. Intra- and Inter-week Variations of Well-
Being Across a Season: A Cohort Study in Elite Youth Male Soccer Players. Front. Psychol. 2021, 12, 671072.
doi:10.3389/fpsyg.2021.671072.
16. Haddad, M.; Stylianides, G.; Djaoui, L.; Dellal, A.; Chamari, K. Session-RPE Method for Training Load Monitoring: Validity,
Ecological Usefulness, and Influencing Factors. Front. Neurosci. 2017, 11, 612. doi:10.3389/fnins.2017.00612.
17. Hooper, S.L.; Mackinnon, L.T. Monitoring Overtraining in Athletes. Sport. Med. 1995, 20, 321–327.
18. De Muynck, G.-J.; Morbée, S.; Soenens, B.; Haerens, L.; Vermeulen, O.; Vande Broek, G.; Vansteenkiste, M. Do both coaches and
parents contribute to youth soccer players’ motivation and engagement? An examination of their unique (de)motivating roles.
Int. J. Sport Exerc. Psychol. 2021, 19, 761–779.
19. Berengüí, R.; Carralero, R.; Castejón, M.A.; Campos-Salinas, J.A.; Cantón, E. Values, motivational orientation and team cohesion
amongst youth soccer players. Int. J. Sports Sci. Coach. 2021. doi:10.1177/17479541211055690.
20. Borg, G. Perceived Exertion and Pain Scales; Human Kinetics: Champaign IL, USA, 1998; ISBN 0880116234.
21. Foster, C.; Florhaug, J.A.; Franklin, J.; Gottschall, L.; Hrovatin, L.A.; Parker, S.; Doleshal, P.; Dodge, C. A new approach to
monitoring exercise training. J. Strength Cond. Res. 2001, 15, 109–115.
22. Batterham, A.M.; Hopkins, W.G. Making Meaningful Inferences about Magnitudes. Int. J. Sports Physiol. Perform. 2006, 1, 50–57.
23. Robey, E.; Dawson, B.; Halson, S.; Gregson, W.; Goodman, C.; Eastwood, P. Sleep quantity and quality in elite youth soccer
players: A pilot study. Eur. J. Sport Sci. 2014, 14, 410–417.
24. Oliveira, R.; Brito, J.P.; Martins, A.; Mendes, B.; Marinho, D.A.; Ferraz, R.; Marques, M.C. In-season internal and external train-
ing load quantification of an elite European soccer team. PLoS ONE 2019, 14, e0209393.
25. Nobari, H.; Silva, A.F.; Clemente, F.M.; Siahkouhian, M.; García-Gordillo, M.Á.; Adsuar, J.C.; Pérez-Gómez, J. Analysis of Fit-
ness Status Variations of Under-16 Soccer Players Over a Season and Their Relationships With Maturational Status and Training
Load. Front. Physiol. 2021, 11, 1840.
26. Martins, A.D.; Oliveira, R.; Brito, J.P.; Loureiro, N.; Querido, S.M.; Nobari, H. Intra-season variations in workload parameters
in europe’s elite young soccer players: A comparative pilot study between starters and non-starters. Healthcare 2021, 9, 977.
27. Oliveira, R.; Brito, J.P.; Moreno-Villanueva, A.; Nalha, M.; Rico-González, M.; Clemente, F.M. Reference values for external and
internal training intensity monitoring in young male soccer players: A systematic review. Healthcare 2021, 9, 1567.
28. Moalla, W.; Fessi, M.S.; Farhat, F.; Nouira, S.; Wong, D.P.; Dupont, G. Relationship between daily training load and psychomet-
ric status of professional soccer players. Res. Sport Med. 2016, 24, 387–394.
29. Greco, G.; Tambolini, R.; Ambruosi, P.; Fischetti, F. Negative effects of smartphone use on physical and technical performance
of young footballers. J. Phys. Educ. Sport 2017, 17, 2495–2501.
30. Fessi, M.S.; Moalla, W. Postmatch Perceived Exertion, Feeling, and Wellness in Professional Soccer Players. Int. J. Sports Physiol.
Perform. 2018, 13, 631–637.
31. Lastella, M.; Roach, G.D.; Sargent, C. Travel fatigue and sleep/wake behaviors of professional soccer players during interna-
tional competition. Sleep Health 2019, 5, 141–147.