Embed Size (px)
Citation preview
A framework for variation discovery and genotyping using next-generation DNA sequencing data
M.A. DePristo1,*, E. Banks1, R.E. Poplin1, K.V. Garimella1, J.R. Maguire1, C. Hartl1, A.A.Philippakis1,2,3, G. del Angel1, M.A Rivas1,4, M. Hanna1, A. McKenna1, T.J. Fennell1, A.M.Kernytsky1, A.Y. Sivachenko1, K. Cibulskis1, S.B. Gabriel1, D. Altshuler1,3,4, and M.J.Daly1,3,4
1Program in Medical and Population Genetics, Broad Institute of Harvard and MIT, FiveCambridge Center, Cambridge, Massachusetts 021422Brigham and Women’s Hospital, 75 Francis Street, Boston, MA 02115 USA3Harvard Medical School, Boston, MA 021164Center for Human Genetic Research, Massachusetts General Hospital, Richard B. SimchesResearch Center, Boston, Massachusetts 02114, USA
AbstractRecent advances in sequencing technology make it possible to comprehensively catalogue geneticvariation in population samples, creating a foundation for understanding human disease, ancestryand evolution. The amounts of raw data produced are prodigious and many computational stepsare required to translate this output into high-quality variant calls. We present a unified analyticframework to discover and genotype variation among multiple samples simultaneously thatachieves sensitive and specific results across five sequencing technologies and three distinct,canonical experimental designs. Our process includes (1) initial read mapping; (2) localrealignment around indels; (3) base quality score recalibration; (4) SNP discovery and genotypingto find all potential variants; and (5) machine learning to separate true segregating variation frommachine artifacts common to next-generation sequencing technologies. We discuss the applicationof these tools, instantiated in the Genome Analysis Toolkit (GATK), to deep whole-genome,whole-exome capture, and multi-sample low-pass (~4×) 1000 Genomes Project datasets.
IntroductionRecent advances in NGS technology now provide the first cost-effective approach to large-scale resequencing of human samples for medical and population genetics. Projects such asthe 1000 Genomes 1, The Cancer Genome Atlas and numerous large medically-focusedexome sequencing projects 2 are underway in an attempt to elucidate the full spectrum ofhuman genetic diversity 1 and the complete genetic architecture of human disease. Theability to examine the entire genome in an unbiased way will make possible comprehensivesearches for standing variation in common disease; mutations underlying linkages inMendelian disease 3; as well as spontaneously arising variation for which no gene-mapping
*Corresponding author: [email protected].
Author contributionsM.A.D., E.B., R.E.P., K.V.G., J.R.M, C.H., A.A.P., G.d.A., M.A.R., T.J.F., A.Y.S., K.C. conceived of, implemented, and performedanalytic approaches. M.A.D., E.B., R.E.P., K.V.G., G.d.A., A.M.K., M.J.D. wrote the manuscript. M.A.D., M.H., A.M. developedPicard and GATK infrastructure underlying the tools implemented here. M.A.D, S.B.G, D.A., M. J. D. lead the team.
NIH Public AccessAuthor ManuscriptNat Genet. Author manuscript; available in PMC 2011 November 01.
Published in final edited form as:Nat Genet. 2011 May ; 43(5): 491–498. doi:10.1038/ng.806.
NIH
-PA Author Manuscript
NIH
-PA Author Manuscript
NIH
-PA Author Manuscript
shortcuts are available (e.g., somatic mutations in cancer 4–6 and de novo mutations 7,8 inautism and schizophrenia).
Many capabilities are required to obtain a complete and accurate record of the variationfrom NGS from sequencing data. Mapping reads to the reference genome9–12 is a firstcritical computational challenge whose cost necessitates each read be aligned independently,guaranteeing many reads spanning indels will be misaligned. The per-base quality scores,which convey the probability that the called base in the read is the true sequenced base 13,are quite inaccurate and co-vary with features like sequencing technology, machine cycleand sequence context 14–16. These misaligned reads and inaccurate quality scores propagateinto single nucleotide polymorphism (SNP) discovery and genotyping, a general problemthat becomes acute in projects with multiple sequencing technologies, generated by manycenters using rapidly evolving experimental processing pipelines, such as the 1000 GenomesProject.
Given well mapped, aligned, and calibrated reads, resolving even simple SNPs, let alonemore complex variation such as multi-nucleotide substitutions, insertions and deletions,inversions, rearrangements, and copy number variation requires sensitive and specificstatistical models 9–12,16–24. Separating true variation from machine artifacts due to the highrate and context-specific nature of sequencing errors is the outstanding challenge in NGSanalysis. Previous approaches have relied on filtering SNP calls that exhibit characteristicsoutside of their normal ranges, such as occurring at sites with too much coverage 18,20, or byrequiring non-reference bases to occur on at least three reads in both synthesisorientations 21. Though effective, such hard filters are frustratingly difficult to develop,require parameterization for each new data set, and are necessarily either restrictive (highspecificity, as in 1000 Genomes) or tolerant (high sensitivity, used in Mendelian diseasestudies, with concomitantly more false positives). Moreover, all of these challenges must beaddressed within the context of a proliferation of sequencing technology platforms and studydesigns (e.g. whole genome shotgun, exome capture sequencing, multiple samplessequenced at shallow coverage), a point not tackled in previous work.
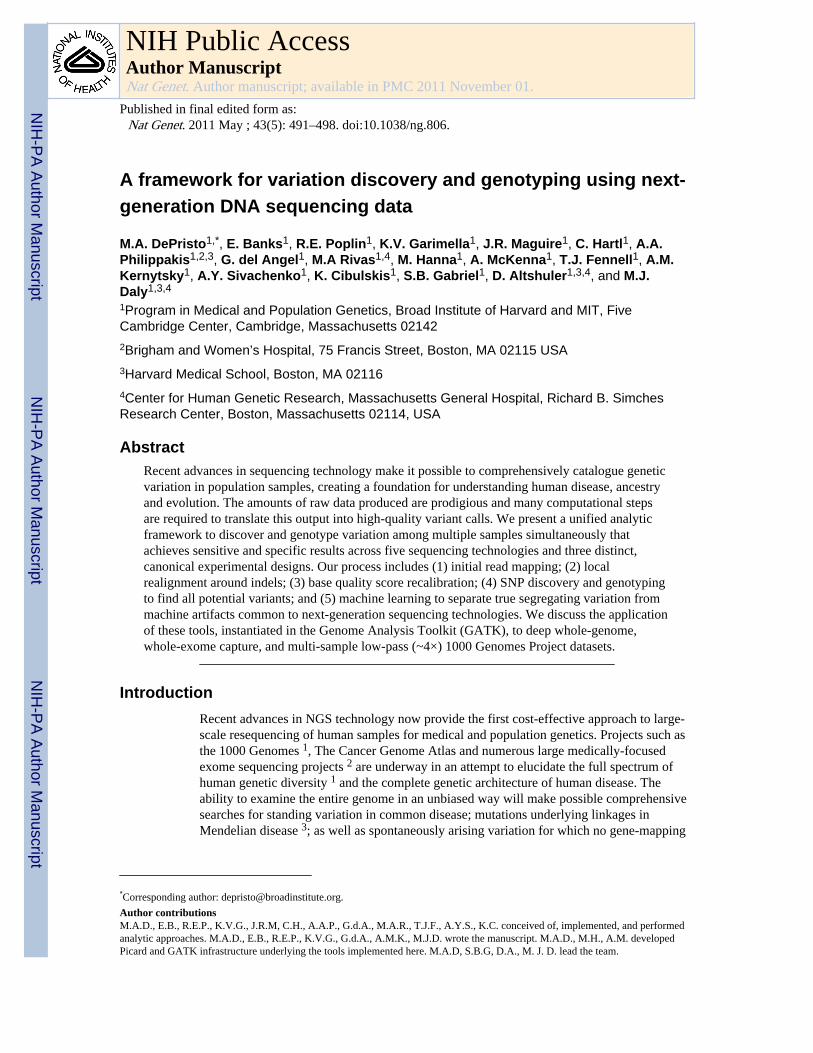
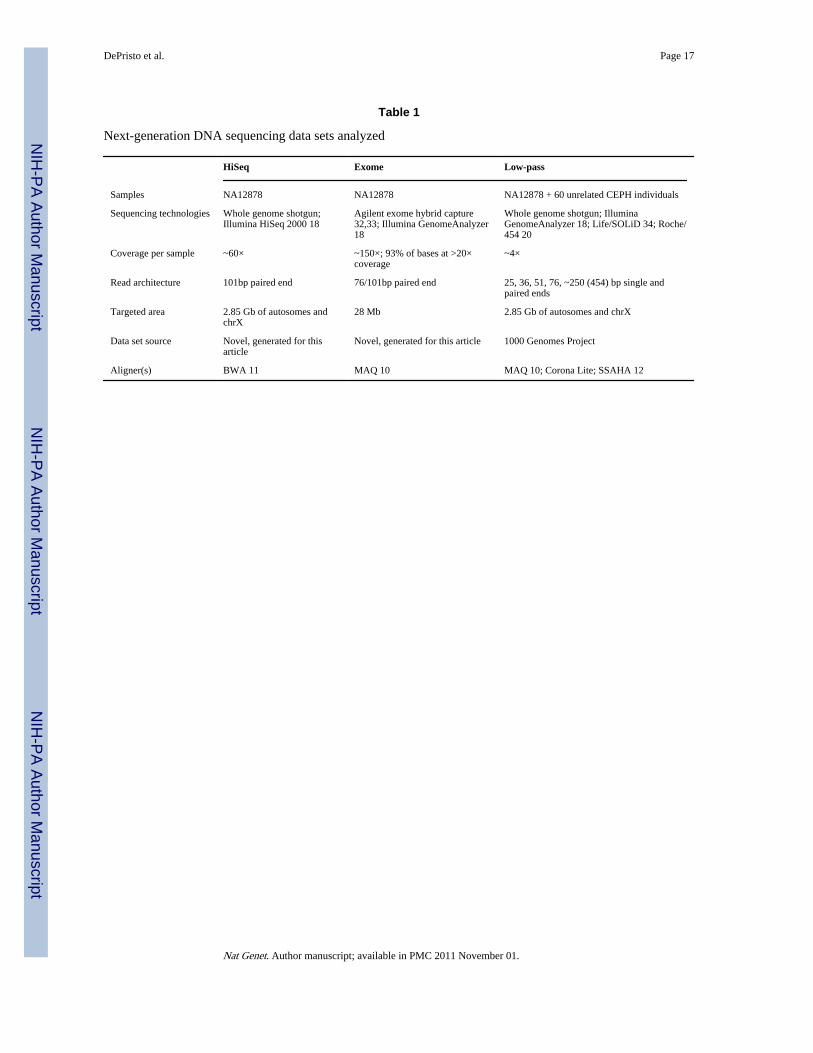
Here we present a single framework and associated tools capable of discovering high-qualityvariation and genotyping individual samples using diverse sequencing machines andexperimental designs (Figure 1). We present several novel methods addressing thechallenges listed above in local realignment, base quality recalibration, multi-sample SNPcalling and adaptive error modeling, which we apply to three prototypical NGS data sets(Table 1). In each data set we include CEPH individual NA12878 to demonstrate theconsistency of results for this individual across all three data sets.
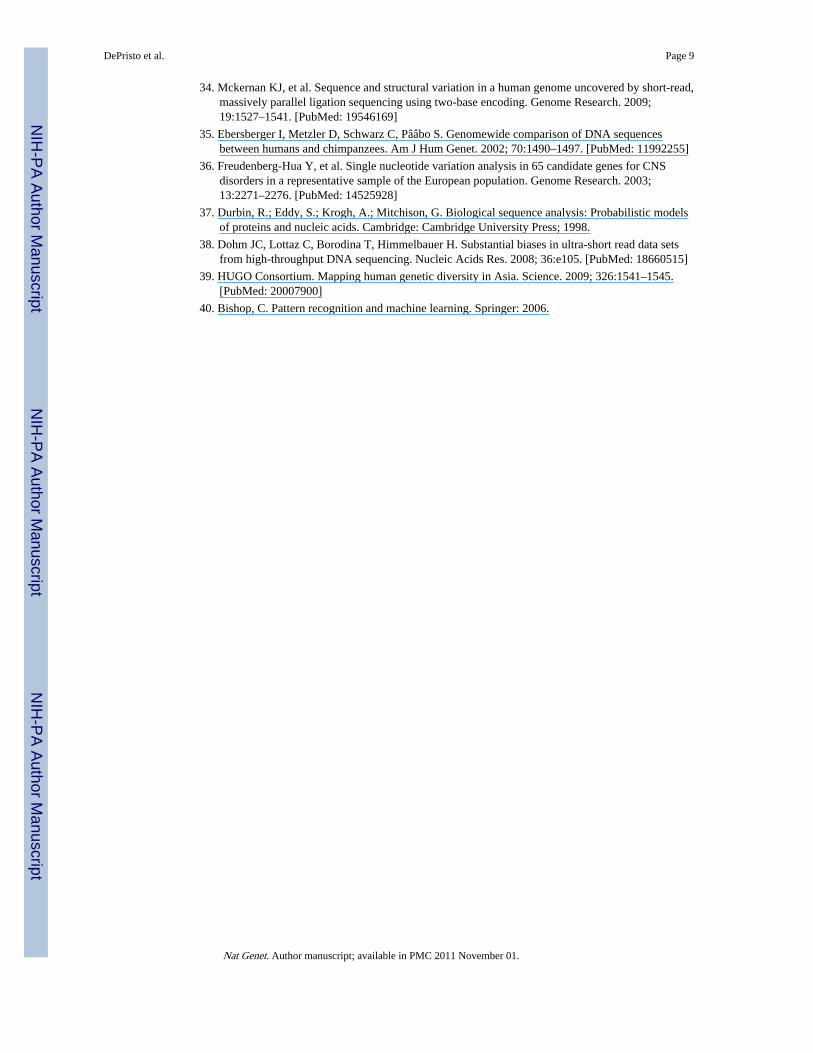
ResultsHere we describe a three-part conceptual framework (Figure 1):
• Phase 1: raw read data with platform-dependent biases is transformed into a single,generic representation with well-calibrated base error estimates, mapped to theircorrect genomic origin, and aligned consistently with respect to one another.Mapping algorithms place reads with an initial alignment on the reference genome,either generated in, or converted to, the technology-independent SAM/BAMreference file format 25. Next, molecular duplicates are eliminated (Suppl. Mats),initial alignments are refined by local realignment, and then an empirically accurateper-base error model is determined.
• Phase 2: the analysis-ready SAM/BAM files are analyzed to discover all sites withstatistical evidence for an alternate allele present, among the samples including
DePristo et al. Page 2
Nat Genet. Author manuscript; available in PMC 2011 November 01.
NIH
-PA Author Manuscript
NIH
-PA Author Manuscript
NIH
-PA Author Manuscript
SNPs, short indels, and CNVs. CNV discovery and genotyping methods, thoughpart of this conceptual framework, are described elsewhere 26.
• Phase 3: technical covariates, known sites of variation, genotypes for individuals,linkage disequilibrium, and family and population structure are integrated with theraw variant calls from phase 2 to separate true polymorphic sites from machineartifacts, and at these sites high-quality genotypes are determined for all samples.
All components after initial mapping and duplicate marking are instantiated in the GenomeAnalysis ToolKit (GATK) 27.
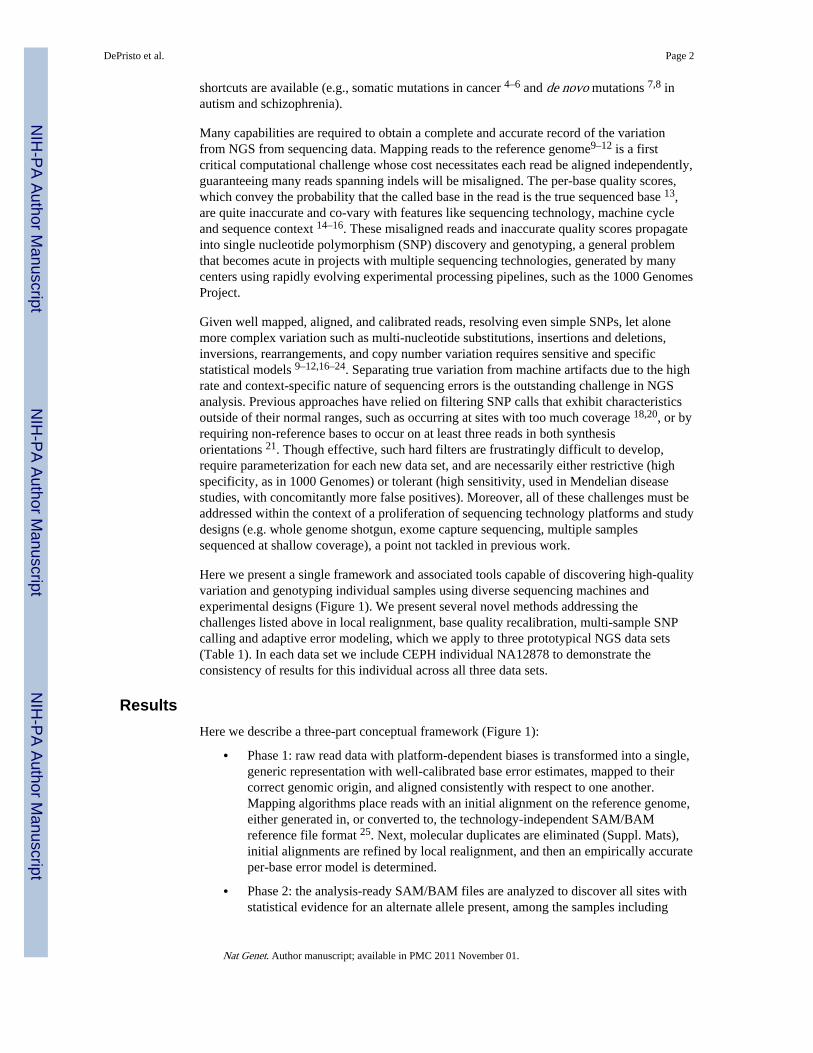
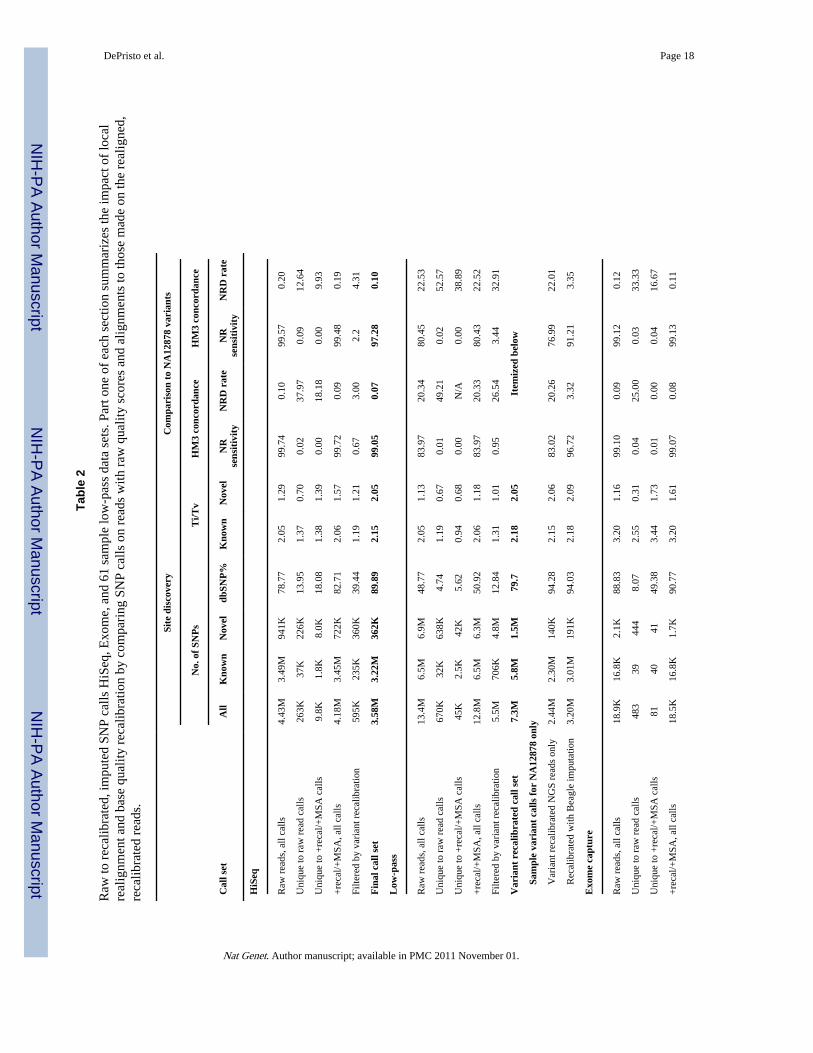
Applying the analysis pipeline to HiSeq data at ˜60× of NA128782.72B bases (~96%) of the 2.83B non-N bases in the autosomal regions and chromosome Xof the human reference genome have sufficient coverage to call variants in the 101bp paired-ended HiSeq data (Table 1). Even though the HiSeq reads were aligned with the gap-enabledBWA, more than 15% of the reads that span known homozygous indels in NA12878 aremisaligned (Supplemental Table 1). Realignment corrects 6.6M of 2.4B total reads in 950Kregions covering 21Mb in the HiSeq data, eliminating 1.8M loci with significantaccumulation of mismatching bases (Supplemental Table 2). The initial data processingsteps (Phase 1) eliminate ~300K SNP calls, more than one fifth of the raw novel calls, withquality metrics consistent with more than 90% of these SNPs being false positives (Table 2).
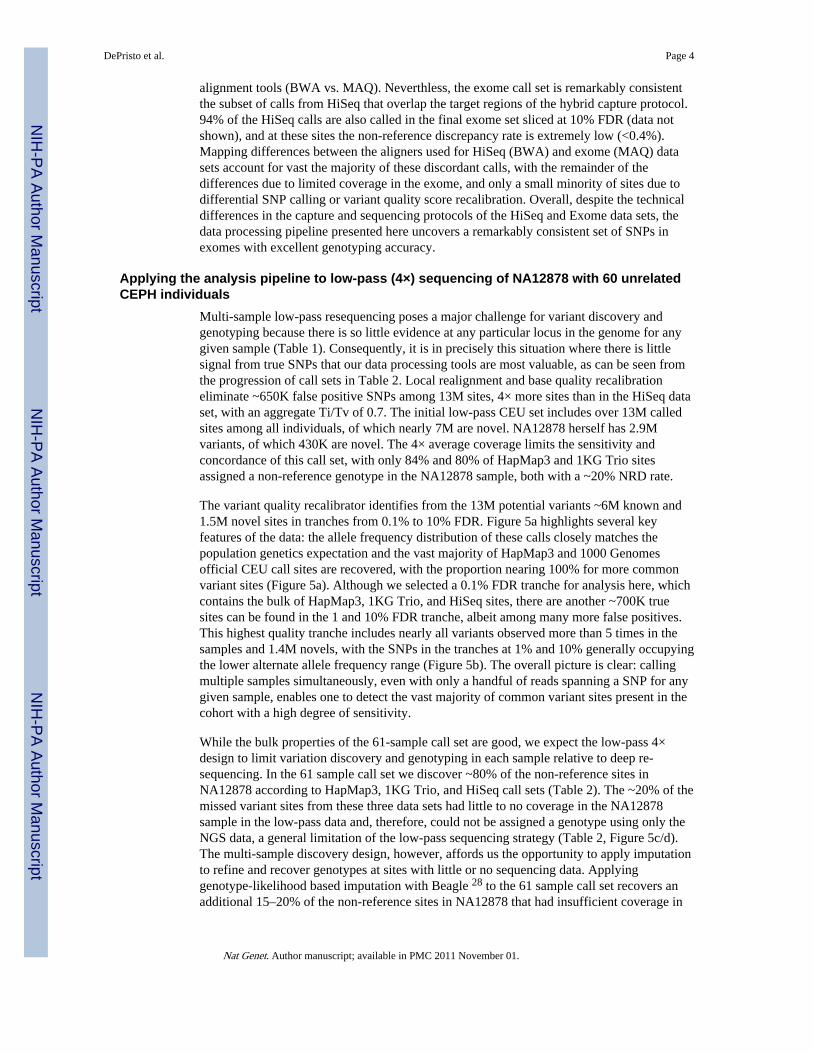
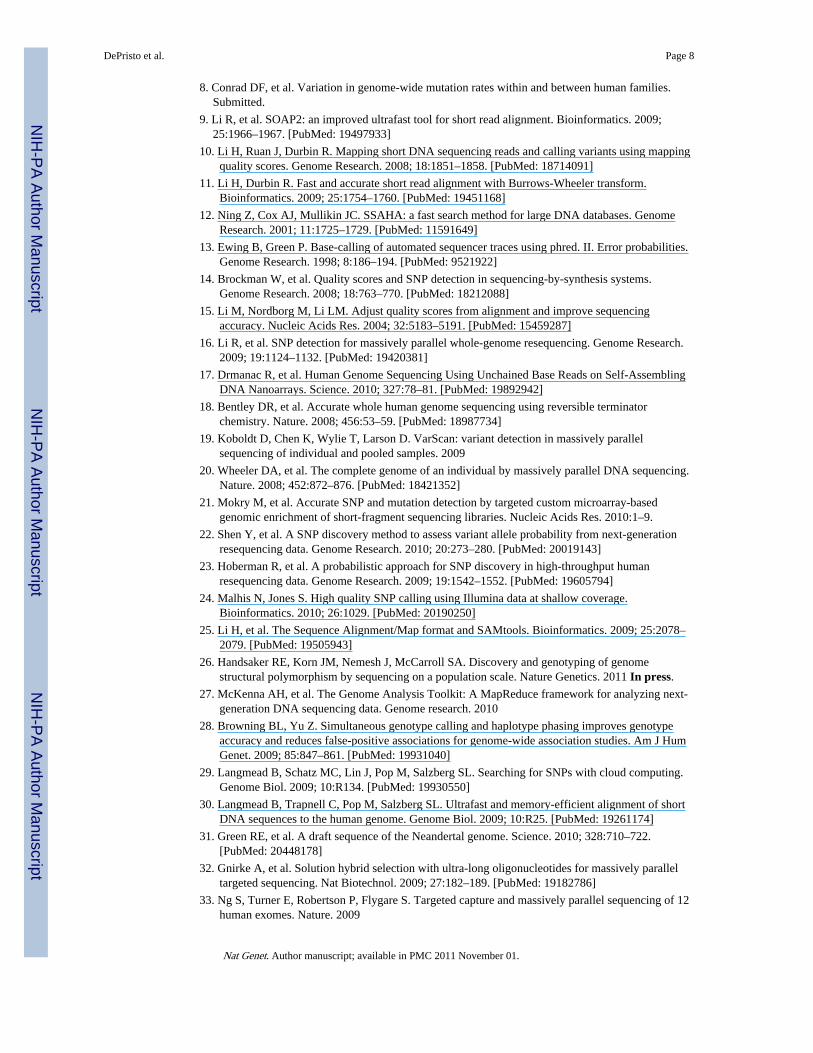
The initial 4.2M confidently called non-reference sites include 99.7% and 99.5% of theHapMap3 and 1KG Trio sites genotyped as non-reference in NA12878; at these variant sitesthe sequencing and genotyping calls are concordant 99.9% of the time (Table 2). Variantquality score recalibration of these initial calls identifies a tranche of SNPs with estimatedFDR of <1% containing 3.2M known variants and 362K novel variants, a 90% dbSNP rate,and Ti/Tv ratios of 2.15 and 2.05, respectively, consistent with our genome-wideexpectations (Box 1). While the variant recalibrator removed ~595K total variants with a Ti/Tv ratio of ~1.2, it retained 99% and 97.3% of the HapMap3 and 1KG Trio non-referencesites. The discordant sites have 100× higher genotype discrepancy rates, suggesting that thesites themselves may be problematic. Almost all of the variants in the 1% tranche arealready present in the even higher stringency 0.1% FDR tranche, while analysis of the 10%FDR tranche suggest that some more variants could be obtained, at the cost of many morefalse positives (Figure 4).
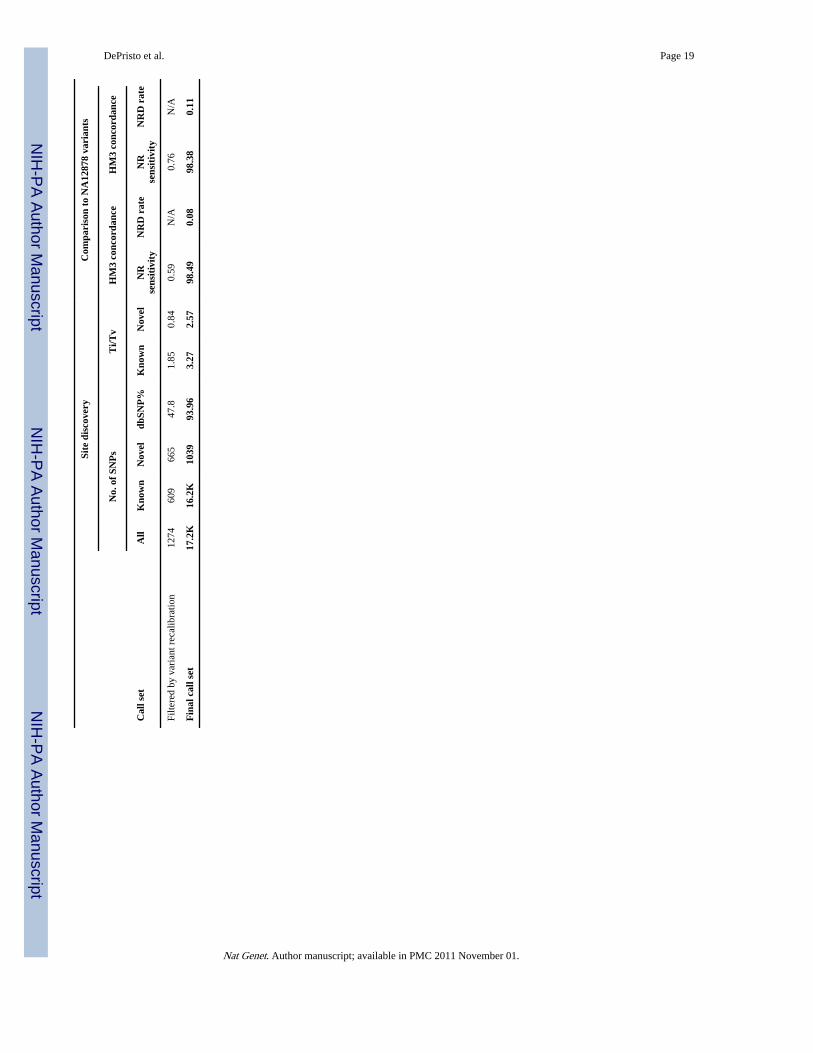
Applying the analysis pipeline to 28Mb exome capture at ˜150× of NA12878The raw data processing tools here eliminated ~450 novel call sites from the pre-MSA/pre-recal call set, representing more than 20% of all the novel calls, with a Ti/Tv of 0.30 - fullyconsistent with all being false positives - while adding several sites present in HapMap3 andthe 1KG Trio. The raw whole exome data call set, at ~150× coverage (Table 1), includes>99% of both the HapMap3 and 1KG Trio non-reference sites within the 28Mb exometarget region, with >99.8% genotype concordance at these sites. As with HiSeq, even withrecalibration and local realignment, however, the Ti/Tv ratio of the novel sites in the initialSNP calls indicates that more than 50% of these calls are false positives. Variant qualityscore recalibration, using only ~5400 SNPs for training, identifies a high-quality subset ofcalls that capture >98% of the HapMap3 and 1KG Trio sites in the target regions. The valueof the tranches is more pronounced in the whole exome (Figure 4d), where 900 of the 1039novel calls come from tranches with FDRs under 1%, despite needing to reach into the 10%FDR tranche to include most true positive SNPs.
The Hiseq WGS and exome capture datasets differ drastically in their sequencing protocols(WGS vs. hybrid capture), the sequencing machines (HiSeq vs. GA), and the initial
DePristo et al. Page 3
Nat Genet. Author manuscript; available in PMC 2011 November 01.
NIH
-PA Author Manuscript
NIH
-PA Author Manuscript
NIH
-PA Author Manuscript
alignment tools (BWA vs. MAQ). Neverthless, the exome call set is remarkably consistentthe subset of calls from HiSeq that overlap the target regions of the hybrid capture protocol.94% of the HiSeq calls are also called in the final exome set sliced at 10% FDR (data notshown), and at these sites the non-reference discrepancy rate is extremely low (<0.4%).Mapping differences between the aligners used for HiSeq (BWA) and exome (MAQ) datasets account for vast the majority of these discordant calls, with the remainder of thedifferences due to limited coverage in the exome, and only a small minority of sites due todifferential SNP calling or variant quality score recalibration. Overall, despite the technicaldifferences in the capture and sequencing protocols of the HiSeq and Exome data sets, thedata processing pipeline presented here uncovers a remarkably consistent set of SNPs inexomes with excellent genotyping accuracy.
Applying the analysis pipeline to low-pass (4×) sequencing of NA12878 with 60 unrelatedCEPH individuals
Multi-sample low-pass resequencing poses a major challenge for variant discovery andgenotyping because there is so little evidence at any particular locus in the genome for anygiven sample (Table 1). Consequently, it is in precisely this situation where there is littlesignal from true SNPs that our data processing tools are most valuable, as can be seen fromthe progression of call sets in Table 2. Local realignment and base quality recalibrationeliminate ~650K false positive SNPs among 13M sites, 4× more sites than in the HiSeq dataset, with an aggregate Ti/Tv of 0.7. The initial low-pass CEU set includes over 13M calledsites among all individuals, of which nearly 7M are novel. NA12878 herself has 2.9Mvariants, of which 430K are novel. The 4× average coverage limits the sensitivity andconcordance of this call set, with only 84% and 80% of HapMap3 and 1KG Trio sitesassigned a non-reference genotype in the NA12878 sample, both with a ~20% NRD rate.
The variant quality recalibrator identifies from the 13M potential variants ~6M known and1.5M novel sites in tranches from 0.1% to 10% FDR. Figure 5a highlights several keyfeatures of the data: the allele frequency distribution of these calls closely matches thepopulation genetics expectation and the vast majority of HapMap3 and 1000 Genomesofficial CEU call sites are recovered, with the proportion nearing 100% for more commonvariant sites (Figure 5a). Although we selected a 0.1% FDR tranche for analysis here, whichcontains the bulk of HapMap3, 1KG Trio, and HiSeq sites, there are another ~700K truesites can be found in the 1 and 10% FDR tranche, albeit among many more false positives.This highest quality tranche includes nearly all variants observed more than 5 times in thesamples and 1.4M novels, with the SNPs in the tranches at 1% and 10% generally occupyingthe lower alternate allele frequency range (Figure 5b). The overall picture is clear: callingmultiple samples simultaneously, even with only a handful of reads spanning a SNP for anygiven sample, enables one to detect the vast majority of common variant sites present in thecohort with a high degree of sensitivity.
While the bulk properties of the 61-sample call set are good, we expect the low-pass 4×design to limit variation discovery and genotyping in each sample relative to deep re-sequencing. In the 61 sample call set we discover ~80% of the non-reference sites inNA12878 according to HapMap3, 1KG Trio, and HiSeq call sets (Table 2). The ~20% of themissed variant sites from these three data sets had little to no coverage in the NA12878sample in the low-pass data and, therefore, could not be assigned a genotype using only theNGS data, a general limitation of the low-pass sequencing strategy (Table 2, Figure 5c/d).The multi-sample discovery design, however, affords us the opportunity to apply imputationto refine and recover genotypes at sites with little or no sequencing data. Applyinggenotype-likelihood based imputation with Beagle 28 to the 61 sample call set recovers anadditional 15–20% of the non-reference sites in NA12878 that had insufficient coverage in
DePristo et al. Page 4
Nat Genet. Author manuscript; available in PMC 2011 November 01.
NIH
-PA Author Manuscript
NIH
-PA Author Manuscript
NIH
-PA Author Manuscript
the sequencing data (Table 2) as well as vastly improving genotyping accuracy (Figure 5c/d).
We further characterize the quality of our low-pass call set as a function of the number ofsamples included during the discovery process in addition to NA12878 herself. Increasingthe number of samples in the cohort rapidly improves both sensitivity and specificity of thecall set. As evidence mounts with more samples that a particular site is polymorphic, ourconfidence in the call increases and the site is more likely to be called (Figure 6a).Distinguishing true positive variants from sequencing and data processing artifacts is moredifficult with few samples and, consequently, low aggregated coverage; adding more readsempowers the error covariates to identify sites as errors by the variant recalibrator (Figure6b and 6c).
The combination of multi-sample SNP calling, variant quality recalibration using errorcovariates, and imputation allows one to achieve a high-quality call set, both in aggregateand per-sample, with astoundingly little data. The aggregated 61-sample set at 4× coverageincludes only four times as much sequencing data as the HiSeq data, yet we discover 3.2Mpolymorphic sites in NA12878, which includes 97%, 91%, and 87% of the variants inHapMap3, 1000 Genomes Trio, and HiSeq call sets, respectively, while also finding ~5Madditional variants among the 60 other samples.
Comparison of hard filtering to variant quality score recalibrationSupplemental Table 3 lists the quality of call sets derived using our previous filteringapproaches on all three data sets relative to the adaptive recalibrator described here. In allcases the adaptive approach outperforms the manually optimized hard filtering previouslydeveloped for this calling system for the 1000 Genomes pilot data. This highlights twoimportant points – first, that a principled integration of all covariates (which may have acomplex correlation structure) should and does outperform single manually definedthresholds on covariates independently, with the added benefit of not requiring humanintervention; second, that an accurate ranking of discovered putative variants by theprobability that each represents a true site permits the definition of tranches for specificity orsensitivity (Figure 4c–e) as appropriate to the needs of the specific project. Although themost permissive tranche includes almost all sites that have any chance of being truepolymorphisms – critical for projects looking for single large effect mutations – the vastmajority of true polymorphisms are present in the highest quality tranche of data (notshown).
Comparison of this calling pipeline to CrossbowTo calibrate the additional value of the tools described here we contrast our results withSNPs called on our raw NA12878 exome data using Crossbow 29, a package combiningbowtie, a gapless read mapping tool based on the Burrows-Wheeler transformation 30 andSoapSNP for SNP detection 16. We chose to perform this analysis on the exome databecause its wide range of read depths and complex error modes make SNP calling achallenge, especially given the small number of novel variants (~1000 per sample) expectedin this 28Mb target. In Supplemental Table 4 the high-level results of the GATK andCrossbow calling pipelines are compared and contrasted. Key metrics such as the number ofnovel SNP calls, their Ti/Tv ratio, the number of calls not seen in either the 1000G trio orthe HiSeq data, and the high nonsense/read-through rates indicate that the Crossbow call sethas lower specificity than the GATK pipeline. This is the case despite applying a aggressiveP-value threshold (P < 0.01) for the base quality rank sum test 16 to filter false positivevariants, which reduces the sensitivity to HM3, 1000G, and the HiSeq call sets by >3%. Asusual, the intersection set between GATK and Crossbow is more specific but less sensitive
DePristo et al. Page 5
Nat Genet. Author manuscript; available in PMC 2011 November 01.
NIH
-PA Author Manuscript
NIH
-PA Author Manuscript
NIH
-PA Author Manuscript
than the calls unique to each pipeline (Table 1), a clear sign that despite the advancespresented here significant work remains in perfecting calling in data sets like single sampleexome capture. Although the value of the data processing and error modeling presented hereis also clear, applying local realignment and base quality score recalibration -- publiclyavailable, easy-to-use modules in the GATK -- are likely to improve the results of theCrossbow pipeline.
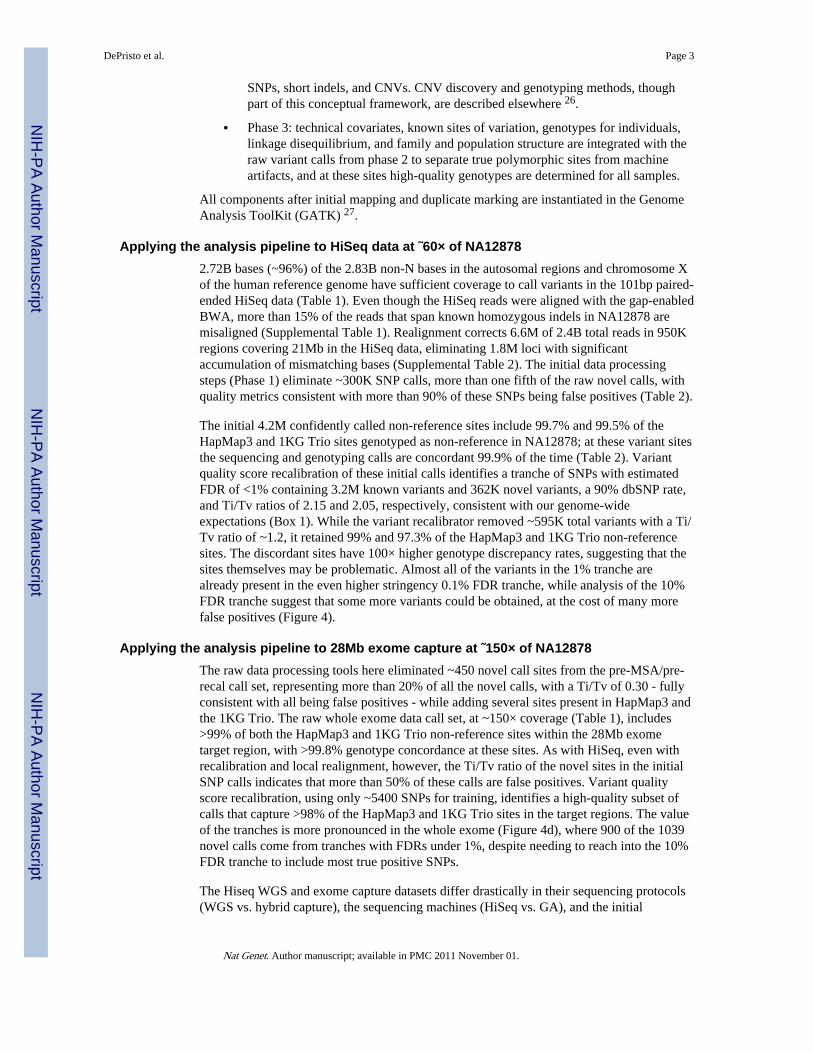
DiscussionThe inaccuracy and covariation patterns differ strikingly between sequencing technologies(Figure 3), which if uncorrected can propagate into downstream analyses. Accuratelyrecalibrated base quality scores eliminates these sequencer-specific biases (Figure 3) andenables integration of data generated from multiple systems. Although developed for earlyNGS data sets like those from the 1000 Genomes Project pilot, the impact of recalibration isstill significant even for data emerging today on newer sequencers like the HiSeq 2000.Together with local realignment, these two data processing methods eliminate millions ofmostly false positive variants while preserving nearly all truly variable sites, such as those inHapMap3 and 1KG Trio sites (Table 2). In single sample data sets, such as HiSeq andexome, without realignment and recalibration these false variants account for more than afifth of all of the novel calls.
Even with very deep coverage, the na‘ve Bayesian model for SNP calling results in an initialcall set with a surprisingly large number of false-positive calls. While we expect 3.3Mknown and 330K novel non-reference sites in a single European sample sequenced genome-wide, the initial HiSeq call set contains 3.5M known and 800K novel calls. The excessivenumber of variable sites, and the low Ti/Tv ratio in particular among the novel calls, impliesthat ~600K of these variants are likely errors resulting from stochastic and systemicsequencing and alignment errors. The same calculations suggest that a similar fraction of theinitial exome calls are likely false positives, while more than 80% of the initial novel lowpass SNP calls are likely errors. The adaptive error modeling developed here enables us toidentify these false positive variants based on their dissimilarity to known variants, despiteerror rates of 50–80% among the novel variants.
In each step of the pipeline, the improvements derive from the correction of systematicerrors made in base calling or read mapping/alignment. By characterizing the specific NGSmachine error processes and capturing our certainty, or lack thereof, that a putative variant istruly present in the sample or population, we deliver not a single concrete call set but acontinuum from confident to less reliable variant calls for use as appropriate to the specificneeds of downstream analysis. Mendelian disease projects can select a more sensitive set ofcalls with a higher error rate to avoid missing that single, high-impact variant, whilecommunity-resource projects like the 1000 Genomes Project can place a high premium onspecificity.
The division between SNP discovery and preliminary genotyping and genotype refinement(columns 2 and 3, Figure 1) avoids embedding in the discovery phase assumptions aboutpopulation structure, sample relationships, and the linkage disequilibrium relationshipsbetween variants. Consequently, our calling approach applies equally well to populationsamples in Hardy-Weinberg equilibrium like mother-father-child trios or interbreedingfamilies suffering from Mendelian disorders. Critically, our framework produces highlysensitive and specific variation calls without the use of linkage disequilibrium and so can beapplied in situations where LD information is unavailable or weak (many organisms) orwould confound analytic goals such as studying LD patterns themselves or comparing
DePristo et al. Page 6
Nat Genet. Author manuscript; available in PMC 2011 November 01.
NIH
-PA Author Manuscript
NIH
-PA Author Manuscript
NIH
-PA Author Manuscript
Neanderthals and modern humans 31. Where appropriate, however, imputation can beapplied to great value, as we demonstrate in the 61 sample CEU low-pass call set.
The analysis results presented here clearly indicate that even with our best currentapproaches we are still far from obtaining a complete and accurate picture of geneticvariation of all types in even a single sample. Even with the HiSeq 101bp paired-end readsnearly 4% (~100 Mb) of the potentially callable genome is considered poorly mapped(Suppl. Mats) and analysis of variants within these regions requires care. Nearly two-thirdsof the differences between the HiSeq and exome call sets can be attributed to different readmappings between BWA and MAQ.
The challenge of obtaining accurate variant calls from NGS data is substantial. We havedeveloped an analysis framework for NGS data that achieves consistent and accurate resultsfrom a wide array of experimental design options including diverse sequencing machineryand distinct sequencing approaches. We have introduced here an integrated approach to dataprocessing and variation discovery from NGS data that is designed to meet thesespecifications. Using data generated both at the Broad Institute and throughout the 1000Genomes project, we have demonstrated that the introduction of improved calibration ofbase quality scores, local realignment to accommodate indels, the simultaneous evaluationof multiple samples from a population, and finally an assessment of the likelihood that anidentified variable site is a true biological DNA variant significantly improves the sensitivityand specificity of variant discovery from NGS data. The impending arrival of yet more NGStechnologies makes even more important modular, extensible frameworks like ours thatproduce high-quality variant and genotype calls despite distinct error modes of multipletechnologies for many experimental designs.
Supplementary MaterialRefer to Web version on PubMed Central for supplementary material.
AcknowledgmentsMany thanks to our colleagues in Medical and Population Genetics and Cancer Informatics and the 1000 GenomesProject who encouraged and supported us during the development of the Genome Analysis ToolKit and associatedtools. This work was supported by grants from the National Human Genome Research Institute, including the LargeScale Sequencing and Analysis of Genomes grant (54 HG003067) and the Joint SNP and CNV calling in 1000Genomes sequence data grant (U01 HG005208). We would also like to thank our excellent anonymous reviewersfor their thoughtful comments.
References1. The 1000 Genomes Project Consortium. A map of human genome variation from population scale
sequencing. Nature. 2010
2. Yi X, et al. Sequencing of 50 Human Exomes Reveals Adaptation to High Altitude. Science. 2010;329:75–78. [PubMed: 20595611]
3. Ng SB, et al. Exome sequencing identifies the cause of a mendelian disorder. Nat Genet. 2009
4. Lee W, et al. The mutation spectrum revealed by paired genome sequences from a lung cancerpatient. Nature. 2010; 465:473–477. [PubMed: 20505728]
5. Pleasance ED, et al. A comprehensive catalogue of somatic mutations from a human cancergenome. Nature. 2009
6. Beroukhim R, et al. The landscape of somatic copy-number alteration across human cancers.Nature. 2010; 463:899–905. [PubMed: 20164920]
7. Roach JC, et al. Analysis of genetic inheritance in a family quartet by whole-genome sequencing.Science. 2010; 328:636–639. [PubMed: 20220176]
DePristo et al. Page 7
Nat Genet. Author manuscript; available in PMC 2011 November 01.
NIH
-PA Author Manuscript
NIH
-PA Author Manuscript
NIH
-PA Author Manuscript
8. Conrad DF, et al. Variation in genome-wide mutation rates within and between human families.Submitted.
9. Li R, et al. SOAP2: an improved ultrafast tool for short read alignment. Bioinformatics. 2009;25:1966–1967. [PubMed: 19497933]
10. Li H, Ruan J, Durbin R. Mapping short DNA sequencing reads and calling variants using mappingquality scores. Genome Research. 2008; 18:1851–1858. [PubMed: 18714091]
11. Li H, Durbin R. Fast and accurate short read alignment with Burrows-Wheeler transform.Bioinformatics. 2009; 25:1754–1760. [PubMed: 19451168]
12. Ning Z, Cox AJ, Mullikin JC. SSAHA: a fast search method for large DNA databases. GenomeResearch. 2001; 11:1725–1729. [PubMed: 11591649]
13. Ewing B, Green P. Base-calling of automated sequencer traces using phred. II. Error probabilities.Genome Research. 1998; 8:186–194. [PubMed: 9521922]
14. Brockman W, et al. Quality scores and SNP detection in sequencing-by-synthesis systems.Genome Research. 2008; 18:763–770. [PubMed: 18212088]
15. Li M, Nordborg M, Li LM. Adjust quality scores from alignment and improve sequencingaccuracy. Nucleic Acids Res. 2004; 32:5183–5191. [PubMed: 15459287]
16. Li R, et al. SNP detection for massively parallel whole-genome resequencing. Genome Research.2009; 19:1124–1132. [PubMed: 19420381]
17. Drmanac R, et al. Human Genome Sequencing Using Unchained Base Reads on Self-AssemblingDNA Nanoarrays. Science. 2010; 327:78–81. [PubMed: 19892942]
18. Bentley DR, et al. Accurate whole human genome sequencing using reversible terminatorchemistry. Nature. 2008; 456:53–59. [PubMed: 18987734]
19. Koboldt D, Chen K, Wylie T, Larson D. VarScan: variant detection in massively parallelsequencing of individual and pooled samples. 2009
20. Wheeler DA, et al. The complete genome of an individual by massively parallel DNA sequencing.Nature. 2008; 452:872–876. [PubMed: 18421352]
21. Mokry M, et al. Accurate SNP and mutation detection by targeted custom microarray-basedgenomic enrichment of short-fragment sequencing libraries. Nucleic Acids Res. 2010:1–9.
22. Shen Y, et al. A SNP discovery method to assess variant allele probability from next-generationresequencing data. Genome Research. 2010; 20:273–280. [PubMed: 20019143]
23. Hoberman R, et al. A probabilistic approach for SNP discovery in high-throughput humanresequencing data. Genome Research. 2009; 19:1542–1552. [PubMed: 19605794]
24. Malhis N, Jones S. High quality SNP calling using Illumina data at shallow coverage.Bioinformatics. 2010; 26:1029. [PubMed: 20190250]
25. Li H, et al. The Sequence Alignment/Map format and SAMtools. Bioinformatics. 2009; 25:2078–2079. [PubMed: 19505943]
26. Handsaker RE, Korn JM, Nemesh J, McCarroll SA. Discovery and genotyping of genomestructural polymorphism by sequencing on a population scale. Nature Genetics. 2011 In press.
27. McKenna AH, et al. The Genome Analysis Toolkit: A MapReduce framework for analyzing next-generation DNA sequencing data. Genome research. 2010
28. Browning BL, Yu Z. Simultaneous genotype calling and haplotype phasing improves genotypeaccuracy and reduces false-positive associations for genome-wide association studies. Am J HumGenet. 2009; 85:847–861. [PubMed: 19931040]
29. Langmead B, Schatz MC, Lin J, Pop M, Salzberg SL. Searching for SNPs with cloud computing.Genome Biol. 2009; 10:R134. [PubMed: 19930550]
30. Langmead B, Trapnell C, Pop M, Salzberg SL. Ultrafast and memory-efficient alignment of shortDNA sequences to the human genome. Genome Biol. 2009; 10:R25. [PubMed: 19261174]
31. Green RE, et al. A draft sequence of the Neandertal genome. Science. 2010; 328:710–722.[PubMed: 20448178]
32. Gnirke A, et al. Solution hybrid selection with ultra-long oligonucleotides for massively paralleltargeted sequencing. Nat Biotechnol. 2009; 27:182–189. [PubMed: 19182786]
33. Ng S, Turner E, Robertson P, Flygare S. Targeted capture and massively parallel sequencing of 12human exomes. Nature. 2009
DePristo et al. Page 8
Nat Genet. Author manuscript; available in PMC 2011 November 01.
NIH
-PA Author Manuscript
NIH
-PA Author Manuscript
NIH
-PA Author Manuscript
34. Mckernan KJ, et al. Sequence and structural variation in a human genome uncovered by short-read,massively parallel ligation sequencing using two-base encoding. Genome Research. 2009;19:1527–1541. [PubMed: 19546169]
35. Ebersberger I, Metzler D, Schwarz C, Pââbo S. Genomewide comparison of DNA sequencesbetween humans and chimpanzees. Am J Hum Genet. 2002; 70:1490–1497. [PubMed: 11992255]
36. Freudenberg-Hua Y, et al. Single nucleotide variation analysis in 65 candidate genes for CNSdisorders in a representative sample of the European population. Genome Research. 2003;13:2271–2276. [PubMed: 14525928]
37. Durbin, R.; Eddy, S.; Krogh, A.; Mitchison, G. Biological sequence analysis: Probabilistic modelsof proteins and nucleic acids. Cambridge: Cambridge University Press; 1998.
38. Dohm JC, Lottaz C, Borodina T, Himmelbauer H. Substantial biases in ultra-short read data setsfrom high-throughput DNA sequencing. Nucleic Acids Res. 2008; 36:e105. [PubMed: 18660515]
39. HUGO Consortium. Mapping human genetic diversity in Asia. Science. 2009; 326:1541–1545.[PubMed: 20007900]
40. Bishop, C. Pattern recognition and machine learning. Springer: 2006.
DePristo et al. Page 9
Nat Genet. Author manuscript; available in PMC 2011 November 01.
NIH
-PA Author Manuscript
NIH
-PA Author Manuscript
NIH
-PA Author Manuscript
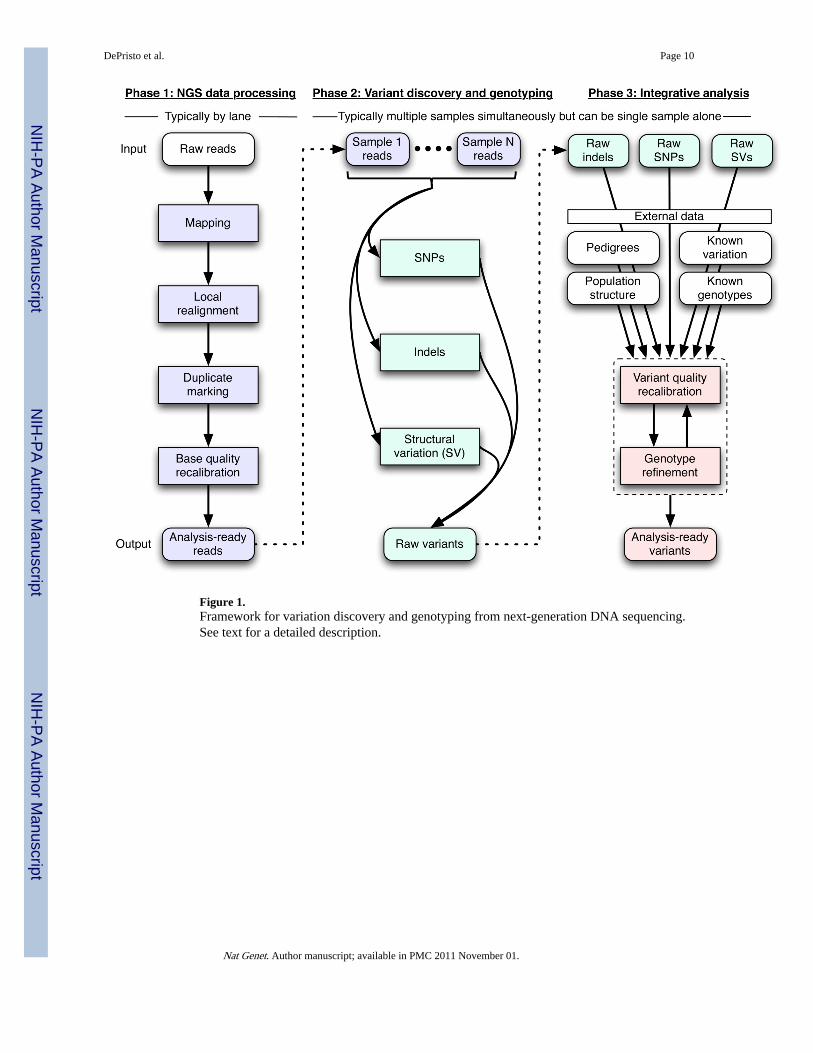
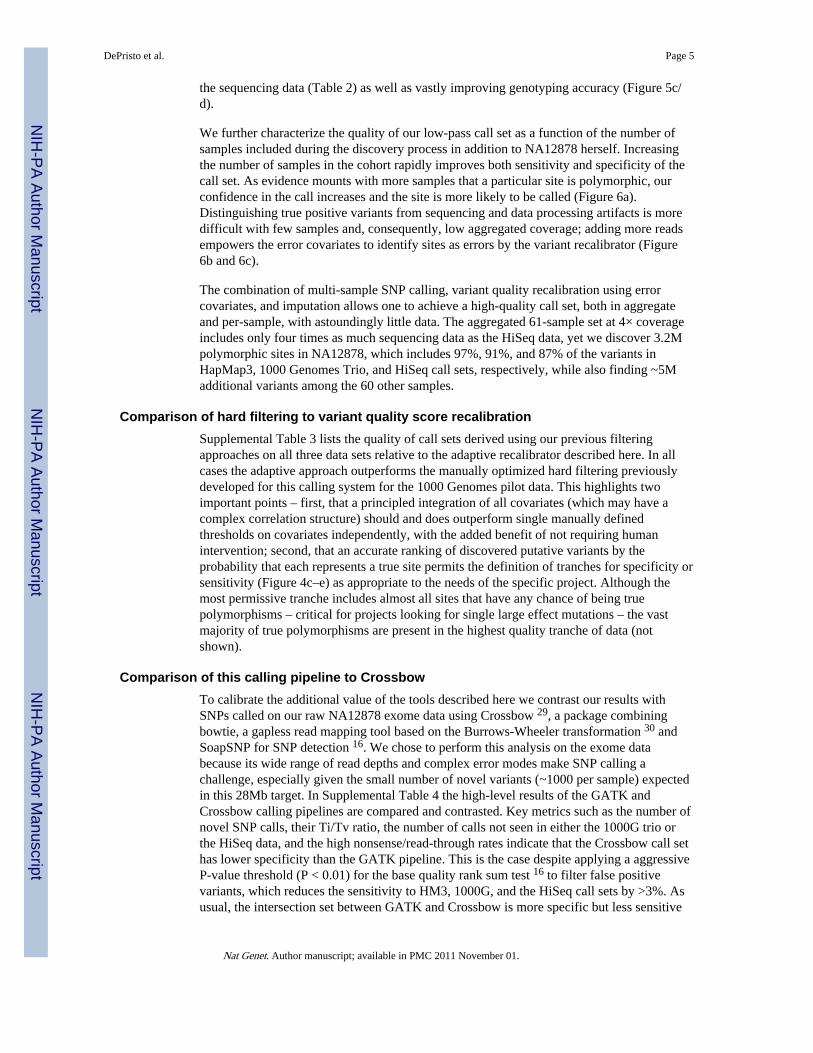
Figure 1.Framework for variation discovery and genotyping from next-generation DNA sequencing.See text for a detailed description.
DePristo et al. Page 10
Nat Genet. Author manuscript; available in PMC 2011 November 01.
NIH
-PA Author Manuscript
NIH
-PA Author Manuscript
NIH
-PA Author Manuscript
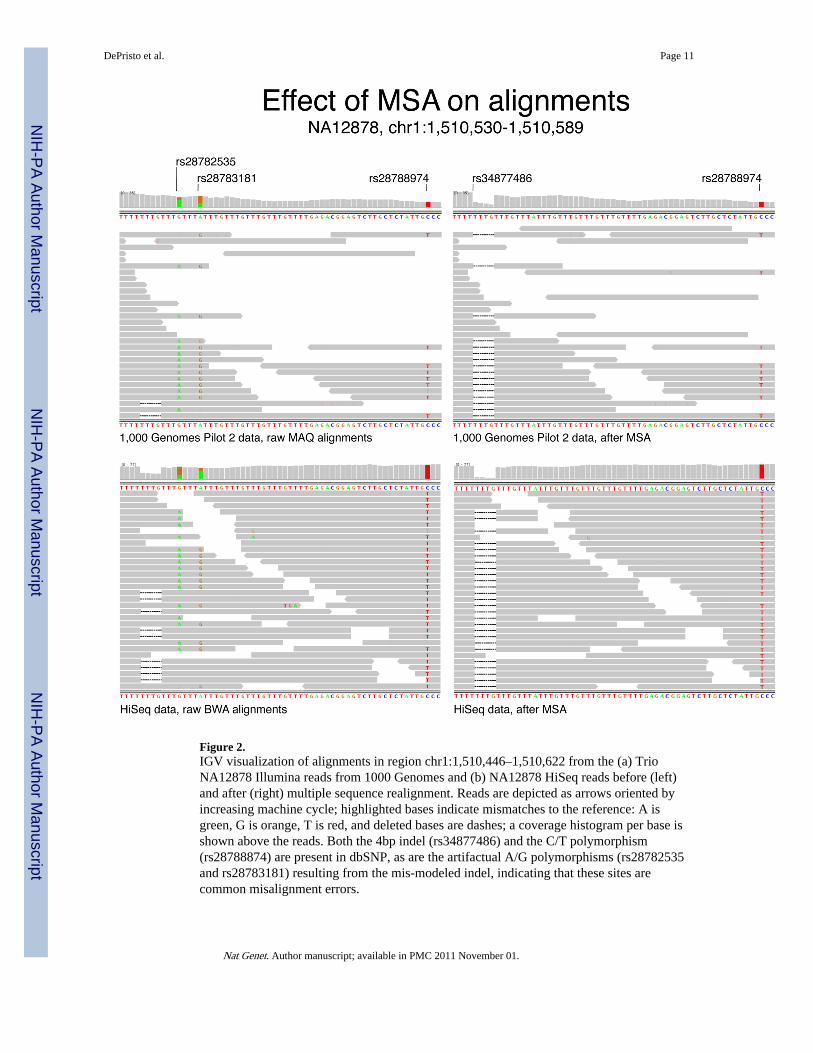
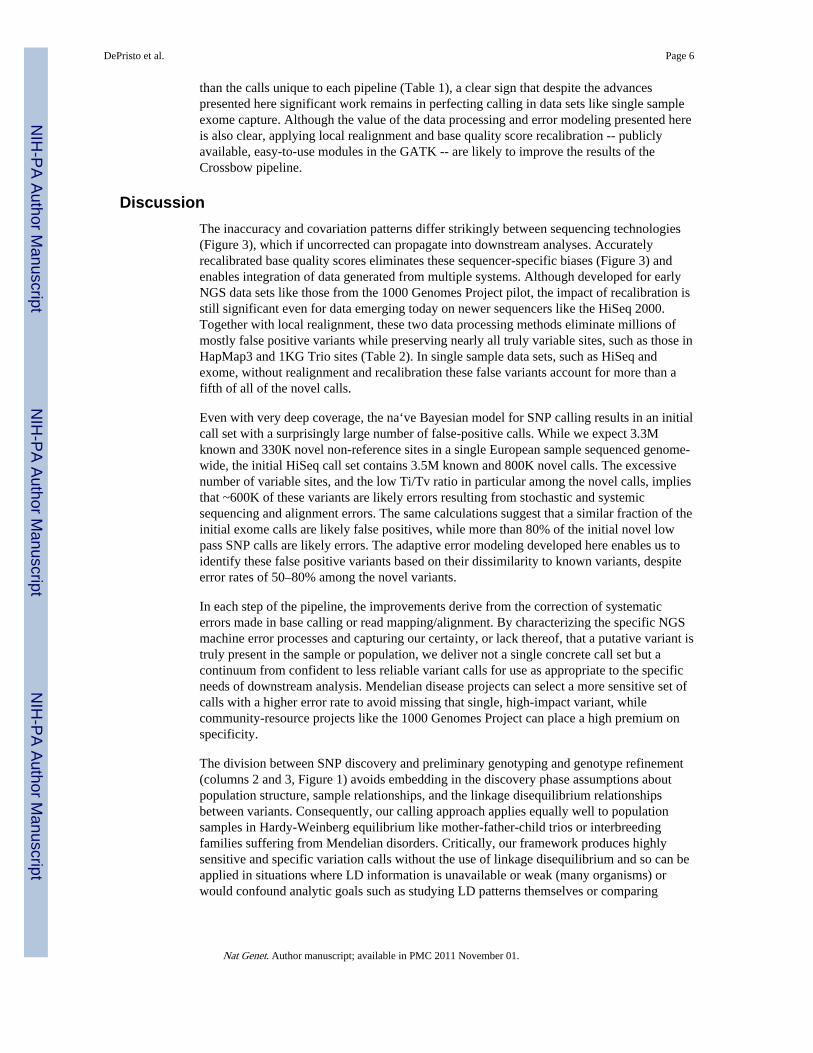
Figure 2.IGV visualization of alignments in region chr1:1,510,446–1,510,622 from the (a) TrioNA12878 Illumina reads from 1000 Genomes and (b) NA12878 HiSeq reads before (left)and after (right) multiple sequence realignment. Reads are depicted as arrows oriented byincreasing machine cycle; highlighted bases indicate mismatches to the reference: A isgreen, G is orange, T is red, and deleted bases are dashes; a coverage histogram per base isshown above the reads. Both the 4bp indel (rs34877486) and the C/T polymorphism(rs28788874) are present in dbSNP, as are the artifactual A/G polymorphisms (rs28782535and rs28783181) resulting from the mis-modeled indel, indicating that these sites arecommon misalignment errors.
DePristo et al. Page 11
Nat Genet. Author manuscript; available in PMC 2011 November 01.
NIH
-PA Author Manuscript
NIH
-PA Author Manuscript
NIH
-PA Author Manuscript
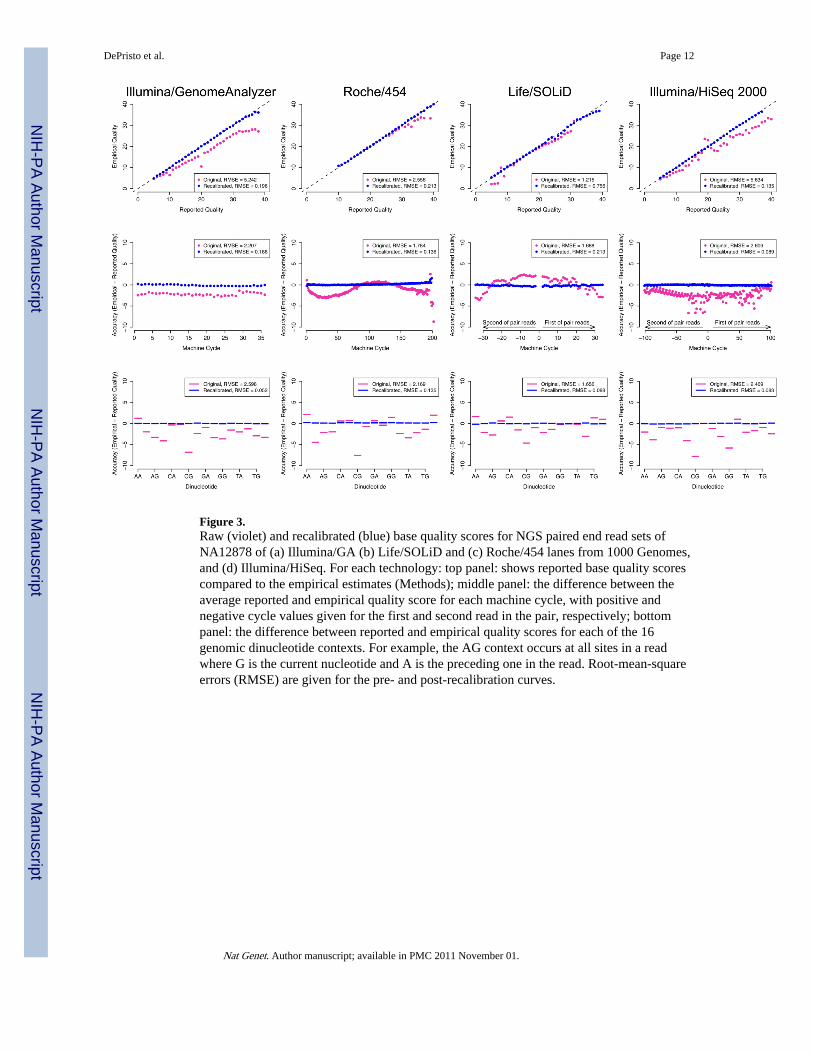
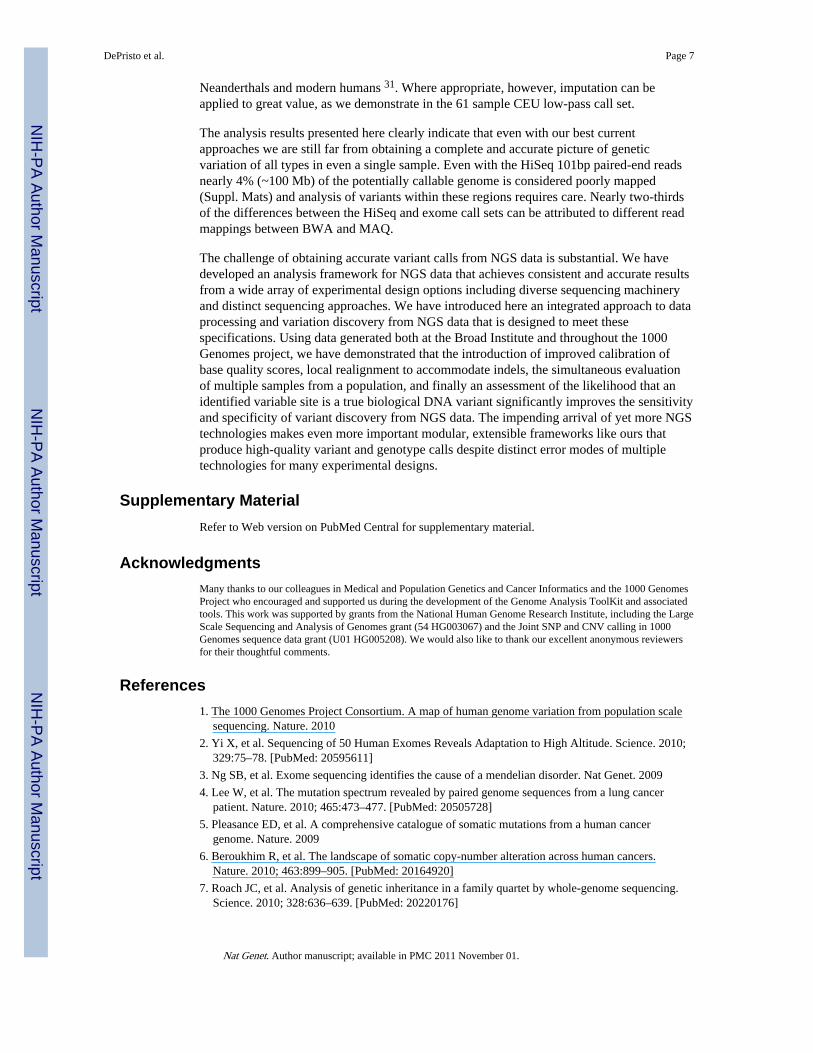
Figure 3.Raw (violet) and recalibrated (blue) base quality scores for NGS paired end read sets ofNA12878 of (a) Illumina/GA (b) Life/SOLiD and (c) Roche/454 lanes from 1000 Genomes,and (d) Illumina/HiSeq. For each technology: top panel: shows reported base quality scorescompared to the empirical estimates (Methods); middle panel: the difference between theaverage reported and empirical quality score for each machine cycle, with positive andnegative cycle values given for the first and second read in the pair, respectively; bottompanel: the difference between reported and empirical quality scores for each of the 16genomic dinucleotide contexts. For example, the AG context occurs at all sites in a readwhere G is the current nucleotide and A is the preceding one in the read. Root-mean-squareerrors (RMSE) are given for the pre- and post-recalibration curves.
DePristo et al. Page 12
Nat Genet. Author manuscript; available in PMC 2011 November 01.
NIH
-PA Author Manuscript
NIH
-PA Author Manuscript
NIH
-PA Author Manuscript
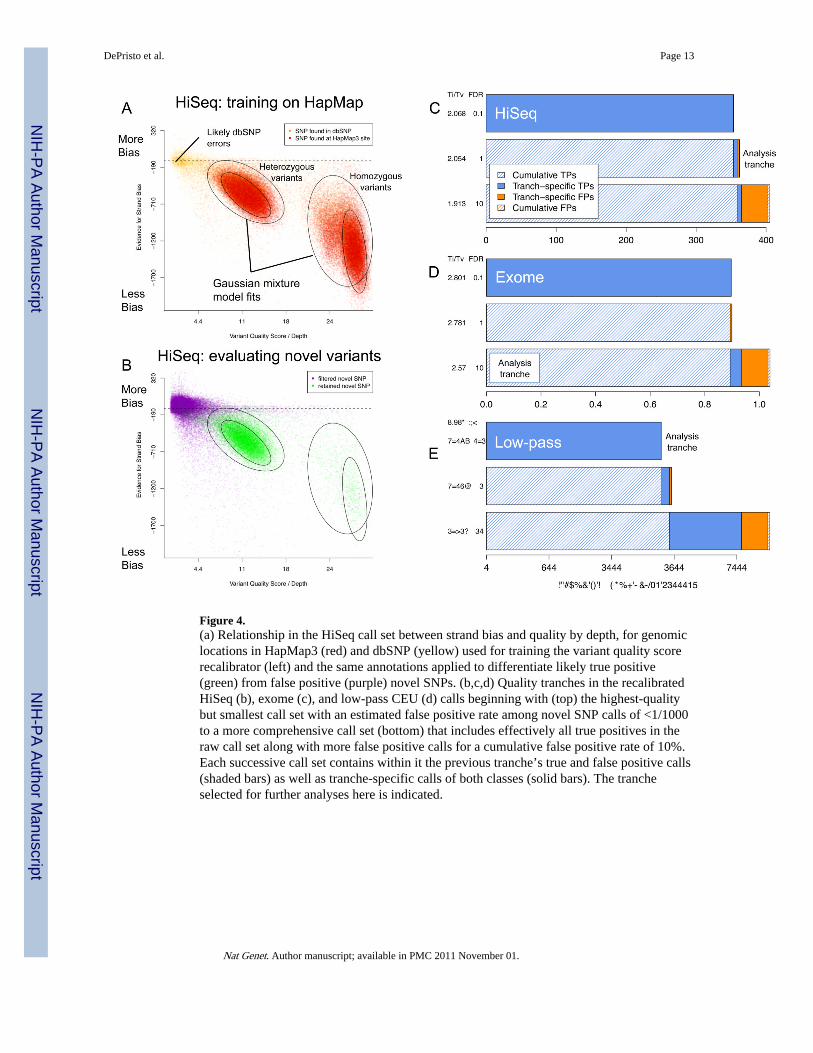
Figure 4.(a) Relationship in the HiSeq call set between strand bias and quality by depth, for genomiclocations in HapMap3 (red) and dbSNP (yellow) used for training the variant quality scorerecalibrator (left) and the same annotations applied to differentiate likely true positive(green) from false positive (purple) novel SNPs. (b,c,d) Quality tranches in the recalibratedHiSeq (b), exome (c), and low-pass CEU (d) calls beginning with (top) the highest-qualitybut smallest call set with an estimated false positive rate among novel SNP calls of <1/1000to a more comprehensive call set (bottom) that includes effectively all true positives in theraw call set along with more false positive calls for a cumulative false positive rate of 10%.Each successive call set contains within it the previous tranche’s true and false positive calls(shaded bars) as well as tranche-specific calls of both classes (solid bars). The trancheselected for further analyses here is indicated.
DePristo et al. Page 13
Nat Genet. Author manuscript; available in PMC 2011 November 01.
NIH
-PA Author Manuscript
NIH
-PA Author Manuscript
NIH
-PA Author Manuscript
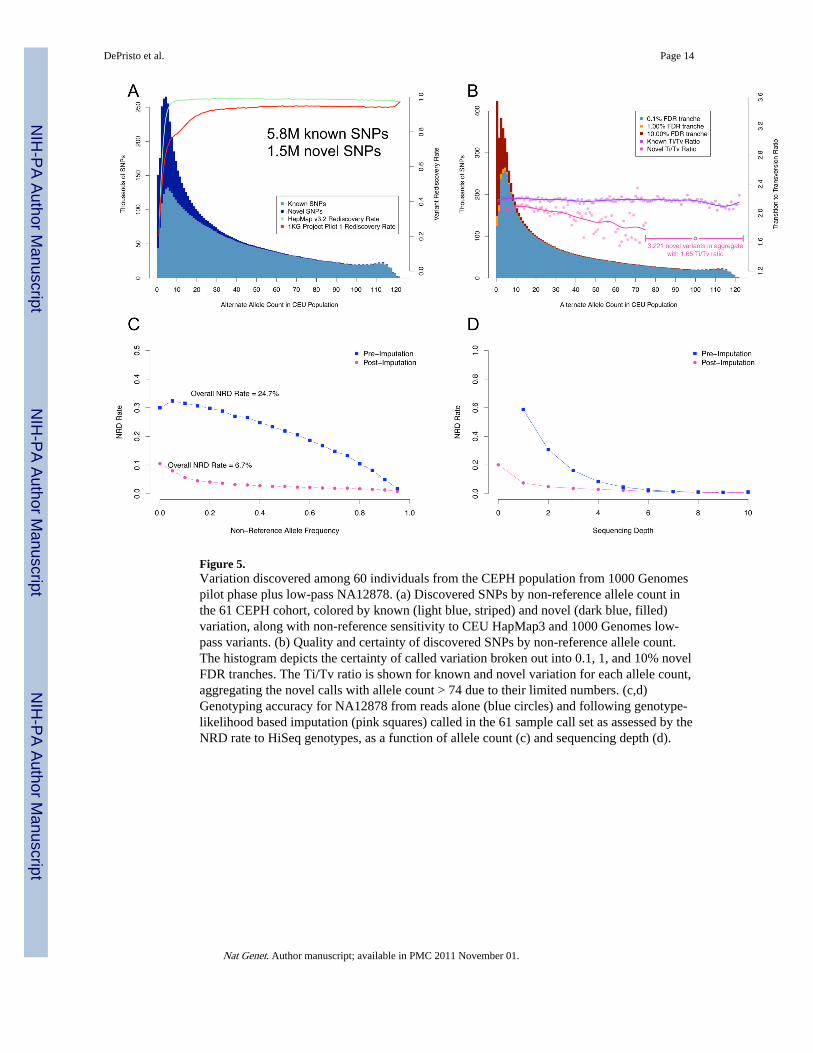
Figure 5.Variation discovered among 60 individuals from the CEPH population from 1000 Genomespilot phase plus low-pass NA12878. (a) Discovered SNPs by non-reference allele count inthe 61 CEPH cohort, colored by known (light blue, striped) and novel (dark blue, filled)variation, along with non-reference sensitivity to CEU HapMap3 and 1000 Genomes low-pass variants. (b) Quality and certainty of discovered SNPs by non-reference allele count.The histogram depicts the certainty of called variation broken out into 0.1, 1, and 10% novelFDR tranches. The Ti/Tv ratio is shown for known and novel variation for each allele count,aggregating the novel calls with allele count > 74 due to their limited numbers. (c,d)Genotyping accuracy for NA12878 from reads alone (blue circles) and following genotype-likelihood based imputation (pink squares) called in the 61 sample call set as assessed by theNRD rate to HiSeq genotypes, as a function of allele count (c) and sequencing depth (d).
DePristo et al. Page 14
Nat Genet. Author manuscript; available in PMC 2011 November 01.
NIH
-PA Author Manuscript
NIH
-PA Author Manuscript
NIH
-PA Author Manuscript
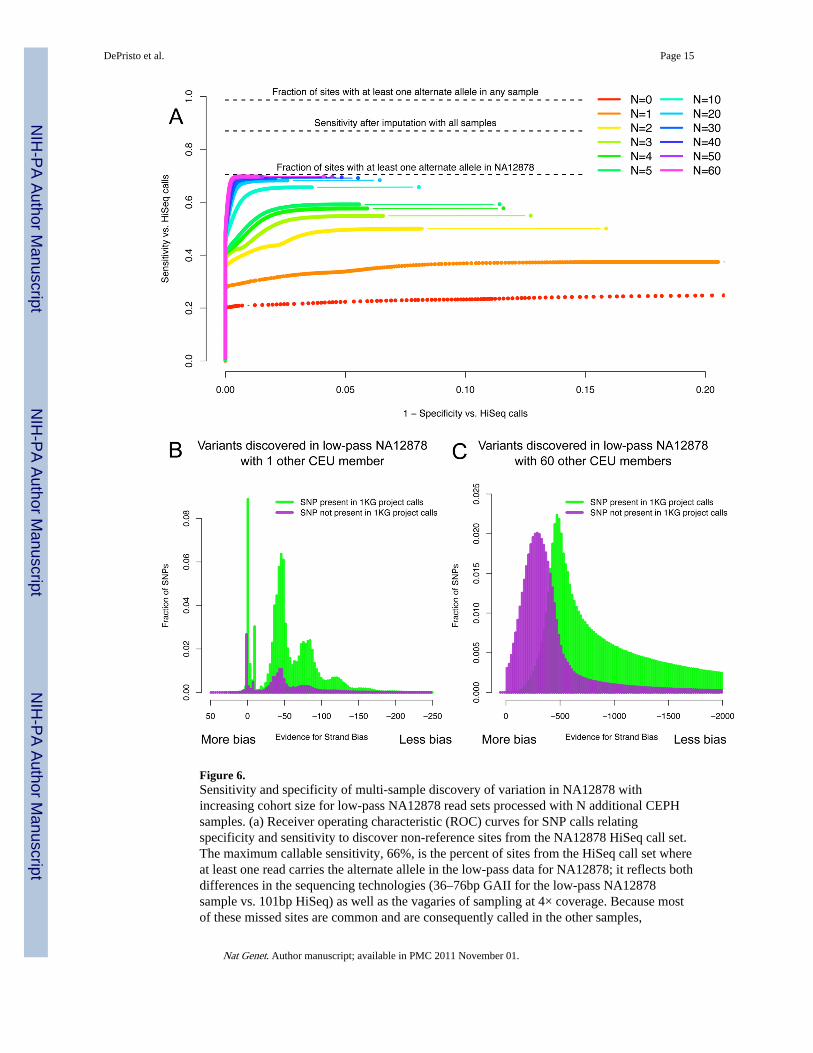
Figure 6.Sensitivity and specificity of multi-sample discovery of variation in NA12878 withincreasing cohort size for low-pass NA12878 read sets processed with N additional CEPHsamples. (a) Receiver operating characteristic (ROC) curves for SNP calls relatingspecificity and sensitivity to discover non-reference sites from the NA12878 HiSeq call set.The maximum callable sensitivity, 66%, is the percent of sites from the HiSeq call set whereat least one read carries the alternate allele in the low-pass data for NA12878; it reflects bothdifferences in the sequencing technologies (36–76bp GAII for the low-pass NA12878sample vs. 101bp HiSeq) as well as the vagaries of sampling at 4× coverage. Because mostof these missed sites are common and are consequently called in the other samples,
DePristo et al. Page 15
Nat Genet. Author manuscript; available in PMC 2011 November 01.
NIH
-PA Author Manuscript
NIH
-PA Author Manuscript
NIH
-PA Author Manuscript
imputation recovers ~50% of these sites. (b,c) Increasing power to identify strand-biased,likely false positive SNP calls with additional samples. Histograms of the Strand Biasannotation at raw variant calls discovered in the low-pass CEU data using NA12878 at 4×combined with one other CEU individual (b) and with 60 other individuals (c) stratified intosites present (green) and not (purple) in the 1000 Genomes CEU trio.
DePristo et al. Page 16
Nat Genet. Author manuscript; available in PMC 2011 November 01.
NIH
-PA Author Manuscript
NIH
-PA Author Manuscript
NIH
-PA Author Manuscript
NIH
-PA Author Manuscript
NIH
-PA Author Manuscript
NIH
-PA Author Manuscript
DePristo et al. Page 17
Table 1
Next-generation DNA sequencing data sets analyzed
HiSeq Exome Low-pass
Samples NA12878 NA12878 NA12878 + 60 unrelated CEPH individuals
Sequencing technologies Whole genome shotgun;Illumina HiSeq 2000 18
Agilent exome hybrid capture32,33; Illumina GenomeAnalyzer18
Whole genome shotgun; IlluminaGenomeAnalyzer 18; Life/SOLiD 34; Roche/454 20
Coverage per sample ~60× ~150×; 93% of bases at >20×coverage
~4×
Read architecture 101bp paired end 76/101bp paired end 25, 36, 51, 76, ~250 (454) bp single andpaired ends
Targeted area 2.85 Gb of autosomes andchrX
28 Mb 2.85 Gb of autosomes and chrX
Data set source Novel, generated for thisarticle
Novel, generated for this article 1000 Genomes Project
Aligner(s) BWA 11 MAQ 10 MAQ 10; Corona Lite; SSAHA 12
Nat Genet. Author manuscript; available in PMC 2011 November 01.
NIH
-PA Author Manuscript
NIH
-PA Author Manuscript
NIH
-PA Author Manuscript
DePristo et al. Page 18
Tabl
e 2
Raw
to r
ecal
ibra
ted,
impu
ted
SNP
calls
HiS
eq, E
xom
e, a
nd 6
1 sa
mpl
e lo
w-p
ass
data
set
s. P
art o
ne o
f ea
ch s
ectio
n su
mm
ariz
es th
e im
pact
of
loca
lre
alig
nmen
t and
bas
e qu
ality
rec
alib
ratio
n by
com
pari
ng S
NP
calls
on
read
s w
ith r
aw q
ualit
y sc
ores
and
alig
nmen
ts to
thos
e m
ade
on th
e re
alig
ned,
reca
libra
ted
read
s.
Site
dis
cove
ryC
ompa
riso
n to
NA
1287
8 va
rian
ts
No.
of
SNP
sT
i/Tv
HM
3 co
ncor
danc
eH
M3
conc
orda
nce
Cal
l set
All
Kno
wn
Nov
eldb
SNP
%K
now
nN
ovel
NR
sens
itiv
ity
NR
D r
ate
NR
sens
itiv
ity
NR
D r
ate
HiS
eq
Raw
rea
ds, a
ll ca
lls4.
43M
3.49
M94
1K78
.77
2.05
1.29
99.7
40.
1099
.57
0.20
Uni
que
to r
aw r
ead
calls
263K
37K
226K
13.9
51.
370.
700.
0237
.97
0.09
12.6
4
Uni
que
to +
reca
l/+M
SA c
alls
9.8K
1.8K
8.0K
18.0
81.
381.
390.
0018
.18
0.00
9.93
+re
cal/+
MSA
, all
calls
4.18
M3.
45M
722K
82.7
12.
061.
5799
.72
0.09
99.4
80.
19
Filte
red
by v
aria
nt r
ecal
ibra
tion
595K
235K
360K
39.4
41.
191.
210.
673.
002.
24.
31
Fin
al c
all s
et3.
58M
3.22
M36
2K89
.89
2.15
2.05
99.0
50.
0797
.28
0.10
Low
-pas
s
Raw
rea
ds, a
ll ca
lls13
.4M
6.5M
6.9M
48.7
72.
051.
1383
.97
20.3
480
.45
22.5
3
Uni
que
to r
aw r
ead
calls
670K
32K
638K
4.74
1.19
0.67
0.01
49.2
10.
0252
.57
Uni
que
to +
reca
l/+M
SA c
alls
45K
2.5K
42K
5.62
0.94
0.68
0.00
N/A
0.00
38.8
9
+re
cal/+
MSA
, all
calls
12.8
M6.
5M6.
3M50
.92
2.06
1.18
83.9
720
.33
80.4
322
.52
Filte
red
by v
aria
nt r
ecal
ibra
tion
5.5M
706K
4.8M
12.8
41.
311.
010.
9526
.54
3.44
32.9
1
Var
iant
rec
alib
rate
d ca
ll se
t7.
3M5.
8M1.
5M79
.72.
182.
05It
emiz
ed b
elow
S
ampl
e va
rian
t ca
lls f
or N
A12
878
only
V
aria
nt r
ecal
ibra
ted
NG
S re
ads
only
2.44
M2.
30M
140K
94.2
82.
152.
0683
.02
20.2
676
.99
22.0
1
R
ecal
ibra
ted
with
Bea
gle
impu
tatio
n3.
20M
3.01
M19
1K94
.03
2.18
2.09
96.7
23.
3291
.21
3.35
Exo
me
capt
ure
Raw
rea
ds, a
ll ca
lls18
.9K
16.8
K2.
1K88
.83
3.20
1.16
99.1
00.
0999
.12
0.12
Uni
que
to r
aw r
ead
calls
483
3944
48.
072.
550.
310.
0425
.00
0.03
33.3
3
Uni
que
to +
reca
l/+M
SA c
alls
8140
4149
.38
3.44
1.73
0.01
0.00
0.04
16.6
7
+re
cal/+
MSA
, all
calls
18.5
K16
.8K
1.7K
90.7
73.
201.
6199
.07
0.08
99.1
30.
11
Nat Genet. Author manuscript; available in PMC 2011 November 01.
NIH
-PA Author Manuscript
NIH
-PA Author Manuscript
NIH
-PA Author Manuscript
DePristo et al. Page 19
Site
dis
cove
ryC
ompa
riso
n to
NA
1287
8 va
rian
ts
No.
of
SNP
sT
i/Tv
HM
3 co
ncor
danc
eH
M3
conc
orda
nce
Cal
l set
All
Kno
wn
Nov
eldb
SNP
%K
now
nN
ovel
NR
sens
itiv
ity
NR
D r
ate
NR
sens
itiv
ity
NR
D r
ate
Filte
red
by v
aria
nt r
ecal
ibra
tion
1274
609
665
47.8
1.85
0.84
0.59
N/A
0.76
N/A
Fin
al c
all s
et17
.2K
16.2
K10
3993
.96
3.27
2.57
98.4
90.
0898
.38
0.11
Nat Genet. Author manuscript; available in PMC 2011 November 01.


