Embed Size (px)
Citation preview

1 23
Arabian Journal of Geosciences ISSN 1866-7511 Arab J GeosciDOI 10.1007/s12517-015-1968-3
A GIS-based assessment of waterquality pollution indices for heavy metalcontamination in Tuticorin Corporation,Tamilnadu, India
S. Selvam, S. Venkatramanan &C. Singaraja
ORIGINAL PAPER
A GIS-based assessment of water quality pollution indicesfor heavy metal contamination in Tuticorin Corporation,Tamilnadu, India
S. Selvam1& S. Venkatramanan2
& C. Singaraja3
Received: 8 January 2015 /Accepted: 21 May 2015# Saudi Society for Geosciences 2015
Abstract The present study was conducted to evaluate themetal pollution of groundwater in the vicinity of TuticorinCorporation in Tamilnadu State, India, used by various pollu-tion indices such as heavy metal pollution index (HPI), heavymetal evaluation index (HEI), and degree of contamination(DOC). Thirty-six groundwater samples were collected duringthe summer season (May 2013) and the concentration ofmetals Al, Cr, Fe, Cu, Mn, Ni, Zn, Cd, and Pb was analyzed.Consequences exhibited that groundwater was contaminatedwith Mn (59.12 ppb), Cu (162.41 ppb), Pb (196.15 ppb), Cr(187.12 ppb), and Cd (10.11 ppb). Correlation and factor anal-ysis revealed that the sources of metals in groundwater in thestudy area are the same, and it may due to the leachates fromthe nearby sewage farm, industrial activity (State IndustriesPromotion Corporation of Tamil Nadu Limited (SIPCOT)),Buckle canal, and solid wastes dumped in the residential area.Groundwater pollution indices of HPI, HEI, and DOC re-vealed that most of groundwater samples belonged to the me-dium to high zones, which was adjacent to the polluted Bucklecanal, SIPCOT industrial waste, and sewage fish farm in thecoastal area. The present study points out that the metal pol-lution causes the degradation of groundwater quality aroundTuticorin coastal corporation. These study results will be veryhelpful for sustainable management of groundwater resources,
and they will enable planners and policymakers to evolve astrategy to solve similar problems elsewhere.
Keywords Heavymetals . HPI . HEI . DOC . Tuticorin
Introduction
Water is the most important natural resource utilized for drink-ing, irrigation, and industrial purposes in various areas. Wateris not only the most important essential constituent of all an-imals, plants, and other organisms but also the pivotal for thesurvivability of mankind in the biosphere. Groundwater oc-curs almost everywhere beneath the earth surface not only in asingle widespread aquifer but also in thousands of local aqui-fer systems. Several factors such as climate, characteristics ofsoil, circulation of groundwater through rock types, topogra-phy of the area, intrusion of saline water in coastal areas,human activities on the ground, etc. posses several effects onthe quality of water (Agarwal et al. 2013). Safe and good-quality drinking water is the basis for good human health.Water provides some elements, but when polluted, it may bedangerous to human health and cause diseases such as variouscancers, adverse reproductive outcomes, cardiovascular dis-ease, and neurological disease (Chidambaram et al. 2007a;Srinivasamoorthy et al. 2008; Magesh and Chandrasekar2012; Singaraja et al. 2012a; Selvam et al. 2013a).
Water contaminated from industrial effluents, pesticides,fertilizers, and detergents finds its way into lakes, streams,rivers, oceans, and other water bodies and adds toxic sub-stances into these aquatic systems. The problem of environ-mental pollution due to toxic metals has raised widespreadconcerns in different parts of the world, and results reportedby various agencies have been alarming. BHeavy metals^ is acollective term which applies to the group of the metals and
* S. [email protected]
1 Department of Geology, V.O. Chidambaram College,Thoothukudi 628008, Tamilnadu, India
2 Department of Earth and Environmental Sciences, Institute ofEnvironmental Geosciences, Pukyong National University,Busan 608-737, Korea
3 Department of Geology, Presidency College, Chennai-5, India
Arab J GeosciDOI 10.1007/s12517-015-1968-3
Author's personal copy

metalloids with atomic density greater than 4 g/cm3 (Huttonand Symon 1986; Nriagu and Pacyna 1988). However, beingheavy metal has little to dowith density but concerns chemicalproperties. Heavy metals include lead (Pb), cadmium (Cd),zinc (Zn), mercury (Hg), arsenic (As), silver (Ag), chromium(Cr), copper (Cu), iron (Fe), nickel (Ni), and platinum groupelements. The main sources of heavy metal pollution are ag-ricultural runoff, sewage, and discharges of untreated andsemi-treated effluents from metal-related industries such asmetal electroplating, manufacturing of batteries, circuitboards, and car repair. Road is also one of the largest sourcesof heavy metals (Farmaki and Thomaidis 2008; Magesh et al.2011; Selvam et al. 2013b). Some heavy metals such as Cu,Fe, Mn, Ni, and Zn are compulsory micronutrients for flora–fauna and microbes. Besides, metals like Cd, Cr, and Pb areharmful beyond a certain limit. Therefore, the heavy metalconcentration in drinking water should be kept in low ppbrange. One of the most hazardous trace metals found in drink-ing water is arsenic (As) being both toxic and carcinogenic. Invery small quantities, even Cr and Ni are required in the body.However, some other metals like As, Cd, Pb, and methylatedmercury have been reported to have no known importance inhuman biochemistry and physiology, and consumption evenat very low concentrations can be toxic. Even for those thathave bioimportance, dietary intakes have to be within regula-tory limits as excesses may result in poisoning or toxicity(Fosmire 1990; Nolan 2003; Young 2005; Chidambaramet al. 2007b; Srinivasamoorthy et al. 2011; Selvam et al.2013c; Singaraja et al. 2015; Venkatramanan et al. 2014).
As the population of Tuticorin Corporation continues torise, human activities like soil fertility remediation by fertilizerapplication, indiscriminate refuse, waste disposal and the useof septic tanks, soak away pits, and pit latrines are on theincreases as well. These activities are capable of producingtoxic leachates which percolate into porous geological stratumaccommodating groundwater, thereby contaminating ground-water as well (Mondal et al. 2010; Singaraja et al. 2012b;Selvam et al. 2014a; Antony Ravindran and Selvam 2014).Borehole water serves as the major source of drinking waterin the local population of Tuticorin Corporation, since onlyvery few households can afford and rely on treated andpurified bottle water. This practice places commercial valueon a relatively noncommercial commodity (groundwater),thereby neglecting quality and professional considerationsand in the process risking public health, all in a bid to max-imize profit.
It is expected that this research can contribute to the iden-tification of heavy metal contamination sources and originsand to the effective conservation and management of ground-water in Tuticorin Corporation, Southern Tamilnadu. It ap-plied both the conventional statistical methods and geographicinformation system (GIS) to develop the source of heavy met-al contamination.
Study area
Tuticorin is located strategically close to the east–west inter-national sea routes on the southeast coast of India. It is acoastal town with a sea port and has been recently upgradedas corporation. Tuticorin was established as a municipality in1866. It attained the status of corporation on 5 August 2008after 142 years. The study area covers a geographical area of154 km2 and lies between 8° 43′–8° 51′N latitude and 78° 5′–78° 10′E longitude (Fig. 1). The population is mainly engagedin agriculture. Numerous salt pans, salt-based industries, andmarine chemical industries are located in this zone. The citywas industrially developed after the construction of the portand became district headquarters in the year 1986. After theformation of the district headquarters, the economic develop-ment was boosted and began to develop rapidly. Therefore,the urban expansion takes place in the different parts of thecity during the study period. This farmwhich is approximately40 ha is totally dedicated to all-year-round agricultural pro-duction with a few population of nomads and agriculturistssettled within the area. Common crops such as tomatoes, gar-den eggs, pepper, spinach, cassava, and other vegetable/leguminous crops are grown in the dry season, while cropslike rice, sugarcane, maize, and guinea corn are also mixedwith the above crops in the rainy season (Selvam et al. 2014b).In the rest of the study area, industries manufacturingchemicals, salt, flower dying, copper wire, copper alloy, alkalichemicals and fertilizers, petrochemicals and plastics, heavywater, chemical dying, and bleaching dispose industrial andhazardous wastes nearby agricultural lands which craft a ma-jor threat to the adjoining groundwater environment. Topo-graphic elevation varies from 0 (near the coastline) to 27 m(msl) in the western part of the study area. The slope is gentlein the western and the central part; further, it is nearly flat inthe eastern part (Selvam et al. 2014c).
Geology and hydrology
The study area consists of 90 % of sedimentary rocks of Ter-tiary to Recent age comprising shell limestone and sand, Tuff-aceous Kankar, sand (aeolian deposits), etc., and the remain-ing area is covered by mixed and composite gneiss of Prote-rozoic age of crystalline rocks (Fig. 1). The sedimentary rocksare fine to medium grained, hard, compact, and fossiliferouswith shells of gastropods and pelecypods. The thickness of thestrata varies from place to place, from a few meters to morethan 20 m. The formation extends in the NE–SW directiondipping SE with low angles. Sand admixed with clay is themajor formation making the aquifer media. The coastal studyarea is underlined by loose-textured coarse calcareous gritsand shell limestone of sub-recent age. Rocks are horizontallybedded with a low dip of 10° to 15° SE. The Archaean groups
Arab J Geosci
Author's personal copy

of formations are crystalline, metamorphic, and finely foliatedwith a general NW–SE trend (Balasubramanaian et al. 1993;Selvam et al. 2014d). The area is covered with black soils inthe western part (Sankarapari area), red soil (sandy loam tosandy soil) in the central part, and alluvial sandy soils (coastalarea) in the eastern part (Fig. 2). Thickness of soil is 3 m andthe sandy soils originated from sandstones with low soil mois-ture retention. Alluvium soils of wind-blown sands and shellsare setup by beach sand and coastal dunes, which have verylow soil moisture retention. Aquifer systems of the district areestablished by unconsolidated and semi-consolidated forma-tions of weathered and fractured crystalline rocks. Porous for-mation of the district exhibits sandstones of Tertiary age, whilerecent formations containing sands, clays, and gravels areconfined to major drainage courses in the district. The maxi-mum thickness of alluvium is 45.0 m bgl, whereas the averagethickness is about 25.0 m (Selvam 2012).
The average annual rainfall of this study area is 877 mm.The NE monsoon contributing 65.4 % of annual rainfall is themajor component of recharge into the aquifer. The total num-ber of rainy days in a year is only 38.5. Rainfall data fromseven stations over the period of 2000–2010 were utilized,
and a perusal of the data shows that the normal rainfall variesfrom 599 to 749 mm, which is far less than that of the stateaverage (942.8 mm). The contribution of the SW monsoon isonly 8.06 % (Selvam 2014).The maximum and minimumrainfall was observed during November and June, respective-ly. Hydrological characteristics of this coastal belt consist oftwo major geological formations such as shell limestone andaeolian deposits. Groundwater occurs in confined and semi-confined condition. Hydraulic properties of these aquifers areexhibited in vertical and horizontal dimensions. The depth ofthe water table varies from 1 to 10 m bgl in post-monsoon and2 to 15 m bgl in pre-monsoon. The mean maximum and min-imum temperature was noted in 37.6 °C (June) and 19.9 °C(January), respectively. During the NE monsoon, the temper-ature came down to 22.30 °C corresponding to a heavy down-pour. The temperature is relatively high and increases the rateof evaporation of the surface water and also the actual evapo-transpiration, which is nearly equal to that of the annual pre-cipitation (Balasubramanaian et al. 1993; Selvam et al.2014e). Based on the scanty contribution of rainfall over re-charge into the groundwater system, it is expected to bevery less.
Fig. 1 Map of geology with sample location of the study area
Arab J Geosci
Author's personal copy

Materials and methods
Groundwater sampling and analysis
Thirty-six groundwater samples were gathered in the yearof 2013 (Fig. 1). Groundwater sampling design wasfollowed by Geological Survey Toposheets (No. 58L/1&5, 58L/2) to identify the drilled bore well sites of thestudy area. Groundwater of drilled wells was sampledfrom the taps of water users after pumping for about10 min to remove stagnant water. Groundwater sampleswere collected from high-quality polyethylene bottlesthrough 0.45-μm cellulose nitric membrane filter to elim-inate suspended materials. Methods of sample collectionand analysis were followed according to the AmericanPublic Health Association (APHA 1995). Most of theborehole wells were developed in bedrock, and the depthof the boreholes ranged between 20 and 250 m. The di-ameters of the borehole wells were 5–8 in. Groundwatersamples for the analysis of metal components were
acidified to pH<2.0 in the field. All samples were storedin ice chests at 4 °C and transported directly to the labo-ratory, where they were analyzed within 2 weeks. pH,electrical conductivity (EC), and DO were measured inthe field using portable instruments. The groundwatersamples were brought to the analytical laboratories ofthe National Geophysical Research Laboratory (Hydera-bad). Each of the thoroughly mixed water samples wasfiltered using Whatman filter paper no.42, and laboratorysamples were collected in 1-l containers, acidified withnitric acid (AR grade) to pH 2 (0.2 % v/v) and storedfor further analysis (Balaram 1993), and then processedfor analysis of elements using an inductively coupledplasma–mass spectrometry (ICP–MS) model ELANDRC II, PerkinElmer Sciex® Instrument, USA. Filteredwater samples were directly introduced into an ICP–MSinstrument by conventional pneumatic nebulization, usinga peristaltic pump with a solution uptake rate of about1 ml/min. The nebulizer gas flow, sample uptake rate de-tector voltages, and lens voltage were optimized for a
Fig. 2 Soil map of the TuticorinCorporation
Arab J Geosci
Author's personal copy

sensitivity of about 50,000 counts/s for 1 ng/ml solution of In.The instrumental and data acquisition parameters are given inBalaram (1993). Calibration was performed using the certifiedreference material NIST 1640 (National Institute of Standardsand Technology, USA), in order to minimize matrix and otherassociated interference effects. Certified reference material fortrace elements SLRS-4 (National Research Council, Canada)was analyzed as an unknown to check the precision and accu-racy of the analysis. Blanks were analyzed along with samplesand corrections were carried out accordingly. Accuracy ofquality assurance (QA) was measured by pointed sampleswith known concentrations of solutes, and precision waschecked by blind duplicate samples from the same site. Thisis to verify that refinement procedures and laboratory proto-cols were acceptable (Koterba et al. 1995; Forstner andWittman 1981). The relative standard deviation (RSD) wasfound to be better than 6 % in the majority of the cases, whichindicates that the precision of the analysis is reasonably good.The analyses were carried out for the elements particularlyheavy metals, potentially toxic elements (PTEs), and othertrace elements and major cations.
Heavy metal evaluation index (HEI)
HEI gives an overall quality of the water with respect to heavymetals (Edet and Offiong 2002) and is expressed as follows:
HEI ¼Xn
i¼1
Hc
Hmac
where Hc and Hmac are the monitored value and maximumadmissible concentration (MAC) of the ith parameter,respectively.
Heavy metal pollution index (HPI)
The HPI method was developed by assigning a rating orweightage (Wi) for each chosen parameter and selecting thepollution parameter on which the index was to be based. Therating is an arbitrary value between 0 and 1, and its selectionreflects the relative importance of individual quality consider-ations. It can be defined as inversely proportional to the rec-ommended standard (Si) for each parameter (Horton 1965;Reddy 1995; Mohan et al. 1996).
In this study, the concentration limits (i.e., the highest per-missible value for drinking water (Si) and maximum desirablevalue (Ii) for each parameter) were taken from the internation-al WHO standard. The uppermost permissive value for drink-ing water (Si) refers to the maximum allowable concentrationin drinking water in the absence of any alternate water source.The desirable maximum value (Ii) indicates the standard limitsfor the same parameters in drinking water.
The HPI, assigning a rating or weightage (Wi) for eachselected parameter, is determined using the expression below(Mohan et al. 1996).
HPI ¼X n
i¼1WiQi
X n
i¼1Wi
whereQi andWi are the sub-index and unit weight of the widthparameter, respectively, and n is the number of parametersconsidered. The sub-index (Qi) is calculated by
Qi ¼Xn
i¼1
Mi −ð Þlif gSi−li
� 100
where Mi, Ii, and Si are the monitored heavy metal, ideal, andstandard values of the ith parameter, respectively. The sign (−)indicates numerical difference of the two values, ignoring thealgebraic sign.
Degree of contamination (DOC)
The contamination index (Cd) summarizes the combined ef-fects of several quality parameters considered harmful tohousehold water (Backman et al. 1997) and is calculated asfollows:
Cd ¼Xn
i¼1
C f i
where
Cd ¼Xn
i¼1
C f i
Cfi=(CAi/CNi)−1; Cfi, CAi, and CNi represent the contamina-tion factor, analytical value, and upper permissible concentra-tion of the ith component, respectively, and N denotes theBnormative value.^ Here, CNi is taken as MAC.
Geostatistical analysis
The experimental data were subjected to statistical analysisusing SPSS software (version 17.0 for Windows). Pearson’sproduct-moment correlation matrix was used to identify therelationship among element pairs. After computation of thecorrelation matrix and to identify the interrelationship, allpairs of constituents were determined. Factor analysis is awidely used statistical technique in groundwater studies be-cause it reduces the number of variables and enables the de-tection of structure in the relationships between variables.Principal component analysis was used to infer the hypothet-ical sources of heavy metals. Exploratory factor analysis wasperformed by varimax rotation (Howitt and Cramer 2005;
Arab J Geosci
Author's personal copy

Tariq et al. 2012; Venkatramanan et al. 2012, 2013; Selvam2015), which minimized the number of variables with a highloading on each component, thereby facilitating the interpre-tation of principle component analysis results.
Concept of IDW
The base map of the Tuticorin area was digitized from surveyof India toposheet using ArcGIS 9.3 software. The precise
locations of sampling points were determined in the fieldusing GARMIN 12-Channel GPS and the exact longitudesand latitudes of sampling points are imported in the GIS plat-form. The spatial distribution for groundwater quality param-eters like HEI, HPI, and DOC was done with the help ofspatial analyst modules in ArcGIS 9.3 software. Inverse dis-tance weighted (IDW) interpolation technique was used forspatial modeling. IDW interpolation determines cell valuesusing a linearly weighted combination of a set of sample
Table 1 Well inventory and chemical characteristics in the study area
Well no. Location name Latitude Longitude PRM
Total depth (m) Depth to water table (m) pH
1 Mullakadu 78.1158 8.7241 12 7 7.8
2 Muniasamy Puram 78.123 8.7243 13.6 11.4 7.8
3 Geetha Nagar 78.1204 8.7335 13 8.7 7.4
4 Athimarapati 78.1064 8.7418 10.3 7.1 7.8
5 Susai Nagar 78.1356 8.7421 19.3 15.4 7.4
6 Tsunami Nagar 78.1548 8.7407 13.6 9.5 7.7
7 Harbour Quateres 78.1721 8.7509 9.2 5.5 7.7
8 Camp I Quateres 78.1459 8.7541 19.6 13.1 7.6
9 Muthiapuram 78.1297 8.7466 19 16 7.4
10 Periyanayaga Puram 78.1016 8.7785 19.6 11.3 7.6
11 Medical College 78.1193 8.7895 18 12 7.6
12 Brayant Nagar 78.1325 8.7869 16 13 7.7
13 C.G.E Colony 78.1441 8.7872 22 17.5 7.7
14 Fisher Colony 78.1525 8.7975 15.3 9 7.9
15 Shunmugapuram 78.1449 8.7987 16 8 7.4
16 Annanagar 78.1298 8.8041 9.3 5 7.5
17 Third Mile 78.1159 8.7885 16.3 10.2 7.8
18 Meelavitan 78.1321 8.7937 19.8 15 7.1
19 SIPCOT 78.0855 8.8024 29.5 25 7.8
20 Sterlite 78.0866 8.8192 70 30 8.8
21 Jothi Nagar 78.1118 8.8423 50 28 10.2
22 Melarasadi 78.1161 8.8686 29 22 7.5
23 Puthur Pandiapuram 78.1203 8.8516 32.3 19 8
24 Mapilaiurani 78.1338 8.8357 16.9 9.5 8.1
25 Devispuram 78.1445 8.8361 46 18.5 7.5
26 Siluvaipatti 78.1545 8.8395 18 15 7.4
27 Talamuthu Nagar 78.1544 8.8289 20.3 13 7.7
28 Thresh Puram 78.1613 8.8163 16.3 7.3 7.8
29 State bank colony 78.1419 8.8155 16.3 4.4 7.5
30 Mapilaiurani South 78.1333 8.8311 9.6 5.5 7.5
31 Ayya samy street 78.1251 8.8172 16.3 8 8
32 Palyapuram 78.1156 8.8146 19.6 8.1 7.9
33 Pandarapatti 78.1074 8.8237 49 27 7.9
34 Vijay Company 78.0964 8.832 76 15 7.9
35 Sankarperi Entrance 78.1012 8.8233 19.3 15 7.5
36 Kalangarai 78.1019 8.7688 25.4 11.2 7.9
Arab J Geosci
Author's personal copy

points. The weight is a function of inverse distance. Further,an input point is from the output cell location, the less impor-tance it has in the calculation of the output value. The outputvalue for a cell using IDW is limited to the range of the inputvalues used to interpolate. Because the IDW is a weighteddistance average, the average cannot be greater than thehighest or less than the lowest input. Therefore, it cannot cre-ate ridges or valleys if these extremes have not already beensampled. Also, because of the averaging, the output surfacewill not pass through the sample points. The best results fromIDWare obtained when sampling is sufficiently dense to rep-resent the local variation that needs to be simulated. Thus, the
IDW technique is ideal for analysis in respect of water qualitydata from various sampling points densely spread out. If thesampling of input points is sparse or very uneven, the resultsmay not adequately represent the desired surface.
Results and discussion
The metal concentrations of the groundwater samples in thepre-monsoon period were statistically analyzed, and the re-sults such as well inventory, maximum, minimum, average,
Table 2 Statistical measures such as minimum, maximum, average, and standard deviation in the pre- and post-monsoon period
Water quality parameters Units Minimum concentration Maximum concentration Average SD
General ions
pH – 7.1 10.2 7.6 7.8
EC μS/cm 350 19100 4887.778 4332.83
TDS mg/l 530 10200 3016.111 2426.35
Metal ions
Al ppb 92.21 560.00 249.36 223.3
Cd ppb 9.00 49.00 10.11 9.32
Cr ppb 50.84 320.00 187.12 101.3
Cu ppb 51.00 313.00 162.41 98.36
Fe ppb 42.00 198.00 124.54 89.63
Mn ppb 23.00 96.42 59.12 41.32
Ni Ppb 315.65 7.50 107.29 91.25
Pb Ppb 63.00 704.00 196.15 102.63
Zn Ppb 39.00 413.00 159.40 123.25
Calculated pollution
HEI – 7.89 44.3 29.55 –
HPI – 25.03 289.62 103.10 –
DOC – 0.56 10.56 4.56 –
Fig. 3 Taxonomy ofgroundwater samples based onthe plot of metal load and pH
Arab J Geosci
Author's personal copy
and standard deviation parameters are given in Tables 1 and 2.To determine the distribution pattern of the concentration ofdifferent elements and to demarcate higher concentrationzones, contour maps for various elements were generated withthe use of the ArcGIS 9.3 software. The negative logarithm ofhydrogen ion concentration (pH) ranged from 7.1 to 10.2 in
pre-monsoon, which indicates that it is slightly alkaline innature and is between the maxi owners of boreholes withinthe city to commercialize the boreholes, which many of theresidents patronize due to its affordability, mum permissiblelimits of WHO standards. EC ranged between 350 and 19,100 μs/cm in pre-monsoon. Higher concentration of EC was
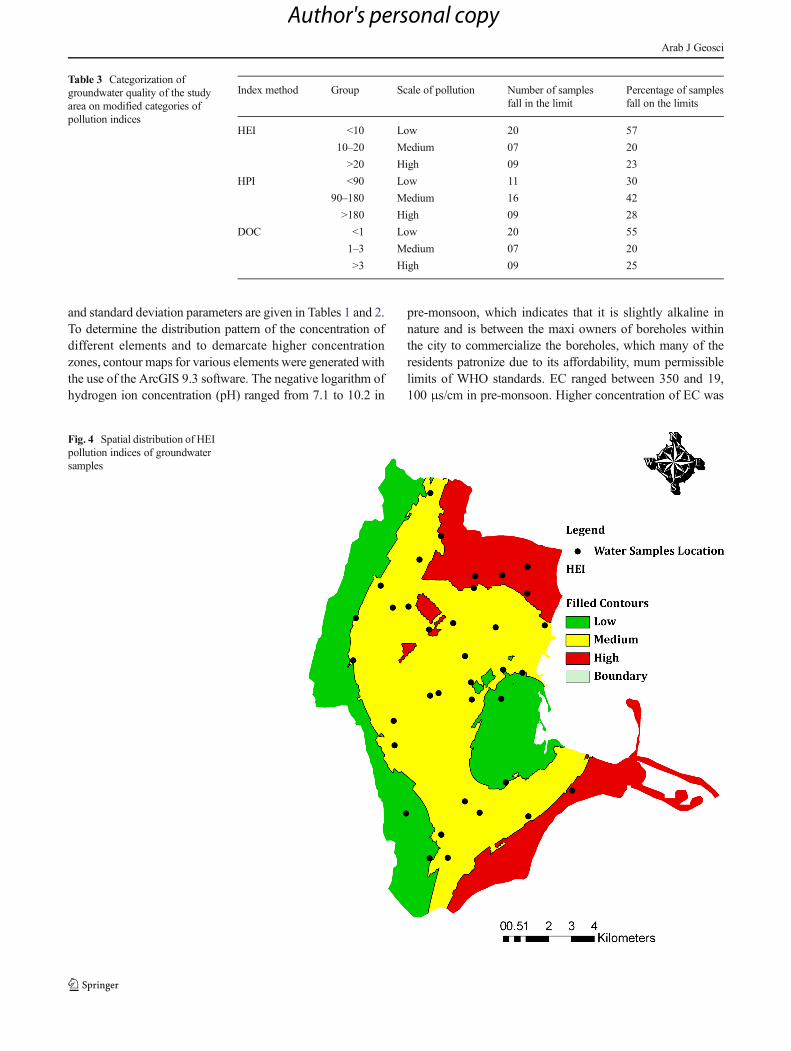
Table 3 Categorization ofgroundwater quality of the studyarea on modified categories ofpollution indices
Index method Group Scale of pollution Number of samplesfall in the limit
Percentage of samplesfall on the limits
HEI <10 Low 20 57
10–20 Medium 07 20
>20 High 09 23
HPI <90 Low 11 30
90–180 Medium 16 42
>180 High 09 28
DOC <1 Low 20 55
1–3 Medium 07 20
>3 High 09 25
Fig. 4 Spatial distribution of HEIpollution indices of groundwatersamples
Arab J Geosci
Author's personal copy

observed in the N–W portion because it is greatly influencedby seawater intrusion and human activity. The level of DO(2.7–8.6 mg/l) in groundwater samples is more or less low,and it could infer the presence of pollutants that consume theoxygen in water (Akinbile and Yusoff 2011).The mean metalconcentration in groundwater samples followed a descendingorder as follows: Cr > Cu >Pb> Fe > Zn > Ni >Mn> Cd. Thebond between metal loads (Fe + Mn + Cu + Zn + Cd) and pHfor the groundwater samples is shown in Fig. 3, and 70 % ofthe samples were plotted in the field of near-neutral and lowmetal sector and the remaining 30 % of the samples fall innear-neutral and high metal sector. The metal contaminationswere increased by various chemical industries and human ac-tivity (Caboi et al. 1999; Venkatramanan et al. 2014).
Pollution indices
Assessments of water quality pollution were carried outby heavy metals of groundwater samples (Edet andOffiong 2002). The study area was classified into three
categories such as low (<10), medium (10–20), and high(>20) categories (Table 3). HEI values ranged from7.89 to44.3. Based on the HEI distribution, 57 % of the samplesfall in a low-pollution zone, and the remaining 43 % ofthe groundwater samples are included in medium andhigh-pollution zones. The medium and high-pollutionzones are located at the N–E and S–E parts of the studyarea. High concentration of HEI in the pollution indices isdue to leaching of industrial waste from soil and also toanthropogenic activities (Fig. 4).
HPI values of all groundwater samples were calculatedusing MAC (maximum acceptable concentration) (Siegel2002). The heavy metal evaluation index was used for abetter understanding of the pollution indices. The valuesare useful to assess the groundwater quality in each sam-ple point. The study area was classified into three zonesaccording to HPI values, that is, low (<90), medium (90–180), and high (>180) categories (Table 3). The HPI valueranged between 25.03 and 289.62. According to HPI dis-tribution (Fig. 5), 30 and 42 % of the samples fall in low
Fig. 5 Spatial distribution of HPIpollution indices of groundwatersamples
Arab J Geosci
Author's personal copy

and medium-pollution zones, respectively, and the re-maining 28 % of samples were above the critical limitof 100 proposed by Prasad and Bose (2001). As per HPIvalues, medium and high categories are considered aspolluted groundwater, and these sampling points are lo-cated near the sea and the State Industries Promotion Cor-poration of Tamil Nadu Limited (SIPCOT) industrial area.Moreover, the metals contaminated by seawater intrusion,industrial waste, and sewage leaked from sewers.
The study area was classified into three zones according toDOC values, that is, low (<1), medium (1–3), and high (>3)categories (Table 3). The value of DOC in the groundwatervaries from 0.56 to 10.56, with an average of 4.56. Accordingto DOC distribution (Fig. 6), 55 % of the samples fall in amedium zone, 20 % in a low zone, and 25 % in a high-pollution zone. High-pollution zones were located near resi-dential areas, the subway, or the buckle channel effluents.Groundwater in this zone was affected by sewage waste andsmall-scale industries (Bhuiyan et al. 2010; Prasanna et al.2012; Venkatramanan et al. 2014).
Geometry of factor analysis
Factor analysis is a useful tool to define the factors that impacton the groundwater quality and its hydrochemical processes.The results of this operation are high factor loadings (close to1 or −1) obtained for the variables correlated in each factor andlow factor loadings (close to 0) obtained for the remainingvariables. The number of factors which is the best varianceof the analyzed data with eigenvalue of >1 exhibits reasonableinterpretation. There are five factors explaining 75.40 % of thetotal variance of the original data set, which is sufficientenough to give a good idea of data structure (Table 4).
The first factor obtained explains the biggest part of vari-ance; it accounts for 41 % of the total variance and 8.1 of theeigenvalue. High factor loadings indicate strong relationshipbetween the variable and the factor describing this variable.This factor has high loadings with DO, Fe, Ni, and Zn (0.90,0.83, 0.85, and 0.60, respectively) and moderate loadings withCd (0.42). Components in factor 1 are derived from mixedsources due to chemical induction of SIPCOT infiltration of
Fig. 6 Spatial distribution ofDOC pollution indices ofgroundwater samples
Arab J Geosci
Author's personal copy

landfill leachate or municipal sewage to the surrounding aqui-fers. The second factor accounts for 11.6 % of the totalvariance and 2.3 of the eigenvalue; it has high loadings withAl, Cr, Mn, and Pb (0.62, 0. 47, 0.59, and 0.73). This indicatesthat the influence of human activity is one of the mostimportant factors controlling groundwater chemistry of thisstudy area. This factor corresponds to the role of unwise useof lead materials and phosphate fertilizers. However, thespatial distribution of contamination observed in the aquifersuggested that the main contamination sources came from theindustrial and agricultural activities. Factor 2 is loaded on Pband Al, which are derived from western part of the study areaalong the SIPCOT chemical industrial effect. The higher
concentration of Pb in groundwater indicates that it is dis-charge from industrial effluents of SIPCOT and humanactivity.
The third factor accounts for 9.2 % of the total variance and1.8 of the eigenvalue; there are high loadings for Cr (0.76) andmoderate loading with Mn (0.42). This is denoted as wastedisposal, petroleum, carbon consumption, and agriculturalpractices. The fourth factor accounts for 7.6 % of the totalvariance and 1.5 of the eigenvalue; it has high loading withCd (0.73) and moderate loading with EC (0.66). The contam-ination of this metal in groundwater is due to the dissolutionand corrosion from household plumbing systems. A higherconcentration of EC in this study area may be derived fromseawater intrusion and anthropogenic sources such as fossilfuel consumption and the industrial production, use, and dis-posal of nickel compounds and alloys (Kasprzak et al. 2003).The fifth factor exhibits high loading of Zn (0.44) and mod-erate loading of pH (0.29), which occurred under alkalineconditions. It accounts for 6.2 % of the total variance and1.2 of the eigenvalue. Despite, the little occurrence of Zn innature, it is also emitted through effluents of many commer-cial industries during smelting (metal processing) activities. Ahigher Zn concentration in downstream was attributed to thegreatest frequency of nearby sources like hazardous wastesites, industrial areas such as lead smelters, and the emissionof industrial effluents through the transmission of iron pipes;municipal sewages are the more concentrated sources of zincin the water (Cole et al. 1984) as this is represented near theSIPCOT region.
Geometry of correlation matrix
Pearson’s correlation coefficient matrices for the analyzed pa-rameters of individual metals are presented in Table 5. Thestatistically significant level is p<0.01. Correlation matrix
Table 4 Varimax-rotated principal component analysis for the heavymetal concentration in samples
Parameters Factors
1 2 3 4 5
pH −.693 −.149 −.320 −.049 .297
EC .136 −.184 −.479 .663 .147
DO .908 .121 .090 −.025 .140
Al .245 .629 −.105 −.089 .216
Cr −.044 .473 .764 −.069 −.258Mn −.582 .596 .429 −.140 −.066Fe .831 .392 −.055 −.134 .112
Ni .859 .326 -.115 .189 .008
Cu −.894 .226 .068 .028 .155
Zn .608 .069 .158 −.098 .442
Cd .428 .501 −.472 .739 −.290Pb −.209 .731 −.448 .224 −.122Total 8.124 2.335 1.844 1.537 1.241
% of variance 40.622 11.676 9.218 7.684 6.204
Cumulative % 40.622 52.298 61.516 69.200 75.404
Table 5 Correlation coefficientsfor parameters of groundwatersamples
pH EC DO Al Cd Cr Cu Fe Mn Ni Pb Zn
pH 1
EC −0.02 1
DO 0.12 0.09 1
Al −0.22 0.02 0.09 1
Cd 0.66 0.17 0.78 0.62 1
Cr 0.03 0.18 0.12 0.23 0.01 1
Cu 0.12 0.21 0.33 −0.11 0.33 0.44 1
Fe −0.45 0.12 0.25 −0.23 0.15 −0.11 0.22 1
Mn −0.22 0.44 −0.22 −0.33 −0.22 0.21 0.31 0.12 1
Ni 0.16 −0.12 −0.15 0.12 −0.33 0.14 −.23 −0.11 0.23 1
Pb 0.65 −0.56 0.39 0.16 0.15 0.09 −0.11 0.11 0.45 0.58 1
Zn 0.22 −0.12 0.33 0.29 0.22 −0.22 −0.03 0.14 0.05 0.06 0.02 1
Significant values are in bold
Arab J Geosci
Author's personal copy

exhibits that pH and Cd and pH and Pb may have the samepotential contamination source, with a correlation coefficientof 0.66 (p<0.01) and 0.65 (p<0.01), respectively. Meanwhile,EC and Mn have a correlation coefficient of 0.44 (p<0.01),and furthermore, significant correlation is exhibited betweenDO and Cd, Al and Cd, Cd and Cu, Cr and Cu, Cu and Mn,Mn and Pb, Ni and Pb shows good correlations with respec-tive correlation coefficient (r) values of 0.78, 0.62, 0.33, 0.44,0.31, 0.45, and 0.58, respectively. However, Fe shows verylow correlations with other variables, indicating the possibilityof different source to the other trace elements. As can be seenfrom Table 5, the absence of correlation between these heavymetals illustrates that the metals are not controlled by a singlefactor. These associations of metals clearly indicate that thegroundwater has assimilated various contaminants from theprocesses of chemical industries and landfill leachate/municipal sewage systems (Tariq et al. 2010). The significantcorrelations among the metals of Mn, Cu, Pb, and Cd revealedthat they may have originated from common sources, prefer-ably from industrial activities.
Conclusion
This work aimed at analyzing the metal pollution status andidentifying the correlations between these examined metals ingroundwater of Tuticorin Corporation. Results of this presentresearch clearly demonstrated that the metal content in thegroundwater was highly polluted by industrial and humanactivity. Groundwater eminence in the study area was influ-enced by various kinds of contamination sources such asSIPCOT industrial wastes, sewage-leaked sewers, groundwa-ter discharged from the subway, and seawater intrusion. Thebond between metal loads (Fe + Mn + Cu + Zn + Cd) and pHfor the groundwater quality exhibits near-neutral and lowmet-al sector and the remaining 30 % fall in the near-neutral andhigh metal sector. Regarding the pollution indices of HPI,HEI, and DOC, it indicates that it is 28, 23, and 25 %, respec-tively, and it is highly polluted due to industries’ leachates andmunicipal sewage system. A remarkable spatial distribution ofthis HPI, HEI, and DOC concentration was found to be in-creased from northwest to western part of the study area be-cause of the SIPCOT industrial effluent. The geometric factoranalysis and Pearson’s correlation matrix suggest that the Mn,Cu, Pb, Cr, and Cd metals clearly indicate that the groundwa-ter has integrated with various contaminant processes ofchemical industries and landfill leachate or municipal sewagesystem. But, factor 4 of EC was mainly derived from seawaterintrusion and irrigation runoff. The recommendation of thispresent research suggested that the government should adoptsome treatment technologies (Central effluent treatment plantand Iron oxyhydroxides and the adsorption/co-precipitationremoval mechanism) to minimize these heavy metal
contaminations in groundwater for safe drinking and otherpublic utilities.
Acknowledgments The first author S. Selvam is thankful to the De-partment of Science and Technology, Government of India, New Delhi,for awarding INSPIRE Fellowship to carry out this study (Ref. No. DST/INSPIRE FELLOWSHIP/2010/ (308), date: 3 August 2010). The authorsare also grateful to Shri A.P.C.V. Chockalingam, Secretary and Dr. C.Veerabahu, Principal, V.O.C College, Tuticorin, for their support to carryout the study.
References
Agarwal E, Rajat A, Garg RD, Garg PK (2013) Delineation of ground-water potential zone: an AHP/ANP approach. J Earth Syst Sci122(3):887–898
Akinbile CO, Yusoff MS (2011) Environmental impact of leachate pol-lution on groundwater supplies in Akure, Nigeria. Int J Environ SciDev 2:81–86
Antony Ravindran A, Selvam S (2014) Coastal disaster damage andneotectonic subsidence study using 2D ERI technique inDhanushkodi, Rameshwaram Island, Tamilnadu, India. MiddleEast J Sci Res 19(8):1117–1122
APHA (1995) Standard methods for the examination of water and waste-water, 19th edn. American Public Health Association, New York
Backman B, Bodis D, Lahermo P, Rapant S, Tarvainen T (1997)Application of a groundwater contamination index in Finland andSlovakia. Environ Geol 36:55–64
Balaram V (1993) Characterization of trace elements in environmentalsamples by ICP-MS. At Spectrosc 6:174–179
Balasubramanaian AR, Thirugnana S, Chellaswamy R, Radhakrishnan V(1993) Numerical modeling for prediction and control of saltwaterencroachment in the coastal aquifers of Tuticorin, UGC publisher,Tamil Nadu. Tech Report, p 21
Bhuiyan MAH, Parvez L, Islam MA, Dampare SB, Suzuki S (2010)Heavy metal pollution of coal mine affected agricultural soils inthe northern part of Bangladesh. J Hazard Mater 173:384–392
Caboi R, Cidu R, Fanfani L, Lattanzi P, Zuddas P (1999) Environmentalmineralogy and geochemistry of the abandoned Pb–ZnMontevecchio-Ingurtosu mining district, Sardinia, Italy. ChronRech Min 534:21–28
Chidambaram S, Prasanna MV, Vasu K, Shahul Hameed A,UnnikrishnaWarrier C, Srinivasamoorthy K (2007a) Study on thestable isotope signatures in groundwater of Gadilam river basin,Tamilnadu, India. Indian J Geochem 22(2):209–221
Chidambaram S, Ramanathan AL, Prasanna MV, Anandhan P,Srinivasamoorthy K, Vasudevan S (2007b) Identification ofhydrogeo chemically active regimes in groundwater of Erode dis-trict, Tamilnadu-a statistical approach. Asian J Water Environ Pollut5(3):93–102
Cole M, Hood L, McDermott R (1984) Ecological invalidity as an axiomof experimental cognitive psychology. Harvard University Press,Cambridge, In press
Edet AE, Offiong OE (2002) Evaluation of water quality pollution indicesfor heavy metal contamination monitoring. A study case fromAkpabuyo-Odukpani area, Lower Cross River Basin (southeasternNigeria). Geol J 57:295–304
Farmaki EG, Thomaidis NS (2008) Current status of the metal pollutionof the environment of Greece – a review. Glob NEST J 10:366–375
Forstner UK, Wittman GTW (1981) Metal pollution in the aquatic envi-ronment. Springer Verlag, Berlin, p 255
Fosmire GJ (1990) Zinc toxicity. Am J Clin Nutr 51(2):225–227
Arab J Geosci
Author's personal copy
Horton RK (1965) An index system for rating water quality. J WaterPollut Control Fed 37:300–306
Howitt D, Cramer D (2005) Introduction to SPSS in psychology: withsupplement for releases 10, 11, 12 and 13. Pearson, Harlow
Hutton M, Symon C (1986) The quantities of cadmium, lead, mercuryand arsenic entering the U.K. environment from human activities.Sci Total Environ 57:129–150
KasprzakKS, Sunderman FW, SalnikowK (2003) Nickel carcinogenesis.Mutat Res 533:67–97
KoterbaMT,Wilde FD, LaphanWW (1995) Groundwater data collectionprotocols and procedures for the national water quality assessmentprogram collection and documentation of water quality samples andrelated data. US Geological Survey Open file report 95–399. USGS,Virginia, p 113
Magesh NS, Chandrasekar N (2012) Evaluation of spatial variations ingroundwater quality by WQI and GIS technique: a case study ofVirudunagar District, Tamil Nadu, India. Arab J Geosci. doi:10.1007/s12517-011-0496-z
Magesh NS, Chandrasekar N, Vetha Roy D (2011) Spatial analysis oftrace element contamination in sediments of Tamiraparani estuary,southeast coast of India. Estuar Coast Shelf Sci 92(4):618–628
Mohan SV, Nithila P, Reddy SJ (1996) Estimation of heavy metal indrinking water and development of heavy metal pollution index. JEnviron Sci Health 31:283–289
Mondal NC, Singh VP, Singh VS, Saxena VK (2010) Determining theinteraction between groundwater and saline water through ground-water major ions chemistry. J Hydrol 388(1–2):100–111
NolanK (2003) Copper toxicity syndrome. J OrthomolMed 12(4):270–282Nriagu JO, Pacyna JM (1988) Quantitative assessment of worldwide con-
tamination of air, water and soils by trace-metals. Nature 333:134–139Prasad B, Bose JM (2001) Evaluation of the heavy metal pollution index
for surface and spring water near a limestone mining area of thelower Himalayas. Environ Geol 41:183–188
Prasanna MV, Praveena SM, Chidambaram S, Nagarajan R, Elayaraja A(2012) Evaluation of water quality pollution indices for heavy metalcontaminationmonitoring: a case study fromCurtin Lake, Miri City,East Malaysia. Environ Earth Sci 67:1987–2001
Reddy SJ (1995) Encyclopaedia of environmental pollution and control,vol. 1. Environmental Media, Karlia
Selvam S (2012) Use of remote sensing and GIS techniques for land useand land cover mapping of Tuticorin Coast, Tamilnadu. Univ JEnviron Res Technol 2(4):233–241
Selvam S (2014) Irrigational feasibility of groundwater and evaluation ofhydrochemistry facies in the SIPCOT Industrial Area, SouthTamilnadu, India: a GIS approach. Water Qual Expo Health. doi:10.1007/s12403-014-0146-2
Selvam S (2015) A preliminary investigation of lithogenic and anthropo-genic influence over fluoride ion chemistry in the groundwater ofthe southern coastal city, Tamilnadu, India. Environ Monit Assess187:106. doi:10.1007/s10661-015-4326-8
Selvam S, Iruthaya Jeba Dhana Mala R, Muthukakshmi V (2013a) Ahydrochemical analysis and evaluation of groundwater quality indexin Thoothukudi district, Tamilnadu, South India. Int J Adv EngAppl2(3):25–37
Selvam S, Manimaran G, Sivasubramanian P (2013b) Hydrochemicalcharacteristics and GIS-based assessment of groundwater qualityin the coastal aquifers of Tuticorin corporation, Tamilnadu, India.Appl Water Sci 3:145–159
Selvam S, Manimaran G, Sivasubramanian P (2013c) Cumulative effectsof septic system disposal and evolution of nitrate contaminationimpact on coastal groundwater in Tuticorin, South Tamilnadu,India. Res J Pharm Biol Chem Sci 4(4):1207–1218
Selvam S, Manimaran G, Sivasubramanian P, Balasubramanian N,Seshunarayana T (2014a) GIS-based evaluation of water qualityindex of groundwater resources around Tuticorin coastal city,South India. Environ Earth Sci 71:2847–2867
Selvam S, Antony Ravindaran A, Rajamanickam M, Sridharan M(2014b) Microbial contamination in the sediments and groundwaterof Tuticorin Corporation, South India using GIS. Int J Pharm PharmSci 6(4):337–340
Selvam S, Manimaran G, Sivasubramanian P, Seshunarayana T (2014c)Geoenvironmental resource assessment using remote sensing andGIS: a case study from southern coastal region. Res J Recent Sci3(1):108–115
Selvam S, Magesh NS, Chidambaram S, RajamanickamM, SashikkumarMC (2014d) A GIS based identification of groundwater rechargepotential zones using RS and IF technique: a case study inOttapidaram taluk, Tuticorin district, Tamil Nadu. Environ EarthSci. doi:10.1007/s12665-014-3664-0
Selvam S, Magesh NS, Sivasubramanian P, Prince Soundranayagam J,Manimaran G, Seshunarayana T (2014e) Deciphering of groundwa-ter potential zones in Tuticorin, Tamil Nadu, using remote sensingand GIS techniques. J Geol Soc India 84:597–608
Siegel FR (2002) Environmental geochemistry of potentially toxicmetals. Springer, Berlin
Singaraja C, Chidambaram S, Prasanna MV, Paramaguru P,Johnsonbabug TC, Thilagavathi R (2012a) A study on the behaviorof the dissolved oxygen in the shallow coastal wells of CuddaloreDistrict, Tamilnadu, India. Water Qual Expo Health 4:1–16. doi:10.1007/s12403-011-0058-3
Singaraja C, Chidambaram S, Anandhan P, Prasann MV, Thivya C,Thilagavathi R (2012b) A study on the status of fluoride ion ingroundwater of coastal hard rock aquifers of south India. Arab JGeosci. doi:10.1007/s12517-012-0675-6
Singaraja C, Chidambaram S, Srinivasamoorthy K, Anandhan P, SelvamS (2015) A study on assessment of credible sources of heavy metalpollution vulnerability in groundwater of Thoothukudi districts,Tamilnadu, India. Water Qual Expo Health. doi:10.1007/s12403-015-0162-x
Srinivasamoorthy K, Chidambaram S, Prasanna MV (2008)Identification of major sources controlling groundwater chemistryfrom a hard rock terrain: a case study from Mettur taluk, Salemdistrict, Tamilnadu, India. J Earth Syst Sci 117(1):49–58
Srinivasamoorthy K, Nanthakumar C, Vasanthavigar M, VijayaragavanK, Rajiv Ganthi R, Chidambaram S (2011) Groundwater qualityassessment from a hard rock terrain, Salem district of Tamilnadu,India. Arab J Geosci 4:91–102. doi:10.1007/s12517-009-0076-7
Tariq SR, Shaheen N, Khalique A, Sha MH (2010) Distribution, correla-tion, and source apportionment of selected metals in tannery efflu-ents, related soils, and groundwater - a case studies from Multan,Pakistan. Environ Monit Assess 166:303–312
Tariq MM, Eyduran E, Bajwa MA, Wahed A, Iqbal F, Javed Y (2012)Prediction of body weight from testicular and morphological char-acteristics in indigenous Mengalishep of Pakistan: using factor anal-ysis scores in multiple linear regression analysis. Int J Agric Biol 14:590–594
Venkatramanan S, Ramkumar T, Anithamary I (2012) A statistical ap-proach on hydrogeochemistry of groundwater in Muthupet coastalregion, Tamin Nadu, India. Carpathian J Earth Environ Sci 7:47–54
Venkatramanan S, Chung SY, Ramkumar T, Gnanachandrasamy G,Vasudevan S (2013) A multivariate statistical approach on physico-chemical characteristics of groundwater in and aroundNagapatttinam district, Cauvery deltaic region of Tamil Nadu,India. Earth Sci Res J 17:97–103
Venkatramanan S, Chung SY, Kim TH, Prasanna MV, Hamm SY (2014)Assessment and distribution of metals contamination in groundwa-ter: a case study of Busan city, Korea. Water Qual Expo Health. doi:10.1007/s12403-014-0142-6
Young RA (2005) Toxicity profiles: toxicity summary for cadmium, RiskAssessment Information System, RAIS, University of Tennessee.http://rais.ornl.gov/tox/profiles/cadmium.shtml. Accessed 8Oct 2014
Arab J Geosci
Author's personal copy

1 23
Your article is protected by copyright and
all rights are held exclusively by Saudi
Society for Geosciences. This e-offprint is
for personal use only and shall not be self-
archived in electronic repositories. If you wish
to self-archive your article, please use the
accepted manuscript version for posting on
your own website. You may further deposit
the accepted manuscript version in any
repository, provided it is only made publicly
available 12 months after official publication
or later and provided acknowledgement is
given to the original source of publication
and a link is inserted to the published article
on Springer's website. The link must be
accompanied by the following text: "The final
publication is available at link.springer.com”.


