Embed Size (px)
Citation preview

BioMed CentralBMC Genomics
ss
Open AcceResearch articleA high resolution RH map of the bovine major histocompatibility complexCandice L Brinkmeyer-Langford1, Christopher P Childers2, Krista L Fritz1, Ashley L Gustafson-Seabury1, Marian Cothran1, Terje Raudsepp1, James E Womack3 and Loren C Skow*1Address: 1Department of Veterinary Integrative Biosciences, College of Veterinary Medicine, Texas A&M University, College Station, Texas 77843-4458, USA, 2Department of Biology, Georgetown University, Washington, DC 20057, USA and 3Department of Veterinary Pathobiology, College of Veterinary Medicine, Texas A&M University, College Station, Texas 77843, USA
Email: Candice L Brinkmeyer-Langford - [email protected]; Christopher P Childers - [email protected]; Krista L Fritz - [email protected]; Ashley L Gustafson-Seabury - [email protected]; Marian Cothran - [email protected]; Terje Raudsepp - [email protected]; James E Womack - [email protected]; Loren C Skow* - [email protected]
* Corresponding author
AbstractBackground: The cattle MHC is termed the bovine leukocyte antigen (BoLA) and, along with theMHCs of other ruminants, is unique in its genomic organization. Consequently, correct and reliablegene maps and sequence information are critical to the study of the BoLA region. The bovinegenome sequencing project has produced two assemblies (Btau_3.1 and 4.0) that differ substantiallyfrom each other and from conventional gene maps in the BoLA region. To independently comparethe accuracies of the different sequence assemblies, we have generated a high resolution map ofBoLA using a 12,000rad radiation hybrid panel. Seventy-seven unique sequence tagged site (STS)markers chosen at approximately 50 kb intervals from the Btau 2.0 assembly and spanning the IIa-III-I and IIb regions of the bovine MHC were mapped on a 12,000rad bovine radiation hybrid (RH)panel to evaluate the different assemblies of the bovine genome sequence.
Results: Analysis of the data generated a high resolution RH map of BoLA that was significantlydifferent from the Btau_3.1 assembly of the bovine genome but in good agreement with theBtau_4.0 assembly. Of the few discordancies between the RH map and Btau_4.0, most could beattributed to closely spaced markers that could not be precisely ordered in the RH panel. Oneprobable incorrectly-assembled sequence and three missing sequences were noted in the Btau_4.0assembly. The RH map of BoLA is also highly concordant with the sequence-based map of HLA(NCBI build 36) when reordered to account for the ancestral inversion in the ruminant MHC.
Conclusion: These results strongly suggest that studies using Btau_3.1 for analyses of the BoLAregion should be reevaluated in light of the Btau_4.0 assembly and indicate that additional researchis needed to produce a complete assembly of the BoLA genomic sequences.
Published: 24 April 2009
BMC Genomics 2009, 10:182 doi:10.1186/1471-2164-10-182
Received: 13 June 2008Accepted: 24 April 2009
This article is available from: http://www.biomedcentral.com/1471-2164/10/182
© 2009 Brinkmeyer-Langford et al; licensee BioMed Central Ltd. This is an Open Access article distributed under the terms of the Creative Commons Attribution License (http://creativecommons.org/licenses/by/2.0), which permits unrestricted use, distribution, and reproduction in any medium, provided the original work is properly cited.
Page 1 of 10(page number not for citation purposes)

BMC Genomics 2009, 10:182 http://www.biomedcentral.com/1471-2164/10/182
BackgroundThe typical mammalian major histocompatiblity complex(MHC) contains a cohort of closely linked and highly pol-ymorphic genes and gene families, many of which partic-ipate in immunity [1]. These genes are usually organizedinto a tightly linked complex defined by three regions orclasses. Class I molecules are ubiquitously expressed onnucleated cells and function to present endogenous pep-tides to CD8+ T cells. Class II molecules are expressedexclusively on antigen-presenting cells including macro-phages, dendritic cells and B lymphocytes, and presentpeptides of exogenous origins to CD4+ helper T cells. Lociin the class III region encode a diverse set of proteins,including many cytokines, but not all genes in the class IIIregion are involved in immunity.
The cattle MHC, termed the bovine leukocyte antigen(BoLA), is similar to the MHCs of other species in thatgenes within BoLA encode proteins that participate in theadaptive and innate immune responses [2] and play cru-cial roles in determining host response to pathogens.However, the organizational features of the MHCs of cat-tle and other ruminants are unique in that class II genesoccur in two segments rather than a single segment asobserved in other mammalian species (e.g. human [3],mouse [4], dog [5], and horse [6]). The two segments arelocated about 20 cM apart and are designated class IIa andclass IIb [7-9]. Class IIa is closely associated with the classI and class III regions, while class IIb is positioned closerto the centromere. The unique separation of class II loci,of related function and tightly linked in other species,makes the study of this part of the bovine genome a highpriority for understanding the processes involved in coor-dinated gene regulation, structure and evolution of theMHC.
Linkage analyses (e.g., [10-12]) and physical gene maps[8,13-16] have defined the general organization of BoLA,but do not provide the detail provided by a sequence-based map. Results from the bovine genome sequencingproject have produced a preliminary assembly 2.0 andtwo subsequent assemblies (Btau_3.1 and 4.0) that differconsiderably from each other and from conventional genemaps [16,17]. The most recent sequence assembly,Btau_4.0, incorporated additional mapping information[14], fingerprint contig (FPC) maps, and bovine andsheep BAC end sequences [18] to resolve many of theinconsistencies of the two prior genome assemblies buthas not been independently verified.
To compare the accuracies of the 3.1 and 4.0 sequenceassemblies of the bovine MHC, we generated a high reso-lution map of BoLA using a 12,000rad radiation hybridpanel [19]. The resolution achievable using this panelexceeds that of the 5,000rad panel [20] previously used to
generate medium-density maps for cattle chromosomes(e.g., [8,21-25]) due to the increased frequency of radia-tion-induced chromosomal breaks. This makes the12,000rad panel suitable for fine mapping genomicregions of interest (e.g., [26]). The map described heredocuments assembly errors in the Btau_3.1 assembly andlargely validates the revisions contained in the 4.0 assem-bly. We also compared the RH map of BoLA with the ver-sion 36 assembly of HLA to demonstrate overallconservation of gene order between BoLA and HLA and tofurther validate the hypothesis that a single ancestralinversion accounts for the organizational differencesbetween the bovine and human MHCs. This informationis critical for identifying linkage disequilibrium and hap-lotype structure of the BoLA region and to facilitate accu-rate comparative genomic studies of BoLA and the MHCsof other species.
ResultsMarker developmentSeventy-seven of the original 80 primer pairs were usedfor mapping. Fourteen of the 77 markers were located inthe class I and class I extended regions of BoLA, 27 werelocated within class IIa or IIa extended regions, 17 werelocated within class IIb, and 19 were located within classIII (more details about marker class and position is avail-able in Additional file 1). Of the three markers notretained for mapping, one marker (12.00) was droppedfrom analysis due to typing ambiguities and two markers(48.10 and 55.30) could not be assigned to specific loca-tions and instead were binned within the IIa/III/I group.Thirty-one of the 184 clones in the RH panel consistentlygave ambiguous genotyping results (typed as "2" for twoor more markers) and were excluded from computation ofthe RH maps.
RH mappingAnalysis of the distribution of STS markers across the RHpanel resulted in the localization of markers into twogroups, corresponding to the BoLA IIb region and theBoLA IIa, III, and I region. The IIb group of 17 markerswas distributed along 125.6 cR, for a resolution of 1marker/7.4 cR. The IIa/III/I group of 60 markers was dis-tributed over 496.6 cR at a resolution of 1 marker/8.3 cR.Resolution in kb was also determined by dividing by thesize in base pairs of each region in Btau_4.0 by thenumber of markers with unique vectors (clustered mark-ers counted as single markers). Using this method, resolu-tion of the RH group for the IIb region of BoLA isapproximately one marker every ~221 kb and resolutionfor the IIa/III/I region of BoLA is one marker every ~184kb.
Twelve (71%) of the markers in the IIb group and 26(43%) of the markers in the IIa/III/I group gave unique
Page 2 of 10(page number not for citation purposes)
BMC Genomics 2009, 10:182 http://www.biomedcentral.com/1471-2164/10/182
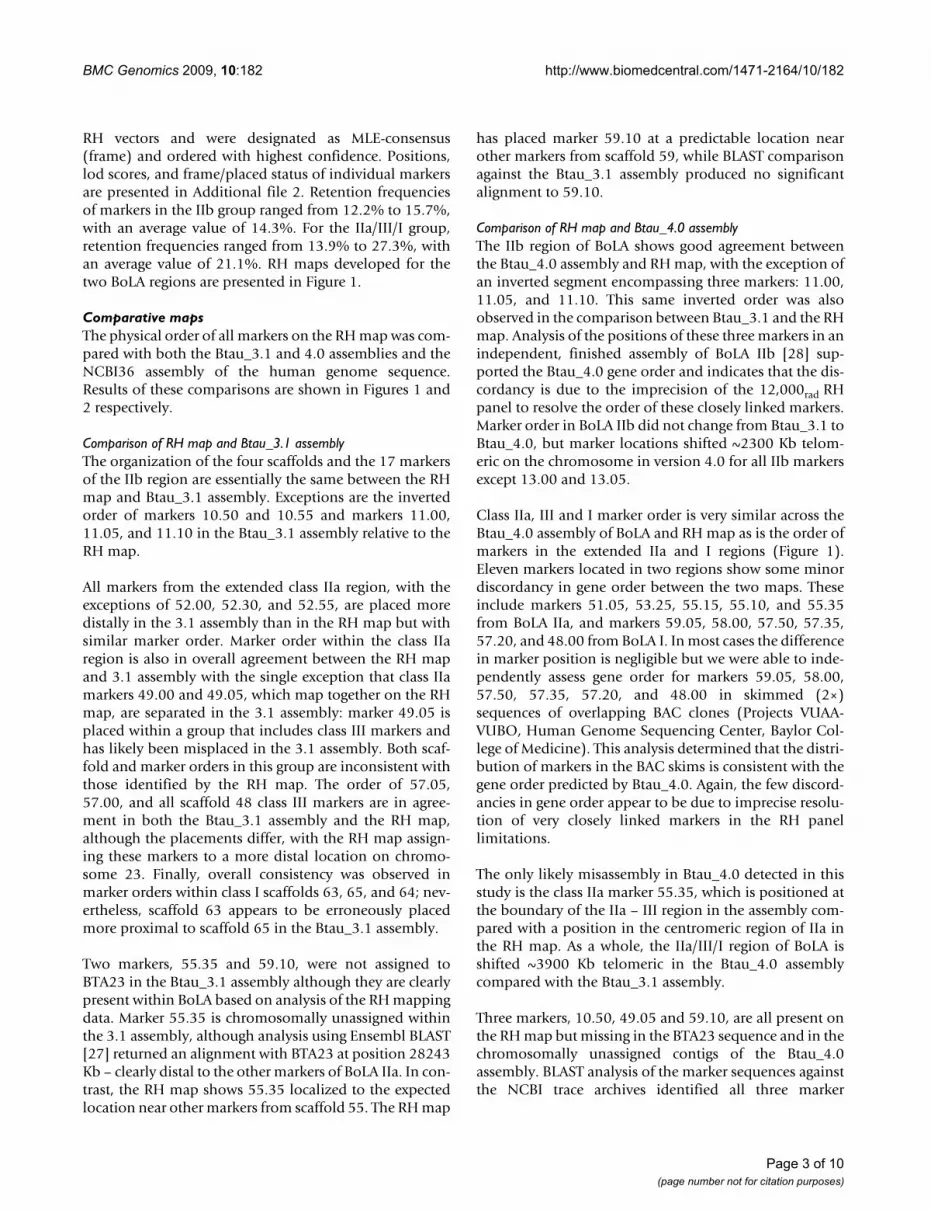
RH vectors and were designated as MLE-consensus(frame) and ordered with highest confidence. Positions,lod scores, and frame/placed status of individual markersare presented in Additional file 2. Retention frequenciesof markers in the IIb group ranged from 12.2% to 15.7%,with an average value of 14.3%. For the IIa/III/I group,retention frequencies ranged from 13.9% to 27.3%, withan average value of 21.1%. RH maps developed for thetwo BoLA regions are presented in Figure 1.
Comparative mapsThe physical order of all markers on the RH map was com-pared with both the Btau_3.1 and 4.0 assemblies and theNCBI36 assembly of the human genome sequence.Results of these comparisons are shown in Figures 1 and2 respectively.
Comparison of RH map and Btau_3.1 assemblyThe organization of the four scaffolds and the 17 markersof the IIb region are essentially the same between the RHmap and Btau_3.1 assembly. Exceptions are the invertedorder of markers 10.50 and 10.55 and markers 11.00,11.05, and 11.10 in the Btau_3.1 assembly relative to theRH map.
All markers from the extended class IIa region, with theexceptions of 52.00, 52.30, and 52.55, are placed moredistally in the 3.1 assembly than in the RH map but withsimilar marker order. Marker order within the class IIaregion is also in overall agreement between the RH mapand 3.1 assembly with the single exception that class IIamarkers 49.00 and 49.05, which map together on the RHmap, are separated in the 3.1 assembly: marker 49.05 isplaced within a group that includes class III markers andhas likely been misplaced in the 3.1 assembly. Both scaf-fold and marker orders in this group are inconsistent withthose identified by the RH map. The order of 57.05,57.00, and all scaffold 48 class III markers are in agree-ment in both the Btau_3.1 assembly and the RH map,although the placements differ, with the RH map assign-ing these markers to a more distal location on chromo-some 23. Finally, overall consistency was observed inmarker orders within class I scaffolds 63, 65, and 64; nev-ertheless, scaffold 63 appears to be erroneously placedmore proximal to scaffold 65 in the Btau_3.1 assembly.
Two markers, 55.35 and 59.10, were not assigned toBTA23 in the Btau_3.1 assembly although they are clearlypresent within BoLA based on analysis of the RH mappingdata. Marker 55.35 is chromosomally unassigned withinthe 3.1 assembly, although analysis using Ensembl BLAST[27] returned an alignment with BTA23 at position 28243Kb – clearly distal to the other markers of BoLA IIa. In con-trast, the RH map shows 55.35 localized to the expectedlocation near other markers from scaffold 55. The RH map
has placed marker 59.10 at a predictable location nearother markers from scaffold 59, while BLAST comparisonagainst the Btau_3.1 assembly produced no significantalignment to 59.10.
Comparison of RH map and Btau_4.0 assemblyThe IIb region of BoLA shows good agreement betweenthe Btau_4.0 assembly and RH map, with the exception ofan inverted segment encompassing three markers: 11.00,11.05, and 11.10. This same inverted order was alsoobserved in the comparison between Btau_3.1 and the RHmap. Analysis of the positions of these three markers in anindependent, finished assembly of BoLA IIb [28] sup-ported the Btau_4.0 gene order and indicates that the dis-cordancy is due to the imprecision of the 12,000rad RHpanel to resolve the order of these closely linked markers.Marker order in BoLA IIb did not change from Btau_3.1 toBtau_4.0, but marker locations shifted ~2300 Kb telom-eric on the chromosome in version 4.0 for all IIb markersexcept 13.00 and 13.05.
Class IIa, III and I marker order is very similar across theBtau_4.0 assembly of BoLA and RH map as is the order ofmarkers in the extended IIa and I regions (Figure 1).Eleven markers located in two regions show some minordiscordancy in gene order between the two maps. Theseinclude markers 51.05, 53.25, 55.15, 55.10, and 55.35from BoLA IIa, and markers 59.05, 58.00, 57.50, 57.35,57.20, and 48.00 from BoLA I. In most cases the differencein marker position is negligible but we were able to inde-pendently assess gene order for markers 59.05, 58.00,57.50, 57.35, 57.20, and 48.00 in skimmed (2×)sequences of overlapping BAC clones (Projects VUAA-VUBO, Human Genome Sequencing Center, Baylor Col-lege of Medicine). This analysis determined that the distri-bution of markers in the BAC skims is consistent with thegene order predicted by Btau_4.0. Again, the few discord-ancies in gene order appear to be due to imprecise resolu-tion of very closely linked markers in the RH panellimitations.
The only likely misassembly in Btau_4.0 detected in thisstudy is the class IIa marker 55.35, which is positioned atthe boundary of the IIa – III region in the assembly com-pared with a position in the centromeric region of IIa inthe RH map. As a whole, the IIa/III/I region of BoLA isshifted ~3900 Kb telomeric in the Btau_4.0 assemblycompared with the Btau_3.1 assembly.
Three markers, 10.50, 49.05 and 59.10, are all present onthe RH map but missing in the BTA23 sequence and in thechromosomally unassigned contigs of the Btau_4.0assembly. BLAST analysis of the marker sequences againstthe NCBI trace archives identified all three marker
Page 3 of 10(page number not for citation purposes)

BMC Genomics 2009, 10:182 http://www.biomedcentral.com/1471-2164/10/182
Page 4 of 10(page number not for citation purposes)
High-resolution radiation hybrid and comparative maps of BoLAFigure 1High-resolution radiation hybrid and comparative maps of BoLA. To the far left and far right are representations of BTA23 generated using the current genome sequence assemblies (Btau_3.1 and Btau_4.0, respectively). The centromere is represented as a black oval and distances are given in kilobases (Kb). The radiation hybrid map of BoLA is in the center, with map units given as centirays (cR). Just to the left and right of the RH map are marker names given in the order ascertained via radiation hybrid analysis, with connecting lines illustrating their comparative locations on the BTA23 maps.
10.0010.0010.0510.0510.2010.2010.2510.2510.3010.3010.3510.3510.4010.4010.4510.4510.5510.5510.5010.5010.6010.6012.0512.0511.0011.0011.0511.0511.1011.1013.0013.0013.0513.05
5000
6000
7000
20000
21000
22000
23000
24000
25000
26000
27000
52.5552.5552.3052.3052.0052.0051.0551.0550.1550.1550.0550.0550.0050.0051.0051.0053.0053.0053.0553.0553.2553.2553.2053.2055.3555.3555.2555.2555.1555.1555.2055.2055.0555.0555.0055.0055.1055.1054.0054.00DQADQA
49.0049.0049.0549.05DQBDQB
DRB3DRB356.0056.0056.0556.0559.0559.0559.1059.1058.0058.0059.0059.0057.6057.6057.5057.5060.0060.0057.5557.5557.3557.3557.3057.3061.0061.0057.4557.4557.4057.4057.2557.2557.1557.1557.1057.1057.2057.2057.0557.0557.0057.0048.0548.0548.0048.0048.1548.1548.2048.2048.3048.3048.2548.2563.2063.2063.1063.1065.0565.0565.0065.0065.1565.1565.1065.1064.2064.2064.0564.05
10.0010.0010.0510.0510.2010.2010.2510.2510.3010.3010.3510.3510.4010.4010.4510.4510.5510.5510.5010.5010.6010.6012.0512.0511.0011.0011.0511.0511.1011.1013.0013.0013.0513.05
52.5552.5552.3052.3052.0052.0051.0551.0550.1550.1550.0550.0550.0050.0051.0051.0053.0053.0053.0553.0553.2553.2553.2053.2055.3555.3555.2555.2555.1555.1555.2055.2055.0555.0555.0055.0055.1055.1054.0054.00DQADQA49.0049.0049.0549.05DQBDQBDRB3DRB356.0056.0056.0556.0559.0559.0559.1059.1058.0058.0059.0059.0057.6057.6057.5057.5060.0060.0057.5557.5557.3557.3557.3057.3061.0061.0057.4557.4557.4057.4057.2557.2557.1557.1557.1057.1057.2057.2057.0557.0557.0057.0048.0548.0548.0048.0048.1548.1548.2048.2048.3048.3048.2548.2563.2063.2063.1063.1065.0565.0565.0065.0065.1565.1565.1065.1064.2064.2064.0564.05
50
100
0
300
BTA23
(Btau_3.1)
Radiation hybrid
map of BoLA
7000
8000
24000
25000
26000
27000
28000
29000
30000
31000
BTA23
(Btau_4.0)
Class I
Class IIa
Class IIb
Class III
50
100
150
200
250
400
450
0
350

BMC Genomics 2009, 10:182 http://www.biomedcentral.com/1471-2164/10/182
Page 5 of 10(page number not for citation purposes)
Comparison of BoLA RH map with homologous human regionFigure 2Comparison of BoLA RH map with homologous human region. Comparison of the high-resolution radiation hybrid map developed in this study with the corresponding region of human chromosome 6 (HSA6). The radiation hybrid map of BoLA is on the left, with units given as cR. Marker names to the right of this are in the order determined through RH mapping. A representative map of HSA6 (with inverted orientation) is located at the far right; connecting lines provide a comparative view of the marker order between the RH map and HSA6. The centromere is represented as a black region in between the two arms, which are labeled "q arm" and "p arm", and distances are given in Kb.
0
1000
25000
26000
27000
28000
29000
30000
31000
32000
33000
34000
35000
36000
37000
38000
39000
40000
41000
42000
43000
44000
45000
46000
47000
48000
49000
50000
51000
52000
53000
10.0010.0010.0510.0510.2010.2010.2510.2510.3010.3010.3510.3510.4010.4010.4510.4510.5510.5510.5010.5010.6010.6012.0512.0511.0011.0011.0511.0511.1011.1013.0013.0013.0513.05
52.5552.5552.3052.3052.0052.0051.0551.0550.1550.1550.0550.0550.0050.0051.0051.0053.0053.0053.0553.0553.2553.2553.2053.2055.3555.3555.2555.2555.1555.1555.2055.2055.0555.0555.0055.0055.1055.1054.0054.00DQADQA49.0049.0049.0549.05DQBDQBDRB3DRB356.0056.0056.0556.0559.0559.0559.1059.1058.0058.0059.0059.0057.6057.6057.5057.5060.0060.0057.5557.5557.3557.3557.3057.3061.0061.0057.4557.4557.4057.4057.2557.2557.1557.1557.1057.1057.2057.2057.0557.0557.0057.0048.0548.0548.0048.0048.1548.1548.2048.2048.3048.3048.2548.2563.2063.2063.1063.1065.0565.0565.0065.0065.1565.1565.1065.1064.2064.2064.0564.05
50
100
0
0
Radiation hybrid
map of BoLA
HSA6
(inverted)
q arm
p arm
Class I
Class IIa
Class IIb
Class III
50
100
150
200
250
300
400
450
350

BMC Genomics 2009, 10:182 http://www.biomedcentral.com/1471-2164/10/182
sequences, revealing that the Btau_4.0 assembly is missingat least three segments of BoLA DNA.
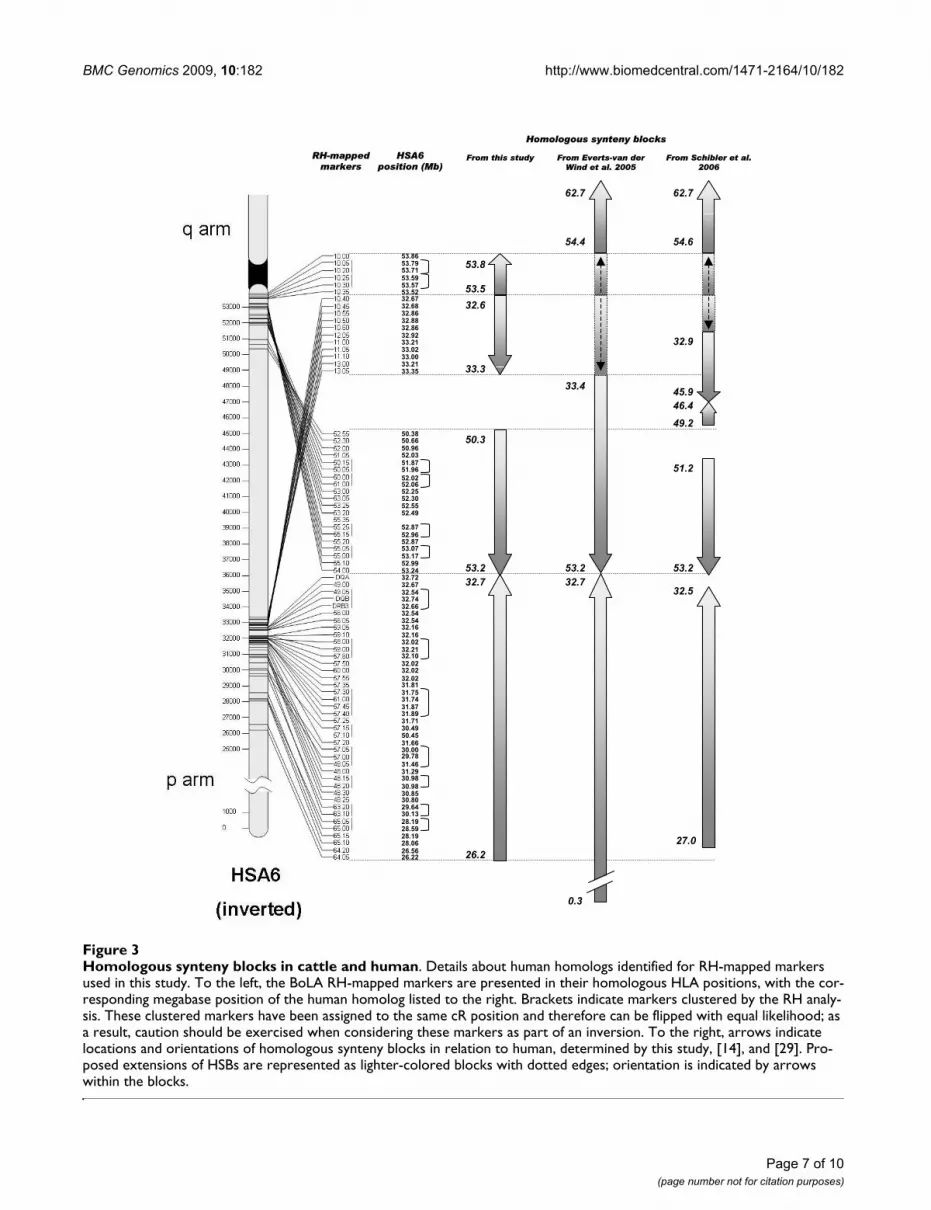
Comparison of RH map and human genomeComparative analysis of the RH map of BoLA and the cor-responding sequence information for HSA6p identifiedfour homologous synteny blocks (HSB) (Figures 2 and 3).Two HSBs are located in the IIb region of BoLA and corre-spond to sequences at 32.6–33.3 Mb and 53.5–53.8 Mbon HSA6. These HSBs represent the regions of HSA6p12and 6p21 that are contiguous in the bovine genome. Theother two HSBs correspond to the IIa/III/I region of BoLAand to sequences 26.2–32.7 Mb and 50.3–53.2 Mb onHSA6 as previously described [14,29]. The positions andboundaries of these blocks were compared with thosedescribed in previous studies ([14,29], Figure 3). Thesestudies also described a HSB corresponding to the 54.4–62.7 Mb [14] or 54.6–62.7 Mb [29] sequence segment ofHSA6 proximal to the centromere. Based on our results,this region of conserved synteny may be extended toinclude sequences at 53.5–53.8 Mb on HSA6p as anextension of this same HSB. The previous studies alsoidentified a HSB corresponding to sequence at 33.4–53.2Mb [14] or 32.9–45.9 Mb on HSA6p [29]; the lowerboundary of this block can be extended to position 32.6Mb on HSA6p based on our results. The remaining twoHSB found in this study, corresponding to sequences50.3–53.2 Mb and 26.2–32.7 Mb on HSA6p, confirm theresults of Schibler et al [29] and Everts-van der Wind et al[14].
Although coding sequences were not used as sources ofSTS markers in this study, the stringent requirements usedto select STS for RH mapping enabled us to reliably iden-tify homologous loci within HSA6 for all but two of thebovine STS markers mapped in this study. These con-served STS markers are incorporated into Figure 2 to inte-grate the RH map with the sequence-based map of HLA.The two markers that could not be located to HLA weremarker 55.35, which returned no significant alignmentsto the human sequence, and marker 57.10, whichreturned multiple alignments to sequences in the HLAclass I region. Marker 57.10 may be located in a region ofHLA that has undergone an expansion not observed in thebovine MHC, thereby making it difficult to identify thelocation of the orthologous marker on HSA6.
DiscussionRadiation hybrid mapping of BoLAThe generation of a high-resolution, physically-orderedradiation hybrid map of BoLA provides an independenttest of the order and arrangement of markers and scaffoldswithin the genome sequence assembly. This validation iscritical for future studies involving the BoLA region, suchas those that seek to identify sequence features (e.g. con-
served functional elements) or clarify the evolution of thisregion. Importantly, the RH map can be used to facilitatecomparisons of the region with other species – particu-larly helpful when the accuracy of an assembly isunknown or uncertain. The relatively high radiation doseused to construct the 12,000rad RH panel used in thisstudy generally provided a high resolution of markerorder for evaluation of sequence assemblies but cautionshould be exercised when relying strictly upon RH map-ping to order very closely spaced markers.
Comparative mappingComparison of RH map and Btau_3.1 assemblyDiscrepancies identified between the RH map describedhere and the version 3.1 assembly of the bovine genomesequence highlight major potential errors in the assembly.Although both maps are in general agreement in the orderof markers for the BoLA IIb region, the RH mapping datado not support the assembly of much of the IIa/III/Iregion, as indicated by the many inconsistencies observedbetween the RH map and sequence assembly (Figure 1).
The RH map compared to the Btau_3.1 map is in generalagreement in the BoLA IIb region (~4579–5363 Kbsequence segment of BTA23) but is far less concordant forthe IIa/III/I region. The arrangements of at least six blocksof sequence (~19635–20172 Kb, ~21650–21284 Kb,~21595–21998 Kb, ~23268–23824 Kb, ~24069–24889Kb, and ~25586–25667 Kb sequence segments inBtau_3.1 are in disagreement with map order as deter-mined by RH mapping and indicates much misassemblyof BoLA sequence in the Btau_3.1 assembly.
Comparison of RH map and Btau_4.0 assemblyThe version Btau_4.0 assembly of the bovine genome isgenerally concurrent with the RH map of BoLA, demon-strating the improved reliability of the new assemblywithin this region. The order of markers across most of theBoLA regions in the version 4.0 assembly is in completeagreement with the RH map, with a few minor exceptions:namely, a small inversion in marker order involvingmarkers 11.00–11.05–11.10 and some discordancy in theorder of a few markers in BoLA IIa and BoLA I, all of whichis attributed to insufficient power of the 12,000rad RHpanel to resolve markers that are within a few Kb of eachother.
Comparison of RH map and human genomeThe development of a high resolution radiation hybridmap of BoLA allows for reliable multispecies comparisonsof the MHC despite the absence of an accurate and con-sistent genome sequence assembly. The comparativemarker order between BoLA and HSA6, when adjusted forthe ruminant inversion (Figure 2), demonstrates aremarkable conservation of gene content and order
Page 6 of 10(page number not for citation purposes)
BMC Genomics 2009, 10:182 http://www.biomedcentral.com/1471-2164/10/182
Page 7 of 10(page number not for citation purposes)
Homologous synteny blocks in cattle and humanFigure 3Homologous synteny blocks in cattle and human. Details about human homologs identified for RH-mapped markers used in this study. To the left, the BoLA RH-mapped markers are presented in their homologous HLA positions, with the cor-responding megabase position of the human homolog listed to the right. Brackets indicate markers clustered by the RH analy-sis. These clustered markers have been assigned to the same cR position and therefore can be flipped with equal likelihood; as a result, caution should be exercised when considering these markers as part of an inversion. To the right, arrows indicate locations and orientations of homologous synteny blocks in relation to human, determined by this study, [14], and [29]. Pro-posed extensions of HSBs are represented as lighter-colored blocks with dotted edges; orientation is indicated by arrows within the blocks.
Homologous synteny blocks
HSA6position (Mb)
33.3533.2133.0033.0233.2132.9232.8632.8832.8632.6832.6753.5253.5753.5953.7153.7953.86
26.2226.5628.0628.1928.5928.1930.1329.6430.8030.8530.9830.9831.2931.4629.7830.0031.6650.4530.4931.7131.8931.8731.7431.7531.8132.0232.0232.0232.1032.2132.0232.1632.1632.5432.5432.6632.7432.5432.6732.7253.2452.9953.1753.0752.8752.9652.87
52.4952.5552.3052.2552.0652.0251.9651.8752.0350.9650.6650.38
From this study
53.2
32.9
32.5
27.0
From Schibler et al. 2006
54.6
62.7
53.2
33.4
32.7
0.3
From Everts-van derWind et al. 2005
54.4
62.7
45.946.449.2
51.2
53.2
50.3
32.7
26.2
33.3
32.653.5
53.8
RH-mappedmarkers

BMC Genomics 2009, 10:182 http://www.biomedcentral.com/1471-2164/10/182
between cattle and humans. Several rearrangements inmarker order are observed between the maps of the twospecies and these regions are prime candidates for furtherstudy to improve our understanding the evolution of themammalian MHC.
ConclusionThe findings of this study provide a high resolution phys-ically ordered radiation hybrid map of the BoLA regionencompassing 80 markers. Comparisons with theBtau_3.1 assembly of the bovine genome sequence shedlight on a number of discrepancies, indicating that cau-tion should be used when interpreting results and draw-ing conclusions based on this assembly. The Btau_4.0assembly of the bovine genome shows far better agree-ment with the RH map; the fact that this assembly can beverified in such a way is indicative of its reliability. Assuch, this assembly will be valuable for future studies inwhich assembly accuracy is paramount, such as searchesfor conserved elements or interpretation of evolutionaryhistories. Additionally, the resolution and reliability ofthe RH map enabled comparisons with the humangenome that help to refine boundaries of HSBs. This mapwill prove useful for future studies of this region of the cat-tle genome as it gives clarification regarding the structureand organization of BoLA and highlights potential inaccu-racies in the Btau_3.1 assembly.
MethodsPrimer design and optimizationMarkers for genotyping the 12,000rad RH panel were iden-tified from the Btau_2.0 assembly of the cattle sequencebased on BLAST alignments to coding sequences from thehuman MHC (NCBI build 36). Assembly scaffolds ofbovine DNA containing human MHC homologues weremasked for repetitive DNA with RepeatMasker [30] andunique PCR primers were designed at ~50 kb intervalsacross the entire version 2.0 assembly of BoLA regions.Primers were designed using the Primer3 program [31]and were further evaluated against the Btau_3.1 assemblyto assure that unique, highly conserved sequence tractswere selected for primer design. Previously publishedprimers for BoLA class II DQA, DQB, and DRB3 [32,33]were also used for genotyping the RH panel. Detailedprimer information is presented in Additional file 1.
Genotyping primers on 12000rad RH panelPCR typings were performed in duplicate in 10-μl reactionvolumes containing 50 ng DNA, 1× buffer (SigmaAldrich), 0.3 pmol of each primer, 0.2 mM dNTPs, 1.5mM MgCl2, and 0.25 U JumpStart REDTaq DNA polymer-ase (Sigma Aldrich). Amplification parameters includedan initial 30-sec denaturation at 94°C; 1 cycle of 94°C for30 sec, 60°C for 30 sec, and 72°C for 30 sec; followed by35 cycles of 30 sec at 94°C (denaturing), 30 sec at opti-
mized annealing temperature (ranging from 56°C to64°C), and 30 sec at 72°C (extension); ending with afinal extension for 5 min at 72°C. Amplification productswere resolved by electrophoresis in 1.0% agarose gels con-taining 0.36 μg/ml ethidium bromide, photographed andmanually scored for the presence of the bovine-specificamplicons. Bovine, hamster and negative control (noDNA) samples were included in each amplification exper-iment. All samples were independently genotyped at leasttwice using this protocol.
Computation of RH mapsRadiation hybrid maps were constructed with the softwarepackage rh_tsp_map [34,35], which utilizes Qsopt [36]and CONCORDE [37] to construct robust RH maps. Mapswere built in such a way as to optimize maximum likeli-hood (MLE) criterion, as described previously [38]. Spe-cifically, pairwise LOD scores were calculated and linkagegroups were identified using the maximum LODs that stillallowed the formation of single groups for the two mainBoLA regions: LOD thresholds of 20.0 and 11.0 for theregions containing BoLA IIb and BoLA IIa, III, and I,respectively. Framework maps were constructed using theprogram frame_markers and comprehensive maps weregenerated with CONCORDE based on five different crite-ria (base MLE, extended MLE, normalized MLE, normal-ized OCB, and weighted OCB). The framework andcomprehensive maps were then compared using the pro-gram compare_frame_script, and markers found to beincongruous between the two maps were removed fromthe framework. This process was then repeated until therewere no discrepancies between the different maps. Eachmap is an optimal marker order based on the MLE defin-ing criteria; therefore, the maps are termed "MLE-consen-sus maps" rather than the more commonly used"framework map".
To test the robustness of the maps, the programsmap_eval and flips were used to evaluate the position ofeach marker in relation to other markers. The programmap_eval was used to calculate the difference in scorebetween the best and second best positions for eachmarker; markers with a threshold of change below 0.5were removed from the framework. The program flips wasthen used to determine the best local arrangement ofmarkers by examining all possible permutations ofmarker order within a sliding window. Lastly, additionalmarkers were added to the MLE-consensus maps using theprogram bin_script, with an upper threshold of 0.1, alower threshold of 0.0, an upper gap threshold of 3, and alower gap threshold of 1 to allow markers that map toidentical positions to be put into a common bin.
Page 8 of 10(page number not for citation purposes)

BMC Genomics 2009, 10:182 http://www.biomedcentral.com/1471-2164/10/182
Construction of comparative mapsMaps were generated to indicate the positions of the RH-mapped markers in relation to the version 3.1 and 4.0assemblies of the bovine genome [39] and to the humangenome (NCBI build 36) of HLA. To identify conservedmarkers, the tract of sequence used for primer design wasanalyzed using the BLASTN option of the Ensembl BLAST-view tool [27] against the version 3.1 assembly of thebovine genome with search sensitivity of "Near-exactmatches", and against the human genome build 36 usinga search sensitivity of "Distant homologies". BLAST align-ment against Btau_4.0 was performed locally using linearscaffold data for each chromosome, available from [18],and the same primer sequence tracts used for the Btau_3.1and human comparative maps.
An alignment result was used for comparative mappingwith human only if the sequence was located on humanchromosome 6p (HSA6p), which contains HLA; and hadan E-value less than 10e-5. If these criteria were met, theposition of the alignment result was used to map the RH-mapped marker relative to other markers already on thehuman map. One marker (10.25) did not have an E-valuelow enough to meet the second criteria but was notexcluded from analysis because alignment results gave theexpected location on HSA6. Marker 55.35 did not meeteither criteria and was therefore removed from the com-parative analysis. A third marker, 57.10, gave unreliablealignment results on HSA6 with relatively high E-values (≥3.2) and was also removed. All other bovine markers weremapped on HLA. Homologous synteny blocks (HSB)were determined according to the criteria outlined in [40].
Authors' contributionsCLB-L synthesized and interpreted the data, constructedcomparative maps, and drafted the manuscript. CPCdesigned primers and performed the RH map computa-tion. KLF coordinated and performed RH typing. ALG-Sand TR provided assistance with typing and ensured thatall data met specific quality and reproducibility criteria.MC performed RH typing and established procedures toensure data consistency. JEW provided the 12,000rad RHpanel. LCS conceived of the study, participated in itsdesign and coordination and helped to draft the manu-script. All authors read and approved the final manu-script.
Additional material
AcknowledgementsWe gratefully acknowledge the contributions of Bhanu Chowdhary for pro-viding feedback and constructive criticism on the study design and manu-script and Jan Elliott for her excellent management of the RH panel. This research was funded by USDA NRI grant 97-35205-5074 to L.C.S. and by funds from College of Veterinary Medicine, Texas Agricultural Experiment Station, The Institute for Bioscience Technology, and Vice President for Research, Texas A&M University.
References1. Trowsdale J: "Both man & bird & beast": comparative organi-
zation of MHC genes. Immunogenetics 1995, 41:1-17.2. Lewin H, Russel G, Glass E: Comparative organization and func-
tion of the major histocompatibility complex of domesti-cated cattle. Immunological Review 1999, 167:145-158.
3. MHC Sequencing Consortium: Complete sequence and genemap of a human major histocompatibility complex. Nature1999, 401(6756):921-923.
4. Mouse Genome Sequencing Consortium: Initial sequencing andcomparative analysis of the mouse genome. Nature 2002,420(6915):520-562.
5. Wagner JL: Molecular Organization of the Canine Major His-tocompatibility Complex. Journal of Heredity 2003, 94(1):23-26.
6. Gustafson AL, Tallmadge RL, Ramlachan N, Miller D, Bird H, AntczakDF, Raudsepp T, Chowdhary BP, Skow LC: An ordered BAC con-tig map of the equine major histocompatibility complex.Cytogenetic and Genome Research 2003, 102(1–4):189-195.
7. Andersson L, Lundén A, Sigurdardottir S, Davies C, Rask L: Linkagerelationships in the bovine MHC region. High recombinationfrequency between class II subregions. Immunogenetics 1988,27(4):273-280.
8. Band M, Larson JH, Womack JE, Lewin HA: A Radiation HybridMap of BTA23: Identification of a Chromosomal Rearrange-ment Leading to Separation of the Cattle MHC Class II Sub-regions. Genomics 1998, 53(3):269-275.
9. Skow LC, Snaples SN, Davis SK, Taylor JF, Huang B, Gallagher DH:Localization of bovine lymphocyte antigen (BoLA) DYA andclass I loci to different regions of Chromosome 23. Mamma-lian Genome 1996, 7(5):388-389.
10. Barendse W, Vaiman D, Kemp S, Sugimoto Y, Armitage S, Williams J,Sun H, Eggen A, Agaba M, Aleyasin S, Band M, Bishop M, Buitkamp J,
Additional file 1Primer information. Detailed primer information for RH-mapped mark-ers, including classification (I, IIa, IIb, III), position within Btau_3.1, primer sequences, product sizes, and annealing temperatures used. All PCR reactions were carried out using 1.5 mM MgCl2. *For DQA and DQB two forward primers were multiplexed and used with a single reverse primer.Click here for file[http://www.biomedcentral.com/content/supplementary/1471-2164-10-182-S1.doc]
Additional file 2Marker information. Centiray position, lod score, and frame/placed sta-tus for each marker. Note that markers labeled as "frame" are considered to be part of the MLE map. Markers 48.10 and 55.30 could not be assigned a discrete location and instead were tentatively localized to spe-cific regions between two markers as indicated by the column labeled "binned between".Click here for file[http://www.biomedcentral.com/content/supplementary/1471-2164-10-182-S2.doc]
Page 9 of 10(page number not for citation purposes)
BMC Genomics 2009, 10:182 http://www.biomedcentral.com/1471-2164/10/182
Publish with BioMed Central and every scientist can read your work free of charge
"BioMed Central will be the most significant development for disseminating the results of biomedical research in our lifetime."
Sir Paul Nurse, Cancer Research UK
Your research papers will be:
available free of charge to the entire biomedical community
peer reviewed and published immediately upon acceptance
cited in PubMed and archived on PubMed Central
yours — you keep the copyright
Submit your manuscript here:http://www.biomedcentral.com/info/publishing_adv.asp
BioMedcentral
Byrne K, Collins F, Cooper L, Coppettiers W, Denys B, DrinkwaterR, Easterday K, Elduque C, Ennis S, Erhardt G, Ferretti L, Flavin N,Gao Q, Georges M, Gurung R, Harlizius B, Hawkins G, et al.: Amedium-density genetic linkage map of the bovine genome.Mammalian Genome 1997, 8:21-28.
11. Kappes S, Keele J, Stone R, McGraw R, Sonstegard T, Smith T, Lopez-Corrales N, Beattie C: A second-generation linkage map of thebovine genome. Genome Research 1997, 7:235-249.
12. Ihara N, Takasuga A, Mizoshita K, Takeda H, Sugimoto M, MizoguchiY, Hirano T, Itoh T, Watanabe T, Reed K, Snelling W, Kappes S, Beat-tie C, Bennett G, Sugimoto Y: A comprehensive genetic map ofthe cattle genome based on 3802 microsatellites. GenomeResearch 2004, 14:1987-1998.
13. McShane RD, Gallagher DS, Newkirk H, Taylor JF, Burzlaff JD, DavisSK, Skow LC: Physical localization and order of genes in theclass I region of the bovine MHC. Anim Genet 2001,32(5):235-239.
14. Everts-van der Wind A, Larkin DM, Green CA, Elliott JS, OlmsteadCA, Chiu R, Schein JE, Marra MA, Womack JE, Lewin HA: A high-resolution whole-genome cattle-human comparative mapreveals details of mammalian chromosome evolution. ProcNatl Acad Sci 2005, 102(51):18526-18531.
15. Itoh T, Watanabe T, Ihara N, Mariani P, Beattie CW, Sugimoto Y,Takasuga A: A comprehensive radiation hybrid map of thebovine genome comprising 5593 loci. Genomics 2005,85(4):413-424.
16. McKay SD, Schnabel RD, Murdoch BM, Aerts J, Gill CA, Gao C, Li C,Matukumalli LK, Stothard P, Wang Z, Van Tassell CP, Williams JL,Taylor JF, Moore SS: Construction of bovine whole-genomeradiation hybrid and linkage maps using high-throughputgenotyping. Anim Genet 2007, 38(2):120-125.
17. Snelling W, Chiu R, Schein JE, Hobbs M, Abbey CA, Adelson DL,Aerts J, Bennett GL, Bosdet IE, Boussaha M, Brauning R, Caetano AR,Costa MM, Crawford AM, Dalrymple BP, Eggen A, Everts-van derWind A, Floriot S, Gautier M, Gill CA, Green RD, Holt R, Jann O,Jones SJ, Kappes SM, Keele JW, de Jong PJ, Larkin DM, Lewin HA,McEwan JC, McKay S, Marra MA, Mathewson CA, Matukumalli LK,Moore SS, Murdoch B, Nicholas FW, Osoegawa K, Roy A, Salih H,Schibler L, Schnabel RD, Silveri L, Skow LC, Smith TP, Sonstegard TS,Taylor JF, Tellam R, Van Tassell CP, Williams JL, Womack JE, WyeNH, Yang G, Zhao S, the International Bovine BAC Mapping Consor-tium: A physical map of the bovine genome. Genome Biol 2007,8(8):R165.
18. Index of [ftp://ftp.hgsc.bcm.tmc.edu/pub/data/Btaurus/fasta/Btau20070913-freeze/]
19. Rexroad CEI, Owens EK, Johnson JS, Womack JE: A 12,000 radwhole genome radiation hybrid panel for high resolutionmapping in cattle: characterization of the centromeric endof chromosome 1. Anim Genet 2000, 31(4):262-265.
20. Womack JE, Johnson JS, Owens EK, Rexroad Iii CE, Schläpfer J, YangY-P: A whole-genome radiation hybrid panel for bovine genemapping. Mammalian Genome 1997, 8(11):854-856.
21. Rexroad CE, Schlapfer JS, Yang Y, Harlizius B, Womack JE: A radia-tion hybrid map of bovine chromosome one. Anim Genet 1999,30(5):325-332.
22. Schläpfer J, Yang Y, Rexroad Iii C, Womack J: A radiation hybridframework map of bovine chromosome 13. ChromosomeResearch 1997, 5(8):511-519.
23. Yang Y-P, Rexroad CE, Schläpfer J, Womack JE: An IntegratedRadiation Hybrid Map of Bovine Chromosome 19 andOrdered Comparative Mapping with Human Chromosome17. Genomics 1998, 48(1):93-99.
24. Amarante MRV, Yang Y-P, Kata SR, Lopes CR, Womack JE: RH mapsof bovine Chromosomes 15 and 29: conservation of humanChromosomes 11 and 5. Mammalian Genome 2000,11(5):364-368.
25. Ozawa A, Band MR, Larson JH, Donovan J, Green CA, Womack JE,Lewin HA: Inaugural Article: Comparative organization ofcattle chromosome 5 revealed by comparative mapping byannotation and sequence similarity and radiation hybridmapping. Proc Natl Acad Sci 2000, 97(8):4150-4155.
26. Prasad A, Schiex T, McKay S, Murdoch B, Wang Z, Womack J, Stoth-ard P, Moore S: High resolution radiation hybrid maps ofbovine chromosomes 19 and 29: comparison with the bovinegenome sequence assembly. BMC Genomics 2007, 8(1):310.
27. Ensembl Multi BlastView [http://www.ensembl.org/Multi/blastview]
28. Childers CP, Newkirk HL, Honeycutt DA, Ramlachan N, Muzney DM,Sodergren E, Gibbs RA, Weinstock GM, Womack JE, Skow LC:Comparative analysis of the bovine MHC class IIb sequenceidentifies inversion breakpoints and three unexpected genes.Anim Genet 2006, 37(2):121-129.
29. Schibler L, Roig A, Mahe MF, Laurent P, Hayes H, Rodolphe F, CribiuEP: High-resolution comparative mapping among man, cat-tle and mouse suggests a role for repeat sequences in mam-malian genome evolution. BMC Genomics 2006, 7:194.
30. RepeatMasker Web Server [http://www.repeatmasker.org/cgi-bin/WEBRepeatMasker]
31. Primer3 [http://frodo.wi.mit.edu/]32. Traul D, Bhushan B, Eldridge J, Crawford T, Li H, Davies C: Charac-
terization of Bison bison major histocompatibility complexclass IIa haplotypes. Immunogenetics 2005, 57(11):845-854.
33. van Eijk M, Stewart-Haynes JA, Lewin HA: Extensive polymor-phism of the BoLA-DRB3 gene distinguished by PCR-RFLP.Anim Genet 1992, 23(6):483-496.
34. Agarwala R, Applegate DL, Maglott D, Schuler GD, Schäffer AA: AFast and Scalable Radiation Hybrid Map Construction andIntegration Strategy. Genome Research 2000, 10(3):350-364.
35. Schäffer AA, Rice ES, Cook W, Agarwala R: rh_tsp_map 3.0: end-to-end radiation hybrid mapping with improved speed andquality control. Bioinformatics 2007, 23(9):1156-1158.
36. QSopt Linear Programming Solver [http://www2.isye.gatech.edu/~wcook/qsopt/]
37. Applegate D, Bixby R, Chvátal V, Cook W: On the solution oftraveling salesman problems. Documenta Mathematica III, Interna-tional Congress of Mathematics 1998, III:645-656.
38. Brinkmeyer-Langford C, Raudsepp T, Lee E-J, Goh G, Schäffer A,Agarwala R, Wagner M, Tozaki T, Skow L, Womack J, Mickelson J,Chowdhary B: A high-resolution physical map of equinehomologs of HSA19 shows divergent evolution comparedwith other mammals. Mammalian Genome 2005, 16(8):631-649.
39. Bovine Genome Project [http://www.hgsc.bcm.tmc.edu/projects/bovine/]
40. Murphy WJ, Larkin DM, der Wind AE-v, Bourque G, Tesler G, AuvilL, Beever JE, Chowdhary BP, Galibert F, Gatzke L, Hitte C, MeyersSN, Milan D, Ostrander EA, Pape G, Parker HG, Raudsepp T,Rogatcheva MB, Schook LB, Skow LC, Welge M, Womack JE, O'BrienSJ, Pevzner PA, Lewin HA: Dynamics of Mammalian Chromo-some Evolution Inferred from Multispecies ComparativeMaps. Science 2005, 309(5734):613-617.
Page 10 of 10(page number not for citation purposes)


