Embed Size (px)
Citation preview
A multi-stage genome-wide association study of bladder canceridentifies multiple susceptibility loci
Nathaniel Rothman1,67, Montserrat Garcia-Closas1,67, Nilanjan Chatterjee1,67, NuriaMalats2,67, Xifeng Wu3,67, Jonine Figueroa1,68, Francisco X Real2,4,68, David Van DenBerg5,68, Giuseppe Matullo6,7,68, Dalsu Baris1,68, Michael Thun8,68, Lambertus AKiemeney9,10,11,68, Paolo Vineis12,7,68, Immaculata De Vivo13,68, Demetrius Albanes1,68,Mark P Purdue1,68, Thorunn Rafnar14,68, Michelle A T Hildebrandt3,68, Anne E Kiltie15,68,Olivier Cussenot16,17,68, Klaus Golka18,68, Rajiv Kumar19,68, Jack A Taylor20,68, Jose IMayordomo21,68, Kevin B Jacobs22,68, Manolis Kogevinas23,24,25,26,68, Amy Hutchinson22,Zhaoming Wang22, Yi-Ping Fu1, Ludmila Prokunina-Olsson1, Laurie Burdette22, MeredithYeager22, William Wheeler27, Adonina Tardón25,28, Consol Serra29, Alfredo Carrato30,Reina García-Closas31, Josep Lloreta32, Alison Johnson33, Molly Schwenn34, Margaret RKaragas35, Alan Schned35, Gerald Andriole Jr36, Robert Grubb III36, Amanda Black1, Eric JJacobs8, W Ryan Diver8, Susan M Gapstur8, Stephanie J Weinstein1, Jarmo Virtamo37,Victoria K Cortessis4, Manuela Gago-Dominguez4, Malcolm C Pike4,38, Mariana C Stern4,Jian-Min Yuan39, David Hunter40, Monica McGrath40, Colin P Dinney41, Bogdan Czerniak42,Meng Chen3, Hushan Yang3, Sita H Vermeulen43,9, Katja K Aben9,10, J Alfred Witjes11,Remco R Makkinje43, Patrick Sulem14, Soren Besenbacher14, Kari Stefansson14,44, ElioRiboli12, Paul Brennan45, Salvatore Panico46, Carmen Navarro47,25, Naomi E Allen48, H BasBueno-de-Mesquita49, Dimitrios Trichopoulos50,51, Neil Caporaso1, Maria Teresa Landi1,Federico Canzian52, Borje Ljungberg53, Anne Tjonneland54, Francoise Clavel-Chapelon55,David T Bishop56, Mark T W Teo56, Margaret A Knowles56, Simonetta Guarrera7, SilviaPolidoro7, Fulvio Ricceri6,7, Carlotta Sacerdote7,57, Alessandra Allione7, Geraldine Cancel-Tassin17, Silvia Selinski18, Jan G Hengstler18, Holger Dietrich58, Tony Fletcher59, PeterRudnai60, Eugen Gurzau61, Kvetoslava Koppova62, Sophia C E Bolick20, Ashley Godfrey20,Zongli Xu20, José I Sanz-Velez63, María D García-Prats63, Manuel Sanchez21, Gabriel
Users may view, print, copy, download and text and data- mine the content in such documents, for the purposes of academic research,subject always to the full Conditions of use: http://www.nature.com/authors/editorial_policies/license.html#terms
Correspondence should be addressed to: Montserrat Garcia-Closas, Section of Epidemiology, Institute of Cancer Research, 15Cotswold Rd, Belmont, Sutton, Surrey SM2 5NG, United Kingdom, [email protected] authors contributed equally to this work.68These authors are the designated representatives of the participating studies.69These authors jointly directed this work.Author ContributionsN.R., M.G-C., N.C., J.F., D.T.S., and S.J.C. organized and designed the study.S.J.C., K.B.J., A.H., Z.W., Y-P.F., .L.P-O., L.B., X.W., M.A.T.H., M.C., D.V.D.B., S.G., S.P., R.R.M., I.D.V., T.R., D.T.B., G.C-T.,J.G.H., R.K., S.C.E.B., and A.G. conducted and supervised genotyping of samples.M.G-C., N.C., N.R., K.B.J., M.Y., N.M., D.T.S., and S.J.C. contributed to the design and execution of statistical analysis.M.G-C., N.R., N.C., N.M., J.F., F.X.R., J.F.F., D.T.S., and S.J.C. wrote the first draft of the manuscript.N.R., M.G-C., N.M., X.W., J.F., D.V.D.B., F.X.R., G.M., D.B., M.T., L.A.K., P.V., I.D.V., D.A., M.P.P., T.R., M.A.T.H., A.E.K.,O.C., K.G., R.K., J.A.T., J.I.M., M.K., A.T., C.S., A.C., R.G-C., J.L., A.J., M.S., M.R.K., A.S., G.A., R.G., A.B., E.J.J., W.R.D.,S.M.G., S.J.W., J.V., V.K.C., M.G-D., M.C.P., M.C.S., J.Y., D.H., M.M., C.P.D., B.C., M.C., H.Y., S.H.V., K.K.A., J.A.W., R.R.M.,P.S., S.B., K.S., E.R., P.B., S.P., C.N., N.E.A., H.B.B., D.T., N.C., M.T.L., F.C., B.L., A.T., F.C-C., D.T.B., M.T.W.T., M.A.K., S.G.,S.P., F.R., C.S., A.A., G.C-T., S.S., J.G.H., H.D., T.F., P.R., E.G., K.K., S.C.E.B., A.G., Z.X., J.I.S-V., M.D.G-P., M.S., G.V., S.P.,S.B., R.N.H., J.F.F., D.T.S., and S.J.C. conducted the epidemiologic studies and contributed samples to the bladder cancer GWASand/or replication.All authors contributed to the writing of the manuscript.
On behalf of all the authors, MG-C declares no competing financial interests.
Please see Supplementary Note for information on support for individual studies that participated in the effort.
NIH Public AccessAuthor ManuscriptNat Genet. Author manuscript; available in PMC 2011 May 1.
Published in final edited form as:Nat Genet. 2010 November ; 42(11): 978–984. doi:10.1038/ng.687.
NIH
-PA Author Manuscript
NIH
-PA Author Manuscript
NIH
-PA Author Manuscript
Valdivia21, Stefano Porru64, Simone Benhamou65,66, Robert N Hoover1, Joseph F FraumeniJr.1, Debra T Silverman1,69, and Stephen J Chanock1,69
1Division of Cancer Epidemiology and Genetics, National Cancer Institute, Bethesda, Maryland,USA 2Spanish National Cancer Research Centre, Madrid, Spain 3Department of Epidemiology,The University of Texas M.D. Anderson Cancer Center, Houston, Texas, USA 4Departament deCiències Experimentals i de la Salut, Universitat Pompeu Fabra, Barcelona, Spain 5Departmentof Preventive Medicine, Keck School of Medicine, University of Southern California, Los Angeles,California, USA 6Department of Genetics, Biology and Biochemistry, University of Torino, Torino,Italy 7Human Genetics Foundation (HuGeF), Torino, Italy 8Epidemiology Research Program,American Cancer Society, Atlanta, Georgia, USA 9Department of Epidemiology, Biostatistics andHealth Technology Assessment, Radboud University Nijmegen Medical Centre, Nijmegen, TheNetherlands 10Comprehensive Cancer Center East, Nijmegen, The Netherlands 11Department ofUrology, Radboud University Nijmegen Medical Centre, Nijmegen, The Netherlands 12ImperialCollege London, London, UK 13Channing Laboratory, Department of Medicine, Brigham andWomen’s Hospital, Boston, Massachusetts, USA 14deCODE Genetics, Reykjavik, Iceland 15GrayInstitute for Radiation Oncology and Biology, University of Oxford, Oxford, UK 16Department ofUrology, Assistance Publique-Hôpitaux de Paris, Tenon Hospital, Paris, France 17Centre deRecherche sur les Pathologies Prostatiques, Paris, France 18Leibniz Research Centre forWorking Environment and Human Factors, Dortmund, Germany 19Division of Molecular GeneticEpidemiology, German Cancer Research Center, Heidelberg, Germany 20National Institute ofEnvironmental Health Sciences, Research Triangle Park, North Carolina, USA 21University ofZaragoza, Zaragoza, Spain 22Core Genotype Facility, SAIC-Frederick, Inc., NCI-Frederick,Frederick, Maryland, USA 23Centre for Research in Environmental Epidemiology (CREAL),Barcelona, Spain 24Municipal Institute of Medical Research, Barcelona, Spain 25CIBEREpidemiología y Salud Pública (CIBERESP), Barcelona, Spain 26National School of PublicHealth, Athens, Greece 27Information Management Services, Inc., Rockville, Maryland, USA28Instituto Universitario de Oncología, Universidad de Oviedo, Oviedo, Spain 29UniversitatPompeu Fabra, Barcelona, Spain 30Ramón y Cajal University Hospital, Madrid, Spain 31Unidadde Investigación, Hospital Universitario de Canarias, La Laguna, Spain 32Hospital del Mar-IMIM,Univesitat Pompeu Fabra, Barcelona, Spain 33Vermont Cancer Registry, Burlington, Vermont,USA 34Maine Cancer Registry, Augusta, Maine, USA 35Dartmouth Medical School, Hanover, NewHampshire, USA 36Department of Urology, Washington University School of Medicine, St. Louis,Missouri, USA 37National Institute for Health and Welfare, Helsinki, Finland 38Department ofEpidemiology and Biostatistics, Memorial Sloan-Kettering Cancer Center, New York, USA39Masonic Cancer Center, University of Minnesota, Minneapolis, Minnesota, USA 40Departmentof Epidemiology, Program in Molecular and Genetic Epidemiology, Harvard School of PublicHealth, Boston, Massachusetts, USA 41Department of Urology, University of Texas M.D.Anderson Cancer Center, Houston, Texas, USA 42Department of Pathology, University of TexasM.D. Anderson Cancer Center, Houston, Texas, USA 43Department of Human Genetics,Radboud University Nijmegen Medical Centre, Nijmegen, The Netherlands 44Faculty of Medicine,University of Iceland, Reykjavik, Iceland 45International Agency for Research on Cancer, Lyon,France 46Department of Clinical and Experimental Medicine, Federico II University, Naples, Italy47Department of Epidemiology, Murcia Regional Health Council, Murcia, Spain 48CancerEpidemiology Unit, Nuffield Department of Clinical Medicine University of Oxford, Oxford, UK49National Institute for Public Health and the Environment (RIVM), Bilthoven, The Netherlands50Department of Epidemiology, Harvard School of Public Health, Boston, Massachusetts, USA51Bureau of Epidemiologic Research, Academy of Athens, Greece 52Genomic EpidemiologyGroup, German Cancer Research Center, Heidelberg, Germany 53Department of Surgical andPerioperative Sciences, University of Umea, Umea, Sweden 54Danish Cancer Society, Institute ofCancer Epidemiology, Copenhagen, Denmark 55Centre for Research in Epidemiology andPopulation Health, Institute Gustave-Roussy, Paris South University, Villejuif, France 56Leeds
Rothman et al. Page 2
Nat Genet. Author manuscript; available in PMC 2011 May 1.
NIH
-PA Author Manuscript
NIH
-PA Author Manuscript
NIH
-PA Author Manuscript
Institute of Molecular Medicine, St James’s University Hospital, University of Leeds, Leeds, UK57Unit of Cancer Epidemiology, University of Torino, Torino, Italy 58Department of Urology, PaulGerhardt Foundation, Wittenberg, Germany 59Institute of Hygiene and Tropical Medicine, London,UK 60National Institute of Environmental Health, Budapest, Hungary 61Babes Bolyai University,Environmental Health Center, Cluj-Napoca, Romania 62State Health Institute, Banská Bystrica,Slovakia 63San Jorge University Hospital, Huesca, Spain 64Department of Experimental andApplied Medicine, Section of Occupational Medicine and Industrial Hygiene, University of Brescia,Italy 65Institut national de la santé et de la recherche médicale, U946, Fondation Jean Dausset-CEPH, Paris, France 66Centre national de la recherche scientifique, UMR8200, Institut Gustave-Roussy, Villejuif, France
AbstractWe conducted a multi-stage, genome-wide association study (GWAS) of bladder cancer with aprimary scan of 589,299 single nucleotide polymorphisms (SNPs) in 3,532 cases and 5,120controls of European descent (5 studies) followed by a replication strategy, which included 8,381cases and 48,275 controls (16 studies). In a combined analysis, we identified three new regionsassociated with bladder cancer on chromosomes 22q13.1, 19q12 and 2q37.1; rs1014971,(P=8×10⁻¹²) maps to a non-genic region of chromosome 22q13.1; rs8102137 (P=2×10⁻¹¹) on19q12 maps to CCNE1; and rs11892031 (P=1×10⁻⁷) maps to the UGT1A cluster on 2q37.1. Weconfirmed four previous GWAS associations on chromosomes 3q28, 4p16.3, 8q24.21 and 8q24.3,validated previous candidate associations for the GSTM1 deletion (P=4×10⁻¹¹) and a tag SNP forNAT2 acetylation status (P=4×10⁻¹¹), as well as demonstrated smoking interactions with bothregions. Our findings on common variants associated with bladder cancer risk should provide newinsights into mechanisms of carcinogenesis.
Bladder cancer is the fourth most common incident cancer in men1 and its frequentrecurrence requires regular screening and interventions. Cigarette smoking and occupationalexposure to aromatic amines have been strongly linked to bladder cancer risk.1 A familyhistory of bladder cancer is associated with an approximately two-fold increase in risk;however, multiple-cancer families are rare and no high-penetrance genes have beenidentified to date2-4. Large meta-analyses of candidate gene studies have provided supportfor associations between NAT2 slow acetylation phenotype5 (defined by NAT2 haplotypes)and a common gene deletion of GSTM16 with bladder cancer risk7,8. Further, gene-environment interactions have been shown for smoking and NAT2 acetylation, with anincreased risk in slow acetylators, apparent only among cigarette smokers7,8.
Previous genome-wide association studies (GWAS) in bladder cancer have identifiedcommon variants in four genomic regions on chromosomes 3q289 (TP63), 4p16.3(TMEM129, TACC3-FGFR3)10, 8q24.219, and 8q24.311 (PSCA) that are associated withrisk. Interestingly, the variants on 8q24.21 map to a region centromeric to MYC that hasbeen identified in GWAS of breast, colorectal and prostate cancers, as well as chroniclymphocytic leukemia12-18. Also, in follow-up analyses, an association with bladder cancerrisk has been suggested for variants near the TERT-CLPTM1L locus on chromosome5p15.33, which has also been associated by GWAS with risk for basal cell carcinoma,cutaneous melanoma, lung, brain and pancreatic cancers19-23. However, the previouslyreported association with bladder cancer did not achieve genome-wide significance.
We conducted a multi-stage GWAS involving 3,532 cases and 5,120 controls of self-described European descent in stage I, and followed up the most notable signals in twostages of replication (stages IIa/b and III) totaling 8,381 cases and 48,275 controls (Figure 1
Rothman et al. Page 3
Nat Genet. Author manuscript; available in PMC 2011 May 1.
NIH
-PA Author Manuscript
NIH
-PA Author Manuscript
NIH
-PA Author Manuscript
and Online Methods). Individuals with scan data in stage I were participants in two case-control studies carried out in Spain and the USA (Maine and Vermont component of theNew England Bladder Cancer Study) and three prospective cohort studies in the USA andFinland (see Supplementary Table 1 online for details). Replication analyses in stage II werecarried out using existing scan data from two earlier studies. First, we evaluated the 100most significant SNPs (excluding previously reported loci and SNPs with pairwise r2>0.8)in 969 cases and 957 controls from the Texas Bladder Cancer study in the USA (stageIIa)11. Five of these SNPs were further evaluated in a second scan of 1,274 cases and 1,832controls in The Netherlands (stage IIb)9. Three of the five SNPs were included or tagged ata pair-wise r2>0.8 in the Dutch scan, and risk associations were confirmed for all three. Instage III, the three SNPs plus a tagging SNP for the NAT2 acetylation status were evaluatedin 6,141 cases and 45,486 controls from 11 case-control and 3 prospective cohort studies inthe USA and Europe (see Figure 1 and Supplementary Table 1).
After quality control analysis of genotypes, we combined the data sets in stage I resulting in589,299 SNPs available for analysis (based on the common SNPs called from both theIllumina Human1M and Human 610-Quad) in 3,532 cases and 5,120 controls (OnlineMethods). A logistic regression model was fit for genotype trend effects (1 d.f.) adjusted forstudy center, age, sex, smoking status (current, former or never) and DNA source (blood/buccal). The quantile-quantile (Q-Q) plot showed little evidence for inflation of the teststatistics as compared to the expected distribution (corrected λ1000 subjects=1.021), whichminimizes the likelihood of substantial hidden population substructure or differentialgenotype calling between cases and controls24 (Online Methods and SupplementaryFigure 1). A Manhattan plot displays the results of the combined GWAS in stage I(Supplementary Figure 2).
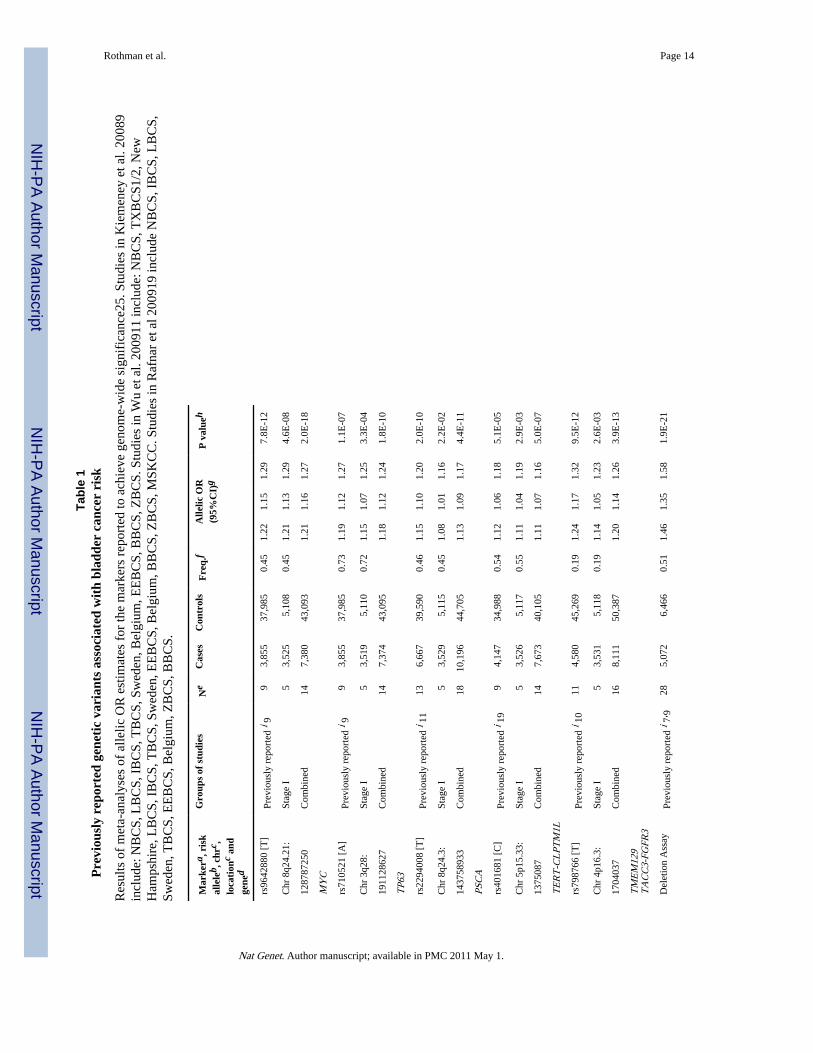
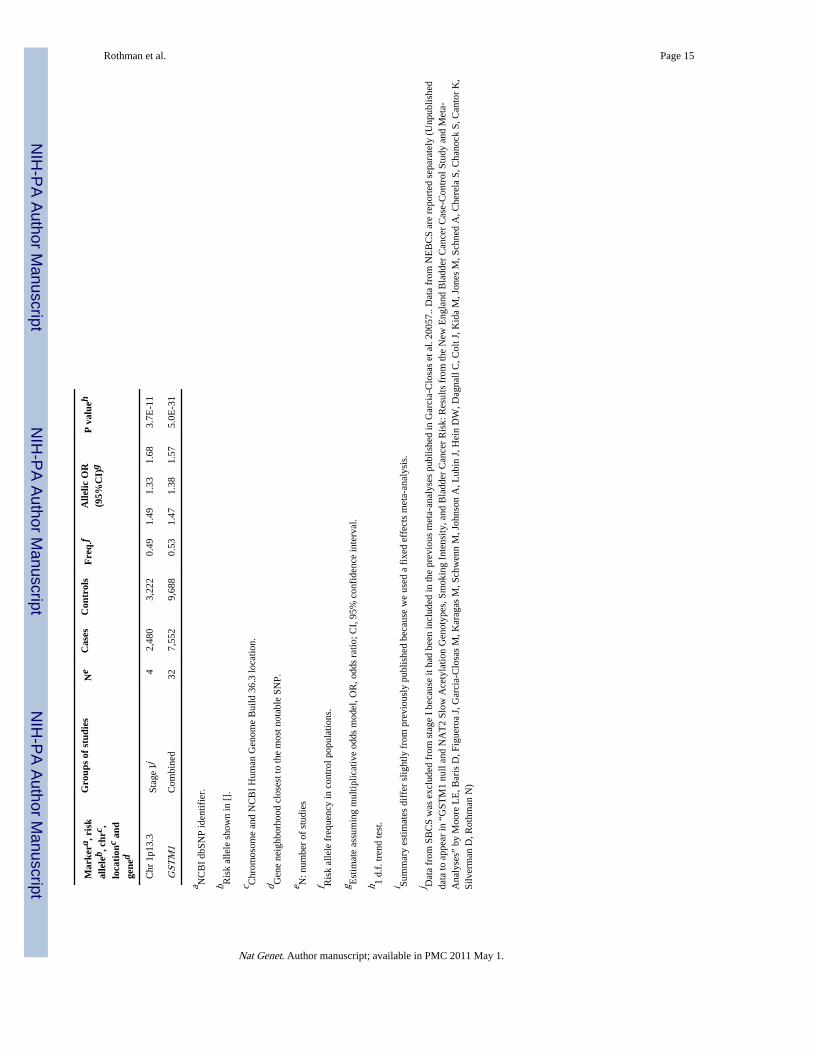
Data from the first stage confirm the associations reported with tag SNPs in the fourpreviously identified genomic regions on chromosomes 3q28 (rs710521)9, 8q24.21(rs9642880)9, 8q24.3 (rs2294008)11 and 4p16.3 (rs798766)10 as well as a suggested regionin 5p15.33 (rs401681; a neighboring SNP, rs2736098, was also reported but data were notavailable in our study)19 (Table 1 and Supplementary Figure 3). Consistent with priorreports9,10, rs9642880 on 8q24.21 and rs798766 on 4p16.3 were most strongly associatedwith tumors of low grade/low risk of progression (Supplementary Table 2). A strongerassociation with low grade/low risk disease was also suggested for rs401681 on 5p15.33(Supplementary Table 2). In addition, we used a copy number variation TaqMan assay7 toassess the presence of GSTM1 on 1p13.3 to genotype stage I samples, and confirmed anassociation with increased bladder cancer risk (Table 1).
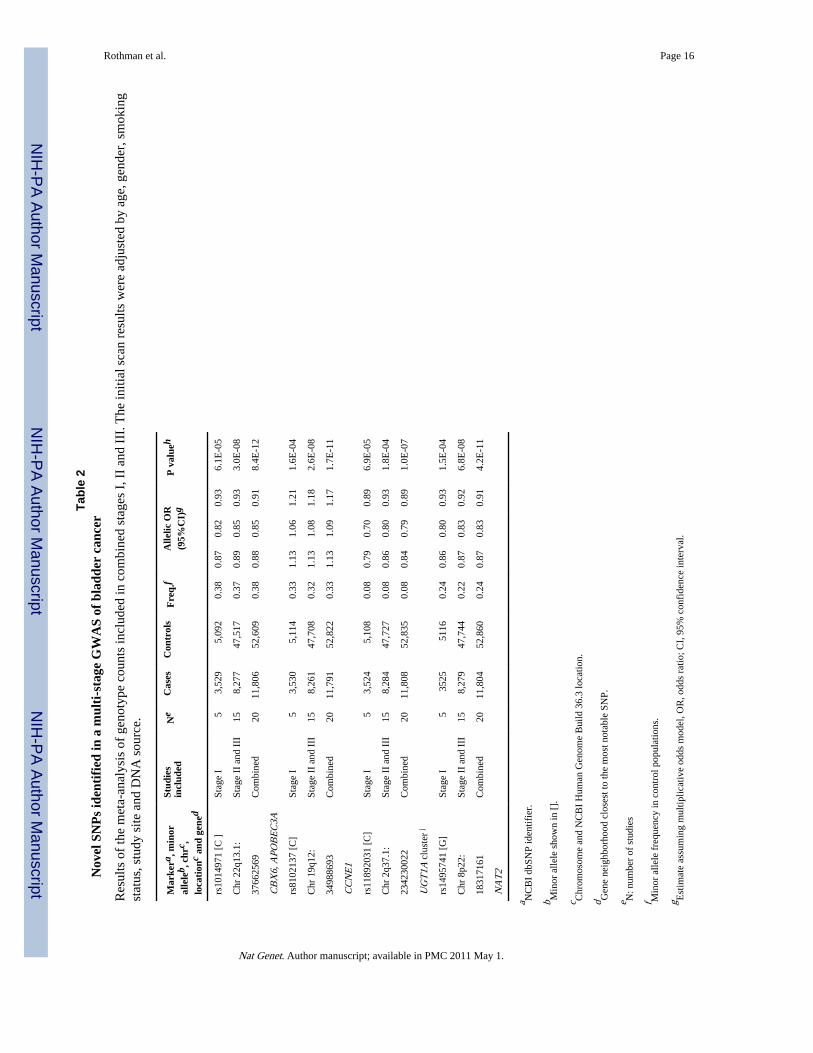
In a combined analysis based on case/control counts by genotype and study, we estimatedodds ratios (ORs) using logistic regression analyses adjusted for study center. Meta-analysesof estimated ORs adjusted for age, sex, smoking status and DNA source producedcomparable point estimates (Supplementary Table 3). Our combined analysis of stages I, IIand III identified three novel genomic regions on chromosomes 22q13.1, 19q12 and 2q37.1that were associated with bladder cancer risk below the threshold for genome-widesignificance (P<5 × 10⁻⁷)25 (Table 2 and Supplementary Figure 4 for study and stagespecific estimates, Figure 2). We also confirmed a signal below genome-wide significancefor rs1495741, which tags the NAT2 acetylator status26 previously reported as a bladdercancer susceptibility locus on 8p227,8. The new SNP is located approximately 10kb of the3′ end of the gene.
The locus on chromosome 22q13.1, rs1014971 (Ptrend=8.4×10⁻¹²; OR per C allele =0.88,95%CI 0.85-0.91)), was primarily associated with high-risk tumors (Supplementary Table2). The locus is located in a non-genic region, approximately 25 kb centromeric of the
Rothman et al. Page 4
Nat Genet. Author manuscript; available in PMC 2011 May 1.
NIH
-PA Author Manuscript
NIH
-PA Author Manuscript
NIH
-PA Author Manuscript
catalytic polypeptide-like 3A (APOBEC3A) and 64 kb telomeric of the chromobox homolog6 (CBX6). APOBEC3A is an apolipoprotein B mRNA editing enzyme that belongs to thecytidine deaminase gene family, which can play a role in the initiation of tumorigenesis bydeamination of cytosine (C) to uracil (U)27. CBX6 is a component of the chromatin –associated polycomb complex involved in transcriptional repression.
In the combined analysis, we observed an association with rs8102137 on chromosome19q12 (Ptrend=1.7×10⁻¹¹; OR per C allele =1.13, 95%CI 1.09-1.17), which maps to thecyclin E1 gene (CCNE1). CCNE1 is a key member of the cyclin/cyclin-dependent kinase(Cdk)/retinoblastoma protein (pRB) pathway which determines the rates of cell cycletransition from G1 to S phase, and is commonly altered in bladder cancer and othertumors28. Cyclin E1 expression in bladder cancer has been associated with high grade ormuscle invasive tumors and poor clinical outcome29. Consistently, rs8102137 was moststrongly associated with risk of high grade/high risk tumors (Supplementary Table 2).
A third locus is marked by rs11892031 (P=1.0×10⁻⁷; OR per C allele =0.84, 95%CI0.79-0.89) on chromosome 2q37.1 and resides in an intronic region of the UDP-glucuronosyltransferase (UGT) 1A gene locus, which encodes the UGT1A family ofproteins. Glucuronidation by UGTs facilitates solubility and removal of substrates such asendo- and xenobiotics (including carcinogens in tobacco smoke) via bile or urine30. Geneticvariation in UGT1A has been associated with predisposition to severe gastrointestinaltoxicity of the anticancer drug irinotecan31. The UGT1A locus is represented by at leastnine highly homologous transcripts, collectively known as UGTs, generated by alternativesplicing. Tissue-specific loss or decreased expression of UGTs has been associated withseveral gastrointestinal cancers and bladder cancer32-34, as well as experimentally inducedbladder cancer in animal models35.
Previously, a promising signal in the CLPTM1L-TERT locus on chromosome 5p15.33 wasreported in a region in which common variants have been associated with multiple cancersin recent GWAS19-23. In addition, rare mutations in TERT have been linked to dyskeratosiscongenita (a bone marrow failure syndrome), idiopathic pulmonary fibrosis, acutemyelogenous leukemia and chronic lymphocytic leukemia36-39. In the first stage of thisGWAS, we observed a moderately significant effect for rs401681 (P= 2.9 × 10⁻³), whichwas at genome-wide significance when combined with the Rafnar et al. data (P = 5.0 × 10⁻⁷;OR per C allele 1.11, 95% CI 1.07-1.16) (Table 1, Supplementary Figure 3).
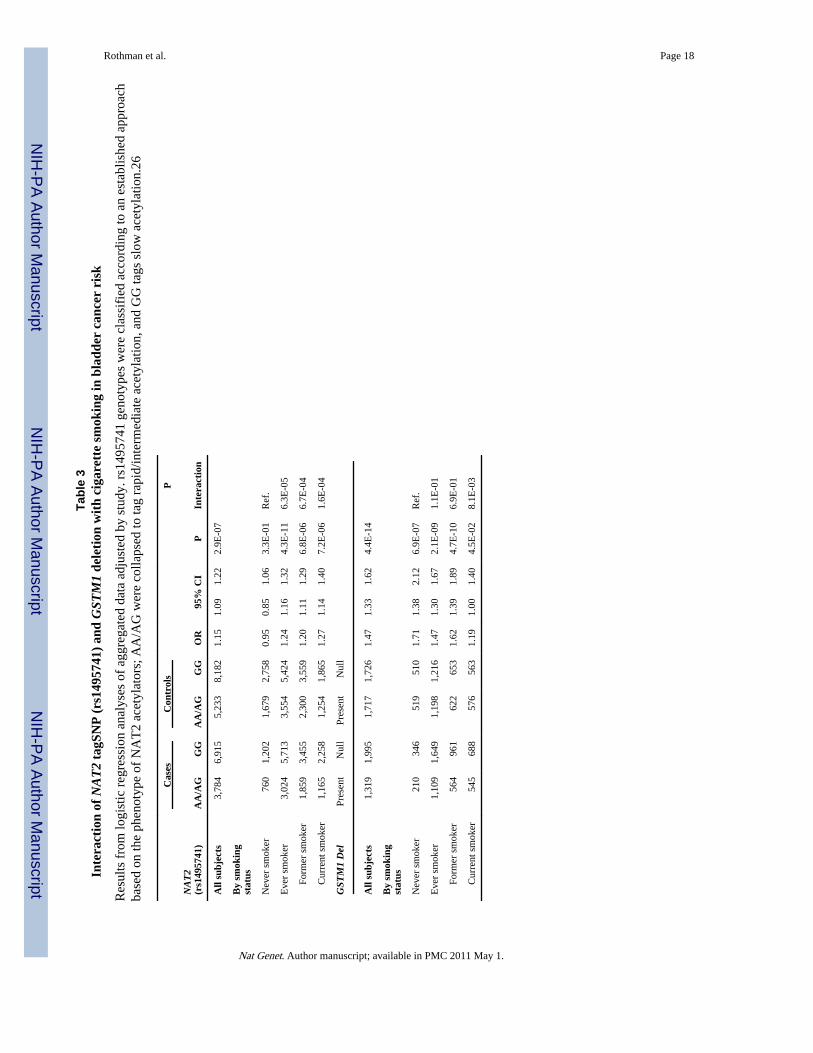
The risk associated with GSTM1 and NAT2 varied in strength across categories of cigarettesmoking, whereas genotype risk associations by smoking categories were of similarmagnitude for the eight susceptibility loci identified by GWAS (Supplementary Table 4). Ina combined analysis, the risk association with GSTM1 deletion was strongest in neversmokers (OR=1.75, 95%CI=1.44-2.13), and progressively weaker in former (OR=1.55,95%CI=1.35-1.78) and current smokers (OR=1.25, 95%CI =1.07-1.46; Pinteraction = 0.008for current vs. never smokers; Table 3). The stronger association of the GSTM1 deletionamong non-smokers is a novel observation that was not evident in previous case-only meta-analyses7. rs1495741 located on the 3′ end of NAT2 is a marker of the NAT2 phenotypeassociated with bladder cancer risk26. The rs1495741 GG genotype marking the slowacetylation phenotype, compared to the combined AG/AA genotypes corresponding to theintermediate/rapid acetylation phenotypes, showed a highly significant (P=5.5×10⁻⁷)association with increased bladder cancer risk that was limited to cigarette smokers(OR=1.24, 95% CI=1.16-1.32 P=4.3×10⁻¹¹; Pinteraction=6.3×10⁻⁵) (Supplementary Figure 5and Supplementary Table 3). This interaction is consistent with the role of NAT2 in thedetoxification of bladder carcinogens such as aromatic amines from tobacco smoke.
Rothman et al. Page 5
Nat Genet. Author manuscript; available in PMC 2011 May 1.
NIH
-PA Author Manuscript
NIH
-PA Author Manuscript
NIH
-PA Author Manuscript
Our three-stage study had adequate power to detect variants of moderate effect sizes over arange of common allele frequencies. For the newly discovered SNP markers, the power todetect the observed associations at a level of genome-wide significance was at 54%, 30%,30% and 6% for rs104971, rs1495741, rs8102137 and rs11892031, respectively. In light ofthe limited power to discover SNPs with modest effect sizes, additional loci with similareffect sizes will likely be identified with larger scale GWAS. Based on a recent estimator40that incorporates novel and previously reported loci together, we estimate thatapproximately two dozen additional bladder cancer susceptibility SNP markers of similarmagnitude and frequencies might be discovered. Future studies should be powered withadequate sample size to detect additional variants.
With the exception of the GSTM1 deletion, relative risk estimates for novel loci are basedon associations using tag SNPs, which most likely underestimate the association withbiologically important alleles. Accordingly, further studies are needed to define thefunctional variants and the clinical utility of risk models that combine genetic markers withepidemiologic risk factors for bladder cancer (i.e. smoking, occupational and environmentalexposures, family history). Our combined analysis of 12,254 individuals with bladder cancerand 53,395 controls has uncovered three new genomic regions associated with bladdercancer risk. Fine-mapping studies of these three regions are needed to identify candidatevariants for functional studies that should shed light into biological mechanisms for theassociations reported through GWAS. This knowledge could establish the foundation fordeveloping improved preventive, diagnostic and/or therapeutic approaches.
Supplementary MaterialRefer to Web version on PubMed Central for supplementary material.
AcknowledgmentsThe bladder cancer GWAS was supported by the intramural research program of the National Institutes of Health,National Cancer Institute.
This project has been funded in part with federal funds from the National Cancer Institute, National Institutes ofHealth, under Contract No. HHSN261200800001E. The content of this publication does not necessarily reflect theviews or policies of the Department of Health and Human Services, nor does mention of trade names, commercialproducts, or organizations imply endorsement by the U.S. Government.
Appendix
Online MethodsStudy Participants
Participants were drawn from 21 studies (Supplementary Table 1). For stage I, cases weredefined as histologically confirmed primary carcinoma of the urinary bladder includingcarcinoma in situ (ICD-0-2 topography codes C67.0-C67.9 or ICD9 codes 188.1-188.9).Each participating study obtained informed consent from study participants and approvalfrom its Institutional Review Board (IRB) for this study. For stage I only, participatingstudies obtained institutional certification permitting data sharing in accordance with theNIH Policy for Sharing of Data Obtained in NIH Supported or Conducted Genome-WideAssociation Studies (GWAS).
Genotyping and Quality ControlFor stage I, genome-wide genotyping was conducted using three chips, SBCS (HumanHap 1Million), NEBC-ME/VT (Human Hap 610-Quad), ATBC, CPS-II and PLCO (cases)
Rothman et al. Page 6
Nat Genet. Author manuscript; available in PMC 2011 May 1.
NIH
-PA Author Manuscript
NIH
-PA Author Manuscript
NIH
-PA Author Manuscript
(Human Hap 610) and controls from CGEMS/GEI for PLCO (Human Hap 550-requivalent). DNA samples were selected for genotyping based on pre-genotyping qualitycontrol measures performed for GWAS at the Core Genotyping Facility of the NCI 4,089blood samples and 2,813 buccal samples were analyzed. Repeat genotyping was performedon 38 blood samples (19 cases and 19 controls) and 10 buccal samples (2 cases and 8controls) on Illumina 1M chips after suitable metrics identified performance issues. Cancerfree controls (N=2003) were previously scanned in CGEMS18 and a lung cancer GWAS21.
Genotype clusters were estimated with samples by study with preliminary completion ratesgreater than 98% per individual study (namely SBCS, NEBC-ME/VT, PLCO, ATBC andCPS-II). Genotypes for the analytical build were based on study specific clustering. SNPassays with locus call rates lower than 90% were excluded.
SNPs with extreme departures from Hardy-Weinberg proportions (P<1×10⁻⁷) wereexcluded from the association analysis due to the increased likelihood of spuriousassociations due to problematic assays or genotyping calling.42 Additional participants wereexcluded based on: 1) completion rates lower than 94-96% (n=203 samples); 2)heterozygosity of less than 22% or >35% (n=12); 3) inter-study unexpected duplicates(n=5); 4) phenotype exclusions (due to ineligibility or incomplete information) (n=94).
Assessment of population structure of study participants was performed withSTRUCTURE43 by seeding the analysis with founder genotypes from three HapMappopulations (Phase I and II build 26).44 A set of 12,898 SNPs with extremely low pair-wisecorrelation (r2<0.004) was selected for this analysis.45-47 A total of 55 participants (43cases and 12 controls) were estimated to have less than 85% HapMap CEU admixture(Supplementary Figure 6). Principal component analysis (PCA) of scanned subjects(excluding inferred sib and half-sib pairs) was performed with GLU (a similar procedure toEIGENSTRAT)45,46 and did not reveal notable eigenvectors. Consequently, a study-specific indicator was used for the stage I analysis46.
We estimated the inflation of the test statistic, λ, adjusted to a sample size of 1000 cases/1000 controls as per the method of de Bakker et. al: λ(corrected)= 1 + (λ−1) × [ncase
−1 +ncont
−1]/[2×10−3 ].48 The corrected estimated λ1000 is 1.021while the uncorrected λ is1.086 (Supplementary Figure 1).
Twenty participant pairs were identified as potential relatives based on genotyping sharingin excess of theoretical expectations. A set of 4,546 SNPs were selected (with completionrates >95%, MAF>0.3 and r2<0.01 in the three HapMap populations) and used to runPREST49 to formally test for cryptic relatedness. 19 unexpected full-sib and 1 parent-childpairs were identified and excluded from PCA (but included in the association analysis). 243expected duplicates (including 6 triplicates in ATBC) were evaluated and yielded aconcordance rate of 99.99%.
The final participant count for stage I analysis was 3,532 cases and 5,120 controls(Supplementary Table 1). The number of SNPs available for association analysis in allstudies but SBCS was 589,299. In the SBCS, genotyped with the Infinium HumanHap 1 Mchip, after quality control metrics were applied, 1,002,634 SNPs were available and 571,643overlapped exactly with the 610Quad/550k data.
TaqMan custom genotyping assays (ABI, Foster City, CA) were designed and optimized for4 SNPs, including the tag SNP for NAT2. In an analysis of 1,107 samples from threestudies, the comparison of the Illumina calls with the TaqMan assays showed an averageconcordance rate of 99.4% (range 99.2-99.8%); no shifts from wild type to homozygotes
Rothman et al. Page 7
Nat Genet. Author manuscript; available in PMC 2011 May 1.
NIH
-PA Author Manuscript
NIH
-PA Author Manuscript
NIH
-PA Author Manuscript
were observed. The Illumina Infinium cluster plots for the four novel associations,rs1014971, rs8102137, rs11892031 and rs1495741 are shown in Supplementary Figure 7.
Association AnalysisAssociation analyses for stage I were conducted using logistic regression, adjusted for age(in five-year categories), sex, smoking (current, former or never), DNA source (buccal/blood) and study. Each SNP genotype was coded as a count of minor alleles, with theexception of X-linked SNPs among men that were coded as 2 if the participant carried theminor allele and 0 if he carried the major allele.50 A score test with one degree of freedomwas performed on all genetic parameters in each model to determine statistical significance.We assessed heterogeneity in genetic effects across studies using the I2 statistic. For theinclusion of stage II and III data, we used genotype counts by case-control status and study,and conducted a fixed effects meta-analysis. We also conducted a meta-analysis based onestimates of allelic odds ratio adjusted by age, sex, smoking status, DNA source and study;the estimates did not materially differ from the fixed-effects meta-analysis (SupplementaryTable 3).
Polytomous logistic regression was used to obtain estimates of effect for different tumorsubtypes. Case-only analyses with tumor type as an outcome were used to test fordifferences in effect size across subtypes. Models for tumor grade constrained the effect sizeto increase linearly across levels. Genotype-smoking interactions were assessed usinglogistic regression for grouped data adjusted by study and including interaction terms. Forestplots by smoking, including summary estimates from fixed effects meta-analyses, are alsoshown for rs1495741.
Data analysis and management was performed with GLU (Genotyping Library and Utilitiesversion 1.0), a suite of tools available as an open-source application for management,storage and analysis of GWAS data, and STATA.
Estimate of Recombination HotspotsSequenceLDhot51 that uses an approximate marginal likelihood method52 was used tocompute likelihood ratio (LR) statistics for a set of putative hotspots across the region ofinterest. We sequentially analyzed subsets of 100 controls of European descent (by pooling5 controls from each study). We used Phasev2.1 to infer the haplotypes as well asbackground recombination rates. The analysis was repeated with five non-overlapping setsof 100 pooled controls.
Data AccessThe CGEMS data portal provides access to individual level data for investigators fromcertified scientific institutions after approval of their submitted Data Access Request.
URLs:
CGEMS portal: http://cgems.cancer.gov/
CGF: http://cgf.nci.nih.gov/
GLU: http://code.google.com/p/glu-genetics/
EIGENSTRAT: http://genepath.med.harvard.edu/~reich/EIGENSTRAT.htm
SNP500Cancer: http://snp500cancer.nci.nih.gov/
Rothman et al. Page 8
Nat Genet. Author manuscript; available in PMC 2011 May 1.
NIH
-PA Author Manuscript
NIH
-PA Author Manuscript
NIH
-PA Author Manuscript
STRUCTURE: http://pritch.bsd.uchicago.edu/structure.html
Tagzilla: http://tagzilla.nci.nih.gov/
References1. Silverman, D.; SS, D.; LE, M.; N, R. Bladder Cancer. In: D, S.; Fraumeni, JF., Jr., editors. Cancer
Epidemiology and Prevention. Oxford University Press; New York, NY: 2006. p. 1101-1127.
2. Kantor AF, Hartge P, Hoover RN, Fraumeni JF Jr. Familial and environmental interactions inbladder cancer risk. Int J Cancer. 1985; 35:703–6. [PubMed: 4008097]
3. Murta-Nascimento C, et al. Risk of bladder cancer associated with family history of cancer: do low-penetrance polymorphisms account for the increase in risk? Cancer Epidemiol Biomarkers Prev.2007; 16:1595–600. [PubMed: 17684133]
4. Aben KK, et al. Segregation analysis of urothelial cell carcinoma. Eur J Cancer. 2006; 42:1428–33.[PubMed: 16737809]
5. Lower GM Jr. et al. N-acetyltransferase phenotype and risk in urinary bladder cancer: approaches inmolecular epidemiology. Preliminary results in Sweden and Denmark. Environ Health Perspect.1979; 29:71–9. [PubMed: 510245]
6. Bell DA, et al. Genetic risk and carcinogen exposure: a common inherited defect of the carcinogen-metabolism gene glutathione S-transferase M1 (GSTM1) that increases susceptibility to bladdercancer. J Natl Cancer Inst. 1993; 85:1159–64. [PubMed: 8320745]
7. Garcia-Closas M, et al. NAT2 slow acetylation, GSTM1 null genotype, and risk of bladder cancer:results from the Spanish Bladder Cancer Study and meta-analyses. Lancet. 2005; 366:649–59.[PubMed: 16112301]
8. Rothman N, Garcia-Closas M, Hein DW. Commentary: Reflections on G. M. Lower and colleagues’1979 study associating slow acetylator phenotype with urinary bladder cancer: meta-analysis,historical refinements of the hypothesis, and lessons learned. Int J Epidemiol. 2007; 36:23–8.[PubMed: 17510073]
9. Kiemeney LA, et al. Sequence variant on 8q24 confers susceptibility to urinary bladder cancer. NatGenet. 2008; 40:1307–12. [PubMed: 18794855]
10. Kiemeney LA, et al. A sequence variant at 4p16.3 confers susceptibility to urinary bladder cancer.Nat Genet. 2010; 42:415–9. [PubMed: 20348956]
11. Wu X, et al. Genetic variation in the prostate stem cell antigen gene PSCA confers susceptibility tourinary bladder cancer. Nat Genet. 2009; 41:991–5. [PubMed: 19648920]
12. Eeles RA, et al. Identification of seven new prostate cancer susceptibility loci through a genome-wide association study. Nat Genet. 2009; 41:1116–21. [PubMed: 19767753]
13. Yeager M, et al. Identification of a new prostate cancer susceptibility locus on chromosome 8q24.Nat Genet. 2009; 41:1055–7. [PubMed: 19767755]
14. Crowther-Swanepoel D, et al. Common variants at 2q37.3, 8q24.21, 15q21.3 and 16q24.1influence chronic lymphocytic leukemia risk. Nat Genet. 2010; 42:132–6. [PubMed: 20062064]
15. Tomlinson IP, et al. A genome-wide association study identifies colorectal cancer susceptibilityloci on chromosomes 10p14 and 8q23.3. Nat Genet. 2008; 40:623–30. [PubMed: 18372905]
16. Easton DF, et al. Genome-wide association study identifies novel breast cancer susceptibility loci.Nature. 2007; 447:1087–93. [PubMed: 17529967]
17. Zanke BW, et al. Genome-wide association scan identifies a colorectal cancer susceptibility locuson chromosome 8q24. Nat Genet. 2007; 39:989–94. [PubMed: 17618283]
18. Yeager M, et al. Genome-wide association study of prostate cancer identifies a second risk locus at8q24. Nat Genet. 2007; 39:645–9. [PubMed: 17401363]
19. Rafnar T, et al. Sequence variants at the TERT-CLPTM1L locus associate with many cancer types.Nat Genet. 2009; 41:221–7. [PubMed: 19151717]
20. Stacey SN, et al. New common variants affecting susceptibility to basal cell carcinoma. Nat Genet.2009
Rothman et al. Page 9
Nat Genet. Author manuscript; available in PMC 2011 May 1.
NIH
-PA Author Manuscript
NIH
-PA Author Manuscript
NIH
-PA Author Manuscript
21. Landi MT, et al. A genome-wide association study of lung cancer identifies a region ofchromosome 5p15 associated with risk for adenocarcinoma. Am J Hum Genet. 2009; 85:679–91.[PubMed: 19836008]
22. Shete S, et al. Genome-wide association study identifies five susceptibility loci for glioma. NatGenet. 2009; 41:899–904. [PubMed: 19578367]
23. Petersen GM, et al. A genome-wide association study identifies pancreatic cancer susceptibilityloci on chromosomes 13q22.1, 1q32.1 and 5p15.33. Nat Genet. 2010; 42:224–8. [PubMed:20101243]
24. Freedman ML, et al. Assessing the impact of population stratification on genetic associationstudies. Nat Genet. 2004; 36:388–93. [PubMed: 15052270]
25. Genome-wide association study of 14,000 cases of seven common diseases and 3,000 sharedcontrols. Nature. 2007; 447:661–78. [PubMed: 17554300]
26. García-Closas M, et al. A single nucleotide polymorphism identified in a genome-wide scan tagsvariation in the N-acetyltransferase 2 phenotype in populations of European background.Pharmacogenet Genomics. 2010
27. Conticello SG. The AID/APOBEC family of nucleic acid mutators. Genome Biol. 2008; 9:229.[PubMed: 18598372]
28. Malumbres M, Barbacid M. To cycle or not to cycle: a critical decision in cancer. Nat Rev Cancer.2001; 1:222–31. [PubMed: 11902577]
29. Richter J, et al. High-throughput tissue microarray analysis of cyclin E gene amplification andoverexpression in urinary bladder cancer. Am J Pathol. 2000; 157:787–94. [PubMed: 10980118]
30. Strassburg CP, Lankisch TO, Manns MP, Ehmer U. Family 1 uridine-5′-diphosphateglucuronosyltransferases (UGT1A): from Gilbert’s syndrome to genetic organization andvariability. Arch Toxicol. 2008; 82:415–33. [PubMed: 18491077]
31. Ando Y, et al. Polymorphisms of UDP-glucuronosyltransferase gene and irinotecan toxicity: apharmacogenetic analysis. Cancer Res. 2000; 60:6921–6. [PubMed: 11156391]
32. Strassburg CP, Manns MP, Tukey RH. Differential down-regulation of the UDP-glucuronosyltransferase 1A locus is an early event in human liver and biliary cancer. Cancer Res.1997; 57:2979–85. [PubMed: 9230212]
33. Strassburg CP, Nguyen N, Manns MP, Tukey RH. Polymorphic expression of the UDP-glucuronosyltransferase UGT1A gene locus in human gastric epithelium. Mol Pharmacol. 1998;54:647–54. [PubMed: 9765507]
34. Giuliani L, et al. Can down-regulation of UDP-glucuronosyltransferases in the urinary bladdertissue impact the risk of chemical carcinogenesis? Int J Cancer. 2001; 91:141–3. [PubMed:11149414]
35. Iida K, et al. Suppression of AhR signaling pathway is associated with the down-regulation ofUDP-glucuronosyltransferases during BBN-induced urinary bladder carcinogenesis in mice. JBiochem. 2009; 147:353–60. [PubMed: 19880377]
36. Calado RT, Young NS. Telomere maintenance and human bone marrow failure. Blood. 2008;111:4446–55. [PubMed: 18239083]
37. Armanios MY, et al. Telomerase mutations in families with idiopathic pulmonary fibrosis. N EnglJ Med. 2007; 356:1317–26. [PubMed: 17392301]
38. Tsakiri KD, et al. Adult-onset pulmonary fibrosis caused by mutations in telomerase. Proc NatlAcad Sci U S A. 2007; 104:7552–7. [PubMed: 17460043]
39. Calado RT, et al. Constitutional hypomorphic telomerase mutations in patients with acute myeloidleukemia. Proc Natl Acad Sci U S A. 2009; 106:1187–92. [PubMed: 19147845]
40. Park JH, et al. Estimation of effect size distribution from genome-wide association studies andimplications for future discoveries. Nat Genet. 2010; 42:570–5. [PubMed: 20562874]
41. Hein DW. N-acetyltransferase 2 genetic polymorphism: effects of carcinogen and haplotype onurinary bladder cancer risk. Oncogene. 2006; 25:1649–58. [PubMed: 16550165]
42. Wigginton JE, Cutler DJ, Abecasis GR. A note on exact tests of Hardy-Weinberg equilibrium. AmJ Hum Genet. 2005; 76:887–93. [PubMed: 15789306]
Rothman et al. Page 10
Nat Genet. Author manuscript; available in PMC 2011 May 1.
NIH
-PA Author Manuscript
NIH
-PA Author Manuscript
NIH
-PA Author Manuscript
43. Pritchard JK, Stephens M, Donnelly P. Inference of population structure using multilocus genotypedata. Genetics. 2000; 155:945–59. [PubMed: 10835412]
44. Frazer KA, et al. A second generation human haplotype map of over 3.1 million SNPs. Nature.2007; 449:851–61. [PubMed: 17943122]
45. Price AL, et al. Principal components analysis corrects for stratification in genome-wideassociation studies. Nat Genet. 2006; 38:904–9. [PubMed: 16862161]
46. Patterson N, Price AL, Reich D. Population structure and eigenanalysis. PLoS Genet. 2006;2:e190. [PubMed: 17194218]
47. Yu K, et al. Population substructure and control selection in genome-wide association studies.PLoS One. 2008; 3:e2551. [PubMed: 18596976]
48. de Bakker PI, et al. Practical aspects of imputation-driven meta-analysis of genome-wideassociation studies. Hum Mol Genet. 2008; 17:R122–8. [PubMed: 18852200]
49. Sun L, Wilder K, McPeek MS. Enhanced pedigree error detection. Hum Hered. 2002; 54:99–110.[PubMed: 12566741]
50. Clayton D. Testing for association on the X chromosome. Biostatistics. 2008; 9:593–600.[PubMed: 18441336]
51. Fearnhead P. SequenceLDhot: detecting recombination hotspots. Bioinformatics. 2006; 22:3061–6.[PubMed: 17060358]
52. Fearnhead P, Harding RM, Schneider JA, Myers S, Donnelly P. Application of coalescent methodsto reveal fine-scale rate variation and recombination hotspots. Genetics. 2004; 167:2067–81.[PubMed: 15342541]
Rothman et al. Page 11
Nat Genet. Author manuscript; available in PMC 2011 May 1.
NIH
-PA Author Manuscript
NIH
-PA Author Manuscript
NIH
-PA Author Manuscript
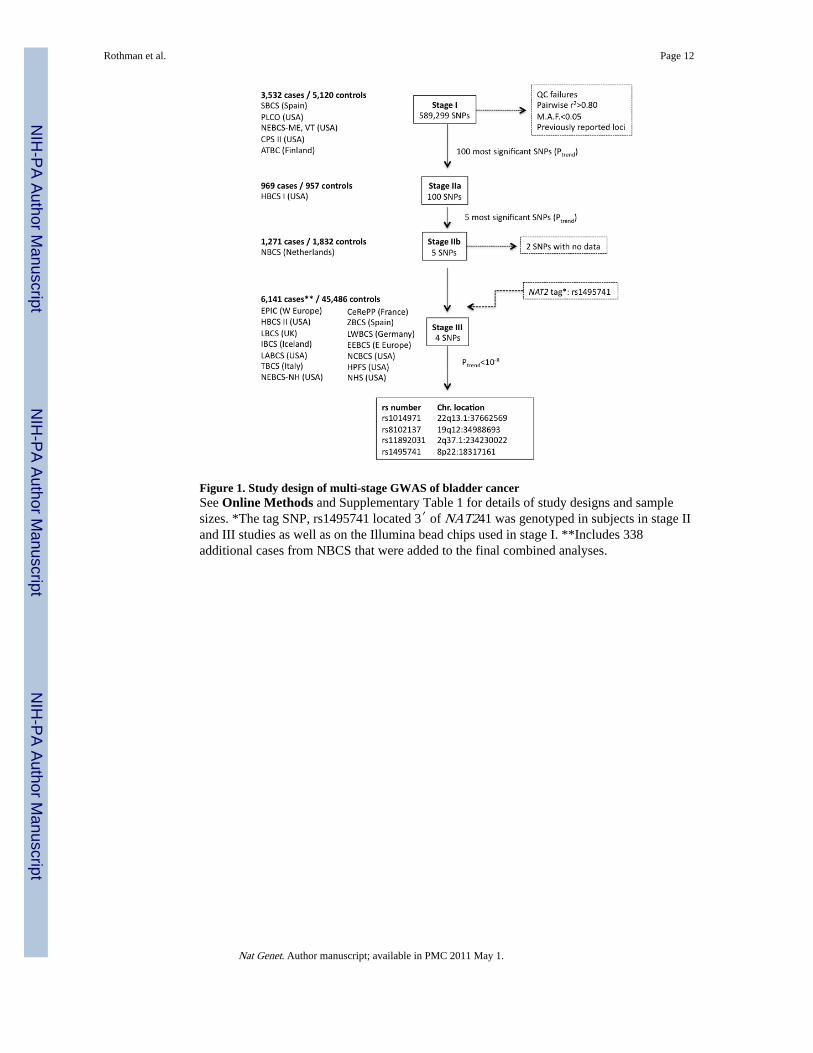
Figure 1. Study design of multi-stage GWAS of bladder cancerSee Online Methods and Supplementary Table 1 for details of study designs and samplesizes. *The tag SNP, rs1495741 located 3′ of NAT241 was genotyped in subjects in stage IIand III studies as well as on the Illumina bead chips used in stage I. **Includes 338additional cases from NBCS that were added to the final combined analyses.
Rothman et al. Page 12
Nat Genet. Author manuscript; available in PMC 2011 May 1.
NIH
-PA Author Manuscript
NIH
-PA Author Manuscript
NIH
-PA Author Manuscript
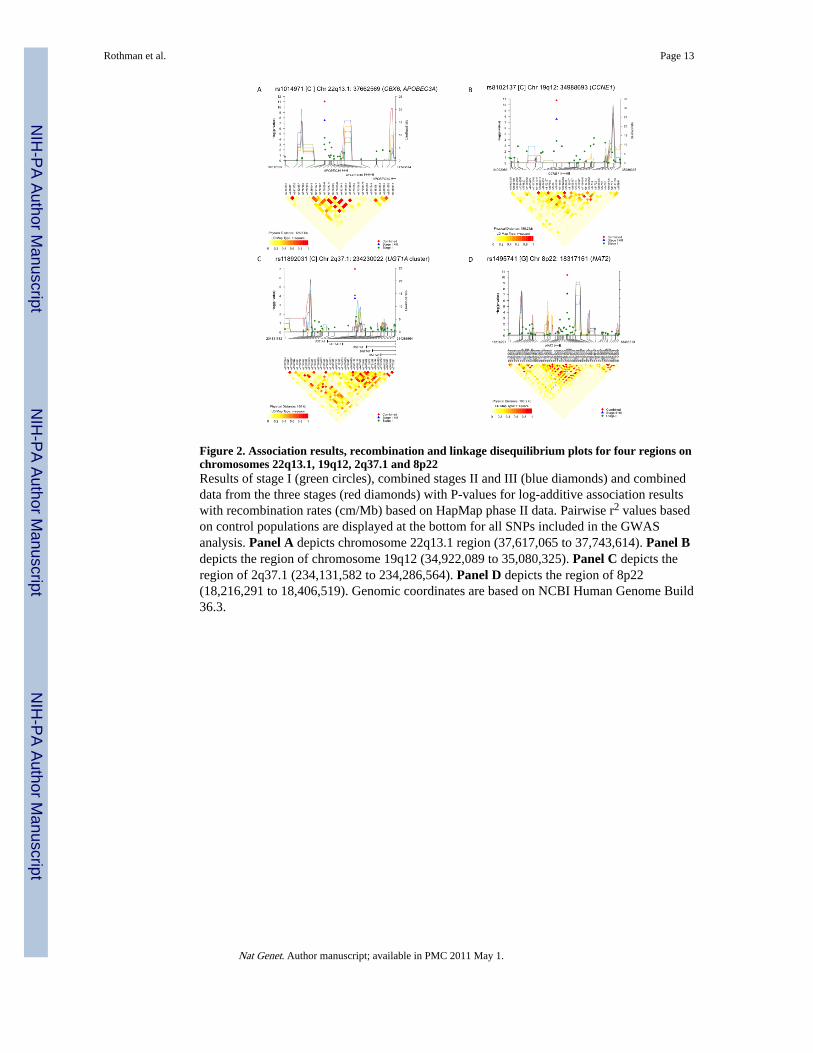
Figure 2. Association results, recombination and linkage disequilibrium plots for four regions onchromosomes 22q13.1, 19q12, 2q37.1 and 8p22Results of stage I (green circles), combined stages II and III (blue diamonds) and combineddata from the three stages (red diamonds) with P-values for log-additive association resultswith recombination rates (cm/Mb) based on HapMap phase II data. Pairwise r2 values basedon control populations are displayed at the bottom for all SNPs included in the GWASanalysis. Panel A depicts chromosome 22q13.1 region (37,617,065 to 37,743,614). Panel Bdepicts the region of chromosome 19q12 (34,922,089 to 35,080,325). Panel C depicts theregion of 2q37.1 (234,131,582 to 234,286,564). Panel D depicts the region of 8p22(18,216,291 to 18,406,519). Genomic coordinates are based on NCBI Human Genome Build36.3.
Rothman et al. Page 13
Nat Genet. Author manuscript; available in PMC 2011 May 1.
NIH
-PA Author Manuscript
NIH
-PA Author Manuscript
NIH
-PA Author Manuscript
NIH
-PA Author Manuscript
NIH
-PA Author Manuscript
NIH
-PA Author Manuscript
Rothman et al. Page 14
Tabl
e 1
Pre
viou
sly
repo
rted
gen
etic
var
iant
s as
soci
ated
wit
h bl
adde
r ca
ncer
ris
k
Res
ults
of
met
a-an
alys
es o
f al
lelic
OR
est
imat
es f
or th
e m
arke
rs r
epor
ted
to a
chie
ve g
enom
e-w
ide
sign
ific
ance
25. S
tudi
es in
Kie
men
ey e
t al.
2008
9in
clud
e: N
BC
S, L
BC
S, I
BC
S, T
BC
S, S
wed
en, B
elgi
um, E
EB
CS,
BB
CS,
ZB
CS.
Stu
dies
in W
u et
al.
2009
11 in
clud
e: N
BC
S, T
XB
CS1
/2, N
ewH
amps
hire
, LB
CS,
IB
CS,
TB
CS,
Sw
eden
, EE
BC
S, B
elgi
um, B
BC
S, Z
BC
S, M
SKC
C. S
tudi
es in
Raf
nar
et a
l 200
919
incl
ude
NB
CS,
IB
CS,
LB
CS,
Swed
en, T
BC
S, E
EB
CS,
Bel
gium
, ZB
CS,
BB
CS.
Mar
kera
, ris
kal
lele
b , c
hrc ,
loca
tion
c an
dge
ned
Gro
ups
of s
tudi
esN
eC
ases
Con
trol
sF
req.
fA
llelic
OR
(95%
CI)
gP
val
ueh
rs96
4288
0 [T
]Pr
evio
usly
rep
orte
d i 9
93,
855
37,9
850.
451.
221.
151.
297.
8E-1
2
Chr
8q2
4.21
:St
age
I5
3,52
55,
108
0.45
1.21
1.13
1.29
4.6E
-08
1287
8725
0C
ombi
ned
147,
380
43,0
931.
211.
161.
272.
0E-1
8
MY
C
rs71
0521
[A
]Pr
evio
usly
rep
orte
d i 9
93,
855
37,9
850.
731.
191.
121.
271.
1E-0
7
Chr
3q2
8:St
age
I5
3,51
95,
110
0.72
1.15
1.07
1.25
3.3E
-04
1911
2862
7C
ombi
ned
147,
374
43,0
951.
181.
121.
241.
8E-1
0
TP6
3
rs22
9400
8 [T
]Pr
evio
usly
rep
orte
d i 1
113
6,66
739
,590
0.46
1.15
1.10
1.20
2.0E
-10
Chr
8q2
4.3:
Stag
e I
53,
529
5,11
50.
451.
081.
011.
162.
2E-0
2
1437
5893
3C
ombi
ned
1810
,196
44,7
051.
131.
091.
174.
4E-1
1
PSC
A
rs40
1681
[C
]Pr
evio
usly
rep
orte
d i 1
99
4,14
734
,988
0.54
1.12
1.06
1.18
5.1E
-05
Chr
5p1
5.33
:St
age
I5
3,52
65,
117
0.55
1.11
1.04
1.19
2.9E
-03
1375
087
Com
bine
d14
7,67
340
,105
1.11
1.07
1.16
5.0E
-07
TE
RT
-CL
PTM
1L
rs79
8766
[T
]Pr
evio
usly
rep
orte
d i 1
011
4,58
045
,269
0.19
1.24
1.17
1.32
9.5E
-12
Chr
4p1
6.3:
Stag
e I
53,
531
5,11
80.
191.
141.
051.
232.
6E-0
3
1704
037
Com
bine
d16
8,11
150
,387
1.20
1.14
1.26
3.9E
-13
TM
EM
129
TA
CC
3-FG
FR3
Del
etio
n A
ssay
Prev
ious
ly r
epor
ted
i 7, 9
285,
072
6,46
60.
511.
461.
351.
581.
9E-2
1
Nat Genet. Author manuscript; available in PMC 2011 May 1.
NIH
-PA Author Manuscript
NIH
-PA Author Manuscript
NIH
-PA Author Manuscript
Rothman et al. Page 15
Mar
kera
, ris
kal
lele
b , c
hrc ,
loca
tion
c an
dge
ned
Gro
ups
of s
tudi
esN
eC
ases
Con
trol
sF
req.
fA
llelic
OR
(95%
CI)
gP
val
ueh
Chr
1p1
3.3
Stag
e Ij
42,
480
3,22
20.
491.
491.
331.
683.
7E-1
1
GST
M1
Com
bine
d32
7,55
29,
688
0.53
1.47
1.38
1.57
5.0E
-31
a NC
BI
dbSN
P id
entif
ier.
b Ris
k al
lele
sho
wn
in [
].
c Chr
omos
ome
and
NC
BI
Hum
an G
enom
e B
uild
36.
3 lo
catio
n.
d Gen
e ne
ighb
orho
od c
lose
st to
the
mos
t not
able
SN
P.
e N: n
umbe
r of
stu
dies
f Ris
k al
lele
fre
quen
cy in
con
trol
pop
ulat
ions
.
g Est
imat
e as
sum
ing
mul
tiplic
ativ
e od
ds m
odel
, OR
, odd
s ra
tio; C
I, 9
5% c
onfi
denc
e in
terv
al.
h 1 d.
f. tr
end
test
.
i Sum
mar
y es
timat
es d
iffe
r sl
ight
ly f
rom
pre
viou
sly
publ
ishe
d be
caus
e w
e us
ed a
fix
ed e
ffec
ts m
eta-
anal
ysis
.
j Dat
a fr
om S
BC
S w
as e
xclu
ded
from
sta
ge I
bec
ause
it h
ad b
een
incl
uded
in th
e pr
evio
us m
eta-
anal
yses
pub
lishe
d in
Gar
cia-
Clo
sas
et a
l. 20
057.
. Dat
a fr
om N
EB
CS
are
repo
rted
sep
arat
ely
(Unp
ublis
hed
data
to a
ppea
r in
“G
STM
1 nu
ll an
d N
AT
2 Sl
ow A
cety
latio
n G
enot
ypes
, Sm
okin
g In
tens
ity, a
nd B
ladd
er C
ance
r R
isk:
Res
ults
fro
m th
e N
ew E
ngla
nd B
ladd
er C
ance
r C
ase-
Con
trol
Stu
dy a
nd M
eta-
Ana
lyse
s” b
y M
oore
LE
, Bar
is D
, Fig
uero
a J,
Gar
cia-
Clo
sas
M, K
arag
as M
, Sch
wen
n M
, Joh
nson
A, L
ubin
J, H
ein
DW
, Dag
nall
C, C
olt J
, Kid
a M
, Jon
es M
, Sch
ned
A, C
here
la S
, Cha
nock
S, C
anto
r K
,Si
lver
man
D, R
othm
an N
)
Nat Genet. Author manuscript; available in PMC 2011 May 1.
NIH
-PA Author Manuscript
NIH
-PA Author Manuscript
NIH
-PA Author Manuscript
Rothman et al. Page 16
Tabl
e 2
Nov
el S
NP
s id
enti
fied
in a
mul
ti-s
tage
GW
AS
of b
ladd
er c
ance
r
Res
ults
of
the
met
a-an
alys
is o
f ge
noty
pe c
ount
s in
clud
ed in
com
bine
d st
ages
I, I
I an
d II
I. T
he in
itial
sca
n re
sults
wer
e ad
just
ed b
y ag
e, g
ende
r, s
mok
ing
stat
us, s
tudy
site
and
DN
A s
ourc
e.
Mar
kera
, min
oral
lele
b , c
hrc ,
loca
tion
c an
d ge
ned
Stud
ies
incl
uded
Ne
Cas
esC
ontr
ols
Fre
q.f
Alle
lic O
R(9
5%C
I)g
P v
alue
h
rs10
1497
1 [C
]St
age
I5
3,52
95,
092
0.38
0.87
0.82
0.93
6.1E
-05
Chr
22q
13.1
:St
age
II a
nd I
II15
8,27
747
,517
0.37
0.89
0.85
0.93
3.0E
-08
3766
2569
Com
bine
d20
11,8
0652
,609
0.38
0.88
0.85
0.91
8.4E
-12
CB
X6,
APO
BE
C3A
rs81
0213
7 [C
]St
age
I5
3,53
05,
114
0.33
1.13
1.06
1.21
1.6E
-04
Chr
19q
12:
Stag
e II
and
III
158,
261
47,7
080.
321.
131.
081.
182.
6E-0
8
3498
8693
Com
bine
d20
11,7
9152
,822
0.33
1.13
1.09
1.17
1.7E
-11
CC
NE
1
rs11
8920
31 [
C]
Stag
e I
53,
524
5,10
80.
080.
790.
700.
896.
9E-0
5
Chr
2q3
7.1:
Stag
e II
and
III
158,
284
47,7
270.
080.
860.
800.
931.
8E-0
4
2342
3002
2C
ombi
ned
2011
,808
52,8
350.
080.
840.
790.
891.
0E-0
7
UG
T1A
clu
ster
j
rs14
9574
1 [G
]St
age
I5
3525
5116
0.24
0.86
0.80
0.93
1.5E
-04
Chr
8p2
2:St
age
II a
nd I
II15
8,27
947
,744
0.22
0.87
0.83
0.92
6.8E
-08
1831
7161
Com
bine
d20
11,8
0452
,860
0.24
0.87
0.83
0.91
4.2E
-11
NA
T2
a NC
BI
dbSN
P id
entif
ier.
b Min
or a
llele
sho
wn
in [
].
c Chr
omos
ome
and
NC
BI
Hum
an G
enom
e B
uild
36.
3 lo
catio
n.
d Gen
e ne
ighb
orho
od c
lose
st to
the
mos
t not
able
SN
P.
e N: n
umbe
r of
stu
dies
f Min
or a
llele
fre
quen
cy in
con
trol
pop
ulat
ions
.
g Est
imat
e as
sum
ing
mul
tiplic
ativ
e od
ds m
odel
, OR
, odd
s ra
tio; C
I, 9
5% c
onfi
denc
e in
terv
al.
Nat Genet. Author manuscript; available in PMC 2011 May 1.

NIH
-PA Author Manuscript
NIH
-PA Author Manuscript
NIH
-PA Author Manuscript
Rothman et al. Page 17h 1
d.f.
tren
d te
st.
Nat Genet. Author manuscript; available in PMC 2011 May 1.
NIH
-PA Author Manuscript
NIH
-PA Author Manuscript
NIH
-PA Author Manuscript
Rothman et al. Page 18
Tabl
e 3
Inte
ract
ion
of N
AT
2 ta
gSN
P (
rs14
9574
1) a
nd G
STM
1 de
leti
on w
ith
ciga
rett
e sm
okin
g in
bla
dder
can
cer
risk
Res
ults
fro
m lo
gist
ic r
egre
ssio
n an
alys
es o
f ag
greg
ated
dat
a ad
just
ed b
y st
udy.
rs1
4957
41 g
enot
ypes
wer
e cl
assi
fied
acc
ordi
ng to
an
esta
blis
hed
appr
oach
base
d on
the
phen
otyp
e of
NA
T2
acet
ylat
ors;
AA
/AG
wer
e co
llaps
ed to
tag
rapi
d/in
term
edia
te a
cety
latio
n, a
nd G
G ta
gs s
low
ace
tyla
tion.
26
Cas
esC
ontr
ols
P
NA
T2
(rs1
4957
41)
AA
/AG
GG
AA
/AG
GG
OR
95%
CI
PIn
tera
ctio
n
All
subj
ects
3,78
46,
915
5,23
38,
182
1.15
1.09
1.22
2.9E
-07
By
smok
ing
stat
us
Nev
er s
mok
er76
01,
202
1,67
92,
758
0.95
0.85
1.06
3.3E
-01
Ref
.
Eve
r sm
oker
3,02
45,
713
3,55
45,
424
1.24
1.16
1.32
4.3E
-11
6.3E
-05
Fo
rmer
sm
oker
1,85
93,
455
2,30
03,
559
1.20
1.11
1.29
6.8E
-06
6.7E
-04
C
urre
nt s
mok
er1,
165
2,25
81,
254
1,86
51.
271.
141.
407.
2E-0
61.
6E-0
4
GST
M1
Del
Pres
ent
Nul
lPr
esen
tN
ull
All
subj
ects
1,31
91,
995
1,71
71,
726
1.47
1.33
1.62
4.4E
-14
By
smok
ing
stat
us
Nev
er s
mok
er21
034
651
951
01.
711.
382.
126.
9E-0
7R
ef.
Eve
r sm
oker
1,10
91,
649
1,19
81,
216
1.47
1.30
1.67
2.1E
-09
1.1E
-01
Fo
rmer
sm
oker
564
961
622
653
1.62
1.39
1.89
4.7E
-10
6.9E
-01
C
urre
nt s
mok
er54
568
857
656
31.
191.
001.
404.
5E-0
28.
1E-0
3
Nat Genet. Author manuscript; available in PMC 2011 May 1.


