Embed Size (px)
Citation preview

DaltonTransactions
PAPER
Cite this: Dalton Trans., 2015, 44,5763
Received 13th August 2014,Accepted 10th February 2015
DOI: 10.1039/c4dt02463j
www.rsc.org/dalton
A new visible-light-excitable ICT-CHEF-mediatedfluorescence ‘turn-on’ probe for the selectivedetection of Cd2+ in a mixed aqueous systemwith live-cell imaging†
Shyamaprosad Goswami,*a Krishnendu Aich,a Sangita Das,a
Chitrangada Das Mukhopadhyay,b Deblina Sarkarc and Tapan Kumar Mondalc
A new quinoline based sensor was developed and applied for the selective detection of Cd2+ both in vitro
and in vivo. The designed probe displays a straightforward approach for the selective detection of Cd2+
with a prominent fluorescence enhancement along with a large red shift (∼38 nm), which may be
because of the CHEF (chelation-enhanced fluorescence) and ICT (internal charge transfer) processes
after interaction with Cd2+. The interference from other biologically important competing metal ions, par-
ticularly Zn2+, has not been observed. The visible-light excitability of the probe merits in the viewpoint of
its biological application. The probe enables the detection of intracellular Cd2+ with non-cytotoxic
effects, which was demonstrated with the live RAW cells. The experimentally observed change in the
structure and electronic properties of the sensor after the addition of Cd2+ were modelled by the density
functional theory (DFT) and time-dependent density functional theory (TDDFT) computational calcu-
lations, respectively. Moreover, the test strip experiment with this sensor exhibits both absorption and
fluorescence color changes when exposed to Cd2+ in a mixed aqueous solution, which also makes the
probe more useful. The minimum limit of detection of Cd2+ by the probe was in the range of 9.9 × 10⁻⁸ M
level.
Introduction
The detection and imaging of biologically relevant target mole-cules through fluorescence in living systems has emerged asan area of intense interest in the chemistry–biology interface,owing to its significant biomedical implications.1 In particular,the development of fluorescent chemosensors for sensing andreporting heavy transition-metal (HTM) ions has been receiv-ing considerable attention in recent years.2 Fluorescent probesare designed and synthesised in such a way that after inter-action with the analytes, they exhibit a drastic change in emis-sion profile, which ultimately shows turn-on or shifts in theemission maxima. This phenomenon is guided by a few pro-posed mechanisms, such as intermolecular charge transfer
(ICT),3 chelation-induced enhanced fluorescence (CHEF),4
photo-induced electron transfer (PET),5 excimer/exciplex for-mation,6 excited-state intramolecular proton transfer,7 andfluorescence resonance energy transfer (FRET).8 Out of these,CHEF-induced fluorescence change is very important as metalions have a tendency to form chelate with the organic donorligands.9 When the CHEF process is in switch-on mode, theconjugation increases drastically, which leads to enhancementin the emission. On the other hand, due to the binding withmetal ions, the ICT mechanism is facilitated over the π-system.This also caused sufficient enhancement in the fluorescence.CHEF- and ICT-mediated probes for the detection of heavy-metal ions are limited, and thus, there exists significant roomfor improvement. HTM ions, in particular Cd2+, have receivedimmense attention due to their harmful effects on publichealth. As Cd2+ has been widely used in agriculture, industry10
and the military for centuries, it can be easily introduced intothe human body through airborne means, such as the inhala-tion of second-hand smoke or by means of food and water.Recent studies indicate that human exposure to cadmium maycause lung, renal and prostate cancers and calcium metab-olism disorders.11 However, the mechanism involved in theCd2+ carcinogenesis remains undefined.12 The U.S. Environ-
†Electronic supplementary information (ESI) available. See DOI: 10.1039/c4dt02463j
aDepartment of Chemistry, Indian Institute of Engineering Science and Technology,
Shibpur, Howrah-711 103, India. E-mail: [email protected];
Fax: +91 33 2668 2916; Tel: +91 33 2668 2961-3bDepartment of Centre for Healthcare Science & Technology, Indian Institute of
Engineering Science and Technology, Shibpur, Howrah-711 103, IndiacDepartment of Chemistry, Jadavpur University, Kolkata, India
This journal is © The Royal Society of Chemistry 2015 Dalton Trans., 2015, 44, 5763–5770 | 5763
Publ
ishe
d on
10
Febr
uary
201
5. D
ownl
oade
d by
Jad
avpu
r U
nive
rsity
on
15/0
4/20
15 0
6:44
:09.
View Article OnlineView Journal | View Issue

mental Protection Agency (EPA) gives an affordable drinkingwater standard for Cd2+ of 5 ppb to prevent the diseasescaused by Cd2+ exposure. The World Health Organization(WHO) also provides a maximum limit of 3 ppb of Cd2+ fordrinking water.13 As a result, the development of a method forthe quantification of Cd2+ in environmental samples as well asin living beings is of great significance for the suppression ofCd2+-carcinogenesis. Thus, extensive research efforts havebeen devoted in recent years, and many fluorescent sensors forCd2+ have been documented in literature.14 However, somelimitations hamper their practical applications. Most of themhave low-water solubility, poor detection limits, and the exci-tation and emission wavelengths are in the UV region, whichlimit their practical biological applications. For in vivoimaging, the excitability of the sensor lies in the visible or NIR(near infrared) region, which are most appropriate for suppres-sing autofluorescence, photo bleaching and photo damage ofthe biological samples. Therefore, there is a critical demandfor developing the sensors, particularly those which are easilysynthesizable and have long excitation wavelengths for promot-ing the in vivo imaging as a focused area of sensing research.
In continuation of our work, in the field of sensor develop-ment,15 we herein report a new visible-light-excitable sensor tomonitor Cd2+ selectively both in vitro and in vivo with non-cyto-toxic properties. The recognition of Cd2+ was investigated byabsorption, emission, 1H NMR and HRMS spectroscopy tech-niques. Further, DFT and TDDFT calculations were performedto investigate the mechanism. Moreover, detection ofcadmium in vivo in live RAW 264.7 cells under confocalmicroscopy has also been demonstrated in this study.
ExperimentalGeneral
Unless otherwise mentioned, materials were obtained fromcommercial suppliers and were used without further purifi-cation. Thin-layer chromatography (TLC) was carried out usingMerck 60 F254 plates with a thickness of 0.25 mm. Meltingpoints were determined on a hot-plate melting-point apparatusin an open-mouth capillary and are uncorrected. 1H and 13CNMR spectra were recorded on JEOL 400 MHz and 100 MHzinstruments, respectively. For NMR spectra, CDCl3 and d6-DMSO were used as solvents using TMS as an internal standard.Chemical shifts are expressed in δ units and 1H–1H and 1H–Ccoupling constants in Hz. UV-vis spectra were recorded on aJASCO V-630 spectrometer. Fluorescence spectra were recordedon a PerkinElmer LS 55 fluorescence spectrometer. IR spectrawere recorded on a JASCO FT/IR-460 plus spectrometer, usingKBr discs. For the titration experiment, we used the cations, viz.[Na+, K+, Ca2+, Ni2+, Mn2+, Zn2+, Cd2+, Cu2+, Fe3+, Cr3+, Pb2+,Hg2+] as their chloride salts and Al3+ as its nitrate salt.
General method of UV-vis and fluorescence titration
UV-vis method. For UV-vis titrations, a stock solution of thereceptor (10 μM) was prepared in [(CH3CN/water), 2/3, v/v] (at
25 °C) using a PBS-buffered solution. The solutions of theguest cations using their chloride salts in the order of 1 × 10⁻⁵
M were prepared in deionized water using a PBS buffer at pH =7.3. Solutions of various concentrations containing the sensorand increasing concentrations of the cations were preparedseparately. The spectra of these solutions were recorded bymeans of the UV-vis method.
Fluorescence method. For fluorescence titrations, the stocksolution of the sensor (10 μM) used was the same as that usedfor UV-vis titration. The solutions of the guest cations usingtheir chloride salts in the order of 1 × 10⁻⁵ M were prepared indeionised water. Solutions of various concentrations contain-ing the sensor and increasing concentrations of the cationswere prepared separately. The spectra of these solutions wererecorded by means of a fluorescence method.
Determination of fluorescence quantum yield
To determine the quantum yields of BPQ and BPQ-Cd2+, werecorded their absorbance in a methanol solution. The emis-sion spectra were recorded using the maximal excitation wave-lengths, and the integrated areas of the fluorescence-correctedspectra were measured. The quantum yields were then calcu-lated by comparing with fluorescein (Φs = 0.97 in basicethanol) as reference using the following equation:
Φx ¼ Φs � ðIx=IsÞ � ðAs=AxÞ � ðnx=nsÞ2
where x and s indicate the unknown and standard solutions,respectively, Φ is the quantum yield, I is the integrated areaunder the fluorescence spectra, A is the absorbance, and n isthe refractive index of the solvent.
Synthetic method for the preparation of the probe
To the suspension of compound A (0.2 g, 0.682 mmol) inethanol, 2-hydroxy-3-(hydroxymethyl)-5-methylbenzaldehyde(0.1 g, 0.682 mmol) was added with continuous stirring. Thereaction mixture was then refluxed for 6 h. After being surethat the reactants were fully consumed, the reaction mixturewas allowed to cool to room temperature. A white precipitateappeared, which was filtered, washed with cold ethanol (1 ml ×2) and dried in air. Yield = (0.24 g) 82%.
Mp = 142–145 °C.1H NMR (400 MHz, CDCl3): δ 2.20 (s, 3H), 5.44 (s, 4H), 7.0
(d, J = 8 Hz, 4H), 7.41 (m, 4H), 7.72 (d, J = 8 Hz, 2H), 6.332 (s,2H), 6.628 (s, 2H), 6.896 (dd, J = 7.05 Hz, 1H), 7.80 (t, J = 8 Hz,2H), 8.13 (dd, 2H), 8.53 (dd, 2H), 8.95 (t, J = 8 Hz, 1H), 11.29(s, 1H), 11.64 (s, 1H).
13C NMR (100 MHz, CDCl3): δ 20.2, 30.9, 70.9, 110.0, 119.6,120.7, 121.9, 122.1, 124.9, 126.7, 128.8, 129.7, 131.6, 136.2,138.5, 140.3, 147.6, 148.7, 149.6, 153.9, 155.6, 156.0, 159.9.
HRMS (ESI, positive): calcd for C25H23N4O4 [M + H]+ (m/z):443.1719; found: 443.1536.
Synthesis of Cd2+ complex (BPQ-Cd2+) of receptor
The receptor, BPQ (50 mg) and CdCl2 (14 mg) were mixedtogether and dissolved in 5 ml of methanol. After reflux for
Paper Dalton Transactions
5764 | Dalton Trans., 2015, 44, 5763–5770 This journal is © The Royal Society of Chemistry 2015
Publ
ishe
d on
10
Febr
uary
201
5. D
ownl
oade
d by
Jad
avpu
r U
nive
rsity
on
15/0
4/20
15 0
6:44
:09.
View Article Online
12 h, the reaction mixture was cooled to room temperature.A reddish-yellow coloured precipitate appeared, which wasfiltered and dried in vacuum.
HRMS (ESI, Positive): calcd for C25H22CdClN4O4 [M + Cd2+
+ Cl−]+ (m/z): 591.0352; found: 591.1286.
Computational method
Full geometry optimizations were carried out using the densityfunctional theory (DFT) method at the B3LYP16–18 level for thecompounds. All elements except for cadmium were assignedthe 6-31+G(d) basis set. The LANL2DZ basis set with theeffective core potential (ECP) set of Hay and Wadt19 was usedfor the Cd2+-complex. The vibrational frequency calculationswere performed to ensure that the optimized geometries rep-resent the local minima, and there were only positive eigen-values. Vertical electronic excitations based on B3LYPoptimized geometries were computed using time-dependentdensity functional theory (TDDFT) formalism20–22 in methanolusing a conductor-like polarizable continuum model(CPCM).23–25 All calculations were performed with Gaussian 09program package26 with the aid of the GaussView visualizationprogram.
Details of live-cell imaging
Materials and methods. Frozen human colorectal carci-noma cell line HCT 116 (ATCC: CCL-247) were obtained fromthe American Type Culture Collection (Rockville, Md., USA)and maintained in Dulbecco’s Modified Eagle’s medium(DMEM, Sigma-Aldrich Chemical Co., St. Louis, Mo., USA) sup-plemented with 10% fetal bovine serum (Invitrogen), penicillin(100 μg ml−1), and streptomycin (100 μg ml−1). The RAW264.7 macrophages were obtained from NCCS, Pune, India,and maintained in DMEM containing 10% (v/v) fetal calfserum and antibiotics in a CO2 incubator. Cells were initiallypropagated in a 25 cm2 tissue culture flask in an atmosphereof 5% CO2 and 95% air at 37 °C humidified air until achieving70–80% confluency.
Fluorescent imaging studies. For fluorescent imaging studies,RAW cells, 7.5 × 10³ cells in 150 μl media were seeded on asterile 12-mm wide Poly L lysine-coated cover-slip and kept ina sterile, 35 mm, covered Petri dish and incubated at 37 °C ina CO2 incubator for 24–30 h. On the following day, cells werewashed three times with phosphate-buffered saline (pH 7.4)and fixed using 4% paraformaldehyde in PBS (pH 7.4) for10 min at room temperature and washed with PBS, followed bypermeabilization using 0.1% saponin for 10 min. The cellswere then incubated with 20 μM CdCl2 dissolved in 100 μlDMEM at 37 °C for 1 h in a CO2 incubator and observed underan epifluorescence microscope (Carl Zeiss). The cells wereagain washed thrice with PBS (pH 7.4) to remove any freemetals and incubated in a DMEM-containing probe (BPQ) to afinal concentration of 1.1 × 10⁻⁶ M followed by washing threetimes with PBS (pH 7.4) to remove excess probe outside thecells. Images were again taken using epifluorescence micro-scope. Before fluorescent imaging, all of the solutions wereaspirated out and mounted on slides in a mounting medium
containing DAPI (1 μg ml−1) and stored under darkness beforemicroscopic images were acquired.
Cytotoxicity assay. The cytotoxic effects of probe CdCl2 andprobe-CdCl2 complex were determined by an MTT assay follow-ing the manufacturer’s instructions (MTT 2003, Sigma-Aldrich,St. Louis, Mo., USA). HCT cells were cultured into 96-wellplates (approximately 104 cells per well) for 24 h. On the fol-lowing day, media were removed and various concentrations ofprobe CdCl2 and probe-CdCl2 complex (0, 15, 25, 50, 75, and100 μM) made in DMEM were added to the cells and incubatedfor 24 h. Solvent control samples (cells treated with DMSO inDMEM), no cells and cells in DMEM without any treatmentwere also included in the study. Following incubation, thegrowth media were removed, and fresh DMEM containingMTT solution was added. The plate was incubated for 3–4 h at37 °C. Subsequently, the supernatant was removed, the insolu-ble colored formazan product was solubilized in DMSO, andits absorbance was measured in a microtiter plate reader (Perkin-Elmer) at 570 nm. The assay was performed in triplicate foreach concentration of probe CdCl2 and probe-CdCl2 complex.The OD value of wells containing only DMEM medium wassubtracted from all readings to remove background influence.Data analysis and the calculation of standard deviation wereperformed with Microsoft Excel 2007 (Microsoft Corporation).
Results and discussionDesign and synthesis
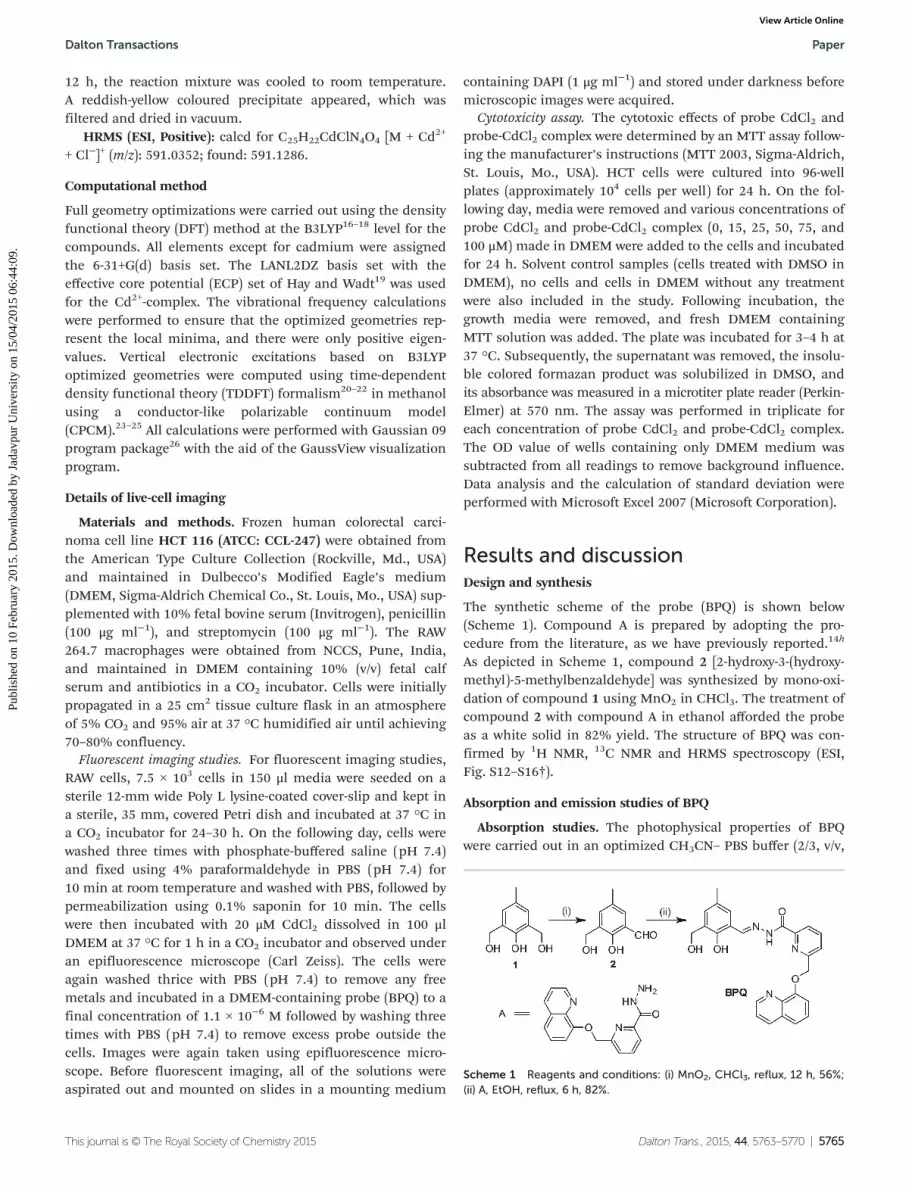
The synthetic scheme of the probe (BPQ) is shown below(Scheme 1). Compound A is prepared by adopting the pro-cedure from the literature, as we have previously reported.14h
As depicted in Scheme 1, compound 2 [2-hydroxy-3-(hydroxy-methyl)-5-methylbenzaldehyde] was synthesized by mono-oxi-dation of compound 1 using MnO2 in CHCl3. The treatment ofcompound 2 with compound A in ethanol afforded the probeas a white solid in 82% yield. The structure of BPQ was con-firmed by 1H NMR, 13C NMR and HRMS spectroscopy (ESI,Fig. S12–S16†).
Absorption and emission studies of BPQ
Absorption studies. The photophysical properties of BPQwere carried out in an optimized CH3CN– PBS buffer (2/3, v/v,
Scheme 1 Reagents and conditions: (i) MnO2, CHCl3, reflux, 12 h, 56%;(ii) A, EtOH, reflux, 6 h, 82%.
Dalton Transactions Paper
This journal is © The Royal Society of Chemistry 2015 Dalton Trans., 2015, 44, 5763–5770 | 5765
Publ
ishe
d on
10
Febr
uary
201
5. D
ownl
oade
d by
Jad
avpu
r U
nive
rsity
on
15/0
4/20
15 0
6:44
:09.
View Article Online

pH = 7.3) solution. UV-vis titration of BPQ with Cd2+ exhibiteda colour change from colorless to light yellow. No other (Na+,K+, Ca2+, Ni2+, Mn2+, Zn2+, Cd2+, Cu2+, Fe3+, Cr3+, Pb2+, Al3+,Hg2+) analyte exhibits any notable distortion in the UV-visprofile (Fig. 1b). Moreover, higher Zn2+ concentration does notlead to any further change. In the absorbance profile, BPQ(10 μM) itself shows two maxima at 307 nm and 365 nm. Uponthe incremental addition of Cd2+ (0–30 µM), the peak at307 nm gradually decreases, resulting in the appearance oftwo new bands at 355 nm and 460 nm (Fig. 1a).
As a result, two clear isosbestic points come into view at330 and 383 nm. The change in the color of chemosensor BPQupon the addition of Cd2+ was clearly visible under visiblelight by the naked eye (Fig. 1a, inset), whereas in the presenceof other metal ions, the metal–ligand solution remained color-less. This is an interesting feature by which we can detect Cd2+
without using any other instrumental technique. Upon inter-action with Cd2+, a prominent new absorbance band at460 nm developed and upon the incremental addition of Cd2+,the peak at 460 nm rapidly increased. During the addition ofCd2+, the absorption ratio (A460/A307) exhibits a good linearcurve of fitness with added Cd2+ concentration (1.1 to 11.7 µM,Fig. S4a, ESI†) with a R2 value of 0.9933. The association con-stant for Cd2+ complexation with BPQ was estimated to be 7.82× 10⁴ M−1 from the Benesi–Hildebrand plot using the dataobtained from UV-vis titration (Fig. S2, ESI†).
To verify the selectivity of BPQ towards Cd2+, a competitionexperiment was performed. To execute this experiment, absor-bance data were recorded at 460 nm after the addition ofvarious guest analytes (30 μM) to the solution of BPQ (CH3CN/H2O, 2/3, v/v, pH = 7.3, PBS buffer) in the presence of Cd2+
(Fig. S6†).Fluorescence studies. The emission spectra of BPQ and its
fluorescence titration with Cd2+ were also recorded in aCH3CN–PBS buffer (2/3, v/v, pH = 7.3) solution. The fluo-rescence spectrum of BPQ (10 μM) exhibits a low emission at512 nm upon excitation at 430 nm. Upon the addition of asmall amount of aqueous Cd2+ solution to the solution ofBPQ, the fluorescence emission at 512 nm is red-shifted
(∼38 nm) to 550 nm (Fig. 2a); this change may be due to theinternal charge transfer (ICT). The incremental addition ofCd2+ (0–20 µM) to the solution of BPQ, leads to a dramaticenhancement of the fluorescence intensity at 550 nm, which isattributed to chelation-induced enhanced fluorescence(CHEF). The fluorescence quantum yield of the sensor wasincreased from 0.02 to 0.46 in the presence of two equivalentsof Cd2+ (ESI). Accordingly, the BPQ fluorescence clearlychanged from turn-off to yellow after the addition of Cd2+,which was observed by the naked eye after illumination underUV light (Fig. 2a, inset).
Herein, Cd2+ forms a stable chelate with BPQ as shown inScheme 2. Notably, the addition of other co-existing metalions, even in an excess amount to the sensor, caused insignifi-cant changes in the emission intensity of the receptor(Fig. 2b). For Zn2+, a slight increase of fluorescence intensitywas observed. However, the twist is the interference, whichoccurs at a different wavelength (506 nm). This is possibly dueto the similar chemical properties of Cd2+ and Zn2+. A goodlinear relationship was observed between the fluorescenceintensity (550 nm) and the added concentration of Cd2+ from0–9.5 μM (Fig. S4b, ESI†). The association constant was deter-mined to be 1.55 × 10⁵ M−1, using the data obtained from fluo-rescence titration. To determine the limit of detection, i.e.,how a lower concentration of Cd2+ can be determined by theprobe (BPQ), we recorded the fluorescence data starting fromthe Cd2+ concentration as low as 10−8 M using 1 µM solution(CH3CN/H2O, 2/3, v/v, pH = 7.3, PBS buffer) of BPQ (Fig. S1,ESI†). From the concentration-dependent fluorescence titra-
Fig. 1 (a) Change of absorption spectra of BPQ (10 µM) upon thegradual addition of Cd2+ (0 to 30 µM). Inset: image showing the visiblecolor change of BPQ before and after the addition of Cd2+ (20 µM). (b)Changes of absorption spectra of BPQ (10 µM) upon the addition ofstated metal ions (30 µM).
Fig. 2 (a) Change of emission spectra of BPQ (10 µM) upon the gradualaddition of Cd2+ (0 to 20 µM). Inset: visible emission observed from BPQin the absence and presence of 20 µM of Cd2+, under UV light. (b)Change of fluorescence spectra of BPQ after the addition of differentmetal ions stated. λex = 430 nm.
Scheme 2 Proposed binding mode of BPQ with Cd2+.
Paper Dalton Transactions
5766 | Dalton Trans., 2015, 44, 5763–5770 This journal is © The Royal Society of Chemistry 2015
Publ
ishe
d on
10
Febr
uary
201
5. D
ownl
oade
d by
Jad
avpu
r U
nive
rsity
on
15/0
4/20
15 0
6:44
:09.
View Article Online

tion experiment, we can see that minimum 9.9 × 10⁻⁸ M Cd2+
can enhance the fluorescence intensity of BPQ at 550 nm.Thus, the detection limit of BPQ was found to be 9.9 × 10⁻⁸ Mfor Cd2+.
Mechanism of Cd2+ sensing. The enhancement in the fluo-rescence intensity of BPQ after the addition of Cd2+ is possiblyattributed to two very important mechanisms: one is ICT, andthe other is CHEF. First, BPQ itself exhibits a low fluorescenceintensity, which may be due to the free rotation of the imine(–CvN) bond. However, after the introduction of Cd2+, this freerotation is inhibited because the metal ion-induced chelationtakes place by involving the binding site of the probe BPQ(–OH group, imine N-atoms and the two heterocyclic donorsegments). The introduction of Cd2+ makes the system morerigid; as a result, both of the mechanisms play key roles in thisfluorescence enhancement.
This also caused sufficient enhancement in the fluo-rescence for the binding mechanism from the ICT point ofview. The CHEF phenomenon in conjunction with the ICTprocess upon interacting with Cd2+ perhaps results in theenhancement in the fluorescence intensity of the free receptoralong with a red shift of ∼38 nm. The proposed CHEF mechan-ism was verified through the HRMS spectra of the BPQ-Cd2+
complex. The stoichiometry of this complexation (BPQ-Cd2+)fits satisfactorily with the relationship of the 1 : 1 (host–guest)binding model, which is supported by the Job’s plot diagram(Fig. S5, ESI†). The HRMS spectrum of BPQ exhibits a peak atm/z 443.1536 possibly for [BPQ + H]+ , whereas the BPQ-Cd2+
complex shows a peak at m/z 591.1286, which may be due to[BPQ + Cd2+ + Cl−]+, also proving the mononuclear complex ofBPQ with Cd2+ (Fig. S19, ESI†). We have recorded 1H NMRspectra of the probe (BPQ) with various concentrations of Cd2+
in d6 DMSO containing 1% D2O. From the NMR data, it wasobserved that the peak arises at δ 12.36 ppm, which graduallydisappears upon the addition of Cd2+. This observation indi-cates the binding of the probe with Cd2+ (Fig. S17†).
Sensing of Cd2+ using TLC plate. Efforts were made toexamine the binding of Cd2+ with the receptor BPQ in thesolid state. In order to investigate a practical application ofthis sensor, an experiment known as the dip-stick method wasperformed. It is a very simple but highly important experimentbecause it gives instant qualitative information without resort-ing to instrumental analysis. In order to perform this exper-iment, we prepared the BPQ solution for inspecting Cd2+ in aCH3CN solution of BPQ (2 × 10⁻⁴ M) and then dried it in air.To investigate Cd2+, we immersed the TLC plate to Cd2+ (2 ×10⁻⁴ M) solution and then exposing it in air to evaporate thesolvent.
The colour of the TLC plates change from light green toyellowish green and under UV light from turn-off to yellow(Fig. 3). This experiment evokes real-time monitoring and isdevoid of using any instrumental analysis; rather, via naked-eye detection and the use of TLC plates, we can easily investi-gate a qualitative instant detection of Cd2+.
Reversibility of RHP. It is a well-known fact that reversibilityis an important criterion for an excellent chemical sensor.
Thus, the chemical reversibility behavior of BPQ was studiedto examine the reusability of the receptor. Reversibility is veryimportant parameter for evaluating the performance of areceptor. To determine whether the complexation process isreversible, emission titration experiments were performedusing the BPQ-Cd2+ complex with S2−. From the titration exper-iment, it is clear that the fluorescence was quenched, and theoriginal BPQ spectra are restored. The light yellow colour ofthe BPQ-Cd2+ solution was dispersed, whereas the colorlesssolution was noticed with a simultaneous addition of S2−
(Fig. S7, ESI†). This indicates the decomplexation of BPQ-Cd2+
as S2− strips away Cd2+ from the binding zone.pH study. From the acid–base titration experiment with the
probe in hand exposed that BPQ does not undergo any notablechange in the fluorescence profile within a pH range from 2–9,this investigation suggests that the molecule is stable in thispH range. However, in strong basic conditions (pH > 9), depro-tonation of the phenolic group causes the coloration alongwith strong yellow fluorescence (Fig. S8, ESI†). Thus, BPQ canbe employed for the detection of Cd2+ in the near-neutral pHrange (pH = 7.3).
Computational study. To further understand the relation-ship between the structural changes of BPQ and its complexwith Cd2+ and the optical response of BPQ to Cd2+, we carriedout density functional theory (DFT) and time-dependentdensity functional theory (TDDFT) calculations with theB3LYP/6-31+G(d) method basis set using the Gaussian 09program. The optimized geometry and the highest occupiedmolecular orbital (HOMO) and lowest unoccupied molecularorbital (LUMO) of BPQ and its Cd2+ complex, respectively, arepresented in Fig. 4.
The UV-vis spectra of BPQ and its Cd complex were calcu-lated using the TDDFT method in a methanol medium. Calcu-lated absorption peaks had agreed well with theexperimentally observed peaks (ESI, Table S1†). In the case ofBPQ, the transition from HOMO to LUMO and HOMO+2 toLUMO had contributed mainly to the excitation at 357 nm and308 nm, respectively (ESI, Table S1†). For the Cd2+ complex,main absorption peaks were at 442 nm and 363 nm generatedfrom the transition of HOMO to LUMO and HOMO toLUMO+2.
Cell viability assay. Considering the thermodynamicallyfavourable binding properties of BPQ with Cd2+, a practicalapplication leading to the further examination of the ability ofthe probe (BPQ) to sense Cd2+ in living cells was needed.
Fig. 3 Images of TLC plates (a) after immersion in a BPQ-acetonitrilesolution and (b) after immersion in a BPQ-Cd2+–acetonitrile solutiontaken in ambient light (left) and under hand-held UV light (right).
Dalton Transactions Paper
This journal is © The Royal Society of Chemistry 2015 Dalton Trans., 2015, 44, 5763–5770 | 5767
Publ
ishe
d on
10
Febr
uary
201
5. D
ownl
oade
d by
Jad
avpu
r U
nive
rsity
on
15/0
4/20
15 0
6:44
:09.
View Article Online

In order to fulfil this objective, it is important to determinethe cytotoxic effect of BPQ and Cd2+ and the complex on livecells. The well-established MTT assay, which is based on themitochondrial dehydrogenase activity of viable cells, wasadopted to study cytotoxicity of the aforementioned com-pounds at varying concentrations mentioned in the Materialsand Methods section. Fig. 5 shows that the probe compounddid not exert any adverse effect on cell viability; the same isthe case when cells were treated with varying concentrationsof CdCl2.
However, exposure of HCT cells to the probe-Cd2+ complexresulted in a decline in cell viability above the 20 µMconcentration.
The effect was more pronounced in higher concentrationsand showed an adverse cytotoxic effect in a dose-dependentmanner. The viability of HCT cells was not influenced by thesolvent (DMSO) as evidenced in Fig. 5, leading to the con-clusion that the observed cytotoxic effect could be attributedto the probe-Cd2+ complex. The results obtained in the in vitrocytotoxic assay suggested that in order to pursue fluorescenceimaging studies of the probe-cadmium complex in live cells, itwould be prudent to choose a working concentration of 20 μMfor the probe compound. Hence, to assess the effectiveness ofcompound BPQ as a probe for the intracellular detection ofCd2+ by fluorescence microscopy, RAW cells were treated with20 μM CdCl2 for 1 h followed by a 10 μM probe solution topromote the formation of probe-cadmium complex. On thebasis of the established 1 : 1 stoichiometry of binding betweenBPQ and Cd2+, it can be reasonably assumed that the concen-tration of the complex formed in the HCT cells would be muchlower than the concentration (20 μM) at which a marginal cyto-toxic effect of the complex was observed (Fig. 5).
Fluorescent imaging of live-cells. Fluorescence microscopicstudies revealed a lack of fluorescence for RAW cells whentreated with either the probe compound or CdCl2 alone (Fig. 6,panels a and b). Upon incubation with CdCl2 followed by theprobe compound, a striking switch-on fluorescence wasobserved inside the RAW cells, which indicated the formationof the probe-cadmium complex, as observed earlier in solutionstudies. Further, an intense green fluorescence was conspicu-ous in the perinuclear region of the RAW cells (Fig. 6, panel b),which indicates that the probe can easily penetrate the cellmembrane and can be used to probe Cd2+ in the cells. Thefluorescence microscopic analysis strongly suggested that
Fig. 5 It represents % cell viability of HCT cells treated with variousconcentrations (10 µM–70 µM) of BPQ for 12 h determined by MTTassay. Results are expressed as mean of three independent experiments.
Fig. 6 Confocal microscopic images of the probe in RAW 264.7 cellspretreated with CdCl2: (a) CdCl2 treatment only at 20 μM concentration,nuclei counterstained with DAPI (1 μg ml−1), (b) treatment a followed byprobe BPQ at a concentration of 1.1 × 10⁻⁶ M, (c) bright field image ofthe cells after treatment and (d) overlay image in a dark field. All imageswere acquired with a 40× objective lens.
Fig. 4 Energy diagrams of HOMO and LUMO orbitals of BPQ andBPQ-Cd2+ complex calculated at the DFT level using a B3LYP/6-31+G(d)basis set.
Paper Dalton Transactions
5768 | Dalton Trans., 2015, 44, 5763–5770 This journal is © The Royal Society of Chemistry 2015
Publ
ishe
d on
10
Febr
uary
201
5. D
ownl
oade
d by
Jad
avpu
r U
nive
rsity
on
15/0
4/20
15 0
6:44
:09.
View Article Online

probe compound could readily cross the membrane barrier,permeate into the RAW cells, and rapidly sense intracellularCd2+. It is noteworthy to mention here that bright field imagesof treated cells did not reveal any gross morphologicalchanges, which suggested that the RAW cells were viable.These findings open up the potential for future in vivo bio-medical applications of the sensor.
Conclusions
In summary, a fluorescent sensing system based on pyridine-hydroxyquinoline moieties has been successfully designed andsynthesized. This visible-light-excitable probe employed ICTand CHEF strategies into one system to obtain a highlyefficient fluorescent molecular switch for the specific detectionof Cd2+. The addition of incremental analyte concentrationexhibits a remarkable emission enhancement accompaniedwith a red-shift in the emission maxima, along with a visiblecolour change from colorless to light yellow. This probe couldafford high selectivity and sensitivity to Cd2+ over metal ions ofinterest, particularly Zn2+ with a very low detection limit of0.56 ppb in physiological conditions. This complexation wasfurther examined by DFT and TDDFT calculations. In addition,to demonstrate its value in practical applications, bio-imagingwas successfully performed by HCT cells. The probe wasapplied to detect intracellular Cd2+ in live cells.
Acknowledgements
The authors thank the CSIR and DST, Government of India,for financial support. K.A., S.D. and D.S. acknowledge theCSIR for providing fellowships.
Notes and references
1 (a) P. N. Prasad, Introduction to Biophotonics, Wiley, NJ,2003; (b) J. B. Pawley, Handbook of Biological ConfocalMicroscopy, Plenum, New York, 1995; (c) J. W. Lichtmanand J.-A. Conchello, Nat. Methods, 2005, 2, 910.
2 (a) J. P. Desvergne and A. W. Czarnik, Chemosensors of Ionand Molecule Recognition, Kluwer, Dordrecht, 1997;(b) B. Valeur and I. Leray, Coord. Chem. Rev., 2000, 205, 3;(c) A. P. de Silva, H. Q. N. Gunaratne, T. Gunnlaugsson,A. J. M. Huxley, C. P. McCoy, J. T. Rademacher andT. E. Rice, Chem. Rev., 1997, 97, 1515; (d) Y. Zhou, Z.-X. Li,S.-Q. Zang, Y.-Y. Zhu, H.-Y. Zhang, H.-W. Hou andT. C. W. Mak, Org. Lett., 2012, 14, 1214; (e) Y. Fu,Q.-C. Feng, X.-J. Jiang, H. Xu, M. Li and S.-Q. Zang, DaltonTrans., 2014, 43, 5815; (f ) X.-J. Jiang, Y. Fu, H. Tang,S.-Q. Zang, H.-W. Hou, T. C. W. Mak and H.-Y. Zhang, Sens.Actuators, B, 2014, 190, 844.
3 (a) Z. Xu, Y. Xiao, X. Qian, J. Cui and D. Cui, Org. Lett.,2005, 7, 889; (b) J. B. Wang, X. F. Qian and J. N. Cui, J. Org.Chem., 2006, 71, 4308; (c) S. Goswami, S. Das and K. Aich,
Tetrahedron Lett., 2013, 54, 4620; (d) S. Goswami, K. Aich,S. Das, A. K. Das, D. Sarkar, S. Panja, T. K. Mondal andS. K. Mukhopadhyay, Chem. Commun., 2013, 49, 10739.
4 (a) N. C. Lim, J. V. Schuster, M. C. Porto, M. A. Tanudra,L. Yao, H. C. Freake and C. Bruckner, Inorg. Chem., 2005,44, 2018; (b) S. Goswami, S. Das, K. Aich, D. Sarkar,T. K. Mondal, C. K. Quah and H.-K. Fun, Dalton Trans.,2013, 42, 15113.
5 (a) T. Gunnlaugsson, A. P. Davis, J. E. O’Brien andM. Glynn, Org. Lett., 2002, 4, 2449; (b) D. H. Vance andA. W. Czarnik, J. Am. Chem. Soc., 1994, 116, 9397;(c) S. K. Kim and J. Yoon, Chem. Commun., 2002, 770.
6 (a) S. Nishizawa, Y. Kato and N. Teramae, J. Am. Chem. Soc.,1999, 121, 9463; (b) J.-S. Wu, J.-H. Zhou, P.-F. Wang,X.-H. Zhang and S.-K. Wu, Org. Lett., 2005, 7, 2133;(c) B. Schazmann, N. Alhashimy and D. Diamond, J. Am.Chem. Soc., 2006, 128, 8607; (d) A. Banerjee, A. Sahana,S. Guha, S. Lohar, I. Hauli, S. K. Mukhopadhyay,J. S. Matalobos and D. Das, Inorg. Chem., 2012, 51, 5699.
7 S. Goswami, S. Das, K. Aich, B. Pakhira, S. Panja,S. K. Mukherjee and S. Sarkar, Org. Lett., 2013, 15, 5412.
8 (a) J. M. Serin, D. W. Brousmiche and J. M. J. Frechet,J. Am. Chem. Soc., 2002, 124, 11848; (b) A. E. Albers,V. S. Okreglak and C. J. Chang, J. Am. Chem. Soc., 2006,128, 9640; (c) S. H. Lee, S. K. Kim, J. H. Bok, S. H. Lee,J. Yoon, K. Lee and J. S. Kim, Tetrahedron Lett., 2005, 46,8163; (d) W. R. Dichtel, J. M. Serin, C. Edder,J. M. J. Frechet, M. Matuszewski, L.-S. Tan,T. Y. Ohulchanskyy and P. N. Prasad, J. Am. Chem. Soc.,2004, 126, 538; (e) M. Suresh, S. Mishra, S. K. Mishra,E. Suresh, A. K. Mandal, A. Shrivastav and A. Das, Org.Lett., 2009, 11, 2740; (f ) P. Mahato, S. Saha, E. Suresh,R. D. Liddo, P. P. Parnigotto, M. T. Conconi,M. K. Kesharwani, B. Ganguly and A. Das, Inorg. Chem.,2012, 51, 1769; (g) K. Sreenath, J. Allen, R. M. W. Davidsonand L. Zhu, Chem. Commun., 2011, 47, 11730;(h) R. J. Wandell, A. H. Younes and L. Zhu, New J. Chem.,2010, 34, 2176.
9 (a) A. M. Jane, M. S. Matin, T. Amy, M. H. John andA. N. Polly, J. Natl. Cancer Inst., 2006, 98, 869;(b) A. Akesson, B. Julin and A. Wolk, Cancer Res., 2008, 68,6435.
10 R. L. Chaney, J. A. Ryan, Y.-M. Li and S. L. Brown, inCadmium in Soils and Plants, ed. M. J. McLaughlin andB. R. Singh, Kluwer, Boston, 1999, 219.
11 (a) G. Jiang, L. Xu, S. Song, C. Zhu, Q. Wu, L. Zhang andL. Wu, Toxicology, 2008, 244, 49; (b) T. Jin, J. Lu andM. Nordberg, Neurotoxicology., 1998, 19, 529.
12 (a) S. Satarug, J. R. Baker, S. Urbenjapol, M. Haswell-Elkins,P. E. B. Reilly, D. J. Williams and M. R. Moore, Toxicol.Lett., 2003, 137, 65; (b) M. Waisberg, P. Joseph, B. Hale andD. Beyersmann, Toxicology, 2003, 192, 95; (c) R. K. Zalupsand S. Ahmad, Toxicol. Appl. Pharmacol., 2003, 186, 163.
13 (a) United States Environmental Protectioin Agency, http://water.epa.gov/drink; (b) World Health Organization,Avenue Appia 20, 1211 Geneva 27, Switzerland, http://www.
Dalton Transactions Paper
This journal is © The Royal Society of Chemistry 2015 Dalton Trans., 2015, 44, 5763–5770 | 5769
Publ
ishe
d on
10
Febr
uary
201
5. D
ownl
oade
d by
Jad
avpu
r U
nive
rsity
on
15/0
4/20
15 0
6:44
:09.
View Article Online

who.int/water_sanitation_health/dwq/chemicals/cadmium/en/.
14 (a) Y. Tan, J. Gao, J. Yu, Z. Wang, Y. Cui, Y. Yang andG. Qian, Dalton Trans., 2013, 42, 11465; (b) L. Xu, M.-L. He,H.-B. Yang and X. Qian, Dalton Trans., 2013, 42, 8218;(c) L.-K. Zhang, Q.-X. Tong and L.-J. Shi, Dalton Trans.,2013, 42, 8567; (d) K. P. Divya, S. Savithri andA. Ajayaghosh, Chem. Commun., 2014, 50, 6020; (e) Y. Xu,L. Xiao, S. Sun, Z. Pei, Y. Pei and Y. Pang, Chem. Commun.,2014, 50, 7514; (f ) L. Xue, C. Liu and H. Jiang, Org. Lett.,2009, 11, 1655; (g) L. Xue, Q. Liu and H. Jiang, Org. Lett.,2009, 11, 3454; (h) S. Goswami, K. Aich, S. Das, A. K. Das,A. Manna and S. Halder, Analyst, 2013, 138, 1903;(i) S. Goswami, K. Aich and D. Sen, Chem. Lett., 2012, 41,863.
15 (a) S. Goswami, K. Aich, A. K. Das, A. Manna and S. Das,RSC Adv., 2013, 3, 2412; (b) S. Goswami, S. Das, K. Aich,D. Sarkar and T. K. Mondal, Tetrahedron Lett., 2013, 54,6892; (c) S. Goswami, S. Das, K. Aich, D. Sarkar andT. K. Mondal, Tetrahedron Lett., 2014, 55, 2695;(d) S. Goswami, K. Aich, S. Das, S. B. Roy, B. Pakhira andS. Sarkar, RSC Adv., 2014, 4, 14210.
16 A. D. Becke, J. Chem. Phys., 1993, 98, 5648.17 C. Lee, W. Yang and R. G. Parr, Phys. Rev. B: Condens.
Matter, 1988, 37, 785.18 D. Andrae, U. Haeussermann, M. Dolg, H. Stoll and
H. Preuss, Theor. Chim. Acta, 1990, 77, 123.19 P. J. Hay and W. R. Wadt, J. Chem. Phys., 1985, 82, 299.
20 R. Bauernschmitt and R. Ahlrichs, Chem. Phys. Lett., 1996,256, 454.
21 R. E. Stratmann, G. E. Scuseria and M. J. Frisch, J. Chem.Phys., 1998, 109, 8218.
22 M. E. Casida, C. Jamorski, K. C. Casida and D. R. Salahub,J. Chem. Phys., 1998, 108, 4439.
23 V. Barone and M. Cossi, J. Phys. Chem. A, 1998, 102, 1995.24 M. Cossi and V. Barone, J. Chem. Phys., 2001, 115, 4708.25 M. Cossi, N. Rega, G. Scalmani and V. Barone, J. Comput.
Chem., 2003, 24, 669.26 M. J. Frisch, G. W. Trucks, H. B. Schlegel, G. E. Scuseria,
M. A. Robb, J. R. Cheeseman, G. Scalmani, V. Barone,B. Mennucci, G. A. Petersson, H. Nakatsuji, M. Caricato,X. Li, H. P. Hratchian, A. F. Izmaylov, J. Bloino, G. Zheng,J. L. Sonnenberg, M. Hada, M. Ehara, K. Toyota, R. Fukuda,J. Hasegawa, M. Ishida, T. Nakajima, Y. Honda, O. Kitao,H. Nakai, T. Vreven, J. A. Montgomery Jr., J. E. Peralta,F. Ogliaro, M. Bearpark, J. J. Heyd, E. Brothers,K. N. Kudin, V. N. Staroverov, R. Kobayashi, J. Normand,K. Raghavachari, A. Rendell, J. C. Burant, S. S. Iyengar,J. Tomasi, M. Cossi, N. Rega, J. M. Millam, M. Klene,J. E. Knox, J. B. Cross, V. Bakken, C. Adamo, J. Jaramillo,R. Gomperts, R. E. Stratmann, O. Yazyev, A. J. Austin,R. Cammi, C. Pomelli, J. W. Ochterski, R. L. Martin,K. Morokuma, V. G. Zakrzewski, G. A. Voth, P. Salvador,J. J. Dannenberg, S. Dapprich, A. D. Daniels, Ö. Farkas,J. B. Foresman, J. V. Ortiz, J. Cioslowski and D. J. Fox, Gaus-sian 09, Revision D.01, Gaussian, Inc., Wallingford CT, 2009.
Paper Dalton Transactions
5770 | Dalton Trans., 2015, 44, 5763–5770 This journal is © The Royal Society of Chemistry 2015
Publ
ishe
d on
10
Febr
uary
201
5. D
ownl
oade
d by
Jad
avpu
r U
nive
rsity
on
15/0
4/20
15 0
6:44
:09.
View Article Online


