Embed Size (px)
Citation preview
www.elsevier.com/locate/biopsycho
Biological Psychology 73 (2006) 242–252
A P300 event-related potential brain–computer interface (BCI):
The effects of matrix size and inter stimulus interval on performance
Eric W. Sellers a,*, Dean J. Krusienski a, Dennis J. McFarland a,Theresa M. Vaughan a, Jonathan R. Wolpaw a,b
a Laboratory of Nervous System Disorders, Wadsworth Center, New York State Department of Health,
E1001 Empire State Plaza, Albany, NY 12201, USAb State University of New York, Albany, NY, 12201, USA
Received 22 December 2005; accepted 15 April 2006
Available online 24 July 2006
Abstract
We describe a study designed to assess properties of a P300 brain–computer interface (BCI). The BCI presents the user with a matrix containing
letters and numbers. The user attends to a character to be communicated and the rows and columns of the matrix briefly intensify. Each time the
attended character is intensified it serves as a rare event in an oddball sequence and it elicits a P300 response. The BCI works by detecting which
character elicited a P300 response. We manipulated the size of the character matrix (either 3 � 3 or 6 � 6) and the duration of the inter stimulus
interval (ISI) between intensifications (either 175 or 350 ms). Online accuracy was highest for the 3 � 3 matrix 175-ms ISI condition, while bit rate
was highest for the 6 � 6 matrix 175-ms ISI condition. Average accuracy in the best condition for each subject was 88%. P300 amplitude was
significantly greater for the attended stimulus and for the 6 � 6 matrix. This work demonstrates that matrix size and ISI are important variables to
consider when optimizing a BCI system for individual users and that a P300-BCI can be used for effective communication.
# 2006 Elsevier B.V. All rights reserved.
Keywords: Amyotrophic lateral sclerosis; Electroencephalogram; Brain–computer interface; P300; Event-related potentials; Rehabilitation
1. Introduction
Several different features of scalp recorded EEG signals are
being used as control signals for brain–computer interface (BCI)
applications; most notably, event-related potentials (Donchin
et al., 2000; Farwell and Donchin, 1988; Serby et al., 2005),
spontaneous sensory motor rhythms (Wolpaw and McFarland,
2004; Pfurtscheller et al., 1996), and slow cortical potentials
(Birbaumer et al., 1999). A comprehensive review is provided by
Wolpaw et al. (2002). Many researchers have demonstrated BCI
accuracy high enough for online communication (Farwell and
Donchin, 1988; Kubler et al., 2005; Serby et al., 2005; Wolpaw
and McFarland, 2004). In addition, researchers have also
reported that patients with amyotrophic lateral sclerosis (ALS)
can use BCI systems with accuracy levels acceptable for
communication using slow cortical potentials, mu rhythms, or
P300 event-related potentials (Birbaumer et al., 1999, 2000;
Kubler et al., 2005; Sellers and Donchin, 2006). These findings
from ALS patients are important because people who suffer from
* Corresponding author. Tel.: +1 518 474 7958; fax: +1 518 486 4910.
E-mail address: [email protected] (E.W. Sellers).
0301-0511/$ – see front matter # 2006 Elsevier B.V. All rights reserved.
doi:10.1016/j.biopsycho.2006.04.007
ALS and other severe motor disabilities are the most likely
candidates for long-term use of BCI systems.
The current study focuses on a P300-BCI. The P300 Speller
described by Farwell and Donchin (1988) presents a 6 � 6 matrix
of characters to a user. The user’s task is to communicate a
specific character by attending to the cell of the matrix that
contains the desired character, and counting the number of times
it is intensified (or flashed). Each row and each column are
intensified and the intensifications are presented in a random
sequence. The sequence of 12 intensifications, each of the 6 rows
and 6 columns, constitutes an oddball paradigm (Fabiani et al.,
1987). The row and the column containing the character to be
communicated (the target) form the rare set, and the other 10
intensifications form the frequent set (the non-targets). The target
items (i.e., the target row and column) should elicit a P300
response if the observer is attending to the stimulus series,
because each target stimulus intensification constitutes a rare
event in the context of all other intensifications.
Classification rates using a 6 � 6 matrix of alphanumeric
characters have been improved beyond those reported by
Farwell and Donchin (1988) in online demonstrations using
stepwise discriminant analysis (SWDA; Donchin et al., 2000)

E.W. Sellers et al. / Biological Psychology 73 (2006) 242–252 243
and independent components analysis (Serby et al., 2005), and
in offline analyses using support vector machines (Kaper et al.,
2004; Meinicke et al., 2002). While the practical value of these
methods remains unclear, the initial results are impressive and
have provided the impetus to continue developing P300-BCI
systems that can perform faster and with higher classification
accuracy. The path to improved performance has focused
almost exclusively on improved signal processing techniques
that maximize the signal-to-noise ratio. The purpose of the
current study is to examine the impact of stimulus properties
and stimulus presentation rates on performance.
1.1. The current study
This study expands upon previous research by comparing
target selection rates using a 3 � 3 version and a 6 � 6 version of
the matrix speller. Allison and Pineda (2003) examined matrix
size manipulations and found that increasing the dimensions (i.e.,
the numbers of rows and columns) of the matrix, while holding
the size of the matrix elements constant, resulted in larger P300
amplitudes for the attended matrix element. They tested 3 matrix
sizes, 4 � 4, 8 � 8, and 12 � 12, and found that P300 amplitude
increased as the size of the matrix increased. This result is
expected since it has been shown that P300 amplitude increases
with smaller probability of the occurrence of a target item (e.g.,
Duncan-Johnson and Donchin, 1977). However, since the
Allison and Pineda (2003) study did not examine classification
rates, it is unclear how their results are related to target selection.
Only two studies have previously examined the effect of
varying the inter-stimulus interval (ISI) between matrix
intensifications; their results conflict. Farwell and Donchin
(1988) reported higher classification rates with a longer ISI,
whereas Meinicke et al. (2002) reported higher classification
accuracy with a shorter ISI.
BCIs that use event-related responses such as the P300 may
have a significant advantage over those that use spontaneous EEG
signals in that they do not require lengthy training periods to
achieve effective BCI use. However, it is not yet clear whether or
not long-term use of a P300-BCI will attenuate the P300 signal.
Several studieshaveexaminedP300 amplitudeandlatency across
time (e.g., Cohen and Polich, 1997; Kinoshita et al., 1996; Polich,
1989; Ravden and Polich, 1998), but not in the context of use in a
BCI. Sellers and Donchin (2006) evaluated the robustness of the
P300 signal accuracy in patients tested over 10 experimental BCI
sessions and reported minimal effects on performance.
The current study examines the effect of matrix size and ISI
on classification accuracy in the selection of target items. We
cross the ISI and matrix size manipulations to create four
experimental conditions. We also examine the consistency of a
user’s performance over time.
2. Methods
2.1. Subjects
Five people (four men age 25, 49, 21, 33, and a woman age 58) participated
in this study which consisted of five sessions spread out over 3 weeks. Two users
had had no prior BCI experience. Three users had had previous BCI experience
but no experience with the P300 Speller paradigm. One user participated in
three 15-min sessions of free spelling (i.e., in which the user freely chooses the
attended character) interspersed in the five sessions of the study period. The
study was approved by the New York State Department of Health Institutional
Review Board, and each user gave informed consent.
2.2. Data acquisition and processing
EEG was recorded using a cap (Electro-Cap International, Inc.) embedded
with 64 electrodes distributed over the entire scalp (Sharbrough et al., 1991). All
64 channels were referenced to the right earlobe, and grounded to the right
mastoid. The EEG was bandpass filtered 0.1–60 Hz, amplified with a SA
Electronics amplifier (20,000�), digitized at a rate of 240 Hz, and stored.
All aspects of data collection and experimental design were controlled by the
BCI2000 system (Schalk et al., 2004).
2.3. Task, procedure, and design
The user sat 1.4 m from a video screen and viewed the matrix display. He or
she was given the option to either recline or sit upright. The 6 � 6 matrix
subtended 8.308H � 10.908W (8.00 in. � 10.50 in.) of visual angle and the
3 � 3 matrix subtended 5.448H � 7.078W (5.25 in. � 6.75 in.). The distance
between each character was 1.548H and 2.668W (0.82 in. � 1.5 in), for the
6 � 6 and 3 � 3 matrices, respectively. The size of each character was
0.708H � 0.578W (0.63 in. � 0.50 in.) in both displays.
The user’s task was to focus attention to one letter of the matrix and note the
number of times the target character intensified. The first of the five sessions
served as a training session to gather data used to derive classification
coefficients for the subsequent experimental sessions. Thus, online feedback
of classification results was not presented to the user in the training session.
Such feedback was provided in the four final sessions (see below).
Each session was composed of eight runs and each run was composed of
‘‘copy-spelling’’ a four-letter word. (In copy spelling, the target letter is
specified so that data for offline analyses can be properly coded.) At the
beginning of each run, the first letter of the word was presented in parentheses
at the end of the word (see Fig. 1). The letter in parentheses was the target letter.
Immediately after the prescribed number of column and row intensifications
(e.g., 20 sequences of 12 flashes in the 6 � 6 matrix 175-ms ISI condition) the
classifier would make a decision. After a 2.5 s delay, the result of the classifier
would appear in the feedback line of the display window. Then, 2.5 s later, the
next character of the word was presented in parentheses at the end of the word
and the user switched attention to this new character. Hence, the total duration
between characters was 5.0 s. This process continued until all four characters of
the word had served as the target letter. All data were collected in this ‘copy-
speller’ mode, in which the user was not given the option to correct mistakes.
We used two different matrix sizes (3 � 3 and 6 � 6) and two different ISIs
(175 and 350-ms) so that there were a total of four experimental conditions. In
each of the five experimental sessions, the user experienced two consecutive
runs in each condition. The four conditions were presented in a counterbalanced
fashion. The variables of matrix size and ISI had independent effects on the time
needed to complete the presentation of a single character. Because we decided
to keep the time allotted to select a character constant for all conditions, each
condition contains different numbers of stimulus sequences per character. For
example, a 6 � 6 matrix requires twice as many flashes to complete one
sequence of intensifications (i.e., flashes of 6 rows and 6 columns) compared
to a 3 � 3 matrix (flashes of 3 rows and 3 columns). To keep the time allotted for
each character selection fixed, each stimulus (i.e., row or column) was presented
twice as many times in the 3 � 3 condition as in the 6 � 6 condition, and twice
as many times in the 175-ms ISI condition as in the 350-ms ISI condition.
Table 1 presents time per character selection and number of stimulus sequences
for each of the four experimental conditions.
2.4. Deriving classification coefficients using SWDA
Stepwise linear discriminant analysis (SWDA) was used to determine
coefficients for online classification (Draper and Smith, 1981). SWDA has

E.W. Sellers et al. / Biological Psychology 73 (2006) 242–252244
Fig. 1. The 3 � 3 and 6 � 6 matrices used in this study. The rows and columns intensify for 100 ms every 175 or 350 ms. The word at the top is the word to be copy-
spelled. The letter in parentheses is the current target letter (i.e., ‘‘I’’). For the 3 � 3 matrix, a P300 should be elicited when the third column or second row intensifies;
similarly, for the 6 � 6 matrix, a P300 should be elicited when the third column or second row intensifies. Online feedback is provided directly below the word being
copied.
been previously shown to classify responses effectively and it compared well
with other methods (Donchin et al., 2000; Farwell and Donchin, 1988). It
provides a spatiotemporal vector of coefficients (channel by sample) that can be
easily implemented online, and it is well established as a successful classifica-
tion technique (Donchin, 1969; Donchin et al., 2000; Farwell and Donchin,
1988; Krusienski et al., 2005; Sellers and Donchin, 2006).
SWDA seeks the optimal discriminant function by adding features (in this
case, channels � time elements) to a linear equation in a stepwise fashion based
on which feature explains the largest amount of unique variance. SWDA
operates by performing a series of forward and backward regression procedures,
in discrete steps. Starting with no initial model terms, the single feature
accounting for the most variance is added to the model. For any feature to
be entered into the model, it was required to account for a significant amount of
variance at the level of P < 0.10. In other words, for a feature to be added to the
model, the model must improve by a P-value of 0.10, as compared to the model
without the feature being included. In each step the model evaluates every
feature to determine the single feature that produces the highest P-value and this
feature is then selected for inclusion.
After each entry, a backward stepwise regression is performed to remove
any features that no longer meet the predetermined criterion to remain in the
model, in this case a P-value of >0.15 was used. This procedure is conducted
because it is possible that a feature will no longer account for a significant
amount of unique variance after additional features have entered the model. The
forward and backward regression process is repeated until the model includes a
predetermined number of features (10 in the present study) or until no additional
features satisfy the entry/removal criteria. Pilot studies showed that the P to
enter (<0.10) and P to remove (>0.15) values were reasonable values to use for
entering and removing features. The SWDA analysis was implemented in
Matlab 7.0 using the Statistics Toolbox STEPWISEFIT function.
Table 1
Time (Sec) and stimulus sequences per character selection (Num) for each of
the matrix size � ISI conditions in the online experiment and in the offline
simulation
3 � 3 Matrix 6 � 6 Matrix
Sec Num Sec Num
Online
175 42.0 40 42.0 20
350 42.0 20 42.0 10
Offline
175 10.5 10 21.0 10
350 21.0 10 42.0 10
2.4.1. Optimizing SWDA coefficients
Offline, SWDA coefficients were derived for each of the 4 conditions (i.e.,
6 � 6 matrix 175-ms ISI, 6 � 6 matrix 350-ms ISI, 3 � 3 matrix 175-ms ISI,
and 3 � 3 matrix 350-ms ISI). Factors known to affect classification accuracy
were varied to determine the optimal set of coefficients (Krusienski et al.,
2005). These factors include moving average window (MA), decimation factor
(DF), reference method (REF), and number/location of channels (ChSet). The
moving average window length was either 4 or 16 samples. Similarly, the
decimation factor was either 4 or 16 samples (i.e., we downsampled the data by
a factor of either 4 or 16). The MA window was first applied to the data, and
then the DF was applied. For example, in the MA/DF 4 condition, the data were
collected at a sample rate of 240 Hz (240 samples/s), a MA window of 4
samples was applied to the data, then it was decimated by a factor of 4; thus, the
input to the SWDA analysis includes every fourth sample (or every 16th
sample in the MA/DF 16 condition). The data was referred to the monopolar
ear reference (MR) used during data collection or re-referenced offline with a
common average reference (CAR). Additionally, two different channel sets
Fig. 2. The electrode montage. As noted in the text, SWDA coefficients were
derived from the 7 electrodes of Set 1 (within the solid line) or from the 29
electrodes of Set 2 (within the dashed line).
E.W. Sellers et al. / Biological Psychology 73 (2006) 242–252 245
Table 2
Parameter combinations for each of the eight sets of coefficients
Set MA/DF REF ChSet
1 4 MR 1
2 4 MR 2
3 4 CAR 1
4 4 CAR 2
5 16 MR 1
6 16 MR 2
7 16 CAR 1
8 16 CAR 2
Coefficients were created by crossing the variables of moving average/decima-
tion (MA/DF), reference site (REF) (i.e., monopolar to right earlobe (MR) or
common average reference (CAR)), and the Channel set (Ch Set) (i.e., Fig. 2).
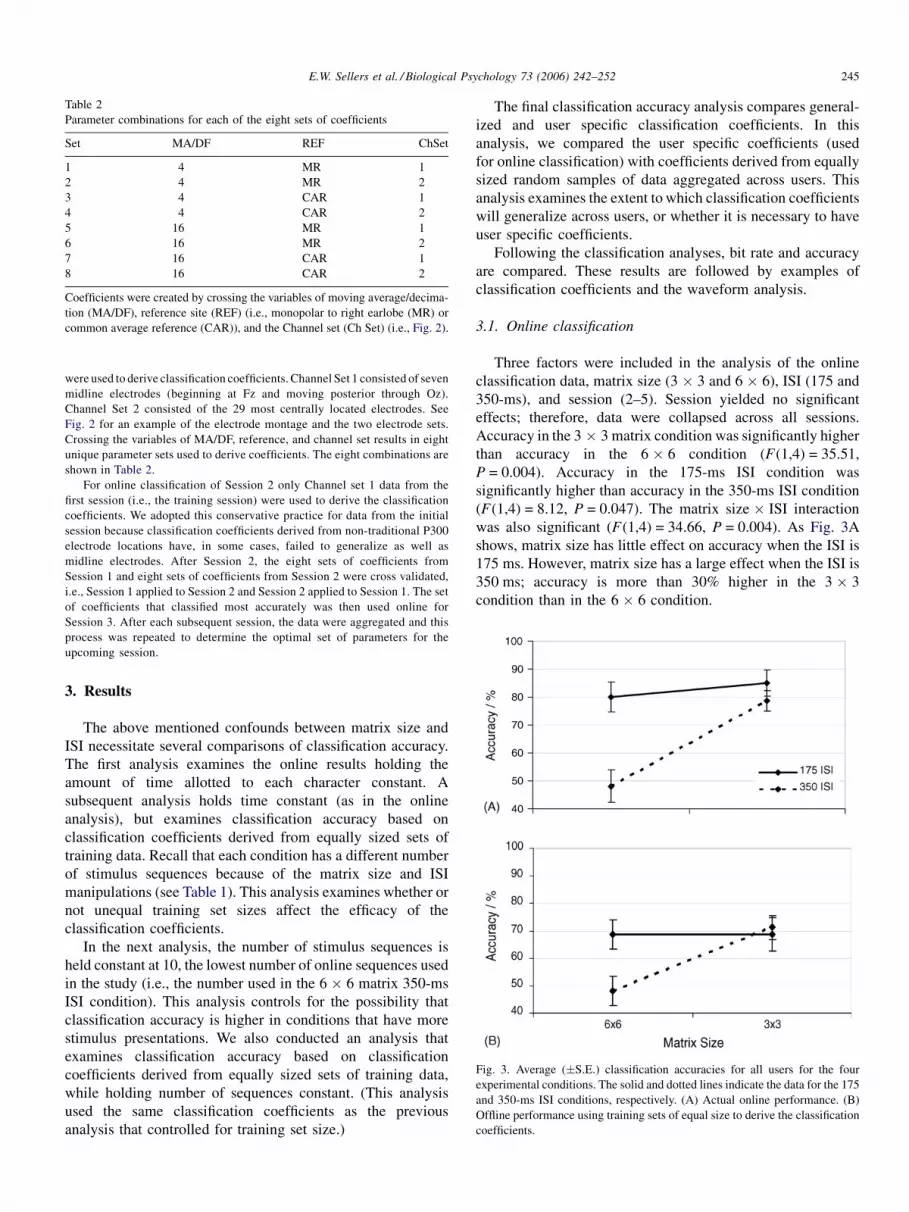
Fig. 3. Average (�S.E.) classification accuracies for all users for the four
experimental conditions. The solid and dotted lines indicate the data for the 175
and 350-ms ISI conditions, respectively. (A) Actual online performance. (B)
Offline performance using training sets of equal size to derive the classification
coefficients.
were used to derive classification coefficients. Channel Set 1 consisted of seven
midline electrodes (beginning at Fz and moving posterior through Oz).
Channel Set 2 consisted of the 29 most centrally located electrodes. See
Fig. 2 for an example of the electrode montage and the two electrode sets.
Crossing the variables of MA/DF, reference, and channel set results in eight
unique parameter sets used to derive coefficients. The eight combinations are
shown in Table 2.
For online classification of Session 2 only Channel set 1 data from the
first session (i.e., the training session) were used to derive the classification
coefficients. We adopted this conservative practice for data from the initial
session because classification coefficients derived from non-traditional P300
electrode locations have, in some cases, failed to generalize as well as
midline electrodes. After Session 2, the eight sets of coefficients from
Session 1 and eight sets of coefficients from Session 2 were cross validated,
i.e., Session 1 applied to Session 2 and Session 2 applied to Session 1. The set
of coefficients that classified most accurately was then used online for
Session 3. After each subsequent session, the data were aggregated and this
process was repeated to determine the optimal set of parameters for the
upcoming session.
3. Results
The above mentioned confounds between matrix size and
ISI necessitate several comparisons of classification accuracy.
The first analysis examines the online results holding the
amount of time allotted to each character constant. A
subsequent analysis holds time constant (as in the online
analysis), but examines classification accuracy based on
classification coefficients derived from equally sized sets of
training data. Recall that each condition has a different number
of stimulus sequences because of the matrix size and ISI
manipulations (see Table 1). This analysis examines whether or
not unequal training set sizes affect the efficacy of the
classification coefficients.
In the next analysis, the number of stimulus sequences is
held constant at 10, the lowest number of online sequences used
in the study (i.e., the number used in the 6 � 6 matrix 350-ms
ISI condition). This analysis controls for the possibility that
classification accuracy is higher in conditions that have more
stimulus presentations. We also conducted an analysis that
examines classification accuracy based on classification
coefficients derived from equally sized sets of training data,
while holding number of sequences constant. (This analysis
used the same classification coefficients as the previous
analysis that controlled for training set size.)
The final classification accuracy analysis compares general-
ized and user specific classification coefficients. In this
analysis, we compared the user specific coefficients (used
for online classification) with coefficients derived from equally
sized random samples of data aggregated across users. This
analysis examines the extent to which classification coefficients
will generalize across users, or whether it is necessary to have
user specific coefficients.
Following the classification analyses, bit rate and accuracy
are compared. These results are followed by examples of
classification coefficients and the waveform analysis.
3.1. Online classification
Three factors were included in the analysis of the online
classification data, matrix size (3 � 3 and 6 � 6), ISI (175 and
350-ms), and session (2–5). Session yielded no significant
effects; therefore, data were collapsed across all sessions.
Accuracy in the 3 � 3 matrix condition was significantly higher
than accuracy in the 6 � 6 condition (F(1,4) = 35.51,
P = 0.004). Accuracy in the 175-ms ISI condition was
significantly higher than accuracy in the 350-ms ISI condition
(F(1,4) = 8.12, P = 0.047). The matrix size � ISI interaction
was also significant (F(1,4) = 34.66, P = 0.004). As Fig. 3A
shows, matrix size has little effect on accuracy when the ISI is
175 ms. However, matrix size has a large effect when the ISI is
350 ms; accuracy is more than 30% higher in the 3 � 3
condition than in the 6 � 6 condition.
E.W. Sellers et al. / Biological Psychology 73 (2006) 242–252246
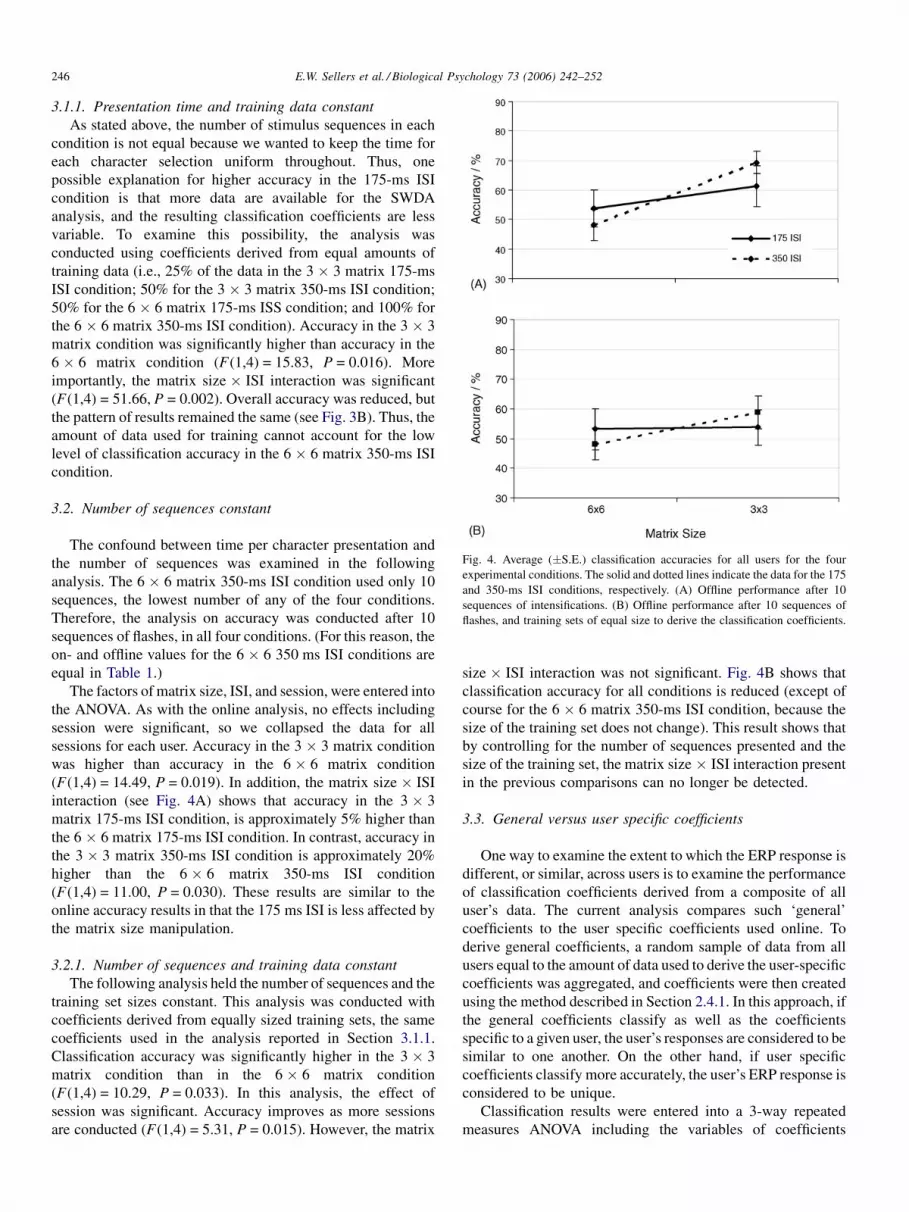
Fig. 4. Average (�S.E.) classification accuracies for all users for the four
experimental conditions. The solid and dotted lines indicate the data for the 175
and 350-ms ISI conditions, respectively. (A) Offline performance after 10
sequences of intensifications. (B) Offline performance after 10 sequences of
flashes, and training sets of equal size to derive the classification coefficients.
3.1.1. Presentation time and training data constant
As stated above, the number of stimulus sequences in each
condition is not equal because we wanted to keep the time for
each character selection uniform throughout. Thus, one
possible explanation for higher accuracy in the 175-ms ISI
condition is that more data are available for the SWDA
analysis, and the resulting classification coefficients are less
variable. To examine this possibility, the analysis was
conducted using coefficients derived from equal amounts of
training data (i.e., 25% of the data in the 3 � 3 matrix 175-ms
ISI condition; 50% for the 3 � 3 matrix 350-ms ISI condition;
50% for the 6 � 6 matrix 175-ms ISS condition; and 100% for
the 6 � 6 matrix 350-ms ISI condition). Accuracy in the 3 � 3
matrix condition was significantly higher than accuracy in the
6 � 6 matrix condition (F(1,4) = 15.83, P = 0.016). More
importantly, the matrix size � ISI interaction was significant
(F(1,4) = 51.66, P = 0.002). Overall accuracy was reduced, but
the pattern of results remained the same (see Fig. 3B). Thus, the
amount of data used for training cannot account for the low
level of classification accuracy in the 6 � 6 matrix 350-ms ISI
condition.
3.2. Number of sequences constant
The confound between time per character presentation and
the number of sequences was examined in the following
analysis. The 6 � 6 matrix 350-ms ISI condition used only 10
sequences, the lowest number of any of the four conditions.
Therefore, the analysis on accuracy was conducted after 10
sequences of flashes, in all four conditions. (For this reason, the
on- and offline values for the 6 � 6 350 ms ISI conditions are
equal in Table 1.)
The factors of matrix size, ISI, and session, were entered into
the ANOVA. As with the online analysis, no effects including
session were significant, so we collapsed the data for all
sessions for each user. Accuracy in the 3 � 3 matrix condition
was higher than accuracy in the 6 � 6 matrix condition
(F(1,4) = 14.49, P = 0.019). In addition, the matrix size � ISI
interaction (see Fig. 4A) shows that accuracy in the 3 � 3
matrix 175-ms ISI condition, is approximately 5% higher than
the 6 � 6 matrix 175-ms ISI condition. In contrast, accuracy in
the 3 � 3 matrix 350-ms ISI condition is approximately 20%
higher than the 6 � 6 matrix 350-ms ISI condition
(F(1,4) = 11.00, P = 0.030). These results are similar to the
online accuracy results in that the 175 ms ISI is less affected by
the matrix size manipulation.
3.2.1. Number of sequences and training data constant
The following analysis held the number of sequences and the
training set sizes constant. This analysis was conducted with
coefficients derived from equally sized training sets, the same
coefficients used in the analysis reported in Section 3.1.1.
Classification accuracy was significantly higher in the 3 � 3
matrix condition than in the 6 � 6 matrix condition
(F(1,4) = 10.29, P = 0.033). In this analysis, the effect of
session was significant. Accuracy improves as more sessions
are conducted (F(1,4) = 5.31, P = 0.015). However, the matrix
size � ISI interaction was not significant. Fig. 4B shows that
classification accuracy for all conditions is reduced (except of
course for the 6 � 6 matrix 350-ms ISI condition, because the
size of the training set does not change). This result shows that
by controlling for the number of sequences presented and the
size of the training set, the matrix size � ISI interaction present
in the previous comparisons can no longer be detected.
3.3. General versus user specific coefficients
One way to examine the extent to which the ERP response is
different, or similar, across users is to examine the performance
of classification coefficients derived from a composite of all
user’s data. The current analysis compares such ‘general’
coefficients to the user specific coefficients used online. To
derive general coefficients, a random sample of data from all
users equal to the amount of data used to derive the user-specific
coefficients was aggregated, and coefficients were then created
using the method described in Section 2.4.1. In this approach, if
the general coefficients classify as well as the coefficients
specific to a given user, the user’s responses are considered to be
similar to one another. On the other hand, if user specific
coefficients classify more accurately, the user’s ERP response is
considered to be unique.
Classification results were entered into a 3-way repeated
measures ANOVA including the variables of coefficients

E.W. Sellers et al. / Biological Psychology 73 (2006) 242–252 247
(general and user specific), matrix (3 � 3 and 6 � 6), and ISI
(175 and 350-ms). Our analysis is limited to effects including
coefficients because the other effects have been examined in
Section 3.1. The only significant effect was the main effect of
coefficients. Mean classification rates for the general and user
specific coefficients were 44.84% and 72.97%, respectively
(F(1,4) = 273.42, P < 0.0001). This result indicates a sig-
nificant amount of user individuality in the ERP response.
3.4. Bit rate comparison
Measurement of bit rate is a method commonly used to
assess BCI performance (e.g. Serby et al., 2005; Wolpaw et al.,
2000, 2002). Table 3 shows bits/min and associated accuracy
for each subject and each experimental condition. The top half
of the table shows online values and the bottom half of the table
shows the values in the offline comparison that held number of
stimulus presentations constant. The following formula
described in Pierce (1980) was used to calculate the number
of bits transmitted per trial:
B ¼ log2 N þ P log2 Pþ ð1� PÞ log2
�1� P
N � 1
�(1)
where N is the number of possible targets, and P is the
probability that the target is accurately classified. Bit rate
(bits/min) can then be computed by dividing B by the trial
duration in minutes.
An ANOVA analogous to those performed on the accuracy
data was also performed on the bit rate data of the online results
and on the offline results holding the number of sequences per
character constant; the factors of matrix size, ISI, and session
were entered into both of the analyses. In the analysis of the
online data two effects reached statistical significance. Bits/min
Table 3
Accuracy and bits/min for each user for each of the four conditions
Subject 3 � 3
175 ISI 350 ISI
Accuracy Bits/min Accuracy Bits/m
Online
1 68.75 2.07 78.13 2.57
2 65.63 2.06 68.75 2.00
3 96.88 4.20 78.13 2.65
4 96.88 4.20 93.75 3.87
5 96.88 4.20 75.00 2.49
Mean 85.00 3.34 78.75 2.71
Offline
1 37.50 3.12 68.75 3.86
2 37.50 3.26 56.25 2.65
3 78.13 11.45 71.88 4.31
4 68.75 8.35 81.25 5.80
5 84.38 12.34 68.75 4.37
Mean 61.25 7.70 69.38 4.19
Top: Online data. Bottom: Offline simulation using only 10 stimulus sequences. The b
together.
in the 175-ms ISI condition were significantly higher than the
bits/min in the 350-ms ISI condition (F(1,1) = 8.92, P = 0.040).
In addition, the increase in bits/min from the 3 � 3 to the 6 � 6
matrix for the 175-ms ISI condition is greater than the increase
for the 350-ms ISI condition, as evidenced by the significant
matrix size � ISI interaction (F(1,4) = 18.96, P = 0.012). In
the offline analysis that constrained the number of sequences,
only one effect reached statistical significance. Bits/min were
higher for the 3 � 3 matrix than for the 6 � 6 matrix
(F(1,1) = 12.06, P = 0.026).
The condition yielding the highest bits/min does not yield
the highest level of accuracy, in neither the online nor the offline
analysis. For example, in the online comparison, 5.25 is the
highest mean bits/min, it results in 80.00% accuracy, and it is
achieved in the 6 � 6 175-ms ISI condition. In contrast, a bit
rate of 3.34 bits/min yields an accuracy of 85.00%, in the 3 � 3
175-ms ISI condition. However, this is not surprising: bit rate is
influenced by the number of alternative choices and the 6 � 6
and 3 � 3 matrix sizes have 36 and 9 choices, respectively. The
offline data in the bottom half of the table presents a different
pattern. The 3 � 3 matrix 175-ms ISI condition yielded
7.70 bits/min, even though accuracy was highest in the 3 � 3
350-ms ISI condition. This too is not surprising, because the
time required to make each selection influences bits/min and
the selections in the 3 � 3 matrix are made in half the time.
(Compared to the 6 � 6 matrix, only half as many stimuli are
needed to present all of the columns and rows in the 3 � 3;
therefore, for the 3 � 3 matrix, the desired number of 10
sequences is reached in half of the time.)
It is also informative to examine bits/min and accuracy for
each user and compare one user to another. In the online
conditions that held time per character constant at 42 s, bit rate
was highest for all users in the 6 � 6 matrix 175-ms ISI
condition, because of the above mentioned reasons. In contrast,
6 � 6
175 ISI 350 ISI
in Accuracy Bits/min Accuracy Bits/min
62.50 3.31 40.63 1.68
53.13 2.67 46.88 2.29
96.88 6.96 50.00 2.75
87.50 5.93 50.00 2.33
100.00 7.39 53.13 3.03
80.00 5.25 48.13 2.41
25.00 1.55 40.63 1.68
37.50 2.95 46.88 2.29
84.38 10.74 50.00 2.75
50.00 5.01 50.00 2.33
71.88 8.89 53.13 3.03
53.75 5.83 48.13 2.41
old values are the highest accuracies and bit rates for each user and for all users
E.W. Sellers et al. / Biological Psychology 73 (2006) 242–252248
the condition that reached the highest level of accuracy varied
from subject to subject. No subject performed best in the 6 � 6
matrix 350-ms ISI condition. In the offline analysis, which held
number of stimuli constant, a different pattern emerged. Bit rate
was highest for all subjects in the 3 � 3 matrix 175-ms ISI
condition. The condition that resulted in highest accuracy
varied from user to user, but as in the online condition, no user
achieved highest accuracy in the 6 � 6 matrix 350-ms ISI
condition. These results show that, while bit rate follows a
similar pattern across users, accuracy shows a more idiosyn-
cratic pattern, and although bit rate is an objective measure of
information transfer it should be used with caution because
accuracy below 50% is not sufficient to operate a BCI.
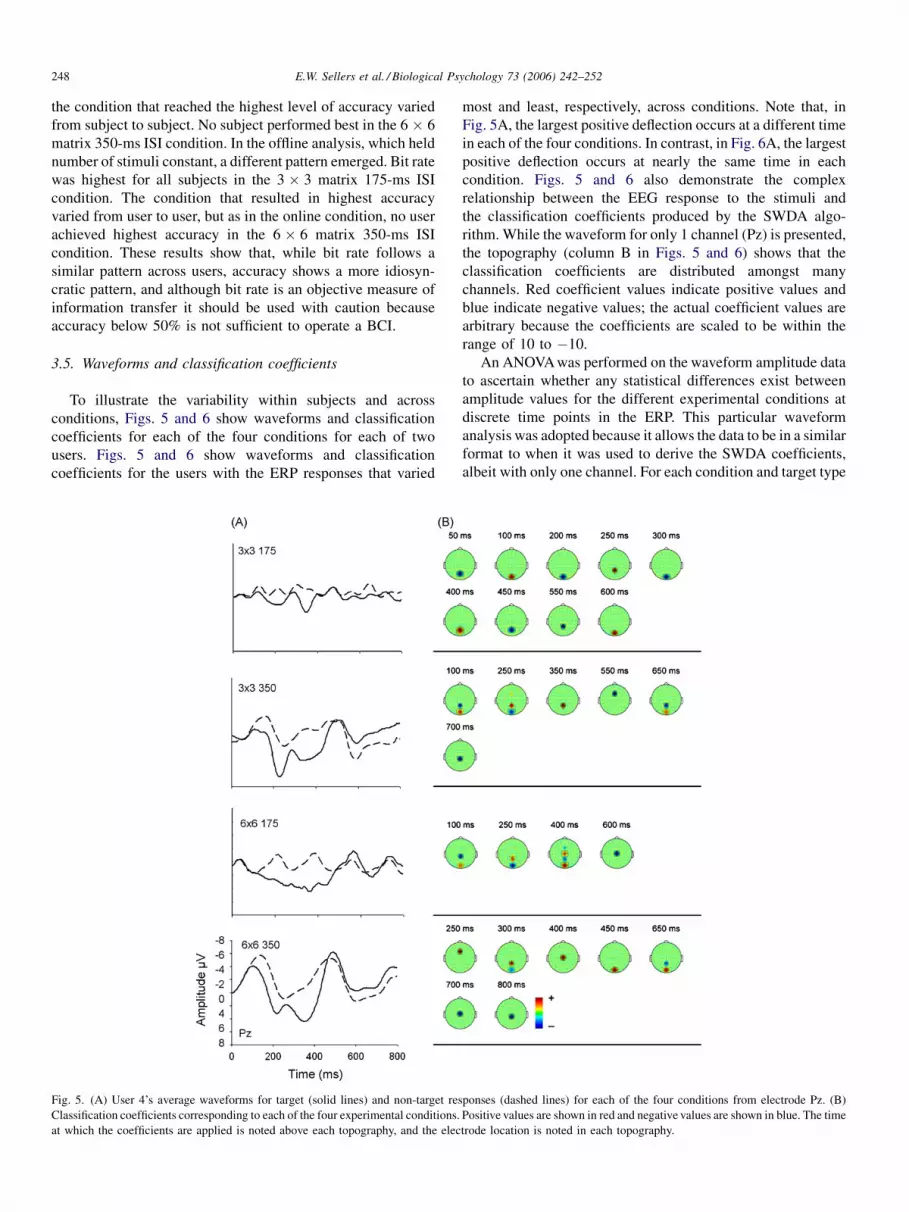
3.5. Waveforms and classification coefficients
To illustrate the variability within subjects and across
conditions, Figs. 5 and 6 show waveforms and classification
coefficients for each of the four conditions for each of two
users. Figs. 5 and 6 show waveforms and classification
coefficients for the users with the ERP responses that varied
Fig. 5. (A) User 4’s average waveforms for target (solid lines) and non-target res
Classification coefficients corresponding to each of the four experimental conditions.
at which the coefficients are applied is noted above each topography, and the elec
most and least, respectively, across conditions. Note that, in
Fig. 5A, the largest positive deflection occurs at a different time
in each of the four conditions. In contrast, in Fig. 6A, the largest
positive deflection occurs at nearly the same time in each
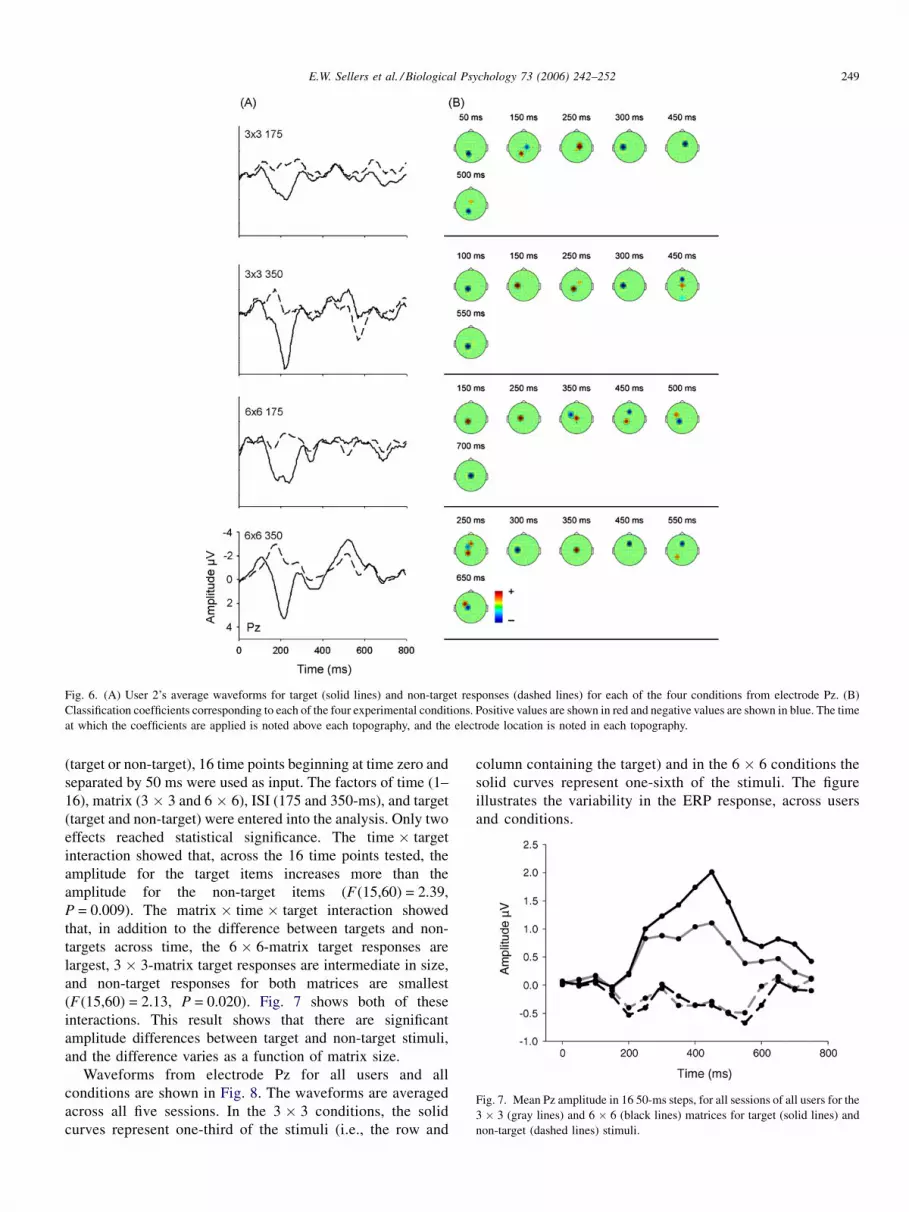
condition. Figs. 5 and 6 also demonstrate the complex
relationship between the EEG response to the stimuli and
the classification coefficients produced by the SWDA algo-
rithm. While the waveform for only 1 channel (Pz) is presented,
the topography (column B in Figs. 5 and 6) shows that the
classification coefficients are distributed amongst many
channels. Red coefficient values indicate positive values and
blue indicate negative values; the actual coefficient values are
arbitrary because the coefficients are scaled to be within the
range of 10 to �10.
An ANOVA was performed on the waveform amplitude data
to ascertain whether any statistical differences exist between
amplitude values for the different experimental conditions at
discrete time points in the ERP. This particular waveform
analysis was adopted because it allows the data to be in a similar
format to when it was used to derive the SWDA coefficients,
albeit with only one channel. For each condition and target type
ponses (dashed lines) for each of the four conditions from electrode Pz. (B)
Positive values are shown in red and negative values are shown in blue. The time
trode location is noted in each topography.
E.W. Sellers et al. / Biological Psychology 73 (2006) 242–252 249
Fig. 6. (A) User 2’s average waveforms for target (solid lines) and non-target responses (dashed lines) for each of the four conditions from electrode Pz. (B)
Classification coefficients corresponding to each of the four experimental conditions. Positive values are shown in red and negative values are shown in blue. The time
at which the coefficients are applied is noted above each topography, and the electrode location is noted in each topography.
Fig. 7. Mean Pz amplitude in 16 50-ms steps, for all sessions of all users for the
3 � 3 (gray lines) and 6 � 6 (black lines) matrices for target (solid lines) and
non-target (dashed lines) stimuli.
(target or non-target), 16 time points beginning at time zero and
separated by 50 ms were used as input. The factors of time (1–
16), matrix (3 � 3 and 6 � 6), ISI (175 and 350-ms), and target
(target and non-target) were entered into the analysis. Only two
effects reached statistical significance. The time � target
interaction showed that, across the 16 time points tested, the
amplitude for the target items increases more than the
amplitude for the non-target items (F(15,60) = 2.39,
P = 0.009). The matrix � time � target interaction showed
that, in addition to the difference between targets and non-
targets across time, the 6 � 6-matrix target responses are
largest, 3 � 3-matrix target responses are intermediate in size,
and non-target responses for both matrices are smallest
(F(15,60) = 2.13, P = 0.020). Fig. 7 shows both of these
interactions. This result shows that there are significant
amplitude differences between target and non-target stimuli,
and the difference varies as a function of matrix size.
Waveforms from electrode Pz for all users and all
conditions are shown in Fig. 8. The waveforms are averaged
across all five sessions. In the 3 � 3 conditions, the solid
curves represent one-third of the stimuli (i.e., the row and
column containing the target) and in the 6 � 6 conditions the
solid curves represent one-sixth of the stimuli. The figure
illustrates the variability in the ERP response, across users
and conditions.

E.W. Sellers et al. / Biological Psychology 73 (2006) 242–252250
Fig. 8. Average waveforms of responses to target stimuli (solid lines) and non-target stimuli (dashed lines) from electrode Pz for each user for all four conditions for
all five sessions.
4. Discussion
This study demonstrates several important points. First, a
previously untested matrix containing only nine items can yield
very high classification rates despite the increased probability
with which the attended item is presented. Second, classifica-
tion accuracy is stable over the course of five experimental
sessions. Third, matrix size and ISI affect classification; and
matrix size and stimulus class (i.e., target versus not-target)
affect waveform morphology. Fourth, a shorter ISI yields
higher classification rates. Fifth, individual differences in the
EEG response play a large role in classification performance, as
shown by significantly higher accuracy when user specific
coefficients were compared to general coefficients. Sixth, the
relationship between accuracy and bits/min must be considered
when a BCI system is being calibrated for a given user.
4.1. Effects of matrix size
Research on the P300 event-related potential has demon-
strated that the amplitude of the P300 response increases as the
probability of the presentation of a target item decreases
(Duncan-Johnson and Donchin, 1977). This result has been
replicated within the context of a matrix speller (Allison and
Pineda, 2003), and in the current study. The current study
expands this finding to demonstrate that the probability
manipulation does not compromise classification accuracy
(at least for the two matrix sizes that were tested).
This finding has important implications for future instantia-
tions of the P300-BCI that may offer different matrix sizes to
perform a variety of different tasks. In such cases, flexibility of
matrix size can be a major asset. For example, one might want
to change the matrix size if visual impairments or other deficits
prevent a potential user from using a BCI. In other cases, a
different matrix size might produce a substantial increase in
accuracy (see User 1, Table 3). Although use of a matrix smaller
than 6 � 6 would necessitate more than one choice to select one
character from the entire English alphabet, the increase in
accuracy might outweigh the additional time required for an
additional selection (see Section 4.3 below for further
discussion).
4.2. Effects of inter stimulus interval
The present study found that the shorter ISI yielded the
highest classification accuracy. This result is consistent with the
ISI effects reported by Meinicke et al. (2002). Farwell and
Donchin (1988) reported higher accuracy rates with a longer
ISI. The reason for the inconsistency is unclear. Nonetheless,
the current findings and the Meinicke et al. (2002) findings are
encouraging because they indicate that a faster display
produces higher classification accuracy and faster commu-
nication. For practical purposes, it appears to be worthwhile to
test multiple ISI values and thereby determine the optimal value
for each user.
4.3. Speed, accuracy, and bits/min
Although bit rate (bits/min) is an objective measure of
information transfer, the importance of accuracy for effective
BCI-based communication should not be overlooked (Wolpaw
et al., 2000, 2002). We performed a simulation to examine the
relationship between bits/character and the number of
selections required to produce an accurately selected series
of 10 characters using error correction, as a function of
accuracy (using a 6 � 6 matrix). The results of the simulation,

E.W. Sellers et al. / Biological Psychology 73 (2006) 242–252 251
Fig. 9. Results of a simulation examining bits/character selection (dashed line)
and selections needed to correctly complete a 10-character sequence with error
correction (solid line) vs. selection accuracy for the 6 � 6 matrix.
based on 10,000 trials, are presented in Fig. 9 (bits/selection
(left axis) and number of selections (right axis)).
Fig. 9 demonstrates some important points. First, while
accuracy levels less than 60% provide substantial bits/selection,
the time needed to produce useful communication might be
unacceptable. For example, with 53% accuracy using the 6 � 6
matrix 175-ms ISI condition, it would take approximately 190
selections, or 1.2 h to produce a 10 item series of characters,
with a corresponding bit rate of 1.7 bits/selection. Thus,
accuracy is of paramount importance for determining the
effectiveness of a practical BCI. As the figure clearly
demonstrates, bit rate increases in a relatively linear fashion
across the range of accuracy, but the number of trials to
completion is very sensitive to accuracy. For example, with an
accuracy of 95%, approximately 10.5 selections are required to
complete a 10-item sequence, with a corresponding bit rate of
4.7 bits/selection. In contrast, with an accuracy of 80%,
approximately 17 selections are required to complete a 10-item
sequence, with a corresponding bit rate of 3.4 bits/selection.
Thus, with a 15% decrease in accuracy (from 95% to 80%), the
bit rate decreases by 29% (from 4.7 to 3.4) and the time to
complete the 10-item sequence increases by 70%.
4.4. The ERP response and classification coefficients
The relationship between the ERP waveform from any given
channel and the classification coefficients is complex. This is
because as many as 1392 spatiotemporal features, distributed
among up to 29 channels, are provided as input to the SWDA
analysis. Thus, the relationship between a set of coefficients
and the ERP responses cannot be captured by examination of
any single channel, or even a subset of a few channel locations.
Moreover, even if only a few channel locations were used to
derive the classification coefficients, the relationship between
the selected time � channel locations and a waveform at a
given location would not be easily ascertained due to factors
such as response variability, component overlap, and suppressor
variables (e.g., Krus and Wilkinson, 1986; MacKinnon et al.,
2000). For example, Fig. 6A shows that the Pz waveforms are
very similar in each of the four conditions. However,
information that discriminates between target and non-target
responses (i.e., the selected classification coefficients) is
distributed among many channels, and at many time points
located outside of the P300 window (see Fig. 6B). This
additional information may benefit the SWDA analysis by
providing baseline correction and/or suppressor variables.
4.5. Waveform differences
The results suggest that P300 responses elicited within the
current paradigm differ across conditions in several respects.
Many factors affect the amplitude, latency, and scalp
distribution of P300 responses (see Fabiani et al., 1987, for a
review). Importantly for current purposes, both matrix size and
stimulus class affect waveform morphology (as measured at
electrode Pz). The larger matrix size produces larger P300
amplitudes for the target stimuli because of the reduced
probability of occurrence (Duncan-Johnson and Donchin,
1977; Allison and Pineda, 2003). Similarly, target stimuli
produce P300 responses and non-target items do not, as is the
case in typical oddball paradigm experiments (Fabiani et al.,
1987; Pritchard, 1981). The results of the waveform analysis
suggest that the P300 Speller paradigm does in fact operate as a
true oddball paradigm because the waveform results are
consistent with predictions based on previous studies that
manipulate target probability using a typical oddball paradigm.
4.6. Classification across multiple sessions
Only one previous study has examined how classification
changes across multiple sessions in a P300-BCI (Sellers and
Donchin, 2006). Using a four-choice sequential oddball task
that included auditory and visual stimuli, the study found that
the main effect of sessions was not significant, over the course
of 10 sessions. The current study, using a matrix style visual
display, also shows no significant change in user performance
over five sessions in the online analysis. Moreover, we have
recently shown (Krusienski et al., 2005) that classification
coefficients derived from data collected up to one year prior to a
subsequent session can classify with near perfect accuracy.
Thus, a user’s performance appears to be quite consistent over
time.
4.7. Conclusions
All five users in this study were able to use a P300-BCI.
Averaging each user’s most accurate condition resulted in mean
accuracy of 88%. Overall, accuracy was higher in the 175-ms
ISI condition than in the 350-ms ISI condition and accuracy
was higher in the 3 � 3 matrix condition than in the 6 � 6
matrix condition. However, both matrix sizes produced
acceptable levels of accuracy. This result has important
implications for the development of future applications that
will employ a menu-driven matrix system. It shows that it is
feasible to present a user with matrices of sizes that vary
according to different functions (e.g., word processing,

E.W. Sellers et al. / Biological Psychology 73 (2006) 242–252252
answering direct questions, environmental controls, sending e-
mail, etc.). Moreover, the consistency of a user’s performance
over time indicates that, although it is necessary to optimize
BCI system parameters to achieve the best performance for
each individual user, it may not be necessary to continually
optimize these parameters over the ensuing time of use.
Furthermore, P300-BCI communication appears to remain
effective over sessions. This has important implications for the
feasibility of eventually providing severely disabled users with
BCIs that they can use in their homes.
Acknowledgements
This work was supported in part by National Institutes of
Health Grants HD30146 (National Center for Medical
Rehabilitation Research of the National Institute of Child
Health and Human Development), EB00856 (National Institute
of Biomedical Imaging and Bioengineering and National
Institute of Neurological Disorders and Stroke), and the James
S. McDonnell Foundation.
References
Allison, B.Z., Pineda, J.A., 2003. ERPs evoked by different matrix sizes:
Implications for a brain computer interface (BCI) system. IEEE Transac-
tions on Neural Systems and Rehabilitation Engineering 11, 110–113.
Birbaumer, N., et al., 1999. A spelling device for the paralyzed. Nature 398,
297–298.
Birbaumer, N., et al., 2000. The thought translation device (TTD) for
completely paralyzed patients. IEEE Transactions on Neural Systems
and Rehabilitation Engineering 8, 190–193.
Cohen, J., Polich, J., 1997. On the number of trials needed for P300. Interna-
tional Journal of Psychophysiology 25, 249–255.
Donchin, E., 1969. Discriminant analysis in average evoked response studies:
The study of single trial data. Electroencephalography and Clinical Neu-
rophysiology 27, 311–314.
Donchin, E., Spencer, K.M., Wijesinghe, R., 2000. The mental prosthesis:
Assessing the speed of a P300-based brain–computer interface. IEEE
Transactions on Rehabilitation Engineering 8, 174–179.
Draper, N., Smith, H., 1981. Applied Regression Analysis, second ed. John
Wiley and Sons, New York, pp. 307–312.
Duncan-Johnson, C., Donchin, E., 1977. On quantifying surprise: The variation
of event-related potentials with subjective probability. Psychophysiology
14, 456–467.
Fabiani, M., Gratton, G., Karis, D., Donchin, E., 1987. Definition, identification,
and reliability of measurement of the P300 component of the event-related
brain potential. Advances in Psychophysiology 2, 1–78.
Farwell, L.A., Donchin, E., 1988. Talking off the top of your head: Toward a
mental prosthesis utilizing event-related brain potentials. Electroencepha-
lography and Clinical Neurophysiology 70, 510–523.
Kaper, M., Meinicke, P., Grossekathoefer, U., Lingner, T., Ritter, H., 2004.
BCI competition 2003-data set IIb: Support vector machines for the P300
speller paradigm. IEEE Transactions on Bio-medical Engineering 51,
1073–1076.
Kinoshita, S., Inoue, M., Maeda, H., Nakamura, J., Morita, K., 1996. Long-term
patterns of change in ERPs across repeated measurements. Physiology &
Behavior 60, 1087–1092.
Krus, D.J., Wilkinson, S.M., 1986. Demonstration of properties of a suppressor
variable. Behavior Research Methods, Instruments, and Computers 18, 21–
24.
Krusienski, D., Sellers, E., Vaughan, T.M., McFarland, D.J., Wolpaw, J.R.,
2005. P300 matrix speller classification via stepwise linear discriminant
analysis. In: Proceedings of the Third International Meeting of Poster
Presentation at the Brain-Computer Interface Technology, Rensselaerville,
New York.
Kubler, A., et al., 2005. Patients with ALS can learn to operate a sensorimotor-
rhythm based brain–computer interface (BCI). Neurology 64, 1775–1777.
MacKinnon, D.P., Krull, J.L., Lockwood, C.M., 2000. Equivalence of the
mediation, confounding and suppression effect. Prevention Science 1,
173–181.
Meinicke, P., Kaper, M., Hoppe, F., Huemann, M., Ritter, H., 2002. Improving
transfer rates in brain computer interface: A case study. NIPS 1107–1114.
Pfurtscheller, G., Flotzinger, D., Pregenzer, M., Wolpaw, J.R., McFarland, D.,
1996. EEG-based brain computer interface. Med Prog Technol. 21, 111–
121.
Pierce, J.R., 1980. An Introduction to Information Theory. Dover, New York,
pp. 145–165.
Polich, J., 1989. Habituation of P300 from auditory stimuli. Psychobiology 17,
19–28.
Pritchard, W., 1981. The psychophysiology of P300. Psychological Bulletin 89,
506–540.
Ravden, D., Polich, J., 1998. Habituation of P300 from visual stimuli. Inter-
national Journal of Psychophysiology 30, 359–365.
Schalk, G., McFarland, D.J., Hinterberger, T., Birbaumer, N., Wolpaw, J.R.,
2004. BCI2000: A general-purpose brain–computer interface (BCI) system.
IEEE Transactions on Bio-medical Engineering 51, 1034–1043.
Serby, H., Yom-Tov, E., Inbar, G.F., 2005. An improved P300-based brain–
computer interface. IEEE Transactions on Neural Systems and Rehabilita-
tion Engineering 13, 89–98.
Sellers, E.W., Donchin, E., 2006. A P300-based brain–computer interface:
Initial tests by ALS patients. Clinical Neurophysiology 117, 538–548.
Sharbrough, F., Chatrian, G.E., Lesser, R.P., Luders, H., Nuwer, M., Picton,
T.W., 1991. American electroencephalographic society guidelines for stan-
dard electrode position nomenclature. Journal of Clinical Neurophysiology
8, 200–202.
Wolpaw, J.R., Birbaumer, N., McFarland, D.J., Pfurtscheller, G., Vaughan,
T.M., 2002. Brain–computer interfaces for communication and control.
Clinical Neurophysiology 113, 767–791.
Wolpaw, J.R., McFarland, D.J., Vaughan, T.M., 2000. Brain–computer interface
research at the Wadsworth Center. IEEE Transactions on Rehabilitation
Engineering 8, 222–225.
Wolpaw, J.R., McFarland, D.J., 2004. Control of a two-dimensional movement
signal by a noninvasive brain–computer interface in humans. Proceedings of
the National Academy of Sciences of the United States of America 101,
17849–17854.