Embed Size (px)
Citation preview

For Peer Review O
nly
A Product-Driven System Approach for Multi-Level Decisions
in Manufacturing Planning and Control
Journal: Production & Manufacturing Research
Manuscript ID: Draft
Manuscript Type: Original Paper
Keywords: Intelligent manufacturing systems, Manufacturing systems, Production planning and control
URL: http://mc.manuscriptcentral.com/tmpr
Production & Manufacturing Research

For Peer Review O
nly
A Product-Driven System Approach for Multi-Level Decisions in
Manufacturing Planning and Control
Manufacturing planning and control systems (MPCS) incorporate processes that
consider several levels of product aggregation and different time horizons for
decision making. The decisions rendered on each level do not always have
similar objectives. In the context of intelligent manufacturing systems (IMS), the
coordination of decisions on different levels is a fundamental problem. Extensive
research on IMS, specifically regarding coordination among decision levels in
product-driven control systems (PDCS), is non-existent. Therefore, simulations
of the planning and control processes are proposed to analyze the coordination of
multi-level objectives. The proposed implementation simulates the coordination
between tactical and operational levels. At the tactical level, production plans are
obtained through a system based on advanced planning and scheduling (APS). At
the operational level, a decentralized system, which is based on distributed
decision rules, is implemented. The simulation considers decentralized decisions
that are managed by production lots, which are modeled as holons, and based on
an industrial study case. The results indicate that coordination is feasible and
highlight the importance of the reactivity caused by the distributed decisions
made by the active lots. The proposed simulation schema can also be used to
compare conventional and holonic collaborative approaches
Keywords: intelligent manufacturing systems; manufacturing systems;
production planning and control.
Subject classification codes: include these here if the journal requires them
1. Introduction
Currently, holonic manufacturing systems (HMS) are a feasible alternative for
improving the flexibility and adaptability of manufacturing. These characteristics are
fundamental because of the complexity and dynamism of the current systems
(Valckenaers et al., 2007). In a holonic system, entities (machines, robots, AGVs or
workers) are modeled as holons, which consist of a physical component and an
information processing component.
Page 1 of 28
URL: http://mc.manuscriptcentral.com/tmpr
Production & Manufacturing Research
123456789101112131415161718192021222324252627282930313233343536373839404142434445464748495051525354555657585960
For Peer Review O
nly
Holons can be individual entities or can be composed of other holons. A set of
organized holons is named a holarchy. The objective is to achieve collaborative
behavior among these holons, in real or simulated systems, which enables them to make
decisions that reflect their environment.
A considerable amount of research has been devoted to the application of this concept
for scheduling decisions and manufacturing execution systems (MES). However, fewer
studies have focused on the relationship between the operation and execution levels and
the upper levels of decision making or enterprise resources planning (ERP) systems.
For example, InteRRaP (Fischer, 1999) defines an agent as a set of functional layers
linked by a control structure, which is based on communication. This architecture is
based on agents using the social model BDI (Belief, Desires and Intentions)
(Wooldridge, 2000). InteRRaP was proposed for flexible manufacturing systems
(FMS). Functional layers correspond to the three basic activities that agents must
perform in a FMS. Activities include coordination, problem solving and implementation
of local plans. This architecture considers planning as the highest level in
the decision tree. Decisions at this level are implemented offline without the potential
for subsequent change.
The architecture PROSA (Product-Resource-Order-Staff Architecture) (Van Brussel et
al., 1998) is an architecture used for modeling and implementing a holonic
manufacturing system. PROSA defines three basic types of holons: orders, products and
resources. In addition, a holon staff can be defined as decision procedures or
knowledge. All holons in this holarchy are organized to conduct manufacturing
activities.
Page 2 of 28
URL: http://mc.manuscriptcentral.com/tmpr
Production & Manufacturing Research
123456789101112131415161718192021222324252627282930313233343536373839404142434445464748495051525354555657585960

For Peer Review O
nly
An interesting aspect of PROSA is its interpretation of a product as an active entity in
the production process, which is a widespread practice in studies that address smart
products (Pannequin et al., 2007). Nevertheless, the majority of the applications using
PROSA as modeling framework for holonic systems concerns operational and control
levels and, more specifically, in the context of modeling and implementation of MES
systems.
ExPlanTech is an agent-based technology for planning and production control
(Pˇechouˇcek et al., 2007). This technology is based on Proplant (Marik et al., 2000),
which is an architecture that was developed as a multi-agent system for project-based
production systems. ExplanTech represents a generalization of Proplant for mass-
production companies. The system functions by using a community of autonomous
agents that represent entities or production information. A central feature of this
technology is based on the premise that no centralized decision mechanism is
utilized.
PABADIS Promise is an architecture for production control based on a pyramid with
three levels of automation (Wunsch and Bratukhin, 2007). One of its main objectives is
to avoid the centralization of decisions by positioning the decision levels closer to the
work-flow levels. Decision levels correspond to the ERP level (tactical level), MES
level (operational level) and control level. Communication between ERP and MES is
based on “web services” using ACL (agent communication language). The architecture
is based on a manufacturing-order operation decomposition that is obtained from ERP.
Although these approaches consider planning and control levels, they do not consider
the inclusion of products as central entities in the decision-making process (except
PROSA). On the contrary, PDCS (McFarlane et al., 2002;Morel et al., 2003, 2007)
Page 3 of 28
URL: http://mc.manuscriptcentral.com/tmpr
Production & Manufacturing Research
123456789101112131415161718192021222324252627282930313233343536373839404142434445464748495051525354555657585960
For Peer Review O
nly
convert the role of products to active agents in the decision-making process, in which
products can be also modeled as holons.
On the other hand, decisions made at the planning level require the inclusion of
medium-term horizons to prevent “myopia”. For that, the resources required for
production (personnel, labor, raw materials, and machinery maintenance) should be
necessarily planned in advance.
Conversely, operational-level decisions are concerned with short-term horizons, which
are inherently “myopic”. Finally, operational-level decisions must respond quickly and
efficiently to disturbances (production blocking, machine breakdowns, and demand
changes). Thus, planning and control systems should be robust, flexible and reactive
with respect to short, medium, and long term decisions.
In this context, in Herrera (2011) and Herrera et al. (2012) we proposed an architecture
that models a holarchy from products and sets of products at each level. This approach
allows coordination among decision levels and their associated decision horizons, while
focusing on the main objective of a production system (its products). Similar to other
approaches in manufacturing (Tang et al., 2011), this architecture is based on the Viable
System Model. The main advantage of this modeling framework is recursion, that is,
each composition level of the holarchy organization exhibits the same structure and
organization on each of its levels. Recursion enables the replication of the same
functions at each level, with only modifications to the objectives and decision methods.
Therefore, the aim of this work is to analyze the coordination between centralized
planning and decentralized control decisions in PDCS. Decentralized decisions are
assumed to be performed by numerous holons. These holons detect disturbances in
planning and trigger local changes that affect central planning. To accomplish this task,
Page 4 of 28
URL: http://mc.manuscriptcentral.com/tmpr
Production & Manufacturing Research
123456789101112131415161718192021222324252627282930313233343536373839404142434445464748495051525354555657585960

For Peer Review O
nly
we developed an agent-based simulation of decisions that is based on an industrial case
study. At the planning level, the goal is to preserve the stability of the plans. At the
operational level, the goal is to minimize makespan degradation by satisfying buffer-
stock constraints.
From the viewpoint of PDCS, the objective of this approach is to demonstrate the
advantages of a distributed decision and analyze its relationship with the objectives of
other decision levels (tactical). The results are obtained through simulation. This
approach aims to obtain quantitative comparisons and validation measures for suitable
benchmarking regarding traditional techniques for production planning and control.
This last point has been defined as a main objective of newer challenges proposed by
the HMS community (Valckenaers et al., 2006).
This paper is organized as follows: Section 2 is dedicated to all elements considered in
the simulation experiment, and Section 3 presents the simulation results. Section 4
presents an analysis of the main results, and Section 5 states the conclusion and
provides some research perspectives.
2. Materials and Methods
2.1 Centralized and distributed decisions
At different levels of MPCS, decisions are obtained by considering a rolling horizon.
Levels are associated with different levels of an aggregation of products, such as
product families, production orders, lots, and finished products or components.
A major challenge is to preserve the coherence of decisions among the levels. But, in
practice, when disturbances occur, the objectives for each level are not easily achieved,
and disturbances may cause major planning changes. Note that frequent changes can be
Page 5 of 28
URL: http://mc.manuscriptcentral.com/tmpr
Production & Manufacturing Research
123456789101112131415161718192021222324252627282930313233343536373839404142434445464748495051525354555657585960

For Peer Review O
nly
the source of considerable instability. In addition, these effects often cause reduced
efficiency and poor productivity. Short-term changes are more frequent and can
significantly reduce system performance. In this context, MPCS should provide
sufficient flexibility at the operational levels and ensure consistency with the defined
objectives at the upper levels.
This approach considers two decision levels: tactical and operational levels. At the
tactical level, the decision concerns the production quantities for every item within a
product family and for each period on a planning time horizon. This problem is
generally associated with the master production schedule (MPS) and is usually modeled
using a lot-sizing model (Pochet and Wolsey, 2006). The objective is to minimize
production costs by establishing a set of parameters as marginal costs and considering
the system capacity. During the first period of this planning horizon and once each
quantity (by item) has been obtained, these quantities must be divided and sequenced to
be incorporated in the manufacturing system. This lot-streaming problem, (Sarin and
Jaiprakash, 2007) whose objectives are to reduce the total production time (Cmax), is
usually applied to manufacturing systems that contain parallel manufacturing processes.
The decision at this level is comprised of a sequence of sub-lots that correspond to the
weekly planning, which considers the production start time and the quantity of each
product to be manufactured.
One of the primary aspects of the lot-streaming problem is that it assumes constant
production rates. These rates may be affected by various disturbances, such as machine
blocking, machine breakdowns or accidents. Due to these occurrences, changes in the
parameters of the model may affect planning efficiency. These changes reduce
production capacity and increase the gap between planning and the
Page 6 of 28
URL: http://mc.manuscriptcentral.com/tmpr
Production & Manufacturing Research
123456789101112131415161718192021222324252627282930313233343536373839404142434445464748495051525354555657585960

For Peer Review O
nly
launched production. This gap is named “system nervousness”.
Our aim is to study the relationships among decision levels in the context of PDS. Then,
products or sub-lots are modeled as holons with the capacity to modify their
environment. Holons are assumed capable of making a single distributed decision. More
specifically, a holon can decide to stop its production at a certain stage and heuristically
reassign the remaining quantity. Re-assignment consists of assigning the quantity that
has not been manufactured to another lot(s) (one or many), which modifies the
planning. Until the new assignment is completed, a part of the sub-lot remains in an
intermediate stock (buffer). The feasibility of this “decision of splitting” is dependent on
the remaining production and stock capacities, and is also dependent on the existence of
similar types of sub-lots (same reference) that were previously planned.
Once the feasibility of divisions has been determined, the sub-lot holon evaluates the
variation in planning through a re-planning linear programming model. The model
seeks to replace the subdivided lots and evaluate different alternatives that will
minimize the increase of Cmax. These alternatives, which correspond to different sub-
sets of the same reference that will increase their size, are placed in the queue sub-
module.
Subsequently, we describe the industrial study case and how the sub-lot holon renders
the previously described decision.
2.2 Study Case
The company selected for the case study is a subcontractor that manufactures
turbochargers for the automotive industry. The facility produces a maximum of ten
thousand products per day with hundreds of references. The plant is divided into
Page 7 of 28
URL: http://mc.manuscriptcentral.com/tmpr
Production & Manufacturing Research
123456789101112131415161718192021222324252627282930313233343536373839404142434445464748495051525354555657585960
For Peer Review O
nly
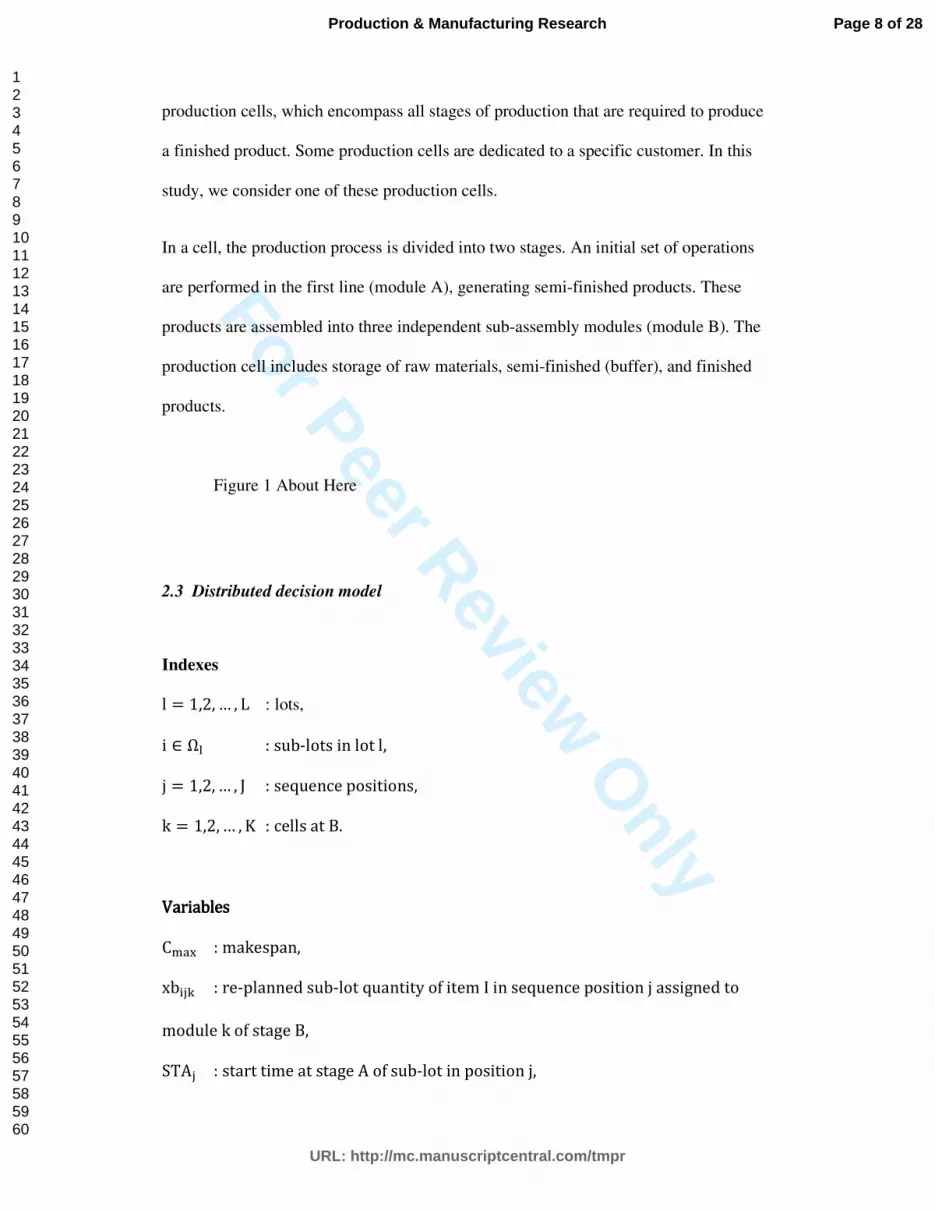
production cells, which encompass all stages of production that are required to produce
a finished product. Some production cells are dedicated to a specific customer. In this
study, we consider one of these production cells.
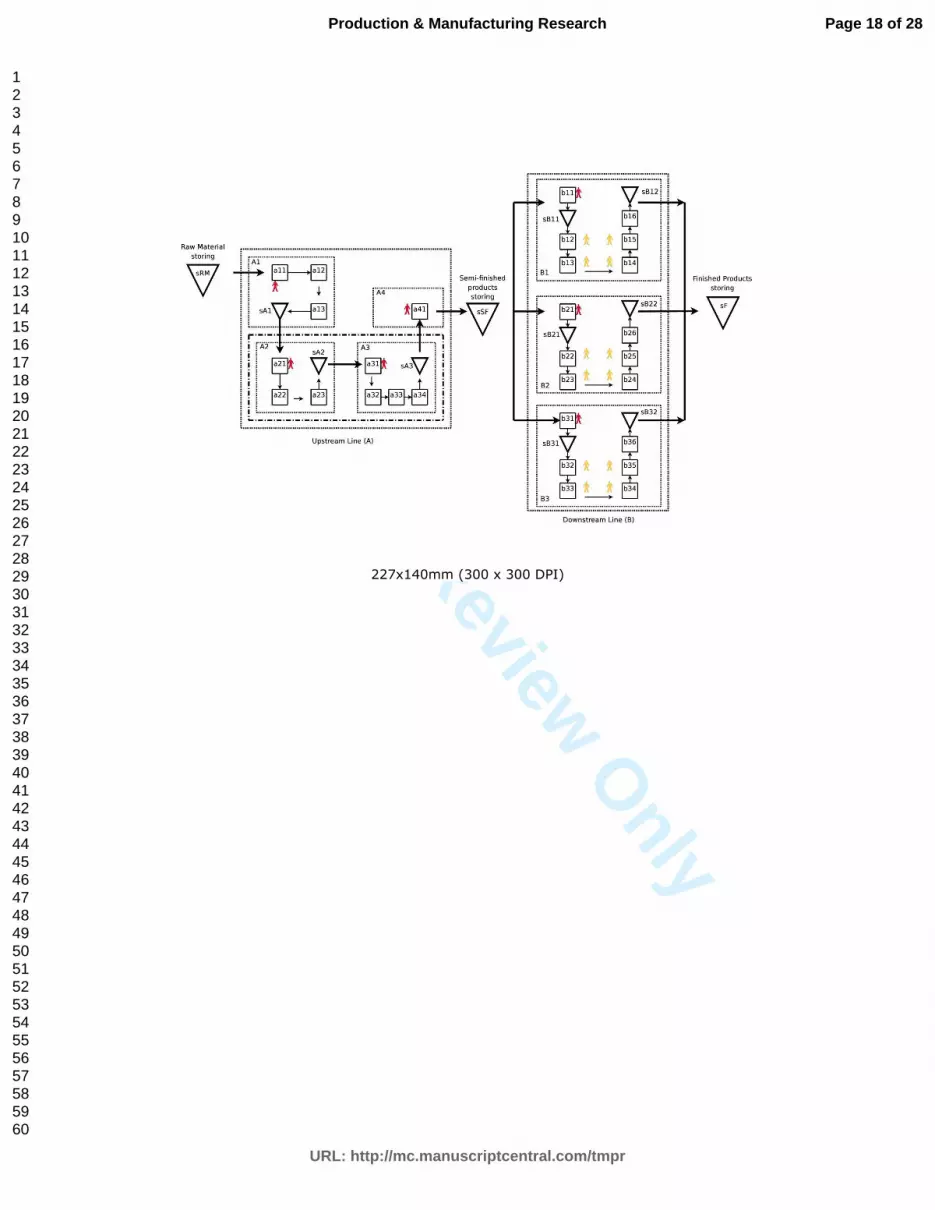
In a cell, the production process is divided into two stages. An initial set of operations
are performed in the first line (module A), generating semi-finished products. These
products are assembled into three independent sub-assembly modules (module B). The
production cell includes storage of raw materials, semi-finished (buffer), and finished
products.
Figure 1 About Here
2.3 Distributed decision model
Indexes
l � 1,2, … , L : lots,
i ∈ Ω� : sub-lots in lot l,
j � 1,2, … , J : sequence positions,
k � 1,2, … , K : cells at B.
VariablesVariablesVariablesVariables
C#$% : makespan,
xb()* : re-planned sub-lot quantity of item I in sequence position j assigned to
module k of stage B,
STA) : start time at stage A of sub-lot in position j,
Page 8 of 28
URL: http://mc.manuscriptcentral.com/tmpr
Production & Manufacturing Research
123456789101112131415161718192021222324252627282930313233343536373839404142434445464748495051525354555657585960

For Peer Review O
nly
STB)* : start time at module k of sub-lot in position j
ParametersParametersParametersParameters
xcut : quantity to be re-planned,
q( : minimum sub-lot size of item i,
TPA( : marginal production time at A of item i,
TPB( : marginal production time at B of item i,
SA( : setup time at A of item i,
SB( : setup time at B of item i,
I � ∑ |Ω�|7(89 : number of sub-lots,
L : number of items,
K : number of sub-modules,
n� � :Q�/q�= : maximum number of sub-lots
in lot l,
Ω� � >1,2, … , n�? : set of sub-lots in lot l
xf()* : fixed sub-lot quantities.
yf()* : fixed sequence.
t@AB : new start time at A for the first sub-lot in the planning after disturbance
detection.
EPFG min C#$% E1G
∑ ∑ ∑ xb()*H*89 � xcutI
)89(JKL E2G
xb()* � 0, iϵΩ�, ∀l ∶ l Q w, ∀j, ∀k E3G
STA9 � t@AB E4G
STA) � STA)T9 U ∑ ∑ ∑ TPA� ∙ xf(E)T9G* U SA� ∙ yf(E)T9G*, ∀j: j W 1H*89
I)89(JKL EG
Page 9 of 28
URL: http://mc.manuscriptcentral.com/tmpr
Production & Manufacturing Research
123456789101112131415161718192021222324252627282930313233343536373839404142434445464748495051525354555657585960
For Peer Review O
nly
STB)* X STA) U ∑ ∑ TPA� ∙ yf()*, ∀j, ∀k(JKY7�89 E5G
STB)* X STBE)T9G* U ∑ ∑ TPB� ∙ [xf(E)T9G* U xb(E)T9G*\ U SB� ∙ yf(E)T9G*, ∀j: j W(JKY7�89
1, ∀k (6)
C#$% X STBI* U ∑ ∑ TPB� ∙ [xf(I* U xb(I*\ U SB� ∙ yf(I*, ∀k(J@Y7�89 (7)
xb()* ∈ ]^, STA, STB, C#$% X 0 (8)
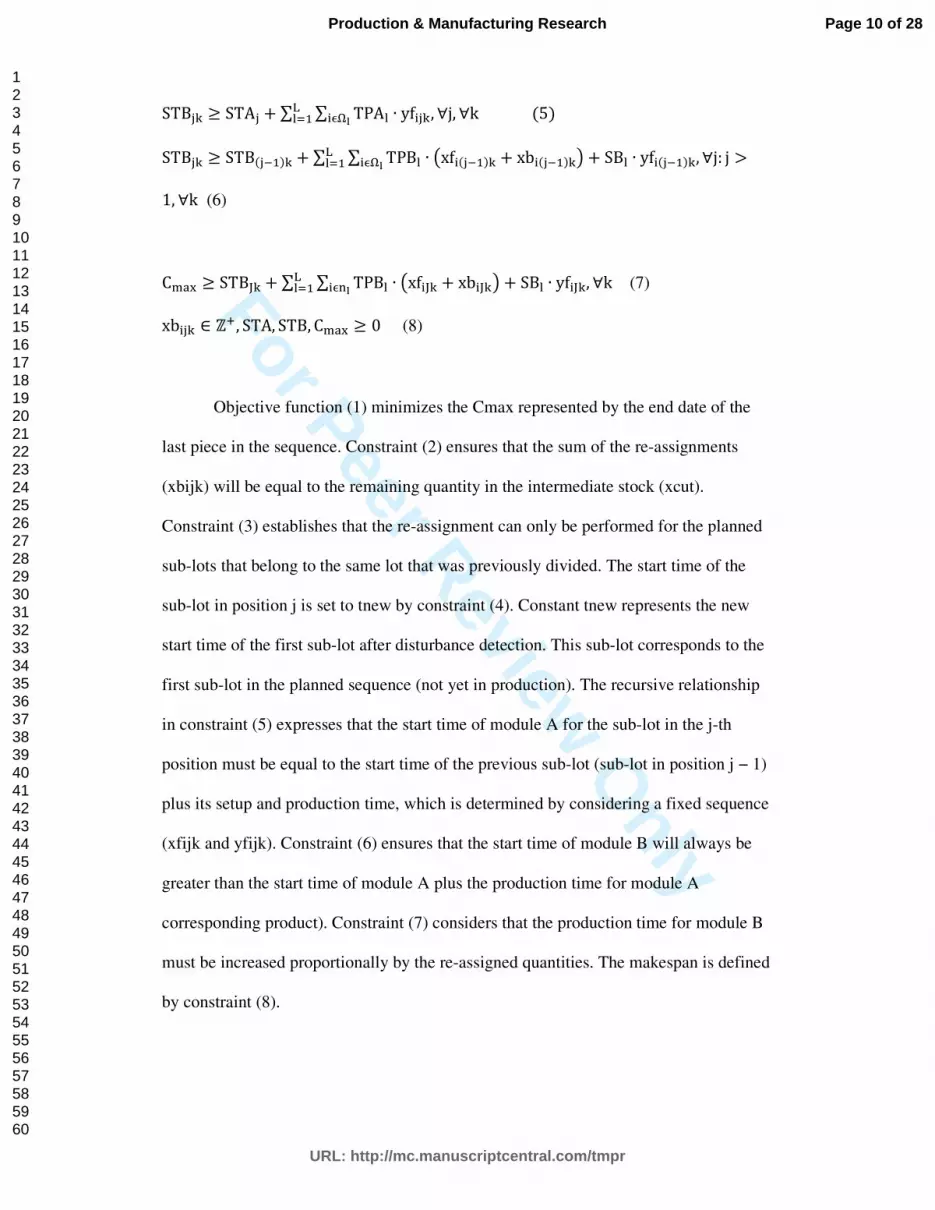
Objective function (1) minimizes the Cmax represented by the end date of the
last piece in the sequence. Constraint (2) ensures that the sum of the re-assignments
(xbijk) will be equal to the remaining quantity in the intermediate stock (xcut).
Constraint (3) establishes that the re-assignment can only be performed for the planned
sub-lots that belong to the same lot that was previously divided. The start time of the
sub-lot in position j is set to tnew by constraint (4). Constant tnew represents the new
start time of the first sub-lot after disturbance detection. This sub-lot corresponds to the
first sub-lot in the planned sequence (not yet in production). The recursive relationship
in constraint (5) expresses that the start time of module A for the sub-lot in the j-th
position must be equal to the start time of the previous sub-lot (sub-lot in position j − 1)
plus its setup and production time, which is determined by considering a fixed sequence
(xfijk and yfijk). Constraint (6) ensures that the start time of module B will always be
greater than the start time of module A plus the production time for module A
corresponding product). Constraint (7) considers that the production time for module B
must be increased proportionally by the re-assigned quantities. The makespan is defined
by constraint (8).
Page 10 of 28
URL: http://mc.manuscriptcentral.com/tmpr
Production & Manufacturing Research
123456789101112131415161718192021222324252627282930313233343536373839404142434445464748495051525354555657585960

For Peer Review O
nly
2.4 Simulation and Parameters
Simulation considers two decision levels. The first level (tactical) is
implemented using an integer programming model that defines quantities as produced
by item and period in a rolling horizon. The details of this model are provided by
Herrera and Thomas (2009). In the first level, the quantities are divided into sub-lots
during the first period, and the sequence to be used in the manufacturing process must
be defined using an integer programming model that solves the lot-streaming problem.
The model is similar to P0 but the quantities and sequences are variable, which
increases the execution time but are performed only at the beginning of the operation
period.
Once the system has been initialized with these results, the simulation begins. A
platform is used at this step (Pannequin et al., 2009) to facilitate the discrete events
simulation and the evaluation of different criteria. During the production period (week),
variations in the production times are simulated for the different modules; disturbances
are simulated as blocking and breakdowns, for example.
To react to perturbations, P0 is solved to determine if a certain quantity of items
is placed into stock and to determine whether this decision improves the planning with
respect to the initial situation. The decision to use this distributed decision process is
dependent on the variation between the planned waiting time and the real time of a
product in the queue of module B.
The simulation is performed considering a horizon of one year, obtaining
weekly operational results, of which some results consider the distributed decision and
some results disregard the distributed decision. Stability is achieved at the tactical level
using a nervousness measure proposed in (Herrera and Thomas, 2009). This measures,
quantifies the variation in the planned quantities on a weekly basis. At the operational
Page 11 of 28
URL: http://mc.manuscriptcentral.com/tmpr
Production & Manufacturing Research
123456789101112131415161718192021222324252627282930313233343536373839404142434445464748495051525354555657585960

For Peer Review O
nly
level, the obtained Cmax and work-in-process (WIP) are compared. Some of the
parameters that were utilized are listed in Table 1.
Table 1 about here
3. Results
3.1 Nervousness
Figure 2 about here
Figure 2 shows the results, considering nervousness, of both cases (centralized
and hybrid) for a comparison. The cases represent situations in which the product is
active (hybrid) and situations in which the product is inactive (centralized). The
complete experiment is discussed in Herrera (2011). The centralized case considers a
model that reduces the nervousness of the plan, thus, its shape in Figure 2 represents a
“stable plan”. These results represent the difference between the launched production
and the weekly planned production for a one-year operational horizon. The figures
cover 60 periods according to a transient period of 8 weeks.
Figure 3 shows the same results after a filter is applied (Savitzky-Golay). The
reason for applying a filter is to distinctly capture the differences between the two
decision systems. This particular filter was chosen because it preserves the haracteristics
of the initial distribution and the relative minimum and maximum, as well as the width
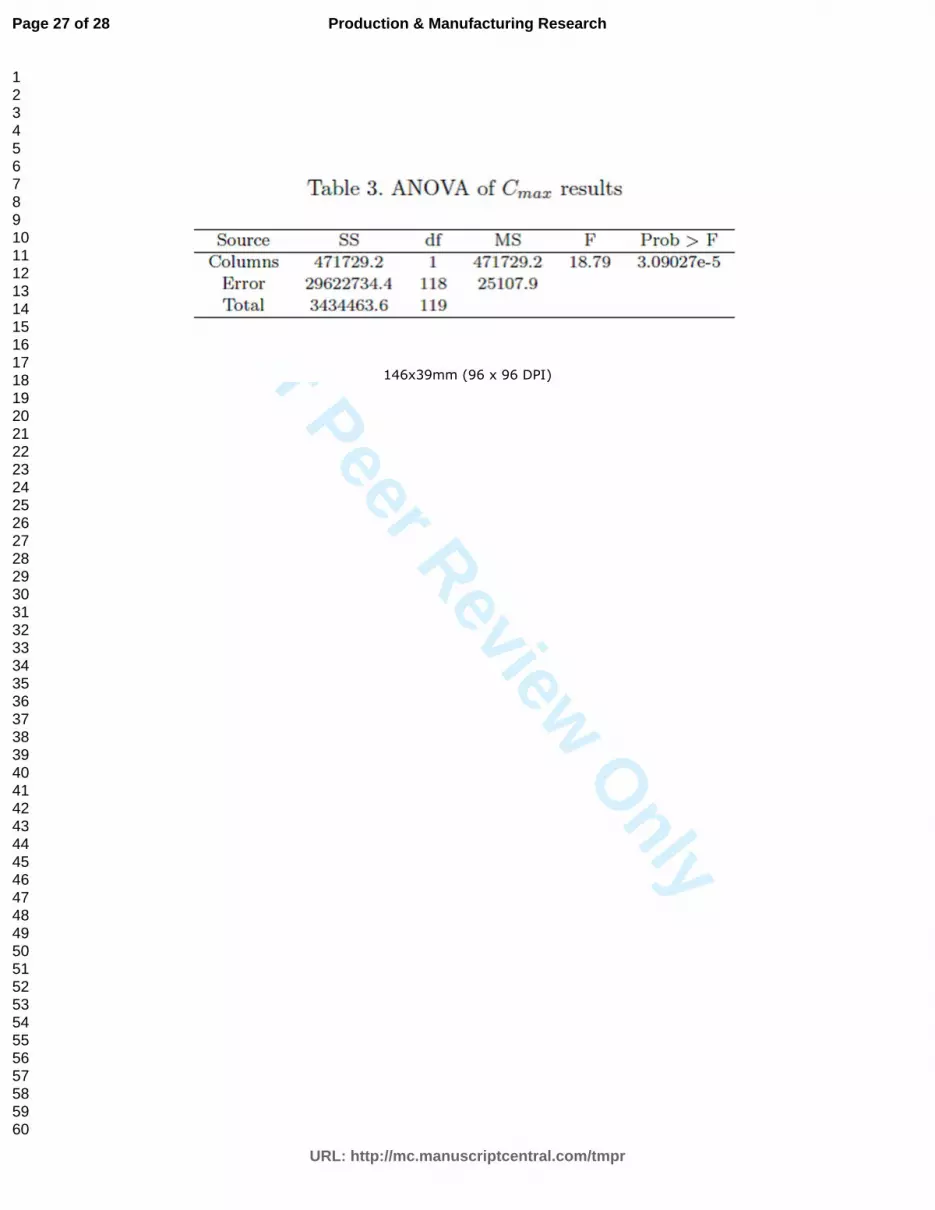
of the peaks. Table 2 displays the results of a statistical hypothesis test that was
employed to verify if differences exist between the series. The H0 hypothesis was
described as “significant differences exist between both cases with respect to the
Page 12 of 28
URL: http://mc.manuscriptcentral.com/tmpr
Production & Manufacturing Research
123456789101112131415161718192021222324252627282930313233343536373839404142434445464748495051525354555657585960

For Peer Review O
nly
nervousness results”, and the H1 hypothesis was described as “significant differences
do not exist between both cases respect to the nervousness results”. The results reveal
no changes in stability for the plans in which the products are active.
3.2 Cmax
Figure 3 about here
Table 2 about here
Figure 4 about here
Figure 4 about here
Table 3 about here
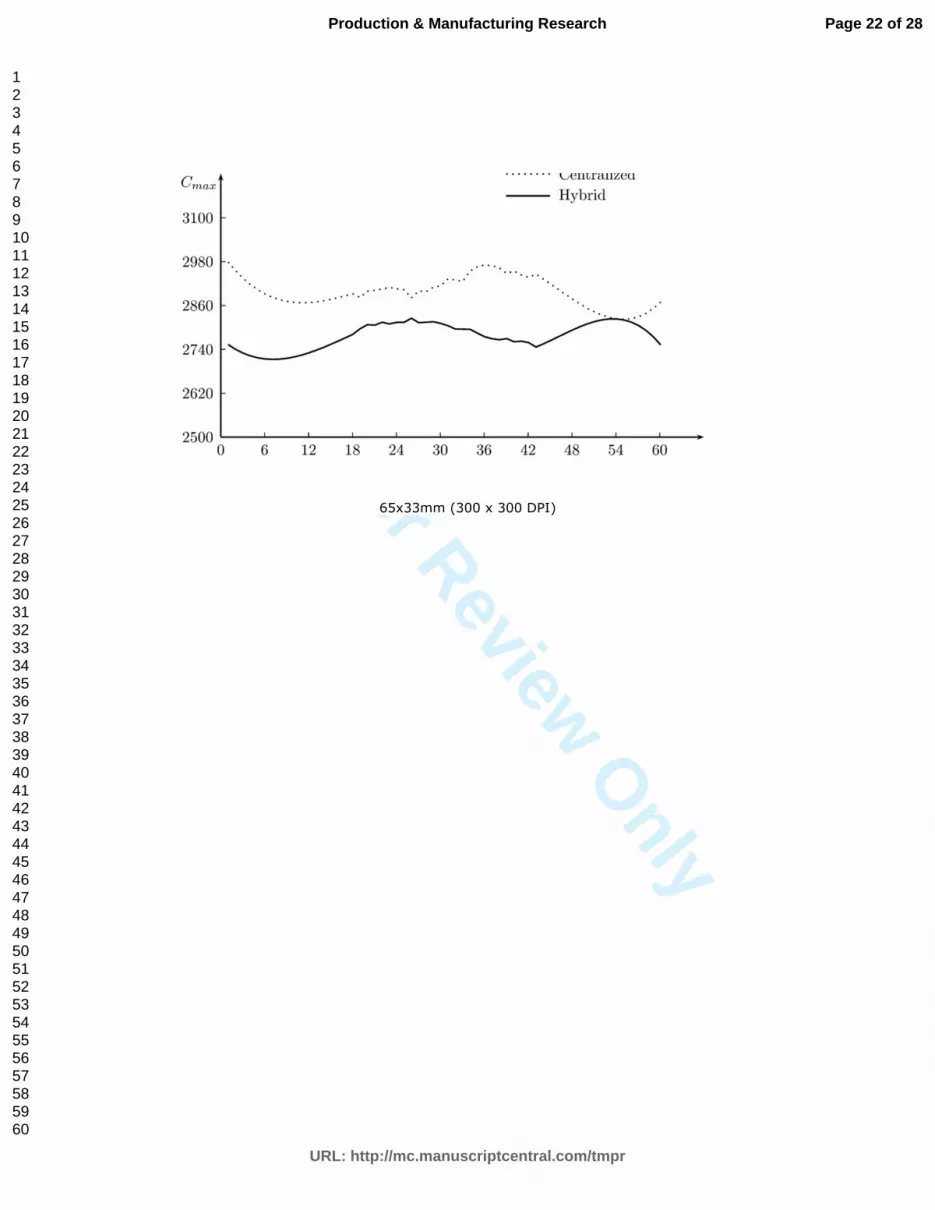
Figure 4 shows the results, considering Cmax, of both cases (centralized and hybrid) for
a comparison. Figure 5 shows products can affect the planning process and considerably
improve the production completion time.
3.1 WIP
This indicator corresponds to the average stock of all references. Its average is
calculated at the end of the week.
Figure 6 about here
Figure 7 about here
Table 4 about here
Page 13 of 28
URL: http://mc.manuscriptcentral.com/tmpr
Production & Manufacturing Research
123456789101112131415161718192021222324252627282930313233343536373839404142434445464748495051525354555657585960

For Peer Review O
nly
Figure 6 displays the results considering the work-in-process, of both cases (centralized
and hybrid) for a comparison. Figure 7 shows the after filtering. Table 4 demonstrates
that the intermediate stock level is utilized more frequently when the products are
active.
4. Discussion
The results of Cmax are particularly interesting because they reveal a net gain
without any deterioration in stability (see Figure 5). This finding indicates that it is
possible to achieve “robustness” in the final results.
Figure 7 demonstrates that we “must pay” in stock (which is intuitively expected) the
gains in nervousness and Cmax. The Cmax efficiency is directly related to the increase
and even saturation of the intermediate stock. Thus, it is possible to conclude that the
proposed approach enables a better utilization of this resource.
5. Conclusion and future work
A simulation of different decision levels for MPCS has been presented. The objective
was to analyze the coordination of decisions at different levels using centralized and
distributed methods. Local decisions represent decisions made by a “holon lot” in the
context of PDCS.
The results demonstrate the feasibility and efficiency of coordination between central
and local decisions with different objectives using a PDS approach. The feasibility of
obtaining a stable planning in the middle-term (tactical level) is assessed and a
Page 14 of 28
URL: http://mc.manuscriptcentral.com/tmpr
Production & Manufacturing Research
123456789101112131415161718192021222324252627282930313233343536373839404142434445464748495051525354555657585960

For Peer Review O
nly
significant performance in reactivity in the short term (operational level) is achieved.
The use of models and methods that are based on mathematical programming is
justified because these models enable acceptable approximations to the problem and
provide a comparison with other approaches as, for example, collaborative strategies.
This stage of our work represents a starting point for further research developments.
The usefulness of the proposed system should be validated in large-production
environments or for situations in which the consideration of centralized decisions is not
feasible at all.
References
Fischer, K. (1999). Agent-based design of holonic manufacturing systems.
Robotics and Autonomous Systems, 27(1-2), 3–13.
Herrera, C. (2011). Cadre générique de planification logistique dans un contexte
de décisions centralisées et distribuées. Ph.D. thesis, Université Henri Poincaré - Nancy
I.
Herrera, C., Belmokhtar, S., and Thomas, A. (2012). “Viable System Model
approach for holonic product-driven manufacturing systems”, volume 402 of Studies in
Computational Intelligence (SCI), 169–181. Springer.
Herrera, C. and Thomas, A. (2009). Simulation of less Master Production
Schedule nervousness model. In Proceedings of the 13th IFAC Symposium on
Information Control Problems in Manufacturing, 1585–1590.
Page 15 of 28
URL: http://mc.manuscriptcentral.com/tmpr
Production & Manufacturing Research
123456789101112131415161718192021222324252627282930313233343536373839404142434445464748495051525354555657585960
For Peer Review O
nly
Marik, V., Pechoucek, M., Stepankova, O., and Lazansky, J. (2000). Proplant:
Multiagent system for production planning. Applied Artificial Intelligence, 14(7), 727–
762.
McFarlane, D., Sarma, S., Chirn, J., Wong, C., and Ashton, K. (2002). The
intelligent product in manufacturing control. Journal of EAIA, 5464.
Morel, G., Panetto, H., Zaremba, M., and Mayer, F.(2003). Manufacturing
Enterprise Control and Management System Engineering: paradigms and open issues.
Annual Reviews in Control, 27, 199–209.Morel, G., Valckenaers, P., Faure,
J.M., Pereira, C.E., and Diedrich, C. (2007). Manufacturing plant control challenges and
issues. Control Engineering Practice, 15, 1321–1331.
Pannequin, R., Morel, G., and Thomas, A. (2007). Benchmarking issues for
product-driven decision-making. 9th International Conference on the Modern
Information Technology in the Innovation Processes of the Industrial Enterprise,
MITIP’2007.
Pannequin, R., Morel, G., and Thomas, A. (2009). The performance of product-
driven manufacturing control: An emulation-based benchmarking study. Computers in
Industry, 60(3), 195–203.
Pechoucek, M., Rehak, M., Charvat, P., Vlcek, T., and Kolar, M. (2007). Agent-
Based Approach to Mass-Oriented Production Planning: Case Study. IEEE Transactions
on Systems, Man, and Cybernetics, Part C, 37(3), 386–395.
Pochet, Y. and Wolsey, L. (2006). Production planning by mixed integer
programming. Springer New York, New York.
Sarin, S. and Jaiprakash, P. (2007). Flow Shop Lot Streaming. Springer, New
York.
Page 16 of 28
URL: http://mc.manuscriptcentral.com/tmpr
Production & Manufacturing Research
123456789101112131415161718192021222324252627282930313233343536373839404142434445464748495051525354555657585960

For Peer Review O
nly
Tang, D., Gu, W., Wang, L., and Zheng, K. (2011). A neuroendocrine-inspired
approach for adaptive manufacturing system control. International Journal of
Production Research, 49(5), 1255–1268. doi: 10.1080/00207543.2010.518734.
Valckenaers, P., Brussel, H.V., Verstraete, P., Germain, B.S., and Hadeli (2007).
Schedule execution in autonomic manufacturing execution systems. Journal of
manufacturing systems, 26(2), 75–84.
Valckenaers, P., Cavalieri, S., Germain, B., Verstraete, P., Hadeli, Bandinelli,
R., Terzi, S., and Brussel, H.(2006). A benchmarking service for the manufacturing
control research community. Journal of Intelligent Manufacturing, 17(6), 667–679.
Van Brussel, H., Wyns, J., Valckenaers, P., Bongaerts, L., and Peeters, P.
(1998). Reference architecture for holonic manufacturing systems: PROSA. Computers
in industry, 37(3), 255–274.
Wooldridge, M. (2000). Reasoning about rational agents. MIT press.
Wunsch, D. and Bratukhin, A. (2007). Multilevel order decomposition in distributed
production. In Emerging Technologies and Factory Automation, 2007. ETFA. IEEE
Conference on, 872–879. IEEE.
Page 17 of 28
URL: http://mc.manuscriptcentral.com/tmpr
Production & Manufacturing Research
123456789101112131415161718192021222324252627282930313233343536373839404142434445464748495051525354555657585960
For Peer Review O
nly
227x140mm (300 x 300 DPI)
Page 18 of 28
URL: http://mc.manuscriptcentral.com/tmpr
Production & Manufacturing Research
123456789101112131415161718192021222324252627282930313233343536373839404142434445464748495051525354555657585960

For Peer Review O
nly
65x33mm (300 x 300 DPI)
Page 19 of 28
URL: http://mc.manuscriptcentral.com/tmpr
Production & Manufacturing Research
123456789101112131415161718192021222324252627282930313233343536373839404142434445464748495051525354555657585960

For Peer Review O
nly
65x33mm (300 x 300 DPI)
Page 20 of 28
URL: http://mc.manuscriptcentral.com/tmpr
Production & Manufacturing Research
123456789101112131415161718192021222324252627282930313233343536373839404142434445464748495051525354555657585960

For Peer Review O
nly
65x33mm (300 x 300 DPI)
Page 21 of 28
URL: http://mc.manuscriptcentral.com/tmpr
Production & Manufacturing Research
123456789101112131415161718192021222324252627282930313233343536373839404142434445464748495051525354555657585960
For Peer Review O
nly
65x33mm (300 x 300 DPI)
Page 22 of 28
URL: http://mc.manuscriptcentral.com/tmpr
Production & Manufacturing Research
123456789101112131415161718192021222324252627282930313233343536373839404142434445464748495051525354555657585960

For Peer Review O
nly
65x33mm (300 x 300 DPI)
Page 23 of 28
URL: http://mc.manuscriptcentral.com/tmpr
Production & Manufacturing Research
123456789101112131415161718192021222324252627282930313233343536373839404142434445464748495051525354555657585960

For Peer Review O
nly
65x33mm (300 x 300 DPI)
Page 24 of 28
URL: http://mc.manuscriptcentral.com/tmpr
Production & Manufacturing Research
123456789101112131415161718192021222324252627282930313233343536373839404142434445464748495051525354555657585960

For Peer Review O
nly
102x65mm (96 x 96 DPI)
Page 25 of 28
URL: http://mc.manuscriptcentral.com/tmpr
Production & Manufacturing Research
123456789101112131415161718192021222324252627282930313233343536373839404142434445464748495051525354555657585960

For Peer Review O
nly
134x29mm (96 x 96 DPI)
Page 26 of 28
URL: http://mc.manuscriptcentral.com/tmpr
Production & Manufacturing Research
123456789101112131415161718192021222324252627282930313233343536373839404142434445464748495051525354555657585960
For Peer Review O
nly
146x39mm (96 x 96 DPI)
Page 27 of 28
URL: http://mc.manuscriptcentral.com/tmpr
Production & Manufacturing Research
123456789101112131415161718192021222324252627282930313233343536373839404142434445464748495051525354555657585960

For Peer Review O
nly
139x43mm (96 x 96 DPI)
Page 28 of 28
URL: http://mc.manuscriptcentral.com/tmpr
Production & Manufacturing Research
123456789101112131415161718192021222324252627282930313233343536373839404142434445464748495051525354555657585960


