Embed Size (px)
Citation preview

ORIGINAL ARTICLE
A Randomized Multicenter Trial to Evaluate Simple UtilityElicitation Techniques in Patients With Gastroesophageal
Reflux Disease
Holger J. Schunemann, MD, PhD,*†‡ David Armstrong, MA, MB BChir,§Alessio Degl’innocenti, PhD,¶ Ingela Wiklund, PhD,¶ Carlo A. Fallone, MD,� Lisa Tanser, MSc,**
Sander Veldhuyzen Van Zanten, MD,†† Diane Heels-Ansdell, MSc,‡ Samer El-Dika, MD, MSc,*Naoki Chiba, MD,§‡‡ Alan N. Barkun, MD,� Peggy Austin,‡ and Gordon H. Guyatt, MD, MSc‡§
Background: Despite recommendations that patients rating theirown health using utility and preference measures such as the feelingthermometer (FT) and standard gamble (SG) should also rate hypo-thetical marker states, little evidence supports marker state use. Weevaluated whether the administration of marker states improvesmeasurement properties of the FT and SG.Methods: We randomized 217 patients with gastroesophageal refluxdisease to complete the FT (self-administered) and SG with markerstates (FT�/SG�, n � 112) or without marker states (FT�/SG�, n� 105) before and after 4 weeks of treatment with a proton pumpinhibitor, esomeprazole. Patients also completed other health-relatedquality of life instruments.Results: The use of marker states did not influence baseline utilityscores (FT� 0.66, FT� 0.68; SG� 0.77, SG� 0.78, on a scale from0 �dead� to 1.0 �full health�). Improvement after therapy was 0.21 inFT� and 0.15 in FT� (both P � 0.001; difference between FT�and FT� � 0.06, P � 0.02). Improvement in SG� was 0.07 (P �0.001) and 0.06 in SG� (P � 0.003) (difference between SG� andSG� � 0.01, P � 0.63). Correlations with other health-relatedquality of life scores were generally stronger, with some statistically
significant differences in correlations, for FT� compared with FT�,but tended to be weaker for SG� compared with SG�.Conclusion: The administration of marker states improved theresponsiveness and validity of the FT but not of the SG. Decisionsabout administering marker states should depend on whether the FTand SG is of primary interest and the importance of optimal validityand responsiveness relative to competing objectives such as effi-ciency.
Key Words: quality of life, visual analogue scale, clinical trial,gastroesophageal reflux disease, GERD, standard gamble, feelingthermometer, preference measures, utilities
(Med Care 2004;42: 1132–1142)
Utility and health state preference measures yield data thatare useful for economic analysis and for measurement of
health-related quality of life (HRQL).1–5 For instance, utilitymeasurements are required to generate quality-adjusted lifeyears (QALY) that are applied broadly in the medical liter-ature.6 Investigators can choose from several methods forobtaining utilities.7–15
Direct preference instruments generate a value or utilityscore for respondents’ current health state, typically on a 0.0to 1.0 scale, where 0.0 indicates dead and 1.0 indicates fullhealth. Authorities regard the standard gamble (SG), a directpreference instrument, as the reference standard for utilitymeasurement.5,13,16 The SG requires interviewer administra-tion, may be conceptually challenging for the patient, andmay be unresponsive to small but important changes inHRQL.17–20 Therefore, investigators use other instruments tomeasure HRQL and obtain utility estimates, including thefeeling thermometer (FT), a visual analog scale presented inthe form of a thermometer.13 When completing the FT,patients choose the score on the thermometer that representsthe value they place on their health state. The FT is far
From the *Department of Medicine, School of Medicine and BiomedicalSciences and the †Department of Social & Preventive Medicine, Schoolof Public Health and Health Professions, University at Buffalo, StateUniversity of New York, Buffalo, New York; the ‡Department ofClinical Epidemiology and Biostatistics and the §Department of Medi-cine, McMaster University, Hamilton, Ontario, Canada; ¶AstraZenecaR&D, Clinical Science, Molndal, Sweden; the �Division of Gastroenter-ology, McGill University Health Center, Montreal, Quebec, Canada;**AstraZeneca R&D, Canada, Mississauga, Ontario, Canada; ††Dalhou-sie University, Halifax, Nova Scotia, Canada; and ‡‡Surrey GI Research/Clinic, Guelph, Ontario, Canada.
Supported by a grant from AstraZeneca Pharmaceuticals Inc, Mississauga,Canada, and Lund, Sweden.
Reprints: Dr. Holger J. Schunemann, McMaster University Health SciencesCentre, Room 2C12, Hamilton, Ontario, L8N 3Z5, Canada. E-mail:[email protected].
Copyright © 2004 by Lippincott Williams & WilkinsISSN: 0025-7079/04/4211-1132
Medical Care • Volume 42, Number 11, November 20041132

simpler than the SG and has shown good responsiveness andvalidity in several studies.17,20–23 Although experience withthe FT is predominantly based on interviewer administration,self-administration may be practicable, especially in the con-text of a clinical trial.
The use of direct preference instruments like the SGand FT requires that patients have a clear sense of the taskinvolved. For example, they must understand how their ownhealth state compares to other health states, including theextreme health states of “full health” and “dead.” To achieveoptimal understanding of the task involved and to increasepatients’ thoughtfulness about their ratings, authorities rec-ommend that patients rate hypothetical health states—patientscenarios or clinical marker states—before rating their ownhealth.24–27 For example, Mohide and colleagues suggestedthat marker states improve task understanding, because theyremind patients to think about specific domains that affecttheir HRQL.27 Marker states may also stimulate patients toconsider how their disease impacts on these HRQL domains.
Patients typically rate 3 marker states representingmild, moderate, and severe impairment of HRQL beforerating their own health. Although the use of marker states iswidespread and makes intuitive sense, few studies haveaddressed their impact on the measurement properties ofdirect preference rating instruments. Indeed, the only directcomparison of which we are aware, our own previous study,failed to demonstrate convincing improvements in measure-ment properties for either the SG or FT with marker states.18
Our previous study was not, however, powered toprovide definitive conclusions. Therefore, we conducted amulticenter randomized trial to compare administration of theFT and SG with and without clinical marker states. We chosepatients with gastroesophageal reflux disease (GERD) be-cause these patients have significantly impaired HRQL andproton pump inhibitors (PPI), such as esomeprazole, providethe most effective symptom relief and subsequent improve-ment in HRQL.28–32
METHODS
Patients and Therapeutic InterventionFrom March 2002 until March 2003, we recruited
outpatients from 17 centers across Canada that care forpatients with GERD. Thirteen centers were specialist gastro-enterology practices, and 4 were general practices, includingboth rural and urban areas. We included patients with aclinical diagnosis of GERD (specific criterion for heartburn:patients identified their main symptom as a burning feeling,rising from the epigastrium or lower part of the chest uptowards the neck), who were at least 18 years of age,symptomatic for 3 months or longer, and had heartburn for 4days or more during the 7 days prior to the first visit. Weincluded only patients who, when asked to think of the pain,
discomfort, upset, or limitations in the activities that theysuffered during the last week as a result of stomach problems,reported at least moderate problems on a 7-point scale rang-ing from no problem to very severe problems. Appendix 1provides a complete list of exclusion criteria.
Recruited patients included patients newly diagnosedwith GERD or patients with a history of GERD who had nottaken PPIs for at least 2 weeks prior to recruitment or thosewilling to refrain from PPI use for 2 weeks or more beforerandomization. After randomization, patients were treatedwith a PPI, esomeprazole 40 mg daily (Nexium, AstraZenecaCanada, Mississauga, Ontario), for 4 weeks.31 The goal ofthis study was to compare the difference between alternativeformats of utility instrument administration. We did notinclude a placebo group and, thus, the results are unlikely toreflect an unbiased assessment of treatment effects.
Direct Preference MeasuresFeeling Thermometer With Marker States (FT�)
The FT is a visual analog scale shown as a thermometerin which the best state is full health (equal to a score of 100)and the worst state is dead (a score of 0).13 We used aself-administered version of the FT. We developed 3 markerstates, intended to represent mild, moderate, and severesymptoms of GERD and the mild, moderate, and severeimpact on HRQL, using items from the Quality of Life inReflux and Dyspepsia (QOLRAD) Questionnaire, a diseasespecific HRQL questionnaire for patients with GERD anddyspepsia.33 We asked participating gastroenterologists toprovide feedback about the marker states and made revisionsaccordingly. Finally, we enrolled 14 patients to evaluate andrefine the marker states.34 Table 1 shows the final markerstates, as presented to study participants:
Feeling Thermometer Without Marker States(FT�)
In the alternative mode of administration, patients com-pleted the self-administered FT rating of their own healthstate without prior exposure to, or rating of, the 3 markerstates.
Standard Gamble (SG)This instrument offers patients 2 options from which a
choice must be made: Choice A is the certain outcome thatthe patient will stay in a health state (their own health state,or a marker state) for t years until death. We varied tdepending on the patient’s age as follows: patients aged morethan 80 years, t � the rest of the patient’s lifetime; age 76–80years, t � 10 years; age 66–75 years, t � 15 years; age56–65, t � 25 years; age 46–55 years, t � 30 years; age36–45 years, t � 35 years; age 26–35 years, t � 40 years;age 18–25 years, t � 45 years. Specifying the duration ofremaining life means that patients use the same time frame as
Medical Care • Volume 42, Number 11, November 2004 Use of Health Marker States and Preference Instruments
© 2004 Lippincott Williams & Wilkins 1133

other patients of the same age and reduces the random errorthat might result from patients inferring different time frames.Varying time frame by age minimizes an additional lack ofrealism that could arise if one chose a single time frame andeither young patients have an unrealistically short duration ofremaining life or old patients have an unrealistically longduration. The alternative (choice B) is a hypothetical treat-ment with 2 possible outcomes: 1) returning to full health(probability p) for t years, at the end of which the patient diesor 2) immediate death (probability 1 � p). Interviewers useda chance board with the ping-pong approach varying theprobability p in steps of 0.05 to obtain the value, p*, wherethe patient considered choice A equal to choice B.13,35 Thisindifference probability, p*, is the utility value for the healthstate or the patient’s own health in choice A in the interval
from dead (� 0) to full health (� 1). The greater a respon-dent’s willingness to accept the risk of a worse outcome (eg,dead) to avoid the health state in choice A, then the lower isthe utility of the state in choice A to them. We administeredthe SG in 2 formats. In one (SG�), patients rated the 3marker states (mild, moderate, and severe GERD) prior torating their own health state. The marker states were identicalto those used with the FT. In the other approach (SG�),patients rated their own health state without prior exposure tothe marker states.
Definition of Full Health and DeathWe defined full health and provided a definition similar
to that of Health Utilities Index Mark 3 (HUI-3) for both theFT and the SG.9,18 The descriptions included phrases such as
TABLE 1. Marker States for Mild, Moderate, and Severe Gastroesophageal Reflux Disease (GERD)
Mild GERD:Most days has mild stomach pain or heartburnAbout once a week feels acid coming back from the stomach into the mouthOnce every week may have problems sleeping due to stomach painRarely has problems carrying out housework or going out to workNo difficulty with activities of social lifeOnce a week feels irritable, frustrated, and anxious about her problem
Moderate GERD:Burning stomach pains daily for some of the day in the upper part of the stomach that rise into the chestSome days of the week feels nauseated and does not feel like eatingHas to avoid some favorite foodsAlmost every day has a feeling of acid coming back from her stomach into the mouthAbout one day a week feels tired and worn outTrouble getting to sleep2 or 3 days a week awakened by pain at nightDifficulty bending overSome difficulty carrying out household responsibilitiesMisses work about once a monthSeveral days a week feels irritable, frustrated, impatient, and angry about the limitations caused by stomach problems
Severe GERD:Severe burning stomach pains every day for much of the day in the upper part of the stomach that rise into the chest and which feellike heartburnMost days of the week feels nauseated and does not feel like eatingHas to avoid many favorite foodsSeveral times a day has a feeling of acid coming back from the stomach into the mouth2 or 3 days a week feels tired and worn outGreat difficulty getting to sleepAwakened up by pain several times every nightGreat difficulty bending overLots of difficulty carrying out household responsibilitiesMisses work 2 or 3 days each monthMost days feel irritable, frustrated, and anxiousAngry about the limitations caused by stomach problems
Schunemann et al Medical Care • Volume 42, Number 11, November 2004
© 2004 Lippincott Williams & Wilkins1134

“Able to see well enough to read ordinary newsprint andrecognize a friend on the other side of the street withoutglasses or contact lenses” and “Able to hear what is said in agroup conversation with at least 3 other people without ahearing aid.” We defined the worst health state as dead(equivalent to a score of 0). We did not ask patients to rate thestates full health or dead.
Validation InstrumentsPatients completed the disease specific QOLRAD at
baseline and follow-up. The QOLRAD consists of 25 itemsacross 5 dimensions: emotional distress, sleep dysfunction,vitality, food/drink problems, and physical/social function-ing.36 Respondents provide answers on a 7-point Likert-typescale. The lower the value, the more severe is the impact ondaily functioning. The QOLRAD is reliable, valid and re-sponsive.36
We also administered the HUI-39 and the MedicalOutcomes Short Form 36 (SF-36) questionnaires at base-line.37 We asked patients about the 4 symptoms (stomachache, heartburn, belching and acid reflux) both at baseline andfollow-up using a 7-point Likert-type scale on which lowerscores indicated milder symptoms.
Study DesignWe randomized patients to either the FT� and SG� or
the FT� and SG� format of direct preference measurement.We asked patients to rate their own health as it had been inthe 2 weeks prior to the interview both at baseline andfollow-up. In the FT�/SG� group, patients first rated the 3marker states on the FT before rating their own health on theFT, followed by the same 3 marker states and their ownhealth on the SG. In the FT�/SG� group, patients rated theirown health on the FT followed by the SG. We chose thisorder of administration because we were interested in evalu-ating the FT as a freestanding self-administered instrument.Therefore, we avoided exposure to any other HRQL instru-ments before patients rated the FT. We also randomized theorder of the marker states in 2 possible sequences (eithermoderate, severe and mild or moderate, mild and severe,respectively) to account for possible effects of administrationorder. We administered all instruments in the same order bothat the baseline and the follow-up visit. The initial interviewstook place on the day prior to commencement of esomepra-zole therapy and the follow-up interview took place at a clinicvisit 4–6 weeks thereafter. Patients continued esomeprazolefor the entire study period. At follow-up the treating clinicianperformed an overall rating of the patients’ change in symp-tom status on a 7-point scale.
An experienced research coordinator (P.A.) from themethod center trained all site interviewers in a day-longsession. Because 2 centers enrolled French-speaking patients,all instruments were translated to French and backtranslated
to English in duplicate or until the method center investiga-tors were satisfied with the back translation.
We performed randomization centrally at the methodcenter in blocks of 8 stratified by center (centers were blindedto block size) and provided all study material (including allHRQL instruments) in prepared sealed envelops to eachcenter. Ethic review boards at all study sites approved thestudy protocol and all patients signed an informed consentform prior to enrollment in the study.
While writing the manuscript, the authors were blind topatients’ group assignment (with the exception of the statistician,DH-A). The authors wrote 2 complete versions of the manu-script with alternative possible allocation patterns to avoid biasin the interpretation of the results.38 That is, the statisticianlabeled results as Group A and B, and the authors were unawareof whether group A was exposed, or not exposed, to the markerstates. The authors then wrote 2 manuscripts. One assumed thatgroup A was exposed to marker states, the other that group Bwas exposed to marker states. We broke the code only afteragreeing that there would be no further changes to the manu-script, and submitted the appropriate manuscript. This approachlimited possible bias during the interpretation of the data thatsome of the authors might have had as a result of our previousstudy. For instance, whether one interprets differences in corre-lations as either weak or strong trends suggesting differentialvalidity of alternative approaches is a matter of judgment.Blinded writing of manuscripts reduces biased interpretation ofthese trends.
Statistical AnalysisWe compared groups using unpaired and paired t-tests
for continuous outcome variables and the �2 test for categor-ical outcome variables. We performed a linear transformationof the FT scores for better comparison with the SG bydividing the scores by 100. Thus, in this analysis the reportedscores on the FT ranged from 0 to 1.
ResponsivenessWe focused on the ability of FT�, FT�, SG�, and
SG� to detect improvement with esomeprazole therapy byperforming paired t-tests comparing baseline and follow-upvalues on the FT with and without the randomly allocatedmarker states. To evaluate relative responsiveness of theinstruments, we compared the differences between scoresfrom the baseline and follow-up visit between the FT withand without use of the marker states using an unpaired t test.We made the same comparison for the SG with and withoutthe marker states.
ValidityWe evaluated the cross-sectional validity of the instru-
ments using data from the baseline visit. We calculated Pearsoncorrelation coefficients for the scores on the FT, SG, HUI-3,QOLRAD, SF-36 and the 4 symptoms questions at baseline and
Medical Care • Volume 42, Number 11, November 2004 Use of Health Marker States and Preference Instruments
© 2004 Lippincott Williams & Wilkins 1135
assumed that higher correlations of the FT and SG with thevalidation instruments would indicate greater validity. To assesslongitudinal validity of the instruments we calculated the Pear-son correlation coefficients for the differences between scoresfrom the baseline and follow-up visit for FT�, FT�, SG� andSG� with the change on the QOLRAD, the clinicians’ assess-ment and the 4 symptoms questions. We compared the Pearsoncorrelation coefficients using the z-test.
Sample SizeThe primary outcome of interest in this study was the
relative responsiveness of the FT�/SG� compared withFT�/SG�. In our previous study, the mean scores in theFT� group (on the scale from 0.00 to 1.00) increased by 0.07�SD 0.20� after the intervention.15 The corresponding changefor the administration of the FT in the FT� group was 0.14�SD 0.21�. Thus, the difference in the magnitude of changebetween the 2 groups was 0.07 �SD 0.20�. We previously alsofound that the minimal important difference on the FT isapproximately 0.05 to 0.08.39 We determined that by enroll-ing 200 patients (100 in each group) we would be able todetect a difference of 0.08 (equal to approximately 0.4 SD ofthe change score) in the change between the 2 groups with a2-tailed test, an assuming alpha of 0.05 and a beta of 0.2.
Multiple TestingFor the evaluation of validity in our study we used a
number of HRQL instruments, some with several dimensions.As a result we performed a multitude of statistical tests,thereby increasing the chances of statistically significantfindings in the absence of adjustment of the p-values. How-ever, in the present report we have made no adjustment formultiple comparisons because we used validation instrumentswith correlated scores and because there is no consensus onhow one should adjust in this analysis.
RESULTSWe initially enrolled 249 patients, of whom 12 patients
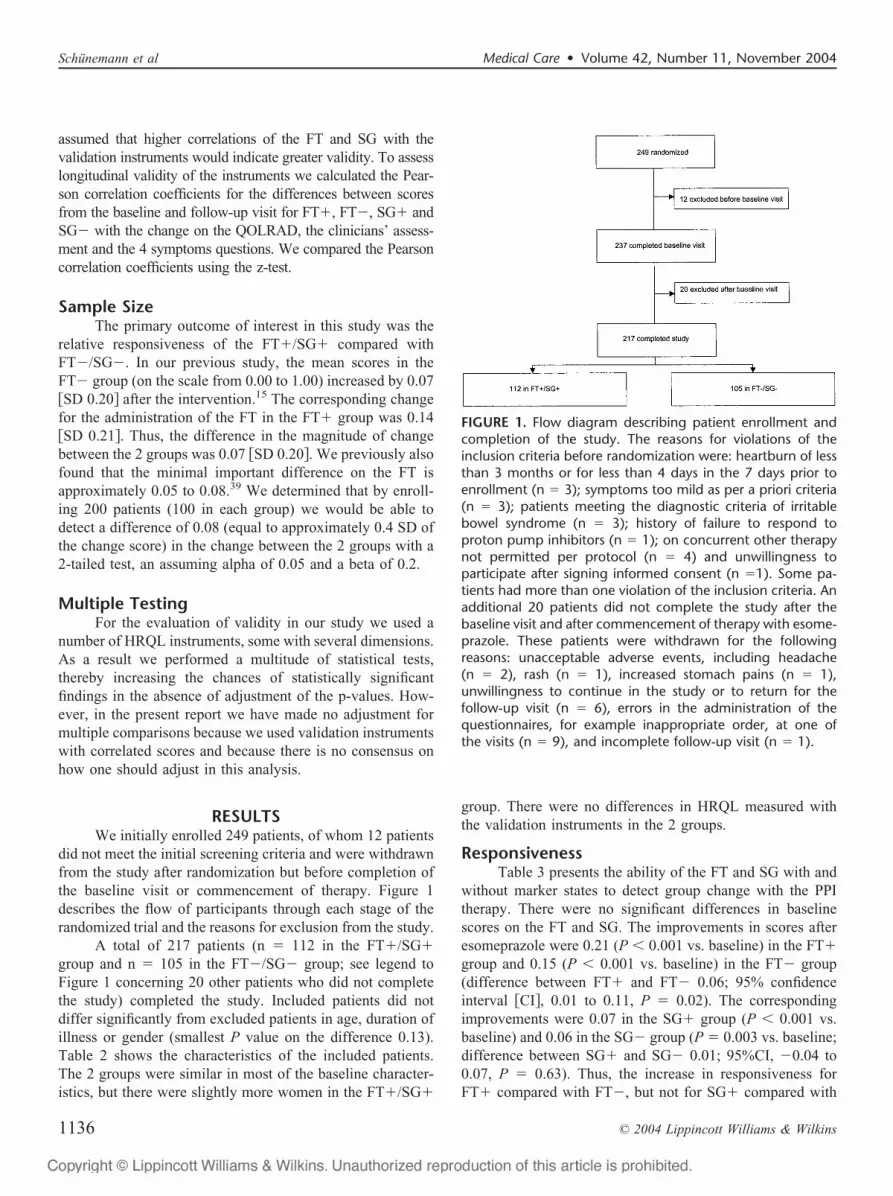
did not meet the initial screening criteria and were withdrawnfrom the study after randomization but before completion ofthe baseline visit or commencement of therapy. Figure 1describes the flow of participants through each stage of therandomized trial and the reasons for exclusion from the study.
A total of 217 patients (n � 112 in the FT�/SG�group and n � 105 in the FT�/SG� group; see legend toFigure 1 concerning 20 other patients who did not completethe study) completed the study. Included patients did notdiffer significantly from excluded patients in age, duration ofillness or gender (smallest P value on the difference 0.13).Table 2 shows the characteristics of the included patients.The 2 groups were similar in most of the baseline character-istics, but there were slightly more women in the FT�/SG�
group. There were no differences in HRQL measured withthe validation instruments in the 2 groups.
ResponsivenessTable 3 presents the ability of the FT and SG with and
without marker states to detect group change with the PPItherapy. There were no significant differences in baselinescores on the FT and SG. The improvements in scores afteresomeprazole were 0.21 (P � 0.001 vs. baseline) in the FT�group and 0.15 (P � 0.001 vs. baseline) in the FT� group(difference between FT� and FT� 0.06; 95% confidenceinterval �CI�, 0.01 to 0.11, P � 0.02). The correspondingimprovements were 0.07 in the SG� group (P � 0.001 vs.baseline) and 0.06 in the SG� group (P � 0.003 vs. baseline;difference between SG� and SG� 0.01; 95%CI, �0.04 to0.07, P � 0.63). Thus, the increase in responsiveness forFT� compared with FT�, but not for SG� compared with
FIGURE 1. Flow diagram describing patient enrollment andcompletion of the study. The reasons for violations of theinclusion criteria before randomization were: heartburn of lessthan 3 months or for less than 4 days in the 7 days prior toenrollment (n � 3); symptoms too mild as per a priori criteria(n � 3); patients meeting the diagnostic criteria of irritablebowel syndrome (n � 3); history of failure to respond toproton pump inhibitors (n � 1); on concurrent other therapynot permitted per protocol (n � 4) and unwillingness toparticipate after signing informed consent (n �1). Some pa-tients had more than one violation of the inclusion criteria. Anadditional 20 patients did not complete the study after thebaseline visit and after commencement of therapy with esome-prazole. These patients were withdrawn for the followingreasons: unacceptable adverse events, including headache(n � 2), rash (n � 1), increased stomach pains (n � 1),unwillingness to continue in the study or to return for thefollow-up visit (n � 6), errors in the administration of thequestionnaires, for example inappropriate order, at one ofthe visits (n � 9), and incomplete follow-up visit (n � 1).
Schunemann et al Medical Care • Volume 42, Number 11, November 2004
© 2004 Lippincott Williams & Wilkins1136
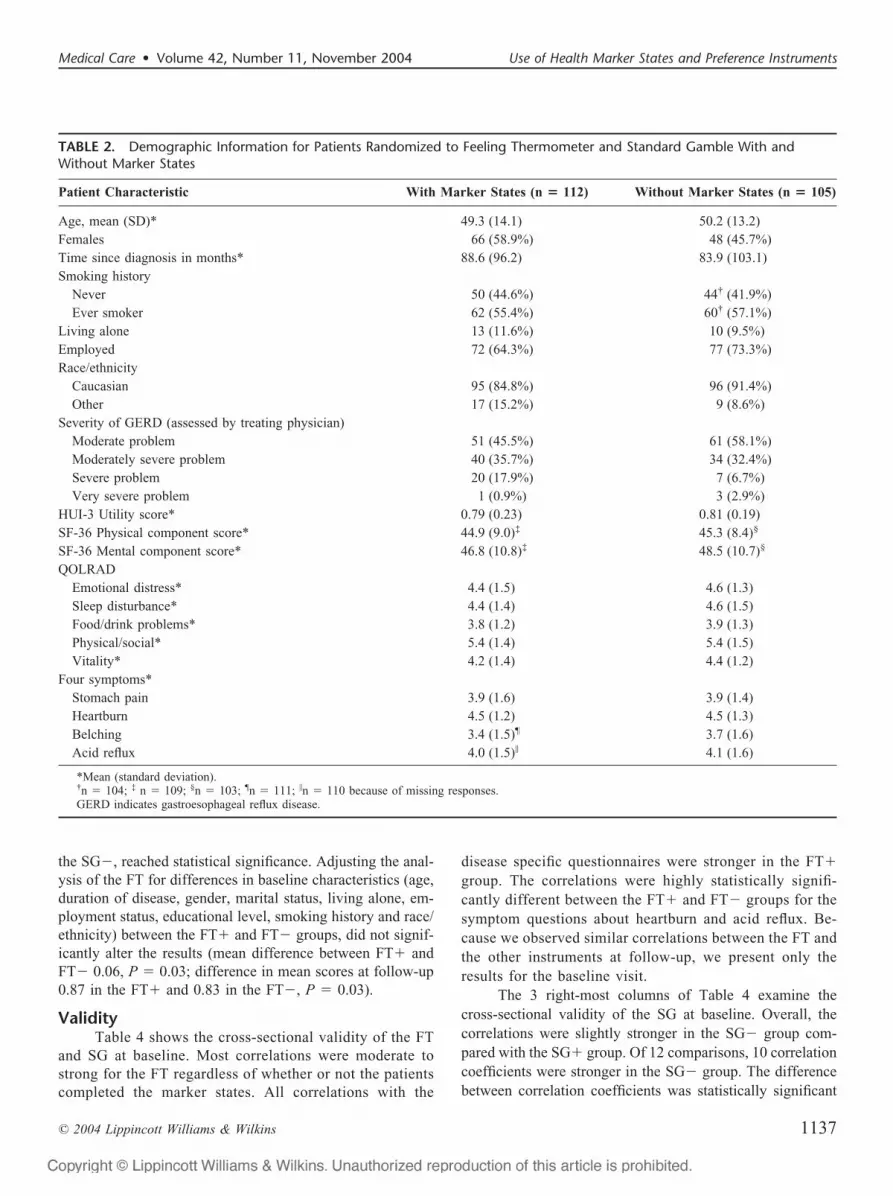
the SG�, reached statistical significance. Adjusting the anal-ysis of the FT for differences in baseline characteristics (age,duration of disease, gender, marital status, living alone, em-ployment status, educational level, smoking history and race/ethnicity) between the FT� and FT� groups, did not signif-icantly alter the results (mean difference between FT� andFT� 0.06, P � 0.03; difference in mean scores at follow-up0.87 in the FT� and 0.83 in the FT�, P � 0.03).
ValidityTable 4 shows the cross-sectional validity of the FT
and SG at baseline. Most correlations were moderate tostrong for the FT regardless of whether or not the patientscompleted the marker states. All correlations with the
disease specific questionnaires were stronger in the FT�group. The correlations were highly statistically signifi-cantly different between the FT� and FT� groups for thesymptom questions about heartburn and acid reflux. Be-cause we observed similar correlations between the FT andthe other instruments at follow-up, we present only theresults for the baseline visit.
The 3 right-most columns of Table 4 examine thecross-sectional validity of the SG at baseline. Overall, thecorrelations were slightly stronger in the SG� group com-pared with the SG� group. Of 12 comparisons, 10 correlationcoefficients were stronger in the SG� group. The differencebetween correlation coefficients was statistically significant
TABLE 2. Demographic Information for Patients Randomized to Feeling Thermometer and Standard Gamble With andWithout Marker States
Patient Characteristic With Marker States (n � 112) Without Marker States (n � 105)
Age, mean (SD)* 49.3 (14.1) 50.2 (13.2)Females 66 (58.9%) 48 (45.7%)Time since diagnosis in months* 88.6 (96.2) 83.9 (103.1)Smoking history
Never 50 (44.6%) 44† (41.9%)Ever smoker 62 (55.4%) 60† (57.1%)
Living alone 13 (11.6%) 10 (9.5%)Employed 72 (64.3%) 77 (73.3%)Race/ethnicity
Caucasian 95 (84.8%) 96 (91.4%)Other 17 (15.2%) 9 (8.6%)
Severity of GERD (assessed by treating physician)Moderate problem 51 (45.5%) 61 (58.1%)Moderately severe problem 40 (35.7%) 34 (32.4%)Severe problem 20 (17.9%) 7 (6.7%)Very severe problem 1 (0.9%) 3 (2.9%)
HUI-3 Utility score* 0.79 (0.23) 0.81 (0.19)SF-36 Physical component score* 44.9 (9.0)‡ 45.3 (8.4)§
SF-36 Mental component score* 46.8 (10.8)‡ 48.5 (10.7)§
QOLRADEmotional distress* 4.4 (1.5) 4.6 (1.3)Sleep disturbance* 4.4 (1.4) 4.6 (1.5)Food/drink problems* 3.8 (1.2) 3.9 (1.3)Physical/social* 5.4 (1.4) 5.4 (1.5)Vitality* 4.2 (1.4) 4.4 (1.2)
Four symptoms*Stomach pain 3.9 (1.6) 3.9 (1.4)Heartburn 4.5 (1.2) 4.5 (1.3)Belching 3.4 (1.5)¶ 3.7 (1.6)Acid reflux 4.0 (1.5)� 4.1 (1.6)
*Mean (standard deviation).†n � 104; ‡ n � 109; §n � 103; ¶n � 111; �n � 110 because of missing responses.GERD indicates gastroesophageal reflux disease.
Medical Care • Volume 42, Number 11, November 2004 Use of Health Marker States and Preference Instruments
© 2004 Lippincott Williams & Wilkins 1137

for the QOLRAD sleep disturbance domain. As with the FT,the correlations between the SG and other instruments atfollow-up were similar to those at baseline.
Table 5 shows the correlations of the change scoresfrom baseline to follow-up for the FT and SG with the othermeasures. The correlation of the FT with the SG was strongerwithout administration of the marker states, but the differencein the correlation coefficient compared with FT� failed toreach statistical significance. Correlations between the FTand other instruments were generally moderately strong andwere stronger in the FT� group compared with the FT�group. Differences between the strength of correlations
reached statistical significance for heartburn, belching andacid reflux symptoms.
Compared with omission of marker states, the adminis-tration of marker states with the SG resulted in similar correla-tion coefficients for most questionnaires. The coefficient wasstatistically significantly weaker for the QOLRAD sleep distur-bance domain in the SG� compared with the SG� group.
The correlations of the FT and SG with the clinicians’global assessment were weak and did not differ by groupassignment. Adjusting these correlation coefficients for dif-ferences in baseline characteristics did not alter the coeffi-cients importantly.
TABLE 3. Responsiveness of the Feeling Thermometer and the Standard Gamble With and Without Marker States
Group nBaseline,
Mean � SDFollow-up,
Mean � SD
Differences: Follow-up �Baseline (95% Confidence
Interval)
P Value for DifferenceBetween the Baseline
and Follow-up
FT with marker states 112 0.66 � 0.21 0.87 � 0.14 0.21 (0.17, 0.25) � 0.001FT without marker states 105 0.68 � 0.17 0.83 � 0.12 0.15 (0.12, 0.18) � 0.001P value for difference between groups 0.39 0.03 0.02
SG with marker states 112 0.77 � 0.18 0.85 � 0.16 0.07 (0.04, 0.11) � 0.001SG without marker states 105 0.78 � 0.21 0.84 � 0.18 0.06 (0.02, 0.10) 0.003P value for difference between groups 0.75 0.84 0.63
TABLE 4. Cross-sectional Validity of the Feeling Thermometer and Standard Gamble Groups at Baseline (Pearson CorrelationCoefficient)
Type ofInstrument QOLRAD Food/Drink Problem
FeelingThermometerWith Marker
States(n � 112)
FeelingThermometer
WithoutMarkerStates
(n � 105)
P Value forComparingCorrelationCoefficients
StandardGamble
WithMarkerStates
(n � 112)
StandardGambleWithoutMarkerStates
(n � 105)
P Value forComparingCorrelationCoefficients
Utility measures Standard gamble 0.37*** 0.55*** 0.09 — — —HUI 3 utility score 0.33*** 0.41*** 0.48 0.27** 0.37*** 0.43
Generic measures SF-36 PCS 0.40***‡ 0.39***§ 0.93 0.27*‡ 0.37***§ 0.43SF-36 MCS 0.35***‡ 0.31**§ 0.74 0.25**‡ 0.20*§ 0.68
Disease-specificquestionnaire
QOLRAD emotional distress 0.57*** 0.36*** 0.049 0.25* 0.29** 0.76
QOLRAD sleep disturbance 0.43*** 0.34*** 0.46 0.11 0.38*** 0.035QOLRAD food/drink problem 0.44*** 0.28** 0.17 0.22* 0.33** 0.38QOLRAD physical/social 0.46*** 0.28** 0.12 0.22* 0.29** 0.58QOLRAD vitality 0.51*** 0.42*** 0.37 0.23* 0.39*** 0.21Four symptoms stomach pain �0.38*** �0.23* 0.24 �0.19* �0.10 0.48Four symptoms heartburn �0.48*** �0.13 0.004 �0.11 �0.15 0.79Four symptoms belching �0.31**¶ �0.10 0.11 �0.00¶ 0.16 0.23Four symptoms acid reflux �0.50***� �0.17 0.006 �0.15� �0.18 0.81
*P � 0.05; ** P � 0.01; *** P � 0.001.‡n � 109; § n � 103; ¶n � 111; � n � 110 because of missing responses.
Schunemann et al Medical Care • Volume 42, Number 11, November 2004
© 2004 Lippincott Williams & Wilkins1138

DISCUSSIONThis randomized controlled trial evaluated the influ-
ence of administering hypothetical health or marker states onthe measurement properties of 2 instruments used to obtainutility scores, the FT and SG. Although both instrumentsdetected change in HRQL or utilities of a magnitude thatpatients would rate as an important difference,39 we observedincreased responsiveness and higher validity in the FT�group than in the FT� group (Table 3). On the other hand,the results suggested slightly greater cross-sectional and lon-gitudinal validity in the SG� group than in the SG� group(Tables 4 and 5).
The strengths of this randomized trial include the care-ful development of the marker states and its randomizedmulticenter design involving a large number of patients. Thestudy’s parallel group design eliminated the possibility of onemethod influencing the administration of the other. In addi-tion, we used an intervention of known effectiveness inregard to improving HRQL in patients with GERD.31 An-other strength of our study was the use of multiple validationinstruments and the use of a self-administered version of theFT. We found that the FT works well as a self-administeredinstrument in clinical trials for which evaluative properties(responsiveness and longitudinal validity) are of greatestimportance. Finally, to reduce bias in interpretation of theresults we agreed upon a final blinded version of the manu-script before knowing whether marker states affected mea-surement properties of the utility instruments.38
The study has some weaknesses. We limited ourselvesto addressing the impact of marker states on the responsive-ness and validity of the FT and SG. Thus, even if markerstates did not improve the validity and the responsiveness ofthe SG, they may be useful in enhancing their interpretabilityfor those evaluating effectiveness of interventions and clini-cians, an issue we did not address in this study.40,41 Inaddition, while we developed the clinical marker states care-fully based on a validated disease-specific questionnaire, theQOLRAD, it is possible that different, equally rigorous waysof developing and defining clinical marker states would haveled to different results. Finally, patients always rated the FTbefore the SG. We chose this approach to test the FT as afreestanding instrument, and because current recommenda-tions from health economists suggest the FT always precedethe SG. The choice means, however, that we cannot excludethat the measurement properties of the FT were superior tothose of the SG because patients experienced fatigue or lostfocus on the task for other reasons.
The FT showed moderate to strong correlations withchange scores on the other questionnaires (Table 5). Thecorrelations were stronger with the marker states, but thedifferences reached statistical significance for only 3 symp-tom questions (Table 5). The SG, in contrast, showed poorlongitudinal validity; correlations were near 0 (Table 5).
Utilities obtained with visual analogue scales, suchas the FT, are usually lower than utilities obtained with theSG.42– 44 That is, patients place a lower apparent value on
TABLE 5. Longitudinal Validity of the Feeling Thermometer and Standard Gamble Correlations Between Changes in theFeeling Thermometer, Standard Gamble, and Other Instruments (Pearson Correlation Coefficient)
Type ofInstrument Instrument
FeelingThermometerWith Marker
States(n � 112)
FeelingThermometer
WithoutMarkerStates
(n � 105)
P Value forComparingCorrelationCoefficients
StandardGamble
WithMarkerStates
(n � 112)
StandardGambleWithoutMarkerStates
(n � 105)
P Value forComparingCorrelationCoefficients
Utility measures Standard gamble 0.21* 0.40*** 0.13 — — —Disease-specific
questionnairesQOLRAD emotional distress 0.48*** 0.30** 0.14 0.03 0.22* 0.18
QOLRAD sleep disturbance 0.29** 0.27** 0.90 �0.05 0.23* 0.037QOLRAD food/drink problem 0.33*** 0.24* 0.47 0.07 0.20* 0.36QOLRAD physical/social 0.38*** 0.26* 0.31 0.01 0.15 0.31QOLRAD vitality 0.36*** 0.37*** 0.92 �0.01 0.17 0.19Clinician’s assessment of change �0.24* �0.30** 0.65 �0.06 �0.18 0.39Four symptoms stomach pain �0.28** �0.20* 0.52 0.14 0.04 0.44Four symptoms heartburn �0.43*** �0.13† 0.022 0.13 �0.09
†
0.12Four symptoms belching �0.27**§ 0.06 0.016 0.12� 0.16 0.77Four symptoms acid reflux �0.43***‡ �0.14 0.025 0.17
‡
0.03 0.31
*P � 0.05; ** P � 0.01; *** P � 0.001.†n � 104; ‡ n � 109; §n � 111 because of missing responses.
Medical Care • Volume 42, Number 11, November 2004 Use of Health Marker States and Preference Instruments
© 2004 Lippincott Williams & Wilkins 1139

impaired health states when using the FT than when usingthe SG. Our results are consistent with these prior findings,and also demonstrate smaller change in scores with the SGthan FT.
The findings of our previous trial in which we random-ized 84 elderly patients with COPD to an interviewer admin-istered FT and SG with or without administration of clinicalmarker states lend some support to the result of this study.18
Twelve weeks after beginning an intensive respiratory reha-bilitation program we found nonsignificant, but analogoustrends toward superior responsiveness with the FT and SGwhen patients rated marker states before rating their ownhealth state and reduced validity of the SG. The previousstudy was limited by its small sample size and, therefore, wemay have failed to detect important differences in respon-siveness. In terms of its cross-sectional validity, the self-administered FT worked well as a discriminative instrumentshowing moderate to high correlations with the validationinstruments (Table 4), irrespective of use of marker states.The SG showed relatively low correlations with the valida-tion instruments when marker states were administered andcross-sectional correlations were slightly higher when markerstates were omitted (Table 4).
In theory, the FT may be subject to end-of-scale aver-sion.45 However, we found substantial cross-sectional andlongitudinal correlations of the FT with generic and diseasespecific HRQL instruments. These findings suggest that end-of-scale aversion does not compromise the validity of the FTas a discriminative and evaluative measure of HRQL in thissetting. Moreover, the large changes in FT scores as a resultof therapy with esomeprazole provides further support for thegood responsiveness the FT had demonstrated in other stud-ies.18,21,22
One important reason why investigators do not use theSG frequently in clinical trials, despite the fact that it fulfillsbest the theoretical criteria of utility measurement, is the timeand effort required to administer the instrument. The tradi-tional use of the SG includes administration of marker states.With respect to the SG, both this study and our previous studysupport use of the SG in the least burdened fashion: withoutprior rating of marker states. Although investigators sug-gested that in contrast to other preference measures the FTmay be prone to context bias in that preference ratings dependon the number of marker states rated46,47 our results do notconfirm these suggestions. The use of marker states enhancedthe measurement properties of the FT. One of the possibleexplanations for the presence of context bias in other studiesis the lack of clearly defined reference points for full healthon rating scales.46,47 We provided a detailed explanation offull health. The trends towards reduced validity of the SGwith the use of marker states indicate that this bias may existfor the SG minimizing or even reversing any potential use-fulness of the marker states when administering the SG.
Change scores and follow-up scores were significantlyhigher in the FT� group. Most patients experienced largeimprovements in their HRQL. Rating marker states at fol-low-up may increase the likelihood that respondents use thefeeling thermometer in a similar fashion at follow-up as theydid at baseline. In other words, if their health state wereidentical at baseline and follow-up, they are more likely tomake the same FT rating; if they are feeling better or worse,their FT rating is more likely to be appropriately higher orlower. Were this the case, rating of marker states wouldreduce random error and result in higher follow-up andchange scores in a group that had improved. Mohide andcolleagues suggested that marker states may also remindpatients how much their disease affects specific HRQL do-mains and how their own health compares to that described inthe marker states.27 Possible explanations for the lack ofmarker states’ usefulness for the SG include fatigue in pa-tients who performed multiple ratings on the SG.13,19 Fatiguecould increase random error in patients rating their ownhealth state. Furthermore, the increased complexity of the SGmight result in difficulties with marker state rating. To theextent that patients find rating a hypothetical health state initself challenging, the SG may increase possible confusion.Future studies should investigate potential differences inreliability of marker state scores measured with differentpreference based instruments and aim at achieving highreliability of marker state ratings. In addition, marker statesmay be particularly helpful as anchors when patient repeattheir rating during several administrations or when patientsare informed about their prior ratings of marker states. Wepreviously showed that informing patients of their previousresponses to HRQL instruments administered after shorterintervals (up to 4 weeks) may improve the validity andresponsiveness of instruments,48,49 although this effect wasless pronounced after intervals of 12 weeks.50
In summary, we have demonstrated that marker statesincreased the responsiveness and validity of the FT. On thecontrary, marker states did not improve measurement prop-erties of the SG. We require studies in different populationsto definitively establish whether any gains in measurementproperties are worth the loss of efficiency associated with useof marker states in the administration of direct preferencemeasures. Until this evidence is available, however, decisionsabout use of marker states should depend on whether the SGand FT is of primary interest, and the importance of optimalvalidity and responsiveness in relation to competing objec-tives such as optimal efficiency.
ACKNOWLEDGMENTSParticipating investigators and affiliation: Dr. Iain Mur-
ray, Quest Clinical Trials, Markham, Ontario; Dr. DanielSadowski, Hys Medical Centre, Edmonton, Alberta; Dr. AlanBarkun and Dr. Serge Mayrand, Montreal General Hospital,
Schunemann et al Medical Care • Volume 42, Number 11, November 2004
© 2004 Lippincott Williams & Wilkins1140

Montreal, Quebec; Dr. Ford Bursey, St. John General Hos-pital, St. John’s, Newfoundland; Dr. Naoki Chiba, Surrey GIResearch/Clinic, Guelph, Ontario; Dr. Lawrence Cohen, Sun-nybrook & Women’s College, Toronto, Ontario; Dr. CarloFallone, Royal Victoria Hospital, Montreal, Quebec; Dr.Francis Joanes, Port Arthur Clinic, Thunder Bay; Dr. DavidMorgan, Hamilton Health Sciences Center, Hamilton, On-tario; Dr. Marc Bradette, L’Hotel-Dieu de Quebec, Quebec;Dr. David Armstrong, McMaster University Medical Centre,Hamilton, Ontario; Dr. Sander Veldhuyzen van Zanten,Queen Elizabeth II Health Sciences Centre, Halifax, NovaScotia; Dr. Pierre Pare, Hospital St. Sacrement, Quebec,Quebec; Dr. W. Olsheski, Albany Medical Clinic, Toronto,Ontario; Dr. Ivor Teitelbaum, Yorkview Medical Centre,North York, Ontario; Dr. Subodh Kanani, Lakeshore WestMedical Professional Centre, Toronto, Ontario; Dr. PaulBraude, Markham Research, Thornhill, Ontario. We wouldlike to thank Eileen Grace, MSc, for the contribution to thestudy.
REFERENCES1. Patrick DL, Erickson P. Health Status and Health Policy: Quality of Life
in Health Care Evaluation and Resource Allocation. Oxford UniversityPress. New York, 1993.
2. Wennberg JE. Outcomes research, cost containment, and the fear ofhealth care rationing. N Engl J Med. 1990;323:1202–1204.
3. Torrance GW, Feeny D. Utilities and quality-adjusted life years. Int JTech Ass Health Care. 1989;5:559–575.
4. Guyatt GH, Feeny DH, Patrick DL. Measuring health-related quality oflife. Ann Intern Med. 1993;118:622–629.
5. Feeny DH, Torrance GW. Incorporating utility-based quality-of-lifeassessment measures in clinical trials. Two examples. Med Care. 1989;27(3 Suppl):S190–S204.
6. Mehrez A, Gafni A. Quality-adjusted life years, utility theory, andhealthy-years equivalents. Med Decis Making. 1989;9:142–149.
7. EuroQol Group. EuroQol–a new facility for the measurement of health-related quality of life. Health Pol. 1990;16:199–208.
8. Kaplan RM, Bush JW, Berry CC. Health status: types of validity and theIndex of Well-being. Health Services Res. 1976;11:478–507.
9. Torrance GW, Furlong W, Feeny D, et al. Multi-attribute preferencesfunctions: Health Utilities Index. Pharmacoeconomics. 1995;6:503–520.
10. Fryback DG, Lawrence WF, Martin PA, et al. Predicting Quality ofWell-being scores from the SF-36: results from the Beaver Dam HealthOutcomes Study. Med Decis Making. 1997;17:1–9.
11. Brazier J, Usherwood T, Harper R, et al. Deriving a preference-basedsingle index from the UK SF-36 Health Survey. J Clin Epidemiol.1998;51:1115–1128.
12. Nichol MB, Sengupta N, Globe DR. Evaluating quality-adjusted lifeyears: estimation of the health utility index (HUI2) from the SF-36. MedDecis Making. 2001;21:105–112.
13. Bennett KJ, Torrance GW. Measuring health state preferences andutilities: rating scale, time trade-off, and standard gamble techniques. In:Spilker B, ed. Quality Of Life And Pharmacoeconomics In ClinicalTrials. 2nd ed. Philadelphia: Lippincott-Raven; 1996:259–260.
14. Brazier J, Deverill M, Green C. The use of health status measures ineconomic evaluation. In Stevens A, Abrams K, Brazier J, et al, eds. TheAdvanced Handbook of Methods in Evidence Based Healthcare. Lon-don: Sage Publications; 2000:195–214.
15. Neumann PJ, Goldie SJ, Weinstein MC. Preference-based measures ineconomic evaluation in health care. Annu Rev Public Health. 2000;21:587–611.
16. Green C, Brazier J, Deverill M. Valuing health related quality of life. Areview of health state valuation techniques. Pharmacoeconomics. 2000;
17:151–165.17. Llewellyn-Thomas H. Health state descriptions: purposes, issues, a
proposal. Med Care. 1996;34:DS109–DS118.18. Schunemann HJ, Griffith L, Stubbing D, et al. A clinical trial to evaluate
the responsiveness and validity of two direct health state preferenceinstruments administered with and without hypothetical marker states inchronic respiratory disease. Med Dec Making. 2003;23:140–149.
19. Llewellyn-Thomas HA, Thiel EC, McGreal MJ. Cancer patients’ eval-uations of their current health states: the influences of expectations,comparisons, actual health status, and mood. Med Dec Making. 1992;12:115–122.
20. Juniper EF, Thompson AK, Roberts JN. Can the standard gamble andrating scale be used to measure quality of life in rhinoconjunctivitis?Comparison with the RQLQ and SF-36. Allergy. 2002;57:201–206.
21. Fries JF, Ramey DR. “Arthritis specific” global health analog scalesassess “generic” health related quality-of-life in patients with rheuma-toid arthritis. J Rheumatol. 1997;24:1697–1702.
22. Bakker C, Rutten M, Vansantenhoeufft M, et al. Patient utilities infibromyalgia and the association with other outcome measures. J Rheu-matol. 1995;22:1536–1543.
23. Juniper EF, Guyatt GH, Feeny DH, et al. Minimum skills required bychildren to complete health-related quality of life instruments for asth-ma: comparison of measurement properties. Eur Respir J. 1996;10:2285–2294.
24. Bennett KJ, Torrance GW, Moran LA, et al. Health state utilities in kneereplacement surgery: the development and evaluation of McKnee.J Rheumatol. 1997;24:1796–1805.
25. Bennett K, Torrance G, Tugwell P. Methodologic challenges in thedevelopment of utility measures of health-related quality of life inrheumatoid arthritis. Contr Clin Trials. 1991;12:118S–128S.
26. Froberg DG, Kane RL. Methodology for measuring health-state prefer-ences–III: population and context effects. J Clin Epidemiol. 1989;42:585–592.
27. Mohide EA, Torrance GW, Streiner DL, et al. Measuring the wellbeingof family caregivers using the time trade-off technique. J Clin Epide-miol. 1988;41:475–482.
28. Mant JWP, Jenkinson C, Murphy MF, et al. Use of the Short Form 36to detect the influence of upper gastrointestinal disease on self-reportedhealth status. Qual Life Res. 1998;7:221–226.
29. Castell D, Kahrilas P, Richter J, et al. Esomeprazole 40 mg comparedwith lansoprazole 30 mg in the treatment of erosive esophagitis. Am JGastroenterol. 2002;97:575–583.
30. Wiklund I. Quality of life in patients with gastroesophageal refluxdisease. Am J Gastroenterol. 2001;96(8 Suppl):S46–S53.
31. Richter JE, Kahrilas JP, Johanson J, et al. Efficacy and safety ofesomeprazole compared with omeprazole in GERD patients with erosiveesophagitis: a randomized controlled trial. Am J Gastroenterol. 2001;96:656–665.
32. Kahrilas P, Falk GW, Johnson DA, et al. Esomeprazole improveshealing and symptom resolution as compared with omeprazole in refluxoesophagitis patients: a randomized controlled trial. Aliment PharmacolTher. 2000;14:1249–1258.
33. Wiklund IK, Junghard O, Grace E, et al. Quality of Life in reflux anddyspepsia patients. Psychometric documentation of a new disease-specificquestionnaire (QOLRAD). Eur J Surg. 1998;(Suppl 583):41–40.
34. Schunemann HJ, Stahl E, Austin P, et al. A comparison of presentinghypothetical health states in narrative and point-by-point format: resultsfrom two randomized trials. Med Dec Making. 2004;24:53–60.
35. Furlong W, Feeny D, Torrance GW, et al. Guide to design and devel-opment of health state utility instrumentation. Centre for Health Eco-nomics and Policy Analysis Working Paper Series Number 90–9 (141pp), McMaster University 1990.
36. Talley NJ, Fullerton S, Junghard O, et al. Quality of life in patients withendoscopy-negative heartburn: reliability and sensitivity of disease-specific instruments. Am J Gastroenterol. 2001;96:1998–2004.
37. Ware JE, Snow KK, Kosinski MA. SF-36 Health Survey Manual andInterpretation Guide. Boston: New England Medical Centre; 1993.
38. Gotzsche PC. Blinding during data analysis and writing of manuscripts.Contr Clin Trials. 1996;17:285–290.
39. Schunemann HJ, Griffith L, Jaeschke R, et al. Evaluation of the minimal
Medical Care • Volume 42, Number 11, November 2004 Use of Health Marker States and Preference Instruments
© 2004 Lippincott Williams & Wilkins 1141

important difference for the feeling thermometer and St. Georges Re-spiratory questionnaire in patients with chronic airflow limitation. J ClinEpidemiol. 2003;56:1170–1176.
40. Guyatt GH. Making sense of quality-of-life data. Med Care. 2000;38(Supp):175–179.
41. Feeny D, Juniper EF, Ferrie PJ, et al. Why not just ask the kids?Health-related quality of life in children with asthma. In: Dennis Drotared, Measuring Health-Related Quality of Life in Children and Adoles-cents: Implications for Research, Practice, and Policy. Mahwah, NJ:Lawrence Erlbaum Associates Publishers; 1998:171–185.
42. Read JL, Quinn RJ, Berwick DM, et al. Preferences for health outcomes:comparisons of assessment methods. Med Decis Making. 1984;4:315–329.
43. Rutten-van Molken MPMH, Bakker CH, Vandoorslaer EKA, et al.Methodological issues of patient utility measurement—experience from2 clinical-trials. Med Care. 1995;33:922–937.
44. Torrance GW. Social preferences for health states: an empirical evalu-ation of three measurement techniques. Socioecon Planning Sci. 1976;10:129–136.
45. Streiner DL, Norman GR. Health Measurement Scales: A PracticalGuide to their Development and Use. 2nd ed. Oxford: Oxford UniversityPress; 1995.
46. Robinson A, Loomes G, Jones-Lee M. Visual analog scales, standardgambles, and relative risk aversion. Med Decis Making. 2001;21:17–27.
47. Bleichrodt H, Johannesson M. An experimental test of a theoreticalfoundation for rating-scale valuations. Med Decis Making. 1997;17:208–216.
48. Guyatt GH, Berman LB, Townsend M, et al. Should study subjects seetheir previous responses? J Chron Dis. 1985;38:1003–1007.
49. Guyatt GH, Townsend M, Keller JL, et al. Should study subjects seetheir previous responses: data from a randomized control trial. J ClinEpidemiol. 42:913–920.
50. Schunemann HJ, Guyatt GH, Griffith L, et al. A randomized controlledtrial to evaluate the effect of informing patients about their pretreatmentresponses to two respiratory questionnaires. Chest. 2002;122:1701–1708.
APPENDIX 1
Exclusion CriteriaWe excluded patients who had (1) any significant alarmsymptoms such as unintentional weight loss, hematemesis,
melena or jaundice; (2) severe concurrent disease, such ashepatobiliary disease, kidney disease, or cardiac or pulmo-nary disorders; (3) had a documented history of clinicallyrelevant abnormal blood chemistry or hematology; (4) re-quired continuous concurrent therapy with warfarin, theophyl-line, phenytoin, bisphosphonates, methotrexate, quinidine,sucralfate, diphenylhydantoins, mephenytoin, nonsteroidalanti-inflammatory drugs, including aspirin at a dose greaterthan 325 mg/d, prostaglandin analogs, such as misoprostol,ketoconazole, fluconazole, itraconazole, diazepam, aminopy-rine, and antipyrine, PPIs other than the product used in thisstudy, prokinetics and histamine H2-receptor antagonists,antibiotics or bismuth compounds; (5) had a history of failureto respond symptomatically to PPIs; (6) consumed PPIs,histamine H2-receptor antagonists, or prokinetics within 2weeks prior to enrollment with the exception of intermittentuse of over-the-counter treatments; (7) endoscopically orradiographically diagnosed gastric or duodenal ulcer withinthe last 10 years; (8) gastroscopy performed within 2 weeks;(9) pregnancy, lactation, or childbearing potential (femalepatients had to be postmenopausal, surgically sterile, or usingmedically accepted contraceptive measures); (10) gastroin-testinal disorders that impaired drug absorption, or otherconditions which could modify the absorption of the studydrug; (11) current or past alcohol or drug abuse; (12) sus-pected or confirmed poor adherence to therapy; (13) contra-indications to esomeprazole (Nexium), such as, previousallergy response or intolerance to PPIs; (14) inability tocomplete quality of life questionnaires because of factorssuch as cognitive impairment or limited ability to read orwrite communicate in English or French.
Schunemann et al Medical Care • Volume 42, Number 11, November 2004
© 2004 Lippincott Williams & Wilkins1142