Embed Size (px)
Citation preview
ICAF 2019 – UNITED STATES NATIONAL REVIEW FOR 2017-2019 – FINAL – PAGE 9/1
CLEARED FOR PUBLIC RELEASE ON 24 MAY 2019; DISTRIBUTION A – UNLIMITED CASE NO. RQ-19-410; CLEARANCE NO. 88 ABW-2019-2583
A REVIEW OF RESEARCH
ON AERONAUTICAL FATIGUE IN THE UNITED STATES
2017 – 2019
Compiled by Dr. Ravinder Chona
Air Force Research Laboratory Wright-Patterson Air Force Base, Ohio, USA
FOR PRESENTATION AT THE MEETING OF THE
INTERNATIONAL COMMITTEE ON AERONAUTICAL FATIGUE AND STRUCTURAL INTEGRITY
2 June 2019 – 7 June 2019
Krakow, Poland
Approved for Public Release; Distribution is Unlimited
ICAF 2019 – UNITED STATES NATIONAL REVIEW FOR 2017-2019 – FINAL – PAGE 9/2
CLEARED FOR PUBLIC RELEASE ON 24 MAY 2019; DISTRIBUTION A – UNLIMITED CASE NO. RQ-19-410; CLEARANCE NO. 88 ABW-2019-2583
ICAF 2019 – UNITED STATES NATIONAL REVIEW FOR 2017-2019 – FINAL – PAGE 9/3
CLEARED FOR PUBLIC RELEASE ON 24 MAY 2019; DISTRIBUTION A – UNLIMITED CASE NO. RQ-19-410; CLEARANCE NO. 88 ABW-2019-2583
TABLE OF CONTENTS
Section Page
9.1. Introduction .................................................................................................................................... 9/7 9.2. Non-Destructive Inspection/Evaluation ....................................................................................... 9/11
9.2.1. Probability of Detection Studies for Advanced Eddy Current Scanning Systems ........................................................................................................................ 9/11
9.2.2. Assessment of Damage and Defect Severity in Composite Materials by Acousto-Ultrasonic Technique .................................................................................... 9/15
9.2.3. Shear-Wave Ultrasonic Inspection of Metallic Structures ........................................... 9/17 9.2.4. Buried Crack Detection Using Eddy Current Arrays ................................................... 9/22 9.2.5. Digital Nondestructive Evaluation/Inspection (NDE/I) Data Capture ......................... 9/24 9.2.6. A New Method for ND Corrosion Inspection Through Paint ...................................... 9/26
9.3. Structural Health Monitoring ....................................................................................................... 9/27 9.3.1. Structural Prognostics and Health Management (SPHM) for the F-35 ....................... 9/27 9.3.2. Unit Cell Approach for Optimized Detection of Fatigue Cracks Using Data
from PZT Sensor Networks ......................................................................................... 9/28 9.4. Structural Teardown Assessments ............................................................................................... 9/31 9.5. Loads and Environment Characterization .................................................................................... 9/33
9.5.1. Modernizing the A-10 Loading Spectrum Development Process................................ 9/33 9.5.2. Sortie Code Based IAT for the TH-1H Helicopter ...................................................... 9/34
9.6. Characterization, Modeling & Testing ......................................................................................... 9/39 9.6.1. Durability Analysis of Complex Metallic Structures Using XFA3D ............................ 9/39 9.6.2. Predictive Corrosion for Condition-Based-Maintenance-Plus (CBM+) ....................... 9/39 9.6.3. A Multiscale, Physical-Criteria-Based Approach for Composite Structural
Assessment .................................................................................................................... 9/42 9.6.4. Fatigue Crack Growth Tests and Analyses on 7249-T76511 Aluminum Alloy
Specimens of Various Thickness Under Simulated Aircraft Wing Loading ................. 9/45 9.6.5. AFGROW Training ....................................................................................................... 9/50 9.6.6. Training: How to Use the Crack Propagation Analysis Tool for 3D Crack
Simulation ..................................................................................................................... 9/51 9.6.7. T-38 Talon Finite Element Model Overview ................................................................ 9/51 9.6.8. Pros and Cons of 3D Crack Growth Simulation Using Finite Elements ....................... 9/55 9.6.9. Development of an Aircraft Component Remaining-Useful-Life Evaluator
Based on Actual Usage .................................................................................................. 9/60 9.6.10. Development of Combined Effects Test Methodology for Improved Aircraft
Material Survivability .................................................................................................... 9/62 9.6.11. Incorporation of High Altitude Environment-Specific Fatigue Crack Growth
Rates into Fracture-Mechanics-Based Life Prediction Methods ................................... 9/64 9.6.12. Predicting Crack Shape Evolution Using 2-D Crack Growth Rate Data ...................... 9/67 9.6.13. Composite Airframe Life Extension: Assessing the Durability and Damage
Tolerance of Advanced Composite Structural Features ................................................ 9/70 9.6.14. Continued Development of the NASGRO Software for Fracture Mechanics and
Fatigue Crack Growth Analysis .................................................................................... 9/73 9.6.15. C-5 Modernization of Analytical Tools for Service Life Assessment .......................... 9/77 9.6.16. Hex-chrome Reduction Studies for KC-135 Corrosion Program .................................. 9/79 9.6.17. What Does a Successful Fatigue Test Mean for Analytical Shortfalls .......................... 9/80
ICAF 2019 – UNITED STATES NATIONAL REVIEW FOR 2017-2019 – FINAL – PAGE 9/4
CLEARED FOR PUBLIC RELEASE ON 24 MAY 2019; DISTRIBUTION A – UNLIMITED CASE NO. RQ-19-410; CLEARANCE NO. 88 ABW-2019-2583
TABLE OF CONTENTS (Cont'd)
Section Page
9.6.18. Assessment of State-of-the-Art Composite Progressive Damage and Failure .............. 9/80 9.6.19. Capability and Implementation of Tools to Predict Strength, Life and High
Energy Impact Response of Composite Structures ....................................................... 9/85 9.6.20. Characterization of da/dN Test Results at Negative Stress Ratios and
Incorporation in Damage Tolerance Life Predictions ................................................... 9/86 9.6.21. Composite Airframe Life Extension Program Project 2: Tools for Assessing
the Durability and Damage Tolerance of Fastened Composite Joints ........................... 9/88 9.6.22. Evaluation of Material Suppliers for Damage Tolerance Properties ............................. 9/91 9.6.23. Active Flutter Suppression ............................................................................................ 9/93 9.6.24. Metallic Materials Properties Development and Standardization (MMPDS) ............... 9/95 9.6.25. Numerical Investigations of High Energy Dynamic Impacts on Adhesively
Bonded Composite Joints .............................................................................................. 9/96 9.6.26. Numerical Investigations of Bearing Failure in Mechanically Fastened
Composite Joints Under Dynamic Loading Conditions .............................................. 9/100 9.6.27. Investigation of Stiffening and Curvature Effects on the Residual Strength
of Composite Stiffened Panels with Large Transverse Notches ................................. 9/104 9.6.28. Effect of Combined Tension and Shear Loading on the Failure of Composite
Structure with Large Notch Damage ........................................................................... 9/108 9.6.29. Fatigue Analysis of Steel Control Cables .................................................................... 9/112 9.6.30. Damage Tolerance of Obliquely Loaded Tapered Lug Geometries ............................ 9/114 9.6.31. Fatigue and Damage Tolerance of Aluminum Tension Fittings ................................. 9/118 9.6.32. Structural Analysis Impact of Falsified Data from a Material Supplier ...................... 9/120 9.6.33. Random Vibration Fatigue Analysis: Application to Railcar Transportation
of Fuselage Panels ....................................................................................................... 9/122 9.7. Prognostics & Risk Analysis ...................................................................................................... 9/125
9.7.1. Fracture Mechanics and Risk Methods Used to Analyze the F-16 Upper End Pad Radius ................................................................................................................. 9/125
9.7.2. Evaluation of Structural Risk Analysis Methods Using F-15 Experience ................. 9/128 9.7.3. Risk Analysis Including Proof Testing in Bonded Composite Design ...................... 9/131 9.7.4. Risk Assessment and Risk Management Methods for Small Airplane COS,
SMART Software ...................................................................................................... 9/133 9.8. Life Enhancement Concepts ...................................................................................................... 9/135
9.8.1. Making Significant Strides Towards Engineered Residual Stress Implementation (ERSI) ............................................................................................... 9/135
9.8.2. Structural Certification of Laser Peening for F-35 Safety Critical Bulkheads ............ 9/138 9.8.3. Demonstrating the Crack Growth Benefit of Cold Working Large Diameter
Holes ............................................................................................................................ 9/143 9.8.4. Fatigue Technology’s ForceTec Rivetless Nut Plate .................................................. 9/146 9.8.5. Structural Certification of Laser Peening for F-35 Safety Critical Forgings ............... 9/150 9.8.6. Fatigue Technology’s Next-Generation Cold Expansion Tool ................................... 9/152 9.8.7. Service-Induced Degradation of Residual Stress at Cold-Expanded Holes ................ 9/155
9.9. Repair Concepts ......................................................................................................................... 9/159 9.9.1. An Approach to Managing Non-Flush Repairs ......................................................... 9/159 9.9.2. F-22 Return to Flight Following Wheels Up Landing Mishap .................................. 9/160
ICAF 2019 – UNITED STATES NATIONAL REVIEW FOR 2017-2019 – FINAL – PAGE 9/5
CLEARED FOR PUBLIC RELEASE ON 24 MAY 2019; DISTRIBUTION A – UNLIMITED CASE NO. RQ-19-410; CLEARANCE NO. 88 ABW-2019-2583
TABLE OF CONTENTS (Cont'd)
Section Page
9.9.3. Bonded Repairs of Composite Panels Representative of Wing Structure ................. 9/163 9.9.4. Analysis Method Development for Determining Bonded Repair Size Limits
in Critical Composite Aircraft Structures .................................................................. 9/166 9.9.5. Novel Analytical Capabilities for Composite Bonded Repairs ................................. 9/169
9.10. Replacement Concepts ............................................................................................................... 9/173 9.10.1. Three-Dimensional Fracture Modeling in Large Forged Aluminum
Components ............................................................................................................... 9/173 9.10.2. Additive Manufacturing on the F-22 ......................................................................... 9/173 9.10.3. Assessment of Emerging Metallic Structures Technologies Through Full-Scale
Test and Analysis ....................................................................................................... 9/174 9.10.4. Assessment of Fatigue Behavior of Advanced Aluminum Alloys Under
Complex Variable Amplitude Loading ...................................................................... 9/178 9.10.5. Airworthiness Certification Compliance of Metal Parts Made Using Additive
Manufacturing ............................................................................................................ 9/180 9.10.6. Wire Feed Additive Manufacturing of Primary Structure: Implementation and
Certification of the 787-9 PAX Floor Galley Diagonal Fittings ................................ 9/183 9.11. Overviews .................................................................................................................................. 9/187 9.11.1. KC-135 Field/PDM Corrosion Deep Dive ................................................................ 9/187 9.11.2. ASIP Recovery: Measuring Successes 15 Years After the Red Team
Review ....................................................................................................................... 9/191 9.11.3. An Overview of the Air Force Research Laboratory Composite Airframe
Life Extension (CALE) Program ............................................................................... 9/192 9.11.4. MQ-9 Reaper Fatigue Spectra Development and Full-Scale Airframe
Fatigue Testing .......................................................................................................... 9/196 9.11.5. T-38 Upper Cockpit Longeron Cracking: Unknown Unknowns are
Unknown Until Known .............................................................................................. 9/197 9.11.6. F-16 Service Life Extension Program – Life Beyond 8,000 Equivalent
Flight Hours ............................................................................................................... 9/200 9.11.7. F-35 Lightning II Joint Strike Fighter Full-Scale Durability Tests............................ 9/204 9.11.8. Methodology for Flaw-Tolerant Design and Certification ........................................ 9/206 9.11.9. Fueling the Fight Introducing the KC-46 Pegasus Tanker ........................................ 9/207 9.11.10. BACN E-11A ASIP Program Overview .................................................................... 9/209 9.11.11. Development of an Aircraft Analytical Weight Estimation Method (AWESM) ....... 9/209 9.11.12. Composite Spectrum Analysis ................................................................................... 9/210 9.11.13. F-35 Lightning II Joint Strike Fighter Full-Scale Durability Tests............................ 9/212 9.11.14. Inspection Interval Extension Analysis Utilizing Usage Severity Differences ......... 9/213 9.11.15. F-35 Structural Design Development and Verification ............................................. 9/213 9.11.16. MQ-9A Reaper Full-Scale Static Test ....................................................................... 9/215 9.11.17. Use As Directed: F-16 ASIP Impacts From Neglected Ladder Maintenance .......... 9/217 9.11.18. Challenges and Successes: The Road from Old Style Mfg to Digital ...................... 9/219 9.11.19. MIL-STD-1587, “Department of Defense Design Criteria Standard: Material
and Process Requirements for Aerospace Weapons Systems” .................................. 9/220 9.11.20. F/A-18 Service Life Assessment Program (SLAP) and Service Life Extension
Program (SLEP) ......................................................................................................... 9/220

ICAF 2019 – UNITED STATES NATIONAL REVIEW FOR 2017-2019 – FINAL – PAGE 9/6
CLEARED FOR PUBLIC RELEASE ON 24 MAY 2019; DISTRIBUTION A – UNLIMITED CASE NO. RQ-19-410; CLEARANCE NO. 88 ABW-2019-2583
ICAF 2019 – UNITED STATES NATIONAL REVIEW FOR 2017-2019 – FINAL – PAGE 9/7
9.1. INTRODUCTION
Leading government laboratories, universities and aerospace manufacturers were invited to contribute summaries of their recent aeronautical fatigue research activities. This report contains those contributions submitted. Inquiries regarding a particular article should be addressed to the person whose name accompanies that article. The generous contributions of each participating organization is hereby gratefully acknowledged. Government • FAA Aircraft Certification Service • FAA Small Airplane Directorate • FAA Small Aircraft Standards Branch • FAA Transport Standards Branch • FAA William J. Hughes Technical Center • NASA Johnson Space Center • Sandia National Laboratories • USA • USAF Life Cycle Management Center – A-10 ASIP • USAF Life Cycle Management Center – A-10 Structures/Aero Section • USAF Life Cycle Management Center – C-5 ASIP • USAF Life Cycle Management Center – F-16 ASIP • USAF Life Cycle Management Center – F-22 ASIP • USAF Life Cycle Management Center – F-22 Program Office • USAF Life Cycle Management Center – F-35 Joint Program Office • USAF Life Cycle Management Center – Hill AFB • USAF Life Cycle Management Center – KC-46 ASIP • USAF Life Cycle Management Center – Mature and Proven Aircraft Division • USAF Life Cycle Management Center – NDI Program Office • USAF Life Cycle Management Center – Robbins AFB Corrosion Office • USAF Life Cycle Management Center – Rotary Wing ASIP • USAF Life Cycle Management Center – T-38 ASIP • USAF Life Cycle Management Center – Wright-Patterson AFB • USAF Research Laboratory – Aerospace Systems Directorate • USAF Research Laboratory – Materials and Manufacturing Directorate • USAF Sustainment Center – Hill AFB NDI Program Office • USAF Sustainment Center – Robins AFB NDI Program Office • USAF Sustainment Center – Tinker AFB NDI Program Office • USN – Naval Research Laboratory • USN – NAVAIR
ICAF 2019 – UNITED STATES NATIONAL REVIEW FOR 2017-2019 – FINAL – PAGE 9/8
Academia • Mississippi State University • St. Mary’s University • Stanford University • University of Arizona • University of Texas – San Antonio • University of Virginia • University of Washington • Wichita State University – NIAR Industry • Acellent Technologies, Inc. • Arconic Technical Center • Aviation Engineering Services LLC • Battelle Memorial Labs • Engineering Software Research & Development (ESRD), Inc. • Fatigue Technology, Inc. (FTI) • General Atomics Aeronautical Systems • Hill Engineering LLC • InterPro, LLC • Jacobs Technology, Inc. • JENTEK Sensors, Inc. • Laser Plasma Technologies • LexTech Inc. • Lockheed Martin Corporation – Aeronautics • Lockheed Martin Corporation – F-16 Program • Lockheed Martin Corporation – F-35 Program • Mercer Engineering Research Center (MERC) • MSC Software Company • Northrop Grumman Corporation • NSE Composites • PeopleTec Inc. • Southwest Research Institute (SwRI) • Spirit AeroSystems • Technical Data Analysis Inc. • The Boeing Company – Boeing Defense • The Boeing Company – Boeing Global Services • The Boeing Company – Commercial Airplanes • The Boeing Company – KC-135 ASIP • The Boeing Company – Research and Technology References, if any, are listed at the end of each article. Figures and tables are integrated into the text of each article. The assistance of Jim Rudd and Pam Kearney, Universal Technology Corporation, in the preparation of this report is greatly appreciated.
ICAF 2019 – UNITED STATES NATIONAL REVIEW FOR 2017-2019 – FINAL – PAGE 9/9
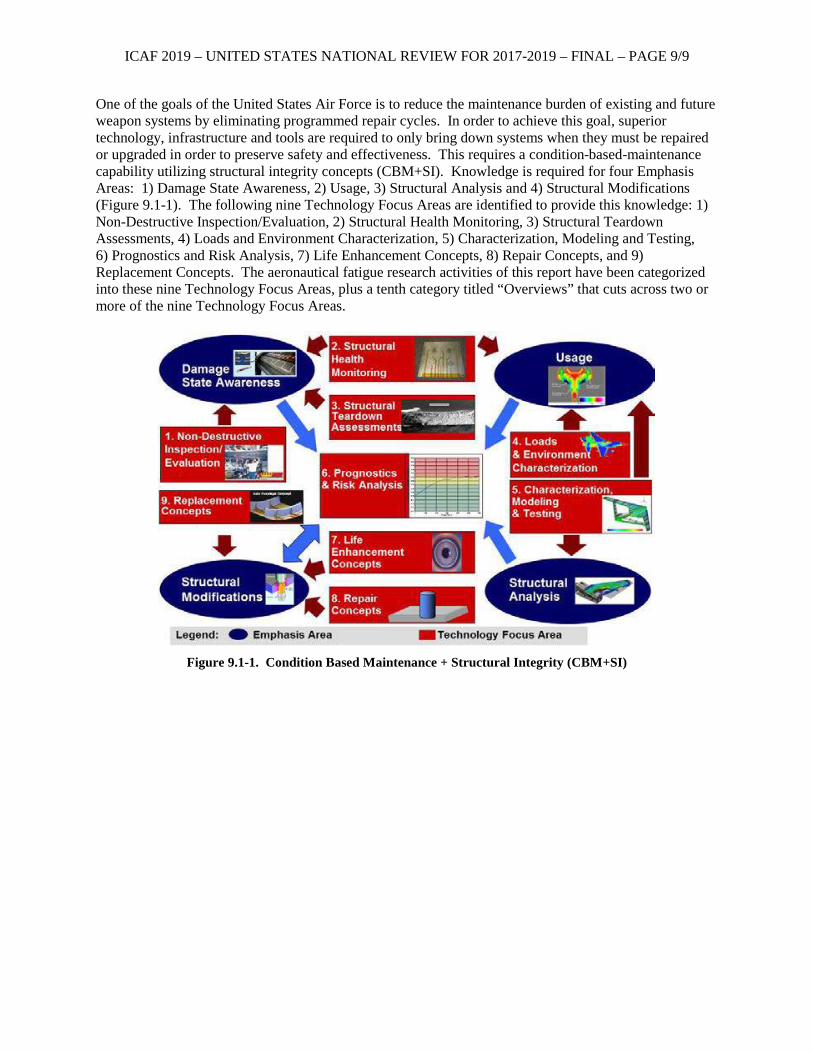
One of the goals of the United States Air Force is to reduce the maintenance burden of existing and future weapon systems by eliminating programmed repair cycles. In order to achieve this goal, superior technology, infrastructure and tools are required to only bring down systems when they must be repaired or upgraded in order to preserve safety and effectiveness. This requires a condition-based-maintenance capability utilizing structural integrity concepts (CBM+SI). Knowledge is required for four Emphasis Areas: 1) Damage State Awareness, 2) Usage, 3) Structural Analysis and 4) Structural Modifications (Figure 9.1-1). The following nine Technology Focus Areas are identified to provide this knowledge: 1) Non-Destructive Inspection/Evaluation, 2) Structural Health Monitoring, 3) Structural Teardown Assessments, 4) Loads and Environment Characterization, 5) Characterization, Modeling and Testing, 6) Prognostics and Risk Analysis, 7) Life Enhancement Concepts, 8) Repair Concepts, and 9) Replacement Concepts. The aeronautical fatigue research activities of this report have been categorized into these nine Technology Focus Areas, plus a tenth category titled “Overviews” that cuts across two or more of the nine Technology Focus Areas.
Figure 9.1-1. Condition Based Maintenance + Structural Integrity (CBM+SI)

ICAF 2019 – UNITED STATES NATIONAL REVIEW FOR 2017-2019 – FINAL – PAGE 9/10
ICAF 2019 – UNITED STATES NATIONAL REVIEW FOR 2017-2019 – FINAL – PAGE 9/11
9.2. NON-DESTRUCTIVE INSPECTION/EVALUATION
9.2.1. Probability of Detection Studies for Advanced Eddy Current Scanning Systems
Ryan Mooers, USAF Research Laboratory – Materials and Manufacturing Directorate
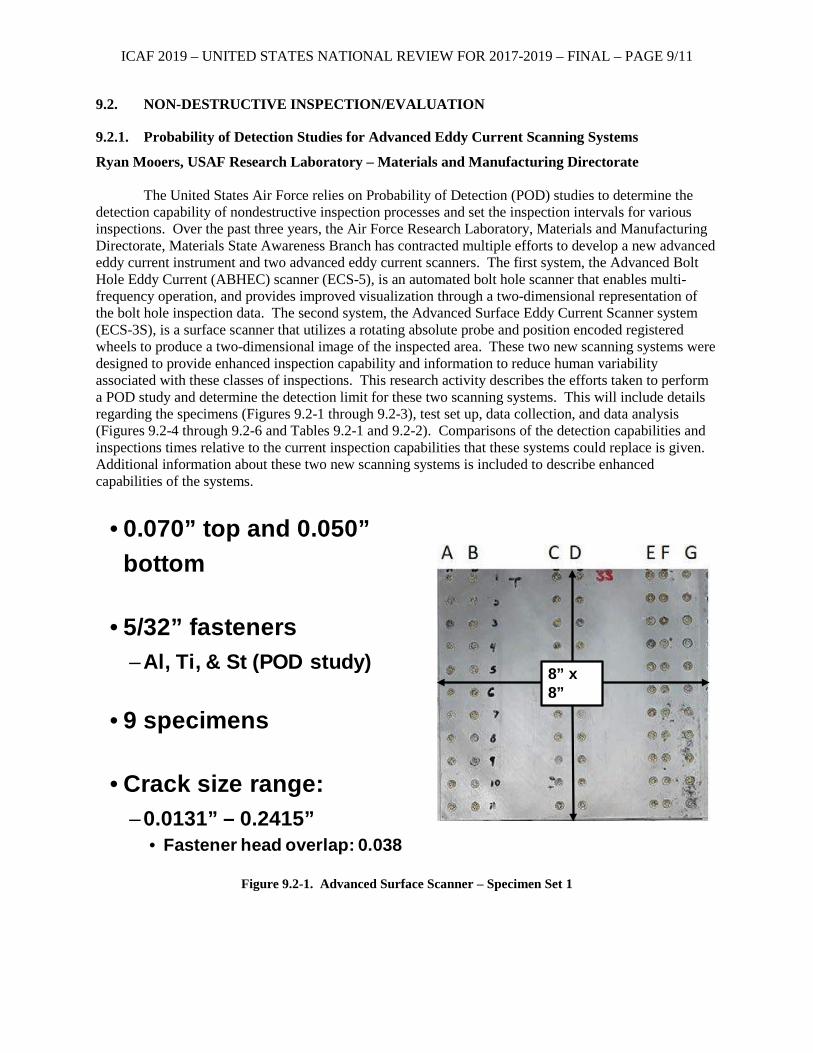
The United States Air Force relies on Probability of Detection (POD) studies to determine the detection capability of nondestructive inspection processes and set the inspection intervals for various inspections. Over the past three years, the Air Force Research Laboratory, Materials and Manufacturing Directorate, Materials State Awareness Branch has contracted multiple efforts to develop a new advanced eddy current instrument and two advanced eddy current scanners. The first system, the Advanced Bolt Hole Eddy Current (ABHEC) scanner (ECS-5), is an automated bolt hole scanner that enables multi-frequency operation, and provides improved visualization through a two-dimensional representation of the bolt hole inspection data. The second system, the Advanced Surface Eddy Current Scanner system (ECS-3S), is a surface scanner that utilizes a rotating absolute probe and position encoded registered wheels to produce a two-dimensional image of the inspected area. These two new scanning systems were designed to provide enhanced inspection capability and information to reduce human variability associated with these classes of inspections. This research activity describes the efforts taken to perform a POD study and determine the detection limit for these two scanning systems. This will include details regarding the specimens (Figures 9.2-1 through 9.2-3), test set up, data collection, and data analysis (Figures 9.2-4 through 9.2-6 and Tables 9.2-1 and 9.2-2). Comparisons of the detection capabilities and inspections times relative to the current inspection capabilities that these systems could replace is given. Additional information about these two new scanning systems is included to describe enhanced capabilities of the systems.
Figure 9.2-1. Advanced Surface Scanner – Specimen Set 1
• 0.070” top and 0.050” bottom
• 5/32” fasteners–Al, Ti, & St (POD study)
• 9 specimens
• Crack size range:–0.0131” – 0.2415”
• Fastener head overlap: 0.038
8” x 8”
ICAF 2019 – UNITED STATES NATIONAL REVIEW FOR 2017-2019 – FINAL – PAGE 9/12
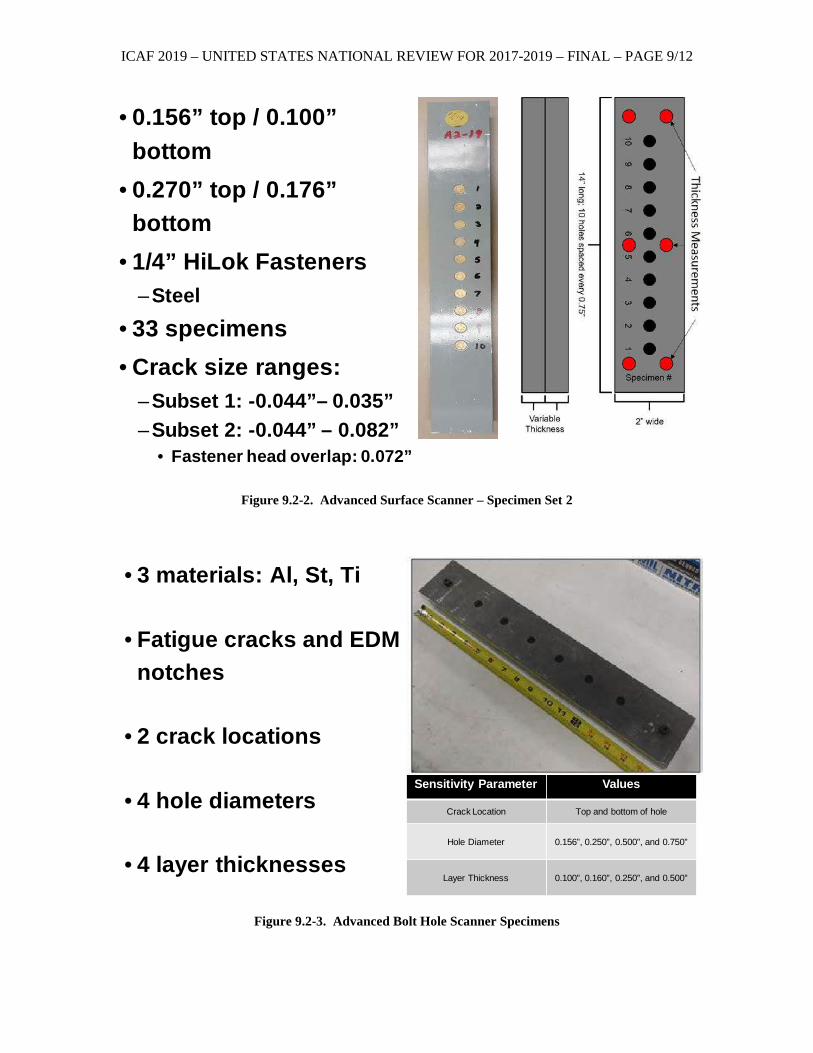
Figure 9.2-2. Advanced Surface Scanner – Specimen Set 2
Figure 9.2-3. Advanced Bolt Hole Scanner Specimens
• 0.156” top / 0.100” bottom
• 0.270” top / 0.176” bottom
• 1/4” HiLok Fasteners–Steel
• 33 specimens• Crack size ranges:
–Subset 1: -0.044”– 0.035”–Subset 2: -0.044” – 0.082”
• Fastener head overlap: 0.072”
• 3 materials: Al, St, Ti
• Fatigue cracks and EDM notches
• 2 crack locations
• 4 hole diameters
• 4 layer thicknesses
Sensitivity Parameter Values
Crack Location Top and bottom of hole
Hole Diameter 0.156”, 0.250”, 0.500”, and 0.750”
Layer Thickness 0.100”, 0.160”, 0.250”, and 0.500”
ICAF 2019 – UNITED STATES NATIONAL REVIEW FOR 2017-2019 – FINAL – PAGE 9/13
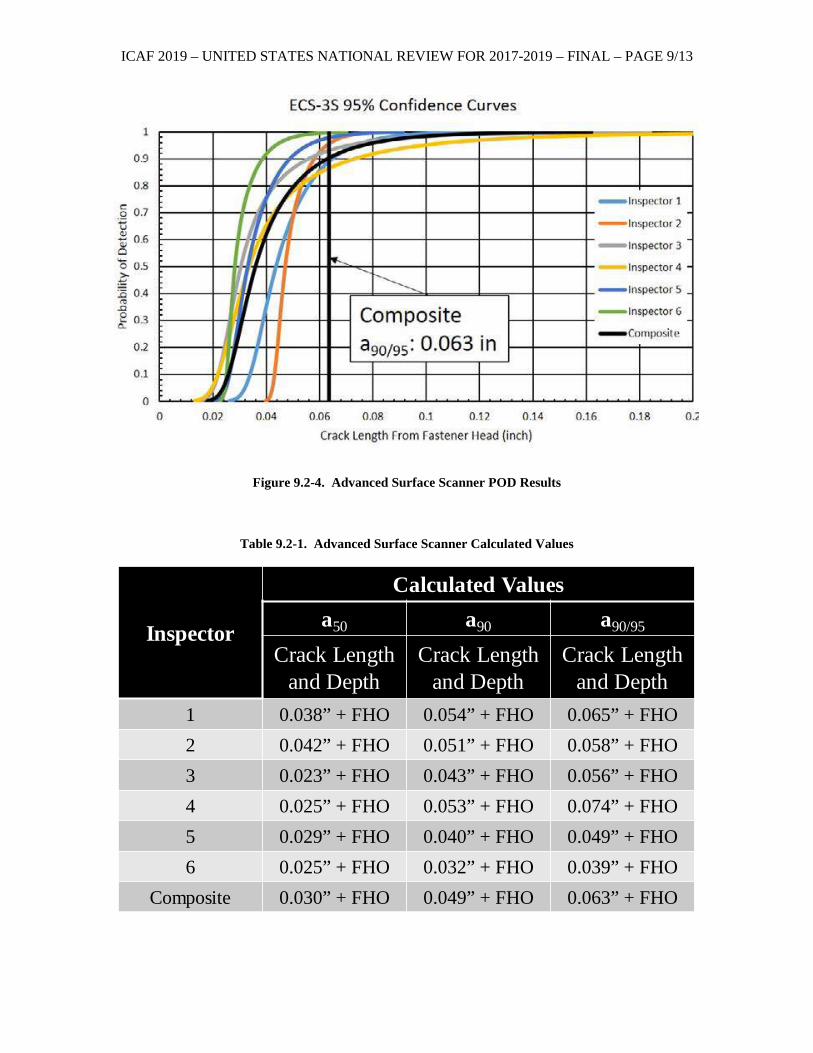
Figure 9.2-4. Advanced Surface Scanner POD Results
Table 9.2-1. Advanced Surface Scanner Calculated Values
Inspector
Calculated Valuesa50 a90 a90/95
Crack Lengthand Depth
Crack Lengthand Depth
Crack Lengthand Depth
1 0.038” + FHO 0.054” + FHO 0.065” + FHO2 0.042” + FHO 0.051” + FHO 0.058” + FHO3 0.023” + FHO 0.043” + FHO 0.056” + FHO4 0.025” + FHO 0.053” + FHO 0.074” + FHO5 0.029” + FHO 0.040” + FHO 0.049” + FHO6 0.025” + FHO 0.032” + FHO 0.039” + FHO
Composite 0.030” + FHO 0.049” + FHO 0.063” + FHO
ICAF 2019 – UNITED STATES NATIONAL REVIEW FOR 2017-2019 – FINAL – PAGE 9/14
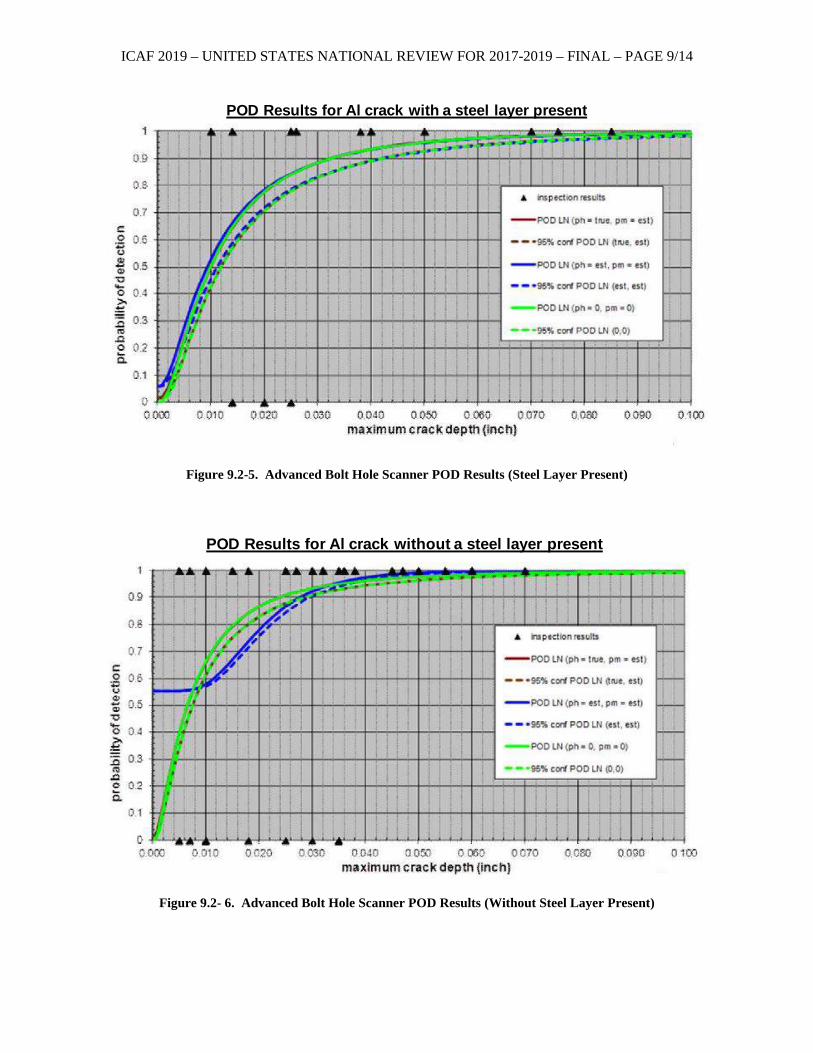
Figure 9.2-5. Advanced Bolt Hole Scanner POD Results (Steel Layer Present)
Figure 9.2- 6. Advanced Bolt Hole Scanner POD Results (Without Steel Layer Present)
POD Results for Al crack with a steel layer present
POD Results for Al crack without a steel layer present
ICAF 2019 – UNITED STATES NATIONAL REVIEW FOR 2017-2019 – FINAL – PAGE 9/15
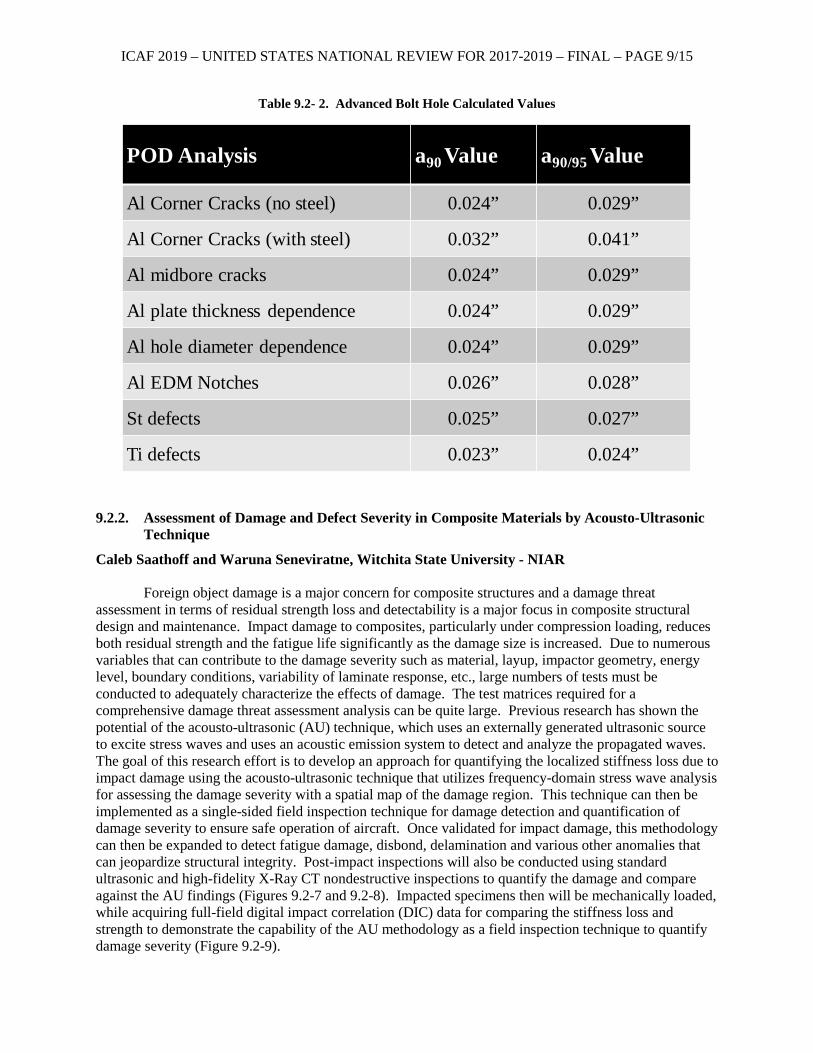
Table 9.2- 2. Advanced Bolt Hole Calculated Values
9.2.2. Assessment of Damage and Defect Severity in Composite Materials by Acousto-Ultrasonic Technique
Caleb Saathoff and Waruna Seneviratne, Witchita State University - NIAR
Foreign object damage is a major concern for composite structures and a damage threat assessment in terms of residual strength loss and detectability is a major focus in composite structural design and maintenance. Impact damage to composites, particularly under compression loading, reduces both residual strength and the fatigue life significantly as the damage size is increased. Due to numerous variables that can contribute to the damage severity such as material, layup, impactor geometry, energy level, boundary conditions, variability of laminate response, etc., large numbers of tests must be conducted to adequately characterize the effects of damage. The test matrices required for a comprehensive damage threat assessment analysis can be quite large. Previous research has shown the potential of the acousto-ultrasonic (AU) technique, which uses an externally generated ultrasonic source to excite stress waves and uses an acoustic emission system to detect and analyze the propagated waves. The goal of this research effort is to develop an approach for quantifying the localized stiffness loss due to impact damage using the acousto-ultrasonic technique that utilizes frequency-domain stress wave analysis for assessing the damage severity with a spatial map of the damage region. This technique can then be implemented as a single-sided field inspection technique for damage detection and quantification of damage severity to ensure safe operation of aircraft. Once validated for impact damage, this methodology can then be expanded to detect fatigue damage, disbond, delamination and various other anomalies that can jeopardize structural integrity. Post-impact inspections will also be conducted using standard ultrasonic and high-fidelity X-Ray CT nondestructive inspections to quantify the damage and compare against the AU findings (Figures 9.2-7 and 9.2-8). Impacted specimens then will be mechanically loaded, while acquiring full-field digital impact correlation (DIC) data for comparing the stiffness loss and strength to demonstrate the capability of the AU methodology as a field inspection technique to quantify damage severity (Figure 9.2-9).
POD Analysis a90 Value a90/95 Value
Al Corner Cracks (no steel) 0.024” 0.029”
Al Corner Cracks (with steel) 0.032” 0.041”
Al midbore cracks 0.024” 0.029”
Al plate thickness dependence 0.024” 0.029”
Al hole diameter dependence 0.024” 0.029”
Al EDM Notches 0.026” 0.028”
St defects 0.025” 0.027”
Ti defects 0.023” 0.024”
ICAF 2019 – UNITED STATES NATIONAL REVIEW FOR 2017-2019 – FINAL – PAGE 9/16
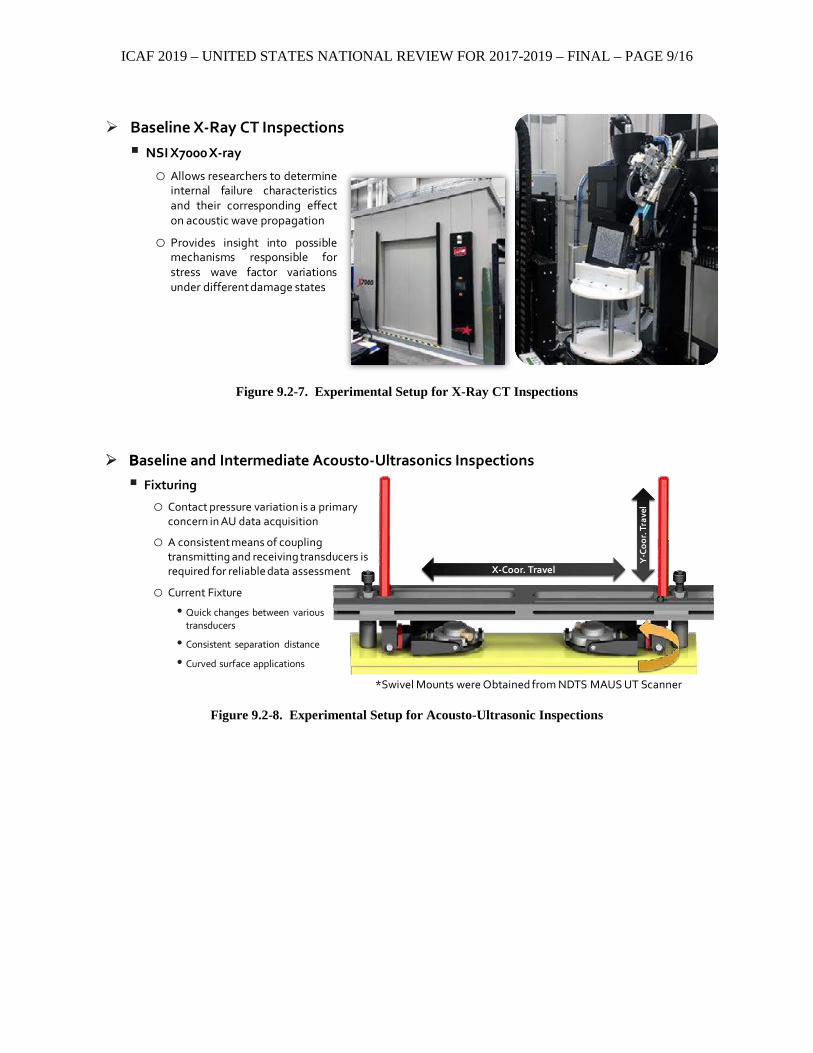
Figure 9.2-7. Experimental Setup for X-Ray CT Inspections
Figure 9.2-8. Experimental Setup for Acousto-Ultrasonic Inspections
Baseline X-Ray CT Inspections
NSI X7000 X-ray
o Allows researchers to determineinternal failure characteristicsand their corresponding effecton acoustic wave propagation
o Provides insight into possiblemechanisms responsible forstress wave factor variationsunder different damage states
Baseline and Intermediate Acousto-Ultrasonics Inspections B
Fixturing
o Contact pressure variation is a primary concern in AU data acquisition
o A consistent means of coupling transmitting and receiving transducers is required for reliable data assessment
o Current Fixture
• Quick changes between various transducers
• Consistent separation distance
• Curved surface applications
Y-C
oor.
Tra
vel
X-Coor. Travel
*Swivel Mounts were Obtained from NDTS MAUS UT Scanner
ICAF 2019 – UNITED STATES NATIONAL REVIEW FOR 2017-2019 – FINAL – PAGE 9/17
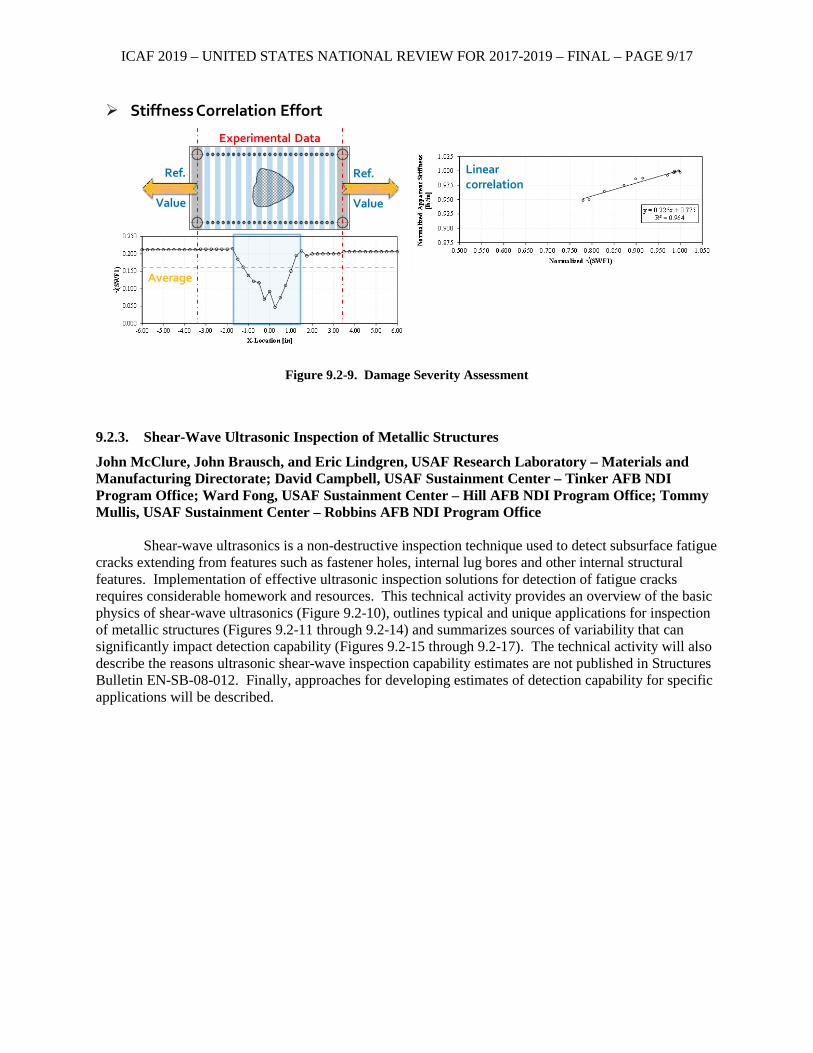
Figure 9.2-9. Damage Severity Assessment
9.2.3. Shear-Wave Ultrasonic Inspection of Metallic Structures
John McClure, John Brausch, and Eric Lindgren, USAF Research Laboratory – Materials and Manufacturing Directorate; David Campbell, USAF Sustainment Center – Tinker AFB NDI Program Office; Ward Fong, USAF Sustainment Center – Hill AFB NDI Program Office; Tommy Mullis, USAF Sustainment Center – Robbins AFB NDI Program Office
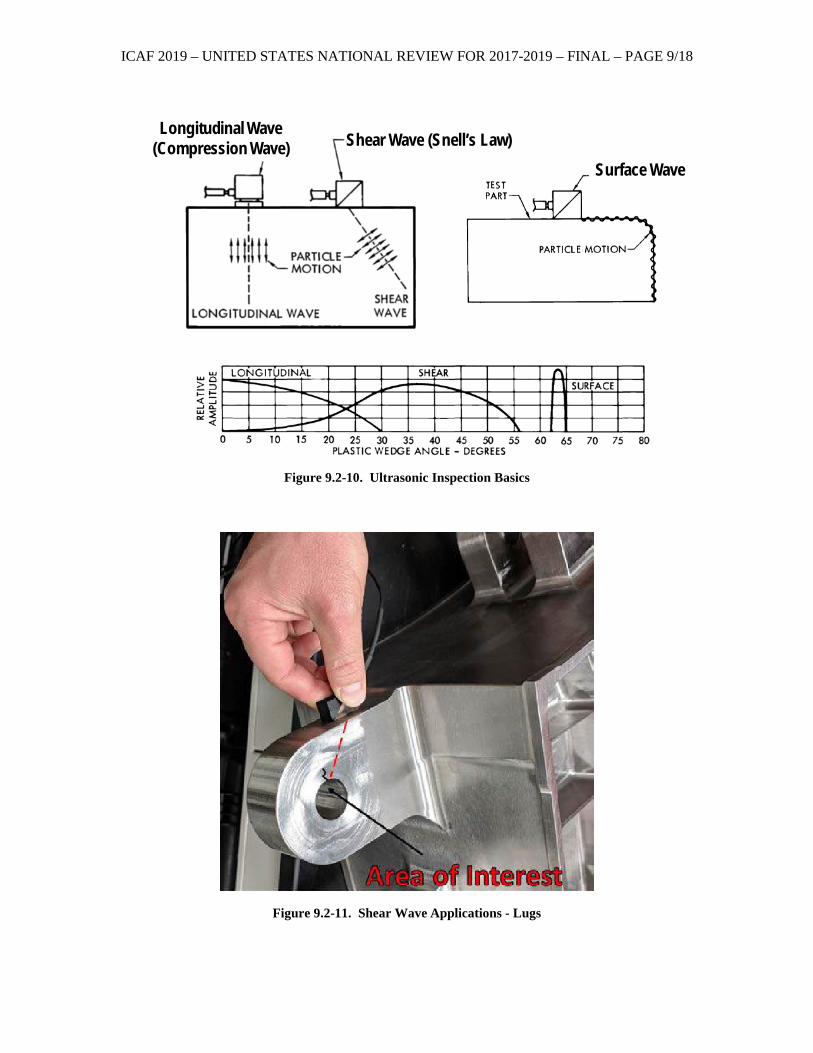
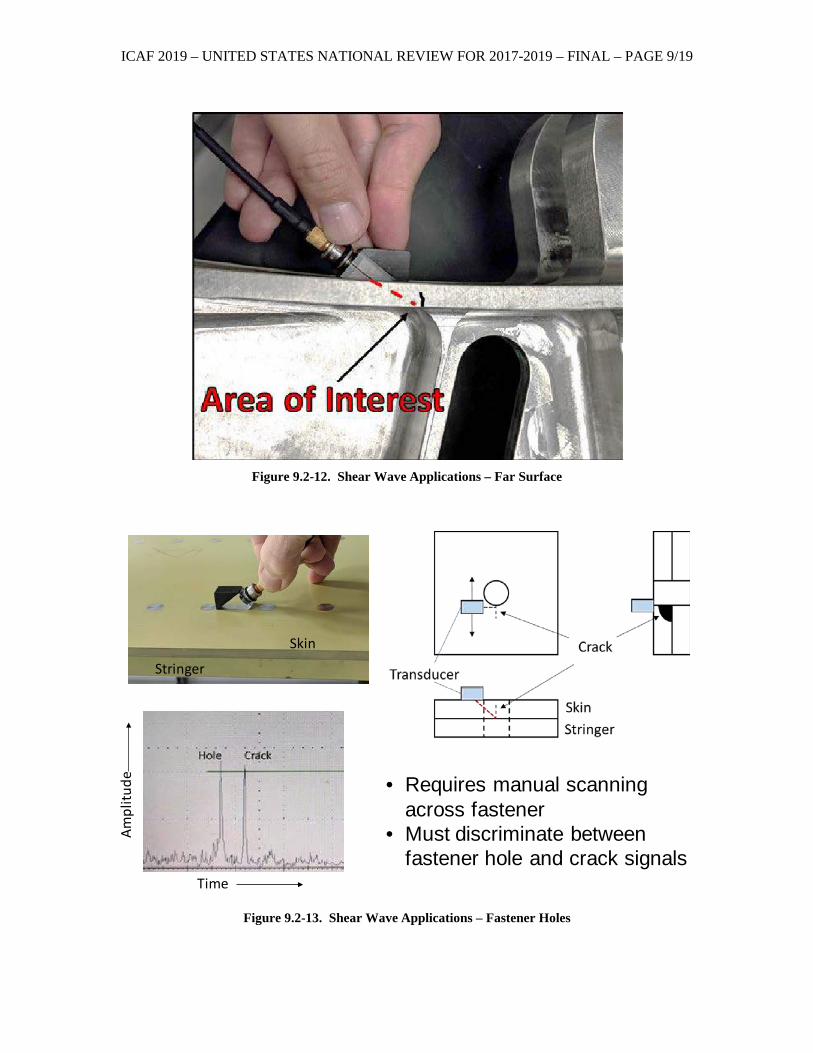
Shear-wave ultrasonics is a non-destructive inspection technique used to detect subsurface fatigue
cracks extending from features such as fastener holes, internal lug bores and other internal structural features. Implementation of effective ultrasonic inspection solutions for detection of fatigue cracks requires considerable homework and resources. This technical activity provides an overview of the basic physics of shear-wave ultrasonics (Figure 9.2-10), outlines typical and unique applications for inspection of metallic structures (Figures 9.2-11 through 9.2-14) and summarizes sources of variability that can significantly impact detection capability (Figures 9.2-15 through 9.2-17). The technical activity will also describe the reasons ultrasonic shear-wave inspection capability estimates are not published in Structures Bulletin EN-SB-08-012. Finally, approaches for developing estimates of detection capability for specific applications will be described.
Stiffness Correlation Effort
Average
Ref.
Value
Ref.
Value
Experimental Data
Linearcorrelation
ICAF 2019 – UNITED STATES NATIONAL REVIEW FOR 2017-2019 – FINAL – PAGE 9/18
Figure 9.2-10. Ultrasonic Inspection Basics
Figure 9.2-11. Shear Wave Applications - Lugs
Longitudinal Wave(Compression Wave) Shear Wave (Snell’s Law)
Surface Wave
ICAF 2019 – UNITED STATES NATIONAL REVIEW FOR 2017-2019 – FINAL – PAGE 9/19
Figure 9.2-12. Shear Wave Applications – Far Surface
Figure 9.2-13. Shear Wave Applications – Fastener Holes
Skin
Stringer
• Requires manual scanning across fastener
• Must discriminate between fastener hole and crack signals
Time
Ampl
itude
ICAF 2019 – UNITED STATES NATIONAL REVIEW FOR 2017-2019 – FINAL – PAGE 9/20
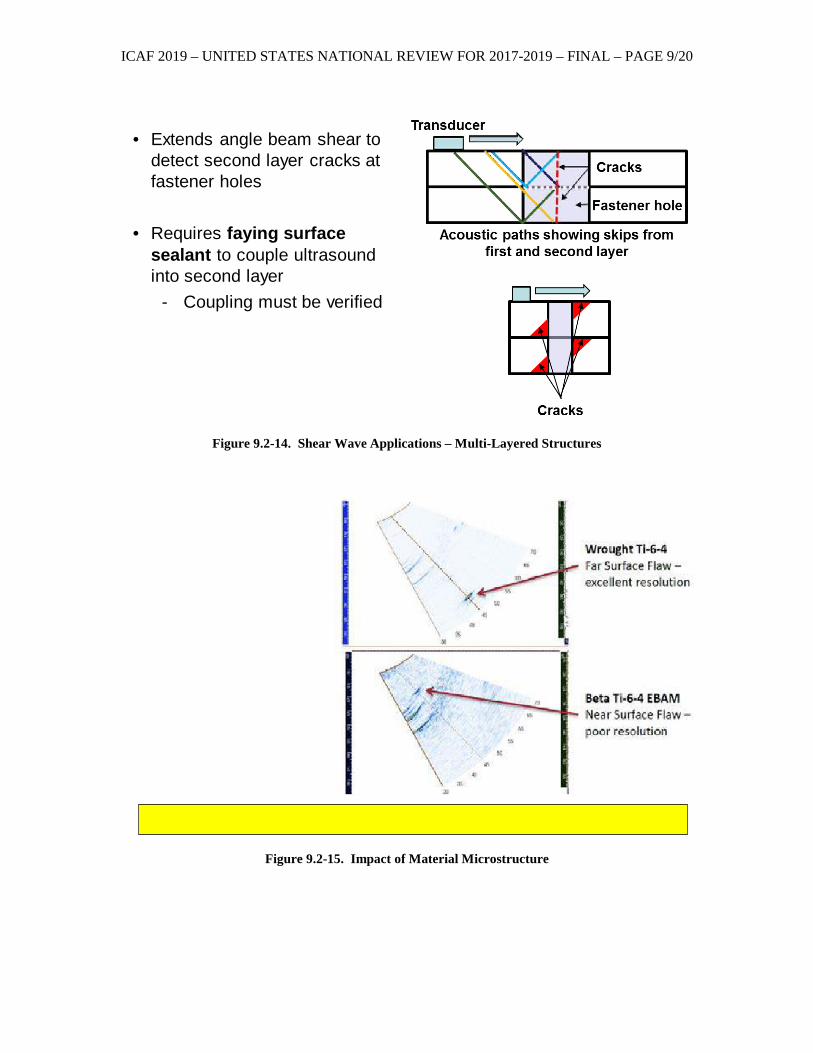
Figure 9.2-14. Shear Wave Applications – Multi-Layered Structures
Figure 9.2-15. Impact of Material Microstructure
• Extends angle beam shear to detect second layer cracks at fastener holes
• Requires faying surface sealant to couple ultrasound into second layer
- Coupling must be verified
ICAF 2019 – UNITED STATES NATIONAL REVIEW FOR 2017-2019 – FINAL – PAGE 9/21
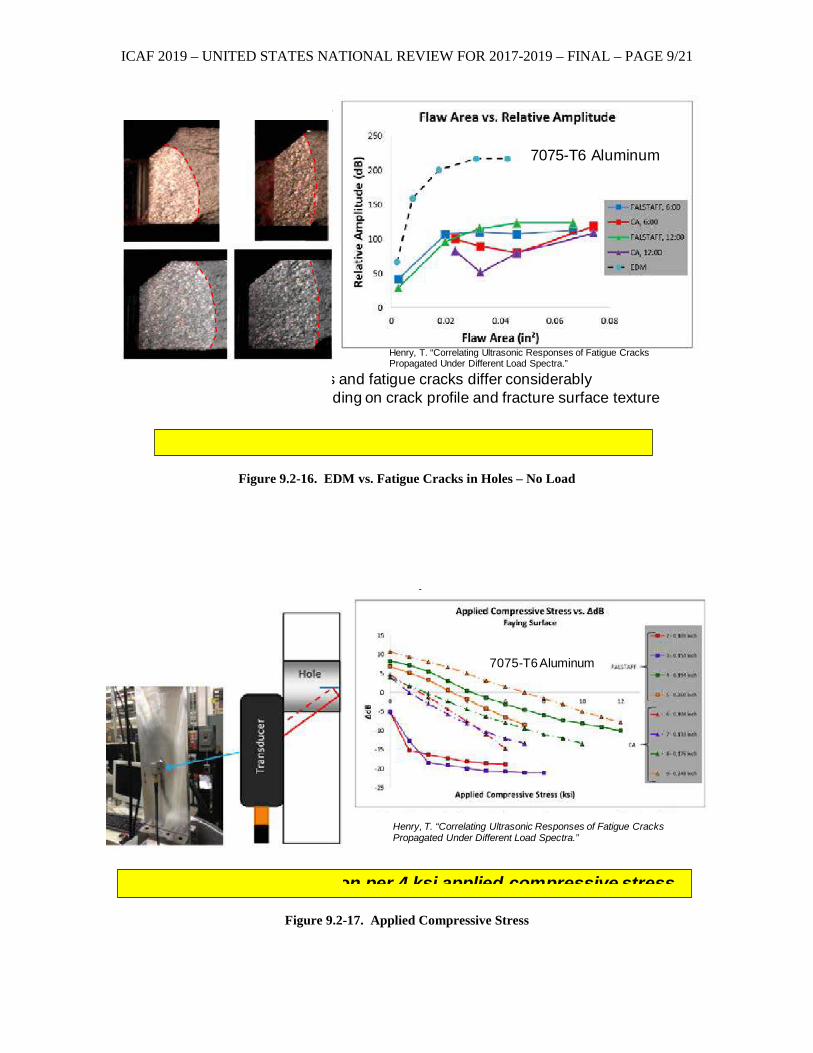
Figure 9.2-16. EDM vs. Fatigue Cracks in Holes – No Load
Figure 9.2-17. Applied Compressive Stress
e
s and fatigue cracks differ considerably ding on crack profile and fracture surface texture
Henry, T. “Correlating Ultrasonic Responses of Fatigue Cracks Propagated Under Different Load Spectra.”
7075-T6 Aluminum
p
Henry, T. “Correlating Ultrasonic Responses of Fatigue Cracks Propagated Under Different Load Spectra.”
7075-T6 Aluminum
on per 4 ksi applied compressive stress
ICAF 2019 – UNITED STATES NATIONAL REVIEW FOR 2017-2019 – FINAL – PAGE 9/22
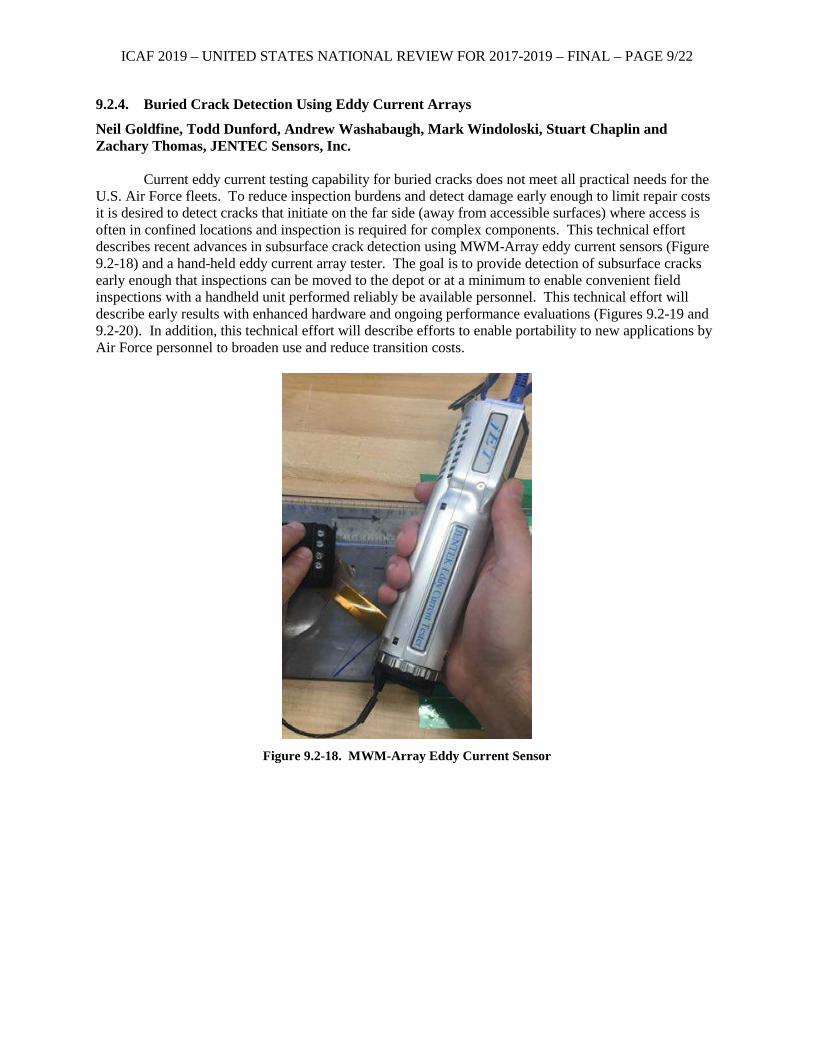
9.2.4. Buried Crack Detection Using Eddy Current Arrays
Neil Goldfine, Todd Dunford, Andrew Washabaugh, Mark Windoloski, Stuart Chaplin and Zachary Thomas, JENTEC Sensors, Inc.
Current eddy current testing capability for buried cracks does not meet all practical needs for the
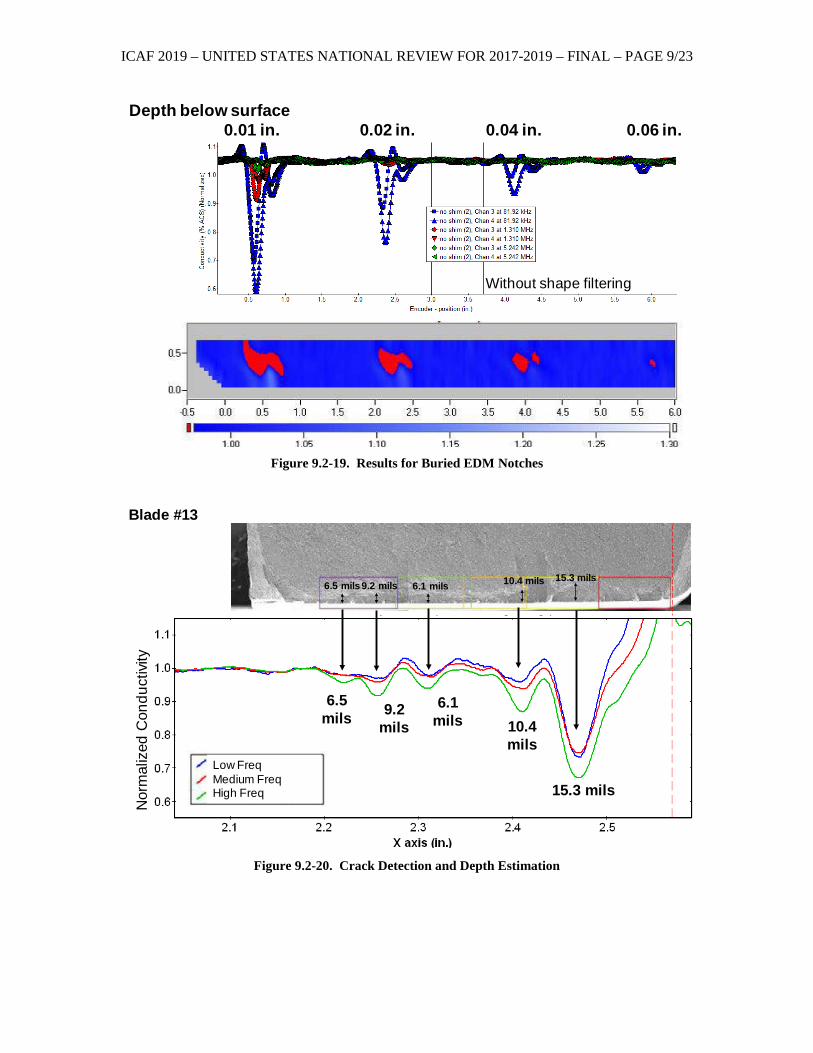
U.S. Air Force fleets. To reduce inspection burdens and detect damage early enough to limit repair costs it is desired to detect cracks that initiate on the far side (away from accessible surfaces) where access is often in confined locations and inspection is required for complex components. This technical effort describes recent advances in subsurface crack detection using MWM-Array eddy current sensors (Figure 9.2-18) and a hand-held eddy current array tester. The goal is to provide detection of subsurface cracks early enough that inspections can be moved to the depot or at a minimum to enable convenient field inspections with a handheld unit performed reliably be available personnel. This technical effort will describe early results with enhanced hardware and ongoing performance evaluations (Figures 9.2-19 and 9.2-20). In addition, this technical effort will describe efforts to enable portability to new applications by Air Force personnel to broaden use and reduce transition costs.
Figure 9.2-18. MWM-Array Eddy Current Sensor
ICAF 2019 – UNITED STATES NATIONAL REVIEW FOR 2017-2019 – FINAL – PAGE 9/23
Figure 9.2-19. Results for Buried EDM Notches
Figure 9.2-20. Crack Detection and Depth Estimation
Depth below surface 0.01 in. 0.02 in. 0.04 in. 0.06 in.
Without shape filtering
15.3 mils10.4 mils
Edge
6.1 mils9.2 mils6.5 mils
Blade #13
Low FreqMedium FreqHigh Freq
Nor
mal
ized
Con
duct
ivity
15.3 mils
10.4 mils
6.1 mils
9.2 mils
6.5 mils
ICAF 2019 – UNITED STATES NATIONAL REVIEW FOR 2017-2019 – FINAL – PAGE 9/24
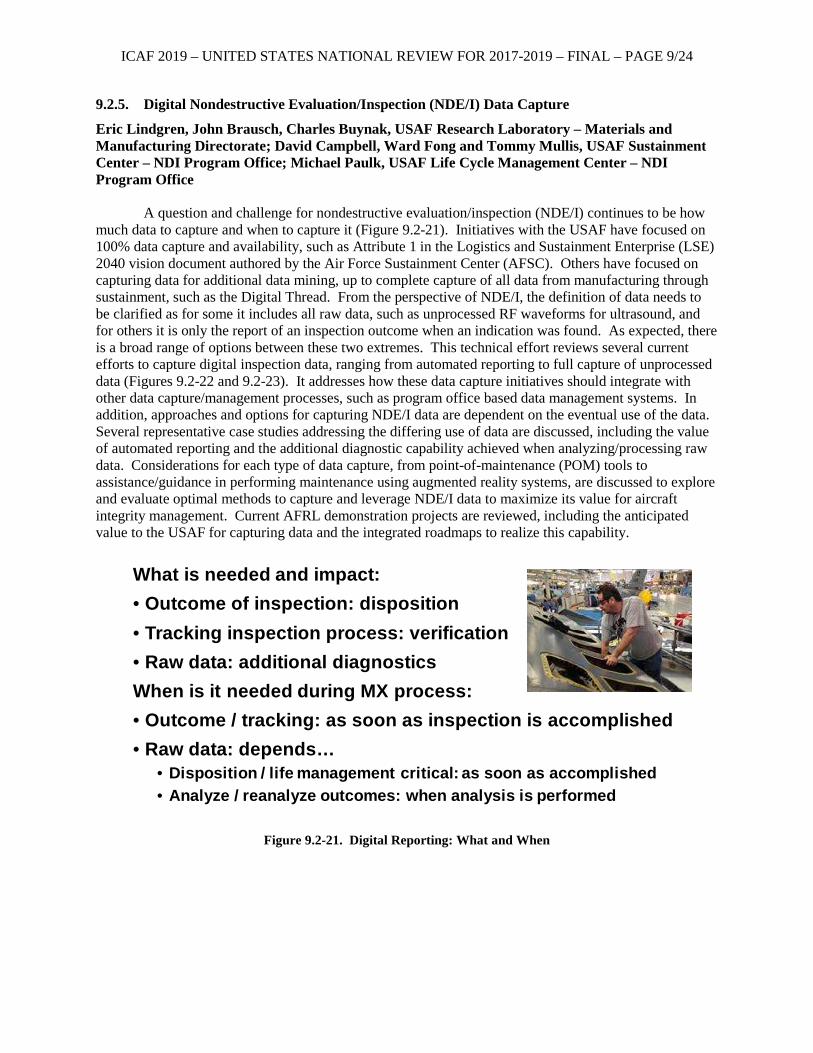
9.2.5. Digital Nondestructive Evaluation/Inspection (NDE/I) Data Capture
Eric Lindgren, John Brausch, Charles Buynak, USAF Research Laboratory – Materials and Manufacturing Directorate; David Campbell, Ward Fong and Tommy Mullis, USAF Sustainment Center – NDI Program Office; Michael Paulk, USAF Life Cycle Management Center – NDI Program Office
A question and challenge for nondestructive evaluation/inspection (NDE/I) continues to be how
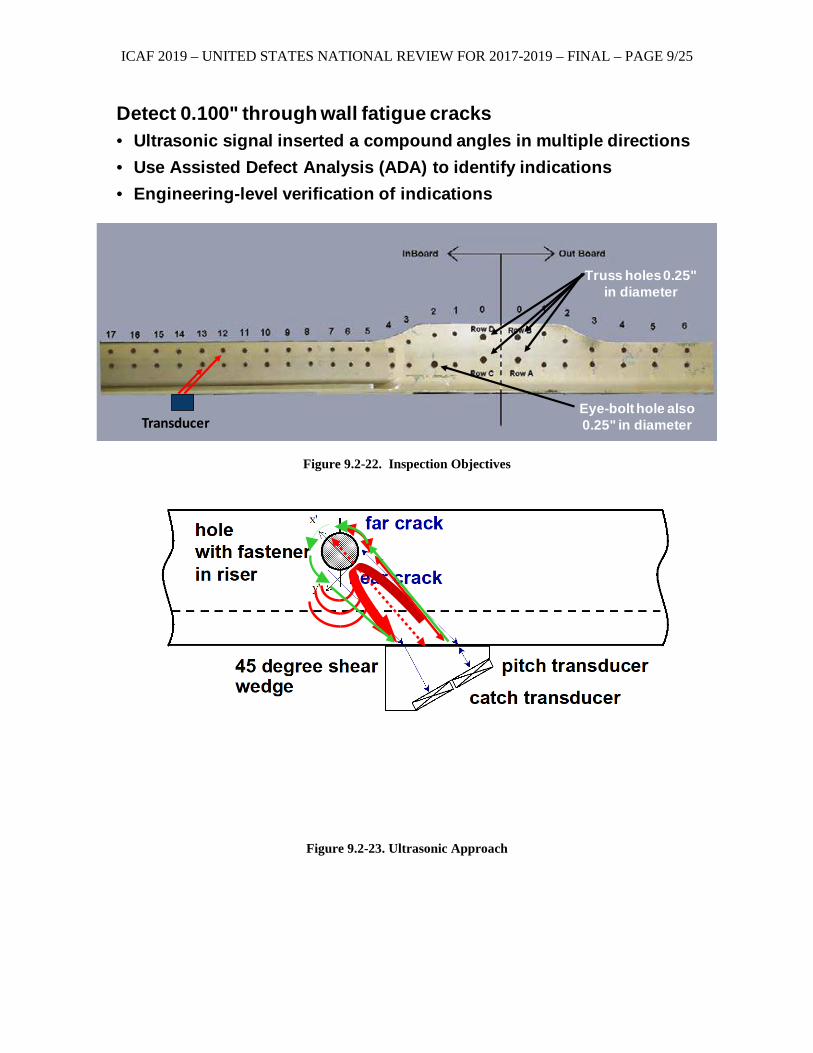
much data to capture and when to capture it (Figure 9.2-21). Initiatives with the USAF have focused on 100% data capture and availability, such as Attribute 1 in the Logistics and Sustainment Enterprise (LSE) 2040 vision document authored by the Air Force Sustainment Center (AFSC). Others have focused on capturing data for additional data mining, up to complete capture of all data from manufacturing through sustainment, such as the Digital Thread. From the perspective of NDE/I, the definition of data needs to be clarified as for some it includes all raw data, such as unprocessed RF waveforms for ultrasound, and for others it is only the report of an inspection outcome when an indication was found. As expected, there is a broad range of options between these two extremes. This technical effort reviews several current efforts to capture digital inspection data, ranging from automated reporting to full capture of unprocessed data (Figures 9.2-22 and 9.2-23). It addresses how these data capture initiatives should integrate with other data capture/management processes, such as program office based data management systems. In addition, approaches and options for capturing NDE/I data are dependent on the eventual use of the data. Several representative case studies addressing the differing use of data are discussed, including the value of automated reporting and the additional diagnostic capability achieved when analyzing/processing raw data. Considerations for each type of data capture, from point-of-maintenance (POM) tools to assistance/guidance in performing maintenance using augmented reality systems, are discussed to explore and evaluate optimal methods to capture and leverage NDE/I data to maximize its value for aircraft integrity management. Current AFRL demonstration projects are reviewed, including the anticipated value to the USAF for capturing data and the integrated roadmaps to realize this capability.
Figure 9.2-21. Digital Reporting: What and When
What is needed and impact:• Outcome of inspection: disposition• Tracking inspection process: verification• Raw data: additional diagnosticsWhen is it needed during MX process:• Outcome / tracking: as soon as inspection is accomplished• Raw data: depends…
• Disposition / life management critical: as soon as accomplished• Analyze / reanalyze outcomes: when analysis is performed
ICAF 2019 – UNITED STATES NATIONAL REVIEW FOR 2017-2019 – FINAL – PAGE 9/25
Figure 9.2-22. Inspection Objectives
Figure 9.2-23. Ultrasonic Approach
Detect 0.100" through wall fatigue cracks• Ultrasonic signal inserted a compound angles in multiple directions• Use Assisted Defect Analysis (ADA) to identify indications• Engineering-level verification of indications
Truss holes 0.25" in diameter
Eye-bolt hole also 0.25" in diameterTransducer
ICAF 2019 – UNITED STATES NATIONAL REVIEW FOR 2017-2019 – FINAL – PAGE 9/26
9.2.6. A New Method for ND Corrosion Inspection Through Paint
Mool Gupta and Andrey Prosvirin, Laser Plasma Technologies Designated MQ-9 Reaper® by its U.S. Air Force, the turboprop-powered, multi-mission
Predator® B Remotely Piloted Aircraft (RPA) was developed with GA-ASI funding and provides significantly greater capabilities than Predator. First flown in 2001, Predator B is a highly sophisticated development built on the experience gained with the company's battle-proven Predator RPA and is a major evolutionary leap forward in overall performance and reliability. In 2013, GA-ASI and the US Air Force, Medium Altitude Unmanned Aerial Systems Division undertook a targeted Airframe Structural Integrity Program for the MQ-9 Reaper platform. This technical effort will outline the need and purpose of the targeted effort, overview the analytical efforts, supplemental testing, ground testing, and flight test efforts undertaken and outline the remaining efforts. The technical effort will also highlight the unique challenges associated with an ASIP effort for unmanned remotely piloted aircraft.
ICAF 2019 – UNITED STATES NATIONAL REVIEW FOR 2017-2019 – FINAL – PAGE 9/27
9.3. STRUCTURAL HEALTH MONITORING
9.3.1. Structural Prognostics and Health Management (SPHM) for the F-35
Wayne Black, Lockheed Martin F-35 Program
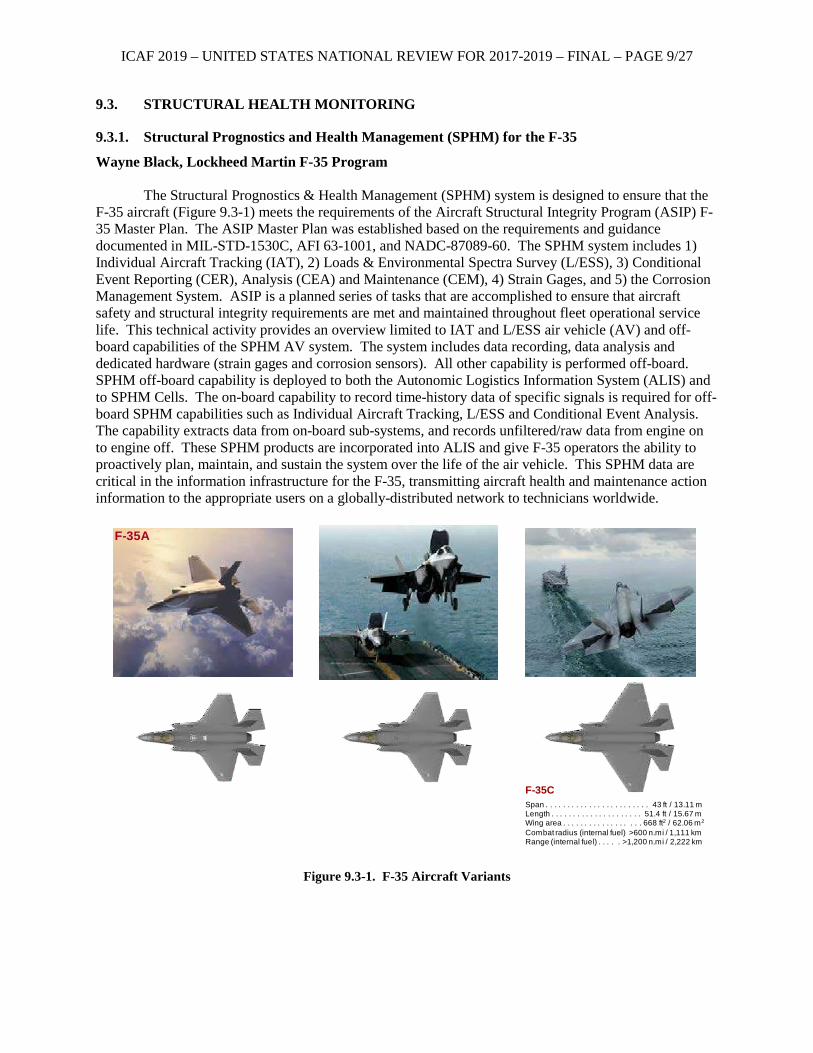
The Structural Prognostics & Health Management (SPHM) system is designed to ensure that the F-35 aircraft (Figure 9.3-1) meets the requirements of the Aircraft Structural Integrity Program (ASIP) F-35 Master Plan. The ASIP Master Plan was established based on the requirements and guidance documented in MIL-STD-1530C, AFI 63-1001, and NADC-87089-60. The SPHM system includes 1) Individual Aircraft Tracking (IAT), 2) Loads & Environmental Spectra Survey (L/ESS), 3) Conditional Event Reporting (CER), Analysis (CEA) and Maintenance (CEM), 4) Strain Gages, and 5) the Corrosion Management System. ASIP is a planned series of tasks that are accomplished to ensure that aircraft safety and structural integrity requirements are met and maintained throughout fleet operational service life. This technical activity provides an overview limited to IAT and L/ESS air vehicle (AV) and off-board capabilities of the SPHM AV system. The system includes data recording, data analysis and dedicated hardware (strain gages and corrosion sensors). All other capability is performed off-board. SPHM off-board capability is deployed to both the Autonomic Logistics Information System (ALIS) and to SPHM Cells. The on-board capability to record time-history data of specific signals is required for off-board SPHM capabilities such as Individual Aircraft Tracking, L/ESS and Conditional Event Analysis. The capability extracts data from on-board sub-systems, and records unfiltered/raw data from engine on to engine off. These SPHM products are incorporated into ALIS and give F-35 operators the ability to proactively plan, maintain, and sustain the system over the life of the air vehicle. This SPHM data are critical in the information infrastructure for the F-35, transmitting aircraft health and maintenance action information to the appropriate users on a globally-distributed network to technicians worldwide.
Figure 9.3-1. F-35 Aircraft Variants
F-35CSpan . . . . . . . . . . . . . . . . . . . . . . . . 43 ft / 13.11 mLength . . . . . . . . . . . . . . . . . . . . . 51.4 ft / 15.67 mWing area . . . . . . . . . . . . . . . . . . 668 ft2 / 62.06 m2
Combat radius (internal fuel) >600 n.mi / 1,111 kmRange (internal fuel) . . . . . >1,200 n.mi / 2,222 km
F-35A
ICAF 2019 – UNITED STATES NATIONAL REVIEW FOR 2017-2019 – FINAL – PAGE 9/28
9.3.2. Unit Cell Approach for Optimized Detection of Fatigue Cracks Using Data from PZT Sensor Networks
Susheel Yadav, Howard Chung, and Amrita Kumar, Acellent Technologies, Inc.; Fukuo Chang, Stanford University; Dennis Roach and Thomas Rice, Sandia National Laboratories
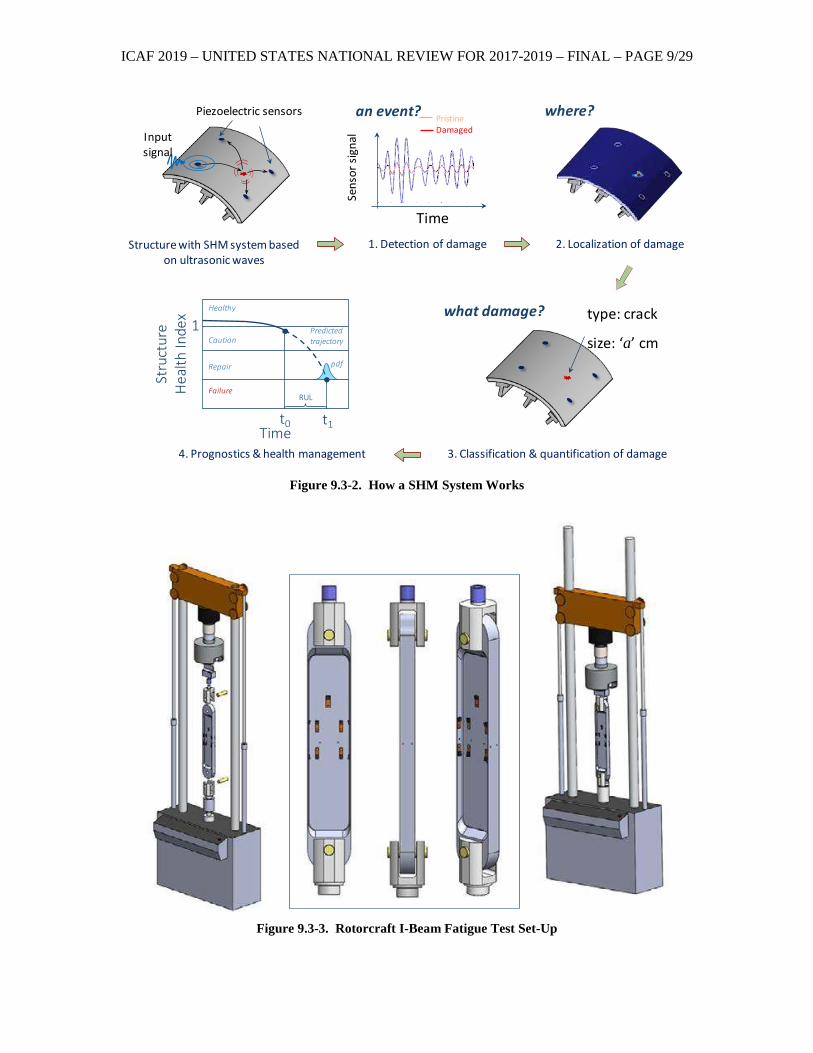
Fatigue cracks in critical aerospace structure are a common occurrence that effect the overall safety, performance and mission readiness of aircraft. Harsh operational conditions combined with inspection obstacles pose additional challenges in the quantification of such types of damage. Prevention of unexpected flaw growth and structural failure could be improved if on-board health monitoring systems are used to continuously assess structural integrity. In recent years, in-situ Structural Health Monitoring (SHM) technologies have shown the potential to efficiently assess structural health condition while minimizing human factors concerns during inspection. In particular, Piezoelectric Transducers (PZT) can be bonded to the structure of interest and utilize Lamb Wave interrogation methods to detect damage that occurs within the sensor array (Figure 9.3-2). Such PZT systems can automatically process data, assess structural condition, and signal the need for human intervention. The use of onboard sensors for real-time health monitoring of aircraft structures can overcome a myriad of inspection impediments stemming from accessibility limitations, complex geometries, and the location and depth of hidden damage. Previous studies have shown that the uncertainties associated with sensor/actuator locations and variations in crack orientations are two key factors that can affect the PZT damage quantification. Acellent Technologies, Inc., in collaboration with the Structures and Composites Laboratory at Stanford University and the Airworthiness Assurance Center at Sandia National Laboratories has developed and tested a calibration-based robust, multipath, scalable, Unit-Cell (UC) approach for enhanced detection and quantification of fatigue cracks. The PZT UC approach uses multiple sensor-paths from a multi-sensor unit (network) together with an adaptive, weighted averaging method to mitigate the effect of sensor positioning error and/or uncertainties associated with crack orientation for quantification in SHM. Extensive coupon tests, using a complex riveted metallic assembly, were conducted and the results were used to validate the performance of this novel, multi-path Unit-Cell approach for damage quantification (Figures 9.3-3 and 9.3.-4). The results from coupon test data are summarized and presented in this technical effort.
ICAF 2019 – UNITED STATES NATIONAL REVIEW FOR 2017-2019 – FINAL – PAGE 9/29
Figure 9.3-2. How a SHM System Works
Figure 9.3-3. Rotorcraft I-Beam Fatigue Test Set-Up
Piezoelectric sensors
Structure with SHM system based on ultrasonic waves
Input signal
Stru
ctur
e H
ealth
Inde
x
Timet0 t1
1Healthy
Caution
Repair
Failure
Predicted trajectory
RUL
4. Prognostics & health management
an event?
1. Detection of damage
Time
Sens
orsig
nal
PristineDamaged
2. Localization of damage
where?
3. Classification & quantification of damage
type: crack
size: ‘a’ cm
what damage?
ICAF 2019 – UNITED STATES NATIONAL REVIEW FOR 2017-2019 – FINAL – PAGE 9/30
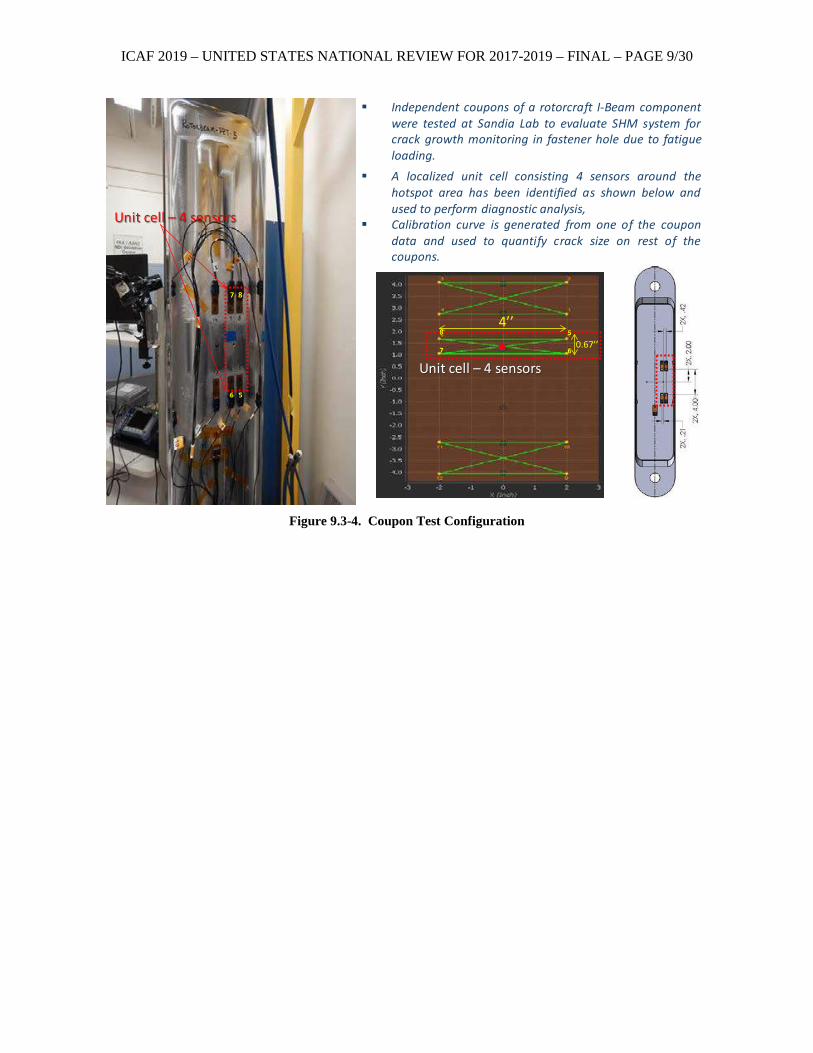
Figure 9.3-4. Coupon Test Configuration
Unit cell – 4 sensors
7 8
6 5
4’’0.67’’
5
6
8
7
Unit cell – 4 sensors
Independent coupons of a rotorcraft I-Beam componentwere tested at Sandia Lab to evaluate SHM system forcrack growth monitoring in fastener hole due to fatigueloading.
A localized unit cell consisting 4 sensors around thehotspot area has been identified as shown below andused to perform diagnostic analysis,
Calibration curve is generated from one of the coupondata and used to quantify crack size on rest of thecoupons.

ICAF 2019 – UNITED STATES NATIONAL REVIEW FOR 2017-2019 – FINAL – PAGE 9/31
9.4. STRUCTURAL TEARDOWN ASSESSMENTS
NO INPUTS WERE SUBMITTED FOR THIS CATEGORY.

ICAF 2019 – UNITED STATES NATIONAL REVIEW FOR 2017-2019 – FINAL – PAGE 9/32
ICAF 2019 – UNITED STATES NATIONAL REVIEW FOR 2017-2019 – FINAL – PAGE 9/33
9.5. LOADS AND ENVIRONMENT CHARACTERIZATION
9.5.1. Modernizing the A-10 Loading Spectrum Development Process
Luciano Smith, Southwest Research Institute (SwRI); Devin Butts and Kurt Schrader, InterPro LLC; Mark Thomsen, USAF Life Cycle Management Center – A-10 Structures Aero Section
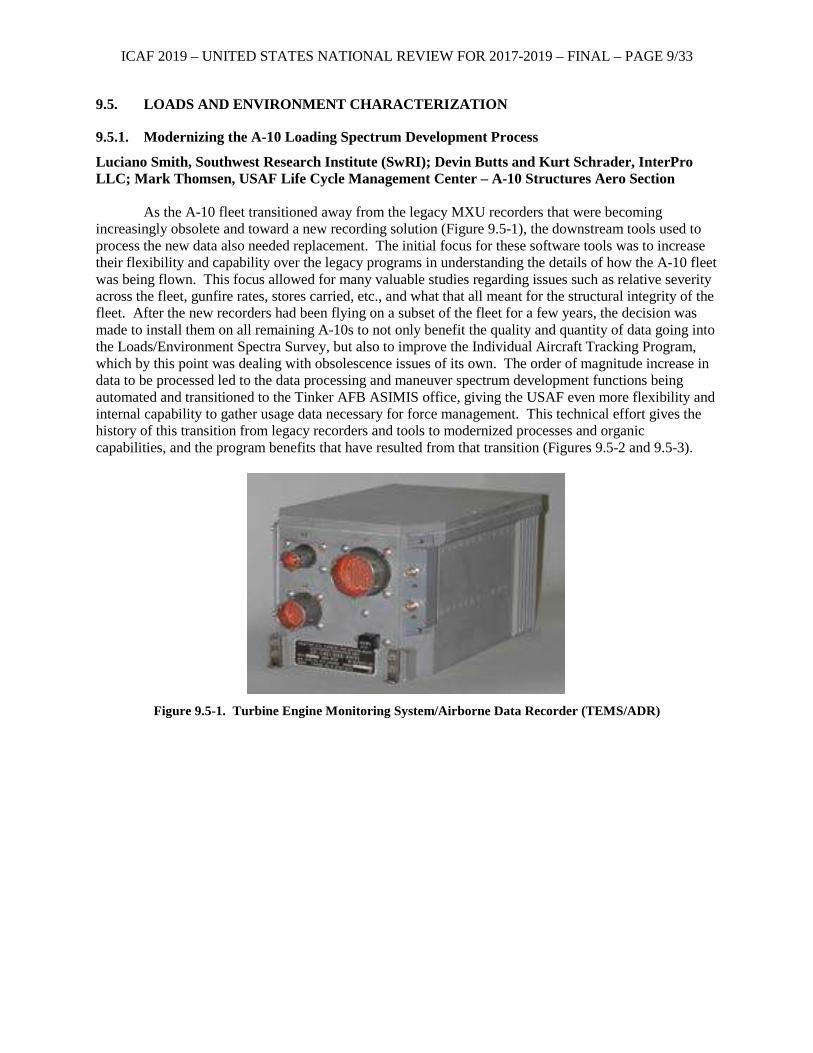
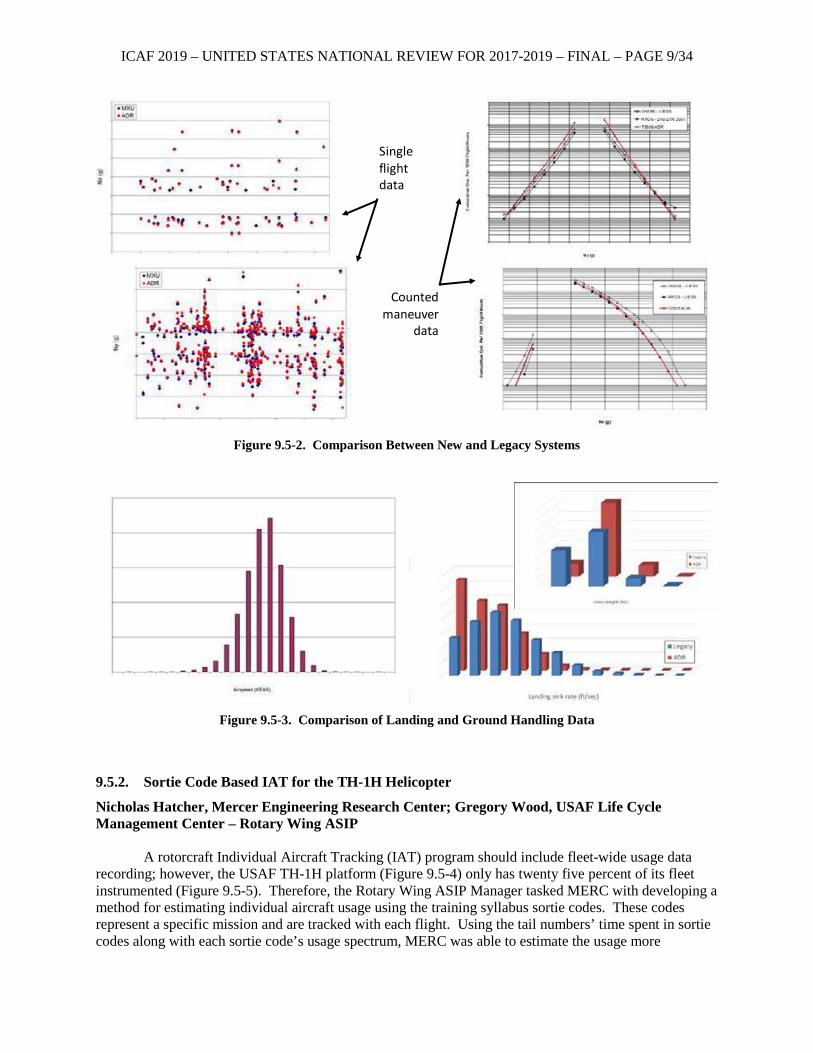
As the A-10 fleet transitioned away from the legacy MXU recorders that were becoming increasingly obsolete and toward a new recording solution (Figure 9.5-1), the downstream tools used to process the new data also needed replacement. The initial focus for these software tools was to increase their flexibility and capability over the legacy programs in understanding the details of how the A-10 fleet was being flown. This focus allowed for many valuable studies regarding issues such as relative severity across the fleet, gunfire rates, stores carried, etc., and what that all meant for the structural integrity of the fleet. After the new recorders had been flying on a subset of the fleet for a few years, the decision was made to install them on all remaining A-10s to not only benefit the quality and quantity of data going into the Loads/Environment Spectra Survey, but also to improve the Individual Aircraft Tracking Program, which by this point was dealing with obsolescence issues of its own. The order of magnitude increase in data to be processed led to the data processing and maneuver spectrum development functions being automated and transitioned to the Tinker AFB ASIMIS office, giving the USAF even more flexibility and internal capability to gather usage data necessary for force management. This technical effort gives the history of this transition from legacy recorders and tools to modernized processes and organic capabilities, and the program benefits that have resulted from that transition (Figures 9.5-2 and 9.5-3).
Figure 9.5-1. Turbine Engine Monitoring System/Airborne Data Recorder (TEMS/ADR)
ICAF 2019 – UNITED STATES NATIONAL REVIEW FOR 2017-2019 – FINAL – PAGE 9/34
Figure 9.5-2. Comparison Between New and Legacy Systems
Figure 9.5-3. Comparison of Landing and Ground Handling Data
9.5.2. Sortie Code Based IAT for the TH-1H Helicopter
Nicholas Hatcher, Mercer Engineering Research Center; Gregory Wood, USAF Life Cycle Management Center – Rotary Wing ASIP
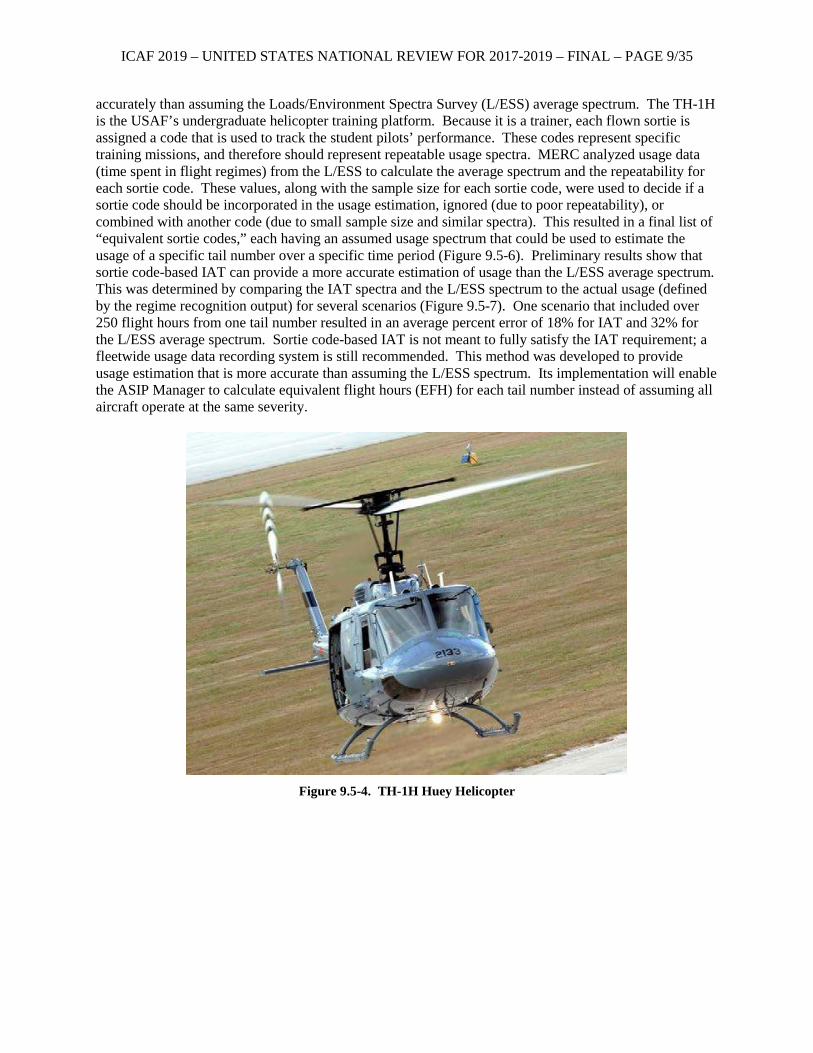
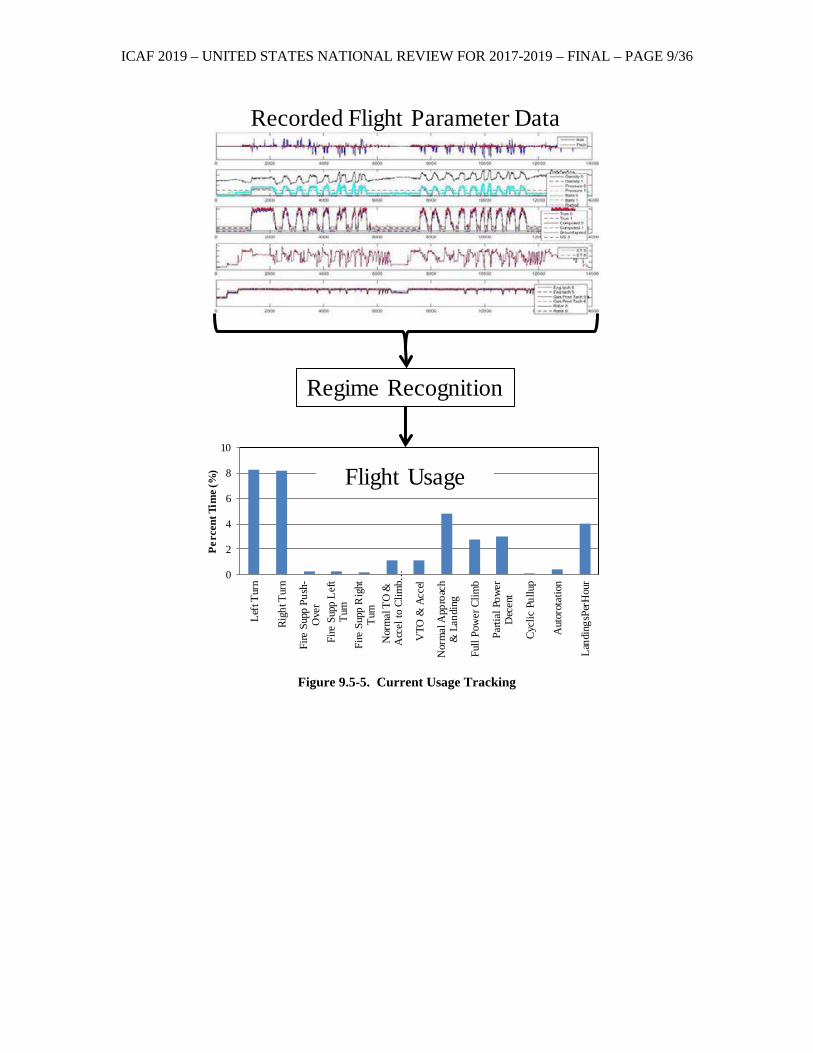
A rotorcraft Individual Aircraft Tracking (IAT) program should include fleet-wide usage data recording; however, the USAF TH-1H platform (Figure 9.5-4) only has twenty five percent of its fleet instrumented (Figure 9.5-5). Therefore, the Rotary Wing ASIP Manager tasked MERC with developing a method for estimating individual aircraft usage using the training syllabus sortie codes. These codes represent a specific mission and are tracked with each flight. Using the tail numbers’ time spent in sortie codes along with each sortie code’s usage spectrum, MERC was able to estimate the usage more
Single flight data
Counted maneuver
data
ICAF 2019 – UNITED STATES NATIONAL REVIEW FOR 2017-2019 – FINAL – PAGE 9/35
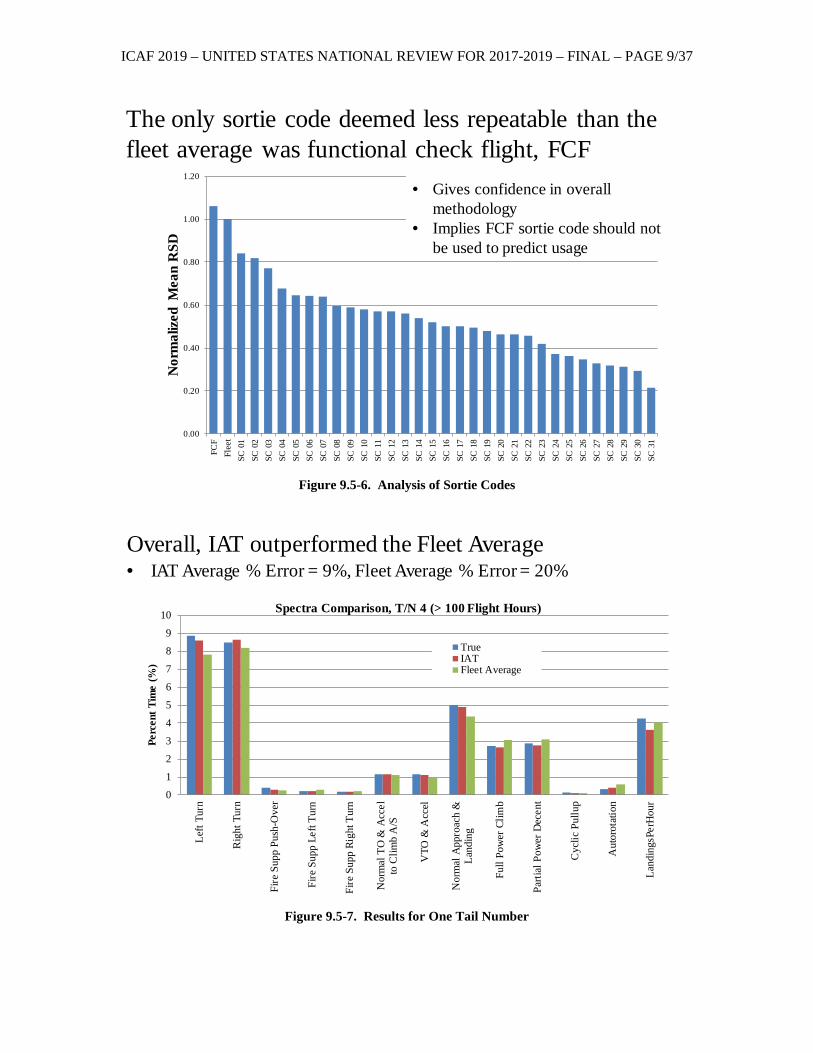
accurately than assuming the Loads/Environment Spectra Survey (L/ESS) average spectrum. The TH-1H is the USAF’s undergraduate helicopter training platform. Because it is a trainer, each flown sortie is assigned a code that is used to track the student pilots’ performance. These codes represent specific training missions, and therefore should represent repeatable usage spectra. MERC analyzed usage data (time spent in flight regimes) from the L/ESS to calculate the average spectrum and the repeatability for each sortie code. These values, along with the sample size for each sortie code, were used to decide if a sortie code should be incorporated in the usage estimation, ignored (due to poor repeatability), or combined with another code (due to small sample size and similar spectra). This resulted in a final list of “equivalent sortie codes,” each having an assumed usage spectrum that could be used to estimate the usage of a specific tail number over a specific time period (Figure 9.5-6). Preliminary results show that sortie code-based IAT can provide a more accurate estimation of usage than the L/ESS average spectrum. This was determined by comparing the IAT spectra and the L/ESS spectrum to the actual usage (defined by the regime recognition output) for several scenarios (Figure 9.5-7). One scenario that included over 250 flight hours from one tail number resulted in an average percent error of 18% for IAT and 32% for the L/ESS average spectrum. Sortie code-based IAT is not meant to fully satisfy the IAT requirement; a fleetwide usage data recording system is still recommended. This method was developed to provide usage estimation that is more accurate than assuming the L/ESS spectrum. Its implementation will enable the ASIP Manager to calculate equivalent flight hours (EFH) for each tail number instead of assuming all aircraft operate at the same severity.
Figure 9.5-4. TH-1H Huey Helicopter
ICAF 2019 – UNITED STATES NATIONAL REVIEW FOR 2017-2019 – FINAL – PAGE 9/36
Figure 9.5-5. Current Usage Tracking
0
2
4
6
8
10
Left
Turn
Righ
t Tur
n
Fire
Sup
p Pu
sh-
Ove
rFi
re S
upp
Left
Turn
Fire
Sup
p R
ight
Turn
Nor
mal
TO
&A
ccel
to C
limb…
VTO
& A
ccel
Nor
mal
App
roac
h&
Lan
ding
Full
Pow
er C
limb
Parti
al P
ower
Dec
ent
Cycl
ic P
ullu
p
Aut
orot
atio
n
Land
ings
PerH
our
Perc
ent T
ime (
%)
Regime Recognition
Recorded Flight Parameter Data
Flight Usage
ICAF 2019 – UNITED STATES NATIONAL REVIEW FOR 2017-2019 – FINAL – PAGE 9/37
Figure 9.5-6. Analysis of Sortie Codes
Figure 9.5-7. Results for One Tail Number
The only sortie code deemed less repeatable than the fleet average was functional check flight, FCF
0.00
0.20
0.40
0.60
0.80
1.00
1.20
FCF
Flee
tSC
01
SC 0
2SC
03
SC 0
4SC
05
SC 0
6SC
07
SC 0
8SC
09
SC 1
0SC
11
SC 1
2SC
13
SC 1
4SC
15
SC 1
6SC
17
SC 1
8SC
19
SC 2
0SC
21
SC 2
2SC
23
SC 2
4SC
25
SC 2
6SC
27
SC 2
8SC
29
SC 3
0SC
31
Nor
mal
ized
Mea
n R
SD• Gives confidence in overall
methodology• Implies FCF sortie code should not
be used to predict usage
Overall, IAT outperformed the Fleet Average• IAT Average % Error = 9%, Fleet Average % Error = 20%
0
1
2
3
4
5
6
7
8
9
10
Left
Turn
Rig
ht T
urn
Fire
Sup
p Pu
sh-O
ver
Fire
Sup
p Le
ft Tu
rn
Fire
Sup
p Ri
ght T
urn
Nor
mal
TO
& A
ccel
to C
limb
A/S
VTO
& A
ccel
Nor
mal
App
roac
h &
Land
ing
Full
Pow
er C
limb
Parti
al P
ower
Dec
ent
Cyc
lic P
ullu
p
Aut
orot
atio
n
Land
ings
PerH
our
Perc
ent T
ime
(%)
Spectra Comparison, T/N 4 (> 100 Flight Hours)
TrueIATFleet Average

ICAF 2019 – UNITED STATES NATIONAL REVIEW FOR 2017-2019 – FINAL – PAGE 9/38
ICAF 2019 – UNITED STATES NATIONAL REVIEW FOR 2017-2019 – FINAL – PAGE 9/39
9.6. CHARACTERIZATION, MODELING & TESTING
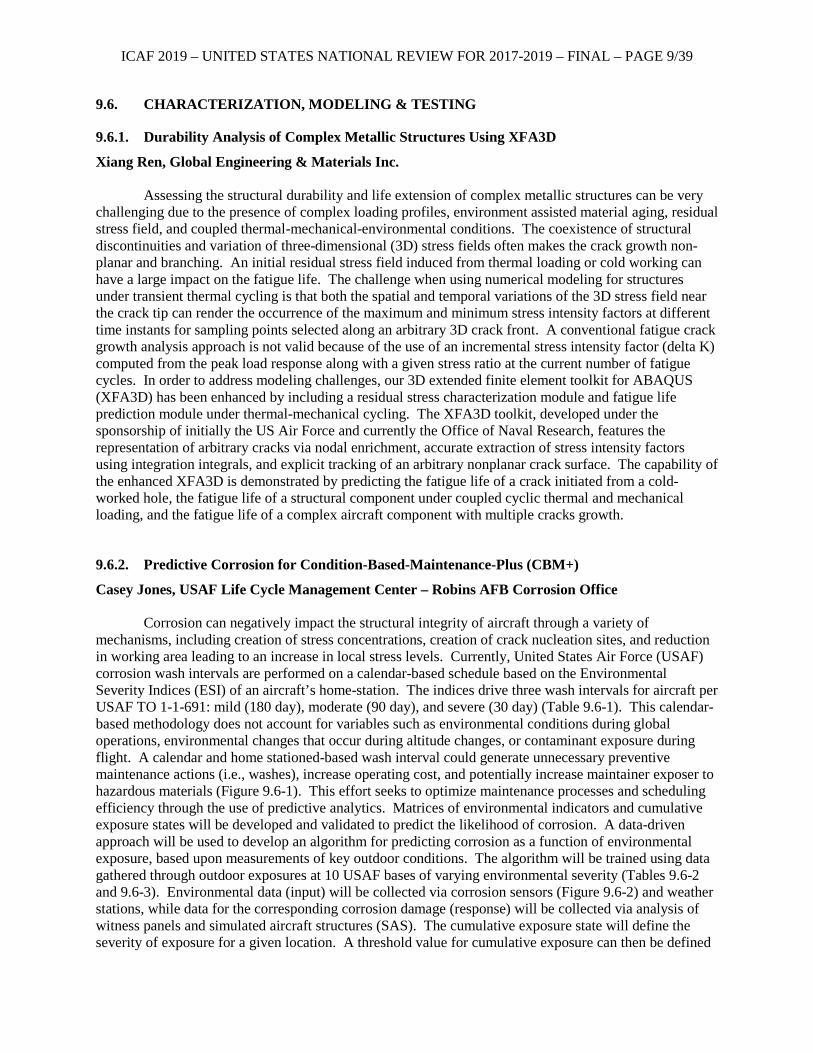
9.6.1. Durability Analysis of Complex Metallic Structures Using XFA3D
Xiang Ren, Global Engineering & Materials Inc.
Assessing the structural durability and life extension of complex metallic structures can be very challenging due to the presence of complex loading profiles, environment assisted material aging, residual stress field, and coupled thermal-mechanical-environmental conditions. The coexistence of structural discontinuities and variation of three-dimensional (3D) stress fields often makes the crack growth non-planar and branching. An initial residual stress field induced from thermal loading or cold working can have a large impact on the fatigue life. The challenge when using numerical modeling for structures under transient thermal cycling is that both the spatial and temporal variations of the 3D stress field near the crack tip can render the occurrence of the maximum and minimum stress intensity factors at different time instants for sampling points selected along an arbitrary 3D crack front. A conventional fatigue crack growth analysis approach is not valid because of the use of an incremental stress intensity factor (delta K) computed from the peak load response along with a given stress ratio at the current number of fatigue cycles. In order to address modeling challenges, our 3D extended finite element toolkit for ABAQUS (XFA3D) has been enhanced by including a residual stress characterization module and fatigue life prediction module under thermal-mechanical cycling. The XFA3D toolkit, developed under the sponsorship of initially the US Air Force and currently the Office of Naval Research, features the representation of arbitrary cracks via nodal enrichment, accurate extraction of stress intensity factors using integration integrals, and explicit tracking of an arbitrary nonplanar crack surface. The capability of the enhanced XFA3D is demonstrated by predicting the fatigue life of a crack initiated from a cold-worked hole, the fatigue life of a structural component under coupled cyclic thermal and mechanical loading, and the fatigue life of a complex aircraft component with multiple cracks growth.
9.6.2. Predictive Corrosion for Condition-Based-Maintenance-Plus (CBM+)
Casey Jones, USAF Life Cycle Management Center – Robins AFB Corrosion Office
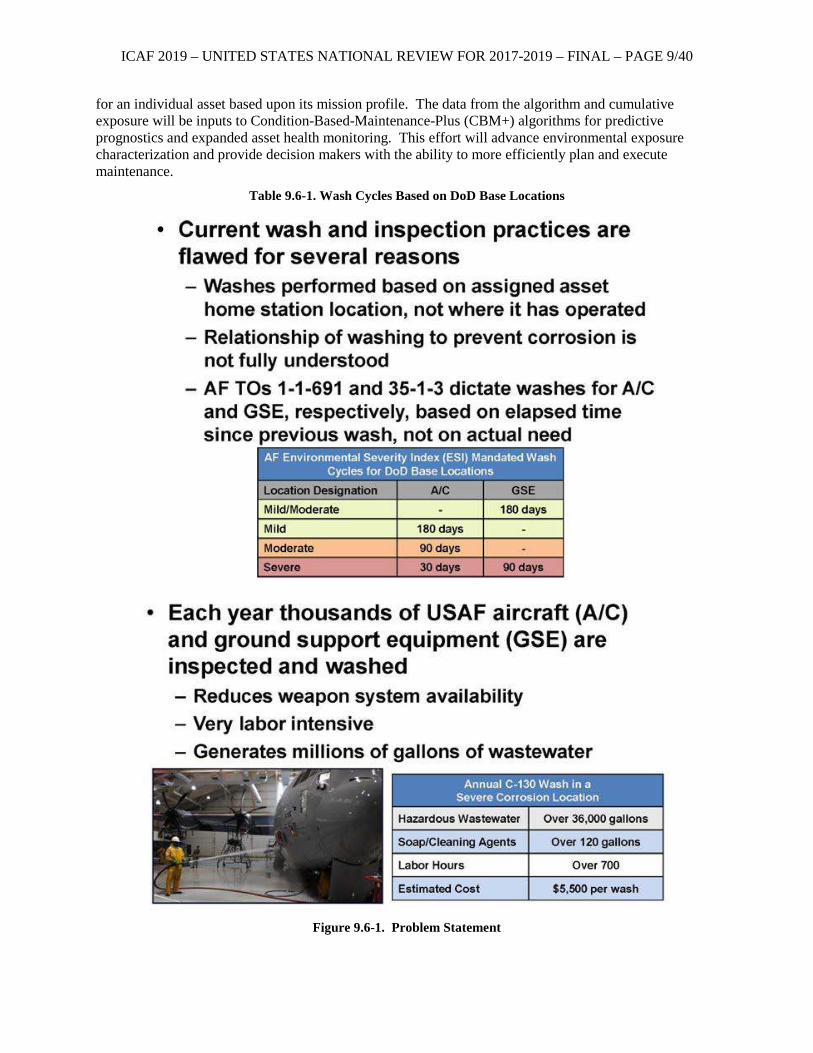
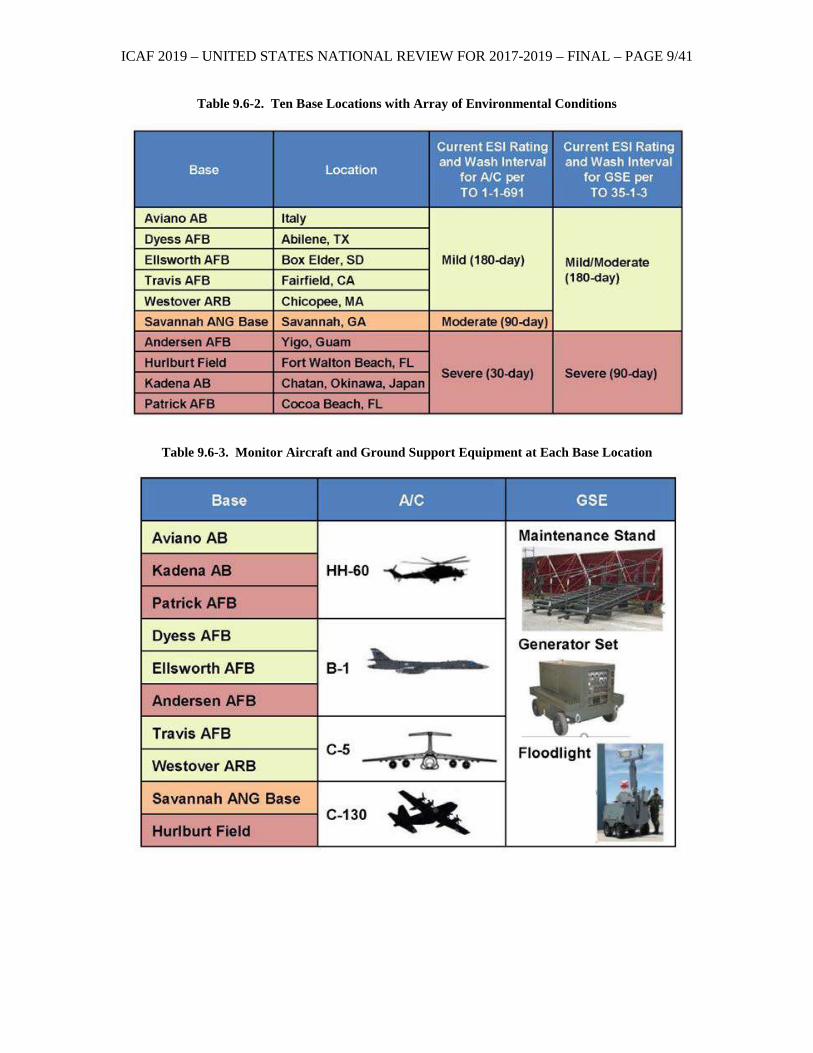
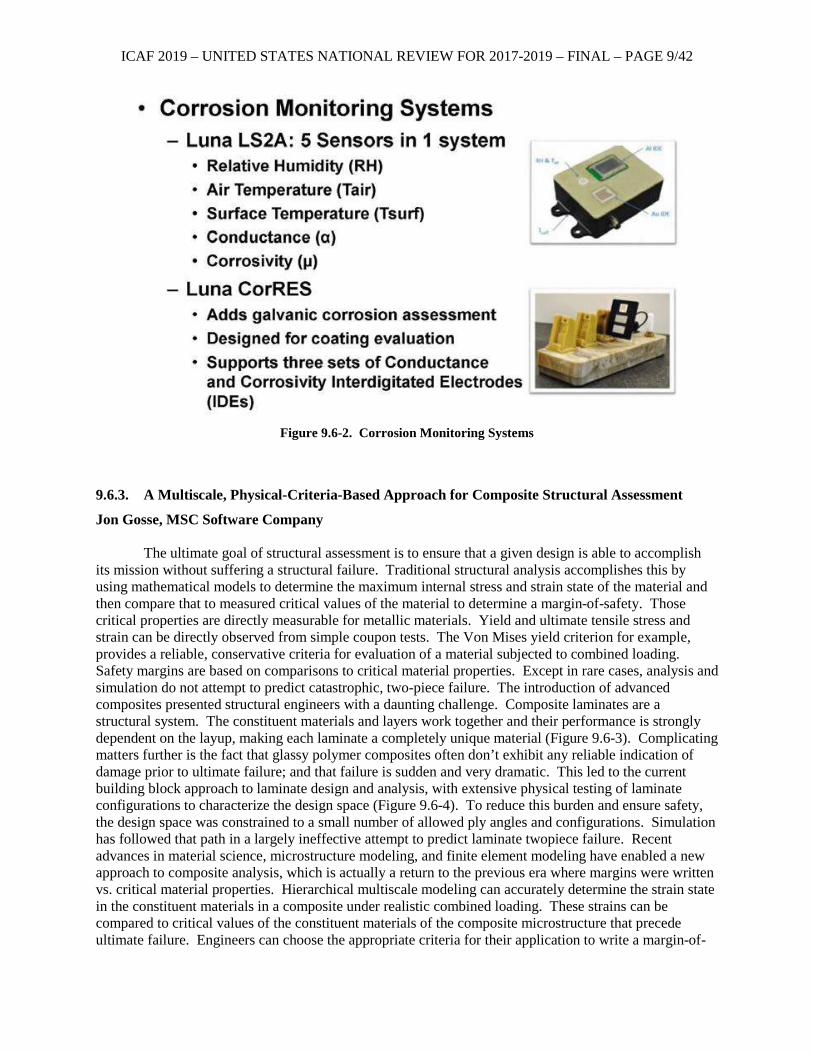
Corrosion can negatively impact the structural integrity of aircraft through a variety of mechanisms, including creation of stress concentrations, creation of crack nucleation sites, and reduction in working area leading to an increase in local stress levels. Currently, United States Air Force (USAF) corrosion wash intervals are performed on a calendar-based schedule based on the Environmental Severity Indices (ESI) of an aircraft’s home-station. The indices drive three wash intervals for aircraft per USAF TO 1-1-691: mild (180 day), moderate (90 day), and severe (30 day) (Table 9.6-1). This calendar-based methodology does not account for variables such as environmental conditions during global operations, environmental changes that occur during altitude changes, or contaminant exposure during flight. A calendar and home stationed-based wash interval could generate unnecessary preventive maintenance actions (i.e., washes), increase operating cost, and potentially increase maintainer exposer to hazardous materials (Figure 9.6-1). This effort seeks to optimize maintenance processes and scheduling efficiency through the use of predictive analytics. Matrices of environmental indicators and cumulative exposure states will be developed and validated to predict the likelihood of corrosion. A data-driven approach will be used to develop an algorithm for predicting corrosion as a function of environmental exposure, based upon measurements of key outdoor conditions. The algorithm will be trained using data gathered through outdoor exposures at 10 USAF bases of varying environmental severity (Tables 9.6-2 and 9.6-3). Environmental data (input) will be collected via corrosion sensors (Figure 9.6-2) and weather stations, while data for the corresponding corrosion damage (response) will be collected via analysis of witness panels and simulated aircraft structures (SAS). The cumulative exposure state will define the severity of exposure for a given location. A threshold value for cumulative exposure can then be defined
ICAF 2019 – UNITED STATES NATIONAL REVIEW FOR 2017-2019 – FINAL – PAGE 9/40
for an individual asset based upon its mission profile. The data from the algorithm and cumulative exposure will be inputs to Condition-Based-Maintenance-Plus (CBM+) algorithms for predictive prognostics and expanded asset health monitoring. This effort will advance environmental exposure characterization and provide decision makers with the ability to more efficiently plan and execute maintenance.
Table 9.6-1. Wash Cycles Based on DoD Base Locations
Figure 9.6-1. Problem Statement
ICAF 2019 – UNITED STATES NATIONAL REVIEW FOR 2017-2019 – FINAL – PAGE 9/41
Table 9.6-2. Ten Base Locations with Array of Environmental Conditions
Table 9.6-3. Monitor Aircraft and Ground Support Equipment at Each Base Location
ICAF 2019 – UNITED STATES NATIONAL REVIEW FOR 2017-2019 – FINAL – PAGE 9/42
Figure 9.6-2. Corrosion Monitoring Systems
9.6.3. A Multiscale, Physical-Criteria-Based Approach for Composite Structural Assessment
Jon Gosse, MSC Software Company The ultimate goal of structural assessment is to ensure that a given design is able to accomplish
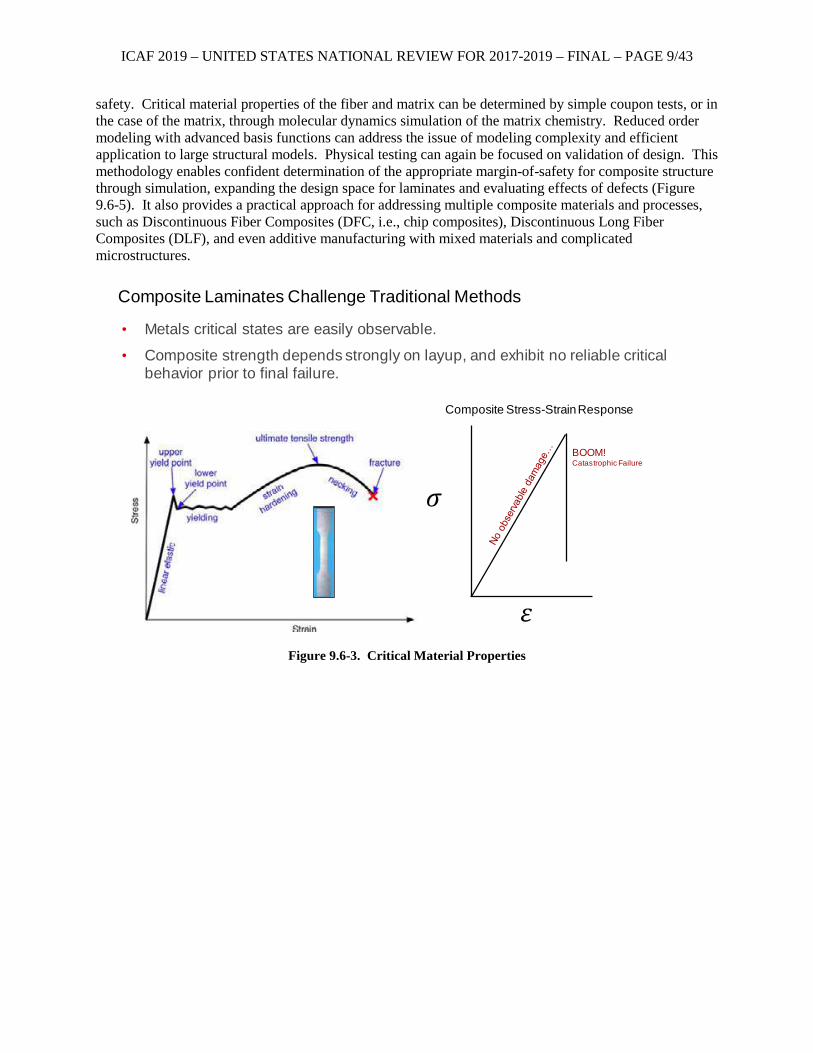
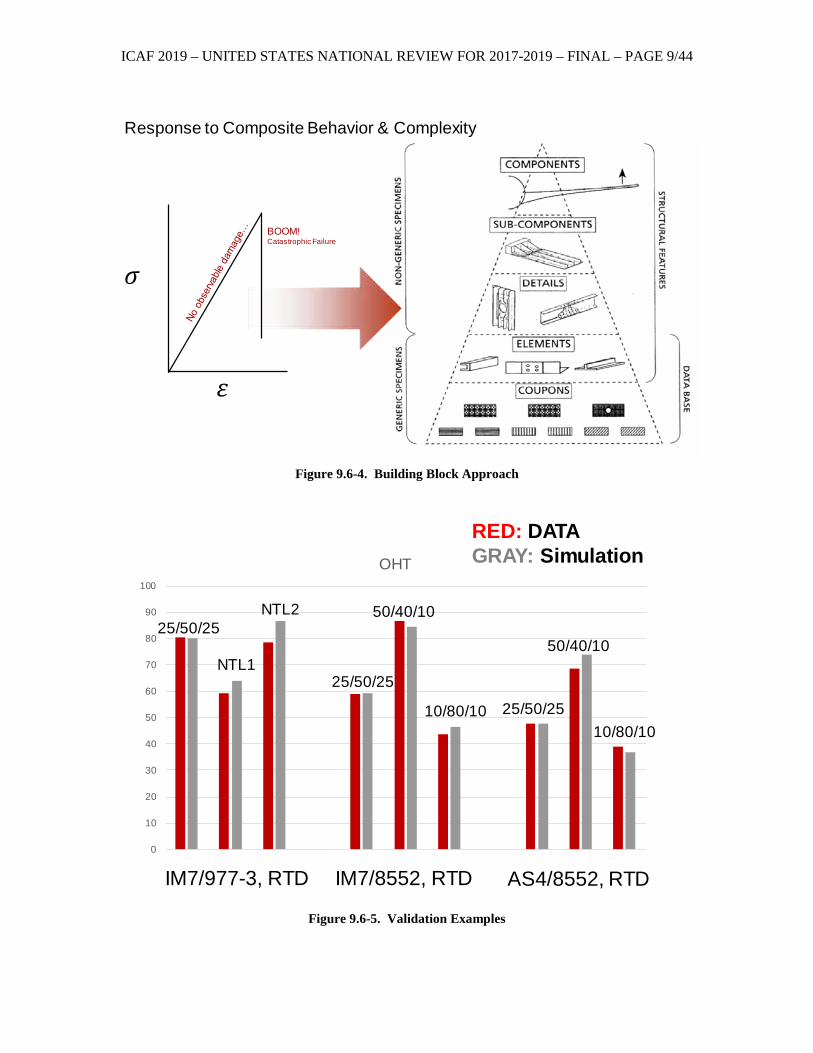
its mission without suffering a structural failure. Traditional structural analysis accomplishes this by using mathematical models to determine the maximum internal stress and strain state of the material and then compare that to measured critical values of the material to determine a margin-of-safety. Those critical properties are directly measurable for metallic materials. Yield and ultimate tensile stress and strain can be directly observed from simple coupon tests. The Von Mises yield criterion for example, provides a reliable, conservative criteria for evaluation of a material subjected to combined loading. Safety margins are based on comparisons to critical material properties. Except in rare cases, analysis and simulation do not attempt to predict catastrophic, two-piece failure. The introduction of advanced composites presented structural engineers with a daunting challenge. Composite laminates are a structural system. The constituent materials and layers work together and their performance is strongly dependent on the layup, making each laminate a completely unique material (Figure 9.6-3). Complicating matters further is the fact that glassy polymer composites often don’t exhibit any reliable indication of damage prior to ultimate failure; and that failure is sudden and very dramatic. This led to the current building block approach to laminate design and analysis, with extensive physical testing of laminate configurations to characterize the design space (Figure 9.6-4). To reduce this burden and ensure safety, the design space was constrained to a small number of allowed ply angles and configurations. Simulation has followed that path in a largely ineffective attempt to predict laminate twopiece failure. Recent advances in material science, microstructure modeling, and finite element modeling have enabled a new approach to composite analysis, which is actually a return to the previous era where margins were written vs. critical material properties. Hierarchical multiscale modeling can accurately determine the strain state in the constituent materials in a composite under realistic combined loading. These strains can be compared to critical values of the constituent materials of the composite microstructure that precede ultimate failure. Engineers can choose the appropriate criteria for their application to write a margin-of-
ICAF 2019 – UNITED STATES NATIONAL REVIEW FOR 2017-2019 – FINAL – PAGE 9/43
safety. Critical material properties of the fiber and matrix can be determined by simple coupon tests, or in the case of the matrix, through molecular dynamics simulation of the matrix chemistry. Reduced order modeling with advanced basis functions can address the issue of modeling complexity and efficient application to large structural models. Physical testing can again be focused on validation of design. This methodology enables confident determination of the appropriate margin-of-safety for composite structure through simulation, expanding the design space for laminates and evaluating effects of defects (Figure 9.6-5). It also provides a practical approach for addressing multiple composite materials and processes, such as Discontinuous Fiber Composites (DFC, i.e., chip composites), Discontinuous Long Fiber Composites (DLF), and even additive manufacturing with mixed materials and complicated microstructures.
Figure 9.6-3. Critical Material Properties
• Metals critical states are easily observable.
• Composite strength depends strongly on layup, and exhibit no reliable critical behavior prior to final failure.
Composite Laminates Challenge Traditional Methods
Composite Stress-Strain Response
𝜎
𝜀
BOOM!Catastrophic Failure
ICAF 2019 – UNITED STATES NATIONAL REVIEW FOR 2017-2019 – FINAL – PAGE 9/44
Figure 9.6-4. Building Block Approach
Figure 9.6-5. Validation Examples
𝜎
𝜀
BOOM!Catastrophic Failure
Response to Composite Behavior & Complexity
0
10
20
30
40
50
60
70
80
90
100
OHT
IM7/977-3, RTD IM7/8552, RTD AS4/8552, RTD
RED: DATAGRAY: Simulation
25/50/25NTL2
NTL1
10/80/10
50/40/10
25/50/25
10/80/10
50/40/10
25/50/25
ICAF 2019 – UNITED STATES NATIONAL REVIEW FOR 2017-2019 – FINAL – PAGE 9/45
9.6.4. Fatigue Crack Growth Tests and Analyses on 7249-T76511 Aluminum Alloy Specimens of Various Thickness Under Simulated Aircraft Wing Loading
James Newman, Jr., Mississippi State University; Kevin Walker, DSTG – Australia The original P-3C aircraft wings were made of 7075-T651 aluminum alloy. An extensive life-
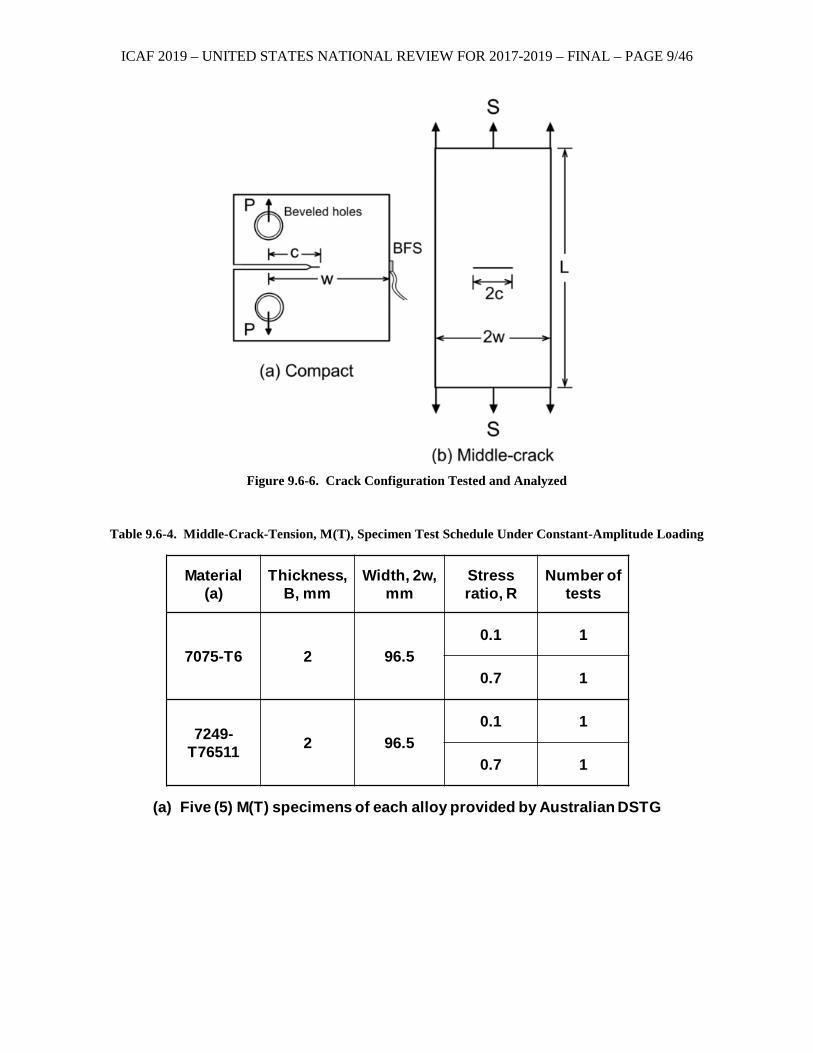
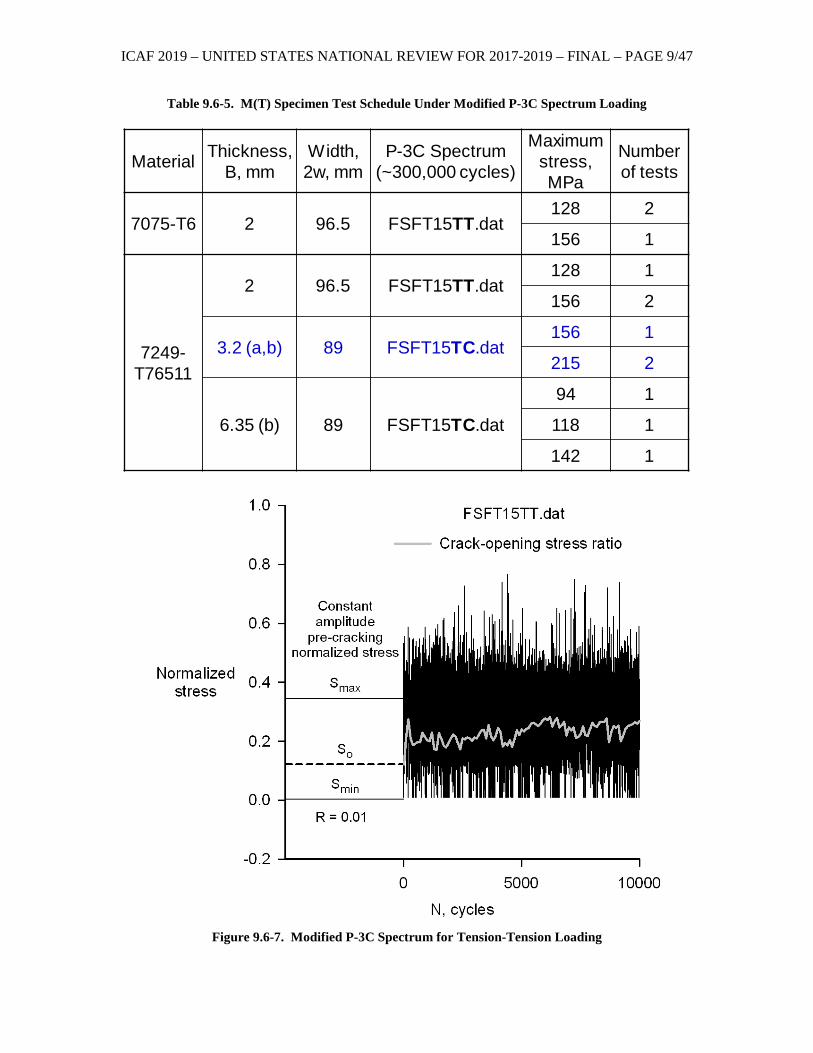
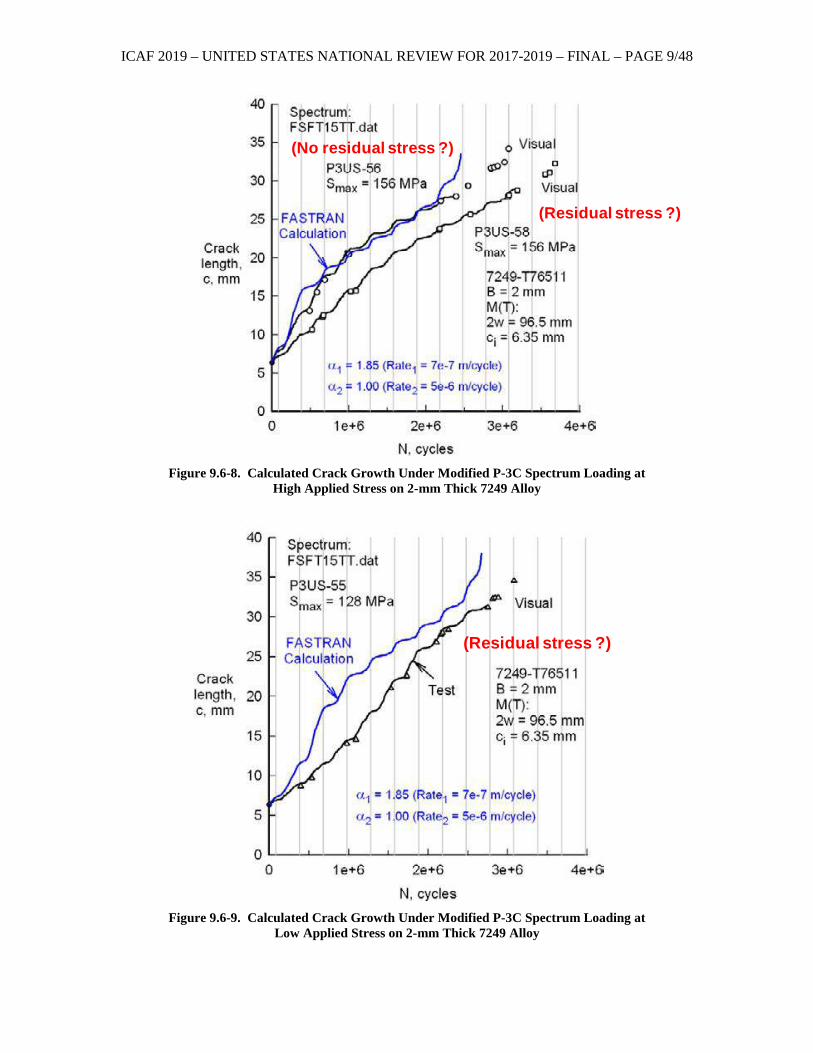
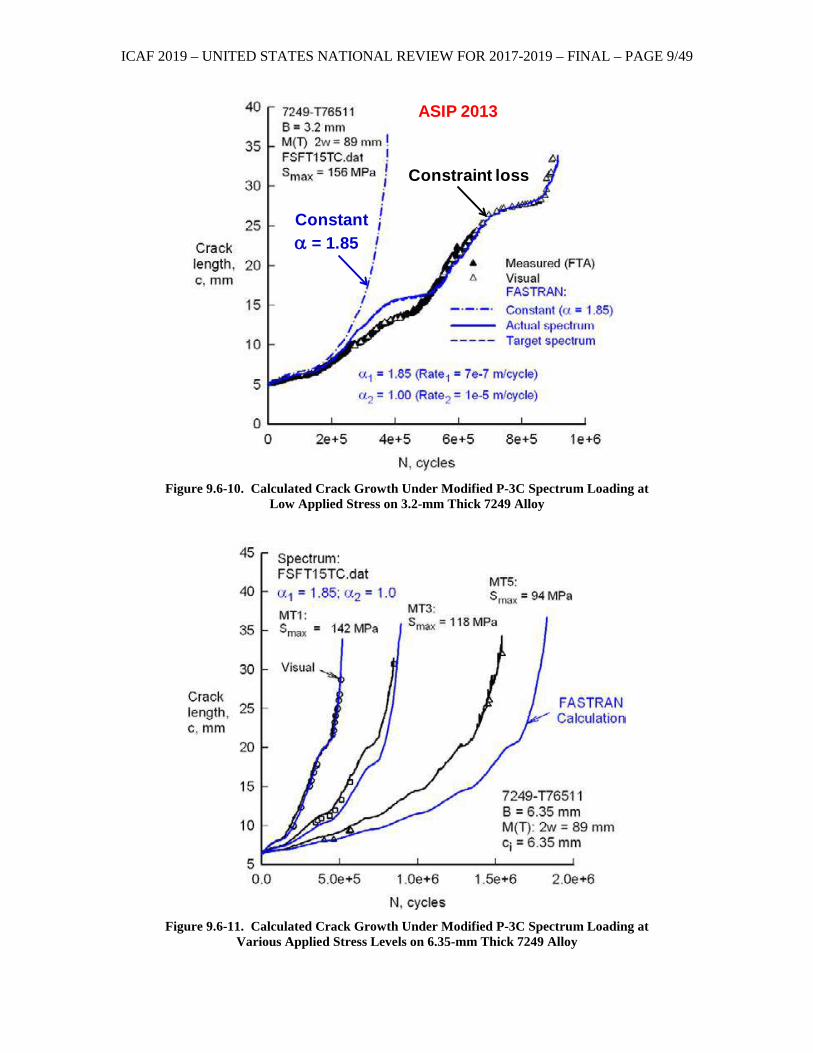
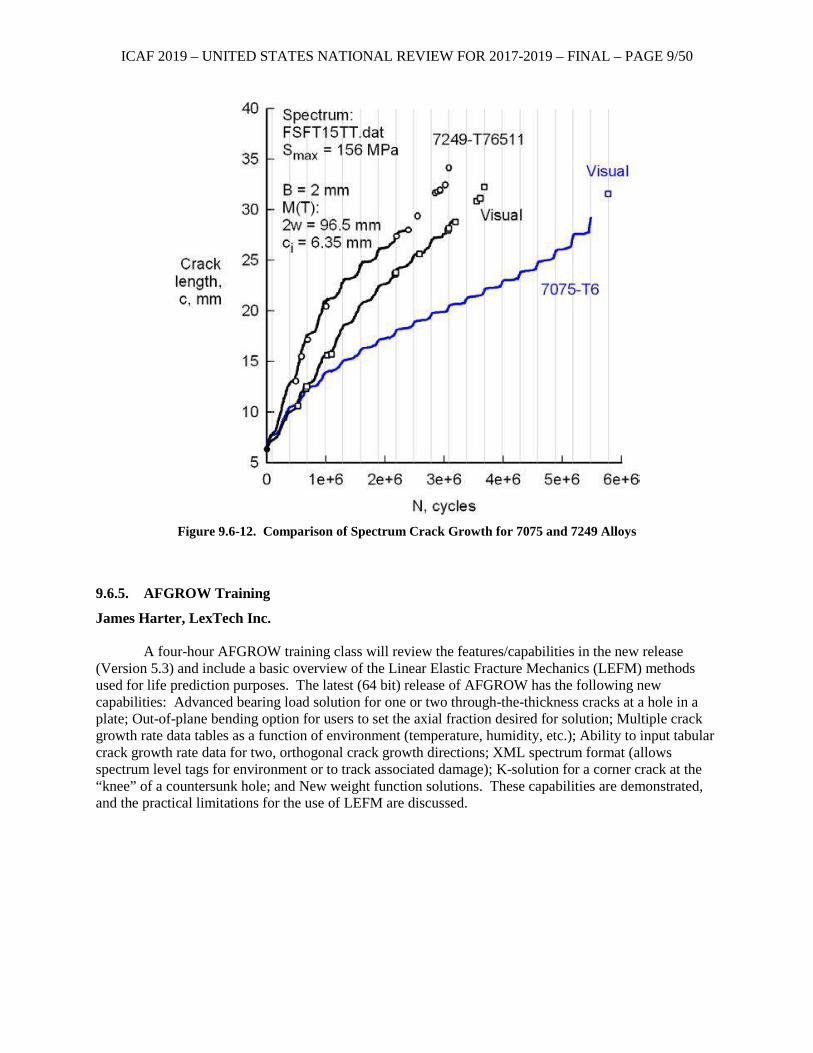
extension program was conducted by the United States, Canada, Australia, and Europe. In some fleets, the wings were replaced with 7249-T76511 aluminum alloy for better fatigue and corrosion performance. This technical activity describes a program to support the P-3C fleets by Mississippi State University and funded by the Australian Defence Science and Technology Group. Fatigue-crack-growth tests under simulated wing loading were conducted on middle-crack-tension, M(T), specimens for thicknesses of 0.08, 0.125 and 0.25 inches (Figure 9.6-6 and Tables 9.6-4 and 9.6-5). A fullscale fatigue test spectrum was obtained from Lockheed-Martin. But the resulting spectrum for testing was condensed (stress amplitudes less than 15% of maximum range were omitted) and the resulting spectrum had about 300,000 cycles (15,000 flights) in one sequence (Figure 9.6-7). Testing under the spectrum loading lasted from less than one to many sequences depending upon sheet thickness. Fatigue-crack-growth calculations were made using FASTRAN. Baseline crack-growth-rate data were obtained from previous tests on compact, C(T), specimens for the various thicknesses. Compression pre-cracking test procedures were used to generate crack-growth-rate data from near threshold to fracture. Sheet thickness did not have a significant affect on ∆K-rate behaviour for constant-amplitude loading. Thus, a single ∆Keff-rate curve was used. A crack-closure analysis was used to collapse ∆K-rate data from C(T) specimens into a narrow band over many orders of magnitude in rates. However, thickness was a significant issue for M(T) spectrum tests. This was caused by the different 3-D constraint condition for the M(T) configurations. Accounting for constraint difference is essential to achieve a good correlation between prediction and test. FASTRAN analyses employed a variable-constraint approach, ranging from plane-strain to plane-stress conditions at a thickness-dependent location in rate. The constraint-loss regime was a function of thickness and was determined based on the spectrum test results. Spectrum tests and analyses generally agreed to within about ±25% (Figures 9.6-8 through 9.6-12). This work is a significant advance in understanding the complex fatigue-crack-growth behaviour in representative aircraft configurations, materials, and loading conditions.
ICAF 2019 – UNITED STATES NATIONAL REVIEW FOR 2017-2019 – FINAL – PAGE 9/46
Figure 9.6-6. Crack Configuration Tested and Analyzed
Table 9.6-4. Middle-Crack-Tension, M(T), Specimen Test Schedule Under Constant-Amplitude Loading
Material (a)
Thickness, B, mm
Width, 2w, mm
Stress ratio, R
Number of tests
7075-T6 2 96.50.1 1
0.7 1
7249-T76511 2 96.5
0.1 1
0.7 1
(a) Five (5) M(T) specimens of each alloy provided by Australian DSTG
ICAF 2019 – UNITED STATES NATIONAL REVIEW FOR 2017-2019 – FINAL – PAGE 9/47
Table 9.6-5. M(T) Specimen Test Schedule Under Modified P-3C Spectrum Loading
Figure 9.6-7. Modified P-3C Spectrum for Tension-Tension Loading
Material Thickness, B, mm
Width, 2w, mm
P-3C Spectrum(~300,000 cycles)
Maximum stress, MPa
Number of tests
7075-T6 2 96.5 FSFT15TT.dat128 2
156 1
7249-T76511
2 96.5 FSFT15TT.dat128 1
156 2
3.2 (a,b) 89 FSFT15TC.dat156 1
215 2
6.35 (b) 89 FSFT15TC.dat
94 1
118 1
142 1
ICAF 2019 – UNITED STATES NATIONAL REVIEW FOR 2017-2019 – FINAL – PAGE 9/48
Figure 9.6-8. Calculated Crack Growth Under Modified P-3C Spectrum Loading at
High Applied Stress on 2-mm Thick 7249 Alloy
Figure 9.6-9. Calculated Crack Growth Under Modified P-3C Spectrum Loading at
Low Applied Stress on 2-mm Thick 7249 Alloy
(Residual stress ?)
(No residual stress ?)
(Residual stress ?)
ICAF 2019 – UNITED STATES NATIONAL REVIEW FOR 2017-2019 – FINAL – PAGE 9/49
Figure 9.6-10. Calculated Crack Growth Under Modified P-3C Spectrum Loading at
Low Applied Stress on 3.2-mm Thick 7249 Alloy
Figure 9.6-11. Calculated Crack Growth Under Modified P-3C Spectrum Loading at
Various Applied Stress Levels on 6.35-mm Thick 7249 Alloy
ASIP 2013
Constantα = 1.85
Constraint loss
ICAF 2019 – UNITED STATES NATIONAL REVIEW FOR 2017-2019 – FINAL – PAGE 9/50
Figure 9.6-12. Comparison of Spectrum Crack Growth for 7075 and 7249 Alloys
9.6.5. AFGROW Training
James Harter, LexTech Inc. A four-hour AFGROW training class will review the features/capabilities in the new release
(Version 5.3) and include a basic overview of the Linear Elastic Fracture Mechanics (LEFM) methods used for life prediction purposes. The latest (64 bit) release of AFGROW has the following new capabilities: Advanced bearing load solution for one or two through-the-thickness cracks at a hole in a plate; Out-of-plane bending option for users to set the axial fraction desired for solution; Multiple crack growth rate data tables as a function of environment (temperature, humidity, etc.); Ability to input tabular crack growth rate data for two, orthogonal crack growth directions; XML spectrum format (allows spectrum level tags for environment or to track associated damage); K-solution for a corner crack at the “knee” of a countersunk hole; and New weight function solutions. These capabilities are demonstrated, and the practical limitations for the use of LEFM are discussed.
ICAF 2019 – UNITED STATES NATIONAL REVIEW FOR 2017-2019 – FINAL – PAGE 9/51
9.6.6. Training: How to Use the Crack Propagation Analysis Tool for 3D Crack Simulation
Matt Watkins, Engineering Software Research & Development (ESRD), Inc.
This two-hour course will provide instructions for using the Crack Propagation Analysis Tool (CPAT) to simulate 3D crack growth at a fastener hole in a fatigue test specimen. Residual stresses due to cold-working of the hole are taken into account. CPAT provides an easy-to-use interface which significantly reduces the manual effort involved in complex crack growth simulations using the finite element method. Finite element solutions are computed using the StressCheck solver, renowned in the aerospace finite element analysis community for extracting high quality stress intensity factors (SIFs) for complex parts and assemblies. Demonstrations of the software will focus on features and capabilities that are particularly suited to the ASIP community, including error and uncertainty propagation throughout the crack growth simulations. Attendees will receive an evaluation copy of the CPAT software. The following is a break-down of the topics to be explored: 1. Overview of Simulation Apps and their relevance. 2. Instructions for the CPAT user interface and feature set. 3. Description of how the tool works “under the hood”, including the basic algorithm and communication with StressCheck through the StressCheck COM API. 4. Instructions for how to use CPAT to assess the effect of error and uncertainty propagations, with examples of solved cases. 5. Q&A Session.
9.6.7. T-38 Talon Finite Element Model Overview
John Taylor, Northrop Grumman Corporation
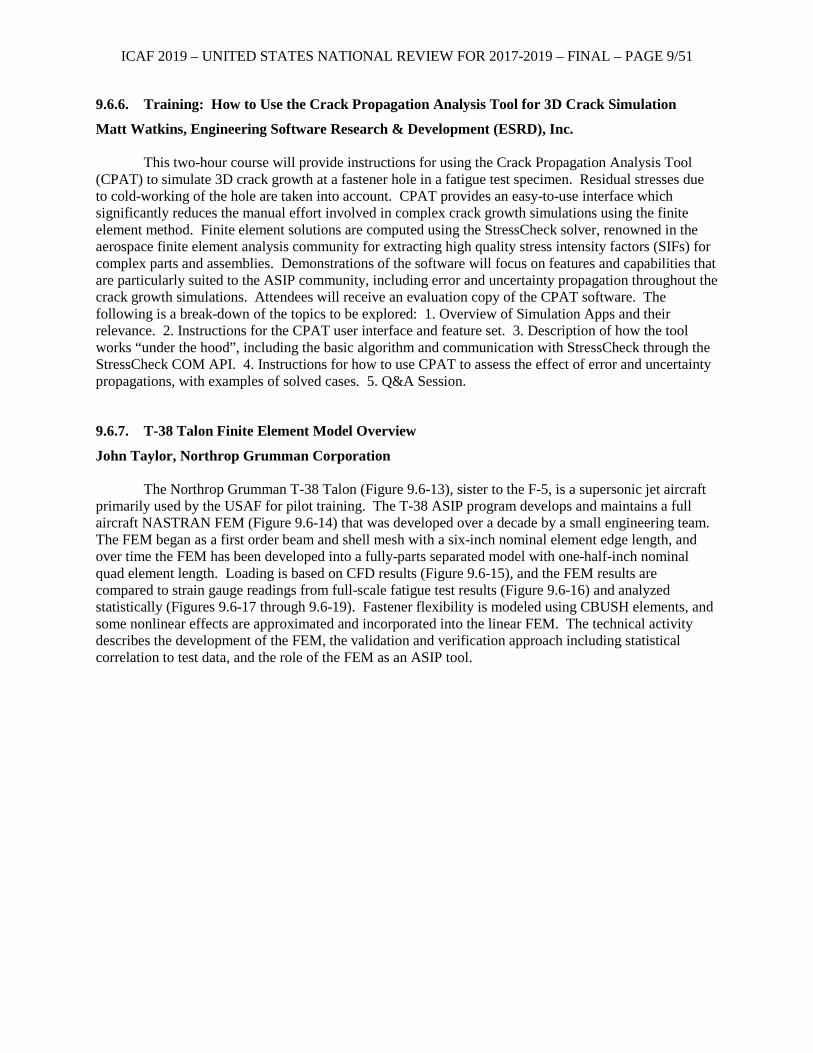
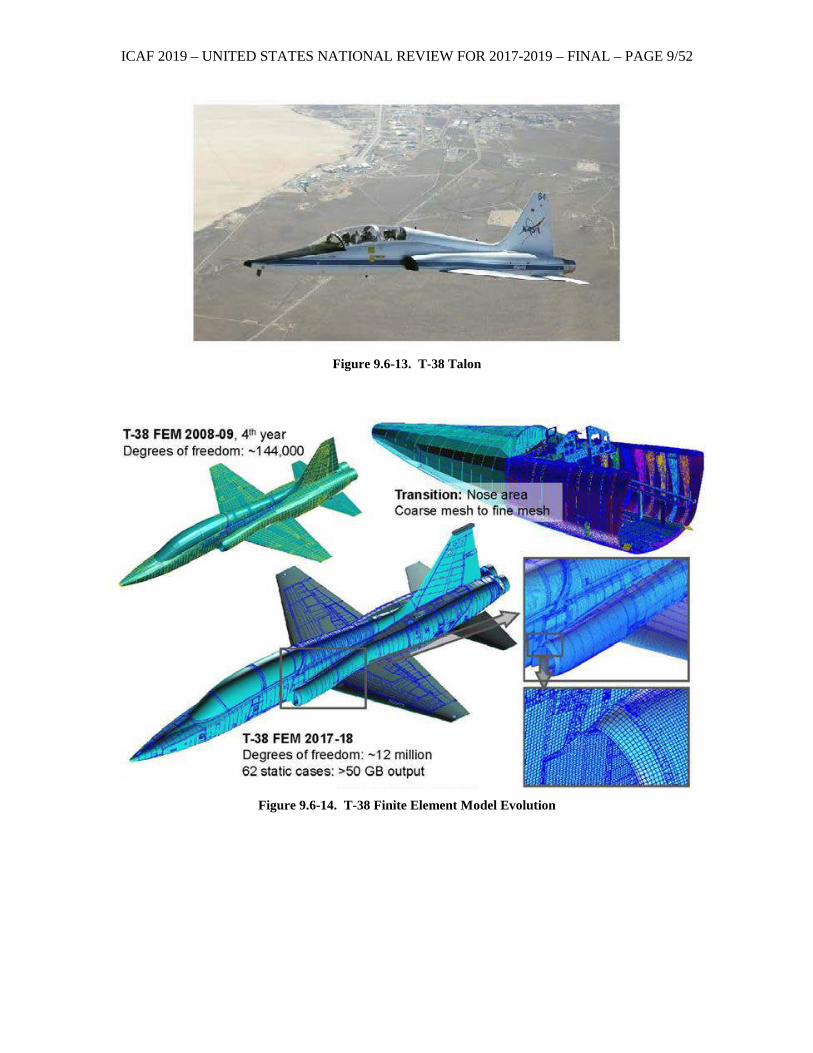
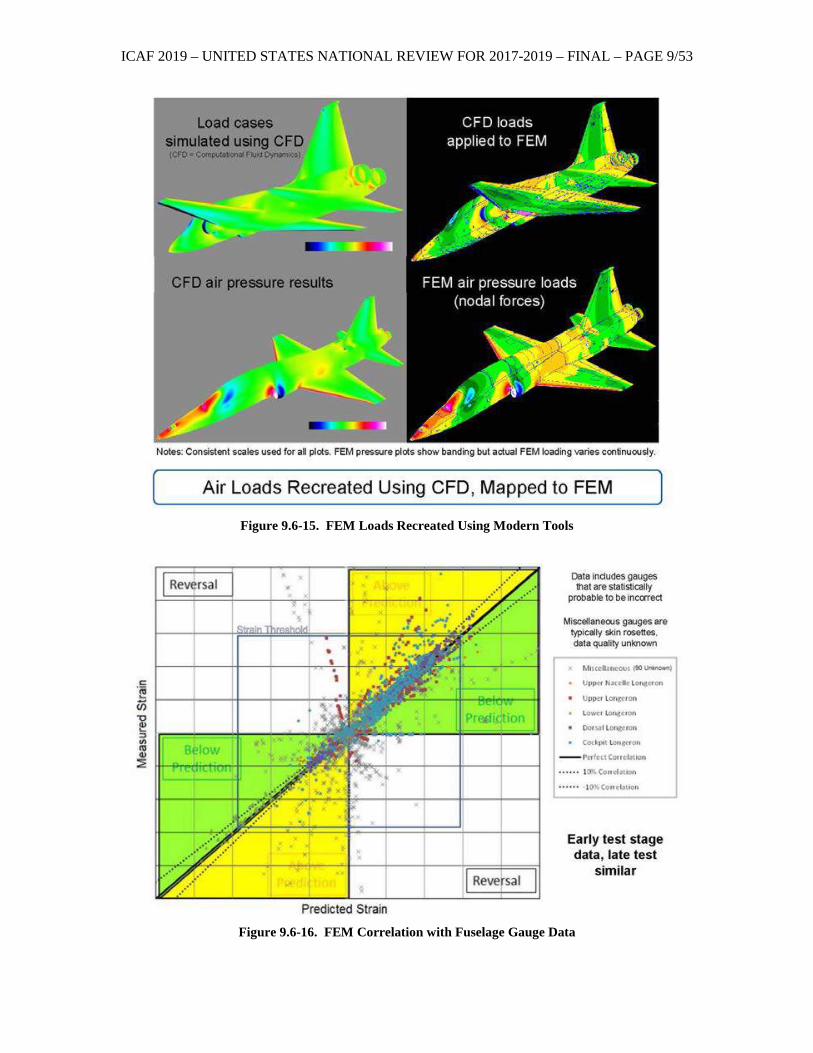
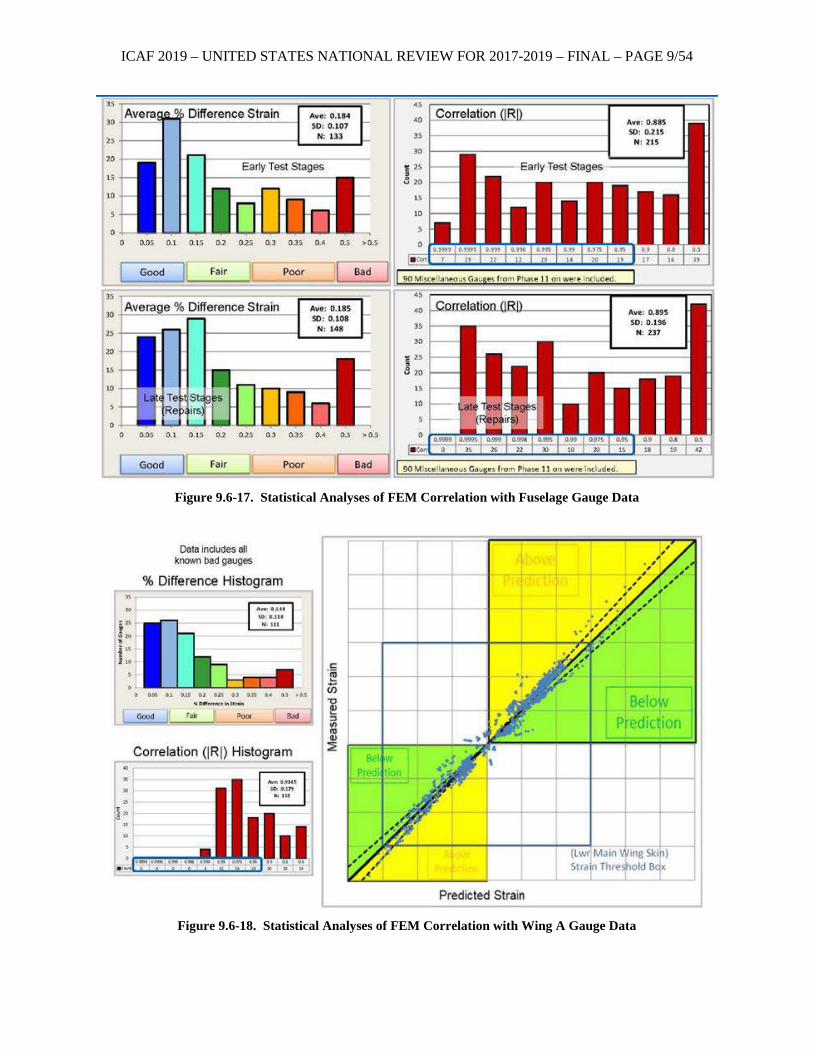
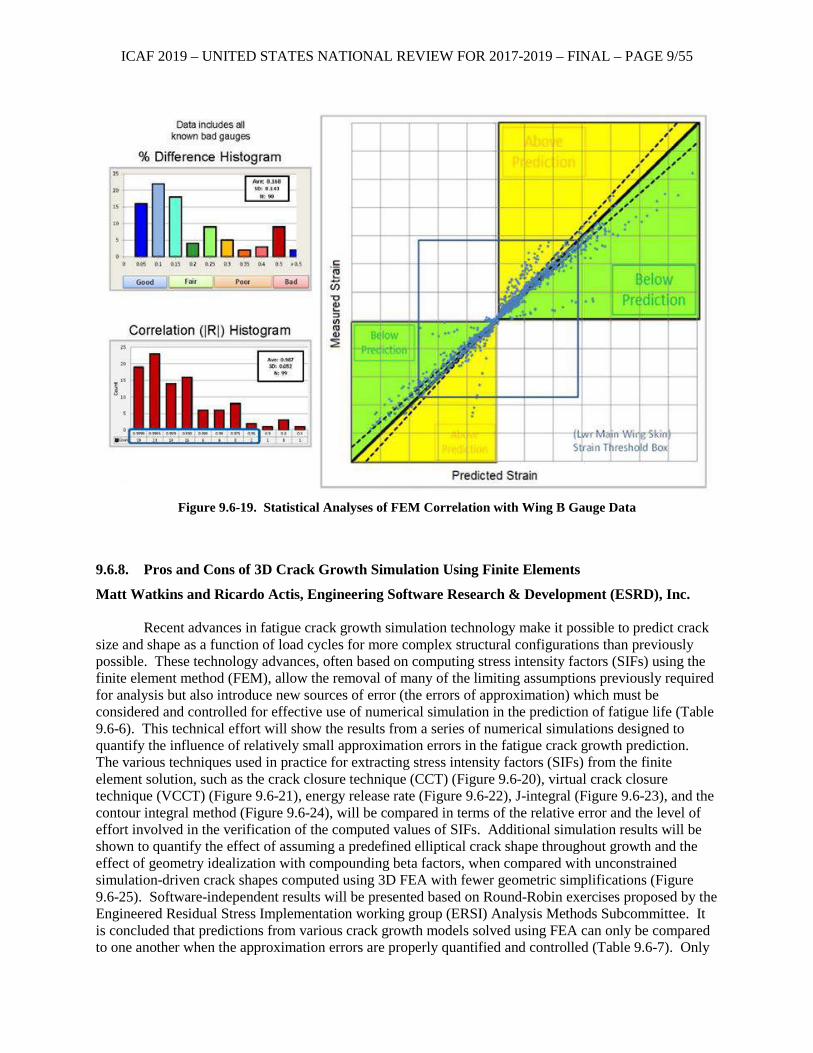
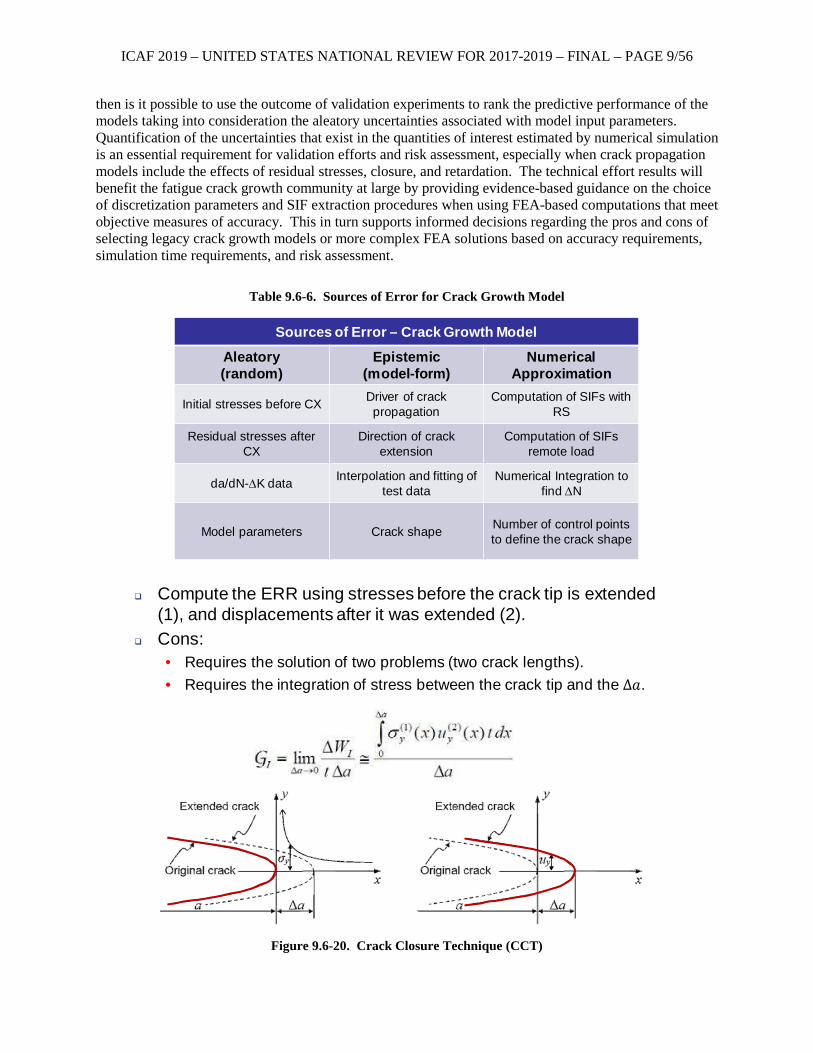
The Northrop Grumman T-38 Talon (Figure 9.6-13), sister to the F-5, is a supersonic jet aircraft primarily used by the USAF for pilot training. The T-38 ASIP program develops and maintains a full aircraft NASTRAN FEM (Figure 9.6-14) that was developed over a decade by a small engineering team. The FEM began as a first order beam and shell mesh with a six-inch nominal element edge length, and over time the FEM has been developed into a fully-parts separated model with one-half-inch nominal quad element length. Loading is based on CFD results (Figure 9.6-15), and the FEM results are compared to strain gauge readings from full-scale fatigue test results (Figure 9.6-16) and analyzed statistically (Figures 9.6-17 through 9.6-19). Fastener flexibility is modeled using CBUSH elements, and some nonlinear effects are approximated and incorporated into the linear FEM. The technical activity describes the development of the FEM, the validation and verification approach including statistical correlation to test data, and the role of the FEM as an ASIP tool.
ICAF 2019 – UNITED STATES NATIONAL REVIEW FOR 2017-2019 – FINAL – PAGE 9/52
Figure 9.6-13. T-38 Talon
Figure 9.6-14. T-38 Finite Element Model Evolution
ICAF 2019 – UNITED STATES NATIONAL REVIEW FOR 2017-2019 – FINAL – PAGE 9/53
Figure 9.6-15. FEM Loads Recreated Using Modern Tools
Figure 9.6-16. FEM Correlation with Fuselage Gauge Data
ICAF 2019 – UNITED STATES NATIONAL REVIEW FOR 2017-2019 – FINAL – PAGE 9/54
Figure 9.6-17. Statistical Analyses of FEM Correlation with Fuselage Gauge Data
Figure 9.6-18. Statistical Analyses of FEM Correlation with Wing A Gauge Data
ICAF 2019 – UNITED STATES NATIONAL REVIEW FOR 2017-2019 – FINAL – PAGE 9/55
Figure 9.6-19. Statistical Analyses of FEM Correlation with Wing B Gauge Data
9.6.8. Pros and Cons of 3D Crack Growth Simulation Using Finite Elements
Matt Watkins and Ricardo Actis, Engineering Software Research & Development (ESRD), Inc.
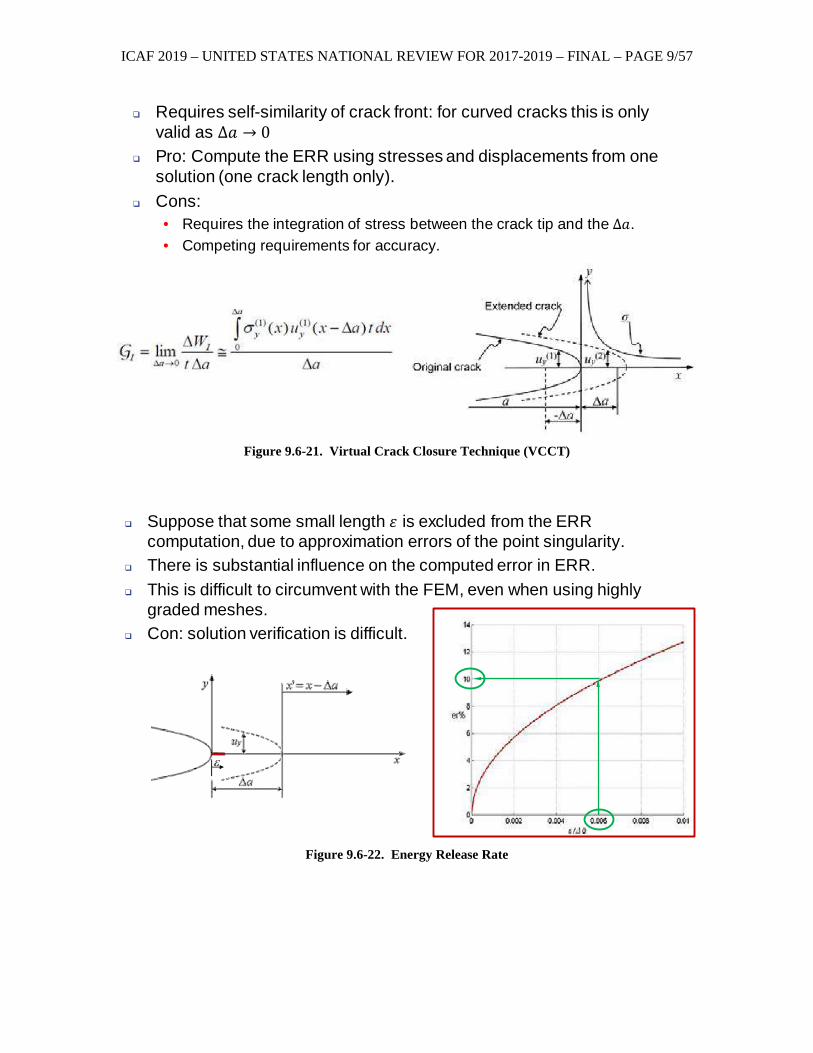
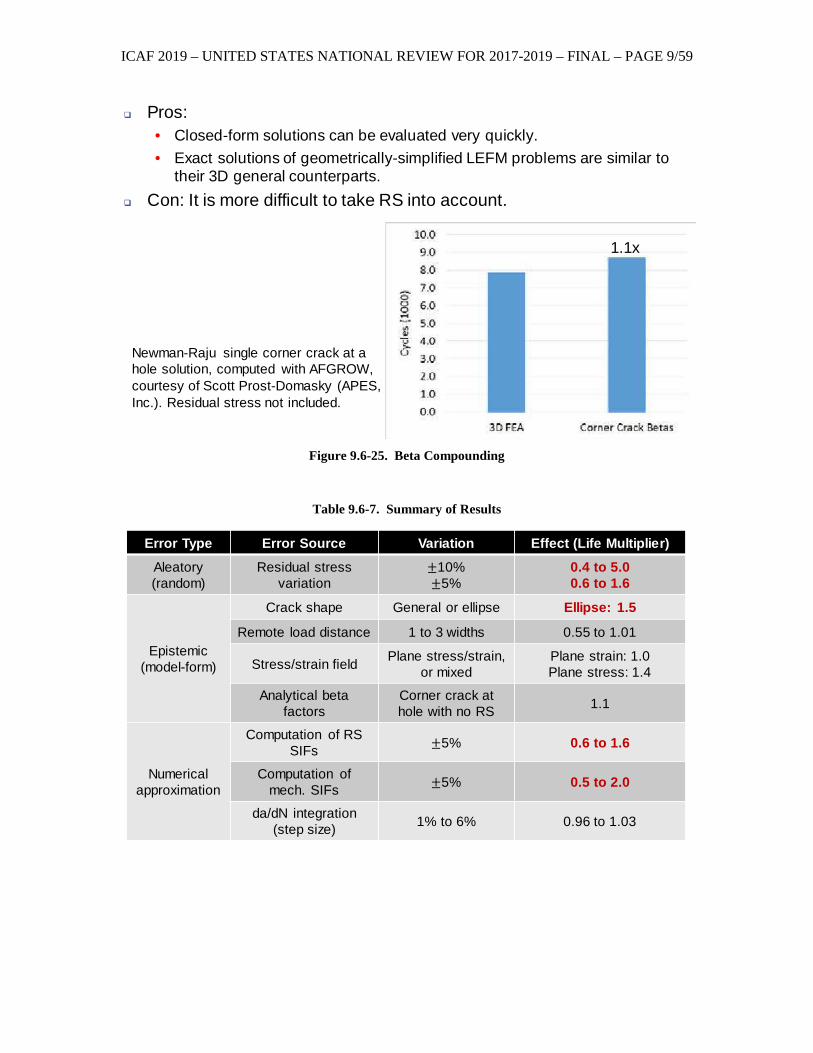
Recent advances in fatigue crack growth simulation technology make it possible to predict crack size and shape as a function of load cycles for more complex structural configurations than previously possible. These technology advances, often based on computing stress intensity factors (SIFs) using the finite element method (FEM), allow the removal of many of the limiting assumptions previously required for analysis but also introduce new sources of error (the errors of approximation) which must be considered and controlled for effective use of numerical simulation in the prediction of fatigue life (Table 9.6-6). This technical effort will show the results from a series of numerical simulations designed to quantify the influence of relatively small approximation errors in the fatigue crack growth prediction. The various techniques used in practice for extracting stress intensity factors (SIFs) from the finite element solution, such as the crack closure technique (CCT) (Figure 9.6-20), virtual crack closure technique (VCCT) (Figure 9.6-21), energy release rate (Figure 9.6-22), J-integral (Figure 9.6-23), and the contour integral method (Figure 9.6-24), will be compared in terms of the relative error and the level of effort involved in the verification of the computed values of SIFs. Additional simulation results will be shown to quantify the effect of assuming a predefined elliptical crack shape throughout growth and the effect of geometry idealization with compounding beta factors, when compared with unconstrained simulation-driven crack shapes computed using 3D FEA with fewer geometric simplifications (Figure 9.6-25). Software-independent results will be presented based on Round-Robin exercises proposed by the Engineered Residual Stress Implementation working group (ERSI) Analysis Methods Subcommittee. It is concluded that predictions from various crack growth models solved using FEA can only be compared to one another when the approximation errors are properly quantified and controlled (Table 9.6-7). Only
ICAF 2019 – UNITED STATES NATIONAL REVIEW FOR 2017-2019 – FINAL – PAGE 9/56
then is it possible to use the outcome of validation experiments to rank the predictive performance of the models taking into consideration the aleatory uncertainties associated with model input parameters. Quantification of the uncertainties that exist in the quantities of interest estimated by numerical simulation is an essential requirement for validation efforts and risk assessment, especially when crack propagation models include the effects of residual stresses, closure, and retardation. The technical effort results will benefit the fatigue crack growth community at large by providing evidence-based guidance on the choice of discretization parameters and SIF extraction procedures when using FEA-based computations that meet objective measures of accuracy. This in turn supports informed decisions regarding the pros and cons of selecting legacy crack growth models or more complex FEA solutions based on accuracy requirements, simulation time requirements, and risk assessment.
Table 9.6-6. Sources of Error for Crack Growth Model
Figure 9.6-20. Crack Closure Technique (CCT)
Sources of Error – Crack Growth ModelAleatory (random)
Epistemic (model-form)
NumericalApproximation
Initial stresses before CX Driver of crack propagation
Computation of SIFs with RS
Residual stresses after CX
Direction of crack extension
Computation of SIFs remote load
da/dN-∆K data Interpolation and fitting of test data
Numerical Integration to find ∆N
Model parameters Crack shape Number of control points to define the crack shape
Compute the ERR using stresses before the crack tip is extended (1), and displacements after it was extended (2).
Cons:• Requires the solution of two problems (two crack lengths).• Requires the integration of stress between the crack tip and the ∆𝑎.
ICAF 2019 – UNITED STATES NATIONAL REVIEW FOR 2017-2019 – FINAL – PAGE 9/57
Figure 9.6-21. Virtual Crack Closure Technique (VCCT)
Figure 9.6-22. Energy Release Rate
Requires self-similarity of crack front: for curved cracks this is only valid as ∆𝑎 → 0
Pro: Compute the ERR using stresses and displacements from one solution (one crack length only).
Cons:• Requires the integration of stress between the crack tip and the ∆𝑎.• Competing requirements for accuracy.
Suppose that some small length 𝜀 is excluded from the ERR computation, due to approximation errors of the point singularity.
There is substantial influence on the computed error in ERR. This is difficult to circumvent with the FEM, even when using highly
graded meshes. Con: solution verification is difficult.
ICAF 2019 – UNITED STATES NATIONAL REVIEW FOR 2017-2019 – FINAL – PAGE 9/58
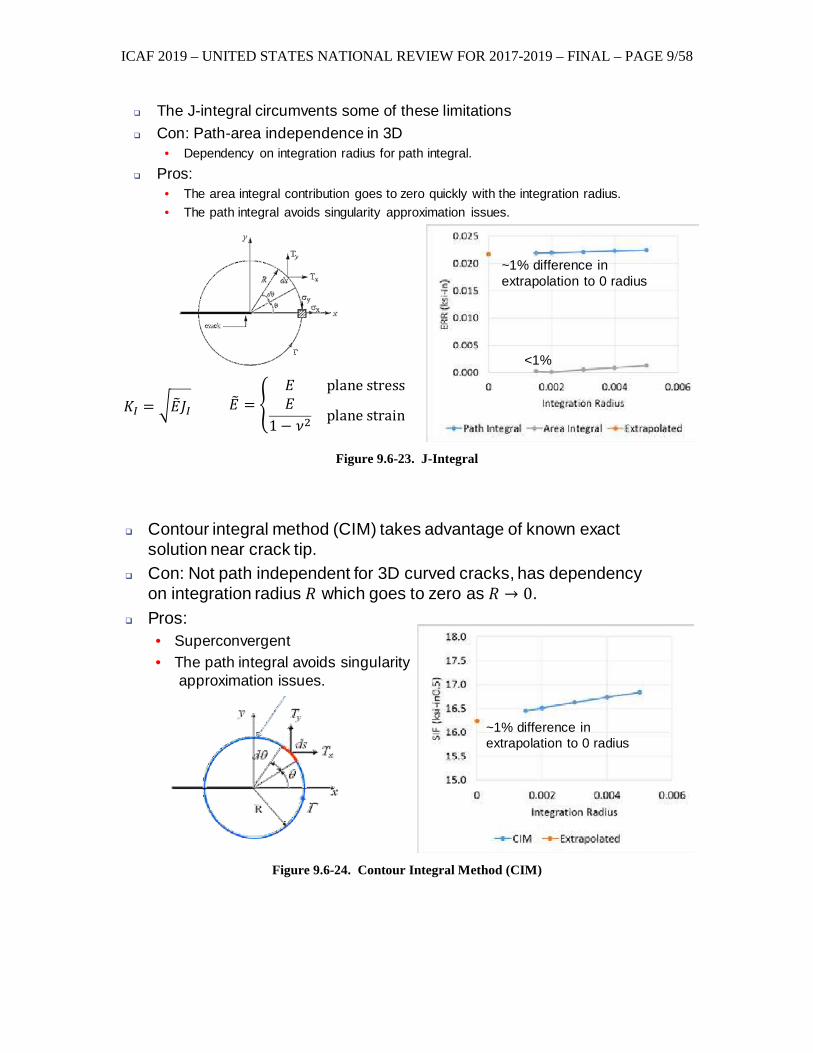
Figure 9.6-23. J-Integral
Figure 9.6-24. Contour Integral Method (CIM)
The J-integral circumvents some of these limitations Con: Path-area independence in 3D
• Dependency on integration radius for path integral. Pros:
• The area integral contribution goes to zero quickly with the integration radius.• The path integral avoids singularity approximation issues.
𝐾𝐼 = 𝐸�𝐽𝐼�
~1% difference in extrapolation to 0 radius
<1%
Contour integral method (CIM) takes advantage of known exact solution near crack tip.
Con: Not path independent for 3D curved cracks, has dependency on integration radius 𝑅 which goes to zero as 𝑅 → 0.
Pros:• Superconvergent• The path integral avoids singularity
approximation issues.
~1% difference in extrapolation to 0 radius
ICAF 2019 – UNITED STATES NATIONAL REVIEW FOR 2017-2019 – FINAL – PAGE 9/59
Figure 9.6-25. Beta Compounding
Table 9.6-7. Summary of Results
Pros:• Closed-form solutions can be evaluated very quickly.• Exact solutions of geometrically-simplified LEFM problems are similar to
their 3D general counterparts. Con: It is more difficult to take RS into account.
1.1x
Newman-Raju single corner crack at a hole solution, computed with AFGROW, courtesy of Scott Prost-Domasky (APES, Inc.). Residual stress not included.
Error Type Error Source Variation Effect (Life Multiplier)Aleatory(random)
Residual stress variation
±10%±5%
0.4 to 5.00.6 to 1.6
Epistemic (model-form)
Crack shape General or ellipse Ellipse: 1.5
Remote load distance 1 to 3 widths 0.55 to 1.01
Stress/strain field Plane stress/strain, or mixed
Plane strain: 1.0Plane stress: 1.4
Analytical beta factors
Corner crack at hole with no RS 1.1
Numerical approximation
Computation of RSSIFs ±5% 0.6 to 1.6
Computation of mech. SIFs ±5% 0.5 to 2.0
da/dN integration (step size) 1% to 6% 0.96 to 1.03
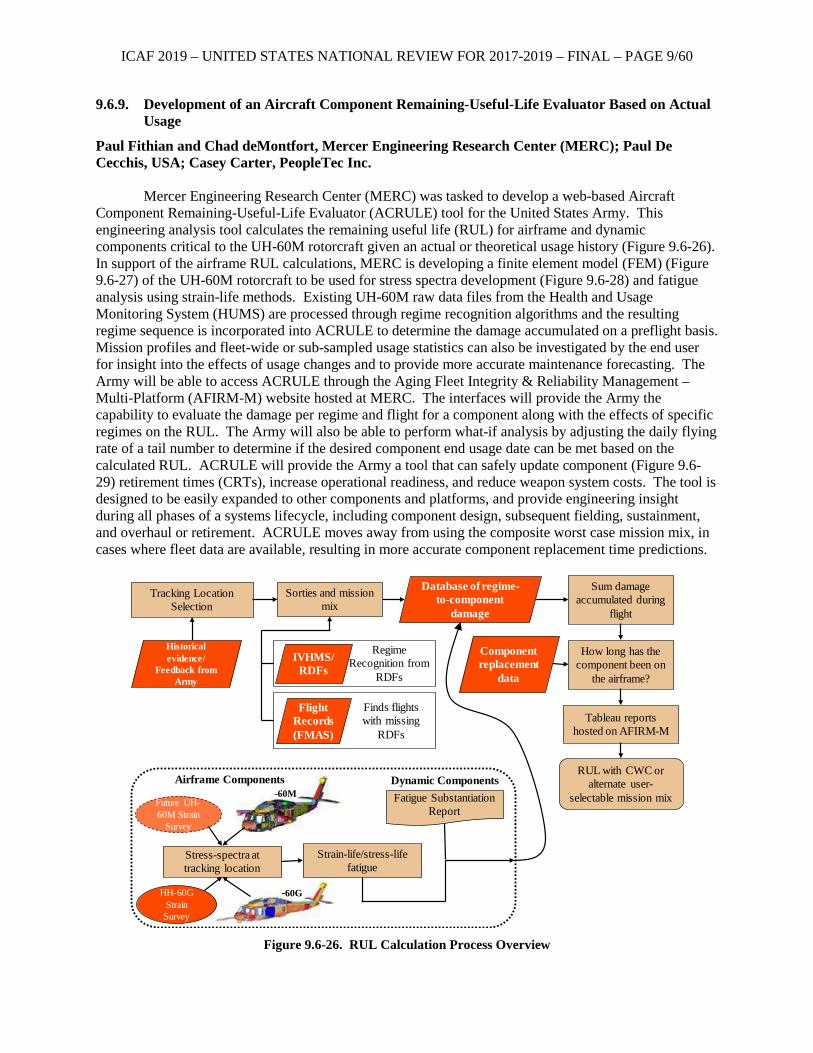
ICAF 2019 – UNITED STATES NATIONAL REVIEW FOR 2017-2019 – FINAL – PAGE 9/60
9.6.9. Development of an Aircraft Component Remaining-Useful-Life Evaluator Based on Actual Usage
Paul Fithian and Chad deMontfort, Mercer Engineering Research Center (MERC); Paul De Cecchis, USA; Casey Carter, PeopleTec Inc.
Mercer Engineering Research Center (MERC) was tasked to develop a web-based Aircraft Component Remaining-Useful-Life Evaluator (ACRULE) tool for the United States Army. This engineering analysis tool calculates the remaining useful life (RUL) for airframe and dynamic components critical to the UH-60M rotorcraft given an actual or theoretical usage history (Figure 9.6-26). In support of the airframe RUL calculations, MERC is developing a finite element model (FEM) (Figure 9.6-27) of the UH-60M rotorcraft to be used for stress spectra development (Figure 9.6-28) and fatigue analysis using strain-life methods. Existing UH-60M raw data files from the Health and Usage Monitoring System (HUMS) are processed through regime recognition algorithms and the resulting regime sequence is incorporated into ACRULE to determine the damage accumulated on a preflight basis. Mission profiles and fleet-wide or sub-sampled usage statistics can also be investigated by the end user for insight into the effects of usage changes and to provide more accurate maintenance forecasting. The Army will be able to access ACRULE through the Aging Fleet Integrity & Reliability Management – Multi-Platform (AFIRM-M) website hosted at MERC. The interfaces will provide the Army the capability to evaluate the damage per regime and flight for a component along with the effects of specific regimes on the RUL. The Army will also be able to perform what-if analysis by adjusting the daily flying rate of a tail number to determine if the desired component end usage date can be met based on the calculated RUL. ACRULE will provide the Army a tool that can safely update component (Figure 9.6-29) retirement times (CRTs), increase operational readiness, and reduce weapon system costs. The tool is designed to be easily expanded to other components and platforms, and provide engineering insight during all phases of a systems lifecycle, including component design, subsequent fielding, sustainment, and overhaul or retirement. ACRULE moves away from using the composite worst case mission mix, in cases where fleet data are available, resulting in more accurate component replacement time predictions.
Figure 9.6-26. RUL Calculation Process Overview
-60G
Tracking Location Selection
Sorties and mission mix
Tableau reports hosted on AFIRM-M
Sum damage accumulated during
flight
Airframe Components
Strain-life/stress-life fatigue
Dynamic Components
How long has the component been on
the airframe?
Future UH-60M Strain
Survey
Stress-spectra at tracking location
HH-60G Strain
Survey
Historical evidence/
Feedback from Army
Regime Recognition from
RDFs
IVHMS/RDFs
Finds flights with missing
RDFs
Flight Records (FMAS)
Database of regime-to-component
damage
Component replacement
data
RUL with CWC or alternate user-
selectable mission mixFatigue Substantiation Report
-60M
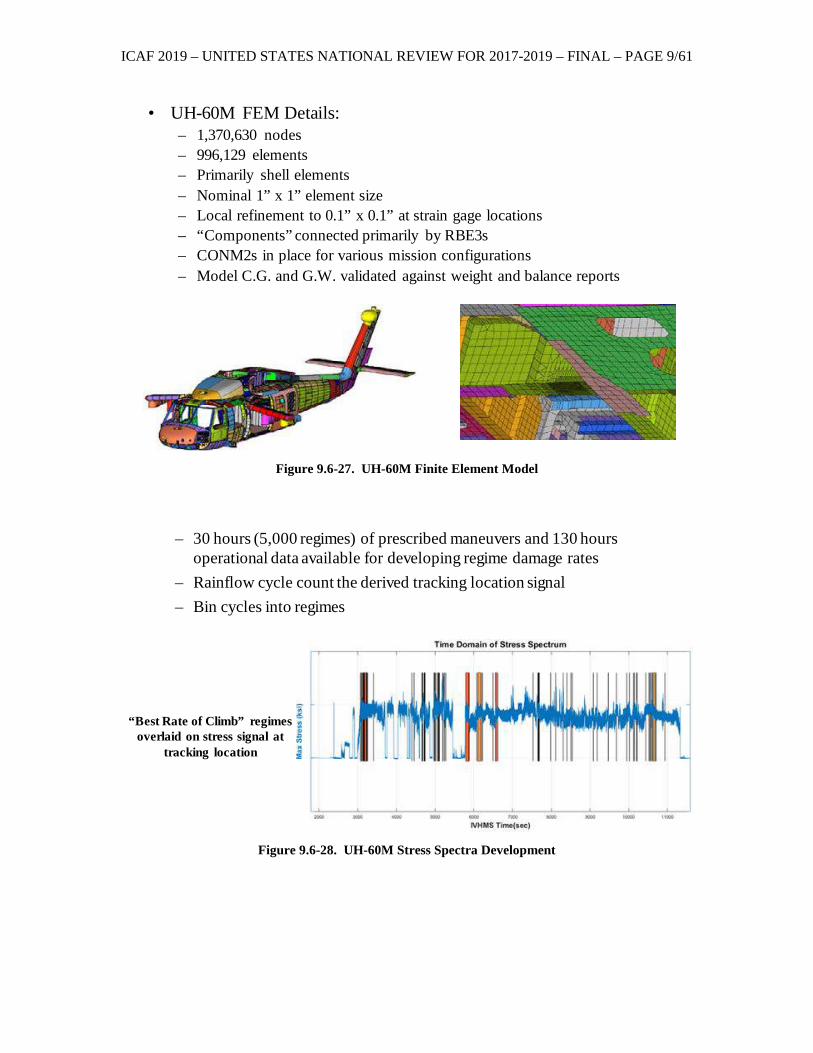
ICAF 2019 – UNITED STATES NATIONAL REVIEW FOR 2017-2019 – FINAL – PAGE 9/61
Figure 9.6-27. UH-60M Finite Element Model
Figure 9.6-28. UH-60M Stress Spectra Development
• UH-60M FEM Details:– 1,370,630 nodes – 996,129 elements – Primarily shell elements– Nominal 1” x 1” element size– Local refinement to 0.1” x 0.1” at strain gage locations– “Components” connected primarily by RBE3s– CONM2s in place for various mission configurations– Model C.G. and G.W. validated against weight and balance reports
– 30 hours (5,000 regimes) of prescribed maneuvers and 130 hours operational data available for developing regime damage rates
– Rainflow cycle count the derived tracking location signal– Bin cycles into regimes
“Best Rate of Climb” regimes overlaid on stress signal at
tracking location
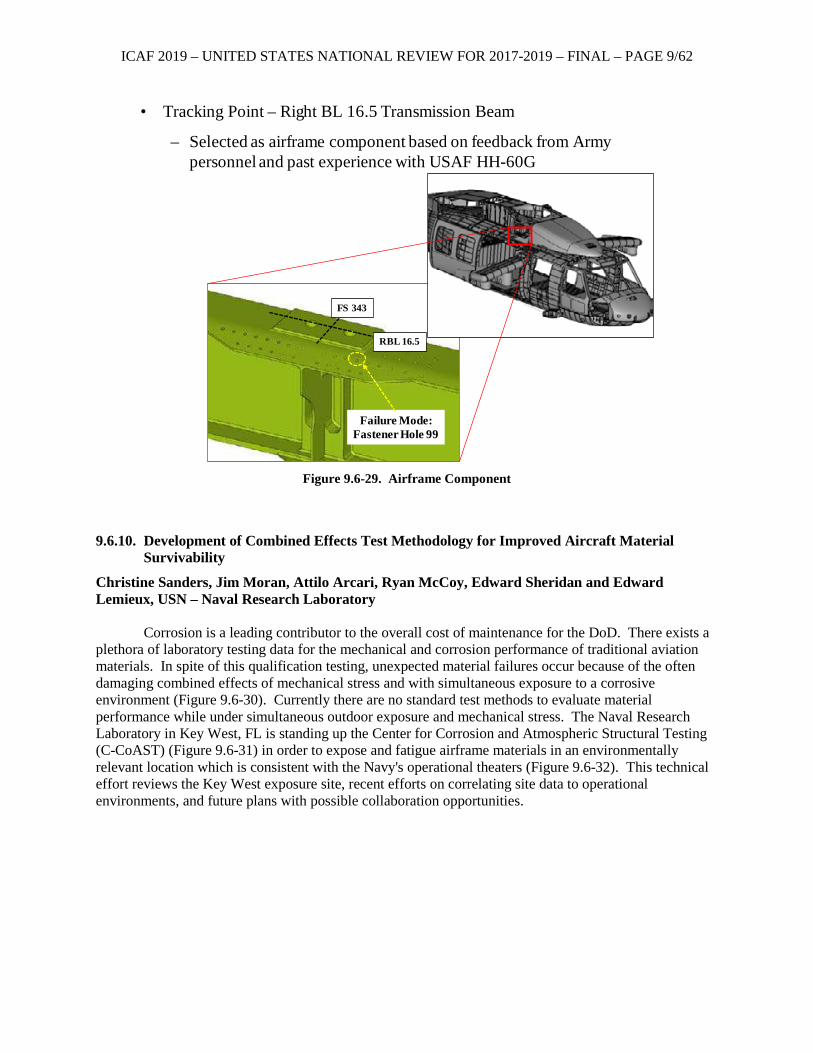
ICAF 2019 – UNITED STATES NATIONAL REVIEW FOR 2017-2019 – FINAL – PAGE 9/62
Figure 9.6-29. Airframe Component
9.6.10. Development of Combined Effects Test Methodology for Improved Aircraft Material Survivability
Christine Sanders, Jim Moran, Attilo Arcari, Ryan McCoy, Edward Sheridan and Edward Lemieux, USN – Naval Research Laboratory
Corrosion is a leading contributor to the overall cost of maintenance for the DoD. There exists a plethora of laboratory testing data for the mechanical and corrosion performance of traditional aviation materials. In spite of this qualification testing, unexpected material failures occur because of the often damaging combined effects of mechanical stress and with simultaneous exposure to a corrosive environment (Figure 9.6-30). Currently there are no standard test methods to evaluate material performance while under simultaneous outdoor exposure and mechanical stress. The Naval Research Laboratory in Key West, FL is standing up the Center for Corrosion and Atmospheric Structural Testing (C-CoAST) (Figure 9.6-31) in order to expose and fatigue airframe materials in an environmentally relevant location which is consistent with the Navy's operational theaters (Figure 9.6-32). This technical effort reviews the Key West exposure site, recent efforts on correlating site data to operational environments, and future plans with possible collaboration opportunities.
• Tracking Point – Right BL 16.5 Transmission Beam
– Selected as airframe component based on feedback from Army personnel and past experience with USAF HH-60G
RBL 16.5
Failure Mode:Fastener Hole 99
FS 343
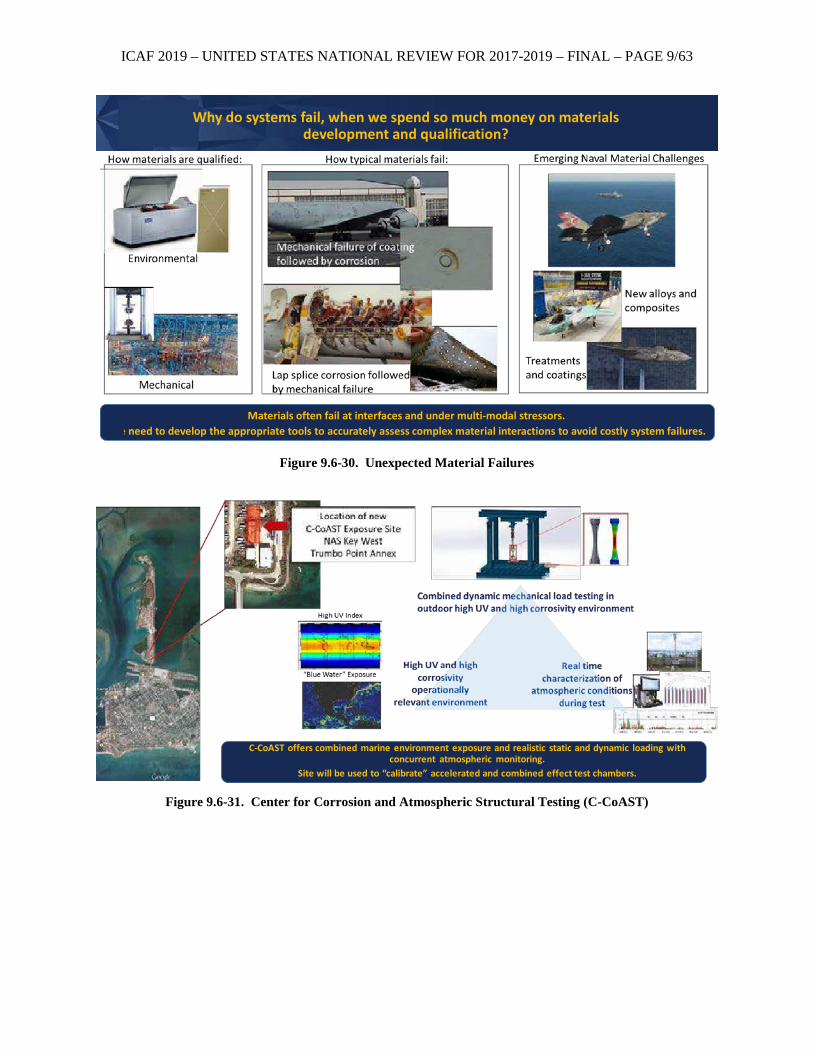
ICAF 2019 – UNITED STATES NATIONAL REVIEW FOR 2017-2019 – FINAL – PAGE 9/63
Figure 9.6-30. Unexpected Material Failures
Figure 9.6-31. Center for Corrosion and Atmospheric Structural Testing (C-CoAST)
Materials often fail at interfaces and under multi-modal stressors. e need to develop the appropriate tools to accurately assess complex material interactions to avoid costly system failures.
Why do systems fail, when we spend so much money on materials development and qualification?
C-CoAST offers combined marine environment exposure and realistic static and dynamic loading with concurrent atmospheric monitoring.
Site will be used to “calibrate” accelerated and combined effect test chambers.
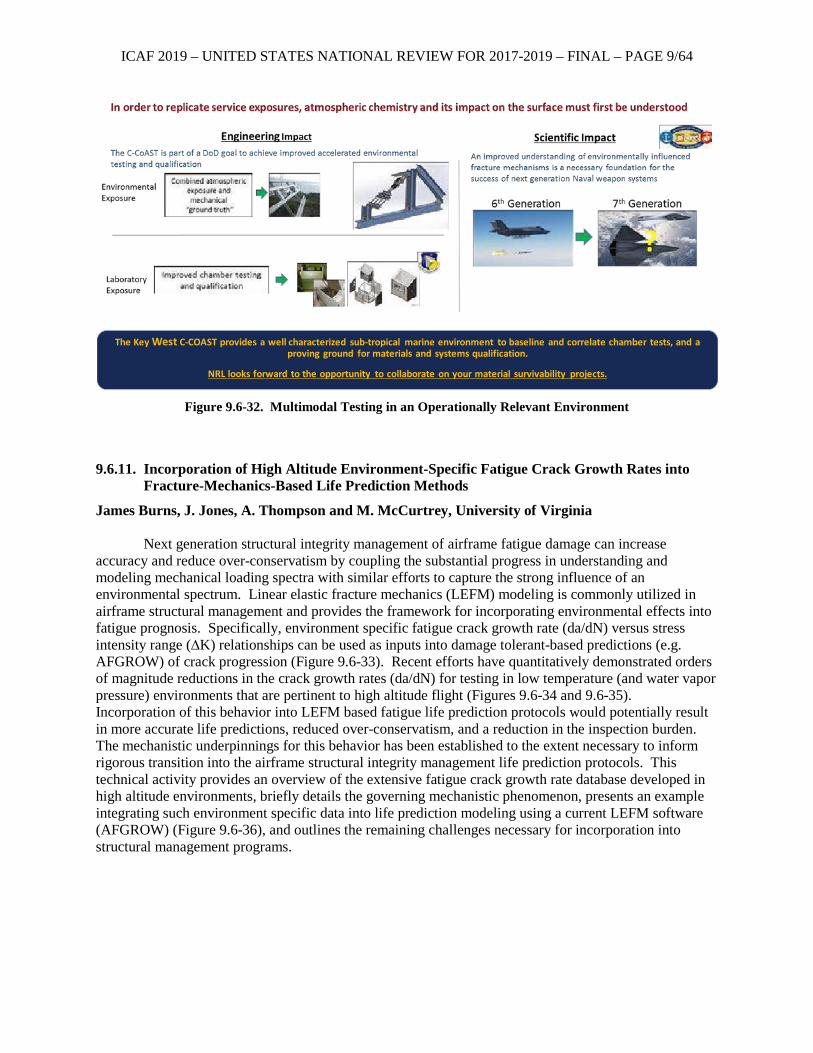
ICAF 2019 – UNITED STATES NATIONAL REVIEW FOR 2017-2019 – FINAL – PAGE 9/64
Figure 9.6-32. Multimodal Testing in an Operationally Relevant Environment
9.6.11. Incorporation of High Altitude Environment-Specific Fatigue Crack Growth Rates into Fracture-Mechanics-Based Life Prediction Methods
James Burns, J. Jones, A. Thompson and M. McCurtrey, University of Virginia
Next generation structural integrity management of airframe fatigue damage can increase accuracy and reduce over-conservatism by coupling the substantial progress in understanding and modeling mechanical loading spectra with similar efforts to capture the strong influence of an environmental spectrum. Linear elastic fracture mechanics (LEFM) modeling is commonly utilized in airframe structural management and provides the framework for incorporating environmental effects into fatigue prognosis. Specifically, environment specific fatigue crack growth rate (da/dN) versus stress intensity range (∆K) relationships can be used as inputs into damage tolerant-based predictions (e.g. AFGROW) of crack progression (Figure 9.6-33). Recent efforts have quantitatively demonstrated orders of magnitude reductions in the crack growth rates (da/dN) for testing in low temperature (and water vapor pressure) environments that are pertinent to high altitude flight (Figures 9.6-34 and 9.6-35). Incorporation of this behavior into LEFM based fatigue life prediction protocols would potentially result in more accurate life predictions, reduced over-conservatism, and a reduction in the inspection burden. The mechanistic underpinnings for this behavior has been established to the extent necessary to inform rigorous transition into the airframe structural integrity management life prediction protocols. This technical activity provides an overview of the extensive fatigue crack growth rate database developed in high altitude environments, briefly details the governing mechanistic phenomenon, presents an example integrating such environment specific data into life prediction modeling using a current LEFM software (AFGROW) (Figure 9.6-36), and outlines the remaining challenges necessary for incorporation into structural management programs.
The Key West C-COAST provides a well characterized sub-tropical marine environment to baseline and correlate chamber tests, and a proving ground for materials and systems qualification.
NRL looks forward to the opportunity to collaborate on your material survivability projects.
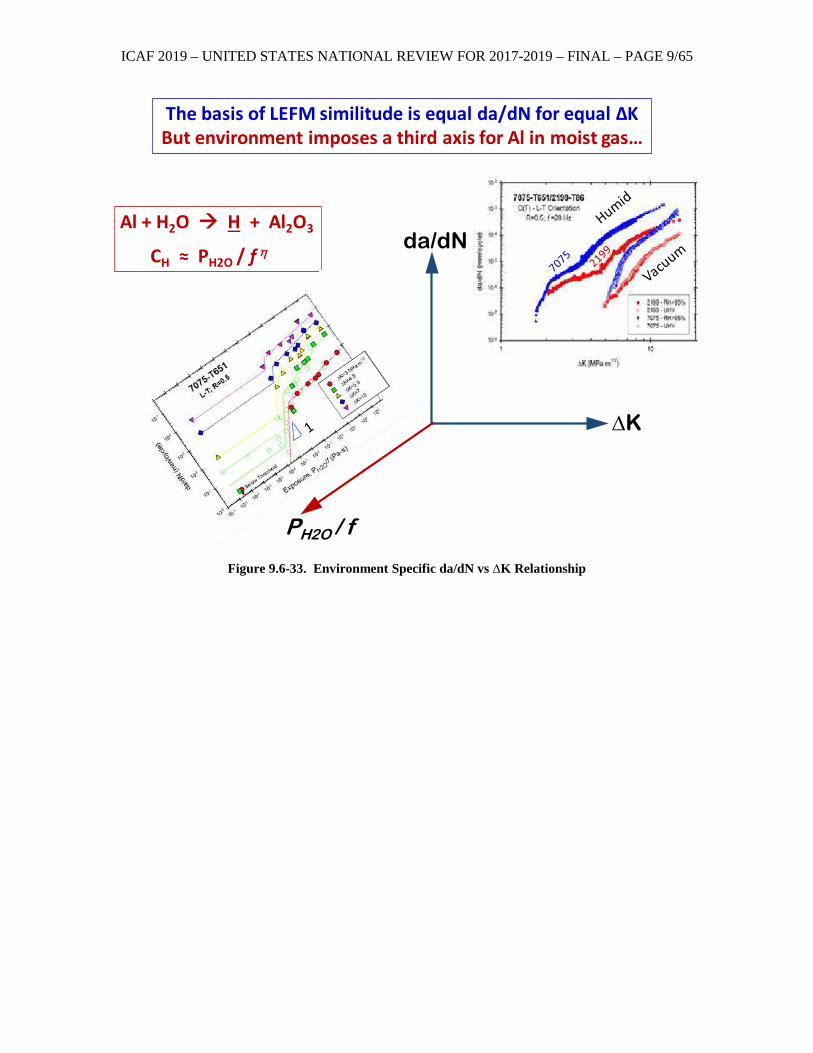
ICAF 2019 – UNITED STATES NATIONAL REVIEW FOR 2017-2019 – FINAL – PAGE 9/65
Figure 9.6-33. Environment Specific da/dN vs ∆K Relationship
da/dN
∆K
PH2O / f
Al + H2O H + Al2O3
CH ≈ PH2O / f η
The basis of LEFM similitude is equal da/dN for equal ∆KBut environment imposes a third axis for Al in moist gas…
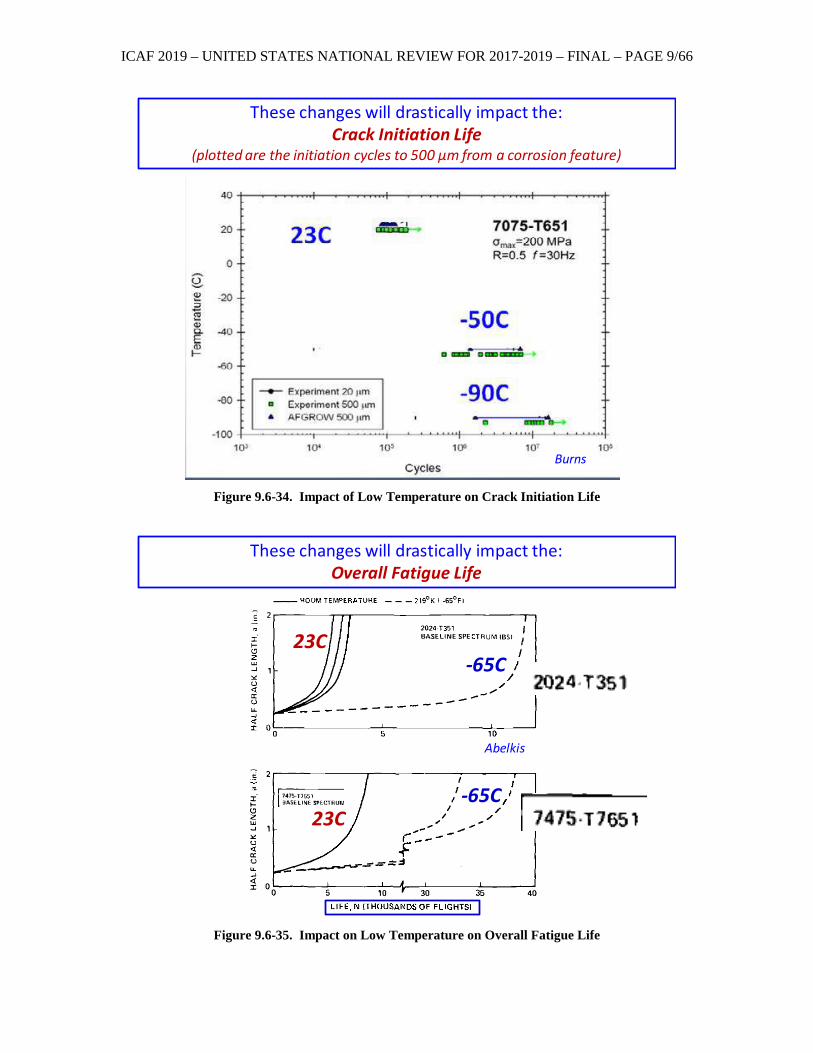
ICAF 2019 – UNITED STATES NATIONAL REVIEW FOR 2017-2019 – FINAL – PAGE 9/66
Figure 9.6-34. Impact of Low Temperature on Crack Initiation Life
Figure 9.6-35. Impact on Low Temperature on Overall Fatigue Life
These changes will drastically impact the:Crack Initiation Life
(plotted are the initiation cycles to 500 μm from a corrosion feature)
Burns
Abelkis
These changes will drastically impact the:Overall Fatigue Life
23C
23C
-65C
-65C
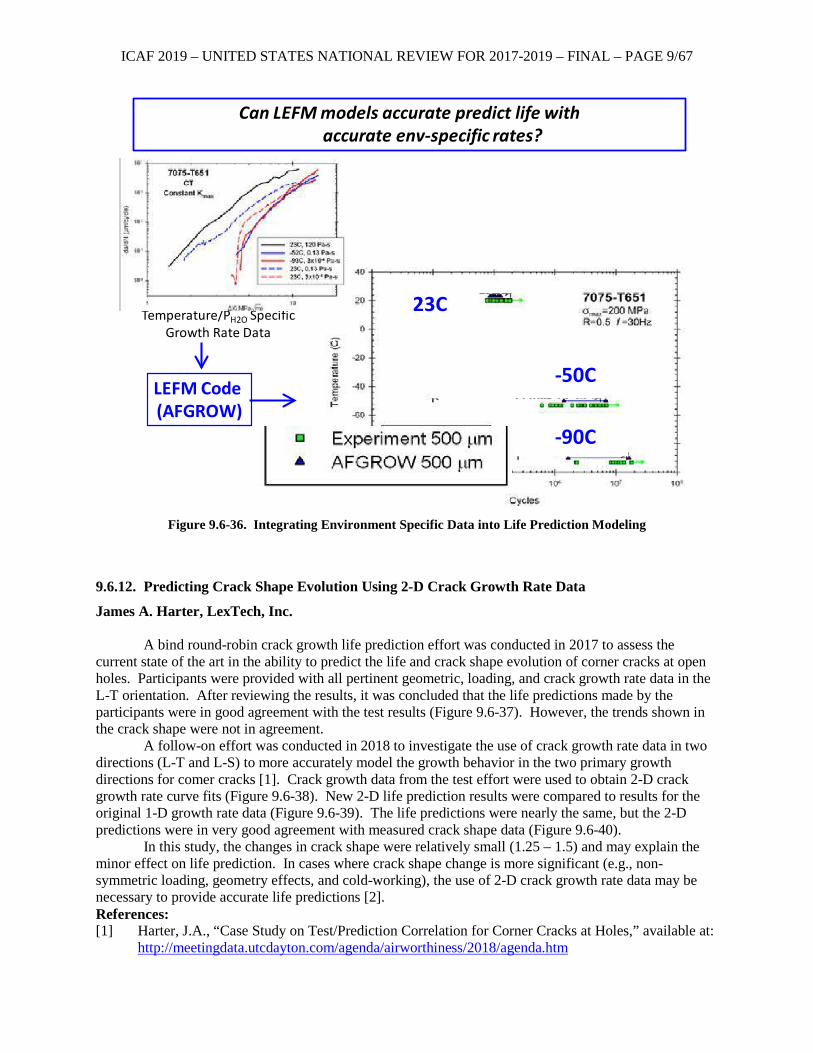
ICAF 2019 – UNITED STATES NATIONAL REVIEW FOR 2017-2019 – FINAL – PAGE 9/67
Figure 9.6-36. Integrating Environment Specific Data into Life Prediction Modeling
9.6.12. Predicting Crack Shape Evolution Using 2-D Crack Growth Rate Data
James A. Harter, LexTech, Inc.
A bind round-robin crack growth life prediction effort was conducted in 2017 to assess the current state of the art in the ability to predict the life and crack shape evolution of corner cracks at open holes. Participants were provided with all pertinent geometric, loading, and crack growth rate data in the L-T orientation. After reviewing the results, it was concluded that the life predictions made by the participants were in good agreement with the test results (Figure 9.6-37). However, the trends shown in the crack shape were not in agreement.
A follow-on effort was conducted in 2018 to investigate the use of crack growth rate data in two directions (L-T and L-S) to more accurately model the growth behavior in the two primary growth directions for comer cracks [1]. Crack growth data from the test effort were used to obtain 2-D crack growth rate curve fits (Figure 9.6-38). New 2-D life prediction results were compared to results for the original 1-D growth rate data (Figure 9.6-39). The life predictions were nearly the same, but the 2-D predictions were in very good agreement with measured crack shape data (Figure 9.6-40).
In this study, the changes in crack shape were relatively small (1.25 – 1.5) and may explain the minor effect on life prediction. In cases where crack shape change is more significant (e.g., non-symmetric loading, geometry effects, and cold-working), the use of 2-D crack growth rate data may be necessary to provide accurate life predictions [2]. References: [1] Harter, J.A., “Case Study on Test/Prediction Correlation for Corner Cracks at Holes,” available at:
http://meetingdata.utcdayton.com/agenda/airworthiness/2018/agenda.htm
Can LEFM models accurate predict life with accurate env-specific rates?
Temperature/PH2O Specific Growth Rate Data
LEFM Code (AFGROW)
23C
-50C
-90C
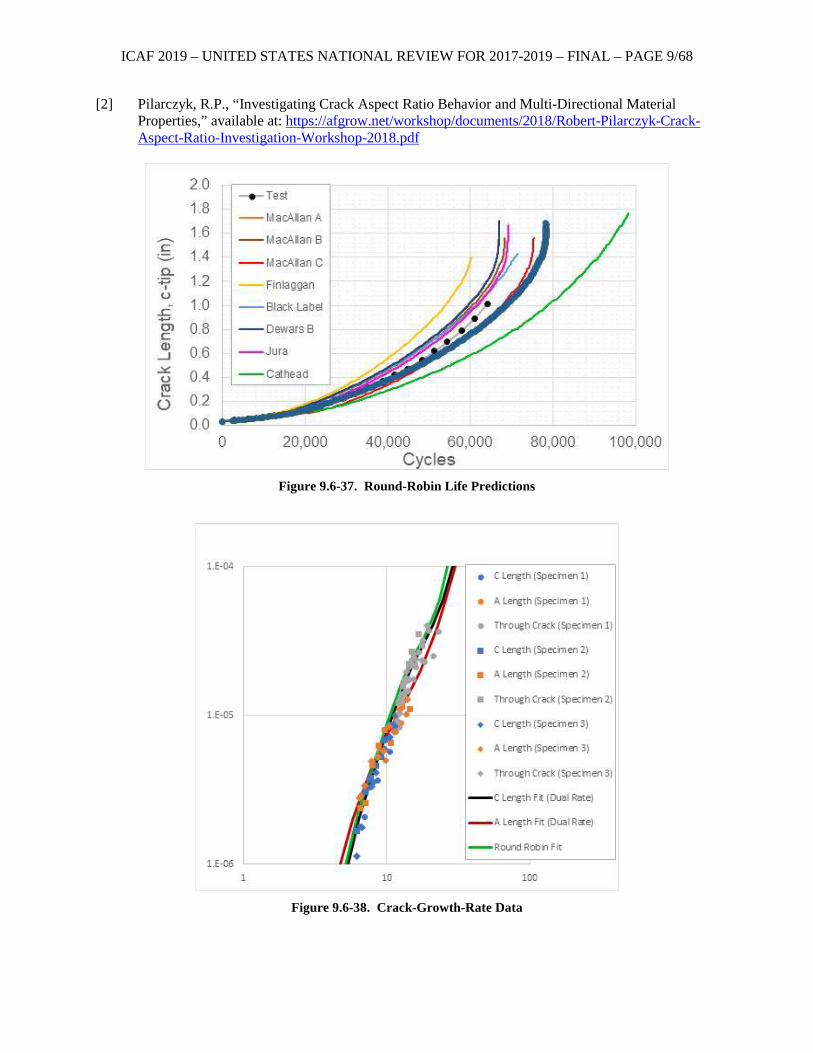
ICAF 2019 – UNITED STATES NATIONAL REVIEW FOR 2017-2019 – FINAL – PAGE 9/68
[2] Pilarczyk, R.P., “Investigating Crack Aspect Ratio Behavior and Multi-Directional Material Properties,” available at: https://afgrow.net/workshop/documents/2018/Robert-Pilarczyk-Crack-Aspect-Ratio-Investigation-Workshop-2018.pdf
Figure 9.6-37. Round-Robin Life Predictions
Figure 9.6-38. Crack-Growth-Rate Data
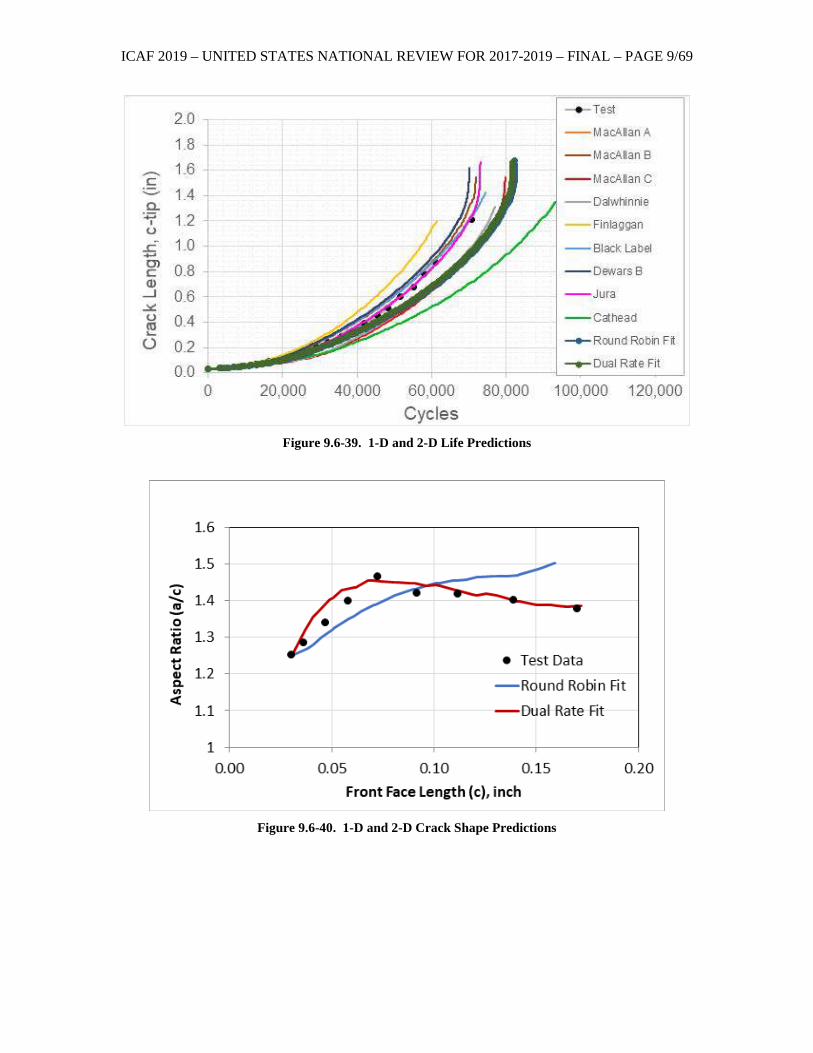
ICAF 2019 – UNITED STATES NATIONAL REVIEW FOR 2017-2019 – FINAL – PAGE 9/69
Figure 9.6-39. 1-D and 2-D Life Predictions
Figure 9.6-40. 1-D and 2-D Crack Shape Predictions
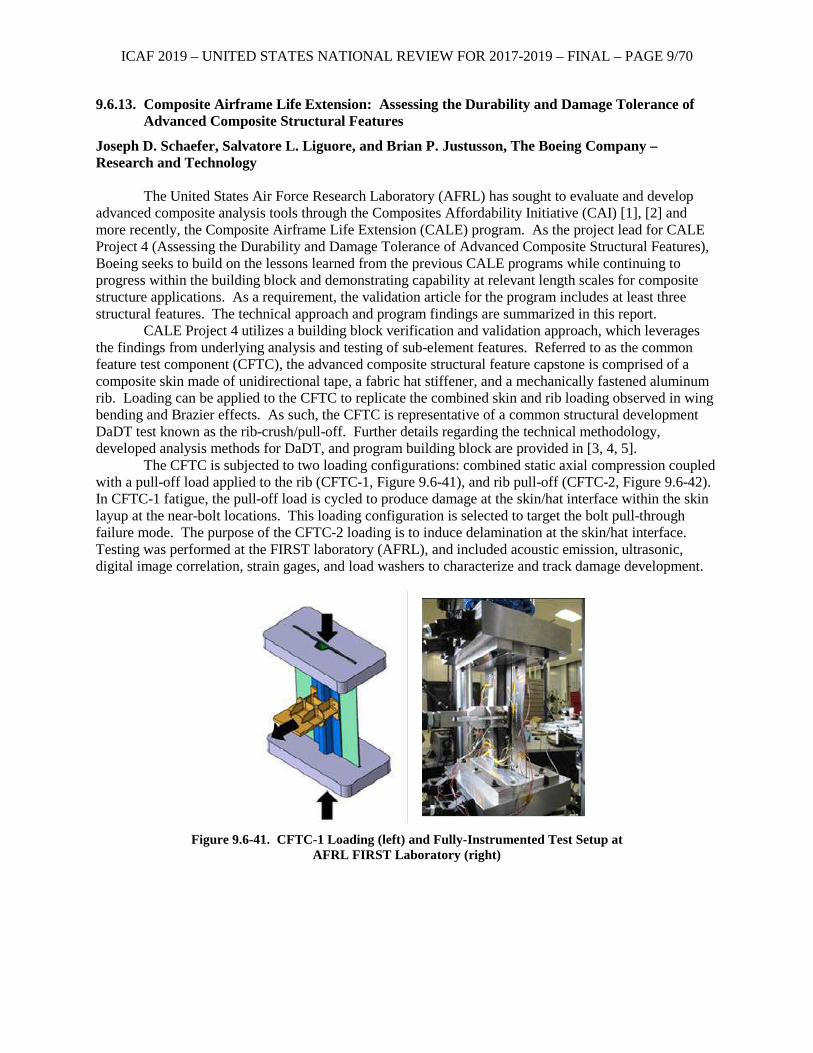
ICAF 2019 – UNITED STATES NATIONAL REVIEW FOR 2017-2019 – FINAL – PAGE 9/70
9.6.13. Composite Airframe Life Extension: Assessing the Durability and Damage Tolerance of Advanced Composite Structural Features
Joseph D. Schaefer, Salvatore L. Liguore, and Brian P. Justusson, The Boeing Company – Research and Technology
The United States Air Force Research Laboratory (AFRL) has sought to evaluate and develop advanced composite analysis tools through the Composites Affordability Initiative (CAI) [1], [2] and more recently, the Composite Airframe Life Extension (CALE) program. As the project lead for CALE Project 4 (Assessing the Durability and Damage Tolerance of Advanced Composite Structural Features), Boeing seeks to build on the lessons learned from the previous CALE programs while continuing to progress within the building block and demonstrating capability at relevant length scales for composite structure applications. As a requirement, the validation article for the program includes at least three structural features. The technical approach and program findings are summarized in this report.
CALE Project 4 utilizes a building block verification and validation approach, which leverages the findings from underlying analysis and testing of sub-element features. Referred to as the common feature test component (CFTC), the advanced composite structural feature capstone is comprised of a composite skin made of unidirectional tape, a fabric hat stiffener, and a mechanically fastened aluminum rib. Loading can be applied to the CFTC to replicate the combined skin and rib loading observed in wing bending and Brazier effects. As such, the CFTC is representative of a common structural development DaDT test known as the rib-crush/pull-off. Further details regarding the technical methodology, developed analysis methods for DaDT, and program building block are provided in [3, 4, 5].
The CFTC is subjected to two loading configurations: combined static axial compression coupled with a pull-off load applied to the rib (CFTC-1, Figure 9.6-41), and rib pull-off (CFTC-2, Figure 9.6-42). In CFTC-1 fatigue, the pull-off load is cycled to produce damage at the skin/hat interface within the skin layup at the near-bolt locations. This loading configuration is selected to target the bolt pull-through failure mode. The purpose of the CFTC-2 loading is to induce delamination at the skin/hat interface. Testing was performed at the FIRST laboratory (AFRL), and included acoustic emission, ultrasonic, digital image correlation, strain gages, and load washers to characterize and track damage development.
Figure 9.6-41. CFTC-1 Loading (left) and Fully-Instrumented Test Setup at
AFRL FIRST Laboratory (right)
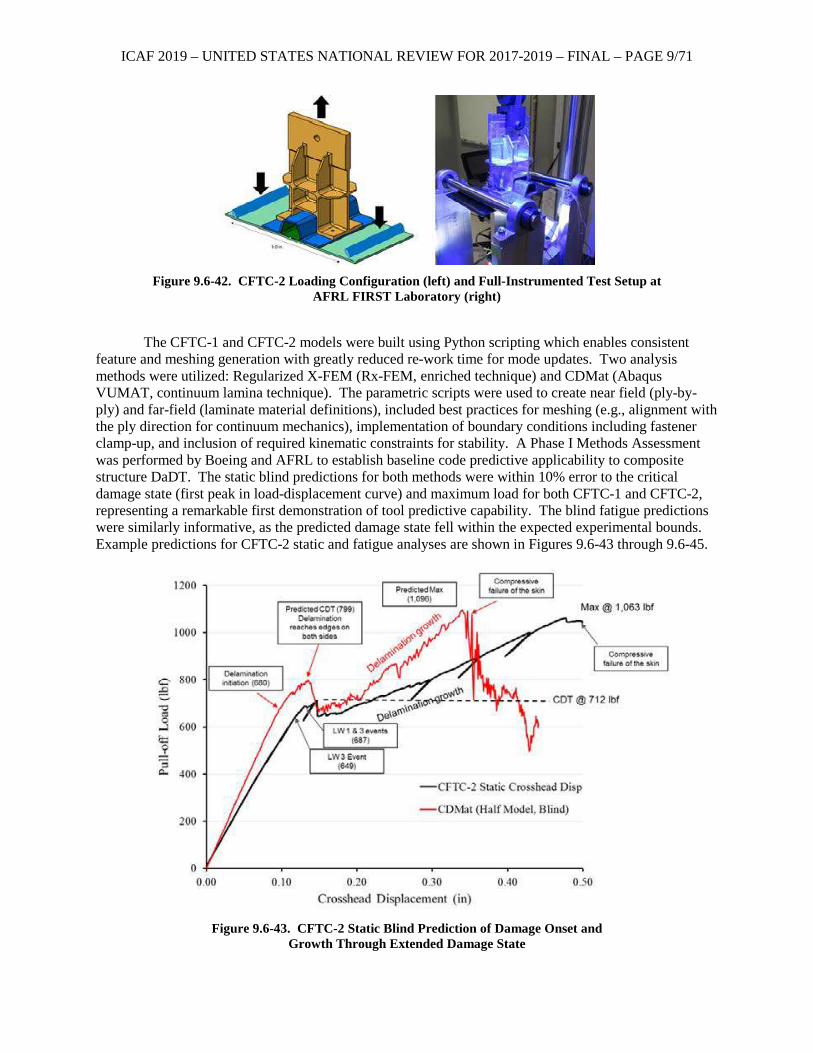
ICAF 2019 – UNITED STATES NATIONAL REVIEW FOR 2017-2019 – FINAL – PAGE 9/71
Figure 9.6-42. CFTC-2 Loading Configuration (left) and Full-Instrumented Test Setup at
AFRL FIRST Laboratory (right)
The CFTC-1 and CFTC-2 models were built using Python scripting which enables consistent
feature and meshing generation with greatly reduced re-work time for mode updates. Two analysis methods were utilized: Regularized X-FEM (Rx-FEM, enriched technique) and CDMat (Abaqus VUMAT, continuum lamina technique). The parametric scripts were used to create near field (ply-by-ply) and far-field (laminate material definitions), included best practices for meshing (e.g., alignment with the ply direction for continuum mechanics), implementation of boundary conditions including fastener clamp-up, and inclusion of required kinematic constraints for stability. A Phase I Methods Assessment was performed by Boeing and AFRL to establish baseline code predictive applicability to composite structure DaDT. The static blind predictions for both methods were within 10% error to the critical damage state (first peak in load-displacement curve) and maximum load for both CFTC-1 and CFTC-2, representing a remarkable first demonstration of tool predictive capability. The blind fatigue predictions were similarly informative, as the predicted damage state fell within the expected experimental bounds. Example predictions for CFTC-2 static and fatigue analyses are shown in Figures 9.6-43 through 9.6-45.
Figure 9.6-43. CFTC-2 Static Blind Prediction of Damage Onset and
Growth Through Extended Damage State
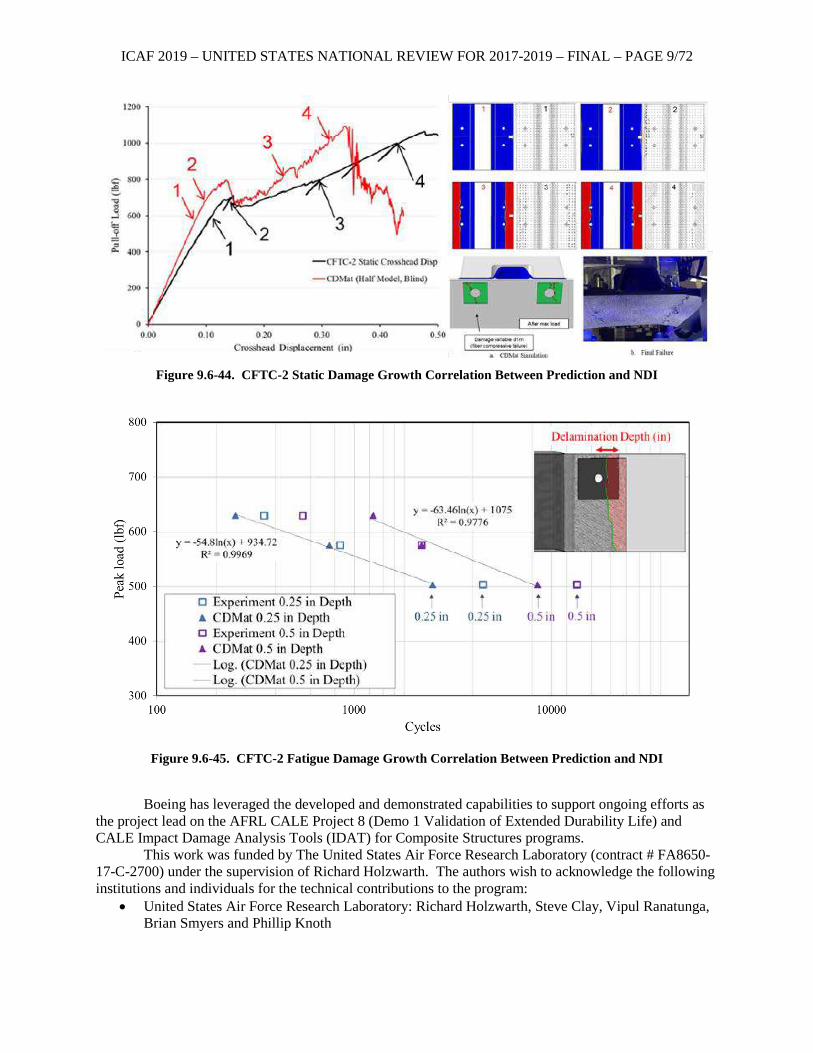
ICAF 2019 – UNITED STATES NATIONAL REVIEW FOR 2017-2019 – FINAL – PAGE 9/72
Figure 9.6-44. CFTC-2 Static Damage Growth Correlation Between Prediction and NDI
Figure 9.6-45. CFTC-2 Fatigue Damage Growth Correlation Between Prediction and NDI
Boeing has leveraged the developed and demonstrated capabilities to support ongoing efforts as
the project lead on the AFRL CALE Project 8 (Demo 1 Validation of Extended Durability Life) and CALE Impact Damage Analysis Tools (IDAT) for Composite Structures programs.
This work was funded by The United States Air Force Research Laboratory (contract # FA8650-17-C-2700) under the supervision of Richard Holzwarth. The authors wish to acknowledge the following institutions and individuals for the technical contributions to the program:
• United States Air Force Research Laboratory: Richard Holzwarth, Steve Clay, Vipul Ranatunga, Brian Smyers and Phillip Knoth
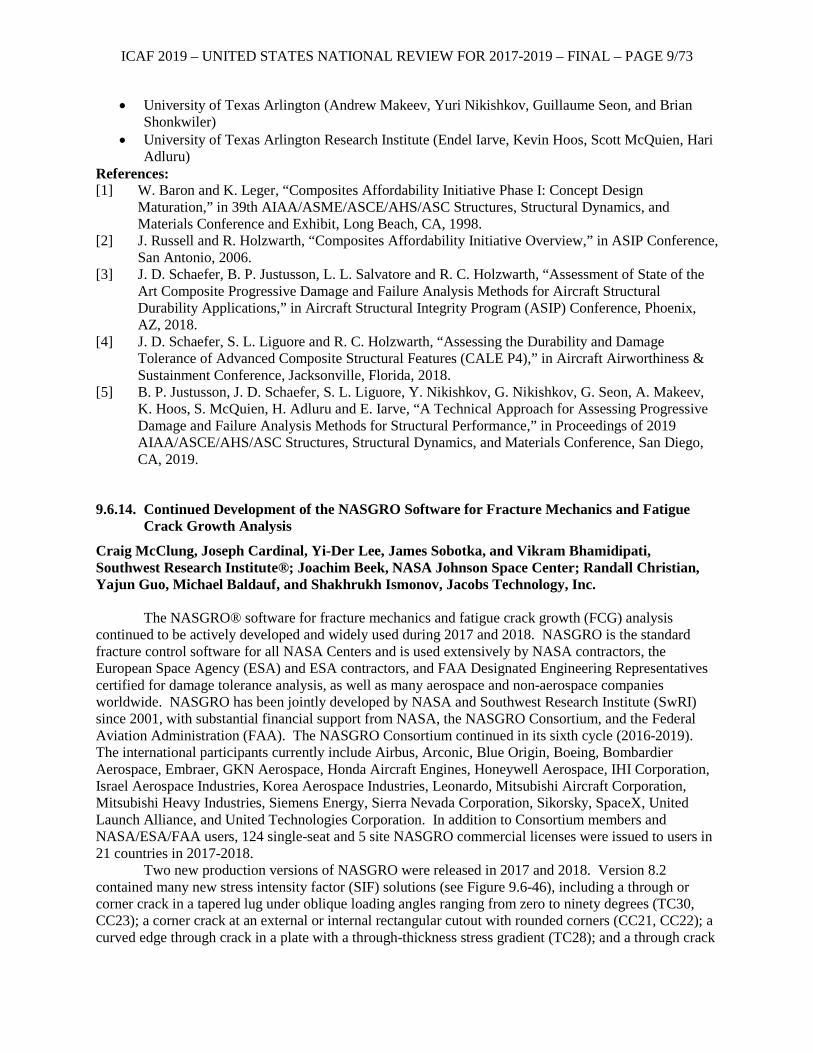
ICAF 2019 – UNITED STATES NATIONAL REVIEW FOR 2017-2019 – FINAL – PAGE 9/73
• University of Texas Arlington (Andrew Makeev, Yuri Nikishkov, Guillaume Seon, and Brian Shonkwiler)
• University of Texas Arlington Research Institute (Endel Iarve, Kevin Hoos, Scott McQuien, Hari Adluru)
References: [1] W. Baron and K. Leger, “Composites Affordability Initiative Phase I: Concept Design
Maturation,” in 39th AIAA/ASME/ASCE/AHS/ASC Structures, Structural Dynamics, and Materials Conference and Exhibit, Long Beach, CA, 1998.
[2] J. Russell and R. Holzwarth, “Composites Affordability Initiative Overview,” in ASIP Conference, San Antonio, 2006.
[3] J. D. Schaefer, B. P. Justusson, L. L. Salvatore and R. C. Holzwarth, “Assessment of State of the Art Composite Progressive Damage and Failure Analysis Methods for Aircraft Structural Durability Applications,” in Aircraft Structural Integrity Program (ASIP) Conference, Phoenix, AZ, 2018.
[4] J. D. Schaefer, S. L. Liguore and R. C. Holzwarth, “Assessing the Durability and Damage Tolerance of Advanced Composite Structural Features (CALE P4),” in Aircraft Airworthiness & Sustainment Conference, Jacksonville, Florida, 2018.
[5] B. P. Justusson, J. D. Schaefer, S. L. Liguore, Y. Nikishkov, G. Nikishkov, G. Seon, A. Makeev, K. Hoos, S. McQuien, H. Adluru and E. Iarve, “A Technical Approach for Assessing Progressive Damage and Failure Analysis Methods for Structural Performance,” in Proceedings of 2019 AIAA/ASCE/AHS/ASC Structures, Structural Dynamics, and Materials Conference, San Diego, CA, 2019.
9.6.14. Continued Development of the NASGRO Software for Fracture Mechanics and Fatigue Crack Growth Analysis
Craig McClung, Joseph Cardinal, Yi-Der Lee, James Sobotka, and Vikram Bhamidipati, Southwest Research Institute®; Joachim Beek, NASA Johnson Space Center; Randall Christian, Yajun Guo, Michael Baldauf, and Shakhrukh Ismonov, Jacobs Technology, Inc.
The NASGRO® software for fracture mechanics and fatigue crack growth (FCG) analysis continued to be actively developed and widely used during 2017 and 2018. NASGRO is the standard fracture control software for all NASA Centers and is used extensively by NASA contractors, the European Space Agency (ESA) and ESA contractors, and FAA Designated Engineering Representatives certified for damage tolerance analysis, as well as many aerospace and non-aerospace companies worldwide. NASGRO has been jointly developed by NASA and Southwest Research Institute (SwRI) since 2001, with substantial financial support from NASA, the NASGRO Consortium, and the Federal Aviation Administration (FAA). The NASGRO Consortium continued in its sixth cycle (2016-2019). The international participants currently include Airbus, Arconic, Blue Origin, Boeing, Bombardier Aerospace, Embraer, GKN Aerospace, Honda Aircraft Engines, Honeywell Aerospace, IHI Corporation, Israel Aerospace Industries, Korea Aerospace Industries, Leonardo, Mitsubishi Aircraft Corporation, Mitsubishi Heavy Industries, Siemens Energy, Sierra Nevada Corporation, Sikorsky, SpaceX, United Launch Alliance, and United Technologies Corporation. In addition to Consortium members and NASA/ESA/FAA users, 124 single-seat and 5 site NASGRO commercial licenses were issued to users in 21 countries in 2017-2018.
Two new production versions of NASGRO were released in 2017 and 2018. Version 8.2 contained many new stress intensity factor (SIF) solutions (see Figure 9.6-46), including a through or corner crack in a tapered lug under oblique loading angles ranging from zero to ninety degrees (TC30, CC23); a corner crack at an external or internal rectangular cutout with rounded corners (CC21, CC22); a curved edge through crack in a plate with a through-thickness stress gradient (TC28); and a through crack
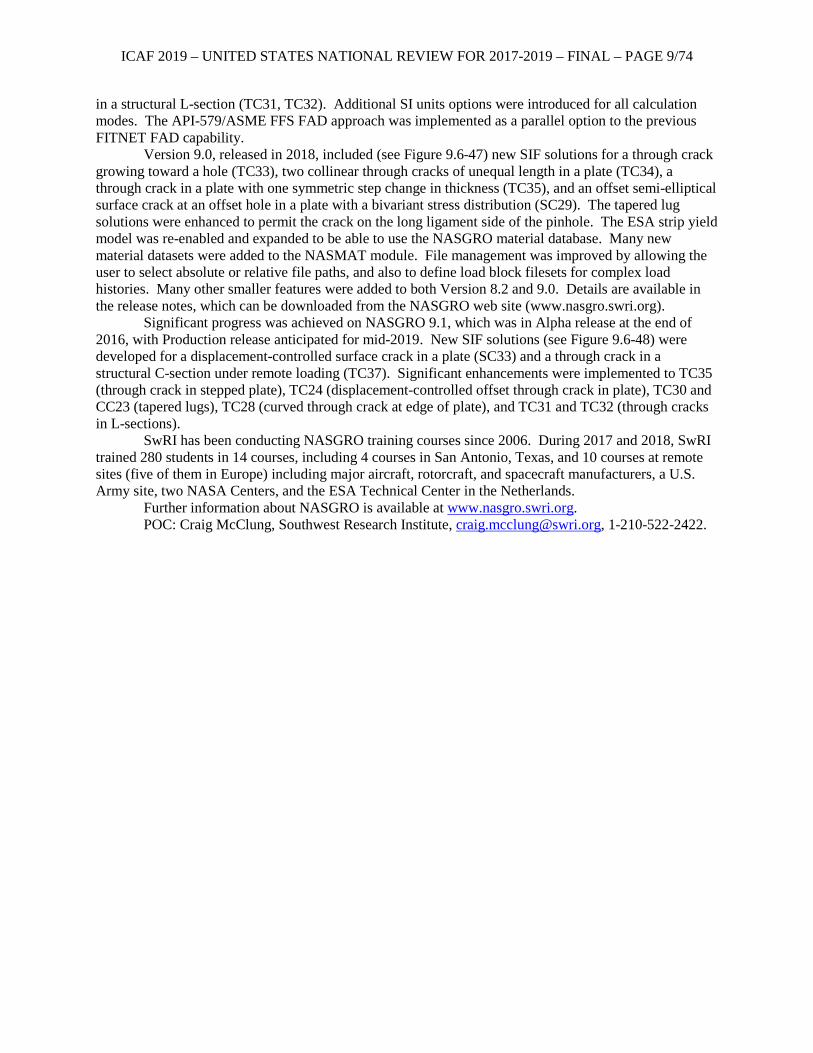
ICAF 2019 – UNITED STATES NATIONAL REVIEW FOR 2017-2019 – FINAL – PAGE 9/74
in a structural L-section (TC31, TC32). Additional SI units options were introduced for all calculation modes. The API-579/ASME FFS FAD approach was implemented as a parallel option to the previous FITNET FAD capability.
Version 9.0, released in 2018, included (see Figure 9.6-47) new SIF solutions for a through crack growing toward a hole (TC33), two collinear through cracks of unequal length in a plate (TC34), a through crack in a plate with one symmetric step change in thickness (TC35), and an offset semi-elliptical surface crack at an offset hole in a plate with a bivariant stress distribution (SC29). The tapered lug solutions were enhanced to permit the crack on the long ligament side of the pinhole. The ESA strip yield model was re-enabled and expanded to be able to use the NASGRO material database. Many new material datasets were added to the NASMAT module. File management was improved by allowing the user to select absolute or relative file paths, and also to define load block filesets for complex load histories. Many other smaller features were added to both Version 8.2 and 9.0. Details are available in the release notes, which can be downloaded from the NASGRO web site (www.nasgro.swri.org).
Significant progress was achieved on NASGRO 9.1, which was in Alpha release at the end of 2016, with Production release anticipated for mid-2019. New SIF solutions (see Figure 9.6-48) were developed for a displacement-controlled surface crack in a plate (SC33) and a through crack in a structural C-section under remote loading (TC37). Significant enhancements were implemented to TC35 (through crack in stepped plate), TC24 (displacement-controlled offset through crack in plate), TC30 and CC23 (tapered lugs), TC28 (curved through crack at edge of plate), and TC31 and TC32 (through cracks in L-sections).
SwRI has been conducting NASGRO training courses since 2006. During 2017 and 2018, SwRI trained 280 students in 14 courses, including 4 courses in San Antonio, Texas, and 10 courses at remote sites (five of them in Europe) including major aircraft, rotorcraft, and spacecraft manufacturers, a U.S. Army site, two NASA Centers, and the ESA Technical Center in the Netherlands.
Further information about NASGRO is available at www.nasgro.swri.org. POC: Craig McClung, Southwest Research Institute, [email protected], 1-210-522-2422.
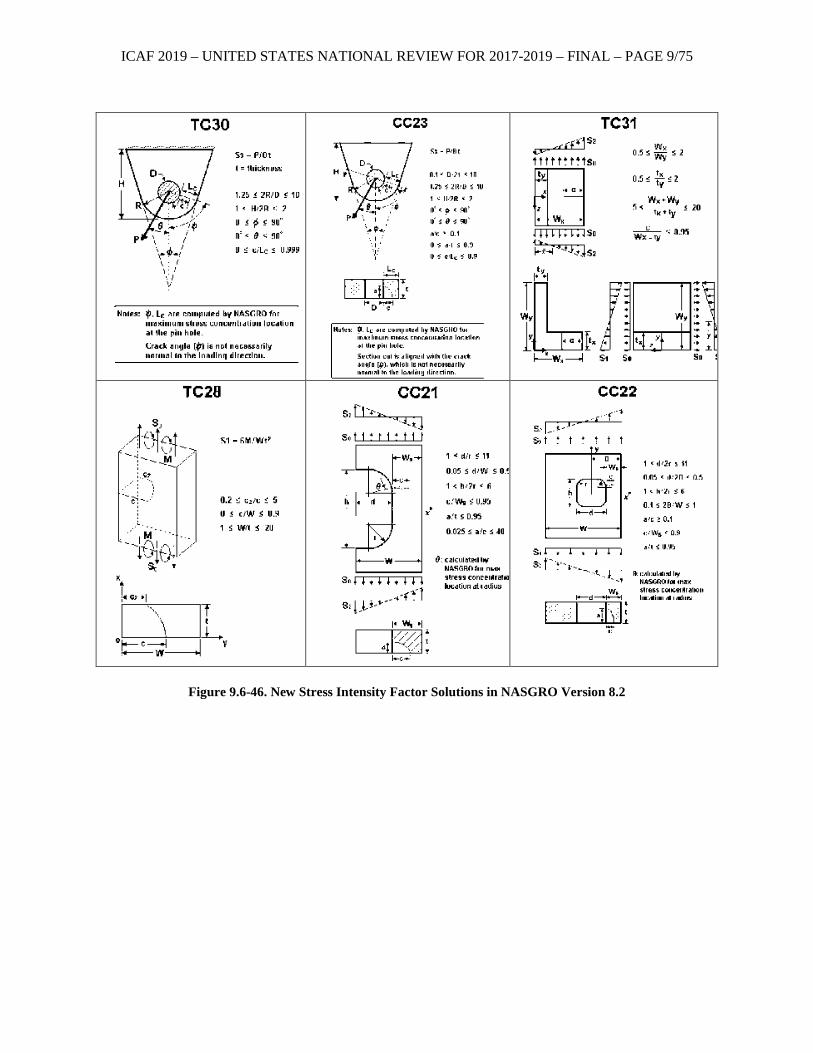
ICAF 2019 – UNITED STATES NATIONAL REVIEW FOR 2017-2019 – FINAL – PAGE 9/75
Figure 9.6-46. New Stress Intensity Factor Solutions in NASGRO Version 8.2
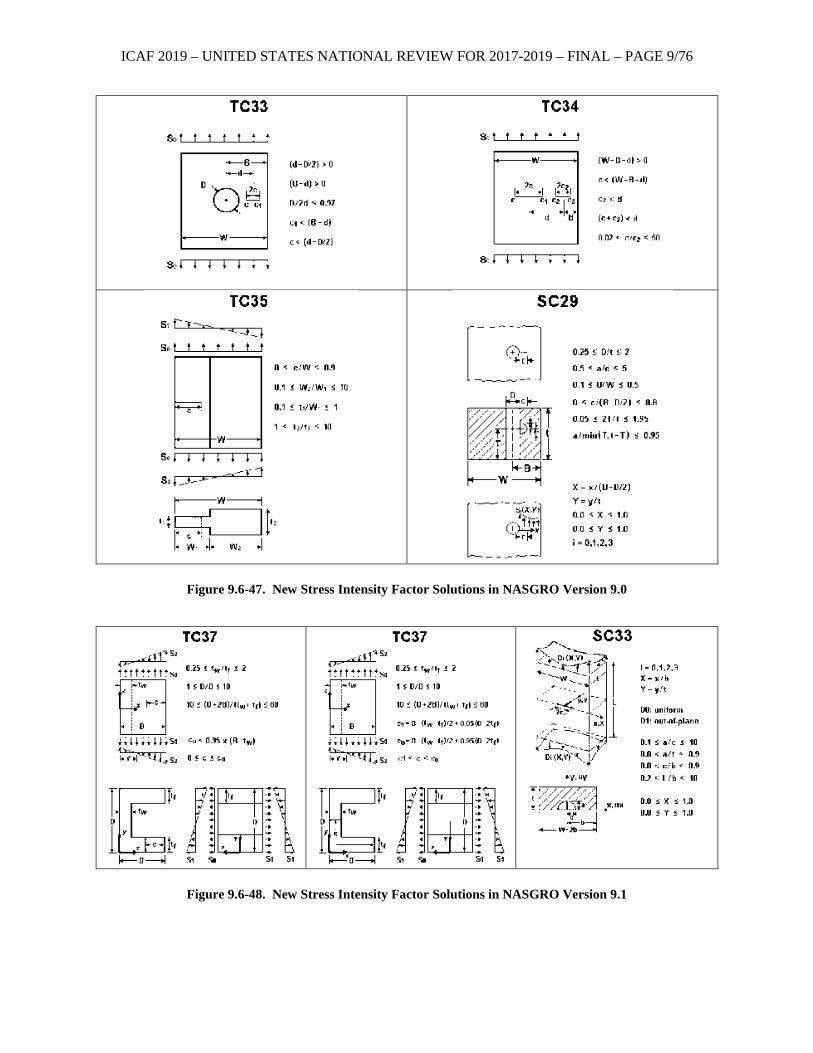
ICAF 2019 – UNITED STATES NATIONAL REVIEW FOR 2017-2019 – FINAL – PAGE 9/76
Figure 9.6-47. New Stress Intensity Factor Solutions in NASGRO Version 9.0
Figure 9.6-48. New Stress Intensity Factor Solutions in NASGRO Version 9.1
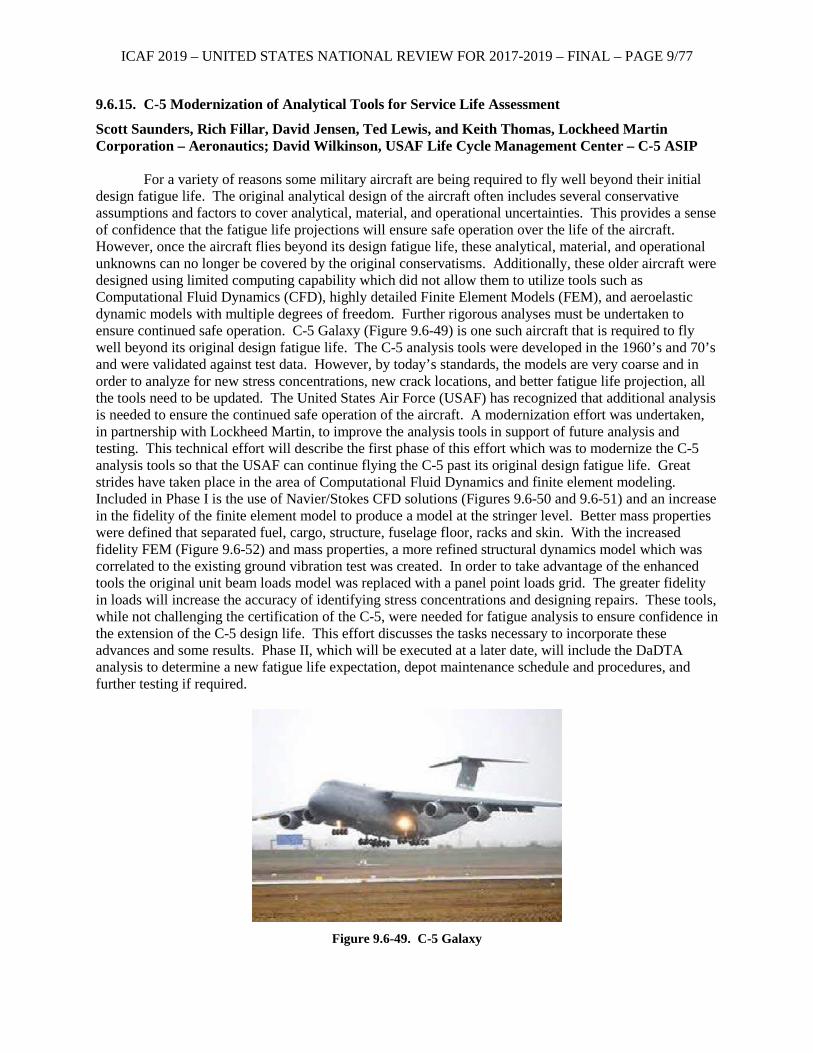
ICAF 2019 – UNITED STATES NATIONAL REVIEW FOR 2017-2019 – FINAL – PAGE 9/77
9.6.15. C-5 Modernization of Analytical Tools for Service Life Assessment
Scott Saunders, Rich Fillar, David Jensen, Ted Lewis, and Keith Thomas, Lockheed Martin Corporation – Aeronautics; David Wilkinson, USAF Life Cycle Management Center – C-5 ASIP
For a variety of reasons some military aircraft are being required to fly well beyond their initial
design fatigue life. The original analytical design of the aircraft often includes several conservative assumptions and factors to cover analytical, material, and operational uncertainties. This provides a sense of confidence that the fatigue life projections will ensure safe operation over the life of the aircraft. However, once the aircraft flies beyond its design fatigue life, these analytical, material, and operational unknowns can no longer be covered by the original conservatisms. Additionally, these older aircraft were designed using limited computing capability which did not allow them to utilize tools such as Computational Fluid Dynamics (CFD), highly detailed Finite Element Models (FEM), and aeroelastic dynamic models with multiple degrees of freedom. Further rigorous analyses must be undertaken to ensure continued safe operation. C-5 Galaxy (Figure 9.6-49) is one such aircraft that is required to fly well beyond its original design fatigue life. The C-5 analysis tools were developed in the 1960’s and 70’s and were validated against test data. However, by today’s standards, the models are very coarse and in order to analyze for new stress concentrations, new crack locations, and better fatigue life projection, all the tools need to be updated. The United States Air Force (USAF) has recognized that additional analysis is needed to ensure the continued safe operation of the aircraft. A modernization effort was undertaken, in partnership with Lockheed Martin, to improve the analysis tools in support of future analysis and testing. This technical effort will describe the first phase of this effort which was to modernize the C-5 analysis tools so that the USAF can continue flying the C-5 past its original design fatigue life. Great strides have taken place in the area of Computational Fluid Dynamics and finite element modeling. Included in Phase I is the use of Navier/Stokes CFD solutions (Figures 9.6-50 and 9.6-51) and an increase in the fidelity of the finite element model to produce a model at the stringer level. Better mass properties were defined that separated fuel, cargo, structure, fuselage floor, racks and skin. With the increased fidelity FEM (Figure 9.6-52) and mass properties, a more refined structural dynamics model which was correlated to the existing ground vibration test was created. In order to take advantage of the enhanced tools the original unit beam loads model was replaced with a panel point loads grid. The greater fidelity in loads will increase the accuracy of identifying stress concentrations and designing repairs. These tools, while not challenging the certification of the C-5, were needed for fatigue analysis to ensure confidence in the extension of the C-5 design life. This effort discusses the tasks necessary to incorporate these advances and some results. Phase II, which will be executed at a later date, will include the DaDTA analysis to determine a new fatigue life expectation, depot maintenance schedule and procedures, and further testing if required.
Figure 9.6-49. C-5 Galaxy
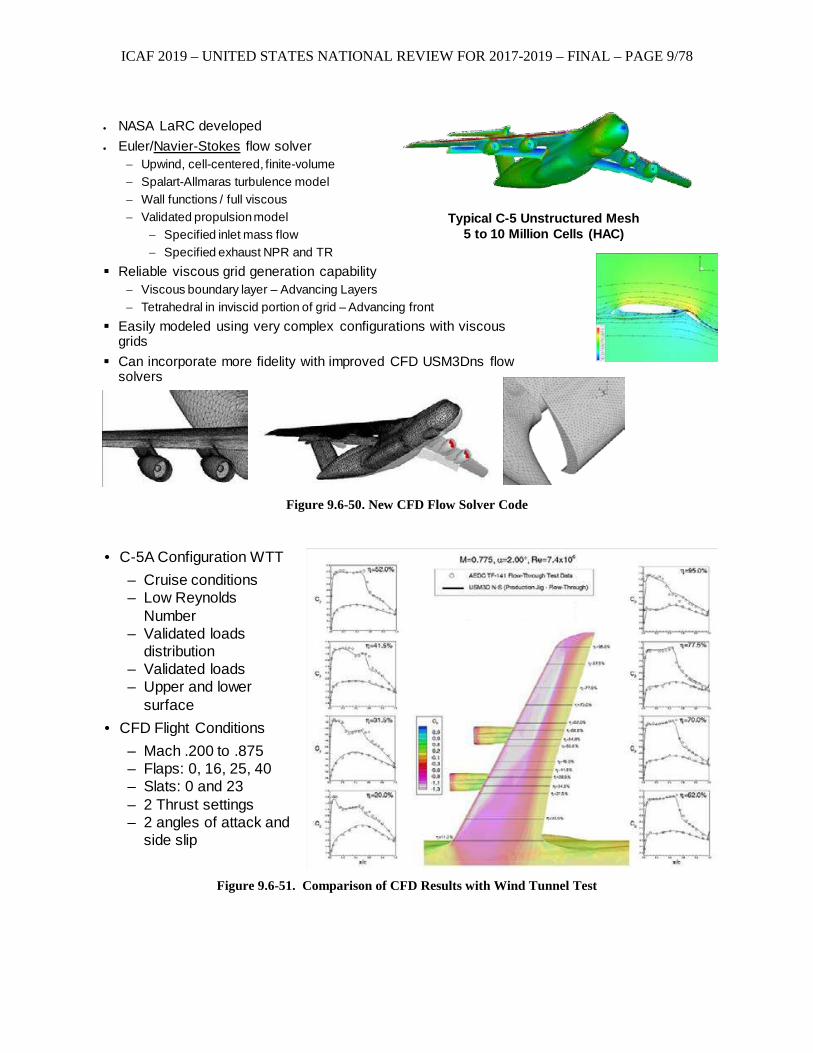
ICAF 2019 – UNITED STATES NATIONAL REVIEW FOR 2017-2019 – FINAL – PAGE 9/78
Figure 9.6-50. New CFD Flow Solver Code
Figure 9.6-51. Comparison of CFD Results with Wind Tunnel Test
• NASA LaRC developed• Euler/Navier-Stokes flow solver
− Upwind, cell-centered, finite-volume− Spalart-Allmaras turbulence model− Wall functions / full viscous− Validated propulsion model
− Specified inlet mass flow− Specified exhaust NPR and TR
Reliable viscous grid generation capability− Viscous boundary layer – Advancing Layers− Tetrahedral in inviscid portion of grid – Advancing front
Easily modeled using very complex configurations with viscous grids
Can incorporate more fidelity with improved CFD USM3Dns flow solvers
Typical C-5 Unstructured Mesh5 to 10 Million Cells (HAC)
• C-5A Configuration WTT– Cruise conditions– Low Reynolds
Number– Validated loads
distribution– Validated loads– Upper and lower
surface• CFD Flight Conditions
– Mach .200 to .875– Flaps: 0, 16, 25, 40– Slats: 0 and 23– 2 Thrust settings– 2 angles of attack and
side slip
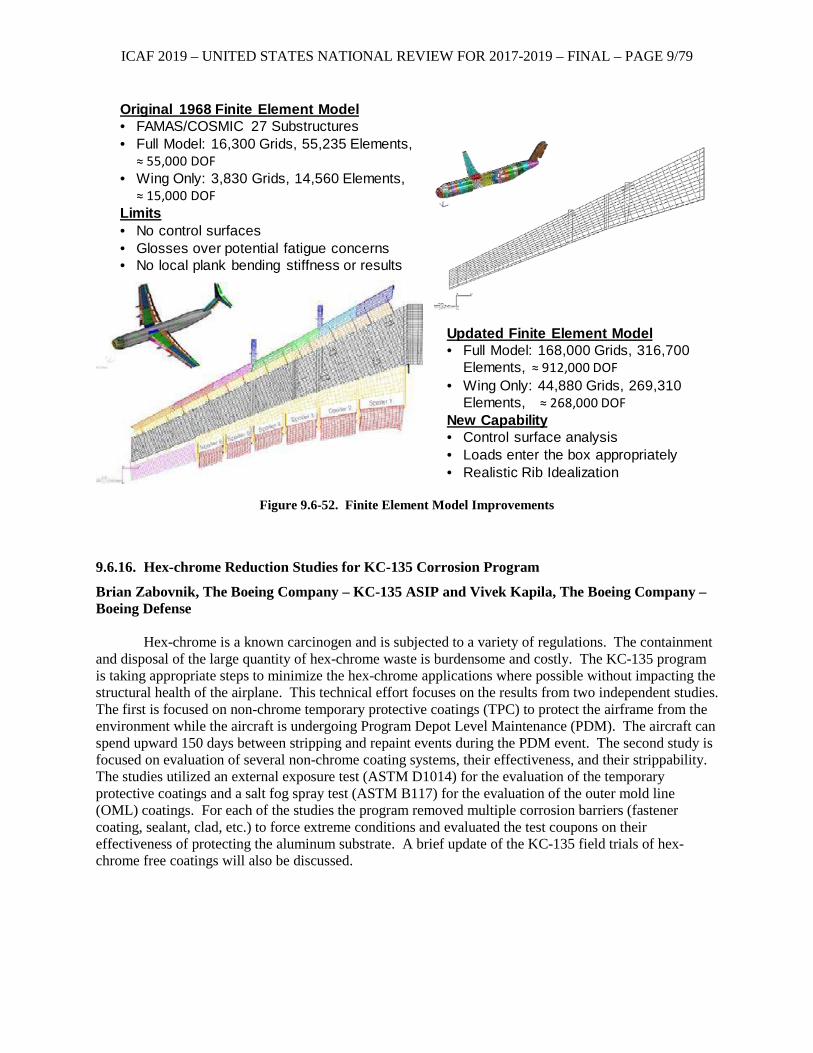
ICAF 2019 – UNITED STATES NATIONAL REVIEW FOR 2017-2019 – FINAL – PAGE 9/79
Figure 9.6-52. Finite Element Model Improvements
9.6.16. Hex-chrome Reduction Studies for KC-135 Corrosion Program
Brian Zabovnik, The Boeing Company – KC-135 ASIP and Vivek Kapila, The Boeing Company – Boeing Defense
Hex-chrome is a known carcinogen and is subjected to a variety of regulations. The containment
and disposal of the large quantity of hex-chrome waste is burdensome and costly. The KC-135 program is taking appropriate steps to minimize the hex-chrome applications where possible without impacting the structural health of the airplane. This technical effort focuses on the results from two independent studies. The first is focused on non-chrome temporary protective coatings (TPC) to protect the airframe from the environment while the aircraft is undergoing Program Depot Level Maintenance (PDM). The aircraft can spend upward 150 days between stripping and repaint events during the PDM event. The second study is focused on evaluation of several non-chrome coating systems, their effectiveness, and their strippability. The studies utilized an external exposure test (ASTM D1014) for the evaluation of the temporary protective coatings and a salt fog spray test (ASTM B117) for the evaluation of the outer mold line (OML) coatings. For each of the studies the program removed multiple corrosion barriers (fastener coating, sealant, clad, etc.) to force extreme conditions and evaluated the test coupons on their effectiveness of protecting the aluminum substrate. A brief update of the KC-135 field trials of hex-chrome free coatings will also be discussed.
Original 1968 Finite Element Model• FAMAS/COSMIC 27 Substructures• Full Model: 16,300 Grids, 55,235 Elements,
≈ 55,000 DOF• Wing Only: 3,830 Grids, 14,560 Elements,
≈ 15,000 DOFLimits• No control surfaces• Glosses over potential fatigue concerns• No local plank bending stiffness or results
Updated Finite Element Model• Full Model: 168,000 Grids, 316,700
Elements, ≈ 912,000 DOF• Wing Only: 44,880 Grids, 269,310
Elements, ≈ 268,000 DOFNew Capability• Control surface analysis• Loads enter the box appropriately• Realistic Rib Idealization
ICAF 2019 – UNITED STATES NATIONAL REVIEW FOR 2017-2019 – FINAL – PAGE 9/80
9.6.17. What Does a Successful Fatigue Test Mean for Analytical Shortfalls
George Crosthwaite, USAF Life Cycle Management Center – F-35 Joint Program Office What does a successful fatigue test program mean for analytical shortfalls and/or field findings?
The lead up to the answer comes in the definition of a “successful” test program. There are two requirements that need to be met to effectively test a new design. The first is a statistically sufficient duration of test beyond the required design life to adequately account for fatigue scatter. The second requirement is the accuracy of the test loading in comparison to the design loads (Goodness of Test). A third requirement subject to discussion is why a finding on the test does not make it unsuccessful. With that definition in mind, this technical effort will delve into what hurdles are found in the correlation efforts with respect to the pre-test condition of the test article and how to correlate your crack growth analysis with a non-finding. After confirming what was tested and acquiring the non-finding evidence through the teardown inspections, we will then be able to arbitrate the validity/impact of existing short life parts based solely on our analytics models as well as the demonstrated field fatigue issues that may have already been discovered and those yet to be.
9.6.18. Assessment of State-of-the-Art Composite Progressive Damage and Failure
Dr. Brian Justusson, Joseph Schaefer, and Sal Liguore, The Boeing Company – Research and Technology; Richard Halzwarth, USAF Research Laboratory, Aerospace Systems Directorate
The prediction of damage events within composite aircraft structures undergoing repeated loading
is critical to informing the overall structural durability and damage tolerance (DaDT). Advanced Progressive Damage and Failure Analysis (PDFA) methods provide the opportunity to assess composite structural performance at the element level of the design and test building block, where testing expense and rework risks increase. These advanced structural analysis methods have the capability to predict initiation and propagation of damage under repeated loading on the basis of individual and interacting damage modes. The objective of the Composite Airframe Life Extension (CALE) program is to evaluate the applicability of these methods to assess the durability and damage tolerance (DaDT) of composite structures within the United States Air Force (USAF) fleet for service life of extension. The Air Force Research Laboratory (AFRL) Composite Airframe Life Extension program has the objectives to (1) Predict the Durability and Damage Tolerance of Structural Features of Advanced Composite Airframes, (2) Demonstrate the Accuracy and Performance of selected Durability and Damage Tolerance Predictive Methods, and (3) Demonstrate the Robustness of the selected Durability and Damage Tolerance Predictive Methods. On CALE Project 4, the prediction of damage initiation and propagation events relative to composite structures under repeated loads is performed at the structural element level. A Common Feature Test Component (CFTC) was designed, manufactured, and tested to experimentally characterize key structural composite failure modes and provide relevant high fidelity inspection data for model evaluation (Figure 9.6-53). Two test plans were performed to provide required model input properties and assess method performance for key failure modes (Test Plan – R), as well as provide CFTC data in static and cyclic loading (Test Plan – 1). Prior to testing, appropriate damage tolerance and durability methods were benchmarked and subsequently used to predict the initiation and propagation of damage for the CFTC in both static and cyclic loading. Following evaluation of method performance, the models were revised and subjected to a new set of loading parameters for pre-test predictions. The current study focuses on a typical hybrid carbon/epoxy and aluminum structural element consisting of co-cured hat stiffened skin and machined aluminum rib. The rib is bolted to the co-cured skin. The primary loading is in-plane axial combined with out-of-plane pull-off. The failure modes of interest is fastener pull-thru and stringer delamination. These advanced PDFA methods are applied to this problem to predict the Initial Damage (ID), as well as, the Extended Damage (ED) state under static and cyclic loading. Boeing and University of Texas – Arlington designed, developed, and performed the analysis of
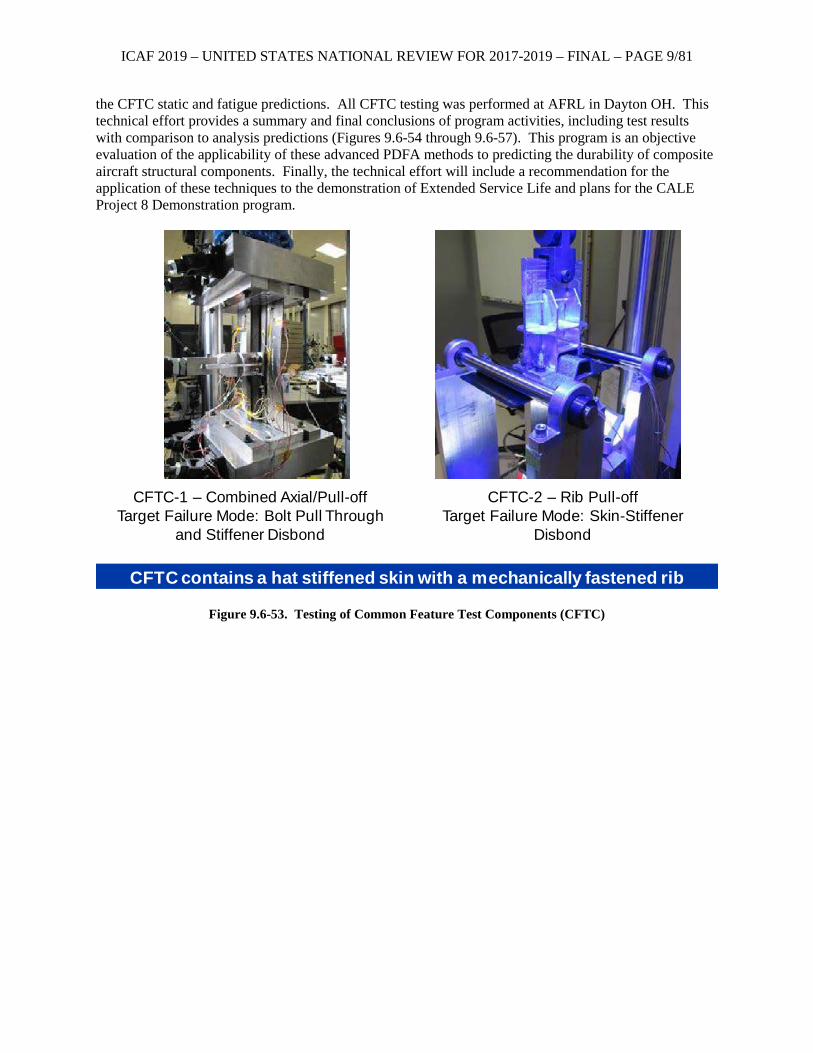
ICAF 2019 – UNITED STATES NATIONAL REVIEW FOR 2017-2019 – FINAL – PAGE 9/81
the CFTC static and fatigue predictions. All CFTC testing was performed at AFRL in Dayton OH. This technical effort provides a summary and final conclusions of program activities, including test results with comparison to analysis predictions (Figures 9.6-54 through 9.6-57). This program is an objective evaluation of the applicability of these advanced PDFA methods to predicting the durability of composite aircraft structural components. Finally, the technical effort will include a recommendation for the application of these techniques to the demonstration of Extended Service Life and plans for the CALE Project 8 Demonstration program.
Figure 9.6-53. Testing of Common Feature Test Components (CFTC)
CFTC contains a hat stiffened skin with a mechanically fastened rib
CFTC-1 – Combined Axial/Pull-offTarget Failure Mode: Bolt Pull Through
and Stiffener Disbond
CFTC-2 – Rib Pull-off Target Failure Mode: Skin-Stiffener
Disbond
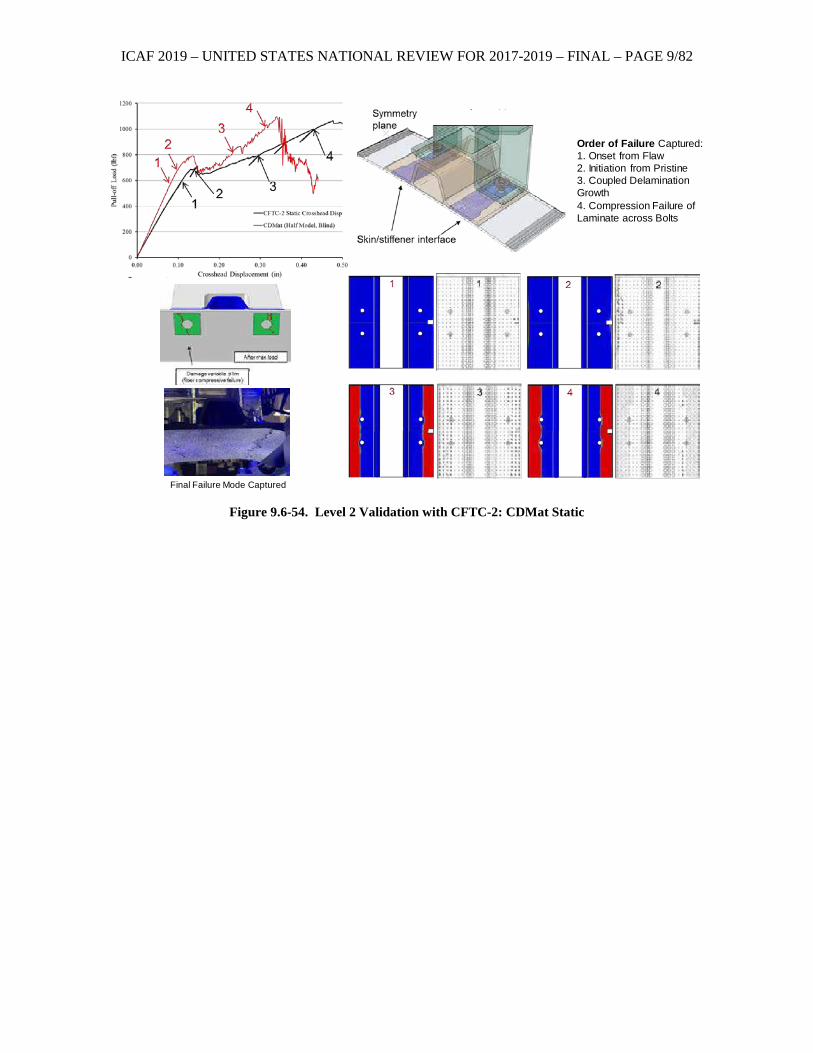
ICAF 2019 – UNITED STATES NATIONAL REVIEW FOR 2017-2019 – FINAL – PAGE 9/82
Figure 9.6-54. Level 2 Validation with CFTC-2: CDMat Static
Final Failure Mode Captured
Order of Failure Captured: 1. Onset from Flaw2. Initiation from Pristine3. Coupled Delamination Growth4. Compression Failure of Laminate across Bolts
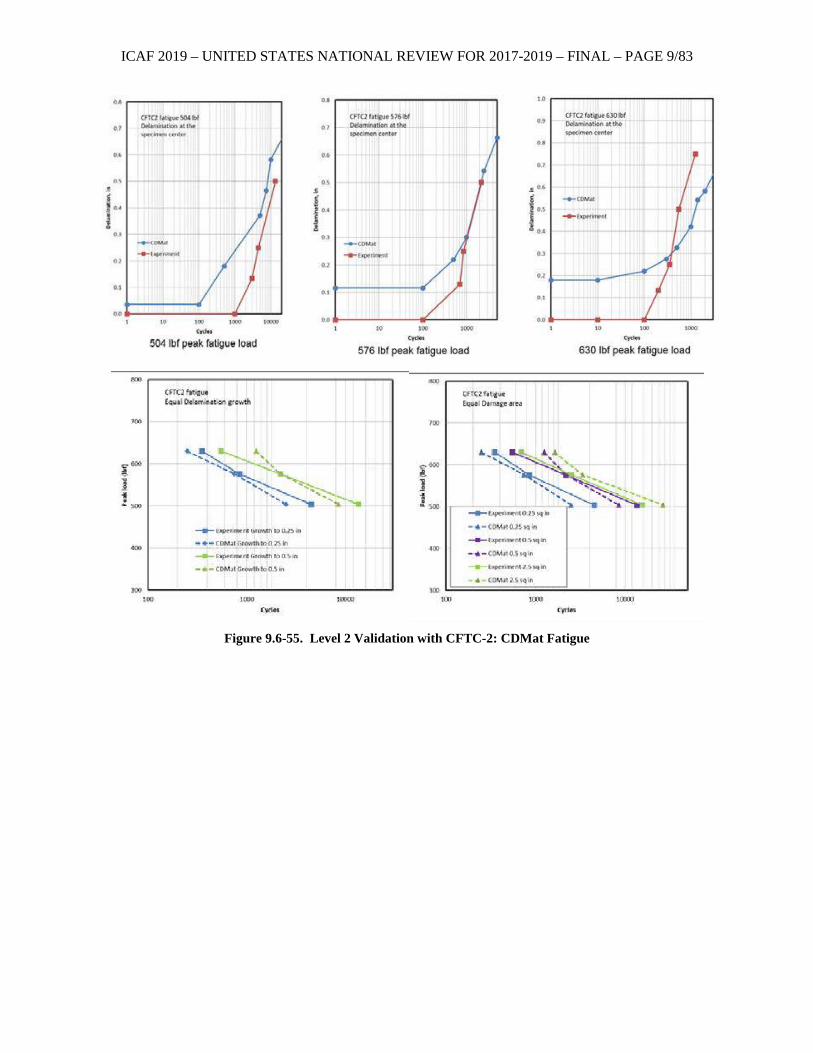
ICAF 2019 – UNITED STATES NATIONAL REVIEW FOR 2017-2019 – FINAL – PAGE 9/83
Figure 9.6-55. Level 2 Validation with CFTC-2: CDMat Fatigue
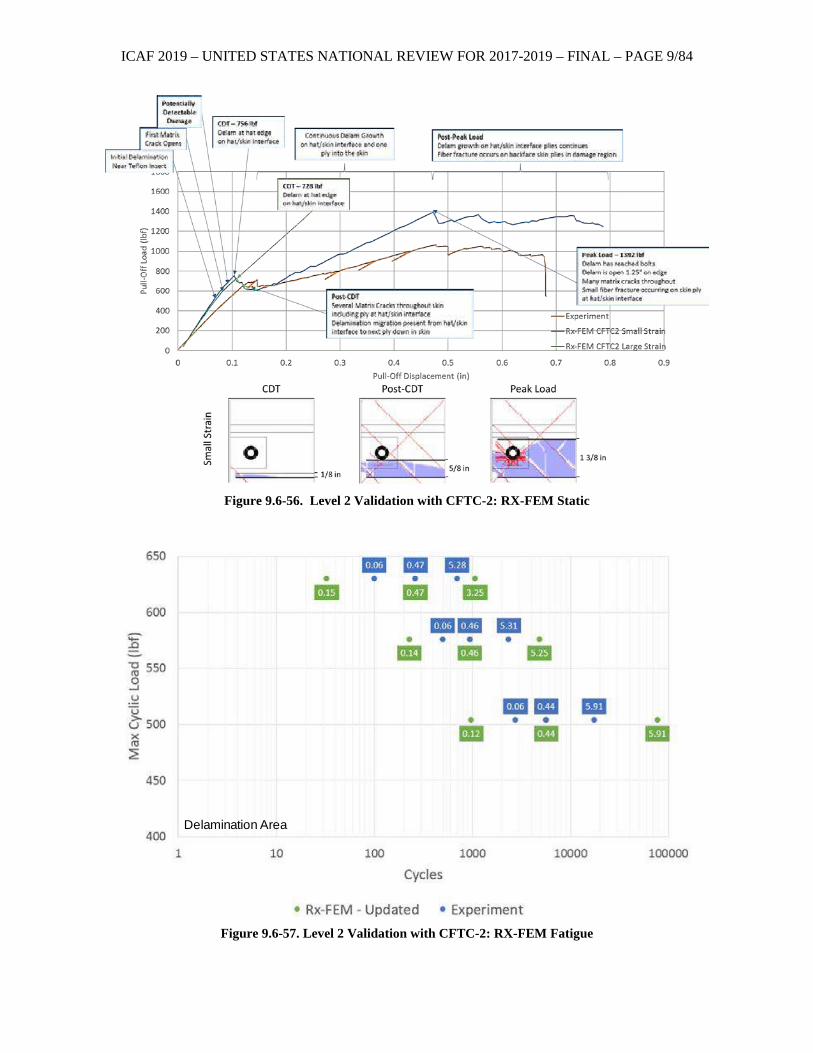
ICAF 2019 – UNITED STATES NATIONAL REVIEW FOR 2017-2019 – FINAL – PAGE 9/84
Figure 9.6-56. Level 2 Validation with CFTC-2: RX-FEM Static
Figure 9.6-57. Level 2 Validation with CFTC-2: RX-FEM Fatigue
Delamination Area
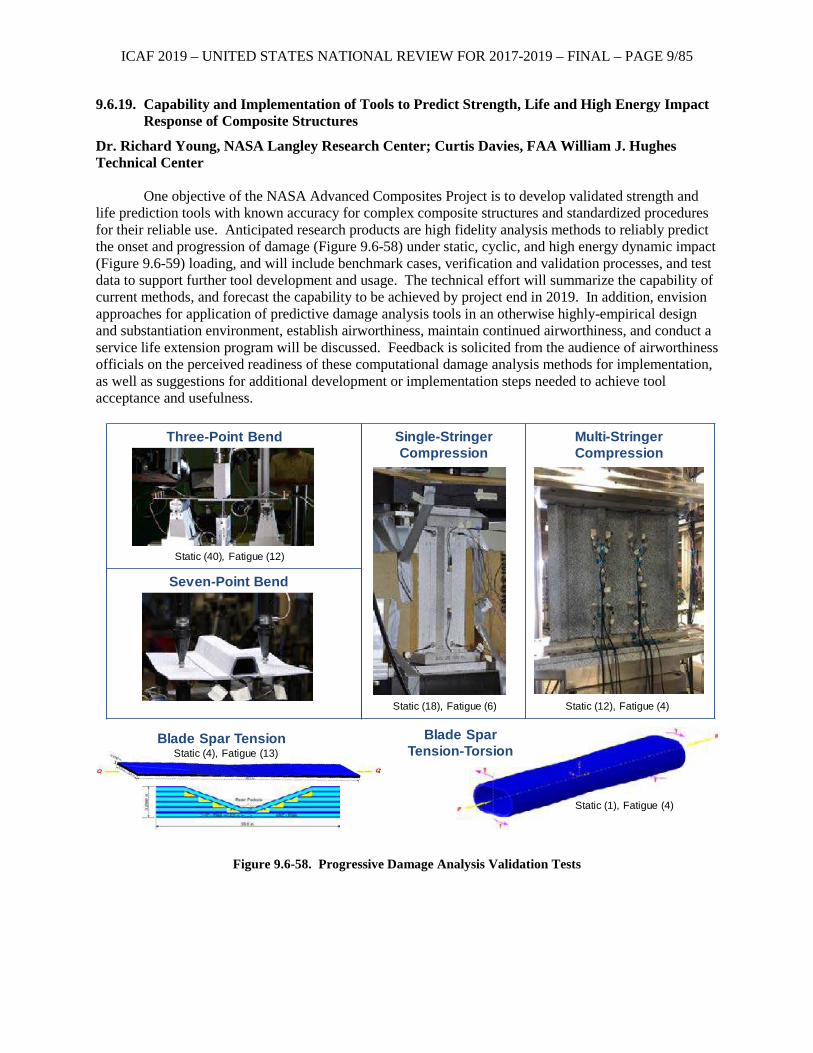
ICAF 2019 – UNITED STATES NATIONAL REVIEW FOR 2017-2019 – FINAL – PAGE 9/85
9.6.19. Capability and Implementation of Tools to Predict Strength, Life and High Energy Impact Response of Composite Structures
Dr. Richard Young, NASA Langley Research Center; Curtis Davies, FAA William J. Hughes Technical Center
One objective of the NASA Advanced Composites Project is to develop validated strength and
life prediction tools with known accuracy for complex composite structures and standardized procedures for their reliable use. Anticipated research products are high fidelity analysis methods to reliably predict the onset and progression of damage (Figure 9.6-58) under static, cyclic, and high energy dynamic impact (Figure 9.6-59) loading, and will include benchmark cases, verification and validation processes, and test data to support further tool development and usage. The technical effort will summarize the capability of current methods, and forecast the capability to be achieved by project end in 2019. In addition, envision approaches for application of predictive damage analysis tools in an otherwise highly-empirical design and substantiation environment, establish airworthiness, maintain continued airworthiness, and conduct a service life extension program will be discussed. Feedback is solicited from the audience of airworthiness officials on the perceived readiness of these computational damage analysis methods for implementation, as well as suggestions for additional development or implementation steps needed to achieve tool acceptance and usefulness.
Figure 9.6-58. Progressive Damage Analysis Validation Tests
Three-Point Bend
Seven-Point Bend
Single-Stringer Compression
Multi-Stringer Compression
Static (40), Fatigue (12)
Static (18), Fatigue (6)
Static (4), Fatigue (13)
Static (12), Fatigue (4)
Blade Spar Tension-Torsion
Blade Spar Tension
Static (1), Fatigue (4)
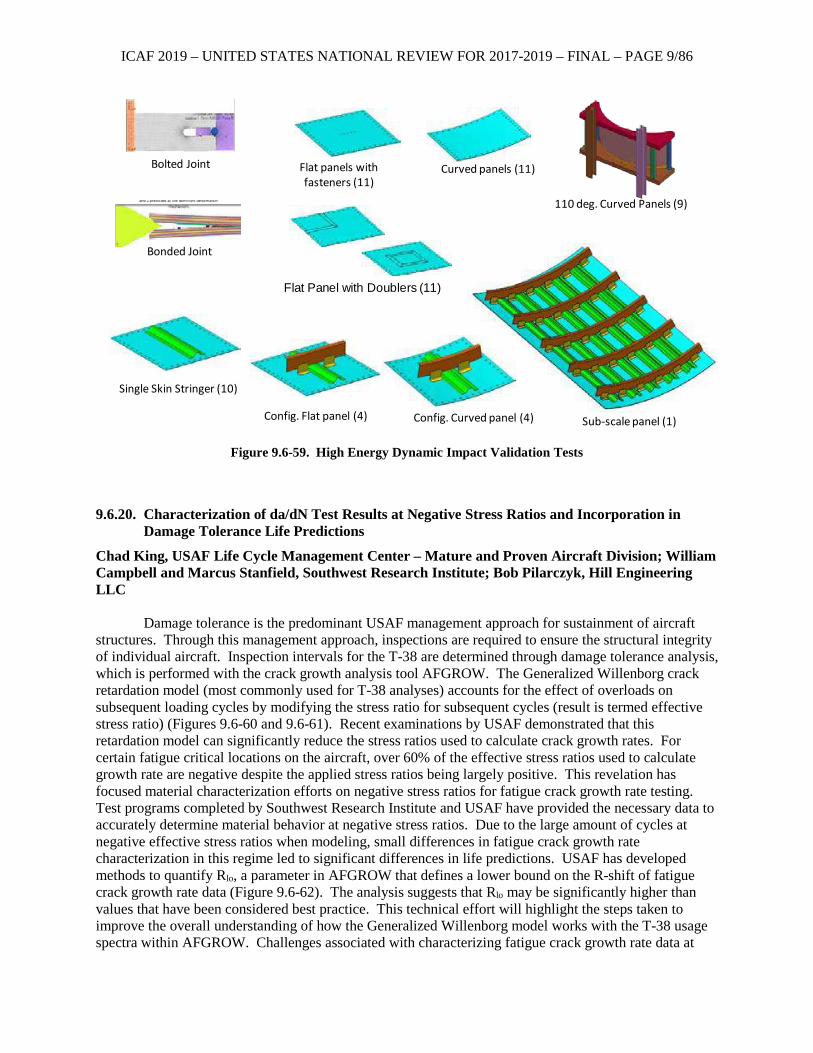
ICAF 2019 – UNITED STATES NATIONAL REVIEW FOR 2017-2019 – FINAL – PAGE 9/86
Figure 9.6-59. High Energy Dynamic Impact Validation Tests
9.6.20. Characterization of da/dN Test Results at Negative Stress Ratios and Incorporation in Damage Tolerance Life Predictions
Chad King, USAF Life Cycle Management Center – Mature and Proven Aircraft Division; William Campbell and Marcus Stanfield, Southwest Research Institute; Bob Pilarczyk, Hill Engineering LLC
Damage tolerance is the predominant USAF management approach for sustainment of aircraft
structures. Through this management approach, inspections are required to ensure the structural integrity of individual aircraft. Inspection intervals for the T-38 are determined through damage tolerance analysis, which is performed with the crack growth analysis tool AFGROW. The Generalized Willenborg crack retardation model (most commonly used for T-38 analyses) accounts for the effect of overloads on subsequent loading cycles by modifying the stress ratio for subsequent cycles (result is termed effective stress ratio) (Figures 9.6-60 and 9.6-61). Recent examinations by USAF demonstrated that this retardation model can significantly reduce the stress ratios used to calculate crack growth rates. For certain fatigue critical locations on the aircraft, over 60% of the effective stress ratios used to calculate growth rate are negative despite the applied stress ratios being largely positive. This revelation has focused material characterization efforts on negative stress ratios for fatigue crack growth rate testing. Test programs completed by Southwest Research Institute and USAF have provided the necessary data to accurately determine material behavior at negative stress ratios. Due to the large amount of cycles at negative effective stress ratios when modeling, small differences in fatigue crack growth rate characterization in this regime led to significant differences in life predictions. USAF has developed methods to quantify Rlo, a parameter in AFGROW that defines a lower bound on the R-shift of fatigue crack growth rate data (Figure 9.6-62). The analysis suggests that Rlo may be significantly higher than values that have been considered best practice. This technical effort will highlight the steps taken to improve the overall understanding of how the Generalized Willenborg model works with the T-38 usage spectra within AFGROW. Challenges associated with characterizing fatigue crack growth rate data at
Bonded Joint
110 deg. Curved Panels (9)
Single Skin Stringer (10)
Sub-scale panel (1)Config. Curved panel (4)
Flat panels with fasteners (11)
Config. Flat panel (4)
Bolted Joint Curved panels (11)
Flat Panel with Doublers (11)
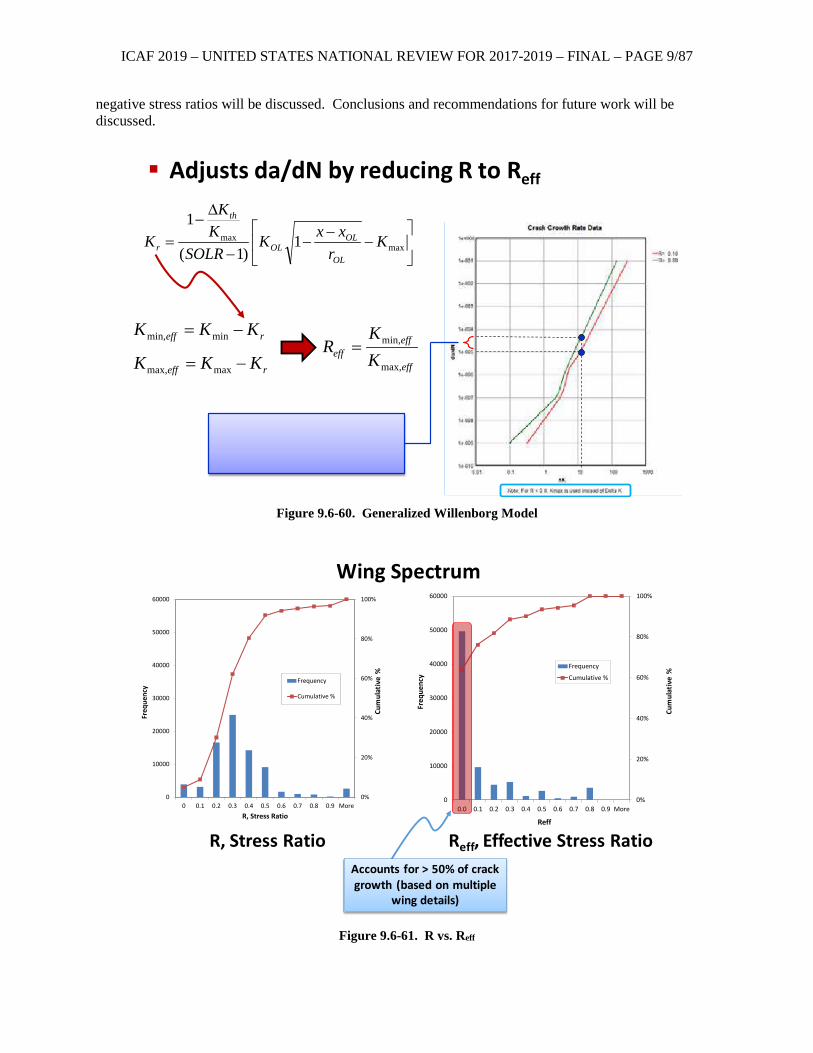
ICAF 2019 – UNITED STATES NATIONAL REVIEW FOR 2017-2019 – FINAL – PAGE 9/87
negative stress ratios will be discussed. Conclusions and recommendations for future work will be discussed.
Figure 9.6-60. Generalized Willenborg Model
Figure 9.6-61. R vs. Reff
Adjusts da/dN by reducing R to Reff
−
−−
−
∆−
= maxmax 1
)1(
1K
rxxK
SOLRK
K
KOL
OLOL
th
r
reff KKK −= minmin,
reff KKK −= maxmax, eff
effeff K
KR
max,
min,=
0%
20%
40%
60%
80%
100%
0
10000
20000
30000
40000
50000
60000
0 0.1 0.2 0.3 0.4 0.5 0.6 0.7 0.8 0.9 More
Freq
uenc
y
R, Stress Ratio
Frequency
Cumulative %
0%
20%
40%
60%
80%
100%
0
10000
20000
30000
40000
50000
60000
0.0 0.1 0.2 0.3 0.4 0.5 0.6 0.7 0.8 0.9 More
Freq
uenc
y
Reff
Frequency
Cumulative %
R, Stress Ratio Reff, Effective Stress Ratio
Wing Spectrum
Cum
ulat
ive
%
Cum
ulat
ive
%
Accounts for > 50% of crack growth (based on multiple
wing details)
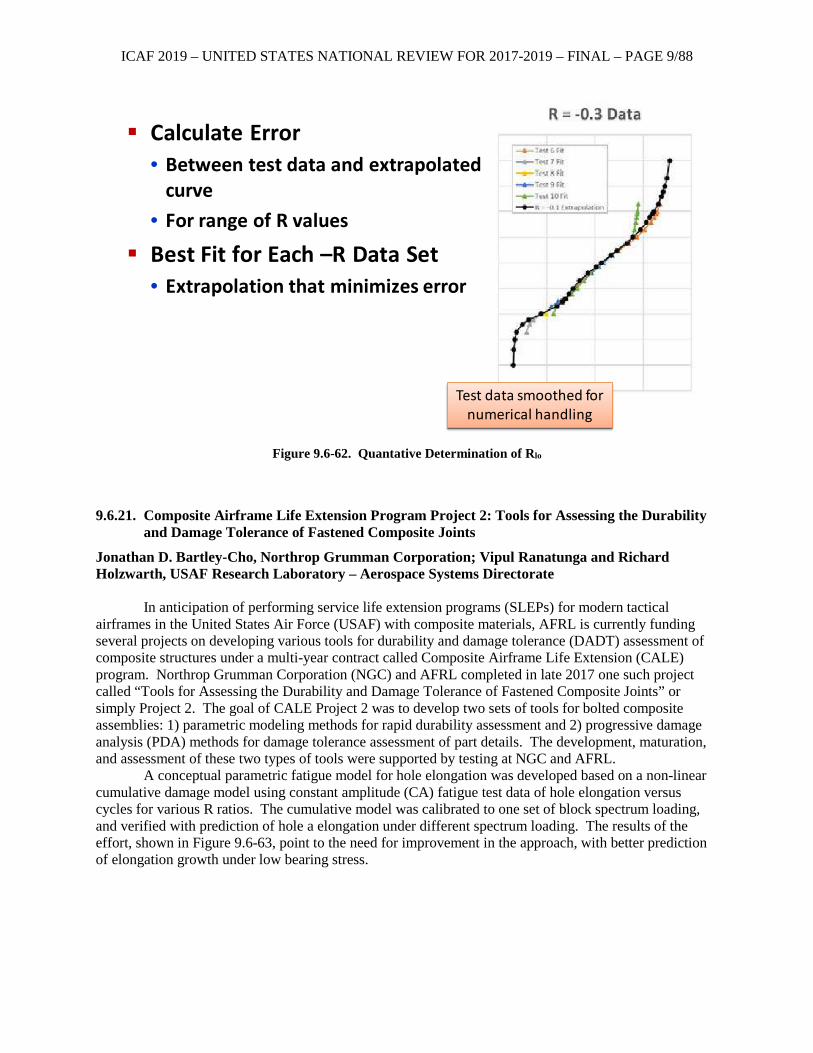
ICAF 2019 – UNITED STATES NATIONAL REVIEW FOR 2017-2019 – FINAL – PAGE 9/88
Figure 9.6-62. Quantative Determination of Rlo
9.6.21. Composite Airframe Life Extension Program Project 2: Tools for Assessing the Durability and Damage Tolerance of Fastened Composite Joints
Jonathan D. Bartley-Cho, Northrop Grumman Corporation; Vipul Ranatunga and Richard Holzwarth, USAF Research Laboratory – Aerospace Systems Directorate
In anticipation of performing service life extension programs (SLEPs) for modern tactical
airframes in the United States Air Force (USAF) with composite materials, AFRL is currently funding several projects on developing various tools for durability and damage tolerance (DADT) assessment of composite structures under a multi-year contract called Composite Airframe Life Extension (CALE) program. Northrop Grumman Corporation (NGC) and AFRL completed in late 2017 one such project called “Tools for Assessing the Durability and Damage Tolerance of Fastened Composite Joints” or simply Project 2. The goal of CALE Project 2 was to develop two sets of tools for bolted composite assemblies: 1) parametric modeling methods for rapid durability assessment and 2) progressive damage analysis (PDA) methods for damage tolerance assessment of part details. The development, maturation, and assessment of these two types of tools were supported by testing at NGC and AFRL.
A conceptual parametric fatigue model for hole elongation was developed based on a non-linear cumulative damage model using constant amplitude (CA) fatigue test data of hole elongation versus cycles for various R ratios. The cumulative model was calibrated to one set of block spectrum loading, and verified with prediction of hole a elongation under different spectrum loading. The results of the effort, shown in Figure 9.6-63, point to the need for improvement in the approach, with better prediction of elongation growth under low bearing stress.
Calculate Error• Between test data and extrapolated
curve• For range of R values
Best Fit for Each –R Data Set• Extrapolation that minimizes error
Test data smoothed for numerical handling
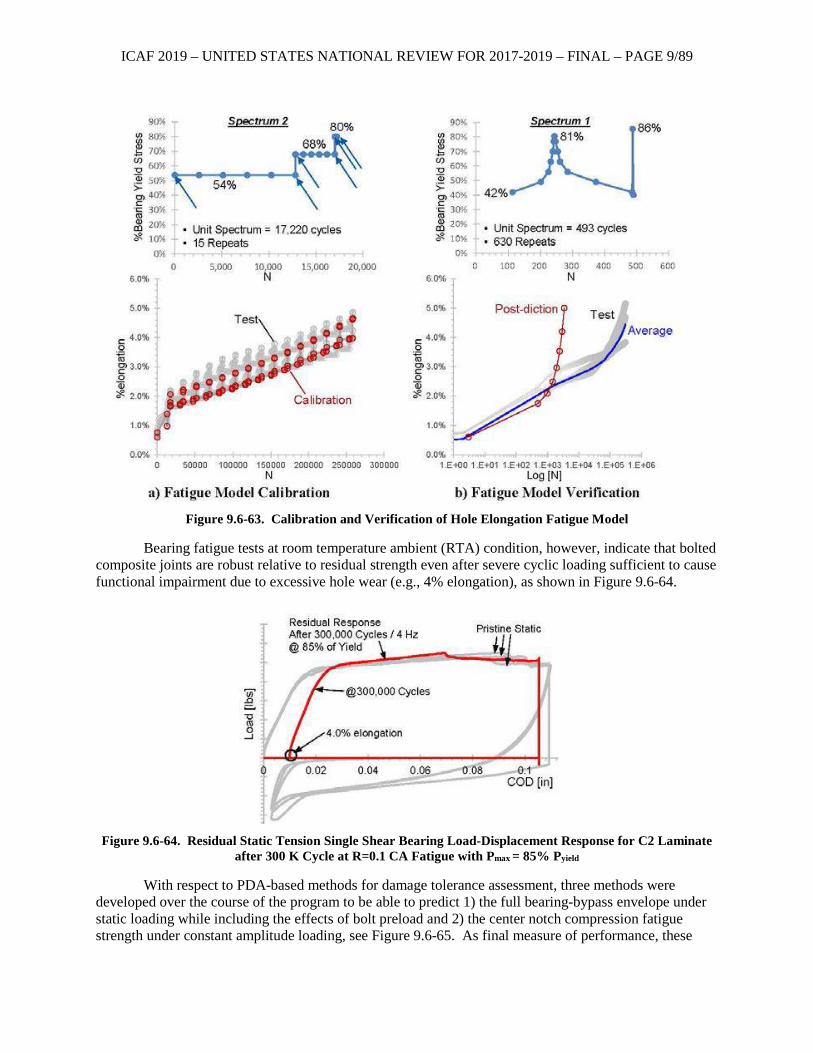
ICAF 2019 – UNITED STATES NATIONAL REVIEW FOR 2017-2019 – FINAL – PAGE 9/89
Figure 9.6-63. Calibration and Verification of Hole Elongation Fatigue Model
Bearing fatigue tests at room temperature ambient (RTA) condition, however, indicate that bolted composite joints are robust relative to residual strength even after severe cyclic loading sufficient to cause functional impairment due to excessive hole wear (e.g., 4% elongation), as shown in Figure 9.6-64.
Figure 9.6-64. Residual Static Tension Single Shear Bearing Load-Displacement Response for C2 Laminate
after 300 K Cycle at R=0.1 CA Fatigue with Pmax = 85% Pyield
With respect to PDA-based methods for damage tolerance assessment, three methods were developed over the course of the program to be able to predict 1) the full bearing-bypass envelope under static loading while including the effects of bolt preload and 2) the center notch compression fatigue strength under constant amplitude loading, see Figure 9.6-65. As final measure of performance, these
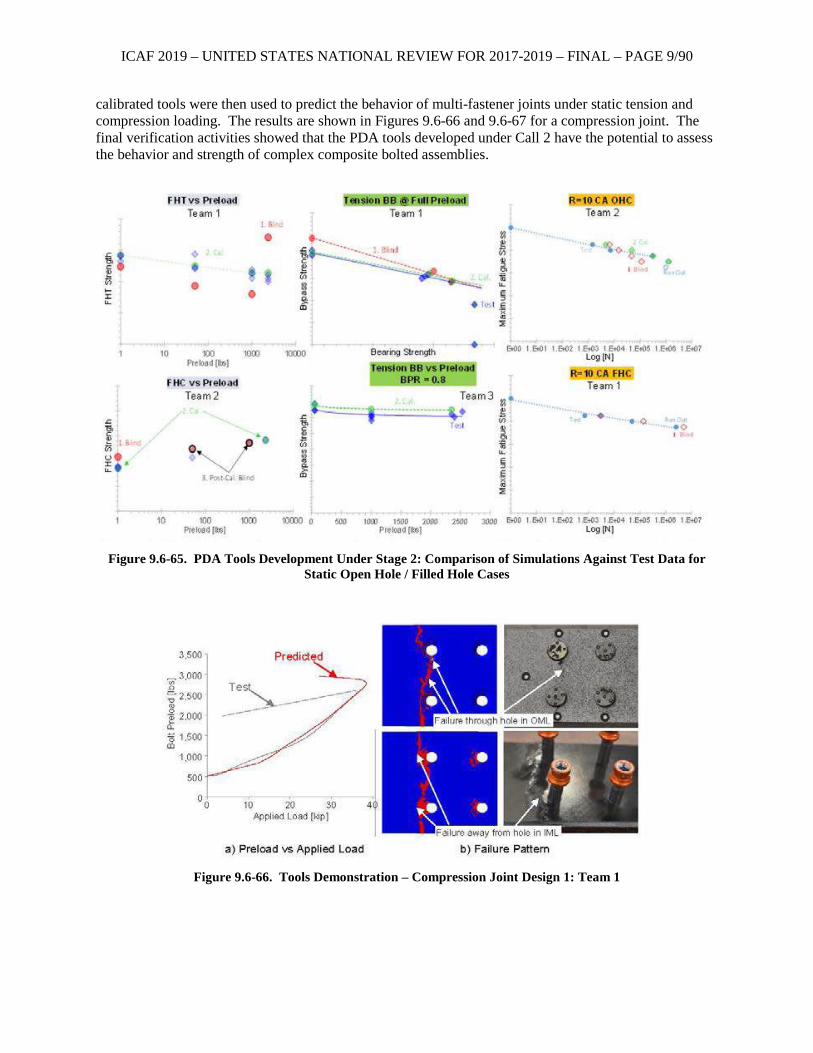
ICAF 2019 – UNITED STATES NATIONAL REVIEW FOR 2017-2019 – FINAL – PAGE 9/90
calibrated tools were then used to predict the behavior of multi-fastener joints under static tension and compression loading. The results are shown in Figures 9.6-66 and 9.6-67 for a compression joint. The final verification activities showed that the PDA tools developed under Call 2 have the potential to assess the behavior and strength of complex composite bolted assemblies.
Figure 9.6-65. PDA Tools Development Under Stage 2: Comparison of Simulations Against Test Data for
Static Open Hole / Filled Hole Cases
Figure 9.6-66. Tools Demonstration – Compression Joint Design 1: Team 1
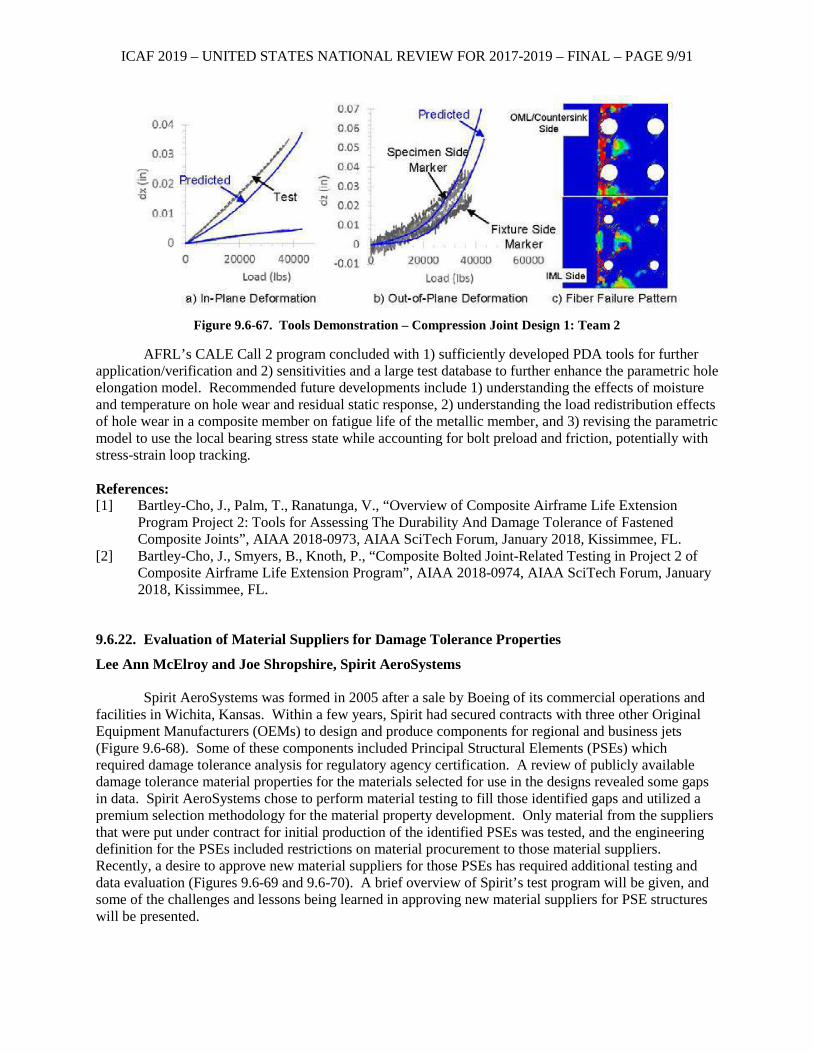
ICAF 2019 – UNITED STATES NATIONAL REVIEW FOR 2017-2019 – FINAL – PAGE 9/91
Figure 9.6-67. Tools Demonstration – Compression Joint Design 1: Team 2
AFRL’s CALE Call 2 program concluded with 1) sufficiently developed PDA tools for further application/verification and 2) sensitivities and a large test database to further enhance the parametric hole elongation model. Recommended future developments include 1) understanding the effects of moisture and temperature on hole wear and residual static response, 2) understanding the load redistribution effects of hole wear in a composite member on fatigue life of the metallic member, and 3) revising the parametric model to use the local bearing stress state while accounting for bolt preload and friction, potentially with stress-strain loop tracking. References: [1] Bartley-Cho, J., Palm, T., Ranatunga, V., “Overview of Composite Airframe Life Extension
Program Project 2: Tools for Assessing The Durability And Damage Tolerance of Fastened Composite Joints”, AIAA 2018-0973, AIAA SciTech Forum, January 2018, Kissimmee, FL.
[2] Bartley-Cho, J., Smyers, B., Knoth, P., “Composite Bolted Joint-Related Testing in Project 2 of Composite Airframe Life Extension Program”, AIAA 2018-0974, AIAA SciTech Forum, January 2018, Kissimmee, FL.
9.6.22. Evaluation of Material Suppliers for Damage Tolerance Properties
Lee Ann McElroy and Joe Shropshire, Spirit AeroSystems Spirit AeroSystems was formed in 2005 after a sale by Boeing of its commercial operations and
facilities in Wichita, Kansas. Within a few years, Spirit had secured contracts with three other Original Equipment Manufacturers (OEMs) to design and produce components for regional and business jets (Figure 9.6-68). Some of these components included Principal Structural Elements (PSEs) which required damage tolerance analysis for regulatory agency certification. A review of publicly available damage tolerance material properties for the materials selected for use in the designs revealed some gaps in data. Spirit AeroSystems chose to perform material testing to fill those identified gaps and utilized a premium selection methodology for the material property development. Only material from the suppliers that were put under contract for initial production of the identified PSEs was tested, and the engineering definition for the PSEs included restrictions on material procurement to those material suppliers. Recently, a desire to approve new material suppliers for those PSEs has required additional testing and data evaluation (Figures 9.6-69 and 9.6-70). A brief overview of Spirit’s test program will be given, and some of the challenges and lessons being learned in approving new material suppliers for PSE structures will be presented.
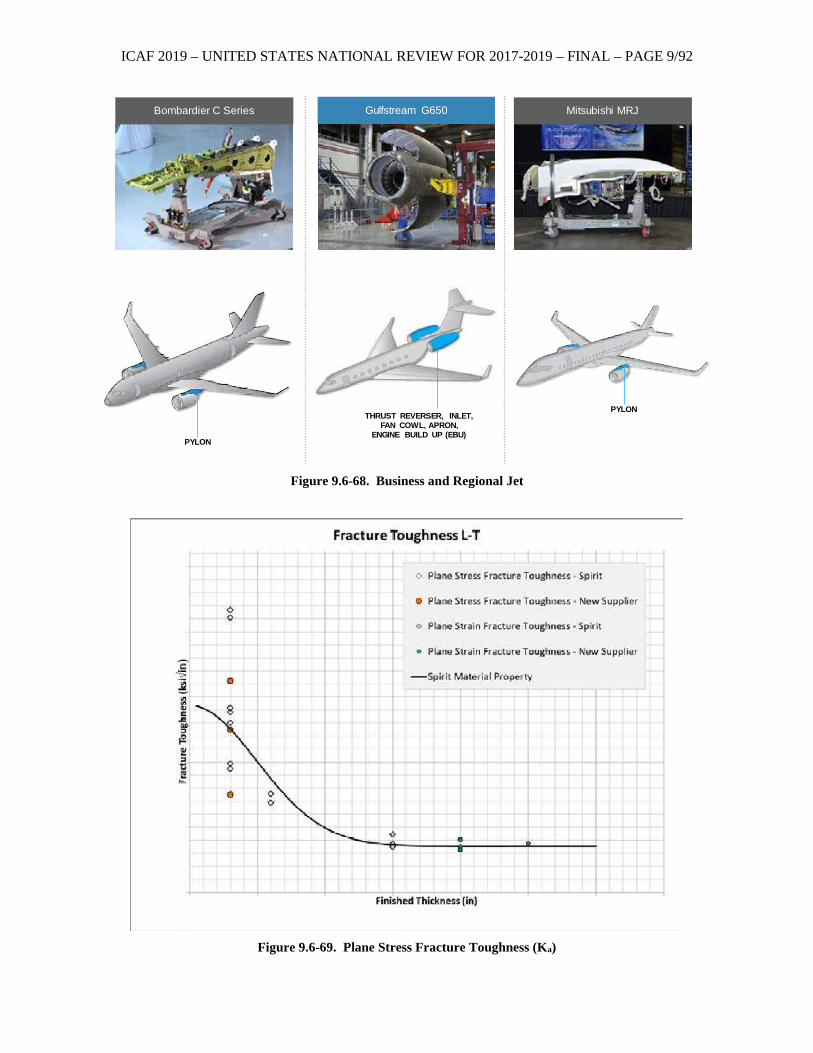
ICAF 2019 – UNITED STATES NATIONAL REVIEW FOR 2017-2019 – FINAL – PAGE 9/92
Figure 9.6-68. Business and Regional Jet
Figure 9.6-69. Plane Stress Fracture Toughness (Ka)
Bombardier C Series Mitsubishi MRJ
PYLON
THRUST REVERSER, INLET,FAN COWL, APRON,
ENGINE BUILD UP (EBU)
PYLON
Gulfstream G650
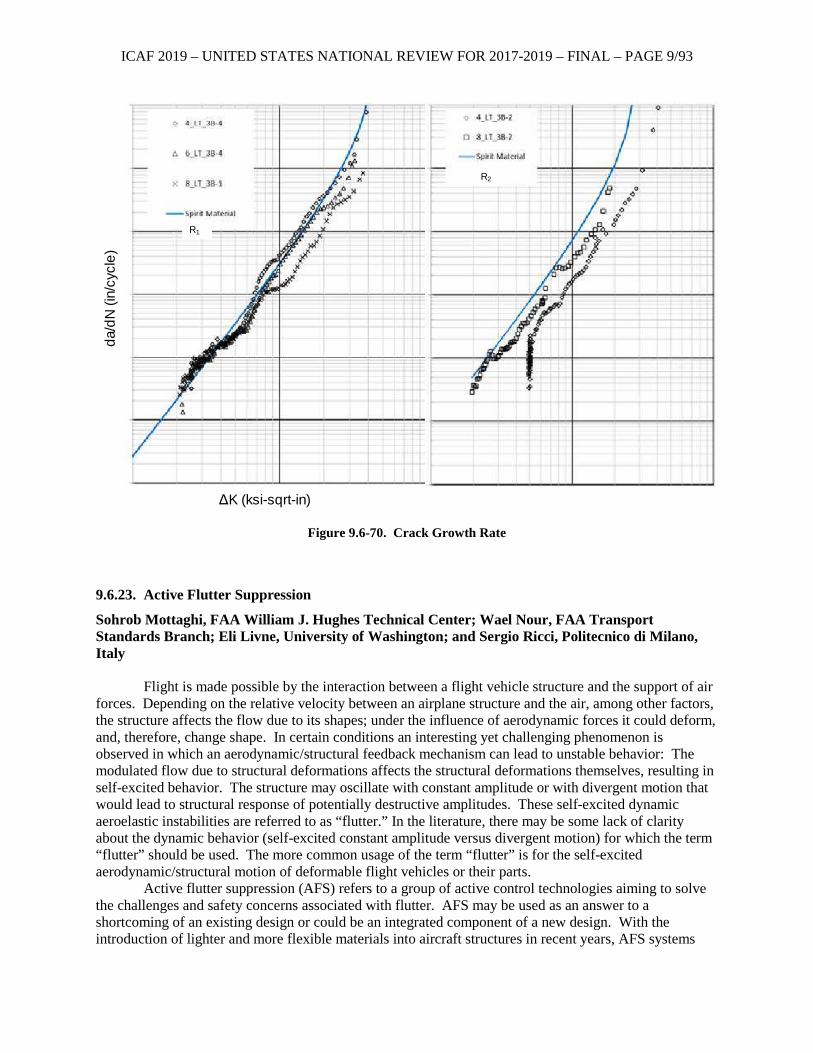
ICAF 2019 – UNITED STATES NATIONAL REVIEW FOR 2017-2019 – FINAL – PAGE 9/93
Figure 9.6-70. Crack Growth Rate
9.6.23. Active Flutter Suppression
Sohrob Mottaghi, FAA William J. Hughes Technical Center; Wael Nour, FAA Transport Standards Branch; Eli Livne, University of Washington; and Sergio Ricci, Politecnico di Milano, Italy
Flight is made possible by the interaction between a flight vehicle structure and the support of air forces. Depending on the relative velocity between an airplane structure and the air, among other factors, the structure affects the flow due to its shapes; under the influence of aerodynamic forces it could deform, and, therefore, change shape. In certain conditions an interesting yet challenging phenomenon is observed in which an aerodynamic/structural feedback mechanism can lead to unstable behavior: The modulated flow due to structural deformations affects the structural deformations themselves, resulting in self-excited behavior. The structure may oscillate with constant amplitude or with divergent motion that would lead to structural response of potentially destructive amplitudes. These self-excited dynamic aeroelastic instabilities are referred to as “flutter.” In the literature, there may be some lack of clarity about the dynamic behavior (self-excited constant amplitude versus divergent motion) for which the term “flutter” should be used. The more common usage of the term “flutter” is for the self-excited aerodynamic/structural motion of deformable flight vehicles or their parts.
Active flutter suppression (AFS) refers to a group of active control technologies aiming to solve the challenges and safety concerns associated with flutter. AFS may be used as an answer to a shortcoming of an existing design or could be an integrated component of a new design. With the introduction of lighter and more flexible materials into aircraft structures in recent years, AFS systems
da/d
N (i
n/cy
cle)
ΔK (ksi-sqrt-in)
R1
R2
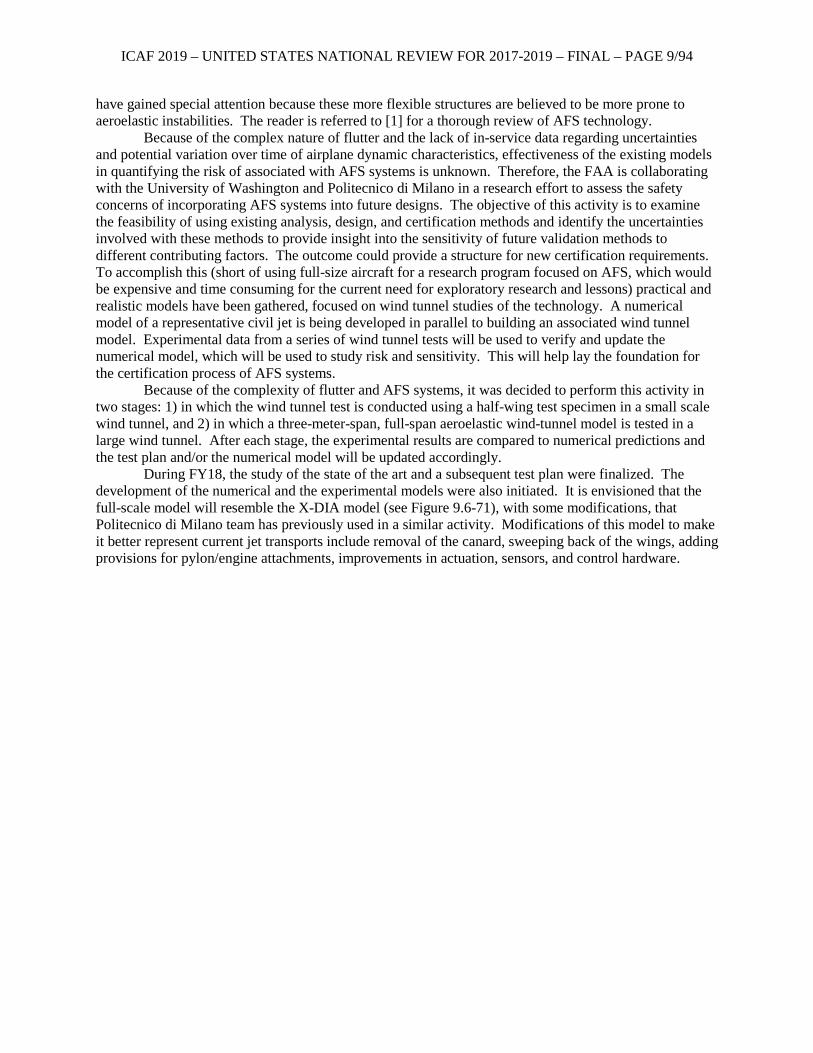
ICAF 2019 – UNITED STATES NATIONAL REVIEW FOR 2017-2019 – FINAL – PAGE 9/94
have gained special attention because these more flexible structures are believed to be more prone to aeroelastic instabilities. The reader is referred to [1] for a thorough review of AFS technology.
Because of the complex nature of flutter and the lack of in-service data regarding uncertainties and potential variation over time of airplane dynamic characteristics, effectiveness of the existing models in quantifying the risk of associated with AFS systems is unknown. Therefore, the FAA is collaborating with the University of Washington and Politecnico di Milano in a research effort to assess the safety concerns of incorporating AFS systems into future designs. The objective of this activity is to examine the feasibility of using existing analysis, design, and certification methods and identify the uncertainties involved with these methods to provide insight into the sensitivity of future validation methods to different contributing factors. The outcome could provide a structure for new certification requirements. To accomplish this (short of using full-size aircraft for a research program focused on AFS, which would be expensive and time consuming for the current need for exploratory research and lessons) practical and realistic models have been gathered, focused on wind tunnel studies of the technology. A numerical model of a representative civil jet is being developed in parallel to building an associated wind tunnel model. Experimental data from a series of wind tunnel tests will be used to verify and update the numerical model, which will be used to study risk and sensitivity. This will help lay the foundation for the certification process of AFS systems.
Because of the complexity of flutter and AFS systems, it was decided to perform this activity in two stages: 1) in which the wind tunnel test is conducted using a half-wing test specimen in a small scale wind tunnel, and 2) in which a three-meter-span, full-span aeroelastic wind-tunnel model is tested in a large wind tunnel. After each stage, the experimental results are compared to numerical predictions and the test plan and/or the numerical model will be updated accordingly.
During FY18, the study of the state of the art and a subsequent test plan were finalized. The development of the numerical and the experimental models were also initiated. It is envisioned that the full-scale model will resemble the X-DIA model (see Figure 9.6-71), with some modifications, that Politecnico di Milano team has previously used in a similar activity. Modifications of this model to make it better represent current jet transports include removal of the canard, sweeping back of the wings, adding provisions for pylon/engine attachments, improvements in actuation, sensors, and control hardware.
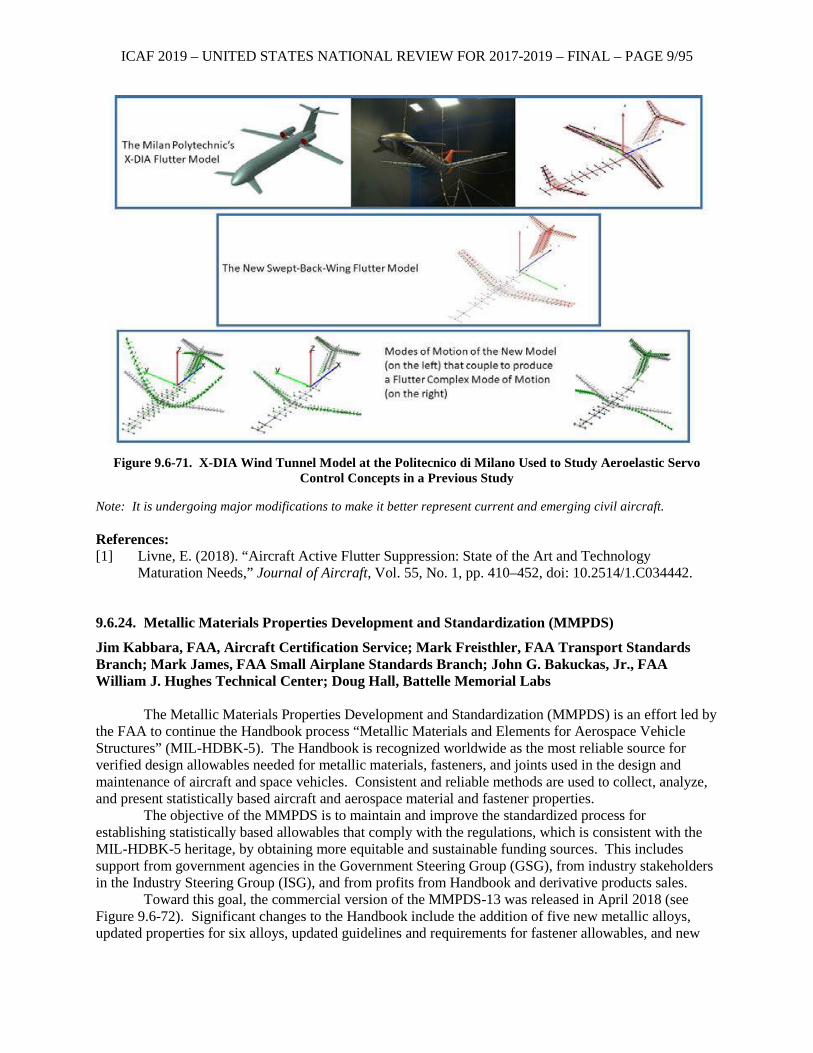
ICAF 2019 – UNITED STATES NATIONAL REVIEW FOR 2017-2019 – FINAL – PAGE 9/95
Figure 9.6-71. X-DIA Wind Tunnel Model at the Politecnico di Milano Used to Study Aeroelastic Servo
Control Concepts in a Previous Study
Note: It is undergoing major modifications to make it better represent current and emerging civil aircraft. References: [1] Livne, E. (2018). “Aircraft Active Flutter Suppression: State of the Art and Technology
Maturation Needs,” Journal of Aircraft, Vol. 55, No. 1, pp. 410–452, doi: 10.2514/1.C034442.
9.6.24. Metallic Materials Properties Development and Standardization (MMPDS)
Jim Kabbara, FAA, Aircraft Certification Service; Mark Freisthler, FAA Transport Standards Branch; Mark James, FAA Small Airplane Standards Branch; John G. Bakuckas, Jr., FAA William J. Hughes Technical Center; Doug Hall, Battelle Memorial Labs
The Metallic Materials Properties Development and Standardization (MMPDS) is an effort led by the FAA to continue the Handbook process “Metallic Materials and Elements for Aerospace Vehicle Structures” (MIL-HDBK-5). The Handbook is recognized worldwide as the most reliable source for verified design allowables needed for metallic materials, fasteners, and joints used in the design and maintenance of aircraft and space vehicles. Consistent and reliable methods are used to collect, analyze, and present statistically based aircraft and aerospace material and fastener properties.
The objective of the MMPDS is to maintain and improve the standardized process for establishing statistically based allowables that comply with the regulations, which is consistent with the MIL-HDBK-5 heritage, by obtaining more equitable and sustainable funding sources. This includes support from government agencies in the Government Steering Group (GSG), from industry stakeholders in the Industry Steering Group (ISG), and from profits from Handbook and derivative products sales.
Toward this goal, the commercial version of the MMPDS-13 was released in April 2018 (see Figure 9.6-72). Significant changes to the Handbook include the addition of five new metallic alloys, updated properties for six alloys, updated guidelines and requirements for fastener allowables, and new
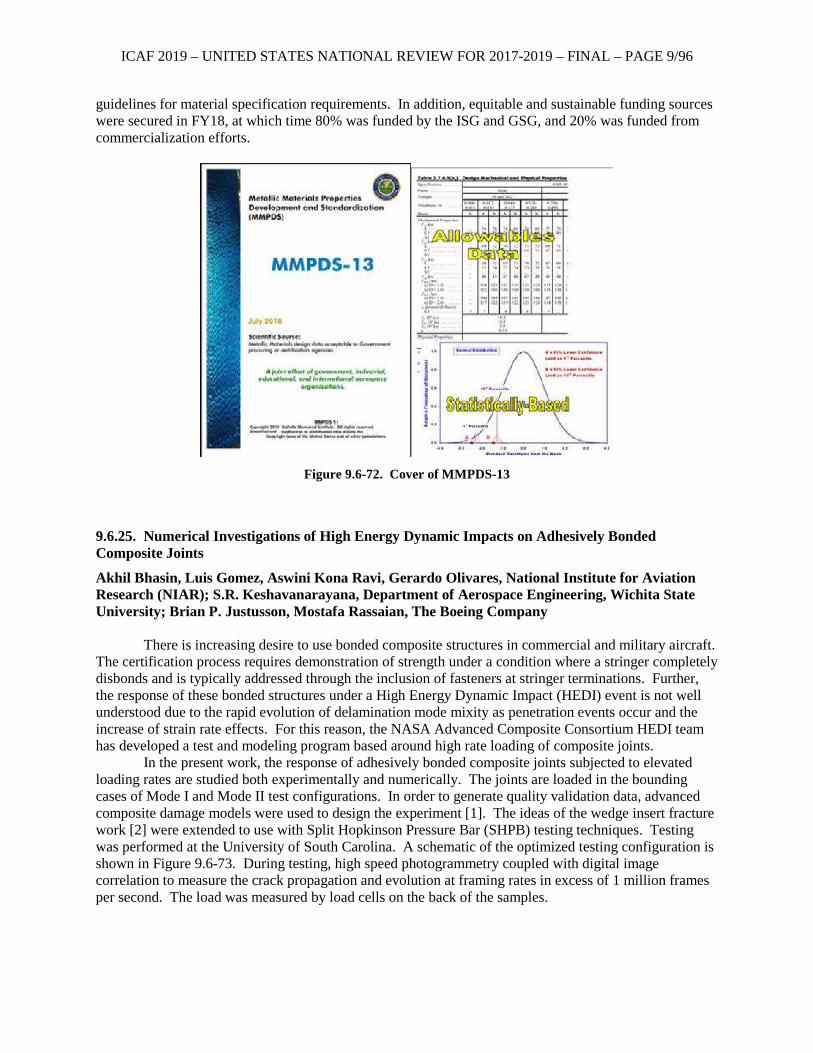
ICAF 2019 – UNITED STATES NATIONAL REVIEW FOR 2017-2019 – FINAL – PAGE 9/96
guidelines for material specification requirements. In addition, equitable and sustainable funding sources were secured in FY18, at which time 80% was funded by the ISG and GSG, and 20% was funded from commercialization efforts.
Figure 9.6-72. Cover of MMPDS-13
9.6.25. Numerical Investigations of High Energy Dynamic Impacts on Adhesively Bonded Composite Joints
Akhil Bhasin, Luis Gomez, Aswini Kona Ravi, Gerardo Olivares, National Institute for Aviation Research (NIAR); S.R. Keshavanarayana, Department of Aerospace Engineering, Wichita State University; Brian P. Justusson, Mostafa Rassaian, The Boeing Company
There is increasing desire to use bonded composite structures in commercial and military aircraft. The certification process requires demonstration of strength under a condition where a stringer completely disbonds and is typically addressed through the inclusion of fasteners at stringer terminations. Further, the response of these bonded structures under a High Energy Dynamic Impact (HEDI) event is not well understood due to the rapid evolution of delamination mode mixity as penetration events occur and the increase of strain rate effects. For this reason, the NASA Advanced Composite Consortium HEDI team has developed a test and modeling program based around high rate loading of composite joints.
In the present work, the response of adhesively bonded composite joints subjected to elevated loading rates are studied both experimentally and numerically. The joints are loaded in the bounding cases of Mode I and Mode II test configurations. In order to generate quality validation data, advanced composite damage models were used to design the experiment [1]. The ideas of the wedge insert fracture work [2] were extended to use with Split Hopkinson Pressure Bar (SHPB) testing techniques. Testing was performed at the University of South Carolina. A schematic of the optimized testing configuration is shown in Figure 9.6-73. During testing, high speed photogrammetry coupled with digital image correlation to measure the crack propagation and evolution at framing rates in excess of 1 million frames per second. The load was measured by load cells on the back of the samples.
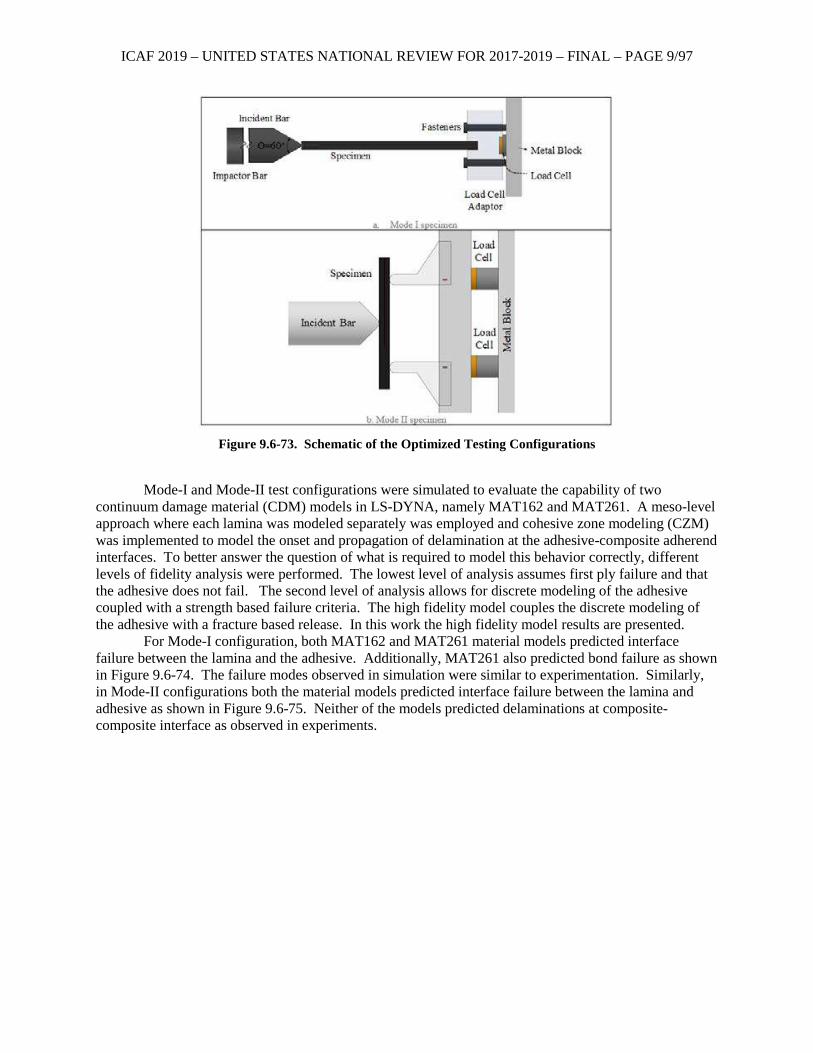
ICAF 2019 – UNITED STATES NATIONAL REVIEW FOR 2017-2019 – FINAL – PAGE 9/97
Figure 9.6-73. Schematic of the Optimized Testing Configurations
Mode-I and Mode-II test configurations were simulated to evaluate the capability of two
continuum damage material (CDM) models in LS-DYNA, namely MAT162 and MAT261. A meso-level approach where each lamina was modeled separately was employed and cohesive zone modeling (CZM) was implemented to model the onset and propagation of delamination at the adhesive-composite adherend interfaces. To better answer the question of what is required to model this behavior correctly, different levels of fidelity analysis were performed. The lowest level of analysis assumes first ply failure and that the adhesive does not fail. The second level of analysis allows for discrete modeling of the adhesive coupled with a strength based failure criteria. The high fidelity model couples the discrete modeling of the adhesive with a fracture based release. In this work the high fidelity model results are presented.
For Mode-I configuration, both MAT162 and MAT261 material models predicted interface failure between the lamina and the adhesive. Additionally, MAT261 also predicted bond failure as shown in Figure 9.6-74. The failure modes observed in simulation were similar to experimentation. Similarly, in Mode-II configurations both the material models predicted interface failure between the lamina and adhesive as shown in Figure 9.6-75. Neither of the models predicted delaminations at composite-composite interface as observed in experiments.
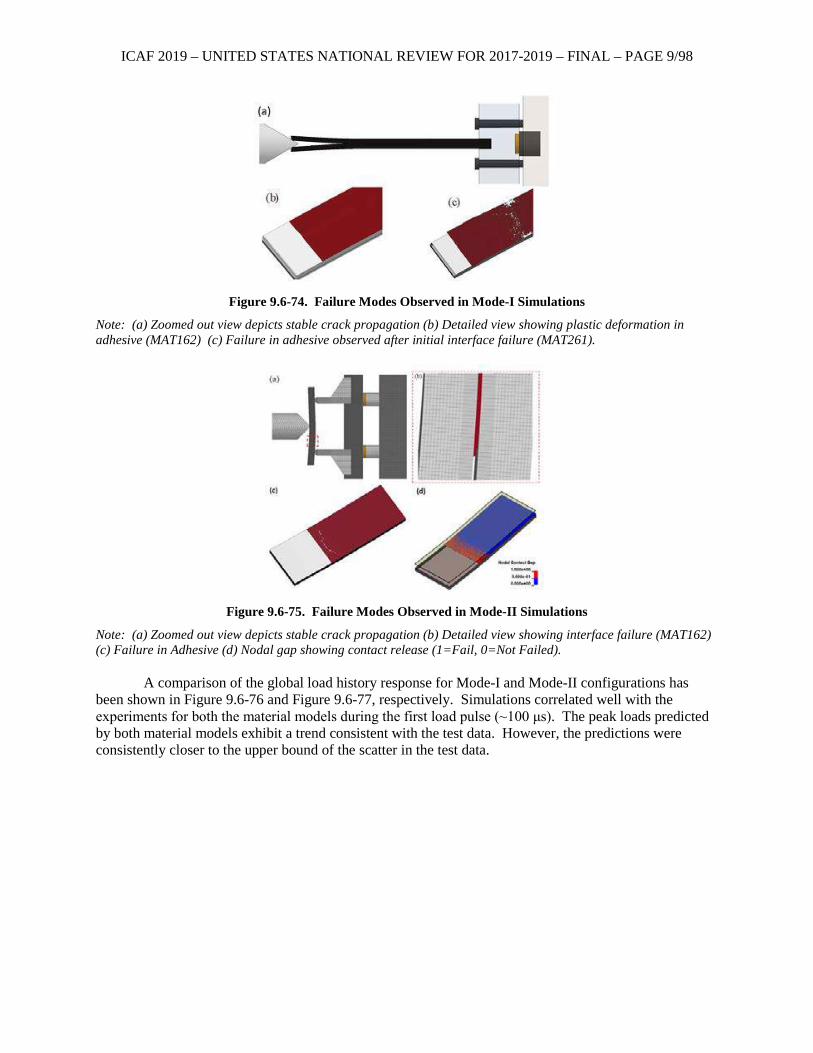
ICAF 2019 – UNITED STATES NATIONAL REVIEW FOR 2017-2019 – FINAL – PAGE 9/98
Figure 9.6-74. Failure Modes Observed in Mode-I Simulations
Note: (a) Zoomed out view depicts stable crack propagation (b) Detailed view showing plastic deformation in adhesive (MAT162) (c) Failure in adhesive observed after initial interface failure (MAT261).
Figure 9.6-75. Failure Modes Observed in Mode-II Simulations
Note: (a) Zoomed out view depicts stable crack propagation (b) Detailed view showing interface failure (MAT162) (c) Failure in Adhesive (d) Nodal gap showing contact release (1=Fail, 0=Not Failed).
A comparison of the global load history response for Mode-I and Mode-II configurations has
been shown in Figure 9.6-76 and Figure 9.6-77, respectively. Simulations correlated well with the experiments for both the material models during the first load pulse (~100 μs). The peak loads predicted by both material models exhibit a trend consistent with the test data. However, the predictions were consistently closer to the upper bound of the scatter in the test data.
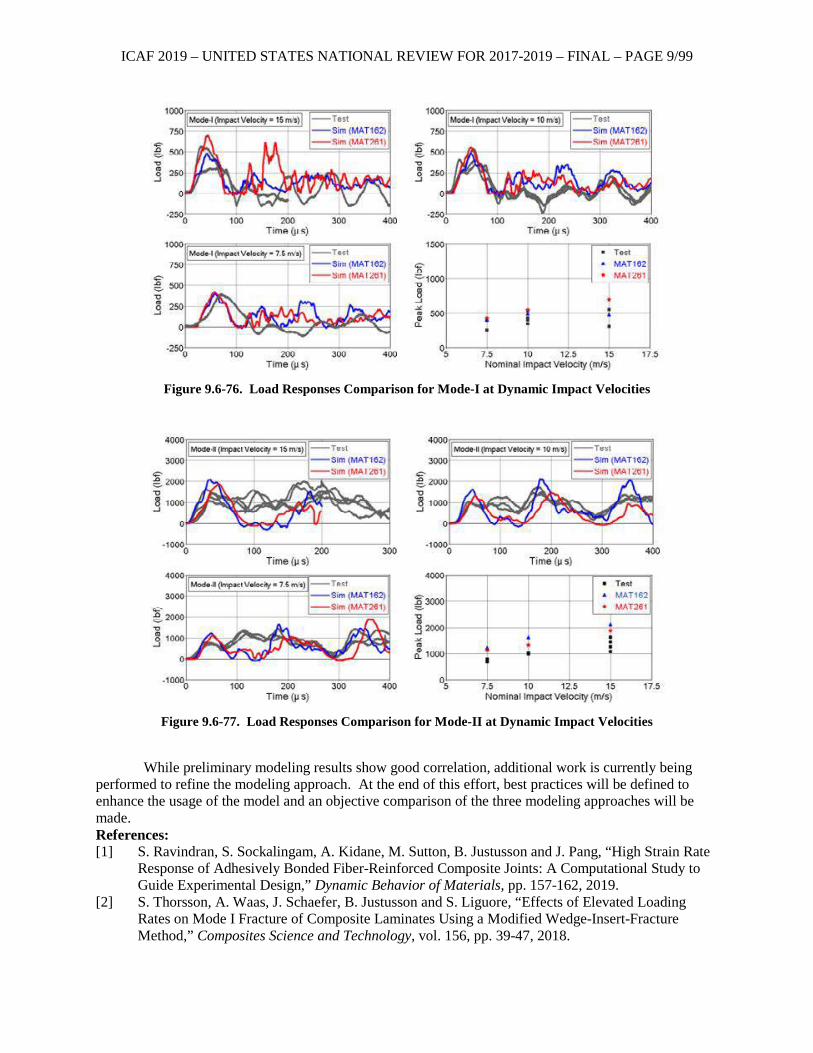
ICAF 2019 – UNITED STATES NATIONAL REVIEW FOR 2017-2019 – FINAL – PAGE 9/99
Figure 9.6-76. Load Responses Comparison for Mode-I at Dynamic Impact Velocities
Figure 9.6-77. Load Responses Comparison for Mode-II at Dynamic Impact Velocities
While preliminary modeling results show good correlation, additional work is currently being
performed to refine the modeling approach. At the end of this effort, best practices will be defined to enhance the usage of the model and an objective comparison of the three modeling approaches will be made. References: [1] S. Ravindran, S. Sockalingam, A. Kidane, M. Sutton, B. Justusson and J. Pang, “High Strain Rate
Response of Adhesively Bonded Fiber-Reinforced Composite Joints: A Computational Study to Guide Experimental Design,” Dynamic Behavior of Materials, pp. 157-162, 2019.
[2] S. Thorsson, A. Waas, J. Schaefer, B. Justusson and S. Liguore, “Effects of Elevated Loading Rates on Mode I Fracture of Composite Laminates Using a Modified Wedge-Insert-Fracture Method,” Composites Science and Technology, vol. 156, pp. 39-47, 2018.
ICAF 2019 – UNITED STATES NATIONAL REVIEW FOR 2017-2019 – FINAL – PAGE 9/100
9.6.26. Numerical Investigations of Bearing Failure in Mechanically Fastened Composite Joints Under Dynamic Loading Conditions
Aswini Kona Ravi, Akhil Bhasin, Luis Gomez, Gerardo Olivares, National Institute for Aviation Research (NIAR); S.R. Keshavanarayana, Department of Aerospace Engineering, Wichita State University; Jenna Pang, Matt Molitor, Mostafa Rassaian, The Boeing Company
Mechanically fastened composite joints are vastly used in aircraft structural components and
experience a wide variety of complex loading depending on structural location. Principles of design in composite fastened joints are derived from well-understood metallic structures and tend to be fairly conservative in most applications. Design rules typically involve static allowables for bearing and fastener pull through; however, the behavior of fastened joints in the presence of increased loading rates is not well understood. To identify and overcome these critical technical gaps, the NASA Advanced Composites Consortium (ACC) High Energy Dynamic Impact Event program seeks to conduct experimental and numerical investigations utilizing state-of-the-art high fidelity methodologies [1] to better understand the complex failure mechanics associated bearing failure under elevated loading rates.
As a part of this overall effort, National Institute for Aviation Research (NIAR) had evaluated the behavior of composite-fastener joints at quasi-static and dynamic loading conditions of 100 in/s, 300 in/s and 500 in/s that are representative of the loading rates observed under high energy dynamic impact conditions. Using high fidelity inspection, data including high speed photogrammetry with digital image correlation, was generated for bearing failure under two loading conditions: titanium pin and Hi-Lok® [2]. Both the joint types were made of the same composite material and nominal bearing diameter but would be used to address the effects of with (Hi-Lok®) and without clamp-up (pin) conditions.
The experimental program was accompanied by numerical analysis. Analysis was conducted using Progressive Damage and Failure Analysis (PDFA) material model available in LS-DYNA, namely MAT162 [3]. A meso-level approach in which each lamina of the composite specimen was modelled separately was employed. To define ply-to-ply interaction and represent delamination behavior, LS-DYNA *CONTACT AUTOMATIC ONE WAY SURFACE TO SURFACE TIEBREAK was utilized. Numerical models were generated in a detailed manner in order to account for the dynamic effects of the test fixture which are greatly significant at high loading rates as shown in Figure 9.6-78.
During pin joints testing, surface ply splitting and delamination caused debris accumulation followed by pin separation from laminates which further resulted in significant laminate bending. In simulations, surface ply splitting was not noticed and elements underneath the pin fail and delete when their erosion criteria were satisfied, as opposed to debris build-up in tests. Numerical models simulated pin separation and subsequent laminate bending; while this behavior was seen early on in the tests, it was not noticed until later stages in analysis. Figure 9.6-79 shows the comparison of global force, strain and kinematics between test and analysis for pin joint configurations. Test data indicated that the force signals exhibit oscillatory behavior for dynamic stroke rates which might not be a true representation of the joint behavior. It was noticed that strain data obtained from the strain gages mounted on the inner surfaces at remote location on the laminates provide a better understanding of the forces experienced by joints at these dynamic rates. The increase in strain levels post-bearing failure (indicated as initial peak) is attributed to the aforementioned bending deformation of laminates caused due to pin separation from laminates.
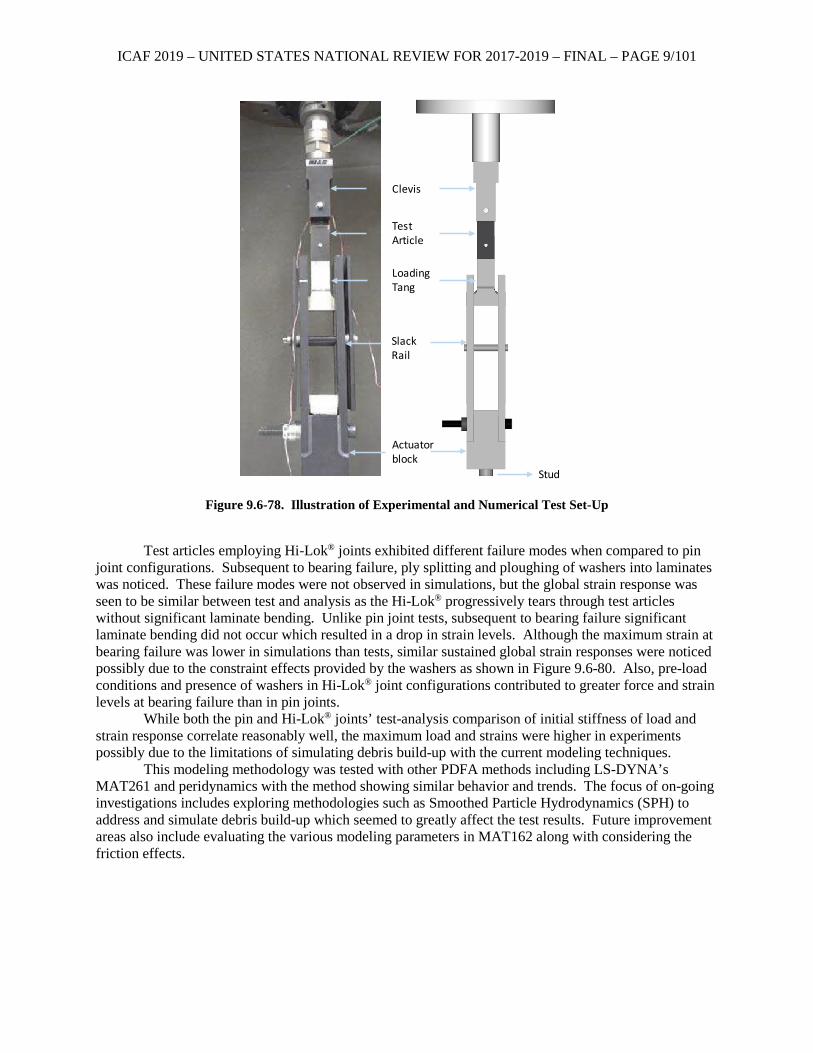
ICAF 2019 – UNITED STATES NATIONAL REVIEW FOR 2017-2019 – FINAL – PAGE 9/101
Figure 9.6-78. Illustration of Experimental and Numerical Test Set-Up
Test articles employing Hi-Lok® joints exhibited different failure modes when compared to pin
joint configurations. Subsequent to bearing failure, ply splitting and ploughing of washers into laminates was noticed. These failure modes were not observed in simulations, but the global strain response was seen to be similar between test and analysis as the Hi-Lok® progressively tears through test articles without significant laminate bending. Unlike pin joint tests, subsequent to bearing failure significant laminate bending did not occur which resulted in a drop in strain levels. Although the maximum strain at bearing failure was lower in simulations than tests, similar sustained global strain responses were noticed possibly due to the constraint effects provided by the washers as shown in Figure 9.6-80. Also, pre-load conditions and presence of washers in Hi-Lok® joint configurations contributed to greater force and strain levels at bearing failure than in pin joints.
While both the pin and Hi-Lok® joints’ test-analysis comparison of initial stiffness of load and strain response correlate reasonably well, the maximum load and strains were higher in experiments possibly due to the limitations of simulating debris build-up with the current modeling techniques.
This modeling methodology was tested with other PDFA methods including LS-DYNA’s MAT261 and peridynamics with the method showing similar behavior and trends. The focus of on-going investigations includes exploring methodologies such as Smoothed Particle Hydrodynamics (SPH) to address and simulate debris build-up which seemed to greatly affect the test results. Future improvement areas also include evaluating the various modeling parameters in MAT162 along with considering the friction effects.
Clevis
Test Article
Loading Tang
Slack Rail
Actuator block
Stud
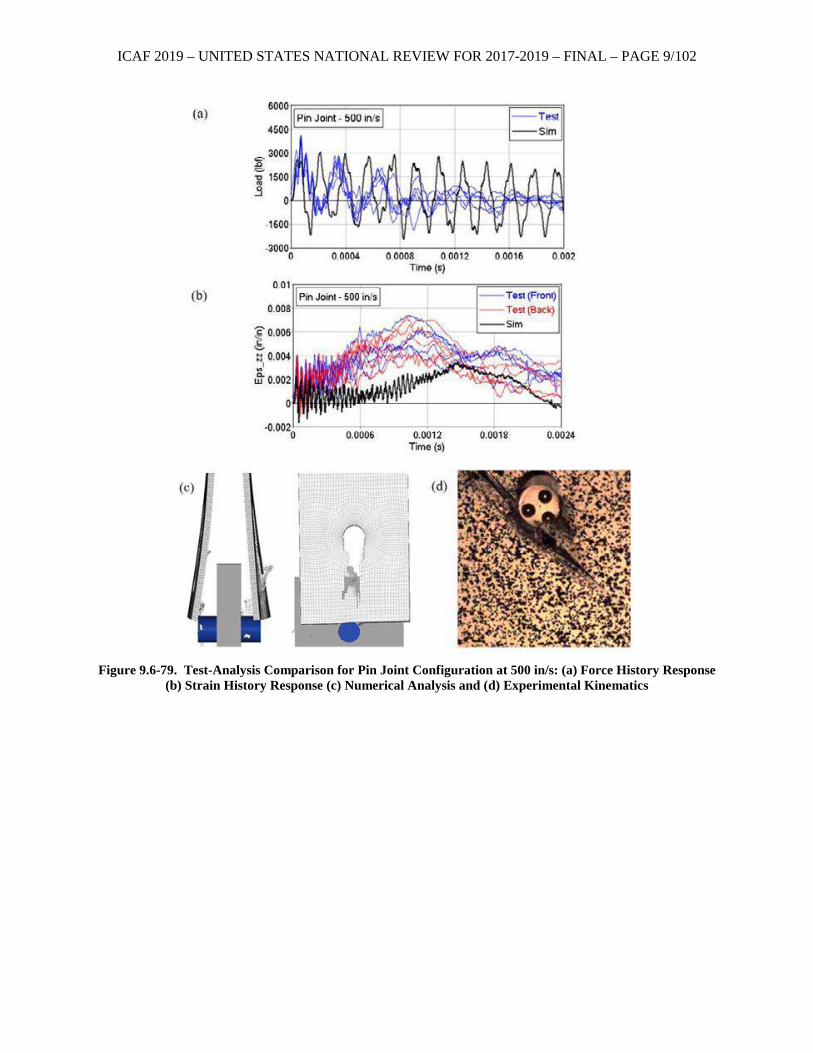
ICAF 2019 – UNITED STATES NATIONAL REVIEW FOR 2017-2019 – FINAL – PAGE 9/102
Figure 9.6-79. Test-Analysis Comparison for Pin Joint Configuration at 500 in/s: (a) Force History Response
(b) Strain History Response (c) Numerical Analysis and (d) Experimental Kinematics
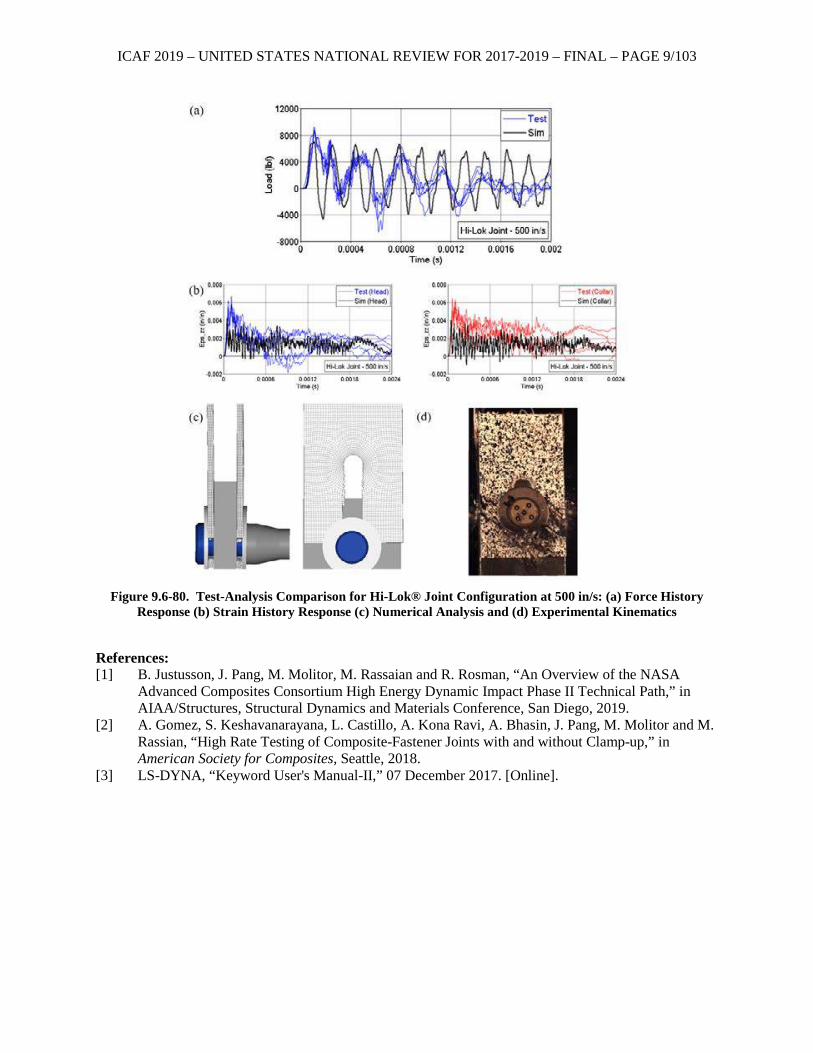
ICAF 2019 – UNITED STATES NATIONAL REVIEW FOR 2017-2019 – FINAL – PAGE 9/103
Figure 9.6-80. Test-Analysis Comparison for Hi-Lok® Joint Configuration at 500 in/s: (a) Force History
Response (b) Strain History Response (c) Numerical Analysis and (d) Experimental Kinematics
References: [1] B. Justusson, J. Pang, M. Molitor, M. Rassaian and R. Rosman, “An Overview of the NASA
Advanced Composites Consortium High Energy Dynamic Impact Phase II Technical Path,” in AIAA/Structures, Structural Dynamics and Materials Conference, San Diego, 2019.
[2] A. Gomez, S. Keshavanarayana, L. Castillo, A. Kona Ravi, A. Bhasin, J. Pang, M. Molitor and M. Rassian, “High Rate Testing of Composite-Fastener Joints with and without Clamp-up,” in American Society for Composites, Seattle, 2018.
[3] LS-DYNA, “Keyword User's Manual-II,” 07 December 2017. [Online].
ICAF 2019 – UNITED STATES NATIONAL REVIEW FOR 2017-2019 – FINAL – PAGE 9/104
9.6.27. Investigation of Stiffening and Curvature Effects on the Residual Strength of Composite Stiffened Panels with Large Transverse Notches
Patrick Enjuto, Mark Lobo, Thomas H. Walker, NSE Composites; Gerardo Peña, Steven Wanthal, and Eric Cregger, The Boeing Company
Predictive methods addressing the large-notch capability of metallic structure generally involve
factoring the fracture capability of a flat, unstiffened panel using factors that address the configuration variables of the final structure (e.g., curvature, stiffening, etc.). These factors have been determined using a combination of numerical methods and experimental evidence.
Residual strength predictions of composite large-notch configurations are more challenging due to the complexity of the damage mechanisms and resulting trajectories, as well as the additional layup and stacking-sequence variables. As a result, progressive damage finite element (FE) analyses are often used for these predictions.
The complexity and computational intensity of these strategies preclude their direct usage in preliminary design studies, where thousands of configurations may be evaluated. Instead, this methodology is used to analyze a range of configurations over the design space of interest, and response surface equations are developed to predict the residual strength. The response surfaces can be developed using standard response surface methods that use linear combinations of polynomial terms addressing the main effects (i.e., design variables) and their interactions. One by-product of this approach is that rapid changes in the predicted residual strength can occur in the response surface beyond the limits of the underlying data, severely restricting their application to new design spaces.
The objective of the current effort was to develop more generalized and rapid analysis methods addressing large-notch residual strength of stiffened panels to support preliminary design activities. More specifically, the effort was limited to addressing the effects of curvature, central severed stiffener, and the first adjacent intact stiffener on the residual strength of panels with bonded or cocured stiffeners, subjected to uniaxial compression loading and exhibiting self-similar damage growth. By developing an improved understanding of key trends over broad ranges of the design variables, appropriate functional forms can be selected for use in the response surfaces, thereby ensuring applicability of the surfaces over a wide range of design variables typical of preliminary design.
An FE modeling approach using ABAQUS® (Reference [1]) was developed for predicting the effects of key variables on large-notch residual strength of stiffened panels (see Reference [2]). Quarter-symmetric models were used, as shown in Figure 9.6-81. This approach includes explicit modeling of the skin and stiffener flanges, but idealizes the stiffener webs and caps as beam elements. Cohesive response is included to simulate translaminar fracture of the skin and flange, and disbonding of the flange from the skin.
An extensive literature review associated with metallic and composite structures was performed to identify anticipated trends and analytical approaches that may form the basis of a non-FE analysis prediction methodology, see Reference [2].
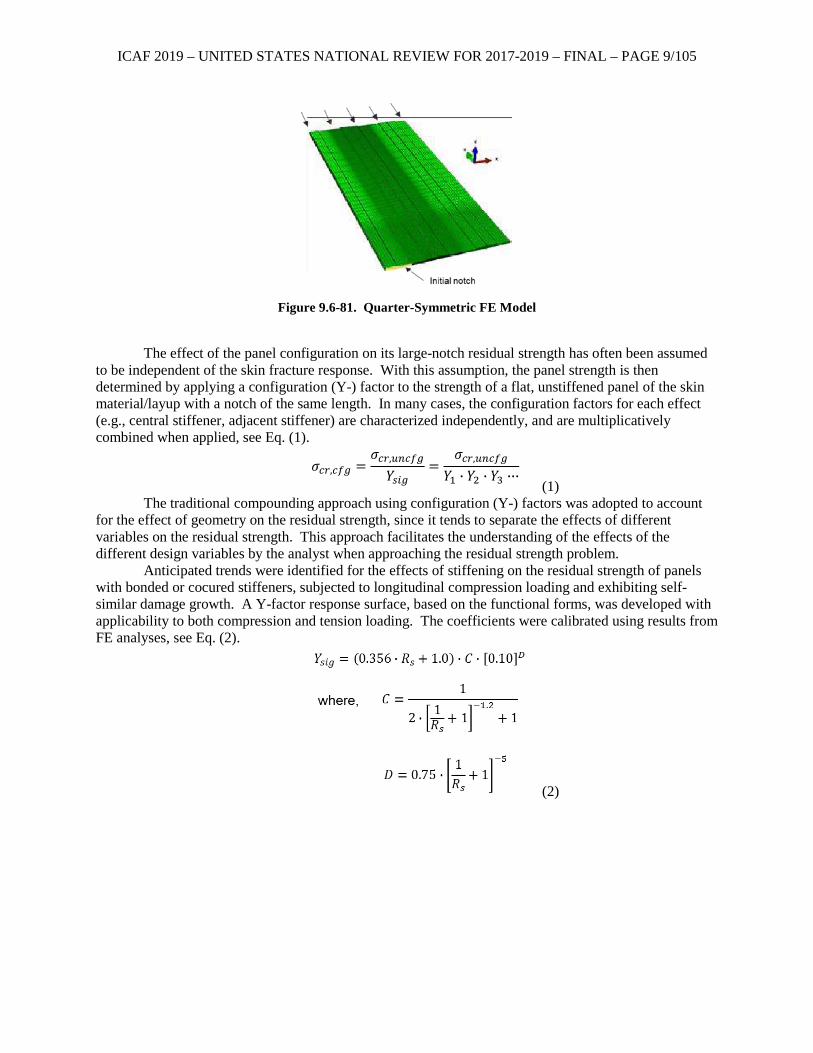
ICAF 2019 – UNITED STATES NATIONAL REVIEW FOR 2017-2019 – FINAL – PAGE 9/105
Figure 9.6-81. Quarter-Symmetric FE Model
The effect of the panel configuration on its large-notch residual strength has often been assumed
to be independent of the skin fracture response. With this assumption, the panel strength is then determined by applying a configuration (Y-) factor to the strength of a flat, unstiffened panel of the skin material/layup with a notch of the same length. In many cases, the configuration factors for each effect (e.g., central stiffener, adjacent stiffener) are characterized independently, and are multiplicatively combined when applied, see Eq. (1).
(1) The traditional compounding approach using configuration (Y-) factors was adopted to account
for the effect of geometry on the residual strength, since it tends to separate the effects of different variables on the residual strength. This approach facilitates the understanding of the effects of the different design variables by the analyst when approaching the residual strength problem.
Anticipated trends were identified for the effects of stiffening on the residual strength of panels with bonded or cocured stiffeners, subjected to longitudinal compression loading and exhibiting self-similar damage growth. A Y-factor response surface, based on the functional forms, was developed with applicability to both compression and tension loading. The coefficients were calibrated using results from FE analyses, see Eq. (2).
(2)
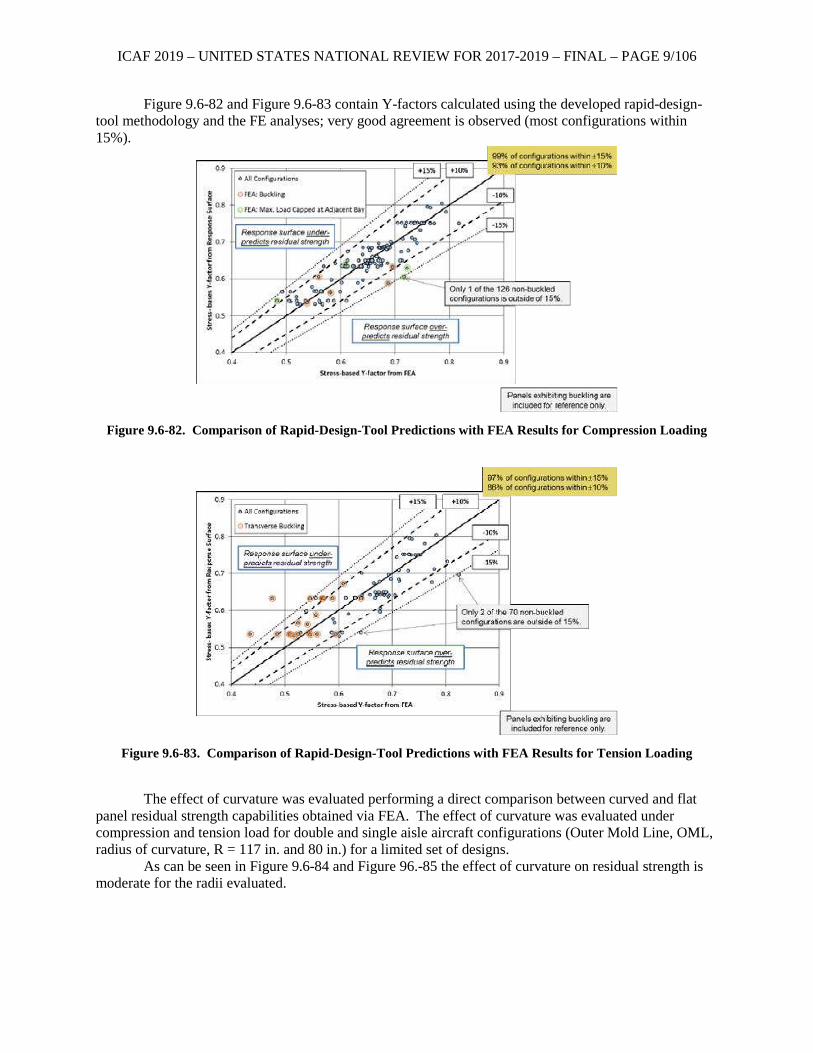
ICAF 2019 – UNITED STATES NATIONAL REVIEW FOR 2017-2019 – FINAL – PAGE 9/106
Figure 9.6-82 and Figure 9.6-83 contain Y-factors calculated using the developed rapid-design-tool methodology and the FE analyses; very good agreement is observed (most configurations within 15%).
Figure 9.6-82. Comparison of Rapid-Design-Tool Predictions with FEA Results for Compression Loading
Figure 9.6-83. Comparison of Rapid-Design-Tool Predictions with FEA Results for Tension Loading
The effect of curvature was evaluated performing a direct comparison between curved and flat
panel residual strength capabilities obtained via FEA. The effect of curvature was evaluated under compression and tension load for double and single aisle aircraft configurations (Outer Mold Line, OML, radius of curvature, R = 117 in. and 80 in.) for a limited set of designs.
As can be seen in Figure 9.6-84 and Figure 96.-85 the effect of curvature on residual strength is moderate for the radii evaluated.
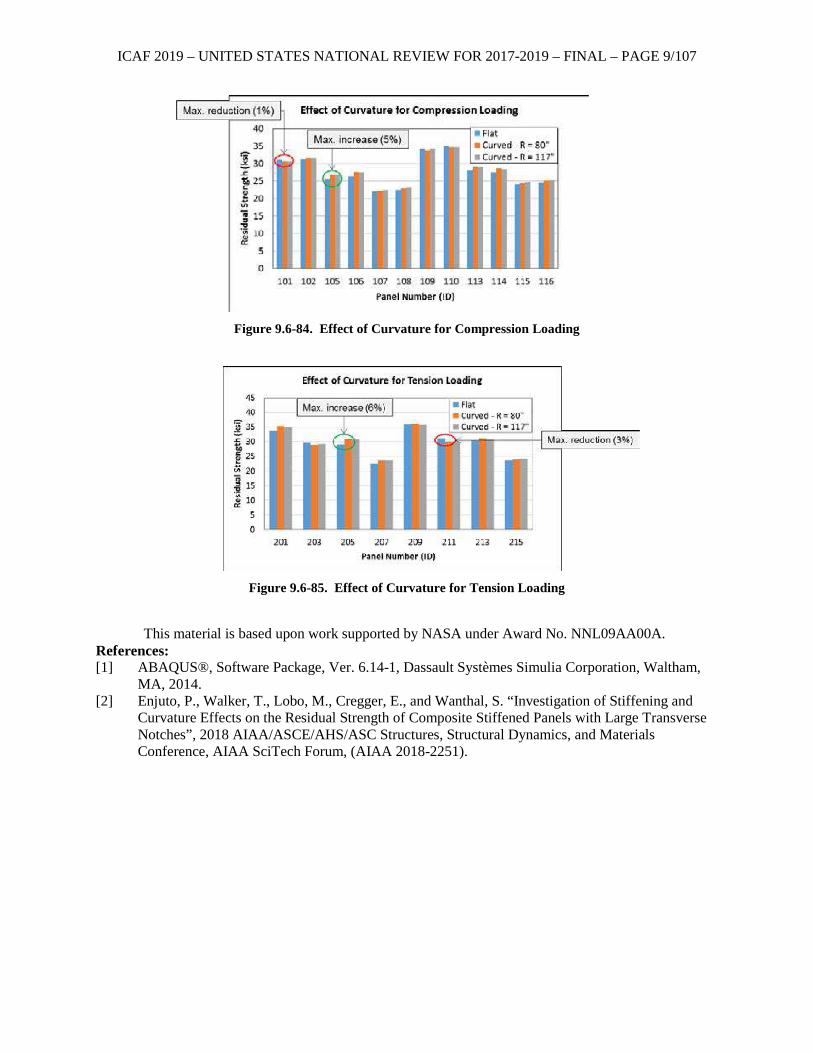
ICAF 2019 – UNITED STATES NATIONAL REVIEW FOR 2017-2019 – FINAL – PAGE 9/107
Figure 9.6-84. Effect of Curvature for Compression Loading
Figure 9.6-85. Effect of Curvature for Tension Loading
This material is based upon work supported by NASA under Award No. NNL09AA00A.
References: [1] ABAQUS®, Software Package, Ver. 6.14-1, Dassault Systèmes Simulia Corporation, Waltham,
MA, 2014. [2] Enjuto, P., Walker, T., Lobo, M., Cregger, E., and Wanthal, S. “Investigation of Stiffening and
Curvature Effects on the Residual Strength of Composite Stiffened Panels with Large Transverse Notches”, 2018 AIAA/ASCE/AHS/ASC Structures, Structural Dynamics, and Materials Conference, AIAA SciTech Forum, (AIAA 2018-2251).
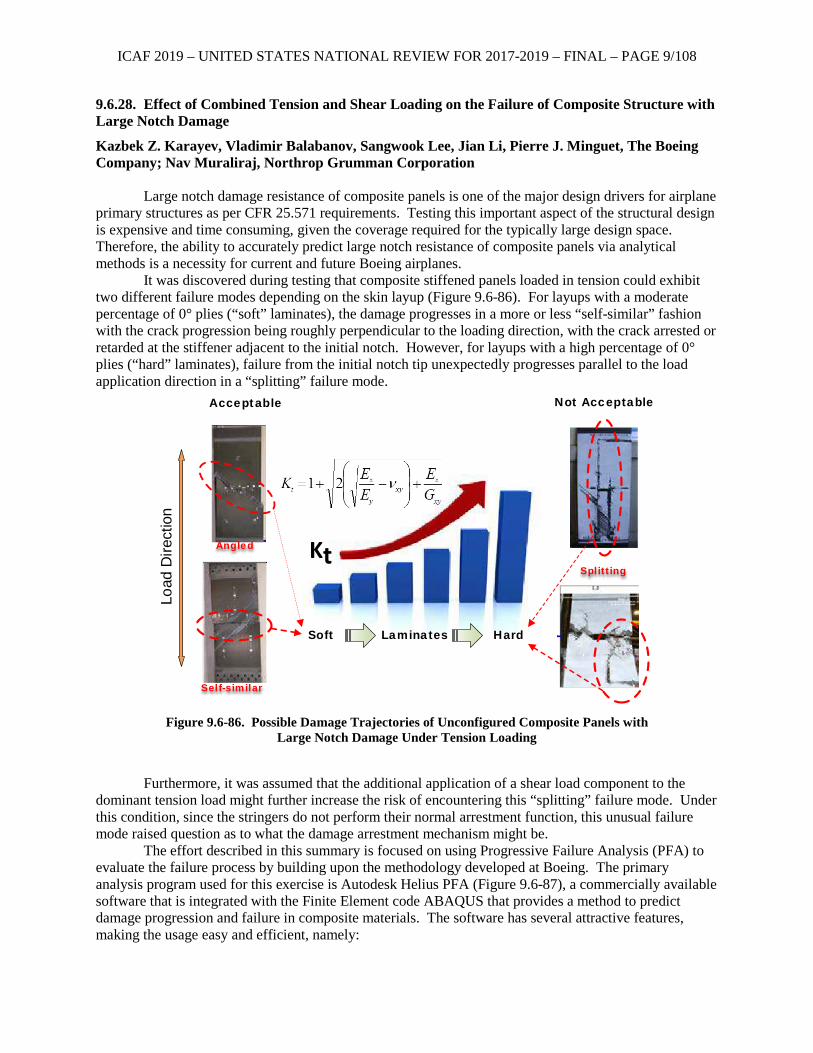
ICAF 2019 – UNITED STATES NATIONAL REVIEW FOR 2017-2019 – FINAL – PAGE 9/108
9.6.28. Effect of Combined Tension and Shear Loading on the Failure of Composite Structure with Large Notch Damage
Kazbek Z. Karayev, Vladimir Balabanov, Sangwook Lee, Jian Li, Pierre J. Minguet, The Boeing Company; Nav Muraliraj, Northrop Grumman Corporation
Large notch damage resistance of composite panels is one of the major design drivers for airplane primary structures as per CFR 25.571 requirements. Testing this important aspect of the structural design is expensive and time consuming, given the coverage required for the typically large design space. Therefore, the ability to accurately predict large notch resistance of composite panels via analytical methods is a necessity for current and future Boeing airplanes.
It was discovered during testing that composite stiffened panels loaded in tension could exhibit two different failure modes depending on the skin layup (Figure 9.6-86). For layups with a moderate percentage of 0° plies (“soft” laminates), the damage progresses in a more or less “self-similar” fashion with the crack progression being roughly perpendicular to the loading direction, with the crack arrested or retarded at the stiffener adjacent to the initial notch. However, for layups with a high percentage of 0° plies (“hard” laminates), failure from the initial notch tip unexpectedly progresses parallel to the load application direction in a “splitting” failure mode.
Figure 9.6-86. Possible Damage Trajectories of Unconfigured Composite Panels with
Large Notch Damage Under Tension Loading
Furthermore, it was assumed that the additional application of a shear load component to the
dominant tension load might further increase the risk of encountering this “splitting” failure mode. Under this condition, since the stringers do not perform their normal arrestment function, this unusual failure mode raised question as to what the damage arrestment mechanism might be.
The effort described in this summary is focused on using Progressive Failure Analysis (PFA) to evaluate the failure process by building upon the methodology developed at Boeing. The primary analysis program used for this exercise is Autodesk Helius PFA (Figure 9.6-87), a commercially available software that is integrated with the Finite Element code ABAQUS that provides a method to predict damage progression and failure in composite materials. The software has several attractive features, making the usage easy and efficient, namely:
Soft HardLaminates
KtSplitting
Self-similar
Angled
Not AcceptableAcceptable
Load
Dire
ctio
n
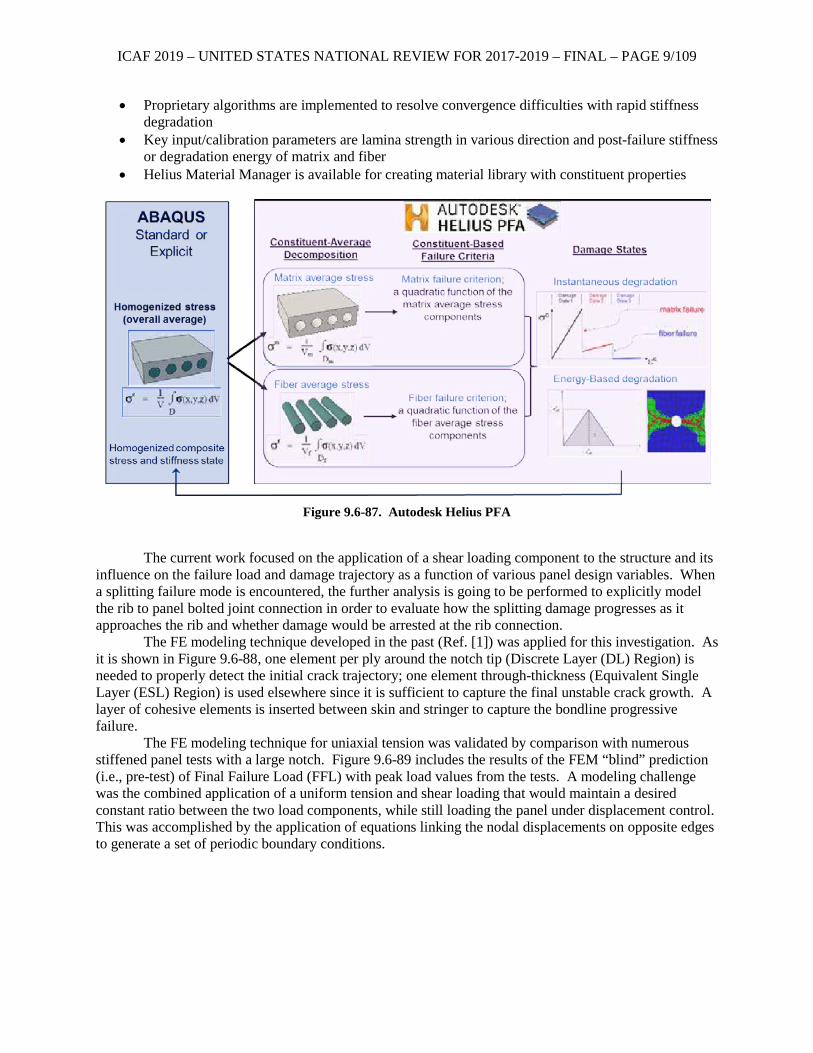
ICAF 2019 – UNITED STATES NATIONAL REVIEW FOR 2017-2019 – FINAL – PAGE 9/109
• Proprietary algorithms are implemented to resolve convergence difficulties with rapid stiffness degradation
• Key input/calibration parameters are lamina strength in various direction and post-failure stiffness or degradation energy of matrix and fiber
• Helius Material Manager is available for creating material library with constituent properties
Figure 9.6-87. Autodesk Helius PFA
The current work focused on the application of a shear loading component to the structure and its
influence on the failure load and damage trajectory as a function of various panel design variables. When a splitting failure mode is encountered, the further analysis is going to be performed to explicitly model the rib to panel bolted joint connection in order to evaluate how the splitting damage progresses as it approaches the rib and whether damage would be arrested at the rib connection.
The FE modeling technique developed in the past (Ref. [1]) was applied for this investigation. As it is shown in Figure 9.6-88, one element per ply around the notch tip (Discrete Layer (DL) Region) is needed to properly detect the initial crack trajectory; one element through-thickness (Equivalent Single Layer (ESL) Region) is used elsewhere since it is sufficient to capture the final unstable crack growth. A layer of cohesive elements is inserted between skin and stringer to capture the bondline progressive failure.
The FE modeling technique for uniaxial tension was validated by comparison with numerous stiffened panel tests with a large notch. Figure 9.6-89 includes the results of the FEM “blind” prediction (i.e., pre-test) of Final Failure Load (FFL) with peak load values from the tests. A modeling challenge was the combined application of a uniform tension and shear loading that would maintain a desired constant ratio between the two load components, while still loading the panel under displacement control. This was accomplished by the application of equations linking the nodal displacements on opposite edges to generate a set of periodic boundary conditions.
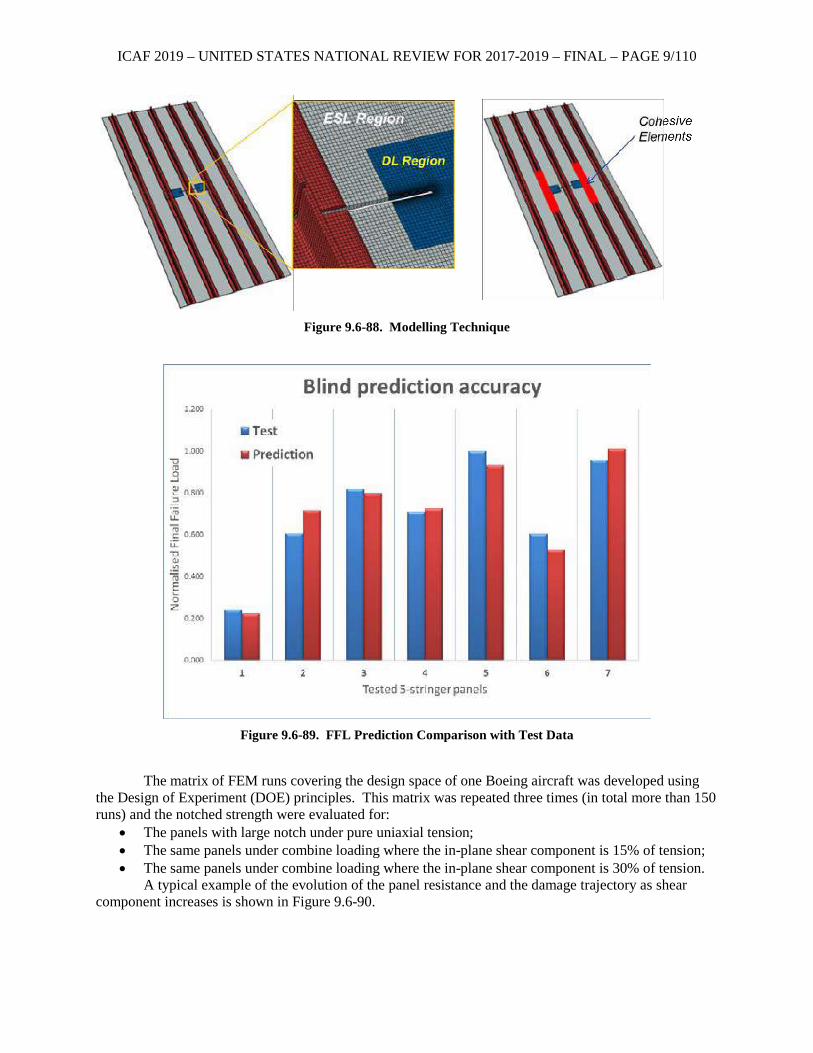
ICAF 2019 – UNITED STATES NATIONAL REVIEW FOR 2017-2019 – FINAL – PAGE 9/110
Figure 9.6-88. Modelling Technique
Figure 9.6-89. FFL Prediction Comparison with Test Data
The matrix of FEM runs covering the design space of one Boeing aircraft was developed using
the Design of Experiment (DOE) principles. This matrix was repeated three times (in total more than 150 runs) and the notched strength were evaluated for:
• The panels with large notch under pure uniaxial tension; • The same panels under combine loading where the in-plane shear component is 15% of tension; • The same panels under combine loading where the in-plane shear component is 30% of tension.
A typical example of the evolution of the panel resistance and the damage trajectory as shear component increases is shown in Figure 9.6-90.
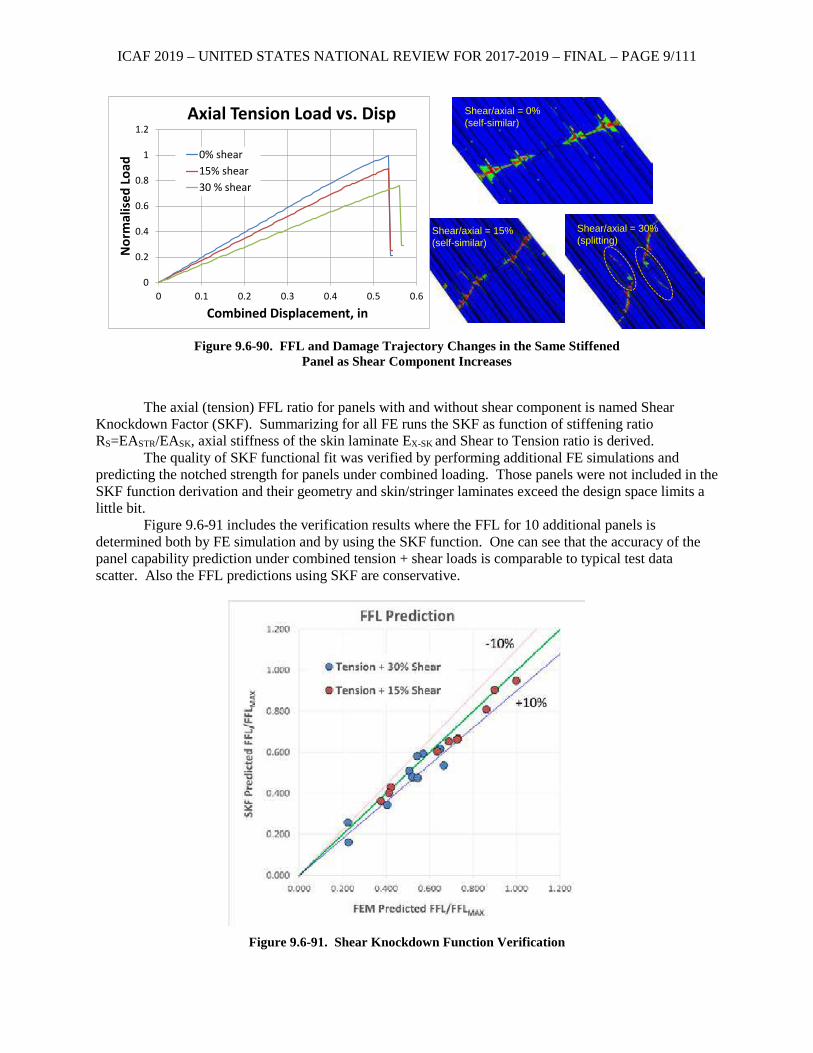
ICAF 2019 – UNITED STATES NATIONAL REVIEW FOR 2017-2019 – FINAL – PAGE 9/111
Shear/axial = 0%(self-similar)
Shear/axial = 15%(self-similar)
Shear/axial = 30%(splitting)
0
0.2
0.4
0.6
0.8
1
1.2
0 0.1 0.2 0.3 0.4 0.5 0.6
Nor
mal
ised
Loa
d
Combined Displacement, in
Axial Tension Load vs. Disp
0% shear15% shear30 % shear
Figure 9.6-90. FFL and Damage Trajectory Changes in the Same Stiffened
Panel as Shear Component Increases
The axial (tension) FFL ratio for panels with and without shear component is named Shear
Knockdown Factor (SKF). Summarizing for all FE runs the SKF as function of stiffening ratio RS=EASTR/EASK, axial stiffness of the skin laminate EX-SK and Shear to Tension ratio is derived.
The quality of SKF functional fit was verified by performing additional FE simulations and predicting the notched strength for panels under combined loading. Those panels were not included in the SKF function derivation and their geometry and skin/stringer laminates exceed the design space limits a little bit.
Figure 9.6-91 includes the verification results where the FFL for 10 additional panels is determined both by FE simulation and by using the SKF function. One can see that the accuracy of the panel capability prediction under combined tension + shear loads is comparable to typical test data scatter. Also the FFL predictions using SKF are conservative.
Figure 9.6-91. Shear Knockdown Function Verification
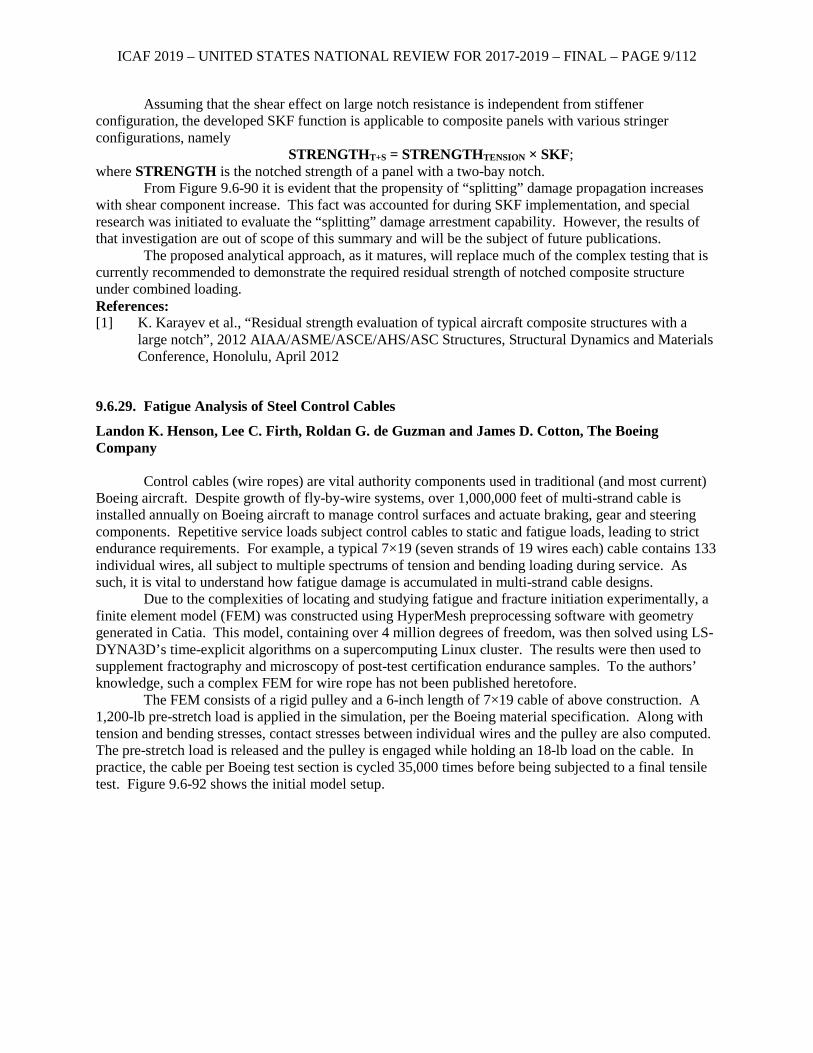
ICAF 2019 – UNITED STATES NATIONAL REVIEW FOR 2017-2019 – FINAL – PAGE 9/112
Assuming that the shear effect on large notch resistance is independent from stiffener configuration, the developed SKF function is applicable to composite panels with various stringer configurations, namely
STRENGTHT+S = STRENGTHTENSION × SKF; where STRENGTH is the notched strength of a panel with a two-bay notch.
From Figure 9.6-90 it is evident that the propensity of “splitting” damage propagation increases with shear component increase. This fact was accounted for during SKF implementation, and special research was initiated to evaluate the “splitting” damage arrestment capability. However, the results of that investigation are out of scope of this summary and will be the subject of future publications.
The proposed analytical approach, as it matures, will replace much of the complex testing that is currently recommended to demonstrate the required residual strength of notched composite structure under combined loading. References: [1] K. Karayev et al., “Residual strength evaluation of typical aircraft composite structures with a
large notch”, 2012 AIAA/ASME/ASCE/AHS/ASC Structures, Structural Dynamics and Materials Conference, Honolulu, April 2012
9.6.29. Fatigue Analysis of Steel Control Cables
Landon K. Henson, Lee C. Firth, Roldan G. de Guzman and James D. Cotton, The Boeing Company
Control cables (wire ropes) are vital authority components used in traditional (and most current) Boeing aircraft. Despite growth of fly-by-wire systems, over 1,000,000 feet of multi-strand cable is installed annually on Boeing aircraft to manage control surfaces and actuate braking, gear and steering components. Repetitive service loads subject control cables to static and fatigue loads, leading to strict endurance requirements. For example, a typical 7×19 (seven strands of 19 wires each) cable contains 133 individual wires, all subject to multiple spectrums of tension and bending loading during service. As such, it is vital to understand how fatigue damage is accumulated in multi-strand cable designs.
Due to the complexities of locating and studying fatigue and fracture initiation experimentally, a finite element model (FEM) was constructed using HyperMesh preprocessing software with geometry generated in Catia. This model, containing over 4 million degrees of freedom, was then solved using LS-DYNA3D’s time-explicit algorithms on a supercomputing Linux cluster. The results were then used to supplement fractography and microscopy of post-test certification endurance samples. To the authors’ knowledge, such a complex FEM for wire rope has not been published heretofore.
The FEM consists of a rigid pulley and a 6-inch length of 7×19 cable of above construction. A 1,200-lb pre-stretch load is applied in the simulation, per the Boeing material specification. Along with tension and bending stresses, contact stresses between individual wires and the pulley are also computed. The pre-stretch load is released and the pulley is engaged while holding an 18-lb load on the cable. In practice, the cable per Boeing test section is cycled 35,000 times before being subjected to a final tensile test. Figure 9.6-92 shows the initial model setup.
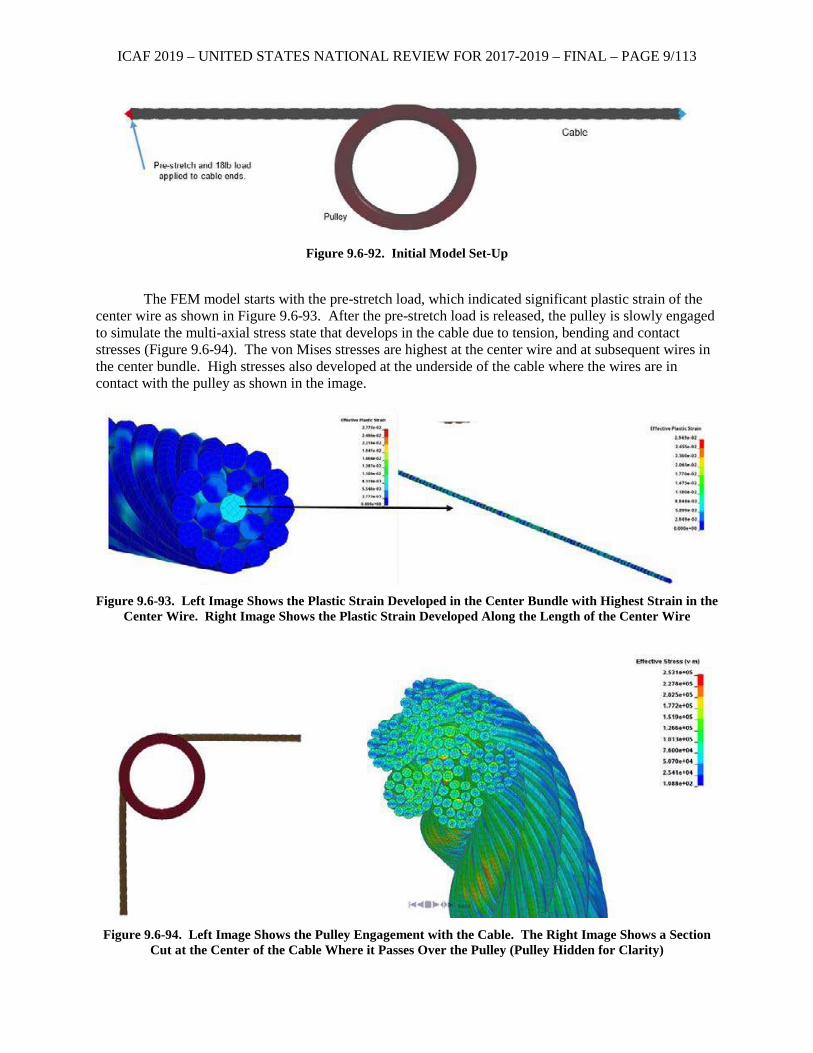
ICAF 2019 – UNITED STATES NATIONAL REVIEW FOR 2017-2019 – FINAL – PAGE 9/113
Figure 9.6-92. Initial Model Set-Up
The FEM model starts with the pre-stretch load, which indicated significant plastic strain of the
center wire as shown in Figure 9.6-93. After the pre-stretch load is released, the pulley is slowly engaged to simulate the multi-axial stress state that develops in the cable due to tension, bending and contact stresses (Figure 9.6-94). The von Mises stresses are highest at the center wire and at subsequent wires in the center bundle. High stresses also developed at the underside of the cable where the wires are in contact with the pulley as shown in the image.
Figure 9.6-93. Left Image Shows the Plastic Strain Developed in the Center Bundle with Highest Strain in the
Center Wire. Right Image Shows the Plastic Strain Developed Along the Length of the Center Wire
Figure 9.6-94. Left Image Shows the Pulley Engagement with the Cable. The Right Image Shows a Section
Cut at the Center of the Cable Where it Passes Over the Pulley (Pulley Hidden for Clarity)
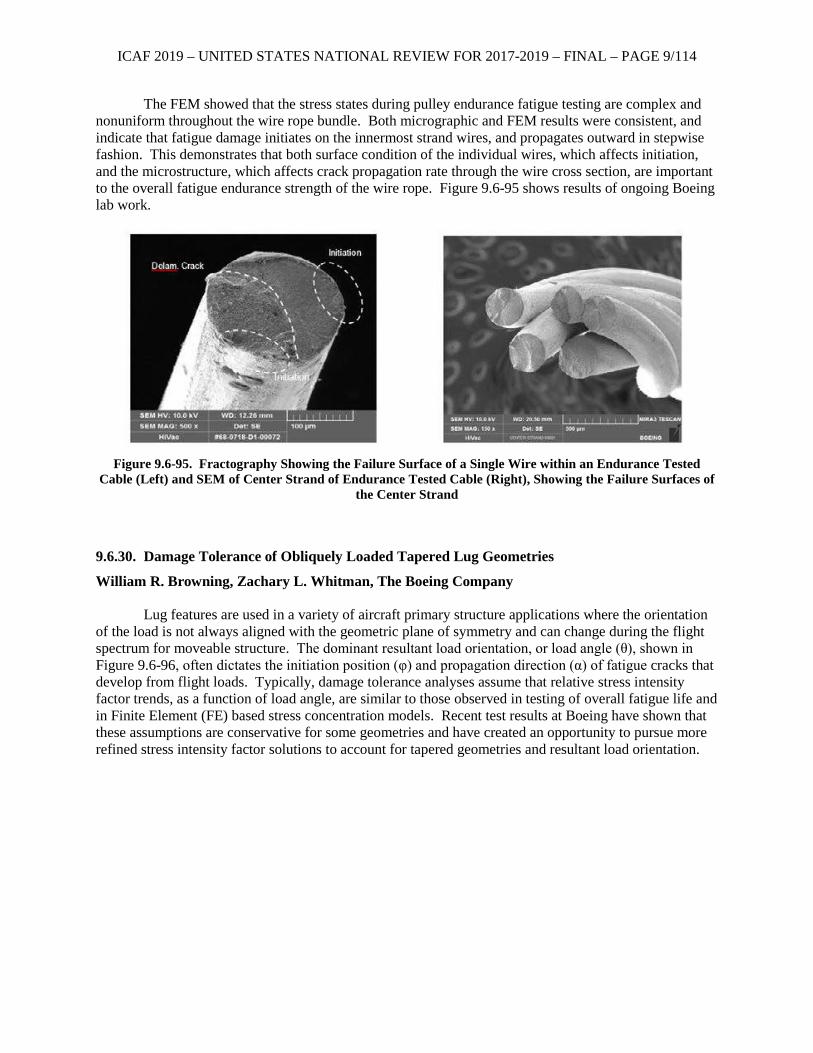
ICAF 2019 – UNITED STATES NATIONAL REVIEW FOR 2017-2019 – FINAL – PAGE 9/114
The FEM showed that the stress states during pulley endurance fatigue testing are complex and nonuniform throughout the wire rope bundle. Both micrographic and FEM results were consistent, and indicate that fatigue damage initiates on the innermost strand wires, and propagates outward in stepwise fashion. This demonstrates that both surface condition of the individual wires, which affects initiation, and the microstructure, which affects crack propagation rate through the wire cross section, are important to the overall fatigue endurance strength of the wire rope. Figure 9.6-95 shows results of ongoing Boeing lab work.
Figure 9.6-95. Fractography Showing the Failure Surface of a Single Wire within an Endurance Tested
Cable (Left) and SEM of Center Strand of Endurance Tested Cable (Right), Showing the Failure Surfaces of the Center Strand
9.6.30. Damage Tolerance of Obliquely Loaded Tapered Lug Geometries
William R. Browning, Zachary L. Whitman, The Boeing Company Lug features are used in a variety of aircraft primary structure applications where the orientation
of the load is not always aligned with the geometric plane of symmetry and can change during the flight spectrum for moveable structure. The dominant resultant load orientation, or load angle (θ), shown in Figure 9.6-96, often dictates the initiation position (φ) and propagation direction (α) of fatigue cracks that develop from flight loads. Typically, damage tolerance analyses assume that relative stress intensity factor trends, as a function of load angle, are similar to those observed in testing of overall fatigue life and in Finite Element (FE) based stress concentration models. Recent test results at Boeing have shown that these assumptions are conservative for some geometries and have created an opportunity to pursue more refined stress intensity factor solutions to account for tapered geometries and resultant load orientation.
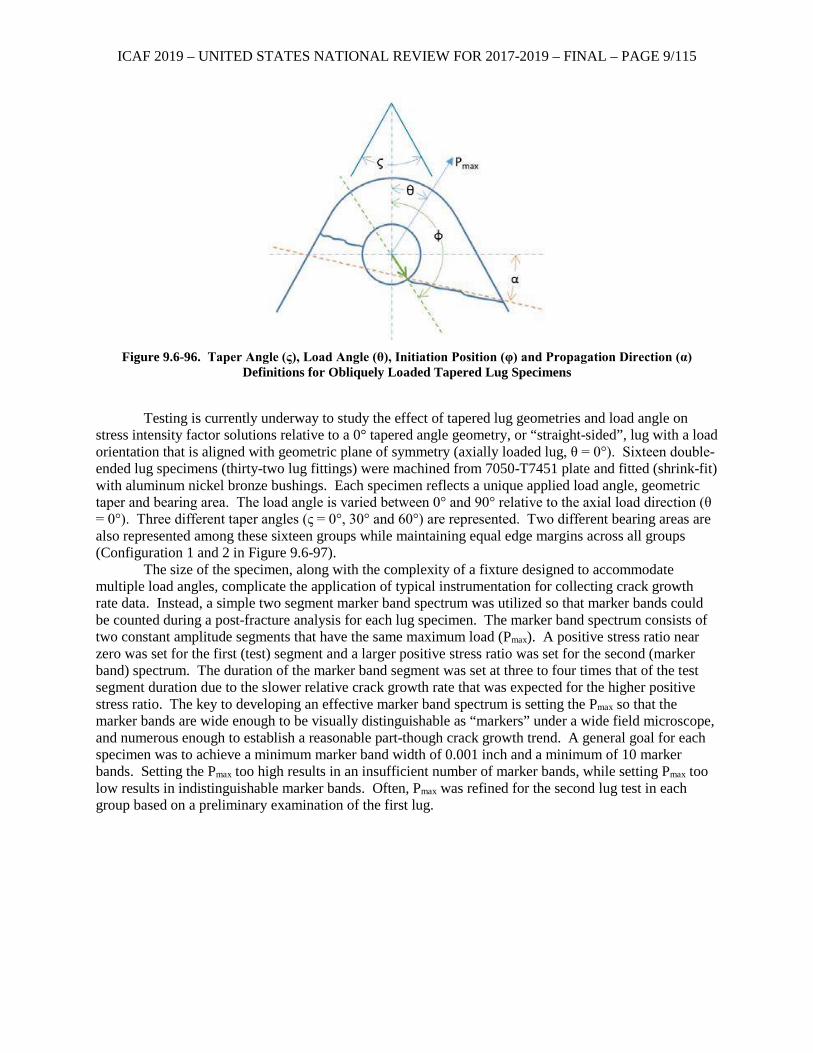
ICAF 2019 – UNITED STATES NATIONAL REVIEW FOR 2017-2019 – FINAL – PAGE 9/115
Figure 9.6-96. Taper Angle (ς), Load Angle (θ), Initiation Position (φ) and Propagation Direction (α)
Definitions for Obliquely Loaded Tapered Lug Specimens
Testing is currently underway to study the effect of tapered lug geometries and load angle on
stress intensity factor solutions relative to a 0° tapered angle geometry, or “straight-sided”, lug with a load orientation that is aligned with geometric plane of symmetry (axially loaded lug, θ = 0°). Sixteen double-ended lug specimens (thirty-two lug fittings) were machined from 7050-T7451 plate and fitted (shrink-fit) with aluminum nickel bronze bushings. Each specimen reflects a unique applied load angle, geometric taper and bearing area. The load angle is varied between 0° and 90° relative to the axial load direction (θ = 0°). Three different taper angles (ς = 0°, 30° and 60°) are represented. Two different bearing areas are also represented among these sixteen groups while maintaining equal edge margins across all groups (Configuration 1 and 2 in Figure 9.6-97).
The size of the specimen, along with the complexity of a fixture designed to accommodate multiple load angles, complicate the application of typical instrumentation for collecting crack growth rate data. Instead, a simple two segment marker band spectrum was utilized so that marker bands could be counted during a post-fracture analysis for each lug specimen. The marker band spectrum consists of two constant amplitude segments that have the same maximum load (Pmax). A positive stress ratio near zero was set for the first (test) segment and a larger positive stress ratio was set for the second (marker band) spectrum. The duration of the marker band segment was set at three to four times that of the test segment duration due to the slower relative crack growth rate that was expected for the higher positive stress ratio. The key to developing an effective marker band spectrum is setting the Pmax so that the marker bands are wide enough to be visually distinguishable as “markers” under a wide field microscope, and numerous enough to establish a reasonable part-though crack growth trend. A general goal for each specimen was to achieve a minimum marker band width of 0.001 inch and a minimum of 10 marker bands. Setting the Pmax too high results in an insufficient number of marker bands, while setting Pmax too low results in indistinguishable marker bands. Often, Pmax was refined for the second lug test in each group based on a preliminary examination of the first lug.
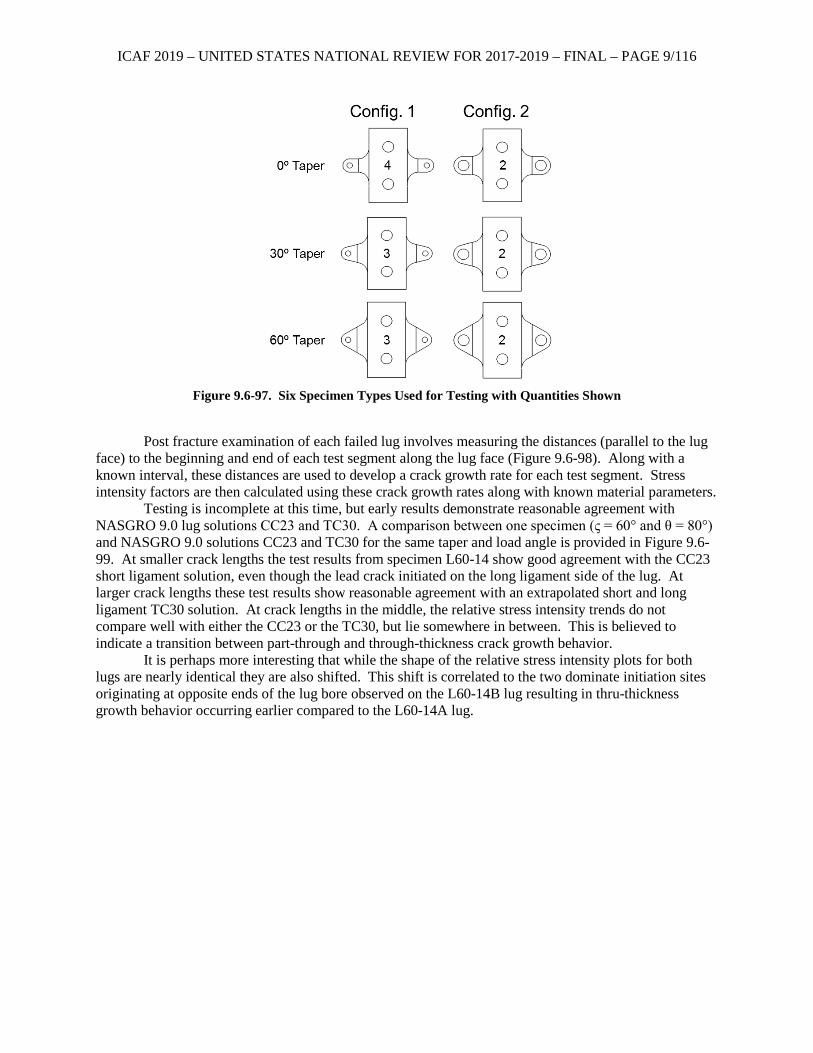
ICAF 2019 – UNITED STATES NATIONAL REVIEW FOR 2017-2019 – FINAL – PAGE 9/116
Figure 9.6-97. Six Specimen Types Used for Testing with Quantities Shown
Post fracture examination of each failed lug involves measuring the distances (parallel to the lug
face) to the beginning and end of each test segment along the lug face (Figure 9.6-98). Along with a known interval, these distances are used to develop a crack growth rate for each test segment. Stress intensity factors are then calculated using these crack growth rates along with known material parameters.
Testing is incomplete at this time, but early results demonstrate reasonable agreement with NASGRO 9.0 lug solutions CC23 and TC30. A comparison between one specimen (ς = 60° and θ = 80°) and NASGRO 9.0 solutions CC23 and TC30 for the same taper and load angle is provided in Figure 9.6-99. At smaller crack lengths the test results from specimen L60-14 show good agreement with the CC23 short ligament solution, even though the lead crack initiated on the long ligament side of the lug. At larger crack lengths these test results show reasonable agreement with an extrapolated short and long ligament TC30 solution. At crack lengths in the middle, the relative stress intensity trends do not compare well with either the CC23 or the TC30, but lie somewhere in between. This is believed to indicate a transition between part-through and through-thickness crack growth behavior.
It is perhaps more interesting that while the shape of the relative stress intensity plots for both lugs are nearly identical they are also shifted. This shift is correlated to the two dominate initiation sites originating at opposite ends of the lug bore observed on the L60-14B lug resulting in thru-thickness growth behavior occurring earlier compared to the L60-14A lug.
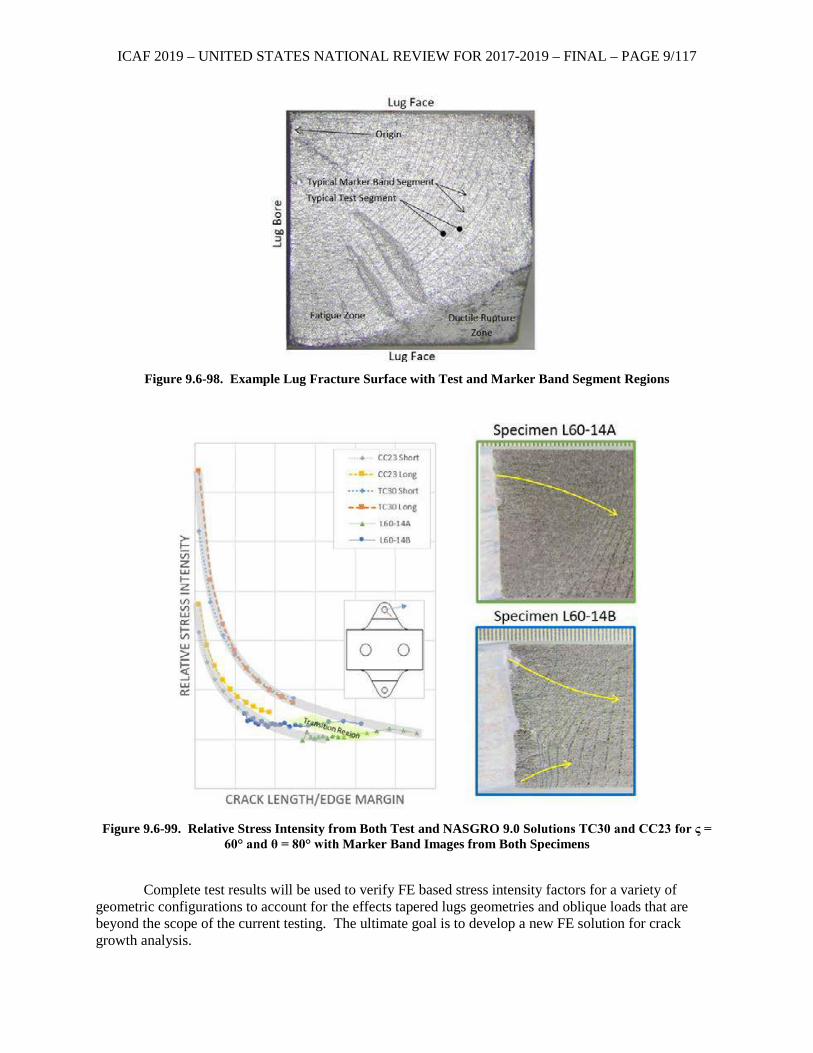
ICAF 2019 – UNITED STATES NATIONAL REVIEW FOR 2017-2019 – FINAL – PAGE 9/117
Figure 9.6-98. Example Lug Fracture Surface with Test and Marker Band Segment Regions
Figure 9.6-99. Relative Stress Intensity from Both Test and NASGRO 9.0 Solutions TC30 and CC23 for ς =
60° and θ = 80° with Marker Band Images from Both Specimens
Complete test results will be used to verify FE based stress intensity factors for a variety of
geometric configurations to account for the effects tapered lugs geometries and oblique loads that are beyond the scope of the current testing. The ultimate goal is to develop a new FE solution for crack growth analysis.
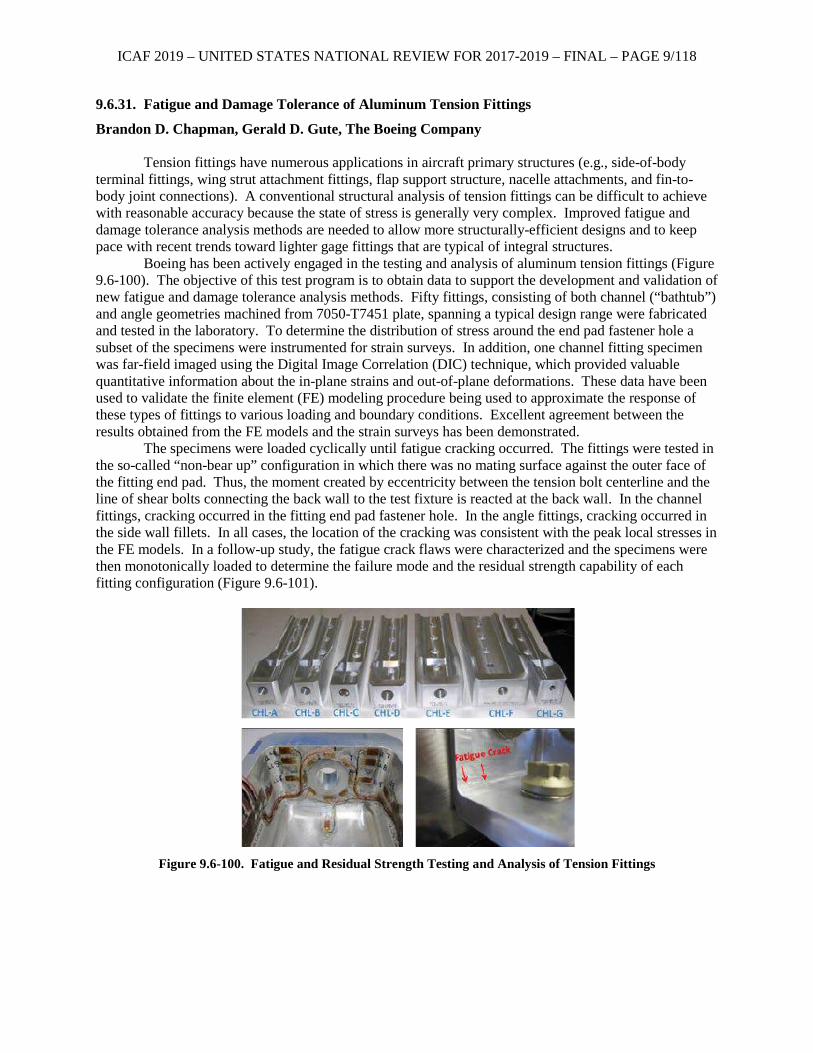
ICAF 2019 – UNITED STATES NATIONAL REVIEW FOR 2017-2019 – FINAL – PAGE 9/118
9.6.31. Fatigue and Damage Tolerance of Aluminum Tension Fittings
Brandon D. Chapman, Gerald D. Gute, The Boeing Company
Tension fittings have numerous applications in aircraft primary structures (e.g., side-of-body terminal fittings, wing strut attachment fittings, flap support structure, nacelle attachments, and fin-to-body joint connections). A conventional structural analysis of tension fittings can be difficult to achieve with reasonable accuracy because the state of stress is generally very complex. Improved fatigue and damage tolerance analysis methods are needed to allow more structurally-efficient designs and to keep pace with recent trends toward lighter gage fittings that are typical of integral structures.
Boeing has been actively engaged in the testing and analysis of aluminum tension fittings (Figure 9.6-100). The objective of this test program is to obtain data to support the development and validation of new fatigue and damage tolerance analysis methods. Fifty fittings, consisting of both channel (“bathtub”) and angle geometries machined from 7050-T7451 plate, spanning a typical design range were fabricated and tested in the laboratory. To determine the distribution of stress around the end pad fastener hole a subset of the specimens were instrumented for strain surveys. In addition, one channel fitting specimen was far-field imaged using the Digital Image Correlation (DIC) technique, which provided valuable quantitative information about the in-plane strains and out-of-plane deformations. These data have been used to validate the finite element (FE) modeling procedure being used to approximate the response of these types of fittings to various loading and boundary conditions. Excellent agreement between the results obtained from the FE models and the strain surveys has been demonstrated.
The specimens were loaded cyclically until fatigue cracking occurred. The fittings were tested in the so-called “non-bear up” configuration in which there was no mating surface against the outer face of the fitting end pad. Thus, the moment created by eccentricity between the tension bolt centerline and the line of shear bolts connecting the back wall to the test fixture is reacted at the back wall. In the channel fittings, cracking occurred in the fitting end pad fastener hole. In the angle fittings, cracking occurred in the side wall fillets. In all cases, the location of the cracking was consistent with the peak local stresses in the FE models. In a follow-up study, the fatigue crack flaws were characterized and the specimens were then monotonically loaded to determine the failure mode and the residual strength capability of each fitting configuration (Figure 9.6-101).
Figure 9.6-100. Fatigue and Residual Strength Testing and Analysis of Tension Fittings
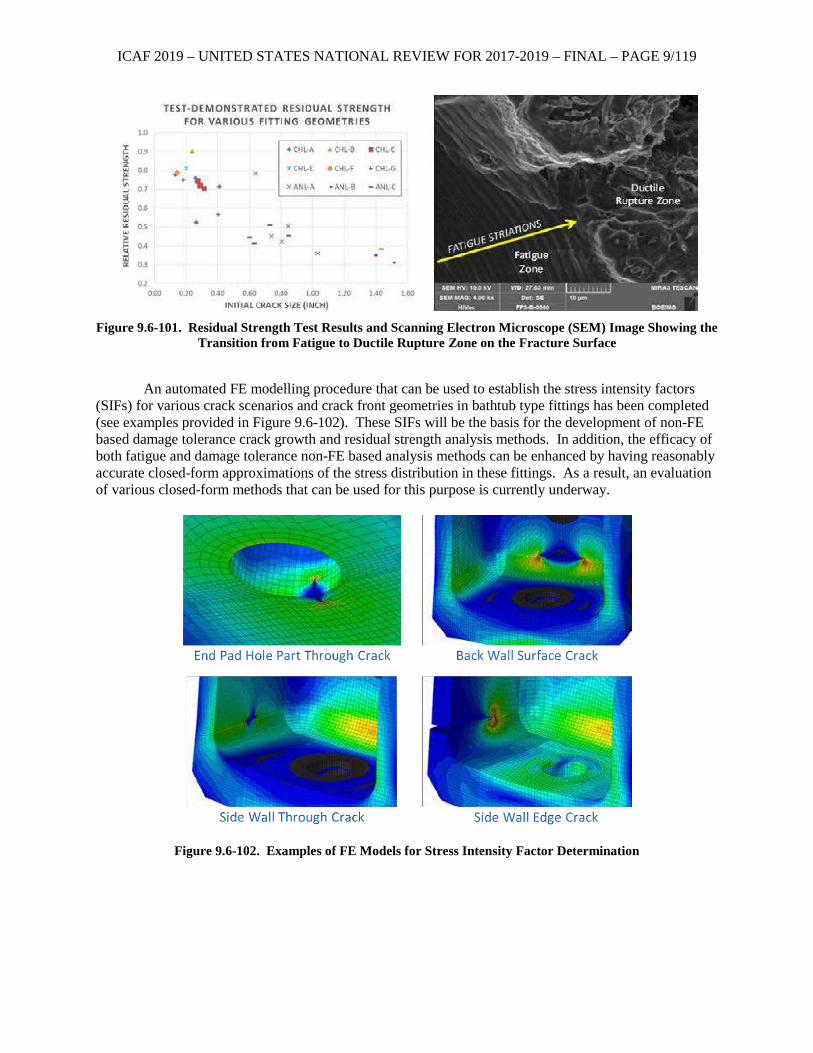
ICAF 2019 – UNITED STATES NATIONAL REVIEW FOR 2017-2019 – FINAL – PAGE 9/119
Figure 9.6-101. Residual Strength Test Results and Scanning Electron Microscope (SEM) Image Showing the
Transition from Fatigue to Ductile Rupture Zone on the Fracture Surface
An automated FE modelling procedure that can be used to establish the stress intensity factors
(SIFs) for various crack scenarios and crack front geometries in bathtub type fittings has been completed (see examples provided in Figure 9.6-102). These SIFs will be the basis for the development of non-FE based damage tolerance crack growth and residual strength analysis methods. In addition, the efficacy of both fatigue and damage tolerance non-FE based analysis methods can be enhanced by having reasonably accurate closed-form approximations of the stress distribution in these fittings. As a result, an evaluation of various closed-form methods that can be used for this purpose is currently underway.
Figure 9.6-102. Examples of FE Models for Stress Intensity Factor Determination
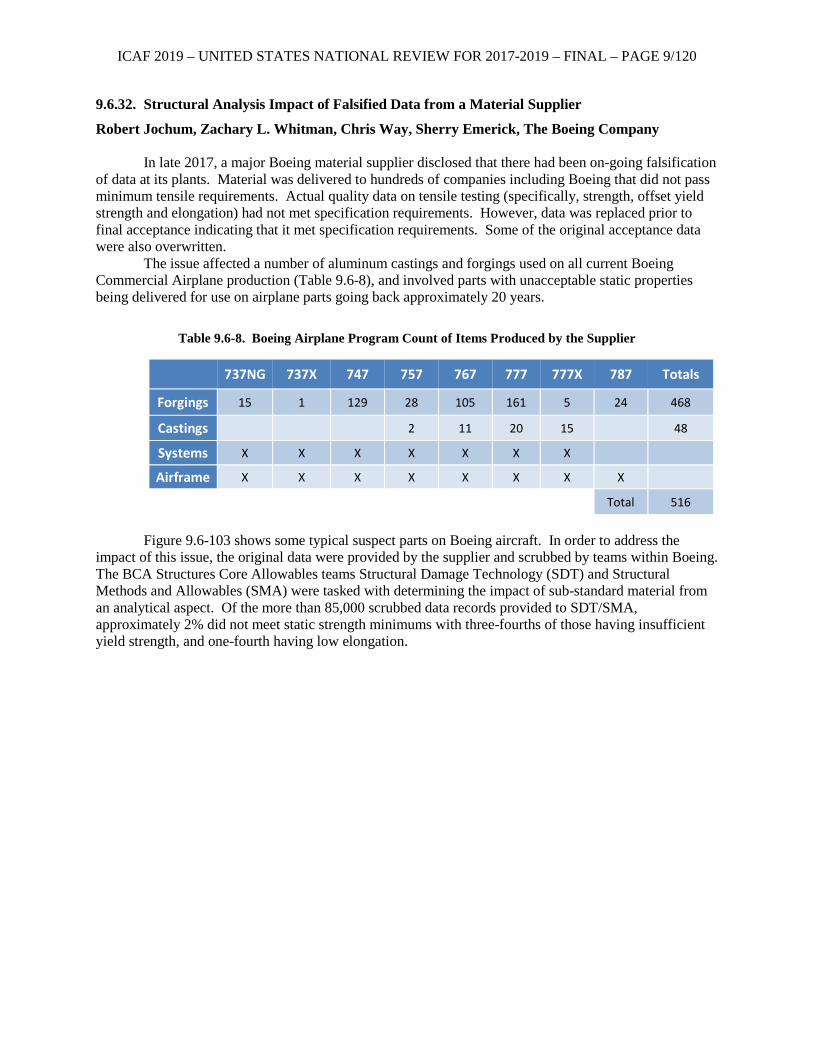
ICAF 2019 – UNITED STATES NATIONAL REVIEW FOR 2017-2019 – FINAL – PAGE 9/120
9.6.32. Structural Analysis Impact of Falsified Data from a Material Supplier
Robert Jochum, Zachary L. Whitman, Chris Way, Sherry Emerick, The Boeing Company
In late 2017, a major Boeing material supplier disclosed that there had been on-going falsification of data at its plants. Material was delivered to hundreds of companies including Boeing that did not pass minimum tensile requirements. Actual quality data on tensile testing (specifically, strength, offset yield strength and elongation) had not met specification requirements. However, data was replaced prior to final acceptance indicating that it met specification requirements. Some of the original acceptance data were also overwritten.
The issue affected a number of aluminum castings and forgings used on all current Boeing Commercial Airplane production (Table 9.6-8), and involved parts with unacceptable static properties being delivered for use on airplane parts going back approximately 20 years.
Table 9.6-8. Boeing Airplane Program Count of Items Produced by the Supplier
737NG 737X 747 757 767 777 777X 787 Totals
Forgings 15 1 129 28 105 161 5 24 468
Castings 2 11 20 15 48
Systems X X X X X X X
Airframe X X X X X X X X
Total 516
Figure 9.6-103 shows some typical suspect parts on Boeing aircraft. In order to address the
impact of this issue, the original data were provided by the supplier and scrubbed by teams within Boeing. The BCA Structures Core Allowables teams Structural Damage Technology (SDT) and Structural Methods and Allowables (SMA) were tasked with determining the impact of sub-standard material from an analytical aspect. Of the more than 85,000 scrubbed data records provided to SDT/SMA, approximately 2% did not meet static strength minimums with three-fourths of those having insufficient yield strength, and one-fourth having low elongation.
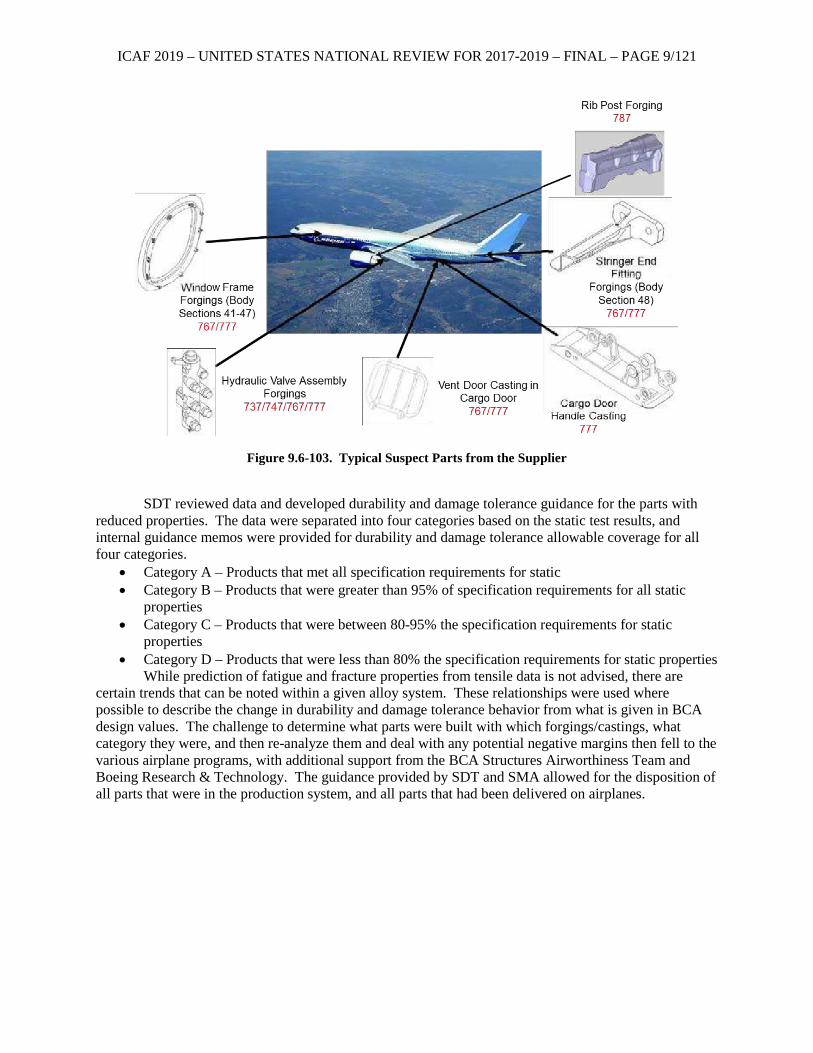
ICAF 2019 – UNITED STATES NATIONAL REVIEW FOR 2017-2019 – FINAL – PAGE 9/121
Figure 9.6-103. Typical Suspect Parts from the Supplier
SDT reviewed data and developed durability and damage tolerance guidance for the parts with
reduced properties. The data were separated into four categories based on the static test results, and internal guidance memos were provided for durability and damage tolerance allowable coverage for all four categories.
• Category A – Products that met all specification requirements for static • Category B – Products that were greater than 95% of specification requirements for all static
properties • Category C – Products that were between 80-95% the specification requirements for static
properties • Category D – Products that were less than 80% the specification requirements for static properties
While prediction of fatigue and fracture properties from tensile data is not advised, there are certain trends that can be noted within a given alloy system. These relationships were used where possible to describe the change in durability and damage tolerance behavior from what is given in BCA design values. The challenge to determine what parts were built with which forgings/castings, what category they were, and then re-analyze them and deal with any potential negative margins then fell to the various airplane programs, with additional support from the BCA Structures Airworthiness Team and Boeing Research & Technology. The guidance provided by SDT and SMA allowed for the disposition of all parts that were in the production system, and all parts that had been delivered on airplanes.
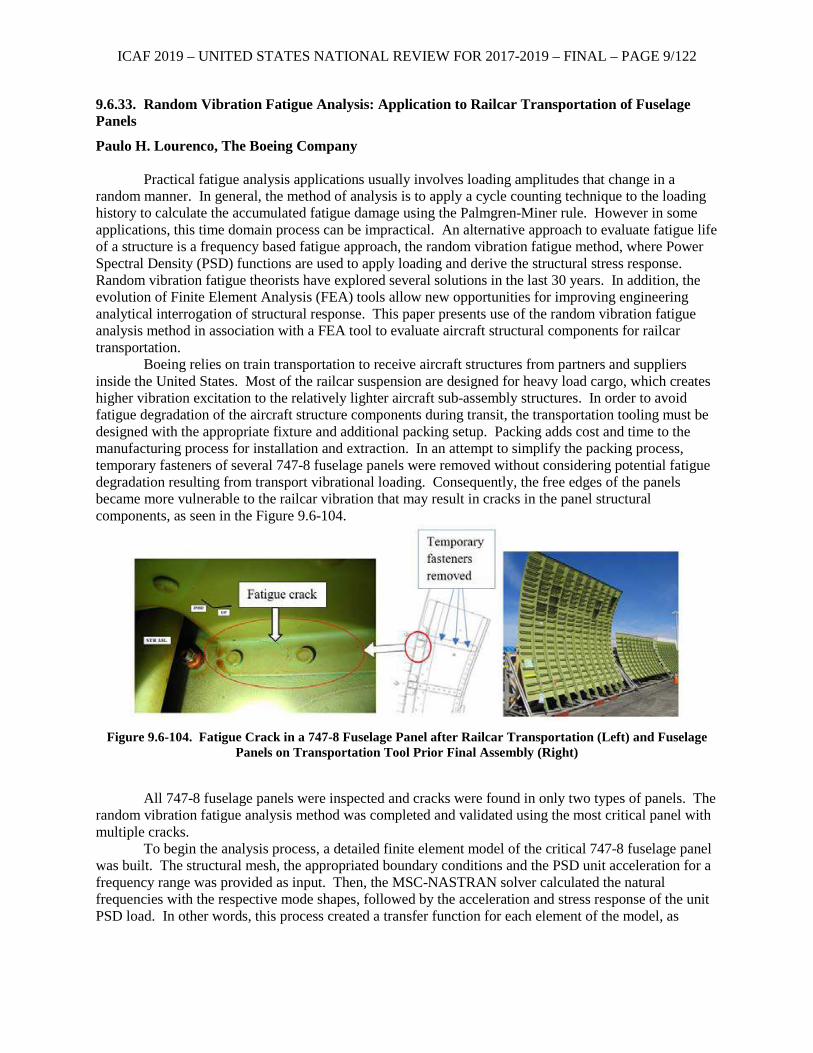
ICAF 2019 – UNITED STATES NATIONAL REVIEW FOR 2017-2019 – FINAL – PAGE 9/122
9.6.33. Random Vibration Fatigue Analysis: Application to Railcar Transportation of Fuselage Panels
Paulo H. Lourenco, The Boeing Company
Practical fatigue analysis applications usually involves loading amplitudes that change in a random manner. In general, the method of analysis is to apply a cycle counting technique to the loading history to calculate the accumulated fatigue damage using the Palmgren-Miner rule. However in some applications, this time domain process can be impractical. An alternative approach to evaluate fatigue life of a structure is a frequency based fatigue approach, the random vibration fatigue method, where Power Spectral Density (PSD) functions are used to apply loading and derive the structural stress response. Random vibration fatigue theorists have explored several solutions in the last 30 years. In addition, the evolution of Finite Element Analysis (FEA) tools allow new opportunities for improving engineering analytical interrogation of structural response. This paper presents use of the random vibration fatigue analysis method in association with a FEA tool to evaluate aircraft structural components for railcar transportation.
Boeing relies on train transportation to receive aircraft structures from partners and suppliers inside the United States. Most of the railcar suspension are designed for heavy load cargo, which creates higher vibration excitation to the relatively lighter aircraft sub-assembly structures. In order to avoid fatigue degradation of the aircraft structure components during transit, the transportation tooling must be designed with the appropriate fixture and additional packing setup. Packing adds cost and time to the manufacturing process for installation and extraction. In an attempt to simplify the packing process, temporary fasteners of several 747-8 fuselage panels were removed without considering potential fatigue degradation resulting from transport vibrational loading. Consequently, the free edges of the panels became more vulnerable to the railcar vibration that may result in cracks in the panel structural components, as seen in the Figure 9.6-104.
Figure 9.6-104. Fatigue Crack in a 747-8 Fuselage Panel after Railcar Transportation (Left) and Fuselage
Panels on Transportation Tool Prior Final Assembly (Right)
All 747-8 fuselage panels were inspected and cracks were found in only two types of panels. The
random vibration fatigue analysis method was completed and validated using the most critical panel with multiple cracks.
To begin the analysis process, a detailed finite element model of the critical 747-8 fuselage panel was built. The structural mesh, the appropriated boundary conditions and the PSD unit acceleration for a frequency range was provided as input. Then, the MSC-NASTRAN solver calculated the natural frequencies with the respective mode shapes, followed by the acceleration and stress response of the unit PSD load. In other words, this process created a transfer function for each element of the model, as
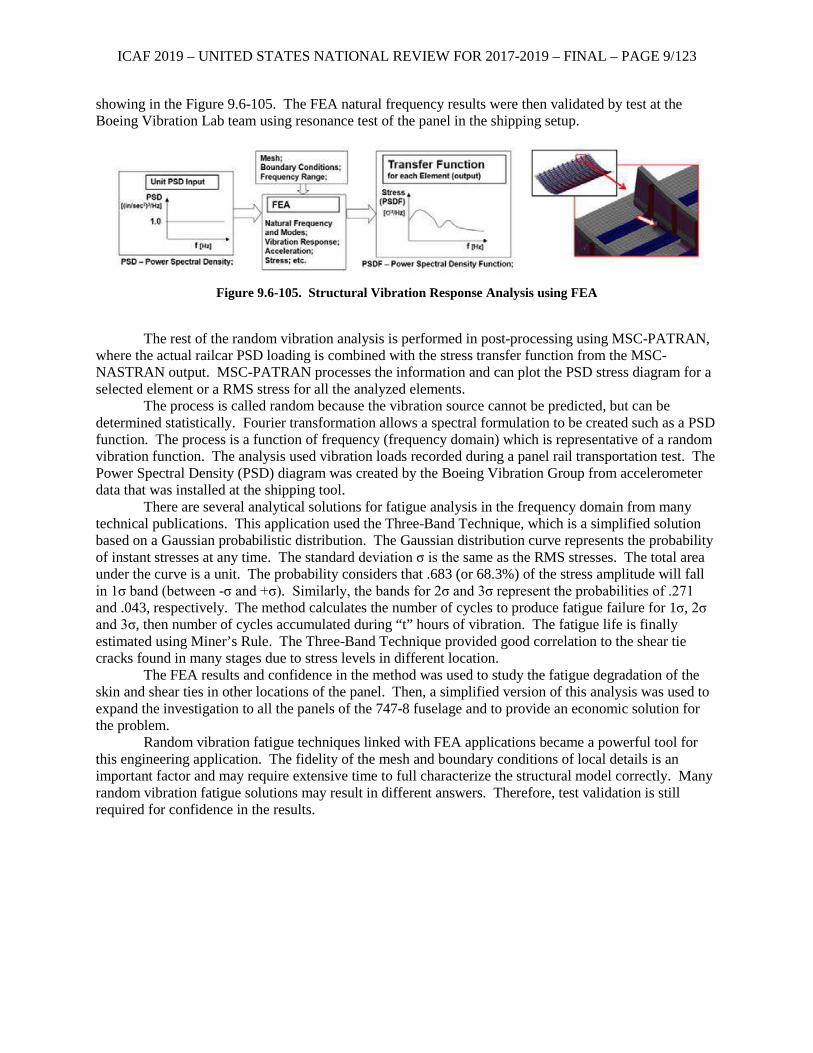
ICAF 2019 – UNITED STATES NATIONAL REVIEW FOR 2017-2019 – FINAL – PAGE 9/123
showing in the Figure 9.6-105. The FEA natural frequency results were then validated by test at the Boeing Vibration Lab team using resonance test of the panel in the shipping setup.
Figure 9.6-105. Structural Vibration Response Analysis using FEA
The rest of the random vibration analysis is performed in post-processing using MSC-PATRAN,
where the actual railcar PSD loading is combined with the stress transfer function from the MSC-NASTRAN output. MSC-PATRAN processes the information and can plot the PSD stress diagram for a selected element or a RMS stress for all the analyzed elements.
The process is called random because the vibration source cannot be predicted, but can be determined statistically. Fourier transformation allows a spectral formulation to be created such as a PSD function. The process is a function of frequency (frequency domain) which is representative of a random vibration function. The analysis used vibration loads recorded during a panel rail transportation test. The Power Spectral Density (PSD) diagram was created by the Boeing Vibration Group from accelerometer data that was installed at the shipping tool.
There are several analytical solutions for fatigue analysis in the frequency domain from many technical publications. This application used the Three-Band Technique, which is a simplified solution based on a Gaussian probabilistic distribution. The Gaussian distribution curve represents the probability of instant stresses at any time. The standard deviation σ is the same as the RMS stresses. The total area under the curve is a unit. The probability considers that .683 (or 68.3%) of the stress amplitude will fall in 1σ band (between -σ and +σ). Similarly, the bands for 2σ and 3σ represent the probabilities of .271 and .043, respectively. The method calculates the number of cycles to produce fatigue failure for 1σ, 2σ and 3σ, then number of cycles accumulated during “t” hours of vibration. The fatigue life is finally estimated using Miner’s Rule. The Three-Band Technique provided good correlation to the shear tie cracks found in many stages due to stress levels in different location.
The FEA results and confidence in the method was used to study the fatigue degradation of the skin and shear ties in other locations of the panel. Then, a simplified version of this analysis was used to expand the investigation to all the panels of the 747-8 fuselage and to provide an economic solution for the problem.
Random vibration fatigue techniques linked with FEA applications became a powerful tool for this engineering application. The fidelity of the mesh and boundary conditions of local details is an important factor and may require extensive time to full characterize the structural model correctly. Many random vibration fatigue solutions may result in different answers. Therefore, test validation is still required for confidence in the results.

ICAF 2019 – UNITED STATES NATIONAL REVIEW FOR 2017-2019 – FINAL – PAGE 9/124
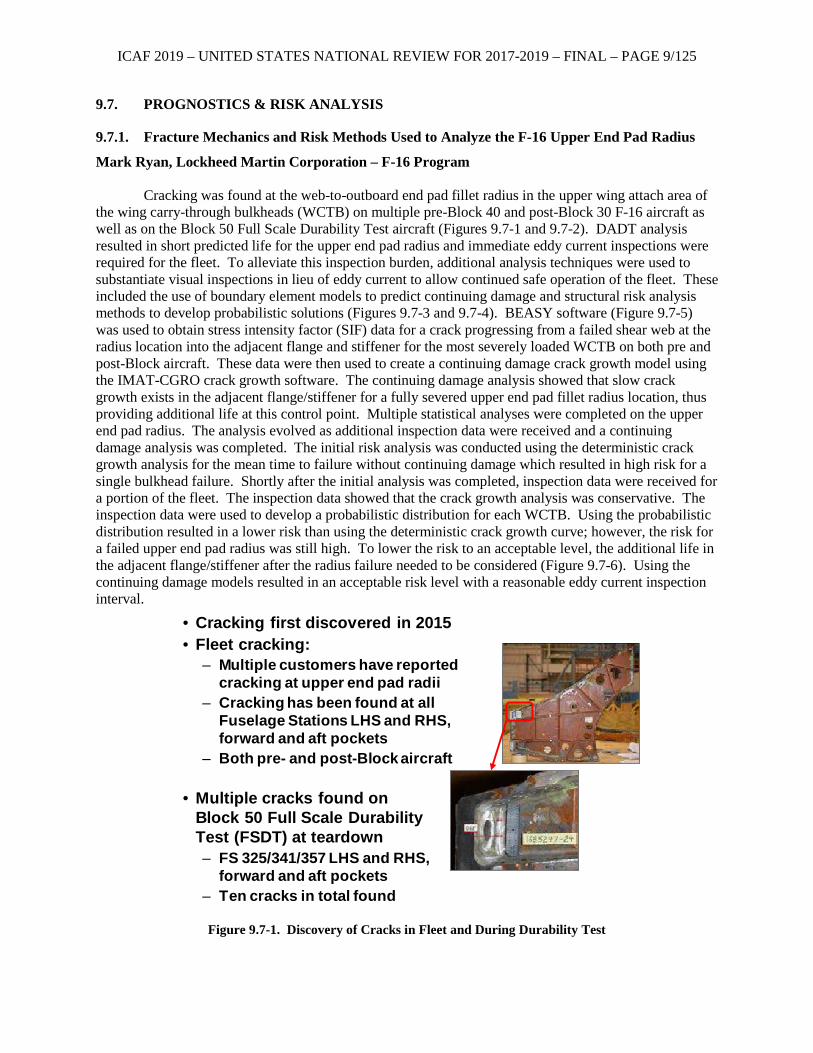
ICAF 2019 – UNITED STATES NATIONAL REVIEW FOR 2017-2019 – FINAL – PAGE 9/125
9.7. PROGNOSTICS & RISK ANALYSIS
9.7.1. Fracture Mechanics and Risk Methods Used to Analyze the F-16 Upper End Pad Radius
Mark Ryan, Lockheed Martin Corporation – F-16 Program Cracking was found at the web-to-outboard end pad fillet radius in the upper wing attach area of
the wing carry-through bulkheads (WCTB) on multiple pre-Block 40 and post-Block 30 F-16 aircraft as well as on the Block 50 Full Scale Durability Test aircraft (Figures 9.7-1 and 9.7-2). DADT analysis resulted in short predicted life for the upper end pad radius and immediate eddy current inspections were required for the fleet. To alleviate this inspection burden, additional analysis techniques were used to substantiate visual inspections in lieu of eddy current to allow continued safe operation of the fleet. These included the use of boundary element models to predict continuing damage and structural risk analysis methods to develop probabilistic solutions (Figures 9.7-3 and 9.7-4). BEASY software (Figure 9.7-5) was used to obtain stress intensity factor (SIF) data for a crack progressing from a failed shear web at the radius location into the adjacent flange and stiffener for the most severely loaded WCTB on both pre and post-Block aircraft. These data were then used to create a continuing damage crack growth model using the IMAT-CGRO crack growth software. The continuing damage analysis showed that slow crack growth exists in the adjacent flange/stiffener for a fully severed upper end pad fillet radius location, thus providing additional life at this control point. Multiple statistical analyses were completed on the upper end pad radius. The analysis evolved as additional inspection data were received and a continuing damage analysis was completed. The initial risk analysis was conducted using the deterministic crack growth analysis for the mean time to failure without continuing damage which resulted in high risk for a single bulkhead failure. Shortly after the initial analysis was completed, inspection data were received for a portion of the fleet. The inspection data showed that the crack growth analysis was conservative. The inspection data were used to develop a probabilistic distribution for each WCTB. Using the probabilistic distribution resulted in a lower risk than using the deterministic crack growth curve; however, the risk for a failed upper end pad radius was still high. To lower the risk to an acceptable level, the additional life in the adjacent flange/stiffener after the radius failure needed to be considered (Figure 9.7-6). Using the continuing damage models resulted in an acceptable risk level with a reasonable eddy current inspection interval.
Figure 9.7-1. Discovery of Cracks in Fleet and During Durability Test
• Cracking first discovered in 2015• Fleet cracking:
– Multiple customers have reported cracking at upper end pad radii
– Cracking has been found at all Fuselage Stations LHS and RHS, forward and aft pockets
– Both pre- and post-Block aircraft
• Multiple cracks found on Block 50 Full Scale Durability Test (FSDT) at teardown– FS 325/341/357 LHS and RHS,
forward and aft pockets– Ten cracks in total found
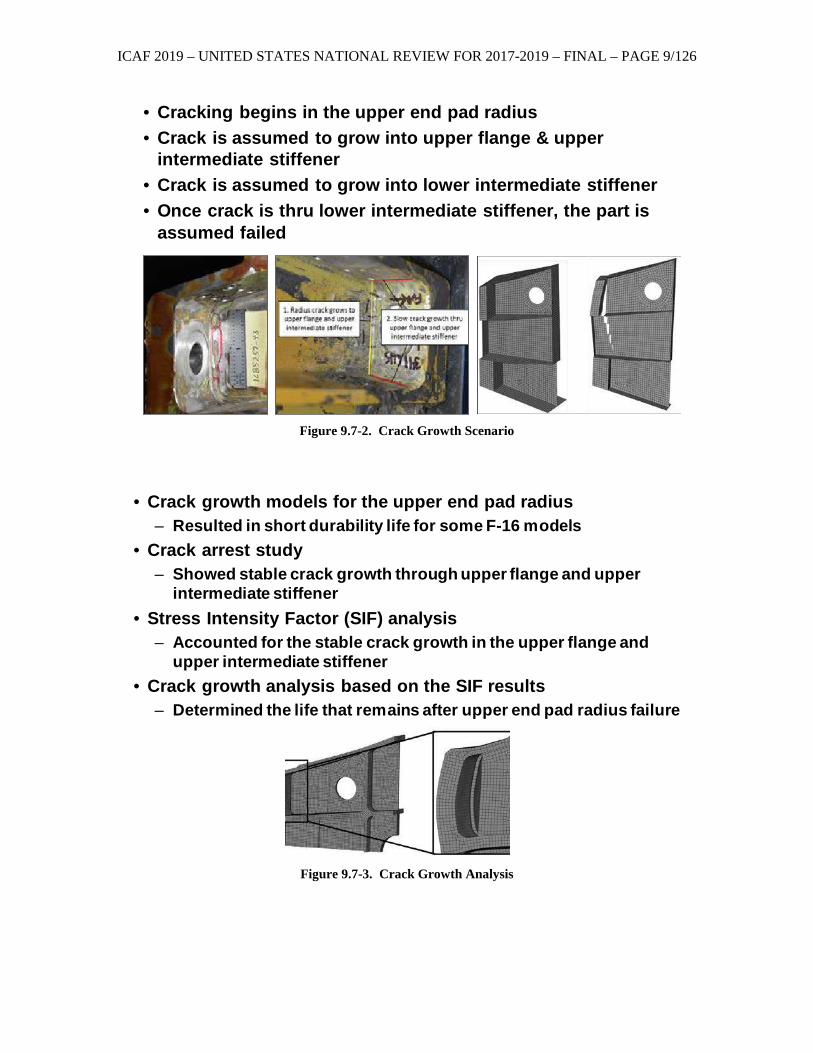
ICAF 2019 – UNITED STATES NATIONAL REVIEW FOR 2017-2019 – FINAL – PAGE 9/126
Figure 9.7-2. Crack Growth Scenario
Figure 9.7-3. Crack Growth Analysis
• Cracking begins in the upper end pad radius• Crack is assumed to grow into upper flange & upper
intermediate stiffener• Crack is assumed to grow into lower intermediate stiffener• Once crack is thru lower intermediate stiffener, the part is
assumed failed
• Crack growth models for the upper end pad radius– Resulted in short durability life for some F-16 models
• Crack arrest study– Showed stable crack growth through upper flange and upper
intermediate stiffener• Stress Intensity Factor (SIF) analysis
– Accounted for the stable crack growth in the upper flange and upper intermediate stiffener
• Crack growth analysis based on the SIF results– Determined the life that remains after upper end pad radius failure
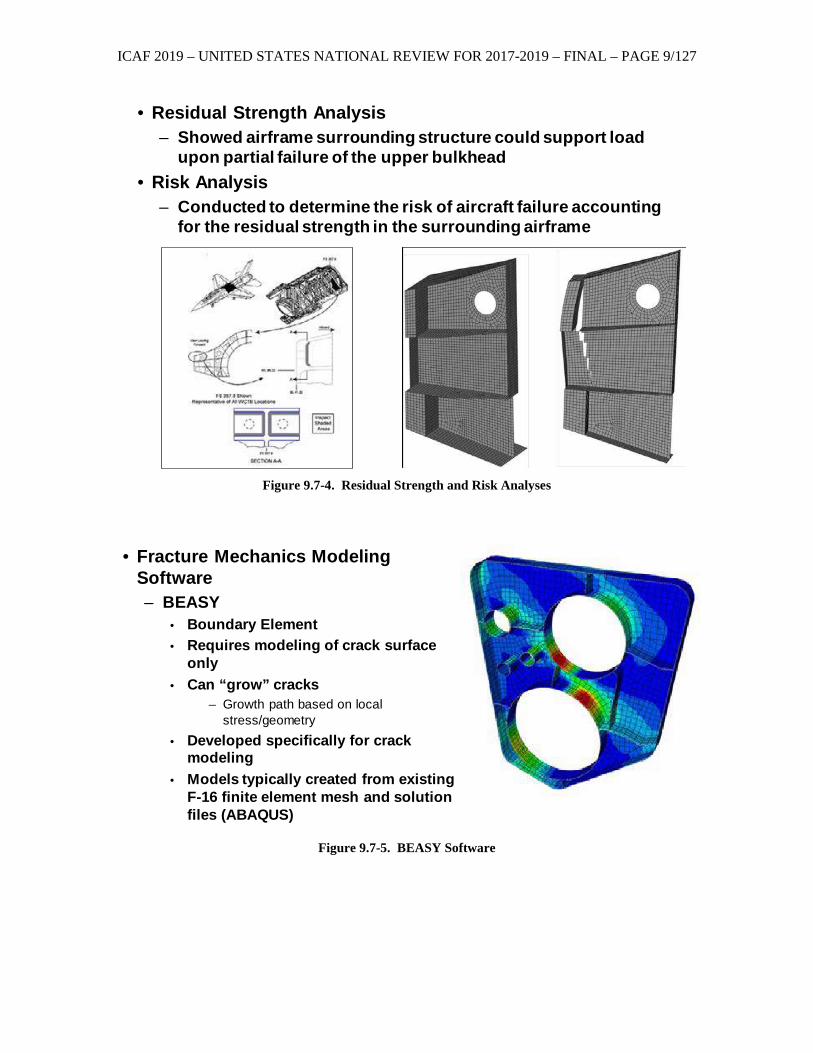
ICAF 2019 – UNITED STATES NATIONAL REVIEW FOR 2017-2019 – FINAL – PAGE 9/127
Figure 9.7-4. Residual Strength and Risk Analyses
Figure 9.7-5. BEASY Software
• Residual Strength Analysis – Showed airframe surrounding structure could support load
upon partial failure of the upper bulkhead• Risk Analysis
– Conducted to determine the risk of aircraft failure accounting for the residual strength in the surrounding airframe
• Fracture Mechanics Modeling Software– BEASY
• Boundary Element• Requires modeling of crack surface
only• Can “grow” cracks
– Growth path based on local stress/geometry
• Developed specifically for crack modeling
• Models typically created from existing F-16 finite element mesh and solution files (ABAQUS)
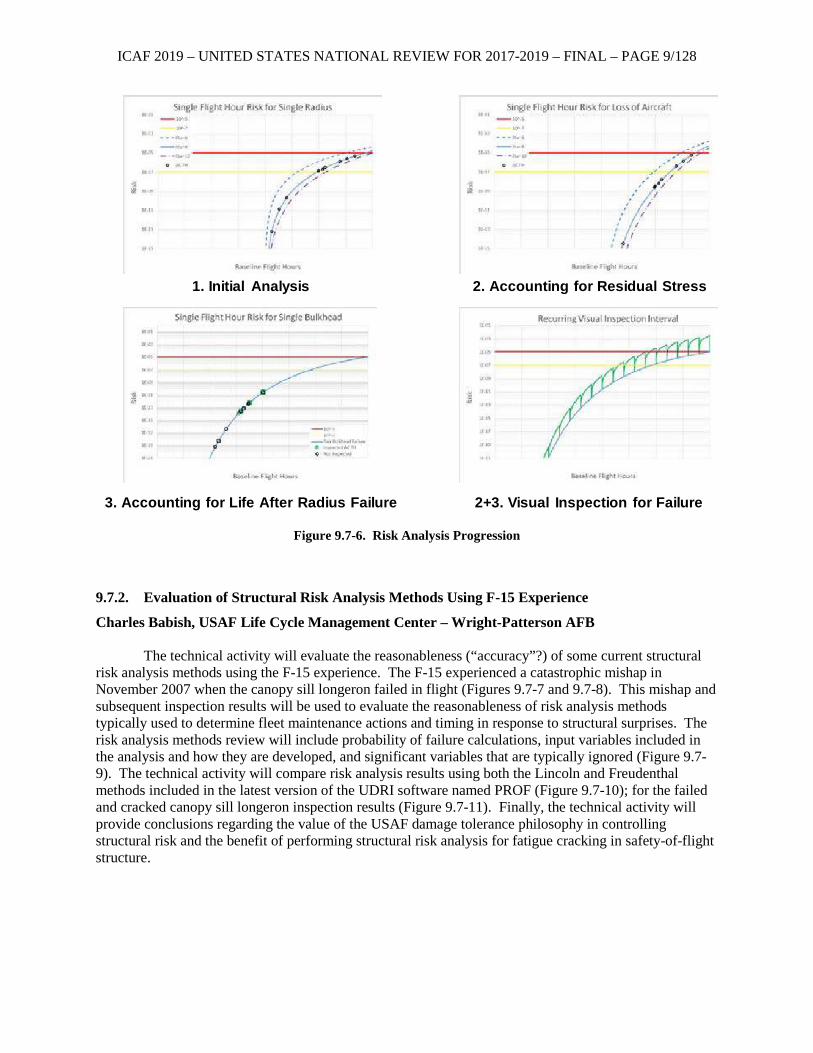
ICAF 2019 – UNITED STATES NATIONAL REVIEW FOR 2017-2019 – FINAL – PAGE 9/128
Figure 9.7-6. Risk Analysis Progression
9.7.2. Evaluation of Structural Risk Analysis Methods Using F-15 Experience
Charles Babish, USAF Life Cycle Management Center – Wright-Patterson AFB The technical activity will evaluate the reasonableness (“accuracy”?) of some current structural
risk analysis methods using the F-15 experience. The F-15 experienced a catastrophic mishap in November 2007 when the canopy sill longeron failed in flight (Figures 9.7-7 and 9.7-8). This mishap and subsequent inspection results will be used to evaluate the reasonableness of risk analysis methods typically used to determine fleet maintenance actions and timing in response to structural surprises. The risk analysis methods review will include probability of failure calculations, input variables included in the analysis and how they are developed, and significant variables that are typically ignored (Figure 9.7-9). The technical activity will compare risk analysis results using both the Lincoln and Freudenthal methods included in the latest version of the UDRI software named PROF (Figure 9.7-10); for the failed and cracked canopy sill longeron inspection results (Figure 9.7-11). Finally, the technical activity will provide conclusions regarding the value of the USAF damage tolerance philosophy in controlling structural risk and the benefit of performing structural risk analysis for fatigue cracking in safety-of-flight structure.
1. Initial Analysis
3. Accounting for Life After Radius Failure
2. Accounting for Residual Stress
2+3. Visual Inspection for Failure
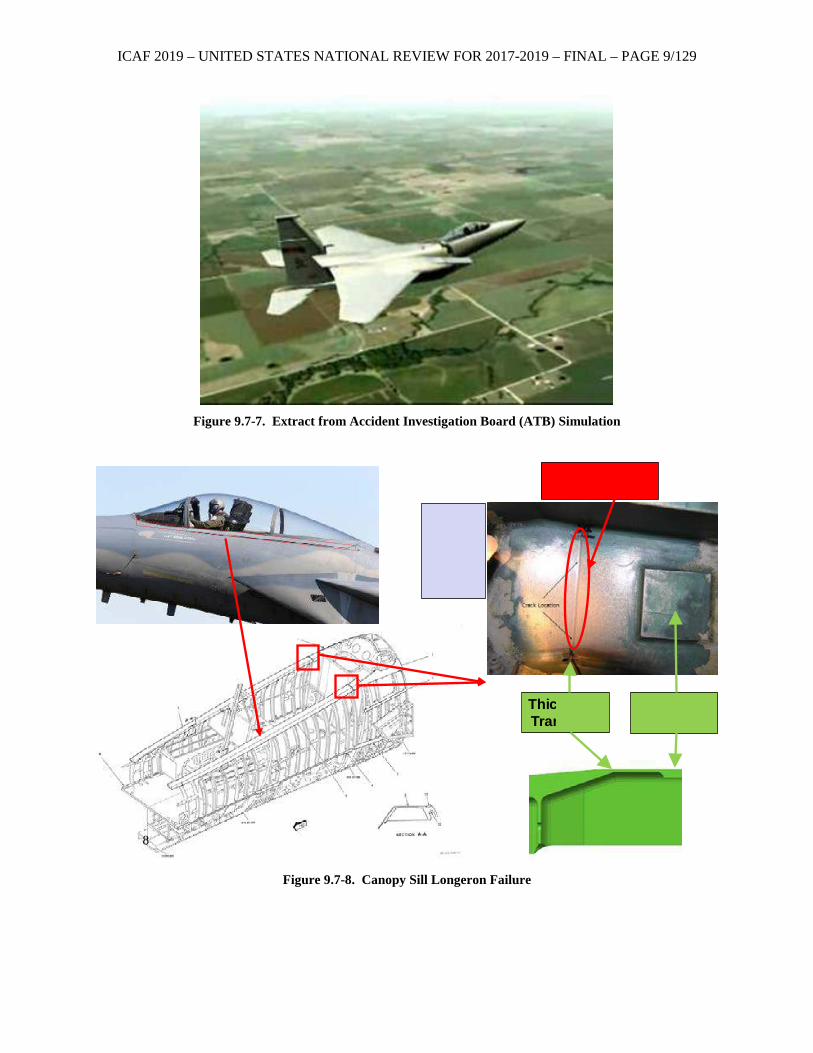
ICAF 2019 – UNITED STATES NATIONAL REVIEW FOR 2017-2019 – FINAL – PAGE 9/129
Figure 9.7-7. Extract from Accident Investigation Board (ATB) Simulation
Figure 9.7-8. Canopy Sill Longeron Failure
8
Thic Tran
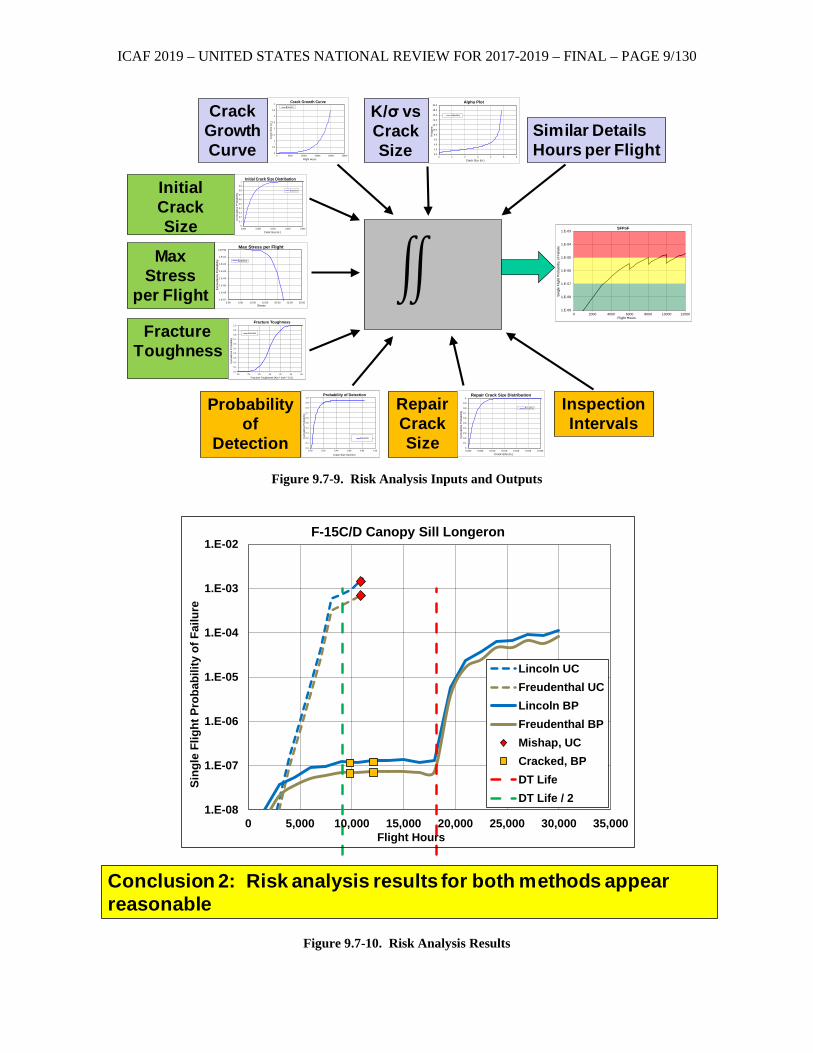
ICAF 2019 – UNITED STATES NATIONAL REVIEW FOR 2017-2019 – FINAL – PAGE 9/130
Figure 9.7-9. Risk Analysis Inputs and Outputs
Figure 9.7-10. Risk Analysis Results
1.E-09
1.E-08
1.E-07
1.E-06
1.E-05
1.E-04
1.E-03
0 2000 4000 6000 8000 10000 12000
Sing
le F
light
Pro
babi
lity
of F
ailu
re
Flight Hours
SFPoF
Similar DetailsHours per Flight0.0
2.0
4.0
6.0
8.0
10.0
12.0
14.0
16.0
18.0
20.0
0 1 2 3 4 5 6
K/si
gma
Crack Size (in.)
Alpha Plot
BaselineK/σ vs Crack Size
1.E-07
1.E-06
1.E-05
1.E-04
1.E-03
1.E-02
1.E-01
1.E+00
0.00 5.00 10.00 15.00 20.00 25.00 30.00
Exce
edan
ce P
roba
bilit
y
Stress
Max Stress per Flight
BaselineMax Stress
per Flight
Initial Crack Size 0
0.1
0.2
0.3
0.4
0.5
0.6
0.7
0.8
0.9
1
0.000 0.005 0.010 0.015 0.020
Cum
ulat
ive
Pro
babi
lity
Crack Size (in.)
Initial Crack Size Distribution
Baseline
0.0
0.1
0.2
0.3
0.4
0.5
0.6
0.7
0.8
0.9
1.0
0.00 0.20 0.40 0.60 0.80 1.00
Cum
ulat
ive
Prob
abilit
y
Crack Size (Inches)
Probability of Detection
Baseline
Probability of
Detection
Inspection Intervals
0
0.5
1
1.5
2
2.5
3
3.5
4
0 5000 10000 15000 20000 25000
Cra
ck S
ize
(in.)
Flight Hours
Crack Growth CurveBaselineCrack
Growth Curve
Fracture Toughness
0.0
0.1
0.2
0.3
0.4
0.5
0.6
0.7
0.8
0.9
1.0
20 25 30 35 40 45 50
Cum
ulat
ive
Prob
abilit
y
Fracture Toughness (Ksi * Inch ^ 0.5)
Fracture Toughness
Baseline
Repair Crack Size 0
0.1
0.2
0.3
0.4
0.5
0.6
0.7
0.8
0.9
1
0.000 0.005 0.010 0.015 0.020 0.025 0.030
Cum
ulat
ive
Prob
abilit
y
Crack Size (in.)
Repair Crack Size Distribution
Baseline
Conclusion 2: Risk analysis results for both methods appear reasonable
1.E-08
1.E-07
1.E-06
1.E-05
1.E-04
1.E-03
1.E-02
0 5,000 10,000 15,000 20,000 25,000 30,000 35,000
Sing
le F
light
Pro
babi
lity
of F
ailu
re
Flight Hours
F-15C/D Canopy Sill Longeron
Lincoln UCFreudenthal UCLincoln BPFreudenthal BPMishap, UCCracked, BPDT LifeDT Life / 2
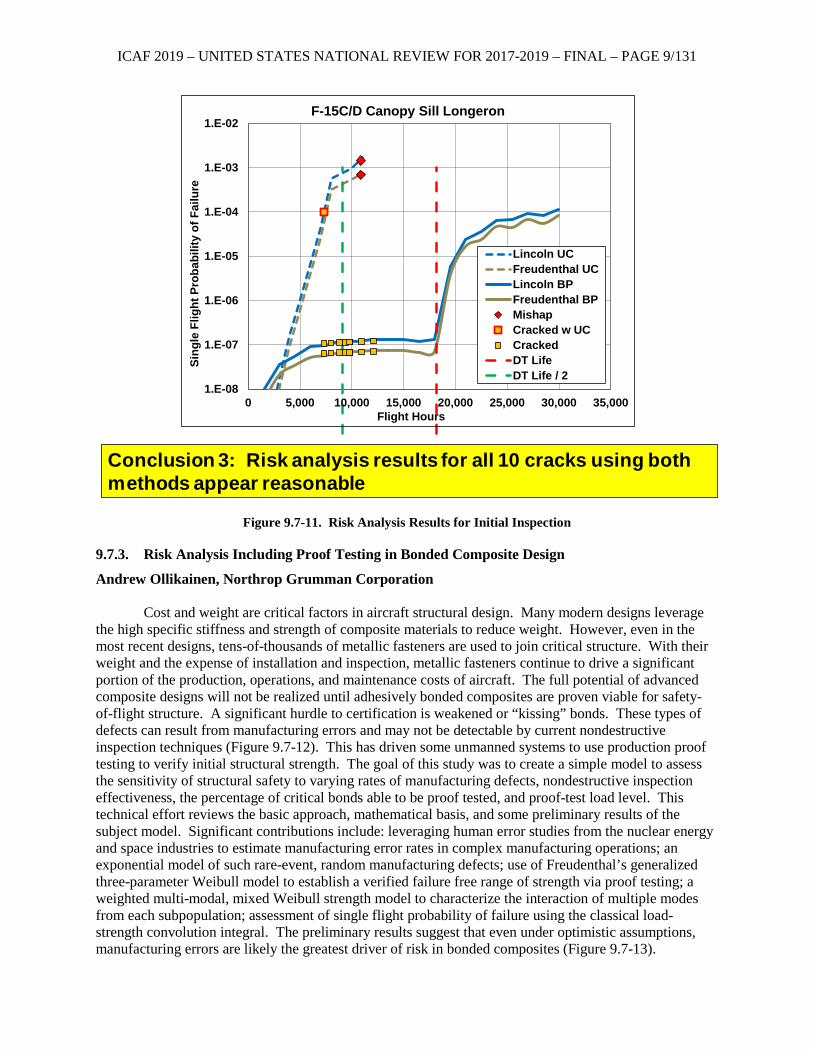
ICAF 2019 – UNITED STATES NATIONAL REVIEW FOR 2017-2019 – FINAL – PAGE 9/131
Figure 9.7-11. Risk Analysis Results for Initial Inspection
9.7.3. Risk Analysis Including Proof Testing in Bonded Composite Design
Andrew Ollikainen, Northrop Grumman Corporation Cost and weight are critical factors in aircraft structural design. Many modern designs leverage
the high specific stiffness and strength of composite materials to reduce weight. However, even in the most recent designs, tens-of-thousands of metallic fasteners are used to join critical structure. With their weight and the expense of installation and inspection, metallic fasteners continue to drive a significant portion of the production, operations, and maintenance costs of aircraft. The full potential of advanced composite designs will not be realized until adhesively bonded composites are proven viable for safety-of-flight structure. A significant hurdle to certification is weakened or “kissing” bonds. These types of defects can result from manufacturing errors and may not be detectable by current nondestructive inspection techniques (Figure 9.7-12). This has driven some unmanned systems to use production proof testing to verify initial structural strength. The goal of this study was to create a simple model to assess the sensitivity of structural safety to varying rates of manufacturing defects, nondestructive inspection effectiveness, the percentage of critical bonds able to be proof tested, and proof-test load level. This technical effort reviews the basic approach, mathematical basis, and some preliminary results of the subject model. Significant contributions include: leveraging human error studies from the nuclear energy and space industries to estimate manufacturing error rates in complex manufacturing operations; an exponential model of such rare-event, random manufacturing defects; use of Freudenthal’s generalized three-parameter Weibull model to establish a verified failure free range of strength via proof testing; a weighted multi-modal, mixed Weibull strength model to characterize the interaction of multiple modes from each subpopulation; assessment of single flight probability of failure using the classical load-strength convolution integral. The preliminary results suggest that even under optimistic assumptions, manufacturing errors are likely the greatest driver of risk in bonded composites (Figure 9.7-13).
1.E-08
1.E-07
1.E-06
1.E-05
1.E-04
1.E-03
1.E-02
0 5,000 10,000 15,000 20,000 25,000 30,000 35,000
Sing
le F
light
Pro
babi
lity
of F
ailu
re
Flight Hours
F-15C/D Canopy Sill Longeron
Lincoln UCFreudenthal UCLincoln BPFreudenthal BPMishapCracked w UCCrackedDT LifeDT Life / 2
Conclusion 3: Risk analysis results for all 10 cracks using both methods appear reasonable
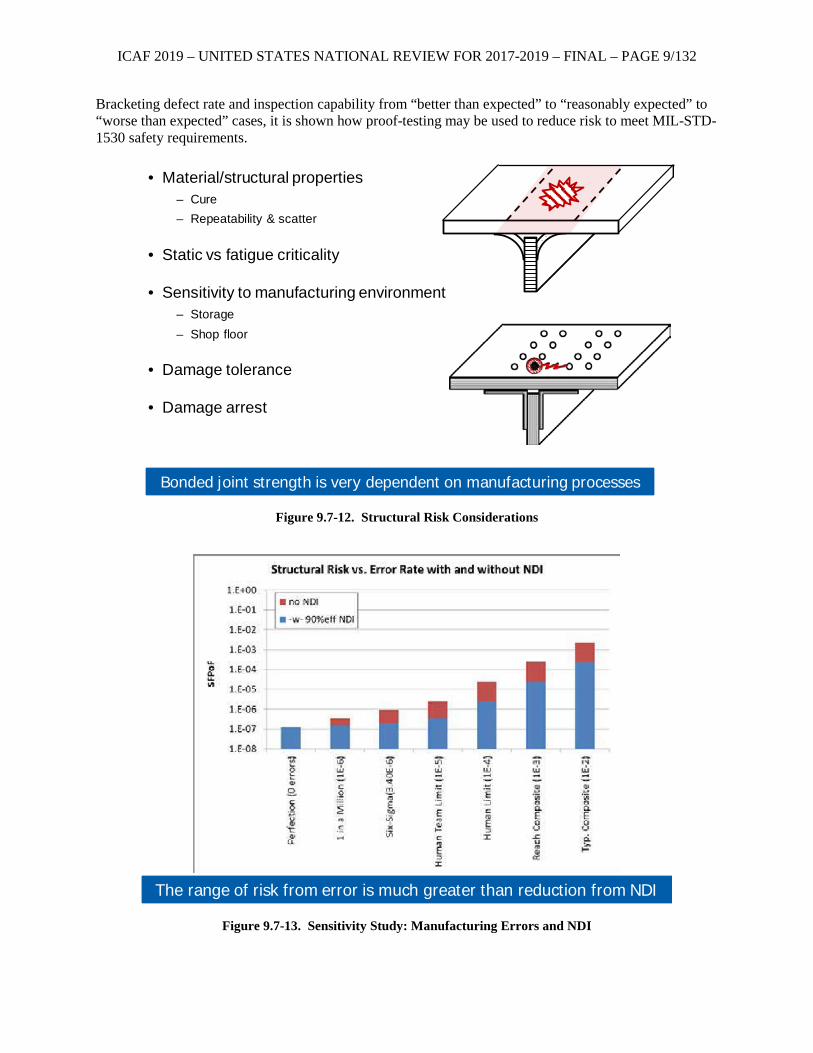
ICAF 2019 – UNITED STATES NATIONAL REVIEW FOR 2017-2019 – FINAL – PAGE 9/132
Bracketing defect rate and inspection capability from “better than expected” to “reasonably expected” to “worse than expected” cases, it is shown how proof-testing may be used to reduce risk to meet MIL-STD-1530 safety requirements.
Figure 9.7-12. Structural Risk Considerations
Figure 9.7-13. Sensitivity Study: Manufacturing Errors and NDI
Bonded joint strength is very dependent on manufacturing processes
• Material/structural properties– Cure– Repeatability & scatter
• Static vs fatigue criticality
• Sensitivity to manufacturing environment– Storage– Shop floor
• Damage tolerance
• Damage arrest
The range of risk from error is much greater than reduction from NDI
ICAF 2019 – UNITED STATES NATIONAL REVIEW FOR 2017-2019 – FINAL – PAGE 9/133
9.7.4. Risk Assessment and Risk Management Methods for Small Airplane COS, SMART Software
Sohrob Mottaghi, FAA William J. Hughes Technical Center; Michael Reyer, FAA Small Airplane Directorate; Harry Millwater, University of Texas at San Antonio; Juan Ocampo, St. Mary’s University
The objective of this activity is to develop the Small Aircraft Risk Technology and Software (SMART). The SMART software is based on a standardized Continued Operational Safety (COS) risk assessment method for small and transport airplanes that is consistent with the FAA safety management principles. It is focused on developing state-of-the-art software that uses advanced statistical and probabilistic methods in risk assessment and risk management of structural issues in general aviation. The outcome of this project will assist the FAA and industry to proactively manage the risk associated with fatigue failure.
The general aviation (GA) aircraft can be traced to more than 100 manufacturers, some of which no longer exist. The GA fleet includes approximately 150,000 airplanes that were certified with no fatigue evaluation requirements. The average age of the GA fleet was approximately 40 years in 2010, and the projected average fleet age will reach close to 50 years in 2020. During the past decade, the effects of aging on GA airplanes have caused primary component failures, some of which led to fatal accidents. As a result, the Small Airplane Directorate has recognized both the need to address the aging issues and that the GA community needs methods and tools to develop adequate fatigue management programs. The principle goal of this requirement is to mitigate the risk associated with fatigue failure.
In 2006, the FAA’s roadmap for GA aging airplanes specified that the FAA shall initiate the development of risk-assessment and risk-management methods in fiscal year 2007 (FY07) and continue developing them beyond FY09 [1]. In 2009, the FAA issued a report on recommendations for GA for the next 20 years [2]. Finding 3.1 of this report states that the Instruction for Continued Airworthiness (at the time the report was written) assumes static airplane condition (i.e., factory new). Therefore, the recommendation was made that airframe and system degradation associated with aging must be considered. Given the large and diverse GA fleet with little information regarding fatigue, the FAA has understood the need to develop tools that can proactively assess and mitigate the risk. To do so, statistical risk analyses are required to be performed on various measurable events that are related to undesirable events. Therefore, various probabilities must be estimated with regard to individual risk and fleet risk to establish a maintenance schedule. This is one of the goals of this multi-year project.
The Small Airplane Directorate has been committed to developing the tools required to overcome these issues. Therefore, the FAA has partnered with the University of Texas at San Antonio and completed three phases of this project between 2007 and 2016 (the fourth phase is currently in progress) as follows:
Phase 1. FY 07-11: Developed SMART|LD software, based on Linear Damage (LD) methodology, for probabilistic fatigue analysis for small airplanes.
Phase 2. FY 09-13: Developed the methodology for SMART|DT software, based on probabilistic Damage Tolerance (DT) concept, for risk assessments and including the tool that enables the assessment of the effect of inspection and repair on the risk and other required random variables.
Phase 3. FY12-16: Verification with in-service findings and developing numerical tools for decreasing the computational time.
Phase 4. FY17-21: Incorporate methodologies developed in Phase 3 into the software, improve the definition of random variables and gather the best available data, develop a crack-growth code internal to the software, develop a graphic user-interface (GUI), and complete a comprehensive training package (Figure 9.7-14).
Phase 4 was started during FY17 as planned and currently is on schedule. An interested reader may refer to [3–8] for more information.
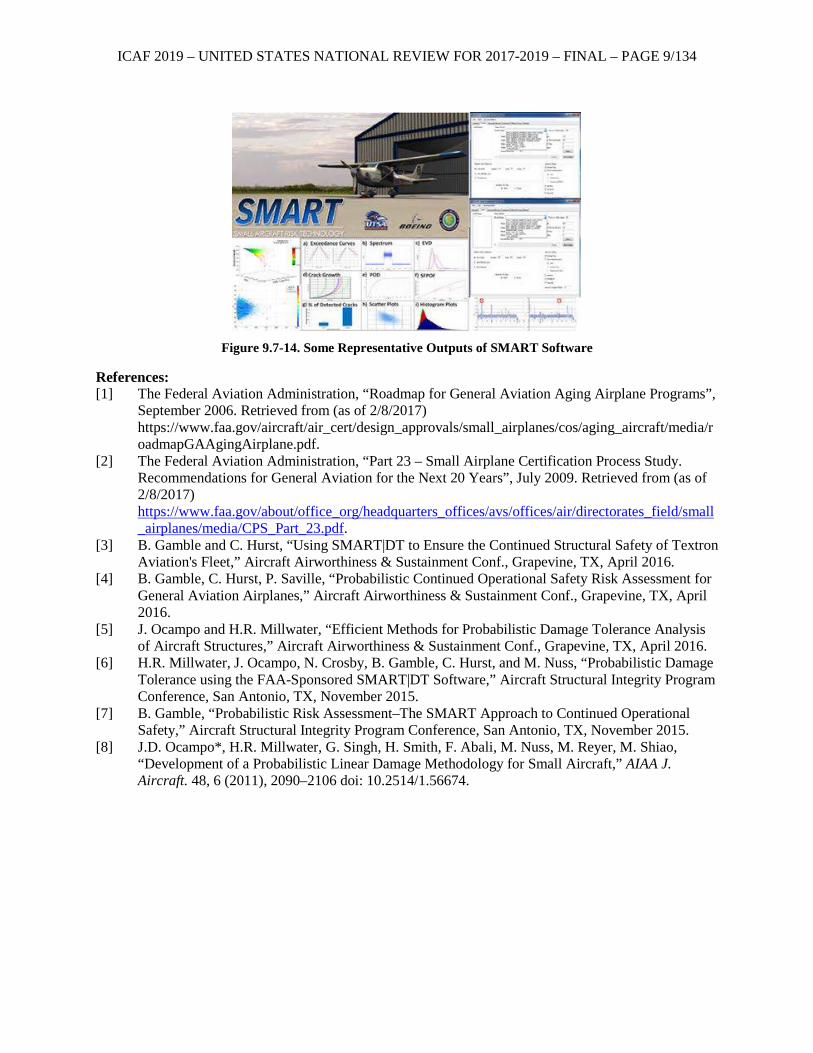
ICAF 2019 – UNITED STATES NATIONAL REVIEW FOR 2017-2019 – FINAL – PAGE 9/134
Figure 9.7-14. Some Representative Outputs of SMART Software
References: [1] The Federal Aviation Administration, “Roadmap for General Aviation Aging Airplane Programs”,
September 2006. Retrieved from (as of 2/8/2017) https://www.faa.gov/aircraft/air_cert/design_approvals/small_airplanes/cos/aging_aircraft/media/roadmapGAAgingAirplane.pdf.
[2] The Federal Aviation Administration, “Part 23 – Small Airplane Certification Process Study. Recommendations for General Aviation for the Next 20 Years”, July 2009. Retrieved from (as of 2/8/2017) https://www.faa.gov/about/office_org/headquarters_offices/avs/offices/air/directorates_field/small_airplanes/media/CPS_Part_23.pdf.
[3] B. Gamble and C. Hurst, “Using SMART|DT to Ensure the Continued Structural Safety of Textron Aviation's Fleet,” Aircraft Airworthiness & Sustainment Conf., Grapevine, TX, April 2016.
[4] B. Gamble, C. Hurst, P. Saville, “Probabilistic Continued Operational Safety Risk Assessment for General Aviation Airplanes,” Aircraft Airworthiness & Sustainment Conf., Grapevine, TX, April 2016.
[5] J. Ocampo and H.R. Millwater, “Efficient Methods for Probabilistic Damage Tolerance Analysis of Aircraft Structures,” Aircraft Airworthiness & Sustainment Conf., Grapevine, TX, April 2016.
[6] H.R. Millwater, J. Ocampo, N. Crosby, B. Gamble, C. Hurst, and M. Nuss, “Probabilistic Damage Tolerance using the FAA-Sponsored SMART|DT Software,” Aircraft Structural Integrity Program Conference, San Antonio, TX, November 2015.
[7] B. Gamble, “Probabilistic Risk Assessment–The SMART Approach to Continued Operational Safety,” Aircraft Structural Integrity Program Conference, San Antonio, TX, November 2015.
[8] J.D. Ocampo*, H.R. Millwater, G. Singh, H. Smith, F. Abali, M. Nuss, M. Reyer, M. Shiao, “Development of a Probabilistic Linear Damage Methodology for Small Aircraft,” AIAA J. Aircraft. 48, 6 (2011), 2090–2106 doi: 10.2514/1.56674.
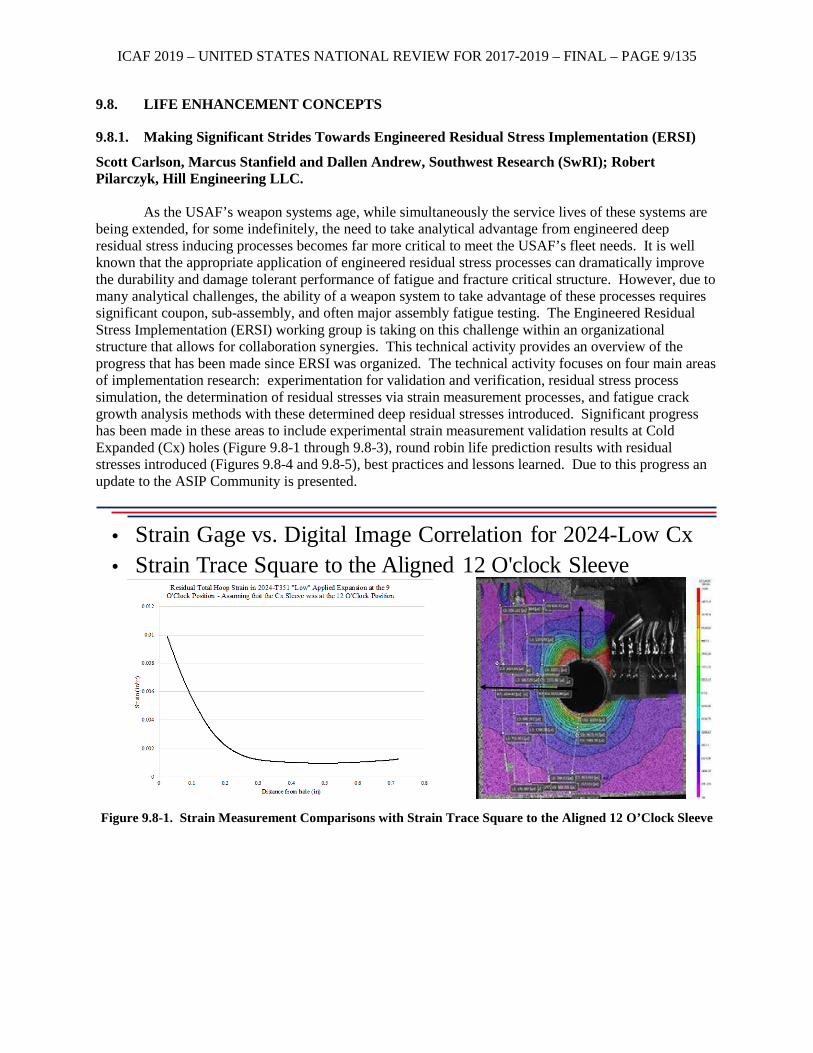
ICAF 2019 – UNITED STATES NATIONAL REVIEW FOR 2017-2019 – FINAL – PAGE 9/135
9.8. LIFE ENHANCEMENT CONCEPTS
9.8.1. Making Significant Strides Towards Engineered Residual Stress Implementation (ERSI)
Scott Carlson, Marcus Stanfield and Dallen Andrew, Southwest Research (SwRI); Robert Pilarczyk, Hill Engineering LLC.
As the USAF’s weapon systems age, while simultaneously the service lives of these systems are
being extended, for some indefinitely, the need to take analytical advantage from engineered deep residual stress inducing processes becomes far more critical to meet the USAF’s fleet needs. It is well known that the appropriate application of engineered residual stress processes can dramatically improve the durability and damage tolerant performance of fatigue and fracture critical structure. However, due to many analytical challenges, the ability of a weapon system to take advantage of these processes requires significant coupon, sub-assembly, and often major assembly fatigue testing. The Engineered Residual Stress Implementation (ERSI) working group is taking on this challenge within an organizational structure that allows for collaboration synergies. This technical activity provides an overview of the progress that has been made since ERSI was organized. The technical activity focuses on four main areas of implementation research: experimentation for validation and verification, residual stress process simulation, the determination of residual stresses via strain measurement processes, and fatigue crack growth analysis methods with these determined deep residual stresses introduced. Significant progress has been made in these areas to include experimental strain measurement validation results at Cold Expanded (Cx) holes (Figure 9.8-1 through 9.8-3), round robin life prediction results with residual stresses introduced (Figures 9.8-4 and 9.8-5), best practices and lessons learned. Due to this progress an update to the ASIP Community is presented.
Figure 9.8-1. Strain Measurement Comparisons with Strain Trace Square to the Aligned 12 O’Clock Sleeve
• Strain Gage vs. Digital Image Correlation for 2024-Low Cx• Strain Trace Square to the Aligned 12 O'clock Sleeve
Position
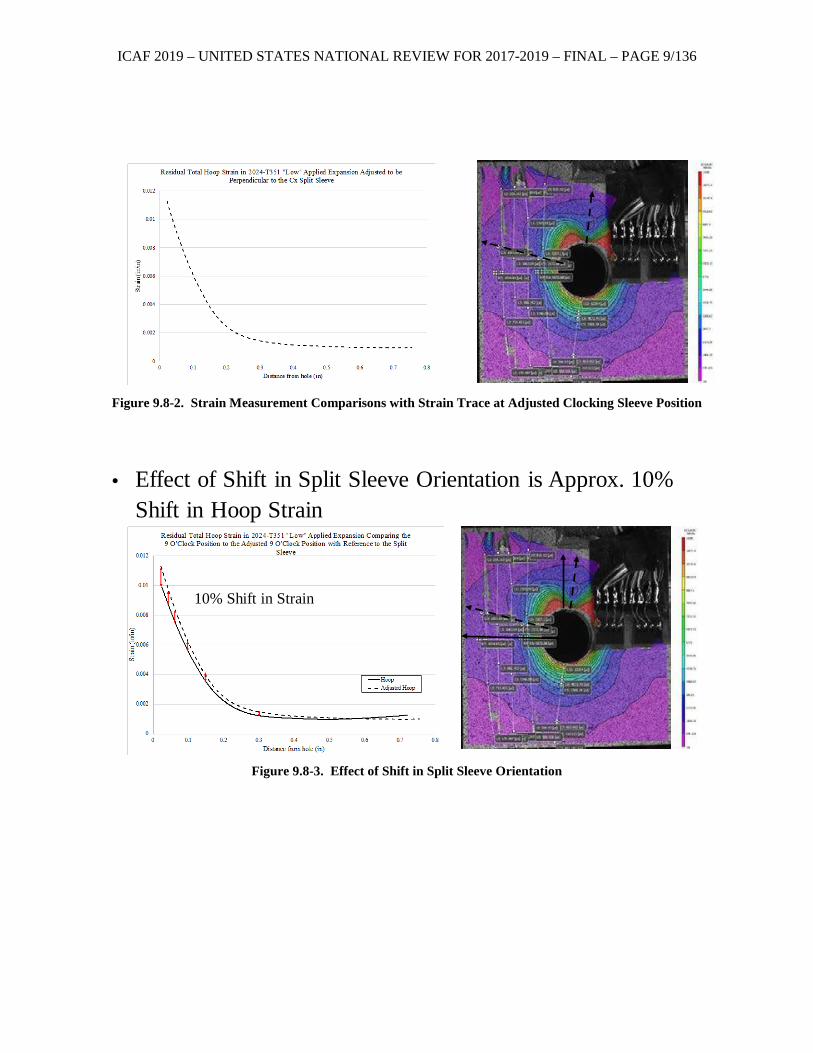
ICAF 2019 – UNITED STATES NATIONAL REVIEW FOR 2017-2019 – FINAL – PAGE 9/136
Figure 9.8-2. Strain Measurement Comparisons with Strain Trace at Adjusted Clocking Sleeve Position
Figure 9.8-3. Effect of Shift in Split Sleeve Orientation
• Effect of Shift in Split Sleeve Orientation is Approx. 10% Shift in Hoop Strain
10% Shift in Strain
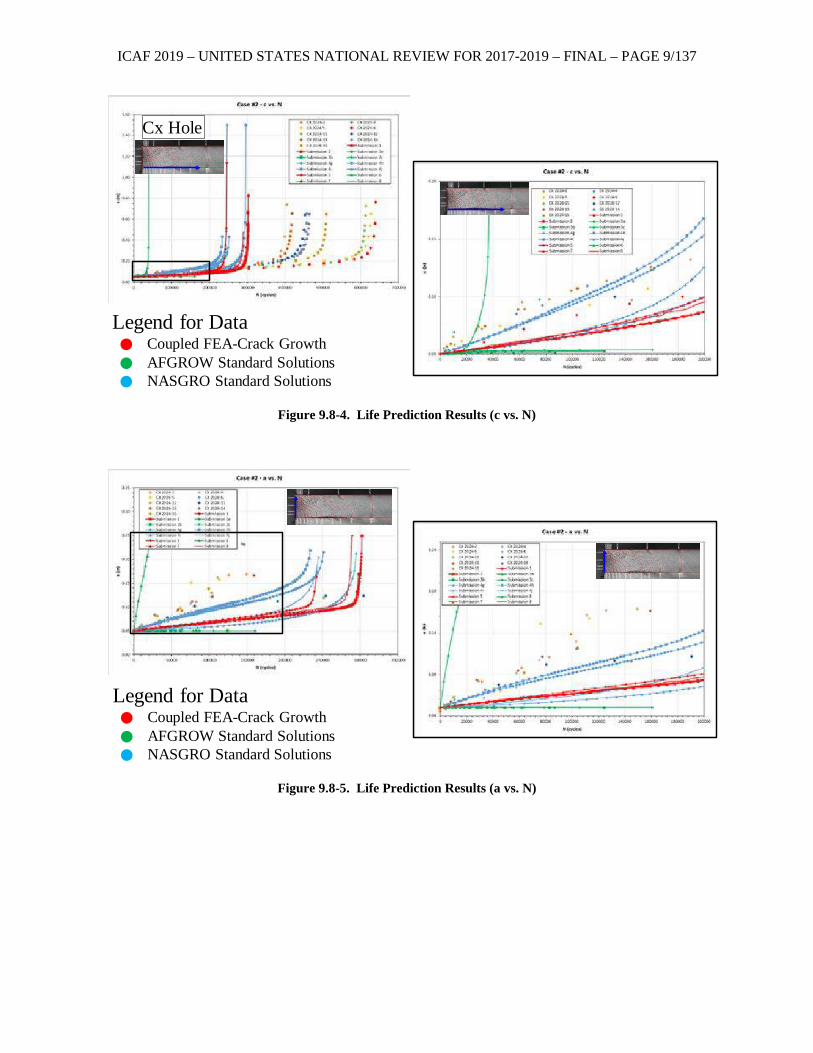
ICAF 2019 – UNITED STATES NATIONAL REVIEW FOR 2017-2019 – FINAL – PAGE 9/137
Figure 9.8-4. Life Prediction Results (c vs. N)
Figure 9.8-5. Life Prediction Results (a vs. N)
Cx Hole
Legend for Data• Coupled FEA-Crack Growth• AFGROW Standard Solutions• NASGRO Standard Solutions
Legend for Data• Coupled FEA-Crack Growth• AFGROW Standard Solutions• NASGRO Standard Solutions
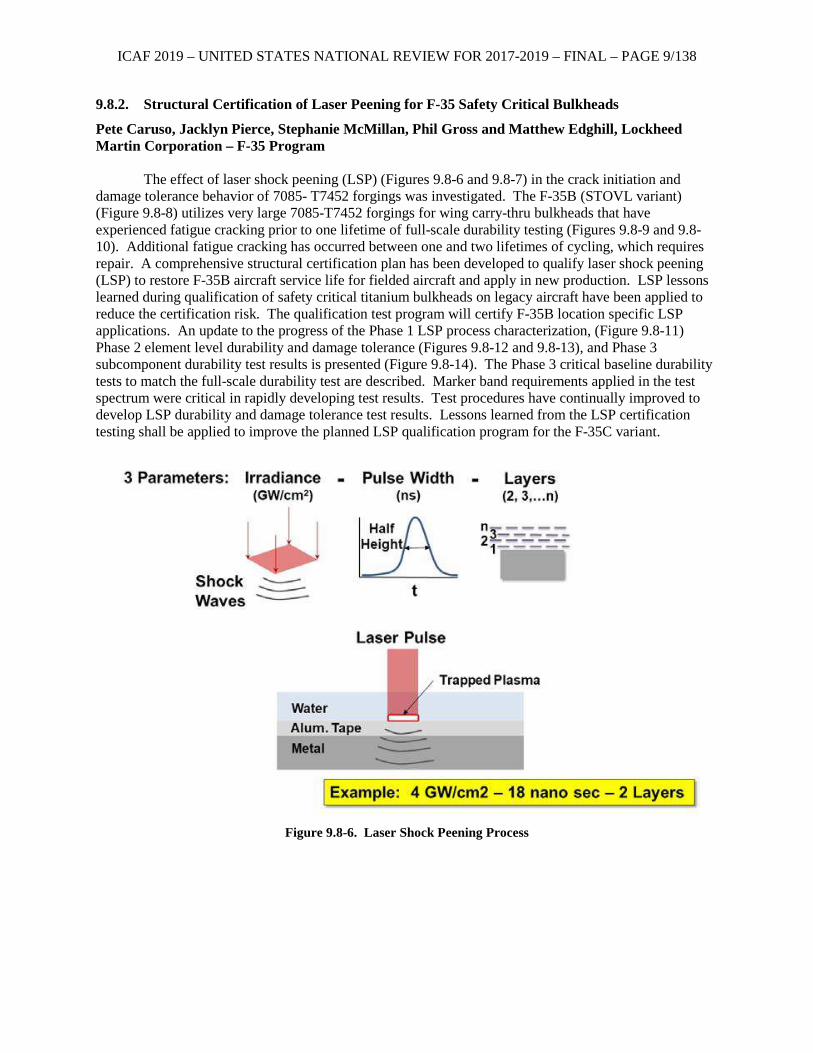
ICAF 2019 – UNITED STATES NATIONAL REVIEW FOR 2017-2019 – FINAL – PAGE 9/138
9.8.2. Structural Certification of Laser Peening for F-35 Safety Critical Bulkheads
Pete Caruso, Jacklyn Pierce, Stephanie McMillan, Phil Gross and Matthew Edghill, Lockheed Martin Corporation – F-35 Program
The effect of laser shock peening (LSP) (Figures 9.8-6 and 9.8-7) in the crack initiation and damage tolerance behavior of 7085- T7452 forgings was investigated. The F-35B (STOVL variant) (Figure 9.8-8) utilizes very large 7085-T7452 forgings for wing carry-thru bulkheads that have experienced fatigue cracking prior to one lifetime of full-scale durability testing (Figures 9.8-9 and 9.8-10). Additional fatigue cracking has occurred between one and two lifetimes of cycling, which requires repair. A comprehensive structural certification plan has been developed to qualify laser shock peening (LSP) to restore F-35B aircraft service life for fielded aircraft and apply in new production. LSP lessons learned during qualification of safety critical titanium bulkheads on legacy aircraft have been applied to reduce the certification risk. The qualification test program will certify F-35B location specific LSP applications. An update to the progress of the Phase 1 LSP process characterization, (Figure 9.8-11) Phase 2 element level durability and damage tolerance (Figures 9.8-12 and 9.8-13), and Phase 3 subcomponent durability test results is presented (Figure 9.8-14). The Phase 3 critical baseline durability tests to match the full-scale durability test are described. Marker band requirements applied in the test spectrum were critical in rapidly developing test results. Test procedures have continually improved to develop LSP durability and damage tolerance test results. Lessons learned from the LSP certification testing shall be applied to improve the planned LSP qualification program for the F-35C variant.
Figure 9.8-6. Laser Shock Peening Process
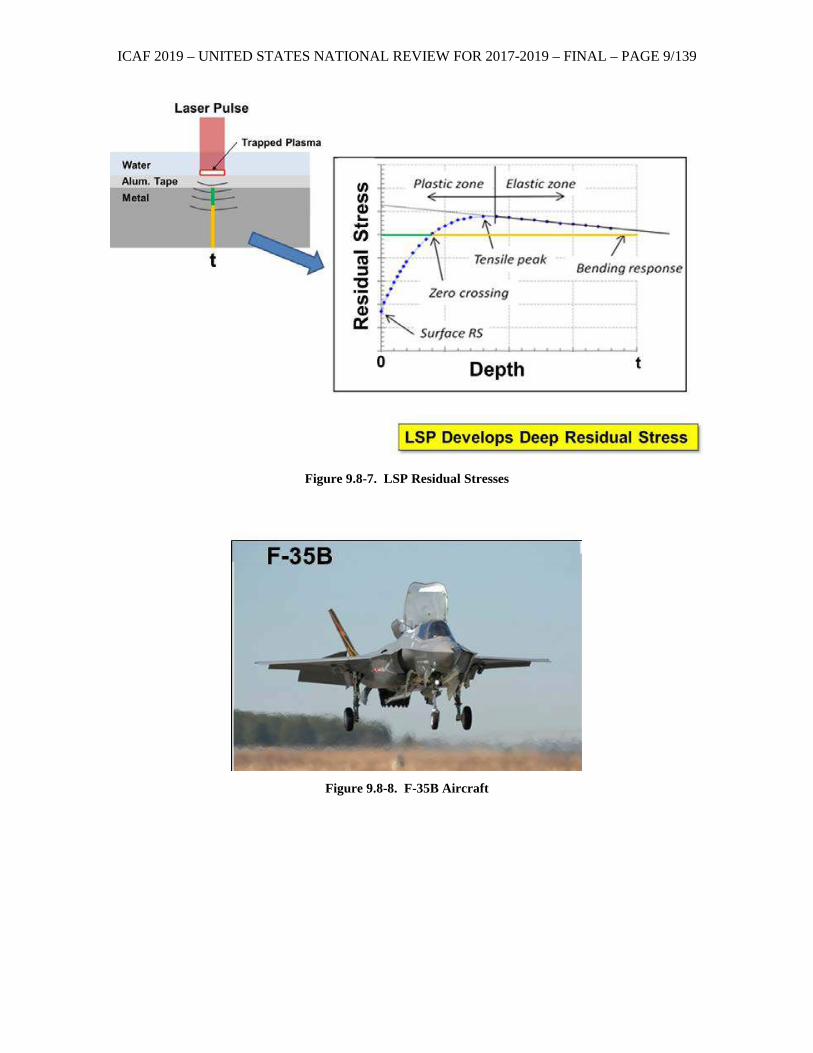
ICAF 2019 – UNITED STATES NATIONAL REVIEW FOR 2017-2019 – FINAL – PAGE 9/139
Figure 9.8-7. LSP Residual Stresses
Figure 9.8-8. F-35B Aircraft
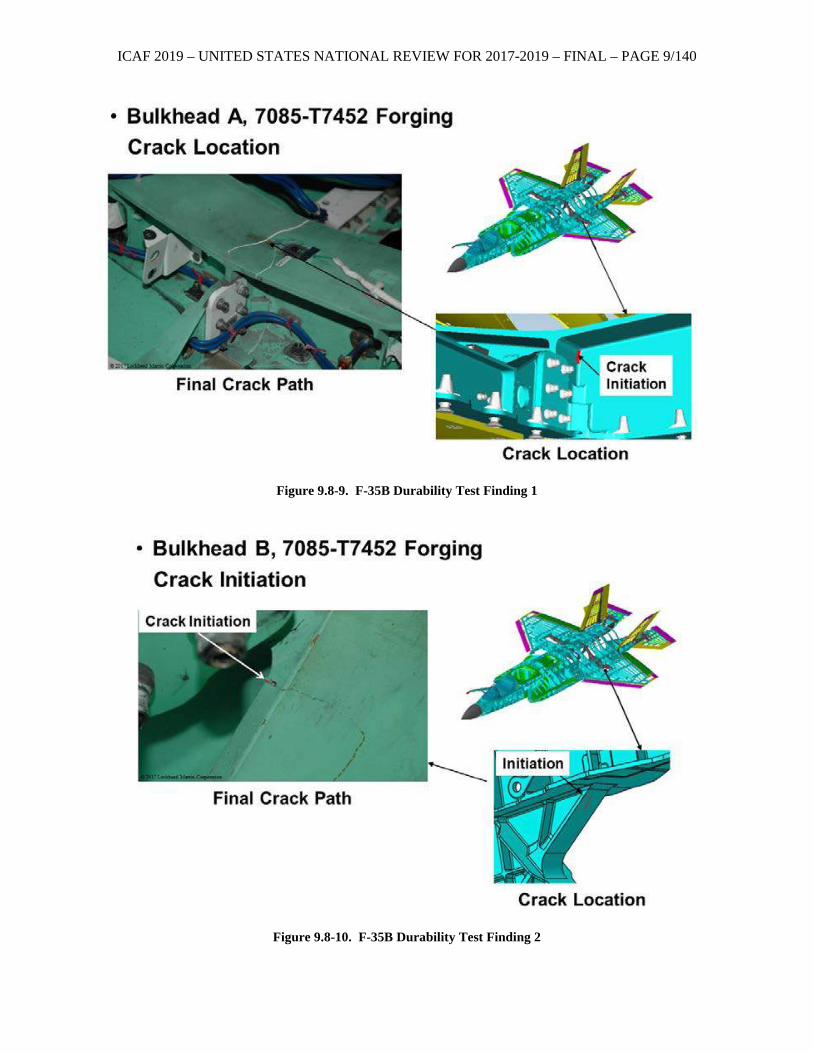
ICAF 2019 – UNITED STATES NATIONAL REVIEW FOR 2017-2019 – FINAL – PAGE 9/140
Figure 9.8-9. F-35B Durability Test Finding 1
Figure 9.8-10. F-35B Durability Test Finding 2
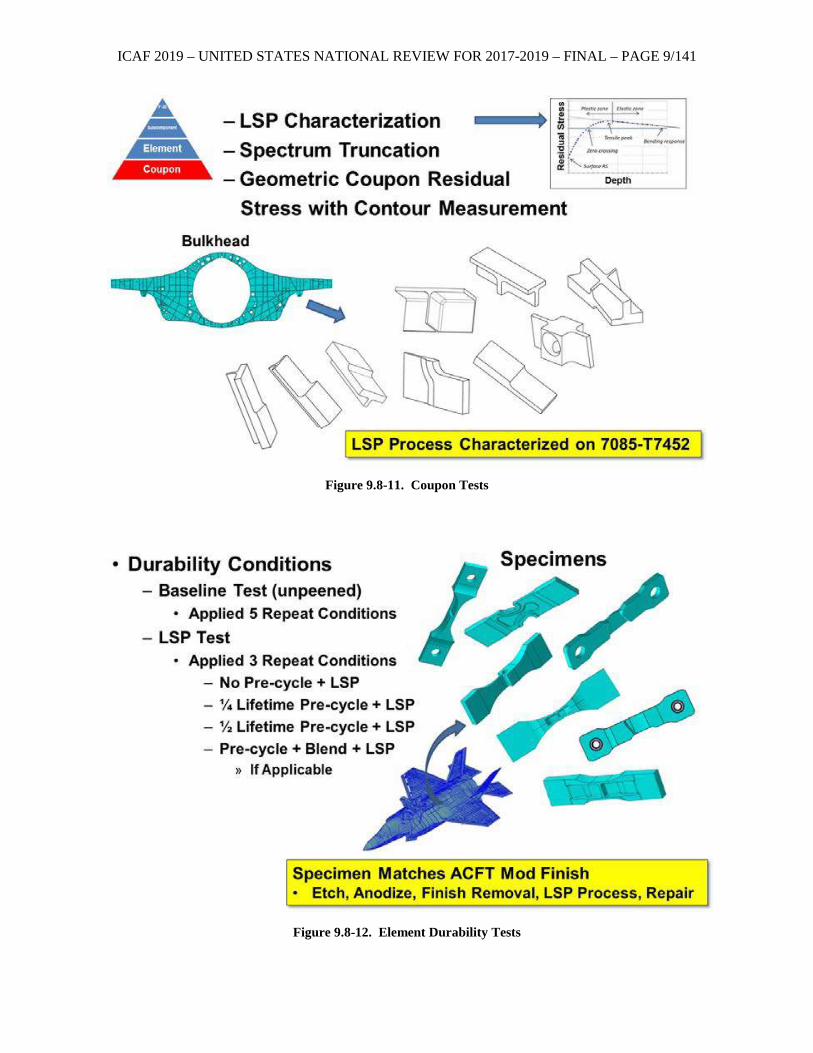
ICAF 2019 – UNITED STATES NATIONAL REVIEW FOR 2017-2019 – FINAL – PAGE 9/141
Figure 9.8-11. Coupon Tests
Figure 9.8-12. Element Durability Tests
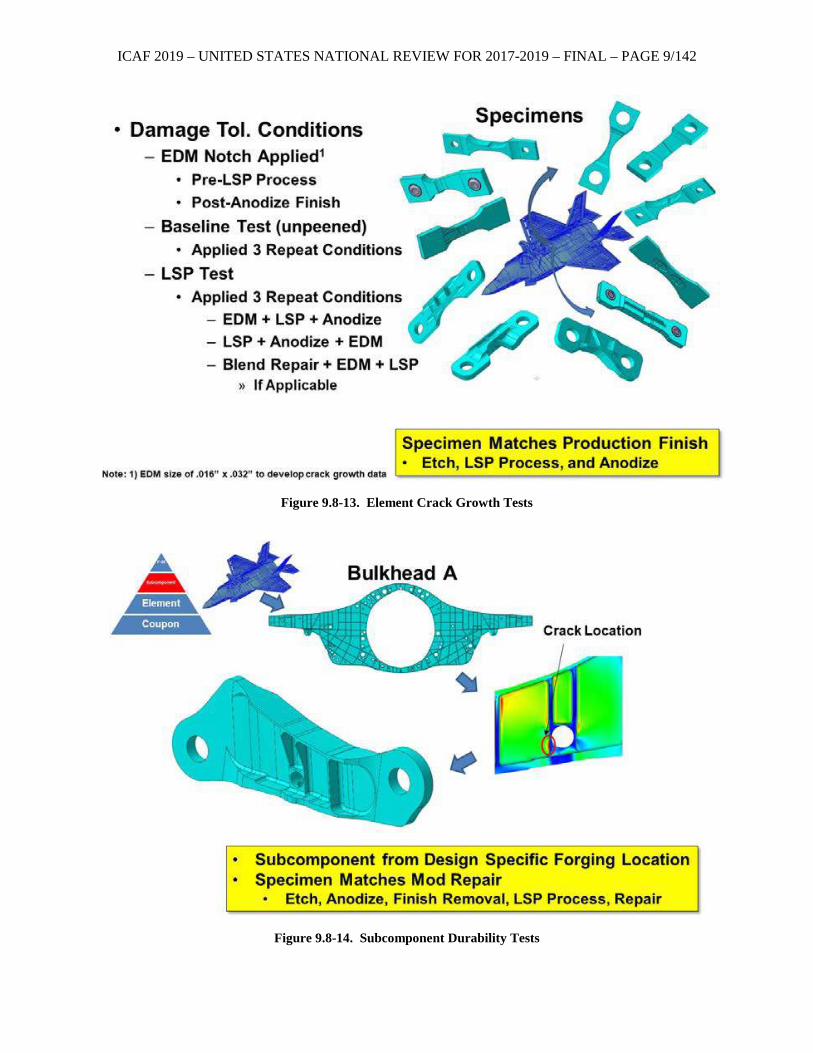
ICAF 2019 – UNITED STATES NATIONAL REVIEW FOR 2017-2019 – FINAL – PAGE 9/142
Figure 9.8-13. Element Crack Growth Tests
Figure 9.8-14. Subcomponent Durability Tests
ICAF 2019 – UNITED STATES NATIONAL REVIEW FOR 2017-2019 – FINAL – PAGE 9/143
9.8.3. Demonstrating the Crack Growth Benefit of Cold Working Large Diameter Holes
Jacob Warner, USAF Life Cycle Management Center – A-10 ASIP; Jeff Bunch, The Boeing Company – Boeing Global Services
Cold expanding holes is a common method used to improve fatigue capability in aircraft structure. It is common practice in aerospace manufacturing to only utilize a portion of the test demonstrated benefit. This practice enables flexibility in dispositioning repairs later in the product life cycle. To facilitate ease of analysis the benefit is frequently defined as a life improvement factor effectively reducing the applied stress. Limits are commonly applied to the demonstrated damage tolerance benefit so that the damage tolerance life with cold working is no greater than the non-cold worked durability crack growth life. This practice for accounting for the life improvement benefit of cold working holes has been successfully implemented on many platforms since cold working was widely adopted as a no-weight gain method for improving structural life. The practice of applying life improvement factors or effective equivalent flaw sizes, however, does not account for the actual residual stress field which reduces the rate of crack growth. This becomes a challenge when applying cold working benefits to large diameter holes (Figure 9.8-15). The challenge arises from the fact that the proportion of cold work does not scale to larger diameter holes, i.e., there is a lower percentage of cold work applied to a 1 inch diameter hole. The bulk of published research and testing focuses on the benefit of split-sleeve cold expansion in smaller holes typical for aerospace fasteners, but recent analysis has shown that the same benefit is not necessarily scalable to larger holes (1-inch and larger). Confidence in cold expansion as a method to improve fatigue performance and its relative simplicity has led to its use in applications of ever increasing diameters. In recent years, the need to quantify the benefit of cold expansion of holes as large as 3 inches in aircraft structures has arisen. In order to quantify the benefit of cold working large holes, a test matrix comprising 24 specimens was developed. The specimens were open hole test specimens with holes spanning 4 diameters (0.25-inch, 0.75-inch, 1.5-inch, and 3.0-inch) and specimens were tested in the cold worked and non-cold worked conditions for each diameter (Figure 9.8-16). The material used for testing was a Ti-6Al-4V Beta Annealed material with a coarse grain structure optimized for slow crack growth properties. Including 0.l25” and 0.50” diameter holes allowed for data from the test matrix to be compared to other legacy test programs. Specimens were pre-cracked prior to cold working to replicate the scenario that a pre-existing flaw could be present at the time of cold working. Test results will be presented comparing the crack growth life improvements on the basis of hole size at similar cold expansion levels to illustrate the effect of hole diameter on cold work benefit (Figures 9.8-17 and 9.8-18). The methodology used to implement the life analysis methods for the purpose of reducing inspection burdens will be discussed.
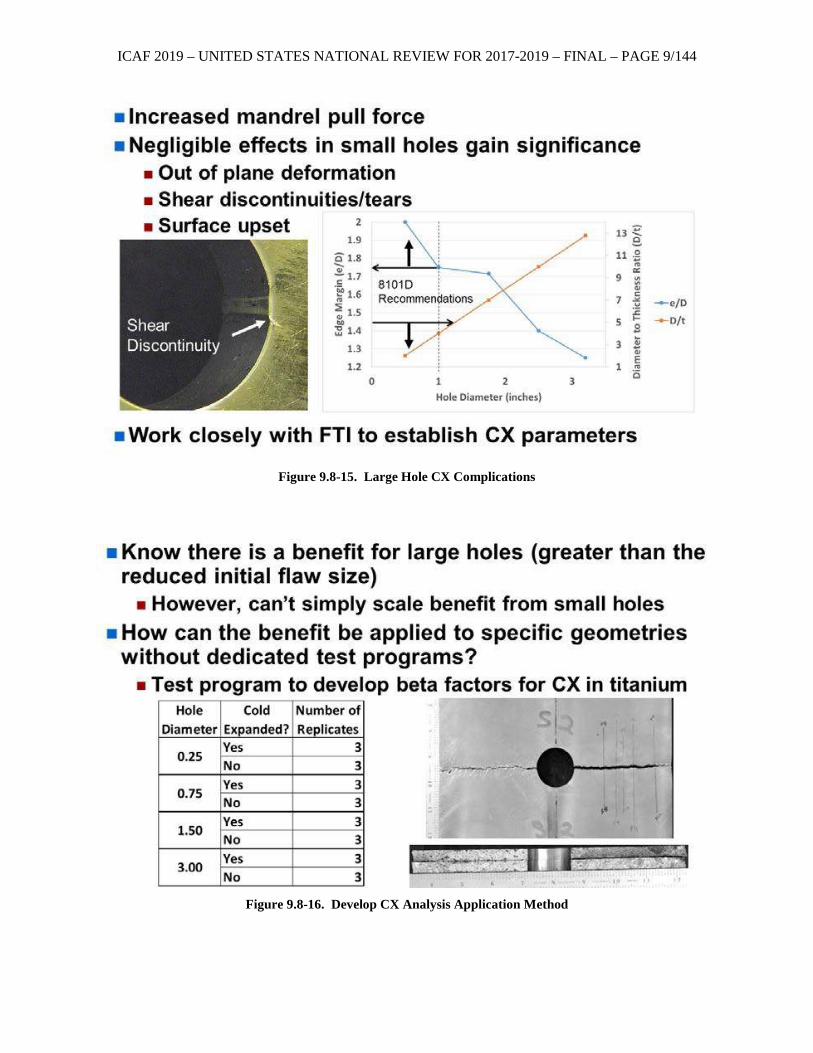
ICAF 2019 – UNITED STATES NATIONAL REVIEW FOR 2017-2019 – FINAL – PAGE 9/144
Figure 9.8-15. Large Hole CX Complications
Figure 9.8-16. Develop CX Analysis Application Method
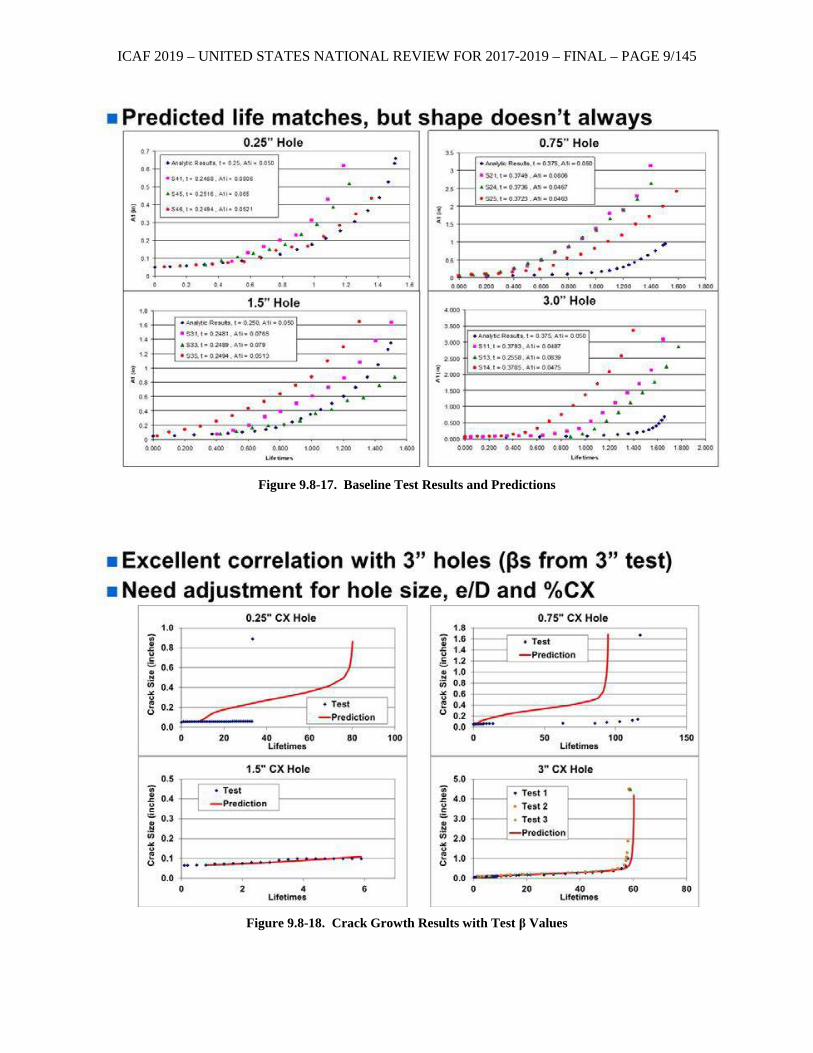
ICAF 2019 – UNITED STATES NATIONAL REVIEW FOR 2017-2019 – FINAL – PAGE 9/145
Figure 9.8-17. Baseline Test Results and Predictions
Figure 9.8-18. Crack Growth Results with Test β Values
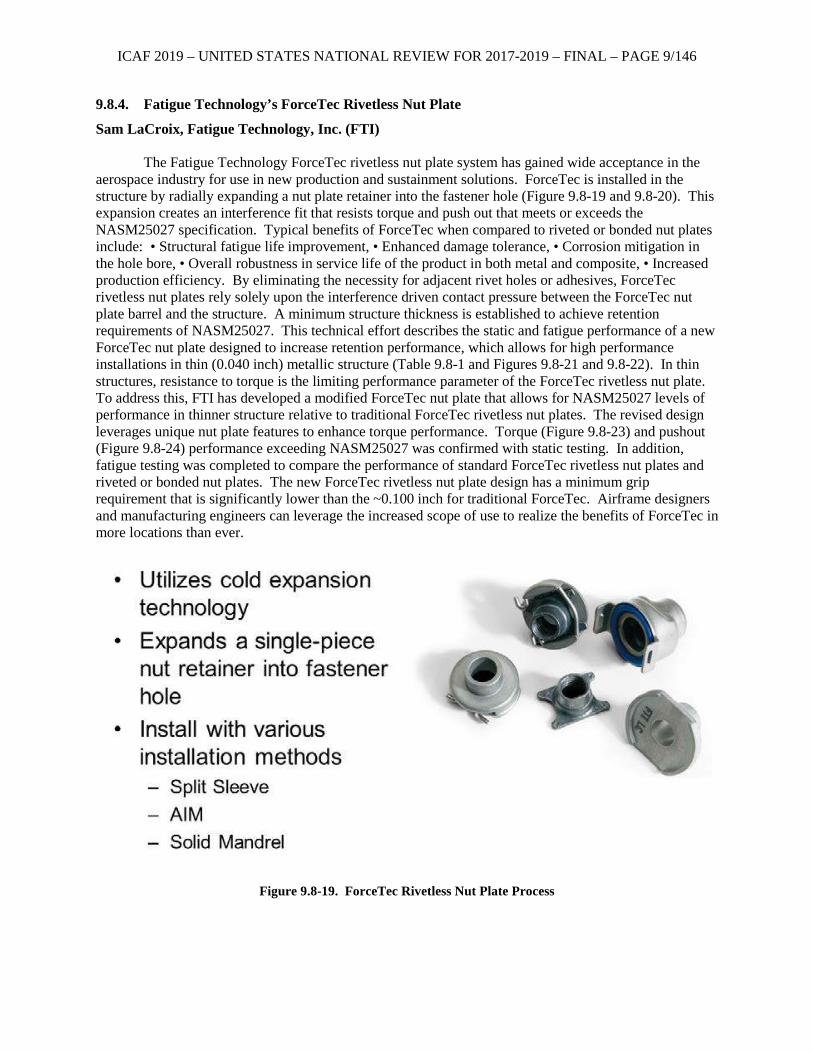
ICAF 2019 – UNITED STATES NATIONAL REVIEW FOR 2017-2019 – FINAL – PAGE 9/146
9.8.4. Fatigue Technology’s ForceTec Rivetless Nut Plate
Sam LaCroix, Fatigue Technology, Inc. (FTI)
The Fatigue Technology ForceTec rivetless nut plate system has gained wide acceptance in the aerospace industry for use in new production and sustainment solutions. ForceTec is installed in the structure by radially expanding a nut plate retainer into the fastener hole (Figure 9.8-19 and 9.8-20). This expansion creates an interference fit that resists torque and push out that meets or exceeds the NASM25027 specification. Typical benefits of ForceTec when compared to riveted or bonded nut plates include: • Structural fatigue life improvement, • Enhanced damage tolerance, • Corrosion mitigation in the hole bore, • Overall robustness in service life of the product in both metal and composite, • Increased production efficiency. By eliminating the necessity for adjacent rivet holes or adhesives, ForceTec rivetless nut plates rely solely upon the interference driven contact pressure between the ForceTec nut plate barrel and the structure. A minimum structure thickness is established to achieve retention requirements of NASM25027. This technical effort describes the static and fatigue performance of a new ForceTec nut plate designed to increase retention performance, which allows for high performance installations in thin (0.040 inch) metallic structure (Table 9.8-1 and Figures 9.8-21 and 9.8-22). In thin structures, resistance to torque is the limiting performance parameter of the ForceTec rivetless nut plate. To address this, FTI has developed a modified ForceTec nut plate that allows for NASM25027 levels of performance in thinner structure relative to traditional ForceTec rivetless nut plates. The revised design leverages unique nut plate features to enhance torque performance. Torque (Figure 9.8-23) and pushout (Figure 9.8-24) performance exceeding NASM25027 was confirmed with static testing. In addition, fatigue testing was completed to compare the performance of standard ForceTec rivetless nut plates and riveted or bonded nut plates. The new ForceTec rivetless nut plate design has a minimum grip requirement that is significantly lower than the ~0.100 inch for traditional ForceTec. Airframe designers and manufacturing engineers can leverage the increased scope of use to realize the benefits of ForceTec in more locations than ever.
Figure 9.8-19. ForceTec Rivetless Nut Plate Process
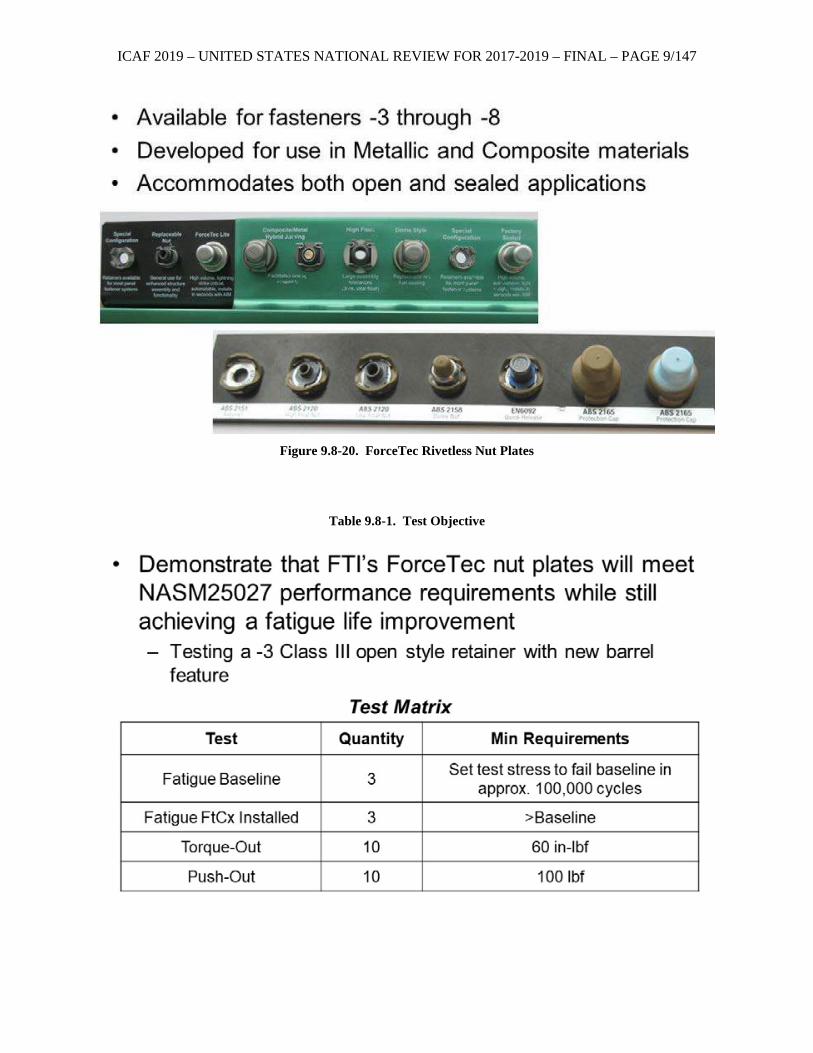
ICAF 2019 – UNITED STATES NATIONAL REVIEW FOR 2017-2019 – FINAL – PAGE 9/147
Figure 9.8-20. ForceTec Rivetless Nut Plates
Table 9.8-1. Test Objective
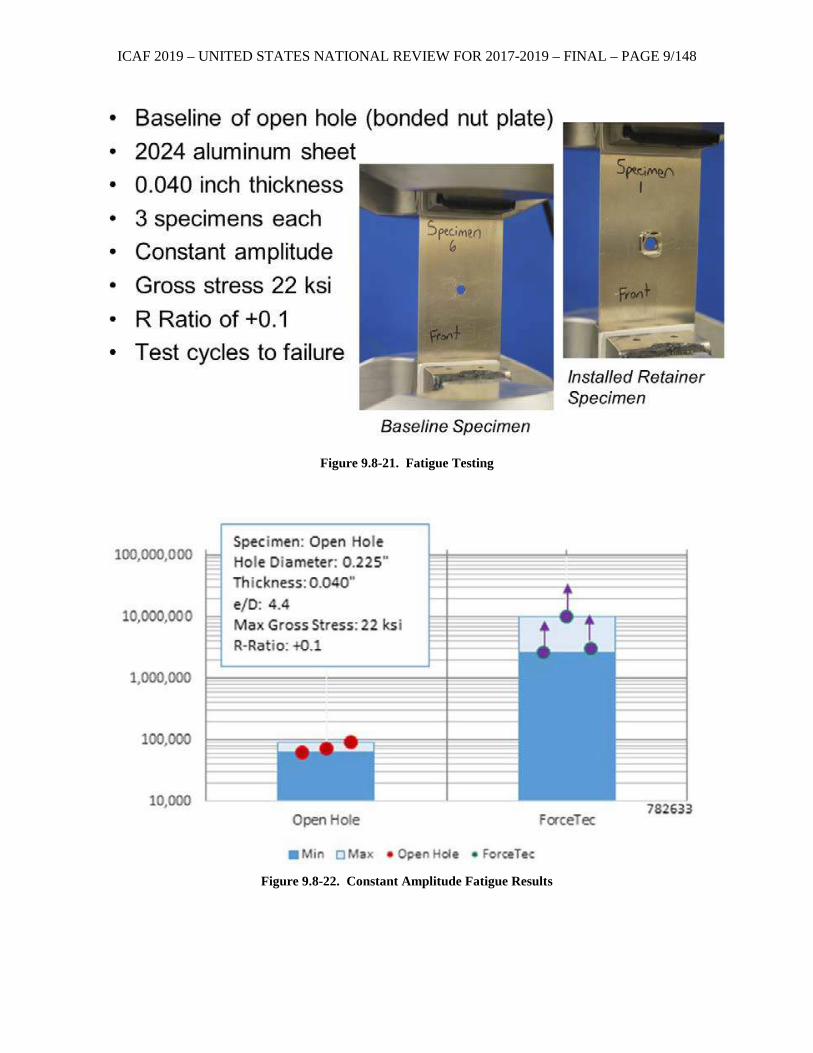
ICAF 2019 – UNITED STATES NATIONAL REVIEW FOR 2017-2019 – FINAL – PAGE 9/148
Figure 9.8-21. Fatigue Testing
Figure 9.8-22. Constant Amplitude Fatigue Results
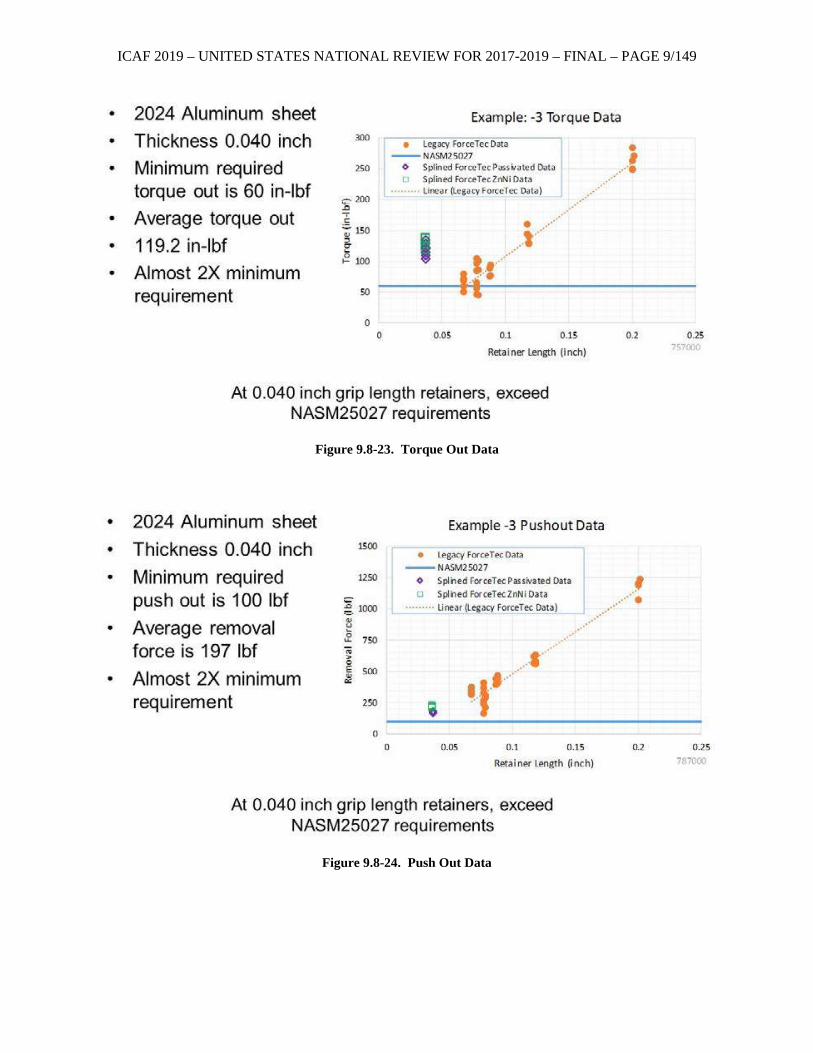
ICAF 2019 – UNITED STATES NATIONAL REVIEW FOR 2017-2019 – FINAL – PAGE 9/149
Figure 9.8-23. Torque Out Data
Figure 9.8-24. Push Out Data
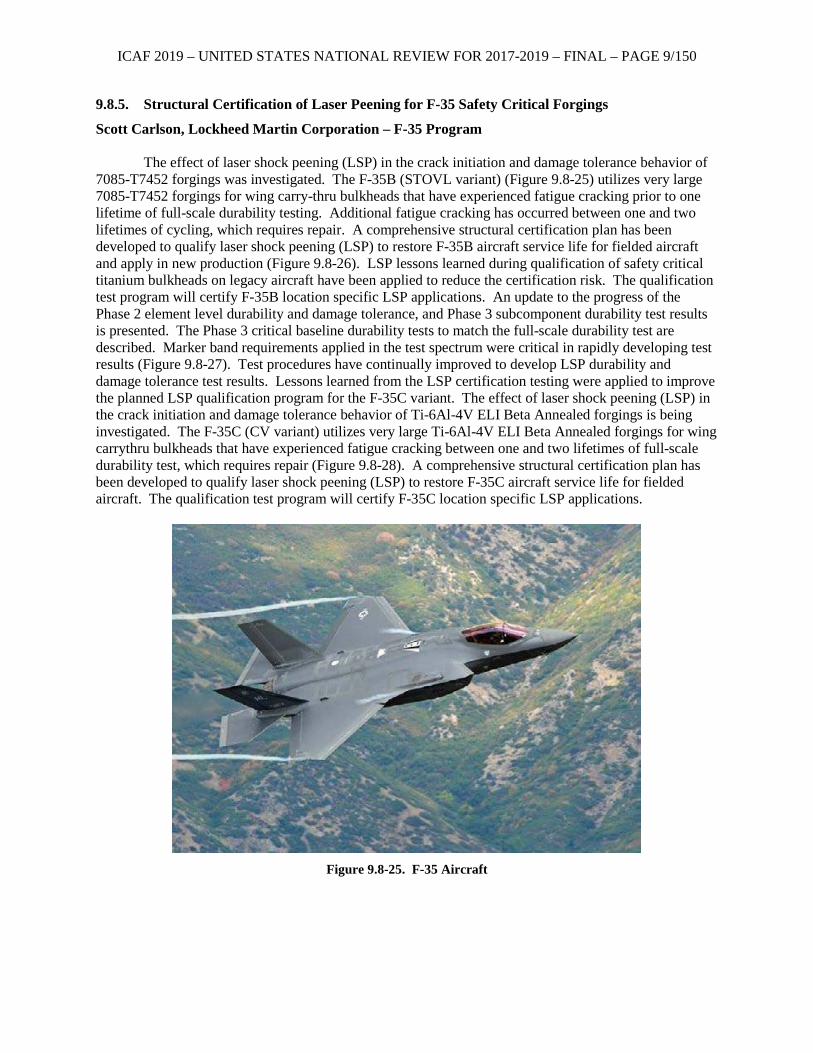
ICAF 2019 – UNITED STATES NATIONAL REVIEW FOR 2017-2019 – FINAL – PAGE 9/150
9.8.5. Structural Certification of Laser Peening for F-35 Safety Critical Forgings
Scott Carlson, Lockheed Martin Corporation – F-35 Program The effect of laser shock peening (LSP) in the crack initiation and damage tolerance behavior of
7085-T7452 forgings was investigated. The F-35B (STOVL variant) (Figure 9.8-25) utilizes very large 7085-T7452 forgings for wing carry-thru bulkheads that have experienced fatigue cracking prior to one lifetime of full-scale durability testing. Additional fatigue cracking has occurred between one and two lifetimes of cycling, which requires repair. A comprehensive structural certification plan has been developed to qualify laser shock peening (LSP) to restore F-35B aircraft service life for fielded aircraft and apply in new production (Figure 9.8-26). LSP lessons learned during qualification of safety critical titanium bulkheads on legacy aircraft have been applied to reduce the certification risk. The qualification test program will certify F-35B location specific LSP applications. An update to the progress of the Phase 2 element level durability and damage tolerance, and Phase 3 subcomponent durability test results is presented. The Phase 3 critical baseline durability tests to match the full-scale durability test are described. Marker band requirements applied in the test spectrum were critical in rapidly developing test results (Figure 9.8-27). Test procedures have continually improved to develop LSP durability and damage tolerance test results. Lessons learned from the LSP certification testing were applied to improve the planned LSP qualification program for the F-35C variant. The effect of laser shock peening (LSP) in the crack initiation and damage tolerance behavior of Ti-6Al-4V ELI Beta Annealed forgings is being investigated. The F-35C (CV variant) utilizes very large Ti-6Al-4V ELI Beta Annealed forgings for wing carrythru bulkheads that have experienced fatigue cracking between one and two lifetimes of full-scale durability test, which requires repair (Figure 9.8-28). A comprehensive structural certification plan has been developed to qualify laser shock peening (LSP) to restore F-35C aircraft service life for fielded aircraft. The qualification test program will certify F-35C location specific LSP applications.
Figure 9.8-25. F-35 Aircraft
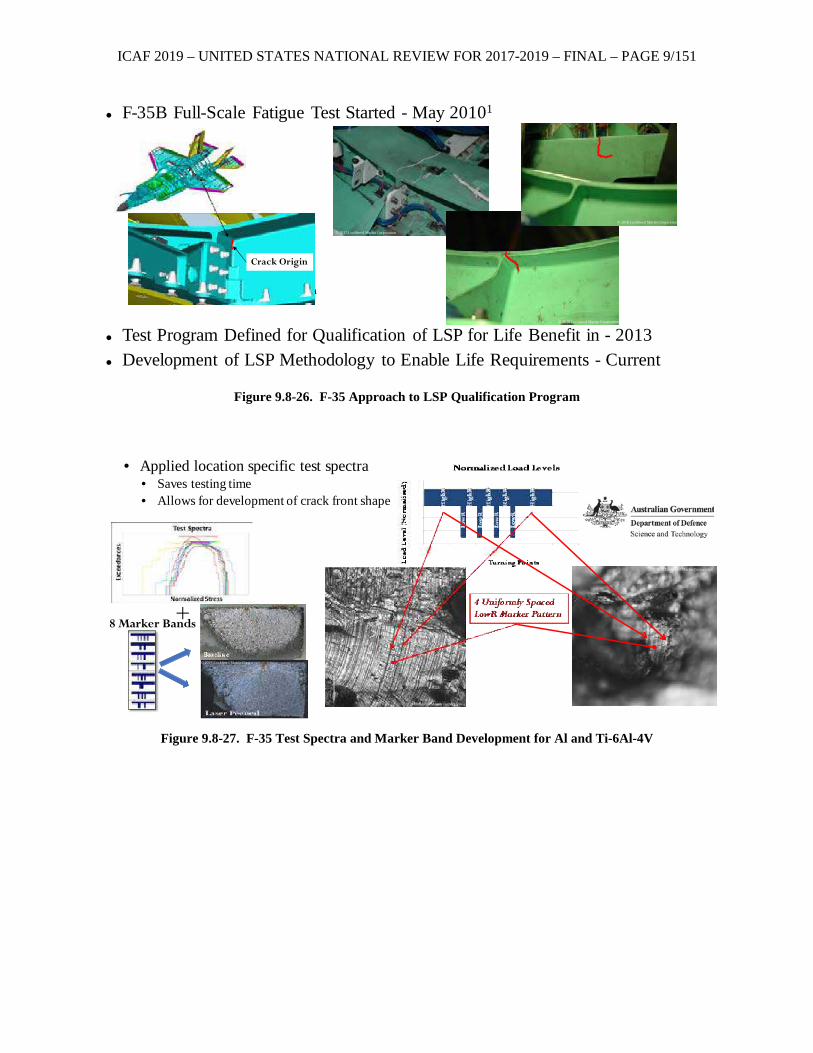
ICAF 2019 – UNITED STATES NATIONAL REVIEW FOR 2017-2019 – FINAL – PAGE 9/151
Figure 9.8-26. F-35 Approach to LSP Qualification Program
Figure 9.8-27. F-35 Test Spectra and Marker Band Development for Al and Ti-6Al-4V
F-35B Full-Scale Fatigue Test Started - May 20101
Test Program Defined for Qualification of LSP for Life Benefit in - 2013 Development of LSP Methodology to Enable Life Requirements - Current
Final Crack Path
Crack Origin
© 2018 Lockheed Martin Corporation
© 2018 Lockheed Martin Corporation
© 2017 Lockheed Martin Corporation
8 Marker Bands+
• Applied location specific test spectra• Saves testing time • Allows for development of crack front shape
© 2018 Lockheed Martin Corporation
© 2018 Lockheed Martin Corporation
© 2018 Lockheed Martin Corp.
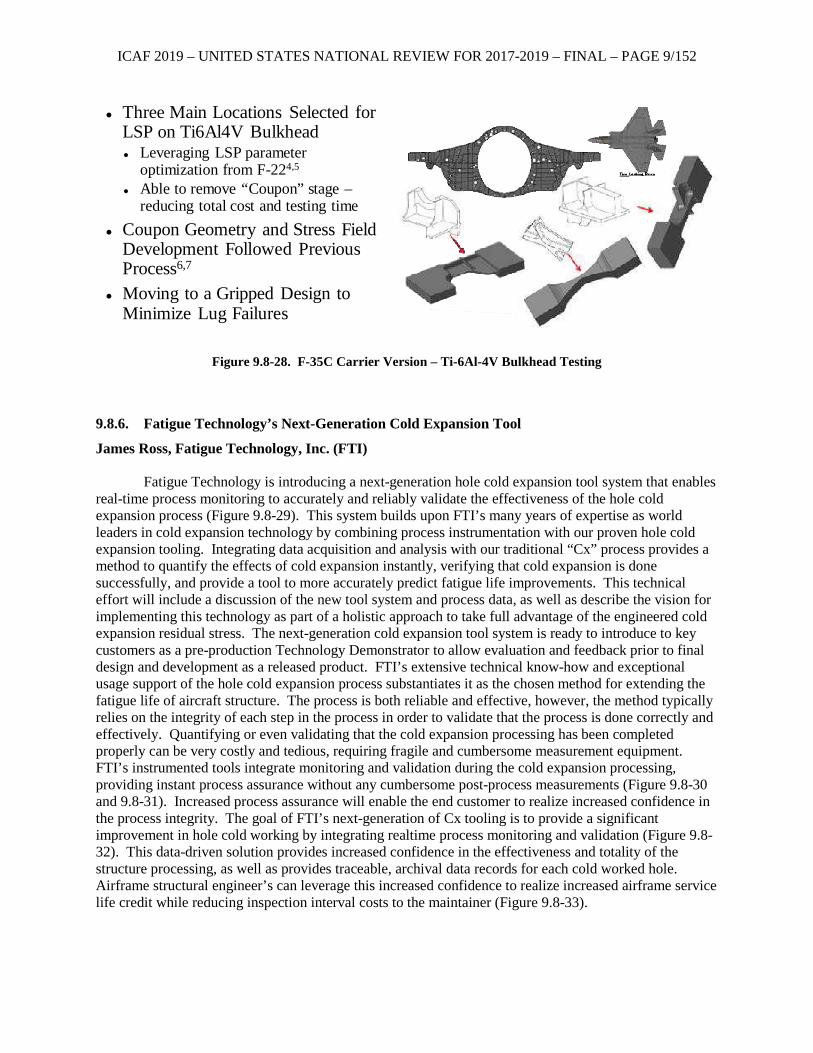
ICAF 2019 – UNITED STATES NATIONAL REVIEW FOR 2017-2019 – FINAL – PAGE 9/152
Figure 9.8-28. F-35C Carrier Version – Ti-6Al-4V Bulkhead Testing
9.8.6. Fatigue Technology’s Next-Generation Cold Expansion Tool
James Ross, Fatigue Technology, Inc. (FTI) Fatigue Technology is introducing a next-generation hole cold expansion tool system that enables
real-time process monitoring to accurately and reliably validate the effectiveness of the hole cold expansion process (Figure 9.8-29). This system builds upon FTI’s many years of expertise as world leaders in cold expansion technology by combining process instrumentation with our proven hole cold expansion tooling. Integrating data acquisition and analysis with our traditional “Cx” process provides a method to quantify the effects of cold expansion instantly, verifying that cold expansion is done successfully, and provide a tool to more accurately predict fatigue life improvements. This technical effort will include a discussion of the new tool system and process data, as well as describe the vision for implementing this technology as part of a holistic approach to take full advantage of the engineered cold expansion residual stress. The next-generation cold expansion tool system is ready to introduce to key customers as a pre-production Technology Demonstrator to allow evaluation and feedback prior to final design and development as a released product. FTI’s extensive technical know-how and exceptional usage support of the hole cold expansion process substantiates it as the chosen method for extending the fatigue life of aircraft structure. The process is both reliable and effective, however, the method typically relies on the integrity of each step in the process in order to validate that the process is done correctly and effectively. Quantifying or even validating that the cold expansion processing has been completed properly can be very costly and tedious, requiring fragile and cumbersome measurement equipment. FTI’s instrumented tools integrate monitoring and validation during the cold expansion processing, providing instant process assurance without any cumbersome post-process measurements (Figure 9.8-30 and 9.8-31). Increased process assurance will enable the end customer to realize increased confidence in the process integrity. The goal of FTI’s next-generation of Cx tooling is to provide a significant improvement in hole cold working by integrating realtime process monitoring and validation (Figure 9.8-32). This data-driven solution provides increased confidence in the effectiveness and totality of the structure processing, as well as provides traceable, archival data records for each cold worked hole. Airframe structural engineer’s can leverage this increased confidence to realize increased airframe service life credit while reducing inspection interval costs to the maintainer (Figure 9.8-33).
Three Main Locations Selected for LSP on Ti6Al4V Bulkhead Leveraging LSP parameter
optimization from F-224,5
Able to remove “Coupon” stage –reducing total cost and testing time
Coupon Geometry and Stress Field Development Followed Previous Process6,7
Moving to a Gripped Design to Minimize Lug Failures
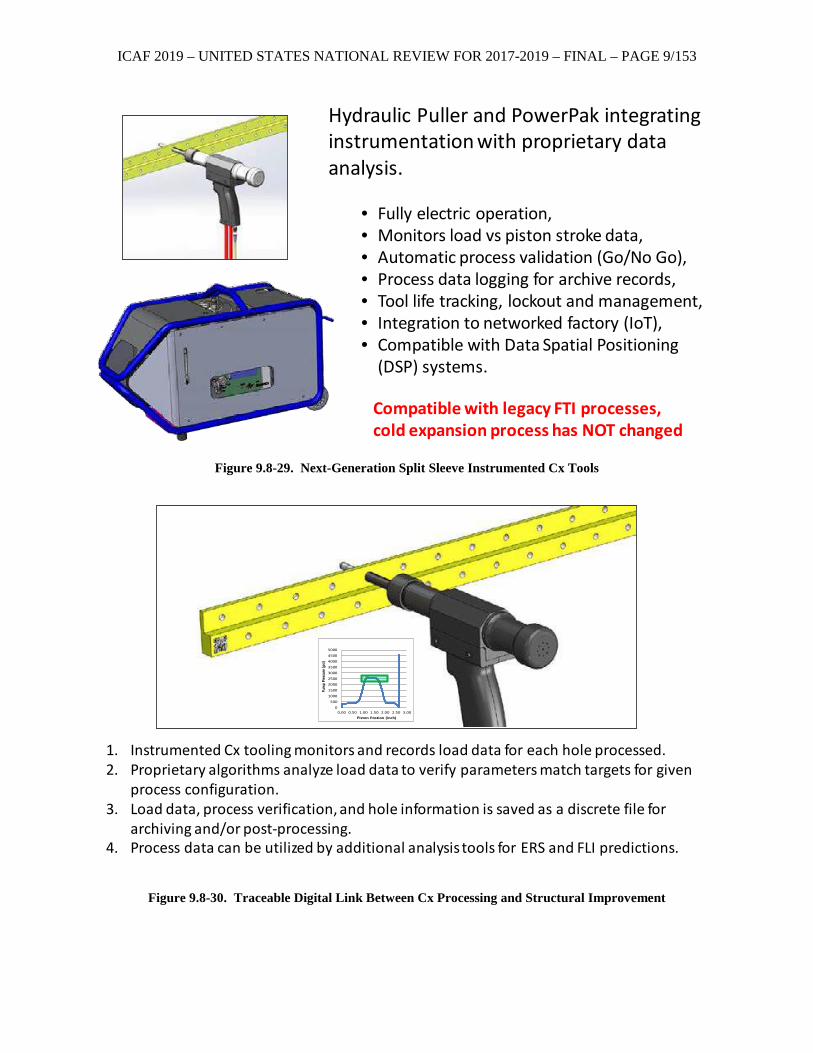
ICAF 2019 – UNITED STATES NATIONAL REVIEW FOR 2017-2019 – FINAL – PAGE 9/153
Figure 9.8-29. Next-Generation Split Sleeve Instrumented Cx Tools
Figure 9.8-30. Traceable Digital Link Between Cx Processing and Structural Improvement
Hydraulic Puller and PowerPak integrating instrumentation with proprietary data analysis.
• Fully electric operation,• Monitors load vs piston stroke data,• Automatic process validation (Go/No Go),• Process data logging for archive records,• Tool life tracking, lockout and management,• Integration to networked factory (IoT),• Compatible with Data Spatial Positioning
(DSP) systems.
Compatible with legacy FTI processes, cold expansion process has NOT changed
1. Instrumented Cx tooling monitors and records load data for each hole processed.2. Proprietary algorithms analyze load data to verify parameters match targets for given
process configuration.3. Load data, process verification, and hole information is saved as a discrete file for
archiving and/or post-processing.4. Process data can be utilized by additional analysis tools for ERS and FLI predictions.
0500
100015002000250030003500400045005000
0.00 0.50 1.00 1.50 2.00 2.50 3.00
Pum
p Pr
essu
re (p
si)
Piston Postion (inch)
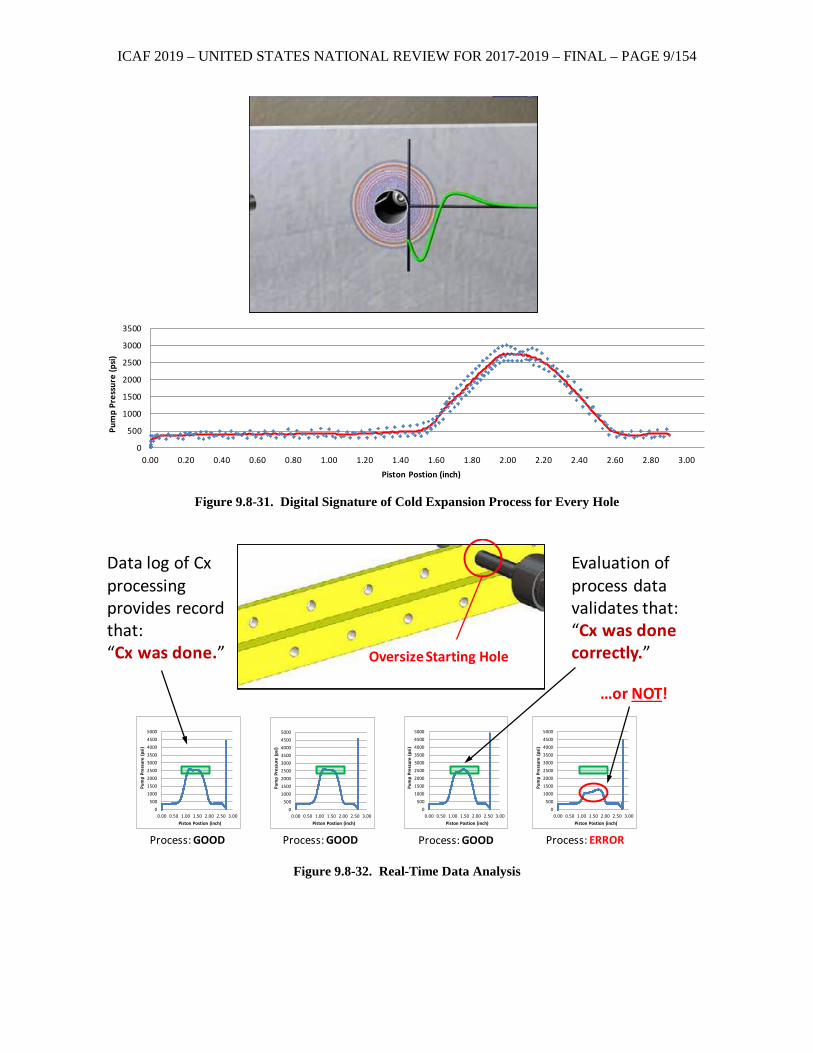
ICAF 2019 – UNITED STATES NATIONAL REVIEW FOR 2017-2019 – FINAL – PAGE 9/154
Figure 9.8-31. Digital Signature of Cold Expansion Process for Every Hole
Figure 9.8-32. Real-Time Data Analysis
0
500
1000
1500
2000
2500
3000
3500
0.00 0.20 0.40 0.60 0.80 1.00 1.20 1.40 1.60 1.80 2.00 2.20 2.40 2.60 2.80 3.00
Pum
p Pr
essu
re (p
si)
Piston Postion (inch)
0500
100015002000250030003500400045005000
0.00 0.50 1.00 1.50 2.00 2.50 3.00
Pum
p Pr
essu
re (p
si)
Piston Postion (inch)
0500
100015002000250030003500400045005000
0.00 0.50 1.00 1.50 2.00 2.50 3.00
Pum
p Pr
essu
re (p
si)
Piston Postion (inch)
0500
100015002000250030003500400045005000
0.00 0.50 1.00 1.50 2.00 2.50 3.00
Pum
p Pr
essu
re (p
si)
Piston Postion (inch)
0500
100015002000250030003500400045005000
0.00 0.50 1.00 1.50 2.00 2.50 3.00
Pum
p Pr
essu
re (p
si)
Piston Postion (inch)
Process: GOOD Process: GOOD Process: GOOD Process: ERROR
Data log of Cx processing provides record that:“Cx was done.”
Evaluation of process data validates that:“Cx was done correctly.”
…or NOT!
Oversize Starting Hole
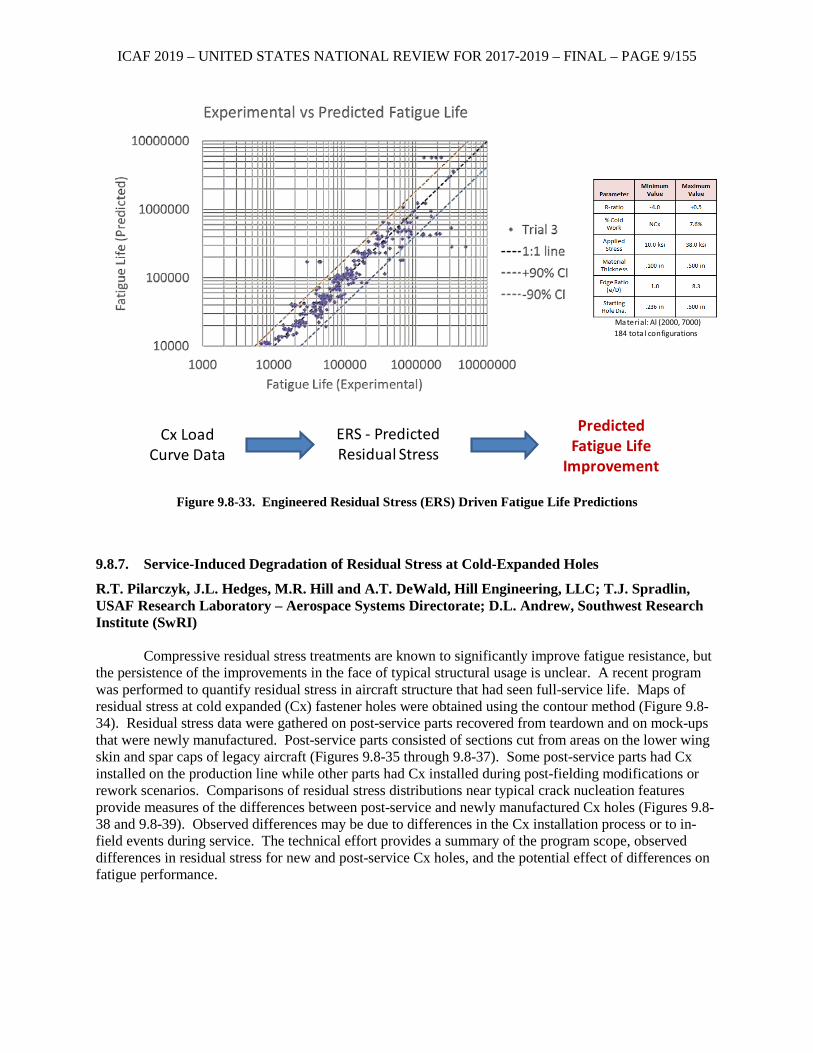
ICAF 2019 – UNITED STATES NATIONAL REVIEW FOR 2017-2019 – FINAL – PAGE 9/155
Figure 9.8-33. Engineered Residual Stress (ERS) Driven Fatigue Life Predictions
9.8.7. Service-Induced Degradation of Residual Stress at Cold-Expanded Holes
R.T. Pilarczyk, J.L. Hedges, M.R. Hill and A.T. DeWald, Hill Engineering, LLC; T.J. Spradlin, USAF Research Laboratory – Aerospace Systems Directorate; D.L. Andrew, Southwest Research Institute (SwRI)
Compressive residual stress treatments are known to significantly improve fatigue resistance, but
the persistence of the improvements in the face of typical structural usage is unclear. A recent program was performed to quantify residual stress in aircraft structure that had seen full-service life. Maps of residual stress at cold expanded (Cx) fastener holes were obtained using the contour method (Figure 9.8-34). Residual stress data were gathered on post-service parts recovered from teardown and on mock-ups that were newly manufactured. Post-service parts consisted of sections cut from areas on the lower wing skin and spar caps of legacy aircraft (Figures 9.8-35 through 9.8-37). Some post-service parts had Cx installed on the production line while other parts had Cx installed during post-fielding modifications or rework scenarios. Comparisons of residual stress distributions near typical crack nucleation features provide measures of the differences between post-service and newly manufactured Cx holes (Figures 9.8-38 and 9.8-39). Observed differences may be due to differences in the Cx installation process or to in-field events during service. The technical effort provides a summary of the program scope, observed differences in residual stress for new and post-service Cx holes, and the potential effect of differences on fatigue performance.
Cx Load Curve Data
ERS - Predicted Residual Stress
Predicted Fatigue Life
Improvement
Material: Al (2000, 7000)184 tota l configurations
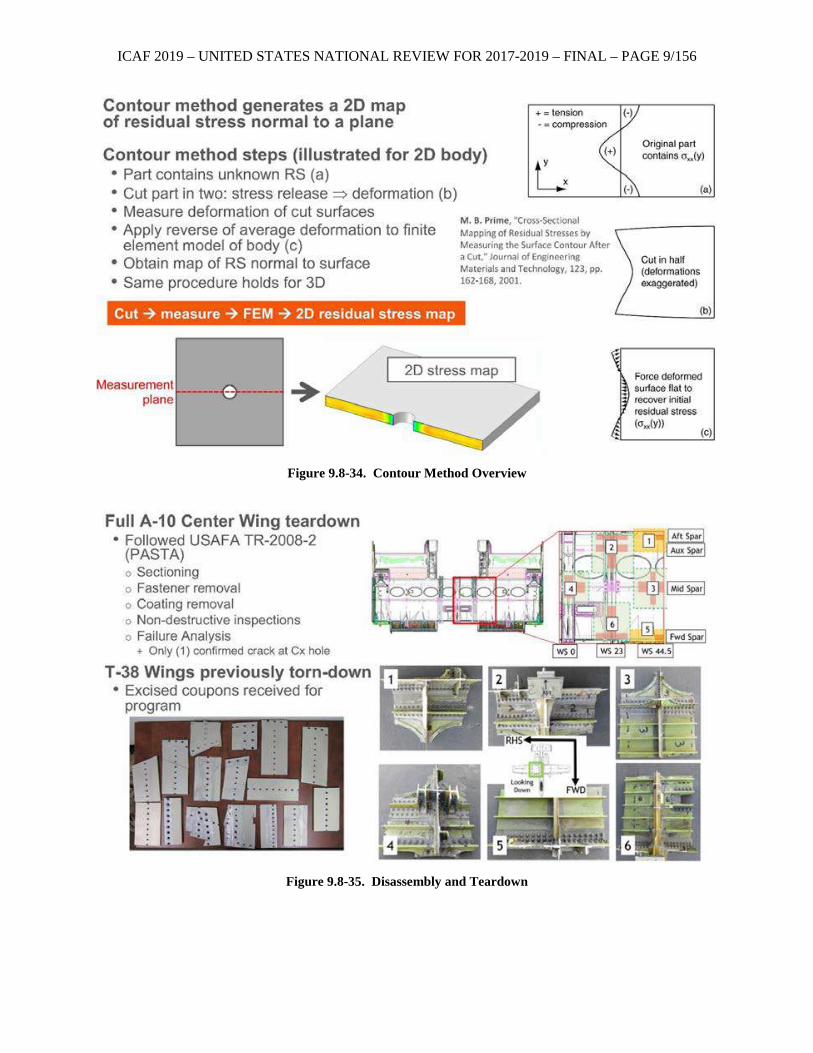
ICAF 2019 – UNITED STATES NATIONAL REVIEW FOR 2017-2019 – FINAL – PAGE 9/156
Figure 9.8-34. Contour Method Overview
Figure 9.8-35. Disassembly and Teardown
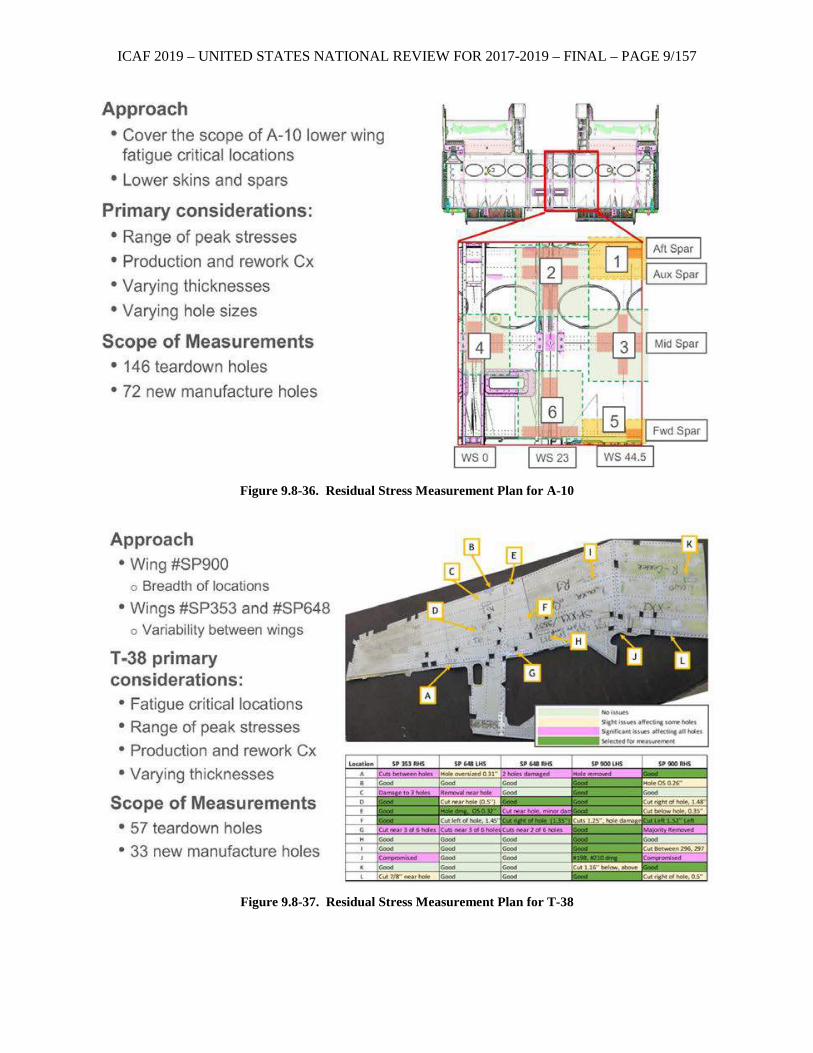
ICAF 2019 – UNITED STATES NATIONAL REVIEW FOR 2017-2019 – FINAL – PAGE 9/157
Figure 9.8-36. Residual Stress Measurement Plan for A-10
Figure 9.8-37. Residual Stress Measurement Plan for T-38
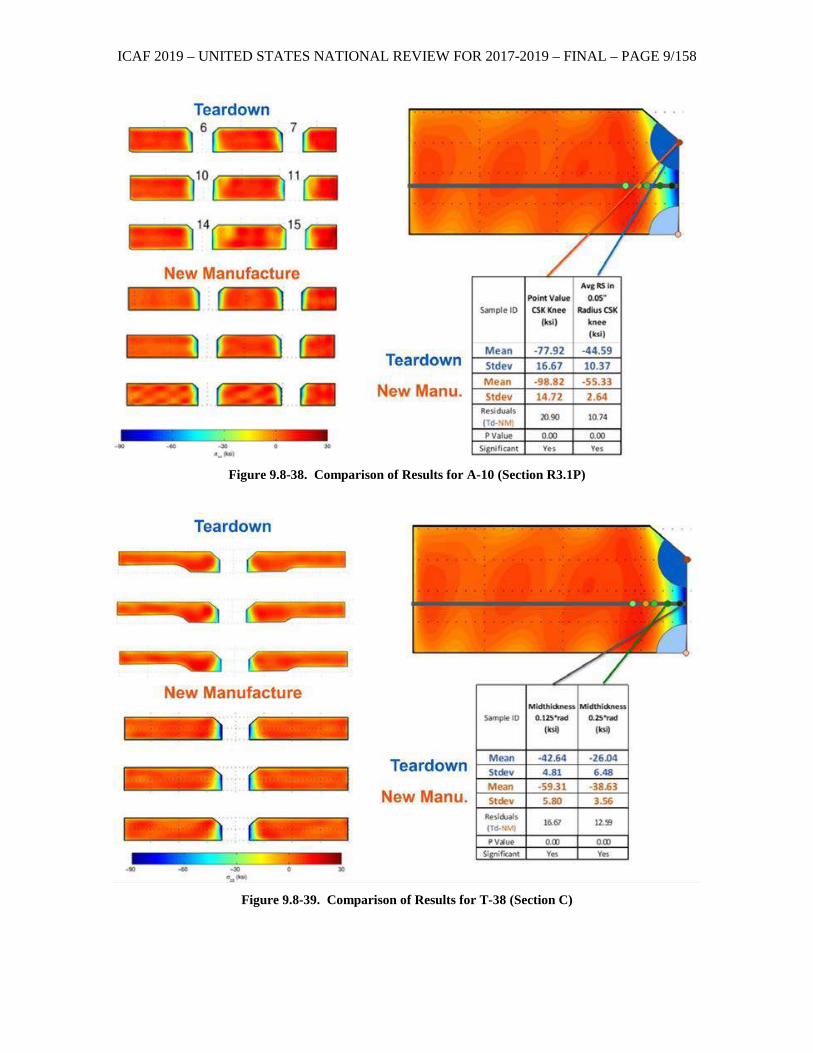
ICAF 2019 – UNITED STATES NATIONAL REVIEW FOR 2017-2019 – FINAL – PAGE 9/158
Figure 9.8-38. Comparison of Results for A-10 (Section R3.1P)
Figure 9.8-39. Comparison of Results for T-38 (Section C)
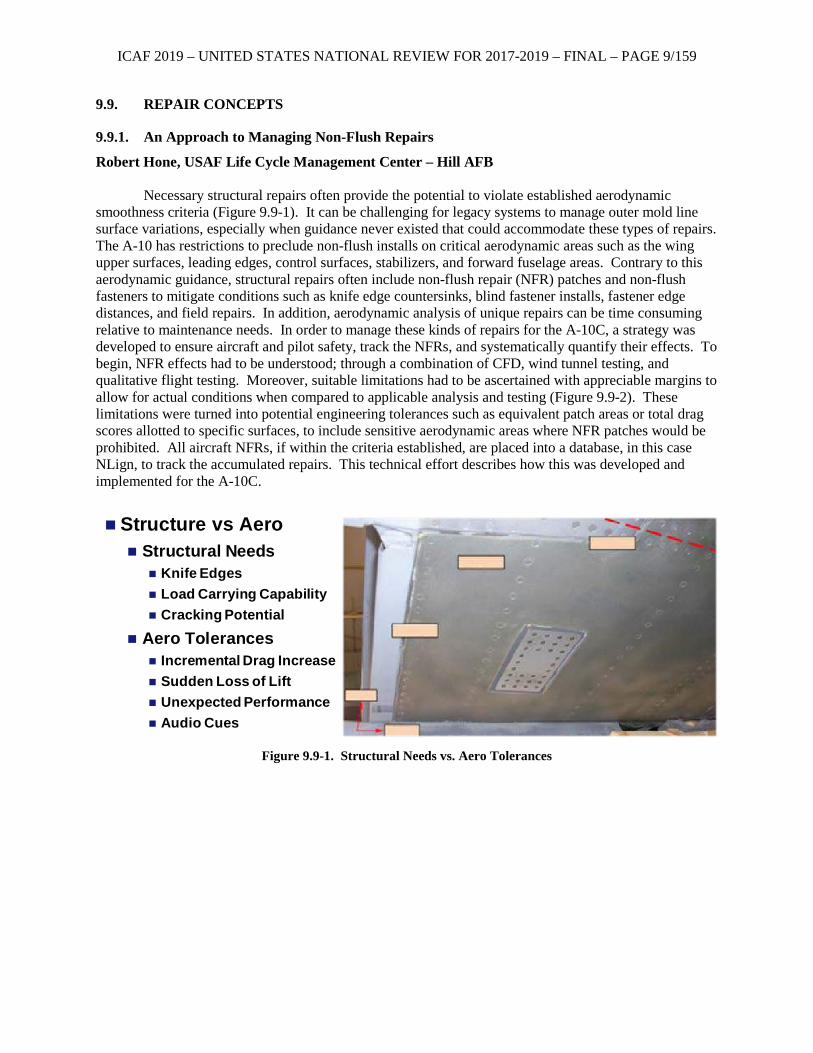
ICAF 2019 – UNITED STATES NATIONAL REVIEW FOR 2017-2019 – FINAL – PAGE 9/159
9.9. REPAIR CONCEPTS
9.9.1. An Approach to Managing Non-Flush Repairs
Robert Hone, USAF Life Cycle Management Center – Hill AFB Necessary structural repairs often provide the potential to violate established aerodynamic
smoothness criteria (Figure 9.9-1). It can be challenging for legacy systems to manage outer mold line surface variations, especially when guidance never existed that could accommodate these types of repairs. The A-10 has restrictions to preclude non-flush installs on critical aerodynamic areas such as the wing upper surfaces, leading edges, control surfaces, stabilizers, and forward fuselage areas. Contrary to this aerodynamic guidance, structural repairs often include non-flush repair (NFR) patches and non-flush fasteners to mitigate conditions such as knife edge countersinks, blind fastener installs, fastener edge distances, and field repairs. In addition, aerodynamic analysis of unique repairs can be time consuming relative to maintenance needs. In order to manage these kinds of repairs for the A-10C, a strategy was developed to ensure aircraft and pilot safety, track the NFRs, and systematically quantify their effects. To begin, NFR effects had to be understood; through a combination of CFD, wind tunnel testing, and qualitative flight testing. Moreover, suitable limitations had to be ascertained with appreciable margins to allow for actual conditions when compared to applicable analysis and testing (Figure 9.9-2). These limitations were turned into potential engineering tolerances such as equivalent patch areas or total drag scores allotted to specific surfaces, to include sensitive aerodynamic areas where NFR patches would be prohibited. All aircraft NFRs, if within the criteria established, are placed into a database, in this case NLign, to track the accumulated repairs. This technical effort describes how this was developed and implemented for the A-10C.
Figure 9.9-1. Structural Needs vs. Aero Tolerances
Structure vs Aero Structural Needs
Knife Edges Load Carrying Capability Cracking Potential
Aero Tolerances Incremental Drag Increase Sudden Loss of Lift Unexpected Performance Audio Cues
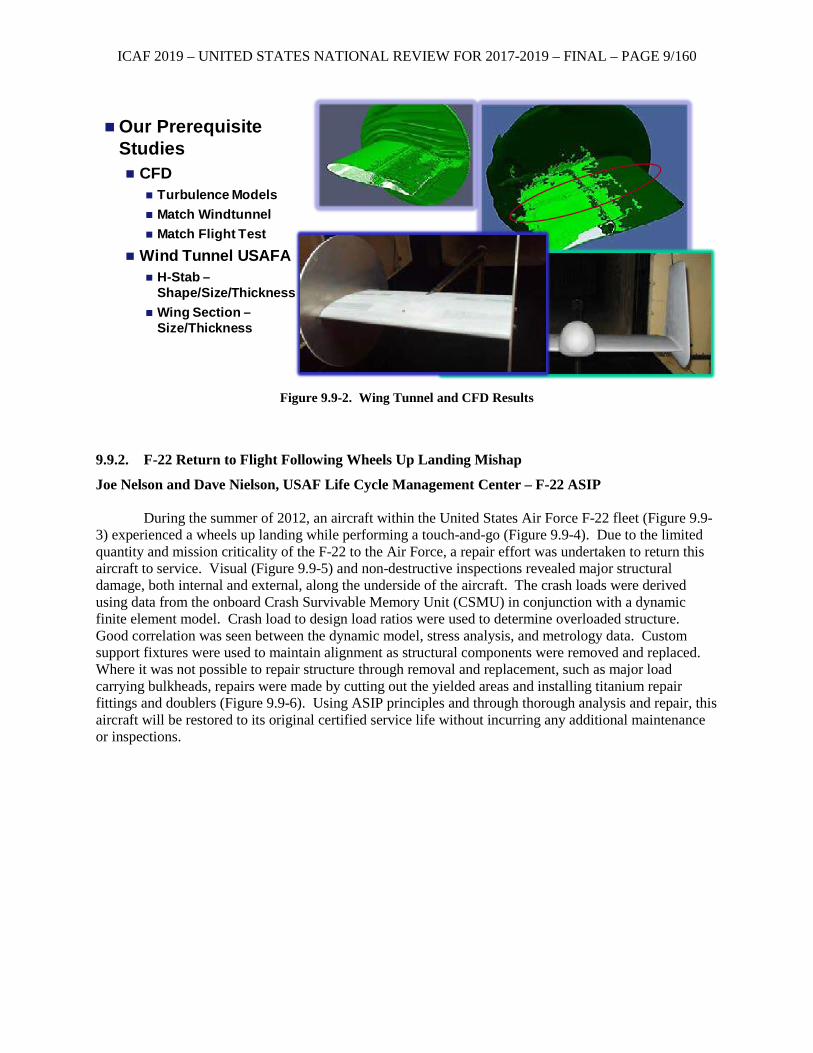
ICAF 2019 – UNITED STATES NATIONAL REVIEW FOR 2017-2019 – FINAL – PAGE 9/160
Figure 9.9-2. Wing Tunnel and CFD Results
9.9.2. F-22 Return to Flight Following Wheels Up Landing Mishap
Joe Nelson and Dave Nielson, USAF Life Cycle Management Center – F-22 ASIP During the summer of 2012, an aircraft within the United States Air Force F-22 fleet (Figure 9.9-
3) experienced a wheels up landing while performing a touch-and-go (Figure 9.9-4). Due to the limited quantity and mission criticality of the F-22 to the Air Force, a repair effort was undertaken to return this aircraft to service. Visual (Figure 9.9-5) and non-destructive inspections revealed major structural damage, both internal and external, along the underside of the aircraft. The crash loads were derived using data from the onboard Crash Survivable Memory Unit (CSMU) in conjunction with a dynamic finite element model. Crash load to design load ratios were used to determine overloaded structure. Good correlation was seen between the dynamic model, stress analysis, and metrology data. Custom support fixtures were used to maintain alignment as structural components were removed and replaced. Where it was not possible to repair structure through removal and replacement, such as major load carrying bulkheads, repairs were made by cutting out the yielded areas and installing titanium repair fittings and doublers (Figure 9.9-6). Using ASIP principles and through thorough analysis and repair, this aircraft will be restored to its original certified service life without incurring any additional maintenance or inspections.
Our Prerequisite Studies CFD
Turbulence Models Match Windtunnel Match Flight Test
Wind Tunnel USAFA H-Stab –
Shape/Size/Thickness Wing Section –
Size/Thickness
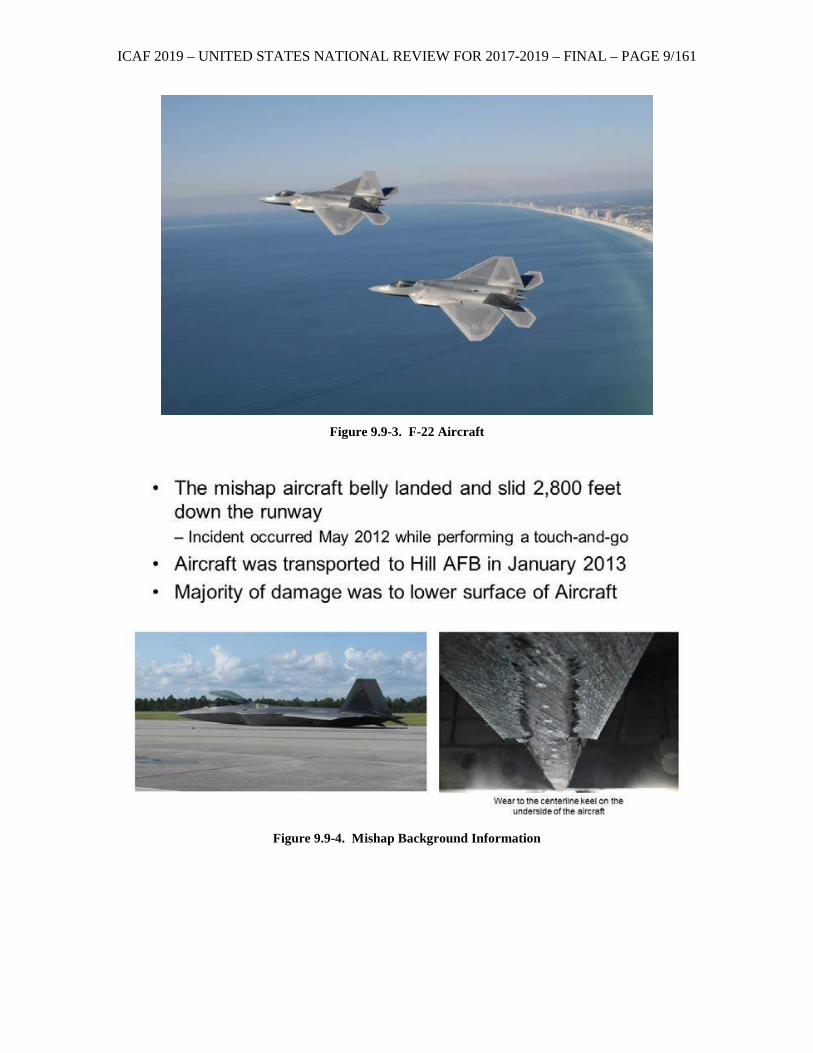
ICAF 2019 – UNITED STATES NATIONAL REVIEW FOR 2017-2019 – FINAL – PAGE 9/161
Figure 9.9-3. F-22 Aircraft
Figure 9.9-4. Mishap Background Information
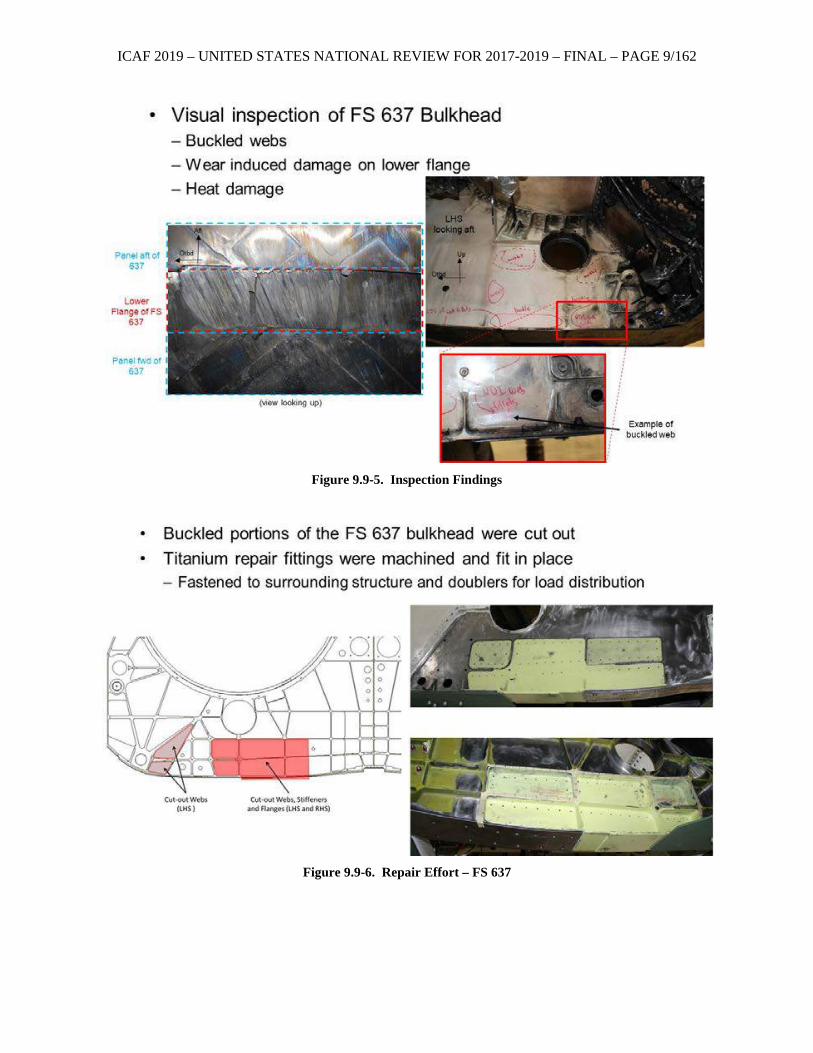
ICAF 2019 – UNITED STATES NATIONAL REVIEW FOR 2017-2019 – FINAL – PAGE 9/162
Figure 9.9-5. Inspection Findings
Figure 9.9-6. Repair Effort – FS 637
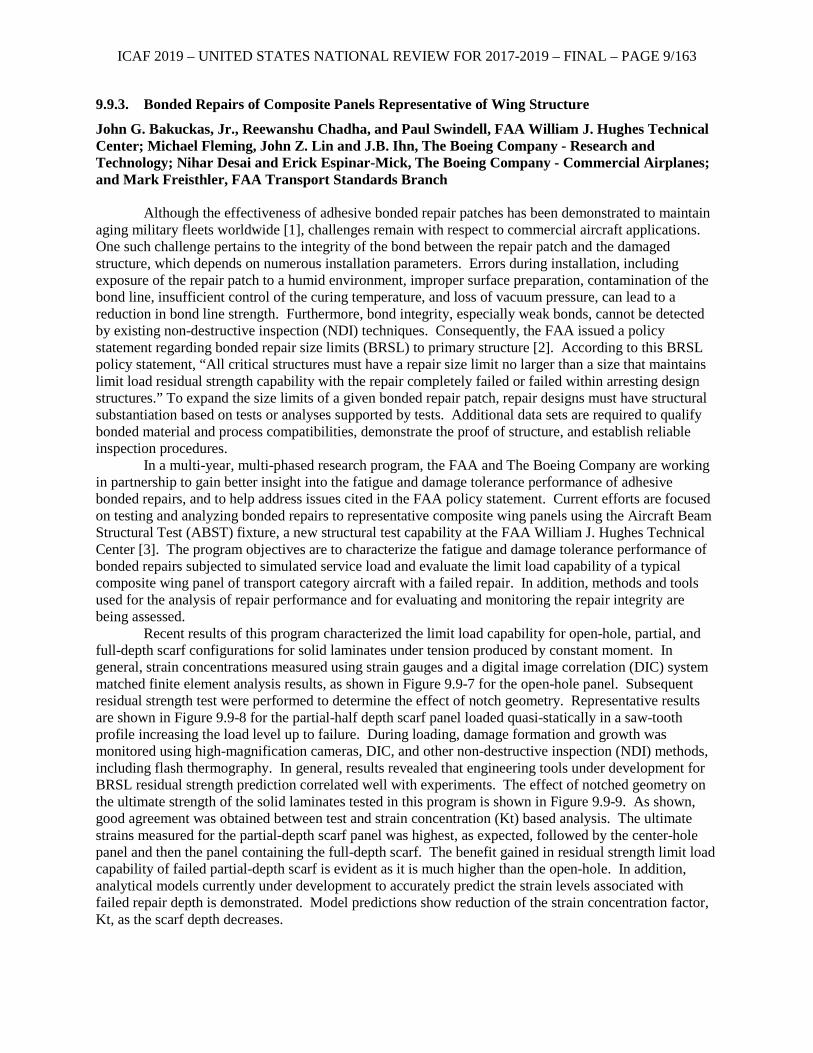
ICAF 2019 – UNITED STATES NATIONAL REVIEW FOR 2017-2019 – FINAL – PAGE 9/163
9.9.3. Bonded Repairs of Composite Panels Representative of Wing Structure
John G. Bakuckas, Jr., Reewanshu Chadha, and Paul Swindell, FAA William J. Hughes Technical Center; Michael Fleming, John Z. Lin and J.B. Ihn, The Boeing Company - Research and Technology; Nihar Desai and Erick Espinar-Mick, The Boeing Company - Commercial Airplanes; and Mark Freisthler, FAA Transport Standards Branch
Although the effectiveness of adhesive bonded repair patches has been demonstrated to maintain aging military fleets worldwide [1], challenges remain with respect to commercial aircraft applications. One such challenge pertains to the integrity of the bond between the repair patch and the damaged structure, which depends on numerous installation parameters. Errors during installation, including exposure of the repair patch to a humid environment, improper surface preparation, contamination of the bond line, insufficient control of the curing temperature, and loss of vacuum pressure, can lead to a reduction in bond line strength. Furthermore, bond integrity, especially weak bonds, cannot be detected by existing non-destructive inspection (NDI) techniques. Consequently, the FAA issued a policy statement regarding bonded repair size limits (BRSL) to primary structure [2]. According to this BRSL policy statement, “All critical structures must have a repair size limit no larger than a size that maintains limit load residual strength capability with the repair completely failed or failed within arresting design structures.” To expand the size limits of a given bonded repair patch, repair designs must have structural substantiation based on tests or analyses supported by tests. Additional data sets are required to qualify bonded material and process compatibilities, demonstrate the proof of structure, and establish reliable inspection procedures.
In a multi-year, multi-phased research program, the FAA and The Boeing Company are working in partnership to gain better insight into the fatigue and damage tolerance performance of adhesive bonded repairs, and to help address issues cited in the FAA policy statement. Current efforts are focused on testing and analyzing bonded repairs to representative composite wing panels using the Aircraft Beam Structural Test (ABST) fixture, a new structural test capability at the FAA William J. Hughes Technical Center [3]. The program objectives are to characterize the fatigue and damage tolerance performance of bonded repairs subjected to simulated service load and evaluate the limit load capability of a typical composite wing panel of transport category aircraft with a failed repair. In addition, methods and tools used for the analysis of repair performance and for evaluating and monitoring the repair integrity are being assessed.
Recent results of this program characterized the limit load capability for open-hole, partial, and full-depth scarf configurations for solid laminates under tension produced by constant moment. In general, strain concentrations measured using strain gauges and a digital image correlation (DIC) system matched finite element analysis results, as shown in Figure 9.9-7 for the open-hole panel. Subsequent residual strength test were performed to determine the effect of notch geometry. Representative results are shown in Figure 9.9-8 for the partial-half depth scarf panel loaded quasi-statically in a saw-tooth profile increasing the load level up to failure. During loading, damage formation and growth was monitored using high-magnification cameras, DIC, and other non-destructive inspection (NDI) methods, including flash thermography. In general, results revealed that engineering tools under development for BRSL residual strength prediction correlated well with experiments. The effect of notched geometry on the ultimate strength of the solid laminates tested in this program is shown in Figure 9.9-9. As shown, good agreement was obtained between test and strain concentration (Kt) based analysis. The ultimate strains measured for the partial-depth scarf panel was highest, as expected, followed by the center-hole panel and then the panel containing the full-depth scarf. The benefit gained in residual strength limit load capability of failed partial-depth scarf is evident as it is much higher than the open-hole. In addition, analytical models currently under development to accurately predict the strain levels associated with failed repair depth is demonstrated. Model predictions show reduction of the strain concentration factor, Kt, as the scarf depth decreases.
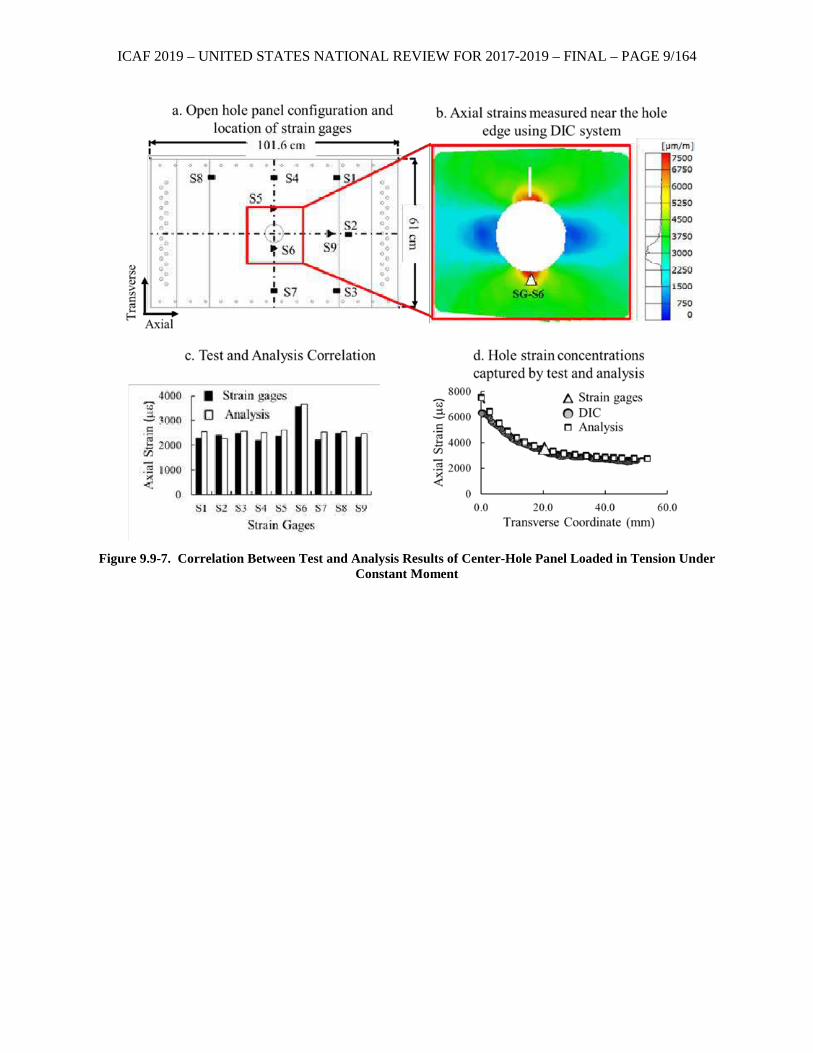
ICAF 2019 – UNITED STATES NATIONAL REVIEW FOR 2017-2019 – FINAL – PAGE 9/164
Figure 9.9-7. Correlation Between Test and Analysis Results of Center-Hole Panel Loaded in Tension Under
Constant Moment
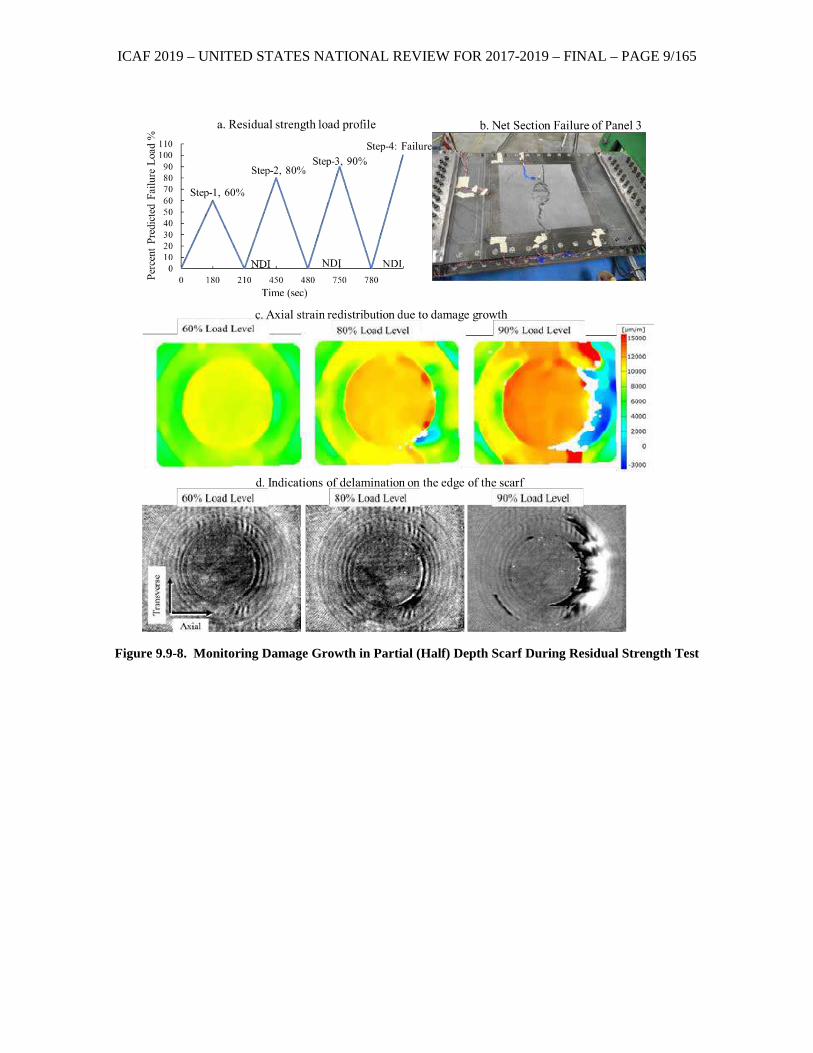
ICAF 2019 – UNITED STATES NATIONAL REVIEW FOR 2017-2019 – FINAL – PAGE 9/165
Figure 9.9-8. Monitoring Damage Growth in Partial (Half) Depth Scarf During Residual Strength Test
ICAF 2019 – UNITED STATES NATIONAL REVIEW FOR 2017-2019 – FINAL – PAGE 9/166
Figure 9.9-9. Effect of Notch Geometry on Residual Strength (Excellent Agreement Between Test and
Analysis Results)
References: [1] Baker, A. A., Rose, L. R. F., and Jones, R. (Eds.), “Advances in the Bonded Composite Repair of
Metallic Aircraft Structure, Volumes 1 and 2,” Elsevier, 2002. [2] Federal Aviation Administration, “Bonded Repair Size Limits,” FAA Policy Statement, U.S.
Department of Transportation, Federal Aviation Administration, Policy No. PS-AIR-100-14-130-001, Initiated By: AIR-100, 2014.
[3] Chadha, R., Bakuckas, J., Fleming, M., Lin, J., and Korkosz, G., “Airframe Beam Structural Test (ABST) Fixture - Capabilities Description and User Manual,” DOT/FAA/TC-TN19/7, 2019.
9.9.4. Analysis Method Development for Determining Bonded Repair Size Limits in Critical Composite Aircraft Structures
John Lin, Michael Fleming, Erick Espinar-Mick, Nihar Desai, The Boeing Company
Continued airworthiness mandates that composite repairs for primary aircraft structures be certified to the same static and damage tolerance criteria as those for pristine design. As the total number of composite airplanes entering revenue service increase, demand for rapid damage/defect assessment and repair has also increased substantially. One of the areas concerning continued safe flight and landing (CSF&L) is bonded repair to critical composite structures. Bonded repairs are often desired due to their superior fit & finish and load transfer characteristics. However, service experience shows past bonded repairs were not always successful, resulting in unexpected repair bond failures. Without a reliable inspection technique to detect weak bonds until related bond fails, the FAA concludes that bonded repair of critical structure is a potential safety threat.
According to FAA Policy Statement (PS-AIR-100-14-130-001), all critical structure must have a repair size no larger than a size that allows limit load strength to be achieved with the repair failed or failed within constraints of the arresting design features (in the repair or base structure). Bonded repairs must be designed to be damage tolerant in order to preclude catastrophic failure due to fatigue, corrosion, manufacturing defects or accidental damage throughout the operational life of the airplane.
Bonded scarf repairs are common for composite aircraft structures. When a scarf repair patch fails in the form of a complete disbond from the parent structure, the remaining parent structure still needs to carry the limit load. Figure 9.9-10 shows a 20:1 scarfed 10-ply CFRP laminate and a 30:1 scarfed
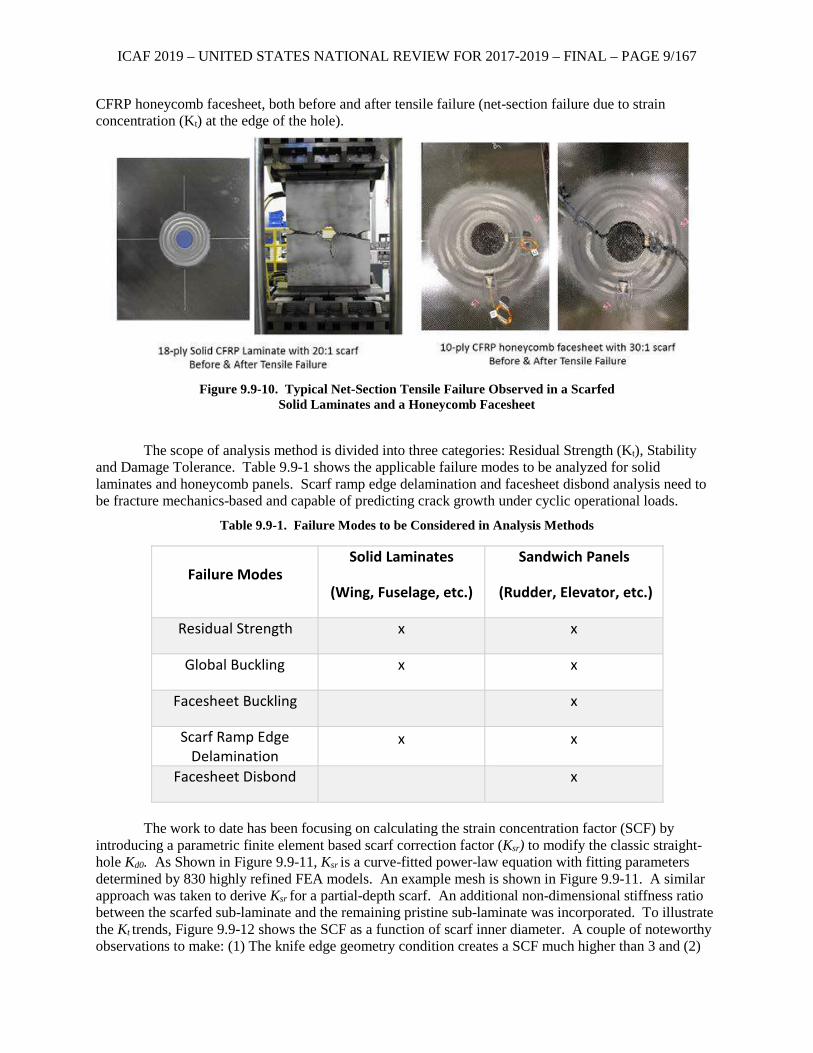
ICAF 2019 – UNITED STATES NATIONAL REVIEW FOR 2017-2019 – FINAL – PAGE 9/167
CFRP honeycomb facesheet, both before and after tensile failure (net-section failure due to strain concentration (Kt) at the edge of the hole).
Figure 9.9-10. Typical Net-Section Tensile Failure Observed in a Scarfed
Solid Laminates and a Honeycomb Facesheet
The scope of analysis method is divided into three categories: Residual Strength (Kt), Stability
and Damage Tolerance. Table 9.9-1 shows the applicable failure modes to be analyzed for solid laminates and honeycomb panels. Scarf ramp edge delamination and facesheet disbond analysis need to be fracture mechanics-based and capable of predicting crack growth under cyclic operational loads.
Table 9.9-1. Failure Modes to be Considered in Analysis Methods
Failure Modes Solid Laminates
(Wing, Fuselage, etc.)
Sandwich Panels
(Rudder, Elevator, etc.)
Residual Strength x x
Global Buckling x x
Facesheet Buckling x
Scarf Ramp Edge Delamination
x x
Facesheet Disbond x
The work to date has been focusing on calculating the strain concentration factor (SCF) by
introducing a parametric finite element based scarf correction factor (Ksr) to modify the classic straight-hole Kd0. As Shown in Figure 9.9-11, Ksr is a curve-fitted power-law equation with fitting parameters determined by 830 highly refined FEA models. An example mesh is shown in Figure 9.9-11. A similar approach was taken to derive Ksr for a partial-depth scarf. An additional non-dimensional stiffness ratio between the scarfed sub-laminate and the remaining pristine sub-laminate was incorporated. To illustrate the Kt trends, Figure 9.9-12 shows the SCF as a function of scarf inner diameter. A couple of noteworthy observations to make: (1) The knife edge geometry condition creates a SCF much higher than 3 and (2)
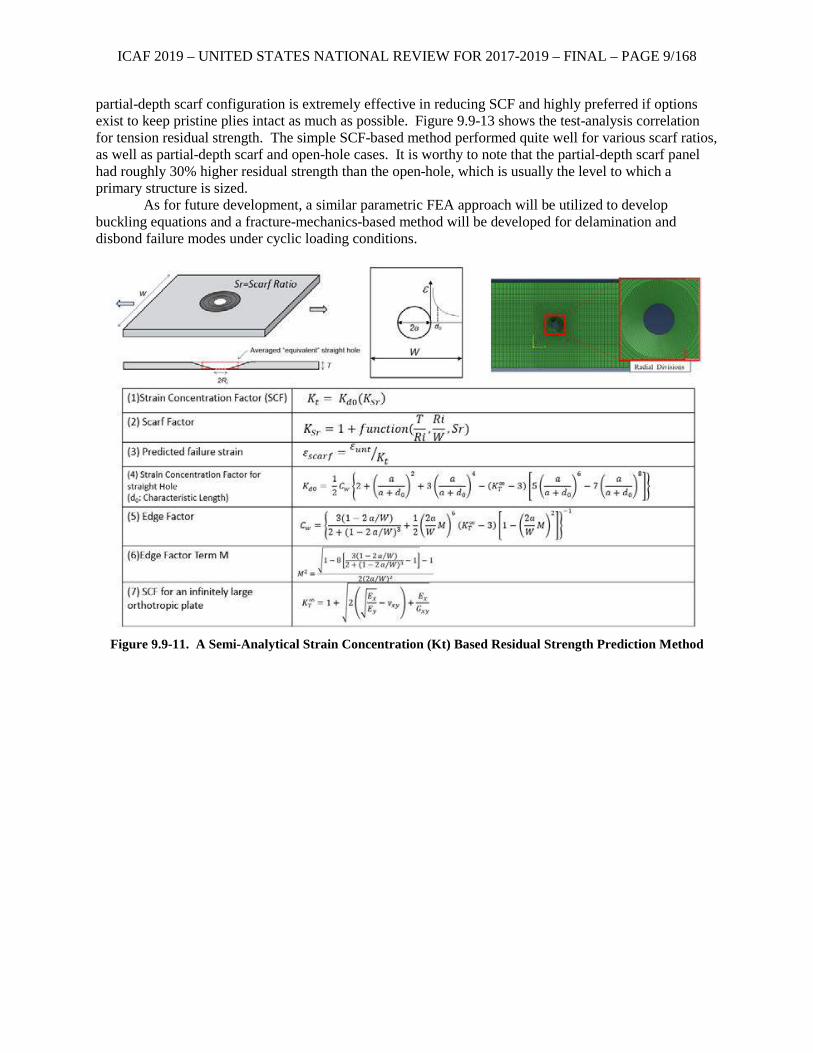
ICAF 2019 – UNITED STATES NATIONAL REVIEW FOR 2017-2019 – FINAL – PAGE 9/168
partial-depth scarf configuration is extremely effective in reducing SCF and highly preferred if options exist to keep pristine plies intact as much as possible. Figure 9.9-13 shows the test-analysis correlation for tension residual strength. The simple SCF-based method performed quite well for various scarf ratios, as well as partial-depth scarf and open-hole cases. It is worthy to note that the partial-depth scarf panel had roughly 30% higher residual strength than the open-hole, which is usually the level to which a primary structure is sized.
As for future development, a similar parametric FEA approach will be utilized to develop buckling equations and a fracture-mechanics-based method will be developed for delamination and disbond failure modes under cyclic loading conditions.
Figure 9.9-11. A Semi-Analytical Strain Concentration (Kt) Based Residual Strength Prediction Method
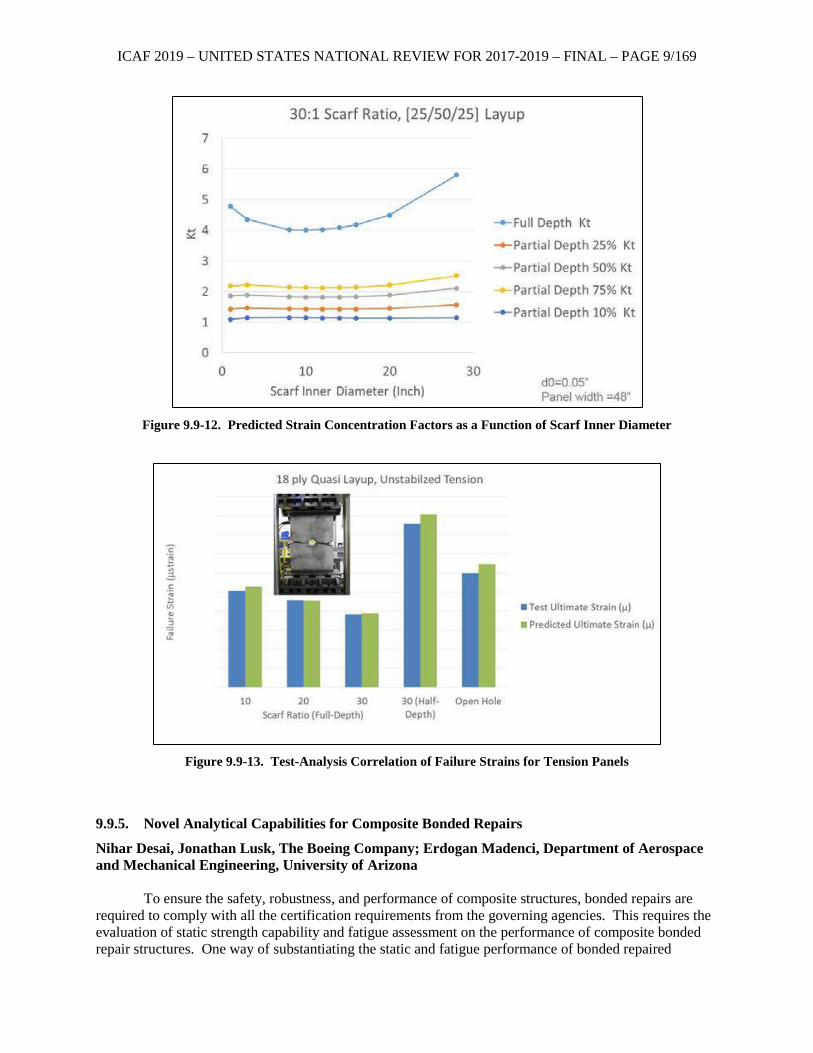
ICAF 2019 – UNITED STATES NATIONAL REVIEW FOR 2017-2019 – FINAL – PAGE 9/169
Figure 9.9-12. Predicted Strain Concentration Factors as a Function of Scarf Inner Diameter
Figure 9.9-13. Test-Analysis Correlation of Failure Strains for Tension Panels
9.9.5. Novel Analytical Capabilities for Composite Bonded Repairs
Nihar Desai, Jonathan Lusk, The Boeing Company; Erdogan Madenci, Department of Aerospace and Mechanical Engineering, University of Arizona
To ensure the safety, robustness, and performance of composite structures, bonded repairs are required to comply with all the certification requirements from the governing agencies. This requires the evaluation of static strength capability and fatigue assessment on the performance of composite bonded repair structures. One way of substantiating the static and fatigue performance of bonded repaired
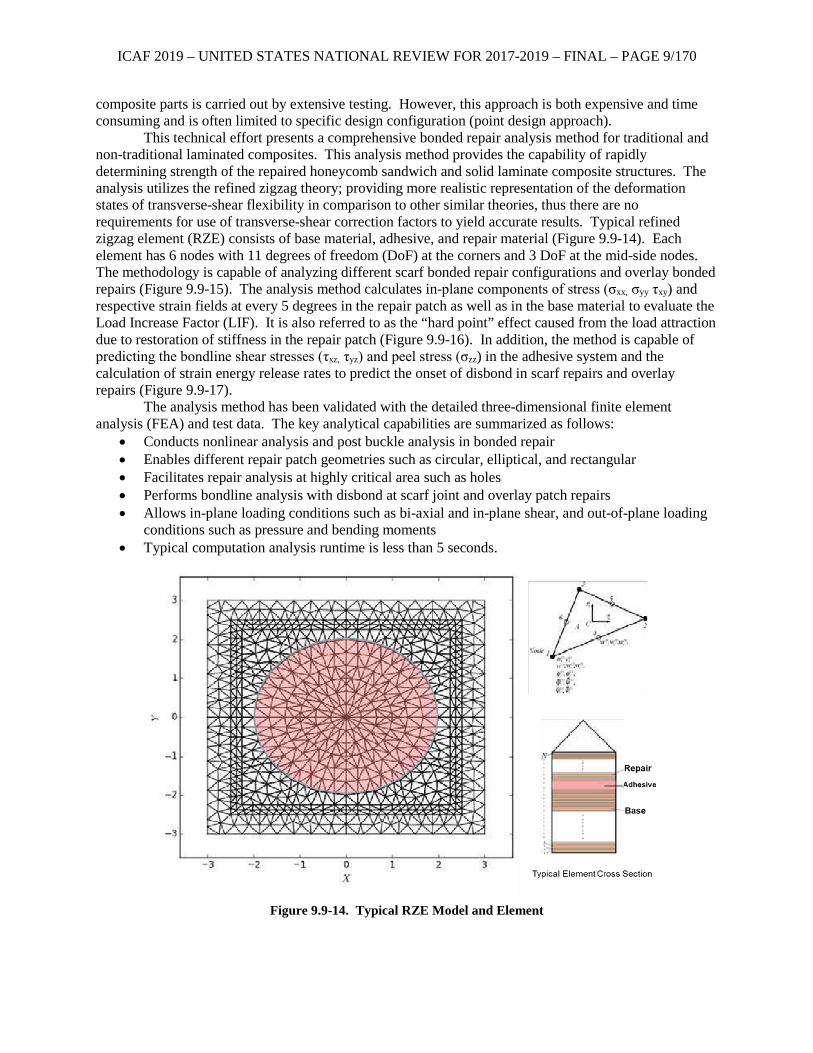
ICAF 2019 – UNITED STATES NATIONAL REVIEW FOR 2017-2019 – FINAL – PAGE 9/170
composite parts is carried out by extensive testing. However, this approach is both expensive and time consuming and is often limited to specific design configuration (point design approach).
This technical effort presents a comprehensive bonded repair analysis method for traditional and non-traditional laminated composites. This analysis method provides the capability of rapidly determining strength of the repaired honeycomb sandwich and solid laminate composite structures. The analysis utilizes the refined zigzag theory; providing more realistic representation of the deformation states of transverse-shear flexibility in comparison to other similar theories, thus there are no requirements for use of transverse-shear correction factors to yield accurate results. Typical refined zigzag element (RZE) consists of base material, adhesive, and repair material (Figure 9.9-14). Each element has 6 nodes with 11 degrees of freedom (DoF) at the corners and 3 DoF at the mid-side nodes. The methodology is capable of analyzing different scarf bonded repair configurations and overlay bonded repairs (Figure 9.9-15). The analysis method calculates in-plane components of stress (σxx, σyy τxy) and respective strain fields at every 5 degrees in the repair patch as well as in the base material to evaluate the Load Increase Factor (LIF). It is also referred to as the “hard point” effect caused from the load attraction due to restoration of stiffness in the repair patch (Figure 9.9-16). In addition, the method is capable of predicting the bondline shear stresses (τxz, τyz) and peel stress (σzz) in the adhesive system and the calculation of strain energy release rates to predict the onset of disbond in scarf repairs and overlay repairs (Figure 9.9-17).
The analysis method has been validated with the detailed three-dimensional finite element analysis (FEA) and test data. The key analytical capabilities are summarized as follows:
• Conducts nonlinear analysis and post buckle analysis in bonded repair • Enables different repair patch geometries such as circular, elliptical, and rectangular • Facilitates repair analysis at highly critical area such as holes • Performs bondline analysis with disbond at scarf joint and overlay patch repairs • Allows in-plane loading conditions such as bi-axial and in-plane shear, and out-of-plane loading
conditions such as pressure and bending moments • Typical computation analysis runtime is less than 5 seconds.
Figure 9.9-14. Typical RZE Model and Element
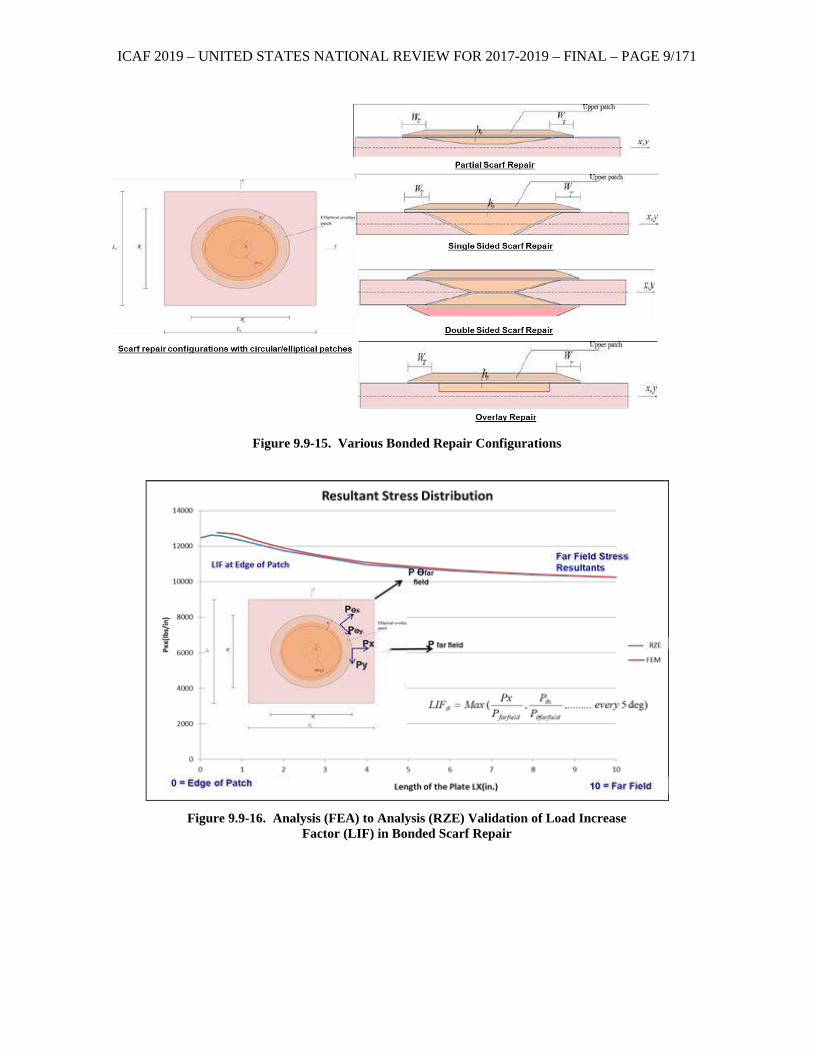
ICAF 2019 – UNITED STATES NATIONAL REVIEW FOR 2017-2019 – FINAL – PAGE 9/171
Figure 9.9-15. Various Bonded Repair Configurations
Figure 9.9-16. Analysis (FEA) to Analysis (RZE) Validation of Load Increase
Factor (LIF) in Bonded Scarf Repair
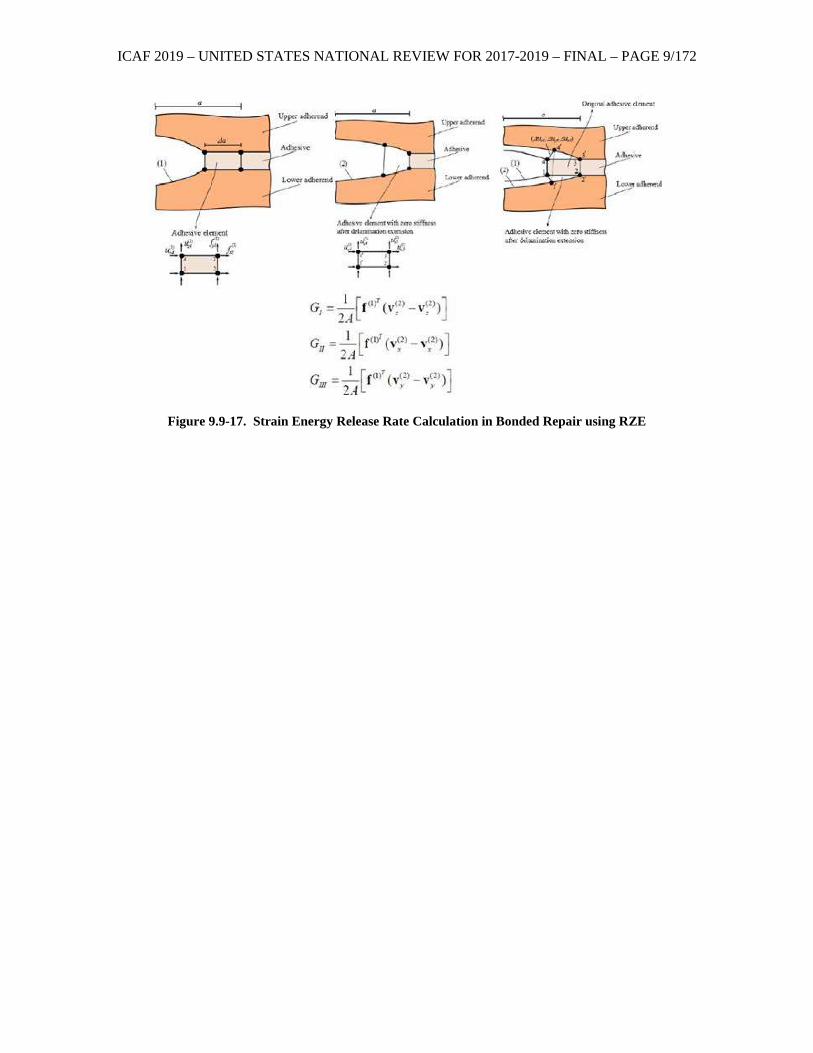
ICAF 2019 – UNITED STATES NATIONAL REVIEW FOR 2017-2019 – FINAL – PAGE 9/172
Figure 9.9-17. Strain Energy Release Rate Calculation in Bonded Repair using RZE
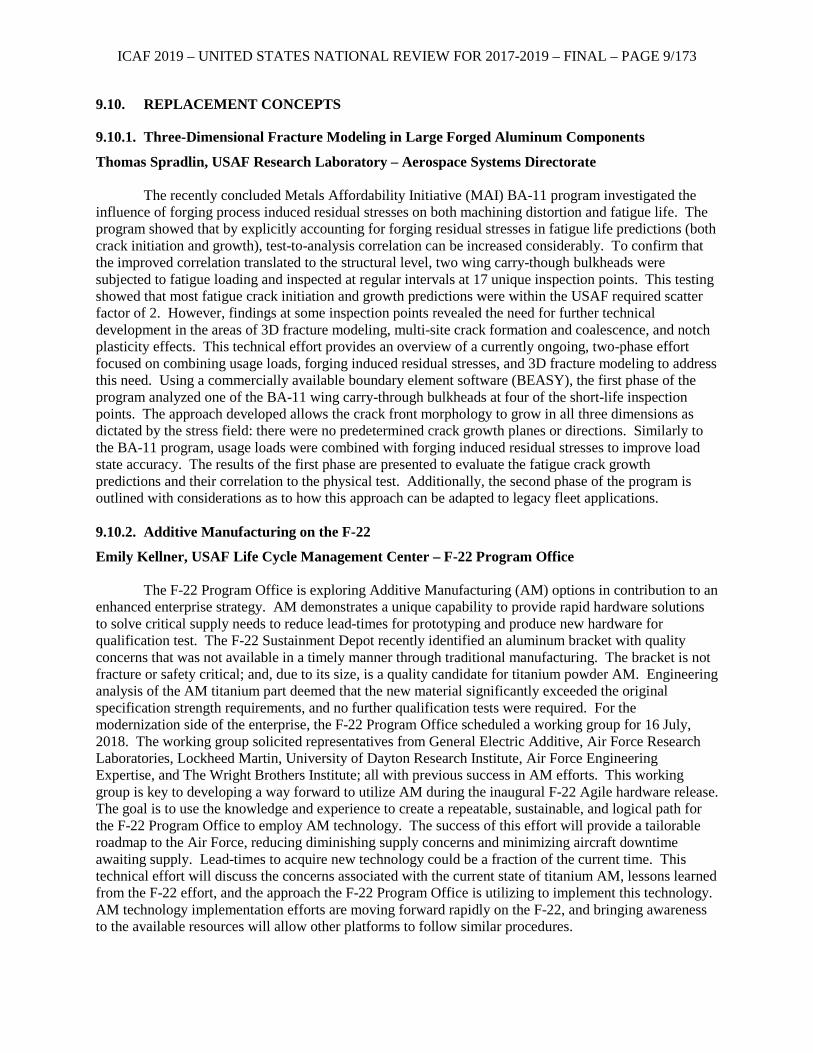
ICAF 2019 – UNITED STATES NATIONAL REVIEW FOR 2017-2019 – FINAL – PAGE 9/173
9.10. REPLACEMENT CONCEPTS
9.10.1. Three-Dimensional Fracture Modeling in Large Forged Aluminum Components
Thomas Spradlin, USAF Research Laboratory – Aerospace Systems Directorate
The recently concluded Metals Affordability Initiative (MAI) BA-11 program investigated the influence of forging process induced residual stresses on both machining distortion and fatigue life. The program showed that by explicitly accounting for forging residual stresses in fatigue life predictions (both crack initiation and growth), test-to-analysis correlation can be increased considerably. To confirm that the improved correlation translated to the structural level, two wing carry-though bulkheads were subjected to fatigue loading and inspected at regular intervals at 17 unique inspection points. This testing showed that most fatigue crack initiation and growth predictions were within the USAF required scatter factor of 2. However, findings at some inspection points revealed the need for further technical development in the areas of 3D fracture modeling, multi-site crack formation and coalescence, and notch plasticity effects. This technical effort provides an overview of a currently ongoing, two-phase effort focused on combining usage loads, forging induced residual stresses, and 3D fracture modeling to address this need. Using a commercially available boundary element software (BEASY), the first phase of the program analyzed one of the BA-11 wing carry-through bulkheads at four of the short-life inspection points. The approach developed allows the crack front morphology to grow in all three dimensions as dictated by the stress field: there were no predetermined crack growth planes or directions. Similarly to the BA-11 program, usage loads were combined with forging induced residual stresses to improve load state accuracy. The results of the first phase are presented to evaluate the fatigue crack growth predictions and their correlation to the physical test. Additionally, the second phase of the program is outlined with considerations as to how this approach can be adapted to legacy fleet applications. 9.10.2. Additive Manufacturing on the F-22
Emily Kellner, USAF Life Cycle Management Center – F-22 Program Office The F-22 Program Office is exploring Additive Manufacturing (AM) options in contribution to an
enhanced enterprise strategy. AM demonstrates a unique capability to provide rapid hardware solutions to solve critical supply needs to reduce lead-times for prototyping and produce new hardware for qualification test. The F-22 Sustainment Depot recently identified an aluminum bracket with quality concerns that was not available in a timely manner through traditional manufacturing. The bracket is not fracture or safety critical; and, due to its size, is a quality candidate for titanium powder AM. Engineering analysis of the AM titanium part deemed that the new material significantly exceeded the original specification strength requirements, and no further qualification tests were required. For the modernization side of the enterprise, the F-22 Program Office scheduled a working group for 16 July, 2018. The working group solicited representatives from General Electric Additive, Air Force Research Laboratories, Lockheed Martin, University of Dayton Research Institute, Air Force Engineering Expertise, and The Wright Brothers Institute; all with previous success in AM efforts. This working group is key to developing a way forward to utilize AM during the inaugural F-22 Agile hardware release. The goal is to use the knowledge and experience to create a repeatable, sustainable, and logical path for the F-22 Program Office to employ AM technology. The success of this effort will provide a tailorable roadmap to the Air Force, reducing diminishing supply concerns and minimizing aircraft downtime awaiting supply. Lead-times to acquire new technology could be a fraction of the current time. This technical effort will discuss the concerns associated with the current state of titanium AM, lessons learned from the F-22 effort, and the approach the F-22 Program Office is utilizing to implement this technology. AM technology implementation efforts are moving forward rapidly on the F-22, and bringing awareness to the available resources will allow other platforms to follow similar procedures.
ICAF 2019 – UNITED STATES NATIONAL REVIEW FOR 2017-2019 – FINAL – PAGE 9/174
9.10.3. Assessment of Emerging Metallic Structures Technologies Through Full-Scale Test and Analysis
John G. Bakuckas, Jr., David Stanley, Yongzhe Tian, and Kevin Stonaker, FAA William J. Hughes Technical Center; Mike Kulak and Po-Yu Chang, FAA Transport Standards Branch; Mark Freisthler, Arconic Technical Center; Marcelo R.B. Rodrigues and Carlos E. Chaves, Embraer – Brazil
The aircraft industry is striving to both improve performance and reduce costs in fabrication, operations, and maintenance by introducing advanced materials in conjunction with innovative manufacturing and production technologies. Significant advancements have been made over the past decade by the aerospace industry in developing new lightweight alloys and product forms, improved structural concepts, and manufacturing processes aimed at being competitive with composite materials in terms of manufacturing cost and performance. Collectively, these advances fall under the umbrella classification of emerging metallic structures technologies (EMST). Substantial investments have been made to demonstrate the potential to design and build durable and damage-tolerant fuselage and wing structural concepts utilizing EMST technologies, including advanced alloys (aluminium-lithium), joining methods (bonding and welding), and metallic-composite hybrids (fiber metal laminates) as documented in references 1–9.
However, the introduction of a new material or concept in the aerospace industry can be quite challenging. A significant amount of test data at the coupon, substructure, and full-scale level is needed to fully vet and properly assess a new technology and understand potential certification and continued airworthiness issues. This includes the assessment for continued relevance of existing regulations and potential development of additional safety standards and regulatory guidance, if needed, with the end goal of maintaining or enhancing the current level of safety afforded by the existing airworthiness standards. For these reasons, regulators and industry ideally should work together in preparation for the application and certification of EMST.
In recognizing these challenges, the FAA, Arconic, and Embraer are collaborating in a research effort to evaluate EMST for fuselage applications through full-scale testing and analysis. The goal is to assess and verify the use of EMST for improved durability and damage tolerance compared with the current baseline aluminum fuselage located on the crown of a typical single-aisle aircraft forward of the wing spar. Several EMST are being considered, including single-piece frames, friction stir welded skin joints, new metallic alloys, bonded stringers, and hybrid construction. Several panels with various EMST are to be tested using the FAA’s Full-Scale Aircraft Structural Test Evaluation and Research (FASTER) facility [10], which is designed for testing fuselage panels and capable of simulating aircraft service load conditions through synchronous application of mechanical and environmental load conditions.
In a phased approach, recent initial efforts have focused on the first baseline panel consisting of 2524-T3 skin and conventional 7000-series aluminum substructure assembled through riveting. The baseline panel was subjected to three phases of testing and accumulated over 84,000 simulated flights over a 10-month period. During all phases of testing, crack growth was monitored and recorded using high-magnification cameras, several nondestructive inspection (NDI) methods, strain gauges, and a digital image correlation (DIC) system. Results from the baseline panel test are summarized in this technical effort and will be compared to future test results for advanced panels containing varying EMST to assess the damage tolerance performance:
• Phase 1: A two-bay hoop skin crack with a total length (tip-to-tip) of 33 mm was inserted with the central stringer severed. The panel was then fatigue tested under simulated flight load conditions for 33,600 cycles, during which the skin crack extended across two stringer bays to a final length of approximately 287 mm, as shown in Figure 9.10-1. In general, slow and stable crack growth was observed during fatigue. The crack surface morphology had distinct transition points, where on the left side the surfaces changed from V (valley) to S (slant) fracture and on the right side transitioned from a +45° to -45° slant fracture. Preliminary results indicate that crack-growth
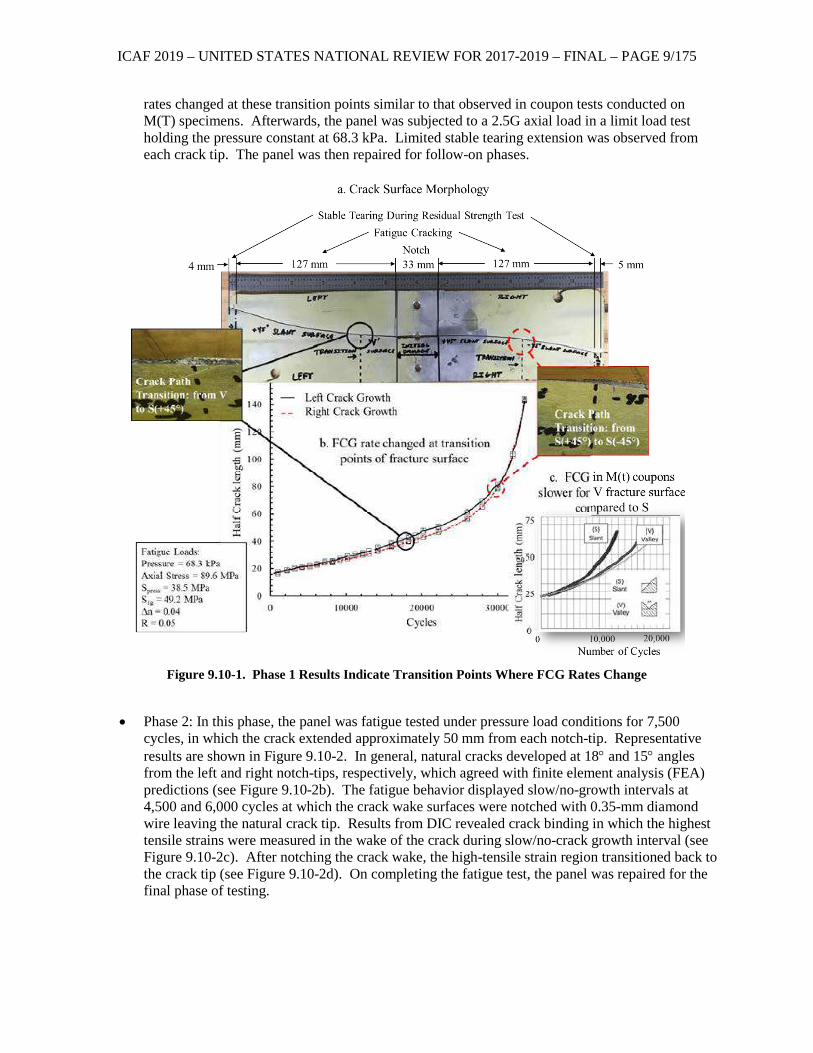
ICAF 2019 – UNITED STATES NATIONAL REVIEW FOR 2017-2019 – FINAL – PAGE 9/175
rates changed at these transition points similar to that observed in coupon tests conducted on M(T) specimens. Afterwards, the panel was subjected to a 2.5G axial load in a limit load test holding the pressure constant at 68.3 kPa. Limited stable tearing extension was observed from each crack tip. The panel was then repaired for follow-on phases.
Figure 9.10-1. Phase 1 Results Indicate Transition Points Where FCG Rates Change
• Phase 2: In this phase, the panel was fatigue tested under pressure load conditions for 7,500
cycles, in which the crack extended approximately 50 mm from each notch-tip. Representative results are shown in Figure 9.10-2. In general, natural cracks developed at 18° and 15° angles from the left and right notch-tips, respectively, which agreed with finite element analysis (FEA) predictions (see Figure 9.10-2b). The fatigue behavior displayed slow/no-growth intervals at 4,500 and 6,000 cycles at which the crack wake surfaces were notched with 0.35-mm diamond wire leaving the natural crack tip. Results from DIC revealed crack binding in which the highest tensile strains were measured in the wake of the crack during slow/no-crack growth interval (see Figure 9.10-2c). After notching the crack wake, the high-tensile strain region transitioned back to the crack tip (see Figure 9.10-2d). On completing the fatigue test, the panel was repaired for the final phase of testing.
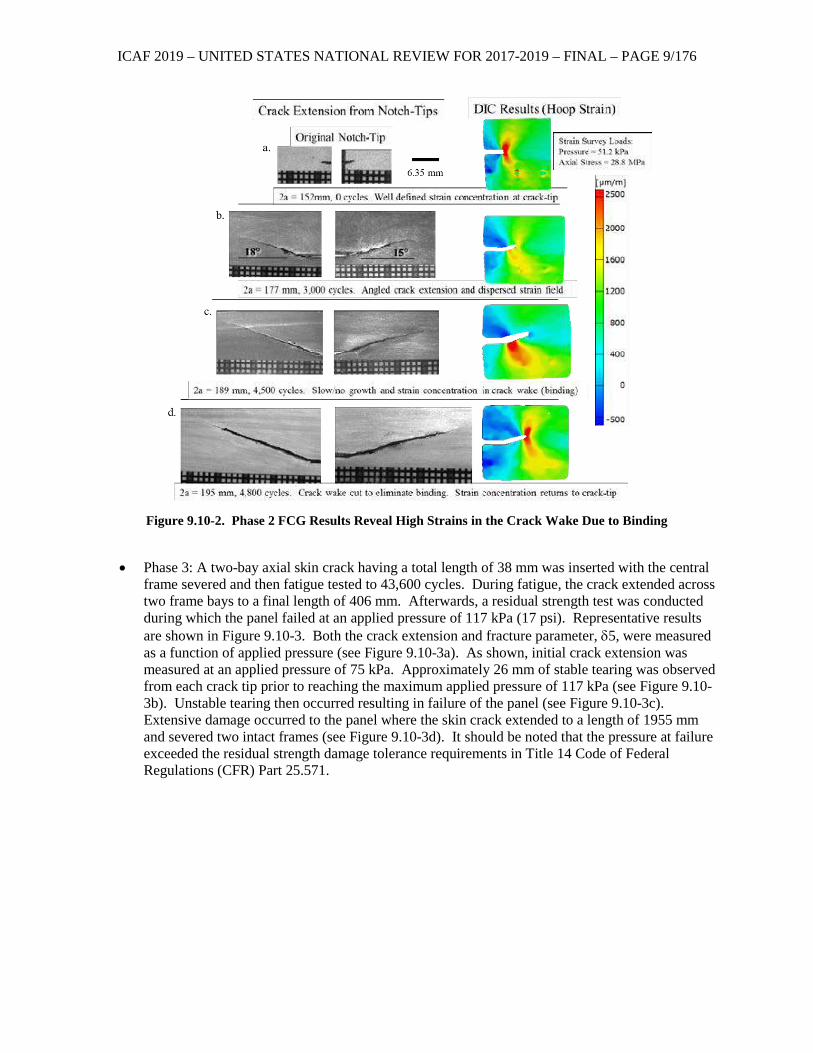
ICAF 2019 – UNITED STATES NATIONAL REVIEW FOR 2017-2019 – FINAL – PAGE 9/176
Figure 9.10-2. Phase 2 FCG Results Reveal High Strains in the Crack Wake Due to Binding
• Phase 3: A two-bay axial skin crack having a total length of 38 mm was inserted with the central
frame severed and then fatigue tested to 43,600 cycles. During fatigue, the crack extended across two frame bays to a final length of 406 mm. Afterwards, a residual strength test was conducted during which the panel failed at an applied pressure of 117 kPa (17 psi). Representative results are shown in Figure 9.10-3. Both the crack extension and fracture parameter, δ5, were measured as a function of applied pressure (see Figure 9.10-3a). As shown, initial crack extension was measured at an applied pressure of 75 kPa. Approximately 26 mm of stable tearing was observed from each crack tip prior to reaching the maximum applied pressure of 117 kPa (see Figure 9.10-3b). Unstable tearing then occurred resulting in failure of the panel (see Figure 9.10-3c). Extensive damage occurred to the panel where the skin crack extended to a length of 1955 mm and severed two intact frames (see Figure 9.10-3d). It should be noted that the pressure at failure exceeded the residual strength damage tolerance requirements in Title 14 Code of Federal Regulations (CFR) Part 25.571.
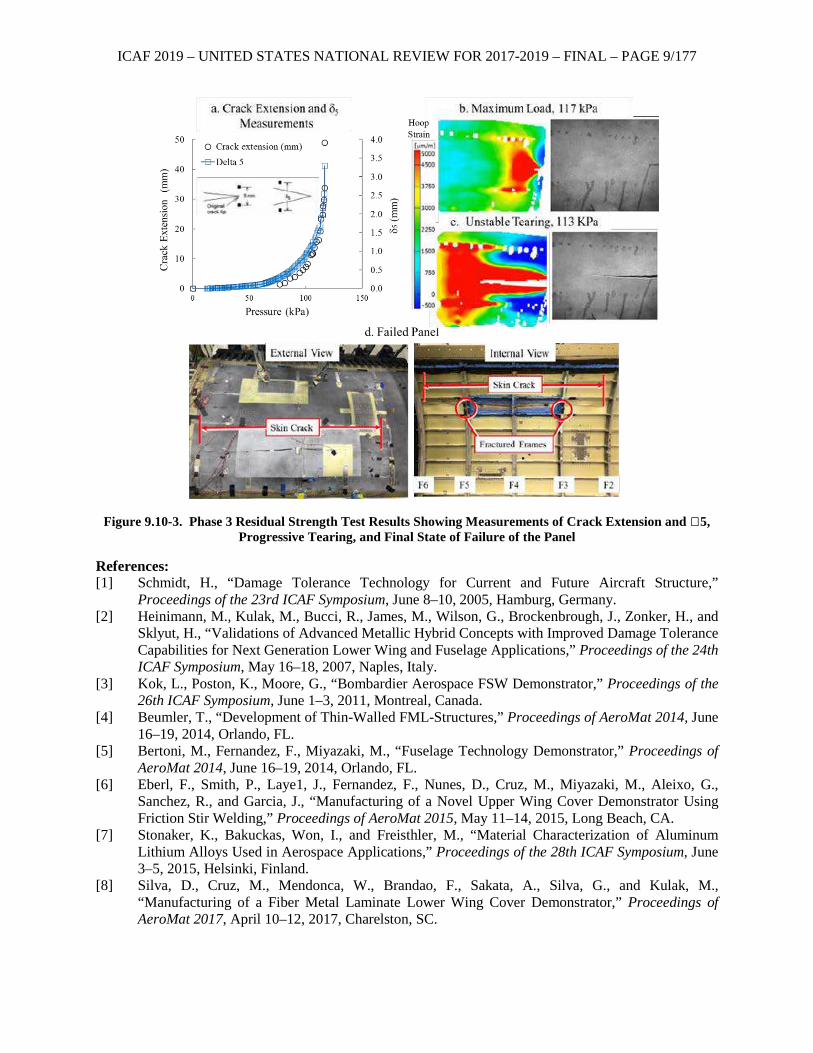
ICAF 2019 – UNITED STATES NATIONAL REVIEW FOR 2017-2019 – FINAL – PAGE 9/177
Figure 9.10-3. Phase 3 Residual Strength Test Results Showing Measurements of Crack Extension and 5,
Progressive Tearing, and Final State of Failure of the Panel
References: [1] Schmidt, H., “Damage Tolerance Technology for Current and Future Aircraft Structure,”
Proceedings of the 23rd ICAF Symposium, June 8–10, 2005, Hamburg, Germany. [2] Heinimann, M., Kulak, M., Bucci, R., James, M., Wilson, G., Brockenbrough, J., Zonker, H., and
Sklyut, H., “Validations of Advanced Metallic Hybrid Concepts with Improved Damage Tolerance Capabilities for Next Generation Lower Wing and Fuselage Applications,” Proceedings of the 24th ICAF Symposium, May 16–18, 2007, Naples, Italy.
[3] Kok, L., Poston, K., Moore, G., “Bombardier Aerospace FSW Demonstrator,” Proceedings of the 26th ICAF Symposium, June 1–3, 2011, Montreal, Canada.
[4] Beumler, T., “Development of Thin-Walled FML-Structures,” Proceedings of AeroMat 2014, June 16–19, 2014, Orlando, FL.
[5] Bertoni, M., Fernandez, F., Miyazaki, M., “Fuselage Technology Demonstrator,” Proceedings of AeroMat 2014, June 16–19, 2014, Orlando, FL.
[6] Eberl, F., Smith, P., Laye1, J., Fernandez, F., Nunes, D., Cruz, M., Miyazaki, M., Aleixo, G., Sanchez, R., and Garcia, J., “Manufacturing of a Novel Upper Wing Cover Demonstrator Using Friction Stir Welding,” Proceedings of AeroMat 2015, May 11–14, 2015, Long Beach, CA.
[7] Stonaker, K., Bakuckas, Won, I., and Freisthler, M., “Material Characterization of Aluminum Lithium Alloys Used in Aerospace Applications,” Proceedings of the 28th ICAF Symposium, June 3–5, 2015, Helsinki, Finland.
[8] Silva, D., Cruz, M., Mendonca, W., Brandao, F., Sakata, A., Silva, G., and Kulak, M., “Manufacturing of a Fiber Metal Laminate Lower Wing Cover Demonstrator,” Proceedings of AeroMat 2017, April 10–12, 2017, Charelston, SC.
ICAF 2019 – UNITED STATES NATIONAL REVIEW FOR 2017-2019 – FINAL – PAGE 9/178
[9] Chaves, C., “A Review of Aeronautical Fatigue Investigations in Brazil,” Proceedings of the 35th ICAF Conference, June 5–6, 2017, Nagoya, Japan.
[10] Tian, Y., and Bakuckas, J., “Full-Scale Aircraft Structural Test Evaluation and Research (FASTER) Fixture - Capabilities Description and User Manual,” DOT/FAA/TC-TN19/6., 2019.
9.10.4. Assessment of Fatigue Behavior of Advanced Aluminum Alloys Under Complex Variable
Amplitude Loading
Kevin Stonaker, David Stanley, and John G. Bakuckas, Jr., FAA William J. Hughes Technical Center; Mike Kulak, Po-Yu Chang, and Gongyao Wang, Arconic Technical Center; Mark Freisthler, FAA Transport Standards Branch
The FAA, Arconic, and Embraer have partnered in an effort to evaluate several emerging metallic
structures technologies (EMST) through full-scale tests and analyses. The goal is to demonstrate the potential for fuselage concepts using EMST to improve durability and damage tolerance compared with the current baseline aluminum fuselage and to assess the relevance of existing damage tolerance regulations (Bakuckas, 2019). In support of the full-scale panel tests, a supplemental test program is being carried out using middle tension (M(T)) coupons to assess the fatigue crack-growth behavior of a circumferential crack in fuselage skin material subjected to a complex variable amplitude spectrum loading. The purpose of this supplemental test program is to establish a methodology of empirically determining the constant amplitude equivalent stress that produces the same fatigue crack-growth (FCG) behavior as a variable amplitude spectrum and to evaluate the effects of a once-per-flight compressive landing load on spectrum FCG.
The specific area of interest for this program is the crown, forward of the front wing spar. A circumferential crack in the crown target area is driven by loads that are spectrum in nature, representing cabin pressurization and fuselage bending from flight, gust, and landing loads. The down-bending spectrum loads, with pressure, add a significant complexity to the stress history. Whereas the full-scale fixture is capable of applying a variable amplitude spectrum loading, it is not practical to do this for the current accelerated testing program and, instead, a constant-amplitude load profile is desired. Therefore, the focus of the supplemental testing is to determine the equivalent constant-amplitude load that produces the same circumferential FCG life in the fuselage crown as the target spectrum. The target spectrum was developed to match the expected in-service loads in the axial direction for the fuselage crown location forward of the wing spar of a generic single-aisle aircraft. In a prior FAA program, down-bending flight load data for the crown was compiled from typical narrow-body aircraft such as the Boeing 727 and 737 (Steadman, 2007). In that work it was found that by reducing the acceleration excursions of the mini-Twist spectrum developed by NLR (Lowak, 1979) by a factor of 2, the flight loads data measured by Steadman was closely matched. Additionally, a once-per-flight compressive landing load was added to the spectrum run by Arconic.
A challenge for this supplemental testing was generating data with flat M(T) coupons that are representative of the expected FCG behavior in the full-scale panel structure. FEA of the full-scale test panel was conducted by Arconic (Kulak, 2019) and was used to predict the stress intensity factor (SIF) at the crack tip for various crack lengths. A comparison of the geometric beta factors for the test panel and simply loaded M(T) coupons highlights the significant difference between the two. The full-scale panel SIF for a skin crack under an intact or broken stringer is influenced by the load redistribution of the stiffened panel structure. Therefore, to develop data using an M(T) specimen that can be considered representative of the full-scale panel, it was necessary to use a K-control approach that accounts for the differences in SIF between the full-scale panel and M(T) coupons. The K-control approach that was used took the SIF solutions from the FEA as the target behavior and adjusted the applied loads to create those conditions based on the compliance measured crack length.
The results of the K-control coupon testing was that 89.6 MPa was chosen as the equivalent constant-amplitude stress that was used for the full-scale panel test (see Figure 9.10-4). That decision
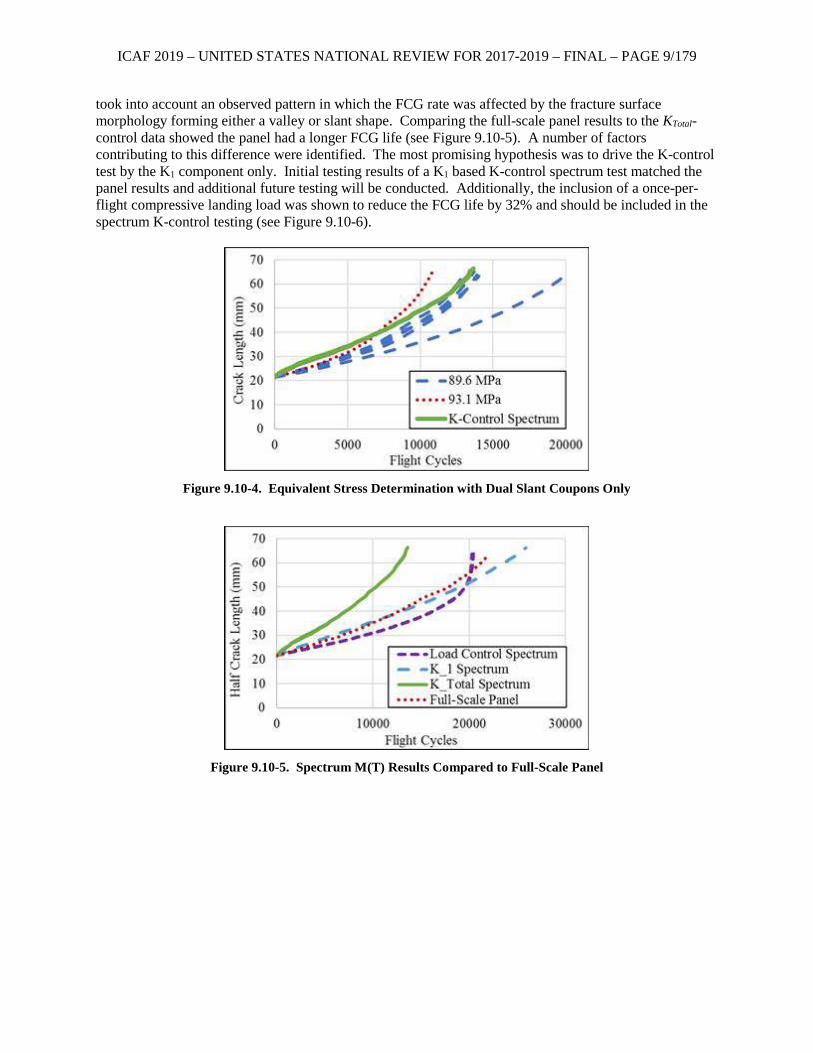
ICAF 2019 – UNITED STATES NATIONAL REVIEW FOR 2017-2019 – FINAL – PAGE 9/179
took into account an observed pattern in which the FCG rate was affected by the fracture surface morphology forming either a valley or slant shape. Comparing the full-scale panel results to the KTotal-control data showed the panel had a longer FCG life (see Figure 9.10-5). A number of factors contributing to this difference were identified. The most promising hypothesis was to drive the K-control test by the K1 component only. Initial testing results of a K1 based K-control spectrum test matched the panel results and additional future testing will be conducted. Additionally, the inclusion of a once-per-flight compressive landing load was shown to reduce the FCG life by 32% and should be included in the spectrum K-control testing (see Figure 9.10-6).
Figure 9.10-4. Equivalent Stress Determination with Dual Slant Coupons Only
Figure 9.10-5. Spectrum M(T) Results Compared to Full-Scale Panel
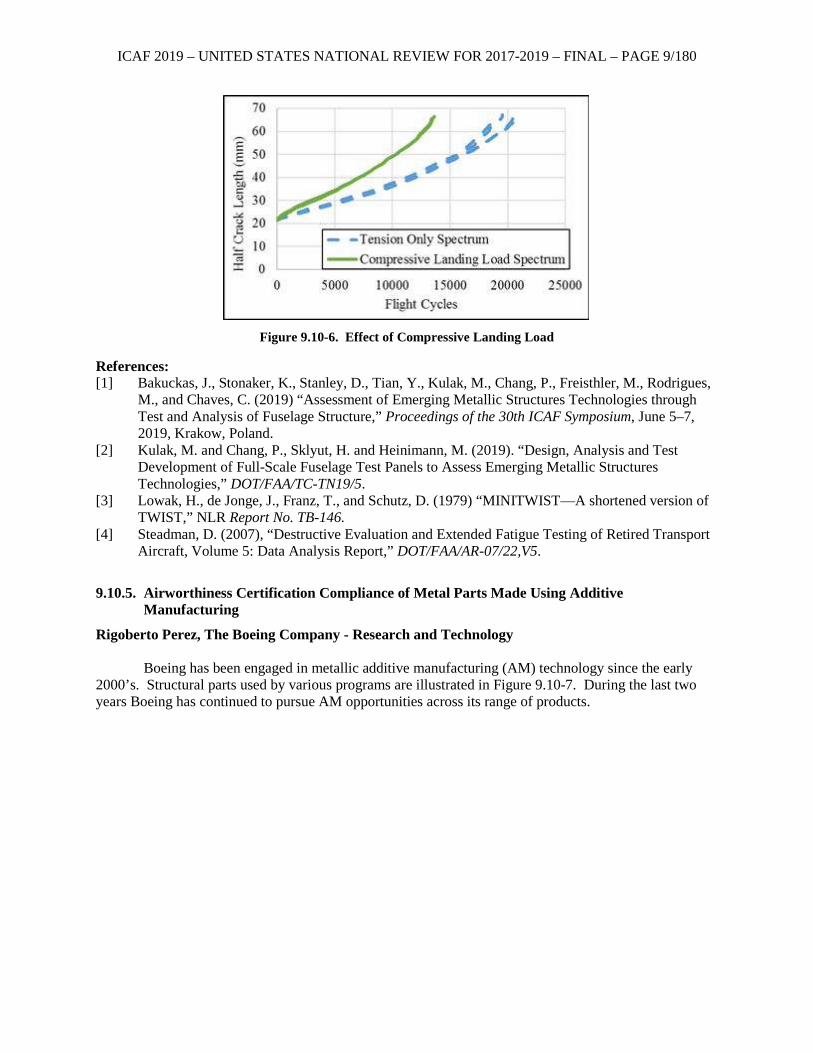
ICAF 2019 – UNITED STATES NATIONAL REVIEW FOR 2017-2019 – FINAL – PAGE 9/180
Figure 9.10-6. Effect of Compressive Landing Load
References: [1] Bakuckas, J., Stonaker, K., Stanley, D., Tian, Y., Kulak, M., Chang, P., Freisthler, M., Rodrigues,
M., and Chaves, C. (2019) “Assessment of Emerging Metallic Structures Technologies through Test and Analysis of Fuselage Structure,” Proceedings of the 30th ICAF Symposium, June 5–7, 2019, Krakow, Poland.
[2] Kulak, M. and Chang, P., Sklyut, H. and Heinimann, M. (2019). “Design, Analysis and Test Development of Full-Scale Fuselage Test Panels to Assess Emerging Metallic Structures Technologies,” DOT/FAA/TC-TN19/5.
[3] Lowak, H., de Jonge, J., Franz, T., and Schutz, D. (1979) “MINITWIST—A shortened version of TWIST,” NLR Report No. TB-146.
[4] Steadman, D. (2007), “Destructive Evaluation and Extended Fatigue Testing of Retired Transport Aircraft, Volume 5: Data Analysis Report,” DOT/FAA/AR-07/22,V5.
9.10.5. Airworthiness Certification Compliance of Metal Parts Made Using Additive
Manufacturing
Rigoberto Perez, The Boeing Company - Research and Technology
Boeing has been engaged in metallic additive manufacturing (AM) technology since the early 2000’s. Structural parts used by various programs are illustrated in Figure 9.10-7. During the last two years Boeing has continued to pursue AM opportunities across its range of products.
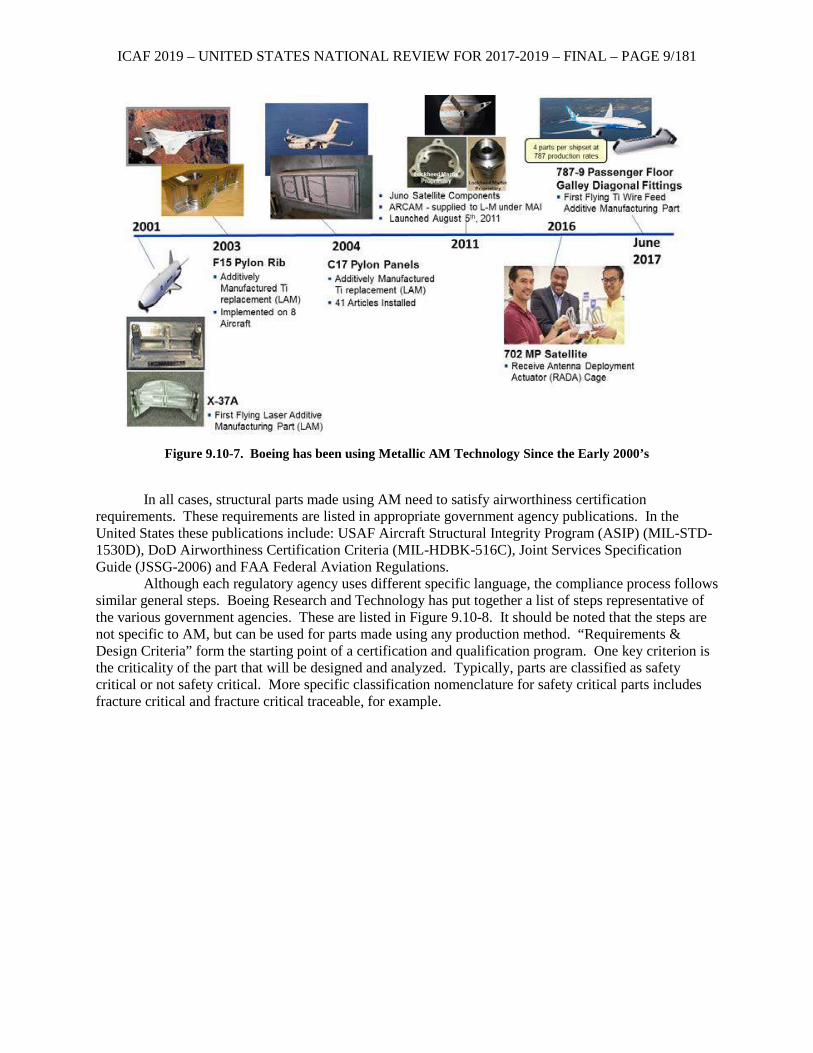
ICAF 2019 – UNITED STATES NATIONAL REVIEW FOR 2017-2019 – FINAL – PAGE 9/181
Figure 9.10-7. Boeing has been using Metallic AM Technology Since the Early 2000’s
In all cases, structural parts made using AM need to satisfy airworthiness certification
requirements. These requirements are listed in appropriate government agency publications. In the United States these publications include: USAF Aircraft Structural Integrity Program (ASIP) (MIL-STD-1530D), DoD Airworthiness Certification Criteria (MIL-HDBK-516C), Joint Services Specification Guide (JSSG-2006) and FAA Federal Aviation Regulations.
Although each regulatory agency uses different specific language, the compliance process follows similar general steps. Boeing Research and Technology has put together a list of steps representative of the various government agencies. These are listed in Figure 9.10-8. It should be noted that the steps are not specific to AM, but can be used for parts made using any production method. “Requirements & Design Criteria” form the starting point of a certification and qualification program. One key criterion is the criticality of the part that will be designed and analyzed. Typically, parts are classified as safety critical or not safety critical. More specific classification nomenclature for safety critical parts includes fracture critical and fracture critical traceable, for example.
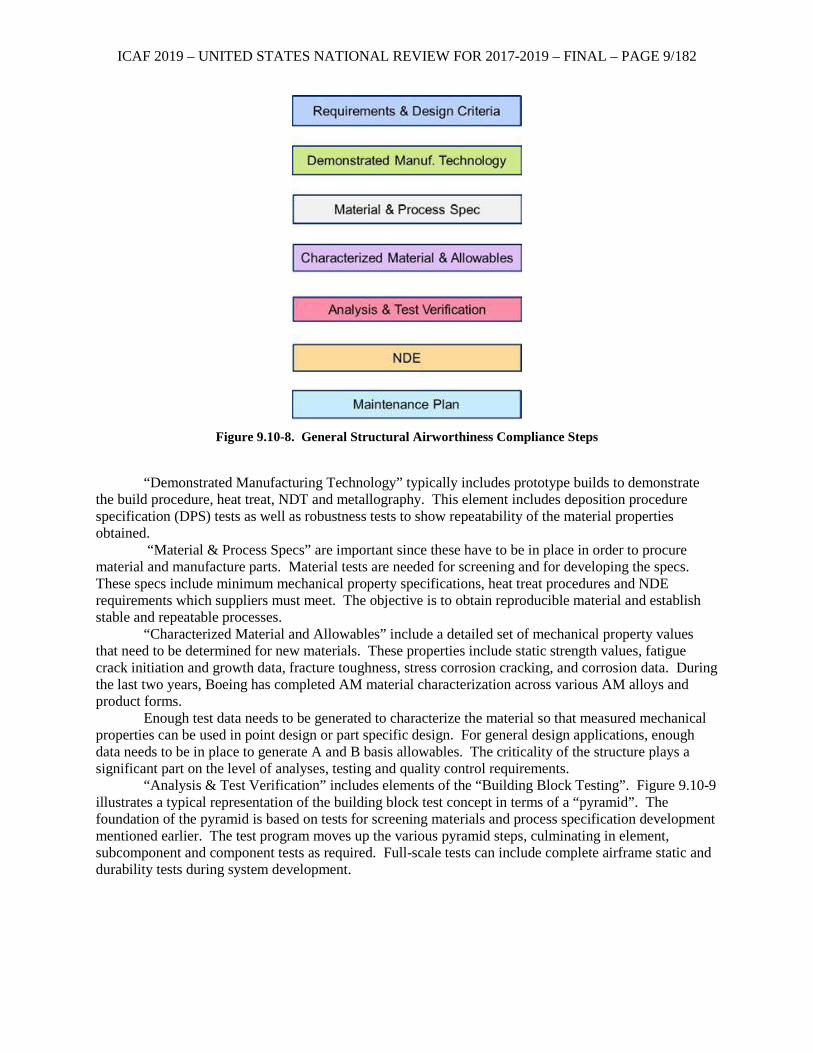
ICAF 2019 – UNITED STATES NATIONAL REVIEW FOR 2017-2019 – FINAL – PAGE 9/182
Figure 9.10-8. General Structural Airworthiness Compliance Steps
“Demonstrated Manufacturing Technology” typically includes prototype builds to demonstrate
the build procedure, heat treat, NDT and metallography. This element includes deposition procedure specification (DPS) tests as well as robustness tests to show repeatability of the material properties obtained.
“Material & Process Specs” are important since these have to be in place in order to procure material and manufacture parts. Material tests are needed for screening and for developing the specs. These specs include minimum mechanical property specifications, heat treat procedures and NDE requirements which suppliers must meet. The objective is to obtain reproducible material and establish stable and repeatable processes.
“Characterized Material and Allowables” include a detailed set of mechanical property values that need to be determined for new materials. These properties include static strength values, fatigue crack initiation and growth data, fracture toughness, stress corrosion cracking, and corrosion data. During the last two years, Boeing has completed AM material characterization across various AM alloys and product forms.
Enough test data needs to be generated to characterize the material so that measured mechanical properties can be used in point design or part specific design. For general design applications, enough data needs to be in place to generate A and B basis allowables. The criticality of the structure plays a significant part on the level of analyses, testing and quality control requirements.
“Analysis & Test Verification” includes elements of the “Building Block Testing”. Figure 9.10-9 illustrates a typical representation of the building block test concept in terms of a “pyramid”. The foundation of the pyramid is based on tests for screening materials and process specification development mentioned earlier. The test program moves up the various pyramid steps, culminating in element, subcomponent and component tests as required. Full-scale tests can include complete airframe static and durability tests during system development.
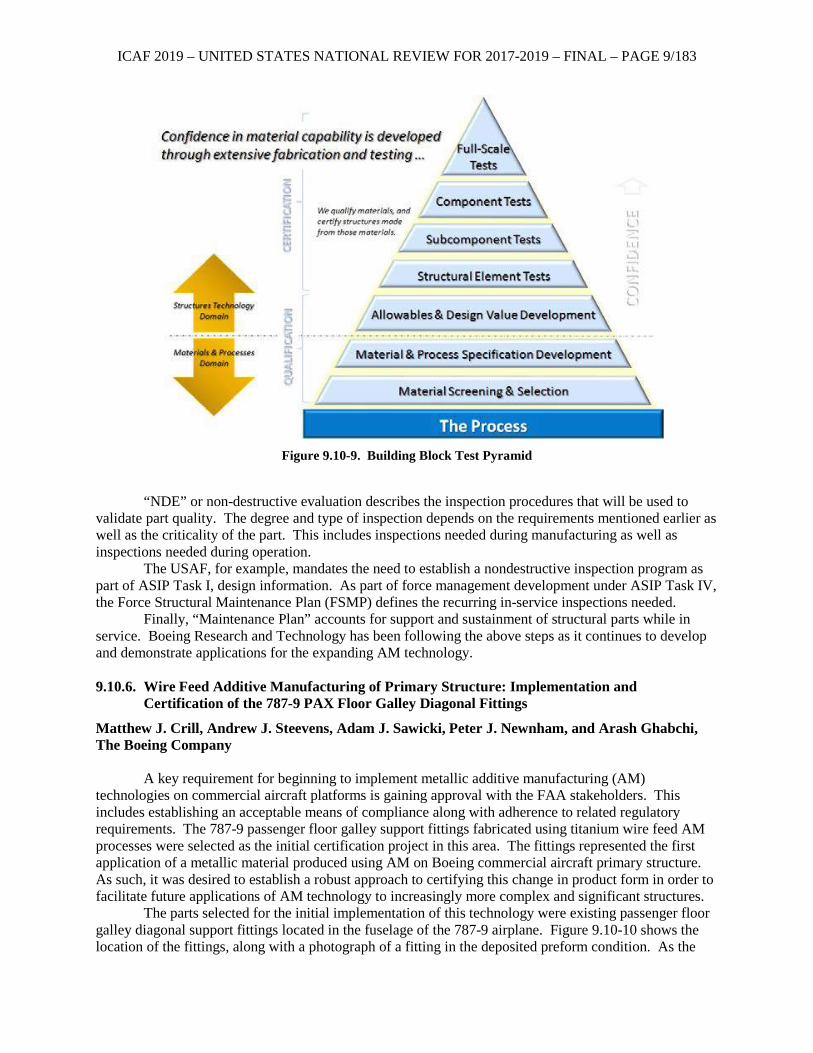
ICAF 2019 – UNITED STATES NATIONAL REVIEW FOR 2017-2019 – FINAL – PAGE 9/183
Figure 9.10-9. Building Block Test Pyramid
“NDE” or non-destructive evaluation describes the inspection procedures that will be used to
validate part quality. The degree and type of inspection depends on the requirements mentioned earlier as well as the criticality of the part. This includes inspections needed during manufacturing as well as inspections needed during operation.
The USAF, for example, mandates the need to establish a nondestructive inspection program as part of ASIP Task I, design information. As part of force management development under ASIP Task IV, the Force Structural Maintenance Plan (FSMP) defines the recurring in-service inspections needed.
Finally, “Maintenance Plan” accounts for support and sustainment of structural parts while in service. Boeing Research and Technology has been following the above steps as it continues to develop and demonstrate applications for the expanding AM technology. 9.10.6. Wire Feed Additive Manufacturing of Primary Structure: Implementation and
Certification of the 787-9 PAX Floor Galley Diagonal Fittings
Matthew J. Crill, Andrew J. Steevens, Adam J. Sawicki, Peter J. Newnham, and Arash Ghabchi, The Boeing Company
A key requirement for beginning to implement metallic additive manufacturing (AM) technologies on commercial aircraft platforms is gaining approval with the FAA stakeholders. This includes establishing an acceptable means of compliance along with adherence to related regulatory requirements. The 787-9 passenger floor galley support fittings fabricated using titanium wire feed AM processes were selected as the initial certification project in this area. The fittings represented the first application of a metallic material produced using AM on Boeing commercial aircraft primary structure. As such, it was desired to establish a robust approach to certifying this change in product form in order to facilitate future applications of AM technology to increasingly more complex and significant structures.
The parts selected for the initial implementation of this technology were existing passenger floor galley diagonal support fittings located in the fuselage of the 787-9 airplane. Figure 9.10-10 shows the location of the fittings, along with a photograph of a fitting in the deposited preform condition. As the
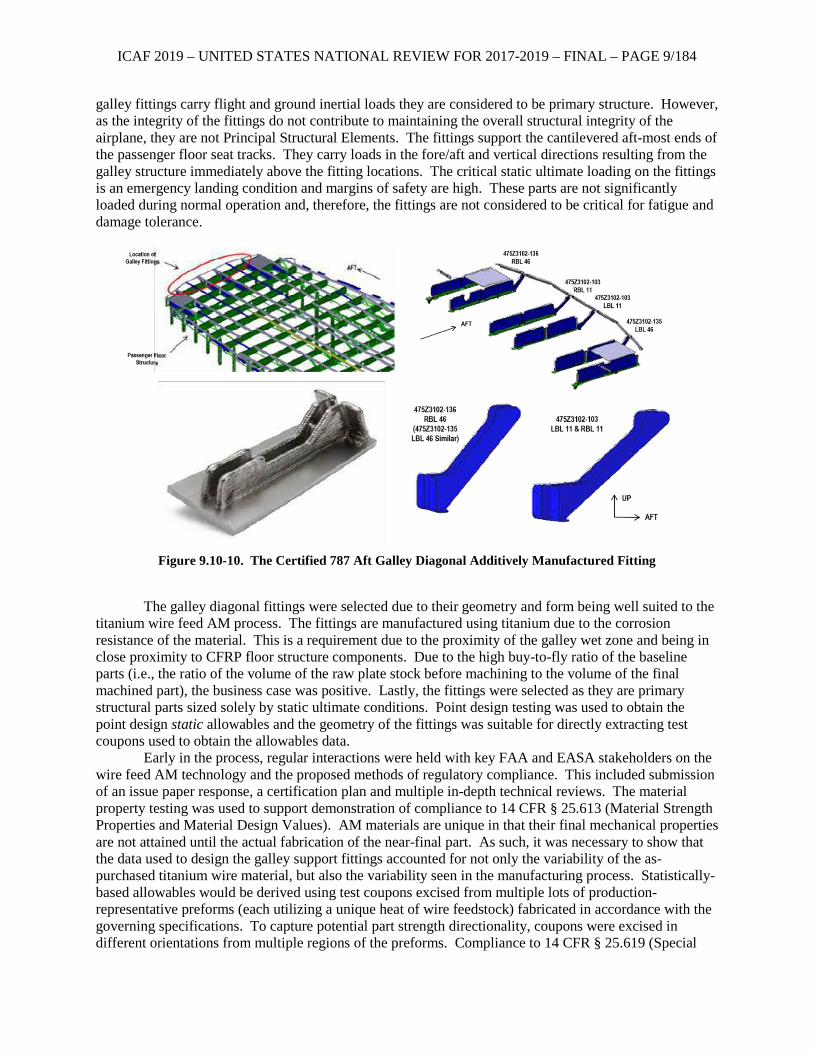
ICAF 2019 – UNITED STATES NATIONAL REVIEW FOR 2017-2019 – FINAL – PAGE 9/184
galley fittings carry flight and ground inertial loads they are considered to be primary structure. However, as the integrity of the fittings do not contribute to maintaining the overall structural integrity of the airplane, they are not Principal Structural Elements. The fittings support the cantilevered aft-most ends of the passenger floor seat tracks. They carry loads in the fore/aft and vertical directions resulting from the galley structure immediately above the fitting locations. The critical static ultimate loading on the fittings is an emergency landing condition and margins of safety are high. These parts are not significantly loaded during normal operation and, therefore, the fittings are not considered to be critical for fatigue and damage tolerance.
Figure 9.10-10. The Certified 787 Aft Galley Diagonal Additively Manufactured Fitting
The galley diagonal fittings were selected due to their geometry and form being well suited to the
titanium wire feed AM process. The fittings are manufactured using titanium due to the corrosion resistance of the material. This is a requirement due to the proximity of the galley wet zone and being in close proximity to CFRP floor structure components. Due to the high buy-to-fly ratio of the baseline parts (i.e., the ratio of the volume of the raw plate stock before machining to the volume of the final machined part), the business case was positive. Lastly, the fittings were selected as they are primary structural parts sized solely by static ultimate conditions. Point design testing was used to obtain the point design static allowables and the geometry of the fittings was suitable for directly extracting test coupons used to obtain the allowables data.
Early in the process, regular interactions were held with key FAA and EASA stakeholders on the wire feed AM technology and the proposed methods of regulatory compliance. This included submission of an issue paper response, a certification plan and multiple in-depth technical reviews. The material property testing was used to support demonstration of compliance to 14 CFR § 25.613 (Material Strength Properties and Material Design Values). AM materials are unique in that their final mechanical properties are not attained until the actual fabrication of the near-final part. As such, it was necessary to show that the data used to design the galley support fittings accounted for not only the variability of the as-purchased titanium wire material, but also the variability seen in the manufacturing process. Statistically-based allowables would be derived using test coupons excised from multiple lots of production-representative preforms (each utilizing a unique heat of wire feedstock) fabricated in accordance with the governing specifications. To capture potential part strength directionality, coupons were excised in different orientations from multiple regions of the preforms. Compliance to 14 CFR § 25.619 (Special
ICAF 2019 – UNITED STATES NATIONAL REVIEW FOR 2017-2019 – FINAL – PAGE 9/185
Factors) was shown via analysis to demonstrate that the strength properties of the wire-feed AM galley support fittings are not subject to appreciable variability due to uncertainties in the manufacturing process, and that no special factor would be required to be applied when calculating strength margins of safety. The demonstration consisted of manufacturing process proofing, establishment of material and process specifications, rigorous supplier and process qualification, development of statistically based design values, and production process monitoring.
Implementation of these initial parts has proven to be a significant step towards further usage of AM parts within Boeing. This project demonstrated the ability to achieve robust process controls throughout part deposition while utilizing standard material testing and data analysis methods for calculating design values. These are key items for ensuring that both Boeing standards and FAA regulations are being met in a rigorous fashion and help set the standard for future efforts.
The recurring benefits received for this first application on the 787 program consist of reductions in both material usage and machining times to achieve lower final part costs. Despite these realized benefits, continuing to develop part-specific design values is not an economical path for additional insertion of candidate parts. In parallel to implementing the galley fittings, a general static allowables testing program was initiated and completed in late 2017. These allowables are being utilized for additional wire feed candidate parts in cases where parts are primarily statically loaded and cost savings are being achieved. This is part of the overall strategy to continue implementing candidate parts that gradually progress towards applications requiring higher levels of criticality while continuing to perform testing for durability and damage tolerance design values.

ICAF 2019 – UNITED STATES NATIONAL REVIEW FOR 2017-2019 – FINAL – PAGE 9/186
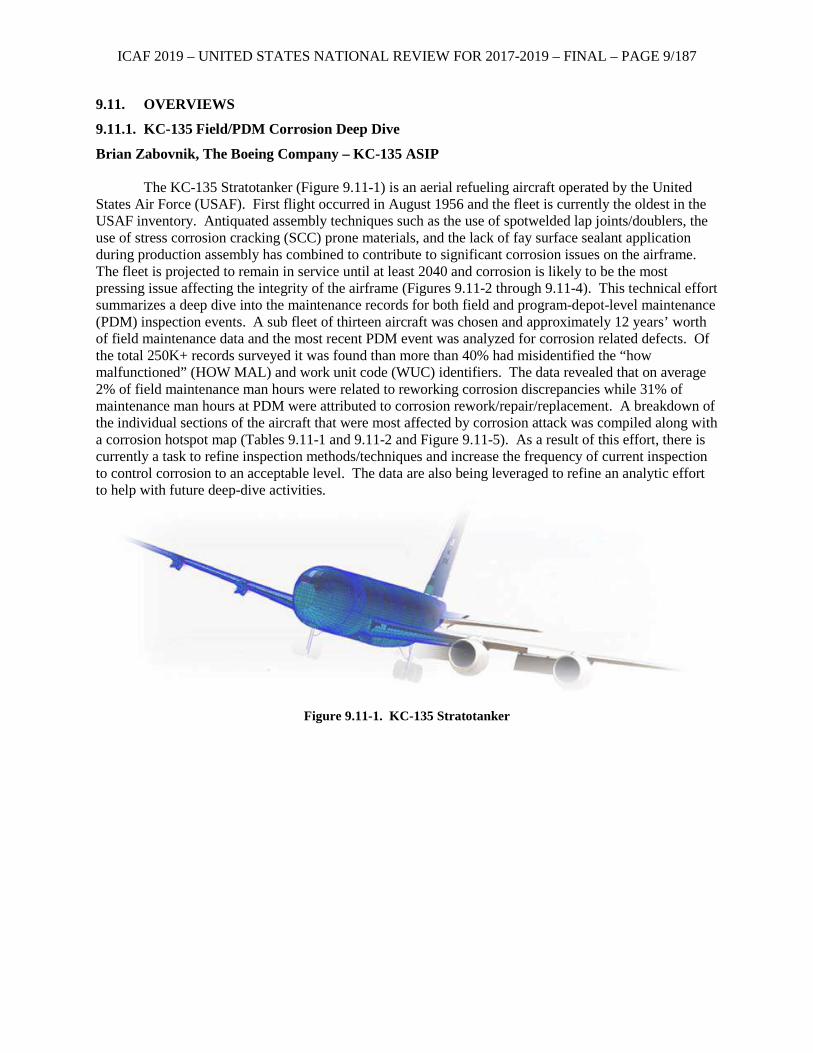
ICAF 2019 – UNITED STATES NATIONAL REVIEW FOR 2017-2019 – FINAL – PAGE 9/187
9.11. OVERVIEWS
9.11.1. KC-135 Field/PDM Corrosion Deep Dive
Brian Zabovnik, The Boeing Company – KC-135 ASIP The KC-135 Stratotanker (Figure 9.11-1) is an aerial refueling aircraft operated by the United
States Air Force (USAF). First flight occurred in August 1956 and the fleet is currently the oldest in the USAF inventory. Antiquated assembly techniques such as the use of spotwelded lap joints/doublers, the use of stress corrosion cracking (SCC) prone materials, and the lack of fay surface sealant application during production assembly has combined to contribute to significant corrosion issues on the airframe. The fleet is projected to remain in service until at least 2040 and corrosion is likely to be the most pressing issue affecting the integrity of the airframe (Figures 9.11-2 through 9.11-4). This technical effort summarizes a deep dive into the maintenance records for both field and program-depot-level maintenance (PDM) inspection events. A sub fleet of thirteen aircraft was chosen and approximately 12 years’ worth of field maintenance data and the most recent PDM event was analyzed for corrosion related defects. Of the total 250K+ records surveyed it was found than more than 40% had misidentified the “how malfunctioned” (HOW MAL) and work unit code (WUC) identifiers. The data revealed that on average 2% of field maintenance man hours were related to reworking corrosion discrepancies while 31% of maintenance man hours at PDM were attributed to corrosion rework/repair/replacement. A breakdown of the individual sections of the aircraft that were most affected by corrosion attack was compiled along with a corrosion hotspot map (Tables 9.11-1 and 9.11-2 and Figure 9.11-5). As a result of this effort, there is currently a task to refine inspection methods/techniques and increase the frequency of current inspection to control corrosion to an acceptable level. The data are also being leveraged to refine an analytic effort to help with future deep-dive activities.
Figure 9.11-1. KC-135 Stratotanker
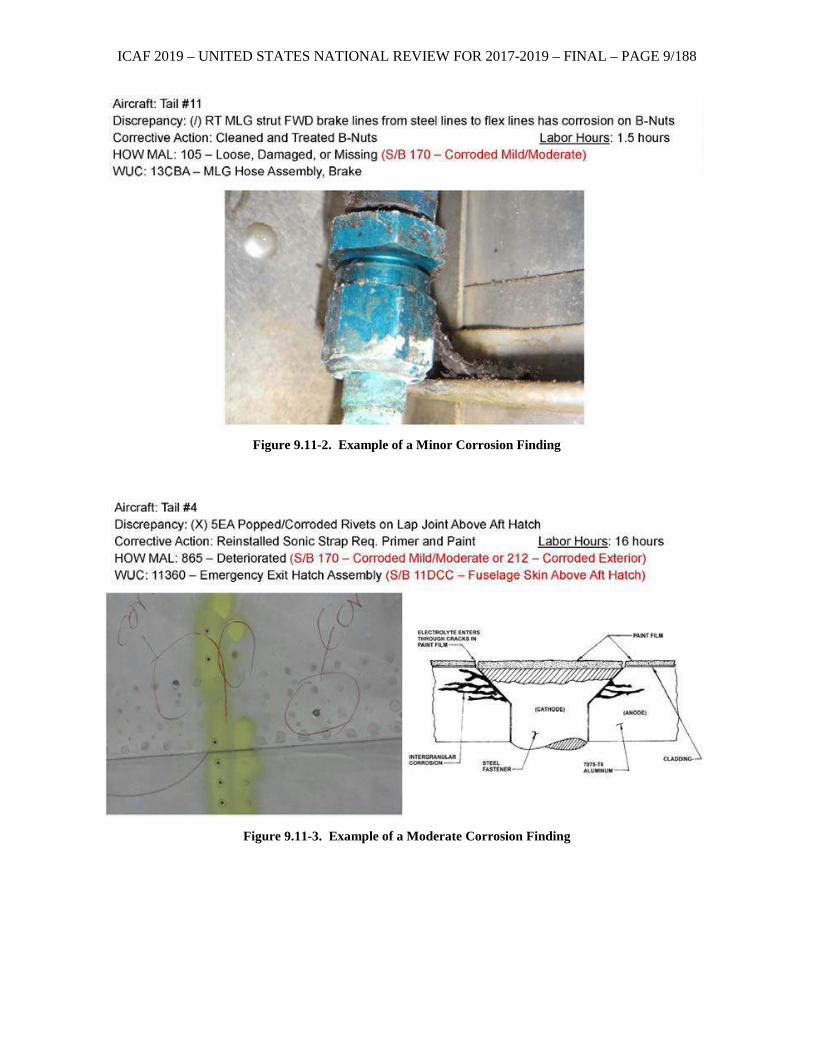
ICAF 2019 – UNITED STATES NATIONAL REVIEW FOR 2017-2019 – FINAL – PAGE 9/188
Figure 9.11-2. Example of a Minor Corrosion Finding
Figure 9.11-3. Example of a Moderate Corrosion Finding
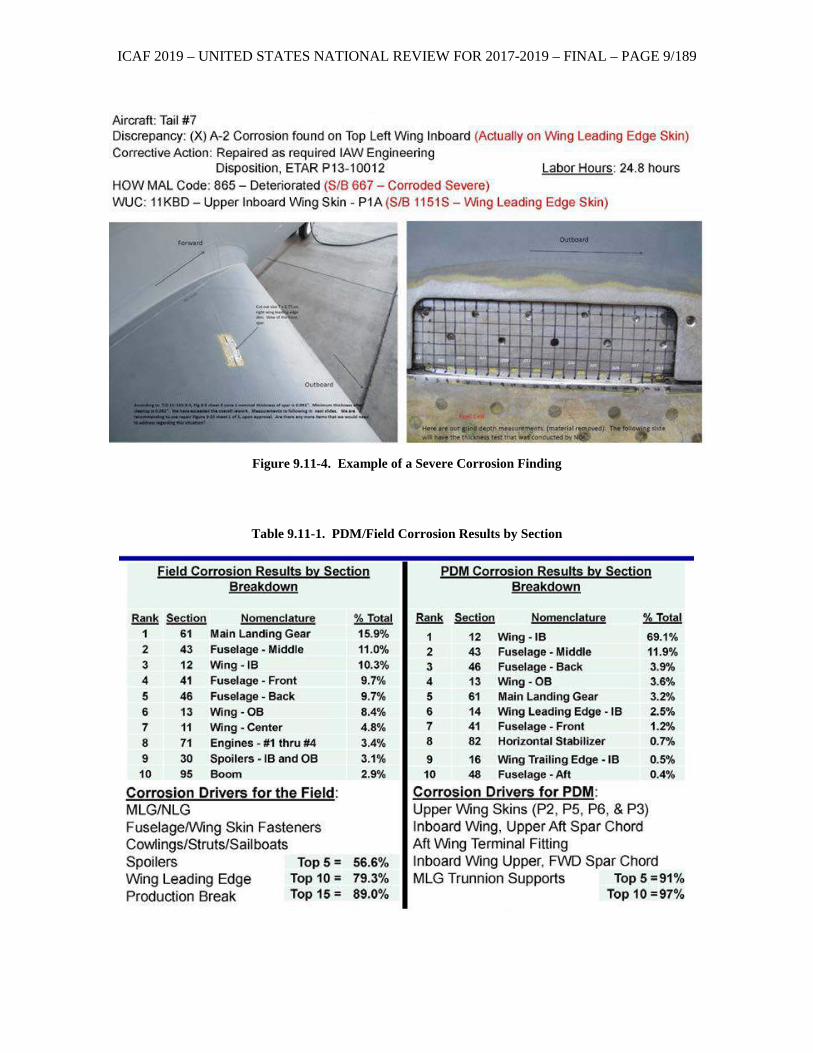
ICAF 2019 – UNITED STATES NATIONAL REVIEW FOR 2017-2019 – FINAL – PAGE 9/189
Figure 9.11-4. Example of a Severe Corrosion Finding
Table 9.11-1. PDM/Field Corrosion Results by Section
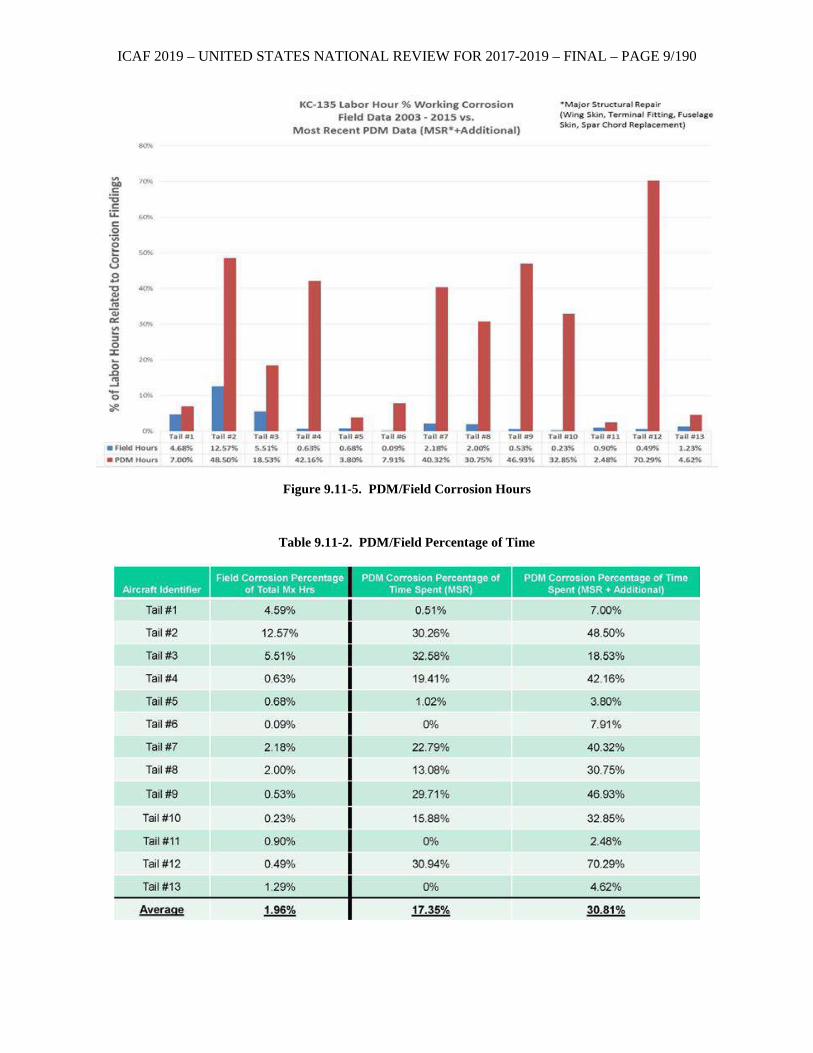
ICAF 2019 – UNITED STATES NATIONAL REVIEW FOR 2017-2019 – FINAL – PAGE 9/190
Figure 9.11-5. PDM/Field Corrosion Hours
Table 9.11-2. PDM/Field Percentage of Time
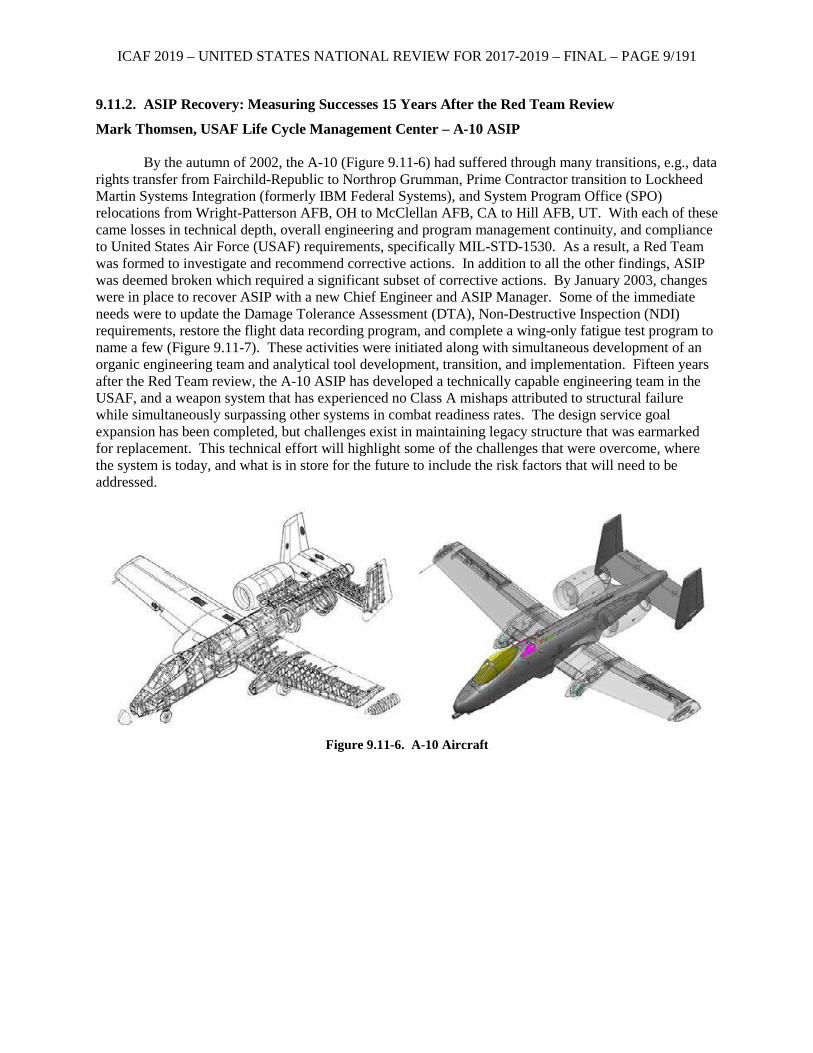
ICAF 2019 – UNITED STATES NATIONAL REVIEW FOR 2017-2019 – FINAL – PAGE 9/191
9.11.2. ASIP Recovery: Measuring Successes 15 Years After the Red Team Review
Mark Thomsen, USAF Life Cycle Management Center – A-10 ASIP By the autumn of 2002, the A-10 (Figure 9.11-6) had suffered through many transitions, e.g., data
rights transfer from Fairchild-Republic to Northrop Grumman, Prime Contractor transition to Lockheed Martin Systems Integration (formerly IBM Federal Systems), and System Program Office (SPO) relocations from Wright-Patterson AFB, OH to McClellan AFB, CA to Hill AFB, UT. With each of these came losses in technical depth, overall engineering and program management continuity, and compliance to United States Air Force (USAF) requirements, specifically MIL-STD-1530. As a result, a Red Team was formed to investigate and recommend corrective actions. In addition to all the other findings, ASIP was deemed broken which required a significant subset of corrective actions. By January 2003, changes were in place to recover ASIP with a new Chief Engineer and ASIP Manager. Some of the immediate needs were to update the Damage Tolerance Assessment (DTA), Non-Destructive Inspection (NDI) requirements, restore the flight data recording program, and complete a wing-only fatigue test program to name a few (Figure 9.11-7). These activities were initiated along with simultaneous development of an organic engineering team and analytical tool development, transition, and implementation. Fifteen years after the Red Team review, the A-10 ASIP has developed a technically capable engineering team in the USAF, and a weapon system that has experienced no Class A mishaps attributed to structural failure while simultaneously surpassing other systems in combat readiness rates. The design service goal expansion has been completed, but challenges exist in maintaining legacy structure that was earmarked for replacement. This technical effort will highlight some of the challenges that were overcome, where the system is today, and what is in store for the future to include the risk factors that will need to be addressed.
Figure 9.11-6. A-10 Aircraft
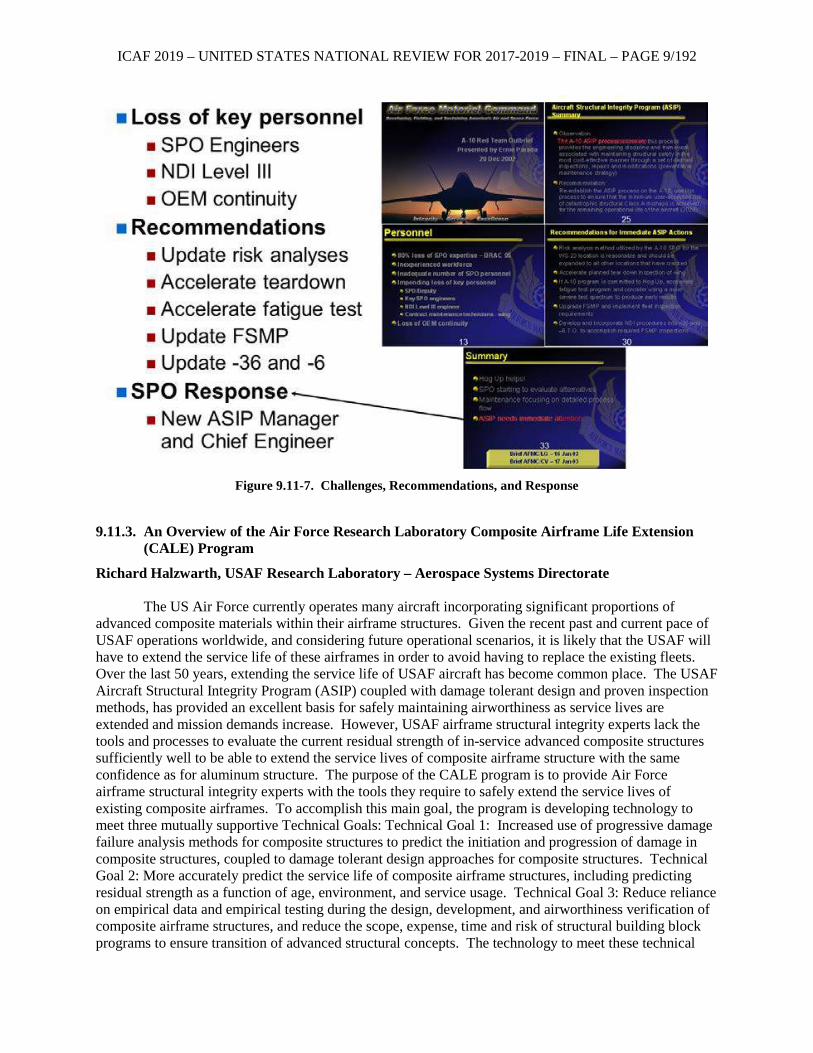
ICAF 2019 – UNITED STATES NATIONAL REVIEW FOR 2017-2019 – FINAL – PAGE 9/192
Figure 9.11-7. Challenges, Recommendations, and Response
9.11.3. An Overview of the Air Force Research Laboratory Composite Airframe Life Extension
(CALE) Program
Richard Halzwarth, USAF Research Laboratory – Aerospace Systems Directorate The US Air Force currently operates many aircraft incorporating significant proportions of
advanced composite materials within their airframe structures. Given the recent past and current pace of USAF operations worldwide, and considering future operational scenarios, it is likely that the USAF will have to extend the service life of these airframes in order to avoid having to replace the existing fleets. Over the last 50 years, extending the service life of USAF aircraft has become common place. The USAF Aircraft Structural Integrity Program (ASIP) coupled with damage tolerant design and proven inspection methods, has provided an excellent basis for safely maintaining airworthiness as service lives are extended and mission demands increase. However, USAF airframe structural integrity experts lack the tools and processes to evaluate the current residual strength of in-service advanced composite structures sufficiently well to be able to extend the service lives of composite airframe structure with the same confidence as for aluminum structure. The purpose of the CALE program is to provide Air Force airframe structural integrity experts with the tools they require to safely extend the service lives of existing composite airframes. To accomplish this main goal, the program is developing technology to meet three mutually supportive Technical Goals: Technical Goal 1: Increased use of progressive damage failure analysis methods for composite structures to predict the initiation and progression of damage in composite structures, coupled to damage tolerant design approaches for composite structures. Technical Goal 2: More accurately predict the service life of composite airframe structures, including predicting residual strength as a function of age, environment, and service usage. Technical Goal 3: Reduce reliance on empirical data and empirical testing during the design, development, and airworthiness verification of composite airframe structures, and reduce the scope, expense, time and risk of structural building block programs to ensure transition of advanced structural concepts. The technology to meet these technical
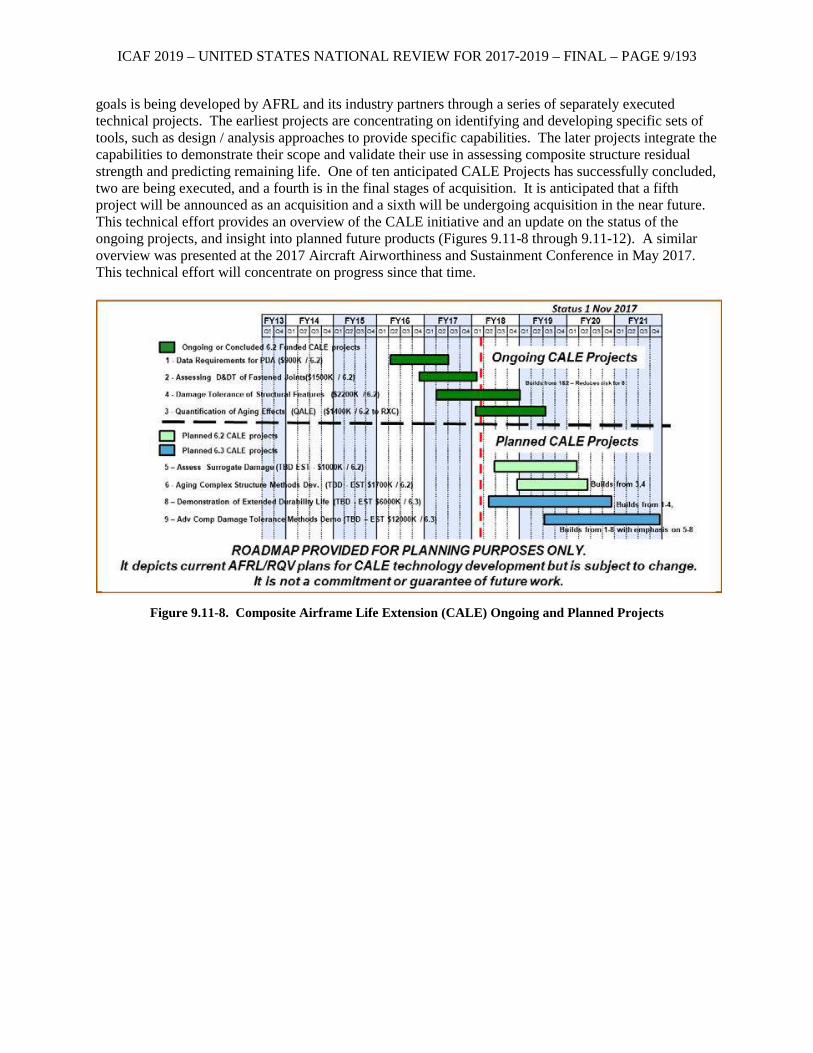
ICAF 2019 – UNITED STATES NATIONAL REVIEW FOR 2017-2019 – FINAL – PAGE 9/193
goals is being developed by AFRL and its industry partners through a series of separately executed technical projects. The earliest projects are concentrating on identifying and developing specific sets of tools, such as design / analysis approaches to provide specific capabilities. The later projects integrate the capabilities to demonstrate their scope and validate their use in assessing composite structure residual strength and predicting remaining life. One of ten anticipated CALE Projects has successfully concluded, two are being executed, and a fourth is in the final stages of acquisition. It is anticipated that a fifth project will be announced as an acquisition and a sixth will be undergoing acquisition in the near future. This technical effort provides an overview of the CALE initiative and an update on the status of the ongoing projects, and insight into planned future products (Figures 9.11-8 through 9.11-12). A similar overview was presented at the 2017 Aircraft Airworthiness and Sustainment Conference in May 2017. This technical effort will concentrate on progress since that time.
Figure 9.11-8. Composite Airframe Life Extension (CALE) Ongoing and Planned Projects
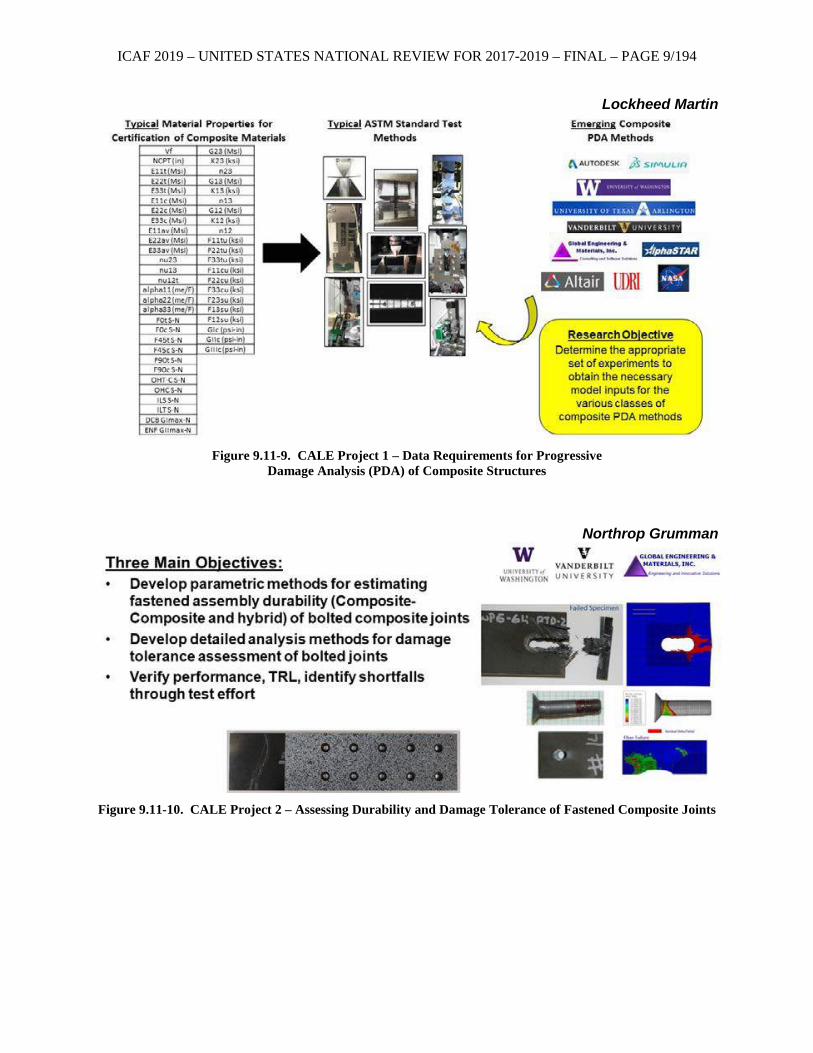
ICAF 2019 – UNITED STATES NATIONAL REVIEW FOR 2017-2019 – FINAL – PAGE 9/194
Lockheed Martin
Figure 9.11-9. CALE Project 1 – Data Requirements for Progressive
Damage Analysis (PDA) of Composite Structures
Northrop Grumman
Figure 9.11-10. CALE Project 2 – Assessing Durability and Damage Tolerance of Fastened Composite Joints
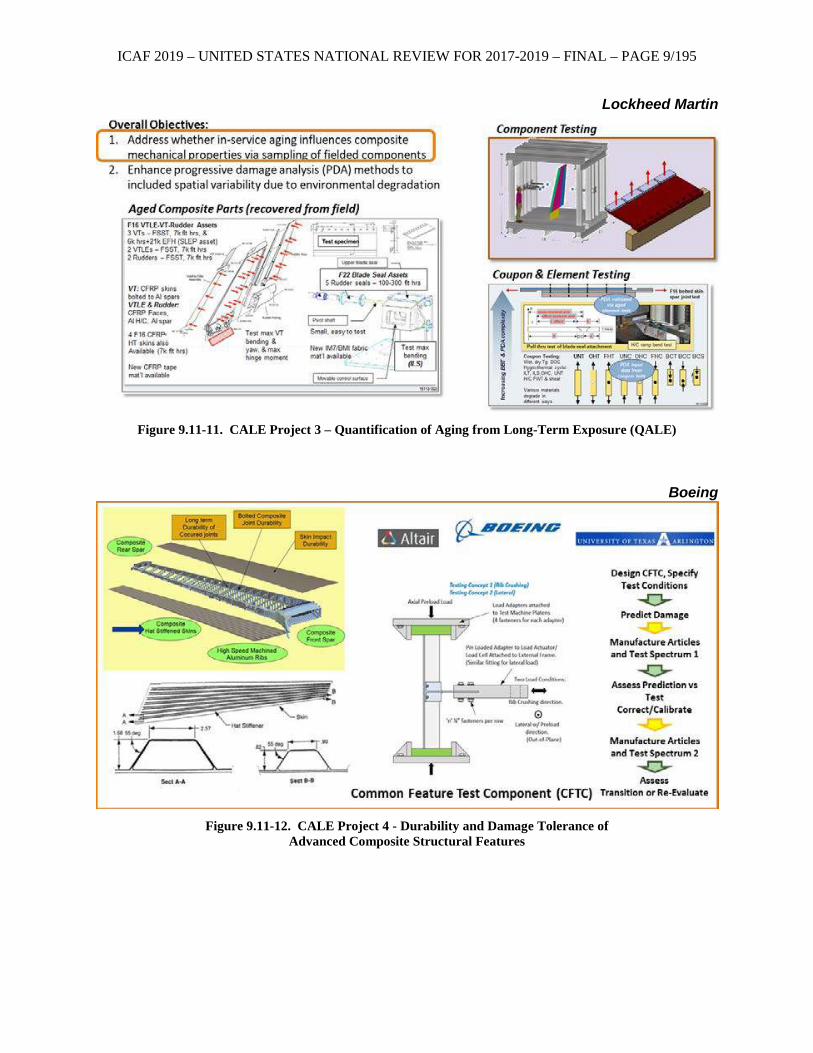
ICAF 2019 – UNITED STATES NATIONAL REVIEW FOR 2017-2019 – FINAL – PAGE 9/195
Lockheed Martin
Figure 9.11-11. CALE Project 3 – Quantification of Aging from Long-Term Exposure (QALE)
Boeing
Figure 9.11-12. CALE Project 4 - Durability and Damage Tolerance of
Advanced Composite Structural Features
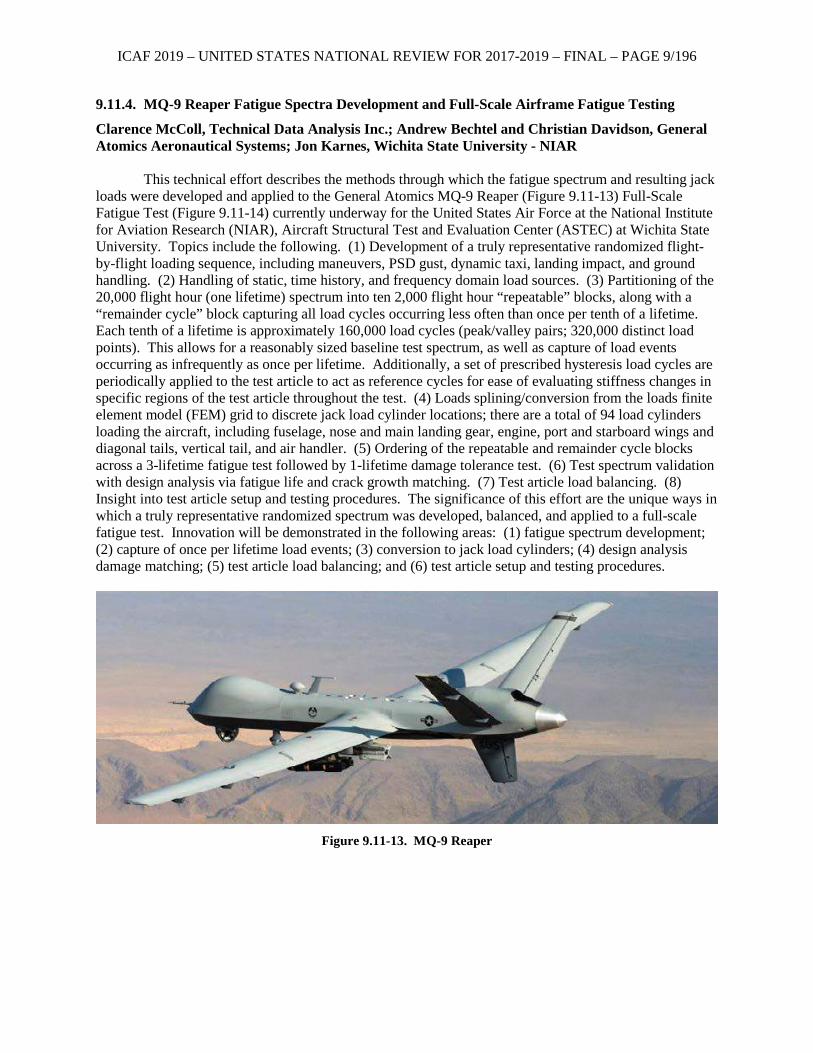
ICAF 2019 – UNITED STATES NATIONAL REVIEW FOR 2017-2019 – FINAL – PAGE 9/196
9.11.4. MQ-9 Reaper Fatigue Spectra Development and Full-Scale Airframe Fatigue Testing
Clarence McColl, Technical Data Analysis Inc.; Andrew Bechtel and Christian Davidson, General Atomics Aeronautical Systems; Jon Karnes, Wichita State University - NIAR
This technical effort describes the methods through which the fatigue spectrum and resulting jack
loads were developed and applied to the General Atomics MQ-9 Reaper (Figure 9.11-13) Full-Scale Fatigue Test (Figure 9.11-14) currently underway for the United States Air Force at the National Institute for Aviation Research (NIAR), Aircraft Structural Test and Evaluation Center (ASTEC) at Wichita State University. Topics include the following. (1) Development of a truly representative randomized flight-by-flight loading sequence, including maneuvers, PSD gust, dynamic taxi, landing impact, and ground handling. (2) Handling of static, time history, and frequency domain load sources. (3) Partitioning of the 20,000 flight hour (one lifetime) spectrum into ten 2,000 flight hour “repeatable” blocks, along with a “remainder cycle” block capturing all load cycles occurring less often than once per tenth of a lifetime. Each tenth of a lifetime is approximately 160,000 load cycles (peak/valley pairs; 320,000 distinct load points). This allows for a reasonably sized baseline test spectrum, as well as capture of load events occurring as infrequently as once per lifetime. Additionally, a set of prescribed hysteresis load cycles are periodically applied to the test article to act as reference cycles for ease of evaluating stiffness changes in specific regions of the test article throughout the test. (4) Loads splining/conversion from the loads finite element model (FEM) grid to discrete jack load cylinder locations; there are a total of 94 load cylinders loading the aircraft, including fuselage, nose and main landing gear, engine, port and starboard wings and diagonal tails, vertical tail, and air handler. (5) Ordering of the repeatable and remainder cycle blocks across a 3-lifetime fatigue test followed by 1-lifetime damage tolerance test. (6) Test spectrum validation with design analysis via fatigue life and crack growth matching. (7) Test article load balancing. (8) Insight into test article setup and testing procedures. The significance of this effort are the unique ways in which a truly representative randomized spectrum was developed, balanced, and applied to a full-scale fatigue test. Innovation will be demonstrated in the following areas: (1) fatigue spectrum development; (2) capture of once per lifetime load events; (3) conversion to jack load cylinders; (4) design analysis damage matching; (5) test article load balancing; and (6) test article setup and testing procedures.
Figure 9.11-13. MQ-9 Reaper
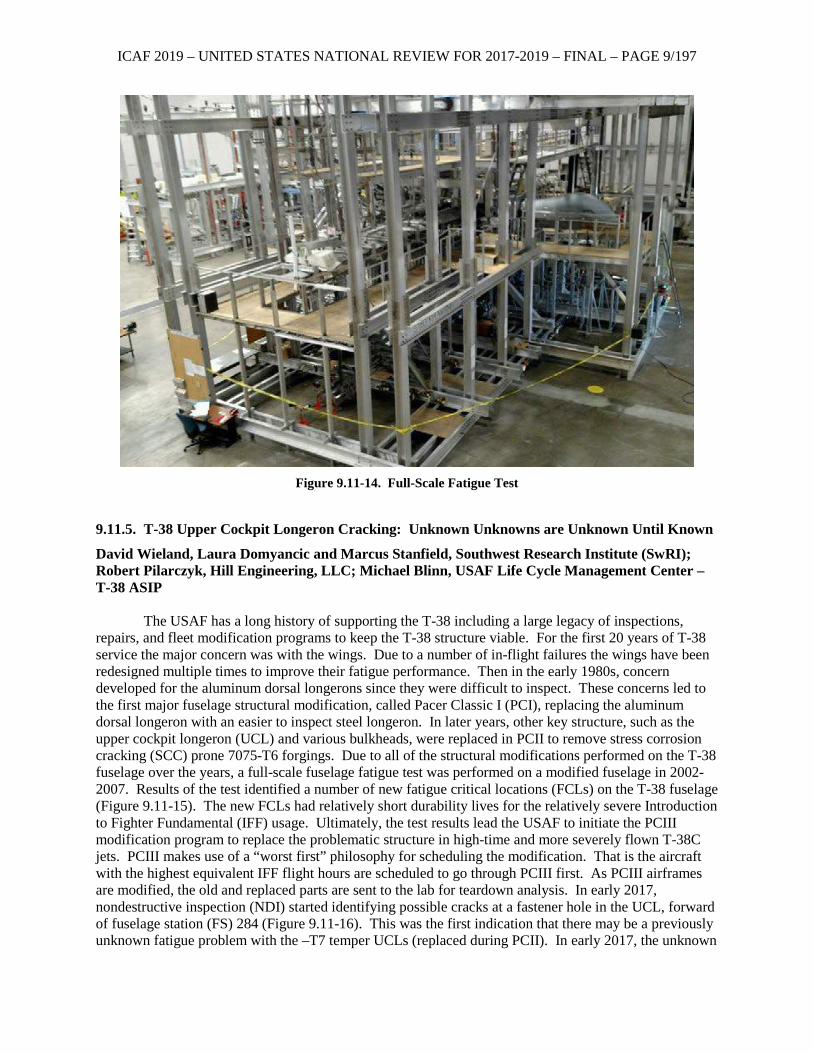
ICAF 2019 – UNITED STATES NATIONAL REVIEW FOR 2017-2019 – FINAL – PAGE 9/197
Figure 9.11-14. Full-Scale Fatigue Test
9.11.5. T-38 Upper Cockpit Longeron Cracking: Unknown Unknowns are Unknown Until Known
David Wieland, Laura Domyancic and Marcus Stanfield, Southwest Research Institute (SwRI); Robert Pilarczyk, Hill Engineering, LLC; Michael Blinn, USAF Life Cycle Management Center – T-38 ASIP
The USAF has a long history of supporting the T-38 including a large legacy of inspections,
repairs, and fleet modification programs to keep the T-38 structure viable. For the first 20 years of T-38 service the major concern was with the wings. Due to a number of in-flight failures the wings have been redesigned multiple times to improve their fatigue performance. Then in the early 1980s, concern developed for the aluminum dorsal longerons since they were difficult to inspect. These concerns led to the first major fuselage structural modification, called Pacer Classic I (PCI), replacing the aluminum dorsal longeron with an easier to inspect steel longeron. In later years, other key structure, such as the upper cockpit longeron (UCL) and various bulkheads, were replaced in PCII to remove stress corrosion cracking (SCC) prone 7075-T6 forgings. Due to all of the structural modifications performed on the T-38 fuselage over the years, a full-scale fuselage fatigue test was performed on a modified fuselage in 2002-2007. Results of the test identified a number of new fatigue critical locations (FCLs) on the T-38 fuselage (Figure 9.11-15). The new FCLs had relatively short durability lives for the relatively severe Introduction to Fighter Fundamental (IFF) usage. Ultimately, the test results lead the USAF to initiate the PCIII modification program to replace the problematic structure in high-time and more severely flown T-38C jets. PCIII makes use of a “worst first” philosophy for scheduling the modification. That is the aircraft with the highest equivalent IFF flight hours are scheduled to go through PCIII first. As PCIII airframes are modified, the old and replaced parts are sent to the lab for teardown analysis. In early 2017, nondestructive inspection (NDI) started identifying possible cracks at a fastener hole in the UCL, forward of fuselage station (FS) 284 (Figure 9.11-16). This was the first indication that there may be a previously unknown fatigue problem with the –T7 temper UCLs (replaced during PCII). In early 2017, the unknown
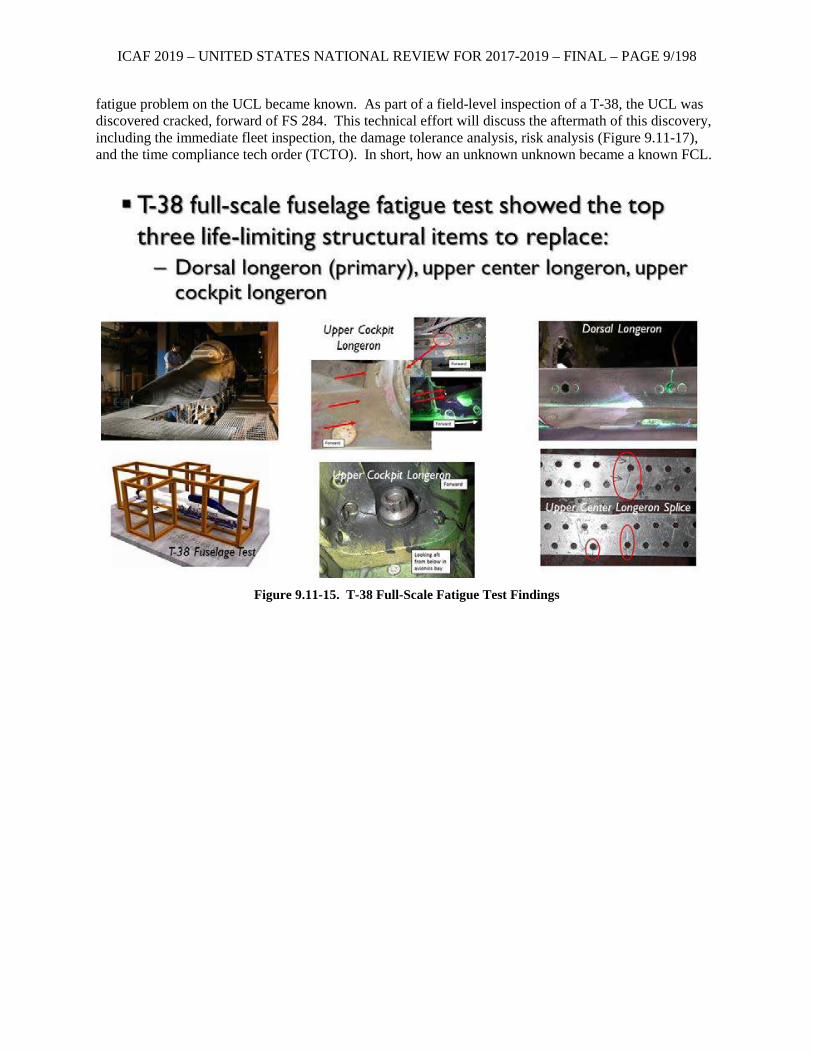
ICAF 2019 – UNITED STATES NATIONAL REVIEW FOR 2017-2019 – FINAL – PAGE 9/198
fatigue problem on the UCL became known. As part of a field-level inspection of a T-38, the UCL was discovered cracked, forward of FS 284. This technical effort will discuss the aftermath of this discovery, including the immediate fleet inspection, the damage tolerance analysis, risk analysis (Figure 9.11-17), and the time compliance tech order (TCTO). In short, how an unknown unknown became a known FCL.
Figure 9.11-15. T-38 Full-Scale Fatigue Test Findings
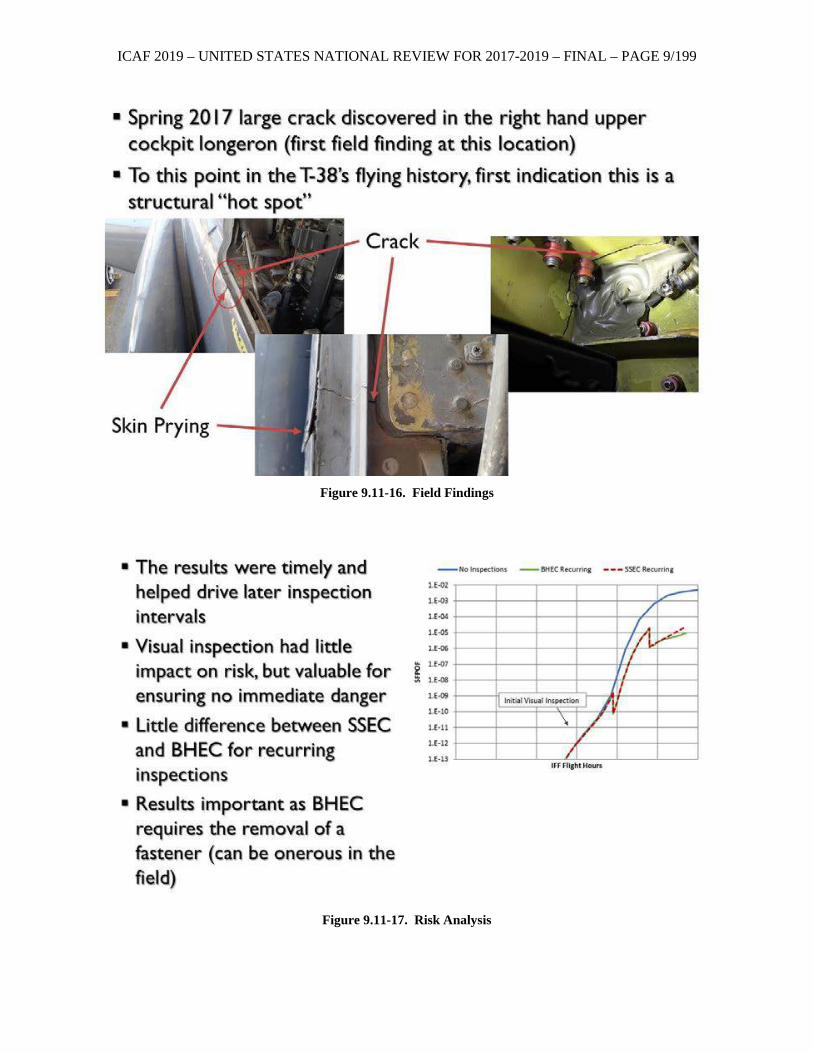
ICAF 2019 – UNITED STATES NATIONAL REVIEW FOR 2017-2019 – FINAL – PAGE 9/199
Figure 9.11-16. Field Findings
Figure 9.11-17. Risk Analysis
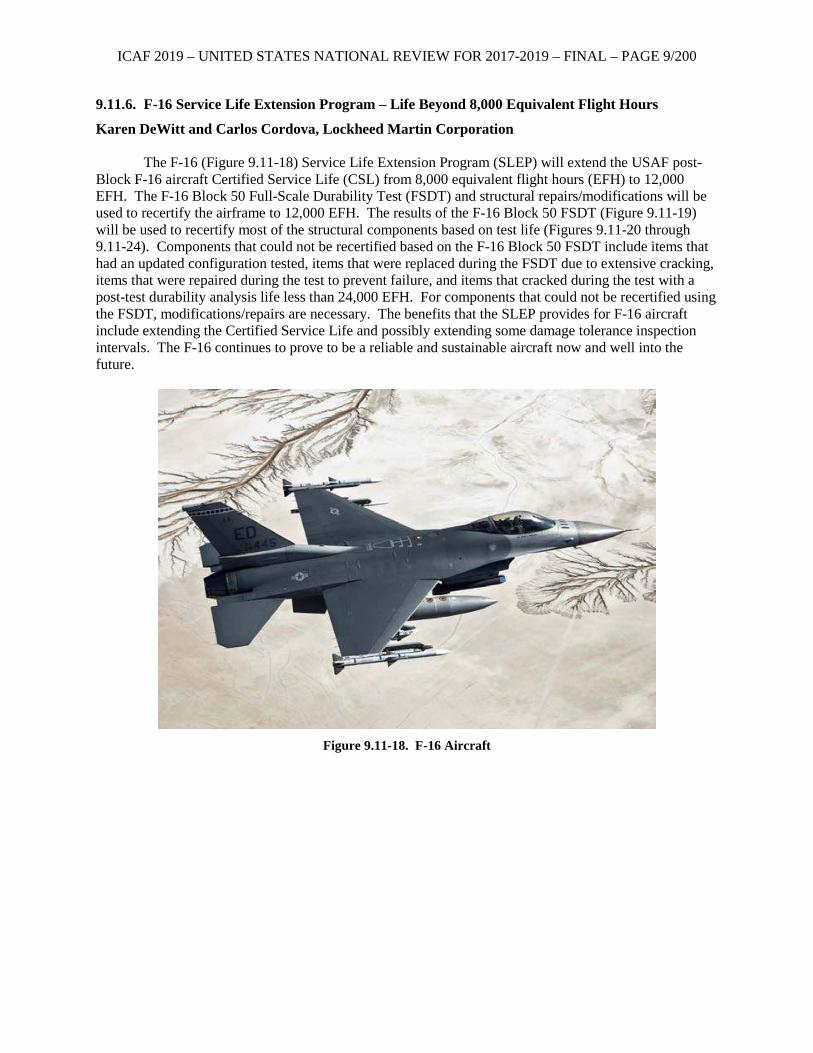
ICAF 2019 – UNITED STATES NATIONAL REVIEW FOR 2017-2019 – FINAL – PAGE 9/200
9.11.6. F-16 Service Life Extension Program – Life Beyond 8,000 Equivalent Flight Hours
Karen DeWitt and Carlos Cordova, Lockheed Martin Corporation The F-16 (Figure 9.11-18) Service Life Extension Program (SLEP) will extend the USAF post-
Block F-16 aircraft Certified Service Life (CSL) from 8,000 equivalent flight hours (EFH) to 12,000 EFH. The F-16 Block 50 Full-Scale Durability Test (FSDT) and structural repairs/modifications will be used to recertify the airframe to 12,000 EFH. The results of the F-16 Block 50 FSDT (Figure 9.11-19) will be used to recertify most of the structural components based on test life (Figures 9.11-20 through 9.11-24). Components that could not be recertified based on the F-16 Block 50 FSDT include items that had an updated configuration tested, items that were replaced during the FSDT due to extensive cracking, items that were repaired during the test to prevent failure, and items that cracked during the test with a post-test durability analysis life less than 24,000 EFH. For components that could not be recertified using the FSDT, modifications/repairs are necessary. The benefits that the SLEP provides for F-16 aircraft include extending the Certified Service Life and possibly extending some damage tolerance inspection intervals. The F-16 continues to prove to be a reliable and sustainable aircraft now and well into the future.
Figure 9.11-18. F-16 Aircraft
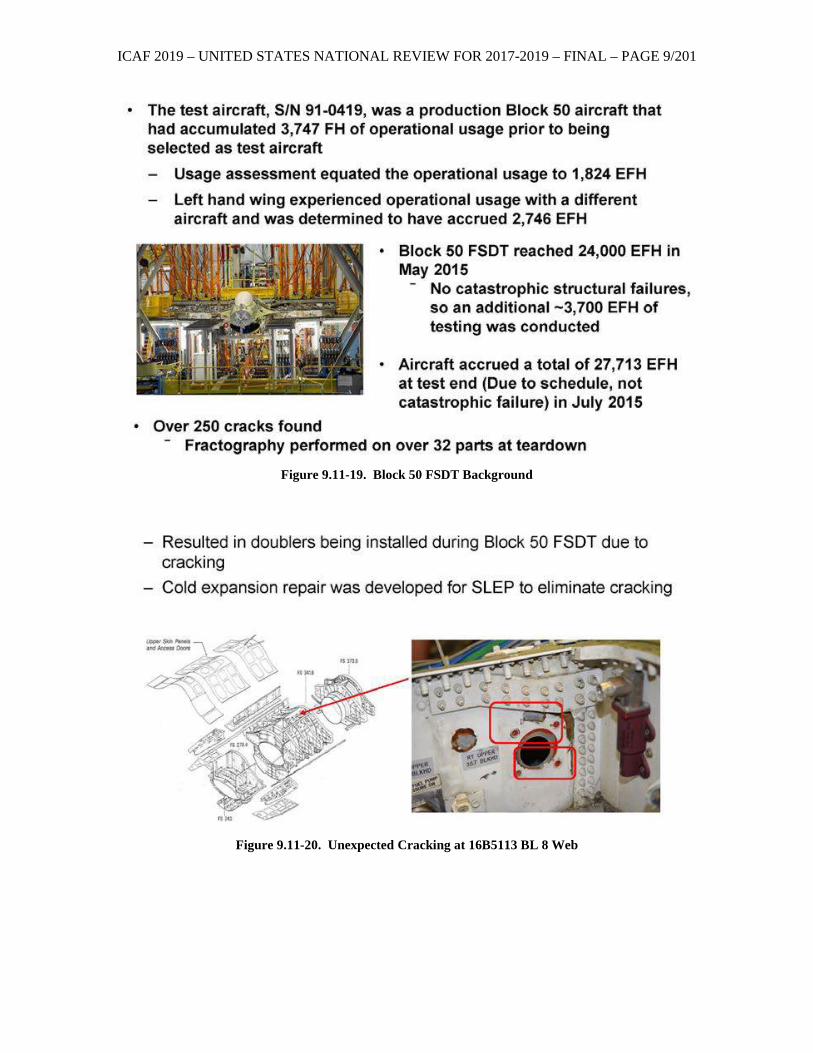
ICAF 2019 – UNITED STATES NATIONAL REVIEW FOR 2017-2019 – FINAL – PAGE 9/201
Figure 9.11-19. Block 50 FSDT Background
Figure 9.11-20. Unexpected Cracking at 16B5113 BL 8 Web
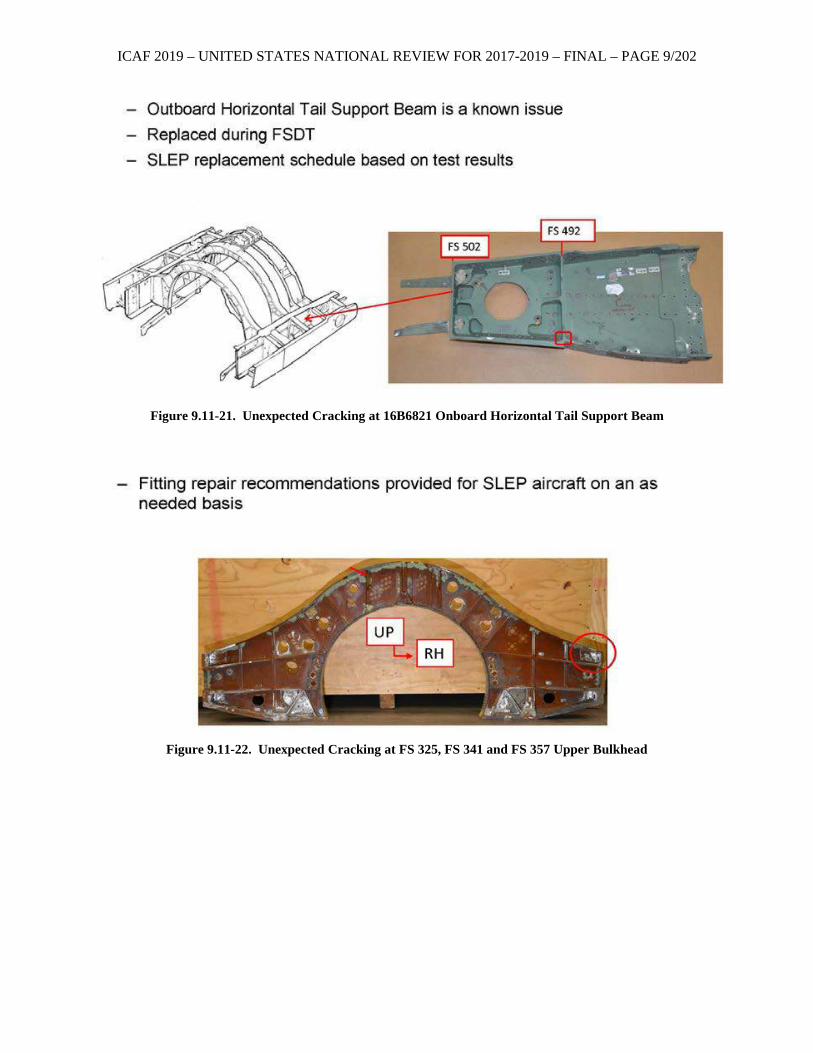
ICAF 2019 – UNITED STATES NATIONAL REVIEW FOR 2017-2019 – FINAL – PAGE 9/202
Figure 9.11-21. Unexpected Cracking at 16B6821 Onboard Horizontal Tail Support Beam
Figure 9.11-22. Unexpected Cracking at FS 325, FS 341 and FS 357 Upper Bulkhead
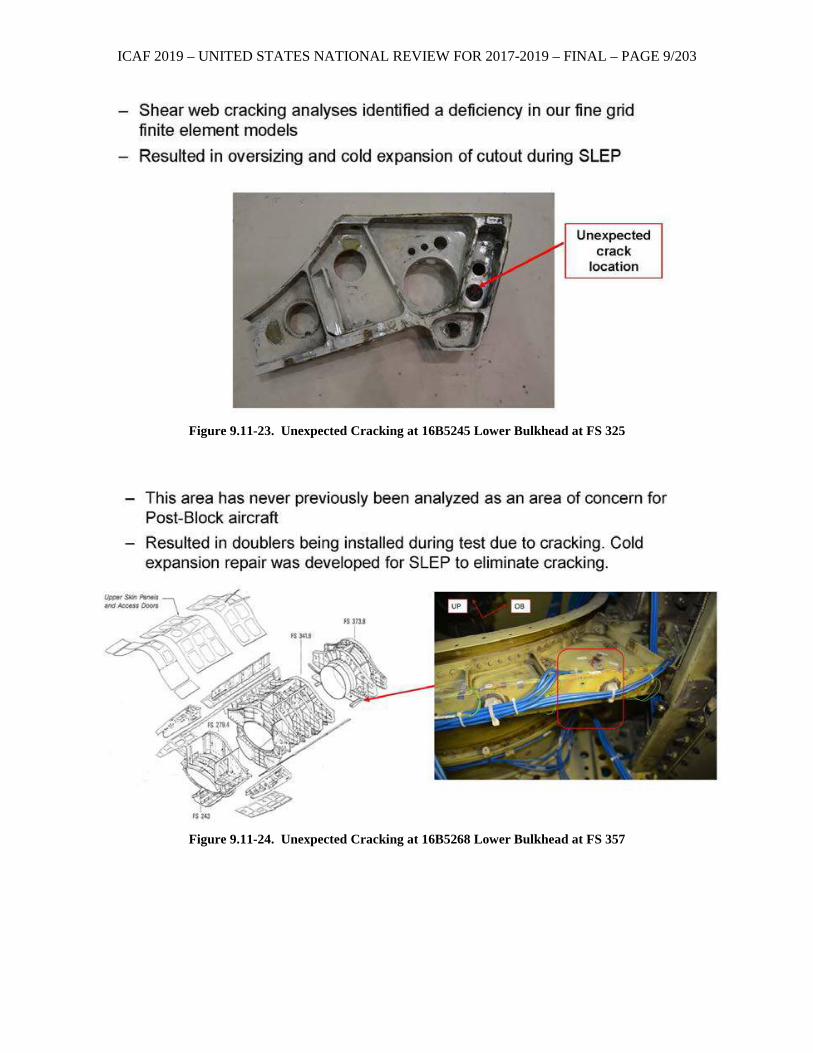
ICAF 2019 – UNITED STATES NATIONAL REVIEW FOR 2017-2019 – FINAL – PAGE 9/203
Figure 9.11-23. Unexpected Cracking at 16B5245 Lower Bulkhead at FS 325
Figure 9.11-24. Unexpected Cracking at 16B5268 Lower Bulkhead at FS 357
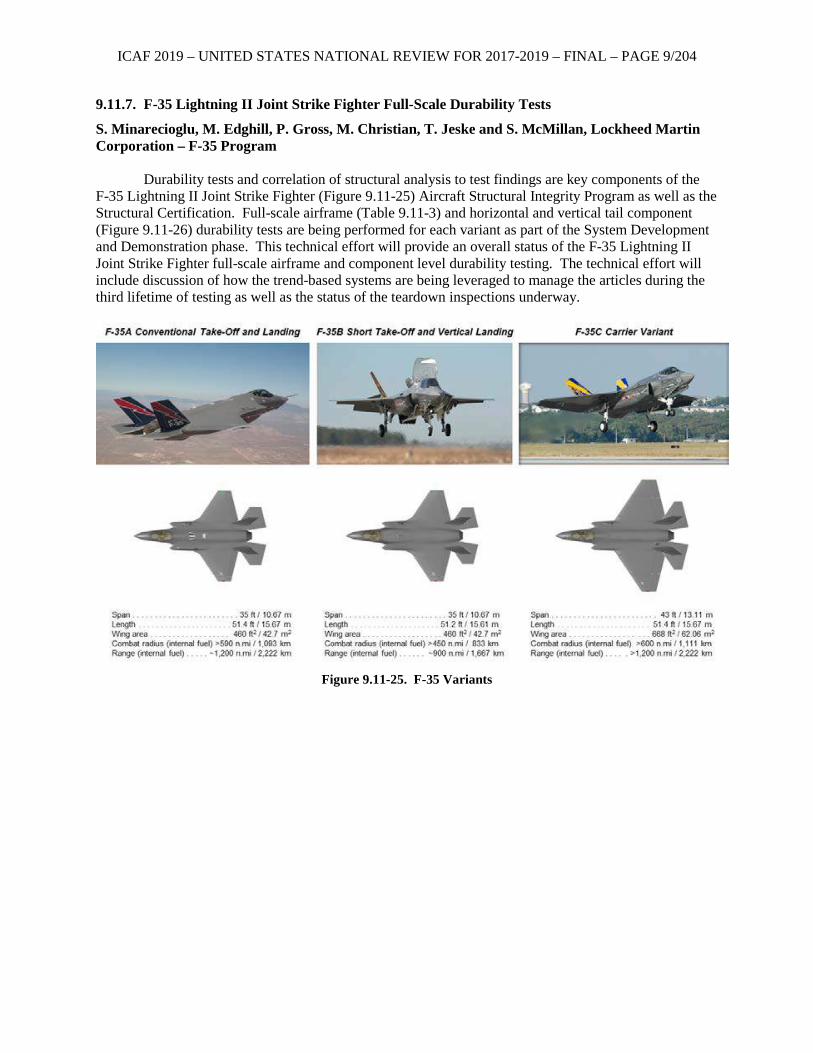
ICAF 2019 – UNITED STATES NATIONAL REVIEW FOR 2017-2019 – FINAL – PAGE 9/204
9.11.7. F-35 Lightning II Joint Strike Fighter Full-Scale Durability Tests
S. Minarecioglu, M. Edghill, P. Gross, M. Christian, T. Jeske and S. McMillan, Lockheed Martin Corporation – F-35 Program
Durability tests and correlation of structural analysis to test findings are key components of the
F-35 Lightning II Joint Strike Fighter (Figure 9.11-25) Aircraft Structural Integrity Program as well as the Structural Certification. Full-scale airframe (Table 9.11-3) and horizontal and vertical tail component (Figure 9.11-26) durability tests are being performed for each variant as part of the System Development and Demonstration phase. This technical effort will provide an overall status of the F-35 Lightning II Joint Strike Fighter full-scale airframe and component level durability testing. The technical effort will include discussion of how the trend-based systems are being leveraged to manage the articles during the third lifetime of testing as well as the status of the teardown inspections underway.
Figure 9.11-25. F-35 Variants
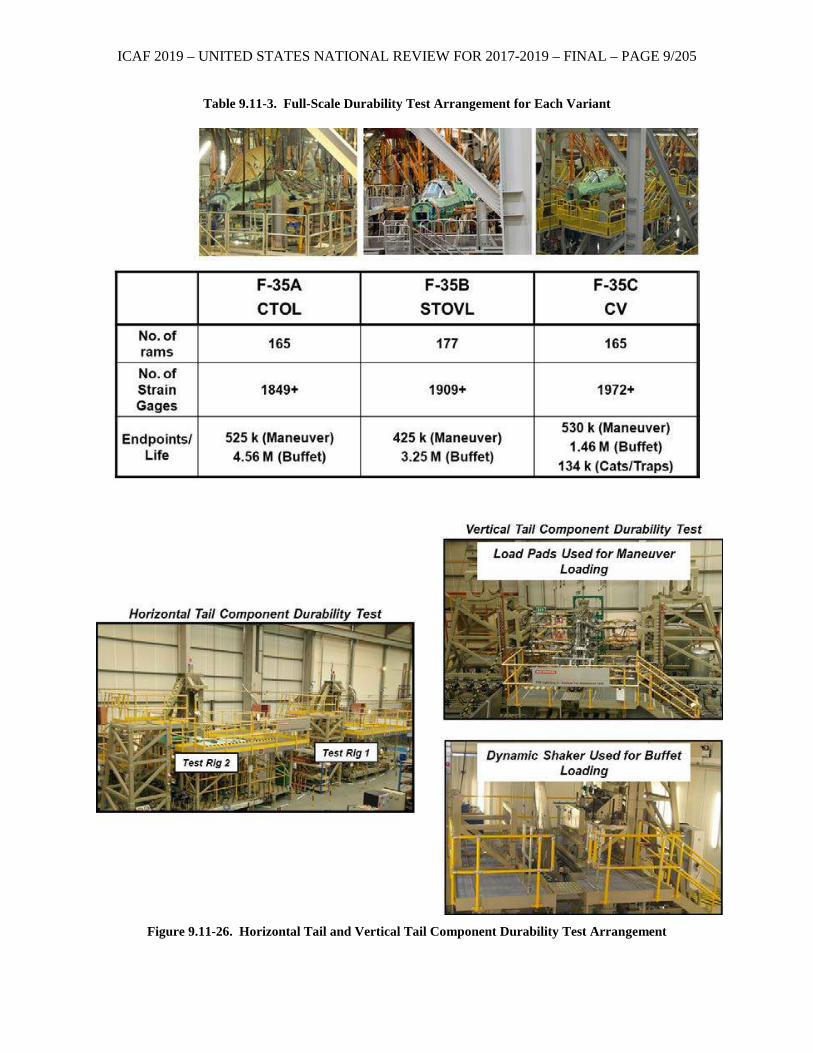
ICAF 2019 – UNITED STATES NATIONAL REVIEW FOR 2017-2019 – FINAL – PAGE 9/205
Table 9.11-3. Full-Scale Durability Test Arrangement for Each Variant
Figure 9.11-26. Horizontal Tail and Vertical Tail Component Durability Test Arrangement
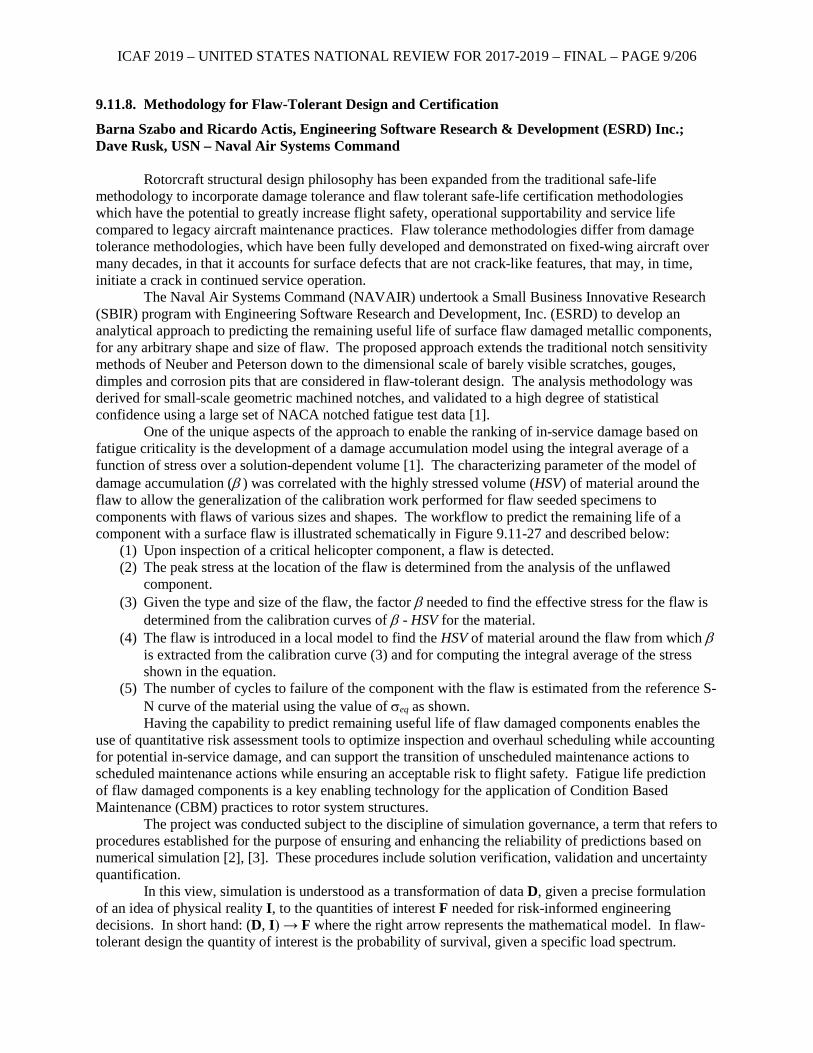
ICAF 2019 – UNITED STATES NATIONAL REVIEW FOR 2017-2019 – FINAL – PAGE 9/206
9.11.8. Methodology for Flaw-Tolerant Design and Certification
Barna Szabo and Ricardo Actis, Engineering Software Research & Development (ESRD) Inc.; Dave Rusk, USN – Naval Air Systems Command
Rotorcraft structural design philosophy has been expanded from the traditional safe-life
methodology to incorporate damage tolerance and flaw tolerant safe-life certification methodologies which have the potential to greatly increase flight safety, operational supportability and service life compared to legacy aircraft maintenance practices. Flaw tolerance methodologies differ from damage tolerance methodologies, which have been fully developed and demonstrated on fixed-wing aircraft over many decades, in that it accounts for surface defects that are not crack-like features, that may, in time, initiate a crack in continued service operation.
The Naval Air Systems Command (NAVAIR) undertook a Small Business Innovative Research (SBIR) program with Engineering Software Research and Development, Inc. (ESRD) to develop an analytical approach to predicting the remaining useful life of surface flaw damaged metallic components, for any arbitrary shape and size of flaw. The proposed approach extends the traditional notch sensitivity methods of Neuber and Peterson down to the dimensional scale of barely visible scratches, gouges, dimples and corrosion pits that are considered in flaw-tolerant design. The analysis methodology was derived for small-scale geometric machined notches, and validated to a high degree of statistical confidence using a large set of NACA notched fatigue test data [1].
One of the unique aspects of the approach to enable the ranking of in-service damage based on fatigue criticality is the development of a damage accumulation model using the integral average of a function of stress over a solution-dependent volume [1]. The characterizing parameter of the model of damage accumulation (β ) was correlated with the highly stressed volume (HSV) of material around the flaw to allow the generalization of the calibration work performed for flaw seeded specimens to components with flaws of various sizes and shapes. The workflow to predict the remaining life of a component with a surface flaw is illustrated schematically in Figure 9.11-27 and described below:
(1) Upon inspection of a critical helicopter component, a flaw is detected. (2) The peak stress at the location of the flaw is determined from the analysis of the unflawed
component. (3) Given the type and size of the flaw, the factor β needed to find the effective stress for the flaw is
determined from the calibration curves of β - HSV for the material. (4) The flaw is introduced in a local model to find the HSV of material around the flaw from which β
is extracted from the calibration curve (3) and for computing the integral average of the stress shown in the equation.
(5) The number of cycles to failure of the component with the flaw is estimated from the reference S-N curve of the material using the value of σeq as shown. Having the capability to predict remaining useful life of flaw damaged components enables the
use of quantitative risk assessment tools to optimize inspection and overhaul scheduling while accounting for potential in-service damage, and can support the transition of unscheduled maintenance actions to scheduled maintenance actions while ensuring an acceptable risk to flight safety. Fatigue life prediction of flaw damaged components is a key enabling technology for the application of Condition Based Maintenance (CBM) practices to rotor system structures.
The project was conducted subject to the discipline of simulation governance, a term that refers to procedures established for the purpose of ensuring and enhancing the reliability of predictions based on numerical simulation [2], [3]. These procedures include solution verification, validation and uncertainty quantification.
In this view, simulation is understood as a transformation of data D, given a precise formulation of an idea of physical reality I, to the quantities of interest F needed for risk-informed engineering decisions. In short hand: (D, I) → F where the right arrow represents the mathematical model. In flaw-tolerant design the quantity of interest is the probability of survival, given a specific load spectrum.
ICAF 2019 – UNITED STATES NATIONAL REVIEW FOR 2017-2019 – FINAL – PAGE 9/207
Simulation governance is the exercise of command and control over all aspects of the transformation (D, I) → F → Fnum where the second right arrow represents the numerical operations needed for obtaining an approximation to F, denoted by Fnum.
Reliance on predictions based on mathematical models is justified if and only if convincing experimental evidence has been developed demonstrating that the transformation (D, I) → F → Fnum yields predictions that are consistently confirmed by the outcome of physical experiments. The development of this evidence is called validation. An essential technical prerequisite is verification that the error |F - Fnum |is sufficiently small.
Figure 9.11-27. Schematic of the Approach to Quantify the Effect of In-Service Damage on Fatigue Life
References: [1] Szabó BA, Actis RL and Rusk D. Predictors of Fatigue Damage Accumulation in the
Neighborhood of Small Notches, International Journal of Fatigue, 92, 52-60, 2016. [2] Szabó BA and Actis RL, Simulation Governance: Technical Requirements for Mechanical Design,
Comput. Methods Appl. Mech. Engrg., vol. 249-252, p. 158-168, 2012. [3] Szabó BA, Actis RL and Rusk D. On the Formulation and Application of Design Rules,
Computers and Mathematics with Applications, 74, 2119-2202, 2017. [4] Rusk DT, Actis RL and Szabo BA. Fatigue Life Prediction of Flaw-Tolerant Damaged Rotorcraft
Structures. Presented at the AHS International 74th Annual Forum & Technology Display, Phoenix Arizona, USA, May 14-17, 2018.
9.11.9. Fueling the Fight Introducing the KC-46 Pegasus Tanker
Ryan Russell, The Boeing Company – Boeing Global Services; Coleen Schneider, USAF Life Cycle Management Center – KC-46 ASIP
The KC-46 Pegasus (Figure 9.11-28) is the newest USAF transport airframe, with a 2018 planned
entry into service. The KC-46 joins the able but aging KC-135 and KC-10 tankers in providing aerial refueling capabilities that are critical to maintaining world-wide air superiority for USAF and our allies
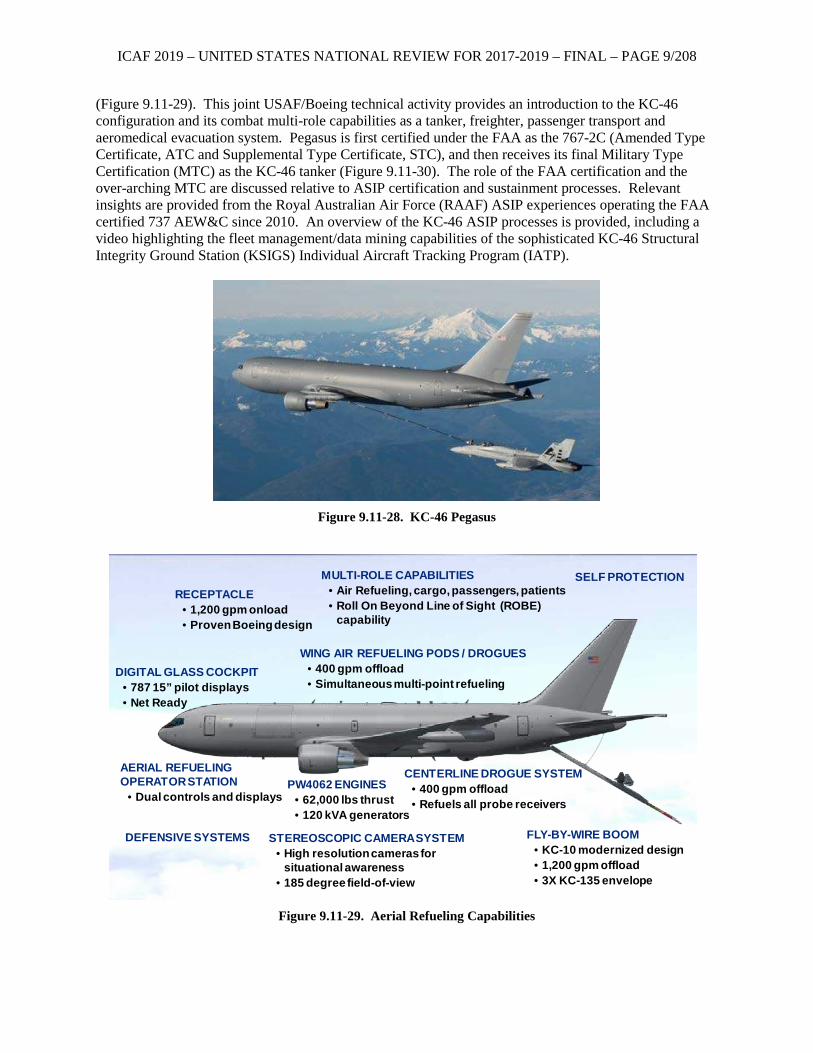
ICAF 2019 – UNITED STATES NATIONAL REVIEW FOR 2017-2019 – FINAL – PAGE 9/208
(Figure 9.11-29). This joint USAF/Boeing technical activity provides an introduction to the KC-46 configuration and its combat multi-role capabilities as a tanker, freighter, passenger transport and aeromedical evacuation system. Pegasus is first certified under the FAA as the 767-2C (Amended Type Certificate, ATC and Supplemental Type Certificate, STC), and then receives its final Military Type Certification (MTC) as the KC-46 tanker (Figure 9.11-30). The role of the FAA certification and the over-arching MTC are discussed relative to ASIP certification and sustainment processes. Relevant insights are provided from the Royal Australian Air Force (RAAF) ASIP experiences operating the FAA certified 737 AEW&C since 2010. An overview of the KC-46 ASIP processes is provided, including a video highlighting the fleet management/data mining capabilities of the sophisticated KC-46 Structural Integrity Ground Station (KSIGS) Individual Aircraft Tracking Program (IATP).
Figure 9.11-28. KC-46 Pegasus
Figure 9.11-29. Aerial Refueling Capabilities
WING AIR REFUELING PODS / DROGUES• 400 gpm offload • Simultaneous multi-point refueling
CENTERLINE DROGUE SYSTEM• 400 gpm offload• Refuels all probe receivers
FLY-BY-WIRE BOOM• KC-10 modernized design• 1,200 gpm offload• 3X KC-135 envelope
AERIAL REFUELING OPERATOR STATION
• Dual controls and displays
STEREOSCOPIC CAMERA SYSTEM• High resolution cameras for
situational awareness• 185 degree field-of-view
DIGITAL GLASS COCKPIT• 787 15” pilot displays• Net Ready
PW4062 ENGINES• 62,000 lbs thrust• 120 kVA generators
MULTI-ROLE CAPABILITIES• Air Refueling, cargo, passengers, patients• Roll On Beyond Line of Sight (ROBE)
capability
RECEPTACLE• 1,200 gpm onload• Proven Boeing design
SELF PROTECTION
DEFENSIVE SYSTEMS
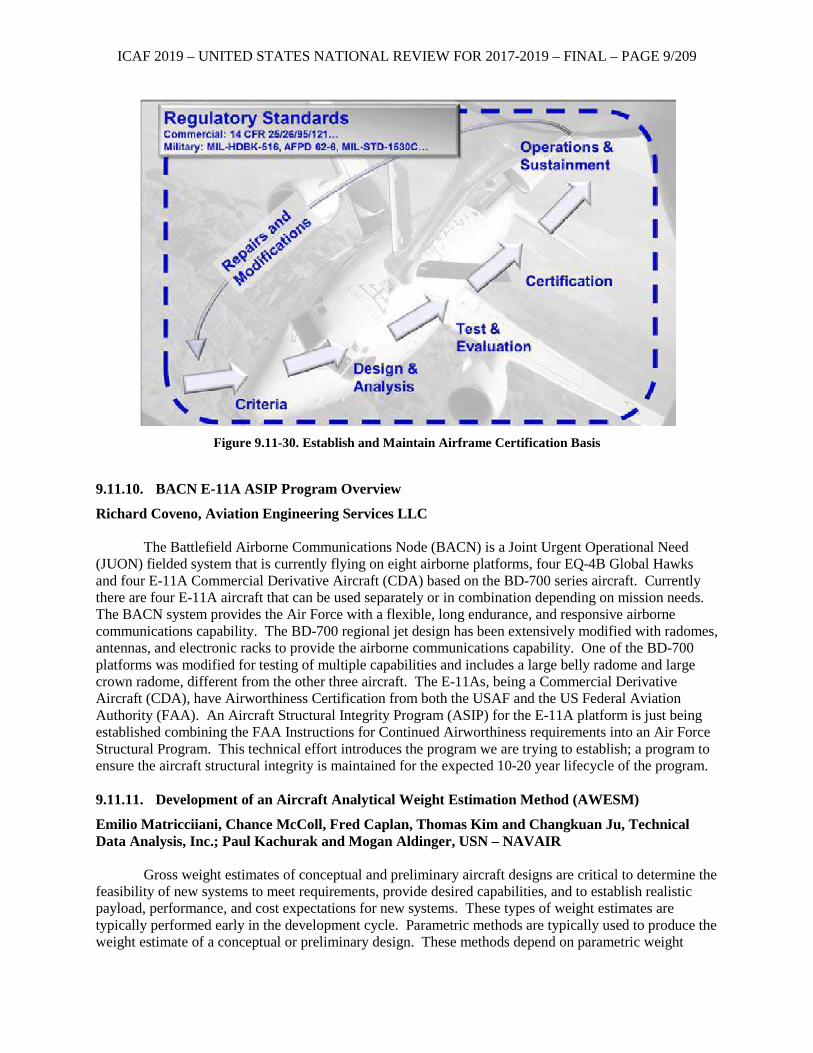
ICAF 2019 – UNITED STATES NATIONAL REVIEW FOR 2017-2019 – FINAL – PAGE 9/209
Figure 9.11-30. Establish and Maintain Airframe Certification Basis
9.11.10. BACN E-11A ASIP Program Overview
Richard Coveno, Aviation Engineering Services LLC The Battlefield Airborne Communications Node (BACN) is a Joint Urgent Operational Need
(JUON) fielded system that is currently flying on eight airborne platforms, four EQ-4B Global Hawks and four E-11A Commercial Derivative Aircraft (CDA) based on the BD-700 series aircraft. Currently there are four E-11A aircraft that can be used separately or in combination depending on mission needs. The BACN system provides the Air Force with a flexible, long endurance, and responsive airborne communications capability. The BD-700 regional jet design has been extensively modified with radomes, antennas, and electronic racks to provide the airborne communications capability. One of the BD-700 platforms was modified for testing of multiple capabilities and includes a large belly radome and large crown radome, different from the other three aircraft. The E-11As, being a Commercial Derivative Aircraft (CDA), have Airworthiness Certification from both the USAF and the US Federal Aviation Authority (FAA). An Aircraft Structural Integrity Program (ASIP) for the E-11A platform is just being established combining the FAA Instructions for Continued Airworthiness requirements into an Air Force Structural Program. This technical effort introduces the program we are trying to establish; a program to ensure the aircraft structural integrity is maintained for the expected 10-20 year lifecycle of the program.
9.11.11. Development of an Aircraft Analytical Weight Estimation Method (AWESM)
Emilio Matricciiani, Chance McColl, Fred Caplan, Thomas Kim and Changkuan Ju, Technical Data Analysis, Inc.; Paul Kachurak and Mogan Aldinger, USN – NAVAIR
Gross weight estimates of conceptual and preliminary aircraft designs are critical to determine the
feasibility of new systems to meet requirements, provide desired capabilities, and to establish realistic payload, performance, and cost expectations for new systems. These types of weight estimates are typically performed early in the development cycle. Parametric methods are typically used to produce the weight estimate of a conceptual or preliminary design. These methods depend on parametric weight
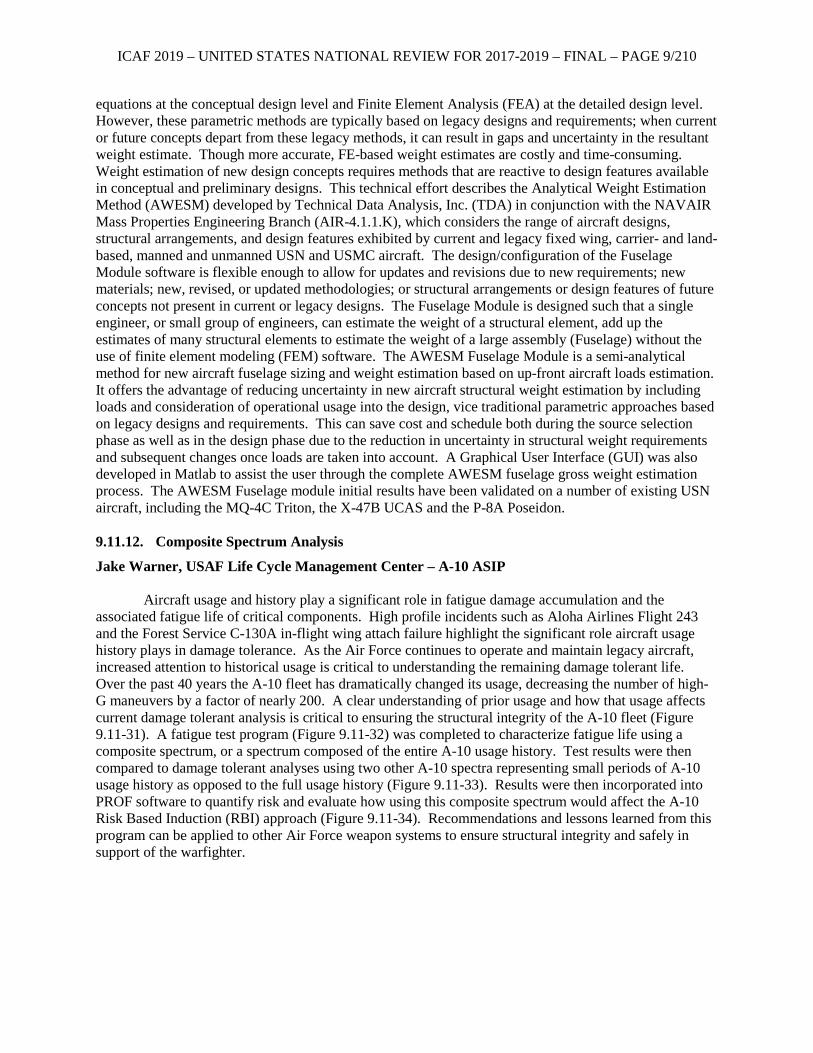
ICAF 2019 – UNITED STATES NATIONAL REVIEW FOR 2017-2019 – FINAL – PAGE 9/210
equations at the conceptual design level and Finite Element Analysis (FEA) at the detailed design level. However, these parametric methods are typically based on legacy designs and requirements; when current or future concepts depart from these legacy methods, it can result in gaps and uncertainty in the resultant weight estimate. Though more accurate, FE-based weight estimates are costly and time-consuming. Weight estimation of new design concepts requires methods that are reactive to design features available in conceptual and preliminary designs. This technical effort describes the Analytical Weight Estimation Method (AWESM) developed by Technical Data Analysis, Inc. (TDA) in conjunction with the NAVAIR Mass Properties Engineering Branch (AIR-4.1.1.K), which considers the range of aircraft designs, structural arrangements, and design features exhibited by current and legacy fixed wing, carrier- and land-based, manned and unmanned USN and USMC aircraft. The design/configuration of the Fuselage Module software is flexible enough to allow for updates and revisions due to new requirements; new materials; new, revised, or updated methodologies; or structural arrangements or design features of future concepts not present in current or legacy designs. The Fuselage Module is designed such that a single engineer, or small group of engineers, can estimate the weight of a structural element, add up the estimates of many structural elements to estimate the weight of a large assembly (Fuselage) without the use of finite element modeling (FEM) software. The AWESM Fuselage Module is a semi-analytical method for new aircraft fuselage sizing and weight estimation based on up-front aircraft loads estimation. It offers the advantage of reducing uncertainty in new aircraft structural weight estimation by including loads and consideration of operational usage into the design, vice traditional parametric approaches based on legacy designs and requirements. This can save cost and schedule both during the source selection phase as well as in the design phase due to the reduction in uncertainty in structural weight requirements and subsequent changes once loads are taken into account. A Graphical User Interface (GUI) was also developed in Matlab to assist the user through the complete AWESM fuselage gross weight estimation process. The AWESM Fuselage module initial results have been validated on a number of existing USN aircraft, including the MQ-4C Triton, the X-47B UCAS and the P-8A Poseidon.
9.11.12. Composite Spectrum Analysis
Jake Warner, USAF Life Cycle Management Center – A-10 ASIP Aircraft usage and history play a significant role in fatigue damage accumulation and the
associated fatigue life of critical components. High profile incidents such as Aloha Airlines Flight 243 and the Forest Service C-130A in-flight wing attach failure highlight the significant role aircraft usage history plays in damage tolerance. As the Air Force continues to operate and maintain legacy aircraft, increased attention to historical usage is critical to understanding the remaining damage tolerant life. Over the past 40 years the A-10 fleet has dramatically changed its usage, decreasing the number of high-G maneuvers by a factor of nearly 200. A clear understanding of prior usage and how that usage affects current damage tolerant analysis is critical to ensuring the structural integrity of the A-10 fleet (Figure 9.11-31). A fatigue test program (Figure 9.11-32) was completed to characterize fatigue life using a composite spectrum, or a spectrum composed of the entire A-10 usage history. Test results were then compared to damage tolerant analyses using two other A-10 spectra representing small periods of A-10 usage history as opposed to the full usage history (Figure 9.11-33). Results were then incorporated into PROF software to quantify risk and evaluate how using this composite spectrum would affect the A-10 Risk Based Induction (RBI) approach (Figure 9.11-34). Recommendations and lessons learned from this program can be applied to other Air Force weapon systems to ensure structural integrity and safely in support of the warfighter.
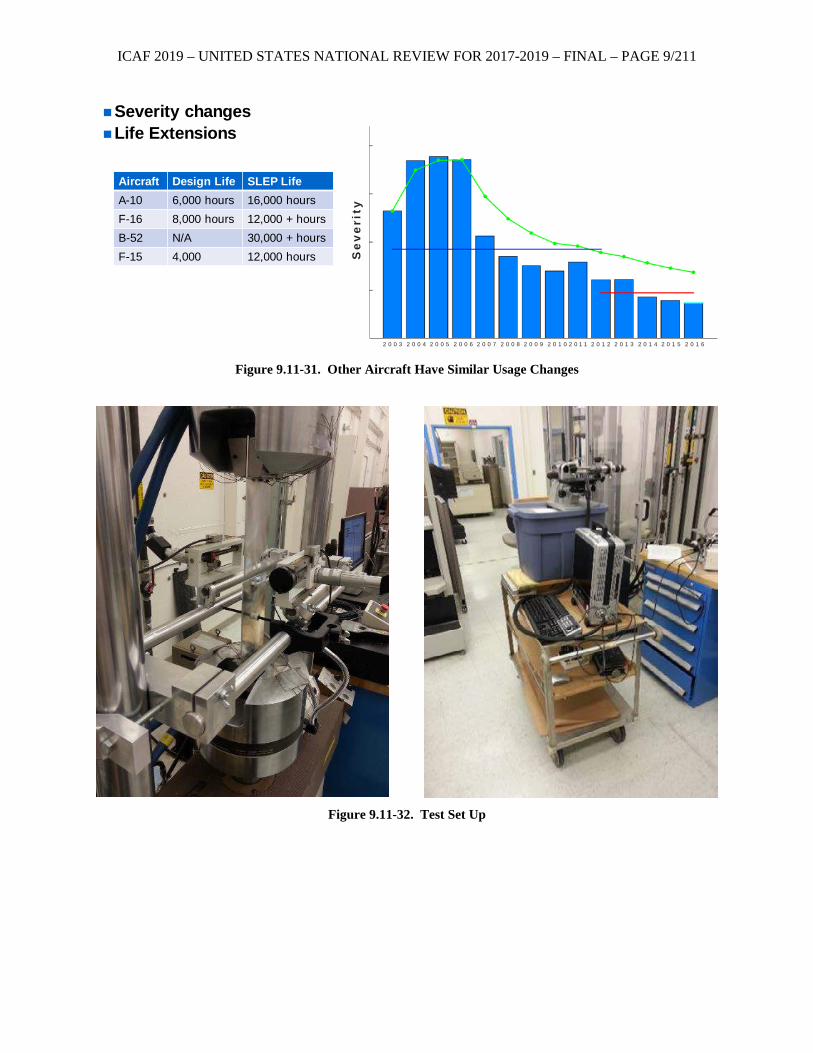
ICAF 2019 – UNITED STATES NATIONAL REVIEW FOR 2017-2019 – FINAL – PAGE 9/211
Figure 9.11-31. Other Aircraft Have Similar Usage Changes
Figure 9.11-32. Test Set Up
2 0 0 3 2 0 0 4 2 0 0 5 2 0 0 6 2 0 0 7 2 0 0 8 2 0 0 9 2 0 1 0 2 0 1 1 2 0 1 2 2 0 1 3 2 0 1 4 2 0 1 5 2 0 1 6
Sev
erit
y
Aircraft Design Life SLEP LifeA-10 6,000 hours 16,000 hoursF-16 8,000 hours 12,000 + hoursB-52 N/A 30,000 + hoursF-15 4,000 12,000 hours
Severity changesLife Extensions
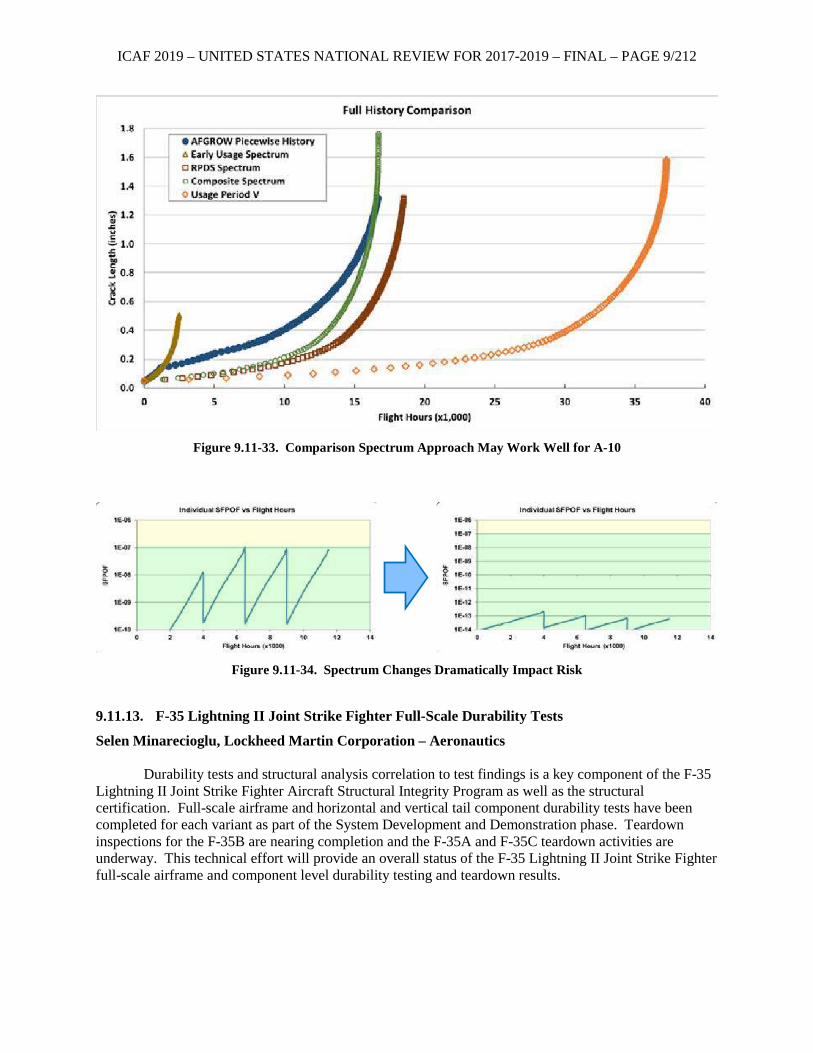
ICAF 2019 – UNITED STATES NATIONAL REVIEW FOR 2017-2019 – FINAL – PAGE 9/212
Figure 9.11-33. Comparison Spectrum Approach May Work Well for A-10
Figure 9.11-34. Spectrum Changes Dramatically Impact Risk
9.11.13. F-35 Lightning II Joint Strike Fighter Full-Scale Durability Tests
Selen Minarecioglu, Lockheed Martin Corporation – Aeronautics Durability tests and structural analysis correlation to test findings is a key component of the F-35
Lightning II Joint Strike Fighter Aircraft Structural Integrity Program as well as the structural certification. Full-scale airframe and horizontal and vertical tail component durability tests have been completed for each variant as part of the System Development and Demonstration phase. Teardown inspections for the F-35B are nearing completion and the F-35A and F-35C teardown activities are underway. This technical effort will provide an overall status of the F-35 Lightning II Joint Strike Fighter full-scale airframe and component level durability testing and teardown results.
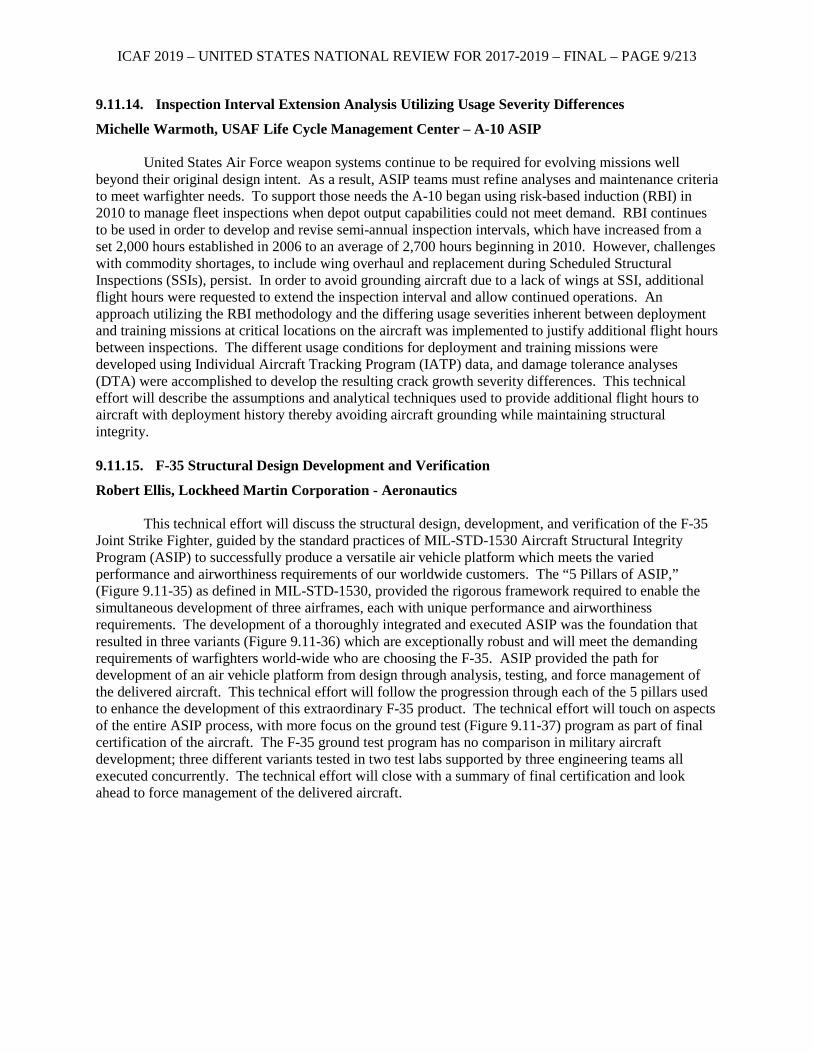
ICAF 2019 – UNITED STATES NATIONAL REVIEW FOR 2017-2019 – FINAL – PAGE 9/213
9.11.14. Inspection Interval Extension Analysis Utilizing Usage Severity Differences
Michelle Warmoth, USAF Life Cycle Management Center – A-10 ASIP United States Air Force weapon systems continue to be required for evolving missions well
beyond their original design intent. As a result, ASIP teams must refine analyses and maintenance criteria to meet warfighter needs. To support those needs the A-10 began using risk-based induction (RBI) in 2010 to manage fleet inspections when depot output capabilities could not meet demand. RBI continues to be used in order to develop and revise semi-annual inspection intervals, which have increased from a set 2,000 hours established in 2006 to an average of 2,700 hours beginning in 2010. However, challenges with commodity shortages, to include wing overhaul and replacement during Scheduled Structural Inspections (SSIs), persist. In order to avoid grounding aircraft due to a lack of wings at SSI, additional flight hours were requested to extend the inspection interval and allow continued operations. An approach utilizing the RBI methodology and the differing usage severities inherent between deployment and training missions at critical locations on the aircraft was implemented to justify additional flight hours between inspections. The different usage conditions for deployment and training missions were developed using Individual Aircraft Tracking Program (IATP) data, and damage tolerance analyses (DTA) were accomplished to develop the resulting crack growth severity differences. This technical effort will describe the assumptions and analytical techniques used to provide additional flight hours to aircraft with deployment history thereby avoiding aircraft grounding while maintaining structural integrity.
9.11.15. F-35 Structural Design Development and Verification
Robert Ellis, Lockheed Martin Corporation - Aeronautics This technical effort will discuss the structural design, development, and verification of the F-35
Joint Strike Fighter, guided by the standard practices of MIL-STD-1530 Aircraft Structural Integrity Program (ASIP) to successfully produce a versatile air vehicle platform which meets the varied performance and airworthiness requirements of our worldwide customers. The “5 Pillars of ASIP,” (Figure 9.11-35) as defined in MIL-STD-1530, provided the rigorous framework required to enable the simultaneous development of three airframes, each with unique performance and airworthiness requirements. The development of a thoroughly integrated and executed ASIP was the foundation that resulted in three variants (Figure 9.11-36) which are exceptionally robust and will meet the demanding requirements of warfighters world-wide who are choosing the F-35. ASIP provided the path for development of an air vehicle platform from design through analysis, testing, and force management of the delivered aircraft. This technical effort will follow the progression through each of the 5 pillars used to enhance the development of this extraordinary F-35 product. The technical effort will touch on aspects of the entire ASIP process, with more focus on the ground test (Figure 9.11-37) program as part of final certification of the aircraft. The F-35 ground test program has no comparison in military aircraft development; three different variants tested in two test labs supported by three engineering teams all executed concurrently. The technical effort will close with a summary of final certification and look ahead to force management of the delivered aircraft.
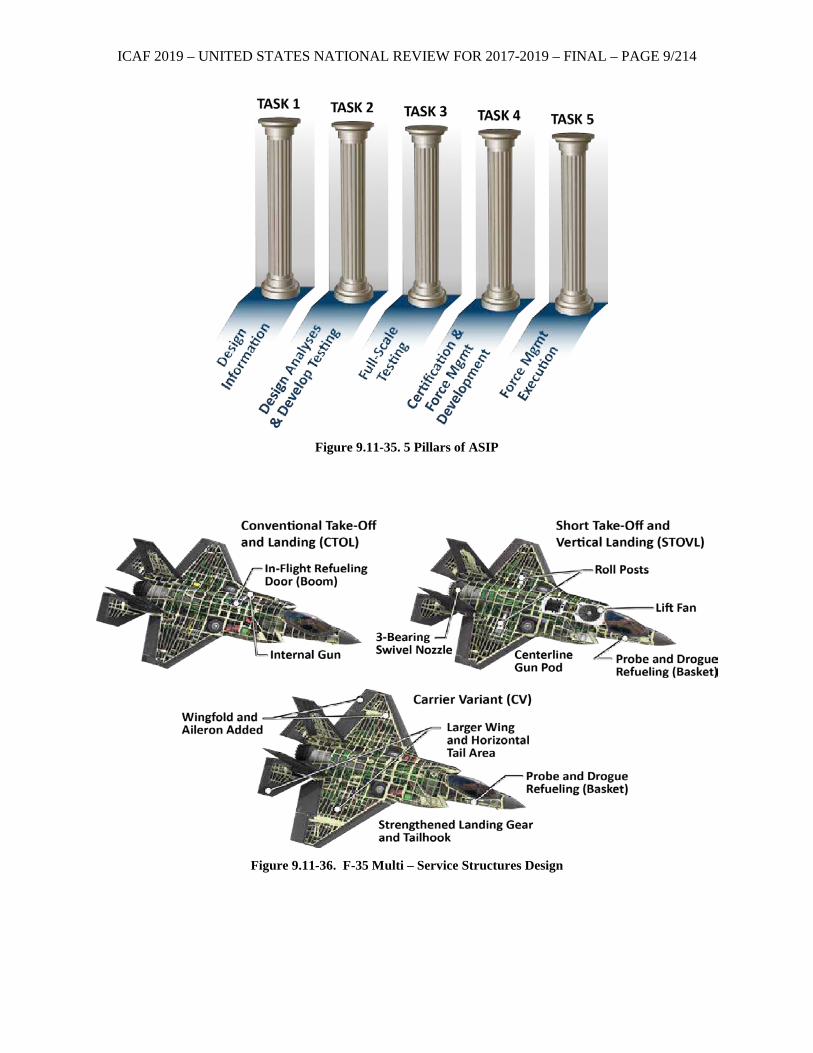
ICAF 2019 – UNITED STATES NATIONAL REVIEW FOR 2017-2019 – FINAL – PAGE 9/214
Figure 9.11-35. 5 Pillars of ASIP
Figure 9.11-36. F-35 Multi – Service Structures Design
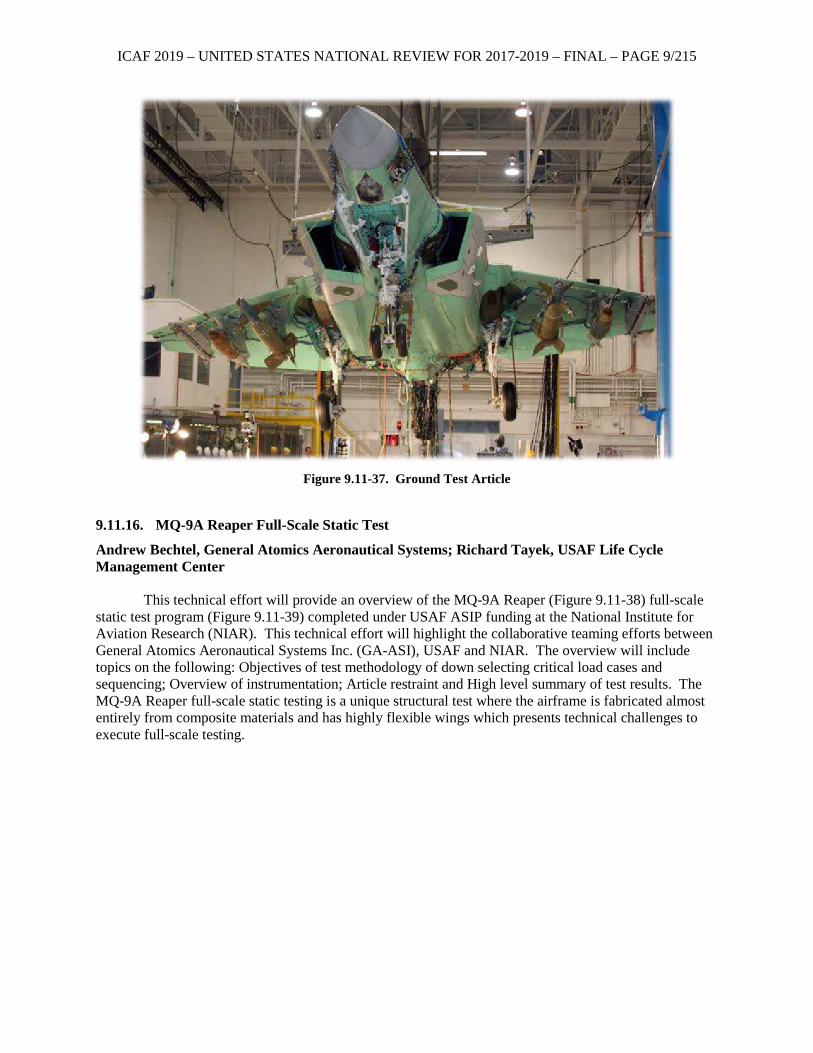
ICAF 2019 – UNITED STATES NATIONAL REVIEW FOR 2017-2019 – FINAL – PAGE 9/215
Figure 9.11-37. Ground Test Article
9.11.16. MQ-9A Reaper Full-Scale Static Test
Andrew Bechtel, General Atomics Aeronautical Systems; Richard Tayek, USAF Life Cycle Management Center
This technical effort will provide an overview of the MQ-9A Reaper (Figure 9.11-38) full-scale
static test program (Figure 9.11-39) completed under USAF ASIP funding at the National Institute for Aviation Research (NIAR). This technical effort will highlight the collaborative teaming efforts between General Atomics Aeronautical Systems Inc. (GA-ASI), USAF and NIAR. The overview will include topics on the following: Objectives of test methodology of down selecting critical load cases and sequencing; Overview of instrumentation; Article restraint and High level summary of test results. The MQ-9A Reaper full-scale static testing is a unique structural test where the airframe is fabricated almost entirely from composite materials and has highly flexible wings which presents technical challenges to execute full-scale testing.
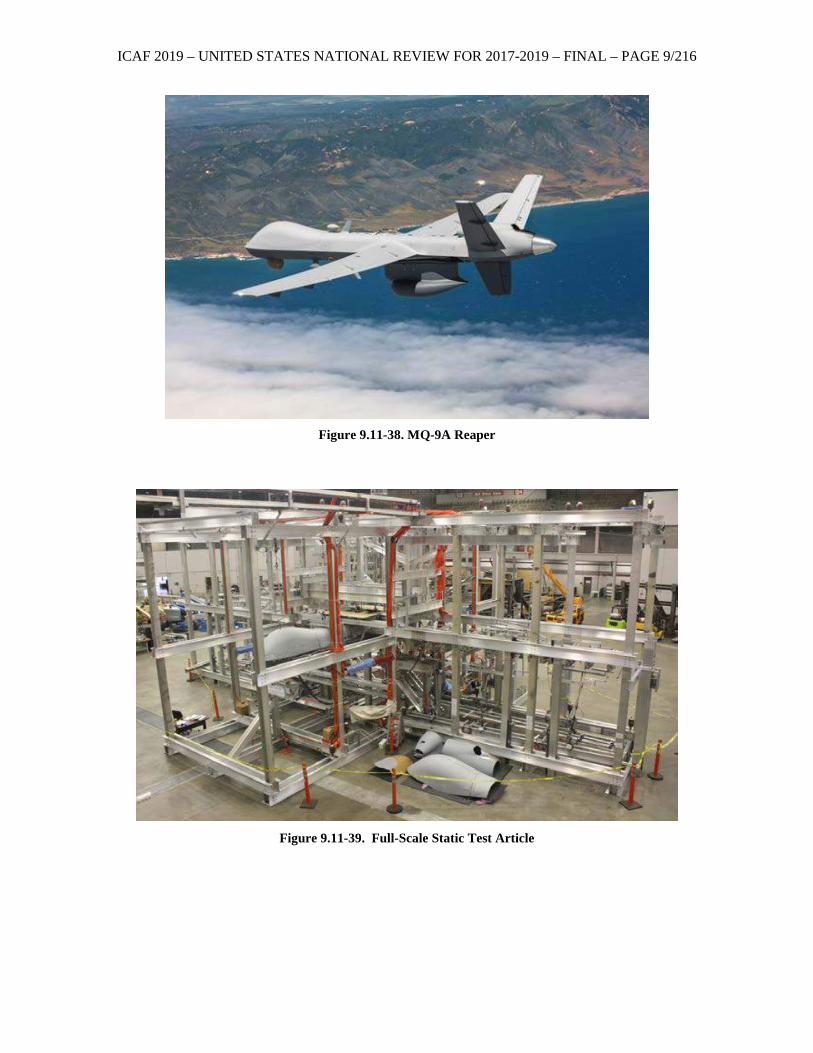
ICAF 2019 – UNITED STATES NATIONAL REVIEW FOR 2017-2019 – FINAL – PAGE 9/216
Figure 9.11-38. MQ-9A Reaper
Figure 9.11-39. Full-Scale Static Test Article
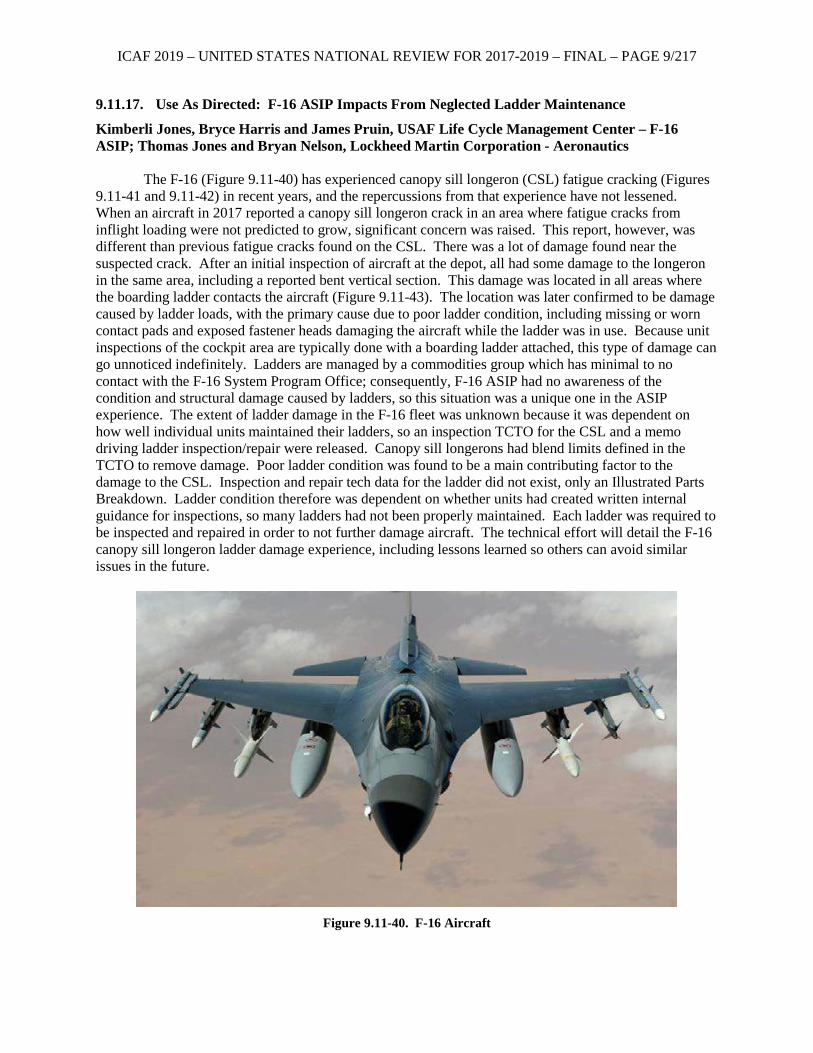
ICAF 2019 – UNITED STATES NATIONAL REVIEW FOR 2017-2019 – FINAL – PAGE 9/217
9.11.17. Use As Directed: F-16 ASIP Impacts From Neglected Ladder Maintenance
Kimberli Jones, Bryce Harris and James Pruin, USAF Life Cycle Management Center – F-16 ASIP; Thomas Jones and Bryan Nelson, Lockheed Martin Corporation - Aeronautics
The F-16 (Figure 9.11-40) has experienced canopy sill longeron (CSL) fatigue cracking (Figures
9.11-41 and 9.11-42) in recent years, and the repercussions from that experience have not lessened. When an aircraft in 2017 reported a canopy sill longeron crack in an area where fatigue cracks from inflight loading were not predicted to grow, significant concern was raised. This report, however, was different than previous fatigue cracks found on the CSL. There was a lot of damage found near the suspected crack. After an initial inspection of aircraft at the depot, all had some damage to the longeron in the same area, including a reported bent vertical section. This damage was located in all areas where the boarding ladder contacts the aircraft (Figure 9.11-43). The location was later confirmed to be damage caused by ladder loads, with the primary cause due to poor ladder condition, including missing or worn contact pads and exposed fastener heads damaging the aircraft while the ladder was in use. Because unit inspections of the cockpit area are typically done with a boarding ladder attached, this type of damage can go unnoticed indefinitely. Ladders are managed by a commodities group which has minimal to no contact with the F-16 System Program Office; consequently, F-16 ASIP had no awareness of the condition and structural damage caused by ladders, so this situation was a unique one in the ASIP experience. The extent of ladder damage in the F-16 fleet was unknown because it was dependent on how well individual units maintained their ladders, so an inspection TCTO for the CSL and a memo driving ladder inspection/repair were released. Canopy sill longerons had blend limits defined in the TCTO to remove damage. Poor ladder condition was found to be a main contributing factor to the damage to the CSL. Inspection and repair tech data for the ladder did not exist, only an Illustrated Parts Breakdown. Ladder condition therefore was dependent on whether units had created written internal guidance for inspections, so many ladders had not been properly maintained. Each ladder was required to be inspected and repaired in order to not further damage aircraft. The technical effort will detail the F-16 canopy sill longeron ladder damage experience, including lessons learned so others can avoid similar issues in the future.
Figure 9.11-40. F-16 Aircraft
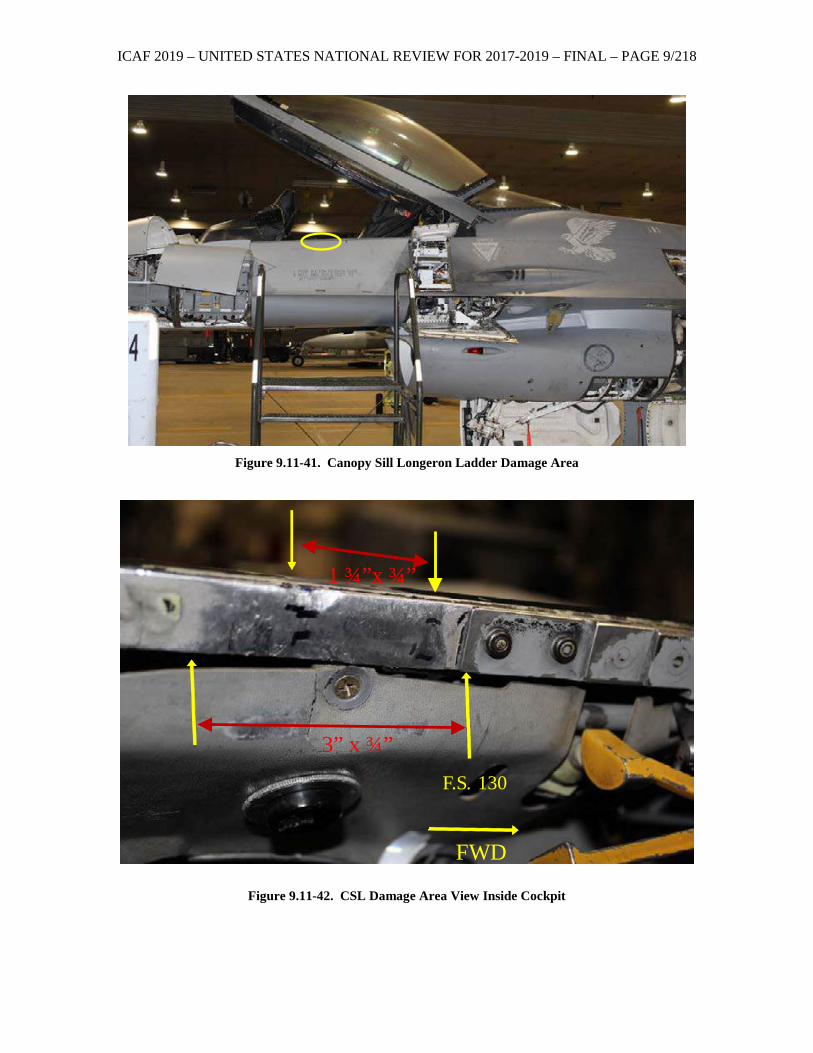
ICAF 2019 – UNITED STATES NATIONAL REVIEW FOR 2017-2019 – FINAL – PAGE 9/218
Figure 9.11-41. Canopy Sill Longeron Ladder Damage Area
Figure 9.11-42. CSL Damage Area View Inside Cockpit
F.S. 130
FWD
3” x ¾”
1 ¾”x ¾”
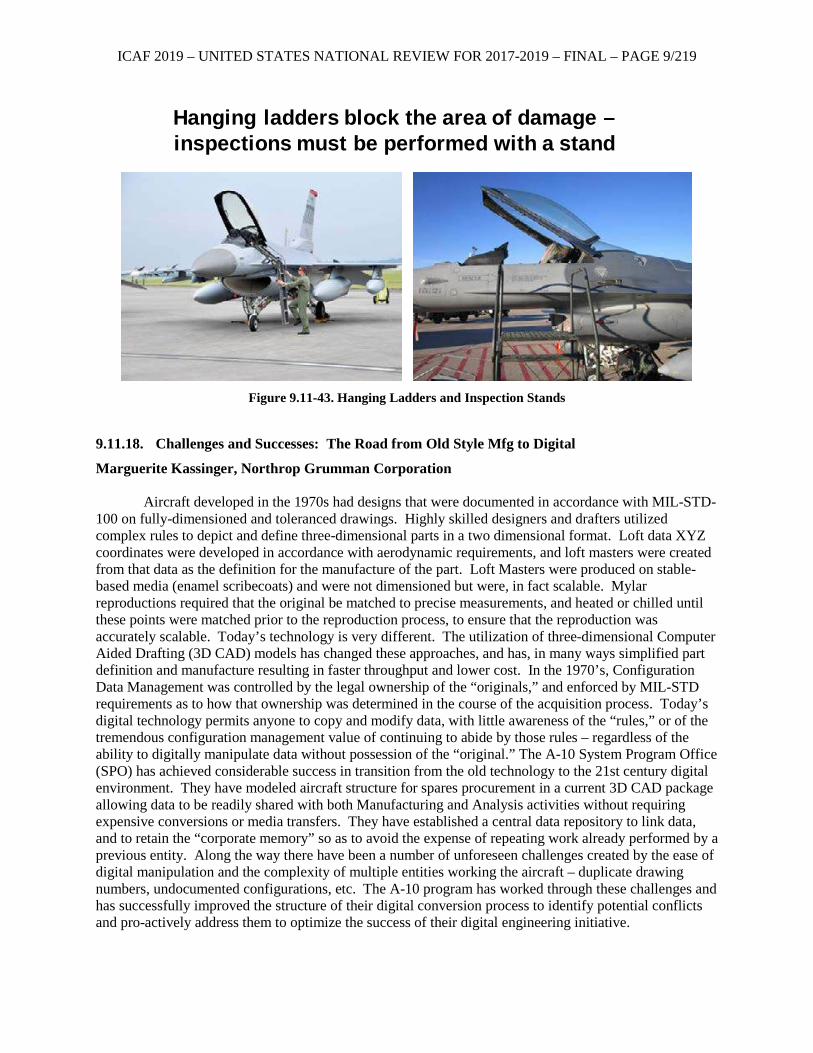
ICAF 2019 – UNITED STATES NATIONAL REVIEW FOR 2017-2019 – FINAL – PAGE 9/219
Figure 9.11-43. Hanging Ladders and Inspection Stands
9.11.18. Challenges and Successes: The Road from Old Style Mfg to Digital
Marguerite Kassinger, Northrop Grumman Corporation Aircraft developed in the 1970s had designs that were documented in accordance with MIL-STD-
100 on fully-dimensioned and toleranced drawings. Highly skilled designers and drafters utilized complex rules to depict and define three-dimensional parts in a two dimensional format. Loft data XYZ coordinates were developed in accordance with aerodynamic requirements, and loft masters were created from that data as the definition for the manufacture of the part. Loft Masters were produced on stable-based media (enamel scribecoats) and were not dimensioned but were, in fact scalable. Mylar reproductions required that the original be matched to precise measurements, and heated or chilled until these points were matched prior to the reproduction process, to ensure that the reproduction was accurately scalable. Today’s technology is very different. The utilization of three-dimensional Computer Aided Drafting (3D CAD) models has changed these approaches, and has, in many ways simplified part definition and manufacture resulting in faster throughput and lower cost. In the 1970’s, Configuration Data Management was controlled by the legal ownership of the “originals,” and enforced by MIL-STD requirements as to how that ownership was determined in the course of the acquisition process. Today’s digital technology permits anyone to copy and modify data, with little awareness of the “rules,” or of the tremendous configuration management value of continuing to abide by those rules – regardless of the ability to digitally manipulate data without possession of the “original.” The A-10 System Program Office (SPO) has achieved considerable success in transition from the old technology to the 21st century digital environment. They have modeled aircraft structure for spares procurement in a current 3D CAD package allowing data to be readily shared with both Manufacturing and Analysis activities without requiring expensive conversions or media transfers. They have established a central data repository to link data, and to retain the “corporate memory” so as to avoid the expense of repeating work already performed by a previous entity. Along the way there have been a number of unforeseen challenges created by the ease of digital manipulation and the complexity of multiple entities working the aircraft – duplicate drawing numbers, undocumented configurations, etc. The A-10 program has worked through these challenges and has successfully improved the structure of their digital conversion process to identify potential conflicts and pro-actively address them to optimize the success of their digital engineering initiative.
Hanging ladders block the area of damage –inspections must be performed with a stand
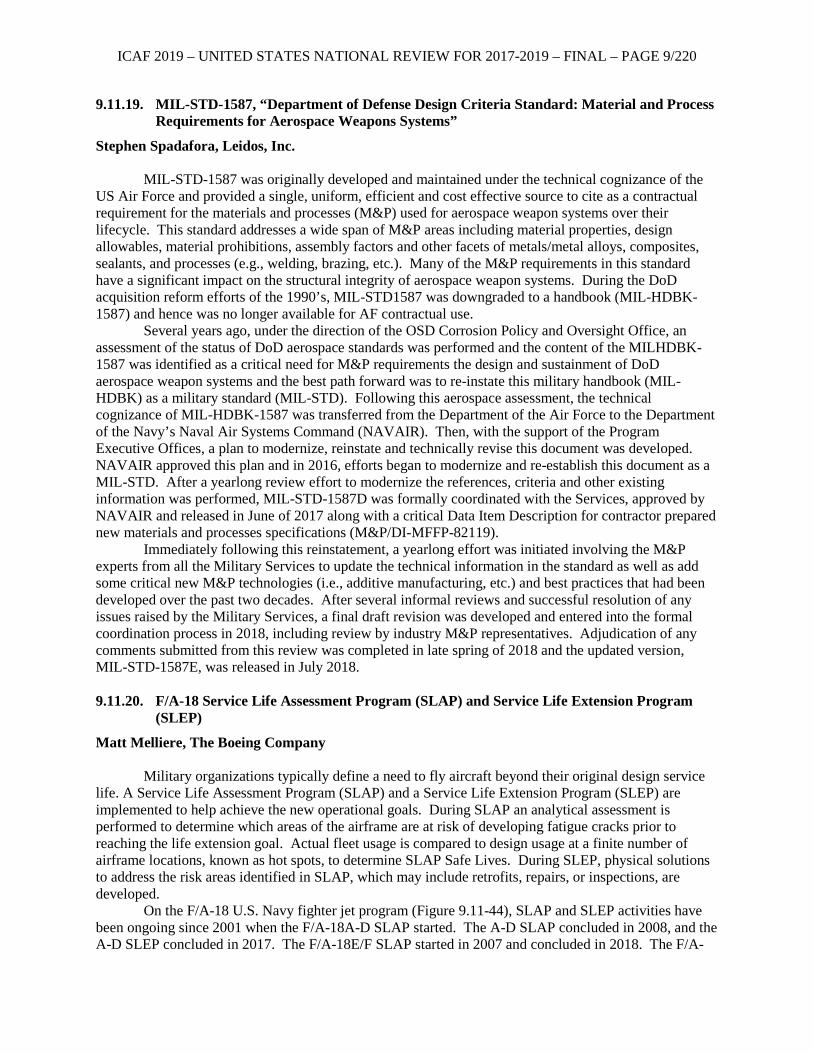
ICAF 2019 – UNITED STATES NATIONAL REVIEW FOR 2017-2019 – FINAL – PAGE 9/220
9.11.19. MIL-STD-1587, “Department of Defense Design Criteria Standard: Material and Process Requirements for Aerospace Weapons Systems”
Stephen Spadafora, Leidos, Inc. MIL-STD-1587 was originally developed and maintained under the technical cognizance of the
US Air Force and provided a single, uniform, efficient and cost effective source to cite as a contractual requirement for the materials and processes (M&P) used for aerospace weapon systems over their lifecycle. This standard addresses a wide span of M&P areas including material properties, design allowables, material prohibitions, assembly factors and other facets of metals/metal alloys, composites, sealants, and processes (e.g., welding, brazing, etc.). Many of the M&P requirements in this standard have a significant impact on the structural integrity of aerospace weapon systems. During the DoD acquisition reform efforts of the 1990’s, MIL-STD1587 was downgraded to a handbook (MIL-HDBK-1587) and hence was no longer available for AF contractual use.
Several years ago, under the direction of the OSD Corrosion Policy and Oversight Office, an assessment of the status of DoD aerospace standards was performed and the content of the MILHDBK-1587 was identified as a critical need for M&P requirements the design and sustainment of DoD aerospace weapon systems and the best path forward was to re-instate this military handbook (MIL-HDBK) as a military standard (MIL-STD). Following this aerospace assessment, the technical cognizance of MIL-HDBK-1587 was transferred from the Department of the Air Force to the Department of the Navy’s Naval Air Systems Command (NAVAIR). Then, with the support of the Program Executive Offices, a plan to modernize, reinstate and technically revise this document was developed. NAVAIR approved this plan and in 2016, efforts began to modernize and re-establish this document as a MIL-STD. After a yearlong review effort to modernize the references, criteria and other existing information was performed, MIL-STD-1587D was formally coordinated with the Services, approved by NAVAIR and released in June of 2017 along with a critical Data Item Description for contractor prepared new materials and processes specifications (M&P/DI-MFFP-82119).
Immediately following this reinstatement, a yearlong effort was initiated involving the M&P experts from all the Military Services to update the technical information in the standard as well as add some critical new M&P technologies (i.e., additive manufacturing, etc.) and best practices that had been developed over the past two decades. After several informal reviews and successful resolution of any issues raised by the Military Services, a final draft revision was developed and entered into the formal coordination process in 2018, including review by industry M&P representatives. Adjudication of any comments submitted from this review was completed in late spring of 2018 and the updated version, MIL-STD-1587E, was released in July 2018. 9.11.20. F/A-18 Service Life Assessment Program (SLAP) and Service Life Extension Program
(SLEP)
Matt Melliere, The Boeing Company Military organizations typically define a need to fly aircraft beyond their original design service
life. A Service Life Assessment Program (SLAP) and a Service Life Extension Program (SLEP) are implemented to help achieve the new operational goals. During SLAP an analytical assessment is performed to determine which areas of the airframe are at risk of developing fatigue cracks prior to reaching the life extension goal. Actual fleet usage is compared to design usage at a finite number of airframe locations, known as hot spots, to determine SLAP Safe Lives. During SLEP, physical solutions to address the risk areas identified in SLAP, which may include retrofits, repairs, or inspections, are developed.
On the F/A-18 U.S. Navy fighter jet program (Figure 9.11-44), SLAP and SLEP activities have been ongoing since 2001 when the F/A-18A-D SLAP started. The A-D SLAP concluded in 2008, and the A-D SLEP concluded in 2017. The F/A-18E/F SLAP started in 2007 and concluded in 2018. The F/A-
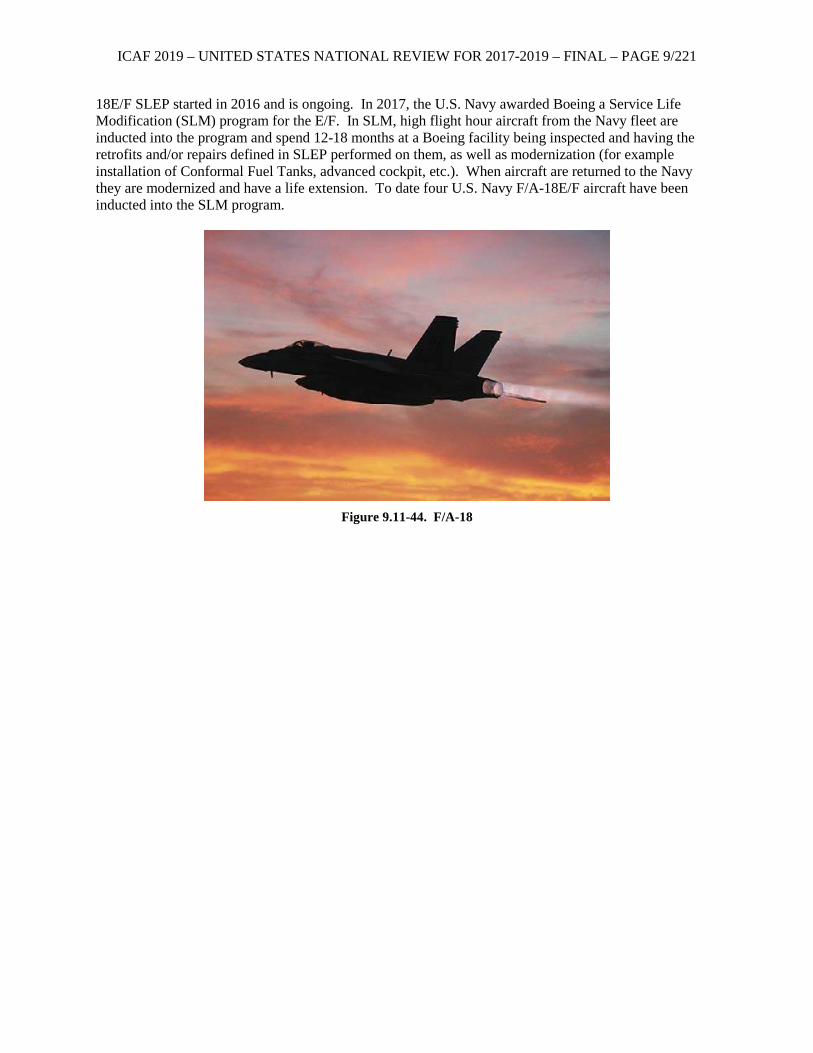
ICAF 2019 – UNITED STATES NATIONAL REVIEW FOR 2017-2019 – FINAL – PAGE 9/221
18E/F SLEP started in 2016 and is ongoing. In 2017, the U.S. Navy awarded Boeing a Service Life Modification (SLM) program for the E/F. In SLM, high flight hour aircraft from the Navy fleet are inducted into the program and spend 12-18 months at a Boeing facility being inspected and having the retrofits and/or repairs defined in SLEP performed on them, as well as modernization (for example installation of Conformal Fuel Tanks, advanced cockpit, etc.). When aircraft are returned to the Navy they are modernized and have a life extension. To date four U.S. Navy F/A-18E/F aircraft have been inducted into the SLM program.
Figure 9.11-44. F/A-18

ICAF 2019 – UNITED STATES NATIONAL REVIEW FOR 2017-2019 – FINAL – PAGE 9/222


