Embed Size (px)
Citation preview

2648
Full PaperMacromolecularChemistry and Physics
A Snapshot of Thermo-Oxidative Degradation Products in Poly(bisphenol A carbonate) by Electrospray Ionization Mass Spectrometry and Matrix-Assisted Laser Desorption Ionization Time of Flight Mass Spectrometry
Sabrina Carroccio,* Paola Rizzarelli, Daniela Zampino
The products derived from thermo-oxidation of poly(bisphenol A carbonate) (PC) and their related degradation pathways are investigated. PC degradation is carried out at 300 ° C in air. The oxidized products are analyzed for the fi rst time by using direct electrospray mass spectrometry (MS) and matrix-assisted laser desorption ionization time of fl ight MS. Together with the formation of bisphenol A oligomers, several new structures containing biphenyl units, phenols, acetophenones, alcohols, acids, and xanthones molecules are detected. The use of thin fi lms, instead of PC bulk, allows one to obtain precise information about mechanisms involved during thermo-oxidative processes and to establish a new order of priorities among the renowned degradative reactions.
1. Introduction
Poly(bisphenol A carbonate) (PC) is widely used in several fi elds, such as food packaging, beverage and milk bottles, electronics, automobile, and optics for its outstanding optical and mechanical properties. However, during its life-time PC is progressively degraded by thermal, photo-, and thermo-oxidative reactions depending on its application. In addition, it is well known that at PC processing tempera-ture (320–350 ° C) thermal, oxidative, and hydrolytic degra-dation may take place. [ 1 , 2 ] Furthermore, in the process of synthesis, the monomers conversion can be incomplete, leaving small amount of monomers and oligomers in
Macromol. Chem. Phys. 2011, 212, 2648−2666
© 2011 WILEY-VCH Verlag GmbH & Co. KGaA, Weinheim wileyon
Dr. S. Carroccio , Dr. P. Rizzarelli , Dr. D. Zampino Istituto di Chimica e Tecnologia dei Polimeri, Consiglio Nazionale delle Ricerche, Via P. Gaifami 18, 95126 Catania, Italy E-mail: [email protected]
the polymer matrix. Low-molecular-weight compounds, including degradation products, additives, residual mono-mers, and oligomers, may migrate from PC containers into the food contact materials. Precise analysis of potentially hazardous substances is needed to ensure consumer safety also in view of the recent changing in cooking lifestyle that has determined the introduction into the market of PC-based containers to be directly subjected to a heating source. [ 3 , 4 ]
Consequently, identifi cation of monomers, oligomers, or other products derived from degradation processes is essential because these compounds might have unsafe effects on human health. Therefore, new, simple, and fast, analytical methods to identify low molecular weight compounds are welcome. Soft ionization mass spectrom-etry (MS) techniques such as matrix-assisted laser desorp-tion ionization (MALDI) and electrospray ionization (ESI) have numerous advantages for analyzing several classes of compounds even in complex mixtures, including high
linelibrary.com DOI: 10.1002/macp.201100417

A Snapshot of Thermo-Oxidative Degradation Products . . .
www.mcp-journal.de
MacromolecularChemistry and Physics
sensitivity, selectivity, and speed. [ 5–7 ] ESI is the primary ion source for today’s liquid chromatography–mass spec-trometry (LC-MS) instruments due to its easy online cou-pling with LC [ 8–13 ] allowing the quantitative analysis. In particular, very accurate quantitative molecular weight data of synthetic polymers have been recently obtained by using hyphenated size exclusion chromatography (SEC)/ESI-MS procedures. [ 10–12 ] However, methods for the direct quantifi cation of different classes of compounds by ESI-MS or ESI-MS/MS have been developed. [ 14–19 ]
The understanding of PC degradation mechanisms and of related decomposition products has produced an increasing research interest over the past two dec-ades. [ 1 , 2 , 20–32 ] It is well established in the literature [ 1 , 2 , 20 ] that thermo-oxidative degradation phenomena are rel-evant during the polymer service life, whereas thermo-lysis and hydrolysis are the main degradative mecha-nisms occurring during injection molding processes. Diverse analytical methods were applied for this kind of studies. Kelleher and co-worker’s [ 21 , 22 ] and Davis’ [ 23 ] oxygen uptake studies demonstrated that, below 125 ° C, oxidative processes in polycarbonate are of minor signifi -cance and do not impart noticeable losses in this mate-rial. Oxygen absorption after more than 625 d at 100 ° C is negligible and only 4 mL O 2 g − 1 are absorbed after 100 h at 200 ° C. Factor [ 1 ] reported that the major problem encountered as a consequence of elevate in-service tem-peratures and during light exposure is yellowing. The extent of discoloration, measured by yellowness index, is infl uenced by light exposure, heating time, and tem-perature. The yellowing rate is linearly related to the applied oxygen pressure as well as to the increasing number of phenolic end groups and to the presence of moisture. Factor and Chu [ 24 ] ascertained by using electron spin resonance spectrometer, gas chromatography–mass spectrometry (GC-MS), and wet chemistry that the yel-lowing effect in oven-aged samples at 140 ° C for 6 months is related to oxidation of the geminal bisphenol-A (BPA) methyl groups. As reported by Factor, [ 1 ] MacLaury and Stoll separated by high-performance liquid chromatog-raphy, the oxidation products obtained after base-hydro-lysis of PC thermo-oxidized at 250 ° C, and analyzed them by UV, IR, NMR, and MS. They confi rmed the oxidation of geminal methyl groups with consequent production of p-hydroxyacetophenone and p-hydroxybenzoic acid. They also suggested the occurrence of additional oxidative reactions such as oxidative coupling and cracking of BPA to form isopropylphenol. [ 1 ] Rivaton et al. [ 25 , 26 ] compared the photochemical and thermal-oxidative behavior of PC and trimethylcyclohexane polycarbonate (TMC-PC) using spectroscopic and chromatographic methods. The results obtained from samples oxidized at 170 ° C indicated the α -H hydrogen abstraction as the primary reaction mecha-nism. Oba et al. [ 27 ] applied the reactive pyrolysis/GC-MS
Macromol. Chem. Phy© 2011 WILEY-VCH Verlag Gwww.MaterialsViews.com
technique to detect the presence of branching and/or crosslinking structures on thermally oxidized PC sam-ples. Several crosslinked structures were recognized in the samples processed at 400 ° C, and it was postulated that these structures were formed by coupling of methylene and/or phenoxy radicals. Further studies [ 29 ] showed, how-ever, that the crosslinking occurs through the coupling of bisphenol units to yield biphenyl structures. Jang and co-workers [ 28 ] reported a study of thermal degradation of PC under air by using thermogravimetric analysis (TGA)/Fou-rier transform infrared (FTIR) and chromatography cou-pled with MS. They suggested that in the main degrada-tion region (480–560 ° C) the assigned structures of small and linear molecules were very similar to those obtained from the degradation under nitrogen fl ow. Thermal oxida-tive degradation of PC at 300 and 350 ° C was also investi-gated by using matrix-assisted laser desorption ionization time of fl ight MS (MALDI-TOF MS). [ 29 , 32 ] MALDI spectra of the thermal oxidized PC samples showed the pres-ence of polymer chains containing a variety of terminal groups: acetophenone, phenyl substituted acetone, phe-nols, benzyl-alcohol, and biphenyl units. The formation of acetophenone and phenol end groups was confi rmed by 1 H NMR analysis. The presence of biphenyl units among thermal oxidation products confi rmed the occurrence of crosslinking processes, which are responsible for the for-mation of the insoluble gel fraction.
The evidence that polymer analysis has taken advan-tage from the development of soft ionization methods has addresses several researchers [ 29–42 ] to explore deg-radation processes by using modern MS. Applications of MALDI to the study of polymer photo- and thermo-oxi-dation are quite recent [ 29–37 ] and involve the collection of MALDI spectra at different irradiation times and/or temperature to observe the structural changes induced by heat or light under an oxidizing or inert atmosphere. The results obtained for the systems so far investigated by MALDI [ 29–37 ] are remarkably highly informative, in com-parison with previous studies based on conventional tech-niques, yielding precise information on the size, structure, and end groups of molecules originated from the oxida-tion processes. Nevertheless, MALDI analysis suffers from various disadvantages: (i) the relatively high tendency to induce fragmentation of labile terminal groups; (ii) the lack of information for low-molecular-weight degrada-tion products; (iii) the nonfacile off-line coupling with SEC; and (iv) the uncertainty of the measurement arising from sample preparation. [ 10–12 , 43 ] Recently, very informa-tive degradation studies on acrylate polymer materials have been carried out by using ESI-MS. [ 38–42 ] In the present work, we report an investigation on thermal-oxidation of PC carried out on thin fi lm samples at 300 ° C in air. Degra-dation products derived from PC materials were extracted in methanol/acetonitrile (90:10, v/v) at three different
2649s. 2011, 212, 2648−2666
mbH & Co. KGaA, Weinheim

26
S. Carroccio et al.
www.mcp-journal.de
MacromolecularChemistry and Physics
times and analyzed for the fi rst time by using direct ESI-MS. MALDI analysis on thermo-oxidized PC fi lms was performed as well. Structural information obtained by both techniques are described and compared.
2. Experimental Section
2.1. Materials
PC and 2-(4 hydroxyphenilazo) benzoic acid (HABA) were pur-chased from Aldrich Chemical Co. (Italy). PC sample was purifi ed before use. The polymer sample (2 g) was dissolved in the min-imum amount of tetrahydrofuran (THF) and precipitated under stirring into acetone (ratio V THF / V CH3COCH3 = 1/10). The solid poly-meric material was fi ltered off and washed with CH 3 COCH 3 .
2.2. Films Preparation and Thermo-Oxidation Procedure
250 μ L of PC solution (2% in THF) were placed in glass vessels and dried at room temperature up to complete solvent evaporation. The thickness of the obtained fi lms was in the range of 3–4 μ m. The thermo-oxidation procedure was carried out by using both puri-fi ed and not purifi ed PC samples. The thin fi lms, formed by casting on the wall of the glass vessel, were thermo-oxidized at 300 ° C in atmospheric air. After 60, 120, and 180 min of heating, the glass vessels were removed from the heating source and appropriate amount of solvent was added to extract degradation products. At each exposure time at least two replicate samples were analyzed by ESI and MALDI-MS. The soluble part in methanol/acetonitrile (90:10, v/v) mixture from original and thermo-oxidized PC sam-ples was analyzed by ESI-MS. The soluble part in THF from thermo-oxidized PC samples was analyzed by MALDI-MS.
2.3. ESI-MS Analysis
ESI-TOF spectra were acquired by a Mariner Biospectrometry Work-station (PerSeptive Biosystems), equipped with an atmospheric pressure ionization source. Mass spectra were recorded working in negative ion mode in the m / z range 100–1200, with 3 s acquisi-tion per spectrum. The spray tip potential was 3 kV and the nozzle potential was 130 V. The quadrupole interface and the nozzle temperature were set at 140 ° C. Nitrogen was used as a nebulizer gas with a fl ow rate of 0.4 L min − 1 . The mass scale was calibrated by using PC oligomers of known structure. Resolution was about 4000 full width at half-maximum (FWHM). For analysis, 20 μ L of sample was injected (direct injection) into the mass spectrometer, using methanol/acetonitrile (90:10, v/v) as solvent at a fl ow rate of 10 μ L min − 1 (Harvard Apparatus syringe pump). Sample injection was performed at three different times (0 min, 30 min, and 24 h) after the addition of solvent mixture in order to screen the neces-sary time for the extraction of thermo-oxidized PC products.
2.4. MALDI-TOF MS Analysis
The PC thermo-oxidized samples were dissolved in THF at a con-centration of about 2 mg mL − 1 . HABA (0.1 M in THF) was used as
50Macromol. Chem. Phys
© 2011 WILEY-VCH Verlag G
matrix. Appropriate volumes of polymer and matrix solutions were mixed to obtain 1:1, 1:2, and 1:3 ratios (sample/matrix v/v). An aliquot of 1 μ L of each sample/matrix mixture was spotted onto the MALDI sample holder and slowly dried to allow matrix crystallization. Applied Biosystems 4800 MALDI TOF/TOF Ana-lyzer (Framingham, USA) mass spectrometer was used in this study to acquire MALDI spectra. The TOF/TOF instrument is equipped with a Nd:YAG laser (355 nm wavelength) of < 500 ps pulse and 200 Hz repetition rate. MALDI-TOF/TOF-MS spectra were recorded in refl ector positive ion mode. The resolution of MALDI spectra reported in the text is about 10 000 FWHM.
The structural identifi cation of MALDI peaks was mainly made on the basis of empirical formulas. However, isotopic resolution was helpful considerably in the peak-assignment process through the comparison of the relative intensities of isotopic peaks corresponding to oligomers of increasing molar mass. [ 35 , 36 ] Some plausible structures were also derived from and supported by previous studies. [ 29–32 ]
3. Results and Discussion
In this study both purifi ed and not purifi ed commercial PC samples were used. Thin PC fi lms, obtained by THF solvent casting in appropriate glassware, were thermo-oxidized at 300 ° C up to 180 min under air. To identify the oxidation products derived from thermo-oxidized fi lms at different degradation times, at least two replicates of PC samples were analyzed by ESI-MS and MALDI-TOF MS. The recorded MS spectra arise from a mixture of nonoxidized and oxi-dized chains, [ 35 , 36 ] consequently the thermo-oxidation was carried out on extremely thin polycarbonate fi lms (see Experimental Section) to maximize the percentage of thermo-oxidation products with respect to the nonoxidized chains in the bulk and to get detailed information about PC degradation mechanisms.
ESI analysis of low mass reaction products extracted from thermo-oxidized PC fi lms was performed in a meth-anol/acetonitrile (90:10, v/v) mixture after 0 min, 30 min, and 24 h (see Experimental Section) from the addition of solvent mixture. ESI mass spectra were acquired in nega-tive ion mode, consequently only negatively polarized products were identifi ed.
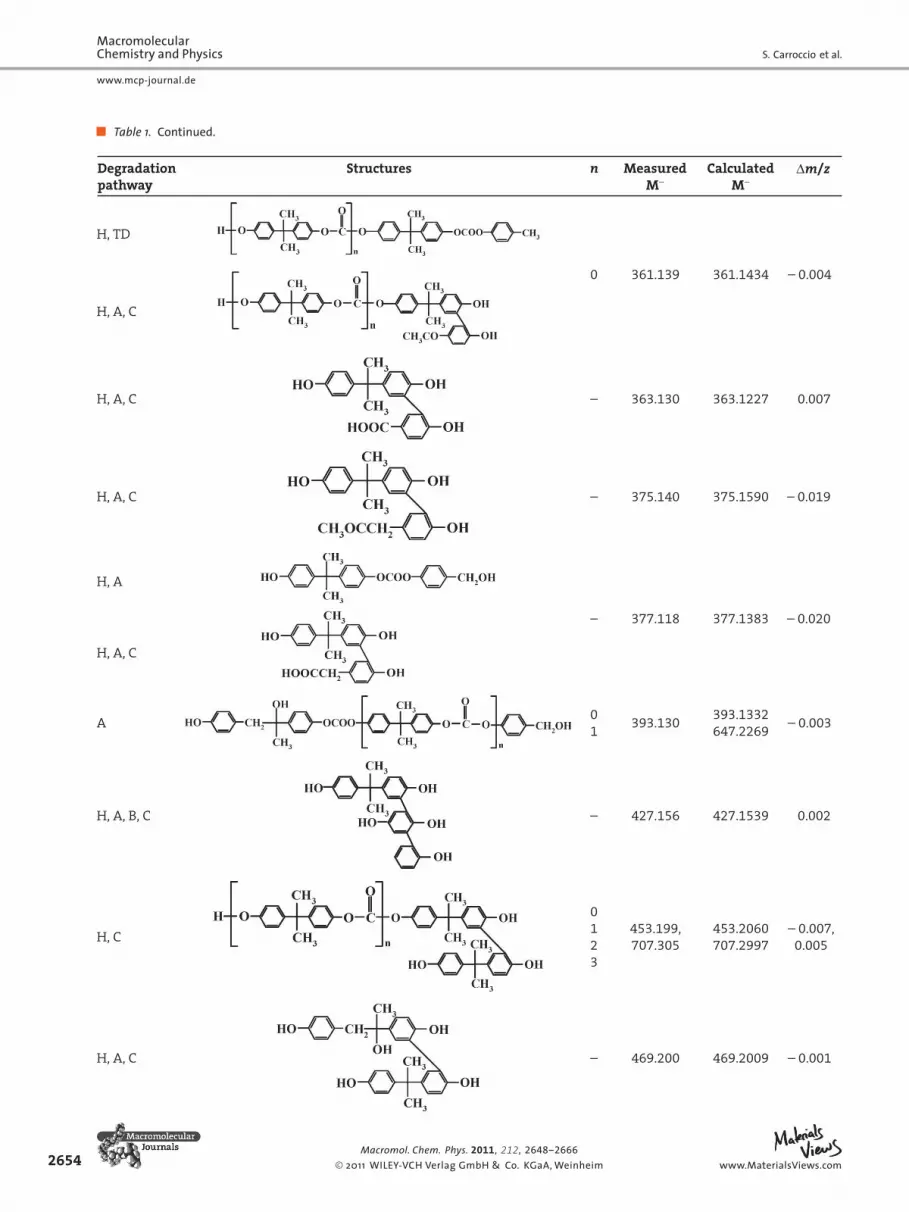
In Table 1 , there are listed the oligomer structures assigned to the ions detected in the ESI mass spectra of the extracted thermo-oxidized PC samples. The identifi ca-tion of low-molecular-weight compounds and oligomer structures produced during degradation processes is of remarkable importance because it allows us to understand the particular mechanism accounting for deterioration of polymeric materials. Furthermore, the detection of mol-ecules produced during degradation processes may high-light the presence of potential hazard products for human and environmental health and be helpful for safety con-trol on PC products for food use.
. 2011, 212, 2648−2666
mbH & Co. KGaA, Weinheim www.MaterialsViews.com

2651
A Snapshot of Thermo-Oxidative Degradation Products . . .
www.mcp-journal.de
MacromolecularChemistry and Physics
Macromol. Chem. Phys. 2011, 212, 2648−2666
© 2011 WILEY-VCH Verlag GmbH & Co. KGaA, Weinheimwww.MaterialsViews.com
Table 1. Structural assignment of ions appearing in the ESI mass spectra acquired in negative ion mode.
Degradation pathway
Structures n Measured M −
Calculated M −
Δ m / z
H, B
– 133.034 133.0648 – 0.031
H, A
– 135.052 135.0440 0.008
H, A
– 137.033 137.0233 0.010
A, H
0 149.059 149.0597 – 0.001
H
0 149.095 149.0961 – 0.001
1 403.193 403.1898 0.009
2 657.295 657.2835 0.011
H, A –
151.053
151.0390 0.014
A, H
– 151.0753 – 0.022
ST
– 163.046 163.0753 – 0.029
ST
– 165.030 165.0546 – 0.025
H, A
– 173.086 173.0209 0.065
ST
– 177.062 177.0546 0.007
ST
– 179.041 179.0339 0.007
H, A, B, C
– 185.065 185.0597 0.005H, A, B, C

2652
S. Carroccio et al.
www.mcp-journal.de
MacromolecularChemistry and Physics
Macromol. Chem. Phys. 2011, 212, 2648−2666
© 2011 WILEY-VCH Verlag GmbH & Co. KGaA, Weinheim www.MaterialsViews.com
Degradation pathway
Structures n Measured M −
Calculated M −
Δ m / z
ST
– 187.081 187.0365 0.044
ST
– 191.069 191.0703 – 0.001
ST
– 193.085 193.0495 0.035
ST
– 195.039 195.0288 0.010
H, A, B, C
– 201.074 201.0546 0.019
ST
– 205.156 205.1587 – 0.003
H, A, B, C
– 211.079 211.0753 0.004
H, A, B, C
– 213.060 213.0546 0.005
H, A, C
– 217.096 217.0495 0.046
ST
– 219.170 219.1743 – 0.004
Table 1. Continued.

2653
A Snapshot of Thermo-Oxidative Degradation Products . . .
www.mcp-journal.de
MacromolecularChemistry and Physics
Macromol. Chem. Phys. 2011, 212, 2648−2666
© 2011 WILEY-VCH Verlag GmbH & Co. KGaA, Weinheimwww.MaterialsViews.com
H
0 227.107 227.1066 0.000
1 481.199 481.2003 – 0.001
2 735.305 735.2940 0.011
3 989.384 989.3877 – 0.004
H, A
01
243.105, 497.194, 751.327
243.1015 0.003
497.1952 – 0.001
751.2891 0.038
A, TD
01
243.0652 0.040
497.1589 0.035
751.2532 0.074
A, B
0 269.084 269.0808 0.003
1 523.175 523.1745 0.000
H, D
– 271.100 271.0965 0.003
A
0 301.110 301.0342 0.075
1 555.197 555.1279 0.069
2 809.314 809.2216 0.092
H, C
0 319.137 319.1329 0.004
1 573.225 573.2266 – 0.002
2 827.334 827.3203 0.014
H, A, C
0 335.132 335.1277 0.004
1 589.210 589.2214 – 0.012
2 843.353 843.3151 0.038
H, C
H, A, TD, C
01
347.128601.258
347.1277601.2214
0.0000.036
Degradation pathway
Structures n Measured M−
Calculated M−
Δm/z
Table 1. Continued.
2654
S. Carroccio et al.
www.mcp-journal.de
MacromolecularChemistry and Physics
Macromol. Chem. Phys. 2011, 212, 2648−2666
© 2011 WILEY-VCH Verlag GmbH & Co. KGaA, Weinheim www.MaterialsViews.com
H, TD
0 361.139 361.1434 – 0.004
H, A, C
H, A, C
– 363.130 363.1227 0.007
H, A, C
– 375.140 375.1590 – 0.019
H, A
– 377.118 377.1383 – 0.020
H, A, C
A
01
393.130393.1332647.2269
– 0.003
H, A, B, C
– 427.156 427.1539 0.002
H, C
0123
453.199, 707.305
453.2060 707.2997
– 0.007, 0.005
H, A, C
– 469.200 469.2009 – 0.001
Degradation pathway
Structures n Measured M−
Calculated M−
Δm/z
Table 1. Continued.

2655
A Snapshot of Thermo-Oxidative Degradation Products . . .
www.mcp-journal.de
MacromolecularChemistry and Physics
Macromol. Chem. Phys. 2011, 212, 2648−2666
© 2011 WILEY-VCH Verlag GmbH & Co. KGaA, Weinheimwww.MaterialsViews.com
A, TD
1 509.144 509.1588 – 0.015
H, A, C
– 527.207 527.1700 – 0.037
H, A, C
– 539.170 539.1700 0.000
H, B, C
– 545.209 545.2322 – 0.023
H, A, TD, C
H, A, C
– 561.216 561.2272 – 0.011
H, A, C
– 619.233 619.2325 0.000
H, A, B, C
– 963.401 963.3375 0.063
H = PC hydrolysis ; A = oxidation of isopropenyl groups ; B = disproportionation of isopropenyl groups C = crosslinking reaction D = forma-tion of xanthone units ; TD = thermal degradation reactions ; ST = oxidation of stabilizers.
Degradation pathway
Structures n Measured M−
Calculated M−
Δm/z
Table 1. Continued.

2656
S. Carroccio et al.
www.mcp-journal.de
MacromolecularChemistry and Physics
0
100
200
300
400
500
600
200 300 400 500 600 700 800 900 1000
0
20
40
60
80
100
120
140
160
180
200
220
240
200 300 400 500 600 700 800 900 1000
500 600 700 800 900 1000
219.170
149.095
205.156
227.107
283.264
336.326 403.193
481.199
509.144
557.127
523.163 601.258
657.295
735.305
989.384
807.470751.327
199.174
219.181
227.108
321.210255.235
403.190
481.199
421.225 517.184 989.392
735.295283.266
m/z
m/z
CH3OH
CH3
CH3O
OO COH
CH3
CH3
OH
3
(a)
(b)
255.229
0
100
200
300
400
500
600
100
200
300
400
500
600
200 300 400 500 600 700 800 900 1000200 300 400 500 600 700 800 900 1000
0
20
40
60
80
20
40
60
80
100
120
140
160
180
200
220
240
100
120
140
160
180
200
220
240
200 300 400 500 600 700 800 900 1000200 300 400 500 600 700 800 900 1000
500 600 700 800 900 1000500 600 700 800 900 1000
219.170
149.095
205.156
227.107
283.264
336.326 403.193
481.199
509.144
557.127
523.163 601.258
657.295
735.305
989.384
807.470751.327
199.174
219.181
227.108
321.210255.235
403.190
481.199
421.225 517.184 989.392
735.295283.266
m/z
m/z
CH3OH
CH3
CH3O
OO COH
CH3
CH3
OH
3
(a)
(b)
255.229
Figure 1 . ESI mass spectra, in negative ion mode, of the products extracted in CH 3 OH/CH 3 CN 90/10 for 30 min from a commercial (a) non-purifi ed and (b) purifi ed PC fi lm sample.
In Figure 1 a and b ESI mass spectra, in negative ion mode, of the products extracted from (a) not purifi ed (b) and purifi ed virgin PC samples, together with an expanded portion ranging from m / z 500 to 1000 (Figure 1 a), are reported. The most abundant ions (Figure 1 a) detected at m / z 219.170 correspond to [2,6-bis(1,1 ′ -dimethylethyl)-4-methyl] phenol (Table 1 ) whereas the peak at m / z 205.156 is assigned to [2,6-bis(1,1 ′ -dimethylethyl)] phenol (Table 1 ). These species may derive from sterically hin-dered phenols as well as from hydrolysis of phosphorus
Macromol. Chem. Phys. 2© 2011 WILEY-VCH Verlag Gm
compounds used as processing and long-term stabilizers. The peak series at m / z 149.095 + n × 254.094 corresponds to PC oligomers having 4-1,1 ′ -dimethylethyl phenol and bis-phenol A as end groups (Table 1 ), whereas the species at m / z 227.107 + n × 254.094 are due to oligomers BPA terminated (Table 1 ). The detection of BPA at m / z 227.107 in virgin PC samples (Figure 1 a and b) suggests the pres-ence into resin formulation of not reacted monomers. In addition, the BPA groups might derived from hydrolysis of carbonate groups during processing operations. The
011, 212, 2648−2666
bH & Co. KGaA, Weinheim www.MaterialsViews.com

A Snapshot of Thermo-Oxidative Degradation Products . . .
www.mcp-journal.de
MacromolecularChemistry and Physics
less abundant ions at m / z 523.163 and at m / z 601.258 (Figure 1 a, expanded portion from m / z 500 to 1000) are assigned, respectively, to (4-phenol carbonate) isopro-penyl benzene (Table 1 ) and to PC chains terminated with phenyl groups (Table 1 ). The peak at m / z 509.144 cor-responds to PC unit bearing styrene as terminal group (Table 1 ). The presence of all species discussed above in the ESI spectrum of the products extracted from not puri-fi ed PC sample is diagnostic for the occurrence of thermal degradation reactions, most likely activated by high tem-perature processing operations. As well known, in the initial step of PC thermal degradation mainly hydrolysis reactions occur, producing phenolic end groups ( m / z 227.107 + n × 254.094). Furthermore, at 400 ° C the dispro-portionation reaction of the BPA isopropylidene bridges of PC leading to phenyl and isopropenyl end groups (Table 1 , m / z 523.163, 509.144, and 601.258) takes place.
The peak at m / z 751.327 (Figure 1 a, expanded portion) can be assigned to two isobaric structures: PC units ter-minated with 4,4 ′ -dihydroxy-2, phenyl propan 2-ol, and/or PC repeat unit having toluene and phenol as chain end
Macromol. Chem. Phys. 2© 2011 WILEY-VCH Verlag Gmwww.MaterialsViews.com
Figure 2 . ESI mass spectrum, in negative ion mode, of the degradatiosample thermo-oxidized for 1 h at 300 ° C.
0
200
400
600
800
1000
1200
1400
1600
1800
2000
2200
200 300 400 500
120 130 140 150 160 170
500 550 600 650
m
m/z
227.107
243.105
319.137269.084
301.110
335.132
361.138
453.206
481.200
603.231
589.210 64
573.225
555.197
545.209
523.175517.179
135.052
137.033151.053
159. 085
165.030
133.074 149.059163.046
17
HO
CH3
CH3
OH
0
200
400
600
800
200
400
600
800
1000
1200
1400
1600
1800
2000
2200
1000
1200
1400
1600
1800
2000
2200
200 300 400 500200 300 400 500
120 130 140 150 160 170120 130 140 150 160 170
500 550 600 650500 550 600 650
m
m/z
227.107
243.105
319.137269.084
301.110
335.132
361.138
453.206
481.200
603.231
589.210 64
573.225
555.197
545.209
523.175517.179
135.052
137.033151.053
159. 085
165.030
133.074 149.059163.046
17
HO
CH3
CH3
OH
(Table 1 ). The existence of phenol species may be merely associated to thermo-oxidation mechanisms occurring during PC processing or lifetime.
The most abundant series of ions in the ESI spectrum of the products extracted from purifi ed PC sample (Figure 1 b) corresponds to PC oligomers BPA terminated. In this mass spectrum, the series at m / z 149.103 + n × 254.094 as well as at m / z 205.156, 219.181, and 255.229 are still present. The peaks at m / z 523.163, 601.258, 509.144, and 751.327, deriving from thermal degradation, are no longer detected most likely as a consequence of PC purifi cation procedure. For this reason, mass spectra reported in the text are related to the degradation products extracted from puri-fi ed PC sample.
In Figure 2 is reported the ESI mass spectrum of the degradation products extracted in CH 3 OH/CH 3 CN 90/10 v/v for 30 min from purifi ed PC sample thermo-oxidized for 1 h at 300 ° C. Several peaks originated from different degradative processes are present in the spectrum and they are mainly due to the degradation mechanisms sum-marized in Scheme 1 . At lower masses (Figure 2 , expanded
2657011, 212, 2648−2666
bH & Co. KGaA, Weinheim
n products extracted in CH 3 OH/CH 3 CN 90/10 for 30 min from a PC fi lm
600 700 800 900 1000
180 190 200 210 220
700 750 800 850 900 950 1000
/z
735.296
745.297935.413 963.401
989.386771.270809.314
843.353
827.334
707.2947.217
187.081
213.060
219.1057.062
179.041
185.075
193.085
191.069
195.039
201.074
209.063
217.096211.079
600 700 800 900 1000600 700 800 900 1000
180 190 200 210 220180 190 200 210 220
700 750 800 850 900 950 1000700 750 800 850 900 950 1000
/z
735.296
745.297935.413 963.401
989.386771.270809.314
843.353
827.334
707.2947.217
187.081
213.060
219.1057.062
179.041
185.075
193.085
191.069
195.039
201.074
209.063
217.096211.079

2658
S. Carroccio et al.
www.mcp-journal.de
MacromolecularChemistry and Physics
rearrangement
O2CH2
CH3
O
.
O2 + H
O
CH3
CH2O
O
H
O
CH3
CH2
CH3
CH3
O O O
O
O++
.
.
R.
CH2COCH3OOHO COCH3OCH2OHO
O2O2
m/z = m/z =
CH2COOHO COOHO
m/z = m/z =
m/z = m/z =
O
CH3
CH2
O
O
.
O
CH3
CH2
OH
O
m/z =
+ H .
243.105, 393.130, 469.200
151.053, 377.118
149.059, 539.170269.084, 335.132
137.033, 301.110
393.130 135.052, 807.470
Scheme 1 . Overall thermal-oxidation processes in PC (pathway mechanism A).
portion from m / z 120 to 225), numerous low abun-dant ions are attributed to species produced by thermo-oxidation of stabilizer molecules ( m / z 163.046, 165.030, 177.062, 179.041, 191.069, 193.085, 195.039, Table 1 ). The most abundant ions in Figure 2 belong to PC oligomers bearing BPA as chain ends ( m / z 227.107, 481.200, 735.296, 989.386, Table 1 ). The detection of these oligomers points out the hydrolysis of carbonate functional groups during the thermo-oxidative degradation at 300 ° C. Air moisture as well as the water that may be formed in situ during the PC thermal oxidation processes can support hydrolysis reactions. As well known, hydrolysis is the major draw-back for PC material both during melt processing and end use applications. Mass series corresponding to PC oligomers having 4-1,1 ′ -dimethylethyl phenol and bis-phenol A as end groups ( m / z 149.095 + n × 254.094) are not longer detected. The low intense peak at m / z 149.059 is reasonably assigned to a thermo-oxidized product related to PC unit with phenyl substituted acetone as terminal group (Table 1 ). Ions at m / z 243.105 + n × 254.094 can be assigned to two isobaric structures: PC units with toluene, phenol carbonate end groups, and/or PC containing 1,2 diphenol 2 propanol (Table 1 ). The calculation of the exact mass values for these species, reported in Table 1 , allows to distinguish between the two structures, addressing
Macromol. Chem. Phys. 2© 2011 WILEY-VCH Verlag Gm
the assignment toward the 1,2 biphenol 2 propanol struc-ture. Ions detected at m / z 269.084, 301.110, 361.138, and 393.136 are assigned to species characterized by a car-bonate linkage (Table 1 ) along the backbone.
Less abundant ions at m / z 133.074, 135.052, 137.033, and 151.053 (Figure 2 , expanded portion ranging from m / z 120 to 225) correspond to isopropenylphenol, ace-tophenol, 4-hydroxy benzoic acid, and 4-hydroxy phenyl-acetic acid, respectively.
The appearance of all the peaks mentioned above are diagnostic to establish the simultaneous occurrence of two different renowned degradative pathways: (A) oxida-tion of the isopropenyl groups of PC ( m / z 135.052, 137.033, 151.053, 243.105 + n × 254.094, 301.110 + n × 254.094, 393.136 + n × 254.094, Scheme 1 ); (B) a disproportionation reaction of the BPA isopropylidene bridges of PC to yield phenyl and isopropenyl end groups ( m / z 133.074, 269.084, 361.138, Equation 1, degradation pathway B).
DisproportionationCH-Transfer
CH3
CH3
+
(1)
As reported in Scheme 1 , ESI data presented above confi rm a primary oxidation mechanism leading to the initial formation of methylene radicals that undergo
011, 212, 2648−2666
bH & Co. KGaA, Weinheim www.MaterialsViews.com

A Snapshot of Thermo-Oxidative Degradation Products . . .
www.mcp-journal.de
MacromolecularChemistry and Physics
rearrangement to more stable benzylic radicals. The sub-sequent reaction with oxygen produces a hydroperoxide intermediate, which may decompose by following two parallel pathways (Scheme 1 , routes I and II). The end groups detected by ESI derive from the reactions depicted in Scheme 1 and this is in agreement with data previously reported. [ 29 ] In addition, ESI analysis allowed to reveal for the fi rst time the identifi cation of PC units containing 1,2-diphenol-2-propanol ( m / z 243.105 + n × 254.094, Table 1 and Scheme 1 , route III) and the presence of carboxylate structures ( m / z 137.033, 151.053, 213.060, 301.110, Table 1 , Scheme 1 , route I and II), most probably due to secondary oxidation processes.
Furthermore, a large number of new peaks was assigned to molecules containing biphenyl units ( m / z 201.074, 213.060, 217.096, 319.137 + n × 254.094, 335.132 + n × 254.094, 453.199 + n × 254.094, 545.209, and 963.401). The formation of these species is in agreement with data reported in the literature for aromatic polymers. [ 1 , 29 , 36 ] According to previous studies carried out by using MALDI MS, [ 29 , 30 ] a second oxidation process may be observed in PC thermo-oxidation and the byphenyl bridges should be most likely originated from oxidative coupling (Equation 2, degradation pathway C) of two phenyl rings between linear PC chains. This crosslinking reaction promotes the production of char-like structures and the gel formation during the thermo-oxidative process. [ 29 , 36 ]
CO
CO
CO
CO
CO
CO
CO
CO
O2
Δ
(2)
The structural identifi cation in Table 1 was mainly made on the basis of molecular mass, thus the biphenyl bridges might be linked to any phenyl ring along the polymer chain. In Table 1 we have just symbolized one of the possible structures.
Figure 3 shows ESI MS, in negative ion mode, of the deg-radation products extracted in CH 3 OH/CH 3 CN 90/10 for (a) 0 min, (b) 30 min, and (c) 24 h from a PC fi lm sample thermo-oxidized for 2 h at 300 ° C. In Figure 3 a–c it is pos-sible to notice a signifi cant increment of the intensity of the peaks at m / z 319.134, 335.129, and 453.199 (Table 1 , Equation 2, pathway C) as well as the appearance of new species at m / z 539.17, 561.216, 527.207, and 619.235, also assigned to biphenyl structures. ESI data suggest that at 300 ° C and 2 h of heating time the crosslinking reaction of PC becomes prominent, producing a large amount of char-like structures. Furthermore, spectra reported in Figure 3 a and b evidence an extensive increment of the intensities of peaks assigned to carbonate structures ( m / z 269.081
Macromol. Chem. Phys. 2© 2011 WILEY-VCH Verlag Gmwww.MaterialsViews.com
+ n × 254.094, 301.108 + n × 254.094, Table 1 ). These spe-cies formed by the thermal (Equation 1, pathway B) and thermo-oxidative reaction of isopropylidene bridges of PC (Scheme 1 , pathway A) seem to be extremely labile and after 24 h of extraction are less abundant or not detected at all. This trend was also observed for the set analysis car-ried out at 300 ° C for 1 and 3 h and it is most likely deter-mined by the susceptibility of carbonate linkages toward hydrolysis reaction. In addition, Figure 3 a–c shows an important increment of abundance of ions at m / z 243.104, the most abundant ions in the ESI spectrum recorded after 24 h of extraction. This phenomenon was also verifi ed for the data collected at 1 and 3 h of heat exposure and it could be explained by a minor speedness of solubilization/extraction of hydroxylate compounds in the solvent mix-ture used. In Figure 3 c the peak at m / z 271.100 is univo-cally assigned to o-carboxyl p,p ′ -isopropylidenebisphenol, whereas in the expanded portion ( m / z range 500–950) it is possible to identify a low intense peak assigned to xan-thone structures ( m / z 789.348, Table 1 ). The identifi cation of such kind of structures is rather unexpected. In fact, xanthone units (Scheme 2 , pathway D) and phenyl and/or isopropenyl end groups (Equation 1, pathway B) derive from pure thermal degradation of PC bulk samples usu-ally at higher temperature (400–450 ° C). To fi nd further evidence on the formation of such compounds at lower temperature, MALDI-MS analysis was performed on PC thin fi lms thermo-oxidized at 300 ° C (see Section 2).
In Figure 4 , there are reported the MALDI mass spectra in refl ectron mode, in the m / z range 1260–1530, of a PC sample thermo-oxidized at 300 ° C (a) for 0 min, (b) 60 min, and (c) 180 min. MALDI mass spectrum of original puri-fi ed PC sample (Figure 4 a) shows three different mass series. The most intense peak series at m / z 1293.461 + n × 254.094 is due to sodiated adducts of cyclic PC oli-gomers (species A, Table 2 ), whereas a second series of peaks with low intensity at m / z 1365.552 + n × 254.094 is assigned to the sodiated ions of PC linear chains bearing tert -butyl phenol end groups at both chain ends (species B, Table 2 ). The third series of peaks at m / z 1443.573 + n × 254.094 corresponds to sodiated adducts of PC linear chains terminated with phenyl group at one end and a BPA-OH groups at the other end (species C, Table 2 ). The MALDI mass spectra of PC samples heated at 300 ° C in air for 60 and 180 min (Figure 4 b and c) exhibit an increased number of peaks with respect to the original sample (Figure 4 a), indicating that the degradative reac-tions are active, producing several new compounds that are revealed and differentiated by MALDI analysis. All the peaks correspond to PC oligomers with different end groups and they have been assigned to a specifi c degrada-tion pathway (Table 2 ). The most abundant ions in Figure 4 b and c belong to PC linear chains having BPA terminal groups at both ends ( m / z 1267.489 + n × 254.094 species
2659011, 212, 2648−2666
bH & Co. KGaA, Weinheim

26
S. Carroccio et al.
www.mcp-journal.de
MacromolecularChemistry and Physics
Figure 3 . ESI MS, in negative ion mode, of the degradation products extracted in CH 3 OH/CH 3 CN 90/10 for (a) 0 min, (b) 30 min, and (c) 24 h from a PC fi lm sample thermo-oxidized for 2 h at 300 ° C.
0
100
200
300
400
500
600
700
800
900
1000
1100
1200
1300
009008007002 300 400 500 600
0
100
200
300
400
500
600
700
800
900
1000
1100
600 700 009008005004003002
0
200
400
600
800
1000
1200
1400
1600
1800
2000
2200
009008007006002 300 400 500
227.108
243.099
271.100319.129
335.129
347.129
361.144
453.204
469.200
487.208579.230
227.107
269.081
243.104
301.109
319.134
335.129
361.130453.199
393.130 481.200561.216
539.170
227.102
243.099
269.081
301.108
319.133
335.129 453.206
347.128
393.136 481.209 561.228
500 550 600 650 700 750 800 850 900 950
561.228
545.223
527.207 579.249
907.425
619.235
637.251
789.348
(a)
(b)
(c)
m/z
m/z
HO OCOO
CH3
CH3
OHOH
OH
CH3
CH3
OHOH
CH3
CH3
OHOH
CH3
CH3
OHOH
CH3
CH3
OHOH
OHOH
OH CH2
CH3
OH
OH
OH
CH3
OHOH CH2
CH3
CH3
OHOH
0
100
200
300
400
500
600
700
800
900
100
200
300
400
500
600
700
800
100
200
300
400
500
600
700
800
900
1000
1100
1200
1300
1000
1100
1200
1300
009008007002 300 400 500 600 009008007002 300 400 500 600
0
100
200
300
400
500
600
700
800
900
100
200
300
400
500
600
700
800
900
1000
1100
1000
1100
600 700 009008005004003002 600 700 009008005004003002
0
200
400
600
800
200
400
600
800
1000
1200
1400
1600
1800
2000
2200
1000
1200
1400
1600
1800
2000
2200
009008007006002 300 400 500 009008007006002 300 400 500
227.108
243.099
271.100319.129
335.129
347.129
361.144
453.204
469.200
487.208579.230
227.107
269.081
243.104
301.109
319.134
335.129
361.130453.199
393.130 481.200561.216
539.170
227.102
243.099
269.081
301.108
319.133
335.129 453.206
347.128
393.136 481.209 561.228
500 550 600 650 700 750 800 850 900 950500 550 600 650 700 750 800 850 900 950
561.228
545.223
527.207 579.249
907.425
619.235
637.251
789.348
(a)
(b)
(c)
m/z
m/z
HO OCOO
CH3
CH3
OHOH
OH
CH3
CH3
OHOH
CH3
CH3
OHOH
CH3
CH3
OHOH
CH3
CH3
OHOH
OHOH
OH CH2
CH3
OH
OH
OH
CH3
OHOH CH2
CH3
CH3
OHOH
D, Table 2 ). The peak at m / z 1293.461 can be reasonable assigned to two isobaric structures corresponding to phenyl/isopropenyl end groups (species T, Table 2 ) and/or cyclic oligomers (species A, Table 2 ) whereas the species B and C are no longer detected. Peaks at m / z 1425.494 + n × 254.094 (series P, Table 2 ) as well as mass series at m / z 1443.556 + n × 254.094 (series Q, Table 2 ) are univocally assigned to degradation compounds with phenyl substi-tute acetone as chain ends. Peaks U ( m / z 1309.440 + n × 254.094, Table 2 ) contain phenol as terminal group. As
60Macromol. Chem. Phys
© 2011 WILEY-VCH Verlag G
previously reported and described in Scheme 1 , phenol, acetophenone, phenyl substitute acetone terminal groups are originated from thermo-oxidative reactions of PC isopropylidene bridges. According to the assignment reported in foregoing MALDI investigation, in Figure 4 b and c peaks J ( m / z 1493.569, Table 2 ), N ( m / z 1401.493, Table 2 ), and I ( m / z 1477.580, Table 2 ) are assigned to species characterized by biphenyl bridges derived from oxidative coupling (Equation 2). These oligomers, detected in the MALDI mass spectrum registered after
. 2011, 212, 2648−2666
mbH & Co. KGaA, Weinheim www.MaterialsViews.com

A Snapshot of Thermo-Oxidative Degradation Products . . .
www.mcp-journal.de
MacromolecularChemistry and Physics
Scheme 2 . Alternative isomerization and degradation processes leading to xanthones (pathway mechanism D).
OCOOa. O
COOH
- H2O
O
CO
b. OCOO O CO
HO HO
CO
CO
OH
- H2O
- H2OΔ
60 min of oxidation at 300 ° C, become less abundant or are not detected at all in the sample thermo-oxidized for 180 min. Series E at m / z 1317.472 + n × 254.094 (Table 2 ) as well as series H, S, L, O, U (Table 2 ) are attributed to oligomeric structures terminated with phenyl or iso-propenyl end groups. The formation of these species is partially in agreement with data reported in the litera-ture. In fact, phenyl and isopropenyl end groups were previously detected in the MALDI MS spectra of thermal degraded PC samples at 400 ° C (Equation 1, degradation pathway B). [ 30 , 32 ] Finally, a considerable number of peaks related to xanthone structures along the chains (series G, K, L, M, O, P, S, Table 2 is detected in PC sample thermo-oxidized at 300 ° C for 60 min. The intensities of these peaks signifi cantly increase in the mass spectrum regis-tered after 180 min of thermo-oxidation. Xanthones are usually generated by pure thermal degradation processes at 400 ° C as well. [ 31 , 32 ] The unexpected formation of this type of condensed aromatic species at lower temperature (300 ° C) could be reasonably justifi ed taking into account that the thermo-oxidation procedure was performed on thin fi lm instead of PC bulk. It is interesting to highlight that in Figure 4 c PC chains containing xanthone units are preponderant and that biphenyl structures are present. Most probably the insoluble thermo-oxidized residue, not analyzed by MALDI and ESI MS, might contain a consid-erable amount of xanthones trapped in the 3D network created by biphenyl units.
In Figure 5 is reported the ESI spectrum of the deg-radation products extracted for 30 min from the PC film samples thermo-oxidized for 3 h at 300 ° C. The peaks assigned to bisphenol A ( m / z 227.110) and to its homologous at m / z 481.204 are still present. The most abundant ions appearing at m / z 319.137 are due to BPA
Macromol. Chem. Phys© 2011 WILEY-VCH Verlag Gwww.MaterialsViews.com
units bearing a phenol attached through a bisphenyl bridge. Numerous peaks having significant intensi-ties ( m / z 335.133, 347.130, 361.139, 363.130, 427.115, 469.198, 527.203, 561.222, 619.233) correspond to struc-tures containing bisphenyl bridges into the molecules. In particular, the peaks appearing at m / z 427.155 and 561.222 are univocally assigned to BPA molecules with two biphenyl bridges. In addition, in Figure 5 it is pos-sible to appreciate an increase of intensity of o-carboxyl p,p ′ -isopropyl bisphenol ( m / z 271.103, Table 1 ) with respect to the spectrum recorded after 2 h of thermo-oxidation.
The two mechanisms postulated in the literature for the production of xanthone units are illustrated in Scheme 2 a and b (pathway D). The former (Scheme 2 a) is accomplished via isomerization of the carbonate group to form aryloxybenzoic acids as intermediate. The alter-native pathway, a Fries rearrangement (Scheme 2 b), could explain the formation of xanthone units. In addi-tion, it provides a plausible route for the production of compounds containing fl uorenone units, which were previously revealed by direct pyrolysis mass spectrom-etry (DPMS) analysis of thermal degraded PC samples. [ 31 ] The detection of o-carboxyl p,p ′ -isopropyl bisphenol ( m / z 271.103, Table 1 ) and the concurrent non-appear-ance of fl uorenone units support the occurrence of the isomerization mechanism of carbonate group depicted in Scheme 2 a. Furthermore, the fl uorenone units, revealed by DPMS studies of thermal degraded PC sample at 550 ° C, were not detected by MALDI and fast atom bombardment MS analyses on PC pyrolyzed samples at 400 and 450 ° C, respectively. [ 31 , 32 ] Most prob-ably the production of fl uorenone units is activated by higher temperatures.
2661. 2011, 212, 2648−2666
mbH & Co. KGaA, Weinheim

2662
S. Carroccio et al.
www.mcp-journal.de
MacromolecularChemistry and Physics
Macromol. Chem. Phys. 2011, 212, 2648−2666
© 2011 WILEY-VCH Verlag GmbH & Co. KGaA, Weinheim www.MaterialsViews.com
Figure 4 . MALDI MS in refl ectron mode , in the m / z range 1260–1530, of a PC sample thermo-oxidized at 350 ° C (a) for 0 min, (b) 60 min, and (c) 180 min.
m/z
K4 Na+
1503.570J4 Na+
1493.581
(a)
(b)
(c)
CH3
CH3
O
O C O
5
PCO
O
CO4
PCHO
CH3
CH 3
O H4
PCH O
CH3
CH3
OH
OH
4
O
CO
OH OCH3
CH 3
OO
O
C H
CH3
CH3 CH3CH
3
4
1260 1280 1300 1320 1340 1360 1380 1400 1420 1440 1460 1480 1500 1520
A5 Na+
1293.461
A5 K+
1309.432 B4 Na+
1365.552
B4 K+
1381.521
C5 Na+
1443.573
1260 1280 1300 1320 1340 1360 1380 1400 1420 1440 1460 1480 1500 1520
D4 Na+
1267.489
A5 Na+
1293. 461 E3 Na+
1317.472
D5 Na+
1521.573
I4 Na+
1477.580H5 Na+
1387.494
G4 Na+
1369.470
F4 Na+
1359.481
1260 1280 1300 1320 1340 1360 1380 1400 1420 1440 1460 1480 1500 1520
L3 Na+
1291.431
M4 Na+
1385.410
G4 Na+
1369.446
D5 Na+
1521.578
K4 Na+
1503.521J4 Na+
1493.569
O3 Na+
1409.466
P4 Na+
1425.494
Q5 Na+
1443.553
N Na+
1401.471
D4 Na+
1267.482
O
CO
OCH3
CH3
OO
O
C H
CH3 CH3
4
PCHO
C H3
CH3
OH
OH
CH3
CH3
OH
4
PC
CH3
CH3
OH O
CO
OCOO3
O
CH3
CH3
OHO
O
C
5
O
CH3
CH3
OHO
O
CCH3COCH2
5
CH3
CH3O
O C OPC =
m/z
K4 Na+
1503.570J4 Na+
1493.581
(a)
(b)
(c)
CH3
CH3
O
O C O
5
PCO
O
CO4
PCHO
CH3
CH 3
O H4
PCH O
CH3
CH3
OH
OH
4
O
CO
OH OCH3
CH 3
OO
O
C H
CH3
CH3 CH3CH
3
4
1260 1280 1300 1320 1340 1360 1380 1400 1420 1440 1460 1480 1500 15201260 1280 1300 1320 1340 1360 1380 1400 1420 1440 1460 1480 1500 1520
A5 Na+
1293.461
A5 K+
1309.432 B4 Na+
1365.552
B4 K+
1381.521
C5 Na+
1443.573
1260 1280 1300 1320 1340 1360 1380 1400 1420 1440 1460 1480 1500 15201260 1280 1300 1320 1340 1360 1380 1400 1420 1440 1460 1480 1500 1520
D4 Na+
1267.489
A5 Na+
1293. 461 E3 Na+
1317.472
D5 Na+
1521.573
I4 Na+
1477.580H5 Na+
1387.494
G4 Na+
1369.470
F4 Na+
1359.481
1260 1280 1300 1320 1340 1360 1380 1400 1420 1440 1460 1480 1500 1520
L3 Na+
1291.431
M4 Na+
1385.410
G4 Na+
1369.446
D5 Na+
1521.578
K4 Na+
1503.521J4 Na+
1493.569
O3 Na+
1409.466
P4 Na+
1425.494
Q5 Na+
1443.553
N Na+
1401.471
D4 Na+
1267.482
O
CO
OCH3
CH3
OO
O
C H
CH3 CH3
4
PCHO
C H3
CH3
OH
OH
CH3
CH3
OH
4
PC
CH3
CH3
OH O
CO
OCOO3
O
CH3
CH3
OHO
O
C
5
O
CH3
CH3
OHO
O
CCH3COCH2
5
CH3
CH3O
O C OPC =

2663
A Snapshot of Thermo-Oxidative Degradation Products . . .
www.mcp-journal.de
MacromolecularChemistry and Physics
Macromol. Chem. Phys. 2011, 212, 2648−2666
© 2011 WILEY-VCH Verlag GmbH & Co. KGaA, Weinheimwww.MaterialsViews.com
Table 2. Structural assignments of sodiated ions appearing in the MALDI-TOF mass spectra (Figure 4 ) of thermo-oxidized PC samples.
Symbol Structures n Measured m / z Calculated m / z Δ m / z
A
5 1293.461 1293.469 – 0.008
B
4 1365.552 1365.552 0.000
C
5 1443.573 1443.562 0.011
D
4 1267.489 1267.479 0.010
5 1521.578 1521.573 0.005
E
3 1317.472 1317.459 0.013
F
4 1359.481 1359.505 – 0.024
G
4 1369.446 1369.490 – 0.044
H
5 1387.494 1387.500 – 0.006
I
4 1477.580 1477.584 – 0.004
J
4 1493.569 1493.578 – 0.009

2664
S. Carroccio et al.
www.mcp-journal.de
MacromolecularChemistry and Physics
Macromol. Chem. Phys. 2011, 212, 2648−2666
© 2011 WILEY-VCH Verlag GmbH & Co. KGaA, Weinheim www.MaterialsViews.com
Symbol Structures n Measured m / z Calculated m / z Δ m / z
K
4 1503.521 1503.563 – 0.042
L
3 1291.431 1291.443 – 0.012
M
4 1385.410 1385.485 – 0.075
N
4
1401.493
1401.516 – 0.023
5 1401.515 – 0.022
O
3 1409.466 1409.522 – 0.056
P
4 1425.494 1425.516 – 0.022
Q
5 1443.553 1443.526 0.027
S
2 1275.452 1275.448 0.004
T
4 1293.461 1293.469 – 0.008
U
4 1309.440 1309.453 – 0.013
V
4 1343.494 1343.510 – 0.016
W
5 1427.511 1427.531 – 0.020
X
2 1475.575 1475.569 0.006
Table 2. Continued.

A Snapshot of Thermo-Oxidative Degradation Products . . .
www.mcp-journal.de
MacromolecularChemistry and Physics
0
100
200
300
200 300 400 500 600 700 800 900
227.110
271.103
243.109
301.114
319.137
335.133
361.139
453.204
393.136
481.204 561.222
527.203
789.332 907.390
469.198
427.155
347.130
619.233
363.130
589.216
m/z
269.084
CH3
CH3
OHOH
OH
CH3
CH3
OHOH
CH3
CH3
OHOH
CH3
CH3
OHOH
CH3
CH3
OHOH
OHOH
0
100
200
300
100
200
300
200 300 400 500 600 700 800 900200 300 400 500 600 700 800 900
227.110
271.103
243.109
301.114
319.137
335.133
361.139
453.204
393.136
481.204 561.222
527.203
789.332 907.390
469.198
427.155
347.130
619.233
363.130
589.216
m/z
269.084
CH3
CH3
OHOH
OH
CH3
CH3
OHOH
CH3
CH3
OHOH
CH3
CH3
OHOH
CH3
CH3
OHOH
OHOH
Figure 5 . ESI mass spectrum, in negative ion mode, of the degradation products extracted in CH 3 OH/CH 3 CN 90/10 for 30 min from a PC fi lm sample thermo-oxidized for 3 h at 300 ° C.
4. Conclusion
ESI MS has been successfully applied for identifying deg-radation products of BPA-PC. In fact, a relevant amount of structural information on the thermo-oxidation products has been found from ESI spectra reported herewith.
The use for the fi rst time of ESI technique for studying PC degradation processes has allowed to obtain the iden-tifi cation of more than 50 compounds originated from PC oxidation at 300 ° C. Together with the formation of BPA and its related oligomers, several new structures con-taining BPA and biphenyl units, phenols, acetophenones, alcohols, acids, and xanthones molecules were detected. Toxicity of BPA is documented by several studies. [ 3–4 ] How-ever, during the degradation of PC many other molecules strictly related to BPA, are produced. Such compounds may represent a potential hazard on human health for their potential toxicity even if they are present in trace. For instance, 4,4 ′ -biphenol ( m / z at 185.075, Table 1 ) is harmful in contact with skin, and irritating to the eyes and respiratory system. It is estrogenic and cytotoxic.
The identifi cation of the species detected allowed also to get precisely information about the degradation mech-anisms involved during thermo-oxidation of PC materials, revealing the concomitant contribution of diverse well-known thermal and thermo-oxidative processes. In par-ticular, the use of thin fi lm instead of PC bulk allowed to establish a new order of priorities among the degradative
Macromol. Chem. Phys. © 2011 WILEY-VCH Verlag Gmwww.MaterialsViews.com
reactions during thermo-oxidative processes. Hydrolysis of carbonate groups with the production of BPA is the predominant degradative reaction at 300 ° C, followed by thermal and thermal-oxidative reactions on the PC isopro-penyl units. Remarkable, alcoholic intermediate oxidation species as well as benzoic and benzylic acids, due to oxi-dation of acetophenone and phenyl substitutes acetone, which had escaped previous studies, have been detected. At higher temperatures, the oxidative coupling reactions leading to the formation of BPA oligomers characterized by biphenyl bridges become signifi cant. Furthermore, structures having xanthone rings along the chains, due to pure thermal degradation mechanisms, are produced and revealed (Table 2 ). Finally, the extraction of o-carboxyl p,p ′ -isopropyl bisphenol molecules among the thermo-oxidized compounds strongly supports the isomerization of the carbonate groups with the consequent production of xanthones units.
ESI analysis represents a valuable alternative to con-ventional methods currently employed for degradation products detection, resulting advantageous for its speedi-ness and high sensitivity. It also may have great potential for identifying oxidized products extracted from other materials by using stimulant solvents.
Acknowledgements : Financial support from the National Council of Research (CNR, Rome) is gratefully acknowledged. Many thanks are due to G. Pastorelli for his technical assistance.
26652011, 212, 2648−2666
bH & Co. KGaA, Weinheim

2666
S. Carroccio et al.
www.mcp-journal.de
MacromolecularChemistry and Physics
Received: July 20, 2011 ; Revised: September 15, 2011 ; Published online: October 31, 2011; DOI: 10.1002/macp.201100417
Keywords: degradation; electrospray ionization mass spectrometry; matrix-assisted laser desorption ionization time of fl ight mass spectrometry; poly(bisphenol A carbonate); thermo-oxidation products
[ 1 ] A. Factor , in Polymer Durability: Degradation, Stabilization and Lifetime Prediction , Advances in Chemical Series 249 , (Eds: R. L. Clough , N. C. Billingham , K. T. Gillen ), American Chemical Society , Washington, D.C. 1996 , p. 59 .
[ 2 ] F. Samperi , M. S. Montaudo , G. Montaudo , in Handbook of Engineering and Speciality, Thermoplastic , Vol 3 , (Eds: S. Thomas , P. M. Visakh ), Wiley-Scrivener , Salem, MA 2011 , p. 493 .
[ 3 ] H. H. Le , E. M. Carlson , J. P. Chua , S. M. Belcher , Toxicol. Lett. 2008 , 176 , 149 .
[ 4 ] C. Neron , D. Acosta , C. Rubio , Food Addit. Contam. 2002 , 19 , 594 .
[ 5 ] S. M. Weidner , S. Trimpin , Anal. Chem. 2010 , 82 , 4811 . [ 6 ] G. Hart-Smith , C. Barner-Kowollik , Macromol. Chem. Phys.
2010 , 211 , 1507 . [ 7 ] T. Gruendling , S. Weidner , J. Falkenhagen , C. Barner-Kowollik ,
Polym. Chem. 2010 , 1 , 617 . [ 8 ] B. N. Pramanik , A. K. Ganguly , M. L. Gross , Applied Electro-
spray Mass Spectrometry , Marcel Dekker , New York 2002. [ 9 ] P. Rizzarelli , G. Impallomeni , G. Montaudo , Biomacromol-
ecules 2004 , 5 , 433 . [ 10 ] T. Gruendling , M. Guilhaus , C. Barner-Kowollik , Anal. Chem.
2008 , 80 , 6915 . [ 11 ] T. Gruendling , M. Guilhaus , C. Barner-Kowollik , Macromol-
ecules 2009 , 42 , 6366 . [ 12 ] T. Gruendling , M. Guilhaus , C. Barner-Kowollik , Macromol.
Rapid Commun. 2009 , 30 , 589 . [ 13 ] T. Gruendling , R. Pickford , M. Guilhaus , C. Barner-Kowollik , J.
Polym. Sci., Part A: Polym. Chem. 2008 , 46 , 7447. [ 14 ] X. Han , R. W. Gross , Proc. Natl. Acad. Sci. USA 1994 , 91 ,
10635 . [ 15 ] D. S. Selby , M. Guilhaus , J. Murby , R. J. Wells , J. Mass Spec-
trom. 1998 , 33 , 1232 . [ 16 ] P. D. Whitfi eld , P. C. Sharp , R. Taylor , P. J. Meikle , J. Lipid Res.
2001 , 42 , 2092 . [ 17 ] S. P. S. Koo , T. Junkers , C. Barner-Kowollik , Macromolecules
2009 , 42 , 62 . [ 18 ] T. G. Flick , R. D. Leib , E. R. Williams , Anal. Chem. 2010 , 82 ,
1179 .
Macromol. Chem. Phys. 2© 2011 WILEY-VCH Verlag Gm
[ 19 ] P. Rizzarelli , D. Zampino , L. Ferreri , G. Impallomeni , Anal. Chem. 2011 , 83 , 654 .
[ 20 ] P. Gijsman , e-Polymers 2008 , 65 . [ 21 ] P. G. Kelleher , J. Appl. Polym. Sci. 1966 , 10 , 843 . [ 22 ] B. D. Gesner , P. G. Kelleher , J. Appl. Polym. Sci. 1969 , 13 , 2183 . [ 23 ] A. Davis , Makromol. Chem. 1970 , 132 , 23 . [ 24 ] A. Factor , M. L. Chu , Polym. Degrad. Stab. 1980 , 2 , 203 . [ 25 ] A. Rivaton , B. Mailhot , J. Soulestin , H. Varghese , J.-L. Gardette ,
Eur. Polymer. J. 2002 , 38 , 1349 . [ 26 ] A. Rivaton , B. Mailhot , J. Soulestin , H. Varghese , J.-L. Gardette ,
Polym. Degrad. Stab. 2002 , 75 , 17 . [ 27 ] K. Oba , Y. Ishida , Y. Ito , H. Ohtani , S. Tsuge , Macromolecules
2000 , 33 , 8173 . [ 28 ] B. N. Jang , C. A. Wilkie , Thermochim. Acta 2005 , 426 , 73 . [ 29 ] S. Carroccio , C. Puglisi , G. Montaudo , Macromolecules 2002 ,
35 , 4297 . [ 30 ] G. Montaudo , S. Carroccio , C. Puglisi , J. Anal. Appl. Pyrolysis
2002 , 64 , 229 . [ 31 ] C. Puglisi , L. Sturiale , G. Montaudo , Macromolecules 1999 , 32 ,
2194 . [ 32 ] C. Puglisi , F. Samperi , S. Carroccio , G. Montaudo , Macromol-
ecules 1999 , 32 , 8821 . [ 33 ] S. Carroccio , C. Puglisi , G. Montaudo , Macromolecules 2005 ,
38 , 6849 . [ 34 ] W. Romão , M. F. Franco , A. H. Iglesias , G. B. Sanvido ,
D. A. Maretto , F. C. Gozzo , R. J. Poppi , M. N. Eberlin , M. A. S. Spinacé , M. A. De Paoli , Polym. Degrad. Stab. 2010 , 95 , 666 .
[ 35 ] P. Rizzarelli , S. Carroccio , Polym. Degrad. Stab. 2009 , 94 , 1825 .
[ 36 ] S. Carroccio , P. Rizzarelli , G. Scaltro , C. Puglisi , Polymer 2008 , 49 , 3371 .
[ 37 ] P. Malanowski , A. T. M. Van Benthem , L. G. J. Van der Ven , J. Laven , S. Kisin , G. De With , Polym. Degrad. Stab. 2011 , 96 , 1141 .
[ 38 ] F. Bennet , G. Hart-Smith , T. Gruendling , T. P. Davis , P. J. Barker , C. Barner-Kowollik , Macromol. Chem. Phys. 2010 , 211 , 1083 .
[ 39 ] F. Bennet , P. J. Barker , T. P. Davis , A. H. Soeriyadi , C. Barner-Kowollik , Macromol. Chem. Phys. 2010 , 211 , 2034 .
[ 40 ] G. Hart-Smith , T. M. Lovestead , T. P. Davis , M. H. Stenzel , C. Barner-Kowollik , Biomacromulecules 2007 , 8 , 2404 .
[ 41 ] F. Bennet , T. M. Lovestead , P. J. Barker , T. P. Davis , M. H. Stenzel , C. Barner-Kowollik , Macromol. Rapid Commun. 2007 , 28 , 1593 .
[ 42 ] A. H. Soeriyadi , F. Bennet , M. R. Whittaker , P. J. Barker , C. Barner-Kowollik , T. P. Davis , J. Polym. Sci., Part A: Polym. Chem. 2011 , 49 , 848 .
[ 43 ] C. M. Guttman , K. M. Flynn , W. E. Wallace , A. J. Kearsley , Macromolecules 2009 , 42 , 1695 .
011, 212, 2648−2666
bH & Co. KGaA, Weinheim www.MaterialsViews.com


