Embed Size (px)
Citation preview
A statistical study on the stand-off distances of interplanetary coronalmass ejections
A. Mujiber Rahman a,n, A. Shanmugaraju b, S. Umapathy a, Y.-J. Moon c
a School of Physics, Madurai Kamaraj University, Madurai, Tamilnadu 625021, Indiab Department of Physics, Arul Anandhar College, Karumathur, Tamilnadu 625514, Indiac School of Space Research, Kyung Hee University, Yongin 446-701, Republic of Korea
a r t i c l e i n f o
Article history:Received 18 January 2013Received in revised form2 October 2013Accepted 8 October 2013Available online 18 October 2013
Keywords:Coronal mass ejectionsInterplanetary shocksStand-off distanceAcceleration
a b s t r a c t
We have analyzed the stand-off distance values of 101 interplanetary CMEs (ICMEs) observed during theperiod 1997–2005. Main aim of the present work is to study the stand-off distance and its dependenceon various parameters of CMEs, ICMEs and IP shocks, Alfvenic Mach numbers and transit time. From thedistribution, the stand-off time and stand-off distance values of many of the events are found to be in therange between �2–20 h and �1–40 R� (R�¼Solar radius). From the correlation between speed of CMEsand stand-off distance, we noted smaller stand-off distance for energetic CMEs, which indicated thatthe driver CME (CME which is generating the shock) and its shock travel closely together. From thecorrelation plot between CME acceleration and stand-off distance, we found that the highly deceleratedevents and highly accelerated events have lower stand-off distance range (i.e., 10–40 R�) than the otherevents. The events with longer travel time to reach 1 AU (470 h) show stand-off times r20 h and forthose faster events (VCME42200 km/s) with smaller travel time (r40 h), stand-off time is extremely low(r10 h). A wide range of stand-off distance is seen for a particular value of CME and ICME parameters.The poor correlations of stand-off distance with all the above parameters confirm that the stand-offdistance does not strongly depend on CME, ICME and IP shock parameters, but depends on acombination of all these parameters. On the other hand, the faster CMEs having lower stand-off distanceand/or stand-off time imply that as long as the CMEs are energetic, the CMEs and shocks travel closelytogether. Also, it can be noted that the stand-off distance is not only dependent on gamma, but it isrelated to other parameters.
& 2013 Elsevier Ltd. All rights reserved.
1. Introduction
It is well established that coronal mass ejections (CMEs) arecomplex events involving the release of large amounts of material,energy, and magnetic field from the Sun into the solar wind. Onceejected CMEs travel through the solar wind and interact with it, oftensetting up fast-mode MHD shocks, which in turn accelerate chargedparticles to very high energies (Gopalswamy et al., 2009). Since thesolar wind is made up of steady and turbulent flows, discontinuities,shocks and also CMEs tend to locally adopt to ambient (i.e., back-ground) solar wind (e.g., Gosling and Riley, 1996; Gopalswamy et al.,2000). These are likely to contribute significant change on thepropagation of the CME. CMEs in the interplanetary medium areknown as interplanetary CMEs or ICMEs for short. The interplanetary(IP) shocks move very fast (�450 to 2500 km/s) and are observed
mainly as discontinuities in the density. It has been found that aCME's full kinematic evolution may undergo three distinct phases: aninitiation phase of slow rising, a major acceleration phase of fastvelocity increasing, and finally a propagation phase with minorvelocity change (Zhang et al., 2001). The first two phases mainlyoccur in the inner corona (i.e., o2.0 R�), while the third phase islargely observed in the outer corona (i.e., 42.0 R�) by traditionalwhite light coronagraphs.
CMEs arrive at the Earth with or without shocks, but those withshocks are generally more energetic (see e.g., Tsurutani et al., 1988;Gopalswamy et al., 2008). If the solar wind plasma is swept upfaster than the Alfven speed, a fast mode MHD shock forms at adistance known as the stand-off distance determined by thegeometry of the driving CME and the upstream Alfvenic Machnumber (Gopalswamy et al., 2005). There are not many studiesespecially on stand-off distance except a few. For example,Gopalswamy and Yashiro (2011) measured the stand-off distanceat the shock nose, where the magnetic field of the ambientmedium was expected to be substantially radial and hence theshock quasi-parallel. Stand-off distance of CME-driven shocks have
Contents lists available at ScienceDirect
journal homepage: www.elsevier.com/locate/jastp
Journal of Atmospheric and Solar-Terrestrial Physics
1364-6826/$ - see front matter & 2013 Elsevier Ltd. All rights reserved.http://dx.doi.org/10.1016/j.jastp.2013.10.001
n Correspondence to: Department of Physics, Hajee Karutha Rowther HowdiaCollege, Uthamapalayam, Tamilnadu 625533, India. Tel.: þ91 9443926682.
E-mail address: [email protected] (A. Mujiber Rahman).
Journal of Atmospheric and Solar-Terrestrial Physics 105-106 (2013) 181–190
been investigated from an in-situ perspective by a few authors(see, e.g., Russell and Mulligan, 2002; Manchester et al., 2004;Odstrcil et al., 2005; Lepping et al., 2008; Zhang et al., 2008).Russell and Mulligan (2002) found that the shock stand-offdistance (i.e., thickness of magnetosheath) was of the order of21 R� at 1 AU for a single event. Lepping et al. (2008) derived anaverage stand-off distance of about 8 R� at 1 AU for 29 eventsduring the period 1996–2006.
Zhang et al. (2008) studied statistically the sizes of 46 inter-planetary coronal mass ejections (ICMEs) and the preceding shocksheath regions in near-Earth space during 1996–2005. The 46events studied were a subset of the events responsible for intense(Dstr�100 nT) geomagnetic storms in which only a single ICMEwas responsible for generating the storm. They found that thedurations and radial sizes of these ICMEs range from 8.0 to 62.0 hand 0.08 to 0.63 AU, respectively, with average values of 30.6 h and0.37 AU. On the other hand, the sheath durations and radial sizesrange from 2.6 to 24.5 h and 0.03 to 0.31 AU, with average valuesof 10.6 h and 0.13 AU.
Farris and Russell (1994) emphasized the importance of theradius of curvature and not the radius from some arbitrary“center” of an obstacle in determining the stand-off distance.Using the results of Landau and Liftshitz (1959) and Spreiteret al. (1966), they explained that the distance of the shock wasdependent upon the size of the obstacle, the ratio of specific heats,and the upstream Mach number. As noted by, Farris and Russell(1994), the dependence of the bow shock position on the size ofthe obstacle is a proportional relationship. Yermolaev et al. (2009)compiled a catalog of large-scale phenomena in the solar windover the observation period of 1976–2000 using the measurementdata presented in the OMNI database. They identified differenttypes such as, heliospheric current sheet, co-rotating interactionregions, ICMEs, sheath, etc. and studied their characteristics. Inaddition, Yermolaev et al. (2010), selection of ICME (MagneticCloud and Ejecta) types was carried out and it was shown thatsheath width depends on ICME type (16 h for sheath before Ejectaand 9 h before MC). Hence, they stressed the importance of ICMEtype in the investigations of sheath width. Eselevich and Eselevich(2011) also studied the generation of shock discontinuities excitedby CMEs in the corona and found that the effective ratio of specificheats varies from 2 to 5/3. They also studied the dependence ofAlfven Mach number on the shock discontinuity in the coronalshocks and interplanetary shocks and concluded that discontinu-ities preceding CMEs are collisionless shocks.
Manoharan and Mujiber Rahman (2011) correlated the stand-off time with CME travel time and found that events with longertravel time to reach 1 AU (i.e., Z70 h) have lesser stand-off times(r20 h). However, the scatter in the stand-off time with respectto the travel time was large and so they suggested the need formore investigations. This is the motivation for the present work.The main objective of the present work is to study the stand-offdistance for 101 events and to correlate them with parameters ofCMEs, ICMEs, IP shocks. This paper is organized as follows: Section2 deals with data selection and important results obtained fromthe study are discussed in Section 3. In Section 4, a summary of theresults is presented.
2. Data selection
In the present work, we considered a set of 101 earth-directedCME events from the list given by Mujiber Rahman et al. (2012),associated with ICMEs and interplanetary shocks observed duringthe period 1997–2005. This list of halo and partial halo CMEsprovides a good sample of events, covering a wide range of speed(�100–3200 km/s) in the LASCO field of view. In our earlier work,
we analyzed the interplanetary parameters of CMEs with andwithout type II bursts. But in the present study, our objective is tofind the correlation of stand-off distance with interplanetaryparameters such as speeds of ICMEs and IP shocks, Mach numbers(both Alfvenic and magnetosonic), Shock transit time and accel-eration. Among the 101 CME events the first 91 CME events wereobtained from the list given by Manoharan et al. (2004) and thenext 10 events were selected from the LASCO CME list (http://cdaw.gsfc.nasa.gov/CME_list/) according to the criteria used byManoharan et al. (2004) and the speed of CMEs should be greaterthan 2200 km/s.
We considered the shock wave disturbances detected by theWind spacecraft during 1997–2005 (available at http://www-spof.gsfc.nasa.gov/wind), supplemented with the shock lists obtainedfrom Proton Monitor (PM) instrument on board SOHO mission(available at http://umtof.bartol.udel.edu/ace). By examining solarwind plasma data (from Solar Wind Experiment (Wind/SWE)instrument, available at http://web.mit.edu/space/www/wind)and interplanetary magnetic field data (from Magnetic FieldInvestigation (Wind/MFI) instrument, available at http://lepmfi.gsfc.nasa.gov/mfi), we identified 101 IP shocks and their associatedinterplanetary CMEs (ICMEs). Solar wind parameters associatedwith the shocks and CME at the near Earth spacecraft wereobtained from the available online data using the website(http://nssdc.gsfc.nasa.gov/omniweb). For each event, we foundthe shock onset date, time, shock speed, Mach numbers (AlfvenicMach number, Ma, Magnetosonic Mach number, Ms) and transittime as described below. The shocks were identified using suddendiscontinuity in plasma parameters of proton density, flow speedand proton temperature as described in Manoharan et al. (2004).The shock speeds (see e.g., Douglas and Park, 1983) were calcu-lated using density and speed from upstream and downstream ofshock, Vs¼(v1n1�v2n2)/(n1�n2), v1 and n1 are speed and densitybefore the shock front (upstream region), v2 and n2 are the speedand density after the shock front (downstream region). AlfvenicMach (Ma) numbers (Velli and Prunetti, 1997) are calculated usingmagnetic field, density and velocity data at the shock front(Ma¼upstream speed/Alfvenic speed) and magnetosonic Machnumbers (Ms¼shock speed/fast mode speed). Transit time isrepresented by the time difference between the CME time inLASCO C2 image and shock time in WIND spacecraft data.
We identified the ICME associated with an IP shock byexamining the solar wind plasma data (proton density, speedand temperature) as well as magnetic field measurements fol-lowed after the IP shock onset, as suggested by Manoharan et al.(2004). There is a number of plasma and magnetic field featuresare associated with ICMEs (i.e. interplanetary ejecta (EJ) of CMEs).However, we identified ejecta using (1) low proton temperature,(2) strong magnetic field, and (3) a smooth rotation in themagnetic field direction indicative of a magnetic cloud (MC).MCs are a subset of ejecta. For a few events, high charge state ofiron has also been examined to identify the ICME plasma. Thepresence of these signatures singly or together varied from oneICME to the other.
In the present study, the stand-off distance is calculatedas follows. The stand-off time of a CME at a distance is given bythe time difference between the arrival of a CME driven shockdisturbance and the CME at the given distance (see, e.g.,Manoharan and Mujiber Rahman (2011), Mujiber Rahman et al.(2012)). That is, the stand-off time is referred as the timedifference between the ICME and IP shock arrival time at 1 AU.The stand-off distance is calculated using stand-off time multipliedby the ICME speed (The peak flow speed during the passage ofICME relative to the instrument). By using this method weobtained stand-off distance values ranging between 0.5 R� and74 R� at 1 AU. We have shown the plots of solar wind magnetic
A. Mujiber Rahman et al. / Journal of Atmospheric and Solar-Terrestrial Physics 105-106 (2013) 181–190182
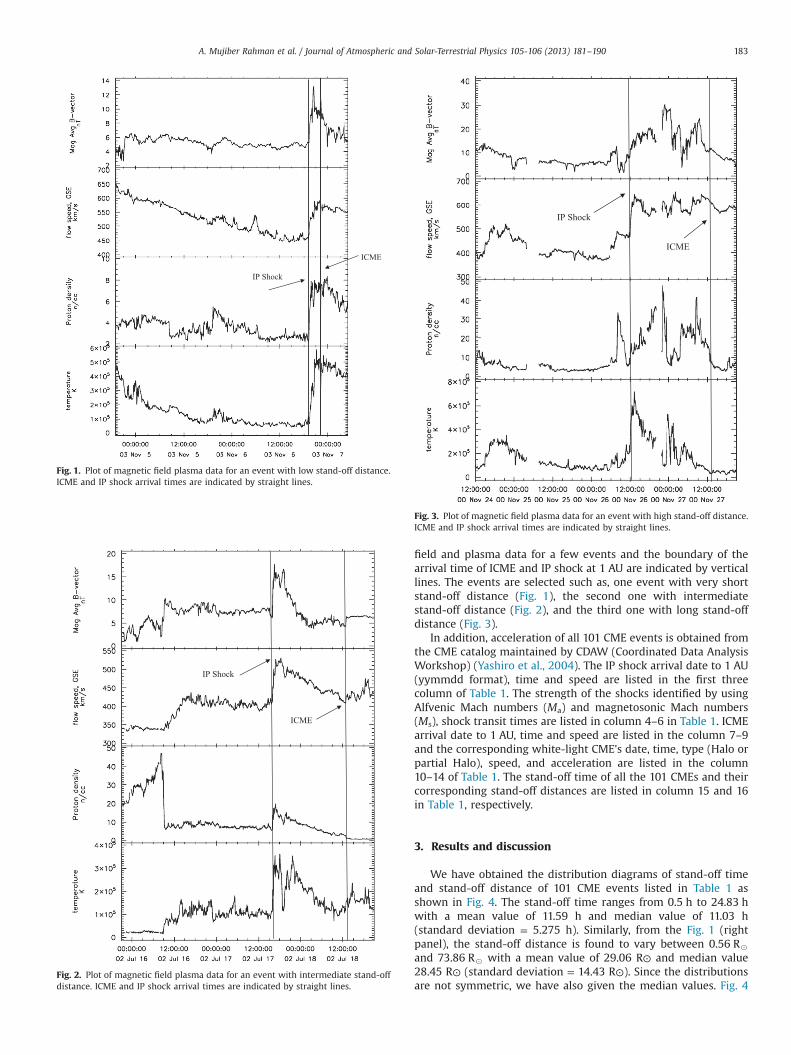
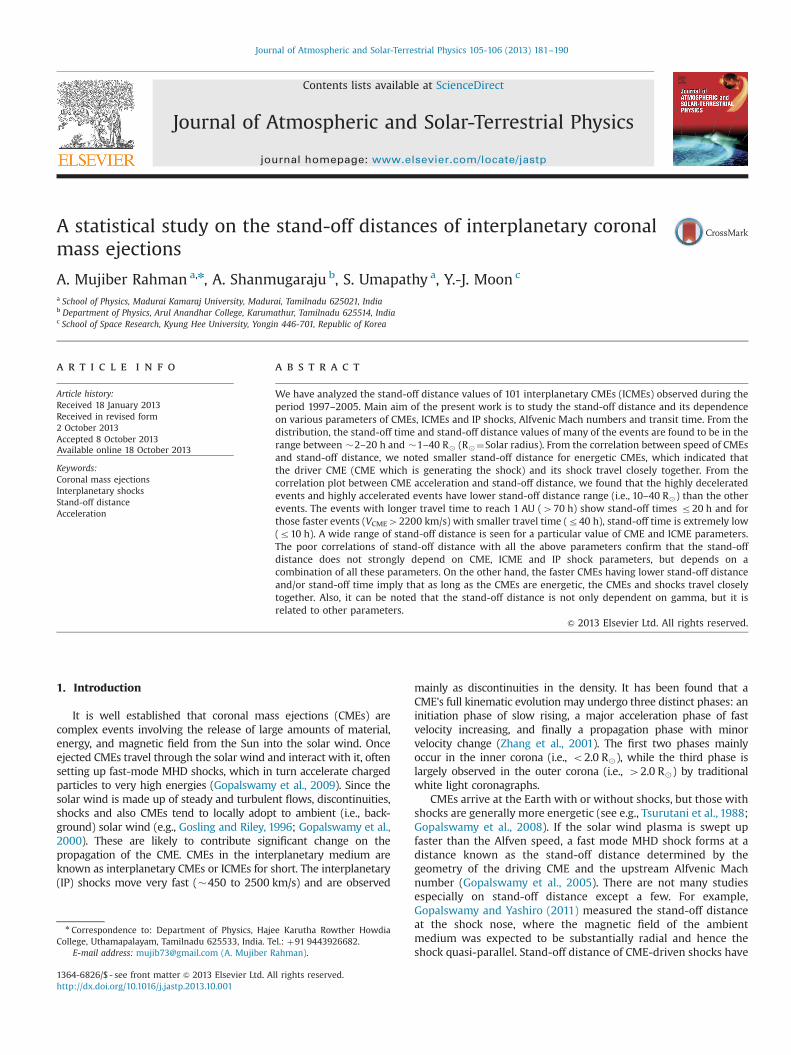
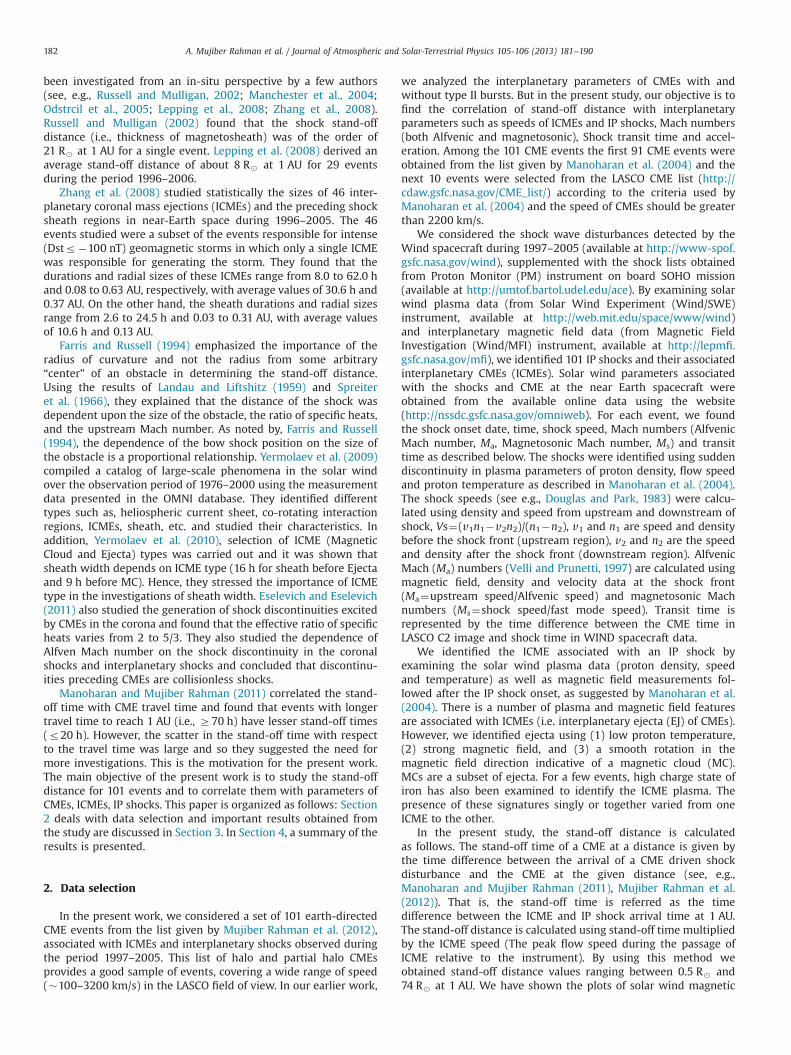
field and plasma data for a few events and the boundary of thearrival time of ICME and IP shock at 1 AU are indicated by verticallines. The events are selected such as, one event with very shortstand-off distance (Fig. 1), the second one with intermediatestand-off distance (Fig. 2), and the third one with long stand-offdistance (Fig. 3).
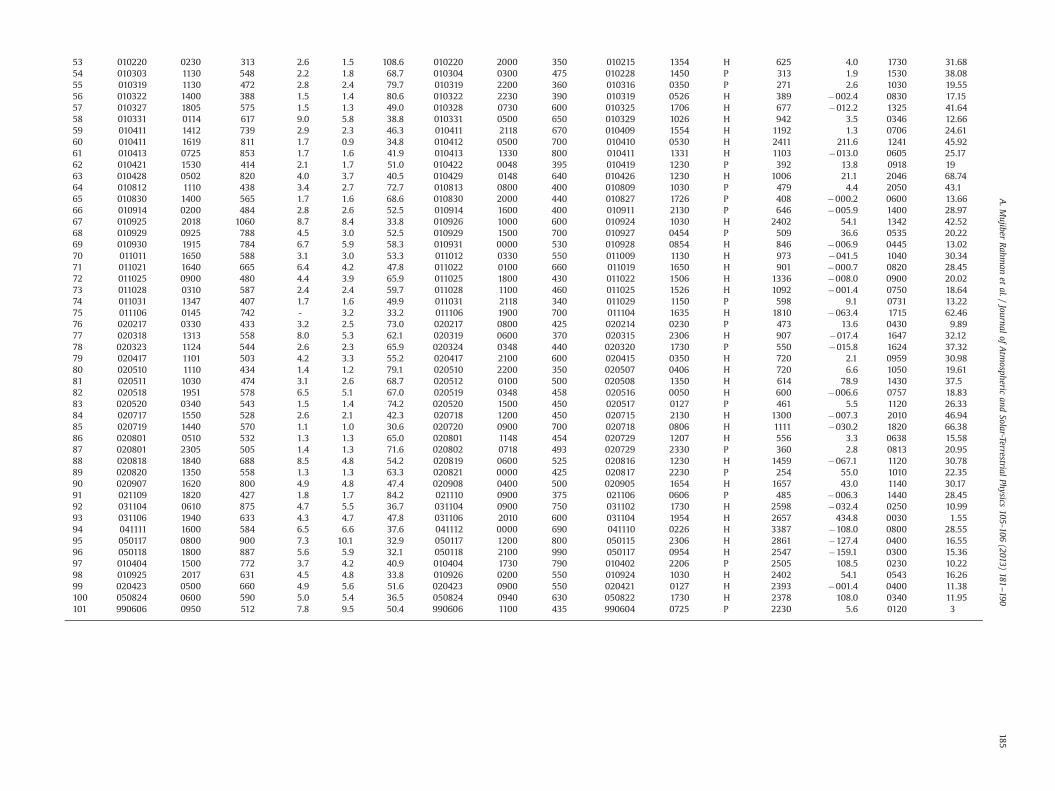
In addition, acceleration of all 101 CME events is obtained fromthe CME catalog maintained by CDAW (Coordinated Data AnalysisWorkshop) (Yashiro et al., 2004). The IP shock arrival date to 1 AU(yymmdd format), time and speed are listed in the first threecolumn of Table 1. The strength of the shocks identified by usingAlfvenic Mach numbers (Ma) and magnetosonic Mach numbers(Ms), shock transit times are listed in column 4–6 in Table 1. ICMEarrival date to 1 AU, time and speed are listed in the column 7–9and the corresponding white-light CME's date, time, type (Halo orpartial Halo), speed, and acceleration are listed in the column10–14 of Table 1. The stand-off time of all the 101 CMEs and theircorresponding stand-off distances are listed in column 15 and 16in Table 1, respectively.
3. Results and discussion
We have obtained the distribution diagrams of stand-off timeand stand-off distance of 101 CME events listed in Table 1 asshown in Fig. 4. The stand-off time ranges from 0.5 h to 24.83 hwith a mean value of 11.59 h and median value of 11.03 h(standard deviation = 5.275 h). Similarly, from the Fig. 1 (rightpanel), the stand-off distance is found to vary between 0.56 R�and 73.86 R� with a mean value of 29.06 R⊙ and median value28.45 R⊙ (standard deviation = 14.43 R⊙). Since the distributionsare not symmetric, we have also given the median values. Fig. 4
IP Shock
ICME
Fig. 1. Plot of magnetic field plasma data for an event with low stand-off distance.ICME and IP shock arrival times are indicated by straight lines.
IP Shock
ICME
Fig. 2. Plot of magnetic field plasma data for an event with intermediate stand-offdistance. ICME and IP shock arrival times are indicated by straight lines.
IP Shock
ICME
Fig. 3. Plot of magnetic field plasma data for an event with high stand-off distance.ICME and IP shock arrival times are indicated by straight lines.
A. Mujiber Rahman et al. / Journal of Atmospheric and Solar-Terrestrial Physics 105-106 (2013) 181–190 183
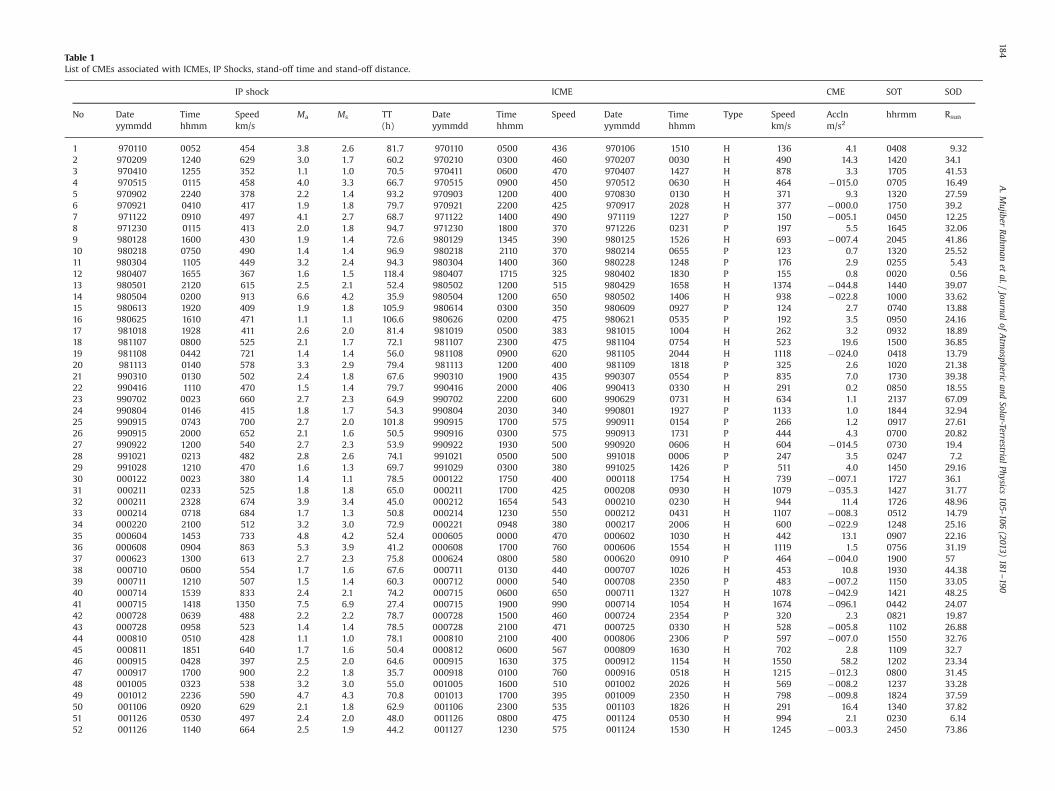
Table 1List of CMEs associated with ICMEs, IP Shocks, stand-off time and stand-off distance.
IP shock ICME CME SOT SOD
No Dateyymmdd
Timehhmm
Speedkm/s
Ma Ms TT(h)
Dateyymmdd
Timehhmm
Speed Dateyymmdd
Timehhmm
Type Speedkm/s
Acclnm/s2
hhrmm Rsun
1 970110 0052 454 3.8 2.6 81.7 970110 0500 436 970106 1510 H 136 4.1 0408 9.322 970209 1240 629 3.0 1.7 60.2 970210 0300 460 970207 0030 H 490 14.3 1420 34.13 970410 1255 352 1.1 1.0 70.5 970411 0600 470 970407 1427 H 878 3.3 1705 41.534 970515 0115 458 4.0 3.3 66.7 970515 0900 450 970512 0630 H 464 �015.0 0705 16.495 970902 2240 378 2.2 1.4 93.2 970903 1200 400 970830 0130 H 371 9.3 1320 27.596 970921 0410 417 1.9 1.8 79.7 970921 2200 425 970917 2028 H 377 �000.0 1750 39.27 971122 0910 497 4.1 2.7 68.7 971122 1400 490 971119 1227 P 150 �005.1 0450 12.258 971230 0115 413 2.0 1.8 94.7 971230 1800 370 971226 0231 P 197 5.5 1645 32.069 980128 1600 430 1.9 1.4 72.6 980129 1345 390 980125 1526 H 693 �007.4 2045 41.8610 980218 0750 490 1.4 1.4 96.9 980218 2110 370 980214 0655 P 123 0.7 1320 25.5211 980304 1105 449 3.2 2.4 94.3 980304 1400 360 980228 1248 P 176 2.9 0255 5.4312 980407 1655 367 1.6 1.5 118.4 980407 1715 325 980402 1830 P 155 0.8 0020 0.5613 980501 2120 615 2.5 2.1 52.4 980502 1200 515 980429 1658 H 1374 �044.8 1440 39.0714 980504 0200 913 6.6 4.2 35.9 980504 1200 650 980502 1406 H 938 �022.8 1000 33.6215 980613 1920 409 1.9 1.8 105.9 980614 0300 350 980609 0927 P 124 2.7 0740 13.8816 980625 1610 471 1.1 1.1 106.6 980626 0200 475 980621 0535 P 192 3.5 0950 24.1617 981018 1928 411 2.6 2.0 81.4 981019 0500 383 981015 1004 H 262 3.2 0932 18.8918 981107 0800 525 2.1 1.7 72.1 981107 2300 475 981104 0754 H 523 19.6 1500 36.8519 981108 0442 721 1.4 1.4 56.0 981108 0900 620 981105 2044 H 1118 �024.0 0418 13.7920 981113 0140 578 3.3 2.9 79.4 981113 1200 400 981109 1818 P 325 2.6 1020 21.3821 990310 0130 502 2.4 1.8 67.6 990310 1900 435 990307 0554 P 835 7.0 1730 39.3822 990416 1110 470 1.5 1.4 79.7 990416 2000 406 990413 0330 H 291 0.2 0850 18.5523 990702 0023 660 2.7 2.3 64.9 990702 2200 600 990629 0731 H 634 1.1 2137 67.0924 990804 0146 415 1.8 1.7 54.3 990804 2030 340 990801 1927 P 1133 1.0 1844 32.9425 990915 0743 700 2.7 2.0 101.8 990915 1700 575 990911 0154 P 266 1.2 0917 27.6126 990915 2000 652 2.1 1.6 50.5 990916 0300 575 990913 1731 P 444 4.3 0700 20.8227 990922 1200 540 2.7 2.3 53.9 990922 1930 500 990920 0606 H 604 �014.5 0730 19.428 991021 0213 482 2.8 2.6 74.1 991021 0500 500 991018 0006 P 247 3.5 0247 7.229 991028 1210 470 1.6 1.3 69.7 991029 0300 380 991025 1426 P 511 4.0 1450 29.1630 000122 0023 380 1.4 1.1 78.5 000122 1750 400 000118 1754 H 739 �007.1 1727 36.131 000211 0233 525 1.8 1.8 65.0 000211 1700 425 000208 0930 H 1079 �035.3 1427 31.7732 000211 2328 674 3.9 3.4 45.0 000212 1654 543 000210 0230 H 944 11.4 1726 48.9633 000214 0718 684 1.7 1.3 50.8 000214 1230 550 000212 0431 H 1107 �008.3 0512 14.7934 000220 2100 512 3.2 3.0 72.9 000221 0948 380 000217 2006 H 600 �022.9 1248 25.1635 000604 1453 733 4.8 4.2 52.4 000605 0000 470 000602 1030 H 442 13.1 0907 22.1636 000608 0904 863 5.3 3.9 41.2 000608 1700 760 000606 1554 H 1119 1.5 0756 31.1937 000623 1300 613 2.7 2.3 75.8 000624 0800 580 000620 0910 P 464 �004.0 1900 5738 000710 0600 554 1.7 1.6 67.6 000711 0130 440 000707 1026 H 453 10.8 1930 44.3839 000711 1210 507 1.5 1.4 60.3 000712 0000 540 000708 2350 P 483 �007.2 1150 33.0540 000714 1539 833 2.4 2.1 74.2 000715 0600 650 000711 1327 H 1078 �042.9 1421 48.2541 000715 1418 1350 7.5 6.9 27.4 000715 1900 990 000714 1054 H 1674 �096.1 0442 24.0742 000728 0639 488 2.2 2.2 78.7 000728 1500 460 000724 2354 P 320 2.3 0821 19.8743 000728 0958 523 1.4 1.4 78.5 000728 2100 471 000725 0330 H 528 �005.8 1102 26.8844 000810 0510 428 1.1 1.0 78.1 000810 2100 400 000806 2306 P 597 �007.0 1550 32.7645 000811 1851 640 1.7 1.6 50.4 000812 0600 567 000809 1630 H 702 2.8 1109 32.746 000915 0428 397 2.5 2.0 64.6 000915 1630 375 000912 1154 H 1550 58.2 1202 23.3447 000917 1700 900 2.2 1.8 35.7 000918 0100 760 000916 0518 H 1215 �012.3 0800 31.4548 001005 0323 538 3.2 3.0 55.0 001005 1600 510 001002 2026 H 569 �008.2 1237 33.2849 001012 2236 590 4.7 4.3 70.8 001013 1700 395 001009 2350 H 798 �009.8 1824 37.5950 001106 0920 629 2.1 1.8 62.9 001106 2300 535 001103 1826 H 291 16.4 1340 37.8251 001126 0530 497 2.4 2.0 48.0 001126 0800 475 001124 0530 H 994 2.1 0230 6.1452 001126 1140 664 2.5 1.9 44.2 001127 1230 575 001124 1530 H 1245 �003.3 2450 73.86
A.M
ujiberRahm
anet
al./Journal
ofAtm
osphericand
Solar-TerrestrialPhysics
105-106(2013)
181–190
184
53 010220 0230 313 2.6 1.5 108.6 010220 2000 350 010215 1354 H 625 4.0 1730 31.6854 010303 1130 548 2.2 1.8 68.7 010304 0300 475 010228 1450 P 313 1.9 1530 38.0855 010319 1130 472 2.8 2.4 79.7 010319 2200 360 010316 0350 P 271 2.6 1030 19.5556 010322 1400 388 1.5 1.4 80.6 010322 2230 390 010319 0526 H 389 �002.4 0830 17.1557 010327 1805 575 1.5 1.3 49.0 010328 0730 600 010325 1706 H 677 �012.2 1325 41.6458 010331 0114 617 9.0 5.8 38.8 010331 0500 650 010329 1026 H 942 3.5 0346 12.6659 010411 1412 739 2.9 2.3 46.3 010411 2118 670 010409 1554 H 1192 1.3 0706 24.6160 010411 1619 811 1.7 0.9 34.8 010412 0500 700 010410 0530 H 2411 211.6 1241 45.9261 010413 0725 853 1.7 1.6 41.9 010413 1330 800 010411 1331 H 1103 �013.0 0605 25.1762 010421 1530 414 2.1 1.7 51.0 010422 0048 395 010419 1230 P 392 13.8 0918 1963 010428 0502 820 4.0 3.7 40.5 010429 0148 640 010426 1230 H 1006 21.1 2046 68.7464 010812 1110 438 3.4 2.7 72.7 010813 0800 400 010809 1030 P 479 4.4 2050 43.165 010830 1400 565 1.7 1.6 68.6 010830 2000 440 010827 1726 P 408 �000.2 0600 13.6666 010914 0200 484 2.8 2.6 52.5 010914 1600 400 010911 2130 P 646 �005.9 1400 28.9767 010925 2018 1060 8.7 8.4 33.8 010926 1000 600 010924 1030 H 2402 54.1 1342 42.5268 010929 0925 788 4.5 3.0 52.5 010929 1500 700 010927 0454 P 509 36.6 0535 20.2269 010930 1915 784 6.7 5.9 58.3 010931 0000 530 010928 0854 H 846 �006.9 0445 13.0270 011011 1650 588 3.1 3.0 53.3 011012 0330 550 011009 1130 H 973 �041.5 1040 30.3471 011021 1640 665 6.4 4.2 47.8 011022 0100 660 011019 1650 H 901 �000.7 0820 28.4572 011025 0900 480 4.4 3.9 65.9 011025 1800 430 011022 1506 H 1336 �008.0 0900 20.0273 011028 0310 587 2.4 2.4 59.7 011028 1100 460 011025 1526 H 1092 �001.4 0750 18.6474 011031 1347 407 1.7 1.6 49.9 011031 2118 340 011029 1150 P 598 9.1 0731 13.2275 011106 0145 742 - 3.2 33.2 011106 1900 700 011104 1635 H 1810 �063.4 1715 62.4676 020217 0330 433 3.2 2.5 73.0 020217 0800 425 020214 0230 P 473 13.6 0430 9.8977 020318 1313 558 8.0 5.3 62.1 020319 0600 370 020315 2306 H 907 �017.4 1647 32.1278 020323 1124 544 2.6 2.3 65.9 020324 0348 440 020320 1730 P 550 �015.8 1624 37.3279 020417 1101 503 4.2 3.3 55.2 020417 2100 600 020415 0350 H 720 2.1 0959 30.9880 020510 1110 434 1.4 1.2 79.1 020510 2200 350 020507 0406 H 720 6.6 1050 19.6181 020511 1030 474 3.1 2.6 68.7 020512 0100 500 020508 1350 H 614 78.9 1430 37.582 020518 1951 578 6.5 5.1 67.0 020519 0348 458 020516 0050 H 600 �006.6 0757 18.8383 020520 0340 543 1.5 1.4 74.2 020520 1500 450 020517 0127 P 461 5.5 1120 26.3384 020717 1550 528 2.6 2.1 42.3 020718 1200 450 020715 2130 H 1300 �007.3 2010 46.9485 020719 1440 570 1.1 1.0 30.6 020720 0900 700 020718 0806 H 1111 �030.2 1820 66.3886 020801 0510 532 1.3 1.3 65.0 020801 1148 454 020729 1207 H 556 3.3 0638 15.5887 020801 2305 505 1.4 1.3 71.6 020802 0718 493 020729 2330 P 360 2.8 0813 20.9588 020818 1840 688 8.5 4.8 54.2 020819 0600 525 020816 1230 H 1459 �067.1 1120 30.7889 020820 1350 558 1.3 1.3 63.3 020821 0000 425 020817 2230 P 254 55.0 1010 22.3590 020907 1620 800 4.9 4.8 47.4 020908 0400 500 020905 1654 H 1657 43.0 1140 30.1791 021109 1820 427 1.8 1.7 84.2 021110 0900 375 021106 0606 P 485 �006.3 1440 28.4592 031104 0610 875 4.7 5.5 36.7 031104 0900 750 031102 1730 H 2598 �032.4 0250 10.9993 031106 1940 633 4.3 4.7 47.8 031106 2010 600 031104 1954 H 2657 434.8 0030 1.5594 041111 1600 584 6.5 6.6 37.6 041112 0000 690 041110 0226 H 3387 �108.0 0800 28.5595 050117 0800 900 7.3 10.1 32.9 050117 1200 800 050115 2306 H 2861 �127.4 0400 16.5596 050118 1800 887 5.6 5.9 32.1 050118 2100 990 050117 0954 H 2547 �159.1 0300 15.3697 010404 1500 772 3.7 4.2 40.9 010404 1730 790 010402 2206 P 2505 108.5 0230 10.2298 010925 2017 631 4.5 4.8 33.8 010926 0200 550 010924 1030 H 2402 54.1 0543 16.2699 020423 0500 660 4.9 5.6 51.6 020423 0900 550 020421 0127 H 2393 �001.4 0400 11.38100 050824 0600 590 5.0 5.4 36.5 050824 0940 630 050822 1730 H 2378 108.0 0340 11.95101 990606 0950 512 7.8 9.5 50.4 990606 1100 435 990604 0725 P 2230 5.6 0120 3
A.M
ujiberRahm
anet
al./Journal
ofAtm
osphericand
Solar-TerrestrialPhysics
105-106(2013)
181–190
185
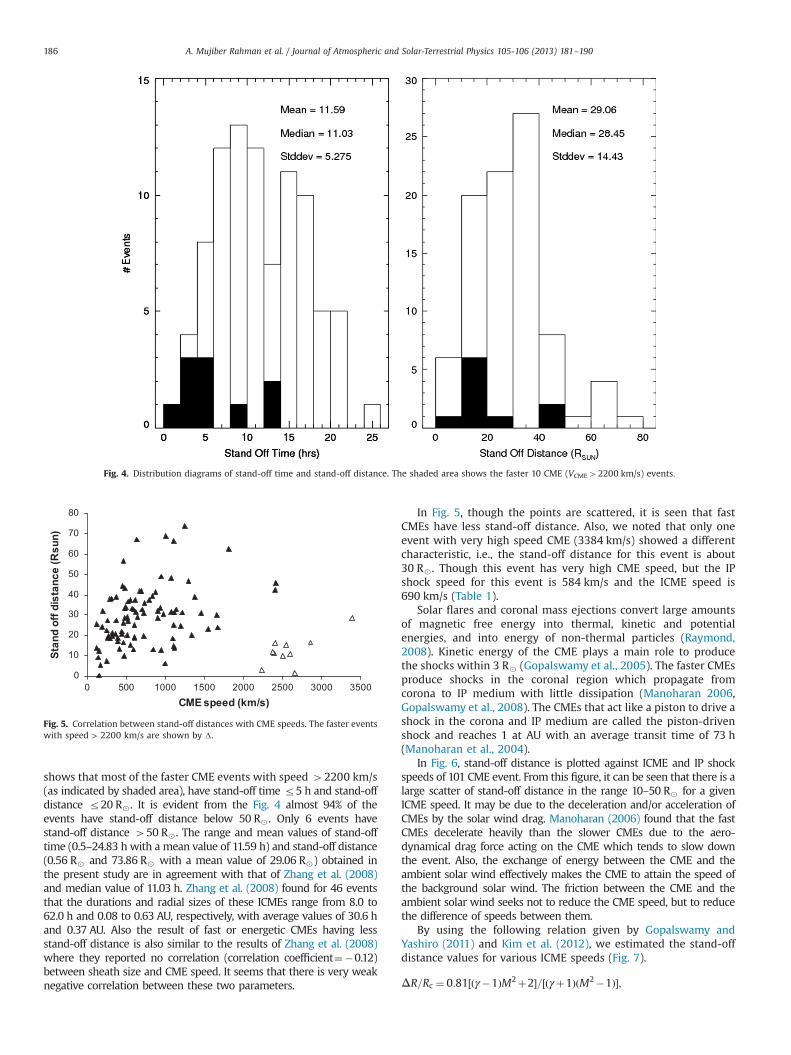
shows that most of the faster CME events with speed 42200 km/s(as indicated by shaded area), have stand-off time r5 h and stand-offdistance r20 R� . It is evident from the Fig. 4 almost 94% of theevents have stand-off distance below 50 R� . Only 6 events havestand-off distance 450 R� . The range and mean values of stand-offtime (0.5–24.83 h with a mean value of 11.59 h) and stand-off distance(0.56 R� and 73.86 R� with a mean value of 29.06 R�) obtained inthe present study are in agreement with that of Zhang et al. (2008)and median value of 11.03 h. Zhang et al. (2008) found for 46 eventsthat the durations and radial sizes of these ICMEs range from 8.0 to62.0 h and 0.08 to 0.63 AU, respectively, with average values of 30.6 hand 0.37 AU. Also the result of fast or energetic CMEs having lessstand-off distance is also similar to the results of Zhang et al. (2008)where they reported no correlation (correlation coefficient¼�0.12)between sheath size and CME speed. It seems that there is very weaknegative correlation between these two parameters.
In Fig. 5, though the points are scattered, it is seen that fastCMEs have less stand-off distance. Also, we noted that only oneevent with very high speed CME (3384 km/s) showed a differentcharacteristic, i.e., the stand-off distance for this event is about30 R� . Though this event has very high CME speed, but the IPshock speed for this event is 584 km/s and the ICME speed is690 km/s (Table 1).
Solar flares and coronal mass ejections convert large amountsof magnetic free energy into thermal, kinetic and potentialenergies, and into energy of non-thermal particles (Raymond,2008). Kinetic energy of the CME plays a main role to producethe shocks within 3 R� (Gopalswamy et al., 2005). The faster CMEsproduce shocks in the coronal region which propagate fromcorona to IP medium with little dissipation (Manoharan 2006,Gopalswamy et al., 2008). The CMEs that act like a piston to drive ashock in the corona and IP medium are called the piston-drivenshock and reaches 1 at AU with an average transit time of 73 h(Manoharan et al., 2004).
In Fig. 6, stand-off distance is plotted against ICME and IP shockspeeds of 101 CME event. From this figure, it can be seen that there is alarge scatter of stand-off distance in the range 10–50 R� for a givenICME speed. It may be due to the deceleration and/or acceleration ofCMEs by the solar wind drag. Manoharan (2006) found that the fastCMEs decelerate heavily than the slower CMEs due to the aero-dynamical drag force acting on the CME which tends to slow downthe event. Also, the exchange of energy between the CME and theambient solar wind effectively makes the CME to attain the speed ofthe background solar wind. The friction between the CME and theambient solar wind seeks not to reduce the CME speed, but to reducethe difference of speeds between them.
By using the following relation given by Gopalswamy andYashiro (2011) and Kim et al. (2012), we estimated the stand-offdistance values for various ICME speeds (Fig. 7).
ΔR=Rc ¼ 0:81½ðγ�1ÞM2þ2�=½ðγþ1ÞðM2�1Þ�;
Fig. 4. Distribution diagrams of stand-off time and stand-off distance. The shaded area shows the faster 10 CME (VCME42200 km/s) events.
0
10
20
30
40
50
60
70
80
0 500 1000 1500 2000 2500 3000 3500
CME speed (km/s)
Stan
d of
f dis
tanc
e (R
sun)
Fig. 5. Correlation between stand-off distances with CME speeds. The faster eventswith speed > 2200 km/s are shown by Δ.
A. Mujiber Rahman et al. / Journal of Atmospheric and Solar-Terrestrial Physics 105-106 (2013) 181–190186
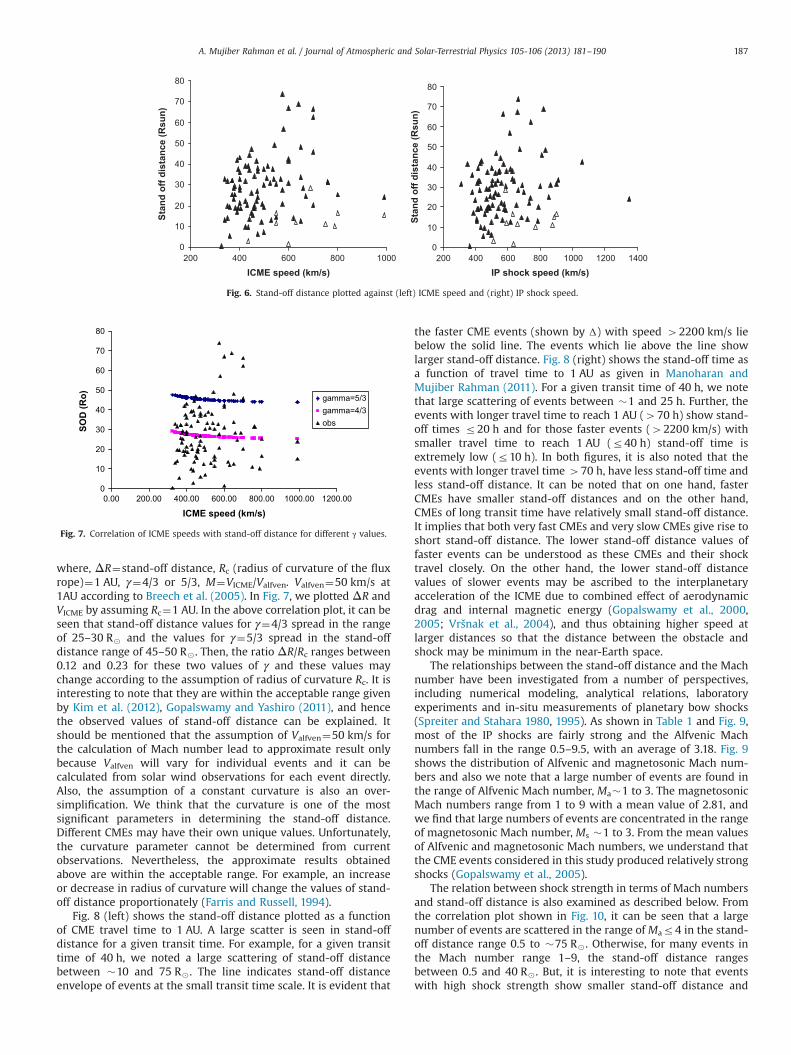
where, ΔR¼stand-off distance, Rc (radius of curvature of the fluxrope)¼1 AU, γ¼4/3 or 5/3, M¼VICME/Valfven. Valfven¼50 km/s at1AU according to Breech et al. (2005). In Fig. 7, we plotted ΔR andVICME by assuming Rc¼1 AU. In the above correlation plot, it can beseen that stand-off distance values for γ¼4/3 spread in the rangeof 25–30 R� and the values for γ¼5/3 spread in the stand-offdistance range of 45–50 R� . Then, the ratio ΔR/Rc ranges between0.12 and 0.23 for these two values of γ and these values maychange according to the assumption of radius of curvature Rc. It isinteresting to note that they are within the acceptable range givenby Kim et al. (2012), Gopalswamy and Yashiro (2011), and hencethe observed values of stand-off distance can be explained. Itshould be mentioned that the assumption of Valfven¼50 km/s forthe calculation of Mach number lead to approximate result onlybecause Valfven will vary for individual events and it can becalculated from solar wind observations for each event directly.Also, the assumption of a constant curvature is also an over-simplification. We think that the curvature is one of the mostsignificant parameters in determining the stand-off distance.Different CMEs may have their own unique values. Unfortunately,the curvature parameter cannot be determined from currentobservations. Nevertheless, the approximate results obtainedabove are within the acceptable range. For example, an increaseor decrease in radius of curvature will change the values of stand-off distance proportionately (Farris and Russell, 1994).
Fig. 8 (left) shows the stand-off distance plotted as a functionof CME travel time to 1 AU. A large scatter is seen in stand-offdistance for a given transit time. For example, for a given transittime of 40 h, we noted a large scattering of stand-off distancebetween �10 and 75 R� . The line indicates stand-off distanceenvelope of events at the small transit time scale. It is evident that
the faster CME events (shown by Δ) with speed 42200 km/s liebelow the solid line. The events which lie above the line showlarger stand-off distance. Fig. 8 (right) shows the stand-off time asa function of travel time to 1 AU as given in Manoharan andMujiber Rahman (2011). For a given transit time of 40 h, we notethat large scattering of events between �1 and 25 h. Further, theevents with longer travel time to reach 1 AU (470 h) show stand-off times r20 h and for those faster events (42200 km/s) withsmaller travel time to reach 1 AU (r40 h) stand-off time isextremely low (r10 h). In both figures, it is also noted that theevents with longer travel time 470 h, have less stand-off time andless stand-off distance. It can be noted that on one hand, fasterCMEs have smaller stand-off distances and on the other hand,CMEs of long transit time have relatively small stand-off distance.It implies that both very fast CMEs and very slow CMEs give rise toshort stand-off distance. The lower stand-off distance values offaster events can be understood as these CMEs and their shocktravel closely. On the other hand, the lower stand-off distancevalues of slower events may be ascribed to the interplanetaryacceleration of the ICME due to combined effect of aerodynamicdrag and internal magnetic energy (Gopalswamy et al., 2000,2005; Vršnak et al., 2004), and thus obtaining higher speed atlarger distances so that the distance between the obstacle andshock may be minimum in the near-Earth space.
The relationships between the stand-off distance and the Machnumber have been investigated from a number of perspectives,including numerical modeling, analytical relations, laboratoryexperiments and in-situ measurements of planetary bow shocks(Spreiter and Stahara 1980, 1995). As shown in Table 1 and Fig. 9,most of the IP shocks are fairly strong and the Alfvenic Machnumbers fall in the range 0.5–9.5, with an average of 3.18. Fig. 9shows the distribution of Alfvenic and magnetosonic Mach num-bers and also we note that a large number of events are found inthe range of Alfvenic Mach number, Ma�1 to 3. The magnetosonicMach numbers range from 1 to 9 with a mean value of 2.81, andwe find that large numbers of events are concentrated in the rangeof magnetosonic Mach number, Ms �1 to 3. From the mean valuesof Alfvenic and magnetosonic Mach numbers, we understand thatthe CME events considered in this study produced relatively strongshocks (Gopalswamy et al., 2005).
The relation between shock strength in terms of Mach numbersand stand-off distance is also examined as described below. Fromthe correlation plot shown in Fig. 10, it can be seen that a largenumber of events are scattered in the range of Mar4 in the stand-off distance range 0.5 to �75 R� . Otherwise, for many events inthe Mach number range 1–9, the stand-off distance rangesbetween 0.5 and 40 R� . But, it is interesting to note that eventswith high shock strength show smaller stand-off distance and
0
10
20
30
40
50
60
70
80
200 400 600 800 1000
ICME speed (km/s)
Stan
d of
f dis
tanc
e (R
sun)
Stan
d of
f dis
tanc
e (R
sun)
0
10
20
30
40
50
60
70
80
200 400 600 800 1000 1200 1400
IP shock speed (km/s)
Fig. 6. Stand-off distance plotted against (left) ICME speed and (right) IP shock speed.
0
10
20
30
40
50
60
70
80
0.00 200.00 400.00 600.00 800.00 1000.00 1200.00
ICME speed (km/s)
SOD
(Ro) gamma=5/3
gamma=4/3obs
Fig. 7. Correlation of ICME speeds with stand-off distance for different γ values.
A. Mujiber Rahman et al. / Journal of Atmospheric and Solar-Terrestrial Physics 105-106 (2013) 181–190 187
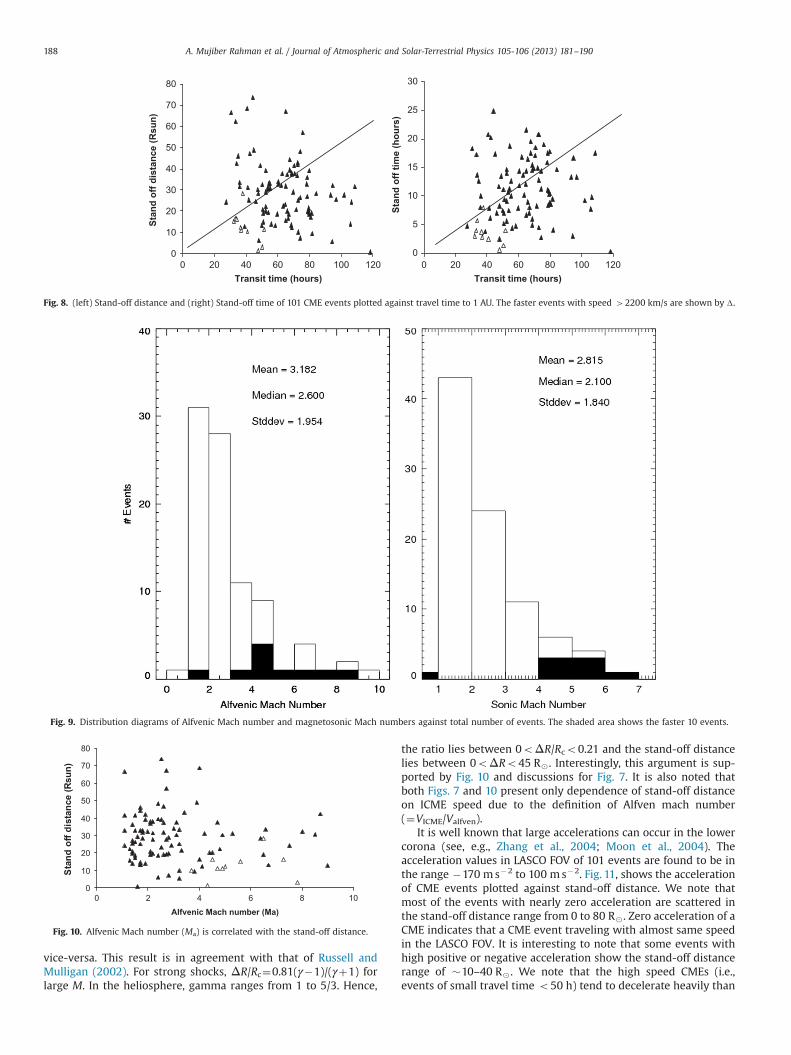
vice-versa. This result is in agreement with that of Russell andMulligan (2002). For strong shocks, ΔR/Rc¼0.81(γ�1)/(γþ1) forlarge M. In the heliosphere, gamma ranges from 1 to 5/3. Hence,
the ratio lies between 0oΔR/Rco0.21 and the stand-off distancelies between 0oΔRo45 R� . Interestingly, this argument is sup-ported by Fig. 10 and discussions for Fig. 7. It is also noted thatboth Figs. 7 and 10 present only dependence of stand-off distanceon ICME speed due to the definition of Alfven mach number(¼VICME/Valfven).
It is well known that large accelerations can occur in the lowercorona (see, e.g., Zhang et al., 2004; Moon et al., 2004). Theacceleration values in LASCO FOV of 101 events are found to be inthe range �170 ms�2 to 100 ms�2. Fig. 11, shows the accelerationof CME events plotted against stand-off distance. We note thatmost of the events with nearly zero acceleration are scattered inthe stand-off distance range from 0 to 80 R� . Zero acceleration of aCME indicates that a CME event traveling with almost same speedin the LASCO FOV. It is interesting to note that some events withhigh positive or negative acceleration show the stand-off distancerange of �10–40 R� . We note that the high speed CMEs (i.e.,events of small travel time o50 h) tend to decelerate heavily than
Fig. 9. Distribution diagrams of Alfvenic Mach number and magnetosonic Mach numbers against total number of events. The shaded area shows the faster 10 events.
0
10
20
30
40
50
60
70
80
0 2 4 6 8 10
Alfvenic Mach number (Ma)
Stan
d of
f dis
tanc
e (R
sun)
Fig. 10. Alfvenic Mach number (Ma) is correlated with the stand-off distance.
0
10
20
30
40
50
60
70
80
0 20 40 60 80 100 120Transit time (hours)
Stan
d of
f dis
tanc
e (R
sun)
0
5
10
15
20
25
30
0 20 40 60 80 100 120Transit time (hours)
Stan
d of
f tim
e (h
ours
)
Fig. 8. (left) Stand-off distance and (right) Stand-off time of 101 CME events plotted against travel time to 1 AU. The faster events with speed 42200 km/s are shown by Δ.
A. Mujiber Rahman et al. / Journal of Atmospheric and Solar-Terrestrial Physics 105-106 (2013) 181–190188
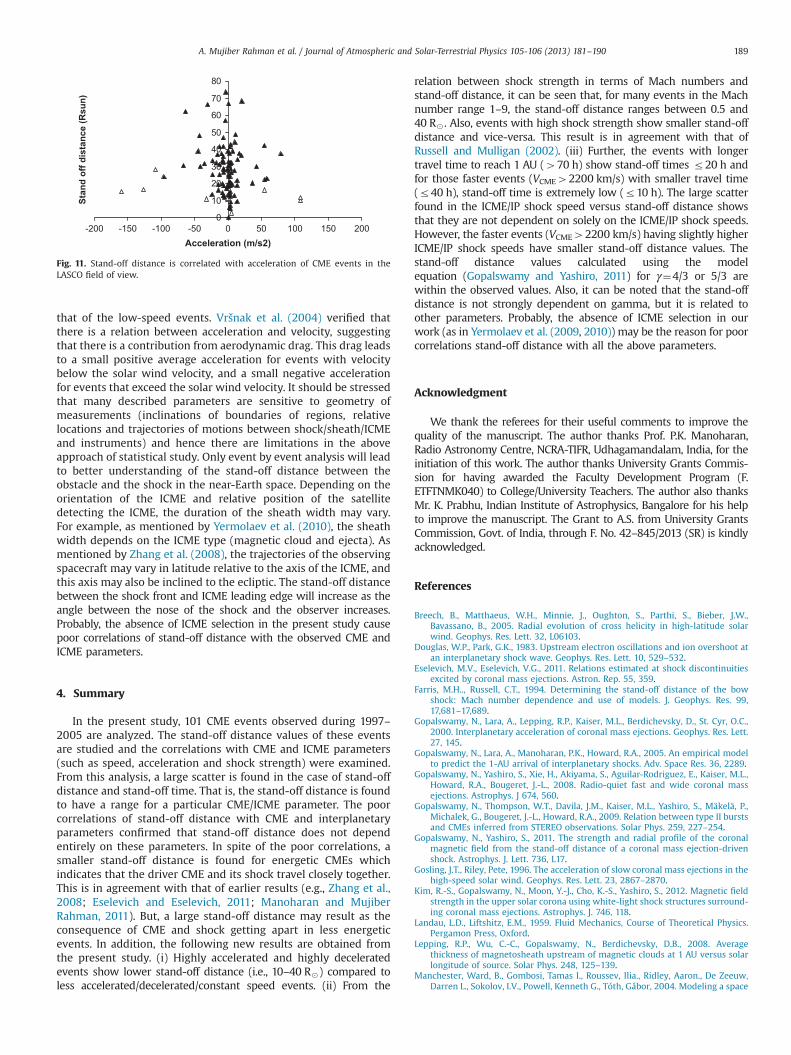
that of the low-speed events. Vršnak et al. (2004) verified thatthere is a relation between acceleration and velocity, suggestingthat there is a contribution from aerodynamic drag. This drag leadsto a small positive average acceleration for events with velocitybelow the solar wind velocity, and a small negative accelerationfor events that exceed the solar wind velocity. It should be stressedthat many described parameters are sensitive to geometry ofmeasurements (inclinations of boundaries of regions, relativelocations and trajectories of motions between shock/sheath/ICMEand instruments) and hence there are limitations in the aboveapproach of statistical study. Only event by event analysis will leadto better understanding of the stand-off distance between theobstacle and the shock in the near-Earth space. Depending on theorientation of the ICME and relative position of the satellitedetecting the ICME, the duration of the sheath width may vary.For example, as mentioned by Yermolaev et al. (2010), the sheathwidth depends on the ICME type (magnetic cloud and ejecta). Asmentioned by Zhang et al. (2008), the trajectories of the observingspacecraft may vary in latitude relative to the axis of the ICME, andthis axis may also be inclined to the ecliptic. The stand-off distancebetween the shock front and ICME leading edge will increase as theangle between the nose of the shock and the observer increases.Probably, the absence of ICME selection in the present study causepoor correlations of stand-off distance with the observed CME andICME parameters.
4. Summary
In the present study, 101 CME events observed during 1997–2005 are analyzed. The stand-off distance values of these eventsare studied and the correlations with CME and ICME parameters(such as speed, acceleration and shock strength) were examined.From this analysis, a large scatter is found in the case of stand-offdistance and stand-off time. That is, the stand-off distance is foundto have a range for a particular CME/ICME parameter. The poorcorrelations of stand-off distance with CME and interplanetaryparameters confirmed that stand-off distance does not dependentirely on these parameters. In spite of the poor correlations, asmaller stand-off distance is found for energetic CMEs whichindicates that the driver CME and its shock travel closely together.This is in agreement with that of earlier results (e.g., Zhang et al.,2008; Eselevich and Eselevich, 2011; Manoharan and MujiberRahman, 2011). But, a large stand-off distance may result as theconsequence of CME and shock getting apart in less energeticevents. In addition, the following new results are obtained fromthe present study. (i) Highly accelerated and highly deceleratedevents show lower stand-off distance (i.e., 10–40 R�) compared toless accelerated/decelerated/constant speed events. (ii) From the
relation between shock strength in terms of Mach numbers andstand-off distance, it can be seen that, for many events in the Machnumber range 1–9, the stand-off distance ranges between 0.5 and40 R� . Also, events with high shock strength show smaller stand-offdistance and vice-versa. This result is in agreement with that ofRussell and Mulligan (2002). (iii) Further, the events with longertravel time to reach 1 AU (470 h) show stand-off times r20 h andfor those faster events (VCME42200 km/s) with smaller travel time(r40 h), stand-off time is extremely low (r10 h). The large scatterfound in the ICME/IP shock speed versus stand-off distance showsthat they are not dependent on solely on the ICME/IP shock speeds.However, the faster events (VCME42200 km/s) having slightly higherICME/IP shock speeds have smaller stand-off distance values. Thestand-off distance values calculated using the modelequation (Gopalswamy and Yashiro, 2011) for γ¼4/3 or 5/3 arewithin the observed values. Also, it can be noted that the stand-offdistance is not strongly dependent on gamma, but it is related toother parameters. Probably, the absence of ICME selection in ourwork (as in Yermolaev et al. (2009, 2010)) may be the reason for poorcorrelations stand-off distance with all the above parameters.
Acknowledgment
We thank the referees for their useful comments to improve thequality of the manuscript. The author thanks Prof. P.K. Manoharan,Radio Astronomy Centre, NCRA-TIFR, Udhagamandalam, India, for theinitiation of this work. The author thanks University Grants Commis-sion for having awarded the Faculty Development Program (F.ETFTNMK040) to College/University Teachers. The author also thanksMr. K. Prabhu, Indian Institute of Astrophysics, Bangalore for his helpto improve the manuscript. The Grant to A.S. from University GrantsCommission, Govt. of India, through F. No. 42–845/2013 (SR) is kindlyacknowledged.
References
Breech, B., Matthaeus, W.H., Minnie, J., Oughton, S., Parthi, S., Bieber, J.W.,Bavassano, B., 2005. Radial evolution of cross helicity in high-latitude solarwind. Geophys. Res. Lett. 32, L06103.
Douglas, W.P., Park, G.K., 1983. Upstream electron oscillations and ion overshoot atan interplanetary shock wave. Geophys. Res. Lett. 10, 529–532.
Eselevich, M.V., Eselevich, V.G., 2011. Relations estimated at shock discontinuitiesexcited by coronal mass ejections. Astron. Rep. 55, 359.
Farris, M.H.., Russell, C.T., 1994. Determining the stand-off distance of the bowshock: Mach number dependence and use of models. J. Geophys. Res. 99,17,681–17,689.
Gopalswamy, N., Lara, A., Lepping, R.P., Kaiser, M.L., Berdichevsky, D., St. Cyr, O.C.,2000. Interplanetary acceleration of coronal mass ejections. Geophys. Res. Lett.27, 145.
Gopalswamy, N., Lara, A., Manoharan, P.K., Howard, R.A., 2005. An empirical modelto predict the 1-AU arrival of interplanetary shocks. Adv. Space Res. 36, 2289.
Gopalswamy, N., Yashiro, S., Xie, H., Akiyama, S., Aguilar-Rodriguez, E., Kaiser, M.L.,Howard, R.A., Bougeret, J.-L., 2008. Radio-quiet fast and wide coronal massejections. Astrophys. J 674, 560.
Gopalswamy, N., Thompson, W.T., Davila, J.M., Kaiser, M.L., Yashiro, S., Mäkelä, P.,Michalek, G., Bougeret, J.-L., Howard, R.A., 2009. Relation between type II burstsand CMEs inferred from STEREO observations. Solar Phys. 259, 227–254.
Gopalswamy, N., Yashiro, S., 2011. The strength and radial profile of the coronalmagnetic field from the stand-off distance of a coronal mass ejection-drivenshock. Astrophys. J. Lett. 736, L17.
Gosling, J.T., Riley, Pete, 1996. The acceleration of slow coronal mass ejections in thehigh-speed solar wind. Geophys. Res. Lett. 23, 2867–2870.
Kim, R.-S., Gopalswamy, N., Moon, Y.-J., Cho, K.-S., Yashiro, S., 2012. Magnetic fieldstrength in the upper solar corona using white-light shock structures surround-ing coronal mass ejections. Astrophys. J. 746, 118.
Landau, L.D., Liftshitz, E.M., 1959. Fluid Mechanics, Course of Theoretical Physics.Pergamon Press, Oxford.
Lepping, R.P., Wu, C.-C., Gopalswamy, N., Berdichevsky, D.B., 2008. Averagethickness of magnetosheath upstream of magnetic clouds at 1 AU versus solarlongitude of source. Solar Phys. 248, 125–139.
Manchester, Ward, B., Gombosi, Tamas I., Roussev, Ilia., Ridley, Aaron., De Zeeuw,Darren L., Sokolov, I.V., Powell, Kenneth G., Tóth, Gábor, 2004. Modeling a space
0
10
20
30
40
50
60
70
80
-200 -150 -100 -50 0 50 100 150 200Acceleration (m/s2)
Stan
d of
f dis
tanc
e (R
sun)
Fig. 11. Stand-off distance is correlated with acceleration of CME events in theLASCO field of view.
A. Mujiber Rahman et al. / Journal of Atmospheric and Solar-Terrestrial Physics 105-106 (2013) 181–190 189
weather event from the Sun to the Earth: CME generation and interplanetarypropagation. J. Geophys. Res. 109, A02107.
Manoharan, P.K., Gopalswamy, N., Yashiro, S., Lara, A., Michalek, G., Howard, R.A.,2004. Influence of coronal mass ejection on propagation of interplanetaryShocks. J. Geophys. Res. 109, A06109.
Manoharan, P.K., 2006. Evolution of coronal mass ejections in the inner helio-sphere:a study using white-light and scintillation images. Solar Phys. 235, 345.
Manoharan, P.K., Mujiber Rahman, A., 2011. Coronal mass ejections propagationtime and associated internal energy. J. Atmos. Solar Terr. Phys. 73, 671–677.
Moon, Y.-J., Cho, K.S., Smith, Z., Fry, C.D., Dryer, M., Park, Y.D., 2004. Flare-associatedcoronal mass ejections with large accelerations. Astrophys. J. 615, 1011–1020.
Mujiber Rahman, A., Umapathy, S., Shanmugaraju, A., Moon, Y.-J., 2012. Solar andinterplanetary parameters of CMEs with and without type II radio bursts. Adv.Space Res. 50, 516–525.
Odstrcil, D., Pizzo, V.J., Arge, C.N., 2005. Propagation of the 12 May 1997interplanetary coronal mass ejection in evolving solar wind structures.J. Geophys. Res. 110, A02106.
Raymond, J.C., 2008. UV diagnostics for the energy budget of flares and CMEs.J. Astrophys. Astron. 29, 187–193.
Russell, C.T., Mulligan, T., 2002. On the magnetosheath thicknesses of interplane-tary coronal mass ejections. Planet. Space. Sci. 50, 527–534.
Spreiter, John R., Alksne, Alberta Y., Abraham-Shrauner, Barbara, 1966. Theoreticalproton velocity distributions in the flow around the magnetosphere. Planet.Space. Sci. 14, 1207.
Spreiter, J.R., Stahara, S.S., 1980. A new predictive model for determining solarwind–terrestrial planet interactions. J. Geophys. Res. 85, 6769–6777.
Spreiter, J.R., Stahara, S.S., 1995. The location of planetary bow shocks: a criticaloverview of theory and observations. Adv. Space Res. 15, 433–449.
Tsurutani, B.T., Smith, E.J., Gonzalez, W.D., Tang, F., Akasofu, S., 1988. Origin ofinterplanetary magnetic fields responsible for major magnetic storms nearsolar maximum (1978–1979). J. Geophys. Res. 93, 8519–8531.
Velli, M., Prunetti, F., 1997. Alfven waves in the solar corona and solar wind. PlasmaPhys. Control Fusion 39, B317.
Vršnak, B., Ruzdjak, D., Sudar, D., Gopalswamy, N., 2004. Kinematics of coronalmass ejections between 2 and 30 solar radii. What can be learned about forcesgoverning the eruption? Astron. Astrophys. 423, 717–728.
Yashiro, S., Gopalswamy, N., Michalek, G., St. Cyr, O.C., Plunkett, S.P., Rich, N.B.,Howard, R.A., 2004. A catalog of white light coronal mass ejections observed bythe SOHO spacecraft. J. Geophys. Res. 109, A07105.
Yermolaev, Yuri.I., Nikolaeva, N.S., Lodkina, I.G., Yermolaev, M.Yu., 2009. Catalog oflarge-scale solar wind phenomena during 1976–2000. Cosmic Res. 47, 81–94.
Yermolaev, Yuri I., Nikolaeva, Nadezhda S., Lodkina, Irina G., Yermolaev, Mikhail Yu,2010. AIP Conf. Proc. 1216, 648.
Zhang, J., Kundu, M.R., White, S.M., Dere, K.P., Newmark, J.S., 2001. Reconcilingextreme-ultraviolet and radio observations of the Sun's corona. Astrophys.J. 561, 396–405.
Zhang, J., Dere, K.P., Howard, R.A., Vourlidas, A., 2004. A study of the kinematicevolution of coronal mass ejections. Astrophys. J. 604, 420–432.
Zhang, J., Poomvises, W., Richardson, I.G., 2008. Size and relative geoeffectiveness ofinterplanetary coronal mass ejections and the preceding shock sheaths duringintense storms in 1996–2005. Geophys. Res. Lett. 35, L02109.
A. Mujiber Rahman et al. / Journal of Atmospheric and Solar-Terrestrial Physics 105-106 (2013) 181–190190


